
und Technologiemarketing Access versus
270
TECHNISCHE UNIVERSITÄT MÜNCHEN TUM School of Management Lehrstuhl für Dienstleistungs- und Technologiemarketing Access versus Ownership: Consumers’ Reactions to an Alternative Consumption Mode Christoph Kai Baumeister Vollständiger Abdruck der von der Fakultät für Wirtschaftswissenschaften der Technischen Universität München zur Erlangung des akademischen Grades eines Doktors der Wirtschaftswissenschaften (Dr. rer. pol.) genehmigten Dissertation. Vorsitzender: Univ.-Prof. Dr. Rainer Kolisch Prüfer der Dissertation: 1. Univ.-Prof. Dr. Florian von Wangenheim, ETH Zürich / Schweiz 2. Univ.-Prof. Dr. Frank-Martin Belz Die Dissertation wurde am 17.12.2013 bei der Technischen Universität München eingereicht und durch die Fakultät für Wirtschaftswissenschaften am 15.02.2014 angenommen.
-
Upload
khangminh22 -
Category
Documents
-
view
1 -
download
0
Transcript of und Technologiemarketing Access versus

TECHNISCHE UNIVERSITÄT MÜNCHEN
TUM School of Management
Lehrstuhl für Dienstleistungs- und Technologiemarketing
Access versus Ownership: Consumers’ Reactions to an
Alternative Consumption Mode
Christoph Kai Baumeister
Vollständiger Abdruck der von der Fakultät für Wirtschaftswissenschaften der
Technischen Universität München zur Erlangung des akademischen Grades eines
Doktors der Wirtschaftswissenschaften (Dr. rer. pol.)
genehmigten Dissertation.
Vorsitzender: Univ.-Prof. Dr. Rainer Kolisch
Prüfer der Dissertation: 1. Univ.-Prof. Dr. Florian von Wangenheim,
ETH Zürich / Schweiz
2. Univ.-Prof. Dr. Frank-Martin Belz
Die Dissertation wurde am 17.12.2013 bei der Technischen Universität München
eingereicht und durch die Fakultät für Wirtschaftswissenschaften am 15.02.2014
angenommen.


Summary I
Summary
During the past century purchasing and ultimately becoming the owner of a good had
been the dominant consumption mode by far. Today the situation on consumer
markets has changed: A new form of consumption – access – has gained tremendous
importance in various consumer goods industries. If a consumer fulfills his or her
consumption needs via the access consumption mode, the user pays for a temporary
right to enjoy the benefits of a good that is owned not by him or her, but by a third
party that provides access to it. Consumer behavior in the context of access is not
well understood yet as most marketing knowledge refers to purchased and owned
goods and cannot be simply transferred to the increasingly relevant access-based
consumption.
This dissertation takes two different perspectives on consumer behavior in situations
where an access consumption mode next to ownership is available. In a first research
project, a consumer’s perspective is taken by investigating which perceptions cause
consumers to prefer one or the other consumption mode. In a second research
project, the perspective of a manager is taken by researching how a company should
ideally market a new access offering. Neither of both research perspectives has been
studied before in this breadth and depth. Existing research on consumption mode
evaluation has worked solely by qualitative means, whereas there is only one
publication yet that deals with one facet of the ideal design of access offerings.
Research project I comprises (a) the development of a formative measurement tool of
consumers’ perceptions and the resulting attitude towards access and ownership and
(b) the results of its application to four different product categories and to consumers
with and without access consumption experience. Based on literature review and
qualitative interviews, a second-order formative model is conceptualized and
validated in a mixed-methods approach. The results show that functional and

II Summary
monetary perceptions are generally most important, followed by experiential and
symbolic perceptions. On a more granular level, access offerings in different
categories are perceived differently, highlighting the importance of multi-category
studies. The contrast of experienced access users with inexperienced access users
further shows that experience affects perceptions of consumption modes. Project I
contributes to the marketing discipline by providing empirically grounded
information about the perception of consumption modes and by advancing theory
development on consumption mode choice. Furthermore, it contributes a
standardized way for managers, policy makers, as well as science to measure and
understand the nature of the factors that drive consumption mode choice – over time,
over different product categories and over different access designs.
In a series of five experiments, research project II investigates (a) the importance of
product brand and service convenience for the success of an access offering, (b) how
current customers of a given brand react to the introduction of an additional access
offering by their brand, and (c) whether the introduction of access ultimately harms
or benefits an existing parent brand that used to solely offer the ownership
consumption mode before. It is found that for consumers’ attitude towards carsharing
offerings the provided service convenience is important, whereas the car brand
appears not to be important. However, for the behavioral intention the results are
reversed. Similarly, in the fashion product category the product brand is generally
found to be important for consumers’ evaluations. Furthermore it is found that
owners of a brand react differently to a new access offering by the respective brand
as compared to non-owners: In case of access offerings that are based on low
prestige brands, non-owners express a more positive evaluation as compared to
owners. In case of access offerings that are based on high prestige brands, owners’
evaluations are better as compared to non-owners – indicating that they perceive
access not as a devaluation of their ownership, but rather as an extension of their
options. Moreover, it is found that the introduction of an additional consumption
mode does not negatively affect the parent brand. Overall, Project II contributes to
the marketing literature by improving the understanding of how access offerings
should be ideally marketed by taking different stakeholders into account.
On a general level, this dissertation contributes several important implications to the
currently rather unexplored research area of consumption modes. Most importantly,

Summary III
this dissertation is the first to show on an empirical basis that access offerings are
fundamentally different as compared to ownership offerings. In addition, the results
of this dissertation, which are based on simultaneous investigations in several
product categories, highlight the need to be cautious when generalizing findings on
access that are based on only a single product category. Besides, attitudes and
behavioral intentions are found to differ which is most likely due to the influence of
social norms and perceived behavioral control, which should be taken into
consideration in future studies.
Future research could investigate access offerings other than the most common
business-to-consumer offerings (which have been in the focus of this thesis) such as
peer-to-peer sharing offerings, long-term leasing offerings, or fractional ownership
models. Another promising but unexplored research area is the influence of different
tariffs on the adoption of access offerings. Ultimately, longitudinal studies could
explore whether companies are in the long run generally better advised to solely offer
either consumption mode or both at the same time.

IV Summary

Acknowledgment V
Acknowledgment
First and foremost I would like to thank Prof. Florian v. Wangenheim for his continuous
support and willingness to discuss my research progress at all times. I sincerely
appreciate the freedom and support he gave me in choosing this topic, selecting
collaboration partners, going abroad and making decisions. Furthermore, I would also
like to thank Prof. Frank-Martin Belz for integrating me into his research group in the
last year of my dissertation and all his helpful comments to my work in progress. I am
also grateful to Prof. Rainer Kolisch for agreeing to become the chairperson of my
dissertation and for facilitating the continuance of the Proset project after Prof.
Wangenheim changed to ETH Zurich.
Furthermore I would like to thank all my present and past colleagues at TUM for their
valuable feedback and support: Sebastian Ackermann, Eva Anderl, Armin Arnold,
Marcella Grohmann, Christian Heumann, Sabine Hommelhoff, Christine Igl, Michael
Lachner, Gabriella Loparco, Armin März, Daniela Schaller, Jan Schumann, Lena
Rehnen, and Marcus Zimmer. I also appreciate the great support from my student
assistants who relieved me at various points during my dissertation: Adnan Azad,
Florian Kaiser, Simone Lambrich, Wen En Lee, Matthias Obermeier, and Patrick Senn.
Besides, I would also like to thank TUM CREATE for making my stay in Singapore
possible and in particular my supervisor Daniel Gleyzes as well as my colleagues Peter
Bartsch, Rahul Gujarathi, Witono Halim and Andreas Schwab for supporting my
research endeavors in Singapore. I am also very grateful for the successful collaboration
with ZebraMobil, which sadly had to close its operations this summer. Thanks a lot to
the two founders Michael Hoene and Michael Ohr. On top, I would also like to thank
Hans Zischka for always being available for our legendary afternoon Nespresso sessions.
Last but definitely not least, I would like to thank my family and friends for always
supporting me. But most importantly, I would like to thank Susanne Wiesmayer for her
everlasting encouragement and all the helpful discussions and review rounds, which
made this work possible at all!

VI Acknowledgment

Table of Contents VII
Table of Contents
Summary ...................................................................................................................... I
Acknowledgment ....................................................................................................... V
Table of Contents ................................................................................................... VII
List of Figures ........................................................................................................... XI
List of Tables ......................................................................................................... XIII
List of Abbreviations ........................................................................................... XVII
1 Introduction .......................................................................................................... 1 1.1 Research Motivation ........................................................................................ 1 1.2 Research Questions ......................................................................................... 4 1.3 Structure of the Thesis ..................................................................................... 6
2 Conceptual Foundation of Consumption Mode Choice ................................... 8 2.1 Definition and Demarcation of Consumption Modes ..................................... 8 2.2 Drivers of Access .......................................................................................... 10 2.3 Typology of Access Offerings ....................................................................... 12
2.3.1 Existing typologies of access offerings .................................................. 12 2.3.2 A two-level typology of access offerings ............................................... 13
2.4 Theories Related to Consumption Mode Choice ........................................... 17 2.5 Current Knowledge on Adoption of Access and Consumption Mode
Choice .......................................................................................................... 20
3 Project I: A Differential Measure of Consumers’ Attitudes towards Consumption Modes ................................................................................................ 28
3.1 Introduction ................................................................................................... 28

VIII Table of Contents
3.2 Theoretical Foundations ................................................................................ 30 3.2.1 Consumers’ perceptions towards consumption modes ........................... 30 3.2.2 Access versus ownership ........................................................................ 31 3.2.3 The importance of perceptions for determining attitude ......................... 32
3.3 Relevant Perceptions of Consumption Modes ............................................... 33 3.3.1 Qualitative research methodology .......................................................... 33 3.3.2 Relevant perceptions of consumption modes ......................................... 36 3.3.3 Summary of the identified perceptions ................................................... 48
3.4 The Formative Measurement Model ............................................................. 50 3.4.1 Content specification .............................................................................. 51 3.4.2 Indicator specification ............................................................................. 51 3.4.3 Indicator collinearity ............................................................................... 54 3.4.4 External validity ...................................................................................... 55
3.5 Methodology of the Empirical Studies .......................................................... 57 3.5.1 Study design ............................................................................................ 57 3.5.2 Sample description .................................................................................. 58 3.5.3 Measures ................................................................................................. 61 3.5.4 Data analysis methods ............................................................................. 61
3.6 Empirical Results ........................................................................................... 63 3.6.1 Attitudes towards and perceptions of access and ownership .................. 63 3.6.2 Assessment of the validity of the measurement model ........................... 69 3.6.3 Comparison of indicator importance across product categories ............. 73 3.6.4 Contrasting perceptions from prospective users and experienced users . 77
3.7 Discussion ...................................................................................................... 82 3.7.1 Discussion of the attitude and perceptions towards access and
ownership .............................................................................................. 82 3.7.2 Discussion of the developed formative measurement model ................. 85 3.7.3 Discussion of indicator importance across product categories ............... 87 3.7.4 Discussion of different perceptions from prospective users versus
experienced users .................................................................................. 88 3.7.5 Applications of the measurement model ................................................. 89 3.7.6 Study limitations & avenues for further research ................................... 91
4 Project II: How Consumers Respond to Consumption Mode Extensions .... 92 4.1 Introduction ................................................................................................... 92 4.2 Hypotheses ..................................................................................................... 96
4.2.1 Hypotheses on the importance of product brands and service convenience ........................................................................................... 97
Table of Contents IX
4.2.2 Hypothesized effects on current owners ............................................... 100 4.2.3 Hypothesized effects on parent brand evaluations ............................... 102
4.3 Methodology ................................................................................................ 106 4.3.1 Study designs ........................................................................................ 106 4.3.2 Sampling ............................................................................................... 112 4.3.3 Measures ............................................................................................... 112
4.4 Results ......................................................................................................... 115 4.4.1 Pretests .................................................................................................. 115 4.4.2 Manipulation checks ............................................................................. 116 4.4.3 Results of hypothesis 1a ....................................................................... 117 4.4.4 Results of hypothesis 1b ....................................................................... 122 4.4.5 Results of hypotheses 2a and 2b ........................................................... 124 4.4.6 Results of hypothesis 3 ......................................................................... 129 4.4.7 Results of the scenario experiment with real customers ....................... 135
4.5 Discussion .................................................................................................... 139 4.5.1 Discussion of the importance of product brands and service
convenience ........................................................................................ 139 4.5.2 Discussion of ownership status effects ................................................. 142 4.5.3 Discussion of the parent brand evaluation ............................................ 144 4.5.4 Managerial implications ....................................................................... 145 4.5.5 Study limitations & avenues for further research ................................. 147
5 General Discussion and Conclusion ............................................................... 149 5.1 Summary of Key Findings ........................................................................... 150 5.2 General Discussion ...................................................................................... 153
5.2.1 Implications for theory and research .................................................... 153 5.2.2 Implications for managers .................................................................... 159
5.3 Directions for Future Studies ....................................................................... 162
References ............................................................................................................... 165
Appendix ................................................................................................................. 183
A. Appendix for Project I .................................................................................... 184
B. Appendix for Project II .................................................................................. 203

X Table of Contents

List of Figures XI
List of Figures
Figure 1: Overview of Research Projects and Research Questions. ............................ 4 Figure 2: Structure of the Thesis. ................................................................................. 6 Figure 3: A Two-Level Typology of Access Offerings. ............................................ 15 Figure 4: Reflective and Formative Measurement Models. ....................................... 50 Figure 5: MIMIC Model of the Second-Order Construct Attitute towards
Consumption Modes. ............................................................................. 56 Figure 6: Description of the Carsharing Access Offering Used in the Survey. ......... 58 Figure 7: Differences between Access and Ownership Perceptions and Attitudes
in Case of Cars and Bicycles. ................................................................ 67 Figure 8: Differences between Access and Ownership Perceptions and Attitudes
in Case of Books and Handbags. ........................................................... 68 Figure 9: Hyhpotheses and Empirical Results of the Ownership Effect according
to Kirmani et al. (1999). ...................................................................... 101 Figure 10: Processing of New Information according to the Bookkeeping and the
Subtyping Model. ................................................................................ 104 Figure 11: Interaction Graph of Access Attitude between Brand Prestige and
Ownership Status as well as Ownership Status and Brand Prestige in Study 2 for Cars. .............................................................................. 125
Figure 12: Interaction Graphs of Access Behavioral Intention between Brand Prestige and Ownership Status as well as between Ownership Status and Brand Prestige in Study 2 for Fashion. ......................................... 127
Figure 13: Perspectives of the Research Projects. ................................................... 150 Figure 14: Description of the Bikesharing Access Offering Used in the Survey
(Project I). ............................................................................................ 186 Figure 15: Description of the Book Rental Access Offering Used in the Survey
(Project I). ............................................................................................ 186 Figure 16: Description of the Handbag Rental Access Offering Used in the
Survey (Project I). ............................................................................... 187 Figure 17: Notional Consumer Reports Article on the Low Prestige Car Brand
from Study 1 (English). ....................................................................... 203 Figure 18: Notional Consumer Reports Article on the Low Prestige Car Brand
from Study 1 (German). ...................................................................... 204 Figure 19: Notional Consumer Reports Article on the Low Prestige Fashion
Brand from Study 1 (English). ............................................................ 204 Figure 20: Notional Consumer Reports Article on the Low Prestige Fashion
Brand from Study 1 (German). ............................................................ 205 Figure 21: Details Table of the Notional Consumer Reports Articles for Cars in
Study 2 (English and German). ........................................................... 206

XII List of Figures
Figure 22: Details Table of the Notional Consumer Reports Articles for Fashion in Study 2 (English and German). ....................................................... 207
Figure 23: Details Table of the Notional Consumer Reports Article for the Low Convenience Condition in Study 3 (English and German). ................ 208
Figure 24: Details Table of the Notional Consumer Reports Article for the Medium Convenience Condition in Study 3 (English and German). .. 209
Figure 25: Details Table of the Notional Consumer Reports Article for the High Convenience Condition in Study 3 (English and German). ................ 210
Figure 26: Text of the Notional Consumer Reports Article for the Low Distance (top) and High Distance (bottom) Branding Strategy in Study 4 (English). ............................................................................................. 211
Figure 27: Text of the Notional Consumer Reports Article for the Low Distance (top) and High Distance (bottom) Branding Strategy in Study 4 (German). ............................................................................................. 212
Figure 28: Interaction Graph of Access Attitude between Price Level and Brand in Study 2 for Cars. .............................................................................. 232
Figure 29: Interaction Graph of Access Attitude between Brand and Price Level in Study 2 for Cars. .............................................................................. 232
Figure 30: Interaction Graph of Access Behavioral Intention between Brand and Price Level in Study 2 for Cars. .......................................................... 232
Figure 31: Interaction Graph of Access Behavioral Intention between Brand and Price Level in Study 2 for Cars. .......................................................... 233
Figure 32: Interaction Graph of Access Behavioral Intention between Brand and Ownership Status in Study 2 for Cars. ................................................ 233
Figure 33: Interaction Graph of Access Behavioral Intention between Ownership Status and Brand in Study 2 for Cars. ................................................. 233
Figure 34: Interaction Graph of Parent Brand Innovativeness between Treatment and Ownership Status in Study 2 for Cars. .......................................... 234
Figure 35: Interaction Graph of Parent Brand Innovativeness between Ownership Status and Treatment in Study 2 for Cars. ........................................... 234
Figure 36: Interaction Graph of Parent Brand Exclusivity between Treatment and Ownership Status in Study 2 for Cars. ................................................ 234
Figure 37: Interaction Graph of Parent Brand Exclusivity between Ownership Status and Treatment in Study 2 for Cars. ........................................... 235
Figure 38: Interaction Graph of Access Attitude between Brand Prestige and Price Level in Study 3. ........................................................................ 235
Figure 39: Interaction Graph of Access Attitude between Price Level and Brand Prestige in Study 3. .............................................................................. 235
Figure 40: Interaction Graph of Access Usage Intention between Brand Prestige and Ownership Status in Study 4. ........................................................ 236
Figure 41: Interaction Graph of Access Usage Intention between Ownership Status and Brand Prestige in Study 4. ................................................. 236
Figure 42: Interaction Graph of Access Usage Intention between Branding Strategy and Brand Prestige in Study 4. .............................................. 237
Figure 43: Interaction Graph of Access Usage Intention between Brand Prestige and Branding Strategy in Study 4. ....................................................... 237

List of Tables XIII
List of Tables
Table 1: Summary of the Literature Review on Publications About Access and
Consumption Mode Choice ................................................................... 24 Table 2: Contrast of Ownership and Access .............................................................. 31 Table 3: Description of In-Depth Interview Participants ........................................... 34 Table 4: Identified Perceptions of Consumption Modes and their Definitions ......... 49 Table 5: Items for Measuring the Attitude towards Consumption Modes ................. 53 Table 6: Differences between the Investigated Product Categories ........................... 57 Table 7: Sample Sizes in the Four Different Survey Conditions with and without
Data Quality Filters (Project I) .............................................................. 59 Table 8: Sociodemographics and Consumption Mode Status for the Four Sub-
Samples (Project I) ................................................................................ 60 Table 9: Respondents Grouped According to their Differential Consumption
Mode Attitudes ...................................................................................... 64 Table 10: Assessment of the Second-Order Construct in PLS .................................. 72 Table 11: Henesler’s PLS Multigroup Analysis across Product Categories .............. 76 Table 12: Group Means on Matching and Control Variables Before and After
Matching ................................................................................................ 78 Table 13: Mean Comparison of Non-Access and Access Users on their Absolute
Access and Differential Perceptions ...................................................... 79 Table 14: Assessment of the Formative Measurement Model for Non-Access
Users as Opposed to Access Users ........................................................ 81 Table 15: Overview of Hypotheses (Project II) ......................................................... 97 Table 16: Overview of Experiments and Specifications of the Experimental
Factors ................................................................................................. 107 Table 17: Results Summary for Testing Hypothesis 1a ........................................... 122 Table 18: Results Summary for Testing Hypothesis 2a and 2b ............................... 129 Table 19: Results Summary for Testing Hypothesis 3 ............................................. 135 Table 20: Results Summary of all Studies and Hypotheses (Project II) .................. 138 Table 21: Original German Items for Measuring the Attitude Towards
Consumption Modes ............................................................................ 184 Table 22: Correaltion Matrix for the Product Categories Cars and Bicycles
(Project I) ............................................................................................. 189 Table 23: Correaltion Matrix for the Product Categories Books and Handbags
(Project I) ............................................................................................. 190 Table 24: Detailed PLS Results on Paths, Loadings and Weights for Cars ............. 191 Table 25: Detailed PLS Results on Paths, Loadings and Weights for Bicycles ...... 192 Table 26: Detailed PLS Results on Paths, Loadings and Weights for Books .......... 193 Table 27: Detailed PLS Results on Paths, Loadings and Weights for Handbags .... 194

XIV List of Tables
Table 28: Assessment of the Nomological Validity for the Overall Construct Usage Intention .................................................................................... 195
Table 29: Differences Between Access and Ownership Perceptions and Attitudes 196 Table 30: Contrast of the Absolute Consumption Mode Perceptions for Cars ........ 197 Table 31: Contrast of the Absolute Consumption Mode Perceptions for Bicycles . 198 Table 32: Contrast of the Absolute Consumption Mode Perceptions for Books ..... 199 Table 33: Contrast of the Absolute Consumption Mode Perceptions for Handbags 200 Table 34: Cross Tabs of Consumption Mode Attitudes for Cars ............................. 201 Table 35: Cross Tabs of Consumption Mode Attitudes for Bicycles ...................... 201 Table 36: Cross Tabs of Consumption Mode Attitudes for Books .......................... 202 Table 37: Cross Tabs of Consumption Mode Attitudes for Handbags .................... 202 Table 38: Sociodemographics for Studies 1 – 5 (Project II) .................................... 213 Table 39: Comprehensive Display of all Measurement Constructs and Items in
German and English (Project II) .......................................................... 215 Table 40: Manipulation Checks for Brand Prestige and Brand Quality .................. 220 Table 41: Manipulation Checks for Service Convenience ....................................... 221 Table 42: Manipulation Checks for Branding Strategy ........................................... 221 Table 43: Simple Main Effect Analysis for the Ownership Status × Brand
Prestige Interaction of the Parent Brand Evaluation ........................... 222 Table 44: Analysis of Covariance for Brand Prestige in Study 1 in the Cars
Category .............................................................................................. 223 Table 45: Analysis of Covariance for Brand Prestige in Study 1 in the Fashion
Category .............................................................................................. 223 Table 46: Analysis of Variance for Ownership Status, Price Level and Brand
Prestige in Study 2 in the Cars Category ............................................. 224 Table 47: Analysis of Variance for Ownership Status, Price Level and Brand
Prestige in Study 2 in the Fashion Category ....................................... 224 Table 48: Analysis of Variance for Ownership Status, Price Level, Brand
Prestige and Convenience Level in Study 3 ........................................ 225 Table 49: Analysis of Variance for Brand Prestige, Ownership Status and
Branding Strategy in Study 4 .............................................................. 226 Table 50: Brand × Access ANCOVA in Study 1 in the Cars Category ................... 227 Table 51: Brand × Access ANCOVA in Study 1 in the Fashion Category ............. 228 Table 52: Analysis of Variance for Brand, Ownership Status, and Treatment in
Study 2 in the Cars Category ............................................................... 229 Table 53: Analysis of Variance for Brand, Ownership Status, and Treatment in
Study 2 in the Fashion Category ......................................................... 230 Table 54: Analysis of Variance for Brand, Ownership Status, and Treatment in
Study 4 ................................................................................................. 231 Table 55: Cell Means in Study 1 in the Cars Category ............................................ 238 Table 56: Cell Means in Study 1 in the Fashion Category ....................................... 238 Table 57: Cell Means in Study 2 in the Cars Category ............................................ 239 Table 58: Cell Means in Study 2 in the Fashion Category ....................................... 240 Table 59: Cell Means in Study 3 .............................................................................. 241 Table 60: Cell Means in Study 4 .............................................................................. 242 Table 61: Cell Means and Analyses of Variance in Study 5 .................................... 243 Table 62: Cars and Fashion Correlation Table in Study 1 (Project II) .................... 245 Table 63: Cars and Fashion Correlation Table in Study 2 (Project II) .................... 246 Table 64: Correlation Table in Study 3 (Project II) ................................................. 247 Table 65: Correlation Table in Study 4 (Project II) ................................................. 248

List of Tables XV
Table 66: Correlation Table in Study 5 (Project II) ................................................. 249

XVI List of Tables

List of Abbreviations XVII
List of Abbreviations
ANCOVA analysis of covariance
ANOVA analysis of variance
B2C business-to-consumer
C2C consumer-to-consumer
e.g. exempli gratia (for example)
i.e. id est (that is)
L loading
MANOVA multivariate analysis of variance
MANCOVA multivariate analysis of covariance
MIMIC multiple indicators and multiple causes
n.s. not significant
OTG omnibus test of group differences
p. page
P2P peer-to-peer
PLS partial least squares
REGWQ Ryan, Einot, Gabriel and Welsch Q (test)
TPB Theory of Planned Behavior
VIF variance inflation factor
vs. versus
W weight
WOM word-of-mouth

XVIII List of Abbreviations

1. Introduction
1
1 Introduction
1.1 Research Motivation
During the past century purchasing and ultimately becoming the owner of a good had
been the dominant consumption mode by far. A consumption mode is defined as the
circumstances under which a consumer fulfills his or her consumption needs. The
ownership consumption mode typically comprises the transfer of the good as well as
the associated property rights from one party to another in exchange of a certain
amount of money (Chen, 2009).1 Both sides – companies and consumers – supported
the dominance of ownership. On the one hand, companies heavily promoted the
importance of ownership in their advertisements: Products that are only rarely
needed were advertised by a you-never-know-when-you-might-need-it-strategy
(Botsman & Rogers, 2010). Furthermore, the wide spread of credit cards facilitated a
buy now – pay later culture, which has accelerated mindless and greater spending
than can be afforded. Consumers therefore got the chance to instantly afford goods
which are ultimately too expensive for them (Botsman & Rogers, 2010). On the other
side, consumers adopted cultural values that caused them to perceive ownership as
the most advantageous form of consumption (Bardhi & Eckhardt, 2012). Historically
ownership is associated with adulthood and is believed to be superior because it is
cheaper than renting in the long run, it allows accumulating capital and provides one
with independence and security (Bardhi & Eckhardt, 2012; Ronald, 2008; Snare,
1972): Ownership earned by labor had become the basis of our modern self-
confidence (Rifkin, 2000).
Today the situation on consumer markets has changed. Ownership is no longer the
only desired and viable solution to consumers’ needs (Bardhi & Eckhardt, 2012; 1 Instead of ownership, Chen used the term possession. As the term possession does not clearly differentiate between something that is permanently owned versus temporally possessed, I decided to use the term ownership instead because when you access something, you legally posses it during the access period but you do not own it.

2 1. Introduction
Belk, 2013b; Botsman & Rogers, 2010; Chen, 2009; Walsh, 2011). Due to several
factors, a new form of consumption called access has gained tremendous importance
during the past decade – it has changed from being a niche solution to a consumption
mode that can compete with the traditional ownership-based consumption. Access
does not rely on the market-mediated exchange of ownership – the ownership rather
stays with one party that simultaneously grants access to it. If a consumer fulfills his
or her consumption needs via the access consumption mode, the user pays for a
temporary right to enjoy the benefits of a good that is owned not by him, but by a
third party that provides access (Chen, 2009). The topic has started to attract interest
by scholars in marketing and consumer research (Bardhi & Eckhardt, 2012; Belk,
2013b; Chen, 2009; Lamberton & Rose, 2012), as well as other academic disciplines
interested in major societal change and transformation (Humphreys & Grayson,
2008; Schaefers, 2013; Schrader, 1999).
Access-based consumption has been growing tremendously over the past few years
in various consumer goods industries such as automobiles, bicycles, fashion, toys or
media (Bardhi & Eckhardt, 2012; Geron, 2013; Lamberton & Rose, 2012). In all
those industries incumbents are being challenged by start-ups that offer innovative
short-term rental offerings, which disrupt the industry and could cause a decline in
sales for those established businesses that purely rely on selling goods (Boesler,
2013). Consider successful access offerings such as carsharing (car2go, Zipcar),
bikesharing (Vélib’, Call a Bike), online fashion rental services (renttherunway.com),
handbag rental services (bagborroworsteal.com), movie rental (Netflix, Lovefilm), or
tool rental (zilok.com) as examples. The carsharing market in the USA is predicted to
be a $3.3 billion market in 2016, while forecasts about Europe predict 15 million
carsharing users until 2020 (Frost & Sullivan, 2010, 2012). There are not only
promising forecasts, but there is also notable success that has already taken place:
The carsharing provider car2go (a subsidiary of Daimler) has recently announced
that its customer base now counts more than half a million signed-up customers and
that it has already reached a profitable business case in some of the cities where it is
offering its service (Daimler, 2013b; Handelsblatt, 2013). Also bikesharing has seen
a remarkable increase in many cities worldwide: Each month already more than 2.2
million bikesharing trips are taking place (Sacks, 2011). The trend towards accessing
goods rather than owning them is a major trend affecting consumers, society and

1. Introduction
3
businesses likewise (Belk, 2013b; Lamberton & Rose, 2012; Lovelock &
Gummesson, 2004).
As a consequence, consumers are increasingly facing the decision about how they
prefer to consume a certain object. Some time ago consumers only had to decide
whether to consume at all and what to consume. In the meantime, accessing goods by
using a service has become a convenient, cost-efficient and environmentally friendly
alternative to ownership in different fields, giving consumers the choice how to
consume: Either by becoming the owner of the item in question or by accessing it
through a service (Botsman & Rogers, 2010; Chen, 2009; Lovelock & Gummesson,
2004; Rifkin, 2000). The Time magazine even classified access as one of 10 ideas
with the ability to “change the world” because it is a financially attractive and green
alternative to the traditional and well-known ownership consumption mode (Walsh,
2011).
A better understanding of consumer behavior in consumption mode choice is also
highly relevant for our society as access might turn out to be a well suited solution to
cope with limited resources, environmental pollution and a rapidly growing global
population living increasingly in densely-populated megacities (Lovelock &
Gummesson, 2004). Thus, access has gained importance on political agendas for
promoting more sustainable consumer behaviors (Lovelock & Gummesson, 2004).
Furthermore, policy makers are interested in access because of its welfare
implications as access offerings enable consumers to consume products that they
cannot afford to buy (Bardhi and Eckhardt 2012; Lamberton and Rose 2012).
Furthermore, access has the potential to interrupt many firms’ business models based
on selling consumer goods (Belk, 2013b). So far it has remained unclear whether
access may be a valuable additional source of revenue or more a threat to a firm’s
existing business model. Besides potential cannibalization effects, a firm with an
access-based business model faces the risk of high capital requirements, a high labor
intensity and a stretching of cash-flows over a longer period of time (Scholl, 2008).
On the other hand, a company could gain advantages by more stable cash-flows,
more direct and long-time customer contacts, the collection of valuable customer
data from detailed usage data, the opportunity to gain a greener and more innovative
image in politics and society, and the possibility to address new or previously lost
market segments (Gansky, 2010; Scholl, 2008).
4 1. Introduction
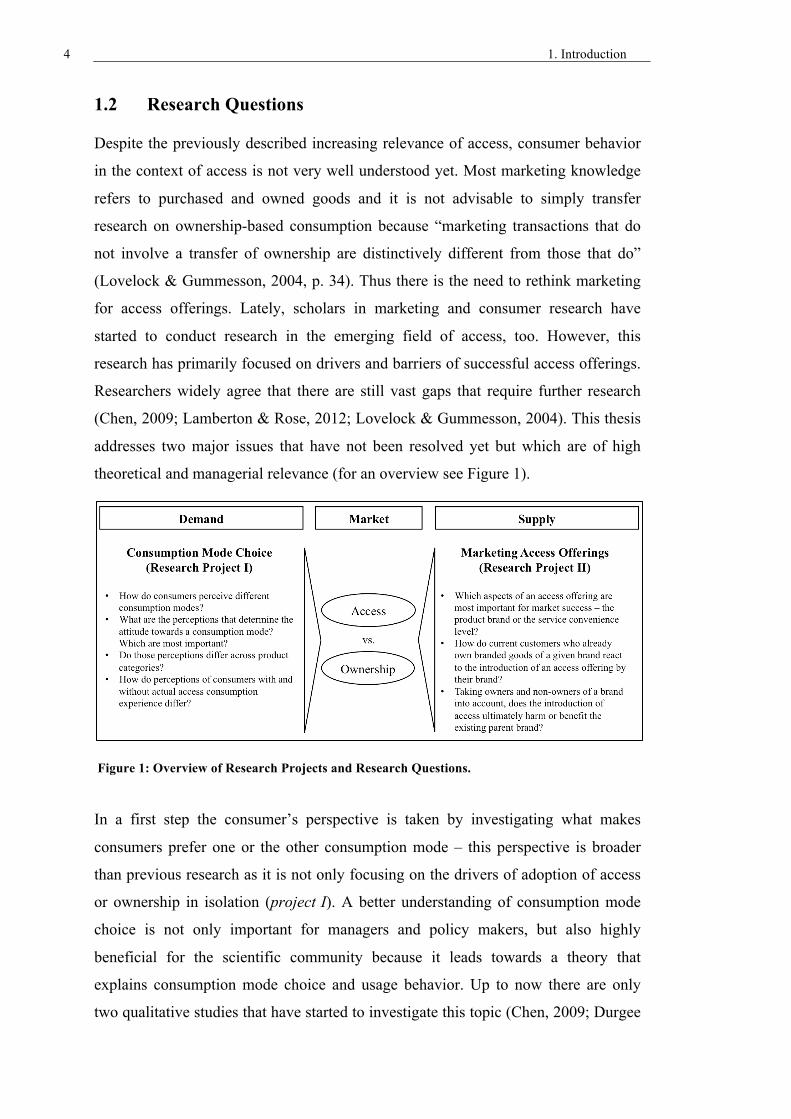
1.2 Research Questions
Despite the previously described increasing relevance of access, consumer behavior
in the context of access is not very well understood yet. Most marketing knowledge
refers to purchased and owned goods and it is not advisable to simply transfer
research on ownership-based consumption because “marketing transactions that do
not involve a transfer of ownership are distinctively different from those that do”
(Lovelock & Gummesson, 2004, p. 34). Thus there is the need to rethink marketing
for access offerings. Lately, scholars in marketing and consumer research have
started to conduct research in the emerging field of access, too. However, this
research has primarily focused on drivers and barriers of successful access offerings.
Researchers widely agree that there are still vast gaps that require further research
(Chen, 2009; Lamberton & Rose, 2012; Lovelock & Gummesson, 2004). This thesis
addresses two major issues that have not been resolved yet but which are of high
theoretical and managerial relevance (for an overview see Figure 1).
Figure 1: Overview of Research Projects and Research Questions.
In a first step the consumer’s perspective is taken by investigating what makes
consumers prefer one or the other consumption mode – this perspective is broader
than previous research as it is not only focusing on the drivers of adoption of access
or ownership in isolation (project I). A better understanding of consumption mode
choice is not only important for managers and policy makers, but also highly
beneficial for the scientific community because it leads towards a theory that
explains consumption mode choice and usage behavior. Up to now there are only
two qualitative studies that have started to investigate this topic (Chen, 2009; Durgee

1. Introduction
5
& O’Connor, 1995). In this project, a formative measurement tool of consumers’
perceptions and the resulting attitude towards access and ownership is developed and
validated. Therefore a mixed methods approach is applied by conducting qualitative
and quantitative studies to investigate how consumers feel about access and
ownership in a given product category and what causes them to develop a favorable
or unfavorable attitude towards a consumption mode. Applying this measurement
model allows answering the following research questions: How do consumers
perceive different consumption modes – that is, access in contrast to ownership?
What are the perceptions that determine the attitude towards a consumption mode?
Which are most important? Do those perceptions differ across product categories?
And ultimately, how do perceptions of consumers with and without actual access
consumption experience differ?
In a second step the perspective of a manager is taken who considers introducing an
access offering to the market, but is wondering which features of the access offering
will be most important for market success and beyond that fears potential negative
feedback effects on the existing parent brand that used to solely offer the ownership
consumption mode (project II). Both issues are highly important for managers, but
have not been addressed by existing research to the author’s best knowledge. This
project experimentally researches how companies can successfully introduce access
offerings into the market, while not hurting existing customer relationships or
damaging the parent brand. Project II is based upon the idea that brand extensions
and the introduction of an additional access offering share certain similarities that
enable transferring research approaches common in the literature on brand extensions
to the research on access. The project strives to answer the following research
questions: Which aspects of an access offering are most important for market success
– the product brand or the service convenience level? How do current customers who
already own branded goods of a given brand react to the introduction of an access
offering by their brand? And finally, taking owners and non-owners of a brand into
account, does the introduction of access ultimately harm or benefit the existing
parent brand?

6 1. Introduction
1.3 Structure of the Thesis
The structure of this thesis is as follows (see also Figure 2). In chapter 2, the
conceptual foundation of this thesis is presented. The chapter provides a definition of
access, the drivers that have lately made access competitive with ownership,
typologies of access offerings and a literature review on access-related research in
marketing and consumer research.
In chapter 3, the development and empirical application of the differential formative
measure of consumers’ attitudes towards consumption modes is presented (project I).
After motivating the research and laying out its theoretical foundations, the relevant
perceptions of consumption modes are presented based upon qualitative studies and a
literature review. Based upon these insights a formative measurement model is
developed in order to investigate what causes consumers to prefer access or
ownership. Subsequently, this model is empirically validated in two empirical
studies. Finally, chapter 3 is closed by a discussion of theoretical and managerial
implications.
1. Introduction
Motivation and importance of this research
2. Conceptual Foundation of Consumption Mode Choice
Definitions, drivers of the rise of access, access offering typologies, current knowledge
3. Project I: A Differential Formative
Measure of Consumers’ Attitudes
towards Consumption Modes
Introduction, theoretical foundations
4. Project II: How Consumers Respond
to Consumption Mode Extensions
Introduction, hypotheses
Relevant
perceptions of
consumption
modes
The formative
measurement
model
Validation of
the
measurement
model
The importance
of product
brands and
service
convenience
Effects on
current owners
Effects on
parent brand
evaluations
Discussion of project I Discussion of project II
5. General Discussion and Conclusion
Summary of key findings, theoretical and managerial contributions, avenues for further research
Figure 2: Structure of the Thesis.
1. Introduction
7
In chapter 4, it is investigated how consumers respond to consumption mode
extensions (project II). After briefly introducing the research questions and deriving
the hypotheses, the methodology of a series of five experimental studies is described.
Subsequently, the results of testing the hypotheses are presented. Similar to the
previous chapter, chapter 4 closes with a discussion of the results from a theoretical
and a managerial point of view.
Finally in chapter 5, the main findings of both projects are summarized, their overall
implications discussed and limitations as well as avenues for further research in the
context of access-based consumption are laid out.

8 2. Conceptual Foundation of Consumption Mode Choice
2 Conceptual Foundation of Consumption Mode Choice
2.1 Definition and Demarcation of Consumption Modes
If a good is consumed that is not owned by oneself or someone close, but a third
party that is being paid for providing access to this good, consumption takes place in
the access consumption mode. This consumption mode gives the consumer a
contract-based, temporary and paid-for right to use something (Durgee & O’Connor,
1995). In principal it is publicly available to every consumer – however, sometimes a
membership may be required (Chen, 2009). In marketing communications this form
of consumption is usually labeled as renting or sharing.2 If the third party that owns
the accessed good is a company, it is a business-to-consumer (B2C) transaction, if a
private person owns it, it is a consumer-to-consumer (C2C) transaction. The latter is
also called peer-to-peer sharing, but is not in focus of this study. This study solely
focuses on access offerings in a B2C context. A generic term that is also often used
in the context of access is collaborative consumption (Botsman & Rogers, 2010).3
Following the classification by Botsman and Rogers, access is similar to one type of
collaborative consumption, which they call product service systems. Unfortunately
this term is already occupied in the marketing literature and rather broadly defined: It
covers the idea of product leasing, renting and sharing, but also more product-
oriented services and result-oriented services (Tukker, 2004). Thus, solely the term
access will be used in the following.
In contrast to the access consumption mode, consumption takes place in the
ownership consumption mode if the consumed good is fully owned by oneself or 2 If a consumer borrows something from a family member or friend this is commonly also called sharing (Belk, 2007, 2010). In this thesis such a private pooling of resources that is not based on contracts nor any form of compensation is not regarded as access but rather as being similar to ownership as such borrowed items can be regarded as joint possessions (Belk, 2010, 2013b). 3 Felson and Spaeth (1978) have used the term collaborative consumption even earlier, however they define it differently: They describe it as coordinated consumption in a group – but it does not contain the idea of consuming a good in form of a rental service (Belk, 2013b).

2. Conceptual Foundation of Consumption Mode Choice
9
someone close (family, close friends). Ownership originates most commonly from
purchasing, receiving a present, inheriting something, or finding something. It
includes having a permanent or long-term right to consume a good. It is exclusively
available to the owner and his or her joint-owners, if any (Chen, 2009).
Consequently, both consumption modes represent different circumstances under
which a consumer fulfills his or her consumption needs. What both consumption
modes have in common though is the consumption act itself – that is using a
consumer good (Chen, 2009). Consumers are increasingly often offered two different
consumption modes, which enables them to choose various options: They cannot
only choose whether to own or not to own, but also whether to switch to access or to
combine access and ownership by using both consumption modes – dependent on
their personal needs and situational circumstances.
The distinction between these two alternative consumption modes is not contrary to
the service dominant logic proposed by Vargo and Lusch (2004), but complements it
with a customer’s point of view that they do not address (Lovelock & Gummesson,
2004). The question here is not about contrasting products vs. services, but under
what circumstances a consumer wants to experience a service: is it by permanently
owning a good or by gaining access whenever there is the need?
Obviously not every product category is equally well suited to be provided via
access. Access offerings are most suitable if the costs of the physical good are not
too low so that the overhead costs do not render access uneconomically by becoming
over-proportionally high, if the good is seldom used by the typical individual so that
is has a large idling capacity, and if the demand is predictable. Furthermore the
provider should be capable of providing a certain critical mass of rented goods in
order to ensure a sufficient level of availability (Botsman & Rogers, 2010). That is
why consumers cannot choose among access and ownership in every product
category (yet).
However, there remains a grey zone of market offerings that are difficult to classify
as either access or ownership (Lovelock & Gummesson, 2004). One example is
fractional ownership. The basic idea is that several strangers collectively purchase an
expensive good, such as a private jet or a boat, and then share its usage time. If
fractional ownership is managed professionally, the operating company usually

10 2. Conceptual Foundation of Consumption Mode Choice
manages more than one good and the customer de facto primarily buys a temporary
usage right and cannot exclude anyone else from also becoming a customer of this
company – even though being the proper owner of a fraction of the good, the
attributes of such a solution resembles access more than ownership. However, if such
an offering is provided on a small scale and is privately managed it is more similar to
ownership that is shared among family, friends, or colleagues. Another market
offering that lies in this grey zone is leasing. On the one hand, leasing is a temporally
limited right that only allows usage, but no modifications. On the other hand leasing
allows permanent usage over a long time period (typically several months or years),
can be seen as an alternative to financing a good by credit, and the leased good is
often perceived as being psychologically owned by the lessee (Lovelock &
Gummesson, 2004). The demarcation of access and ownership is difficult for both –
fractional ownership and leasing. However, this thesis focuses on cases where access
is clearly different from ownership, which is in line with the majority of market
offerings and all recent research on this topic (Bardhi & Eckhardt, 2012; Lamberton
& Rose, 2012). When a common theory of consumption modes has been agreed on,
this theory should be further refined for these market offerings in the grey zone
between access and ownership.
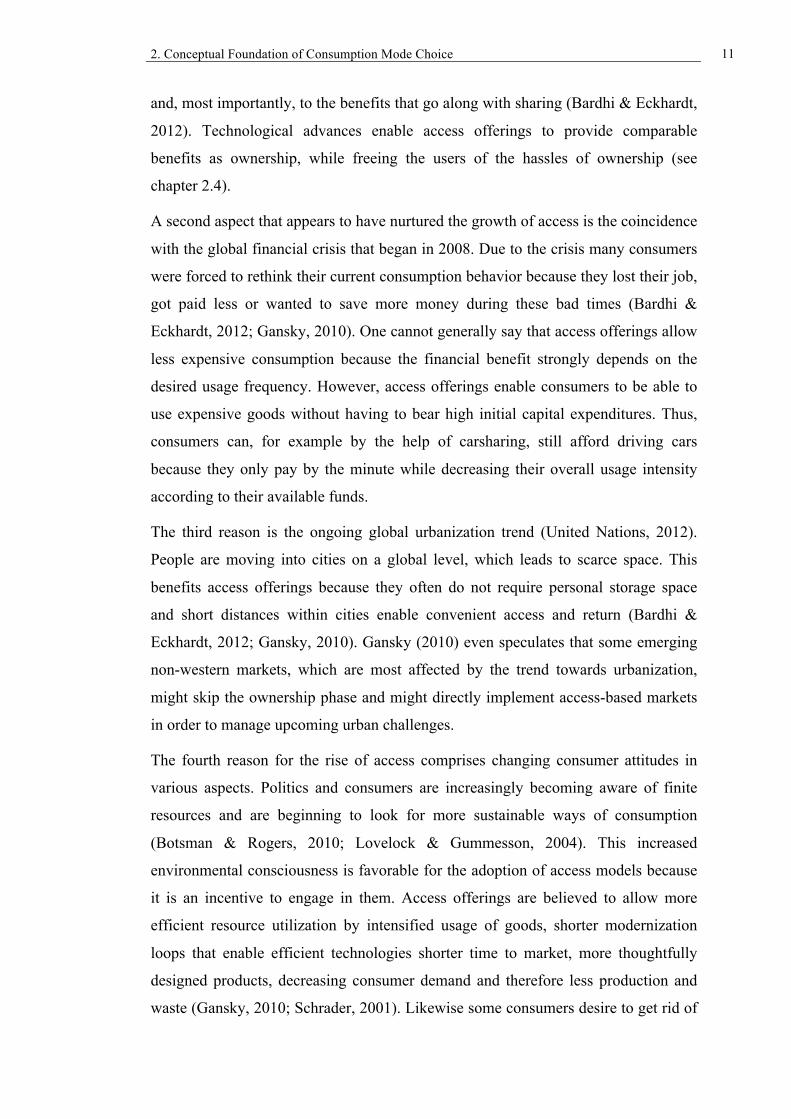
2.2 Drivers of Access
Based upon the literature, there are four major reasons for the recent rise of access.
They can be summarized under the following main topics: technological advances,
the global financial crisis, urbanization and changing consumer attitudes.
First, access offerings are succeeding today because they are based upon recently
matured technologies such as the Internet, wireless networks, smartphones, miniature
sensors and GPS (Botsman & Rogers, 2010; Gansky, 2010; Lovelock &
Gummesson, 2004). These technologies enable the provision of more convenient and
cost-efficient access services as compared to classical rental offerings (Lovelock &
Gummesson, 2004). They provide consumers with all relevant information at any
place and therewith enable convenience, control and associations that are much
closer to ownership (Botsman & Rogers, 2010). These technological advances also
enabled peer-2-peer sharing of digitalized music and the success of online social
communities, which have accustomed many consumers to these new technologies
2. Conceptual Foundation of Consumption Mode Choice
11
and, most importantly, to the benefits that go along with sharing (Bardhi & Eckhardt,
2012). Technological advances enable access offerings to provide comparable
benefits as ownership, while freeing the users of the hassles of ownership (see
chapter 2.4).
A second aspect that appears to have nurtured the growth of access is the coincidence
with the global financial crisis that began in 2008. Due to the crisis many consumers
were forced to rethink their current consumption behavior because they lost their job,
got paid less or wanted to save more money during these bad times (Bardhi &
Eckhardt, 2012; Gansky, 2010). One cannot generally say that access offerings allow
less expensive consumption because the financial benefit strongly depends on the
desired usage frequency. However, access offerings enable consumers to be able to
use expensive goods without having to bear high initial capital expenditures. Thus,
consumers can, for example by the help of carsharing, still afford driving cars
because they only pay by the minute while decreasing their overall usage intensity
according to their available funds.
The third reason is the ongoing global urbanization trend (United Nations, 2012).
People are moving into cities on a global level, which leads to scarce space. This
benefits access offerings because they often do not require personal storage space
and short distances within cities enable convenient access and return (Bardhi &
Eckhardt, 2012; Gansky, 2010). Gansky (2010) even speculates that some emerging
non-western markets, which are most affected by the trend towards urbanization,
might skip the ownership phase and might directly implement access-based markets
in order to manage upcoming urban challenges.
The fourth reason for the rise of access comprises changing consumer attitudes in
various aspects. Politics and consumers are increasingly becoming aware of finite
resources and are beginning to look for more sustainable ways of consumption
(Botsman & Rogers, 2010; Lovelock & Gummesson, 2004). This increased
environmental consciousness is favorable for the adoption of access models because
it is an incentive to engage in them. Access offerings are believed to allow more
efficient resource utilization by intensified usage of goods, shorter modernization
loops that enable efficient technologies shorter time to market, more thoughtfully
designed products, decreasing consumer demand and therefore less production and
waste (Gansky, 2010; Schrader, 2001). Likewise some consumers desire to get rid of

12 2. Conceptual Foundation of Consumption Mode Choice
conspicuous consumption and to simplify their lives in order to have more time to
enjoy life and reduce waste (Lawson, 2011). On the contrary, some consumers live
an increasingly transitory lifestyle that potentially increases stress. However, both
groups could prefer access to ownership as it allows them to own less and to be more
flexible. Also the consumers’ experience orientation is believed to be increasing.
Consumers’ need for new experiences cannot be satisfied with owning goods
anymore as only access is fast enough to allow a fast series of different experiences
(Lovelock & Gummesson, 2004; Rifkin, 2000). It is also argued that the general
attitude towards ownership is changing and losing some of the value formerly
associated with it due to sociological changes. Nowadays the young generation in
western markets does hardly know any scarcity at all and also their parents did not
educate them to particularly value ownership because they themselves have been
accustomed to affluence since their childhood. That is why the social status
associated with ownership decreases as compared to older generations (Berry &
Maricle, 1973; Durgee & O’Connor, 1995; Obenberger & Brown, 1976).
Furthermore, the younger generation is more than any previous generation believed
to be able to signal their social status by not owning physical objects, but by using
virtual communities or access offerings (Botsman & Rogers, 2010; Gansky, 2010).
2.3 Typology of Access Offerings
Access offerings can come in many different forms, which demands a structuring.
There have already been first approaches to cluster access offerings, which are
presented next. However, authors also note the need for more detailed typologies
(Lamberton & Rose, 2012). Subsequently to the presentation of the existing
typologies, a new typology of access offerings is introduced. It is more
comprehensive than previous ones and differentiates on the product category level as
well as on the level of the specific access offerings.
2.3.1 Existing typologies of access offerings
Lovelock and Gummesson (2004) were the first to introduce five broad categories of
non-ownership services. They intended to point out that not all non-ownership
services share general properties. The categories they introduced are as follows:
rented goods services (e.g. carsharing, power tools rental), place and space rentals

2. Conceptual Foundation of Consumption Mode Choice
13
(e.g. a rented apartment, a hotel room, a seat in an aircraft), labor and expertise
rentals (e.g. car repair, surgery, management consulting), physical facility access and
usage (e.g. museum, spa, conference site), as well as network access and usage (e.g.
utilities, telecommunications networks, banking). Particularly rented goods services
and to a lesser degree place and space rental as well as physical facility access and
usage correspond to the definition of access in this thesis as they enable consumers
the consumption of physical goods, which are not owned by them but by a third
party. Nonetheless this classification is very general and does not differentiate further
than the type of accessed object.
In a recent publication, Bardhi and Eckhardt (2012) introduced six dimensions that
can serve to categorize the wide range of available access offerings on a more
detailed level: (1) temporality, (2) anonymity, (3) market mediation, (4) consumer
involvement, (5) type of accessed object, and (6) political consumerism. Temporality
encompasses the duration of a consumer’s relationship with a provider and the length
of object usage. Anonymity refers to the degree that something is either consumed
exclusively in private (e.g. carsharing) or in public (e.g. gym equipment) – or is even
shared with others (e.g. couch surfing). The level of market mediation labels whether
an access offering is for profit or not for profit. Consumer involvement can be high or
low and refers to the degree of co-creation the consumer has to take. The type of
accessed object differentiates between experiential or functional objects as well as
between physical and digital goods. Finally, political consumerism refers to the
provider’s motivation for offering an access service – ranging from ideological
interests to filling a market gap.
2.3.2 A two-level typology of access offerings
The typology for access offerings that is suggested integrates existing ideas and adds
new and important dimensions that have been overlooked in the past. Additionally it
is suggested to separate between dimensions that depend on the product category and
those that describe different forms of access offerings because some product
characteristics have important implications for the design of access offerings.
To differentiate between product categories, four dimensions are proposed on the
first level: price level, visibility of consumption, durability of goods, and main
consumption goal (see Figure 3).

14 2. Conceptual Foundation of Consumption Mode Choice
Price Level. This dimension refers to the general price level of ownership in a given
product category. For example, a car is generally more expensive than a bicycle,
which is generally more expensive than a book. The price of the product if it was
owned is important because it strongly influences the economics of an access
offering. Further it might be an indicator of the typical prestige value associated with
a product category.
Visibility of consumption. The social visibility of consumption is considered to be
important as it determines whether only the individual or a broader group of people
has an effect on the consumer’s behavior (Bearden & Etzel, 1982; Richins, 1994b). If
social visibility is low then the product is consumed in private, while if visibility is
high its consumption must take place in public. Thus this dimension contains aspects
of Bardhi and Eckhardt’s (2012) anonymity dimension.
Durability of goods. The typical durability of a good is defined as after what time
period a good is typically abandoned. This is important for two reasons. First, it
determines how long an access provider can monetize a given good. For example,
seasonal products such as fashion do not score well on this dimension. Second, it
defines the typical rebuy frequency. This can be a proxy of consumer involvement as
well as how frequently a consumer might reconsider his consumption mode choice.
Main consumption goal. Some product categories are mainly used due to their
functional benefits, while others are used primarily for their hedonic benefits. Purely
functional and purely hedonic products are the two ends of a continuum as products
can also contain aspects of both (Voss, Spangenberg, & Grohmann, 2003).
Functional goods are valued for solving practical or functional needs. On the other
hand, hedonic goods allow experiencing enjoyment, pleasure, or fun (O’Curry &
Strahilevitz, 2001). Bardhi and Eckhardt (2012) as well as Chen (2009) have
previously noted the importance to distinguish product categories according to the
main consumption goal consumers associate with them.

2. Conceptual Foundation of Consumption Mode Choice
15
Figure 3: A Two-Level Typology of Access Offerings.
The second level in the proposed typology serves to distinguish access offerings
within a given product category. Six dimensions to characterize access offers are
proposed: level of convenience, tangibility, transaction length, positioning, price
model, and contracting partners.
Level of convenience. It comprises the degree of service provided to the customer,
which renders an offering more or less convenient. The less time and effort is
necessary to use a service, the higher the convenience (Berry, Seiders, & Grewal,
2002). The higher the accessibility of the access offering (e.g. density of pick-up
locations, speed of logistics, provision of upfront information, drop-off locations)
and the more burdens the provider takes care off (e.g. maintenance, cleaning, fuel),
the more convenient the offering for the consumer. Especially the latter addresses the
same issue as Bardhi and Eckhardt’s (2012) consumer involvement dimension. If a
customer is required to be highly involved and to co-create a lot, the provider has
fewer responsibilities. Thus the offering is less convenient per se.
Tangibility. This dimension distinguishes between offerings that are delivered in
form of material goods versus those that are delivered digitally. This distinction goes
along with either a sequential or parallel usage of goods. If access to material goods
is provided (e.g. DVD-rental) the usage sequence among customers is sequential; if
consumers get access to immaterial goods (e.g. streaming of digital movies)
between product categories
within product categories
• price level • visibility of consumption • durability of goods • main consumption goal
• level of convenience • tangibility • transaction length • positioning • price model • contracting partners

16 2. Conceptual Foundation of Consumption Mode Choice
consumption is parallel. This dimension picks up one of the two distinctions that
Bardhi and Eckhardt (2012) suggest for their type of accessed object dimension.
Transaction length. This dimension is similar to the sub-dimension duration of
access, which Bardhi and Eckhardt (2012) conceptualized to be one aspect of
temporality. It is defined as the length of the rental period that is offered. Sometimes
providers only offer either short-term or long-term rentals – sometimes they also
offer both. Taking the example of cars, a very short-term rental is usually offered by
carsharing companies, which allow rental by the minute. Car rental companies
usually rent cars for a time period of one day till a few months. If someone wants to
rent a car for an even longer time period, he or she has to lease a car. Leasing
contracts typically allow possessing a car for a continuous time period of several
years until it has to be returned to the leasing company. The longer the length of the
rental period, the more similar access and ownership become (see also chapter 2.1).
Positioning. As all market offerings, also access offerings can be positioned in a
certain way. Access offerings can be positioned in many different ways, e.g. as low-
cost, premium, particularly sustainable or serving a distinct market niche. This can be
achieved by the product brands offered for renting, the service design, the service
quality and the provider brand. Furthermore the provider can decide how much
variety, that is how many different product models, to offer.
Price model. Access offerings can also differ according to the price model(s) that are
available. Most simply, the offer of one provider can be less expensive than the offer
of another. This difference in price level can be due to positioning, level of
convenience, or operational process skills. Offerings can also differ in terms of the
flexibility they allow, e.g. an offering could offer high flexibility by charging no
service fee and not imposing any minimum subscription duration. Finally, the billing
mechanism can differ as for all services: It can be pay-per-use, a flat-rate or a
combination of both (e.g. a three part-tariff with a monthly basic fee which covers an
specific amount of usage; if this amount is exceeded a pay-per-use tariff applies).
Contracting partners. Finally the basic business model of access providers can differ.
It either relies on renting out goods which are provided by a company to consumers
(B2C business model), or it solely relies on providing a market place where
2. Conceptual Foundation of Consumption Mode Choice
17
consumers willing to rent out can find other consumers willing to borrow some good
(C2C business model).
2.4 Theories Related to Consumption Mode Choice
The very basic theory in the context of consumption mode choice is the Property
Rights Theory. According to this theory, a person can have a maximum of four
property rights related to a certain good. If this is the case, the person is the full
owner of this good. The four property rights are (Alchian & Demsetz, 1973; Coase,
1960; Demsetz, 1967; Furubotn & Pejovich, 1972):
• the right to use the good (jus usus),
• the right to return the yield form using the good (jus usus fructus),
• the right to convert form and structure of the good (jus abusus),
• the right to transfer one or more of these rights to other persons (jus
successionis).
These rights allow the owner of a good to regulate or deny usage from others, use it
whenever and wherever he wants, retain profits, modify or sell it (Snare, 1972). In
case of access, a consumer gets the right to use the good (jus usus) and the right to
retain the benefit from using the good (jus usus fructus) – both are being paid-for and
temporally limited to the renting period (Moeller & Wittkowski, 2010; Schrader,
2000). Thus access also gives a consumer the property rights to consume a rented
good. However, the extent of these rights is limited as compared to ownership.
Berry and Maricle (1973) agreed that property is established by having certain rights,
but they added that ownership also goes along with commitment and responsibilities,
which should not be disregarded. These are called burdens of ownership:
• bearing risks with regard to product alteration and/or obsolescence,
• bearing risks with regard to making an incorrect product selection,
• being responsible for maintenance and repair of the product,
• bearing the full cost of goods for which a consumer has only infrequent use.

18 2. Conceptual Foundation of Consumption Mode Choice
Those burdens as well as the liabilities of ownership, conceptualized by Schrader
(2000, 2001), make up functional reasons for consumers to prefer access versus
ownership. A good that is owned by a consumer comprises the following liabilities:
• the liability to use the good (in order to derive value of a good, it is necessary
to not only purchase the good, but to actively use it),
• the liability to accommodate the good (a good has to be stored in such a way
that it does not bother anyone),
• the liability to maintain the good (a good has to be maintained so that using it
does not endanger others),
• the liability to re-alienate and dispose (to abandon ownership, the consumer
has to correctly transfer all property rights to the buyer or to lawfully dispose
the good),
• the cost and effort liability (the owner has to bear all monetary and non-
monetary costs that are connected to purchasing and using the good).
Property Rights Theory, the burdens of ownership and the liabilities of ownership
only explain the functional benefits and impediments that consumers are facing in
case of ownership. Yet, the marketing literature agrees that especially the symbolic
function of ownership is also very important in order to explain consumer behavior
(Allen & Ng, 1999; Dittmar, 1992).
Purchasing and owning goods is not only done for the psychical benefits they
provide, but also for their symbolic meaning (Ariely & Norton, 2009). The
background for the existence of a symbolic meaning lies in the fact that we identify
ourselves with our possessions, which thereby become part of our extended self-
concept (Belk, 1988). In other words, the consumption behavior has an effect on the
consumers’ self-concept (ideal self and actual self). Kleine et al. (1995) also
investigate the person-object relationship in consumer behavior, which they call
material possession attachment. It is believed that possessions, to which we have a
close relationship, reflect our personal lives. Frequently, the possible symbolic
meanings are classified in those that are used in order to communicate to others
(external meaning) and those guiding the development and refinement of the self-

2. Conceptual Foundation of Consumption Mode Choice
19
concept (internal meaning) (Csikszentmihalyi & Rochberg-Halton, 1981; Richins,
1994b; Sirgy, 1982; Solomon, 1983).
Besides being relevant for self-reflection, ownership can internally also serve as a
symbol of control. Perceiving and having control is important for consumers’ well-
being and is thus a motivator to seek ownership (Furby, 1991). Besides, ownership
can serve as a storage of personal memories that give stability and security as well as
the reification of values, interests or skills (Allen & Ng, 1999; Belk, 1988; Ger &
Belk, 1996; Prentice, 1987; Richins, 1994a, 1994b).
The external symbolic meaning can be subdivided into vertical and horizontal
consumption symbolism. The former stands for consumption in order to demonstrate
prestige or social status – sometimes also referred to as conspicuous consumption,
which means to be continuously trying to communicate a high social status by
extensive and demonstrative consumption (Veblen, 1994). The aimed for social
status can either be the current or the targeted position on society. Prestige objects
only serve their purpose when they are scarce and thus sought-after. Horizontal
consumption, on the other hand, refers to signaling group belonging. Its objective is
to underline existing group membership by, for example, special clothes or living a
certain lifestyle (Dittmar, 1992). The more extensive the required material
equipment, the larger the effect on self-identity (Laverie, Kleine III, & Kleine, 2002).
What makes it difficult to apply those theories on consumption mode choice is that
those theories do not clearly differentiate between (permanent) ownership and
(temporal) possession (Scholl, 2006; Schrader, 2001). This fuzziness is due to the
fact that the consumption mode had only recently been conceptually separated from
the consumed items (Chen, 2009) and the linguistic term possession is “somewhat
ambiguous” (Aikhenvald & Dixon, 2012, p. 2). In common language the terms
possession and ownership are frequently used interchangeably. However from a legal
point of view they are two distinct concepts (Aikhenvald & Dixon, 2012). In case of
consumption mode choice, exactly this distinction becomes very relevant. Thus
existing research cannot easily be transferred and so far it is unclear what kind of
symbolic meaning persists in case of access.
Even though also services and experiences can contain symbolic meaning (Dodson,
1996; Schrader, 2001), it remains open whether access offerings can contain the

20 2. Conceptual Foundation of Consumption Mode Choice
same type and level of meaning compared to ownership. In particular the person-
object relationship and the personal attachment to objects due to feelings of
familiarity or memories are expected to be generally lower for access due to the
temporal and circumstantial nature of access (Chen, 2009) – however it could be a
different case for the relationship to the provider as it lasts for a longer time period.
On the external side, one can well imagine that group belonging is expressed by
using the same access offering that the peer group uses. Thus common beliefs or
values such as non-materialistic values or eco-consciousness could be displayed.
When it comes to signaling social status it becomes more difficult. In principal
ownership should be associated with more prestige because (at least) its acquisition
requires more capital outlay. But one has to keep in mind that from an external point
of view, it might not be recognizable whether someone uses an access offering or
whether he or she also owns the good (Belk, 2013b). Depending on the visibility of
the access offering, a third party might not be able to differentiate and thus the
symbolic signal might be equal. Nevertheless, the person internally knows which
consumption mode he or she is using and might even feel embarrassed about being
mistaken as the owner of a good (Durgee & O’Connor, 1995).
2.5 Current Knowledge on Adoption of Access and Consumption
Mode Choice
Research on the access consumption mode is still rather scarce and further research is
considered to be required (Bardhi & Eckhardt, 2012; Chen, 2009). This section
chronologically describes the advances that were made in the research on access and
consumption mode choice until now – Table 1 gives an alphabetically arranged
overview about all relevant publications on access.
Looking at the research that particularly focuses on access reveals that the early
studies (as from 1995) have mostly either taken a conceptual approach or a
qualitative research design in order to provide a more profound theoretical
foundation. Building on this knowledge, quantitative studies (as from 2010) analyzed
the antecedents of access acceptance. Recent experimental studies (as from 2011)
investigate the effects of emphasizing certain aspects of an access offering in
marketing communications as well as the impact of consumption mode choice on
post-purchase satisfaction.

2. Conceptual Foundation of Consumption Mode Choice
21
Relatively early, Durgee and O’Conner (1995) qualitatively investigated access-
based consumption by focusing on the potentially different person-object
relationship. They concluded that terminal materialism is associated with the desire
for ownership, while instrumental materialism can be associated with the general
desire for consumption – no matter by which consumption mode. Further they found
consumers to show less personal attachment with rented goods than purchased
goods. Similarly they found cognitive dissonance to be lower for rented goods. The
major reasons for renting which they identified are: access is perceived to be more
economical – this is considered positively either in order to save money or to get
access to otherwise expensive goods; the increased variety that is inherent in renting;
and not having to worry about storage and maintenance.
In his dissertation, Schrader’s (2001) main contribution is the extensive set of
potentially relevant indicators for preferring access over ownership that he finds.4 He
identified the following list of relevant offering and personal related indicators and
empirically tested them in two product categories: property rights, burdens of
ownership, loss of symbolic meaning, perceived risk, awareness of access, property
status, socio-demographics, environmental consciousness, materialism, and
innovativeness.
After early and singular research on access, it was Lovelock and Gummesson (2004),
who introduced the rental/access paradigm as a new lens for services marketing and
highlighted the importance for further research in this field. They challenged past
services marketing theory by proposing “that market transactions that do not involve
a transfer of ownership are distinctively different from those that do” (Lovelock &
Gummesson, 2004, p. 34). Lovelock and Gummesson (2004) also propose several
important implications. First, they assume that consumers’ product brand preferences
will become less important in case of access, while the service provider brand and
the characteristics of its offering will gain importance (this implication is empirically
tested in chapter 4). Second, they posit that access allows consumers to benefit from
economies of scale that origin from sharing resources while still being able to enjoy
separation or privacy. Furthermore, sharing resources leads to a more efficient
allocation of the earth’s finite resources. Third, time is supposed to become more
4 The dissertation was written in German (Schrader, 2001). To the author’s best knowledge there is only one English publication based upon his dissertation (Schrader, 1999).

22 2. Conceptual Foundation of Consumption Mode Choice
important because access is usually only granted for a limited time frame. A related
but untouched topic is convenience. If consumers need to spend a lot of time (and
effort) to make use of a service they will not use it and try to replace it (e.g. by
ownership). Fourth, pricing will not only be related to quality and value any more,
but also to time. Besides time-based costing, a usage-intensity-based costing might
also make sense for some offerings.
Also taking a purely conceptual approach, Scholl (2006, 2008) argues under which
conditions consumers will be willing to replace ownership by access.5 Based on
different theoretical perspectives (new institutional economics, identity theory,
practice theory), he develops a framework for successfully marketing access
offerings. As he identified the lack of symbolic meaning of access offerings as their
major drawback in contrast to ownership offers, he proposes eight possibilities to
increase the symbolic meaning associated with access offerings. First, he suggests
increasing the ease of access to the access offering by flexible hours, online
reservations or delivery services. Second, he proposes to offer a large amount of
rental goods to ensure availability. Third, he recommends offering a wide variety of
rental goods to fit various user needs. Fourth, he advises to include only high quality
products in the offering to enable high performance. Fifth, he recommends providing
only products that are easy to use in order to minimize learning costs. Sixth, he
suggests designing consumer interactions with the service provider as user-friendly
as possible. Seventh, he proposes that an appealing and clear design of the physical
surrounding will lead to a high level of perceived control. Eighth, he advocates
branding the access provider in order to provide orientation, create trust and convey
prestige. He reasons that a high level of functional quality will lead to internal
feelings of control and to enable signaling others that one is using a high quality
service instead of ownership.
In another qualitative study, Chen (2009) compared the desires and values of art
collectors (ownership-based consumption) and exhibition visitors (access-based
consumption). The objective was to identify drivers for consumption mode choice
and to contrast the dimensions of perceived value in this special setting that is purely
non-functional. She found that not everyone desires ownership. This is due to
5 Scholl’s dissertation is written in German (Scholl, 2008). However, most of the results are also lined out in the proceedings of a conference (Scholl, 2006).

2. Conceptual Foundation of Consumption Mode Choice
23
different desires, which shape consumption mode choice. She also finds that the
perceived value differs among art collectors and visitors to art museums. However in
the case of arts, the consumption mode itself is not the key for satisfying desires.
Satisfaction comes primarily form the art itself.
Weinert (2010) takes a different perspective and focuses on the perceived value of
ownership against the background of access. In his dissertation he identifies and
quantifies the importance of those dimensions that constitute the perceived value of
ownership. In the context of owned vacation homes he conducted means-end
interviews to identify a set of relevant value dimensions. Based upon those findings
he quantified their importance by applying a best-worst-scaling technique. He finds
that the following value dimensions are important to owners (in descending order):
pleasure, enabling interpersonal relations, increased independency and privacy,
functional benefits, appealing and modifiable design and style, financial aspects,
symbolizing personal success in life, enabling spirituality and cultural expression,
prestige value, and self-expression.
In the first quantitative study on the personal determinants of access adoption, Möller
and Wittkowski (2010) investigate the influence of six personal factors on the
adoption of rental offerings. Based on an online sample, they find that three of the six
proposed determinants have a significant impact on access adoption (R2 = .16). These
are: importance of possessions (negatively correlated), convenience orientation and
trend orientation (both positively correlated). They find non-significant estimates for
experience orientation, price consciousness and environmentalism. When
interpreting the results, one has to take into account that all personal determinants
were measured on a global level rather than product category specific. Furthermore,
their constructs were quite narrowly defined and thus they potentially missed
important aspects. For example, importance of possessions is defined to solely relate
to the importance of property rights – not taking into account any symbolic
meanings. In addition to that, the items used to measure convenience orientation
exclusively relate to the burdens of ownership but not to any inconveniences that can
occur in access (e.g. need for a reservation, process of pick-up and return).

24 2. Conceptual Foundation of Consumption Mode Choice
Table 1: Summary of the Literature Review on Publications About Access and Consumption Mode Choice
Publication Study Context and Design Research Focus Key Findings
Bardhi and Eckhardt (2012)
Carsharing (user interviews; n = 40)
The nature of access-based consumption
Access users do not identify with the used items; rented goods are valued for their functional value, while access itself contains symbolic value; monitoring and regulations by the provider are perceived as necessary; users do not relate to the provider brand
Belk (2013b) Conceptual
Comparing sharing and collaborative consumption and the implications for businesses
Being what one can access replaces being what one owns; Increasing uncertainty whether someone is the true owner of a good or not; established business can respond by diversifying out of the industry, legally fighting start-ups or adopting the new business model
Chen (2009)
Arts (interviews and self-reports from art collectors and art museum visitors; n = 116)
Drivers of consumption mode choice and value perceptions of consumption modes
Ownership is not the ultimate expression of consumer desire; the perceived value of access and ownership is different
Durgee and O’Connor (1995)
Any recently rented item (self-reports; n = 113)
The person-object relationship in case of access
Only terminal materialism is related to striving for ownership; personal attachment is lower for rental items; variety in rental allows self-exploration; perceived price advantage is the major reasons to chose access
Lamberton and Rose (2012)
Carsharing (survey; n = 369); cell phone minute sharing plan (experiment; n = 123); bikesharing (experiment; n = 105)
Understanding adoption of access offerings with different characteristics
The perceived risk of non-availability is a key determinant for sharing adoption; consumers are more likely to use access offerings if co-users are perceived to have dissimilar usage patterns; if usage is perceived to be similar, consumers are more likely to use access when their own usage intensity is low
Lawson (2011)
Any access service (user interviews I / user interviews II / survey; n = 12 / n = 11 / n = 232); movies & textbooks (experiment; n = 122)
Consumer motivation to use access; decision-making process in case of access; impact of consumption mode choice on satisfaction
Identifies six major reasons to use access; decision-making in case of access is associated with less choice commitment and more satisfying choice strategies; bad quality has a smaller effect on satisfaction in access as compared to ownership

2. Conceptual Foundation of Consumption Mode Choice
25
Publication Study Context and Design Research Focus Key Findings
Lovelock and Gummesson (2004)
Conceptual Identifying a new perspective on services marketing
Introducing the rental/access paradigm along with several assumptions; product characteristics will become less important; access is cost-efficient and more resource-efficient than ownership; time becomes more important in access; access requires new pricing strategies
Möller and Wittkowski (2010)
Several unspecified rental offerings (expert interviews / online survey; n = 6 / n = 461)
Personal determinants of a preference for rental offerings
Identified six determinants; three of six were found to be significant: importance of possessions, convenience orientation, and trend orientation; no significant influence was found for: experience orientation, price consciousness, and environmentalism
Bardhi, Eckhardt and Arnould (2012)
Nomadic consumers (consumer interviews; n = 16)
The person-object relationships of global nomads
Nomadic consumers form rather circumstantial relations to their possessions; they prefer access over ownership
Weinert (2010)*
Vacation homes (interviews with vacation home owners / online survey; n = 52 / n = 177)
Dimensions of the perceived value of ownership
Dimensions of the perceived value of ownership (the order gives their importance ranking): pleasure, enabling interpersonal relations, increased independency and privacy, functional benefits, appealing and modifiable design and style, financial aspects, symbolizing personal success in life, enabling spirituality and cultural expression, prestige value, and self-expression.
Scholl (2006, 2008) Conceptual
Characteristics that increase the acceptance of access offerings
Elements that should be used in order to successfully market an access offer: ease of access, high amount of rental goods, variety of rental goods, easy-to-use rental products, high quality rental products, interaction with the provider, physical surrounding, service provider brand
Schrader (2001)
Carsharing and washing services (conjoint and survey; n = 366)
Determinants of the acceptance of access
The major contribution is the set of identified determinants: property rights, burdens of ownership, loss of symbolic meaning, perceived risk, awareness of access, property status, sociodemographics, environmental consciousness, materialism, and innovativeness
* This dissertation also investigated further research questions, which are not reported here.

26 2. Conceptual Foundation of Consumption Mode Choice
In her dissertation, Lawson (2011) investigated three topics related to access: the
consumer’s motivation to use non-ownership services, the decision making process
for non-ownership consumption choices and the impact of the consumption mode on
satisfaction after the good has been purchased or rented. The results of her consumer
interviews contain six major reasons to engage in access: no burdens of ownership,
cost savings, increased variety, social status as (normally too) expensive goods are
used, environmentally friendly behavior, and the possibility to try before you buy.
The decision making process about which non-ownership offering to use has been
found to be associated with little choice commitment and the frequent use of
satisficing choice strategies. Furthermore the last study showed that in case of low-
quality outcomes, access leads to less dissatisfaction as compared to ownership in a
movie rent vs. buy experiment.
Besides conceptualizing six dimensions on which access offerings can differ, Bardhi
and Eckhardt (2012) investigated the consumption of carsharing by 40 interviews
with Zipcar users.6 They found very little identification or personal attachment
between users and the rented objects, which led to the tendency to overuse the rented
cars. The motivation to use access is primarily based on its functional value (cost
savings and convenience). Sign value does only stem from the consumption mode
itself: using access is thought to signal economical, convenient, flexible and green
consumption behavior. The access provider is expected to monitor usage and to set
up rules. Further they found no identification among users as well as the brand of the
access provider.
Bardhi, Eckhardt and Arnould (2012) find that nomadic consumers (consumers with
highly cosmopolitan, unpredictable and uncertain lifestyles) form only liquid
relations to their possessions and prefer access to ownership. The value of
possessions for those consumers is strongly dependent on current circumstances.
They value functional value over symbolic value and prefer digital goods due to their
flexibility. These findings challenge prior research that argued that consumers form
long-lasting relationships and are strongly attached to their possessions especially in
unstable life situations. Those insights further show that increased flexibility is one
of the key benefits of access offerings. With the increase of nomadic lifestyles, an
increase in demand for access offerings all over the world can be expected.
6 Zipcar is the largest American carsharing provider.

2. Conceptual Foundation of Consumption Mode Choice
27
In their empirical paper, Lamberton and Rose (2012) have focused on the drivers of
access adoption. In their first study they tested a number of reasons to share – mainly
inspired by Henning-Thurau et al. (2007) – on the likelihood to use carsharing
instead of car ownership. Besides knowledge, cost-related and functional elements,
the perceived risk of non-availability was found to have a significant influence on the
likelihood to choose sharing.7 However they noted that more research on the specific
sources of functional and cost-related beliefs as well as different product categories
is necessary. Moral and social benefits had no significant influence on sharing
propensity in their sample. In study two and three they performed experiments and
found that managers can influence perceptions of personal and sharing partner’s
usage patterns in order to influence the perceived risk of non-availability. The
associated perceived risk was larger among similar und unspecified co-users than
among users with dissimilar usage patterns. Consumers considering sharing with
similar others were found to be more likely to do so when their own usage need is
comparatively low. However, when interpreting the results, it has to be taken into
account that the presented access offerings have been designed in a way that
everyone is likely to save costs as compared to ownership.
In a recent conceptual study, Belk (2013b) suggested that the common wisdom that
“you are what you own” (p.5) may need to be revised into “you are what you share”
(p.5) due to the rise of access offerings on the supply as well as the demand side. He
argued that this trend increases the uncertainty whether someone who possesses a
certain good is its true owner. Furthermore he emphasized the implications for
companies which are still solely offering the ownership consumption mode: Those
companies that are challenged by new ventures should rather not diversify away into
another industry or start legal fights against the newcomers, but adopt the trend by
also providing access-based offerings themselves.
7 Lamberton and Rose note that the importance of cost-related beliefs could be underrepresented because participants might not have done the mental calculations to realize the cost savings associated with sharing. They argue that this could have lead to an overweighting of the more intuitive risk of non-availability (Lamberton & Rose, 2012, p. 116).

28 3. Project I: A Differential Measure of Consumers’ Attitudes towards Consumption Modes
3 Project I: A Differential Measure of Consumers’
Attitudes towards Consumption Modes
3.1 Introduction
As a consequence of the increased competitiveness of access, more and more
companies start providing access offerings as a stand-alone offering or in addition to
ownership offerings (Bardhi & Eckhardt, 2012; Walsh, 2011). However, these
companies are currently in a blind flight because they lack an understanding why
consumers prefer one or the other consumption mode. These companies have started
to offer access because they recognized a demand and the possibility to fulfill it.
However, it is not well understood how consumers think about these competing
consumption modes and why they prefer one to another.
In order to address this problem, it is not feasible to comprehensively benchmark
both consumption modes in an objective way. Thus managers must understand the
subjective perceptions of access and ownership in order to better understand
consumption mode evaluations. To the author’s best knowledge, industry, policy and
science are currently lacking a tool to assess those subjective customer perceptions in
a quantitative way. Managers would greatly benefit from such a tool that is suitable
for improving access and ownership offerings, performing market segmentation, or
tracking how consumers’ opinions are evolving over time. The latter is also of high
relevance to policy makers who could use such market data for supporting decisions
about economic promotion programs. The scientific community also benefits by such
a measurement model because it helps to advance the knowledge about consumers’
perceptions of consumption modes and leads towards a theory that explains
consumption mode choice and usage behavior.
In this research project, a new formative construct called attitude towards
consumption modes is developed based upon qualitative research and the existing

3. Project I: A Differential Measure of Consumers’ Attitudes towards Consumption Modes
29
literature. Perceptions of consumption modes, which are found to be relevant for the
attitude towards consumption modes, are conceptualized to cause this new construct.
The perceptions forming the construct as well as the construct itself are
conceptualized as difference scores in order to enable a comparative examination of
access and ownership.
The newly developed formative construct is then empirically validated in five
empirical studies covering four different product categories (cars, bicycles, books
and handbags). In the fifth study the formative measurement model is further
validated with a sample of signed-up carsharing customers in order to demonstrate its
validity with experienced access users, too. Applying the measurement model allows
answering the following research questions: How do consumers perceive different
consumption modes – that is, access in contrast to ownership? What are the
perceptions that determine the attitude towards a consumption mode? Which are
most important? Do those perceptions differ across product categories? And, how
does experience with access offerings affect perceptions?
The purpose of this work is twofold: it aims at (a) the development of a formative
measurement tool of consumers’ perceptions and the resulting evaluation of access
and ownership and (b) at understanding the differences between different product
categories as well as between consumers with and without access consumption
experience. The outcome of this work enables managers, policy makers and scholars
to measure the perceptions of consumption modes in a standardized way in order to
understand the nature of those factors that drive consumption mode choice.
The structure of this research project is as follows: First, a brief literature review and
some theoretical foundations are provided. Second, the relevant consumption mode
perceptions for determining the attitude are derived by combining qualitative insights
with existing findings and theories. Third, the construction of the formative
measurement model is described. Fourth, the results of the application of the
measurement tool in five empirical studies are analyzed in order to answer the posed
research questions. To conclude, the implications for theory and practice are
discussed and important areas for future research are highlighted.

30 3. Project I: A Differential Measure of Consumers’ Attitudes towards Consumption Modes
3.2 Theoretical Foundations
While chapter 2 presented definitions of access and ownership (chapter 2.1) and a
general literature review (chapter 2.5), the focus of the following is on the direct
contrast between those two consumption modes.
3.2.1 Consumers’ perceptions towards consumption modes
So far, there has only been sparse research directly comparing consumers’
evaluations of access and ownership. These research articles have either helped to
build the conceptual foundation of this distinction (Belk, 2007; Lovelock &
Gummesson, 2004) or approached the research topic solely by qualitative methods
(Chen, 2009; Durgee & O’Connor, 1995). Lovelock and Gummesson have declared
that access and ownership are “distinctively different” (2004, p. 34) from one another
and that comprehensive in-depth analysis of customer behavior in this context is
required. Belk conceptually contrasts sharing and owning, too. In his conclusion
Belk (2007, p. 137) poses the question, “why own when you can share?”. Durgee and
O’Connor (1995) qualitatively analyzed the person-object relationships in both
consumption modes as well as the reasons to choose access or ownership. Chen
(2009), on the other hand, has contrasted both consumption modes in a qualitative
study on museum visitors and art collectors. With the help of interviews and self-
reports, she investigated the drivers of consumption mode choice and the perceived
value of the respective consumption modes.
All remaining studies, which deal with consumers’ evaluation of access offerings,
have, to the author’s best knowledge, solely focused on the determinants of access
acceptance. The natural counterpart of access – ownership – has not been taken into
account in those studies. On the one hand, Lawson (2011) as well as Bardhi &
Eckhardt (2012) have qualitatively captured consumers’ motivations to use access
offerings. On the other hand, Schrader (2001), Möller and Wittkowski (2010) as well
as Lamberton and Rose (2012) have empirically measured perceptions and personal
determinants for their relevance for access acceptance (see also chapter 2.5. for a
more detailed discussion of these publications).

3. Project I: A Differential Measure of Consumers’ Attitudes towards Consumption Modes
31
3.2.2 Access versus ownership
A prerequisite for contrasting access and ownership is the recognition that marketing
theory needs to separate the consumption mode (access or ownership) from the
consumption object (a car, a bicycle, a book, etc.). Chen (2009) was the first to
highlight this issue and to note that previous research has very often not conceptually
separated those two entities. This is not surprising, considering the dominant role
ownership played in the past, which also explains the little integration of access into
marketing theory to date. However, a growing research community agrees on the fact
that there are distinctive differences between access and ownership and that a
separation of consumption mode from consumed objects is necessary (Bardhi &
Eckhardt, 2012; Chen, 2009; Durgee & O’Connor, 1995; Lovelock & Gummesson,
2004).
Table 2: Contrast of Ownership and Access
Ownership Access
Market transactions money for ownership money for consumption time
Transfer of rights full property rights usage right only
Temporality infinite temporally restricted
Consumer-object relations close relationships distant relationships
Access and ownership differ in a number of features: market transactions, transferred
rights, temporality, and consumer-object relationships (see Table 2). In case of
ownership, money is exchanged for ownership between buyer and seller to complete
a market transaction. In contrast, an access transaction exchanges money for
consumption time, while the ownership stays with the provider at all times (Durgee
& O’Connor, 1995). In case of ownership, the purchaser receives full property rights
(Alchian & Demsetz, 1973; Coase, 1960; Demsetz, 1967; Furubotn & Pejovich,
1972). This enables the purchaser not only to use the object, but also to modify it,
permit or prohibit usage by others, and to lend or sell the object to others. In terms of
temporality, access is a temporal right, whereas ownership is a permanent right until
it is transferred to another party (Chen, 2009). Against the background of ownership,
various papers address consumer-object relationships and find that consumers
strongly identify with their belongings and integrate them into their extended self-

32 3. Project I: A Differential Measure of Consumers’ Attitudes towards Consumption Modes
concept (Belk, 1988) or that important possessions reflect the owner’s values
(Richins, 1994a). Contrasting the consumer-object relationship in both consumption
modes, Durgee and O’Connor (1995) found less concerns about product features, a
focus on functional aspects and less post-purchase dissonance for access. Chen
(2009) found consumers who use the ownership consumption mode to desire strong
self-identification with their objects, to build intimate relationships with these goods,
and to desire possessing and controlling them. In case of access, consumers are found
to not identify with the objects, to form rather distant and circumstantial relationships
to the goods, and to appreciate sharing them with others.
3.2.3 The importance of perceptions for determining attitude
Well-known and frequently applied action theories like the Theory of Reasoned
Action (Fishbein & Ajzen, 1975) or its advancement, the Theory of Planned
Behavior (TPB) (Ajzen, 1991), provide the theoretical foundation for the relationship
between perceptions and attitude. These theories are based on the idea that a set of
beliefs about a specific action causes the overall attitude towards this action, which
then causes the behavioral intention towards this action and finally the behavior
itself.8
Even though Fishbein and Ajzen (1975) conceptualize attitude to be determined by
an underlying belief structure (expectancy-value model)9, these beliefs are typically
aggregated into one unidimensional overall construct of attitude in empirical studies
(Taylor & Todd, 1995). Returning to the original idea, several researches have
successfully applied approaches to decompose attitude into multidimensional
constructs (Bagozzi, 1981, 1982; Pavlou & Fygenson, 2006; Shimp & Kavas, 1984).
These approaches help academics and managers to thoroughly understand which
underlying relationships between perceptions and attitude are important to predict
behavior (Taylor & Todd, 1995).
8 As it is common practice in marketing science to use the term perception synonymous with the term belief, I follow this practice as well (Ahearne, Rapp, Hughes, & Jindal, 2010; Rossiter, 2011a). This interpretation is in line with the epistemological concept of perceptual beliefs, which are beliefs that are directly “grounded in our perceptional experience of the world” (O’Brien, 2013). 9 The classical expectancy-value model contains the idea that certain beliefs weighted with their importance can be summed up to form a certain attitude. This approach also has the disadvantage that it requires an additional importance rating for each perception. This increases the amount of necessary items by factor two, but could be replaced by the importance derived from statistical analysis (Gustafsson & Johnson, 2004; Pavlou & Fygenson, 2006).

3. Project I: A Differential Measure of Consumers’ Attitudes towards Consumption Modes
33
This research project builds upon the decompositional approach because it intends to
explain what causes consumers to prefer access or ownership. To derive relevant
perceptions, qualitative studies have been conducted that borrowed from Ajzen’s
(2006) proposed procedure for belief elicitation studies.
3.3 Relevant Perceptions of Consumption Modes
Proprietary qualitative investigations have been combined with existing research
results in order to deviate a set of the most relevant perceptions for consumption
mode attitudes. The structure of this chapter is as follows: First, the applied research
methodology is described in terms of data collection, sample choice, and analysis
methods. Subsequently, the results of the qualitative studies as well as the literature
review are presented in combination.
3.3.1 Qualitative research methodology
In total, in-depth interviews with 46 consumers in Singapore and Germany as well as
an online-survey with open-ended questions among 34 German consumers have been
conducted. The vast majority of interviews were tape-recorded and fully transcribed
(in six cases, notes had to be taken instead as respondents refused recording).
Sampling was guided by the objective to gain a heterogeneous sample that differs in
age, cultural background, and experience with access offerings. With an increasing
number of interviews the amount of unique content per interview decreased until a
level of saturation was reached after questioning 80 consumers in two different
cultural contexts.
The procedure of the interviews took place at a location most convenient for the
respondents – their workplace, their home, at a restaurant or on campus. The
interviews lasted between 13 and 82 minutes (average: 47 min.) and were conducted
between October and May 2012. The interviewees’ age ranged from 20 to 72; 24
were students, 21 were working adults, one was a retiree; 17 of the participants were
female, 29 were male; 21 interviewees have already had personal experience with
access offerings (see Table 3).

34 3. Project I: A Differential Measure of Consumers’ Attitudes towards Consumption Modes
Table 3: Description of In-Depth Interview Participants
ID Gender Age Access experience
Interview location
Ethnic origin
Interview duration in minutes
#1 male 27 no Singapore Chinese 66 #2 male 25 no Singapore Chinese 56 #3 female 27 no Singapore Chinese 50 #4 female 25 yes Singapore Chinese 66 #5 male 26 no Singapore Indian 55 #6 male 28 yes Singapore Indian 59 #7 male 29 no Singapore Chinese 52 #8 male 22 yes Singapore Chinese 54 #9 male 23 yes Singapore Chinese 51 #10 male 28 no Singapore Chinese 65 #11 female 21 yes Singapore Chinese 60 #12 female 21 yes Singapore Chinese 56 #13 female 21 yes Singapore Chinese 54 #14 female 21 no Singapore Chinese 56 #15 male 22 yes Singapore Chinese 53 #16 male 40 no Singapore Chinese 56 #17 female 39 no Singapore Chinese 61 #18 male 35 no Singapore Chinese 63 #19 female 44 no Singapore Chinese 82 #20 male 23 no Singapore Bangladeshi 58 #21 female 22 no Singapore Chinese 49 #22 female 22 no Singapore Indian 57 #23 male 24 yes Singapore Indian 52 #24 male 21 yes Singapore Chinese 59 #25 male 23 yes Singapore Chinese 56 #26 female 20 yes Singapore Chinese 52 #27 female 20 no Singapore Chinese 55 #28 female 45 yes Singapore Chinese 62 #29 male 62 yes Singapore Chinese 68 #30 female 24 no Germany German 25 #31 female 56 no Germany German 28 #32* male 33 yes Germany German 41 #33 male 26 yes Germany German 23 #34 female 20 no Germany German 18 #35 male 27 yes Germany German 20 #36* male 22 yes Germany German 37 #37* male 72 no Germany German 43 #38* male 42 yes Germany German 30 #39 male 56 no Germany German 27 #40 male 24 no Germany German 25 #41 male 21 no Germany German 13 #42 male 23 no Germany German 16 #43 male 23 no Germany German 18 #44* male 28 yes Germany German 36 #45* male 24 yes Germany German 33 #46 female 23 no Germany German 33 Note. * Interviewee has not agreed to audio recording. Interviewer took notes instead.

3. Project I: A Differential Measure of Consumers’ Attitudes towards Consumption Modes
35
The objective of the interviews was to learn as much as possible about how
consumers distinguish consumption modes, which advantages and disadvantages
they view, and what they regard as the major reasons for someone to use a certain
consumption mode. The interviews were semi-structured and based on an interview
guideline. The Singaporean interviews included projective methods such as sentence
completion tasks, word association tasks and the third-person technique in order to
stimulate associations and not directly accessible motives (Naderer & Balzer, 2007;
Rook, 2006). The interviews in Singapore covered a broad spectrum of product
categories, whereas the interviews in Germany had a more specific focus on
carsharing.
Additionally, a total of 34 German consumers completed a self-administered online-
survey that was conducted in order to confirm the results of the in-depth interviews
(Theobald, 2010). The open-ended questions covered subjective perceptions of
consumption modes in three different product categories.10 To ensure a comparable
knowledge among all respondents, the access offerings were described by a short text
and a video at the outset. Then the respondents were asked to answer open-ended
questions about advantages and disadvantages of access and ownership respectively.
The average duration to complete the open-ended questions was 13 minutes. The
interviewees were between 20 and 63 years old; 13 of 34 participants were female;
10 were still in education, 21 were employed and three retired.
The subsequent analysis and interpretation of the interview transcripts was conducted
as suggested by Spiggle’s (1994) overview of qualitative analysis techniques in
consumer research. Each transcript was read individually and important statements
were categorized by coding first. Continuously comparing coded text within a
category and re-reading the transcripts was then used to iteratively refine the
categories. These codes were then condensed into more abstract conceptual
constructs, which were systematically compared to each other in tabulations.
Eventually, 18 constructs could be classified into four dimensions as described in the
next section.
10 All respondents were asked about two product categories each – one of them always being
carsharing. The second product category for women was handbag sharing, while men were exposed to a ski rental service.

36 3. Project I: A Differential Measure of Consumers’ Attitudes towards Consumption Modes
3.3.2 Relevant perceptions of consumption modes
The analysis of the qualitative data resulted in identifying four internally
homogeneous dimensions to which the 18 identified perceptions could be assigned:
monetary perceptions, functional perceptions, experiential perceptions, and symbolic
perceptions. The classification into these superordinate groups shares similarities
with categorizations that have been introduced by various authors in order to classify
aspects of consumer perceived value (Boksberger & Melsen, 2011; Richins, 1994b;
Smith & Colgate, 2007).
Monetary perceptions
Total costs. The individual perception of how much monetary costs arise during the
entire consumption process has frequently emerged as a topic in the interviews: the
higher the perceived total costs, the less favorable the evaluation of the respective
consumption mode (Berry & Maricle, 1973; Durgee & O’Connor, 1995; Lamberton
& Rose, 2012; Lawson, 2011; Lovelock & Gummesson, 2004). The total costs
comprise all monetary costs that are associated with a given consumption mode. That
is initial, one-time costs (e.g. purchasing price, sign-up fee) as well as running costs
(e.g. insurance, operating material, taxes, depreciation, usage fees, monthly
membership fees). The perceived costs for one consumption mode and its perceived
value-for-money ratio depend heavily on the individual usage intensity (Berry &
Maricle, 1973; Nunes, 2000) and the preference for a certain temporal partitioning of
payment flows.11 Some consumers consider access to be financially advantageous or
to facilitate the financing of a certain lifestyle, as these respondents (#19 and #28)
stated:
I think sharing would be cheaper. Given that you own it, you sometimes don’t use it.
You can share among more people – then the overall cost will be less. (#19)
But if you lease a car or rent a car – if you don’t need [it] then you don’t have to pay.
You pay as you use, so that is more practical. (#28)
However, consumers also believe that the price advantage of access can turn if the
usage intensity or the usage period increases, as another participant (#18) said:
11 An access and an ownership offering can provide the same core benefit; however they usually come
with different payment models. Thus it usually depends on the frequency and the duration of the need to decide which consumption mode is cheaper. In general, ownership becomes the more economic the more it is used (Durgee & O’Connor, 1995; Moore & Taylor, 2009).

3. Project I: A Differential Measure of Consumers’ Attitudes towards Consumption Modes
37
If you are a regular user of a vehicle or something, quite often it is better to invest in
it, rather than to rent it.
Predictability of costs. The degree of predictability is different from the total costs,
as it does not refer to the total sum of costs but the ease of predicting the accruing
amount of costs in advance. A high degree of predictability is expected to affect the
evaluation of a specific consumption mode positively as it reduces financial
uncertainty for consumers. An easy-to-understand cost structure facilitates this
perception. To the author’s best knowledge, this aspect has not been addressed in the
literature before. In the interviews it frequently occurred that consumers had
difficulties in estimating their total costs of ownership – especially for goods that
require payments at various points in time such as cars. On the one hand, consumers
value access because no unscheduled repair costs occur and consumers can predict
their costs quite well as they only pay what they need, as one respondent (#18)
explained:
Renting is economical. I mean that it’s good in the sense that I only rent when I need
it. So of course my expenses are controlled in that sense.
On the other hand, consumers fear that renting costs could fluctuate and thus render
access costs even less predictable than ownership, as another respondent (#5) stated:
But if you rent it [a house], it [the lease] is very fluctuating. So I think at least in
Singapore, owning is better than renting.
Functional perceptions
Transaction effort. The transaction effort is the one-off time and effort that is
necessary to get started in a consumption mode. In case of ownership this
encompasses making the purchase (product selection, supplier choice, purchase
channel selection, waiting times) whereas in case of access registering with an access
provider (provider selection, process performance of rental agents, registration
forms) (Lamberton & Rose, 2012; Lovelock & Gummesson, 2004). This can also be
illustrated by the interviews. For example, respondent #16 thinks loudly about
consumption mode choice:
If I want to purchase something, I have to do some research beforehand and need
time to go buy it. If I rent it the provider has done the research for me but I also need
to register before I can start renting.

38 3. Project I: A Differential Measure of Consumers’ Attitudes towards Consumption Modes
This perception is similar to one of the service convenience dimensions identified by
Berry et al. (2002), labeled decision convenience. According to their research as well
as according to the conducted interviews, the higher the perceived transaction effort,
the less favorable the attitude towards the consumption mode.
Pre- and post-usage effort. The pre- and post-usage effort can be defined as the
necessary time and effort that incurs before and after each usage of the good. Again
consumers naturally prefer as much convenience as possible: the lower the effort
perception, the more positive a consumer’s attitude towards the consumption mode.
In case of ownership, effort before usage comprises retrieving or transporting the
product to the site where it is supposed to be used; in the case of access this contains
search effort for retrieving availability and locations as well as logistical effort to
either receive the good or to arrive at the pick-up location (Durgee & O’Connor,
1995; Lamberton & Rose, 2012; Lovelock & Gummesson, 2004). Compared to
ownership, where easy accessibility is usually given, in the case of access it appears
to be crucial. A statement by respondent #14 exemplifies this issue:
They [the carsharing users] maybe won’t feel that they are in control of the car, as
they always have to go through a sequence of steps so that they can get to the car
that they want. Whereas when you have a car, you just get in and go. Whereas for
carsharing, you’ve to find it and then you’ve to go through the registration, key in
your pin and so on. (#14)
However, the level of convenience among access offerings varies. Consumers
appreciate that for example some access offerings provide increased access
convenience through delivery to the doorstep or short distances to pick-up locations.
One of the respondents (#26) said:
It [carsharing] is quite cheap as compared to taking a taxi and it’s convenient like
there’s one car in walking distance and then you can park it on the streets even – I
think that’s really very convenient.
As this statement shows, time and effort are required both before and after usage.
The effort after usage refers to either stowing or returning the good. Similarly, this
effort is usually low in case of ownership, but can vary when it comes to access.
When consumers perceive return convenience to be inappropriately low, they look
out for alternatives – one strategy to avoid return inconvenience while still cutting
costs is to shop on secondary markets, as respondent #12 reported:

3. Project I: A Differential Measure of Consumers’ Attitudes towards Consumption Modes
39
I buy second-hand DVDs from – I don’t know – Cash Converters and stuff like that.
Because I don’t like the fact that if I rent, I have to go back to the shop to return it.
It’s taking too much time and I mean you have to pay for it anyway.
Alternatively one can use even more convenient service offerings that are provided
by persons such as taxi drivers, as respondent #1 explained:
With a taxi you can go to any place and get a drop off – that’s it. But with carsharing
you might have some restrictions that eventually you will need to go back and return
the car in some place.
Maintenance effort. Another source of effort that consumers try to minimize is the
time and effort associated with cleaning, maintaining and repairing a good (Durgee
& O’Connor, 1995; Lawson, 2011). The maintenance effort is one of four issues that
Berry and Maricle (1973) called the burdens of ownership. In contrast to ownership,
these duties are typically part of the access provider’s business. Respondent #28
explains how she experienced this burden:
But if you own it, for the case of a car, sometimes owning a car can be a chore, can
be a burden.
However, the extent of required maintenance depends on the industry: a car, for
example, generally requires a higher level of maintenance than a handbag, which
only needs to be cleaned from time to time. Reasons why consumers prefer not being
responsible for maintenance includes a general preference to have more leisure time
and the decreased personal financial risk in case of unexpected but necessary repair
work. Respondents #45 and #19 explained those issues from their personal
experience:
Owning a car is a lot of effort: Maintenance, changing tires, insurance and so on. I
definitely don’t need such an effort besides my job. That’s why carsharing is a
wonderful alternative for me. (#45)
For example, if you have a house then you own that place, you have to pay for all the
incidentals that go with it. For example if there is a leak in the roof, you have to pay
for it. But if you lease such a place, then in that case you don’t have to. In that case,
you can get the owner to do it. (#19)
Storage effort. The perceived storage effort is defined as the necessary effort that is
associated with storing the good between two uses. Again the interviews and prior
research showed that consumers prefer to minimize their effort (Durgee &

40 3. Project I: A Differential Measure of Consumers’ Attitudes towards Consumption Modes
O’Connor, 1995; Lamberton & Rose, 2012). Consumers usually have to find a
permanent storage solution when owning a product, whereas when they access a
product it depends on the rental period whether a temporal or even not any storage
place at all is required. If the rented good is returned directly after usage, it is the
provider’s responsibility to store the good. Consumers appreciate it if access
providers take over this effort, as a statement by respondent #3 exemplifies:
I think the positive aspect would be that I don’t have to think about like where I need
to have parking. Because when I return, I know that there are reserved parking spots
– this would be the positive aspect.
Use limitations. The perception of use limitations is defined as the degree to which a
consumer feels limited in his or her usage possibilities given a certain consumption
mode. Limitations may comprise the way of usage as well as the usage location,
point in time, and duration. The importance of this issue clearly emerged from the
interviews, but has never been explicitly mentioned in previous literature. The
interviews showed that consumers prefer the consumption mode with which they
associate less use limitations. According to property rights theory, the owner of a
good is not restricted in use except by law (Alchian & Demsetz, 1973; Coase, 1960;
Demsetz, 1967; Furubotn & Pejovich, 1972). This is also the way most consumers
perceive ownership on this dimension, as a statement by interviewee #4 shows:
Good is that, you can do whatever you want to. Wherever you want to use it and
whatever reason you want to use for – it is up to you. So you are not restricted, as
compared to leasing.
However, even in the case of ownership, it might happen that the inherent
characteristics of the owned good do not allow using it in certain cases – e.g. a long
car trip with a very old car. Nevertheless, the limitations that go along with an access
offering are typically perceived to be larger: the provider’s terms and conditions
might prohibit certain use cases limiting the variety; restricted opening hours might
limit possible usage times; and product modifications are almost always strictly
forbidden. Nonetheless there are cases where an access offering is able to provide
even more usage possibilities than ownership: Free-floating carsharing schemes that
allow one-way trips without returning the car to its original pick-up location, for
example. That provides ways of usage that are not even possible in case of
ownership.

3. Project I: A Differential Measure of Consumers’ Attitudes towards Consumption Modes
41
Inflexibility. The perception of being inflexible is defined as the subjective feeling of
having limited options because of having chosen a certain consumption mode.
Having little flexibility is generally regarded as negative, especially when life
circumstances are changing. Bardhi et al. (2012) showed that consumers with a
highly transitory lifestyle prefer not being bound to physical objects but being
flexible instead. But both, ownership and access offerings can contain a lock-in
effect that leads to a loss in flexibility. In case of ownership, this happens because of
its definitive character: the selected product might turn out to not match the user’s
needs or to become outdated, but the owner is bound to the product due to his or her
investment. Both issues are also among the so-called burdens of ownership (Berry &
Maricle, 1973). Conversely in case of access a long contract period might also lock a
consumer into an inflexible situation. Thus in both consumption modes, consumers
can feel being locked-in. Interviewee #28 described her thoughts about inflexibility
as follows:
It depends on the object you are talking about. If the object requires heavy capital
investment, it can be very immobile. It’s not as liquid as cash – you need to be sure
that you’re able to sell it quickly or you’re able to convert it into cash if you need it
in an emergency – unless the object can be used as a mortgage or as collateral.
One further facet of flexibility is the perceived scope of choice. Access offerings
usually allow a new product selection from a set of products before each use, while
the product selection for an ownership offering has to be made at the time of
purchase and is permanent as from then (Berry & Maricle, 1973; Durgee &
O’Connor, 1995; Lamberton & Rose, 2012). With a high need for flexibility in terms
of variety, consumers appreciate access, as respondent #3 stated:
Because the style of the handbag changes some people say they do not want to own
it, that is, buy it and own it. This way they can change their handbag really
frequently.
Risk of failure. The risk of failure is defined as the perceived probability of a
technical failure or partial damage of the product during use. This particular aspect
has not been described in previous literature on consumption modes and emerged
from the interviews. Naturally, consumers prefer the consumption mode that goes
along with fewer risks. The nature of access offerings naturally increases this
perception because different persons sequentially use goods. Consumers fear the
42 3. Project I: A Differential Measure of Consumers’ Attitudes towards Consumption Modes
tragedy of the commons (Hardin, 1968) that causes item conditions to be poor due to
over-usage or free riders, as interviewee #10 stated:
I believe something that I own is solely my own responsibility. So how good it is or
how bad it is, is up for me to decide. Again, in sharing the quality of the object or the
property tends to drop because responsibility gets diversified. So, it can work very
well if both parties are really very concerned about the property. But it can also work
very badly, because as I said, everybody’s business is nobody’s business.
In case of ownership, consumers also perceive the risk of failure but appreciate the
personal knowledge of their product and thus feel more capable in estimating the
risk, as respondent #28 reported:
Why I own a car? Because I know my car and I know the condition of my car. I’m
the only one who uses it – the reliability is there. I know the functions and no one
actually has made anything to the car.
Risk of non-availability. The risk of non-availability is defined as the perceived risk
that the desired good is not available at the time when it is needed (Lamberton &
Rose, 2012). Lamberton and Rose (2012) found that the risk of non-availability is a
key determinant of a consumer’s sharing propensity and that mechanisms to lower its
perceived existence leads to increased usage likelihood of access offerings. Non-
availability can not only occur in access offerings, but also in owned goods –
consider for example the good having a breakdown or being used by a family
member or friend. However, consumers usually neglect those instances and assume
completely unconstrained availability in case of ownership, as this statement (#32)
exemplifies:
It [the owned good] is simply there when you need it – also in the case of an
emergency.
Whereas access offers have an inherent risk of non-availability because the access
provider has usually less goods in its inventory than it has customers. In case of peak
demand this can lead to non-availability, as respondent #23 described:
You don’t want to compromise on your luxury at the end of the day. Like after work
at 5pm, carsharing has some restrictions. You can‘t just go out and have it when you
want it. Most of the times you might clash with someone else’s appointment. If they
own a car and they want to go anywhere on the weekend they don’t have to worry.

3. Project I: A Differential Measure of Consumers’ Attitudes towards Consumption Modes
43
But also in the case of access offerings this risk can be lowered by the provider – e.g.
by offering convenient reservation mechanisms (Lovelock & Gummesson, 2004).
Experiential perceptions
Absence of costs. The perception of an absence of costs is defined as the degree to
which consumers have the feeling that no costs are incurring during the consumption
process. The importance of this aspect and its positive impact on consumption mode
evaluation arose from the in-depth interviews. The idea of the relevance of the
presence of costs during consumption – also called taxi meter effect – has already
been found to be an important antecedent of flat-rate bias in the pricing literature
(Lambrecht & Skiera, 2006). It describes the degree to which the pleasure of using is
reduced by thinking about the running costs during consumption. In case a product is
purchased once and does not cause running costs, the perception of absence of costs
is high. The picture changes for products that are owned but require continuous
investments, such as cars. In case of access offerings it depends on the pricing tariff
in place. In case of pay-as-you-go pricing the costs are highly present, whereas in the
more unlikely case of a flat-rate tariff the costs could be neglected, too. That is why
consumers generally perceive costs to be more absent in case of ownership, as the
following statement by one respondent (#16) shows:
Owning is great. If you pay your car fully, you basically have a better feeling. Then
you don’t have the boredom of paying installments or leasing or what so ever.
Environmental friendliness. The perception of environmental friendliness of a
consumption mode can be defined as the degree to which consuming via access or
ownership is considered to cause little harm on the environment. In my interviews as
well as in interviews conducted by Lawson (2011), it emerged that the perception of
eco-friendliness has a positive impact on the attitude towards consumption modes but
is described more as a side-effect. For example, interviewee #9 made the following
statement:
Whereas if you share a car, you show that you don’t actually need a car. And you
also show that you’re not so wealthy and you show to a small extent that you maybe
play a part towards saving the environment. Because you only use it when there’s a
need.

44 3. Project I: A Differential Measure of Consumers’ Attitudes towards Consumption Modes
It is generally agreed upon that access offerings have more potential than ownership
with regard to successfully coping with limited resources due to the higher good
utilization in access and incentives for producers to attach more importance on
durability or to upgrade and refurbish rented goods (Berry & Maricle, 1973;
Lovelock & Gummesson, 2004; Mont, 2002; Schrader, 1999). However, when
looking at the big picture, the availability of access offerings might also cause
additional consumption or lead to cost savings which consumers reinvest into even
more harmful consumption practices – thus access is not necessarily more
sustainable than ownership (Mont, 2004; Tukker & Tischner, 2006). Nevertheless,
the interviews showed that consumers consider access – taken for itself – to be more
environmentally friendly than ownership. The following statement shows
respondent’s (#35) view:
There are so many cars that simply stand around idle. Maybe especially now, in
times of climate and environmental change, I don’t think it is wrong to think about
not purchasing a new car or not using one’s car as there are other cars around
anyway.
Need for careful handling. The need for careful handling in a specific consumption
mode is defined as the perceived degree to which a consumer feels obliged to ensure
that he or she is handling the good with care. Feeling compelled to handle a good
very carefully leads to a less positive evaluation of a consumption mode because it
reduces the consumers’ lightheartedness. In the literature, it has often been argued
that access users handle items less carefully because they are not the owners (Bardhi
& Eckhardt, 2012; Durgee & O’Connor, 1995). On the contrary, in the context of toy
rental libraries it was found that parents place even more importance on careful
handling when toys are rented rather than owned (Ozanne & Ozanne, 2011).
Similarly the results of the interviews show that that at least some consumers feel
more obliged to handle a rented good carefully because they fear being punished for
non-compliance, as respondent #45 explained:
I am more cautious in case of carsharing. I believe that in case of actual faults, I will
face very high costs and I do not want to have the hassle with the rental company.
Fun while using. The perceived fun while using is defined as the extent of hedonic
feelings that consumers experience while they are using a certain consumption mode.
The interviews showed that the more fun a consumption mode is associated with, the

3. Project I: A Differential Measure of Consumers’ Attitudes towards Consumption Modes
45
more positive its evaluation. The enjoyment that consumers feel when they use a
certain channel has also been identified as one of the factors that influences the
choice among multiple channels (Blattberg, Kim, & Neslin, 2008; Verhoef, Neslin,
& Vroomen, 2007). The literature on perceived value also comprises hedonic value
as one of the most important dimensions (Richins, 1994b; Smith & Colgate, 2007).
In his investigation of the perceived value of ownership, Weinert (2010) identified
pleasure to be the most important dimension. In the literature on access, Chen (2009)
found that hedonic feelings are also highly relevant for the perceived value. Thus
hedonic aspects are expected to be important for both consumption modes, but the
in-depth interviews showed that the associated emotional feelings are different. In
case of ownership, consumers especially regard individual freedom as providing
pleasure (Durgee & O’Connor, 1995). For instance, this can be seen by the following
answer from an interviewee (#7) to my question what most fun about owning a car
is:
I can go anywhere – freedom. Freedom, yep.
In case of access it is mainly the product variety that causes a lot of pleasure.
Consumers enjoy using different kinds of products and being able to use up-scale
models that they could not afford to purchase (Durgee & O’Connor, 1995; Lawson,
2011). For example see the following statement by respondent #3:
I think it’s good for those who are really into branded goods. Like, I don’t know
there are some girls that love to change branded goods – so I think it’s good for
them, and they get to save some money.
Symbolic perceptions
Being part of a community. The perception of being part of a community can be
defined as the subjective feeling of belonging to a community when choosing a
certain consumption mode. For consumers, the attractiveness of a consumption mode
increases with social interaction between users of the same consumption mode and
the possibility to identify with the consumption mode. Also in the multichannel
literature it was found that the quest for social interaction is one of the factors that
influences channel choice (Balasubramanian, Raghunathan, & Mahajan, 2005). In
the interviews this aspect usually came up as a side effect. However, consumers tend
to perceive this perception to be stronger in case of access as compared to ownership,
as the following statement by respondent #23 exemplifies:

46 3. Project I: A Differential Measure of Consumers’ Attitudes towards Consumption Modes
I mean through sharing you can have more bond, a better bond between the people,
between the groups. So like sharing a room or a house, or sharing a car – that they
have in Singapore: carpool. And so it’s about community involvement, community
bonding which is lacking in Singapore to a certain extent.
Signaling one’s personality. The perception of signaling one’s personality when
using a certain consumption mode is defined as the degree to which using a product
via access or ownership is believed to signal one’s personal values, beliefs, attitude,
interest, and capabilities. It has been identified in previous research on consumer
behavior in both consumption modes (Chernev, Hamilton, & Gal, 2011; Goodman &
Irmak, 2013; Richins, 1994b; Schrader, 2001; Thompson & Norton, 2011; Weinert,
2010; Wilcox, Kim, & Sen, 2009). Such a symbolic meaning can be internally (that
is for oneself) and externally (that is with respect to others) relevant. The analysis of
the interviews revealed that consumers desire to express their identity also in
consumption mode choice. Thus, the higher the possibilities to express one’s
personality, the more favorable the evaluation of the respective consumption mode.
With the usage of access instead of ownership consumers associate signaling
ecologically responsible behavior, flexibility and reasonable behavior. According to
one respondent (#38), an access user wants to show his or her future-mindedness by
behaving ecologically responsible whereas owners want to demonstrate their
capabilities:
Car owners frequently want to show how much money they have and carsharing
users want to show that they behave with ecological awareness and forward-looking.
Owners also use the possibility of customizing a good in order to express their
personalities, as the following interviewee (#26) stated:
I think before I buy a car, I would do quite a lot of research online and then I will
look very carefully at the aesthetic design and all, so the car which I buy, would
somewhat represent me – sort of express my individuality by the design, the interior
features, what I am looking out for: comfort or safety or whatever.
Personal attachment. In the context of consumption modes, personal attachment is
defined as the perceived degree of psychological closeness to the specific good that
is being used in a given consumption mode. Previous research in the domain of
ownership found that personal attachment stems from a good representing personal
memories or relevant interpersonal ties (Dittmar, 1992; Kleine & Baker, 2004;
3. Project I: A Differential Measure of Consumers’ Attitudes towards Consumption Modes
47
Richins, 1994a; Scholl, 2006). Thus consumers perceive feelings of connectedness
and familiarity. As those feelings are generally desirable, a positive link between this
perception for a given consumption mode and the attitude towards it is expected. The
results of the interviews suggest that the degree to which consumers feel personally
attached to an accessed good is significantly less due to the small amount of time that
is spent with one particular good, the fact that one is usually not using the exact same
good the next time and knowing that the good is shared with others. These findings
are also mirrored by the results of Durgee and O’Connor’s (1995) and Bardhi and
Eckhardt’s (2012) qualitative investigations. They can also be illustrated by the
interviews – for example, interviewee #35 explained:
That is like a normal rental car. You simply pick-up the car, drive it, the seat is
different, the steering wheel feels different compared to your own car, then you park
it and that’s it. The car is definitely a strange car to you.
In an early study, Durgee and O’Connor (1995) found that objects with high
emotional attachment are even considered as “too personal to rent” (p. 99). Some of
the interviewees shared this opinion, for example respondent #22 stated:
If there is a clothing sharing service – similar to the carsharing – I don’t think I will
want to rent all the clothes or something because it’s something very personal.
Impressing others. The perception of impressing others when using a certain
consumption mode can be defined as the degree to which a consumer believes that it
makes a good impression on others when he or she uses a certain consumption mode.
The cause for deriving social prestige by using a particular consumption mode can be
manifold: it might be very expensive, it might be very new and innovative, it might
offer great flexibility, or it might be beneficial for the environment (Scholl, 2006).
The interviewee’s opinions about the social prestige associated to each consumption
mode differed a lot – nonetheless this facet is expected to positively influence the
attitude towards consumption modes as people generally strive to achieve social
prestige (Eastman, Goldsmith, & Flynn, 1999). Impressing others or signaling one’s
status can not only be achieved by ownership but also by the way a good is used as
several authors noted (Berry & Maricle, 1973; Bourdieu, 1982; Durgee & O’Connor,
1995; Schrader, 2001; Weinert, 2010). Some consumers were found to believe that
access in general positively influences one’s social prestige because it represents a
reasonable consumption behavior as it is more economically and ecologically viable

48 3. Project I: A Differential Measure of Consumers’ Attitudes towards Consumption Modes
– similar to results by Bardhi and Eckhardt (2012). If high prestige brands are
accessed, some consumers believe that such a behavior nonetheless encompasses
high social prestige, as one respondent (#2) answered to the question whether the
social status would be changed if a luxury car was accessed rather than owned:
Yes, it is the same. It is an expensive car. An expensive car will always reflect a high
status. Even if you don’t own the car.
However others believe that ownership is the only possibility to demonstrate one’s
social prestige, as this statement by another interviewee (#39) shows:
In the moment when you own something, I can of course decide which car brand I
want to buy. Well, that is of course related to my identity. If I buy a Porsche, I want
to be able to drive fast and of course I have a certain status symbol as well.
The results of the interviews is that the majority of interviewees had the opinion that
owning goods has more social prestige associated than accessing it, as the following
statement (by respondent #8) exemplifies:
I think it looks better when I own the thing. As in what they think of me. It’s still
status.
3.3.3 Summary of the identified perceptions
The previous description of perceptions is the most comprehensive collection of
relevant perceptions for determining consumers’ attitude towards consumption
modes. It is based on extensive proprietary investigations and a meta-analysis of all
related and relevant literature.
In the end, 18 different perceptions clustered into four dimensions have been
identified (see Table 4). Three of those perceptions have not been mentioned in any
related form in the relevant literature. The degree to which costs are deemed
predictable, the risk of a failure during consumption and the degree to which costs do
not come to the fore during the consumption process have been found to also be
relevant in consumers’ evaluations of consumption modes. The remaining identified
perceptions confirm earlier findings, propositions or indirect hints.

3. Project I: A Differential Measure of Consumers’ Attitudes towards Consumption Modes
49
Table 4: Identified Perceptions of Consumption Modes and their Definitions
Dimension Perception Definition
Monetary perceptions
Total costs The individual perceptions of how much monetary cost arise during the entire consumption process.
Predictability of costs
The ease of predicting the accruing amount of costs in advance.
Functional perceptions
Transaction effort
The one-off time and effort that is necessary to get started in a consumption mode.
Pre- and post-usage effort
The necessary time and effort that incurs before and after each usage of the good.
Maintenance effort
The time and effort associated with cleaning, maintaining and repairing a good.
Storage effort The necessary effort that is associated with storing the good between two uses.
Use limitations The degree to which a consumer feels limited in his or her usage possibilities given a certain consumption mode.
Inflexibility The subjective feeling of having limited options by having chosen a certain consumption mode.
Risk of failure The perceived probability of a technical failure or partial damage of the product during usage.
Risk of non-availability
The perceived risk that the desired good is not available at the time when it is needed.
Experiential perceptions
Absence of costs The degree to which consumers have the feeling that no costs are incurring during the consumption process.
Environmental friendliness
The degree to which consuming via access or ownership is considered to cause little harm on the environment.
Need for careful handling
The perceived degree to which a consumer feels to be required to make sure that he or she is handling the good with care.
Fun while using The extent of hedonic feelings that consumers experience while they are using a certain consumption mode.
Symbolic perceptions
Being part of a community
The subjective feeling of belonging to a community when choosing a certain consumption mode
Signaling one’s personality
The degree to which using a product via access or ownership is believed to signal one’s personal values, beliefs, attitude, interest, and capabilities.
Personal attachment
The perceived degree of psychological closeness to the specific good that is being used in a given consumption mode.
Impressing others
The degree to which a consumer believes that it makes a good impression on others when he or she uses a certain consumption mode.

50 3. Project I: A Differential Measure of Consumers’ Attitudes towards Consumption Modes
3.4 The Formative Measurement Model
For the purpose of linking the perceptions to the attitude towards a consumption
mode, a formative measurement model has been constructed. Such a formative
measurement model implies that the perceptions are the causes for the attitude.
Similar to Richins (1994b), this approach is not focused “on measuring how much
value [a certain consumption modes has, but] rather on the nature and sources of that
value” (p. 505). This thinking is analogous to a decompositional approach to measure
attitude (Pavlou & Fygenson, 2006; Taylor & Todd, 1995).
Even though the awareness of formative measurement specification has increased
over the last ten years, reflectively specified constructs are still the norm in marketing
and consumer behavior (Briggs & Grisaffe, 2009; Jarvis, MacKenzie, & Podsakoff,
2003). The key difference between the two approaches is the cause direction between
the indicators and the latent construct: Reflective constructs are defined to cause their
indicators, while formative constructs are defined to be caused by their indicators
(Diamantopoulos, Riefler, & Roth, 2008; Diamantopoulos & Winklhofer, 2001;
Jarvis et al., 2003) (see Figure 4).
Figure 4: Reflective and Formative Measurement Models. Adapted from Diamantopoulos et al.
(2008).
The criteria for developing a formative measurement model are different from those
for reflective measurement models. Diamantopoulos and Winklhofer (2001) have
pointed out four relevant issues for the construction of formatively specified
constructs: (a) content specification, (b) indicator specification, (c) indicator
collinearity and (d) external validity. The following chapters proceed along those
four issues in order to outline the construction of the formative measure at hand.

3. Project I: A Differential Measure of Consumers’ Attitudes towards Consumption Modes
51
3.4.1 Content specification
First, the latent construct to be measured has to be precisely defined in order to
specify its scope (Diamantopoulos & Winklhofer, 2001; Rossiter, 2002). In this
research project, the formative construct is labeled attitude towards consumption
modes. Note that it is defined as a differential measure that directly contrasts the
evaluation of access and ownership. If it takes positive values, the attitude towards
access is more positive than the attitude towards ownership. Values close to zero
indicate indifference between both consumption modes.12 In turn, if the measure
takes negative values, a consumer favors ownership over access. The reason to
define the construct in a differential rather than an absolute manner was to increase
parsimony and ease of interpretation by integrating both consumption modes into one
model. The approach of using difference scores is similar to the specification of
SERVQUAL. However, the intensively discussed concerns about difference-scales
in the case of SERVQUAL (Cronin Jr & Taylor, 1994; Parasuraman, Zeithaml, &
Berry, 1988, 1994) are not applicable to this case because here two alternatives are
set in relation to each other, rather than comparing pre- and post beliefs of the same
service.
The construct’s domain of content is defined as all cost-related, functional,
experiential and symbolic perceptions that cause the differential overall attitude
towards consumption modes. The rated objects are defined as consumption offerings
from a specific product category via access or ownership. The raters are consumers –
independent of their current consumption mode behavior: it does not matter whether
he or she currently accesses, owns, accesses and owns at the same time, or does not
consume anything in the given product category.
3.4.2 Indicator specification
The indicators of a formative construct must capture all relevant perceptions in order
to cover the entire scope of the construct (Diamantopoulos & Winklhofer, 2001).
Each indicator is supposed to cover a different aspect, as all indicators taken together
12 In the case of a differential definition some information is lost because the use of difference scores renders those two cases where both consumption modes are evaluated very positively or negatively to be undistinguishable. However the case that a consumer has a negative attitude towards both consumption modes is deemed rather unlikely, as this would mean complete anti-consumerism in the respective product category.

52 3. Project I: A Differential Measure of Consumers’ Attitudes towards Consumption Modes
form the construct. Thus any left-out cause excludes a part of the construct itself and
leads to an increase in measurement error (Diamantopoulos, 2006).
The specification of the indicators and their operationalization in this research has
been based upon the proprietary qualitative pre-studies as well as the comprehensive
literature review. The objective was to make the items applicable to both
consumption modes (access and ownership) as well as to a wide variety of product
categories.
The indicators are specified to reflect differential perceptions, just as it is the case for
the overall construct. However, measuring the items is specified to take place in
absolute form as this facilitates ratings for respondents and allows collecting the
richest level of data.13 Thus the corresponding items for access and ownership need
to be subtracted from each other to derive differential indicators. The beliefs for
access and ownership are measured simultaneously by placing the answer scales for
both consumption modes right next to each other. Thus each respondent gives a
within-subjects evaluation of an access offering and an ownership offering in one
product category. It should further be noted that the proposed causes are perceptions
without judgments, rather than evaluations of aspects of the overall consumption
mode attitude.
The conventional guidelines for item formulation were followed. Wording clarity
was achieved by using unambiguous, common language and formulating short and
simple items (Netemeyer, Bearden, & Sharma, 2003). The employed answer scales
are unipolar in nature and provide seven answer categories, which are labeled by
numbers from 1 to 7. Each belief is represented by one measurement item because
the beliefs are concrete and self-reportable (Ajzen, 1991; Bergkvist & Rossiter, 2007;
Drolet & Morrison, 2001; Rossiter, 2011b).
13 By measuring the beliefs in absolute form the respondent’s absolute anchor points become obvious
and it is still possible to derive relative scores by computation.

3. Project I: A Differential Measure of Consumers’ Attitudes towards Consumption Modes
53
Table 5: Items for Measuring the Attitude towards Consumption Modes
Perception Item (English Version) Answer Scale
Total costs For me, the amount of total costs will be… a
Predictability of costs I think that the incurring costs can be well predicted. b
Absence of costs You feel like incurring no costs while using. b
Transaction effort I believe the one-time effort for purchasing and registering respectively to be… a
Pre-usage effort I believe the required effort before each use to be… a
Post-usage effort I believe the required effort after each use to be… a
Maintenance effort I believe the effort for maintenance to be… a
Storage effort I believe the effort to find a suitable storage place to be… a
Risk of non-availability The risk that ___ is not available when I want to use it is… a
Risk of failure The risk of failure when using ___ is… a
Use limitations The way, duration and place of my usage is strongly restricted. b
Need for careful handling During usage one feels like having to be very careful. b
Inflexibility* The flexibility in different situations in life is… a
Fun while using Usage is a lot of fun. b
Being part of a community I have a feeling of belonging to other ____owners / access users. b
Environmental friendliness I consider using ___ environmentally friendly. b
Signaling one’s personality Owning / accessing ___ strongly expresses my personality. b
Personal attachment I believe that one has a strong personal attachment to an owned / accessed ___. b
Impressing others It makes a good impression on others when owning / accessing a ___. b
Answer Scales
a very low (1) … very high (7)
b not at all (1) … absolutely (7)
Note. * reverse coded item. The breaks “____” need to be filled in with the respective product category.

54 3. Project I: A Differential Measure of Consumers’ Attitudes towards Consumption Modes
The item development process itself was iterative in nature and based on three
pretests. After each pretest improvements were made. The first pretest was done with
seven marketing scholars who were asked to rate and comment content validity,
applicability to both consumption modes and inter-independency. Subsequently the
revised item set was tested with five potential respondents to investigate whether the
instructions and the response format were clear and whether the items were easy to
understand and non-ambiguous. After another revision, a large respondents pretest
with 124 participants was conducted online. The setting was highly comparable to
the conditions of the final survey. Pretesters’ comments were used to make last
refinements.
Table 5 displays the final items and the respective answer scales. The development
of the item battery and the survey itself were done in German (see appendix A.1).
The English translation has been validated by a back-translation procedure.
3.4.3 Indicator collinearity
One of the challenges when dealing with formative indicators is multicollinearity. A
high degree of indicator collinearity makes it more difficult to distinguish the
influences of separate indicators as formative measurement models are based on
multiple regression analysis (Cenfetelli & Bassellier, 2009; Diamantopoulos et al.,
2008; Diamantopoulos & Winklhofer, 2001). According to Diamantopoulos and
Winklhofer (2001), multicollinearity is a particular issue for two reasons: First,
excessive collinearity influences the magnitudes of the indicator weights, which
serve as validity indicators for formative measurement models. Second, those
indicators, which can be predicted by linear combinations of other indicators, are
candidates for exclusion from the item battery because they contain no to little
additional information.
In order to test for multicollinearity, it is recommended to analyze item-to-item
correlations and the variance inflation factor (VIF). As an indicator of
multicollinearity, the literature mentions various VIF cutoff values: They range from
10 (Diamantopoulos et al., 2008; Hair, 1998) over 5 (Hair, Ringle, & Sarstedt, 2011)
to 3.3 (Diamantopoulos & Siguaw, 2006). In case of increased VIF value, the current
literature recommends to eliminate items only if they show a high degree of
correlation (e.g. .90) with another item and if it is conceptually feasible to delete one

3. Project I: A Differential Measure of Consumers’ Attitudes towards Consumption Modes
55
of them (Cenfetelli & Bassellier, 2009; Diamantopoulos et al., 2008). If the degree of
correlation between two indicators is more moderate (e.g. .80) and it is logically
reasonable, it is recommended to combine both formative indicators into a composite
index by calculating the mean and to use this index in subsequent analysis (Albers &
Hildebrandt, 2006; Cenfetelli & Bassellier, 2009).
3.4.4 External validity
In contrast to reflectively specified constructs, it does not make sense to assess the
reliability (e.g. by Cronbach’s alpha) for formative measures due to the fact that the
items are supposed to be independent from each other and to be causing the construct
– rather than being uniformly caused. Instead, the focus is on assessing the validity
of formative measures. The validity assessment should cover the following three
issues: indicator validity, construct validity, and nomological validity
(Diamantopoulos & Winklhofer, 2001; Jarvis et al., 2003).
First, the bivariate correlations between the proposed indicators and another variable
measuring the content of the item battery at a global level should be analyzed. For
indicator validity, the correlation should be significant in order to retain the indicator
in the item battery (Diamantopoulos & Winklhofer, 2001).
Second, all items should be analyzed simultaneously in one set in order to test for
construct validity. For that purpose a multiple indicators and multiple causes
(MIMIC) model (Goldberger & Hauser, 1971; Jöreskog & Goldberger, 1975) can be
used. The proposed indicators act as direct causes of a reasonably related latent
construct, which is simultaneously specified by two or more reflective indicators. A
good model fit (e.g. R2 ≥ .30) as well as significant and plausible indicator weights
show construct validity (Chin, 1998; Diamantopoulos & Winklhofer, 2001). Based
upon the results of the qualitative pre-studies, a second-order definition has been
chosen for the MIMIC model (see Figure 5). Within the classification of
multidimensional constructs by Jarvis et al. (2003), this specification is classified as
type IV because both – first-order and second-order constructs – are specified in a
formative way. A second-order construct is advantageous as it creates smaller pools
of items that compete with each other for impact (Cenfetelli & Bassellier, 2009) and

56 3. Project I: A Differential Measure of Consumers’ Attitudes towards Consumption Modes
it facilitates interpretation at a more abstract level (Edwards, 2001; Wetzels,
Odekerken-Schröder, & Van Oppen, 2009).14
Third, the nomological validity of a formative measurement model should be
assessed, by linking it to other theoretically related constructs that are reflectively
measured. Those constructs can either be antecedents or consequences of the
construct under development. If the theoretically justified relation can be empirically
proven, nomological validity is given (Diamantopoulos & Winklhofer, 2001).
Finally, formative measurement models should also be cross-validated with further
data sets after they have been constructed and tested for validity (Diamantopoulos &
Winklhofer, 2001). In this research project, the cross-validation is achieved by
testing the formative measurement with five different samples in four different
product categories.
Figure 5: MIMIC Model of the Second-Order Construct Attitute towards Consumption Modes.
14 Simply a large number of indicators (e.g. more than 10) leads to a greater likelihood of low and thereby non-significant indicator weights because indicators compete with each other for impact (Cenfetelli & Bassellier, 2009). In case of non-significant weights it is recommended to either consider removing these indicators (Diamantopoulos & Winklhofer, 2001), or nonetheless keeping all items to preserve content validity (Bollen & Lennox, 1991), or to create a second-order construct in order to create multiple, but smaller item pools (Cenfetelli & Bassellier, 2009).

3. Project I: A Differential Measure of Consumers’ Attitudes towards Consumption Modes
57
3.5 Methodology of the Empirical Studies
3.5.1 Study design
To empirically assess the proposed formative measurement model for the attitude
towards consumption modes, respondents of an online survey were randomly
assigned to one of four conditions, which differed with regard to the product
category that was presented. The four product categories were: cars, bicycles, books
and handbags (the latter only open to women).
The assessment of the measurement model has been performed in several product
categories because the field of access offerings bears a high degree of diversity.
Differences between access offers do not only exist within a given product category
but also between product categories (see chapter 2.3). Among the most important
are: typical purchase price, durability, visibility of consumption, and main
consumption goal (see Table 6). Due to possible differences among those
dimensions, it becomes obvious that research on access should not cover one product
category only, but rather include two or more product categories in order to derive
more generalizable findings.
Table 6: Differences between the Investigated Product Categories
Category Purchase price Durability Visibility of consumption Main consumption goal
Cars high high public mainly functional
Bicycles medium high public mainly functional
Books low medium private mainly hedonic
Handbags medium medium public functional and hedonic
In all four conditions, the structure of the questionnaires and the general scenario
described to the respondents was very similar. First, the respondents were told that
they had heard about a new access offering available in their town, which they would
be discussing with some of their friends. Subsequently, they were exposed to a
detailed description of an access offering from the respective product category in
order to provide everyone with the same information on the access offering. In terms
of features and price, the description was designed to be as close to current market

58 3. Project I: A Differential Measure of Consumers’ Attitudes towards Consumption Modes
offerings as possible. The description provided information on the registration
process, the rent out process, pricing, and return of the rental good (see Figure 6 for
an example and appendix A.2 for the remaining descriptions). No details were given
on the product brands available in the access offering or on the brand of the access
provider. The ownership consumption mode was not described in detail – owning a
good of the respective product category was simply presented as an alternative
option. Next, the respondents were asked to state their perceptions of both
consumption modes by filling in the item battery that measured their perceptions of
owning and accessing a good of the respective product category.
Figure 6: Description of the Carsharing Access Offering Used in the Survey.
3.5.2 Sample description
An external panel provider recruited the participants of this study and compensated
them for their effort. The recruitment took place in Germany. All participants had to
be older than 18 years. The survey was programmed in German, using the online-
survey tool Unipark. At a completion rate of 79%, in total 2,552 persons completed
the survey during the field period in Summer 2012 (median survey duration: 10m
40s). After applying a quality filter in order to exclude respondents with
unrealistically short completion times (<7 minutes) and a bad quality indicator (<

3. Project I: A Differential Measure of Consumers’ Attitudes towards Consumption Modes
59
.25), a sample size of 2,098 remained with a median survey duration of 11m 36s (see
Table 7 for details on categories).15
Table 7: Sample Sizes in the Four Different Survey Conditions with and without Data Quality Filters (Project I)
Cars Bicycles Books Handbags Total
All completes 773 765 508 506 2,552
Filtered completes 633 627 410 428 2,098
Note. Filtered completes are those that fulfilled the data quality requirements (duration ≥ 7 minutes and quality ≥.25).
In total the sample contains 54.2% female respondents. The median age is 45 years
with a distribution ranging from 18 to 78 years. The level of education is above the
average within the German population. About one quarter (26.2%) lives in single-
households, which is below the average of the general population. The median of the
monthly household net income is between 2,000 and 3,000€.
For a detailed comparison of the above reported criteria from the four samples that
were randomly exposed to one of the four product categories, refer to Table 8. The
table shows that the share of people currently owning a good from the respective
product category is generally high (ranging from 84.4% for cars to 98.5% for books).
However, the percentage of respondents currently using an access offering in the
respective categories is comparably low: It ranges between 1.2% and 3.2% - while
the books condition was an exception. As libraries have been around for a long time
period, about one third (31.7%) currently uses such an access service.
15 The critical value of duration was set to 7 minutes as pretest showed that not even reading through
the whole survey was possible in that time period. The quality indicator is an indicator calculated by Unipark for the individual completion time of each page in comparison to the average page completion time of all respondents. The critical value used was .25.

60 3. Project I: A Differential Measure of Consumers’ Attitudes towards Consumption Modes
Table 8: Sociodemographics and Consumption Mode Status for the Four Sub-Samples (Project I)
Criteria Cars (n = 633)
Bicycles (n = 627)
Books (n = 410)
Handbags (n = 428)
Gender
Male 55.8% 51.4% 69.5% 0%
Female 44.2% 48.6% 30.5% 100%
Age Groups
18-29 18.2% 17.1% 13.7% 21.5%
30-39 20.6% 20.0% 17.1% 19.9%
40-49 23.3% 30.2% 27.8% 29.0%
50-59 25.6% 24.3% 22.9% 20.6%
60+ 12.3% 8.5% 18.5% 9.1%
Highest Level of Education
Basic secondary school or none 11.8% 12.9% 14.1% 13.8%
Middle secondary school 30.0% 34.0% 38.0% 41.6%
Higher secondary school 29.4% 28.1% 24.9% 25.5%
University degree or doctoral degree 28.7% 25.0% 23.0% 19.2%
Household Size
1 person 28.3% 29.2% 23.9% 21.0%
2 persons 37.9% 36.2% 38.0% 37.6%
3 persons 17.5% 18.7% 18.3% 21.3%
4 and more persons 16.2% 16.1% 19.8% 20.0%
Monthly Household Net Income
≤ 1,000€ 11.7% 13.7% 11.2% 10.3%
1,001€ – 2,000€ 27.6% 28.5% 24.4% 32.0%
2,001€ – 3,000€ 21.8% 21.7% 24.1% 18.2%
3,001€ – 4,000€ 12.6% 10.8% 14.1% 11.2%
4,001€ – 5,000€ 7.0% 5.3% 6.6% 3.7%
> 5,000€ 4.1% 2.7% 3.7% 3.5%
Not answered 15.2% 17.2% 15.9% 21.0%
Owners in Respective Category
Yes 84.4% 85.3% 98.5% 96.0%
No 15.6% 14.7% 1.5% 4.0%
Access User in Respective Category
Yes 3.2% 1.8% 31.7% 1.2%
No 96.8% 98.2% 68.3% 98.8%

3. Project I: A Differential Measure of Consumers’ Attitudes towards Consumption Modes
61
3.5.3 Measures
The majority of the measures have already been presented in context with the
specification of the construct’s indicators in chapter 3.4.2. Thus, only the remaining
measures are described in this section.
In order to fully specify the MIMIC model, in which the formative measurement
model is tested, a global measure of the attitude towards a consumption mode is
necessary, too. Similar to the perceptions, it has been measured in an absolute way.
The overall attitude towards owning and accessing has been measured by two
semantic differentials (very bad / very good; very disadvantageous / very
advantageous). The answer scale was bipolar and ranged from -3 to +3.
Furthermore, the behavioral intention towards each consumption mode was
measured in order to assess the formative measure’s nomological validity. Two items
measured the behavioral intention separately for both consumption modes, one
asking for the intended usage probability within the next 12 months and the other
asking for the intended usage intensity. Both were measured on an unipolar 7-point
answer scale, which was labeled with probabilities, ranging from 0% to 100%.
Again, measurement was performed for both consumption modes separately.
Moreover, a set of control variables (socio-demographics, ownership and access
behavior) was measured, too.
3.5.4 Data analysis methods
The data analyses have been performed with SPSS and SmartPLS (Ringle, Wende, &
Will, 2005). The latter was used to perform all calculations for the formative
measurement model.
I chose PLS for three reasons. First, it does not have any distributional assumptions,
thus it does not require multivariate normal data. Second, there are no identification
problems for formative measurement models. And third, PLS is more appropriate
when the theory is at an early stage and the focus is more on theory development
rather than empirical testing of an existing research model (Diamantopoulos, 2011;
Teo, Wei, & Benbasat, 2003).
The chosen settings in SmartPLS were based on current recommendations in the
literature on PLS: the PLS algorithm has been run with the path weighting scheme

62 3. Project I: A Differential Measure of Consumers’ Attitudes towards Consumption Modes
(Hair et al., 2011), for the bootstrapping algorithm sign changes were allowed at the
construct level (Tenenhaus, Vinzi, Chatelin, & Lauro, 2005), the number of bootstrap
samples was set to 5,000 in all analyses (Hair et al., 2011), and the number of cases
was always equal to the number of observations for all bootstrapping calculations
(Hair et al., 2011).

3. Project I: A Differential Measure of Consumers’ Attitudes towards Consumption Modes
63
3.6 Empirical Results
The results section is ordered into four parts. First, the absolute perceptions of access
and ownership are contrasted in order to gain first insights into differences between
the two consumption modes (chapter 3.6.1). Second, the proposed formative
measurement model is evaluated. As from there on, all analyses are based upon
difference scores. This evaluation goes hand in hand with determining the
importance of the individual perceptions for determining the attitude towards
consumption modes (chapter 3.6.2). Third, the model results are compared across the
four product categories as the second step only covers separate evaluations (chapter
3.6.3). Fourth, the effects of experience with the access consumption mode are
analyzed with an additional sample in order to highlight how perceptions change
with increased usage experience (chapter 3.6.4).
3.6.1 Attitudes towards and perceptions of access and ownership
In order to gain a better understanding of how access and ownership are perceived
and to facilitate the interpretation of successive results, this section reports the means
differences for all attitudes and perceptions. To contrast the perceptions of the two
consumption modes, t-tests for paired samples were calculated for all product
categories. Figure 7 and Figure 8 give an overview of the results by displaying the
differences between the means of the access and the ownership condition.16 If the
mean difference is positive, the perception for access is stronger, if it is negative, the
perception for ownership is more pronounced.
Results for overall attitudes
Looking at overall attitudes first, the attitude towards access is found to be
consistently worse than the attitude towards ownership across all product categories.
The smallest difference is found in the case of books (Δbooks, att1 = -1.09 and Δbooks, att2
= -0.88), while the largest difference is found in the case of handbags (Δbags, att1 = -
3.51 and Δbags, att2 = -3.22). In order to get a better impression of the data distribution
it is good to know how many respondents have a more favorable attitude towards
ownership, how many are indifferent among access and ownership, and how many
16 Table 29, Table 30, Table 31, Table 32, and Table 33 in the appendix provide more detailed results for each product category.

64 3. Project I: A Differential Measure of Consumers’ Attitudes towards Consumption Modes
prefer access.17 In all categories except books, respondents have a more favorable
attitude towards ownership than access (60% – 83%). In case of books, the
majority’s attitude is indifferent (55%). The ratio of respondents whose attitude is
more favorable towards access than ownership, ranges from 2% in case of handbag
rental and bikesharing to 9% in case of libraries (see Table 9 for a quick overview
and Table 34 – Table 37 in the appendix for the detailed crosstabs).
Table 9: Respondents Grouped According to their Differential Consumption Mode Attitudes
Clusters Cars Bicycles Books Handbags
Ownership better than access 60% 63% 37% 83%
Indifferent between access and ownership 33% 34% 55% 15%
Access better than ownership 7% 2% 9% 2%
Note. Those being indifferent were defined as having answered the sum of both attitude scales with a maximum deviation of ±2.
Results for monetary perceptions
The differences in perception for total costs vary among the investigated categories.
In the case of cars there was no significant difference, t(632) = 0.84, p ≥ .10, Δ =
0.08 (see Figure 7 and Figure 8). However, bicycles, t(626) = 22.09, p ≤ .001, Δ =
2.16, and handbags, t(427) = 21.10, p ≤ .001, Δ = 2.64, are perceived as more
expensive in the access condition, whereas books are perceived as cheaper when they
are accessed rather than owned, t(409) = -17.41, p ≤ .001, Δ = -2.06. The
predictability of costs is perceived to be higher for ownership offerings in three of
four categories – books being the exception with a small difference in favor of
access, t(409) = 4.04, p ≤ .001, Δ = 0.44.
Results for functional perceptions
The initial transaction effort is perceived to be greater for ownership than for access
only in the case of cars, t(632) = -6.30, p ≤ .001, Δ = -0.64. In case of bicycles and
handbags access is believed to cause more effort, while in case of books the
perceptions concerning the initial effort do not differ significantly (t(409) = 1.24, p =
.21, Δ = 0.13). Pre- and post-usage effort are perceived to be greater for access in all
product categories. The effort to maintain the product is perceived to be lower in case
17 Those being indifferent were defined as having answered the sum of both attitude scales with a maximum deviation of ±2.
3. Project I: A Differential Measure of Consumers’ Attitudes towards Consumption Modes
65
of access for cars and bicycles (Δcars = -1.72, Δbicycles = -0.83), but higher for books
and handbags (Δbooks = 0.51, Δbags = 1.75).
The perceived storage effort is believed to be higher for access in all cases – except
books, t(409) = -5.02, p ≤ .001, Δ = -0.63. Consistently across the four product
categories, access offers are perceived as coming with significantly more use
limitations and more inflexibility. The perceived risk of non-availability and the risk
of failure are perceived as being higher in case of access. The differences in means
are comparatively large: ranging from Δbooks = 2.14 to Δbags = 3.53 for risk of non-
availability and from Δcars = 1.69 to Δbags = 3.23 for risk of failure.
Results for experiential perceptions
The perceived absence of costs is found to be greater for ownership than for access –
books are again the exception, t(409) = 5.81, p ≤ .001, Δ = 0.85. The results for
environmental friendliness are also inconsistent: Access is only perceived to be more
environmentally friendly than ownership for cars (Δ = 0.87) and books (Δ = 1.86) –
in the product categories bicycles (Δ = -0.11) and handbags (Δ = -0.86) it is the other
way around. Consumers perceive a greater need for careful handling in access than
ownership. Ownership is expected to allow more fun while using in all categories,
too. However the spreads for fun while using are comparatively small (ranging from
Δbooks = -0.57 to Δcars = -1.25).
Results for symbolic perceptions
The differences between access and ownership for the perception being part of a
community is only significant for books – in all other product categories the
perception does not differ significantly across access and ownership. Signaling one’s
personality, being personally attached, and impressing others are perceived to be
more distinctive in case of ownership for all four product categories; however the
differences between the consumption modes are mostly small. The perception of
personal attachment is an exception as the analysis revealed rather large differences
(ranging from Δ = -2.27 for books to Δ = -3.12 for handbags).
Results Summary
To summarize, the comparatively negative attitude towards access is also mirrored in
the perceptions – given the direction of the predicted cause-effect relationship turns

66 3. Project I: A Differential Measure of Consumers’ Attitudes towards Consumption Modes
out as hypothesized in the next chapter. In case of cars, 13 out of 18 perceptions turn
out to be less favorable for access in comparison to ownership (see Figure 7 and
Figure 8). Disregarding the ties, only the effort for the initial transaction effort,
maintenance effort and the environmental friendliness turn out to be more favorably
perceived for access than for ownership. In case of bikesharing, even more
perceptions turn out unfavorable: In 15 out of 18 perceptions access is evaluated
worse. Only the perceptions of maintenance effort and environmental friendliness are
more positive for bikesharing than for a personally owned bicycle. In case of books
only 11 out of 18 perceptions are rated less favorable. Monetary related perceptions,
absence of costs, storage effort, being part of a community, and environmental
friendliness are evaluated better for libraries than for owning books for oneself. In
the handbags product category, the rental service has less favorable perceptions
attached in every dimension – except for a tie in being part of a community. In most
of the cases the expectations based on the interview results can be fulfilled, however
some unexpected results occur, too: The perceptions of predictability of costs and
storage effort are only better for access in case of books. Access is perceived to be
more inflexible in all product categories and the environmental friendliness is only
evaluated to be better for access than for ownership in two out of four product
categories.

3. Project I: A Differential Measure of Consumers’ Attitudes towards Consumption Modes
67
Figure 7: Differences between Access and Ownership Perceptions and Attitudes in Case of Cars and Bicycles. Note. The differences have been calculated by subtracting the ownership perception from the corresponding access perception. * indicate significant differences on a 5%-level based upon paired samples t-tests.

68 3. Project I: A Differential Measure of Consumers’ Attitudes towards Consumption Modes
Figure 8: Differences between Access and Ownership Perceptions and Attitudes in Case of Books and Handbags. Note. The differences have been calculated by subtracting the ownership perception from the corresponding access perception. * indicate significant differences on a 5%-level based upon paired samples t-tests.

3. Project I: A Differential Measure of Consumers’ Attitudes towards Consumption Modes
69
3.6.2 Assessment of the validity of the measurement model
The validity evaluation goes hand in hand with determining the importance of each
perception for causing the overall construct. As described in the section on formative
measurement models (see chapter 3.4), indicator collinearity has to be investigated
before the external validity can be assessed.
Assessment of indicator collinearity
The results of the multicollinearity analysis indicate mostly nonhazardous (≤ .70)
item-to-item correlations, denoting that indicator collinearity is no major problem
(see Table 22 and Table 23 in the appendix). Only the two items pre-usage effort and
post-usage effort, which have been measured separately as pretest participants had
found it easier to judge them separately, showed noticeable statistical values. The
correlations between pre-usage effort and post-usage effort are high (ranging from
.72 for books to .82 for handbags). Further, also the VIF indicators exceed the (most
conservative) cutoff value of 3.3 that has been proposed by Diamantopoulos and
Siguaw (2006). The observed values range from 2.4 to 3.9 depending on the product
category. Given its logical feasibility, the two critical items were combined into a
joined indicator – pre- and post-usage effort – that has been calculated as their
average.
Assessment of external validity
For assessing the external validity of the formative measurement model, it is
necessary to specify it as a MIMIC model (see Figure 5). The 18 indicators are
specified to cause their associated first-order construct. The latter then cause the
second-order construct overall attitude towards consumption modes. To complete the
MIMIC model, two reflective indicators specify the second-order construct. The
results of the analysis can be found in Table 10, which provides the most relevant
information in one place (more detailed analysis can be found in Table 24, Table 25,
Table 26, and Table 27 in the appendix): Loadings (L), weights (W), variance
explained (R2), and predictive relevance (Q2).18 The indicators’ loadings and their
significances show each indicator’s absolute importance. It is equal to the zero-order 18 Q2-values are derived by a procedure called blindfolding. Those measures are cross-validated
redundancy measures, which should be reported for each reflectively measured endogenous construct (in this case the reflectively specified overall attitude). Values > 0 indicate predictive relevance.

70 3. Project I: A Differential Measure of Consumers’ Attitudes towards Consumption Modes
correlation and is used to assess indicator validity (Hair et al., 2011). The indicators’
weights show the importance of each indicator relatively to all other indicators – thus
it is a measure of the perception’s importance. Jointly with the model fit this
information is used to assess construct validity (Hair et al., 2011).
The results lead to the conclusion that indicator validity is given as the vast majority
of items shows significant loadings (when testing two-sided on a 5%-level). Only the
items environmental friendliness in case of bicycles and being part of a community
for books are found to be non-significant.
As expected, not all items with significant loadings also show significant weights.
This means that there is a relationship, but the indicator does not contribute beyond
the influence of other indicators in the item set (Cenfetelli & Bassellier, 2009). Six
indicators have significant weights across all four investigated product categories:
total costs, predictability of costs, absence of costs, need for careful handling, fun
while using, and personal attachment. Only the perception risk of non-availability is
surprisingly not found to have a significant weight in any product category.
However, this perception has not been removed from the item battery, following
Cenfetelli and Bassellier (2009) methodologically, because its loadings are
significant, logical feasibility is provided, and prior evidence by Lamberton and Rose
(2012) is given, too. The remaining perceptions have significant weights in one to
three product categories. Those perceptions, which have significant loadings and
weights, all have plausible signs that turned out as expected.19 The explained
variance exceeds the threshold of a good model fit (R2 ≥ .30) in all categories (R2cars
= .44, R2books = .34, R2
bags = .37), except for bicycles (R2bicycles = .24) (Chin, 1998;
Diamantopoulos & Winklhofer, 2001).
Taking a more abstract point of view by looking at the path coefficients of the four
product categories, one can see that the functional perceptions path coefficient is
comparatively large and significant in all product categories. 20 Monetary and
experiential perceptions’ path coefficients are significant in three out of four cases
with medium size. The path coefficients of symbolic perceptions are only significant
in two out of four cases and are comparatively small in size.
19 To receive the sign of a perception, one needs to calculate it by multiplying the sign of the weight with the sign of the respective path-coefficient. 20 Paths denote the link between the first-order constructs and the second-order construct.

3. Project I: A Differential Measure of Consumers’ Attitudes towards Consumption Modes
71
In order to test the hierarchical measurement model for nomological validity, the
second-order construct overall attitude towards consumption modes has been
replaced by a relatively specified construct that represents the behavioral intention to
use consumption modes. Again, this construct is specified by two reflective items.
PLS analysis reveals a good fit in terms of variance explained (R2cars
= .28, R2books =
.41, R2bicycles = .18, R2
bags = .22) and mostly significant path coefficients linking the
first with the second-order constructs with signs as expected (for more details please
refer to Table 28 in the appendix).
Additional analyses showed that including the constructs social norm and perceived
behavioral control (which are typically part of TPB-models) into the model
substantially increases the amount of variance explained. If attitude, social norms and
perceived behavioral control predict the behavioral intention the R2 are as follows:
R2cars
= .53, R2books = .55, R2
bicycles = .37, R2bags = .35.

72 3. Project I: A Differential Measure of Consumers’ Attitudes towards Consumption Modes
Table 10: Assessment of the Second-Order Construct in PLS
Cars Bicycles Books Handbags
L P W L P W L P W L P W
Monetary Perceptions -.30** -.21** .02 -.14**
Total costs .89** .73** .93** .82** -.70** -.51* .95** .87**
Predictability of costs -.73** -.49** -.62** -.39** .87** .74** -.55** -.31**
Functional Perceptions -.22** -.28** -.37** -.42**
Transaction effort .56** .18* .59** .18 .51** .21* .70** .13
Pre- and post-usage effort .64** .12 .88** .54** .77** .45** .80** .43**
Maintenance effort .58** .43** .40** .13 .52** .00 .66** .05
Storage effort .65** .17* .58** .04 .72** .57** .71** .36**
Use limitations .52** .26** .70** .28** .42** .14 .42** .14
Inflexibility .59** .32** .56** .25** .38** .14 .49** .32**
Risk of failure .60** .25** .38** -.11 .37** .09 .53** .08
Risk of non-availability .45** -.04 .55** .09 .36** -.02 .42** .03
Experiential Perceptions .24** .10 .23** .15**
Absence of costs .38** .28** .58** .35** .52** .27* .51** .25*
Environmental friendliness .63** .51** .26 .08 .53** .43** .77** .53**
Need for careful handling -.36** -.23** -.56** -.38** -.30** -.27* -.26** -.23*
Fun while using .78** .62** .82** .68** .80** .69** .77** .53**
Symbolic Perceptions .10** .02 .13** .03
Being part of a community .64** .43** .54** .35 .19 .16 .52** .32*
Signaling one’s personality
.65** .31*
.41* -.04
.52** .23
.84** .54**
Personal attachment .69** .44** .83** .69** .93** .78** .80** .48**
Impressing others .72** .31* .68** .38 .58** .21 .49** .00
R2 .44 .24 .34 .37
Q2 .38 .20 .26 .32
n 633 627 410 428
Note: * p ≤ .05; ** p ≤ .01; L: Loading; P: Path coefficient; W: Weight.

3. Project I: A Differential Measure of Consumers’ Attitudes towards Consumption Modes
73
3.6.3 Comparison of indicator importance across product categories
After analyzing the product categories in isolation, the question arises whether the
identified differences in weights and path coefficients between the investigated
product categories are statistically significant or not. Therefore, a two-step approach
is taken: First, an omnibus test of group differences – similar to an ANOVA – is
conducted. Second, the groups are tested pairwise for differences – similar to
pairwise t-tests.
When analyzing group effects in structural models, measurement invariance is
usually a prerequisite (Sarstedt, Henseler, & Ringle, 2011). However the question
that was raised previously specifically addresses potential differences in the
measurement model. Thus the focus of this analysis is on product category-related
differences in the perceptions’ weights and the first-order path coefficients as the
measurement items have been held constant across product categories (Huber, 2007).
Omnibus test of group differences
To test for differences among the four groups, the omnibus test of group differences
(OTG) was chosen because it prevents boosting the family-wise error rate when all
possible group comparisons are conducted. Additionally it does not rely on any
distributional assumptions (Sarstedt et al., 2011). The omnibus test relies on
bootstrapping, permutation and random selection, but can be applied to standard PLS
output.21 The OTG analysis (set to 5,000 Monte Carlo runs as recommended) reveals
group differences across all product categories for all indicators and first-order
constructs. The null hypothesis of equal weights can be rejected at p ≤ .001 due to FR
values ranging from 546.92 (transaction effort) to 129,961.40 (total costs).
Multi-group comparisons
Current methodological papers criticize the common parametric approach for multi-
group comparisons by Keil et al. (2000), which is a modification of an independent
samples t-test, because it requires the data to be normally distributed, the groups need
to have similar sample size and its results are comparatively liberal (Dibbern & Chin,
2005; Henseler, Ringle, & Sinkovics, 2009; Sarstedt et al., 2011).22 An approach that
21 I would like to thank Jörg Henseler for providing me the corresponding computation code file for R. 22 Additionally, the original formula by Keil et al. (2000) contains an error. A corrected formula can
be found e.g. in Sarstedt et al. (2011).

74 3. Project I: A Differential Measure of Consumers’ Attitudes towards Consumption Modes
is well-suited to handle the non-normally distributed data at hand is Henseler’s PLS
multigroup analysis (Henseler, Martens, & Naes, 2007; Henseler et al., 2009). In
contrast to other methods it is quite conservative and easily applicable as the author
provides a spreadsheet to perform the necessary calculations. This method uses
bootstrap estimates for each comparison group in order to evaluate the robustness of
the group-specific estimates (Sarstedt et al., 2011). It can only be used to test the
one-sided hypothesis that the estimate for one group is larger than the other –
however this is unproblematic as the primary interest is in testing for differences that
are assumed based on the sign of the delta between the two estimates.
In comparison to the results from the omnibus group test, the results of the more
conservative multi group tests reveal less significant differences. Beginning with the
pairwise comparisons of the PLS weights, it can be shown that for nine perceptions
no significant differences are found. This is the case for: transaction effort, use
limitations, inflexibility, risk of non-availability, absence of costs, need for careful
handling, fun while using, being part of a community, and impressing others (see
Table 11). For those beliefs the relative importance in determining the respective
first-order construct does not significantly (on a 5%-level) differ across the four
investigated product categories.
However, within each perception sub-dimension also significant differences in PLS
weights are found (see Table 11). In case of monetary perceptions, the significant
differences in total costs (all p ≤ .001) and in predictability of costs (all p ≤ .001)
within the book category represent a special case: they are mainly due to the positive
sign of the path coefficient of monetary perceptions, which leads to the reversed sign
for the weights of both perceptions.
For the beliefs determining the functional perceptions, notable differences between
cars and the other product categories are found. The pre- and post-usage effort
perception is comparatively less important (at least p ≤ .01), while the perceived
maintenance effort is more important (at least p ≤ .01) for cars than elsewhere. The
perceived risk of failure is significantly more important (p ≤ .001) for cars than for
bicycles. Furthermore the perceived storage effort is significantly less important (at
least p ≤ .01) for bicycles than for cars, books or handbags.

3. Project I: A Differential Measure of Consumers’ Attitudes towards Consumption Modes
75
Also for the beliefs determining the experiential perceptions, bicycles play a special
role: environmental friendliness is significantly less important (at least p ≤ .03) for
bicycles as compared to other categories. Investigating the group-wise comparisons
for those beliefs determining the symbolic perceptions, two significant differences
are found: the importance of the perception to signal one’s personality is
significantly higher for handbags than for bicycles (p = .02) and the importance of
personal attachment is significantly higher (p = .04) for books than for cars.
The reporting of the results concludes with the finding that for the path coefficients
of all four first-order constructs, significant differences have been found. Monetary
perceptions are significantly less important (at least p ≤ .01) for books than for any
other product category. Additionally, monetary perceptions are more important (p =
.01) for cars than for handbags. Functional perceptions are significantly more
important for handbags than cars (p ≤ .001) or bikes (p = .01) and more important for
books than cars (p ≤ .001). In the case of experiential perceptions, the importance is
less for bicycles than for cars (p = .02) or books (p ≤ .05). Lastly the importance of
symbolic perceptions is less important for bikes than for books (p ≤ .05).

76 3. Project I: A Differential Measure of Consumers’ Attitudes towards Consumption Modes
Table 11: Henesler’s PLS Multigroup Analysis across Product Categories
PLS Weights p-values of differences
Cars Bikes Books Bags a b c d e f
Monetary perceptions
Total costs .73 .82 -.51 .87 – ≤.00 – ≤.00 – ≤.00
Predictability of costs -.49 -.39 .74 -.31 – ≤.00 – ≤.00 – ≤.00
Functional perceptions
Transaction effort .18 .18 .21 .13 – – – – – –
Pre- and post-usage effort .12 .54 .45 .43 ≤.00 .01 .01 – – –
Maintenance effort .43 .13 .00 .05 .01 ≤.00 ≤.00 – – –
Storage effort .17 .04 .57 .36 – ≤.00 – ≤.00 .01 –
Use limitations .26 .28 .14 .14 – – – – – –
Inflexibility .32 .25 .14 .32 – – – – – –
Risk of failure .25 -.11 .09 .08 ≤.00 – – – – –
Risk of non-availability -.04 .09 -.02 .03 – – – – – –
Experiential perceptions
Absence of costs .28 .35 .27 .25 – – – – – –
Environmental friendliness .51 .08 .43 .53 ≤.00 – – .03 .01 –
Need for careful handling -.23 -.38 -.27 -.23 – – – – – –
Fun while using .62 .68 .69 .53 – – – – – –
Symbolic perceptions
Being part of a community .43 .35 .16 .32 – – – – – –
Signaling one’s personality .31 -.04 .23 .54 – – – – .02 –
Personal attachment .44 .69 .78 .48 – .04 – – – –
Impressing others .31 .38 .21 .00 – – – – – –
Path Coefficients p-values of differences
Cars Bikes Books Bags a b c d e f
Monetary perceptions -.30 -.21 .02 -.14 – ≤.00 .01 ≤.00 – .01
Functional perceptions -.22 -.28 -.37 -.42 – ≤.00 ≤.00 – .01 –
Experiential perceptions .24 .10 .23 .15 .02 – – .05 – –
Symbolic perceptions .10 .02 .13 .03 – – – .05 – –
Note. a: cars vs. bikes; b: cars vs. books; c: cars vs. bags; d: bikes vs. books; e: bikes vs. bags; f: books vs. bags.
3. Project I: A Differential Measure of Consumers’ Attitudes towards Consumption Modes
77
3.6.4 Contrasting perceptions from prospective users and experienced
users
The results reported so far are based on samples with little experience of access
offerings, as it is still commonplace on the market. However, it is interesting to see
whether perceptions change when consumers have more access experience and to
additionally validate the measurement model with experienced access uses. These
results allow a forecast of the perceptions that will prevail within society when
access becomes more common in our every day lives. For that purpose customers of
a carsharing provider have been additionally surveyed with a similar survey to the
one previously described. To ensure comparability, the collaborating carsharing
provider’s offering was identical to the carsharing scenario that was described to the
panel respondents in my previous study.
Differences in perceptions between the sample of carsharing users and the sample of
inexperienced consumers can theoretically stem from three sources: (a) fundamental
differences in terms of attitudes towards access or ownership, (b) different personal
circumstances and (c) from the difference in usage experience. In order to eliminate
the potentially alternative explanations (a) and (b), the sample from both groups has
been matched on variables measuring attitudes and socio-demographics. The result
are two comparable groups with the same basic attitudes towards owning a car and
carsharing respectively, which only differ in their access usage behavior.
Matching procedure
The matching of the two samples was conducted by propensity score matching.23
According to preliminary considerations, a 1:1-matching without replacement has
been conducted on a set of variables measuring attitudes and socio-demographics
(see Table 12). After the matching process the balance of all matching variables and
their interactions was investigated. All remaining standardized differences are
smaller than the proposed threshold of d = .25. Also the overall Χ2 balance test
reveals no imbalances (Χ2(9) = 2.99, p = .97) and the L1 measure decreased from .996
to .992. Both are indicators of improved overall balance (Thoemmes, 2011).
23 Propensity score matching has been conducted in SPSS with the custom dialog “PS Matching” provided by Thoemmes (2011). The estimation was done with the logistic regression algorithm. As recommended, matching was performed by the nearest neighbor algorithm, while units outside the area of common support have been discarded and the caliper was set equal to .10 (Thoemmes, 2011).

78 3. Project I: A Differential Measure of Consumers’ Attitudes towards Consumption Modes
Before matching, the two samples (sample sizes n = 518 and n = 260 respectively)
differed on 10 out of 11 matching variables on an α-level of .05 (see Table 12).24
After the matching, the samples (n = 121 each) differ no longer significantly on any
of the matching variables. The fact that the access knowledge is significantly
different between non-access users and access users (before and) after matching
indicates that the matched groups differ in terms of their access experience – given
the assumption that increased experience leads to greater knowledge.
Table 12: Group Means on Matching and Control Variables Before and After Matching
Before matching After matching Non-
access users
Access users p Matching variable
Non-access users
Access users p
43.98 34.31 ≤.01 Age 35.45 36.69 .42 1.88 1.77 .08 Adults living in household 1.87 1.87 1.00 0.40 0.20 ≤.01 Children living in household 0.32 0.30 .78 2.87 3.23 ≤.01 Net household income per month 3.04 3.10 .77 4.25 5.06 ≤.01 Level of education 4.91 5.02 .51 4.28 6.04 ≤.01 Access attitude variable 1 5.52 5.55 .81 4.05 5.88 ≤.01 Access attitude variable 2 5.31 5.31 1.00 6.04 4.83 ≤.01 Ownership attitude variable 1 5.43 5.16 .17 6.01 4.90 ≤.01 Ownership attitude variable 2 5.50 5.22 .17 -1.76 1.21 ≤.01 Differential1 attitude variable 1 0.10 0.40 .20 -1.96 0.98 ≤.01 Differential1 attitude variable 2 -0.18 0.09 .26
Control variable
2.72 5.67 ≤.01 Access knowledge 3.35 5.59 ≤.01
518 260 n 121 121 Note. 1 Differential does not denote a new variable, but the difference score between access and the ownership.
Comparison of non-access users with access users
Comparing the absolute perceptions of access as well as the differential perceptions
(contrasting access and ownership) reveals several significant differences of group
means on an α-level of .05 (see Table 13). If not otherwise stated, the following
differences have been found for both analysis perspectives.
While the perceived total costs of access are not significantly different (Δ = 0.12, p >
.10), experienced access users perceive a higher predictability of costs compared to
non-access users (Δ = 0.43, p = .03). All effort perceptions of access – except storage
effort, which remains indifferent (Δ = 0.40, p > .05) – are lower when respondents
have more usage experience. Also the risk perceptions of access offerings decrease
24 The smaller sample size compared to the previously reported numbers is due to the fact that those few respondents in the panel group that already had used a carsharing offering (compare Table 8) were excluded for this analysis.

3. Project I: A Differential Measure of Consumers’ Attitudes towards Consumption Modes
79
with more usage experience. The experiential perceptions are not found to differ
significantly across both groups. Only those who have more usage experience
perceive the fun while using an access offering as significantly higher than when
using an own car (Δ = 0.59, p ≤ .01). However, they also seem to have another
benchmark because the comparison based on the difference scores does not reveal a
significant difference (Δ = 0.29, p > .10). More experience with carsharing also leads
to a significantly lower perception of being part of a community in the access
offering (Δ = 0.62, p ≤ .01). Also the perception of being personally attached to the
good in case of access decreases significantly (Δ = 0.41, p = .02). However, the
differential perception of personal attachment is not found to be significant on a 5%-
significance level (Δ = 0.49, p > .05). The perception of impressing others shows a
contrary pattern: The absolute perceptions of the access offering do not differ
significantly, whereas the differential point of view reveals that users with access
experience believe to impress others significantly more when using an access
offering instead of an ownership offer (Δ = 0.78, p ≤ .01).
Table 13: Mean Comparison of Non-Access and Access Users on their Absolute Access and Differential Perceptions
Absolute Access Perceptions Differential Perceptions
Perceptions
Non-Access users
Access users p
Non-Access users
Access users p
Monetary perceptions Total costs 3.69 3.81 .50 -1.09 -1.60 .07
Predictability of costs 4.79 5.22 .03* 0.30 1.28 ≤.01* Functional perceptions
Transaction effort 2.60 2.22 .02* -2.01 -2.95 ≤.01* Pre- and post-usage effort 3.52 2.87 ≤.01* 1.51 1.08 .05
Maintenance effort 1.79 1.17 ≤.01* -2.73 -3.28 .01* Storage effort 3.53 3.93 .07 0.91 0.70 .49
Use limitations 4.60 4.45 .44 2.79 2.90 .66 Inflexibility 4.28 3.95 .07 2.64 2.18 .09
Risk of failure 3.53 2.34 ≤.01* 0.92 -0.31 ≤.01* Risk of non-availability 4.93 3.71 ≤.01* 3.36 2.13 ≤.01*
Experiential perceptions Absence of costs 2.67 2.80 .53 -0.97 -1.29 .29
Environmental friendliness 4.43 4.17 .26 1.50 1.73 .30 Need for careful handling 5.31 5.16 .41 1.60 1.76 .56
Fun while using 4.33 4.92 ≤.01* -0.69 -0.40 .16 Symbolic perceptions
Being part of a community 3.69 3.07 ≤.01* 0.45 0.91 .05 Signaling one’s personality 3.43 3.31 .60 -0.29 -0.30 .97
Personal attachment 2.47 2.06 .02* -2.62 -3.11 .07 Impressing others 3.81 3.81 1.00 -0.42 0.36 ≤.01*
Note. * p ≤ .05; Columns not labeled with p display means.

80 3. Project I: A Differential Measure of Consumers’ Attitudes towards Consumption Modes
Assessment of the formative measurement model for non-access users as
opposed to access users
Additionally the PLS model has been calculated for the matched groups. The
variance explained for both models is good, R2 = .41 for non-access users and R2 =
.53 for access users (see Table 14). In both cases one of the four path coefficients
does not turn out to be significant: in case of non-access users this is the case for
functional perceptions (P = -.13, t = 1.45, p > .05) and in case of access users for
symbolic perceptions (P = .10, t = 1.42, p > .05). For functional perceptions
Henseler’s multigroup comparison approach also returns a significant difference (p ≤
.05) between the path coefficients in both models – thus functional perceptions are
more important for experienced access users in the cars product category.
Investigating the weights in both groups reveals that some perceptions gain
importance for experienced access users, while others lose importance. Henseler’s
PLS multigroup comparison additionally reveals whether these differences turn out
to be significant or not (see Table 14). For experienced access users, the weights of
the differential perceptions of, pre- and post usage effort (p ≤ .05), total costs (p ≤
.10) and environmental friendliness (p ≤ .10) increase as compared to inexperienced
consumers. On the contrary, the importance for the perception of absence of costs
decreases (p ≤ .01). Interestingly, the signs of signaling one’s personality and of
impressing others have a negative effect on the overall attitude towards consumption
modes for access users. Thus those two perceptions have a negative effect on the
overall attitude towards consumption modes for this group of consumers.

3. Project I: A Differential Measure of Consumers’ Attitudes towards Consumption Modes
81
Table 14: Assessment of the Formative Measurement Model for Non-Access Users as Opposed to Access Users
Non-Access users Access users Group test for
differences Loadings Weights Loadings Weights
Coefficient (t-value)
Coefficient (t-value)
Coefficient (t-value)
Coefficient (t-value)
p-value
Monetary Perceptions -.32 (3.83)** -.37 (5.79)** –
Total costs .84 (8.42)** .62 (4.28)** .95 (19.19)** .87 (8.44)** .08
Predictability of costs -.82 (8.10)** -.58 (3.68)** -.53 (2.89)** -.32 (2.17)* –
Functional Perceptions -.13 (1.45) -.33 (4.38)** .05
Transaction effort .30 (1.78) .07 (.53) .24 (2.03)* -.13 (1.20) –
Pre- and post-usage effort .36 (1.96)* -.02 (.15) .79 (8.80)** .38 (2.64)* .01
Maintenance effort .47 (3.07)** .30 (1.67) .58 (4.75)** .37 (2.23)* –
Storage effort .79 (5.36)** .55 (2.83)** .54 (4.24)** .31 (2.24)* –
Use limitations .40 (2.20)* .17 (.96) .55 (4.56)** .32 (2.26)* –
Inflexibility .11 (.85) .00 (.02) .51 (4.81)** .16 (1.38) –
Risk of failure .68 (4.27)** .43 (2.33)* .48 (3.08)** .21 (1.48) –
Risk of non-availability .45 (2.43)* .10 (.64) .31 (2.38)* -.05 (.61) –
Experiential Perceptions .20 (2.23)* .17 (2.12)* –
Absence of costs .54 (3.91)** .42 (2.91)** .14 (1.05) -.02 (.13) ≤.01
Environmental friendliness .48 (2.71)** .37 (2.42)* .85 (7.16)** .72 (4.73)** .06
Need for careful handling -.48 (2.94)** -.31 (1.90) -.21 (1.41) -.12 (.97) –
Fun while using .70 (5.75)** .63 (4.47)** .71 (5.12)** .51 (2.72)** –
Symbolic Perceptions .19 (2.17)* .10 (1.42) –
Being part of a community .39 (2.01)* .13 (.94) .38 (2.49)* .24 (1.61) –
Signaling one’s personality .78 (4.98)** .44 (2.12)* .15 (1.13) -.33 (1.74) ≤.001
Personal attachment .69 (4.64)** .34 (1.85) .66 (5.39)** .47 (3.13)** –
Impressing others .80 (7.21)** .47 (2.60)** -.84 (9.21)** -.76 (6.22)** ≤.001
R2 .41 .53
Q2 .31 .37
n 121 121
Note. The results written in line of the superordinate constructs are the path coefficients and their corresponding t-values. The values in brackets are the corresponding t-values. * p ≤ .05; ** p ≤ .01. The column group test for differences displays the results of Henseler’s multigroup test for significant differences in path coefficients and weights. A dash (–) denotes a p-value larger than p = .10.

82 3. Project I: A Differential Measure of Consumers’ Attitudes towards Consumption Modes
3.7 Discussion
In summary this research project provides five principal findings: First, a set of 18
relevant perceptions for determining a consumer’s attitude towards a consumption
mode has been identified by qualitative research. These perceptions can be clustered
into the four superordinate domains monetary, functional, experiential, and symbolic
perceptions. Second, a formative measurement model of the differential attitude
towards access and ownership that is based on the qualitative findings has been
developed and successfully empirically validated. Third, the ranking of the general
importance of different consumption mode perceptions is as follows: Functional and
monetary perceptions are most important, followed by experiential perceptions and
finally symbolic perceptions. Fourth, no two forms of access are alike: Access
offerings in different product categories are perceived quite differently – especially
on the level of perceptions. Fifth, perceptions change as consumers gain experience
with access offerings.
The implications of these principal findings for scholars and managers are discussed
subsequently: First, theoretical and therein integrated managerial implications of the
empirical findings are discussed. Then, the general managerial relevance of the
newly developed measurement model is illustrated by describing various applications
in the industry. Finally, this work closes with limitations and avenues for further
research.
3.7.1 Discussion of the attitude and perceptions towards access and
ownership
In order to empirically prove Lovelock and Gummesson’s proposition that
“marketing transactions that do not involve a transfer of ownership are distinctively
different from those that do” (2004, p. 34) as well as Chen’s (2009) qualitative
findings that the perceived value of access and ownership is different, this study
contrasts the relevant perceptions of consumption modes in four different product
categories. All in all, a lot of significantly different perceptions have been found.
Thus these propositions could be empirically confirmed.
The perception of the total amount of costs that accrue is not consistently in favor of
one or the other consumption mode across product categories. This might be due to

3. Project I: A Differential Measure of Consumers’ Attitudes towards Consumption Modes
83
the different pricing tariffs. In case of carsharing, bikesharing and handbag rental a
pay-per-use schema was offered. In contrast to that, the book rental service had the
typical flat-rate pricing tariff, which lead to the perception that in case of books,
access is cheaper than ownership. Further, this perception also depends on the
suitability of the access business case in the respective product category. This
influence is inherent in the data, as the prices of the exemplary access offerings have
been based on current market prices.
Contrary to expectations, the newly identified perception predictability of costs is
perceived to be larger for ownership than for access in all product categories. Based
on the findings from the interviews, a different outcome had been expected. A likely
explanation is the current lack of experience with pay-per-use models. This
explanation is supported by the comparison of experienced vs. inexperienced access
users. This comparison has shown that experienced access users believe they can
predict the costs of an access offering better than those with no real-world experience
in the access consumption mode.
As expected, the initial transaction effort is perceived to be less or equal for
ownership in all product categories where purchasing is no big deal and purchasing
prices are comparatively low (bicycles, books and handbags). In case of cars, where
the purchase is associated with high involvement and a very high purchase price,
signing up for a carsharing provider is perceived to be a comparatively smaller effort.
The finding that the pre- and post-usage effort is perceived to be greater for access in
all cases also comes with little surprise due to the access inherent characteristic of
frequent interactions with the access provider, which complicate the core usage
experience. Feeling relieved from the burden of maintenance in case of access is
only the case for cars and bicycles where repairs and maintenance are comparatively
frequently required. The result that the burden of storage is perceived to be even
higher for access than ownership in case of cars, bicycles and handbags has been
highly unexpected. A possible reason is that consumers feel even more effort when
they have to find a suitable storage space for a quite large good from time to time
rather than permanently. However, the findings that consumers perceive more use
limitations as well as higher risks of failure and non-availability in case of access
come as expected.

84 3. Project I: A Differential Measure of Consumers’ Attitudes towards Consumption Modes
There is yet another finding that has come as a surprise and requires an explanation:
the respondents perceive to be more inflexible when they use access. There is no
doubt that access has the potential to add flexibility to life, but the predominant
opinion of consumers seems to be that something that is not permanently available
results in less flexibility than having the chance to live a leaner life with less
possessions and the chance to always get the most suitable product for their needs.
As flexibility has been quite broadly defined in this research, going into more detail
on this aspect is definitely a promising avenue for further research.
Consumers perceive the accruing costs to be less present in case of the quasi flat-rate
ownership – except when access is offered in a real flat-rate model, as it was the case
for books. This aspect has not been discussed in the literature on consumption modes
before, but the empirical outcome comes as expected.
Another interesting finding that deserves further research is the perceived
environmental friendliness of access and ownership respectively. Access is perceived
to be significantly friendlier to the environment solely in case of cars and books.
Bicycles might be perceived to be environmentally friendly in any case because
consumers assume that people would use bikesharing rather as a complement than a
substitute – thus the overall number of bicycles would not be reduced. The
perception that owning handbags is more environmentally friendly than renting
handbags might be explained by the logic that shipping handbags back and forth
causes additional (unnecessary) emissions. Another explanation would be that
consumers assume that due to their overall negative attitude towards this particular
access service, providers would not be able to reach a capacity utilization that is
comparable to the utilization of a handbag that is personally owned and thus
frequently used.
Contradicting the tragedy of the commons and prior argumentation in the literature
on access (Durgee & O’Connor, 1995), but confirming the finding from the
interviews, the majority of consumers feels a greater need for carefully handling the
product in case of access as compared to ownership. This is in line with statements
from access providers who were surprised at how little the rented objects got
damaged (M. Hoene, personal communication, 10.04.2012). However, this result
might also be biased by a (in this study not controlled for) social desirability bias.

3. Project I: A Differential Measure of Consumers’ Attitudes towards Consumption Modes
85
Consumers do not believe that they belong more towards a community if they use
access as compared to ownership. The only exception are books, which might be
explained by the fact that people feel more bound to each other due to the
membership-like business model. The remaining three symbolic perceptions,
signaling personality, personal attachment and impressing others, are all absolutely
stronger in case of ownership – confirming expectations. However, the measured
differences are rather small – except in case of personal attachment. This leads to the
conclusion that people believe that signaling to others can also happen when using
something that is not theirs. The empirical data show that access offerings can
contain a similar type of symbolic meaning but at a slightly lower level. However,
this empirical investigation also shows that consumers nevertheless believe that they
cannot form a personal connection to a rented object, which confirms the qualitative
findings by Bardhi and Eckhardt (2012) as well as Chen (2009).
3.7.2 Discussion of the developed formative measurement model
This study is one of the first that develops and validates a formative-formative
second-order construct. The construct attitude towards consumption modes is a
differential measure and is caused by four super-ordinate constructs that are
themselves caused by a total of 18 perceptions. Due to its specification, it can be
applied to various product categories.
In total, the quality criteria of the formative measurement models are satisfactory and
render it ready to be used in further settings. Indicator collinearity has not been a
problem and indicator validity has almost invariably been given. Construct validity
has been partly constricted by insignificant weights. But those are regarded as normal
by the current literature in case of a large amount of indicators (Cenfetelli &
Bassellier, 2009). Additionally, the importance of the perceptions (and thus the
significance of the weights) could be shown to depend strongly on the product
category. Thus, some perceptions are important in one product category, while others
are only important in another product category. The model fit, which is another
indicator of construct validity, has reached the minimum R2 value of .30 in all
product categories except for bicycles. However, in four of five remaining models,
this value has been clearly exceeded. Even though the evaluation of the measurement

86 3. Project I: A Differential Measure of Consumers’ Attitudes towards Consumption Modes
model has had some restrictions in some product categories, it has turned out to be
well suitable for diverse settings overall.
The importance of the four superordinate constructs confirms and details previous
findings. Taking all four investigated product categories together, functional
perceptions are the most (in case of bicycles, books and handbags) or second-most
(in case of cars) important determinants of relative consumption mode attitude. This
confirms existing findings by Bardhi and Eckhardt (2012) who found that rented
goods are especially valued for their functional value and the results by Lamberton
and Rose (2012) who showed that functional elements are the main predictor for a
consumer’s likelihood of using access offerings. Monetary perceptions are found to
be in general second-most important. However, in the most expensive product
category – cars – this perception was even most important for determining the overall
attitude. Again this result mirrors the access-specific findings of Lamberton and Rose
(2012) and Durgee and O’Connor (1995). In the four investigated product categories
experiential perceptions were almost equally important as monetary perceptions.
Generally least important was the category of symbolic perceptions. Nonetheless,
this study shows that using a service can transfer a symbolic meaning, too.
At the indicator level, a total of six perceptions has significant weights in all product
categories: total costs, predictability of costs, absence of costs, need for careful
handling, fun while using, and personal attachment. Surprisingly none of the beliefs
in this list stems from the influential first-order construct functional perceptions. This
leads to the conclusion that the product category strongly determines which kind of
functional perceptions are most important. Thus managers are well advised to focus
on the aforementioned six perceptions plus the relevant functional perceptions when
designing a business model or planning an advertising campaign.
The only perception that has not been found to reach a significant weight in any
product category was the risk of non-availability. As it has significant loadings
though, it seems to have been suppressed by other more influential aspects
(Cenfetelli & Bassellier, 2009). This might also be the explanation why this finding
contradicts Lamberton and Rose (2012) who identified the risk of non-availability as
one of the key indicators of sharing propensity. Some functional aspects included in
this study – but not part of Lamberton and Rose’s (2012) study – seem to explain the
same variance as the risk of non-availability does. Based on the perceptions’

3. Project I: A Differential Measure of Consumers’ Attitudes towards Consumption Modes
87
definitions this is most likely true for effort before- and post-usage or perceived
inflexibility. Especially the latter’s definition has been rather broad and could be
specified in more detail in future investigation.
3.7.3 Discussion of indicator importance across product categories
The investigated product categories have inherently different characteristics, which
made it necessary to explicitly investigate differences among those categories. Cars,
for example, are very expensive and their usage is observable to others. On the other
hand, books are much cheaper, more frequently bought and often consumed in a
private setting. However, handbags are more expensive, typically used as status
symbols and run out of fashion pretty quickly. Thus it would have been rather
surprising if no differences had existed. But this is clearly not the case. The results
clearly show that it is important to conduct research in more than one product
category if one aims for generalizable results on consumers’ consumption mode
behavior.
In case of monetary perceptions it is found that the importance of this first-order
construct increases with an increase of the typical purchase price. That means in case
of cars it is most important, in case of bicycles second most, and so on. The topic of
cost savings seems to become more relevant, the more expensive a purchase would
be.
Functional perceptions were already described as being highly important in general,
but also greatly varying in terms of the importance of sub-aspects. Pre- and post-
usage effort is found to be significantly less important for cars as compared to other
product categories. This might be due to the rather straightforward process in how to
access and return cars in carsharing offerings and the small difference between
getting to your own car versus getting to a carsharing car. On the contrary, the
perceived maintenance effort is significantly more important for cars than for any
other product category. This is probably due to the fact that maintenance is most
frequently required for cars and thus facilitation in case of access has the biggest
impact. Further, the perceived storage effort is relatively unimportant for bicycles.
This might be explained by the always-available option to park a bicycle on the
sidewalk and no need to provide some personal space for the rented good.

88 3. Project I: A Differential Measure of Consumers’ Attitudes towards Consumption Modes
Experiential as well as symbolic perceptions are found to be less important for
bicycles than for other categories. The small path coefficients of these first-order
constructs let assume that bikes are regarded as a purely functional offering. Thus the
majority of respondents seem not to use bikes for fun or to signal their social status.
This might similarly explain why personal attachment is significantly more
important for books than for cars. Cars are seen as a mode of transportation, while
books are felt to be more personal.
3.7.4 Discussion of different perceptions from prospective users versus
experienced users
Contrasting the perceptions of registered customers of a carsharing provider with
those of consumers without any carsharing experience reveals important insights into
what direction perceptions throughout society could develop when access becomes
more common. After the two samples were matched by their consumption mode
attitudes and socio-demographics one finds that – assuming that matching corrected
all relevant ex-ante group differences – experienced access users perceive access
offerings more positively in various dimensions due to learning effects.
Experienced access users perceive lower risks of non-availability and failure –
confirming the expectation by Lamberton and Rose (2012) – perceive less required
effort and feel to impress others even stronger when they are using access.
Additionally, they also learned to predict the accruing costs for access better in
advance. These modifications in beliefs are plausible and signal that consumers need
to get to know access better in order to value its benefits more strongly. On the other
hand, carsharing users feel less bound to the community of carsharing members and
even less personally attached to the cars as compared to inexperienced consumers.
These modifications are also plausible and show that some effects get even more
pronounced with actual usage experience.
Besides, the formative measurement model has also been successfully re-evaluated
with the additional sample of carsharing users. Comparing the thereby calculated
importance with the importance of the matched sample without experience also
shows some displacements. Experienced carsharing users attach more importance on
functional aspects and less importance on symbolic aspects when evaluating access
and ownership. Thus, it is important to communicate differently to existing and yet-

3. Project I: A Differential Measure of Consumers’ Attitudes towards Consumption Modes
89
to-become customers. The latter appreciate positive symbolic meaning that is
associated with using a certain consumption mode more than existing users do.
Learning effects seem to cause the perceived absence of costs to become less
important in determining the differential overall attitude. Thus, it is important to
communicate this issue primarily to yet-to-become customers – for example by
promoting flat-rate pricing models. On the other hand, perceived pre- and post-usage
effort and environmental friendliness become more important for users with access
experience. Access providers should try to stress those issues when communicating
to their customers or trying to actively modify their business models concerning
these aspects. For example, they could make the rental process even more convenient
or replace their fleet by environmentally friendly electric vehicles.
3.7.5 Applications of the measurement model
The newly developed formative measurement model of consumers’ attitudes towards
consumption modes is a valid instrument that companies and public institutions can
use to evaluate the perceptions and the overall attitude towards access and
ownership. Consequently, it helps companies to decide which consumption mode to
offer and to learn which offering characteristics are most important to consumers.
For example, manufacturers deciding to move towards offering access as an
additional consumption mode (consider, e.g., Daimler’s car2go or BMW’s
DriveNow) may evaluate market potential and consumer preferences in different
markets using this instrument. But it also helps public institutions to monitor
consumers’ perceptions and attitudes towards consumption modes in order to
promote economic development programs or to support initiatives that strive to
establish more sustainable ways of consumption. The results of the measurement tool
can also be used by consumer policy organizations that aim to trigger political
initiatives that ease access-based business models by changing regulations or giving
special permissions (e.g. for parking carsharing vehicles).
The measurement model has been designed to be applicable across a broad variety of
product categories. The measurement items can easily be adapted to different product
categories, as its successful application in four different categories within the work at
hand has shown. Thus it can be easily applied in various different contexts.

90 3. Project I: A Differential Measure of Consumers’ Attitudes towards Consumption Modes
The instrument can further be used to determine the relative importance of different
perceptual dimensions and perceptions from a consumers’ point of view. If a PLS
model is applied, the path coefficients and weights are easy to interpret measures of
attribute importance. This helps companies to better understand what causes
consumers to develop their overall attitudes towards consumption modes. Highly
important aspects that are inherent in the current market offering should be
particularly stressed in communication activities. If one particular perception is
found to be important but the offering is not able to fulfill expectations, the
management should try to take additional measures in order to improve relevant
perceptions.
Another application of the measurement model is to use the importance of the
perceptions to cluster customers or markets into homogeneous segments. The
resulting segments then differ in their particular perception of consumption modes.
The segments can serve as the foundation for targeted marketing campaigns or to
develop custom-fit offerings that have specific features or are supported by
additional services that make up for perceived shortcomings. In follow-up analyses,
these segments can be compared according to their socio-demographics or behavioral
data in order to directly derive managerial marketing strategies that can easily be
implemented.
One further application is to periodically measure the perceptions of both
consumption modes in order to monitor potential changes in consumers’ beliefs and
preferences. A company that is not yet offering access can track how an additional
consumption mode next to ownership is evaluated and why it is valued or refused.
When time has come, this company knows exactly which aspects of an access
offering will be decisive and can act accordingly.
Finally, the measurement model can help companies in developing new access
offerings. A company can benchmark an ownership offering against several variants
of an access offering by including additional item sets for the alternative access
offerings. The measurement of the ownership offering does not have to be repeated
for each access offering because the same values can be used. The measurement
model provides a standardized format to measure the particular perceptions of the
access concepts as well as to benchmark it with existing ownership offerings.

3. Project I: A Differential Measure of Consumers’ Attitudes towards Consumption Modes
91
3.7.6 Study limitations & avenues for further research
As this is the very first empirical study investigating perceptions and attitudes of both
consumption modes – access and ownership – at the same time, the study’s
limitations offer valuable avenues for further research. A potential limitation stems
from the fact that the rental goods have not been specified in terms of brands or
product type. This was done in order to increase comparability to the completely
unspecified ownership condition, but might have lead to different notions.
Furthermore, the measurement of the (symbolic) perceptions might have been biased
by social desirability, which has not been controlled for. Future studies could either
include controls for the social desirability bias or try applying the third party
technique. In terms of study design, the use of a matched sample in order to compare
experienced to inexperienced access users might be criticized. If possible, it would
be interesting to conduct a longitudinal randomized field experiment to overcome a
potentially insufficient matching procedure. Replications using different product
categories or collecting data in other countries would add to the generalizability of
this study’s findings. Bicycles are, for example, used mainly for utility reasons in
Northern Europe, whereas in North America riding a bicycle is seen as a recreational
activity (E. Rosenthal, 2011). It would be interesting to see how this difference will
affect the results.
The recent rise of access led to the notion that ownership is not the exclusive
consumption mode anymore. Even though consumers are increasingly facing the
choice between access and ownership, the marketing literature has only had a very
limited understanding about consumers’ consumption mode perceptions and
attitudes. The measurement model puts forward aids to close current gaps in the
marketing literature on consumption modes as well as practitioners to perform
market segmentations or to evaluate the consumption modes they offer or plan to
offer. Thus this study contributes to the marketing literature by providing an item
battery that is highly useful for the marketing discipline and to the managerial
practice in industries in which access is on the rise.

92 4. Project II: How Consumers Respond to Consumption Mode Extensions
4 Project II: How Consumers Respond to Consumption
Mode Extensions
4.1 Introduction
Brand extensions are a common strategy to support the introduction of product or
service innovations (D. A. Aaker & Keller, 1990; Völckner & Sattler, 2006). A well-
known brand adds credibility, visibility, supports communication, and – in case of
success – helps to build brand equity for the parent brand. However, the overall
success of a brand extension depends on the extension’s inherent features, the
reactions of existing customers and whether the parent brand ultimately benefits or
suffers.
A brand that introduces an access offering in addition to its ownership offerings can
be regarded as extending its brand in order to conduct a business model innovation.
Thus, managers face similar challenges when they introduce access as a new
consumption mode, which the under-researched field of access-based consumption
cannot answer yet (Chen, 2009; Lovelock & Gummesson, 2004): (1) Which aspects
of an access offering are most important for market success – the product brand or
the service convenience level? (2) How do current customers who already own
branded goods of a given brand react to the introduction of an access offering by
their brand? And finally (3), taking owners and non-owners of a brand into account,
does the introduction of access ultimately harm or benefit the existing parent brand?
In the past, companies in consumer good markets have mainly relied on business
models that transfer the ownership of the products at sale from the company to the
consumer. The phenomenon that goods manufacturing companies start offering an
additional access consumption mode by offering their own branded goods to
consumers as a service in form of short-term rentals is relatively new. In 2009
Daimler launched car2go, the first carsharing service that has been launched by a car

4. Project II: How Consumers Respond to Consumption Mode Extensions
93
manufacturer. Car2go has reached more than 500,000 customers within just four
years (Daimler, 2013b). After registering, customers can easily rent and return Smart
cars anywhere in one of more than 20 cities worldwide where car2go’s service is
available in the meantime (Daimler, 2013a). Soon after, various competitors such as
BMW (DriveNow), CITROËN (Multicity), Ford (Ford2go), and Volkswagen
(quicar) followed.
Existing research on consumer behavior is not transferable to this new mode of
consumption due to the fact that access-based consumption takes place without the
consumer acquiring ownership (Chen, 2009; Lovelock & Gummesson, 2004). Thus
many important research avenues are currently under-researched. The aim of this
research project is to advance theory and managerial knowledge on (1) how different
designs of access offerings affect consumers’ evaluations of those, (2) how
ownership status affects the evaluation of access offerings, and (3) whether the
parent brand is affected by the introduction of access as an additional consumption
mode. Research questions (1) and (2) focus on consumers’ evaluations of access
offerings. This perspective is highly relevant for both start-ups and incumbents
providing access-based offerings. The third research question (3) takes a broader
perspective as it regards reciprocal effects between the introduction of access and the
parent brand. Therefore this question is especially important for incumbent
companies, which already provide an ownership consumption mode.
Especially with regard to the first research question (1), one should note that there is
not the one and only access offering that is the alternative to an ownership offering –
similar to brand extensions, which can also differ on many features. An access
offering for a given branded good can vary on multiple aspects such as the provided
service convenience (e.g. availability, ease of pick-up and return), the service quality
or the pricing model. Lovelock and Gummesson (2004) addressed this important
aspect and proposed that consumers who evaluate access offerings will attach less
importance to the product brand as compared to the characteristics of the access
provider. Bardhi and Eckhardt (2012) already found first support of this proposition
in a qualitative study on the acceptance of access offerings: Access users’ sign value
has been found to primarily stem from the access consumption mode itself and not
from the product brand. Lamberton and Rose (2012) added further emphasis on the
importance of understanding consumers’ evaluations of different versions of access
94 4. Project II: How Consumers Respond to Consumption Mode Extensions
offerings. However – to the author’s best knowledge – no empirical study has
addressed this research question so far. Answers to the importance of different
features of access offerings are of high importance to the management of access
providers as well as goods manufacturers because they want to know which brands to
include in access offerings and whether the cumbersomely created brand equity is
still relevant for access offerings.
The second research question (2) covers a delicate managerial issue. How the brand’s
current customers are likely to react is a basic issue for the management of a product
brand, which is included into a new access offering. Companies must be concerned
that current brand owners either evaluate the access offering too positively or too
negatively. A very favorable evaluation of the access offering might lead a large
number of customers to switch to the new consumption mode, which ultimately
causes cannibalization of sales. A very negative evaluation, on the other hand, might
cause negative spillover effects for the parent brand, which might cause customers to
switch to another brand. An additional access offer therefore ideally attracts brand
non-owners – consumers who currently own a different brand or no product of the
category in question. This research project is the first to raise the question whether
consumers’ brand ownership plays a role in determining their evaluation of access
offerings.
If a brand has traditionally only been available via ownership and now becomes
available via access as well, the incumbent’s brand equity might be affected by this
adaptation of its marketing strategy. This idea has been introduced by Lamberton and
Rose (2012) and is the basis of the third research question (3). Thus, the perspective
of an incumbent company asking itself whether adding an access offering will harm
its well-established brand name is taken. Referring to this question Lamberton and
Rose (2012) have assumed that access offerings might be beneficial for the brand
image or the consumers’ brand attitude – but again no empirical studies have
investigated this research question yet. The question of potential spillover effects has
been intensively researched in the literature on brand extensions. This thesis
therefore draws upon brand extension literature in which positive and negative
spillover effects from the extension to the parent brand as well as the reactions of
owners in contrast to non-owners have been frequently investigated (Dall’Olmo
4. Project II: How Consumers Respond to Consumption Mode Extensions
95
Riley, Pina, & Bravo, 2013; Kim, Lavack, & Smith, 2001; Kirmani, Sood, &
Bridges, 1999).
In order to address the three above mentioned research questions, a series of five
studies has been conducted in the course of this research project. In those consumer
experiments various features of the access offering and differences in the
characteristics of the consumers have been manipulated. Investigating potential
spillover effects on the parent brands made it necessary to additionally collect
evaluations of the parent brands when they solely offered ownership. Two of the five
studies were conducted in two different product categories (cars and fashion) in order
to test generalizability. To additionally increase external validity, one experiment
was done with customers of a carsharing service instead of general consumer
samples.
The structure of this work is as follows: The next section derives hypotheses on the
evaluation of access and parent brands by integrating marketing theories, research on
brand extensions as well as existing research results on access-based consumption. In
the subsequent section, the methodology of all five studies is presented. The
subsequent chapter presents the results of the experiments ordered by the three
groups of hypotheses. A discussion of the results, their implications for theory and
management and avenues for fruitful future research form the conclusion of this
research project.

96 4. Project II: How Consumers Respond to Consumption Mode Extensions
4.2 Hypotheses
Access offerings and brand extensions have certain similarities in common. In both,
brand extensions and additions of an access offering, a company extends its offering
and in doing so makes use of the same parent brand. Therefore theories and research
approaches on brand extensions are well suited to be transferred to the emerging
research area of access. However, there are also substantial differences between
access offerings and good offerings that make it impossible to directly transfer
results from the traditional brand extension literature to access offerings.
Existing research on brand extensions focuses on supporting the launch of product or
service innovations, whereas the introduction of an access offering constitutes a
business model innovation. Companies do not start to offer new products, but offer
their existing products with a different ownership structure: In access there is no
transfer of ownership – the customer only pays for consumption time. Furthermore
the brand extension literature frequently differentiates step-down versus step-up
brand extensions. This distinction is difficult to transfer to access offerings because it
is not clear whether consumers perceive an access offering as subordinate or superior
to existing ownership offers.
The hypotheses of this research project are ordered according to three research
questions that have been raised in the introduction (see also Table 15). All
hypotheses have their counterparts in the research on brand extensions: The first set
of hypotheses is related to different characteristics of the access offering, which is
similar to the question which characteristics of a brand extension lead to success
(Broniarczyk & Alba, 1994; Lei, de Ruyter, & Wetzels, 2008; Milberg, Sinn, &
Goodstein, 2010). The second set of hypotheses addresses the importance of the
consumers’ brand ownership status, which has also been covered in the research on
brand extensions (Kirmani et al., 1999). Finally, the third hypothesis takes a different
perspective by focusing on the potentially modified evaluation of the parent brand
(and not the access offering anymore) – an approach that has also been a key topic in
the research on brand extensions (Boisvert, 2012a; Dall’Olmo Riley et al., 2013;
Gürhan-Canli & Maheswaran, 1998).

4. Project II: How Consumers Respond to Consumption Mode Extensions
97
Table 15: Overview of Hypotheses (Project II)
Reference point Hypotheses
Access evaluation
H1a: The evaluation of access offerings is independent of the prestige level of the product brands the access offering is based on.
H1b: The evaluation of access offerings becomes more favorable with an increasing level of convenience that is offered by the access provider.
H2a: Compared to non-owners, owners of a distinct low prestige brand exhibit more favorable evaluations of an access offering that is based on this low prestige brand.
H2b: Compared to non-owners, owners of a distinct high prestige brand exhibit less favorable evaluations of an access offering that is based on this high prestige brand.
Parent brand evaluation
H3: The introduction of access as an additional consumption mode does not affect the parent brand’s evaluation.
4.2.1 Hypotheses on the importance of product brands and service
convenience
The product brand used to play a major role in all ownership-based business models.
But how important will the product brand still be in access offerings? Will other
aspects become even more important?
The basic idea behind brand extensions is to leverage an existing and well-known
brand by using the same brand name for other, new products. Thus the brand name is
supposed to function as a quality surrogate in the uncertain situation of the market
launch of a new product (D. A. Aaker & Keller, 1990; Völckner & Sattler, 2006).
Even though brands are of high importance for goods and services, the locus of
importance is different. In packaged goods “the product [emphasis added] is the
primary brand” (Berry, 2000, p. 128) and serves consumers internally as a surrogate
for the overall value of the good and externally as a signal towards others (Dawar &
Parker, 1994; Dodds, Monroe, & Grewal, 1991). This supports the underlying
rationale of brand extensions. Contrarily, in case of services “the company [emphasis
added] is the primary brand” (Berry, 2000, p. 128). This difference is important in
order to predict the importance of product brands in access offerings: Accordingly,
the product brand will only be one of many relevant features that constitute the
service brand. Other important factors are service features that enable easy access,

98 4. Project II: How Consumers Respond to Consumption Mode Extensions
recovery of control and low prices (Berry & Parasuraman, 1991; Lovelock &
Gummesson, 2004).
This proposition is also supported by the theory about person-object relationships. It
is well known that we identify with our possessions in such a way that we regard
those as a more or less central part of ourselves. Possessions are said to become part
of our extended self-concept (Belk, 1988). However, research results have shown that
those person-object relationships generally become weaker when goods are accessed
rather than owned. For example, Durgee and O’Connor (1995) found that consumers
show less personal attachment towards rented goods as compared to purchased
goods. Also Bardhi and Eckhardt (2012) found very little identification or personal
attachment between users and their rented objects. On the other hand, it is
theoretically also possible that extensive access users start to consider the access
experience and the rented goods as part of their selves. This possibility is explicitly
not excluded by Belk (1988, 2013a), but it is deemed to be less effective as compared
to material possessions due to three reasons: shared goods can never be unique,
shared goods can be exchanged by the provider without the user’s involvement and
they do not gather patina from personal usage.
Several important research articles have claimed that product brands are
comparatively unimportant in access offerings. Lovelock and Gummesson (2004)
expect product brands to be of little importance in case of access while
characteristics of the service offering are believed to become the decisive factor.
Lawson (2011) builds on this assumption and speculates that need fulfillment and
convenience will be more important as compared to the brand of the rented product
for consumers who compare different access offers. Furthermore, qualitative research
by Bardhi and Eckhardt (2012) has shown that carsharing users primarily value the
utilitarian benefits whereas identity enhancement, which might be supported by the
use of specific brands or identifying with a brand community, only plays a minor
role. However, so far there has not been any empirical research that has tested theses
claims in the context of access offerings.
In contrast, there is only one slightly related empirical study by Ainscough et al.
(2011) that investigated the effects of the car model, the rental agency image and the
price on the consumers’ willingness to rent a car during their vacation. They found
the car model to be important for consumers’ decision making. However, this comes

4. Project II: How Consumers Respond to Consumption Mode Extensions
99
at no surprise because in their study the two car options differed in their size.
Naturally the larger car model was preferred in the setting of a multi-day vacation
trip with luggage. Further they found a low importance of the car rental agency, but
this is probably due to the fact that they only differentiated between a low budget and
a normal car rental firm that both offered exactly the same service level. Thus, the
study by Ainscough et al. (2011) is not relevant for answering the general research
question of this study and a thorough empirical investigation is still necessary.
Brands are differentiated in various ways. Typical classifications of brands that were
investigated in research on brand extensions are functional vs. prestige brands (Kim
et al., 2001), prestige vs. luxury brands (Dall’Olmo Riley et al., 2013) or non-
prestige vs. prestige brands (Kirmani et al., 1999). In this thesis, the focus is on low
vs. high prestige brands because this is a one-dimensional distinctive feature that has
been successfully applied before (Kirmani et al., 1999) and is not potentially
connected to functionality (Broniarczyk & Alba, 1994).25 High prestige brands are
defined as brands which are bought for status, prestige and exclusivity reasons,
whereas low prestige brands are bought primarily for their value for money (Park,
Milberg, & Lawson, 1991).
Consumers are well aware that an access offering gives them only limited property
rights for a short period of time (Lovelock & Gummesson, 2004). One can argue that
due to the weaker relationships consumers form with accessed goods, they probably
also care less about the characteristics of these goods – among them the product
brand. Thus, consumers are expected to be indifferent among access offers based
upon a low vs. a high prestige product brand. The set-up hypothesis is a hypothesis
of equivalence (Wellek, 2010):
H1a: The evaluation of access offerings is independent of the prestige level of the
product brands the access offering is based on.
According to its definition, service convenience comprises the “consumers' time and
effort perceptions related to buying or using a service” (Berry et al., 2002, p. 1) and
is modeled to directly affect the service evaluation in terms of satisfaction, service
quality and fairness. Berry et al. (2002) differentiate five types of service
25 Classifying functional vs. prestige brands would make room for the possibility that the functional brand provides more or better functionality, whereas the prestige brand mainly represents a high level of social prestige, while it provides less functionality as compared to the functional brand.

100 4. Project II: How Consumers Respond to Consumption Mode Extensions
convenience, out of which three relate well to access offerings: access convenience,
transaction convenience, and benefit convenience. Access convenience refers to the
time and effort required to initiate service delivery, transaction convenience covers
all expenditures of time and effort to initiate a transaction, whereas benefit
convenience describes the experienced convenience during the core service process.
For access offerings this translates, for example, into the ease of getting to the
renting stations for pickup and drop-off, the availability of rental goods, the
possibility to make reservations, the temporal flexibility concerning the beginning
and the end of rentals, and the ease of interacting with the provider.
In line with Lovelock and Gummesson (2004) and Lawson (2011) the product
brand’s decline in importance is hypothesized to go along with an increase of the
importance of the access offering’s level of service convenience. As the product
brand is expected to be unimportant, the degree of service convenience is predicted
to have a positive effect as it directly affects the usage experience:
H1b: The evaluation of access offerings becomes more favorable with an increasing
level of convenience that is offered by the access provider.
4.2.2 Hypothesized effects on current owners
If a product brand additionally becomes available via access, there are usually a lot
of consumers who are already customers of this brand by having purchased a product
from this brand. The big challenge for those brands is then: not to scare their existing
customers, to simultaneously attract new customers and not to cannibalize their
overall sales.
A study on vertical brand extensions found that a relevant characteristic for the
success of brand extensions is the ownership status of the consumers – that is: Are
they already owners of a product of the parent brand that now introduces the brand
extension – or not?26 Kirmani et al. (1999) compared the reactions of owners and
non-owners to different kinds of vertical brand extensions and expected to find a so-
called ownership effect, which implies that owners as compared to non-owners react
26 Research on brand extensions typically differentiates horizontal and vertical brand extensions. Vertical extensions can either be positioned below or above the current position (step-down or step-up extensions). Both kinds of vertical brand extensions are very common in the industry. For example, in the automobile industry one brand typically introduces various models that differ regarding to price, size and quality (e.g. BMW 1 series, 3 series and 5 series).

4. Project II: How Consumers Respond to Consumption Mode Extensions
101
more favorably to brand extensions due to their generally more favorable attitude
towards the parent brand.
The logic of the ownership effect, which indicates that owners are likely to react
more favorably to any actions of their brand because they have greater familiarity,
knowledge, involvement and liking towards this brand can be motivated by various
theories. According to the mere exposure effect, people already tend to prefer things,
simply because they are familiar with them (Zajonc, 1968). In a similar fashion, the
mere ownership effect predicts that physical possession leads to greater involvement,
which in turn leads to a greater liking for the brand. We associate owned objects with
ourselves and like them because we strive to maintain a positive self-image (Barone,
Shimp, & Sprott, 1997; Beggan & Allison, 1997; Beggan, 1992). Various empirical
studies also found direct experience as well as ownership to cause higher
involvement and more favorable brand attitudes (Alba & Hutchinson, 1987; Celsi &
Olson, 1988; Hoch & Deighton, 1989; Kirmani et al., 1999). Furthermore, owners
have voluntarily decided to purchase the brand in the past “because they expect it to
provide valuable benefits” (Kirmani et al., 1999, p. 89).
Surprisingly, Kirmani et al. (1999) found a deviation from the ownership effect in a
study on brand extensions. They found that in case of low prestige brands the
ownership effect does hold for any kind of brand extension (step-up or step-down).
But, for high prestige brands the ownership effect was found to only hold for upward
extensions. Against previous expectations, owners of high prestige brands evaluate a
downward extension of their brand less favorably as compared to non-owners (see
Figure 9).
Figure 9: Hyhpotheses and Empirical Results of the Ownership Effect according to Kirmani et al. (1999).
Kirmani et al. (1999) explain this phenomenon with the high prestige brand owners’
fear to lose exclusivity, while non-owners welcome the simplified availability due to
102 4. Project II: How Consumers Respond to Consumption Mode Extensions
the lower prices. Also owners of high prestige brands like their brands more than
others (Kirmani et al., 1999). However, they have purchased a good from a high
prestige brand mainly due to its exclusivity that causes its associated social prestige
(Chernev et al., 2011; Eastman et al., 1999; Park, Jaworski, & Maclnnis, 1986;
Wilcox et al., 2009). Thus, owners of a high prestige brand dislike a downward brand
extension because it dilutes their ownership by decreasing the brand’s exclusivity.
The question of how owners evaluate the introduction of access is definitely an
important question for goods manufacturing companies which neither want to scare
away their customers nor cannibalize their sales. Following the propositions by
Shocker et al. (2004), an access offering as well as a brand extension are substitutes
to the original products. As access offerings typically allow usage at a lower price as
compared to ownership and are easily available for much more people, it is likely
that consumers regard access similar to a step-down brand extension. Considering
access as a substitute to ownership and similar to a downwards extension, one would
expect owners of high prestige brands to react similarly unfavorably to the
introduction of access as Kirmani et al. (1999) found in their study on brand
extensions. Thus the following hypotheses are formulated for low and high prestige
brands:
H2a: Compared to non-owners, owners of a distinct low prestige brand exhibit more
favorable evaluations of an access offering that is based on this low prestige brand.
H2b: Compared to non-owners, owners of a distinct high prestige brand exhibit less
favorable evaluations of an access offering that is based on this high prestige brand.
4.2.3 Hypothesized effects on parent brand evaluations
Research on brand extensions typically not only investigates the effects of the parent
brand on its extension, but also in turn how the extension can affect the equity of the
parent brand. In the literature, those effects on the beliefs or attitude towards the
parent brand are commonly called parent brand dilution or reciprocity effects
(Boisvert, 2012a, 2012b; Gürhan-Canli & Maheswaran, 1998; Loken & John, 1993).
Transferring this approach to the introduction of access as an additional consumption
4. Project II: How Consumers Respond to Consumption Mode Extensions
103
mode, the question is whether and, if so, how the parent brand will be affected by the
introduction of access.
The research on brand extensions typically builds upon categorization theory (Sujan
& Bettman, 1989; Weber & Crocker, 1983) in order to explain how incongruent
information is processed. The information that a parent brand introduces a brand
extension is typically considered as being incongruent with the consumers’ existing
schema of the brand. An extension usually has a significantly different price and
quality, which is not consistent with the consumers’ previous associations (Kim et
al., 2001). Depending on how this inconsistent information is processed, the parent
brand might become more or less diluted. Categorization theory proposes two
processing models that are directly relevant for brand extensions.
One processing model that categorization theory proposes is the so-called
bookkeeping model. The idea is that “each instance of stereotype-relevant
information is used to modify the stereotype gradually” (Weber & Crocker, 1983, p.
961) (see Figure 10). So, any piece of inconsistent information weakens the
corresponding belief of the parent brand and leads to a slightly less favorable
evaluation of the parent brand (Fishbein & Ajzen, 1975; Kim et al., 2001). Empirical
studies on brand extensions confirm this theory. Especially vertical step-down
extensions were found to face a high risk of parent brand image dilution (D. A.
Aaker, 1997; Kim et al., 2001; Lei et al., 2008)
Another processing model that is suggested by categorization theory is the so-called
subtyping model. If the inconsistent information is more radical and only partially
applies to the previous stereotype, people develop new stereotypic structures with a
separate set of beliefs associated with each subtype rather than modifying the
superordinate stereotype (Gürhan-Canli & Maheswaran, 1998; Weber & Crocker,
1983) (see Figure 10). The subtyping model is used to explain the successful
shielding effect of distancing techniques: If a brand extension is positioned further
away from the parent brand (e.g. by linguistic or graphical means), the parent brand
was found to be less negatively affected (Kim et al., 2001; Kirmani et al., 1999).

104 4. Project II: How Consumers Respond to Consumption Mode Extensions
Figure 10: Processing of New Information according to the Bookkeeping and the Subtyping Model.
The subtyping model can also be used to explain the results from Dall’Olmo Riley et
al. (2013) on the feedback effects of vertical downscale brand extensions on the
parent brand: They found that very up-scale luxury brands (e.g. Porsche or Prada) do
not suffer from dilution effects, whereas prestige brands (e.g. Audi or Diesel) suffer
from such effects. Consistent with categorization theory, a more atypical extension,
(the brand extension of the luxury parent brand is more atypical, because the distance
between the original brand and its mass market extension is larger as compared to a
prestige brand) has less impact on the parent brand because the subtyping (and not
the bookkeeping) model applies (Dall’Olmo Riley et al., 2013).
Current research on access, however, offers little guidance. Only Lamberton and
Rose (2012) encourage further research that “adopt[s] a broader view of sharing
systems” (p. 123) by investigating the consequences for the parent brand of starting
to offer access offerings. They expect positive effects on brand attitude, loyalty and
corporate image due to the improved resource utilization that is inherent in access
offerings due to intensified and prolonged usage (Belz, 1998; Berry & Maricle, 1973;
Lovelock & Gummesson, 2004; Scholl, 2008). On the other hand, these positive
effects on the environment might be offset by increased logistics and maintenance
efforts. Furthermore, Lamberton and Rose (2012) did not discuss a potentially
negative effect on the parent brand’s image due to potentially inconsistent
associations, which is an important topic in research on brand extensions (John,
Loken, & Joiner, 1998; Milberg, Whan Park, & McCarthy, 1997).

4. Project II: How Consumers Respond to Consumption Mode Extensions
105
When applying categorization theory to the introduction of access offerings, the
question is which processing model will apply. It has been argued before that
consumers perceive access offers quite differently as compared to ownership: Goods
are no longer purchased but rented on a short-term basis; no transfer of ownership
takes place; the personal relation to the object becomes much weaker. Thus,
consumers are expected not to fine-tune their established stereotype of the parent
brand, but to develop a new subtype when confronted with the incongruent
information that a company is adding an access consumption mode. For the parent
brand’s evaluation this means that the original stereotype will still be perceived as
accurate and will not be changed. Hence it is expected that the introduction of an
additional access offer will not affect the parent brand’s evaluation. Furthermore, the
introduction of access as an additional consumption mode is neither clearly similar to
a step-down nor a step-up brand extension. Depending on the pricing tariff and the
provided service quality, consumers might perceive access as superior or worse than
ownership. Thus, it is expected that the parent brand’s evaluation will not be affected
for both types of parent brands – low and high prestige parent brands:
H3: The introduction of access as an additional consumption mode does not affect
the parent brand’s evaluation.

106 4. Project II: How Consumers Respond to Consumption Mode Extensions
4.3 Methodology
In order to address the proposed hypotheses, a series of five experimental studies has
been conducted. Studies 1 and 2 have been conducted in two different product
categories each – cars and fashion – because previous research has shown (see
chapter 3) that drawing general conclusions about access offerings is difficult. Thus,
seven experiments have been conducted in total.
Both product categories, cars and fashion, are suitable for business-to-consumer
access offerings and comprise a large range of different brands with different
positioning strategies that allows picking distinct low and high prestige brands.27
Furthermore, authors of relevant studies in the brand extension literature used similar
product categories which enables better comparability: Kirmani et al. (1999) as well
as Dall’Ollmo Riley et al. (2013) both investigated the car and the fashion industry,
while Kim et al. (2001) researched cars and wristwatches.
It is also important to note that access offerings for cars and fashion differ in certain
ways. A carsharing car always needs to be clearly marked, so that it can be found,
whereas rented clothes do not need a publicly visible mark. The usage duration for
carsharing is usually between a few minutes to a few hours, whereas fashion is
typically rented for several days and is also used for a longer period of time. Finally,
the price paid for fashion is a lot less compared to cars, while the purchase frequency
is a lot higher for the former. Due to those differences it is important to investigate
different product categories in order to test external validity across categories. At the
same time it is difficult to derive causal effects from the just mentioned category
characteristics by comparing the results from two product categories, as two different
categories never differ solely in one particular aspect.
4.3.1 Study designs
The study designs of all experiments share a lot of commonalities (see also Table 16
for an overview). Their differences as well as commonalities are presented
subsequently.
27 The product categories, cars and fashion, are both suitable because those products typically have a high idling capacity and are not too cheap (Botsman & Rogers, 2010).
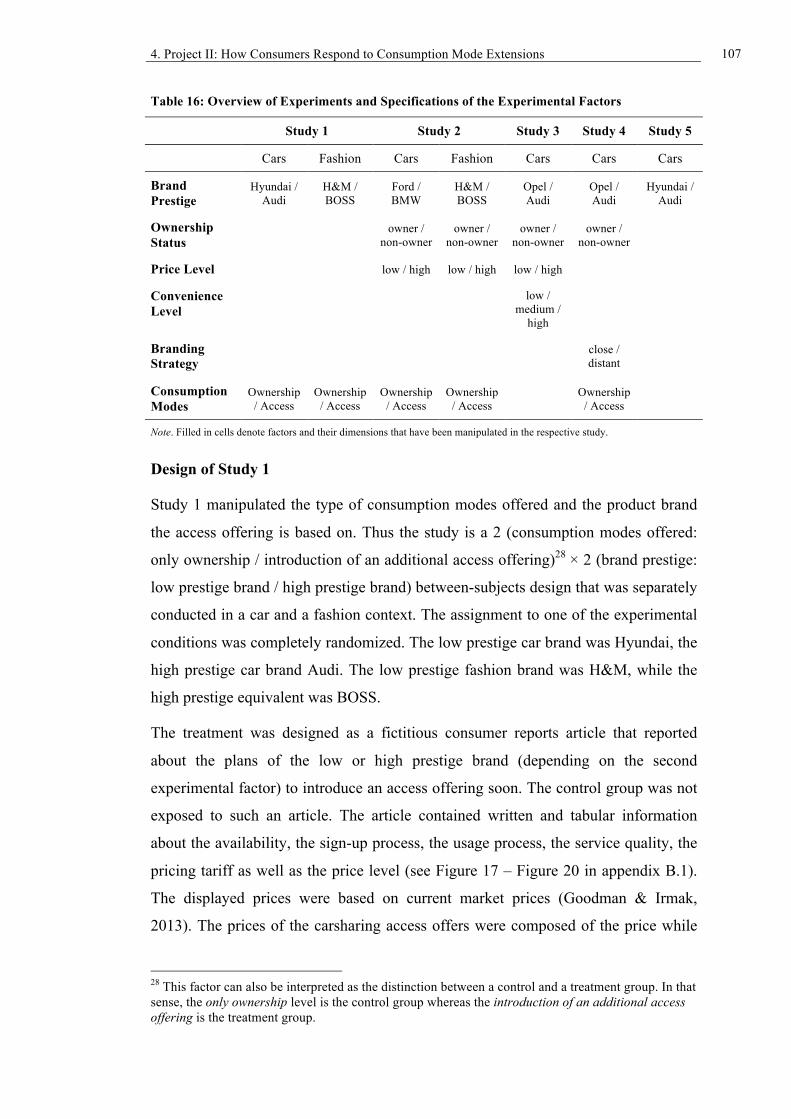
4. Project II: How Consumers Respond to Consumption Mode Extensions
107
Table 16: Overview of Experiments and Specifications of the Experimental Factors
Study 1 Study 2 Study 3 Study 4 Study 5
Cars Fashion Cars Fashion Cars Cars Cars
Brand Prestige
Hyundai / Audi
H&M / BOSS
Ford / BMW
H&M / BOSS
Opel / Audi
Opel / Audi
Hyundai / Audi
Ownership Status owner /
non-owner owner /
non-owner owner /
non-owner owner /
non-owner
Price Level low / high low / high low / high
Convenience Level
low / medium /
high
Branding Strategy close /
distant
Consumption Modes
Ownership / Access
Ownership / Access
Ownership / Access
Ownership / Access Ownership
/ Access
Note. Filled in cells denote factors and their dimensions that have been manipulated in the respective study.
Design of Study 1
Study 1 manipulated the type of consumption modes offered and the product brand
the access offering is based on. Thus the study is a 2 (consumption modes offered:
only ownership / introduction of an additional access offering)28 × 2 (brand prestige:
low prestige brand / high prestige brand) between-subjects design that was separately
conducted in a car and a fashion context. The assignment to one of the experimental
conditions was completely randomized. The low prestige car brand was Hyundai, the
high prestige car brand Audi. The low prestige fashion brand was H&M, while the
high prestige equivalent was BOSS.
The treatment was designed as a fictitious consumer reports article that reported
about the plans of the low or high prestige brand (depending on the second
experimental factor) to introduce an access offering soon. The control group was not
exposed to such an article. The article contained written and tabular information
about the availability, the sign-up process, the usage process, the service quality, the
pricing tariff as well as the price level (see Figure 17 – Figure 20 in appendix B.1).
The displayed prices were based on current market prices (Goodman & Irmak,
2013). The prices of the carsharing access offers were composed of the price while
28 This factor can also be interpreted as the distinction between a control and a treatment group. In that sense, the only ownership level is the control group whereas the introduction of an additional access offering is the treatment group.

108 4. Project II: How Consumers Respond to Consumption Mode Extensions
driving and the price while parking: 0.22€/minute and 0.09€/minute for Hyundai and
0.25€/minute and 0.10€/minute for Audi respectively. The prices for the fashion
rental offers were illustrated by providing price information for renting a pair of
jeans, a gown and a suit plus shirt for a period of five days. The pricing was 12€,
11€, and 33€ for H&M and 20€, 52€, and 81€ for BOSS.
A priori G*Power 3 calculations showed that a sample size of n = 128 in each
product category would have been required to find medium-sized effects of f = .25
(calculated with α = .05, (1-β) = .80 numerator df = 1, number of groups = 4) (Faul,
Erdfelder, & Lang, 2009). The size of the collected sample for both product
categories was N = 302. Due to the resulting small cell sizes, analyses of covariance
were necessary for study 1 in order to control for potential effects due to unequal
group assignments.
Design of Study 2
Study 2 additionally investigates the impact of ownership status (i.e. being owner of
the product brand the access offering is based upon or not) and the price level of the
access offering. Compared to study 1 this enables testing hypotheses H2a and H2b
additionally and to rule out the possibility that the results from study 1 have been
influenced by the unequal (but market-oriented) prices of the two access offerings.
The study was designed as a 2 (consumption modes offered: only ownership /
introduction of an additional access offering) × 2 (product brand: low prestige brand /
high prestige brand) × 2 (ownership status: non-owner / owner) × 2 (price level: low
prices / high prices) between-subjects design that was separately conducted in a car
and a fashion context. The assignment to all factor levels was random, except for the
factor ownership status, which was accomplished based upon self-declaration.
The low prestige car brand used in this experiment was Ford, while the high prestige
car brand was BMW. The low prestige fashion brand was H&M, while the high
prestige equivalent was BOSS – similar to study 1. In this study, there were two
different price levels for each access offering: The low price level was equivalent to
the prices of the low prestige access offerings from study 1, while the high price
level was equivalent to those prices that were used for the high prestige access
offering in the former study. Thus each access offering was priced with the same two
price levels – irrespective of the product brand it was based upon. As in study 1, the

4. Project II: How Consumers Respond to Consumption Mode Extensions
109
treatments were designed as notional consumer report articles that were only
presented to respondents in the access condition (see Figure 21 and Figure 22 in
appendix B.1).
The appropriate sample size was calculated a priori with G*Power 3 (effect size f =
.10, α = .05, (1-β) = .80, numerator df = 1, number of groups =12) and added up to a
required sample size of 787 respondents for each product category.29 The total
sample size collected was N = 1807.
Design of Study 3
The focus of study 3 is the more detailed examination of consumers’ evaluation of
access offerings with different characteristics. In this study the set of manipulated
factors that shape the access offering is further extended to enable testing of
hypothesis 1b, too: In addition to the prestige level of the product brand, the price
and the ownership status, the service convenience of the offerings is manipulated in
this study. The design of the study is a 2 (product brand prestige: low prestige / high
prestige) × 2 (price level: low price level / high price level) × 2 (ownership status:
non-owner / owner) × 3 (service convenience level: low convenience level / medium
convenience level / high convenience level) between subjects experimental design.
The treatment came again in the form of a notional consumer reports article that
described the respective access offering. Respondents were randomly assigned to all
factors, except for ownership status. As before, this was a self-declared attribute.
The service convenience level was varied in three steps, which had been successfully
pretested before the experiment (see chapter 4.4.1). The three convenience levels
differed in terms of availability, ease of renting and returning, quality of provider
interaction, service quality provided and insurance terms (see Figure 23 – Figure 25
in appendix B.1). As different brands as well as different convenience levels cause
different costs for the provider, the notional access offerings had to be priced
accordingly – the higher the access offering’s convenience level and the brand
prestige of the good it is based upon, the higher the price. The factor price level had
two values in order to test for price level related effects. The prices were either 10%
below (low price level) or 10% above (high price level) current market prices in
29 The factor price level was nested in the access condition. Thus a total of 12 groups for each product category were formed.

110 4. Project II: How Consumers Respond to Consumption Mode Extensions
Germany (see Figure 23 – Figure 25 in appendix B.1). The context of this study was
the automobile industry. The brand Opel served as the low prestige car brand and
Audi as the high prestige product brand.
The appropriate sample size was calculated a priori with G*Power 3 (f = .10, α = .05,
(1-β) = .80, numerator df = 2, number of groups = 24). The calculation results in a
minimum sample size of 967 respondents. The total sample size collected was N =
1,088.
Design of Study 4
The main purpose of study 4 is to explicitly test whether the parent brand might have
remained unaffected by the introduction of access solely due to the respondents’
implicit presumption that the access offering would be branded highly distant from
the parent brand. This might have happened because the treatments in studies 1 and 2
did not contain explicit information on how the access offering is positioned. In this
study, the new access offering is therefore either branded to be close to the parent
brand or to be rather distant.
The experimental design of study 4 was a 2 (product brand prestige: low prestige /
high prestige) × 2 (access offer branding strategy: close to parent brand / distant from
parent brand) × 2 (ownership status: non-owner / owner) × 2 (consumption modes
offered: only ownership / introduction of an additional access offering) between
subjects design. Those in one of the treatment groups were again exposed to a
notional consumer reports article that described the respective access offering. Those
in the control condition were not given any information on an access offering and
were solely questioned about their parent brand evaluation. Respondents were
randomly assigned to all factors, except for ownership status, which was self-
declared. The experiment was conducted only in the cars industry. The brands used
were identical to those from study 3 (Audi and Opel).
By placing the parent brand name directly next to the term carsharing (e.g.
AudiCarsharing) the close branding distance condition was operationalized. In the
far branding distance condition, the parent brand was not part of the actual access
brand (CarNow), the relation between the access brand and the parent brand was
only mentioned in the article (Kim et al., 2001) (see Figure 26 and Figure 27 in
appendix B.1).

4. Project II: How Consumers Respond to Consumption Mode Extensions
111
The appropriate minimum sample size is n = 787 according to a priori calculation
with G*Power 3 (f = .10, α = .05, (1-β) = .80, numerator df = 1, number of groups =
12). The total sample size collected was N = 871.
Design of Study 5
Study 5 is different to the previously described studies because it has been a scenario
experiment with signed-up carsharing customers. The study’s objective was to find
out how customers would react to a switch from the current high prestige product
brand to a low prestige car brand.
The respondents were randomly assigned to one of two conditions. In the treatment
condition they read a scenario that told them to imagine that the carsharing firm
would change the car brand of its carsharing fleet from a high prestige brand (Audi)
to a low prestige brand (Hyundai).30 As respondents were not given any information
on a change of price, they had to assume that the price per minute stayed unchanged
– however this can only be assumed because the cooperating carsharing provider did
not wish to provide any information on this issue to the respondents.
For the purpose of this experiment an online survey was sent to all customers of a
cooperating carsharing firm. Participants were incentivized by the option to take part
in a lottery.31 In total 350 customers completed the survey in January 2013. The
random assignment resulted in n = 171 respondents in the treatment group and n =
179 in the control group.
After reading the scenario, the respondents were asked to answer questions related to
the high prestige car brand, the low prestige car brand and the brand and offering of
the carsharing provider. In the control condition the respondents did not receive
information about any potential change in car brands, but a short note that they
would be asked some questions about the carsharing provider’s brand and offering,
the current car brand (the high prestige brand), and one further car brand that would
be randomly determined. However, the additional car brand was not randomly
determined, but was always the low prestige brand that was also used in the
treatment condition (Hyundai) in order to have a baseline with which the results of
30 As this was an experiment in a real setting, it was not possible to design a stronger manipulation (e.g. a scenario that the company is about to switch brands) in order to not scare the carsharing company’s customers. 31 Participants could win free minutes with the carsharing provider as well as backpacks.
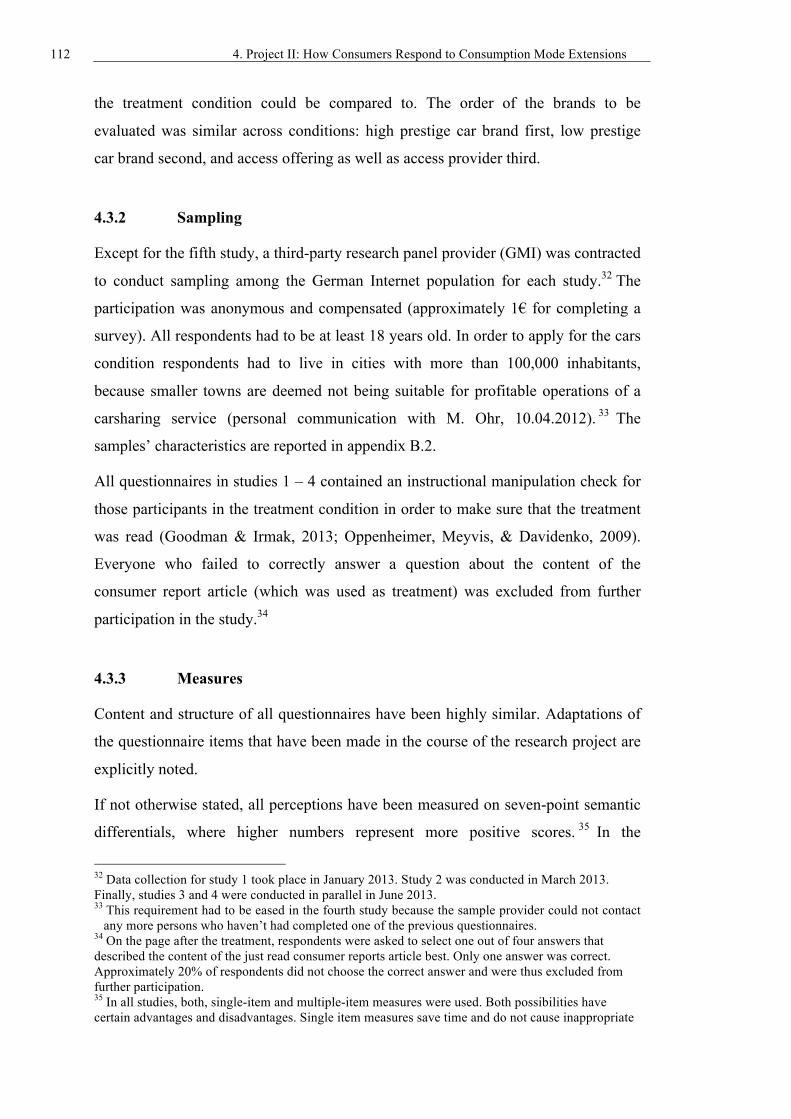
112 4. Project II: How Consumers Respond to Consumption Mode Extensions
the treatment condition could be compared to. The order of the brands to be
evaluated was similar across conditions: high prestige car brand first, low prestige
car brand second, and access offering as well as access provider third.
4.3.2 Sampling
Except for the fifth study, a third-party research panel provider (GMI) was contracted
to conduct sampling among the German Internet population for each study.32 The
participation was anonymous and compensated (approximately 1€ for completing a
survey). All respondents had to be at least 18 years old. In order to apply for the cars
condition respondents had to live in cities with more than 100,000 inhabitants,
because smaller towns are deemed not being suitable for profitable operations of a
carsharing service (personal communication with M. Ohr, 10.04.2012). 33 The
samples’ characteristics are reported in appendix B.2.
All questionnaires in studies 1 – 4 contained an instructional manipulation check for
those participants in the treatment condition in order to make sure that the treatment
was read (Goodman & Irmak, 2013; Oppenheimer, Meyvis, & Davidenko, 2009).
Everyone who failed to correctly answer a question about the content of the
consumer report article (which was used as treatment) was excluded from further
participation in the study.34
4.3.3 Measures
Content and structure of all questionnaires have been highly similar. Adaptations of
the questionnaire items that have been made in the course of the research project are
explicitly noted.
If not otherwise stated, all perceptions have been measured on seven-point semantic
differentials, where higher numbers represent more positive scores. 35 In the
32 Data collection for study 1 took place in January 2013. Study 2 was conducted in March 2013. Finally, studies 3 and 4 were conducted in parallel in June 2013. 33 This requirement had to be eased in the fourth study because the sample provider could not contact
any more persons who haven’t had completed one of the previous questionnaires. 34 On the page after the treatment, respondents were asked to select one out of four answers that described the content of the just read consumer reports article best. Only one answer was correct. Approximately 20% of respondents did not choose the correct answer and were thus excluded from further participation. 35 In all studies, both, single-item and multiple-item measures were used. Both possibilities have certain advantages and disadvantages. Single item measures save time and do not cause inappropriate

4. Project II: How Consumers Respond to Consumption Mode Extensions
113
following, the English versions of the items are reported even though the
questionnaires were administered in German. For a comprehensive table with all
constructs in German and English, please see Table 39 in appendix B.3.
The structure and content of the questionnaires was as follows: First respondents
were welcomed to the study. Next, they had to answer screening questions about
their age, size of city, car ownership and fashion brands ownership. The answers to
those questions were used to determine a respondents’ ownership status. For car
ownership, respondents had to state the brands of their most and (if applicable)
second most driven car. For fashion brands, respondents had to indicate the amount
of clothes they own from different fashion brands on a labeled 5-point scale (1: none;
2: very few; 3: relatively few; 4: relatively many; 5: lots of). Respondents who
indicated ownership of the car brands in question or owned more than relatively few
pieces of a fashion brand were considered as owners.
After that, respondents in the treatment condition were presented the consumer
reports article or the notional scenario description in study 5, followed by the
instructional manipulation check question and questions concerning the evaluation of
the access offering. Attitude towards the access offering was an average of three
items that asked how the respondents thought about this new offering (not favorable
at all / very favorable, very negative / very positive, worthless / valuable). The
intention to use was measured by asking for the probability of using the access
offering by the help of a five-point probability scale (0-19% / 20-39% / 40-59% / 60-
79% / 80-100%). Only in study 5 an additional measure of the perceived price
fairness of the access offering was part of the questionnaire. Its measurement took
place with a single item on a 7-point semantic differential (the prices for this sharing
offering are too cheap / are too expensive).
From there on the questionnaires for both – control and treatment group – were equal
again. The next part of the questionnaire dealt with the evaluation of the product
respondent behavior (Drolet & Morrison, 2001). They are suitable for concretely, unambiguous constructs, such as attitude, beliefs or intentions (Bergkvist & Rossiter, 2007; Diamantopoulos, Sarstedt, Fuchs, Wilczynski, & Kaiser, 2012; Rossiter, 2002). On the other hand they are not suitable for complex constructs such as personality traits (Bergkvist & Rossiter, 2007). Multi-item measures also provide a less discriminating response scale as compared to multi-item measures (Bergkvist & Rossiter, 2007). Furthermore, a study found that the predictive validity performance of single-items can be relatively variable across product categories and stimuli (Diamantopoulos et al., 2012). Being aware of arguments pro and contra, both methods are used. This comes with the advantage, that common method bias is reduced (Bergkvist & Rossiter, 2007).

114 4. Project II: How Consumers Respond to Consumption Mode Extensions
brand. Subjects were asked about their brand attitude, brand purchase intention,
willingness to pay a price premium and the willingness to recommend the brand to
others. Brand attitude was an average of two items that asked how people thought
about the brand (not favorable at all / very favorable, dislike very much / like very
much). The remaining three aspects of brand evaluation were measured by single-
items each (purchasing something from this brand is highly unlikely / likely, I am not
/ am willing to pay more for this brand than for a comparable brand, I would not /
would definitely recommend this brand to others). Furthermore, the respondents were
also asked about their subjective brand image in terms of innovativeness (very
predictable / very innovative) and eco-friendliness (acts not environmentally friendly
/ acts very environmentally friendly) to gain insights into the kind of potential image
changes. As from study 2 the measurement of brand image was extended by a
measure of brand exclusivity, which was also measured on a 7-point semantic
differential (this brand is available to everyone / this brand is only available to an
exclusive group). Finally, respondents had to answer a series of control questions.

4. Project II: How Consumers Respond to Consumption Mode Extensions
115
4.4 Results
The presentation of the results proceeds along the lines of the proposed hypotheses in
order to facilitate a clear presentation. Additional comprehensive results tables can
be found in appendices B.4 – B.10.
4.4.1 Pretests
In order to support the selection of suitable stimuli for the experiments, pretests on
brand prestige and different service convenience levels have been conducted before
they have been applied in the experiments.
Pretests on Brand Prestige
In a pretest of brand prestige, respondents were asked to evaluate various automobile
and fashion brands concerning their brand familiarity, brand attitude and perceived
brand prestige in order to select appropriate low and high prestige brands
(Dall’Olmo Riley et al., 2013; Kim et al., 2001; Milberg et al., 2010). The
presentation order of the brands was random. The evaluations were all measured on
seven-point semantic differentials. In this pretest 125 respondents took part and
evaluated both sets of brands. As all investigated brands were well known (M > 4.90)
and at least neutrally evaluated (M > 3.09), the brands for the studies could be
selected based on their associated prestige level. Means (with standard deviations in
parentheses) for the low prestige car brands were 3.35 (1.27) for Ford and 3.11 (1.16)
for Opel; means for the high prestige car brands were 6.12 (0.89) for Audi and 6.54
(.62) for BMW.36 The low prestige fashion brands’ prestige was evaluated at 3.38
(1.32) for H&M, whereas high prestige fashion brands were evaluated at 6.42 (0.75)
for BOSS.
Pretests on Service Convenience Level
Different levels of service convenience were pretested for carsharing offerings in a
second pretest. Each participant was asked to read one table that described an access
offering and to rate the access offering in terms of the convenience it offers to a 36 Due to a technical failure the sample that evaluated Ford only comprised 23 respondents. That is why a second pretest was conducted at the end of the questionnaire of study 1 with all respondents from the no-treatment group in the car product category (n = 222). In this pretest Ford’s brand prestige was evaluated at 4.16 (1.39). The higher prestige evaluation is in line with the evaluation of other low prestige brands in this pretest (e.g. Škoda with 3.62 (1.36)).

116 4. Project II: How Consumers Respond to Consumption Mode Extensions
customer on a seven-point semantic differential: (1) not at all convenient … (7) very
convenient. In total there were three different versions of access offerings described,
but the respondents only read one of them, as it was a between-subjects set-up. In
contrast to the experimental stimuli, no specific brand was mentioned.
The convenience level pretest for cars was conducted at the end of all surveys in
study 1, which were in the cars and no-treatment condition (n = 150). The three types
of carsharing offerings were rated as follows: 3.92 (1.32) for the low convenience,
4.85 (1.53) for the medium convenience, and 5.47 (1.25) for the high convenience
access offering. Games-Howell post-hoc tests showed that low and medium
convenience levels were significantly different, p ≤ .01. However, the difference
between medium and high convenience narrowly missed the 5%-significance level
with p = .10.
4.4.2 Manipulation checks
The manipulation check to control the intended manipulation of brand prestige by
investigating two different brands has been successful in all five studies (see
appendix B.4). The perceived brand prestige has always been significantly larger for
the high prestige brand as compared to the low prestige brand. Except for study 3, the
analysis of each manipulation check has been performed solely with those
respondents in the respective control conditions.37
Further it could be shown that despite the manipulation of brand prestige, the
corresponding brand quality judgments have been comparable across both product
categories. This has been tested additionally for studies 1 and 2 in order to rule out
alternative explanations (see appendix B.4).
Also the additional manipulation check in study 3 to control the intended differences
among the three service convenience levels has been successful. The manipulation
check in study 4 for the perceived branding distance has been successful, too (see
Table 41 and Table 42 in appendix B.4).
37 Study 3 was designed without a control condition. Thus, the brand prestige manipulation check in this study has been based upon respondents, who were exposed to one of the access offerings. However, they had to be non-owners in order to eliminate ownership effects.

4. Project II: How Consumers Respond to Consumption Mode Extensions
117
4.4.3 Results of hypothesis 1a
Hypothesis 1a suggests that the evaluation of the access offering is independent of
the product brand’s prestige level. This hypothesis could be tested for all seven
experiments. To assess this hypothesis, in each case a MAN(C)OVA and follow-up
AN(C)OVAs were calculated for the two dependent variables access attitude and
access usage intention, which measure the access evaluation. Because this
hypothesis is testing equivalence and a non-significant test is no sufficient proof of
equivalence, specific tests of equivalence have been performed additionally (Wellek,
2010).38
Results of study 1 – cars
In study 1, the MANCOVA contained those control variables that do not harm the
assumptions as covariates:39 access involvement, access fit and age. The main effect
of brand prestige, V = .00, F(2, 64) = .01, p > .10, is found to be non-significant in
the multivariate and the univariate analysis of variance, Fattitude(1, 65)= .02, p > .10,
Fintention(1, 65) = .02, p > .10 (see Table 44 in appendix B.6).
In order to specifically test the hypothesis of equivalence, the equivalence range was
set to the strict tolerance level ε = ± .36 (Wellek, 2010, p. 16). An alpha-level = .05
results in a very low test power of (1-β) = .15 due to the small sample size. Thus the
more liberal tolerance level ε = ± .74 was applied in this case. The t-values based on
the adjusted means for access attitude (tattitude = 0.85) and usage intention (tintention =
0.37) are within the critical interval [-1.38, 1.38]. Thus, equivalence at a liberal level
is given and hypothesis 1a is supported.
38 A test of equivalence does not strictly test for equivalence, but assumes a tolerable zone around the mean differences of two groups (in the case of equivalence tests for two unrelated samples). Wellek (2010) also describes equivalence as “equality except for practically irrelevant deviations” (p. 1). The null and alternative hypotheses to be tested in a two-group design are: H0: Θ ≤ -ε1 or Θ ≥ ε2; H1: -ε1 < Θ < ε2 Where Θ is the parameter of the degree of dissimilarity (commonly defined as (µ1 – µ2)/σ) and ε1 and ε2 define the equivalence interval (the smaller the latter two values, the stricter the test). Wellek (2010) recommends to set ε = .74 for liberal equivalence and ε = .36 for strict equivalence. Wellek (2010) provides R and SAS codes for computing critical intervals and test power for t-values from independent samples t-tests on the accompanying website of his book. If the observed t-value falls inside the critical interval, the null hypothesis can be rejected and equivalence within a tolerable zone is assumed (Wellek, 2010). 39 All covariates had to have significant correlations with one or both of the dependent variables. Further the point-biserial correlations between the covariates and the treatment effect had to be low to medium in order to limit confounding between covariate and treatment. Furthermore, all potential covariates were controlled for treatment-by-covariate interactions (homogeneity of regression) by calculating type III models with all potential interactions (Warner, 2012). To be included in the final type I model the control variables had to have significant effects (Hair, 1998).

118 4. Project II: How Consumers Respond to Consumption Mode Extensions
Results of study 1 – fashion
In the MANCOVA, with access involvement and access fit as covariates, the level of
brand prestige is found to be significant, V = .10, F(2, 62) = 3.51, p ≤ .05, after
having taken into account the covariates. The picture for the dependent variable
access attitude is similar (F(1, 63) = 7.09, p ≤ .05), while in case of access usage
intention the main effect of brand prestige, F(1, 63) = 0.50, p > .10, is not significant
(see Table 45 in appendix B.6).
Despite showing no significant effect, the t-value of the adjusted mean for access
usage intentions lies neither within the strict [-0.19, 0.19] nor the liberal [-1.37, 1.37]
critical interval (taccess usage intention = -1.68). Consequently H1a is not supported in case
of fashion.
Results of study 2 – cars
In the cars category in study 2, a MANOVA on access evaluation revealed a
significant main effect of brand, V = .02, F(2, 572) = 5.32, p ≤ .01, and a significant
two-way interaction of price × brand, V = .01, F(2, 572) = 3.16, p ≤ .05. Further, the
two-way interaction owner × brand narrowly misses the significance level, V = .01,
F(2, 572) = 2.85, p ≤ .10 (see Table 46 in appendix B.6).
The univariate analysis for access attitude shows that the main effect of the brand’s
prestige level is not significant, F(1, 573) = 0.49, p > .10. Setting the equivalence
range at the strict tolerance level ε = ± 0.36 (Wellek, 2010, p. 16), the critical interval
for t [-2.69, 2.69] covers the estimated t-value (t = 0.68) at a test power (1-β) = .99.
Thus at a strict level, equivalence is given and hypothesis 1a is supported.
The ANOVA for the dependent variable intention to use the access offering reveals a
significant main effect of brand, F(1, 573) = 6.35, p ≤ .05. The usage intention is
found to be higher for high prestige car brands (M = 2.08) in comparison to low
prestige car brands (M = 1.84), F(1, 573) = 6.35, p ≤ .05.40 Thus H1a is contradicted if
the usage intention is used as a proxy for the evaluation of an access offering.
Furthermore, the results show that the different price levels in study 1 have not
influenced the results. Even though the main effect of price is significant for access
40 This result is not contradicted by the significant ownership status × brand and price level × brand interactions because they are both hybrid in nature and leave the brand prestige factor interpretable (see Figure 30 - Figure 33 in the appendix).

4. Project II: How Consumers Respond to Consumption Mode Extensions
119
attitude, it is rendered not interpretable by an interesting interaction effect between
brand prestige and price level.41 Interaction tables reveal that an access offering
based upon a low prestige product and priced at the lower level leads to more
favorable evaluations as compared to the higher price level (interaction effect = .14
for attitude; interaction effect = .08 for usage intention). More interestingly, it can
also be learned that access offerings with high prestige brands are more favorably
evaluated if they are priced at the higher price level as compared to a lower price.
Results of study 2 – fashion
In the fashion product category, the MANOVA on access evaluation reveals a
significant main effect of brand (V = .03, F(2, 605) = 7.90, p ≤ .001) as well as a
significant two-way interaction between ownership status and brand (V = .02, F(2,
605) = 5.91, p ≤ .01) (see Table 47 in appendix B.6).
Contradicting H1a, the ANOVA results for access attitude reveal a significant main
effect of the prestige level of the fashion brand, F(1, 606) = 11.31, p ≤ .01. Access
offerings based on high prestige brands are more favorably evaluated (M = 4.07) as
compared to low prestige brands (M = 3.62).
The ANOVA with access usage intention as dependent variable also reveals a
significant main effect for brand (F(1, 606) = 13.83, p ≤ .001).42 The significant
effect of brand contradicts hypothesis 1a. Analyzing the group means shows that if a
fashion access offering is based on a high prestige brand it is more likely to be used
as if it was based on a low prestige brand (Mhigh prestige = 1.80 > Mlow prestige = 1.50).
Results of study 3 – cars
A MANOVA reveals a non-significant main effect of brand prestige. However, the
interactions ownership status × brand prestige (V = .01, F(2, 1063) = 3.12, p ≤ .05)
and price × brand prestige (V = .01, F(2, 1063) = 3.12, p ≤ .01) are found to be
significant (see Table 48 in appendix B.6).
The hypothesis is supported for access attitude as the main effect of brand prestige is
found to be not significant (F(1, 1064) = 0.13, p ≥ .10) and the test of equivalence
41 See Figure 28 and Figure 29 in the appendix. 42 The interaction graphs of the significant ownership status × brand interaction reveal equal ranks. Thus this interaction effect can be classified as ordinal and both significant main effects can be interpreted at a global level.

120 4. Project II: How Consumers Respond to Consumption Mode Extensions
(Wellek, 2010) is positive: The t-value of the independent t-test between the low and
the high brand prestige groups, t = -0.34, falls well within the critical interval for
strict equivalence. An even stricter tolerable zone that only accepts 5%-deviations as
compared to 10%-deviations also covers the calculated t-value in the critical interval
[-1.32, 1.32] for ε = 0.18.43
Also in the case of access usage intention, hypothesis 1a is fully supported. The main
effect of brand prestige is found to be not significant (F(1, 1064) = 0.58, p ≥ .10) and
the test of equivalence based upon a t-test (t = 0.76) yields positive results for strict
equivalence and the even stricter equivalence – similar to the previously reported
results.
Also in this study the main effect of price is either not interpretable due to disordinal
interactions or not significant.44 Furthermore the interaction pattern between price
level and brand prestige, which has already been identified in study 2 on cars, is
confirmed (interaction effect = .11 each).
Results of study 4 – cars
In study 4, the MANOVA only reveals one significant effect – namely the main
effect of brand prestige (V = .01, F(2, 571) = 3.39, p ≤ .05). Two interaction effects
narrowly miss the 5%-significance level: the brand prestige × ownership status
interaction (V = .01, F(2, 571) = 2.80, p ≤ .10) as well as the brand prestige ×
branding strategy interaction (V = .01, F(2, 571) = 2.64, p ≤ .10) (see Table 49 in
appendix B.6).
For the dependent variable access attitude, hypothesis 1a can be confirmed. The
main effect is found to be not significant (F(1, 572) = 0.15, p ≥ .10) and based on the
independent samples t-test (t = 0.39), the test of equivalence reveals equivalence at
the strictest level [-0.55, 0.55] for ε = 0.18. But, the ANOVA for the dependent
variables access usage intention reveals a significant main effect by brand prestige
43 Wellek (2010) based his initial suggestion to use the tolerance level ε = 0.36 for testing strict tolerance based upon the basic assumption that people generally rate probabilities of medium size that differ by no more than εbasic = 10% as rather similar. If εbasic is further reduced, even stricter tolerance levels can be calculated. Wellek derives the appropriate tolerance level ε for a two-sample t-test by the following equation (ϕ-1 denotes the quantile function for the standard normal distribution): ε = 2.5×ϕ-1(.5 + εbasic). 44 For the corresponding interaction graphs of brand prestige × price level, see Figure 38 and Figure 39 in appendix B.8.

4. Project II: How Consumers Respond to Consumption Mode Extensions
121
(F(1, 572) = 6.24, p ≤ .05).45 Thus the equivalence hypothesis 1a cannot be supported
by this data.
A short note to the already mentioned brand prestige × branding strategy interaction:
this interaction turns out to be significant for access usage intention, F(1, 572) =
5.28, p ≤ .05).46 It reveals an interesting pattern, as a close branding strategy between
parent brand and access offerings turns out to be especially positive for high prestige
product brands (interaction effect = .12), whereas low prestige product brands suffer
from such a strategy (simple main effects: F(1, 576) = 11.50, p ≤ .01). Low prestige
product brands should rather be included in an access offering branded with a larger
distance to the parent brand.
Results summary for hypothesis 1a
To summarize the results for cars, equivalence between the two different product
brands has been found in two out of four experiments. In the remaining two
experiments the access attitude has been found to be equivalent, while the behavioral
intention to use the access offering has been significantly higher for the high prestige
product brand. In case of the two experiments in the fashion industry the results have
consistently shown a more favorable access evaluation for the high prestige product
brand (see Table 17).
However, it needs to be taken into account that each study had a different
experimental design in terms of the type of the included experimental factors. Thus it
was accounted for a different part of the overall variance in each study (e.g. study 3
contained the most variants of access offerings and reveals equivalence across
product brands) (Warner, 2012). Furthermore, the heightened importance of the
brand in the second study might be explained by an unintended priming effect that
has not been present in the first study: In study 2, brand related control variables
have been collected directly before the treatment, whereas in study 1 those variables
were measured after the treatment and the measurement of the dependent variables.
Just having answered questions on how one relates to a brand, which shortly after is
claimed to be in the process of introducing access, might have caused an increased 45 The interaction between ownership status and brand prestige is hybrid in nature, as the cell mean ranks only switch for ownership status. Thus the main effect of brand prestige stays unaffected and interpretable (see Figure 40 and Figure 41 in the appendix). 46 The interaction is hybrid in nature: the main effect of brand prestige stays interpretable (see Figure 42 and Figure 43 in the appendix).

122 4. Project II: How Consumers Respond to Consumption Mode Extensions
and – under normal circumstances – unrealistic mental presence of the brand when
the respondents read the actual treatment.
Table 17: Results Summary for Testing Hypothesis 1a
Access Attitude Access Usage Intention
MANOVA
Univariate Analyses
Equivalence Tests
Univariate Analyses
Equivalence Tests
Study 1 – Cars 0.01 (.99)
0.02 (.89)
liberal equivalence
0.02 (.89)
liberal equivalence
Study 1 – Fashion 3.51 (.04)
7.09 (.01)
no equivalence
0.50 (.48)
no equivalence
Study 2 – Cars 5.32 (.01)
0.49 (.49)
strict equivalence
6.35 (.01)
no equivalence
Study 2 – Fashion 7.90 (≤.001)
11.31 (≤.01)
no equivalence
13.83 (≤.001)
no equivalence
Study 3 – Cars 0.63 (.53)
0.13 (.72)
strictest equivalence
0.58 (.45)
strictest equivalence
Study 4 – Cars 3.39 (.03)
0.15 (.70)
strictest equivalence
6.24 (.01)
no equivalence
Note. The results of the analyses of variance only display the results for the main effects of brand prestige. F-values are displayed above the corresponding p-values in parentheses.
4.4.4 Results of hypothesis 1b
Hypothesis 1b predicts that an increased level of service convenience will positively
influence the access evaluation. Taken together with hypothesis 1a the proposition
that service convenience is more important than the product brand can be tested
additionally by a relative importance analysis. Only the design of study 3 is suitable
to test hypothesis 1b and to perform a relative importance analysis.
A relative importance analysis enables to partition the explained variance among the
experimental factors (Johnson, 2000; LeBreton, Tonidandel, & Krasikova, 2013;
Tonidandel & LeBreton, 2011).47 If the model of interest contains interactive effects,
it requires a special analysis of relative importance – the so-called residualized
relative importance analysis (LeBreton et al., 2013). This method is able to cope
with the hierarchical nature of higher order regression models whereas general
47 Common estimates of importance such as visually inspecting the standardized regression coefficients, comparing simple bivariate correlations, or the change in R2 are problematic: They either “do not appropriately partition variance when predictors are correlated”, “fail to take into account the relationships between the predictors”, or they credit “any shared explanatory variance […] to the variable that was entered first in the regression equation” (all quotes from Tonidandel & LeBreton, 2011, p. 2).

4. Project II: How Consumers Respond to Consumption Mode Extensions
123
relative importance analysis requires unrestricted regression models without inherent
ordering of the variables (LeBreton et al., 2013). After all assumptions are met, the
cross-products have to be residualized for the respective relevant lower order effects,
before a traditional relative weight analysis with all lower order effects and the
calculated residuals can be performed.48
Results of study 3 – cars
A MANOVA results in a significant main effect for the factor convenience level (V =
.02, F(4, 2128) = 5.19, p ≤ .001) (see Table 48 in appendix B.6). The univariate
follow-up analyses show mixed results.
For the dependent variable access attitude, hypothesis 1b is supported as the main
effect of service convenience is found to be significant (F(2, 1064) = 9.02, p ≤ .001)
and the cell means rank as expected (Mlow convenience = 4.69 < Mmedium convenience = 5.03 <
Mhigh convenience = 5.10). However, planned repeated contrasts show that only the low
convenience level differs significantly from the medium as well as the high
convenience level (p ≤ .01). Medium and high convenience level are found to differ
not significantly (p = .88).
The results of the residualized relative importance analysis for the dependent variable
access attitude show that service convenience is more important than the product
brand (see Table 48): First, the relative importance of the main effect of brand
(0.25%) is significantly lower (95% CI [.004, .033]) as compared to the importance
of the main effect of the convenience level (29.77%). Second, even though two
interaction effects, in which brand prestige is part of, are quite large (brand prestige ×
price: 13.01% and brand prestige × ownership status: 5.22%), the sum of the relative
importance of all brand prestige-related effects (24.40%) is about half as large as all
convenience level-related effects (41.45%).49
For the dependent variable access usage intention, the main effect of service
convenience narrowly misses the 5%-significance level (F(2, 1064) = 2.62, p ≥ .05).
48 It is required that “all variables have been standardized and (…) any cross-products (…) have been appropriately computed as the cross-products of the standardized variables” (LeBreton, Tonidandel, & Krasikova, 2013, p. 454). The residuals r are calculated by saving the residual of the following regression equation, where U and V denote main effects and U × V the interaction effect: U × V = β1 × U + β2 × U + r. 49 Even though Le Breton et al. (2013) do not recommend adding up the percentage of variance explained in some special cases, it does make sense in this case, as it is possible to interpret the result if higher-order effects are counted for all factors to which they relate.

124 4. Project II: How Consumers Respond to Consumption Mode Extensions
Even though the ranking of the three convenience levels turns out as expected (Mlow
convenience = 2.11 < Mmedium convenience = 2.15 < Mhigh convenience = 2.31), the differences are
too marginal in order to become significant. Thus hypothesis 1b cannot be supported.
In order to assess whether service convenience or brand prestige is more important, a
residualized relative importance analysis was performed, too. Even though the main
effect of convenience level accounts for more of the total variance explained (9.77%
vs. 1.14%) – this time, the bootstrapping analysis does not reveal a significant
difference. Further, brand prestige is part of the two strongest interactions: brand
prestige × price (15.35%) and brand prestige × ownership status (11.92%). Also the
sum of the relative importance of all brand prestige-related effects (30.56%) is larger
than all convenience-level effects (17.75%). Thus the proposition that service
convenience is more important is not supported.
Results summary for hypothesis 1b
The proposition that service convenience plays an important role and is thus more
important than the product brand can only be partially supported. In case of the
dependent variable access attitude, the hypothesis is fully supported by investigating
the main effects and the residualized relative importance analysis; whereas in case of
the behavioral intention the main effect of the service convenience level is found to
be narrowly not significant and the relative importance analysis can not determine a
superiority. It is interesting to see how the convenience level loses importance when
it comes to behavioral in contrast to attitudinal measures.
4.4.5 Results of hypotheses 2a and 2b
Hypotheses 2a and 2b propose an interaction effect between ownership status and
product brand: They predict that owners evaluate access offerings more positively
than non-owners – owners of high prestige brands being the exception with a reverse
effect expected. These hypotheses could be tested in four experiments.
Beforehand, the validity of the general ownership effect is confirmed by anticipating
some side results of the subsequent analyses of parent brand evaluation for
hypothesis 3: Consistently across studies 2 and 3, the main effects of brand prestige,
ownership status and the corresponding interaction turn out to have significant
effects in the MANOVAs (see Table 52 – Table 54 in appendix B.7). These results

4. Project II: How Consumers Respond to Consumption Mode Extensions
125
confirm the assumption of the ownership effect: owners are more favorable towards
their brands as compared to non-owners. Interestingly, simple main effects of the
interactions further reveal that owners of high prestige brands express a particularly
favorable evaluation of their brand (see Table 43 in B.7).50
Results of study 2 – cars
In study 2, the two-way interaction ownership status × brand narrowly misses the
significance level, V = .01, F(2, 572) = 2.85, p ≤ .10, in the MANOVA, but both
univariate analyses reveal significant interaction effects.
Figure 11: Interaction Graph of Access Attitude between Brand Prestige and Ownership Status as well as Ownership Status and Brand Prestige in Study 2 for Cars. Note: error bars represent standard error of means; 3.5 = neutral scale mean.
The univariate analysis for access attitude reveals a significant interaction effect of
ownership status × brand prestige, F(1, 573) = 4.45, p ≤ .05 (see Figure 11).
However, the analysis of the interaction effect table reveals a pattern contrary
expectation: 51 Owners of the high prestige brand have more favorable access
attitudes towards an access offering based on this high prestige brands as compared
to non-owners (interaction effect = .12), whereas owners of the low prestige brand
have less favorable access evaluations of an access offering of this low prestige
brand in contrast to non-owners of this brand (interaction effect = -.12). Simple main
effects analysis reveals neither a significant difference between owners and non-
owners in case of the low prestige brand, F(1, 577) = 2.85, p >.10, nor in the case of
50 All interaction graphs reveal ordinal interaction – thus, the main effects are interpretable, too. 51 The cell means do not allow differentiating among main and interaction effects. Thus they might be misleading. That’s why it is recommended to calculate the interaction effects by subtracting the cell and row means from each cell value and finally adding the grand mean (R. Rosenthal & Rosnow, 1991; Umesh, Peterson, McCann-Nelson, & Vaidyanathan, 1996; Warner, 2012).

126 4. Project II: How Consumers Respond to Consumption Mode Extensions
the high prestige brand, F(1, 577) = 3.06, p > .05. Overall hypothesis 2a and 2b are
contradicted, because the effect turns out unlike expected.
In case of the dependent variable access usage intention, the ownership status ×
brand interaction effect is also found to be significant, F(1, 573) = 3.85, p ≤ .05.
Follow-up cell means analyses show that the behavioral intention to use access offers
based on the low prestige brand differs only marginally between owners and non-
owners (Mlow prestige, owner = 1.82 ≤ Mlow prestige, non-owner = 1.85), whereas the intention to
use access offerings based on the high prestige brand are significantly higher (F(1,
577) = 6.51, p ≤ .05; interaction effect = .09) for owners of this brand in contrast to
non-owners (Mhigh prestige, owner = 2.25 > Mhigh prestige, non-owner = 1.91). The effect is
similar to the one found for the dependent variable access attitude, but both findings
contradict the original hypotheses H2a and H2b.
Results of study 2 – fashion
In the fashion product category, the MANOVA on access evaluation reveals
significant main effects of ownership status (V = .06, F(2, 605) = 20.31, p ≤ .001)
and brand (V = .03, F(2, 605) = 7.90, p ≤ .001) as well as a significant two-way
interaction between ownership status and brand (V = .02, F(2, 605) = 5.91, p ≤ .01).
The univariate analysis for access attitude shows that the predicted interaction effect
between ownership status and brand is not significant, F(1, 606) = 1.95, p > .10 (see
Table 47 in appendix B.6). Thus hypotheses 2a and 2b are contradicted.
The univariate analysis for access usage intention reveals a different picture: a
significant main effect for brand and ownership as well as a marginally non-
significant ownership status × brand interaction (F(1, 606) = 2.82, p ≤ .10) (see Table
47 and Figure 12). Follow-up investigations by the help of interaction tables were
most insightful because the main effects mask the nature of interactions quite
strongly: Simple effect analysis based on the cell means finds significant differences
between owners and non-owners in case of the low prestige brand (F(1, 610) = 8.41,
p ≤ .01) as well as the high prestige brand (F(1, 610) = 28.54, p ≤ .001). In both cases
the probability to use the access offering seem to be larger for owners (see Figure
12).

4. Project II: How Consumers Respond to Consumption Mode Extensions
127
Figure 12: Interaction Graphs of Access Behavioral Intention between Brand Prestige and Ownership Status as well as between Ownership Status and Brand Prestige in Study 2 for Fashion. Note: error bars represent standard error of means; 3.5 = neutral scale mean.
The interaction table finally reveals that the interaction effect causes a positive effect
for owners of high prestige brands (interaction effect = .07) as opposed to non-
owners of high prestige brands (interaction effect = -.07). For low prestige brands the
pattern is the other way round: non-owners are more likely to use it (interaction
effect = .07) as compared to owners (interaction effect = -.07). Thus both hypotheses
on the ownership effect are contradicted, because the effect turned out different than
predicted.
Results of study 3 – cars
In study 3, the MANOVA results in significant main effects for the factors
ownership status and convenience level. Further, the interaction ownership status ×
brand prestige (V = .01, F(2, 1063) = 3.12, p ≤ .05) is found to be significant (see
Table 48 in appendix B.6).
For the dependent variable access attitude, the interaction effect was found to be
narrowly not significant at the 5%-level, F(1, 1064) = 2.88, p ≤ .10. However, simple
main effect analysis reveals that in case of the high prestige brand, owners have
significantly more positive attitudes than non-owners (F(1, 1084) = 16.11, p ≤ .001).
In case of the low prestige brand, simple main effect analysis only finds a narrowly
not significant result (F(1, 1084) = 2.86, p ≤ .10). The interaction table reveals that
despite the cell means (which have been influenced by the big positive impact of
being owner) in case of low prestige product brands, the interaction effect is actually
negative for owners (interaction effect = -.07). Altogether, the hypotheses cannot be
supported as the follow-up analysis reveals pattern contrary expectations (but in line
with the results of study 2).

128 4. Project II: How Consumers Respond to Consumption Mode Extensions
The interaction effect between ownership status and brand prestige is found to be
significant for access usage intention (F(1, 1064) = 5.88, p ≤ .05). The interaction
effect table reveals a pattern contrary the hypotheses: Owners of a car by Audi (the
high prestige brand) have more favorable behavioral usage intentions as compared to
non-owners (interaction effect = .09), whereas owners of a car by Opel (the low
prestige brand) react comparatively negative towards an introduction of an access
offering based upon their brand (interaction effect = -.09). Simple main effects
analysis also reveals a significant more positive behavioral intention for owners as
compared to non-owners in case of the high prestige brand (F(1, 1084) = 26.21, p ≤
.001). In case of the low prestige brand the effect is narrowly not significant at a 5%-
significance level (F(1, 1084) = 3.04, p ≤ .10) and also misleading as it is influenced
by the main effects. Altogether, hypotheses 2a and 2b cannot be supported but reveal
a consistent pattern similar to the results of study 2.
Results of study 4 – cars
In the MANOVA in study 4, the brand prestige × ownership status interaction (V =
.01, F(2, 571) = 2.80, p ≤ .10) narrowly misses the 5%-significance level (see Table
49 in appendix B.6). In the ANOVA for access attitude, the interaction between
brand prestige and ownership status turns out to be significant, F(1, 572) = 3.94, p ≤
.05. The interaction table shows that the original hypotheses are not supported,
nonetheless the results are consistent with those of the previous studies: Owners of
the high prestige brand express more positive attitudes as compared to non-owners
(interaction effect = .12), while owners of the low prestige brand are less favorable as
compared to non-owners (interaction effect = -.12).
In the ANOVA for access usage intention, one finds the brand prestige × ownership
status interaction effect to be significant, too (F(1, 572) = 4.04, p ≤ .05). The
interaction table reveals the same pattern as for the dependent variable access attitude
(interaction effect = .10). Thus the initial hypotheses 2a and 2b have to be rejected,
but the pattern found in the previous studies is confirmed once more.
Results summary for hypotheses 2a and 2b
Even though relevant interaction effects between ownership status and brand prestige
have been found in all cases except one, the interactions have not turned out as
hypothesized. Instead, it is found that owners react more favorable than non-owners
4. Project II: How Consumers Respond to Consumption Mode Extensions
129
in case of high prestige brands, whereas owners react less favorable in case of low
prestige brands. The finding for high prestige brands is against the findings by
Kirmani et al. (1999), but in line with the initial idea of the ownership effect. The
result for low prestige brands is different from both, the original concept of the
ownership effect and different from the findings by Kirmani et al. (1999) in the
domain of brand extensions. However, these effects are consistently found in both
product categories.
Table 18: Results Summary for Testing Hypothesis 2a and 2b
Access Attitude Access Usage Intention
MANOVA
Univariate Analyses
Interaction Effect
Univariate Analyses
Interaction Effect
Study 2 – Cars 2.85 (.06)
4.45 (.04)
low prestige brand: -.12
high prestige brand:
.12
3.85 (.05)
low prestige brand: -.09
high prestige brand:
.09
Study 2 – Fashion 5.91 (≤.01)
1.95 (.16) n.a. 2.82
(.09)
low prestige brand: -.07
high prestige brand:
.07
Study 3 – Cars 3.12 (.04)
2.88 (.09)
low prestige brand: -.07
high prestige brand:
.07
5.88 (.02)
low prestige brand: -.09
high prestige brand:
.09
Study 4 – Cars 2.80 (.06)
3.94 (.05)
low prestige brand: -.12
high prestige brand:
.12
4.04 (.05)
low prestige brand: -.10
high prestige brand:
.10
Note. The results of the analyses of variance only display the results for the interaction effects between ownership status and brand prestige. F-values are displayed above the corresponding p-values in parentheses. The signs of the interaction effects are from an owner’s perspective: a positive sign indicates that owners are more favorable, whereas a negative sign indicates that owners are less favorable – in each case compared to non-owners.
4.4.6 Results of hypothesis 3
Hypothesis 3 takes a broader perspective and suggests that consumers will not
change their evaluation of the parent brand, if it introduces an additional access
offering based on its product brand. The evaluation of the parent brand has been

130 4. Project II: How Consumers Respond to Consumption Mode Extensions
operationalized by the following four dependent variables each: brand attitude,
brand purchase intention, brand WOM, willingness to pay a price premium.
As equivalence is hypothesized, tests of equivalence according to Wellek (2010) are
performed. For these tests it is necessary to rely on t-values, as tests based on F-
values are not available. Thus, explanatory power is lost because no second factor
can reduce the variability within cells (Warner, 2012).
The hypothesis could be tested in five different experiments. Additionally, analyses
of further dependent brand image variables have been conducted in order to also gain
insights on how the brand image is potentially modified through the addition of the
access consumption mode.
Results of study 1 – cars
After taking into account all suitable and significant covariates in the MANCOVA
(see Table 50 in appendix B.7) a significant effect of brand prestige is identified,
whereas no significant effect of introducing the access offering is found (V = .05,
F(4, 143) = 1.74, p > .10). Also the interaction term is found to be not significant, V
= .03, F(4, 143) = 0.95, p > .10.
After controlling for relevant covariates (as listed in Table 50), brand attitude differs
significantly among the brands and – relevant for hypothesis testing – among the
number of consumption modes offered, F(1, 148) = 4.41, p ≤ .05. The adjusted
means show that the brand attitude suffers if access is introduced (MAccess = 4.74 <
MOwnership = 5.13). For the dependent variables brand purchase intention and brand
word-of-mouth the effects of additionally introducing access are not significant.
Comparing the t-values (tbrand purchase intention = 0.18; tbrand wom = 0.46) of the adjusted
group means with the critical interval for strict equivalence [-0.61, 0.61] supports the
notion of equivalence for these two dependent variables. Furthermore the main effect
of introducing access for the dependent variable willingness to pay a price premium
for the product brand is narrowly not significant at a 5%-level, F(1, 148) = 3.20, p ≤
.10, but at the same time no strict equivalence can be confirmed (tbrand wtp price premium =
-2.53). Overall, hypothesis 3 is only partly supported in the automobile product
category.
A modification of the parent brand image is only found for the brand’s
innovativeness, but not for its ecological friendliness. For the brand’s innovativeness,

4. Project II: How Consumers Respond to Consumption Mode Extensions
131
the brand × treatment effect is found to be significant, F(1, 146) = 4.55, p ≤ .05.
Investigating the adjusted cell means leads to the conclusion that low prestige brands
benefit in terms of innovativeness (MAccess = 5.06 > MOwnership = 4.48, t(72) = 2.30, p
≤ .05), while there is little change for high prestige brands (MAccess = 4.92 < MOwnership
=5.04, t(80) = -0.55, p > .10).
Results of study 1 – fashion
In the fashion product category, the MANCOVA reveals that only the main effect of
brand prestige has a significant impact on the product brand evaluation, while the
introduction of access does not significantly affect the parent brand’s evaluation (see
Table 51 in appendix B.7). Also the ANCOVAs reveal no significant main or
interaction effects by the introduction of access.
Comparing the t-values based upon adjusted means with the critical intervals for
strict equivalence [-0.55, 0.55] supports the notion of equivalence for brand attitude
(tbrand attitude = -0.48), brand purchase intention (tbrand purchase intention = -0.20) and brand
WOM (tbrand WOM = -0.55). Liberate equivalence (critical interval [-2.79, 2.79]) is
found for the willingness to pay a price premium (tbrand WTP price premium = -2.02). This
largely supports the hypothesis that the introduction of access as an additional
consumption mode does not affect the parent brand’s evaluation.
Concerning parent brand image modifications, it is found that only the main effect of
access becomes almost significant, F(1, 133) = 3.78, p ≤ .10. In case of the low
prestige brand the innovativeness perception increases from MOwnership = 4.26 to
MAccess = 4.61 and in case of the high prestige brand from MOwnership = 4.69 to MAccess
= 5.08.
Results of study 2 – cars
For this analysis it was necessary to create a nested factor, called treatment, because
the experimental factor price level solely refers to the access offering. The nested
factor treatment has three levels: ownership only, introducing access at a low price,
introducing access at a high price.
Even though the multivariate analysis shows a significant effect of brand prestige,
ownership status, and the brand prestige by ownership status interaction, all

132 4. Project II: How Consumers Respond to Consumption Mode Extensions
treatment related effects have been found to be not significant – thus basically
supporting the hypothesis (see Table 52 in appendix B.7).
As proposed all ANOVAs reveal no signifncant effects, but the main effect of
treatment for the dependent variable word-of-mouth only narrowly misses
significance, F(1, 880) = 2.30, p ≤ .10. The tests of equivalence, which required to
pool the different price levels into one group, all revealed equivalence. All t-values
fall well into the critical interval [-3.47, 3.47] for strict equivalence tests according to
Wellek (2010): tbrand attitude = 1.49; tbrand purchase intention = 0.57; tbrand WOM = 1.95; tbrand WTP
price premium = 0.69. Thus hypothesis 3 is supported.
The modification of the parent brand image has been investigated for the perceived
parent brand’s innovativeness, exclusiveness and environmental friendliness. Except
for the latter, some treatment related effects have been found.
In case of brand innovativeness the main effect of the treatment factor (F(2, 880) =
2.49, p ≤ .10) and the interaction of ownership status × treatment (F(2, 880) = 2.80, p
≤ .10) narrowly miss the 5%-significance level. The latter interaction is disordinal in
nature (see Figure 34 and Figure 35 in appendix B.8), thus rendering the main
treatment effect unsuitable for further interpretation. Investigating the interaction
itself, only the introduction of access at a low price level causes non-owners to
significantly increase their innovativeness beliefs (t(305) = 2.90, p ≤ .01).
For the brand’s exclusiveness the main effect of the treatment narrowly misses the
significance level of 5% (F(2, 880) = 2.42, p ≤ .10) as well as the ownership status ×
treatment interaction (F(2, 880) = 2.84, p ≤ .10). As the interaction’s nature is hybrid
due to a change in order for the treatment factor, only the interaction itself is suitable
for further interpretation (see Figure 36 and Figure 37 in appendix B.8). Follow-up
contrasts show that non-owners beliefs are very little modified, whereas owners
perceive less exclusivity when an access brand is introduced. However this loss is
only significant for the access offering priced at the higher price level (t(295) = 2.85,
p ≤ .01).
Results of study 2 – fashion
Similar to the previous section, a nested factor has been created for the following
analyses in the fashion category. The MANOVA results show that none of the
treatment related factors are significant (see Table 53 in appendix B.7).
4. Project II: How Consumers Respond to Consumption Mode Extensions
133
For all four dependent variables, the main effect of treatment is found to be not
significant at a 5%-level – as expected. The critical interval for strict equivalence [-
3.47, 3.47] contains all t-values from the independent samples t-test between the
ownership and the pooled access conditions: tbrand attitude = -0.67; tbrand purchase intention =
-0.18; tbrand WOM = -0.83; tbrand WTP price premium = -1.83. Thus hypothesis 3 is supported.
Also for the fashion product category three dimensions of potential brand image
modifications have been investigated. However for neither innovativeness, nor eco-
friendliness, nor exclusivity any treatment related significant effects are found.
Results of study 4 – cars
Also in study 4 it has been necessary to create a nested factor, but with different
levels. In this study it integrates the type of consumption modes offered with the
branding strategy of the access offering. Thus, the treatment factor has three levels:
ownership only, an additional access offering with a close branding strategy and an
additional access offering with a distant branding strategy.
The multivariate analysis yields significant results for the main effects brand prestige
and ownership status, but not for the treatment factor, V = .01, F(8, 1714) = .62, p ≥
.10. Further, two of the four interactions are found to be significant: the brand
prestige × ownership status interaction (V = .03, F(4, 856) = 7.33, p ≤ .001) and the
treatment × ownership status interaction (V = .03, F(8, 1714) = 2.72, p ≤ .01) (see
Table 54 in appendix B.7).
Similar to the MANOVA and confirming the expectations, for neither of the
dependent variables the main effect of treatment is significant. For the purpose of the
equivalence test, the two branding strategies were pooled into one joined group as no
differences between the original three groups have been found by the ANOVAs. The
t-values of the independent samples t-tests range between t = 0.16 and t = 1.18 and
fall between the critical interval for strict equivalence [-3.36; 3.36]. Thus hypothesis
3 is supported.
Moreover, the treatment by ownership status interaction shall be further analyzed as
it yields a significant result in the MANOVA and in two cases an only narrowly not
significant result in the ANOVAs. One of those cases is the ANOVA with the
dependent variable brand purchase intention, F(2, 858) = 2.68, p ≤ .10. Simple main
effects analysis reveals a significant difference for the treatment factor among

134 4. Project II: How Consumers Respond to Consumption Mode Extensions
owners, F(2, 865) = 3.80; p ≤ .05. Pairwise comparisons find only one significant
difference: that is, owners develop a significantly higher brand purchase intention as
compared to the condition in which only ownership is available if the brand
introduces a distantly branded additional access offering (mean difference = 0.53; p
≤.01). The other case is the ANOVA with the willingness to pay a price premium for
the brand, F(2, 858) = 2.81, p ≤ .10. In this case the simple main effect analysis
neither reveals significant differences for owners, nor for non-owners.
As in previous studies, it was further analyzed whether the parent brand image is
modified by the introduction of access. For the dependent variable parent brand
innovativeness, only the main effects turn out to be significant – among them the
main effect treatment, F(2, 858) = 9.45, p ≤ .001. A REGWQ post-hoc test shows
that all sub-groups differ significantly: The parent brand innovativeness perception
increases significantly if an additional closely branded access offering (M = 4.99) is
introduced as compared to the control condition (M = 4.75). It further increases
significantly if you compare a distantly branded access offering (M = 5.22) to a
closely branded access offering (M = 4.99). The parent brand’s ecological
friendliness (F(2, 858) = 1.28, p ≥ .10) as well as the parent brand’s exclusivity (F(2,
858) = 0.61, p ≥ .10) are not significantly affected by the introduction of an access
offering.
Results summary for hypothesis 3
In summary the hypothesis that the introduction of an access offering does not
impact the evaluation of the parent brand is confirmed. Only for two dependent
variables in study 1 no equivalence could be proven (see Table 19). However, this
study suffers under a comparatively small sample size and the associated need to rely
on ANCOVAs.
Study 4 helps to rule out an alternative explanation, as the type of sub-branding of
the access offering in relation to its parent brand was explicitly manipulated to be
either close or distant. But none of these two strategies changes the results from the
previous studies. Thus the results show that the type of branding strategy only plays a
minor role.
Nonetheless some modifications of the parent’s brand image have been found.
Overall, brands seem to gain a more innovative image – except their original rating is
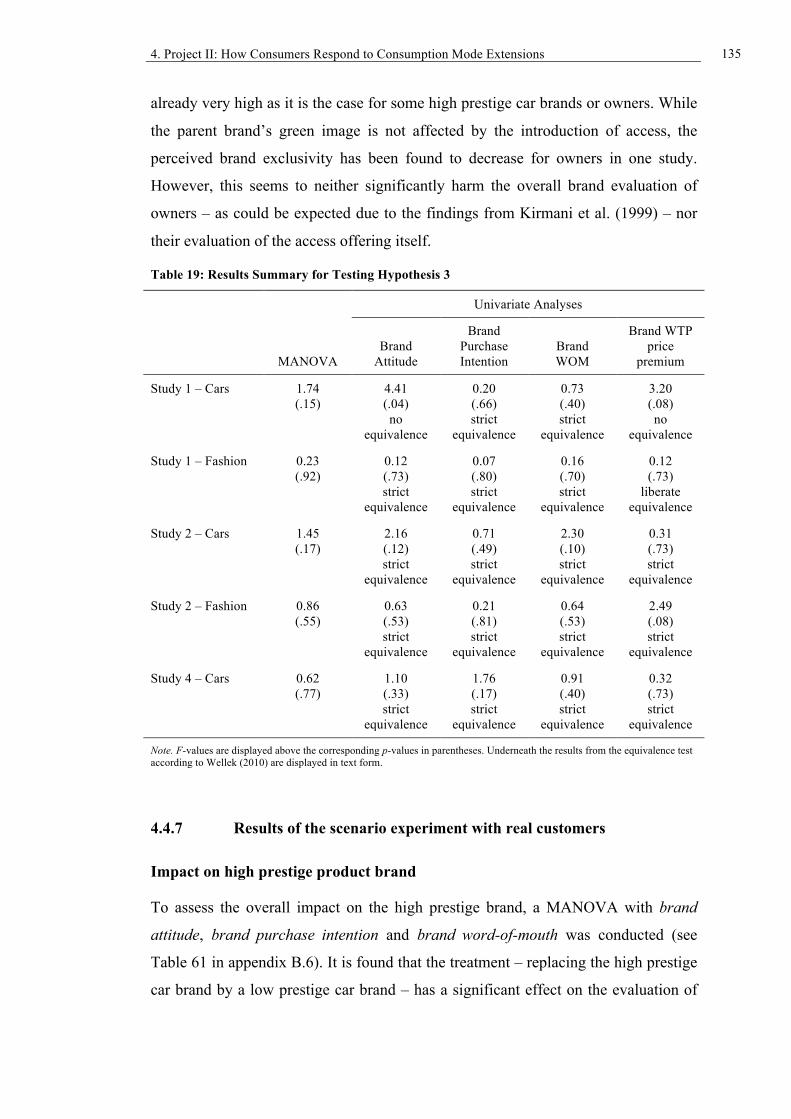
4. Project II: How Consumers Respond to Consumption Mode Extensions
135
already very high as it is the case for some high prestige car brands or owners. While
the parent brand’s green image is not affected by the introduction of access, the
perceived brand exclusivity has been found to decrease for owners in one study.
However, this seems to neither significantly harm the overall brand evaluation of
owners – as could be expected due to the findings from Kirmani et al. (1999) – nor
their evaluation of the access offering itself.
Table 19: Results Summary for Testing Hypothesis 3
Univariate Analyses
MANOVA Brand
Attitude
Brand Purchase Intention
Brand WOM
Brand WTP price
premium
Study 1 – Cars 1.74 (.15)
4.41 (.04) no
equivalence
0.20 (.66) strict
equivalence
0.73 (.40) strict
equivalence
3.20 (.08) no
equivalence
Study 1 – Fashion 0.23 (.92)
0.12 (.73) strict
equivalence
0.07 (.80) strict
equivalence
0.16 (.70) strict
equivalence
0.12 (.73)
liberate equivalence
Study 2 – Cars 1.45 (.17)
2.16 (.12) strict
equivalence
0.71 (.49) strict
equivalence
2.30 (.10) strict
equivalence
0.31 (.73) strict
equivalence
Study 2 – Fashion 0.86 (.55)
0.63 (.53) strict
equivalence
0.21 (.81) strict
equivalence
0.64 (.53) strict
equivalence
2.49 (.08) strict
equivalence
Study 4 – Cars 0.62 (.77)
1.10 (.33) strict
equivalence
1.76 (.17) strict
equivalence
0.91 (.40) strict
equivalence
0.32 (.73) strict
equivalence
Note. F-values are displayed above the corresponding p-values in parentheses. Underneath the results from the equivalence test according to Wellek (2010) are displayed in text form.
4.4.7 Results of the scenario experiment with real customers
Impact on high prestige product brand
To assess the overall impact on the high prestige brand, a MANOVA with brand
attitude, brand purchase intention and brand word-of-mouth was conducted (see
Table 61 in appendix B.6). It is found that the treatment – replacing the high prestige
car brand by a low prestige car brand – has a significant effect on the evaluation of

136 4. Project II: How Consumers Respond to Consumption Mode Extensions
the high prestige car brand, V = .02, F(3, 346) = 2.87, p ≤ .05. Follow-up analysis
show that the cell means in the treatment group are significantly more positive for
brand attitude (F(1, 348) = 3.42, p ≤ .10) and for the willingness to recommend the
brand to others (F(1, 348) = 4.81, p ≤ .05). Only the purchase intention is not found
to be significantly affected (F(1, 348) = 0.27, p > .10).
Investigations of the brand image show that the high prestige brand is perceived to
have even higher prestige (F(1, 348) = 4.99, p ≤ .05) and higher quality (F(1, 348) =
3.41, p ≤ .10) if it is not part of the access offering anymore. The brand
innovativeness, however, is not significantly affected by a brand switch (F(1, 348) =
3.09, p > .10).
Impact on low prestige product brand
The overall impact for the low prestige car brand of being included in the access
offering is not significant (V = .00, F(3, 346) = 0.21, p > .10). Also the univariate
analysis for brand attitude (F(1, 348) = 0.39, p > .10), purchase intention (F(1, 348)
= 0.16, p > .10) and willingness to recommend to others (F(1, 348) = 0.59, p > .10)
all yield no significant results.
Also the low prestige brand’s image remains largely unaffected. Only the brand
innovativeness increases with the inclusion into the access offering (F(1, 348) = 2.97,
p ≤ .10).
Impact on the access offering and the access provider brand
If the access provider switches the type of brand that it offers, the attitude towards its
access offering is not statistically significantly affected (F(1, 348) = 1.44, p > .10). A
test of equivalence (Wellek, 2010) reveals equivalence at the strict tolerance level
ε = ± 0.36 (t(348) = -0.71, critical interval for t [-1.72, 1.72], α = .05, (1-β) = .91).
However, the probability that customers continue their usage in the future decreases
significantly (F(1, 348) = 3.97, p ≤ .05). The perceived price fairness of both offers is
not significantly different F(1, 348) = 0.86, p > .10).
The customers’ attitude towards the access provider brand was also not significantly
affected (F(1, 348) = 0.51, p > .10). Again the test of equivalence revealed a positive
result at the strict level (t(348) = -1.00, critical interval for t [-1.72, 1.72], α = .05, (1-
β) = .91). The users’ willingness to recommend the brand to others in case of the
4. Project II: How Consumers Respond to Consumption Mode Extensions
137
switch was also found to be not significantly different (F(1, 348) = 0.11, p > .75).
Regarding the access provider’s brand image, neither the brand prestige (F(1, 348) =
2.63, p > .10) nor the quality (F(1, 348) = 0.15, p > .10) are significantly affected.
Results summary for the scenario experiment with real customers in study 5
In summary, it is found that the customers’ (hypothetical) reaction to a switch from a
high prestige car brand (Audi) to a low prestige car brand (Hyundai) in a real
carsharing offering is rather marginal. Thus also for real customers of an access
offering, the type of brand an access offering is based upon seems to be rather
unimportant. This adds further validity to the previously reported results, which have
been based upon experiments with general consumers only.
The consumers’ attitude towards the carsharing offer as well as the carsharing brand
stays equal given the scenario of a car brand switch. Only the intended future usage
probability is significantly reduced. It remains unclear whether this is the direct result
of the brand switch or only due to the generally increased uncertainty that was
induced by the experimental scenario. Nonetheless this should be seen as a warning
that there might be potential negative effects for the access provider as well.
Furthermore, cautious is required because it cannot be precluded that customers in
the brand-switch scenario hoped for a price decrease in the long run as no
information on the pricing was given due to the carsharing provider’s request.
Interestingly the high prestige brand’s evaluation and image becomes more favorably
after it has been replaced by a low prestige brand. That means that consumers with
brand experience who are currently able to use this high prestige car brand at a low
price (as compared to a purchase) appreciate such a brand even more if it is no longer
available via access. On the other hand the low prestige car brand seems to be neither
harmed nor to really benefit by being included in an access offering.
It shall be noted that the order of the measures of the dependent variables was always
equal and not randomized. This might have led to order effects such as that the
treatment was most present in respondents’ minds when they were questioned about
the high prestige brand (that was always measured first). This might potentially
explain why the high prestige brand was affected the most.

138 4. Project II: How Consumers Respond to Consumption Mode Extensions
Table 20: Results Summary of all Studies and Hypotheses (Project II) St
udy
5
Car
s
þý
at
titud
e:
equi
vale
nt
eval
uatio
n in
tent
ion:
hi
gh p
rest
ige
bran
d be
tter e
valu
ated
Not
e. þ
hyp
othe
sis s
uppo
rted;
ý h
ypot
hesi
s not
supp
orte
d; ¨
no
clea
r res
ult.
Stud
y 4
Car
s
þý
at
titud
e:
equi
vale
nt
eval
uatio
n in
tent
ion:
hi
gh p
rest
ige
bran
d be
tter e
valu
ated
ý
owne
rs e
valu
ate
it w
orse
ý
owne
rs e
valu
ate
it be
tter
þ
no sp
illov
er
Stud
y 3
Car
s
þ
equi
vale
nt
eval
uatio
n
þý
at
titud
e:
posi
tive
effe
ct
inte
ntio
n:
no e
ffec
t
ý
owne
rs e
valu
ate
it w
orse
ý
owne
rs e
valu
ate
it be
tter
Stud
y 2
Fash
ion
ý
high
pre
stig
e br
and
bette
r ev
alua
ted
ý
attit
ude:
in
tera
ctio
n n.
s. in
tent
ion:
ow
ners
eva
luat
e it
wor
se
ý
attit
ude:
in
tera
ctio
n n.
s. in
tent
ion:
ow
ners
eva
luat
e it
wor
se
þ
no sp
illov
er
Car
s
þý
at
titud
e:
equi
vale
nt
eval
uatio
n in
tent
ion:
hi
gh p
rest
ige
bran
d be
tter e
valu
ated
ý
owne
rs e
valu
ate
it w
orse
ý
owne
rs e
valu
ate
it be
tter
þ
no sp
illov
er
Stud
y 1
Fash
ion
ý
high
pre
stig
e br
and
bette
r eva
luat
ed
þ
no sp
illov
er
Car
s
þ
equi
vale
nt
eval
uatio
n
¨
resu
lts n
ot c
lear
H1a
: The
eva
luat
ion
of a
cces
s off
erin
gs
is in
depe
nden
t of t
he p
rest
ige
leve
l of
the
prod
uct b
rand
s the
acc
ess o
ffer
ing
is
base
d on
.
H1b
: The
eva
luat
ion
of a
cces
s off
erin
gs
beco
mes
mor
e fa
vora
ble
with
an
incr
easi
ng le
vel o
f con
veni
ence
that
is
offe
red
by th
e ac
cess
pro
vide
r.
H2a
: Com
pare
d to
non
-ow
ners
, ow
ners
of
a d
istin
ct lo
w p
rest
ige
bran
d ex
hibi
t m
ore
favo
rabl
e ev
alua
tions
of a
n ac
cess
of
ferin
g th
at is
bas
ed o
n th
is lo
w
pres
tige
bran
d.
H2b
: Com
pare
d to
non
-ow
ners
, ow
ners
of
a d
istin
ct h
igh
pres
tige
bran
d ex
hibi
t le
ss fa
vora
ble
eval
uatio
ns o
f an
acce
ss
offe
ring
that
is b
ased
on
this
hig
h pr
estig
e br
and.
H3:
The
intro
duct
ion
of a
cces
s as a
n ad
ditio
nal c
onsu
mpt
ion
mod
e do
es n
ot
affe
ct th
e pa
rent
bra
nd’s
eva
luat
ion.
Access Evaluation Parent Brand Evaluation

4. Project II: How Consumers Respond to Consumption Mode Extensions
139
4.5 Discussion
Overall, the results of the conducted studies are of great importance because this
research project is the first to address consumer behavior in situations where
consumers face the introduction of different types of access offerings, which is
becoming an increasingly significant consumption mode next to ownership. In
particular, this research is the first to shed light on consumers’ evaluations in case of
different characteristics of the access offerings, on different reactions from owners
and non-owners, and on the consequences for the involved parent brands.
The discussion will draw upon the results of all studies, which are summarized in
Table 20. The findings will be compared to existing theoretical knowledge and used
to derive meaningful managerial implications. This section will end with study
limitations and an outlook on promising future research avenues in this emerging
field.
4.5.1 Discussion of the importance of product brands and service
convenience
While there has never been any doubt that with the rise of access brands in general
might lose importance, a decreasing importance of product brands in access offers
that goes hand-in-hand with an increasing importance of service convenience has
been postulated by different scholars (Lawson, 2011; Lovelock & Gummesson,
2004). This dissertation is the first to test this postulate in two different product
categories.
In the automobile industry the results consistently show that the consumers’ attitude
towards the announced access offering is not affected by the fact whether a high or a
low prestige car serves as the basis of the access offering. However, if one regards
the stated behavioral intention instead of the attitude the usage intention is
significantly higher for high prestige car brands in three out of five studies. In the
fashion industry, the consumers’ access evaluation is also not independent from the
prestige level of the brand: a fashion rental that lends out apparel from a high
prestige brand causes more positive evaluations than one based on a low prestige
fashion brand (see Table 20).
140 4. Project II: How Consumers Respond to Consumption Mode Extensions
Some of these results give proof to the current theory, while others deliver
objections. Thus it is required to advance and refine the theory in order to be able to
explain what it depends on whether or not the product brand is important in access
offerings. So, how can the results of the studies at hand be explained? In the
following four possible explanations for the differences between the categories are
proposed. Subsequently, the different results for the two outcomes, attitude and
behavioral intention, are discussed.
First, product brands might be more important for the evaluation of access offers if
the gap in product quality between the investigated brands is large. Given the novelty
of access offerings, product brands might serve consumers as cues, which function as
surrogate indicators of the overall quality of the access offering (Olson & Jacoby,
1972). Transferred to the studies at hand, the different results in the cars and the
fashion context might be caused by a larger perceived quality gap between low and
high prestige brands in case of fashion as compared to cars – even though the studies
at hand did not intend to manipulate this factor. However, additional analyses in
studies one and two showed that quality perceptions in both product categories were
comparable (see appendix B.4). Thus it remains to be seen in future studies whether
the distance in product quality (and thus the convenience during the consumption
process) will impact the importance of the brand in access offerings. However, this
approach does not yet help to explain the differing results of the study at hand.
Second, the importance of the product brand might depend on the general price level
of a product category and the ratios between purchasing and rental price for the
different brands within a product category. In a very expensive product category,
such as cars, consumers probably do not even compare the rental prices in cents with
the purchase prices of thousands of Euros (Nagle & Hogan, 2006). However, in case
of fashion, it is more likely that consumers compare purchase and rental prices
because they are less apart. If the purchase price then lies under a certain threshold,
consumers might go straight away for the purchase because access is – in absolute
terms – not that much less. This effect in combination with an over-proportional
impact of handling fees for access offerings that build upon low prestige (and thus

4. Project II: How Consumers Respond to Consumption Mode Extensions
141
also low priced) product brands could explain the different results for fashion and
cars.52
Third, external symbolic meanings might explain the differences between the two
investigated product categories. Carsharing cars have to be clearly marked as such.53
Thus third parties will require little effort to recognize that the driver of this car is not
its true owner. This might explain the low importance of the car brand, because
others will easily recognize that the driver of a high prestige carsharing car is only a
carsharing user anyway. For fashion, the case is different. Rented fashion does not
need to be marked as such. Thus outsiders will have no possibility to find out
whether someone rented or purchased a given piece of fashion. This makes it more
beneficial for some consumers to choose the high prestige brand, as they benefit
from the social prestige associated with wearing expensive clothes while only paying
the rental fee (Eastman et al., 1999).
Fourth, the typical rental duration might influence the importance of the product
brand. The typical usage duration for carsharing is usually between a few minutes to
a few hours, whereas rented fashion is typically rented for several days and is also
worn for a longer period of time. The shorter the usage duration, the less important
the characteristics of the product (among them, its brand) will be and the more
important the core need fulfillment and the ease of beginning and ending a rental will
become.
Prices might also help to explain the different results for access attitude and
behavioral intention in the automobile industry. As mentioned before, for cars, the
rental price is very small compared to the typical purchase price. Thus consumers
might not care about the car brand and express the same attitude towards carsharing
offerings based upon different brands, but when it comes to whether they would use
it (at least once), they can more easily imagine to try out driving the high prestige car
if a price-per-minute allows an affordable testing of such a car.
Drawing upon the Theory of Planned Behavior one could further argue that
consumers feel internally indifferent towards a low and a high prestige car brand, but
52 It has been assumed that an access provider wants to earn the same ratio of the initial purchase price
for low and high prestige product brands. Adding the fix costs for cleaning, delivering, returning, and overhead, an access offering based on a low prestige product brand is over-proportionally charged with these routine costs.
53 A carsharing car needs to be clearly marked, so that others can locate the car.

142 4. Project II: How Consumers Respond to Consumption Mode Extensions
they fear disapproval by their peers if they use a low prestige car in a carsharing offer
(Ajzen, 1991). On the other hand, it might be the case that consumers expect their
peers to react favorably if they use a carsharing offering based upon a high prestige
brand and that using such a service might be something consumers consider worth
telling their friends which would increase their social reputation. Both lines of
argument would explain the increased behavioral intention to use carsharing
offerings.
The inclusion of the service convenience factor in the automobile industry has
further shown that a higher service convenience is important in determining the
attitude towards the access attitude, whereas the behavioral intention is found not to
be affected by this factor. This finding needs an explanation: Possibly consumers
perceive the impact of an increased service convenience as being too weak to cause
additional behavioral intentions as opposed to only more favorable attitudes. In
contrast to attitude, behavioral intentions might be hampered by personal
circumstances that render carsharing simply unsuitable.
4.5.2 Discussion of ownership status effects
The results of four experiments show that ownership status plays an important role in
the evaluation of additionally introduced access offerings. However, the nature of the
interaction effect has been unexpected: Non-owners evaluate newly introduced
access offerings based on low prestige brands more positively than owners, whereas
access offers based on high prestige brands are evaluated more favorably by owners
than non-owners (see Table 20). This effect has been consistent across both product
categories and different brands.
Interestingly, this finding is neither in line with the initial definition of the ownership
effect nor with the empirical results Kirmani et al. (1999) found in their research on
the evaluation of brand extensions. The initial definition of the ownership effect says
that owners react more positively to actions of the brand they own because they have
more favorable attitudes towards it. In contrast, the study by Kirmani et al. (1999)
showed that this effect only holds for brand extensions by non-prestige parent brands
– for prestige parent brands they found that owners react less favorably than non-
owners in case of a downward brand stretch.

4. Project II: How Consumers Respond to Consumption Mode Extensions
143
As for the low prestige brands, the result found in the experiments at hand
contradicts the initial idea of the ownership effect. So, how can this result be
explained? It is possible that owners of the low prestige brand perceive a particular
low degree of fit between the brand and the added access offering, as they are those
consumers who know the brand best because they already own it. Maybe they think
that their low prestige brand is not suitable for being included in an access offering
due to the specific brand image they have in mind. In the literature on brand
extensions, fit has been found to be an important determinant for the evaluation of
brand extensions (Carter & Curry, 2011; Loken & John, 1993; Völckner & Sattler,
2006).
Besides, the owners’ evaluation might be caused by reactance due to frustration
because everyone is now able to get access to their brand without making any
significant investment. This effect is likely to occur especially for low prestige
brands because those brands are usually bought primarily for their value-for-money
(Park et al., 1991). The owners had already made their purchase decision at a point in
time when they did not know about an alternative access offering based upon their
preferred brand. Thus they might feel to have wasted money, which causes their
reaction to be less favorable compared to non-owners.
As for high prestige brands the results are in line with the initial definition of the
ownership effect, but in contrast to the results by Kirmani et al. (1999). How can this
deviation in case of access offerings be explained? Owners generally feel a stronger
attachment to their brands (Beggan, 1992; Belk, 1988; Kirmani et al., 1999). This
study finds that this effect is even stronger for owners of high prestige brands as
compared to owners of low prestige brands (see chapter 4.4.5). Given that the brand
evaluation from owners of high prestige brands is so positive, owners seem to
perceive an additional access offer not as a devaluation of their ownership (as they
do in case of step-down brand extensions (Kirmani et al., 1999)) but rather as an
extension of options. Owners of high prestige brands seem to appreciate that they can
use their brand in even more situations in life and experience different product
variants through the help of an additional access offer. These findings also challenge
the proposition by Shocker et al. (2004) that access offerings are perceived as
substitutes to owned goods. These results rather suggest that consumers perceive
access offers as complements and not as substitutes.

144 4. Project II: How Consumers Respond to Consumption Mode Extensions
Finally, there is the question whether the results will be stable over time. As both
investigated access offerings are rather new to the market, consumers have not
become used to the availability of a second consumption mode. Thus one could
argue that owners have not yet truly realized that not only they, but also anybody else
can drive or wear their brand.
4.5.3 Discussion of the parent brand evaluation
This is the first study that empirically approaches the question whether parent brands
suffer from or gain from halo effects by introducing an additional consumption
mode. Consistently across three studies and two product categories it has been found
that the parent brand evaluation is not changed by the introduction of an additional
access offer. This applies equally for owners as well as non-owners and for both, low
and high prestige parent brands. In study 4 the branding distance between parent
brand and its access offering was manipulated additionally, but not even that has had
an impact on the results.
All experiments found equivalent parent brand evaluations – with and without the
introduction of access. Thus the theoretical implications of this finding need to be
discussed. These results challenge the only proposition on the effects of introducing
access on the parent brand, which was put forward by Lamberton and Rose (2012).
Against their proposition in none of the five experiments a positive effect on brand
evaluation has been found. They based their assumption on the idea that consumers
would recognize the positive environmental effects of access offerings and thereupon
develop a more positive picture of the parent brand. Based upon the research at hand,
this idea cannot be supported either. Additional analyses of parent brand image
dimensions have shown that in none of the experiments a modification of the
environmental friendliness perception has taken place. However, in most of the cases
the parent brand’s innovativeness perception increased if the brand introduced access
as an additional consumption mode.
Furthermore, the fact that no modifications of the parent brand evaluation have been
found leads to two competing conclusions based upon categorization theory: Either,
the information of introducing an access offer is perceived to be only incremental
and very much congruent with the existing perception of the parent brand, or, the
information is so inconsistent and radical that the subtyping model applies. Based on

4. Project II: How Consumers Respond to Consumption Mode Extensions
145
this research, no final decision can be made. However, the former conclusion is
rather unlikely because research on brand extensions, which are common practice as
compared to the introduction of an additional access consumption mode, has
frequently shown that the parent brand image is modified by such extensions (J. L.
Aaker, 1997; Kim et al., 2001; Lei et al., 2008). Thus the latter conclusion seems to
be more likely.
Interestingly, not even the branding distance plays a role in answering the question
whether the parent brand evaluation becomes modified or not. In contrast to the
research on brand extensions, a distant branding strategy is apparently not even
necessary to shield the parent brand from negative spillover effects due to the
introduction of access offers. This result is in contrast to the current practice of car
manufacturers, which have launched their carsharing offers with a lot of distance to
the parent brand, e.g. car2go, which is the carsharing brand by Daimler. However
there are also other reasons for a distant branding strategy. Those companies might
not only aim to shield their parent brands, but also aim to introduce more than one of
their car brands in the same carsharing service (e.g. Mini and BMW, which both
belong to the BMW Group and are part of the carsharing offering DriveNow) and to
intentionally build a new brand that stands for mobility services and not only
vehicles (J. Kolling, personal communication, 20.06.2013).
4.5.4 Managerial implications
For managers a series of important questions can be answered based upon the
empirical results of this study. First, which brand should offer an access offering or
which product brand should an access offering be based upon? As for fashion it is
recommendable to base an access offering on a high prestige product brand. For cars,
the product brand only plays a minor role. The fifth study even shows that managers
of (product brand independent) access companies could save costs by not relying on
high prestige brands. This might then give them the chance to focus on important
aspects such as service quality or building a stronger service brand.
Second, which aspects of an access offering are most important for market success?
It is definitely the mix of service convenience, pricing and the products that are lent
out. Generally ranking those elements is difficult as it is likely to be very much
industry dependent.
146 4. Project II: How Consumers Respond to Consumption Mode Extensions
Third, is having a strong product brand an asset when it comes to access offerings?
At least for cars, consumers do not care about the product brand. However, it has
been interesting to see that access offerings based on high prestige brands are
evaluated better if they are more expensive. This gives providers the chance to
charge higher prices as consumers seem to perceive prices as quality signals. Study 4
also shows that access offerings that are branded highly distant to the parent brand
are not evaluated worse. On the one hand, this is good news for new entrants because
they can simply use any strong product brand as a basis for their proprietary access
offering. On the other hand, incumbents could also try out access quite easily as they
do not need to fear too much negative spillover effects. Thus, especially high prestige
fashion brands should consider introducing access offerings – at the moment the
market only consists of new entrants that offer access offerings for fashion.
Fourth, does a distant branding strategy – as it can be frequently observed in the
carsharing market – make sense for access offerings that are introduced as additional
consumption modes? As already mentioned, a distant branding strategy in contrast to
a close branding strategy seems to be unnecessary as in neither case the parent brand
evaluation is affected. On the other hand, it was found that a close branding strategy
is favorable for high prestige product brands, whereas for low prestige product
brands it is definitely better to include them in a distantly branded access offering in
order to increase usage intentions.
Fifth, in which cases do access offerings harm existing customer relationships or
cannibalize sales? The answer to this question depends on the product brand’s
prestige. In case of high prestige brands, owners are found to be even stronger
supporters of the access consumption modes as compared to non-owners. In case of
low prestige brands, this pattern changes. Thus, such offerings should primarily be
targeted at non-owners and cautiousness is required regarding the development of the
existing customer relationships. With regard to sales, access is an add-on business in
the short run. Long-term effects, on the contrary, have not been investigated yet.
However, it is possible that sales cannibalization does indeed happen when current
owners decide to switch to access and not to repurchase a newer model. Furthermore
the allure of high prestige brands might diminish over time when rarity is not given
anymore.

4. Project II: How Consumers Respond to Consumption Mode Extensions
147
4.5.5 Study limitations & avenues for further research
This study provides the first substantial empirical assessment of consumers’ response
to the introduction of access, but it is also subject to some limitations and a natural
limitation in scope. These limitations might serve as starting points for further
research.
First, all five studies reported here have been conducted in a hypothetical setting.
Thus one might argue that the treatments in this series of experiments have been too
weak in order to cause realistic reactions because the treatments did not contain any
personal real life experience or anecdotes by family and friends. The fifth study has
been conducted with actual customers of a carsharing provider, though. But the
treatment, a change of car brands, has been hypothetical only. Even though it is
difficult to conduct, further field research on actual access offerings is desirable.
Second, in all five studies cross-sectional designs have been employed. Thus the
external validity could be enhanced by a longitudinal design that makes it possible to
detect the temporal stability of the findings at hand. Positive or negative effects
might simply need some time to evolve – depending on market acceptance of the
access offering and the way consumers end up perceiving access. Thus it would be
useful if further research addressed those issues in longitudinal field studies, which
would overcome the limitations of cross-sectional designs.
Third, generalizing the results of the experiments in this study to other than the
investigated product categories (cars and fashion) should be made with great caution.
Already the investigation of only two product categories uncovered different effects.
In summary, it was important to investigate two different product categories in order
to show that caution is required when generalizations about access are made.
However, as different product categories usually differ on more than one
characteristic (price level, rebuy frequency, usage duration, ease of ownership
perception) at the same time, it is not easy to isolate one of them. However, this can
also be seen as a fruitful starting point for further research. Extending this research to
further product categories is thus highly encouraged.
Fourth, this research has only been conducted with German respondents. Thus,
further research should investigate the reported results for cultural differences in
other countries and cultures.
148 4. Project II: How Consumers Respond to Consumption Mode Extensions
Fifth, even though different brands were used in the various experiments, specific
brands might have caused specific effects. Testing further brands that differ to an
even greater degree in their brand prestige (e.g. low cost brands vs. upscale luxury
brands) or that differ in other features than brand prestige might also be interesting
(e.g. brand quality as mentioned above). Furthermore, the assortment size of an
access offering might also be an influential variable of an access offering. A large
assortment can stem from providing different models or even different brands in
order to provide customers with more choice.
5. General Discussion and Conclusion
149
5 General Discussion and Conclusion
This dissertation pursues the overarching goal of studying consumers’ reactions to
the two alternative consumption modes, access and ownership. By relying on a
mixed-methods approach, which combines consumer interviews, surveys with
prospective users as well as actual users and a series of scenario-experiments, two
different perspectives are taken in order to advance this so far under-researched
topic: On the one hand, the consumers’ perspective is studied by investigating how
consumers perceive and evaluate two different consumption modes. On the other
hand, a company’s perspective is taken by researching how a company should ideally
market a new access offering. Neither of both research perspectives has been studied
before in this breadth and depth. Existing research on consumption mode evaluation
has solely relied on qualitative techniques (Chen, 2009; Durgee & O’Connor, 1995);
and there is only one publication yet that deals with one facet of the ideal design of
access offerings (Lamberton & Rose, 2012).
From a theoretical perspective, this thesis supports the development of a theory on
consumption mode choice and the development of a theoretical basis for the
marketing of access offerings. From a managerial point of view, the results of this
thesis help to develop a better understanding why consumers prefer one or the other
consumption mode and to guide the strategic design of access offerings and the
corresponding market entry strategy. In addition to that, the findings are also
important for policy makers interested in promoting access given the scarcity of
resources and a growing world population.
This chapter presents a general discussion of the key results of this dissertation and
proceeds as follows: First, the key findings that have been presented in detail in the
previous chapters are briefly summarized. Subsequently their general implications
for theory, research and management are discussed. Finally the dissertation is closed
with concluding remarks and directions for future studies.

150 5. General Discussion and Conclusion
Figure 13: Perspectives of the Research Projects.
5.1 Summary of Key Findings
Key findings of project I
The outcome of the qualitative research is a set of 18 perceptions that are relevant
when consumers consider different consumption modes. These perceptions are
clustered into four dimensions – monetary, functional, experiential, and symbolic
perceptions. All the perceptions have served as foundation for the development of a
second-order formative measurement model whose empirical validation allows
answering all research questions.
The results indicate that consumers perceive access and ownership significantly
different on a variety of perceptions. Thereof the following findings are of particular
importance: Overall, consumers do not perceive the total amount of costs to be
higher or lower in either of the consumption modes across product categories: in case
of cars no significant differences are found, bikesharing and handbag rentals are
perceived to be more expensive than ownership, whereas book rentals are believed to
be cheaper than purchasing books. Against expectations, consumers perceive the
predictability of costs to be larger for ownership than for access. Furthermore,
consumers perceive access to render them surprisingly less flexible as compared to
ownership. In terms of perceived environmental friendliness, the results depend on
the product category: Access is only perceived to be significantly friendlier to the
environment than ownership in case of cars and books – but not consistently across
all investigated categories. Against prior literature, consumers feel a greater need for
carefully handling the product if they access it rather than own it. Finally, consumers
perceive a significantly lower personal attachment to a rented good as compared to
an owned product. However, the remaining symbolic perceptions differ on a rather

5. General Discussion and Conclusion
151
small extent showing that signaling symbolic meanings to others cannot only happen
in case of ownership.
The empirical validation of the formative measurement model shows that all of the
qualitatively identified perceptions are well suited to determine the attitude towards a
consumption mode. On a superordinate level, functional and monetary perceptions
are found to be most important for determining the differential consumption modes
attitude. The experiential perceptions dimension follows next, whereas the set of
symbolic perceptions is generally least important. On an individual perception level
six perceptions have significant weights in all investigated product categories: total
costs, predictability of costs, absence of costs, need for careful handling, fun while
using, and personal attachment. Only one perception is not found to have a
significant weight in any product category – the risk of non-availability.
The empirical results also validate the existence of significant differences in access
offerings from different product categories. In particular, monetary perceptions
become the more important, the more expensive the product category is. The
importance of individual functional perceptions, on the other hand, strongly depends
on the product category. For example, perceived maintenance effort is significantly
more important for cars than for any other product category. For bicycles,
experiential and symbolic perceptions are found to be significantly less important
than for any other product category.
Finally, the contrast of experienced access users with inexperienced access users
shows that experience affects perceptions of consumption modes. Experienced
access users perceive the access consumption mode to contain a smaller risk of non-
availability and a smaller risk of failure. Furthermore their effort perceptions are not
as strong and they believe even stronger in impressing others by their consumption
mode choice. On the other side, experienced access users feel even less bound to a
community and less personal attachment to rented goods as compared to users
without actual experience. Moreover, for consumers with carsharing experience
functional perceptions become more important yet, whereas symbolic perceptions
become less important for determining their consumption modes evaluation.

152 5. General Discussion and Conclusion
Key findings of project II
In a series of five experiments it is found that, for cars, the consumers’ attitude
towards the announced access offering is not affected by the prestige level of the
product brand, which serves as basis for the offering. However, it is found that the
service convenience level of the access offering plays a significant and relatively
more important role for consumers’ attitude towards an access offering. The
consumers’ behavioral intention though, is found to be higher for a high prestige
product brand in three out of five experiments. In the case of behavioral intentions
the service convenience level is not found to affect the consumers’ evaluations of the
access offering. Two of those experiments have also been conducted in a second
product category, the fashion industry. There it is found that consumers’ evaluations
of an announced access offering, measured by either attitude or behavioral intention,
significantly increase for rental offerings based on high prestige brands as compared
to low prestige brands.
Moreover, the results of four experiments demonstrate that the ownership status of a
consumer – that is being already owner of a product from the brand that introduces
an access offering, or not – influences his or her evaluation of an access offering. In
case of access offerings that are based on low prestige brands, non-owners express a
more positive evaluation as compared to owners. In case of access offerings that are
based on high prestige brands, owners’ evaluations are better as compared to non-
owners. This effect can be consistently shown across different brands and both
product categories.
Furthermore, it is found that the introduction of an additional consumption mode
does not negatively affect the parent brand. The consumers’ evaluation of the parent
brand is not influenced by the announcement of introducing access across three
studies in two different product categories. The results show that it does not matter
whether the parent brand is a low or a high prestige brand or whether consumers
have already been customers of that firm or not. Also the branding distance between
the parent brand and the new access offering has not been found to affect the result.

5. General Discussion and Conclusion
153
5.2 General Discussion
5.2.1 Implications for theory and research
This dissertation contributes several important implications for the currently rather
unexplored research area of consumption modes. These implications can be grouped
into three categories – general implications that originate from both research projects
as well as implications that originate from either of the two conducted research
projects.
Implications across both research projects
Most importantly, this dissertation is the first to show on an empirical basis that
access market offerings are fundamentally different from ownership market
offerings. This can be shown for both perspectives which have been taken in this
dissertation: the consumer’s point of view in research project I, as well as the
managerial point of view in research project II. In the first project, it is shown that
consumers perceive access and ownership differently on a set of 18 perceptions. In
the second project, it is found that product brands play a smaller role in access
offerings than in ownership offerings. Furthermore it is shown that the direction of
an interaction effect based on the consumers’ ownership status and the product brand
is reversed in case of access offerings. These fundamental differences prove the
proposition by Lovelock and Gummesson (2004) that access and ownership
marketing transactions are prominently different. Furthermore these differences
confirm that existing marketing theories cannot be directly transferred to access
offerings because the vast majority of marketing theories has been developed under
the implicit assumption that consumption can only take place in the ownership
consumption mode (Bardhi & Eckhardt, 2012; Chen, 2009). Thus, given the rise of
access, it is necessary to reassess the marketing literature regarding consumer-object,
consumer-provider and consumer-consumer relationships on their transferability to
consumption that takes place in the access consumption mode.
Moreover, this dissertation is the first research project in the context of access that
has empirically investigated and compared several product categories: cars, bicycles,
books, handbags and clothing. In summary, various important differences between
different product categories have been found. This leads to the conclusion that
154 5. General Discussion and Conclusion
studies on access that only cover one product category can reveal interesting insights,
but are not sufficient in order to make generalizations that hold for access in general.
Product categories differ in at least four features that have important implications for
the corresponding access offerings: price level, visibility of consumption, durability
of goods, and main consumption goal (see chapter 2.3.2 for more details). On top, it
is important to note that also the design of access offerings within a product category
can differ decisively. The typology, proposed in this dissertation, contains six
important dimensions on which access offerings within a given product category can
differ: level of convenience, positioning, tangibility, transaction length, price model,
and contracting partners. Thereof the first two have been investigated in-depth in the
second research project, but the remaining dimensions have been excluded due to
complexity reasons. This potential variety for an access offering – even within a
product category – should be taken into account in future studies on access offerings,
too.
Moreover, the results of both research projects show that there is a gap between
consumers’ expressed attitude and behavioral intention to use either of the
consumption modes. In research project II, the consumers’ attitude towards a
carsharing access offering is found to be not affected by the product brand, whereas
the behavioral intention is affected. On top, a high level of service convenience is
found to be crucial for consumers’ attitude, whereas not for consumers’ behavioral
usage intention. Also in project I, a decrease in the variance explained is found when
using behavioral intention as the dependent variable instead of the attitude. However,
this difference can be explained by drawing upon the Theory of Planned Behavior:
Additional analysis shows that the amount of variance explained, in case of using the
behavioral intention as the explained variable, substantially increases by including
the remaining two constructs of the TPB: social norm and perceived behavioral
control (Ajzen, 1991). This leads to the conclusion that in case of consumption mode
choice the behavioral intention is constrained by perceived social norms and
perceived behavioral control. Constraints by perceived social norms might be due to
a historical bias against renting (Ronald, 2008) and the still low usage level of access
offerings among general consumers, which render access special. Consumers might
as well perceive a lack of behavioral control if they used access due to the following
reasons: the restricted availability of access offerings, the intention to use a good

5. General Discussion and Conclusion
155
over a long period of time, as this is generally believed to not match access very well
(Moore & Taylor, 2009), as well as other personal circumstances such as already
owning a good in the respective category or living in a large household in which
many people can economically share owned goods.
Implications by project I
Project I contributes to the marketing literature by providing empirically grounded
information about the perception of consumption modes and by advancing theory
development on consumption mode choice. It takes a broader perspective than
previous research as it does not solely focus on the adoption of access (Lamberton &
Rose, 2012; Moeller & Wittkowski, 2010; Schrader, 2001) or solely applies
qualitative methods (Chen, 2009; Durgee & O’Connor, 1995). Furthermore, it
contributes a standardized way to measure and understand the nature of the factors
that drive consumption mode choice – over time, over different product categories
and over different access designs. Besides, it could help to explain other important
marketing outcomes such as usage intensity, satisfaction or customer retention.
With regard to how consumers perceive access and ownership respectively, project I
provides new insights – partly confirming and partly contradicting previous
propositions and research. Overall, it is found that even though access has gained
popularity, ownership is still the preferred consumption mode by the general
consumer. With regard to the perceived total costs it is found that consumers
perceive carsharing similarly expensive as ownership, bicycle and handbag rental as
more expensive, whereas book rentals as more economical compared to ownership.
This is in contrast to Bardhi and Eckhardt (2012) who found that carsharing users
value the economical advantage of access. However, it needs to be taken into account
that these users had already chosen access – probably at least partly because the cost
structure matches their usage needs, which does not seem to be the case in general. In
contrast to Bardhi and Eckhardt (2012), this research project further finds that the
perceived flexibility is generally higher in ownership. This contradiction might also
be explained by a sample bias: Carsharing users value a different kind of flexibility
as compared to the general consumer. The former are happy to be free by not being
bound to a particular product, whereas the latter value the flexibility that arises from
permanently owning a good which is thus always available. Furthermore, this study

156 5. General Discussion and Conclusion
finds that access is not always perceived as being more environmentally friendly than
ownership – this perception depends on the product category at question. Only in
case of cars and books, consumers perceive using access to be more eco-friendly.
This means that consumers do not share the predominant opinion in the literature that
access is generally more environmentally friendly than ownership (Bardhi &
Eckhardt, 2012; Lovelock & Gummesson, 2004; Schrader, 1999). Interestingly, this
research project also finds the perception of being required to handle the product
carefully to be greater in case of access. This is contradictory to the tragedy of the
commons (Hardin, 1968) as well as prior literature (Durgee & O’Connor, 1995). The
interviews reveal that being afraid of punishments by the access providers is most
likely the key driver of this perception. Thus, consumers seem to believe that the
control mechanisms by other users and by the access providers work well to prohibit
selfish behavior. Furthermore, prior postulates and qualitative findings that the
consumer-object relationship is weaker in case of access are empirically confirmed
for the first time (Bardhi & Eckhardt, 2012; Durgee & O’Connor, 1995).
The empirical validation of the formative measurement model in four different
product categories shows that the amount of important factors for determining
consumers’ attitude towards consumption modes is large and that the individual
importance is varying across industries. The latter finding empirically confirms a
presumption by Lamberton and Rose (2012). Generally, the dimensions of functional
and monetary perceptions are most important. This is in line with the speculations on
the general importance of various factors for predicting the adoption of access
offerings by Lamberton and Rose (2012) as well as Bardhi and Eckhardt (2012).
However, the results of this research project do not only empirically confirm their
speculations on the drivers of the adoption of access – beyond that it is found that
functional and monetary perceptions are also most important for the evaluation of
consumption modes in general, followed by experiential and symbolic perceptions.
Furthermore, the dimension of monetary perceptions is the more important for
determining consumers’ attitude towards consumption modes, the more expensive
the product category is. Overall, these findings show that the types of value that are
discussed in the literature on customer value creation are suitable to be used for
consumption mode choice, too (Boksberger & Melsen, 2011; Smith & Colgate,
2007).

5. General Discussion and Conclusion
157
On an individual perception level, it is found that the relative importance is strongly
dependent on the product category. This is particularly the case for functional
perceptions. As those are closely linked to the theoretical construct service
convenience, one could draw upon this literature stream for further research (Berry et
al., 2002; Colwell, Aung, Kanetkar, & Holden, 2008; Seiders, Voss, Godfrey, &
Grewal, 2007). Surprisingly, the perceived risk of non-availability is not found to be
important in any product category despite the importance Lamberton and Rose
(2012) attach to this perception. On top, it has not been found either to have a
significant weight in the formative model for experienced access users. The fact that
this study accounts for more perceptions than the study by Lamberton and Rose
probably causes its minor importance, but at the same time challenges the study by
Lamberton and Rose who have focused on this particular perception.
The perceptions of the access consumption mode are not static but change with
increasing access usage experience due to learning effects. For example, risk
perceptions decrease, the predictability of costs increases, but the personal
attachment decreases even further. Thus, project I also confirms the expectation by
Lamberton and Rose (2012) that the importance of different factors varies between
familiar and unfamiliar customers: the functional dimension becomes more
important, whereas the symbolic dimension loses importance. Thus, it is important to
consider the respondents’ usage experience when comparing different findings.
Implications by project II
Project II contributes to the marketing literature by improving the understanding of
how access offerings should be marketed. It is the first study that empirically
investigates the importance of the product brand, the service convenience level and
the ownership status of the consumers. Furthermore, to the author’s best knowledge
there has not been any study that has empirically investigated potential spillover
effects due to the introduction of an additional access offering onto the parent brand
before.
The results of this study show that the findings in the brand extension literature
cannot be simply transferred, even though the conceptualization of this study makes
successfully use of the theoretical basis of brand extensions. For example, the
interaction effect between ownership status and product brand turns out exactly

158 5. General Discussion and Conclusion
opposite as compared to findings from the brand extension literature by Kirmani et
al. (1999). This seems to be due to the fact that in case of brand extensions a new
product is introduced as an additional ownership offering under the same parent
brand, whereas in case of the introduction of an additional access offering an existing
product is offered as a service.
Lovelock and Gummesson’s (2004) proposition that in access offerings the
importance of the product brand will decrease, while the importance of the provider’s
characteristics will increase cannot be supported without restrictions based on the
results at hand. The results indicate that it depends on the product category as well as
on the outcome variable whether this proposition applies or not. In the fashion
industry the product brand plays a role for consumers – probably because the price
difference between purchasing and renting is lower as compared to cars, a third party
cannot distinguish owned vs. rented apparel, and the rental period is typically longer
as compared to carsharing. However, this study only allows the conclusion that the
product brand does play a role in fashion rental offerings because this study did not
investigate whether the provider’s characteristics are more important or not. In the
case of cars more extensive experiments have been conducted. These results lead to
the conclusion that for the consumers’ attitude towards carsharing offerings the
product brand does not matter at all and that the provided service convenience level
is more important than the product brand – confirming Lovelock and Gummesson’s
(2004) proposition. For the consumers’ behavioral intention, on the other hand, the
product brand is found to be important in three out of five experiments and also
found to be more relevant than the service convenience level. These differences can
be explained by the small price per minute that allows test-driving high prestige cars
for a very low price and the perception of social norms, which seem to be in favor of
the high prestige brand.
Similar to the literature on brand extensions, the additional consideration of the
consumers’ ownership status has helped to explain additional variance and to derive
important insights on potentially negative effects on existing customers of a brand.
Also in case of access offerings an interaction effect of ownership status and product
brand prestige is found – however its outcome is different from Kirmani and
colleagues’ (1999) study on brand extensions: Non-owners evaluate newly
introduced access offerings based on low prestige brands more positively than

5. General Discussion and Conclusion
159
owners, whereas access offers based on high prestige brands are evaluated more
favorably by owners than non-owners. This leads to the presumption that low
prestige brand owners perceive a particularly low degree of fit between the brand and
the added access offering. Alternatively, their evaluation might be caused by
reactance due to frustration that there is now a more economical way to use the same
product, which they had bought primarily due to its value for money. High prestige
brand owners, on the other hand, seem to perceive an additional access offering by
their brand not as devaluation of their ownership, but rather as an extension of
options.
Lamberton and Rose’s (2012) proposition that adding access as an additional
consumption mode might positively influence the brand evaluation is disproved by
the results of this research project: In none of the studies the parent brand evaluation
gets modified by the introduction of an additional access offering. The only
perception that is found to be affected in almost all studies is the parent brand’s
innovativeness rating. From a theoretical point of view, this result can best be
explained by categorization theory (Sujan & Bettman, 1989; Weber & Crocker,
1983): The information that a brand introduces an additional access offering is so
inconsistent and radical compared to the existing belief structures about this brand,
that consumers do not modify their existing brand beliefs but create a new sub-type
for the access offering.
5.2.2 Implications for managers
First of all managers are facing the big question whether the rise of access will
continue or not. On the one hand, one could argue that the sharing economy and
collaborative consumption are currently only being hyped in the media because it is a
new topic that fits the current zeitgeist. Access can also be regarded as having been a
trend that has been primarily caused by the financial crisis and which will soon end
after the crisis has been completely overcome and consumers have enough money to
purchase everything they need (Belk, 2013b). Finally, one could argue that it is
challenging to create a profitable access-based business model.
It is difficult to refute all remaining skepticism regarding the future development of
access. However, there are number of reasons why access has not been a one-off
trend, but will permanently remain an important topic: First, there are a number of

160 5. General Discussion and Conclusion
access companies, which already operate profitable – take Netflix (BBC, 2013) or
car2go as examples, the latter having claimed to have profitable operations in some
of the cities where the service is offered (Daimler, 2013b; Handelsblatt, 2013). The
fact that many companies, which operate on access-based business models, are not
profitable (yet) is due to the fact that these companies are new ventures, which
typically need some time to reach the break-even (Kakati, 2003). Second, a number
of professional venture capitalists are investing in access-based start-ups because
they expect them to grow significantly and generate a lot of profits – otherwise they
would not invest their funds into those start-ups (Collaborative Fund, 2013; Rooney,
2012). Third, further technological advances will make access offerings even more
relevant than today. Imagine what micro-drones or autonomous cars can make
possible if they are used for transporting rented goods back and forth or for
transporting passengers. Fourth, governments are likely to increasingly incentivize
the usage of access offerings in order to promote an economical use of scarce
resources in light of a growing world population, while simultaneously being able to
fulfill customer needs (Belk, 2013b). The first Chinese cities are, for example,
already enforcing bikesharing offerings in order to fight pollution and congestion
(Waldmeir, 2013). Similar to Belk who writes “it would be folly to ignore sharing
and collaborative consumption as alternative ways of consuming and as new business
paradigms” (Belk, 2013b, p. 5), incumbent companies are suggested to drive the
trend towards access or at least prepare for that trend, whereas new ventures should
exploit their opportunities if they manage to identify promising new markets.
Interestingly, industries differ a lot in their maturity of access offerings. The
probably most advanced industry is the car industry. Many different players – car
manufacturers (e.g. Daimler, BMW, or Citroën) as well as new entrants (e.g. Zipcar
or Deutsche Bahn) – are currently offering different kind of carsharing offers. In all
other industries, such as fashion, handbags, bicycles, movies, or tools, access
offerings are exclusively offered by new entrants (e.g. Rent-the-Runway, Netflix or
all municipal bikesharing providers). Thus, it remains interesting to see how
incumbents will react. They can either ignore those new offerings, introduce access
offerings by themselves or purchase successful access providers (as Avis did with
Zipcar) in order to exploit the opportunities of enlarged markets and to establish
closer customer relationships (Belk, 2013b). In the following section, general

5. General Discussion and Conclusion
161
managerial advice based on the outcomes of this thesis is given to those who
consider introducing access offerings or have already done so.
The first recommendation is to make use of the measurement tool, which has been
developed and validated in research project I. It is beneficial for a number of typical
challenges: First, it helps to develop a better understanding of what perceptions drive
consumption mode choice. Second, it can be used to cluster customers into relevant
market segments. Third, its periodical application allows monitoring changes that
develop over time. Fourth, it can be used to develop and benchmark new access or
ownership offerings. As the measurement model has been developed to be adaptable
to any product category, it can be applied in many different industries.
In general, the following perceptions are most influential in determining a
consumers’ attitude towards consumption modes: total costs, predictability of costs,
absence of costs, need for careful handling, fun while using, and personal
attachment. Moreover, the functional perceptions are very important. However, their
individual importance is strongly industry-dependent so that no general advice can be
given on which ones to focus. Managers should focus on these perceptions when
they design new market offerings or plan an advertising campaign to effectively
activate consumers. Furthermore, managers should watch out for last mile
innovations (e.g. same-day delivery, automated parcel pick-up locations or parcel
delivery by drones) as these make online shopping as well as receiving and returning
rented goods more convenient and cheaper – thus addressing the two most important
dimensions of perceptions, functional and monetary perceptions. It is also important
to use different communication strategies for consumers with access experience vs.
those without: Experienced access users attach even more importance to functional
perceptions, while the importance of symbolic perceptions further declines.
Besides, managers are keen to know how an access offering should be ideally
designed and whether its introduction might have negative consequences for the
parent brand. In the fashion industry, an access offering should offer fashion by high
prestige brands in order to attract customers. In case of cars the difference between
cars by a high and a low prestige brand is smaller. Thus, offering a carsharing service
with low prestige cars is an interesting option, which allows saving costs or investing
those savings into service features that render the carsharing offering more
convenient. Interestingly, owners of a high prestige brand that introduces access react
162 5. General Discussion and Conclusion
more favorable than all non-owners, whereas owners of a low prestige brand react
less positive as compared to all other consumers. Thus, low prestige brands should
try to target different market segments compared to their current target segment,
whereas high prestige brands can benefit by directly targeting their existing
customers who appreciate this extension of their consumption options. New entrants
and established companies are both well suited to provide access offerings, as the
proximity to an established brand is not found to affect consumers’ evaluations and
no negative spillover effects are found. Thus, new entrants can pick any product
brand and start providing their access offer, whereas established companies do not
need to fear negative consequences.
5.3 Directions for Future Studies
Overall, this thesis is among the first publications that focus on the increasingly
relevant topic of consumption mode choice. Existing research has almost exclusively
assumed that consumption takes place in the ownership consumption mode, which
causes the need to reassess a lot of marketing knowledge in the context of access. As
a consequence there remain a lot of promising research questions, which should be
addressed in future studies.
Generally, future studies on consumption mode choice or those that are solely
focused on access should investigate more than only one product category. Both
research projects in this dissertation clearly reveal that access offerings across
different product categories are not similar. Thus, identifying and explaining these
differences remains an important research area.
To the author’s best knowledge, all existent empirical research – as well as this
dissertation – has exclusively researched B2C access offerings. However, the market
for peer-to-peer (P2P) sharing is also growing significantly (The Economist, 2013).
In these cases the company only provides the digital marketplace where private
lenders and borrowers of goods such as cars, rooms, parking space, books or tools
are brought together. On the one hand, it would be interesting to investigate the
lenders’ motivation. On the other hand, the measurement model put forward in
research project I could be applied (and potentially refined) for borrowers in a P2P
context in order to find differences in contrast to b2c access offerings.

5. General Discussion and Conclusion
163
A related area for future research is the so-called grey zone between access and
ownership (see chapter 2.1). Future research could reassess the validity of the
formative measurement model as well as the results from research project II in cases
when the consumption takes place via leasing or fractional ownership in order to
shed light on this grey zone.
The application of the measurement model for determining consumers’ attitude
towards consumption modes has revealed the importance of cost perceptions. As
access offerings can be provided with many different tariff types it will be interesting
to see how the tariff type will influence perceptions and preferences of consumers.
Especially access offerings with flat-rate pricing are interesting as this form of tariff
is most similar to ownership. However, the economic feasibility of flat-rate access
offerings should also not be forgotten.
Even though the hypothetical access offerings in all studies of this dissertation have
been described as only offering one kind of brand, there are access offerings, which
offer their customers a multitude of brands. In those cases it will be interesting to see
whether brand preferences as well as brand picking behavior will change as the brand
decision does not only happen once but before every usage.
All studies in this dissertation are based on cross-sectional designs. However,
longitudinal research designs would be beneficial in order to find whether the
findings stay constant over time and to answer the question whether access only
cannibalizes product sales or enlarges the market. In order to reveal some of the
former effects, samples of users without access experience have been contrasted to
samples with actual access experience. Nonetheless, it remains open how the general
perception of access will develop among non-access users.
The question remains whether it is ultimately more beneficial for a company in the
long run to offer both consumption modes or to offer solely one of them. The results
of this dissertation provide first insights that access can be an add-on business on the
short run, but future research is necessary to investigate long-term effects.

164 5. General Discussion and Conclusion

References
165
References
Aaker, D. A. (1997). Should you take your brand to where the action is? Harvard
Business Review, 75(5), 135–143.
Aaker, D. A., & Keller, K. L. (1990). Consumer evaluations of brand extensions.
Journal of Marketing, 54(1), 27–41.
Aaker, J. L. (1997). Dimensions of brand personality. Journal of Marketing
Research, 24(August), 347–356.
Ahearne, M., Rapp, A., Hughes, D. E., & Jindal, R. (2010). Managing sales force
product perceptions and control systems in the success of new product introductions.
Journal of Marketing Research, 47(4), 764–776.
Aikhenvald, A. Y., & Dixon, R. M. W. (2012). Possession and Ownership: A cross-
linguistic typology. Oxford, UK: Oxford University Press.
Ainscough, T. L., Trocchia, P. J., & Gum, J. R. (2011). Consumer rental car choice:
Price, agent, and brand effects. Journal of Business & Economics Research, 7(7),
39–48.
Ajzen, I. (1991). The theory of planned behavior. Organizational Behavior and
Human Decision Processes, 50(2), 179–211.
Ajzen, I. (2006). Constructing a theory of planned behavior questionnaire. Retrieved
September 4, 2013, from http://people.umass.edu/aizen/pdf/tpb.measurement.pdf
Alba, J. W., & Hutchinson, J. W. (1987). Dimensions of consumer expertise. Journal
of Consumer Research, 13(4), 411–454.
Albers, S., & Hildebrandt, L. (2006). Methodische Probleme bei der
Erfolgsfaktorenforschung – Messfehler, formative versus reflektive Indikatoren und
die Wahl des Strukturgleichungsmodells. Zeitschrift für betriebswirtschaftliche
Forschung, 58(1), 1–38.
166 References
Alchian, A. A., & Demsetz, H. (1973). The property right paradigm. Journal of
Economic History, 33(1), 16–27.
Allen, M. W., & Ng, S. H. (1999). The direct and indirect influences of human
values on product ownership. Journal of Economic Psychology, 20(1), 5–39.
Ariely, D., & Norton, M. I. (2009). Conceptual consumption. Annual Review of
Psychology, 60, 475–499.
Bagozzi, R. P. (1981). Attitudes, intentions, and behavior: A test of some key
hypotheses. Journal of Personality and Social Psychology, 41(4), 607.
Bagozzi, R. P. (1982). A field investigation of causal relations among cognitions,
affect, intentions, and behavior. Journal of Marketing Research, 19(4), 562.
Balasubramanian, S., Raghunathan, R., & Mahajan, V. (2005). Consumers in a
multichannel environment: Product utility, process utility, and channel choice.
Journal of Interactive Marketing, 19, 12–30.
Bardhi, F., & Eckhardt, G. M. (2012). Access-based consumption: The case of car
sharing. Journal of Consumer Research, 39(4), 881–898.
Bardhi, F., Eckhardt, G. M., & Arnould, E. J. (2012). Liquid relationship to
possessions. Journal of Consumer Research, 39(3), 510–529.
Barone, M. J., Shimp, T. A., & Sprott, D. E. (1997). Mere ownership revisited: A
robust effect? Journal of Consumer Psychology, 6(3), 257–284.
BBC. (2013, October 22). Netflix profits jump as subscribers pass 40 million. BBC.
Retrieved from http://bbc.in/1eFNFav
Bearden, W. O., & Etzel, M. J. (1982). Reference group influence on product and
brand purchase decisions. Journal of Consumer Research, 9(2), 183–194.
Beggan, J. K. (1992). On the social nature of nonsocial perception: The mere
ownership effect. Journal of Personality and Social Psychology, 62(2), 229–237.
Beggan, J. K., & Allison, S. T. (1997). More there than meets their eyes: Support for
the mere-ownership effect. Journal of Consumer Psychology, 6(3), 285–297.
Belk, R. (1988). Possessions and the extended self. Journal of Consumer Research,
15(2), 139–168.

References
167
Belk, R. (2007). Why not share rather than own? The Annals of the American
Academy of Political and Social Science, 611(1), 126–140.
Belk, R. (2010). Sharing. Journal of Consumer Research, 36(5), 715–734.
Belk, R. (2013a). Extended self in a digital world. Journal of Consumer Research,
40(3), 477–500.
Belk, R. (2013b). You are what you can access: Sharing and collaborative
consumption online. Journal of Business Research, forthcoming.
doi:10.1016/j.jbusres.2013.10.001
Belz, F. (1998). Ökologische Innovationen in der Kreislaufwirtschaft: Leistungs-
statt Produktverkauf. IWÖ-Diskussionsbeitrag, (62).
Bergkvist, L., & Rossiter, J. R. (2007). The predictive validity of multiple-item
versus single-item measures of the same constructs. Journal of Marketing Research,
44(2), 175–184.
Berry, L. L. (2000). Cultivating service brand equity. Journal of the Academy of
Marketing Science, 28(1), 128–137.
Berry, L. L., & Maricle, K. (1973). Consumption without ownership: Marketing
opportunities for today and tomorrow. MSU Business Topics, 33–41.
Berry, L. L., & Parasuraman, A. (1991). Marketing services: Competing through
quality. New York, NY, USA: Free Press.
Berry, L. L., Seiders, K., & Grewal, D. (2002). Understanding service convenience.
Journal of Marketing, 66(3), 1–17.
Blattberg, R. C., Kim, B.-D., & Neslin, S. A. (2008). Database Marketing: Analyzing
and Managing Customers. New York: Springer.
Boesler, M. (2013, August 12). The rise of the renting and sharing economy could
have catastrophic ripple effects. Business Insider. Retrieved November 4, 2013, from
http://read.bi/14Hlk2X
Boisvert, J. (2012a). The impact of vertical service line extensions and brand salience
on reciprocal transfer of image and performance associations. Journal of Service
Research, 15(4), 443–459.
168 References
Boisvert, J. (2012b). The reciprocal impact of vertical service line extensions on
parent brands: The roles of innovativeness, quality, and involvement. Managing
Service Quality, 22(6), 546–564.
Boksberger, P. E., & Melsen, L. (2011). Perceived value: a critical examination of
definitions, concepts and measures for the service industry. Journal of Services
Marketing, 25(3), 229–240.
Bollen, K., & Lennox, R. (1991). Conventional wisdom on measurement: A
structural equation perspective. Psychological Bulletin, 110(2), 305.
Botsman, R., & Rogers, R. (2010). What’s mine is yours: How collaborative
consumption is changing the way of life. New York: HarperBusiness.
Bourdieu, P. (1982). Die feinen Unterschiede: Kritik der gesellschaftlichen
Urteilskraft. Frankfurt am Main: Suhrkamp.
Brady, T., Davies, A., & Gann, D. M. (2005). Creating value by delivering integrated
solutions. International Journal of Project Management, 23(5), 360–365.
Briggs, E., & Grisaffe, D. (2009). Service performance-loyalty intentions link in a
business-to-business context: The role of relational exchange outcomes and customer
characteristics. Journal of Service Research, 13(1), 37–51.
Broniarczyk, S. M., & Alba, J. W. (1994). The importance of the brand in brand
extension. Journal of Marketing Research, 31(May), 214–228.
Carter, R. E., & Curry, D. J. (2011). Perceptions versus performance when managing
extensions: new evidence about the role of fit between a parent brand and an
extension. Journal of the Academy of Marketing Science, 41(2), 253–269.
Celsi, R. L., & Olson, J. C. (1988). The role of involvement in attention and
comprehension processes. Journal of Consumer Research, 15(2), 210–224.
Cenfetelli, R. T., & Bassellier, G. (2009). Interpretation of formative measurement in
information systems research. MIS Quarterly, 33(4), 689–707.
Chen, Y. (2009). Possession and access: Consumer desires and value perceptions
regarding contemporary art collection and exhibit visits. Journal of Consumer
Research, 35(6), 925–940.

References
169
Chernev, A., Hamilton, R., & Gal, D. (2011). Competing for consumer identity:
Limits to self-expression and the perils of lifestyle branding. Journal of Marketing,
75(3), 66–82.
Chin, W. W. (1998). The partial least squares approach for structural equation
modeling. In G. A. Marcoulides (Ed.), Modern Methods for Business Research (pp.
295–336). Mahwah, NJ: Lawrence Erlbaum Associates Publishers.
Coase, R. H. (1960). The problem of social cost. Journal of Law and Economics,
3(10), 1–44.
Collaborative Fund. (2013). Collaborative fund backs the shared future.
Collaborative fund backs the shared future. Retrieved November 27, 2013, from
http://www.collaborativefund.com/
Colwell, S. R., Aung, M., Kanetkar, V., & Holden, A. L. (2008). Toward a measure
of service convenience: multiple-item scale development and empirical test. Journal
of Services Marketing, 22(2), 160–169.
Cotte, J., & Wood, S. L. (2004). Families and innovative consumer behavior: A
triadic analysis of sibling and parental influence. Journal of Consumer Research,
31(1), 78–86.
Cronin Jr, J. J., & Taylor, S. A. (1994). SERVPERF versus SERVQUAL:
reconciling performance-based and perceptions-minus-expectations measurement of
service quality. Journal of Marketing, 58(1), 125–131.
Csikszentmihalyi, M., & Rochberg-Halton, E. (1981). The meaning of things:
Domestic symbols and the self. Cambridge University Press.
Daimler. (2013a, May 16). München wird weiß-blau: car2go kommt in die
bayerische Landeshauptstadt. Daimler Global Media Site. Retrieved May 24, 2013,
from http://media.daimler.com/dcmedia/0-921-614319-49-1599557-1-0-0-0-0-1-
12759-614216-0-0-0-0-0-0-0.html?TS=1369397643962
Daimler. (2013b, October 24). 5 Jahre car2go: 500.000 Kunden und 1 Million
Mieten monatlich. Retrieved October 29, 2013, from
http://media.daimler.com/dcmedia/0-921-614319-49-1643832-1-0-0-0-0-1-12635-0-
0-1-0-0-0-0-0.html?TS=1383038472067

170 References
Dall’Olmo Riley, F., Pina, J. M., & Bravo, R. (2013). Downscale extensions:
Consumer evaluation and feedback effects. Journal of Business Research, 66(2),
196–206.
Dawar, N., & Parker, P. (1994). Marketing universals: consumers’ use of brand
name, price, physical appearance, and retailer reputation as signals of product
quality. The Journal of Marketing, 58(2), 81–95.
Demsetz, H. (1967). Toward a theory of property rights. The American Economic
Review, 57(2), 347–359.
Diamantopoulos, A. (2006). The error term in formative measurement models:
interpretation and modeling implications. Journal of Modelling in Management, 1(1),
7–17.
Diamantopoulos, A. (2011). Incorporating formative measures into covariance-based
structural equation models. MIS Quarterly, 35(2), 335–358.
Diamantopoulos, A., Riefler, P., & Roth, K. P. (2008). Advancing formative
measurement models. Journal of Business Research, 61(12), 1203–1218.
Diamantopoulos, A., Sarstedt, M., Fuchs, C., Wilczynski, P., & Kaiser, S. (2012).
Guidelines for choosing between multi-item and single-item scales for construct
measurement: a predictive validity perspective. Journal of the Academy of Marketing
Science, 40(3), 434–449.
Diamantopoulos, A., & Siguaw, J. A. (2006). Formative versus reflective indicators
in organizational measure development: A comparison and empirical illustration.
British Journal of Management, 17(4), 263–282.
Diamantopoulos, A., & Winklhofer, H. M. (2001). Index construction with formative
indicators: An alternative to scale development. Journal of Marketing Research,
38(2), 269–277.
Dibbern, J., & Chin, W. W. (2005). Multi-group comparison: Testing a PLS model
on the sourcing of application software services across Germany and the U.S.A using
a permutation based algorithm. In F. Bliemel, A. Eggert, G. Fassott, & J. Henseler
(Eds.), Handbuch PLS-Pfadmodellierung (pp. 135–159). Stuttgart: Schäffer
Poeschel.
References
171
Dittmar, H. (1992). The social psychology of material possessions: To have is to be.
Hemel Hempstead, UK: Harvester Wheatsheaf.
Dodds, W. B., Monroe, K. B., & Grewal, D. (1991). Effects of price, brand, and store
information on buyers’ product evaluations. Journal of Marketing Research, 28(3),
307–319.
Dodson, K. J. (1996). Peak experiences and mountain biking: Incorporating the bike
into the extended self. Advances in Consumer Research, 23, 317–322.
Drolet, A. L., & Morrison, D. G. (2001). Do we really need multiple-item measures
in service research? Journal of Service Research, 3(3), 196–204.
Durgee, J. F., & O’Connor, G. C. (1995). An exploration into renting as consumption
behavior. Psychology and Marketing, 12(2), 89–104.
Eastman, J. K., Goldsmith, R. E., & Flynn, L. R. (1999). Status consumption in
consumer behavior: Scale development and validation. Journal of Marketing Theory
and Practice, 7(3), 41.
Edwards, J. R. (2001). Multidimensional constructs in organizational behavior
research: An integrative analytical framework. Organizational Research Methods,
4(2), 144–192.
Esch, F.-R., Langner, T., Schmitt, B. H., & Geus, P. (2006). Are brands forever?
How brand knowledge and relationships affect current and future purchases. Journal
of Product & Brand Management, 15(2), 98–105.
Faul, F., Erdfelder, E., & Lang, A.-G. (2009). Statistical power analyses using
G*Power 3.1: Tests for correlation and regression analyses. Behavior Research
Methods, 41(4), 1149–1160.
Felson, M., & Spaeth, J. L. (1978). Community structure and collaborative
consumption: A routine activity approach. American Behavioral Scientist, 21(4),
614–624.
Fishbein, M., & Ajzen, I. (1975). Belief, attitude, intention and behavior: An
introduction to theory and research. Reading, MA, USA: Addidon Wesley.
Frost & Sullivan. (2010, January 18). Analysis of the market for carsharing in North
America.

172 References
Frost & Sullivan. (2012, July 31). Business models and opportunities in the European
traditional and peer-to-peer carsharing market.
Furby, L. (1991). Understanding the psychology of possession and ownership: A
personal memoir and an appraisal of our progress. Journal of Social Behavior and
Personality, 6(6), 457–463.
Furubotn, E. G., & Pejovich, S. (1972). Property rights and economic theory: a
survey of recent literature. Journal of Economic Literature, 10(4), 1137–1162.
Gansky, L. (2010). The mesh: Why the future of business is sharing. New York, NY,
USA: Portfolio Penguin.
Ger, G., & Belk, R. W. (1996). Cross-cultural differences in materialism. Journal of
Economic Psychology, 17(1), 55–77.
Geron, T. (2013, January 23). Airbnb and the unstoppable rise of the share economy.
Forbes.com. Retrieved May 24, 2013, from
http://www.forbes.com/sites/tomiogeron/2013/01/23/airbnb-and-the-unstoppable-
rise-of-the-share-economy/
Goldberger, A. S., & Hauser, R. (1971). The treatment of unobservable variables in
path analysis. Sociological Methodology, 3(8), 1–1.
Goodman, J., & Irmak, C. (2013). Having versus consuming: Failure to estimate
usage frequency makes consumers prefer multifeature products. Journal of
Marketing Research, 50(1), 44–54.
Gürhan-Canli, Z., & Maheswaran, D. (1998). The effects of extensions on brand
name dilution and enhancement. Journal of Marketing Research, 35(4), 464–473.
Gustafsson, A., & Johnson, M. D. (2004). Determining attribute importance in a
service satisfaction model. Journal of Service Research, 7(2), 124–141.
Hair, J. F. (1998). Multivariate data analysis (5. ed.). Upper Saddle River, NJ, USA:
Prentice Hall.
Hair, J. F., Ringle, C. M., & Sarstedt, M. (2011). PLS-SEM: Indeed a silver bullet.
Journal of Marketing Theory and Practice, 19(2), 139–152.
Handelsblatt. (2013, January 21). Daimler macht mit Carsharing teilweise Gewinn.
Retrieved October 29, 2013, from

References
173
http://www.handelsblatt.com/unternehmen/industrie/zukunftsgeschaeft-daimler-
macht-mit-carsharing-teilweise-gewinn/7665532.html
Hardin, G. (1968). The Tragedy of the Commons. Science, 162, 1243–1248.
Hennig-Thurau, T., Henning, V., & Sattler, H. (2007). Consumer file sharing of
motion pictures. Journal of Marketing, 71(4), 1–18.
Henseler, J., Martens, H., & Naes, T. (2007). A new and simple approach to multi-
group analysis in partial least squares path modeling. In Proceedings of PLS’07: 5th
International Symposium on PLS and Related Methods (Vol. 7, pp. 104–107). Aas,
Norway. Retrieved from http://repository.ubn.ru.nl/handle/2066/47214
Henseler, J., Ringle, C. M., & Sinkovics, R. R. (2009). The use of partial least
squares path modeling in international marketing. Advances in International
Marketing, 20(2009), 277–319.
Hoch, S. J., & Deighton, J. (1989). Managing what consumers learn from experience.
Journal of Marketing, 53(2), 1–20.
Huber, F. (2007). Kausalmodellierung mit partial least squares (1. ed.). Wiesbaden:
Gabler.
Humphreys, A., & Grayson, K. (2008). The intersecting roles of consumer and
producer: A critical perspective on co-production, co-creation and prosumption.
Sociology Compass, 2(3), 963–980.
Jarvis, C. B., MacKenzie, S. B., & Podsakoff, P. M. (2003). A critical review of
construct indicators and measurement model misspecification in marketing and
consumer research. Journal of Consumer Research, 30(2), 199–218.
John, D. R., Loken, B., & Joiner, C. (1998). The negative impact of extensions: can
flagship products be diluted? Journal of Marketing, 62(1), 19–32.
Johnson, J. W. (2000). A heuristic method for estimating the relative weight of
predictor variables in multiple regression. Multivariate Behavioral Research, 35(1),
1–19.
Jöreskog, K. G., & Goldberger, A. S. (1975). Estimation of a model with multiple
indicators and multiple causes of a single latent variable. Journal of the American
Statistical Association, 70(351), 631–639.

174 References
Kakati, M. (2003). Success criteria in high-tech new ventures. Technovation, 23(5),
447–457.
Keil, M., Tan, B. C. Y., Wei, K.-K., Saarinen, T., Tuunainen, V., & Wassenaar, A.
(2000). A cross-cultural study on escalation of commitment behavior in software
projects. MIS Quarterly, 24(2), 299.
Kim, C. K., Lavack, A. M., & Smith, M. (2001). Consumer evaluation of vertical
brand extensions and core brands. Journal of Business Research, 52(3), 211–222.
Kirmani, A., Sood, S., & Bridges, S. (1999). The ownership effect in consumer
responses to brand line stretches. Journal of Marketing, 63(1), 88–101.
Kleine, S. S., & Baker, S. M. (2004). An integrative review of material possession
attachment. Academy of Marketing Science Review, 1(1), 1–39.
Kleine, S. S., Kleine III, R. E., & Allen, C. T. (1995). How is a possession “me” or
“not me”? Characterizing types and an antecedent of material possession attachment.
Journal of Consumer Research, 22(3), 327–343.
Lamberton, C., & Rose, R. (2012). When is ours better than mine? A framework for
understanding and altering participation in commercial sharing systems. Journal of
Marketing, 76(4), 109–125.
Lambrecht, A., & Skiera, B. (2006). Paying too much and being happy about it:
Existence, causes, and consequences of tariff-choice biases. Journal of Marketing
Research, 43(2), 212–223.
Laverie, D. A., Kleine III, R. E., & Kleine, S. S. (2002). Reexamination and
extension of Kleine, Kleine, and Kernan’s social identity model of mundane
consumption: The mediating role of the appraisal process. Journal of Consumer
Research, 28(4), 659–669.
Lawson, S. J. (2011). Forsaking ownership: Three essays on non-ownership
consumption and alternative forms of exchange (Doctoral dissertation). Florida State
University. Retrieved from http://etd.lib.fsu.edu/theses/available/etd-07252011-
215026/
LeBreton, J. M., Tonidandel, S., & Krasikova, D. V. (2013). Residualized relative
importance analysis: A technique for the comprehensive decomposition of variance
References
175
in higher order regression models. Organizational Research Methods, 16(3), 449–
473.
Lei, J., de Ruyter, K., & Wetzels, M. (2008). Consumer responses to vertical service
line extensions. Journal of Retailing, 84(3), 268–280.
Loken, B., & John, D. R. (1993). Diluting brand beliefs: when do brand extensions
have a negative impact? Journal of Marketing, 57(3), 71–84.
Lovelock, C., & Gummesson, E. (2004). Whither services marketing? In search of a
new paradigm and fresh perspectives. Journal of Service Research, 7(1), 20–41.
Lynn, M., & Harris, J. (1997). The desire for unique consumer products: A new
individual differences scale. Psychology & Marketing, 14(6), 601–616.
Milberg, S. J., Sinn, F., & Goodstein, R. C. (2010). Consumer reactions to brand
extensions in a competitive context: does fit still matter? Journal of Consumer
Research, 37(3), 543–553.
Milberg, S. J., Whan Park, C., & McCarthy, M. S. (1997). Managing negative
feedback effects associated with brand extensions: The impact of alternative
branding strategies. Journal of Consumer Psychology, 6(2), 119–140.
Moeller, S., & Wittkowski, K. (2010). The burdens of ownership: reasons for
preferring renting. Managing Service Quality, 20(2), 176–191.
Mont, O. K. (2002). Clarifying the concept of product–service system. Journal of
Cleaner Production, 10(3), 237–245.
Mont, O. K. (2004). Institutionalisation of sustainable consumption patterns based on
shared use. Ecological Economics, 50(1-2), 135–153.
Moore, A., & Taylor, M. (2009). Why buy when you can rent? A brief investigation
of differences in acquisition mode based on duration. Applied Economics Letters,
16(12), 1211–1213.
Naderer, G., & Balzer, E. (2007). Qualitative Marktforschung in Theorie und Praxis:
Grundlagen, Methoden und Anwendungen (1. ed.). Wiesbaden: Gabler.
Nagle, T. T., & Hogan, J. E. (2006). The strategy and tactics of pricing (4. ed.).
Upper Saddle River, NJ, USA: Prentice Hall.

176 References
Netemeyer, R. G., Bearden, W. O., & Sharma, S. (2003). Scaling procedures: Issues
and applications. Thousand Oaks, CA, USA: Sage.
Netemeyer, R. G., Krishnan, B., Pullig, C., Wang, G., Yagci, M., Dean, D., … Wirth,
F. (2004). Developing and validating measures of facets of customer-based brand
equity. Journal of Business Research, 57(2), 209–224.
Nunes, J. C. (2000). A cognitive model of people’s usage estimations. Journal of
Marketing Research, 37(4), 397–409.
O’Brien, D. (2013). The epistemology of perception. Internet Encyclopedia of
Philosophy. Retrieved October 2, 2013, from http://www.iep.utm.edu/epis-per/
O’Curry, S., & Strahilevitz, M. (2001). Probability and mode of acquisition effects
on choices between hedonic and utilitarian options. Marketing Letters, 12(1), 37–49.
Obenberger, R. W., & Brown, S. W. (1976). A marketing alternative: Consumer
leasing and renting. Business Horizons, 19(5), 82–86.
Olson, J. C., & Jacoby, J. (1972). Cue utilization in the quality perception process. In
Proceedings of the Third Annual Conference of the Association for Consumer
Research (pp. 167–179). Chicago, IL, USA.
Oppenheimer, D. M., Meyvis, T., & Davidenko, N. (2009). Instructional
manipulation checks: Detecting satisficing to increase statistical power. Journal of
Experimental Social Psychology, 45(4), 867–872.
Ozanne, L. K., & Ozanne, J. L. (2011). A child’s right to play: The social
construction of civic virtues in toy libraries. Journal of Public Policy & Marketing,
30(2), 264–278.
Parasuraman, A., Zeithaml, V. A., & Berry, L. L. (1988). SERVQUAL: A multiple-
item scale for measuring consumer perceptions of service quality. Journal of
Retailing, 64(1), 12–37.
Parasuraman, A., Zeithaml, V. A., & Berry, L. L. (1994). Reassessment of
expectations as a comparison standard in measuring service quality: implications for
further research. Journal of Marketing, 58(1), 111–124.
Park, C. W., Jaworski, B. J., & Maclnnis, D. J. (1986). Strategic brand concept-
image management. Journal of Marketing, 50(4), 135–145.
References
177
Park, C. W., Milberg, S., & Lawson, R. (1991). Evaluation of brand extensions: the
role of product feature similarity and brand concept consistency. Journal of
Consumer Research, 18(2), 185–193.
Pavlou, P. A., & Fygenson, M. (2006). Understanding and predicting electronic
commerce adoption: An extension of the theory of planned behavior. MIS Quarterly,
30(1), 115–143.
Prentice, D. A. (1987). Psychological correspondence of possessions, attitudes, and
values. Journal of Personality and Social Psychology, 53(6), 993.
Richins, M. L. (1994a). Special possessions and the expression of material values.
Journal of Consumer Research, 21(3), 522–533.
Richins, M. L. (1994b). Valuing things: the public and private meanings of
possessions. Journal of Consumer Research, 21(3), 504–521.
Rifkin, J. (2000). The age of access: How the shift from ownership to access is
transforming modern life. London, UK: Penguin.
Ringle, C. M., Wende, S., & Will, A. (2005). SmartPLS 2.0 (M3) Beta. Hamburg:
SmartPLS. Retrieved from http://www.smartpls.de
Ronald, R. (2008). The ideology of home ownership: Homeowner societies and the
role of housing (1st ed.). Houndmills, UK: Palgrave Macmillan.
Rook, D. W. (2006). Let’s pretend: Projective methods reconsidered. In R. W. Belk
(Ed.), Handbook of qualitative research methods in marketing (pp. 143–155). Glos,
UK: Edward Elgar Publishing Limited.
Rooney, B. (2012, July 18). Sharing Gains Currency on Internet. The Wall Street
Journal. Retrieved November 27, 2013, from http://on.wsj.com/1au0sIW
Rosenthal, E. (2011, July 15). The US could learn some lessons from Europe on
biking. The Guardian. Retrieved December 3, 2013, from http://gu.com/p/3vtbt/tw
Rosenthal, R., & Rosnow, R. (1991). Essentials of behavioral research. New York,
NY, USA: McGraw Hill.
Rossiter, J. R. (2002). The C-OAR-SE procedure for scale development in
marketing. International Journal of Research in Marketing, 19(4), 305–335.

178 References
Rossiter, J. R. (2011a). Marketing measurement revolution: The C-OAR-SE method
and why it must replace psychometrics. European Journal of Marketing, 45(11/12),
1561–1588.
Rossiter, J. R. (2011b). Measurement for the social sciences. New York, NY, USA:
Springer.
Sacks, D. (2011, May). The sharing economy. Fast Company. Retrieved October 29,
2013, from http://www.fastcompany.com/1747551/sharing-economy
Sarstedt, M., Henseler, J., & Ringle, C. M. (2011). Multigroup analysis in partial
least squares (PLS) path modeling: Alternative methods and empirical results. In
Advances in International Marketing (Vol. 22, pp. 195–218). Bingley: Emerald
Group Publishing.
Schaefers, T. (2013). Exploring carsharing usage motives: A hierarchical means-end
chain analysis. Transportation Research Part A: Policy and Practice, 47, 69–77.
Scholl, G. (2006). Product Service Systems. In Proceedings: Perspectives on Radical
Changes to Sustainable Consumption and Production (SCP). Copenhagen.
Scholl, G. (2008). Marketing nachhaltiger Dienstleistungen: Bedingungen der
Übernahme und Empfehlungen zur Vermarktung von eigentumsersetzenden
Konsumpraktiken. Marburg: Metropolis.
Schrader, U. (1999). Consumer Acceptance of Eco-efficient Services. Greener
Management International, (25), 105.
Schrader, U. (2000). Eine Frage der Rechte und Pflichten. Ökologisches
Wirtschaften, 15(5), 16–18.
Schrader, U. (2001). Konsumentenakzeptanz eigentumsersetzender Dienstleistungen.
Frankfurt am Main: Peter Lang.
Seiders, K., Voss, G. B., Godfrey, A. L., & Grewal, D. (2007). SERVCON:
development and validation of a multidimensional service convenience scale.
Journal of the Academy of Marketing Science, 35(1), 144–156.
Shimp, T. A., & Kavas, A. (1984). The theory of reasoned action applied to coupon
usage. Journal of Consumer Research, 11(3), 795–809.

References
179
Shocker, A. D., Bayus, B. L., & Kim, N. (2004). Product complements and
substitutes in the real world: The relevance of “other products.” Journal of
Marketing, 68(1), 28–40.
Sirgy, M. J. (1982). Self-concept in consumer behavior: A critical review. Journal of
Consumer Research, 9(3), 287–300.
Smith, J. B., & Colgate, M. (2007). Customer value creation: A practical framework.
Journal of Marketing Theory & Practice, 15(1), 7–23.
Snare, F. (1972). The concept of property. American Philosophical Quarterly, 9(2),
200–206.
Solomon, M. R. (1983). The role of products as social stimuli: A symbolic
interactionism perspective. Journal of Consumer Research, 10(3), 319–329.
Spiggle, S. (1994). Analysis and interpretation of qualitative data in consumer
research. Journal of Consumer Research, 21(3), 491–503.
Spiggle, S., Nguyen, H. T., & Caravella, M. (2012). More than fit: Brand extension
authenticity. Journal of Marketing Research, 49(6), 967–983.
Sujan, M., & Bettman, J. R. (1989). The effects of brand positioning strategies on
consumers’ brand and category perceptions: Some insights from schema research.
Journal of Marketing Research, 26(4), 454–467.
Taylor, S., & Todd, P. (1995). Decomposition and crossover effects in the theory of
planned behavior: A study of consumer adoption intentions. International Journal of
Research in Marketing, 12(2), 137–155.
Tenenhaus, M., Vinzi, V. E., Chatelin, Y.-M., & Lauro, C. (2005). PLS path
modeling. Computational Statistics & Data Analysis, 48(1), 159–205.
Teo, H. H., Wei, K. K., & Benbasat, I. (2003). Predicting intention to adopt
interorganizational linkages: An institutional perspective. MIS Quarterly, 27(1), 19–
49.
The Economist. (2013, March 9). Peert-to-peer rental: The rise of the sharing
economy. The Economist. Retrieved November 28, 2013, from
http://econ.st/14x9PoB

180 References
Theobald, E. (2010). Qualitative Online-Marktforschung (1. ed.). Baden-Baden:
Nomos.
Thoemmes, F. (2011). An SPSS R menu for propensity score matching. Available at
http://arxiv.org/abs/1201.6385.
Thompson, D. V., & Norton, M. I. (2011). The social utility of feature creep. Journal
of Marketing Research, 48(3), 555–565.
Tian, K. T., Bearden, W. O., & Hunter, G. L. (2001). Consumers’ need for
uniqueness: Scale development and validation. Journal of Consumer Research,
28(1), 50–66.
Tonidandel, S., & LeBreton, J. M. (2011). Relative importance analysis: A useful
supplement to regression analysis. Journal of Business and Psychology, 26(1), 1–9.
Tukker, A. (2004). Eight types of product–service system: eight ways to
sustainability? Experiences from SusProNet. Business Strategy and the Environment,
13(4), 246–260.
Tukker, A., & Tischner, U. (2006). Product-services as a research field: past, present
and future. Reflections from a decade of research. Journal of Cleaner Production,
14(17), 1552–1556.
Umesh, U. N., Peterson, R. A., McCann-Nelson, M., & Vaidyanathan, R. (1996).
Type IV error in marketing research: The investigation of ANOVA interactions.
Journal of the Academy of Marketing Science, 24(1), 17–26.
United Nations. (2012, April 5). Africa and Asia to lead urban population growth in
the next four decades. Press Release. New York, NY, USA.
Vargo, S. L., & Lusch, R. F. (2004). Evolving to a new dominant logic for
marketing. Journal of Marketing, 68(1), 1–17.
Veblen, T. (1994). The theory of the leisure class an economic study of institutions.
New York, NY, USA: Penguin Books.
Verhoef, P. C., Neslin, S. A., & Vroomen, B. (2007). Multichannel customer
management: Understanding the research-shopper phenomenon. International
Journal of Research in Marketing, 24(2), 129–148.

References
181
Völckner, F., & Sattler, H. (2006). Drivers of brand extension success. Journal of
Marketing, 70(2), 18–34.
Voss, K. E., Spangenberg, E. R., & Grohmann, B. (2003). Measuring the hedonic
and utilitarian dimensions of consumer attitude. Journal of Marketing Research,
40(3), 310–320.
Waldmeir, P. (2013, April 19). Congestion pushes Chinese on to their bikes.
Financial Times. Retrieved from http://on.ft.com/13lCAW4
Walsh, B. (2011). Today’s smart choice: Don’t own. Share. Time.com. Retrieved
March 30, 2011, from http://ti.me/13XZQOI
Warner, R. M. (2012). Applied statistics: From bivariate through multivariate
techniques (2nd ed.). Thousand Oaks, CA, USA: Sage Publications Ltd.
Weber, R., & Crocker, J. (1983). Cognitive processes in the revision of stereotypic
beliefs. Journal of Personality and Social Psychology, 45(5), 961–977.
Weinert, R. (2010). Eigentum als eine Determinante des Konsumentenverhaltens:
Das Beispiel Zweitwohnung (Doctoral dissertation). Universität St. Gallen. Retrieved
from
http://www1.unisg.ch/www/edis.nsf/SysLkpByIdentifier/3717/$FILE/dis3717.pdf
Wellek, S. (2010). Testing statistical hypotheses of equivalence and noninferiority
(2nd ed.). Boca Raton, FL, USA: CRC Press.
Wetzels, M., Odekerken-Schröder, G., & Van Oppen, C. (2009). Using PLS path
modeling for assessing hierarchical construct models: Guidelines and empirical
illustration. MIS Quarterly, 33(1), 177.
Wilcox, K., Kim, H. M., & Sen, S. (2009). Why do consumers buy counterfeit luxury
brands? Journal of Marketing Research, 46(2), 247–259.
Zajonc, R. B. (1968). Attitudinal effects of mere exposure. Journal of Personality
and Social Psychology Monograph Supplement, 9(2, part 2), 1–27.

182 References

Appendix A.1
183
Appendix
A. Appendix for Project I .................................................................................... 184 A.1. PCM Item Battery ....................................................................................... 184 A.2. Description of Access Offerings ................................................................ 186 A.3. Correlation Matrices ................................................................................... 188 A.4. Detailed PLS Results .................................................................................. 191 A.5. Assessment of the Nomological Validity ................................................... 195 A.6. Absolute Consumption Mode Perceptions ................................................. 196 A.7. Cross Tabs of the Consumption Mode Attitudes ....................................... 201
B. Appendix for Project II .................................................................................. 203 B.1. Experimental Treatments ............................................................................ 203 B.2. Sample Characteristics ............................................................................... 213 B.3. Measures ..................................................................................................... 215 B.4. Manipulation Checks .................................................................................. 220 B.5. Additional Analyses ................................................................................... 222 B.6. MANOVAs for Access Evaluation ............................................................ 223 B.7. MANOVAs for Parent Brand Evaluation ................................................... 227 B.8. Interaction Graphs ...................................................................................... 232 B.9. Cell Means .................................................................................................. 238 B.10. Correlation Tables ...................................................................................... 244

184 Appendix A.1
A. Appendix for Project I
A.1. PCM Item Battery
Table 21: Original German Items for Measuring the Attitude Towards Consumption Modes
Perception Item (German Version) Answer Scale
Total costs Meiner Einschätzung nach sind die Gesamtkosten für mich... a
Predictability of costs Ich finde, dass man die anfallenden Kosten gut abschätzen kann. b
Absence of costs Bei der Nutzung hat man das Gefühl, dass einem keine Kosten entstehen. b
Transaction effort Ich finde den einmaligen Aufwand beim Kauf bzw. der Registrierung... a
Pre-usage effort Ich finde den erforderlichen Aufwand vor jeder Verwendung... a
Post-usage effort Ich finde den erforderlichen Aufwand nach jeder Verwendung... a
Maintenance effort Ich empfinde den Aufwand zur Instandhaltung / Pflege als... a
Storage effort Ich empfinde den Aufwand einen geeigneten Abstellort / Aufbewahrungsort zu finden als... a
Risk of non-availability Das Risiko, dass ___ nicht verfügbar ist, wenn ich es nutzen möchte ist... a
Risk of failure Das Risiko eines Defekts / einer Beschädigung wenn man ___ nutzt ist... a
Use limitations Ich bin bei der Verwendung hinsichtlich Art, Dauer und dem Ort der Verwendung stark eingeschränkt. b
Need for careful handling Bei der Verwendung hat man das Gefühl, dass man sehr vorsichtig sein muss. b
Inflexibility* Die Flexibilität in verschiedenen Lebenssituationen ist... a
Fun while using Die Verwendung bereitet viel Vergnügen. b
Being part of a community Ich fühle mich anderen ___ Eigentümern / Nutzern verbunden. b
Environmental friendliness Die Nutzung empfinde ich als umweltfreundlich. b

Appendix A.1
185
Perception Item (German Version) Answer Scale
Signaling one’s personality Ein ___ zu besitzen / zu nutzen drückt stark die eigene Persönlichkeit aus. b
Personal attachment Ich finde man hat eine starke persönliche Bindung zum/zur ___. b
Impressing others Es macht einen guten Eindruck auf Andere ___ zu besitzen / zu nutzen. b
Answer Scales
a sehr gering (1) … sehr hoch (7)
b überhaupt nicht (1) … voll und ganz (7)
* reverse coded item
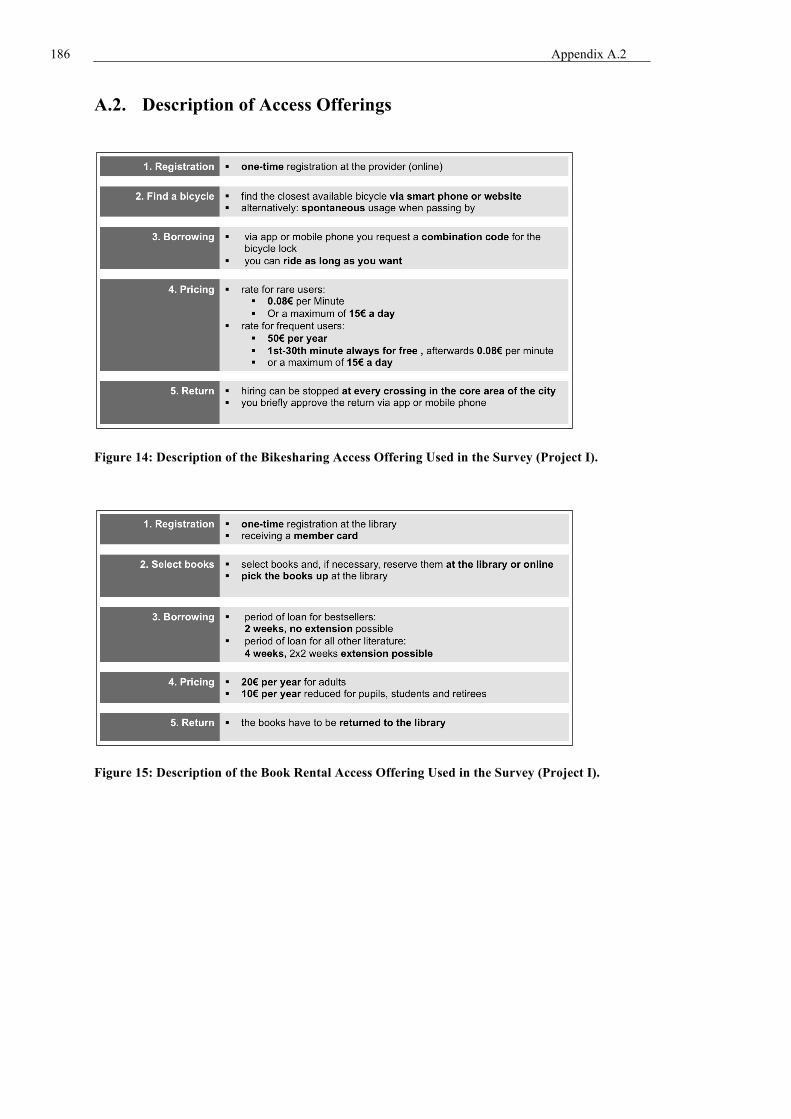
186 Appendix A.2
A.2. Description of Access Offerings
Figure 14: Description of the Bikesharing Access Offering Used in the Survey (Project I).
Figure 15: Description of the Book Rental Access Offering Used in the Survey (Project I).

Appendix A.2
187
Figure 16: Description of the Handbag Rental Access Offering Used in the Survey (Project I).

188 Appendix A.3
A.3. Correlation Matrices

Appendix A.3
189
Table 22: Correaltion Matrix for the Product Categories Cars and Bicycles (Project I)
SD
2.45
2.61
2.83
2.45
2.01
2.03
2.33
2.15
1.64
1.53
0.89
1.86
2.44
1.63
2.34
2.32
2.64
2.33
2.31
1.80
2.00
Not
e. In
ter-
corr
elat
ions
, mea
ns a
nd st
anda
rd d
evia
tions
for c
ars (
n =
633)
are
pre
sent
ed b
elow
the
diag
onal
. Int
er-c
orre
latio
ns, m
eans
and
stan
dard
dev
iatio
n fo
r bic
ycle
s (n=
627
) are
pre
sent
ed a
bove
the
diag
onal
. * p ≤
.05
M
2.16
-1.5
2
-2.7
0
0.73
2.40
2.04
-0.8
2
1.49
-0.9
5
-0.1
1
-0.1
1
-0.6
6
-2.7
4
-0.5
1
2.08
2.25
1.41
3.09
2.33
-2.0
4
-2.0
1
21
-.33*
.20*
.16*
-.22*
-.36*
-.34*
-.13*
-.24*
.22*
.09*
.07
.08*
.17*
.11*
-.29*
-.15*
-.25*
-.22*
-.16*
.80*
—
-1.9
1
2.22
20
-.37*
.27*
.18*
-.26*
-.35*
-.33*
-.20*
-.23*
.26*
.13*
.08*
.08*
.16*
.15*
-.29*
-.18*
-.22*
-.23*
-.15*
—
.79*
-1.6
8
2.20
19
.25*
-.23*
-.21*
.22*
.43*
.43*
.21*
.34*
-.17*
.00
.02
-.09*
-.22*
-.11*
.31*
.34*
.10*
.57*
—
-.29*
-.28*
1.69
2.18
18
.28*
-.21*
-.20*
.24*
.47*
.42*
.09*
.41*
-.12*
.00
.01
-.05
-.21*
-.06
.43*
.32*
.31*
—
.46*
-.21*
-.23*
3.49
2.20
17
.11*
-.16*
-.10*
.12*
.26*
.27*
.07
.25*
-.18*
-.05
-.10*
-.12*
-.15*
-.06
.37*
.16*
—
.46*
.23*
-.26*
-.31*
3.04
2.13
16
.25*
-.20*
-.26*
.19*
.34*
.35*
.14*
.32*
-.14*
-.02
.07
-.09*
-.26*
-.09*
.47*
—
.17*
.30*
.26*
-.19*
-.18*
1.78
2.11
15
.33*
-.24*
-.24*
.20*
.46*
.45*
.11*
.37*
-.18*
-.04
.06
-.13*
-.26*
-.14*
—
.37*
.42*
.47*
.34*
-.23*
-.26*
3.15
2.21
14
-.10*
.27*
.12*
-.17*
-.17*
-.19*
-.17*
-.09*
.27*
.30*
.15*
.45*
.30*
—
-.16*
-.12*
-.11*
-.13*
-.20*
.30*
.20*
-0.6
6
1.85
13
-.16*
.30*
.33*
-.05
-.36*
-.23*
.00
-.16*
.25*
.12*
.01
.31*
—
.38*
-.39*
-.23*
-.22*
-.32*
-.27*
.26*
.23*
-2.8
1
2.37
12
-.11*
.26*
.16*
-.19*
-.19*
-.19*
-.15*
-.15*
.23*
.19*
.12*
—
.28*
.37*
-.15*
-.12*
-.08*
-.10*
-.23*
.26*
.19*
-0.5
7
1.87
11
.00
.12*
.07
-.02
.05
.01
-.08*
.03
.27*
.17*
—
.19*
-.03
.17*
.10*
.06
-.01
.06
-.07
.35*
.29*
0.87
1.86
10
-.03
.23*
.11*
-.13*
-.10*
-.14*
-.09*
-.06
.35*
—
.25*
.24*
.11*
.30*
-.01
.05
-.09*
-.07
-.11*
.26*
.19*
0.08
1.70
9
-.12*
.28*
.20*
-.11*
-.20*
-.19*
-.13*
-.15*
—
.32*
.20*
.29*
.36*
.33*
-.30*
-.18*
-.27*
-.23*
-.25*
.41*
.39*
-1.2
5
1.86
8 .23*
-.25*
-.18*
.26*
.47*
.52*
.34*
—
-.30*
-.13*
-.09*
-.15*
-.21*
-.21*
.36*
.31*
.30*
.34*
.40*
-.33*
-.30*
1.51
2.26
7 .18*
-.26*
.04
.40*
.20*
.33*
—
.23*
-.12*
-.14*
-.37*
-.12*
.15*
-.07
-.12*
.05
.01
-.04
.11*
-.30*
-.25*
-1.7
2
2.33
6 .38*
-.33*
-.26*
.52*
.80*
—
.14*
.49*
-.29*
-.12*
-.07
-.19*
-.23*
-.19*
.40*
.23*
.33*
.41*
.40*
-.30*
-.29*
2.00
1.97
5 .41*
-.31*
-.31*
.42*
—
.76*
.07
.44*
-.28*
-.09*
-.05
-.16*
-.31*
-.17*
.44*
.24*
.42*
.49*
.39*
-.29*
-.28*
2.40
2.01
4 .36*
-.30*
-.09*
—
.25*
.31*
.50*
.26*
-.19*
-.18*
-.29*
-.16*
.02
-.13*
-.03
.13*
.12*
.08*
.20*
-.30*
-.24*
-0.6
4
2.56
3
-.27*
.42*
—
-.02
-.13*
-.07
-.05
-.11*
.08*
.03
.03
.13*
.16*
.13*
-.14*
-.18*
-.05
-.10*
-.10*
.18*
.21*
-0.8
6
2.14
2
-.29*
—
.17*
-.32*
-.27*
-.29*
-.33*
-.35*
.29*
.17*
.27*
.26*
.23*
.21*
-.18*
-.19*
-.16*
-.16*
-.29*
.39*
.36*
-0.6
6
2.51
1 —
-.34*
-.20*
.28*
.23*
.23*
.27*
.25*
-.22*
-.13*
-.33*
-.10*
-.13*
-.11*
.17*
.19*
.10*
.14*
.20*
-.45*
-.47*
0.08
2.33
Var
iabl
e
Tota
l cos
ts
Pred
icta
bilit
y of
cos
ts
Abs
ence
of c
osts
Tran
sact
ion
effo
rt
Pre-
usag
e ef
fort
Post
-usa
ge e
ffor
t
Mai
nten
ance
eff
ort
Stor
age
effo
rt
Fun
whi
le u
sing
Bei
ng p
art o
f a c
omm
unity
Envi
ronm
enta
l frie
ndlin
ess
Sign
alin
g on
e’s p
erso
nalit
y
Pers
onal
atta
chm
ent
Impr
essi
ng o
ther
s
Use
lim
itatio
ns
Nee
d fo
r car
eful
han
dlin
g
Infle
xibi
lity
Ris
k of
non
-ava
ilabi
lity
Ris
k of
failu
re
Atti
tude
1
Atti
tude
2
1 2 3 4 5 6 7 8 9 10
11
12
13
14
15
16
17
18
19
20
21
M
SD

190 Appendix A.3
Table 23: Correaltion Matrix for the Product Categories Books and Handbags (Project I) SD
2.59
2.44
3.13
2.34
2.16
2.20
2.71
2.83
2.18
2.02
2.51
2.30
2.60
1.96
2.83
2.53
3.30
2.47
2.27
2.04
2.35
Not
e. In
ter-
corr
elat
ions
, mea
ns a
nd st
anda
rd d
evia
tions
for b
ooks
(n =
410
) are
pre
sent
ed b
elow
the
diag
onal
. Int
er-c
orre
latio
ns, m
eans
and
stan
dard
dev
iatio
n fo
r han
dbag
s (n=
428
) are
pre
sent
ed a
bove
the
diag
onal
. * p ≤
.05
M
2.64
-1.9
6
-3.0
0
2.02
3.46
3.58
1.75
1.02
-1.2
0
-0.1
1
-0.8
6
-1.1
6
-3.1
2
0-.6
9
2.96
3.75
0.46
3.53
3.23
-3.5
1
-3.2
2
21
-.37*
.22*
.22*
-.34*
-.42*
-.39*
-.34*
-.38*
.30*
.12*
.30*
.19*
.19*
.11*
-.22*
-.08
-.25*
-.23*
-.28*
.84*
—
-0.8
9
2.01
20
-.41*
.23*
.19*
-.41*
-.45*
-.41*
-.37*
-.39*
.32*
.14*
.31*
.24*
.21*
.14*
-.24*
-.13*
-.29*
-.23*
-.29*
—
.79*
-1.0
9
1.77
19
.30*
-.16*
-.15*
.40*
.46*
.46*
.30*
.30*
-.20*
-.04
-.17*
-.19*
-.19*
-.06
.25*
.27*
.05
.50*
—
-.18*
-.18*
2.75
1.96
18
.27*
-.16*
-.20*
.21*
.38*
.45*
.18*
.15*
-.10*
.02
-.19*
-.11*
-.18*
-.05
.23*
.25*
.11*
—
.35*
-.20*
-.15*
2.14
2.97
17
.09*
-.13*
-.04
.22*
.13*
.10*
.14*
.15*
-.12*
-.04
-.14*
-.14*
-.05
.02
.17*
.11*
—
.33*
.11*
-.21*
-.17*
1.16
2.92
16
.21*
-.03
-.15*
.15*
.34*
.33*
.18*
.05
-.01
.10*
.02
-.01
-.26*
.11*
.48*
—
.09
.18*
.30*
-.16*
-.10*
2.30
2.28
15
.20*
-.07
-.14*
.12*
.32*
.30*
.16*
.08
-.10*
.17*
-.12*
-.06
-.18*
.05 —
.42*
.22*
.25*
.35*
-.20*
-.21*
2.84
2.46
14
-.05
.30*
.18*
-.08
-.04
-.03
-.13*
-.12*
.42*
.27*
.29*
.44*
.35*
—
-.22*
-.07
-.03
-.10*
-.16*
.18*
.16*
-0.7
8
1.53
13
-.17*
.35*
.34*
-.12*
-.22*
-.21*
-.13*
-.08
.37*
.18*
.18*
.47*
—
.39*
-.28*
-.22*
-.19*
-.17*
-.32*
.27*
.28*
-2.2
7
2.24
12
-.15*
.41*
.27*
-.23*
-.21*
-.17*
-.25*
-.22*
.41*
.22*
.25*
—
.28*
.30*
-.09
-.10*
-.14*
-.17*
-.07
.18*
.12*
-0.3
7
1.31
11
-.32*
.34*
.24*
-.23*
-.28*
-.29*
-.20*
-.15*
.36*
.17*
—
.11*
-.05
.02
.11*
.20*
-.01
-.02
.10*
.23*
.21*
1.86
2.05
10
-.03
.17*
.14*
-.15*
-.09
.00
-.03
-.04
.39*
—
.22*
.06
.04
-.04
.03
.15*
-.08
-.04
-.01
.07
.05
0.39
1.69
9
-.13*
.34*
.20*
-.22*
-.22*
-.19*
-.30*
-.26*
—
.10*
.10*
.19*
.32*
.23*
-.22*
-.12*
-.28*
-.13*
-.20*
.35*
.33*
-0.5
7
1.49
8 .27*
-.19*
.03
.46*
.35*
.38*
.69*
—
-.10*
-.06
-.25*
-.12*
.01
-.03
.04
.07
.02
.14*
.05
-.37*
-.34*
-0.6
3
2.54
7 .31*
-.21*
-.05
.48*
.41*
.48*
—
.47*
-.09
.07
-.03
-.05
-.07
.00
.15*
.31*
.14*
.22*
.16*
-.28*
-.23*
0.51
2.22
6 .47*
-.28*
-.29*
.52*
.82*
—
.35*
.22*
-.30*
-.02
-.03
-.18*
-.34*
-.20*
.39*
.24*
.30*
.32*
.35*
-.38*
-.34*
2.47
2.17
5 .48*
-.30*
-.34*
.58*
—
.72*
.35*
.21*
-.30*
-.02
-.06
-.15*
-.31*
-.16*
.36*
.23*
.32*
.27*
.32*
-.34*
-.34*
1.86
2.19
4 .41*
-.20*
-.12*
—
.31*
.24*
.19*
.21*
-.14*
.04
-.15*
-.05
-.02
-.01
.09
.14*
.23*
.23*
.14*
-.28*
-.22*
0.13
2.14
3
-.26*
.42*
—
-.27*
-.25*
-.18*
-.17*
-.26*
.13*
.00
.29*
.23*
.08
.15*
-.08
-.13*
-.10*
-.11*
-.04
.24*
.20*
0.85
2.97
2
-.28*
—
.47*
-.22*
-.12*
-.09
-.10*
-.24*
.17*
.11*
.29*
.18*
.05
.11*
.00
-.06
-.08
-.13*
.02
.19*
.16*
0.44
2.23
1 —
-.26*
-.31*
.27*
.03
.05
-.01
.28*
.06
-.06
-.30*
.01
.14*
.08
-.05
-.03
-.10*
-.06
-.09
-.15*
-.13*
-2.0
6
2.39
Var
iabl
e
Tota
l cos
ts
Pred
icta
bilit
y of
cos
ts
Abs
ence
of c
osts
Tran
sact
ion
effo
rt
Pre-
usag
e ef
fort
Post
-usa
ge e
ffor
t
Mai
nten
ance
eff
ort
Stor
age
effo
rt
Fun
whi
le u
sing
Bei
ng p
art o
f a c
omm
unity
Envi
ronm
enta
l frie
ndlin
ess
Sign
alin
g on
e’s p
erso
nalit
y
Pers
onal
atta
chm
ent
Impr
essi
ng o
ther
s
Use
lim
itatio
ns
Nee
d fo
r car
eful
han
dlin
g
Infle
xibi
lity
Ris
k of
non
-ava
ilabi
lity
Ris
k of
failu
re
Atti
tude
1
Atti
tude
2
1 2 3 4 5 6 7 8 9 10
11
12
13
14
15
16
17
18
19
20
21
M
SD

Appendix A.4
191
A.4. Detailed PLS Results
Table 24: Detailed PLS Results on Paths, Loadings and Weights for Cars
Paths Loadings Weights
Coefficient t-value Coefficient t-value Coefficient t-value SE
Monetary Perceptions -.30** 8.05
Total costs .89** 26.54 .73** 12.72 .06
Predictability of costs -.73** 13.63 -.49** 7.16 .07
Functional Perceptions -.22** 5.71
Transaction effort .56** 8.37 .18* 2.17 .08
Pre- and post-usage effort .64** 1.79 .12 1.39 .09
Maintenance effort .58** 8.41 .43** 5.73 .08
Storage effort .65** 11.16 .17* 2.09 .08
Use limitations .52** 7.28 .26** 2.72 .10
Inflexibility .59** 8.61 .32** 3.79 .08
Risk of failure .60** 9.22 .25** 3.11 .08
Risk of non-availability .45** 6.50 -.04 0.50 .09
Experiential Perceptions .24** 5.92
Absence of costs .38** 5.38 .28** 4.19 .07
Environmental friendliness .63** 1.26 .51** 8.48 .06
Need for careful handling -.36** 4.72 -.23** 3.24 .07
Fun while using .78** 17.73 .62** 11.31 .05
Symbolic Perceptions .10** 2.93
Being part of a community .64** 6.66 .43** 3.93 .11
Signaling one’s personality .65** 6.64 .31* 2.24 .14
Personal attachment .69** 8.45 .44** 3.97 .11
Impressing others .72** 9.16 .31* 2.53 .12
R2 .44
Q2 .38
n 633
Note. ** p ≤ 01; * p ≤ .05.

192 Appendix A.4
Table 25: Detailed PLS Results on Paths, Loadings and Weights for Bicycles
Paths Loadings Weights
Coefficient t-value Coefficient t-value Coefficient t-value SE
Monetary Perceptions -.21** 4.87
Total costs .93** 26.34 .82** 13.16 .06
Predictability of costs -.62** 7.99 -.39** 4.33 .09
Functional Perceptions -.28** 6.26
Transaction effort .59** 8.78 .18 1.85 .09
Pre- and post-usage effort .88** 21.00 .54** 4.69 .11
Maintenance effort .40** 4.51 .13 1.27 .10
Storage effort .58** 8.07 .04 0.39 .10
Use limitations .70** 1.63 .28** 2.88 .10
Inflexibility .56** 7.25 .25** 2.86 .09
Risk of failure .38** 4.33 -.11 1.00 .10
Risk of non-availability .55** 7.37 .09 0.83 .11
Experiential Perceptions .10 1.79
Absence of costs .58** 5.39 .35** 2.74 .13
Environmental friendliness .26 1.65 .08 0.44 .17
Need for careful handling -.56** 4.72 -.38** 2.78 .14
Fun while using .82** 9.30 .68** 5.84 .12
Symbolic Perceptions .02 .46
Being part of a community .54** 3.14 .35 1.83 .19
Signaling one’s personality .41* 2.13 -.04 0.17 .23
Personal attachment .83** 7.19 .69** 4.11 .17
Impressing others .68** 4.27 .38 1.70 .22
R2 .24
Q2 .20
n 627
Note. ** p ≤ 01; * p ≤ .05.

Appendix A.4
193
Table 26: Detailed PLS Results on Paths, Loadings and Weights for Books
Paths Loadings Weights
Coefficient t-value Coefficient t-value Coefficient t-value SE
Monetary Perceptions .02 .39
Total costs -.70** 3.72 -.51* 2.16 .24
Predictability of costs .87** 6.28 .74** 3.80 .19
Functional Perceptions -.37** 8.76
Transaction effort .51** 5.37 .21* 2.12 .10
Pre- and post-usage effort .77** 12.71 .45** 4.54 .10
Maintenance effort .52** 6.68 .00 0.03 .10
Storage effort .72** 1.86 .57** 6.51 .09
Use limitations .42** 4.47 .14 1.40 .10
Inflexibility .38** 4.19 .14 1.48 .09
Risk of failure .37** 4.35 .09 0.92 .10
Risk of non-availability .36** 4.11 -.02 0.21 .10
Experiential Perceptions .23** 4.12
Absence of costs .52** 5.51 .27* 2.54 .11
Environmental friendliness .53** 5.07 .43** 3.95 .11
Need for careful handling -.30** 2.75 -.27* 2.57 .11
Fun while using .80** 12.18 .69** 8.52 .08
Symbolic Perceptions .13** 2.83
Being part of a community .19 1.10 .16 0.95 .16
Signaling one’s personality .52** 4.05 .23 1.61 .15
Personal attachment .93** 13.26 .78** 5.53 .14
Impressing others .58** 3.93 .21 1.14 .19
R2 .34
Q2 .26
n 410
Note. ** p ≤ 01; * p ≤ .05.
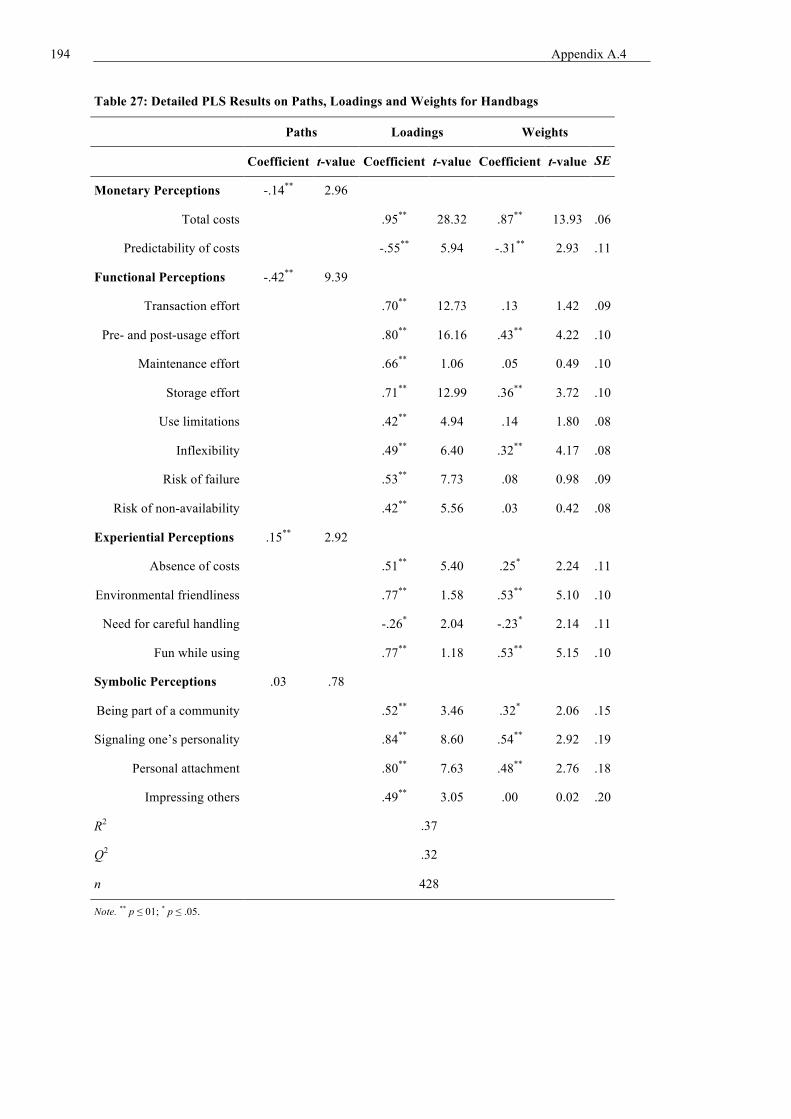
194 Appendix A.4
Table 27: Detailed PLS Results on Paths, Loadings and Weights for Handbags
Paths Loadings Weights
Coefficient t-value Coefficient t-value Coefficient t-value SE
Monetary Perceptions -.14** 2.96
Total costs .95** 28.32 .87** 13.93 .06
Predictability of costs -.55** 5.94 -.31** 2.93 .11
Functional Perceptions -.42** 9.39
Transaction effort .70** 12.73 .13 1.42 .09
Pre- and post-usage effort .80** 16.16 .43** 4.22 .10
Maintenance effort .66** 1.06 .05 0.49 .10
Storage effort .71** 12.99 .36** 3.72 .10
Use limitations .42** 4.94 .14 1.80 .08
Inflexibility .49** 6.40 .32** 4.17 .08
Risk of failure .53** 7.73 .08 0.98 .09
Risk of non-availability .42** 5.56 .03 0.42 .08
Experiential Perceptions .15** 2.92
Absence of costs .51** 5.40 .25* 2.24 .11
Environmental friendliness .77** 1.58 .53** 5.10 .10
Need for careful handling -.26* 2.04 -.23* 2.14 .11
Fun while using .77** 1.18 .53** 5.15 .10
Symbolic Perceptions .03 .78
Being part of a community .52** 3.46 .32* 2.06 .15
Signaling one’s personality .84** 8.60 .54** 2.92 .19
Personal attachment .80** 7.63 .48** 2.76 .18
Impressing others .49** 3.05 .00 0.02 .20
R2 .37
Q2 .32
n 428
Note. ** p ≤ 01; * p ≤ .05.

Appendix A.5
195
A.5. Assessment of the Nomological Validity
Table 28: Assessment of the Nomological Validity for the Overall Construct Usage Intention
Cars Bicycles Books Handbags
L P W L P W L P W L P W
Monetary Perceptions -.17** -.22** -.11** -.11*
Total costs .87** .70** .96** .88** .89** .76** .91** .79**
Predictability of costs -.76** -.52** -.53** -.28* -.68** -.48* -.65** -.43**
Functional Perceptions -.38** -.17** -.47** -.30**
Transaction effort .38** .03 .50** .09 .57** .28** .71** .23
Pre- and post-usage effort .66** .08 .91** .61** .88** .59** .81** .35*
Maintenance effort .38** .30** .24* -.03 .41** -.05 .58** .01
Storage effort .69** .23** .52** -.05 .46** .28** .60** .22
Use limitations .58** .18* .68** .21 .53** .22** .54** .27**
Inflexibility .70** .38** .50** .19 .50** .19* .46** .27**
Risk of failure .67** .30** .57** .10 .39** .03 .63** .20
Risk of non-availability .64** .14 .69** .20 .40** -.01 .47** .04
Experiential Perceptions .06 .10* .13** .07
Absence of costs .30* .19 .80** .62** .56** .33** .39** .12
Environmental friendliness
.55** .40** .16 .00
.40** .33** .52** .32*
Need for careful handling -.34** -.19 -.54** -.31* -.48** -.43** -.67** -.66**
Fun while using .88** .75** .67** .50** .75** .63** .66** .52**
Symbolic Perceptions .04 .08* .14** .12*
Being part of a community .81** .67** .38** .24 .25 .22 .30* .12
Signaling one’s personality
.47** .10
.34* -.04
.51** .22
.78** .51**
Personal attachment .61** .41* .96** .91** .92** .76** .90** .71**
Impressing others .65** .25 .45** .12 .59** .23 .30 -.20
R2 .28 .18 .41 .22
Q2 .25 .16 .34 .18
n 633 627 410 428
Note. ** p ≤ 01; * p ≤ .05; L: Loadings; P: Path Coefficients; W: Weights.

196 Appendix A.6
A.6. Absolute Consumption Mode Perceptions
Table 29: Differences Between Access and Ownership Perceptions and Attitudes
Cars Bicycles Books Handbags
Δ p Δ p Δ p Δ p
Monetary Perceptions
Total costs 0.08 .40 2.16 ≤ .001 -2.06 ≤ .001 2.64 ≤ .001
Predictability of costs -0.66 ≤ .001 -1.52 ≤ .001 0.44 ≤ .001 -1.96 ≤ .001
Functional Perceptions
Transaction effort -0.64 ≤ .001 0.73 ≤ .001 0.13 .214 2.02 ≤ .001
Pre-usage effort 2.40 ≤ .001 2.40 ≤ .001 1.86 ≤ .001 3.46 ≤ .001
Post-usage effort 2.00 ≤ .001 2.04 ≤ .001 2.47 ≤ .001 3.58 ≤ .001
Maintenance effort -1.72 ≤ .001 -0.83 ≤ .001 0.51 ≤ .001 1.75 ≤ .001
Storage effort 1.51 ≤ .001 1.49 ≤ .001 -0.63 ≤ .001 1.02 ≤ .001
Use limitations 3.16 ≤ .001 2.09 ≤ .001 2.84 ≤ .001 2.96 ≤ .001
Inflexibility 3.04 ≤ .001 1.41 ≤ .001 1.16 ≤ .001 0.46 .004
Risk of failure 1.69 ≤ .001 2.33 ≤ .001 2.75 ≤ .001 3.23 ≤ .001
Risk of non-availability 3.49 ≤ .001 3.09 ≤ .001 2.14 ≤ .001 3.53 ≤ .001
Experiential Perceptions
Absence of costs -0.86 ≤ .001 -2.70 ≤ .001 0.85 ≤ .001 -3.00 ≤ .001
Environmental friendliness 0.87 ≤ .001 -0.11 .002 1.86 ≤ .001 -0.86 ≤ .001
Need for careful handling 1.78 ≤ .001 2.25 ≤ .001 2.30 ≤ .001 3.75 ≤ .001
Fun while using -1.25 ≤ .001 -0.95 ≤ .001 -0.57 ≤ .001 -1.20 ≤ .001
Symbolic Perceptions
Being part of a community 0.08 .23 -0.12 .061 0.39 ≤ .001 -0.11 .242
Signaling one’s personality -0.57 ≤ .001 -0.66 ≤ .001 -0.37 ≤ .001 -1.16 ≤ .001
Personal attachment -2.81 ≤ .001 -2.74 ≤ .001 -2.27 ≤ .001 -3.12 ≤ .001
Impressing others -0.66 ≤ .001 -0.51 ≤ .001 -0.78 ≤ .001 -0.69 ≤ .001
Attitude
Attitude 1 (good/bad) -1.68 ≤ .001 -2.04 ≤ .001 -1.09 ≤ .001 -3.51 ≤ .001
Attitude 2 (advantageous / disadvantageous) -1.92 ≤ .001 -2.01 ≤ .001 -0.88 ≤ .001 -3.22 ≤ .001
Note. Δ: Mean access perception – mean ownership perception; p: p-value of paired sample t-Test between access and ownership perceptions.

Appendix A.6
197
Table 30: Contrast of the Absolute Consumption Mode Perceptions for Cars
Access Ownership
Variable M SD M SD Δ t(632) p
Total costs 4.41 1.63 4.33 1.45 0.08 0.84 .40
Predictability of costs 4.28 1.72 4.93 1.53 -0.66 -6.56 ≤ .001
Presence of costs 2.71 1.60 3.57 1.80 -0.86 -1.14 ≤ .001
Transaction effort 3.24 1.50 3.88 1.90 -0.64 -6.30 ≤ .001
Pre-usage effort 4.17 1.53 1.77 1.29 2.40 3.07 ≤ .001
Post-usage effort 3.81 1.59 1.81 1.28 2.00 25.48 ≤ .001
Maintenance effort 2.27 1.54 4.00 1.47 -1.74 -18.61 ≤ .001
Storage effort 3.85 1.66 2.35 1.59 1.51 16.82 ≤ .001
Risk of non-availability 5.16 1.48 1.67 1.38 3.49 39.95 ≤ .001
Risk of failure 4.13 1.55 2.43 1.46 1.69 19.59 ≤ .001
Use limitations 4.93 1.53 1.78 1.38 3.15 35.94 ≤ .001
Need for careful handling 5.27 1.63 3.49 1.72 1.78 21.16 ≤ .001
Flexibility 4.66 1.54 1.62 1.24 3.04 35.95 ≤ .001
Fun while using 4.00 1.57 5.24 1.74 -1.25 -16.89 ≤ .001
Being part of a community 3.08 1.81 3.00 1.90 0.08 1.21 .23
Environmental friendliness 4.21 1.67 3.35 1.56 0.87 11.75 ≤ .001
Signaling one’s personality 3.15 1.78 3.72 2.02 -0.57 -7.69 ≤ .001
Personal attachment 2.40 1.49 5.21 1.83 -2.81 -29.79 ≤ .001
Impressing others 3.36 1.63 4.02 1.90 -0.66 -8.98 ≤ .001
Attitude 1 (good/bad) 4.31 1.56 5.99 1.30 -1.68 -19.14 ≤ .001
Attitude 2 (advantageous / disadvantageous) 4.07 1.57 5.98 1.39 -1.92 -21.68 ≤ .001
Note. The results of the t-test are based upon a paired sample t-Test. The number in parentheses in the label of the second column from the right denotes the degrees of freedom.

198 Appendix A.6
Table 31: Contrast of the Absolute Consumption Mode Perceptions for Bicycles
Access Ownership
M SD M SD Δ t(627) p
Total costs 4.41 1.75 2.24 1.51 2.16 22.09 ≤ .001
Predictability of costs 4.03 1.85 5.55 1.68 -1.52 -14.59 ≤ .001
Presence of costs 2.80 1.71 5.50 1.91 -2.70 -23.86 ≤ .001
Transaction effort 3.32 1.63 2.59 1.75 0.73 7.44 ≤ .001
Pre-usage effort 4.06 1.57 1.66 1.22 2.40 29.98 ≤ .001
Post-usage effort 3.75 1.66 1.71 1.23 2.04 25.24 ≤ .001
Maintenance effort 2.30 1.66 3.12 1.47 -0.82 -8.86 ≤ .001
Storage effort 3.39 1.79 1.90 1.32 1.49 17.37 ≤ .001
Risk of non-availability 4.72 1.66 1.63 1.36 3.09 33.16 ≤ .001
Risk of failure 4.46 1.66 2.13 1.40 2.33 25.26 ≤ .001
Use limitations 4.33 1.70 2.24 1.73 2.08 22.30 ≤ .001
Need for careful handling 5.05 1.79 2.80 1.82 2.25 24.24 ≤ .001
Flexibility 4.00 1.74 2.59 1.84 1.41 13.32 ≤ .001
Fun while using 4.62 1.65 5.57 1.67 -0.95 -14.40 ≤ .001
Being part of a community 3.48 1.95 3.59 2.07 -0.11 -1.88 .06
Environmental friendliness 6.36 1.30 6.47 1.19 -0.11 -3.04 .002
Signaling one’s personality 3.25 1.76 3.91 2.00 -0.66 -8.91 ≤ .001
Personal attachment 2.41 1.55 5.15 1.98 -2.74 -28.10 ≤ .001
Impressing others 3.20 1.72 3.71 1.92 -0.51 -7.85 ≤ .001
Attitude 1 (good/bad) 4.40 1.59 6.44 1.03 -2.04 -28.41 ≤ .001
Attitude 2 (advantageous / disadvantageous) 4.27 1.62 6.29 1.32 -2.01 -25.19 ≤ .001
Note. The results of the t-test are based upon a paired sample t-Test. The number in parentheses in the label of the second column from the right denotes the degrees of freedom.

Appendix A.6
199
Table 32: Contrast of the Absolute Consumption Mode Perceptions for Books
Access Ownership
M SD M SD Δ t(410) p
Total costs 2.43 1.50 4.49 1.61 -2.06 -17.41 ≤ .001
Predictability of costs 5.62 1.64 5.18 1.83 0.44 4.04 ≤ .001
Presence of costs 4.54 1.85 3.69 2.13 0.85 5.81 ≤ .001
Transaction effort 2.88 1.56 2.75 1.77 0.13 1.24 .21
Pre-usage effort 3.91 1.63 2.05 1.38 1.86 17.18 ≤ .001
Post-usage effort 4.23 1.65 1.76 1.23 2.47 23.08 ≤ .001
Maintenance effort 2.92 1.76 2.42 1.56 0.51 4.62 ≤ .001
Storage effort 2.32 1.63 2.95 1.82 -0.63 -5.02 ≤ .001
Risk of non-availability 4.61 1.75 2.47 1.86 2.14 14.59 ≤ .001
Risk of failure 4.43 1.55 1.68 1.21 2.75 28.41 ≤ .001
Use limitations 4.80 1.79 1.96 1.48 2.84 23.44 ≤ .001
Need for careful handling 5.43 1.58 3.13 1.82 2.30 2.43 ≤ .001
Flexibility 4.22 1.74 3.06 1.72 1.16 8.08 ≤ .001
Fun while using 5.20 1.56 5.77 1.49 -0.57 -7.78 ≤ .001
Being part of a community 3.65 1.94 3.26 1.90 0.39 4.67 ≤ .001
Environmental friendliness 5.76 1.43 3.90 1.69 1.86 18.39 ≤ .001
Signaling one’s personality 4.16 1.70 4.52 1.79 -0.37 -5.68 ≤ .001
Personal attachment 3.04 1.59 5.31 1.70 -2.27 -2.51 ≤ .001
Impressing others 3.66 1.60 4.44 1.78 -0.78 -1.32 ≤ .001
Attitude 1 (good/bad) 5.24 1.55 6.33 1.00 -1.09 -12.44 ≤ .001
Attitude 2 (advantageous / disadvantageous) 5.11 1.61 6.00 1.33 -0.88 -8.94 ≤ .001
Note. The results of the t-test are based upon a paired sample t-Test. The number in parentheses in the label of the second column from the right denotes the degrees of freedom.

200 Appendix A.6
Table 33: Contrast of the Absolute Consumption Mode Perceptions for Handbags
Access Ownership
M SD M SD Δ t(428) p
Total costs 5.63 1.64 2.99 1.62 2.64 21.10 ≤ .001
Predictability of costs 4.11 1.92 6.07 1.58 -1.96 -16.59 ≤ .001
Presence of costs 2.53 1.76 5.54 2.05 -3.00 -19.87 ≤ .001
Transaction effort 4.21 1.89 2.19 1.55 2.02 17.83 ≤ .001
Pre-usage effort 5.24 1.58 1.78 1.37 3.46 33.14 ≤ .001
Post-usage effort 5.32 1.58 1.74 1.44 3.58 33.70 ≤ .001
Maintenance effort 4.15 2.10 2.40 1.53 1.75 13.34 ≤ .001
Storage effort 3.46 2.12 2.44 1.73 1.02 7.46 ≤ .001
Risk of non-availability 5.33 1.60 1.81 1.57 3.53 29.51 ≤ .001
Risk of failure 5.03 1.65 1.80 1.44 3.23 29.45 ≤ .001
Use limitations 5.01 1.92 2.04 1.67 2.96 21.71 ≤ .001
Need for careful handling 6.24 1.38 2.49 1.72 3.75 3.72 ≤ .001
Flexibility 3.66 2.11 3.21 1.93 0.46 2.86 ≤ .001
Fun while using 4.09 1.92 5.29 1.88 -1.20 -11.40 ≤.001
Being part of a community 2.71 2.00 2.82 2.09 -0.11 -1.17 .24
Environmental friendliness 4.30 2.04 5.16 1.83 -0.86 -7.12 ≤ .001
Signaling one’s personality 3.75 1.99 4.91 2.03 -1.16 -1.47 ≤ .001
Personal attachment 2.46 1.66 5.57 1.85 -3.12 -24.79 ≤ .001
Impressing others 3.53 1.92 4.22 2.02 -0.69 -7.32 ≤ .001
Attitude 1 (good/bad) 3.02 1.72 6.53 0.95 -3.51 -35.51 ≤ .001
Attitude 2 (advantageous / disadvantageous) 3.09 1.78 6.31 1.32 -3.22 -28.40 ≤ .001
Note. The results of the t-test are based upon a paired sample t-Test. The number in parentheses in the label of the second column from the right denotes the degrees of freedom.

Appendix A.7
201
A.7. Cross Tabs of the Consumption Mode Attitudes
Table 34: Cross Tabs of Consumption Mode Attitudes for Cars Su
m o
f att
itude
s tow
ards
acc
ess
Sum of attitudes towards ownership 2 3 4 5 6 7 8 9 10 11 12 13 14 Sum
2 1 0 0 0 0 0 2 0 0 5 1 0 30 39 3 0 0 1 0 0 0 0 1 0 1 0 1 3 7 4 0 0 0 0 0 1 4 0 2 1 4 0 19 31 5 0 0 0 0 0 0 1 0 1 0 5 0 6 13 6 0 0 1 0 1 0 1 0 3 4 12 4 28 54 7 0 0 0 0 0 0 0 0 2 1 8 9 21 41 8 2 1 0 0 0 1 31 5 8 10 32 12 72 174 9 0 0 0 0 0 0 3 3 3 6 8 7 18 48
10 1 0 0 2 2 0 3 8 10 10 24 6 29 95 11 0 0 0 0 0 0 4 2 3 4 7 3 7 30 12 2 0 0 0 1 0 3 4 5 3 10 3 19 50 13 0 0 1 0 0 1 1 0 2 1 0 1 5 12 14 0 0 1 3 2 0 2 4 1 2 4 2 18 39
Sum 6 1 4 5 6 3 55 27 40 48 115 48 275 633
Color Absolute Relative white 381 60%
light grey 210 33% dark grey 42 7%
Table 35: Cross Tabs of Consumption Mode Attitudes for Bicycles
Sum
of a
ttitu
des t
owar
ds a
cces
s
Sum of attitudes towards ownership 2 3 4 5 6 7 8 9 10 11 12 13 14 Sum
2 4 0 1 0 0 1 2 0 3 0 2 0 37 50 3 0 0 0 0 0 0 0 0 0 0 1 0 0 1 4 0 0 0 0 0 0 0 0 1 0 3 2 18 24 5 0 0 0 0 0 0 2 0 1 0 3 0 9 15 6 0 0 0 0 0 0 2 2 0 0 4 0 15 23 7 0 0 0 0 0 1 1 0 2 2 2 4 12 24 8 0 0 0 1 2 3 25 4 4 4 30 6 126 205 9 0 0 0 0 0 0 3 1 2 4 4 4 22 40
10 0 0 0 0 0 0 2 1 6 1 13 5 46 74 11 0 0 0 0 0 0 0 1 0 4 8 4 23 40 12 0 0 0 0 0 1 3 2 0 3 16 4 41 70 13 0 0 0 0 0 0 1 0 0 0 3 0 11 15 14 0 0 0 0 0 0 3 1 1 0 3 2 36 46
Sum 4 0 1 1 2 6 44 12 20 18 92 31 396 627
Color Absolute Relative white 398 63%
light grey 216 34% dark grey 13 2%

202 Appendix A.7
Table 36: Cross Tabs of Consumption Mode Attitudes for Books Su
m o
f att
itude
s tow
ards
acc
ess
Sum of attitudes towards ownership 2 3 4 5 6 7 8 9 10 11 12 13 14 Sum
2 0 0 0 0 0 0 0 0 2 0 0 0 6 8 3 0 0 0 0 0 0 0 0 1 0 0 0 0 1 4 0 0 0 0 0 0 3 0 0 0 0 0 3 6 5 0 0 0 0 0 0 1 0 0 0 0 0 7 8 6 0 0 0 0 0 0 1 1 0 1 5 2 9 19 7 0 0 1 0 0 0 1 1 0 1 2 3 5 14 8 0 0 0 0 0 1 13 4 4 7 11 4 45 89 9 0 0 0 0 0 0 1 0 3 0 0 1 6 11
10 0 0 0 1 0 0 3 2 6 4 15 3 15 49 11 0 0 0 0 0 0 1 0 1 3 4 4 6 19 12 0 0 0 0 0 0 3 4 3 5 16 7 40 78 13 0 0 0 0 0 0 1 0 0 1 0 2 5 9 14 0 0 0 0 0 0 10 3 6 6 15 6 53 99
Sum 0 0 1 1 0 1 38 15 26 28 68 32 200 410
Color Absolute Relative white 150 37%
light grey 224 55% dark grey 36 9%
Table 37: Cross Tabs of Consumption Mode Attitudes for Handbags
Sum
of a
ttitu
des t
owar
ds a
cces
s
Sum of attitudes towards ownership 2 3 4 5 6 7 8 9 10 11 12 13 14 Sum
2 1 0 0 1 0 0 7 0 2 1 6 4 98 120 3 0 0 0 0 1 0 0 0 1 0 3 0 3 8 4 0 0 0 0 0 0 3 0 0 2 2 3 33 43 5 0 0 0 0 0 0 0 0 0 2 1 4 8 15 6 0 0 0 0 0 0 2 2 2 5 6 2 22 41 7 0 0 0 0 0 0 2 0 2 0 1 1 10 16 8 2 0 1 0 0 0 10 1 5 3 17 1 56 96 9 0 0 0 0 0 0 1 0 1 1 4 1 12 20
10 0 0 0 0 0 0 0 0 2 0 1 1 19 23 11 0 0 0 0 0 0 1 0 1 2 2 0 2 8 12 0 0 0 0 0 0 0 1 2 0 8 0 14 25 13 0 0 0 0 0 0 0 0 0 1 0 0 2 3 14 0 0 0 0 0 0 0 1 2 0 2 0 5 10
Sum 3 0 1 1 1 0 26 5 20 17 53 17 284 428
Color Absolute Relative white 354 83%
light grey 66 15% dark grey 8 2%

Appendix B.1
203
B. Appendix for Project II
B.1. Experimental Treatments
Figure 17: Notional Consumer Reports Article on the Low Prestige Car Brand from Study 1 (English).

204 Appendix B.1
Figure 18: Notional Consumer Reports Article on the Low Prestige Car Brand from Study 1 (German).
Figure 19: Notional Consumer Reports Article on the Low Prestige Fashion Brand from Study 1 (English).

Appendix B.1
205
Figure 20: Notional Consumer Reports Article on the Low Prestige Fashion Brand from Study 1 (German).

206 Appendix B.1
Figure 21: Details Table of the Notional Consumer Reports Articles for Cars in Study 2 (English and German). Note: Words in italics were not part of the original design. The tabels include the prices for both price levels. However, the original tables only contained either or.

Appendix B.1
207
Figure 22: Details Table of the Notional Consumer Reports Articles for Fashion in Study 2 (English and German). Note: Words in italics were not part of the original design. The tabels include the prices for both price levels. However, the original tables only contained either or.

208 Appendix B.1
Figure 23: Details Table of the Notional Consumer Reports Article for the Low Convenience Condition in Study 3 (English and German). Note: Words in italics were not part of the original design. The tabels include the prices for both price levels. However, the original tables only contained either or.

Appendix B.1
209
Figure 24: Details Table of the Notional Consumer Reports Article for the Medium Convenience Condition in Study 3 (English and German). Note: Words in italics were not part of the original design. The tabels include the prices for both price levels. However, the original tables only contained either or.

210 Appendix B.1
Figure 25: Details Table of the Notional Consumer Reports Article for the High Convenience Condition in Study 3 (English and German). Note: Words in italics were not part of the original design. The tabels include the prices for both price levels. However, the original tables only contained either or.

Appendix B.1
211
Figure 26: Text of the Notional Consumer Reports Article for the Low Distance (top) and High Distance (bottom) Branding Strategy in Study 4 (English). Note: The original treatment also contained detail tables, similar to those from study 1. The alternative version for the low prestige brand is not displayed here. The only difference is that the term “Audi” was replaced by “Opel”.

212 Appendix B.1
Figure 27: Text of the Notional Consumer Reports Article for the Low Distance (top) and High Distance (bottom) Branding Strategy in Study 4 (German). Note: The original treatment also contained detail tables, similar to those from study 1. The alternative version for the low prestige brand is not displayed here. The only difference is that the term “Audi” was replaced by “Opel”.

Appendix B.2
213
B.2. Sample Characteristics
Table 38: Sociodemographics for Studies 1 – 5 (Project II)
Criterion Study 1 (n =302)
Study 2 (n = 1807)
Study 3 (n =1088)
Study 4 (n =871)
Study 5 (n =350)
Gender (%)
Male 52.32% 49.53% 49.72% 49.14% 70.86%
Female 47.68% 50.47% 50.28% 50.86% 29.14%
Age Groups (%)
18-29 20.20% 19.59% 27.21% 40.30% 41.71%
30-39 22.52% 21.69% 25.64% 22.96% 32.86%
40-49 33.11% 28.00% 16.45% 16.30% 17.71%
50-59 24.17% 23.52% 16.54% 11.25% 5.71%
60+ 0.00% 7.19% 14.15% 9.18% 2.00%
Highest Level of Education (%)
Basic secondary school or none 9.27% 11.79% 10.29% 5.51% -
Middle secondary school 36.42% 33.04% 30.42% 30.20% -
Higher secondary school 28.15% 26.40% 29.41% 34.79% -
University degree or doctoral degree 26.16% 28.78% 29.87% 29.51% -
Number of Adults in Household (%)
1 person 35.43% 30.60% 31.43% 31.69% -
2 persons 48.68% 54.51% 55.06% 55.11% -
3 persons 11.92% 10.35% 8.36% 8.96% -
4 or more persons 3.97% 4.54% 5.15% 4.24% -
Number of Kids in Household (%)
0 children 70.20% 73.55% 74.08% 75.09% -
1 child 17.88% 15.61% 15.07% 15.27% -
2 children 11.26% 8.47% 8.9% 7.92% -
3 or more children .66% .50% 1.92% 1.72% -
Monthly Household Net Income (%)
≤ 1,000€ 14.24% 12.45% 14.71% 19.63% -
1,001€ – 2,000€ 28.81% 29.66% 30.88% 28.82% -
2,001€ – 3,000€ 26.49% 25.62% 27.67% 23.54% -
3,001€ – 4,000€ 8.28% 17.27% 13.88% 15.84% -
4,001€ – 5,000€ 8.94% 8.36% 8.18% 6.54% -
> 5,000€ 5.30% 6.64% 4.69% 5.63% -
Not answered 7.95% - - - -

214 Appendix B.2
Criterion Study 1 (n =302)
Study 2 (n = 1807)
Study 3 (n =1088)
Study 4 (n =871)
Study 5 (n =350)
City Size (%)
less than 100,000 inhabitants 23.51% 26.78% .00% 4.71% -
100,001 – 500,000 inhabitants 30.79% 33.37% 47.89% 48.11% -
500,001 – 1,000,000 inhabitants 19.21% 17.49% 24.36% 18.94% -
more than 1,000,000 inhabitants 26.49% 22.36% 27.76% 28.24% -
Note. A dash (-) denotes that this answer category has not been part of the respective survey.

Appendix B.3
215
B.3. Measures
Table 39: Comprehensive Display of all Measurement Constructs and Items in German and English (Project II)
Construct Items (German) Items (English) Source
Access attitude
(α = .93)
Wie beurteilen Sie das neue Verleihangebot von ____ insgesamt?2
finde ich sehr schlecht / finde ich sehr gut
sehe ich sehr negativ / sehe ich sehr positiv
finde ich sehr unbrauchbar / finde ich sehr nützlich
How do you evaluate the new access offering by ____?2
not favorable at all / very favorable;
very negative / very positive;
worthless / valuable
adapted from (Esch, Langner, Schmitt, & Geus, 2006; Kim et al., 2001; Spiggle, Nguyen, & Caravella, 2012)
Access usage intention
Wie wahrscheinlich würden Sie ein solches Angebot nutzen?
sehr unwahrscheinlich / sehr wahrscheinlich
How likely are you to use such an offering?
very unlikely / very likely
adapted from (Kim et al., 2001)
Access price fairness5
Wie beurteilen Sie das Carsharing-Angebot?
die Preise sind zu günstig / die Preise sind zu teuer
How do you evaluate the carsharing offering?
the prices are too cheap / the prices are too expensive
none
Brand attitude
(α = .96)
Wie ist Ihre generelle Einstellung gegenüber ____?2
finde ich sehr schlecht / finde ich sehr gut;
mag ich überhaupt nicht / mag ich sehr gerne
How is your general attitude towards ____?2
not favorable at all / very favorable;
dislike very much / like very much
adapted from (Boisvert, 2012b; Kim et al., 2001)
Brand purchase intention
Wie werden Sie sich gegenüber ____ verhalten?2
mir ____ von dieser Marke zu kaufen ist sehr unwahrscheinlich / mir ____ von dieser Marke zu kaufen ist sehr wahrscheinlich;
How will you behave towards ____ in the future?2
purchasing _____ from this brand is highly unlikely / purchasing _____ from this brand is highly likely
adapted from (Kim et al., 2001)

216 Appendix B.3
Construct Items (German) Items (English) Source
Brand word-of-mouth intentions
Wie werden Sie sich gegenüber ____ verhalten?2
ich würde diese Marke Anderen nicht weiterempfehlen / ich würde Anderen diese Marke auf jeden Fall weiterempfehlen
How will you behave towards ____ in the future?2
I would not recommend this brand to others / I would definitely recommend this brand to others
adapted from (Brady, Davies, & Gann, 2005; Spiggle et al., 2012)
Brand willingness to pay a price premium
Wie werden Sie sich gegenüber ____ verhalten?2
ich bin nicht bereit für diese Marke mehr als für vergleichbare Marken zu bezahlen / ich bin bereit für diese Marke mehr als für vergleichbare Marken zu bezahlen
How will you behave towards ____ in the future?2
I am not willing to pay more for this brand than for a comparable brand / I am willing to pay more for this brand than for a comparable brand
adapted from (Netemeyer et al., 2004)
Access involvement
Wie beurteilen Sie das neue Verleihangebot von ____ insgesamt?2
ist mir gänzlich unwichtig / ist mir sehr wichtig
How do you evaluate the new access offering by ____?2
not important to me / very important to me
adapted from (Boisvert, 2012b)
Access fit (α = .86)
Wie gut passt das Verleihangebot zu ____?2
das Verleihangebot passt gar nicht zu ____ / das Verleihangebot passt sehr gut zu ____;
das Verleihangebot macht sehr wenig Sinn für ____/ das Verleihangebot macht sehr viel Sinn für ____
How do you evaluate the fit between the access offering and ____?2
very low fit with ____ / very high fit with ____;
makes little sense for ____ / makes a lot of sense for ____
adapted from (Milberg et al., 2010)
Access knowledge
Ich kenne mich sehr gut mit Sharing- und Vermietangeboten (z.B. Carsharing, Bikesharing, Handtaschenverleih, etc.) aus.
I am well versed in sharing and rental offerings (e.g. carsharing, bikesharing, handbag rentals, etc.).
none
Brand innovativeness
Wie beurteilen Sie das Image von ____?2
überhaupt nicht innovativ / sehr innovativ
How do you evaluate the brand image of ____?2
very predictable / very innovative
adapted from (Boisvert, 2012b)

Appendix B.3
217
Construct Items (German) Items (English) Source
Brand eco-friendliness
Wie beurteilen Sie das Image von ____?2
verhält sich nicht umweltfreundlich / verhält sich sehr umweltfreundlich
How do you evaluate the brand image of ____?2
acts not environmentally friendly / acts very environmentally friendly
none
Brand exclusivity1
Wie beurteilen Sie das Image von ____?2
ist der breiten Masse zugänglich / ist nur einer exklusiven Gruppe zugänglich
How do you evaluate the brand image of ____?2
this brand is available to everyone / this brand is only available to an exclusive group
none
Brand quality5
Wie beurteilen Sie das Image von ____?2
bietet sehr geringe Qualität / bietet sehr hohe Qualität
How do you evaluate the brand image of ____?2
offers very low quality / offers very high quality
adapted from (Kim et al., 2001)
Brand familiarity
Ich kenne die Marke ____ sehr gut.2
I am very familiar with the brand ____.2
adapted from (Kim et al., 2001; Milberg et al., 2010)
Self-brand connection (α = .92)
Ich empfinde eine persönliche Verbindung zu ____.2
Ich kann mich mit ____ sehr gut identifizieren.2
I feel a personal connection to ____.2
I can identify very well with ____.2
adapted from (Spiggle et al., 2012)
Category hedonism
Mir bereitet es Freude mich mit ____ zu beschäftigen.3
Für mich sollten ____Spaß machen.3
For me it is exciting to be engaged with ____.3
From my point of view ____ should be fun.3
adapted from (Voss et al., 2003)
Category utilitarianism
Für mich sind / ist ____ Mittel zum Zweck.3
Für mich sollte(n) ____ funktional sein.3
For me, ____ are practical.3
For me, ____ should be functional.3
adapted from (Voss et al., 2003)
Ease of ownership perception
Außenstehende können sehr leicht erkennen, dass einem ein ____ nicht selbst gehört.4
Outside can easily recognize that one is not the true owner of _____.4
none
Brand visibility
Viele Personen um mich herum nehmen wahr, welche Marke mein(e) ____ hat.3
A lot of persons around me notice the brand of my _____.3 none
Age Bitte geben Sie Ihr Alter an. Please indicate your age. none.

218 Appendix B.3
Construct Items (German) Items (English) Source
Gender Bitte geben Sie Ihr Geschlecht an. Please indicate your gender. none
City size Wie viele Einwohner hat Ihr derzeitiger Wohnort?
How many inhabitants live in your current place of residence?
none
Car ownership
Wie viele Autos gibt es in Ihrem Haushalt?
Bitte geben Sie die Marke, die Fahrzeugklasse und das Alter jedes Ihrer Autos an.
How many cars do you have in your household?
Please indicate the brand, vehicle category and age of each of your cars.
none
Fashion ownership
Wie viele Kleidungsstücke der folgenden Kleidermarken besitzen Sie?
How many pieces of clothing by the following brands do you own?
none
Car availability
Wie häufig steht Ihnen ein privater PKW zum fahren zur Verfügung?
How frequently is a private car available to you? none
Status consciousness (α = .85)
Ich würde ein Produkt alleine aus Prestigegründen kaufen.
Ich bin an neuen Produkten interessiert, die als Statussymbol gelten.
Ich würde durchaus mehr Geld für ein Prestigeobjekt ausgeben, als für ein vergleichbares Produkt mit weniger Prestige.
Bei der Kaufentscheidung ist es mir egal, ob ein Produkt Prestigecharakter hat.
I would buy a product just because it has status.
I am interested in new products with status.
I would pay more for a product if it had status.
A product is more valuable to me if it has some snob appeal.
adapted from (Eastman et al., 1999)
Variety seeking (α = .73)
Ich schaue mir Werbung oft aus reiner Neugier an.
Mir wird langweilig wenn ich immer die gleichen Marken kaufe - selbst wenn sie gut sind.
Ich kaufe gerne mal etwas anderes, um mehr Vielfalt zu erleben.
I often read advertisements just out of curiosity.
I get bored with buying the same brands even if they are good.
I enjoy taking chances in buying something unfamiliar, just to get some variety in my purchases.
adapted from (Cotte & Wood, 2004)

Appendix B.3
219
Construct Items (German) Items (English) Source
Innovativeness (α = .94)
Mir macht es Spaß immer das Neuste zu kaufen.
Ich kaufe gerne neue Produkte bevor es Andere tun.
Ich finde es spannend die neusten Produkte zu kaufen.
Overall, I enjoy buying the latest products.
I like to purchase new products before others do.
Overall, it is exciting to buy the latest products.
adapted from (Völckner & Sattler, 2006)
Avoidance of similarity1
(α = .89)
Ich genieße es Dinge die zu besitzen, die andere nicht besitzen.
Ich versuche Produkte oder Marken zu vermeiden, die üblicherweise vom durchschnittlichen Konsumenten gekauft werden.
Je gewöhnlicher ein Produkt oder eine Marke in der Allgemeinbevölkerung ist, desto weniger bin ich daran interessiert.
Produkte, die regelmäßig von der breiten Masse gekauft werden, sind nicht viel Wert.
I enjoy having things that others do not.
I avoid products or brands that have been accepted and purchased by the average consumer.
The more commonplace a product or brand is among the general population, the less interested I am in buying it.
Products don’t seem to hold much value when everyone purchases them regularly.
adapted from (Lynn & Harris, 1997; Tian, Bearden, & Hunter, 2001)
Note. Text in italics denotes a question, whereas standard text denotes the items. The reported Cronbach’s α are from study 1, if not otherwise indicated. 1 These constructs are only relevant for studies 2-4. 2 The blanks in these items need to be filled with the respective brand name. 3 The blanks in these items need to be filled with the term of the corresponding product category. 4 The blanks in these items need to be filled with the general term for access offerings in the corresponding product category. 5 These constructs are only relevant for studies 1, 2 and 5.

220 Appendix B.4
B.4. Manipulation Checks
Table 40: Manipulation Checks for Brand Prestige and Brand Quality
low prestige brand M (SD)
high prestige brand M (SD)
independent samples
t-test t (p)
Brand Prestige
Study 1, Cars: Hyundai vs. Audi 3.76 (1.34) 5.30 (1.34) -5.31 (≤ .001)
Study 1, Fashion: H&M vs. BOSS 4.10 (1.35) 5.12 (1.42) -3.12 (≤ .01)
Study 2, Cars: Ford vs. BMW 3.94 (1.33) 5.51 (1.61) -9.44 (≤ .001)
Study 2, Fashion: H&M vs. BOSS 4.01 (1.38) 5.05 (1.43) -6.41 (≤ .001)
Study 3, Cars: Opel vs. Audi 3.92 (1.46) 5.45 (1.48) -12.31 (≤ .001)
Study 4, Cars: Opel vs. Audi 3.63 (1.33) 5.19 (1.41) -6.90 (≤ .001)
Study 5, Cars: Hyundai vs. Audi 2.76 (1.20) 5.63 (1.21) -23.60 (≤ .001)
Brand Quality
Study 1, Cars: Hyundai vs. Audi 4.15 (1.33) 5.45 (1.22) -4.72 (≤ .001)
Study 1, Fashion: H&M vs. BOSS 3.83 (1.39) 5.02 (1.24) -3.95 (≤ .001)
Study 2, Cars: Ford vs. BMW 4.52 (1.37) 5.51 (1.67) -5.75 (≤ .001)
Study 2, Fashion: H&M vs. BOSS 3.96 (1.32) 5.09 (1.46) -7.07 (≤ .001)
Note. The bold variable denotes the respective depending variable. The first mentioned brand name is the low prestige brand. Except study 3 all reported measurements were collected from the control groups. Study 3 was designed without a control condition. Thus, the brand prestige manipulation check in this study is based upon respondents who were exposed to one of the access offerings. However, only non-owners’ responses were used for the manipulation check in order to get an objective result.

Appendix 0
221
Table 41: Manipulation Checks for Service Convenience
Table 42: Manipulation Checks for Branding Strategy
low convenience
level M (SD)
medium convenience
level M (SD)
high convenience
level M (SD)
ANOVA F ( p)
Study 3, Cars 4.67 (1.38) 5.15 (1.34) 5.42 (1.36) 28.44 (≤ .001)
Note. On the questionnaire page after the consumer reports article, respondents were asked the following questions as a manipulation check of the convenience level: “How do you judge the convenience of this carsharing offering?” Answers were collected on a 7-item semantic differential labeled very inconvenient on the left and very convenient on the right. Post-hoc tests reveal significant differences for all pairwise comparisons.
close branding strategy M (SD)
distant branding strategy M (SD)
independent samples
t-test t ( p)
Study 4, Cars 2.76 (1.85) 3.35 (2.04) -3.62 (≤ .001)
Note. Subsequently to the consumer reports article, respondents were asked the following questions as a manipulation check of the branding strategy: “How similar is the product brand to the brand of the access provider?” Answers were collected on a 7-item semantic differential, anchored by product brand and provider brand are identical and product brand and provider brand are completely different.

222 Appendix B.5
B.5. Additional Analyses
Table 43: Simple Main Effect Analysis for the Ownership Status × Brand Prestige Interaction of the Parent Brand Evaluation
Cell Means
Interaction Effect from
ANOVA
low prestige
brand owners high prestige brand owners
Simple Main Effect
Analysis
Study 2, Cars
Brand attitude 0.48 (.49) 5.52
(1.26) 6.17
(1.10) 30.38 (<.001)
Brand purchase intention 6.51 (.01) 5.37
(1.55) 5.89
(1.41) 11.78 (<.01)
Brand WOM 3.36 (.07) 5.19
(1.54) 6.03
(1.27) 34.84 (<.001)
Brand WTP 26.88 (<.001) 3.86
(1.62) 5.34
(1.54) 92.63 (<.001)
Study 2, Fashion
Brand attitude 0.09 (.76) 5.12
(1.30) 5.55
(1.19) 14.85 (<.001)
Brand purchase intention 0.37 (.54) 5.33
(1.40) 5.32
(1.31) 0.01 (.93)
Brand WOM 0.31 (.58) 4.86
(1.49) 5.11
(1.66) 5.09 (.02)
Brand WTP 14.39 (<.001) 3.54
(1.53) 4.65
(1.52) 59.58 (<.001)
Study 4, Cars
Brand attitude 10.04 (<.01) 5.71
(1.25) 6.37 (.99) 28.85
(<.001)
Brand purchase intention 0.09 (.76) 5.41
(1.54) 5.96
(1.33) 12.68 (<.001)
Brand WOM 0.19 (.66) 5.23
(1.63) 5.94
(1.55) 12.75 (<.001)
Brand WTP 7.30 (.01) 3.87
(1.63) 5.28
(1.63) 79.94 (<.001)
Note. F-values are displayed above the corresponding p-values in parentheses in the columns labeled interaction effect from ANOVA and simple main effect analysis. In the columns that display the cell means the means are displayed above the standard deviation in parentheses.
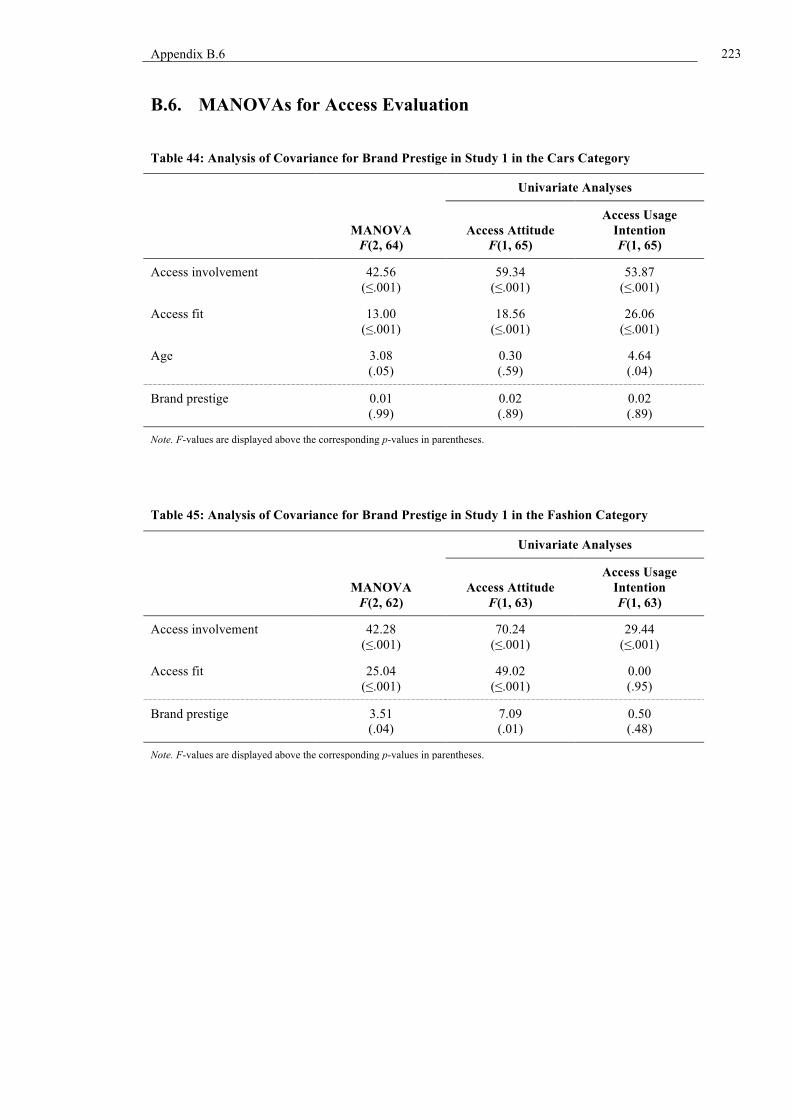
Appendix B.6
223
B.6. MANOVAs for Access Evaluation
Table 44: Analysis of Covariance for Brand Prestige in Study 1 in the Cars Category
Univariate Analyses
MANOVA
F(2, 64) Access Attitude
F(1, 65)
Access Usage Intention F(1, 65)
Access involvement 42.56 (≤.001)
59.34 (≤.001)
53.87 (≤.001)
Access fit 13.00 (≤.001)
18.56 (≤.001)
26.06 (≤.001)
Age 3.08 (.05)
0.30 (.59)
4.64 (.04)
Brand prestige 0.01 (.99)
0.02 (.89)
0.02 (.89)
Note. F-values are displayed above the corresponding p-values in parentheses.
Table 45: Analysis of Covariance for Brand Prestige in Study 1 in the Fashion Category
Univariate Analyses
MANOVA
F(2, 62) Access Attitude
F(1, 63)
Access Usage Intention F(1, 63)
Access involvement 42.28 (≤.001)
70.24 (≤.001)
29.44 (≤.001)
Access fit 25.04 (≤.001)
49.02 (≤.001)
0.00 (.95)
Brand prestige 3.51 (.04)
7.09 (.01)
0.50 (.48)
Note. F-values are displayed above the corresponding p-values in parentheses.

224 Appendix B.6
Table 46: Analysis of Variance for Ownership Status, Price Level and Brand Prestige in Study 2 in the Cars Category
Univariate Analyses
MANOVA F(2, 572)
Access Attitude F(1, 573)
Access Usage Intention F(1, 573)
Owner 1.45 (.23)
0.15 (.70)
2.74 (.10)
Price 2.61 (.07)
4.86 (.03)
2.39 (.12)
Brand 5.32 (.01)
0.49 (.49)
6.35 (.01)
Owner × Price 1.65 (.19)
3.24 (.07)
1.11 (.29)
Owner × Brand 2.85 (.06)
4.45 (.04)
3.85 (.05)
Price × Brand 3.16 (.04)
5.81 (.02)
3.05 (.08)
Owner × Price × Brand 0.50 (.61)
0.49 (.49)
0.10 (.75)
Note. F-values are displayed above the corresponding p-values in parentheses.
Table 47: Analysis of Variance for Ownership Status, Price Level and Brand Prestige in Study 2 in the Fashion Category
Univariate Analyses
MANOVA F(2, 605)
Access Attitude F(1, 606)
Access Usage Intention F(1, 606)
Owner 20.31 (≤.001)
2.13 (.15)
34.12 (≤.001)
Price 0.58 (.56)
0.01 (.93)
0.66 (.42)
Brand 7.90 (≤.001)
11.31 (≤.01)
13.83 (≤.001)
Owner × Price 0.92 (.40)
0.02 (.88)
0.98 (.32)
Owner × Brand 5.91 (≤.01)
1.95 (.16)
2.82 (.09)
Price × Brand 0.61 (.54)
0.27 (.61)
0.23 (.64)
Owner × Price × Brand 1.23 (.29)
0.21 (.65)
2.18 (.14)
Note. F-values are displayed above the corresponding p-values in parentheses.

Appendix B.6
225
Table 48: Analysis of Variance for Ownership Status, Price Level, Brand Prestige and Convenience Level in Study 3
Univariate Analyses
Relative Weights Analysis
MANOVA F(2, 1063)
Access Attitude
F(1, 1064)
Access Usage Intention F(1, 1064)
Access Attitude
Access Usage
Intention
Owner 14.07 (≤.001)
17.33 (≤.001)
23.89 (≤.001)
31.09%
49.25%
Price 2.05 (.13)
4.06 (.04)
0.64 (.42)
7.39% 1.28%
Brand 0.63 (.53)
0.13 (.72)
0.58 (.45)
0.25% 1.14%
Convenience 5.19 (≤.001)
9.02 (≤.001)
2.62 (.07)
29.77% 9.77%
Owner × Price 0.81 (.45)
0.71 (.40)
1.55 (.21)
1.38% 3.23%
Owner × Brand 3.12 (.04)
2.88 (.09)
5.88 (.02)
5.22% 11.92%
Owner × Convenience
1.35 (.25)
1.72 (.18)
0.66 (.52)
0.66% 1.86%
Price × Brand 4.94 (.01)
6.94 (.01)
7.69 (.01)
13.01% 15.35%
Price × Convenience
0.94 (.44)
0.14 (.87)
0.96 (.39)
0.47% 3.83%
Brand × Convenience
1.04 (.38)
1.96 (.14)
0.48 (.62)
3.63% 0.19%
Owner × Price × Brand
0.04 (.96)
0.08 (.78)
0.03 (.85)
0.21% 0.07%
Owner × Price × Convenience
0.77 (.54)
1.37 (.26)
0.19 (.82)
4.83% 0.21%
Owner × Brand × Convenience
0.25 (.91)
0.14 (.87)
0.46 (.63)
0.52% 1.33%
Price × Brand × Convenience
0.31 (.87)
0.56 (.57)
0.14 (.87)
1.14% 0.03%
Owner × Price × Brand × Convenience
0.67 (.61)
0.83 (.44)
0.13 (.88)
0.43% 0.53%
Note. F-values are displayed above the corresponding p-values in parentheses. The results of the relative weight analysis are displayed in form of the rescaled importance weights, which are calculated by dividing the raw weights by the model R2 and then multiplying these values by 100%. The resulting percentages indicate the proportion of variance explained attributable to each effect.

226 Appendix B.6
Table 49: Analysis of Variance for Brand Prestige, Ownership Status and Branding Strategy in Study 4
Univariate Analyses
MANOVA F(2, 571)
Access Attitude F(1, 572)
Access Usage Intention F(1, 572)
Brand 3.39 (.03)
0.15 (.70)
6.24 (.01)
Owner 1.11 (.33)
1.81 (.18)
1.33 (.25)
Branding 0.51 (.60)
1.01 (.32)
0.10 (.76)
Brand × Owner 2.80 (.06)
3.94 (.05)
4.04 (.05)
Brand × Branding 2.64 (.07)
1.21 (.27)
5.28 (.02)
Owner × Branding 1.71 (.18)
3.16 (.08)
1.49 (.22)
Brand × Owner × Branding 1.90 (.15)
3.66 (.06)
1.37 (.24)
Note. F-values are displayed above the corresponding p-values in parentheses.
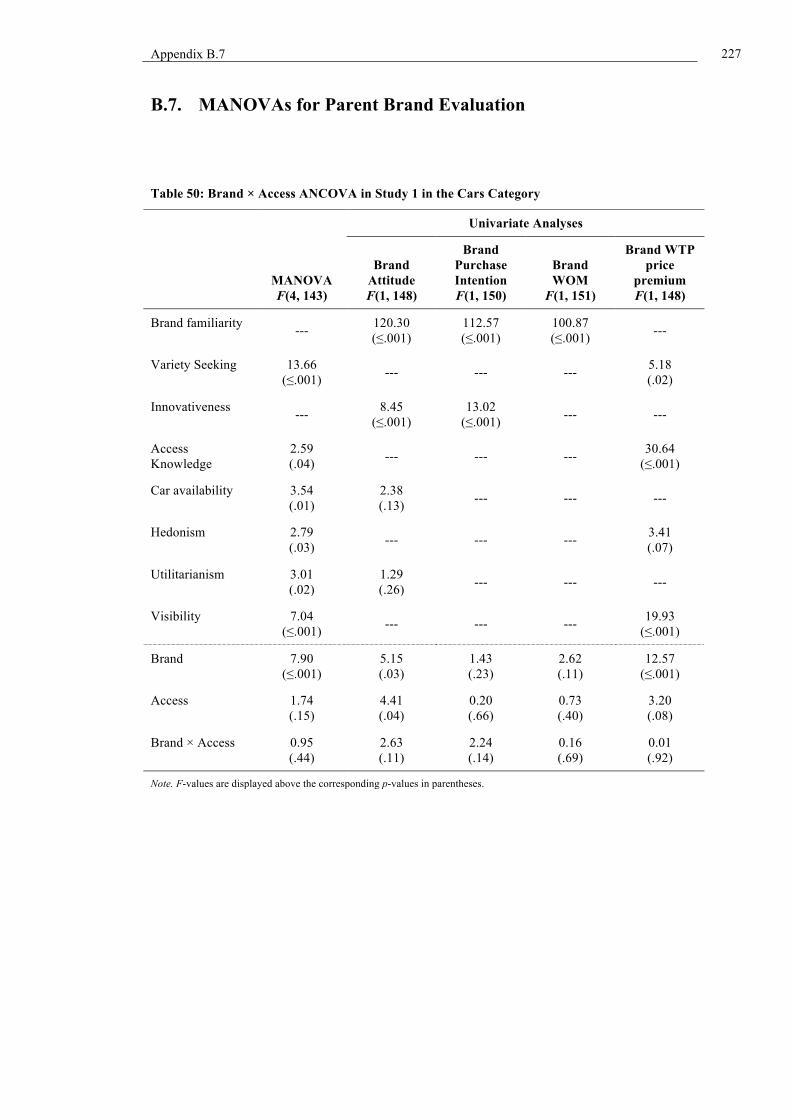
Appendix B.7
227
B.7. MANOVAs for Parent Brand Evaluation
Table 50: Brand × Access ANCOVA in Study 1 in the Cars Category
Univariate Analyses
MANOVA F(4, 143)
Brand Attitude F(1, 148)
Brand Purchase Intention F(1, 150)
Brand WOM
F(1, 151)
Brand WTP price
premium F(1, 148)
Brand familiarity --- 120.30 (≤.001)
112.57 (≤.001)
100.87 (≤.001) ---
Variety Seeking 13.66 (≤.001) --- --- --- 5.18
(.02)
Innovativeness --- 8.45 (≤.001)
13.02 (≤.001) --- ---
Access Knowledge
2.59 (.04) --- --- --- 30.64
(≤.001)
Car availability 3.54 (.01)
2.38 (.13) --- --- ---
Hedonism 2.79 (.03) --- --- --- 3.41
(.07)
Utilitarianism 3.01 (.02)
1.29 (.26) --- --- ---
Visibility 7.04 (≤.001) --- --- --- 19.93
(≤.001)
Brand 7.90 (≤.001)
5.15 (.03)
1.43 (.23)
2.62 (.11)
12.57 (≤.001)
Access 1.74 (.15)
4.41 (.04)
0.20 (.66)
0.73 (.40)
3.20 (.08)
Brand × Access 0.95 (.44)
2.63 (.11)
2.24 (.14)
0.16 (.69)
0.01 (.92)
Note. F-values are displayed above the corresponding p-values in parentheses.

228 Appendix B.7
Table 51: Brand × Access ANCOVA in Study 1 in the Fashion Category
Univariate Analyses
MANOVA F(4, 134)
Brand Attitude F(1, 136)
Brand Purchase Intention F(1, 138)
Brand WOM
F(1, 138)
Brand WTP price
premium F(1, 140)
Personal brand connection
42.33 (≤.001)
73.28 (≤.001)
158.15 (≤.001)
69.11 (≤.001)
72.73 (≤.001)
Brand familiarity --- 10.80 (≤.001)
29.95 (≤.001)
17.52 (≤.001) ---
Status consciousness
5.09 (≤.001)
4.52 (.04)
3.34 (.07) --- ---
Utilitarianism 3.47 (.01)
14.44 (≤.001) --- 4.49
(.04) ---
Ownership perceptibility
2.96 (.02)
5.40 (.02) --- --- ---
Brand visibility --- --- --- --- 9.09 (≤.001)
High prestige brand ownership
5.92 (≤.001)
3.10 (.08)
12.56 (≤.001) --- ---
Low prestige brand ownership --- --- --- 8.04
(.01) ---
Brand 11.23 (≤.001)
5.22 (.02)
10.68 (≤.001)
5.44 (.02)
0.87 (.35)
Access 0.23 (.92)
0.12 (.73)
0.07 (.80)
0.16 (.70)
0.12 (.73)
Brand × Access 0.70 (.59)
1.14 (.29)
0.42 (.52)
0.00 (.99)
0.00 (.99)
Note. F-values are displayed above the corresponding p-values in parentheses.

Appendix B.7
229
Table 52: Analysis of Variance for Brand, Ownership Status, and Treatment in Study 2 in the Cars Category
Univariate Analyses
MANOVA F(4, 877)
Brand Attitude F(1, 880)
Brand Purchase Intention F(1, 880)
Brand WOM
F(1, 880)
Brand WTP price
premium F(1, 880)
Brand 30.90 (≤.001)
51.96 (≤.001)
5.36 (.02)
43.07 (≤.001)
71.94 (≤.001)
Owner 113.63 (≤.001)
262.45 (≤.001)
516.89 (≤.001)
285.48 (≤.001)
199.55 (≤.001)
Treatment 1.45 (.17)
2.16 (.12)
0.71 (.49)
2.30 (.10)
0.31 (.73)
Brand × Owner 7.41 (≤.001)
0.48 (.49)
6.51 (.01)
3.36 (.07)
26.88 (≤.001)
Brand × Treatment 1.23 (.28)
0.93 (.40)
0.27 (.76)
0.45 (.64)
0.19 (.83)
Owner × Treatment 0.88 (.53)
2.75 (.06)
1.85 (.16)
1.68 (.19)
0.95 (.39)
Brand × Owner × Treatment
1.11 (.36)
0.83 (.44)
0.68 (.51)
1.78 (.17)
0.65 (.52)
Note. F-values are displayed above the corresponding p-values in parentheses.

230 Appendix B.7
Table 53: Analysis of Variance for Brand, Ownership Status, and Treatment in Study 2 in the Fashion Category
Univariate Analyses
MANOVA F(4, 900)
Brand Attitude F(1, 903)
Brand Purchase Intention F(1, 903)
Brand WOM
F(1, 903)
Brand WTP price
premium F(1, 903)
Brand 29.70 (≤.001)
33.11 (≤.001)
0.50 (.48)
14.23 (≤.001)
49.80 (≤.001)
Owner 135.58 (≤.001)
267.05 (≤.001)
523.97 (≤.001)
169.89 (≤.001)
152.22 (≤.001)
Treatment 0.86 (.55)
0.63 (.53)
0.21 (.81)
0.64 (.53)
2.49 (.08)
Brand × Owner 6.06 (≤.001)
0.09 (.76)
0.37 (.54)
0.31 (.58)
14.39 (≤.001)
Brand × Treatment 0.03 (.97)
0.44 (.64)
0.34 (.71)
0.60 (.55)
0.05 (.95)
Owner × Treatment 0.82 (.59)
1.10 (.33)
1.11 (.33)
0.06 (.95)
1.11 (.33)
Brand × Owner × Treatment
0.34 (.95)
0.57 (.57)
0.07 (.93)
0.92 (.40)
0.09 (.91)
Note. F-values are displayed above the corresponding p-values in parentheses.

Appendix B.7
231
Table 54: Analysis of Variance for Brand, Ownership Status, and Treatment in Study 4
Univariate Analyses
MANOVA F(4, 856)
Brand Attitude F(1, 859)
Brand Purchase Intention F(1, 859)
Brand WOM
F(1, 859)
Brand WTP price
premium F(1, 859)
Brand 46.17 (≤.001)
115.73 (≤.001)
22.39 (≤.001)
49.49 (≤.001)
99.29 (≤.001)
Owner 114.59 (≤.001)
244.87 (≤.001)
446.93 (≤.001)
182.28 (≤.001)
152.05 (≤.001)
Treatment 0.62 (.77)
1.10 (.33)
1.76 (.17)
0.91 (.40)
0.32 (.73)
Brand × Owner 7.33 (≤.001)
10.04 (≤.01)
0.09 (.76)
0.19 (.66)
7.30 (.01)
Brand × Treatment 0.41 (.92)
0.53 (.59)
0.27 (.76)
0.05 (.95)
0.70 (.50)
Owner × Treatment 2.72 (.01)
0.36 (.70)
2.68 (.07)
1.01 (.36)
2.81 (.06)
Brand × Owner × Treatment
0.82 (.58)
0.91 (.40)
0.28 (.76)
1.62 (.20)
0.27 (.76)
Note. F-values are displayed above the corresponding p-values in parentheses.

232 Appendix B.8
B.8. Interaction Graphs
Interaction Graphs – Study 2
Figure 28: Interaction Graph of Access Attitude between Price Level and Brand in Study 2 for Cars. Note: error bars represent standard error of means; 3.5 = neutral scale mean.
Figure 29: Interaction Graph of Access Attitude between Brand and Price Level in Study 2 for Cars. Note: error bars represent standard error of means; 3.5 = neutral scale mean.
Figure 30: Interaction Graph of Access Behavioral Intention between Brand and Price Level in Study 2 for Cars. Note: error bars represent standard error of means; 3.5 = neutral scale mean.
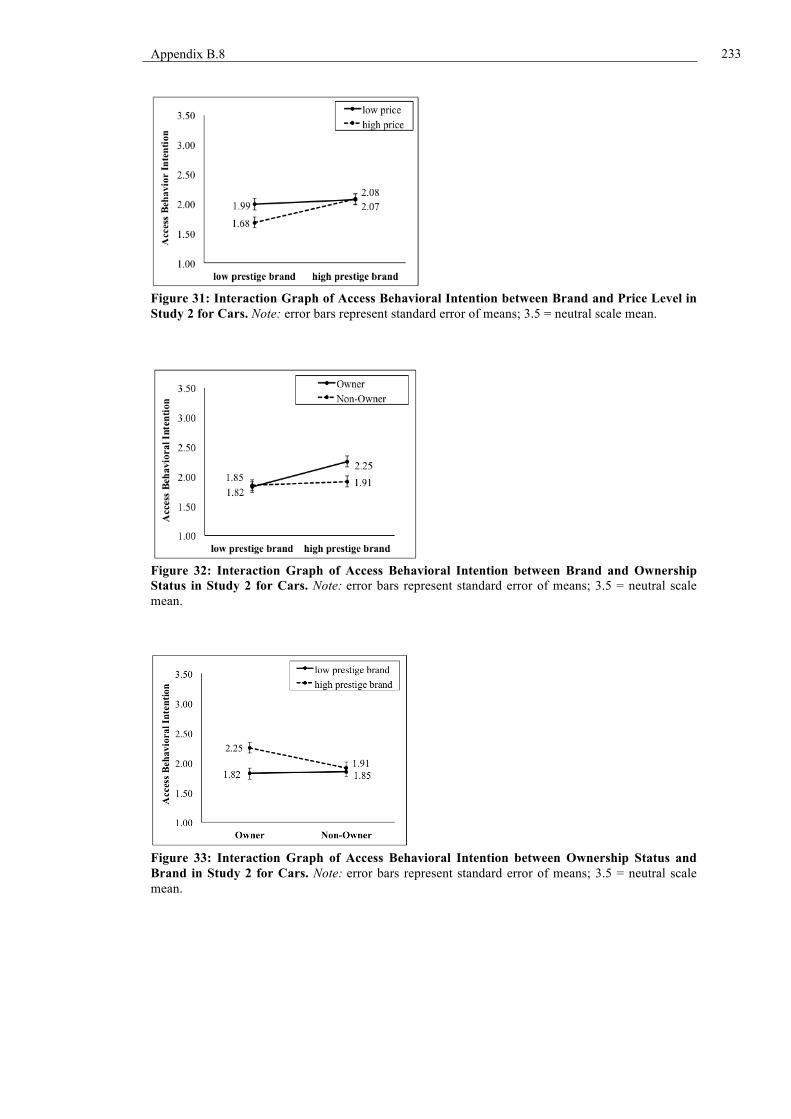
Appendix B.8
233
Figure 31: Interaction Graph of Access Behavioral Intention between Brand and Price Level in Study 2 for Cars. Note: error bars represent standard error of means; 3.5 = neutral scale mean.
Figure 32: Interaction Graph of Access Behavioral Intention between Brand and Ownership Status in Study 2 for Cars. Note: error bars represent standard error of means; 3.5 = neutral scale mean.
Figure 33: Interaction Graph of Access Behavioral Intention between Ownership Status and Brand in Study 2 for Cars. Note: error bars represent standard error of means; 3.5 = neutral scale mean.
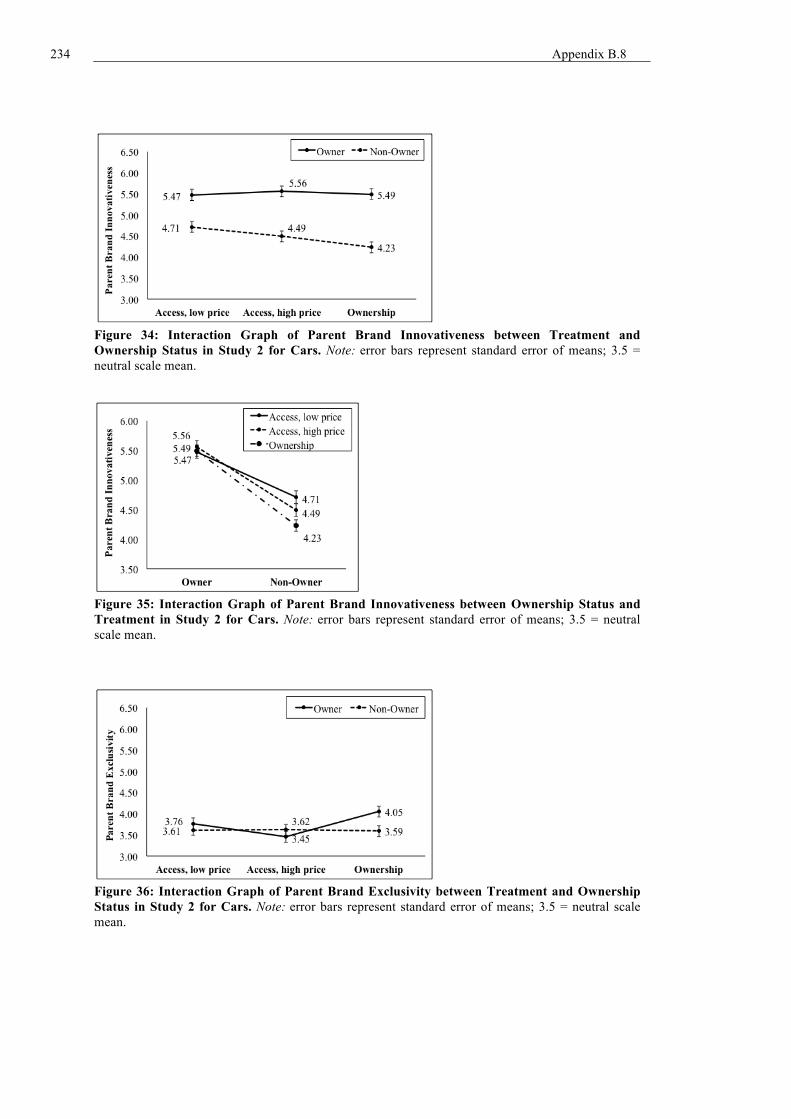
234 Appendix B.8
Figure 34: Interaction Graph of Parent Brand Innovativeness between Treatment and Ownership Status in Study 2 for Cars. Note: error bars represent standard error of means; 3.5 = neutral scale mean.
Figure 35: Interaction Graph of Parent Brand Innovativeness between Ownership Status and Treatment in Study 2 for Cars. Note: error bars represent standard error of means; 3.5 = neutral scale mean.
Figure 36: Interaction Graph of Parent Brand Exclusivity between Treatment and Ownership Status in Study 2 for Cars. Note: error bars represent standard error of means; 3.5 = neutral scale mean.
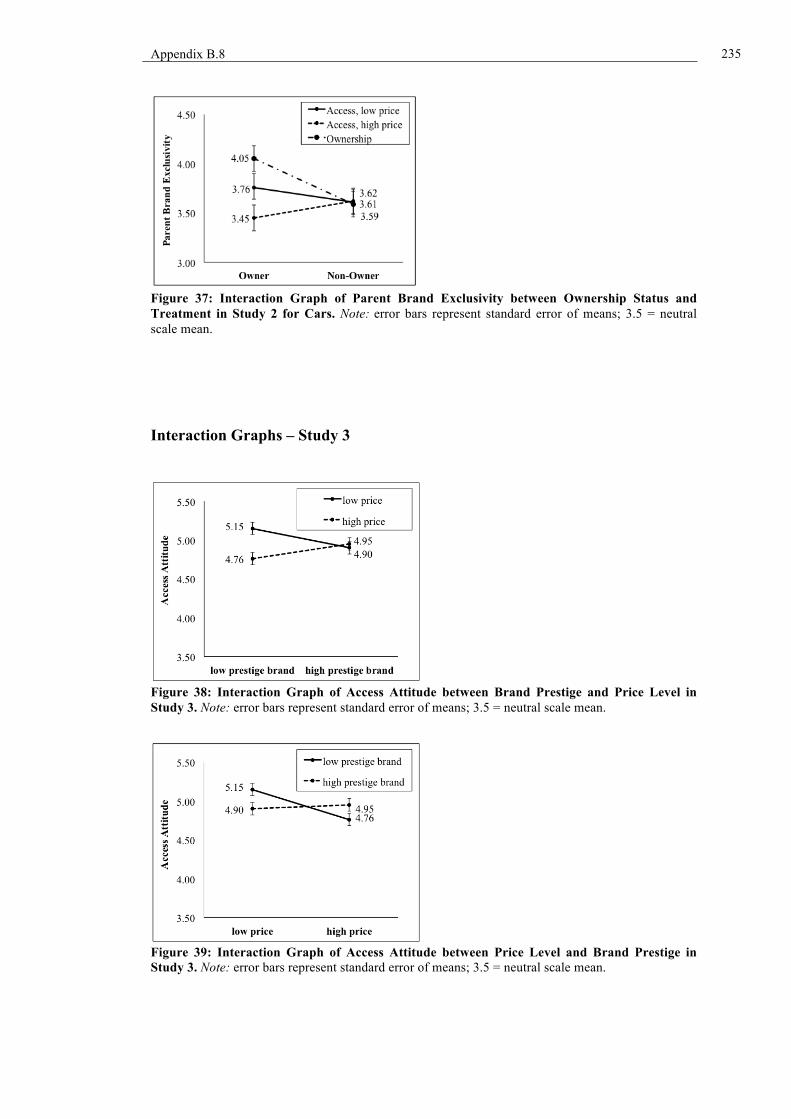
Appendix B.8
235
Figure 37: Interaction Graph of Parent Brand Exclusivity between Ownership Status and Treatment in Study 2 for Cars. Note: error bars represent standard error of means; 3.5 = neutral scale mean.
Interaction Graphs – Study 3
Figure 38: Interaction Graph of Access Attitude between Brand Prestige and Price Level in Study 3. Note: error bars represent standard error of means; 3.5 = neutral scale mean.
Figure 39: Interaction Graph of Access Attitude between Price Level and Brand Prestige in Study 3. Note: error bars represent standard error of means; 3.5 = neutral scale mean.

236 Appendix B.8
Interaction Graphs – Study 4
Figure 40: Interaction Graph of Access Usage Intention between Brand Prestige and Ownership Status in Study 4. Note: error bars represent standard error of means; 3.5 = neutral scale mean.
Figure 41: Interaction Graph of Access Usage Intention between Ownership Status and Brand Prestige in Study 4. Note: error bars represent standard error of means; 3.5 = neutral scale mean.

Appendix B.8
237
Figure 42: Interaction Graph of Access Usage Intention between Branding Strategy and Brand Prestige in Study 4. Note: error bars represent standard error of means; 3.5 = neutral scale mean.
Figure 43: Interaction Graph of Access Usage Intention between Brand Prestige and Branding Strategy in Study 4. Note: error bars represent standard error of means; 3.5 = neutral scale mean.

238 Appendix B.9
B.9. Cell Means
Table 55: Cell Means in Study 1 in the Cars Category
Low Prestige Brand High Prestige Brand
Access Ownership Access Ownership
Access Offering Perceptions
Access attitude 5.37 (1.17) --- 5.17 (1.31) ---
Access usage intentions 1.93 (0.98) --- 1.86 (1.24) ---
Product Brand Perceptions
Brand attitude 4.27 (1.52) 4.36 (1.26) 5.27 (1.68) 5.76 (1.20)
Brand purchase intention 3.57 (1.81) 3.41 (1.73) 4.10 (2.13) 4.35 (1.85)
Brand WOM 3.82 (1.42) 3.96 (1.38) 5.02 (1.69) 5.05 (1.69)
Brand WTP price premium 2.46 (1.37) 3.22 (1.55) 3.90 (1.83) 4.33 (1.66)
Brand innovativeness 4.64 (1.03) 4.15 (1.45) 5.31 (1.20) 5.30 (1.22)
Brand ecological friendliness 4.43 (1.14) 4.41 (1.24) 4.81 (1.40) 4.80 (1.14)
Cell size n 28 46 42 40 Note. Standard deviations in parentheses.
Table 56: Cell Means in Study 1 in the Fashion Category
Low Prestige Brand High Prestige Brand
Access Ownership Access Ownership
Access Offering Perceptions
Access attitude 3.65 (1.75) --- 4.29 (1.55) ---
Access usage intentions 1.49 (1.01) --- 1.72 (1.02) ---
Product Brand Perceptions
Brand attitude 4.57 (1.53) 4.79 (1.38) 4.86 (1.56) 4.78 (1.20)
Brand purchase intention 4.74 (1.77) 4.76 (1.92) 3.38 (2.06) 3.78 (1.58)
Brand WOM 4.37 (1.63) 4.41 (1.57) 4.47 (1.55) 4.56 (1.26)
Brand WTP price premium 3.14 (1.35) 3.41 (1.78) 3.13 (1.72) 3.50 (1.74)
Brand innovativeness 4.74 (1.29) 4.41 (1.38) 4.91 (1.25) 4.62 (1.11)
Brand ecological friendliness 3.46 (1.29) 3.55 (1.33) 4.66 (1.10) 4.36 (0.94)
Cell size n 35 29 32 50 Note. Standard deviations in parentheses.

Appendix B.9
239
Table 57: Cell Means in Study 2 in the Cars Category
Hig
h pr
estig
e br
and
Non
-ow
ner
Ow
ner-
ship
---
---
4.46
2.99
3.79
3.06
4.58
3.96
4.17
80
Acc
ess,
hi
gh
pric
e
4.57
1.85
5.01
3.23
4.22
3.40
4.99
4.33
4.41
73
Acc
ess,
lo
w
pric
e
4.68
1.96
4.83
3.40
4.48
3.28
5.17
4.41
4.28
75
Ow
ner
Ow
ner-
ship
---
---
6.16
6.04
6.16
5.47
6.12
5.42
4.78
76
Acc
ess,
high
pr
ice
4.99
2.32
6.30
5.93
5.94
5.33
6.15
5.37
4.35
72
Acc
ess,
low
pr
ice
4.84
2.17
6.04
5.67
5.99
5.21
6.09
5.19
4.56
70
Low
pre
stig
e br
and
Non
-ow
ner
Ow
ner-
ship
---
---
4.13
3.16
3.52
2.79
3.89
4.05
3.01
80
Acc
ess,
hi
gh
pric
e
4.54
1.66
4.18
3.32
3.80
2.84
3.99
4.11
2.82
74
Acc
ess,
lo
w
pric
e
5.37
2.04
4.38
3.21
3.75
3.04
4.24
4.08
2.93
72
Ow
ner
Ow
ner-
ship
---
---
5.55
5.35
5.01
3.80
4.87
4.56
3.32
75
Acc
ess,
high
pr
ice
4.63
1.70
5.65
5.55
5.32
3.97
4.96
4.68
2.55
74
Acc
ess,
low
pr
ice
4.87
1.94
5.34
5.20
5.24
3.80
4.86
4.82
2.96
71
Acc
ess O
ffer
ing
Perc
eptio
ns
Acc
ess a
ttitu
de
Acc
ess u
sage
in
tent
ions
Pr
oduc
t Bra
nd
Perc
eptio
ns
Bra
nd a
ttitu
de
Bra
nd p
urch
ase
inte
ntio
n
Bra
nd W
OM
Bra
nd W
PP
Bra
nd in
nova
tiven
ess
Bra
nd e
colo
gica
l fr
iend
lines
s
Bra
nd e
xclu
sivi
ty
Cel
l siz
e n
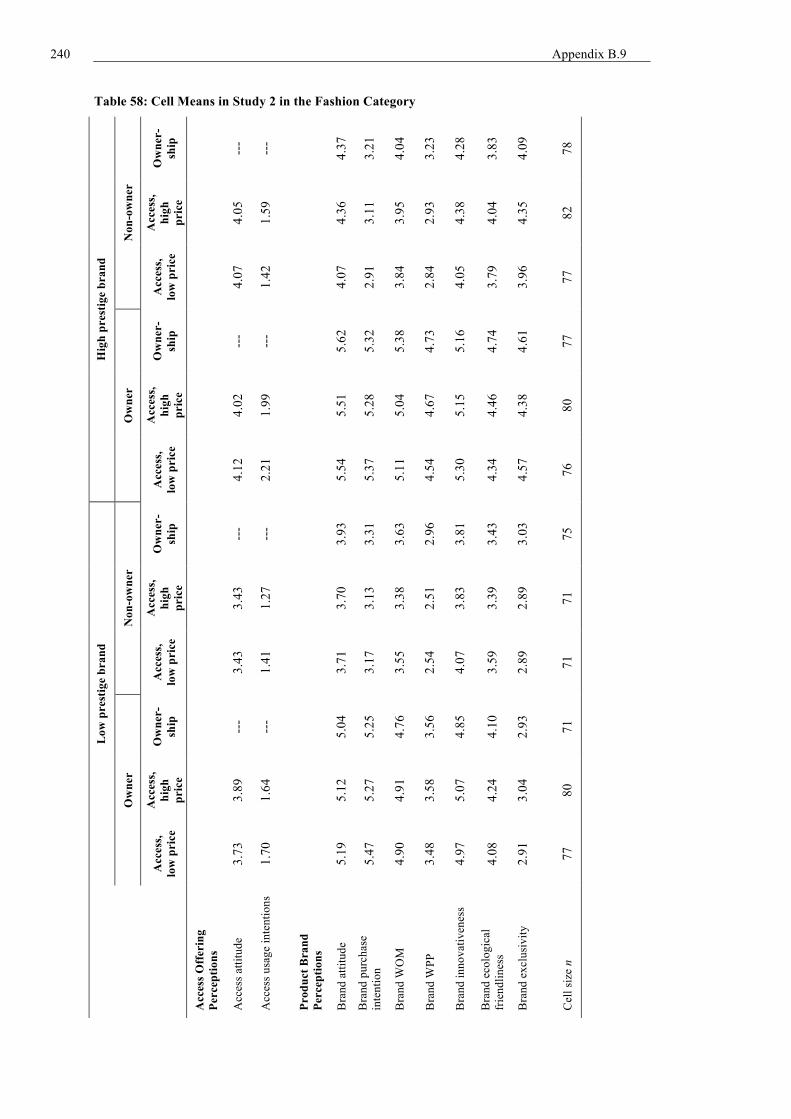
240 Appendix B.9
Table 58: Cell Means in Study 2 in the Fashion Category H
igh
pres
tige
bran
d
Non
-ow
ner
Ow
ner-
ship
---
---
4.37
3.21
4.04
3.23
4.28
3.83
4.09
78
Acc
ess,
hi
gh
pric
e
4.05
1.59
4.36
3.11
3.95
2.93
4.38
4.04
4.35
82
Acc
ess,
lo
w p
rice
4.07
1.42
4.07
2.91
3.84
2.84
4.05
3.79
3.96
77
Ow
ner
Ow
ner-
ship
---
---
5.62
5.32
5.38
4.73
5.16
4.74
4.61
77
Acc
ess,
high
pr
ice
4.02
1.99
5.51
5.28
5.04
4.67
5.15
4.46
4.38
80
Acc
ess,
low
pri
ce
4.12
2.21
5.54
5.37
5.11
4.54
5.30
4.34
4.57
76
Low
pre
stig
e br
and
Non
-ow
ner
Ow
ner-
ship
---
---
3.93
3.31
3.63
2.96
3.81
3.43
3.03
75
Acc
ess,
hi
gh
pric
e
3.43
1.27
3.70
3.13
3.38
2.51
3.83
3.39
2.89
71
Acc
ess,
lo
w p
rice
3.43
1.41
3.71
3.17
3.55
2.54
4.07
3.59
2.89
71
Ow
ner
Ow
ner-
ship
---
---
5.04
5.25
4.76
3.56
4.85
4.10
2.93
71
Acc
ess,
high
pr
ice
3.89
1.64
5.12
5.27
4.91
3.58
5.07
4.24
3.04
80
Acc
ess,
low
pri
ce
3.73
1.70
5.19
5.47
4.90
3.48
4.97
4.08
2.91
77
Acc
ess O
ffer
ing
Perc
eptio
ns
Acc
ess a
ttitu
de
Acc
ess u
sage
inte
ntio
ns
Prod
uct B
rand
Pe
rcep
tions
Bra
nd a
ttitu
de
Bra
nd p
urch
ase
inte
ntio
n
Bra
nd W
OM
Bra
nd W
PP
Bra
nd in
nova
tiven
ess
Bra
nd e
colo
gica
l fr
iend
lines
s
Bra
nd e
xclu
sivi
ty
Cel
l siz
e n

Appendix B.9
241
Table 59: Cell Means in Study 3
Low
pre
stig
e br
and
Non
owne
r
Hig
h pr
ice
Hig
h co
nven
ienc
e
4.86
(1
.56)
1.
98
(1.1
7)
44
Hig
h pr
estig
e br
and
Non
owne
r
Hig
h pr
ice
Hig
h co
nven
ienc
e
4.73
(1
.39)
2.
36
(1.3
1)
45
Med
ium
co
nven
ienc
e
4.87
(1
.45)
1.
98
(1.2
8)
47
Med
ium
co
nven
ienc
e
5.00
(1
.35)
2.
20
(1.4
3)
53
Low
co
nven
ienc
e
4.33
(1
.53)
1.
98
(1.1
8)
45
Low
co
nven
ienc
e
4.54
(1
.38)
1.
94
(1.2
3)
46
Low
pri
ce
Hig
h co
nven
ienc
e
5.24
(1
.49)
2.
36
(1.3
1)
44
Low
pri
ce
Hig
h co
nven
ienc
e
4.80
(1
.34)
1.
91
(1.0
9)
46
Med
ium
co
nven
ienc
e
5.38
(1
.05)
2.
20
(1.4
3)
50
Med
ium
co
nven
ienc
e
4.58
(1
.35)
1.
75
(.97)
44
Low
co
nven
ienc
e
4.45
(1
.35)
1.
94
(1.2
3)
48
Low
co
nven
ienc
e
4.45
(1
.37)
1.
80
(.93)
44
Ow
ner
Hig
h pr
ice
Hig
h co
nven
ienc
e
5.07
(1
.52)
2.
20
(1.2
9)
44
Ow
ner
Hig
h pr
ice
Hig
h co
nven
ienc
e
5.53
(1
.19)
2.
70
(1.3
0)
44
Med
ium
co
nven
ienc
e
4.92
(1
.17)
2.
02
(1.0
9)
44
Med
ium
co
nven
ienc
e
4.99
(1
.32)
2.
35
(1.3
0)
46
Low
co
nven
ienc
e
4.55
(1
.39)
2.
02
(1.3
2)
44
Low
co
nven
ienc
e
4.92
(1
.38)
2.
50
(1.3
4)
44
Low
pri
ce
Hig
h co
nven
ienc
e
5.41
(1
.15)
2.
55
(1.3
1)
44
Low
pri
ce
Hig
h co
nven
ienc
e
5.18
(1
.60)
2.
78
(1.4
3)
45
Med
ium
co
nven
ienc
e
5.35
(1
.34)
2.
50
(1.3
7)
44
Med
ium
co
nven
ienc
e
5.14
(1
.27)
2.
34
(1.2
6)
44
Low
co
nven
ienc
e
5.07
(1
.30)
2.
25
(1.1
4)
44
Low
co
nven
ienc
e
5.26
(1
.45)
2.
31
(1.3
5)
45
Acc
ess O
ffer
ing
Perc
eptio
ns
Acc
ess a
ttitu
de
Acc
ess u
sage
in
tent
ions
Cel
l siz
e n
Acc
ess O
ffer
ing
Perc
eptio
ns
Acc
ess a
ttitu
de
Acc
ess u
sage
in
tent
ions
Cel
l siz
e n

242 Appendix B.9
Table 60: Cell Means in Study 4 H
igh
pres
tige
bran
d
Non
owne
r
Ow
ners
hip
---
---
5.20
(1
.36)
3.57
(1
.93)
4.47
(1
.70)
3.43
(1
.83)
4.95
(1
.42)
4.05
(1
.32)
4.03
(1
.45)
74
Acc
ess,
dist
ant
bran
ding
5.
03
(1.3
9)
2.19
(1
.35)
5.
46
(1.2
4)
3.72
(1
.65)
4.79
(1
.44)
3.92
(1
.58)
5.39
(1
.08)
4.43
(1
.33)
4.32
(1
.52)
72
Acc
ess,
clos
e br
andi
ng
4.
62
(1.3
7)
2.15
(1
.15)
5.
22
(1.3
2)
3.51
(1
.88)
4.35
(1
.65)
3.47
(1
.72)
5.15
(1
.35)
4.50
(1
.30)
4.40
(1
.61)
72
Ow
ner
Ow
ners
hip
---
---
6.17
(1
.22)
5.68
(1
.54)
5.81
(1
.59)
5.26
(1
.57)
5.57
(1
.54)
5.13
(1
.54)
4.47
(1
.57)
72
Acc
ess,
dist
ant
bran
ding
4.
99
(1.4
0)
2.27
(1
.24)
6.
42
(.88)
6.21
(1
.12)
5.82
(1
.85)
5.11
(1
.81)
6.05
(1
.17)
5.08
(1
.29)
4.48
(1
.57)
73
Acc
ess,
clos
e br
andi
ng
5.
43
(1.4
4)
2.73
(1
.39)
6.
51
(.79)
6.00
(1
.27)
6.19
(1
.09)
5.47
(1
.51)
6.18
(.8
7)
5.44
(1
.39)
4.68
(1
.54)
73
Low
pre
stig
e br
and
Non
owne
r
Ow
ners
hip
---
---
4.12
(1
.33)
3.30
(1
.67)
3.59
(1
.52)
2.84
(1
.59)
3.64
(1
.26)
4.04
(1
.17)
3.16
(1
.75)
73
Acc
ess,
dist
ant
bran
ding
5.
12
(1.5
4)
2.26
(1
.33)
4.
04
(1.5
2)
3.07
(1
.84)
3.85
(1
.66)
2.97
(1
.57)
4.34
(1
.44)
4.42
(1
.19)
2.88
(1
.69)
73
Acc
ess,
clos
e br
andi
ng
4.
90
(1.3
4)
1.99
(1
.32)
4.
12
(1.6
0)
2.97
(1
.80)
3.77
(1
.50)
2.59
(1
.56)
3.84
(1
.31)
4.03
(1
.22)
3.11
(1
.75)
73
Ow
ner
Ow
ners
hip
---
---
5.65
(1
.18)
5.13
(1
.72)
5.21
(1
.61)
3.99
(1
.57)
4.86
(1
.32)
5.00
(1
.35)
3.44
(2
.05)
72
Acc
ess,
dist
ant
bran
ding
5.
06
(1.2
5)
2.17
(1
.07)
5.
83
(1.0
8)
5.65
(1
.38)
5.32
(1
.53)
3.79
(1
.62)
5.10
(1
.19)
4.88
(1
.13)
3.06
(1
.81)
72
Acc
ess,
clos
e br
andi
ng
4.
81
(1.4
0)
1.90
(1
.02)
5.
67
(1.4
6)
5.44
(1
.48)
5.17
(1
.75)
3.83
(1
.73)
4.81
(1
.40)
4.85
(1
.19)
3.15
(2
.00)
72
Acc
ess O
ffer
ing
Perc
eptio
ns
Acc
ess a
ttitu
de
Acc
ess u
sage
inte
ntio
n
Pare
nt B
rand
Per
cept
ions
Bra
nd a
ttitu
de
Bra
nd p
urch
ase
inte
ntio
n
Bra
nd W
OM
Bra
nd W
PP
Bra
nd in
nova
tiven
ess
Bra
nd e
colo
gica
l frie
ndlin
ess
Bra
nd e
xclu
sivi
ty
Cel
l siz
e n

Appendix B.9
243
Table 61: Cell Means and Analyses of Variance in Study 5
Treatment:
M (SD) Control: M (SD)
MANOVA: F-value (p-value)
Univariate Analysis:
F-value (p-value)
High prestige car brand
Brand attitude 6.01 (1.22) 5.76 (1.30)
2.87 (.04)
3.42 (.07)
Brand purchase intention 3.93 (2.05) 4.04 (1.91) 0.27 (.61)
Brand WOM 5.44 (1.56) 5.07 (1.61) 4.81 (.03)
Brand prestige 5.93 (1.09) 5.65 (1.21) --- 4.99 (.03)
Brand quality 5.99 (1.08) 5.77 (1.23) --- 3.41 (.07)
Brand innovativeness 5.58 (1.24) 5.39 (1.28) --- 1.95 (.16)
Low prestige car brand
Brand attitude 3.50 (1.17) 3.42 (1.25)
0.21 (.89)
0.39 (.53)
Brand purchase intention 2.20 (1.40) 2.14 (1.35) 0.16 (.69)
Brand WOM 2.92 (1.35) 2.81 (1.42) 0.59 (.44)
Brand prestige 2.76 (1.15) 2.76 (1.20) --- 0.00 (1.00)
Brand quality 3.57 (1.10) 3.40 (1.20) --- 1.81 (.18)
Brand innovativeness 3.47 (1.21) 3.23 (1.37) --- 2.97 (.09)
Access provider brand
Access attitude 5.50 (1.23) 5.63 (1.16) --- 1.01 (.32)
Access usage intentions 5.52 (1.78) 5.88 (1.62) --- 3.97 (.05)
Access price fairness 4.87 (1.13) 4.98 (1.13) --- 0.86 (.35)
Brand attitude 5.91 (1.14) 5.99 (1.03) --- 0.51 (.48)
Brand WOM 6.08 (1.20) 6.12 (1.18) --- 0.11 (75)
Brand prestige 5.14 (1.20) 4.94 (1.13) --- 2.63 (.11)
Brand quality 5.74 (1.13) 5.69 (1.03) --- 0.15 (.70)
Brand innovativeness 5.58 (1.24) 5.59 (1.13) --- 0.01 (.92)
Cell size n 171 179

244 Appendix B.10
B.10. Correlation Tables

Appendix B.10
245
Table 62: Cars and Fashion Correlation Table in Study 1 (Project II)
SD
1.25
1.14
1.81
1.35
1.54
1.91
1.64
1.74
1.96
1.84
1.49
1.69
1.41
1.57
1.63
1.44
1.89
1.71
2.05
n.a.
n.a.
10.7
4
Not
e. In
ter-
corr
elat
ions
, mea
ns a
nd st
anda
rd d
evia
tions
for t
he p
rodu
ct c
ateg
ory
cars
are
pre
sent
ed a
bove
the
diag
onal
; tho
se fo
r the
pro
duct
cat
egor
y fa
shio
n ar
e pr
esen
ted
belo
w th
e di
agon
al.
* p <
.05;
n.a
. = n
ot a
vaila
ble
beca
use
the
varia
ble
is o
nly
rela
ted
to o
ne o
f the
pro
duct
cat
egor
ies.
M
5.25
1.89
3.66
4.99
4.95
3.87
4.50
3.55
3.74
3.18
2.90
3.74
3.48
2.79
4.32
5.18
3.78
3.99
4.15
n.a.
n.a.
40.6
0
22
.03
.19
-.03
.17
-.02
-.01
.01
-.15
-.06
-.07
-.22*
-.17
-.10
-.08
-.09
.20*
-.33*
-.13
.06
n.a.
n.a.
—
40.6
4
11.0
7
21
n.a.
n.a.
n.a.
n.a.
n.a.
n.a.
n.a.
n.a.
n.a.
n.a.
n.a.
n.a.
n.a.
n.a.
n.a.
n.a.
n.a.
n.a.
n.a.
n.a.
—
-.36*
2.77
1.27
20
n.a.
n.a.
n.a.
n.a.
n.a.
n.a.
n.a.
n.a.
n.a.
n.a.
n.a.
n.a.
n.a.
n.a.
n.a.
n.a.
n.a.
n.a.
n.a.
—
.13
.02
1.55
0.83
19
.04
.10
.09*
-.07
.10
.25*
.22*
.13
.30*
.30*
.07
.08
.11
.09
.48*
.01
.39*
.21*
—
n.a.
n.a.
n.a.
n.a.
n.a.
18
.16
.18
.33*
.13
.32*
.33*
.28*
.21*
.39*
.42*
.18*
.24*
.25*
.27*
.33*
.14
.42*
—
n.a.
.25*
.00
.01
2.79
1.55
17
.28*
.23
.39*
.17
.39*
.35*
.39*
.42*
.54*
.53*
.47*
.50*
.45*
.39*
.63*
-.02
—
.37*
n.a.
.24*
.25*
-.25*
3.40
1.73
16
.11
-.03
-.11*
.20
.08
-.03
.13
-.12
.06
.00
.25*
-.09
.02
-.06
-.30
—
-.20
-.13
n.a.
-.03
-.14
.22*
4.74
1.30
15
.40*
.35*
.44*
.31*
.34*
.43*
.36*
.23*
.46*
.49*
.41*
.43*
.46*
.37*
—
-.38*
.44*
.20*
n.a.
.20*
.31*
-.14
4.43
1.45
14
.27*
.39*
.46*
.29*
.31*
.36*
.32*
.37*
.40*
.45*
.54*
.55*
.50*
—
.16
.08
.24*
.37*
n.a.
.26*
.06
-.08
2.60
1.53
13
.45*
.43*
.49*
.47*
.35*
.44*
.40*
.39*
.43*
.52*
.54*
.70*
—
.37*
.45*
-.25*
.58*
.46*
n.a.
.29*
.17*
-.08
3.36
1.31
12
.34*
.26*
.41*
.31*
.38*
.42*
.33*
.36*
.34*
.48*
.58*
—
.61*
.29*
.57*
-.35*
.61*
.30*
n.a.
.25*
.22*
-.24*
3.45
1.58
11
.21
.35*
.55*
.23
.30*
.36*
.25*
.45*
.31*
.40*
—
.54*
.60*
.34*
.31*
-.23*
.63*
.42*
n.a.
.27*
.23*
-.23*
2.62
1.43
10
.29*
.33*
.32*
.32*
.72*
.75*
.66*
.60*
.82*
—
.56*
.47*
.47*
.40*
.33*
-.07
.51*
.33*
n.a.
.36*
.37*
-.25*
2.89
1.59
9 .09
.19
.15
.23
.64*
.64*
.63*
.56*
—
.66*
.43*
.40*
.36*
.31*
.32*
-.10
.41*
.11
n.a.
.41*
.37*
-.14
3.90
1.78
8 .11
.39*
.30*
.06
.54*
.62*
.55*
—
.39*
.57*
.50*
.35*
.44*
.32*
.22*
.01
.47*
.31*
n.a.
.31*
.29*
-.07
3.32
1.65
7 .31*
.31*
.23
.38*
.76*
.64*
—
.58*
.55*
.53*
.26*
.31*
.30*
.24*
.28*
.08
.28*
.07
n.a.
.29*
.40*
-.11
4.47
1.47
6 .22
.50*
.37*
.32*
.69*
—
.67*
.58*
.66*
.67*
.32*
.33*
.33*
.32*
.24*
.04
.33*
.18*
n.a.
.47*
.33*
-.09
4.12
1.88
5 .30*
.28*
.23
.41*
—
.63*
.77*
.47*
.51*
.54*
.21*
.23*
.23*
.24*
.20*
.21*
.23*
-.03
n.a.
.31*
.28*
-.05
4.75
1.39
4 .68*
.42*
.52*
—
.33*
.16
.28*
.31*
.21
.15
.12
.13
.20
.25*
.05
.11
.27*
-.11
n.a.
.20
.19
-.11
3.93
1.74
3 .63*
.66*
—
.51*
.33*
.34*
.42*
.65*
.26*
.41*
.41*
.33*
.41*
.37*
.13
.14
.38*
.05
n.a.
.23
.25*
-.26*
2.84
1.71
2
.59*
—
.56*
.28*
.06
.16
.17
.40*
.28*
.39*
.35*
.23
.27*
.24
.06
-.07
.28*
-.04
n.a.
.14
.21
-.21
1.60
1.02
1 —
.44*
.61*
.75*
.37*
.20
.35*
.40*
.19
.23
.14
.05
.14
.28*
.11
.08
.26*
-.14
n.a.
.27*
.38*
-.20
3.96
1.67
Var
iabl
e
Acc
ess a
ttitu
de
Acc
ess u
sage
inte
ntio
n
Acc
ess i
nvol
vem
ent
Acc
ess f
it
Bra
nd a
ttitu
de
Bra
nd p
urch
ase
inte
ntio
n
Bra
nd w
ord
of m
outh
Bra
nd W
TP p
rice
prem
ium
Bra
nd fa
mili
arity
Pers
onal
bra
nd c
onne
ctio
n
Stat
us c
onsc
ious
ness
Inno
vativ
enes
s
Var
iety
seek
ing
Acc
ess k
now
ledg
e
Hed
onis
m
Util
itaria
nism
Vis
ibili
ty
Ow
ners
hip
perc
eptib
ility
Car
Ava
ilabi
lity
Bos
s app
arel
ow
ned
H&
M a
ppar
el o
wne
d
Age
1 2 3 4 5 6 7 8 9 10
11
12
13
14
15
16
17
18
19
20
21
22
M
SD

246 Appendix B.10
Table 63: Cars and Fashion Correlation Table in Study 2 (Project II) SD
1.42
1.15
1.44
1.99
1.75
1.86
1.48
1.37
1.77
1.40
1.69
1.34
1.45
1.76
1.48
1.89
1.81
11.9
8 N
ote.
Inte
r-co
rrel
atio
ns, m
eans
and
stan
dard
dev
iatio
ns fo
r the
pro
duct
cat
egor
y ca
rs a
re p
rese
nted
abo
ve th
e di
agon
al; t
hose
for t
he p
rodu
ct c
ateg
ory
fash
ion
are
pres
ente
d be
low
the
diag
onal
. * p
< .0
5
M
4.81
1.95
5.15
4.40
4.75
3.82
4.98
4.57
3.68
2.63
3.50
3.38
2.78
3.91
5.35
3.69
3.96
42.1
2
18
-.02
-.07
-.03
-.06
-.02
-.11*
.00
.02
-.08*
-.32*
-.33*
-.14*
-.23*
-.02
.12*
-.15*
-.13*
—
41.8
0
11.8
7
17
.12*
.14*
.10*
.12*
.12*
.10*
.14*
.10*
.08*
.15*
.21*
.13*
.19*
.22*
-.02
.35*
—
-.13*
2.52
1.55
16
.09*
.17*
.26*
.31*
.27*
.28*
.27*
.25*
.14*
.33*
.38*
.29*
.33*
.46*
-.09*
—
.34*
-.13*
3.06
1.66
15
.07
.00
-.01
-.04
-.01
-.13*
.00
-.02
-.05
-.31*
-.11*
-.02
-.15*
-.16*
—
-.18*
-.09*
.23*
4.78
1.33
14
.06
.20*
.31*
.30*
.28*
.27*
.33*
.27*
.12*
.32*
.37*
.28*
.28*
—
-.33*
.36*
.13*
-.18*
4.13
1.62
13
.02
.19*
.11*
.18*
.12*
.24*
.10*
.14*
.19*
.58*
.55*
.45*
—
.43*
-.20*
.51*
.32*
-.19*
2.82
1.46
12
.18*
.22*
.22*
.17*
.17*
.22*
.24*
.19*
.13*
.37*
.47*
—
.51*
.48*
-.09*
.39*
.22*
-.11*
3.29
1.33
11
.13*
.21*
.21*
.20*
.19*
.26*
.19*
.15*
.17*
.53*
—
.52*
.61*
.49*
-.21*
.50*
.23*
-.26*
3.51
1.67
10
.06
.21*
.19*
.24*
.21*
.34*
.15*
.19*
.24*
—
.56*
.40*
.63*
.38*
-.32*
.53*
.26*
-.22*
2.64
1.43
9 .03
.04
.17*
.12*
.16*
.29*
.26*
.19*
—
.15*
.14*
.18*
.16*
.07*
.02
.14*
.16*
-.02
3.66
1.86
8 .22*
.29*
.54*
.49*
.57*
.48*
.64*
—
.33*
.21*
.22*
.28*
.18*
.25*
.04
.23*
.10*
-.02
4.01
1.27
7 .24*
.22*
.70*
.56*
.67*
.55*
—
.59*
.21*
.20*
.28*
.30*
.22*
.34*
.02
.30*
.08*
-.08*
4.59
1.37
6 .17*
.28*
.57*
.68*
.63*
—
.46*
.48*
.32*
.37*
.34*
.30*
.34*
.31*
-.11*
.38*
.12*
-.09*
3.48
1.71
5 .25*
.27*
.75*
.73*
—
.60*
.61*
.52*
.17*
.24*
.29*
.24*
.22*
.34*
-.03
.30*
.11*
-.07*
4.38
1.62
4 .15*
.26*
.69*
—
.69*
.61*
.59*
.44*
.09*
.29*
.32*
.28*
.24*
.36*
-.09*
.36*
.09*
-.14*
4.24
1.81
3 .29*
.28*
—
.70*
.69*
.57*
.63*
.52*
.19*
.22*
.19*
.29*
.24*
.24*
.02
.31*
.03
-.11*
4.69
1.39
2
.46*
—
.32*
.30*
.35*
.34*
.33*
.28*
.19*
.22*
.19*
.29*
.24*
.24*
.02
.31*
.03
-.11*
1.66
1.02
1 —
.60*
.25*
.18*
.27*
.26*
.29*
.26*
.16*
.11*
.13*
.17*
.19*
.15*
.07*
.16*
-.03
-.12*
3.85
1.66
Var
iabl
e
Acc
ess a
ttitu
de
Acc
ess u
sage
inte
ntio
n
Bra
nd a
ttitu
de
Bra
nd p
urch
ase
inte
ntio
n
Bra
nd w
ord
of m
outh
Bra
nd W
TP p
rice
prem
ium
Bra
nd in
nova
tiven
ess
Bra
nd e
co-f
riend
lines
s
Bra
nd E
xclu
sivi
ty
Stat
us c
onsc
ious
ness
Inno
vativ
enes
s
Var
iety
seek
ing
Avo
idan
ce o
f sim
ilarit
y
Hed
onis
m
Util
itaria
nism
Vis
ibili
ty
Ow
ners
hip
perc
eptib
ility
Age
1 2 3 4 5 6 7 8 9 10
11
12
13
14
15
16
17
18
M
SD
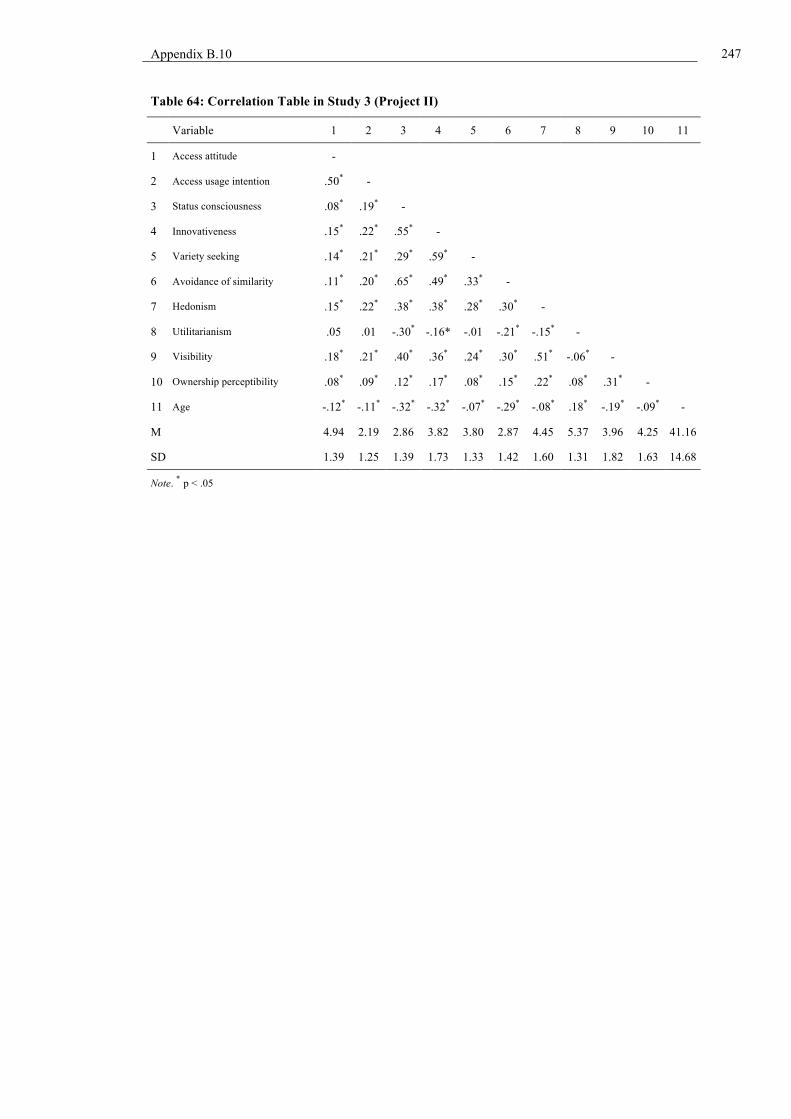
Appendix B.10
247
Table 64: Correlation Table in Study 3 (Project II)
Variable 1 2 3 4 5 6 7 8 9 10 11
1 Access attitude -
2 Access usage intention .50* -
3 Status consciousness .08* .19* -
4 Innovativeness .15* .22* .55* -
5 Variety seeking .14* .21* .29* .59* -
6 Avoidance of similarity .11* .20* .65* .49* .33* -
7 Hedonism .15* .22* .38* .38* .28* .30* -
8 Utilitarianism .05 .01 -.30* -.16* -.01 -.21* -.15* -
9 Visibility .18* .21* .40* .36* .24* .30* .51* -.06* -
10 Ownership perceptibility .08* .09* .12* .17* .08* .15* .22* .08* .31* -
11 Age -.12* -.11* -.32* -.32* -.07* -.29* -.08* .18* -.19* -.09* -
M 4.94 2.19 2.86 3.82 3.80 2.87 4.45 5.37 3.96 4.25 41.16
SD 1.39 1.25 1.39 1.73 1.33 1.42 1.60 1.31 1.82 1.63 14.68
Note. * p < .05

248 Appendix B.10
Table 65: Correlation Table in Study 4 (Project II) 18
-
37.0
0
13.6
5
Not
e. * p
< .0
5
17 -
-.07*
4.33
1.74
16 - .3
0*
-.11*
4.12
1.86
15 -
-.13*
.05
.20*
5.27
1.38
14 -
-.26*
.52*
.25*
-.07*
4.47
1.66
13 - .2
6*
-.23*
.29*
.12*
-.22*
3.06
1.48
12 - .2
9*
.28*
-.10*
.31*
.11*
-.02
3.80
1.36
11 - .5
9*
.45*
.35*
-.23*
.34*
.14*
-.26*
3.94
1.71
10 - .4
8*
.28*
.60*
.29*
-.38*
.30*
.03
-.30*
3.01
1.44
9 - .21*
.10*
.13*
.22*
.08*
.00
.10*
.01
.01
3.77
1.81
8 - .18*
.16*
.18*
.25*
.10*
.33*
-.01
.28*
.06
.08*
4.65
1.36
7 - .58*
.27*
.14*
.14*
.20*
.08*
.30*
.02
.30*
.12*
.07*
4.99
1.49
6 - .55*
.43*
.33*
.35*
.24*
.22*
.25*
.24*
-.17*
.28*
.05
-.09*
3.89
1.87
5 - .59*
.63*
.48*
.13*
.13*
.10*
.11*
.07*
.31*
-.04
.28*
.09*
-.02
4.86
1.78
4 - .67*
.63*
.56*
.39*
.14*
.23*
.21*
.17*
.15*
.36*
-.13*
.34*
.09*
-.14*
4.52
2.01
3 - .71*
.71*
.53*
.70*
.47*
.15*
.11*
.12*
.14*
.03
.32*
-.03
.31*
.11*
-.02
5.36
1.51
2 - .17*
.14*
.16*
.21*
.24*
.16*
.08*
.08
.21*
.26*
.13*
.16*
.01
.16*
.14*
-.03
2.21
1.26
1 - .44*
.25*
.15*
.29*
.20*
.22*
.20*
-.01
.08
.09*
.10*
.05
.11*
-.05
.14*
.06
-.14*
5.00
1.40
Var
iabl
e
Acc
ess a
ttitu
de
Acc
ess u
sage
inte
ntio
n
Bra
nd a
ttitu
de
Bra
nd p
urch
ase
inte
ntio
n
Bra
nd w
ord
of m
outh
Bra
nd W
TP p
rice
prem
ium
Bra
nd in
nova
tiven
ess
Bra
nd e
co-f
riend
lines
s
Bra
nd E
xclu
sivi
ty
Stat
us c
onsc
ious
ness
Inno
vativ
enes
s
Var
iety
seek
ing
Avo
idan
ce o
f sim
ilarit
y
Hed
onis
m
Util
itaria
nism
Vis
ibili
ty
Ow
ners
hip
perc
eptib
ility
Age
1 2 3 4 5 6 7 8 9 10
11
12
13
14
15
16
17
18
M
SD

Appendix B.10
249
Table 66: Correlation Table in Study 5 (Project II)
20 —
5.59
1.18
Not
e. * p
< .0
5
19 —
.66*
5.71
1.08
18 —
.59*
.64*
5.04
1.17
17 —
.37*
.58*
.58*
6.10
1.19
16 —
.71*
.51*
.64*
.69*
5.95
1.08
15 —
.01
-.06
.00
-.07
-.02
4.93
1.13
14 —
-.07
.43*
.52*
.25*
.31*
.35*
5.71
1.71
13 —
.51*
.00
.64*
.65*
.42*
.49*
.56*
5.57
1.19
12 — .0
3
-.04
.02
-.03
.03
-.02
-.04
.00
3.35
1.30
11 —
.63*
-.0
7
-.03
-.05
-.07
-.01
-.06
-.03
-.07
3.48
1.15
10 —
.61*
.66*
.05
.02
-.03
-.02
.03
.10
-.05
.02
2.76
1.18
9 —
.57*
.53*
.51*
-.0
8
.02
.01
-.08
-.03
-.05
-.12*
-.11*
2.87
1.38
8 —
.61*
.45*
.36*
.38*
-.1
1*
-.07
.06
-.15*
-.13*
-.03
-.19*
-.09
2.17
1.37
7 —
.55*
.67*
.60*
.58*
.47*
-.0
3
-.02
-.03
-.09
-.03
-.05
-.17*
-.13*
3.46
1.21
6 —
-.13*
-.10*
-.10
-.04
-.04
-.03
.20*
.12*
-.01
.18*
.14*
.20*
.27*
.16*
5.48
1.26
5 —
.57*
-.1
3*
-.18*
-.05
-.09
.02
-.03
.15*
.14*
-.01
.25*
.19*
.23*
.36*
.13*
5.88
1.16
4 —
.74*
.64*
-.1
0
-.06
.01
-.01
.03
.03
.14*
.13*
-.01
.22*
.18*
.23*
.29*
.17*
5.79
1.16
3 —
.60*
.66*
.63*
-.1
6*
-.13*
-.03
-.07
-.02
-.01
.16*
.14*
-.03
.19*
.13*
.18*
.34*
.12*
5.25
1.59
2
—
.46*
.32*
.31*
.42*
-.1
6*
.05
-.13*
-.14*
-.09
-.07 .07
.14*
.03
.05
-.01
.11*
.11*
.08*
3.99
1.97
1
Hig
h pr
estig
e ca
r br
and
—
.49*
.71*
.53*
.58*
.63*
-.1
8*
-.16*
-.19*
-.13*
-.10
-.11*
.2
0*
.11*
.01
.21*
.13*
.20*
.29*
.14*
5.88
1.26
Var
iabl
e
Bra
nd a
ttitu
de
Bra
nd p
urch
ase
inte
ntio
n
Bra
nd W
OM
Bra
nd p
rest
ige
Bra
nd q
ualit
y
Bra
nd in
nova
tiven
ess
Low
pre
stig
e ca
r br
and
Bra
nd a
ttitu
de
Bra
nd p
urch
ase
inte
ntio
n
Bra
nd W
OM
Bra
nd p
rest
ige
Bra
nd q
ualit
y
Bra
nd in
nova
tiven
ess
Acc
ess p
rovi
der
bran
d
Acc
ess a
ttitu
de
Acc
ess u
sage
inte
ntio
ns
Acc
ess p
rice
fairn
ess
Bra
nd a
ttitu
de
Bra
nd W
OM
Bra
nd p
rest
ige
Bra
nd q
ualit
y
Bra
nd in
nova
tiven
ess
SD
1 2 3 4 5 6 7 8 9 10
11
12
13
14
15
16
17
18
19
20
M

250 Appendix B.10