Uncertainty and Sensitivity Studies with TRACE-SUSA and TRACE-DAKOTA by Means of Steady State BFBT...
12
Hindawi Publishing Corporation Science and Technology of Nuclear Installations Volume 2013, Article ID 610598, 11 pages http://dx.doi.org/10.1155/2013/610598 Research Article Uncertainty and Sensitivity Studies with TRACE-SUSA and TRACE-DAKOTA by Means of Steady State BFBT Data Wadim Jaeger, 1 Victor Hugo Sánchez Espinoza, 1 Francisco Javier Montero Mayorga, 2 and Cesar Queral 2 1 Karlsruhe Institute of Technology, Institute for Neutron Physics and Reactor Technology, Hermann-von-Helmholtz-Platz 1, 76344 76344 Eggenstein-Leopoldshafen, Germany 2 Universidad Politecnica de Madrid, Departamento de Sistemas Energeticos ETSI Minas, Alenza 4, 28003 Madrid, Spain Correspondence should be addressed to Wadim Jaeger; [email protected] Received 16 October 2012; Accepted 8 February 2013 Academic Editor: Borut Mavko Copyright © 2013 Wadim Jaeger et al. is is an open access article distributed under the Creative Commons Attribution License, which permits unrestricted use, distribution, and reproduction in any medium, provided the original work is properly cited. e subject of the present paper is the uncertainty and sensitivity studies for steady state BFBT results including pressure drop and void fraction measurements. e investigations are performed with TRACE (version 5.0 patch 2), thermal hydraulic modeling, and SUSA and DAKOTA; both tools are for the evaluation of uncertainties and sensitivities. For this purpose, the NUPEC BFBT experimental data base is used. e advantage of applying two different uncertainty and sensitivity tools in combination with TRACE is that the user effect can be excluded. Since in both cases the TRACE model of the BFBT bundle is identical the differences in the results are related to the capabilities of the uncertainty and sensitivity tools. e reference results with TRACE show that the code is very well able to represent both single- and two-phase flows even though it is a 1D coarse mesh system code. For selected cases, an uncertainty study was performed. Even though a reduced number of uncertain parameters are considered in the DAKOTA investigation, compared to the one with SUSA, similar results are obtained. e results indicate also that even small parameter variations can yield to rather large variations of the selected output parameters. 1. Introduction e quality and reliability of the predictions of best-estimate system codes rely on the validation of their physical models. e present generation of system codes employs the latest physical models in order to describe the different phenomena which occur during normal and off-normal operation of Light Water Reactors (LWR). Due to the absence of mech- anistic models empirical models are used to represent the underlying phenomena. Because of the complex nature of the involved physics, the limitations related to acquisition of accurate experimental data, for example, measurement fabrication, and the challenges related to computation and simulation of the models, but also the results, are afflicted by uncertainties. Since the current system codes are used as design and licensing tools of nuclear installations the uncertainties must be quantified in order to prove whether the investigated design stays within acceptance criteria and that physical limits are not exceeded. Input and boundary condition uncertainties are considered in this study. erefore, best-estimate codes and tools for the evalua- tion of uncertainties and the quantification of the sensitivities are applied together, called Best Estimate Plus Uncertainty (BEPU). In the present paper the system code TRACE is used to perform the thermohydraulic evaluation of a BWR fuel assembly which is used in the NUPEC BWR Full- Size Fine Mesh Bundle Test (BFBT). For the uncertainty and sensitivity study the tool SUSA (Soſtware system for Uncertainty and Sensitivity Analysis) [1–3] and the program DAKOTA (Design Analysis Kit for Optimization and Teras- cale Application) [4] are used. Both codes are used to perform the statistical propagation of input parameter uncertainties. TRACE and other thermal hydraulic codes in combina- tion with programs for uncertainty and sensitivity studies
Transcript of Uncertainty and Sensitivity Studies with TRACE-SUSA and TRACE-DAKOTA by Means of Steady State BFBT...

Hindawi Publishing CorporationScience and Technology of Nuclear InstallationsVolume 2013, Article ID 610598, 11 pageshttp://dx.doi.org/10.1155/2013/610598
Research ArticleUncertainty and Sensitivity Studies with TRACE-SUSA andTRACE-DAKOTA by Means of Steady State BFBT Data
Wadim Jaeger,1 Victor Hugo Sánchez Espinoza,1
Francisco Javier Montero Mayorga,2 and Cesar Queral2
1 Karlsruhe Institute of Technology, Institute for Neutron Physics and Reactor Technology,Hermann-von-Helmholtz-Platz 1, 76344 76344 Eggenstein-Leopoldshafen, Germany
2Universidad Politecnica de Madrid, Departamento de Sistemas Energeticos ETSI Minas,Alenza 4, 28003 Madrid, Spain
Correspondence should be addressed to Wadim Jaeger; [email protected]
Received 16 October 2012; Accepted 8 February 2013
Academic Editor: Borut Mavko
Copyright © 2013 Wadim Jaeger et al. This is an open access article distributed under the Creative Commons Attribution License,which permits unrestricted use, distribution, and reproduction in any medium, provided the original work is properly cited.
The subject of the present paper is the uncertainty and sensitivity studies for steady state BFBT results including pressure drop andvoid fraction measurements. The investigations are performed with TRACE (version 5.0 patch 2), thermal hydraulic modeling,and SUSA and DAKOTA; both tools are for the evaluation of uncertainties and sensitivities. For this purpose, the NUPEC BFBTexperimental data base is used. The advantage of applying two different uncertainty and sensitivity tools in combination withTRACE is that the user effect can be excluded. Since in both cases the TRACEmodel of the BFBT bundle is identical the differencesin the results are related to the capabilities of the uncertainty and sensitivity tools. The reference results with TRACE show thatthe code is very well able to represent both single- and two-phase flows even though it is a 1D coarse mesh system code. Forselected cases, an uncertainty study was performed. Even though a reduced number of uncertain parameters are considered inthe DAKOTA investigation, compared to the one with SUSA, similar results are obtained. The results indicate also that even smallparameter variations can yield to rather large variations of the selected output parameters.
1. Introduction
The quality and reliability of the predictions of best-estimatesystem codes rely on the validation of their physical models.The present generation of system codes employs the latestphysical models in order to describe the different phenomenawhich occur during normal and off-normal operation ofLight Water Reactors (LWR). Due to the absence of mech-anistic models empirical models are used to represent theunderlying phenomena. Because of the complex nature ofthe involved physics, the limitations related to acquisitionof accurate experimental data, for example, measurementfabrication, and the challenges related to computation andsimulation of the models, but also the results, are afflictedby uncertainties. Since the current system codes are usedas design and licensing tools of nuclear installations theuncertainties must be quantified in order to prove whether
the investigated design stays within acceptance criteria andthat physical limits are not exceeded. Input and boundarycondition uncertainties are considered in this study.
Therefore, best-estimate codes and tools for the evalua-tion of uncertainties and the quantification of the sensitivitiesare applied together, called Best Estimate Plus Uncertainty(BEPU). In the present paper the system code TRACE isused to perform the thermohydraulic evaluation of a BWRfuel assembly which is used in the NUPEC BWR Full-Size Fine Mesh Bundle Test (BFBT). For the uncertaintyand sensitivity study the tool SUSA (Software system forUncertainty and Sensitivity Analysis) [1–3] and the programDAKOTA (Design Analysis Kit for Optimization and Teras-cale Application) [4] are used. Both codes are used to performthe statistical propagation of input parameter uncertainties.
TRACE and other thermal hydraulic codes in combina-tion with programs for uncertainty and sensitivity studies

2 Science and Technology of Nuclear Installations
have been used since several years mainly for the analysis ofexperimental data and for licensing evaluation methodolo-gies.Thefirstmethodology for uncertainty analysis applied tothermal hydraulic codes was the Code Scaling, Application,and Uncertainty methodology (CSAU), proposed by theUS NRC. It is based on response surfaces for uncertaintytreatment [5]. Later, other BEPU methodologies were devel-oped replacing the response surface technique by statisticalsampling methods. With these methodologies it is possibleto determine the tolerance limit. Some of the most commonmethodologies in nuclear safety are ASTUM of Westing-house, the SUSA package of the GRS, and TRACG of GeneralElectrics. For further reading please refer to [6, 7]. Manyinternational projects have been carried out in order toprove and to improve the existing methodologies includingBEMUSE [8, 9], UAM [10]. The BEMUSE benchmark is acomparative exercise to, for example, evaluate the quality andapplicability of best estimate system codes for uncertaintystudies. While the BEMUSE phase is more related to bestestimate codes like TRACE, CATHARE, or RELAP; theUAMbenchmark is covering the different parts and levels of thewhole calculation process: neutronics and thermal hydraulicsmultiscale and multiphysics application.
The NUPEC BFBT benchmark [11] is a source of exper-imental data of great variety for the purpose of code valida-tion. In the frame of the BFBT test program, single- and two-phase pressure losses, void fraction, and critical power testswere performed during steady state and transient conditions.In the present paper the pressure losses for single- andtwo-phase flow and the void fraction measurement data areselected for the comparative uncertainty and sensitivity study.For the investigations the same TRACE code version and thesame input deck are used with SUSA and with DAKOTA.By doing so, the user effect is excluded from the analysis aswell as the effect of different physical models since the sameare always used. The authors are aware that even though usereffect and physical model effect play no role, physical modelsmay need improvement.
The propagation of uncertainties in model parametersis not considered in this study. The reasons are the missinginformation about the range of uncertainty of model param-eters as well as their distribution. Currently, the internationalPREMIUM project endorsed by the OECD/NEA is aiming toevaluate the uncertainties of physical models or nonmeasure-able parameters (e.g., interfacial drag coefficients, influenceof bubble diameter). Based on the outcome of this project,physical parameter models can be included in such kind ofinvestigation if their PDF and their range of variation areidentified.
2. BFBT Benchmark
2.1. General Remarks. In the frame of the OECD/NEANUPEC BFBT benchmark data have been provided relatedto pressure drop, critical power, and void fraction mea-surements for a BWR fuel assembly mock-ups. These datacover a wide range of BWR like operational conditions [11].Stationary as well as transient results are provided covering
not only normal operation but also typical BWR transientslike a turbine trip without bypass or a trip of a recirculationpump. The experiments were focused 8 × 8 fuel assemblies.Two different designs have been investigated: a regular8 × 8 fuel assembly with unheated rods in the center anda high burn-up assembly with a central water rod. In theexperimental program, different scenarios characterized bydifferent axial and radial power profiles were considered.
The benchmark is divided into two phases with thefollowing sub topics.
(i) Phase I: void distribution benchmark
(a) Exercise 1: steady-state subchannel grade bench-mark, where subchannel, meso- and micro-scopic approaches can be used.
(b) Exercise 2: steady-state microscopic gradebenchmark, where meso- and microscopicapproaches and molecular dynamics can beutilized.
(c) Exercise 3: transient macroscopic grade bench-mark, where a subchannel approach can beapplied.
(d) Exercise 4: uncertainty analysis of the void dis-tribution benchmark.
(ii) Phase II: critical power benchmark
(a) Exercise 0: steady-state pressure drop bench-mark.
(b) Exercise 1: steady-state benchmark, whichapplies a one-dimensional approach with BTcorrelations and a subchannel mechanisticapproach.
(c) Exercise 2: transient benchmark, which applies aone-dimensional approachwith BT correlationsand a subchannel mechanistic approach.
The main features of the investigated fuel assembly, an8 × 8 high burn up GE design, are summarized in Table 1.Experiments were also performed for the other bundle types,but only the high burn-up version, assembly type 4, is usedfor the present analysis.
2.2. PressureDropMeasurements. Thepressure drop has beenmeasured during single and two phases where at single phasethe pressure drop is the difference between the absolutepressures at two given positionsminus the gravitational term.For two-phase flow condition, the pressure drop is simplythe difference between the two considered elevations. Theright-hand side of Figure 1 shows a sketch of the pressuresensor positions. PT N007 refers to the inlet of the heatedsection, while PTN010 is at the outlet of the heated section,3708mm above the inlet. At several positions pressure tabsare placed to account for, for example, the pressure drop overa spacer grid or the influence of rising elevations. For thepresent analysis, the pressure drop/difference between inletand outlet is compared to the predictions. The differentialpressure tab dpT9 is used for the comparison.
Science and Technology of Nuclear Installations 3
dpT1dpT3
dpT4
dpT9dpT5
dpT6
dpT7
dpT8
dpT2
210
256
256
256
512
512
1024
682
N010PT
N007PT
Rotation
Detectors
Detector
Detector
Detector
X-ray tube
X-ray tube
X-ray tube
X-ray tube
X-ray CT scanner
Simulated fuel rod
X-raydensitometer
Figure 1: Void fraction and pressure drop measurement positions.
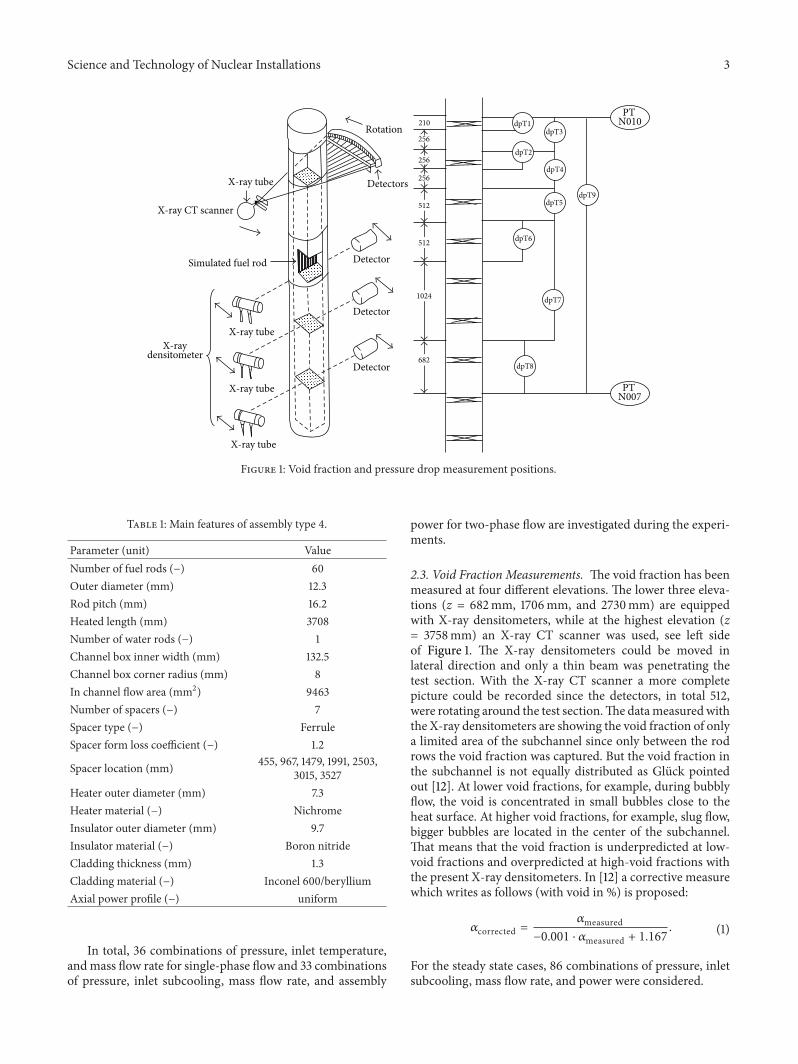
Table 1: Main features of assembly type 4.
Parameter (unit) ValueNumber of fuel rods (−) 60Outer diameter (mm) 12.3Rod pitch (mm) 16.2Heated length (mm) 3708Number of water rods (−) 1Channel box inner width (mm) 132.5Channel box corner radius (mm) 8In channel flow area (mm2) 9463Number of spacers (−) 7Spacer type (−) FerruleSpacer form loss coefficient (−) 1.2
Spacer location (mm) 455, 967, 1479, 1991, 2503,3015, 3527
Heater outer diameter (mm) 7.3Heater material (−) NichromeInsulator outer diameter (mm) 9.7Insulator material (−) Boron nitrideCladding thickness (mm) 1.3Cladding material (−) Inconel 600/berylliumAxial power profile (−) uniform
In total, 36 combinations of pressure, inlet temperature,andmass flow rate for single-phase flow and 33 combinationsof pressure, inlet subcooling, mass flow rate, and assembly
power for two-phase flow are investigated during the experi-ments.
2.3. Void Fraction Measurements. The void fraction has beenmeasured at four different elevations. The lower three eleva-tions (z = 682mm, 1706mm, and 2730mm) are equippedwith X-ray densitometers, while at the highest elevation (z= 3758mm) an X-ray CT scanner was used, see left sideof Figure 1. The X-ray densitometers could be moved inlateral direction and only a thin beam was penetrating thetest section. With the X-ray CT scanner a more completepicture could be recorded since the detectors, in total 512,were rotating around the test section.The datameasuredwiththe X-ray densitometers are showing the void fraction of onlya limited area of the subchannel since only between the rodrows the void fraction was captured. But the void fraction inthe subchannel is not equally distributed as Gluck pointedout [12]. At lower void fractions, for example, during bubblyflow, the void is concentrated in small bubbles close to theheat surface. At higher void fractions, for example, slug flow,bigger bubbles are located in the center of the subchannel.That means that the void fraction is underpredicted at low-void fractions and overpredicted at high-void fractions withthe present X-ray densitometers. In [12] a corrective measurewhich writes as follows (with void in %) is proposed:
𝛼corrected =𝛼measured
−0.001 ⋅ 𝛼measured + 1.167. (1)
For the steady state cases, 86 combinations of pressure, inletsubcooling, mass flow rate, and power were considered.

4 Science and Technology of Nuclear Installations
3. Working Methodology
3.1. TRACE-SUSA and TRACE-DAKOTA Interface. TheTRACE code is a widely used best-estimate system codewhich is under development by US NRC and subcontractors.It is intended to be used for the analysis of LWRs and relatedfacilities with the focus on normal, off-normal, and acci-dental scenarios. TRACE [13] features a 2-fluid, 6-equationapproach where the conservation equations for mass, energy,and momentum are solved for the liquid and gas phase. Bothphases have their own temperature and velocity field, whilethe pressure field is of common nature. Empirical closurelaws and correlations are provided to calculate quantitieslike the wall-to-fluid heat transfer/drag or interfacial heattransfer/drag in order to close the conservative equations.Following a component approach, LWR typical componentslike valves, pumps, pipes, separators, and so forth can bemodeled. For the present analysis, the CHAN componentis used which has been especially developed for BWR fuelassemblies. The main feature of this component is that eachpin can be represented with its respective power profile. Inaddition, water rods can be simulated.
TRACE is used for the thermohydraulic analysis of theBWR fuel assembly. The uncertainty and sensitivity study isperformed with SUSA and DAKOTA. SUSA is the Softwarefor Uncertainty and Sensitivity study developed by the GRS[3]. SUSA follows an input error propagation approachmean-ing that uncertainties of input parameters, for example, inputand boundary conditions, material data or physical models,are taken into account by means of an uncertainty bandand a distribution between the maximum and minimumvalue expressed by the probability density function (PDF).In addition, for the purpose of, for example, numericalstability analysis, nonphysical parameters like the axial orradial nodalization, or the time step size can be changed, too.These uncertainties propagate through the calculations andinfluence the output will have an uncertainty band.The inputparameters are varied simultaneously within their minimumand maximum according to their assigned distribution. Eachparameter is treated independently in case no correlationbetween them is present. In order to reach a chosen statisticalfidelity, the number of samplings, being equal to the numberof code runs, has to be settled prior to the analysis. Theuser has to define the probability content, p, which is theprobability that a given variable will be between its lowerand upper bounds and the level of confidence, 𝛽, whichexpresses that p is overestimated conservatively with a certainprobability meaning how confident one is that p between thelower and upper bounds. The level of confidence takes intoaccount the finite number of samplings/code runs. Acceptedvalues for the probability content and the level of confidenceare 95% for the two-sided tolerance limit. By means ofquantiles, the Wilk’s formula [3, 14] can be derived whichconnects the probability content and the level of confidencewith the number of code running to be performed:
𝛽 = 1 − 𝑝𝑁− 𝑁 ⋅ (1 − 𝑝) ⋅ 𝑝
𝑁−1. (2)
Entering 0.95 for 𝑝 and 𝛽 will yield 93 for the numberof code runs (N). That means that 93 combinations of the
input parameters will be considered for the uncertainty andsensitivity analysis. Figure 2 gives an overview about theinformation flowbetweenTRACE and SUSA [15]. Both codesare run stand alone.
The input parameters with the uncertain range andthe distribution are entered into SUSA. SUSA performsrandom sampling, as in the present study, or Latin hypercubesampling. A list with the chosen number of input parametercombinations will be generated.
By means of scripts the combinations are taken fromSUSA and, for example, 93 new input decks are generatedautomatically. These 93 input decks will be executed and 93outputs are generated. Information from these 93 outputswill be extracted with scripts and fed into SUSA to performthe actual uncertainty and sensitivity study. Since the dataexchange is based on scripts any parameter in the input deck,or source code, can be considered in the study as long as all ofthe information (minimum, maximum, PDF, etc.) is known.
DAKOTA, developed by the Sandia National Labora-tories, is described as a multilevel parallel object-orientedframework for design optimization, parameter estima-tion, uncertainty quantification, and sensitivity analysis [4].DAKOTA has been implemented into the Symbolic NuclearAnalysis Package (SNAP)—the graphical user interface forcodes like TRACE. The basic theory about sampling, uncer-tainty quantification, and sensitivity analysis is identical toSUSA. In addition, DAKOTA employs also the formula ofWilk.The data flow between TRACE andDAKOTA is similarto the one of TRACE and SUSA as depicted in Figure 2 withthe exception that the data extracted is automatized and noactions from the user are required. Since everything is donein SNAP, the user does not need to write scripts for the datatransfer. One only needs to select the input parameters, theuncertainty band with the corresponding distribution, thenumber of samples, the type of sampling, and the desiredoutput parameters. The disadvantage of this process is thatonly parameters can be selected which are made available toDAKOTA in SNAP.
Currently, not all parameters of the input deck areavailable for uncertainty analysis, see the following section.Moreover, the parameters which can be selected are limitedto the input deck. Model parameters cannot be selected yeteven if all necessary uncertain parameters are known.
3.2. Selected Uncertain Parameters. For these investigationsthe output parameters of interest are the pressure drop (singleand two phases) and the void fraction. The selected param-eters are listed in Table 2 for TRACE-SUSA and TRACE-DAKOTA along with information about the uncertaintyrange. All uncertainty parameters have in common that theprobability density function will follow a normal distributionexcept for the inlet temperature which is flat (uniform). Therange of the uncertainties is taken from theNUPEC specifica-tion [16]. Besides the inlet temperature all uncertainty rangesare given as percental variation.
The selection of the uncertain parameters is based, forexample, on experience, expert judgment, the recommen-dations of the benchmark specifications, the access of theseparameters (input or source code parameter), and whether

Science and Technology of Nuclear Installations 5
Parameterselection
∙ Parameter 1∙ Parameter 2∙ Parameter 3
∙ Parameter 𝑛
TRACE
SUSA
SUSA
Parameter 𝑖
𝑌
𝑌Time point 𝑡𝑥Time point 𝑡
𝑥
Uncertainty
Sensitivity
Dataextraction(e.g. script)
Inputmanipulation(e.g., script)Parameter samples
(e.g., 100 values perparameter)
SUSAU + Sinput
Ref. Max.Min.
Ref.TRACE
input
Ref.TRACE
input
𝑛
TRACEinputs
𝑛
TRACEoutputs
𝑓𝑝𝑖
𝑃1
𝑃𝑛
∙ · · ·
Figure 2: TRACE-SUSA information flow chart (with𝑁 = 100).
Table 2: Uncertain parameters.
No. (SUSA/DAKOTA) Parameter Range Distribution1 1 Outlet pressure ±1.0% Normal2 2 Mass flow rate ±1.0% Normal3 3 Inlet temperature ±1.5 K Uniform4 4 Wall roughness ±5.0% Normal5 5 K-spacer ±5.0% Normal6 — Hydraulic diameter ±1.0% Normal7 — Flow area ±1.0% Normal8 6 Power ±1.5% Normal
or not the uncertainties (minimal andmaximal variation) areknown. Furthermore, the selection has to consider the subjectof the analysis. Since, for example, the pressure drops will beevaluating parameters like the mass flow rate, and the wallroughness is of interest. As the investigation will show, thesame input parameters will have a different level of influenceon the output parameters for the different investigations. Ingeneral, the physical connection between the input parameterand the output parameter must be given. Based in thisrelationship the influence is determined.
Besides the explicitly mentioned parameters like massflow rate, power, inlet temperature/subcooling and hydraulicdiameter, the parameters wall roughness and the form losscoefficient of the spacer grid have been considered, too. Forthe spacer grid a value of 1.2 is suggested by the benchmarkteam. An uncertainty of ±5% is considered. For the wallroughness, not even a reference value is stated. Based onengineering judgment a value of 2.5 𝜇m ±5% is considered.
As mentioned in the previous subsection, not allparameters of the input deck can be selected and assignedwith an uncertainty band. In addition, the capabilities relatedto the correlation between two parameters are limited. Thisis rather a problem of the DAKOTA implementation intoSNAP than a problemwithDAKOTA and SNAPS itself. SinceDAKOTA has been implemented recently into SNAP, the fullDAKOTA capabilities are not yet accessible, and the incorpo-ration will also be improved in the near future. An example ofthe limited capabilities is the fact that the hydraulic diameteris not yet considered as uncertain parameter.
The TRACE model consists of 25 axial cells which mustbe all changed. With scripts it is an easy task to assign amultiplier to each cell. But with TRACE-DAKOTA every cellmust be selected per hand requiring a lot of time to do suchchanges. The problem arises if parameters which are affectedby the change of the hydraulic diameter must be changed,too. This is the case for the flow area and also for the volume.If the hydraulic diameter increases, the flow area increases,too. The hydraulic diameter is multiplied with, for example,a factor of 1.01, and the flow area is multiplied with a factorof 1.0201 (1.01 × 1.01) due to the quadratic dependency of thediameter. For the present range of the diameter uncertaintyof ±1.0% an almost perfect linear correlation is assumedbetween themultiplication factors for diameter and flow area.Thereby, the relation between the hydraulic diameter andthe flow area is treated as for a cylindrical pipe. It was notpossible to assign this dependency of the hydraulic diameterand the flow area with TRACE-DAKOTA. Therefore, thehydraulic diameter is not considered. Note that in the presentinvestigation the hydraulic diameter and the flow area arethe parameters which take into account the experimentallymeasured distortion of the assembly. That could be lateral

6 Science and Technology of Nuclear Installations
Table 3: Input parameter combinations and uncertainty results for the single-phase flow pressure drop cases.
Case (P700x) Poutlet (bar) MFR (t/h) Tinlet (K) Exp. (Pa) Mean (Pa) Max (Pa) Min (Pa) SD (Pa) Error (%)
02 2.0 14.5 311.65 1920 1872 2010 1762 57 −2.491881 1928 1831 24 −2.05
07 2.0 39.7 309.35 10990 10356 11266 9647 372 −5.7710371 10732 10009 181 −5.63
13 2.0 9.9 449.65 740 1004 1068 958 25 35.701010 1053 961 22 35.43
16 9.8 24.8 449.35 4060 4252 4618 3988 144 4.734293 4427 4079 97 5.74
30 71.6 34.7 558.85 8570 8975 9793 8385 318 4.739011 9366 8625 159 5.15
35 71.6 64.8 557.75 22770 29588 32337 27604 1072 6.5529657 30887 28221 605 6.80
movement but also a reduced canister box width, a reducedpitch, or a changed rod diameter.
4. Results
In this section, the results obtained for single- and two-phase flow pressure drop calculations as well as the voidfraction calculation, are presented. First, the relative valuesobtained with respect to the experimental values are shownand followed by the evaluation ofwhich uncertain parametersare the most important ones in each case for DAKOTA andSUSA calculations.
4.1. Single-Phase Flow Pressure Drop. All 36 scenarios forassembly type four have been modeled and simulated withTRACE. Six scenarios are selected for the uncertainty andsensitivity study.Meaning that 2 times (SUSA andDAKOTA)6 times 93 equal to 1116 calculations are performed for thissubsection.The results of the uncertainty analyses along withthe input parameter combinations are given in Table 3 forSUSA and DAKOTA (the first values of mean, max, min,etc., are for SUSA, the second one for DAKOTA).The results,in relative form, are also plotted in Figure 3. One can seethat, except for case P70013, the relative error is in the rangeof ±5%. For case P70013 an error of more than 35% hasbeen calculated. A comparison of the absolute values showsthat an experimental value of 740 Pa was measured, whilethe calculated one is in the range of 1000 Pa. The absolutedifference is only 260 Pa which is almost negligible. But therelative deviation is high. Figure 3 shows that the pressuredrop is in general overpredicted, considering all 36 cases.One also can note that the uncertainty band for the TRACE-SUSA runs is wider than the one for TRACE-DAKOTA,as the smaller standard deviation indicates. That is relatedto the additional parameter, hydraulic diameter (flow areaand volume) considered in the TRACE-SUSA but not in theTRACE-DAKOTA study.
In order to identify the input parameters where theirvariations have the largest influence on the single-phase flow
0.8
0.9
1
1.1
1.2
1.3
1.4
1.5
00 02 04 06 08 10 12 14 16 18 20 22 24 26 28 30 32 34 36Case (P700xx)
ReferenceMean (SUSA)Maximum (SUSA)Minimum (SUSA)
Mean (DAKOTA)Maximum (DAKOTA)Minimum (DAKOTA)
Relat
ive s
ingl
e-ph
ase p
ress
ure d
rop
(—)
Figure 3: Relative single-phase flow pressure drop and uncertaintyband for TRACE-SUSA and TRACE-DAKOTA.
pressure drop, a sensitivity analysiswas performed. SUSAandDAKOTA use, among others, the Pearson’s product momen-tum coefficient to quantify the correlation between inputand output parameters. These coefficients are summarizedin Table 4 (first line for SUSA, second for DAKOTA). WithTRACE-SUSA, the hydraulic diameter is the most importantparameter. A value of around −0.75 indicates a strongdependence, and a negative sign means that an increase ofthe hydraulic diameter results in a decrease of the pressuredrop. Since the hydraulic diameter is not part of the TRACE-DAKOTA analysis, a different parameter, the form losscoefficient of the spacers, is the dominant parameter. Outletpressure, inlet temperature, and wall roughness show a weakor almost no dependency. In general, values between−0.3 and+0.3 indicate a weak dependency or an independency. Thesensitivity coefficient of themass flow rate is high for TRACE-DAKOTA but low for TRACE-SUSA. Since the hydraulic

Science and Technology of Nuclear Installations 7
Table 4: Sensitivity coefficients for the single-phase flow pressure drop.
Case (P700x) Outlet pressure Mass flow rate Inlet temperature Wall roughness 𝐾-spacer Hydraulic diameter
02 0.143 0.281 −0.240 −0.106 0.539 −0.7490.030 0.550 0.045 0.076 0.836 —
07 0.152 0.283 −0.229 −0.131 0.570 −0.7470.007 0.506 0.003 −0.008 0.859 —
13 0.138 0.287 −0.184 −0.081 0.585 −0.7540.045 0.636 −0.113 −0.029 0.764 —
16 0.150 0.285 −0.174 −0.093 0.603 −0.7510.044 0.851 −0.200 −0.022 0.476 —
30 0.154 0.284 −0.135 −0.108 0.614 −0.749−0.022 0.510 −0.062 0.024 0.849 —
35 0.152 0.282 −0.129 −0.112 0.624 −0.7470.434 0.393 −0.240 −0.001 0.645 —
Table 5: Input parameter combinations and uncertainty results for the two-phase flow pressure drop cases.
Case (P600x) Poutlet (bar) MFR (t/h) hsub(kJ/kg) 𝑃 (MW) Exp. (Pa) Mean (Pa) Max (Pa) Min (Pa) SD (Pa) Error (%)
01 71.6 20.2 53.3 0.863 27400 26376 26955 25788 264 −3.7426369 26840 25915 196 −3.76
08 71.7 55.0 49.0 3.057 65720 64000 68566 60755 1732 −2.6263774 66553 61297 1098 −2.96
14 71.6 70.1 50.6 3.884 91270 90818 98174 85491 2817 −0.5090257 93822 86191 1835 −1.11
20 71.6 45.1 51.8 4.363 68830 64003 68386 60185 1777 −7.0163712 65725 61955 960 −7.44
22 86.4 20.2 50.7 0.837 26830 26008 26587 25435 262 −3.0625934 26492 25377 236 −3.34
30 86.4 70.2 51.4 5.076 100770 101399 109640 95273 3216 0.62100810 105480 95578 2086 0.04
diameter is the major source for the pressure drop variationthe sensitivity coefficient of themass flow rate, and of all otherparameters, must be higher if that parameter is not presentin the analysis. Based on the present result the ranking is asfollows: 1 = hydraulic diameter, 2 = K-spacer, and 3 = massflow rate.
4.2. Two-Phase Flow Pressure Drop. As for the single-phasecase, all scenarios for assembly type four are modeled, and6 representative scenarios are selected for the uncertaintyand sensitivity analysis. The input and boundary parametercombinations of the six selected cases are given on the left sideof Table 5. The right side shows the result of the uncertaintyanalysis, and Figure 4 shows the mean, maximum, andminimum for SUSA and DAKOTA in relative values. It canbe seen that the calculations underpredict the experimentalresults. The overall error is in the order of ±5%. For the sixselected cases the absolute error ranges from almost zero to7.5%. Again, the TRACE-DAKOTA results are characterizedby the smaller standard deviation and the resulting narroweruncertainty band.
0.8
0.9
1
1.1
1.2
00 03 06 09 12 15 18 21 24 27 30 33Case (P600xx)
ReferenceMean (SUSA)Maximum (SUSA)Minimum (SUSA)
Mean (DAKOTA)Maximum (DAKOTA)Minimum (DAKOTA)
Relat
ive t
wo
phas
e pre
ssur
e dro
p (—
)
Figure 4: Relative two-phase flow pressure drop and uncertaintyband for TRACE-SUSA and TRACE-DAKOTA.

8 Science and Technology of Nuclear Installations
Table 6: Sensitivity coefficients for the two-phase flow pressure drop.
Case (P600x) Outlet pressure Mass flow rate Inlet temperature Wall roughness 𝐾-spacer Hydraulic diameter Power
01 0.189 0.212 −0.645 −0.013 0.387 −0.486 −0.040−0.391 0.322 0.802 0.314 0.002 — 0.029
08 −0.184 0.263 0.406 0.055 0.342 −0.700 0.126−0.396 0.287 0.672 0.087 0.509 — 0.013
14 −0.197 0.252 0.447 0.058 0.328 −0.678 0.131−0.394 0.272 0.730 0.061 0.408 — 0.232
20 −0.158 0.245 0.308 0.044 0.331 −0.750 0.181−0.413 0.284 0.641 0.086 0.485 — 0.334
22 0.202 0.203 −0.653 −0.017 0.390 −0.479 −0.033−0.280 0.250 0.865 0.030 0.263 — 0.098
30 −0.193 0.250 0.400 0.056 0.338 −0.701 0.149−0.445 0.269 0.646 0.070 0.502 — 0.294
Table 7: Input parameter combinations and uncertainty results for the void fraction cases.
Case (4101-) Poutlet (bar) MFR (t/h) hsub(kJ/kg) 𝑃 (MW) Exp. (Pa) Mean (−) Max (−) Min (−) SD (−) Error (%)
04 9.73 10.2 43.9 0.82 0.840 0.843 0.847 0.838 0.002 0.310.842 0.846 0.838 0.002 0.25
18 39.19 10.14 51.5 1.00 0.755 0.778 0.785 0.770 0.003 2.980.779 0.785 0.770 0.003 3.14
29 39.17 54.68 50.3 3.92 0.757 0.766 0.773 0.758 0.004 1.170.765 0.774 0.757 0.004 1.11
47 71.32 29.94 50.6 1.43 0.536 0.573 0.594 0.551 0.010 6.970.573 0.599 0.552 0.010 6.97
64 71.59 69.53 53.6 1.57 0.263 0.254 0.327 0.181 0.033 3.380.254 0.312 0.186 0.033 3.38
82 86.35 54.54 52.9 1.85 0.376 0.416 0.456 0.375 0.018 10.540.415 0.450 0.377 0.020 10.31
The sensitivity coefficients have almost similar values forall considered cases, see Table 6. The fluctuations are relatedto the varying input and boundary conditions. The onlyexception is the inlet temperature which has relative highnegative values for cases 1 and 22. But for the rest of thecases positive values between 0.3–0.4 are calculated. For thenamed cases, the boundary conditions show that they arecharacterized by lowmass flow rate and low power.Therefore,the impact of their variation is losing against the impactof the inlet subcooling (inlet temperature) which is almostconstant for all cases.The highest values are calculated for thehydraulic diameter followed by the inlet temperature and theK-factor for the spacer grid.
The sensitivity coefficients of the TRACE-DAKOTA anal-ysis indicate a slightly different relation between the param-eters. For the inlet temperature exclusively high positivevalues, >0.6, are calculated, even for case 1 and 22 for whichthe TRACE-SUSA analysis predicted negative values of 0.65.That means that for the TRACE-SUSA analysis the pressuredrop would increase with decreasing inlet temperature. ForTRACE-DAKOTA the influence of the inlet temperature
would be in the opposite direction; increasing inlet temper-ature yields increasing pressure drop. One explanation couldbe the absence of the hydraulic diameter, which amplifies theinfluence of the inlet temperature compared to the TRACE-SUSA analysis.
4.3. Void Fraction. Six cases out of 86 are selected for thisinvestigation. The input and boundary conditions and theresults regarding the uncertainties are given in Table 7. Con-sidering the reference results of all 86 scenarios, a tendencyto overpredict the void fraction can be seen. In addition, therelative error is slightly depending on the void fraction. Athigher void fractions the error is lower than at lower voidfractions. Another finding is that the uncertainty band iswider at lower void fractions as shown in Table 7 and inFigure 5. At a void fraction of 0.84, as in case 410104, theuncertainty band can be almost neglected, while for case410164, void = 0.263, the band is clearly visible.
For two of the six cases the void fraction is plotted asfunction of the axial height in Figure 6 and Figure 7 forcase 410104 and 410164, respectively. The same tendency

Science and Technology of Nuclear Installations 9
0.6
0.7
0.8
0.9
1
1.1
1.2
1.3
01 06 11 16 21 26 31 36 41 46 51 56 61 66 71 76 81 86
Reference Mean (SUSA)Maximum (SUSA) Minimum (SUSA)Mean (DAKOTA) Maximum (DAKOTA)Minimum (DAKOTA)
Case (4101-xx)
Relat
ive o
utle
t voi
d fr
actio
n (—
)
Figure 5: Relative outlet void fraction and uncertainty band forTRACE-SUSA and TRACE-DAKOTA.
−0.10.00.10.20.30.40.50.60.70.80.9
0 0.5 1 1.5 2 2.5 3 3.5 4
Experiment (corrected)Mean (SUSA) Mean (DAKOTA)Minimum (SUSA) Minimum (DAKOTA)Maximum (SUSA) Maximum (DAKOTA)
4101-04
Axial location (m)
Experiment (original)
Void
frac
tion
(—)
Figure 6: Axial void fraction profile for case 4101-04.
0
0.05
0.1
0.15
0.2
0.25
0.3
0 0.5 1 1.5 2 2.5 3 3.5 4
4101-64
Axial location (m)
Experiment (corrected)Mean (SUSA) Mean (DAKOTA)Minimum (SUSA)Minimum (SUSA)
Minimum (DAKOTA)Minimum (DAKOTA)
Experiment (original)
Void
frac
tion
(—)
Figure 7: Axial void fraction profile for case 4101-64.
can be seen. The higher the void fraction the closer theminimum and maximum are to the mean value. In additionto the corrected results, the original measured data pointsare plotted. It can be seen that the correction is morepronounced at higher void fractions. It is also clearly visiblethat considering the original void fractions, the TRACEpredictionswill always underpredict themeasurements.Withthe corrections, the discrepancies are reduced. With bothuncertainty codes almost identical results are obtained. Thatmeans that the hydraulic diameter, as the only differencebetween the two codes, is not important as it is for thepressure drop simulations. That can be best seen by theidentical standard deviations.
The wider uncertainty band at lower void fractions mightbe related to the flow regime which is present at the differentvoid fractions. At lower void fractions the regime is bubblyslug flow, while at higher void fractions annular mist flow.The differences in calculating the interfacial friction and theirsensitivity to the parameters which are varied could be onereason for the observed behavior.
The sensitivity coefficients according to Pearson’smomentum correlation coefficient are given in Table 8. Itis clearly visible that the inlet temperature, which in factrepresents the inlet subcooling, is the input parameterof highest importance. Besides the inlet temperature, thepower is also of importance, but the range of the sensitivitycoefficient ranges from almost zero to values up to 0.6. Atlow-void fractions, the values for the mass flow rate are closeto zero while for high-void fraction the values are close to−0.25, meaning that an increase of the mass flow rate alwaysresults in a decrease of the void fraction. Parameters like thehydraulic diameter or K factor have almost no impact onthe outlet void fraction which explains why TRACE-SUSAand TRACE-DAKOTA predict the same results. It can beseen that at low-void fractions the sensitivity coefficient forthe inlet temperature is very high, around 0.9, while the onefor the power is very low. With increasing void fraction thesensitivity coefficient for the inlet temperature decreases.Thecoefficient for the power is increasing linearly with increasingvoid fractions, going from <0.1 at a void fraction of 0.25to values of around 0.6 at void fractions >0.8. Since thevariation is almost constant, ±1.5 K for the inlet temperatureand ±1% for the power, the change of the absolute valuesis getting more pronounced with higher temperatures andpowers. With increasing assembly power the outlet voidfraction is increased. That means that a variation of 1% ofan already high assembly power will result in much moreadditional energy which is released in the systems as 1% at alow assembly power. At low-void fractions, the variation ofthe inlet subcooling (inlet temperature) has more influenceon the resulting void fraction as at higher void fractionsbecause the inlet subcooling is the only parameter whichaffects the results according to the sensitivity study.
5. Summary and Conclusions
In this paper steady state results of the NUPEC BFBT database for single- and two-phase flow pressure drop and void

10 Science and Technology of Nuclear Installations
Table 8: Sensitivity coefficients for the void fraction cases.
Case (4101-) Outlet pressure Mass flow rate Inlet temperature Wall roughness 𝐾-spacer Hydraulic diameter Power
04 −0.159 −0.216 0.721 −0.072 −0.150 −0.205 0.461−0.474 −0.239 0.640 −0.052 −0.012 — 0.500
18 −0.225 −0.205 0.651 −0.071 −0.120 −0.275 0.500−0.415 −0.246 0.656 0.029 0.012 — 0.567
29 −0.250 −0.252 0.718 −0.060 −0.210 0.043 0.352−0.476 −0.236 0.698 −0.039 0.005 — 0.459
47 −0.331 −0.114 0.830 0.021 −0.167 −0.024 0.213−0.425 −0.185 0.828 0.010 0.014 — 0.284
64 −0.304 −0.018 0.899 0.053 −0.162 0.004 0.053−0.450 −0.080 0.884 −0.006 0.001 — 0.098
82 −0.343 −0.059 0.864 0.045 −0.167 0.011 0.115−0.502 −0.130 0.862 −0.016 0.022 — 0.180
fraction measurements are used to perform an uncertaintyand sensitivity study with TRACE-SUSA and TRACE-DAKOTA. One major drawback of the current TRACE-DAKOTA tool is that not all input and boundary conditionscan be included due to programming or practical reason.That becomes noticeable when inclusion of the geometricalparameters is needed.
Especially for the calculation of the pressure drop, thevariation of the hydraulic diameter is important. In fact, forthe single-phase flow pressure drop analysis it turned outthat this parameter is the most important one in terms ofsensitivity related to its variation. For the two-phase flowcases the importance changed. In this case, the inlet temper-ature, which is taking into account the inlet subcooling, isthe dominant parameter, while the hydraulic diameter andalso the form loss coefficient of the spacer grid are of lessimportance. That is reasonable since the change of the inlettemperature will provoke a change of the void fraction.
Concerning the void fraction cases, TRACE-SUSA andTRACE-DAKOTA predict similar results. This means thatthe variation of the hydraulic diameter is not important.This has also been proofed by the calculated sensitivitycoefficients which are similar for both codes. Besides thegeneral insignificance of the hydraulic diameter in the presentcase, a reason might be also the rather small variation of theparameter. A larger, for example, 5%, variation may causedifferences for both options. One important finding of thatinvestigation is that the width of the uncertainty band isa function of the void fraction. At high-void fractions theinfluence of the inlet subcooling is minimal, while the onefor the power is gaining importance. At low-void fractions,the investigation showed that only the inlet temperature hasan influence, while the power can be declared unimportant.
In general, the comparison between measurements andpredictions shows a good agreement which proofs thatTRACE is able to represent the stationary behavior in a BWRfuel assembly at different operational conditions.
Based on the present investigation it can be concludedthat both tools TRACE-SUSA and TRACE-DAKOTA givesimilar results if the same parameters are included inthe investigation. That is comprehensible since SUSA and
DAKOTA are based on the same mathematical formulations.From the practical point of view DAKOTA has the advantagethat it is implemented in SNAP and the user can use the samegraphical interface as with TRACE. In addition, program-ming skills are not required since everything is automatized.The major drawback of DAKOTA is that in its currentimplementation stage as it cannot be used if parameters arecorrelated to each other. In case the investigation is focusedon physical model parameters, DAKOTA cannot be usedat all. This is the biggest advantage of SUSA. Even thoughprogramming skills aremandatory, the user can change everyparameter which needs to be considered in the uncertaintyand sensitivity analysis.
Conflict of Interests
The authors hereby declare that no conflict of interest ispresent between them and the commercial entities men-tioned in the context of the paper.
Acknowledgments
Thanks are due to the Program “Nuclear Safety Research” ofKIT for the financial support of the Research Topic “Multi-physicsMethodologies for ReactorDynamics and Safety” andto the Deutscher Akademischer Austausch Dienst (DAAD).
References
[1] B. Krzykacs, E. Hofer, and M. Kloos, “A software system forprobabilistic uncertainty and sensitivity analysis of results fromcomputer models,” Proceedings of the International Confer-ence on Probabilistic Safety Assessment and Management, SanDiego, USA, 1994.
[2] GRS, SUSA V3.5 user’s guide and tutorial, Gesellschaft fuerAnlagen- und Reaktorsicherheit, Cologne, Germany, 2002.
[3] H. Glaeser, “GRS method for uncertainty and sensitivity evalu-ation of code results and applications,” Science and Technologyof Nuclear Installations, vol. 2008, Article ID 798901, 2008.
[4] B. Adams, K. Dalbey, M. Eldred, D. Gay, L. Swiler, W. Bohn-hoff et al., DAKOTA, A Multilevel Parallel Object-Oriented

Science and Technology of Nuclear Installations 11
Framework for Design Optimization, Parameter Estimation,Uncertainty Quantification, and Sensitivity Analysis Version 5. 1User’s Manual, Sandia National Laboratories, Livermore, Calif,USA, 2011.
[5] B. E. Boyack, I. Catton, R. B. Duffey et al., “Quantifyingreactor safety margins part 1: an overview of the code scaling,applicability, and uncertainty evaluationmethodology,”NuclearEngineering and Design, vol. 119, no. 1, pp. 1–15, 1990.
[6] M. Nissley, C. Frepoli, K. Ohkawa, and K. Muftuoglu, RealisticLarge-Break LOCA Evaluation Methodology Using the Auto-mated Statistical Treatment of Uncertainty Method (ASTRUM).WCAP-16009-NP,Westinghouse Electric Company, Pittsburgh,Pa, USA, 2003.
[7] S. Kawamura and T. Hara, Best Estimate Methods for LicensingAnalysis. Best-Estimate Methods in Nuclear Installation SafetyAnalysis, American Nuclear Society, Washington, DC, USA,2000.
[8] A. de Crecy, P. Bazin, H. Glaeser, T. Skorek, J. Joucla, P. Probst etal., “BEMUSEphase III report: Uncertainty and sensitivity anal-ysis of the LOFT L2-5 test,” Tech. Rep. NEA/CSNI/R(2007)4,2007.
[9] F. Reventos, M. Perez, L. Batet, A. Guba, I. Toth, T. Mieussetet al., “BEMUSE phase V report: Uncertainty and sensitivityanalysis of a LBLOCA in Zion nuclear power plant,” Tech. Rep.NEA/SCNI/R(2009)13, 2009.
[10] K. Ivanov,M.Avramova, I. Kodeli, andE. Sartori,Benchmark forUncertainty Analysis in Modelling (UAM) for Design, Operationand Safety Analysis of LWRs Volume I: Specification and SupportData for the Neutronics Cases, OECD Nuclear Energy Agency,2007.
[11] B. Neykov, F. Aydogan, L. Hochreiter, K. Ivanov, H. Utsuno,K. Fumio et al., NUPEC BWR Full-Size Fine Mesh Buncle Test(BFBT) Benchmark Volume I: Specifications, OECD/NEA, 2005.
[12] M. Gluck, “Validation of the sub-channel code F-COBRA-TF. Part II. Recalculation of void measurements,” NuclearEngineering and Design, vol. 238, no. 9, pp. 2317–2327, 2008.
[13] US NRC, TRACE V5. 0 Theory Manual-Field Equations, Solu-tion Methods, and Physical Models, U.S. Nuclear RegulatoryCommission, 2010.
[14] S. Wilks, “Determination of sample sizes for setting tolerancelimits,” The Annals of Mathematical Statistics, vol. 12, no. 1, pp.91–96, 1941.
[15] W. Jager, V. Sanchez, and R. Macian-Juan, “On the uncertaintyand sensitivity analysis of experiments with supercritical waterwith TRACE and SUSA,” Proceedings of the 18th InternationalConference onNuclear Enginnering (ICONE ’10), Xi’an, China,2010.
[16] B. Neykov, L. Hochreiter, K. Ivanov, H. Utsuno, E. Sartori, andM.Martin,NUPECBWRFull-Size Fine-MeshBundle Test (BFBTBenchmark) Volume II: Uncertainty and Sensitivity Analysesof Void Distribution and Critical Power-Specification, OECDNuclear Energy Agency, 2007.

TribologyAdvances in
Hindawi Publishing Corporationhttp://www.hindawi.com Volume 2014
International Journal of
AerospaceEngineeringHindawi Publishing Corporationhttp://www.hindawi.com Volume 2014
FuelsJournal of
Hindawi Publishing Corporationhttp://www.hindawi.com Volume 2014
Journal ofPetroleum Engineering
Hindawi Publishing Corporationhttp://www.hindawi.com Volume 2014
Industrial EngineeringJournal of
Hindawi Publishing Corporationhttp://www.hindawi.com Volume 2014
Power ElectronicsHindawi Publishing Corporationhttp://www.hindawi.com Volume 2014
Advances in
CombustionJournal of
Hindawi Publishing Corporationhttp://www.hindawi.com Volume 2014
Journal of
Hindawi Publishing Corporationhttp://www.hindawi.com Volume 2014
Renewable Energy
Submit your manuscripts athttp://www.hindawi.com
Hindawi Publishing Corporationhttp://www.hindawi.com Volume 2014
StructuresJournal of
International Journal of
RotatingMachinery
Hindawi Publishing Corporationhttp://www.hindawi.com Volume 2014
EnergyJournal of
Hindawi Publishing Corporationhttp://www.hindawi.com Volume 2014
Hindawi Publishing Corporation http://www.hindawi.com
Journal ofEngineeringVolume 2014
Hindawi Publishing Corporation http://www.hindawi.com Volume 2014
International Journal ofPhotoenergy
Hindawi Publishing Corporationhttp://www.hindawi.com Volume 2014
Nuclear InstallationsScience and Technology of
Hindawi Publishing Corporationhttp://www.hindawi.com Volume 2014
Solar EnergyJournal of
Hindawi Publishing Corporationhttp://www.hindawi.com Volume 2014
Wind EnergyJournal of
Hindawi Publishing Corporationhttp://www.hindawi.com Volume 2014
Nuclear EnergyInternational Journal of
Hindawi Publishing Corporationhttp://www.hindawi.com Volume 2014
High Energy PhysicsAdvances in
The Scientific World JournalHindawi Publishing Corporation http://www.hindawi.com Volume 2014