Ulysses - ESPON
279
Ulysses Using applied research results from ESPON as a yardstick for cross-border spatial development planning Targeted Analysis 2013/2/10 Scientific Report for the Final Report Multi-Thematic Territorial Analysis of the Eastern and Northern Finland – Russia Cross-Border Area (Euregio Karelia) Version 30/07/2012
-
Upload
khangminh22 -
Category
Documents
-
view
1 -
download
0
Transcript of Ulysses - ESPON

Ulysses Using applied research results from ESPON as a yardstick for
cross-border spatial development planning
Targeted Analysis 2013/2/10
Scientific Report for the Final Report
Multi-Thematic Territorial Analysis
of the
Eastern and Northern Finland – Russia Cross-Border Area (Euregio Karelia)
Version 30/07/2012

This report presents the Multi-Thematic Territorial
Analysis results of a Targeted Analysis conducted
within the framework of the ESPON 2013
Programme, partly financed by the European
Regional Development Fund.
The partnership behind the ESPON Programme
consists of the EU Commission and the Member
States of the EU27. plus Iceland, Liechtenstein,
Norway and Switzerland. Each partner is
represented in the ESPON Monitoring Committee.
This report does not necessarily reflect the opinion
of the members of the Monitoring Committee.
Information on the ESPON Programme and projects
can be found on www.espon.eu
The web site provides the possibility to download
and examine the most recent documents produced
by finalised and ongoing ESPON projects.
This basic report exists only in an electronic version.
© ESPON & Lappeenranta University of
Technology, 2012.
Printing, reproduction or quotation is authorised
provided the source is acknowledged and a copy is
forwarded to the ESPON Coordination Unit in
Luxembourg.

Ulysses Final Report - Multi-thematic Territorial Analysis of Euregio Karelia 3
List of authors
Lappeenranta University of Technology (LUT)
Virpi Kaisto
Project researcher
Project group:
Tecnalia, Spain (LP)
Karlsruher Institut für Technologie (KIT), Germany
Democritus University of Thrace, Greece
Lappeenranta University of Technology, Finland
University of Aveiro, Portugal
University of Luxemburg

Ulysses Final Report - Multi-thematic Territorial Analysis of Euregio Karelia 4
Glossary
CBA: Abbreviation for Cross-Border Area. ESPON countries: 27 EU Member States and Iceland, Lichtenstein, Norway and Switzerland FUA: Abbreviation for Functional Urban Area. LAU: Abbreviation for the Local Administrative Units (LAUs) compatible with NUTS classification. LAU 1: The upper LAU level (formerly NUTS level 4) is defined for most, but not all of the countries. LAU 2: The lower LAU level (formerly NUTS level 5) consists of municipalities or equivalent units in the 27 EU Member States. NUTS: Abbreviation for the Nomenclature of territorial units for statistics. The NUTS classification is a hierarchical system for dividing up the economic territory of the EU for the purpose of collection, development and harmonisation of EU regional statistics. NUTS 1: major socio-economic regions NUTS 2: basic regions for the application of regional policies NUTS 3: small regions for specific diagnoses SNUTS 1-3: “Similar to NUTS” classification applied in this report for the Russian territories. SLAU 1-2: “Similar to LAU” classification applied in this report for the Russian local administrative units.

Ulysses Final Report - Multi-thematic Territorial Analysis of Euregio Karelia 5
Table of contents
Chapter 1. Executive Summary 8 1.1. ULYSSES project in brief 8 1.2. Key analysis 8
1.2.1. Demography 8 1.2.2. Polycentric development 8 1.2.3. Urban-rural relationship 9 1.2.4. Accessibility and connectivity 9 1.2.5. Gothenburg and Lisbon / Europe 2020 strategy 9 1.2.6. Factor analysis 9 1.2.7. Institutional analysis 9
1.3. Identified challenges 9 1.4. Proposed strategies 10
1.4.1. Strategies to tackle territorial challenges in Euregio Karelia 10 1.4.2. General strategies for Euregio Karelia 11
1.5. Further steps 11 Chapter 2. General overview 12
2.1. ULYSSES project in brief 12 2.2. General overview of the area 13
Chapter 3. Demographic analysis 15 3.1. Population 15 3.2. Influence of the border on settlement patterns 16
Chapter 4. Polycentric development 16 4.1. Functional Urban Areas 16 4.2. Morphological analysis of FUAs 17
Source: Eurostat, Rosstat 17 Source: Eurostat 17 Source: Eurostat, Rosstat 18
4.3. Functional analyses of FUAs 18 Chapter 5. Urban-rural relationship 18
5.1. Land use patterns 18 5.2. Gross value added and employment in agriculture and fishing 19
Source: Eurostat, Kareliâstat 19 Chapter 6. Accessibility and connectivity 20
6.1. Accessibility by road, rail and air 21 6.2. Internet accessibility 22
Chapter 7. Lisbon / Europe 2020 and Gothenburg objectives 22 7.1. Economy and employment 23
7.1.1. GDP per capita 23 7.1.2. Economic sectors 23
7.2. Research and innovation 24 7.3. Social cohesion 24 7.4. Environmental analysis 24
7.4.1. Environmental performance 24 7.4.2. Environmental capacity 25 7.4.3. Climate change 25
Chapter 8. Factor analyses 25 8.1. Location 25

Ulysses Final Report - Multi-thematic Territorial Analysis of Euregio Karelia 6
8.2. Demographic dynamism and immigration 26 8.3. Economy 26 8.4. Research and development 27 8.5. Administrative centres 27 8.6. Environment 27
Chapter 9 – Cross-border governance 28 9.1. General framework and analysis 28 9.2. Euregio Karelia 28
9.2.1. Structural dimension 28 9.2.2. Activity dimension 29 9.2.3. Spatial development and transport 29
Chapter 10 – Integrated territorial analysis and scenarios 31 10.1. Objectives and methodology 31 10.2. Current status of Euregio Karelia 31 10.3. ESPON 3.2. scenarios and Euregio Karelia 32
10.3.1. Integrated baseline (trend) scenario 32 10.3.2. Danubian Europe: Integrated cohesion-oriented scenario 32 10.3.3. Rhine-Rhone Europe: competitiveness-oriented scenario 33
10.4. Most relevant challenges for Euregio Karelia 33 Chapter 11 – Suggested strategies 35
11.1. Suggested strategies for Euregio Karelia 35 11.1.1. Strategies to tackle territorial challenges in Euregio Karelia 35 11.1.2. General strategies for Euregio Karelia 35
Chapter 12 – General conclusions 36 Annexes 36 References 37

Ulysses Final Report - Multi-thematic Territorial Analysis of Euregio Karelia 7
To the reader
This report is the Scientific Report of the Ulysses-project. It presents research results for the Eastern and Northern Finland - Russia cross-border area (Euregio Karelia). The first part of the report (chapters 2-8) summarises research results of the Multi-thematic cross-border territorial analysis (MTA). The full report (MTA) is annex 1 to this report. The second part of this report (chapter 9) summarizes research results of the Cross-border governance analysis. The full Cross-border governance analysis is annex 2 to this report. The last part of the report (chapters 10-11) presents research results of the Integrated analysis. It includes identified challenges and proposed strategies for the CBA. Description of the methodology and full tables of the SWOT analysis are annex 3 to this report. As this is a summary report, please refer to the annexes for full data and methodology explanations. Please also pay attention that certain analyses were performed on NUTS 2 level, and the analyses thus include regions that are not in the territory of Euregio Karelia.

Ulysses Final Report - Multi-thematic Territorial Analysis of Euregio Karelia 8
Chapter 1. Executive Summary
1.1. ULYSSES project in brief
ULYSSES is an experimental and innovative project supported by eighteen European border and cross-border areas (hereafter CBA) that aim at using research results from ULYSSES as a yardstick for decentralised cross-border spatial development activities. Analyses in ULYSSES are based on data and methods developed by previous projects of the ESPON programme. In ULYSSES, a targeted analysis including high-quality, comprehensive and multi-thematic territorial analyses (hereafter MTA), was performed on six specific CBAs across Europe. The MTA focused on the main topics of the Territorial Agenda of the European Union (EU 2006, 2011), namely (i) cross-border polycentric development, (ii) patterns of urban/rural relationship, (iii) levels of accessibility and connectivity, (iv) effects of demographic change (territorial profile), and (v-vi) level of attainment of Lisbon/Europe 2020 and Gothenburg objectives by the CBA (territorial performance). In parallel, an in-depth statistical analysis was performed. It included (i) a catching-up analysis; (ii) a principal components analysis, and (iii) a multiple regression analysis. Additionally, a comprehensive cross-border institutional performance analysis was included for each CBA. This analysis captured the diversity of governance frameworks existing in the CBAs and it included a structural dimension, i.e. the overall framework that can hardly be influenced by the partners of cross-border cooperation, as well as an activity dimension, i.e. the intensity and continuity of institutionalised cross-border cooperation on the regional level. Further, an integrated analysis taking into account previous inputs was performed. Methodologically the integrated analysis adopted the form of a two-phase SWOT analysis that included (i) a status-analysis phase in which the findings derived from previous research tasks were organised and prioritised, and (ii) an action-decision phase in which a response to the identified challenges was proposed as potential strategies. Both the challenges and strategies were discussed and eventually validated by stakeholders of the MTA areas. The SWOT analysis is the main contribution of the ULYSSES-project to the Practical Guide that the Association of European Border Regions will develop in the near future.
1.2. Key analysis
1.2.1. Demography
Population change has been negative in Euregio Karelia in the first half of the 2000s. Euregio Karelia has also suffered of a decline in migration rates. Population decline has, however, been less severe in the second half of the 2000s, and total fertility rate has shown a gradual improvement. Demographic performance has varied widely between the regions of Euregio Karelia and the only region with a positive total population change, natural change and net migration has been Northern Ostrobothnia that is to most parts located on the western border of Finland. Finnish regions of Euregio Karelia, located in the proximity of the Finnish-Russian border have been attracting migrants from Russia.
1.2.2. Polycentric development
Euregio Karelia has a polycentric urban structure that is not dominated by one big city. The CBA has a small amount of FUAs and a small share of FUA inhabitants. FUAs of the CBA have been attracting population more than rural regions and population has been increasing in all the FUAs (except for Kajaani). In almost all the FUAs dominating economic activity was traditional manufacturing. There are great differences in GDP between the FUAs, and the largest differences are observed between the Finnish and Russian FUAs.

Ulysses Final Report - Multi-thematic Territorial Analysis of Euregio Karelia 9
1.2.3. Urban-rural relationship
Euregio Karelia is in the European context classified as a CBA with low urban influence and low human intervention. The share of agricultural areas in Euregio Karelia is significantly lower than the European average. This is explained by the large share of forests in the total area. Urbanisation of agricultural areas has been below ESPON average in Euregio Karelia. Concerning economy and employment in rural areas, there has been an increase in GVA by agriculture and fishing, but the share of those fields of economy in total GVA has been decreasing. Accordingly there has been a decline in the share of employment in the field in general employment statistics. This tendency has been less severe in border regions.
1.2.4. Accessibility and connectivity
Euregio Karelia is located far from central European road and rail infrastructure and thus has low accessibility and connectivity. Despite its remote location, air connections make the CBA better accessible to the European countries. In comparison with European average, multimodal accessibility (by road, rail and air) of Euregio Karelia has been declining. Accessibility within the CBA is very much affected by the external border with a passport control and customs checks. There are three international border crossing points in the territory of Euregio Karelia. Cross-border traffic has been increasing steadily and the border crossing infrastructure has been developed. Between 2007 and 2011 the number of border crossings increased at an annual rate of 7,8 %. Thus the connectivity between the Finnish and Russian regions of the CBA is increasing. Finnish regions of the CBA have a high "virtual" connectivity and the share of households with internet connection has been increasing also in the Russian part of Euregio Karelia.
1.2.5. Gothenburg and Lisbon / Europe 2020 strategy
Compared to the leading region (London) Northern Ostrobothnia is classified as middle income region, while both North Karelia and Kainuu are indentified as less developed regions and the Republic of Karelia as a very laggard region. Growth of GDP has been strong in the Republic. There are large differences in GDP per capita between the Finnish and Russian regions. The Finnish-Russian border has had positive effects on trade in the cities located in close proximity of the border. There is a strong variance between regions concerning performance in R&D and social cohesion, Eastern Finland and the Republic of Karelia performing the weakest. Sensitivities to climate change are low in Euregio Karelia. Environmental issues pose a great challenge for the CBA. Low waste water treatment capacity of the Republic of Karelia affects the whole CBA. When compared to other European countries, there is a low share of Natura 2000 areas in the CBA. Wind energy potential, on the contrary, is above the European average in all the regions of the CBA.
1.2.6. Factor analysis
In the European context Euregio Karelia is physically far away from Central Europe, but it scores relatively high in terms of research and development and has low levels of pollution. In terms of economic development and urbanisation Euregio Karelia is below European average and there are significant differences between performances of the regions. Only the Finnish regions were included in the analysis.
1.2.7. Institutional analysis
Euregio Karelia is located on the EU external border, which creates a relatively difficult structural context for cross-border governance and institutionalized spatial planning. Cross-border cooperation does take place in Euregio Karelia in a multi-faceted and increasing way. Still, the difference to internal EU cooperation is very obvious and a spatial planning or a transport policy has not been institutionalized on a cross-border level yet.
1.3. Identified challenges
We have found two thematically cross-cutting challenges that in our view have the strongest influence on future developments of Euregio Karelia. The first challenge is the EU external border and its direct and

Ulysses Final Report - Multi-thematic Territorial Analysis of Euregio Karelia 10
indirect influence on territorial dynamics and performance of the CBA. In comparison with the EU internal borders, the border between Finland and Russia continues to function as a barrier for the movement of people and goods. However, our study shows that during the 2000s the border between Finland and Russia has become a relevant factor influencing territorial development of the border regions. The border has affected migration patterns, accessibility within the CBA and economy and trade. These developments gradually influence, among others, population patterns and social welfare in the border regions. In addition, cross-border framework is a challenge when dealing with independent national or regional developments. For example environmental protection, such as waste water treatment capacity is weaker on the Russian side of Euregio Karelia, but environmental state, such as water pollution affects both sides of the border. All the “border effects” are subject to change depending on current EU policies. The first challenge is thus to pay attention to border effects and continue collaboration in spatial planning across the border. The second key element affecting territorial development in Euregio Karelia is urban-rural relationship. In the European context Euregio Karelia has a relatively small amount of FUAs (only one FUA in the Republic of Karelia) and the share of FUA inhabitants is below the European average. On the contrary, there are large uninhabited or sparsely populated areas in the CBA and the population is ageing in the rural areas. The future spatial development in Euregio Karelia is very much dependent on how rural areas will develop in economic sense and will the population find employment in rural areas. At the moment rural areas are losing inhabitants and the share of traditional rural fields of activity is decreasing in general economy and employment statistics. Large rural areas are strong assets to Euregio Karelia when it comes to natural energy potentials, nature protection or sustainable tourism. New small businesses could arise to rural areas in connection with tourism development, organic farming and bio-fuel production. Rural areas require intensive environmental protection in order to prevent possible environmental problems from occurring. In an ideal situation urban and rural areas develop a relationship where they benefit and support each other.
1.4. Proposed strategies
1.4.1. Strategies to tackle territorial challenges in Euregio Karelia
Border as strength -strategy This strategy aims at developing Euregio Karelia into an attractive and active cross-border area. Cross-border travelling is visa-free and trade and services in the border area foster. The development of small businesses and entrepreneurship is supported. Possible social problems are tackled with proactive social policy. Attention is paid to the safety and security of the border areas. - Lobby visa-free travelling between EU and Russia. - Improve infrastructure and accessibility and public transportation across the border by means of road, rail and air transportation. - Lobby the local knowledge of the importance of Russia’s WTO membership. - Enhance the foundation of new firms and start-ups by creating a culture of entrepreneurship and by fostering a business-friendly environment in the border areas. - Develop more efficient business services and promote systematic training of students in companies. - Fight discriminations in the labour market and enhance employment opportunities for foreign employees (education, language training etc.). - Enhance integration of immigrants in socio-spatial structures. ECO-Karelia -strategy In this strategy Euregio Karelia acts as a pioneer region in promoting sustainable development in the Northern cross-border areas. Environmental cooperation across the border is of utmost importance. New technologies are supported to develop rural areas into sustainable areas of nature protection, organic

Ulysses Final Report - Multi-thematic Territorial Analysis of Euregio Karelia 11
farming and bio-energy production. Sustainable tourism provides services both for local inhabitants and incoming tourists. - Support the move towards a more intangible economy to reduce energy consumption. - Support the development of new energy technologies and use of alternative energy systems such as wind energy and biomass. Support collaboration across the border in these fields. - Enhance environmental protection and corporate responsibility in environmental issues. - Enhance environmental, cultural and social quality of tourism to support local development and protect social and cultural identities and physical environment.
1.4.2. General strategies for Euregio Karelia
So far Euregio Karelia has functioned as a cooperation forum fostering collaborative projects and actions across the Finnish-Russian border. At the moment representatives of the Finnish and Russian regions are working on a common strategy to have a clearer vision for future orientations of the cooperation. Our study shows that Euregio Karelia has great territorial assets that it should value and foster and, on the hand, it has challenges that it should tackle across the border. Territorial assets and challenges should be formulated into (1) a vision of the CBA in a certain time frame, (2) a mission that sets the main object for the work of Euregio Karelia and (3) values that give qualitative attributes for the cooperation and for priorities of spatial planning in general. These values should be made visible for the general public and actors on both sides of the border should commit themselves to the common values. They can also be utilized when lobbying special characteristics and challenges of external border areas to EU officials. As our study shows, the influence of the Finnish-Russian border on territorial development in Euregio Karelia is increasing. We therefore suggest the actors in Euregio Karelia to intensify cross-border collaboration in spatial planning. It is also important to continue studying territorial trends in the CBA and distribute information about the trends to local actors.
1.5. Further steps
SWOT analysis, where territorial challenges were identified in this study, was a scenario exercise, where Euregio Karelia was viewed from the perspective of possible policy orientations of the European Union. It is necessary to notice that Euregio Karelia is an external border area and part of the CBA is located outside the Union. EU policies naturally have influences also on neighbouring countries. These are either indirect influences of territorial changes in the Member States or direct effects of EU foreign policy; neighbourhood policy and strategic partnerships. These effects have been discussed in the analysis. Consideration of territorial developments and policy orientations in Russia, and their influence on Euregio Karelia was beyond the scope of this project, but they could be a subject to further analyses.

Ulysses Final Report - Multi-thematic Territorial Analysis of Euregio Karelia 12
Chapter 2. General overview
2.1. ULYSSES project in brief
ULYSSES is an experimental and innovative project supported by eighteen European border and cross-border areas (hereafter CBA) that aim at using research results from ULYSSES as a yardstick for decentralised cross-border spatial development activities. Analyses in ULYSSES are based on data and methods developed by previous projects of the ESPON programme. In ULYSSES, a targeted analysis including high-quality, comprehensive and multi-thematic territorial analyses (hereafter MTA), was performed on six specific CBAs across Europe. These are: 1) Upper Rhine cross-border area along the land
borders between France, Germany and Switzerland,
2) Cross-border area along the entire Spanish-French
land border (Pyrenees),
3) Cross-border area along the land border between
Greece and Bulgaria,
4) Cross-border area covering parts of Eastern and
Northern Finland – Russian land border (Euregio
Karelia),
5) Cross-border area along the borders between
Poland, Germany (land border) and Sweden (maritime
border) (Euroregion Pomerania), and
6) Extremadura/Alentejo on the border between Spain
and Portugal.
The MTA has focused on the main topics of the Territorial Agenda of the European Union (EU 2006, 2011), namely (i) cross-border polycentric development, (ii) patterns of urban/rural relationship, (iii) levels of accessibility and connectivity, (iv) effects of demographic change (territorial profile), and (v-vi) level of attainment of Lisbon/Europe 2020 and Gothenburg objectives (territorial performance). In parallel, an in-depth statistical analysis was performed. This analysis included (i) a catching-up analysis; (ii) a principal components analysis, and (iii) a multiple regression analysis. These analyses have been performed on different scales, so that the indicators of each CBA have been compared to different spatial levels (NUTS III, cross-border, national and EU27/ESPON levels). The data used in the analyses included ESPON datasets (e.g.
morphological urban areas) and EUROSTAT indicators (e.g. demography indicators), data from national databases and additional information provided by local stakeholders. Additionally, a comprehensive cross-border institutional performance analysis was included for each CBA. This analysis captured the diversity of governance frameworks existing in the CBAs and it included a structural dimension, i.e. the overall framework that can hardly be influenced by the partners of cross-border cooperation, as well as an activity dimension, i.e. the intensity and continuity of institutionalised cross-border cooperation on the regional level. The structural dimension included such factors as (i) the political status of the border (e.g. EU membership / historicity, Schengen status), (ii) the planning system (i.e. the planning culture family), (iii) the physical status of the border (e.g. geomorphology), and (iv) the language barrier (i.e. number of languages existing in the area). These domains have been combined in a synthesis score that indicates whether the borders functions as a separation, an interface or a link. The activity dimension took into account (i) historicity of the cross-border cooperation (i.e. earliest founding date of the cross-border cooperation), (ii) maturity of cross-border cooperation (i.e. INTERREG III participation), (iii) institutional thickness in cross-border cooperation (i.e. number of permanent institutionalisations), (iv) current activity (in terms of operative EGTC), (v) cross-border spatial development on regional level (e.g. joint GIS tools), and (vi) existing cross-border transport projects (e.g. TEN-T corridors crossing the border). These domains were combined in a synthesis score that classified the borders as borders of integration, cooperation or separation. Further, an integrated analysis taking into account previous inputs was performed. From a methodological perspective, this integrated analysis adopted the form of a two-phase SWOT analysis that included (i) a status-analysis phase in which the findings derived from previous research tasks were organised and prioritised as main challenges, and (ii) an action-decision phase in which a response to each one of the identified challenges was proposed as a potential strategy. The opportunities and threats identified in the SWOT analysis were contrasted with the scenarios developed by ESPON 3.2. -project. These scenarios were (i) the Baseline / trend scenario, (ii) the

Ulysses Final Report - Multi-thematic Territorial Analysis of Euregio Karelia 13
Danubian Europe / cohesion-oriented scenario, and (iii) the Rhine-Rhone Europe / competitiveness-oriented scenario. Implications of these scenarios were taken into account when making conclusions of the final opportunities and threats. Challenges and strategies were discussed and validated by stakeholders of the MTA areas. The SWOT analysis is the main contribution from the ULYSSES project to the Practical Guide that the Association of European Border Regions will develop in the near future.
2.2. General overview of the area
Euregio Karelia is a cross-border area situated on the Finnish-Russian border area. It is formed out of three Finnish regions; North Karelia, Kainuu and Northern Ostrobothnia, and the Republic of Karelia in the Russian Federation. The borderline dividing these regions is an external border of the European Union and it is approximately 700 kilometres long. Euregio Karelia has a total area of 270,624 km² and a total population of 1 324 918 inhabitants. In contrast to EU internal borders, there exists no visa-free entry on the Finnish-Russian border, and the visa regulations are determined by the EU-Russian visa agreement and the Schengen-regime. There are three international border crossing points between in the territory of Euregio Karelia. These are (from south to north) Niirala-Vârtsilâ between North Karelia and the Republic of Karelia, Vartius-Lûttâ between Kainuu and the Republic of Karelia and Kuusamo-Suoperâ between Northern Ostrobothnia and the Republic of Karelia. From the perspective of NUTS division Euregio Karelia appears as follows.1 On the Finnish side it includes three NUTS 3 level regions; North Karelia, Kainuu and Northern Ostrobothnia. Two of these regions, North Karelia and Kainuu belong to the NUTS 2 region of Eastern Finland, and Northern Ostrobothnia belongs to the NUTS 2 region of Northern Finland.
1 The NUTS version applied here is 2008.
Map 1. Map of Euregio Karelia.
Since Russia is not a member of the European Union, it does not apply the NUTS division to its territories. A SNUTS (“Similar to NUTS”) classification was created for the purposes of the study and it follows the Russian administrative structure. Russian Federation represents level 0 and the eight federal districts (federal’nye okruga) constitute level 1. The federal districts are formed out of 83 federal subjects (sub”ekty federacii) that represent level 2 in this study. The Republic of Karelia (Respublika Kareliâ) is a federal subject of the Russian Federation and, accordingly, a SNUTS 2 level region. It belongs to the North-western Federal District that represents SNUTS 1 level in this study. Municipal regions (LAU1 level) of the Republic of Karelia were aggregated into three SNUTS 3 regions; Northern part of the Republic, Southern part of the Republic and the City District of Petrozavodsk.
Oulu
Kajaani
JoensuuPetrozavodsk
The Republic of Karelia
Kainuu
North Karelia
Northern Ostrobothnia
This map does notnecessarily reflect theopinion of the ESPONMonitoring Committee
0 40 80 120 16020Km
Local level: NUTS 3Year: 2010
Source: Statistics Finland and Kareliâstat© EuroGeographics Association for administrative boundaries
© Project ULYSSES, 2012
0 620310 Km
LegendAdministrative centres

Ulysses Final Report - Multi-thematic Territorial Analysis of Euregio Karelia 14
Table 1. NUTS 0-3 and LAU 1 division of Eastern and Northern Finland – Russia CBA (Euregio Karelia)
NUTS level NUTS ID NUTS LAU ID LAU 1
NUTS 0 FI Finland (Suomi)
NUTS 1 FI1 Mainland Finland (Manner-Suomi)
NUTS 2 FI13 Eastern Finland (Itä-Suomi)
NUTS 3 FI133 North Karelia (Pohjois-Karjala)
122 Joensuu
124 Keski-Karjala
125 Pielisen Karjala
NUTS 3 FI134 Kainuu
181 Kehys-Kainuu
182 Kajaani
NUTS 2 FI1A Northern Finland (Pohjois-Suomi)
NUTS 3 FI1A2 Northern Ostrobothnia (Pohjois-Pohjanmaa)
171 Oulu
173 Oulunkaari
174 Raahe
175 Haapavesi-Siikalatva
176 Nivala-Haapajärvi
177 Ylivieska
178 Koillismaa
SNUTS 0 RU Russia (Russiâ)
SNUTS 1 RU3 Northwestern Federal District (Severo-Zapadnyj federal'nyj okrug)
SNUTS 2 RU3D The Republic of Karelia (Respublika Kareliâ)
SNUTS 3 RU3D1 City District of Petrozavodsk (Petrozavodskij gorodskoj okrug)
RU3D1 City District of Petrozavodsk (Petrozavodskij gorodskoj okrug)
SNUTS 3 RU3D2 Northern part of the Republic of Karelia (Severnaâ čast' Respubliki Kareliâ)
RU3D21 Kostamukšskij gorodskoj okrug
RU3D22 Belomorskij municipal'nyj rajon
RU3D23 Kaleval'skij nacional'nyj rajon
RU3D24 Kemskij municipal'nyj rajon
RU3D25 Louhskij municipal'nyj rajon
RU3D26 Medvež'egorskij municipal'nyj rajon
RU3D27 Muezerskij municipal'nyj rajon
RU3D28 Segežskij municipal'nyj rajon
SNUTS 3 RU3D3 Southern part of the Republic of Karelia (Ûžnaâ čast' Respubliki Kareliâ)
RU3D31 Sortaval'skij municipal'nyj rajon
RU3D32 Kondopožskij municipal'nyj rajon
RU3D33 Lahdenpohskij municipal'nyj rajon
RU3D34 Oloneckij nacional'nyj municipal'nyj rajon
RU3D35 Pitkârantskij municipal'nyj rajon
RU3D36 Prionežskij municipal'nyj rajon
RU3D37 Prâžinskij nacional'nyj municipal'nyj rajon
RU3D38 Pudožskij municipal'nyj rajon
RU3D39 Suoârvskij municipal'nyj rajon

Ulysses Final Report - Multi-thematic Territorial Analysis of Euregio Karelia 15
Chapter 3. Demographic analysis
The aim of this chapter is to analyse the demographic dynamics and trends in the Eastern and Northern Finland – Russia CBA (Euregio Karelia). We start by describing the demographic dynamics in the area. How densely populated is the CBA? What does the age and sex structure of the CBA look like? What seem to be the temporal dynamics of the population growth? The second objective of the chapter is to understand whether the border is influencing settlement patterns.
3.1. Population
Euregio Karelia has a total population of 1 324 918 inhabitants. The Republic of Karelia has the largest population with 684 212 inhabitants and Kainuu has the smallest population with 82 634 inhabitants. From the perspective of sex structure, Euregio Karelia has a 52,14 % female majority. In 2010 the share of 0-14 year old population in Euregio Karelia was 16,51 %, the share of 15-64 year old population 69,39 % and the share of population over 65 years of age 14,10 %. Population density of Euregio Karelia was 7 inhabitants per km² in 2010. On the Finnish side, Northern Ostrobothnia had the highest population density with 11,1 inhabitants per km² and Kainuu the lowest density with 3,8 inhabitants per km². On the Russian side the City District of Petrozavodsk had the highest density with 2397 inhabitants per km² and the Northern part of the Republic of Karelia the lowest density with 2,6 inhabitants per km². While the population density has been declining in North Karelia, Kainuu and the Republic of Karelia, the population density in Northern Ostrobothnia has been increasing through the whole 1990s and 2000s. Total fertility rate in the CBA has been increasing from 1,74 in 2000 to 1,94 in 2009. Dependency ratios varied widely between the regions of Euregio Karelia. In the Finnish regions, North Karelia and Kainuu had high old age dependency ratios, and Northern Ostrobothnia a high young age dependency ratio. In the Republic of Karelia there was a small amount of both young and
elderly dependents for the working age population. Map 2. LAU 1 level population density in Euregio Karelia
in 2010.
We compared the population growth during two four-year periods, the first one including years 2001 to 2005 and the second one years 2006 to 2010. Euregio Karelia shows negative population growth in both periods. When we compare the two periods it is possible to detect a general tendency in the population growth. Regions where population has been increasing between 2001 and 2005 have continued to grow between 2006 and 2010, and the population growth has been more extensive during the second period. The second period was more favourable also for regions suffering from population decrease. Even if they continued to lose inhabitants, negative population growth was less severe than during the first period. North Karelia and Kainuu suffered both from a negative natural increase and a negative net migration. In Northern Ostrobothnia both natural increase and net migration were positive. Within the Republic of Karelia, Northern and Southern
This map does notnecessarily reflect theopinion of the ESPONMonitoring Committee
0 40 80 120 16020Km
Local level: LAU 1Year: 2010
Source: Statistics Finland and Kareliâstat© EuroGeographics Association for administrative boundaries
© Project ULYSSES, 2012
0 610305 Km
LegendInhabitants per Square km² 2010
0,70 - 2,90
2,91 - 5,20
5,21 - 9,80
9,81 - 15,10
15,11 - 47,50
47,51 - 2397,00

Ulysses Final Report - Multi-thematic Territorial Analysis of Euregio Karelia 16
parts of the Republic had a negative natural change and a negative net migration. The City District of Petrozavodsk also had a negative natural change of population, but migration to the city was strong.
3.2. Influence of the border on
settlement patterns
We performed low level analyses in order to study trends of settlement patterns in Euregio Karelia, and to discover whether the border is attracting or repulsing population. First, we examined the
relationship between border distance and
population change on LAU 1 level. The analysis was performed only on the Finnish regions. Three indicators were considered in the analysis; annual population growth (between 2000 and 2010), population density and distance to the border as the crow flies (air distance). The analysis shows that there is no significant “border effect” in Euregio Karelia. In other words population growth and density are not related to border distance. It is possible to argue whether this type of analysis suits regions with a low population density. To study the matter more closely, we performed additional analysis on the amount of foreign
inhabitants in the Finnish LAU 2 regions of Euregio
Karelia to examine a hypothesis, according to which Finnish border regions have been attracting migrants from Russia. Based on the data it is possible to conclude that LAU 2 level regions located in North Karelia close to the border crossing point of Niirala-Vârtsilâ have been increasing their share of foreign inhabitants more than regions located in other parts of Euregio Karelia. When we take a look at the country of origin, mother tongue and citizenship of population living in North Karelia, it is possible to observe that the largest share of foreign inhabitants or inhabitants with foreign origins in the region are from Russia or the former Soviet Union. We thus claim that there is a border effect on settlement patterns in the regions located in close vicinity of the Finnish-Russian border in North Karelia.
Chapter 4. Polycentric development
The aim of this chapter is to study polycentric development, in other words, structure of city network in the Eastern and Northern Finland – Russia CBA. Methodology that we applied for studying polycentricity originates from ESPON 1.1.1 -project. The given project considers two different aspects of polycentric development. The first one is morphological (the distribution of urban areas in a given territory) and the second one relational (networks of flows and cooperation between urban areas at different scales). Data applied in this study has been developed by ESPON 1.4.3 -project and all the analyses are based on the concept of Functional Urban Area (FUA), originally generated in ESPON 1.1.1 -project. Functional Urban Areas consist of a core municipality and municipalities surrounding the core. Only part of the analysis could be made on the Russian side of the CBA, since ESPON 1.4.3 did not cover Russian territory and therefore no data was available.
4.1. Functional Urban Areas
FUAs were studied on NUTS 2 level and the analyses thus included also FUAs that are not located in the territory of Euregio Karelia. FUAs located in Euregio Karelia are Oulu (Northern Ostrobothnia), Joensuu (North Karelia), Kajaani (Kainuu) and Petrozavodsk (The Republic of Karelia). The largest FUA of Euregio Karelia is the City of Petrozavodsk and Prionežskij municipality that surrounds the city. The largest FUA on the Finnish side of the CBA is Oulu with 221 325 inhabitants. Population growth between 2001 and 2006 has been positive in all the FUAs except for Kajaani (-2,9 % decrease).

Ulysses Final Report - Multi-thematic Territorial Analysis of Euregio Karelia 17
Map 3. FUAs and MUAs of the Eastern and Northern
Finland – Russia CBA.
4.2. Morphological analysis of FUAs
It is characteristic for a polycentric urban system that no city dominates over other cities in demographic or economic sense. A polycentric urban system lacks hierarchy, and cities are relatively similar of size. We analysed the hierarchy of the city system in the Eastern and Northern Finland – Russia CBA by calculating the slope of rank size distribution of the FUAs. It was -0,88 in 2006. This indicates that the CBA has a polycentric urban structure, more polycentric than the average urban structure in ESPON countries.
Figure 1. Rank size distribution of population (2006).
Source: Eurostat, Rosstat
The slope of rank size distribution of FUA GDP was -0,81 in 2006. Even if this value indicates of a polycentric CBA, it has to be noticed that the value did not include data for Petrozavodsk FUA. That would have, due to the significant differences in GDP, affected the final values. Figure 2. Rank size distribution of FUA GDP (2006).
Source: Eurostat
While the slope of rank size distribution considers all FUAs in a region, primacy rate excludes the largest FUA from the analysis. High primacy rate indicates of a monocentric urban structure with one dominating FUA, and low primacy rate of a polycentric urban structure. Primacy rate for the Eastern and Northern Finland – Russia CBA was 0,79 in 2006. This suggests that urban structure of the region is not dominated by one big city, but that the size of the biggest FUA (Petrozavodsk) is actually smaller than anticipated by the rank-size distribution of the FUAs.
!
!
Oulu
Kajaani
Rovaniemi
PetrozavodskJoensuuKuopio
Mikkeli
Kemi - Tornio
Kokkola
Tallinn
Helsinki
Regional level: FUAYear: 2001
Origin of data: ESPON DBSource: EUROSTAT, IGEAT
© EuroGeographicsAssociation for administrative boundaries
This map does notnecessa rily reflect theopinion of the ESPONMonitoring Committee
Morpho logical and Func tional Urban Areas
0 900450km
Legend © ULYSSES, 2011
Morphological Urban Areas and Functional Urban Areas, acco rding to the ESPON 1.4.3(established from data from 2001)
Pe
tro
zavo
dsk
Ou
lu
Ku
op
io
Joe
nsu
u
Ke
mi -
To
rnio
Ro
va
nie
mi
Ka
jaa
ni
Mik
ke
liK
okko
la
10.000
100.000
1.000.000
1 10
Pop.
Rank
Slope = -0,88
Ou
lu
Ku
op
io
Joe
nsu
u
Ko
kko
la
Ke
mi -
To
rnio
Mik
ke
li
Ka
jaa
ni
Ro
va
nie
mi
100
1000
10000
1 10
GDP
Rank size
Slope = -0,81

Ulysses Final Report - Multi-thematic Territorial Analysis of Euregio Karelia 18
The gini coefficient of the FUA Thiessen polygons is an indicator that measures how the FUAs are spaced throughout a given region. The gini coefficient for thiessen polygons in Eastern and Northern Finland – Russia CBA valued at 41,7 %, which indicates that FUAs are evenly spaced and services accessible (in theory) throughout the CBA. In the case of Euregio Karelia this analysis is problematic, because it does not take into account the border and the practical hindrance that it presents for taking advantage of services provided by FUAs on the other side of the border. Finally, we have compared rank size distribution of FUAs in the Eastern and Northern Finland – Russia CBA to the overall distribution of FUAs in ESPON countries. This analysis demonstrates the expected amount and size of a FUA in a region according to its total population. Rank-size distribution of FUAs in the Eastern and Northern Finland – Russia CBA follows the so called “European distribution” of FUAs relatively well. It does lack hierarchy to some extend (leading FUA with a considerable size) and the amount of FUAs is smaller, but the slope of FUA distribution is very similar to the expected distribution. Figure 3. Rank size distribution of FUAs in the Eastern
and Northern Finland – Russia CBA to the overall
distribution of FUAs in ESPON countries (2006).
Source: Eurostat, Rosstat
The average size of FUAs in the CBA is approximately two thirds of the average size of FUAs in Finland and about half the size of FUAs in ESPON countries. Only 51,1 % of the CBA’s total population lives in FUAs, while 73,7 % of Finnish
population and 74,8 % of ESPON space population inhabits FUAs.
4.3. Functional analyses of FUAs
Concerning functional specialization of FUAs, in almost all the FUAs of the Eastern and Northern Finland CBA dominating economic activity is traditional manufacturing (incl. mining and energy production). The second most important sectors were the service sector and the trade and transport -sector. There is a wide gap in GDP per inhabitant between the Finnish FUAs and Petrozavodsk FUA. The FUA with the highest GDP per inhabitant on the Finnish side of Euregio Karelia was Oulu (29 000 €) and the FUA with the lowest GDP per inhabitant Joensuu (21 000 €). In Petrozavodsk GDP per inhabitant was 3 500 €. Unemployment was over 8 % in all the Finnish FUAs, but only 3,6 % in Petrozavodsk.
Chapter 5. Urban-rural relationship
Urban-rural relationship is another key concept of European spatial policy. Active relations between urban areas and surrounding rural regions are considered a means to achieve sustainable development and territorial cohesion. To be able to study urban and rural areas, we have made a distinction between structural and functional properties of a region. Structural properties include established land-use patterns, settlement structure and the distribution of population, while functional properties refer to the factual use of the physical environment (various forms of production, consumption and communication).
5.1. Land use patterns
Different typologies have been established in order to classify regions to urban and rural territories. The typology that was developed in ESPON 1.1.2 project is based on tree indicators; land cover, population density and the presence/absence of a FUA. This typology classifies all the regions of Euregio Karelia as regions with low urban influence and low human
0
100000
200000
300000
400000
0 5 10 15Rank
FUA number and
population
Expected
Actual

Ulysses Final Report - Multi-thematic Territorial Analysis of Euregio Karelia 19
intervention. Eurostat uses an urban-rural typology that considers the regions of the CBA as predominantly rural regions. SNUTS 3 regions of the Republic of Karelia have not been included in the analysis due to the lack of data. The share of agricultural areas in Euregio Karelia values significantly lower than European average. The share of agricultural areas in the ESPON countries was 38,65 % in 2006, while the largest share of agricultural areas in the CBA was 7,91 % in Northern Ostrobothnia. The lowest share of agricultural areas was in Kainuu (1,75 %) and in the Republic of Karelia (1,16 %). The small share of agricultural land in these two regions is related to the large share of forests. In Kainuu forests cover 90 % of the region’s territory, which is the largest share of forests in whole Finland.2 In the Republic of Karelia forests covered 80,6 % of the total area in 1998 and 80 % in 2007.3 The share of agricultural areas has been increasing in all the Finnish regions of Euregio Karelia between 2000 and 2006, while in the Republic of Karelia the share of agricultural areas and areas under cultivation has been decreasing. Urbanisation of agricultural areas in the regions of Euregio Karelia has been below the European average (ESPON countries). Largest areas of agricultural land were urbanised in Northern Ostrobothnia (0,36 ha per 10 000 ha of agricultural land), while in Kainuu only 0,01 ha per 10 000 ha of agricultural land was urbanised. Urbanisation of natural and semi-natural areas in Northern Ostrobothnia and North Karelia has been stronger than in ESPON countries in average. The share of artificial areas in Euregio Karelia has been very low. The largest share of artificial areas was in Northern Ostrobothnia (2,67) and the smallest in Kainuu (0,26). Compared to the ESPON average the changes in artificial land cover in the regions of Euregio Karelia have been moderate. Between 2000 and 2006 in ESPON countries in average 9,25 ha per 10 000 ha of agricultural land, and 2,49 ha per 10 000 ha of natural and semi-natural land was converted into artificial land. In Northern Ostrobothnia, where the biggest
2 Statistics Finland 2011. 3 Struktura zemel’nogo fonda 1998; Ekonomičeskoe razvitie 2007.
changes took place in the regions of Euregio Karelia, only 0,36 ha per 10 000 ha of agricultural and 2,34 ha of natural and semi-natural areas were converted into artificial areas.
5.2. Gross value added and employment
in agriculture and fishing
Gross Value Added (GVA) is a measure in economics of the value of goods and services produced in an area. The following figure presents GVA produced by agriculture, hunting, forestry and fishing (NACE classes A-B, hereafter referred to as agriculture and fishing) in the regions of Euregio Karelia between 1997 and 2008. There has been a common trend in all the studied Finnish regions of a slight decrease in GVA in the first half of the 2010 decade, and a slight recovery of GVA during two last years of the studied period. In the Republic of Karelia there has been a significant increase in the GVA throughout the whole studied period. Figure 4. Gross value added by agriculture and fishing
in Euregio Karelia between 1997 and 2008.
Source: Eurostat, Kareliâstat
0,00
50,00
100,00
150,00
200,00
250,00
300,00
350,00
400,00
19
97
19
98
19
99
20
00
20
01
20
02
20
03
20
04
20
05
20
06
20
07
20
08
GV
A (
M€
/ E
CU
)
North Karelia
Kainuu
Northern Ostrobothnia
The Republic of Karelia

Ulysses Final Report - Multi-thematic Territorial Analysis of Euregio Karelia 20
The share of GVA by agriculture and fishing in total GVA has decreased in all the Finnish regions between 1997 and 2008. In Euregio Karelia the decrease has been strongest in Northern Ostrobothnia, where the share of agriculture and fishing in total GVA has dropped at an annual rate of -4,09 %. In the Republic of Karelia, on the contrary, both GVA agriculture and fishing and the share of those fields of economy in total GVA has increased during the studied period. The annual growth rate has been as high as 24,63. Map 4. Annual growth rate of the share of GVA by
agriculture and fishing in total GVA in Euregio Karelia
between 1997 and 2008.
Employment statistics for agriculture and fishing show a gradual decrease in the European Union, Finland and Russia between 2000 and 2008. The trend has prevailed also in all the regions of Euregio Karelia. Decrease in employment in agriculture and fishing has naturally reduced the share of employment in general employment statistics. The share of employment in agriculture and fishing has dropped in all the studied regions. In Euregio Karelia the greatest decrease has taken place in
the Republic of Karelia, where the share of employment in agriculture and fishing has decreased at an annual rate of -3,71 %. When we compare the regions of Euregio Karelia to Finland, Russia and European Union, it is possible to observe that both the Finnish regions and the Republic of Karelia show larger shares of employment in agriculture and fishing than national or European averages. Map 5. Annual growth rate of the share of employment
in agriculture and fishing in Euregio Karelia between
2000 and 2008.
Chapter 6. Accessibility and
connectivity
Accessibility of a region is determined by two factors, its geographical location and infrastructure. While the geographical location cannot be changed, improving connectivity can. Accessibility is a key policy aim of the European Union, since accessibility of a region determines the extent to which it can participate in economic
This map does notnecessarily reflect theopinion of the ESPONMonitoring Committee
0 30 60 90 12015Km
Local level: NUTS 3Year: 2008
Source: Eurosta and Kareliâstat© EuroGeographics Association for administrative boundaries
© Project ULYSSES, 2012
0 625312,5 Km
LegendAnnual change of the share of GVA byagriculture and fishig, 97-08Typology
Predominantly urban
Intermediate regions
Predominantly rural regions
missing value-4,22 - -2,27
-2,26 - 2,85
>= 2,86
<= -10,18
-10,17 - -7,31
-7,30 - -4,23
This map does notnecessarily reflect theopinion of the ESPONMonitoring Committee
0 30 60 90 12015Km
Local level: NUTS 3Year: 2008
Source: Eurosta and Kareliâstat© EuroGeographics Association for administrative boundaries
© Project ULYSSES, 2012
0 625312,5 Km
LegendAnnual change of the share of employed in agricultu re and fishing, 00-08Typology
Predominantly urban
Intermediate regions
Predominantly rural regions
missing value<= -7,43
-7,42 - -4,39
-4,38 - -2,48
-2,47 - -1,02
-1,01 - 3,90
>= 3,91

Ulysses Final Report - Multi-thematic Territorial Analysis of Euregio Karelia 21
growth. The aim of this chapter is to evaluate accessibility and connectivity levels of the Eastern and Northern Finland – Russia CBA. What is the accessibility level of the CBA in comparison with European countries? What is the general accessibility of the CBA regarding different modes of transport? What is the level of internet access in the Eastern and Northern Finland – Russia CBA? Before going into the analyses, we present a map of Euregio Karelia with transport infrastructure to give an idea of what the accessibility and connectivity of the CBA looks like. In the map main roads are marked with blue colour and railways with black and white lines. There are three main accesses (international border crossing points) across the Finnish-Russian border in Euregio Karelia. These are (from south to north) Niirala-Vârtsilâ between North Karelia and the Republic of Karelia, Vartius-Lûttâ between Kainuu and the Republic of Karelia and Kuusamo-Suoperâ between Northern Ostrobothnia and the Republic of Karelia. Main airports are located in Oulu, Kuusamo, Kajaani, Joensuu and Petrozavodsk. Map 6. Main transport infrastructure in Euregio Karelia.
We have studied the Eastern and Northern Finland – Russia CBA from the perspective rail, road, air and multimodal (synthesizing all the modes of transportation) accessibility. We used an indicator named potential accessibility, which is a similar indicator to demographic potential. This means that it relates activities to be reached with travel time it takes to reach them. As the potential accessibility was in ESPON 1.2.1 project produced for two different years, it was possible for us to study the evolution of infrastructure development between 2001 and 2006. Analyses were not performed for the Republic of Karelia due to the lack of data.
6.1. Accessibility by road, rail and air
In the context of ESPON space potential accessibility of the Finnish regions of Euregio Karelia by road is very low, between 6,2 (North Karelia) and 3,1 (Kainuu). This is understandable considering the remote location of the regions from the main European road infrastructure. In the context of the CBA North Karelia has the best accessibility (142,2), while Northern Ostrobothnia and Kainuu value lower in the analysis (82,57 and 71,1). The index change in the accessibility between 2001 and 2006 has been negative in all the regions. The regions of Euregio Karelia are not easily accessed by rail in the context of European countries (ESPON space), even if they do value slightly higher in the rail than in the road accessibility. Within the CBA North Karelia is the most accessible region by rail and Northern Ostrobothnia the least accessible. Index change by rail has been negative in all the regions. Air connections make Euregio Karelia better accessible to the European countries than road and rail infrastructure. Accessibility by air to North Karelia valued at 55,2, to Kainuu at 50,8 and to Northern Ostrobothnia at 44,8. In the context of the CBA the regions valued relatively similarly. Index change in the standardized potential accessibility was positive in North Karelia and Kainuu, while Northern Ostrobothnia performed worse. It is possible to argue how well these figures correspond to reality. If we look at flight traffic from and to the regions of Euregio Karelia, the busiest airport is located in Oulu, Northern Ostrobothnia.

Ulysses Final Report - Multi-thematic Territorial Analysis of Euregio Karelia 22
Considering accessibility by air in the CBA, there are no direct flights between the regions of Euregio Karelia. In order, for example, to get from Joensuu to Oulu (or Kajaani), one needs to fly to Helsinki and change the flight there. Thus no real flight connections exist between the regions of Euregio Karelia. Multimodal accessibility combines all the above analysed forms of transport and demonstrates general accessibility levels. Relatively good air accessibility of Euregio Karelia clearly affects the multimodal accessibility levels of the region. In the context of ESPON countries, North Karelia values at 48,2, Kainuu at 44,2 and Northern Ostrobothnia at 39,1. Index change of standardised potential accessibility has in all the regions been negative. While the accessibility analyses did not include Russian side of Euregio Karelia and ignored the cross-border aspect of accessibility within the CBA, we studied the evolution of cross-border traffic on the three international border crossing points on the territory of Euregio Karelia. Passenger traffic has been increasing significantly on the border crossing points of Niirala-Vârtsilâ and Kuusamo-Suoperâ between 2007 and 2011, while growth on the crossing point on Vartius-Lûtta has remained moderate. In 2007 there were 898 435 border crossings by passengers on Niirala-Vârtsilâ crossing point, 408 938 on Vartius-Lûtta and 17 408 on Kuusamo-Suoperâ. In 2011 the respective amounts were 1 281 037 on Niirala-Vârtsilâ, 467 126 on Vartius-Lûtta and 42 512 on Kuusamo-Suoperâ border crossing point. In total between 2007 and 2011 the number of border crossings in Euregio Karelia has increased at an annual rate of 7,8 %.
6.2. Internet accessibility
Compared to physical accessibility, the Eastern and Northern Finland – Russia CBA ranks considerably higher with its “virtual connectivity”. In 2009 75,6 % of households in the NUTS 2 region of Northern Finland had a broadband internet connection and in Eastern Finland the respective figure was 60 %. The European average in 2009 was 56 %. According to Rosstat the amount of households with internet connection has been increasing also in Russia. No data was available on broadband internet connections in the Republic of Karelia,
but the share of households with internet connection in the Republic was 19,7 % in 2005 and 37,4 % in 2009. Map 7. Households with broadband internet connection
in the Eastern and Northern Finland – Russia CBA in
2009.
Chapter 7. Lisbon / Europe 2020 and
Gothenburg objectives
The core idea of the Lisbon strategy (2000) was for the European Union to become the most dynamic and competitive knowledge-based economy in the world by 2010. In June 2010 European Council adopted the new "Europe 2020 Strategy" that was adjusted to the current economic situation and challenges. The Europe 2020 Strategy identified three key drivers for growth that included smart, sustainable and inclusive growth. Gothenburg Strategy was launched by the European Commission in 2001 to complement the Lisbon Strategy by adding an environmental dimension to the Lisbon process for employment, economic reform and social cohesion. The goal of our study was to measure the performance of the Eastern and Northern Finland – Russia CBA regarding the
!
!
!
Tallinn
Helsinki
Stockholm
Regional level: NUTS 2Year: 2004, 009
Origin of data: European Commission, 5th Cohesion Report;Pro Inno Europe, Regional Innovation Scoreboard 2009
© EuroGeographicsAssociation for administrative boundaries
This map does notnecessarily reflect theopinion of the ESPONMonitoring Committee
Househo lds with broadband internet access
0 860430km
Legend © ULYSSES, 2011
<missing value>
Percent of househols with broadband internet access NUTS 2, 2009 (Sweden, Poland 2004)
<= 12,50
12,51 - 25,00
25,01 - 37,50
37,51 - 50,00
50,01 - 62,50
62,51 - 75,00
75,01 - 87,50
>= 87,51

Ulysses Final Report - Multi-thematic Territorial Analysis of Euregio Karelia 23
socio-economic and environmental goals set up in the Lisbon / Europe 2020 and Gothenburg strategies.
7.1. Economy and employment
7.1.1. GDP per capita
In order to study regional disparities in the GDP per capita we used coefficient of deviation in our analyses. The higher the coefficient of deviation is, the higher are the disparities within the analysed geographical unit. In Euregio Karelia the coefficient of deviation was 54,3 in 2008, which was above the average deviation of ESPON NUTS 3 regions (51,2). This signifies that the disparities in GDP per capita are higher between regions of Euregio Karelia than regions of ESPON countries. The coefficient has, however, been decreasing in Euregio Karelia; in 1997 it was 65,6. The main reason behind the positive trend in Euregio Karelia is the increase in GDP per inhabintant in the Republic of Karelia; in 1997 GDP per inhabitant was 484 € and in 2008 already 4580 €. Next, we performed two different analyses on the data on GDP per capita at NUTS 3 level. In the first one we compared each NUTS 3 region with the leading region in terms of GDP per capita (West Inner London, UKI11), through index number
analysis. In the second one we applied a logistic function to establish the relative performance of each NUTS 3 to the leading region, exploring the notion of territorial catching-up. The best performing region among the regions of Euregio Karelia in terms of GDP per capita is Northern Ostrobothnia. Compared to the leading region Northern Ostrobothnia is classified as middle income region, while both North Karelia and Kainuu are indentified as less developed regions and the Republic of Karelia as a very laggard region. In the catching-up analysis, the Republic of Karelia was classified as a steady catching-up region and in theory it would need 27 years to catch up with the leading region in terms of GDP per inhabitant (this is a mathematical calculation based on the growth of GDP per capita). The growth of GDP per capita has been more modest in the Finnish regions of Euregio Karelia. Northern Ostrobothnia was the only region that was classified as a (slow)
converging region. North Karelia and Kainuu were classified as non converging regions.
7.1.2. Economic sectors
The leading sector in the North Karelia and Kainuu in 2008 was public administration and community services, which produced 26,54 % of the total GVA in North Karelia and 28,61 % in Kainuu. In Northern Ostrobothnia and the Republic of Karelia the leading economic field was industry. Construction has been the field of economic activity that has shown greatest growth in all the Finnish regions of Euregio Karelia between 1997 and 2008. The second greatest positive annual growth rate was recorded in all the regions of Euregio Karelia by financial intermediation and real estate. In the Republic of Karelia both these fields are very moderate compared to the Finnish regions and EU in general. Especially the field of financial intermediation and real estate represents a very low share in the total GVA. Highest share of employment in all the Finnish regions of Euregio Karelia was in 2008 recorded in public administration and community services. In Kainuu the share was exceptionally high, as 43,30 % of total employment was recorded in this sector. In the Republic of Karelia wholesale and retail trade had the same share of employment (28,95 %) as public administration and community services (28,84 %). The importance of forestry sector on economy in Kainuu and the Republic of Karelia is reflected in the share of employment in agriculture and fishing. While in 2008 the European average share in that field was 5,67 % and the Finnish average 4,83 %, the share of employment in Kainuu was 10,34 % and in the Republic of Karelia 12,81 %. Annual growth in employment between 2000 and 2008 has been strongest in construction in all the regions of Euregio Karelia, except for Northern Ostrobothnia where the growth has been stronger in the sector of financial intermediation and real estate. Since the shown values and performed analyses concerning economy do not consider cross-border aspect, we have studied tax free trade statistics to get an idea of how the border effects trade (and thus economy) in the territory of Euregio Karelia. When we look at the period between 2006 and 2011 two Finnish cities of Euregio Karelia have been in the top eight cities in tax free sales. The growth in duty free trade has been largest in

Ulysses Final Report - Multi-thematic Territorial Analysis of Euregio Karelia 24
Joensuu of all the Finnish cities. Duty free trade in the city grew 539,8 % between 2006 and 2011 and the annual growth was as great as 88 %. In Kajaani the trade grew 366,6 % between the given time period and annual growth rate valued at 53,5 %.4 It can thus be concluded that border has an increasing effect on trade and economy in the Finnish border regions of Euregio Karelia.
7.2. Research and innovation
Total intramural R&D expenditure in 2007 was higher in Finland than in EU countries in average. Expenditure was even higher than the Finnish average in Northern Finland (5,38) while in Eastern Finland R&D expenditure was below Finnish and EU average (1,61). When looking at the sectoral R&D expenditure it is obvious that expenditure in Northern Finland and Finland in general has been greatest in the business sector. Northern Finland shows stronger performance than Eastern Finland both in the amount of EPO (European Patent Office) patent applications and the amount of persons employed in high and medium tech manufacturing activities. The amount of EPO patent applications from Russia was two per million inhabitants in 2007. This value, however, does not reflect the performance of the country in the field of innovation, since Russia has its own patent system and legislation. There is no data available on R&D expenditure in the Republic of Karelia. The Republic is, however, among the worst performing Russian regions in innovation potential, climate and output. According to the Comparative innovation analysis of the regions of the Russian Federation, the Republic of Karelia ranks 72nd in the Regional Summary Innovation Index -list.
7.3. Social cohesion
Unemployment in the CBA was close to the European average in 2010. Unemployment rate was 10,1 % in Eastern and Northern Finland and 9,6 % in the Republic of Karelia, while it was 9,6 %
4 Global Blue 2012.
in the European Union (EU27). Unemployment rate for Finland was 8,4 % and for Russia 7,5 %. Youth unemployment rate valued highest in Eastern Finland and in the Republic of Karelia. Concerning the other social cohesion indicators, Eastern Finland and the Republic of Karelia performed slightly weaker than Northern Finland.
7.4. Environmental analysis
We applied two sets of indicators for environmental analysis of the Eastern and Northern Finland – Russia CBA; indicators from the European Commission’s 5th Cohesion Report5 and indicators from the ESPON Climate Project regarding the region’s sensitivity for climate change. From the European Commission’s 5th Cohesion Report we selected six indicators, namely, soil sealed area, ozone exceedance, waste water treatment capasity, share of Natura 2000 areas, and solar energy and wind energy potential. While the first four indicators show concrete environmental performance of the region, the last two indicate what could be the region’s capacity in exploiting alternative energy sources in an energy source transition scenario.
7.4.1. Environmental performance
The first indicator of environmental performance that we studied was soil sealing. Soil sealing means covering of soil for housing, roads or other land developments. In 2006 97 m² of soil per inhabitant was sealed in North Karelia, 100 m² in Kainuu and 415 m² in Northern Ostrobothnia. The value for Northern Ostrobothnia is well above the Finnish (217,75 m²) and European averages (214 m²). Ozone concentration exceedances were low or non-existence in Euregio Karelia. North Karelia and Kainuu had no days with exceedances in 2008 and Northern Ostorbothnia only one. Urban waste water treatment capacity was 99 % both in Eastern and Northern Finland. In the Republic of Karelia only 15,7 % of the total amount of waste water was purified. Measures
5 Fifth Report on Economic, Social and Territorial Cohesion 2010.

Ulysses Final Report - Multi-thematic Territorial Analysis of Euregio Karelia 25
are taken to improve the ecological state of water bodies in the Republic of Karelia. The share of Natura 2000 areas in the Finnish regions of Euregio Karelia corresponds with the average Finnish share of Natura areas. It, however values significantly lower than the average European share of Natura 2000 areas. As Natura network does not cover Russian territories, we examined the share of land of specially protected territories and objects in Russia and the Republic of Karelia. The share of this land type is very low in the Republic of Karelia (1,6 %), even lower than in Russia (2,0 %). Even if the share of protected natural areas is low in the Eastern and Northern Finland – Russia CBA, there are efforts to protect natural reserves in the Finnish-Russian border area. The most extensive of these measures is “The Green Belt of Fennoscandia”, which is a network of current and planned protected areas along the Finnish-Russian and Russian-Norway borders. Map 8. Wind energy potential (onshore full load hours)
in Euregio Karelia between 2000 and 2005.
7.4.2. Environmental capacity
Solar energy resources are in all the regions of Euregio Karelia below national and EU27 average. Wind energy potential, on the other hand, is above the European average in all the regions of Euregio Karelia. Northern Ostrobothnia with sea shore has the biggest wind energy potential.
7.4.3. Climate change
We studied the sensitivity of the Eastern and Northern Finland – Russia CBA to climate change based on methods applied in ESPON Climate project.6 Sensitivities to climate change were generally low in all the regions of Euregio Karelia.
Chapter 8. Factor analyses
The aim of the factor analyses was to compare the CBA’s territorial profile to the performance of the CBA from the perspective of Lisbon/Europe 2020 Strategy and Gothenburg objectives. Two sets of indicators were established for the analyses: one for territorial profile variables and one for performance variables. Data and maps produced in these analyses contextualise Euregio Karelia in a European territorial framework. The Republic of Karelia was not included in the analyses due to lack of data.
8.1. Location
The factor of centrality expresses central location and has high positive correlations with all the indicators regarding potential accessibility and, to a lesser extent with the share of employment in financial intermediation and real estate, employment in high and medium tech manufacturing activities and with commuting to other regions. It also has a strong negative correlation with the share of employment and GVA in agriculture and fishing. Euregio Karelia scores low in the centrality factor. All the regions of the CBA are below national
6 ESPON Climate 2011.
This map does notnecessarily reflect theopinion of the ESPONMonitoring Committee
0 30 60 90 12015Km
Local level: NUTS 3Year: 2000-2005
Sources: EEA ETC-ACC, REGIO-GIS Origin of data: Source:European Commision, 5th Cohesion Report
© EuroGeographics Association for administrative boundaries
© Project ULYSSES, 2012
0 625312,5 Km
LegendOnshore full load hours, 2000-2005 (numbe hours yea r) at 80m hub height
<missing values>1100 - 1400
1500 - 2000
>= 2100
<= 410
420 - 730
740 - 1000

Ulysses Final Report - Multi-thematic Territorial Analysis of Euregio Karelia 26
average and the average of all the studied countries. In general this factor shows highest values in central European countries. In the less central regions, the higher values tend to concentrate around capitals and other major urban agglomerations. When we look at the location and accessibility of Euregio Karelia from the perspective of services and transport factor, we can see that in the European context Euregio Karelia scores low in these aspects. The significant indicators of this factor are the share of GVA and employment in wholesale and retail trade, hotels and restaurants and transport. Many of the regions with the high scores in this factor seem to be linked to tourism (Southern Spain and Portugal, the alpine regions, Paris, Greece, Rome, etc.). Map 9. Results of analysis on Centrality in Euregio
Karelia.
8.2. Demographic dynamism and
immigration
The factor of demographic dynamism correlates with young age dependency ratio, crude rate of natural population increase, total fertility rate and old age dependency rate (this last one has a negative correlation). In Euregio Karelia the regions are performing very differently in demographic terms and the only region that is performing better than the European average is Northern Ostrobothnia. In the European context, regions with the lowest scores in demographic dynamism are in the Mediterranean countries. Concerning the factor of immigration that correlates with the indicators of population growth and net migration ratio, Northern Ostrobothnia is the only region in Euregio Karelia that is performing better than European average.
8.3. Economy
The factor of economic development has a high correlation with GDP per capita, share of Natura 2000 areas and soil sealed area. It is a factor, which expresses high degrees of development and urbanization. In Euregio Karelia Northern Ostrobothnia had the highest score in this factor. North Karelia and Kainuu scored significantly lower than Northern Ostrobothnia and the Finnish and European average. In Europe regions with the highest scores for this factor are concentrated in central Europe and Scandinavia and in capital cities of more marginal countries. What comes to economic catching-up, a factor that relates GDP level and growth between 1997 and 2008 of a given region to the pattern evidenced by the leading region, Northern Ostrobothnia is again the best performing region of Euregio Karelia. The overall pattern of the border regions is to follow the national tendency. The factor of construction correlates with the indicators of GVA and employment in construction. The regions with the highest score in this factor are Ireland, Spain, the Baltic States and Eastern Germany. In Euregio Karelia the highest score was received by Northern Ostrobothnia and the lowest by Kainuu. Concerning the factor of unemployment the situation is similar with the performance of
This map does notnecessarily reflect theopinion of the ESPONMonitoring Committee
0 150 300 450 60075Km
Local level: Lau 1Year: 2010
Source: Kareliâstat© EuroGeographics Association for administrative boundaries
© Project ULYSSES, 2012
Legend
NUTS3_RG_20M_2006FAC1_1
-4,01 - -0,96
-0,95 - -0,25
-0,24 - 0,18
0,19 - 0,58
0,59 - 0,89
0,90 - 2,17
missing value

Ulysses Final Report - Multi-thematic Territorial Analysis of Euregio Karelia 27
Northern Ostrobothnia being more positive. The unemployment factor correlates with variables such as unemployment, long-term unemployment and youth unemployment. The geographical distribution of this factor’s scores shows a concentration of highest values in the more depressed areas of Europe and countries with a structurally high unemployment.
8.4. Research and development
Research and development factor mainly relates to variables of innovation and scientific development such as R&D investment of different sectors and, to a lesser extent, EPO patent applications and tertiary educated active population. The Scandinavian countries have a very favourable position in this factor. In Euregio Karelia Northern Ostrobothnia is the only region performing better than national or EU average, while North Karelia and Kainuu are performing weaker in respect to this factor. Map 10. Results of analysis on Research and
development in Euregio Karelia.
8.5. Administrative centres
Most important indicators for this factor are the share employment and GVA in public administration, community services and activities of household and the share of employment and GVA in industry. The regions with the highest scores of this factor are highly depressed regions in which, because of their poor economic performance, the public sector assumes an important position. Euregio Karelia has very high scores in this factor. On a different note, this indicator also relates to the different levels of state interventionism, with the Scandinavian countries and France revealing overall high scores. In Euregio Karelia Northern Ostrobothnia scored the weakest results and Kainuu the highest.
8.6. Environment
The factor of environmental risks relates mainly to variables linked to the regions’ sensitivity to climate change. These regions are typically located in coastal areas and other flood prone areas. Environmental risks in Euregio Karelia are low according to this analysis and it has a lower sensibility to climate change than Finnish or European regions in general. The same applies for the factor of pollution, the significant variable of which is ozone concentration exceedance. In the European context, pollution is low in Euregio Karelia.
This map does notnecessarily reflect theopinion of the ESPONMonitoring Committee
0 150 300 450 60075Km
Local level: Lau 1Year: 2010
Source: Kareliâstat© EuroGeographics Association for administrative boundaries
© Project ULYSSES, 2012
Legend
NUTS3_RG_20M_2006FAC2_1
-2,41 - -0,98
-0,97 - -0,51
-0,50 - -0,02
-0,01 - 0,65
0,66 - 1,74
1,75 - 3,90
missing value

Ulysses Final Report - Multi-thematic Territorial Analysis of Euregio Karelia 28
Chapter 9 – Cross-border governance
9.1. General framework and analysis
A comprehensive cross-border institutional performance analysis was realized for Euregio Karelia in the framework of Ulysses project. This analysis captured the diversity of governance frameworks existing within the CBA by paying regard to both the structural dimension, i.e. the overall framework that can hardly be influenced by the partners of cross-border cooperation, as well as the activity dimension, i.e. the intensity and continuity of institutionalised cross-border cooperation on regional level. For the sake of simplicity and applicability, the structural dimension included factors like (i) the political status of the border (e.g. EU membership / historicity, Schengen status); (ii) the planning system (i.e. the planning culture family); (iii) the physical status (e.g. geomorphology), and; (iv) the language barrier (i.e. number of languages existing in the area). These domains have been combined in a synthesis score that allows saying if the border functions as separation, interface or as a link. The activity dimension has taken account of (i) the historicity of cross-border cooperation in general (i.e. earliest founding date of cross-border cooperation); (ii) the maturity of cross-border cooperation (i.e. INTERREG III participation); (iii) the institutional thickness in cross-border cooperation (i.e. number of permanent institutionalisations); (iv) the current activity (in terms of operative EGTC); (v) the cross-border spatial development on regional level (e.g. joint GIS tools), and; (vi) the existing cross-border transport projects (e.g. TEN-T corridors crossing the border). These domains have been combined in a synthesis score that classifies the borders function as integration, cooperation or separation.
Map 11. The map shows the overall picture for all the
Ulysses CBAs and visualises the above mentioned
indicators: The border effects due to differing political
structures are mapped, represented by the borders
(lines) in different colours. The activity dimension in
cross-border governance is represented by different
colours of the regions themselves (surfaces).
9.2. Euregio Karelia
9.2.1. Structural dimension
The structural dimension in Karelia is particular. Firstly, the low density of population, settlements and infrastructure has immediate implications also for cross-border cooperation. Secondly, the border is an external EU border with visa obligations, along which high socio-economic differences have developed; the political systems are hardly to compare; the language barrier is high. Within the framework of an ESPON project, one has to stress the fact that cooperation across the Finnish-Russian border is not to compare with internal EU cooperation schemes – the political, juridical and functional framework is very different. Still, and despite all barriers, cooperation across external borders is of high

Ulysses Final Report - Multi-thematic Territorial Analysis of Euregio Karelia
political and territorial relevance in Euregio
Karelia.
9.2.2. Activity dimension
The cross-border cooperation in the region is
based on the Euregio Karelia, established in 2000.
This institution is not only the inter
cooperation platform, but in particular the basis
for the EU neighbourhood projects (supported by
ERDF, TACIS, and currently the ENPI CBC). The
activity in this framework has been and is high
several hundreds of projects have been conducted
with regard to economic and cultural cooperation,
tourism, environment etc. (see Neighbourhood
Programme Karelia n.y.).
Beyond the interregional cooperation, the political
cooperation on the multinational level must be
considered, notably the Barents Euro
Council (BEAC), and the Council of the Baltic Sea
States (CBSS). These institutions are not visualized
in the map as they do not fit the regional focus of
the methodological framework.
Summarizing the institutional setting, one can
state that – despite the relatively difficult
structural context, cross-border cooperation does
take place in multi-faceted and increasing wa
Still, the difference to internal EU cooperation is
not surprisingly – very obvious.
9.2.3. Spatial development and transport
With regard to transport policy, the overall limited
activity is due to the very limited population
density in this region: The TEN-T priorities do not
touch the Karelia perimeter – the TEN
12 (Nordic triangle) passes south of the perimeter.
On a bilateral level, the Barentslink initiative has
been very active in order to promote better large
scale accessibility. On the regional level, a serious
of punctual improvements has been achieved in
the framework of neighbourhood programme:
The Karelia cooperation aims explicitly at
improving the transport situation, in particular
with regard to border crossing.
Neither a spatial planning nor a transport policy
has been institutionalised on a cross
yet. However, in particular two documents have
so far developed a strategic framework for cross
border cooperation, considering systematically
the territorial dimension (Röpelinen 2000 and
2005).
thematic Territorial Analysis of Euregio Karelia
political and territorial relevance in Euregio
border cooperation in the region is
based on the Euregio Karelia, established in 2000.
This institution is not only the inter-regional
cooperation platform, but in particular the basis
for the EU neighbourhood projects (supported by
currently the ENPI CBC). The
activity in this framework has been and is high –
several hundreds of projects have been conducted
with regard to economic and cultural cooperation,
tourism, environment etc. (see Neighbourhood
d the interregional cooperation, the political
cooperation on the multinational level must be
considered, notably the Barents Euro-Arctic
Council (BEAC), and the Council of the Baltic Sea
States (CBSS). These institutions are not visualized
hey do not fit the regional focus of
Summarizing the institutional setting, one can
despite the relatively difficult
border cooperation does
faceted and increasing way.
Still, the difference to internal EU cooperation is –
9.2.3. Spatial development and transport
With regard to transport policy, the overall limited
activity is due to the very limited population
T priorities do not
the TEN-T priority
12 (Nordic triangle) passes south of the perimeter.
On a bilateral level, the Barentslink initiative has
been very active in order to promote better large
On the regional level, a serious
of punctual improvements has been achieved in
the framework of neighbourhood programme:
The Karelia cooperation aims explicitly at
improving the transport situation, in particular
spatial planning nor a transport policy
has been institutionalised on a cross-border level,
yet. However, in particular two documents have
so far developed a strategic framework for cross-
border cooperation, considering systematically
sion (Röpelinen 2000 and
Map 12. Governance framework and institutional
mapping in Euregio Karelia.
29
Governance framework and institutional

Ulysses Final Report - Multi-thematic Territorial Analysis of Euregio Karelia 30
Map 13. Territorial synthesis map for Euregio Karelia.

Ulysses Final Report - Multi-thematic Territorial Analysis of Euregio Karelia 31
Chapter 10 – Integrated territorial analysis and scenarios
10.1. Objectives and methodology
This chapter highlights the main conclusions of the integrated analysis, which combines elements of the previous chapters aimed at describing the current status and identifying the most relevant challenges faced by the Eastern and Northern Finland – Russia CBA (Euregio Karelia). A traditional SWOT analysis (Strengths, Weaknesses, Opportunities, Threats) has been the framework to analyse the territory’s current status based on two axes, present/future factor (or internal/external), and positive/negative influence, to decide what action should be taken (suggested strategies are developed under Chapter 11). Strengths and weaknesses (combination of present factor and positive/negative influence) show the current status and were drawn upon the research done in the set of themes addressed in previous chapters. Opportunities and threats (combination of future factor and positive/negative influence) identified in the aforementioned research work were contrasted with the ESPON 3.2. Spatial scenarios and orientations in relation to the ESDP and Cohesion Policy scenarios (namely Baseline/trend scenario, Danubian Europe or the cohesion-oriented scenario and Rhine-Rhone Europe or the competitiveness-oriented scenario) and their implications for the CBA under analysis. All this work lead to the Final Opportunities and Threats, which set the basis for the identification of the most relevant challenges of Euregio Karelia. The results of this SWOT analysis (included in annex) have been validated by the stakeholders.
10.2. Current status of Euregio Karelia
In demographic terms Euregio Karelia is struggling from negative population change. Accordingly the population density in the CBA has been declining. Net migration has not been able to compensate for decrease of population, because it has been moderate and below the national averages. Urban structure in Euregio Karelia is not dominated by one big city, but it is relatively polycentric. However, the urban structure of the CBA could be fragile, because there is a fairly small total amount of Functional Urban Areas (9) in the CBA compared to the European average. On the Russian side of Euregio Karelia there is only one FUA, which is Petrozavodsk. The FUAs are dependent on traditional manufacturing and thus very vulnerable to effects of globalisation. Euregio Karelia is in the European context classified as a CBA with low urban influence and low human intervention. Eurostat classification considers the CBA as a predominantly rural region. Euregio thus appears rural from the European perspective. The share of agricultural areas in the region’s total area is significantly lower than the European average. This is partly explained by the large share of forests in the total area. Euregio Karelia is located far from central European road and rail infrastructure and thus has low accessibility and connectivity. Despite its remote location, air connections make the CBA better accessible to the European countries. Considering connectivity within the CBA, the Finnish-Russian border, being an external border of the European Union, does not allow free movement of people and goods. Cross-border traffic has been steadily increasing and the border crossing infrastructure has been developed. Thus the Finnish and Russian regions of the CBA have become better accessible to each other. Finnish regions of the CBA have a high "virtual" connectivity and the share of households with internet connection has been increasing also in the Russian part of Euregio Karelia. All the Finnish regions of Euregio Karelia (except for Northern Ostrobothnia) have been in economic terms identified as less developed non converging regions and the Republic of Karelia as a very laggard region with a steady catching-up performance. There are also large differences in GDP per capita between the Finnish and Russian regions of the CBA. The Finnish-Russian border has had positive effects on trade in the

Ulysses Final Report - Multi-thematic Territorial Analysis of Euregio Karelia 32
regions located in close proximity of the border. There is a strong variance between regions of Euregio Karelia concerning performance in research and innovation and social cohesion, Eastern Finland and the Republic of Karelia performing the weakest. Sensitivities to climate change are generally low in Euregio Karelia. Environmental issues, however, pose a great challenge for the CBA. Weak environmental performance of the Republic of Karelia affects the whole CBA and regions surrounding it. When compared to other European countries, there is a low share of Natura 2000 areas in the CBA. Wind energy potential, on the contrary, is above European average in all the regions of the CBA. Euregio Karelia is located on the EU external border, which creates a relatively difficult structural context for cross-border governance and institutionalized spatial planning. Cross-border cooperation does take place in Euregio Karelia in a multi-faceted and increasing way. Still, the difference to internal EU cooperation is very obvious and a spatial planning or a transport policy has not been institutionalized on a cross-border level yet.
10.3. ESPON 3.2. scenarios and Euregio Karelia
This chapter studies the three above mentioned 2030 scenarios elaborated by ESPON 3.2. -project. These spatial scenarios are closely related to ESDP and Cohesion Policy scenarios and our goal is to understand how they would influence Euregio Karelia.
10.3.1. Integrated baseline (trend) scenario
This scenario is based on the continuation of trends and on the principle that no major changes occur in mainstream and ongoing EU policies. Since regional policy was continued with vigour by the EU, rural regions have been better able to keep their inhabitants and skilled workers. Thus negative population trend in Euregio Karelia has been less severe. Migration across the border in Euregio Karelia has remained moderate, because EU has continued to facilitate movement between the member states, but has been more circumspect regarding immigration from outside the Union. Investments in infrastructure supported by the EU have allowed building new infrastructure to improve accessibility and better connect the FUAs in the CBA. However, disparities in accessibility between cities and peripheries of the CBA have remained significant. The development of border infrastructure on the Finnish-Russian border has enabled traffic flows to increase gradually. New small businesses have arisen to rural areas in connection with tourism development, organic farming and bio-fuel production. New technologies and investments in R&D have offered new possibilities for the forest industry to decrease the dependence on traditional manufacturing and to increase the amount of new innovations. Negative impacts of climate change have increased slightly in the CBA in terms of the amount of natural hazards and the appearance of foreign species to the natural habitat.
10.3.2. Danubian Europe: Integrated cohesion-oriented scenario
This is a prospective, policy-oriented scenario. In this scenario, the main priorities of public policies at EU level, in a context of growing globalisation, are focused on economic, social and territorial cohesion and not on global competitiveness. A proactive social policy is put into place at EU level in order to stimulate domestic fertility rates. Special attention is paid at childcare support and tax incentives. This has affected western parts of Euregio Karelia where the age structure of the population is such that benefits from the policies and support. Border regions continue to suffer from population decrease and migration does not compensate the loss of population, because the EU has introduced strict immigration controls for non-EU countries. Euregio Karelia has maintained its polycentric structure and regional disparities have been less significant than in the baseline scenario. Accessibility within the Finnish territories of the CBA is increasing, because EU supports the building of strategic regional transport axes. The process of economic diversification has had positive

Ulysses Final Report - Multi-thematic Territorial Analysis of Euregio Karelia 33
effects on rural areas that have benefited from strong promotion of renewable energy and organic farming. Energy production in rural areas might have had negative impacts on the environment, if environmental, landscape and cultural values were not considered when initializing bio-energy production. Strong EU support in environmental protection has had a positive impact on Euregio Karelia with large areas of uninhabited and sparsely habited territories. Environmental cross-border cooperation and collaboration in the governance of natural resources is facing difficulties due to lack of financing.
10.3.3. Rhine-Rhone Europe: competitiveness-oriented scenario
This is a prospective, policy-oriented scenario. It is based on the assumption of a significant reshaping of EU policies originating in the disappointing results of the implementation of the Lisbon Strategy during the period 2002-2005. A selective immigration policy has been introduced to attract the best minds to the EU from outside the Union. Migration patterns in Euregio Karelia have improved and the CBA has been able to attract worker migrants to such fields that are lacking competent work force. However, social cohesion and integration have been viewed as secondary policies by the EU. In Euregio Karelia rapid increase in migration and the lack of attention at social integration of migrants has resulted in social conflicts among the inhabitants. The low accessibility of Euregio Karelia has improved, because EU has invested in external accessibility and transport links with neighbouring countries. Infrastructure on Finnish-Russian border crossings has been developed. Investments in R&D, education and training and ICT infrastructure have had positive impacts on FUAs with universities and high tech industry. They have been attracting young people and skilled workers. Rural areas of Euregio Karelia have declined. Due to challenging rural conditions, organic farming has given way to large scale crops that might be harmful to low scale organic farming. Eastern Finland has continued to perform weak in terms of economy and employment. The ageing population has faced social problems, because generous pension schemes have been abandoned and many basic services are no longer available in rural regions.
10.4. Most relevant challenges for Euregio Karelia
We have found two thematically cross-cutting challenges that in our view have the strongest influence on future developments of Euregio Karelia. The first challenge is the EU external border and its direct and indirect influence on territorial dynamics and performance of the CBA. In comparison with the EU internal borders, the border between Finland and Russia continues to function as a barrier for the movement of people and goods. However, our study shows that during the 2000s the border between Finland and Russia has become a relevant factor influencing territorial development of the border regions. The border has affected migration patterns, accessibility within the CBA and economy and trade. These developments gradually influence, among others, population patterns and social welfare in the border regions. In addition, cross-border framework is a challenge when dealing with independent national or regional developments. For example environmental protection, such as waste water treatment capacity is weaker on the Russian side of Euregio Karelia, but environmental state, such as water pollution affects both sides of the border. All the “border effects” are subject to change depending on current EU policies. The first challenge is thus to pay attention to border effects and continue collaboration in spatial planning across the border. The second key element affecting territorial development in Euregio Karelia is urban-rural relationship. In the European context Euregio Karelia has a relatively small amount of FUAs (only one FUA in the Republic of Karelia) and the share of FUA inhabitants is below European average. On the contrary, there are large uninhabited or sparsely populated areas in the CBA. The future spatial development in Euregio Karelia is very much dependent on how rural areas will develop in economic sense and will the population find employment in rural areas. At the moment rural areas are losing inhabitants and the share of traditional rural fields of activity is decreasing in general economy and employment statistics. Large rural areas are strong assets to Euregio Karelia when it comes to natural energy potentials, nature protection or

Ulysses Final Report - Multi-thematic Territorial Analysis of Euregio Karelia 34
sustainable tourism. New small businesses could arise to rural areas in connection with tourism development, organic farming and bio-fuel production. Rural areas require intensive environmental protection in order to prevent possible environmental problems from occurring. In an ideal situation urban and rural areas develop a relationship where they benefit and support each other.

Ulysses Final Report - Multi-thematic Territorial Analysis of Euregio Karelia 35
Chapter 11 – Suggested strategies
11.1. Suggested strategies for Euregio Karelia
11.1.1. Strategies to tackle territorial challenges in Euregio Karelia
Border as strength -strategy This strategy aims at developing Euregio Karelia into an attractive and active cross-border area. Cross-border travelling is visa-free and trade and services in the border area foster. The development of small businesses and entrepreneurship is supported. Possible social problems are tackled with proactive social policy. Attention is paid to the safety and security of the border areas. - Lobby visa-free travelling between EU and Russia. - Improve infrastructure and accessibility and public transportation across the border by means of road, rail and air transportation. - Lobby the local knowledge of the importance of Russia’s WTO membership. - Enhance the foundation of new firms and start-ups by creating a culture of entrepreneurship and by fostering a business-friendly environment in the border areas. - Develop more efficient business services and promote systematic training of students in companies. - Fight discriminations in the labour market and enhance employment opportunities for foreign employees (education, language training etc.). - Enhance integration of immigrants in socio-spatial structures. ECO-Karelia -strategy In this strategy Euregio Karelia acts as a pioneer region in promoting sustainable development in the Northern cross-border areas. Environmental cooperation across the border is of utmost importance. New technologies are supported to develop rural areas into sustainable areas of nature protection, organic farming and bio-energy production. Sustainable tourism provides services both for local inhabitants and incoming tourists. - Support the move towards a more intangible economy to reduce energy consumption. - Support the development of new energy technologies and use of alternative energy systems such as wind energy and biomass. Support collaboration across the border in these fields. - Enhance environmental protection and corporate responsibility in environmental issues. - Enhance environmental, cultural and social quality of tourism to support local development and protect social and cultural identities and physical environment.
11.1.2. General strategies for Euregio Karelia
So far Euregio Karelia has functioned as a cooperation forum fostering collaborative projects and actions across the Finnish-Russian border. At the moment representatives of the Finnish and Russian regions are working on a common strategy to have a clearer vision for future orientations of the cooperation. Our study shows that Euregio Karelia has great territorial assets that it should value and foster and, on the hand, it has challenges that it should tackle across the border. Territorial assets and challenges should be formulated into (1) a vision of the CBA in a certain time frame, (2) a mission that sets the main object for the work of Euregio Karelia and (3) values that give qualitative attributes for the cooperation and for priorities of spatial planning in general. These values should be made visible for the general public and actors on both sides of the border should commit themselves to the common values. They can also be utilized when lobbying special characteristics and challenges of external border areas to EU officials. As our study shows, the influence of the Finnish-Russian border on territorial development in Euregio Karelia is increasing. We therefore suggest the actors in Euregio Karelia to intensify cross-border

Ulysses Final Report - Multi-thematic Territorial Analysis of Euregio Karelia 36
collaboration in spatial planning. It is also important to continue studying territorial trends in the CBA and distribute information about the trends to local actors.
Chapter 12 – General conclusions
SWOT analysis, where territorial challenges were identified in this study, was a scenario exercise, where Euregio Karelia was viewed from the perspective of possible policy orientations of the European Union. It is necessary to notice that Euregio Karelia is an external border area and parts of the cross-border region are located outside the Union. EU policies naturally have influences also on neighbouring countries. These are either indirect influences of territorial changes in the member states or direct effects of EU foreign policy; neighbourhood policy and strategic partnerships. These effects have been discussed in the analysis. Consideration of territorial developments and policy orientations in Russia, and their influence on Euregio Karelia was beyond the scope of this project, but they could be a subject to further analyses.
Annexes
Annex 1 – Multi-thematic Cross-Border Territorial Analysis (MTA) for the Eastern and
Northern Finland - Russia CBA
Annex 2 – Cross-Border Governance Analysis (Institutional performance)
Annex 3 – SWOT analysis

Ulysses Final Report - Multi-thematic Territorial Analysis of Euregio Karelia 37
References
Ekonomičeskoe razvitie Respubliki Kareliâ 2007. Available at:
http://www.gov.karelia.ru/Info/2007/eco_resource07d.html ESDP. European Spatial Development Perspective. Towards Balanced and Sustainable Development of the
Territory of the European Union. European Commission 1999. Available at: http://ec.europa.eu/regional_policy/sources/docoffic/official/reports/pdf/sum_en.pdf
ESPON Climate. Climate Change and Territorial Effects on Regions and Local Economies. Draft Final Report 2011. Available at: http://www.espon.eu/export/sites/default/Documents/Projects/AppliedResearch/CLIMATE/ESPON_Climate_SummaryReport_final.pdf
ESPON 1.1.1. Potentials for Polycentric Development in Europe. Project report. Nordregio 2005. Available at: http://www.espon.eu/export/sites/default/Documents/Projects/ESPON2006Projects/ThematicProjects/Polycentricity/fr-1.1.1_revised-full.pdf
ESPON 1.1.2. Urban-rural relations in Europe. 2005. Available at: http://www.espon.eu/export/sites/default/Documents/Projects/ESPON2006Projects/ThematicProjects/UrbanRural/fr-1.1.2_revised-full_31-03-05.pdf
ESPON 1.2.1. Transport services and networks: territorial trends and basic supply of infrastructure for territorial cohesion. Project report 2004. Available at: http://www.espon.eu/export/sites/default/Documents/Projects/ESPON2006Projects/ThematicProjects/TransportTrends/fr-1.2.1-full.pdf
ESPON 1.4.3. Study on Urban Functions. Project report. 2007. Available at: http://www.espon.eu/export/sites/default/Documents/Projects/ESPON2006Projects/StudiesScientificSupportProjects/UrbanFunctions/fr-1.4.3_April2007-final.pdf
Europe 2020. A strategy for smart, sustainable and inclusive growth. European Commission 2010. Available at: http://eur-lex.europa.eu/LexUriServ/LexUriServ.do?uri=COM:2010:2020:FIN:EN:PDF
Fifth Report on Economic, Social and Territorial Cohesion. Investing in Europe’s future. European Commission 2010. Available at: http://ec.europa.eu/regional_policy/sources/docoffic/official/reports/cohesion5/index_en.cfm
Statistics Finland. Suomen maapinta-alasta 4,4 prosenttia rakennettua maata. Tiedote 5.7.2011. Available at: http://stat.fi/ajk/tiedotteet/2011/tiedote_007_2011-07-05.html
Struktura zemel’nogo fonda Respubliki Karelia. 1998. Available at: http://www.gov.karelia.ru/Power/Committee/Land/Otch98/part1.html
Territorial Agenda of the European Union 2020. Towards an Inclusive, Smart and Sustainable Europe of Diverse Regions. 2011. Available at: http://www.eu2011.hu/files/bveu/documents/TA2020.pdf

Ulysses Final Report - Multi-thematic Territorial Analysis of Euregio Karelia - Annexes 38
Annex 1 – Multi-thematic Cross-Border Territorial A nalysis
(MTA) for the Eastern and Northern Finland - Russia CBA

Ulysses Final Report - Multi-thematic Territorial Analysis of Euregio Karelia - Annexes 2
Ulysses
Using applied research results from ESPON as a yardstick for
cross-border spatial development planning
Targeted Analysis 2013/9/30
Multi-thematic Cross-Border Territorial Analysis
of the
Eastern and Northern Finland – Russia Cross-Border Area (Euregio Karelia)
Version 30/07/2012

Ulysses Final Report - Multi-thematic Territorial Analysis of Euregio Karelia - Annexes 3
This report presents Multi-thematic Territorial
Analysis results of a Targeted Analysis conducted
within the framework of the ESPON 2013
Programme, partly financed by the European
Regional Development Fund.
The partnership behind the ESPON Programme
consists of the EU Commission and the Member
States of the EU27, plus Iceland, Liechtenstein,
Norway and Switzerland. Each partner is
represented in the ESPON Monitoring Committee.
This report does not necessarily reflect the opinion
of the members of the Monitoring Committee.
Information on the ESPON Programme and projects
can be found on www.espon.eu
The web site provides the possibility to download
and examine the most recent documents produced
by finalised and ongoing ESPON projects.
This basic report exists only in an electronic version.
© ESPON & Tecnalia, 2012.
Printing, reproduction or quotation is authorised
provided the source is acknowledged and a copy is
forwarded to the ESPON Coordination Unit in
Luxembourg.

Ulysses Final Report - Multi-thematic Territorial Analysis of Euregio Karelia - Annexes 4
List of authors Lappeenranta University of Technology (LUT) Virpi Kaisto Project researcher Project group: Tecnalia, Spain (LP) Karlsruher Institut für Technologie (KIT), Germany Democritus University of Thrace, Greece Lappeenranta University of Technology, Finland University of Aveiro, Portugal University of Luxemburg

Ulysses Final Report - Multi-thematic Territorial Analysis of Euregio Karelia - Annexes 5
Nomenclature
CBA: Abbreviation for Cross-Border Area. ESPON countries: 27 EU Member States and Iceland, Liechtenstein, Norway and Switzerland FUA: Abbreviation for Functional Urban Area. LAU: Abbreviation for the Local Administrative Units (LAUs) compatible with NUTS classification. LAU 1: The upper LAU level (formerly NUTS level 4) is defined for most, but not all of the countries. LAU 2: The lower LAU level (formerly NUTS level 5) consists of municipalities or equivalent units in the 27 EU Member States. NUTS: Abbreviation for the Nomenclature of territorial units for statistics. The NUTS classification is a hierarchical system for dividing up the economic territory of the EU for the purpose of collection, development and harmonisation of EU regional statistics. NUTS 1: major socio-economic regions NUTS 2: basic regions for the application of regional policies NUTS 3: small regions for specific diagnoses SNUTS 1-3: “Similar to NUTS” classification applied in this report for the Russian territories. SLAU 1-2: “Similar to LAU” classification applied in this report for the Russian local administrative units.

Ulysses Final Report - Multi-thematic Territorial Analysis of Euregio Karelia - Annexes 6
Executive summary This report presents research results of the Ulysses project´s Task 2.2. concerning the Eastern and Northern Finland – Russia cross-border area (Euregio Karelia). In the given task multi-thematic cross-border territorial analyses were performed on statistical data with the aim of analysing territorial development in the cross-border area (CBA). Euregio Karelia is a cross-border region situated on the Finnish-Russian border area and it has a total area of 270,624 km² and a total population of 1 324 918 inhabitants. Euregio Karelia is formed out of three Finnish regions; North Karelia, Kainuu and Northern Ostrobothnia and the Republic of Karelia in the Russian Federation. The Finnish regions represent level 3 in the NUTS classification. Since Russia is not a member of the European Union, it does not apply the NUTS division to its territories. A SNUTS (“Similar to NUTS”) classification was created for the purposes of the Ulysses study and the Republic of Karelia was identified as SNUTS 2 level region. The borderline dividing the Finnish and the Russian regions is an external border of the European Union and it is approximately 700 kilometres long. In contrast to EU internal borders, there exists no visa-free entry on the Finnish-Russian border, and the visa regulations are determined by the EU-Russia visa agreement and the Schengen-regime. The regions collaborate across the border under the title of Euregio Karelia, which is a cooperation forum founded in 2000. The main aim of the Euregio is to develop living conditions in the region by improving economic wellbeing and social justice among the inhabitants. This first theme of this study was demographic analysis of the CBA. Population change has been negative in Euregio Karelia during the first decade of the 2000s. Accordingly population density in the CBA has been declining. Euregio Karelia has also suffered of a decline in migration rates and net migration has been below the national averages. Population decline has, however, been less severe in the second half of the 2000s. Demographic performance has varied widely between the regions of Euregio Karelia and the only region with a positive total population change, natural change and net migration has been Northern Ostrobothnia that is to most parts located on the western border of Finland. North Karelia and Kainuu, located in Eastern Finland, have suffered from negative population growth and negative migration, while in the Republic of Karelia population growth has been negative, but net migration positive. Total fertility rate of Euregio Karelia has been increasing from 1,74 in 2000 to 1,94 in 2009. On NUTS 2 level, Northern Finland is the only region with fertility rate over the replacement level. Northern Ostrobothnia is the only region in Euregio Karelia that has a larger amount of children (aged 0-14) than elderly people (65 years or more). The share of elderly population is largest in Kainuu (20,65 %) and North Karelia (19,43 %), while in the Republic of Karelia only 11,94 % of the population is 65 years or more and the working age population covers 73,33 % of the total population. Demographic in-depth analysis based on population growth and density related to border distance, show that there is no significant “border effect” on settlement patterns in Euregio Karelia. Analyses performed on a lower territorial level, however, show that Finnish regions located in North Karelia in the close proximity of the Finnish-Russian border have been attracting migrants from Russia. The second topic analysed here was polycentric development, in other words the urban structure of the CBA. The Eastern and Northern Finland – Russia CBA has a small amount of Functional Urban Areas and a small share of FUA inhabitants compared to the European average There are nine FUAs in the CBA (NUTS 2 level), and four of them are located in the territory of Euregio Karelia; Oulu (in Northern Ostrobothnia), Joensuu (in North Karelia), Kajaani (in Kainuu) and Petrozavodsk (in The Republic of Karelia). The largest FUA of the CBA (in terms of population) is the city of Petrozavodsk and Prionežskij municipality that surrounds the city. Population change has been positive between 2001 and 2006 in all the FUAs with the exception of Kajaani (-2,9 % decrease). Analyses show that Euregio Karelia has a polycentric urban structure, more polycentric than the average urban structure in ESPON countries. The slope of rank size distribution of FUA GDP was -0,81 in 2006. This value indicates of a polycentric cross-border area, but it has to be noticed that the analysis did not include data for the Petrozavodsk FUA. That would have, due to the significant differences in GDP in Finland and Russia, affected the final values. Primacy rate for the Eastern and Northern Finland – Russia CBA was 0,79 in 2006. This suggests that urban structure of the region is not dominated by one big city, but that the size

Ulysses Final Report - Multi-thematic Territorial Analysis of Euregio Karelia - Annexes 7
(amount of population) of the biggest FUA (Petrozavodsk) is actually smaller than anticipated by the rank-size distribution of the FUAs. In almost all the FUAs dominating economic activity was traditional manufacturing (incl. mining and energy production). The second most important sectors were the service sector and the trade and transport -sector. There is a wide gap in GDP per inhabitant between the Finnish and Russian FUAs. Considering FUAs that are located in the territory of Euregio Karelia, the FUA with the highest GDP per inhabitant was Oulu (29 000 €) and the FUA with the lowest GDP per inhabitant Petrozavodsk (3 500 €). Unemployment was over 8 % in all the Finnish FUAs, but only 3,6 % in Petrozavodsk. The next theme analysed in this study was urban-rural relationship. First we applied typologies from ESPON 1.1.2 -project and Eurostat to classify the regions into rural and urban areas. ESPON 1.1.2 typology classifies all the regions of Euregio Karelia as regions with low urban influence and low human intervention. The Eurostat typology classifies the regions as predominantly rural regions. The share of agricultural areas in Euregio Karelia is significantly lower than the European average (ESPON countries). This is explained by the large share of forests in the total area. The largest share of agricultural areas in the CBA was 7,91 % in Northern Ostrobothnia, while the share of agricultural areas in the ESPON countries was 38,65 % in 2006. Urbanisation of agricultural areas has been below the European average. The share of GVA by agriculture and fishing in total GVA has decreased in all the Finnish regions between 1997 and 2008. In the Republic of Karelia the share has been gradually increasing. Even if there has been an increase in GVA by agriculture and fishing, the share of those fields of economy in the total GVA has decreased. Accordingly there has been a decline in the share of employment in the field in general employment statistics. This tendency has been less severe in border regions. Accessibility and connectivity of Euregio Karelia is low in terms of accessibility by road and rail. This is understandable considering the remote location of the CBA from the main European transport infrastructure. Air connections make Euregio Karelia better accessible, even if the regions are still harder to access than European regions in average. Accessibility by air valued at 55,2 in North Karelia, 50,8 in Kainuu at and at 44,8 in Northern Ostrobothnia (ESPON countries = 100). It is possible to argue how well these figures correspond to reality. If we look at flight traffic statistics in Euregio Karelia, the busiest airport is located in Oulu, Northern Ostrobothnia. Multimodal accessibility combines all the above analysed forms of transport and demonstrates general accessibility levels. Relatively good air accessibility of Euregio Karelia increases the multimodal accessibility levels of the CBA. Index change of standardised potential accessibility has in all the regions been negative. Greatest decrease of accessibility has taken place in Northern Ostrobothnia and the smallest in Kainuu. In comparison to the physical accessibility, Euregio Karelia ranks considerably higher in its “virtual connectivity”. In 2009 75,6 % of households in the NUTS 2 region of Northern Finland had a broadband internet connection and in Eastern Finland the respective figure was 60 %. The European average in 2009 was 56 %. No data was available on broadband internet connections in the Republic of Karelia, but in 2005 the share of households with internet connection in the Republic was 19,7 % and in 2009 already 37,4 %. Accessibility within the CBA is very much affected by the external border with a passport control and customs checks. There are three international border crossing points in the territory of Euregio Karelia. Cross-border traffic has been increasing steadily and the border crossing infrastructure has been developed. Between 2007 and 2011 the number of border crossings increased at an annual rate of 7,8 %. Thus the connectivity between the Finnish and Russian regions of the CBA is increasing. Analyses on Lisbon / Europe 2020 and Gothenburg objectives included four subcategories: economy and employment, research and innovation, social cohesion and environment. The disparities in GDP per capita are higher between regions of Euregio Karelia than regions of ESPON countries. The differences have, however, been decreasing and the main reason behind the positive trend is the increase in GDP per inhabintant in the Republic of Karelia. The best performing region among the regions of Euregio Karelia in terms of GDP per capita is Northern Ostrobothnia. Compared to the leading region Northern Ostrobothnia is classified as middle income region, while both North Karelia and Kainuu are indentified as less developed regions and the Republic of Karelia as a very laggard region. In the catching up analysis we evaluated the speed of catching-up with the leading region (West Inner London). The Republic of Karelia was classified as a steady catching-up region and in theory it would need

Ulysses Final Report - Multi-thematic Territorial Analysis of Euregio Karelia - Annexes 8
27 years to catch up with the leading region in terms of GDP per inhabitant. The growth of GDP per capita has been more modest in the Finnish regions of Euregio Karelia. Northern Ostrobothnia was the only region that was classified as a (slow) converging region. The leading economic sectors in Euregio Karelia in 2008 were industry and public administration. Industry had the highest share of GVA in Northern Ostrobothnia and the Republic of Karelia, while public administration was the leading sector in North Karelia and Kainuu. Construction showed greatest growth in all the Finnish regions of Euregio Karelia between 1997 and 2008. Highest share of employment in all the Finnish regions of Euregio Karelia was in 2008 recorded in public administration and community services. In the Republic of Karelia wholesale and retail trade had the same share of employment as public administration and community services. Annual growth in employment between 2000 and 2008 was strongest in the construction sector in almost all the regions of Euregio Karelia. Statistics on duty-free trade show that two cities of Euregio Karelia (Joensuu and Kajaani) have been in the top eight cities in tax free sales in Finland. The growth in duty free trade of all the Finnish cities has been strongest in Joensuu. The Finnish-Russian border has thus had positive effects on trade in the regions located in close proximity of the border. Total intramural R&D expenditure was higher than the Finnish and EU average in Northern Finland, while in Eastern Finland R&D expenditure was below the Finnish and EU average. There was no data available on R&D expenditure in the Republic of Karelia, but the Republic is among the worst performing Russian regions in innovation potential, climate and output. There is a strong variance between regions of Euregio Karelia concerning performance in social cohesion, Eastern Finland and the Republic of Karelia performing the weakest. Unemployment in Eastern and Northern Finland was slightly above the Finnish and European average, and unemployment in the Republic of Karelia was at the level of EU, but higher than the average for the Russian Federation (2010). Youth unemployment was well above the national and EU averages in all the regions. Infant mortality rate was below EU average in the Finnish regions, but above the average in the Republic of Karelia. We studied environmental performance of Euregio Karelia based on indicators from the European Commission’s 5th Cohesion Report and ESPON Climate Project. From the 5th Cohesion Report we selected six indicators; soil sealed area, ozone exceedance, waste water treatment capacity, Natura 2000 areas, and solar energy and wind power potential. In North Karelia and Kainuu soil sealing was below the Finnish and European average, but in Northern Ostrobothnia significantly higher that the Finnish and European average. Ozone concentration exceedances were low or non-existent in Euregio Karelia. Urban waste water treatment capacity in Euregio Karelia differed widely between the Finnish and Russian territories. In Eastern and Northern Finland the capacity was 99 %, but in the Republic of Karelia only 15,7 %. Measures are taken to improve the ecological state of the water bodies in the Republic. The share of Natura 2000 areas valued significantly lower than the European average (EU27). Solar energy potential in the CBA was well below the leading European regions. Wind energy potential, on the other hand, was above the average. Sensitivities to climate change were low in Euregio Karelia compared to the European average. Factor analyses combined indicators from the previous sections and showed the performance of Euregio Karelia in the European context. Only the Finnish regions were included in this analysis. Euregio Karelia is physically far away from Central Europe, but it scores relatively high in terms of research and development and has low levels of pollution. In terms of economic development and urbanisation Euregio Karelia is below European average and there are significant differences between performances of the regions.

Ulysses Final Report - Multi-thematic Territorial Analysis of Euregio Karelia - Annexes 9
Table of contents
Chapter 1. Introduction ................................................................................................................................... 16
1.1. Research objectives .............................................................................................................................. 16 1.2. General overview of the Eastern and Northern Finland – Russia CBA (Euregio Karelia) ..................... 17
Chapter 2. Demographic analysis of the Eastern and Northern Finland – Russia CBA ................................... 26 2.1. Demographic dynamics ........................................................................................................................ 26
2.1.1. Total population ............................................................................................................................ 26 2.1.2. Population density ........................................................................................................................ 30 2.1.3. Population change ........................................................................................................................ 36 2.1.4. Natural population change and net migration ............................................................................. 40 2.1.5. Population projections .................................................................................................................. 44 2.1.6. Total fertility rates ........................................................................................................................ 46 2.1.7. Dependency ratios ........................................................................................................................ 49 2.1.8. Commuting ................................................................................................................................... 50
2.2. Effects of the border on settlement patterns ...................................................................................... 51 2.3. Chapter conclusions ............................................................................................................................. 57
Chapter 3. Polycentric development in the Eastern and Northern Finland – Russia CBA .............................. 58 3.1. Functional Urban Areas ........................................................................................................................ 59 3.2. Morphological analysis of FUAs ........................................................................................................... 62 3.3. Functional analyses of FUAs ................................................................................................................. 69 3.4. Chapter conclusions ............................................................................................................................. 73
Chapter 4. Urban-rural relationship in the Eastern and Northern Finland – Russia CBA (Euregio Karelia) .... 74 4.1. Land use patterns ................................................................................................................................. 75 4.2. Gross value added and employment in agriculture and fishing .......................................................... 84 4.3. Chapter conclusions ............................................................................................................................. 93
Chapter 5. Accessibility and connectivity in the Eastern and Northern Finland – Russia CBA (Euregio Karelia) ......................................................................................................................................................................... 94
5.1. Accessibility by road ............................................................................................................................. 97 5.2. Accessibility by rail ............................................................................................................................. 101 5.3. Accessibility by air .............................................................................................................................. 105 5.4. Multimodal accessibility ..................................................................................................................... 109 5.5. Broadband internet access................................................................................................................. 113 5.6. Cross-border traffic ............................................................................................................................ 115 5.7. Chapter conclusions ........................................................................................................................... 115
Chapter 6. Performance of Eastern and Northern Finland – Russia CBA (Euregio Karelia) from the perspective of Lisbon / Europe 2020 and Gothenburg objectives ................................................................ 116
6.1. Economy and employment ................................................................................................................ 117 6.1.1. GDP per capita ............................................................................................................................ 117 6.1.2. Economic sectors ........................................................................................................................ 124
6.2. Research and innovation .................................................................................................................... 127 6.3. Social cohesion ................................................................................................................................... 128 6.4. Environmental analysis ...................................................................................................................... 129
6.4.1. Environmental performance ....................................................................................................... 129 6.4.2. Environmental capacity .............................................................................................................. 140 6.4.3. Climate change ........................................................................................................................... 145
6.5. Chapter conclusions ........................................................................................................................... 150 Chapter 7. Factor analyses ............................................................................................................................ 152
7.1. Centrality (FAC1_1) ............................................................................................................................ 155 7.2. Research and development (FAC2_1) ................................................................................................ 157

Ulysses Final Report - Multi-thematic Territorial Analysis of Euregio Karelia - Annexes 10
7.3. Administrative centres (FAC3_1) ....................................................................................................... 159 7.4. Demographic dynamism (FAC4_1) ..................................................................................................... 161 7.5. Environmental risks (FAC5_1) ............................................................................................................ 163 7.6. Services and transport (FAC6_1) ........................................................................................................ 165 7.7. Immigration (FAC7_1) ........................................................................................................................ 167 7.8. Construction (FAC8_1) ....................................................................................................................... 169 7.9. Unemployment (FAC1_2) ................................................................................................................... 171 7.10. Catching-up regions (FAC2_2) .......................................................................................................... 174 7.11. Economic development (FAC3_2) .................................................................................................... 177 7.12. Pollution (FAC4_2)............................................................................................................................ 180 7.13. Chapter conclusions ......................................................................................................................... 182
Territorial synthesis map ............................................................................................................................... 183 References ..................................................................................................................................................... 184

Ulysses Final Report - Multi-thematic Territorial Analysis of Euregio Karelia - Annexes 11
List of maps Map 1. Map of Euregio Karelia. ....................................................................................................................... 18
Map 2. Map of NUTS 2 level units of the Eastern and Northern Finland – Russia CBA. ................................. 21
Map 3. Map of NUTS 3 level units of the Eastern and Northern Finland – Russia CBA. ................................. 22
Map 4. Map of LAU 1 level regions of Euregio Karelia. ................................................................................... 23
Map 5. NUTS 3 level population density in Euregio Karelia in 2010. .............................................................. 34
Map 6. LAU 1 level population density in Euregio Karelia in 2010.................................................................. 35
Map 7. Annual population growth rate in Euregio Karelia between 2000 and 2009. .................................... 38
Map 8. LAU 1 level annual population growth rate in Euregio Karelia between 2001 and 2010. .................. 39
Map 9. Category map of population change in Euregio Karelia between years 2001 and 2010. ................... 43
Map 10. Map of total fertility rates in the Eastern and Northern Finland – Russia CBA in 2009. .................. 48
Map 14. Demographic potential in the LAU 1 regions of Euregio Karelia (year 2009). .................................. 56
Map 12. FUAs and MUAs of the Eastern and Northern Finland – Russia CBA. ............................................... 61
Map 13. FUA Thiessen polygons for the Eastern and Northern Finland – Russia CBA. .................................. 67
Map 14. Share of different NACE sectors in the value added of FUAs in the Eastern and Northern Finland –
Russia CBA (year 2006). ................................................................................................................................... 71
Map 15. GDP per inhabitant in the FUAs of Eastern and Northern Finland – Russia CBA (year 2006). .......... 72
Map 16. Euregio Karelia according to ESPON 1.1.2. and Eurostat urban rural typologies. ............................ 76
Map 17. Share of agricultural areas in Euregio Karelia in 2006. ..................................................................... 78
Map 18. Urbanisation of agricultural areas in Euregio Karelia between 2000 and 2006. .............................. 80
Map 19. Urbanisation of natural and semi-natural areas in Euregio Karelia between 2000 and 2006. ......... 81
Map 20. Land use change from agricultural to artificial areas in Euregio Karelia between 2000 and 2006. . 83
Map 21. Share of GVA by agriculture and fishing in total GVA in Euregio Karelia (2008). .............................. 87
Map 22. Annual growth rate of the share of GVA by agriculture and fishing in Euregio Karelia between 1997
and 2008. ......................................................................................................................................................... 88
Map 23. Share of employment in agriculture and fishing in total employment in Euregio Karelia (2008). ... 91
Map 24. Annual growth rate of the share of employment in agriculture and fishing in Euregio Karelia
between 2000 and 2008. ................................................................................................................................. 92
Map 25. Main transport infrastructure in Euregio Karelia. ............................................................................. 95
Map 26. Potential accessibility of the Finnish regions of Euregio Karelia by road in the context of ESPON
countries (2006). ............................................................................................................................................. 98
Map 27. Potential accessibility of the Finnish regions of Euregio Karelia by road in the context of the
CBA(2006). ....................................................................................................................................................... 99
Map 28. Index change of standardised potential accessibility by road in the Finnish regions of Euregio
Karelia between 2001 and 2006. ................................................................................................................... 100
Map 29. Potential accessibility of the Finnish regions of Euregio Karelia by rail in the context of ESPON
countries (2006). ........................................................................................................................................... 102
Map 30. Potential accessibility of the Finnish regions of Euregio Karelia by rail in the context of the CBA
(2006). ........................................................................................................................................................... 103
Map 31. Index change of standardised potential accessibility by rail in the Finnish regions of Euregio Karelia
between 2001 and 2006. ............................................................................................................................... 104
Map 32. Potential accessibility of the Finnish regions of Euregio Karelia by air in the context of ESPON
countries (2006). ........................................................................................................................................... 106
Map 33. Potential accessibility of the Finnish regions of Euregio Karelia by air in the context of the CBA
(2006). ........................................................................................................................................................... 107

Ulysses Final Report - Multi-thematic Territorial Analysis of Euregio Karelia - Annexes 12
Map 34. Index change of standardised potential accessibility by air in the Finnish regions of Euregio Karelia
between 2001 and 2006. ............................................................................................................................... 108
Map 35. Multimodal potential accessibility of the Finnish regions of Euregio Karelia in the context of ESPON
countries (2006). ........................................................................................................................................... 110
Map 36. Multimodal potential accessibility of the regions of Euregio Karelia in the context of the cross-
border region (2006). .................................................................................................................................... 111
Map 37. Index change of standardised multimodal potential accessibility in the Finnish regions of Euregio
Karelia between 2001 and 2006. ................................................................................................................... 112
Map 38. Households with broadband internet connection in the Eastern and Northern Finland – Russia CBA
in 2009. .......................................................................................................................................................... 114
Map 39. GDP per capita of the Finnish regions of Euregio Karelia indexed to the leading NUTS 1 region of
London (2008). .............................................................................................................................................. 120
Map 40. Performance of the regions of Euregio Karelia in GDP per capita between 1997 and 2008 compared
to the leading NUTS 1 region of London. ...................................................................................................... 123
Map 41. Soil sealed area in Euregio Karelia in 2006...................................................................................... 131
Map 42. Ozone concentration exceedances (days) in Euregio Karelia in 2008. ........................................... 133
Map 43. Urban waste water treatment capacity in the Eastern and Northern Finland – Russia CBA (2007).
....................................................................................................................................................................... 136
Map 44. Share of Natura 2000 areas of total area (%) in Euregio Karelia in 2009. ....................................... 138
Map 45. The Green Belt of Fennoscandia and the protected areas in the Finnish-Russian border area. .... 140
Map 46. Solar energy resources (kWh per year) in Euregio Karelia between 1981 and 1990 (average per
year). .............................................................................................................................................................. 142
Map 47. Wind energy potential (onshore full load hours) in Euregio Karelia between 2000 and 2005
(average per year). ........................................................................................................................................ 144
Map 48. Physical sensitivity to climate change in Euregio Karelia. ............................................................... 147
Map 49. Social sensitivity to climate change in Euregio Karelia. .................................................................. 148
Map 50. Economic sensitivity to climate change in Euregio Karelia. ............................................................ 149
Map 51. Results of analysis on Centrality FAC1_1 in Euregio Karelia. .......................................................... 156
Map 52. Results of analysis on Research and development (FAC2_1) in Euregio Karelia. ........................... 158
Map 53. Results of analysis on Administrative centres (FAC3_1) in Euregio Karelia. ................................... 160
Map 54. Results of analysis on Demographic dynamism (FAC4_1) in Euregio Karelia. ................................ 162
Map 55. Results of analysis on Environmental risks (FAC5_1) in Euregio Karelia. ........................................ 164
Map 56. Results of analysis on Services and transport (FAC6_1) in Euregio Karelia. ................................... 166
Map 57. Results of analysis on Immigration (FAC7_1) in Euregio Karelia. .................................................... 168
Map 58. Results of analysis on Construction (FAC8_1) in Euregio Karelia. ................................................... 170
Map 59. Results of analysis on Unemployment (FAC1_2) in Euregio Karelia. .............................................. 173
Map 60. Results of analysis on Catching-up regions (FAC2_2) in Euregio Karelia. ....................................... 176
Map 61. Results of analysis on Economic development (FAC3_2) in Euregio Karelia. ................................. 179
Map 62. Results of analysis on Pollution (FAC4_2) in Euregio Karelia (tendencies). .................................... 181
Map 63. Territorial synthesis map for Euregio Karelia .................................................................................. 183
List of tables Table 1. NUTS 0-3 and LAU 1 division of Eastern and Northern Finland – Russia CBA (Euregio Karelia) ........ 19
Table 2. Total area of NUTS 0-3 and LAU 1 level units of the CBA .................................................................. 25

Ulysses Final Report - Multi-thematic Territorial Analysis of Euregio Karelia - Annexes 13
Table 3. Demographic parameters studied for the Eastern and Northern Finland – Russia CBA (Euregio
Karelia). ............................................................................................................................................................ 26
Table 4. Total population in the Eastern and Northern Finland – Russia CBA (Euregio Karelia)..................... 28
Table 5. Amount of male and female population in the Eastern and Northern Finland – Russia CBA (Euregio
Karelia). ............................................................................................................................................................ 29
Table 6. Population by age groups in the Eastern and Northern Finland – Russia CBA (Euregio Karelia). ..... 29
Table 7. Population density in the Eastern and Northern Finland – Russia CBA (Euregio Karelia). ................ 32
Table 8. Population change in the Eastern and Northern Finland – Russia CBA (Euregio Karelia) between
2001 and 2010. ................................................................................................................................................ 36
Table 9. Population growth rates in the Eastern and Northern Finland – Russia CBA (Euregio Karelia). ....... 37
Table 10. Natural population increase and net migration in the Eastern and Northern Finland – Russia CBA
(Euregio Karelia) between 2001 and 2010. ..................................................................................................... 40
Table 11. Crude rate of natural increase in Euregio Karelia between 2000 and 2009. ................................... 41
Table 12. Crude rate of net migration in Euregio Karelia between 2000 and 2009. ....................................... 41
Table 13. Dependency ratios in Euregio Karelia in 2009. ................................................................................ 49
Table 14. Commuting to another region in the Eastern and Northern Finland - Russia CBA between 2000
and 2009 (NUTS 2 delimitation). ..................................................................................................................... 50
Table 15. Commuting to a foreign country in the Eastern and Northern Finland - Russia CBA between 2000
and 2009 (NUTS 2 delimitation). ..................................................................................................................... 51
Table 16. Unstandardized and standardized annual population change, border distance and population
density in the Finnish LAU 1 regions of Euregio Karelia between 2000 and 2010. ......................................... 52
Table 17. Regression statistics picturing the “border effect” in theFinnish LAU 1 level regions of Euregio
Karelia. ............................................................................................................................................................. 52
Table 18. Demographic potential values in the LAU 1 level regions of Euregio Karelia (year 2009). ............. 54
Table 19. Indicators for the study of polycentric development in the Eastern and Northern Finland – Russia
CBA. ................................................................................................................................................................. 58
Table 20. FUAs of the Eastern and Northern Finland – Russia CBA. ............................................................... 60
Table 21. Morpholocigal indicators for the Eastern and Northern Finland – Russia CBA (2006). .................. 68
Table 22. Functional indicators for the Eastern and Northern Finland – Russia CBA (2006). ......................... 69
Table 23. Urban-rural relationship parameters studied for Euregio Karelia. .................................................. 74
Table 24. Agricultural areas (category 2 of the Corine Land Cover) in Euregio Karelia. ................................. 77
Table 25. Urban fabric (categories 111 and 112 of the Corine Land Cover) in Euregio Karelia. ..................... 79
Table 26. Artificial surfaces (category 1 of the Corine Land Cover) in Euregio Karelia. .................................. 82
Table 27. Gross value added by agriculture and fishing in Euregio Karelia between 1997 and 2008. ........... 84
Table 28. GVA by agriculture and fishing, and share of GVA by agriculture and fishing in total GVA in Euregio
Karelia between 1997 and 2008. ..................................................................................................................... 86
Table 29. Employment in agriculture and fishing in Euregio Karelia between 2000 and 2008. ..................... 89
Table 30. Employment in agriculture and fishing, and share of employment in agriculture and fishing in total
employment in Euregio Karelia between 2000 and 2008. .............................................................................. 90
Table 31. Parameters studied for the accessibility and connectivity in the Eastern and Northern Finland –
Russia CBA (Euregio Karelia). ........................................................................................................................... 96
Table 32. Potential accessibility of Euregio Karelia in the context of ESPON space and the CBA (2006). ...... 96
Table 33. Standardised potential accessibility of Euregio Karelia in the context of ESPON countries and the
CBA (2006). ...................................................................................................................................................... 97
Table 34. Indicators applied for the study of Lisbon / Europe 2020 and Gothenburg Strategies. ................ 116

Ulysses Final Report - Multi-thematic Territorial Analysis of Euregio Karelia - Annexes 14
Table 35. GDP per capita (euro) in the leading NUTS 1 region (London), in the leading Finnish region
(Uusimaa) and the regions of Euregio Karelia between 1997 and 2008. ...................................................... 118
Table 36. GDP per capita of the regions of Euregio Karelia (and the Finnish region of Uusimaa) indexed to
the leading NUTS 1 region of London (2008). ............................................................................................... 119
Table 37. Catching-up analysis of the Finnish regions of Euregio Karelia (performance in GDP per capita
between 1997 and 2008 compared to the leading NUTS 1 region of London). ............................................ 121
Table 38. Share of GVA by NACE (Rev. 1.1) in the regions of Euregio Karelia in 2008. ................................. 124
Table 39. Annual growth rate of GVA by NACE in Euregio Karelia between 1997 and 2008 (% share of total
GVA). .............................................................................................................................................................. 124
Table 40. Share of employment in total employment by NACE sectors (Rev. 1.1) in Euregio Karelia (2008).
....................................................................................................................................................................... 125
Table 41. Annual growth rate of the share of employment by NACE sectors in total employment in Euregio
Karelia between 2000 and 2008. ................................................................................................................... 126
Table 42. Indicators for research and innovation in the Eastern and Northern Finland- Russia CBA ........... 128
Table 43. Social cohesion indicators for the Eastern and Northern Finland – Russia CBA. .......................... 129
Table 44. Soil sealing in Euregio Karelia in 2006. .......................................................................................... 130
Table 45. Ozone concentration exceedances in Euregio Karelia in 2008. ..................................................... 132
Table 46. Urban waste water treatment capacity in the Eastern and Northern Finland – Russia CBA (2007).
....................................................................................................................................................................... 134
Table 47. Share of Natura 2000 areas of total area (%) in Euregio Karelia in 2009. ..................................... 137
Table 48. Solar energy resources in the regions of Euregio Karelia between 1981 and 1990. ..................... 141
Table 49. Wind energy potential (onshore full load hours) in Euregio Karelia between 2000 and 2005
(average per year). ........................................................................................................................................ 143
Table 50. Climate sensitivity values for the Finnish regions of Euregio Karelia. ........................................... 145
Table 51. Indicators for the study of territorial profile of Euregio Karelia. ................................................... 153
Table 52. Indicators for the study of territorial performance of Euregio Karelia. ........................................ 154
Table 53. Results of analysis on Centrality FAC1_1 in Euregio Karelia. ......................................................... 155
Table 54. Results of analysis on Research and development (FAC2_1) in Euregio Karelia. .......................... 157
Table 55. Results of analysis on Administrative centres (FAC3_1) in Euregio Karelia................................... 159
Table 56. Results of analysis on Demographic dynamism (FAC4_1) in Euregio Karelia. ............................... 161
Table 57. Results of analysis on Environmental risks (FAC5_1) in Euregio Karelia. ...................................... 163
Table 58. Results of analysis on Services and transport (FAC6_1) in Euregio Karelia. .................................. 165
Table 59. Results of analysis on Immigration (FAC7_1) in Euregio Karelia. .................................................. 167
Table 60. Results of analysis on Construction (FAC8_1) in Euregio Karelia. ................................................. 169
Table 61. Results of analysis on Unemployment (FAC1_2) in Euregio Karelia. ............................................. 171
Table 62. Results of analysis on Catching-up regions (FAC2_2) in Euregio Karelia. ...................................... 174
Table 63 Results of analysis on Economic development (FAC3_2) in Euregio Karelia. ................................. 177
Table 64. Results of analysis on Pollution (FAC4_2) in Euregio Karelia. ........................................................ 180
List of figures Figure 1. Age structure in Euregio Karelia. ...................................................................................................... 30
Figure 2. Population density in Euregio Karelia between years 2000 and 2010. ............................................ 33
Figure 3. Expected and actual natural population change and net migration in Euregio Karelia between
years 2000 and 2010. ...................................................................................................................................... 45

Ulysses Final Report - Multi-thematic Territorial Analysis of Euregio Karelia - Annexes 15
Figure 4. Total population change in Euregio Karelia between 2000 and 2010 and logarithmic trend line for
population projection. ..................................................................................................................................... 46
Figure 5. Evolution of total fertility rates in the Eastern and Northern Finland – Russia CBA between 2000
and 2009. ......................................................................................................................................................... 47
Figure 6. Scatter chart of young and old age dependency ratios in Euregio Karelia in 2009. ......................... 50
Figure 7. Rank size distribution of the population in Functional Urban Areas of ESPON countries (2006). ... 63
Figure 8. Rank size distribution of GDP in Functional Urban Areas in ESPON countries (2006). .................... 64
Figure 9. Rank size distribution of the population of Functional Urban Areas in the Eastern and Northern
Finland – Russia CBA (2006). ........................................................................................................................... 65
Figure 10. Rank size distribution of GDP in Functional Urban Areas in the Eastern and Northern Finland –
Russia CBA (Finnish FUAs, 2006). .................................................................................................................... 66
Figure 11. Rank size distribution of FUAs in the Eastern and Northern Finland – Russia CBA to the overall
distribution of FUAs in ESPON countries (2006). ............................................................................................ 68
Figure 12. Gross value added by agriculture and fishing in Euregio Karelia between 1997 and 2008. .......... 85
Figure 13. Employment in agriculture and fishing in Euregio Karelia between 2000 and 2008. .................... 89
Figure 14. Coefficient of deviation of GDP per capita between 1997 and 2008. .......................................... 118
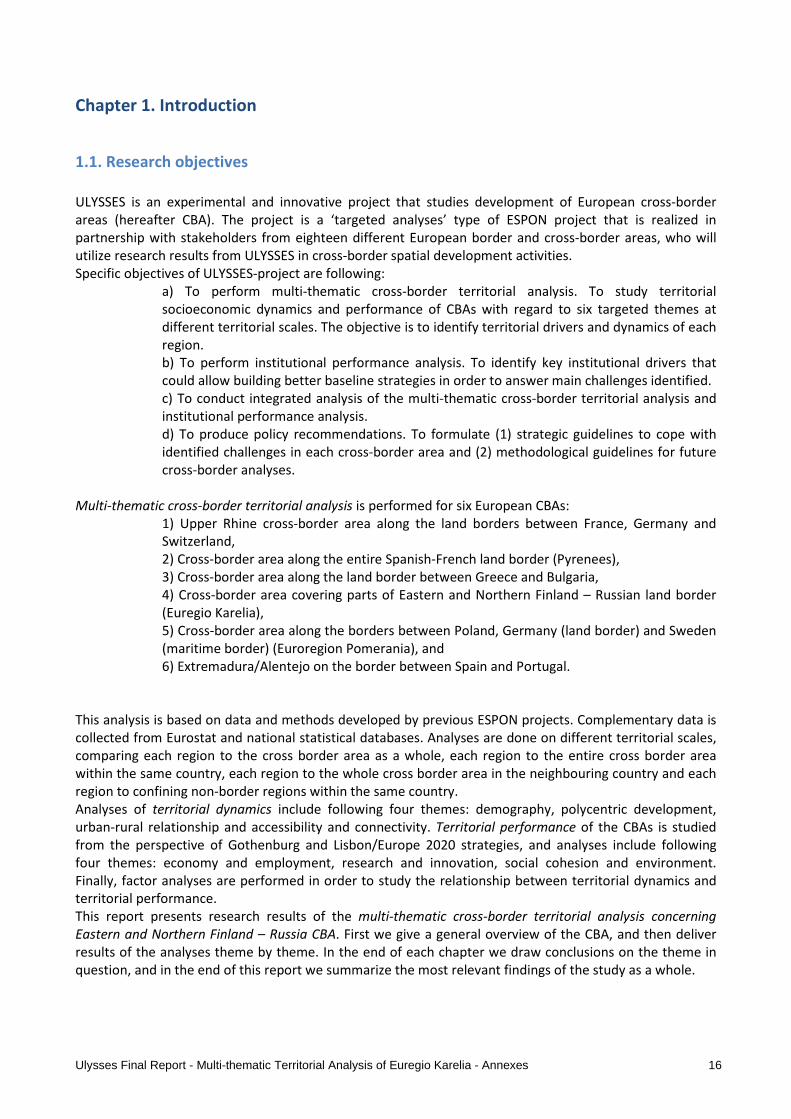
Ulysses Final Report - Multi-thematic Territorial Analysis of Euregio Karelia - Annexes 16
Chapter 1. Introduction
1.1. Research objectives
ULYSSES is an experimental and innovative project that studies development of European cross-border areas (hereafter CBA). The project is a ‘targeted analyses’ type of ESPON project that is realized in partnership with stakeholders from eighteen different European border and cross-border areas, who will utilize research results from ULYSSES in cross-border spatial development activities. Specific objectives of ULYSSES-project are following:
a) To perform multi-thematic cross-border territorial analysis. To study territorial socioeconomic dynamics and performance of CBAs with regard to six targeted themes at different territorial scales. The objective is to identify territorial drivers and dynamics of each region. b) To perform institutional performance analysis. To identify key institutional drivers that could allow building better baseline strategies in order to answer main challenges identified. c) To conduct integrated analysis of the multi-thematic cross-border territorial analysis and institutional performance analysis. d) To produce policy recommendations. To formulate (1) strategic guidelines to cope with identified challenges in each cross-border area and (2) methodological guidelines for future cross-border analyses.
Multi-thematic cross-border territorial analysis is performed for six European CBAs: 1) Upper Rhine cross-border area along the land borders between France, Germany and Switzerland, 2) Cross-border area along the entire Spanish-French land border (Pyrenees), 3) Cross-border area along the land border between Greece and Bulgaria, 4) Cross-border area covering parts of Eastern and Northern Finland – Russian land border (Euregio Karelia), 5) Cross-border area along the borders between Poland, Germany (land border) and Sweden (maritime border) (Euroregion Pomerania), and 6) Extremadura/Alentejo on the border between Spain and Portugal.
This analysis is based on data and methods developed by previous ESPON projects. Complementary data is collected from Eurostat and national statistical databases. Analyses are done on different territorial scales, comparing each region to the cross border area as a whole, each region to the entire cross border area within the same country, each region to the whole cross border area in the neighbouring country and each region to confining non-border regions within the same country. Analyses of territorial dynamics include following four themes: demography, polycentric development, urban-rural relationship and accessibility and connectivity. Territorial performance of the CBAs is studied from the perspective of Gothenburg and Lisbon/Europe 2020 strategies, and analyses include following four themes: economy and employment, research and innovation, social cohesion and environment. Finally, factor analyses are performed in order to study the relationship between territorial dynamics and territorial performance. This report presents research results of the multi-thematic cross-border territorial analysis concerning
Eastern and Northern Finland – Russia CBA. First we give a general overview of the CBA, and then deliver results of the analyses theme by theme. In the end of each chapter we draw conclusions on the theme in question, and in the end of this report we summarize the most relevant findings of the study as a whole.

Ulysses Final Report - Multi-thematic Territorial Analysis of Euregio Karelia - Annexes 17
1.2. General overview of the Eastern and Northern Finland – Russia CBA (Euregio Karelia)
Euregio Karelia is a cross-border area situated on the Finnish-Russian border area. It is formed out of three Finnish regions; North Karelia, Kainuu and Northern Ostrobothnia and the Republic of Karelia in the Russian Federation. The borderline dividing these regions is an external border of the European Union and it is approximately 700 kilometres long. In contrast to EU internal borders, there exists no visa-free entry on the Finnish-Russian border, and the visa regulations are determined by the EU-Russian visa agreement and the Schengen-regime. On the Finnish side the regions belonging to Euregio Karelia are located in eastern and northern Finland and they stretch across the whole mainland from the Finnish-Swedish maritime border to the Finnish-Russian land border. On the Russian side the Republic of Karelia is located in north-west Russia and it borders the White Sea in the north and Lake Ladoga in the south. The regions collaborate across the border under the title of Euregio Karelia, which is a cooperation forum founded in 2000. The main aim of the Euregio is to develop living conditions in the region by improving economic wellbeing and social justice among the inhabitants.

Ulysses Final Report - Multi-thematic Territorial Analysis of Euregio Karelia - Annexes 18
Map 14. Map of Euregio Karelia.
Oulu
Kajaani
JoensuuPetrozavodsk
The Republic of Karelia
Kainuu
North Karelia
Northern Ostrobothnia
This map does notnecessarily reflect theopinion of the ESPONMonitoring Committee
0 40 80 120 16020Km
Local level: NUTS 3Year: 2010
Source: Statistics Finland and Kareliâstat© EuroGeographics Association for administrative boundaries
© Project ULYSSES, 2012
0 620310 Km
LegendAdministrative centres

Ulysses Final Report - Multi-thematic Territorial Analysis of Euregio Karelia - Annexes 19
In the Ulysses project quantitative statistical analysis were made on the case study areas utilizing the NUTS classification (Nomenclature of territorial units for statistics) established by Eurostat. From the perspective of NUTS division Euregio Karelia appears as follows.7 On the Finnish side it includes three NUTS 3 level regions; North Karelia, Kainuu and Northern Ostrobothnia. Two of these regions, North Karelia and Kainuu belong to the NUTS 2 region of Eastern Finland, and Northern Ostrobothnia belongs to the NUTS 2 region of Northern Finland. Since part of the analysis were made on NUTS 2 level, it is necessary to notice that both Eastern and Northern Finland include NUTS 3 regions that are not members of Euregio Karelia, namely Northern and Southern Savonia in Eastern Finland and Lapland and Central Ostrobothnia in Northern Finland. In this report we use the concept of Euregio Karelia when referring to North Karelia, Kainuu and Northern Ostrobothnia in Finland and the Republic of Karelia in the Russian Federation. With Eastern and Northern Finland – Russia CBA we refer to NUTS 2 level regions of Eastern and Northern Finland and the Republic of Karelia in the Russian Federation. Since Russia is not a member of the European Union, it does not apply the NUTS division to its territories. Therefore a SNUTS (“Similar to NUTS”) classification was created for the purposes of the Ulysses study and it follows the Russian administrative structure.8 In the SNUTS division Russian Federation represents level 0 and the eight federal districts (federal’nye okruga) constitute level 1. The federal districts are formed out of 83 federal subjects (sub”ekty federacii) that represent level 2 in this study. The Republic of Karelia (Respublika Kareliâ) is a federal subject of the Russian Federation and, accordingly, a SNUTS 2 level region. It belongs to the North-western Federal District that represents SNUTS 1 level in this study. As the following Russian administrative level, the municipal raions, is more or less comparable with LAU1 level, there is no regional division in Russia which corresponds to the NUTS 3 division. Municipal regions of the Republic of Karelia were therefore aggregated into three SNUTS 3 regions; Northern part of the Republic, Southern part of the Republic and the City District of Petrozavodsk, all having around 200 000 inhabitants and thereby fulfilling the NUTS 3 level requirements set up by Eurostat. Full use of these regions in the analyses was restricted due to the fact that data had to be aggregated from SLAU 1 level data, which in most of the cases was not available. In addition, these regions are artificial and do not function as administrative entities. Thus there exists little concrete need for information concerning these regions. The use of aggregated SNUTS 3 level units of the Republic of Karelia was therefore limited only to the demographic analyses. In the rest of the analyses we examined the Republic of Karelia on SNUTS 2 level. Table 2. NUTS 0-3 and LAU 1 division of Eastern and Northern Finland – Russia CBA (Euregio Karelia)
NUTS level NUTS ID NUTS LAU ID LAU 1
NUTS 0 FI Finland (Suomi)
NUTS 1 FI1 Mainland Finland (Manner-Suomi)
NUTS 2 FI13 Eastern Finland (Itä-Suomi)
NUTS 3 FI133 North Karelia (Pohjois-Karjala)
122 Joensuu
124 Keski-Karjala
7 The NUTS version applied here is 2008. The Finnish NUTS division has changed in the beginning of year 2012. On NUTS 2 level following changes took place: Southern Finland was divided into two regions; the metropolitan region of Helsinki-Uusimaa (FI1B) and Southern Finland (FI1C). Eastern and Northern Finland merged into one region; Eastern and Northern Finland (FI1D). Changes on NUTS 2 level led to changes in the coding and naming of NUTS 3 level regions. Concerning Euregio Karelia, the new code of North Karelia is FI1D3, the code of Kainuu FI1D4 and the code of Northern Ostrobothnia FI1D6. 8 This work was carried out by following the example of ESPON Database 2013 project, where a SNUTS division was introduced to countries of the Western Balkans that were lacking the NUTS division (Serbia, Bosnia, Albania).

Ulysses Final Report - Multi-thematic Territorial Analysis of Euregio Karelia - Annexes 20
125 Pielisen Karjala
NUTS 3 FI134 Kainuu
181 Kehys-Kainuu
182 Kajaani
NUTS 2 FI1A Northern Finland (Pohjois-Suomi)
NUTS 3 FI1A2 Northern Ostrobothnia (Pohjois-Pohjanmaa)
171 Oulu
173 Oulunkaari
174 Raahe
175 Haapavesi-Siikalatva
176 Nivala-Haapajärvi
177 Ylivieska
178 Koillismaa
SNUTS 0 RU Russia (Russiâ)
SNUTS 1 RU3 Northwestern Federal District (Severo-Zapadnyj federal'nyj okrug)
SNUTS 2 RU3D The Republic of Karelia (Respublika Kareliâ)
SNUTS 3 RU3D1 City District of Petrozavodsk (Petrozavodskij gorodskoj okrug)
RU3D1 City District of Petrozavodsk (Petrozavodskij gorodskoj okrug)
SNUTS 3 RU3D2 Northern part of the Republic of Karelia (Severnaâ čast' Respubliki Kareliâ)
RU3D21 Kostamukšskij gorodskoj okrug
RU3D22 Belomorskij municipal'nyj rajon
RU3D23 Kaleval'skij nacional'nyj rajon
RU3D24 Kemskij municipal'nyj rajon
RU3D25 Louhskij municipal'nyj rajon
RU3D26 Medvež'egorskij municipal'nyj rajon
RU3D27 Muezerskij municipal'nyj rajon
RU3D28 Segežskij municipal'nyj rajon
SNUTS 3 RU3D3 Southern part of the Republic of Karelia (Ûžnaâ čast' Respubliki Kareliâ)
RU3D31 Sortaval'skij municipal'nyj rajon
RU3D32 Kondopožskij municipal'nyj rajon
RU3D33 Lahdenpohskij municipal'nyj rajon
RU3D34 Oloneckij nacional'nyj municipal'nyj rajon
RU3D35 Pitkârantskij municipal'nyj rajon
RU3D36 Prionežskij municipal'nyj rajon
RU3D37 Prâžinskij nacional'nyj municipal'nyj rajon
RU3D38 Pudožskij municipal'nyj rajon
RU3D39 Suoârvskij municipal'nyj rajon

Ulysses Final Report - Multi-thematic Territorial Analysis of Euregio Karelia - Annexes 21
Map 15. Map of NUTS 2 level units of the Eastern and Northern Finland – Russia CBA.
Northern Finland
The Republic of Karelia
Eastern Finland
This map does notnecessarily reflect theopinion of the ESPONMonitoring Committee
0 40 80 120 16020Km
Local level: NUTS 2Year: 2010
Source: Statistics Finland and Kareliâstat© EuroGeographics Association for administrative boundaries
© Project ULYSSES, 2012
0 620310 Km
LegendNUTS 2

Ulysses Final Report - Multi-thematic Territorial Analysis of Euregio Karelia - Annexes 22
Map 16. Map of NUTS 3 level units of the Eastern and Northern Finland – Russia CBA.
KainuuNorthern part of the Republic of Karelia
North Karelia
Southern part of the Republic of Karelia
Northern Ostrobothnia
City District of Petrozavodsk
This map does notnecessarily reflect theopinion of the ESPONMonitoring Committee
0 30 60 90 12015Km
Local level: NUTS 3Year: 2010
Source: Statistics Finland and Kareliâstat© EuroGeographics Association for administrative boundaries
© Project ULYSSES, 2012
0 620310 Km
LegendNUTS 3

Ulysses Final Report - Multi-thematic Territorial Analysis of Euregio Karelia - Annexes 23
Map 17. Map of LAU 1 level regions of Euregio Karelia.
Kajaani
Joensuu
Kehys-Kainuu
Oulunkaari
Koillismaa
Louhskij municipal'nyj rajon
Oulu
Pielisen Karelia
Siikalatva
RaaheMuezerskij municipal'nyj rajon
Pudožskij municipal'nyj rajon
Medvež'egorskij municipal'nyj rajon
Suoârvskij municipal'nyj rajon
Kaleval'skij nacional'nyj rajon
Belomorskij municipal'nyj rajon
Segežskij municipal'nyj rajon
Ylivieska
Kemskij municipal'nyj rajon
Keski-Karjala
Prionežskij municipal'nyj rajon
Nivala-Haapajärvi
Kondopožskij municipal'nyj rajon
Pitkârantskij municipal'nyj rajon
Prâžinskij nacional'nyj municipal'nyj rajon
Oloneckij nacional'nyj municipal'nyj rajon
Kostamukšskij gorodskoj okrug
Lahdenpohskij municipal'nyj rajon
Sortaval'skij municipal'nyj rajon
Petrozavodskij gorodskoj okru
This map does notnecessarily reflect theopinion of the ESPONMonitoring Committee
0 30 60 90 12015Km
Local level: LAU 1Source: ESPON Database
© EuroGeographics Association for administrative boundaries
© Project ULYSSES, 2012
0 600300 Km

Ulysses Final Report - Multi-thematic Territorial Analysis of Euregio Karelia - Annexes 24
Euregio Karelia has four administrative centres; Joensuu in North Karelia, Kajaani in Kainuu, Oulu in Northern Ostrobothnia and Petrozavodsk in the Republic of Karelia.9 Joensuu is located 376 km north-east of Helsinki, Kajaani 474 km and Oulu 540 km north of Helsinki (as the crow flies). As the Ulysses-project studies border regions, it is necessary to point out that the territory of Euregio Karelia is only partly located at the Finnish-Russian border. The distances of the administrative centres from the border well illustrate this fact. Joensuu is situated 65 km and Kajaani 120 km from the Russian border, but Oulu lies on the western coast of Finland approx. 200 km from the border to Russia. On the Russian side, Petrozavodsk is situated 697 km north-west of Moscow and the distance to the Finnish border is approximately 200 km. There are three international border crossing points between Finland and Russia on the territory of Euregio Karelia. These are (from south to north) Niirala-Vârtsilâ between North Karelia and the Republic of Karelia, Vartius-Lûttâ between Kainuu and the Republic of Karelia and Kuusamo-Suoperâ between Northern Ostrobothnia and the Republic of Karelia. Euregio Karelia has a total area of 270,624 km². The Finnish NUTS 3 regions of North Karelia, Kainuu and Northern Ostrobothnia cover 90,124 km², which is 33,3 % of the CBA’s total area and 23 % of the total area of Finland. The Republic of Karelia (SNUTS 2) has a total area twice as large (180,500 km²), and it covers 66,7 % of the CBA’s total area, but only 1,1 % of the total area of Russia. On NUTS 2 level the Finnish areas of Eastern and Northern Finland have a total area of 236,087 km², which is as much as 60 % of the total area of Finland.
9 When addressing Euregio Karelia from an administrative point of you, one has to point out that Euregio Karelia has been established by the respective regions in year 2000 to function as a cooperation forum and it forms no administrative entity and possesses no legislative power. On the Finnish side it is also not easy to point out administrative centres of the CBA on the basis of NUTS division, since statistical NUTS regions do not always correspond with administrative regions. Administrative centre of Mainland Finland (NUTS 1) is naturally the capital of Finland Helsinki, but NUTS 2 level regions (suuralueet) have been created from NUTS 3 regions exceptionally for statistical purposes. NUTS 3 level regions (maakunnat), provinces, are headed by regional councils that are responsible for strategy-based development of the regions and have certain statutory tasks related to regional development. Provinces can therefore be considered administrative regions. In Russia Petrozavosk is the administrative capital of the Republic of Karelia.

Ulysses Final Report - Multi-thematic Territorial Analysis of Euregio Karelia - Annexes 25
Table 3. Total area of NUTS 0-3 and LAU 1 level units of the CBA
NUTS ID NUTS LAU ID LAU 1 Total Area (km²) 2011 (Russia 2010)
(%) of CBA
FI Finland (Suomi) 390 903,13
FI1 Mainland Finland (Manner-Suomi) 377 579,62
FI13 Eastern Finland (Itä-Suomi) 85 168,48
FI133 North Karelia (Pohjois-Karjala) 21 583,7 8 %
122 Joensuu 2 751,07
124 Keski-Karjala 3 319,4
125 Pielisen Karjala 6 760,5
FI134 Kainuu 24,451.6 9 %
181 Kehys-Kainuu 15 434,5
182 Kajaani 9 017,1
FI1A Northern Finland (Pohjois-Suomi) 150,918.4
FI1A2 Northern Ostrobothnia (Pohjois-Pohjanmaa)
44,088.44 16,3 %
171 Oulu 6 514,5
173 Oulunkaari 11 206,4
174 Raahe 4 908,2
175 Haapavesi-Siikalatva 4 162,8
176 Nivala-Haapajärvi 3 989,5
177 Ylivieska 4 847,5
178 Koillismaa 8 459,6
RU Russia (Russiâ) 17098,200.00
RU3 Northwestern Federal District (Severo-Zapadnyj federal'nyj okrug)
1687,000.00
RU3D The Republic of Karelia (Respublika Kareliâ)
180,500.00 66,7 %
RU3D1 City District of Petrozavodsk (Petrozavodskij gorodskoj okrug)
RU3D1 City District of Petrozavodsk (Petrozavodskij gorodskoj okrug)
113.00*
RU3D2 Northern part of the Republic of Karelia (Severnaâ čast' Respubliki Kareliâ)
102,762.00*
RU3D21 Kostamukšskij gorodskoj okrug 4046.00*
RU3D22 Belomorskij municipal'nyj rajon 12,797.00*
RU3D23 Kaleval'skij nacional'nyj rajon 13,260.00*
RU3D24 Kemskij municipal'nyj rajon 8029.00*
RU3D25 Louhskij municipal'nyj rajon 22,552.00*
RU3D26 Medvež'egorskij municipal'nyj rajon 13,695.00*
RU3D27 Muezerskij municipal'nyj rajon 17,660.00*
RU3D28 Segežskij municipal'nyj rajon 10,723.00*
RU3D3 Southern part of the Republic of Karelia (Ûžnaâ čast' Respubliki Kareliâ)
53,948.00*
RU3D31 Sortaval'skij municipal'nyj rajon 2190.00*
RU3D32 Kondopožskij municipal'nyj rajon 2951.00*
RU3D33 Lahdenpohskij municipal'nyj rajon 2210.00*
RU3D34 Oloneckij nacional'nyj municipal'nyj rajon 3988.00*
RU3D35 Pitkârantskij municipal'nyj rajon 2255.00*
RU3D36 Prionežskij municipal'nyj rajon 4475.00*
RU3D37 Prâžinskij nacional'nyj municipal'nyj rajon 6395.00*
RU3D38 Pudožskij municipal'nyj rajon 12,745.00*
RU3D39 Suoârvskij municipal'nyj rajon 13,739.00*
Euregio Karelia 270,624.00 100 %
* Land territory
Sources: Statistics Finland, Rosstat and Kareliâstat

Ulysses Final Report - Multi-thematic Territorial Analysis of Euregio Karelia - Annexes 26
Chapter 2. Demographic analysis of the Eastern and Northern Finland – Russia CBA
Demographic decline and the ageing of population is one of the main challenges in the European Union.
Even if the population in EU (27) has been growing without a break since 1960, climbing up to 502.5 million
in January 2011, net migration instead of natural change has been the main determinant of population
growth since the beginning of 1990s. Europeans have generally been having fewer children, and the total
fertility rate that describes the average number of children that would be born by a woman over her lifetime
has declined from well above the replacement ratio (2.1 live births per woman) to 1.56 in 2008.10
Population
decline is especially problematic for peripheral regions, including border regions that are often situated on
the fringe of nation states, since young people tend to migrate to large urban areas, and the peripheral
regions are left with a skewed age structure and the responsibility to provide services for the ageing
population.11
The aim of this chapter is to analyse demographic dynamics and trends in the Eastern and Northern Finland - Russia CBA (Euregio Karelia). We start by describing the demographic dynamics in the area. How densely populated is the CBA? What does the age and sex structure of the CBA look like? What seems to be the temporal dynamics of the population growth? The second objective of the chapter is to understand whether the border is influencing settlement patterns. In order to study the demographic situation and future trends in the CBA, we have identified a set of indicators. These are listed in the following table. Methods of analysing the chosen parameters are explained in each subchapter separately. Table 4. Demographic parameters studied for the Eastern and Northern Finland – Russia CBA (Euregio Karelia).
Parameter – Indicator Period covered Data source NUTS level
Total population 2010 Eurostat, Rosstat, Kareliâstat NUTS 0 – LAU 1
Total population by sex 2010 Eurostat, Rosstat, Kareliâstat NUTS 0 – NUTS 3
Total population by age 2010 Eurostat, Rosstat, Kareliâstat NUTS 0 – NUTS 3
Population density 2000-2010 Eurostat, Rosstat, Kareliâstat, Statistics Finland
NUTS 0 – LAU 1
Total population change 2001-2010 Eurostat, Rosstat, Kareliâstat NUTS 0 – NUTS 3
Population growth rate 2001-2005 / 2006-2010
Eurostat, Rosstat, Kareliâstat NUTS 0 – NUTS 3
Annual population growth rate 2001-2010 Eurostat, Rosstat, Kareliâstat NUTS 0 – LAU 1
Natural population change 2001-2010 Eurostat, Rosstat, Kareliâstat NUTS 0 – NUTS 3
Net migration 2001-2010 Eurostat, Rosstat, Kareliâstat NUTS 0 – NUTS 3
Crude rate of natural increase 2000-2009 Eurostat, Rosstat, Kareliâstat NUTS 0 – NUTS 3
Crude rate of net migration 2000-2009 Eurostat, Rosstat, Kareliâstat NUTS 0 – NUTS 3
Total fertility rate 2000-2009 Eurostat, Rosstat, Kareliâstat NUTS 0 – NUTS 3
Total, old and young dependency ratios 2009 Eurostat, Rosstat, Kareliâstat NUTS 0 – NUTS 3
Commuters to other regions among/by active population
2000-2009 Eurostat NUTS 0 –NUTS 2
Commuters to a foreign country among/by active population
2000-2009 Eurostat NUTS 0 –NUTS 2
2.1. Demographic dynamics
2.1.1. Total population
10 There has been a slight recovery in the TFR rates since 2003, when the ratio was as low as 1.47. 11 Population and population change statistics 2011; Fertility statistics 2011.

Ulysses Final Report - Multi-thematic Territorial Analysis of Euregio Karelia - Annexes 27
Euregio Karelia has a total population of 1 324 918 inhabitants. The Republic of Karelia has the largest population with 684 212 inhabitants and Kainuu has the smallest population with 82 634 inhabitants. With the total of 640 706 inhabitants, the three Finnish regions, North Karelia, Kainuu and Northern Ostrobothnia constitute 12 % of the total population of Finland. The Republic of Karelia, on the other hand, only has 0,5 % of the total population of Russia. When compared to the total population of the European Union (EU27), which in 2010 was 501 120 688 citizens, the population of Euregio Karelia makes up 0,3 % of the EU population.

Ulysses Final Report - Multi-thematic Territorial Analysis of Euregio Karelia - Annexes 28
Table 5. Total population in the Eastern and Northern Finland – Russia CBA (Euregio Karelia).
NUTS ID NUTS LAU ID LAU 1 Population in 2010
% of the CBA total population
FI Finland (Suomi) 5 351 427
FI1 Mainland Finland (Manner-Suomi) 5 323 693
FI13 Eastern Finland (Itä-Suomi) 652 346
FI133 North Karelia (Pohjois-Karjala) 165 962 12,5 %
122 Joensuu 122 985
124 Keski-Karjala 19 228
125 Pielisen Karjala 23 653
FI134 Kainuu 82 634 6,2 %
181 Kehys-Kainuu 24 447
182 Kajaani 57 626
FI1A Northern Finland (Pohjois-Suomi) 643 989
FI1A2 Northern Ostrobothnia (Pohjois-Pohjanmaa)
392 110 29,6 %
171 Oulu 226 402
173 Oulunkaari 23 396
174 Raahe 34 731
175 Haapavesi-Siikalatva 15 230
176 Nivala-Haapajärvi 30 455
177 Ylivieska 43 800
178 Koillismaa 20 951
RU Russia (Russiâ) 141 914 509
RU3 Northwestern Federal District (Severo-Zapadnyj federal'nyj okrug)
13 437 106
RU3D The Republic of Karelia (Respublika Kareliâ)
684 212 51,6 %
RU3D1 City District of Petrozavodsk (Petrozavodskij gorodskoj okrug)
RU3D1 City District of Petrozavodsk (Petrozavodskij gorodskoj okrug)
270 601 20,4 %
RU3D2 Northern part of the Republic of Karelia (Severnaâ čast' Respubliki Kareliâ)
190 874 14,4 %
RU3D21 Kostamukšskij gorodskoj okrug 30 241
RU3D22 Belomorskij municipal'nyj rajon 21 065
RU3D23 Kaleval'skij nacional'nyj rajon 9 470
RU3D24 Kemskij municipal'nyj rajon 18 604
RU3D25 Louhskij municipal'nyj rajon 16 746
RU3D26 Medvež'egorskij municipal'nyj rajon 34 172
RU3D27 Muezerskij municipal'nyj rajon 14 613
RU3D28 Segežskij municipal'nyj rajon 45 963
RU3D3 Southern part of the Republic of Karelia (Ûžnaâ čast' Respubliki Kareliâ)
222 737 16,8 %
RU3D31 Sortaval'skij municipal'nyj rajon 32 885
RU3D32 Kondopožskij municipal'nyj rajon 41 827
RU3D33 Lahdenpohskij municipal'nyj rajon 15 273
RU3D34 Oloneckij nacional'nyj municipal'nyj rajon 24 962
RU3D35 Pitkârantskij municipal'nyj rajon 21 931
RU3D36 Prionežskij municipal'nyj rajon 23 246
RU3D37 Prâžinskij nacional'nyj municipal'nyj rajon 16 882
RU3D38 Pudožskij municipal'nyj rajon 24 614
RU3D39 Suoârvskij municipal'nyj rajon 21 117
Euregio Karelia 1 324 918 100 %
Source: Eurostat, Rosstat, Kareliâstat

Ulysses Final Report - Multi-thematic Territorial Analysis of Euregio Karelia - Annexes 29
From the perspective of sex structure, Euregio Karelia has a female majority of 52,14 % of the total population. Female majority derives mainly from the large female representation in the Republic of Karelia, where 54,28 % of the inhabitants are women. Russia in general has a considerable female majority and females constitute 53,75 % of the total population. In Finland the distribution between male and females is more even. Males constitute 49,05 % and females 50,95 % of the total population. In the Finnish regions of Euregio Karelia, the share of males and females is almost equal (50,04 % of the population are men and 49,96 % women). In the European Union (EU27) 48,82 % of the citizens are male and 51,18 % female. Table 6. Amount of male and female population in the Eastern and Northern Finland – Russia CBA (Euregio Karelia).
NUTS ID NUTS Male population in 2010
Male population % of total population
Female population in 2010
Female population % of total population
FI Finland (Suomi) 2 625 067 49,05 % 2 726 360 50,95 %
FI1 Mainland Finland (Manner-Suomi) 2 611 260 49,05 % 2 712 433 50,95 %
FI13 Eastern Finland (Itä-Suomi) 322 649 49,46 % 329 697 50,54 %
FI133 North Karelia (Pohjois-Karjala) 82 498 49,71 % 83 464 50,29 %
FI134 Kainuu 41 356 50,05 % 41 278 49,95 %
FI1A Northern Finland (Pohjois-Suomi) 323 149 50,18 % 320 840 49,82 %
FI1A2 Northern Ostrobothnia (Pohjois-Pohjanmaa) 197 412 50,35 % 194 698 49,65 %
RU Russia (Russiâ) 65 639 380 46,25 % 76 275 129 53,75 %
RU3 Northwestern Federal District (Severo-Zapadnyj federal'nyj okrug)
6 155 504 45,81 % 7 281 602 54,19 %
RU3D The Republic of Karelia (Respublika Kareliâ) 312 816 45,72 % 371 396 54,28 %
RU3D1 City District of Petrozavodsk (Petrozavodskij gorodskoj okrug)
119 006 44 % 151 595 56 %
RU3D2 Northern part of the Republic of Karelia (Severnaâ čast' Respubliki Kareliâ)
90 398 47,36 % 100 476 56,64 %
RU3D3 Southern part of the Republic of Karelia (Ûžnaâ čast' Respubliki Kareliâ)
103 412 46,43 % 119 325 53,57 %
Euregio Karelia 634 082 47,86 % 690 836 52,14 %
Source: Eurostat, Rosstat, Kareliâstat
In terms of age structure, the share of 0-14 year old population in Euregio Karelia in 2010 was 16,51 %, the share of 15-64 year old population 69,39 % and the share of population over 65 years of age 14,10 %. Northern Ostrobothnia was the only Finnish region in Euregio Karelia that had a larger amount of children (aged 0-14) than elderly people (65 years or more). In contrast to the other regions, where the share of 0-14 year olds was approximately 15 %, in Northern Ostrobothnia it was 20,55 %. The share of elderly population was largest in Kainuu (20,65 %) and North Karelia (19,43 %). In the Republic of Karelia only 11,94 % of the population was 65 years or more and the working age population was 73,33 % of the total population. The share of working age population was highest in the City District of Petrozavodsk (75,11 %). Small share of elderly people is very typical for Russia and the oldest age group consists to a large extend of women. The share of women among the population above 65 years was 68,69 %, when in Finland 58,77 % of the population over 65 years of age were female. In the European Union the age structure of the population was similar to the Finnish one with 15,62 % of the population belonging to the youngest age group, 67,01 % of the population to the working age population and 17,38 % of the population to the eldest age group. Table 7. Population by age groups in the Eastern and Northern Finland – Russia CBA (Euregio Karelia).
NUTS ID NUTS 0-14 year olds (% of total population)
15-64 year olds (% of total population)
65- year olds (% of total population)
FI Finland (Suomi) 16,60 % 66,39 % 17,01 %
FI1 Mainland Finland (Manner-Suomi) 16,60 % 66,39 % 17,01 %
FI13 Eastern Finland (Itä-Suomi) 15,06 % 64,69 % 20,25 %
FI133 North Karelia (Pohjois-Karjala) 15,11 % 65,46 % 19,43 %

Ulysses Final Report - Multi-thematic Territorial Analysis of Euregio Karelia - Annexes 30
FI134 Kainuu 15,03 % 64,32 % 20,65 %
FI1A Northern Finland (Pohjois-Suomi) 18,94 % 65,23 % 15,83 %
FI1A2 Northern Ostrobothnia (Pohjois-Pohjanmaa) 20,55 % 65,21 % 14,24 %
RU Russia (Russiâ) 15,08 % 72,03 % 12,89 %
RU3 Northwestern Federal District (Severo-Zapadnyj federal'nyj okrug)
13,64 % 73,10 % 13,27 %
RU3D The Republic of Karelia (Respublika Kareliâ) 14,73 % 73,33 % 11,94 %
RU3D1 City District of Petrozavodsk (Petrozavodskij gorodskoj okrug)
13,39 % 75,11 % 11,50 %
RU3D2 Northern part of the Republic of Karelia (Severnaâ čast' Respubliki Kareliâ)
15,20 % 73,43 % 11,37 %
RU3D3 Southern part of the Republic of Karelia (Ûžnaâ čast' Respubliki Kareliâ)
15,95 % 71,08 % 12,98 %
Euregio Karelia 16,51 % 69,39 % 14,10 %
Source: Eurostat, Rosstat, Kareliâstat
Figure 5. Age structure in Euregio Karelia.
Source: Eurostat, Rosstat, Kareliâstat
2.1.2. Population density
Population density was 7 inhabitants per km² in Euregio Karelia in 2010. The population density in Euregio Karelia is low when compared to the European Union average (116 inhabitants per km² in 2008), yet it is similar to the national averages in Finland (17,9 inhabitants per km²) and Russia (8,3 inhabitants per km²). On NUTS 2 level the most densely populated area of the Eastern and Northern Finland – Russia CBA was Eastern Finland with 9,3 inhabitants per km², and the most sparsely populated area was the Republic of Karelia with 3,8 inhabitants per km². On NUTS 3 level there were great differences between the regions. On the Finnish side, Northern Ostrobothnia had the highest population density with 11,1 inhabitants per km² and Kainuu the lowest density with 3,8 inhabitants per km². On the Russian side the City District of
0% 10% 20% 30% 40% 50% 60% 70% 80% 90% 100%
North Karelia
Kainuu
Northern Ostrobothnia
Finland
Republic of Karelia
Russian Federation
Euregio Karelia
EU27
0-14 years
15-64 years
65- years

Ulysses Final Report - Multi-thematic Territorial Analysis of Euregio Karelia - Annexes 31
Petrozavodsk had the highest density with 2397 inhabitants per km² and the Northern part of the Republic of Karelia the lowest density with 2,6 inhabitants per km² . While the population density has been declining in North Karelia, Kainuu and the Republic of Karelia, the population density in Northern Ostrobothnia has been increasing through the whole 1990s and 2000s. When we look at the situation in Northern Ostrobothnia on LAU 1 level, it is possible to detect that the increase in population density has been positive only in Oulu region. The population density in Oulu region was 34,7 inhabitants per km² in 1990, 41 inhabitants per km² in 2000, and 48,2 inhabitants per km² in 2010. In Oulu city (LAU 2) there were 98,9 inhabitants per km² in 2010. As mentioned above, Oulu is the urban centre of Northern Ostrobothnia and it is located on the western border of Finland. It is therefore not in the direct sphere of influence of the Finnish-Russian border. As to the other administrative centres of Euregio Karelia, the most densely populated city was Petrozavodsk with 2 395 inhabitants per km² (2010) and the most sparsely populated city Kainuu with 20,8 inhabitants per km² (2010). In Joensuu the population density was 30,5 inhabitants per km² in 2010.

Ulysses Final Report - Multi-thematic Territorial Analysis of Euregio Karelia - Annexes 32
Table 8. Population density in the Eastern and Northern Finland – Russia CBA (Euregio Karelia).
NUTS ID NUTS LAU ID LAU 1 Inhabitants per km² 2010
FI Finland (Suomi) 17,7
FI1 Mainland Finland (Manner-Suomi) 17,7
FI13 Eastern Finland (Itä-Suomi) 9,3
FI133 North Karelia (Pohjois-Karjala) 9,3
122 Joensuu 13
124 Keski-Karjala 7,8
125 Pielisen Karjala 4,1
FI134 Kainuu 3,8
181 Kehys-Kainuu 1,8
182 Kajaani 7,7
FI1A Northern Finland (Pohjois-Suomi) 4,8
FI1A2 Northern Ostrobothnia (Pohjois-Pohjanmaa) 11,1
171 Oulu 47,5
173 Oulunkaari 2,4
174 Raahe 13,4
175 Haapavesi-Siikalatva 3,8
176 Nivala-Haapajärvi 8,1
177 Ylivieska 13
178 Koillismaa 2,9
RU Russia (Russiâ) 8,3
RU3 Northwestern Federal District (Severo-Zapadnyj federal'nyj okrug)
8
RU3D The Republic of Karelia (Respublika Kareliâ) 3,8
RU3D1 City District of Petrozavodsk (Petrozavodskij gorodskoj okrug)
RU3D1 City District of Petrozavodsk (Petrozavodskij gorodskoj okrug)
2397
RU3D2 Northern part of the Republic of Karelia (Severnaâ čast' Respubliki Kareliâ)
2,6
RU3D21 Kostamukšskij gorodskoj okrug 7,5
RU3D22 Belomorskij municipal'nyj rajon 1,7
RU3D23 Kaleval'skij nacional'nyj rajon 0,7
RU3D24 Kemskij municipal'nyj rajon 2,3
RU3D25 Louhskij municipal'nyj rajon 0,7
RU3D26 Medvež'egorskij municipal'nyj rajon 2,5
RU3D27 Muezerskij municipal'nyj rajon 0,8
RU3D28 Segežskij municipal'nyj rajon 4,3
RU3D3 Southern part of the Republic of Karelia (Ûžnaâ čast' Respubliki Kareliâ)
7
RU3D31 Sortaval'skij municipal'nyj rajon 15,1
RU3D32 Kondopožskij municipal'nyj rajon 7,1
RU3D33 Lahdenpohskij municipal'nyj rajon 6,9
RU3D34 Oloneckij nacional'nyj municipal'nyj rajon 6,3
RU3D35 Pitkârantskij municipal'nyj rajon 9,8
RU3D36 Prionežskij municipal'nyj rajon 5,2
RU3D37 Prâžinskij nacional'nyj municipal'nyj rajon 2,6
RU3D38 Pudožskij municipal'nyj rajon 1,9
RU3D39 Suoârvskij municipal'nyj rajon 1,5
Euregio Karelia 4,9
* Population densities for Russian regions and Euregio Karelia have been calculated using total areas (km²) of the
regions. Densities for the Finnish regions are for land areas.
Source: Statistics Finland, Kareliâstat

Ulysses Final Report - Multi-thematic Territorial Analysis of Euregio Karelia - Annexes 33
Figure 6. Population density in Euregio Karelia between years 2000 and 2010.
Source: Eurostat, Rosstat, Statistics Finland
0,0
2,0
4,0
6,0
8,0
10,0
12,0
14,0
16,0
18,0
20,0
2000 2001 2002 2003 2004 2005 2006 2007 2008 2009 2010
Po
pu
lati
on
de
nsi
ty (
inh
ab
ita
nts
pe
r k
m²)
North Karelia
Kainuu
Northern Ostrobothnia
Finland
Republic of Karelia
Russia
Euregio Karelia

Ulysses Final Report - Multi-thematic Territorial Analysis of Euregio Karelia - Annexes 34
Map 18. NUTS 3 level population density in Euregio Karelia in 2010.
This map does notnecessarily reflect theopinion of the ESPONMonitoring Committee
0 40 80 120 16020Km
Local level: NUTS 3Year: 2010
Source: Statistics Finland and Kareliâstat© EuroGeographics Association for administrative boundaries
© Project ULYSSES, 2012
0 610305 Km
LegendInhabitants per Square km² 2010 National average 2009
FI = 15,74RU = 8,30
2,6
2,7 - 3,8
3,9 - 8,3
8,4 - 9,3
9,4 - 15,7
15,8 - 2397,0

Ulysses Final Report - Multi-thematic Territorial Analysis of Euregio Karelia - Annexes 35
Map 19. LAU 1 level population density in Euregio Karelia in 2010.
This map does notnecessarily reflect theopinion of the ESPONMonitoring Committee
0 40 80 120 16020Km
Local level: LAU 1Year: 2010
Source: Statistics Finland and Kareliâstat© EuroGeographics Association for administrative boundaries
© Project ULYSSES, 2012
0 610305 Km
LegendInhabitants per Square km² 2010
0,70 - 2,90
2,91 - 5,20
5,21 - 9,80
9,81 - 15,10
15,11 - 47,50
47,51 - 2397,00

Ulysses Final Report - Multi-thematic Territorial Analysis of Euregio Karelia - Annexes 36
2.1.3. Population change
Population change12 was negative in Euregio Karelia between years 2001 and 2010, and during this time the Euregio lost a total of 33 879 inhabitants. The City District of Petrozavodsk and Northern Ostrobothnia had positive, but other regions a negative population change. Growth was strongest in Northern Ostrobothnia, where total population increased by 23 512 inhabitants. Northern part of the Republic of Karelia, on the other hand, suffered from the largest population decrease (-26 980 inhabitants). Table 9. Population change in the Eastern and Northern Finland – Russia CBA (Euregio Karelia) between 2001 and
2010.
NUTS ID NUTS Total population 2001
% of CBA population
Total population 2010
% of CBA population
Total population change 2001-2010
FI Finland (Suomi) 5 181 115
5 351 427
170 312
FI1 Mainland Finland (Manner-Suomi) 5 155 339 5 323 693 168 354
FI13 Eastern Finland (Itä-Suomi) 680 870 652 346 -28 524
FI133 North Karelia (Pohjois-Karjala) 171 609
12,63 % 165 962
12,53 % -5 647
FI134 Kainuu 89 777 6,61 % 82 634 6,24 % -7 143
FI1A Northern Finland (Pohjois-Suomi) 628 418 643 989 15 571
FI1A2 Northern Ostrobothnia (Pohjois-Pohjanmaa) 368 598 27,13 % 392 110 29,60 % 23 512
RU Russia (Russiâ) 146 303 611 141 914 509 -4 389 102
RU3 Northwestern Federal District (Severo-Zapadnyj federal'nyj okrug)
14 198 896 13 437 106 -761 790
RU3D The Republic of Karelia (Respublika Kareliâ) 728 813 53,64 % 684 212 51,64 % -44 601
RU3D1 City District of Petrozavodsk (Petrozavodskij gorodskoj okrug)
265 709 19,55 % 270 601 20,42 % 4 892
RU3D2 Northern part of the Republic of Karelia (Severnaâ čast' Respubliki Kareliâ)
217 854 16,00 % 190 874 14,41 % -26 980
RU3D3 Southern part of the Republic of Karelia (Ûžnaâ čast' Respubliki Kareliâ)
245 250 18,00 % 222 737 16,81 % -22 513
Euregio Karelia 1 358 797 100 % 1 324 918 100 % -33 879
Source: Eurostat, Rosstat, Kareliâstat
When we compare total population change in Euregion Karelia between two four-year periods, 2001 to 2005 and 2006 to 2010, the CBA shows a negative population growth rate13 in both periods, a 1,70 % decrease between 2001 and 2005, and a 0,55 % decrease between 2006 and 2010. During the first period Euregio Karelia lost 23 096 and during the second period 7 318 inhabitants. Again, the only regions with a positive population growth rate during both periods were the City District of Petrozavodsk and Northern Ostrobothnia. On the Finnish side Kainuu and on the Russian side the Northern part of the Republic of Karelia suffered from the greatest population decrease during both periods.
12 Population change illustrates the change in the area’s population over time and it is determined by four factors; births, deaths, immigrants and emigrants. Natural population change is the difference between the number of live births and deaths during a given time period. Total population change, unlike natural population change, takes into account migration. 13 A positive growth rate indicates that the population has been increasing and a negative rate that the population has been decreasing.
�����ℎ���� = ����� �����ℎ�������� ��– ����� �����ℎ���� �� ������ ������� �����ℎ���� �� ������ ��

Ulysses Final Report - Multi-thematic Territorial Analysis of Euregio Karelia - Annexes 37
When we compare the two periods it is possible to detect a general tendency in the population growth. Regions where population was been increasing between 2001 and 2005 continued to grow between 2006 and 2010, and the population growth was more extensive during the second period. The second period was more favourable also for regions suffering from population decrease. Even if they continued to lose inhabitants, negative population growth was less severe than during the first period. The difference in population growth between the first and second period was greatest in the City District of Petrozavodsk, where during 2001 and 2005 population growth rate was 0,26 % and during 2006 and 2010 2,07 %. The population of the European Union (EU27) increased both between 2001 and 2005 (1,52 %) and between 2006 and 2010 (1,60 %). When we look at the whole period from 2001 to 2010, Euregio Karelia had an annual population growth rate of -0,28 %.14 Northern part of the Republic of Karelia had the greatest annual change (-1,46 %) and the smallest annual change took place in the City District of Petrozavodsk, where the population increased at an annual rate of 0,20 %. Northern Ostrobothnia showed greater annual population growth (0,69 %) than Finnish regions in general. In Finland population increased at an annual rate of 0,36 % that was slightly below the annual population growth rate of the European Union (0,39 %). Annual population growth rate for Russia was -0,34 %. Table 10. Population growth rates in the Eastern and Northern Finland – Russia CBA (Euregio Karelia).
NUTS ID NUTS Growth rate 2001-2005
Growth rate 2006-2010
Annual population growth rate 2001-2010
FI Finland (Suomi) 1,07 % 1,82 % 0,36 %
FI1 Mainland Finland (Manner-Suomi) 1,06 % 1,81 % 0,36 %
FI13 Eastern Finland (Itä-Suomi) -2,03 % -1,78 % -0,47 %
FI133 North Karelia (Pohjois-Karjala) -1,74 % -1,40 % -0,37 %
FI134 Kainuu -4,25 % -3,13 % -0,92 %
FI1A Northern Finland (Pohjois-Suomi) 0,55 % 1,50 % 0,27 %
FI1A2 Northern Ostrobothnia (Pohjois-Pohjanmaa) 3,45 % 3,73 % 0,69 %
RU Russia (Russiâ) -1,93 % -0,59 % -0,34 %
RU3 North-Western Federal District (Severo-Zapadnyj federal'nyj okrug) -3,30 % -1,40 % -0,61 %
RU3D The Republic of Karelia (Respublika Kareliâ) -3,53 % -1,91 % -0,70 %
RU3D1 City District of Petrozavodsk (Petrozavodskij gorodskoj okrug) 0,26 % 2,07 % 0,20 %
RU3D2 Northern part of the Republic of Karelia (Severnaâ čast' Respubliki Kareliâ) -6,33 % -5,02 % -1,46 %
RU3D3 Southern part of the Republic of Karelia (Ûžnaâ čast' Respubliki Kareliâ) -5,14 % -3,76 % -1,06 %
Euregio Karelia -1,70 % -0,55 % -0,28 %
Source: Eurostat, Rosstat, Kareliâstat
14 Annual population growth rate is an indicator that illustrates an average annual percent change in the total
population during a given time period and it is calculated according to the following formula:
�����������ℎ���� = � ����� �����ℎ�������� ������� �����ℎ���� �� ������ ���
�
��������� ��
− 1

Ulysses Final Report - Multi-thematic Territorial Analysis of Euregio Karelia - Annexes 38
Map 20. Annual population growth rate in Euregio Karelia between 2000 and 2009.
!
!
!
Tallinn
Helsinki
Stockholm
Regional level: NUTS 3 Year: 2000, 2009
Origin of data: Eurostat, ESPON DB, National Statistical Institute of Russia and Andorra © EuroGeographics Association for administrative boundaries
This map does notnecessarily reflect theopinion of the ESPONMonitoring Committee
Annual population growth rate
0 990495km
Legend© ULYSSES, 2011
<missing values>
Annual growth rate 2000-2009 (%)
0,01 - 0,38
0,39 - 1,25
>= 1,26
<= -1,25
-1,24 - -0,35
-0,34 - 0,00
EU27 = 0,38FI = 0,33RU = -0,38Total CBR = -0,33
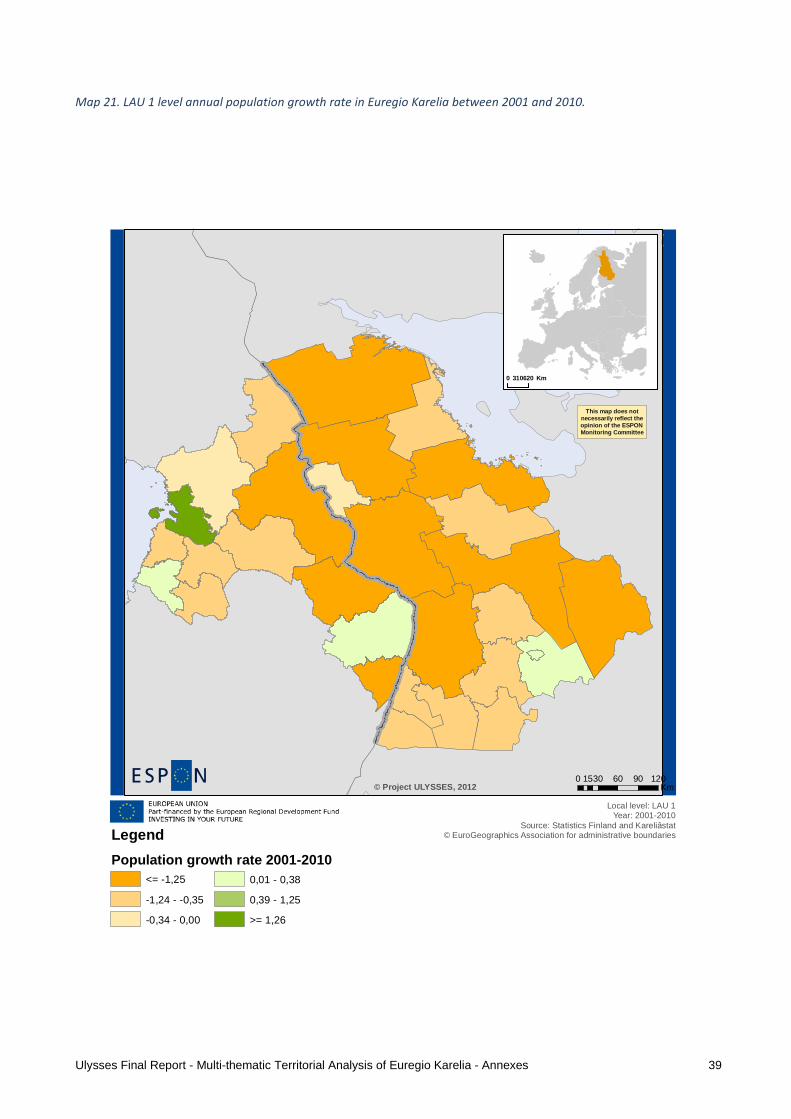
Ulysses Final Report - Multi-thematic Territorial Analysis of Euregio Karelia - Annexes 39
Map 21. LAU 1 level annual population growth rate in Euregio Karelia between 2001 and 2010.
This map does notnecessarily reflect theopinion of the ESPONMonitoring Committee
0 30 60 90 12015Km
Local level: LAU 1Year: 2001-2010
Source: Statistics Finland and Kareliâstat© EuroGeographics Association for administrative boundaries
© Project ULYSSES, 2012
0 620310 Km
Legend
Population growth rate 2001-20100,01 - 0,38
0,39 - 1,25
>= 1,26
<= -1,25
-1,24 - -0,35
-0,34 - 0,00

Ulysses Final Report - Multi-thematic Territorial Analysis of Euregio Karelia - Annexes 40
2.1.4. Natural population change and net migration
In order to better understand the mechanisms of population change we have analysed natural increase (births – deaths) and net migration (immigrants – emigrants)15 in the CBA between years 2001 and 2010. When we look at Euregio Karelia as a whole, natural increase affected the population change more than net migration. There were, however, great differences between the regions. On the Finnish side, North Karelia and Kainuu suffered both from a negative natural increase and a negative net migration. In North Karelia both factors had a similar significance on population decrease, but in Kainuu net migration was a more significant determinant; between 2001 and 2010 there were 1 966 deaths over births and 5 738 emigrants over immigrants. In Northern Ostrobothnia both natural increase and net migration were positive. Net migration was a less significant factor from the perspective of population growth. On the Russian side, the Republic of Karelia suffered from a very negative natural population change. Between 2001 and 2010 there were 47 564 deaths over births, and even if migration to the region was positive (3 912 immigrants over emigrants) it was not able to compensate the natural loss of population. Within the Republic of Karelia, Northern and Southern parts of the Republic had a negative natural change and a negative net migration. The City District of Petrozavodsk also had a negative natural change of population, but migration to the city was strong; between the studied time period there were 19 500 immigrants over emigrants in the city. Table 11. Natural population increase and net migration in the Eastern and Northern Finland – Russia CBA (Euregio
Karelia) between 2001 and 2010.
NUTS ID NUTS Natural increase 2001-2010
Net migration 2001-2010
FI Finland (Suomi) 92 888 101 273
FI1 Mainland Finland (Manner-Suomi) 92 586 99 344
FI13 Eastern Finland (Itä-Suomi) -13 489 -16 831
FI133 North Karelia (Pohjois-Karjala) -3 064 -2 679
FI134 Kainuu -1 966 -5 738
FI1A Northern Finland (Pohjois-Suomi) 27 763 -9 407
FI1A2 Northern Ostrobothnia (Pohjois-Pohjanmaa) 25 442 925
RU Russia (Russiâ) -6 414 386 3 024 911
RU3 North-Western Federal District (Severo-Zapadnyj federal'nyj okrug) -938 099 268 469
RU3D The Republic of Karelia (Respublika Kareliâ) -47 564 3 912
RU3D1 City District of Petrozavodsk (Petrozavodskij gorodskoj okrug) -10 455 19 500
RU3D2 Northern part of the Republic of Karelia (Severnaâ čast' Respubliki Kareliâ) -17 096 -10 359
RU3D3 Southern part of the Republic of Karelia (Ûžnaâ čast' Respubliki Kareliâ) -20 013 -5 229
Euregio Karelia -27 152 -3 580
*Russian net migration values do not include statistical adjustments.
Source: Eurostat, Rosstat, Kareliâstat
Crude rate for natural population change16 for Euregio Karelia increased from -1,4 in 2000 to -0,1 in 2009. This indicates that natural population change is getting more positive in the CBA. Again, it is possible to
15 For a national population, net migration refers to external migration (movements between countries), and is the difference between external arrivals and external departures. For a subnational population, net migration includes both external migration and internal migration (movement within a country), and is the difference between external arrivals and external departures, plus the difference between internal arrivals and internal departures.
16 Crude rate of natural increase illustrates the difference between births and deaths during a year to the average
population and it is expressed per 1 000 inhabitants.
������������������ ������� = ������� ������� ��� ������������������� �� ��ℎ������ 1000

Ulysses Final Report - Multi-thematic Territorial Analysis of Euregio Karelia - Annexes 41
detect great differences between the regions. Northern Ostrobothnia had a considerably stronger growth than the Finnish or European Union regions in average. Crude rates for North Karelia and Kainuu, on the contrary, were below national and EU averages. Table 12. Crude rate of natural increase in Euregio Karelia between 2000 and 2009.
NUTS ID NUTS 2000 2001 2002 2003 2004 2005 2006 2007 2008 2009
EU27 0,6 0,5 0,3 0,2 0,8 0,6 1,0 1,0 1,3 1,0
FI Finland (Suomi) 1,4 1,5 1,2 1,5 1,9 1,9 2,0 1,8 2,0 2,0
FI133 North Karelia (Pohjois-Karjala)
-1,6 -1,6 -2,6 -2,0 -1,9 -1,5 -1,3 -1,6 -2,3 -1,2
FI134 Kainuu -1,7 -1,8 -2,7 -2,7 -2,0 -0,9 -3,5 -2,1 -2,7 -2,4
FI1A2 Northern Ostrobothnia (Pohjois-Pohjanmaa)
5,4 5,7 6,0 6,0 6,5 7,3 7,1 7,1 7,0 7,3
RU Russia (Russiâ) -6,5 -6,5 -6,4 -6,1 -5,5 -5,9 -4,8 -3,3 -2,6 -1,8
RU3D The Republic of Karelia (Respublika Kareliâ)
-7,8 -7,9 -8,6 -9,6 -8,2 -8,1 -6,9 -5,3 -5,0 -4,0
Euregio Karelia -1,4 -1,4 -2,0 -2,1 -1,4 -0,8 -1,1 -0,5 -0,8 -0,1
Source: Eurostat, Rosstat
Crude rate of net migration17 in Euregio Karelia also increased between 2000 and 2009. In 2000 it was -3,1 and in 2009 -1,1 in 2009. Net migration trend was most positive in Kainuu; in 2000 there were 12,8 emigrants over immigrants (per 1000 inhabitants), but in 2009 only 3,9 emigrants over immigrants (per 1000 inhabitants). Crude rate of net migration increased also in Finland and in the European Union in general. The Republic of Karelia has been following the migration rates of Russia, where migration both in and out of the country has been strong during the whole 2000s, and the crude rate of net migration has varied between -0,8 and 2,5 (not including year 2009, when the crude rate of net migration was 9,2) without having a clear pattern of improvement or decline. Table 13. Crude rate of net migration in Euregio Karelia between 2000 and 2009.
NUTS ID NUTS 2000 2001 2002 2003 2004 2005 2006 2007 2008 2009
EU27 1,5 1,3 3,8 4,2 4,0 3,6 3,2 3,9 3,3 1,8
FI Finland (Suomi) 0,5 1,2 1,0 1,1 1,3 1,7 2,0 2,6 2,9 2,7
FI133 North Karelia (Pohjois-Karjala)
-3,9 -3,1 -3,7 -1,5 -1,2 0,2 -3,5 -3,1 -1,4 0,2
FI134 Kainuu -12,8 -12,9 -9,9 -6,5 -5,0 -6,8 -7,8 -4,7 -4,8 -3,9
FI1A2 Northern Ostrobothnia (Pohjois-Pohjanmaa)
2,5 1,4 -0,7 -0,8 1,4 0,8 -0,2 0,2 0,1 0,3
RU Russia (Russiâ) 2,5 2,0 3,1 -0,8 0,7 0,9 1,1 1,8 1,8 9,2
RU3D The Republic of Karelia (Respublika Kareliâ)
1,7 2,2 2,7 0,0 0,0 0,2 0,6 1,7 0,4 -0,8
Euregio Karelia -3,1 -3,1 -2,9 -2,2 -1,2 -1,5 -2,7 -1,5 -1,4 -1,1
*Net migration values for the Republic of Karelia do not include statistical adjustments.
17 Crude rate of net migration is the difference between immigrants and emigrants during a year (including statistical
adjustments) to the average population and it is expressed per 1 000 inhabitants.
��������������� ���� �� =���� ���� �� ��� ������������������� �� ��ℎ������ 1000

Ulysses Final Report - Multi-thematic Territorial Analysis of Euregio Karelia - Annexes 42
Source: Eurostat, Rosstat
The following map summarises demographic performance of the regions of Euregio Karelia between years 2001 and 2010. As illustrated, Northern Ostrobothnia is the only region in Euregio Karelia that has during the given time period had a positive natural and total population growth and a positive net migration. North Karelia and Kainuu, on the contrary, have suffered from negative population growth and negative net migration, while in the Republic of Karelia population growth has been negative, but net migration positive. What the map does not show are the disparities in demographic performance within the Republic of Karelia. There Northern and Southern parts of the Republic had a negative natural change and a negative net migration. The City District of Petrozavodsk also had a negative natural change of population, but a positive net migration.

Ulysses Final Report - Multi-thematic Territorial Analysis of Euregio Karelia - Annexes 43
Map 22. Category map of population change in Euregio Karelia between years 2001 and 2010.
This map does notnecessarily reflect theopinion of the ESPONMonitoring Committee
0 30 60 90 12015Km
Local level: NUTS 3Year: 2001-2010
Source: Statistics Finland and Kareliâstat© EuroGeographics Association for administrative boundaries
© Project ULYSSES, 2012
0 620310 Km
Legend
Total increase Change natural increase Change net migration
positive growth positive natural increase positive migration
positive growth negative natural increase positive migration
positive growth positive natural increase negative migration
negative growth positive natural increase negative migration
negative growth negative natural increase positive migration
negative growth negative natural increase negative migration
Population growth 2001-2010

Ulysses Final Report - Multi-thematic Territorial Analysis of Euregio Karelia - Annexes 44
2.1.5. Population projections
The following two figures represent the expected and actual natural population change and net migration in Euregio Karelia between 2000 and 2010.18 The figures show that if the natural population growth in Euregio Karelia would have followed the Finnish and Russian national averages, it would not have dropped dramatically in the beginning of 2000s. Since year 2003 natural population change in Euregio Karelia has been positive to such an extent that it has almost reached the national averages. Net migration, on the other hand, has been below the national averages through the whole last decade, and contrary to the strong positive trend on national level between 2007 and 2010, Euregio Karelia has suffered from a decline in migration rates. We have also calculated a simple population projection for Euregio Karelia based on population data between 2000 and 2010. The amount of population in the Euregio was 1 364 783 in 2000 and it has been gradually decreasing until 2010 when it was 1 324 918 inhabitants. In a decade the CBA has lost almost 40 000 inhabitants. According to a logarithmic trend line for population projection, the amount of population in Euregio Karelia continues to decrease. In 2020 the total population of Euregio Karelia would be slightly above 1 310 000 inhabitants. This projection is purely mathematical and it does not take into account any real-world processes.
18 Expected natural population change and net migration are synthetic figures that illustrate regions’ behaviour assuming that regions would follow the patterns of their respective countries. Accordingly we have calculated Euregio Karelia’s expected natural population change and net migration assuming that, first, the Finnish regions would have followed the Finnish national natural population change and net migration figures, and, second, that the Republic of Karelia would have behaved according to the Russian national avarages. In order to calculate the rates, national natural population change and net migration averages were weighted according to the regions’ population.

Ulysses Final Report - Multi-thematic Territorial Analysis of Euregio Karelia - Annexes 45
Figure 7. Expected and actual natural population change and net migration in Euregio Karelia between years 2000 and
2010.
* Net migration values for the Republic of Karelia do not include statistical adjustments.
Source: Eurostat, Rosstat
-5
-4
-3
-2
-1
0
1
2
3
4
2000 2001 2002 2003 2004 2005 2006 2007 2008 2009 2010
Expected Euregio Karelia
Net migration
Natural increase
-5
-4
-3
-2
-1
0
1
2
2000 2001 2002 2003 2004 2005 2006 2007 2008 2009 2010
Actual Euregio Karelia
Net migration
Natural increase

Ulysses Final Report - Multi-thematic Territorial Analysis of Euregio Karelia - Annexes 46
Figure 8. Total population change in Euregio Karelia between 2000 and 2010 and logarithmic trend line for population
projection.
Source: Eurostat, Rosstat
2.1.6. Total fertility rates
Total fertility rate (TFR)19 of the Eastern and Northern Finland – Russia CBA has increased from 1,74 in 2000 to 1,94 in 2009. In general total fertility rates showed a gradual increase in all the regions of the CBA during the given time period, as did the fertility rates of Finland and Russia. Northern Finland is the only region with the fertility rate over the replacement level. In 2000 TFR in Northern Finland was 2,08, but in 2008 already 2,27. Lowest fertility rates of the CBA were recorded in the Republic of Karelia, where TFR was 1,18 in 2000 and 1,39 in 2009. These figures did during the first half of the decade follow average fertility rates in Russia, but since 2004 TFR of the Republic of Karelia has been significantly below the national average (1,54 in 2009). The Republic of Karelia is thus the only region of the Eastern and Northern Finland – Russia CBA with a total fertility rate below EU average (1,6 in 2008).
19 Total fertility rate (TFR) is an indicator that describes the average number of children that would be born by a
woman over her lifetime if she were to live to the end of her child-bearing years (15-49 years) and bear children in
accordance with current age-specific fertility rates. The TFR is a synthetic rate and it is not based on the fertility of any
real group of women. A total fertility rate of around 2.1 live births per woman represents the so-called replacement
level, which is the average number of live births per woman required to keep the population size constant if there
were no inward or outward migration. Total fertility rate has been studied here on NUTS 2 level.
y = -18392ln(x) + 1E+06
R² = 0,9767
1280000
1290000
1300000
1310000
1320000
1330000
1340000
1350000
1360000
1370000
1380000
2000
2001
2002
2003
2004
2005
2006
2007
2008
2009
2010
2011
2012
2013
2014
2015
2016
2017
2018
2019
2020
Inh
ab
ita
nts

Ulysses Final Report - Multi-thematic Territorial Analysis of Euregio Karelia - Annexes 47
Figure 9. Evolution of total fertility rates in the Eastern and Northern Finland – Russia CBA between 2000 and 2009.
* Total fertility rates for year 2009 are missing for the NUTS 2 regions of Eastern and Northern Finland.
Source: Eurostat, Rosstat
0,9
1,1
1,3
1,5
1,7
1,9
2,1
2,3
2,5
2000 2001 2002 2003 2004 2005 2006 2007 2008 2009
To
tal fe
rtil
y r
ate
Euregio Karelia
Finland
Russia
Eastern Finland
Northern Finland
Rep. of Karelia
Euregio Karelia

Ulysses Final Report - Multi-thematic Territorial Analysis of Euregio Karelia - Annexes 48
Map 23. Map of total fertility rates in the Eastern and Northern Finland – Russia CBA in 2009.
This map does notnecessarily reflect theopinion of the ESPONMonitoring Committee
0 40 80 120 16020Km
Local level: NUTS 2Year: 2009
Source: Eurostat and Rosstat© EuroGeographics Association for administrative boundaries
© Project ULYSSES, 2012
0 610305 Km
LegendTotal Fertility Rate 2009
< 1,34
1,35 - 1,59
1,60 - 1,84
1,85 - 2,09
2,1 - 2,34
> 2,5

Ulysses Final Report - Multi-thematic Territorial Analysis of Euregio Karelia - Annexes 49
2.1.7. Dependency ratios
Dependency ratios20, in other words the amount of dependents on the working age population, were close to the European average in Euregio Karelia in 2009. Total dependency ratio for Euregio Karelia was 49,32. It signifies that there were 49,32 persons aged 0-14 and over 64 years of age for every 100 person in the working age population. Dependency ratios varied widely between the regions of Euregio Karelia. In the Finnish regions, North Karelia and Kainuu had high old age dependency ratios (29,14 and 31,61). Northern Ostrobothnia had a high young age (31,43) but a low old age dependency ratio (21,68) that results of high fertility in the region and a growing number of people in the working age. In the Republic of Karelia there was a small amount of both young and elderly dependents for the working age population that is mostly due to low fertility and low life expectancy in the region, and in the country in general. Young age dependency ratio was 19,74 and old age dependency ratio 16,73 in the Republic of Karelia in 2009. Within the Republic of Karelia the City District of Petrozavodsk had both the lowest young and old age dependency ratios. There was thus a large share of working age population in the city compared to young and elderly age groups. The dependency ratios were highest in the Southern part of the Republic. On LAU 1 level the lowest total dependency ratio was recorded in the city district of Kostamuksha (Kostamukšskij gorodskoj okrug), which is located in the close vicinity of the Finnish-Russian border. Young age dependency ratio was close to the dependency ratio of the Republic, but old age dependency ratio was very low in Kostamuksha; 6,35 in 2009. The ratio was even lower in 2000 (3,97), but it has been increasing since. Kostamuksha has been attracting working age population with employment opportunities in its mining complex and other companies, and it has been the only region in the Republic of Karelia with a positive natural population growth between 2000 and 2010. Table 14. Dependency ratios in Euregio Karelia in 2009.
NUTS ID NUTS Young age dependency 2009
Old age dependency 2009
Total dependency 2009
EU27 23,28 25,61 48,90
FI Finland (Suomi) 25,15 25,18 50,33
FI133 North Karelia (Pohjois-Karjala) 23,35 29,14 52,49
FI134 Kainuu 23,58 31,61 55,20
FI1A2 Northern Ostrobothnia (Pohjois-Pohjanmaa) 31,43 21,68 53,11
RU Russia (Russiâ) 20,70 18,54 39,24
RU3D The Republic of Karelia (Respublika Kareliâ) 19,74 16,73 36,48
20 Dependency ratios are indicators that are used to study the level of pressure on productive population supporting
the young and/or old population. These ratios are expressed as the number of dependents to the working age
population. Accordingly, young age dependency ratio is the amount of 0-14 olds for every 100 person in the working
age population, and old age dependency ratio is the number of people over 64 years of age for every 100 person in
the working age population. Total dependency ratio is the combination of young and old age dependency ratios.
�������������������� � =����������������0 − 14
����������������15 − 64100
������������������ � =����������������64����������
����������������15 − 64100
����������������� � =����������������0 − 14 + ����������������64�����
����������������15 − 64100

Ulysses Final Report - Multi-thematic Territorial Analysis of Euregio Karelia - Annexes 50
RU3D1 City District of Petrozavodsk (Petrozavodskij gorodskoj okrug)
17,38
15,65
33,03
RU3D2 Northern part of the Republic of Karelia (Severnaâ čast' Respubliki Kareliâ)
20,57
15,91
36,47
RU3D3 Southern part of the Republic of Karelia (Ûžnaâ čast' Respubliki Kareliâ)
22,05
18,86
40,91
Euregio Karelia 24,53 24,79 49,32
Source: Eurostat, Rosstat
Figure 10. Scatter chart of young and old age dependency ratios in Euregio Karelia in 2009.
Source: Eurostat, Rosstat
2.1.8. Commuting
Following tables give an idea of the extent of commuting among population in the Eastern and Northern Finland - Russia CBA. The analyses cover only the Finnish regions, because no commuting data was available for Russia and the Republic of Karelia. Commuting to another region increased between 2000 and 2010 both in Eastern and Northern Finland. Commuting was above the Finnish but below the European average in both regions. Table 15. Commuting to another region in the Eastern and Northern Finland - Russia CBA between 2000 and 2009
(NUTS 2 delimitation).
NUTS ID NUTS Commuting to another region (% of active population)
2000 2001 2002 2003 2004 2005 2006 2007 2008 2009
10,0
15,0
20,0
25,0
30,0
35,0
10,0 15,0 20,0 25,0 30,0 35,0 40,0 45,0
Old
ag
e d
ep
en
de
ncy
20
09
Young age dependency 2009
Euregio Karelia
Finland
Russia
Northern
Ostrobothnia
North Karelia
Kainuu
Rep. of Karelia

Ulysses Final Report - Multi-thematic Territorial Analysis of Euregio Karelia - Annexes 51
EU27 EU27 4,44 4,86 5,57 5,10 5,07 5,58 5,88 5,86 5,84 5,85
RU Russia N/A N/A N/A N/A N/A N/A N/A N/A N/A N/A
FI Finland 1,75 1,89 1,82 1,84 1,78 1,85 1,89 1,96 2,02 2,40
FI13 Eastern Finland (Itä-Suomi)
2,53 2,54 2,51 2,65 2,75 2,82 2,53 2,80 2,88 4,27
FI1A Northern Finland (Pohjois-Suomi)
2,51 2,56 2,34 2,20 2,14 2,08 2,44 2,69 2,51 2,76
RU3D The Republic of Karelia (Respublika Kareliâ
N/A N/A N/A N/A N/A N/A N/A N/A N/A N/A
Source: Eurostat
Commuting to a foreign country was most typical in Northern Finland, and the values were slightly above the Finnish, but below the European average. In Eastern Finland commuting to a foreign country was well below national and EU averages. Table 16. Commuting to a foreign country in the Eastern and Northern Finland - Russia CBA between 2000 and 2009
(NUTS 2 delimitation).
NUTS ID NUTS Commuting to a foreign country (% of active population)
2000 2001 2002 2003 2004 2005 2006 2007 2008 2009
EU27 EU27 0,35 0,38 0,41 0,40 0,43 0,48 0,53 0,60 0,61 0,61
RU Russia N/A N/A N/A N/A N/A N/A N/A N/A N/A N/A
FI Finland 0,15 0,15 0,17 0,13 0,13 0,14 0,14 0,12 0,13 0,13
FI13 Eastern Finland (Itä-Suomi)
0,10 0,13 0,13 0,13 0,10 0,03 0,03 0,03 0,13 0,07
FI1A Northern Finland (Pohjois-Suomi)
0,27 0,17 0,37 0,23 0,20 0,20 0,37 0,30 0,33 0,19
RU3D The Republic of Karelia (Respublika Kareliâ
N/A N/A N/A N/A N/A N/A N/A N/A N/A N/A
Source: Eurostat
2.2. Effects of the border on settlement patterns
The previous analyses give a general picture of the demographic trends in the Eastern and Northern Finland - Russia CBA. The geographic scale of the analyses, however, does not allow making conclusions about the effects of the border on settlement patterns. We have therefore performed lower level analyses in order to study trends of settlement patterns in Euregio Karelia, and to discover whether the border is attracting or repulsing population. First, we examined the relationship between border distance and population change on LAU 1 level. The analysis was performed only on the Finnish regions. Three indicators were considered in the analysis; annual population growth (between 2000 and 2010), population density and distance to the border as the crow flies (air distance).21 The following table presents the examined LAU 1 regions and both original and standardized values that were applied in the analysis.
21 The so called “border effect” was calculated according to the following formula:
�����ℎ ��� = � + ����� + ��� + !

Ulysses Final Report - Multi-thematic Territorial Analysis of Euregio Karelia - Annexes 52
Table 17. Unstandardized and standardized annual population change, border distance and population density in the
Finnish LAU 1 regions of Euregio Karelia between 2000 and 2010.
Unstandardized Standardized
LAU ID
LAU Annual population growth 2000–2010
Border distance (km)
Population density 2000 (inhabitants /km2)
Annual population growth 2000–2010
Border distance (km)
Population density 2000 (inhabitants /km2)
122 Joensuu 0,14 57,20 12,59 0,76 -0,80 0,16
124 Keski-Karjala -1,48 26,15 6,71 -0,94 -1,16 -0,29
125 Pielisen Karjala
-1,67 36,50 3,25 -1,13 -1,04 -0,55
181 Kehys-Kainuu -1,86 34,95 1,91 -1,33 -1,06 -0,65
182 Kajaani -0,45 109,47 6,69 0,14 -0,20 -0,29
171 Oulu 1,65 184,27 49,97 2,33 0,66 2,99
173 Oulunkaari -0,33 135,64 2,19 0,27 0,10 -0,63
174 Raahe -0,48 231,34 13,87 0,11 1,19 0,26
175 Haapavesi-Siikalatva
-1,12 191,87 4,22 -0,56 0,74 -0,48
176 Nivala-Haapajärvi
-0,66 217,29 8,17 -0,08 1,03 -0,18
177 Ylivieska 0,12 259,95 13,82 0,73 1,52 0,25
178 Koillismaa -0,87 41,10 2,70 -0,29 -0,99 -0,59
Annual population growth
Border distance
Population density
Mean value -0,58 127,14 10,51
Standard deviation value* 0,96 87,21 13,19
*Standard deviation shows how much variation there is from the average (mean value).
Source: Eurostat, Statistics Finland
Table 18. Regression statistics picturing the “border effect” in theFinnish LAU 1 level regions of Euregio Karelia.
Regression Statistics
Multiple R 0,871786
R Square 0,760012
Adjusted R Square 0,706681
Standard Error 0,541589
Observations 12
Coefficients Standard Error t Stat P-value Lower 95% Upper 95% Lower 95,0% Upper 95,0%
Intercept -1,6E-16 0,156343 -1E-15 1 -0,35367 0,353673 -0,35367 0,353673
Border distance (km) 0,225147 0,176383 1,276468 0,233742 -0,17386 0,624154 -0,17386 0,624154
Density 2000 (inhabitants/km2) 0,761392 0,176383 4,316692 0,001943 0,362385 1,160398 0,362385 1,160398
The analysis show that there is no significant “border effect” as the p-value for border distance is above the significant level of 0,05. In other words, according to this analysis population growth and density in the
Db is the distance to the border from a region’s centre point and dis the density of a given region. Values for the
chosen indicators were standardized by subtracting the mean value from the original value and dividing the received
value by the standard deviation value.

Ulysses Final Report - Multi-thematic Territorial Analysis of Euregio Karelia - Annexes 53
Finnish regions of Euregio Karelia are not related to border distance. It is possible to argue whether this type of analysis suits regions with a low population density. To study the matter more closely, we performed additional analysis on the amount of foreign inhabitants in
the Finnish LAU 2 regions of Euregio Karelia to examine a hypothesis, according to which Finnish border regions have been attracting migrants from Russia. We first ranked regions of Euregio Karelia according to the share of foreign inhabitants in 2010 and seleted ten regions with the largest share. Second, we selected ten regions with the biggest positive change in the share of foreign inhabitants between 2000 and 2010. LAU 2 regions with the largest share of foreign inhabitants in 2010 were Oulu, Siikajoki, Kajaani, Lieksa, Outokumpu, Joensuu, Rääkkylä, Tohmajärvi, Kitee and Kesälahti. LAU 2 regions with the biggest change in the share of foreign inhabitants between 2000 and 2010 were Oulu, Siikajoki, Kajaani, Lieksa, Outokumpu, Rääkkylä, Tohmajärvi, Kitee, Sotkamo and Kontiolahti. Five of these regions have reception centres for asylum seekers and especially in the smaller municipalities the amount of foreign inhabitants is very much connected to the amount of refugees in the centres. Based on this data it is, however, possible to detect that LAU 2 level regions located in North Karelia close to the border crossing point of Niirala-Vârtsilâ have been increasing their share of foreign inhabitants more than regions located in other parts of Euregio Karelia. When we take a look at the country of origin, mother tongue and citizenship of population living in North Karelia, it is possible to observe that the largest share of foreign inhabitants or inhabitants with foreign origins in the region are from Russia or the former Soviet Union. If in 2010 in Northern Ostrobothnia 15 % of foreign inhabitants had a Russian citizenship, in North Karelia the share was 50 % and in Kainuu 38 %. We thus claim that there is a border effect on settlement patterns in the regions located in close vicinity of the Finnish-Russian border in North Karelia. In Kainuu it is possible to observe that Sotkamo as a popular recreational municipality among the Russian and Finnish tourists has also increased its share of foreign inhabitants. In the Republic of Karelia we studied net migration on LAU 1 level between 2001 and 2010 and detected that migration flows are to a large extend concentrated to the City district of Petrozavodsk and the two regions surrounding it (Prâžinskij nacional'nyj municipal'nyj rajon and Prionežskij municipal'nyj rajon). In 2010 there were only two other regions with a positive net migration. These were Muezerskij municipal'nyj rajon and Sortaval'skij municipal'nyj rajon that are located at the Finnish border. The population figures, however, are low and net migration has been positive in these regions only the last year or two. It is thus not possible to consider this a border effect. Rather the population is concentrating in Petrozavodsk and regions surrounding it. What does become evident in the statistics is that the Republic of Karelia is losing population to Finland. On a yearly basis around 300 people are migrating from the Republic to Finland. Based on the available statistics it is not possible to judge where they settle in Finland, but Finland is clearly the most favoured migration destination for inhabitants from the Republic of Karelia, while the Republic is receiving migrants mainly from southern parts of the former Soviet Union, from countries such as Azerbaidžan, Armenia, Georgia, Kazakhstan and Ukraine. Finally, we projected demographic potential in Euregio Karelia.22 To analyse this indicator on a regional level, population and distances between centre points of all LAU 1 regions of Euregio Karelia, as well as
22 The demographic potential of a given point “i” relative to “j” was obtained through the following formula:
�� = � �����
�
"�= potential in j
#� = population in j
��$ = distance between j e i

Ulysses Final Report - Multi-thematic Territorial Analysis of Euregio Karelia - Annexes 54
NUTS 3 regions in the rest of Finland and SNUTS 2 regions in Russia were considered.23 The purpose of studying demographic potential was not to measure actual population perspectives, but rather to reflect on population potential of a region considering its location. According to the analysis the highest demographic potential in Euregio Karelia is in the region of Oloneckij rajon located by Lake Ladoga in the Republic of Karelia. In order to calculate demographic potential index values for the LAU 1 regions of Euregio Karelia, the demographic potential of Oloneckij rajon was defined 100. Next, all the other regions were indexed to the score of Oloneckij rajon. The high demographic potential of Oloneckij rajon is explained by its location. The region is located closest to the metropolitan area of St. Petersburg and thus it is theoretically a potential region for suburbanisation of the city. It is possible to argue that in reality suburbanisation of St.Petersburg does not reach Oloneckij rajon. According to Russian migration studies, migration between St. Petersburg and Leningrad region that surrounds the city has since 1990 been unprofitable for the city. The effects in Oloneckij rajon, however, are more related with the building of summer cottages or second homes. Suburbanisation of St. Petersburg reaches a radius of approximately 100-200 kilometres from the city, and Oloneckij is situated 290 kilometres from the city.24 Table 19. Demographic potential values in the LAU 1 level regions of Euregio Karelia (year 2009).
LAU ID LAU Potential 2009 Potential Index
122 Joensuu 84616,19 76,12
182 Kajaani 69463,42 62,49
181 Kehys-Kainuu 66427,58 59,76
178 Koillismaa 58250,17 52,40
124 Keski-Karjala 93047,16 83,70
176 Nivala-Haapajärvi 71812,13 64,60
171 Oulu 64638,42 58,15
173 Oulunkaari 61290,69 55,14
125 Pielisen Karjala 77675,49 69,87
174 Raahe 66029,96 59,40
175 Siikalatva 69479,81 62,50
177 Ylivieska 67609,55 60,82
RU3D24 Kemskij municipal'nyj rajon 62381,26 56,12
RU3D32 Kondopožskij municipal'nyj rajon 88008,38 79,17
RU3D33 Lahdenpohskij municipal'nyj rajon 108850,1 97,92
RU3D25 Louhskij municipal'nyj rajon 58366,05 52,50
RU3D22 Belomorskij municipal'nyj rajon 68122,01 61,28
RU3D23 Kaleval'skij nacional'nyj rajon 63781,77 57,38
RU3D31 Sortaval'skij municipal'nyj rajon 100673,6 90,56
Region’s own potential was included in the study by dividing a region’s population by one fourth of its perimeter. This value was calculated through the area of the region and not its actual perimeter. 23 Considering the huge distances in Russia, only the closest SNUTS 2 regions were included in the calculation, namely those of Moskva, Sankt-Peterburg, Vladimirskaâ oblast', Arhangelskaâ oblast', Neneckij avtonomnyj okrug, Belgorodskaâ oblast', Brânskaâ oblast', Vologodskaâ oblast', Voronežskaâ oblast', Ivanovskaâ oblast', Kaliningradskaâ oblast', Tverskaâ oblast', Kalužskaâ oblast', Kostromskaâ oblast', Kurskaâ oblast', Murmanskaâ oblast', Lipeckaâ oblast', Leningradskaâ oblast', Moskovskaâ oblast', Novgorodskaâ oblast', Orlovskaâ oblast', Pskovskaâ oblast', Râzanskaâ oblast', Smolenskaâ oblast', Tambovskaâ oblast', Tul'skaâ oblast', Âroslavskaâ oblast' and Respublika Komi. 24 Olon 2011; Statističeskoe izučenie 2011.

Ulysses Final Report - Multi-thematic Territorial Analysis of Euregio Karelia - Annexes 55
RU3D26 Medvež'egorskij municipal'nyj rajon 80662,31 72,56
RU3D27 Muezerskij municipal'nyj rajon 73361,04 65,99
RU3D34 Oloneckij nacional'nyj municipal'nyj rajon 111164 100,00
RU3D35 Pitkârantskij municipal'nyj rajon 108741 97,82
RU3D36 Prionežskij municipal'nyj rajon 102393,3 92,11
RU3D37 Prâžinskij nacional'nyj municipal'nyj rajon 99284,55 89,31
RU3D38 Pudožskij municipal'nyj rajon 85336,43 76,77
RU3D28 Segežskij municipal'nyj rajon 73088,96 65,75
RU3D39 Suoârvskij municipal'nyj rajon 89043,18 80,10
RU3D11 City District of Petrozavodsk (Petrozavodskij gorodskoj okrug) 110860,6 99,73
RU3D21 Kostamukšskij gorodskoj okrug 66063,82 59,43
Source: Eurostat, Rosstat

Ulysses Final Report - Multi-thematic Territorial Analysis of Euregio Karelia - Annexes 56
Map 24. Demographic potential in the LAU 1 regions of Euregio Karelia (year 2009).
!
!
Tallinn
Helsinki
Regional level: Lau 1 Year: 2009
Source: National Statistical Institutes of Finland and Russia© EuroGeographics Association for administrative boundaries
This map does notnecessarily reflect theopinion of the ESPONMonitoring Committee
Demographic potential
0 825412,5km
Legend© ULYSSES, 2011
<missing values>
Demographic potential 2009 indexed to the highest s core (Oloneckij rajon = 100)
0,01 - 56,12
56,13 - 61,28
61,29 - 65,99
66,00 - 76,77
76,78 - 89,31
89,32 - 100,00

Ulysses Final Report - Multi-thematic Territorial Analysis of Euregio Karelia - Annexes 57
2.3. Chapter conclusions
Population change was negative in Euregio Karelia between years 2001 and 2010, and during this time the Euregio lost a total of 33 879 inhabitants. The City District of Petrozavodsk and Northern Ostrobothnia had positive, but other regions a negative population change. When we compare periods between 2001 and 2005 and 2006 and 2010, it is possible to detect a general tendency in the population growth. Regions where population was increasing during the first period continued to grow during the second period, and the population growth was more extensive during the second period. The second period was more favourable also for regions suffering from population decrease. Even if they continued to lose inhabitants, negative population growth was less severe than during the first period. Concerning population density on NUTS 3 level there were great differences between the regions of Euregio Karelia. On the Finnish side, Northern Ostrobothnia had the highest population density with 11,1 inhabitants per km² and Kainuu the lowest density with 3,8 inhabitants per km². On the Russian side the City District of Petrozavodsk had the highest density with 2397 inhabitants per km² and the Northern part of the Republic of Karelia the lowest density with 2,6 inhabitants per km². While the population density has been declining in North Karelia, Kainuu and the Republic of Karelia, the population density in Northern Ostrobothnia has been increasing through the whole 1990s and 2000s. When we look at the situation in Northern Ostrobothnia on LAU 1 level, it is possible to detect that the increase in population density has been positive only in Oulu region (located on Finland’s western border). North Karelia and Kainuu suffered both from a negative natural increase and a negative net migration. In Northern Ostrobothnia both natural increase and net migration were positive. Within the Republic of Karelia, Northern and Southern parts of the Republic had a negative natural change and a negative net migration. The City District of Petrozavodsk also had a negative natural change of population, but migration to the city was strong. Total fertility rate (TFR) of the Eastern and Northern Finland – Russia CBA increased from 1,74 in 2000 to 1,94 in 2009. Northern Finland was the only region with the fertility rate over the replacement level. Dependency ratios varied widely between the regions of Euregio Karelia. In the Finnish regions, North Karelia and Kainuu had high old age dependency ratios, and Northern Ostrobothnia a high young age dependency ratio. In the Republic of Karelia there was a small amount of both young and elderly dependents for the working age population. Low level (LAU 1 and LAU 2) analysis show that Finnish regions located in North Karelia close to the border crossing point of Niirala-Vârtsilâ have been increasing their share of foreign inhabitants more than regions located in other parts of Euregio Karelia. Largest share of foreign inhabitants or inhabitants with foreign origins in North Karelia are from Russia or the former Soviet Union.It is thus possible to argue that the border is attracting population in the Finnish border regions.
Ulysses Final Report - Multi-thematic Territorial Analysis of Euregio Karelia - Annexes 58
Chapter 3. Polycentric development in the Eastern and Northern Finland – Russia
CBA
The concept of polycentric development has gained widespread currency in planning and territorial
development strategies. It is an important prerequisite for studying urban trends, because it reflects the
actual role played by cities in regional development. It also has the ability to exceed administrative
boundaries, since smaller administrative regions are combined according to their functional orientation and
not following the traditional hierarchical classification of regions.25
Polycentricity plays a fundamental role
in European regional policy and European Spatial Development Perspective (ESDP). According to ESDP
pursuit of polycentricity helps to avoid further economic and demographic concentration in the core area of
the EU. Balanced and sustainable development of local entities and regions creates real locational
advantage of the EU vis-à-vis other large economic regions in the world.26
Territorial Agenda of the
European Union 2020 promotes polycentric development at regional, macro-regional and cross-border
levels. The report states that small and medium-sized towns can play a crucial role at regional
development.27
Finland as a member of the European Union has adopted the goals of polycentricity into national and regional planning. According to the Regional Development Strategy of the country the development of a spatially well-balanced regional structure is of high priority for Finland.28 Even if the regional policy of Russian Federation does not recognize the concept of polycentricity, it also aims at balanced socio-economic development of its Federal Subjects.29 During the last five years Ministry of Regional Development has been preparing a spatial planning programme that employs multipolar development as a key concept and aims at creating 15-17 city agglomerations that would besides Moscow, Saint Petersburg and Kazan function as growth centres of the country.30 The aim of this chapter is to study polycentric development, in other words, structure of city network in the Eastern and Northern Finland – Russia CBA. First, we present functional urban areas (FUAs) of the CBA and provide information of their area (km²), population, population change and compactness. Second, we perform several analyses in order to detect whether the urban structure of the Eastern and Northern Finland – Russia CBA is polycentric. We also examine whether the amount and size of urban centres in the region deviates from the rank-size distribution of urban centres in the European Union (EU27). Finally we have a look at functional specialization of the urban areas. Indicators selected for the analysis are in the following table. Table 20. Indicators for the study of polycentric development in the Eastern and Northern Finland – Russia CBA.
Variable name Geographical scale
Source Time frame Observations
Morphological and Functional Urban Areas ESPON 1.4.3 2001; 2006 Some data has been gathered for the FUA mostly based on the values of the NUTS 3 which they overlap (GDP, unemployment, etc.)
25 Antikainen 2005. 26 ESDP 1999. 27 Territorial Agenda 2020. 28 Suomen aluekehittämisstrategia 2013. 29 Koncepciâ soveršenstvovaniâ regional´noj politiki v Rossijskoj Federacii. 30 Strategičeskoe planirovanie v regionah i gorodah Rossii 2010.

Ulysses Final Report - Multi-thematic Territorial Analysis of Euregio Karelia - Annexes 59
Population FUA ESPON 1.4.3., Kareliâstat
2000; 2006
% effective FUA population change 2001-2006
FUA ESPON 1.4.3., Kareliâstat
2001-2006
Compactness 2001 (MUA pop/FUA pop) FUA ESPON 1.4.3., Kareliâstat
2001
Slope of rank size distribution (population) FUA ESPON 1.4.3., Kareliâstat
2000; 2006
Slope of rank size distribution (GDP) FUA ESPON 1.4.3. 2000; 2006
Primacy rate (population) FUA ESPON 1.4.3., Kareliâstat
2006
Primacy rate (GDP) FUA ESPON 1.4.3. 2006
Gini coefficient thiessen polygons (%) FUA ESPON 1.4.3., Kareliâstat
2006
% population in FUA FUA ESPON 1.4.3., Eurostat
2006
Methodology that we applied for studying polycentricity originates from ESPON 1.1.1 -project.31 The given project considers two different aspects of polycentric development. The first one is morphological (the distribution of urban areas in a given territory) and the second one relational (networks of flows and cooperation between urban areas at different scales). Both of these aspects are closely linked, since relations between cities are crucial for polycentricity; nodes without connections between each other would not form a polycentric system. We have, however, limited our study to the morphological aspect of polycentricity. Analysis on how different urban agglomerations interact with their surroundings and each other could not, due to the lack of data, have been performed soundly on a broad scale. Data applied in this study is developed by ESPON 1.4.3 -project and all the analyses are based on the concept of Functional Urban Area (FUA), generated in ESPON 1.1.1 -project. Functional Urban Areas consist of a core municipality and municipalities surrounding the core. In ESPON 1.4.3 FUAs were defined by aggregating LAU 2 level regions from different NUTS 3 or 2 level regions. In our study we have included FUAs that have at least 60 % of their area overlapping with the area of the cross-border region, and FUAs, who’s Morphological Urban Area (MUA), that is the core municipality, is located within the limits of the cross-border area. The analyses on polycentricity have been made on NUTS 2 scale, because the study of urban structure is not meaningful on low geographical scales based on the possible small amount of FUAs. In the selection of FUAs we have followed requirements set up by ESPON 1.4.3. According to the project MUAs should have a core with more than 650 inhabitants per km² (NUTS 5 level unit) or with more than 20 000 inhabitants if they have a clear concentrated morphological core. In total FUAs should have a minimum population of 50 000 inhabitants.32 Only part of the analysis could be made on the Russian side of the CBA, since ESPON 1.4.3 did not cover Russian territory and therefore no data was available.
3.1. Functional Urban Areas
Functional Urban Areas of the Eastern and Northern Finland – Russia CBA are presented in the following table and map. The table provides information on the area (km²), population, population change and compactness of the FUAs. The map pictures the location of FUAs and their MUAs (core regions presented in violet colour). The Eastern and Northern Finland – Russia CBA has been studied here on NUTS 2 level, and
therefore cities outside the actual territory of Euregio Karelia have been included in the study. FUAs located
31 ESPON 1.1.1. 32 ESPON 1.4.3.

Ulysses Final Report - Multi-thematic Territorial Analysis of Euregio Karelia - Annexes 60
in Euregio Karelia are Oulu (Northern Ostrobothnia), Joensuu (North Karelia), Kajaani (Kainuu) and Petrozavodsk (The Republic of Karelia). The largest FUA of the Eastern and Northern Finland – Russia CBA was in 2006 the City of Petrozavodsk and Prionežskij municipality that surrounds the city. This FUA is the only Functional Urban Area on the Russian side of the CBA that fulfils the requirements set up by ESPON 1.4.3 for FUAs. There were 265 072 inhabitants in Petrozavodsk in 2006 and 23 110 in Prionežskij municipality.33 Petrozavodsk was the most compact FUA in the CBA. MUA population formed 93 % of the total population of the FUA.34 The largest FUA on the Finnish side of the Eastern and Northern Finland – Russia CBA in 2006 was Oulu with 221 325 inhabitants and the smallest Kokkola with 50 434 inhabitants. If we consider only FUAs located on the territory of Euregio Karelia the smallest FUA was Kajaani with 55 802 inhabitants. Population growth was positive in all the FUAs except for Kajaani (-2,9 % decrease) between 2001 and 2006. Oulu and Joensuu had an almost 9 % population growth. Population in Petrozavodsk was growing between 2001 and 2003, and after a decline between 2004 and 2005, the amount of population has been increasing steadily, reaching 293 847 inhabitants in 2010. Table 21. FUAs of the Eastern and Northern Finland – Russia CBA.
FUA ID
FUA FUA area (km²) FUA population 2001
FUA population 2006
Population change 2001-2006 (%)
Compactness 2001 (MUA population / FUA population)
FI10438 Oulu 6 946,20 203 293 221 325 8,9 61
FI10434 Kuopio 3 401,13 113 758 118 305 4 76
FI10427 Joensuu 4 315,80 87 419 95 062 8,7 59
FI10430 Kemi-Tornio 4 314,15 69 539 67 861 -2,4 33
FI10441 Rovaniemi 8 016,79 35 427 57 849 63,3* 100
FI10429 Kajaani 6 740,19 57 451 55 802 -2,9 63
FI10437 Mikkeli 3 239,13 54 560 54 220 -0,6 86
FI10431 Kokkola 1 828,11 49 933 50 434 1 71
PETRO Petrozavodsk + Prionežskij municipal'nyj rajon
4 588 285 015** 288 182 7,8 93
*The Rural Municipality of Rovaniemi merged to the City of Rovaniemi in 2006.
**January 1 2006 SLAU 1 region of Vepsskaâ nacional’naâ volost’ joined Prionežskij municipal'nyj rajon. Here the
population of both of these regions in included in the FUA population.
Source: ESPON 1.4.3 -project and Kareliâstat
33 No data was available for SLAU 2 level regions of the municipality of Prionežskij municipal'nyj rajon. Data is therefore for the whole SLAU 1 level region of Prionežskij municipal'nyj rajon. 34 When considering the whole NUTS 2 territory, the most compact FUA was Rovaniemi in Northern Finland (NUTS 2), The high value for compactness results from the fact that January 1 2006 the rural municipality of Rovaniemi, surrounding the city of Rovaniemi merged to the city. Hence the population that used to live outside MUA is now considered MUA population, even if it continues to inhabit territories outside the actual urban centre of the FUA.

Ulysses Final Report - Multi-thematic Territorial Analysis of Euregio Karelia - Annexes 61
Map 25. FUAs and MUAs of the Eastern and Northern Finland – Russia CBA.
!
!
Oulu
Kajaani
Rovaniemi
PetrozavodskJoensuuKuopio
Mikkeli
Kemi - Tornio
Kokkola
Tallinn
Helsinki
Regional level: FUAYear: 2001
Origin of data: ESPON DBSource: EUROSTAT, IGEAT
© EuroGeographicsAssociation for administrative boundaries
This map does notnecessa rily reflect theopinion of the ESPONMonitoring Committee
Morpho logical and Func tional Urban Areas
0 900450km
Legend © ULYSSES, 2011
Morphological Urban Areas and Functional Urban Areas, acco rding to the ESPON 1.4.3(established from data from 2001)

Ulysses Final Report - Multi-thematic Territorial Analysis of Euregio Karelia - Annexes 62
3.2. Morphological analysis of FUAs
It is characteristic for a polycentric urban system that no city dominates over other cities in demographic or economic sense. In other words, a polycentric urban system lacks hierarchy, and cities are relatively similar of size. We have analysed the hierarchy of city systems, first, in the countries participating in ESPON programme (27 EU Member States and Iceland, Liechtenstein, Norway and Switzerland) and, second, in the Easterns and Northern Finland – Russia CBA by calculating slope of rank size distribution of the FUAs.35 Following figure presents rank size distribution of population in the Functional Urban Areas of ESPON countries. All the FUAs of ESPON countries have been ranked from largest to smallest, and related to each other according to their size (blue marks). The black line in the chart is the statistical log-linear line that presents a hypothetical homogeneous distribution of FUAs. A relatively flat line (low absolute value of β) implicates of a polycentric urban system, whereas a steep line stands for a more monocentric system, where a one city dominates over others.36 The slope of equation for ESPON countries (β) for year 2006 was -1,0521, which signifies that urban system in the ESPON countries is polycentric. (ESPON β-value is very close to -1, which corresponds to regularity known as Zipf’s law.) When we have a look at the hypothetical log-linear line, it is possible to observe that urban system of ESPON countries lacks hierarchy at the upper end of the rank size distribution. The largest city should, according to the log-linear line, have a population much higher than the approximate 13 million that the largest FUA in the ESPON space, London, actually has.
35 In order to calculate slope of rank size distribution, FUAs of a given territory are ranked from largest to smallest
according to the amount of population. After that following equation is computed: %�&����� ��' = � + �%�(���()
*LN is a function that returns the natural logarithm of a value.
This function is a so called rank-size equation in the Lotka form. If estimated relation holds, the size distribution of
FUAs follows a statistical log-linear distribution. The slope of equation (β) indicates the level of hierarchy and thus the
level of polycentricity in a region; the lower the absolute value of β, the higher the level of polycentricity. 36 ESPON 1.1.1.

Ulysses Final Report - Multi-thematic Territorial Analysis of Euregio Karelia - Annexes 63
Figure 11. Rank size distribution of the population in Functional Urban Areas of ESPON countries (2006).
Source: ESPON 1.4.3 -project Rank size distribution can be calculated also for gross domestic product in the FUAs. The following figure presents how the ESPON FUAs have ranked according to GDP. Here the slope of the log-linear line is steeper (-1,3608) than in the population chart because of greater differences in GDP between the leading FUAs (London and Paris) and the FUAs with the lowest GDP. The steep drop in the lower end of the distribution line is caused by a group of approximately two hundred FUAs with GDP less than 400 M€. GDP for London FUA was 589 028 M€ in 2006 and for Paris 520 533 M€.
y = -1,0521x + 18,297
R² = 0,937
0
2
4
6
8
10
12
14
16
18
20
0 1 2 3 4 5 6 7 8
Po
pu
lati
on
20
06
(LN
)
Rank (LN)

Ulysses Final Report - Multi-thematic Territorial Analysis of Euregio Karelia - Annexes 64
Figure 12. Rank size distribution of GDP in Functional Urban Areas in ESPON countries (2006).
Source: ESPON 1.4.3 -project
The slope of rank size distribution of FUA population in the Eastern and Northern Finland – Russia CBA was -0,94 in 2001. In 2006 the slope of rank size distribution valued at -0,88 that could indicate of a move towards a more polycentric urban system. The change is, however, more related to the merger of Rovaniemi rural municipality and city, and hence the increase in population in the smallest FUA of the CBA. Nevertheless the Eastern and Northern Finland – Russia CBA has a polycentric urban structure, more polycentric than the average urban structure in ESPON countries.
y = -1,3608x + 16,203
0
2
4
6
8
10
12
14
16
18
0 1 2 3 4 5 6 7 8
GD
P (
LN)
Rank size (LN)

Ulysses Final Report - Multi-thematic Territorial Analysis of Euregio Karelia - Annexes 65
Figure 13. Rank size distribution of the population of Functional Urban Areas in the Eastern and Northern Finland –
Russia CBA (2006).
Source: ESPON 1.4.3 -project and Kareliâstat (population data)
As GDP data was missing for Petrozavodsk and Prionežskij municipal'nyj rajon, the rank size distribution of FUA GDP only applies for the Finnish cities of the CBA. The slope of rank size distribution of FUA GDP was -0,81 in 2006. Even if this value indicates of a polycentric cross-border area, it is possible to observe great differences between the leading FUA Oulu, where GDP was 6 362 M€ and Kajaani, where GDP was 1 204 M€ in 2006.
Pe
tro
zavo
dsk
+ P
rio
ne
žskij
mu
nic
ipa
l'n
yj
rajo
n
Ou
lu
Ku
op
io
Joe
nsu
u
Ke
mi -
To
rnio
Ro
va
nie
mi
Ka
jaa
ni
Mik
ke
li
Ko
kko
la
10.000
100.000
1.000.000
1 10
Po
pu
lati
on
Rank
Slope = -0,88

Ulysses Final Report - Multi-thematic Territorial Analysis of Euregio Karelia - Annexes 66
Figure 14. Rank size distribution of GDP in Functional Urban Areas in the Eastern and Northern Finland – Russia CBA
(Finnish FUAs, 2006).
Source: ESPON 1.4.3 –project (GDP data)
While the slope of rank size distribution considers all FUAs in a region, primacy rate excludes the largest FUA from the analysis. It is an indicator that measures how much the size of the largest FUA deviates from the regression line of the rank-size distribution of the FUAs in a given region. If the primacy rate values above 1, the population of the main FUA is above the expected value, and, on the contrary, if the primacy rate is below 1, the largest FUA is smaller than what would be expected by the regression line of the rank-size distribution of FUAs. High primacy rate thus indicates of a monocentric urban structure with one dominating FUA, and low primacy rate of a polycentric urban structure. Primacy rate for the Eastern and Northern Finland – Russia CBA was 0,79 in 2006. This suggests that urban structure of the region is not dominated by one big city, but that the size of the biggest FUA (Petrozavodsk) is actually smaller than anticipated by the rank-size distribution of the FUAs. Primacy rate for Finland was 2,05 and 0,14 for ESPON countries in 2006. The value for Finland is caused by the large size of Helsinki FUA compared to the size of other FUAs in the country. The Finnish GDP primacy rate was also high and valued at 2,17 in 2006, indicating of accumulation of production in the capital region of the country. The distribution of GDP among the FUAs in Eastern and Northern Finland was more balanced and valued at 1,34. (Petrozavodsk was excluded from the analysis due to the lack of data.) The gini coefficient of the FUA Thiessen polygons is an indicator that measures how the FUAs are spaced throughout a given region. Values close to 100 % indicate of great inequalities in the FUA distribution while values below 100 % imply that FUAs are more evenly spaced.37 The gini coefficient for thiessen polygons in
37 For this indicator, polygons were produced based on ESPON 1.4.3 FUA layer (made available by the ESPON DB 2013) so that the limits of the polygons were established exactly midways between two FUAs. On national level, gini coefficients were produced considering the border as a limit. This measure implicitly evaluates overall distribution of the population. However, it has a problem of attributing same weight to all different FUAs and it does not reflect the actual
Ou
lu
Ku
op
io
Joe
nsu
u
Ko
kko
la
Ke
mi -
To
rnio
Mik
ke
li
Ka
jaa
ni
Ro
va
nie
mi
100
1000
10000
1 10
GD
P
Rank size
Slope = -0,81

Ulysses Final Report - Multi-thematic Territorial Analysis of Euregio Karelia - Annexes 67
Eastern and Northern Finland – Russia CBA valued at 41,7 %, which indicates that FUAs are evenly spaced and services accessible (in theory) throughout the CBA. In the case of Euregio Karelia this analysis is problematic, because it does not take into account the border and the practical hindrance that it presents for taking advantage of services provided by FUAs on the other side of the border. In a cross-border context certain services, such as health care, education and social services are also not available for foreign citizens. Map 26. FUA Thiessen polygons for the Eastern and Northern Finland – Russia CBA.
Source: ESPON 1.4.3 -project and Kareliâstat (population data)
Finally, we have compared rank size distribution of FUAs in the Eastern and Northern Finland CBA to the
overall distribution of FUAs in ESPON countries (27 EU Member States and Iceland, Liechtenstein, Norway and Switzerland). For this exercise, rank-size coefficients were estimated considering all FUAs in ESPON countries. The actual rank-size distribution of the FUAs was thereafter compared with what would be expected if the regions would follow the European distribution. This analysis demonstrates the expected amount and size of a FUA in a region according to its total population. As the following figure illustrates, rank-size distribution of FUAs in the Eastern and Northern Finland – Russia CBA follows the so called
influence of a city. It should, therefore, be essentially understood as a way to evaluate whether the minimum amount of services that an urban agglomeration can provide is accessible throughout the region.
!
!
!
!
!
!
!
!
!
!
Helsinki

Ulysses Final Report - Multi-thematic Territorial Analysis of Euregio Karelia - Annexes 68
“European distribution” of FUAs relatively well. It lacks hierarchy to some extend (leading FUA with a considerable size) and the amount of FUAs is smaller, but the slope of FUA distribution is very similar to the expected distribution. Figure 15. Rank size distribution of FUAs in the Eastern and Northern Finland – Russia CBA to the overall distribution of
FUAs in ESPON countries (2006).
Source: ESPON 1.4.3 -project and Kareliâstat (population data)
Following table summarizes morphological analyses of FUAs and presents the Eastern and Northern Finland – Russia CBA in the context of Finnish FUAs and FUAs of the ESPON countries. If we compare the average size of FUAs in the CBA, it is approximately two thirds of the average size of FUAs in Finland and about half the size of FUAs in ESPON countries. What is also worth mentioning, is the fact that only 51,1 % of the CBA’s total population lives in FUAs, while 73,7 % of Finnish population and 74,8 % of ESPON space population inhabits FUAs. Table 22. Morpholocigal indicators for the Eastern and Northern Finland – Russia CBA (2006).
CBA FI RF** ESPON
Slope of rank size distribution (population) -0,88 -0,97 N/A -1,06
Slope of rank size distribution (GDP)* -0,81 -1,14 N/A -1,36
Primacy rate (population) 0,79 2,05 N/A 0,14
Primacy rate (GDP)* 1,34 2,17 N/A 0,05
Number of FUAs 9 22 N/A 1552
Average FUA population 112785,6 175985,2 N/A 245298,6
Minimum FUA population 44737 47918 N/A 3216
Maximum FUA population 294212 1440824 N/A 12972492
0
50000
100000
150000
200000
250000
300000
350000
400000
0 2 4 6 8 10 12 14
FU
A P
op
ula
tio
n
Rank
Expected / actual FUA rank size distribution
Expected
Actual

Ulysses Final Report - Multi-thematic Territorial Analysis of Euregio Karelia - Annexes 69
% of population in FUAs 51,1 73,7 N/A 74,8
% effective FUA population change 2001–2006 51,2 4,8 N/A 3,0
Compactness 2001 (MUA population / FUA population)
65,4 70,6 N/A 64,9
Gini coefficient thiessen polygons 41,7 47,96 N/A -
* Values do not include Petrozavodsk FUA.
** Values for the Russian Federation are missing, because ESPON 1.4.3. -project did not cover Russia and it was not in
the scope of this project to produce the missing data.
Source: Eurostat, ESPON 1.4.3.
3.3. Functional analyses of FUAs
We have selected a group of socio-economic indicators in order to study functional specialization of FUAs in the Eastern and Northern Finland – Russia CBA. Since data is not available for these indicators on FUA level, we have made estimations according to the values of NUTS 3 regions that the given FUAs are part of.38 Selected indicators include unemployment rates, GDP per inhabitant and gross value added (GVA) by NACE.39 In almost all the FUAs dominating economic activity was traditional manufacturing (incl. mining and energy production). The second most important sectors were the service sector and the trade and transport -sector. The following table presents GDP per inhabitant and the share of different NACE sectors in the GVA of the FUAs. There is a wide gap in GDP per inhabitant between the Finnish FUAs and Petrozavodsk FUA. Considering FUAs that are located in the territory of Euregio Karelia, the FUA with the highest GDP per inhabitat on the Finnish side was Oulu (29 000 €) and the FUA with the lowest GDP per inhabitant Joensuu (21 000 €). In Petrozavodsk GDP per inhabintant was 3 500 €. Considering the Finnish FUAs of the CBA (NUTS 2 delimitation) it is possible to observe that the FUAs located in western parts had the highest GDP per inhabitant. Unemployment was over 8 % in all the Finnish FUAs, but only 3,6 % in Petrozavodsk. Table 23. Functional indicators for the Eastern and Northern Finland – Russia CBA (2006).
FUA ID
Gross Value Added by NACE, % of total GVA GDP per inhabitant (1000 euros)
Unemployment rate
FUA Agriculture, forestry and fishing (AB)
Mining, manufacturing and energy
Construction (F)
Trade and transport
Finance and business
Other services (L-P)
38 As the values are estimates they have to be interpreted with some care. 39 GDP is the abbreviation for gross domestic product. GVA is the abbreviation for gross value added.
NACE (Statistical classification of economic activities) version applied here is 1.1.
A = Agriculture, hunting and forestry, B = Fishing
C = Mining and quarrying, D = Manufacturing, E = Electricity, gas and water supply
F = Construction
G = Wholesale and retail trade; repair of motor vehicles, motorcycles and personal and household goods, H = Hotels and restaurants, I = Transport, storage and communications
J = Financial intermediation, K = Real estate, renting and business activities
L = Public administration and defence; compulsory social security, M = Education, N = Health and social work, O = Other community, social and personal services activities, P = Activities of private households as employers and undifferentiated production activities of private households
Q = Extraterritorial organisations and bodies

Ulysses Final Report - Multi-thematic Territorial Analysis of Euregio Karelia - Annexes 70
(CDE) (GHI) services (J-K)
FI10438 Oulu 3,3 31,2 7,3 16,9 18,1 23,1 29 9,8
FI10434 Kuopio 5,8 23,2 6,7 18,8 18,5 27,1 23 9,8
FI10427 Joensuu 6,9 25,9 7 18,3 16,1 25,7 21 10,4
FI10430 Kemi - Tornio 6,6 28 6,3 18,9 15,4 24,9 28 12,4
FI10441 Rovaniemi 6,6 28 6,3 18,9 15,4 24,9 17 12,4
FI10429 Kajaani 10,4 20,5 6,7 16,1 16,6 29,8 22 17,1
FI10437 Mikkeli 10,1 20,3 6,6 18,4 16,8 27,8 24 11,5
FI10431 Kokkola 5 34,8 6,2 18,7 14 21,3 39 8,7
PETRO Petrozavodsk + Prionežskij municipal'nyj rajon*
6,3 32,6 4,9 31,4 5,1 19,7 3,5 3,6
* Values for Petrozavodsk FUA are shares of Gross Regional Product for the Republic of Karelia. GDP per inhabintant is
the Gross Regional Product per inhabitant (120 753,76 rubles) in the Republic of Karelia. The unemployment rate by
ILO method is also for the Republic of Karelia.
Sources: Eurostat, Rosstat, Kareliâstat

Ulysses Final Report - Multi-thematic Territorial Analysis of Euregio Karelia - Annexes 71
Map 27. Share of different NACE sectors in the value added of FUAs in the Eastern and Northern Finland – Russia CBA
(year 2006).
!
!
!
Tallinn
Helsinki
StockholmRegional level: FUA
Year: 2006Origin of data: EUROSTAT, ESPON 1.4.3
Source: EUROSTAT, ESPON DB© EuroGeographicsAssociation for administrative boundaries
This map does notnecessa rily reflect theopinion of the ESPONMonitoring Committee
Share of NACE in the value added of FUA
0 990495km
Legend © ULYSSES, 2011
Share of NACE sectors in the value added of the FUA, 2006
<Morphological Urban Area>
<Functional Urban Area>
G_H_I
I_K
L_to_P
NACE sectors
AB
CE
F

Ulysses Final Report - Multi-thematic Territorial Analysis of Euregio Karelia - Annexes 72
Map 28. GDP per inhabitant in the FUAs of Eastern and Northern Finland – Russia CBA (year 2006).
This map does notnecessarily reflect theopinion of the ESPONMonitoring Committee
0 60 120 180 24030Km
Local level: NUTS 3Year: 2006
Source: ESPON DatabaseOrigin of data: Eurostat, ESPON 1.4.3
© EuroGeographics Association for administrative boundaries
© GETIN_UA, Project ULYSSES, 2011
0 690345 Km
LegendGDP per inhabitant, 2006 (thousands of Euros)
2,00 - 7,00
7,01 - 17,00
17,01 - 24,00
24,01 - 30,00
30,01 - 37,00
37,01 - 51,00
missing valueFUA average GDP per inhabESPON = 21,23FI = 30,36RS = n/d

Ulysses Final Report - Multi-thematic Territorial Analysis of Euregio Karelia - Annexes 73
3.4. Chapter conclusions
Population change was positive in all the FUAs of the Eastern and Northern Finland – Russia CBA between 2001 and 2006, with the exception of Kajaani (-2,9 % decrease). The largest FUA of the CBA is Petrozavodsk, which is formed of the city of Petrozavodsk and Prionežskij municipality that surrounds the city and has a total population of 288 182 inhabitants. The urban structure of the Eastern and Northern Finland – Russia CBA is polycentric, more polycentric than the average urban structure in the ESPON countries. The slope of rank size distribution of FUA population in the CBA was -0,88 in 2006. The slope of rank size distribution of FUA GDP was -0,81 in 2006. Even if this value indicates of a polycentric cross-border area, it has to be noticed that the value did not include data for Petrozavodsk FUA. That would have, due to the significant differences in GDP, affected the final values. Primacy rate for the Eastern and Northern Finland – Russia CBA was 0,79 in 2006. This suggests that urban structure of the CBA is not dominated by one big city, but that the size of the biggest FUA (Petrozavodsk) is actually smaller than anticipated by the rank-size distribution of the FUAs. In almost all the FUAs dominating economic activity was traditional manufacturing (incl. mining and energy production). The second most important sectors were the service sector and the trade and transport -sector. There was a wide gap in GDP per inhabitant between the Finnish and Russian FUAs. Considering FUAs that are located in the territory of Euregio Karelia, the FUA with the highest GDP per inhabitant was Oulu (29 000 €) and the FUA with the lowest GDP per inhabitant Petrozavodsk (3 500 €). Unemployment was over 8 % in all the Finnish FUAs, but only 3,6 % in Petrozavodsk.

Ulysses Final Report - Multi-thematic Territorial Analysis of Euregio Karelia - Annexes 74
Chapter 4. Urban-rural relationship in the Eastern and Northern Finland – Russia
CBA (Euregio Karelia)
Urban-rural relationship is another key concept of European spatial policy. Active relations between urban
areas and surrounding rural regions are considered a means to achieve sustainable development and
territorial cohesion. Recent studies (including ESPON 1.1.2 “Urban-rural relations in Europe”) have shown
that urban-rural linkages are now moving beyond single one-way exchanges towards a dynamic web of
interdependencies, which shape the development of both cities and countryside. New technologies are a
good example of new elements that influence the pattern and character of flows between rural and urban
areas.40
It is the recognition of the complexity of urban-rural relationships that has gained political attention
both at national and European levels. European Spatial Development Perspective (ESDP) speaks about going
beyond traditional co-operation and building successful long-term partnerships between urban and rural
areas.41
According to the Territorial Agenda 2020 urban-rural partnerships should include integrated
governance and planning aspects.42
To be able to study urban and rural areas, ESPON 1.1.2 project makes a distinction between structural and functional properties of a region. Structural properties include established land-use patterns, settlement structure and the distribution of population, while functional properties refer to the factual use of the physical environment (various forms of production, consumption and communication). Following this distinction the project defines urban-rural relations as follows: structural relations of urban and rural areas are determined by the way the physical environment is constituted and shaped, while functional relations between urban and rural areas are determined by the way the physical environment is utilised.43 In our analyses we have examined both dimensions of urban-rural relations, however, with a limited selection of parameters. First we take a look at land use patterns in the Eastern and Northern Finland – Russia CBA, and then analyse how the traditional rural fields of economic activity; agriculture, forestry and fishing have developed in the CBA.44 Table 24. Urban-rural relationship parameters studied for Euregio Karelia.
Variable name Geographical scale
Source Time frame
Urban-rural typology NUTS 3 ESPON DB/ Eurostat
Agricultural areas NUTS 3 ESPON DB, The Republic of Karelia State Government Bodies
1990; 2000; 2006
40 Kūle 2010. 41 ESDP 1999. 42 Territorial Agenda 2020. 43 ESPON 1.1.2. 44 We have faced some limitations regarding data. Although it is possible to get land cover data on a very low geographical scale from the Corine Land Cover, indicators such as employment and economic patterns are only available at NUTS 3 level. Typologies established by ESPON and Eurostat are also available only at broad scale, and it is not possible to link the indicators with rural or urban areas at any significant scale. We have therefore focused on these typologies on NUTS 3 level and highlighted differences between them regarding land use patterns as well as socioeconomic indicators. Besides the ESPON typology on urban and rural regions, data for land types has been included in the analysis. What comes to evaluating interaction (flows of people and goods or computer mediated communication) between urban and rural areas, there is no data available on EUROSTAT or ESPON.

Ulysses Final Report - Multi-thematic Territorial Analysis of Euregio Karelia - Annexes 75
Urban fabric NUTS 3 Corine Land Cover, The Republic of Karelia State Government Bodies
2000–2006
Artificial surfaces NUTS 3 Corine Land Cover 2000–2006
Gross value added in agriculture, forestry and fishing
NUTS 3 Eurostat, Rosstat, Kareliâstat 1997–2008
Employment in agriculture, forestry and fishing NUTS 3 Eurostat, Rosstat 2000–2008
4.1. Land use patterns
Different typologies have been established to classify regions to urban and rural territories. One of these typologies was developed in ESPON 1.1.2 project and it is based on tree indicators; land cover, population density and the presence/absence of a FUA. Based on different combinations of these indicators, NUTS 3 regions are classified in the project as having high or low human influence (population densities) and urban intervention (land cover). Eurostat uses an urban-rural typology that is a revision of OECD typology and classifies regions according to three steps. First, clusters of urban grid cells are created with a minimum population density of 300 inhabitants per km² and a minimum population of 5 000 inhabitants. All cells outside the urban clusters are considered rural. Second, NUTS 3 regions of less than 500 km² are grouped with one or more neighbours solely for classification purposes. All NUTS 3 regions in a grouping are classified in the same way. Third, NUTS 3 regions are classified based on the share of population in rural grid cells. Regions with more than 50 % of total population in rural grid cells are categorized as predominantly rural, regions with 20 % to 50 % of total population in rural grid cells as intermediate and regions with less than 20 % of total population in rural grid cells as predominantly urban regions. Further, some regions that are predominantly rural are considered intermediate in the presence of a city with more than 200 000 inhabitants, and intermediate regions located next to cities of over 500 000 inhabitants are considered urban.45 Following map presents the regions of Euregio Karelia based on these two typologies. ESPON 1.1.2 typology classifies all the regions of the CBA as regions with low urban influence and low human intervention. The Eurostat typology considers the regions of the CBA as predominantly rural regions. SNUTS 3 regions of the Republic of Karelia have not been included in the analysis due to the lack of data. If we, however take a look at the regions from the perspective of the Eurostat typology (with more simple classification) and the population and population density data, we could conclude that City District of Petrozavodsk (Petrozavodskij gorodskoj okrug) would be a predominantly urban, the Southern part of the Republic of Karelia (Ûžnaâ čast' Respubliki Kareliâ) an intermediate and the Northern part of the Republic of Karelia (Severnaâ čast' Respubliki Kareliâ) a predominantly rural region.
45 A revised urban-rural typology 2010.

Ulysses Final Report - Multi-thematic Territorial Analysis of Euregio Karelia - Annexes 76
Map 29. Euregio Karelia according to ESPON 1.1.2. and Eurostat urban rural typologies.
This map does notnecessarily reflect theopinion of the ESPONMonitoring Committee
0 30 60 90 12015Km
Local level: NUTS 3Year: 2008
Source: EEA Corine Land Cover, EurostatOrigin of data: Eurostat, ESPON DB
© EuroGeographics Association for administrative boundaries
© Project ULYSSES, 2012
0 625312,5 Km
LegendESPON 1.1.2 typology
missing value
EUROSTAT typology
Predominantly urban
Intermediate regions
Predominantly rural regions
Urban influence Human intervention
High High
High Medium
High Low
Low High
Low Medium
Low Low

Ulysses Final Report - Multi-thematic Territorial Analysis of Euregio Karelia - Annexes 77
The share of agricultural areas in Euregio Karelia values significantly lower than the European average (ESPON countries). Share of agricultural areas in the ESPON countries was 38,65 % in 2006, while the largest share of agricultural areas in the CBA was 7,91 % in Northern Ostrobothnia. The lowest share of agricultural areas was in Kainuu (1,75 %) and in the Republic of Karelia (1,16 %). The small share of agricultural land in these regions is related to the large share of forests. In Kainuu forests cover 90 % of the region’s territory, which is the largest share of forests in whole Finland.46 In the Republic of Karelia forests covered 80,6 % of the total area in 1998 and 80 % in 2007.47 The share of agricultural areas has been increasing in all the Finnish regions of Euregio Karelia between 2000 and 2006, while in the Republic of Karelia the share of agricultural areas and areas under cultivation has been decreasing. This is a common trend in Russia, where the share of areas under cultivation has decreased at an annual rate of -275,51 between 1990 and 2006. The following table presents agricultural areas in Euregio Karelia, Finland, Russia and ESPON countries. Land cover data that is used here and in the following analyses has been categorized according to the Corine Land Cover (CLC). CLC has five main categories of land use; (1) artificial, (2) agricultural, (3) forests and semi-natural areas, (4) wetlands and (5) water bodies. Agricultural areas include arable land, permanent crops, pastures and heterogeneous agricultural land. Table 25. Agricultural areas (category 2 of the Corine Land Cover) in Euregio Karelia.
Agricultural areas (ha)
NUTS ID NUTS Total 1990 Total 2000 Total 2006 Share of total area 2006 (%)
Net formation of land cover 1990–2006
Net formation of land cover by total area 1990–2006 (per 10 000)
Annual growth rate 1990–2006 (per 1000)
ESPON space 182685050,0 205227723,0 184577384,0 38,65 1892334,0 39,621 6,44
FI Finland 0,0 2941221,0 2959725,0 8,78 18504,0** 5,49** 10,46**
RU Russia 117705160,0 84669640,0 75276990,0 4,40 -42428170,0 -248,14 -275,51
FI133 North Karelia (Pohjois-Karjala)
0,0 121366,0 122299,0 5,67 933,0** 4,32** 12,77**
FI134 Kainuu 0,0 41501,0 42861,0 1,75 1360,0** 5,56** 53,89**
FI1A2 Northern Ostrobothnia (Pohjois-Pohjanmaa)
0,0 278190,0 293772,0 7,91 15582,0** 41,98** 91,25**
RU3D The Republic of Karelia (Respublika Kareliâ)*
293200,0 82830,0*
188700,0 64820,0*
210300,0 45130,0*
1,16 0,24*
-82900,0 -37700,0*
-19,65* -372,42*
*Areas under cultivation
**Data for 2000–2006
Source: ESPON Database, Kareliâstat
Methodology: Tabulate area between CLC2000 level 3 and NUTS 2006 (levels 1, 2, 3) and aggregation at CLC2000 level
1.
46 Statistics Finland 2011. 47 Struktura zemel’nogo fonda 1998; Ekonomičeskoe razvitie 2007.

Ulysses Final Report - Multi-thematic Territorial Analysis of Euregio Karelia - Annexes 78
Map 30. Share of agricultural areas in Euregio Karelia in 2006.
This map does notnecessarily reflect theopinion of the ESPONMonitoring Committee
0 30 60 90 12015Km
Local level: NUTS 3Year: 2006
Source: EEA, Corine Land Cover© EuroGeographics Association for administrative boundaries
© Project ULYSSES, 2012
0 625312,5 Km
Legend
Percent of agricultural areas by NUTS 3, 2006
Legend
Typology
Predominantly urban
Intermediate regions
Predominantly rural regions
missing value0,0 - 13,5
13,6 - 33,1
33,2 - 38,7
38,8 - 51,0
51,1 - 64,2
64,3 - 89,8

Ulysses Final Report - Multi-thematic Territorial Analysis of Euregio Karelia - Annexes 79
Urbanisation of agricultural areas in Euregio Karelia has been below the European average (ESPON countries). Between 2000 and 2006 127745,51 ha of agricultural area in the ESPON countries was urbanised, that is 2,67 ha urbanised land per 10 000 ha of agricultural land. In Euregio Karelia largest areas of agricultural land were urbanised in Northern Ostrobothnia (0,36 ha per 10 000 ha of agricultural land), while in Kainuu only 0,01 ha per 10 000 ha of agricultural land was urbanised. Urbanisation of natural and semi-natural areas was stronger in Northern Ostrobothnia and North Karelia than in ESPON countries in average. In ESPON countries 0,34 ha of natural and semi-natural land was urbanised between 2000 and 2006. In Northern Ostrobothnia the share was 1,10 and in North Karelia 0,83. The Finnish average for the given period was 0,75. Urbanisation in the Finnish regions of Euregio Karelia (and in Finland in general) has hence affected more natural and semi-natural areas, while in ESPON countries urbanisation has decreased the share of agricultural land. The following table presents changes in the urban fabric in Euregio Karelia, Finland and ESPON countries between 2000 and 2006. 48 The following maps illustrate urbanisation of agricultural, and natural and semi-natural areas in the CBA between 2000 and 2006. Table 26. Urban fabric (categories 111 and 112 of the Corine Land Cover) in Euregio Karelia.
Urban fabric (ha) (2000–2006)
NUTS ID NUTS Formation of new land cover
Consumption of land cover
Net formation of land cover
Net formation of land cover by total area (per 10000)
Urbanisation of agricultural areas (2000–2006)
Urbanisation of agricultural areas by total area (per 10 000)
Urbanisation of natural and semi-natural areas
Urbanisation of natural and semi-natural areas by total area (per 10 000)
ESPON space
191290,05 1447,96 189842,09 3,97 127745,51 2,67 16003,73 0,34
FI Finland 3417,26 27,08 3390,18 1,01 803,13 0,24 2528,67 0,75
RU Russia N/A N/A N/A N/A N/A N/A N/A N/A
FI133 North Karelia (Pohjois-Karjala)
205,68 0,00 205,68 0,95 25,72 0,12 179,96 0,83
FI134 Kainuu 11,30 0,00 11,30 0,05 1,35 0,01 9,95 0,04
FI1A2 Northern Ostrobothnia (Pohjois-Pohjanmaa)
565,59 0,00 565,59 1,52 132,85 0,36 406,55 1,10
RUD3 The Republic of Karelia (Respublika Kareliâ)
752,00* N/A N/A N/A N/A N/A N/A N/A
* Data for 2008.
Source: EEA Corine Land Cover, The Republic of Karelia State Government Bodies
Methodology: Intersection of CLC land cover changes with level 3 and NUTS 2006 (levels 1, 2, 3) and aggregation at
CLC2000-2006 level 2.
48 Urban fabric belongs to the 1st CLC category of artificial surfaces. Two subcategories of urban fabric have been included in the table. These are 1.1.1 that corresponds to continuous urban fabric and 1.1.2 that corresponds to discontinuous urban fabric.

Ulysses Final Report - Multi-thematic Territorial Analysis of Euregio Karelia - Annexes 80
Map 31. Urbanisation of agricultural areas in Euregio Karelia between 2000 and 2006.
This map does notnecessarily reflect theopinion of the ESPONMonitoring Committee
0 30 60 90 12015Km
Local level: Lau 1Year: 2000 - 2006
Source: EEA Corine Land Cover Origin of Data: EEA
© EuroGeographics Association for administrative boundaries
© Project ULYSSES, 2012
0 640320 Km
Urban rural typology
Predominantly urban
Intermediate regions
Predominantly rural regions
LegendUrbanization of agricultural areas (per 10000), 200 0-06
5,28 - 10,56
10,57 - 24,89
>= 24,90
<= 1,04
1,05 - 2,67
2,68 - 5,27
missing value

Ulysses Final Report - Multi-thematic Territorial Analysis of Euregio Karelia - Annexes 81
Map 32. Urbanisation of natural and semi-natural areas in Euregio Karelia between 2000 and 2006.
This map does notnecessarily reflect theopinion of the ESPONMonitoring Committee
0 30 60 90 12015Km
Local level: Lau 1Year: 2000 - 2006
Source: EEA Corine Land Cover Origin of Data: EEA
© EuroGeographics Association for administrative boundaries
© Project ULYSSES, 2012
0 640320 Km
Urban rural typology
Predominantly urban
Intermediate regions
Predominantly rural regions
LegendUrbanization of natural and semi-natural areas (per 10000), 2000-06
missing value0,58 - 1,10
1,11 - 2,40
>= 2,41
<= 0,09
0,10 - 0,34
0,35 - 0,57

Ulysses Final Report - Multi-thematic Territorial Analysis of Euregio Karelia - Annexes 82
Between 2000 and 2006 the share of artificial areas49 in the ESPON countries was 10,63 ha per 10 000 ha of land. In Finland the share of artificial areas was significantly lower (3,23) and in Euregio Karelia even lower than the Finnish average. The largest share of artificial areas was in Northern Ostrobothnia (2,67) and the smallest in Kainuu (0,26). Compared to the ESPON average the changes in artificial land cover in Euregio Karelia have been moderate. In Northern Ostrobothnia, where the biggest changes took place, only 0,36 ha per 10 000 ha of agricultural and 2,34 ha of natural and seminatural areas were converted into artificial areas. Table 27. Artificial surfaces (category 1 of the Corine Land Cover) in Euregio Karelia.
Artificial Surfaces (ha) (2000–2006)
NUTS ID NUTS Formation of new land cover
Consumption of land cover
Net formation of land cover
Share of net formation of land cover (per 10 000)
Agricultural to artificial areas (2000–2006)
Agricultural to artificial areas by total area (per 10 000)
Natural and semi-natural to artificial areas
Natural and semi-natural to artificial areas by total area (per 10000)
ESPON space
667087,81 159607,44 507480,37 10,63 441994,68 9,25 118710,43 2,49
FI Finland 12211,36 1325,65 10885,71 3,23 2069,14 0,61 8843,11 2,62
RU Russia N/A N/A N/A N/A N/A N/A N/A N/A
FI133 North Karelia (Pohjois-Karjala)
422,68 38,98 383,70 1,78 25,72 0,12 357,99 1,66
FI134 Kainuu 85,61 21,28 64,33 0,26 1,35 0,01 62,98 0,26
FI1A2 Northern Ostrobothnia (Pohjois-Pohjanmaa)
1054,33 62,13 992,19 2,67 132,85 0,36 869,62 2,34
RUD3 The Republic of Karelia (Respublika Kareliâ)
N/A N/A N/A N/A N/A N/A N/A N/A
Source: EEA Corine Land Cover
Methodology: Intersection of CLC land cover changes with level 3 and NUTS 2006 (levels 1, 2, 3) and aggregation at
CLC2000-2006 level 2.
49 Artificial areas include in the CLC classification (1.1) urban fabric, (1.2) industrial, commercial and transport units, (1.3) mine, dump and constructions sites and (1.4) artificial non-agricultural vegetated areas (green urban areas and sports and leisure facilities).

Ulysses Final Report - Multi-thematic Territorial Analysis of Euregio Karelia - Annexes 83
Map 33. Land use change from agricultural to artificial areas in Euregio Karelia between 2000 and 2006.
This map does notnecessarily reflect theopinion of the ESPONMonitoring Committee
0 30 60 90 12015Km
Local level: NUTS 3Year: 2000 - 2006
Source: EEA, Corine Land Cover© EuroGeographics Association for administrative boundaries
© Project ULYSSES, 2012
0 625312,5 Km
LegendArea changed from agricultural to artificial (per 10000) 2000-06Typology
Predominantly urban
Intermediate regions
Predominantly rural regions
<= 1,04
1,05 - 2,67
2,68 - 5,27
5,28 - 10,56
10,57 - 24,89
>= 24,90
missing value

Ulysses Final Report - Multi-thematic Territorial Analysis of Euregio Karelia - Annexes 84
4.2. Gross value added and employment in agriculture and fishing
The following table presents GVA produced by agriculture, hunting, forestry and fishing (NACE classes A-B, hereafter referred to as agriculture and fishing) in
Euregio Karelia, Finland and the European Union (EU27) between 1997 and 2008. There has been a common trend in all the studied Finnish regions of a
slight decrease in GVA in the first half of the 2010 decade, and a slight recovery of GVA during two last years of the studied period. In the Republic of Karelia
there has been a significant increase in the GVA throughout the whole studied period.
Table 28. Gross value added by agriculture and fishing in Euregio Karelia between 1997 and 2008.
GVA by agriculture and fishing (millions of euro/ECU)
NUTS
ID
NUTS 1997 1998 1999 2000 2001 2002 2003 2004 2005 2006 2007 2008
EU27 EU27 196578,60 194025,70 190538,70 195587,10 205609,80 198864,60 194881,10 204970,50 185614,10 185243,60 200954,70 171307,50
FI Finland 3857,20 3483,50 3675,00 4027,00 3980,00 3988,00 3869,00 3806,00 3789,00 3479,00 4723,00 4641,00
RU Russia* 5815,07
(140443,9
Milliard
RUB)
5688,73
(137393,3
M RUB)
13346,43
(322339,0
M RUB)
15686,82
(427152,0
M RUB)
21084,34
(534066,4
M RUB)
19231,72
(571687,8
M RUB)
19070,41
(651069,4
M RUB)
24337,94
(883382,0
M RUB)
26818,24
(991149,3
M RUB)
34076,11
(1160495,9
M RUB)
37613,50
(1304962,7
M RUB)
45165,96
(1625342,1
M RUB)
FI133 North Karelia
(Pohjois-Karjala)
214,90 194,30 204,50
192,00 232,10 241,80 234,70 222,10 230,30 199,10 278,90 278,30
FI134 Kainuu 126,30 123,20 111,10 88,20 110,00 112,40 106,30 104,40 106,70 127,90 154,20 172,20
FI1A2 Northern
Ostrobothnia
(Pohjois-
Pohjanmaa)
315,40 313,20 305,80 305,00 307,60 301,70 296,90 285,70 286,00 257,00 378,00 356,30
RUD3 The Republic of
Karelia
(Respublika
Kareliâ)*
15,55
(375,6
Milliard
RUB)
17,92
(432,8 M
RUB)
33,10
(799,4 M
RUB)
27,46
(747,7 M
RUB)
40,36
(1022,2 M
RUB)
42,55
(1265,0 M
RUB)
41,36
(1412,2 M
RUB)
141,26
(5127,1 M
RUB)
143,64
(5308,6 M
RUB)
153,68
(5233,7 M
RUB)
224,68
(7795,2 M
RUB)
175,27
(6307,3 M
RUB)
*Euro values for Russia and the Republic of Karelia have been calculated with the currency converter of the European Commission using the exchange rate of the first
month of the year in question when available. For the values of year 2002 mean exchange rate of the year provided by the Bank of Finland was used.
Source: Eurostat, Rosstat, Kareliâstat

Ulysses Final Report - Multi-thematic Territorial Analysis of Euregio Karelia - Annexes 85
Figure 16. Gross value added by agriculture and fishing in Euregio Karelia between 1997 and 2008.
Source: Eurostat, Kareliâstat
The share of GVA by agriculture and fishing in total GVA has decreased in all the Finnish regions between 1997 and 2008. Even if there was an increase in the GVA by agriculture and fishing, the share of those fields of economy in the total GVA has decreased. The decrease has been strongest in Northern Ostrobothnia, where the share of agriculture and fishing in total GVA dropped at an annual rate of -4,09 %. In the Republic of Karelia, on the contrary, both GVA agriculture and fishing and the share of those fields of economy in total GVA increased during the studied period. The annual growth rate was 24,63 %.
0,00
50,00
100,00
150,00
200,00
250,00
300,00
350,00
400,00
1997 1998 1999 2000 2001 2002 2003 2004 2005 2006 2007 2008
GV
A (
M€
/ E
CU
)
North Karelia
Kainuu
Northern Ostrobothnia
The Republic of Karelia

Ulysses Final Report - Multi-thematic Territorial Analysis of Euregio Karelia - Annexes 86
Table 29. GVA by agriculture and fishing, and share of GVA by agriculture and fishing in total GVA in Euregio Karelia
between 1997 and 2008.
GVA by agriculture and fishing
(millions of euro/ECU)
GVA by agriculture and
fishing, share of total
GVA (%)
Annual growth rate GVA
by agriculture and
fishing 1997-2008
Annual growth rate of
share of GVA by
agriculture and
fishing 1997-2008
NUTS
ID
NUTS 1997 2008 1997 2008
EU27 EU27 196578,6 171307,5 2,82 1,75 1,26 -4,23
FI Finland 3857,2 4641 4,12 2,87 1,70 -3,22
RU Russia 5815,07
(140443,9
Milliard RUB)
45165,96
(1625342,1 M
RUB)
6,60 4,80 24,93 -2,85
FI133 North Karelia
(Pohjois-Karjala)
214,9 278,3 9,41 7,64 2,38 -1,87
FI134 Kainuu 126,3 172,2 10,08 9,57 2,86 -0,48
FI1A2 Northern
Ostrobothnia
(Pohjois-Pohjanmaa)
315,4 356,3 5,35 3,38 1,11 -4,09
RUD3 The Republic of
Karelia (Respublika
Kareliâ)
15,55
(375,6 Milliard
RUB)
175,27
(6307,3 M
RUB)
3,9 5,5 24,63 3,17
Source: Eurostat, Rosstat, Kareliâstat

Ulysses Final Report - Multi-thematic Territorial Analysis of Euregio Karelia - Annexes 87
Map 34. Share of GVA by agriculture and fishing in total GVA in Euregio Karelia (2008).
This map does notnecessarily reflect theopinion of the ESPONMonitoring Committee
0 30 60 90 12015Km
Local level: NUTS 3Year: 2008
Source: Eurosta and Kareliâstat© EuroGeographics Association for administrative boundaries
© Project ULYSSES, 2012
0 625312,5 Km
LegendPercent of GVA from agriculture and fishig by total GVA 2008Typology
Predominantly urban
Intermediate regions
Predominantly rural regions
missing value6,30 - 10,10
10,11 - 15,49
>= 15,50
<= 1,75
1,76 - 3,81
3,82 - 6,29

Ulysses Final Report - Multi-thematic Territorial Analysis of Euregio Karelia - Annexes 88
Map 35. Annual growth rate of the share of GVA by agriculture and fishing in Euregio Karelia between 1997 and 2008.
This map does notnecessarily reflect theopinion of the ESPONMonitoring Committee
0 30 60 90 12015Km
Local level: NUTS 3Year: 2008
Source: Eurosta and Kareliâstat© EuroGeographics Association for administrative boundaries
© Project ULYSSES, 2012
0 625312,5 Km
LegendAnnual change of the share of GVA byagriculture and f ishig, 97-08Typology
Predominantly urban
Intermediate regions
Predominantly rural regions
missing value-4,22 - -2,27
-2,26 - 2,85
>= 2,86
<= -10,18
-10,17 - -7,31
-7,30 - -4,23

Ulysses Final Report - Multi-thematic Territorial Analysis of Euregio Karelia - Annexes 89
Employment statistics for agriculture and fishing show a gradual decrease in the European Union, Finland and Russia between 2000 and 2008. The trend has prevailed also in Euregio Karelia. The following table presents employment statistics for the given period, and the following figure temporal evolution of employment in agriculture and fishing in Euregio Karelia between 2000 and 2008. Table 30. Employment in agriculture and fishing in Euregio Karelia between 2000 and 2008.
Employment in agriculture and fishing (thousands of persons)
NUTS
ID
NUTS 2000 2001 2002 2003 2004 2005 2006 2007 2008
EU27 EU27* 17112,90 15846,30 14540,40 14368,70 13880,20 13686,60 13111,90 12875,70 11706,90
FI Finland 136,90 131,50 125,90 124,90 123,40 123,20 122,80 123,00 121,90
RU Russia 9134,43 8642,49 8349,19 7911,90 7542,85 7519,50 7287,73 7070,12 6816,66
FI133 North Karelia (Pohjois-
Karjala)
7,20 7,00 7,00 7,00 6,90 6,60 6,60 6,60 6,50
FI134 Kainuu 4,10 4,00 3,80 3,90 3,80 3,70 3,70 3,80 3,70
FI1A2 Northern Ostrobothnia
(Pohjois-Pohjanmaa)
13,80 13,60 12,90 13,00 12,60 11,80 11,80 11,80 11,70
RU3D The Republic of Karelia
(Respublika Kareliâ)
46,22 42,99 41,79 41,67 39,51 37,27 38,42 36,00 34,88
*NL not included in 2000; UK not included in 2000 and 2001.
Source: Eurostat and Rosstat
Figure 17. Employment in agriculture and fishing in Euregio Karelia between 2000 and 2008.
Source: Eurostat and Rosstat
0,00
5,00
10,00
15,00
20,00
25,00
30,00
35,00
40,00
45,00
50,00
2000 2001 2002 2003 2004 2005 2006 2007 2008
Em
plo
ym
en
t (1
00
0 p
ers
on
s)
North Karelia
Kainuu
Northern Ostrobothnia
The Republic of Karelia

Ulysses Final Report - Multi-thematic Territorial Analysis of Euregio Karelia - Annexes 90
Decrease in employment in agriculture and fishing has naturally reduced the share of employment in general employment statistics. In Euregio Karelia the greatest decrease has taken place in the Republic of Karelia, where the share of employment in agriculture and fishing decreased at an annual rate of -3,71 %. Kainuu on the other hand showed smallest changes; the share of employment in agriculture and fishing was 11,99 in 2000 and 10,34 in 2008. When we compare the regions of Euregio Karelia to Finland, Russia and European Union, it is possible to observe that both the Finnish regions and the Republic of Karelia show larger shares of employment in agriculture and fishing than national or European averages. Table 31. Employment in agriculture and fishing, and share of employment in agriculture and fishing in total
employment in Euregio Karelia between 2000 and 2008.
Employment in agriculture
and fishing (thousands of
persons)
Share of employment in
agriculture and fishing by
total employed (%)
Annual growth rate of
employment in
agriculture and fishing
2000-2008
Annual growth rate of
share of employment in
agriculture and fishing
2000-2008
NUTS
ID
NUTS 2000 2008 2000 2008
EU27 EU27* 17701,10 11706,90 8,41 5,87 -5,04 -4,39
FI Finland 136,9 121,9 5,97 4,83 -1,44 -2,62
RU Russia 9134,43 6816,66 14,16 9,96 -3,59 -4,31
FI133 North Karelia
(Pohjois-Karjala)
7,2 6,5 11,32 9,72 -1,27 -1,89
FI134 Kainuu 4,1 3,7 11,99 10,34 -1,27 -1,84
FI1A2 Northern
Ostrobothnia
(Pohjois-
Pohjanmaa)
13,8 11,7 9,33 7,12 -2,04 -3,32
RU3D The Republic of
Karelia (Respublika
Kareliâ)
46,22 34,88 13,47 9,95 -3,46 -3,71
*For NL and UK no data was available for 2000 and therefore data from 2001 (NL) and 2002 (UK) was used.
Source: Eurostat and Rosstat

Ulysses Final Report - Multi-thematic Territorial Analysis of Euregio Karelia - Annexes 91
Map 36. Share of employment in agriculture and fishing in total employment in Euregio Karelia (2008).
This map does notnecessarily reflect theopinion of the ESPONMonitoring Committee
0 30 60 90 12015Km
Local level: NUTS 3Year: 2008
Source: Eurosta and Kareliâstat© EuroGeographics Association for administrative boundaries
© Project ULYSSES, 2012
0 625312,5 Km
LegendPercent of employed in agriculture and fishing by total employment, 08Typology
Predominantly urban
Intermediate regions
Predominantly rural regions
missing value<= 2,66
2,67 - 5,87
5,88 - 10,57
10,58 - 16,53
16,54 - 28,73
>= 28,74

Ulysses Final Report - Multi-thematic Territorial Analysis of Euregio Karelia - Annexes 92
Map 37. Annual growth rate of the share of employment in agriculture and fishing in Euregio Karelia between 2000
and 2008.
This map does notnecessarily reflect theopinion of the ESPONMonitoring Committee
0 30 60 90 12015Km
Local level: NUTS 3Year: 2008
Source: Eurosta and Kareliâstat© EuroGeographics Association for administrative boundaries
© Project ULYSSES, 2012
0 625312,5 Km
LegendAnnual change of the share of employed in agricultu re and fishing, 00-08Typology
Predominantly urban
Intermediate regions
Predominantly rural regions
missing value<= -7,43
-7,42 - -4,39
-4,38 - -2,48
-2,47 - -1,02
-1,01 - 3,90
>= 3,91

Ulysses Final Report - Multi-thematic Territorial Analysis of Euregio Karelia - Annexes 93
4.3. Chapter conclusions
ESPON 1.1.2 typology considers all the Finnish regions of Euregio Karelia as regions with low urban influence and low human intervention. The Eurostat typology considers the Finnish regions of the CBA as predominantly rural regions. The share of agricultural areas in Euregio Karelia is significantly lower than European average (ESPON countries). Share of agricultural areas in the ESPON countries was 38,65 % in 2006, while the largest share of agricultural areas in the CBA was 7,91 % in Northern Ostrobothnia. Urbanisation of agricultural areas in Euregio Karelia has been below the European average (ESPON countries). Urbanisation of natural and semi-natural areas has been above European average in Northern Ostrobothnia and North Karelia. The share of GVA by agriculture and fishing in total GVA has decreased in all the Finnish regions between 1997 and 2008. In the Republic of Karelia the share has been gradually increasing. Even if there has been an increase in GVA by agriculture and fishing, the share of those fields of economy in the total GVA has decreased between 1997 and 2008 in all the regions of Euregio Karelia. The decrease has been strongest in Northern Ostrobothnia, where the share of agriculture and fishing in total GVA has dropped at an annual rate of -4,09 %.

Ulysses Final Report - Multi-thematic Territorial Analysis of Euregio Karelia - Annexes 94
Chapter 5. Accessibility and connectivity in the Eastern and Northern Finland –
Russia CBA (Euregio Karelia)
Accessibility of a region is determined by two factors, its geographical location and infrastructure. While the
geographical location cannot be changed, improving connectivity can. European Spatial Development
Perspective (ESDP) states that good accessibility of European regions improves not only their competitive
position but also the competitiveness of Europe as a whole. Accessibility is accordingly a key policy aim of the European Union, since accessibility of a region determines the extent to which it can participate in
economic growth. According to ESDP accessibility in certain parts of Europe is poor, which can make these
areas less attractive for many types of investment. Islands and border regions often belong to this type of
territories and they have to find specific solutions in order to succeed.50 Territorial Agenda 2020, on the
other hand, states that fair and affordable accessibility to services of general interest, information,
knowledge and mobility are essential for territorial cohesion. Providing services and minimising
infrastructure barriers can improve sustainable and harmonious territorial development of the European
Union. According to the agenda it is of major importance to secure access to road, rail, water-based and air
transport, and to other infrastructure facilities such as broadband and Trans-European energy networks.51
The aim of this chapter is to evaluate accessibility and connectivity levels of Euregio Karelia. What is the accessibility level of the CBA in comparison with European countries? What is the general accessibility of the CBA regarding different modes of transport? What is the level of broadband internet access in the CBA? Data for the analyses comes from ESPON database.52 As for connectivity data, the ESPON database has only very few indicators, which are on NUTS 2 level and only for year 2003. Given the advancements in this area, data from the 5th Cohesion Report and from the European Innovation Scoreboard and Eurostat has been used regarding households’ internet access. Before going into the analyses, we present a map of Euregio Karelia with main transport infrastructure to give an idea of the accessibility and connectivity of the CBA. In the map main road connections are marked with blue colour and railways with black and white lines. There are three main accesses (international border crossing points) across the Finnish-Russian border in Euregio Karelia. These are (from south to north) Niirala-Vârtsilâ between North Karelia and the Republic of Karelia, Vartius-Lûttâ between Kainuu and the Republic of Karelia and Kuusamo-Suoperâ between Northern Ostrobothnia and the Republic of Karelia. Main airports are located in Oulu, Kuusamo, Kajaani, Joensuu and Petrozavodsk.
50 ESDP 1999; SURE 2009. 51 Territorial Agenda 2020. 52 Most of the data for accessibility available at the ESPON database is outdated and available mostly for the 1999 NUTS version. The use of NUTS 1999 delimitations is specially limiting since changes in the coding systems and actual boundaries of the regions have occurred in almost all of the countries in Europe. Nonetheless, the potential accessibility by different modes of transportation has been updated in 2006 and re-calculated to fit the then ruling NUTS 3 delimitation retroactively for 2001, and it is therefore available for two different comparable years. For us this was particularly useful as this indicator does not limit itself to measuring the transport network, but synthesizes overall accessibility of the regions by relating the travel time (impedance function) with the population that can be reached (activity function).

Ulysses Final Report - Multi-thematic Territorial Analysis of Euregio Karelia - Annexes 95
Map 38. Main transport infrastructure in Euregio Karelia.

Ulysses Final Report - Multi-thematic Territorial Analysis of Euregio Karelia - Annexes 96
Table 32. Parameters studied for the accessibility and connectivity in the Eastern and Northern Finland – Russia CBA
(Euregio Karelia).
Variable name Geographical
scale
Source Time frame
Potential accessibility road, rail, air and multimodal
indexed to ESPON average
NUTS 3 ESPON DB 2001;2006
Potential accessibility road, rail, air and multimodal
indexed to CBA average
NUTS 3 ESPON DB 2001;2006
Potential accessibility road, rail, air and multimodal
index change 2001-2006
NUTS 3 ESPON DB 2001;2006
Households with broadband internet connection,
2009
NUTS 2 European Commission 5th Cohesion Report,
Regional Innovation Scoreboard
2009 (2004 NO,
PL)
We have studied Euregio Karelia from the perspective rail, road, air and multimodal (synthesizing all the modes of transportation) accessibility. We used an indicator named potential accessibility, which is a similar indicator to demographic potential. This means that it relates activities to be reached with travel time it takes to reach them.53 The method applied here originates from ESPON 1.2.1 project. The concept of potential accessibility is based on the assumption that the attraction of a destination increases with size, and declines with distance, travel time or cost. Destination size is usually represented by population or economic indicators such as GDP or income.54 We have summarized results of the potential accessibility analyses in the following table. It represents how accessible regions of Euregio Karelia are, first, in the context of ESPON countries and, second, in the context of the cross-border area. Analyses were not performed for the Republic of Karelia due to the lack of data. We will interpret the results separately for each transport mode in the following subchapters. Table 33. Potential accessibility of Euregio Karelia in the context of ESPON space and the CBA (2006).
NUTS
ID
NUTS Rail
ESPON
Road
ESPON
Air
ESPON
Multimodal
ESPON
Rail
CBA
Road
CBA
Air
CBA
Multimodal
CBA
FI133 North Karelia (Pohjois-Karjala) 10,3 6,2 55,2 48,2 135,53 142,20 106,65 106,78
FI134 Kainuu 6,3 3,1 50,8 44,2 82,89 71,10 98,15 97,92
FI1A2 Northern Ostrobothnia
(Pohjois-Pohjanmaa)
6 3,6 44,8 39,1 78,95 82,57 86,55 86,62
RU3D The Republic of Karelia
(Respublika Kareliâ)
N/A N/A N/A N/A N/A N/A N/A N/A
53 Potential accessibility is calculated according to the following formula:
�� = ���
exp�� (−����)
where A� is the accessibility of area i, W� is the activity W to be reached in area j, and C�� is the generalised cost of reaching area j from area i. A� is the total of the activities reachable at j weighted by the ease of getting from i to j. The interpretation is that the greater the number of attractive destinations in areas j is and the more accessible areas j are from area i, the greater is the accessibility of area i. 54 The potential accessibility model uses centroids of NUTS 3 regions as origins and destinations. The accessibility model calculates minimum travel times between the centroids of the NUTS 3 regions. For each NUTS 3 region the value of the potential accessibility indicator is calculated by summing up the population in all other regions including those outside ESPON space weighted by the travel time to get there.

Ulysses Final Report - Multi-thematic Territorial Analysis of Euregio Karelia - Annexes 97
Source: ESPON DB
As the potential accessibility was in ESPON 1.2.1 project produced for two different years, it was possible for us to study the evolution of infrastructure development between 2001 and 2006. Here, the index change of accessibility was used. For this indicator the accessibility values of 2001 were standardised to the ESPON average of that year and those of 2006 to the average of that year. Each ESPON average was set to 100 and the regional values were transformed accordingly. The maps show the differences in the index values, i.e. the change in position of the regions relative to other regions. Positive values express an improvement in relative locational quality, while negative values express a loss in relative locational quality.55 Table 34. Standardised potential accessibility of Euregio Karelia in the context of ESPON countries and the CBA (2006).
Standardised potential accessibility
(ESPON = 100)
Standardised potential accessibility
(CBA = 100)
NUTS ID NUTS Rail Road Air Multimodal Rail Road Air Multimodal
FI133 North Karelia (Pohjois-Karjala) 10,3 6,2 55,2 48,2 136,7 144,2 109,8 110,0
FI134 Kainuu 6,3 3,1 50,8 44,2 83,6 72,1 101,1 100,8
FI1A2 Northern Ostrobothnia (Pohjois-Pohjanmaa) 6 3,6 44,8 39,1 79,6 83,7 89,1 89,2
RU3D The Republic of Karelia (Respublika Kareliâ) N/A N/A N/A N/A N/A N/A N/A N/A
Source: ESPON DB
5.1. Accessibility by road
In the context of ESPON space potential accessibility of the Finnish regions of Euregio Karelia by road was very low, between 6,2 (North Karelia) and 3,1 (Kainuu). This is understandable considering the remote location of the regions from the main European road infrastructure. In the context of the CBA North Karelia had the best accessibility (142,2), while Northern Ostrobothnia and Kainuu valued lowest (82,57 and 71,1). The index change in the accessibility between 2001 and 2006 was negative in all the regions, varying between -0,3 in North Karelia and -0,1 in Northern Ostrobothnia.
55 Potential Accessibility Indicators 2007.

Ulysses Final Report - Multi-thematic Territorial Analysis of Euregio Karelia - Annexes 98
Map 39. Potential accessibility of the Finnish regions of Euregio Karelia by road in the context of ESPON countries
(2006).
This map does notnecessarily reflect theopinion of the ESPONMonitoring Committee
0 30 60 90 12015Km
Local level: NUTS 3Year: 2006
Source: Spiekermann & Wegener, Urban and Regional Research (S&W)Origin of data: ESPON DB
© EuroGeographics Association for administrative boundaries
© Project ULYSSES, 2012
0 625312,5 Km
LegendPotential accessibility by road indexed to ESPON av erage, 2006
<missing values>80,71 - 100,00
100,01 - 167,60
>= 167,61
<= 23,80
23,81 - 50,40
50,41 - 80,70

Ulysses Final Report - Multi-thematic Territorial Analysis of Euregio Karelia - Annexes 99
Map 40. Potential accessibility of the Finnish regions of Euregio Karelia by road in the context of the CBA(2006).
This map does notnecessarily reflect theopinion of the ESPONMonitoring Committee
0 30 60 90 12015Km
Local level: NUTS 3Year: 2006
Source: Spiekermann & Wegener, Urban and Regional Research (S&W)Origin of data: ESPON DB
© EuroGeographics Association for administrative boundaries
© Project ULYSSES, 2012
0 625312,5 Km
LegendPotential accessibility by road indexed to CBA aver age, 2006
<missing values><= 57,50
57,51 - 84,14
84,15 - 100,00
100,01 - 112,34
112,35 - 125,71
>= 125,72

Ulysses Final Report - Multi-thematic Territorial Analysis of Euregio Karelia - Annexes 100
Map 41. Index change of standardised potential accessibility by road in the Finnish regions of Euregio Karelia between
2001 and 2006.
This map does notnecessarily reflect theopinion of the ESPONMonitoring Committee
0 30 60 90 12015Km
Local level: NUTS 3Year: 2000-2006
Source: Spiekermann & Wegener, Urban and Regional Research (S&W)Origin of data: ESPON DB
© EuroGeographics Association for administrative boundaries
© Project ULYSSES, 2012
0 625312,5 Km
LegendPotential accessibility by road standardized index change, 2000-2006
<missing values><= -5
-4,9 - -2,3
-2,2 - 0,0
0,01 - 9,0
9,1 - 19
>= 20

Ulysses Final Report - Multi-thematic Territorial Analysis of Euregio Karelia - Annexes 101
5.2. Accessibility by rail
The Finnish regions of Euregio Karelia are not easily accessed by rail in the context of European countries (ESPON space), even if they do value slightly higher in the rail than in the road accessibility; between 10,3 (North Karelia) and 6 (Northern Ostrobothnia). Within the CBA North Karelia is the most accessible region by rail (135,53) and Northern Ostrobothnia the least accessible (78,95). Index change in the potential accessibility by rail has been negative in all the regions varying from -0,4 in North Karelia to -0,1 in Kainuu and Northern Ostrobothnia.

Ulysses Final Report - Multi-thematic Territorial Analysis of Euregio Karelia - Annexes 102
Map 42. Potential accessibility of the Finnish regions of Euregio Karelia by rail in the context of ESPON countries (2006).
This map does notnecessarily reflect theopinion of the ESPONMonitoring Committee
0 30 60 90 12015Km
Local level: NUTS 3Year: 2006
Source: Spiekermann & Wegener, Urban and Regional Research (S&W)Origin of data: ESPON DB
© EuroGeographics Association for administrative boundaries
© Project ULYSSES, 2012
0 625312,5 Km
LegendPotential accessibility by rail indexed to ESPON av erage, 2006
<missing values>74,21 - 105,00
105,01 - 143,80
>= 143,81
<= 15,40
15,41 - 31,70
31,71 - 74,20

Ulysses Final Report - Multi-thematic Territorial Analysis of Euregio Karelia - Annexes 103
Map 43. Potential accessibility of the Finnish regions of Euregio Karelia by rail in the context of the CBA (2006).
This map does notnecessarily reflect theopinion of the ESPONMonitoring Committee
0 30 60 90 12015Km
Local level: NUTS 3Year: 2006
Source: Spiekermann & Wegener, Urban and Regional Research (S&W)Origin of data: ESPON DB
© EuroGeographics Association for administrative boundaries
© Project ULYSSES, 2012
0 625312,5 Km
LegendPotential accessibility by rail indexed to CBA aver age, 2006
<missing values><= 70,14
70,15 - 84,92
84,93 - 100,00
100,01 - 109,13
109,14 - 126,80
>= 126,81

Ulysses Final Report - Multi-thematic Territorial Analysis of Euregio Karelia - Annexes 104
Map 44. Index change of standardised potential accessibility by rail in the Finnish regions of Euregio Karelia between
2001 and 2006.
This map does notnecessarily reflect theopinion of the ESPONMonitoring Committee
0 30 60 90 12015Km
Local level: NUTS 3Year: 2000-2006
Source: Spiekermann & Wegener, Urban and Regional Research (S&W)Origin of data: ESPON DB
© EuroGeographics Association for administrative boundaries
© Project ULYSSES, 2012
0 625312,5 Km
LegendPotential accessibility by rail standardized index change, 2000-2006
<missing values><= -6,10
-6,09 - -2,10
-2,09 - 0,00
0,01 - 6,30
6,31 - 13,80
>= 13,81

Ulysses Final Report - Multi-thematic Territorial Analysis of Euregio Karelia - Annexes 105
5.3. Accessibility by air
Air connections make Euregio Karelia more accessible to the European countries than road and rail infrastructure. Accessibility by air of North Karelia valued at 55,2, Kainuu at 50,8 and Northern Ostrobothnia at 44,8. In the context of the CBA the accessibility of the regions was similar; North Karelia had the highest (106,65) and Northern Ostrobothnia the lowest (86,55) accessibility. Index change in standardized potential accessibility was positive in North Karelia and Kainuu (0,3), while Northern Ostrobothnia performed worse and valued at -2. It is possible to argue how well these figures correspond to reality. If we look at flight traffic from and to the regions of Euregio Karelia, the busiest airport is located in Oulu, Northern Ostrobothnia. Oulu airport hosted 92 993 passengers on international and 802 791 passengers on domestic flights during year 2008, while the airport of Joensuu in North Karelia hosted only 9 439 passengers on international and 134 274 passengers on domestic flights. Kajaani airport had the least passengers, 3 379 on international and 84 622 on domestic flights.56 Basing on these figures one would assume that Northern Ostrobothnia would rank as the most accessible region by air in Euregio Karelia. Considering the figures on accessibility by air in the CBA, one should be aware of the fact that there are no direct flights between the regions of Euregio Karelia. In order, for example, to get from Joensuu to Oulu (or Kajaani), one needs to fly to Helsinki and change the flight there. Thus no real flight connections exist between the regions of Euregio Karelia.
56 Finavia 2008.

Ulysses Final Report - Multi-thematic Territorial Analysis of Euregio Karelia - Annexes 106
Map 45. Potential accessibility of the Finnish regions of Euregio Karelia by air in the context of ESPON countries (2006).
This map does notnecessarily reflect theopinion of the ESPONMonitoring Committee
0 30 60 90 12015Km
Local level: NUTS 3Year: 2006
Source: Spiekermann & Wegener, Urban and Regional Research (S&W)Origin of data: ESPON DB
© EuroGeographics Association for administrative boundaries
© Project ULYSSES, 2012
0 625312,5 Km
LegendPotential accessibility by air indexed to ESPON ave rage, 2006
<missing values>81,61 - 100,00
100,01 - 128,20
>= 128,21
<= 45,80
45,81 - 62,80
62,81 - 81,60

Ulysses Final Report - Multi-thematic Territorial Analysis of Euregio Karelia - Annexes 107
Map 46. Potential accessibility of the Finnish regions of Euregio Karelia by air in the context of the CBA (2006).
This map does notnecessarily reflect theopinion of the ESPONMonitoring Committee
0 30 60 90 12015Km
Local level: NUTS 3Year: 2006
Source: Spiekermann & Wegener, Urban and Regional Research (S&W)Origin of data: ESPON DB
© EuroGeographics Association for administrative boundaries
© Project ULYSSES, 2012
0 625312,5 Km
LegendPotential accessibility by air indexed to CBA avera ge, 2006
<missing values><= 64,80
64,81 - 85,25
85,26 - 100,00
100,01 - 107,15
107,16 - 133,48
>= 133,49

Ulysses Final Report - Multi-thematic Territorial Analysis of Euregio Karelia - Annexes 108
Map 47. Index change of standardised potential accessibility by air in the Finnish regions of Euregio Karelia between
2001 and 2006.
This map does notnecessarily reflect theopinion of the ESPONMonitoring Committee
0 30 60 90 12015Km
Local level: NUTS 3Year: 2000-2006
Source: Spiekermann & Wegener, Urban and Regional Research (S&W)Origin of data: ESPON DB
© EuroGeographics Association for administrative boundaries
© Project ULYSSES, 2012
0 625312,5 Km
LegendPotential accessibility by air standardized index c hange, 2000-2006
<missing values>0,01 - 2,4
2,5 - 8,4
>= 8,5
<= -20
-19 - -5,8
-5,7 - 0,0

Ulysses Final Report - Multi-thematic Territorial Analysis of Euregio Karelia - Annexes 109
5.4. Multimodal accessibility
Multimodal accessibility combines all the above analysed forms of transport and demonstrates general accessibility levels. Relatively good air accessibility of Euregio Karelia clearly affects the multimodal accessibility levels of the region. In the context of ESPON countries, North Karelia valued at 48,2, Kainuu at 44,2 and Northern Ostrobothnia at 39,1. In the context of the CBA, North Karelia had the highest (106,78) and Northern Ostrobothnia the lowest (86,62) accessibility. Index change of standardised potential accessibility was negative in all the regions. Greatest decrease in accessibility took place in Northern Ostrobothnia (-2), and the smallest in Kainuu (-2).

Ulysses Final Report - Multi-thematic Territorial Analysis of Euregio Karelia - Annexes 110
Map 48. Multimodal potential accessibility of the Finnish regions of Euregio Karelia in the context of ESPON countries
(2006).
This map does notnecessarily reflect theopinion of the ESPONMonitoring Committee
0 30 60 90 12015Km
Local level: NUTS 3Year: 2006
Source: Spiekermann & Wegener, Urban and Regional Research (S&W)Origin of data: ESPON DB
© EuroGeographics Association for administrative boundaries
© Project ULYSSES, 2012
0 625312,5 Km
LegendMultimodal accessibility indexed to ESPON average, 2006
<missing values>>= 45,60
45,61 - 61,20
61,21 - 76,40
76,41 - 91,00
91,01 - 125,90
>= 125,91

Ulysses Final Report - Multi-thematic Territorial Analysis of Euregio Karelia - Annexes 111
Map 49. Multimodal potential accessibility of the regions of Euregio Karelia in the context of the cross-border region
(2006).
This map does notnecessarily reflect theopinion of the ESPONMonitoring Committee
0 30 60 90 12015Km
Local level: NUTS 3Year: 2006
Source: Spiekermann & Wegener, Urban and Regional Research (S&W)Origin of data: ESPON DB
© EuroGeographics Association for administrative boundaries
© Project ULYSSES, 2012
0 625312,5 Km
LegendMultimodal accessibility indexed to CBA average, 20 06
<missing values><= 57,14
57,15 - 81,53
81,54 - 92,59
92,60 - 100,00
100,01 - 122,91
>= 122,92

Ulysses Final Report - Multi-thematic Territorial Analysis of Euregio Karelia - Annexes 112
Map 50. Index change of standardised multimodal potential accessibility in the Finnish regions of Euregio Karelia
between 2001 and 2006.
This map does notnecessarily reflect theopinion of the ESPONMonitoring Committee
0 30 60 90 12015Km
Local level: NUTS 3Year: 2000-2006
Source: Spiekermann & Wegener, Urban and Regional Research (S&W)Origin of data: ESPON DB
© EuroGeographics Association for administrative boundaries
© Project ULYSSES, 2012
0 625312,5 Km
LegendMultimodal accessibility standardized index change, 2000-2006
<missing values><= -7,9
-7,8 - -3
-2,9 - 0,00
0,01 - 5,5
5,6 - 14
>= 15

Ulysses Final Report - Multi-thematic Territorial Analysis of Euregio Karelia - Annexes 113
5.5. Broadband internet access
Compared to the physical accessibility, Euregio Karelia ranked considerably higher with its “virtual connectivity”. In 2009 75,6 % of households in the NUTS 2 region of Northern Finland had a broadband internet connection and in Eastern Finland the respective figure was 60 %. The European average in 2009 was 56 %. Broadband internet access is a political objective in Finland, and in 2008 the Finnish government ratified a project called “Broadband 2015” that aims at providing broadband internet connection to all citizens (99 % of the citizens should have a maximum two kilometre distance to an optical fibre or cable network, enabling a 100Mbit internet connection).57 Eastern and Northern Finland are, however, problematic regions when achieving this challenge. These regions are mostly sparsely populated and distances between populated areas are long. According to Rosstat the amount of households with internet connection has been increasing also in Russia. No data was available on broadband internet connections in the Republic of Karelia, but in 2005 the share of households with internet connection in the Republic was 19,7 % and in 2009 already 37,4 %.
57 Ficora 2011.

Ulysses Final Report - Multi-thematic Territorial Analysis of Euregio Karelia - Annexes 114
Map 51. Households with broadband internet connection in the Eastern and Northern Finland – Russia CBA in 2009.
!
!
!
Tallinn
Helsinki
Stockholm
Regional level: NUTS 2Year: 2004, 009
Origin of data: European Commission, 5th Cohesion Report;Pro Inno Europe, Regional Innovation Scoreboard 2009
© EuroGeographicsAssociation for administrative boundaries
This map does notnecessa rily reflect theopinion of the ESPONMonitoring Committee
Househo lds with broadband internet access
0 860430km
Legend © ULYSSES, 2011
<missing value>
Percent of househols with broadband internet access NUTS 2, 2009 (Sweden, Poland 2004)
<= 12,50
12,51 - 25,00
25,01 - 37,50
37,51 - 50,00
50,01 - 62,50
62,51 - 75,00
75,01 - 87,50
>= 87,51

Ulysses Final Report - Multi-thematic Territorial Analysis of Euregio Karelia - Annexes 115
5.6. Cross-border traffic
Accessibility within Euregio Karelia is very much affected by the external border with a passport control and customs checks. We have briefly studied the evolution of cross-border traffic on the territory of Euregio Karelia in order to address cross-border aspect of accessibility within the CBA. There are three international border crossing points in the territory of Euregio Karelia. Cross-border traffic has been increasing steadily and the border crossing infrastructure has been developed. Passenger traffic has been increasing significantly on the border crossing points of Niirala-Vârtsilâ and Kuusamo-Suoperâ between 2007 and 2011, while growth on the crossing point on Vartius-Lûtta has remained moderate. In 2007 there were 898 435 border crossings by passengers on Niirala-Vârtsilâ crossing point, 408 938 on Vartius-Lûtta and 17 408 on Kuusamo-Suoperâ. In 2011 the respective amounts were 1 281 037 on Niirala-Vârtsilâ, 467 126 on Vartius-Lûtta and 42 512 on Kuusamo-Suoperâ border crossing point. In total between 2007 and 2011 the number of border crossings in Euregio Karelia has increased at an annual rate of 7,8 %. Thus the connectivity between the Finnish and Russian regions of the CBA is increasing.
5.7. Chapter conclusions
When analysing accessibility and connectivity of Euregio Karelia, geographical facts become evident. The CBA is situated far from European core areas and transport infrastructure. Potential accessibility of the Finnish regions of Euregio Karelia in the context of ESPON space by road was very low, between 6,2 (North Karelia) and 3,1 (Kainuu). The Finnish regions of Euregio Karelia were not easily accessed by rail either, even if they valued slightly higher in the rail than in the road accessibility; between 10,3 (North Karelia) and 6 (Northern Ostrobothnia). Air connections to Euregio Karelia make the region better accessible to the European countries than road and rail infrastructure. Accessibility by air in North Karelia valued at 55,2, in Kainuu at 50,8 and in Northern Ostrobothnia at 44,8. It is possible to argue how well these figures correspond to reality. If we look at flight traffic from and to the regions of Euregio Karelia, the busiest airport is located in Oulu, Northern Ostrobothnia. Multimodal accessibility combines all the above analysed forms of transport and demonstrates general accessibility levels. Relatively good air accessibility of Euregio Karelia clearly affects the multimodal accessibility level of the region. In the context of ESPON countries, North Karelia valued at 48,2, Kainuu at 44,2 and Northern Ostrobothnia at 39,1. In the context of the CBA, North Karelia had the highest (106,78) and Northern Ostrobothnia the lowest (86,62) accessibility. Index change of standardised potential accessibility was in all the regions negative. Greatest decrease of accessibility took place in Northern Ostrobothnia, and the smallest in Kainuu. In comparison to the physical accessibility, Euregio Karelia ranks considerably higher in its “virtual connectivity”. In 2009 75,6 % of households in the NUTS 2 region of Northern Finland had a broadband internet connection and in Eastern Finland the respective figure was 60 %. The European average in 2009 was 56 %. No data was available on broadband internet connections in the Republic of Karelia, but in 2005 the share of households with internet connection in the Republic was 19,7 % and in 2009 already 37,4 %. Accessibility within the CBA is very much affected by the external border with a passport control and customs checks. There are three international border crossing points in the territory of Euregio Karelia. Cross-border traffic has been increasing steadily and the border crossing infrastructure has been developed. Between 2007 and 2011 the number of border crossings increased at an annual rate of 7,8 %. Thus the connectivity between the Finnish and Russian regions of the CBA is increasing.

Ulysses Final Report - Multi-thematic Territorial Analysis of Euregio Karelia - Annexes 116
Chapter 6. Performance of Eastern and Northern Finland – Russia CBA (Euregio
Karelia) from the perspective of Lisbon / Europe 2020 and Gothenburg objectives
Lisbon Strategy was launched in 2000 by the European Council as a response to the challenges of
globalisation and ageing. The core idea of the strategy was for the European Union to become the most
dynamic and competitive knowledge-based economy in the world by 2010. The Strategy underlined
sustainable economic growth and promoted social cohesion and respect for the environment. Lisbon Strategy was re-launched in 2005 with more focused goals and clearer division of responsibilities between
EU and national levels. The new revised Lisbon Strategy concentrated on two particular themes; growth and
jobs.58 Objectives of the Lisbon Strategy were achieved only partly in the Member States. Economic crisis
was one the biggest obstacles that hindered the realization of National Reform Programmes.
In June 2010 European Council adopted a new "Europe 2020 Strategy" that was adjusted to the current
economic situation and challenges. The Europe 2020 Strategy identified three key drivers for growth that
included smart growth (fostering knowledge, innovation, education and digital society), sustainable growth
(making our production more resource efficient while boosting competitiveness of the EU) and inclusive
growth (raising participation in the labour market, the acquisition of skills and the fight against poverty).
Gothenburg Strategy (‘A Sustainable Europe for a Better World: A European Union Strategy for Sustainable Development’) was launched by the European Commission in 2001 to complement the Lisbon Strategy by
adding an environmental dimension to the Lisbon process for employment, economic reform and social
cohesion.59
The goal of our study was to measure the performance of the Eastern and Northern Finland – Russia CBA (Euregio Karelia) regarding the socio-economic and environmental goals set up in the Lisbon / Europe 2020 and Gothenburg strategies. Analyses were divided into four subcategories: economy and employment, research and innovation, social cohesion and environment. Table 35. Indicators applied for the study of Lisbon / Europe 2020 and Gothenburg Strategies.
Variable name Geographical scale Source Time frame
GDP per capita NUTS 3 Eurostat, Russian Federal State Statistics
Service, Kareliâstat
1997–2009
Gross value added by NACE NUTS 3 Eurostat 1997–2008
Employment by NACE NUTS 3 Eurostat 2000–2008
Total intramural R&D expenditure NUTS 2 Eurostat 2007
EPO patents by million of inhabitants NUTS 2 Eurostat 2007
Employment in medium and high tech
manufacturing
NUTS 2 ESPON DB (Regional Innovation Scoreboard),
Russian Federal State Statistics Service
2004
Unemployment rate NUTS 2 Eurostat 2010
Long term unemployment NUTS 2 Eurostat 2009
58 Lisbon Strategy evaluation 2010. 59 Strategy for sustainable development 2009.

Ulysses Final Report - Multi-thematic Territorial Analysis of Euregio Karelia - Annexes 117
Youth unemployment rate NUTS 2 Eurostat 2010
Population at risk of poverty after social transfers NUTS 2 Eurostat 2008
Infant mortality rate NUTS 2 Eurostat 2008
Population aged 25-64 with tertiary education NUTS 2 Eurostat 2010
Soil sealed area NUTS 3 European Commission’s 5th
Cohesion Report 2006
Ozone concentration exceedances NUTS 3 European Commission’s 5th
Cohesion Report 2008
Urban waste water treatment NUTS 2 European Commission’s 5th
Cohesion Report 2007
Share of Natura 2000 areas NUTS 3 European Commission’s 5th
Cohesion Report 2009
Solar energy resources NUTS 3 European Commission’s 5th
Cohesion Report 1981–1990
Wind energy potential NUTS 3 European Commission’s 5th
Cohesion Report 2000–2005
Physical sensitivity to climate change NUTS 3 ESPON Climate project
Social sensitivity to climate change NUTS 3 ESPON Climate project
Economic sensitivity to climate change NUTS 3 ESPON Climate project
6.1. Economy and employment
6.1.1. GDP per capita
In order to study regional disparities in GDP per capita we used coefficient of deviation in our analyses.60 The higher the coefficient of deviation is, the higher the disparities are within the analysed geographical unit. In Euregio Karelia the coefficient of deviation was 54,3 in 2008, which was above the average deviation of ESPON NUTS 3 regions (51,2). This signifies that the disparities in GDP per capita are higher between regions of Euregio Karelia than regions of ESPON countries. The coefficient has, however, been decreasing in Euregio Karelia; in 1997 it was 65,6. The main reason behind the positive trend in Euregio Karelia is the increase in GDP per inhabintant in the Republic of Karelia; in 1997 GDP per inhabitant was 484 € and in 2008 already 4580 €.61 When we compare the Republic of Karelia with Russian Federation, it is possible to observe that in 1997 GDP per capita was almost as high in the Republic as in the country (598 €), but in 2008 GDP per capita for the Russian Federation was significantly higher (7981 €). The coefficient of deviation of ESPON space (NUTS 3 regions) has been decreasing in the 2000s, while the disparities between regions in Finland have been increasing slightly.
60 This indicator is obtained by calculating the ratio of the standard deviation to the mean, and it is a good way to
compare geographical units which differ greatly in their average values. The coefficient of deviation was calculated,
besides the cross-border areas, for the countries of which the CBA is part of as well as for all the NUTS 3 and NUTS 0
level regions and countries of the ESPON space (on NUTS 0 level separately for EU27+CH+NO and EU27).The
coefficient was calculated excluding the Swiss and Russian regional data because it was not available. Formula for
producing coefficients of deviation is following:
������ ����� �� = � ���������� ���������
61 GDP per inhabintant values for the Republic of Karelia were calculated from the Gross Regional Product per inhabitant. Roubles were converted to Euros using the mean exchange rates of the European Central Bank.

Ulysses Final Report - Multi-thematic Territorial Analysis of Euregio Karelia - Annexes 118
Figure 18. Coefficient of deviation of GDP per capita between 1997 and 2008.
Source: Eurostat, Rosstat, Kareliâstat
Next, we performed two different analyses on the data on GDP per capita at NUTS 3 level. In the first one we compared each NUTS 3 region with the leading region in terms of GDP per capita (West Inner London, UKI11), through index number analysis. In the second one we applied a logistic function to establish the relative performance of each NUTS 3 to the leading region, exploring the notion of territorial catching-up.62 Table 36. GDP per capita (euro) in the leading NUTS 1 region (London), in the leading Finnish region (Uusimaa) and the
regions of Euregio Karelia between 1997 and 2008.
ID 1997 1998 1999 2000 2001 2002 2003 2004 2005 2006 2007 2008
UKI London 32200 35200 38600 43600 44300 46400 44800 48300 50000 53400 56700 50600
FI181 Uusimaa 28000 31000 33100 36000 38000 38300 37800 39400 40600 42800 46200 46900
FI133 North
Karelia
(Pohjois-
Karjala)
15100 15500 16600 18600 19100 19200 20200 21200 22100 23400 24600 25100
FI134 Kainuu 15500 15500 16200 16400 18100 18600 19000 19900 19800 21600 23300 24800
FI1A2 Northern
Ostrobot
19000 19600 20300 22200 21600 24600 25900 27000 27600 27500 30500 31300
62 In theory, for both analyses the value of reference for GDP per capita would be the highest value among all NUTS 3, that of the West Inner London -region. However, at this territorial level, GDP per capita can be affected by several factors, such as high population fluctuations and significant mismatches between jobs (and wealth production) and the place of residence. In fact, in economically central places (of which London is a good example), there normally is a steady flow of migrant workers, as well as commuters from other NUTS 3 regions, and the GDP per capita of the economic centre is seriously overestimated. For that reason, instead of simply considering the GDP per capita of the West Inner London (UKI11) NUTS 3, the whole Greater London (UKI) NUTS 1 was used as a reference for this analysis.
0
10
20
30
40
50
60
70
80
1997 1998 1999 2000 2001 2002 2003 2004 2005 2006 2007 2008
Co
eff
icie
nt o
f d
ev
iatio
n
Euregio Karelia
Euregio Karelia
Finnish regions
of Euregio
Karelia
Finland
ESPON_N3
ESPON_N0

Ulysses Final Report - Multi-thematic Territorial Analysis of Euregio Karelia - Annexes 119
hnia
(Pohjois-
Pohjanma
a)
RU3D The
Republic
of Karelia
(Respubli
ka
Kareliâ)*
484 566 1018 1476 1770 1928 1879 2126 3118 3540 4309 4580
*Gross Regional Product per inhabitant. Roubles converted to Euros using the mean exchange rates of the European
Central Bank.
Source: Eurostat, Rosstat, Kareliâstat
The first analysis, GDP indexed to the leading region, involved indexation of GDP per capita in each NUTS 3 region of Euregio Karelia to the value of London (UKI) region in 2008.63 The results of the analysis are presented in the following table. The best performing region among the regions of Euregio Karelia in terms of GDP per capita is Northern Ostrobothnia. Compared to the leading region Northern Ostrobothnia is classified as middle income region, while both North Karelia and Kainuu are indentified as less developed regions and the Republic of Karelia as a very laggard region. The leading region in Finland, Uusimaa performs relatively well compared to the leading region. It has an index of 92,69 and it is classified as a rich region. In the Finnish context this illustrates the accumulation of production and welfare in the capital region. Table 37. GDP per capita of the regions of Euregio Karelia (and the Finnish region of Uusimaa) indexed to the leading
NUTS 1 region of London (2008).
ID 2008 Index number Class Code
UKI London 50600 100 very rich region 1
FI181 Uusimaa 46900 92,69 rich region 2
FI133 North Karelia (Pohjois-Karjala) 25100 49,60 less developed region 4
FI134 Kainuu 24800 49,01 less developed region 4
FI1A2 Northern Ostrobothnia (Pohjois-
Pohjanmaa)
31300 61,86 middle income region 3
RU3D The Republic of Karelia (Respublika
Kareliâ)*
4580 9,05 very laggard region 6
Source: Eurostat, Rosstat, Kareliâstat
63 The value of the leading region is by definition 100,0. Following formula is applied in the analysis:
��������� = ���������� × 100
where GDP� is the GDP per capita of a given NUTS 3 region and GDP� is the GDP per capita of the NUTS 2 region of
London.

Ulysses Final Report - Multi-thematic Territorial Analysis of Euregio Karelia - Annexes 120
Map 52. GDP per capita of the Finnish regions of Euregio Karelia indexed to the leading NUTS 1 region of London
(2008).
This map does notnecessarily reflect theopinion of the ESPONMonitoring Committee
0 30 60 90 12015Km
Local level: NUTS 3Year: 2008
Source: Eurostat© EuroGeographics Association for administrative boundaries
© Project ULYSSES, 2012
0 625312,5 Km
Legend
GDP per capita indexed to the leading region London UKI = 100
<missing values>very rich region >=95
rich region [75-95[
midle income region [0-74[
less developed region [30-50[
laggard region [15-30[
very laggard region <15

Ulysses Final Report - Multi-thematic Territorial Analysis of Euregio Karelia - Annexes 121
The catching up analysis evaluates the speed of catching-up with the leading region, through a standard logistic process. The catching-up process analysis sets the relative position of each NUTS 3 region and its relative trajectory up to the level of 95% of the GDP of the leading region in 50 years. The difference of performance of each region in comparison to the leading region is measured in years needed to reach the level assumed above.64 All regions with a performance of 95% or higher compared to the leading region were considered leading regions. The analysis distinguishes converging regions from diverging regions, and the different levels of catching-up performance. Leading regions are the ones who already have a GDP close to that of the London NUTS 1 region. Fast converging regions have a growth rate which allows them to reach the leader in no more than 20 years, steady catching-up regions between 21 to 50 years, slow catching-up regions between 51 to 100 and slow converging regions between 101 to 250 years. Non converging regions have great distances in terms of GDP and are growing at a rate equal or slightly superior to the leader and diverging regions are growing less than the leader.
leading region >=95% (GPD already close to the leader)
fast converging region [0-20]
steady catching-up region [20-50]
slow catching-up region [50-100]
slow converging region [100-250]
non converging region >250
diverging region growth (g) < growth London (g*) The following table and map illustrate the results of the catching-up analysis for Euregio Karelia. The Republic of Karelia was classified as a steady catching-up region and in theory it would need 27 years to catch up with the leading region in terms of GDP per inhabitant (this is a mathematical calculation based on the growth of GDP per capita). The growth of GDP per capita has been more modest in the Finnish regions of Euregio Karelia. Northern Ostrobothnia was the only region that was classified as a (slow) converging region. North Karelia and Kainuu were classified as non converging regions. When compared to the leading Finnish region Uusimaa, which is according to the analysis a fast converging region, it is possible to see huge internal differences between the growth rates of the Finnish regions. Uusimaa has five years to the leader, while the strongest region of Euregio Karelia, Northern Ostrobothnia, would need 218 years to catch up with the leading region. Table 38. Catching-up analysis of the Finnish regions of Euregio Karelia (performance in GDP per capita between 1997
and 2008 compared to the leading NUTS 1 region of London).
ID Annual
growth rate
G = relative
growth
K = relative position
(GDP)
A = constante
for G e K
years to the
leader
class code
UKI London 0,0419
FI181 Uusimaa 0,0480 0,0058 0,08 0,080 5,085844042 fast converging
region
2
FI133 North Karelia
(Pohjois-
0,0473 0,0051 1,02 0,010 291,3114868 non converging
region
6
64 According to these assumptions, the logistic function which describes the problem is represented as follows:
� = 0,95�� = ��1 + ����� �1�
The data used for the catching up analysis was GDP per capita for the years 1997 and 2008.

Ulysses Final Report - Multi-thematic Territorial Analysis of Euregio Karelia - Annexes 122
Karjala)
FI134 Kainuu 0,0437 0,0016 1,04 0,003 928,0722515 non converging
region
6
FI1A2 Northern
Ostrobothnia
(Pohjois-
Pohjanmaa)
0,0464 0,0043 0,62 0,011 218,3128582 slow converging
region
5
RU3D The Republic
of Karelia
(Respublika
Kareliâ)*
0,2266 0,1772 10,05 0,195 26,95204514 steady catching-
up region
3
Source: Eurostat, Rosstat, Kareliâstat

Ulysses Final Report - Multi-thematic Territorial Analysis of Euregio Karelia - Annexes 123
Map 53. Performance of the regions of Euregio Karelia in GDP per capita between 1997 and 2008 compared to the
leading NUTS 1 region of London.
This map does notnecessarily reflect theopinion of the ESPONMonitoring Committee
0 30 60 90 12015Km
Local level: NUTS 3Year: 1997-2008Source: Eurostat
© EuroGeographics Association for administrative boundaries
© Project ULYSSES, 2012
0 625312,5 Km
Legend
Catching-up with the leading region according to l ogistic function on GDP per capita 97-08
<missing values>leading region
fast converging region
steady catching-up region
slow catching-up region
slow converging region
non converging region
diverging region

Ulysses Final Report - Multi-thematic Territorial Analysis of Euregio Karelia - Annexes 124
6.1.2. Economic sectors
Following tables differentiate the economic structure and evolution in Euregio Karelia between 1997 and 2008 and enable comparing the economic and employment structure of the region to the European and national averages. The economic performance is expressed in Gross Value Added, which presents overall contribution of different economic sectors to the total output of a region. The employment by sectors, on the other hand, illustrates the importance of different economic sectors in the composition of a regions’ workforce. The leading economic sectors in Euregio Karelia in 2008 were industry and public administration. Industry had the highest share of GVA in Northern Ostrobothnia and the Republic of Karelia, while public administration was the leading sector in North Karelia and Kainuu. The shares of different economic sectors in Euregio Karelia were in general similar to the shares of economic sectors in the European Union and Finland. The share of agricultural sector was larger in the regions of Euregio Karelia. Table 39. Share of GVA by NACE (Rev. 1.1) in the regions of Euregio Karelia in 2008.
Share of GVA by NACE (Rev. 1.1) 2008 (%)
NUTS
ID
NUTS Agriculture;
fishing (A-B)
Industry
(except
construction)
(C-E )
Construction
(F)
Wholesale and
retail trade;
hotels and
restaurants;
transport (G-I)
Financial
intermediation;
real estate (J-K)
Public administration
and community
services; activities of
households (L-P)
EU27 EU27 1,75 19,61 6,48 21,08 28,27 22,80
FI Finland 2,87 25,00 7,25 19,70 23,09 22,09
RU Russia 4,8 32,7 6,9 32 11,1 12,5
FI133 North Karelia
(Pohjois-Karjala)
7,64 21,85 9,09 16,16 18,72 26,54
FI134 Kainuu 9,57 18,35 9,38 15,05 19,05 28,61
FI1A2 Northern
Ostrobothnia
(Pohjois-
Pohjanmaa)
3,38 32,38 8,59 14,03 19,45 22,16
RUD3 The Republic of
Karelia
(Respublika
Kareliâ)
5,5 33,2 4,6 28,1 5,8 22,8
Source: Eurostat, Rosstat
Construction showed greatest growth in all the Finnish regions of Euregio Karelia between 1997 and 2008. Annual growth rate of the share of construction in total GVA was highest in Kainuu, where it valued at 12,13 %. Also in North Karelia and Northern Ostrobothnia construction increased its share in total GVA more than any other economic sector (annual rate was 11,45 % in North Karelia and 9,61 % in Northern Ostrobothnia). In Finland the share of construction also increased during the given period, while in the European Union the share decreased by an annual rate of -4,33 %. The second greatest positive annual growth rate was recorded in financial intermediation and real estate. In the Republic of Karelia the share of this field was moderate compared to the Finnish regions and EU in general. Table 40. Annual growth rate of GVA by NACE in Euregio Karelia between 1997 and 2008 (% share of total GVA).
Annual growth rate of GVA by NACE 1997-2008 (%)
NUTS
ID
NUTS All NACE Agriculture;
fishing (A-
B)
Industry
(except
construction)
(C-E )
Construction
(F)
Wholesale
and retail;
hotels &
restaurants;
Financial
intermediation;
real estate (J-K)
Public
administration
and community
services;

Ulysses Final Report - Multi-thematic Territorial Analysis of Euregio Karelia - Annexes 125
transport (G-I
)
activities of
households (L-P)
EU27 EU27 3,12 1,26 -1,48 -4,33 -2,96 4,36 3,37
FI Finland 5,08 1,70 4,17 7,86 4,58 6,66 4,85
RU Russia N/A N/A N/A N/A N/A N/A N/A
FI133 North Karelia
(Pohjois-Karjala)
4,33 2,38 3,03 11,45 4,09 5,61 3,77
FI134 Kainuu 3,35 2,86 -0,13 12,13 3,24 5,52 3,24
FI1A2 Northern
Ostrobothnia
(Pohjois-
Pohjanmaa)
5,42 1,11 5,33 9,61 3,57 7,46 4,84
RUD3 The Republic of
Karelia
(Respublika
Kareliâ)
N/A N/A N/A N/A N/A N/A N/A
Source: Eurostat, Rosstat
Highest share of employment in all the Finnish regions of Euregio Karelia was in 2008 recorded in public administration and community services. In Kainuu the share was exceptionally high and valued at 43,30 % of total employment. Public administration had the highest share of employment also in Finland and in EU27 countries. In the Republic of Karelia wholesale and retail trade had the same share of employment (28,95 %) as public administration and community services (28,84 %). Even if construction generated a large share of the GVA in the regions, the share of employment in that sector was relatively low in 2008. The importance of forestry sector on economy in Kainuu and the Republic of Karelia was reflected in the high share of employment in sector A-B (agriculture, hunting, forestry and fishing). While the European average share in that field was 5,67 % and the Finnish average 4,83 %, the share of employment in sectors A-B was 10,34 % in Kainuu and 12,81 % in the Republic of Karelia in 2008. Table 41. Share of employment in total employment by NACE sectors (Rev. 1.1) in Euregio Karelia (2008).
Share of employment by NACE 2008 (%)
NUTS
ID
NUTS Agriculture;
fishing (A-B)
Industry (except
construction)
(C-E)
Construction (F) Wholesale and
retail trade;
hotels and
restaurants;
transport (G-I)
Wholesale and
retail; hotels &
restaurants;
transport (G-I)
Public
administration
and community
services; activities
of households (L-
P)
EU27 EU27* 5,67 18,08 7,72 25,10 14,31 29,13
FI Finland 4,83 18,14 7,58 23,32 13,63 32,50
RU Russia 11,48 20,62 8,00 27,38 9,17 24,89
FI133 North Karelia
(Pohjois-Karjala)
9,72 18,39 8,22 17,94 7,77 37,97
FI134 Kainuu 10,34 13,41 6,98 17,32 8,94 43,30
FI1A2 Northern
Ostrobothnia
(Pohjois-
Pohjanmaa)
7,12 19,60 8,52 19,11 12,11 33,60
RUD3 The Republic of
Karelia (Respublika
Kareliâ)
12,81 19,66 6,82 28,95 5,78 28,84

Ulysses Final Report - Multi-thematic Territorial Analysis of Euregio Karelia - Annexes 126
Source: Eurostat, Rosstat
Annual growth in employment between 2000 and 2008 was strongest in the construction sector in almost all the regions of Euregio Karelia. Only in Northern Ostrobothnia the growth was stronger in the sector of financial intermediation and real estate. The share of employment in agriculture and fishing, and industry has decreased in all the regions of Euregio Karelia, Finland, Russia and the European Union. Table 42. Annual growth rate of the share of employment by NACE sectors in total employment in Euregio Karelia
between 2000 and 2008.
Annual growth rate of employment by NACE 2000-2008 (%)
NUTS
ID
Nuts name All
NACE
Agriculture;
fishing (A-B)
Industry (except
construction)
(C-E )
Constructio
n (F)
Wholesale and
retail; hotels &
restaurants;
transport (G-I )
Financial
intermediatio
n; real estate
(J-K)
Public
administration
and community
services;
activities of
households (L-P)
EU27 EU27* 0,82 -4,05 -0,48 2,00 1,18 2,59 1,47
FI Finland 1,21 -1,44 -0,66 2,59 1,22 3,88 1,50
RU Russia 0,75 -3,26 -0,99 2,99 2,99 2,51 0,94
FI133 North Karelia
(Pohjois-
Karjala)
0,63 -1,27 -0,40 3,74 0,10 3,02 0,92
FI134 Kainuu 0,57 -1,27 -1,46 3,49 0,20 5,41 0,75
FI1A2 Northern
Ostrobothnia
(Pohjois-
Pohjanmaa)
1,32 -2,04 -1,07 3,06 1,53 6,20 1,76
RUD3 The Republic
of Karelia
(Respublika
Kareliâ)
0,26 -2,91 -0,20 4,68 1,55 -0,98 0,30
*EU27 data for 2000 includes data for 2001 for NL and 2002 for UK. EU27 data for 2008 includes data for 2007 for IT.
Source: Eurostat and Rosstat
Since the shown values and performed analyses concerning economy do not consider cross-border aspect, we have studied tax free trade statistics to get an idea of how the border effects trade (and thus economy) in the territory of Euregio Karelia. Duty free shopping is available in the European Union for travellers from outside the Member States. Thus the statistics for tax free trade cover only the Finnish territories and there is no such data available in the Republic of Karelia.65 Two cities located in the territory of Euregio Karelia were in the top eight cities in tax free sales in Finland between 2006 and 2011. Joensuu was on the fifth
65 We have used the duty free trade statistics from Global Blue, which is the largest VAT refund company in Europe.

Ulysses Final Report - Multi-thematic Territorial Analysis of Euregio Karelia - Annexes 127
place with the total sale of 27,3 M€ and Kajaani on the eight place with the total sale of 15,3 M€. The two leading cities in tax free sales were Helsinki (317,8 M€) and Lappeenranta (250,5 M€). Even if the difference between the leading cities and the cities in Euregio Karelia was wide, the growth in duty free trade was largest in Joensuu of all the Finnish cities. Duty free trade in the city grew 539,8 % between 2006 and 2011 and the annual growth was as great as 88 %. In Kajaani the trade grew 366,6 % between the given time period and annual growth rate valued at 53,5 %.66 It can thus be concluded that the Finnish-Russian border has an increasing effect on the trade and economy on the Finnish border regions of Euregio Karelia.
6.2. Research and innovation
Tree types of indicators are used for studying research and innovation of regions. These include enablers, firm activities and outputs. Since a wide-ranging analysis on all of these topics was not possible in the context of this project and due to the lack of data (NUTS 2 coverage is very poor for most of the indicators) we have selected in our analysis following indicators: intramural R&D expenditures as a percentage of GDP (R&D expenditures in the government sector (GOVERD), the higher education sector (HERD) and business R&D expenditures (BERD)), amount of EPO patents and employed persons in high and medium tech manufacturing activities. Total intramural R&D expenditure in 2007 was higher in Finland than in EU countries in average (3,47 in Finland and 2,01 in EU27). Expenditure was even higher than the Finnish average in Northern Finland (5,38) while in Eastern Finland R&D expenditure was below the Finnish and EU average (1,61). When looking at the sectoral R&D expenditure it is obvious that expenditure in Northern Finland and Finland in general has been greatest in the business sector. Expenditure on high education was slightly above the Finnish and EU average in both Eastern and Northern Finland (0,74 in Eastern and 0,77 in Northern Finland). There is no data available on R&D expenditure in the Republic of Karelia. The Republic is, however, among the worst performing Russian regions in innovation potential, climate and output. According to the Comparative innovation analysis of the regions of the Russian Federation, the Republic of Karelia ranks 72nd in the Regional Summary Innovation Index -list. The list included 80 Russian Federal Districts and the top ten regions were Magadan region, Perm territory, Novgorod region, Ulianovsk region, the city of Moscow, Tomsk region, the city of St. Petersburg, Nizhny Novgorod region, the Republic of Tatarstan and Samara region.67 Northern Finland showed stronger performance than Eastern Finland both in the amount of EPO (European Patent Office) patent applications and the amount of persons employed in high and medium tech manufacturing activities. There were 97,13 EPO patent applications per million inhabitants from Northern Ostrobothnia in 2007, but only 30,49 patent applications from Eastern Finland. The share of employed persons in high and medium tech manufacturing activities was slightly below the European average (98,94 %) in Northern Finland, while in Eastern Finland the share was only 61,63 %. The amount of EPO patent applications from Russia was two per million inhabitants in 2007. This value, however, does not reflect the performance of the country in the field of innovation, since Russia has its own patent system and legislation.68
66 Global Blue 2012. 67 Regional Summary Innovation Index (RSII) was used as in the analysis as the composite indicator of the level of innovation activity in the RF regions. The RSII calculation methodology was similar to that used in European Scoreboards. It measured the innovation potential, climate and output of the regions. (Kiselev 2010.) 68 There have been attempts to harmonize the Russian patent system with the European one under a EU-funded project. http://www.epo.org/news-issues/news/2009/20091105.html

Ulysses Final Report - Multi-thematic Territorial Analysis of Euregio Karelia - Annexes 128
Table 43. Indicators for research and innovation in the Eastern and Northern Finland- Russia CBA
NUTS
ID
NUTS Total intramural R&D expenditure 2007 EPO patents per
million of
inhabitants
2007
Employed persons in high and
medium tech manufacturing
activities (% of total workforce
EU25 = 100) 2004*
Total Business
enterprise
sector
Government
sector
Higher
education
EU27 EU27 2,01 1,18 0,24 0,42 N/A N/A
RU Russia 1,12 0,72 0,32 0,07 2 N/A
FI Finland 3,47 2,51 0,29 0,65 111,37 103,47
FI13 Eastern
Finland (Itä-
Suomi)
1,61 0,65 0,21 0,74 30,49 61,63
FI1A Northern
Finland
(Pohjois-
Suomi)
5,38 4,33 0,29 0,77 97,13 98,94
RU3D The Republic
of Karelia
(Respublika
Kareliâ)
N/A N/A N/A N/A N/A N/A
Source: Eurostat
*Source: ESPON DB (Regional Innovation Scoreboard)
6.3. Social cohesion
We have studied social cohesion of the Eastern and Northern Finland - Russia CBA by analysing unemployment rates, infant mortality rate, scope of tertiary education and the share of population at risk of poverty after social transfers69. Unemployment in the CBA was close to the European average in 2010. Unemployment rate was 10,1 % in Eastern and Northern Finland and 9,6 % in the Republic of Karelia, while it was 9,6 % in the European Union (EU27). Unemployment rate for Finland was 8,4 % and for Russia 7,5 %. Youth unemployment rate valued highest in Eastern Finland and in the Republic of Karelia. Concerning the other social cohesion indicators, Eastern Finland and the Republic of Karelia performed slightly weaker than Northern Finland. Long term unemployment rate was 2,0 % in Eastern Finland and 1,3 % in Northern Finland in 2009. Youth unemployment rate, on the other hand, was 25,1 % in Eastern Finland, 24,3 % in the Republic of Karelia and 22,9 % in Northern Finland in 2010. The share of population at risk of poverty after social transfers rated at 17, 8 % for Eastern Finland and at 16,7 % for the Republic of Karelia, while the share in Northern Finland was 15,6 %. There was also a smaller share of population aged 25 to 64 with tertiary education in Eastern Finland (31,9 %) than in Northern Finland (34,7 %). Both regions performed in this respect below Finnish average (38,1 %) but well above the European average (25,9 %).
69 Population at risk of poverty is defined as “persons having equalised disposable income (i.e. adjusted for household size and composition) of less than 60% of national median”.

Ulysses Final Report - Multi-thematic Territorial Analysis of Euregio Karelia - Annexes 129
Table 44. Social cohesion indicators for the Eastern and Northern Finland – Russia CBA.
NUTS
ID
NUTS Unemployment
rate, 2010
Long-term
unemployment
rate, 2009 (>=12
months)
Youth
unemployment
rate, 2010 (% of
labour force aged
15-24)
Population at
risk of poverty
after social
transfers, 2008
(% of total
population)
Infant
mortality
rate 2008
Population aged
25-64 with
tertiary
education, 2010
EU27 EU27 9,6 3,0 20,9 17,0 4,3 25,9
RU Russia 7,5 1,0 21,9 13,4* 8,5 (before
1st year of
age)
27,8 (high
professional)***
FI Finland 8,4 1,4 21,4 13,6 2,6 38,1
FI13 Eastern Finland
(Itä-Suomi)
10,1 2,0 25,1 17,8 2,3 31,9
FI1A Northern Finland
(Pohjois-Suomi)
10,1 1,3 22,9 15,6 2,6 34,7
RU3D The Republic of
Karelia (Respublika
Kareliâ)
9,6 N/A 39,2 (15-20)**
24,3 (15-29)**
16,7* 5,8 N/A
* Amount of population with income below poverty level.
** Values for 2008
*** Value for 2007
Source: Eurostat, Rosstat
6.4. Environmental analysis
We have applied two sets of indicators for environmental analysis of the Eastern and Northern Finland - Russia CBA; indicators from the European Commission’s 5th Cohesion Report and indicators from the ESPON Climate Project regarding the region’s sensitivity for climate change. From the European Commission’s 5th Cohesion Report we selected six indicators; soil sealed area, ozone exceedance, waste water treatment, Natura 2000 areas, solar energy and wind potential. While the first four indicators show concrete environmental performance of the region, the last two indicate what could be the region’s capacity in exploiting alternative energy sources in an energy source transition scenario.
6.4.1. Environmental performance
The first indicator of environmental performance that we have studied is soil sealing.70 According to the 5th Cohesion Report Soil sealing is particularly high in highly urbanised areas such as parts of the Netherlands, North Belgium, West and South Germany and central and south-east parts of the UK. In Mediterranean regions, soil sealing is relatively high along the coasts where rapid urbanisation is associated with the expansion of tourism. The indicator for soil sealing per inhabitant reveals that in North Karelia 97 m², in Kainuu 100 m² and in Northern Ostrobothnia 415 m² of soil per inhabitant was sealed in 2006. The value for Northern Ostrobothnia is well above the Finnish (217,75 m²) and European averages (214 m²).
70 Soil sealing means covering of soil for housing, roads or other land developments. When land is sealed, the area for soil to carry out its natural functions including the absorption of rainwater for infiltration and filtering is reduced. Sealed areas may have a great impact on surrounding soils by changing water flow patterns and by increasing the fragmentation of biodiversity.

Ulysses Final Report - Multi-thematic Territorial Analysis of Euregio Karelia - Annexes 130
Table 45. Soil sealing in Euregio Karelia in 2006.
NUTS ID NUTS Soil sealed area, 2006
(% total area)
Soil sealing per inhabitant (m² per
inhabitant), 2006
EU27 (NUTS 2 average) 6,72 214
FI Finland 0,90 217,75
RU Russia N/A N/A
FI133 North Karelia (Pohjois-Karjala) 0 97
FI134 Kainuu 0 100
FI1A2 Northern Ostrobothnia (Pohjois-Pohjanmaa) 0 415
RUD3 The Republic of Karelia (Respublika Kareliâ) N/A N/A
Source: European Comission 5th
Cohesion Report

Ulysses Final Report - Multi-thematic Territorial Analysis of Euregio Karelia - Annexes 131
Map 54. Soil sealed area in Euregio Karelia in 2006.
This map does notnecessarily reflect theopinion of the ESPONMonitoring Committee
0 30 60 90 12015Km
Local level: NUTS 3Year: 2006
Source: European Commision, 5th Cohesion Report Origin of data: EEA, REGIO-GIS
© EuroGeographics Association for administrative boundaries
© Project ULYSSES, 2012
0 625312,5 Km
LegendSoil sealed area, 2006 (% total area)
<missing values>8,01 - 13,00
13,01 - 23,00
>= 23,01
<= 2,00
2,01 - 4,00
4,01 - 8,00

Ulysses Final Report - Multi-thematic Territorial Analysis of Euregio Karelia - Annexes 132
The second indicator for environmental performance we have studied is ozone concentration exceedances. The European Union aims at reducing ozone levels and particulate matter in the air. The 5th Cohesion Report states that there is much evidence on high ground-level ozone concentrations harming lungs and irritating the respiratory system. Ozone concentrations often exceed EU thresholds in cities, especially in southern Europe.71 Ozone concentration exceedances were low or non-existence in Euregio Karelia. North Karelia and Kainuu had no days with exceedances in 2008 and Northern Ostorbothnia only one. Finnish average for the given year was 2,09 and European (EU27) average 9,99. Table 46. Ozone concentration exceedances in Euregio Karelia in 2008.
NUTS ID NUTS Ozone concentration exceedances in NUTS 3
regions (days), 2008
EU27 (NUTS 2 average) 9,99
FI Finland 2,09
RU Russia N/A
FI133 North Karelia (Pohjois-Karjala) 0
FI134 Kainuu 0
FI1A2 Northern Ostrobothnia (Pohjois-Pohjanmaa) 1
RUD3 The Republic of Karelia (Respublika Kareliâ) N/A
Source: European Comission 5th
Cohesion Report
71 Fifth Report on Economic, Social and Territorial Cohesion 2010.

Ulysses Final Report - Multi-thematic Territorial Analysis of Euregio Karelia - Annexes 133
Map 55. Ozone concentration exceedances (days) in Euregio Karelia in 2008.
This map does notnecessarily reflect theopinion of the ESPONMonitoring Committee
0 30 60 90 12015Km
Local level: NUTS 3Year: 2008
Source: GMES-Promote, Eurostat, JRC, REGIO-GISOrigin of data: EC 5th Cohesion Report
© EuroGeographics Association for administrative boundaries
© Project ULYSSES, 2012
0 625312,5 Km
Legend
Ozone concentration exceedances in NUTS 3 regions ( days), 2008
<missing values><= 2,20
2,21 - 5,02
5,03 - 9,99
10,00 - 16,23
16,24 - 26,07
>= 26,08
Days with ground-level ozone concentration above 120 µg/m³

Ulysses Final Report - Multi-thematic Territorial Analysis of Euregio Karelia - Annexes 134
The third indicator for environmental performance that we used was urban waste water treatment capacity. According to the 5th Cohesion Report, urban waste water is not yet treated adequately in all the Member States, especially in regions of EU12 countries, but also in several of the EU15 countries. Treatment of waste water is necessary to preserve the quality of water reserves, for drinking, use by industry, tourism and agriculture and for environmental reasons. For urban areas, treatment, which removes most contaminants from sewage, is mandatory. Urban waste water treatment capacity in the Eastern and Northern Finland – Russia CBA was slightly above the Finnish and EU averages in 2007. Urban waste water treatment capacity in both Eastern and Northern Finland was 99 %, while in Finland the capacity was 98,98 % and in the European Union (EU27) 92,53 %. The situation in the Republic of Karelia was, however, quite the opposite. Only 15,7 % of the total amount of waste water was purified. National programme for the rehabilitation and recovery of the Baltic Sea ecosystem (The Russian Federation 2010) states that the quantity of wastewater discharged into the water bodies of the Baltic Sea basin by the Republic of Karelia was 151,3 million m3 (no mention of year for the data). Of the total amount, 123,7 million m3 was insufficiently treated wastewater, 3,9 million m3 untreated and 23,6 million m3 standard pure. Municipal wastewater treatment is the most pressing environmental issue in the Republic of Karelia: “Up to 240 million m3 of wastewater is discharged annually into the Karelian water bodies, of which 191 million m3 are not sufficiently treated, while nearly 35 million m3 is discharged untreated. There are 92 wastewater treatment plants in 111 settlements of the Republic of Karelia; of those, only 32 WWTPs of the major water users met the [HELCOM] design parameters in 2008. Until now, there are no wastewater systems in six district centres, namely Kem, Belomorsk, Medvezhjegorsk, Pudozh, Loukhi, and Kalevala. In several cities parts of sewerage systems are not connected to WWTPs, and wastewater from these territories is discharged without any treatment (Sortavala and Lakhdenpokhya).”72 According to the Ministry of Economic Development of the Republic of Karelia measures are taken to improve the ecological state of water bodies in the Republic of Karelia.73 Russia has also signed the Convention on the Protection of the Marine Environment of the Baltic Sea Area (HELCOM) that entered into force 17 January 2000. Table 47. Urban waste water treatment capacity in the Eastern and Northern Finland – Russia CBA (2007).
NUTS ID NUTS Urban waste water treatment capacity, 2007
EU27 (NUTS 2 average) 92,53
FI Finland 98,98
RU Russia 66,6*
FI13 Eastern Finland (Itä-Suomi) 99
FI1A Northern Finland (Pohjois-Suomi) 99
RUD3 The Republic of Karelia (Respublika Kareliâ) 15,7*
72 National programme 2010. 73 The latest step is the contract of a EUR 32 million investment package that the Finnish and Russian governments together with the Petrozavodsk Communal Utilities Systems (PKS) and a group of international financial institutions signed in July 2012. The package finances the improvement of drinking water quality and the reduction of untreated wastewater being discharged into Lake Onega in Northwestern Russia.

Ulysses Final Report - Multi-thematic Territorial Analysis of Euregio Karelia - Annexes 135
* The Russian values have been calculated based on the amount of waste water in million m³ (total) and the amount
of unpurified waste water in million m³ (total).
Source: European Comission 5th
Cohesion Report, Rosstat

Ulysses Final Report - Multi-thematic Territorial Analysis of Euregio Karelia - Annexes 136
Map 56. Urban waste water treatment capacity in the Eastern and Northern Finland – Russia CBA (2007).
!
!
!
!
Riga
Tallinn
Helsinki
Stockholm
Regional level: NUTS 2Year: 2007
Origin of data: DG ENV, REGIO-GISSource: European Commision, 5th Cohesion Report
© EuroGeographicsAssociation for administrative boundaries
This map does notnecessa rily reflect theopinion of the ESPONMonitoring Committee
Urban waste water treatment capacity
0 1.300650km
Legend © ULYSSES, 2011
<missing value>
Urban waste water treatment capacity NUTS 2, 2007
79,66 - 92,53
92,54 - 99,00
>= 99,01
<= 23,65
23,66 - 69,21
69,22 - 79,65
NUTS 2 averageEU 27 = 92,53FI = 98,98

Ulysses Final Report - Multi-thematic Territorial Analysis of Euregio Karelia - Annexes 137
The last environmental performance indicator that we studied was the share of Natura 2000 areas. Natura 2000 is an EU wide network of nature preservation areas. The aim of Natura is to ensure long-term survival of threatened species and habitats. According to the EU Nature Directives, conservation should be achieved while taking account of economic, social, cultural, regional and recreational needs. Regions should consider the sites as important assets in development strategies: Natura 2000 areas could be used to attract more visitors and to develop economic activities related to ecotourism, as well as enhancing the quality of life of the people living in the nearby regions.74 The share of Natura 2000 areas in the Finnish regions of Euregio Karelia corresponded with the average Finnish share of Natura areas. It, however valued significantly lower than the average European (EU27) share of Natura 2000 areas. While 4 % of the total area of North Karelia and 7 % of the total area of Kainuu and Northern Ostrobothnia were Natura 2000 areas, in the European countries (EU27) the average share was 14,24 %. As Natura 2000 network does not cover Russian territories, we examined the share of land of specially protected territories and objects in Russia and the Republic of Karelia. The share of this land type is very low in the Republic of Karelia (1,6 %), even lower than in Russia (2,0 %). Table 48. Share of Natura 2000 areas of total area (%) in Euregio Karelia in 2009.
NUTS ID NUTS NATURA 2000 areas, 2009 (% of total)
EU27 (NUTS 2 average) 14,24
FI Finland 5,70
RU Russia 2,0*
FI133 North Karelia (Pohjois-Karjala) 4
FI134 Kainuu 7
FI1A2 Northern Ostrobothnia (Pohjois-Pohjanmaa) 7
RU3D The Republic of Karelia (Respublika Kareliâ) 1,6*
* Land of specially protected territories and objects. Value for Russia is for year 2010. Value for the Republic of Karelia
is for year 2008.
Source: European Comission 5th
Cohesion Report, The Republic of Karelia State Government Bodies, Rosreestr
74 Fifth Report on Economic, Social and Territorial Cohesion 2010.
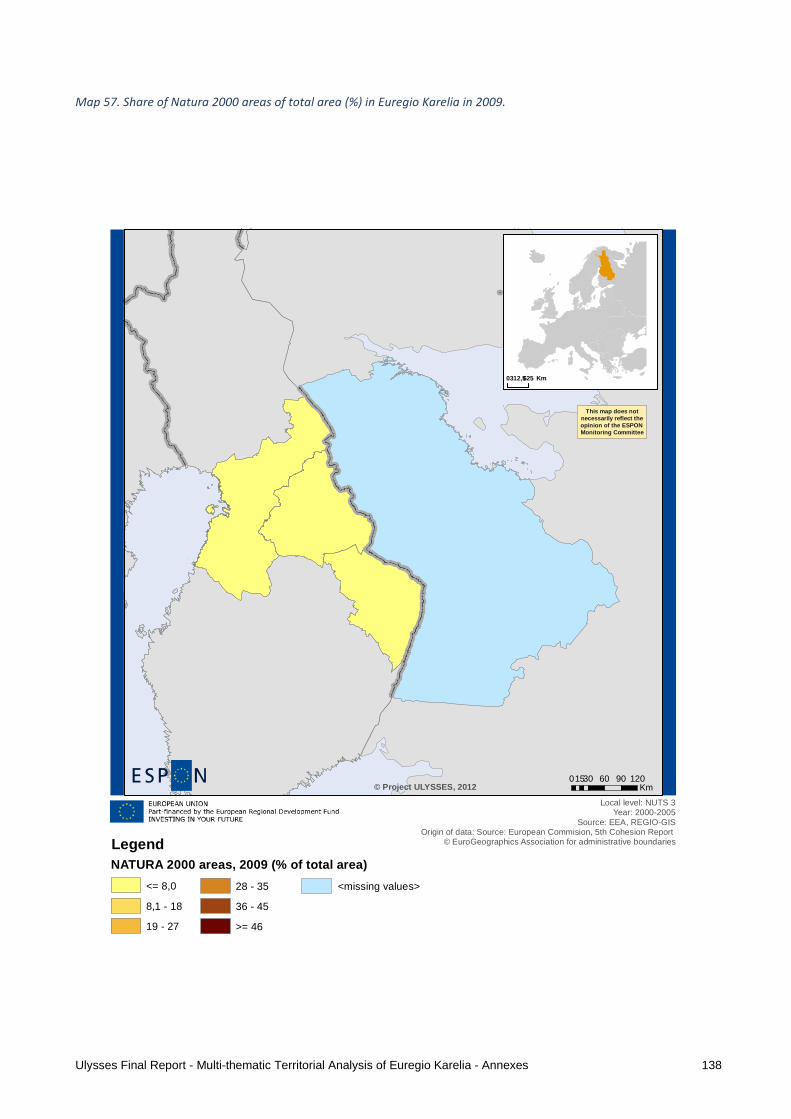
Ulysses Final Report - Multi-thematic Territorial Analysis of Euregio Karelia - Annexes 138
Map 57. Share of Natura 2000 areas of total area (%) in Euregio Karelia in 2009.
This map does notnecessarily reflect theopinion of the ESPONMonitoring Committee
0 30 60 90 12015Km
Local level: NUTS 3Year: 2000-2005
Source: EEA, REGIO-GISOrigin of data: Source: European Commision, 5th Cohesion Report
© EuroGeographics Association for administrative boundaries
© Project ULYSSES, 2012
0 625312,5 Km
LegendNATURA 2000 areas, 2009 (% of total area)
<missing values><= 8,0
8,1 - 18
19 - 27
28 - 35
36 - 45
>= 46
Ulysses Final Report - Multi-thematic Territorial Analysis of Euregio Karelia - Annexes 139
Even if the share of protected natural areas was low in the Eastern and Northern Finland – Russia CBA, there are efforts to protect natural reserves in the Finnish-Russian border area. The most extensive of these measures is “The Green Belt of Fennoscandia”, which is a network of current and planned protected areas along the Finnish-Russian and Russian-Norway borders. The Green Belt involves multi-scale co-operation on nature conservation between the three countries, particularly concerning the establishment and management of protected areas from national parks to smaller nature reserves. The core areas of the Green Belt are protected areas of both federal and regional subordination, which are ecologically linked with Natura 2000 areas. The planned protected areas are particularly large on the Russian side, where there are e.g. large areas of valuable primeval forests, because of the wide frontier zone that has prevented economic exploitation of the forests.75
75 Building up the Green Belt of Fennoscandia 2008.

Ulysses Final Report - Multi-thematic Territorial Analysis of Euregio Karelia - Annexes 140
Map 58. The Green Belt of Fennoscandia and the protected areas in the Finnish-Russian border area.
Source: Finnish Environment Institute SYKE
6.4.2. Environmental capacity
Production of renewable energy has a strong geographical dimension. Solar energy potential is far greater in the southern regions, while the potential of wind power is greatest in areas along the Atlantic and North

Ulysses Final Report - Multi-thematic Territorial Analysis of Euregio Karelia - Annexes 141
Sea coasts. Regions can play an important role in facilitating and encouraging renewable energy production.76 Solar energy resources were in all the regions of Euregio Karelia below national and European average. The potential was approximately 1050 KWh per year, which is well below the leading European regions (Ragusa in Italy with 2027 kWh per year), but well above European regions with the least solar potential (UK Shetland islands with 922 kWh per year). Table 49. Solar energy resources in the regions of Euregio Karelia between 1981 and 1990.
NUTS ID NUTS Solar energy resources per NUTS 3 regions (kWh per year, 1981-1990)
EU27 (NUTS 2 average) 1304,46
FI Finland 1094,42
RU Russia N/A
FI133 North Karelia (Pohjois-Karjala) 1 046
FI134 Kainuu 1 042
FI1A2 Northern Ostrobothnia (Pohjois-Pohjanmaa) 1 057
RUD3 The Republic of Karelia (Respublika Kareliâ) N/A
Source: European Comission 5th
Cohesion Report
76 Fifth Report on Economic, Social and Territorial Cohesion 2010.

Ulysses Final Report - Multi-thematic Territorial Analysis of Euregio Karelia - Annexes 142
Map 59. Solar energy resources (kWh per year) in Euregio Karelia between 1981 and 1990 (average per year).
This map does notnecessarily reflect theopinion of the ESPONMonitoring Committee
0 30 60 90 12015Km
Local level: NUTS 3Year: 2006
Source: European Commision, 5th Cohesion Report Origin of data: Source: JRC (Photovoltaic Geographical Information System)
© EuroGeographics Association for administrative boundaries
© Project ULYSSES, 2012
0 625312,5 Km
Legend
Solar energy resources per NUTS 3 regions (kWh per year, 1981-1990)
<missing values>1304,00 - 1595,14
1595,15 - 1777,86
>= 1777,87
<= 1100,53
1100,54 - 1182,65
1182,66 - 1303,99
Average is calculated on the yearly sum of global irradiation on optimally-inclined surface (kWh/m2)

Ulysses Final Report - Multi-thematic Territorial Analysis of Euregio Karelia - Annexes 143
Wind energy potential, on the other hand, was above the European average in Euregio Karelia. Northern Ostrobothnia with the sea shore had the biggest wind energy potential (1715 onshore full load hours per year). Table 50. Wind energy potential (onshore full load hours) in Euregio Karelia between 2000 and 2005 (average per
year).
NUTS ID NUTS Wind energy potential: onshore full load
hours, 2000-2005 (number of hours year) At
80 m hub height.
EU27 (NUTS 2 average) 1378,98
FI Finland 2033,58
RU Russia N/A
FI133 North Karelia (Pohjois-Karjala) 1 532
FI134 Kainuu 1 540
FI1A2 Northern Ostrobothnia (Pohjois-Pohjanmaa) 1 715
RUD3 The Republic of Karelia (Respublika Kareliâ) N/A
Source: European Comission 5th
Cohesion Report

Ulysses Final Report - Multi-thematic Territorial Analysis of Euregio Karelia - Annexes 144
Map 60. Wind energy potential (onshore full load hours) in Euregio Karelia between 2000 and 2005 (average per year).
This map does notnecessarily reflect theopinion of the ESPONMonitoring Committee
0 30 60 90 12015Km
Local level: NUTS 3Year: 2000-2005
Sources: EEA ETC-ACC, REGIO-GIS Origin of data: Source:European Commision, 5th Cohesion Report
© EuroGeographics Association for administrative boundaries
© Project ULYSSES, 2012
0 625312,5 Km
LegendOnshore full load hours, 2000-2005 (numbe hours yea r) at 80m hub height
<missing values>1100 - 1400
1500 - 2000
>= 2100
<= 410
420 - 730
740 - 1000

Ulysses Final Report - Multi-thematic Territorial Analysis of Euregio Karelia - Annexes 145
6.4.3. Climate change
We studied the sensitivity of the Eastern and Northern Finland CBA to climate change based on methods applied in ESPON Climate project (Climate Change and Territorial Effects on Regions and Local Economies in Europe).77 We selected three following themes for analysis:
− Combined physical sensitivity, which relates to all human artefacts that are important for territorial
development and potentially affected by climate change. This includes settlements, roads, railways,
airports and harbours. These physical assets of a region are typically adapted to normal regional
weather conditions and can withstand smaller climatic changes. However, buildings and
infrastructure are sensitive to extreme weather events like flash floods, large scale river floods and
coastal storm surges which’s frequency and magnitude may change due to climate change.
− Combined social sensitivity, which relates to human populations that may be adversely or positively
affected by climate change. In particular, this encompasses climate-related sensitivities in regard to
public health and personal mobility. In particular this dimension includes populations sensitive to
river flooding, coastal flooding, flash floods and heat (i.e. senior citizen in urban heat islands). These
populations are mainly concentrated in south-european agglomerations and along the coastline,
and the most sensitive regions are coastal agglomerations in the Mediterranean.
− Combined economic sensitivity, which relates to economic activities or sectors that are especially
sensitive to climatic changes. This includes agriculture and forestry whose economic goods are
highly dependent on suitable climate. Tourism, both summer and winter tourism, capitalises on
specific climatic conditions. The energy sector is also very sensitive: Power plants need water for
cooling and are sensitive to flooding. Private households and the service sector require heating
and/or cooling and thus demand more or less energy.
Sensitivities to climate change were generally low in Euregio Karelia. Physical sensitivity was slightly higher in Northern Ostrobothnia (0,21) than in North Karelia (0,13) and Kainuu (0,10). Table 51. Climate sensitivity values for the Finnish regions of Euregio Karelia.
NUTS ID NUTS Physical
sensitivity
Social sensitivity Environmental
sensitivity
Cultural
sensitivity
Economic
sensitivity
FI133 North Karelia (Pohjois- 0,13075 0,121373 0,528294 0,132645 0,482306
77 The ESPON Climate –project’s methodology was following: The exposure analysis focused on the climatic changes as such. It made use of existing projections on climate change and climate variability from the CCLM climate model, whose results have been used, among others, by the 4th IPCC assessment report on climate change. Using the IPCC climate scenario A1B (Nakicenovic et al. 2000) the ESPON Climate project aggregated data for two time periods (1961-1990 and 2071-2100) for eight climate stimuli. River flooding and sea level rise were added as two immediate ‘triggered effects’ of these climate stimuli. Each region was then assessed in regard to its climate change sensitivity. For each sensitivity dimension (physical, environmental, social, economic and cultural) several sensitivity indicators were developed. Each indicator was calculated in absolute and relative terms and then combined.

Ulysses Final Report - Multi-thematic Territorial Analysis of Euregio Karelia - Annexes 146
Karjala)
FI134 Kainuu 0,103853 0,093605 0,564205 0,135309 0,497818
FI1A2 Northern Ostrobothnia
(Pohjois-Pohjanmaa)
0,207093 0,157675 0,597053 0,089436 0,766142
Source: ESPON Climate project

Ulysses Final Report - Multi-thematic Territorial Analysis of Euregio Karelia - Annexes 147
Map 61. Physical sensitivity to climate change in Euregio Karelia.
This map does notnecessarily reflect theopinion of the ESPONMonitoring Committee
0 30 60 90 12015Km
Local level: NUTS 3Source: ESPON Climate Project, 2011
Origin of data: ESPON Climate Projec based onE-PRTR 2010, Leutenschlager et al. 2009, Corine land Cover 200/2006,
Gallego et al. 2009, Eurostat 2009LISFLOOD A1B CCLM 2010, DIVA 2004, Hydro 1K
© EuroGeographics Association for administrative boundaries
© Project ULYSSES, 2012
0 625312,5 Km
LegendPhysical sensitivity to climate change
<missing values>
> 0,20 - 0,40
<= 0,20
> 0,80
> 0,60 - 0,80
> 0,40 - 0,60

Ulysses Final Report - Multi-thematic Territorial Analysis of Euregio Karelia - Annexes 148
Map 62. Social sensitivity to climate change in Euregio Karelia.
This map does notnecessarily reflect theopinion of the ESPONMonitoring Committee
0 30 60 90 12015Km
Local level: NUTS 3Source: ESPON Climate Project, 2011
Origin of data: ESPON Climate Projec based onE-PRTR 2010, Leutenschlager et al. 2009, Corine land Cover 200/2006,
Gallego et al. 2009, Eurostat 2009LISFLOOD A1B CCLM 2010, DIVA 2004, Hydro 1K
© EuroGeographics Association for administrative boundaries
© Project ULYSSES, 2012
0 625312,5 Km
LegendSocial sensitivity to climate change
<missing values>
> 0,20 - 0,40
<= 0,20
> 0,80
> 0,60 - 0,80
> 0,40 - 0,60

Ulysses Final Report - Multi-thematic Territorial Analysis of Euregio Karelia - Annexes 149
Map 63. Economic sensitivity to climate change in Euregio Karelia.
This map does notnecessarily reflect theopinion of the ESPONMonitoring Committee
0 30 60 90 12015Km
Local level: NUTS 3Source: ESPON Climate Project, 2011
Origin of data: ESPON Climate Projec based onE-PRTR 2010, Leutenschlager et al. 2009, Corine land Cover 200/2006,
Gallego et al. 2009, Eurostat 2009LISFLOOD A1B CCLM 2010, DIVA 2004, Hydro 1K
© EuroGeographics Association for administrative boundaries
© Project ULYSSES, 2012
0 625312,5 Km
LegendEconomic sensitivity to climate change
<missing values>
> 0,20 - 0,40
<= 0,20
> 0,80
> 0,60 - 0,80
> 0,40 - 0,60

Ulysses Final Report - Multi-thematic Territorial Analysis of Euregio Karelia - Annexes 150
6.5. Chapter conclusions
Analyses on Lisbon / Europe 2020 and Gothenburg objectives included four subcategories: economy and employment, research and innovation, social cohesion and environment. The disparities in GDP per capita are higher between regions of Euregio Karelia than regions of ESPON countries. The differences have, however, been decreasing and the main reason behind the positive trend is the increase in GDP per inhabintant in the Republic of Karelia. The best performing region among the regions of Euregio Karelia in terms of GDP per capita is Northern Ostrobothnia. Compared to the leading region Northern Ostrobothnia is classified as middle income region, while both North Karelia and Kainuu are indentified as less developed regions and the Republic of Karelia as a very laggard region. In the catching up analysis we evaluated the speed of catching-up with the leading region (West Inner London). The Republic of Karelia was classified as a steady catching-up region and in theory it would need 27 years to catch up with the leading region in terms of GDP per inhabitant. The growth of GDP per capita has been more modest in the Finnish regions of Euregio Karelia. Northern Ostrobothnia was the only region that was classified as a (slow) converging region. The leading economic sectors in Euregio Karelia in 2008 were industry and public administration. Industry had the highest share of GVA in Northern Ostrobothnia and the Republic of Karelia, while public administration was the leading sector in North Karelia and Kainuu. Construction showed greatest growth in all the Finnish regions of Euregio Karelia between 1997 and 2008. Highest share of employment in all the Finnish regions of Euregio Karelia was in 2008 recorded in public administration and community services. In the Republic of Karelia wholesale and retail trade had the same share of employment as public administration and community services. Annual growth in employment between 2000 and 2008 was strongest in the construction sector in almost all the regions of Euregio Karelia. Two cities located in the territory of Euregio Karelia were in the top eight cities in tax free sales in Finland between 2006 and 2011. Joensuu was on the fifth place with the total sale of 27,3 M€ and Kajaani on the eight place with the total sale of 15,3 M€. The growth in duty free trade was largest in Joensuu of all the Finnish cities. Duty free trade in the city grew 539,8 % between 2006 and 2011 and the annual growth was as great as 88 %. Total intramural R&D expenditure was higher than the Finnish average in Northern Finland while in Eastern Finland R&D expenditure was below the Finnish and EU average. There is no data available on R&D expenditure in the Republic of Karelia. The Republic is, however, among the worst performing Russian regions in innovation potential, climate and output. Unemployment in the CBA was close to the European average in 2010. Unemployment rate was 10,1 % in Eastern and Northern Finland and 9,6 % in the Republic of Karelia, while it was 9,6 % in the European Union (EU27). Concerning the other social cohesion indicators, Eastern Finland and the Republic of Karelia performed slightly weaker than Northern Finland. We applied two sets of indicators for environmental analysis; indicators from the European Commission’s 5th Cohesion Report (soil sealed area, ozone exceedance, waste water treatment, Natura 2000 areas, solar energy and wind potential) and indicators from the ESPON Climate Project regarding the region’s sensitivity for climate change. Soil sealing per inhabitant was 97 m² in North Karelia, 100 m² in Kainuu and 415 m² in Northern Ostrobothnia in 2006. Ozone concentration exceedances were low or non-existence in Euregio Karelia. Urban waste water treatment capacity was 99 % both in Eastern and Northern Finland. In the Republic of Karelia only 15,7 % of the total amount of waste water was purified. Measures are taken to improve the ecological state of water bodies in the Republic of Karelia. The share of Natura 2000 areas in the Finnish regions of Euregio Karelia valued significantly lower than the average European (EU27) share of Natura 2000 areas. As Natura 2000 network does not cover Russian territories, we examined the share of land of specially protected territories and objects in Russia and the Republic of Karelia. The share of this land type is very low in the Republic of Karelia (1,6 %), even lower than in Russia (2,0 %). Even if the share of protected natural areas is low in the Eastern and Northern Finland – Russia CBA, there are efforts to protect natural reserves in the Finnish-Russian border area. The most

Ulysses Final Report - Multi-thematic Territorial Analysis of Euregio Karelia - Annexes 151
extensive of these measures is “The Green Belt of Fennoscandia”, which is a network of current and planned protected areas along the Finnish-Russian and Russian-Norway borders. Solar energy resources were in all the regions of Euregio Karelia below national and European average. Wind energy potential, on the other hand, was above the European average. Sensitivities to climate change were generally low in Euregio Karelia.

Ulysses Final Report - Multi-thematic Territorial Analysis of Euregio Karelia - Annexes 152
Chapter 7. Factor analyses
The aim of the factor analyses was to compare the CBA’s territorial profile to the performance of the CBA from the perspective of Lisbon / Europe 2020 Strategy and Gothenburg objectives. Two sets of indicators were established for the analyses: one for territorial profile variables and one for performance variables. The first set considered variables linked to overall characteristics of the different regions on the themes that where considered in previous chapters (accessibility, rural-urban relationship and demography). Polycentricity was excluded at this point, because instead of using NUTS 3 level as a unit of analysis, it is based on the definition of FUAs and thus is not comparable. On the other hand, indicators that are normally associated with the Lisbon/Europe 2020 and Gothenburg objectives at the input level (such as R&D investment, active population with tertiary education and so forth) have also been included, since the differentiation was made between dependent and independent variables and not merely based on thematic categories. Unlike most studies on innovation, the EPO patent applications have also been included at this level. This is because, although they can be understood as an output of innovation, innovation in itself is an input of economic performance.

Ulysses Final Report - Multi-thematic Territorial Analysis of Euregio Karelia - Annexes 153
Table 52. Indicators for the study of territorial profile of Euregio Karelia.
Indicator UNITS Year Geographical unit
Population density inhabitant/km2 2009 NUTS 3
Crude rate of population increase per 1000 2008 NUTS 3
Crude rate of net migration per 1000 2008 NUTS 3
Crude rate of natural increase per 1000 2008 NUTS 3
Young age dependency rate % 2008 NUTS 3
Old age dependency rate % 2008 NUTS 3
Total fertility rate 2008 NUTS 2
Commuters to other region per 1000 2009 NUTS 2
Rural typology nominal 2008 NUTS 3
Agricultural areas by total area % 2006 NUTS 3
Annual growth rate 1990-2006 of agricultural areas per 10000 1990-2006 NUTS 3
Net formation of urban fabric by total area 2000-2006 per 10000 1990-2006 NUTS 3
Potential accessibility by air index % 2006 NUTS 3
Potential accessibility by rail index % 2006 NUTS 3
Potential accessibility by road index % 2006 NUTS 3
Change of the standardized rail index % 2001-2006 NUTS 3
Change of the standardized road index % 2001-2006 NUTS 3
Change of the standardized air index % 2001-2006 NUTS 3
Share of employment in agriculture and fishing (A-B ) % 2008 NUTS 3
Share of employment in industry (except construction) (C-E ) % 2008 NUTS 3
Share of employment in construction (F) % 2008 NUTS 3
Share of employment in wholesale and retail trade; hotels and restaurants; transport (G-I ) % 2008 NUTS 3
Share of employment in financial intermediation; real estate (J-K) % 2008 NUTS 3
Share of employment in public administration and community services; activities of
households (L-P)
% 2008 NUTS 3
Share of GVA in agriculture; fishing (A-B ) % 2008 NUTS 3
Share of GVA in industry (except construction) (C-E ) % 2008 NUTS 3
Share of GVA in construction (F) % 2008 NUTS 3
Share of GVA in wholesale and retail trade; hotels and restaurants; transport (G-I ) % 2008 NUTS 3
Share of GVA in financial intermediation; real estate (J-K) % 2008 NUTS 3
Share of GVA in public administration and community services; activities of households (L-P) % 2008 NUTS 2
Total intramural R&D expenditure by GDP % 2007 NUTS 2
Intramural R&D expenditure of business enterprise sector by GDP % 2007 NUTS 2
Intramural R&D expenditure of government sector by GDP % 2007 NUTS 2
Intramural R&D expenditure of higher education sector by GDP % 2007 NUTS 2
EPO patents per million of inhabitants by GDP % 2007 NUTS 2
Employed persons in high and medium tech manufacturing activities by total workforce (EU
25 = 100)
% 2004 NUTS 2
Population aged 25-64 with tertiary education % 2010 NUTS 2
Physical sensitivity to climate change rate n/a NUTS 3
Social sensitivity to climate change rate n/a NUTS 3
Environmental sensitivity to climate change rate n/a NUTS 3
Cultural sensitivity to climate change rate n/a NUTS 3
Economic sensitivity to climate change rate n/a NUTS 3

Ulysses Final Report - Multi-thematic Territorial Analysis of Euregio Karelia - Annexes 154
The second set considered variables linked to the performance of the regions concerning indicators related to the Lisbon/Europe 2020 and Gothenburg indicators at the output level. Table 53. Indicators for the study of territorial performance of Euregio Karelia.
Indicator UNITS Year Geographical unit
Unemployment rate % 2008 NUTS 3
Long-term unemployment rate (>=12 months) % 2009 NUTS 2
Youth unemployment rate, per labor force aged 15-24 % 2008 NUTS 3
Infant mortality rate % 2008 NUTS 2
GDP per capita indexed to the EU average % 2008 NUTS 3
Catching-up nominal 1997-2008 NUTS 3
Natura 2000 area % 2006 NUTS 3
Ozone concentration exceedance, per year % 2008 NUTS 3
Waste water treatment capacity % 2007 NUTS 2
Soil sealed area % 2006 NUTS 3
In order to analyse the relations between the territorial profile and the regions performance, two different analysis where performed. First, a factor analysis for each set of indicators. Second, several multiple linear regressions having as independent variables each factor of the performance indicators and as dependent variables all the factors of the territorial profile.

Ulysses Final Report - Multi-thematic Territorial Analysis of Euregio Karelia - Annexes 155
7.1. Centrality (FAC1_1)
The first factor expresses central location and has an explained variance of % 14,83. It has high positive correlations with all the indicators regarding potential accessibility and, to a lesser extent, with the share of employment in financial intermediation and real estate, employment in high and medium tech manufacturing activities and with commuting to other regions. It also has a strong negative correlation with the share of employment and GVA in agriculture and fishing. This factor has its highest values in central European countries, especially in the Ruhr, Belgium and Southern England, in a pattern that clearly lines out the blue banana. In the less central region, the higher values tend to be concentrated around capitals and other major urban agglomerations. This is valid also for Euregio Karelia, where all the regions are below country average and the average of all the studied countries. Table 54. Results of analysis on Centrality FAC1_1 in Euregio Karelia.
NUTS ID NUTS FAC1
Scores Country comparison (weighted NUTS
3 average)
Country
/CBA
country level
(+ -)
Percentile
all NUTS 3
CS4 RU FI All CBA
countries
All All Countries -0,96 20
RU Russia
FI Finland -0,96 0,00 0,00 20
FI133 North Karelia (Pohjois-Karjala) -1,43 -0,47 -0,47 - - 20
FI134 Kainuu -1,66 -0,70 -0,70 - - 20
FI1A2 Northern Ostrobothnia (Pohjois-Pohjanmaa) -1,59 -0,63 -0,63 - - 20
RU3D The Republic of Karelia (Respublika Kareliâ)

Ulysses Final Report - Multi-thematic Territorial Analysis of Euregio Karelia - Annexes 156
Map 64. Results of analysis on Centrality FAC1_1 in Euregio Karelia.
This map does notnecessarily reflect theopinion of the ESPONMonitoring Committee
0 150 300 450 60075Km
Local level: Lau 1Year: 2010
Source: Kareliâstat© EuroGeographics Association for administrative boundaries
© Project ULYSSES, 2012
Legend
NUTS3_RG_20M_2006FAC1_1
-4,01 - -0,96
-0,95 - -0,25
-0,24 - 0,18
0,19 - 0,58
0,59 - 0,89
0,90 - 2,17
missing value

Ulysses Final Report - Multi-thematic Territorial Analysis of Euregio Karelia - Annexes 157
7.2. Research and development (FAC2_1)
The explained variance of the research and development factor is % 8,04 and it mainly relates variables that are linked to innovation and scientific development such as R&D investment of different sectors and, to a lesser extent, EPO patent applications and tertiary educated active population. As said in the introduction, the indicators in this factor are mostly available on a NUTS 2 level, meaning that a very high score in a specific NUTS 3 can lead to a whole cluster with high values. Besides the capital cities, it is possible to identify specific innovation strongholds such as important university towns or high tech industries (Airbus in the Toulouse area, Volkswagen around Wolfsburg, Cambridge or the Silicon Glen). The Scandinavian countries also have a very favourable position in this factor. In Euregio Karelia Northern Ostrobothnia is the only region performing better in research and development analysis that basically confirms the previous analyses conducted in this study on this topic. Table 55. Results of analysis on Research and development (FAC2_1) in Euregio Karelia.
NUTS ID NUTS FAC2
Scores Country comparison (weighted NUTS
3 average)
Country
/CBA country
level
Percentile
all NUTS 3
CS4 RU FI All CBA
countries
All All Countries 1,85 95
RU Russia
FI Finland 1,85 0,00 0,00 95
FI133 North Karelia (Pohjois-Karjala) 0,69 -1,15 -1,15 - - 95
FI134 Kainuu 0,79 -1,05 -1,05 - - 95
FI1A2 Northern Ostrobothnia (Pohjois-Pohjanmaa) 2,99 1,14 1,14 + + > 95
RU3D The Republic of Karelia (Respublika Kareliâ)

Ulysses Final Report - Multi-thematic Territorial Analysis of Euregio Karelia - Annexes 158
Map 65. Results of analysis on Research and development (FAC2_1) in Euregio Karelia.
This map does notnecessarily reflect theopinion of the ESPONMonitoring Committee
0 150 300 450 60075Km
Local level: Lau 1Year: 2010
Source: Kareliâstat© EuroGeographics Association for administrative boundaries
© Project ULYSSES, 2012
Legend
NUTS3_RG_20M_2006FAC2_1
-2,41 - -0,98
-0,97 - -0,51
-0,50 - -0,02
-0,01 - 0,65
0,66 - 1,74
1,75 - 3,90
missing value

Ulysses Final Report - Multi-thematic Territorial Analysis of Euregio Karelia - Annexes 159
7.3. Administrative centres (FAC3_1)
The indicators with the highest coefficients of correlation of this factor are the share of employment and GVA in public administration, community services and activities of household and the share of employment and GVA in industry. Its explained variance is % 8,36. The regions with the highest scores in this factor are highly depressed regions in which, because of their poor economic performance, the public sector assumes an important position. Most of the border NUTS 3 regions in Spain and Portugal have very high scores in this factor, as well as Karelia. The other cross-border regions seem to be closer to the national patterns. On a different note, this indicator also relates to the different levels of state interventionism, with the Scandinavian countries and France revealing overall high scores. In Euregio Karelia Northern Ostrobothnia scored the weakest results and Kainuu the highest. This again reflects the earlier presented GVA and employment statistics for these regions. Table 56. Results of analysis on Administrative centres (FAC3_1) in Euregio Karelia.
NUTS ID NUTS FAC3
Scores Country comparison (weighted NUTS
3 average)
Country
/CBA country
level
Percentile
all NUTS 3
CS4 RU FI All CBA
countries
All All Countries 0,09 80
RU Russia
FI Finland 0,09 0,00 0,00 80
FI133 North Karelia (Pohjois-Karjala) 1,04 0,95 0,95 + + 95
FI134 Kainuu 1,60 1,50 1,50 + + > 95
FI1A2 Northern Ostrobothnia (Pohjois-Pohjanmaa) -0,04 -0,14 -0,14 - - 50
RU3D The Republic of Karelia (Respublika Kareliâ)

Ulysses Final Report - Multi-thematic Territorial Analysis of Euregio Karelia - Annexes 160
Map 66. Results of analysis on Administrative centres (FAC3_1) in Euregio Karelia.
This map does notnecessarily reflect theopinion of the ESPONMonitoring Committee
0 150 300 450 60075Km
Local level: Lau 1Year: 2010
Source: Kareliâstat© EuroGeographics Association for administrative boundaries
© Project ULYSSES, 2012
Legend
NUTS3_RG_20M_2006FAC3_1
-3,27 - -1,42
-1,41 - -0,66
-0,65 - -0,05
-0,04 - 0,55
0,56 - 1,25
1,26 - 2,89
missing value

Ulysses Final Report - Multi-thematic Territorial Analysis of Euregio Karelia - Annexes 161
7.4. Demographic dynamism (FAC4_1)
This factor has an explained variance of % 7,22. The variables with the highest coefficient of correlation are young age dependency rate, crude rate of natural population increase, total fertility rate and old age dependency rate (the last one has a negative correlation). The regions with the lowest scores in this factor are in the Mediterranean countries, such as Portugal, Spain and Greece as well as Germany. In Euregio Karelia the best performance in demographic dynamism has Northern Ostrobothnia, while the Kainuu has the lowest dynamism. Table 57. Results of analysis on Demographic dynamism (FAC4_1) in Euregio Karelia.
NUTS ID NUTS FAC4
Scores Country comparison (weighted NUTS
3 average)
Country
/CBR country
level
Percentile
all NUTS 3
CS4 RU FI All CBR
countries
All All Countries 1,11 5
RU Russia
FI Finland 1,11 0,00 0,00 5
FI133 North Karelia (Pohjois-Karjala) 0,52 -0,60 -0,60 - - 5
FI134 Kainuu 0,40 -0,71 -0,71 - - 5
FI1A2 Northern Ostrobothnia (Pohjois-Pohjanmaa) 2,40 1,29 1,29 + + 5
RU3D The Republic of Karelia (Respublika Kareliâ)

Ulysses Final Report - Multi-thematic Territorial Analysis of Euregio Karelia - Annexes 162
Map 67. Results of analysis on Demographic dynamism (FAC4_1) in Euregio Karelia.
This map does notnecessarily reflect theopinion of the ESPONMonitoring Committee
0 150 300 450 60075Km
Local level: Lau 1Year: 2010
Source: Kareliâstat© EuroGeographics Association for administrative boundaries
© Project ULYSSES, 2012
Legend
NUTS3_RG_20M_2006FAC4_1
-2,52 - -1,34
-1,33 - -0,65
-0,64 - -0,02
-0,01 - 0,65
0,66 - 1,43
1,44 - 3,12
missing value

Ulysses Final Report - Multi-thematic Territorial Analysis of Euregio Karelia - Annexes 163
7.5. Environmental risks (FAC5_1)
This factor relates mainly to variables linked to the regions’ sensitivity to climate change. As can be seen in the map, these regions are essentially located in coastal areas and other flood prone areas, such as areas close to the Danube or the Po. The regions of Euregio Karelia have a lower sensibility to climate change than Finnish or European regions in general. Table 58. Results of analysis on Environmental risks (FAC5_1) in Euregio Karelia.
NUTS ID NUTS FAC5
Scores Country comparison (weighted NUTS
3 average)
Country
/CBR country
level
Percentile
all NUTS 3
CS4 RU FI All CBR
countries
All All Countries -0,42 50
RU Russia
FI Finland -0,42 0,00 0,00 50
FI133 North Karelia (Pohjois-Karjala) -0,13 0,29 0,29 + + 80
FI134 Kainuu -0,18 0,24 0,24 + + 80
FI1A2 Northern Ostrobothnia (Pohjois-Pohjanmaa) -0,11 0,30 0,30 + + 80
RU3D The Republic of Karelia (Respublika Kareliâ)

Ulysses Final Report - Multi-thematic Territorial Analysis of Euregio Karelia - Annexes 164
Map 68. Results of analysis on Environmental risks (FAC5_1) in Euregio Karelia.
This map does notnecessarily reflect theopinion of the ESPONMonitoring Committee
0 150 300 450 60075Km
Local level: Lau 1Year: 2010
Source: Kareliâstat© EuroGeographics Association for administrative boundaries
© Project ULYSSES, 2012
Legend
NUTS3_RG_20M_2006FAC5_1
-2,62 - -0,73
-0,72 - -0,23
-0,22 - 0,31
0,32 - 1,14
1,15 - 2,72
2,73 - 7,03
missing value

Ulysses Final Report - Multi-thematic Territorial Analysis of Euregio Karelia - Annexes 165
7.6. Services and transport (FAC6_1)
The significant indicators of this factor is the share of GVA and employment in wholesale and retail trade, hotels and restaurants and transport (NACE G-I). Many of the regions with the high scores in this factor seem to be linked to tourism (Southern Spain and Portugal, the alpine regions, Paris, Greece, Rome, etc.). The significance of services and transport in Euregio Karelia seems low according to this analysis, since all its regions score significantly lower than the Finnish or European average. Table 59. Results of analysis on Services and transport (FAC6_1) in Euregio Karelia.
NUTS ID NUTS FAC6
Scores Country comparison (weighted NUTS
3 average)
Country
/CBR country
level
Percentile
all NUTS 3
CS4 RU FI All CBR
countries
All All Countries -0,22 50
RU Russia
FI Finland -0,22 0,00 0,00 50
FI133 North Karelia (Pohjois-Karjala) -1,19 -0,97 -0,97 - - 20
FI134 Kainuu -1,20 -0,98 -0,98 - - 20
FI1A2 Northern Ostrobothnia (Pohjois-Pohjanmaa) -1,19 -0,97 -0,97 - - 20
RU3D The Republic of Karelia (Respublika Kareliâ)

Ulysses Final Report - Multi-thematic Territorial Analysis of Euregio Karelia - Annexes 166
Map 69. Results of analysis on Services and transport (FAC6_1) in Euregio Karelia.
This map does notnecessarily reflect theopinion of the ESPONMonitoring Committee
0 150 300 450 60075Km
Local level: Lau 1Year: 2010
Source: Kareliâstat© EuroGeographics Association for administrative boundaries
© Project ULYSSES, 2012
Legend
NUTS3_RG_20M_2006FAC6_1
-3,85 - -0,89
-0,88 - -0,17
-0,16 - 0,57
0,58 - 1,65
1,66 - 3,42
3,43 - 5,66
missing value

Ulysses Final Report - Multi-thematic Territorial Analysis of Euregio Karelia - Annexes 167
7.7. Immigration (FAC7_1)
The highly correlated variables of this factor are population growth and net migration rate. While many regions in central and western Europe show high scores in this factor, in the eastern countries the high scores are generally restricted to the capital cities. In Portugal border regions in general (and Alentejo in particular) have much lower values than the coastal regions, suggesting an internal migrations process towards the coast. In Euregio Karelia Northern Ostrobothnia shows stronger performance in this factor than European regions in average. North Karelia and Kainuu, on the contrary, show weak performance. Table 60. Results of analysis on Immigration (FAC7_1) in Euregio Karelia.
NUTS ID NUTS FAC7
Scores Country comparison (weighted NUTS
3 average)
Country
/CBR country
level
Percentile
all NUTS 3
CS4 RU FI All CBR
countries
All All Countries 0,45 80
RU Russia
FI Finland 0,45 0,00 0,00 80
FI133 North Karelia (Pohjois-Karjala) -0,50 -0,95 -0,95 - - 50
FI134 Kainuu -0,86 -1,31 -1,31 - - 20
FI1A2 Northern Ostrobothnia (Pohjois-Pohjanmaa) 0,59 0,14 0,14 + + 80
RU3D The Republic of Karelia (Respublika Kareliâ)

Ulysses Final Report - Multi-thematic Territorial Analysis of Euregio Karelia - Annexes 168
Map 70. Results of analysis on Immigration (FAC7_1) in Euregio Karelia.
This map does notnecessarily reflect theopinion of the ESPONMonitoring Committee
0 150 300 450 60075Km
Local level: Lau 1Year: 2010
Source: Kareliâstat© EuroGeographics Association for administrative boundaries
© Project ULYSSES, 2012
Legend
NUTS3_RG_20M_2006FAC7_1
-3,27 - -1,21
-1,20 - -0,48
-0,47 - 0,14
0,15 - 0,85
0,86 - 1,87
1,88 - 5,21
missing value

Ulysses Final Report - Multi-thematic Territorial Analysis of Euregio Karelia - Annexes 169
7.8. Construction (FAC8_1)
The highly correlated variables of this factor are GVA and employment in construction. The regions with the highest score in this factor belong to Ireland, Spain, the Baltic States and Eastern Germany. In Euregio Karelia the highest score is received by Northern Ostrobothnia and the lowest by Kainuu. Table 61. Results of analysis on Construction (FAC8_1) in Euregio Karelia.
NUTS ID NUTS FAC8
Scores Country comparison (weighted NUTS
3 average)
Country
/CBR country
level
Percentile
all NUTS 3
CS4 RU FI All CBR
countries
All All Countries -0,06 80
RU Russia
FI Finland -0,06 0,00 0,00 80
FI133 North Karelia (Pohjois-Karjala) 0,25 0,31 0,31 + + 80
FI134 Kainuu 0,02 0,09 0,09 + + 80
FI1A2 Northern Ostrobothnia (Pohjois-Pohjanmaa) 0,33 0,39 0,39 + + 80
RU3D The Republic of Karelia (Respublika Kareliâ)
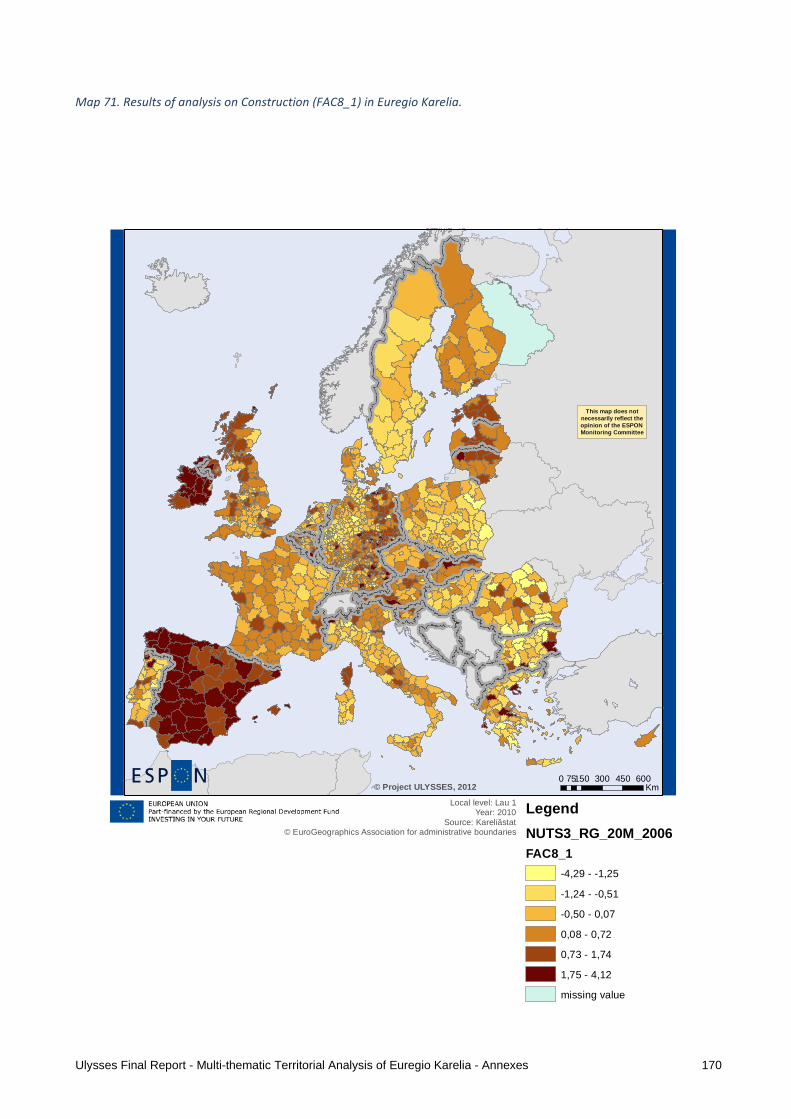
Ulysses Final Report - Multi-thematic Territorial Analysis of Euregio Karelia - Annexes 170
Map 71. Results of analysis on Construction (FAC8_1) in Euregio Karelia.
This map does notnecessarily reflect theopinion of the ESPONMonitoring Committee
0 150 300 450 60075Km
Local level: Lau 1Year: 2010
Source: Kareliâstat© EuroGeographics Association for administrative boundaries
© Project ULYSSES, 2012
Legend
NUTS3_RG_20M_2006FAC8_1
-4,29 - -1,25
-1,24 - -0,51
-0,50 - 0,07
0,08 - 0,72
0,73 - 1,74
1,75 - 4,12
missing value

Ulysses Final Report - Multi-thematic Territorial Analysis of Euregio Karelia - Annexes 171
7.9. Unemployment (FAC1_2)
The first component explains % 24,19 of the variance and its highly correlated variables are unemployment, long-term unemployment and youth unemployment. The geographical distribution of this factor’s scores shows a concentration of the highest values in the more depressed areas of Europe and countries with a structurally high unemployment (e.g. Southern Italy and Spain, Eastern Germany, Slovakia and Greece). Regions which used to have a strong industrial base also evidence relatively high scores in this factor, namely some regions in northern France and Portugal, Wallonia, the Setúbal Peninsula, Liverpool and Manchester. In some border-areas, regions seem to have higher scores in this indicator than the more centrally located regions. This is the case in Portugal, on the northern border of France and Bulgaria, Finnish Karelia or the Czech Republic where it borders eastern Germany. The previously presented unemployment statistics with high unemployment rates in the regions of Euregio Karelia support the results of this analysis, and all the Finnish regions of Euregio Karelia perform weaker than the Finnish and European average. Table 62. Results of analysis on Unemployment (FAC1_2) in Euregio Karelia.
NUTS ID NUTS FAC1_2
Percentile
all NUTS 3
Scores Country comparison (weighted
NUTS 3 average)
Country
/CBR country
level
Percentile
all NUTS 3
CS4 RU FI All CBR
countries
All All Countries 20 -0,38 50
RU Russia
FI Finland 20 -0,38 0,00 0,00 50
FI133 North Karelia (Pohjois-Karjala) 5 0,59 0,97 0,97 + + 80
FI134 Kainuu 5 0,56 0,94 0,94 + + 80
FI1A2 Northern Ostrobothnia (Pohjois-
Pohjanmaa)
5 -0,11 0,26 0,26 + + 80
RU3D The Republic of Karelia (Respublika
Kareliâ)
From the regression it is possible to see that, although the overall variation of the factor that is explained by the context factors is small, its relation to most of them is statistically significant. The coefficients indicate that high levels of unemployment have a strong negative relation to a high investment in R&D, demographic dynamism, central locations and high levels of immigration. As expected, the factor referring to administrative centres has a significant and positive impact and unemployment.
Regression Statistics
Multiple R 0,59374
R Square 0,35252
Adjusted R Square 0,34699
Standard Error 0,80809
Observations 1298
Coefficients Standard Error t Stat P-value Lower 95% Upper 95% Lower 95,0% Upper 95,0%

Ulysses Final Report - Multi-thematic Territorial Analysis of Euregio Karelia - Annexes 172
Intercept -3,4E-09 0,022430 -1,5E-07 1 -0,0440 0,0440 -0,0440 0,0440
FAC1_1 -0,13913 0,022438 -6,20045 7,57172E-10 -0,1831 -0,0951 -0,1831 -0,0951
FAC2_1 -0,17056 0,022438 -7,60142 5,62205E-14 -0,2146 -0,1265 -0,2146 -0,1265
FAC3_1 0,35445 0,022438 15,79682 1,64522E-51 0,3104 0,3985 0,3104 0,3985
FAC4_1 -0,17954 0,022438 -8,00162 2,72054E-15 -0,2236 -0,1355 -0,2236 -0,1355
FAC5_1 -0,01938 0,022438 -0,86369 0,387920516 -0,0634 0,0246 -0,0634 0,0246
FAC6_1 0,04804 0,022438 2,140949 0,032465709 0,0040 0,0921 0,0040 0,0921
FAC7_1 -0,12934 0,022438 -5,76408 1,02676E-08 -0,1734 -0,0853 -0,1734 -0,0853
FAC8_1 0,07384 0,022438 3,29098 0,001025468 0,0298 0,1179 0,0298 0,1179
FAC9_1 -0,16827 0,022438 -7,49914 1,19255E-13 -0,2123 -0,1242 -0,2123 -0,1242
FAC10_1 -0,29276 0,022438 -13,0475 1,24326E-36 -0,3368 -0,2487 -0,3368 -0,2487
FAC11_1 -0,08551 0,022438 -3,81081 0,000145058 -0,1295 -0,0415 -0,1295 -0,0415

Ulysses Final Report - Multi-thematic Territorial Analysis of Euregio Karelia - Annexes 173
Map 72. Results of analysis on Unemployment (FAC1_2) in Euregio Karelia.
This map does notnecessarily reflect theopinion of the ESPONMonitoring Committee
0 150 300 450 60075Km
Local level: Lau 1Year: 2010
Source: Kareliâstat© EuroGeographics Association for administrative boundaries
© Project ULYSSES, 2012
Legend
NUTS3_RG_20M_2006FAC1_2
-1,86 - -0,88
-0,87 - -0,36
-0,35 - 0,20
0,21 - 0,93
0,94 - 1,92
1,93 - 4,65
missing value

Ulysses Final Report - Multi-thematic Territorial Analysis of Euregio Karelia - Annexes 174
7.10. Catching-up regions (FAC2_2)
The total explained variance of this factor is % 18,71 and its most significant variable is catching-up. This indicator relates GDP level and growth between 1997 and 2008 of a given region to the pattern evidenced by the leading region. Its correlated variables also include urban waste water treatment capacity and infant mortality. As can be seen on the map, the correlation between high GDP growth and poor social conditions is essentially a consequence of a very high growth rate witnessed by the eastern European countries throughout the late 1990s and early 2000s (some countries even had occasional double digit growth rates), while the central European countries, starting from a high initial position, witnessed relatively small growth rates. The overall pattern of border regions seems to essentially follow the national tendency. The Finnish regions of Euregio Karelia show weak performance in this factor (Northern Ostrobothnia stronger than North Karelia and Kainuu). If the Republic of Karelia would have been included in this analysis, it most likely would have scored higher than the Finnish regions. Table 63. Results of analysis on Catching-up regions (FAC2_2) in Euregio Karelia.
NUTS ID NUTS FAC2_2
Scores Country comparison (weighted
NUTS 3 average)
Country
/CBR country
level
Percentile
all NUTS 3
CS4 RU FI All CBR
countries
All All Countries -0,09 80
RU Russia
FI Finland -0,09 0,00 0,00 80
FI133 North Karelia (Pohjois-Karjala) -0,48 -0,39 -0,39 - - 50
FI134 Kainuu -0,51 -0,42 -0,42 - - 50
FI1A2 Northern Ostrobothnia (Pohjois-Pohjanmaa) -0,18 -0,09 -0,09 - - 80
RU3D The Republic of Karelia (Respublika Kareliâ)
As stated above, negative correlation of the catching-up indicator with other performance indicators in this factor is essentially linked to high growth rates of the eastern countries in the initial decades of their transition to a market economy. As this is an historic contingency and does not follow a deeper causal nexus, the regression analysis was made only for the catching-up indicators. The regression of this indictor, which has a slightly higher R square then the previous one, shows that it is statistically related to many components of the territorial profile. Confirming what has previously been said about this indicator, the catching up process is especially strong in eastern countries and therefore the highest negative coefficients occur in factor 1 (central location) and factor 3 (administrative centres). On the other hand, in central Europe the regions which perform best in this indicator are the ones located in the blue banana and, even in Eastern Europe, the top performing regions tend to be the more central ones. This might explain why the catching-up process is also negatively related to rurality (factor 9 - low density and growth of agricultural areas).
Regression Statistics
Multiple R 0,6261119
R Square 0,3920161
Adjusted R Square 0,3868156

Ulysses Final Report - Multi-thematic Territorial Analysis of Euregio Karelia - Annexes 175
Standard Error 0,7830609
Observations 1298
Coefficients Standard Error t Stat P-value Lower 95% Upper 95% Lower 95,0% Upper 95,0%
Intercept -6,26829E-08 0,0217 -2,884E-06 0,9999977 -0,043 0,043 -0,043 0,043
FAC1_1 -0,352 0,0217 -16,197241 7,7102E-54 -0,395 -0,310 -0,395 -0,310
FAC2_1 -0,102 0,0217 -4,7047433 2,8164E-06 -0,145 -0,060 -0,145 -0,060
FAC3_1 -0,326 0,0217 -14,995851 5,713E-47 -0,369 -0,283 -0,369 -0,283
FAC4_1 0,053 0,0217 2,4167366 0,01579882 0,010 0,095 0,010 0,095
FAC5_1 0,140 0,0217 6,44670648 1,6131E-10 0,098 0,183 0,098 0,183
FAC6_1 0,091 0,0217 4,18168723 3,0895E-05 0,048 0,134 0,048 0,134
FAC7_1 0,042 0,0217 1,9210766 0,05494291 -0,001 0,084 -0,001 0,084
FAC8_1 -0,049 0,0217 -2,2370838 0,02545166 -0,091 -0,006 -0,091 -0,006
FAC9_1 -0,297 0,0217 -13,645679 1,0773E-39 -0,339 -0,254 -0,339 -0,254
FAC10_1 -0,168 0,0217 -7,7085769 2,5325E-14 -0,210 -0,125 -0,210 -0,125
FAC11_1 0,017 0,0217 0,78598351 0,43202194 -0,026 0,060 -0,026 0,060

Ulysses Final Report - Multi-thematic Territorial Analysis of Euregio Karelia - Annexes 176
Map 73. Results of analysis on Catching-up regions (FAC2_2) in Euregio Karelia.
This map does notnecessarily reflect theopinion of the ESPONMonitoring Committee
0 150 300 450 60075Km
Local level: Lau 1Year: 2010
Source: Kareliâstat© EuroGeographics Association for administrative boundaries
© Project ULYSSES, 2012
Legend
NUTS3_RG_20M_2006FAC2_2
-1,68 - -0,61
-0,60 - -0,18
-0,17 - 0,48
0,49 - 1,39
1,40 - 2,56
2,57 - 4,30
missing value

Ulysses Final Report - Multi-thematic Territorial Analysis of Euregio Karelia - Annexes 177
7.11. Economic development (FAC3_2)
The variables with the highest coefficient of correlation in this factor are GDP per capita, % of Natura 2000 and soil sealed area and its explained variance is % 17,57. It can therefore be understood as a factor which expresses high degrees of development and urbanization. As expected, the regions with the highest scores for this factor are concentrated in central Europe and Scandinavia and also include the capital cities of more marginal countries. In Euregio Karelia Northern Ostrobothnia was (as in the previous analyses) the region with the strongest economic performance. North Karelia and Kainuu scored significantly lower than Northern Ostrobothnia and the Finnish and European average. Table 64 Results of analysis on Economic development (FAC3_2) in Euregio Karelia.
NUTS ID NUTS FAC3_2
Scores Country comparison (weighted
NUTS 3 average)
Country
/CBR country
level
Percentile
all NUTS 3
CS4 RU FI All CBR
countries
All All Countries 0,66 95
RU Russia
FI Finland 0,66 0,00 0,00 95
FI133 North Karelia (Pohjois-Karjala) 0,05 -0,61 -0,61 - - 80
FI134 Kainuu -0,03 -0,69 -0,69 - - 80
FI1A2 Northern Ostrobothnia (Pohjois-Pohjanmaa) 0,22 -0,44 -0,44 - - 80
RU3D The Republic of Karelia (Respublika Kareliâ)
The explanatory capacity of this regression is significantly higher than that of the previous factors. The coefficients, once again, show a significant relation with most of the factors of the territorial profile. The overall picture from the coefficients is a positive effect from factors related to location and R&D (factor 1 and 2). Central location explains much more of different economic development levels than the investment in R&D. Similar conclusions can be drawn from the highly negative coefficient of the indicator related to rurality (factor 9) meaning that, on themselves, density and central location seem to be more important than research and innovation. The weight of the construction sector is also considerably negative, probably meaning that, at a certain stage, high economic development is more linked to a strong service sector than infrastructural development.
Regression Statistics
Multiple R 0,824258
R Square 0,679401
Adjusted R Square 0,676659
Standard Error 0,568631
Observations 1298
Coefficients Standard Error t Stat P-value Lower 95% Upper 95% Lower 95,0% Upper 95,0%
Intercept -1E-07 0,01578 -7,1E-06 0,999994301 -0,0310 0,0310 -0,0310 0,0310
FAC1_1 0,4545 0,01579 28,78786 4,4844E-141 0,4236 0,4855 0,4236 0,4855
FAC2_1 0,1623 0,01579 10,27749 7,24251E-24 0,1313 0,1932 0,1313 0,1932
FAC3_1 0,0837 0,01579 5,303401 1,33687E-07 0,0528 0,1147 0,0528 0,1147
FAC4_1 0,0844 0,01579 5,348225 1,05025E-07 0,0535 0,1154 0,0535 0,1154
FAC5_1 0,1545 0,01579 9,785094 7,39012E-22 0,1235 0,1855 0,1235 0,1855
FAC6_1 0,0372 0,01579 2,356502 0,018597296 0,0062 0,0682 0,0062 0,0682

Ulysses Final Report - Multi-thematic Territorial Analysis of Euregio Karelia - Annexes 178
FAC7_1 0,1029 0,01579 6,518061 1,02027E-10 0,0719 0,1339 0,0719 0,1339
FAC8_1 -0,3541 0,01579 -22,4252 2,83549E-94 -0,3851 -0,3231 -0,3851 -0,3231
FAC9_1 -0,5195 0,01579 -32,9051 8,784E-173 -0,5505 -0,4886 -0,5505 -0,4886
FAC10_1 -0,0122 0,01579 -0,7752 0,438363708 -0,0432 0,0187 -0,0432 0,0187
FAC11_1 -0,0321 0,01579 -2,03075 0,042485717 -0,0630 -0,0011 -0,0630 -0,0011

Ulysses Final Report - Multi-thematic Territorial Analysis of Euregio Karelia - Annexes 179
Map 74. Results of analysis on Economic development (FAC3_2) in Euregio Karelia.
This map does notnecessarily reflect theopinion of the ESPONMonitoring Committee
0 150 300 450 60075Km
Local level: Lau 1Year: 2010
Source: Kareliâstat© EuroGeographics Association for administrative boundaries
© Project ULYSSES, 2012
Legend
NUTS3_RG_20M_2006FAC3_2
-2,39 - -0,78
-0,77 - -0,20
-0,19 - 0,53
0,54 - 1,70
1,71 - 3,57
3,58 - 8,21
missing value

Ulysses Final Report - Multi-thematic Territorial Analysis of Euregio Karelia - Annexes 180
7.12. Pollution (FAC4_2)
The significant variable of this factor is ozone concentration exceedance. The ozone concentration is related to a photo chemical reaction of pollutants and depends on the presence/absence of heavy industries, traffic levels, sun exposure but also on wind conditions. This means that emissions in one place can affect neighbouring regions, that high emission in southern countries will lead to higher ozone levels than in northern countries and that favourable wind conditions can lead to low levels in regions with high emissions and vice-versa. Therefore, a regression analysis of this indicator with the context factors has necessarily a very limited explanatory capacity and can lead to relations that lack any evident logic if the atmospheric conditions are not taken into account. Although the map shows some overall tendencies, the regression analysis shouldn’t be taken into account. There also seem to be some discrepancies on the way it is measured in different countries, as it is not plausible that there are so clear cuts on some borders, such as can be seen in Ireland. According to this analysis, pollution factor is less relevant for Euregio Karelia than for European regions in average. Table 65. Results of analysis on Pollution (FAC4_2) in Euregio Karelia.
NUTS ID NUTS FAC4_2
Scores Country comparison (weighted
NUTS 3 average)
Country
/CBR country
level
Percentile
all NUTS 3
CS4 RU FI All CBR
countries
All All Countries -0,58 20
RU Russia
FI Finland -0,58 0,00 0,00 20
FI133 North Karelia (Pohjois-Karjala) -0,87 -0,28 -0,28 - - 20
FI134 Kainuu -0,86 -0,28 -0,28 - - 20
FI1A2 Northern Ostrobothnia (Pohjois-Pohjanmaa) -0,78 -0,19 -0,19 - - 20
RU3D The Republic of Karelia (Respublika Kareliâ)
Regression Statistics
Multiple R 0,453723
R Square 0,205864
Adjusted R Square 0,199071
Standard Error 0,894946
Observations 1298
Coefficients Standard Error t Stat P-value Lower 95% Upper 95% Lower 95,0% Upper 95,0%
Intercept 1,07E-07 0,0248 4,3E-06 0,999996569 -0,04873 0,04873 -0,04873 0,04873
FAC1_1 -0,0666 0,0249 -2,67974 0,007461916 -0,11534 -0,01784 -0,11534 -0,01784
FAC2_1 -0,1221 0,0249 -4,91213 1,01672E-06 -0,17082 -0,07332 -0,17082 -0,07332
FAC3_1 -0,0901 0,0249 -3,62692 0,000298046 -0,13888 -0,04138 -0,13888 -0,04138
FAC4_1 -0,1422 0,0249 -5,72284 1,30207E-08 -0,19096 -0,09346 -0,19096 -0,09346
FAC5_1 0,0631 0,0249 2,537822 0,011271718 0,01431 0,11182 0,01431 0,11182
FAC6_1 0,2723 0,0249 10,95641 9,05477E-27 0,22352 0,32102 0,22352 0,32102
FAC7_1 0,2268 0,0249 9,12637 2,66302E-19 0,17804 0,27554 0,17804 0,27554
FAC8_1 -0,1153 0,0249 -4,63984 3,8429E-06 -0,16405 -0,06655 -0,16405 -0,06655
FAC9_1 -0,0461 0,0249 -1,85425 0,06393185 -0,09483 0,00267 -0,09483 0,00267
FAC10_1 0,1137 0,0249 4,573888 5,24943E-06 0,06491 0,16241 0,06491 0,16241
FAC11_1 -0,0175 0,0249 -0,70285 0,482273479 -0,06622 0,03129 -0,06622 0,03129

Ulysses Final Report - Multi-thematic Territorial Analysis of Euregio Karelia - Annexes 181
Map 75. Results of analysis on Pollution (FAC4_2) in Euregio Karelia (tendencies).
This map does notnecessarily reflect theopinion of the ESPONMonitoring Committee
0 150 300 450 60075Km
Local level: Lau 1Year: 2010
Source: Kareliâstat© EuroGeographics Association for administrative boundaries
© Project ULYSSES, 2012
Legend
NUTS3_RG_20M_2006FAC4_2
-1,49 - -0,64
-0,63 - -0,21
-0,20 - 0,35
0,36 - 1,32
1,33 - 3,40
3,41 - 8,96
missing value

Ulysses Final Report - Multi-thematic Territorial Analysis of Euregio Karelia - Annexes 182
7.13. Chapter conclusions
Factor analyses combined indicators from the previous sections and showed the performance of Euregio Karelia in the European context. Only the Finnish regions were included in this analysis. Euregio Karelia is physically far away from Central Europe, but it scores relatively high in terms of research and development and has low levels of pollution. In terms of economic development and urbanisation Euregio Karelia is below European average and there are significant differences between performances of the regions.

Ulysses Final Report - Multi-thematic Territorial Analysis of Euregio Karelia - Annexes 183
Territorial synthesis map
Map 76. Territorial synthesis map for Euregio Karelia

Ulysses Final Report - Multi-thematic Territorial Analysis of Euregio Karelia - Annexes 184
References
Antikainen, Janne. The concept of Functional Urban Area. Findings of the ESPON 1.1.1 project. In
Metropolregionen 7/2005. Available at: http://www.bbsr.bund.de/cln_032/nn_340582/BBSR/DE/Veroeffentlichungen/IzR/2005/Heft07Metropolregionen.html?__nnn=true
Building up the Green Belt of Fennoscandia. Envelope. Newsletter of the Finnish Environment Institute SYKE 2/2008. Available at: http://mmm.multiedition.fi/syke/envelope/Envelope5/Envelope_5_2008_Green_Belt.php
Ekonomičeskoe razvitie Respubliki Kareliâ 2007. Available at: http://www.gov.karelia.ru/Info/2007/eco_resource07d.html
ESDP. European Spatial Development Perspective. Towards Balanced and Sustainable Development of the Territory of the European Union. European Commission 1999. Available at: http://ec.europa.eu/regional_policy/sources/docoffic/official/reports/pdf/sum_en.pdf
ESPON Climate. Climate Change and Territorial Effects on Regions and Local Economies. Draft Final Report 2011. Available at: http://www.espon.eu/export/sites/default/Documents/Projects/AppliedResearch/CLIMATE/ESPON_Climate_SummaryReport_final.pdf
ESPON 1.1.1. Potentials for Polycentric Development in Europe. Project report. Nordregio 2005. Available at: http://www.espon.eu/export/sites/default/Documents/Projects/ESPON2006Projects/ThematicProjects/Polycentricity/fr-1.1.1_revised-full.pdf
ESPON 1.1.2. Urban-rural relations in Europe. 2005. Available at: http://www.espon.eu/export/sites/default/Documents/Projects/ESPON2006Projects/ThematicProjects/UrbanRural/fr-1.1.2_revised-full_31-03-05.pdf
ESPON 1.2.1. Transport services and networks: territorial trends and basic supply of infrastructure for territorial cohesion. Project report 2004. Available at: http://www.espon.eu/export/sites/default/Documents/Projects/ESPON2006Projects/ThematicProjects/TransportTrends/fr-1.2.1-full.pdf
ESPON 1.4.3. Study on Urban Functions. Project report. 2007. Available at: http://www.espon.eu/export/sites/default/Documents/Projects/ESPON2006Projects/StudiesScientificSupportProjects/UrbanFunctions/fr-1.4.3_April2007-final.pdf
Europe 2020. A strategy for smart, sustainable and inclusive growth. European Commission 2010. Available at: http://eur-lex.europa.eu/LexUriServ/LexUriServ.do?uri=COM:2010:2020:FIN:EN:PDF
Fertility statistics - Statistics Explained (2011/10/4), Eurostat. Available at: http://epp.eurostat.ec.europa.eu/statistics_explained/index.php/Fertility_statistics
Ficora: Laajakaista 2015 - Haja-asutusalueiden 100 megan laajakaistahanke. 2011. Available at: http://www.ficora.fi/index/saadokset/ohjeet/laajakaista2015.html
Fifth Report on Economic, Social and Territorial Cohesion. Investing in Europe’s future. European Commission 2010. Available at: http://ec.europa.eu/regional_policy/sources/docoffic/official/reports/cohesion5/index_en.cfm
Finavia: Suomen lentoliikennetilasto 2008. Available at: http://www.finavia.fi/files/finavia2/liikennetilastot_pdf/40021_Finavia_tilasto_LR.pdf
Global Blue tax free trade statistics in Finland. Sales by cities between 2006-2011. Global Blue Finland 2012. Kiselev, Vladimir. Comparative innovation analysis of the regions of the Russian Federation. 2010. Available
at: http://www.oecd.org/dataoecd/57/4/48071418.pdf Koncepciâ soveršenstvovaniâ regional´noj politiki v Rossijskoj Federacii. Ministerstvo regional’nogo razvitiâ
Rossijskoj Federacii. Available at: http://www.minregion.ru/OpenFile.ashx/koncept.doc?AttachID=1677

Ulysses Final Report - Multi-thematic Territorial Analysis of Euregio Karelia - Annexes 185
Kūle, Laila. Urban-Rural Partnership in Latvian Regional Policy and Practice Context. Regional Studies Association Annual International Conference 2010. Available at: http://regional-studies-assoc.ac.uk/events/2010/may-pecs/papers/Kule.pdf
Lisbon Strategy evaluation document. European Commission 2010. Available at: http://ec.europa.eu/archives/growthandjobs_2009/pdf/lisbon_strategy_evaluation_en.pdf
National programme for the rehabilitation and recovery of the Baltic Sea ecosystem (Strategy). The Russian Federation 2010. Available at: http://www.helcom.fi/stc/files/BSAP/RU_NIP.pdf
Oloneckij rajon. Available at: http://www.olon-rayon.ru Population and population change statistics - Statistics Explained (2011/10/4), Eurostat. Available at:
http://epp.eurostat.ec.europa.eu/statistics_explained/index.php/Population_and_population_change_statistics
A revised urban-rural typology. Eurostat regional yearbook 2010. Available at: http://epp.eurostat.ec.europa.eu/cache/ITY_OFFPUB/KS-HA-10-001-15/EN/KS-HA-10-001-15-EN.PDF
Statistics Finland. Suomen maapinta-alasta 4,4 prosenttia rakennettua maata. Tiedote 5.7.2011. Available at: http://stat.fi/ajk/tiedotteet/2011/tiedote_007_2011-07-05.html
Statističeskoe izučenie migracii naseleniâ. Available at: http://vsempomogu.ru/statistika/345-20.html Strategičeskoe planirovanie v regionah i gorodah Rossii. 2010. Available at:
http://www.minregion.ru/press_office/terms/836.html Strategy for sustainable development 2009. Available at:
http://europa.eu/legislation_summaries/environment/sustainable_development/l28117_en.htm Struktura zemel’nogo fonda Respubliki Karelia. 1998. Available at:
http://www.gov.karelia.ru/Power/Committee/Land/Otch98/part1.html SUccess for convergence Regions’ Economies (SURE). Structured empirical analysis for convergence regions:
identifying success factors for consolidated growth / SEARCH. Interim report 2009. Available at: http://www.espon.eu/export/sites/default/Documents/Projects/TargetedAnalyses/SURE/SURE_Interim_Report.pdf
Suomen aluekehittämisstrategia 2013. Aluekehittämisstrategiatyöryhmän mietintö. Sisäasiainministeriön julkaisu 10 / 2003. Available at: http://www.intermin.fi/intermin/biblio.nsf/C35EF1AFD77776E8C2256CE100228AEE/$file/aluekehittamisstrategia_2013.pdf
Territorial Agenda of the European Union 2020. Towards an Inclusive, Smart and Sustainable Europe of Diverse Regions. 2011. Available at: http://www.eu2011.hu/files/bveu/documents/TA2020.pdf
Update of Selected Potential Accessibility Indicators. Final Report 2007. Available at: http://www.mdrl.ro/espon_cd2/Project_Reports/Scientific_briefing_and_networking/MapUpdate_final_report.pdf

Ulysses Final Report - Multi-thematic Territorial Analysis of Euregio Karelia - Annexes 186
The ESPON 2013 Programme is part-financed by the European Regional Development Fund, the EU Member States and the Partner States Iceland, Liechtenstein, Norway and Switzerland. It shall support policy development in relation to the aim of territorial cohesion and a harmonious development of the European territory.

Ulysses Final Report - Multi-thematic Territorial Analysis of Euregio Karelia - Annexes 187
Annex 2 – Cross-Border Governance Analysis (Institu tional performance)
Ulysses Task 2.3 – Institutional Performance
Tobias Chilla, Sofie Jaeger, University of Luxembourg
Executive Summary Task 2.3
Territorial Governance and institutional performance in cross-border regions
Cross-border governance in contemporary Europe mostly means cooperation on the regional level (in particular Euregios), in many cases complemented by partners on the local level (city networks etc.). The interregional cooperation is embedded within the multi-level governance of the European political system where nation states and the EU are major players. Against this background, the analysis of cross-border governance has to take two dimensions into account:
- Firstly, the regional partners are not completely free to develop political activities within cross-
border cooperation, but they have to cope with national regulations and frameworks that are
hardly to be modified: the overall political architecture of the nation state (e.g. federal vs. central)
or the planning system (e.g. land use regulation vs. comprehensive integrated approaches) do play
an important role in cross-border governance, too. In some cases, the systems from either side of
the border fit quite well, in other cases the differences are large and can hamper efficient cross-
border cooperation. – Within Ulysses Task 2.3 we call this the structural dimension which means
the overall framework that can hardly be influenced by the partners of inter-regional cross-border
cooperation.
- Second, inter-regional cross-border cooperation in Europe is established and developed for more
than four decades now, and the countless examples are differing largely in terms of activity,
continuity, historicity, forms of institutionalization, efficiency etc. These differences are not only to
be explained by structural frameworks but also by the success of the regional actors. – Within
Ulysses Task 2.3 we call this the activity dimension which means the intensity and continuity of
cross-border cooperation on the regional level.

Ulysses Final Report - Multi-thematic Territorial Analysis of Euregio Karelia - Annexes 188
Both the structural dimension and the activity dimension have been operationalized by a series of indicators that have been weighted, combined and mapped (for details on the methodology and the data behind see Annex). The analysis is based on different sources: As the Ulysses project is an ESPON priority 2 project, existing ESPON data and findings are a primary resource. Moreover, scientific and grey literature has been consulted and information from stakeholders has been a further basis.
Structural Dimension Activity Dimension
Domain Indicator
Domain Indicator
Political status of the
border
EU membership / historicity Maturity of cross-
border cooperation
Interreg III participation
Schengen status Historicity of cross-
border cooperation in
general
Earliest founding date of
cross-border cooperation
Physical status of the
border
Geomorphology Institutional thickness
in cross-border
cooperation
Number of permanent
institutionalisations
(Euregios, citynetworks,
Eurodistricts etc.)
Institutional status:
Planning culture
Belonging to planning
culture traditions according
to different studies
Current activity Number of EGTCs
Language barrier Belonging to language
families (linguistic distance)
Cross-border spatial
development on
regional level
Joint tools of territorial
monitoring
Strategic cross-border
spatial development
documents
Cross-border transport
projects
TEN-T corridors crossing a
border in the perimeter of
the region
important cross-border
projects on the regional
scale in preparation or
established (especially rail)
Table: Indicators for analysing the institutionalised cross-border cooperation (for details and sources see Annex)
Overall results
The map shows the overall picture for the Ulysses regions by visualising the above mentioned indicators: The border effects due to differing political structures are mapped, represented by the borders (lines) in different colours. The activity dimension in cross-border governance is represented by different colours of the regions themselves (surfaces).

Ulysses Final Report - Multi-thematic Territorial Analysis of Euregio Karelia - Annexes 189
One has to admit that the map can only show a very synthetic and generalised picture. The results must not be misunderstood in a way that it would evaluate institutional settings from a normative setting; the approach is a purely analytical one.
Map: Structural Dimension and activity dimension of the Uysses regions’ institutional setting

Ulysses Final Report - Multi-thematic Territorial Analysis of Euregio Karelia - Annexes 190
A more detailed description is given in the later chapter on the respective border regions. However, already at this point, we can draw some conclusions with regard to the European level:
- Some patterns of the map might confirm some well-known characteristics of European borders: the
internal EU 15 borders are – from a structural point of view – much more favourable for cross-
border governance than – for example – external EU borders or borders with transition states. It is
not surprising that the cooperation in the Upper Rhine region is closer than that one in Karelia.
However, the map illustrates at the same time that the structural dimension cannot be seen in a
deterministic way. Institutionalised cross-border cooperation does have a considerable scope of
action. Just to give an example: Though the challenges in the Pyrenees region are not less
important than in many other regions, the cross-border institutionalisation has been particularly
intensive.
- On the basis of the six regions of the Ulysses project the map shows the diversity of borders and
border regions in Europe also from the institutional point of view: The structural and the activity
dimension have very different values. Obviously, a full equity of these spatial patterns in Europe’s
border regions is not a reasonable objective, in particular not in the short and medium term.
Territorial diversity has to come along with different institutional settings. Taylor made institutions
have to face the respective challenges on the ground. From the perspective of territorial cohesion
one has to state that – following the principle of tailor made strategies – all regions have to develop
their own ways in order to exploit their cross-border potential.
- The pattern also indicates that socio-economic development alone does not determine cross-
border governance, neither. For example, both the mountainous area of the Pyrenees and the
densely populated Upper Rhine area with a high degree of functional integration show similar
patterns in the cooperation schemes, despite all socio-economic differences. The link between
socio-economic and institutional performance will be further elaborated in the coming months for
the final report of the project.

Ulysses Final Report - Multi-thematic Territorial Analysis of Euregio Karelia - Annexes 191
Detailed report task 2.3
Methodology
As pointed out in the summarising part of task 2.3, the institutional analysis differentiates two dimensions: On the one hand, the structural dimension means the overall framework that can hardly be influenced by the partners of inter-regional cross-border cooperation. The activity dimension addresses the intensity and continuity of institutionalised cross-border cooperation on the regional level.
Structural dimension
Political Status of the border
The political status of the border is an important context for regional cross-border development that cannot fundamentally be influenced (see table below for an overview). Firstly, the territorial governance in cross-border regions is strongly influenced by the political status of the border: The historicity and the degree of liberalization play an important role. The indicator “EU membership/historicity” allows categorising the borders into four groups: EU12/15, EU 25/others and external borders. Switzerland is considered as a category of its own as it is a non-member-state, but takes part in the Schengen agreement and is a particular active player in cross-border issues for decades now. These groups are assigned to a ordinal scale; this scale is weighted (factor 2). This categorisation is mainly based on the ESPON projects Typologies (pp. 26ff) and Geospecs (see Interim Report map 13). Secondly, the status of the Schengen regulations within a border area is an additional framework to the overall political status. In this context, not the complete juridical matter is taken into account but only the travel zone in which border controls of persons are phased out. This is in particular an interesting aspect with regard to Switzerland, not being an EU member state, but participating in the Schengen system; it is also of particular relevance for the cases of Karelia and Bulgaria.
Planning system
Secondly, the political and planning system of each country can be very different to the neighbouring countries. Depending on the differences between the planning systems, the border effects are more or less stronger with regard to territorial development. The indicator for this border effect is if the countries on either side of the borders are considered to be part of the same “planning family” in the existing studies on planning systems. Depending from the perspective, some countries are always considered to be part of the same family, others only in some studies or even in none of them. The studies considered here comprise the ESPON 2006 project on Governance, Newman 1996, CEC 1997 and Nadin & Stead 2008. These assessments are ‘translated’ into a numerical scale that, again, makes up four categories of more or less strong border effects. As this factor seems to be the most crucial one for territorial development, factor 3 in weighting stresses its influence.
Physical status
Moreover, the physical status of the border is taken into account: It is true that physical features do not determine political processes; but the fact that – just for example – Poland and Sweden do not share a common land border should not be ignored. This is why three categories differentiate fundamental

Ulysses Final Report - Multi-thematic Territorial Analysis of Euregio Karelia - Annexes 192
geomorphological features (sea border, alpine border, and other borders as rivers, low mountains and green borders). These three domains are combined in a synthesis score that allows saying if the borders function as separation, interface or even as a link. The categorisation is mainly based on the ESPON study from 2006 “ESPON Interact cross-border cooperation” (p. 18 of the final report).
Languages
Language barriers do not only hinder everyday life and socio-economic integration in border areas, but it is also for political processes not easy to overcome these barriers. In some regions no linguistic border exists at all, in others the barrier is very high. In this analysis, the language barrier is assessed following the categorisation of language families (see e.g. Beekes 1995; for a simplified mapping see also the English Wikipedia site for the notion ‘Indo-European languages’).
Dimension
Indicators Quantification Main
Sources
Weighting
Political status of the border
EU membership / historicity
Ordinal scale 4 = EU 12/15 3 = CH 2 = EU 25/27 1 = external borders (NB: highest score country counts)
ESPON Typologies (pp. 26 ff.) ESPON Geospecs (Interim Report map 13)
2
Schengen status
2 = participating in free travel zone 1 = not participating in free travel zone
1
Physical status of the border
Geomorphology Ordinal scale 3 = other borders 2 = mountainous (dominant of the high mountains classification) 1 = sea border
EPON Interact cross-border cooperation (18 final report)
1
Institutional status: Planning culture
Being mentioned as member of the same planning culture families in different studies
Numerical scale 0 = strong differentials 0,1-1,0 1,1-2,0 2,1-3,5 = weak differentials
ESPON 2006/2.3.2; Newman 1996; CEC 1997; Nadin/ Stead 2008
3
Language barrier To what extent is language barriers existing in the area
Ordinal Scale 3 = Same language 2 = Similar language (semi-communication possible)
Literature, e.g. Beekes 1995
1

Ulysses Final Report - Multi-thematic Territorial Analysis of Euregio Karelia - Annexes 193
1 = Very different language
Tab.: Methodology to assess the territorial character of the border (structural dimension)
Activity dimension
The scheme for the activity dimension takes into account six domains (see table below). The first four domains address cross-border cooperation in general. The next two indicators go beyond cross-border cooperation in general and, instead, address more in detail the policy of spatial development. The last two
indicators address then the transport policy (see table below).
Historicity of cross-border cooperation in general
The importance of the historicity of cross-border cooperation lies in the assumption that a joint experience facilitates to handle current challenges as the mutual trust and knowledge serves as a good basis. It is true that cross-border cooperation has not begun only in the last years or decades, but that today’s situation can only be explained by taking into account the longer history going back to medieval times. This study, however, limits the focus to the post war cooperation, as the technical and institutional setting with regard to multilateral and European regulations can be seen as the relevant era. Thus, the earliest post-war funding date of an interregional cross-border institution is seen as evidence for the historicity of cross-border cooperation.
Maturity of cross-border cooperation
Without any doubt, cross-border cooperation has fundamentally been influenced by European politics. In particular the INTERREG (A) programmes and the pre-accession funding have played a major role. The INTERREG programme is based on both a top-down and a bottom-up approach: So even if the overall programme framework is to a large extent defined on the European and multi-national level, the involvement of (border) regions is still a clear sign for commitment and a functioning cooperation. Considering the technical and political challenges to overcome in order to ensure successful Interreg participation, the underlying capacity building is considerable. The indicator used here is the participation in the Interreg III programme, as elaborated by the ESPON Geospecs project (Interim Report).
Institutional thickness in cross-border cooperation
‘Institutional thickness’ is a notion from political and economic geography and describes the presence of many institutions that are involved in a certain thematic and that are located near to one another. Institutional thickness is not only the outcome a high and dynamic activity. It is, at the same time, seen as a precondition for regional innovation capacity and dynamic development. The relevant institutions are considered for the overall analysis on the European and regional level, and they are also mapped in a cartographic sense. Showing the respective perimeters does not only illustrate the current situation in an instructive way, but it is also an important basis for the later link to socio-economic analyses.

Ulysses Final Report - Multi-thematic Territorial Analysis of Euregio Karelia - Annexes 194
With regard to cross-border policy, only the cross-border cooperation on the (inter-) regional level is taken into account. This approach leaves out two other kinds of cooperation forms: On the one hand, bi- or multi-national cooperation (e.g. the Council of the Baltic Sea States). This form of cooperation is left out is it does not necessarily say a lot about the interregional cooperation, though it might influence the regional development intensively. On the other hand, all programme structures – like in particular ERDF eligibility areas – are not taken into account either. Though these perimeters (like PAMINA in the Upper Rhine or POCTEFA in the Pyrenees) are of high importance, they are linked to a very limited period of time and can change fundamentally. Moreover, the pure existence of eligibility perimeters does not prove automatically intensive cross-border cooperation. Thus, the number of non-temporary cross-border institutions on the regional level is taken as the quantitative indicator for the institutional analysis.
Current activity (EGTC)
With the indicator for “current activity” this analysis takes into account that cross-border cooperation depends to a large extent on personal engagements and particular constellations in the border areas which can change due to political dynamic etc. As the indicator for current activity, the number of EGTCs (European Groupings of Territorial Cooperation) is taken. EGTCs have been developed as a governance tool by the European Commission in 2006 (European regulation 1082/2006): After implementation of the respective framework on the national levels (art. 16/17), a series of border-regions have implemented this tool for a large variety of contexts. The EGTCs are high on the European agenda and their adaptation in the different regions demands a considerable effort with regard to juridical clarification and political coordination. It is true that also before the EGTC regulation a series of Governance tools on the European as on the multi-lateral level has supported cross-border cooperation in many ways (e.g. the Council of Europe’s European
Outline Convention on Transfrontier Co-operation from 1980/95, the Convention of Karlsruhe from 1996 between Germany, Luxembourg, Switzerland and France). The particular features of an EGTC is that it
- is applicable in the same way in all European member states
- is open to all public bodies (local and regional authorities as well as member states)
- can have a strong mandate if assigned by the respective superior levels
- has a legal personality (i.e. can employ their own staff, can lead a European programme, launch
public procurement procedures or conclude conventions with private actors). As the EGTC tool can only be applied to EU member states, this indicator seems problematic with regard to the Karelia region where it cannot be implemented for juridical reasons. This is why any alternative major institutional project would be taken into account alternatively. The number of EGTCs that are enacted or under preparation is taken as the quantified indicator.
Cross-border spatial development on regional level
As the Ulysses project is focussing on territorial development, the spatial planning policy is of most relevance here. In particular in border regions, territorial development can hardly be driven by economic processes alone, but has to be framed and supported by planning support. Within the structural dimension, we have already taken into account the differences of the national planning systems. In this context, the focus lies on the concrete activities on the (inter-)regional level. Here, the study takes into account two indicators:

Ulysses Final Report - Multi-thematic Territorial Analysis of Euregio Karelia - Annexes 195
Firstly, the existence joint tools for spatial analyses and monitoring – e.g. cross-border GIS projects – is captured. Given the large difficulties with data availability and harmonisation, there is no complete and perfect cross-border GIS, yet. However, some projects have already brought together an interesting basis. These projects are not only a potential tool for later planning procedures, but they also bring together the relevant people on the technical and political level. The existence of tools is captured by a binary quantification (yes/no). Secondly, the existence of a joint territorial development strategy is taken into account. All cross-border institutions do have some kind of general agreement and in parallel, a series of programming documents for European funding has been elaborated. Some regions, however, go a step beyond the general will for ‘balanced’ and ‘sustainable’ development and have more concrete visions for the spatial allocation of future developments. Here, both the existence and the age of the documents are taken into account.
Cross-border transport projects
Border studies have shown for many cases that the bottlenecks in transport infrastructure are the most pressing problems. This is true for regions with specific geographical characteristics, but also for regions with high economic development and for border crossing the former ‘iron curtain’. In this study, we take into account two indicators: Firstly, the number of TEN corridors is a good indicator for the dynamic of the cross-border transport policy. Concretely, the top-30-priorities of the TEN-T policy are taken into account. It is true that TEN corridors are negotiated on the European level mostly between representatives of the member states and also with the Commission. At the same time, TEN priorities are a certain evidence of the capacity to set a certain region on the European agenda. In general, this goes along with a certain support of representatives from the respective regions, so it is a speaking indicator in this context. Still, the involvement in the TEN networks does not give the whole picture, as TEN connections can also just link metropolises that are outside the cross-border region. This is why, secondly, major transport projects (namely train infrastructure) is taken into account on the regional level if it has an explicit cross-border dimension. Also for reasons of practicability, local and regional transport projects are not considered if they do not cross the border. In some cases, the cross-border effect still might be considerable, but this study does not give the scope to go into depths of many individual projects.
Dimension
Indicators Quantification Main Sources
Maturity of cross-border cooperation
Interreg III participation
4 = Long-standing cooperation with a very high or high level of maturity 3 = Long-standing or experienced co-operation with a medium-high level of maturity 2= Experienced or more recent co-operation with a medium-low level of maturity 1= More recent co-operation with a low level of maturity
ESPON Geospecs Interim report
Historicity of cross- Earliest founding 4 = 1960-1990 div.

Ulysses Final Report - Multi-thematic Territorial Analysis of Euregio Karelia - Annexes 196
border cooperation in general
date of cross-border cooperation
3 = 1991-2000 2 = 2001- today 1 = none
Institutional thickness in cross-border cooperation
Number of permanent institutionalisations (Euregions, city networks, Eurodistricts etc.)
4 = > 3 institutionalisations 3 = 2 institutionalisations 2 = 1 institutionalisation 1 = none
div.
Current activity
EGTC 3 = existing EGTC(s) 2 = EGTC(s) in preparation 1 = no EGTC activity
Committee of the Regions; national and regional sources
Cross-border spatial development on regional level
Joint tools 2 = yes 1 = no
Diverse regional sources
Joint spatial development document
3 = yes, younger than 2005 2 = yes, from 2000-2005 1 = no, or older than 2000
div. regional sources
Cross-border transport projects
TEN-T corridors crossing a border in the perimeter of the regions
Number EU DG Transport, TEN-T Executive Agency
important cross-border projects on the regional scale in preparation or established (esp. rail)
Number div. regional sources
Tab. 2 Indicator for the dimension “activity” in cross-border cooperation
Quantifying the qualitative data and representing the results
As the explanations above have already indicated, the indicators taken into account are combined for a synthesis analysis and for visualisation and mapping. With regard to the structural dimension, the different aspects have been weighted in order to keep the focus on institutional issues for territorial development. The physical barriers and the linguistic challenges play an important role for every-day cooperation, but they do not determinate institutional choices and settings. In order to allow a visual and comparable analyses, for each dimension a categorisation has been made either using existing categories from previous studies or making up new ones. The categories are all given a numeric values according to the level of integration in cross-border cooperation. For each case study a data is collected and a numeric value is given for all the dimensions. The synthesis of the axes is made by summing all the scores for each case study. On basic of the synthesis scores a thematic map has been produced which integrates the two axes. The activity axis represented on the area/territory of the case study (polygon) and the structural axis represented on the national borders (lines) within the case-study region. It is worth noting that this methodology can only give a general idea of the territorial governance of the respective regions. Cooperation and its success does not exclusively depend on formal institutions but also

Ulysses Final Report - Multi-thematic Territorial Analysis of Euregio Karelia - Annexes 197
on informal, often personal connections. These cannot be assessed in the framework of this ESPON priority 2 project. Similarly, a serious of potentially relevant indicators could not have been considered for various reasons; still, the overall framework does lead to a relevant analysis: The main objective of this task 2.3 is to bring together the ESPON information and building the basis for the overall analysis when being linked to the socio-economic in a next step.
Results
Mapping the European perspective
In the main report, the overall results have already been represented in form of a European map. The figure below shows the described patterns as 2-D-grapic, again differentiating the structural dimension and the regional status. The following chapters explain the underlying regional situations within the different Ulysses regions.
Fig. 1: Visualisation of the results on the European level in a 2-D-graphic

Ulysses Final Report - Multi-thematic Territorial Analysis of Euregio Karelia - Annexes 198
Results for the regional level
Upper Rhine
Map 1 Institutional Mapping of the Upper Rhine region
Structural Dimension

Ulysses Final Report - Multi-thematic Territorial Analysis of Euregio Karelia - Annexes 199
The reputation of the Upper Rhine as one of the pioneers of cross-border cooperation must not conceal that the structural dimension of the Upper Rhine does bear considerable challenges. The political situation has to take into account that three countries – one of them being a non-EU member state – are involved, and being divided by a language barrier. Even if Switzerland is a country with several languages, the Swiss border region near Basel belongs to the German speaking part. The planning systems of the three involved countries bring together the centralized French tradition, the federal German system and the Swiss culture of considerable competences on the local and canton level. The border between Germany and France is – according to the quantifying analysis – are stricter barrier mainly due to the different planning traditions and due to the language barrier. The Rhine River is – on the one hand – a common symbol of this border region which helps to establish a common identity. On the other hand, bridging the large river and organizing the transport infrastructure within the limited scope of the Rhine valley between considerable hill ranges is an ongoing challenge. Activity dimension
The Upper Rhine area is – from the institutional point of view – an extraordinary case. In 1963, the European wide first cross-border institution of the post-war period on the interregional level was founded here (Regio Basiliensis). Today, the density of cross-border institutions is extremely high as the map reveals. This ‘institutional thickness’ comprises the Upper Rhine conference with its multiple activities, the privately initiated Metrobasel, a series of Eurodistricts and most recently also initiatives for EGTCs. Also the current dynamic is large; notably the leitmotif of the Tri-national Metropolitan Region is currently discussed in the framework of the Upper Rhine Conference. Even beyond the institutions shown on the map, a large variety of cross-border activities can be named: The already mentioned Regio Basiliensis is not shown as it is not only based on territories but also on individual and corporate membership. Moreover, from the European perspective, the Interreg space PAMINA might be one of the most prominent cases of active programme involvement (here not shown as it has just been a temporary programme structure). From the scientific perspective, the Euro-Institute in Kehl is an inspiring institution for cross-border development. The high degree of institutionalised cross-border activity can also be illustrated by means of the four Infobest along the border that aim to inform and help the civil society with regard to cross-border issues. On the one hand, this ‘institutional thickness’ is witness of the long-standing cooperation and can be inspiration for younger cross-border cooperation. On the other hand, the overlapping institutions are sometimes seen as a challenge for political coordination and efficiency. Spatial development
The Upper Rhine region has shown remarkable efforts with regard to the territorial development, even if the institutional territory is extremely large and morphologically challenging. Firstly, the common GIS (GISOR/SIGRS) is developing towards a European benchmark for cross-border territorial monitoring. This is true with regard to data harmonisation and stable institutionalisation of the project. Even if the data basis has to further develop, the currently available output also for planning processes is remarkable. Also with regard to joint spatial development projects, the Upper Rhine can look back on a series of comprehensive strategic documents – some more general (in particular the spatial vision from 2002), others more specific (e.g. with regard to cross-border commercial areas). Also the more recent strategy for the Trinational Metropolitan Region does reflect territorial implications and seems to be a promising input.
Transport

Ulysses Final Report - Multi-thematic Territorial Analysis of Euregio Karelia - Annexes 200
Reflecting on the transport situation in the Upper Rhine region recalls automatically the international Airport of Mulhouse/Basel literally on the border between two countries, opened just after World War II: This airport is one of the European symbols for cross-border integrations – even if the airport is not embedded into the rail-network, yet. The integration of the region into the network of the TENs priorities is considerable (priorities 24 and 28). On the regional level, the following projects have to be mentioned: In Strasbourg, the extension of the Tram net across the border is an important project. Moreover, the New Rhine Bridge in Strasbourg now allows much higher train speed than before. Near Basel, the Tram line to Weil am Rhein is being extended, and also the connection of the airport into the rail net is being discussed. However, the activity in the transport sector seems to slightly lack behind the ambitious efforts with regard to territorial development strategies. For example, there is neither a comprehensive transport development scheme, nor has a comprehensive cross-border tariff system in public transport yet been established.

Ulysses Final Report - Multi-thematic Territorial Analysis of Euregio Karelia - Annexes 201
Pyrenees
Map 2 Institutional Mapping Pyrenees
Structural Dimension
The cross-border cooperation in the Pyrenees is very much characterized by the presence of the mountainous barrier. The situation can be regarded as the most exemplary case of a ‘natural’ border. The dominant languages of this large border region – Spanish and French – do both belong to the Romantic languages, but still they make up a serious language barrier (which is being complemented by regional languages such as Basque and Catalan). . From a political point of view, the border along the Pyrenees is an ‘old’ (EU15) border, even if the status of the small state Andorra is a particular one. With regard to territorial development and spatial planning, the two systems of France and Spain are quite different. From an institutional point of view, France has a much more centralised system even if the local level does have considerable influence. Spain is much more focussed on the autonomous communities.

Ulysses Final Report - Multi-thematic Territorial Analysis of Euregio Karelia - Annexes 202
On the content side, France traditionally has focussed on the comprehensive approach of aménagement du
territoire whilst Spain is following to some extent a land use regulation approach without an excessive degree of regulation. So though the region as a whole is often seen as belonging to a Romanistic tradition, the differences should not be underestimated. Activity dimension
In this region, the earliest cross-border cooperation institution in the modern sense has been funded in 1983 – the Communauté de Travail des Pyrénées which is until today a key institution. The importance of this institution is in particular underlined as it is commissioned to carry out the current ERDF programme of territorial cooperation. In this function, the perimeter is not linked to the Comunauté de Travail itself but to the programme perimeter POCTEFA, which is not shown here as it currently is a pure programme structure. Beyond the Comunauté de Travail, a series of cross-border institutions has been established, as shown in the map. Most remarkably, perhaps, is the high activity with regard to EGTCs. The Pyrenees have very early explored this new instrument and still new EGTCs are being established. As on all the institutional mappings, also in this case the programme structures are not shown, also the Euroinstitut Catalan is not mapped, that is linked to the current ERDF funding. Amongst other objectives, the objective of this institution is to offer courses on the administrative details of ‘the other side of the border’, one of the most pressing concerns in many cross-border regions. Spatial development
With regard to spatial development, two tools should be mentioned: Firstly, the statistical atlas for the Pyrenees offers some interactive cartography for the border area in a stricter sense. Even if not all kind of data is available, the tool is a good starting point for the territorial understanding in the region. Moreover, some years ago, the Observatoire des Trafics à travers les Pyrénées (OTP) has started to publish the development of the Pyrenees traffic, but in recent years, not many publications have been released. With regard to strategic territorial development documents, most available documents are linked to the European programmes. In programming and evaluation documents, the territorial dimension is very present. With regard to a joint territorial vision on the interregional level, in 2005 the study “l’avenir des
Pyrénées dans le context européen” has built the basis for a political spatial development concept.
Transport
Because of the high barrier effect of the Pyrenees mountain range, the transport policy is of crucial importance within this region. In recent years, the efforts have been very high in order to make progress in this respect. These endeavours have been successful in particular with regard to the TEN priorities (priorities no. 3 and 16): Not less the three TEN corridors cross the Pyrenees’ border, amongst them the Central Pyrenees Crossing that still has to be concretised. On the regional level, a series of political meetings has taken place. Already in 2006, a joint declaration on transport in the Pyrenees Euregio has underlined the importance of this policy. Some regional projects have been started, in particular the renovation and reopening of the Pau-Canfranc train connection and the EU co-funded renovation of the Tunnel Bielsa Aragounet. Still, also in this region, a comprehensive joint cross-border development concept has yet not been detailed.

Ulysses Final Report - Multi-thematic Territorial Analysis of Euregio Karelia - Annexes 203
Bulgaria – Greece
Map 3 Institutional mapping of the border between Bulgaria and Greece
Structural Dimension
The structural situation in this border region is challenging. Two different languages make up a serious linguistic barrier. Moreover, the differences between the political systems of Bulgaria as a transformation state on the one side and Greece as an EU member state since 1981 on the other side are considerable. This is true in general, but also with regard to planning traditions. Bulgaria, as a transition state, has a tradition of highly centralised planning procedures in socialist times. During the last two decades, the systems have been reinvented, but it takes time to make the renewed institutions and procedures powerful. It takes even more time, to establish cross-border cooperation that is adapted to the new planning systems. In physical terms, the border between both regions is characterised by a hilly and sometimes mountainous terrain. Activity dimension
Despite the fact that the structural situation is challenging, cross-border cooperation on the regional level does take place, on a technical level even since the 1970s. Given the natural situation of the border region, water management is an issue of high relevance that has led to a large experience of cooperation on this issue. The notion of “Hydro-Diplomacy” (Mylopoulos et al. 2008; Darakas 2002) illustrates, that this technical cooperation is of high importance for the overall political setting.

Ulysses Final Report - Multi-thematic Territorial Analysis of Euregio Karelia - Annexes 204
With regard to institutionalised cross-border cooperation, three Euroregions have been established during the 1990s. Two of them are currently active, whilst in recent years the Euregion Strymon-Strouma has not been very visible. The region has been involved in a serious of INTERREG (and Phare) projects and promotes the deepening of cross-border interaction. Despite a series of projects, the cooperation in this region is still in a phase of trust building (Godfried 2009). On a larger scale, the cross-border cooperation is much reflected in the framework of the Black Sea Economic Cooperation (BSEC) and the Southeast European Cooperative Initiative (SECI). As these institutions are not part of the interregional cooperation, they are not mapped on the institutional mapping above. Spatial development and Transport
Spatial planning has not been a systematic object to cross-border cooperation, yet. This is due also to the fact, that the institutions have not yet reached a level of institutional power to exercise such a long term task. This has to be seen against the background, that the decentralisation of the planning systems is still going on and very much linked to European incentives (see Godfried 2009). With regard to transport, two aspects have to be mentioned: First, a TEN-T priority has already been realised on the axis Sofia – Athens, crossing the border here. Secondly, a series of EU funded projects for regional transport projects has been established. However, a comprehensive regional transport scheme has not yet been developed.

Ulysses Final Report - Multi-thematic Territorial Analysis of Euregio Karelia - Annexes 205
Karelia
Map 4 Institutional Mapping Karelia
Structural Dimension
The structural dimension in Karelia is particular. Firstly, the low density of population, settlements and infrastructure has immediate implications also for cross-border cooperation. Secondly, the border is an external EU border with Visa obligations, along which high socio-economic differences have developed; the political systems are hardly to compare; the language barrier is high. Within the framework of an ESPON project, one has to stress the fact that cooperation across the Finnish-Russian border is not to compare with internal EU cooperation schemes – the political, juridical and functional framework is very different. Still, and despite all barriers, cooperation across external borders is of high political and territorial relevance. Activity dimension
The cross-border cooperation in the region is based on the Euregio Karelia, being established in 2000. This institution is not only the inter-regional cooperation platform, but in particular the basis for the EU neighbourhood projects (supported by ERDF, TACIS, and currently the ENPI CBC). The activity in this

Ulysses Final Report - Multi-thematic Territorial Analysis of Euregio Karelia - Annexes 206
framework has been and is high – several hundreds of projects have been conducted with regard to economic and cultural cooperation, tourism, environment etc. (see Neighbourhood Programme Karelia
n.y.). Beyond the interregional cooperation, the political cooperation on the multinational level must be considered, notably the Barents Euro-Arctic Council (BEAC), and the Council of the Baltic Sea States (CBSS). These institutions are not visualized in the map as they do not fit the regional focus of the methodological framework (see above). Summarizing the institutional setting, one can state that – despite the relatively difficult structural context, cross-border cooperation does take place in multi-faceted and increasing way. Still, the difference to internal EU cooperation is – not surprisingly – very obvious. Spatial development and Transport
With regard to transport policy, the overall limited activity is due to the very limited population density in this region: The TEN-T priorities do not touch the Karelia perimeter – the TEN-T priority 12 (Nordic triangle) passes south of the perimeter. On a bilateral level, the Barentslink initiative has been very active in order to promote better large scale accessibility. On the regional level, a serious of punctual improvements has been achieved in the framework of neighbourhood programme: The Karelia cooperation aims explicitly at improving the transport situation, in particular with regard to border crossing. Neither a spatial planning nor the transport policy has been institutionalised on a cross-border level, yet. However, in particular two documents have so far developed a strategic framework for cross-border cooperation, considering systematically the territorial dimension (Röpelinen 2000 and 2005).

Ulysses Final Report - Multi-thematic Territorial Analysis of Euregio Karelia - Annexes 207
Pomerania
Map 5 Institutional mapping Pomerania
Structural Dimension
The particular situation in this region brings together a land border and a sea border that separate three national states with very different institutional settings and traditions. The language barrier between Sweden and Germany is less high than the Polish-German one, but so called semi-communication also is not possible in this case, either (understanding the other language without having learned it). From a political point of view, three different traditions meet here – the Scandinavian, the transformation and the Germanic tradition come together. Against this background one must state that the structural dimension is challenging.

Ulysses Final Report - Multi-thematic Territorial Analysis of Euregio Karelia - Annexes 208
Activity dimension
Also with regard to the cross-border activity, the cross-border cooperation is a particular one as the cooperation is not only characterised by the trinational platform of the Euroregion of Pomerania, but also by further bi- and multi-lateral cooperation. Firstly, and although not part of the Pomerania cooperation, the Öresund committee has to be mentioned in this context: The cooperation between Sweden and Denmark (Malmö and Copenhagen) has become one of the most famous cooperation. Secondly, the cooperation between Poland and Germany as well as between Germany and Sweden is very much organised in a bilateral way on different levels. In particular the Polish-German cooperation is a prominent part of the Euroregion Pomerania activities in recent years.
Thirdly, and on a larger scale, much activity can be seen on the multilateral level: in particular the Baltic
Sea States Subregional Co-operation (BSSSC), the Council of the Baltic Sea States (CBSS), Union of the Baltic Cities (UBC), the Baltic Development Forum and, most recently, the Baltic Sea Macro region process have to be mentioned in this context (all of them are not included in the map as they are not fitting the interregional methodological scope of this work). This enumeration illustrates that the number of institutions on this level that is far higher than the interregional cooperation. This is mainly due to the multi-national character of the Baltic sea as a political object. The political setting in this region makes multi-national cooperation even more important, as EU and non EU member states and very different political traditions are meeting here.
Spatial development and Transport
The tri-lateral aspect of the cooperation it most visible within the transport policy: The sea is linking all the three partner regions, that are involved in the TEN-T priority ‘Motorways of the Sea’. Linked to this are a large variety of seaway projects (clean shipping, technical harmonization etc.). Moreover, the Central
European Transport Corridor (“Route 65”) has mobilised considerable activity in recent years. On the bilateral level between Germany and Poland, a series of projects has been initiated in recent years, in particular linking Berlin and Szczecin. On a more local level, the agglomeration of Szczecin is currently developing its cross-border linkages in the direction of Berlin: the Szczecin Cross-border Development Plan (the concept) is being developed. Moreover, the Pomerania region is influenced by two major cross-border transport projects that are not in the core of the Pomerania perimeter: The Öresund Crossing between Sweden and Germany – combining bridge and tunnel and opened in 2000 – is one of the symbols for European cross-border development. Moreover, the preparation for the so called Fehmarn Belt between Denmark and Germany is maybe the most spectacular current cross-border project that without a doubt will have direct consequences also for the Pomerania region. With regard to spatial development, in 1995 the German – Polish concept for spatial development was a starting point for spatial development. The 2006 development and activity concept of the Euroregion consequently formulates principles of cross-border German development even if it remains quite abstract with regard to spatial consequences.

Ulysses Final Report - Multi-thematic Territorial Analysis of Euregio Karelia - Annexes 209
Extremadura / Alentejo
Map 6 Institutional Mapping of the region Extremadura / Alentejo
Structural Dimension
The Extremadura/Alentejo border separates two Iberian countries that share some important characteristics. The overall political and the planning systems show some similarities, and the languages allow to a certain extent semi-communication (reciprocal understanding without being fluent in the respective language). Also from a morphological point of view, the border does not represent a major barrier. Activity dimension
The cross-border cooperation in the region can look back to a large experience of EU programme based projects, currently in particular as the INTERREG platform POCTEP. Only recently, in 2009, the involved regions have founded the joint institution of “Eurace” that is comparable to the ‘classical’ Euroregion we know from other parts in Europe.

Ulysses Final Report - Multi-thematic Territorial Analysis of Euregio Karelia - Annexes 210
Nevertheless, the concentration of cross-border cooperation on different levels is high as the map reveals (city-networks and interregional cooperation). Currently, the dynamic is high as not only the foundation of Eurace but also the presence of new EGTCs show. Spatial development and Transport
An interactive cartographic tool does exist and is accessible online. The recent strategic document Eurace 2020 not only gives a comprehensive territorial analysis of the cross-border setting but also defines strategic guidelines and objectives that are ambitious. One has to admit that this document is the outcome of an outsourced study and has to be concretised and implemented in a political way. The step towards a joint transport and territorial development strategy would be the next logic step.

Ulysses Final Report - Multi-thematic Territorial Analysis of Euregio Karelia - Annexes 211
Bibliography
General sources
Beekes, R. (1995). Comparative Indo-European Linguistics. CEC = Commission of the European Communities (1997): The EU Compendium of Spatial Planning Systems
and Policies. Regional Development Studies. Luxembourg, Office for Official Publications of the European Communities.
DG REGIO (2011): EGTC Projects. (http://portal.cor.europa.eu/egtc/en-US/Projects/already/Pages/welcome.aspx)
ESPON (2007a) Governance of territorial and urban policies 2.3.2. Final Report. Luxembourg, ESPON. (http://www.espon.eu/export/sites/default/Documents/Projects/ESPON2006Projects/PolicyImpactProjects/Governance/fr-2.3.2_final_feb2007.pdf)
ESPON (2007b): INTERACT-ESPON. Synthesis Report. Luxembourg, ESPON. (http://www.espon.eu/export/sites/default/Documents/Publications/ESPON2006Publications/SynthesisReportESPONINTERact/Territorial_evidence_web.pdf)
ESPON (2009): Typology Compilation. Interim Report. Luxembourg, ESPON. (http://www.espon.eu/export/sites/default/Documents/Projects/ScientificPlatform/TypologyCompilation/fir-090615.pdf)
ESPON (2010): METROBORDER. Final Report. Luxembourg, ESPON. (http://www.espon.eu/export/sites/default/Documents/Projects/TargetedAnalyses/METROBORDER/METROBORDER_-_Final_Report_-_29_DEC_2010.pdf)
ESPON (2011a): GEOSPECS. Interim Report. Luxembourg, ESPON. (http://www.espon.eu/export/sites/default/Documents/Projects/AppliedResearch/GEOSPECS/GEOSPECS_Interim-Report_16-03-2011.pdf)
ESPON (2011b): SGPTD. Interim Report. Luxembourg, ESPON. (http://www.espon.eu/export/sites/default/Documents/Projects/AppliedResearch/SGPTD/SGPTD-Interim-Report_28-02-2011_xrevx.pdf)
EU (2010): Trans-European Transport Network Progress on Priority Axes May 2010. Brussels, TEN-T EA. EU (n.y.): TEN-T Projects in FIGURES. Brussels, TEN-T EA. (http://tentea.ec.europa.eu/en/ten-t_projects/) KNIELING, J.; OTHENGRAFEN, F. (2009): Planning cultures in Europe: decoding cultural phenomena in urban
and regional planning. Ashgate. LANGHAGEN-ROHRBACH, C. (2010): Raumordnung und Raumplanung. Wissenschaftliche Buchgesellschaft. MOT (2007): Atlas de la coopération transfrontalière. Paris NADIN, V.; STEAD, D. (2008): European Spatial Planning Systems, Social Models and Learning. disP – The
Planning Rewiev 172(1), p. 35-47. NEWMAN, P.; THORNLY, A. (1996): Urban Planning in Europe: International Competition, National Systems,
and Planning Projects. London, Routledge. NEWMAN, D. (2006): The lines that continue to separate us: borders in our ‘borderless’ world. Progress in
Human Geography 30(2): 143-161. PERKMANN, M. (2007): Policy entrepreneurship and multilevel governance: a comparative study of
European cross-border regions. Environment and Planning C: Government and Policy 25(6): 861-879.
REITEL, B. (2006): Governance in cross-border agglomerations in Europe – the examples of Basel and Strasbourg. Europa Regional 14(1): 9-21.

Ulysses Final Report - Multi-thematic Territorial Analysis of Euregio Karelia - Annexes 212
Upper Rhine
BAK Basel Economics (2008): Regionalprofil Oberrhein. Im Auftrag von EURES-Transfrontalier Oberrhein. Basel, Schiltigheim.
ESPON (2010): METROBORDER. Final Report. Luxembourg, ESPON. (http://www.espon.eu/export/sites/default/Documents/Projects/TargetedAnalyses/METROBORDER/METROBORDER_-_Final_Report_-_29_DEC_2010.pdf)
GISOR (2010): Geographisches Informationssystem des Oberrrhein. GISOR-SIGRS. (http://sigrs-gisor.org/Pre_index_DE.html)
Jakob, Eric (2010): Der Oberrhein – Ein Governance-Modell für andere Grenzregionen?, in: Joachim Beck/Birte Wassenberg (Ed.), Grenzüberschreitende Zusammenarbeit leben und erforschen, Band 2: Grenzregionen in Europa, Stuttgart.
UPPER RHINE CONFERENCE (2002): Raumordnerisches Leitbild für das Mandatsgebiet der Oberrheinkonferenz“. German-French-Swiss Upper Rhine Conference. (http://www.oberrheinkonferenz.org/de/themen-und-projekte/raumordnung/projekte/raumordnerisches-leitbild/)
UPPER RHINE CONFERENCE (2005): Grenzüberschreitende Gewerbezonen - Unterschiede zum Wohle aller nutzen". German-French-Swiss Upper Rhine Conference. (http://www.oberrheinkonferenz.org/de/themen-und-projekte/raumordnung/projekte/gewerbezonen/)
UPPER RHINE CONFERENCE (2010) : Eine Strategie für die Trinationale Metropolregion Oberrhein 2020. Schneider-Sliwa, R. (2008): Enjeux et transformations des régions métropolitaines du sud du Rhin
supérieur, Revue Géographique de l'Est, 48 (3-4), mis en ligne le 02 mars 2010. URL: http://rge.revues.org/1718 (14.10.2010).
Pyrenees
ATLAS DE STATISTIQUE DES PYRENEES (2011). http://atlas.ctp.org/site_fr/p1_present_fr.php
EUROREGION PYRENEES-MEDITERRANEAN (2011). L’Eurorégion Pyrénées-Méditerranée. http://www.euroregio.eu/eu/AppJava/fr/
CTP; GENERALITAT DE CATALUNYA (2006): L'avenir des Pyrénées dans les contexte européen, Fondements d’une stratégie participative. URBAN T.C.
CTP (2011). La Communauté de Travail des Pyrénées. http://www.ctp.org/ EUROINSTITUT CATALAN (2011). L’Euroinstitut Catalan Transfrontalier (EICT).
http://www.euroinstitut-cat.eu/ EUROCITÉ BASQUE (2011). Eurocité Basque Bayonne – San-Sebastián.
http://www.eurocite.org EUROREGION PYRENEES-MEDITERRANEAN (2006): Les transports dans l’Eurorégion, Déclaration commune.
http://www.euroregio.eu/eu/Images/decl_transport_tcm331-51182.pdf EUROPRESS (2011): Creado el 'Espacio Portalet'. Spain.
http://www.europapress.es/aragon/noticia-gobierno-aragon-departamento-frances-pirineos-atlanticos-crean-espacio-portalet-20110519133937.htmlHOSPITAL DE CERDAGNE (2011: http://www.hcerdanya.eu
GECT TUNEL DE BIELSA (2011). Consortium Tunnel Bielsa – Aragnouet. http://www.bielsa-aragnouet.org Heredero de Pablos, Maria Isabel ; Blanca Olmedillas Blanco (2009) : Las fronteras españolas en Europa: de
INTERREG a la cooperación territorial europea. Investigaciones Regionales. 16 : 191 - 215
LE JOURNAL DU PAYS BASQUE (2011): L’Eurorégion Aquitaine-Euskadi sur les rails. http://www.lejpb.com/paperezkoa/20110608/271262/fr/L%E2%80%99Euroregion-Aquitaine-Euskadi-sur-les-rail

Ulysses Final Report - Multi-thematic Territorial Analysis of Euregio Karelia - Annexes 213
L'OBSERVATOIRE DES TRAFICS AU TRAVERS DES PYRÉNÉES (2011). (http://www.midi-pyrenees.equipement.gouv.fr/82/action_regionale/pyrenees/pyrenees.htm)
Morata, Francesc (2010): Euroregions i integració europea. Doc. Anàl. Geogr. 56 (1) : 41-56 Secretaria de Estado de Cooperacion Territorial / Direccion General de Cooperacion Autonomica (2010) :
Las Agrupaciones Europeas de Cooperacion Territorial (AECT)
Greece-Bulgaria
AEBR (n.y.): Factsheet Euroregion Rodopi. http://www.aebr.eu//files/filemanager_files//Regionen/R/Rodopi__GR_BG_/Fact_Sheet_Euroregion_Rodopi.pdf
AEBR (n.y.): Factsheet Euroregion Nestos-Mesta. http://www.aebr.eu//files/filemanager_files//Regionen/N/Nestos-Mesta/Fact_sheet_Nesto-Mesta.pdf
AEBR (2011): Cross-Border Cooperation Areas/Structures 2011 map. http://www.aebr.eu/files/publications/AEBR_map_2011.pdf
ANASTASAKIS, O.; BECHEV D.; VROUSALIS, N. (ed.) (2009): Greece in the Balkans: Memory, Conflict and Exchange. Cambridge Scholars Publishing.
AYDIN, M. (2005): Regional Cooperation in the Black Sea and the Role of Institutions. Perceptions, Journal of International Affairs vol. X.
BOYADJIEVA, M. (2001): Greek-Bulgarian Trade and Cross Border Cooperation: Future Perspectives. International Conference: Restructuring, Stability and Development in Southeastern Europe. Volos, Greece.
CAD., S. S.; YALISI, M. F. P.; TERSANE, E. (2010): Report of the Meeting of BSEC Working Group on Cooperation in Emergency Assistance and Liaison Officers of the BSEC Network on Emergency Assistance. Organization of the Black Sea Economic Cooperation, Istanbul.
GODTFRIED, S. (2009): On Track with Thrace: Exploring Cross-Border Cooperation in the EU’s South-Eastern External Borders. Master Thesis, Universiteit Twente and Westfälische Wilhelms-Universität Münster.
JALOV, A.; STAMENOVA, M.; ZOUPIS, K. (2005): Historical Review of the Cooperation between Bulgarian and Greece Cavers. Contribution to the History of Greek and Bulgarian Speleology.
MANOLI, P. (n.y.): Greece’s Engagement with the Black Sea Economic Cooperation. Xenophon paper no 2. Unfolding the Black Sea Economic Cooperation, Views from the region.
MINISTR Y OF ECONOMY AND FINANCE (2007a): European Territorial Cooperation Programme, Greece-Bulgaria 2007-2013, Final version. Hellenic Republic.
MINISTRY OF ECONOMY AND FINANCE (2007b): European Territorial Cooperation Programme, Greece-Bulgaria 2007-2013, Final version (incorporating EC’s comments). Hellenic Republic.
MYLOPOULOS, Y.; KOLOKYTHA, E.; VAGIONA, D. (2004): Transboundary Water Management in Nestos River, the European “Iron Curtain” Project. Protection and Restoration of the Environment VII, Surface, Waterflow and Quality. Aristotle University of Thessaloniki, Greece.
MYLOPOULOS, M. et al (2008): Hydrodiplomacy in Practice: Transboundary water Management in Northern Greece. Global NEST Journal, 10 (3), pp 287-294, Greece.
PAPACHRISTOU, E.; DARAKAS, E.; BELLOU, A. (2001): Experience of the Cross Border Cooperation between Greece and Bulgaria: The Case of Nestos River. International Conference: Restructuring, Stability and Development in Southeastern Europe. Volos, Greece.
Darakas, Efthymios (2002): The transboundary River Nestos and its water quality assessment: cross-border cooperation between Greece and Bulgaria. The environmentalist 22: 367–375
PSYLOLIGNOU, A. (1998): Greece-Bulgaria, Bilateral Relations and Prospects. In Baourakis G. (ed.) The
Common Agricultural Policy of the European Union: New market trends . p. 231-235. CIHEAM-IAMC, Chania, Greece.

Ulysses Final Report - Multi-thematic Territorial Analysis of Euregio Karelia - Annexes 214
Karelia
EUROREGIO KARELIA (2011): Euroregio Karelia. http://www.euregiokarelia.com/en/euregio-karelia/yleisesittely/
Neighbourhood Programme Karelia (n.y.) : Neighbourhood Programme projects 2001–2008. http://www.euregiokarelia.fi/attachments/Projects_ENG.pdf
Röpelinen, A. (2005): Euregio Karelia, aluerakenne 2000+, rajat, kulttuuriympäristö ja kehittyvät liikenneyhteydet (= Euregio Karelia, Spatial structure 2000+, borders, cultural environment and the developing transport infrastructure). Pohjois-Pohjanmaan liitto
Röpelinen, A. (2000): Euregio Karelia, aluerakenne, Euregio Karelia -alueen alueidenkäytön suunnittelun edistäminen (=Euregio Karelia: spatial structure: Promoting spatial planning in Euregio Karelia). Pohjois-Pohjanmaan liitto
Liikanen, I., Zimin, D., Ruusuvuori, J., Eskelinen, H. (2007): Karelia - a cross-border region? The EU and cross-border region-building on the Finnish-Russian border . Publications of the Karelian Institute, 146
EXLINEA (2006): Lines of Exclusion as Arenas of Co-operation: Reconfiguring the External Boundaries of Europe – Policies, Practices, Perceptions. Final project report.
Pomerania
EUROREGION POMERANIA (2011). Euroregion Pomerania. www.euregiokarelia.com EUROREGION POMERANIA (2006): Grenzüberschreitendes Entwicklungs- & Handlungskonzept der
Euroregion Pomerania. Euroregion Pomerania. http://www.pomerania.net/main.cfm?l=de&rubrik=2&th=5&newsid=561
Kaczmarek, T.; T. Stryjakiewicz (2006): Grenzüberschreitende Entwicklung und Kooperation im deutsch-polnischen Grenzraum aus polnischer Sicht. Europa Regional 14 (2): 61-70
Öresunds Committee (2011): Om oss. The Öresunds Committee. http://www.oresundskomiteen.dk/ Zschiedrich, Harald (Hg., 2010): Wirtschaftliche Zusammenarbeit in Grenzregionen: Erwartungen -
Bedingungen – Erfahrungen. Berlin
Extrematdura- Alentejo
DUERO-DUERO (2011): Agrupación Europea de Cooperación Territorial DUERO-DOURO. www.duero-douro.com/index2.php?pagina=articulo&cod=8&lang=es&tema=aect
EUROACE (2010): EUROACE 2020, Una Estrategia para la Euroregión Alentejo-Centro-Extramadura. Euroregion EUROACE. www.euro-ace.eu/sites/default/files/estrategia_euroace_2020_esp.pdf
EUROACE (2011a). Euroregion EUROACE. http://www.euro-ace.eu/en/cross-border-cooperation/history EUROACE (2011b): Other cross-border cooperations. Euroregion EUROACE.
www.euro-ace.eu/en/cross-border-cooperation/other-cross-border-cooperation-organisations-in-euroace
EUROACE (2011c): Observatorio EUROACE. Euroregion EUROACE. http://observatorio.euro-ace.eu LA RAYA - A RAIA (2011). Association La Raya- A Raia. www.laraya-araia.org
Medeiros, Eduardo (2010): Old vs recent cross-border cooperation: Portugal–Spain and Norway–Sweden. Area 42 (4) : 434–443
Medeiros, Eduardo (n.y.): Euro-Meso-Macro: The new regions in Iberian and European space. Working paper.
Morata, Francesc (2010): Euroregions i integració europea. Doc. Anàl. Geogr. 56 (1) : 41-56 Secretaria de Estado de Cooperacion Territorial / Direccion General de Cooperacion Autonomica (2010) :
Las Agrupaciones Europeas de Cooperacion Territorial (AECT) TRIURBIR (2011). Triángulo Urbano Ibérico Rayano. 7x7. Rede Transfronteiriça 7 X 7.

Ulysses Final Report - Multi-thematic Territorial Analysis of Euregio Karelia - Annexes 215
Annex 3 - SWOT analysis for Euregio Karelia
1. Objectives and methodology
The SWOT analysis performed in the Ulysses project included two phases, a status-analysis phase and an action-decision phase. All information in the analysis was based on research results achieved in the multi-thematic and institutional analyses. A traditional SWOT analysis (Strengths, Weaknesses, Opportunities, Threats) was the framework to analyse the territory’s current status based on two axes, present/future factor (or internal/external), and positive/negative influence, to decide what action should be taken. Strengths and weaknesses (combination of present factor and positive/negative influence) show the current status of the CBA. Research results that were initially marked as strengths, weaknesses, opportunities and threats underwent an analysis, in which they were viewed from the perspective of three possible scenarios (Baseline (trend) scenario, Competitiveness oriented scenario and Cohesion oriented scenario produced by ESPON 3.2. project). Final opportunities and threats were formulated based on the scenario exercise. The second phase of the SWOT analysis was the Action-Decision Phase. In this phase the strengths, weaknesses, opportunities and threats were translated into possible strategies and policy options. There were four types of strategies, so called SO-, ST-, WO- and WT-strategies. SO- strategies were strategies to maximize strength under the opportunity. ST-Strategies were strategies to avoid threats by taking advantage of strengths. WO-Strategies were strategies to take advantage of the opportunity by complementing the weaknesses. Finally WT-Strategies were strategies to face present problems in the face of foreseeable downturns. Based on the strategies policy options were then formulated for Euregio Karelia.

Ulysses Final Report - Multi-thematic Territorial Analysis of Euregio Karelia - Annexes 216
2. Status-analysis phase
2.1. Initial strengths, weaknesses, opportunities and threats
Strengths Weaknesses Opportunities Threats
De
mo
gra
ph
y
Total fertility rate has
been increasing in all the
regions of Euregio Karelia
since 2000.
Negative population
growth has been less
severe in the CBA
between 2006 and 2010
than during the previous
four-year-period.
The proximity of the
border has attracted
migrants from Russia to
Eastern Finland.
Euregio Karelia shows
negative population
change between 2001 and
2010. Accordingly the
population density in the
CBA has been declining.
Net migration has been
below the national
averages.
Improved border crossing
infrastructure and relaxed
border crossing and
migration policies attract
an increasing number of
migrants to the border
areas of Euregio Karelia.
The amount of population
continues to decrease.
Migration to the CBA
remains moderate, and
migration in general
causes social problems
(unemployment of
migrants, lack of social
integration).
Sparsely populated rural
areas suffer most of the
population decline,
because inhabitants move
to urban areas.
Po
lyce
ntr
icit
y
The CBA has a relatively
polycentric urban
structure that is not
dominated by one big city.
Population has been
increasing in all the FUAs
(except for Kajaani).
A relatively small amount
of FUAs (9) and small
share of FUA inhabitants.
Only one FUA in the
Republic of Karelia.
Great differences in GDP
between the FUAs. In
almost all the FUAs
dominating economic
activity is traditional
manufacturing.
Due to the polycentric
structure the provision of
services is relatively even
in the CBA.
Great differences in GDP
per inhabitant in the
Finnish and Russian FUAs
that on the other hand
foster border trade but on
the other hand hinder
largest part of the
population in the Republic
of Karelia to make use of
services on the Finnish
side of the CBA.
The FUAs are dependent
on traditional
manufacturing and thus
very vulnerable to effects
of globalisation.
Urb
an
-ru
ral
rela
tio
nsh
ip
Urbanisation of
agricultural areas has
been below the ESPON
average. Changes in
artificial land cover have
been moderate.
An increase in GVA by
agriculture and fishing.
Even if there has been an
increase in GVA by
agriculture and fishing, the
share of those fields of
economy in total GVA has
been decreasing.
Accordingly there has
been a decline in the
share of employment in
the field in general
employment statistics.
Large sparsely populated
rural areas with low
human intervention are
strong assets for the CBA.
A part of them can be
developed into
recreational areas with
sustainability and nature
conservation as main
values. Other possible
paths are organic farming
and production of bio-
fuels.
Nature values are
secondary in the
development of rural and
agricultural areas. In the
long run this decreases
the attractiveness of the
area in terms of
recreational use.

Ulysses Final Report - Multi-thematic Territorial Analysis of Euregio Karelia - Annexes 217
Acc
ess
ibil
ity
an
d c
on
ne
ctiv
ity
Despite its remote
location, air connections
make the CBA accessible
to the European countries.
The CBA has a high
"virtual" connectivity
(Finnish regions).
Cross-border traffic has
been steadily increasing.
Low connectivity to
European road and rail
infrastructure. Index
change of standardized
multimodal potential
accessibility has been
negative.
Improved cross-border
infrastructure and visa-
free travelling across the
Finnish-Russian border
will improve accessibility
within the CBA.
The increasing amount of
households with internet
access improves
connectivity within the
CBA and with other parts
of the EU.
Connectivity to European
transport infrastructure
remains low that has a
negative impact on the
competitiveness of the
CBA.
Border crossing
infrastructure on the
Finnish-Russian border is
not developed and traffic
flows don't grow. Border
crossing policies are
hardened that decreases
the movement of people
and goods across the
border.
Lisb
on
/ E
uro
pe
20
20
ob
ject
ive
s
Strong forest industry and
large share of
employment in the field.
The Finnish-Russian
border has positive effects
on trade and the
development of service
sector in the regions
located close to the
border.
Only one region of the
CBA classified as middle
income. Other regions
identified as less
developed regions.
Eastern Finland and the
Republic of Karelia
performing weak in terms
of R&D and social
cohesion.
Large differences in GDP
per capita between the
Finnish and Russian
regions of the CBA.
Increasing traffic across
the Finnish-Russian border
allows the service sector
to develop on both sides
of the border.
New forms of cooperation
are developed in the CBA
in order to improve the
performance of Eastern
Finland and the Republic
of Karelia in terms of
economy, R&D and social
cohesion.
Eastern Finland and the
Republic of Karelia
continue to perform weak
in terms of economy, R&D
and social cohesion.
Differences in GDP per
capita continue to grow
between Eastern and
Western parts of Euregio
Karelia on the Finnish side
and between the Finnish
regions and the Republic
of Karelia.
Go
the
nb
urg
ob
ject
ive
s
Sensitivities to climate
change are generally low
in the CBA.
Wind energy potential is
above European average
in all the regions of the
CBA.
Weak urban waste water
treatment capacity in the
Republic of Karelia. This
affects water quality in the
whole Baltic Sea water
basin.
Low share of Natura 2000
areas.
The CBA develops
adaptation capacity and
operates proactively
against the effects of
climate change.
Euregio Karelia takes
advantage of existing
natural energy potentials
and build renewable
energy sources.
Future economic growth,
in particular the
development of the
service sector is
controversial to the
sustainable development
of the CBA.
Environmental issues are
not discussed and handled
in collaboration with the
Russian and Finnish
authorities.

Ulysses Final Report - Multi-thematic Territorial Analysis of Euregio Karelia - Annexes 218
Cro
ss-b
ord
er
go
ve
rna
nce
Despite of the external
border and socio-
economic differences
cross-border cooperation
exists and is of high
political and territorial
relevance.
Two documents have so
far developed a strategic
framework for cross-
border cooperation,
considering systematically
the territorial dimension.
Euregio Karelia is divided
by an external EU border
with visa obligations,
along which high socio-
economic differences,
different political systems
and a high language
barrier. The border is thus
classified as a barrier in
comparison with the EU
internal borders.
Neither a spatial planning
nor a transport policy has
been institutionalised on a
cross-border level.
Collaboration between
Finnish and Russian
regions of Euregio Karelia
on spatial planning is
continued in the form of
information exchange and
common publications.
Common efforts are taken
to improve infrastructure
leading to the border
crossing points and
services available for the
travellers.
Collaboration between
Finnish and Russian
regions of Euregio Karelia
on spatial planning is
discontinued. No
information exchange on
spatial plans on either side
of the border is taking
place.

Ulysses Final Report - Multi-thematic Territorial Analysis of Euregio Karelia - Annexes 219
2.2. Scenario exercise
ESPON project 3.2 “Spatial Scenarios and Orientations in relation to the ESDP and Cohesion Policy” (2006) was a project that studied future evolutions of European regions. It elaborated three roll-forward scenarios - one baseline and two prospective policy scenarios. These scenarios provide a general vision of the evolution of the European territory as a result of specific policy choices. They don’t take into account other possible events that might influence the territory, e.g. possible financial crises or natural catastrophes.
2.2.1. Integrated baseline (trend) scenario
This scenario is based on the continuation of trends and on the principle that no major changes occur in mainstream and ongoing EU policies.
− Most EU sectoral policies largely continued − Renewed efforts from Lisbon strategy: extra investments in R&D and education − Regional policy continued with vigour − Investments in new infrastructure to improve accessibility between old and new member states − No major changes to immigration policy − Cutbacks in Agricultural policy
We have collected in the following table main ideas from the scenario and organised these ideas by the themes of Ulysses project.
Demography General EU
trends
Reduced population ageing and stable European population.
Large groups of people are retiring from working life. Demand for
highly skilled people is growing in Europe and competition between
regions for attracting young skilled people is increasing.
Immigration from outside Europe is contained by public policies, but
not really stopped.
Socio-economic dualisation and socio-spatial segregation is progressing
in cities.
Northern and
sparsely
populated areas
Finland and Sweden witness urban population growth but rural decline.
Russian Baltic Sea Region area experiences a continuing overall decline
in population terms.
Population ageing increases across the area. By 2030 median age is
significantly higher than in the early 2000s. The oldest population is
found in Eastern Finland, with a median age above 50.
In areas with strong population decline quality of public and private
services is declining and new investments are barely made.
Polycentric
development
General EU
trends
Settlement systems in terms of polycentricity have not changed
fundamentally in the EU, even if there has been concentration of flows
activities in metropolitan areas and major cities.
Accelerating globalisation has affected FUAs with low or intermediate
technologies and activities have declined.
Northern and
sparsely
populated areas
In the Western periphery, higher or medium growth rates are observed
in regions with metropolitan areas like Southern Finland. MEGA-rural
divide particularly important as economic development is generally
concentrated to urban growth poles.

Ulysses Final Report - Multi-thematic Territorial Analysis of Euregio Karelia - Annexes 220
Urban/rural
relationship
General EU
trends
Strong differentiation can be observed within and between rural areas.
Some become rather wealthy on the basis of residential and tourist
functions, especially related to the attraction of retired people, or of
intensive agricultural production. Others become subject to
depopulation and marginalisation.
European agriculture follows a triple tendency: bulk production, niche-
market development for high value products (taking advantage of high
productivity know-how, such as is required for organic farming) and
extensive management of semi-natural areas (principally through
grazing).
Rural areas are significantly affected by the new energy paradigm, both
in positive and negative terms. As a consequence of high-energy input;
agricultural production methods (for heating, treating and fertilizing)
with increasing energy prices lead to higher consumer prices for food
produced in the EU. High potentials exist for the production of bio-
fuels.
Northern and
sparsely
populated areas
Urban and housing policies are favouring more energy-efficient types
of settlements and buildings, making possible additional energy savings
and greater use of renewables. Home working is strongly developing,
as well as other types of ICT applications such as the access to public
and private services, e-shopping, educational and cultural programmes
etc.
Accessibility and
connectivity
General EU
trends
The area of high accessibility broadly covering the pentagon is
widening in almost all directions. By 2030, disparities in accessibility
between centre and peripheries remain significant.
Transport flows continue to grow under the influence of progressing
European integration and of accelerating globalisation.
ERDF and the Cohesion Fund support significantly the development of
transport infrastructure in the less developed countries and regions.
Population ageing and the increasing number of retirees generate new
forms of mobility, very different from the classical home-work
relations, more linked to recreation, cultural activities, travelling,
health care etc.
Northern and
sparsely
populated areas
The Europe-wide accessibility of these areas and the accessible GDP, at
less than 10 hours, have remained by 2030 among the lowest in
Europe, with few investments in transport infrastructure, except for
the road networks in the proximity of medium-sized urban centres
(Oulu, Rovaniemi, Sundsval/Härnesand, Ostersund, Umeå, Uleå).
The very low level of rail infrastructure makes the transport system of
these regions (road, airlines) more dependent upon oil. The continuous
increase of oil prices has negatively affected the accessibility of these
regions.
Lisbon Strategy General EU
trends
Technology is progressing in a variety of fields. Biotechnologies are
producing a true breakthrough with a wide diversity of applications.
Although new technologies are further transforming life and
production in Europe, only a modest number of them are generated in
Europe.

Ulysses Final Report - Multi-thematic Territorial Analysis of Euregio Karelia - Annexes 221
Northern and
sparsely
populated areas
Increasing energy prices affect more strongly the countries and regions
with traditional industries, both in Western and Eastern Europe. At
European-wide scale, peripheral regions whose economies are more
dependent upon transport are losing a part of their competitiveness
because no major substitution possibilities to road and air
transportation are possible.
While general economic growth in the region (with the exception of
the German and, in particular, Russian BSR areas) continues to outpace
the EU average, with labour productivity increasing, spatial polarisation
is increasingly exacerbated. The main engines for development are the
main metropolitan areas in the region: Stockholm, Helsinki, Malmö-
Copenhagen, Oslo, Gothenburg, Hamburg, Berlin, Warsaw, Krakow,
and St Petersburg.
Trend of falling relative competitiveness is expected to continue.
Gothenburg
strategy
General EU
trends
Water shortage is an increasing problem in Southern Europe because
of alarming drought trends calling for a number of new strategies.
Continued road traffic growth, despite higher energy prices, driven by
economic development and infrastructure investments means more
potential emissions.
Environmental legislation fosters technological developments.
The impacts of climate change have been becoming significant up to
2030, as in the increased occurrence of natural hazards (floods,
droughts and heat waves) and shifting climate zones. Floods have
caused much damage, more so in countries which had not invested in
preventive measures.
Northern and
sparsely
populated areas
Increasing heavy rain falls in Northern and Central Europe, but also in
Southern Europe, where they may reach extreme intensity, cause more
damaging river floods and hazards.
Move towards the service economy is stronger, which leads to a
reduction of the environmental footprint of manufacturing industries.
Inter-regional tensions for the appropriation of water resources are
emerging. In northern European regions, on the contrary, more
favourable situations appear. In Finland, positive effects of climate
change are observed in agriculture, forestry and in energy
consumption. [According to latest studies the effects are actually
negative.]
Negative impact of climate change has been increasing: hot summers
with drought, producing damage to the vegetation, reducing the
available biomass production and therefore reducing the outputs of
forestry and related activities. Forest fires have become more frequent.

Ulysses Final Report - Multi-thematic Territorial Analysis of Euregio Karelia - Annexes 222
Cross-border
governance
General EU
trends
Contrary to the internal borders, the quality and intensity of cross-
border co-operation along external borders is still significantly lower,
since strict border-control-procedures set limitations for cross-border
mobility. Whereas many internal border regions tend to become
spaces of integration and co-operation, the majority of regions along
external borders remain “spaces of division”.
Picture emerging from the baseline scenario in Euregio Karelia
Since regional policy was continued with vigour by the EU, rural regions have been better able to keep their inhabitants and skilled workers. Thus negative population trend in Euregio Karelia has been less severe. Migration across the border in Euregio Karelia has remained moderate, because EU has continued to facilitate movement between the member states, but has been more circumspect regarding immigration from outside the Union. Investments in infrastructure supported by the EU have allowed building new infrastructure to improve accessibility and better connect the FUAs in the CBA. However, disparities in accessibility between cities and peripheries of the CBA have remained significant. The development of border infrastructure on the Finnish-Russian border has enabled traffic flows to increase gradually. New small businesses have arisen to rural areas in connection with tourism development, organic farming and bio-fuel production. New technologies and investments in R&D have offered new possibilities for the forest industry to decrease the dependence on traditional manufacturing and to increase the amount of new innovations. Negative impacts of climate change have increased slightly in the CBA in terms of the amount of natural hazards and the appearance of foreign species to the natural habitat. SWOT analysis on the opportunities and threats emerged from the baseline scenario in Euregio Karelia
Scenario 1: Baseline (trend) scenario
opportunity threat
Demography Since regional policy is continued with
vigour by the EU, rural regions are
better able to keep their inhabitants
and skilled workers. Thus negative
population trend in Euregio Karelia is
less severe.
The amount of population continues
to decrease and age. Sparsely
populated rural areas suffer most,
because younger inhabitants move to
urban areas and rural areas are not
able to compete for skilled workers.
Since EU continues to facilitate
movement between the member
states, but is more circumspect
regarding immigration from outside
the Union, migration across the
border in Euregio Karelia slows down.
Polycentricity FUA population increases and Euregio
Karelia maintains its polycentric
structure.
Investments in infrastructure
supported by the EU allow building
new infrastructure to improve
accessibility and better connect the
FUAs in the CBA.
Polycentricity measured by GDP
declines in the CBA as the effects of
globalisation vary largely between
different FUAs.
FUAs lose population and GDP
decreases, because intermediate
technologies and activities decline.

Ulysses Final Report - Multi-thematic Territorial Analysis of Euregio Karelia - Annexes 223
Urban-rural relationship New small businesses arise to rural
areas in connection with tourism
development, organic farming and
bio-fuel production.
Developing home working
applications, as well as other types of
ICT applications such as access to
public and private services, e-
shopping, educational and cultural
programmes enable people to
continue to populate rural areas.
Traditional agricultural production
faces difficulties with the increasing
energy prices that lead to higher
consumer prices for food produced in
the CBA.
Accessibility and connectivity Accessibility of the CBA has not
decreased due to ERDF and the
Cohesion Fund that have supported
the development of transport
infrastructure in the less developed
countries and regions.
The development of border
infrastructure on the Finnish-Russian
border has enabled the traffic flows to
increase. This has had positive effects
on the economy of border regions.
Disparities in accessibility between
cities and peripheries of the CBA
remain significant.
Low level of rail infrastructure makes
the transport system of the CBA more
dependent upon oil and the
fluctuation of oil prices.
Lisbon / Europe 2020 strategy New technologies and investments in
R&D offer new possibilities for the
forest industry to decrease the
dependence on traditional
manufacturing and to increase the
amount of new innovations.
Increasing energy prices affect the
CBA, because it is relies on traditional
industries. Thus the trend of falling
relative competitiveness is expected
to continue in the CBA.
Spatial polarization of economic
growth continues.
Gothenburg strategy EU environmental legislation fosters
technological developments. Euregio
Karelia is able to take advantage of
latest innovations in environmental
technologies and to participate in
their development.
Euregio Karelia moves towards the
service economy and is able to reduct
the environmental impact of
manufacturing industries.
Negative impacts of climate change
increase in the CBA. The amount of
natural hazards and the appearance
of foreign species to the natural
habitat increases.
Cross-border governance Regional policy including the
neighbourhood dimension enhances
cooperation across the Finnish-
Russian border.
Whereas many internal border
regions tend to become spaces of
integration and co-operation, Euregio
Karelia remains a “space of division”.

Ulysses Final Report - Multi-thematic Territorial Analysis of Euregio Karelia - Annexes 224
2.2.2. Rhine-Rhone Europe: competitiveness-oriented scenario
This is a prospective, policy-oriented scenario. It is based on the assumption of a significant reshaping of EU policies originating in the disappointing results of the implementation of the Lisbon Strategy during the period 2002-2005.
− Emphasis on expanding and improving the common market
− EU enlargements is part of the strategy
− Neighbourhood policy is being strengthened. Importance of the third pillar of EU policies (foreign policy, justice, security etc.)
− Funds from regional and agricultural policies to R&D, education and training and ICT infrastructure
− Strongest regions and links between them supported
− A selective immigration policy
− Environmental protection, social cohesion and integration viewed as secondary
The following table includes main ideas from the scenario organised by the themes of Ulysses project.
Demography General EU
trends
Population ageing is stronger in a number of peripheral regions.
Opening of external EU borders to (selected) immigration. To plug the gap
caused by the expanding support ratio, a vigorous ‘labour replacement’
immigration policy is being co-ordinated across the EU, targeting young
and/or highly skilled labour from across the world.
Northern and
sparsely
populated areas
Faster depopulation and lower investments in strategic infrastructure,
human resource development and entrepreneurship in peripheral regions.
High unemployment rates on both sides of the border enhance out-migration
in border regions.
Northern Periphery area and the southern shore of the Baltic both see
continuing population decline, as economic opportunities aggregate towards
urban centres. A limited number of urban areas beyond the Nordic capital
region core, such as Oulu benefit, given their advantageous positions in
terms of high-tech industrial development and/or port facilities and
transportation.
Polycentric
development
General EU
trends
Development concentrated in the pentagon. Very few metropolitan areas
outside of this area generate significant attraction and polarisation effects.
At regional and local scale, European citizens adapt their behaviour to
increasing transport costs and organise their mobility, as far as possible, in a
more rational way (car sharing, public transport, change of residential
location).
While younger generations and immigrants concentrate in and around
metropolitan areas, retirees move towards attractive rural areas, small and
medium-sized towns and develop new patterns of mobility more related to
recreation, cultural activities, health care, leisure travelling etc.
Northern and
sparsely
populated areas
This propensity towards ‘urban crowding’ has potentially quite significant
environmental and transport-related impacts in the areas concerned, as
transport and housing endowments are put under significant strain in the
Nordic capital regions, while the northern periphery area and certain parts of
Poland suffer in that that essential basic services are no longer automatically
provided in certain areas due to population decline.

Ulysses Final Report - Multi-thematic Territorial Analysis of Euregio Karelia - Annexes 225
Urban/rural
relationship
General EU
trends
Regions with metropolitan areas and large cities are clearly favoured, both in
the pentagon and outside. Compared with the baseline scenario, the least
favoured regions are rural areas, both in the centre and in the peripheries.
In the field of green biotechnologies, the development of gene-modified
crops diffuses widely. Large agricultural and food companies benefit more
from the outputs of research and are more capable of meeting the
requirements of consumer protection. Regions with intensive and productive
agriculture, especially the most central ones, are the main beneficiaries.
In the absence of a strong spatial planning policy, the consequence is a
progressive elimination of organic farming and of conventional agricultural
production by gene-modified farming.
Low priority given to environmental protection and animal welfare.
The strong decrease of EU support has affected the exploitation of certain
types of renewable energy sources, as well as investments in tourist
infrastructure outside the most attractive places. Tourism is therefore
spatially more concentrated than under baseline assumptions.
Northern and
sparsely
populated areas
The regions which show weaker performance than in the baseline scenario
are almost all located in the European peripheries: northern regions of the
Nordic countries etc.
Large energy companies also buy or control wide areas in fertile agricultural
regions for the production of energy crops or in areas well suited for wind
energy production.
Accessibility and
connectivity
General EU
trends
Improvement of the external accessibility of Europe and the transport links
with neighbouring countries.
The networking of metropolitan areas progresses significantly, driven by the
private economy and especially by large companies.
Broadband networks are developed mainly between metropolitan areas and
large cities throughout Europe.
Northern and
sparsely
populated areas
Many border regions gain only little benefit from the reconstruction and
modernisation of Trans-European road and rail networks. They remain more
or less transport corridors, whereas the agglomerations in the hinterland are
capable of reinforcing their position.
A slight negative difference can only be observed in northern
Sweden and Finland in Europe-wide multi-modal accessibility.

Ulysses Final Report - Multi-thematic Territorial Analysis of Euregio Karelia - Annexes 226
Lisbon Strategy General EU
trends
Technological development is the cornerstone of the new policies, the
objective being to reduce the gap between Europe and other advanced
economies.
Resources are diverted towards R&D, technological development, ICT,
education and training.
The sectors in which Europe performs with high competitiveness are
especially biotechnologies, energy and transport.
Generous pension schemes are abandoned as life expectancy in many
occupational groups continues to rise.
Social friction as it arises is met with strong restraint and there are
perceptible increases in surveillance and security, which have become a
major business in their own right.
Northern and
sparsely
populated areas
After 2015, the trends are likely to continue and reduce the relative
competitiveness of these regions.
The development and application of innovative solutions in less developed
regions is much more problematic, because of insufficient financial
resources.
The overall absence of a strong cohesion policy leads to a situation where the
majority of the economically weak border regions remain in a status of
backwardness, particularly in terms of low employment opportunities and
correspondingly high unemployment rates.
High-tech sectors and their ancillary service partners are stressed at the
expense of traditional industrial production – though some ‘traditional’
sectors such as mining do survive in the northern periphery area in particular.
Gothenburg
strategy
General EU
trends
Emissions related to inter-urban traffic are globally higher than in the
baseline scenario. This results from stronger investments in the road and
motorway networks.
Global energy consumption is not being reduced, at least in the short term;
because growth implies, despite further progress in the energy intensity of
the economy, stronger energy consumption.
New generations of nuclear power plants are developed and widespread.
Energy supply diversification is being promoted, however not only renewable
energy sources.
The new energy supply strategies have both positive and negative impacts on
the environment and on citizens' security.

Ulysses Final Report - Multi-thematic Territorial Analysis of Euregio Karelia - Annexes 227
Northern and
sparsely
populated areas
The weakness of structural and rural development policies does not make
the full exploitation of the renewable energy potential of less developed
regions possible.
Climate change is recognized as a major problem, but measures to adapt to
its consequences are principally taken at the global/international level.
Pressure from Russia, in the form of the emergence of certain unforeseen
‘problems’ with the gas pipeline also increase dramatically after further EU
enlargements.
As no specific prevention measures were taken, forest fires have increased
during hot summers, destroying a part of traditional forest landscapes.
Cross-border
governance
General EU
trends
Border regions are no longer able to rely on European assistance schemes
which, until 2013, provided specific support for overcoming border specific
hindrances.
Picture emerging from the competitiveness -oriented scenario in Euregio Karelia
A selective immigration policy has been introduced to attract the best minds to the EU from outside the Union. Migration patterns in Euregio Karelia have improved and the CBA has been able to attract worker migrants to such fields that are lacking competent work force. However, social cohesion and integration have been viewed as secondary policies by the EU. In Euregio Karelia rapid increase in migration and the lack of attention at social integration of migrants has resulted in social conflicts among the inhabitants. The low accessibility of Euregio Karelia has improved, because EU has invested in external accessibility and transport links with neighbouring countries. Infrastructure on Finnish-Russian border crossings has been developed. Investments in R&D, education and training and ICT infrastructure have had positive impacts on FUAs with universities and high tech industry. They have been attracting young people and skilled workers. Rural areas of Euregio Karelia have declined. Due to challenging rural conditions, organic farming has given way to large scale crops that might be harmful to low scale organic farming. Eastern Finland has continued to perform weak in terms of economy and employment. The ageing population has faced social problems, because generous pension schemes have been abandoned and many basic services are no longer available in rural regions. SWOT analysis on the opportunities and threats emerged from the competitiveness-oriented scenario in
Euregio Karelia
Scenario 2: Rhine-Rhone Europe: the competitiveness-oriented scenario
opportunity threat
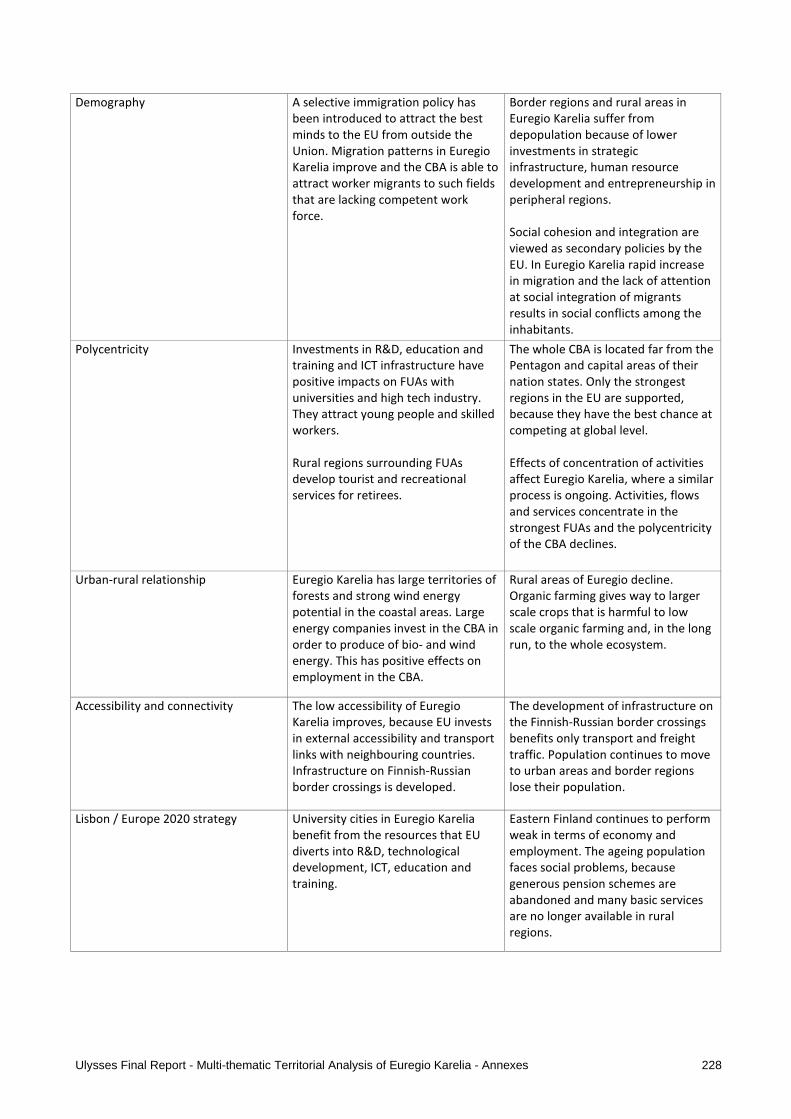
Ulysses Final Report - Multi-thematic Territorial Analysis of Euregio Karelia - Annexes 228
Demography A selective immigration policy has
been introduced to attract the best
minds to the EU from outside the
Union. Migration patterns in Euregio
Karelia improve and the CBA is able to
attract worker migrants to such fields
that are lacking competent work
force.
Border regions and rural areas in
Euregio Karelia suffer from
depopulation because of lower
investments in strategic
infrastructure, human resource
development and entrepreneurship in
peripheral regions.
Social cohesion and integration are
viewed as secondary policies by the
EU. In Euregio Karelia rapid increase
in migration and the lack of attention
at social integration of migrants
results in social conflicts among the
inhabitants.
Polycentricity Investments in R&D, education and
training and ICT infrastructure have
positive impacts on FUAs with
universities and high tech industry.
They attract young people and skilled
workers.
Rural regions surrounding FUAs
develop tourist and recreational
services for retirees.
The whole CBA is located far from the
Pentagon and capital areas of their
nation states. Only the strongest
regions in the EU are supported,
because they have the best chance at
competing at global level.
Effects of concentration of activities
affect Euregio Karelia, where a similar
process is ongoing. Activities, flows
and services concentrate in the
strongest FUAs and the polycentricity
of the CBA declines.
Urban-rural relationship Euregio Karelia has large territories of
forests and strong wind energy
potential in the coastal areas. Large
energy companies invest in the CBA in
order to produce of bio- and wind
energy. This has positive effects on
employment in the CBA.
Rural areas of Euregio decline.
Organic farming gives way to larger
scale crops that is harmful to low
scale organic farming and, in the long
run, to the whole ecosystem.
Accessibility and connectivity The low accessibility of Euregio
Karelia improves, because EU invests
in external accessibility and transport
links with neighbouring countries.
Infrastructure on Finnish-Russian
border crossings is developed.
The development of infrastructure on
the Finnish-Russian border crossings
benefits only transport and freight
traffic. Population continues to move
to urban areas and border regions
lose their population.
Lisbon / Europe 2020 strategy University cities in Euregio Karelia
benefit from the resources that EU
diverts into R&D, technological
development, ICT, education and
training.
Eastern Finland continues to perform
weak in terms of economy and
employment. The ageing population
faces social problems, because
generous pension schemes are
abandoned and many basic services
are no longer available in rural
regions.

Ulysses Final Report - Multi-thematic Territorial Analysis of Euregio Karelia - Annexes 229
Gothenburg strategy Vast areas of the CBA remain with low
human influence and as urban
concentration continues these areas
become strong natural assets for the
CBA in terms of nature protection and
sustainable tourism.
Low priority is given to environmental
protection. This increases the risk of
environmental problems and hazards,
especially when the amount of traffic
across the border grows constantly.
Cross-border governance There is a very concrete need to
improve cross-border governance and
collaborative spatial planning in a
situation, where cross-border traffic
increases, but no policies or measures
are tackling the consequences. This
need functions as an impetus towards
active, more structured /
institutionalised form of cooperation
in spatial planning in Euregio Karelia.
The CBA is no longer able to rely on
European assistance schemes, but has
to tackle alone problems related to
spatial, social and environmental
effects of competitiveness oriented
policies.

Ulysses Final Report - Multi-thematic Territorial Analysis of Euregio Karelia - Annexes 230
2.2.3. Danubian Europe: Integrated cohesion-oriented scenario
This is a prospective, policy-oriented scenario. In this scenario, the main priorities of public policies at EU level, in a context of growing globalisation, are focused on economic, social and territorial cohesion and not on global competitiveness.
− 2004 EU enlargement and economic disparities called for a full integration of various parts of the EU
− Territorial cohesion as a matter of principle
− Regional policy as the main vehicle: structural funds, investments in infrastructure
− Only minor reforms to agricultural policy
− Adaptation to climate change
− Proactive social policy: childcare support, tax incentives
− Strict immigration controls for non-EU countries The following table includes main ideas from the scenario organised by the themes of Ulysses project.
Demography General EU
trends
Revival of fertility rates in many European countries. Amplified by the
support of public policies in favour of families. Flexibility in child-care
arrangements and pension ages are becoming the norm. Confronting
institutional forms of ageism and removing compulsory retirement ages.
External migration becomes more restrictive. Migration policies within the
EU are better coordinated and adapted to fulfil the goals of ‘replacement’.
Specific controls are also being introduced with socio-cultural integration in
mind.
Northern and
sparsely
populated areas
Population ageing continues to affect various parts of the continent. Stronger
in central Sweden and Finland.
The demographic potential weaker in central Sweden and southern Finland.
Falling total population is also continuing to impact many eastern areas of
Europe.
The slow-down of out-migration of young women had a positive impact on
fertility rates. The demographic potential in 2030 however is not more
favourable than under baseline assumptions.
Polycentric
development
General EU
trends
Less concentrated, but more widespread pattern regarding attraction and
polarization potential of metropolitan areas in 2030. Urban settlements are
characterized by more polycentricity. Emergence of several peripheral
integrated zones.
Regional disparities are still important by 2030, although less significant than
in the baseline scenario. Global European growth and competitiveness are,
however, lower.
Northern and
sparsely
populated areas
Territorial integration at transnational and cross-border level, driven by
networks of cities, is weaker than in the baseline scenario.

Ulysses Final Report - Multi-thematic Territorial Analysis of Euregio Karelia - Annexes 231
Urban/rural
relationship
General EU
trends
Metropolitan areas and other large agglomerations are significantly
supported, but also small and medium-sized towns in less developed regions
are more strongly supported, especially as far as services of general interest
are concerned.
Rural areas benefit from stronger support through the cohesion policies and
from stable support of the agricultural policy. The strong promotion of
renewable energy sources creates wealth in rural areas and counterbalances
the decline of a number of traditional weakly competitive agricultural
activities.
The structural funds are concentrated on improving the socio-economic
viability of marginalised rural areas in all member countries. Improving
landscape and nature is also an important priority. The process of economic
diversification of rural areas is much stronger than in the case of the baseline
scenario.
Consumers become more and more aware of the possibility of steering
production in the direction of organic farming and regional and other quality
products through their spending behaviour.
Northern and
sparsely
populated areas
In Western as well as in Eastern Europe there are a decreasing number of
rural areas experiencing marginalisation and abandonment. These are rural
areas where the demographic situation (high level of population ageing), the
production conditions (low level of soil fertility, increasing drought) and the
attractiveness are very unfavourable.
Decentralised systems of energy production and distribution are developing,
encompassing rural areas together with their small and medium-sized towns.
The external energy dependency of such regions is reduced and energy
production is at the same time a new source of income for farmers and rural
areas in general.
In the case of energy production in rural areas, both positive and negative
impacts to the environment are being generated. Despite the adoption of
new regulations, damage to natural and cultural landscapes cannot be
excluded.
By 2030, the less populated Nordic regions have become somewhat more
attractive than they were in the early 2000s.
Accessibility and
connectivity
General EU
trends
A difference with the baseline scenario is that, in addition to major corridors,
support is also given to a number of strategic regional transport axes in the
context of rural development plans, so as to connect as many medium-sized
and small towns as possible to the trunk networks. The cohesive scenario
pays also greater attention to a better balance of transport modes and
promotes significantly efficient railway and waterway systems.
Northern and
sparsely
populated areas
A supply-side improvement of broadband access in disadvantaged regions
fosters the demand for internet services delivered by broadband, e.g. by the
establishment of e-learning opportunities for citizens and employees in less
densely populated areas and by offering e-government solutions.

Ulysses Final Report - Multi-thematic Territorial Analysis of Euregio Karelia - Annexes 232
Lisbon Strategy General EU
trends
EU supports the attraction of external investments and to enhance the
development of regions own firms. Priority is given to the development of
transport links between supported regions and the core nodes of their
countries, and also on strengthening the networks of business and research
cooperation with the stronger regions.
Unconditional assistance to territories concerns mainly support to the
improvement of the environment and of some basic facilities.
Concerning technological evolution differences to Baseline scenario exist in
the regional patterns of innovation. In addition, various EU regulations are
enacted to guide technological developments and their impacts more
efficiently.
Northern and
sparsely
populated areas
Economically, the impact of the cohesion approach is again highly
differentiated. In the north – a rather atypical ‘peripheral’ region - where,
paradoxically, most people live in small urban environments rather than in
traditional rural settings, the changes to the structural fund and agricultural
regimes bring little cheer.
Structural policies pay a greater deal of attention to energy issues and
allocate a higher amount of resources in eligible regions to support measures
of energy savings and of diversification of energy supply sources.
Energy price rises continually. The mix of nuclear power and alternative
energy strategies remains dominant in the Nordic countries.
In sum, the cohesion scenario has little impact on the northern periphery.
On the Finnish side, catching up is also largely above average. Sustained EU
support to economic activities has had very positive impacts.
Gothenburg
strategy
General EU
trends
In the cohesion scenario, the environment is viewed as one of the main
pillars of European solidarity. Environmental targets are set at a higher level
than in the baseline scenario.
Stronger attention paid to environmentally-friendly transport modes and
related investments, especially in railways, tend to reduce the environmental
footprint of the transport sector and to contribute to the improvement of air
quality. Kyoto implementation is also taken very seriously by the EU.
Northern and
sparsely
populated areas
Significant amount of resources from the Structural Funds and Rural
Development Policy is allocated to environmental improvement and
protection in less favoured areas.
Cross-border
governance
General EU
trends
Regional disparities are still important by 2030, although less significant than
in the baseline scenario. Global European growth and competitiveness are
however lower.
Northern and
sparsely
populated areas
Territorial integration at transnational and cross-border level, driven by
networks of cities, is weaker than in the baseline scenario.
Picture emerging from the cohesion-oriented scenario in Euregio Karelia
A proactive social policy is put into place at EU level in order to stimulate domestic fertility rates. Special attention is paid at childcare support and tax incentives. This will has affected western parts of Euregio

Ulysses Final Report - Multi-thematic Territorial Analysis of Euregio Karelia - Annexes 233
Karelia where the age structure of the population is such that they have benefited from the policies and support. Border regions continue to suffer from population decrease and migration does not compensate the loss of population, because the EU has introduced strict immigration controls for non-EU countries. Euregio Karelia has maintained its polycentric structure and regional disparities have been less significant than in the baseline scenario. Accessibility within the Finnish territories of the CBA is increasing, because EU supports the building of strategic regional transport axes. The process of economic diversification has had positive effects on rural areas that have benefited from strong promotion of renewable energy and organic farming. Energy production in rural areas could have had negative impacts on the environment, if environmental, landscape and cultural values have not been considered when initializing bio-energy production. Strong EU support in environmental protection has a positive impact on Euregio Karelia that has large areas of uninhabited or sparsely habited territories. However, environmental cross-border cooperation that would allow collaboration in the governance of natural resources is facing difficulties due to lack of financing. SWOT analysis on the opportunities and threats emerged from the cohesion-oriented scenario in Euregio
Karelia
Scenario 2: Danubian Europe: the cohesion oriented scenario
opportunity threat
Demography A proactive social policy is put into
place at EU level in order to stimulate
domestic fertility rates. Special
attention is paid at childcare support
and tax incentives. This will mainly
affect western parts of Euregio Karelia
where the age structure of the
population is such that they will
benefit from the policies and support.
The EU introduces strict immigration
controls for non-EU countries. This
slows down migration from Russia
the Finnish regions of Euregio
Karelia.
Polycentricity Population and welfare in the EU
spreads widely outside the pentagon
and other metropolitan areas. Also
Euregio Karelia maintains its
polycentric structure and regional
disparities are less significant than in
the baseline scenario.
Territorial integration and networks
of cities on the Finnish-Russian
border are not developed.
Urban-rural relationship The process of economic
diversification has positive effects on
rural areas that benefit from strong
promotion of renewable energy and
organic farming. External energy
dependency is reduced and energy
production is a new source of income
for farmers and rural areas in general.
New technologies are developed and
cross-border collaboration in
decentralized renewable energy
production is processing.
Energy production in rural areas is
increasing in Euregio Karelia with
negative impacts on the
environment. Environmental,
landscape and cultural values have
not been considered when
initializing bio-energy production.

Ulysses Final Report - Multi-thematic Territorial Analysis of Euregio Karelia - Annexes 234
Accessibility and connectivity Accessibility within the Finnish
territories of the CBA is increasing,
because EU supports the building of
strategic regional transport axes. A
special attention is paid to the
development of the rail network.
High (broadband) internet accessibility
in the Finnish parts of Euregio Karelia
creates new business opportunities
both for urban and rural areas.
Focus in the development of
accessibility is on the Finnish regions
of Euregio Karelia. Cross-border
infrastructure is not developed and
accessibility of Russian regions of
Euregio Karelia remains low.
Lisbon / Europe 2020 strategy The development of business
networks and research cooperation
with stronger regions makes Euregio
Karelia more attractive to external
investments.
Euregio Karelia takes advantage of
supports allocated to the energy
sector to diversify its energy supply
sources.
Disparities in GDP increase between
the Finnish and Russian regions of
Euregio Karelia, because business
cooperation concentrates in the
Finnish areas of Euregio Karelia.
Gothenburg strategy Strong EU emphasis and support in
environmental protection has a
positive impact on Euregio Karelia that
has large areas of uninhabited or
sparsely habited territories.
Environmental cross-border
cooperation that would allow
collaboration in the governance of
natural resources is facing
difficulties due to lack of financing.
For the same reason, waste water
treatment capacity remains low in
the Republic of Karelia affecting the
whole Baltic Sea water basin.
Cross-border governance Regional policy supports the
development of Finnish territories of
Euregio Karelia. With the help of
existing cooperation and networks
positive effects spread to the Republic
of Karelia.
Lack of funding and mutual
understanding decrease the level of
cross-border cooperation in spatial
planning.
2.3. Final opportunities and threats
Opportunities Threats
De
mo
gra
ph
y
Overall less negative population change continues
and relatively uncontrolled migration policy for non-
EU citizens prevails. To attract more young
migrants, childcare support and tax incentives for
families are maintained.
Migration slows down, because EU introduces strict
immigration controls for non-EU citizens. At the
same time childcare support and tax incentives for
families mostly benefit western parts of Euregio
Karelia that already have the highest fertility rates.

Ulysses Final Report - Multi-thematic Territorial Analysis of Euregio Karelia - Annexes 235
Po
lyce
ntr
icit
y All the FUAs of Euregio Karelia are able widen their
economical activities and decrease the dependence
on traditional manufacturing.
Population growth continues.
Rural-urban relationship strengthens as rural areas
develop recreational services for FUA inhabitants.
Only the strongest FUAs are able to develop
economically and thus attract population. Weaker
FUAs lose their population and differences in GDP
increase.
Urb
an
-ru
ral
rela
tio
nsh
ip
Sustainable rural development based on
advancement and production of renewable energy,
organic farming and ecotourism. Active cross-border
collaboration in all these fields.
Large rural areas are taken over by multinational
companies. Productivity instead of sustainability
guides the principles of these companies. Local
actors lose the management and responsibility over
rural territories.
Acc
ess
ibil
ity
an
d
con
ne
ctiv
ity
All transport modes are developed, but special
attention is paid to air connections improving the
EU level accessibility of the CBA.
Cross-border infrastructure is improved and visa-
free travelling across the Finnish-Russian border
improves accessibility within the CBA.
No investments are made on traffic infrastructure.
Cross-border infrastructure is not developed and it
hinders the increase of accessibility within Euregio
Karelia.
Lisb
on
/ E
uro
pe
20
20
ob
ject
ive
s
Forest industry and other forms of traditional
manufacturing advance with the help of new
technologies and innovations.
Growing cross-border traffic improves employment
and welfare in the border regions.
Traditional manufacturing decreases in the CBA and
other fields of economy are not able to replace lost
places of employment.
Border regions continue to perform weak in terms
of economy and employment and, thus, lose work
age population.
Go
the
nb
urg
ob
ject
ive
s
Euregio Karelia acts as a pioneer region in
promoting sustainable development in the Northern
cross-border areas. Environmental cooperation,
including bio-energy production, across the border
is of utmost importance.
Low priority is given to sustainability and
environmental protection. Cooperation across the
border in environmental issues is discontinued.
Cro
ss-b
ord
er
go
ve
rna
nce
Cooperation in spatial planning is continued in
Euregio Karelia and all parties commit themselves to
same goals and values. Border crossing
infrastructure is the main priority.
Cross-border traffic increases, but no policies or
measures are taken to tackle the consequences. No
cross-border governance or collaborative spatial
planning.
3. Action-decision phase
3.1. Action-decision table
SO-strategy
Strategies to
maximize strengths
under opportunities
WO-strategy
Strategies to take
advantage of
opportunities by
complementing
weaknesses
ST-strategy
Strategies to avoid
threats by taking
advantage of
strengths
WT-strategy
Strategies to face
present problems in
the face of
foreseeable
downturns

Ulysses Final Report - Multi-thematic Territorial Analysis of Euregio Karelia - Annexes 236
Demographic change > Develop childcare
support and tax
incentives for families
to foster fertility rates
and to attract more
young migrants.
> Endorse loose
immigration policy for
non-EU citizens.
> Enhance the
widening of
economical activities
and foundation of
new firms in the CBA
to create new jobs
and keep inhabitants
in the CBA.
> Endorse loose
immigration policy for
non-EU citizens and
enhance integration
of immigrants in
socio-spatial
structures.
> Support the
creation of jobs and
mobility of labour in
the border regions.
> Develop services
and technologies for
the elderly.
> Coordinate the
development of
transport
infrastructures and
services in regions
with a considerable
population decline.
> Develop sufficient
and affordable social
services (health,
education, child care
facilities, facilities for
the elderly etc.) and
innovative solutions
for the provision of
such services in the
sparsely populated
areas.
Polycentric
development
> Support R&D
activities, the
development of new
technologies, service
sector and creative
industries towards a
more knowledge
based economy.
> Support the existing
polycentric structure
of urban settlements.
> Support widening of
economical activities
and entrepreneurship
in FUAs.
> Enhance cross-
border cooperation
between FUAs.
> Support the
specialization of FUAs
based on existing
strengths and
potentials.
> Enhance the
development of
certain technology
clusters in FUAs.
> Study regularly the
development of FUAs
and support the
weaker FUAs in
widening economic
activities.
Urban/rural
relationship
> Support the
advancement and
production of
renewable energy,
organic farming and
ecotourism in rural
areas.
> Enhance cross-
border collaboration
of rural areas and
their small cities.
> Develop innovative
tailor-made solutions
for rural regions to
diversify economic
activities and to take
advantage of existing
potentials.
> Promote urban-
rural partnerships in
territorial
governance.
> Encourage local
actors in rural areas
to engage in energy
production. It can
function as a new
source of income
contributing to
stabilise rural
economies in a
competitive context.
> Enhance
environmental,
cultural and social
quality of tourism to
support rural
development and
protect social and
cultural identities and
physical environment.
> Enhance sustainable
development of
natural and
agricultural areas.

Ulysses Final Report - Multi-thematic Territorial Analysis of Euregio Karelia - Annexes 237
Accessibility and
connectivity
> Develop
accessibility of the
CBA by investing in
transport
infrastructure and
broadband
communication
networks
> Lobby visa-free
travelling and new
models for border
procedures between
EU and Russia.
> Develop public
transport connections
across the Finnish-
Russian border.
> Develop external
and internal
accessibility of the
CBA.
> Encourage
“intelligent” solutions
for providing
transport services in
disperse settlements
areas.
> Support a number
of strategic regional
transport axes and
the interlinking of
these with the
primary, long-
distance network (in
national and cross-
border context).
> Lobby the
importance of
regional and cross-
border infrastructure
on national and EU
level.
Lisbon Strategy > Support forest
industry and other
forms of traditional
manufacturing to
advance with the help
of new technologies
and innovations
> Enhance the
foundation of new
firms and start-ups by
creating a culture of
entrepreneurship and
by fostering a
business-friendly
environment in the
border area.
> Enhance cross-
border cooperation in
the field of new
technologies and
innovations.
> Fight
discriminations in the
labour market and
enhance employment
opportunities for
foreign employees
(education, language
training etc.).
> Enhance
entrepreneurship and
support new and
existing businesses in
the border area.
> Lobby the local
knowledge of the
importance of
Russia's WTO
membershirp.
> Support the
development of
cross-border
infrastructure to
allow larger cross-
border flows.
> Create new tools for
enhancing clusters
and SME cooperation
across the border.

Ulysses Final Report - Multi-thematic Territorial Analysis of Euregio Karelia - Annexes 238
Gothenburg strategy > Develop and market
Euregio Karelia as a
pioneer region in
promoting
sustainable
development in the
Northern cross-
border areas.
> Support the move
towards a more
intangible economy
to reduce energy
consumption.
> Enhance cross-
border collaboration
in environmental
issues.
> Enhance proactive
environmental
protection and
corporate
responsibility in
environmental issues.
> Further network
and interlink natural
sites and protected
areas of regional,
national and
transnational
importance.
> Support the
development of new
energy technologies
and use of alternative
energy systems such
as wind energy and
biomass. Enhance
cross-border
collaboration in these
fields.
> Support active
policies to face
impacts of climate
change and climate
hazards, such as
forest fires, floods,
loss of biodiversity.
> Enhance
improvement of
forest management.
> Support
technological
development in the
protection of water
and water efficiency.
Cross-border
governance
> Continue and
advance cross-border
cooperation in spatial
planning.
> Support cross-
border cooperation in
all fields including
innovation,
education,
employment, trade,
tourism, preservation
of cultural and
environmental assets.
> Advance the use of
EU regional and
structural funds for
the development of
the CBA and the
advancement of
cross-border
cooperation.
> Consider cross-
border aspect in local
and regional plans.
> Lobby the
importance of cross-
border cooperation
and governance on
national and EU-level.
> Enhance cross-
border collaboration
in the fields of safety
and security.
> Support cross-
border cooperation
programmes based
on knowledge
exchange.
> Advance proactive
measures in securing
positive social climate
and safe living
environment in
border areas.
3.2. Most relevant challenges for Euregio Karelia
We have found two thematically cross-cutting challenges that in our view have the strongest influence on future developments of Euregio Karelia. The first challenge is the EU external border and its direct and indirect influence on territorial dynamics and performance of the CBA. In comparison with the EU internal borders, the border between Finland and Russia continues to function as a barrier for the movement of people and goods. However, our study shows that during the 2000s the border between Finland and Russia has become a relevant factor influencing territorial development of the border regions. The border has affected migration patterns, accessibility within the CBA and economy and trade. These developments gradually influence, among others, population patterns and social welfare in the border regions. In addition, cross-border framework is a challenge when dealing with independent national or regional developments. For example environmental protection, such as waste water treatment capacity is weaker on the Russian side of Euregio Karelia, but environmental state, such as water pollution affects both sides of the border. All the “border effects” are subject to change depending on current EU policies. The first challenge is thus to pay attention to border effects and continue collaboration in spatial planning across the border. The second key element affecting territorial development in Euregio Karelia is urban-rural relationship. In the European context Euregio Karelia has a relatively small amount of FUAs (only one FUA in the Republic

Ulysses Final Report - Multi-thematic Territorial Analysis of Euregio Karelia - Annexes 239
of Karelia) and the share of FUA inhabitants is below the European average. On the contrary, there are large uninhabited or sparsely populated areas in the CBA and the population is ageing in the rural areas. The future spatial development in Euregio Karelia is very much dependent on how rural areas will develop in economic sense and will the population find employment in rural areas. At the moment rural areas are losing inhabitants and the share of traditional rural fields of activity is decreasing in general economy and employment statistics. Large rural areas are strong assets to Euregio Karelia when it comes to natural energy potentials, nature protection or sustainable tourism. New small businesses could arise to rural areas in connection with tourism development, organic farming and bio-fuel production. Rural areas require intensive environmental protection in order to prevent possible environmental problems from occurring. In an ideal situation urban and rural areas develop a relationship where they benefit and support each other.

Ulysses Final Report - Multi-thematic Territorial Analysis of Euregio Karelia - Annexes 240
3.3. Suggested strategies for Euregio Karelia
3.3.1. Strategies to tackle the territorial challenges and opportunities
Border as strength -strategy This strategy aims at developing Euregio Karelia into an attractive and active cross-border area. Cross-border travelling is visa-free and trade and services in the border area foster. The development of small businesses and entrepreneurship is supported. Possible social problems are tackled with proactive social policy. Attention is paid to the safety and security of the border areas. - Lobby visa-free travelling between EU and Russia. - Improve infrastructure and accessibility and public transportation across the border by means of road, rail and air transportation. - Lobby the local knowledge of the importance of Russia’s WTO membership. - Enhance the foundation of new firms and start-ups by creating a culture of entrepreneurship and by fostering a business-friendly environment in the border areas. - Develop more efficient business services and promote systematic training of students in companies. - Fight discriminations in the labour market and enhance employment opportunities for foreign employees (education, language training etc.). - Enhance integration of immigrants in socio-spatial structures. ECO-Karelia -strategy In this strategy Euregio Karelia acts as a pioneer region in promoting sustainable development in the Northern cross-border areas. Environmental cooperation across the border is of utmost importance. New technologies are supported to develop rural areas into sustainable areas of nature protection, organic farming and bio-energy production. Sustainable tourism provides services both for local inhabitants and incoming tourists. - Support the move towards a more intangible economy to reduce energy consumption. - Support the development of new energy technologies and use of alternative energy systems such as wind energy and biomass. Support collaboration across the border in these fields. - Enhance environmental protection and corporate responsibility in environmental issues. - Enhance environmental, cultural and social quality of tourism to support local development and protect social and cultural identities and physical environment. 3.3.2. General strategies for Euregio Karelia
So far Euregio Karelia has functioned as a cooperation forum fostering collaborative projects and actions across the Finnish-Russian border. At the moment representatives of the Finnish and Russian regions are working on a common strategy to have a clearer vision for future orientations of the cooperation. Our study shows that Euregio Karelia has great territorial assets that it should value and foster and, on the hand, it has challenges that it should tackle across the border. Territorial assets and challenges should be formulated into (1) a vision of the CBA in a certain time frame, (2) a mission that sets the main object for the work of Euregio Karelia and (3) values that give qualitative attributes for the cooperation and for priorities of spatial planning in general. These values should be made visible for the general public and actors on both sides of the border should commit themselves to the common values. They can also be utilized when lobbying special characteristics and challenges of external border areas to EU officials. As our study shows, the influence of the Finnish-Russian border on territorial development in Euregio Karelia is increasing. We therefore suggest the actors in Euregio Karelia to intensify cross-border collaboration in spatial planning. It is also important to continue studying territorial trends in the CBA and distribute information about the trends to local actors.

The ESPON 2013 Programme is part-financed by the European Regional Development Fund, the EU Member States and the Partner States Iceland, Liechtenstein, Norway and Switzerland. It shall support policy development in relation to the aim of territorial cohesion and a harmonious development of the European territory.