
UK and Eurozone´s Labour Markets Reaction to the Financial Crisis in the perspective of the British...
17
1 UK and Eurozone´s Labour Markets Reaction to the Financial Crisis in the perspective of the British EU Membership – Application of the Phillips Curve Mgr. Ing. Barbora Fialová University of Economics in Prague Náměstí Winstona Churchilla 4,130 67, Praha 3 Phone: +420 732 238 375, e-mail: [email protected] Ing. Šimon Buryan University of Economics in Prague Náměstí Winstona Churchilla 4,130 67, Praha 3 Phone: +420 732 716 030, e-mail: [email protected] Abstract Aim of this paper is to access differences of labour market in the UK and selected Eurozone member states that are considered as a core of the EU. A model of the Phillips curve was proposed in this paper in order to study differences in labour market with regards to elasticity of unemployment rate to inflation rate and with regards to labour market-to-price level time lags. The article is also discussing reactions of selected countries to the financial crisis and primarily prospects of further integration of the UK to the EU/Eurozone. Accessing the differences of selected countries` labour markets is one of the vital findings for the future decision of the UK, whether it should deepen its economic ties with the EU/Eurozone or do the right opposite. JEL classification codes: E24 Keywords: UK, Eurozone, Phillips Curve, Labor markets, Differentiation Acknowledgements This paper has been supported by the project VŠE – IGA 7/2014.
Transcript of UK and Eurozone´s Labour Markets Reaction to the Financial Crisis in the perspective of the British...
1
UK and Eurozone´s Labour Markets Reaction to the
Financial Crisis in the perspective of the British EU
Membership – Application of the Phillips Curve
Mgr. Ing. Barbora Fialová
University of Economics in Prague
Náměstí Winstona Churchilla 4,130 67, Praha 3
Phone: +420 732 238 375, e-mail: [email protected]
Ing. Šimon Buryan
University of Economics in Prague
Náměstí Winstona Churchilla 4,130 67, Praha 3
Phone: +420 732 716 030, e-mail: [email protected]
Abstract
Aim of this paper is to access differences of labour market in the UK and selected Eurozone
member states that are considered as a core of the EU. A model of the Phillips curve was
proposed in this paper in order to study differences in labour market with regards to elasticity
of unemployment rate to inflation rate and with regards to labour market-to-price level time
lags. The article is also discussing reactions of selected countries to the financial crisis and
primarily prospects of further integration of the UK to the EU/Eurozone. Accessing the
differences of selected countries` labour markets is one of the vital findings for the future
decision of the UK, whether it should deepen its economic ties with the EU/Eurozone or do
the right opposite.
JEL classification codes: E24
Keywords: UK, Eurozone, Phillips Curve, Labor markets, Differentiation
Acknowledgements
This paper has been supported by the project VŠE – IGA 7/2014.
2
1. Introduction
The United Kingdom (UK) is well known as the "awkward" member of the European Union
(EU). The country had been a part of the ever-first enlargement of the European integration in
1973. Since then, the UK challenges constantly the ongoing integrational processes within the
European Community (EC) and lately EU. However tough is the British support for
strengthening the Single Market, a large number of British opt-outs has been negotiated and
performed on the other hand. Especially when seen from the Eurozone perspective, it is rather
possible that the UK would never accept the single currency (Allen, 2013).
When discussing the process of differentiated integration within the EU, the UK is
always the most obvious representative. This notion has been even invigorated after the
General Election in the UK in May 2015, when a quite surprising victory has been achieved
by the David Cameron´s Conservative party. In the perspective of the EU future, this is a
vital point, because of the previous Cameron´s pledge to arrange a referendum that would
decide whether the UK will keep on being an EU member or not any more. This commitment
should have been fulfilled under condition that the Conservatives manage to form a majority
Government in spring 2015. Even few days before the General Election this possibility
seemed to be rather improbable. Nevertheless, it is more than clear after the election that the
Conservatives would be able to govern the country on their own for the next five years. This
has strong implications for the future British approach to the European integration, because
the Conservatives will not be limited in conceptualising their new European policy unlike in
the previous coalition government, where they had partners in rather euro-positive Liberal
Democrats (The Economist, 2015).
This is supposed to result in a full implementation of the Cameron´s European policy
programme summed up in January 2013 as “reform, renegotiation, referendum”. In that time,
David Cameron delivered a so called Bloomberg speech, in which he made, apart from
complex reassessment of the EU-British relationship and its future prospects, an
announcement about planned renegotiation of the British EU membership and consequent
in/out referendum that would take place by the end of 20171 (Gov.uk, 2014a). However this
announcement has been more a reaction to domestic policy development2, the proposed
process of reviewing the balance of European competences in the UK would have be of an
essential importance for the future EU-UK relationship (Gov.uk, 2014b).
Aim of this paper is to contribute to the debate about EU competences in the UK
through accessing differences of British labour market on one side and selected Eurozone
member states representing the core of the European integration on the other side, as well as
we will discuss labour markets of the USA and the Eurozone as a group. Accessing the
differences of selected countries` labour markets could be one of the vital findings for the
future decision of the UK electorate, whether their country should deepen its economic ties
with the Eurozone or do the right opposite.
1 Justification for this announcement contained three main points (Policy Network 2013, 25): 1) the potential
discrimination of non-Euro countries by the Eurozone; 2) the over-reach of EU regulation onto national policy-
making; 3) the lack of legitimacy of EU processes and the need for a greater role of national parliaments. 2 The announcement has provoked a large number of negative reactions, most of all because the new European
policy programme has been highly influenced by rising British euro-scepticism resulting in increased strength of
the United Kingdom Independence Party (UKIP). Roger Liddle (2014, 220), for example, wrote about the
Bloomberg speech with respect to its general pro-European tone the following: “For all Cameron´s fine words, it
was a bad day for Britain.” Emerson and Blockmans (2013, 1) suggest that the process after the speech has been
“full of political and economics hazards”. On the other hand, according to the Policy Network Report for the
City of London Corporation, “beyond the initially negative reaction, David Cameron´s speech seems to are
opened up a debate on EU reform which most UK partners welcome” (Policy Network 2013, 37).
3
A model of the Phillips curve was proposed in this paper in order to study differences
in labour market with regards to elasticity of unemployment rate to inflation rate and with
regards to labour market-to-price level time lags in the selected countries. The article is also
discussing primarily prospects of further integration of the UK to the Eurozone and EU
markets.
1.1. Methodology and data
In order to be able to make qualified British labour markets differences analysis, we have
selected following reference countries:
- Germany
- France
- Italy
- The Netherlands
- USA
- plus the Eurozone as a group.
The key criterion for the selection has been an existence of strong economic ties with
the UK, given the fact that our aim is to study the EU markets. The second criterion has been
more long-term, i.e. we have taken into consideration historical ties with the selected
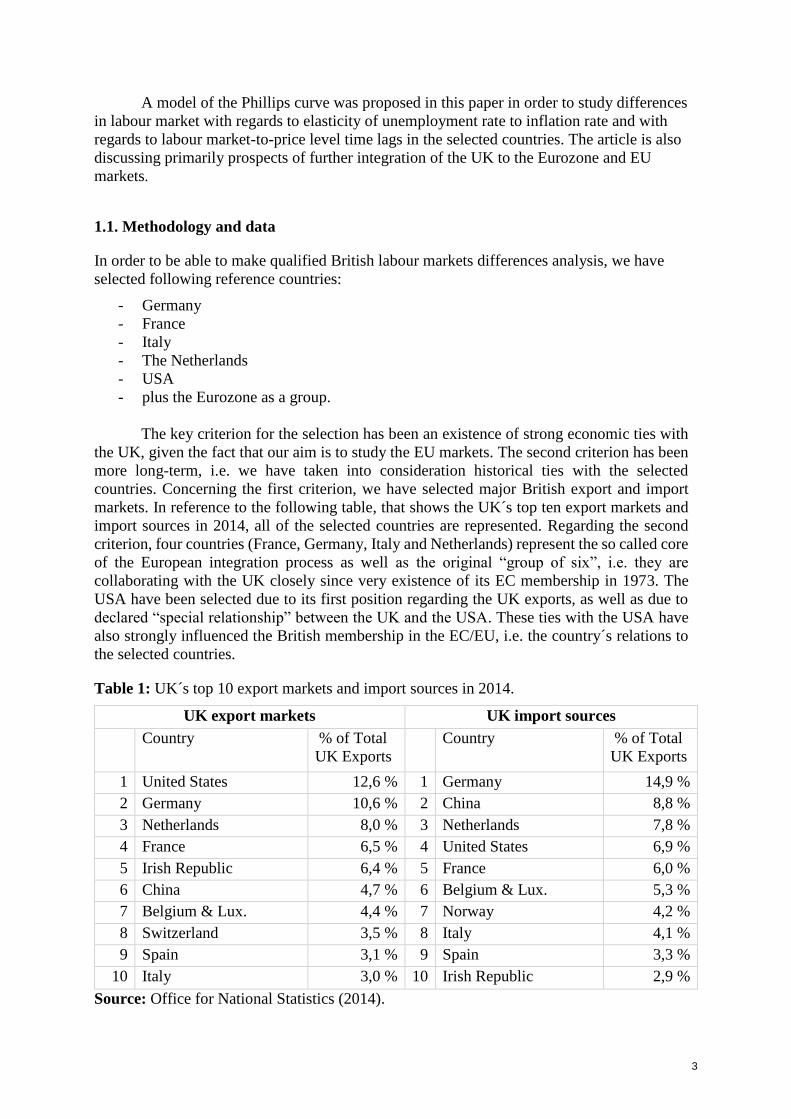
countries. Concerning the first criterion, we have selected major British export and import
markets. In reference to the following table, that shows the UK´s top ten export markets and
import sources in 2014, all of the selected countries are represented. Regarding the second
criterion, four countries (France, Germany, Italy and Netherlands) represent the so called core
of the European integration process as well as the original “group of six”, i.e. they are
collaborating with the UK closely since very existence of its EC membership in 1973. The
USA have been selected due to its first position regarding the UK exports, as well as due to
declared “special relationship” between the UK and the USA. These ties with the USA have
also strongly influenced the British membership in the EC/EU, i.e. the country´s relations to
the selected countries.
Table 1: UK´s top 10 export markets and import sources in 2014.
UK export markets UK import sources
Country % of Total
UK Exports
Country % of Total
UK Exports
1 United States 12,6 % 1 Germany 14,9 %
2 Germany 10,6 % 2 China 8,8 %
3 Netherlands 8,0 % 3 Netherlands 7,8 %
4 France 6,5 % 4 United States 6,9 %
5 Irish Republic 6,4 % 5 France 6,0 %
6 China 4,7 % 6 Belgium & Lux. 5,3 %
7 Belgium & Lux. 4,4 % 7 Norway 4,2 %
8 Switzerland 3,5 % 8 Italy 4,1 %
9 Spain 3,1 % 9 Spain 3,3 %
10 Italy 3,0 % 10 Irish Republic 2,9 %
Source: Office for National Statistics (2014).
4
The paper is analysing two basic data sets of the selected countries as well as of the
Eurozone as a group. The analysed period includes years 1998 – 2014. The first data set
which we have used has been the time series of unemployment rate evidenced by Eurostat.
The second data set, the time series of consumer price index, has been gained from the OECD
statistics.
Based on the above introduced data sets, we have constructed the OLS model for each
of the selected country´s labour market. We have used the Cochrane-Orcutt method to be able
to study the short term relation between inflation and unemployment. The created models of
individual countries´ labour markets enabled us to access country differences in different time
lags and different elasticities of unemployment rate to inflation.
Using methods of the time series statistical analysis, a model of the Phillips curve has
been developed for each of the countries (and Eurozone as a group). The models have been
created through using an autoregressive model, as well as using the method of Cochrane-
Orcutt, in order to filter out the possible autocorrelation effects. As already indicated above,
the models are working with short term (annual) data and are covering, as already indicated, a
period of the years 1998 – 2014.
2. Theory
This paper analyses a modelled Phillips curve of the British economy compared to selected
Eurozone member states, the USA and the Eurozone as a whole. A. W. Phillips originally
examined annual wage inflation and unemployment rates in the UK for rather longer period of
the years 1860–1957 (Phillips 1958). His concept has been later extended by Paul A.
Samuelson and Robert M. Solow by substituting price inflation for wage inflation, under
several conditions. The inverse relation has been valid for a short-term period, i.e. the so
called “short-term Phillips curve” was created (Samuelson and Solow, 1960). Later on, other
economists undertook similar research for other countries and concluded the same
relationship observations as Phillips and Samuelson with Solow.
Even before Phillips (already in 1926), Irving Fisher had described the relation
between inflation and the unemployment rate in an article in International Labour Review.
Based on data gained exclusively from the USA, covering the period of 1915–1925, he had
first found an extraordinarily high correlation between the rate of price changes and the
volume of trade. Continuing in analysing the given data set, he later discovered a strong
correlation between the rate of unemployment changes and the inflation. According to the
author, this could have had important implications for the then economic policy of the USA
given the fact that this relation had not been realised before. He also anticipates that the then
governments could be able to substantially prevent unemployment due to unemployment rate
and inflation correlation (Fisher, 1973).
However, the article of Irving Fisher had not been known to A. W. Phillips. The data
analysed by Phillips, published in his article called The Relation between Unemployment and
the Rate of Change of Money Wage Rates in the United Kingdom, 1861–1957 (published in
1958 in Economica), appeared to demonstrate an inverse as well as stable relationship
between unemployment and rising wages. The final curve designed from the data analysis
suggested, that “the rate of change of money wage rates can be explained by the level of
unemployment and the rate of change of unemployment, except in or immediately after those
years in which there is a sufficiently rapid rise in import prices to offset the tendency for
increasing productivity to reduce the cost of living” (Phillips, 1958: 299).
Samuelson and Solow (1960) have developed Phillips´ idea as follows. According to
their analysis, changes in the level of unemployment have a direct effect on the actual level of
5
price inflation. The accepted explanation during the 1960’s based on their work had been that
a fiscal stimulus, and increase in aggregate demand, would trigger the following sequence of
reactions. First, a fiscal policy stimulus to the economy increases demand for labour. Based
on this, the unemployment rate naturally falls down. However, firms now compete for smaller
labour force available, and they have to raise nominal wages in order to attract the workers.
That increases workers´ bargaining power which they logically use to get even higher nominal
wages. This of course has further effect on wage costs rise. Finally, given the fact that wage
costs are a substantial part of overall production costs, this results in an increased price of
final production, i.e. inflation rises.
During the 1960s and 1970s, the Phillips Curve became a policy guide within a
common governmental practice for many states. This policy, meanwhile becoming known as
stop-go, relied strongly on possibilities of fiscal policy.
Nevertheless, due to structural crises in the 1970´s, the stable relationship between
unemployment rate and inflation did not seemed to work in the same way as before. The
Phillips curve functioning in the economy became badly discredited because of the
unexpected experience of stagflation. However, later on, during the so called Keynesian
resurgence, the Phillips curve has been again used to justify expansionary monetary and fiscal
policy (Mulligan 2002).
Already before the crises, Edmund Phelps (1967) and Milton Friedman (1968)
challenged theoretical foundations of Phillips´ article. Both of these economists have argued
that nominal wages, which had been analysed by Phillips, were irrelevantly based on expected
workers´ behaviour. According to them, worker behaviour was dependent only on real wages,
i.e. inflation-adjusted-wages. Real wages would adjust in order to balance supply and demand
of labour. Natural rate of unemployment, also called the non-accelerating inflation rate of
unemployment (NAIRU), would then be established (Mulligan 2002).
To conclude this part, according to Phelps and Friedman, there is not just one Phillips
curve applicable for a given economy, but rather a series of short run Phillips Curves. In a
long term, the Phillips Curve has a shape of vertical line which shows the NAIRU. According
to the authors´ conclusions, the trade-off between unemployment rate and inflation is not
applicable in the long term.
Discussion on Phillips Curve is still divided in the economic theory. According to Ma
(2012), the modern Phillips curve still aims at identifying and searching for the trade-off
between the rate of inflation and the rate of unemployment as in the 1960´s. However, a fierce
debate about functionality of the curve has been led in economics already for more than fifty
years now. Especially questions regarding economic recession and dealing with it are opened
and probably will remain in that manner.
To sum up, The Phillips curve was primarily well-accepted by Keynesians, because
the curve provided a useful tool to conceptualise economic policies in order to set nominal
wages and unemployment in the best possible way. Later, neoclassical economists and
monetarist took part, when Milton Friedman and Edmund Phelps proposed a new version of
Phillips curve which focuses on the role of expectations on inflation and that is effective only
in the short term (Ma 2012).
3. British labour market as a key point for future arrangement with the EU
As suggested above, recent statistics support the view that the extreme trade-off between
unemployment and inflation rates that occurred according to Phillips in the past, are no longer
regarded as existing in the full original scale. However, based on our data set from the British
6
economy from recent years, there could be periods of years identified when the relationship is
still valid.
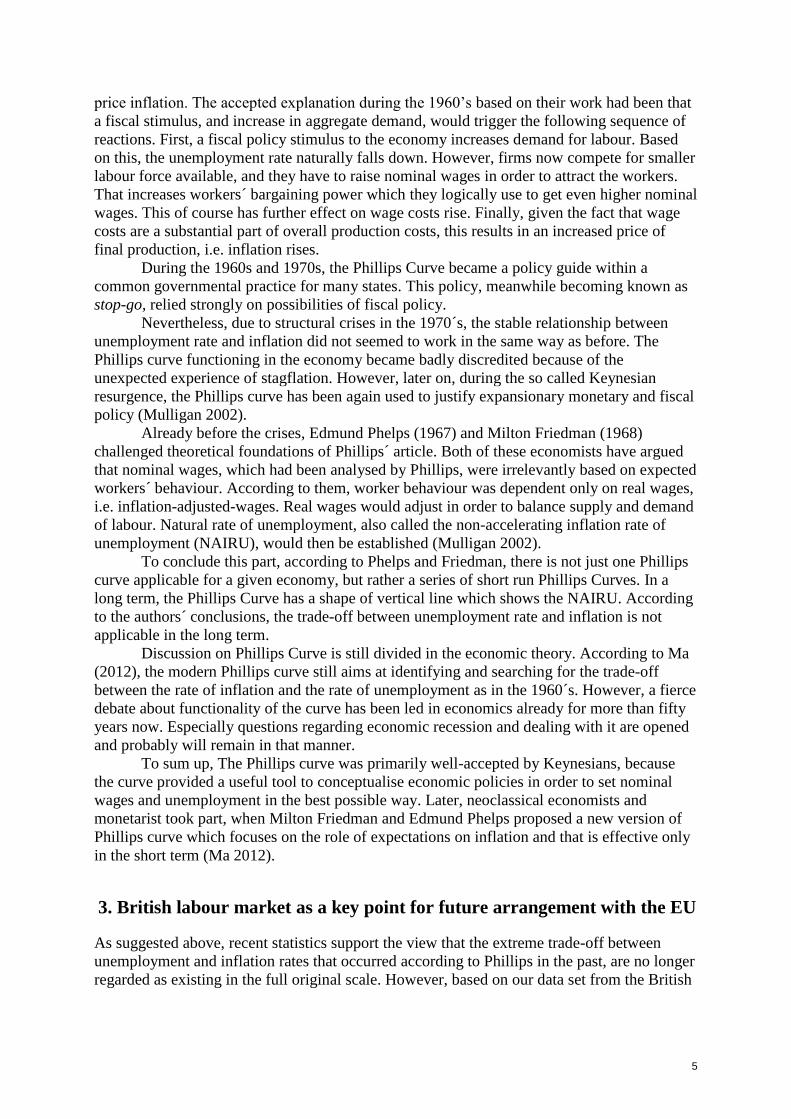
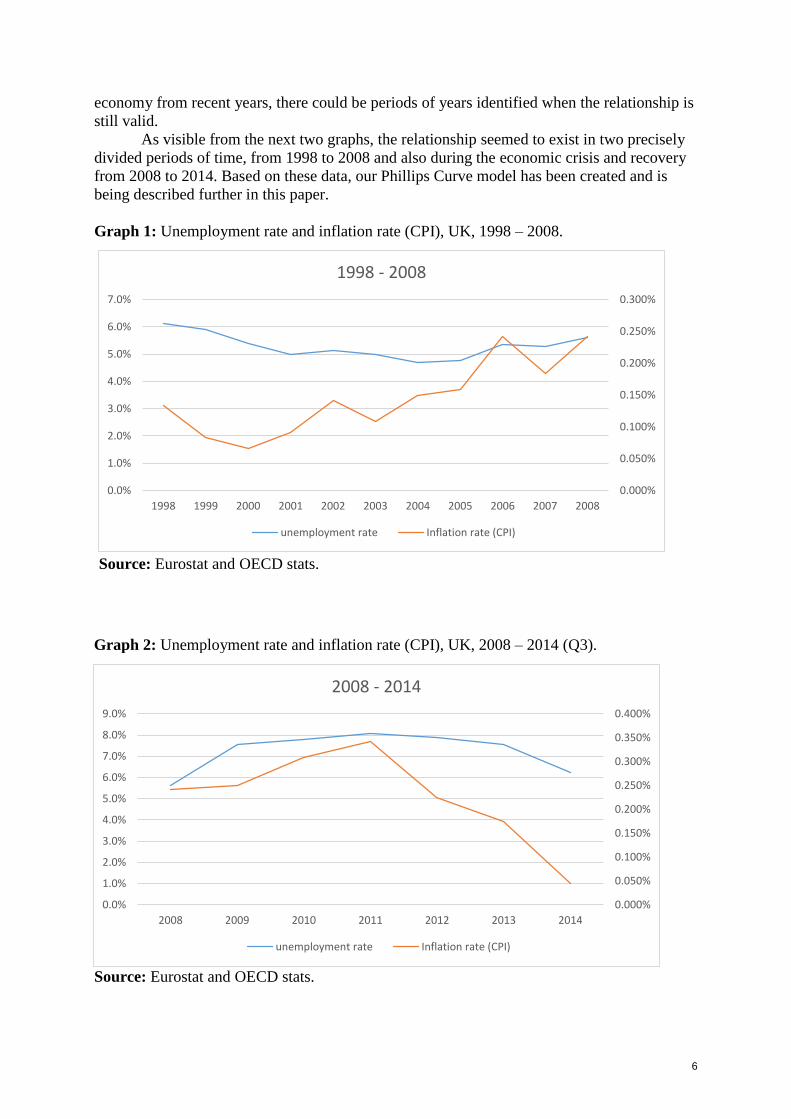
As visible from the next two graphs, the relationship seemed to exist in two precisely
divided periods of time, from 1998 to 2008 and also during the economic crisis and recovery
from 2008 to 2014. Based on these data, our Phillips Curve model has been created and is
being described further in this paper.
Graph 1: Unemployment rate and inflation rate (CPI), UK, 1998 – 2008.
0.000%
0.050%
0.100%
0.150%
0.200%
0.250%
0.300%
0.0%
1.0%
2.0%
3.0%
4.0%
5.0%
6.0%
7.0%
1998 1999 2000 2001 2002 2003 2004 2005 2006 2007 2008
1998 - 2008
unemployment rate Inflation rate (CPI)
0.000%
0.050%
0.100%
0.150%
0.200%
0.250%
0.300%
0.350%
0.400%
0.0%
1.0%
2.0%
3.0%
4.0%
5.0%
6.0%
7.0%
8.0%
9.0%
2008 2009 2010 2011 2012 2013 2014
2008 - 2014
unemployment rate Inflation rate (CPI)
Graph 2: Unemployment rate and inflation rate (CPI), UK, 2008 – 2014 (Q3).
Source: Eurostat and OECD stats.
Source: Eurostat and OECD stats.

7
When considering slighter longer term than in above described graphs, formerly,
supply side reforms3 have enabled the UK to implement expansive fiscal and monetary
policies in order to lower unemployment rate without experiencing rise of inflation rate. The
strengthened independence of the Bank and England has also played a role through
weakening the link between current and future inflation using the method of inflation
targeting. Last but not least, improvements in labour market flexibility have contributed to the
above stated, along with increased labour immigration. This point stays strongly in connection
with the British EU membership, because it is one of the sticking points when considering EU
competences in the UK.
The EU competences in the UK have been under thorough review in the past two years
(2012 – 2014). It has been an essential part of David Cameron´s plan summed up in the
slogan "reform, renegotiation, referendum" within the above mentioned Bloomberg speech in
January 2013. Anyway, while it has been not entirely clear how the government wanted to
influence the reform of the EU, which moreover is being already introduced4, the redefinition
of Britain's relationship with the EU, as a basis for future possible future referendum and
subsequent renegotiation, is already prepared5 (Parliament.uk 2014).
As already suggested above, labour market has been one of the disputable points based
not only on the Review findings. According to Emerson, Avery et al. (2014), prevailing
portion of the 32 analyses give (maybe unexpectedly) a very positive impression about the
European policies and their functioning in the UK. However, there is a very vital exception
regarding the studies on fundamental rights, and most importantly the exception concerning
the studies on free movement of persons and on social and employment policies. The latter
two are strongly connected to the labour markets.
The free movement of persons report suggests that there are significant differences in
opinion on this topic among the report contributors. Some of them considered free movement
of persons as both an essential part of the European Single Market and definitively positive
for the UK economy. Others however concentrated rather on negative effects of the free
movement of persons, such as possible increase of competition for jobs in the UK as well as
pressure on public services or housing. A discussion had been also led on the potential of
immigration from the new member states. This has been expected by several contributors to
create greater social inequality. (Gov.uk 2014c, 6).
As visible from the next table, immigration that is strongly connected to the issue of
the free movement of persons is a very important issue not only for the British politicians and
the Report stakeholders, but primarily for the British public that face problems arising from 3 During 1980s and 1990s various supply side policies have been introduced in the UK. During Margaret
Thatcher´s governments, privatisation has been carried out in order to slim down the state and to introduce
market functioning into the privatised industries. In some of them, the privatisation has led to strengthened
competition, lower prices and improved quality. In the same period, income taxes have been cut as well. The
most effective measure for labour market flexibility has been a reduction of Trade Unions´ power (Jenkins
2007). 4 The five principles defined in the Bloomberg speech by David Cameron, including above all competitiveness
and related Single Market importance, as well as the subsidiarity principle, flexibility, democratic accountability
and fairness, are highly in compliance with Jean-Claude Juncker’s reform program which aims at Single Market
importance and its support by the investment plan (Cameron 2013), (European Commission 2015). 5 The review has been finished in the end of 2014. The Review of the Balance of Competences is “an audit of
what the EU does and how it affects the UK” (Gov.uk 2012, 6). Government departments are supposed to
consult the Parliament and its committees, business, the devolved administrations, civil society, as well as
European partners and the EU institutions to look thoroughly at how the EU’s competences work in practice in
the UK. The main aim of the process is according to the governmental introduction (Gov.uk 2012, 6) to “inform
the public debate on the EU in the UK and Europe”. The review is not supposed to produce specific
recommendations for British European policy or to suggest future scenarios. The Review structure copies
broadly speaking the EU- accession chapters. The complete set comprises of 32 complex studies (Gov.uk 2012,
12).

8
the issue on a day-to-day basis. The public voice will be of an essential importance regarding
the future referendum on the British EU membership and that is why the free movement of
persons and its impact on British labour market needs to be watched.
Table 2: important issues for the EU and UK citizens.
EU Ranking UK Ranking
1 Unemployment (45%) Immigration (38%)
2
Economic situation
(24%) Unemployment (22%)
3 Immigration (18%)
Health & social security
(22%)
Source: Standard Eurobarometer 82 / autumn 2014
Even more disputable issue among the 32 reports of The Review of the Balance of
Competences is social and employment policy. Many analysis respondents were pragmatic
about the likelihood of continued EU competence in the UK in this area. Many of the
respondents who argued against the existing EU competence over social and employment
matters suggested that these policies were of a vital importance for the British future.
According to the report contributors, the social and employment policy needs to reflect
domestic culture and traditions, rather than integrate itself deeper into European structures
(Gov.uk 2014d, 6).
Functioning of the British labour market will be one of the key issues in discussions
about the future of the British EU membership. Especially problems arising from increasing
immigration flows from the newer EU member states could influence British public´s
decision in the referendum.
4. Findings
4.1. The model for the United Kingdom
In order to model Phillips Curve models for selected economies based on the above described
data, we have used the econometrical software Gretl. As mentioned above in the data and
methodology section, annual data for the time period of 1998 – 2014 have been used. In this
section, we discuss the model created for the British economy´s data.
In the following tables, the model parameters are introduced, as well as the results of
the tests of heteroscedasticity, autocorrelation and normality of residuals. Finally, the model
has enabled us to create a British Phillips Curve equation, which will be discussed in the
further sections.
9
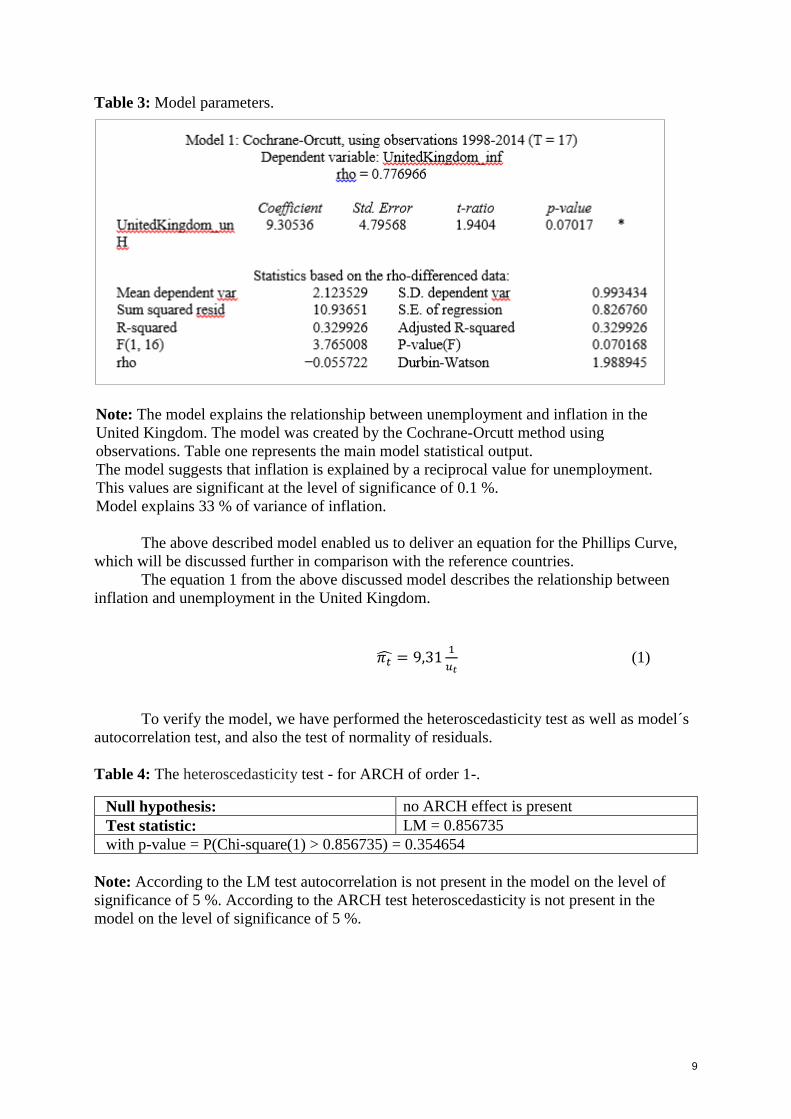
Table 3: Model parameters.
The above described model enabled us to deliver an equation for the Phillips Curve,
which will be discussed further in comparison with the reference countries.
The equation 1 from the above discussed model describes the relationship between
inflation and unemployment in the United Kingdom.
𝜋�̂� = 9,311
𝑢𝑡 (1)
To verify the model, we have performed the heteroscedasticity test as well as model´s
autocorrelation test, and also the test of normality of residuals.
Table 4: The heteroscedasticity test - for ARCH of order 1-.
Null hypothesis: no ARCH effect is present
Test statistic: LM = 0.856735
with p-value = P(Chi-square(1) > 0.856735) = 0.354654
Note: According to the LM test autocorrelation is not present in the model on the level of
significance of 5 %. According to the ARCH test heteroscedasticity is not present in the
model on the level of significance of 5 %.
Note: The model explains the relationship between unemployment and inflation in the
United Kingdom. The model was created by the Cochrane-Orcutt method using
observations. Table one represents the main model statistical output.
The model suggests that inflation is explained by a reciprocal value for unemployment.
This values are significant at the level of significance of 0.1 %.
Model explains 33 % of variance of inflation.
10
Table 5: Test for normality of residuals –
Null hypothesis: error is normally distributed
Test statistic: Chi-square(2) = 1.94689
with p-value = 0.37778
Note: The residuals of the model don´t have a normal distribution on the level of significance
of 5 %.
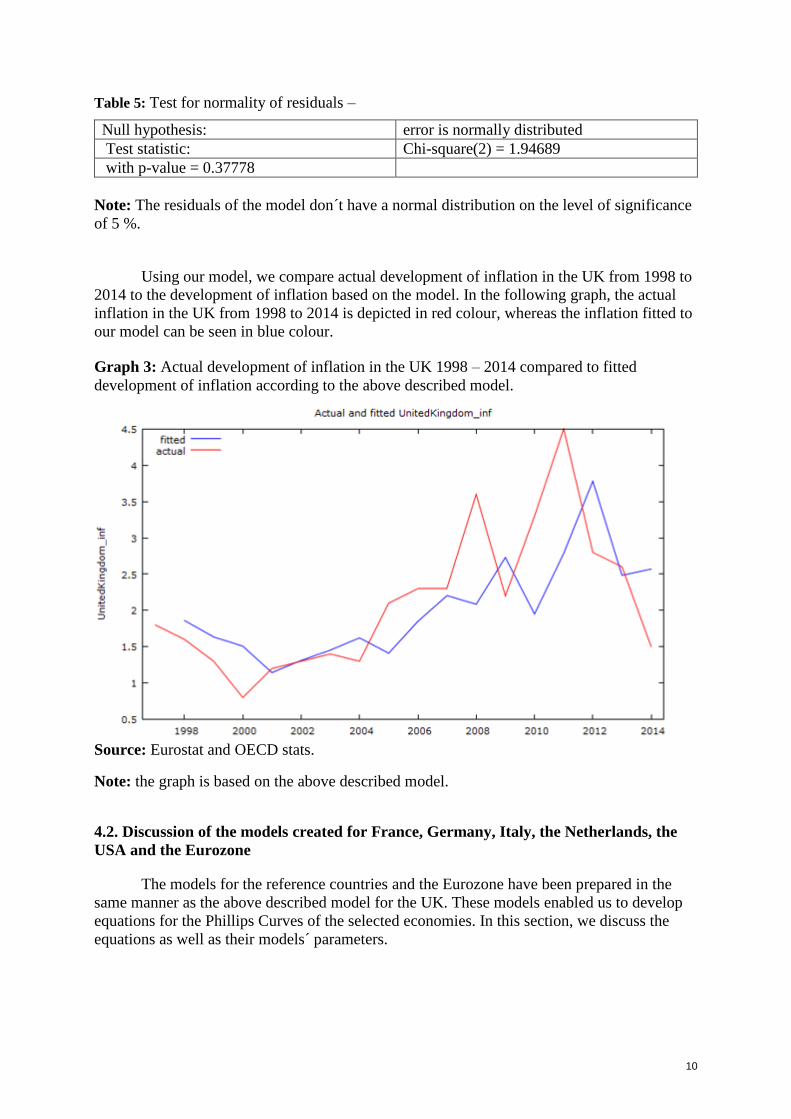
Using our model, we compare actual development of inflation in the UK from 1998 to
2014 to the development of inflation based on the model. In the following graph, the actual
inflation in the UK from 1998 to 2014 is depicted in red colour, whereas the inflation fitted to
our model can be seen in blue colour.
Graph 3: Actual development of inflation in the UK 1998 – 2014 compared to fitted
development of inflation according to the above described model.
Source: Eurostat and OECD stats.
Note: the graph is based on the above described model.
4.2. Discussion of the models created for France, Germany, Italy, the Netherlands, the
USA and the Eurozone
The models for the reference countries and the Eurozone have been prepared in the
same manner as the above described model for the UK. These models enabled us to develop
equations for the Phillips Curves of the selected economies. In this section, we discuss the
equations as well as their models´ parameters.
11
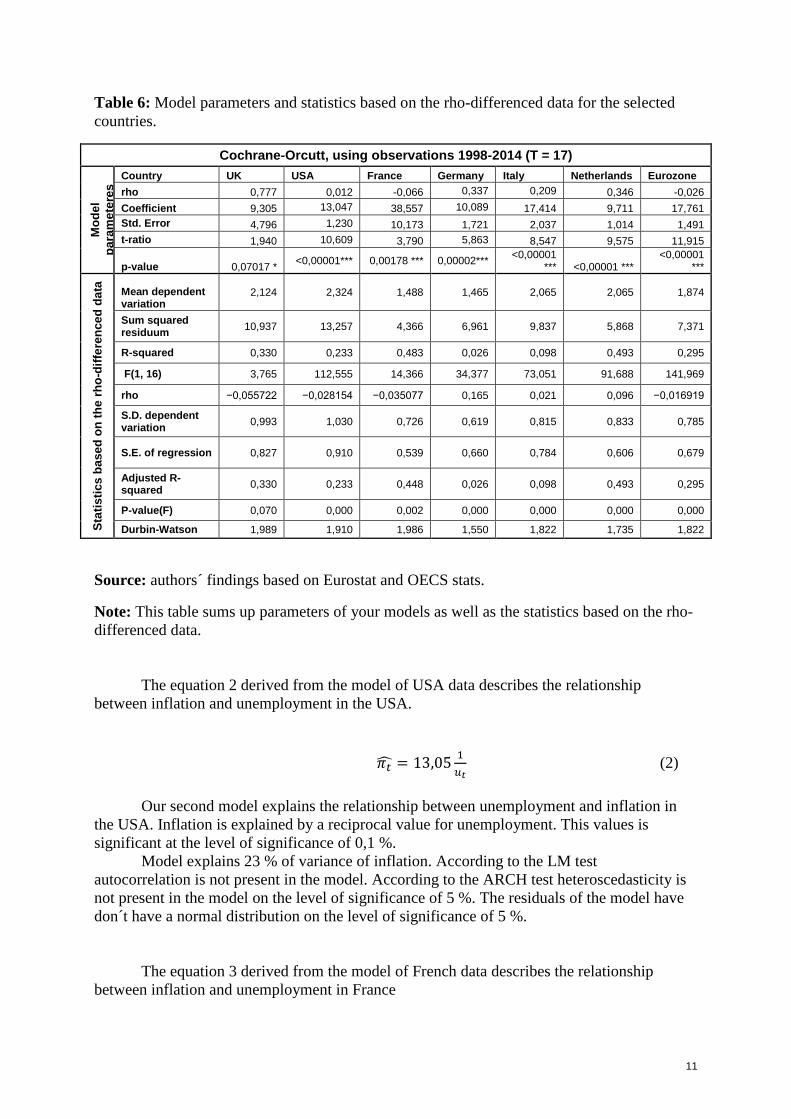
Table 6: Model parameters and statistics based on the rho-differenced data for the selected
countries.
Cochrane-Orcutt, using observations 1998-2014 (T = 17)
Mo
de
l
pa
ram
ete
res Country UK USA France Germany Italy Netherlands Eurozone
rho 0,777 0,012 -0,066 0,337 0,209 0,346 -0,026
Coefficient 9,305 13,047 38,557 10,089 17,414 9,711 17,761
Std. Error 4,796 1,230 10,173 1,721 2,037 1,014 1,491
t-ratio 1,940 10,609 3,790 5,863 8,547 9,575 11,915
p-value 0,07017 * <0,00001*** 0,00178 *** 0,00002***
<0,00001 *** <0,00001 ***
<0,00001 ***
Sta
tis
tics
ba
se
d o
n t
he
rh
o-d
iffe
ren
ce
d d
ata
Mean dependent variation
2,124 2,324 1,488 1,465 2,065 2,065 1,874
Sum squared residuum
10,937 13,257 4,366 6,961 9,837 5,868 7,371
R-squared 0,330 0,233 0,483 0,026 0,098 0,493 0,295
F(1, 16) 3,765 112,555 14,366 34,377 73,051 91,688 141,969
rho −0,055722 −0,028154 −0,035077 0,165 0,021 0,096 −0,016919
S.D. dependent variation
0,993 1,030 0,726 0,619 0,815 0,833 0,785
S.E. of regression 0,827 0,910 0,539 0,660 0,784 0,606 0,679
Adjusted R-squared
0,330 0,233 0,448 0,026 0,098 0,493 0,295
P-value(F) 0,070 0,000 0,002 0,000 0,000 0,000 0,000
Durbin-Watson 1,989 1,910 1,986 1,550 1,822 1,735 1,822
Source: authors´ findings based on Eurostat and OECS stats.
Note: This table sums up parameters of your models as well as the statistics based on the rho-
differenced data.
The equation 2 derived from the model of USA data describes the relationship
between inflation and unemployment in the USA.
𝜋�̂� = 13,051
𝑢𝑡 (2)
Our second model explains the relationship between unemployment and inflation in
the USA. Inflation is explained by a reciprocal value for unemployment. This values is
significant at the level of significance of 0,1 %.
Model explains 23 % of variance of inflation. According to the LM test
autocorrelation is not present in the model. According to the ARCH test heteroscedasticity is
not present in the model on the level of significance of 5 %. The residuals of the model have
don´t have a normal distribution on the level of significance of 5 %.
The equation 3 derived from the model of French data describes the relationship
between inflation and unemployment in France
12
𝜋�̂� = 38,571
𝑢𝑡− 2,68 (3)
The third model explains the relationship between unemployment and inflation in
France. Inflation is explained by a constant and a reciprocal value for unemployment. Both
values are significant at the level of significance 5 %.
Model explains 48 % of variance of inflation. The model as he a whole is according to
the F-test significant at the level of significance 5 %. According to the LM test,
autocorrelation is not present in the model at the level of significance 5 %. According to the
ARCH test, heteroscedasticity is not present in the model on the level of significance of 5 %.
The equation 4 derived from the model of German data describes the relationship
between inflation and unemployment in Germany
𝜋�̂� = 10,091
𝑢𝑡 (4)
The fourth model explains the relationship between unemployment and inflation in
Germany. Inflation is explained by a reciprocal value for unemployment. This value is
significant at the level of significance 5 %.
However, the model explains just 2,5 % of variance of inflation. The model as a
whole is according to the F-test significant at the level of significance 5 %. According to the
LM test, autocorrelation is not present in the model at the level of significance 5 %.
According to the ARCH test, heteroscedasticity is not present in the model on the level of
significance of 5 %.
The equation 5 derived from the model of Italian data describes the relationship
between inflation and unemployment in Italy.
𝜋�̂� = 17,411
𝑢𝑡 (5)
The fifth model explains the relationship between unemployment and inflation in Italy.
Inflation is explained by a reciprocal value for unemployment. The value is significant at the
level of significance 5 %.
Model explains 9,8 % of variance of inflation. According to the LM test,
autocorrelation is not present in the model at the level of significance 5 %. According to the
ARCH test, heteroscedasticity is not present in the model on the level of significance of 5 %.
The residuals of the model have don´t have a normal distribution on the level of significance
of 5 %.
The equation 6 derived from the model of Dutch data describes the relationship
between inflation and unemployment in the Netherlands.
𝜋�̂� = 9,711
𝑢𝑡 (6)
13
The next model explains the relationship between unemployment and inflation in
Netherlands. Inflation is explained by a reciprocal value for unemployment. This value is
significant at the level of significance 5 %.
Model explains 49 % of variance of inflation. According to the LM test,
autocorrelation is not present in the model at the level of significance 5 %. According to the
ARCH test, heteroscedasticity is not present on the level of significance of 5 %.
The equation 7 derived from the model of Eurozone data describes the relationship
between inflation and unemployment in the Eurozone.
𝜋�̂� = 17,761
𝑢𝑡 (7)
This model explains the relationship between unemployment and inflation in the
Eurozone. Inflation is explained by a reciprocal value for unemployment. This values is
significant at the level of significance of 0,1 %.
Model explains 30 % of variance of inflation. According to the LM test,
autocorrelation is not present in the model. According to the ARCH test, heteroscedasticity is
not present in the model on the level of significance of 5 %. The residuals of the model don´t
have a normal distribution on the level of significance of 5 %.
4.3. Results comparison
In this section, we discuss actual Phillips Curves developed based on our models.
14
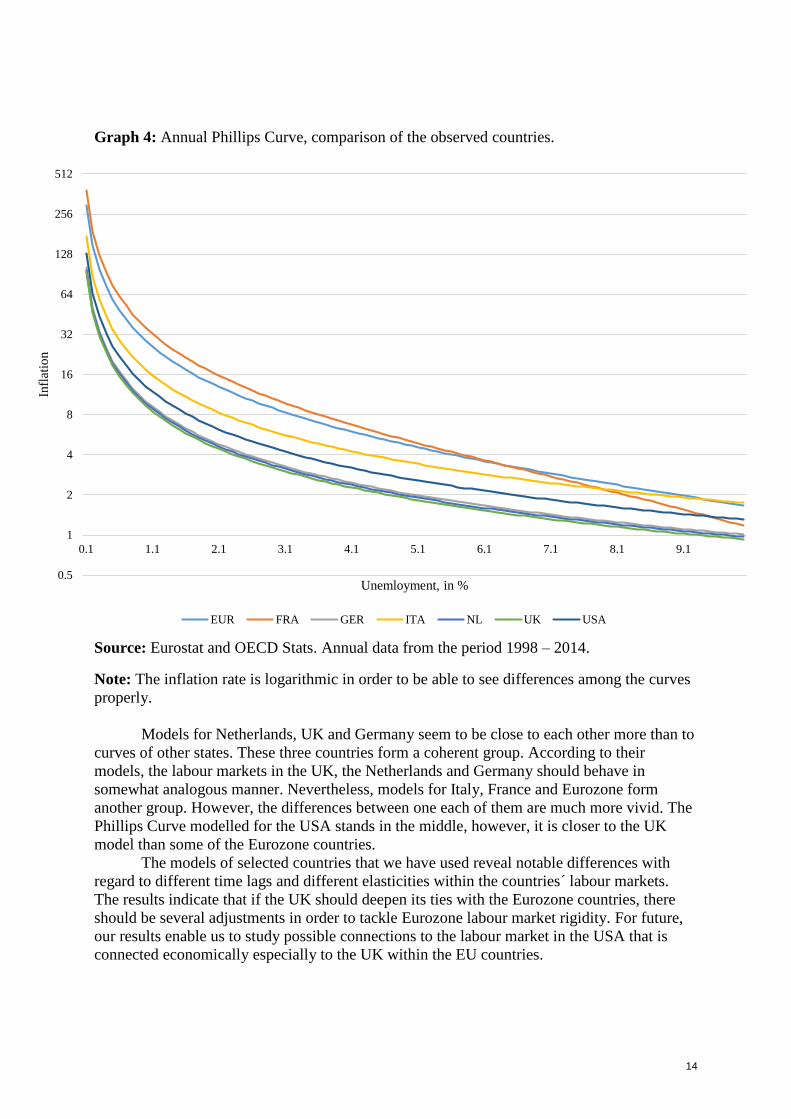
Graph 4: Annual Phillips Curve, comparison of the observed countries.
Source: Eurostat and OECD Stats. Annual data from the period 1998 – 2014.
Note: The inflation rate is logarithmic in order to be able to see differences among the curves
properly.
Models for Netherlands, UK and Germany seem to be close to each other more than to
curves of other states. These three countries form a coherent group. According to their
models, the labour markets in the UK, the Netherlands and Germany should behave in
somewhat analogous manner. Nevertheless, models for Italy, France and Eurozone form
another group. However, the differences between one each of them are much more vivid. The
Phillips Curve modelled for the USA stands in the middle, however, it is closer to the UK
model than some of the Eurozone countries.
The models of selected countries that we have used reveal notable differences with
regard to different time lags and different elasticities within the countries´ labour markets.
The results indicate that if the UK should deepen its ties with the Eurozone countries, there
should be several adjustments in order to tackle Eurozone labour market rigidity. For future,
our results enable us to study possible connections to the labour market in the USA that is
connected economically especially to the UK within the EU countries.
0.5
1
2
4
8
16
32
64
128
256
512
0.1 1.1 2.1 3.1 4.1 5.1 6.1 7.1 8.1 9.1
Infl
atio
n
Unemloyment, in %
EUR FRA GER ITA NL UK USA
15
5. Conclusion
In this paper, our aim was to develop Phillips Curves based on data from the last
seventeen years, in order to cover the crisis and consequent recovery period as well as the
growth period before. We have used annual data from Eurostat for the unemployment and
from the OECD stats for the annual inflation rates. We have developed models using the
software Gretl in order to set up relevant equations for the Phillips Curves. The results
enabled us to see major differences in labour markets´ behaviour in the UK, compared to the
Netherlands, Germany, the USA, Italy, France, and also the Eurozone as a whole.
The basic motivation for the above stated has been the UK´s awkward relationship to
the EU and the possible option that the referendum on staying in the UK will take place in
2017. In our opinion, the UK´s secession from the European integration would have
disastrous consequences both for the UK economy and the EU countries, especially those
from the Eurozone. Based on that, we think that developing arguments about British
economic ties and similarities to the Eurozone markets could somewhat enrich the debates
about the British membership and its meaning for the future.
As we can tell from our models, British labour markets behave almost in the same
manner as the labour markets of the Netherlands and Germany, which we consider as
important Eurozone members. However, there can be similarities observed also compared to
the USA´s labour market, which also represent the main UK exports market. On the other
hand, these ties does not have to be an argument for escaping the EU in the light of the
actually negotiated Transatlantic Trade and Investment Partnership (TTIP). This agreement
could even help the UK economy to ease its exports through the EU trade partnership frame.
16
References
[1] Allen, D., 2013. The United Kingdom: Towards Isolation and a Parting of the Ways? In:
Bulmer, S., Lequesne, Ch., 2013: The Member States of the European Union. Second
Edition. Oxford: Oxford University Press. Pp. 108–131. ISBN 978-0-19-954483-7.
[2] Cameron, D., 2013. EU Speech at Bloomberg [online]. Gov.uk, 23.1.2013. [2015-5-10].
Retrieved from: <https://www.gov.uk/government/speeches/eu-speech-at-bloomberg>.
[3] Emerson, M.; Blockmans, S., 2013. British Balance of Competence Reviews, Part I:
Competences about right, so far. EPIN Working Paper No. 35, October 2013. ISBN 978-94-
6138-362-4.
[4] Emerson, M; Avery. G. et al., 2014. British Balance of Competence Reviews, Part III:
More reform than renegotiation or repatriation. EPIN Working Paper No. 45, December
2014. ISBN 978-94-6138-431-7.
[5] European Commission, 2014. Standard Eurobarometer 82, Public opinion on the European
Union, autumn 2014. National Report – United Kingdom. [2015-5-15]. Retrieved from:
<http://ec.europa.eu/public_opinion/archives/eb/eb82/eb82_uk_uk_nat.pdfhttp://ec.europa.e
u/public_opinion/archives/eb/eb82/eb82_uk_uk_nat.pdf>.
[6] European Commission, 2015. The Commission and its priorities [online]. Europa.eu,
25.2.2015. [2015-4-17]. Retrieved from: <http://ec.europa.eu/index_en.htm>.
[7] Fisher, I., 1973. I Discovered the Phillips Curve: “A Statistical Relation between
Unemployment and Price Changes”. Journal of Political Economy, Vol. 81, No. 2, Part 1
(Mar. – Apr., 1973), pp. 496-502. [2015-5-8]. Retrieved from:
<http://www.jstor.org/stable/1830534>.
[8] Friedman, 1968. The Role of Monetary Policy. The American Economic Review, Vol. 58,
No. 1 (Mar., 1968), pp. 1-17. [2015-5-9]. Retrieved from:
<http://www.jstor.org/stable/1831652>.
[9] Gov.uk, 2012. Review of the Balance of Competences between the United Kingdom and the
European Union, Presented to Parliament by the Secretary of State for Foreign and
Commonwealth Affairs by Command of Her Majesty [online]. Foreign & Commonwealth
Office, © Crown copyright [2014-10-23]. ISBN 9780101841528. Retrieved from:
<https://www.gov.uk/government/uploads/system/uploads/attachment_data/file/35458/eu-
balance-of-competences-review.pdf>.
[10] Gov.uk, 2014a. Guidance: Review of the balance of competences. Foreign &
Commonwealth Office, © Crown copyright [2015-5-8]. Retrieved from:
<https://www.gov.uk/review-of-the-balance-of-competences>.
[11] Gov.uk, 2014b. EU speech at Bloomberg. Cabinet Office, Prime Minister's Office, 10
Downing Street and The Rt Hon David Cameron MP, 23.1.2013, © Crown copyright [2015-
5-8]. Retrieved from: <https://www.gov.uk/government/speeches/eu-speech-at-bloomberg>.
[12] Gov.uk, 2014c. Review of the Balance of Competences between the United Kingdom and
the European Union. The Single Market: Free Movement of Persons. Home
Office and Department for Work and Pensions, 22.7.2014 [online]. © Crown copyright
[2015-5-10]. Retrieved from: <https://www.gov.uk/government/consultations/free-
movement-of-persons-review-of-the-balance-of-competences>.
[13] Gov.uk, 2014d. Review of the Balance of Competences between the United Kingdom and
the European Union. Social and Employment Policy. Department for Business, Innovation
& Skills, Department for Culture, Media & Sport, Department for Work and
Pensions, Foreign & Commonwealth Office , 22.7.2014 [online]. © Crown copyright [2015-
5-10]. Retrieved from: < https://www.gov.uk/government/consultations/review-of-uk-and-
eu-balance-of-competences-call-for-evidence-on-social-and-employment-policy>.
17
[14] Jenkins, 2007. Thatcher and Sons. A Revolution in Three Acts. London: Penguin Books.
ISBN 978-0-141-00624-6.
[15] Liddle, R., 2014. The Europe Dilemma: Britain and the drama of EU integration. London:
I.B. Tauris. ISBN 978-1-78076-223-4.
[16] Ma, J., 2012. Mystery of modern Phillips curve. Modern Economy, 3(8), 907-914. Retrieved
from <http://search.proquest.com/docview/1321120006?accountid=17203>.
[17] Mulligan, R. F., 2011. AN AUSTRIAN REHABILITATION OF THE PHILLIPS
CURVE. Cato Journal, 31(1), 87-98. [2015-5-13]. Retrieved from:
<http://search.proquest.com/docview/858458596?accountid=17203>.
[18] Office for National Statistics, 2014. UK Trade, December 2014. [2015-5-9]. Retrieved
from: <http://www.ons.gov.uk/ons/dcp171778_391926.pdf>.
[19] Parliament.uk, 2014. The future of the European Union: UK Government policy - Foreign
Affairs Committee [online]. © Parliamentary copyright 2013, 11. 6. 2013. [2015-5-10].
Retrieved from:
<http://www.publications.parliament.uk/pa/cm201314/cmselect/cmfaff/87/8708.htm>.
[20] Phelps, E., 1967. Phillips Curves, Expectations of Inflation and Optimal Unemployment
over Time. Economica, New Series, Vol. 34, No. 135, (Aug., 1967), pp. 254-281. [2015-5-
8]. Retrieved from: <http://www.jstor.org/stable/2552025>.
[21] Phillips, A. W., 1958. The Relation between Unemployment and the Rate of Change of
Money Wage Rates in the United Kingdom, 1861–1957. Economica, New Series, Vol. 25,
No. 100 (Nov., 1958), pp. 283-299. [2015-5-8]. Retrieved from:
<http://www.jstor.org/stable/2550759>.
[22] Policy Network, 2013. Britain´s Financial Services Industry in a Changing Europe. A
Policy Network Report for the City of London Corporation. Policy Network, December 12th
2013 [2015-5-8]. Retrieved from: <http://www.policy-
network.net/publications/4542/Britains-financial-services-industry-in-a-changing-Europe>.
[23] Samuelson, P. A.; Solow, R. M., 1960. Problem of Achieving and maintaining a Stable
Price Level. Analytical Aspects of Anti-Inflation Policy. The American Economic Review,
Vol. 50, No. 2, Papers and Proceedings of the Seventy-second Annual Meeting of the
American Economic Association (May, 1960), pp. 177-194. [2015-5-8]. Retrieved from:
<http.jstor.otg/stable/1815021>.
[24] The Economist, 2015. Cam again. 9th May 2015, from the print edition. [2015-5-9].
Retrieved from: <http://www.economist.com/news/leaders/21650722-conservatives-have-
triumphed-polls-governing-will-be-much-harder-cam-again>.