
ucd school of biosystems and food engineering
206
BIOSYSTEMS AND FOOD ENGINEERING RESEARCH REVIEW 24 UCD SCHOOL OF BIOSYSTEMS AND FOOD ENGINEERING UNIVERSITY COLLEGE DUBLIN, BELFIELD, DUBLIN 4, IRELAND Tel +353-1-7167484 Fax +353-1-7167415 E-mail [email protected] Web site www.ucd.ie/biosystems Document Number: ISSN 1649-475X May 2019 Editors: Enda J. Cummins and Thomas P. Curran
-
Upload
khangminh22 -
Category
Documents
-
view
3 -
download
0
Transcript of ucd school of biosystems and food engineering

BIOSYSTEMS AND FOOD
ENGINEERING
RESEARCH REVIEW 24
UCD SCHOOL OF BIOSYSTEMS AND FOOD ENGINEERING
UNIVERSITY COLLEGE DUBLIN,
BELFIELD, DUBLIN 4, IRELAND
Tel +353-1-7167484 Fax +353-1-7167415
E-mail [email protected]
Web site www.ucd.ie/biosystems
Document Number: ISSN 1649-475X
May 2019
Editors: Enda J. Cummins and Thomas P. Curran

ii
FOREWORD
The Twenty Fourth Annual Research Review describes the ongoing research programme in the
School of Biosystems and Food Engineering at University College Dublin from over 107
researchers (12 academic staff, 1 technician, 16 postdoctoral researchers and 78 postgraduates).
The research programme covers three focal areas: Food and Process Engineering; Bioresource
Systems; and Bioenvironmental Engineering. Each area is divided into sub-areas as outlined in
the Table of Contents which also includes the name of the research scholar (in bold); the
research supervisor(s); the title of the research; the nature of the research programme; and the
research sponsors. It also includes the noting of four awards for presentational excellence at the
Twenty Fourth Annual Biosystems and Food Engineering Research Seminar held in
University College Dublin on Thursday 14th
March 2019.
The six Appendices in the Review provide:
a listing of research projects in progress which were not included in the Review;
profiles of Postdoctoral Research Scholars;
The Editors gratefully acknowledge the dedicated work of the individual research scholars, their
research supervisors and the financial support of research sponsors. Suggestions as to how
future editions might be improved in presentation, style or content would be greatly appreciated.
A copy of this book is available to download from the UCD Research Repository at:
http://researchrepository.ucd.ie
The review also includes papers from the School’s Taught Masters Programmes as follows:
ME - Biosystems and Food Engineering
http://www.ucd.ie/eacollege/studywithus/engineering/biosystemsfood/biosystems.html
MEngSc – Food Engineering
http://www.ucd.ie/eacollege/studywithus/engineering/biosystemsfood/food.html
MSc – Environmental Technology
http://www.ucd.ie/eacollege/studywithus/engineering/biosystemsfood/environmental.html
MSc – Sustainable Energy and Green Technologies
http://www.ucd.ie/eacollege/studywithus/engineering/biosystemsfood/sustainable.html
ENDA CUMMINS and TOM CURRAN 31st May 2019

iii
TABLE OF CONTENTS
Title Page i
Foreword ii
Table of Contents iii
FOOD & PROCESS ENGINEERING
Imaging/Computer Vision
Falkovskaya A, Herrero-Langreo A, Gowen A. Discrimination between fresh and
previously frozen poultry during and after thawing using hyperspectral imaging
(PhD). 1
Lei T, Sun DW. Classification of different brands of cheddar cheese using
hyperspectral imaging (PhD). Chinese Scholarship Council (CSC) and University
College Dublin (UCD). Junior PhD winner (Yr 1-2). Joint Award for Best Seminar
Presentation. 5
Caponigro V, Gowen A. Hyperspectral imaging to detect dairy products (PhD).
Science Foundation Ireland (SFI), Investigators Programme. 9
Lin X, Sun DW. Non-destructive investigation on moisture content uniformity and
shrinkage rate caused by microstructure effect during microwave-vacuum drying
(PhD). Chinese Scholarship Council (CSC) and University College Dublin (UCD). 10
Dorrepaal R, Gowen A. The development of chemical imaging and chemometric
techniques to investigate fundamental biomaterial interactions with biological
systems (PhD). European Research Council. 11
Risk Assessment/Traceability
He Q, Butler F. A spatial investigation into VTEC distribution in Ireland (MSc
Research). FIRM as administered by the Irish Department of Agriculture, Food and
the Marine. 12
Wang X, Butler B. Exposure assessment for biotoxins and viruses arising from
consumption of Irish produced shellfish (PhD). Chinese Scholarship Council (CSC)
and University College Dublin (UCD). 16
Nag N, Cummins E. The comparative public and animal health risks associated with
spreading Anaerobic Digestate, animal manure and slurry on land (PhD). FIRM as
administered by the Irish Department of Agriculture, Food and the Marine. Junior
PhD winner (Yr 1-2). Joint Award for Best SeminarPresentation. 19

iv
Table of Contents (continued)
Li L, Cummins E. Risk Characterization of ENPs for Humans (PhD). Scholarship
Council (CSC) and University College Dublin (UCD). 20
Food Processing/Process Analytical Technology Chen TJ, Miao S, Sun DW. Comparison of hot water, microwave-assisted and deep
eutectic solvents extraction of polysaccharides from T. Fuciformis and its water
holding ability (PhD). Scholarship Council (CSC) and University College Dublin
(UCD). 21
Ummat U, O’Donnell CP, Rajauria G, Tiwari BK. Application of novel technologies
for estimation of biomolecules from seaweeds (PhD). Science Foundation Ireland
funded “Bioeconomy Research Centre “BEACON” (project no. 0586). 25
Zhang K, Tiwari B, Sun DW, Zhao M. Diagnostics of reactive species generated by
cold and hot plasma (PhD). Chinese Scholarship Council (CSC) and University
College Dublin (UCD). 29
Kang R, O’Donnell CP. Exploration of dielectric spectroscopy as a process
analytical tool for fat content determination in homogenized milk (PhD). Chinese
Scholarship Council (CSC) and University College Dublin (UCD). 30
Wen L, Sun DW, Tiwari BK. Research on simultaneous and sequential ultrasound-
and microwave-assisted methods for aqueous extraction of bioactive compounds
from coffee silverskin (PhD). Chinese Scholarship Council (CSC) and University
College Dublin (UCD). 31
Xu G, O’Shea N, O’Donnell CP. The application of a bulk acoustic wave (baw)
sensor as a process analytical technology (PAT) tool for monitroing acid-induced
milk coagulation (PhD). Teagasc Walsh Fellowship Scheme. 32
Bista A, O’Donnell C, O’Shea N, Tobin J. Framing solutions for adoption of Process
Analytical Technology (PAT) in the dairy processing factory of the future &
development of PAT tools for monitoring and control of milk concentrates (MSc
Research). Enterprise Ireland. 36
Hildebrand G, Tiwari BK, O’Donnell CP. Ultrasound assisted processing of the
microalga chlorella vulgaris for enhanced protein extraction (ME). 38
Dahiya S, Herrero-Langreo A, Ferone M, Scanell AGM, Gowen A. NIR-
hyperspectral imaging of bacteria on luria bertani agar media (MEngSc). 42
Chhaya RS, Butler F. Thermal resistance of pathogens – cronobacter sakazakii
(MEngSc). 46
Dai J, O’Donnell CP. Adulteration dectection of whiskey using UV-VIS
spectroscopy (MEngSc). 50

v
Table of Contents (continued)
Gong Y, Butler F. Risk assessment of marine toxins (MEngSc). 54
Paseda PO, Grace P. Impacts of storage conditions on barley quality (MEngSc). 58
Ramesh J, O’Donnell C. Adulteration detection in gin using uv-vis and nir
spectroscopy. (MEngSc) 62
Talwar N, Murphy F. Valorizaion of food waste is key in circular economy
(MEngSc). 66
Valgadde PS, Sun DW, Lin X. NIR hyperspectral imaging in visualizing moisture
distribution of apple slices during hot air oven drying (MEngSc). 70
Varghese NM, Cummins E. Antimicrobial usage in food and agriculture (MEngSc). 73
Vivekanand V, Caponigro V, Gowen A. Evaluation of bioplastics formulated from
food waste using NIR spectroscopy imaging (MEngSc). 77
Xu G, Butler F. Genome analysis of pathogens for resistance to sanitation products
(MEngSc). 81
Yin Y, Sun DW, Lin X. Hyperspectral imaging to measure the mosture content of
kiwi slices using hot-air drying (MEngSc). 85
Yuan Z, Gowen A. Investigation of penetration depth of nir light in food packaging
(MEngSc). 89
ENERGY & THE ENVIRONMENT
Sustainable Energy
Darling CD, McDonnell KP. Development of a feasibility plan to convert a
surfboard manufacturing plant into a sub-zero facility with respect to carbon
footprint of the products and energy footprint of the process (MSc). 93
Dhotre S, Murphy F. Technological potential for biomass to biofuels production and
strategies to improve sustainability in ireland’s transition to the circular bio-economy
(MSc). 96
Evans A, Grace P. Technical and economic analysis of energy storage systems
(MSc). 100
Gaikwad A, Murphy F, Carton JG. A strategic roadmap for development of
hydrogen infrastructure (production, distribution and application) in Ireland (MSc). 104
Gleeson M, McDonnell K. A feasibility study of options to reduce plastic
contamination of marine environments (MSc). 108

vi
Table of Contents (continued)
Latpate AC, Curran T. IoT (internet of things) solution for sewer blockage detection
(MSc) 112
Virupaksha A, McDonnell KP. Microgeneration of electricity using solar energy
(MSc). 116
Hussain Naqvi H, McDonnell K. Understanding solar energy charity to advance geo
political dynamics (MSc). 120
Nombakuse Z, Murphy F. Assessment of wind power integration to solar
photovoltaic mini-grid (MSc). 124
O’Mhaoinigh R, Curran TP. A feasibility study of the agrocycle marketplace –
secondary & qualitative research (MSc). 128
Pitroda HB, McDonnell KP. Feasibility study of energy efficiency solutions in
existing public lighting systems in Ireland (MSc). 132
Pitt Ryan L, Murphy F. Mapping and characterizing biomass resources for
sustainable value chain development (MSc). 136
Vansia RY, McDonnell KP. Study of energy efficient measures in buildings and
evaluating the feasibility for the implementation of renewable energy (MSc). 140
Wang S, McDonnell KP. Techno-economic assessment of strategies to decarbonize
Moneypoint power station (MSc). 144
Brereton R, Grace P. The efficiency of solar water heating in Ireland (MSc). 148
Environmental Technology/Modelling
Greene G, Curran T. A comparative analysis of the environmental impact
assessments of wind farms (MSc). 152
Wade EJ, Xu JL, Gowen A. Alleviation of substrate interference in ftir spectra
during microplastics detection (MSc). Taught Masters Award for Best Seminar
Presentation. 156
Wyer K, Kelleghan DB, Hayes E, Everard M, Curran T. Modelling ammonia
concentration in a pig finishing house (MSc Research). Research Masters Award
for Best Seminar Presentation. 160
Monahan C, Cummins E. Risk assessment of antimicrobial residues in
environmental settings: sources, pathways and eventual fate (PhD). Environmental
Protection Agency. 164

vii
Table of Contents (continued)
Byrne MP , Tobin JT, Forrestal P, Richards K, Danaher M, Cummins E, O’
Callaghan TF. The nitrogen cycle a mini review (PhD). FIRM as administered by the
Irish Department of Agriculture, Food and the Marine. 168
Goh BB, Whetton R, Holden NM. Remote sensing for winter wheat yield monitoring
and prediction (PhD). Science Foundation Ireland (SFI). 172
BIOENVIRONMENTAL ENGINEERING
Sustainable Agriculture/Conservation
Braud L, McDonnell KP, Murphy F. Life cycle assessment of phycocyanin
production from arthrospira platensis in a concept of biorefinery (PhD). Horizon
2020. 176
Mediboyina MK, Murphy F, Holden N. Life cycle assessment of integrated
biorefinery for conversion of dairy side streams to high value bio-based chemicals
(PhD). EU Non Framework. 180
Tashi T, Holden NM. Process Model and Life Cycle Assessment of Whole Milk
Powder (PhD). Dairy Processing Technology Center (DPTC), Enterprise Ireland and
the Dalai Lama Trust Organization. 184
Herron J and Curran T. Preliminary modelling of the environmental impact of the
inclusion of white clover in perennial ryegrass swards on intensive pasture based
dairy production systems (PhD). Teagasc Walsh Fellowship Scheme. 185
Vinagre-Sendino J and Curran T. Sustainable Sludge Management in Ireland
(PhD). Irish Research Council Employment Based Postgraduate Scheme. 186
APPENDICES
Appendix 1 Listing of research projects in progress which have not been
included in the Research Review. 187
Appendix 2 Profiles of Postdoctoral Research Scholars. 188

DISCRIMINATION BETWEEN FRESH AND PREVIOUSLY FROZEN
POULTRY DURING AND AFTER THAWING USING
HYPERSPECTRAL IMAGING
Anastasia Falkovskaya, Ana Herrero-Langreo, Aoife Gowen
UCD School of Biosystems and Food Engineering, University College Dublin, Belfield, Dublin 4,
Ireland.
Abstract
In an attempt to meet consumer demands for fresh meat while benefiting from increased shelf life of
frozen meat, retailers may be influenced to label products thawed from frozen as fresh meat. However,
freezing reduces product quality and are therefore perceived as undesirable by consumers. The objective
of this study is to apply hyperspectral imaging (HSI) techniques in the near infrared region (978 - 1678
nm) to discriminate between fresh (n = 9) and previously frozen (n = 9) chicken breast fillets during and
after thawing. Treatment samples were frozen for 24 h at -15°C, after which they were moved to 4°C for
7 hours. At this point, the internal temperature of previously frozen samples was 0.44°C ± 1.33,
indicating samples were still thawing. Following imaging, samples were stored in 4°C for 24 hours to
allow for full thawing and imaged again. Partial least squares discriminant analysis (PLS-DA) models
were built using combinations of the following pre-treatments: transformation to absorbance, standard
normal variate (SNV), and mean centring of data. Discrimination models performed favourably while
samples were still thawing. The best PLS-DA model was achieved by using data transformed to
absorbance and pre-treated with SNV and mean centring, resulting in a correct classification rate of
74.43% in the training set and 80.14% in the test set. Discrimination of the two classes after thawing
was poor, resulting in a correct classification rate of 58.92% in the training set and 59.11% in the test
set. Poor discrimination was likely a result of increased absorbance of surface moisture due to drip loss
from decreased water holding capacity of samples after freezing. Future work is needed to develop
methods which could efficiently remove surface moisture either physically or from the spectral data set.
Introduction
Fresh poultry meat is highly perishable, so retailers may choose to freeze meat to prolong shelf life of
products. However, freezing reduces product quality and are therefore perceived as undesirable by
consumers in comparison with fresh meat. Specifically, lipid and protein oxidation increases while
water holding capacity and colour decrease with each freeze-thaw cycle (Ali et al., 2015). In an attempt
to meet consumer demands for fresh meat while benefiting from increased shelf life of frozen meat,
retailers may be influenced to label products thawed from frozen as fresh meat. Previous studies show
that between 8-15% of analysed fresh meat samples are mislabelled thawed meat (Ballin and Lametsch,
2008). As a result, authentication techniques are required to ensure correct labelling. Currently used
authentication techniques include enzymatic, DNA based, spectroscopic (e.g. UV, NIR, NMR), bio-
imaging (e.g. microscopy, electron microscopy), and sensory analytical methods (Ballin and Lametsch,
2008). Although current non-spectroscopic methods are capable of discriminating between fresh and
thawed meat, they are time consuming, destructive, and rely on trained professionals. In contrast,
hyperspectral imaging (HSI) is a time efficient and non-destructive analytical tool that can be automated
for high-throughput implementation (Gowen et al., 2007). Using HSI instead of traditional
spectroscopic methods can be advantageous because one system has the potential to identify thawed
samples while simultaneously gathering other spatially significant information (e.g. bacteria distribution
on samples). Although there have been several successful Vis-NIR in the wavelength range of 400 –
2498 nm (Liu et al., 2004) and FTIR in the wavelength range of 2500 - 20000 nm (Grunert et al., 2016)
spectroscopy attempts, HSI has not yet been applied to discrimination between fresh and thawed
poultry. The objective of this study is to apply HSI in the near infrared region (978 - 1678 nm) to
discriminate between fresh and previously frozen chicken breast fillets during and after thawing.
1

Materials and Methods
Poultry samples
Fresh chicken breast fillets (n = 18) were acquired from a local supermarket. All samples were from free
range, grain fed chickens, traceable to the same farm. Samples were randomly assigned to control (n =
9) and treatment (n = 9) groups. Control samples were kept at 4°C for the duration of the experiment.
Treatment samples were frozen at -15°C for 24 hours, after which they were moved to 4°C. At this
point, internal temperature of all samples was measured by inserting a digital thermometer probe into
each sample. All samples were then imaged on the ventral side after 7 hours at 4°C, while treatment
samples were still thawing (i.e. internal temperature was 0-2°C). Next, samples were kept at 4°C for a
further 24 hours to allow for full thawing of treatment samples and imaged on the ventral side.
Hyperspectral imaging system
The HSI system used operated from 880 - 1720 nm in the near-infrared (NIR) region with a spectral
resolution of 7 nm. Images were 320 rows x 580 columns x 121 bands.
Software
Hyperspectral images were obtained using the acquisition software SScanner (v1.4.5, DV Optics,
Padua, Italy). All data analysis was completed using MatLab R2018b (MathWorks, Massachusetts,
USA).
Data analysis
In order to reduce noise, the spectral range was reduced to 978 - 1678 nm. Greyscale images at 1503 nm
were used to segment samples from background, using Otsu’s method (Otsu, 1979) for automatic
threshold selection to partition pixels. Next, 10% of pixels were extracted from each hyperspectral
image to be used for partial least squares discriminant analysis (PLS-DA) models. The resulting subset
was further split into a training and independent test set. Models were built using combinations of the
following pre-treatments: transformation to absorbance, standard normal variate (SNV), and mean
centring of data. Models were compared based on their correct classification (%) of the independent test
set to determine the best model.
Results and Discussion
Figure 1. Mean reflectance (± 1 SD) spectra of fresh (n = 9) and previously frozen (n = 9) chicken breast fillets
during (a) and after (b) thawing.
Discrimination between fresh and previously frozen chicken breast fillets was only possible while
samples were still thawing. During thawing, the best PLS-DA model was achieved by using data
transformed to absorbance and pre-treated with SNV and mean centring. This model used five latent
variables and was capable of discriminating between pixels of fresh and previously frozen chicken
breast fillets with a correct classification rate of 74.43% in the training set and 80.14% in the test set
(a) (b)
2

(Table 1). The regression coefficients resulting from the PLS-DA model identified 1034 and 1132 nm as
the most influential wavelengths for discrimination between classes. Change in temperature of water is
expected to result in a sideways shift of the OH sensitive region between 1400 and 1500 nm (Tøgersen
et al., 2003). Despite differences in temperature (Table 2), no sideways shift is observed in this region
between fresh and previously frozen samples (Figure 1). Because HSI is a surface technique, this shift
may not have been observed due to surface temperatures being comparable between treatment groups.
As a result, it is possible that the model was able to discriminate between treatment classes based on
true structural differences between samples rather than temperature. However, after a further 24 h of
storage, these differences may have been overpowered by the strong absorbance of the developing
surface moisture layer. Previous work has found that drip loss of poultry increases with increasing
storage time, resulting in increased surface moisture of samples (Marcinkowska-Lesiak et al., 2016). No
PLS-DA models were able to reliably discriminate between pixels of fresh and previously frozen
chicken breast fillets after thawing. Although no model had a correct classification rate of over 60%,
data transformed to absorbance and pre-treated with SNV had the highest correct classification rate of
58.92% in the training set and 59.11% in the test set (Table 1). Future work could mitigate the effects of
increased drip loss with increased storage time by using different storage methods. For example,
modified atmosphere packaging (MAP) with high oxygen content was found in previous work to result
in the least amount of drip loss after 15 days of storage (Marcinkowska-Lesiak et al., 2016).
Previous spectroscopic work was able to discriminate between fresh and previously frozen poultry using
bands in the 1400-1600 nm region (Liu et al., 2004). These distinctive bands are a result of overlapping
first overtones of OH/NH stretching modes of water interacting with itself and with protein complexes,
typical of meat composition (Liu et al., 2004). It is possible that these distinctive bands were not
observed in the current work due to increased surface moisture of samples as a result of extended
storage time. Samples used by Liu et al. (2004) were packaged 8 h post mortem and immediately placed
into treatment temperatures, beginning the experiment. In contrast, samples used for this study were
stored for an unknown amount of time prior to the experiment in MAP packaging. Upon being assigned
a treatment, individual samples were transferred into polyethylene-linear low density (LLDPE) freezer
bags. Over the duration of the experiment, drip loss likely increased with increased storage time
(Marcinkowska-Lesiak et al., 2016). Rather than receiving the signals of the OH/NH stretching modes
of the meat samples, the detector may have only recorded the strong absorbance of the surface moisture.
However, this does not occur in all pixels (Figure 2). If the number of pixels receiving signals
associated with surface moisture is different between treatment groups, this may explain why
discrimination was possible only during thawing. If it is possible to extract only the spectra which show
the signals of the OH/NH stretching modes, it could be possible to discriminate between fresh and
previously frozen poultry despite surface moisture.
Table 1. Correct classification results (%) of PLS-DA models and number of latent variables (LVs) used on
training and test sets during (7 h) and after thawing (31 h) using various pre-treatments.
During thawing (7 h) After thawing (31 h)
Pre-treatment Correct classification
(%)
LVs Correct classification
(%)
LVs
Training
(n =
51656)
Test
(n =
23758)
Training
(n =
50250)
Test
(n =
24839)
Raw data 73.59 74.45 6 58.64 56.82 10
SNV 74.09 73.58 6 56.74 56.21 8
Mean centre 74.67 76.92 6 58.96 58.99 5
SNV + Mean centre 74.49 78.48 7 56.06 56.74 7
Absorbance 74.04 74.94 7 56.95 58.34 10
Absorbance + SNV 74.34 74.36 6 56.67 57.71 9
Absorbance + Mean centre 75.87 78.77 9 58.92 59.11 5
Absorbance + SNV + Mean centre 74.43 80.14 5 56.59 58.96 6
3

Table 2. Internal temperature of fresh (n = 9) and previously frozen chicken breast fillets during thawing (n = 9).
Treatment Mean temperature (°C) Standard deviation
Fresh 5.89 1.33
Previously frozen 0.44 1.83
Figure 2. Reflectance of randomly selected 1 in 1000 spectra from training set (n = 50)
Conclusions
Successful discrimination between fresh and previously frozen poultry could only be predicted during
thawing using HSI. However, it was not possible to successfully discriminate between fresh and
previously frozen poultry after thawing, due to increased surface moisture due to drip loss of samples
overpowering the signal of the sample. Future work is needed to develop methods which could
efficiently remove surface moisture either physically from the sample or from the spectral data set.
Acknowledgements
Funding for this project was provided by the Department of Food Agriculture and the Marine, under the
Food Institutional Research Measure (FIRM).
References
Ali, S., Zhang, W., Rajput, N., Khan, M.A., Li, C.-B., Zhou, G.-H., 2015. Effect of multiple freeze -
thaw cycles on the quality of chicken breast meat. Food Chem. 173, 808–814.
Gowen, A.A., O’Donnell, C.P., Cullen, P.J., Downey, G., Frias, J.M., 2007. Hyperspectral imaging – an
emerging process analytical tool for food quality and safety control. Trends Food Sci. Technol. 18,
590–598.
Grunert, T., Stephan, R., Ehling-Schulz, M., Johler, S., 2016. Fourier Transform Infrared Spectroscopy
enables rapid differentiation of fresh and frozen/thawed chicken. Food Control, 60, 361–364.
Liu, Y., Barton, F.E., Lyon, B.G., Windham, W.R., Lyon, C.E., 2004. Two-Dimensional Correlation
Analysis of Visible/Near-Infrared Spectral Intensity Variations of Chicken Breasts with Various
Chilled and Frozen Storages. J. Agric. Food Chem. 52, 505–510.
Marcinkowska-Lesiak, M., Zdanowska-Sąsiadek, Ż., Stelmasiak, A., Damaziak, K., Michalczuk, M.,
Poławska, E., Wyrwisz, J., Wierzbicka, A., 2016. Effect of packaging method and cold-storage
time on chicken meat quality. CyTA - J. Food, 14, 41–46.
Otsu, N., 1979. A Threshold Selection Method from Gray-Level Histograms. IEEE Trans. Syst. Man.
Cybern. 9, 62–66.
Tøgersen, G., Arnesen, J.F., Nilsen, B.N., Hildrum, K.I., 2003. On-line prediction of chemical
composition of semi-frozen ground beef by non-invasive NIR spectroscopy. Meat Sci. 63, 515–
523.
4

CLASSIFICATION OF DIFFERENT BRANDS OF CHEDDAR
CHEESE USING HYPERSPECTRAL IMAGING
Tong Lei1, Da-Wen Sun
1
1Food Refrigeration and Computerized Food Technology (FRCFT), UCD School of Biosystems
and Food Engineering, University College Dublin, Belfield, Dublin 4, Ireland
Abstract
The present study aimed to investigate the feasibility of application of NIR-HSI to classification
brands of Cheddar cheese. For the hyperspectral data, a probability based PLSDA was used to
discriminate 4 brands of Cheddar cheeses. 18 PLS components were selected and the correct
classification rate was 85% for both the cross-validation set and testing set. It is hoped that this
study should provide a theoretical foundation on discriminating cheese products and set
directions for the broader application of HSI in relevant research fields.
Introduction
Cheese manufacturers use milk from different geographic origins with various additives and
specific production equipment to make Cheddar cheese resulting in a difference between
qualities. However, the difference between various brands of Cheddar cheese is hard to
distinguish by consumers, particularly when cheese is used as an ingredient in various foods,
which enables the possibility of adulteration. Conventional classification methods mainly rely
on detecting contents of specific chemicals in cheeses, such as phytosterol (Kim et al., 2014)
and volatile compounds (Gan et al., 2016), which requires a bulk of chemical analysis and are
time-consuming. Therefore, development of a rapid and non-destructive measurement tool for
discriminating Cheddar cheese is needed.
Hyperspectral imaging (HSI) has great potential to be used as a non-destructive assessment
tool for cheese brands classification. Near-infrared (NIR)-HSI has been widely used in dairy
research, recent literatures include detecting melamine in powdery milk (Fu et al., 2014;
Huang et al., 2016; Lim et al., 2016), characterising milk powders based on different
manufacturers and functional qualities (Munir et al., 2018), detecting and quantifying various
milk powder adulterants (Forchetti and Poppi, 2017). NIR-HSI was also applied to cheese
quality evaluation in recent years. NIR-HSI coupled with PLSR was found to be suitable to
predict fat content and hardness of semi-hard cheese during ripening (Darnay et al., 2017).
However, applications of HSI in cheese products for classification purpose are still scarce.
Darnay et al. (2017) conducted the only research for classifying cheeses with different
enzyme treatments using NIR-HSI coupled with linear and quadratic discriminant analysis
(LDA and QDA) models.
The objective of this study was to classify different brands of Cheddar cheese using
hyperspectral imaging.
Materials and Methods
Cheddar cheese samples: 4 brands (A, B, C, D) of plastic-sealed red Cheddar cheese were
purchased from local supermarkets (Dublin, Ireland), each brand of cheese was produced in 4
batches. All cheese samples were kept refrigerated at 4 °C before analysis. Cheddar cheeses
were cut into small blocks with size of 2.8 × 2.8 × 1.5cm (5 replicate blocks for each batch).
The number of all samples is: 5 replicates × 4 batches × 4 brands = 80 . Samples are
divided into two subsets: cross-validation set and testing set. The number of samples in the
cross-validation set is: 5 replicates × 3 batches × 4 brands = 60 , and the number of
samples in the testing set is: 5 replicates × 1 batch × 4 brands = 20. The reason for this
5

setting is to measure the predicting ability of models for new samples in different batches.
Normally, the difference between different batches in one brand might have the biggest effect
on classification accuracy.
NIR-Hyperspectral imaging systems: A laboratorial NIR-HSI system was used to acquire
the hyperspectral images of cheese samples in reflectance model with 306 × 320 pixels. The
captured spectral region of the HSI system was 950.35-1654.15 nm with a constant interval of
2.76 nm. However, the wavelength range of 1030.39-1527.19 nm was selected for further
analysis because spectral data in this range have high signal-to-noise ratio. Finally, 181
reflectance data were obtained for each spectrum.
Spectral data analysis: Before PLSDA modelling, 1st derivative Savitzky–Golay (window
size: 9, polynomial order:3) method was used for spectral preprocessing. Partial least squares
discriminant analysis (PLSDA) is a supervised classification technique that bases on partial
least squares regression (PLSR) (Ballabio and Consonni, 2013; Su and Sun, 2016). In the
present study, a probability based PLSDA proposed by Pérez et al. (2009) which integrates
probability density function (PDF) and the Bayes Theorem was used for class assignment. 10-
fold cross-validation is also applied to prevent over-fitting of the calibration model.
Results and Discussion
Selection of the number of PLS components is an important step in the data analysis because
too few or too many components will lead to under or over-fitting of the data, respectively
(Gowen et al., 2011). According to the variances of both spectra and class matrix explained
by different PLS components, PLS components with the number ranging from 12 to 22 were
used for modelling and further selection. For cross-validation set, the average correct
classification rates over 10 times 10-fold cross-validation were calculated for each number of
PLS components. The corresponding optimal models were also built after 10 times cross-
validation. The frequencies of samples that appeared in the perfectly predicted test group in
each fold were counted. The samples with highest 5 frequencies were culled from the cross-
validation set, the rest samples were used for establishing a new model to classify testing set.
The number of culled samples is 5 in order to avoid duplication with models that were already
used in cross-validation (6 samples were separated as test group in each fold during cross-
validation). These obsoleting samples were not outliers because they can be successfully
discriminated using models built by other samples, however, models built by them cannot
perfectly classify other samples because they might contain interference that would affect the
classification ability of PLSDA.
Table 1. Classification results of two sample sets using different PLS components
Number of PLS
components
Correct classification rate
of cross-validation set
Correct classification rate of
testing set
11 67.33% 35.00%
12 69.33% 45.00%
13 77.17% 55.00%
14 79.17% 70.00%
15 81.17% 70.00%
16 82.00% 70.00%
17 80.17% 70.00%
18 85.00% 85.00%
19 86.00% 40.00%
20 84.33% 60.00%
21 85.67% 45.00%
22 85.50% 55.00%
6

Table 1 shows the correct classification rates for both cross-validation set and testing set. The
trends of these correct rates were shown in Figure 1. With the increase of PLS components, the
model explained more information about the data, therefore, the correct classification rate of
cross-validation set continuously rose. The rate of testing set also rapidly increased until
reached a peak with 18 PLS components. After that, the correct classification rate for the testing
set dropped quickly due to the problem of overfitting. Therefore, the best number of PLS
components was 18, and the correct classification rates of both two sample sets were 85%.
Table 2 shows the correct classification rates for 4 brands of Cheddar cheese in testing set using
18 PLS components. For all four brands, the optimal model can classify them with relatively
high correct rates (>80%).
Table 2. Classification results of 4 brands of cheese in testing set (18 PLS components)
Brand of Cheddar cheese Number of Samples Correct classification rate
A 5 80%
B 5 100%
C 5 80%
D 5 80%
The only previous work about cheese classification using NIR-HSI systems was conducted by
Darnay et al. (2017), they classified cheeses based on different enzyme treatment with correct
rates of 88% and 85% by LDA and QDA, respectively. Although brands classification is a
more difficult work than enzyme treatment classification due to the less difference between
variables, similarly good results were still obtained in present study. The limitations of
present study are: the classification ability to new brands other than current 4 brands is
unknown; more preprocessing methods should be used before modelling; there is still room
for improvement of classification results.
Conclusions
A robust probability based PLSDA model was established when using 18 PLS components
without the problem of overfitting in this study. This work proved that NIR-HSI system has
the potential to classify different brands of Cheddar cheese with a relatively high accuracy
rate of 85%. Future work will focus on comparing different classification models and
investigate the connection between cheese (manufacturing and nutritional) differences and
feature wavelengths.
35.00%
45.00%
55.00%
65.00%
75.00%
85.00%
1 1 1 2 1 3 1 4 1 5 1 6 1 7 1 8 1 9 2 0 2 1 2 2
Cross-validation set Testing set
Figure 1. Change of correct classification rates with number of PLS
components
Number of PLS components
Co
rrec
t cl
assi
fica
tio
n r
ate
7

Acknowledgements
The authors would like to acknowledge University College Dublin (UCD) and China
Scholarship Council (CSC, China) for financial support to his PhD study under the UCD-CSC
funding scheme.
References
Ballabio, D., & Consonni, V. (2013). Classification tools in chemistry. Part 1: linear models.
PLS-DA. Analytical Methods, 5(16), 3790-3798.
Darnay, L., Králik, F., Oros, G., Koncz, Á., & Firtha, F. (2017). Monitoring the effect of
transglutaminase in semi-hard cheese during ripening by hyperspectral imaging.
Journal of Food Engineering, 196, 123-129.
Forchetti, D. A. P., & Poppi, R. J. (2017). Use of NIR hyperspectral imaging and multivariate
curve resolution (MCR) for detection and quantification of adulterants in milk
powder. LWT-Food Science and Technology, 76, 337-343.
Fu, X., Kim, M. S., Chao, K., Qin, J., Lim, J., Lee, H., et al. (2014). Detection of melamine in
milk powders based on NIR hyperspectral imaging and spectral similarity analyses.
Journal of Food Engineering, 124, 97-104.
Gan, H. H., Yan, B., Linforth, R. S. T., & Fisk, I. D. (2016). Development and validation of an
APCI-MS/GC–MS approach for the classification and prediction of Cheddar cheese
maturity. Food chemistry, 190, 442-447.
Gowen, A. A., Downey, G., Esquerre, C., & O'Donnell, C. P. (2011). Preventing over‐fitting
in PLS calibration models of near‐infrared (NIR) spectroscopy data using regression
coefficients. Journal of Chemometrics, 25(7), 375-381.
Huang, M., Kim, M. S., Delwiche, S. R., Chao, K., Qin, J., Mo, C., et al. (2016). Quantitative
analysis of melamine in milk powders using near-infrared hyperspectral imaging and
band ratio. Journal of Food Engineering, 181, 10-19.
Kim, J., Kim, J. W., Kim, N. S., Lee, J. H., Han, K. M., & Cho, S. (2014). Discrimination of
commercial cheeses from fatty acid profiles and phytosterol contents obtained by GC
and PCA. Food Chemistry, 143, 40-47.
Lim, J., Kim, G., Mo, C., Kim, M. S., Chao, K., Qin, J., et al. (2016). Detection of melamine
in milk powders using near-infrared hyperspectral imaging combined with regression
coefficient of partial least square regression model. Talanta, 151, 183-191.
Munir, M. T., Wilson, D. I., Yu, W., & Young, B. R. (2018). An evaluation of hyperspectral
imaging for characterising milk powders. Journal of Food Engineering, 221, 1-10.
Pérez, N. F., Ferré, J., & Boqué, R. (2009). Calculation of the reliability of classification in
discriminant partial least-squares binary classification. Chemometrics and Intelligent
Laboratory Systems, 95(2), 122-128.
Su, W.-H., & Sun, D.-W. (2016). Facilitated wavelength selection and model development for
rapid determination of the purity of organic spelt (Triticum spelta L.) flour using
spectral imaging. Talanta, 155, 347-357.
8

Vicky Caponigro
Project Title: Hyperspectral imaging to detect dairy products
Project Leader: Assoc. Prof. Aoife Gowen
Abstract
The purpose of this study is detect the variation of nutrients in dried milk on stainless steel 316-2B and
304-2B and aluminium using multimodal hyperspectral imaging (HSI). To achieve this goal 3
experiments were carried out: 1) in order to have different concentrations of the most influential nutrients
(i.e. proteins, carbohydrates and fats) different types of dairy residues (i.e. dried whole milk, skimmed
milk, protein milk, butter milk and butter) were characterized 2) the initial whole milk volume, from
0.5mL to post water washed residues and 3) the lactose concentration. The characterisation of different
types of dairy residues were carried out using Raman and FTIR HSI. For the initial whole milk volume
and lactose study Raman, FTIR and macro NIR HSI were used. The Raman spectra were corrected for
cosmic rays using an in-house function. In the case of FTIR data, both the Near Infrared (NIR) and Mid
Infrared (MIR) ranges were collected simultaneously and split into two ranges and pre-treated
independently. Before re-concatenation, the spectra were normalised using the Euclidean norm. Raman
and FTIR data set were both pretreated by obtaining the Savitzky-Golay derivative and using Standard
Normal Variate normalisation. For the macro NIR data, the noise was removed and the spectra were
transformed into pseudo absorbance and subsequently SNV was applied. The image background was
removed by finding the value bigger than one and subtracting the mean silicon spectrum. Later, principal
components analysis (PCA) were applied for all the studies and partial least squares-discriminant analysis
(PLS-DA) for the characterisation of different types of dairy residues .
PCA on both Raman and FTIR spectroscopy, shows a good separation between the different dairy
products. Despite that, observing the Raman spectra, it is easier to identify the signals of chemical groups
and their effect on the loadings of PCA. In addition, PLS-DA was applied to classify each dairy product.
Both spectroscopic techniques also give good results in prediction. However, Raman spectroscopy results
are less precise at recognising different products. PCA on macro NIR is sensitive to volume change and it
was possible to differentiate the contaminated samples from the clean surfaces. It is also possible to
follow a clear trend with the decrease of the milk volume. From PCA on Raman data it is possible to
discriminate the cleaned surfaces from the other samples but it is difficult to identify a trend between
different volume samples. The volume variation is evident in PCA on pretreated FTIR spectra. However,
the sample with just milk residues for stainless steel 316 and aluminium appear similar to the clean
surfaces. In addition, applying PCA to the lactose concentration FTIR datasets it was possible to
distinguish the pure lactose and milk images and some trend in the middle value. The Raman dataset in
this study seems to not have relevant information. In conclusion, from characterisation of different types
of dairy residues study it is clear that both FTIR and Raman spectroscopy, in combination with
chemometrics approaches, are suitable to discriminate the various dairy product types. In addition, the
other studies underline how the Raman and macro NIR HSI are sensitive to a volume change, whereas
FTIR HSI is more suitable for the lactose study.
Selected Recent Publications
Caponigro V., Marini F., Dorrepaal R. M., Herrero-Langreo A., Scannell A., Gowen A. A. (2019).
“Raman and Fourier Transform Infrared hyperspectral imaging to study dairy residues on different
surfaces”. J. Spectral Imaging, 8, a3. DOI: https://doi.org/10.1255/jsi.2019.a3
9

Xiaohui Lin
Project Title: Non-destructive investigation on moisture content uniformity and shrinkage rate caused by
microstructure effect during microwave-vacuum drying
Project Leader: Prof. Da-Wen Sun
Abstract
Microwave-vacuum drying (MVD) are relatively time saving and efficient drying methods. Although the
shrinkage between hot air drying and MVD have been compared, the shrinkage and moisture distribution
between the fiber perpendicular and parallel samples, the samples with and without peel during MVD
were still not investigated. Thus, this study applied hyperspectral imaging and computer vision to
investigate the shrinkage and moisture distribution difference between the different ginger samples. The
microwave-vacuum dryer used in the experiment was designed by Food Refrigeration and Computerized
Food Technology (FRCRT, Dublin, Ireland). A laboratory hyperspectral imaging system was used to
acquire the hyperspectral images of ginger sample in the reflectance model. A computer vision system
was applied to acquire the images of samples during MVD. The quantitative models between the moisture
content and the spectral data of the ginger slices based on diverse spectral pre-processing methods
covering the raw spectra and those modified by standard normal variate (SNV) and multiplicative scatter
correction (MSC) were established by partial least regression model (PLS). All the data analysis was
implemented in Matlab R2016a (The MathWorks, Inc., Natick, Massachusetts, USA). The PLS models
with SNV pretreatment was the optimal model to predict moisture content of ginger slices, and thus it was
used to predict the moisture distribution of ginger slices. The shrinkage rate of the sample with peel were
significantly higher than the sample without peel. The shrinkage rate of width and length of perpendicular
samples is higher than parallel samples. In addition, the shrinkage rate of width and length in parallel
samples were different. The shrinkage rate of width was higher than that of the length. In the above, the
shrinkage rate and moisture distribution was different between perpendicular and parallel samples, and
between samples with and without peel. The current study could provide an insight in to the moisture
distribution and shrinkage difference between different cutting direction samples, and provide a direction
for the improvement of drying food quality.
Selected Recent Publications
Lin, X., Xu, J.L. and Sun, D.W. (2019). ‘Investigation of moisture content uniformity of microwave-
vacuum dried mushroom (Agaricus bisporus) by NIR hyperspectral imaging’, LWT-Food Science
and Technology. https://doi.org/10.1016/j.lwt.2019.03.034
10

Ronan Dorrepaal
Project Title: The development of chemical imaging and chemometric techniques to investigate
fundamental biomaterial interactions with biological systems
Project Leader: Assoc. Prof. Aoife Gowen
Abstract
A biomaterial is traditionally defined as ''any substance (other than a drug) or combination of substances,
synthetic or natural in origin, which can be used for any period of time, as a whole or as a part of a system
which treats, augments, or replaces any tissue, organ, or function of the body'' (Galletti and Boretos
1983).
Our recent study (Dorrepaal and Gowen 2018) investigated spatial heterogeneity in magnesium
oxychloride cements using hyperspectral chemical imaging (HCI). The ability to inspect cements within a
mould allows for the assessment of material formation in real time in addition to factors affecting ultimate
material formation. Both macro scale NIR HCI and micro scale pixel-wise Raman chemical mapping
were employed to characterise the same specimens. NIR imaging is rapid, however spectra are often
convoluted through the overlapping of overtone peaks, which can make interpretation difficult. Raman
spectra are more easily interpretable, however Raman imaging can suffer from slower acquisition times,
particularly when the signal to noise ratio is relatively poor and the spatial resolution is high. To
overcome the limitations of both, Raman/NIR data fusion techniques were explored and implemented.
Spectra collected using both modalities were co-registered and intra and inter-modality peak correlations
were investigated while k-means cluster patterns were compared. In addition, partial least squares
regression models, built using NIR spectra, predicted chemical-identifying Raman peaks with an R2 of up
to >0.98. As macro scale imaging presented greater data collection speeds, chemical prediction maps
were built using NIR HCIs.
References
Galletti, P.M., Boretos, J.W. (1983) ‘Report on the Consensus Development Conference on “Clinical
Applications of Biomaterials” 1-3 November 1983’, Journal of Biomedical Materials Research,
17(3), 539–555, available: http://doi.wiley.com/10.1002/jbm.820170312 [accessed 9 Apr 2018].
Selected Recent Publications
Dorrepaal, R.M., Gowen, A.A. (2018) ‘Identification of Magnesium Oxychloride Cement Biomaterial
Heterogeneity using Raman Chemical Mapping and NIR Hyperspectral Chemical Imaging’,
Scientific Reports, 8(13034), 1–11, available: http://www.nature.com/articles/s41598-018-31379-5.
Acknowledgements:
This study was supported by the European Commission under the 7th Framework Programme (Grant
agreement nos. 335508).
11

A SPATIAL INVESTIGATION INTO VTEC DISTRIBUTION IN IRELAND
Qiongyu He, Francis Butler
UCD School of Biosystems and Food Engineering. University College Dublin, Belfield, Dublin 4, Ireland
Abstract
E.coli, as one of the most prevalence bacteria colonized in the intestinal tract of humans and animals, and
also remains the most frequent cause of common bacterial infection ,septicaemia and different clinical
infections. Verocytotoxigenic E. coli is considered to have the highest diarrhoeagenic virulence. From the
epidemiology side, compared with the outbreak data in other EU countries, Ireland has the highest rate of
human cases of Verocytotoxigenic E. coli with about 15 cases of per 100,000 population. This project of
using the one-health approach to survey the epidemiology assess the spatial distribution of VTEC in
Ireland is also look at cross-sectoral collaborations across environment, agri-food chain, human public
health and veterinary. The whole project is divided into several parts, this paper would focus mainly on
the downstream parts which are drawing SNP tree using Newick format and locating metagene data of
VTEC distribution in Ireland using GPS software. The whole metagene information of VTEC in Ireland
can be presented after these two steps.
Instruction
Mapping tools and SNP tree can be used to show the prevalence of VTEC in Ireland and a database will
be built based on the samples collected from environment food and food-producing animals in different
regions. VTEC, living in the intestines of animals and humans, belongs to harmful strains of E. coli which
are able to produce shiga toxin that can cause severe illness. The symptoms of VTEC infection include
bloody diarrhea and abdominal cramps. The incubation period is about 10 days. Along the agri-food
chain, lots of steps from farm to food can be considered high risk. In this project, VTEC recovered from
food-producing animals, environment and food will be exploited by using whole genome sequencing.
Thus the data gap regarding prevalence and types of VTEC can be filled. The whole concept of this
project is so called metagenomics.
Metagenomics mainly focus on those genetic materials that are directly recovered from environmental
samples. Compared with the traditional genomics cultivation, which relies on clonal cultures, methods
used today take a ‘shotgun’ approach to detect all genes from the sample community directly from the
environment which means the concept of metagenomics detection have much more potential to find out
the genomic diversity and integrity. With the hidden diversity of microscopic life revealed, the
investigation of unbiased information of the whole micro world could process more smoothly. In this
project, samples from different ecological niches would be collected and analyzed. Thus reasonable
assumptions regarding the relationship between VTEC spatial distribution and environment could be
made based on metagenomics information. Among all the graphical tools, SNP tree, which visualises the
results of genome sequencing, constructing distance matrix by differences of a single nucleotide, is an
intuitive way to show the ties and comparisons among different subspecies of targeted microorganism.
12
A unique format named Newick is the way to represent the graph-theoretical trees. This format has its
own grammar using commas and parentheses. Software like PARSNP could be used to visualize Newick
language and then present the tree. With the increase in applications of Newick in taxonomy, more and
more applicable online tools have been developed to simplify the coding procedure of Newick. Alternated
choices like the Nexus file format can also be used in bioinformatics. But this method needs to cooperate
with Newick in most cases.
Mapping all the spots of metagenomics of VTEC in an Irish map is the last step. Normally different spots
will be measured by longitude and latitude. Varieties of software can be used at this stage. Some software
are quite useful in customising mapping projects and the information can be shared real time on the
internet. It’s also very easy to access the backstage database to download different kinds of map. Using
QGIS as an example, the drawback would be that the creating user’s own database requires complicated
procedures. Other online tools like Microreact and BatchGeo are very good options which requires less
effort.
Methodology
Data: Samples are recovered from different channels including animal-carcass swabs, high risk agri-food
chain and human faecal specimens collected by UCD, TEAGASC and HPSC, respectively. Serogroup
diversity will be detected thorough the WGS method. The metadata will be transferred through the
pipeline between organizations. Information like Sample type, Date of Recovery, Origin (country) should
be included in the metadata.
Mapping Preparation : An online tool named Microreact, which is a tool for open data visualization and
sharing for genomic epidemiology, is chosen in this stage. This software requires two kinds of files to
work--The Newick format files and the data base in Excel.
To get the Newick data, we need use a tool named PARSNP. This software can analyse and compare gene
sequencing in Fasta format from different serotypes. A SNP tree can be created and the tree could be
saved in Newick format. Excel should contain the database created with all the results of the samples. The
basic parameters include Latitude, Longitude, Year, Color and Shape. All the color has their own defining
codes which can be identified by the software. The gene sequences of 31 different kinds of
staphylococcus will be used.
13

Figure 1: Excel database
Thus the whole mapping result will be presented like below:
Figure 2: Mapping using Microreact
14

Discussion
Whole gene sequencing is a precise and convenient method to detect serotype diversity of microbes.
Using this method, varieties of genes can be preserved and also detailed information like base mutations
can easily be compared. Using metadata with the SNP tree of sequencing information on the side is an
intuitive way to help understand the link between outbreaks and sources.
Monitoring and presenting the spread of notable pathogenic organism is critical for agri-food safety and
also should be valued by government to inform policy. Micro react is a useful tool to visually present
genetic data.
References:
Nunan,N.,Wu,K,. Ritz,K. (2003) “Spatial distribution of bacterial communities and their relationships
with the micro-architecture of soil” FEMS Microbiology Ecology, 44(2), 203–215.
Bloemberg, G. V., Wijfjes A. H.., Lamers G. E.., Stuurman N.., Lugtenberg B. J..(2000) “Simultaneous
imaging of Pseudomonas fluorescens WCS365 populations expressing three different autofluorescent
proteins in the rhizosphere new perspectives for studying microbial communities” Mol. Plant
Microbe Interact. 13, 1170-1176.
Bundt, M., F. Widmer, M., Pesaro, J. Zeyer., P. Blaser.( 2001)” Preferential flow paths: biological ‘hot
spots’ in soils” Soil Biol. Biochem. 33, 729-738
15

EXPOSURE ASSESSMENT FOR BIOTOXINS AND VIRUSES ARISING
FROM CONSUMPTION OF IRISH PRODUCED SHELLFISH
Xiyao Wang, Francis Butler
UCD School of Biosystems and Food Engineering, University College Dublin, Belfield, Dublin 4,
Ireland.
Abstract
Marine biotoxins is a growing concern worldwide. They are naturally occurring chemicals generated
by mostly harmful algae blooms (HABs). Biotoxins can easily accumulate in shellfish, leading to
human intoxication after consumption of contaminated seafood products. Based on poisoning
symptoms, marine biotoxins are grouped into paralytic shellfish poisoning (PSP), amnesic shellfish
poisoning (ASP), diarrheic shellfish poisoning (DSP), neurotoxic shellfish poisoning (NSP), and
ciguatera fish poisoning (CFP). In Ireland, the most popular marine biotoxin is diarrheic shellfish
poisoning (DSP) associated with outbreaks and harvesting area closures. This project used toxin
occurrence data recorded by public authorities in Ireland with consumption data to develop the first
quantitative exposure assessments for these marine biotoxins. A Monte Carlo simulation approach
will be used to characterize the exposure assessment based on hazard occurrence data obtained from
publicly available data sources.
Introduction
Marine biotoxins are considered a growing concern for public health. This trend not only poses a
threat to wildlife but also to humans. These biotoxins are naturally occurring chemicals produced by
phytoplankton, especially those harmful algal blooms (HABs). The occurrence of the blooms depends
on different environmental factors. In recent years, due to global warming and therefore changes in
weather conditions, specific HAB taxa tend to occur more often and at unexpected places, leading to
higher biotoxin level can be detected from water samples (Alexander et al. 2009). Marine biotoxins
can easily accumulate in seafood products. Consumption of contaminated seafood can cause human
illness, symptoms vary from diarrhea, nausea, vomiting, and abdominal cramps to neurological
disorders (Alexander et al. 2009). On the other hand, harvest area closures with prohibited harvesting
activities and product recall are also triggered by the biotoxins when it exceeds the regulation limits,
leading to economic loss to shellfish industries(Nicolas et al. 2017).
Shellfish is regarded as the primary food vectors for these human illnesses. As filter feeders, shellfish,
especially oysters, mussels, and clams, can filter large quantities of water per hour. When HAB
happens, there could be millions of algal per litre of water, making high concentrations of toxin
accumulate in the shellfish tissues (Paredes et al. 2011). Reported cases caused by ingestion of
biotoxins are up to 6000 worldwide during the 21st century. Based on poisoning symptoms, marine
biotoxins are grouped into paralytic shellfish poisoning (PSP), amnesic shellfish poisoning (ASP),
diarrheic shellfish poisoning (DSP), neurotoxic shellfish poisoning (NSP), and ciguatera fish
poisoning (CFP) (Gao et al. 2015). The objective of this project is to establish the very first
exposure assessment for marine biotoxins accumulating in Irish produced shellfish, initially
targeting on DSP toxin group in mussels.
There are numbers of marine biotoxins that are prevalent in Irish waters. The Irish Marine Institute
routinely monitors for a number of HABs that are responsible for different toxin groups, including
the Pseudo-nitzshia species responsible for Amnesic shellfish poisoning (ASP); the Protoperidinium
species (most likely) responsible for Azaspiracid Poisoning (AZP); Dinophysis species (and others)
responsible for Diarrhetic Shellfish Poisoning (DSP); Alexandrium species responsible for Paralytic
16

Shellfish Poisoning (PSP). Among these toxin groups, DSP attracts the most attention from the
Marine Institute as it causes the most bay closures in Ireland, resulting in a severe impact on shellfish
industries. In addition, there have been numbers of outbreaks associated with the ingestion of DSP
toxins. The dominate toxins responsible for DSP is okadaates (OAs). This toxin group involves
okadaic acid (OA) and its derivatives the dinophysistoxins (DTXs), which includes DTX1, DTX2,
DTX3 groups, DTX 4 and DTX5 groups. OAs are widely distributed all over the world, but are
especially abundant in Europe, Japan, and South America (Valdiglesias et al. 2013).
Materials and Methods
Investigated location
Bantry is one of the production areas under monitored. It is located in the southwest of Cork in Ireland
which is suffering from HABs explosion following with biotoxins contamination issues.
Consequently, bay closure happens frequently during the peak period.
Figure 1. Shellfish production area-Bantry
Data collection and processing
This risk assessment project was achieved with toxin occurrence data provided by the Marine institute
coupled with intake data generated by another co-project. The HAB Weekly Bulletin from the Marine
Institute provides the information on the potential development of toxic and/or harmful phytoplankton
(Figure 2.), also the level of biotoxin detected from shellfish samples (Table 1).
A Monte Carlo simulation approach is used to characterize the exposure assessment based on hazard
occurrence data obtained from publicly available data sources.
Table 1. DSP level in shellfish harvested from Bantry
Harvesting site Investigation period Biotoxin level
Bantry outer 06/01/2014 <LOQ*
Bantry outer 08/01/2014 <LOQ*
Bantry outer 10/03/2014 0.03
Bantry outer 25/03/2014 0.02 *LOQ = Limit of Quantification
17

Figure 2. HAB Bulletin from the Marine institute
Future work
The next step of this project is data management. In other words, the data trend will be assessed based
on the weekly HAB Bulletin from the Marine Institute.
Acknowledgement
This project is undertaken with the instruction of Joe Silk from the Marine Institute. The intake data
are provided by Dr. Eileen Gibney and Sophie Govzman.
References
Alexander, J., Benford, D., Boobis, A., Ceccatelli, S., Cravedi, J., Domenico, A. Di, Doerge, D.,
Dogliotti, E., Edler, L., Farmer, P., Fink-gremmels, J., Fürst, P., Guerin, T., Knutsen, H.K.,
Livesey, C., Machala, M., Mutti, A., Schlatter, J., Leeuwen, R. Van (2009) ‘Marine biotoxins in
shellfish – Domoic acid Scientific Opinion of the Panel on Contaminants in the Food Chain
Adopted on 2 July 2009’, The EFSA Journal, 1181, 1–61.
Gao, Z., Liu, B., Huo, D., Yan, H., Jia, L., Du, Y., Qian, H., Yang, Y., Wang, X., Li, J., Wang, Q.
(2015) ‘Increased norovirus activity was associated with a novel norovirus GII.17 variant in
Beijing, China during winter 2014–2015’, BMC Infectious Diseases, 15(1), 574,
Nicolas, J., Hoogenboom, R.L.A.P., Hendriksen, P.J.M., Bodero, M., Bovee, T.F.H., Rietjens,
I.M.C.M., Gerssen, A. (2017) ‘Marine biotoxins and associated outbreaks following seafood
consumption: Prevention and surveillance in the 21st century’, Global Food Security, 15, 11-21
The HAB Bulletin. The Marine institute, available: https://www.marine.ie/Home/site-area/data-services/interactive-maps/weekly-hab-bulletin
Paredes, I., Rietjens, I.M.C.M., Vieites, J.M., Cabado, A.G. (2011) ‘Update of risk assessments of
main marine biotoxins in the European Union’, Toxicon, 58(4), 336-354.
Valdiglesias, V., Prego-Faraldo, M.V., Paśaro, E., Meńdez, J., Laffon, B. (2013) ‘Okadaic Acid: More
than a diarrheic toxin’, Marine Drugs, 11(11), 4328–4349.
18

Rajat Nag, BE, MSc
Project Title: The comparative public and animal health risks associated with spreading
Anaerobic Digestate, animal manure and slurry on land
Project Supervisor: Assoc. Prof. Enda Cummins
Abstract
Anaerobic Digestion (AD) has been identified as the cleanest green technology which can utilise
farmyard manure and slurry (FYM&S) and food waste to produce heat and electricity. The
digestate is a valuable co-product of this process and can be used as an organic soil conditioner.
This feedstock can contain a significant number of pathogens (bacteria, fungi, viruses, parasites).
AD, pasteurisation and storage can inactivate pathogens; however, complete inactivation is
unlikely. Once the FYM&S and digestate are applied on land, the pathogens can transmit
through air, water, soil and food. The objective of this study was to estimate the human and
animal risk associated with spreading FYM&S and anaerobic digestate on land with the help of
qualitative and quantitative risk assessment models. Qualitative and semi-quantitative models
were used for hazard analysis. A total of 99 pathogens were scored based on their thermal
resilience, ability to spread through different environmental pathways and severity of the disease.
Initial concentration in farmyard manure and slurry was estimated with a Bayesian inference
model. Different recipes were tested to check the fate of pathogens through AD, pasteurization
(pre or post) and storage conditions. Stochastic models were studied to quantify the decay of
pathogens in air, water and soil. A Gaussian air dispersion model was used to calculate the
concentration of pathogens transmitted through the air. Next, an infiltration model was
developed to determine the runoff volume and infiltration depth associated with specific storm
events. Soil Conservation Service (SCS) model (USEPA) was used to maximise runoff and the
Green-Ampt explicit model (USEPA) was used to maximise infiltration for groundwater
contamination. Finally, a food model was built with a combination of a predictive and stochastic
models to determine the potential number of pathogens ingested while consuming ready-to-eat
salads. Hazard identification identified Cryptosporidium parvum, Mycobacterium spp.,
Norovirus, Salmonella spp., Listeria monocytogenes, Clostridium spp., E. coli (EPEC), Yersinia
enterocolitica as the most resilient pathogens which may cause disease. The restriction period
and crop growing time are important parameters which allow the pathogens to decay by
desiccation, heat and UV ray from the sun. The air model found that there is a potential threat to
workers during the spreading of digestate; however, after 24 hours of the spreading the risk is
minimal. The water model shows that pathogens have the potential to enter groundwater and
surface water. Chlorine treatment in the food packaging industry reduces the pathogen count;
though, the failure to provide a low temperature in the storage and shelf life can increase the
pathogen count significantly. The models developed in this study will help to assess the
comparative public and animal health risks associated with spreading Anaerobic Digestate,
animal manure and slurry on land.
19

Yingzhu Li, BE, M.EngSc.
Project Title: Risk Characterization of ENPs for Humans
Project Leader: Assoc. Prof. Enda Cummins
Abstract
Engineered nanoparticles (ENPs) have been shown to be toxic through animal tests, of which some can be
extrapolated to human equivalent dose-response relationships. During this project, hazard
characterization, as the first step of the risk assessment process, has been conducted. The prioritization of
ENPs in the European market in terms of risk to human health reveals that the AgNP is the ENP with the
highest concern. However, the corresponding behavior kinetics in natural waters under various
environmental conditions is considered a black box during the risk assessing process of ENPs. Therefore,
the environmental fate of AgNPs needs to be explored further to develop more accurate exposure
assessments. Overall, this project aims to establish a comprehensive risk assessment of ENPs for human
health. A semi-quantitative methodology is adopted for a risk ranking model. An exposure assessment of
the highest ranking ENPs selected by the ranking will be established by constructing a response surface
model (RSM). Environmental experiments are also designed as part of this project to identify the most
critical environmental parameters influencing ENP behavior. This study highlights that, guidelines for
ENP hazard characterization need to be revised and separated from traditional chemical hazard tests due
to their unique physicochemical characterization of toxicity. Given the assessment of hazard and exposure
potential resulting from various environmental routes, AgNP ranked the highest in terms of risks
following the environmental exposure, especially from aquatic systems. The natural environment is a sink
for ENPs depositing and posing a health risk to humans. Environmental experiments are expected to
reveal the key influential parameters and corresponding kinetics on AgNP aquatic behavior.
20

COMPARISON OF HOT WATER, MICROWAVE-ASSISTED
AND DEEP EUTECTIC SOLVENTS EXTRACTION OF
POLYSACCHARIDES FROM T. FUCIFORMIS AND ITS WATER
HOLDING ABILITY
Tianjiao Chen, Song Miao and Da-Wen Sun 1UCD School of Biosystems Engineering, University College Dublin, Belfield, Dublin 4,
Ireland 2Food chemistry and technology Department, Teagasc Food Research Centre,
Moorepark, Fermoy, Co. Cork, Ireland
Abstract
This experiment was carried out to investigate the most efficient and eco-friendly
polysaccharides extraction method of T. fuciformis and Polysaccharides of T. fuciformis,
which will be extracted by using hot water, microwave-assisted, deep eutectic solvents. The
highest yield level will be microwave-assisted. Deep eutectic solvents show a good and non-
destructive performance in extraction as a green solvent. Water holding capacity of T.
fuciformis’ Polysaccharides will be tested with casein. UV-visible spectrophotometric
analysis will be applied to analyze the composition of Polysaccharides.The study will offer
comparisons among T. fuciformis polysaccharide extraction methods and their water holding
capacity with casein.
Introduction
T. fuciformis shows a low content in energy and lipid, but has a rich content in protein, and
dietary fibres, which contains various minerals, trace elements and vitamins. TPS has lots of
bioactivities such as enhancing immunity, decreasing blood sugar, anti-aging ,anti-tumour,
and anti-mutagenicity.
It is reported that most of extraction of T. fuciformis polysaccharides focusing on the fruiting
body and mycelium. Extraction and purification is most important step for further research,
like polysaccharide yield, quality, chemical structure and characterization. Hot water is the
most popular method applied into extraction in T. fuciformis, but it is time-consuming and destructive. Microwave-assisted extraction (MAE), a relatively novel extracting approach
using a microwave applicator as an energy source, has received increasing attention(Chen, Y.,
Zhao, L., Liu, B. and Zuo, S., 2012). MAE has many merits with shorter time, less solvent,
higher extraction rate, and superior products quality at lower cost(H. Li et al.,2014). Deep
eutectic solvents (DES) is used as a green solvent. DES have the ability of donating and
accepting protons and electrons, which confers them the ability to form hydrogen bonds,
increasing therefore their dissolution capability (Zhang, Q. H et al., 2012).The properties of
DES, especially: low costs, and others like biopolymer dissolution ability, biodegradability,
non-toxicity, polarity and recyclability make them appropriate media for polysaccharides
processing (Zdanowicz, M., Wilpiszewska, K. and Spychaj, T., 2018).There isn’t a study
showing that the differences of polysaccharides in T. fuciformis among this three
methods.Therefore, the main objective of this study is to get the most efficient and eco-
friendly polysaccharides extraction method of T. fuciformis by comparing the
differences among three extraction methods: hot water, MAE and DES. Water holding
capacity will be tested with casein to show the properties change.
Materials and Methods
Materials and Chemicals
21

T. fuciformis was obtained from Fuzhou, Fujian Province, China. The fruit bodies have been
defatted and isolated in aqua to get rid of water-soluble polysaccharides. Then it is kept and
sealed at room temperature for storage. Choline chloride (AR grade), ethylene Glycol,
glycerol, phenol, rhamnose, concentrated sulfuric acid, HPLC grade isopropyl alcohol (IPA),
and urea were purchased from Sigma, Ireland.
Chemical Analysis
Total sugar content will be determined by phenol–sulfuric acid method using Rhamnose as
standard (Dubois, M.,1956). A Unico 7200 spectrophotometer will be applied to analyze
polysaccharides in the extracted solution.
Preparation of HTP
It will be boiled in distilled water for 4 h at 100 °C. After filtration to remove debris
fragments, the filtrate will be concentrated in a rotary evaporator. Protein will be removed
with the Sevag method (Sun, Zhang, Zhang, & Niu, 2010). Then the solution will be added
into three volumes of 95% ethanol for 24h at 4 °C. The precipitate will be collected by
centrifugation to get crude polysaccharides.
Preparation of MTP
The microwave-assisted extraction will be performed by applying a microwave reactor with
emission frequency of 2450 MHz and maximum output power 750 W. Samples of 0.5 g of the
dried powder will be extracted with 40 fold volumes of distilled water and then filtered under
vacuum. The filtrate will be diluted to 100 mL for determining the polysaccharide content.
Preparation of DTP
All the three DESs will be separated to extract polysaccharides from T. fuciformis.
Experiment I: 0.5 g dried powder will be involved separately into 10 g of DES in a beaker.
The mixture will be heated at 85/95 °C for 1 h. Experiment II: 0.5 g dried powder will be
heated with 10 g of DES with 10% water for 1 h. The mixtures thus attained from these two
experiments will be centrifuged separately and the solid content will be washed several times
by applying IPA and drying under vacuum.
Purification of polysaccharides
Four crude polysaccharides will be dissolved in deionized water, respectively. After filtrated
through a filter membrane (0.45 μm), each sample will be loaded on a column of DEAE-
cellulose DE 52 and then washed with gradient NACl solution (0–1.00 mol/l). The main
fraction will be got together and lyophilized for each crude polysaccharide.
Water holding capacity (WHC)
The WHC of the T. fuciformis will tested by a centrifugal method. Approximately 5 g T.
fuciformis will be centrifuged at 1000g (4 °C) for 10 min. WHC will be represented by the
proportion of the retained mass of T. fuciformis after centrifugation compared with the
original mass of it. The experiments will be presented triplicate.
UV-visible spectrophotometric analysis
Each of the above-mentioned samples (0.5 mg) will be dissolved in 5 mL of distilled water.
The absorbance will be determined from 190 to 800 nm, using a UV-2450 UV-visible
spectrophotometer.
Statistical analysis
All analyses will be performed in triplicate. The experimental outcomes acquired will be
expressed as means ± standard error. Data will be analyzed by analysis of variance (P < 0.05)
using Origin 7.5 software (Origin Lab Corp., Northampton, MA, USA).
22

Results and Discussion
Yield and monosaccharide composition of HTP, MTP and DTP
Literature review : The yield of PA was 4.2% and The total yield of PA and PB is 23.1%.
According to the yield and composition of PA and PB, we hypothesize that the acid treatment
may extract pectic polysaccharides loosely connected to the hemicellulose, while alkali may
extract pectic polysaccharides more tightly associated with the hemicelluloses (Zhang, H et
al.,2018).
Table 1. Yields and monosaccharide compositions of PA and PB(Zhang, H et al.,2018).
Yield
(wt. %)
Galacturonic
acid (mol %)
Neutral sugar composition (mol %)
Rhamnose Glucose Galactose Arabinose Xylose
PA 4.2 ± 0.7 51.8 ± 1.0 6.2 ± 0.1 –– 4.1 ± 0.1 27.5 ± 0.2 10.4±0.1
PB 18.9±2.3 20.3 ± 0.9 11.7 ± 0.1 8.9 18.5± 0.2 40.6 ± 1.1 ––
Expected results: In my study, the yield of HTP will be closed 13.8±0.7 mol % (Zhang, L and
Wang, M., 2016), the yield of MTP will be 69.07 mol % (Y. Chen et al.,2012) and the yield
of DTP should be more than MTP and HTP, since there is no report about the yield of DTP.
Structure characterization of HTP, MTP and DTP Literature review : UV results show that there was a small absorption peak at 260 and 280 nm,
indicating there were small amount of protein. The monosaccharide composition analysis
indicated that TPS was mainly composed of rhamnose, xylose, mannose and glucose in the
molar ratio of 1.13: 1.00: 4.70: 0.81 (Zhang, Y.K et al.,2017).
Expected results: In the UV results, it shows the compositions of HTP, MTP and DTP.
Meanwhile, a small absorption peak of protein and polysaccharides of T. fuciformis.
Water holding capacity analysis
Literature review: TPS could improve the WHC of myofibrillar protein gels. TPS at
concentrations between 0.3 to 0.5% did not improve the WHC of myofibrillar protein gel
significant (P>0.05). However, the gel strength was enhanced significantly (P<0.05) with TPS
ranging from 0.6% to 0.7%( Zhang, Y.K et al.,2017).
Expected results: In my study, the HTP, MTP and DTP will interact with casein working
together as a protein gel. It is obvious that WHC of gel biopolymer will be improved and the
best performance will be DTP, because DES won’t cause huge changes in the molecular
structure.
Conclusions
This study will demonstrate the extraction efficiency of three methods in polysaccharides of
T. fuciformis, which shows that DES will offer a productive and eco-friendly performance.
MAE will show the most high yield of polysaccharides. WHC also will be studied in this
research as a basic functional property. In the future, there should be more profound study
about the mechanism of WHC ability of T. fuciformis and any other functional properties.
References
Chen, Y., Zhao, L., Liu, B. and Zuo, S., 2012. Application of response surface methodology
to optimize microwave-assisted extraction of polysaccharide from Tremella. Physics
Procedia, 24, pp.429-433.
Dubois, M., Gilles, K.A., Hamilton, J.K., Rebers, P.T. and Smith, F., 1956. Colorimetric
method for determination of sugars and related substances. Analytical chemistry, 28(3),
pp.350-356.
23

H. Wang, H. Liu, and S. Han, “Microwave-assisted extraction and purification research of tea
Polyphenols,” Chinese Agricultural Science Bulletin, vol. 26, no. 19, pp. 66-69, October
2010.
Li, H., Lee, H.S., Kim, S.H., Moon, B. and Lee, C., 2014. Antioxidant and anti-inflammatory
activities of methanol extracts of Tremella fuciformis and its major phenolic acids.
Journal of food science, 79(4), pp.C460-C468.
Y. Chen, L. Zhao, B. Liu, S. Zuo.Application of response surface methodology to optimize
microwave-assisted extraction of polysaccharide from Tremella. Phys. Procedia, 24
(2012), pp. 429-433
Zdanowicz, M., Wilpiszewska, K. and Spychaj, T., 2018. Deep eutectic solvents for
polysaccharides processing. A review. Carbohydrate polymers.
Zhang, H., Chen, J., Li, J., Yan, L., Li, S., Ye, X., Liu, D., Ding, T., Linhardt, R.J., Orfila, C.
and Chen, S., 2018. Extraction and characterization of RG-I enriched pectic
polysaccharides from mandarin citrus peel. Food hydrocolloids, 79, pp.579-586.
Zhang, L. and Wang, M., 2016. Polyethylene glycol-based ultrasound-assisted extraction and
ultrafiltration separation of polysaccharides from Tremella fuciformis (snow fungus).
Food and bioproducts processing, 100, pp.464-468.
Zhang, Q. H.; Vigier, K. D.; Royer, S.; Jerome, F. Deep eutectic solvents: Syntheses,
properties and applications. Chem. Soc. Rev. 2012, 41, 7108−7146.
Zhang, Y.K., Zhang, Q., Lu, J., Xu, J.L., Zhang, H. and Wang, J.H., 2017. Physicochemical
properties of Tremella fuciformis polysaccharide and its interactions with myofibrillar
protein. Bioactive carbohydrates and dietary fibre, 11, pp.18-25
24

APPLICATION OF NOVEL TECHNOLOGIES FOR ESTIMATION OF
BIOMOLECULES FROM SEAWEEDS
Viruja Ummat1,2
, Colm P. O’Donnell2, Gaurav Rajauria
3 and Brijesh Kumar Tiwari
1
1Food Chemistry and Technology, Teagasc Food Research Centre, Ashtown, Dublin 15, Ireland.
2School of Biosystems and Food Engineering, University College Dublin, Belfield, Dublin 4, Ireland.
3School of Agriculture and Food Science, University College Dublin, Belfield, Dublin 4, Ireland.
Abstract
The objective of this study was to employ ultrasound assisted extraction (UAE) for extraction of
bioactives from seaweeds. Extraction of bioactive compounds i.e. total phenolic content (TPC) and
total phlorotannin content (TPhC), from brown seaweed Fucus vesiculosus was carried out using
UAE. Dried seaweed sample (2 g) was mixed with 30%, 50% and 70% ethanol solutions (20 ml) in
ratio 1:10 and an ultrasound treatment (35 kHz, 130 kHz, control: No ultrasound) was given for 10
and 30 min followed by centrifugation (3,000 g for 15 min at 20 ℃). The yield (%) was determined
and the results showed that the combination: 30% ethanol for 30 min at 130 KHz, was most effective
gave the maximum yield. Ultrasound was found to increase the extraction yield and it was also
observed that the recovery of bioactive compounds depends largely on the solvent, extraction time
and applied frequency.
Introduction
Seaweeds are rich sources of proteins, carbohydrates, polyunsaturated fatty acid and aminoacids,
which possess various biological activities including antioxidant, anticancer, anti tumor and
immunomodulatory (Holdt and Kraan, 2011). These biological activities are mainly attributed to to
the presence of phenolic compounds (e.g. phlorotannins and flavanols)(Gómez-Guzmán et al., 2018).
Phlorotannins obtained from seaweeds have gained recognition for their anti-inflammatory,
antidiabetic, antioxidant and anti-bacterial properties (Namvar et al., 2013) for a range of food and
non-food applications.
Several extraction technologies are already being used to extract these bioactives from seaweeds and
involves the use of corrosive and toxic solvents including chloroform, chlorobenzene, acetone,
methanol and acetonitrile etc, depending mainly on the properties of the target compound. However,
the safety risks of these solvents make it imperative to eliminate the use of these solvents or minimize
their quantity used. Also, due to several other disadvantages of using conventional technologies
including long duration of treatments, low extraction yields, high energy consumption and high
capital investments, enhance the need of developing technologies for extraction(Tiwari, 2015). This
motive to develop a sustainable process of extraction has led to more research into UAE, owing to
decreased levels of solvent consumption, shorter duration of extraction and cheaper running
costs(Chemat et al., 2017). UAE, is a versatile, easy to use and a low investment demanding clean and
green extraction technology, for obtaining a wide range of molecules like polysaccharides, proteins,
peptides, essential oils and various bioactive compounds etc and has several benefits as compared to
other novel technologies (e.g., SFE, pressurized solvent extraction or ASE).
The objective of this study was to evaluate the extraction of bioactive compounds from Brown
seaweed Fucus vesiculosus using ultrasound.
25

Dried seaweed sample (2g) + 30, 50 and 70% Ethanol (20mL)
Ultrasound treatment (35 KHz, 130 KHz, control: No
ultrasound) for 10 and 30 min
Centrifugation (3,000 g for 15 min at 20 ℃)
Yield (%) determined
Analysis of total phenolic and phlorotannin content
Materials and methods
Materials
Brown seaweed Fucus vesiculosus was purchased from Quality Sea Veg., Co. Donegal, Ireland and
washed to remove any debris and epiphytes attached. The samples were further dried using an air
circulating oven (55°C) for 5 days followed by grinding to 1 mm particle sized powder, using a
hammer mill (Retsch SM100, GmbH, Germany). Ethanol analytical grade was obtained from Merck,
Germany.
Ultrasound extraction and analysis
Powdered seaweed sample (2g) was mixed with 20 mL of 30%,50% and 70% ethanol solution (v/v),
in 50 mL containers. The sample:solvent ratio was fixed as 1:10. An ultrasound treatment of 35 kHz
and 130 kHz (Figure 1) were applied using an ultrasound bath (Elma Ultrasonics, Germany) and the
tests were performed in duplicate. Similar steps were followed for control samples, except giving any
ultrasound treatment. The supernatants were separated and stored at 4 ℃, while the residues were
stored at -20 ℃. Extracts obtained were analysed for Total Phenolic Content (TPC) and Total
Phlorotannin Content (TPhC) using methods outlined by Rajauria et al. (2016). TPC and TPhC
contents were expressed as mg GE/g and mg PhE/g respectively.
Figure 1. Experimental Flow Chart
Results and discussions
Figure 2 shows the TPC and TPhC content of various fractions obtained. It was observed that the
maximum TPC yield 591.01±9.26 mg GAE/g was obtained in samples extracted with 30% ethanol
and an ultrasound treatment of 130 kHz for 30 min, while the minimum i.e. 316.44±6.06 mg GAE/g
was extracted with 70% ethanol from control samples (Figure 2c). Similarly, TPhC, a maximum yield
of 478.22±7.58 mg PhE/g was obtained in samples extracted with 30% ethanol and an ultrasound
treatment of 130 kHz for 30 min (Figure 2e), while the least i.e. 253.58±4.96 mg PhE/g was observed
in the samples extracted with 70% ethanol and 30 min without any ultrasound treatment (Figure 2f). It
was also noted, in both TPC and TPhC values, that samples treated with ultrasound for 30 min
showed better yields as compared to 10 min, irrespective of the ultrasound frequency and strength of
the solvent used. However, the changes were not similar in the control samples, which were given no
ultrasound treatment.
The ultrasound treatment facilitated the extraction of both TPC and TPhC and the most effective
treatment was found to be as 130 kHz for 30% ethanol for 30 min. Increased extraction yields was
found to be that high ultrasonic power increases the temperature of extraction, leading to solubility of
analytes in the solvent, thereby facilitating diffusion from the sample matrix to the solvent(Esclapez et
al., 2011).
26

Conclusion
The most effective treatment for extracting polyphenols and phlorotannin was done to be 30%
ethanol, 130 kHz for 30 min, as it yielded the highest total phenol and total phlorotannin content
(591.01±9.26 mg GAE/g and 478.22±7.58 mg PhE/g respectively). Ultrasound can increase the
extraction yield. Recovery of bioactive compounds depends largely on solvent, extraction time and
applied frequency.
Figure 2. (a) Total phenolic content(TPC) extracted with 30 kHz (b) TPC extracted with 130 kHz (c)
TPC extracted from control samples (d) Total Phlorotannin Content (TPhC) extracted with 30 kHz (e)
TPhC extracted with 130 kHz (f) TPhC extracted from control samples
Acknowledgement The research was funded by Science Foundation Ireland funded “Bioeconomy Research Centre
“BEACON” (project no. 0586).
a) b)
c) d)
e) f)
27

Reference
Chemat, F., Rombaut, N., Sicaire, A.-G., Meullemiestre, A., Fabiano-Tixier, A.-S. & Abert-Vian, M.
(2017). Ultrasound assisted extraction of food and natural products. Mechanisms, techniques,
combinations, protocols and applications. A review. Ultrasonics sonochemistry, 34, 540-560.
Esclapez, M., García-Pérez, J. V., Mulet, A. & Cárcel, J. (2011). Ultrasound-assisted extraction of
natural products. Food Engineering Reviews, 3, 108.
Gómez-Guzmán, M., Rodríguez-Nogales, A., Algieri, F. & Gálvez, J. (2018). Potential role of
seaweed polyphenols in cardiovascular-associated disorders. Marine drugs, 16, 250.
Holdt, S. L. & Kraan, S. (2011). Bioactive compounds in seaweed: functional food applications and
legislation. Journal of applied phycology, 23, 543-597.
Namvar, F., Mohamad, R., Baharara, J., Zafar-Balanejad, S., Fargahi, F. & Rahman, H. S. (2013).
Antioxidant, antiproliferative, and antiangiogenesis effects of polyphenol-rich seaweed
(Sargassum muticum). BioMed research international, 2013.
Rajauria, G., Foley, B. & Abu-Ghannam, N. (2016). Identification and characterization of phenolic
antioxidant compounds from brown Irish seaweed Himanthalia elongata using LC-DAD–ESI-
MS/MS. Innovative food science & emerging technologies, 37, 261-268.
Tiwari, B. K. (2015). Ultrasound: A clean, green extraction technology. TrAC Trends in Analytical
Chemistry, 71, 100-109.
28

Kexin Zhang
Project Title: Diagnostics of reactive species generated by cold and hot plasma
Project Leader: Prof. Brijesh Tiwari, Prof. Da-We Sun, and Dr. Ming Zhao
Abstract
Introduction: Plasma is the fourth state of matter, consisting of highly excited species. Plasma
treatment has been regarded as a novel process technique and been applied to a wide range
products in food industry. Plasma generated reactive species (mainly refer to reactive nitrogen
and oxygen species) play an important role in microbial decontamination, toxin degradation and
surface modification of packaging materials.
Objective: This study aims to detect plasma generated reactive species using both wet chemical
based colorimetric method and non-destructive optical absorption spectroscopy.
Methods employed: Deionized water (25 ml) was treated using cold and hot plasma for 5min,
10min and 20min, respectively. After the treatment, the concentration levels of H2O2, NO2-, and
NO3- in the plasma activated water were detected using titanium oxysulfate (Sigma-Aldrich),
Griess reagent (Sigma-Aldrich) and nitrate test kit (Merck), respectively. The optical absorption
spectra (OAS) of plasma generated reactive species were collected using a CCS spectroscopy
(CCS200, THORLABS) in the wavelength range of 350-900 nm with the illumination
enhancement of a tungsten halogen lamp (QTH10/M, THORLABS). The CCS spectroscopy
probe was placed vertically underneath the plasma nozzle and its position to tungsten halogen
lamps was adjusted to achieve a high signal to noise ratio of the spectra. Absorption spectral data
of each measurement was averaged from 50 times of scans.
Main result: Results of the chemical analysis revealed that the concentration levels of H2O2,
NO2- and NO3
- in the activated water were increased during the treatment time. Spectral results
showed that spectral shape differences are observed between the air base (control) and plasma.
Absorption spectra, which were acquired after 5, 10 and 20 min plasma treatments, lay out in a
pattern following the logical order of treatment time.
Conclusion sentences: In conclusion, different concentration levels of reactive species under
different treatment time were found in both of the chemical references and OAS spectral data.
The future work will be investigated to explore the correlations between the chemical references
and OAS spectral information.
Selected Recent Publications
Zhang, K., Perussello, C.A., Milosavljević, V., Cullen, P.J., Sun, D.W. and Tiwari, B.K., (2019)
‘Diagnostics of plasma reactive species and induced chemistry of plasma treated foods’.
Critical reviews in food science and nutrition, 59(5), 812-825.
29

Renxi Kang, BE, M.EngSc., PhD
Project Title: Exploration of dielectric spectroscopy as a process analytical tool for fat content
determination in homogenized milk
Project Leader: Prof. Colm P. O’Donnell
Abstract
This study explored the potential of dielectric spectroscopy (DS) as a process analytical tool for fat
content determination in homogenized milk samples at a critical control temperature (i.e. 4 ºC) during
milk manufacturing and transporting. Pasteurized milk (n = 72) including whole milk, low-fat milk and
skim milk was purchased in local markets. The dielectric properties of milk samples (i.e. dielectric
constant ε′, and loss factor ε″) over the range of 0.2-20 GHz were measured using an Agilent 85070E
high temperature open-ended coaxial-line probe kit connected to a N5230A analyser (Agilent
Technologies, Santa Clara, USA) at 4±1 ºC. Partial least squares regression (PLSR) models and
univariate linear regression models were developed for fat prediction. The PLSR model performances
yielded values for the ratio of the prediction error to deviation (RPD) of 1.86-2.00 and 1.64-2.04 for fat
prediction using the dielectric constant and loss factor, respectively. The RPD values between 1.5 and 2
may only distinguish between low and high values; The RPD values between 2.0 and 2.5 indicate the
possibility for approximate quantitative prediction. For the results of univariate linear regression models,
R2 values of 0.54, 0.39 and 0.50, 0.31 were revealed between the dielectric constant and loss factor of
each sample at 915 and 2450 MHz and fat content, respectively. In this study, dielectric spectroscopy
didn’t show a great potential for fat determination in homogenized milk at 4 ºC. The shortcomings of
daily calibration, disturbance of air-bubble, extreme sensitivity to temperature and limited detection range
(only 1cm3 area around the probe) seriously restricts dielectric spectroscopy as a process analytical tool in
dairy industry.
30

Le WEN, BSc
Project Title: Research on simultaneous and sequential ultrasound- and microwave-assisted methods for
aqueous extraction of bioactive compounds from coffee silverskin
Project Leaders: Prof. Da-wen SUN; Prof. Brijesh K Tiwari
Coffee silverskin (CSS), as a coffee waste, has stimulated scientific interest for alternative applications
due to its nutritional and functional properties. Ultrasound-assisted extraction (UAE) and microwave-
assisted extraction (MAE) has been considered efficient and economic novel extraction techniques which
have been proposed to overcome various disadvantages encountered by conventional extraction methods.
The combined application of the two extraction methods has showed many advantages. In this work,
simultaneous ultrasound- and microwave-assisted (S-UMAE) and sequential ultrasound- and microwave-
assisted aqueous extraction methods (U-MAE and M-UAE) were both applied, and the effects of different
conditions were analysed for the extraction of phenolics from coffee silverskin. In addition, the combined
extraction technologies were compared with their individual techniques (UAE alone and MAE alone) for
the effects on the extraction yield, antioxidant capacity and contents of caffeine and some widely-known
bioactive compounds from coffee silverskin.
S-UMAE achieved 25.9%, 16.7% 13.1% and 12.8% higher extraction yield than UAE, MAE, U-MAE
and M-UAE, respectively. The antioxidant capacity and chlorogenic acids (CGAs) content were also
enhanced significantly by S-UMAE than by the other methods. Caffeine content showed no significant (P
> 0.05) difference between the extraction methods. Compared with U-MAE, extracts obtained by M-UAE
exhibited higher antioxidant capacity (28.57% and 20.60% on DPPH and FRAP values, respectively) and
68.19% higher total content of CGAs. Three-cycle S-UMAE (20 min each cycle) under the optimised
conditions achieved a similar yield of total phenolics obtained by three-cycle conventional methanol
extraction (24 hours extraction each cycle). The micro-structure investigation of CSS showed the
combination of UAE and MAE can be a more effective extraction technique for extraction of bioactive
compounds from plant materials. This work shows the potential and compatibility of the application of
combined extraction technologies on the extraction of bioactive compounds from CSS. It could be an
effective option to accomplish a balance between extraction efficiency, product quality, consumption of
solvent and production costs in the industry.
31

THE APPLICATION OF A BULK ACOUSTIC WAVE (BAW) SENSOR
AS A PROCESS ANALYTICAL TECHNOLOGY (PAT) TOOL FOR
MONITROING ACID-INDUCED MILK COAGULATION
Guangya Xu
1,2, Norah O’Shea
2 and Colm P. O’Donnell
1.
1UCD School of Biosystems and Food Engineering, University College Dublin, Belfield, Dublin 4,
Ireland. 2Food Chemistry and Technology Department, Teagasc Food Research Centre, Moorepark, Fermoy,
Co. Cork, Ireland
Abstract
This study evaluates the application of a bulk acoustic wave (BAW) sensor as a process analytical
technology (PAT) tool for acid-induced milk coagulation kinetics as a function of different
temperatures. A rotational rheometer was used as a reference method to measure viscoelastic parameters
i.e. storage modulus (G′) and loss tangent (tan δ), which were compared with acoustic viscosity (AV)
attained from a BAW sensor. A wireless pH probe was used to monitor the pH of the milk as it
decreased from 6.6 to 4.6. Three coagulation temperatures (30, 31, 32°C) were investigated during the
coagulation process. Gelation starting point and maximum gel strength were the main parameters taken
from the graph developed from the rheometer. To evaluate the viability and accuracy of the sensor for
real-time viscosity measurement, the follow up work will include studying the effect of different GDL
levels (2.5%, 3%, 3.5%) on the response received from BAW sensor as it monitors the gelation process.
Abbreviation Key: PAT = process analytical technology, BAW = bulk acoustic wave, GDL =
glucono-δ-lactone, AV = acoustic viscosity, G′ = storage modulus, tan δ = loss tangent.
Introduction
Viscoelastic properties are critical indicators in dairy production especially in products such as cheese
and yoghurt. They are usually used to determine the cutting time of products. If the curd is cut too
early, the gel will be fragile resulting in curd and fat loss, which is vital for cheese yield and quality
(Benedito et al., 2002; Budelli et al., 2017). Conversely, if the curd is cut too late, this can cause a
firm gel and results in retarded syneresis and a product with high moisture content that requires a
longer ripening time (Benedito et al., 2002; Budelli et al., 2017). Visual inspection carried out by
experienced staff as well as off-line instrumentation are still used by cheese manufactures to ensure
the quality of the end-product. To improve the yield and quality of the product, a robust, non-
destructive and real-time approach for the cutting time prediction for cheese manufacture is required.
Process analytical technology (PAT) is defined as a mechanism to design, analyse and control
manufacturing processes through real-time non-destructive evaluation of critical quality attributes of
products during processes and/or at intermediate stages (Panikuttira et al. 2018). This work used an
acoustic wave sensor as a PAT tool for real-time process monitoring. The acoustic sensor used in this
study is a thickness shear mode (TSM) BAW sensor, which uses an AT-cut quartz crystal with a
resonant frequency of 5.3 MHz for acoustic impedance detection. This is made by placing the quartz
crystal wave resonator in contact with the sample, and a change in resonate frequency obtained due to
the wave damping when it is propagating through the sample. The current application of this type of
sensor is viscosity measurement for products such as oil (Durdag 2008).
The objective of this study was to investigate the feasibility of using a BAW sensor as a PAT tool
to monitor acid-induced milk coagulation process at different temperatures and GDL levels.
32

Materials and Methods
100 ml of rehydrated skim milk (protein, 3.2% w/w; fat 0.4% w/w) was prepared 14 hours prior to the
test day. Three process temperatures (30, 31, 32°C) were investigated respectively, and one level of
GDL (3% w/v) was chose for the acidification experiment.
A small jacketed vessel connected to a water bath was used as a milk sample container as shown in
Figure 1. A wireless pH probe is inserted into the sample and secured at the top of the heating vessel
for pH monitoring from 6.6 to 4.6 during the gelation process. AV during coagulation process was
obtained from the BAW sensor which was mounted at the bottom of the vessel, and was collected by
the data acquisition software. The oscillation test, as a reference method, was performed on a
rotational rheometer for viscoelastic parameters (G′ and tan δ). These two parameters will be used
along with AV for a mathematical model development.
Figure 1. Experimental layout to monitor milk coagulation
Results
The results of both pH and AV profiles are shown in Figure 2. As can be observed from the graph,
AV clearly increases whereas pH reduces with time.
Skim milk heated using a higher temperature reached a firmer gel in a shorter time. It is also quicker
for the sample to reach pH 4.6 when heated at a higher temperature. Among the three different
temperatures, 32°C was the fastest temperature to reach the same AV reading whereas 30°C was the
slowest. Those results are consistent with results showed in previous study (Anema, 2008).
Figure 3 compares AV and G′ readings, these two parameters clearly show the same increasing trend.
Results from the BAW sensor indicate that the onset of gelling began 10 minutes prior to the
reference method. This suggests that the sensor is more sensitive to changes in gel structure compared
to the reference method. Additional experiments are required for a stable and repeatable measurement
and model development to achieve an accurate result.
33

Figure 2. Acoustic viscosity (AV) and pH at 3 different coagulation temperatures (30, 31, 32°C) with
time after acidulant (3% w/v GDL) addition.
Figure 3. Comparison of acoustic viscosity (AV) with storage modulus (G′) at 30°C with time after
acidulant (3% w/v GDL) addition.
Conclusion
The mechanism behind acid-induced milk gelation is already well-known (Anema 2008), this work
concentrated on investigating if a BAW sensor can measure AV in accordance milk a reference method,
as acid-induced gelation occurs. The gelation staring point monitored by the BAW sensor was quicker
compared to the off-line rheometer measurement.
The next task in this project involves (a) method optimization and (b) investigating different GDL levels
as a second factor to see the influence of GDL concentration on milk coagulation process. A
mathematical model (i.e. regression model) will be developed using acoustic viscosity and viscoelastic
parameters (G′ and tan δ) to test the sensitivity of using BAW sensor for gelation monitoring.
References
Anema, S.G. (2008) 'Effect of temperature and rate of acidification on the rheological properties of
34

acid skim milk gels', Journal of Food Processing and Preservation, 32(6), 1016-1033.
Budelli, E., Pérez, N., Negreira, C. and Lema, P. (2017) 'Evaluation of ultrasonic techniques for on
line coagulation monitoring in cheesemaking', Journal of Food Engineering, 209, 83-88.
Benedito, J., Carcel, J., Gonzalez, R. and Mulet, A. (2002) 'Application of low intensity ultrasonics to
cheese manufacturing processes', Ultrasonics, 40(1-8), 19-23.
Panikuttira, B., O'Shea, N., Tobin, J.T., Tiwari, B.K. and O'Donnell, C.P. (2018) 'Process analytical
technology for cheese manufacture', International Journal of Food Science & Technology,
53(8), 1803-1815.
Durdag, K. (2008) 'Solid state acoustic wave sensors for real-time in-line measurement of oil
viscosity', Sensor Review, 28(1), 68-73.
35

Archana Bista, B.Tech, M. Tech
Project Title: Framing solutions for adoption of Process Analytical Technology (PAT) in the dairy
processing factory of the future & development of PAT tools for monitoring and control of milk
concentrates
Project Leader: Prof. Colm O’Donnell
Teagasc Supervisors: Dr. Norah O’Shea and Dr. John Tobin
Abstract
Viscosity is one of the main parameters that can affect the optimal running of a spray-drier and the
functional properties of the final dairy powder e.g. dispersability, flowability and particle size of the
powder. In particular, concentrates of a high viscosity, if not monitored can result in fouling of major
processing stages involved in the production of dairy powders e.g. evaporation and spray drying. The
measurement of process viscosity using inline instruments allows real time monitoring and control of
concentrate flow behavior while also allowing optimisation of the total solids content pumped to the spray
drier. The main objective of this project “Investigating Process Analytical Technologies (PAT) in a dairy
processing plant” is to identify and investigate relevant and emerging PAT suitable for installation in Irish
dairy factories. The PAT currently under investigation include Proline Promass I300 and FLOWave
(inline flowmeters) for real time monitoring of dairy concentrate viscosity prior to spray drying. Promass
I300 measures viscosity directly (torsional mode) and the FLOWave measures the viscosity indirectly
using a surface acoustic wave.
Skim milk powder was reconstituted using reverse osmosis water at ~50 °C and stored overnight at 4 °C
prior to flow measurements. Furthermore, liquid skim milk (~9% total solid (TS) content) was evaporated
to 40% and 45% TS). The application of Proline Promass I300 was evaluated at laboratory (25 °C) and
pilot scale (68.5 °C) using reconstituted skim milk powder, it was rehydrated from 10-40% total solids
(TS) and liquid skim milk evaporated to 40% and 45% TS respectively. Similarly, FLOWave was
evaluated to measure inline viscosity of reconstituted skim milk (10-36% TS) at laboratory scale (25 °C).
In addition to inline viscosity measurement, offline measurements were also performed. Viscosity was
measured using a rotational rheometer (reference method 300 s-1
), pH (pH meter), density (portable
density meter) and total solids content (smart trac). A regression analysis was performed on data collected
from inline instruments and offline (reference method) measurements. The goodness of fit was evaluated
by adjusted R2 value and standard error of prediction (SEP).
A linear positive relationship (R2
= 0.99) was observed between inline viscosity measured using Promass
I300 and offline viscosity measured using a rotational rheometer with a standard error of prediction of
0.42 mPa.s. For the pilot scale experiment using liquid evaporated skim milk, viscosities measured inline
using Promass I300 were lower than the offline viscosity measured using a rotational rheometer
(reference method 300 s-1
). The viscosity of the process concentrate once taken from the pipe and
analyzed using the reference method, increased by 38.7% and 34.1% for 40% TS and 45% TS
respectively compared to the inline viscosity from Promass I300. For FLOWave experiments, inline
viscosity of skim milk concentrate (10-36% TS) was measured indirectly using FLOWave at 25 °C and a
reference sample were measured offline using a rotational rheometer. An exponential negative
relationship was observed (R2 = 0.99) between inline and offline viscosity measurements with a standard
error of prediction of 0.93 mPa.s. Hence, these studies demonstrate the application and importance of
inline instruments to monitor the process viscosity of a dairy concentrate in real time. Further experiments
36

to evaluate the performance of these inline instruments to monitor inline viscosity of other dairy
concentrate (milk protein concentrate) at higher total solids content and temperature (mimicking industrial
processing conditions) would provide more information on their application.
Selected Recent Publications
Bista A, Hogan SA, O'Donnell CP, Tobin JT, O'Shea N (2019) “Evaluation and validation of an inline
Coriolis flowmeter to measure viscosity during laboratory and pilot-scale food processing”, Innovative
food science and emerging technologies, 54, 211-218.
This project is funded by Enterprise Ireland.
37
ULTRASOUND ASSISTED PROCESSING OF THE MICROALGA
CHLORELLA VULGARIS FOR ENHANCED PROTEIN
EXTRACTION
Gunda Hildebrand
1, Brijesh K. Tiwari
1,2, Colm P. O’Donnell
1
1UCD School of Biosystems and Food Engineering, University College Dublin, Belfield,
Dublin 4, Ireland. 2Teagasc Ashtown Food Research Centre, Teagasc, Ashtown, Dublin 15, Ireland.
Abstract
The true value of microalgae as a promising ubiquitous resource containing many valuable
macronutrients, micronutrients and bioactive compounds has only fully been understood in
recent years. The thick cell wall of Chlorella vulgaris creates a barrier to these valuable
components. Ultrasound (US) treatment can cause the necessary cell wall lysis to facilitate
extraction of compounds from within the cell such as proteins. High power US treatments
increased the protein yield from C. vulgaris by 10.6 % for solvent based extractions and
caused significant treatment time reductions. The incorporation of an US treatment caused an
increase of free amino acids by 55.6 % in enzyme assisted extractions. The results indicate
that further investigations should be carried out with US as a pre-treatment to enzyme assisted
extractions and more enzymes with different functioning mechanisms should be analyzed.
Introduction
Adapting food production and distribution systems to cater for the continually increasing
population has long since become a global issue (Rask and Rask 2011). The rapid economic
development in certain parts of the world paired with the general efforts towards
(environmental) sustainability, create an unprecedented level of complexity for this challenge
(Tilman et al 2011). One necessary step on the way to reducing the negative impact our
current reliance on intensive agriculture and other exploitative food production systems have
on the environment is to search for and develop alternative sources for the nutrients the
human body needs to survive (Pojić et al 2018).
One entire group of organisms that has been largely ignored in diets the world over is algae in
the form of seaweeds and microalgae. Their ability to grow in both fresh and saline water
makes this aquatic plant group very versatile and almost ubiquitous. One microalga that was
isolated and grown in pure culture very early on is the Chlorella vulgaris strain (Sydney et al
2014) due to its high content of valuable components such as lipids, carbohydrates, proteins,
vitamins, minerals, antioxidants and pigments (Kulkarni and Nikolov 2018).
The main hurdle affecting the use of the valuable components of C. vulgaris is its thick cell
wall (100 – 200 nm) that provides both sound mechanical and chemical protection to the cell
(Sydney et al 2014). Thus, the key to its utilisation is the disruption of the tough cell wall.
Ultrasound (US) is one of the novel non-thermal processing technologies of great interest to
the food processing industry (Rastogi 2011). The effect on which most of the applications of
US treatments are based is called bubble cavitation which is caused by the localised and
repeated collapse of vapour bubbles (Luque-Garcıa and Luque de Castro 2003). These
cavitations can lead to cell wall lysis of biological cells and thus assist the extraction of
compounds from within the cell, such as proteins.
The objective of this study was to determine the effects solvent use, enzyme activity,
ultrasound treatments and a combination thereof have on protein extraction from the
microalga Chlorella vulgaris using protein content estimation, amino acid profiling and
SEM imaging.
38

Materials and Methods
Axenic Chlorella vulgaris powder produced in a closed cultivation system and dried in a
drum dryer (dry matter: 95.5 g/100 g) with 22.7 % protein, 14.2 % lipids, 38.7 %
carbohydrates and 32.9 % fibre was supplied by Nutress B.V., Phycom, Nijkerk, The
Netherlands. The C. vulgaris powder was stored at room temperature.
Ultrasound (US) treatments at two wave frequencies (35 kHz and 130 kHz) were applied in a
Transonic Ti-H-10 Fisher Bioblock Scientific (Germany) Ultrasound Bath and high-power
immersed probe treatments were applied at full power for 10 min using a UIP500hd
Ultrasonic Transducer (Hielscher Ultrasound Technology, Germany).
Single solvent and sequential solvent extraction protocols were based on the method
introduced by Kadam et al. (2017). The solvents H2O and 0.4 M citric acid, HCl and NaOH
(Sigma Aldrich, UK) were compared. A solid (C. vulgaris powder) to solvent ration of 1:10
was applied. Control samples were placed into a temperature-controlled shaker.
Lyophilized powdered lysozyme (Sigma Aldrich, UK) and the protease AP-30L (Enzyme
Supplies Ltd., UK) were used for the enzyme assisted extractions. US was applied as both a
pretreatment before enzyme addition (US probe system, 10 min) and for the duration of the
enzyme activity phase (US bath system). The pH of all samples was adjusted prior to enzyme
addition and all samples were kept at the optimum temperature of 40°C for the duration of the
active enzyme phase (1, 2, 6 and 18h). The enzymes were inactivated at 85°C prior to
centrifugation.
All samples were centrifuged for 15 min at 8500 g-force. Resulting pellets were freeze dried.
Protein analysis was carried out according to the Dumas method and the results calculated
using the sample specific protein factor of 6.35 (Safi et al 2013). Amino acid profiling was
carried out using High Pressure Liquid Chromatography (HPLC). SEM images of untreated
and treated C. vulgaris cells were create using a Scanning Electron Microscope. All
experiments were carried out in duplicate. The statistical methods applied to the data to test
for significance comprised of a variance analysis using ANOVA.
Results and Discussion
Solvent assisted extractions
Both the results from the single solvent extraction and the NaOH/HCl sequential solvent
extraction showed that NaOH extracts greater amounts of protein from C. vulgaris than other
solvents such as HCl, citric acid and H2O. The results from the HCl/NaOH sequential solvent
extraction method shown in Error! Reference source not found. reveal that the level of
protein recovery after the second solvent stage did not increase significantly over time for the
control samples, all reaching their maxima between 29 – 32 %. The US treated samples
showed a similar level of protein recovery after the first solvent stage compared to the control
samples but jumped to a 10.6 % higher level than the control samples after the second solvent
stage. Thus, US treatment is effective in increasing the overall protein yield and reducing the
necessary treatment time of sequential solvent extractions. Safi et al. (2014) showed that
treatments at pHs above 10 can increase access to cytoplasmic proteins. Proteins are also
more soluble at higher pHs which suggests that the yield could be further increased by
39
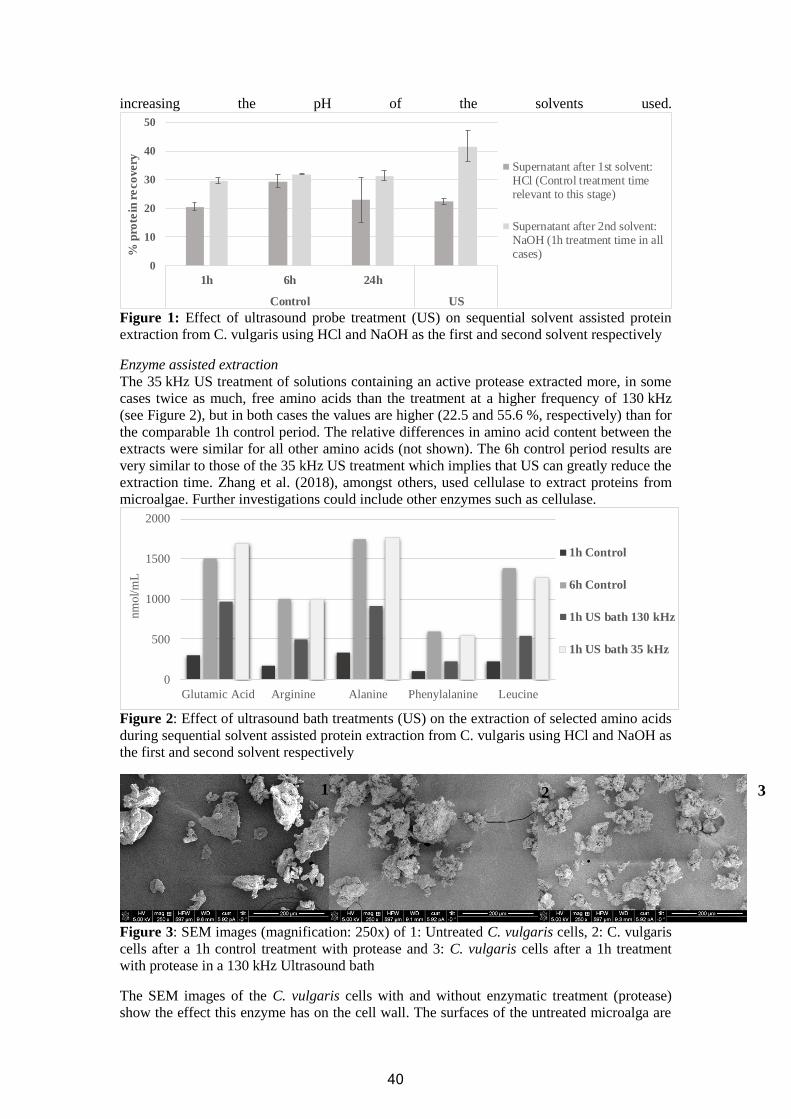
increasing the pH of the solvents used.
Figure 1: Effect of ultrasound probe treatment (US) on sequential solvent assisted protein
extraction from C. vulgaris using HCl and NaOH as the first and second solvent respectively
Enzyme assisted extraction
The 35 kHz US treatment of solutions containing an active protease extracted more, in some
cases twice as much, free amino acids than the treatment at a higher frequency of 130 kHz
(see Figure 2), but in both cases the values are higher (22.5 and 55.6 %, respectively) than for
the comparable 1h control period. The relative differences in amino acid content between the
extracts were similar for all other amino acids (not shown). The 6h control period results are
very similar to those of the 35 kHz US treatment which implies that US can greatly reduce the
extraction time. Zhang et al. (2018), amongst others, used cellulase to extract proteins from
microalgae. Further investigations could include other enzymes such as cellulase.
Figure 2: Effect of ultrasound bath treatments (US) on the extraction of selected amino acids
during sequential solvent assisted protein extraction from C. vulgaris using HCl and NaOH as
the first and second solvent respectively
Figure 3: SEM images (magnification: 250x) of 1: Untreated C. vulgaris cells, 2: C. vulgaris
cells after a 1h control treatment with protease and 3: C. vulgaris cells after a 1h treatment
with protease in a 130 kHz Ultrasound bath
The SEM images of the C. vulgaris cells with and without enzymatic treatment (protease)
show the effect this enzyme has on the cell wall. The surfaces of the untreated microalga are
0
10
20
30
40
50
1h 6h 24h
Control US
% p
rote
in r
eco
very Supernatant after 1st solvent:
HCl (Control treatment timerelevant to this stage)
Supernatant after 2nd solvent:NaOH (1h treatment time in allcases)
0
500
1000
1500
2000
Glutamic Acid Arginine Alanine Phenylalanine Leucine
nm
ol/
mL
1h Control
6h Control
1h US bath 130 kHz
1h US bath 35 kHz
1
2
3
40

not as broken up and uneven as the treated ones. Image 2 and 3 are very similar, showing that
this effect is not due to the US treatment. The protease AP-30L contains exo- and endo-
peptidase activity, hydrolyzing high molecular weight proteins into low molecular weight
peptides. It is likely that this is the process affecting the changes visible in the SEM images.
Conclusions
US treatments were successful in increasing the yield (10.6 % for NaOH/HCl sequential
solvent extraction) and reducing the treatment time (by 50 min) of solvent based protein
extractions. US treatments increased the free amino acid content of the enzyme assisted
extractions by up to 55.6 %. US as a preliminary treatment step to enzyme assisted extraction
should be further investigated as this could optimise enzyme access to the cell and reduce the
negative effects of temperature spikes on the heat sensitive enzymes during the US treatment.
The variance in results from the two investigated enzymes and the multitude of enzymatic
functioning mechanisms suggests that the number of investigated enzymes should be
increased to find the one most suited to protein extraction from C. vulgaris.
Acknowledgements
The authors would like to thank Nutress B.V., Phycom for supplying the Chlorella vulgaris
samples for this research project and Dr. Mahesha M. Poojary of the Department of Food
Science at University of Copenhagen, Denmark for carrying out the amino acid profiling.
References
Kadam, S.U., Álvarez, C., Tiwari B.K., O'Donnell C.P. (2017) "Extraction and
characterization of protein from Irish brown seaweed Ascophyllum nodosum," Food
research international (Ottawa, Ont.) 99(Pt 3), 1021–1027.
Kulkarni, S., and Nikolov, Z., (2018) "Process for selective extraction of pigments and
functional proteins from Chlorella vulgaris," Algal Research 35, 185–193.
Luque-Garcıa, J.L. and Luque de Castro, M.D. (2003) "Ultrasound: a powerful tool for
leaching," TrAC Trends in Analytical Chemistry 22(1), 41–47.
Pojić, M., Mišan, A.,Tiwari, B.T. (2018) "Eco-innovative technologies for extraction of
proteins for human consumption from renewable protein sources of plant origin," Trends
in Food Science & Technology 75, 93–104.
Rask, K.J., Rask, N. (2011) "Economic development and food production–consumption
balance: A growing global challenge," Food Policy 36(2), 186–196.
Rastogi, N.K. (2011) "Opportunities and challenges in application of ultrasound in food
processing," Critical reviews in food science and nutrition 51(8), 705–722.
Safi, C., Charton, M., Pignolet, O., Silvestre, F., Vaca-Garcia, C., Pontalier, P.-Y. (2013)
"Influence of microalgae cell wall characteristics on protein extractability and
determination of nitrogen-to-protein conversion factors," Journal of Applied Phycology
25(2), 523–529.
Safi, C., Ursu, A.V., Laroche, C., Zebib, B., Merah, O., Pontalier, P.-Y., Vaca-Garcia, C.
(2014) "Aqueous extraction of proteins from microalgae: Effect of different cell
disruption methods," Algal Research 3, 61–65.
Sydney, E.B., Novak, A.C., Carvalho, J.C. de, Soccol, C.R. (2014) "Respirometric Balance
and Carbon Fixation of Industrially Important Algae," In: Pandey A (ed.) Biofuels from
algae 67–84.
Tilman, D., Balzer, C., Hill, J., Befort, B.L. (2011) "Global food demand and the sustainable
intensification of agriculture," Proceedings of the National Academy of Sciences of the
United States of America 108(50), 20260–20264.
Zhang, R., Chen, J., Zhang, X. (2018) "Extraction of intracellular protein from Chlorella
pyrenoidosa using a combination of ethanol soaking, enzyme digest, ultrasonication and
homogenization techniques," Bioresource technology 247, 267–272.
41
NIR-HYPERSPECTRAL IMAGING OF BACTERIA ON LURIA BERTANI
AGAR MEDIA
Shilpa Dahiya1, Ana Herrero-Langreo
1,2, Mariateresa Ferone
1,4, Amalia G.M. Scanell
2,3,4, Aoife Gowen
1,2
1 UCD School of Biosystems and Food Engineering, University College of Dublin (UCD), Belfiled,
Dublin 4 Ireland. 2 UCD Institute of Food and Health.
3 UCD Centre for Food Safety
4 UCD School of Agriculture and Food Science
Abstract
The application of hyperspectral imaging for the detection and identification of bacteria is a developing
field with promising pragmatic applications and explicit difficulties. Two Bacillus strains, B.subtilis (BS)
and B.amyloliquifaciens (BA) (Gram positive) and one E.coli (EC) (Gram negative) were cultured on 8
ml of Luria Bertani (LB) agar from 10-2
dilutions utilizing the plate-streaking method. Six replicates for
each bacterial strain and six control replicates of sterile LB agar were imaged with a NIR (880-1720 nm)
push broom hyperspectral imaging system. Principal Components Analysis (PCA) was used as a first
exploratory approach to observe spectral differences between the colonies of the three bacterial strains. A
Partial Least Squares Discriminant Analysis model (PLS-DA) was calibrated on four of the six replicates
and validated on the two remaining samples for each strain, obtaining 98 % correctly classified
classification (CC) in calibration and 49% in validation. In further works, other modelling approaches will
be considered, such as a sequential discrimination model, first aiming to discriminate Gram positive from
Gram negative bacteria, and then to discriminate between Bacillus species. Colony classification instead
of pixel classification can also be tested in further research.
Introduction
The microbial contamination of food or food products are of most extreme significance to food industries
as it relates not exclusively to authorizing of an organization, yet in addition the wellbeing of the
customers. Therefore, there is a demand of the development of such methods that leads to rapid detection
of microorganisms in the food sector (He and Sun 2015). Culturing and colony counting takes a few days
to identify microorganisms inferable from long incubation periods and followed by characterization
which requires biochemical tests. Further, methods such as ELISA and PCR require prepared staff and
constant buy of costly and reagent units (Yeni et al. 2014). Thus, the regular culture strategies,
immunological techniques and PCR may delay the procedure of fast recognition of microorganisms in the
food industry.
NIR Hyperspectral imaging consolidates NIR spectroscopy and PC vision to acquire both spatial and
spectral information in one framework. Hypercubes are three-dimensional squares of information made
out of two spatial and one wavelength measurement (M. ElMasry and Nakauchi 2016). Chemometrics
incorporates distinctive pre-treatment strategies and displaying devices, used to break down the spectra
(Cheng and Sun 2015). The spectra separated from hyperspectral images are by and large pre-treated to
improve signal quality. The pre-treated spectra are then corresponded with estimated various genuine
model like PLS-DA (M. ElMasry and Nakauchi 2016).
The objective of the study was discrimination of bacteria on LB agar and polystyrene petri dishes
utilizing NIR Hyperspectral imaging.
42

Materials and Methods
Sample preparation
The following bacterial type strains were evaluated: B. amyloliquefaciens DSM 7, B. subtilis DSM 10,
and E. coli DSM 11250. Each bacterium was grown in LB medium and incubated at 30o C in a rotary
shaker at 180 rpm. The bacterial cultures were serially diluted in Ringer solution up to 10-2
and then, each
species was streaked on 8 ml of LB agar Petri plates for obtaining single colonies. Polystyrene petri
dishes 100 mm diameter and 15 mm height were used for the incubation. Six replicates of each bacterium
were produced. The petri plates were incubated at 30o C for 48 hours (static incubation). LB agar was
chosen because it is a general growth medium containing only tryptone, yeast extract, sodium chloride
and bacteriological agar. Ringers solution was used as an isotonic diluting fluid for suspending the
bacterial cells. It is isotonic with bacteria and thus prevents them from being subjected to osmotic stress
when they are removed from their habitual environment. All procedures were performed under aseptic
conditions. After incubation, the plates were allowed to equilibrate with the ambient temperature for
about one hour before imaging.
NIR Hyperspectral imaging
A pushbroom NIR (880– 1720 nm) hyperspectral imaging framework (DV Optics, Padova, Italy), was
utilized to scan each of the Petri plates. A 100 % reflectance standard tile was utilized as a white
reference. The polystyrene plastic lid of the petri plates was replaced with autoclaved sterile borosilicate
glass lids in class II Laminar wind current hood to avoid imaging artifacts produced by the plastic. Six
replicates of each bacterial species and six LB sterile agar petri dishes were imaged (24 pictures
altogether). All petri dishes were placed in the same position for imaging to allow the automatic
segmentation of the dishes from the background.
Data analysis
Reflectance for each image was calculated by the DV Optics system native software SScaner using a
standardized white porcelain tile as white reference. Further data analysis was performed in Matlab
(Version R2018b, Mathworks, USA). The spectral range was limited from 978 nm to 1600 nm to avoid
spectral noise observed at the edges of the detector. The spectra for each pixel was transformed to
absorbance and pre-treated by Standard Normal Variate (SNV). Masking of the region of interest for each
plate was done in two steps. As a first step a single circular mask was applied to every image to segment
the petri dish from the background. As a second step, regions of interest containing the bacterial colonies
were manually identified. Four replicates of each bacterial strain were used as a calibration dataset. Two
replicates were used for validation. PCA was applied on the spectra corresponding to the calibration
dataset colonies. PLS-DA model was, further on, used to discriminate between the three bacteria. The
performance of the model was assessed by the percentage of CC, calculated on the calibration and the
validation dataset.
Results and Discussion
Bacterial Growth
The bacterial growth test confirmed the viability of the three bacterial cultures on 8 ml of LB agar and
incubated for 48 hours at 30º Celsius (Figure 1).
43

a b c
Figure 1. (a) B. subtilis (BS) (b) B. amyloliquefaciens (BA) and (c) E. coli (EC)
Exploratory analysis and classification of bacteria
The first two Principal Components of the PCA applied on the pre-treated absorbance spectra of the
calibration dataset gathered 95% of the variance. PCA scores of the first 2 PCs, show a clear separation
between EC, BA and BS. An overlap between BA and BS scores can also be observed.
Figure 2. PCA scores of calibration dataset on PC1 and PC2. Each point corresponds to an individual
pixel.
PLS-DA showed good discrimination results on the calibration dataset with a percentage of CC of 89%
(Figure 3). Nevertheless, CC on validation was only 49%. As observed in the prediction map on Figure
4, better classification results were obtained for the first replicate (first column of plates) than for the
second replicate. Some factors explaining this result could be the effect of different colony sizes and the
similarities between BA and BS spectral profiles.
Figure 3. PLS-DA of predicted model for calibration data set, colormap scale indicates the bacteria
species. First row of plates corresponds to BA, second row to BS and third row to EC. Each column
corresponds to a plating replicate.
44

Figure 4. Predicted classification for validation data set, colormap scale indicates the bacteria species.
First row of plates corresponds to BA, second row to BS and third row to EC. Each column corresponds
to a plating replicate.
Conclusion
This work explores the feasibility of using NIR hyperspectral imaging for the discrimination of three
bacterial species B. amyloliquefaciens (BA), B. subtilis (BS) and E. coli (EC), cultured on Luria Bertani
(LB) media in polystyrene petri dishes. Exploratory data analysis (PCA) showed clear spectral differences
between EC, BA and BS. Although discrimination results between the three strains was reasonably good
in calibration (89% of correctly classified pixels) obtained by Partial Least Squares Discriminant Analysis
model (PLS-DA), poor results were obtained on the validation dataset (49% of correctly classified pixels).
These results suggest the need to adjust the modelling approach and extend the calibration dataset to
improve the robustness of the discrimination. According to the results of the exploratory analysis, further
work could explore the application of two sequential PLS-DA models: one to discriminate gram-positive
from gram-negative bacteria and the second one to discriminate between BA and BS. Further
experimentation is also being currently carried on in order to provide additional data to calibrate a more
robust discrimination model.
Acknowledgement
This research is a part of major HyperMicroMacro project which was funded by Science Foundation
Ireland (SFI) under the investigators programme Proposal ID 15/IA/2984.
References
Cheng, J.-H., Sun, D.-W. (2015) ‘Recent Applications of Spectroscopic and Hyperspectral Imaging
Techniques with Chemometric Analysis for Rapid Inspection of Microbial Spoilage in Muscle
Foods’, Comprehensive Reviews in Food Science and Food Safety, 14(4), 478–490.
He, H.-J., Sun, D.-W. (2015) ‘Hyperspectral imaging technology for rapid detection of various microbial
contaminants in agricultural and food products’, Trends in Food Science & Technology, 46(1), 99–
109.
M. ElMasry, G., Nakauchi, S. (2016) ‘Image analysis operations applied to hyperspectral images for non-
invasive sensing of food quality – A comprehensive review’, Biosystems Engineering, 142, 53–82.
Yeni, F., Acar, S., Polat, Ö.G., Soyer, Y., Alpas, H. (2014) ‘Rapid and standardized methods for detection
of foodborne pathogens and mycotoxins on fresh produce’, Food Control, 40, 359–367.
45
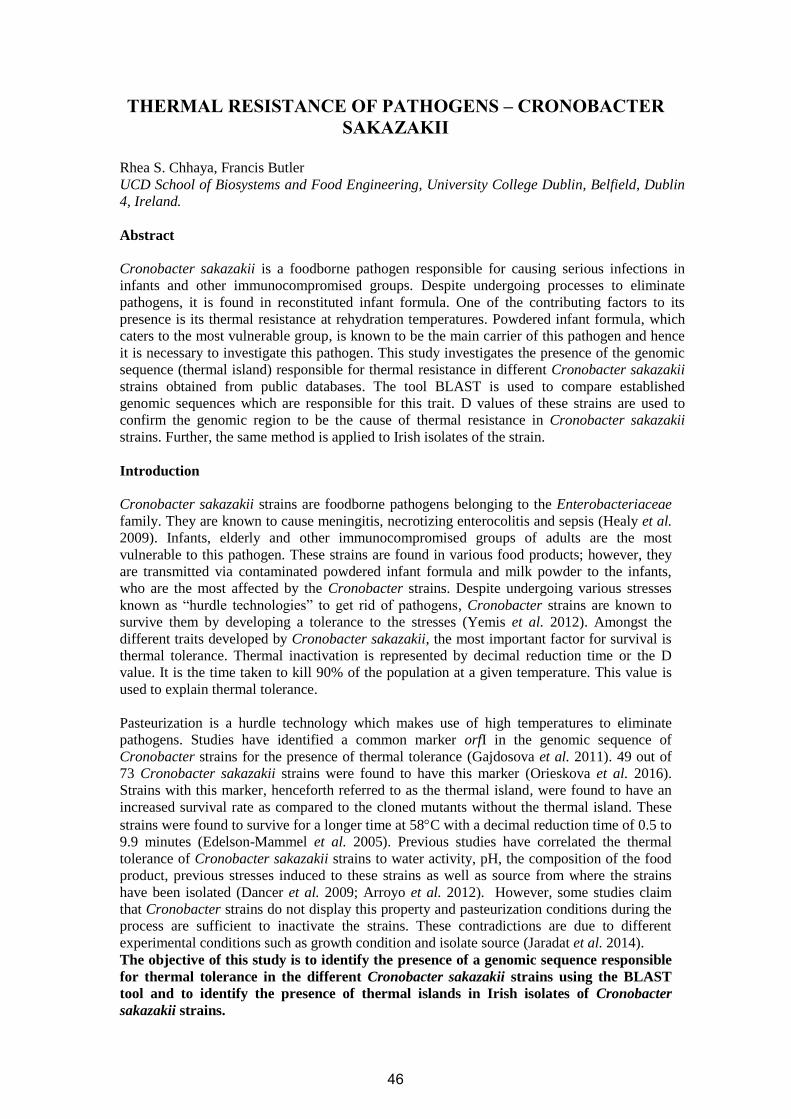
THERMAL RESISTANCE OF PATHOGENS – CRONOBACTER
SAKAZAKII
Rhea S. Chhaya, Francis Butler
UCD School of Biosystems and Food Engineering, University College Dublin, Belfield, Dublin
4, Ireland.
Abstract
Cronobacter sakazakii is a foodborne pathogen responsible for causing serious infections in
infants and other immunocompromised groups. Despite undergoing processes to eliminate
pathogens, it is found in reconstituted infant formula. One of the contributing factors to its
presence is its thermal resistance at rehydration temperatures. Powdered infant formula, which
caters to the most vulnerable group, is known to be the main carrier of this pathogen and hence
it is necessary to investigate this pathogen. This study investigates the presence of the genomic
sequence (thermal island) responsible for thermal resistance in different Cronobacter sakazakii
strains obtained from public databases. The tool BLAST is used to compare established
genomic sequences which are responsible for this trait. D values of these strains are used to
confirm the genomic region to be the cause of thermal resistance in Cronobacter sakazakii
strains. Further, the same method is applied to Irish isolates of the strain.
Introduction
Cronobacter sakazakii strains are foodborne pathogens belonging to the Enterobacteriaceae
family. They are known to cause meningitis, necrotizing enterocolitis and sepsis (Healy et al.
2009). Infants, elderly and other immunocompromised groups of adults are the most
vulnerable to this pathogen. These strains are found in various food products; however, they
are transmitted via contaminated powdered infant formula and milk powder to the infants,
who are the most affected by the Cronobacter strains. Despite undergoing various stresses
known as “hurdle technologies” to get rid of pathogens, Cronobacter strains are known to
survive them by developing a tolerance to the stresses (Yemis et al. 2012). Amongst the
different traits developed by Cronobacter sakazakii, the most important factor for survival is
thermal tolerance. Thermal inactivation is represented by decimal reduction time or the D
value. It is the time taken to kill 90% of the population at a given temperature. This value is
used to explain thermal tolerance.
Pasteurization is a hurdle technology which makes use of high temperatures to eliminate
pathogens. Studies have identified a common marker orfI in the genomic sequence of
Cronobacter strains for the presence of thermal tolerance (Gajdosova et al. 2011). 49 out of
73 Cronobacter sakazakii strains were found to have this marker (Orieskova et al. 2016).
Strains with this marker, henceforth referred to as the thermal island, were found to have an
increased survival rate as compared to the cloned mutants without the thermal island. These
strains were found to survive for a longer time at 58C with a decimal reduction time of 0.5 to
9.9 minutes (Edelson-Mammel et al. 2005). Previous studies have correlated the thermal
tolerance of Cronobacter sakazakii strains to water activity, pH, the composition of the food
product, previous stresses induced to these strains as well as source from where the strains
have been isolated (Dancer et al. 2009; Arroyo et al. 2012). However, some studies claim
that Cronobacter strains do not display this property and pasteurization conditions during the
process are sufficient to inactivate the strains. These contradictions are due to different
experimental conditions such as growth condition and isolate source (Jaradat et al. 2014).
The objective of this study is to identify the presence of a genomic sequence responsible
for thermal tolerance in the different Cronobacter sakazakii strains using the BLAST
tool and to identify the presence of thermal islands in Irish isolates of Cronobacter
sakazakii strains.
46

Methodology
For the purpose of this study, Cronobacter sakazakii sequences available on public databases
will be downloaded and previously established markers for the thermal island will be used to
identify the same in these genomic sequences using BLAST (Figure 1). The thermal island
will be compared with the previous findings of Gajdosva et al. (2011) and Orieskova et al.
(2016) to determine the presence or absence of thermal resistance in the strains. D values and
Z values for the strains, obtained from literature, will be used to find the D values at 72C and
to determine the verify the thermal tolerance of these strains. Further, the presence of the
thermal island will be determined on Irish isolates of these strains.
Figure 1. BLAST tool layout
BLAST tool The Basic Local Alignment Search Tool (BLAST) by National Centre of Biotechnology
Information facilitates users to compare DNA sequences to established genomic sequences
whose traits and functions are known. This can then be used to categorize the previously
unknown DNA sequence and identify whether similar traits are present.
Results and Discussion
It is expected that the strains display the same genomic sequence for thermal tolerance, which is
verified by previous studies (Gajdosova et al. 2011). The marker orfI is expected to be present
in the same strains as given by literature. These strains are expected to give a higher D value as
compared to strains without the thermal island. Moreover, the data of isolates obtained from
hospitals as compared to those from other origins should show a higher thermal resistance than
the ones obtained from other sources.
Table 1 shows the different Cronobacter sakazakii strains with their D58 values. The strains with
the higher values had the orfI marker present. This corroborates with the assumption that there
is a genomic sequence responsible for thermal resistance in Cronobacter sakazakii strains.
47

Table 1. D values for Cronobacter sakazakki strains (Gajdosova et al. 2011)
As seen from Table 1, the ATCC 29544 has the thermal marker present. Therefore, ATCC
29544 has a flatter slope as compared to 220108 as the genomic sequence contributes to heat
resistance. The isolates used for the studies have different environmental conditions which
attribute to the differences in D value. Therefore, the same needs to be accounted for.
Conclusions
The presence of the thermal island (represented by the genomic marker orfI) in Cronobacter
sakazakii strains was related to their thermal resistance. The higher D values of those strains
confirmed the same. However, the presence of the marker does not give information about the
thermal properties of the individual strains and therefore, further study of the same is required.
This information will be applied to Irish isolates of Cronobacter sakazakii strains to determine
the thermal resistance developed by them and take the necessary steps to eliminate any potential
threat to neonates.
References
Arroyo, C., Cebrián, G., Condón, S. and Pagán, R. (2012) 'Development of resistance in
Cronobacter sakazakii ATCC 29544 to thermal and nonthermal processes after
exposure to stressing environmental conditions', Journal of Applied Microbiology,
112(3), 561-570
Dancer, G.I., Mah, J.H., Rhee, M.S., Hwang, I.G. and Kang, D.H. (2009) 'Resistance of
Enterobacter sakazakii (Cronobacter spp.) to environmental stresses', Journal of
Applied Microbiology, 107(5), 1606-1614
Edelson-Mammel, S.G., Porteous, M.K. and Buchanan, R.L. (2005) 'Survival of Enterobacter
sakazakii in a Dehydrated Powdered Infant Formula', Journal of Food Protection,
68(9), 1900-1902
Gajdosova, J., Benedikovicova, K., Kamodyova, N., Tothova, L., Kaclikova, E., Stuchlik, S.,
Turna, J. and Drahovska, H. (2011) 'Analysis of the DNA region mediating increased
thermotolerance at 58A degrees C in Cronobacter sp and other enterobacterial
strains', Antonie Van Leeuwenhoek International Journal of General and Molecular
Microbiology, 100(2), 279-289
Healy, B., Cooney, S., O'Brien, S., Iversen, C., Whyte, P., Nally, J., Callanan, J.J. and
Fanning, S. (2009) 'Cronobacter (Enterobacter sakazakii): An Opportunistic
Foodborne Pathogen', Foodborne Pathogens and Disease, 7(4), 339-350
Jaradat, Z.W., Al Mousa, W., Elbetieha, A., Al Nabulsi, A. and Tall, B.D. (2014)
'Cronobacter spp.--opportunistic food-borne pathogens. A review of their virulence
48

and environmental-adaptive traits', Journal of medical microbiology, 63(Pt 8), 1023-
1037,
Orieskova, M., Kajsik, M., Szemes, T., Holy, O., Forsythe, S., Turna, J. and Drahovska, H.
(2016) 'Contribution of the thermotolerance genomic island to increased thermal
tolerance in Cronobacter strains', Antonie van Leeuwenhoek, 109(3), 405-414
Yemis, G.P., Pagotto, F., Bach, S. and Delaquis, P. (2012) 'Thermal Tolerance and Survival
of Cronobacter sakazakii in Powdered Infant Formula Supplemented with Vanillin,
Ethyl Vanillin, and Vanillic Acid', Journal of Food Science, 77(9), M523-M527
49

ADULTERATION DETECTION OF WHISKEY USING UV-VIS
SPECTROSCOPY
Jingwen Dai, Colm O’Donnell
UCD School of Biosystems and Food Engineering, University College Dublin, Belfield, Dublin
4, Ireland.
Abstract
Whiskey is a distilled product that is very popular in the world. It is usually made from sprouted
grains such as barley, wheat, and rye. Because whiskey is very popular, it is also considered a
distilled alcoholic beverage that is prone to adulteration. The most common form of adulteration
is by inclusion or dilution, such as a mixture of water and alcohol, industrial alcohol, edible
alcohol or food colouring. UV-VIS spectrophotometer detection can effectively identify
adulterated whiskey samples, which can be mainly analysed by a stoichiometry method.
Introduction
Whiskey was originally a distilled alcoholic beverage that was to be fermented in wooden
barrels for at least three years (Wiśniewska et al., 2017). In order to make profits quickly,
some merchants in the market will mixed in harmful substances. This may cause nausea,
dizziness, blindness, kidney failure and even death. The adulteration of food is essentially a
behaviour that deceives consumers, but because whisky is a high-concentration alcoholic
beverage, it is often considered an object of easy food adulteration. During the brewing
process, most of the flavour is derived from the fermentation of the mash in the germinated
grain. Only water and plain caramel (for aesthetics) are considered reasonable additions that
can be added to distilled alcoholic beverages (Wiśniewska et al., 2015). Everything else is
considered an adulterated object. Based on the hazards and risks that adulterated whiskey can
bring, researching related technologies for adulteration detection can help suppress many
dangerous and illegal benefits.
UV-VIS is an ultraviolet-visible absorption spectrum that belongs to the electromagnetic
spectrum, which are all due to the transition of valence electrons. It generally refers to the
absorbance or reflectance spectrum of the UV-visible region. The wavelength range is about
190nm-750nm. It can be used to analyse the composition, content, and structure of the
substance (Cantarelli et al., 2015). The UV-Vis spectrum has its own spectral properties,
which are assessed by comparing the spectral properties of the product sample with
established baselines. There are many adulterated frauds in the alcoholic beverage industry,
so there is a need for adulterated detection technology that is inexpensive and has no
secondary damage. Spectroscopy is a relatively inexpensive, simple technique for qualitative
analysis of liquid samples. After obtaining spectrally relevant data, principal component
analysis (PCA) and chemometric analysis can be performed to help identify and judge the
meaning of the analytical results. In general, UV-Vis spectroscopy is a non-destructive,
reagent-free component analysis method that is considered a cheap and easy-to-use technique
for adulterated detection of alcoholic beverages.
The objective of this study was to distinguish high quality of whiskey from cheaper
commercial grade or blend or adulterated whiskey with added water or ethanol using
UV-VIS spectroscopy and analyzing the data using chemometric techniques like PCA
and PLSR.
50

Materials and Methods
In this study were whiskey samples was analysed using UV-Vis spectrophotometers. First of all,
different whisky brands and brewing methods can greatly affect its quality. The first step was to
choose whiskies (cheap, medium-priced, and expensive) that vary in price and may vary in
composition. The detection instrument used, UV-visible spectrophotometer, which is available
in the UCD Biosystems and Food Engineering school laboratory.
Figure 1. (A) UV-Vis spectrophotometers; (B) Different brands of whiskey are POWERS,
JAMESON, LAMBAY, TEELING (from left to right)
Principle
Ultraviolet-visible spectrophotometers essentially work by π- or n-electron (non-bonded)
molecules that absorb light in the UV or visible range to excite these electrons into higher
anti-bond molecular orbitals (Pontes et al., 2006).
Determination of quality indices
In the whisky test, set a solution of alcohol and water is set as the baseline (40% alcohol and
60% water), because the alcohol content of many different brands of whisky on the market is
about 40%. As a study of adulteration testing, adding different proportions of water to
whiskey samples (such as adding 5%-30% water).
Data analysis
In order to obtain data that is helpful for research, it can be guided to some extent by data
prediction. In the course of the experiment, samples were analysed in twice to ensure the
reference value of the experimental data. Some advanced ideas can be very helpful for the
experiment. For example, whisky is usually a caramel colour liquid. It is reasonable to expect
that the sample should be diluted when using an ultraviolet-visible spectrophotometer, using
water as a baseline. The solution is mixed with alcohol as a diluent.
Results and Discussion
Prediction of absorption curve
By studying some of the existing literature, it is generally known that significant differences in
absorption spectra can be noted at about 205 nm (Martins et al., 2017). The Martins et al.’s
literature examined different brands of whiskey using an ultraviolet-visible spectrophotometer.
The results show that a 12-year brand has a higher absorbance than an 8-year brand, but
regardless of the brand, their absorbance performance trends are roughly the same.
A. B.
51

Currently available results
At present, the experimental research carried out in this paper only carries out the selection of
the brand and the preliminary determination of the sample, and one of the samples is tested after
water mixing. As shown in Figure 2, for the pure sample of the four samples, it can be seen that
the absorption curves and absorption peaks of different brands of whiskey are very different.
Figure 2. UV–Vis spectra of whiskies samples (Sample 1 is POWERS, Sample 2 is
JAMESON, Sample 3 is LAMBAY, Sample 4 is TEELING)
Figure 3. POWERS whiskey dilution with water
Figure 3 shows POWERS whiskey dilution with water. The top line is pure whiskey sample,
and other lines are followed by whiskey samples with 5% to 30% water added (from up to
down). It can be seen that the greater the proportion of water added, the lower the absorbance,
the relatively flat the absorption peak, and the overall trend of decreasing.
52
Figure 4. PCA score plot of whiskey dilution with water
Figure 4. shows the water adulterated samples. The variables are evenly distributed in PC1
and PC2. PC1 and PC2 together can explain 97% of X-variances. After using MATLAB,
using the ellipse tool, I found that only three data are outside the ellipse. However, the cluster
of data is scattered, the distribution is relatively fused, only one cluster is linear, but another
cluster is particularly scattered, so it cannot give a very reliable analysis.
Conclusions
Ultraviolet-visible spectroscopy is a good way to detect the composition of whiskey, and the use
of a three-sample test can ensure data availability and results. However, because this research
experiment is very limited in terms of brand popularity and number of samples, it is possible to
develop simulation tests or use a larger number of samples to obtain reliable data in future
research. However, it can still be stated that the ultraviolet-visible spectroscopic technique is a
technique for safely, conveniently, quickly and effectively detecting the adulteration of
whiskey.
References
Cantarelli, M. Á., et al. (2015) 'Authentication and Discrimination of Whiskies of High
Commercial Value by Pattern Recognition', Food Analytical Methods, 8(3), 790-798.
Martins, A. R., et al. (2017) 'Discrimination of whisky brands and counterfeit identification
by UV–Vis spectroscopy and multivariate data analysis', Food Chemistry, 229, 142-151.
Pontes, M. J. C., et al. (2006) 'Classification of distilled alcoholic beverages and verification
of adulteration by near infrared spectrometry', Food Research International, 39(2), 182-
189.
Wiśniewska, P., et al. (2017) 'Authentication of whisky due to its botanical origin and way of
production by instrumental analysis and multivariate classification methods',
Spectrochimica Acta Part A: Molecular and Biomolecular Spectroscopy, 173, 849-853.
Wiśniewska, P., et al. (2015) 'Chemical composition analysis and authentication of whisky',
Journal of the Science of Food and Agriculture, 95(11), 2159-2166.
53

RISK ASSESSMENT OF MARINE TOXINS
Yao Gong, Francis Butler
UCD School of Biosystems and Food Engineering, University College Dublin, Belfield, Dublin
4, Ireland.
Abstract
Shellfish poisoning caused by marine toxins has been a hot topic for researchers, causing
environmental pollution and economic losses. The increase in the occurrence, frequency and
geographical distribution of blooms may increase human exposure to these toxins and cause
public health problems. The objective of this study was to conduct a dietary risk assessment of
marine toxins produced in Ireland and provide an overview of human exposure to marine toxins
by consumers and susceptible populations.
Introduction
Marine toxins are various chemical compounds mainly produced by phytoplankton and they
are widely present in high-salt ocean environments (Krahl, 2009; Mulvenna et al., 2012). It
has numerous properties with a diverse chemical structure and small molecular weight, as
well as high biological activity and unique mechanism of action. Many governmental and
non-governmental agencies have developed an interest in it. It is estimated that approximately
2% of phytoplankton species have potential toxigenic capacity among all known
phytoplankton species (Krahl, 2009). During the proliferation of algal population, the dense
concentration of cells will form to cause visible blooms, called ‘red tide’. The reason for
forming of other invisible blooms is that they can proliferate well below the surface and some
algae are colorless (Daguer et al., 2018). All the visible and invisible blooms are generally
known as Harmful algal blooms (HABs).
HABs are becoming a common event with increasing occurrence in Ireland and worldwide.
As a serious ecological disaster on a global scale, HABs may cause mass economic losses,
and will also cause a serious of marine ecology and food safety problems. There are several
negative impacts on the environment, such as damage to the gills of fish, oxygen depletion of
the water column and contamination of shellfish (James et al., 2010).
Marine toxins are not directly absorbed by humans but accumulated along the food chain,
which ultimately has adverse effects on humans (Daguer et al., 2018). Biotoxins can be
transmitted between organisms, typically filter-feeding bivalve molluscs and herbivorous
finfish. Toxins are initially produced naturally by phytoplankton and distributed throughout
the ocean environment. Some bivalve molluscs, including mussels, clams, scallops, and
oysters are contaminated with toxins because they graze on algae and the toxins concentrated
efficiently in the organism. Secondary consumers include marine mammals, birds, fish, etc.,
which get food from primary consumers, so the toxins will be transferred to the secondary
consumers (Oyaneder et al., 2017). Human beings are both secondary consumers and tertiary
consumers and toxins thus are passed on to humans (James et al., 2010). There are four main
biotoxins groups: Amnesic shellfish poisoning (ASP), Paralytic shellfish poisoning (PSP),
Diarrheic shellfish poisoning (DSP), Azaspiracids shellfish poisoning (AZP). Different toxins
have their own regulatory limits and if the dose exceeds the limits, it will cause harmful
effects on consumers ranging from nausea to death (Tong et al., 2018).
The objective of this study was to conduct a dietary risk assessment of marine toxins
produced in Ireland and provide an overview of exposure to marine toxins by
consumers and susceptible populations.
54

Materials and Methods
Data collection
The data required includes weekly closure level for each toxin, distribution map, and latest
relevant legislation and it is collected from the database of the website of Marine Institute
(Marine Institute, 2014).
Data analysis
Data analysis will include the marine toxins detected in the ocean and the risk assessment.
The method to analyze the risk assessment should follow the standard human health risk
assessment approach, which divided into four steps:
(1) Hazard identification: qualitatively determine whether the chemical compounds or agent
have the ability to harm human health. (2) Dose-respond assessment: qualitative examine the
dose required to generate appreciable detectable adverse health effects in animals and
humans. (3) Exposure assessment: determine the route, frequency, duration and extent to
which humans will be exposed to toxins through ingestion, inhalation and dermal contact and
the nature of exposed individual and populations. (4) Risk characterization: integrate the
information of hazard presence, dose-response and exposure assessment and analyze the
possibility of the level of hazard that can produce clinical effects.
Results and Discussion
The monitoring sites cover the entire sea area of Ireland, with a large proportion of sampling
points in the south and southwest. In the analysis of the trend of DSP toxins in the different
geographic distribution in the period of one year, the South which is prone to problems in
history has been selected and studied. Mytilus edulis was chosen as the research object
because the mussel farm is located in the south and it is one of the most common species of
toxins.
The shellfish toxicity data provided by Marine Institute includes the location of monitoring
sites, monitoring time, biological species, toxin types, and monitoring results. The figure
below is the location of monitoring points and corresponding trend graphs. The abscissa of
the trend graph is in month, which is convenient for observing the sudden burst of the DSP
toxins.
Figure 1. The location of site one (51°46'19.0"N 9°48'43.0"W).
55

Figure 1. The DSP toxin concentration trend of site one.
As shown on the figure, the red threshold line represents the legal limit above which
production areas were closed (0.16 μg/g expressed as OA equivalents). As can be seen from
the diagram, in Kilmakilloge, the toxins in Mytilus edulis have been in a relatively stable state
from January to July, and the value is less than the limit of detection. The concentration of
toxins increased tremendously from August to October, reaching a maximum of 6.82 µg/g on
October 1. After that, although there is a clear downward trend, it is still in a state of
fluctuation that can be detected.
This toxin is characterized by sudden and large outbreaks with little or no warning, so it must
be highly vigilant for fluctuations in its level of fluctuations and the presence of potentially
pathogenic species. In general, good weather and sea conditions may increase the likelihood
of early seasonal jumps in levels of DSP.
Conclusions
In this study, the increased level of toxins was affected by the temperature and nutrient of the
water and rocky strata, and it is shown as seasonal trend using a distribution map and the
annual DSP concentration figures. DSP tends to occur more frequently in summer and the
duration can last over three months. Areas with zero detection levels also need attention
because there is still the probability of a sudden outbreak. The research effort, such as the
development of the method of toxin control, the test of detection technology and risk
assessment of human health, also needs to be worked on.
Acknowledgements
This research has been undertaken with the financial support of UCD School of Biosystems
Engineering, University College Dublin.
References
Daguer, H., Hoff, R.B., Molognoni, L., Kleemann, C.R. and Felizardo, L.V. (2018)
‘Outbreaks, toxicology, and analytical methods of marine toxins in seafood’, Current
Opinion in Food Science, 24, pp. 43-55.
James, K.J., Carey, B., O'halloran, J. and Škrabáková, Z. (2010) ‘Shellfish toxicity: human
health implications of marine algal toxins’, Epidemiology & Infection, 138(7), 927-940.
56

Krahl, P.L. (2009) ‘Harmful algal bloom-associated marine toxins: a risk assessment
framework’, Archives of environmental & occupational health, 64(2), 129-134.
Marine Institute (2014). Marine Institute. Available at:
https://www.marine.ie/Home/home/. Mulvenna, V., Dale, K., Priestly, B., Mueller, U., Humpage, A., Shaw, G., Allinson, G. and
Falconer, I. (2012) ‘Health risk assessment for cyanobacterial toxins in
seafood’, International journal of environmental research and public health, 9(3), 807-
820.
Oyaneder Terrazas, J., Contreras, H. and García, C. (2017) ‘Prevalence, variability and
bioconcentration of saxitoxin-group in different marine species present in the food
chain’, Toxins, 9(6), 190.
Tong, T.T.V., Le, T.H.H., Tu, B.M. and Le, D.C. (2018) ‘Spatial and seasonal variation of
diarrheic shellfish poisoning (DSP) toxins in bivalve mollusks from some coastal regions
of Vietnam and assessment of potential health risks’, Marine pollution bulletin, 133,
911-919.
57

IMPACTS OF STORAGE CONDITIONS ON BARLEY QUALITY
Peter O. Paseda, Patrick Grace
UCD School of Biosystems and Food Engineering, University College Dublin, Belfield, Dublin 4, Ireland.
Abstract
Barley grains are one of the most important raw materials that go into the brewing process. During the
storage period between harvesting and malting, these grains due to an increase in temperature and
moisture content undergo some changes resulting in a deterioration in quality. This study aims to
understand what happens during this storage period. Data from strategically positioned sensors in the
storage bin are used to assess the effects of grain location in storage and establish a correlation between
storage parameters and germination potential. Preliminary results show that the location of barley grains
within storage bin influences its moisture content and temperature. Grains close to storage bin walls were
found to be cooler with the exception of sensor 56 while grain close to the top on both sides of the bin had
a higher moisture content. This study serves as a stepping stone to preventing barley quality deterioration
during the storage period and possibly proffering of quality improvement methods.
Introduction
The goal of every organization is to deliver goods and services of consistent quality as it makes the brand
feel more dependable, builds consumer trust and is also a marketing tool on its own. The same goes for
brewing companies, one of the goals is to provide products with consistent sensory properties to the
consumers. Among the numerous factors that affect the achievement of this goal is the quality of raw
materials. To achieve consistency in product quality, raw materials of consistent quality are required.
Malt is one of the major ingredients used to manufacture beer and therefore the quality of the malt is of
paramount importance. Malt is produced by the controlled germination of barley grains (Hordeum
vulgare), which is initiated by steeping barley grains in water, followed by germination and kilning
periods (Woonton et al. 2005a). This process is known as malting and the objective of this process is to
convert raw grains into malt by the production of a number of enzymes within the grain which is further
utilized during brewing. To ensure this is achieved, barley must be able to germinate rapidly and
uniformly.
Dormancy can interfere with the rapid and uniform germination of barley, thereby reducing the resultant
malt quality (Woonton et al. 2005b). Post-harvest storage is a well-practised means of overcoming
dormancy of malting barley but it is expensive and can be troublesome. The respiratory and metabolic
processes in cereal grains continue during storage. Thus, the physical and biochemical changes occur on
grains (Iconomou et al. 2006). Some moisture change in grains is usual under normal storage conditions.
However, if the humidity and temperature are not controlled in the environment, then the negative
conditions such as mould, germination, decay, rancidity may occur (Sharma et al. 2007). The variability
of malt components during its storage depends mainly on temperature and water activity (moisture
content). Both of these factors should be as low as to preserve the high quality of malt (Francakova et al.
2012).
The objective of this study was to look at the influence of location on temperature and moisture
content of barley grains and also to establish a relationship between storage parameters
(temperature, moisture content & storage time) and germination potential.
58

Materials and Methods
Data collection
Horizontal reinforced concrete grain storage facility was fitted with sensors 1m apart vertically and 6m
apart horizontally as shown in figure 1 below. These sensors collect temperature and relative humidity
data, the relative humidity data is used to provide an indicative moisture content. Irish barley harvested in
July 2018 was stored in this storage facility and temperature and moisture content data were collected.
Figure 1. Diagrammatical representation of sensor positions with corresponding sensor numbers
Germination test
Barley samples were taken from each sensor position every three months and their germination potential
was tested. The 4 mL and 8 mL germinative test on all samples was carried out using a modification of
the European Brewery Convention methods 3.6.2 and 3.7 as in (Krajcovic et al. 2016).
Data analysis
Microsoft Excel was used to carry out a correlation and regression analysis between the three storage
parameters (temperature, moisture content, storage time) and the response variable (gemination potential).
The average temperature and moisture content for each corresponding storage time period was used in the
analysis.
Results, Expected Results and Discussion
Influence of location on temperature and moisture content
Plots of temperature and moisture content variation between the start date of data collection (15
September 2018) and 31 December 2018 is shown below (figure 1). The barley grains at the centre of the
storage facility were generally warmer than those close to storage facility walls with the exception of
sensor 56. The cooler temperature of barley grains close to storage bin walls was majorly an influence of
the outside temperature.
Barley grains at the centre of storage facility had a lower moisture content as compared to grains close to
the bin walls (seen in figure 2). This trend was a result of a temperature gradient within the storage bin. In
the warmer regions, there is an increase in the partial pressure of water vapour while in the warmer
regions, there is a decrease in the partial pressure of water vapour as a result of an increase and a decrease
in temperature respectively. As a result, water vapour tends to migrate from warm regions to cool regions
and in order to attain an equilibrium status with the surrounding air, grains in the warmer regions lose
moisture while in the cooler regions gain moisture. Air density difference was also considered as one of
the reasons for the trend.
59

A general drop in temperature and moisture content was noticed before day 40. This could have been a
result of aeration or an outdoor weather condition. An anomaly was observed in sensor 65 readings after
day 70, which could be due to condensation, sensor malfunction or barely a representation of the outdoor
weather conditions.
Figure 2: Temperature variation in storage bin
Figure 3: Moisture content variation in storage bin
60

Relationship between storage parameters and germination
Germination data was still being worked on and yet to be available but review of literature showed that
for the best germination results, barley grains must be maintained at or below a moisture content and
temperature of 14% and 14ºC respectively.
Conclusion
The data presented indicates location of barley grains in storage bin has an impact on its temperature and
moisture content. The grains at the centre of storage bin were found to be warmer than those on either
side. External temperature also influenced temperature on sides of grains of storage bin. Moisture
migration due to temperature gradient impacted moisture content of grains at different locations in storage
bin. This is of practical importance to maltsters and grain storage personnel seeking to understand what
happens during grain storage in prevention of grain quality deterioration.
Acknowledgements
The authors acknowledge the support provided by Minch Malt Ltd. and Strawchip Ltd. throughout this
project.
References
Francakova, H., Liskova, M. and Bojnanska, T. (2012) 'Germination Index as an Indicator of Malting
Potential', Czech Journal of Food Sciences, 30(4), 377-384.
Iconomou, D., Athanasopoulos, P., Arapoglou, D., Varzakas, T. and Christopoulou, N. (2006) 'Cereal
quality characteristics as affected by controlled atmospheric storage conditions', American
Journal Food Technology, 1, 149-157.
Krajcovic, T., Psota, V., Sachambula, L. and Mareček, J. (2016) 'The effect of long-term storage on
quality of malting barley grain and malt', Journal of Central European Agriculture, 17(4), 917-
931.
Sharma, S., Gambhir, S. and Munshi, S.K. (2007) 'Changes in lipid and carbohydrate composition of
germinating soybean seeds under different storage conditions', Asian Journal of Plant Science,
6, 502-507.
Woonton, B.W., Jacobsen, J.V., Sherkat, F. and Stuart, I.M. (2005a) 'Changes in Germination and
Malting Quality During Storage of Barley', Journal of the Institute of Brewing, 111(1), 33-41.
Woonton, B.W., Sherkat, F. and Maharjan, P. (2005b) 'The influence of barley storage on respiration and
glucose-6-phosphate dehydrogenase during malting', Journal of the Institute of Brewing, 111(4),
388-395.
61

ADULTERATION DETECTION IN GIN USING UV-VIS AND NIR
SPECTROSCOPY
Jayasri Ramesh, Colm O’Donnell
UCD School of Biosystems and Food Engineering, University College Dublin, Belfield, Dublin 4,
Ireland.
Abstract
Gin is a widely consumed and commercially important alcoholic beverage that has been associated
with issues of fraudulent practice. In this study, NIR and UV-VIS spectroscopy associated with
chemometric methods is used, for detection of adulterant in different gin brands. Three gin samples
are used and diluted with three common adulterants like water, ethanol, and a cheap brand gin.
Spectral data of both adulterated and non-adulterated samples will be obtained using spectroscopic
technique and the characterization of brands will be accomplished by chemometric methods based on
PCA and SIMCA.
Introduction
Gin is a spirit-based alcohol where the predominant flavour is derived from juniper berries. It is an
extremely popular spirit in various countries like United Kingdom, France and Germany for
exportation to the rest of the world. The United States has proven to be the most important import
country in the Gin market. Gin is a complex mixture of diverse substances like water (distilled,
demineralized, softened or permuted which should be capable for human consumption), neutral
alcohol of agricultural origin (cooking, mashing, fermentation and distillation) and added botanicals
(juniper berries, coriander seed, angelica root, sweet and bitter orange peel and licorice root) (Riu-
Aumatell et al. 2016). It is a colourless beverage containing at least 37.5% alcohol and is usually
consumed by mixing with tonic water, ice and lemon or other beverages (Riu-Aumatell et al. 2016).
Gin is a highly consumed liquor however; it has been associated with issues of adulteration and
misbranding. Other alcoholic beverages like whisky, vodka, etc are also highly adulterated but their
price in market is low, resulting in high consumption rate. Presently, food fraud cases have been
increasing, making the authenticity of the food and drinks an issue of vital consideration. Brand
falsification is also the major issue in alcoholic beverages occurring mostly in illegal factories, bars or
restaurants (Cantarelli et al. 2015). The occurrence of these malpractices is to maximize the profit of
the counterfeit. Furthermore, addition of adulterant to the branded spirit is another common fraudulent
practice. This fraudulent behaviour have become a serious health issue for the consumers buying
counterfeit spirits (Cantarelli et al. 2015). Therefore, it is of prime importance to develop a reliable
analytic tool to help control this fraudulent risk (Markechová et al. 2014).
UV-VISIBLE (wavelength range 190-750nm) and NIR (wavelength range 700-2500nm) are
spectroscopic techniques that provide information regarding the chemical bonds in functional groups
of both volatile and non-volatile spirits (Li et al. 2014). They are simple, cost effective and non-
destructive techniques used to verify the authenticity and discrimination of commercial brands
(Nascimento et al. 2011). The spectral data obtained from spectroscopic results is further subjected to
the chemometric analysis (PCA and SIMCA) which helps to classify the spectral scores in multi-
dimensional space. Hence, coupling chemometric analysis with spectrometric techniques plays a vital
role in the achievement of fraudulent screening in alcoholic beverages. In this study, a rapid and
simple method for authentication of three gin brands from different origin is adopted based on
spectroscopic and chemometric techniques (Pontes et al. 2006).
The objective of this study is to investigate UV-VISIBLE and NIR spectroscopy in combination
with chemometric analysis to detect adulteration in three different gin brands.
62

Materials and Methods
Four different gin samples (cheap and premium) were analysed in this study and samples were
purchased from local alcohol supermarkets. The brand name and the alcohol content of each gin
samples are listed in Table 1. UV-VIS and NIR spectroscopy equipment in the UCD School of
Biosystems and Food Engineering laboratory is used to detect the adulterant in the samples and other
materials like deionised water, ethanol, pipettes, quartz cell cuvette are the important materials to be
used in this study. Three test sets will be carried out based on the adulterant use: First, deionised water
will be used as one of the adulterants in diluting the three gin brands (Thin, MOR and Bombay) to
evaluate the dilution samples (adulterant/gin in volume: 0, 1, 2, 5, 10, 20, 30 and 40%). Secondly,
pure ethanol will be used to analyse the dilution of the gin samples (adulterant/gin in volume: 0, 1, 2,
5, 10, 20, 30 and 40%). Third, to determine the effect of adding cheap gin brand (Hampstead) to the
other three gin samples (adulterant/gin in volume: 0, 1, 2, 5, 10, 20, 30 and 40%). These tests will be
analysed in triplicate sets to verify efficiency. Multivariate signal connection (MSC) is used to pre-
treat the obtained spectral data to reduce the undesirable noise. Once the spectral peaks are obtained,
the unscrambler X software (v10.4, CAMO software AS, Oslo, Norway) will be applied to enhance
the Chemometric models.
Table 1. Brand name and alcohol content of gin samples
Brand Name Alcohol (v/v) (%)
Thin gin (Irish Dry Gin) 40
Hampstead (London Dry Gin) 40
Bombay Sapphire (London Dry Gin) 40
MOR (Handcrafted Irish Gin) 40
Results
Non-diluted gin samples
Figure 1 represents the spectral peaks for four non-diluted gin samples (based on the averaged value
of triplicate measurements) using UV-VIS spectroscopy from the wavelength 200 to 500nm. It is clear
from the graph that the Thin Gin (Irish Dry Gin) has the highest absorbance and Bombay Sapphire
(London Dry Gin) has the lowest absorbance when compared to the other gin samples.
Figure 1. Spectral peaks of non-diluted gin samples using UV-VIS spectroscopy.
-0.5
0
0.5
1
1.5
2
2.5
3
3.5
200 250 300 350 400 450 500
Ab
sorb
ance
Wavelength (nm)
Thin Gin
Hampstead Gin
Bombay sapphaire
MOR gin
63

Thin gin diluted with water
Figure.2 represents the spectral peaks for Thin Gin (Irish Dry Gin) diluted with deionised water
(adulterant/gin in volume: 0, 5, 15 and 30%) using UV-VIS spectroscopy from the wavelength 200 to
500nm. As we discussed earlier Thin Gin (Irish Dry Gin) has the highest absorbance rate, but when
the pure gin is diluted with added adulterant (deionised water) the absorbance rate tends to reduce,
and it is clear from the graph that increasing the adulterant tends to decrease the absorbance rate hence
the quality.
Figure 2. Spectral peaks of Thin Gin diluted with deionised water using UV-VIS spectroscopy.
Results and Discussion
UV-VIS spectroscopy
From the above obtained results, the classification of gin brands with added adulterant is hardly
achievable using only the spectral data obtained from different spectroscopic techniques. Thus,
chemometric analysis (PCA and SIMCA) combined with spectrometric technique is a good way to
accomplish a fast data acquisition which further helps to carry out the data treatment accurately with
low cost (Pontes et al. 2006).
The study on chemometric models provided by (Nascimento et al. 2011) shows that the PC1 and PC2
score plot is the best way to differentiate the non-adulterated and adulterated samples of any alcoholic
beverages. The results from the above study were successful, thus chemometric methods combined
with UV-VIS spectroscopy is one of the efficient techniques to be implemented for the current study
on Gin.
NIR spectroscopy
The study provided by Pontes et al. (2006) mainly focuses on spectra of the 69 analysed samples of
alcoholic beverages (whisky, brandy, rum and vodka) by using NIR spectroscopy. The spectral peaks
obtained for each beverage presented very similar peaks, thus PCA and SIMCA were used to
characterize each group.
The expected result can be very similar to the chemometric model score plot obtained for vodka
samples analysis because of the colourless property. After modelling, it was observed that two
principle components (PC1 and PC2) were enough to characterize the alcohol samples. PC1 involves
the differentiation of whisky and brandy to that of rum and vodka which means that without this
component the boundaries of two groups will be blurred. PC2, indicates the proximity between the
two groups (Pontes et al. 2006).
0
0.5
1
1.5
2
2.5
3
3.5
200 250 300 350 400 450 500
Ab
sorb
ance
Wavelength (nm)
Non-adulterated Gin
5% adulteration (v/v)
15 % adulteration (v/v)
30% adulteration (v/v)
64

Two groups of alcohol beverages were tested by SIMCA using the PCA data, to verify the prediction
ability of each alcohol samples. Thus, at the laboratory level, where the alcohol samples were
adulterated with water, ethanol and methanol showed 100% of correct prediction at the confidence
level of 95% (Pontes et al. 2006). The expected result will replicate to those above mentioned
chemometric methods in combination with both spectroscopic techniques (UV-VIS and NIR).
Conclusion
The study has proposed a methodology to tackle the problem of adulteration. This is done by
classifying and authenticating the adulteration in gin samples using UV-VIS and NIR spectroscopy
along with chemometric methods including PCA and SIMCA. The expected results will be obtained
by collecting data from three gin samples using spectroscopic techniques. On further, analysing the
result in Unscrambler X software, the quality of the samples will be determined rendering them safe
for human consumption.
References
Cantarelli, M.Á., Azcarate, S.M., Savio, M., Marchevsky, E.J. and Camiña, J.M. (2015)
'Authentication and Discrimination of Whiskies of High Commercial Value by Pattern
Recognition', Food Analytical Methods, 8(3), 790-798, available:
http://dx.doi.org/10.1007/s12161-014-9958-8.
Li, Z., Wang, P.-P., Huang, C.-C., Shang, H., Pan, S.-Y. and Li, X.-J. (2014) 'Application of Vis/NIR
Spectroscopy for Chinese Liquor Discrimination', Food Analytical Methods, 7(6), 1337-1344,
available: http://dx.doi.org/10.1007/s12161-013-9755-9.
Markechová, D., Májek, P., Kleinová, A. and Sádecká, J. (2014) 'Determination of the adulterants in
adulterant–brandy blends using fluorescence spectroscopy and multivariate methods', Anal.
Methods, 6(2), 379-386, available: http://dx.doi.org/10.1039/C3AY41405A.
Nascimento, E.C.L., Araújo, M.C.U. and Galvão, R.K.H. (2011) 'A flow-batch analyzer for UV-Vis
spectrophotometric detection of adulteration in distilled spirits', Journal of the Brazilian
Chemical Society, 22(6), 1061-1067, available: http://dx.doi.org/10.1590/S0103-
50532011000600009.
Pontes, M.J.C., Santos, S.R.B., Araújo, M.C.U., Almeida, L.F., Lima, R.A.C., Gaião, E.N. and Souto,
U.T.C.P. (2006) 'Classification of distilled alcoholic beverages and verification of
adulteration by near infrared spectrometry', Food Research International, 39(2), 182-189,
available: http://dx.doi.org/https://doi.org/10.1016/j.foodres.2005.07.005.
Riu-Aumatell, M., Caballero, B., Finglas, P.M. and Toldrá, F. (2016) 'Gin' in Encyclopedia of Food
and Health, Oxford: Academic Press, 222-226.
65

VALORIZAION OF FOOD WASTE IS KEY IN CIRCULAR ECONOMY
Nishtha Talwar, Fionnuala Murphy
UCD School of Biosystems and Food Engineering, University College Dublin, Belfield, Dublin 4,
Ireland.
Abstract
Industrial food waste management is one of the main challenges to overcome to ensure a sustainable
environment. This calls for a need to minimise waste or use waste as a resource through the concept
of valorisation of food waste to produce additional value-added products and developing new
sustainable value chains to move towards establishing circular economy. This study is a quantitative
analysis and characterisation of food waste arising in food industries from County Monaghan, Ireland.
Alternative food waste valorisation opportunities will be proposed, followed by studying the resulting
impact on the environment. The objectives of the study are; 1) collection of food waste data for
Monaghan food industries, 2) identification of potential food waste valorisation processes, and 3)
estimation of the resulting environmental impacts using Life Cycle Assessment (LCA) methodology.
Introduction
Climate change, increased urbanization and population growth has affected developing and developed
countries in several ways. One such consequence has been for food production, as high population has
high energy and goods demand, leading to increasing environmental impacts. This has pressurised the
agriculture and farming systems to prevent and minimise food waste, which will impact the energy-
environment nexus (Imbert 2017). Food and Agriculture Organization (FAO) of the United Nations
has estimated that more than 1.3 billion tonnes of food are wasted every year (Laso et al. 2016). Food
waste, a pollutant, arising from various stages of food value chain, significantly contributes to
greenhouse gas emissions, particularly methane, when food waste reaches landfill (Dorward 2012).
Therefore, utilizing waste streams to address the challenges faced by energy and agriculture sector in
Ireland is key to moderating greenhouse gas (GHG) emissions. This can be done by producing
bioenergy and bio-products from waste material generated during primary and secondary processing
of food products, to offset the use of fossil-based products. This approach will help meet Ireland’s
energy target of 16% from biomass (Sustainable Energy Authority of Ireland 2017), implying a need
to visualise negative-valued waste as a potential renewable stock (Garcia-Garcia et al. 2019).
Implementing valorisation techniques has proved to be a strong contender, as compared to the practice
of landfilling or incinerating waste. Despite the increased levels of waste, the landfilling rate has
dropped from 63.8% in 1995 to 25.3% in 2015 (Garcia-Garcia et al. 2019). For example, “the
recovery of organic material by composting has grown with an average annual rate of 5.4 % from
1995 to 2015” (Imbert 2017). Valorisation practices are aimed at increasing feedstock supply to
produce energy, goods and providing socio-economic and environmental benefits (Imbert 2017).
From the environmental standpoint, the sustainability of alternative food waste valorisation
techniques can be evaluated using Life Cycle Assessment (LCA); an effective decision-making tool
which provides evidence for the impacts of these valorisation techniques (Garcia-Garcia et al. 2019).
This study is a quantitative analysis and characterisation of food waste arising in food industries from
County Monaghan, Ireland. Alternative food waste valorisation opportunities will be proposed,
followed by studying the resulting impact on the environment. The objectives of the study are 1) collection of food waste data for Monaghan food industries, 2)
identification of potential food waste valorisation processes, and 3) estimation of the resulting
environmental impact using LCA methodology.
66

New Waste Framework in European Union (EU)
The EU directive (2008/98/EC) outlines, the policies for waste management, which is based on the
concept of waste hierarchy, prioritizing reuse and recycle. Generally, incineration is the choice when
dealing with biowaste. However, this reduces the opportunity to extract valuable bioproducts and bio-
energy (European Commission 2014). In 2014, the EU introduced the concept of circular economy
with the slogan of “take, make and dispose”, to encourage circular resource management approach
(European Commission 2014). The proposal is to recycle and reuse 70% of the biowaste material,
thereby reducing landfill. This was to replace the linear economy, thus transitioning to a circular
economy. Valorisation plays a key role in establishing circular economy in the food sector, by
integrating bio-based industries and valorising the whole biomass with the application of various
technologies (Blikra et al. 2018).
Meat Industry
Most of the waste in the meat industry is generated during slaughtering (Bujak 2015). The
composition of waste is skin, blood, bones, tendons and visceral organs. The decomposition of meat
waste is difficult; hence their processing is required. According to Commission Regulation (EU) No.
142/2011, the residues from the meat industry are regarded as low-risk materials. They need to be
converted to safe materials prior to their transportation and storage. The directive has also mentioned
the specification for the same. A survey estimates that beef and pork share about 11.4% and 7.5% of
the total revenue coming from the by-products respectively (Bujak 2015; Ghosh et al. 2019). Efficient
use of by-products from the meat industry enhances the economy of the country. This might also
result in controlling of environmental pollution. On one hand, many countries have limited the use of
meat by products due to safety and hygiene issues. On the other hand, waste from the meat industry
have the potential to be recycled and converted to useful products of high biological value (Ghosh et
al. 2019). One such approach of utilising waste from the meat industry is shown in figure 1.
Figure 1. Suggested approach for utilising waste from the meat industry.
Fruit and Vegetable Industry
In Europe, the waste produced during the different stages of fruit and vegetable supply chain is
distributed as follows: agricultural production (20%), postharvest handling and storage (5%),
processing and packaging (2%), distribution (10% for fresh fruits and 2% for processed fruits) and
consumption (19% for fresh fruits and 15% for processed fruits) (Verma et al. 2019). Thus, the high
quantity of waste produced calls for the development of the biorefinery concept for valorising the
non-preventable wastes. In County Monaghan, the predominant fruits and vegetable industry is that of
mushrooms. This study will thus focus on waste streams generated from the mushroom industry.
Mushrooms represents a 63 billion US dollar market in year 2013. The consumption of mushrooms is
growing annually, resulting in sales growth (Grimm and Wösten 2018). Spent mushroom substrate
(SMS) is available in huge amounts, 1 kg of fresh mushrooms results in 5 kg of spent substrate (i.e., 2
kg dry weight). Thus, making SMS a potential source for producing high quality bio- based product
67

such as compost or biofuel. It can also be used to extract enzymes for industries and bioremediation
(Grimm and Wösten 2018).
Dairy Industry
Dairy industries consume significant volumes of water in food industries; the water requirement for
the production of one litre of processed milk is 2-5 L of water, inclusive of cleaning and washing
operations (Arvanitoyannis and Giakoundis 2006). Dairy wastewater consists of high organic content
such as fats, proteins and carbohydrates. Releasing this wastewater into water-bodies leads to
eutrophication. Moreover, the wastewater produced from cleaning in place (CIP), consisting of
surfactants and detergents also cause toxicity to the marine life. One of the approaches to reduce
wastewater is to establish pre-treatment strategies such as wetlands; a promising technique where
aerobic and anaerobic digestion breaks down organic materials (Arvanitoyannis and Giakoundis
2006). In County Monaghan, a benchmarking exercise for energy consumed in the production of 1
litre of milk conducted in 2007 was 0.074 kWh (Carty 2010).
Poultry Industry
Waste produced from the poultry industry comprises of empty shells, infertile eggs, dead embryos
from late hatchings, dead chickens, a viscous liquid from eggs, decaying tissue and waste water. A
high protein waste with 43–71% moisture is generated from hatcheries and dried waste containing
28.8 MJ/kg of gross energy. (Glatz et al. 2011). Apparent metabolizable energy (AME) of the
hatchery waste by-product meal is 23.9 MJ/kg and the apparent amino acid availability of the
hatchery waste by-product meal is 73.5% (Glatz et al. 2011). This gives a huge opportunity to develop
high protein feedstock, organic fertiliser or other valued products.
Methodology
The structure of this research project can be divided in four steps. At first, characterisation and
quantification of waste streams arising from food industries in county Monaghan will be done. A
short summary for the same is explained in table 1.
Table 1. Companies in county Monaghan, with their major food product and potential waste streams.
Major Food
product Name of the Company Potential Waste Streams
Fresh and Packaged
Mushrooms
Monaghan Mushrooms Ireland
Tyholland Co., Gold Circle
Mushrooms
Spent mushroom substrate, Small
stubs, stalks of mushrooms after
harvest, Deformed mushrooms
Beef
Liffey Meats Ltd. ABP Food
Group, Mallon Sausage, Kepak,
Rangeland Foods Ltd, Katie
McCaghey Poultry Processing Skin, bones, blood, gastro-intestinal
tract, tendon and visceral organs,
waste water containing organic and
inorganic fixed Phosphorous. Pork
Mallon Sausage, Katie McCaghey
Poultry Processing
Chicken Katie McCaghey Poultry
Processing
Lamb ABP Food Group, Katie McCaghey
Poultry Processing
Wool, bones, horns, hooves and waste
water containing Phosphorous.
Duck Silver Hill Foods Skin, bones, blood, beak and waste
water
Egg The Nest Box Egg Company Shells, Infertile eggs, viscous egg
liquid and waste water.
Dairy Lakeland Dairies
Dairy Waste Water containing organic
components as well as toxins from
detergents and surfactants.
68

The next step is to develop a preliminary value chain by quantifying the waste, collecting data for
different waste streams from the industries itself. This is followed by collecting and grouping the
valorisation techniques based on characterisation of the wastes. Finally, the last step is to model a full
life cycle assessment of valorisation technologies, to assess the environmental impact of the system.
Conclusion
The demand for energy, food, and goods has been ever increasing because of population growth, but
the resources are limited. The production of food waste is approximately 1.3 billion tonnes a year
(Laso et al. 2016). Considering the implications on food security, economic status and environmental
impact, food waste needs to be tackled at every stage of food supply chain. According to United
nations (UN) 2030 target of achieving sustainable development goals and European Commission
2015, for adopting the circular economy strategy contributes towards the goal of zero waste. Overall,
the bio-economy and the circular economic model represent a great opportunity for tackling the food
waste issue. This is true in case of medium-high income countries where the bulk of the problem is
associated with overconsumption behaviours occurring at the end of the food supply chain. However,
this transition needs to be accompanied by public policies. Demand and supply side polices are crucial
for pushing out emerging sectors such as the bio-economy. In recent years there has been an increased
interest in the policy mix for promoting sustainability transitions. This type of approach can provide
effective guidance to policy makers ensuring the basis for a further development of the sector.
References
Arvanitoyannis, I.S., Giakoundis, A. (2006) ‘Current strategies for dairy waste management: A
review’, Critical Reviews in Food Science and Nutrition, 46(5), 379–390.
Blikra, E., Romeo, D., Thomsen, M. (2018) ‘Biowaste valorisation in a future circular bioeconomy’,
Procedia CIRP, 69(May), 591–596.
Bujak, J.W. (2015) ‘New insights into waste management – Meat industry’, Renewable Energy, 83,
1174–1186.
Carty, M. (2010) ‘Farming the Environment’.
Dorward, L.J. (2012) ‘Where are the best opportunities for reducing greenhouse gas emissions in the
food system (including the food chain)? A comment’, Food Policy, 37(4), 463–466.
European Commission (2014) ‘European Commission: Towards a circular economy: A zero waste
programme for Europe (COM(2014)/398).
Garcia-Garcia, G., Stone, J., Rahimifard, S. (2019) ‘Opportunities for waste valorisation in the food
industry – A case study with four UK food manufacturers’, Journal of Cleaner Production, 211,
1339–1356.
Ghosh, S., Gillis, A., Sheviryov, J., Levkov, K., Golberg, A. (2019) ‘Towards waste meat biorefinery:
Extraction of proteins from waste chicken meat with non-thermal pulsed electric fields and
mechanical pressing’, Journal of Cleaner Production, 208, 220–231.
Glatz, P., Miao, Z., Rodda, B. (2011) ‘Handling and treatment of poultry hatchery waste: A review’,
Sustainability, 3(1), 216–237.
Grimm, D., Wösten, H.A.B. (2018) ‘Mushroom cultivation in the circular economy’, Applied
Microbiology and Biotechnology, 102(18), 7795–7803.
Imbert, E. (2017) ‘Food waste valorization options: Opportunities from the bioeconomy’, Open
Agriculture.
Laso, J., Margallo, M., Celaya, J., Fullana, P., Bala, A., Gazulla, C., Irabien, A., Aldaco, R. (2016)
‘Waste management under a life cycle approach as a tool for a circular economy in the canned
anchovy industry’, Waste Management and Research.
Meera, P., Kumaran, S. (2014) ‘Making Mushroom Production Process a Zero Waste Enterprise’,
5(2), 236–243.
Sustainable Energy Authority of Ireland (2017) ‘Sustainability Criteria Options and Impacts for irish
Bioenergy Resources’, Sustainable Energy Authority of Ireland.
Verma, M., Plaisier, C., van Wagenberg, C.P.A., Achterbosch, T. (2019) ‘A systems approach to food
loss and solutions: Understanding practices, causes, and indicators’, Sustainability (Switzerland),
11(3).
69

NIR HYPERSPECTRAL IMAGING IN VISUALIZING MOISTURE
DISTRIBUTION OF APPLE SLICES DURING HOT AIR OVEN
DRYING
Priyanka S. Valgadde, Da-Wen Sun, Xiaohui Lin
UCD School of Biosystems and Food Engineering, University College Dublin, Belfield, Dublin-4,
Ireland.
Abstract
NIR Hyperspectral imaging system is a robust and innovative technique which has proven to be an
effective tool to detect moisture distribution in the sample. This is an accurate way of analysis which
helps in providing superior quality food. Hyperspectral imaging is the combination of spectral and
spatial information. Apples will be washed, peeled and sliced into infinite slabs of thickness 2,4 and 6
mm and 45-55mm diameter using a stainless-steel food slicer. A total 30 samples of the three
mentioned thickness will then go for dehydration. Drying will be carried out in hot-air oven at 70℃
and moisture content will be checked every 30 min which will be recorded until the final moisture
content reaches 22%. The dehydrated apple slices will be subjected to hyperspectral imaging system
to visualize moisture distribution throughout the samples.
Introduction
Drying or dehydration is a familiar thermal technique highly used for preservation of agro-based food
product. The drying process takes place in various modes such as conduction, convection, radiation or
a combination. The process of the drying is assessed with respect to its efficiency in eliminating the
moisture to certain desired level as well as minimizing the reduction of the quality aspects of the agro-
based product. Hence, drying uniformity is a prominent factor in examining the dehydration method
and the finished product (Y. Sun, 2017). Hot-air drying is a classic example of convective dehydration
method. This technique is generally used for dehydrating various agricultural produce. Typically, in
hot-air drying, the air from the surrounding environment is electrically heated and forced over the
dehydrating material. Firstly, the heat is carried to the surface of the sample by convection and then to
the centre by conduction (Y. Sun, 2017).
Hyperspectral imaging is an innovative and effective quality inspection system. It is non-thermal and
non-destructive technology which fulfils the consumers demand for superior food quality. This novel
technique comes with the advantage of its aptitude to integrate both spectroscopy and traditional
imaging technique. Hence, it is a combination of spectral and spatial distribution. It makes direct
evaluation of different components as well as locating the spatial distribution of these components
across the test sample (Y. Sun, 2017). This method is simple, accurate and requires a limited level of
sample preparation. Hyperspectral imaging is carried out in three different modes namely reflectance,
transmittance and interactance.
The objective of the study was to investigate the potential of hyperspectral imaging technique in
visualizing the moisture distribution of apple slices during hot air drying.
Material and Methods
Sample Preparation
The apples (Variety: GALA, produce of: Germany) will be procured from the local supermarket. The
fresh apples to be used in this study will be procured from the local supermarket. Initial to
dehydration the apples will be washed, peeled and sliced into infinite slabs of thickness 2,4 and 6 mm
and 45-55mm diameter using a stainless-steel food slicer (Meisami-asl , 2010). A total 30 samples
of the three mentioned thickness will then go for dehydration. Drying will be carried out in hot-air
oven at 70℃ and moisture content will be checked every 30 min which will be recorded until final
70

moisture content reaches 22% as given in UN Standards for dehydration of apple slices (UNECE
Standard DDP-16,1998). The moisture content will be measured according to AOAC method.
Hyperspectral Imaging System
The hyperspectral images of apple slices will be secured by using a line-scan hyperspectral
reflectance imaging system. Hyperspectral imaging is three dimensional. This system consists of a
high-performance CCD camera (Xeva 992, Xenics Infrared Solutions, Leuven, Belgium) , a
spectrograph (ImSpector N17E, Specim, Spectral Imaging Ltd., Oulu, Finland) linked with C-
mounted lens (S31-f/2.0, Specim, Spectral Imaging Ltd., Oulu, Finland), an illuminating unit (500 W
halogen lamps (JP245V-500WC, Ushio Inc., Tokyo, Japan) and a computer equipped with image
acquisition software (SpectraSENS, Gilden Photonics Ltd., Glasgow, UK) (Elmasry, 2012).
Image Acquisition and Calibration
The images will be acquired by the CCD camera. The camera is a two-dimensional detector which
simultaneously gather the spectral and spatial information. The spectrograph is the crucial part of the
system which is intended to develop a spectrum for each point on the scanned line. An accurate
calibration is needed to guarantee the dependability of the extracted data (Pu and Sun, 2015). The
reflectance needs calibration as the spectral information collected from the CCD camera carries the
intensity of detector signals and not the real reflectance values. The extracted data will be pre-
processed mathematically to assimilate impact on spectra which will improve the calibration model.
Pre-processing is required to identify the region of interest and extracting spectral features (Gowen,
2007).
Data Analysis
The extracted data is tremendous in quantity which requires a combination of multivariate matrices
and visualization tool. The data in this study will be analysed by using MATLAB. The data analysis
method will incorporate mathematical technique which will evaluate multiple variables concurrently.
The reflectance data obtained will be simulated.
Optimal Wavelength Selection
Data analysis will be followed by the selection of optimum wavelength. The best subset of
wavelength is required to find the moisture distribution in dried apple slices. The optimal wavelength
is selected because they are equally or more efficient than the full set of wavelengths. The wavelength
carrying most spectral data will be selected. Optimal wavelengths give the physical and chemical data
of the tested sample (Pu and Sun, 2015).
As the sample will travel through different stages from image acquisition to data analysis, it will
conclude with an illustration of the chemical composition of the sample in the visual form; also called
chemical imaging which will reflect the moisture distribution in case of this study.
Expected Results and Discussions
Drying Kinetics
As reported in Amjad; (2017), the rate of dehydration depends on thickness of the slices. The
moisture content reduces logarithmically with time at given drying conditions. The statistical analysis
shows that drying time significantly affects the temperature and slice thickness. Similar drying
kinetics are expected in the present study.
Spectrum of Apple Slices
In the paper presented by Amjad, 2017, the spectral reflectance curve of slices represents
effectiveness of reflecting radiant energy. The samples of higher moisture content demonstrate
minimum variation in reflectance while the sample with low moisture content shows maximum
variation in reflectance. This indicates that the higher moisture content sample has greater absorption
of light at given wavelengths. The present study is expected to illustrate related spectrum behaviour.
71

PLS Model and Moisture Prediction Maps
PLS models are robust method used to illustrate fundamental relationships. The prediction of moisture
distribution in the slices will be investigated using PLS model as reported in Amjad; (2017). The PLS
models are optimal and will be used to establish moisture prediction maps in this study.
Conclusion
In this study, NIR hyperspectral reflectance imaging system will be applied to gain hyperspectral
images of apple slices during hot-air drying process. Moisture content will be measured by AOAC
method. The spectral data hence obtained will represent reflectance values at certain wavelengths.
PLS model will give accurate moisture distribution in the apple slices.
Reference
Amjad, W. et al. (2017) ‘Hyperspectral imaging for the determination of potato slice moisture content
and chromaticity during the convective hot air drying process Partial Least Squares
regression’, Biosystems Engineering. Elsevier Ltd, 166, 170–183.
Elmasry, G. et al. (2012) ‘Principles and Applications of Hyperspectral Imaging in Quality Evaluation
of Agro-Food Products : A Review’, Critical Reviews in Food Science and Nutrition,52,
999–1023.
Gowen, A. A. et al. (2007) ‘Hyperspectral imaging e an emerging process analytical tool for food
quality and safety control’, Trends in Food Science & Technology ,18, 590–598.
Meisami-asl, E., Rafiee, S., Keyhani, A. and Tabatabaeefar, A. (2010). "Drying of apple slices (var.
Golab) and effect on moisture diffusivity and activation energy", Plant Omics Journal, 3(3),
97-102.
Pu, Y. and Sun, D. (2015) ‘Vis – NIR hyperspectral imaging in visualizing moisture distribution of
mango slices during microwave-vacuum drying’, Food Chemistry. Elsevier Ltd, 188, 271–
278.
Sun, Y. et al. (2017) ‘Non-Destructive Prediction of Moisture Content and Freezable Water Content
of Purple-Fleshed Sweet Potato Slices during Drying Process Using Hyperspectral Imaging
Technique’, Food Analytical Methods, 10, 1535–1546.
United Nations, New York and Geneva, 1998."UNECE standard DDP16: Dried apples", 2-12.
72

ANTIMICROBIAL USAGE IN FOOD AND AGRICULTURE
Neenu Mariam Varghese, Enda Cummins,
UCD School of Biosystems and Food Engineering, University College Dublin, Belfield, Dublin 4,
Ireland
Abstract
Antimicrobial usage in food animals plays a major role in emerging human health issues. The use of
antimicrobials is inevitable as they are used to inactivate or inhibit the growth of microorganisms in
food animals. The residues of the antibiotics could also be present in the animal’s tissues. Therefore,
when humans consume animal derived food products (such as the meat, egg or milk), there is a
chance of transfer of these antibiotics into human bodies. This can lead to many health concerns in
humans, including the development of antibiotic resistance, hypersensitivity reactions, toxicity,
teratogenicity and even carcinogenicity. From the literature reviewed, it is reported that the most
commonly used antibiotics in animals are the tetracyclines (oxytetracycline OTC, tetracycline TTC,
chlorotetracycline CTC, doxycycline DOC) followed by fluoroquinolones and penicillin. This study is
focusing on human exposure to these antibiotics in humans using Monte Carlo stimulation methods.
This paper presents a framework model for the development of this risk assessment.
Introduction
Antimicrobials are substances that are used to kill microorganisms or to inhibit their growth. They are
commonly used in food derived animals for disease treatment, prevention, control, growth promotion
or to improve feed conversion efficiency (Marshall and Levy, 2011). The commercial production of
antimicrobials and its application after the late 1940s in food derived animals resulted in the effective
treatment of infections, which were earlier considered to be untreatable (Saini et al. 2012).
Unfortunately, the introduction of antimicrobials gradually resulted in the emergence of antimicrobial
resistance (AMR).
The increased level of AMR can have a negative influence on the production of livestock by either
affecting productivity of the farm or by increasing the cost for disease treatment. Antimicrobial use
appears highest for chicken production (138 doses/1000 animal-day) followed by swine and dairy
cattle (Cuong et al. 2018).
The high-level usage of the antibiotics thus raises the possibility that residues would remain in the
edible tissues of the livestock which is meant for human consumption. This residue may cause a
health threat to humans. Therefore, internationally recognized organizations like the World Health
Organization (WHO), and the Food and Agriculture Organization (FAO/WHO 1988) have set
maximum residue limit (MRL’s) of the antimicrobial’s agents (Salama et al. 2011).
The method used in this study to assess potential human exposure to antimicrobials is through Monte
Carlo stimulation methods. It is a method for iteratively evaluating a deterministic model using sets of
random numbers as inputs. This method is used when the model is complex, non-linear or involves
more than just a couple of uncertain parameters. Figure 1 represents a flow diagram representation for
the various pathways. The flow diagram indicates the transfer of antimicrobials from one source to
another.
The objective of this study is to assess antimicrobial usage in animal husbandry (bovine, ovine,
avian, swine) and to assess potential transfer of these antimicrobials into the food products
(meat, milk and egg) and finally to assess potential human exposure.
73

Figure 1: Flow diagram for the potential transfer pathways of antibiotics
Materials and Methods
The antimicrobials are given to the animals either by the injection administration or through the feed.
Through the bio-transfer a certain amount of the antibiotics would be transferred from animals into
food products such as the meat, egg and milk. EU regulations have specified the maximum residue
limit (MRL) for various antibiotics. According to the EU regulations the MRL for the ampicillin in all
food producing species are 50 μg/kg (muscle, fat, kidney) and 4 μg/kg for the milk. While the MRL
for the tetracycline in all food producing species are 600 μg/kg (kidney), 100 μg/kg (muscle and milk)
and 200 μg/kg (eggs).
Injection of higher levels of antimicrobials into animals is done mainly to prevent the disease and to
promote the growth. As a result, the bio-transfer of antimicrobials into the animal tissue would be
greater. This can result in human’s exposure when they consume these products. The exposure level
in humans is found by multiplying the level of antibiotics in the food products such as the milk, egg,
or meat by the rate of consumption. The quantitative risk assessment model is developed through an
excel sheet.
Human exposure = Rf × Cf
Where:
Rf = antimicrobial residues in food products (milk, meat, egg).
Cf = Consumption of food product (milk, meat, egg) by humans.
After assessing the exposure level, the hazard characterization stage involved in the food chain is
investigated. Following the exposure of humans to the antimicrobials through the food, there is the
possibility of getting serious health issues such as allergies, antibiotic resistance, hypersensitivity
reactions, toxicity, teratogenicity and even carcinogenicity.
The flow diagram (Fig 2) represents the framework model that has developed for the risk assessment
on the human exposure to antimicrobials due to the usage of antimicrobials in the animal husbandry.
74

The various stages involved in the transfer of the antimicrobials from the animals to the humans is
shown the framework.
Animal Husbandry
(bovine, ovine, avian, swine)
Amount administered Antibiotic consumption by animals Amount administered
through medicine (Am ) (tetracycline, penicillin, ampicillin) through feed (Af)
Residual Concentration
Bio-transfer factor of antimicrobials in Processing Factors
(Rb) food product (egg, milk, meat) Cook(Rc), heat(Rh)
Consumption of meat
Milk and egg Human exposure Body weight (bw)
(Cmeat, Cmilk, Cegg)
Hazard characterization NOAEL
Figure 2: Framework to assess the quantitative transfer of antibiotics from the food animals to
humans
Results and Discussion
A framework model for the development of this risk assessment has been developed. The future work
for this project involves the collection of more information regarding the inputs in each stage of the
framework from various literature reviews. After collecting all the required data’s, these are then
incorporated into the Excel sheet to develop a Model Carlo stimulation model using the RASP
software tool (Cummins, 2019). The model will assess the risk assessment of human exposure to
antimicrobials by consuming meat, milk and eggs. Based on the acceptable daily intake value and the
exposure of humans to these antimicrobials, the risk involved can be found.
Conclusion
The usage of the antimicrobials on animal husbandry has a lot of advantages but when it is over used
this can create serious impacts on both animals and humans. Therefore, the usage of the
antimicrobials should be done based on the EU Codex Alimentarius. The transfer of the
antimicrobials may take place in the food chain, from animals to the humans. Humans may get
exposed to these antimicrobials when they consume the products of animal origin (such as milk, meat
and egg). If the level of the antimicrobials is higher than the acceptable level, it may have a negative
impact on human health. Now a day’s people have become more concerned about their health.
Therefore, they became more careful about the food they consume. Therefore, the use of the
antimicrobials in the animals should always be as per the EU regulations of the Codex Alimentarius.
75

References
Cummins E. (2019) “Risk Assessment Software Package (RASP)”, available from Dr. Enda
Cummins, Biosystems and Food Engineering, UCD.
Cuong, N., Padungtod, P., Thwaites, G., Carrique-Mas, J. (2018) "Antimicrobial Usage in Animal
Production: A Review of the Literature with a Focus on Low- and Middle-Income
Countries", Antibiotics, 7(3), 75.
Marshall, B. and Levy, S. (2011). Food Animals and Antimicrobials: Impacts on Human
Health. Clinical Microbiology Reviews, 24(4), 718-733.
Saini, V., McClure, J., Léger, D., Dufour, S., Sheldon, A., Scholl, D., Barkema, H. (2012)
"Antimicrobial use on Canadian dairy farms", Journal of Dairy Science, 95(3), 1209-1221.
Salama, N., Abou-Raya, S., Shalaby, A., Emam, W., Mehaya, F. (2011) "Incidence of tetracycline
residues in chicken meat and liver retailed to consumers", Food Additives and Contaminants:
Part B, 4(2), 88-93.
Sharma, C., Rokana, N., Chandra, M., Singh, B., Gulhane, R., Gill, J., Ray, P., Puniya, A., Panwar, H.
(2018) "Antimicrobial Resistance: Its Surveillance, Impact, and Alternative Management
Strategies in Dairy Animals", Frontiers in Veterinary Science, 4.
76

EVALUATION OF BIOPLASTICS FORMULATED FROM FOOD
WASTE USING NIR SPECTROSCOPY IMAGING
Vaibhavi Vivekanand, Vicky Caponigro, Aoife Gowen
UCD School of Biosystems and Food Engineering, University College Dublin, Belfield, Dublin 4,
Ireland.
Abstract
Plastic pollution can affect land, water and oceans negatively and also cause human health
degradation and the food chain. Most plastics are derived from petroleum or natural gas, which are
diminishing day by day. Manufacturing and developing bioplastics can be a sustainable solution to the
problem. Initially, land grown crops were used to prepare bioplastics, as it is not a sustainable option
and counters the Life cycle assessment of Starch based bioplastics. The real challenge is to synthesize
new materials from food waste and not from land grown crops.This study will focus on upcycling
banana peels, that contributes largely to the food waste generation. The characteristics of the
bioplastics will be evaluated by determining the tensile strength, water resistivity, mechanical and
thermal properties, rate of biodegradability. Near Infrared hyperspectral imaging is a new approach
that identifies plastic by several groups. The applicability is effective due to its simple instrumentation
and ability to detect spectra fast and without pre-process sample preparation. The NIR-HSI data will
be acquired using the push-broom system in the wavelength range of 950-1700 nm.
Keywords: Bioplastics, Banana peel, NIR, food waste, biodegradable, plastic, starch-based
Introduction
Plastics is a class of organic carbon chain polymers, is widely used in the daily life due to its
exceptional properties and pursuance over other materials like metal and wood, having advantages -
light weight, low price, high strength, user-friendliness (Álvarez-Chávez et al. 2012; Zhang et al.
2017). These significant properties have made plastic a very influential form of polymer, which is a
high molecular weight thermoplastic that can be molded into objects, films or filaments, derived from
petroleum as a by-product. As plastics are non-biodegradable, or their rate of decomposition is as long
as a decade and derived from non-renewable resources. To overcome the disadvantages, application
of the green chemistry, synthesis of biodegradable plastics is a sustainable approach to the
environmental crisis. The next concern is the broad range of environmental impacts, such as soil
erosions, deforestation, water and air pollution along with greenhouse gas emissions during the
process of food production, storage and transportation and waste management accompanied with the
generation of food waste (Schanes et al. 2018). Though, starch-based bioplastics are sustainable and
completely biodegradable, come along with drawbacks like long term instability due to water
absorption, ageing caused by retrogradation and poor mechanical properties. To overcome the
drawbacks, glycerol is added as a plasticizer to improve shelf-life and elasticity of the end product
(Ismail et al. 2016). Characterization and evaluation of plastic properties will be conducted on various
samples namely, the biodegradable synthetic plastic which will behave as the control, banana peel
bioplastic, potato starch-based plastic and banana peel and corn starch-based bioplastic at different
concentrations. Therefore, the study aims to investigate the tensile, mechanical and biodegradable
properties along with evaluation of the bioplastic films in terms of thermal properties and functional
group. Load test is to characterize the strength of the film whereas the water absorption test will
evaluate its ability to intake water that enhances the biodegradability, which is evaluated by the 5 days
soil burial test (Sultan and Johari 2017).
The objective of the study is to investigate the properties of bioplastic synthesized from banana
peel starch using NIR hyperspectral imaging. The results obtained will be compared with those
obtained for potato-starch based bioplastics, as well as other biodegradable synthetic plastics.
77

Materials and Methods
The research will be conducted as follows and is based on the literature review of development of
bioplastics from banana peel starch and potato starch (Ismail et al. 2016; Sultan and Johari 2017).
Materials
Bananas from supermarket, analytical grade hydrochloric acid (36% v/v) [Sigma-Aldrich CAS 7647-
01-0], glycerol (99.5% v/v) [Sigma-Aldrich CAS 56-81-5], sodium hydroxide (0.5M) [Supleco CAS
1310-73-2], 1% corn starch, acetic acid solution [Sigma-Aldrich CAS 64-19-7] were purchased from
Dublin, Ireland.
Instrumentation
The instrument used was Near Infrared hyperspectral imaging – push-broom spectral scanner, Data
acquisition software SScanner (DV Optics Ltd.) working in the wavelength region of 880-1720 nm.
Extraction of starch from the banana peel
Peel will be separated from the banana using stainless steel knife and cut into small pieces. The small
pieces will then be placed in 5-6% acetic acid solution before boiling. Banana peels to be boiled in
distilled water in 800 mL beaker for 30 minutes. Water will be decanted off and dried for 30 minutes.
Pureed the dried peels using a hand blender to form a fluid paste, after which paste will be filtered out
to separate the starch from the banana peel.
Preparation of the bioplastic film
25 mL of banana peel starch is to be placed in 50 mL beaker to which 3 mL of 0.5M HCl has to be
added and mixed using a glass rod. Add 2 mL of glycerol to the mixture and thoroughly mix using a
glass rod. The mixture has to be poured into a petri-dish and will be placed in the hot air oven at 60°C
for 30 minutes.
Preparation of the bioplastic film in addition with corn starch
25mL of banana peel starch placed in 50 mL beaker to which 3 mL of 0.5M HCl is to be added and
mixed using a glass rod. Add 2 mL of glycerol to the mixture and thoroughly mix using a glass rod. 3
ml of 1% corn starch will be added as a co-biopolymer and stir the mixture again. 3 mL of 0.5M
NaOH is to be added to the blend, which will be poured into a petri-dish and placed in the hot-air
oven at 60°C for 30 minutes.
Load test
A Bioplastic film is to be cut into 2 cm x 6 cm size. Film hooked onto the retort stand will be placed
3.5cm apart. A spring balance to be hooked onto the middle of the film and add weight load until
sample breaks apart. 3 such repeats will be performed and recorded to obtain an average value.
Tensile strength will be calculated using the following formula:
Tensile strength = Weight load(N)/Area of cross section of biofilm(m2)
Water absorption test
A bioplastic film is to be cut into 1cm x 2cm size. The initial weight will be recorded. Place the film
is in 60 mL water at room temperature for 24 hours. The film will be taken out of water and wiped
clean and the final weight will be recorded. The amount of water uptake will be calculated using the
formula:
Water absorption % = [(Final wt. (g) – Initial wt. (g))/Initial wt. (g)] x 100
Biodegradability test
78

5 days soil burial test will be carried out. The bioplastic film is to be cut into 1 cm x 2 cm size. The
film is to be buried in the soil, soil microorganisms will feed on it, which will result into weight loss
of the bioplastic film. Amount of biodegradation will be calculated as:
Soil degradation % = [(Final wt. (g) – Initial wt. (g))/ Initial wt. (g)] x 100
NIR hyperspectral imaging
NIR spectroscopy equipment at the School of Biosystems and Food Engineering (UCD) laboratory
will be used to process the samples. All the samples will be transported by a moving conveyor belt
with adjustable speed and will be compared with the standards. The apparatus is used for obtaining
NIR reflectance spectra with the wavelength region from 950 to 1700 nm every 7 nm. A diffused light
cylinder source with tungsten lamps provides the required energy for the sensing unit. The NIR-HSI is
controlled by a PC unit equipped with Spectral Scanner software. This technique is usually used to
determine the water structure of polymers. For better interpretation of the spectra, multivariate
analysis will be used to characterize the chemical bonds and vibrations in the films in terms of
hydrogen bonding (Xu et al. 2018).
Data analysis
The selection of the wavelength will be carried out using MatlabR2018a (The Math Works, Inc. USA)
in combination with method of principal component analysis (PCA) after pre-treatment process.
Expected Results and Discussion
The experiment will result in formation of bioplastic film synthesized by the starch from the banana
peel. As the experimentation has not yet commenced, therefore the following expected results are best
described based on the references to the current literature.
Load test
On determining the tensile strength of the sample, which will be compared with the tensile strength of
the standard biodegradable synthetic plastics. According to the literature, the banana peel and corn
starch bioplastic have the highest tensile strength due to cross linking chains in the amylose molecule
of the starch (Sultan and Johari 2017).
Water Absorption test
This test determines the water resistance of the film which is a required characteristic to provide the
properties of a conventional plastic. The absorption test of the film will be carried out for 24 hours
and according to the literature review, the film with the corn starch is expected to have the highest
water intake estimated at around 108.98% concentration (Sultan and Johari 2017). The potato starch-
based bioplastic is estimated to have around 32.35% and the water intake of the banana peel starch-
based bioplastic is to be determined yet. Presence of glycerol in the film, creates a tendency to absorb
water as it is hydrophilic low molecular carbohydrates, but depends on the number of hydroxyl groups
present and the molecular weight of glycerol (Sultan and Johari 2017).
Biodegradability test
According to the literature, the film is expected to have weight losses due to degradation process and
feeding of soil microorganisms. It is expected to absorb moisture from the soil, may swell and become
soft. After the burial test, it is expected to diminish in size, tend to become crisp and fragile (Imam et
al. 2005). This is said to be a result due to degradation of the starch molecules in the film. The
darkening of the sample is expected to be a sign of onset of decay (Manimaran et al. 2016).
NIR hyperspectral imaging
On conducting NIR-HSI, it is expected to provide information on the hydration level and distribution
of water in the bioplastic films and these results can be linked to the above tests that will be
performed through multivariate data analysis.
79

Conclusion
The bioplastic films using banana peels and corn starch is to be formulated. The 4 samples namely
conventional biodegradable synthetic plastic (standard), banana peel starch-based bioplastic, potato
starch-based bioplastic and banana peel and corn starch-based bioplastic is to be compared and their
respective characteristics will be studied, and an overall scoring will determine the bioplastic with
best characteristics. This research can have a potential application in the food packaging industry if
found to be compatible with various food products.
Bibliography
Álvarez-Chávez, C.R., Edwards, S., Moure-Eraso, R., Geiser, K. (2012) ‘Sustainability of bio-based
plastics: General comparative analysis and recommendations for improvement’, Journal of
Cleaner Production, 23(1), 47–56.
Huang, A.L., Chua, H., Yu, P.H., Chen, G.Q., Lo, W. (2008) ‘Conversion of food industrial wastes
into bioplastics’, Applied Biochemistry and Biotechnology, 70–72(1), 603–614.
Imam, S.H., Cinelli, P., Gordon, S.H., Chiellini, E. (2005) ‘Characterization of biodegradable
composite films prepared from blends of poly(vinyl alcohol), cornstarch, and lignocellulosic
fiber’, Journal of Polymers and the Environment, 13(1), 47–55.
Ismail, N.A., Mohd Tahir, S., Yahya, N., Abdul Wahid, M.F., Khairuddin, N.E., Hashim, I., Rosli, N.,
Abdullah, M.A. (2016) ‘Synthesis and Characterization of Biodegradable Starch-Based
Bioplastics’, Materials Science Forum, 846, 673–678.
Manimaran, D.S., Nadaraja, K., Vellu, J., Francisco, V., Kanesen, K., Yusoff, Z. Bin (2016)
‘Production of Biodegradable Plastic From Banana Peel’, 1(1), 1–7.
Rossi, M., Lent, T., Johnson, W. (2006) ‘Creating Safe and Healthy Spaces : Selecting Materials that
Support Healing Health Care Without Harm at a conference sponsored by’, Chief Executive,
(September).
Schanes, K., Dobernig, K., Gözet, B. (2018) ‘Food waste matters - A systematic review of household
food waste practices and their policy implications’, Journal of Cleaner Production,
182(February), 978–991.
Sultan, N.F.K., Johari, W.L.W. (2017) ‘The development of banana peel/corn starch bioplastic film: a
preliminary study’, Bioremediation Science and Technology Research, 5(1), 12–17.
Xu, J.L., Gowen, A.A., Sun, D.W. (2018) ‘Time series hyperspectral chemical imaging (HCI) for
investigation of spectral variations associated with water and plasticizers in casein based
biopolymers’, Journal of Food Engineering, 218, 88–105.
Zhang, Y., Zheng, Y., Li, X., Bai, J., Xu, J. (2017) ‘A discrimination model in waste plastics sorting
using NIR hyperspectral imaging system’, Waste Management, 72, 87–98.
80

GENOME ANALYSIS OF PATHOGENS FOR RESISTANCE TO
SANITATION PRODUCTS
Ge Xu, Francis Butler
UCD School of Biosystems and Food Engineering, University College Dublin, Belfield,
Dublin 4, Ireland.
Abstract
Listeria monocytogenes is a common foodborne pathogen with a mortality rate of 20-40%,
which is defined by the World Health Organization as one of the four major foodborne
pathogens globally. In the context of global environmental health and food safety concerns,
the use of sanitation products is increasing in several environments including in health care,
veterinary, and food product development. As the selection pressure of sanitisers increases,
the resistance of pathogenic microorganisms continues to increase. The formation of
biofilms is one of the important causes of microbial resistance to sanitisers, and biofilms in
nature are often found in the form of multiple microorganisms. In the biofilm, Listeria
monocytogenes and commensal bacteria form biofilms, which help bacteria survive in the
anti-drug stress environment.
Introduction
In recent years, food safety has become a public health concern of the world. Foodborne
pathogens are the leading cause of foodborne diseases and cause serious harm to human
health. They are serious risks to food safety. Listeria monocytogenes (LM) is a common
foodborne pathogen, and WHO listed it as one of the four major foodborne pathogens in the
1990s. Listeria monocytogenes is a zoonotic disease that is widespread in nature and can
exist in a variety of foods (Farbor 1991). It can develop from fever, gastroenteritis to severe
invasive diseases (listeriosis), leading to sepsis, encephalitis, endocarditis, meningitis and
other syndromes (Charlier et al., 2017). Listeria monocytogenes belongs to the genus
Listeria. It is a Gram-negative short rod with no spores. The growth environment is aerobic
and facultative anaerobic, which can grow and survive in extreme environments. It has a
growth temperature of -1.5°C to 50°C, a pH of 4.3- 9.6, high salt tolerance, and can
withstand freezing and drying (Doyle et al., 2001; Gardan et al., 2003). After the 1980s,
Listeria monocytogenetic food poisoning in Europe and the United States showed an
upward trend. In addition to contaminating animal foods such as milk and meat products,
the bacteria can also be found in vegetable foods.
The objective of this study was to analyze the gene sequence contributing to sanitizer
resistance and mechanism of action and control the growth of the Listeria
monocytogenes for reducing risks to the environment and humans.
Vitas et al. (2004) tested 293 raw meat products in Spain with a contamination rate of
34.9% for Listeria monocytogenes and 36.1% for raw poultry products. For dairy products,
the Listeria contamination rate was found to be 6.8% in 340 raw milk samples from Spain.
The detection rate of Listeria monocytogenes in 100 pieces of smoked salmon in Spain is
28%. In addition to animal foods, the presence of Listeria monocytogenes in soils and
animal manure as a fertilizer allows plants such as vegetables to be contaminated with
Listeria monocytogenes in the field. The contamination rate of Listeria monocytogenes in
Danish vegetable products is 12.1%-34% (Nørrung et al., 1999). The biofilm refers to a
micro-organism adsorbed on the surface of an inert object, which secretes a polysaccharide
matrix, fibrin, lipoprotein, and extracellular polymer (EPS) such as DNA, which are
adhered to each other and aggregated and formed into a multi-organized structure. It is a
special growth state in which microbes are adapted to the stress environment to form a
81
favourable environment. Biofilms are ubiquitous and can be formed on a variety of
surfaces. More than 90% of microorganisms in nature are in the form of biofilms.
Materials and Methods
Identification of bacteria strains
The genomes of the Listeria monocytogenes strains were downloaded from NCBI
(www.ncbi.nlm.nih.gov).
Data analysis
A number of studies have reported on biofilm formation. Pan et al. (2006) measured biofilm
cell viability and biofilm resistance to sanitizer using an automatic plate reader on an agar
plate, the survival rate is equal to No/Ni, where Ni is CFU/ml after treatment with sanitizer
and No is the initial count of CFU/ml before treatment. The final factors that result in
different data are: (i) two different biofilm matrices, stainless steel and Teflon; (ii) Two
treatments under the SFP model, one for the experimental group treated with the sanitizer
and the blank control group without the sanitary treatment. From the previous researches,
the active efflux pump is the main mechanism for tolerance to sanitisers, which is inherent
(Aase, 2000). Dutta et al. (2013) have demonstrated that in BAC-tolerant Listeria
monocytogenes from various sources, the bcrABC box is present in 98.6% of isolates. The
most suitable method for determining the MIC of antibacterial drugs is to observe the
growth of pathogen after incubation for a certain period. The MIC is determined to inhibit
the growth of pathogens with a drug-concentrated agar plate. With the residue of the
sanitiser, the resistance of the pathogen gradually increases. Genetically moving elements
also play an important role in the transmission of resistance genes in Listeria
monocytogenes. In isolates carrying bcrABC, Dutta et al. (2013) have proposed that
chromosomal transmission and subsequent integration and other resistance genes are
mediated through plasmids containing transposons.
Results and Discussion
Biofilm inactivation of Listeria monocytogenes by sanitiser (BC) under SFP system
The test of Pan et al. (2006) showed that the degree of deactivation on the surface of
stainless steel is usually higher than the degree of deactivation on Teflon. In the first week,
the biofilm was clearly inactivated. In the next two weeks, the cell concentration did not
change much, indicating a progressive increase in biofilm resistance. The resulting
resistance mechanisms mainly include: the physical hindrance of extracellular polymers in
the biofilm can effectively reduce the intra-membrane strains. The concentration of the
bacteriostatic drug is also the blocking effect, so that the microorganisms in the membrane
have enough time to open and express the corresponding drug resistance gene (Mah and
O’toole, 2001).
The analysis of bcrABC gene’s resistance to BC
Sequence analysis revealed that the bcrABC resistance gene cassette is part of a composite
transposon. After deletion of bcrB gene or bcrC gene, the MIC of both mutants decreased to
10 μg/mL, indicating that the efflux pump bcrBC protein mediates the resistance of LM
strain to BC. Therefore, it is speculated that the constitutive overexpression of the bcrBC
gene is fatal to cells. The strain H7550 was exposed to a sublethal concentration of BC (like
10 μg/mL), and the transcription level of the bcrABC resistance gene cassette was
significantly increased. However, when the mass concentration of BC solution was increased
by twice or 4 times, the transcription level of the bcrABC resistance gene cassette was
basically unchanged.
82

Expected work
Due to the coexistence mechanism of Listeria monocytogenes, the dominant commensal
bacteria coexisting with it should be found out. For example, the superior commensal
bacteria were isolated from the food processing equipment, and the dominant commensal
bacteria and LM coexisted to form a biofilm. It provides a new theoretical basis for effective
control of food safety issues arising from LM as a potential source of contamination in food
products and processing, and better removal of residual LM biofilms. The effect of these
dominant commensal bacteria on the regulation of the monocytogenes of the Listeria
monocytogenes, and the effect of the coincidence, remains to be further explored.
Conclusions
In order to study the tolerance of Listeria monocytogenes to disinfectants, the BC sensitivity
test showed that the ability of Listeria monocytogenes to tolerate benzalkonium chloride in
the food environment under sanitation products environment is constantly increasing.
Biofilm formation is the main reason for the important role of microbial pathogenicity and
drug resistance. The structural characteristics and dynamic mechanism of mixed biofilms in
micro-ecological systems are mainly derived from the internal inductive system
communication between different species interaction. bcrABC can be transmitted in Listeria
monocytogenes strains, and most resistant strains contain bcrABC. In addition, it is also
another resistance determinant of Listeria monocytogenes (Katharios-Lanwermeyer et al.,
2012).
References
Aase, B., Sundheim, G., Langsrud, S., Rørvik, L.M. (2000) ‘Occurrence of and a possible
mechanism for resistance to a quaternary ammonium compound in Listeria
monocytogenes’, International journal of food microbiology, 62(1-2), 57-63.
Charlier, C., Perrodeau, É., Leclercq, A., Cazenave, B., Pilmis, B., Henry, B., Lopes, A.,
Maury, M.M., Moura, A., Goffinet, F., Dieye, H.B. (2017) ‘Clinical features and
prognostic factors of listeriosis: The MONALISA national prospective cohort study’,
Lancet Infect. Dis. 17(5), 510-519.
Doyle, M.E., Mazzotta, A.S., Wang, T., Wiseman, D.W., Scott, V.N., (2001) ‘Heat
resistance of Listeria monocytogenes’, Food Prot. 64(3), 410-429.
Dutta, V., Elhanafi, D., Kathariou, S. (2013) ‘Conservation and Distribution of the
Benzalkonium Chloride Resistance Cassette bcrABC in Listeria monocytogenes’,
Applied and Environmental Microbiology, 79(19), 6067.
Elhanafi, D., Dutta, V., Katharious, S. (2010) ‘Genetic characterization of plasmid-
associated benzalkonium chloride resistance determinants in a Listeria
monocytogenes strain from the 1998-1999 outbreak’, Applied and Environmental
Microbiology, 76(24), 8231-8238.
Farbor, J.M. (1991) ‘Listeria monocytogenes a Food-Borne Pathogen’, Microbiological
Reviews, 55(3), 476-511.
Gardan, R., Cossart, P., The European Listeria Genome Consortium, Labadie, J., European
Listeria Genome Consortium, The European Listeria Genome Consortium (2003)
‘Identification of Listeria monocytogenes genes involved in salt and alkaline-pH
tolerance’, Appl. Environ. Microbiol, 69, 3137-3143.
Katharios-Lanwermeyer, S., Rakic-Martinez, M., Elhanafi, D., Ratani, S., Tiedje, J.M.,
Kathariou, S. (2012) ‘Coselection of Cadmium and Benzalkonium Chloride
Resistance in Conjugative Transfers from Nonpathogenic Listeria spp. to Other
Listeriae’, Applied and Environmental Microbiology, 78(21), 7549-7556.
Mah, T.F.C., O’toole, G.A. (2001) ‘Mechanisms of biofilm resistance to antimicrobial
agents’, Trends in microbiology, 9(1), 34-39.
83

Nørrung, B., Andersen, J.K., Schlundt, J. (1999) ‘Incidence and control of Listeria
monocytogenes in foods in Denmark’, International Journal of Food Microbiology,
53(2-3), 195-203.
Pan, Y., Jr, F.B., Kathariou, S. (2006) ‘Resistance of Listeria monocytogenes Biofilms to
Sanitizing Agents in a Simulated Food Processing Environment’, Applied and
Environmental Microbiology, 72(12), 7711-7717.
Vitas, A.I., Garcia-Jalon, V.A.e.I. (2004) ‘Occurrence of Listeria monocytogenes in fresh
and processed foods in Navarra (Spain)’, International Journal of Food
Microbiology, 90, 349-356.
84

HYPERSPECTRAL IMAGING TO MEASURE THE MOSTURE
CONTENT OF KIWI SLICES USING HOT-AIR DRYING
Yalan Yin, Da-Wen Sun, Xiaohui Lin
UCD School of Biosystems and Food Engineering, University College Dublin, Belfield,
Dublin 4, Ireland.
Abstract
Hyperspectral imaging is a rapid and non-destructive detection technique for quality analysis
such as moisture content, which is operated by simultaneously offering spectral data. The
purpose of this study was to demonstrate the feasibility of hyperspectral imaging in measuring
moisture content of kiwifruit under hot-air drying process. The data processing and analysis
were based on Matlab 2015a. Calibration model was based on partial least square regression
(PLSR) to establish the relationship between spectral data and moisture distribution.
Introduction
Kiwifruit is considered as “the king of the fruits” given the high contents of Vitamin C and
polyphenol compounds with antioxidant activity (Zhou et al. 2018). Due to its multi-nutritional
value, many studies have demonstrated kiwifruit’s beneficial effect on human health such as
cancer prevention. Moreover, the moisture content (MC) of kiwifruit was found ranging from
80% to 86% (wet basis) (Cangi et al. 2011). Therefore, kiwifruit has a very short shelf-life and
is highly perishable after harvest.
In order to overcome the problem of the short-life of kiwifruit, drying has become one of the
commonest preservation alternatives to increase storage stability. There are various drying
techniques for food, such as microwave vacuum drying, freeze drying, hot-air drying as well as
radio frequency-vacuum drying. Among of these, hot-air drying is a simple and common
method for fruits and vegetables drying. During the hot-air drying process, the heated dried air
is forced to flow through the samples and thermal energy is transmitted to the surface of
samples by convection and then transferred to the interior by heat conduction (Chin et al. 2015).
In addition, by reducing water content, the concentrations of various ingredients increase, giving
the dried kiwifruit other flavors, shapes and textures.
With increasingly demand for fruit quality, assessment of quality attributes has becoming a big
concern. In order to meet the requirement and quality assurance, sophisticated analytical
procedures for quality control have been carried out. Compared with traditional methods,
hyperspectral imaging (HSI) techniques is a potential analytical tool with following advantages:
fast operation speed, non-destructive analysis, without prior sample preparation and
synchronous assessment. Using HSI methods, the quality attributes such as moisture content in
the samples can be visualized during the drying process. In recent year, HSI has been researched
for apple, banana and mango (Pu and Sun 2016; Nguyen-Do-Trong et al. 2018). However, the
information on using HSI for evaluating kiwifruit MC during hot-air drying processes is limited.
The objective of the study was to investigate the potential and feasibility of
hyperspectral imaging techniques for measurement of moisture content of kiwifruit
during hot-air dying process.
85

Materials and methods
Sample Preparation
Fresh kiwifruits (variety: kiwi Hayward, ctinidia Deliciosa Planch, Greece) were purchased
from the local supermarket Tesco. Similar ripeness and size (diameters = 35-45 mm, length=50-
60 mm) were selected. Then the fruits were stored in a refrigerator at 4°C until testing, and the
fruits were peeled and cut into slices with diameter 35-45 mm and three thickness: 2, 4, 6 mm
for initial dehydration of kiwi. Ten samples for each thickness were prepared, and then the
weight was recorded. The drying procedure was carried out in a hot-air drier at 60°C. Every
hour, the kiwi was taken out of dryer to check the weight until the moisture content of kiwifruit
samples decreasing to constant weight. The weight and diameter were measured and are shown
in Table 1.
Table 1. Weight and diameter measurement
Thickness (mm) 2 4 6
No. of kiwi slices 10 10 10
Diameter (mm) 35-45 35-45 35-45
Weight (g) 2.7±0.2 5.5±0.5 9.0±1.0
Moisture content
Using hot-air dryer to determine the moisture content (MC) of each slice at 105°C until a
constant weight. The MCs are calculated by the following equation:
W =𝑊0−𝑊𝑐
𝑊𝑐,
Where W0 is the original weight, Wc is the slices constant drying weight.
Hyperspectral Imaging System
The moisture content of kiwifruit was visualized by using a HSI system (Figure 1) and the detail
of the setup was described in the previous study (Lin et al. 2019). The system consists of a CCD
camera (Canon PowerShot A75, Canon, USA), a spectrometer, a zoom lens (value at f = 4.5,
speed at 1/10), a sample holder, and four lamps (Kaiser Fototechnik, 126 Buchen, Germany).
Hyperspectral image acquisition program was used to synchronize the movement of the
samples.
Figure 1. hyperspectral reflectance imaging system (Nguyen-Do-Trong et al. 2018)
86

Image acquisition and data analysis
When the translation stage was operated, the kiwi slices were progressively conveyed through
the field of detector and the surfaces of kiwi slices was successively scanned. The white and
black references were applied to remove the influence of darkness from camera. Imaging and
spectra processing were conducted by Matlab software 2015a. In order to obtain reliable and
robust prediction model, standard normal variate (SNV) and Savitzky-Golay (SG) were applied
in pre-treatment of spectral data to remove background information and reduce noises. A large
amount of spectral data extracted from hyperspectral imaging needed the establishment of
multivariate analysis of correlated spectral data and moisture. Partial least squared regression, a
reliable multivariate calibration method, was applied to relate spectral data and reference values
(Qu et al. 2017). After calculating the calibration equation, it is necessary to validate its
predictive performance for samples. Root mean square error (RMSE) and coefficient of
determination (R2) are significant criterion to evaluate model’s performance. The values of
RMSE should be low enough to get acceptable calibration equations (Pu and Sun 2015).
Results and Discussions
Mathematical modeling of drying Kinetics
The dynamic models of kiwifruit drying were conducted at a temperature of 60°C. R2, RMSE
and 𝜒2 are statistical parameters for the dynamic model (Mahjoorian et al. 2017). Slice
thickness had a significant effect on dying time and the moisture ratio was significantly affected
by dying time and thickness.
Modelling and prediction of moisture content
The study establishing a PLSR model based on spectra data and visualized MC in dehydrated
kiwifruit. The value of R2 should be close to 1, meaning a perfect linear relationship between
predicted and reference values (Sun et al. 2017).
Selection of optimal wavelength
The selection of wavelength plays an important role in multispectral imaging systems, which
could simplify large amounts of spectral data. In this study, the wavelengths were selected by
means of the corresponding regression coefficient obtained from the PLSR model, and then the
moisture content prediction model was constructed according to the selected wavelength. (Sun
et al. 2017).
Conclusion
In the present study, hyperspectral imaging techniques demonstrated the feasibility in measuring
moisture content of kiwifruit under hot-air drying process. Moisture content was measured by
conventional methods. Based on original spectral data set, PLSR models acquired accurate
prediction maps of moisture content in kiwi slices. Optimum wavelengths were also chosen to
simplify the spectral data.
References
Cangi, R., Altuntas, E., Kaya, C. and Saracoglu, O. (2011) 'Some chemical and physical
properties at physiological maturity and ripening period of kiwifruit ('Hayward')',
African Journal of Biotechnology, 10(27), 5304-5310.
Chin, S.K., Siew, E.S. and Soon, W.L. (2015) 'Drying characteristics and quality evaluation
of kiwi slices under hot air natural convective drying method', International Food
Research Journal, 22(6), 2188-2195.
Lin, X., Xu, J.-L. and Sun, D.-W. (2019) 'Investigation of moisture content uniformity of
microwave-vacuum dried mushroom (Agaricus bisporus) by NIR hyperspectral
imaging', LWT, available: http://dx.doi.org/10.1016/j.lwt.2019.03.034.
87

Mahjoorian, A., Mokhtarian, M., Fayyaz, N., Rahmati, F., Sayyadi, S. and Ariaii, P. (2017)
'Modeling of drying kiwi slices and its sensory evaluation', Food Science & Nutrition,
5(3), 466-473, available: http://dx.doi.org/10.1002/fsn3.414.
Nguyen-Do-Trong, N., Dusabumuremyi, J.C. and Saeys, W. (2018) 'Cross-polarized VNIR
hyperspectral reflectance imaging for non-destructive quality evaluation of dried
banana slices, drying process monitoring and control', Journal of Food Engineering,
238, 85-94, available: http://dx.doi.org/10.1016/j.jfoodeng.2018.06.013.
Pu, Y.-Y. and Sun, D.-W. (2015) 'Vis–NIR hyperspectral imaging in visualizing moisture
distribution of mango slices during microwave-vacuum drying', Food Chemistry, 188,
271-278, available: http://dx.doi.org/10.1016/j.foodchem.2015.04.120.
Pu, Y.-Y. and Sun, D.-W. (2016) 'Prediction of moisture content uniformity of microwave-
vacuum dried mangoes as affected by different shapes using NIR hyperspectral
imaging', Innovative Food Science and Emerging Technologies, 33, 348-356,
available: http://dx.doi.org/10.1016/j.ifset.2015.11.003.
Qu, J.-H., Sun, D.-W., Cheng, J.-H. and Pu, H. (2017) 'Mapping moisture contents in grass
carp (Ctenopharyngodon idella) slices under different freeze drying periods by Vis-
NIR hyperspectral imaging', LWT - Food Science and Technology, 75, 529-536,
available: http://dx.doi.org/10.1016/j.lwt.2016.09.024.
Sun, Y., Liu, Y., Yu, H., Xie, A., Li, X., Yin, Y. and Duan, X. (2017) 'Non-Destructive
Prediction of Moisture Content and Freezable Water Content of Purple-Fleshed
Sweet Potato Slices during Drying Process Using Hyperspectral Imaging Technique',
Food Analytical Methods, 10(5), 1535-1546, available:
http://dx.doi.org/10.1007/s12161-016-0722-0.
Zhou, X., Xu, R., Zhang, B., Pei, S., Liu, Q., Ramaswamy, H.S. and Wang, S. (2018) 'Radio
Frequency-Vacuum Drying of Kiwifruits: Kinetics, Uniformity, and Product Quality',
Food and Bioprocess Technology, 11(11), 2094-2109, available:
http://dx.doi.org/10.1007/s11947-018-2169-3.
88

INVESTIGATION OF PENETRATION DEPTH OF NIR LIGHT
IN FOOD PACKAGING
Zhihao Yuan and Aoife Gowen
UCD School of Biosystems and Food Engineering, University College Dublin, Belfield,
Dublin 4, Ireland.
Abstract
As a non-destructive measurement technology, near-infrared (NIR) hyperspectral imaging
technology has become more and more mature in the research of food packaging plastics, and it
has been possible to classify different plastics. In this study, three commonly used food
packaging plastics, including PE, PVC and PVDC, were selected for research. The experimental
results will be obtained by testing 270 samples with a spectral frequency in the range of 4000-
7000 cm-1. In addition, the spectrum of polystyrene is selected as the reference spectrum in this
study. All experimental data will be processed by MATLAB for data analysis. This study is
mainly aimed at the optical characterization of plastic film samples to explore the feasibility of
quantifying the penetration depth of NIR hyperspectral imaging light on packaging plastics, so
as to further explore the thickness of food plastic packaging in the thickness range will not
affect the non-destructive testing results of food.
Introduction
Compared with traditional chemical procedures, instrumental methods, sensory analysis and
screening methods, near-infrared reflectance (NIR) spectroscopy is a more sensitive, fast and
non-destructive analytical technique, which sample preparation is simple and can be evaluated
simultaneously (Fraser et al., 2003). According to last surveys, NIR spectroscopy has been
successfully applied to the determination of substances in food safety, such as protein and fat
content in meat and sugar content in fruits (Fraser et al., 2003; Prieto et al., 2009). In addition,
NIR can be used to distinguish foods that are not detectable by the senses (Porep et al., 2015).
Therefore, in the food production chain, if NIR can penetrate the plastic packaging of the
finished product to carry out non-destructive quality inspection of the food, which not only can
guarantee the quality and safety of the food, but also can minimize the commercial cost
(Lammertyn et al., 2000). In fact, this study is to determine the maximum NIR penetration
depth of food packaging plastics, which is related to how to choose the optimum thickness
packaging to achieve quality assurance without compromising quality testing results.
According to others research, NIR spectroscopy has relationship with the composition,
thickness and the process of plastic. It is well known that NIR can penetrate to a depth from mm
to cm (Prieto et al., 2009). Some studies have shown that the penetration of NIR radiation is
related to wavelength, which varies with the type of plastic. The penetration depth of NIR varies
from 2-3 mm at 900-1900 nm (5263 cm-1-11111 cm-1) to 4 mm at 700-900 nm (11111 cm-
114285 cm-1) in some apple thickness studies (Lammertyn et al., 2000).
Food packaging film is a plastic film that is commonly used to seal food in containers, to block
moisture and to prevent direct contact between air and food, keeping food fresh for a long
period of time. General plastic film is about 0.0005 inches (12.7 microns) thick, and most
household brand plastic film is between 8 to 10 microns thick (Zheng et al., 2018). The main
purpose of the current international research is to quantify the thickness of NIR radiation
penetrating samples. Then to study the penetration depth of NIR radiation at different
wavelengths.
89

The primary objective of this study is to compare the NIR penetration depth of several
common plastic packaging, including PE, PVC and PVDC, to ensure that the impact of
packaging on the test results is minimized when non-destructively testing food quality.
Materials and Methods
Materials
First, choose from 3 different brands of PE, PVC and PVDC food packaging film and take a
5mm (n = 5) diameter plastic film plug from them. Then, these samples will be cut to
different thicknesses of 1 mm to 5 mm, which thickness of each plastic film slice is measured
three times with a caliper and averaged. Repeat the experiment three to five times for each
kind of packaging film (Padalkar et al., 2015).
Table 1. Data table sample
Classification (%)
Species PVC PE PVC
Brands Tesco Lidl Spar Tesco Lidl Spar Tesco Lidl Spar
Sample 1 2 3 1 2 3 1 2 3 1 2 3 1 2 3 1 2 3 1 2 3 1 2 3 1 2 3
Depth
(mm)
1
2
3
4
5
Instrument
As figure 1 shows (CAMLIN, 2019), the push-broom hyperspectral imaging (HSI) system is a
highly integrated optoelectronic system used to obtain high spectral lines, which is based on
Gigabit Ethernet InGaAs cameras and imaging spectrometers for extending near-infrared
spectroscopy systems. This system uses an imaging spectrometer and camera to record a
spectral image (two-dimensional image) in which the first dimension has a spatial map and
the second dimension is the spectral axis. HSI systems are built from spectral sensors,
scanning mechanisms, software and signal processing. These components are typically used
to acquire and analyze hyperspectral data sets and then centrally extract data.
Figure 1. Push-broom HIS system (Gowen, 2019)
90
Methods
NIR fiber optic probe data collection
NIR spectra will be obtained using a 3 mm diameter silica glass NIR fiber optic reflective
probe (Art Photonics, Berlin, Germany) coupled to push-broom HSI system (Padalkar et al.,
2015). The spectra of plastic samples of different thicknesses will be collected in contact
mode, some of which placed a polystyrene plate with a spectral resolution of 16 cm -1 below,
and the other part did not (Huang et al., 2016). In this study, the background spectrum is
collected from the mirrored surface. Results included 270 co-added scans in the frequency
range of 4000-7000 cm-1.
Meanwhile, the reference spectrum will be collected from a polystyrene plate, which
thickness is 0.54 mm, to identify a target peak (Padalkar et al., 2015). During the experiment
(Padalkar et al., 2015), polystyrene will be placed on the mirrored surface and sample will be
placed on the polystyrene. When sample is less than 1 mm, data will be collected in the form
of transflective. As the thickness of sample increases, diffuse reflection will become dominant
in the spectrum.
Data analysis
Using MATLAB 2018 to process NIR spectra. Spectra of packaging films in different
thicknesses will be analysed to understand the effect of thickness increase on the NIR
spectrum. For data analysis, the NIR spectral range is divided into two regions: 4000-5100 cm
-1 and 5100-7000 cm -1 (Padalkar et al., 2015). Polystyrene peaks will be identified and
evaluated to determine penetration depth in different regions. The spectra about samples with
and without polystyrene plates will be compared to determine the penetration depth of the
NIR.
The spectra will be first visually compared to see if a polystyrene peak is visible in the
original sample spectrum when the polystyrene plate is placed underneath sample. In
addition, second derivative spectra will be used to improve the evaluation of the presence of
polystyrene in the spectrum of food packaging plastics.
Results and Discussion
No results have yet been obtained. The following is the expected experimental results.
The NIR spectrum of the packaging film with varying thicknesses
Comparing the spectra of plastic films of different thicknesses, the effect of increasing the
thickness on the spectrum will be obtained. It is expected that as the thickness increases, not
only the peak is changing, but the data acquisition mode also changes. When the thickness is
less than 1 mm, the data is collected in a transflective mode while the radiation penetrates the
sample and is reflected back from the mirror (Zomeño et al., 2012). However, as the thickness
increases, the data is primarily in the form of diffuse reflection (Porep et al., 2015).
Therefore, when the data collection method changes, the maximum penetration thickness of
different food packaging plastic films can be found.
Comparison of original and second-order derivatives of NIR spectra of food packaging films
of different thicknesses with polystyrene underneath
If the polystyrene peak is clearly visible in all areas of the NIR spectrum, this indicates that
the NIR penetrates the sample.
References
CAMLIN. (2019) Hyperspectral Imaging Systems. Available at:
https://www.camlingroup.com/product/hyperion-hsi [Accessed 2019].
91

Fraser, D.G., Jordan, R.B., Künnemeyer, R. & McGlone, V.A. 2003, "Light distribution
inside mandarin fruit during internal quality assessment by NIR spectroscopy",
Postharvest Biology and Technology, 27(2), 185-196.
Gowen, A. (2019) Pushbroom HSI System [Photograph]. Dublin: Irish Government
Department of Agriculture, Fisheries and Food (Food Institutional Research Measure).
Huang, M., Kim, M.S., Chao, K., Qin, J., Mo, C., Esquerre, C., Delwiche, S. & Zhu, Q. 2016,
"Penetration depth measurement of near-infrared hyperspectral imaging light for milk
powder", Sensors (Switzerland),16(4), 441-441.
Lammertyn, J., Peirs, A., De Baerdemaeker, J. & Nicolaı, B. 2000, "Light penetration
properties of NIR radiation in fruit with respect to non-destructive quality assessment",
Postharvest Biology and Technology, 18(2), 121-132.
Padalkar, M.V. & Pleshko, N. 2015, "Wavelength-dependent penetration depth of near
infrared radiation into cartilage", Analyst, 14(7), 293-21.
Porep, J.U., Kammerer, D.R. & Carle, R. 2015, "On-line application of near infrared (NIR)
spectroscopy in food production", Trends in Food Science & Technology, 46(2), 211-
230.
Prieto, N., Roehe, R., Lavín, P., Batten, G. & Andrés, S. 2009, "Application of near infrared
reflectance spectroscopy to predict meat and meat products quality: A review", Meat
Science, 83(2), 175-186.
Zheng, Y., Bai, J., Xu, J., Li, X. & Zhang, Y. 2018, "A discrimination model in waste plastics
sorting using NIR hyperspectral imaging system", Waste Management, 72, 87-98.
Zomeño, C., Juste, V. & Hernández, P. 2012, "Application of NIRS for predicting fatty acids
in intramuscular fat of rabbit", Meat Science, 91(2), 155-159.
92

DEVELOPMENT OF A FEASIBILITY PLAN TO CONVERT A
SURFBOARD MANUFACTURING PLANT INTO A SUB-ZERO
FACILITY WITH RESPECT TO CARBON FOOTPRINT OF THE
PRODUCTS AND ENERGY FOOTPRINT OF THE PROCESS
Chris D. Darling, Kevin P. McDonnell
UCD School of Biosystems and Food Engineering, University College Dublin, Belfield, Dublin 4,
Ireland
Abstract
The sport of surfing has been in existence since the 1700s wherein the sailor Captain James Cook
recorded seeing Polynesian natives enjoying the sport, floating in the sea atop wooden planks made
from Balsa wood. Over the past 230 years the sport has grown in popularity, especially since the
1970s. Rising demand has seen the manufacture of the surfboard vessel go form solid wood plank to
high density Polyurethane(PU) foam, coated with Unsaturated Polyester Resin. A rough estimate of
the number of surfboards manufactured today stands at 400,000, with manufacturing facilities located
all over the world. The carbon footprint of the process has, until very recently, been overlooked.
However, the industry has seen substantial developments in the last 8 to 10 years with regard to the
raw material involved. This research review suggests that a large reduction in the carbon and energy
footprint of the facility is possible, but reaching sub-zero levels of footprint may be unfeasible given
the present advancement in raw materials required.
Introduction
The objective of this study is to determine the feasibility of converting a surfboard
manufacturing factory into a sub-zero production facility with respect to carbon footprint of the
product and energy consumption of the process.
Surfboards have been commonly constructed using concrete pressure moulded Polyurethane(PU)
foam and encased with a mixture of Unsaturated Polyester Resin(UPR) and cloth weave (Beck, 2017).
The foam is cut, or planed, down to its required dimensions and then encased in UPR/cloth weave for
structural integrity and to seal the foam from water interference. Once the resin is dry, plastic moulds
are inserted into the underside of the board, allowing for the attachment of the fins. Finally, the
surfboard is then sanded down to a gloss smooth finish. As will be shown, the entire manufacturing
process leads to a significant amount of waste and dust.
Technology Advancements:
In recent times, more advance methods of manufacture have seen two type of technologies becoming
more mainstream
1. Expanded Polystyrene Foam (EPS) encased with Marine-specific Epoxy Resin
2. Algae-based PU foam, encased with Polyester Resin.
93

1. The main advantage of EPS foam and Epoxy Resin lies in the recyclability and low carbon content
of the materials. Whilst PU foam, made from Polyols extracted from crude oil, is not recyclable, EPS
foam is 100% recyclable, it can be ground down and re-used as packaging and coffee cups. The foam
is made from styrene, a liquid hydrocarbon. It comes in the form of tiny spheres glued together, and
the foam itself is 95% air. When it is broken down, 25% of the tiny spheres can be re-used in a new
block of foam. A rough value for the carbon footprint of this foam can be found in the figure below.
Marine-Specific Epoxy resin, compared to Unsaturated Polyester Resin, has a 40% bio-content and it
emits substantially less volatile organic compounds. The figure below quantifies the reduction in
carbon footprint that Epoxy provides, compared to UPR.
2. Algae-based PU foam is becoming more mainstream every year, since it’s creation in 2011 and this
can be used to reduce the carbon footprint of products(ArcticFoam 2015). Many eco-friendly
manufacturers use Epoxy resin to encase the foam, further reducing the carbon footprint. A
representation of the extent of impact an individual PU/UPR surfboard has on the local environment
can be shown through the Life Cycle Analysis performed on behalf of Firewire Surfboards. The figure
below illustrates the emissions from the PU/UPR surfboard, and compares it with the that of
EPS/Epoxy/Wood shell surfboards.
In a similar study, The Surfboard Cradle-to-Grave (Schultz, 2009) , the author calculated the
emissions for both types of raw materials through the database Economic Input-Output Life Cycle
Assesment (EIOLCA)(University 2019) showed that the major contributing factors to the production
process are raw materials, manufacturing energy and waste from the process. Surprisingly, the carbon
emissions from transport were low, compared to the raw materials. It was estimated from a report by
Pure Strategies that between 0.9 and 2.22kg of CO2 are emitted from transport of materials from Asia
to California and then from West Coast of America to East.
It has been estimated that the number of surfboards manufactured globally is 400,000(Pitta, 2003).
This is a substantial number, considering each surfboard emits a minimum of 33.5kg CO2, overall
equating to 13,400 MT CO2 e. It can be estimated that at least 50% of all surfboards are made using
the more toxic approach (PU/UPR) and 50% the lesser approach. This equates to 16220 MT CO2 e
(9,520MT CO2 + 6,700 MT CO2 e). However, a report written in 2015 detailed that the sale of Algae-
based PU foam had risen to 85,000 products sold, which is a substantial market share, and could
reduce footprint. (Hepler, 2015)
Materials and Methods
To perform the simulations required for the feasibility of a zero carbon and energy emissions factory,
a facility in Clare has been chosen as a template. This is the largest surfboard manufacturing factory
in Ireland and is also typical of an average manufacturing plant due to that fact that it employs two
separate types of materials in the production process, performed by two different types of
craftsperson. One construction technique involves PU/UPR materials, whilst the other technique
involves EPS/Epoxy.
To ascertain the material and energy requirements for functionality of the factory an audit was
performed, with the permissions of the owners. A range of topics were examined covering the
production process, transport of goods, materials disposal and air emissions.
It is the intention of this thesis to employ GaBi v 3 software to calculate the carbon footprint of
materials and manufacturing energy of the process. It is also the intention to employ Screenview 4.0.1
to assess the air pollution and possible mitigation therein
94

Results and Discussion
At the current stage in this thesis it is difficult to predict what kind of results to expect from the
simulations, however it is expected that the outcomes will be able to address the following key points:
- From the audit performed preliminary figures for the energy requirements will be quantifiable,
and proposals for alternative sources of sustainable energy that could meet the demand will be
assessed, and the costs and industrial regulations can be considered.
- In terms of thermal efficiency, alternative carbon neutral materials can be assessed, and
considered
- In terms of raw materials used, alternative carbon reducing foams can be proposed, the cost of
which should be similar to existing technologies.
- A calculation of waste and reduction thereof can be estimated, for both production processes, but
the mitigation of each is to be seen.
- In the event that simulations show that a low carbon footprint can be achieved, it is feasible to
propose the purchase of carbon credits from established carbon sequestration farms to further
lower the overall footprint. (Clark, 2011)
Conclusion
Based on the evidence from existing literature, a reduction in the carbon footprint of the raw materials
is achievable. By using recyclable EPS foam, eco-friendly Epoxy resin and Algae-based PU foam, the
production process can be made more environmentally friendly. In addition, by using energy efficient
appliances and renewable energy sources, the energy footprint of the process can be substantially
reduced. Making these changes within this factory is feasible. However, the feasibility of a sub-zero
manufacturing facility with respect to carbon and energy footprint is unlikely without the use of
carbon credits, due to the technology advancements of raw materials at this point in time. The fact that
there is a growing community of scientists and manufacturers actively working to reduce the
environmental burden of the production process does bring hope for the future, thereby allowing the
possibility of such a burden-free facility to exist.
References
ArcticFoam (2015) Arctic Foam-About Us, available: http://arcticfoam.us/about-us/ [accessed
01/04/2019].
Beck, H. (2017) The difference between Epoxy and Polyurethane surfboards, available:
https://surfwithamigas.com/the-difference-between-epoxy-and-polyurethane-surfboards/
[accessed 07/08/2019].
Clark, D. (2011) Complete Guide to Carbon Offsetting, available:
https://www.theguardian.com/environment/2011/sep/16/carbon-offset-projects-carbon-
emissions [accessed 0/04/2019].
Hepler, L. (2015) Have surfers discovered the future of sustainable design, available:
https://www.greenbiz.com/article/have-surfers-discovered-future-sustainable-design
[accessed 04/04/2019].
Pitta, J. (2003) 'Kowabunga! A surfin'safari supply chain', WORLD TRADE, 16(7), 16-19.
Schultz, T. (2009) 'The surfboard cradle-to-grave project'.
University, C.M. (2019) Economic Input-Output Life Cycle Assessment, available:
http://www.eiolca.net [accessed 07/08/2019].
95

TECHNOLOGICAL POTENTIAL FOR BIOMASS TO BIOFUELS
PRODUCTION AND STRATEGIES TO IMPROVE
SUSTAINABILITY IN IRELAND’S TRANSITION TO THE
CIRCULAR BIO-ECONOMY
Sanket Dhotre, Fionnuala Murphy
UCD School of Biosystems and Food Engineering, University College Dublin, Belfield, Dublin
4, Ireland.
Abstract
This study is a part of Agri Bio Circular Economy, a project funded by the Sustainable Energy
Association of Ireland which will help Ireland transform into a Circular Bio-Economy as well as
achieve EU renewable targets. The project focuses on two counties in Ireland where the
potential for new biomass to biofuel value chains will be identified in line with the circular
economy principle and cascading of biomass concept. The environmental impacts associated in
the upstream production process will be assessed using life cycle analysis methodology. The
results will provide a strategy for Ireland to achieve the sustainable regional bio economy.
Introduction
Under the Kyoto Protocol, the EU has committed to reducing GHG emissions (UNFFC
1998). The Renewable Energy Directive (RED) is the most important legislation in the
European Union (EU) and Ireland that influences renewable energy growth. The RED sets
two compulsory targets for Ireland's renewable energy to be met by 2020. The first is termed
as overall renewable energy share (RES) which is at least 16% of Ireland’s gross final energy
consumption should be from renewable energy sources. The second is focused on transport
sector and defined as RES-T which states that minimum 10% of energy consumed in road and
train transport should come from renewable energy sources. Further, apart from the
compulsory targets, two more are set, one is for electricity referred as RES-E which is 40%
and second is for heat referred as RES-H which is 12% (Dennehy et al. 2010).
Biofuels are defined as primarily produced liquid, gas and solid fuels from biomass. A variety
of fuels can be produced from biomass such as Biogas, Bioethanol, Biodiesel, Biomethane,
Hydrogen. Biofuels have emerged as one of the most strategically important sustainable
sources of fuel and are considered a significant way further in reducing greenhouse gas
emissions, improving air quality and biodegradability. For environmental and economic
sustainability, renewable and carbon-neutral biofuels are needed.(Nigam and Singh 2011).
Until 2009, the majority of the liquid biofuels were imported in Ireland than produced
indigenously (Gusciute et al. 2015). Since 2010, suppliers of oil products are required to mix
biofuels with the fossil fuel they sell as road transport fuels in Ireland. This scheme is known
as the Biofuels Obligation Scheme (BOS) and is administered by the National Oil Reserves
Agency (NORA). Fuel suppliers are issued certificates for each litre of mixed biofuels that
meet the minimum sustainability requirements set out in the RED and in the Directive on
indirect land-use change (ILUC) (Dennehy et al. 2010). Due to state afforestation programs
and government support for bioenergy crop production, the biomass resource base in Ireland
is expanding (Gusciute et al. 2015).
The aim of this study is to assess the technical potential of production of biofuels using
the circular economy approach and associated impacts in a holistic life cycle analysis
manner improving the sustainability of biofuels
96

Methodology
Circular Economy
A circular economy aims to increase the share of renewable or recyclable resources and
reduce the economy's consumption of raw materials and energy while at the same time
protecting the environment by reducing emissions and minimizing material losses. Systemic
approaches, including eco-design, sharing, reuse, repair, refurbishment and recycling of
existing products and materials, can play an important role in maintaining the usefulness and
value of products, components and materials (European Environmental Agency 2018).
Through the circular economy pathway new sustainable value chains will be assessed by
cascading biomass for production of biofuels, where product, material and resource value
shall be maintained for as long as possible and where waste generation is minimized. In this
study, the Butterfly model will be the central focus where each biofuel production value chain
will be discussed.
Figure 1. The Butterfly model, Source - (‘Circular Economy System Diagram’ 2019)
In the butterfly model(figure 1), there are two cycles; biological which comprises of
ecosystem materials, and technical which consists finite stocks such as precious metals and
fossil fuels. This model will help to reduce the value losses by using the value cascading
principle.
Production of Biofuels
Biofuels can be classified as primary and secondary biofuels into two categories. The primary
biofuels are produced directly from woody or cellulosic plant material burning and from dry
animal waste. Secondary biofuels can be divided into three generations, each generated
indirectly from plant and animal material. The first generation of biofuels is ethanol derived
from starch-rich food crops or biodiesel derived from animal waste fats such as cooking
grease. Bioethanol from non-food cellulosic biomass and biodiesel from oil-rich plant seeds
such as soybean or jatropha is the second generation. The third generation biofuels produced
from cyanobacterial, microalgae and other microbes, are the most promising approach to
meeting global energy demands (Rodionova et al. 2017).
The EU has introduced sustainability criteria for biofuel production related GHG emissions,
which could have a significant impact on future sustainable biofuel types. Biofuels must
97

achieve a minimum reduction of 35
percent in GHG emissions compared to
fossil fuels from 2013 to 2017. Recent
figures mentioned in table no 1.
Summarizes GHG emissions from
Ireland's indigenous biofuels production,
only residual biodiesel meets this
minimum reduction. The targeted
reduction will increase to 50% in 2017,
which can be met by both residue
biodiesels. However, the target reaches
60% beyond 2017, which can only be met
by RVO biodiesel. Biodiesel from oil
seed rape, bioethanol, and biomethane
from wheat, barley, and sugar beet, and grass biomethane, all fail to meet even the minimum
criteria for sustainability. This shows the improvements needed to increase the sustainability
of these biofuels in current biomass production and processing methods(Gusciute et al. 2015).
In this study, biofuels considered will be Bioethanol, Biodiesel, Tallow, Green Biomethane.
Figure 2. Diverse technological routes for the production of biofuels, Source - (Nigam and
Singh 2011)
Life Cycle Analysis
Environmental Life Cycle Assessment (LCA) is an established methodology for evaluating
product environmental impacts and has been widely applied in Ireland to energy systems,
agricultural products and foods. Incorporation of this holistic life cycle analysis approach in
this study will help identifying environmental indicators and burdening hotspots in the
biofuels production system and value chains which will enhance the economic and
environmental sustainability deliver maximum value by cascading biomass to biofuels. GABI
Table 1. GHG emissions in Ireland associated
with the production of indigenous biofuels
98

software will be used to perform the overall modelling to calculate the impacts (Council and
Council 2017).
Expected Outcomes
At the end of the study, the expected results will highlight strategies to increase the
sustainability of biofuel production and related impacts. The circular economy approach will
be helpful to develop and to ensure the viability and potential uptake of these novel value
chains which will help Ireland towards bio-economy and achieve the EU targets.
Conclusion
The overall increasing market of biofuels worldwide states that biofuels are globally
accepted, and advanced technological advancement should be undertaken so that it can be
large asset to replace the fossil fuels in all sectors like energy, transport, heat. Following the
circular economy pathway can be more promising to minimize burdens on the ecosystem and
increase cascading principle and accelerate the transition to a bio based circular economy in
Ireland.
References
Circular Economy System Diagram [online] (2019) available:
https://www.ellenmacarthurfoundation.org/circular-economy/infographic [accessed 29
Mar 2019].
Council, T.C., Council, C. (2017) ‘Agri Bio Circular Economy ( ABC Economy )’.
Dennehy, E., Howley, M., Gallachóir, B.Ó., Barriscale, A., SEAI (2010) ‘Renewable Energy
in Ireland 2010’, 1–48.
European Environmental Agency (2018) The Circular Economy and the Bioeconomy
Partners in Sustainability.
Gusciute, E., Devlin, G., Murphy, F., McDonnell, K. (2015) ‘Transport Sector in Ireland: Can
2020 National Policy Targets Drive Indigenous Biofuel Production to Success?’,
Advances in Bioenergy: The Sustainability Challenge, 419–430.
Nigam, P.S., Singh, A. (2011) ‘Production of liquid biofuels from renewable resources’,
Progress in Energy and Combustion Science, 37(1), 52–68, available:
http://dx.doi.org/10.1016/j.pecs.2010.01.003.
Rodionova, M. V., Poudyal, R.S., Tiwari, I., Voloshin, R.A., Zharmukhamedov, S.K., Nam,
H.G., Zayadan, B.K., Bruce, B.D., Hou, H.J.M., Allakhverdiev, S.I. (2017) ‘Biofuel
production: Challenges and opportunities’, International Journal of Hydrogen Energy,
42(12), 8450–8461, available: http://dx.doi.org/10.1016/j.ijhydene.2016.11.125.
UNFFC (1998) ‘Kyoto Protocol To the United Nations Framework Kyoto Protocol To the
United Nations Framework’, Review of European Community and International
Environmental Law, 7, 214–217, available:
http://unfccc.int/resource/docs/convkp/kpeng.pdf.
99

TECHNICAL AND ECONOMIC ANALYSIS OF ENERGY STORAGE SYSTEMS
Andrew Evans, Patrick Grace.
UCD School of Biosystems and Food Engineering, University College Dublin, Belfield, Dublin 4, Ireland.
Abstract
With the current global energy crises and global warming, there is an increasing need for the deployment of
renewable energy systems. The economic viability of these renewable energy systems is crucial for
development. The issue of intermittency hinders the economic viability. Energy storage systems provide a
solution to this intermittency. This research will analyse the technical and economic considerations in
relation to the deployment of energy storage systems to support renewable energy systems that are
intermittent. The results are intended to aid in the development of renewable energy systems within Ireland
in the future. The payback period, net present value, and cost of electricity will be considered along with the
potential of price arbitrage in the Irish energy market.
Introduction
Global climate change and the global energy crisis are two major issues facing society. The burning of
fossil fuels to generate electricity is a significant cause of both aforementioned issues. Ireland has made a
commitment to meet the renewable energy targets set by the European Union with a 40% share of
electricity to be from renewable sources by the year 2020 (SEAI 2019). Therefore, the development of
renewable energy systems is essential. Unfortunately, the intermittency associated with renewable energy
systems means that they are unreliable and, in most cases, must be supported by electricity produced from
fossil fuels. Energy storage systems provide a solution to this issue. Energy storage systems allow excess
electricity produced to be stored during times of excess supply, and the stored energy can subsequently be
used during times of excess demand. Wind energy is the renewable energy system to be considered in this
research due to the potential of wind resources in the Irish context. Ireland has one of the best wind
resources available in the World and as such wind energy will continue to be developed into the future.
Renewable energy is of significant environmental importance, as well as providing “a sustainable,
economic opportunity for Ireland, both in terms of providing a secure, indigenous, source of energy, and
as an export in the longer term” (SEAI 2019).
There are a number of energy storage systems types available, including battery storage, pumped-hydro
storage, hydrogen storage, compressed air energy storage and flywheels. The focus of this research will
be on pumped-hydro storage, battery storage and hydrogen storage. Pumped-hydro energy storage is a
large scale option, where water is pumped from a lower reservoir to a higher reservoir during times of
excess supply. The water is than released down to the lower reservoir through a turbine to generate
electricity when required. The rationale behind this decision is due to pumped-hydro being a well-
established mature technology with an example in Turlough Hill, Co. Wicklow. The high potential of
battery storage as there is an instantaneous supply of electricity and hydrogen storage as an option due to
the significant environmental potential of hydrogen as an energy carrier. The process of electrolysis is
used to split water into hydrogen and oxygen. The hydrogen can be extracted and stored in tanks to be
used at a later date to generate electricity or to be used in transportation. The potential of price arbitrage is
an interesting concept to attract investment in energy storage systems. Price arbitrage is the purchasing of
electricity during hours of low demand when electricity prices are low, such as during the night, and
selling this electricity during peak hours when electricity prices are high. This provides an opportunity for
potential investors to make a return on the money they invest which is fundamentally how investors are
attracted to developments.
The objective of this research is to identify the most feasible energy storage system to support wind
energy from an economic perspective in an Irish context.
100

Methodology
In order to be able to assess the viability of the different energy storage systems it will be necessary to
undertake a review of the current policy regarding renewable energy. The focus will be on EU policy and
Irish policy. This research will use the HOMER software package to assess the economic viability of the
different renewable energy storage system–energy storage system configurations to be considered.
HOMER (Hybrid Optimisation of Multiple Energy Resources) is a software package that allows
comparisons to be made between multiple different configurations of energy types and storage types. The
software allows an array of data to be input and calculates the cost of each system configuration to aid in
the design of the optimal system. HOMER software is appropriate for this research to allow a comparison
of each different energy storage systems to be made. In order to assess the potential of price arbitrage,
Irish electricity markets will be studied to identify the optimal periods to purchase and sell the electricity.
Literature Overview
Energy Storage Technologies
The research will be based on supporting the intermittency of a wind farm. The energy storage system
technologies focused on in this research are pumped-hydro, battery storage and hydrogen storage.
“Energy storage systems at an improper size would result in no-reasonable installation, operation and
maintenance costs” (Xia et al. 2018). Therefore, conducting a technical and economic analysis of the
different storage options is necessary. Utilising the HOMER software, a variety of different sizes of each
energy storage system will be analysed to distinguish the most viable. Hybrid systems will be considered
also to determine whether a mix of energy storage systems would be more economically viable. There are
several different battery options to utilise. “Lithium‐ ion, zinc–bromine, lead–acid, and sodium–nickel
chloride are examples of the batteries that have been significantly developed recently” (Balali et al.
2017). A series of different battery types will be assessed to identify the best in the context of this
research.
Economics
As outlined above the associated payback period, net present value and cost of electricity will be
considered in this research. Other research has considered the economics associated with energy storage
systems. Atherton et al. (2017), found that “the Lithium-Ion and Redox energy storage system types are
the only economically viable options” and that “the Lithium-Ion energy storage system type is found to
deliver the fastest payback time”. This is based on research in South Australia. Kaldellis et al. (2009)
undertook a techno-economic analysis of different energy storage systems for Aegean island autonomous
networks and found “the minimum life cycle electricity generation cost is expected for flow batteries and
pumped-hydro storage (i.e. 0.095€/kWh)”. In the study it was concluded “it is the Na–S batteries that may
be thought as suitable for very small island cases, while pumped-hydro storage comprise the optimum
solution for big size islands” (Kaldellis et al. 2009). This would suggest for the Irish context battery
storage would not be the best option due to difficulties associated with scale up.
Kotowicz et al. (2017) researched energy storage systems with distributed hydrogen production. As part
of the research an economic analysis was performed. The “economic analyses pointed to the advantage of
systems with higher value of the degree of storage”. Therefore, the viability of hydrogen as a storage
medium would work best at a larger scale. Olateju et al. (2016) undertook a techno-economic analysis of
a large scale wind-hydrogen system. In the study “the development of a 563 MW integrated wind-
hydrogen model with energy storage is proposed”. In this study it was found “the wind turbine capital
cost has a considerable impact on the hydrogen cost estimates” (Olateju et al. 2016). Therefore, it would
be feasible to integrate a hydrogen production system into existing wind farms.
101

Results and Discussion
As this research is ongoing the expected results are outlined. The outcome that is expected from this
research is that at present pumped-hydro energy storage is the most viable from an economic perspective.
This is despite the requirement for large amounts of infrastructure and a significant water demand. “The
electrical energy systems (EES) technologies of pumped hydro storage (PHS) and compressed air energy
storage (CAES) sustain limited future potential in Germany due to the lack of suitable spacious locations
or underground formations” (Kyriakopoulos and Arabatzis 2016). It is expected that battery storage will
be a promising technology but will be too large per unit of energy that is stored. There are also concerns
over the end of life disposal of batteries, whether they can be recycled or will pose another environmental
issue or significant economic cost for disposal. Hydrogen energy is expected to be too costly at present
due to storage and transportation costs as there is currently limited infrastructure in place to support
hydrogen in the economy. There are also concerns over the safety of hydrogen as it is a volatile gas. It is
important to identify the main reasons for hydrogen storage being too expensive and ways in which these
costs can be reduced to increase the viability of hydrogen as a storage option. The interest in hydrogen is
on the basis that the energy generated from hydrogen can be regarded as carbon neutral if the electricity
used in the electrolysis process comes from a renewable energy system. By incorporating hydrogen
storage with a renewable energy system such as a wind farm it will be possible to provide electricity
without releasing any greenhouse gases into the atmosphere.
Conclusion
It is becoming increasingly important to integrate more renewable energy systems into the electricity grid
to reduce global warming in the future. Therefore, ways to provide stability to the supply of these
intermittent technologies is required. Energy storage systems provide a solution to the issues of
intermittency. The development of these systems is reliant on the availability of funding, which is reliant
on the economic viability associated with these systems. The research aim is to provide sufficient insight
into the viability of these systems to potential investors and whether these systems are viable in the long
term. These aims will be addressed by providing information on the net present value, the potential
payback period of project as well as the potential of price arbitrage.
References
Atherton, J., Sharma, R. and Salgado, J. (2017) 'Techno-economic analysis of energy storage systems for
application in wind farms', Energy, 135, 540-552, available:
http://dx.doi.org/10.1016/j.energy.2017.06.151.
Balali, M.H., Nouri, N., Omrani, E., Nasiri, A. and Otieno, W. (2017) 'An overview of the environmental,
economic, and material developments of the solar and wind sources coupled with the energy
storage systems: Environmental, Economic, Material analysis of PV and wind', International
Journal of Energy Research, 41(14), 1948-1962, available: http://dx.doi.org/10.1002/er.3755.
Kaldellis, J.K., Zafirakis, D. and Kavadias, K. (2009) 'Techno-economic comparison of energy storage
systems for island autonomous electrical networks', Renewable and Sustainable Energy Reviews,
13(2), 378-392, available: http://dx.doi.org/10.1016/j.rser.2007.11.002.
Kotowicz, J., Bartela, Ł. and Dubiel-Jurgaś, K. (2017) 'Analysis of Energy Storage System with
Distributed Hydrogen Production and Gas Turbine', Archives of Thermodynamics, 38(4), 65-87,
available: http://dx.doi.org/10.1515/aoter-2017-0025.
102

Kyriakopoulos, G.L. and Arabatzis, G. (2016) 'Electrical energy storage systems in electricity generation:
Energy policies, innovative technologies, and regulatory regimes', Renewable and Sustainable
Energy Reviews, 56, 1044-1067, available: http://dx.doi.org/10.1016/j.rser.2015.12.046.
Olateju, B., Kumar, A. and Secanell, M. (2016) 'A techno-economic assessment of large scale wind-
hydrogen production with energy storage in Western Canada', International Journal of Hydrogen
Energy, 41(21), 8755-8776, available: http://dx.doi.org/10.1016/j.ijhydene.2016.03.177.
SEAI (2019) Renewable Energy in Ireland, Dublin.
Xia, S., Chan, K.W., Luo, X., Bu, S., Ding, Z. and Zhou, B. (2018) 'Optimal sizing of energy storage
system and its cost-benefit analysis for power grid planning with intermittent wind generation',
Renewable Energy, 122, 472-486, available:
http://dx.doi.org/https://doi.org/10.1016/j.renene.2018.02.010.
103

A STRATEGIC ROADMAP FOR DEVELOPMENT OF HYDROGEN
INFRASTRUCTURE (PRODUCTION, DISTRIBUTION AND
APPLICATION) IN IRELAND
Abhijeet Gaikwad1, Fionnuala Murphy
1, James G. Carton
2
1 UCD School of Biosystem and Food Engineering, University College Dublin, Belfield, Dublin4,
Ireland. 2Mechanical & Manufacturing Engineering, Dublin City University, Dublin 9, Ireland.
Abstract:
Due to environmentally disruptive nature of fossil fuels, renewable alternative energy sources are
receiving more attention. The increased global warming caused by fossil fuel combustion has led to
intense research into improved low emission energy choices. Hydrogen is a clean fuel candidate, as it
produces just water as a by-product during combustion. A variety of renewable and non-renewable
sources can generate hydrogen. The hydrogen economy some say is an inevitable energy system
scenario for the future in which the available (preferably renewable) energy can generate electricity
that can be stored or transported using hydrogen and meet all the energy requirements of human
civilisation. The transition to a hydrogen economy may have already begun. This paper reviews
hydrogen production, storage, distribution and utilization technologies. The expected results of this
paper will be a strategy for the hydrogen economy transition in Ireland.
Introduction:
The main challenge facing the modern world is the use of fossil fuels, as a result of their concomitant
use for daily life. An alternative combustible which can replace non-renewable fossil fuels is therefore
essential (Planton et al. 2008). Replacing fossil fuel with hydrogen for ultimate use could meet
technical, environmental and cost challenges (Vijayavenkataraman et al. 2012). Hydrogen is the clean
fuel of the future and is one way of storing energy and transporting it. Hydrogen fuel can be produced
from a variety of sources; for example, water and natural gas are abundant sources of hydrogen. The
cheapest way of producing hydrogen is to react steam on white-hot coal, but this produces enormous
quantities of carbon monoxide, reducing interest of this method (Global Relations Forum 2013). A
suitable substitute should therefore be developed for producing high volumes of hydrogen. Methane is
the cheapest source of hydrogen in the modern world producing smaller amounts of carbon oxides (H.
SHIGA 2002). Hydrogen can also be produced from renewable sources, referred to as green
hydrogen. This fundamental change in the global energy system can lead to substantial improvements
in energy systems and can help decarbonize the energy mix, reducing the impact of climate change. A
number of studies examined the prospect and strategies possible to transition to the "hydrogen
economy".
The objective of this work is to identify best possible scenarios to enhance a sustainable
transition towards a hydrogen economy, in terms of economic and environmental sustainability
considerations which can help Ireland to be one of the sustainable, low carbon economies in the
Europe.
Production
Hydrogen can be produced from a variety of sources and methods as shown in figure 1. This study
reviews these methods briefly representing the cost of technologies, cost of hydrogen produced,
efficiencies and advantages-disadvantages of each technology along with storage of hydrogen energy
(as shown in table 2), supply chain and applications. The following table shows various compared
parameters:
104

Figure 1: Hydrogen production methods (Nikolaidis and Poullikkas 2017)
Table 1: Cost of hydrogen production through different processes (Nikolaidis and Poullikkas 2017)
Process Feedstock Capital Cost
M$
H2 Cost
$/Kg
H2 Cost
€/kg
Efficiency
%
SMR with CCS Natural Gas 226.4 2.27 2.22-2.56 60-85
SMR without CCS Natural Gas 180.7 2.08 < 2 60-85
CG with CCS Coal 545.6 1.63 80 (Ju and Lee
2017)
CG without CCS Coal 435.9 1.34
ATR (CH4) with
CCS
Natural Gas 183.8a
1.48 60-75
Methane Pyrolysis Natural Gas - 1.59-1.70
Biogas Pyrolysis Woody
Biomass
53.4b
1.25-2.20 2-3 35-50
Biogas Gasification Woody
Biomass
149.3c
1.77-2.05 2-3 47-56
(Gnanapragasam
and Rosen 2017)
Direct Bio-
photolysis
Water +
Algea
50 $/m2
2.13 10
Solar PV
Electrolysis
Water 12-54.5 5.78-23.27 4-6 40-60
Wind Electrolysis Water 504.8-499.6d
5.89-6.03 4-6 40-60
Nuclear
Thermolysis
Water 39.6-2107.6e
2.17-2.63 20-45
Solar Thermolysis Water 5.7-16f
7.98-8.40 20-45
(As the costs depend on the size of the plant and quantity produced, average range is provided as per
respective references).
(FCH JU_Report, 2017) for the Hydrogen costs in €/kg
a 600MW hydrogen plant with capital cost of 306.35 $/kWH2
b 72.9 ton/day plant capacity with capital costs of 53.4 M$
c plant capacity of 72.9 ton/day with capital cost of 149.3 M$
d 504.8 M$ is coproduction of hydrogen with electricity
e 2107.6 M$ cost considers 583 ton/day.
105

Storage
Storing hydrogen is a complex task where cost for storing hydrogen depends on the quantity of
hydrogen; as underground hydrogen storage is most economical in case of bulk quantity; it isn’t
feasible for modest quantities. Using abandoned natural gas wells is the cheapest alternative, followed
by solution salt mining and hard rock mining (Global CCS Institute 2018). The table 2 shows methods
of hydrogen storage.
Table 2: Hydrogen storage methods and costs (Yu Wang, Julia Kowal, Matthias Leuthold 2012)
Method Volume considered Pressure
(bar)
Cost
(€/kg)
Salt Cavity 500,000 m3 (for 12
ton)a
60-180 5.56 (2079.44)
Compressed gas 12 ton 3330 m3 45 374.74
Pipe container 12 ton 3330 m3 45 507.07
Pipeline 12 ton 3330 m3 45 1059.74
Cryo liquid 12 ton > 50 83.40
a if considered storing 12 ton hydrogen in salt cavity, it will cost 2079.44
€/kg
(salt cavity only economical feasible at bulk quantity i.e. above 150,000 m3).
Distribution
The supply chain in this study is discussed, considering the central plant for hydrogen production with
the design capacity of 150,000 kg/day. The cost associated with supply and dispensing are associated
with 1000kg/day hydrogen.
Table 3: Distribution of Hydrogen cost comparison (Simbeck and Chang 2002)
Feedstock Liquid tanker ($/Kg) Gas tube trailer
($/Kg)
Pipeline ($/Kg)
Natural gas 3.66 4.39 5.00
Coal 4.51 5.18 5.62
Biomass 4.98 5.77 6.29
Water 7.62 8.39 9.13
Expected outcome
This study has its emphases on the transition from a fossil-fuel based economy to mitigate GHG
emissions with major focus on a hydrogen economy. To enhance this transition there is need to
initiate the set-up of hydrogen infrastructure (i.e. production, storage, distribution and application) in
Ireland. This study aims to provide the best possible scenarios to initiate this infrastructure by
comparing the production, distribution and storage methods for hydrogen, based on economic and
environmental sustainability considerations. Furthermore, the role and potential of hydrogen to meet
the renewable energy targets set by the government will be discussed. As the research is on-going, the
cost data will be represented in euro for better compatibility to utilise this work.
Conclusion
Hydrogen is one of the most attractive sustainable fuel sources which has potential to replace fossil
fuels as it has wide application area; electricity generation, fuel for transport, heating, fertiliser,
various industrial uses. Thus, this study will provide a roadmap to establish hydrogen economy in the
Ireland stating environmental, economic and societal benefits.
106

References
FCH JU (2017) Development of Business Cases for Fuel Cells and Hydrogen Applications for
Regions and Cities, Brussels, available: https://www.fch.europa.eu/sites/default/files/FCH
Docs/171121_FCH2JU_Application-Package_WG5_P2H_Green hydrogen %28ID
2910583%29 %28ID 2911641%29.pdf [accessed 25 Mar 2019].
Global CCS Institute (2018) Of CCS Global Status The, available: www.globalccsinstitute.com.
[accessed 25 Mar 2019].
Global Relations Forum (2013) Turkish Energy Strategy in the 21st Century: Weathering
Uncertainties and Discontinuities.
Gnanapragasam, N. V., Rosen, M.A. (2017) ‘A review of hydrogen production using coal, biomass
and other solid fuels’, Biofuels, 8(6), 725–745, available:
http://dx.doi.org/10.1080/17597269.2017.1302662.
H. Shiga, K.S. (2002) ‘Large-scale hydrogen production from biogas’, International Journal of
Hydrogen Energy, 23(8), 631–640.
Ju, Y., Lee, C.-H. (2017) ‘Evaluation of the energy efficiency of the shell coal gasification process by
coal type’, Energy Conversion and Management, 143, 123–136, available:
https://linkinghub.elsevier.com/retrieve/pii/S0196890417302935 [accessed 24 Mar 2019].
Nikolaidis, P., Poullikkas, A. (2017) ‘A comparative overview of hydrogen production processes’,
Renewable and Sustainable Energy Reviews, 67, 597–611, available:
http://dx.doi.org/10.1016/j.rser.2016.09.044.
Planton, S., Déqué, M., Chauvin, F., Terray, L. (2008) ‘Expected impacts of climate change on
extreme climate events’, Comptes Rendus - Geoscience, 340(9–10), 564–574.
Simbeck, D., Chang, E. (2002) ‘Hydrogen Supply: Cost Estimate for Hydrogen Pathways—Scoping
Analysis. January 22, 2002—July 22, 2002’, (November), available:
http://www.nrel.gov/docs/fy03osti/32525.pdf.
Vijayavenkataraman, S., Iniyan, S., Goic, R. (2012) ‘A review of climate change, mitigation and
adaptation’, Renewable and Sustainable Energy Reviews, 16(1), 878–897, available:
http://dx.doi.org/10.1016/j.rser.2011.09.009.
Yu Wang, Julia Kowal, Matthias Leuthold, D.U.S. (2012) ‘Storage system of renewable energy
generated hydrogen’, Electrochemical Energy Conversion and Storage Systems, 11, available:
https://pdf.sciencedirectassets.com/277910/1-s2.0-S1876610212X00201/1-s2.0-
S1876610212014968/main.pdf?x-amz-security-
token=FQoGZXIvYXdzEDAaDC1As3L4gfTvoNxBbiK3A3fUSpWKqt5jIrWEhBXcssuosQQjf
FF2rr2Ji6brNu7EK8NkeHTmZpWpS5p%2F12LPKyHgQlW5jKkitFBx8BOc8UsxEDrTjQ
[accessed 25 Mar 2019].
107

A FEASIBILITY STUDY OF OPTIONS TO REDUCE PLASTIC
CONTAMINATION OF MARINE ENVIRONMENTS
Margaret Gleeson, Kevin McDonnell
UCD School of Biosystems and Food Engineering, University College Dublin, Belfield,
Dublin 4,
Ireland.
Abstract
Currently there is a significant amount of plastics in the ocean globally, and this is on an upward
trajectory. Efforts to mitigate the influx of plastics to marine environments have not yet been
successful, with the estimated amount of marine plastic to increase by 2025 as approximately 8
million metric tonnes of plastic enters the ocean annually. This thesis aims to assess the feasibility of
marine plastic recovery and prevention. Three solutions will be assessed under economic, societal and
technical aspects to determine their feasibility in solving the marine plastic problem. The three
solutions to be examined in detail are; waste management infrastructure improvement in developing
countries; societal transition towards sustainable consumer behaviour through the removal of single
use plastics; and repurposing recovered marine plastics through different methods of recycling.
Introduction
Large volumes of plastics are produced annually, and due to their short use phase, durable
composition and low recycling rates, a significant amount of plastics enter oceans globally (Lebreton
et al. 2017). The dispersal, durability and mobility of plastics makes it extremely difficult to monitor
and establish governance over (Dauvergne 2018). Between 60-90% of marine litter is plastic, with
over 9 million metric tonnes of plastic entering oceans in 2015 (Jambeck et al. 2015; Dauvergne
2018). Marine plastic can be separated into two categories; macro plastics (=/>5mm) and micro
plastics (<5mm) (Lohr et al. 2017). Micro plastics can be further categorized into primary and
secondary microplastics (Dauvergne 2018). Primary microplastics are already under 5mm when
entering oceans, where as secondary microplastics are formed through the degradation and
fragmentation of macro plastics (Nor and Obbard 2014). These micro plastics have been found in
numerous food and drink items, however the severity of their impacts on human health is relatively
unknown as this is a recent discovery and limited research has been conducted (Ribeiro et al. 2018).
Marine plastics can be found globally, from Arctic and Antarctic sea ice to coastal locations around
the world and areas of sea as deep as the Marina trench (Jambeck et al. 2015).
Due to the globalization of the plastics industry, increased production coupled with poor waste
management, and the land sources of marine plastic being so vast, it is difficult to establish
governance over the issue (Jambeck et al. 2015; Dauvergne 2018). Limited improvements are being
made when quantified against the magnitude of the problem, and government and non-government
organisations struggle to gain control over the growing issue.
The objective of this study is to assess the feasibility of potential solutions to the marine plastic
problem by focusing on mitigation at the source of plastic production, consumption and
disposal.
Theoretical Methods
Literature Review
This thesis will examine the current state of the marine plastic problem, including the current recovery
technologies, mitigation schemes and global policies surrounding the issue. Through this analysis,
108

potential feasible solutions can be determined. The three areas of the marine plastic problem that are
being examined are waste management in developing countries, repurposing of recovered marine
plastics through recycling, and transitioning society towards more sustainable consumper habits
through the removal of single use plastics.
Case Study
This thesis will assess the economic, societal and technical feasibility of transitioning a society
towards sustainable consumer behaviours through the removal of single use plastics. UCD campus
will be examined in this context, considering how this plastic removal could be implemented in all the
campus shops, restaurants and cafes. The use of biodegradable plastics will be considered instead,
coupled with an exemplary waste management scheme to compost and dispose of these biodegradable
plastics.
Interviews
In July of 2018, the Dun Laoghaire - Rathdown county council begun a movement to make their
town the first single-use plastic free town in Ireland. Interviews with members of this initiative will be
conducted to examine how they are implementing these changes in society and to identify the issues
they are facing so far with the project. This will assist with the feasibility study on how to make UCD
single use plastic free, as numerous shops in the Dun Laoghaire - Rathdown area have already made
the transition to become plastic free.
Literature Overview and Expected Results
Since this thesis is in the early stages of completion, the proposed solutions will be further developed
and the following section contains an overview of each solution in context with each problem.
Waste Management Infrastructure
To determine how large volumes of plastic enters the ocean, it is important to identify the land-based
pathways and the quantities of marine plastic based on their origin locations (Jambeck et al. 2015).
Plastic concentrations show a direct correlation with human population densities (Lebreton et al.
2017). Population size and the waste management infrastructure of a specific region are the main
factors determining how waste enters the oceans from these regions (Jambeck et al. 2015).
Developing countries have under developed waste management infrastructure, and therefore these
countries have high volumes of mismanaged waste entering land-based waterways and eventually the
oceans (Jambeck et al. 2015).
The largest river catchments contributing to the marine plastic problem are located in Asia; this
coupled with Asia’s rapid economic development means future mitigation schemes and waste
management infrastructure needs to be implemented to mitigate future risks of increased plastic
influxes into the ocean (Lebreton et al. 2017). The large volumes of plastics found in the North
Pacific Ocean suggest that this is the location where plastics from Asian countries accumulate
(Lebreton et al. 2017). This is unsurprising considering Asian countries are the largest producers of
plastic globally, with China accounting for 28% of all global production in 2015 (Dauvergne 2018).
With large volumes of plastic being produced in these countries, and inadequate waste management
infrastructure it is not surprising that the influx rates of these mismanaged plastic waste into oceans is
occurring at an alarming magnitude.
Circulate Capital is an investment management firm that focuses on stopping plastic flow into the
world’s oceans by financing innovation, companies, and infrastructure dedicated to this cause, along
with developing the circular economy (Circulate Capital 2018). The Circulate Capital project called
The Incubator Network partners with The Ocean Conservancy aims to improve waste management
infrastructure in developing countries (Circulate Capital 2018). This is a new initiative to increase the
progression of solving the ocean plastics problem (Circulate Capital 2018). The Incubator Network
partner with existing incubator programs to build waste management systems and recycling
innovators in India and Indonesia to increase the quality and quantity of regional waste management
109

and recycling companies working to prevent plastics entering the ocean (Circulate Capital 2018). As
an organisation geared towards solving the marine plastic problem, they aim to bring together the
political, economic, financial and social components needed to solve the issue of marine plastics
(Circulate Capital 2018). It is mandatory at this stage that different companies and government bodies
work in collaboration to overcome this environmental hazard. Along with the Incubation Network
project, there are numerous non-government organisations trying to improve the marine plastics
problem through mitigating the amount of mismanaged waste, and subsequently plastic entering
oceans. These include, but are not limited to; the G7, the Honolulu strategy and the Global Partnership
on Marine Litter (Lohr et al. 2017).
With global peak waste to be reached in 2100, it is mandatory that waste management infrastructure
in developing countries be improved drastically to target the marine plastic problem at the site of land
plastic disposal. These improvements can be achieved through a combination of government policy
improvements concerning waste disposal and non-government organisations focused on addressing
the marine plastic problem at the source. Potential solutions combining policies and waste
management in these regions will be further assessed in this thesis to determine feasible
solution/solutions for these countries in order to minimise plastic waste entering oceans and develop a
more circular economy for these countries.
Recovery Solutions
Currently there are numerous recovery movements to capture marine plastic and repurpose this plastic
through recycling, mainly by chemical and energy recovery (Iniguez et al. 2017). Majority of these
recovery movements occur at coastal locations and are limited to beach and coastal clean ups. The
Ocean Cleanup project is currently the only project of its magnitude working at physically removing
marine plastic from the ocean at the site of the Pacific Garbage Patch (Ocean Cleanup 2019). Once
this plastic has been recovered it can be recycled as polyolefin waste, which can be converted into
clean fuels and other valuable products such as naphtha and polymers (Iniguez et al. 2017). The
economic and technical feasibility of large scale valorisation of the recovered marine plastic waste to
these products of value will be considered, also accounting for the degradation of the plastic at sea.
Reduction of Single Use Plastic
The global governance of plastic is failing to get a handle on the marine plastic pollution problem, as
the amount of plastic that is set to enter the ocean by 2025 will potentially be double the amount
already in oceans in 2010 (Dauvergne 2018). International policies are uncoordinated, there is
resistance from the plastic production industry to abide by government legislation, and weaknesses
exist in re-enforcement of legislations (González Carman et al. 2015). This is coupled with important
factors such as increased production, global consumption, and growing international trade (Dauvergne
2018). The market for plastics has become increasingly dominant since its emergence in 1930, with
the largest sector for plastic use in society being packaging of products with comprises approximately
40% of all manufactured plastics with consumer items accounting for another 25% (Jambeck et al.
2015; Dauvergne 2018).
The difficulty governing the environmental repercussions from the plastics industry arises from both
the versatility of plastic products and the rapidly growing market for plastics (Dauvergne 2018). The
current knowledge of the marine plastic problem provides the basis for effective action, however there
is a lack of efficient policies and initiatives establishing control over the problem (Lohr et al. 2017).
One of the solutions of the marine plastic problem lies within transitioning towards more sustainable
ways of production and consumption in society (Lohr et al. 2017). Transitioning society away from
plastic use completely will be difficult, but an alternative is replacing single use plastics with
biodegradable plastics. This allows society to gradually transition towards a circular economy,
creating a plastic substitute for consumers to purchase. This solution will be examined through a
feasibility study of how to make UCD campus single use plastic free. The on-campus shops,
restaurants, and cafes will be the focus of this study. UCD has over 30,000 students and a fast
population turnover rate; if UCD became single use plastic free it would be creating a population that
is constantly growing and moving into the work place with sustainable consumer behaviour habits.
110

Similar single use plastic free movements are occurring in communities around the world. To solve
the marine plastic problem, a multitude of solutions will need to be established including; state and
federal legislation, hard and soft laws, along with consumer and manufacturer responsibility for the
nature of product used and its correct disposal through implementing a circular economy perspective
(Schuyler et al. 2018).
Conclusion
Further research needs to be conducted concerning the feasibility of the suggested solutions and how
they can be implemented. Solutions to the marine plastic problem are contextual and combine to form
the pieces needed to solve this marine plastic jigsaw puzzle. Short term solutions involve the
improvement of waste management infrastructure, along with marine plastic recovery and recycling.
Long term solutions to the marine plastic problem involve societal progression towards a circular
economy, with more sustainable consumerism and a significant reduction in plastic use.
References
Dauvergne, P. (2018) 'Why is the global governance of plastic failing the oceans?', Global
Environmental Change, 51, 22-31, available:
http://dx.doi.org/10.1016/j.gloenvcha.2018.05.002.
Dun Laoghaire County Council (2018) Reducing Plastics in Our Rivers and Seas, available:
http://ecouncil.dlrcoco.ie:9071/documents/s60770/Blank%20Motion%20Report.pdf [accessed
24/03/2019].
González Carman, V., Machain, N. and Campagna, C. (2015) 'Legal and institutional tools to mitigate
plastic pollution affecting marine species: Argentina as a case study', Marine Pollution
Bulletin, 92(1-2), 125-133, available: http://dx.doi.org/10.1016/j.marpolbul.2014.12.047.
Iñiguez, M.E., Conesa, J.A. and Fullana, A. (2017) 'Pollutant content in marine debris and
characterization by thermal decomposition', Marine Pollution Bulletin, 117(1-2), 359-365,
available: http://dx.doi.org/10.1016/j.marpolbul.2017.02.022.
Jambeck, J.R., Geyer, R., Wilcox, C., Siegler, T.R., Perryman, M., Andrady, A., Narayan, R. and
Law, K.L. (2015) 'Plastic waste inputs from land into the ocean', Science, 347(6223), 768-
771.
Lebreton, L.C., Van der Zwet, J., Damsteeg, J.-W., Slat, B., Andrady, A. and Reisser, J. (2017) 'River
plastic emissions to the world’s oceans', Nature communications, 8, 15611.
Löhr, A., Savelli, H., Beunen, R., Kalz, M., Ragas, A. and Van Belleghem, F. (2017) 'Solutions for
global marine litter pollution', Current Opinion in Environmental Sustainability, 28, 90-99,
available: http://dx.doi.org/10.1016/j.cosust.2017.08.009.
Nor, N.H.M. and Obbard, J.P. (2014) 'Microplastics in Singapore’s coastal mangrove ecosystems',
Marine pollution bulletin, 79(1-2), 278-283.
Ribeiro, F., O'Brien, J.W., Galloway, T. and Thomas, K.V. (2019) 'Accumulation and fate of nano-
and micro-plastics and associated contaminants in organisms', Trends in Analytical
Chemistry, 111, 139-147, available: http://dx.doi.org/10.1016/j.trac.2018.12.010.
Schuyler, Q., Hardesty, B.D., Lawson, T.J., Opie, K. and Wilcox, C. (2018) 'Economic incentives
reduce plastic inputs to the ocean', Marine Policy, 96, 250-255, available:
http://dx.doi.org/10.1016/j.marpol.2018.02.009.
Circulate Capital (2018) 'Network Developed to Accelerate Ocean Plastic Solutions', available:
Waste360 (Online), New York: Informa. Sep 21, 2018.
111

IoT (INTERNET OF THINGS) SOLUTION FOR SEWER BLOCKAGE
DETECTION
Aniket C. Latpate and Thomas P. Curran
UCD School of Biosystems and Food Engineering, University College Dublin, Belfield, Dublin 4,
Ireland.
Abstract
Sewer blockage problems are widespread these days many major countries like the US, UK are
dealing with so-called ‘fatbergs. Major flooding incidents in the UK and other countries are associated
with the sewer blockages. These sewer blockages usually occur due to deposition of fat, oil and grease
(FOG) waste along with other materials such as sanitary items such as wet wipes. There are many
technologies available in the market for sewer blockage detection, but it is still challenging to find the
exact location of the blockage. Internet of Things (IoT) is a revolutionary technology which connects
many objects in a network and makes them work to achieve a common goal. Using IoT, it is possible
to create a system which can detect the possibility of blockages in the sewers and provide a warning
before it happens.
Introduction
Background
Fat Oil and Grease (FOG) is a byproduct from multifamily housings and Food Service Establishments
(FSEs) such as restaurants, meat processing factories, residential buildings (Wallace et al. 2017).
These FOGs react with other sanitary products such as wet wipes, condoms, nappies in the sewers and
create a concrete-like insoluble solid material which blocks the pipeline and causes sanitary sewer
overflows (SSOs). Sewer overflows can cause severe environmental and health impacts (EPA, 2004).
According to several studies (He et al. 2013; Hao et al. 2017), about 40 to 50 % of SSO-related
incidents occur in United States (US) due to deposition of FOGs in sewer lines. In the United
Kingdom (UK), about 300,000 sewer blockages occur every year, and 75% are caused by FOGs. The
cost of maintenance and removal of FOG blockages in the UK was around £15-50 million (Mills
2010; Williams et al. 2012).
This congregated mass of fat, oil and grease in sewers is also known as a ‘fatberg’. The term ‘fatberg’
was initially coined by media when the first fatberg found in Kingston upon the Thames in 2013. In
the year 2015, a 10-tonne fatberg was found in Chelsea, west London and in the same year, the
Oxford Dictionary officially added the term ’fatberg’ into their collection (Ratcliffe 2015; Adams
2018). Fatbergs featured heavily in the media when the largest ever fatberg was found in Whitechapel,
East London - it was 130 tons in weight (equal to two Airbus 318 aircraft or 19 African elephants) and
240 meters in length (equal to London’s Tower Bridge). The removal cost of the fatberg and repair of
underground sewer network was estimated around £400,000 (Moore-Bridger 2017; Adams 2018).
FOGs can be prevented from entering the sewer line by using Grease Interceptors (GI) or Grease
Traps (Sager 1996). This GIs can be installed in food service establishments (FSEs), meat and food
processing plants and multi-housing societies to recover fat, oil and grease content and reduce the risk
of fatberg formation in sewers. A FOG prevention program was launched in Dublin in 2008 by Dublin
City Council (DCC), which has been largely successful and reduction in blockages due to fatbergs
was observed (Wallace et al. 2017).
The objective of this research is to find and develop a cheaper IOT solution for sewer blockage
detection.
Context of work
In the UK and Ireland, most of the sewer inspections are carried out by using CCTV method. To
eliminate sewer overflows it is necessary to keep an up to date information of sewer conditions.
112

Recent developments in optical technology made it possible to include 2D and 3D scanning
technologies such as Digisaver@
, Panoramo@
& Spherix@
with CCTV method to improve the visible
inspection and structural of sewer walls (Chae et al. 2008). Sensing methods such as acoustic sensing
method, pipeline breakage sensing method were introduced to detect structural damages in the sewer
system. Acoustic sensing method uses sound waves to detect blockages and damages in pipelines.
Similarly, pipeline breakage sensing system uses multiple pressure sensors to measure water pressure
at different locations and identify breakage location in the pipeline (Ziska 1990; Kurisu et al. 1998).
Many computational models have been developed to predict the sewer blockages, but these models
are not very accurate due to insufficient data availability. Development of better alternate methods is
necessary to create an accurate and real-time data for finding the exact location of blockages in
sewers; the accurate data will also help us to improve mathematical modellings used in the predictive
analysis.
This can be achieved by using the Internet of Things (IoT) based solutions. The concept of IoT is that,
it connects many objects such as sensors, actuators, phones, computers, Radio Frequency
Identification (RFIDs) using unique addressing schemes and works together to achieve a common
goal (Atzori et al. 2010). UCD (University College Dublin) conducting this research in collaboration
with the Science Foundation Ireland funded Connect Centre and their Pervasive Nation project which
is the testbed for Ireland’s ‘Internet of Things’ (IoT).
Methodology
Components & Design
The concept of the project is by continuous monitoring of different parameters (temperature,
humidity, water level & pressure) in sewers; it is possible to identify a potential blockage before it
occurs. Components of the project are a sensor, a gateway device, router, a server and admin
computer with a user interface. Figure 1 represents the layout of the project.
Figure 1: Project components
Sensors
To monitor various parameters, different IOT sensors are required. Multiple Industrial IoT (IIOT)
sensors such as temperature sensor, ultrasonic sensor, gas sensor, humidity sensor, pressure sensor &
level sensor will be connected to a Multi-circuit board with power supply controller. A power supply
controller provides a specific amount of power required for each sensor. These sensors will be
compacted in a sensor board with wireless capability. Table 1 presents the different sensors and their
specifications, which will be used in the project.
Gateway device & protocols
An IoT gateway device aggregates and processes data from multiple sensors before sending it to the
admin’s system. There are many IoT protocols available such as Bluetooth, Zigbee, Z-wave,
6LowPan, Thread, WIFI, Cellular, NFC (Near Field Communication) and LoRaWAN. Selection of a
protocol is based on IOT application factors such as range, data requirement, battery life and the
communication speed (DesignSpark 2019). For this project WIFI protocol will be used, it targets
WANs (Wide-Area Networks) and provides secure bi-directional communication and suitable with
IIOT applications.
Table 1: List of Sensors
113

Name of the sensor
Company Operating range
Resolution Operating Voltage
References
Ultrasonic Maxbotix
5cm – 500cm 5 mm 2.7V to 5.5V (Maxbotix 2018)
Temperature
and Humidity
Sensirion - - 2.7V to 5.5V (Sensirion 2018)
Pressure Measurem
ent
Specialties
0 to 14 bar 1/0.6/0.4/0
.3/0.2
mbar
2.7V to 3.3V (Specialities 2019)
Laser Sensor Garmin 1cm to 40 m
(131ft) +/- 1cm 2.7V to 5.5V (Garmin 2019)
Design simulation
The circuit for the multisensory device will be tested by using simulation software such as Microsoft
Azure IoT (Microsoft 2019) and National Instrument’s LabView-2018 (NI 2019). There are several
simulation software packages available in the market, but these three software were chosen based on
user interface and availability.
Experimental testing
The next phase of the project after the simulation is the construction of a physical model. This model
will be installed and tested in UCD campus sewers.
Results and discussion
Previous study
In a previous experiment (Curran 2018), the ‘Kotahi Level Monitor sensor’ and ‘Sagemcom Siconia
PN1 sensor’ for monitoring humidity, temperature and pressure were installed in UCD sewers. They
concluded that using real-time data of different parameters available from IoT sensors, it is possible to
pinpoint the exact location of sewer blockages and eliminate them before a blockage occurs. They
also concluded that the efficiency and accuracy of the results could be improved by using a more
robust and wider range of IoT sensors.
Simulation results from this study will be used to build a sensor device which will be installed in the
UCD campus. The sensor device will produce different output results such as temperature, water
level, humidity and gas levels, which will be studied to determine the blockage condition in the sewer.
Conclusion
The result from the past study shows that it is possible to build an advance warning system using IoT.
In this study, more options for range and sensors will be examined. An IoT device simulation will
help to determine the number of sensors and devices in the system, expected results and challenges in
the physical world.
References
Adams, T. (2018) 'London’s fatberg on the show: ‘We thought of pickling it’' available:
https://www.theguardian.com/culture/2018/feb/04/fatberg-museum-london-display-pickling-
age-waste [accessed 01/04/2019].
Atzori, L., Iera, A. and Morabito, G. (2010) 'The internet of things: A survey', Computer networks,
54(15), 2787-2805.
Chae, M.J., Kim, W. and Hwang, H.-k. (2008) 'Digital pipeline image scanning and intelligent data
management for sewer pipelines' in Pipelines 2008: Pipeline Asset Management: Maximizing
Performance of our Pipeline Infrastructure, 1-11.
114

DesignSpark (2019) 11 Internet of Things (IoT) Protocols You Need to Know About, available:
https://www.rs-online.com/designspark/eleven-internet-of-things-iot-protocols-you-need-to-
know-about [accessed 01/04/2019].
Epa, U.S. (2004) 'Report to Congress: Impacts and control of CSOs and SSOs', Office of Water.
available: https://www.epa.gov/sites/production/files/2015-
10/documents/csossortc2004_full.pdf [accessed 30/03/2019].
Garmin (2019) LIDAR V3hp datasheet, available:
https://cdn.sparkfun.com/assets/9/a/6/a/d/LIDAR_Lite_v3HP_Operation_Manual_and_Techn
ical_Specifications.pdf [accessed 23/07/2019].
Hao, Z., Malyala, D., Dean, L. and Ducoste, J. (2017) 'Attenuated Total Reflectance Fourier transform
infrared spectroscopy for determination of Long Chain Free Fatty Acid concentration in oily
wastewater using the double wavenumber extrapolation technique', Talanta, 165, 526-532.
He, X., Francis Iii, L., Leming, M.L., Dean, L.O., Lappi, S.E. and Ducoste, J.J. (2013) 'Mechanisms
of fat, oil and grease (FOG) deposit formation in sewer lines', Water research, 47(13), 4451-
4459.
Kurisu, H., Sekozawa, T., Shimauchi, S. and Yoda, M. (1998) 'Pipeline breakage sensing system and
sensing method'. available: https://www.concawe.eu/wp-content/uploads/2017/01/rpt_98-1-
2003-01974-01-e.pdf [accessed 02/04/2019].
Maxbotix (2018) 'Maxbotix Ultrasonis sensor (MB7360) datasheet.' available:
https://www.maxbotix.com/Ultrasonic_Sensors/MB7360.htm [accessed 23/07/2019].
Specialities, M. (2019) Barometric Sensor MS5803-14BA datasheet, available:
https://cdn.sparkfun.com/datasheets/Sensors/Weather/ms5803_14ba.pdf [accessed
23/07/2019].
Microsoft (2019) IoT | Microsoft Azure, available: https://azure.microsoft.com/en-us/free/iot/
[accessed 01/04/2019].
Mills, P. (2010) FOGs build up and removal: problems and solutions, UK: Cranfield University,
available: http://www.policyconsulting.co.uk/downloads/FOGs_Cranfield_March2010.pdf
[accessed 30/3/2019].
Moore-B, B. (2017) ''Biggest ever' fatberg weighing whopping 130 tonnes found in east London
sewer', EveningStandard, 12th September 2017, available:
https://www.standard.co.uk/news/london/biggest-ever-fatberg-weighing-whopping-130-
tonnes-found-in-east-london-sewer-a3632476.html [accessed 10/03/2019].
NI (2019) Labview 2018, LAbview IOT simulator, available: http://www.ni.com/en-
ie/shop/labview/labview-details.html [accessed 01/04/2019].
Ratcliffe, R. (2015) '10-tonne fatberg removed from west London sewer', The Guardian, 2015-04-21,
available: http://www.theguardian.com/uk-news/2015/apr/21/huge-10-ton-fatberg-removed-
chelsea-sewer-london [accessed 30/03/2019].
Sager, R.J. (1996) 'Grease and oil trap', avilable: https://patents.google.com/patent/US5505860A/en
[accessed 30/03/2019].
Sensirion (2018) Sensirion Temprature & Humidity Sensor Datasheet (SHT20). available:
https://www.mouser.com/ds/2/682/Sensirion_Humidity_Sensors_SHT20_Datasheet-
1274196.pdf [accessed 23/07/2019].
SICK (2019) UM18-218161101 | Distance sensors SICK, available:
https://www.sick.com/ag/en/distance-sensors/ultrasonic-sensors/um18/um18-
218161101/p/p334362 [accessed 01/04/2019].
Wallace, T., Gibbons, D., O'Dwyer, M. and Curran, T.P. (2017) 'International evolution of fat, oil and
grease (FOG) waste management – A review', Journal of Environmental Management, 187,
424-435, available: http://dx.doi.org/https://doi.org/10.1016/j.jenvman.2016.11.003.
Williams, J.B., Clarkson, C., Mant, C., Drinkwater, A. and May, E. (2012) 'Fat, oil and grease
deposits in sewers: Characterisation of deposits and formation mechanisms', Water Research,
46(19), 6319-6328, available: http://dx.doi.org/https://doi.org/10.1016/j.watres.2012.09.002.
Ziska, T.J. (1990) 'Sewer line detection system', avilable:
https://repository.up.ac.za/bitstream/handle/2263/19303/Erasmus_Methods(2009).pdf?sequen
ce=1 [accessed 1/04/2019].
115
https://www.rs-online.com/designspark/eleven-internet-of-things-iot-protocols-you-need-to-know-about

MICROGENERATION OF ELECTRICITY
USING SOLAR ENERGY
Vinay Mulenahalli Virupaksha, Kevin P. McDonnell
UCD School of Biosystems and Food Engineering, University College Dublin, Belfield,
Dublin 4, Ireland.
Abstract
The electricity generation using solar energy is one of the sustainable forms of renewable
energy, however the uptake of solar PV system remains very low in Ireland. The aim of this
study is to determine the pathway for the deployment of PV systems for microgeneration
under Irish climatic conditions at a location based in Dublin. This was accomplished by
estimating the electricity load requirement of each residential building, designing a
community based PV installation project and carrying out power flow analysis on the
electricity network model of the grid for the proposed PV system. Results indicate the life
cycle GHG emissions from solar PV is significantly lower compared to that of the national
grid and potential to improve sustainability of the community by self-generation,
consumption and feeding the excess electricity to the grid.
Introduction
Ireland is significantly dependent of fossil fuel imports and has limited indigenous fossil
energy resources. In 2014 fossil fuels (coal, natural gas, oil and peat) accounted for 91.4% of
the primary energy demand for electricity and generation of heat. The burning of fossil fuels
for the generation of energy is the dominant contributor to greenhouse gas emissions (GHG)
equating to 63.3% of total national GHG emissions in 2012 (Murphy and McDonnell 2017).
In line with European Union, 2009/28/EC Renewable Energy Directive (RED) Ireland is
committed to decrease GHG emissions and advance in developing alternative energy sources
to find reduce the national dependence on fossil fuels. Under this RED, Ireland’s overall
renewable energy target of 16% is driving the urgency to deploy indigenous renewable
sources of energy. The National Renewable Energy Action Plan (NREAP) outlines the target
of 40% electricity use from renewables by the year 2020 (Murphy and McDonnell 2017).
In 2017 the Sustainable Energy Authority of Ireland (SEAI) estimates the overall renewable
energy supply was 10.6% and Ireland is 26th out of the EU-28 for progress towards overall
2020 renewable energy target. In 2017 62% of renewable energy was renewable electricity,
overall renewable energy has displaced 1.8 Mt of fossil fuel consumption and avoided 4.2
MtCO2 of GHG emissions in 2017 out of which 80% of CO2 emissions reduction were from
generation of electricity (SEAI 2019). The major share of renewable energy includes wind,
hydro and biomass however, the share of power generation from solar remains very low
around 49 PV micro-generation grid connected installations at the end of the year 2012. The
SEAI highlights Ireland is not on track to meet 2020 renewable energy targets and has
estimated that for each percentage point shortfall in meeting these targets has an implication
of €100 million to €150 million. The objective of this study was to assess the potential of
harnessing the solar PV microgeneration of community based projects into the grid in
Ireland and to explore a crowd funding mechanism for community ownership of solar
PV microgeneration projects in Ireland.
Materials and Methods
System Description
The proposed solar PV microgeneration community project consists of 68 residential
buildings located at Belfield, Dublin. The solar irradiance data is collected from the nearest
116

weather station at Dublin airport at 963 kWh/m2. The PV panels are mounted on the roof-top
of each building with collector facing south direction with an tilt angle of 30. Each PV solar
panels considered for use in this system are the Hanwha Q cells1 Q peak G4.1 300 Rev4
monocrystalline modules with dimensions of 1670 × 1000 × 32 mm, linking to a surface area
of 1.67 m2 with an efficiency of 18%. Annual average solar irradiation received by these
modules is 1074 kWh/m2. The roof area available for mounting of PV panels is 10.042 m
2
(Murphy and McDonnell 2017). PV system details are listed in Table 1.
The total solar PV installed effect of each building is calculated using equation 2Wpi = A × r (1)
Where, Wpi = Total solar PV installed effect of each building in kW
A = Total roof area in m2
r = solar panel efficiency in %
The number of panels installed in each building is calculated using equation 2Np = Wpi/Wp (2)
Where, Np = Number of panels installed in each building
Wpi = Total solar PV installed effect of each building in kW
Wp = Nominal power rating of the panel in kW
The annual peak output of the PV system of each building is calculated using the equation 2Ep = A × r × H × C (3)
Where, Ep = Annual peak output of the PV system in kWh/year
H = Annual average irradiation on tilted panels in kWh/m2
C = Coefficient for losses (range between 0.9 to 0.5)
2Losses details depend on site, technology and sizing of the system includes Inverter losses (6
to 15%), Temperature losses (5 to 15%), DC cable losses (1 to 3%), AC cable losses (1 to
3%), Shading (0 to 40%), weak irradiation (3 to 7%), Losses due to dust, snow (0 to 2%),
degradation of modules (0.5 to 1%), other losses (1 to 2%).
The Performance ratio of the PV system is calculated using equation 2PR = (Ep/Wpi/H) × 100 (4)
Where, PR = Performance ratio of the PV system in %
Table 1. Details of the PV system
Data for each building Unit Quantity
Area of the roof area (A) m2 10.042
Panel efficiency (r) % 18
Installed effect (Wpi) kW 1.8
Nominal power of panel (Wp) kW 0.3
Number of panels (Np) piece 6
Annual average irradiation (H) kWh/m2 1074
Coefficient for losses (C) factor 0.8
Annual peak power output (Ep) kWh/year 1553
Performance ratio (PR) % ~ 80
Lifetime expectancy years 30
1Hanwha Q Cells manufacturing facilities in China, Malaysia and South Korea.
2photovoltaic-software.com/principle-resources.
117

Electricity loads
With approval from each building owner, electricity demand data can be collected to build the
detailed annual load characteristics with average maximum hourly electricity use kWh or
Figure 1 shows the example of monthly electricity use in relation to the maximum hourly
electricity use kWh/h for a typical household with low annual usage of 3100 kWh (La and
Ryan 2017).
Figure 1. Annual building electricity demand kWh.
Solar PV electricity generation
The system was modelled using PV×SOL software (pvsol-online.valentin-software.com). The
monthly solar PV electricity generation is shown in Figure 2.
Figure 2. Annual PV electricity generation kWh.
Electricity network model
The electricity network model is build based on a real MV and LV power transmission and
distribution network supplying a surrounding town and rural area. The pertinent data has been
provided by ESBN. The network model consists of 38 kV primary substation with 2 x
5MVA, 38/10 kV transformers, 10kV feeder has a total circuit route length of 40km with mix
of overhead lines and underground cables, the distribution substation with 1 x 630 kVA,
10/0.400 kV transformer is located at a distance of 5.9 km from the primary substation, LV
network includes 06 low voltage underground cable feeders, each cable feeder of size 185
mm2 cross sectional area conductor connect to around 11 buildings via street pillars equating
the total to 68 residential buildings (Ellis and Breathnach 2017).
Results and Discussion
A comparison between Figure 1 and 2 indicates the low annual match between use of
electricity and available PV electricity in Ireland. Figure 3 shows the expected annual
electricity – with PV generation for self-consumption (653 kWh) & for grid feed-in (900
kWh) and demand on grid (2448 kWh).
0
50
100
150
200
250
300
350
Jan Feb Mar Apr May Jun Jul Aug Sep Oct Nov Dec
0
50
100
150
200
250
Jan Feb Mar Apr May Jun Jul Aug Sep Oct Nov DecMonth
ly P
V e
lect
rici
ty k
Wh
M
on
thly
ele
ctri
city
kW
h
118

Figure 3. Annual electricity – PV for self-consumption, grid feed-in and demand on grid
Prediction of annual CO2 emission reduction
Life cycle GHG emissions from solar PV electricity production (69 g CO2-eq per kWh-1
) in
Ireland is approximately 6.5 times lower than the GHG emissions from electricity production
on the national grid (457 g CO2-eq per kWh-1
) (Murphy and McDonnell 2017).
Prediction of annual savings in electricity/money
Savings in electricity and money by each residential building is equated to annual PV
electricity that are directly self-consumed and by electricity fed to the grid at the prevailing
rate of feed in tariff.
Prediction of annual losses reduction from power grid
The power flow study of the primary substation, MV network, distribution substation and LV
network during the winter maximum load reading estimates the technical losses to be 106kW
for entire 68 residential buildings (Ellis and Breathnach 2017).
Prediction of annual indigenous fossil resource or import displaced.
The annual displacement of coal, natural gas, oil resource is estimated by equating the annual
solar PV electricity production (kWh) and electricity losses with the factor 3.2704x10-07
ktoe
for coal, 0.00303 ktoe for natural gas and 2.24 x 10-07
ktoe for oil.
Conclusions
Annual reduction in CO2 emissions, electricity consumption from grid, electricity losses and
displacement of fossil fuel resource is predicted using above methods. This study showed that
solar electricity generation will yield significant GHG emission savings compared to the
national grid of Ireland and will result in further greening of national grids. The economic
payback time of solar PV systems is associated with extending of renewable energy feed in
tariff (REFIT) which is critical for the future uptake of PV in Ireland.
References
Ellis, F., Breathnach, L. (2017) FlexiGrid - The Impact of a Storage Network on Existing and
Future Grid Infrastructure Using Power Systems Analysis Software, Dublin.
La, S., Ryan, L. (2017) ‘Solar PV where the sun doesn ’ t shine : Estimating the economic
impacts of support schemes for residential PV with detailed net demand pro fi ling’,
Energy Policy, 108(June), 731–741.
Murphy, F., McDonnell, K. (2017) ‘A Feasibility Assessment of Photovoltaic Power Systems
in Ireland; a Case Study for the Dublin Region’, sustainability, 1–14.
SEAI (2019) Renewable Energy in Ireland 2019 Report, Dublin.
0
100
200
300
Jan Feb Mar Apr May Jun Jul Aug Sep Oct Nov Dec
Self Consumption Grid feed in Demand on Grid
Mo
nth
ly e
lect
rici
ty k
Wh
1
3
3
2
2
1
119

UNDERSTANDING SOLAR ENERGY CHARITY TO ADVANCE
GEO POLITICAL DYNAMICS
Haider Hussain Naqvi, Kevin McDonnell
UCD School of Biosystems and Food Engineering, University College Dublin, Belfield, Dublin
4, Ireland.
Abstract
The growth of renewable energy and its implementation in the power sector has already come
so far than any of other energy resource which also includes fossil fuels. Globally, there is a
new trend of transformation of energy which is a kind of shifting from fossil fuels to any
source which can be replaced naturally in certain time period. The concept of this research is
to understand how a renewable energy in this case solar can be used as a charity of trade
purpose between developing and developed nations. This transformation of energy can bring
out global development in a sustainable and legitimate manner. Moreover, the study be an
exploratory review deriving its threads of geopolitical energy trade through documents from
the government, scientific papers and articles. Significant portion of this study will utilize
secondary research which involved interviews with influential and experienced dignitaries of
the field. This paper presents the whole phenomenon of energy charity and its transformation
to outlines the initiative based on sustainable energy development.
Introduction
Today, there are 1.4 billion individuals around the globe that need access to power, some 85%
of them in provincial territories. Without extra devoted approaches, by 2030 the quantity of
individuals drops, however just to 1.2 billion but still it is beneficial. Some 15% of the total
populace still need to get to, source their energy from renewable energy their geographical
location possesses. Most of them living in Sub-Saharan Africa (Solangi et al 2011). Also, these
nations hold enough potential to create an adequate measure of sunlight based energy that can
be transported to different nations in return of assets they need. Nonetheless, planning an
effective solar oriented collecting framework to understand the potential advantages of energy
reaping requires an analysis of significant number of components. For instance, solar-based
energy supply is exceedingly time changing and may not generally be adequate to control the
installed framework. Gathering segments, for example, solar based boards, and energy
stockpiling components, such as, batteries or ultracapacitors, have diverse voltage-current
attributes which influence energy use and capacity choices (Raghunathan et al 2005). Thus, a
system to exchange energy generated with one nation then delivered to the next would require
an abundant measure of energy collecting plants that can capture and move sun-powered energy
into power. Government officials are always belittling the genuine capability of solar energy
(Commoner 1980).
The study aims to conduct an in-depth literature review of existing research done in the field of
energy policy in India and conduct in-depth interviews to further explore the possibilities of
energy transfer on the qualitative forefront. The research will be based on feasibility study.
Moreover, the primary data will be collected through in-depth expert interviews and will be
further strengthened by fieldwork in developing nations particularly India.
The objective of this study is to understand whether solar energy can be used a as
renewable energy tool for energy charity, where the solar energy-rich developing
countries can transfer the energy to developed countries and improve the geopolitical
relations, which would further advance the development of developing nations.
120

Materials and Method
The study started with the aim of understanding how energy charity with respect to solar
energy can impact the scene of geopolitics between developing and developed nations. Over a
period, the research narrowed down to the regional geopolitics and the solar energy charity
with respect to the villages situated near the major solar energy producing plants. In order to
make the study structured, a set of five research questions were developed which further
helped in defining the research objective and methodology of the study. The research
questions are as follows:
1. What is the current status of solar energy consumption in the villages of India?
2. What is the overall proportion of solar energy consumption in different sectors
majorly industry and households in different zones of India?
3. Who all are the major actors (stakeholders) who define the policies and programs
with respect to solar energy production and consumption?
4. Are villagers willing to accept solar energy as the only source of energy for their
personal and agricultural needs?
5. What is the overall awareness of villagers with respect to solar energy in a developing
nation like India?
A glimpse of answers from the research questions came from already existing literature
however, the concrete picture was derived from the ground experience.
In order to understand the current state of development with respect to solar energy
consumption, acceptance and creation, the length and breadth of a developing nation India
needed to be studied. The research majorly derives its validation from exploratory research
which focused a particular objective of understanding the potential lying in solar energy.
To derive a right sample for the research, India was divided into four zones namely North,
East, West and South. Further, one state from each zone was selected based on the work done
in the field of solar energy. Ten villages were considered for the study to understand the
acceptance and feasibility of solar energy creation and consumption with respect to the
operations of Government and local NGOs working on solar energy. The sample can be
understood as follows:
121

Figure 1. India divided in four zones with their respective areas.
Results and Discussion
The interviews yielded an advanced understanding of solar energy mechanisms. It helped in
understanding how it can yield a strong thread of advancing geopolitical relations between
developing and developed nations. Unless there is a method to transport the energy gathered
within with one nation or to facilitate the transfer of that energy to the next region through
links either hung on utility posts, covered in the ground or generally submerged in the ocean,
sunlight based energy would require the transportation and utilization of huge stockpiling
batteries to give control. Such a capacity medium would not be financially viable or feasible
on a small scale.
Power Networks in different nations can be interconnected and consequently purchased and
sold from one another when a request requires. However, that requires extensive scale
circulation to be set up over built up. Small chance that you are simply undertaking to transfer
capacity to nearby site for it to utilize a small-scale display, certainly it’s a more financially
viable to purchase and execute either a convenient or structured framework. While one is
creating their own capacity locally and not getting profit by a sector which has a wealth of
daylight introduction, they are likewise not being forced to again consider an agreement
which can be a risky journey for them which they are improbably ready to manage.
The exchange of energy to a remote nation is potentially possible on the grounds that the
European national power framework lines are associated by mean of the synchronous lattice
of Continental Europe. Once the energy supplier delivers in the matrix there's no real way to
perceive the source, you simply consent to a Power Purchase Arrangement (PPA) or present a
buy request on the energy showcase and that is it, the physical piece of the exchange will be
adjusted by the Transmission Systems Operator (TSO).
India
North
Jammu and
Kashmir
Ladakh
10 Villages
Two NGOs
East
Arunanchal Pradesh
Itanagar
10 Villages
One Local NGO
West
Gujarat
Ahmedabad
10 Villages
Two NGOs
South
Kerala
Cochin
10 Villages
One NGO
122

Conclusions
The study conducted todate considered the insights received from interviewing the professionals
and scholars from the field. The interview analysis presented that the transfer of renewable
energy like solar energy can improve the relations and development agenda between developed
and developing nations. Moreover, India being a hub of diverse terrains also holds the potential
of generating energy in deserts and transferring the same to foreign countries. However, a
strong potential and viability of such Energy Transfer and Charity projects is unexplored and
requires a great deal of scholar research to understand the relative impact.
Additionally, India is an untapped market for renewable energy especially solar energy. The
potential of Indian renewable energy production is underutilized due to poor infrastructure and
lack of public policy. However, India has initiated a tremendous growth phenomenon in
transforming energy sector with renewable energy production. There is a scope of foreign
investments in the field of renewable energy and the same being transferred to foreign countries.
A concept of Energy exchange can be established where a regulating body would ensure the
trade of energy as a currency and presentation of the same in the Gross Domestic Product of
every nation. Here the agenda of globalization and achievement of sustainable development
goals will take place through energy trade and charity. Moreover, the countries who possess
geographical advantage of solar energy will hold the veto power where they will be the
regulating authority of the same. The same concept can be implemented to other energy sector
however, solar energy can be transformed and utilized in various ways as compared to other
energy.
Acknowledgements
The research was possible with the help of supporting institutions like TERI (The Energy and
Resources Institute) and Renewable World.
References
Commoner, B. (1980) 'Politics of energy', Germany: Carussell.
Davis, D.H. (1982) 'Energy politics'. United States: N. p.
Kaygusuz, K. (2012) 'Energy for sustainable development: A case of developing countries',
Renewable and Sustainable Energy Reviews, 16(2), 1116-1126.
Raghunathan, V., Kansal, A., Hsu, J., Friedman, J. and Srivastava, M. (2005) 'Design
considerations for solar energy harvesting wireless embedded systems', IEEE Press,
64.
Solangi, K.H., Islam, M.R., Saidur, R., Rahim, N.A. and Fayaz, H. (2011) 'A review on
global solar energy policy', Renewable and sustainable energy reviews, 15(4), 2149-
2163.
123
ASSESSMENT OF WIND POWER INTEGRATION TO SOLAR
PHOTOVOLTAIC MINI-GRID.
Zenande Nombakuse, Fionnuala Murphy
UCD School of Biosystems and Food Engineering, University College Dublin, Belfield, Dublin 4,
Ireland
Abstract
Access to electricity predominantly enables improvement in socio-economic development and
economic growth in poor societies. Renewable energy smart grid technologies solicit deliverance of
real and sustainable decentralized energy solutions for remote and rural communities. This paper aims
to investigate the rationale to integrate wind turbine generators to the existing 75-kilowatt (kW) solar
photovoltaic with the storage of 370-kilowatt-hour (kWh), the backup diesel generator of 20 kW with
400 liters of diesel storage to the off-grid rural community. The power distribution intended for 70
household stands, the maximum power supply is 55.7 kW that is 300 kWh/day. The power demand
per stand is 1.3 kW equated to 7 kWh/day. Hybrid Optimization Model for Electric Renewable Pro
(HOMER) grid design software to simulate optimal system configuration and scalability of wind
power integration to hybrid solar photovoltaic. The work on this paper presents the technical aspects
and risks associated with the inclusion of a wind power component to solar mini-grids, data analysis
and the expected performance of the proposed system will be presented. The simulation results
envisage finding out how realistic to implement wind energy system integration and the advancement
of renewable energy technologies to substantiate the deployment of mini-grids.
Introduction
The South African constitution authenticates the electricity as the basic right under the municipal
services in section 73 of the Municipal Systems Act. One of the South African Government objectives
is to provide access to electricity to all of its citizens. Geographical constraints, low-density
populations and high costs for grid extension hinder the provision of electricity to rural and remote
communities. The hybrid wind-solar photovoltaic mini-grid renewable energy system assessed in this
paper aimed at electrifying rural and remote areas that are off the electricity grid. Integration of wind
turbine generators to the ground-mounted hybrid solar photovoltaic system with the diesel generator
and batteries storage is investigated to deliver sustainably and decentralized power generation.
Renewable energy sources offer a viable alternative to the provision of power in rural areas, and the
seasonal variations of wind and solar resources are complementary to each other (Lal et al. 2011).
Application of mini-grids in South Africa is not a new concept, barriers to implementing smart grids
include institutional capacity, policy formulation, lack of mini-grid precedents and social cohesion.
Previous studies concluded that it is not feasible to deliver sustainable mini-grids in South Africa
based on the challenges of competing with low-cost grid electricity are not so prominent ((SP) 2003;
Power 2003; Azimoh et al. 2016). The lifetime cost of electricity grid extension in rural areas is lower
than installing off-grid renewable energy solutions (Yadoo and Cruickshank 2012). Furthermore,
implemented mini-grid at Lucingweni in South Africa present the challenge of inadequate power
supply (spatial) to match the demand potential and opportunities (Szewczuk 2013).
This study investigates the feasibility of implementing hybrid wind-solar mini-grid in rural remote
areas, by analyzing the simulation and modeling of wind power generators. Combined assessment of
renewable energy sources with the input from battery storage, and diesel generator to equate to the
demand load of the community. Optimization of renewable energy technologies and decentralized
energy distribution has the potential to meet the rural energy demand load potential. The assessment
will present a hybrid system design, power quality, and scalability of wind power generators to ensure
the stability of the system in any working condition.
The objective of this study was to investigate the technical aspects and risks associated with the
inclusion of a wind power component to solar mini-grids.
124

Material and Methods
The proposed hybrid renewable energy system consists of wind power generator integrated to the
existing energy system consisting of solar photovoltaic battery storage, diesel generator (backup unit),
and the inverter as depicted in figure 1 below. Light Detection and Ranging (LiDAR) for wind
resource assessment will be used to collect physical wind measurements for six months. The wind
data collected will be correlated with the Fort Beaufort monthly meteorological data, and Wind Atlas
for South Africa. The viability of hybrid wind-solar mini-grid energy system provides a reliable
energy supply compared to the separate use of energy systems for the off-grid rural remote areas.
Diesel generator backup systems used to cope with the intermittency of solar and wind energy supply.
Figure 1. General schematic diagram of the hybrid system (Lal et al. 2011).
Location of the study area
Upper Blinkwater is a small rural village located at the Raymond Mhlaba Local Municipality, in the
Province of the Eastern Cape, South Africa, located in a higher plateau (height res. 900 m above sea
level) at 32° 34.7' south and 26° 33.5' east. The village is not grid-connected. However, there is no
prospect of electrifying the village for the next coming five to ten years. The rural village consists of
53 households, a school and a church, and a separate cluster of 7 standalone houses, approximately
23km north-west of Fort Beaufort in the Eastern Cape, South Africa. The rough terrain, low electricity
demand, low population density, high-cost grid extension, and remote locality of the village hinders
the electrification of the village (Szewczuk 2013).
Measurements
Preliminary wind assessment at 50 meters above ground level is about 6 meters per second at the site.
The wind speed and direction will be measured for six months.
Wind power integration assessment
Mini-grid code
Integrated energy planning for wind turbine generator to simulate and model the mini-grid is
investigated using the HOMER Pro grid design software. The intermittent wind power generation will
be analyzed. The relevant factors such as optimization and sensitivity analyses of various conditions
on the risk and technical aspect will be determined. Furthermore, HOMER Pro will be used to assess
the feasibility of utilizing renewable energy sources to electrify remote rural areas.
HOMER Micro-grid modeling
Simulation
HOMER Pro software simulates based on the system design with various energy component or
equipment combination. However, the simulation is carried out using 1-hour intervals, during which
all of the parameters (load, input and output power from the components, etc.) remain constant
(Bernal-Agustín and Dufo-López 2009). For this study, the wind speed variance and energization will
be simulated to determine the best feasible system configuration, which can adequately serve the
125

electric demand. Additionally, the HOMER simulation results depict graphics with detail and
precision.
Optimization
Subsequently to simulation, optimization of wind component to determine and review the holistic
system approach of hybrid renewable energy system configuration with the lowest total net present
cost.
Sensitivity analysis
The analysis will determine how changes in the input variable affect the performance of the system
and the relative ranking of different systems.
Results and discussions
The envisaged and proposed hybrid solar–wind power generation system consists of PV array, wind
turbine, diesel generator, battery bank, converter, and other auxiliary components as depicted in figure
2 below.
Figure 2. HOMER schematic diagram of solar- wind hybrid system (Ramli et al. 2018).
HOMER Pro grid software design performs hundreds or thousands of hourly simulations (to ensure
best possible matching of demand and supply) and offers a list of feasible schemes ranked based on
the NPC (net present cost) (Lal et al. 2011). The simulated results will ensure the power generator
provides enough power to meet the demand load profile. Furthermore, the results will characterize the
electrical energy production, annual electrical load served, excess electricity, renewable energy
fraction, capacity shortage and unmet load. The battery bank and the diesel generator will cope with
the intermittent wind and solar power. The autonomous operation of mini-grids needs to be
considered and mini-grid operation has a far-reaching impact on the existing safety, control,
protection, and dispatch practices and strategies of electrical energy, yet mini-grid operation has
neither been fully understood nor investigated (Katiraei et al. 2005).
Conclusions
The study will analyze and improve integration of wind and solar renewable energy generation and
parity with energy demand forecasting. Previous studies illustrate the deliverance of sustainable and
meaningful energy to remote and rural communities utilizing renewable energy technologies. Creating
reliance and replication of mini-grids to other un-electrified rural communities. Implementation of
mini-grid will certainly influence the decision-makers on the energy policy development to include
mini-grids, and thereby creating economic opportunities and to stimulate economic growth.
126

Acknowledgments
The South Africa Government with Germany’s state of Lower Saxony are acknowledged.
References
Azimoh, C.L., Klintenberg, P., Wallin, F., Karlsson, B. and Mbohwa, C. (2016) 'Electricity for
development: Mini-grid solution for rural electrification in South Africa', Energy Conversion
and Management, 110, 268-277, available:
http://dx.doi.org/https://doi.org/10.1016/j.enconman.2015.12.015.
Bernal-Agustín, J.L. and Dufo-López, R. (2009) 'Simulation and optimization of stand-alone hybrid
renewable energy systems', Renewable and Sustainable Energy Reviews, 13(8), 2111-2118,
available: http://dx.doi.org/https://doi.org/10.1016/j.rser.2009.01.010.
Lal, D., Bhusan Dash, B. and Akella, A.K. (2011) Optimization of PV/Wind/Micro-Hydro/Diesel
Hybrid Power System in HOMER for the Study Area.
Power, S. (2003) Community Electricity in Rural South Africa: Renewable mini-grid assessment,
available: https://www.globalelectricity.org/content/uploads/Renewable-Mini-Grid-
Assessment-in-SA-Prefeasibility-Study.pdf [accessed 31 March 2019].
Ramli, M.A., Bouchekara, H. and Alghamdi, A.S. (2018) 'Optimal sizing of PV/wind/diesel hybrid
microgrid system using multi-objective self-adaptive differential evolution algorithm',
Renewable Energy, 121, 400-411.
Szewczuk, S. (2013) 'Overview of CSIR's activities towards smart sustainable energy for rural
communities', in 2013 Proceedings of the 21st Domestic Use of Energy Conference, IEEE, 1-
6.
Yadoo, A. and Cruickshank, H. (2012) 'The role for low carbon electrification technologies in poverty
reduction and climate change strategies: A focus on renewable energy mini-grids with case
studies in Nepal, Peru and Kenya', Energy Policy, 42, 591-602, available:
http://dx.doi.org/https://doi.org/10.1016/j.enpol.2011.12.029.
127

A FEASIBILITY STUDY OF THE AGROCYCLE MARKETPLACE –
SECONDARY & QUALITATIVE RESEARCH
Ronan O’Mhaoinigh and Thomas P. Curran
UCD School of Biosystems and Food Engineering, University College Dublin, Belfield, Dublin 4,
Ireland.
Abstract
AgroCycle Marketplace is the result of a Horizon 2020 project, AgroCycle. It is an online trading
platform which facilitates the free flow of waste across the European agri-food industry and beyond,
thus reducing waste through industrial symbiosis. The hypothesis is that the AgroCycle Marketplace
Platform, by targeting the agri-food industry, can be economically sustainable. The objective of this
study was to unearth potential customers’ views, preferences, needs and wants regarding the
AgroCycle Marketplace offering via qualitative empirical research; and secondary research of current
trends, policies and legislation. Preliminary results indicate that policy makers, industry leaders and
ultimately, potential customers, find that there is a real and pressing need for the product.
Introduction
The global scientific community strongly believe that the 1oC increase in the world’s temperature,
compared to the pre industrialisation period, has principally been caused by the emission of
Greenhouse Gases, (GHG), for which mankind is responsible (Intergovernmental Panel on Climate
Change 2018). It has been found that agriculture, forestry and land use change are responsible for
30.9% of GHG emissions (Swaminathan and Kesavan 2012). Studies have found that the percentage
of world food waste is approximately 33% (Gustavsson et al. 2011). With such high levels of waste
associated with the production and consumption of food, the solution is obvious. The agri-food
industry can have a prodigious and direct impact on global warming by simply reducing food waste.
Today, inadequate food security is an acute problem with 100 million children under the age of twelve
being underweight; and 3.1 million children under the age of five dying from hunger annually
(McGuire 2015; United Nations 2019). The agri-food industry must act so as to create a more
sustainable and just world.
As the European Union’s resources are becoming scarce and its per capita material consumption rates
are above global averages, it has been actively incorporating Circular Economy (CE) policies and
procedures since 2011 (European Commission 2011). Also in 2011, the European Union (EU)
initiated a move to consolidate its research, innovation and resources under one umbrella strategic
framework, Horizon 2020. Its objective is to secure Europe’s global competitiveness by nurturing
avant-garde technologies, processes, practices and methodologies, products and services (European
Commission 2019).
AgroCycle was a Horizon 2020 project whose objective was to make the agri-food industry more
sustainable by the recycling and valorisation of waste streams. One of the AgroCycle tasks was to
develop AgroCycle Marketplace, an online trading platform which would facilitate the intricate free
flow of waste across the different components of the European agri-food industry and beyond, thus
rendering it dynamic, and ultimately, reducing waste through industrial symbiosis (AgroCycle 2019a;
AgroCycle 2019b). The next step, which was outside the scope of the AgroCycle project, is to
commercialise the AgroCycle Marketplace.
The objective of this study was to unearth potential customers’ views, preferences, needs and
wants regarding the AgroCycle Marketplace offering via qualitative empirical research; and
secondary research of current trends, tendencies, policies and legislation.
128

Materials and Methods
Regarding the theoretical perspective within which the study will be grounded, the disciplinary
orientation of this study is business administration. The study will conduct secondary research which
will consider a broad range of literature including concepts, models and theories from scientific
journals, business journals, legislation and policy journals. Websites from reputable sources of
information like the EU and the United Nations (UN) will also be considered. The problem
statement, or feasibility statement, “the AgroCycle Marketplace Platform, by targeting the agri-food
industry, can be economically sustainable”, is defined within this framework. The purpose of the
study, in turn, “to unearth potential customers’ views, preferences, needs and wants regarding the
AgroCycle Marketplace offering” is established within the problem statement (Merriam and Tisdell
2016).
The literature review was conducted with a view to carrying out secondary research which would
serve to both: 1) Achieve the purpose of the study by identifying and analysing macro level trends,
tendencies, policies and legislation which shape micro level views, preferences, needs and wants; 2)
Help shape and define the empirical research.
If the aim of research is to understand how a community or individuals within it perceive a particular
issue, then qualitative methods are often appropriate (Baruch 1999). The objective of this research is
to unearth potential customers’ views, preferences, needs and wants regarding the AgroCycle
Marketplace. So, qualitative research, rather than quantitative research, would be the optimal
strategy. At this point in time, AgroCycle Marketplace is not aware of the critical factors, (from the
potential customer’s perspective), which will be decisive in the proliferation, or non-proliferation, of
online platform users. Any quantitative research that it would design would be based upon criteria
that it would be obliged to assume, which would be a perilous strategy. AgroCycle Marketplace
cannot quantify phenomena of which it is not aware. It is obliged to use qualitative research so as to
discover what the potential customer values most, thus, the key point to success.
Qualitative research comprises a combination of interpretive and material practices that visualises the
world, converting it into a range of representations such as photographs, recordings, interviews, and
field notes. Researchers investigate real world settings, analysing and interpreting phenomena in an
attempt to describe the meanings people attribute to them (Lincoln and Denzin 2005).
There are five principal qualitative approaches: 1) Narrative research; 2) Case study; 3) Grounded
theory; 4) Ethnographic research; 5) Phenomenology (Creswell 2013). Phenomenology research
strives to illustrate what people who share the same experience have in common, thus converting
individual experiences into a representation of a group experience (Van Manen 2016). The researcher
amasses data from a number of individuals and establishes an overarching experience from a group
perspective (Moustakas 1994). The research question is to unearth views, preferences, needs and
wants of a specific group, the agri-food industry participants, and so, phenomenology research will be
utilised.
With regard to the sample size, the authors have decided that, so as to maximise the richness and
variety of the data, as many interviews as the time constraints will permit will be considered.
Interviewees will be selected randomly from, but not limited to, the following events: 1) Irish
National Ploughing Championships 2018; 2) ICT-Biochain's Digital Innovation Hub Launch 2019; 4)
Agri Innovation Summit 2019; 5) UK AD and World Biogas Expo 2019; 6) Res Urbis Stakeholder
Meeting. Potential concerns related to procedures, data analysis, ethical considerations,
trustworthiness, potential research bias and limitations will be identified and dealt with using
recognised, world class industry standards, norms and procedures.
129

Results
The secondary research has identified that in order for the AgroCycle Marketplace to be a success, it
must attract a critical mass of users (Chesney and Lawson 2015). AgroCycle Marketplace’s target
markets are: 1) Suppliers of waste; 2) and Potential “Value-isers” of waste. As there is so much waste
created right across the agri-food industry, there is no shortage of suppliers. So, the question
“whether the demand will be sufficient, or not?”, is crucial. In order for the demand to be
satisfactory, there has to be enough viable means of valorising waste. What is of the utmost
importance is that these waste valorisation means can lead to profitable, stand-alone business units,
without the aid of government financial subsidies. The alternative being that they are not sustainable,
and the foundations under which the CE is built, simply crumble.
This paper has reviewed state of the art technologies for valorising waste and finds that the future
looks promising. For example, aqueous biphasic systems made up of Carbohydrates and cholinium-
derived bistriflimide ionic liquids were studied with a view to extract carbohydrates and antioxidants
from agri-food waste (Neves et al. 2019). There are attempts to produce hydroxymethylfurfural from
agri-food waste and to assess the catalytic efficiency of tetravalent and trivalent metals (Yu et al.
2017). Despite some challenges, it was found that the elevated fat, protein and sugar substances
found in most agri-food waste streams can be successfully commercialised via enzymatic valorisation
(Andler and Goddard 2018). Nonetheless, there are a limited number of sustainable “waste
valorisation business models” in existence today. It has been found however, that Anaerobic
Digestion, (AD), is a means of valorising waste that has been used since ancient times and has
proliferated across the globe, particularly during the twentieth centenary (He 2010). It has been
proposed that AD can be the hub in the EU’s, and consequently the world’s, drive towards a CE
(Fagerström et al. 2019). This leads us to the hypothesis of the study: “the AgroCycle Marketplace
Platform, by targeting the agri-food industry, can be economically sustainable”. As sustainable
business models related to agri-food waste valorisation technologies are still in the development stage,
the question “can the AgroCycle Marketplace establish its foundations upon the AD industry?” begs
itself. From a strategic point of view, it may make sense to focus AgroCycle Marketplace’s source of
revenue on the AD industry in the short to medium term. However, as other valorisation techniques
may become more prominent in the medium to long term, this study will not be solely limited to the
AD industry. As of yet, the secondary research is in progress. The final report will address issues
such as truth value, transferability, triangulation, dependability, conformability, subjectivity and
replicability. Ultimately, considering that qualitative inquiry can lead to multiple understandings, the
report will strive to document the truth considering our present knowledge (Marshall and Rossman
2015).
Discussion
The AgroCycle Team did make contact with potential customers. However, a requirement to carry
out market research was identified as the audience, (the partners, owners and stakeholders of the
AgroCycle Project), do not know if the AgroCycle Marketplace would be a commercial success; and
consequently, if they should invest in it. The unique contribution that this study will provide are
potential customers’ views, preferences, needs and wants regarding the AgroCycle Marketplace
offering. However, the conclusiveness of qualitative research has been questioned (Sale et al. 2002);
and so, the results of this study may have to be complemented by further quantitative research.
Conclusions
AgroCycle Marketplace, a Horizon 2020 project, is an online trading platform which facilitates the
free flow of waste and can reduce waste through industrial symbiosis. The objective of this study is to
unearth potential customers’ views, preferences, needs and wants regarding the AgroCycle
Marketplace offering via qualitative empirical research; and secondary research. Preliminary results
are positive. However, the results of this study may have to be complemented by further quantitative
research.
130

References
AgroCycle (2019a) A blueprint and EU policy -forming protocol for the recycling and valorisation of
agri-food waste, available: http://www.agrocycle.eu/#project [accessed July 30, 2019].
AgroCycle (2019b) AgroCycle Marketplace, available: http://www.agrocycle-
platform.com/marketplace [accessed July 30, 2019].
Andler, S.M. and Goddard, J.M. (2018) 'Transforming food waste: how immobilized enzymes can
valorize waste streams into revenue streams', npj Science of Food, 2(1), 19, available:
http://dx.doi.org/10.1038/s41538-018-0028-2.
Baruch, Y. (1999) 'Response Rate in Academic Studies — A Comparative Analysis', Human
Relations, 52(4), 421-438, available: http://dx.doi.org/10.1023/A:1016905407491.
Chesney, T. and Lawson, S. (2015) 'Critical Mass and Discontinued Use of Social Media', Systems
Research and Behavioral Science, 32(3), 376-387, available:
http://dx.doi.org/10.1002/sres.2231.
Creswell, J.W. (2013) Qualitative inquiry and research design: choosing among five approaches,
London;Los Angeles;: SAGE.
European Commission (2011) Roadmap to a Resource Efficient Europe, available: https://eur-
lex.europa.eu/legal-content/EN/TXT/?uri=CELEX:52011DC0571 [accessed July 30, 2019].
European Commission (2019) What is Horizon 2020?, available:
https://ec.europa.eu/programmes/horizon2020/en/what-horizon-2020 [accessed July 30,
2019].
Fagerström, A., Al Seadi, T., Rasi, S. and Briseid, T. (2019) The role of Anaerobic Digestion and
Biogas in the Circular Economy, IEA Bioenergy.
Gustavsson, J., Cederberg, C., Sonesson, U., Van Otterdijk, R. and Meybeck, A. (2011) Global food
losses and food waste, FAO Rome.
He, P.J. (2010) 'Anaerobic digestion: An intriguing long history in China', Waste Management, 30(4),
549-550, available: http://dx.doi.org/10.1016/j.wasman.2010.01.002.
Intergovernmental Panel on Climate Change (2018) Global Warming of 1.5 oC, available:
https://www.ipcc.ch/site/assets/uploads/sites/2/2019/05/SR15_SPM_version_report_LR.pdf
[accessed July 30, 2019].
Lincoln, Y.S. and Denzin, N.K. (2005) The SAGE handbook of qualitative research, Thousand Oaks
(Calif.): SAGE Publications.
Marshall, C. and Rossman, G.B. (2015) Designing qualitative research, Los Angeles: SAGE.
McGuire, S. (2015) 'FAO, IFAD, and WFP. The State of Food Insecurity in the World 2015: Meeting
the 2015 International Hunger Targets: Taking Stock of Uneven Progress. Rome: FAO, 2015',
Advances in nutrition (Bethesda, Md.), 6(5), 623-624, available:
http://dx.doi.org/10.3945/an.115.009936.
Merriam, S.B. and Tisdell, E.J. (2016) Qualitative research: a guide to design and implementation,
San Francisco, CA: Jossey-Bass, a Wiley brand.
Neves, C.M.S.S., Figueiredo, M., Reis, P.M., Sousa, A.C.A., Cristóvão, A.C., Fiadeiro, M.B., Rebelo,
L.P.N., Coutinho, J.A.P., Esperança, J.M.S.S. and Freire, M.G. (2019) 'Simultaneous
Separation of Antioxidants and Carbohydrates From Food Wastes Using Aqueous Biphasic
Systems Formed by Cholinium-Derived Ionic Liquids', Frontiers in Chemistry, 7(459),
available: http://dx.doi.org/10.3389/fchem.2019.00459.
Sale, J.E., Lohfeld, L.H. and Brazil, K. (2002) 'Revisiting the quantitative-qualitative debate:
Implications for mixed-methods research', Quality and quantity, 36(1), 43-53.
Swaminathan, M.S. and Kesavan, P.C. (2012) 'Agricultural Research in an Era of Climate Change',
Agricultural Research, 1(1), 3-11, available: http://dx.doi.org/10.1007/s40003-011-0009-z.
United Nations (2019) UN Sustainable Development Goals - Goal 2: Zero Hunger, available:
https://www.un.org/sustainabledevelopment/hunger/ [accessed July 30, 2019].
Van Manen, M. (2016) Researching lived experience: Human science for an action sensitive
pedagogy, Routledge.
Yu, I.K.M., Tsang, D.C.W., Yip, A.C.K., Chen, S.S., Ok, Y.S. and Poon, C.S. (2017) 'Valorization of
starchy, cellulosic, and sugary food waste into hydroxymethylfurfural by one-pot catalysis',
Chemosphere, 184, 1099-1107, available:
http://dx.doi.org/https://doi.org/10.1016/j.chemosphere.2017.06.095.
131

FEASIBILITY STUDY OF ENERGY EFFICIENCY SOLUTIONS IN
EXISTING PUBLIC LIGHTING SYSTEMS IN IRELAND
Harsh B. Pitroda, Kevin P. McDonnell
UCD School of Biosystems and Food Engineering, University College Dublin, Belfield, Dublin
4, Ireland.
Abstract
The energy efficiency targets for Ireland are crucial and very much essential. Implementing
cost effective and energy efficient proven technologies like LED retrofitting and Central
Management System in Ireland’s public lighting system will be beneficial to the government
to achieve the national targets for reducing energy consumption along with positive economic
and financial returns. Both the technologies can have proven benefits of about 55% savings in
cost as well as energy in Ireland’s existing public lighting system.
Introduction
The Government of Ireland has designated ‘Energy Efficiency’ as fundamental and integral
share as well as one of the main pillars of Ireland’s modern energy policy (Ireland.
Department of Communications, Climate Action and Environment, 2009; Department of
Communications, Climate Action and Environment, 2019). A national target of 20% energy
efficiency by 2020 is envisaged by Government of Ireland in its first ‘National Energy
Efficiency Action Plan (NEEAP)’ as per requirement of Article 24 of EU Energy Efficiency
Directive (Department of Communications, Climate Action and Environment, 2019). Also,
higher target of 33% energy efficiency by 2020 has been set for public sector in the country
so as to implicate a national contribution and to recognize that the government must take a
lead role in achieving these bold and essential national targets (Ireland. Department of
Communications, Climate Action and Environment, 2009; Department of Communications,
Climate Action and Environment, 2019).
In 2017, the Government produced Ireland's 4th NEEAP which stipulated a comprehensive
overview on the progress made towards the above set targets. Based on this report, the public
sector target is estimated to equate to 3,910 GWh annual energy savings by 2020 (Ireland.
Department of Communications, Climate Action and Environment, 2017). As of 2016, public
sector has achieved 20% (2,336 GWh) energy efficiency improvement on business as usual
while 31 local authorities have reported almost 21% (298 GWh) energy efficiency
improvement together (SEAI, 2017a; Ahern, B. et al., 2019). These 31 local authorities
account for more than 15% (1418 GWh) of total public sector energy consumption (SEAI,
2017a). Out of which 472 GWh primary electricity is consumed by public lighting system to
operate approximately half a million street lights all over the country (Ahern, B. et al., 2019).
The public lighting system is one of the important sub-sectors where range of energy
efficiency measures can be implemented to achieve Ireland’s energy efficiency targets in the
public sector as these lights consume approximately 50% of the entire electricity consumption
and about 33% of the total energy consumption of all local authorities (SEAI, 2017a).
The objective of this study is to analyse the techno-economic feasibility of different
energy efficiency solutions in existing public lighting systems in Ireland.
Materials and Methods
Existing scenario
The inventory of 31 local authorities’ public lighting system comprises of 486,627 street lights
(as of 2017) which includes about 33% Low Pressure Sodium Lights (SOX), 58% High
132

Pressure Sodium Lights (SON) while only 9% energy efficient LED Lights (Ahern, B. et al.,
2019). The Irish Government is spending more than €56 million in public expenditure every
year for the operation and maintenance of these luminaries so as to operate public lighting
system smoothly (Ahern, B. et al., 2019). This paper will focus on assessing the saving potential
in energy as well as money for the two major energy efficiency strategies which is expected to
have a greater positive impact. The techno economic assessment is based on the business case
and cost benefit analysis report as prepared by Road Management Office (Ahern, B. et al.,
2019). The overall saving potential is calculated on overall public lighting system assuming that
all the 31 local authorities implement these solutions together with all funding available.
LED Retrofitting
Light emitting diode (LED) is the most proven energy efficient technology currently being
implemented worldwide in artificial lighting system. Simply retrofitting of conventional lighting
system with LED luminaries can achieve savings of 50-70% in energy as well as cost of
electricity consumption. LED’s have an estimated life of about 100,000 hours which equals
more than 20 years in operation (Ahern, B. et al., 2019)('LED Drivers with 100,000 Hour
Measured Lifespans' 2012). LED luminaries have gained much popularity in being an energy
efficient alternative for conventional public lights like SOX and SON as its increased colour
rendering index proves to be beneficial in increased safety on streets. Its maintenance costs are
significantly low due to low requirement of maintenance activity (Ahern, B. et al., 2019).
Considering the best technology available in market, LED retrofitting has a very high potential
in achieving maximum energy savings in all the local authorities of Ireland. Few of the local
authorities have implemented small scale LED retrofitting projects, but there is a need for the
Irish Government to look upon a larger scaled or country wide retrofitting project. By replacing
remaining 442,831 public lights of SOX/SON type with at least 50% efficient LED lamps,
country’s public lighting department can become significantly more energy efficient. For
carrying out cost analysis and evaluating the payback period, following parameters are
incorporated as mentioned in Table 1.
Table 1. Parameters for cost analysis of LED retrofitting
Sr.
No.
Parameter Value Source
1. Cost of LED Luminaire with bracket € 447 each (Ahern, B. et al., 2019)
2. Life of Luminaire Driver 12 years (Ahern, B. et al., 2019)
3. Cost of Driver replacement € 50 each (Ahern, B. et al., 2019)
4. LED retrofitting period 2 years Assumed
5. No. of lights replaced with LED in 1st year 221,416 Assumed
6. No. of lights replaced with LED in 2nd
year 221,415 Assumed
7. Cost of implementing project, procurement
process and infrastructure upgrade
€ 43 per
light
Estimated (Ahern, B. et al.,
2019)
Central Management System (CMS) and Smart Metering
About 90% of the public lighting system in Ireland is presently unmetered ie. the energy
consumption is calculated from lamp wattages and fixed yearly operation of 4,150 hours using
pre-decided unmetered lighting profiles. This method has many unrealised losses in local
authorities’ energy expenses. Implementation of Smart Metering and Central Management
System (CMS) technologies in addition to LED retrofitting can assure further improvement in
energy savings in Ireland. Smart metering will benefit the whole system in recording actual
energy consumption, whereas with CMS the switching on/off and dimming patterns can be
remotely set and operated along with saving energy. As no actual energy consumption is
measured, the energy savings and cost benefits from smart metering solution can be evaluated
by further technical and financial analyses on existing methodology of the local authorities for
accounting and payment processing. Of all the public lights, there is a potential of setting up
CMS in 50% of these lights which are present in less traffic areas or empty rural streets. CMS
133

are online systems and numerous patterns can be defined for on or off of individual street lights
and/or to reduce the intensity of lamps during different operation timings. To analyse efficiency
of such a system in Ireland, two different dimming profiles (25% on Pattern 1 & 25% on Pattern
2) are considered as shown in Figure 1. The switch on/off times will directly depend on actual
dusk and dawn timings throughout the year, but the overall operating hours (4,150 hrs) is
considered to be similar to existing for baseline analyses of energy savings.
Figure 1. Dimming Profiles for Street Lights (Ahern, B. et al., 2019).
The CMS is programmed with the operation pattern 1 of 25% of total street lights (Post LED
scenario) in which the intensity of street lights is decreased to 75% at 9 pm and further reduced
50% at 12 am until 5 am. For another 25% of total street lights, the pattern 2 is defined in which
the intensity of street light is decreased to 65% at 9 pm and further reduced to 35% at 12 am
until 5 am. This pattern can be remotely modified by authorised representatives so as to create
variability in the system as per required situation. For carrying out cost analysis and evaluating
the payback period, following parameters are incorporated as mentioned in Table 2.
Table 2. Parameters for cost analysis of LED retrofitting
Sr. Parameter Value Source
1. Cost of CMS including maintenance € 50 per light (Ahern, B. et al., 2019)
2. Cost of CMS communication yearly € 3 per light per year (Ahern, B. et al., 2019)
3. Street Light operational hours yearly 4,150 hrs Similar to existing scenario
For the economic analysis of the energy efficiency solutions, following parameters are taken
into considerations: Inflation rate of 1.9% pa. on maintenance cost of non-LED lights (€ 22 per
light per year) and LED lights (€ 10 per light per year), 2% yearly increase in electricity cost of
€ 0.139 per kWh presently. For the large-scale implementation, the economies of scale are not
taken into consideration in the present study.
Results
With implementation of LED retrofitting and CMS with two dimming profiles, all over the
country, following results can be expected or achieved as illustrated in Table 3 and Table 4.
Table 3. Post LED Retrofitting energy savings expected
Parameters Value Source
Existing actual energy consumption 227 GWh Calculated
Existing primary energy consumption 472 GWh Using primary energy factor
of 2.08 (SEAI, 2017b)
Post LED + CMS actual energy consumption 101 GWh Calculated
Post LED + CMS primary energy
consumption
210 GWh Calculated
Savings in actual energy consumption 126 GWh Calculated
Savings in primary energy consumption 262 GWh
134

Table 4. Post LED Retrofitting cost savings expected
Parameters Value Source
Existing annual expenditure (Capital cost +
Electricity cost + Maintenance Cost) € 44m
Calculated (Incremental
with respective escalation)
Post LED + CMS annual expenditure € 20m Calculated (Incremental
with respective escalation)
Overall savings in annual expenditure € 24m Calculated
Investment cost (LED Cost + Infrastructure
upgrade cost + Project implementation cost) € 217m Calculated
Payback period < 9.5 years
Conclusions
Overall with largescale implementation of these two energy efficiency solutions in public
lighting system of Ireland will provide a benefit of more than 55% energy efficiency in
primary energy consumption. This also impacts the savings of Government funds in long term
with overall annual savings of about € 24 million. The payback period of these solutions is
estimated to be less than 9.5 years. These expected savings can be further improved by
strategic and efficient business model by considering economies of scale, competitive
tendering and procurement and higher efficient products.
Acknowledgements
The authors acknowledge the support from Road Management Office, Ireland for providing
their internal report of a business case and cost benefit analysis on ‘Local Authority Public
Lighting Efficiency Project in Ireland’ prepared by Ahern, B., Quill, D., and Bourke, B.
References
Ahern, B., Quill, D. and Bourke, B. (2019) ‘Local Authority Public Lighting Energy
Efficiency Project’, Internal Road Management Office report. Unpublished
Department of Communications, Climate Action and Environment (2019) ‘National Energy
Efficiency Action Plan (NEEAP)’, available at: https://www.dccae.gov.ie/en-
ie/energy/topics/Energy-Efficiency/energy-efficiency-directive/national-energy-
efficiency-action-plan-(neeap)/Pages/National-Energy-Efficiency-Action-Plan-
(NEEAP).aspx [accessed on: 17 March 2019] Department of Communications, Climate Action and Environment (2009) ‘Maximising
Ireland’s Energy Efficiency: The National Energy Efficiency Action Plan 2009 –
2020’, available at: https://www.dccae.gov.ie/documents/NEEAP%201.pdf
[accessed on: 17 March 2019] Department of Communications, Climate Action and Environment (2017) ‘National Energy
Efficiency Action Plan for Ireland #4 2017-2020’, available at:
https://www.dccae.gov.ie/documents/NEEAP%204.pdf [accessed on: 17 March
2019]
'LED Drivers with 100,000 Hour Measured Lifespans', (2012) Power Electronics
Technology (Online Exclusive). SEAI (2017a) ‘Annual Report 2017 on Public Sector Energy Efficiency Performance’,
available at:
https://www.seai.ie/resources/publications/2017_Annual_Report_on_Public_Se
ctor_Energy_Efficiency_Performance.pdf SEAI (2017b) ‘Derivation of Primary Energy & CO2 Factors for Electricity in DEAP’,
available at: https://www.seai.ie/resources/publications/DEAP-Elec-Factors-
2017.pdf
135

MAPPING AND CHARACTERIZING BIOMASS RESOURCES FOR
SUSTAINABLE VALUE CHAIN DEVELOPMENT
Luke Pitt Ryan, Fionnuala Murphy
UCD School of Biosystems and Food Engineering, University College Dublin, Belfield, Dublin 4, Ireland.
Abstract
Sustainable value chain development is essential for the circular bioeconomy in Ireland. Maximizing the
values of biomass supply chains; with the production of energy and bio-based products and maximizing
the lifecycle of materials. A characterization of the biomass resources in the regions of Monaghan and
Tipperary will be useful in determining which technologies (biorefineries) should be developed.
Geographic Information Systems is a tool which will present data and information on the biomass streams
in Tipperary and Monaghan. Securing supply chains from these sources to help develop a functional
circular market is the goal. Government incentives and collaboration with existing companies in the
agricultural and forestry industry may be required.
Introduction
The circular bioeconomy in Ireland aims to produce renewable biological resources and convert these
feedstocks into bio-based products and bio-energy. These feedstocks are generated from supply chains
such as agriculture, forestry, fisheries, food and residual waste industries. When planning the
construction of biorefineries, the feedstock supply chain of the biomass in the given region must be
accounted for. The two regions this study focuses on are Monaghan and Tipperary; agri-food is a huge
industry in both these regions. Closing nutrient loops during cultivation of food and bioresources,
maintaining the value of products for as long as possible while mitigating environmental damage is in line
with the circular economy ideal set out by the European Commission (Commission 2018).
This project aims to analyze and quantify the production of biomass in Monaghan and Tipperary,
describing their current waste treatment methods and their uses. To evaluate sustainable value chain
development, the following objectives must be completed;
Feedstock Assessment
Market Potential Assessment
Sustainability Assessment
Technology Potential
Sustainable value chains in these two regions come with many benefits for both environmental and
economic purposes; job creation, ecological damage mitigation and raw material acquisition. Agri-food
production is a pillar in Irish society and the Irish economy. The main sectors in the agri-food biomass
sector can be characterized by livestock manure, cereal straw, fruit pomace, vegetable, pomace, leaves,
peels, oil, fruit, seeds. Currently agricultural-waste streams in these two regions are under-utilized for the
purpose of animal feed, energy recovery and bio-fertilizer (Agrocycle 2019). Essentially the aim of this
study was to research the potential to set up sustainable bio-based value chains. The possible value chains
include; bioenergy, biochemicals and other biomaterials. At a time where there is uncertainty regarding
the rural economy, sustainable value chains in the agri-food sector can benefit rural growth(Murphy et al.
2016). Stakeholders involved in this study include; farmers, public authorities (county councils) and
companies from industries including the agri-food sector.
The objective of this study is to map and characterize the major biomass value chains in Monaghan
and Tipperary, specifically agricultural and forestry waste.
136

Materials and Methods
Feedstock Assessment
Feedstock is the key factor in determining the bioresource availability in the two regions and ultimately
will determine which technologies will be feasible. The feedstock assessment is the first step in the
biomass supply chain, different studies have presented different results in terms of feedstock estimates,
however it is widely understood from several bioenergy studies that the discrepancies which influence
bioenergy potential include; system boundaries, biomass resource types, use of heterogeneity of datasets
and scenario assumptions (Batidzirai 2013).
Market Potential Assessment
The market potential will depend on the technological potential and the comparisons between biomass
and other energy sources such as fossil fuels. Demand driven cost supply analysis are necessary for the
market potential assessment(Batidzirai 2013). ‘A farm to gate’ cost analysis will be conducted for this
study which will include a comparison of energy prices and energy carriers. Competing feed, fuel and
fertilizer sources on the market have been investigated (Batidzirai et al. 2016).
Technology Potential
Technology in the biomass industry is in its early development and constantly updating and advancing.
The possible technologies to be implemented in the two regions include anaerobic digestion and
gasification and will depend on the feedstock assessment and the market potential assessment.
Sources used to characterize bioresource availability in the two regions
Agrocycle is particularly useful for determining physicochemical characteristics of the waste streams
produced in the agri-food industry and how to make the best use of them (Agrocycle 2019). The SEAI
Bioenergy forecasts provide information by (TJ) forecasts of biomass across Ireland for the future 15
years (SEAI 2015). Other sources include; SEAI Bioenergy supply in Ireland 2015 – 2025, EPA statistics,
County Council data and Coillte.
Characterizing Biomass for Energy Potential
The characterization of biomass in this study is ultimately to investigate its potential to be converted to
energy and bio-based products. Analysis for biomass energy characteristics include: higher heating value
(HHV), lower heating value (LHV), volatile matter, ash yield(Agrocycle 2019). Physical properties will
be defined by weight (Wt), volume (Vol) and moisture content (MC).
GIS
Using geographical information systems (GIS) data, a characterization of the biomass streams in each
region will be presented, along with the processes which generate the biomass, including cultivation,
harvesting, animal by-products and many more. GIS is useful to visually present information in a map
format and display the relationships between regions and the biomass generated, trends in agricultural
activity and supply chains. The specific GIS software used for this study is ArcGIS software.
Agri Bio Circular Economy (ABC Economy)
ABC Economy is a project lead by Dr Fionnuala Murphy, engaging with stakeholders; project partner
Cre, and project collaborators Tipperary Country Council and Monaghan County Council.
Data Analysis
The analysis for this study involved literature research (Andre Brosowski 2013), examining existing
reviews, various studies on a global scale, continental scale and national scale. The potentials of this
study include: an understanding of the (TJ) of biomass feedstock, the suitable technology to be
implemented such as anaerobic digestion, gasification, incineration. The area potential in both Tipperary
137

and Monaghan will depend on factors including; protected areas, crop land, urban land, marginal or low
quality land, planning and legislation (Dornburg et al. 2010)
Results and Discussion
Theoretical Resource Assessment
For estimating manures produced by cattle, pigs and poultry, projected livestock number are combined
with the estimates of quantity of manure produced each day and the proportion of animal waste managed
by liquid slurry systems is considered (SEAI 2015). The feedstock production potential is theoretical and
based on agricultural production levels, the residue production and chemical characteristics (moisture
content, calorific values), covering the regions of Tipperary and Monaghan. The biomass resources will
cover agri-waste and forestry biomass. Moisture content, heating value and energy density will be
determined by mass and energy yield. The technical biomass energy potential prediction is based on the
food and feed production in the regions and the biophysical conditions including soil, water and climate
(Batidzirai 2013).
Suitable Technology
The theoretical resource Assessment has determined that the technology which should be implemented in
the two regions include; anaerobic digestion, gasification and combustion.
Conclusion
Establishing a sustainable biomass resource feedstock supply is essential for the circular economy ideal to
prosper in Ireland. The feedstock assessment in the two regions of Monaghan and Tipperary has provided
important data on the biomass supply chains in both cases, which will be useful in determining the best
technology, infrastructure and value chains to be developed in these two regions.
Acknowledgements
This research has been undertaken with the assistance of the Tipperary County Council and the Monaghan
County Council with funding from Sustainable Energy Association of Ireland grant number RDD365.
References
ABCEconomy (2018) Agri Bio Circular Economy (ABC Economy), UCD Dublin.
Agrocycle (2019) 'A Blueprint and EU Policy-Forming Protocol for Recycling and Valorisation of Agri-
Food Waste'.
Andre Brosowski, D.T. (2013) 'Biomass Potential In Africa', International Renewable Energy Agency.
Batidzirai, B. (2013) 'Design of Sustainable Biomass Value Chains: Optimizing the supply logistics and
use of biomass over time', Energy & Resources.
Batidzirai, B., Valk, M., Wicke, B., Junginger, M., Daioglou, V., Euler, W. and Faaij, A.P.C. (2016)
'Current and future technical, economic and environmental feasibility of maize and wheat
residues supply for biomass energy application: Illustrated for South Africa', Biomass and
Bioenergy, 92, 106-129.
Commission, E. (2018) 'Directive (EU) 2018/2001 of the European Parliament and of the Council of 11
December 2018 on the promotion of the use of energy renewable sources'.
Dornburg, V., van Vuuren, D., van de Ven, G., Langeveld, H., Meeusen, M., Banse, M., van Oorschot,
M., Ros, J., van den Born, G.J., Aiking, H., Londo, M., Mozzaffarian, H., Verwey, P., Lysen, E.
and Faaij, A. (2010) 'Bioenergy revisited: Key factors in global potentials of bioenergy', Energy
and Environmental Science, 3(3), 258-267.
138

Murphy, F., Sosa, A., McDonnell, K. and Devlin, G. (2016) 'Life cycle assessment of biomass-to-energy
systems in Ireland modelled with biomass supply chain optimisation based on greenhouse gas
emission reduction', Energy, 109, 1040-1055.
SEAI (2015) Bioenergy Supply in Ireland 2015 - 2035, Wilton Park House, Wilton Place, Dublin 2,
Ireland.
139

STUDY OF ENERGY EFFICIENT MEASURES IN BUILDINGS
AND EVALUATING THE FEASIBILITY FOR THE
IMPLEMENTATION OF RENEWABLE ENERGY
Ruchi Y. Vansia, Kevin P. McDonnell
UCD School of Biosystems and Food Engineering, University College Dublin, Belfield,
Dublin 4, Ireland.
Abstract
This study is carried out for analyzing thin-film solar plant as an energy efficiency measure in
Agriculture building in University College Dublin. This technology can prove to be beneficial in
such old structured buildings to become more efficient and contribute to achieving renewable
energy targets. A 50 kW thin film solar plant installed on the rooftop of Ag building can save
more than 3% by reducing energy costs by EUR 9,000. Further savings can be evaluated by
integrating small scale wind turbines.
Introduction
The 2030 climate and energy framework stated by Europe includes EU-wide targets and
policy objectives for the period from 2021 to 2030 (European Commission 2019). The
European Union had set the 2020 targets under the Directive 2009/28/EC which are revised
upwards in 2018. The key targets for 2030 are wide spread in three areas affirming firstly
cutting down the Greenhouse gas emissions by at least 40%, secondly by increasing no less
than 32% share for renewable energy and the last which states at least 32.5% improvement in
energy efficiency (European Commission 2019). Ireland is committed to produce from
renewable sources at least 16% of all energy consumed by 2020 (Department of
Communications, Climate Action, and Environment, 2019). As per the current scenario
globally, the target to have 40% of electricity consumed from renewable energy sources is
one of the most demanding and most likely will be revised upwards.
University College Dublin has the Energy unit dedicated with the determination of conserving
energy, reducing costs and achieving sustainable energy sources (UCD Estate Services 2019).
The unit is playing its part in the global effort against climate change by means of the
efficient consumption of energy and expanding the amount of energy obtained from low-
carbon or renewable generation. UCD recognizes this potential and has invested in a
renewable biomass boiler, solar PV and solar thermal panel on campus buildings (UCD Estate
Services 2019). There are a few buildings on campus which are quite old structurally and
have relatively low energy saving and efficiency measures compared to the other building
structures on the campus. UCD agriculture and food science centre is one of those old
structure built in the 1980s and needs to improve the energy efficiency of the building and
build up a renewable generation system for the building.
Solar energy is the most abundant and infinite source of energy and there has been substantial
attention in developing efficient technologies to convert solar energy into electricity or
thermal energy since the energy crisis in the 1970s (Settino et al. 2018). Numerous solar
photovoltaic technologies comprising a wafer, thin film and organic, have been studied to
accomplish dependability, cost- efficiency and high efficiency with huge success (Lee and
Ebong 2017).
The objective of this study is to determine the feasibility of energy efficient measures in
the agriculture building of the UCD agriculture and food science centre located in
University College Dublin and optimization with renewable energy like solar and wind.
140

Materials and Methods
Thin Film Solar Cell Technology
A thin-film solar cell is a second-generation solar cell, they are favourable because of their
minimum material usage and rising efficiencies. This paper has included the potential of each
technology in a commercial setting and its reliability in Ag Building is equally explored in
this paper, the evolution of technology is discussed in both aspects technical and economical
settings, and market share and reliability are equally explored. A thin-film solar panel is made
up of one or more thin layers of photovoltaic materials that are laid onto a substrate like glass,
plastic or metal. They have a benefit over the traditional solar panel. They are lightweight
because of their construction where the panels are sandwiched between glass without a frame
(Solar-estimate 2019). A thin film solar panel has a lesser impact on the environment since
they use less silicon. Amorphous silicon (α-Si), Copper Indium Gallium Selenide (CIGS), and
Cadmium Telluride (CdTe) are the three most commonly used thin film solar cells. These
three technologies can be merged into Building Integrated Photovoltaics (BIPV). It is utilized
in BIPV as PV glazing material that can be laminated on windows (Solar-estimate 2019). In
Table 1, Commercial modules of Thin films and their efficiencies are shown escalating and
prominent (Lee and Ebong 2017).
Table 1. Chart of commercial module efficiencies (Lee and Ebong 2017).
TFS cell type Champion Research Module Efficiency Percentage
CdTe CX3–85 - Calyxo 8.5
a-Si Sharp Thin Film Module a-Si/micro-Si 9.5
a-Si MICROMORPH™ G5 - TEL Solar 12.2
CIGS SP3S−250 - SoloPower 12.7
CIGS SL2 CIGS Thin-Film Module - Solibro 13.3
CIGS SF170-S CIS Module - Solar Frontier 13.8
CdTe FS−4112 First Solar Series 4™ PV module 14.0
CIGS TS−165-C2- TSMC Solar 15.2
CIGS M-GE101E092 - Manz 16
CdTe TSMC Solar 16.5
CdTe First Solar 18.6
Methodology
For this study, a walk-through survey was carried out to examine the potential for Ag
building. The mandatory data was collected and evaluated from the UCD Estate Services and
ESB Active Energy Manager Portal regarding the details of the Ag building like the area and
layout of the building, energy consumption-management and efficiency of the Ag building
(ESB 2018). At the same time, factors such as- Solar radiation and daylight times, policies,
legislation, economic fund, and current energy efficiency measures have also been analysed
and is incorporated to create a viable data set for analysis to be carried out on.
Optimization Models
Optimization models will be developed using energy system modelling software like
HOMER PRO Renewable Energy and PVSyst V6.78. In this case, a modified energy system
model will be created using Microsoft Excel from a mixture of the data acquired from the
software considered in addition to the relevant information gathered externally. A further
study needs to be carried out using HOMER for evaluating the consistent electrical system.
This can be incorporated with the Solar PV system to develop a model that highlights the
optimal energy system solution from an economic point of view along with its feasibility.
141

Model approach and potential
Based on the studies and research, two solutions for energy efficient measures in Ag building
with the integration of renewable energy source can be implemented:
1. Thin Film Solar Cell Technology: Thin film Solar cell panels on the rooftop and Flexible
thin films mounted on the concrete structures on the outer sides of the agriculture building
2. Small Scale Wind Turbine: On the roof, small-scale wind turbines can be installed to obtain
greener energy.
Application in agriculture building of the UCD agriculture and food science centre
Figure 1. Top view layout of roof-top of agriculture building.
Here is the top view layout of roof-top of agriculture building to illustrate the solar
technology and installation along with wind turbines. Based on the preliminary survey and
data collected, it was examined that the total roof area is 822 m2. and upon evaluating, around
522 m. of an area of efficient utilization for thin-film solar plant was observed. Whereas,
some of the other space on the roof-top can be used for installing wind turbines. A Solar
plant can be installed having a capacity of 50 kW with the total panel area of 300 m2. From
this installation, 40 GWh will be the annual energy generated from the plant and Ag building
can have annual cost savings of about EUR 9,000 considering only the 60% roof area for the
Solar technology. Along with this, if flexible thin films and wind turbines are incorporated in
this green energy generation than Ag building can have an optimal benefit on environmental
aspects as well as in an economical way.
Economic Feasibility
Subsequently, another study needs to be carried out for assessing economic feasibility based
on the overall results. This will be achieved by a characteristic approach to evaluating the
viability of energy projects on economic perspectives. Net Present Value of the project will be
examined as it basically calculates the project’s future cash flows compared to the initial
investment. Positive values will approximate the economic viability of the project owing to
the profit gained. Furthermore, the payback period will be planned and will be evaluated to
manage extensive payback period as mostly the lengthier the payback period the bigger risk
to investors. Relative analyses will be carried out so that it can highlight what makes solar PV
economically viable in an educational institution with old structures and provide a basis for
further research into measures to ensure economic viability in the future for existing
buildings.
Results
Expected Results
The project is still in the information accumulation phase and so it is known what the precise
results will be. Although, upon evaluation of one system in this study, there are expected
142

results which are positive for a part. By installing a Solar plant having a capacity of 50 kW,
we can generate annual energy of 40 GWh and can save annually about EUR 9,000 from an
evaluation done for Solar technology. Along with this, the energy proficiency can be further
amplified by using 3 quantities of 5KW Wind Turbine on the rooftop for greener energy
generation and economic advantages.
Conclusions
In concluding, the thin film solar plant of 50 kW is the potential energy efficient solution
which can be implemented in the Agriculture building located in University College Dublin to
decrease its overall carbon footprint. Also optimizing this micro energy generation can be
done by integrating small scale wind turbines. Further technical study in this will conclude,
by thorough and precise analysis of energy efficient measures and incorporating it with solar
and wind energy, to find ways to attain the best possible outcomes for an economic and
environmentally suitable energy system. Currently, it is expected that external factors such as
those deliberated in the expected results will be the deciding factor in this analysis based on
literature and comparisons to other countries where solar PV has a large market share of
energy production.
Acknowledgments
The authors would like to thank the building services of UCD as well as the UCD Estate
services for providing necessary details regarding the campus buildings. The authors would
also like to acknowledge ESB Cylon Active Energy, Ireland for their statistical data of the
energy consumption and generation.
References
Department of Communications, Climate Action and Environment (2019) ‘Renewable
Energy’, available at: https://www.dccae.gov.ie/en-ie/energy/topics/Renewable-
Energy/Pages/default.aspx [accessed on: 19th March 2019]
Electricity Supply Board (2018) 'Electricity Supply Board Cylon Active Energy', available at:
https://esb.cylonaem.com/energy/ (Accessed 13th March 2019)
European Commission (2019) '2030 climate & energy framework', available at:
https://ec.europa.eu/clima/policies/strategies/2030_en [accessed on: 19th March
2019]
Lee, T.D. and Ebong, A.U. (2017) 'A review of thin film solar cell technologies and
challenges', Renewable and Sustainable Energy Reviews, 70, 1286-1297, available:
http://dx.doi.org/10.1016/j.rser.2016.12.028.
Settino, J., Sant, T., Micallef, C., Farrugia, M., Staines, C.S., Licari, J. and Micallef, A.
(2018) 'Overview of solar technologies for electricity, heating and cooling
production', Renewable and Sustainable Energy Reviews, 90, 892-909.
Solar-estimate (2019) 'What are thin film solar panels, how do they work and why aren’t they
used for residential solar systems?', available at: https://www.solar-
estimate.org/news/2018-07-14-what-are-thin-film-solar-panels-how-do-they-work-
and-why-arent-they-used-for-residential-solar-systems [accessed on: 21th March
2019]
UCD Estate Services (2019) 'Energy Management', available at:
https://ucdestates.ie/about/sustainability/energy-management/
143

TECHNO-ECONOMIC ASSESSMENT OF STRATEGIES TO
DECARBONIZE MONEYPOINT POWER STATION
Shuheng Wang, Kevin P. McDonnell
UCD School of Biosystems and Food Engineering, University College Dublin, Belfield, Dublin 4,
Ireland.
Abstract
With climate change becoming an ever-more pressing issue and global legislation enforcing stricter
emissions control, countries are facing a growing need to decarbonize their electricity generation. For
many countries, coal still represents a large fraction of power generation, despite coal being one of the
‘dirtiest’ fuels for electricity generation. This study will explore the feasibility of three methods for
decarbonizing coal power plants, using Moneypoint Power Plant as a case study: conversion to biomass
feedstock; retrofitting carbon capture and storage (CCS) technology; and implementation of both
methods. This study will ideally form a basis for future investigations into retrofitting coal power plants
with decarbonizing technology.
Introduction
Despite the growth of the renewable energy sector in recent years, global dependence on fossil fuels
like coal will likely continue for the next several decades (Davies et al. 2017). Coal power plants are
established technologies with long lifetimes—up to 40 years—so policies to decarbonize electricity
generation must deal with these ‘dirty’ power plants in addition to implementing technologies such as
wind, solar, and nuclear. Some strategies to clean up coal power plants are highlighted in the table
below from Davies et al. (2017):
Table 1: Examples of ‘clean coal’ technologies (Davies et al. 2017)
Technology Description
Advanced Pulverized-Coal
Combustion
Increase temperature and pressure via steam cycle
regeneration to improve efficiency
Integrated Gasification
Combined Cycle
Gasify coal pre-combustion to produce cleaner-burning
synthetic gas
Oxy-Fuel Combustion Add oxygen to combustion process to improve efficiency
(higher temperature and pressure)
Pre-Drying of Lignite Dry lignite (brown coal) via air drying or fluidized bed
dryers to improve efficiency
Biomass Co-Firing Substitute biomass for coal for cleaner feedstock without
mechanical changes to the power plant
Post-Combustion CCS Capture CO2 from flue gas via chemical or physical
methods, then store or use the captured CO2
Most of the above methods are not suitable for retrofitting, and only mitigate emissions. However, the
IPCC states that the world needs to achieve negative carbon emissions to keep global warming below
2°C (Consoli 2019). The two methods with the potential to achieve zero, then negative, emissions are:
conversion to biomass feedstock and post-combustion CCS. Biomass feedstock has the potential to be
carbon neutral and, in combination with CCS, has the potential to achieve negative emissions (Drax
Group 2019).
The objective of this study is to investigate the economic and technical feasibility of various
retrofitting schemes for the decarbonization of coal power plants via feedstock conversion and
carbon capture technologies.
144

Materials and Methods
Decarbonization Options
The ideal retrofitting option from an environmental standpoint is biomass energy with carbon capture
and storage (BECCS); this would necessitate converting a coal power station to biomass feedstock,
then installing CCS technology to handle the flue gas from biomass incineration (Consoli 2019). This
option offers the potential for negative carbon emissions if the biomass feedstock is produced
sustainably and becomes a ‘carbon neutral’ fuel (Consoli 2019). However, this is also a significant
change that will likely need to take place in phases over a longer period of time. The other two
options this study will consider are: retrofitting Moneypoint with CCS technology without changing
operations otherwise; and converting Moneypoint to biomass feedstock without CCS technology.
Potential biomass feedstock includes energy crops, agricultural/forestry residues, and other wastes
(SEAI 2019). These biomass sources are often pre-processed into pellets before being burned as fuel.
In Ireland, the most likely sources of biomass are wood residues (i.e. woodchips and wood pellets).
Irish biomass from forest and wood industry by-products already complies with EU sustainability
criteria, and wood processing sites are common in Ireland (SEAI 2019). However, energy crops and
agricultural wastes are other feasible options as well.
The most commonly deployed carbon capture system is chemical absorption or scrubbing, often using
amine-based solvents such as monoethanolamine (MEA) (Wang et al. 2017). The power plant flue
gas is sent into a counterflow absorption column, where the flue gas flows upwards and the solvent
flows downwards, absorbing CO2 as the two phases interact; this system can extract a CO2 stream
with up to 99% purity (Wang et al. 2017). The rich-loading solvent stream is then heated to regenerate
the solvent and separate the CO2 for transport to either storage (often geological) or further use (Xue
et al. 2017).
Figure 1: Schematic of CO2 capture process using MEA (Wang et al. 2017; Xue et al. 2017)
The biggest issues with a CCS system is the amount of energy needed in the stripping column to
regenerate the solvent (Wang et al. 2017). This energy use will lower the overall power plant
efficiency and increase the cost of the produced electricity (Al-Qayim et al. 2015)
Economic Feasibility
For a retrofitting operation to move forward, the project must demonstrate economic feasibility. This
study will assess the economic viability of the three different options using payback period, levelized
cost of electricity (LCOE) and cost of CO2 avoided (Al-Qayim et al. 2015).
The formula for LCOE, assuming a constant amount of net electricity produced and sold each year, is
as below in Eq. 1 (Rubin 2012):
𝐿𝐶𝑂𝐸 ($
𝑀𝑊ℎ) =
(𝑇𝐶𝑅)(𝐹𝐶𝐹)+𝐹𝑂𝑀
(𝑀𝑊)(𝐶𝐹)(8766)+ 𝑉𝑂𝑀 + (𝐻𝑅)(𝐹𝐶) (Eq. 1)
where
145
TCR = total capital requirement in the base year of analysis ($)
FCF = fixed charge factor (constant frac.)
FOM = fixed O&M costs ($/yr)
MW = net power output of the plant (constant MW)
CF = capacity factor of plant (constant frac.)
VOM = variable O&M excluding fuel cost ($/MWh)
HR = net power plant heat rate (MJ/MWh)
FC = fuel cost per unit energy ($/MJ)
For this study, FCF will be calculated using Eq. 2 (Rubin et al. 2013):
𝐹𝐶𝐹 =𝑟(1+𝑟)𝑡
(1+𝑟)𝑡−1 (Eq. 2)
where
r = interest rate/discount rate
t = economic life of the plant
The cost of CO2 avoided is the cost associated with keeping a unit of CO2 emissions out of the
atmosphere, and is a comparison between a retrofitted plant and the current Moneypoint
configuration. This cost will be calculated as below (Rubin et al. 2013):
𝐶𝑜𝑠𝑡 𝑜𝑓 𝐶𝑂2 𝑎𝑣𝑜𝑖𝑑𝑒𝑑 ($
𝑡𝐶𝑂2) =
(𝐿𝐶𝑂𝐸)𝑟𝑒𝑡𝑟𝑜𝑓𝑖𝑡−(𝐿𝐶𝑂𝐸)𝑟𝑒𝑓
(𝑡𝐶𝑂2/𝑀𝑊ℎ)𝑟𝑒𝑓−(𝑡𝐶𝑂2/𝑀𝑊ℎ)𝑟𝑒𝑡𝑟𝑜𝑓𝑖𝑡 (Eq. 3)
For economic feasibility, the payback period and LCOE cannot be too high, and the cost of CO2
avoided should be as low as possible.
Technical Feasibility
Other technical considerations this study will consider are feedstock availability and the engineering
changes required to successfully implement these retrofitting schemes. The preference is for domestic,
abundant feedstock sources. Importing feedstock is not only detrimental for energy security, but also
generates extraneous environmental burdens. Choosing a limited feedstock will incur high costs and
energy insecurity. In addition, this study will consider physical demands of retrofitting Moneypoint.
These demands might include changing turbine designs, introducing biomass feeding mechanisms,
increasing land use for a CCS unit, connecting a CCS unit to both CO2 transportation pipelines and
flue gas lines, etc.
Another key criterion for this study is the ability of the three options to reduce the carbon emissions of
Moneypoint in a sustainable way. For this reason, the annual CO2 emissions of each retrofit option
will be compared to the reference emissions of an un-changed Moneypoint operating at the same
capacity, to ensure that a significant change in CO2 is achieved compared to the reference plant.
Results and Discussion
Based on initial research, the feasibility of CCS and biomass retrofitting is expected to depend partially
on the availability of profitable CO2 sinks and inexpensive, sustainable feedstock (Drax Group 2019).
The high costs associated with amine solvent regeneration mean that CCS units have high operation
costs; moreover, the energy consumed by the regeneration process will decrease the efficiency of the
overall power plant (Al-Qayim et al. 2015). Both issues will increase the final cost of the electricity
generated by the power plant. To offset this increase in cost and accelerate payback of the capital
expenditures of the retrofit, a CCS project should try to derive value from its captured CO2 stream.
Existing commercial CCS deployments in power plants use the captured CO2 in a variety of sectors,
from enhanced oil recovery to the fizzy drink industry; these additional revenue streams help make the
CCS retrofitting projects economically viable (Drax Group 2019; NRG Energy 2019).
Biomass feedstocks have a lower energy density and less-developed supply chain compared to fossil
fuels (Consoli 2019). For a baseload power supply, reliable and cheap fuel sources are essential; these
146

considerations will be key in successfully changing Moneypoint’s feedstock from coal to biomass
(Davies and Madden 2017). The more cheap, domestic biomass feedstock Ireland can supply without
relying on foreign imports, the more Irish energy security will benefit. A retrofitting project will likely
need to address both of the highlighted concerns—valorising the CO2 stream and ensuring a secure
biomass supply—to achieve economic and technical feasibility.
Conclusions
Further research into the economic and technical aspects of each of the retrofitting options is needed.
This paper defines the parameters that will be used to quantitatively assess the feasibility of each
option, and lays the groundwork for a process to evaluate the suitability of any coal power plant for
biomass or CCS retrofitting. Transitioning Moneypoint to a power plant using biomass as a feedstock
and/or using CCS technology is expected to reduce emissions associated with power generation in
Ireland, and potentially increase Ireland’s energy security if biomass can be domestically sourced.
However, the realities of implementing such a system need to be thoroughly evaluated to avoid
implementing a project that is economically or technically infeasible.
References
Al-Qayim, K., Nimmo, W. and Pourkashanian, M. (2015) 'Comparative techno-economic assessment
of biomass and coal with CCS technologies in a pulverized combustion power plant in the
United Kingdom', International Journal of Greenhouse Gas Control, 43, 82-92.
Consoli, C. (2019) 2019 Perspective - Bioenergy and Carbon Capture and Storage: Global CCS
Institute.
Davies, G. and Madden, C. (2017) Ireland's Low Carbon Future - Dimensions of a Solution: ESB.
Davies, K., Malik, A., Li, J. and Aung, T.N. (2017) 'A meta-study on the feasibility of the
implementation of new clean coal technologies to existing coal-fired power plants in an effort
to decrease carbon emissions', PAM Review: Energy Science & Technology, 4, 30-45.
Drax Group (2019) Europe's first bioenergy carbon capture and storage pilot now underway,
available: https://www.drax.com/press_release/world-first-co2-beccs-ccus/. NRG Energy (2019) Petra Nova: Carbon capture and the future of coal power, available: https://
www.nrg.com /case-studies/ petra-nova.html.
Rubin, E., Booras, G., Davison, J., Ekstrom, C., Matuszewski, M., McCoy, S. and Short, C. (2013)
Toward a Common Method of Cost Estimation for CO2 Capture and Storage at Fossil Fuel
Power Plants: Global CCS Institute.
Rubin, E.S. (2012) 'Understanding the pitfalls of CCS cost estimates', International Journal of
Greenhouse Gas Control, 10, 181-190, available:
http://dx.doi.org/https://doi.org/10.1016/j.ijggc.2012.06.004.
SEAI (2019) Bioenergy, available: https://www.seai.ie/sustainable-solutions/renewable-
energy/bioenergy/. Wang, Y., Zhao, L., Otto, A., Robinius, M. and Stolten, D. (2017) 'A Review of Post-combustion
CO2 Capture Technologies from Coal-fired Power Plants', Energy Procedia, 114, 650-665,
available: http://dx.doi.org/https://doi.org/10.1016/j.egypro.2017.03.1209.
Xue, B., Yu, Y., Chen, J., Luo, X. and Wang, M. (2017) 'A comparative study of MEA and DEA for
post-combustion CO2 capture with different process configurations', International Journal of
Coal Science & Technology, 4(1), 15-24.
147

THE EFFICIENCY OF SOLAR WATER HEATING IN IRELAND
Ross Brereton, Patrick Grace
UCD School of Biosystems and Food Engineering, University College Dublin, Belfield, Dublin 4, Ireland.
Abstract
The efficiency of two specific designs of solar water heating systems was investigated under
temperate oceanic climatic conditions in the low irradiance region of Ireland. Design parameters and
climatic conditions are applied into simulation formulas in order to obtain estimations of the annual
average energy yield. Calculations were carried out for two separate solar collector designs: A parabolic
trough collector design and a solar plane collector design. Simulations of the performance for each of
these designs was carried out and results are presented. The results were compared, and the efficiency and
sustainability of each design were calculated. The results obtained demonstrated that the through
technology has the potential to be more efficient than solar plane collector technology.
Introduction
Over half the world's consumption of energy can be attributed to heating applications, an amount that is
as high as 129 exajoules (129 × 1018
joules) (3.583 × 10⁷ MWh). Over 75% of this energy used for
heating, is obtained through the use and combustion of fossil fuels resulting in almost 33% of global CO2
emissions (Eisentraut & Brown 2014). Analysing the environmental impacts of these heating systems is,
therefore, of great importance as it can help us build more sustainable and environmentally friendly
systems.Conti et al (2016) have predicted in an international energy report that world energy demand is
set to increase significantly throughout the next number of decades and by as much as 48% by 2040. A
significant hotspot for this energy consumption has long been heating systems and in particular,
residential heating systems. Energy consumption within the residential sector of the EU (European Union)
maintains an average annual increase of 0.9%, not only this but in 2016 it accounted for 10% of the total
GHG’s (Greenhouse Gas) emitted worldwide (EEA 2016). The EU has adopted a new 2020 energy policy
package in direct response to this global rise in energy consumption (EC 2008). The main objectives of
this package were; Improve energy efficiency by 20%, reduce GHG emissions by 20%, increase
renewable usage to cover 20% of EU energy consumption by 2020 and have at least 10% of vehicle fuel
comprised of biofuel by 2020 (Tulus et al 2019). Solar thermal heating systems are an innovative
technology which could substantially reduce emissions produced from heating systems and help meet
these ambitious goals set out by the EU. It is predicted that if solar thermal systems are utilized
effectively and efficiently in Europe, by 2030 they have the potential to cover half of the heat demand in
the continent (Endale 2019). This prediction demonstrates the potential for solar thermal technologies,
even in areas with average to low irradiance such as Europe. Pinel et al (2011) have also reported that
installations of solar thermal systems within the residential sector could effectively cover the heat demand
in many countries worldwide. These installations could, therefore, go a long way to reducing the 10% of
global GHG’s emitted from the residential sector.
Of all the solar thermal technologies, solar water heating is the most environmentally friendly and
economically viable system which harnesses the unlimited supply of energy from the sun (Shukla et al
2013). The most common solar water heating system utilized today is a solar plane collector system and
although this system has proved effective, the parabolic solar trough design which this paper will look at
in detail has the potential for even more impressive results.
The objective of this study was to calculate the efficiency of a parabolic solar trough water heating
system when utilized in Ireland and compare it to the efficiency of a solar plane collector system.
148

Materials and methods
Predicting the annual energy saving potential of Solar Water Heating systems is essential to analysing
their efficiency and economic feasibility. This energy output achieved from a solar water heating system
is dependent upon several factors such as climatic conditions, storage tank volumes, design and optimal
sizing of components. All of these factors will have to be included when modelling the design of the solar
water heating system if accurate results are to be obtained.
The solar water heating system which this report will be studying in detail is a parabolic solar trough
system. Similar to a CSP (concentrated solar power) system, a Parabolic Solar Trough system utilizes
mirrored surfaces which are curved into a parabola shape to allow incoming solar energy to be directed
towards a centre receiver tube which extends the length of the system, see (Fig. 1). Cold water is pumped
through the receiver tube at one end of the trough system, this water is then heated as it passes through the
tube due to the concentrated solar energy and exits the tube at the other end of the system where it is
stored in a storage tank. This heated water may then be used in a household or public amenity such as a
swimming pool (Islam et al 2015). A tracking system may also be added to the system, which can
substantially improve energy output. (Fig.1) Illustrates a typical design of a parabolic solar through
system. The system comprises of a circulating pump, parabolic trough collectors, storage tank and a
thermal relief valve. The relief valve is designed to relive energy when water temperatures within the
storage tank exceed 100°C (Kalogirou 2002). A parabolic trough collector has the potential to generate
large amounts of electricity and can prove highly beneficial for heating applications such as water heating
(Kalogirou 2002). The efficiency and power delivery of this system depend on a number of factors as
mentioned above; the design plays a very important role in achieving an efficient system. Receiver
absorptivity, mirror reflectivity, flow rate, and incident angle are all details which will need to be
calculated and modelled within a software programme in order to obtain feasible and usable data (Reddy
2012).
Figure 1. Diagram illustrating the typical design of a parabolic solar through system Source: (Islam et al
2015), (Kalogirou 2002).
149

Irradiance values
Solar Irradiance is a determination of the level of solar power which reaches a select location, in this case,
Ireland and is a crucial component to consider when modelling the efficiency of a solar thermal system.
Irradiance values are mathematically represented by watts per metre squared or W/m2. Irradiance varies
dramatically depending on the location on earth and with the seasons as they are directly affected by
climatic conditions. The yearly solar irradiation in Dublin, Ireland is calculated to be in the range of 1000
W/m2 and this is the irradiance value which will be inputted into the model
(http://contemporaryenergy.co.uk) (http://www.greenrhinoenergy.com). It is also important to note that
this irradiance value is similar to other cities that have successfully implemented solar energy and heating
systems including several projects in northern Germany.
Modelling the system
Sizing of components within the design of a solar system is an important and difficult task to get right.
This includes difficult data components to predict, such as irradiance values and climatic conditions and
predictable data components such as collector characteristics. This section will determine how all data
acquired is formulated within a model so that sufficient data may be obtained, this will be done so by
using the modelling system TRNSYS (transient simulation program) (TRNSYS 1996). TRNSYS is a
quasi-steady simulation model. The program comprises of numerous subroutines that are utilized to
model subsystem components. TRNSYS has the ability to connect all these components in any way
required to complete the simulation, it does so through utilizing differential equations. Therefore, through
the use of TRNSYS, the difficult task of completing a simulation for a solar energy system comes down
to identifying what particular components are required and how they can be mathematically represented
(Kalogirou 2002).
Results
The optimal overall design and optimization of components were calculated for a parabolic solar trough
solar water heating system in Ireland, in order to obtain accurate estimations on system efficiency and
overall energy output. The results of this study indicate that the utilization of a parabolic solar trough
solar water heating system in Ireland can achieve greater water temperatures and a higher energy output
than a conventional flat plate solar collector (Krueger et al 2000). This result is believed to be greatly
influenced through the use of the tracking system which allows for the parabolic trough to be inclined
towards the sun at all times to allow for maximum solar energy absorbance. Results have indicated that
the flow rate of the water within the system increases as the size of the receiver increases. However, if the
receiver size is increased this results in reduced efficiency of heat gain (Islam et al 2015). A case study
which carried out simulations on the performance of different solar water heating systems also
demonstrated that the trough technology is more efficient than the plane collector technology, this is
especially more apparent at high fluid temperatures of 60° - 75°C (Krueger et al 2000). The study region
also has a direct solar irradiation of 1080 W/m2 very similar to that of Ireland. These results show that
Ireland has the energy capacity to efficiently utilize these systems.
Conclusion
The results of this study demonstrate that at lower temperature ranges the parabolic solar trough design is
more efficient and economically viable than flat plate solar collectors. Therefore, the use of these systems
in residential buildings or public amenities for district heating could prove to be environmentally and
economically sustainable. This is extremely important in a sector which has shown to consume vast
amounts of energy and contribute a high percentage of GHG emissions to global levels. There is,
150

however, one downfall with the parabolic solar trough design and most solar water and thermal heating
systems which is the high investment costs. Although, these costs are substantial the application of a
parabolic solar water heating system in Ireland should be closely investigated and considered for future
construction projects in Ireland.
References
Conti, J., Holtberg, P., Diefenderfer, J., LaRose, A., Turnure, J.T., Westfall, L. (2016) ‘International
Energy Outlook 2016 with Projections to 2040’, USDOE Energy Information Administration (EIA),
Washington, DC (United States) Office of Energy Analysis.
EEA. (2016) ‘Annual European Union greenhouse gas inventory 1990-2014 and inventory report 2016’,
Copenhagen European Environment Agency.
Eisentraut, A., Brown, A. (2014) ‘Heating without global warming: market developments and policy
considerations for renewable heat’, IEA: Paris France.
Endale, A. (2019) ‘Analysis of status, potential and economic significance of solar water heating system
in Ethiopia’, Renewable energy, 132, 1167–1176.
European Commission. (2008) ‘Memo on the Renewable Energy and Climate Change Package’,
Brussels; 2008.
http://contemporaryenergy.co.uk/insolation-map/
Islam, M.K., Hasanuzzaman, M., Rahim, N.A. (2015) ‘Modelling and analysis of the effect of different
parameters on a parabolic-trough concentrating solar system’ RSC Advances, (46).
Kalogirou, S.A. (2002) ‘Parabolic trough collectors for industrial process heat in Cyprus’, Energy, 27(9),
813–830.
Krueger, D., Heller, A., Hennecke, K., Duer, K. (2000) ‘PARABOLIC TROUGH COLLECTORS FOR
DISTRICT HEATING SYSTEMS AT HIGH LATITUDES? - A CASE STUDY’, Energy,
50(100), 150.
Pinel, P., Cruickshank, C.A., Beausoleil-Morrison, I., Wills, A. (2011) ‘A review of available methods for
seasonal storage of solar thermal energy in residential applications’, Renewable and Sustainable
Energy Reviews, 15(7), 3341–3359.
Reddy, K.S. (2012) ‘Solar collector field design and viability analysis of stand-alone parabolic trough
power plants for Indian conditions’, Energy Sustain Dev, 16(4), 456–470.
Shukla, R., Sumathy, K., Erickson, P., Gong, J. (2013) ‘Recent advances in the solar water heating
systems: A review’, Renewable and Sustainable Energy Reviews, 19, 173–190.
TRNSYS program Manual. (1996) University of Wisconsin, Madison, USA: Solar Energy Laboratory.
Tulus, V., Abokersh, M.H., Cabeza, L.F., Vallès, M., Jiménez, L., Boer, D. (2019) ‘Economic and
environmental potential for solar assisted central heating plants in the EU residential sector:
Contribution to the 2030 climate and energy EU agenda’, Applied Energy, 236, 318–339.
151

A COMPARATIVE ANALYSIS OF THE ENVIRONMENTAL IMPACT
ASSESSMENTS OF WIND FARMS
Robert Greene, Thomas Curran
UCD School of Biosystems and Food Engineering, University College Dublin, Belfield, Dublin 4,
Ireland.
Abstract
The conversion of wind power into different forms of useful energy is hardly a novel concept. The
potential of wind energy has been recognised for the past 3,000 years as a source of inexpensive,
renewable power. Despite being a source of clean, environmentally friendly energy, wind farms face a
high level of opposition, the bulk of which occurring on a local level. While a number of different
externalities have been identified, a lack of communication between wind farm developers and the
local communities in an area seems to be at the heart of the issue. This lack of engagement has
resulted in a level of distrust forming. However, studies show that attitudes towards wind farm
development become increasingly positive through early community engagement, with developers
freely providing information on each stage of development publicly and providing different forms of
monetary compensation for local communities and individuals.
Introduction
The progression of human culture is linked with the development of new energy sources. The shift
from wind and solar powered technologies to fossil fuel technologies took place over the last two
centuries, with coal coming to prominence in the 19th century, oil in the 20
th century and now natural
gas (Hall et al. 2004). In 2013, it was estimated that the world consumed 13,583 million tonnes of oil
(Zainol et al. 2017). While fossil fuel reserves are currently increasing, our heavy dependency and
their finite nature make fossil fuel use unsustainable (Sorrell et al. 2010; Abas et al. 2015). Moreover,
there is an extensive range of environmental impacts associated with the extraction and combustion of
fossil fuels (Ellabban et al. 2014). Renewable energy technologies provide sources of energy that are
continuously replenished by nature, turning these forms of naturally occurring energy into usable
forms of energy such electricity, heat and fuel. It is estimated that renewable energy sources have the
potential to generate over 3,000 times the current global energy demands, highlighting their
importance as a modern source of fuel and energy (Ellabban et al. 2014).
Of the available renewable energy technologies, wind energy is the only proven and mature technique
for the generation of electricity that is at present commercially promising. Wind can be an effective
source of power generation that has significant potential to close the gap of the world’s energy
demands. Wind energy is a renewable source of clean free energy that does not produce toxic gases
during power generation and occupies relatively little land area (Kumar et al. 2016). Wind power
converts wind energy via the use of wind turbines into a useful form of energy such as electricity and
mechanical energy (Leung and Yang 2012). Wind turbines are generally grouped together into wind
power plants or wind farms, typically in the size of 5 to 300 MW (Ellabban et al. 2014). Globally,
wind energy is responsible for the generation of 539 GW of energy in 2017 alone. While hailed as a
relatively benign source of energy which offers a host of benefits to local community’s post
construction, wind farms meet a high level of opposition at a local level. This level of resistance has
resulted in the development of wind farms becoming increasingly more difficult (Warren et al. 2005).
The objective of this study is to compare and contrast objections to wind farms and identify the
best practice for developers aiming to achieve planning approval.
152

Materials and Method
Data on wind farms, their development, environmental issues, and objections were collected. Data
was collected using online databases such as Google Scholar and the University College Dublin One
Search search engine (which incorporates a large number of different literature sources, including
scientific journals, books, reports, etc.). Data was searched for online by inputting different relevant
terms including keywords such as; “Wind Energy”, “Wind Power”, “Wind Turbine”, “Environmental
Issues of Wind Turbines”, “Wind Farm Development”, “Wind Farm Objections”, “Not In My
Backyard Syndrome”, etc. and their possible synonyms into database search engines.
Data collected was evaluated for further reading, taking into account the relevance of; the title of the
literature, date, source, number of citations, abstract and any ethical issues possibly relating to the
literature such as plagiarism, transparency of the methodology and results, bias, etc. Where possible,
data was collected from scientific journals no older than 10 years old.
Results and Discussion
Wind farm objections:
While accepted at an international level due to their potential as a source of renewable energy, the
development of wind farms is controversial in many countries across the world (Warren et al. 2005).
While there are a significant number of barriers to the development of wind farms, the heart of the
controversy seems to be opposition at a local level. This form of opposition appears to be shared
across many different countries and not unique to one. Studies have shown this form of localised
negative opposition occurs for a diverse number of reasons ranging from landscape impairment,
biodiversity loss, noise pollution, shadow flicker and deterioration in property prices (Warren et al.
2005; Ladenburg 2009; Jensen et al. 2015; van Rensburg et al. 2015). The most common type of
objection to the development of wind farms are those relating to human welfare. A study carried out
by Rensburg et al. in 2015 cited the most common reason for planning refusal to be the possible
impacts wind turbines will have on the natural landscape accounting for 17% of refusals. This is
closely followed by conflicts that local communities have with the strategic development plan
proposed by the developer accounting for 12% of refusals in Ireland, proximity to dwellings at 5%,
public safety at 2% and adverse effects on tourism at 1% (van Rensburg et al. 2015). A separate study
carried out by Warren et al. in 2011 found that opposition to wind farms partly occurs due to the
exaggerated perceptions of the possible impacts of living close to a wind farm, with a desire for wind
farms to be out of sight and therefore out of mind (Warren et al. 2005). Interestingly however, many
studies argue that these reasons are too simplistic to characterise the opposition to wind farms, with
many studies also indicating that there is a high level of distrust between wind farm developers and
local communities (Warren et al. 2005; van Rensburg et al. 2015; Brennan and Van Rensburg 2016).
In a study carried out by Brennan and Van Rensburg, 66% of individuals who completed a survey
stated that they did not believe a wind farm developer would cooperate with the local community,
refusing to provide information around the development or financial support (Brennan and Van
Rensburg 2016).
Best Practice for Wind Farm Developers
Creating a strong and trusting relationship between wind farm developers and local populations as
early as possible is of utmost importance for the approval of a wind farm development proposal. As
stated above, a high level of distrust exists between local communities and wind farm developers,
with communities often not satisfied with the strategic development plan laid out by developers
(Warren et al. 2005; DCCAE 2016; van Rensburg et al. 2017). Communication and engagement
between developers and the local community is essential, especially at the commencement of the
153

development process to gain an understanding of different stakeholder’s views for the development
and for them to be considered in the projects final design (Warren et al. 2005; Jones and Richard Eiser
2010; DCCAE 2016). To achieve this, a nominated community liaison person should be appointed as
a point of contact for local residents to communicate with developers. In addition to the provision of
clear and transparent information about the project and any milestones achieved (Jones and Richard
Eiser 2010; DCCAE 2016; van Rensburg et al. 2017).
The community liaison and developers should engage with the community throughout each stage of
the development and at a minimum create a dedicated website, regular newsletters and outreach
programmes (DCCAE 2016; van Rensburg et al. 2017). Additionally, a strategic development plan
for the project and community should be created and approved by key community members (Brennan
and Van Rensburg 2016). Interestingly, attitudes on the development of wind farms tend to become
more positive over time, with individuals who have a negative attitude towards wind farms becoming
more accepting over time. This can further strengthen the attitudes of those who support the
construction of wind farms (Warren et al. 2005; Jones and Richard Eiser 2010; Brennan and Van
Rensburg 2016). In addition to providing transparent information to local communities, a host of
benefits can be availed of by local communities and residents post construction (van Rensburg et al.
2015; Brennan and Van Rensburg 2016; DCCAE 2016). These benefits can come in a number of
different forms such as employment, the creation of community funds and discount in electricity costs
for local residents (Warren et al. 2005; Jones and Richard Eiser 2010; DCCAE 2016). Studies on
resident’s willingness to accept wind farms in their locality indicate that the majority of community
members are willing to make monetary trade-offs to permit the progression of wind farm
developments in their locality (Ladenburg 2009; Jones and Richard Eiser 2010; Brennan and Van
Rensburg 2016). While the level of monetary compensation varies from development to development,
depending on the height, number and set back distance of the wind turbines, one study found
individuals generally require between €319.70 and €437.53 in compensation per annum to accept the
construction of wind farms in their locality (Brennan and Van Rensburg 2016). Monetary
compensation can come in a number of different forms such as community funds, monetary payments
or benefits in kind such as discounted electricity (DCCAE 2016; van Rensburg et al. 2017).
Conclusion
Wind energy is a renewable source of clean, free energy that is accessible worldwide. Despite this and
being able to provide a host of benefits to the local communities and residents situated close by, wind
farms face a high level of opposition, especially from local communities. This opposition can occur
for a number of different reasons; however, it would seem that there is a level of distrust experienced
by local communities towards wind farm developers due to lack of communication and engagement
between wind farm developers and the local communities. To combat this, it is essential for
developers to set up a source of communication with local communities to address their concerns and
wants relating to the development. Additionally, monetary compensation should be provided to local
communities and residents for allowing the development of a wind farm in the locality, with most
people attitudes on wind farms becoming increasingly positive post construction.
References
Abas, N., Kalair, A., Khan, N. (2015) ‘Review of fossil fuels and future energy technologies’,
Futures, 69, 31–49, available: http://dx.doi.org/10.1016/j.futures.2015.03.003.
Brennan, N., Van Rensburg, T.M. (2016) ‘Wind farm externalities and public preferences for
community consultation in Ireland: A discrete choice experiments approach’, Energy Policy, 94,
355–365, available: https://linkinghub.elsevier.com/retrieve/pii/S0301421516302002.
DCCAE (2016) Code of Practice for Wind Energy Development in Ireland Guidelines for Community
154
Engagement, available: https://www.dccae.gov.ie/documents/Code of Practice community
engagment.pdf.
Ellabban, O., Abu-Rub, H., Blaabjerg, F. (2014) ‘Renewable energy resources: Current status, future
prospects and their enabling technology’, Renewable and Sustainable Energy Reviews, 39, 748–
764, available: http://dx.doi.org/10.1016/j.rser.2014.07.113.
Hall, C., Tharakan, P., Hallock, J., Cleveland, C., Jefferson, M. (2004) ‘Erratum: Hydrocarbons and
the evolution of human culture’, Nature, 427(6970), 175–175, available:
http://www.nature.com/articles/nature02217.
Jensen, C.U., Panduro, T.E., Lundhede, T.H. (2015) ‘The Vindication of Don Quixote: The Impact of
Noise and Visual Pollution from Wind Turbines’, Land Economics, 90(4), 668–682, available:
http://le.uwpress.org/cgi/doi/10.3368/le.90.4.668 [accessed 1 Apr 2019].
Jones, C.R., Richard Eiser, J. (2010) ‘Understanding “local” opposition to wind development in the
UK: How big is a backyard?’, Energy Policy, 38(6), 3106–3117, available:
http://dx.doi.org/10.1016/j.enpol.2010.01.051.
Kumar, Y., Ringenberg, J., Depuru, S.S., Devabhaktuni, V.K., Lee, J.W., Nikolaidis, E., Andersen,
B., Afjeh, A. (2016) ‘Wind energy: Trends and enabling technologies’, Renewable and
Sustainable Energy Reviews, 53, 209–224, available:
https://linkinghub.elsevier.com/retrieve/pii/S1364032115009016.
Ladenburg, J. (2009) ‘Stated public preferences for on-land and offshore wind power generation - A
review’, Wind Energy, available: http://doi.wiley.com/10.1002/we.308 [accessed 1 Apr 2019].
Leung, D.Y.C., Yang, Y. (2012) ‘Wind energy development and its environmental impact: A review’,
Renewable and Sustainable Energy Reviews, 16(1), 1031–1039, available:
http://linkinghub.elsevier.com/retrieve/pii/S1364032111004746.
van Rensburg, T.M., Brennan, N., Kenny, P., Breen, B. (2017) An Economic Analysis of Wind Farm
Externalities and Public Preferences for Renewable Energy in Ireland, Dublin, available:
https://www.seai.ie/documents/research-projects/RDD-000137.pdf.
van Rensburg, T.M., Kelley, H., Jeserich, N. (2015) ‘What influences the probability of wind farm
planning approval: Evidence from Ireland’, Ecological Economics, 111, 12–22, available:
http://dx.doi.org/10.1016/j.ecolecon.2014.12.012.
Sorrell, S., Speirs, J., Bentley, R., Brandt, A., Miller, R. (2010) ‘Global oil depletion: A review of the
evidence’, Energy Policy, 38(9), 5290–5295, available:
https://www.sciencedirect.com/science/article/pii/S0301421510003204 [accessed 22 Feb 2019].
Warren, C.R., Lumsden, C., O’Dowd, S., Birnie, R. V. (2005) ‘“Green on green”: Public perceptions
of wind power in Scotland and Ireland’, Journal of Environmental Planning and Management,
48(6), 853–875.
Zainol, M.Z., Ismail, N., Zainol, I., Abu, A., DahalanW. (2017) ‘A Review on the Status of Tidal
Energy’, Science International, 29(3), 659–667.
155

ALLEVIATION OF SUBSTRATE INTERFERENCE IN FTIR
SPECTRA DURING MICROPLASTICS DETECTION
Emma J. Wade, Jun-Li Xu, Aoife A Gowen
UCD School of Biosystems and Food Engineering, University College Dublin, Belfield, Dublin 4,
Ireland.
Abstract
Plastic pollution is a growing global environmental problem. Microplastics (MPs) are pieces of plastic
<5 mm in diameter and are classified as primary and secondary MPs based on their origins. A
standardized protocol for the sampling, separation and detection of MPs has not yet been established.
Fourier transform infrared (FTIR) is a reliable technique for the detection of plastic polymers.
Transmission mode is suitable for clear materials however a substrate is required to hold MPs in place.
Principle component analysis (PCA) after Standard Normal Variate (SNV) pre-treatment demonstrates
good performance for differentiating between plastic polymer and the substrate. Minimizing the spectral
interference of such a substrate will allow for the application of this technique to identify MPs in field
samples, potentially contributing to the development of a standardized protocol for their identification
and quantification.
Introduction
MPs are defined as pieces of plastic that are < 5 mm in diameter or along their longest edge in the case
of fibers (Dris et al. 2017). They are classified into primary and secondary MPs, based on their
origins. Primary MPs are particles that are intentionally engineered to be small such as microbeads
found in cosmetics. Secondary MPs are broken fragments from larger plastic products (e.g. plastic
bottles, fishing equipment, other plastic waste). Plastics can be broken down in various ways, such as
wave action in the sea or UV light induced degradation (Sharma and Chatterjee 2017). MPs have been
found in table salt, beer, tap water, bottled water, organic fertilizers and marine organisms (Auta et al.
2017; Dris et al. 2017; Prata 2018; Schymanski et al. 2018).
Since MPs are ubiquitous, a detection method is necessary. FTIR has been utilized to analyse MP
samples. The plastic polymers present in MP samples can be identified rapidly by comparing the
resulting spectra with spectra of known polymers from spectral libraries or by using literature. Two
modes are possible in FTIR; reflectance and transmittance modes. Refractive errors can occur in
reflectance mode due to the irregularity in the shapes of MP. This is a disadvantage because the
spectra can be distorted. When working in transmittance mode, IR light must go through the sample,
therefore a substrate through which IR light can penetrate is necessary. If MPs are too thick then the
IR light will not penetrate (Bergmann et al. 2015).
PCA reduces data dimensionality and has been applied to spectral data in the past as a pre-processing
step (Wold et al. 1987). The data matrix is broken down into two different contributing factors; the
score matrix which implies the association between the samples and the loading matrix which implies
the “load” explaining the variance in each principle component (PC). By observing the PCA scores
plot, similarities between samples can be detected. The more grouping together the more similarities
in spectral behaviour exist (Serranti et al. 2018). SNV pre-processing centres and scales each spectrum
by its standard deviation (Bi et al. 2016).
The objective of this study is to minimise the spectral interference caused by the substrate when
detecting MPs using FTIR.
156

Materials and methods
FTIR (Nicolet iN10 Infrared Microscope) was used to discriminate between materials. Four plastic
polymers: Polycarbonate (PC), polyethylene (PE), polytetrafluoroethylene (PTFE) and polyvinyl
chloride (PVC) were scanned singularly with no substrate present. They were then cut up into small
pieces in order to simulate MPs and placed on a substrate. A metal mesh of pore size 45 m from The
Mesh Company (Warrington) Ltd. was used as the substrate for two reasons; firstly, the pores allow
measurements to be taken in transmission mode and secondly it holds the MP pieces in place with no
need for an adhesive. Both PCA and SNV pre-processing were conducted on MATLAB.
Results and discussion
The mean spectra for the mesh, PC, PVC, PE and PTFE are shown in figure 1 above. In ¾ cases the
signal including the mesh is lower than the reference polymer. The opposite is found for PE where the
signal increases with the addition of the mesh. In the future more polymers will be analysed in order to
investigate this phenomenon. Figure 2 shows the mean spectra after SNV pre-processing. The SNV pre-
processing minimises the interference caused by the mesh and appears to be a promising tool to use.
Figure 1. Mean spectra for mesh, PC, PVC, PE and PTFE
Figure 2. Mean spectra of PC, PVC and PTFE after SNV pre-processing
157

Figure 3 shows an intensity image of PE taken on the mesh at 700 cm-1
. In comparison with the light
image on the left a clear distinction between polymer and mesh cannot be observed.
Figure 3. Intensity image of PE taken at 700 cm
-1 with aperture size of 100 m x 100 m and step size
of 100 m (on left), and light image of PE (on right)
PCA was carried out on the image as shown in Figure 4. However, distinction between polymer and
mesh cannot be achieved based on the first three score images.
Figure 4. Image after PCA pre-processing
Results of performing SNV prior to PCA are shown in figure 5 above. As shown, polymer pixels are
highlighted in blue in PC1 score image while mesh pixels are in red, indicating a good separation
between polymer and mesh.
Figure 5. Image after SNV followed by PCA
158

Conclusions
The substrate used was suitable for working in transmission mode due to its 45 m pore size. This
allowed IR light to pass through the sample and the pore in order to give a good spectrum. Another
benefit of using this mesh was its ability to hold the MPs stable on it without the use of adhesives
which could interfere with the readings. SNV pre-processing seems to be an auspicious tool to use in
order to reduce spectral interference caused by the substrate. Applying SNV followed by PCA to
images facilitates a clearer separation between polymer and substrate than applying PCA alone. In
conclusion, PCA combined with SNV pre-processing appears to be a promising approach to alleviate
substrate interference for MPs detection.
References
Auta, H., Emenike, C. and Fauziah, S. (2017) 'Distribution and importance of microplastics in the
marine environment: A review of the sources, fate, effects, and potential solutions',
Environment International, 102, 165-176, available:
http://dx.doi.org/10.1016/j.envint.2017.02.013.
Bergmann, M., Gutow, L. and Klages, M. (2015) 'Marine Anthropogenic Litter', Marine
Anthropogenic Litter, 1-447, available: http://dx.doi.org/10.1007/978-3-319-16510-3.
Bi, Y., Yuan, K., Xiao, W., Wu, J., Shi, C., Xia, J., Chu, G., Zhang, G. and Zhou, G. (2016) 'A local
pre-processing method for near-infrared spectra, combined with spectral segmentation and
standard normal variate transformation', Analytica Chimica Acta, 909, 30-40, available:
http://dx.doi.org/10.1016/j.aca.2016.01.010.
Dris, R., Gasperi, J., Mirande, C., Mandin, C., Guerrouache, M., Langlois, V. and Tassin, B. (2017) 'A
first overview of textile fibers, including microplastics, in indoor and outdoor environments',
Environmental Pollution, 221, 453-458, available:
http://dx.doi.org/10.1016/j.envpol.2016.12.013.
Prata, J. (2018) 'Airborne microplastics: Consequences to human health?', Environmental Pollution,
234, 115-126, available: http://dx.doi.org/10.1016/j.envpol.2017.11.043.
Schymanski, D., Goldbeck, C., Humpf, H. and Furst, P. (2018) 'Analysis of microplastics in water by
micro-Raman spectroscopy: Release of plastic particles from different packaging into mineral
water', Water Research, 129, 154-162, available:
http://dx.doi.org/10.1016/j.watres.2017.11.011.
Serranti, S., Palmieri, R., Bonifazi, G. and Cozar, A. (2018) 'Characterization of microplastic litter
from oceans by an innovative approach based on hyperspectral imaging', Waste Management,
76, 117-125, available: http://dx.doi.org/10.1016/j.wasman.2018.03.003.
Sharma, S. and Chatterjee, S. (2017) 'Microplastic pollution, a threat to marine ecosystem and human
health: a short review', Environmental Science and Pollution Research, 24(27), 21530-21547,
available: http://dx.doi.org/10.1007/s11356-017-9910-8.
Wold, S., Esbensen, K. and Geladi, P. (1987) 'Principal component analysis', Chemometrics and
Intelligent Laboratory Systems, 2(1-3), 37-52, available: http://dx.doi.org/10.1016/0169-
7439(87)80084-9.
159

MODELLING AMMONIA CONCENTRATION IN A PIG FINISHING
HOUSE
Katie Wyera, David B. Kelleghan
a, Enda Hayes
b, Mark Everard
b, and Tom P. Curran
a
a UCD School of Biosystems and Food Engineering, University College Dublin, Belfield, Dublin 4,
Ireland b University of the West England, Bristol, United Kingdom.
Abstract
There are a number of EU directives which aim to protect sensitive habitats and species from
pollutants such as atmospheric ammonia. Extensive, long-term monitoring of NH3 emissions is
expensive, requiring the use of equipment such as Photoacoustic or Cavity Ringdown sensors. Pig
farms are recognised as hotspots for NH3 emissions and can contribute to high localised NH3
concentrations. This study aimed to develop a preliminary statistical model capable of accurately
determining ammonia concentrations in a pig finishing house using simple, easily measured
parameters previously collected by the AmmoniaN2K project. This model was capable of estimating
ammonia concentration (in ppm) in the monitored pig finishing house. This paper suggests further
development of this model, improving its accuracy and application to other intensive hotspot sources.
Introduction
The European Habitats Directive (92/43/EEC) and Birds Directive (2009/147/EC) require that all
European Union (EU) member states to identify Natura 2000 sites, and maintain the network of these
designated sites as having “favourable conservation status” (Kelleghan et al. 2019). Pollution from
atmospheric pollutants, specifically from atmospheric ammonia (NH3) is a major threat to global
biodiversity. The National Emissions Ceiling Directive (2016/2284/EU) requires that each member
state monitor and report on a number of atmospheric pollutants, including NH3. The pig production
industry in Ireland accounts for 7% of all national NH3 emissions (EEA 2006). Although this
emission level may seem relatively minute on a national scale, these hotspots of ammonia emissions
can have a much higher concentration (and thus, impact) on a local scale.
Intensive NH3 emission monitoring of pig finishing houses was conducted by the AmmoniaN2K
project between 2016 and 2018, where indoor concentrations of NH3 were recorded. This intensive
monitoring was conducted using a Los Gatos Research Ultraplorable Ammnoia Analyser (UAA)
which is relatively expensive, and as such is not feasible for long-term extensive monitoring. In order
to accurately monitor and report NH3 emissions from pig production facilities without entailing
excessive cost, it is suggested that the data collected during AmmoniaN2K monitoring be utilised to
develop a preliminary statistical model capable of predicting NH3 concentrations, utilising other more
easily measured parameters, primarily temperature, relative humidity and ventilation rate (based on
carbon dioxide mass balance).
The objective of this study was to analyse data collected from a single pig finsihing house to
deveopl a sample statistical model capable of closley approximating NH3 concentrations using
only simple parameters.
Materials and Methods
Data Accumulation
This study aimed to analyse the feasibility of generating a working statistical model. Therefore, only
data from one farm over a one month period was analysed. The month used was June 2016, and was
160

gathered from previous intensive monitoring of an intensive integrated pig farm in Co. Meath, Ireland.
Monitoring in this finishing house was conducted semi-continuously. This house was monitored for
an hour in sequence with two other finishing houses, and outdoor concentrations. During monitoring,
Temperature (°C), ventilation rate (m3/s), ammonia concentration (ppm), and relative humidity (%)
were collected at second intervals. This amounted to 713,280 data points collected for this preliminary
examination.
Data Analysis
For each analysis which was carried out, ammonia concentration was assumed as the dependant
variable while temperature, ventilation rate, and relative humidity were considered to be independent
variables. Pearson’s correlation coefficient calculations were carried out on ammonia concentration
vs. each individual parameter for each individual day monitored. The resultant R-values were then
used to determine if the dependant and independent variables were correlated with each other.
For the remaining analyses, the total daily data was minimised by generating daily means for each
parameter. Using these means, ANOVA analyses were carried out between the dependant and
independent variables. For generation of the preliminary statistical model, any variable with a P-value
of 0.15 or greater was to be excluded from the model. The statistical model itself was produced using
regression analysis on excel.
Results and Discussion
Pearson’s Correlation Coefficient (R-values)
R-values were obtained for each set of daily data, testing the correlation between ammonia and the
independent variables. The range of the R-values obtained for these independent variables was high.
The highest R-value found was for ammonia vs. temperature on day fourteen (R2 = 0.86). This
indicates a strong correlation between ammonia vs. temperature, showing that as temperature
increases, ammonia concentration decreases. This may also be influenced by ventilation rate. If
ventilation rates are high, the concentration of ammonia in house may be lower.
The lowest R-value obtained was for ammonia versus ventilation rate on day three (R2 = 0.20). This
R-value indicated a negative correlation, although not a strong one. This was the lowest R-value
obtained, and was an outlier when compared to the spread of R-values from the rest of the data
analysed. Scatter plots visually representing these correlations can be seen in Figure 1.
161

Figure 1. Scatter plots of ammonia (ppm) vs. temperature (°C) [left], and ammonia (ppm) vs.
ventilation rate (m3/s) [right].
ANOVA Analysis
ANOVA analyses conducted on the daily mean for each parameter determined that all three
parameters were to be used in the statistical model. Ammonia versus temperature had a P-value of
0.081, ammonia versus ventilation rate had a P-value of 0.04, and ammonia versus relative humidity
had a P-value of 0.002. Each of these P-values determined that the independent variables had a
statistically significant effect on ammonia concentrations that was not due to chance. These results are
comparable to other studies which also state that these independent variables effect ammonia
concentration in livestock houses (Rosenbaum et al. 2010, Phillipe et al. 2011).
Regression Analysis and Development of Statistical Model
Using regression analysis on excel for the dependant and independent variables, coefficients were
determined as follows; temperature (-6.018), ventilation rate (0.463), and relative humidity (0.055).
These coefficients were used to generate the statistical model equation which can be seen as equation
one, where T = temperature (°C), RH = relative humidity (%) and VR = ventilation rate (m3/s).
NH3 (ppm) = 216.37 + (T) (-8.6807) + (RH) (-0.20441) + (VR) (-0.00277)
Equation 1. Preliminary statistical model to determine ammonia concentration (ppm)
In order to test the models capability of determining ammonia concentration, known ammonia
concentration values for June 2016 and August 2016 were plotted against the models predicted
ammonia concentrations for the same months. A visual representation of these plots can be seen in
Figure 2. The model ammonia data closely represents the actual ammonia concentration data for each
month, with the largest concentration differences being between day 11 in June (-1.8 ppm) and day 20
in August (+1.7 ppm). It was expected that the model for June would be accurate, as this was the data
with which the model was produced. August’s data was not used in the model, and therefore shows
that the model is capable of predicting ammonia concentrations in this pig finishing house.
y = 30750e-0.394x R² = 0.8629
0
1
2
3
4
5
6
7
21 22 22 23
Am
mo
nia
co
nc.
(p
pm
)
Temperature (°C)
Temperature vs. Ammonia (Day 14)
y = -1.272ln(x) + 6.2322 R² = 0.2018
0
1
2
3
4
5
6
7
2 2 3 3
Am
mo
nia
co
nc
(pp
m)
Ventilation Rate (m3/s)
Ammonia vs. Ventilation Rate (Day 03)
162

Figure 2. Ammonia concentration (ppm) from model versus actual known values in June 2016 (left)
and August 2016 (right).
Conclusions
The preliminary statistical model that was generated in this study was found to be accurate. This study
shows that the development of a statistical model for ammonia concentration determination in pig
finishing houses may be a feasible option for long term extensive monitoring. Statistical models such
as these may be functional for determining NH3 concentration in hotspot areas, such as poultry rearing
and other pig rearing facilities. This model may also be extended to reach industries such as dairy and
beef, but would need to be cattle specific as emissions differ greatly from each sector. It is
recommended that further analyses on the data sets collected by the AmmoinaN2K project be carried
out. This would involve the analysis of over 100 million records, and would be expected to yield more
confident results. This would result in a more accurate model which could be integrated into future
monitoring programmes across Ireland.
References
Kelleghan, D.B. et al., 2019. Mapping ammonia risk on sensitive habitats in Ireland. Science of the
Total Environment, 649, 1580–1589. Available at:
https://doi.org/10.1016/j.scitotenv.2018.08.424.
Rosenbaum, M.D. et al., 2010. Disparities in ammonia, temperature, humidity, and airborne
particulate matter between the micro-and macroenvironments of mice in individually ventilated
caging. Journal of the American Association for Laboratory Animal Science : JAALAS, 49(2),
177–83.
EEA Report 2/2006 - Intergration of Environment into EU Agriculture Policy - The IRENA Indicator-
Based Assesment Report.
Philippe, F.X., Cabaraux, J.F. & Nicks, B. (2011). Ammonia emissions from pig houses:
Influencing factors and mitigation techniques. Agriculture, Ecosystems and
Environment, 141, 245 – 260.
0
2
4
6
8
10
0 1 2 3 4 5 6 7 8 9 10 11 12 13 14 15
AM
MO
NIA
CO
NC
. (P
PM
)
DAY
Model concentration vs. known ammonia
concentration (June 2016)
Actual MODEL0
2
4
6
8
10
16 17 18 19 20 21
AM
MO
NIA
CO
NC
. (P
PM
)
DAY
Model concentration vs. known ammonia
concentration (August 2016)
Actual Model
163

RISK ASSESSMENT OF ANTIMICROBIAL RESIDUES IN
ENVIRONMENTAL SETTINGS: SOURCES, PATHWAYS AND
EVENTUAL FATE
Ciaran O. Monahan, Enda Cummins.
UCD School of Biosystems and Food Engineering, University College Dublin, Belfield, Dublin 4,
Ireland.
Abstract
Antibiotic resistance in pathogenic bacteria can be caused by the presence of antimicrobial residues in
natural settings. Risk assessment methodologies can be used to investigate industrial sources of
antimicrobials that enter natural settings, primarily ground and surface waters, potentially contributing
to the development of antimicrobial resistant bacteria. Two primary industries are investigated:
healthcare and agriculture. Information from government agencies has been compiled, with the intent
to construct a model generating predicted environmental concentrations for a risk ranking.
Introduction
The development of antimicrobial resistance in pathogenic bacteria is a pressing issue, leading to
increased incidences of illnesses that do not respond to antibiotic treatment. Antimicrobial resistant
Bacteria (ARB) causes three main issues; increased hospital stays, increasing cost of treating
infections, and a restriction of surgical procedures requiring antimicrobials (Laxminarayan et al.,
2013).”ARBs in natural settings can act as pathogens, with recreational water users potentially
contracting disease via ingestion of water” (O’Flaherty et al., 2019). Environmental ARB can also
function as reservoirs of resistance genes. Resistance can be transferred between bacteria via mobile
genetic elements. Therefore, understanding the movement of antimicrobials from human use into
natural settings is paramount in understanding how to mitigate and prioritise management strategies.
Antimicrobials lead to the development and selection of ARB when the concentration of the
antimicrobial exceeds the Minimum Inhibitory Concentration (MIC). Once this concentration is
exceeded, a selective pressure is exerted, favouring the proliferation of ARB. A second concentration,
lower than the MIC, called the Minimum Selective Concentration (MSC), has also been proposed by
several publications (Bengtsson-Palme and Larsson, 2016). Current consensus is that two sectors
contribute to the majority of antimicrobial pollution into the environment; agriculture and health.
In health, antimicrobials are prescribed to treat illness in both hospital and community settings. Due to
low bioavailability, antimicrobials pass through the gastrointestinal (GI) tract of the patient unchanged
or in the form of active metabolites, then are egested into sewage waters. From here, they pass into
surface and ground waters, creating antibiotic residues in natural systems. The over-prescription of
antibiotics to treat non-bacterial illnesses, as well as patient non-compliance is also associated with
the development of ARB.
In agriculture, antimicrobials are used to treat illness, and also administered to livestock at constant
low doses as a growth promoter. As in the health sector, antibiotics pass through the GI tract of the
organism and are egested in faeces. When this is left or used as fertiliser, antimicrobials can leach into
soil and move into ground and surface waters. Agriculture is a major consumer of antimicrobials. In
Ireland, 103.4 tonnes of antimicrobials were sold for veterinary use in 2016 (Department of Health,
2018).
The objective of this paper is to establish an understanding of the current state of antimicrobial
pollution sources and establish an appropriate risk assessment methodology to examine it.
164

Materials and Methods
The process of risk assessment allows for an objective and quantitative analysis to compare several
risk factors. Risk ranking is a quantitative method of comparing different risk factors, allowing for
informed prioritisation of certain factors in management. In the context of antimicrobial resistance,
risk assessment can be used to offer insights in two ways; firstly, a risk ranking between different
industries, and secondly, a risk ranking between different antimicrobials.
A Risk Quotient (RQ) is a numerical value obtained by dividing a Predicted Environmental
Concentration (PEC) value by a Predicted No Effect Concentration (PNEC) value. A PEC value is the
observed or predicted concentration of an investigated chemical. The PNEC is the theoretical limit
above which an inhibitory or selective effect is observed. Several methods have been developed and
used in other risk assessment procedures which allow predictive modelling of antimicrobial
partitioning and movement into natural systems. These models allow a PEC to be generated. Current
studies into antimicrobial pollution use PNEC values only for eukaryotic species; algae, arthropods
and fish. Therefore, these risk rankings do not directly represent risk of antimicrobial resistance
developing or being selected for. A 2016 paper used MSC values to generate PNEC estimates for
many different bacterial species, utilising the precautionary principle (Bengtsson-Palme and Larsson,
2016). The incorporation of these values, as well as PEC values generated via the model would
constitute a novel approach to evaluating risk of ARB development.
Results and discussion
Several official government sources provide usage rates for different antimicrobial use in different
sectors. The One Health report (2019), which synthesises data from the health and agricultural sectors
states that per unit biomass, humans consume more than three times the amount animals do, stating
figures of 155.6 mg/kg of estimated biomass per year in humans and 48.0 mg/kg of estimated biomass
per year in animals (Department Of Health, 2018). In the health industry, the primary antimicrobials
used are beta lactams, macrolides and tetracyclines.
Table 1: Antimicrobials used in combined hospitals and the community in Ireland 2017,(Adapted
from ECDC, 2017)
Antimicrobial classes
Percentage of total usage
Tetracyclines 13.50%
Amphenicols <0.1%
Beta-lactam antibacterials, penicillins 49.20%
Other beta-lactam antibacterials 6.00%
Sulfonamides and trimethoprim 4.30%
Macrolides, lincosamides and
streptogramins 21.10%
Aminoglycoside antibacterials 0.50%
Quinolone antibacterials 4.30%
Combinations of antibacterials 0.00%
Other antibacterials 1.00%
Total 100%
In the agricultural industry, in both the Irish and European contexts, the primary antimicrobials
administered are tetracyclines, penicillins and sulphonamides.
165

Table 2: Table of antimicrobial sales for veterinary uses in 30 EU countries in 2016. (Adapted from
ESVAC 2017)
Antimicrobial family Percentage of total usage
Tetracyclines 32%
Penicillins 26%
Sulphonamides 12%
Macrolides 7%
Aminoglycosides 5%
Polymyxins 5%
Other 13%
Total 100%
Conclusion
Using the above consumption data, a simulation model is being constructed to estimate levels of
different antimicrobial groups being released into natural systems from different industries, with the
view toward constructing a risk ranking. Previous studies in this field have used simulation models to
estimate levels of antimicrobial pollution from hospitals (Harris, Cormican and Cummins, 2013). This
study will attempt to use a similar rationale and expand it to apply to agricultural runoff as well.
In the construction of this model, information from the literature will be used. In particular;
information from pre-exiting literature regarding soil sorption rates, half-lives in water, and
bioavailability of antimicrobials.
Acknowledgements
This research is funded by the Environmental Protection Agency (EPA) under the EPA Research
Program, 2014-2020 as part of the AREST project (Project code: 2017/HW/LS/1)
References
Bengtsson-Palme, J. and Larsson, D. G. J. (2016) ‘Concentrations of antibiotics predicted to select for
resistant bacteria: Proposed limits for environmental regulation’, Environment International.
Pergamon, 86, 140–149. doi: 10.1016/J.ENVINT.2015.10.015.
Department of Health (2018). Ireland’s first One Health Report on Antimicrobial Use and
Antimicrobial Resistance. Available at:https://health.gov.ie/national-patient-safety-
office/patient-safety-surveillance/antimicrobial-resistance-amr-2/
European Centre for Disease Control (2017) Available at: https://ecdc.europa.eu/en/antimicrobial-
consumption/database/distribution-by-antimicrobial-group
ESVAC (2017) Sales of veterinary antimicrobial agents in 30 European countries in 2016. Available
at: https://www.ema.europa.eu/en/documents/report/sales-veterinary-antimicrobial-agents-30-
european-countries-2016-trends-2010-2016-eighth-esvac_en.pdf
Harris, S., Cormican, M. and Cummins, E. (2013) ‘Risk Ranking of Antimicrobials in the Aquatic
Environment from Human Consumption: An Irish Case Study’, Human and Ecological Risk
Assessment: An International Journal. Taylor & Francis Group , 19(5), 1264–1284. doi:
10.1080/10807039.2012.713826.
Laxminarayan, R., Duse, A., Wattal, C., M Zaidi, A. K., L Wertheim, H. F., Sumpradit, N., Vlieghe,
E., Levy Hara, G., Gould, I. M., Goossens, H., Greko, C., So, A. D., Bigdeli, M., Tomson, G.,
Woodhouse, W., Ombaka, E., Quizhpe Peralta, A., Naz Qamar, F., Mir, F., Kariuki, S., qar
166

Bhutta, Z. A., Coates, A., Bergstrom, R., Wright, G. D., Brown, E. D. and Cars, O. (2013) ‘The
Lancet Infectious Diseases Commission Antibiotic resistance-the need for global solutions Part
1: Global epidemiology of antibiotic resistance and use’, The Lancet Infectious Diseases, 13,
1057–1098. doi: 10.1016/S1473-3099(13)70318-9.
O’Flaherty, E., Solimini, A., Pantanella, F. and Cummins, E. (2019) ‘The potential human exposure to
antibiotic resistant-Escherichia coli through recreational water’, Science of The Total
Environment, 650, 786–795. doi: 10.1016/j.scitotenv.2018.09.018.
167

THE NITROGEN CYCLE A MINI REVIEW
Maria P. Byrne1,2
, John T. Tobin1, Patrick Forrestal
3, Karl Richards
3, Martin Danaher
4, Enda
Cummins2, Tom F. O’ Callaghan
1 *
1Food Chemistry & Technology Dept , Teagasc Food Research Centre, Moorepark, Fermoy, Co.
Cork, Cork, Ireland. 2University College Dublin, School of Biosystems and Food Engineering, Agriculture and Food
Science Belfield Dublin 4, Ireland. 3Teagasc, Johnstown Castle, Co. Wexford, Ireland.
4Food Safety Dept, Ashtown Food Research Centre, Teagasc, Ashtown, Dublin 15, Dublin, Ireland.
Abstract
Nitrogen is the building block of protein and is essential for all living organisms. Nitrogen is the 5th
most abundant element and makes up 78% of the earth’s atmosphere. The natural nitrogen cycle is
complex and although plentiful nitrogen is largely inaccessible to living organisms in its gaseous
form. It must first be converted into bioavailable nitrogen though redox reactions. In this way
Nitrogen can exist in many oxidative states. This mini review examines the natural nitrogen cycle and
how nitrogen is made available to organisms and how anthropogenic activity has greatly influenced
the nitrogen cycle.
Introduction
The nitrogen cycle is composed of four main steps nitrogen fixation & ammonification, nitrification,
and denitrification and can be defined as the continuous movement of nitrogen in the environment in
various forms active and inactive. 78% of our atmosphere is made up of diatomic inorganic nitrogen
gas (N2). Nitrogen is essential for the growth and development of plants and animals, and allows for
the production of amino acids and genetic material which ultimately form proteins. Nitrogen cycles
through our biosphere but cannot be directly assimilated from the air by plants in its inorganic form
and requires nitrogen fixing i.e conversion to organic ammonium and nitrate compounds. This process
is called fixation and is carried out by nitrifying bacteria present in the soil. Occurring due to
transformations to N2‘s oxidative state via oxidation and reduction through the donation or accepting
electrons.
Objective Comprehensive Mini Review of the Natural Nitrogen Cycle
Nitrogen Fixation
Nitrogen fixation is an oxygen sensitive process that ultimately allows for the conversion of inactive
N2 into active forms of N which can be utilized by plants. Biological Nitrogen Fixation (BNF) occurs
when bacteria convert atmospheric di-nitrogen into Ammonium (NH4+) by utilising metalloenzymes
called nitrogenases in anaerobic environments. Microorganisms including bacteria and archea
synthesize these nitrogenase enzyme complexes such as molybdenum-iron protein dinitrogenase and
or vanadium iron protein dinitrogenase reductase where one molecule of H2 is formed via the
hydrolysis of 16 equivalents of ATP. This process allows for the production of nitrogenase-generated
NH4+ (de Bruijn, 2015). Nitrogenase can be used to break the triple covalent bond in atmospheric N2
and ultimately leads to the production of ammonia (NH3) which becomes ammonium NH4+ when
mixed with water providing a source of N that can be utilized by plants (Stein and Klotz, 2016). The
process of BNF is described in the equation below
N2 + 8H++ 8e
−+ 16Mg (ATP) → 2NH3 + H2 + 16Mg (ADP) + 16Pi
There are two types of nitrogen-fixing bacteria comprising of ‘free-living (nonsymbiotic) bacteria
including cyanobacteria, Anabaena and Nostoc and genera such as Azotobacter, Beijerinckia,
Clostridium and mutualistic (symbiotic) bacteria which invade root hairs and form nodes in plant
168

roots examples, include the relationship between Rhizobium & leguminous plants, Frankia &
dicotyledonous species (actinorhizal plants); and certain Azospirillum species & cereal grasses
(Franche et al., 2009).
Ammonification
Organic Nitrogen can also be returned to the soil via the process of ammonification. During this
process detritovores (usually bacteria), examples, of which include Pseudomonas and Bacillus return
nitrogen from waste or dead organisms into ammonia which can combine with water to form
ammonium and return to the soil. Fungi have also been cited to exhibit high ammonification activities
examples include Acremonium, Alternaria and Penicillium. The process of ammonification is
considered an essential part in the nitrogen cycle and often determines the amount of NH4+ in soil and
the amount of volatilized NH3 (Huang et al., 2019).
Nitrification During nitrification ammonium (NH4
+) ions and ammonia (NH3) are oxidized and converted to
Nitrites (NO2-) and nitrates (NO3-) by nitrifying bacteria present in the soil. When NH4
+ oxidizes
NO2−, N2O may be produced as an intermediate product lost to the atmosphere. (Gilsanz et al., 2016)
The Nitrifying bacteria responsible for the nitrification process are chemotrophic bacteria that thrive
at 25 – 30oC and favour alkaline pH. There are two types of nitrifying bacteria these include bacteria
which convert ammonia to nitrite and include Nitrosomonas, Nitrosococcus & Nitrosospira bacteria.
These bacteria are ammonium oxidizers utilizing enzymes including ammonia monooxygenase
(AMO) and hydroxylamine oxidoreductase (HAO). Ammonia monooxygenase oxidizes Ammonia to
hydroxylamine using two quinone pool electrons. A transmembrane copper protein catalyses the
oxidation reaction. Hydroxylamine oxidoreductase catalyses hydroxylamine resulting in the
production of 4 electrons and nitrite. The quinone pool replenished with 2 electrons with the other 2
electrons creating a proton motive force through the membrane releasing nitrites
NH2OH + H2O ➜ NO2- + 5H
+ + 4e
-
NH3 + O2 ➜ NO2- + 3H
+ + 2e
-
The second type of nitrifying bacteria convert nitrite to nitrate examples of these nitrite oxidizing
bacteria include Nitrobacter, Nitrospina, Nitrococcus & Nitrospira. To allow this oxidation reaction
to take place an iron-sulphur molybdoprotein enzyme nitrite oxidoreductase (NXR) is utilized. NXR
enzyme is responsible for the electron transport chain. The mechanism allowing the conversion of
nitrite to nitrate via the use of NXR is external. (Bitton, 2002)
NO2- + H2O ➜ NO3- + 2H
+ + 2e
-
Excess nitrates in soil, are prone to leaching and may cause pollution of waterways, via excess
enrichment of nitrogen entering ground or surface waters. Which often causes overgrowth of
phytoplankton leading to eutrophication. The overgrowth of phytoplankton can, in turn, deplete water
oxygen levels causing hypoxia and dead zones (Paerl, 2009). Other negative impacts of excess
nitrogen include water acidification, loss of biodiversity and negative human health impacts such as
blue baby syndrome (Leach et al., 2016). These negative effects are often associated with human
activities including the use of nitrogen fertilisers and burning of fossil fuels which result in excessive
levels of bioavailable nitrogen. (Bernhard, 2010) Efforts to prevent pollution of water bodies with
excess nitrates has led to much interest in nitrification inhibitors such as Dicyandiamide (DCD) which
work by inhibiting NH4+
and NH3 oxidation by nitrifying bacteria (Soares et al., 2012) and in recent
years urease inhibitors have been explored as mitigation tools to minimise nitrogen losses via
ammonia volatilization .
Anammox Strous et al. (1999) discover and anaerobic type of ammonia oxidation known as Anammox and
carried out by prokaryotic Planctomycetes bacteria, these bacteria oxidise ammonia using nitrite as an
169

electron acceptor to produce N2 this process is thought to be an especially important nitrogen loss
pathway in marine environments (Bernhard, 2010).
NH4+ + NO2
- ➜ N2 + 2H2O
Assimilation
Bioavailable nitrogen can be assimilated by plants through their root system in the form of ammonium
or nitrate. Plants prefer uptake of nitrates over ammonium as particle uptake is faster due to
ammonium being positively charged and therefore, bound to the negatively charged soil particles. Soil
conditions will dominate the type of nitrogen available to plants with ammonium being the principal
source in acidic and anaerobic soil conditions and nitrate being the principal type in well-aerated soil
conditions (Miller and Cramer, 2005). Once assimilated the majority of the nitrate absorbed is
transported to the shoot of the plant here a reduction reaction occurs utilizing nitrate reductase present
in the cytoplasm to produce nitrite. A further reduction reaction occurs utilizing nitrite reductase
present of the enzyme glutamine synthetase (GS) to produce ammonium. The resulting ammonium or
ammonium taken from the soil directly can then be assimilated into amino acids by way of the
GS/glutamine-2-oxoglutarate aminotransferase (GOGAT) cycle (Xu et al., 2012).
Denitrification Denitrification is a microbial process carried out in anaerobic conditions by heterotrophic bacteria that
utilize organic carbon as an energy source to reduce to nitrate (NO3-) to Nitrogen gas (N2). During this
process NO3-
acts as an electron acceptor and is reduced to NO2– followed by NO (Gilsanz et al.,
2016). NO is toxic to cells so bacteria quickly transform it into N2O which is a necessary intermediate
in the denitrification pathway that causes nitrogen losses from the soil system and ultimately converts
it back to atmospheric N2.
NO3- → NO2
- → NO→ N2O → N2
The levels of NO and N2O produced are dependent on various factors including soil PH, O2 Levels &
levels of Nitrates present in the soil.
Denitrifying bacteria use enzymes such as nitrate oxide reductase (NOR), an essential membrane
protein complex produced by the metabolic processes in denitrifying bacteria to make these N
transformations possible, NOR is associated with haem/copper cytochrome oxidases and can be
classified into two groups quinols (qNOR) usually present in pathogenic bacteria. Which responsible
for removing NO created in there surrounding environment or cytochrome c redox type proteins
(cNOR) present in many denitrifying bacteria. Classification is determined by the type of electron
donor they use some examples of denitrifying bacteria include Pseudomonas stutzeri, Ralstonia
eutropha, and various other proteobacteria (Hendriks et al., 2000). Which are specialized to carry out
the denitrification though their ability to utilize nitrate as a final electron acceptor in order to respire
anaerobically when soil O2 is absent or in low levels (Burger and Venterea, 2011). These bacteria are
classified by the end products they produce and are known as complete denitrifiers who produce N2 or
incomplete denitrifiers who produce N2O. Certain fungi have also been cited to have the potential to
produce N2O though the use of the enzyme (P-450nor) which is part of the cytochrome P-450 family
and is used to catalyse NO reduction to N2O (Hendriks et al., 2000). Denitrification is an essential part
of the nitrogen cycle and deemed advantageous as a way to remove nitrates from wastewater. It is
however, often regarded as negative in regards to agricultural practices due to losses of N applied
through fertilizers. This is especially the case with CAN-based fertilizers that apply nitrate directly to
the soil. N2O released into the atmosphere during Denitrification also negatively impacts the
environment in various ways. N2O stimulates Ozone (O3) destruction contributing to global warming
and climate change.
Conclusion
Nitrogen is an essential nutrient for both primary production in the food chain and biodiversity of
ecosystems. The nitrogen cycle is mainly driven by microbes present in the soil and consists of four
main pathways though which nitrogen is recycled throughout the biosphere including Nitrogen
170

Fixation, Ammonification, Nitrification, Denitrification. In 1998 a new pathway was discovered for
the anaerobic oxidation of ammonia known as Anammox which is thought to play a vital role in
marine nitrogen recycling. Bioavailable nitrogen may be assimilated by plants or recycled back into
its gaseous form by microorganism. Anthropogenic activities such as the use of nitrogen based
fertilisers and burning of fossil fuels can greatly disrupt the nitrogen cycle and cause pollution, health
and economic concerns. It is likely that as the world’s population continues to grow disruption of the
nitrogen cycle cause by anthropogenic activities may threaten our resources and it will be necessary to
employ mitigation technologies to minimise such disruptions and alterations to the global nitrogen
cycle.
References Bernhard, A. 2010. The nitrogen cycle: Processes. Players, and Human.
Bitton, G. 2002. Encyclopedia of Environmental Microbiology: Sp-Z; Index, Wiley.
Burger, M. & Venterea, R. T. 2011. Effects of nitrogen fertilizer types on nitrous oxide emissions.
Understanding Greenhouse Gas Emissions from Agricultural Management. American
Chemical Society.
DE Bruijn, F. J. 2015. Biological Nitrogen Fixation. In: LUGTENBERG, B. (ed.) Principles of Plant-
Microbe Interactions: Microbes for Sustainable Agriculture. Cham: Springer International
Publishing.
Franche, C., Lindström, K. & Elmerich, C. 2009. Nitrogen-fixing bacteria associated with leguminous
and non-leguminous plants. Plant and Soil, 321, 35-59.
Gilsanz, C., Báez, D., Misselbrook, T. H., Dhanoa, M. S. & Cárdenas, L. M. 2016. Development of
emission factors and efficiency of two nitrification inhibitors, DCD and DMPP. Agriculture,
Ecosystems & Environment, 216, 1-8.
Hendriks, J., Oubrie, A., Castresana, J., Urbani, A., Gemeinhardt, S. & Saraste, M. 2000. Nitric oxide
reductases in bacteria. Biochimica et Biophysica Acta (BBA) - Bioenergetics, 1459, 266-273.
Huang, Y., LI, D., Wang, L., Yong, C., Sun, E., Jin, H. & Huang, H. 2019. Decreased enzyme
activities, ammonification rate and ammonifiers contribute to higher nitrogen retention in
hyperthermophilic pretreatment composting. Bioresource Technology, 272, 521-528.
Leach, A. M., Emery, K. A., Gephart, J., Davis, K. F., Erisman, J. W., Leip, A., Pace, M. L.,
D’ODorico, P., Carr, J., Noll, L. C., Castner, E. & Galloway, J. N. 2016. Environmental
impact food labels combining carbon, nitrogen, and water footprints. Food Policy, 61, 213-
223.
Miller, A. & Cramer, M. 2005. Root nitrogen acquisition and assimilation. Root Physiology: from
Gene to Function. Springer.
Paerl, H. W. 2009. Controlling Eutrophication along the Freshwater—Marine Continuum: Dual
Nutrient (N and P) Reductions are Essential. Estuaries and Coasts, 32, 593-601.
Pūtaiao., S. L. H. P. A. 2013. The nitrogen cycle.
Soares, J. R., Cantarella, H. & Menegale, M. L. D. C. 2012. Ammonia volatilization losses from
surface-applied urea with urease and nitrification inhibitors. Soil Biology and Biochemistry,
52, 82-89.
Stein, L. Y. & Klotz, M. G. 2016. The nitrogen cycle. Current Biology, 26, R94-R98.
Strous, M., Fuerst, J. A., Kramer, E. H., Logemann, S., Muyzer, G., Van DE Pas-Schoonen, K. T.,
Webb, R., Kuenen, J. G. & Jetten, M. S. 1999. Missing lithotroph identified as new
planctomycete. Nature, 400, 446.
Xu, G., Fan, X. & Miller, A. J. 2012. Plant Nitrogen Assimilation and Use Efficiency. Annual Review
of Plant Biology, 63, 153-182.
171

REMOTE SENSING FOR WINTER WHEAT YIELD MONITORING
AND PREDICTION
Bing-Bing E. Goh, Rebecca Whetton, Nicholas M. Holden
UCD School of Biosystems and Food Engineering, University College Dublin, Belfield, Dublin 4,
Ireland. (SFI CONSUS Strategic Partnership Project)
Abstract
Yield mapping is an important support tool for precision agriculture management. Spatial distribution
of yield is very important for farmers to understand field condition and achieve yield potential.
However, yield map generated from onboard yield monitoring systems are erroneous due to sensor
performance, calibration issues and limitations of the transfer function model for the combine, which
can be of poor quality. This study is a preliminary examination of the use of satellite images to
improve the quality of yield maps. The confidence interval of the yield prediction model is between
722.62 and 723.78 with 95% of confidence level. The model indicates that there is good evidence
that REIP and Yield are related. The residuals values of the yield prediction model were defined from
the values other than between 722.62 and 723.78 to identify the location of unlikely yield values. The
method helps to improve the quality of the yield map to better predict the yield value even pre-harvest
date.
Introduction
Crop yield is measured as sellable crop harvested (tonnes) per unit area (hectare) of cultivated land. It
is an important metric because it indicates success of farming practices, allows monitoring of food
security is a key input for calculating gross margin at the field scale and for predicting what might
happen the following year (Fischer, 2015). Each crop has a maximum possible yield, which is called
the yield potential, but each year a farmer has in mind a target yield for each field, or unit of land.
The farmers can compare crop yield to target yield and yield potential to find out how well they are
competing in the market. For that reason, a farmer’s goal is to achieve the target yields close to yield
potential for the minimum financial outlay (Haak, 2019). This should maximise gross margin. If the
farmer’s crop yield is greater than the target yield, it means the farmer is making more money than
planned. It is essential for farmers to balance the price of growing a crop (crop husbandry) with the
target yield (expected income from sale) so that they can earn as much money as possible (Lobell et
al., 2009; Sadras et al., 2015). Additionally, if the crop yield has declining for consecutive years,
farmers can make the decision to switch to other crops.
During the last three decades, yield measurement has evolved from coarse result of using volume or
mass per wagon/trailer to calculate average yield per field, to advance onboard yield monitoring
system that produce a yield map during the harvest operations (Chung et al.,2016). The creation of a
yield map is key development in precision agriculture. Many farmers place high confidence and
believe that yield maps can provide reliable indication of yield variation within a field (AWG Farms
Inc. n.d.), which can be used to estimate the amount of nutrient removed by the crop or target
properties for spay planning (Reitz and Kutzbach, 1996; Luck and Fulton, 2015). Farmers can
calculate profit based on the yield information on yield map after harvest (Vellidis et al., 2017).
Moreover, the yield map also helps farmers to identify sub-field management zones for more precise
future management planning (Bramley and Ouzman, 2019).
The objective of this research was to evaluate the potential of producing accurate and reliable
yield map using satellite radar imagery using the most successful vegetation index reported in
the literature. If it proves successful a more detailed study will be undertaken, else an
alternative approach will be defined.
Yield maps are being used by farmers and research organisation without full knowledge of their
accuracy. Onboard yield monitoring data contains errors that will influence the final result on yield
map due to: (1) forward speed variation, which has a non-linear relationship between yield and
172

throughput (Arslan, S. and Colvin, T.S. 2002); (2) static transfer function models that describe grain
flow from cutter bar to clean grain elevator that contribute to error in ascribing a recorded value to a
location in the field; (3) grain moisture sensing, which is confounded by dust and dirt; (4) location
error from the Global Navigation Satellite System (GNSS); and (5) variation in cut width, which is
difficult to maintain but is assumed to be constant (Fulton et al.,2018). The time when onboard yield
maps become available is also suboptimal for farm management, because the farmer only has a map
of the outcome once the harvest is complete, therefore it cannot contribute to planning in the yield it
applies to. In order to get more value from yield maps, a greater level of map accuracy is required,
especially when management decisions are based on this single piece of evidence, and a method to
estimate yield earlier in the year would allow the map to be used for real-time management rather than
just planning.
Materials and Methods
Study Site
The preliminary evaluation was completed using a study site located in Porton UK (Figure 1). The
farm is situated at 51°8'30"N and 1°44'40"W, and an area of 14.9 hectares growing winter wheat was
selected (Figure 2). A combine harvester on board yield map from 12th August 2017 was used as the
ground truth data. Bearing in mind the issues noted above, this cannot be considered a gold standard
dataset.
Figure 1: Location map of study area Figure 2: Location map of farm area
Satellite Imagery
Data were taken from Sentinel-2 from 22nd
June 2017 as GS50, when uptake of nitrogen from soil is
minimal and nitrogen in the leaves will be mobilized to contribute to grain filling (Joseph L. et al
2016). The Sentinel-2 imagery consists of 13 spectral bands with 3 different resolutions (10 m, 20 m,
60m). Bands 2 to 4 and 8 are available at 10 m resolution, bands 5, 6, 7 and 8a (typically used for
vegetation characteristics) and shortwave bands 11 and 12 are at 20 m resolution and bands 1, 9 and
10 are at 60 m resolution (mainly used for atmospheric corrections) (ESA Sentinel Online 2019). The
data were used to calculate the Red-Edge Inflection Point (REIP) vegetation index from four red edge
and near infrared bands (ca. 670, 700, 740 and 780 nm; bands 4, 5, 6, 7), which is reported as the best
performing index to describe winter wheat N concentration (Mistele et al. 2004). REIP is calculated
by (eq 1) (Guyot et al. 1988):
Study
Area
Winter
Wheat
Farm
173

𝑅𝐸𝐼𝑃 = 700 + 40 ((
670nm+780nm
2)−700𝑛𝑚
740𝑛𝑚−700𝑛𝑚)
Data Analysis
Both yield map and the Sentinel-2 data were sampled to a raster image with 10 m resolution. The
relationship was modelled using type II linear regression (Lieberman and Cunningham 2009) because
of similar uncertainty in both datasets and because neither yield nor REIP is an independent variable,
but both are assumed to be dependent on some other variable, which is unknown. There were a total
of 1443 sample points extracted from the yield map and REIP map and the model was implemented
using a R script. (Legendre 2008)
Results and Discussion
The result of Model II regression (Figure 3) showed neither the correlation (R2=0.033) nor regression
coefficient (R=0.184) was significant. This is expected from the data errors in the yield monitor and
the time difference between observations during which unknown changes might have occurred. The
95% confidence interval is between 722.62 and 723.78 and does not include 0. It also means there is
good evidence that REIP and Yield are related. Thus, for REIP values other than between 722.62 and
723.78 of the yield prediction models to be identified to locate the point with unlikely yield values for
the sample location.
As the approach was not particularly successful at the sub-field scale, different time series of satellite
imagery and yield maps from more fields will be used to develop a more useful yield prediction
model. The better accuracy yield maps will be integrated with other geographical data such as
weather, soil, and applications in one single dashboard for better farm management decision support.
Figure 3: Model II regression of REIP vs Yield
Conclusions
Yield map is an important piece of information and support tool for management decision. Therefore,
the knowledge of understanding the factors that contributes to the quality of yield map is important
among the farmers and researchers. The Red-Edge Inflection Point (REIP) vegetation index
implemented at sub-field scale using Sentinal-2 data was not a reliable means of estimating winter
wheat yield as early as GS58.
174

Acknowledgements
This research has been undertaken with the strategic partnership program between Science
Foundation Ireland and ORIGIN Enterprise, CONSUS under Grant Number 16/SPP/3296
References
Arslan, S. and Colvin, T.S. (2002) ‘Grain Yield Mapping: Yield Sensing, Yield Reconstruction,
and Errors’, Precision Agriculture, Volume 3(2), 135-154, available:
https://doi.org/10.1023/A:1013819502827 [accessed 3 Apr, 2019]
AWG Farms Inc. (n.d.) awgfarms.com, available: http://www.awgfarms.com/Mapping.PDF [accessed
27 Mar 2019]
Bramley, R.G.V. and Ouzman, J., (2019). Farmer attitudes to the use of sensors and automation in
fertilizer decision-making: nitrogen fertilization in the Australian grains sector. Precision
Agriculture, 20(1), pp.157-175.
Chung, S.-O., Choi, M.-C., Lee, K.-H., Kim, Y.-J., Hong, S.-J. and Li, M., (2016). Sensing
Technologies for Grain Crop Yield Monitoring Systems: A Review. Journal of Biosystems
Engineering, 41(4), pp.408-417.
ESA Sentinel Online (2019) Overview of Sentinel-2, available:
https://sentinel.esa.int/web/sentinel/missions/sentinel-2/overview [accessed 27 Mar 2019].
Fischer, R.A., (2015). Definitions and determination of crop yield, yield gaps, and of rates of change.
Field Crops Research, 182, pp.9-18.
Fulton, J., Hawkins, E., Taylor, R., Franzen, A., Shannon, D.K., Clay, D.E. and Kitchen, N.R., (2018).
Yield Monitoring and Mapping. In: ACSESS Publications. [online] American Society of
Agronomy, Crop Science Society of America, and Soil Science Society of America, Inc.
Available at:
https://dl.sciencesocieties.org/publications/books/abstracts/acsesspublicati/precisionagbasics/
63 [accessed 3 Apr. 2019]
Guyot, G., Baret, F., & Major, D.J. (1988). High spectral resolution: Determination of spectral shifts
between the red and the near infrared, International Archives of Photogrammetry and Remote
Sensing, 11, 750-760.
Haak D. (2019). Crop Yield: Definition & Consequences, available:
https://study.com/academy/lesson/crop-yield-definition-consequences.html [accessed 18 Mar
2019]
Joseph, L., John S., Deirdre D., Richie H., Shay P., Dermot F., Steven K., Liz G., Mark P., David W.,
Fiona H. and Michael H. (2016) Winter Wheat Guide 1st ed., Carlow: Teagasc.
Legendre, Pierre, (2008). Model II Regression User Guide, R Edition. Version 1.7-3. CRAN.R-
project.org, 05 Feb 2018, available: https://cran.r-
project.org/web/packages/lmodel2/index.html [accessed 25 Mar 2019]
Lobell, D.B., Cassman, K.G., Field, C.B., (2009). Crop Yield Gaps: Their Importance, Magnitudes,
and Causes. Annu. Rev. Environ. Resour. 34, 179–204.
https://doi.org/10.1146/annurev.environ.041008.093740
Luck J.D. and Fulton J.P., (2015), Improving Yield Map Quality by Reducing Errors through Yield
Data File Post-Processing. Institute of Agriculture and Natural Resources, University of
Nebraska, available: http://extensionpublications.unl.edu/assets/pdf/ec2005.pdf [ accessed 25
Mar 2019]
Mistele, B., Gutser, R, and Schmidhalter, U., (2004). Validation of Field-Scaled Spectral
Measurements of the Nitrogen Status in Winter Wheat. In: Program book of the joint
conference ICPA. Minneapolis, USA, pp.1187-1195.
Reitz, P. and Kutzbach, H.D., (1996). Investigation on a particular yield mapping system for combine
harvesters. Computers and Electronics in Agriculture, 14(2-3), pp.137-150.
Sadras, V., Cassman, K.G.G., Grassini, P., Hall, A.J., Bastiaanssen, W.G.M., Laborte, A.G., Milne,
A.E., Sileshi , G., Steduto (2015) Yield gap analysis of field crops: methods and case studies.,
Italy: FAO and DWFI.
Vellidis, G., Barnes, E., Brannen, H.S., (2017), Cotton Yield Maps: Tools for increasing efficiency &
profitability. USA: Cotton Incorporated.
175

LIFE CYCLE ASSESSMENT OF PHYCOCYANIN PRODUCTION
FROM ARTHROSPIRA PLATENSIS IN A CONCEPT OF BIOREFINERY
Léa Braud, Kevin P. McDonnell, Fionnuala Murphy
UCD School of Biosystems and Food Engineering, University College Dublin, Belfield, Dublin 4, Ireland
Abstract
Arthrospira platensis is a blue-green microalga (i.e. cyanobacteria) commonly known as Spirulina.
This species naturally synthesizes phycocyanin, a blue pigment which accounts for up to 20% of the
biomass. Phycocyanin is extracted and mainly used as food colouring and supplement, and as natural
pigment in cosmetics. More recently, bioactivity tests have shown its promising biological properties
(e.g. antioxidative, hepatoprotective). Despite the fact that the extraction process is well-established,
there is a need to improve the value chain to reduce the production costs and make the European
market more competitive. In this context, the SpiralG project aims to revisit the whole phycocyanin
production process. The Life Cycle Sustainability Assessment study conducted will evaluate the
environmental, social, and economic impacts, and ensure a reduction of at least 10% of the carbon
footprint.
Introduction
Microalgae have recently received considerable research attention for their promising biotechnological
applications in the food, feed, cosmetics, nutritional, pharmaceutical, and bioenergy industries
(Odjadjare et al., 2017). These microorganisms are widely cultivated in open ponds or closed
photobioreactors for the production of high value biomolecules such as pigments, proteins, lipids,
carbohydrates, vitamins, and antioxidants (Markou et al., 2013). As higher plants, microalgae are
capable of photosynthesis: they use light to synthetize energy-rich organic molecules from carbon
dioxide and water, and release dioxygen (Packer et al., 2011). More interestingly, microalgal cultures
do not compete with arable lands and show higher energy yields per area than conventional crops
(Clarens et al., 2011). Since they also have the ability to grow in wastewater and a high capability to
fix carbon dioxide from flue gases (Singh et al., 2016), microalgae are an interesting alternative
feedstock for biorefineries (Chew et al., 2017). Spirulina is an aquatic blue-green microalga which has
been harvested for decades from natural lakes in African countries. The biomass has been used as a
source of nutrients in traditional food (Habib, 2008). Nowadays, this well-known species is mainly
cultivated in open raceway ponds for biomass production. Spirulina is mostly commercialised in the
form of powder as food supplement for its high content in proteins and vitamins. However, this
microalga is particularly interesting for the two pigments responsible for its blue-green colour:
phycocyanin and chlorophyll. Since the American Food and Drug Administration (FDA) approved
phycocyanin as natural blue dye in 2013, new applications were developed in the food and cosmetic
industries (e.g. food colouring, edible dye in ice creams, natural dye in cosmetics etc.). More recently,
studies have shown the antioxidative and hepatoprotective properties of phycocyanin and its potential
use for cancer treatment (Fernandes e Silva et al., 2018).
The European phycocyanin market is largely dominated by imports from the Asian market which
comprises companies producing up to 20 MT of dried phycocyanin per year (Habib, 2008). Despite
the well-established Spirulina cultivation and phycocyanin extraction processes, there is a need for
improving the value chain to make the European market more competitive. In this context, the SpiralG
project gathers four industrial partners to revisit the sourcing, extraction, and co-valorisation of
Spirulina in a concept of biorefinery. The aim is to develop a demonstration plant able to produce
10 MT of phycocyanin per year and reduce the carbon footprint by 10% at least. A Life Cycle
Sustainability Assessment (LCSA) will be conducted to evaluate the environmental, social, and
economic impacts of the production chain. This paper provides a description of the system studied
and the methodology that will be used to implement the LCSA in the frame of the SpiralG
project.
176

The LCSA study will assess the environmental, economic, and social impacts of phycocyanin
production from Spirulina in a concept of biorefinery. This analysis will ensure that the revisited value
chain enables a reduction of at least 10% of the carbon footprint and highlights the process stages
responsible for the largest environmental impacts.
Description of the system studied
The modelled system comprises all the process stages from Spirulina cultivation to phycocyanin
production (extraction and treatment) and co-product valorisation. The system is subdivided into three
units: biomass production, biomass processing, and phycocyanin extraction and treatment. Figure 1
shows all stages included in the system from the inoculation to the end- and co-products treatment.
The function of the system is to produce phycocyanin. The functional unit considered is 1 kilogram of
dried phycocyanin extracted from wet or dried Spirulina biomass. Phycocyanin will be used as a
natural blue dye in the food, feed, and cosmetics industries. The co-products valorisation could lead to
the development of new applications or the commercialisation of new products.
The phycocyanin life cycle begins with the extraction of raw materials for biomass production (cradle)
and ends with the packaging of the end- and -by-products (gate). Therefore, the LCSA analysis will be
conducted on a cradle-to-gate system, according to the International Organization for Standardization
(ISO) 14040 and 14044 requirements.
Figure 1: Diagram of the phycocyanin production process and definition of the system boundaries
The system boundaries include all the process stages and will capture the full impacts of the value
chain. The reduction of the production costs will be achieved by implementing automated stages with
the use of new facilities and machinery, and by optimising the nutrient inputs. The reduction of the
177

energy consumption during the cultivation will be achieved by using photovoltaic panels and solar
heating systems. Through this project, new extraction methodologies will be developed and research
on the phycocyanin content enhancement of the biomass will be conducted.
The LCSA study will be based on primary data (i.e. directly collected on the production and
transformation sites). Mass flows, energy flows, and environmental losses will be measured.
Secondary data (i.e. based on laboratory experiments or extracted from databases) could be used to
complete missing data. This LCSA analysis will be one of the first studies conducted on phycocyanin
production, on a cradle-to-gate system, and based on primary data. The results will provide
background information for process improvement and optimisation to achieve the goals defined in the
frame of the SpiralG project.
Description of the process stages
Unit 1: Biomass production
The biomass production site is located in Sardinia (Italy). Spirulina is cultivated in six open raceway
ponds in a greenhouse. The environmental conditions (e.g. light, temperature, pH, nutrient supply) are
controlled. Each pond is inoculated with concentrated Spirulina from maintained cultures. Water and
nutrients are regularly added to maintain an optimal growth. The biomass is continuously mixed with
paddle wheels during the day. Spirulina growth parameters are monitored by operators and enable the
establishment of the harvesting program. The ponds are cleaned once a month by removing microalgae
and salty residues with water, and once a year with detergents to remove the sediments.
Unit 2: Biomass processing
The biomass processing unit consists of all the stages from biomass harvesting to packaging and
shipping. These stages reduce the water content from 99% to 8% and the production of a stable
biomass for phycocyanin extraction. The biomass is harvested everyday using three pumps (one for
two ponds). The biomass is directed through three separate process lines. The filtration facility
consists of three vibrating and filtering systems, one for each process line. The microalgae broth is
separated into a concentrated paste and a clarified water stream that is pumped back to the ponds. The
resulting paste is dehydrated by using three water presses (one per process line). The humidity is
reduced from 99% to 75%. After dehydration, the paste moves to the dry or wet lines. In the dry line,
the paste is shaped, dried, and packaged while the paste is directly packaged in the wet line. Dried
bags are stored in wardrobes and wet bags are frozen. The biomass is then shipped for the next process
stages.
Unit 3a: Phycocyanin extraction and treatment
The extraction of phycocyanin from Spirulina biomass is conducted using a continuous flow mixing
and extraction system to develop a full integrated production line. The continuous extraction method
replaces the two steps method using two centrifuges and allow the separation of the by-products and
their concentration which reduce the shipping costs. In addition, a three-tangential filtration system
will be tested to ensure the sterilisation, purification, and washing of the phycocyanin extracts. Three
different drying systems (spray drying, freeze drying, and band drying) will be studied and adapted to
the product quality requirements.
Unit 3b: Co-products extraction and valorisation
New extraction methods will be tested at the laboratory scale to favour the use of eco-friendly
technologies such as green solvents, commercial enzymes, and ultrasounds technologies. The
development of new extraction systems should improve co-product extraction yields. These co-
products will be treated separately in two fractions: the proteins, peptides, and amino acid fraction, and
the carbohydrate fraction. In addition, bioactivity tests will be conducted.
178

Conclusion
Most of the LCA studies conducted on microalgae-based products focused on bioenergy production
(biofuel and biogas) and highlighted process bottlenecks. Therefore, the research interests were
oriented towards high-value molecules production such as omega-3 fatty acids, pigments, or vitamins.
Phycocyanin recently gained a considerable attention for its potential industrial applications.
Therefore, the LCSA study conducted in the frame of the SpiralG project will be one of the first
studies focusing on phycocyanin production in a concept of biorefinery and based on on-site data
collection. The LCSA results will serve as a decision supporting tool for the project partners to
improve the value chain and make the European phycocyanin market more competitive.
Acknowledgement
This research is part of the SpiralG project which has received funding from the Bio Based Industries
Joint Undertaking (JU) under grant agreement No 792257. The JU receives support from the European
Union’s Horizon 2020 research and innovation programme and the Bio Based Industries Consortium.
References
Chew, K.W., Yap, J.Y., Show, P.L., Suan, N.H., Juan, J.C., Ling, T.C., Lee, D.-J., and Chang, J.-S.
(2017). Microalgae biorefinery: High value products perspectives. Bioresource Technology 229,
53–62.
Clarens, A.F., Nassau, H., Resurreccion, E.P., White, M.A., and Colosi, L.M. (2011). Environmental
Impacts of Algae-Derived Biodiesel and Bioelectricity for Transportation. Environmental
Science & Technology 45, 7554–7560.
Fernandes e Silva, E., Figueira, F. da S., Lettnin, A.P., Carrett-Dias, M., Filgueira, D. de M.V.B.,
Kalil, S., Trindade, G.S., and Votto, A.P. de S. (2018). C-Phycocyanin: Cellular targets,
mechanisms of action and multi drug resistance in cancer. Pharmacological Reports 70, 75–80.
Habib, M.A.B. (2008). A review on culture, production and use of Spirulina as food for humans and
feeds for domestic animals and fish (Rome: Food and Agriculture Organization of the United
Nations).
Markou, G., and Nerantzis, E. (2013). Microalgae for high-value compounds and biofuels production:
A review with focus on cultivation under stress conditions. Biotechnology Advances 31, 1532–
1542.
Odjadjare, E.C., Mutanda, T., and Olaniran, A.O. (2017). Potential biotechnological application of
microalgae: a critical review. Critical Reviews in Biotechnology 37, 37–52.
Packer, A., Li, Y., Andersen, T., Hu, Q., Kuang, Y., and Sommerfeld, M. (2011). Growth and neutral
lipid synthesis in green microalgae: A mathematical model. Bioresource Technology 102, 111–
117.
Singh, V., Tiwari, A., and Das, M. (2016). Phyco-remediation of industrial waste-water and flue gases
with algal-diesel engenderment from micro-algae: A review. Fuel 173, 90–97.
179

LIFE CYCLE ASSESSMENT OF INTEGRATED BIOREFINERY FOR
CONVERSION OF DAIRY SIDE STREAMS TO HIGH VALUE BIO-
BASED CHEMICALS
Maneesh Kumar Mediboyina, Fionnuala Murphy, Nicholas Holden
UCD School of Biosystems and Food Engineering, University College Dublin, Belfield, Dublin
4, Ireland.
Abstract
The EU’s post milk quota era represents a higher production of milk and milk products.
Consequently, expansion of the European dairy processing activities is expected to result in an
increase in generation of by-products and waste at the same time. However, dairy processors lack a
reliable disposal routes to treat dairy side stream mainly whey permeate (WP) and de-lactose whey
permeate (DLP). Due to the raising concerns regarding waste minimization and environmental issues,
there is an increasing demand on EU milk processing industries to develop processes that are viable
and sustainable to volarise industrial waste to high value products. Addressing this issue,
AgriChemWhey project aims to build a first-of-a-kind integrated symbiotic industrial biorefinery to
volarise over 25,000 tonnes per annum of undervalued European dairy processing side stream (WP
and DLP). This paper will majorly focus on sustainability evaluation of the process for conversion of
dairy waste streams (WP and DLP) to high value bio-based chemicals mainly polylactic acid (PLA)
using LCA as a tool.
Introduction
Since the abolition of milk quotas in 2015, European Union (EU) farmers now have greater potential
to produce milk and milk products. Moreover, due to the growing domestic consumption and export
demand for EU cheese, the production is expected to reach 11.2 million tons by 2025 (FAO, 2019).
This surge in cheese production is directly linked to the production of cheese whey and other side
streams. Currently, the dairy processing industries faces a significant issue related to disposal of
whey. As, it is considered to have the prime polluting potentials with BOD and COD values in the
range of 27-60 g/L and 50-102 g/L, respectively (Prazeres et al., 2012). The high level of organic load
of whey is believed to be ten times higher than municipal waste water due to presence of water,
lactose, protein, fats and minerals (Carvalho et al., 2013). Therefore, the disposal of whey is
considered problematic and often landfilled or discharged in to the local water bodies.
To reduce the waste and recover the nutrients, European dairy industry processes the whey to produce
whey proteins, lactose and whey powders. The extraction of protein and lactose from whey in turn
results in the by-products like whey permeate (WP) and de-lactose whey permeate (DLP) (Smith et
al., 2016). However, due to the presence of high lactose in the side streams of whey concentration
process, WP possess almost as high as BOD of the raw whey. Even the lactose concentration process
results in the DLP that ends up with significant amount of sugars and fats (Ahmed et al., 2013) . So,
the WP and DLP represent a key challenge for the dairy industry due to a lack of reliability in current
disposal routes and create a sustainability bottleneck for the expansion of milk production in the EU’s
“post-milk-quota era”. AgriChemWhey will build a world’s first integrated biorefinery to valorise
these residues from dairy processing to make sustainable bio-based products such as chemicals and
biopolymers (PLA) with improved sustainability profiles. Though all the AgriChemWhey
technologies are feasible and implementable, to have real value in a circular bioeconomy, they must
be demonstrated to be sustainable. Therefore, the objective of this work is to evaluate the
sustainability of the integrated biorefinery processes for conversion of dairy residues to bio-
based products and will be explored through life cycle assessment (LCA) of all integrated
process and products.
180

Materials and Methods
Goal and Scope
The main goal of this study is to evaluate the environmental impacts of the integrated biorefinery
process for production of PLA and other by-products from dairy side streams. The environmental
impacts will be estimated following the ISO 14040/14044 standards methodology (ISO 2006a, b).
The impacts will majorly cover resource depletion, land usage, greenhouse gas (GHG) emissions,
fresh water eutrophication and acidification potential. OpenLCA will be used as a platform for
assessing the environmental impacts.
The functional unit is defined as 1 ton of PLA produced from dairy side streams (DP and DLP). The
system boundary considered is “gate to gate” comprising transportation of DP/DLP from dairy gate
till exit of AgriChemWhey plant gate. The “gate to gate” approach mainly includes the upstream
(Pretreatment and centrifugation) and downstream processes (Fermentation, Nano-filtration,
centrifugation, vacuum filtration, distillation and concentration) involved in conversion of DP/DLP to
PLA at AgriChemWhey plant (Fig. 1). The co-products obtained during the PLA production process
will be valorised as a new value chain for industrial symbiosis with local industries. Thus, closing the
loops to create azero waste process making it a circular bio-economy approach.
Allocation method
According to ISO 14044 (ISO 2006b), a product should be appropriately allocated with its associated
emissions and impacts by sub-dividing the process system. However, it is not possible with the PLA
production system as its co-products (calcium phosphate, gypsum and bacterial biomass) shares
significant unit process with PLA system. It is rare in multifunctional processes to divide into
subsystems and thereby avoiding the allocation. Therefore, to avoid the allocation in such complex
processes, ISO 14044 (2006b) recommends system expansion, which indicates the inclusion of
avoided production of co-products (calcium phosphate, gypsum and bacterial biomass) from other
systems. The co-products obtained from this process will be validated for its use in agri-food industry,
particularly for fertilizer and mushroom production (gypsum and bacterial biomass) and mineral
supplement (calcium phosphate).
Life cycle inventory
All the processes included in the process from dairy farm gate to AgriChemWhey biorefinery gate are
clearly outlined in Fig.1. Initially, the data regarding mass, energy flows and environmental losses for
modelling will be collected from the AgriChemWhey pilot plant. Additional data which is not
available will be adopted from the literature and Ecoinvent database. The data collected and collated
from pilot plant and literature will be used to refine the unit process models, to facilitate the inventory
data for estimating the resource depletion, environmental impacts and industrial symbiosis. Various
models will be developed towards the process considering the variables parameters that has
significant impact on the PLA yield. There are some input parameters involved in this process study
that can considerably contribute to the output, majorly to the environmental impacts and resource
depletion. Thus, sensitivity analysis will be performed to evaluate the effect of variation of these input
on end results.
181

Figure 1: System boundaries and process flow steps for conversion of dairy side streams to PLA
Results and Discussion
Since the study is in the initial stages, it is anticipated that the environmental impact profile of the
second-generation PLA produced from dairy waste streams would be established and compared with
PLA produced from other sources, such as sucrose or corn sugar (glucose). It will also be compared
with the first-generation plastic production systems (PE, PET, PP etc.,) as the AgriChemWhey’s PLA
would replace the non-renewable plastics in milk packaging applications.
The major hotspots in the AgriChemWhey process will be identified and optimized by selecting the
best modelled scenario that contributes in the lower resource depletion and reduced environmental
impacts by varying the parameters that significantly affects the PLA production. It is expected that
the system expansion of the process by including the avoided burden of the co-products with
alternative production processes will enhance the overall environmental profile of the PLA
production process.
As the co-products, specifically WP and DLP derived gypsum can replace the mined or quarried
gypsum, thus significantly benefit the end users (used in agricultural sector as biofertilizer and
mushroom production) both in economic and environmental perspective. It will also help in averting
the excessive nutrient loss to the water stream by binding phosphates.
Conclusion:
The present study assumes to deliver a holistic, life cycle sustainability model for integrated
biorefinery for conversion of dairy waste streams (WP and DLP) to PLA and other by-products. As
the AgriChemWhey process represents a novel circular bio-economy approach within the dairy value
chain, the life cycle sustainability results would strength the replication potential of this process
Calcium
phosphate Gypsum
Biomass
(Fermentatio
n residue)
WP/DLP Lactic Acid
(LA)
Poly Lactic
Acid (PLA)
Upstream Downstream
Polymerization
& Condensation
182

across other regions of Europe. It is also expected that the integration of life cycle results of the
process with socio and techno-economic dimensions would facilitate the demonstration of bio-
economy build around the system is genuinely sustainable.
Acknowledgement
The authors gratefully acknowledge funding from Bio Based Industries Joint Undertaking under the
European Union’s Horizon 2020 research and innovation programme (BBI-JU-H2020-744310).
References
Ahmed, L., Martin-Diana, AB., Rico, D., Barry-Ryan C. (2013) ‘Effect of delactosed whey permeate
treatment on physico-chemical, sensorial, nutritional and microbial properties of whole
tomatoes during postharvest storage’, LWT -Food Science and Technology, 51(1), 367–374.
doi: 10.1016/J.LWT.2012.10.006.
Carvalho, F., Prazeres, A. R. and Rivas, J. (2013) ‘Cheese whey wastewater: Characterization and
treatment’, Science of The Total Environment, 445–446, 385–396. doi:
10.1016/J.SCITOTENV.2012.12.038.
FAO. (2019) ‘OECD-FAO Agricultural Outlook 2016-2025’,
https://stats.oecd.org/index.aspx?queryid=71234. Accessed 28 March 2019
ISO. ISO 14040: 2006 Environmental management — Life cycle assessment — Principles and
framework. Epub ahead of print 2006. DOI:10.1002/jtr.
ISO. ISO 14040: 2006 Environmental management — Life cycle assessment — Requirements and
guidelines. 3.
Prazeres, A. R., Carvalho, F. and Rivas, J. (2012) ‘Cheese whey management: A review’, Journal of
Environmental Management, 48–68. doi: 10.1016/j.jenvman.2012.05.018.
Smith, S. T., Metzger, L. and Drake, M. A. (2016) ‘Evaluation of whey, milk, and delactosed
permeates as salt substitutes’, Journal of Dairy Science, 99(11), 8687–8698. doi:
10.3168/JDS.2016-10904.
183

Tenzin Tashi, BE, MSc
Project Title: Process Model and Life Cycle Assessment of Whole Milk Powder
Project Leader: Prof. Nicholas M. Holden
Abstract
EU milk quota abolition in April 2015 led to a target of 50% increase in Ireland’s milk
production volume by 2020, which represented about 7.6 billion litres. This increased milk
volume created both an opportunity for Irish dairy processor to increase their production capacity
and challenge to produce dairy products in a sustainable manner. Therefore, the objective of this
project was to develop a process model and conduct a life cycle assessment for Whole Milk
Powder (WMP). A commercial SuperPro Designer process simulation software was used to
model whole milk powder manufacturing process and GaBi software was used for LCA. The
process model approach was chosen because the energy and water consumption data in a large
multi-product dairy plant were available as an aggregated form. A process model approach can
bridge the data gap encountered due to lack of high-resolution empirical data and consequently, a
process model was developed for WMP production process consisting of key unit operations (i.e.
separation, homogenization, evaporation and spray drying operation). The mass and energy
consumption data at key unit operations were estimated based on the thermo-physical properties
of the milk and heat & mass balance calculation. The energy consumption result for key unit
operations were validated with the industry data.
It was found that energy consumption (i.e. steam and electricity) for spray drying unit operation
represented about 70-80 % of the total energy consumed. Moreover, evaporation unit operation
consumed less energy compare to spray drying operation due to using 5-stage 2-effect falling-
film Mechanical Vapour Recompression (MVR) evaporator, which consumed electricity in the
first effect and a small fraction of live steam in the second effect. This research project identified
the energy consumption of spray drying unit operation as the hotspot, contributing major portion
to WMP carbon footprint. Therefore, it is essential to reduce the energy consumption for the
spray dryer unit operation in order to reduce its carbon footprint.
184

Jonathan Herron BAgrSc
Project Title: Preliminary modelling of the environmental impact of the inclusion of white clover in
perennial ryegrass swards on intensive pasture based dairy production systems
Project Leader: Dr. Thomas P. Curran
Abstract
Fertilizer N application is a key source of nitrous oxide (N2O) emissions from grass based systems. A
previous paper has highlighted first results from the whole farm modelling of nitrous oxide emissions
when considering silage harvest date and fertiliser application on intensive and extensive beef production
(Herron et al., 2019). White clover (WC) is a common legume that fixates N from the atmosphere and
releases it into the soil as plant available N through exudates in the root to companion plants. The
inclusion of WC into a PRG sward thus has potential to reduce reliance on N fertilizer. The objective of
this study therefore was to conduct life cycle assessments (LCA) to determine the effect of the inclusion
of WC into PRG swards on the environmental impact of pasture based dairy systems. Cradle to farm gate
LCA of pasture based dairy systems on three treatments obtained from the Teagasc clover experiments
were conducted (i) a PRG/WC receiving 150kg of N/ha per year (CL150) (ii) a PRG/WC receiving 250kg
of N/ha per year (CL250) and (iii) a PRG only sward receiving 250kg of N/ha per year (GR250).. The
Moorepark Dairy Systems Model (MDSM) and the Moorepark Dairy Environmental Model were
amalgamated to create a hybrid model that allows for the improvement in production system description
and the calculation of environmental impacts that are more representative of the systems simulated. The
hybrid model was modified with particular focus on nitrogen (N) flow in the model. Equations that
calculate the quantity of forage N deriving from atmospheric fixation were added to the model. Recently
developed country specific N excretion equations for each animal category were added to the model to
capture N use efficiency of dairy animals. Regarding N2O emissions, to ensure the model is representative
of Irish pasture based systems recently developed country specific emission factors for fertiliser N
application and excreta deposited onto pasture were added. The environmental impact categories assessed
were global warming potential, non-renewable energy use, acidification potential and eutrophication
potential. Environmental impacts were expressed per tonne of fat and protein corrected milk (FPCM).
Preliminary results are highlighted here. The GR250 system was found to have the greatest environmental
impact per kg FPCM across all impact categories. Although CL250 system was found to have the greater
environmental impact when expressed on an area basis, due to the positive effect of the inclusion of WC
on milk production, when expressed on a product basis CL250 was more efficient. Moreover, the
substitution of synthetic N fertilizer with N derived from the atmosphere in CL150 system further reduced
the environmental impact of dairy production system on both an area and product basis. This reduction in
environmental impact occurs due to the reduction in total CO2 N2O, NH3 and NO3 losses and non-
renewable energy usage from the substitution of carbon intensive N fertilizer with N derived from
atmospheric fixation. Moreover, the improvement in animal performance with the inclusion of WC
further reduced the environmental intensity across all environmental impact categories. In conclusion, this
preliminary LCA study indicated that the inclusion of WC into a PRG sward can reduce the
environmental impact of intensive pasture based dairy system at a given stocking rate and farm area.
Acknowledgements
This study is funded under the Walsh Fellowship Scheme.
Recent Publications
Herron, J. et al. (2019) ‘Whole farm modelling the effect of grass silage harvest date and nitrogen
fertiliser rate on nitrous oxide emissions from grass-based suckler to beef farming systems’,
Agricultural Systems. Elsevier, 175, pp. 66–78. doi: 10.1016/J.AGSY.2019.05.013.
185

Juan Vinagre-Sendino, BE, M.Eng., M.Sc.
Project Title: Sustainable Sludge Management in Ireland
Project Leader: Dr. Thomas P. Curran
Abstract
It is a well-known fact that sludge contains valuable nutrients and organic substances. That is why, in
Ireland, over 98% of wastewater sludge was re-used in agriculture in 2014. However, there are many
constraints to land application of sludge such as metal accumulation in soil and crops or groundwater and
surface runoff contamination. Moreover, in Ireland, there are closed periods for sludge spreading during
the winter months due to the implementation of the Nitrates Directive and S.I. 31 of 2014. Furthermore,
the expansion of the agri-food sector with the Foodwise 2025 Strategy will lead to the generation of extra
sludge, thus, creating extra pressure to find sustainable strategies for sludge management. On account of
all the mentioned limitations and due to the steady increase in sludge quantity which is expected to
continue in the upcoming years, sludge management has become a growing environmental challenge.
The objective of this project is to compile an inventory of sludge currently applied to land in Ireland
according to source in order to assess the long-term capacity of land for sludge management e.g. nutrient
limits, distance from sources and economic aspects. The project will also include a multicriteria
Geographical Information System (GIS) analysis.
The performance of a GIS multicriteria analysis and the assessment of the long-term capacity of land for
sludge management is being carried out on a county basis. The information is being collected from
relevant datasets from the EPA, the Geological Survey of Ireland, the National Park & Wildlife Service,
Teagasc, the Local Authorities and the Department of Agriculture, (i.e sludge quantities, soil properties,
protected areas, distance to waterbodies, groundwater vulnerability, etc). GIS tools will allow merging all
information and layers into one map, thereby figuring out and depicturing the most risky and sensitive
zones to sludge land spreading in Ireland. This analysis will simultaneously help to spot new areas for
sludge land spreading and to cope with the problem that poses the fact that the soil-holding capacity for
sludge application is expected to deplete in some areas of the country within a few years. The project will
finally permit establishing sustainable sludge recommendations, alternatives and strategies.
Since sludge quantities are expected to increase in the upcoming years and, so far, sludge spreading seems
to have been the only feasible disposal alternative, a proper sludge inventory which helps to develop an
accurate assessment of the long-term capacity of land for sludge management is required in Ireland.
The research project is still in the middle of its third year and key objectives and results were scheduled to
be attained in a four-year scheme. To date the achievement of the key objectives and the development of
the GIS analysis are still ongoing.
Acknowledgements
This project is funded by the Irish Research Council as part of the Employment Based Postgraduate
Programme with Veolia Water Ireland as the Employment Partner. The authors would like to thank and
appreciate all parties for their support.
186

Appendix 1 (Research projects in progress which have not been included in the Research Review)
Achata EM, Esquerre CA, O’Donnell CP. NIR - Hyperspectral imaging and chemometrics as a
pat tool for the prediction of food powders mixing kinetics (PhD). FIRM as administered
by the Irish Department of Agriculture, Food and the Marine.
Charoux C, O’Donnell CP, Tiwari B, Scannell A. Design and development of novel
technologies to improve the removal of biofilms and destruction of spores. FIRM as
administered by the Irish Department of Agriculture, Food and the Marine
Dunne K, Holden NM, Daly K. Prediction of phosphorus sorption capacity in agricultural soils
using DRIFT spectroscopy (PhD). Teagasc Walsh Fellowship Scheme.
Guth F, Ward S, McDonnell KP. Disease level assessment in crop plots using RGB images and
deep learning algorithms (PhD). Brazilian agency Conselho Nacional de Desenvolvimento
Científico e Tecnológico – CNPq.
Hao Q, Butler F. Occurrence of Cronobacter in a dairy powder ingredient plant (PhD). China
Scholarship Council (CSC) and University College Dublin (UCD).
Henihan LE, O’Donnell C, Esquerre C, Murphy EG, O’Callaghan DJ. Comparison of front-face
fluorescence spectroscopy and fourier transform infrared spectroscopy as process
analytical tools in dairy ingredient and infant formula manufacture (PhD). Food
Institutional Research Measure (FIRM) administered by the Irish Department of
Agriculture, Food and the Marine.
Li F and Butler F. Efficacy of novel thermal and non-thermal processes to reduc e spore
numbers within daiy manufacturing processes (PhD).
Liu R and Holden N. Greenhouse gas emissions from homogenization for liquid milk production
(PhD). CSC-UCD Scholarship Scheme.
Luo J, Esquerre C., O’Donnell C. Applying PAT tools to monitor milk coagulation in cheese
manufacture (MEngSc Res).
Panikuttira B and O’Donnell C. Development of process analytical tools for food processing
(PhD).
Shaikh S, Zhao M, O’Donnell C. Development of PAT tools for the quantitative analysis of
minerals in infant formulas (PhD). IRC post graduate scholarship programme .
Stanley S, Crickley S, Curran T. Impact of european and irish legislation on the design of dairy
wastewater treatment processes (MSc Res). Irish Research Council Employment Based
Postgraduate Scheme in collaboration with WEW Engineering Ltd.
Zhao YM, de Alba Ortega M, Sun DW, Tiwari B. Quality evaluation of mackerel fillets after
high pressure treatment (PhD). China Scholarship Council (CSC) and University College
Dublin (UCD).
187
Appendix 2
Profiles of Postdoctoral Research Scholars
Nebras Alattar, BSc,MSc, PhD Physics
Project Title: Chemical Imaging and Chemometrics to Accelerate and Improve Patient Prostate Biopsy
Assessment for Cancer.
Project Leader: Associate Prof. Aoife Gowen
Abstract
Currently diagnostic and therapy methods are often limited by insufficient sensitivity, specificity and
spatial resolution, depending upon staining processes to illustrate vital features of a tissue. Nowadays,
Raman imaging technique is more and more often used in analysis of biological samples, including
tissues and cells, with the prospect to become a potent new method of medical diagnostics. However, this
chemical imaging technique has potential not just for diagnosis but for prognosis of cancer based on
direct characterisation of the biochemistry of a tissue sample. The aim of this work is to combine Raman
Chemical Imaging with conventional methods (immunohistochemistry) to generate highly detailed
chemical images that contain imperceptible biochemical information from the prostate tissue. Raman
chemical images are acquired using a Raman microscope with spatial mapping ability to provide a
detailed chemical map over the surface of a sample. Three multivariate analysis (MVA) methods;
Independent Component Analysis (ICA), Partial Least Squares (PLS) and K-means, are employed here to
generate chemical images. Integrating the chemical images with existing digital pathology and patient
medical histories have been proposed to generate predictive models of patient outcomes from pre-radical
prostatectomy data.
Background, Skills & Qualifications
I obtained a BSc in Physics, in 1997, from Almustansiriyah University-Baghdad and MSc in physics, in
the field of optics & lasers, in 2002 from University of Baghdad. I have joined the department of laser and
optoelectronics /university of technology-Baghdad as assistant lecturer in 2005. In 2010, I have awarded a
scholarship funded from the ministry of higher education-Iraq to obtain PhD degree in UCD. I obtained
the PhD from school of physics/UCD in early 2015. My thesis, was centred on the development of a
multifunctional microscope which has applications in spanning fluorescence imaging, Raman
spectroscopy, fluorescence correlation spectroscopy, time correlated single photon counting, and Raman
imaging. Following my PhD, I was awarded a post doc position funded by SFI, focusing on the
development of an optical system for investigation and sensing the pathological bacteria. This experience
helped me to develop an image analysis modulus, in the field of the digital pathology, in my next post-
doctoral fellow role. This modulus would quantify protein expression in tumour/non-tumour areas, was
generated by immunohistochemistry methodology. Currently, I am working with associate prof. Aoife
Gowen in spectral imaging research group as a post doc funded by HRB.
Selected Recent Publications
Malallah, R.; Li, H.; Qi, Y.; Cassidy, D.; Muniraj, I.; Al-Attar, N.; Sheridan, J. T., Improving the
uniformity of holographic recording using multi-layer photopolymer: Part II Experimental results.
Journal of the Optical Society of America A 2019.
188

Malallah, R. e.; Li, H.; Qi, Y.; Cassidy, D.; Muniraj, I.; Al-Attar, N.; Sheridan, J. T., Improving the
uniformity of holographic recording using multilayer photopolymer Part I Theoretical analysis.
Journal of the Optical Society of America A 2019.
O'Connor, D.; Kelly, C. M.; Crown, J.; Russell, N.; Barron, S.; Loughman, T.; Lynch, S.; O'Grady, A.;
Sheehan, K. M.; Fay, J.; Saha, A.; Dynoodt, P.; Fender, B.; Wang, C.-J. A.; O'Leary, D.; Bracken, A.
P.; Rahman, A.; Gonzalez, C. A.; Al-Attar, N.; Gallagher, W. M., Additional prognostic value of
OncoMasTR multigene prognostic signature to clinicopathological information in patients with HR-
positive, HER2-negative, lymph node-negative breast cancer from the TAILORx Tissue Bank,
Ireland. Journal of Clinical Oncology 2019, 37 (15_suppl), 535-535.
189

Wenhao Chen, BSc, MSc, PhD
Project title: AGROCYCLE/VALUMICS
Project Leader: Professor Nicholas M. Holden
Abstract
The aim of AGROCYCLE is promoting circular economy in agriculture and food sector. The main
objective of the AGROCYCLE project is to further develop, demonstrate and validate novel processes,
practices and products for the sustainable use of agricultural waste, co-products and by-products (AWCB).
The systems will be tested and evaluated from technical, environmental and socio-economic perspectives,
including their impact on the sustainability of agricultural systems, thereby contributing to the creation of
sustainable value chains in the farming and processing sectors. A key aspect is identifying sustainable
extraction rates for wastes, as well as guidance on the optimal use of crop residues (in particular straw)
for soil improvement taking into account the need to maintain soil organic matter levels. This project
developed several waste valorization technologies to produce bioenergy, biomaterial and nutrient from
agriculture waste. The objective of VALUMICS is to improve the resilience, integrity and sustainability
of global food supply chains. VALUMICS project provides decision makers throughout food value
chains with a comprehensive suite of approaches and tools that will enable them to evaluate the impact of
strategic and operational policies to enhance the resilience, integrity and sustainability of food value
chains for European countries. This overall objective is divided into specific aims, which are associated
with the four operational phases of the project where key activities have been defined, and these are
supported by efficient project management and communication strategies to achieve the overall objective.
Background, skills & Qualifications
I have completed my BSc in Nanjing Agricultural University in 2011. After that I obtained my MSc
(2012) and PhD (2017) in University College Dublin, School of Biosystems and Food Engineering.
During my PhD, my research focus is about LCA application in livestock systems. My PhD was funded
by EU project SILF and Irish government funded project eRuminent. The objective of SILF is using
information and communication technology (ICT) systems to improve production efficiency,
environmental performance and animal welfare of livestock system. The focus of eRuminent is to
evaluate the ecosystem service in livestock system. Currently, I work in School of Biosystems
Engineering, UCD, as a postdoctoral researcher under the guidance of Prof. Nicholas M. Holden.
Recent publications
Chen, W., Oldfield, T.L., Katsantonis, D., Kadoglidou, K., Wood, R. and Holden, N.M., 2019. The
socio-economic impacts of introducing circular economy into Mediterranean rice production. Journal
of Cleaner Production, 218, 273-283.
Chen, W. and Holden, N.M., 2018. Bridging environmental and financial cost of dairy production: A
case study of Irish agricultural policy. Science of The Total Environment, 615, 597-607.
Chen, W. and Holden, N.M., 2018. Tiered life cycle sustainability assessment applied to a grazing dairy
farm. Journal of Cleaner Production, 172,1169-1179.
Chen, W. and Holden, N.M., Social life cycle assessment of average Irish dairy farm. The International
Journal of Life Cycle Assessment, 22(9),1459-1472.
Chen, W., White, E. and Holden, N.M., 2016. The effect of lameness on the environmental performance
of milk production by rotational grazing. Journal of environmental management, 172, 143-150.
190

Mariateresa Ferone, MSc, PhD
Project title: HyperMicroMacro: Multi-scale hyperspectral imaging for enhanced understanding and
control of food microbiology
Project Leader: Professor Aoife Gowen, Dr. Amalia Scannell
Abstract
Recent developments in hardware have made it possible to obtain macroscopic HSI data using rapid, low
cost hand-held systems which have the potential to vastly improve the food industry’s ability to rapidly
identify contamination along the processing chain. However, this potential is hampered by two key
challenges. Firstly, there is a lack of knowledge of the underlying biochemical reactions resulting in
changes in spectra of contaminated foods that occur at the macroscopic level. This makes it difficult to
separate changes in the spectra due to natural senescence from those due to microbial growth. Secondly,
there is no existing methodology to link microscopic, mesoscopic and macroscopic HSI of bacterial
colonies.
HyperMicroMacro addresses critical gaps in our knowledge of food safety by developing new
understanding of the growth and persistence of bacteria, spores and biofilms on surfaces using
hyperspectral imaging at multiple spatial scales (from microscopic to macroscopic) and spectral
modalities (e.g. Raman, IR and Fluorescence) combined with microbial characterization and high
throughput sequencing. This approach will provide new insights on the persistence of food related
microorganisms and their behaviour on foods and other surfaces.
Background, skills & Qualifications
I have completed BSc (2011) MSc (2014) and PhD (2018) in Industrial Biotechnology at University of
Naples “Federico II”, Italy. My PhD thesis addressed the issue of increase the competitiveness of the
microbial succinic acid production by two different strategies: 1- the utilization of low-cost, non-
food-based feedstock (i.e. lignocellulosic biomass and industrial waste streams); 2- bioreactor
design and optimization. During my PhD, I acquired skills and competences about
microorganism cultivations (both aerobic and anaerobic), design and set up of different reactor
types and operation conditions, different analytical techniques (HPLC, GC, TOC/TN, etc.) and
data analysis.
Currently, I work in School of Biosystems Engineering, UCD, as a postdoctoral researcher in food
microbiology under the guidance of Prof. Gowen and Dr. Scannell.
Publications
Ferone M., Raganati F., Olivieri G., Salatino P., Marzocchella A., Succinic Acid Production from
Hexoses and Pentoses by Fermentation of Actinobacillus succinogenes, Chemical Engineering
Transactions, 2016, 49, 211-216
Ferone M., Raganati F., Olivieri G., Salatino P., Marzocchella A., Biosuccinic acid from lignocellulosic-
based hexoses and pentoses by Actinobacillus succinogenes. Appl Biochem Biotechnol (2017).
doi:10.1007/s12010-017-2514-4
Ferone M., Raganati F., Olivieri G., Salatino P., Marzocchella A., Continuous Succinic Acid
Fermentation by Actinobacillus Succinogenes: Assessment of Growth and Succinic Acid Production
Kinetics. Appl Biochem Biotechnol (2018). Doi: 10.1007/s12010-018-2846-8
191

Ferone M., Raganati F., Ercole A., Olivieri G., Salatino P., Marzocchella A., Continuous succinic acid
fermentation by Actinobacillus succinogenes in a packed bed biofilm reactor. Biotechnol Biofuels
(2018) 11:138 https://doi.org/10.1186/s13068-018-1143-7
Ferone M., Ercole A., Raganati F., Olivieri G., Salatino P., Marzocchella A., Efficient succinic acid
production from leftover beverages by Actinobacillus succinogenes. Biotechnol Progress (2019)
2019;e2863. https://doi.org/10.1002/btpr.2863
Raganati F., Procentese A., Ferone M., Olivieri G., Russo M.E., Salatino P. Marzocchella A., Continuous
glucose fermentation by Clostridium acetobutylicum – kinetics issues under acidogenesis and
solventogenesis conditions. Submitted to International Scientific Journal.
Ferone M., Olivieri G., Salatino P., Marzocchella A., Bioreactors for succinic acid production processes.
Critical Reviews in Biotechnology (2019) DOI: 10.1080/07388551.2019.1592105
Lu T., Marmion, M., Ferone M., Wall P., Scannell A. G.M., Farm to Shelf strategies to minimize
Campylobacter contamination in retail chicken 1: On-farm interventions. Submitted to International
Scientific Journal.
Lu T., Marmion, M., Ferone M., Wall P., Scannell A. G.M., Farm to Shelf strategies to minimize
Campylobacter contamination in retail chicken 2: Processing and retail storage. Submitted to
International Scientific Journal.
Skoog E., Ferone M., Montriwat P., Mapelli
V., Olsson
L., ATP levels and membrane lipid composition
give insights to the difference in adipic acid tolerance in Candida viswanathii and Saccharomyces
cerevisiae. Submitted to International Scientific Journal.
192

Ana Herrero-Langreo, BSC, M.EngSc, PhD
Project Title: Multi-scale hyperspectral imaging for enhanced understanding and control of food
microbiology (HyperMicroMacro)
Project Leader: Assoc. Prof. Aoife Gowen and Assoc. Prof. Amalia Scanell
Abstract
Ana is a senior Postdoctoral researcher in the HyperMicroMacro Project, working with Aoife Gowen
in the UCD Spectral Imaging Research Group - University College Dublin. HyperMicroMacro
addresses critical gaps in our knowledge of food safety by developing new understanding of the
growth and persistence of bacteria, spores and biofilms on surfaces. The overarching aim of this
project is to create the knowledge base required to develop a user-friendly hand-held device, capable
of detecting and identifying microbes on a range of surfaces. We will address these questions using
hyperspectral imaging (HSI) at multiple spatial scales (from microscopic to macroscopic) and spectral
modalities (e.g. Raman, IR and Fluorescence) combined with microbial characterisation and high
throughput sequencing (HTS). This approach will provide new insights on the persistence of food
related microorganisms and their behaviour on foods and other surfaces. The knowledge developed
will allow us to develop a prototype rapid detection system to improve safety and security of the food
chain. Funding for this research was provided by Science Foundation Ireland (SFI) under the
investigators programme Proposal ID 15/IA/2984
Background, Skills & Qualifications
She finished her PhD in non-destructive assessment of fruit quality in 2010 in Universidad Politécnica
de Madrid (Spain). Since then, she has worked in the adaptation and development of multivariate data
analysis methods to a wide variety of food science and agronomical applications. Some examples of
her research include the adaptation of sampling methods to the calibration of spatial models in
precision viticulture, (Herrero-Langreo et al., 2018); the assessment and improvement of NIR model
robustness for plant breeding purposes; and the integration of spatial and spectral information for
sampling (Gowen et al., 2019) and model assessment (Herrero-Langreo et al., 2019); Her current
research at UCD focuses on the application of hyperspectral imaging for the investigation of
microbial growth in food matrices, exploration of different spectral modalities at different scales and
development of adapted chemometric approaches for developing new understanding of the growth
and persistence of bacteria, spores and biofilms on surfaces. Her last publication, feature article in the
prestigious journal Analytica Chimica Acta, proposes a methodology to first, quantitatively evaluate
the spatial structure of prediction maps, and then, use this information to assess model performance.
The main advantage of the approach is that is based only on the spatial characterization of prediction
maps and does not require ground truth values. This approach could also be used to characterize the
spatial distribution of a sample, allowing for example to quantify the aggregation of bacteria within
the context of the project HyperMicroMacro.
Selected Recent Publications
Gowen A., Xu J.-L., Herrero-Langreo A., Comparison of Spectral Selection Methods in the
Development of Classification Models from Visible Near Infrared Hyperspectral Imaging Data,
(2019) Journal of Spectral Imaging. 8 a4.
Herrero-Langreo A., Gorretta N., Tisseyre B., Gowen A., Xu J.-L., Chaix G., Roger J.-M., (2019).
Using Spatial Information For Evaluating The Quality Of Prediction Maps From Hyperspectral
Images: A Geostatistical Approach, Analytical Chimica Acta. In Press
Herrero-Langreo A., Tisseyre B., Roger J.M., Scholasch T., Payen S., (2018) Test of Sampling
Methods to Optimize the Calibration of Vine Water Status Spatial Models. Precision Agriculture.
19 (2), 365-378.
193

Rosanna Kleemann, BA BAI, MSc, EngD
Project title: Agri Bio Circular Economy – Developing sustainable value chains from waste
Project Leader: Assistant Professor Fionnuala Murphy
Abstract
Ireland has one of the most challenging targets to meet a 20% reduction in greenhouse gas (GHG)
emissions on 2005 levels by 2020. Agriculture accounts for 33% of Ireland’s GHG emissions and is
expected to increase due to dairy sector expansion caused by the removal of milk quotas. Agri Bio
Circular Economy (ABC Economy) targets the agricultural and forestry sectors to develop bio-based
products and energy generation from waste streams in a cascading system of biomass use to reduce GHG
emissions. Novel value chains will be created in conjunction with farmers, food processors, and foresters
in counties Monaghan and Tipperary. Workshops were held in each county to understand stakeholders’
opinions on the opportunities and barriers to developing new value chains from their wastes. Using this
information coupled with detailed data on feedstocks, novel value chains will be developed based on
technological and market potential. ABC Economy moves beyond current research by conducting full
Life Cycle Assessment (LCA) to highlight the synergies and trade-offs between using biomass for bio-
based products and energy generation.
Background, Skills & Qualifications
I have strong expertise in water and waste management, sustainable development, and circular economy,
through both industrial and academic roles. I gained my engineering doctorate (EngD) in Sustainability
for Engineering and Energy Systems from the University of Surrey. My doctorate, based in Thames
Water UK, focused on the sustainable recovery of phosphorus from wastewater. I have presented my
research on various media outlets including BBC news, Sky news, Al Jazeera, and The Independent and
Guardian newspapers. Currently, I work in the School of Biosystems Engineering, UCD, as a
postdoctoral researcher on the Agri Bio Circular Economy (ABC Economy) project under the guidance of
Assistant Prof. Fionnuala Murphy. I have a keen interest in conducting industry relevant research,
maintaining links between industry and academia, and disseminating research through a variety of
methods to reach a wider audience.
Recent publications
Kleemann, R., Chenoweth, J., Clift, R., Morse, S., Pearce, P. & Saroj, D. (2016) Comparison of
Characteristics and Phosphorus Recovery from Pyrolysis and Incineration Residues Waste
Management DOI: 10.1016/j.wasman.2016.10.055
Kleemann, R., Chenoweth, J., Clift, R., Morse, S., Pearce, P. & Saroj, D. (2015) Evaluation of Local and
National Effects of Recovering Phosphorus at Wastewater Treatment Plants: Lessons Learned from
the UK Resources, Conservation and Recycling DOI: 10.1016/j.resconrec.2015.09.007
Shepherd, J.G., Kleemann, R., Bahri-Esfahani, J., Hudek, L., Suriyagoda, L., Vandamme, E. and Van
Dijk, K.C.. (2015). The Future of Phosphorus in our Hands Nutrient Cycling in Agroecosystems DOI:
10.1007/s10705-015-9742-1
Kleemann, R. and Morse, S. (2015) Sustainable Phosphorus Management — A Global Transdisciplinary
Roadmap by Roland W. Scholz, Amit Roy, Fridolin S. Brand, Deborah T. Hellums and Andrea E.
Ulrich Ecological Economics, 114, 245-246. DOI: 10.1016/j.ecolecon.2015.02.009
194

Anastasia Ktenioudaki, BSc, MSc, PhD
Project title: A real-time forecast decision support system for the food supply chain (FreshProof)
Project Leader: Professor Colm P. O’Donnell
Abstract
The project focuses on an innovative systems approach to address existing food supply chain waste and
shortcomings in food safety, integrity and traceability. Data on critical environmental conditions in the
field and during processing and distribution of fresh fruit and vegetables, will be collected and merged
with data on products quality attributes, nutritional value and shelf-life performance. The project is
aiming to combine both pre- and postharvest conditions in a single decision support tool, implementing
prediction models to determine the remaining shelf-life and nutritional value of a product to consumer
level.
Background, Qualifications and Skills
My current research is funded by the European Union’s Horizon 2020 research and innovation
programme under the Marie Sklodowska-Curie Global Fellowship grant. I am currently hosted at the
Food Quality Laboratory, University of South Florida, Tampa, USA. I obtained a PhD in Biosystems
Engineering from University College Dublin in 2008, which assessed novel rheological and
physical/chemical techniques for wheat quality evaluation.
Since graduating I have worked in multidisciplinary research projects as a research officer and post-
doctoral researcher at Teagasc Food research Centre, Ashtown; and I had the opportunity to lead NPD
and research projects in my previous role as a senior research and development scientist at Kerry Global
Technology and Innovation Centre, Ireland. My research projects have mainly been in the areas of food
engineering and food science focusing on the development of new quantitative and qualitative
methodologies for assessing product quality, monitoring shelf-life and investigating physicochemical and
nutritional properties of food and food molecular structure.
Previous studies include an MSc in Biosystems Engineering from UCD and a BSc in Agriculture from
Aristotle University of Thessaloniki, Greece.
Recent Publications
Ktenioudaki A, O’Donnell CP, do Nascimento Nunes MC, 2019. Modelling the biochemical and sensory
changes of strawberries during storage under diverse relative humidity conditions. Postharvest
Biology and Technology 154:148-158
Mc Carthy U, Uysal I., Mercier S, Badia R, Ktenioudaki A, O’Donnell C, 2018. Global food security –
Issues, challenges and technological solutions. Trends in Food Science and Technology, Trends in
Food Science & Technology 77:11-20
O'Shea N, Ktenioudaki A, Smyth TP, McLoughlin P, Doran L, Auty, M. A. E., Arendt, E., Gallagher, E.,
2015. Physicochemical assessment of two fruit by-products as functional ingredients: Apple and
orange pomace. Journal of Food Engineering 153:89-95
Ktenioudaki A, Alvarez-Jubete L, Smyth TJ, Kilcawley K, Rai DK, Gallagher E. 2015. Application of
bioprocessing techniques (sourdough fermentation and technological aids) for brewer's spent grain
breads. Food Research International 73:107-16
Ktenioudaki A, Alvarez-Jubete L, Gallagher E. 2015. A Review of the Process-Induced Changes in the
Phytochemical Content of Cereal Grains: The Breadmaking Process. Critical Reviews in Food
Science and Nutrition 55:611-9
195

Sindhuraj Mukherjee, Ph.D.
Project title: Automation of Agrochemical Product Development
Project Leader: Associate Professor Aoife Gowen
Abstract
Quantification of multiple chemical components in complex agrochemical formulations is a challenging
task and cannot be chromatographically separated to allow the use of standard quantitation techniques that
are effective for baseline separated peaks. Currently this quantitative step is highly resource intensive and
requires multiple iterative steps to prepare different combinations of the complex components together
with a visual comparison of the chromatographic profile of the product being analysed with the profiles of
the various synthetic blends. Simple deconvolution of chemical peaks is not easily achieved due to co-
elution and is further complicated with multivariate data sets. The use of multivariate calibration models,
to deal with complex multidimensional datasets (e.g. infrared, Raman, NMR and mass spectra) is seen as
having excellent potential for this application.
This project will eventually combine an automated sample preparation unit together with a design of
experiments (DoE) and chemometrics to prepare and evaluate the resultant chromatographic data which
will allow a more automated, rapid and accurate determination of the composition of complex
formulations.
Background, skills & Qualifications
I completed my PhD at the UCD School of Biosystems and Food Engineering, specialising in the
development and validation of protocols for hyperspectral imaging, specifically for studying interactions
between polymeric surfaces and water. I also learnt to apply and adapt chemometric and experimental
strategies to evaluate and manage the multidimensional data generated from the experiments leading to
insight of molecular level processes. Before that, I received my Bachelor’s and Master’s degree in
Biotechnology specialising in the application of hyperspectral imaging on complex food matrices for
calorie intake estimation.
Recent publications
Mukherjee, S., Martinez-Gonzalez, J. and Gowen, A. (2019). Feasibility of attenuated total reflection-
fourier transform infrared (ATR-FTIR) chemical imaging and partial least squares regression (PLSR)
to predict protein adhesion on polymeric surfaces. The Analyst, 144(5),1535-1545.
Mukherjee, S., Martínez-González, J., Dowling, D. and Gowen, A. (2018). Predictive modelling of the
water contact angle of surfaces using attenuated total reflection – Fourier transform infrared (ATR-
FTIR) chemical imaging and partial least squares regression (PLSR). The Analyst, 143(15),3729-
3740.
196

Joe Sweeney, BSc, Eng, MSc, PhD
Project title: Biosensors for Biological processes
Project Leader: Dr. Fionnuala Murphy
Abstract
My research area which is a combination of computer science and microbiology entails creating novel
cost-effective monitoring and control systems for biological processes. Biosensors that where initially
developed in UCD with a view to providing a robust cost effective monitoring and control system for
high throughput grass silage fed AD systems, are currently being adapted to include an array of
fermentation processes. A major focus of these biosensors is providing monitoring and control systems to
the emerging Green Biorefinery sector. Grass being the Green biorefineries primary input substrate has
meant that a monitoring and control system can be developed by adapting the biosensors that were
initially developed for grass-silage fed AD.
Background, skills & Qualifications
BSc in Industrial microbiology (2007), MSc in Computer science (2012) and PhD in Biosystems
Engineering (2016), (UCD). As part of my MSc in computer science I was employed as a software
developer on an Enterprise Ireland funded research project where I was responsible for developing the
various assembly- and C-programming-language algorithms necessary to adapt digital signal processors,
to implement the “Ultrasonic athlete tracking system”. My PhD which was funded by the Charles Parsons
Science Foundation Ireland project entailed developing novel biosensors capable of provisioning small-
scale, remotely deployed anaerobic digestion systems with cost effective and robust monitoring and
control systems. To bring this project to completion extensive use of both computer science and
microbiology techniques were required. I am currently working as a postdoctoral researcher in the School
of Biosystems Engineering (UCD) under the guidance of Dr. Fionnuala Murphy and Prof. Kevin
McDonnell on the BBIJU project, SpiralG.
Recent publications
Sweeney, J., Murphy, C.D. & McDonnell, K. Towards an effective biosensor for monitoring AD leachate:
a knockout E. coli mutant that cannot catabolise lactate. Appl Microbiol Biotechnol (2015) 99: 10209.
doi:10.1007/s00253-015-6887-4
Sweeney, J.B., Murphy, C.D. & McDonnell, K. Development of a bacterial propionate-biosensor for
anaerobic digestion monitoring. Enzyme Microb. Technol. (2017) doi:
10.1016/j.enzmictec.2017.09.011
197

Rebecca L. Whetton, BSc, PhD
Project title: Crop Optimisation Through Sensing, Understanding and Visualisation - Crop Nutrition,
limits to yield potential
Work package Leader: Prof. Nick Holden
Abstract
The overall project is a multi and inter-disciplinary approach to investigate digital, precision
agriculture and crop science. As part of the larger project, the work package aims to provide the
scientific underpinning for decision support related to nutrient (mainly nitrogen) use efficiency (NUE)
for winter wheat crops grown in Europe. While nitrogen supply is effectively unlimited, current
technology relies on fossil energy for the creation of suitable N fertilisers. Other macro-nutrients such
as phosphorus have a limited global supply, with peak-P predicted to occur between 2027 and 2033.
This mean that NUE needs to be increased to remove limits from the supply side. In addition,
eutrophication associated with N (limiting nutrient in oceans) and P (limiting nutrient in fresh waters)
losses will be reduced with increased NUE. NUE is regulated by many factors, both biotic and abiotic,
many of which are understood, but their relative priority is not clearly defined.
Background, skills and qualifications
I Completed a BSc (Hons) degree in Biological sciences: Ecology and Environmental Management at
Nottingham Trent University in 2013. During which I took a year’s placement at an Agro-research
company. In 2018 I graduated from Cranfield University with a PhD in Multi-sensor and data fusion
approaches for determining yield limiting factors, and in-situ measurements of yellow rust and
fusarium head blight in cereal crops. Shortly after submitting the thesis I assisted on a remote sensing
project at Rothamsted research in 2017, and then began a PostDoc later that year at UCD in the
department of Biosystems Engineering. My current work is focused on improving Nitrogen use
efficiency, with a main aspect of that being predictions of nitrogen mineralisation potential using Mid
infrared spectroscopy.
Selected recent publications
The current work conducted in UCD is now being prepared for publication
Whetton, R.L., Hassall, K.L., Waine, T.W. and Mouazen, A.M., 2018. Hyperspectral measurements
of yellow rust and fusarium head blight in cereal crops: Part 1: Laboratory study. biosystems
engineering, 166,101-115.
Whetton, R.L., Waine, T.W. and Mouazen, A.M., 2018. Hyperspectral measurements of yellow rust
and fusarium head blight in cereal crops: Part 2: On-line field measurement. Biosystems
engineering, 167, 144-158.
Whetton, R.L., Waine, T.W. and Mouazen, A.M., 2018. Evaluating management zone maps for
variable rate fungicide application and selective harvest. Computers and Electronics in
Agriculture, 153, 202-212.
198

Junli Xu, BSc, PhD
Project title: Prediction of preosteoblastic cell attachment on different polymers using ATR-FTIR and
Raman spectroscopy
Project Leader: Associate Professor Aoife Gowen
Abstract
Interactions between bone and biomaterials are vitally important to the success of the implants and bone
tissue engineering scaffolds. Although a general understanding of biocompatibility, biofouling and
degradation of biomaterials exists, the molecular mechanisms driving these processes at the interface
between cell and biomaterial are still largely unknown. Water is typically the first molecule that comes
into contact with biomaterials inside the human body and it plays a key role in mediating subsequent
protein and cell adhesion, which ultimately determine the biocompatibility of a material. This project
aims to explore the multivariate modelling in conjunction with Attenuated Total Reflection-Fourier
Transform Infrared (ATR-FTIR) and Raman chemical imaging to investigate whether experimentally
characterized surface chemistry can be used to predict surface cell adhesion. ATR-FTIR and Raman
spectra were collected on dry and wetted polymeric surfaces, followed by evaluation of preosteoblastic
MC3T3-E1 cell attachment. Partial Least Squares Regression (PLSR) models were built using IR spectra
as the predictor variable.
Background, skills & Qualifications
I received my Bachler degree in Food Engineering (2014), Zhejiang University. My PhD thesis,
completed in 2018, focused on the application of hyperspectral imaging on quality control of salmon
fillets and development of some original algorithms to improve image analysis. My ongoing research
aims to apply vibrational chemical imaging, including near-infrared imaging, Fourier transform near
infrared (FTIR) imaging, dark-field microscopy combined with hyperspectral imaging (HSI), Raman
imaging, to characterize the interaction between water/cell and different varieties of polymers.
Recent publications
Xu, J. L., & Gowen, A. A. Spatial-spectral analysis method using texture features combined with PCA
for information extraction in hyperspectral images. Journal of Chemometrics. 2019, e3132.
Xu, J. L., et al. Development of a polarized hyperspectral imaging system for investigation of absorption
and scattering properties. Journal of Near Infrared Spectroscopy. 2019.
Herrero-Langreo, A, Gorretta, N, Tisseyre, B, Gowen, A.A, Xu, J. L., Chaix, G, Roger, J. Using spatial
information for evaluating the quality of prediction maps from hyperspectral images: A geostatistical
approach. Analytica Chimica Acta. 2019.
Xu, J. L., & Gowen, A. A. Investigation of plasticizer aggregation problem in casein based biopolymer
using chemical imaging. Talanta. 2019, 193, 128-138.
Lin, X., Xu, J. L., & Sun, D. W. Investigation of moisture content uniformity of microwave-vacuum
dried mushroom (Agaricus bisporus) by NIR hyperspectral imaging. LWT. 2019.
Xu, J. L., et al. A polarized hyperspectral imaging system for in vivo detection: Multiple applications in
sunflower leaf analysis. Computers and Electronics in Agriculture. 2019, 158, 258-270.
199