Food Chemistry
1262
Page i Food Chemistry Third Edition Edited by Owen R. Fennema University of Wisconsin- Madison Madison, Wisconsin M ARCEL DEKKER, INC. NEW YORK • BASEL • HONG KONG
-
Upload
khangminh22 -
Category
Documents
-
view
0 -
download
0
Transcript of Food Chemistry

Pag e i
Food Chemistry
Third Edition
Edited byOwen R. Fennema
University of Wisconsin-Madison
Madison, Wisconsin
MARCEL DEKKER, INC.
NEW YORK • BASEL • HONG KONG

Pag e ii
Library of Congress Cataloging-in-Publication Data
Food chemistry / edited by Owen R. Fennema. — 3rd ed.p. cm. — (Food science and technology)Includes index.ISBN 0-8247-9346-3 (cloth : alk. paper). — ISBN 0-8247-9691-8(paper : alk. paper)1. Food—Analysis. 2. Food—Composition. I. Fennema, Owen R.II. Series: Food science and technology (Marcel Dekker, Inc.); v. 76.TX541.F65 1996664'.001'54—dc20
96-19500CIP
The publisher offers discounts on this book when ordered in bulk quantities. For more information, write to SpecialSales/Professional Marketing at the address below.
This book is printed on acid-free paper.
Copyright © 1996 by Marcel Dekker, Inc. All Rights Reserved.
Neither this book nor any part may be reproduced or transmitted in any form or by any means, electronic or mechanical,including photocopying, microfilming, and recording, or by any information storage and retrieval system, without permission inwriting from the publisher.
Marcel Dekker, Inc.270 Madison Avenue, New York, New York 10016
Current printing (last digit):10 9 8 7 6 5 4 3 2
PRINTED IN THE UNITED STATES OF AMERICA

Pag e iii
Preface to the Third Edition
More than a decade has passed since the publication of the second edition of Food Chemistry, so the appropriateness of anupdated version should be apparent. The purposes of the book remain unchanged: it is primarily a textbook for upper divisionundergraduates and beginning graduate students who have sound backgrounds in organic chemistry and biochemistry, and issecondarily a reference book. Information on food analysis is intentionally absent, except where its presence fits logically withthe topic under discussion. As a textbook for undergraduates, it is designed to serve as the basis of a two-semester course onfood chemistry with the assumption that the instructor will make selective reading assignments as deemed appropriate. Individualchapters in the book should be useful as the basis of graduate-level courses on specialized topics in food chemistry.
The third edition differs in several important respects from the second. The chapters prepared by first-time contributors aretotally new. These cover such topics as proteins, dispersions, enzymes, vitamins, minerals, animal tissues, toxicants, andpigments. Chapters by contributors to the second edition have been thoroughly revised. For example, in the chapter “Water andIce,” a major addition deals with molecular mobility and glass transition phenomena. The result is a book that is more than 60%new, has greatly improved graphics, and is better focused on material that is unique to food chemistry.
Chapters have been added on the topics of dispersions and minerals. In the second edition, treatment of dispersions wasaccomplished in the chapters “Lipids,” “Proteins,” and “Carbohydrates,” and minerals were covered in the chapter “Vitaminsand Minerals.” Although this was organizationally sound, the result was superficial treatment of dispersions and minerals. Thenew chapters on these topics provide depth of coverage that is more consistent with the remainder of the book. Associated withthese changes is a chapter, written by a new contributor, that is now devoted solely to vitamins. It is my belief that this chapterrepresents the first complete, in-depth treatise on vitamins with an emphasis on food chemistry.
I would be remiss not to thank the contributors for their hard work and tolerance of my sometimes severe editorial oversight.They have produced a book that is of first-rate quality. After twenty years and two previous editions, I am finally satisfied that allmajor topics are covered appropriately with regard to breadth and depth of coverage, and that a proper focus on reactionspertaining specifically to foods has been achieved. This focus successfully dis-

Pag e iv
tinguishes food chemistry from biochemistry in the same sense that biochemistry is distinct from, yet still dependent on, organicchemistry.
Although I have planned and edited this edition with great care, minor errors are inevitable, especially in the first printing. If theseare discovered, I would very much appreciate hearing from you so that corrections can be effected promptly.
OWEN R. FENNEMA
Page ix
Contents
Preface to the Third Edition iii
Preface to the Second Edition v
Preface to the First Edition vii
Contributors xi
1. Introduction to Food ChemistryOwen R. Fennema and Steven R. Tannenbaum
1
2. Water and IceOwen R. Fennema
17
3. Dispersed Systems: Basic ConsiderationsPieter Walstra
95
4. CarbohydratesJames N. BeMiller and Roy L. Whistler
157
5. LipidsWassef W. Nawar
225
6. Amino Acids, Peptides, and ProteinsSrinivasan Damodaran
321
7. EnzymesJohn R. Whitaker
431
8. VitaminsJesse F. Gregory III
531
9. MineralsDennis D. Miller
617

Pag e v
Preface to the Second Edition
Considerable time has passed since publication of the favorably received first edition so a new edition seems appropriate. Thepurpose of the book remains unchanged—it is intended to serve as a textbook for upper division undergraduates or beginninggraduate students who have sound backgrounds in organic chemistry and biochemistry, and to provide insight to researchersinterested in food chemistry. Although the book is most suitable for a two-semester course on food chemistry, it can be adaptedto a one-semester course by specifying selective reading assignments. It should also be noted that several chapters are ofsufficient length and depth to be useful as primary source materials for graduate-level specialty courses.
This edition has the same organization as the first, but differs substantially in other ways. The chapters on carbohydrates, lipids,proteins, flavors, and milk and the concluding chapter have new authors and are, therefore, entirely new. The chapter on fooddispersions has been deleted and the material distributed at appropriate locations in other chapters. The remaining chapters,without exception, have been substantially modified, and the index has been greatly expanded, including the addition of achemical index. Furthermore, this edition, in contrast to the first, is more heavily weighted in the direction of subject matter that isunique to food chemistry, i.e., there is less overlap with materials covered in standard biochemistry courses. Thus the book hasundergone major remodeling and refinement, and I am indebted to the various authors for their fine contributions and for theirtolerance of my sometimes severe editorial guidance.
This book, in my opinion, provides comprehensive coverage of the subject of food chemistry with the same depth andthoroughness that is characteristic of the better quality introductory textbooks on organic chemistry and biochemistry. This, Ibelieve, is a significant achievement that reflects a desirable maturation of the field of food chemistry.
OWEN R. FENNEMA

Pag e vii
Preface to the First Edition
For many years, an acute need has existed for a food chemistry textbook that is suitable for food science students withbackgrounds in organic chemistry and biochemistry. This book is designed primarily to fill the aforementioned need, andsecondarily, to serve as a reference source for persons involved in food research, food product development, quality assurance,food processing, and in other activities related to the food industry.
Careful thought was given to the number of contributors selected for this work, and a decision was made to use different authorsfor almost every chapter. Although involvement of many authors results in potential hazards with respect to uneven coverage,differing philosophies, unwarranted duplication, and inadvertent omission of important materials, this approach was deemednecessary to enable the many facets of food chemistry to be covered at a depth adequate for the primary audience. Since I amacutely aware of the above pitfalls, care has been taken to minimize them, and I believe the end product, considering it is a firstedition, is really quite satisfying—except perhaps for the somewhat generous length. If the readers concur with my judgment, Iwill be pleased but unsurprised, since a book prepared by such outstanding personnel can hardly fail, unless of course the editormismanages the talent.
Organization of the book is quite simple and I hope appropriate. Covered in sequence are major constituents of food, minorconstituents of food, food dispersions, edible animal tissues, edible fluids of animal origin, edible plant tissues and interactionsamong food constituents—the intent being to progress from simple to more complex systems. Complete coverage of all aspectsof food chemistry, of course, has not been attempted. It is hoped, however, that the topics of greatest importance have beentreated adequately. In order to help achieve this objective, emphasis has been given to broadly based principles that apply tomany foods.
Figures and tables have been used liberally in the belief that this approach facilitates understanding of the subject matterpresented. The number of references cited should be adequate to permit easy access to additional information.
To all readers I extend an invitation to report errors that no doubt have escaped my attention, and to offer suggestions forimprovements that can be incorporated in future (hopefuly) editions.
Since enjoyment is an unlikely reader response to this book, the best I can hope for is that readers will find it enlightening andwell suited for its intended purpose.
OWEN R. FENNEMA

Page x
10. ColorantsJ. H. von Elbe and Steven J. Schwartz
651
11. FlavorsRobert C. Lindsay
723
12. Food AdditivesRobert C. Lindsay
767
13. Toxic SubstancesMichael W. Pariza
825
14. Characteristics of MilkHarold E. Swaisgood
841
15. Characteristics of Edible Muscle TissuesE. Allen Foegeding, Tyre C. Lanier, and Herbert O. Hultin
879
16. Characteristics of Edible Plant TissuesNorman F. Haard and Grady W. Chism
943
17. Summary: Integrative ConceptsPetros Taoukis and Theodore P. Labuza
1013
Appendices
A. International System of Units (SI), The Modernized Metric System 1043
B. Conversion Factors (Non-SI Units to SI Units) 1047
C. Greek Alphabet 1048
Index 1051

Page xi
Contributors
James N. BeMiller Department of Food Science, Purdue University, West Lafayette, Indiana
Grady W. Chism Department of Food Science and Technology, The Ohio State University, Columbus, Ohio
Srinivasan Damodaran Department of Food Science, University of Wisconsin—Madison, Madison, Wisconsin
Owen R. Fennema Department of Food Science, University of Wisconsin—Madison, Madison, Wisconsin
E. Allen Foegeding Department of Food Science, North Carolina State University, Raleigh, North Carolina
Jesse F. Gregory III Department of Food Science and Human Nutrition, University of Florida, Gainesville, Florida
Norman F. Haard Department of Food Science and Technology, Institute of Marine Resources, University of California,Davis, California
Herbert O. Hultin Department of Food Science, University of Massachusetts, Amherst, Massachusetts
Theodore P. Labuza Department of Food Science and Nutrition, University of Minnesota, St. Paul, Minnesota
Tyre C. Lanier Department of Food Science, North Carolina State University, Raleigh, North Carolina
Robert C. Lindsay Department of Food Science, University of Wisconsin—Madison, Madison, Wisconsin
Dennis D. Miller Department of Food Science, Cornell University, Ithaca, New York

Page xii
Wassef W. Nawar Department of Food Science, University of Massachusetts, Amherst, Massachusetts
Michael W. Pariza Department of Food Microbiology and Toxicology, Food Research Institute, University ofWisconsin—Madison, Madison, Wisconsin
Steven J. Schwartz* Department of Food Science, North Carolina State University, Raleigh, North Carolina
Harold E. Swaisgood Department of Food Science, North Carolina State University, Raleigh, North Carolina
Steven R. Tannenbaum Department of Chemistry, Division of Toxicology, Massachusetts Institute of Technology,Cambridge, Massachusetts
Petros Taoukis Department of Chemical Engineering, National Technical University of Athens, Athens, Greece
J. H. von Elbe Department of Food Science, University of Wisconsin—Madison, Madison, Wisconsin
Pieter Walstra Department of Food Science, Wageningen Agricultural University, Wageningen, The Netherlands
Roy L. Whistler Department of Biochemistry, Purdue University, West Lafayette, Indiana
John R. Whitaker Department of Food Science and Technology, University of California, Davis, California
*Present affiliation: The Ohio State University, Columbus, Ohio.

Pag e 1
1Introduction to Food Chemistry
Owen R. FennemaUniversity of Wisconsin—Madison, Madison, WisconsinSteven R. TannenbaumMassachusetts Institute of Technology, Cambridge, Massachusetts
1.1. What Is Food Chemistry? 1
1.2. History of Food Chemistry 2
1.3. Approach to the Study of Food Chemistry 7
1.3.1. Quality and Safety Attributes 7
1.3.2. Chemical and Biochemical Reactions 7
1.3.3. Effect of Reactions on the Quality and Safety of Food 7
1.3.4. Analysis of Situations Encountered During the Storage andProcessing of Food
10
1.4. Societal Role of Food Chemists 13
1.4.1. Why Should Food Chemists Become Involved in SocietalIssues?
13
1.4.2. Types of Involvement 13
References 15
1.1 What is Food Chemistry?
Concern about food exists throughout the world, but the aspects of concern differ with location. In underdeveloped regions ofthe world, the bulk of the population is involved in food production, yet attainment of adequate amounts and kinds of basicnutrients remains an ever-present problem. In developed regions of the world, food production is highly mechanized and only asmall fraction of the population is involved in this activity. Food is available in abundance, much of it is processed, and the use ofchemical additives is common. In these fortunate localities, concerns about food relate mainly to cost, quality, variety,convenience, and the effects of processing and added chemicals on wholesomeness and nutritive value. All of these concerns fallwithin the realm of food science—a science that deals with the physical, chemical, and biological properties of foods as theyrelate to stability, cost, quality, processing, safety, nutritive value, wholesomeness, and convenience.
Food science is an interdisciplinary subject involving primarily bacteriology, chemistry,

Pag e 2
biology, and engineering. Food chemistry, a major aspect of food science, deals with the composition and properties of foodand the chemical changes it undergoes during handling, processing, and storage. Food chemistry is intimately related tochemistry, biochemistry, physiological chemistry, botany, zoology, and molecular biology. The food chemist relies heavily onknowledge of the aforementioned sciences to effectively study and control biological substances as sources of human food.Knowledge of the innate properties of biological substances and mastery of the means of manipulating them are commoninterests of both food chemists and biological scientists. The primary interests of biological scientists include reproduction,growth, and changes that biological substances undergo under environmental conditions that are compatible or marginallycompatible with life. To the contrary, food chemists are concerned primarily with biological substances that are dead or dying(postharvest physiology of plants and postmortem physiology of muscle) and changes they undergo when exposed to a verywide range of environmental conditions. For example, conditions suitable for sustaining residual life processes are of concern tofood chemists during the marketing of fresh fruits and vegetables, whereas conditions incompatible with life processes are ofmajor interest when long-term preservation of food is attempted. In addition, food chemists are concerned with the chemicalproperties of disrupted food tissues (flour, fruit and vegetable juices, isolated and modified constituents, and manufacturedfoods), single-cell sources of food (eggs and microorganisms), and one major biological fluid, milk. In summary, food chemistshave much in common with biological scientists, yet they also have interests that are distinctly different and are of the utmostimportance to humankind.
1.2 History of Food Chemistry
The origins of food chemistry are obscure, and details of its history have not yet been rigorously studied and recorded. This isnot surprising, since food chemistry did not acquire a clear identity until the twentieth century and its history is deeply entangledwith that of agricultural chemistry for which historical documentation is not considered exhaustive [5,14]. Thus, the followingbrief excursion into the history of food chemistry is incomplete and selective. Nonetheless, available information is sufficient toindicate when, where, and why certain key events in food chemistry occurred, and to relate some of these events to majorchanges in the wholesomeness of the food supply since the early 1800s.
Although the origin of food chemistry, in a sense, extends to antiquity, the most significant discoveries, as we judge them today,began in the late 1700s. The best accounts of developments during this period are those of Filby [12] and Browne [5], andthese sources have been relied upon for much of the information presented here.
During the period of 1780–1850 a number of famous chemists made important discoveries, many of which related directly orindirectly to the chemistry of food. The works of Scheele, Lavoisier, de Saussure, Gay-Lussac, Thenard, Davy, Berzelius,Thomson, Beaumont, and Liebig contain the origins of modern food chemistry. Some may question whether these scientists,whose most famous discoveries bear little relationship to food chemistry, deserve recognition as major figures in the origins ofmodern food chemistry. Although it is admittedly difficult to categorize early scientists as chemists, bacteriologists, or foodchemists, it is relatively easy to determine whether a given scientist made substantial contributions to a given field of science.From the following brief examples it is clearly evident that many of these scientists studied foods intensively and madediscoveries of such fundamental importance to food chemistry that exclusion of their contributions from any historical account offood chemistry would be inappropriate.
Carl Wilhelm Scheele (1742–1786), a Swedish pharmacist, was one of the greatest

Pag e 3
chemists of all time. In addition to his more famous discoveries of chlorine, glycerol, and oxygen (3 years before Priestly, butunpublished), he isolated and studied the properties of lactose (1780), prepared mucic acid by oxidation of lactic acid (1780),devised a means of preserving vinegar by means of heat (1782, well in advance of Appert's “discovery”), isolated citric acidfrom lemon juice (1784) and gooseberries (1785), isolated malic acid from apples (1785), and tested 20 common fruits for thepresence of citric, malic, and tartaric acids (1785). His isolation of various new chemical compounds from plant and animalsubstances is considered the beginning of accurate analytical research in agricultural and food chemistry.
The French chemist Antoine Laurent Lavoisier (1743–1794) was instrumental in the final rejection of the phlogiston theory andin formulating the principles of modern chemistry. With respect to food chemistry, he established the fundamental principles ofcombustion organic analysis, he was the first to show that the process of fermentation could be expressed as a balancedequation, he made the first attempt to determine the elemental composition of alcohol (1784), and he presented one of the firstpapers (1786) on organic acids of various fruits.
(Nicolas) Théodore de Saussure (1767–1845), a French chemist, did much to formalize and clarify the principles of agriculturaland food chemistry provided by Lavoisier. He also studied CO2 and O2 changes during plant respiration (1840), studied themineral contents of plants by ashing, and made the first accurate elemental analysis of alcohol (1807).
Joseph Louis Gay-Lussac (1778–1850) and Louis-Jacques Thenard (1777–1857) devised in 1811 the first method todetermine percentages of carbon, hydrogen, and nitrogen in dry vegetable substances.
The English chemist Sir Humphrey Davy (1778–1829) in the years 1807 and 1808 isolated the elements K, Na, Ba, Sr, Ca,and Mg. His contributions to agricultural and food chemistry came largely through his books on agricultural chemistry, of whichthe first (1813) was Elements of Agriculture Chemistry, in a Course of Lectures for the Board of Agriculture [8]. Hisbooks served to organize and clarify knowledge existing at that time. In the first edition he stated,
All the different parts of plants are capable of being decomposed into a few elements. Their uses as food, or for the purpose of the arts,depend upon compound arrang ements of these elements, which are capable of being produced either from their org anized parts, or fromthe juices they contain; and the examination of the nature of these substances is an essential part of ag ricultural chemistry.
In the fifth edition he stated that plants are usually composed of only seven or eight elements, and that [9] “the most essentialvegetable substances consist of hydrogen, carbon, and oxygen in different proportion, generally alone, but in some few casescombined with azote [nitrogen]” (p. 121).
The works of the Swedish chemist Jons Jacob Berzelius (1779–1848) and the Scottish chemist Thomas Thomson (1773–1852)resulted in the beginnings of organic formulas, “without which organic analysis would be a trackless desert and food analysis anendless task” [12]. Berzelius determined the elemental components of about 2000 compounds, thereby verifying the law ofdefinite proportions. He also devised a means of accurately determining the water content of organic substances, a deficiency inthe method of Gay-Lussac and Thenard. Moreover, Thomson showed that laws governing the composition of inorganicsubstances apply equally well to organic substances, a point of immense importance.
In a book entitled Considérations générales sur l' analyse organique et sur ses applications [6], Michel Eugene Chevreul(1786–1889), a French chemist, listed the elements known to exist at that time in organic substances (O, Cl, I, N, S, P, C, Si,H, Al, Mg, Ca, Na, K, Mn, Fe) and cited the processes then available for organic analysis: (a) extraction with a neutral solvent,such as water, alcohol, or aqueous ether, (b) slow distillation, or fractional distillation,

Pag e 4
(c) steam distillation, (d) passing the substance through a tube heated to incandescence, and (e) analysis with oxygen. Chevreulwas a pioneer in the analysis of organic substances, and his classic research on the composition of animal fat led to the discoveryand naming of stearic and oleic acids.
Dr. William Beaumont (1785–1853), an American Army surgeon stationed at Fort Mackinac, Mich., performed classicexperiments on gastric digestion that destroyed the concept existing from the time of Hippocrates that food contained a singlenutritive component. His experiments were performed during the period 1825–1833 on a Canadian, Alexis St. Martin, whosemusket wound afforded direct access to the stomach interior, thereby enabling food to be introduced and subsequentlyexamined for digestive changes [4].
Among his many notable accomplishments, Justus von Liebig (1803–1873) showed in 1837 that acetaldehyde occurs as anintermediate between alcohol and acetic acid during fermentation of vinegar. In 1842 he classified foods as either nitrogenous(vegetable fibrin, albumin, casein, and animal flesh and blood) or nonnitrogenous (fats, carbohydrates, and alcoholic beverages).Although this classification is not correct in several respects, it served to distinguish important differences among various foods.He also perfected methods for the quantitative analysis of organic substances, especially by combustion, and he published in1847 what is apparently the first book on food chemistry, Researches on the Chemistry of Food [18]. Included in this bookare accounts of his research on the water-soluble constituents of muscle (creatine, creatinine, sarcosine, inosinic acid, lactic acid,etc.).
It is interesting that the developments just reviewed paralleled the beginning of serious and widespread adulteration of food, andit is no exaggeration to state that the need to detect impurities in food was a major stimulus for the development of analyticalchemistry in general and analytical food chemistry in particular. Unfortunately, it is also true that advances in chemistrycontributed somewhat to the adulteration of food, since unscrupulous purveyors of food were able to profit from the availabilityof chemical literature, including formulas for adulterated food, and could replace older, less effective empirical approaches tofood adulteration with more efficient approaches based on scientific principles. Thus, the history of food chemistry and thehistory of food adulteration are closely interwoven by the threads of several causative relationships, and it is thereforeappropriate to consider the matter of food adulteration from a historical perspective [12].
The history of food adulteration in the currently more developed countries of the world falls into three distinct phases. Fromancient times to about 1820 food adulteration was not a serious problem and there was little need for methods of detection. Themost obvious explanation for this situation was that food was procured from small businesses or individuals, and transactionsinvolved a large measure of interpersonal accountability. The second phase began in the early 1800s, when intentional foodadulteration increased greatly in both frequency and seriousness. This development can be attributed primarily to increasedcentralization of food processing and distribution, with a corresponding decline in interpersonal accountability, and partly to therise of modern chemistry, as already mentioned. Intentional adulteration of food remained a serious problem until about 1920,which marks the end of phase two and the beginning of phase three. At this point regulatory pressures and effective methods ofdetection reduced the frequency and seriousness of intentional food adulteration to acceptable levels, and the situation hasgradually improved up to the present time.
Some would argue that a fourth phase of food adulteration began about 1950, when foods containing legal chemical additivesbecame increasingly prevalent, when the use of highly processed foods increased to a point where they represented a major partof the diet of persons in most of the industrialized countries, and when contamination of some foods with undesirable by-products of industrialization, such as mercury, lead, and pesticides, became of public and
Pag e 5
regulatory concern. The validity of this contention is hotly debated and disagreement persists to this day. Nevertheless, thecourse of action in the next few years seems clear. Public concern over the safety and nutritional adequacy of the food supplyhas already led to some recent changes, both voluntary and involuntary, in the manner in which foods are produced, handled,and processed, and more such actions are inevitable as we learn more about proper handling practices for food and as estimatesof maximum tolerable intake of undesirable constituents become more accurate.
The early 1800s was a period of especially intense public concern over the quality and safety of the food supply. This concern,or more properly indignation, was aroused in England by Frederick Accum's publication A Treatise on Adulterations of Food[1] and by an anonymous publication entitled Death in the Pot [3]. Accum claimed that “Indeed, it would be difficult to mentiona single article of food which is not to be met with in an adulterated state; and there are some substances which are scarcely everto be procured genuine” (p. 14). He further remarked, “It is not less lamentable that the extensive application of chemistry to theuseful purposes of life, should have been perverted into an auxiliary to this nefarious traffic [adulteration]” (p. 20).
Although Filby [12] asserted that Accum's accusations were somewhat overstated, the seriousness of intentional adulteration offood that prevailed in the early 1800s is clearly exemplified by the following not uncommon adulterants cited by both Accum andFilby:
Annatto: Adulterants included turmeric, rye, barley, wheat flour, calcium sulfate and carbonate, salt, and Venetian red (ferricoxide, which in turn was sometimes adulterated with red lead and copper).
Pepper, black: This important product was commonly adulterated with gravel, leaves, twigs, stalks, pepper dust, linseedmeal, and ground parts of plants other than pepper.
Pepper, cayenne. Substances such as vermillion (a-mercury sulfide), ocher (native earthy mixtures of metallic oxides andclay), and turmeric were commonly added to overcome bleaching that resulted from exposure to light.
Essential oils: Oil of turpentine, other oils, and alcohol.
Vinegar: Sulfuric acid
Lemon juice: Sulfuric and other acids
Coffee: Roasted grains, occasionally roasted carrots or scorched beans and peas; also, baked horse liver.
Tea: Spent, redried tea leaves, and leaves of many other plants.
Milk: Watering was the main form of adulteration; also, the addition of chalk, starch, turmeric (color), gums, and soda wascommon. Occasionally encountered were gelatin, dextrin, glucose, preservatives (borax, boric acid, salicylic acid, sodiumsalicylate, potassium nitrate, sodium fluoride, and benzoate), and such colors as annatto, saffron, caramel, and somesulfonated dyes.
Beer: “Black extract,” obtained by boiling the poisonous berries of Cocculus indicus in water and concentrating the fluid,was apparently a common additive. This extract imparted flavor, narcotic properties, additional intoxicating qualities, andtoxicity to the beverage.
Wine: Colorants: alum, husks of elderberries, Brazil wood, and burnt sugar, among others. Flavors: bitter almonds, tinctureof raisin seeds, sweet-brier, oris root, and others. Aging agents: bitartrate of potash, “oenathis” ether (heptyl ether), and leadsalts. Preservatives: salicylic acid, benzoic acid, fluoborates, and lead salts. Antacids: lime, chalk, gypsum, and lead salts.
Sugar: Sand, dust, lime, pulp, and coloring matters.
Butter: Excessive salt and water, potato flour, and curds.

Pag e 6
Chocolate: Starch, ground sea biscuits, tallow, brick dust, ocher, Venetian red (ferric oxide), and potato flour.
Bread: Alum, and flour made from products other than wheat.
Confectionery products: Colorants containing lead and arsenic.
Once the seriousness of food adulteration in the early 1800s was made evident to the public, remedial forces graduallyincreased. These took the form of new legislation to make adulteration unlawful, and greatly expanded efforts by chemists tolearn about the native properties of foods, the chemicals commonly used as adulterants, and the means of detecting them. Thus,during the period 1820–1850, chemistry and food chemistry began to assume importance in Europe. This was possible becauseof the work of the scientists already cited, and was stimulated largely by the establishment of chemical research laboratories foryoung students in various universities and by the founding of new journals for chemical research [5]. Since then, advances infood chemistry have continued at an accelerated pace, and some of these advances, along with causative factors, are mentionedbelow.
In 1860, the first publicly supported agriculture experiment station was established in Weede, Germany, and W. Hanneberg andF. Stohmann were appointed director and chemist, respectively. Based largely on the work of earlier chemists, they developedan important procedure for the routine determination of major constituents in food. By dividing a given sample into severalportions they were able to determine moisture content, “crude fat,” ash, and nitrogen. Then, by multiplying the nitrogen value by6.25, they arrived at its protein content. Sequential digestion with dilute acid and dilute alkali yielded a residue termed “crudefiber.” The portion remaining after removal of protein, fat, ash, and crude fiber was termed “nitrogen-free extract,” and this wasbelieved to represent utilizable carbohydrate. Unfortunately, for many years chemists and physiologists wrongfully assumed thatlike values obtained by this procedure represented like nutritive value, regardless of the kind of food [20].
In 1871, Jean Baptiste Duman (1800–1884) suggested that a diet consisting of only protein, carbohydrate, and fat wasinadequate to support life.
In 1862, the Congress of the United States passed the Land-Grant College Act, authored by Justin Smith Morrill. This acthelped establish colleges of agriculture in the United States and provided considerable impetus for the training of agricultural andfood chemists. Also in 1862, the United States Department of Agriculture was established and Isaac Newton was appointed thefirst commissioner.
In 1863, Harvey Washington Wiley became chief chemist of the U.S. Department of Agriculture, from which office he led thecampaign against misbranded and adulterated food, culminating in passage of the first Pure Food and Drug Act in the UnitedStates (1906).
In 1887, agriculture experiment stations were established in the United States following enactment of the Hatch Act.Representative William H. Hatch of Missouri, Chairman of the House Committee on Agriculture, was author of the act. As aresult, the world's largest national system of agriculture experiment stations came into existence, and this had a great impact onfood research in the United States.
During the first half of the twentieth century, most of the essential dietary substances were discovered and characterized, namely,vitamins, minerals, fatty acids, and some amino acids.
The development and extensive use of chemicals to aid in the growth, manufacture, and marketing of foods was an especiallynoteworthy and contentious event in the middle 1900s.
This historical review, although brief, makes the current food supply seem almost perfect in comparison to that which existed inthe 1800s.

Pag e 7
1.3 Approach to the Study of Food Chemistry
It is desirable to establish an analytical approach to the chemistry of food formulation, processing, and storage stability, so thatfacts derived from the study of one food or model system can enhance our understanding of other products. There are fourcomponents to this approach: (a) determining those properties that are important characteristics of safe, high-quality foods, (b)determining those chemical and biochemical reactions that have important influences on loss of quality and/or wholesomeness offoods, (c) integrating the first two points so that one understands how the key chemical and biochemical reactions influencequality and safety, and (d) applying this understanding to various situations encountered during formulation, processing, andstorage of food.
1.3.1 Quality and Safety Attributes
It is essential to reiterate that safety is the first requisite of any food. In a broad sense, this means a food must be free of anyharmful chemical or microbial contaminant at the time of its consumption. For operational purposes this definition takes on amore applied form. In the canning industry, “commercial” sterility as applied to low-acid foods means the absence of viablespores of Clostridium botulinum. This in turn can be translated into a specific set of heating conditions for a specific product ina specific package. Given these heating requirements, one can then select specific time-temperature conditions that will optimizeretention of quality attributes. Similarly, in a product such as peanut butter, operational safety can be regarded primarily as theabsence of aflatoxins—carcinogenic substances produced by certain species of molds. Steps taken to prevent growth of themold in question may or may not interfere with retention of some other quality attribute; nevertheless, conditions producing a safeproduct must be employed.
A list of quality attributes of food and some alterations they can undergo during processing and storage is given in Table 1. Thechanges that can occur, with the exception of those involving nutritive value and safety, are readily evident to the consumer.
1.3.2 Chemical and Biochemical Reactions
Many reactions can alter food quality or safety. Some of the more important classes of these reactions are listed in Table 2.Each reaction class can involve different reactants or substrates depending on the specific food and the particular conditions forhandling, processing, or storage. They are treated as reaction classes because the general nature of the substrates or reactants issimilar for all foods. Thus, nonenzymic browning involves reaction of carbonyl compounds, which can arise from existingreducing sugars or from diverse reactions, such as oxidation of ascorbic acid, hydrolysis of starch, or oxidation of lipids.Oxidation may involve lipids, proteins, vitamins, or pigments, and more specifically, oxidation of lipids may involvetriacylglycerols in one food or phospholipids in another. Discussion of these reactions in detail will occur in subsequent chaptersof this book.
1.3.3 Effect of Reactions on the Quality and Safety of Food
The reactions listed in Table 3 cause the alterations listed in Table 1. Integration of the information contained in both tables canlead to an understanding of the causes of food deterioration. Deterioration of food usually consists of a series of primary eventsfollowed by

Pag e 8
TABLE 1 Classification of Alterations That Can Occur in Food During Handling ,Processing , or Storag e
Attribute Alteration
Texture Loss of solubilityLoss of water-holding capacityToug heningSoftening
Flavor Development of:Rancidity (hydrolytic or oxidative)Cooked or caramel flavorsOther off-flavorsDesirable flavors
Color DarkeningBleachingDevelopment of other off-colors
Development of desirable colors (e.g ., browning of baked g oods)
Nutritive value Loss, deg radation or altered bioavailability of proteins, lipids,vitamins, minerals
Safety Generation of toxic substancesDevelopment of substances that are protective to healthInactivation of toxic substances
secondary events, which, in turn, become evident as altered quality attributes (Table 1). Examples of sequences of this type areshown in Table 3. Note particularly that a given quality attribute can be altered as a result of several different primary events.
The sequences in Table 3 can be applied in two directions. Operating from left to right one can consider a particular primaryevent, the associated secondary events, and the effect on a
TABLE 2 Some Chemical and Biochemical Reactions That Can Lead to Alteration of Food Qualityor Safety
Types of reaction Examples
Nonenzymic browning Baked g oods
Enzymic browning Cut fruits
Oxidation Lipids (off-flavors), vitamin deg radation, pig mentdecoloration, proteins (loss of nutritive value)
Hydrolysis Lipids, proteins, vitamins, carbohydrates, pig ments
Metal interactions Complexation (anthocyanins), loss of Mg from chlorophyll,catalysis of oxidation
Lipid isomerization Cis trans, nonconjug ated conjug ated
Lipid cyclization Monocyclic fatty acids
Lipid polymerization Foaming during deep fat frying
Protein denaturation Eg g white coag ulation, enzyme inactivation
Protein cross-linking Loss of nutritive value during alkali processing
Polysaccharide synthesis In plants postharvest
Glycolytic chang es Animal tissue postmortem, plant tissue postharvest


Pag e 9
TABLE 3 Cause-and-Effect Relationships Pertaining to Food Alterations During Handling , Storag e, andProcessing
Primary causative event Secondary event Attribute influenced (see Table 1)
Hydrolysis of lipids Free fatty acids react with protein Texture, flavor, nutritive value
Hydrolysis ofpolysaccharides
Sug ars react with proteins Texture, flavor, color, nutritivevalue
Oxidation of lipids Oxidation products react with many otherconstituents
Texture, flavor, color, nutritivevalue; toxic substances can beg enerated
Bruising of fruit Cells break, enzymes are released, oxyg enaccessible
Texture, flavor, color, nutritivevalue
Heating of g reenveg etables
Cell walls and membranes lose integ rity,acids are released, enzymes become inactive
Texture, flavor, color, nutritivevalue
Heating of muscle tissue Proteins denature and ag g reg ate, enzymesbecome inactive
Texture, flavor, color, nutritivevalue
Cis trans conversionsin lipids
Enhanced rate of polymerization duringdeep fat frying
Excessive foaming during deep fatfrying ; diminished bioavailabilityof lipids
quality attribute. Alternatively, one can determine the probable cause(s) of an observed quality change (column 3, Table 3) byconsidering all primary events that could be involved and then isolating, by appropriate chemical tests, the key primary event.The utility of constructing such sequences is that they encourage one to approach problems of food alteration in an analyticalmanner.
Figure 1 is a simplistic summary of reactions and interactions of the major constituents
FIGURE 1Summary of chemical interactions among major food constituents: L, lipid pool
(triacylg lycerols, fatty acids, and phospholipids); C, carbohydrate pool(polysaccharides, sug ars, org anic acids, and so on); P, protein pool (proteins,
peptides, amino acids, and other N-containing substances).

Pag e 10
TABLE 4 Important Factors Governing the Stability of Foods During Handling ,Processing , and Storag e
Product factors: chemical properties of individual constituents (includingcatalysts), oxyg en content, pH, water activity, T g and W g
Environmental factors: temperature (T), time (t), composition of the atmosphere,chemical, physical or biolog ical treatments imposed, exposure to lig ht,contamination, physical abuse
Note. W ater activity = p/p 0, where p is the partial pressure of water vapor abovethe food and p 0 is the vapor pressure of pure water; T g is the g lass transitiontemperature; W g is the product water content at T g.
of food. The major cellular pools of carbohydrates, lipids, proteins, and their intermediary metabolites are shown on the left-hand side of the diagram. The exact nature of these pools is dependent on the physiological state of the tissue at the time ofprocessing or storage, and the constituents present in or added to nontissue foods. Each class of compound can undergo its owncharacteristic type of deterioration. Noteworthy is the role that carbonyl compounds play in many deterioration processes. Theyarise mainly from lipid oxidation and carbohydrate degradation, and can lead to the destruction of nutritional value, to off-colors,and to off-flavors. Of course these same reactions lead to desirable flavors and colors during the cooking of many foods.
1.3.4 Analysis of Situations Encountered During the Storage and Processing of Food
Having before us a description of the attributes of high-quality, safe foods, the significant chemical reactions involved in thedeterioration of food, and the relationship between the two, we can now begin to consider how to apply this information tosituations encountered during the storage and processing of food.
The variables that are important during the storage and processing of food are listed in Table 4. Temperature is perhaps the mostimportant of these variables because of its broad influence on all types of chemical reactions. The effect of temperature on anindividual reaction can be estimated from the Arrhenius equation, k = Ae-D E/RT. Data conforming to the Arrhenius equation yielda straight line when logk is plotted versus 1/T. Arrhenius plots in Figure 2 represent reactions important in food deterioration. Itis evident that food reactions generally conform to the Arrhenius relationship over a limited intermediate temperature range butthat deviations from this relationship can occur at high or low temperatures [21]. Thus, it is important to remember that theArrhenius relationship for food systems is valid only over a range of temperature that has been experimentally verified.Deviations from the Arrhenius relationship can occur because of the following events, most of which are induced by either highor low temperatures: (a) enzyme activity may be lost, (b) the reaction pathway may change or may be influenced by a competingreaction(s), (c) the physical state of the system may change (e.g., by freezing), or (d) one or more of the reactants may becomedepleted.
Another important factor in Table 4 is time. During storage of a food product, one frequently wants to know how long the foodcan be expected to retain a specified level of quality. Therefore, one is interested in time with respect to the integral of chemicaland/or microbiological changes that occur during a specified storage period, and in the way these changes combine to determinea specified storage life for the product. During processing, one is often

Pag e 11
FIGURE 2Conformity of important deteriorative reactions
in food to the Arrhenius relationship. (a)Above a certain value of T there may bedeviations from linearity due to a chang e
in the path of the reaction. (b) As thetemperature is lowered below the freezing
point of the system, the ice phase (essentiallypure) enlarg es and the fluid phase, whichcontains all the solutes, diminishes. This
concentration of solutes in the unfrozen phasecan decrease reaction rates (supplement theeffect of decreasing temperature) or increasereaction rates (oppose the effect of declining
temperature), depending on the nature ofthe system (see Chap. 2). (c) For an enzymicreaction there is a temperature in the vicinityof the freezing point of water where subtle
chang es, such as the dissociation of anenzyme complex, can lead to a sharp decline
in reaction rate.
interested in the time it takes to inactivate a particular population of microorganisms or in how long it takes for a reaction toproceed to a specified extent. For example, it may be of interest to know how long it takes to produce a desired brown color inpotato chips during frying. To accomplish this, attention must be given to temperature change with time, that is, the rate oftemperature change (dT/dt). This relationship is important because it determines the rate at which microorganisms are destroyedand the relative rates of competing chemical reactions. The latter is of interest in foods that deteriorate by more than one means,such as lipid oxidation and nonenzymic browning. If the products of the browning reaction are antioxidants, it is important toknow whether the relative rates of these reactions are such that a significant interaction will occur between them.

Pag e 12
Another variable, pH, influences the rates of many chemical and enzymic reactions. Extreme pH values are usually required forsevere inhibition of microbial growth or enzymic processes, and these conditions can result in acceleration of acid- or base-catalyzed reactions. In contrast, even a relatively small pH change can cause profound changes in the quality of some foods, forexample, muscle.
The composition of the product is important since this determines the reactants available for chemical transformation. Particularlyimportant from a quality standpoint is the relationship that exists between composition of the raw material and composition of thefinished product. For example, (a) the manner in which fruits and vegetables are handled postharvest can influence sugar content,and this, in turn, influences the degree of browning obtained during dehydration or deep-fat frying. (b) The manner in whichanimal tissues are handled postmortem influences the extents and rates of glycolysis and ATP degradation, and these in turn caninfluence storage life, water-holding capacity, toughness, flavor, and color. (c) The blending of raw materials may causeunexpected interactions; for example, the rate of oxidation can be accelerated or inhibited depending on the amount of saltpresent.
Another important compositional determinant of reaction rates in foods is water activity (aw). Numerous investigators haveshown aw to strongly influence the rate of enzyme-catalyzed reactions [2], lipid oxidation [16,22], nonenzymic browning [10,16],sucrose hydrolysis [23], chlorophyll degradation [17], anthocyanin degradation [11], and others. As is discussed in Chapter 2,most reactions tend to decrease in rate below an aw corresponding to the range of intermediate moisture foods (0.75–0.85).Oxidation of lipids and associated secondary effects, such as carotenoid decoloration, are exceptions to this rule; that is, thesereactions accelerate at the lower end of the aw scale.
More recently, it has become apparent that the glass transition temperature (Tg) of food and the corresponding water content(Wg) of the food at Tg are causatively related to rates of diffusion-limited events in food. Thus, Tg and Wg have relevance to thephysical properties of frozen and dried foods, to conditions appropriate for freeze drying, to physical changes involvingcrystallization, recrystallization, gelatinization, and starch retrogradation, and to those chemical reactions that are diffusion-limited(see Chap. 2).
In fabricated foods, the composition can be controlled by adding approved chemicals, such as acidulants, chelating agents,flavors, or antioxidants, or by removing undesirable reactants, for example, removing glucose from dehydrated egg albumen.
Composition of the atmosphere is important mainly with respect to relative humidity and oxygen content, although ethylene andCO2 are also important during storage of living plant foods. Unfortunately, in situations where exclusion of oxygen is desirable,this is almost impossible to achieve completely. The detrimental consequences of a small amount of residual oxygen sometimesbecome apparent during product storage. For example, early formation of a small amount of dehydroascorbic acid (fromoxidation of ascorbic acid) can lead to Maillard browning during storage.
For some products, exposure to light can be detrimental, and it is then appropriate to package the products in light-imperviousmaterial or to control the intensity and wavelengths of light, if possible.
Food chemists must be able to integrate information about quality attributes of foods, deteriorative reactions to which foods aresusceptible, and the factors governing kinds and rates of these deteriorative reactions, in order to solve problems related to foodformulation, processing, and storage stability.

Pag e 13
1.4 Societal Role of Food Chemists
1.4.1 Why Should Food Chemists Become Involved in Societal Issues?
Food chemists, for the following reasons, should feel obligated to become involved in societal issues that encompass pertinenttechnological aspects (technosocietal issues).
• Food chemists have had the privilege of receiving a high level of education and of acquiring special scientific skills, and theseprivileges and skills carry with them a corresponding high level of responsibility.
• Activities of food chemists influence adequacy of the food supply, healthfulness of the population, cost of foods, waste creationand disposal, water and energy use, and the nature of food regulations. Because these matters impinge on the general welfare ofthe public, it is reasonable that food chemists should feel a responsibility to have their activities directed to the benefit of society.
• If food chemists do not become involved in technosocietal issues, the opinions of others—scientists from other professions,professional lobbyists, persons in the news media, consumer activists, charlatans, antitechnology zealots—will prevail. Many ofthese individuals are less qualified than food chemists to speak on food-related issues, and some are obviously unqualified.
1.4.2 Types of Involvement
The societal obligations of food chemists include good job performance, good citizenship, and guarding the ethics of the scientificcommunity, but fulfillment of these very necessary roles is not enough. An additional role of great importance, and one that oftengoes unfulfilled by food chemists, is that of helping determine how scientific knowledge is interpreted and used by society.Although food chemists and other food scientists should not have the only input to these decisions, they must, in the interest ofwise decision making, have their views heard and considered. Acceptance of this position, which is surely indisputable, leads tothe obvious question, “What exactly should food chemists do to properly discharge their responsibilities in this regard?” Severalactivities are appropriate.
1. Participate in pertinent professional societies.
2. Serve on governmental advisory committees, when invited.
3. Undertake personal initiatives of a public service nature.
The latter can involve letters to newspapers, journals, legislators, government regulators, company executives, universityadministrators, and others, and speeches before civic groups.
The major objectives of these efforts are to educate and enlighten the public with respect to food and dietary practices. Thisinvolves improving the public's ability to intelligently evaluate information on these topics. Accomplishing this will not be easybecause a significant portion of the populace has ingrained false notions about food and proper dietary practices, and becausefood has, for many individuals, connotations that extend far beyond the chemist's narrow view. For these individuals, food maybe an integral part of religious practice, cultural heritage, ritual, social symbolism, or a route to physiological well-being—attitudes that are, for the most part, not conducive to acquiring an ability to appraise foods and dietary practices in asound, scientific manner.
One of the most contentious food issues, and one that has eluded appraisal by the

Pag e 14
public in a sound, scientific manner, is the use of chemicals to modify foods. “Chemophobia,” the fear of chemicals, has afflicteda significant portion of the populace, causing food additives, in the minds of many, to represent hazards inconsistent with fact.One can find, with disturbing ease, articles in the popular literature whose authors claim the American food supply is sufficientlyladen with poisons to render it unwholesome at best, and life-threatening at worst. Truly shocking, they say, is the manner inwhich greedy industrialists poison our foods for profit while an ineffectual Food and Drug Administration watches with placidunconcern. Should authors holding this viewpoint be believed? It is advisable to apply the following criteria when evaluating thevalidity of any journalistic account dealing with issues of this kind.
• Credibility of the author. Is the author, by virtue of formal education, experience, and acceptance by reputable scientists,qualified to write on the subject? The writer should, to be considered authoritative, have been a frequent publisher of articles inrespected scientific journals, especially those requiring peer review. If the writer has contributed only to the popular literature,particularly in the form of articles with sensational titles and “catch” phrases, this is cause to exercise special care in assessingwhether the presentation is scholarly and reliable.
• Appropriateness of literature citations. A lack of literature citations does not constitute proof of irresponsible or unreliablewriting, but it should provoke a feeling of moderate skepticism in the reader. In trustworthy publications, literature citations willalmost invariably be present and will direct the reader to highly regarded scientific publications. When “popular” articlesconstitute the bulk of the literature citations, the author's views should be regarded with suspicion.
• Credibility of the publisher. Is the publisher of the article, book, or magazine regarded by reputable scientists as a consistentpublisher of high-quality scientific materials? If not, an extra measure of caution is appropriate when considering the data.
If information in poison-pen types of publications are evaluated by rational individuals on the basis of the preceding criteria, suchinformation will be dismissed as unreliable. However, even if these criteria are followed, disagreement about the safety of foodsstill occurs. The great majority of knowledgeable individuals support the view that our food supply is acceptably safe andnutritious and that legally sanctioned food additives pose no unwarranted risks [7,13,15,19,24–26]. However, a relatively smallgroup of knowledgeable individuals believes that our food supply is unnecessarily hazardous, particularly with regard to some ofthe legally sanctioned food additives, and this view is most vigorously represented by Michael Jacobson and his Center forScience in the Public Interest. This serious dichotomy of opinion cannot be resolved here, but information provided in Chapter13 will help undecided individuals arrive at a soundly based personal perspective on food additives, contaminants in foods, andfood safety.
In summary, scientists have greater obligations to society than do individuals without formal scientific education. Scientists areexpected to generate knowledge in a productive, ethical manner, but this is not enough. They should also accept theresponsibility of ensuring that scientific knowledge is used in a manner that will yield the greatest benefit to society. Fulfillment ofthis obligation requires that scientists not only strive for excellence and conformance to high ethical standards in their day-to-dayprofessional activities, but that they also develop a deep-seated concern for the well-being and scientific enlightenment of thepublic.

Pag e 15
References
1. Accum, F. (1966). A Treatise on Adulteration of Food, and Culinary Poisons, 1920, Facsimile reprint by MallinckrodtChemical Works, St. Louis, MO.
2. Acker, L. W. (1969). Water activity and enzyme activity. Food Technol. 23(10):1257–1270.
3. Anonymous (1831). Death in the Pot. Cited by Filby, 1934 (Ref. 12).
4. Beaumont, W. (1833). Experiments and Observations of the Gastric Juice and the Physiology of Digestion, F. P.Allen, Plattsburgh, NY.
5. Browne, C. A. (1944). A Source Book of Agricultural Chemistry. Chronica Botanica Co., Waltham, MA.
6. Chevreul, M. E. (1824). Considérations générales sur l'analyse organique et sur ses applications. Cited by Filby, 1934 (Ref.12).
7. Clydesdale, F. M., and F. J. Francis (1977). Food, Nutrition and You, Prentice-Hall, Englewood Cliffs, NJ.
8. Davy, H. (1813). Elements of Agricultural Chemistry, in a Course of Lectures for the Board of Agriculture, Longman,Hurst, Rees, Orme and Brown, London, Cited by Browne, 1944 (Ref. 5).
9. Davy, H. (1936). Elements of Agricultural Chemistry, 5th ed., Longman, Rees, Orme, Brown, Green and Longman,London.
10. Eichner, K., and M. Karel (1972). The influence of water content and water activity on the sugar-amino browning reactionin model systems under various conditions. J. Agric. Food Chem. 20(2):218–223.
11. Erlandson, J. A., and R. E. Wrolstad (1972). Degradation of anthocyanins at limited water concentration. J. Food Sci.37(4):592–595.
12. Filby, F. A. (1934). A History of Food Adulteration and Analysis, George Allen and Unwin, London.
13. Hall, R. L. (1982). Food additives, in Food and People (D. Kirk and I. K. Eliason, eds.), Boyd and Fraser, SanFrancisco, pp. 148–156.
14. Ihde, A. J. (1964). The Development of Modern Chemistry, Harper and Row, New York.
15. Jukes, T. H. (1978). How safe is our food supply? Arch. Intern. Med. 138:772–774.
16. Labuza, T. P., S. R. Tannenbaum, and M. Karel (1970). Water content and stability of low-moisture and intermediate-moisture foods. Food Techol. 24(5):543–550.
17. LaJollo, F., S. R. Tannenbaum, and T. P. Labuza (1971). Reaction at limited water concentration. 2. Chlorophylldegradation. J. Food Sci. 36(6):850–853.
18. Liebig, J. Von (1847). Researches on the Chemistry of Food, edited from the author's manuscript by William Gregory;Londson, Taylor and Walton, London. Cited by Browne, 1944 (Ref. 5).
19. Mayer, J. (1975). A Diet for Living, David McKay, Inc., New York.
20. McCollum, E. V. (1959). The history of nutrition. World Rev. Nutr. Diet. 1:1–27.
21. McWeeny, D. J. (1968). Reactions in food systems: Negative temperature coefficients and other abnormal temperatureeffects. J. Food Technol. 3:15–30.
22. Quast, D. G., and M. Karel (1972). Effects of environmental factors on the oxidation of potato chips. J. Food Sci.37(4):584–588.
23. Schoebel, T., S. R. Tannenbaum, and T. P. Labuza (1969). Reaction at limited water concentration. 1. Sucrose hydrolysis.J. Food Sci. 34(4):324–329.

24. Stare, F. J., and E. M. Whelan (1978). Eat OK—Feel OK, Christopher Publishing House, North Quincy, MA.
25. Taylor, R. J. (1980). Food Additives, John Wiley & Sons, New York.
26. Whelan, E. M. (1993). Toxic Terror, Prometheus Books, Buffalo, NY.

Pag e 17
2Water and Ice
OWEN R. FENNEMA
University of Wisconsin—Madison, Madison, Wisconsin
Prologue: Water—The Deceptive Matter of Life and Death 18
2.1 Introduction 18
2.2 Physical Properties of Water and Ice 19
2.3 The Water Molecule 20
2.4 Association of Water Molecules 22
2.5 Structure of Ice 24
2.5.1 Pure Ice 24
2.5.2 Ice in the Presence of Solutes 29
2.6 Structure of Water 29
2.7 Water-Solute Interactions 30
2.7.1 Macroscopic Level (Water Binding, Hydration, and waterHolding Capacity)
30
2.7.2 Molecular Level: General Comments 31
2.7.3 Molecular Level: Bound Water 31
2.7.4 Interaction of Water with Ions and Ionic Groups 32
2.7.5 Interaction of Water with Neutral Groups Possessing Hydrogen-Bonding Capabilities (Hydrophilic Solutes)
33
2.7.6 Interaction of Water with Nonpolar Substances 35
2.7.7 Details of Water Orientation Adjacent to Organic Molecules 37
2.7.8 Hydration Sequence of a Protein 38
2.8 Water Activity and Relative Vapor Pressure 42
2.8.1 Introduction 42
2.8.2 Definition and Measurement 42
2.8.3 Temperature Dependence 44

2.9 Moisture Sorption Isotherms 47
2.9.1 Definition and Zones 47
2.9.2 Temperature Dependence 50
2.9.3 Hysteresis 50
Pag e 18
2.10 Relative Vapor Pressure and Food Stability 52
2.11 Molecular Mobility (Mm) and Food Stability 55
2.11.1 Introduction 55
2.11.2 State Diagrams 57
2.11.3 Nine Key Concepts Underlying the Molecular MobilityApproach to Food Stability
59
2.11.4 Technological Aspects: Freezing 72
2.11.5 Technological Aspects: Air Drying 79
2.11.6 Technological Aspects: Vacuum Freeze-Drying(Lyophilization)
79
2.11.7 Technological Aspects: Other Applications of the MmApproach (Partial Listing)
80
2.11.8 Technological Aspects: Estimation of Relative Shelf Life 80
2.11.9 Technological Aspects: Relationship of Tg and Mm to RelativeVapor Pressure (p/p0) and Moisture Sorption Isotherms
80
2.11.10 Summary Statements Regarding the Mm Approach to FoodStability
82
2.12 Combined Methods Approach to Food Stability 83
2.13 Concluding Comments About Water 85
Glossary: Molecular Mobility and Food Stability 85
Acknowledgments 87
Abbreviations and Symbols 87
Bibliography 88
References 88
Prologue: Water—The Deceptive Matter of Life and Death

Unnoticed in the darkness of a subterranean cavern, a water droplet trickles slowly down a stalactite, following a path left bycountless predecessors, imparting, as did they, a small but almost magical touch of mineral beauty. Pausing at the tip, the dropletgrows slowly to full size, then plunges quickly to the cavern floor, as if anxious to perform other tasks or to assume differentforms. For water, the possibilities are countless. Some droplets assume roles of quiet beauty—on a child's coat sleeve, where asnowflake of unique design and exquisite perfection lies unnoticed; on a spider's web, where dew drops burst into suddenbrilliance at the first touch of the morning sun; in the countryside, where a summer shower brings refreshment; or in the city,where fog gently permeates the night air, subduing harsh sounds with a glaze of tranquility. Others lend themselves to the noiseand vigor of a waterfall, to the overwhelming immensity of a glacier, to the ominous nature of an impending storm, or to thepersuasiveness of a tear on a woman's cheek. For others the role is less obvious but far more critical. There is life—initiated andsustained by water in a myriad of subtle and poorly understood ways—or death inevitable, catalyzed under specialcircumstances by a few hostile crystals of ice; or decay at the forest's floor, where water works relentlessly to disassemble thepast so life can begin anew. But the form of water most familiar to humans is none of these; rather, it is simple, ordinary, anduninspiring, unworthy of special notice as it flows forth in cool abundance from a household tap. “Humdrum,” galunks a frog inconcurrence, or so it seems as he views with stony indifference the watery milieu on which his very life depends. Surely, then,water's most remarkable feature is deception, for it is in reality a substance of infinite complexity, of great and unassessableimportance, and one that is endowed with a strangeness and beauty sufficient to excite and challenge anyone making itsacquaintance.
2.1 Introduction
On this planet, water is the only substance that occurs abundantly in all three physical states. It is the only common liquid and isthe most widely distributed pure solid, being ever present
Pag e 19
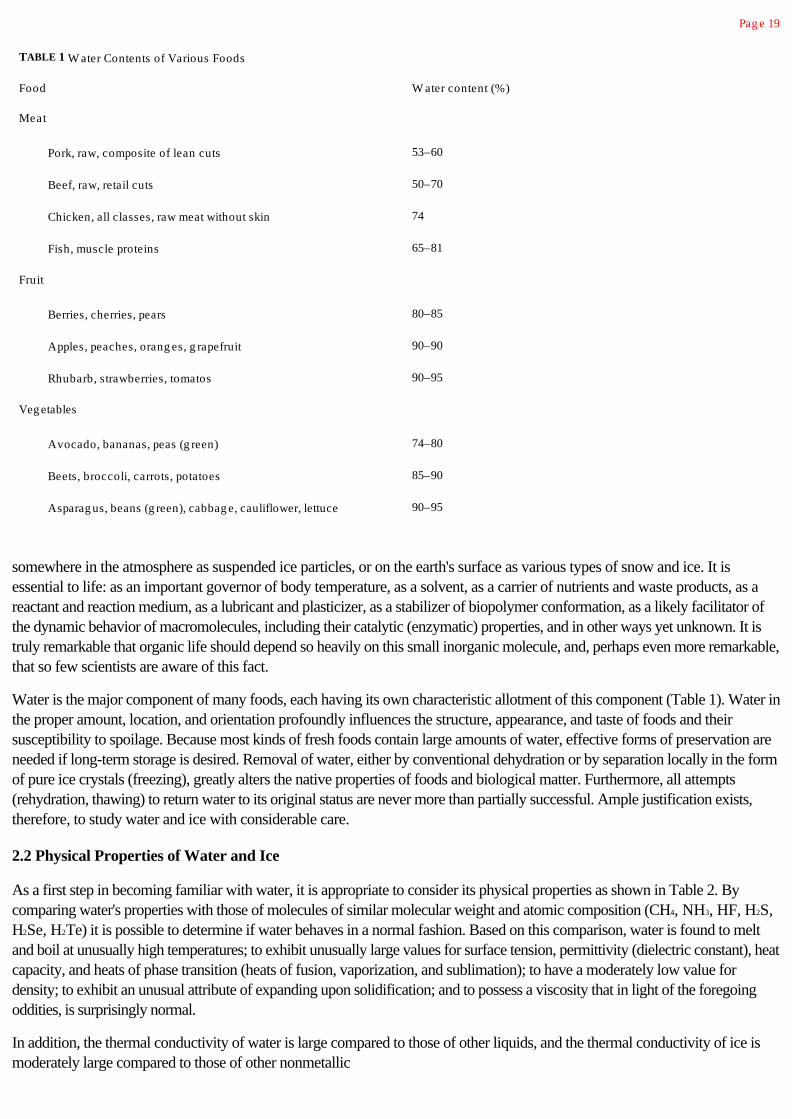
TABLE 1 W ater Contents of Various Foods
Food W ater content (%)
Meat
Pork, raw, composite of lean cuts 53–60
Beef, raw, retail cuts 50–70
Chicken, all classes, raw meat without skin 74
Fish, muscle proteins 65–81
Fruit
Berries, cherries, pears 80–85
Apples, peaches, orang es, g rapefruit 90–90
Rhubarb, strawberries, tomatos 90–95
Veg etables
Avocado, bananas, peas (g reen) 74–80
Beets, broccoli, carrots, potatoes 85–90
Asparag us, beans (g reen), cabbag e, cauliflower, lettuce 90–95
somewhere in the atmosphere as suspended ice particles, or on the earth's surface as various types of snow and ice. It isessential to life: as an important governor of body temperature, as a solvent, as a carrier of nutrients and waste products, as areactant and reaction medium, as a lubricant and plasticizer, as a stabilizer of biopolymer conformation, as a likely facilitator ofthe dynamic behavior of macromolecules, including their catalytic (enzymatic) properties, and in other ways yet unknown. It istruly remarkable that organic life should depend so heavily on this small inorganic molecule, and, perhaps even more remarkable,that so few scientists are aware of this fact.
Water is the major component of many foods, each having its own characteristic allotment of this component (Table 1). Water inthe proper amount, location, and orientation profoundly influences the structure, appearance, and taste of foods and theirsusceptibility to spoilage. Because most kinds of fresh foods contain large amounts of water, effective forms of preservation areneeded if long-term storage is desired. Removal of water, either by conventional dehydration or by separation locally in the formof pure ice crystals (freezing), greatly alters the native properties of foods and biological matter. Furthermore, all attempts(rehydration, thawing) to return water to its original status are never more than partially successful. Ample justification exists,therefore, to study water and ice with considerable care.
2.2 Physical Properties of Water and Ice
As a first step in becoming familiar with water, it is appropriate to consider its physical properties as shown in Table 2. Bycomparing water's properties with those of molecules of similar molecular weight and atomic composition (CH4, NH3, HF, H2S,H2Se, H2Te) it is possible to determine if water behaves in a normal fashion. Based on this comparison, water is found to meltand boil at unusually high temperatures; to exhibit unusually large values for surface tension, permittivity (dielectric constant), heatcapacity, and heats of phase transition (heats of fusion, vaporization, and sublimation); to have a moderately low value fordensity; to exhibit an unusual attribute of expanding upon solidification; and to possess a viscosity that in light of the foregoingoddities, is surprisingly normal.
In addition, the thermal conductivity of water is large compared to those of other liquids, and the thermal conductivity of ice ismoderately large compared to those of other nonmetallic

Pag e 20
TABLE 2 Physical Properties of W ater and Ice
Property Value
Molecular weig ht 18.0153
Phase transition properties
Melting point at 101.3 k Pa (1 atm) 0.000°C
Boiling point at 101.3 k Pa (1 atm) 100.000°C
Critical temperature 373.99°C
Critical pressure 22.064 MPa (218.6 atm)
Triple point 0.01°C and 611.73 Pa (4.589 mm Hg )
Enthalpy of fusion at 0°C 6.012 kJ (1.436 kcal)/mol
Enthalpy of vaporization at 100°C 40.657 kJ (9.711 kcal)/mol
Enthalpy of sublimination at 0°C 50.91 kJ (12.16 kcal)/mol
Temperature
Other properties 20°C 0°C 0°C (ice) -20°C (ice)
Density (g /cm3 0.99821 0.99984 0.9168 0.9193
Viscosity (pa·sec) 1.002×10⁻³ 1.793×10⁻³ — —
Surface tension ag ainst air (N/m) 72.75×10⁻³ 75.64×10⁻³ — —
Vapor pressure (kPa) 2.3388 0.6113 0.6113 0.103
Heat capacity (J/g ·K) 4.1818 4.2176 2.1009 1.9544
Thermal conductivity (liquid) (W /m·K) 0.5984 0.5610 2.240 2.433
Thermal diffusitity (m2/s) 1.4×10⁻⁷ 1.3×10⁻⁷ 11.7×10⁻⁷ 11.8 ×10⁻⁷
Permittivity (dielectric constant) 80.20 87.90 ~90 ~98
Source: Mainly Ref. 69.
solids. Of greater interest is the fact that the thermal conductivity of ice at 0°C is approximately four times that of water at thesame temperature, indicating that ice will conduct heat energy at a much greater rate than will immobilized water (e.g., in tissue).The thermal diffusivities of water and ice are of even greater interest since these values indicate the rate at which the solid andliquid forms of HOH will undergo changes in temperature. Ice has a thermal diffusivity approximately nine times greater than thatof water, indicating that ice, in a given environment, will undergo a temperature change at a much greater rate than will water.These sizable differences in thermal conductivity and thermal diffusivity values of water and ice provide a sound basis forexplaining why tissues freeze more rapidly than they thaw, when equal but reversed temperature differentials are employed.
2.3 The Water Molecule
Water's unusual properties suggest the existence of strong attractive forces among water molecules, and uncommon structuresfor water and ice. These features are best explained by considering the nature of first a single water molecule and then smallgroups of molecules. To form a molecule of water, two hydrogen atoms approach the two sp3 bonding orbitals of oxygen andform two covalent sigma (s) bonds (40% partial ionic character), each of which has a dissociation energy of 4.6×10² kJ/mol(110 kcal/mol). The localized molecular orbitals remain symmetrically oriented about the original orbital axes, thus retaining anapproximate


Pag e 21
tetrahedral structure. A schematic orbital model of a water molecule is shown in Figure 1A and the appropriate van der Waalsradii are shown in Figure 1B.
The bond angle of the isolated water molecule (vapor state) is 104.5° and this value is near the perfect tetrahedral angle of109°28'. The O-H internuclear distance is 0.96 Å and the van der Waals radii for oxygen and hydrogen are, respectively, 1.40and 1.2 Å.
At this point, it is important to emphasize that the picture so far presented is oversimplified. Pure water contains not onlyordinary HOH molecules but also many other constituents in trace amounts. In addition to the common isotopes 16O and 1H,also present are 17O, 18O, 2H
FIGURE 1Schematic model of a sing le HOH molecule: (a) sp 3
config uration, and (b) van der W aals radii for a HOHmolecule in the vapor state.

Pag e 22
(deuterium) and 3H (tritium), giving rise to 18 isotopic variants of molecular HOH. Water also contains ionic particles such ashydrogen ions (existing as H3O+), hydroxyl ions, and their isotopic variants. Water therefore consists of more than 33 chemicalvariants of HOH, but the variants occur in only minute amounts.
2.4 Association of Water Molecules
The V-like form of an HOH molecule and the polarized nature of the O-H bond result in an unsymmetrical charge distributionand a vapor-state dipole moment of 1.84D for pure water. Polarity of this magnitude produces intermolecular attractive forces,and water molecules therefore associate with considerable tenacity. Water's unusually large intermolecular attractive forcecannot, however, be fully accounted for on the basis of its large dipole moment. This is not surprising, since dipole moments giveno indication of the degree to which charges are exposed or of the geometry of the molecule, and these aspects, of course, havean important bearing on the intensity of molecular association.
Water's large intermolecular attractive forces can be explained quite adequately in terms of its ability to engage in multiplehydrogen bonding on a three-dimensional basis. Compared to covalent bonds (average bond energy of about 335 kJ/mol),hydrogen bonds are weak (typically 2–40 kJ/mol) and have greater and more variable lengths. The hydrogen bond betweenoxygen and hydrogen has a dissociation energy of about 13–25 kJ/mol.
Since electrostatic forces make a major contribution to the energy of the hydrogen bond (perhaps the largest contribution), andsince an electrostatic model of water is simple and leads to an essentially correct geometric picture of HOH molecules as theyare known to exist in ice, further discussion of the geometrical patterns formed by association of water molecules will emphasizeelectrostatic effects. This simplified approach, while entirely satisfactory for present purposes, must be modified if otherbehavioral characteristics of water are to be explained satisfactorily.
The highly electronegative oxygen of the water molecule can be visualized as partially drawing away the single electrons from thetwo covalently bonded hydrogen atoms, thereby leaving each hydrogen atom with a partial positive charge and a minimalelectron shield; that is, each hydrogen atom assumes some characteristics of a bare proton. Since the hydrogen—oxygenbonding orbitals are located on two of the axes of an imaginary tetrahedron (Fig. 1a), these two axes can be thought of asrepresenting lines of positive force (hydrogen-bond donor sites). Oxygen's two lone-pair orbitals can be pictured as residingalong the remaining two axes of the imaginary tetrahedron, and these then represent lines of negative force (hydrogen-bondacceptor sites). By virtue of these four lines of force, each water molecule is able to hydrogen-bond with a maximum of fourothers. The resulting tetrahedral arrangement is depicted in Figure 2.
Because each water molecule has an equal number of hydrogen-bond donor and receptor sites, arranged to permit three-dimensional hydrogen bonding, it is found that the attractive forces among water molecules are unusually large, even whencompared to those existing among other small molecules that also engage in hydrogen bonding (e.g., NH3, HF). Ammonia, withits tetrahedral arrangement of three hydrogens and one receptor site, and hydrogen fluoride, with its tetrahedral arrangement ofone hydrogen and three receptor sites, do not have equal numbers of donor and receptor sites and therefore can form only two-dimensional hydrogen-bonded networks involving less hydrogen bonds per molecule than water.
Conceptualizing the association of a few water molecules becomes considerably more complicated when one considers isotopicvariants and hydronium and hydroxyl ions. The

Pag e 23
hydronium ion, because of its positive charge, would be expected to exhibit a greater hydrogen-bond donating potential thannonionized water (dashed lines are hydrogen bonds).
STRUCTURE 1Structure and hydrog en-bondpossibilities for a hydronium
ion. Dashed lines are hydrog enbonds.
The hydroxyl ion, because of its negative charge, would be expected to exhibit a greater hydrogen-bond acceptor potential thanun-ionized water (XH represents a solute or a water molecule).
STRUCTURE 2Structure and hydrog en-bond
possibilities for a hydroxylion. Dashed lines are hydrog en bonds and XH represents
a solute or a water molecule.
Water's ability to engage in three-dimensional hydrogen bonding provides a logical explanation for many of its unusualproperties; its large values for heat capacity, melting point, boiling point, surface tension, and enthalpies of various phasetransitions all are related to the extra energy needed to break intermolecular hydrogen bonds.
The permittivity (dielectric constant) of water is also influenced by hydrogen bonding. Although water is a dipole, this fact alonedoes not account for the magnitude of its permittivity. Hydrogen-bonded clusters of molecules apparently give rise tomultimolecular di-

Pag e 24
FIGURE 2Hydrog en bonding of water molecules in a
tetrahedral config uration. Open circles are oxyg en atomsand closed circles are hydrog en atoms. Hydrog en
bonds are represented by dashed lines.
poles, which effectively increase the permittivity of water. Water's viscosity is discussed in a later section.
2.5 Structure of Ice
The structure of ice will be considered before the structure of water because the former is far better understood than the latter,and because ice's structure represents a logical extension of the information presented in the previous section.
2.5.1 Pure Ice
Water, with its tetrahedrally directed forces, crystallizes in an open (low density) structure that has been accurately elucidated.The O-O internuclear nearest-neighbor distance in ice is 2.76 Å and the O-O-O bond angle is about 109°, or very close to theperfect tetrahedral angle of 109°28' (Fig. 3). The manner in which each HOH molecule can associate with four others(coordination number of four) is easily visualized in the unit cell of Figure 3 by considering molecule W and its four nearestneighbors 1, 2, 3, and W'.
When several unit cells are combined and viewed from the top (down the c axis) the hexagonal symmetry of ice becomesapparent. This is shown in Figure 4a. The tetrahedral

Pag e 25
FIGURE 3Unit cell of ordinary ice at 0°C. Circles
represent oxyg en atoms of watermolecules.
Nearest-neig hbor internuclear O-Odistance
is 2.76 Å; q is 109°.
substructure is evident from molecule W and its four nearest neighbors, with 1, 2, and 3 being visible, and the fourth lying belowthe plane of the paper directly under molecule W. When Figure 4a is viewed in three dimensions, as in Figure 4b, it is evidentthat two planes of molecules are involved (open and filled circles). These two planes are parallel, very close together, and theymove as a unit during the “slip” or flow of ice under pressure, as in a glacier. Pairs of planes of this type comprise the “basalplanes” of ice. By stacking several basal planes, an extended structure of ice is obtained. Three basal planes have beencombined to form the structure shown in Figure 5. Viewed down the c axis, the appearance is exactly the same as that shown inFigure 4a, indicating that the basal planes are perfectly aligned. Ice is monorefringent in this direction, whereas it is birefringent inall other directions. The c axis is therefore the optical axis of ice.
With regard to the location of hydrogen atoms in ice, it is generally agreed that:
1. Each line connecting two nearest neighbor oxygen atoms is occupied by one hydrogen atom located 1 ± 0.01 Å from theoxygen to which it is covalently bonded, and 1.76 ± 0.01 A° from the oxygen to which it is hydrogen bonded. This configurationis shown in Figure 6A.
2. If the locations of hydrogen atoms are viewed over a period of time, a somewhat different picture is obtained. A hydrogenatom on a line connecting two nearest neighbor oxygen atoms, X and Y, can situate itself in one of two possiblepositions—either 1 Å from X or 1 A° from Y. The two positions have an equal probability of being occupied. Expressed inanother way, each position will, on the average, be occupied half of the time. This is possible because HOH molecules, exceptat extremely low temperatures, can cooperatively rotate, and hydrogen atoms can “jump” be-
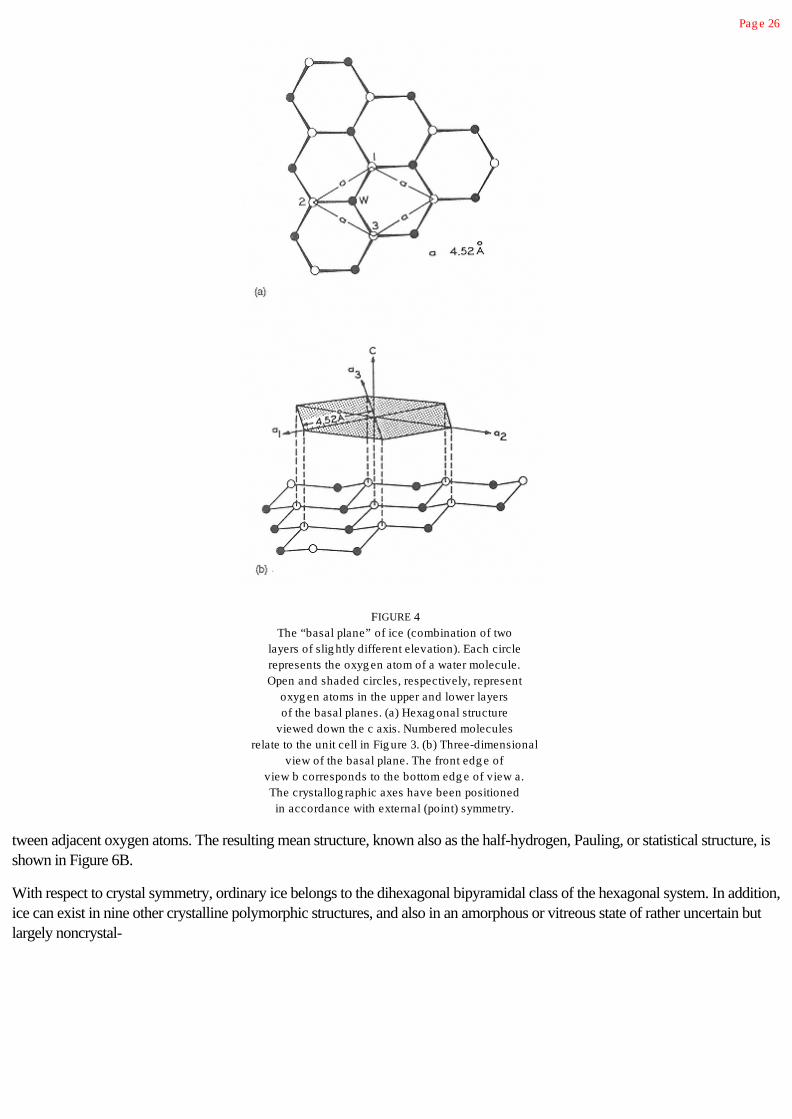
Pag e 26
FIGURE 4The “basal plane” of ice (combination of two
layers of slig htly different elevation). Each circlerepresents the oxyg en atom of a water molecule.Open and shaded circles, respectively, represent
oxyg en atoms in the upper and lower layersof the basal planes. (a) Hexag onal structure
viewed down the c axis. Numbered moleculesrelate to the unit cell in Fig ure 3. (b) Three-dimensional
view of the basal plane. The front edg e ofview b corresponds to the bottom edg e of view a.The crystallog raphic axes have been positionedin accordance with external (point) symmetry.
tween adjacent oxygen atoms. The resulting mean structure, known also as the half-hydrogen, Pauling, or statistical structure, isshown in Figure 6B.
With respect to crystal symmetry, ordinary ice belongs to the dihexagonal bipyramidal class of the hexagonal system. In addition,ice can exist in nine other crystalline polymorphic structures, and also in an amorphous or vitreous state of rather uncertain butlargely noncrystal-

Pag e 27
FIGURE 5The extended structure of ordinary ice. Only oxyg en atoms are shown. Open and
shaded circles, respectively, represent oxyg en atoms in upper and lower layers of abasal plane.
line structure. Of the eleven total structures, only ordinary hexagonal ice is stable under normal pressure at 0°C.
The structure of ice is not as simple as has been indicated. First of all, pure ice contains not only ordinary HOH molecules butalso ionic and isotopic variants of HOH. Fortunately, the isotopic variants occur in such small amounts that they can, in mostinstances, be ignored, leaving for major consideration only HOH, H+ (H3O+), and OH-.
Second, ice crystals are never perfect, and the defects encountered are usually of the orientational (caused by proton dislocationaccompanied by neutralizing orientations) or ionic types (caused by proton dislocation with formation of H3O+ and OH-) (seeFig. 7). The presence of these defects provides a means for explaining the mobility of protons in ice and the small decrease in dcelectrical conductivity that occurs when water is frozen.
In addition to the atomic mobilities involved in crystal defects, there are other types of activity in ice. Each HOH molecule in iceis believed to vibrate with a root mean amplitude (assuming each molecule vibrates as a unit) of about 0.4 Å at -10°C.Furthermore, HOH molecules that presumably exist in some of the interstitial spaces in ice can apparently diffuse slowly throughthe lattice.
Ice therefore is far from static or homogeneous, and its characteristics are dependent on temperature. Although the HOHmolecules in ice are four-coordinated at all temperatures, it is necessary to lower the temperature to about -180°C or lower to“fix” the hydrogen atoms in one of the many possible configurations. Therefore, only at temperatures near -180°C or lower will

Pag e 28
FIGURE 6
Location of hydrog en atoms ( )in the structure of ice. (A)
Instantaneous structure. (B) Meanstructure [known also as the
half-hydrog en ( ), Pauling , orstatistical structure]. Open circle
is oxyg en.
FIGURE 7Schematic representation of proton defects in ice.
(A) Formation of orientational defects. (B) Formationof ionic defects. Open and shaded circlesrepresent oxyg en and hydrog en atoms,
respectively. Solid and dashed lines representchemical bonds and hydrog en bonds, respectively.

Pag e 29
all hydrogen bonds be intact, and as the temperature is raised, the mean number of intact (fixed) hydrogen bonds will decreasegradually.
2.5.2 Ice in the Presence of Solutes
The amount and kind of solutes present can influence the quantity, size, structure, location, and orientation of ice crystals.Consideration here will be given only to the effects of solutes on ice structure. Luyet and co-workers [75,77] studied the natureof ice crystals formed in the presence of various solutes including sucrose, glycerol, gelatin, albumin, and myosin. They devised aclassification system based on morphology, elements of symmetry, and the cooling velocity required for development of varioustypes of ice structure. Their four major classes are hexagonal forms, irregular dendrites; coarse spherulites, and evanescentspherulites.
The hexogonal form, which is most highly ordered, is found exclusively in foods, provided extremely rapid freezing is avoidedand the solute is of a type and concentration that does not interfere unduly with the mobility of water molecules. Gelatin at highconcentrations will, for example, result in more disordered forms of ice crystals.
2.6 Structure of Water
To some, it may seem strange to speak of structure in a liquid when fluidity is the essence of the liquid state. Yet it is an old andwell-accepted idea [96] that liquid water has structure, obviously not sufficiently established to produce long-range rigidity, butcertainly far more organized than that of molecules in the vapor state, and ample to cause the orientation and mobility of a givenwater molecule to be influenced by its neighbors.
Evidence for this view is compelling. For example, water is an “open” liquid, being only 60% as dense as would be expected onthe basis of close packing that can prevail in nonstructured liquids. Partial retention of the open, hydrogen-bonded, tetrahedralarrangement of ice easily accounts for water's low density. Furthermore, the heat of fusion of ice, while unusually high, issufficient to break only about 15% of the hydrogen bonds believed to exist in ice. Although this does not necessarily require that85% of the hydrogen bonds existing in ice be retained in water (for example, more could be broken, but the change in energycould be masked by a simultaneous increase in van der Waals interactions), results of many studies support the notion that manywater-water hydrogen bonds do exist.
Elucidation of the structure of pure water is an extremely complex problem. Many theories have been set forth, but all areincomplete, overly simple, and subject to weaknesses that are quickly cited by supporters of rival theories. That is, of course, ahealthy situation, which will eventually result in an accurate structural picture (or pictures) of water. In the meantime, fewstatements can be made with any assurance that they will stand essentially unmodified in years to come. Thus, this subject will bedealt with only briefly.
Three general types of models have been proposed: mixture, interstitial, and continuum (also referred to as homogeneous oruniformist models) [5]. Mixture models embody the concept of intermolecular hydrogen bonds being momentarily concentratedin bulky clusters of water molecules that exist in dynamic equilibrium with other more dense species—momentarily meaning ~10-
11 sec [73].
Continuum models involve the idea that intermolecular hydrogen bonds are distributed uniformly throughout the sample, and thatmany of the bonds existing in ice simply become distorted rather than broken when ice is melted. It has been suggested that thispermits a continuous network of water molecules to exist that is, of course, dynamic in nature [107,120].
The interstitial model involves the concept of water retaining an ice-like or clathrate-type

Pag e 30
structure with individual water molecules filling the interstitial spaces of the clathrates. In all three models, the dominant structuralfeature is the hydrogen-bonded association of liquid water in ephemeral, distorted tetrahedra. All models also permit individualwater molecules to frequently alter their bonding arrangements by rapidly terminating one hydrogen bond in exchange for a newone, while maintaining, at constant temperature, a constant degree of hydrogen bonding and structure for the entire system.
The degree of intermolecular hydrogen bonding among water molecules is, of course, temperature dependent. Ice at 0°C has acoordination number (number of nearest neighbors) of 4.0, with nearest neighbors at a distance of 2.76 Å. With input of thelatent heat of fusion, melting occurs; that is, some hydrogen bonds are broken (distance between nearest neighbors increases)and others are strained as water molecules assume a fluid state with associations that are, on average, more compact. As thetemperature is raised, the coordination number increases from 4.0 in ice at 0°C, to 4.4 in water at 1.50°C, then to 4.9 at 83°C.Simultaneously, the distance between nearest neighbors increases from 2.76 Å in ice at 0°C, to 2.9 Å in water at 1.5°C, then to3.05 Å at 83°C [7,80].
It is evident, therefore, that the ice-to-water transformation is accompanied by an increase in the distance between nearestneighbors (decreased density) and by an increase in the average number of nearest neighbors (increased density), with the latterfactor predominating to yield the familiar net increase in density. Further warming above the melting point causes the density topass through a maximum at 3.98°C, then gradually decline. It is apparent, then, that the effect of an increase in coordinationnumber predominates at temperatures between 0 and 3.98°C, and that the effect of increasing distance between nearestneighbors (thermal expansion) predominates above 3.98°C.
The low viscosity of water is readily reconcilable with the type of structures that have been described, since the hydrogen-bonded arrangements of water molecules are highly dynamic, allowing individual molecules, within the time frame of nano- topicoseconds, to alter their hydrogen-bonding relationships with neighboring molecules, thereby facilitating mobility and fluidity.
2.7 Water-Solute Interactions
2.7.1 Macroscopic Level (Water Binding, Hydration, and Water Holding Capacity)
Before dealing with water-solute interactions at the molecular level, it is appropriate to discuss water-related phenomenareferred to by terms such as water binding, hydration, and water holding capacity.
With respect to foods, the terms “water binding” and “hydration” are often used to convey a general tendency for water toassociate with hydrophilic substances, including cellular materials. When used in this manner, the terms pertain to themacroscopic level. Although more specialized terms, such as “water binding potential,” are defined in quantitative terms, they stillapply only to the macroscopic level. The degree and tenacity of water binding or hydration depends on a number of factorsincluding the nature of the nonaqueous constituent, salt composition, pH, and temperature.
“Water holding capacity” is a term that is frequently employed to describe the ability of a matrix of molecules, usuallymacromolecules present at low concentrations, to physically entrap large amounts of water in a manner that inhibits exudation.Familiar food matrices that entrap water in this way include gels of pectin and starch, and cells of tissues, both plant and animal.

Pag e 31
Physically entrapped water does not flow from tissue foods even when they are cut or minced. On the other hand, this waterbehaves almost like pure water during food processing; that is, it is easily removed during drying, is easily converted to ice duringfreezing, and is available as a solvent. Thus, its bulk flow is severely restricted, but movement of individual molecules isessentially the same as that of water molecules in a dilute salt solution.
Nearly all of the water in tissues and gels can be categorized as physically entrapped, and impairment of the entrapmentcapability (water holding capacity) of foods has a profound effect on food quality. Examples of quality defects arising fromimpairment of water holding capacity are syneresis of gels, thaw exudate from previously frozen foods, and inferior performanceof animal tissue in sausage resulting from a decline in muscle pH during normal physiological events postmortem.
Gel structures and water holding capacity are discussed more fully in other chapters.
2.7.2 Molecular Level: General Comments
Mixing of solutes and water results in altered properties of both constituents. Hydrophilic solutes cause changes in the structureand mobility of adjacent water, and water causes changes in the reactivity, and sometimes structure, of hydrophilic solutes.Hydrophobic groups of added solutes interact only weakly with adjacent water, preferring a nonaqueous environment.
The bonding forces existing between water and various kinds of solutes are of obvious interest, and these are summarized inTable 3.
2.7.3 Molecular Level: Bound Water
Bound water is not a homogeneous, easily identifiable entity, and because of this, descriptive terminology is difficult, numerousdefinitions have been suggested, and there is no consensus about which one is best. This term is controversial, frequentlymisused, and in general, poorly understood, causing increasing numbers of scientists to suggest that its use be terminated.
TABLE 3 Classifications of Types of W ater-Solute Interactions
Type ExampleStreng th of interaction comparedto water-water hydrog en bond a
Dipole-ion W ater-free ion
W ater-charg ed g roup on org anicmolecule
Greaterb
Dipole-dipole W ater-protein NHW ater-protein COW ater-sidechain OH
Approx. equal
Hydrophobic hydration W ater + Rc R(hydrated) Much less (DG>0)
Hydrophobic interaction R(hydrated) + R(hydrated) R2
(hydrated) + H2ONot comparable d (>hydrophobicinteraction; DG<0)
aAbout 12-25 kJ/mol.
bBut much weaker than streng th of sing le covalent bond.
cR is alkyl g roup.
dHydrophobic interactions are entropy driven, whereas dipole-ion and dipole-dipole interactions are enthalpydriven.

Pag e 32
Although this may be desirable, the term “bound water” is so common in the literature that it must be discussed.
The numerous definitions proposed for “bound water” should indicate why this term has created confusion [3,51]:
1. Bound water is the equilibrium water content of a sample at some appropriate temperature and low relative humidity.
2. Bound water is that which does not contribute significantly to permittivity at high frequencies and therefore has its rotationalmobility restricted by the substance with which it is associated.
3. Bound water is that which does not freeze at some arbitrary low temperature (usually-40°C or lower).
4. Bound water is that which is unavailable as a solvent for additional solutes.
5. Bound water is that which produces line broadening in experiments involving proton nuclear magnetic resonance.
6. Bound water is that which moves with a macromolecule in experiments involving sedimentation rates, viscosity, or diffusion.
7. Bound water is that which exists in the vicinity of solutes and other nonaqueous substances and has properties differingsignificantly from those of “bulk” water in the same system.
All of these definitions are valid, but few will produce the same value when a given sample is analyzed.
From a conceptual standpoint it is useful to think of bound water as “water that exists in the vicinity of solutes and othernonaqueous constituents, and exhibits properties that are significantly altered from those of ‘bulk water’ in the same system.”Bound water should be thought of as having “hindered mobility” as compared to bulk water, not as being “immobilized.” In atypical food of high water content, this type of water comprises only a minute part of the total water present, approximately thefirst layer of water molecules adjacent to hydrophilic groups. The subject of bound water (hindered water) will be discussedfurther in the section dealing with molecular mobility (Mm) in frozen systems.
Interactions between water and specific classes of solutes will now be considered.
2.7.4 Interaction of Water with Ions and Ionic Groups
Ions and ionic groups of organic molecules hinder mobility of water molecules to a greater degree than do any other types ofsolutes. The strength of water-ion bonds is greater than that of water-water hydrogen bonds, but is much less than that ofcovalent bonds.
The normal structure of pure water (based on a hydrogen-bonded, tetrahedral arrangement) is disrupted by the addition ofdissociable solutes. Water and simple inorganic ions undergo dipole-ion interactions. The example in Figure 8 involves hydrationof the NaCl ion pair. Only first-layer water molecules in the plane of the paper are illustrated. In a dilute solution of ions in water,second-layer water is believed to exist in a structurally perturbed state because of conflicting structural influences of first-layerwater and the more distant, tetrahedrally oriented “bulk-phase” water. In concentrated salt solutions, bulk-phase water wouldnot exist and water structure would be dominated by the ions.
There is abundant evidence indicating that some ions in dilute aqueous solution have a net structure-breaking effect (solution ismore fluid than pure water), whereas others have a net structure-forming effect (solution is less fluid than pure water). It shouldbe understood that the term “net structure” refers to all kinds of structures, either normal or new types of water structure. Fromthe standpoint of “normal” water structure, all ions are disruptive.

Pag e 33
FIGURE 8Likely arrang ement of water molecules
adjacent to sodium chloride. Onlywater
molecules in plane of paper are shown.
The ability of a given ion to alter net structure is related closely to its polarizing power (charge divided by radius) or simply thestrength of its electric field. Ions that are small and/or multivalent (mostly positive ions, such as Li+, Na+, H3O+, Ca2+, Ba2+,Mg2+, Al3+, F-, and OH-) have strong electric fields and are net structure formers. The structure imposed by these ions more thancompensates for any loss in normal water structure. These ions strongly interact with the four to six first-layer water molecules,causing them to be less mobile and pack more densely than HOH molecules in pure water. Ions that are large and monovalent
(most of the negatively charged ions and large positive ions, such as K+, Rb+, Cs+, Cl-, Br-, I-, , , , and have rather weak electric fields and are net structure breakers, although the effect is very slight with K+. These ions
disrupt the normal structure of water and fail to impose a compensating amount of new structure.
Ions, of course, have effects that extend well beyond their influence on water structure. Through their varying abilities to hydrate(compete for water), alter water structure, influence the permittivity of the aqueous medium, and govern the thickness of theelectric double layer around colloids, ions profoundly influence the “degree of hospitality” extended to other nonaqueous solutesand to substances suspended in the medium. Thus, conformation of proteins and stability of colloids (salting-in, salting-out inaccord with the Hofmeister or lyotropic series) are greatly influenced by the kinds and amounts of ions present [18,68].
2.7.5 Interaction of Water with Neutral Groups Possessing Hydrogen-Bonding Capabilities (Hydrophilic Solutes)
Interactions between water and nonionic, hydrophilic solutes are weaker than water-ion interactions and about the same strengthas those of water-water hydrogen bonds. Depending on the strength of the water-solute hydrogen bonds, first-layer water mayor may not exhibit reduced mobility and other altered properties as compared to bulk-phase water.
Solutes capable of hydrogen bonding might be expected to enhance or at least not disrupt the normal structure of pure water.However, in some instances it is found that the distribution and orientation of the solute's hydrogen-bonding sites aregeometrically incompatible with those existing in normal water. Thus, these kinds of solutes frequently have a disruptive influenceon the normal structure of water. Urea is a good example of a small hydrogen-bonding solute that for geometric reasons has amarked disruptive effect on the normal structure of water.

Pag e 34
It should be noted that the total number of hydrogen bonds per mole of solution may not be significantly altered by addition of ahydrogen-bonding solute that disrupts the normal structure of water. This is possible since disrupted water-water hydrogenbonds may be replaced by water-solute hydrogen bonds. Solutes that behave in this manner have little influence on “netstructure” as defined in the previous section.
Hydrogen bonding of water can occur with various potentially eligible groups (e.g., hydroxy1, amino, carbony1, amide, imino,etc.). This sometimes results in “water bridges” where one water molecule interacts with two eligible hydrogen-bonding sites onone or more solutes. A schematic depiction of water hydrogen bonding (dashed lines) to two kinds of functional groups found inproteins is shown:
STRUCTURE 3
Hydrog en bonding (dotted lines) ofwater to
two kinds of functional g roupsoccurring
in proteins.
A more elaborate example involving a three-HOH bridge between backbone peptide units in papain is shown in Figure 9.
It has been observed that hydrophilic groups in many crystalline macromolecules are separated by distances identical to thenearest-neighbor oxygen spacing in pure water. If this spacing prevails in hydrated macromolecules this would encouragecooperative hydrogen bonding in first- and second-layer water.
FIGURE 9Examples of a three-moleculewater bridg e in papain; 23, 24,and 25 are water molecules.
(From Ref. 4.)
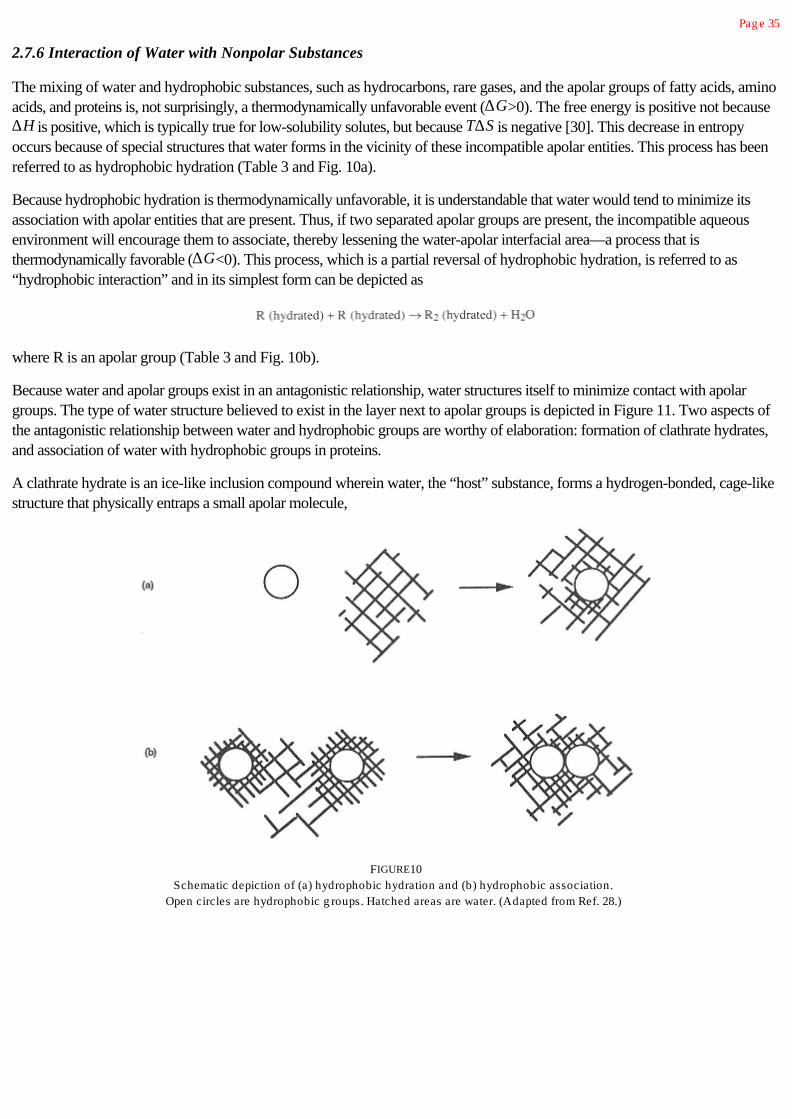
Pag e 35
2.7.6 Interaction of Water with Nonpolar Substances
The mixing of water and hydrophobic substances, such as hydrocarbons, rare gases, and the apolar groups of fatty acids, aminoacids, and proteins is, not surprisingly, a thermodynamically unfavorable event (DG>0). The free energy is positive not becauseDH is positive, which is typically true for low-solubility solutes, but because TDS is negative [30]. This decrease in entropyoccurs because of special structures that water forms in the vicinity of these incompatible apolar entities. This process has beenreferred to as hydrophobic hydration (Table 3 and Fig. 10a).
Because hydrophobic hydration is thermodynamically unfavorable, it is understandable that water would tend to minimize itsassociation with apolar entities that are present. Thus, if two separated apolar groups are present, the incompatible aqueousenvironment will encourage them to associate, thereby lessening the water-apolar interfacial area—a process that isthermodynamically favorable (DG<0). This process, which is a partial reversal of hydrophobic hydration, is referred to as“hydrophobic interaction” and in its simplest form can be depicted as
where R is an apolar group (Table 3 and Fig. 10b).
Because water and apolar groups exist in an antagonistic relationship, water structures itself to minimize contact with apolargroups. The type of water structure believed to exist in the layer next to apolar groups is depicted in Figure 11. Two aspects ofthe antagonistic relationship between water and hydrophobic groups are worthy of elaboration: formation of clathrate hydrates,and association of water with hydrophobic groups in proteins.
A clathrate hydrate is an ice-like inclusion compound wherein water, the “host” substance, forms a hydrogen-bonded, cage-likestructure that physically entraps a small apolar molecule,
FIGURE10Schematic depiction of (a) hydrophobic hydration and (b) hydrophobic association.
Open circles are hydrophobic g roups. Hatched areas are water. (Adapted from Ref. 28.)

Pag e 36
FIGURE11Proposed water orientation at a
hydrophobic surface. (Adapted fromRef. 68.)
known as the “guest.” These entities are of interest because they represent the most extreme structure-forming response of waterto an apolar substance and because microstructures of a similar type may occur naturally in biological matter. Clathrate hydratesare, in fact, crystalline, they can easily be grown to visible size, and some are stable at temperatures above 0°C provided thepressure is sufficient.
The guest molecules of clathrate hydrates are low-molecular-weight compounds with sizes and shapes compatible with thedimensions of host water cages comprised of 20–74 water molecules. Typical guests include low-molecular-weighthydrocarbons and halogenated hydrocarbons; rare gases; short-chain primary, secondary, and tertiary amines; and alkylammonium, sulfonium, and phosphonium salts. Interaction between water and guest is slight, usually involving nothing more thanweak van der Waals forces. Clathrate hydrates are the extraordinary result of water's attempt to avoid contact with hydrophobicgroups.
There is evidence that structures similar to crystalline clathrate hydrates may exist naturally in biological matter, and if so, thesestructures would be of far greater importance than crystalline hydrates since they would likely influence the conformation,reactivity, and stability of molecules such as proteins. For example, it has been suggested that partial clathrate structures mayexist around the exposed hydrophobic groups of proteins. It is also possible that clathrate-like structures of water have a role inthe anesthetic action of inert gases such as xenon. For further information on clathrates, the reader is referred to Davidson [15].
Unavoidable association of water with hydrophobic groups of proteins has an important influence on protein functionality[5,124]. The extent of these unavoidable contacts is potentially fairly great because nonpolar side chains exist on about 40% ofthe amino acids in typical oligomeric food proteins. These nonpolar groups include the methy1 group of alanine, the benzyl groupof phenylalanine, the isopropy1 group of the valine, the mercaptomethy1 group of cysteine, and the secondary buty1 andisobuty1 groups of the leucines. The nonpolar groups of other compounds such as alcohols, fatty acids, and free amino acidsalso can participate in hydrophobic interactions, but the consequences of these interactions are undoubtedly less important thanthose involving proteins.
Because exposure of protein nonpolar groups to water is thermodynamically unfavorable, association of hydrophobic groups or“hydrophobic interaction” is encouraged, and this occurrence is depicted schematically in Figure 12. Hydrophobic interactionprovides a major driving

Pag e 37
FIGURE 12Schematic depiction of a g lobular protein underg oing
hydrophobic interaction. Open circles are hydrophobicg roups, “L-shaped” entities around circles are watermolecules oriented in accordance with a hydrophobic
surface, and dots represent water molecules associatedwith polar g roups.
force for protein folding, causing many hydrophobic residues to assume positions in the protein interior. Despite hydrophobicinteractions, it is estimated that nonpolar groups in globular proteins typically occupy about 40–50% of the surface area.Hydrophobic interactions also are regarded as being of primary importance in maintaining the tertiary structure of most proteins[19,85,123]. It is therefore of considerable importance that a reduction in temperature causes hydrophobic interactions tobecome weaker and hydrogen bounds to become stronger.
2.7.7 Details of Water Orientation Adjacent to Organic Molecules
Although determination of the arrangement of water molecules near organic molecules is experimentally difficult, this is an activefield of research and useful data have been obtained. The hydrated pyranose sugar ring is shown in Figure 13 and a computer-simulated cross section of hydrated myoglobin is shown in Figure 14. Assuming a separation distance of 2.8 Å betweenhydration sites and full occupancy of these sites, about 360 HOH molecules would be in the primary hydration shell ofmyoglobin [71].

Pag e 38
FIGURE 13Association of a-D-g lucose with tetrahedrally arrang ed
water molecules. Heavy solid line represents the side viewof the pyranose ring . Oxyg ens and hydrog ens of water are
represented by open and filled circles, respectively.Covalent and hydrog en bonds are represented by solid
and broken lines, respectively. The hydroxymethyl protons[H(6)] are not shown. (From Ref. 122.)
2.7.8 Hydration Sequence of a Protein
It is instructive to consider water absorption by a dry food component and the location and properties of water at each stage ofthe process. A protein is chosen for this exercise because proteins are of major importance in foods, because they contain all ofthe major types of functional groups that are of interest during hydration, and because good data are available.
Shown in Table 4 are properties of globular proteins (based primarily on lysozyme) and the associated water at various stages ofhydration. The corresponding sorption isotherm is shown in Figure 19. The table is self-explanatory except for a few points.Hydration “zones” are referred to in both the table and the figure. These zones are useful aids to discussion but they are unlikelyto actually exist (a continuum of water properties is much more likely).
A sample having a water content corresponding to the junction of Zones I and II is said to have a BET monolayer water content(the term “BET” comes from the names of the originators of the concept: Brunauer, Emmett, and Teller [8]). In this instance theBET monolayer water content is about 0.07 g HOH/g dry protein, and this corresponds to a p/p0 value of about 0.2 (p is thepartial pressure of water in the food and p0 is the vapor pressure of pure water at the same temperature; p/p0 is more commonlyreferred to as aw). The BET monolayer value is of special importance because it often provides a good first estimate of thelargest moisture content

Pag e 39
FIGURE 14Cross-section of a hydrated myog lobin molecule as determined bymolecular dynamics simulation. Mesh cag es depict hig h probabilitysites of 1st-layer water molecules, stick fig ure represents the protein
time-averag ed structure. (From Ref. 72.)
a dry product can contain and still exhibit maximum stability. Although the BET value is commonly referred to as a monolayer,this is a faulty concept. For example, in starch the BET value corresponds to about one water molecule per anhydroglucose unit[126].
Also note that in Table 4 the term “true monolayer” is used. This term has a meaning quite different from BET monolayer. Truemonolayer refers to the water content at the junction of zones IIB and III (in this example, a water content of about 0.38 gHOH/g dry protein and a p/p0 of about 0.85). This value corresponds to about 300 mol HOH per mol lysozyme and a moisturecontent of 27.5 wt%, with one HOH occupying, on average, 20 Å2 of protein surface area [103]. This water content issignificant because it represents the minimum water content

Pag e 40
TABLE 4 W ater/Protein Properties at Various Stag es of Hydration a
Bulk-phase water
PropertiesConstitutional
waterb
Hydration shell (<3 Å from surface) Freec Entrapped d
General description for lysozyme Constitutional water is assumed to be present in the dry protein at the onset of the hydration process.W ater is first absorbed at sites of ionized, carboxylic and amino side chains, with about 40 molwater/mol lysozyme associating in this manner. Further absorption of water results in g radualhydration of less attractive sites, mainly amide carbonyl g roups of the protein backbone. Attainmentof true monolayer hydration of the protein is achieved at 0.38 g H 2O/g dry protein, by waterassociating with sites that are still less attractive. At this point, there is, on averag e, 1 HOH/20 Å 2 ofprotein surface
Fullyhydrated
Fullyhydrated
Approximate water content: g H 2O/gdry protein (h) mol H2O/mol dryprotein wt% based on lysozyme
<0.01 h<81%
0.01–0.07 h8–561–6.5%
0.07–0.25 h56–2006.5–20%
0.25–0.58 h200–30420–27.5%
> 0.38 h> 304> 27.5%
> 0.38 h>304>27.5%
Location on isotherme Relative vaporpressure (p/p 0) Zone
<0.02p/p0
Zone I, extremeleft
0.02–0.2p/p 0
Zone I0.2–0.75p/p 0
Zone IIA0.75–0.85p/p 0
Zone IIB> 0.85 p/p0
Zone III> 0.85 p/p0
Zone III
W ater properties Normal Normal
Structure Critical part ofnative proteinstructure
W ater interactsprincipally with charg edg roups (~2 HOH/g roup)
At 0.07 h: transition insurface water fromdisordered to orderedand/or from dispersedto clustered
W ater interactsprincipally with polarprotein surface g roups(~1 HOH/ polar site)
W ater clusters centeredon charg ed and polarsites
Clusters fluctuate in sizeand/or arrang ement
At 0.25 h: start ofcondensation of water ontoweakly interacting unfilledpatches of protein surface
At 0.38 h: monolayer ofwater covers the surface ofthe protein and water
(table continued on next page)

Pag e 41
(table continued from previous page)
Bulk-phase water
PropertiesConstitutional
waterb
Hydration shell (<3 Å from surface) Freec Entrapped d
state; associated withcompletion of charg edg roup hydration
At 0.15 h: long -rang econnectivity of thesurface water isestablished
phase beg ins to form, andg lass-rubber transitionoccurs
Thermodynamic transfer properties f
D¯G (kJ/mol) > ¦-6¦ -6 -0.8 Close to bulk water NA NA
D¯H (kJ/mol) > ¦-17¦ -70 -2.1 Close to bulk water NA NA
Approximate mobility (residence time) 10-2 to 10-8 sec <10-8 sec < 10-9 sec < 10-9 to 10-11 sec 10-11 to 10-12
sec10-11 to 10-
12 sec
Freezability Unfreezable Unfreezable Unfreezable Unfreezable Normal Normal
Solvent capability None None None to slig ht Slig ht to moderate Normal Normal
Protein properties
Structure Folded statestable
W ater beg ins toplasticize amorphousreg ions
Further plasticization ofamorphous reg ions
Mobility Enzymaticactivityneg lig ible
Enzymatic activityneg lig ible
Internal protein motion (Hexchang e) increases from1/1000 at 0.04 h to fullsolution rate at 0.15 h
At 0.1–0.15 h:chymotrypsin and someother enzymes developactivity
At 0.38 h: lysozyme specificactivity is 0.1 that in dilutesolution
Maximum Maximum
aData from Rupley and Careri [103], Otting et al. [86], Lounnas and Pettit [71,72], Franks [30], and other sources. Based larg ely on lysozyme.
bW ater molecules that occupy specific locations in the interior of the solute macromolecule.
cMacroscopic flow not physically constrained by a macromolecular matrix.
dMacroscopic flow physically constrained by a macromolecular matrix.
eSee Fig ure 19.
fPartial molar values for transfer of water from bulk phase to hydration shell.

Pag e 42
needed for “full hydration,” that is, occupancy of all first-layer sites. Further added water will have properties that do not differsignificantly from those of bulk water.
2.8 Water Activity and Relative Vapor Pressure
2.8.1 Introduction
It has long been recognized that a relationship, although imperfect, exists between the water content of food and its perishability.Concentration and dehydration processes are conducted primarily for the purpose of decreasing the water content of a food,simultaneously increasing the concentration of solutes and thereby decreasing perishability.
However, it has also been observed that various types of food with the same water content differ significantly in perishability.Thus, water content alone is not a reliable indicator of perishability. This situation is attributable, in part, to differences in theintensity with which water associates with nonaqueous constituents—water engaged in strong associations is less able to supportdegradative activities, such as growth of microorganisms and hydrolytic chemical reactions, than is weakly associated water. Theterm “water activity” (aw) was developed to account for the intensity with which water associates with various nonaqueousconstituents.
Food stability, safety, and other properties can be predicted far more reliably from aw than from water content. Even so, aw isnot a totally reliable predictor. The reasons for this will be explained in the next section. Despite this lack of perfection, aw
correlates sufficiently well with rates of microbial growth and many degradative reactions to make it a useful indicator of productstability and microbial safety. The fact that aw is specified in some U.S. federal regulations dealing with good manufacturingpractices for food attests to its usefulness and credibility [44].
2.8.2 Definition and Measurement
The notion of substance “activity” was rigorously derived from the laws of equilibrium thermodynamics by G. N. Lewis, and itsapplication to foods was pioneered by Scott [108,109]. It is sufficient here to state that
aw = ƒ/ƒ0 (1)
where ƒ is the fugacity of the solvent (fugacity being the escaping tendency of a solvent from solution) and ƒ0 is the fugacity of thepure solvent. At low pressures (e.g., ambient), the difference between ƒ/ƒ0 and p/p0 is less than 1%, so defining aw in terms ofp/p0 is clearly justifiable. Thus,
aw = p/p0 (2)
This equality is based on the assumptions of solution ideality and the existence of thermodynamic equilibrium. With foods, bothassumptions are generally violated. Consequently, Equation 2 must be taken as an approximation and the proper expression is
(3)
Because p/p0 is the measured term and sometimes does not equal aw, it is more accurate to use the term p/p0 rather than aw. Thispractice will be followed here. “Relative vapor pressure” (RVP) is the name for p/p0, and these terms will be usedinterchangeably. Despite the scientific soundness of using RVP rather aw, the reader should be aware that the term aw is inwidespread use, appears in other chapters of this book and is not improper provided the user understands its true meaning.
Failure of the aw-RVP approach to be a perfect estimator of food stability occurs for two

Pag e 43
basic reasons: violation of assumptions underlying Equation 2, and solute-specific effects. Violation of Equation 2 assumptionscan, but usually does not, detract unduly from the usefulness of RVP as a technological tool. An exception occurs if dry productsare prepared by absorption of water rather than desorption (hysteresis effects), and this will be discussed later. Violation ofEquation 2 assumptions does, however, invalidate RVP as a tool for mechanistic interpretations in instances where thetheoretical models used are based on these assumptions (often true of models for moisture sorption isotherms).
In a few instances that can be of great importance, solute-specific effects can cause RVP to be a poor indicator of food stabilityand safety. This can occur even when the assumptions underlying Equation 2 are fully met. In these situations, foods with thesame RVP but different solute compositions will exhibit different stabilities and other properties. This is an important point thatmust not be overlooked by anyone relying on RVP as a tool for judging the safety or stability of food. Figure 15 is provided toreinforce this point. These data clearly indicate that the minimum p/p0 for growth of Staphylococcus aureus is dependent onsolute type.
RVP is related to percent equilibrium relative humidity (ERH) of the product environment as follows:
RVP = p/p0 = %ERH/100 (4)
Two aspects of this relationship should be noted. First, RVP is an intrinsic property of the sample whereas ERH is a property ofthe atmosphere in equilibrium with the sample. Second, the Equation 4 relationship is an equality only if equilibrium has beenestablished between the product and its environment. Establishment of equilibrium is a time-consuming process even with verysmall samples (less than 1 g) and almost impossible in large samples, especially at temperatures below ~50°C.
The RVP of a small sample can be determined by placing it in a closed chamber for a time sufficient to achieve apparentequilibrium (constant weight) and then measuring either pressure or relative humidity in the chamber [33,52,90,119,125].Various types of instruments are available for measuring pressure (manometers) and relative humidity (electric hygrometers,dew-point instruments). Knowledge of freezing point depression can also be used to determine RVP [26]. Based oncollaborative studies, the precision of aw determinations is about ±0.02.
If one desires to adjust a small sample to a specific RVP, this can be done by placing it in
FIGURE 15Minimum relative vapor pressure (RVP) for
g rowth of Staphylococcus aureus as influencedby solute used to produce the RVP. Temperature
is close to optimum for g rowth. PEG ispolyethylene g lycol. (From Ref. 11.)

Pag e 44
a closed chamber at constant temperature, maintaining sample atmosphere at constant relative humidity by means of anappropriate saturated salt solution [69,119], and storing it until constant sample weight is achieved.
2.8.3 Temperature Dependence
Relative vapor pressure is temperature dependent, and the Clausius-Clapeyron equation in modified form provides a means forestimating this temperature dependence. This equation, although based on aw, is applicable to RVP and has the following form[128]:
(5)
where T is absolute temperature, R is the gas constant, and DH is the isosteric net heat of sorption at the water content of thesample. By rearrangement, this equation can be made to conform to the generalized equation for a straight line. It then becomesevident that a plot of In aw versus 1/T (at constant water content) should be linear and the same should be true for In p/p0 versus1/T.
Linear plots of In p/p0 versus 1/T for native potato starch at various moisture contents are shown in Figure 16. It is apparent thatthe degree of temperature dependence is a function of moisture content. At a starting p/p0 of 0.5, the temperature coefficient is0.0034°C-1 over the temperature range 2–40°C. Based on the work of several investigators, temperature coefficients for p/p0
(temperature range 5–50°C; starting p/p0 0.5) range from 0.003 to 0.02°C-1 for high-carbohydrate or high-protein foods [128].Thus, depending on the product, a 10°C change
FIGURE 16Relationship between relative water
vaporpressure and temperature for native
potato starch of different watercontents.
W ater content values following eachline are
g HOH/g dry starch. (From Ref. 128.)

Pag e 45
in temperature can cause a 0.03–0.2 change in p/p0. This behavior can be important for a packaged food because it will undergoa change in RVP with a change in temperature, causing the temperature dependence of its stability to be greater than that of thesame product unpackaged.
Plots of In p/p0 versus 1/T are not always linear over broad temperature ranges, and they generally exhibit sharp breaks with theonset of ice formation. Before showing data at subfreezing temperatures, it is appropriate to consider the definition of RVP as itapplies to subfreezing temperatures. This is necessary because a question arises as to whether the denominator term (p0) shouldbe equated to the vapor pressure of supercooled water or to the vapor pressure of ice. The vapor pressure of supercooledwater turns out to be the proper choice because (a) values of RVP at subfreezing temperatures can then, and only them, beaccurately compared to RVP values at above-freezing temperatures and (b) choice of the vapor pressure of ice as p0 wouldresult, for samples containing ice, in a meaningless situation whereby RVP would be unity at all subfreezing temperatures. Thesecond point results because the partial pressure of water in a frozen food is equal to the vapor pressure of ice at the sametemperature [25,121].
Because the vapor pressure of supercooled water has been measured down to -15°C, and the vapor pressure of ice has beenmeasured to much lower temperatures, it is possible to accurately calculate RVP values for frozen foods. This is clearly apparentwhen one considers the following relationship:
(6)
Where pff is the partial pressure of water in partially frozen food, p0(SCW) is the vapor pressure of pure supercooled water, andpice is the vapor pressure of pure ice.
Presented in Table 5 are RVP values calculated from the vapor pressures of ice and supercooled water, and these values areidentical to those of frozen foods at the same temperatures. Figure 17 is a plot of log p/p0 versus 1/T, illustrating that (a) therelationship is linear at
TABLE 5 Vapor Pressures and Vapor Pressure Ratios of W ater and Ice
Vapor pressure
Liquid watera
Iceb or foodcontaining ice
Temperature (°C) (Pa) (torr) (Pa) (torr) (p ice/p water)
0 611b 4.58 611 4.58 1.00
-5 421 3.16 402 3.02 0.95
-10 287 2.15 260 1.95 0.91
-15 191 1.43 165 1.24 0.86
-20 125 0.94 103 0.77 0.82
-25 80.7 0.61 63 0.47 0.78
-30 50.9 0.38 38 0.29 0.75
-40 18.9 0.14 13 0.098 0.69
-50 6.4 0.05 3.9 0.029 0.61
aSupercooled at all temperatures except 0°C. Observed data above -15°C, calculatedbelow -15°C [79].
bObserved data from Ref. 69.


Pag e 46
FIGURE 17Relationship between relative vapor pressure and temperature for a complex
food above and below freezing . (From Ref. 24.)
subfreezing temperatures, (b) the influence of temperature on RVP is typically far greater at subfreezing temperatures than atabove-freezing temperatures, and (c) a sharp break occurs in the plot at the freezing point of the sample.
Two important distinctions should be noted when comparing RVP values at above- and below-freezing temperatures. First, atabove-freezing temperatures, RVP is a function of sample composition and temperature, with the former factor predominating.At subfreezing temperatures, RVP becomes independent of sample composition and depends solely on temperature; that is, inthe presence of an ice phase RVP values are not influenced by the kind or ratio of solutes present. As a consequence, anysubfreezing event that is influenced by the kind of solute present (e.g., diffusion-controlled processes, catalyzed reactions, andreactions that are affected by the absence or presence of cryoprotective agents, by antimicrobial agents, and/or by chemicalsthat alter pH and oxidation-reduction potential) cannot be accurately forecast based on the RVP value [25]. Consequently, RVPvalues at subfreezing temperatures are far less valuable indicators of physical and chemical events than are RVP values at above-freezing temperatures. It follows that knowledge of RVP at a subfreezing temperature cannot be used to predict RVP at anabove-freezing temperature.
Second, as the temperature is changed sufficiently to form or melt ice, the meaning of RVP, in terms of food stability, alsochanges. For example, in a product at -15°C (p/p0=0.86), microorganisms will not grow and chemical reactions will occurslowly. However, at 20°C and

Pag e 47
p/p0 0.86, some chemical reactions will occur rapidly and some microorganisms will grow at moderate rates.
2.9 Moisture Sorption Isotherms
2.9.1 Definition and Zones
A plot of water content (expressed as mass of water per unit mass of dry material) of a food versus p/p0 at constant temperatureis known as a moisture sorption isotherm (MSI). Information derived from MSIs are useful (a) for concentration anddehydration processes, because the ease or difficulty of water removal is related to RVP, (b) for formulating food mixtures so asto avoid moisture transfer among the ingredients, (c) to determine the moisture barrier properties needed in a packaging material,(d) to determine what moisture content will curtail growth of microorganisms of interest, and (e) to predict the chemical andphysical stability of food as a function of water content (see next section).
Shown in Figure 18 is a schematic MSI for a high-moisture food plotted to include the full range of water content from normal todry. This kind of plot is not very useful because the data of greatest interest—those in the low-moisture region—are not shownin sufficient detail. Omission of the high-moisture region and expansion of the low-moisture region, as is usually done, yields anMSI that is much more useful (Fig. 19).
Several substances that have MSIs of markedly different shapes are shown in Figure 20. These are resorption (or adsorption)isotherms prepared by adding water to previously dried samples. Desorption isotherms are also common. Isotherms with asigmoidal shape are characteristic of most foods. Foods such as fruits, confections, and coffee extract that contain large amountsof sugar and other small, soluble molecules and are not rich in polymeric materials exhibit a J-type isotherm shown as curve 1 inFigure 20. The shape and position of the isotherm are determined by several factors including sample composition, physicalstructure of the sample (e.g., crystalline or amorphous), sample pretreatments, temperature, and methodology.
Many attempts have been made to model MSIs, but success in achieving good conform-
FIGURE 18Schematic moisture sorption isotherm
encompassing a broad rang e ofmoisturecontents.

Pag e 48
FIGURE 19Generalized moisture sorption
isotherm forthe low-moisture seg ment of a food
(20°C).
ance of a model to the full range of actual data for an MSI has been difficult. The oldest and best known model is that ofBrunauer, Emmett, and Teller [8]. One of the best models is that developed by Guggenheim [36], Anderson [2], and DeBoer[16], and this is referred to as the GAB model.
As an aid to understanding the meaning and usefulness of sorption isotherms it is sometimes appropriate to divide them intozones as indicated in Figure 19. As water is added (resorption), sample composition moves from Zone I (dry) to Zone III (highmoisture) and the properties of water associated with each zone differ significantly. These properties are described next and aresummarized in Table 4.
Water present in Zone I of the isotherm is most strongly sorbed and least mobile. This water associates with accessible polarsites by water-ion or water-dipole interactions, is unfreezable at -40°C, has no ability to dissolve solutes, and is not present insufficient amount to have a plasticizing effect on the solid. It behaves simply as part of the solid.
The high-moisture end of Zone I (boundary of Zones I and II) corresponds to the “BET monolayer” moisture content of thefood. The BET monolayer value should be thought of as approximating the amount of water needed to form a monolayer overaccessible, highly polar groups of the dry matter. In the case of starch, this amounts to one HOH per anhydroglucose unit [126].Zone I water constitutes a tiny fraction of the total water in a high-moisture food material.
Water added in Zone II occupies first-layer sites that are still available. This water associates with neighboring water moleculesand solute molecules primarily by hydrogen bonding, is slightly less mobile than bulk water, and most of it is unfreezable at -40°C. As water is added in the vicinity of the low-moisture end of Zone II, it exerts a significant plasticizing action on solutes,lowers their glass transition temperatures, and causes incipient swelling of the solid matrix. This action, coupled with thebeginning of solution processes, leads to an

Pag e 49
FIGURE 20Resorption isotherms for various
foods andbiolog ical substances. Temperature
20°C,except for number 1, which is 40°C: (1)
confection (main componentpowdered
sucrose), (2) spray-dried chicoryextract,
(3) roasted Columbian coffee, (4) pigpancreas extract powder, (5) native rice
starch. (From Ref. 127.)
acceleration in the rate of most reactions. Water in Zones I and Zone II usually constitutes less than 5% of the water in a high-moisture food material.
In the vicinity of the junction of Zones II and III, water is sufficient to complete a true monolayer hydration shell formacromolecules such as globular proteins, and is sufficient to lower the glass transition temperature of macromolecules so thatsample temperature and Tg are equal. Further addition of water (Zone III) causes a glass-rubber transition in samples containingglassy regions, a very large decrease in viscosity, a very large increase in molecular mobility, and commensurate increases in therates of many reactions. This water is freezable, available as a solvent, and readily supports the growth of microorganism. ZoneIII water is referred to as bulk-phase water (Table 4). Additional water will have the properties of bulk-phase water and will notalter properties of existing solutes.
In gels or cellular systems, bulk-phase water is physically entrapped so that macroscopic flow is impeded. In all other respectsthis water has properties similar to that of water in a dilute salt solution. This is reasonable, since a typical water molecule addedin Zone III is “insulated” from the effects of solutes molecules by several layers of Zone I and Zone II water molecules. Thebulk-phase water of Zone III, either entrapped or free, usually constitutes more than 95% of the total water in a high-moisturefood, a fact that is not evident from Figure 19.
As mentioned earlier, the zone boundaries indicated in Figure 19 are simply an aid to discussion rather than a reality. It isbelieved that water molecules can interchange rapidly within and between “zones” and that the concept of a continuum of waterproperties existing through Zones I–III is conceptually sounder than the notion of distinctly different properties existing in eachzone. It is also of interest that addition of water to a dry material containing only a few water molecules will increase the mobilityand lessen the residence time of these original water

Pag e 50
molecules [103]. However, addition of water to materials already having complete or near complete hydration shells is unlikelyto have a significant effect on the properties of water originally present.
The important effects that these solute-induced differences in water properties have on stability of foods will be discussed in alater section. At this point, it will suffice to say that the most mobile fraction of water existing in any food sample governsstability.
2.9.2 Temperature Dependence
As mentioned earlier, RVP is temperature dependent; thus MSIs must also be temperature dependent. An example involvingpotato slices is shown in Figure 21. At any given moisture content, food p/p0 increasing with increasing temperature, inconformity with the Clausius-Clapeyron equation.
2.9.3 Hysteresis
An additional complication is that an MSI prepared by addition of water (resorption) to a dry sample will not necessarily besuperimposable on an isotherm prepared by desorption. This lack
FIGURE 21Moisture desorption isotherms for potatoes at various
temperatures. (Redrawn from Ref. 35.)

Pag e 51
of superimposability is referred to as “hysteresis,” and a schematic example is shown in Figure 22. Typically, at any given p/p0,the water content of the sample will be greater during desorption than during resorption. MSIs of polymers, glasses of low-molecular-weight compounds, and many foods exhibit hysteresis [46,47].
The magnitude of hysteresis, the shape of the curves, and the inception and termination points of the hysteresis loop can varyconsiderably depending on factors such as nature of the food, the physical changes it undergoes when water is removed oradded, temperature, the rate of desorption, and the degree of water removal during desorption [45]. The effect of temperature ispronounced; hysteresis is often not detectable at high temperatures (~80°C) and generally becomes increasingly evident as thetemperature is lowered [126].
Several largely qualitative theories have been advanced to explain sorption hysteresis [46,47]. These theories involve factorssuch as swelling phenomena, metastable local domains, chemisorption, phase transitions, capillary phenomena, and the fact thatnonequilibrium states become increasingly persistent as the temperature is lowered. A definitive explanation (or explanations) ofsorption hysteresis has yet to be formulated.
Sorption hysteresis is more than a laboratory curiosity. Labuza et al. [55] have conclusively established that lipid oxidation instrained meat from chicken and pork, at p/p0 values in the range of 0.75–0.84, proceeds much more rapidly if the samples areadjusted to the desired p/p0 value by desorption rather than resorption. The desorption samples, as already noted, would containmore water at a given p/p0 than the resorption samples. This would cause the high-moisture sample to have a lower viscosity,which in turn would cause greater catalyst mobility, greater exposure of catalytic sites because of the swollen matrix, andsomewhat greater oxygen diffusivity than in the lower moisture (resorption) sample.
In another study, Labuza et al. [56] found that the p/p0 needed to stop the growth of several microorganisms is significantlylower if the product is prepared by desorption rather than resorption.
By now it should be abundantly clear that MSIs are highly product specific, that the MSI for a given product can be changedsignificantly by the manner in which the product is prepared, and that these points are of practical importance.
FIGURE 22Hysteresis of moisture sorption
isotherm.

Pag e 52
2.10 Relative Vapor Pressure and Food Stability
Food stability and p/p0 are closely related in many situations. The data in Figure 23 and Table 6 provide examples of theserelationships. Shown in Table 6 are various common microorganisms and the range of RVP permitting their growth. Also shownin this table are common foods categorized according to their RVP.
Data in Figure 23 are typical qualitative relationships between reaction rate and p/p0 in the
FIGURE 23Relationships among relative water vapor pressure, food stability
and sorption isotherms. (A) Microbial g rowth versus p/p 0. (B)Enzymic hydrolysis versus p/p 0. (C) Oxidation (nonenzymic)
versus p/p0. (D) Maillard browning versus p/p 0. (E)Miscellaneous reaction rates versus p/p 0. (F) W ater content
versus p/p0. All ordinates are “relative rate” except for F. Datafrom various sources.

Pag e 53
TABLE 6 Relative Vapor Pressure and Growth of Microorg anisms in Food
Rang e ofp/p0
Microorg anisms g enerally inhibitedby lowest p/p 0 in this rang e Foods g enerally within this rang e
1.00–0.95 Pseudomonas, Escherichia, Proteus,Shigella, Klebsiella, Bacillus,Clostridium perfringens, someyeasts
Hig hly perishable (fresh) foods and canned fruits,veg etables, meat, fish, and milk; cooked sausag es andbreads; foods containing up to approximately 40%(w/w) sucrose or 7% sodium chloride
0.95–0.91 Salmonella, Vibrioparahaemolyticus, C. botulinum,Serratia, Lactobacillus,Pediococcus, some molds, yeasts(Rhodotorula, Pichia)
Some cheeses (Cheddar, Swiss, Muenster, Provolone),cured meat (ham), some fruit juice concentrates; foodscontaining up to 55% (w/w) sucrose or 12% sodiumchloride
0.91–0.87 Many yeasts (Candida, Torulopsis,Hansenula), Micrococcus
Fermented sausag e (salami), spong e cakes, drycheeses, marg arine; foods containing up to 65% (w/w)sucrose (saturated) or 15% sodium chloride
0.87–0.80 Most molds (mycotoxig enicpenicillia), Staphylococcus aureus,most Saccharomyces (bailii) spp.,Debaryomyces
Most fruit juice concentrates, sweetened condensedmilk, chocolate syrup, maple and fruit syrups; flour,rice, pulses containing 15–17% moisture; fruit cake;country-style ham, fondants, hig h-ratio cakes
0.80–0.75 Most halophilic bacteria,mycotoxig enic asperg illi
Jam, marmalade, marzipan, g lacé fruits, somemarshmallows
0.75–0.65 Xerophilic molds (Aspergilluschevalieri, A. candidus, Wallemiasebi),Saccharomyces bisporus
Rolled oats containing approximately 10% moisture;g rained noug ats, fudg e, marshmallows, jelly, molasses,raw cane sug ar, some dried fruits, nuts
0.65–0.60 Osmophilic yeasts (Saccharomycesrouxii), few molds (Aspergillusechinulatus, Monascus bisporus)
Dried fruits containing 15–20% moisture; some toffeesand caramels; honey
0.50 No microbial proliferation Pasta containing approximately 12% moisture; spicescontaining approximately 10% moisture
0.40 No microbial proliferation W hole eg g powder containing approximately 5%moisture
0.30 No microbial proliferation Cookies, crackers, bread crusts, etc. containing 3–5%moisture
0.20 No microbial proliferation W hole milk powder containing 2–3% moisture; driedveg etables containing approximately 5% moisture;corn flakes containing approximately 5% moisture;country style cookies, crackers
Source: Ref. 6

Pag e 54
temperature range 25–45°C. For comparative purposes a typical isotherm, Figure 23F, is also shown. It is important toremember that the exact reaction rates and the positions and shapes of the curves (Fig. 23A-E) can be altered by samplecomposition, physical state and structure of the sample, composition of the atmosphere (especially oxygen), temperature, and byhysteresis effects.
For all chemical reactions in Figure 23, minimum reaction rates during desorption are typically first encountered at the boundaryof Zones I and II of the isotherm (p/p0 0.20–0.30), and all but oxidative reactions remain at this minimum as p/p0 is furtherreduced. During desorption, the water content at the first-encountered rate minimum is the “BET monolayer” water content.
The unusual relationship between rate of lipid oxidation and p/p0 at very low values of p/p0 deserves comment (Fig. 23C).Starting at the extreme left of the isotherm, added water decreases the rate of oxidation until the BET monolayer value isattained. Clearly, overdrying of samples subject to oxidation will result in less than optimum stability. Karel and Yong [48] haveoffered the following interpretative suggestions regarding this behavior. The first water added to a very dry sample is believed tobind hydroperoxides, interfering with their decomposition and thereby hindering the progress of oxidation. In addition, this waterhydrates metal ions that catalyze oxidation, apparently reducing their effectiveness.
Addition of water beyond the boundary of Zones I and II (Fig. 23C and Fig. 23F) results in increased rates of oxidation. Kareland Yong [48] suggested that water added in this region of the isotherm accelerates oxidation by increasing the solubility ofoxygen and by allowing macromolecules to swell, thereby exposing more catalytic sites. At still greater p/p0 values (> ~ 0.80)the added water may retard rates of oxidation, and the suggested explanation is that dilution of catalysts reduces theireffectiveness.
It should be noted that curves for the Maillard reaction, vitamin B1 degradation, and microbial growth all exhibit rate maxima atintermediate to high p/p0 values (Fig. 23A, D, E). Two possibilities have been advanced to account for the decline in reactionrate that sometimes accompanies increases in RVP in foods having moderate to high moisture contents [20,54].
1. For those reactions in which water is a product, an increase in water content can result in product inhibition.
2. When the water content of the sample is such that solubility, accessibility (surfaces of macromolecules), and mobility of rate-enhancing constituents are no longer rate-limiting, then further addition of water will dilute rate-enhancing constituents anddecrease the reaction rate.
Since the BET monolayer value of a food provides a good first estimate of the water content providing maximum stability of adry product, knowledge of this value is of considerable practical importance. Determining the BET monolayer value for aspecific food can be done with moderate ease if data for the low-moisture end of the MSI are available. One can then use theBET equation developed by Brunauer et al. [8] to compute the monolayer value
(8)
where aw is water activity, m is water content (g H2O/g dry matter), m1 is the BET monolayer value, and C is a constant. Inpractice, p/p0 values are used in Equation 8 rather than aw values.
From this equation, it is apparent that a plot of aw/m(1-aw) versus aw, known as a BET plot, should yield a straight line. Anexample for native potato starch, with aw replaced by p/p0, is shown in Figure 24. The linear relationship, as is generallyacknowledged, begins to deteriorate at p/p0 values greater than about 0.35.
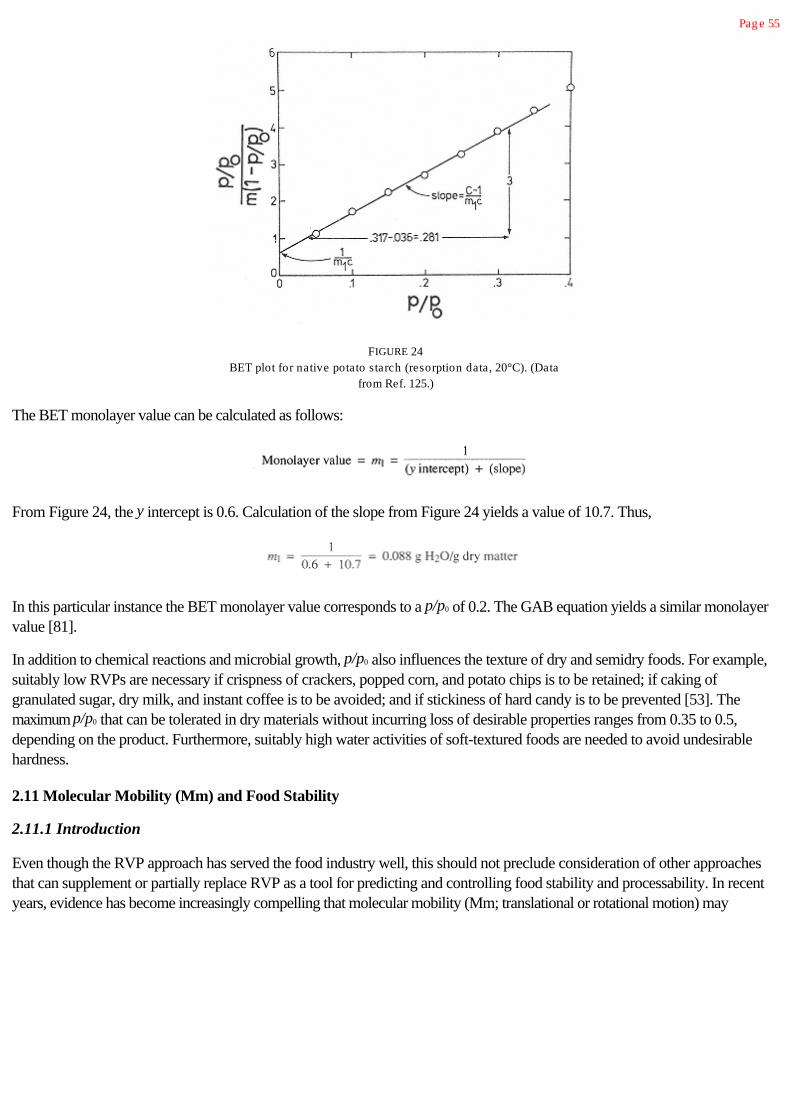
Pag e 55
FIGURE 24BET plot for native potato starch (resorption data, 20°C). (Data
from Ref. 125.)
The BET monolayer value can be calculated as follows:
From Figure 24, the y intercept is 0.6. Calculation of the slope from Figure 24 yields a value of 10.7. Thus,
In this particular instance the BET monolayer value corresponds to a p/p0 of 0.2. The GAB equation yields a similar monolayervalue [81].
In addition to chemical reactions and microbial growth, p/p0 also influences the texture of dry and semidry foods. For example,suitably low RVPs are necessary if crispness of crackers, popped corn, and potato chips is to be retained; if caking ofgranulated sugar, dry milk, and instant coffee is to be avoided; and if stickiness of hard candy is to be prevented [53]. Themaximum p/p0 that can be tolerated in dry materials without incurring loss of desirable properties ranges from 0.35 to 0.5,depending on the product. Furthermore, suitably high water activities of soft-textured foods are needed to avoid undesirablehardness.
2.11 Molecular Mobility (Mm) and Food Stability
2.11.1 Introduction
Even though the RVP approach has served the food industry well, this should not preclude consideration of other approachesthat can supplement or partially replace RVP as a tool for predicting and controlling food stability and processability. In recentyears, evidence has become increasingly compelling that molecular mobility (Mm; translational or rotational motion) may

Pag e 56
be an attribute of foods that deserves attention because it is related causally to many important diffusion-limited properties offood.
Luyet and associated in the United States and Rey in France were apparently the first to draw attention to the relevance of Mm(glassy states, recrystallization, collapse temperatures during freeze drying) to properties of biological materials [74, 76, 78, 94].John D. Ferry, a professor of chemistry at the University of Wisconsin, and his associates formulated many of the basic conceptspertaining to Mm in nonequilibrium systems consisting of synthetic, amorphous polymers [27,130]. In 1966, White andCakebread [129] described the important role of glassy and supersaturated states in various sugar-containing foods andsuggested that the existence of these states has an important influence on the stability and processability of many foods.Duckworth et al. [17] demonstrated the relevance of Mm to rates of nonenzymic browning and ascorbic acid oxidation, andthereby provided further evidence that the relationship between Mm and food stability is one of considerable importance.
Widespread recent interest in the relationship between Mm and food properties was created primarily by Felix Franks [29] andthe team of Louise Slade and Harry Levine [60–67, 112–118]. They showed that important basic principles underlying thebehavior of synthetic, amorphous polymers, as developed by Ferry's group and others, apply to the behavior of glass-formingfoods. Slade and Levine used the phrase “food polymer science approach” to describe the interrelationships just mentioned;however, the term “molecular mobility” (Mm) seems preferable because this term is simple and emphasizes the underlying aspectof importance. The work of Slade and Levine has been relied on heavily during preparation of this section on Mm.
The importance of the Mm concept, which lay unappreciated by food scientists for many years, lends support to an importantprinciple: For those in applied sciences who aspire to engage in pioneering work, much more can be gained from scientificliterature that underlies or is peripheral to their primary field of endeavor than from literature that is central to it. Evidence nowsuggests that Mm is causally related to diffusion-limited properties of foods that contain, besides water, substantial amounts ofamorphous, primarily hydrophilic molecules, ranging in size from monomers to polymers. The key constituents with respect toMm are water and the dominant solute or solutes (solute or solutes comprising the major fraction of the solute portion). Foodsof this type include starch-containing foods, such as pasta, boiled confections, protein-based foods, intermediate-moisturefoods, and dried, frozen, or freeze-dried foods. Some properties and behavioral characteristics of food that are dependent onMm are shown in Table 7.
When a food is cooled and/or reduced in moisture content so that all or part of it is converted to a glassy state, Mm is greatlyreduced and diffusion-limited properties become stable. It is important to note the qualifying term “diffusion-limited.” Mostphysical properties/changes are diffusion-limited, but some chemical properties/reactions are controlled more by chemicalreactivity than diffusion. Approaches to predicting whether rates of chemical reactions are limited by diffusion or chemicalreactivity are available but calculations are not simple. This matter will be discussed further in Section 2.11.3.2. Even if futurework establishes that the Mm approach applies to virtually all physical properties of foods but only to some chemical properties,the importance of this approach remains sufficient to justify careful study.
It is appropriate at this point to suggest that the RVP and Mm approaches to food stability are, for the most part,complementary rather than competitive. Although the RVP approach focuses on the “availability” of water in foods, such as thedegree to which it can function as a solvent, and the Mm approach focuses on microviscosity and diffusibility of chemicals infoods, the latter, of course, is dependent on water and its properties [83].
Because several terms used in the following discussion will be unfamiliar to many readers of this book and/or have been poorlydefined in other works, a glossary appears at the end of this chapter. Many readers will find it useful to study the glossary beforeproceeding further.

Pag e 57
TABLE 7 Some Properties and Behavioral Characteristics of Foods That Are Governed by Molecular Mobility(Diffusion-Limited Chang es in Products Containing Amorphous Reg ions)
Dry or semidry foods Frozen foods
Flow properties and stickinessCrystallization and recrystallization
Moisture mig ration (ice crystallization, formation of in-packag e ice)
Sug ar bloom in chocolateCracking of foods during drying
Lactose crystallization (''sandiness'' in frozen desserts)
Texture of dry and intermediate moisture foods Enzymatic activity
Collapse of structure during secondary(desorption) phase of freeze-drying
Structural collapse of amorphous phase dur- ingsublimation (primary) phase of freeze-drying
Escape of volatiles encapsulated in a solid,amorphous matrix
Shrinkag e (partial collapse of foam-like frozen desserts)
Enzymatic activity
Maillard reaction
Gelatinization of starch
Staling of bakery products caused byretrog radation of starch
Cracking of baked g oods during cooling
Thermal inactivation of microbial spores
Source: Adapted from Ref. 114.
2.11.2 State Diagrams
Consideration of “state” diagrams is highly pertinent to the discussion of Mm and stability of foods that are frozen or havereduced moisture contents. State diagrams are much more suitable for this purpose than conventional phase diagrams. Phasediagrams pertain solely to equilibrium conditions. State diagrams contain equilibrium information as well as information onconditions of nonequilibrium and metastable equilibrium “states.” State diagrams are, therefore, supplemented phase diagrams,and they are appropriate because foods that are dried, partially dried, or frozen do not exist in a state of thermodynamicequilibrium.
A simplified temperature-composition state diagram for a binary system is shown in Figure 25. Important additions to the
standard phase diagram are the glass transition curve (Tg) and the line extending from TE to , with both lines representingmetastable conditions. Samples located above the glass transition curve and not on any line exist, with few exceptions, in a stateof nonequilibrium, as will be discussed subsequently. State diagrams of this format will be used several times during the followingdiscussion of Mm in foods.
When using these diagrams, it is assumed that pressure is constant and the time dependency of the metastable states, althoughreal, is of little or no commercial importance (not true of nonequilibrium states). It also should be recognized that each simplesystem will have its own characteristic state diagram that differs quantitatively, but not qualitatively, from that in Figure 25, andthat most foods are so complex that they cannot be accurately or easily represented on a state diagram. For all complex foods,both dry and frozen, accurate determination of a glass transition curve (or more properly zone, as will be discussed later) isdifficult, but estimates are essential if the Mm approach to food stability is to be used effectively. Although estimates of Tg forcomplex foods are not easy to obtain, this can be done with accuracy sufficient for commercial use.

Pag e 58
Fig ure 25State diag ram of a binary system. Assumptions: maximal freeze concentration, no
solute crystallization, constant pressure, no time dependence. is the melting
point curve, T E is the eutectic point, is the solubility curve, T g is the g lass
transition curve, and is the solute-specific g lass transition temperature of amaximally freeze concentrated solution. Heavy dashed lines represent conditions of
metastable equilibrium. All other lines represent conditions of equilibrium.
Establishing the equilibrium curves ( Fig. 25) for complex foods also can be difficult. For dry or semidry foods
the curve, the major equilibrium curve of importance, usually cannot be accurately depicted as a single line. A commonapproach is to base the state diagram on water and a food solute of dominating importance to the properties of the complexfood, then deduce properties of the complex food from this diagram. For example, a state diagram for sucrose-water is useful
for predicting the properties and behavior of cookies during baking and storage [67]. Determining curves for dry orsemidry complex foods that do not contain a dominating solute is a difficult matter that has not yet been satisfactorily resolved.
For frozen foods, the situation is somewhat better because the melting point curve ( ), the major equilibrium curve ofimportance, is often known or easily determined. Thus, it is possible, with accuracy sufficient for commercial purposes, toprepare a state diagram for a complex frozen food.
For binary systems, the effect of different solutes on the glass transition curve is shown schematically in Figure 26. Note that the
left end of the Tg curve is always fixed at -135°C, the Tg of water. Thus, differences in location of the curve depend on andon Tg of the dry solute.

Pag e 59
FIGURE 26State diag ram of a binary system showing the influence of solute type on the
position of the g lass transition curve. The extreme left position of the T g curve isalways fixed at the vitrification temperature of pure water (-135°C), the midpoint
at the solute's , and the extreme rig ht position at the T g of the pure solute; aand b are curves for different solutes. Assumptions stated in Fig ure 25 apply here.
2.11.3 Nine Key Concepts Underlying the Molecular Mobility Approach to Food Stability
2.11.3.1 Concept 1. Many Foods Contain Amorphous Components and Exist in a State of Metastable Equilibrium orNonequilibrium
Complex foods frequently contain amorphous (noncrystalline solid or supersaturated liquid) regions. Biopolymers are typicallyamorphous or partly amorphous. Examples include proteins such as gelatin, elastin, and gluten, and carbohydrates such asamylopectin and amylose. Many small molecules such as sugars also can exist in an amorphous state, and all dried, partiallydried, frozen, and freeze-dried foods contain amorphous regions.
Amorphous regions exist in metastable equilibrium or nonequilibrium. Attainment of thermodynamic equilibrium (minimum freeenergy) is not a goal during food processing, though this condition results in maximum stability. Thermodynamic equilibrium isincompatible with life, including that of fruits and vegetables postharvest, and is incompatible with satisfactory quality in foods.Thus, a major goal of food scientists/technologists, although they rarely view their duties in this manner, is to maximize thenumber of desirable food attributes that depend on metastable equilibrium states, and to achieve acceptable stability for thosedesirable attributes that must unavoidably depend on nonequilibrium states. Hard candy (amorphous solid) is a

Pag e 60
common example of a metastable food, and emulsions, small ice crystals, and unsaturated lipids are examples of foodcomponents that exist in a state of unstable nonequilibrium. Metastable states of food components often can be achieved bydrying or freezing.
2.11.3.2 Concept 2. The Rates of Most Physical Events and Some Chemical Events Are Governed by MolecularMobility (Mm)
Because most foods exist in metastable or nonequilibrium states, kinetic rather than thermodynamic approaches are often moreappropriate for understanding, predicting, and controlling their properties. Molecular mobility (Mm) is a kinetic approachconsidered appropriate for this purpose because it is causatively related to rates of diffusion-limited events in foods. The WLF(Williams-Landel-Ferry) equation (see Section 2.11.3.5) provides the means for estimating Mm at temperatures above the glass
transition temperature and below or . State diagrams indicate conditions of temperature and composition that permitmetastable and nonequilibrium states to exist.
The utility of the Mm approach for predicting many kinds of physical changes has been reasonably well established. However,situations do exist where the Mm approach is of questionable value or is clearly unsuitable. Some examples are (a) chemicalreactions whose rates are not strongly influenced by diffusion, (b) desirable or undesirable effects achieved through the action ofspecific chemicals (e.g., alteration of pH or oxygen tension), (c) situations in which sample Mm is estimated on the basis of apolymeric component (Tg of polymer) and where Mm of small molecules that can penetrate the polymer matrix is a primarydeterminant of the product attribute of interest [110,111], and (d) growth of vegetative cells of microorganisms (p/p0 is a morereliable estimator than Mm) [12,13]. Point (a) deserves further attention because most authors of papers on Mm and itsrelevance to food stability are strangely silent on this important topic. Some useful references are Rice [95], Connors [14],Kopelman and Koo [50], Bell and Hageman [2a], and Haynes [40].
It is appropriate to first consider chemical reactions in a solution at ambient temperature. In this temperature range, somereactions are diffusion-limited but many are not. At constant temperature and pressure, three primary factors govern the rate atwhich a chemical reaction will occur: a diffusion factor, D (to sustain a reaction, reactants must first encounter each other), afrequency-of-collision factor, A (number of collisions per unit time following an encounter), and a chemical activation-energyfactor, Ea (once a collision occurs between properly oriented reactants the energy available must be sufficient to cause areaction, that is, the activation energy for the reaction must be exceeded). The latter two terms are incorporated in the Arrheniusrelationship depicting the temperature dependence of the reaction rate constant. For a reaction to be diffusion-limited, it is clearthat factors A and Ea must not be rate-limiting; that is, properly oriented reactants must collide with great frequency and theactivation energy must be sufficiently low that collisions have a high probability of resulting in reaction. Diffusion-limited reactionstypically have low activation energies (8–25 kJ/mol). In addition, most “fast reactions” (small Ea and large A) are diffusion-limited. Examples of diffusion-limited reactions are proton transfer reactions, radical recombination reactions, acid-basereactions involving transport of H+ and OH-, many enzyme-catalyzed reactions, protein folding reactions, polymer chain growth,and oxygenation/deoxygenation of hemoglobin and myoglobin [89,95]. These reactions may involve a variety of chemical entitiesincluding molecules, atoms, ions, and radicals. At room temperature, diffusion-limited reactions occur with bimolecular rateconstants of about 1010 to 1011 M-1s-1; therefore a rate constant of this magnitude is regarded as presumptive evidence of adiffusion-limited reaction. It is also important to note that reactions in solution can go no faster
Pag e 61
than the diffusion-limited rate; that is, the diffusion-limited rate is the maximum rate possible (conventional reaction mechanismsare assumed). Thus, reactions occurring at rates significantly slower than the diffusion-limited maximum are limited by A or Ea ora combination of these two.
The theory describing diffusion-limited reactions was developed by Smoluchowski in 1917. For spherical, uncharged particles,the second-order diffusion-limited rate constant is
where NA is Avogadro's number, D1 and D2 are the diffusion constants for particles 1 and 2, respectively, and r is the sum of theradii of particles 1 and 2, that is, the distance of closest approach. This equation was subsequently modified by Debye toaccommodate charged particles and by others to accommodate additional characteristics of real systems. Nonetheless, theSmoluchowski equation provides an order-of-magnitude estimate of kdif.
Of considerable pertinence to the present discussion is the viscosity and temperature dependence of the diffusion constant. Thisrelationship is represented by the Stokes-Einstein equation:
D= kT/pbhrs
where k is the Boltzmann constant, T is absolute temperature, b is a numerical constant (about 6), h is viscosity, and rs is thehydrodynamic radius of the diffusing species. This dependence of D (and therefore kdif) on viscosity is a point of special interestbecause viscosity increases dramatically as temperature is reduced in the WLF region.
It appears likely that rates of some reactions in high moisture foods at ambient conditions are diffusion-limited and rates of othersare not. Those that are would be expected to conform reasonably well to WLF kinetics as temperature is lowered or watercontent is reduced. Among those that are not diffusion-limited at ambient conditions (probably uncatalyzed, slow reactions),many probably become so as temperature is lowered below freezing or moisture is reduced to the point where solutesaturation/supersaturation becomes common. This is likely because a temperature decrease would reduce the thermal energyavailable for activation and would increase viscosity dramatically, and/or because a reduction in water content would cause apronounced increase in viscosity. Because the frequency-of-collision factor, A, is not strongly viscosity dependent, it probably isnot an important determinant of the reaction-limiting mechanism under the circumstances described [9]. This likely conversion ofsome chemical reactions from non-diffusion-limited to diffusion-limited as temperature is lowered or water content is reducedshould result, for those reactions behaving in this manner, in poor conformance to WLF kinetics in the upper part of the WLFregion and much better conformance in the lower part of the WLF region.
2.11.3.3 Concept 3. Free Volume Is Mechanistically Related to Mm
As temperature is lowered, free volume decreases, making translational and rotational motion (Mm) more difficult. This has adirect bearing on movement of polymer segments, and hence on local viscosity in foods. Upon cooling to Tg, free volumebecomes sufficiently small to stop translational motion of polymer segments. Thus, at temperatures <Tg, the stability of diffusion-limited properties of food is generally good. Increases in free volume (usually undesirable) can be achieved by addition of a low-molecular-weight solvent, such as water, or by increasing temperature, with both actions increasing translational motion ofmolecules. The free volume

Pag e 62
concept is useful in that it provides a mechanistic basis for the Mm versus stability relationship, but as yet, it has not beensuccessfully applied as a quantitative tool for predicting food stability.
2.11.3.4 Concept 4. Most Foods Exhibit a Glass Transition Temperature (T g or ) or Range
The Tg has an important relationship to the stability of diffusion-limited properties of food. Foods that normally containamorphous regions or develop them during cooling or drying will exhibit a Tg or Tg range. In biological systems, solutes seldomcrystallize during cooling or drying so amorphous regions and glass transitions are common. The stability of diffusion-limitedproperties of substances of this type often can be estimated from the relationship between Mm and Tg. Mm, and thus alldiffusion-limited events, including many quality-deteriorating reactions, usually becomes severely restricted below Tg.Unfortunately, many foods are stored at T>Tg, resulting in much greater Mm and much poorer stability than that attainable atT<Tg.
To determine Tg with reasonable accuracy it must be measured. In simple systems this can be accomplished using a differentialscanning calorimeter (DSC) equipped with a derivative plotting accessory, but great care must be exercised to achieve accurateresults. In complex systems (most foods), accurate determination of Tg by DSC is very difficult, and dynamic mechanicalanalysis (DMA) and dynamic mechanical thermal analysis (DMTA) have been used as alternate techniques [77a]. All of theseapproaches are costly, and none is suited to in-plant measurements.
The observed Tg depends on the type of instrument used, the experimental conditions employed, and the interpretative skill of
the operator [1,10,39,43,82,92,101,111]. A particularly good example concerns values for (Tg of frozen samples
determined under conditions where maximal freeze concentration is presumably achieved). For a given substance, valuesreported after about 1990 tend to be lower than values determined earlier. These discrepancies are caused by differences inexperimental procedures, clearly demonstrating the inappropriateness of reporting Tg values to an accuracy of greater than±1°C. Whether the recent values more accurately reflect conditions prevailing in commercial foods is still a matter of
controversy, and it should be noted that values reported by Slade and Levine pertain to samples with initial water contentsof 80%. This is fairly typical of natural foods, whereas values reported more recently are based on initial water contents that arevery low. Several criteria for ascertaining whether a glass transition has been accurately determined by DSC are given byWolanczyk [131].
Various equations are available for calculating Tg of samples containing only a few components, and this approach can provide auseful estimate when sample composition and Tg values of the components are known. The oldest and simplest equation, asapplied here to a binary system, is that of Gordon and Taylor [34].
where Tg1 and Tg2 are the glass transition values (in K) of components 1 (water) and 2 of the sample, respectively; w1 and w2 arethe weight fractions of components 1 and 2 of the sample; and k is an empirical constant. Refinements to this equation areavailable in the literature [38].
2.11.3.5 Concept 5. Molecular Mobility and Diffusion-Limited Food Stability Are Unusually Temperature
Dependent Between Tm and T g (Note: Tm Here Is Taken to Mean Either or , Whichever Is Appropriate)
Within this temperature range, which for foods may be as large as 100°C or as small as about 10°C, the vast array of productshaving amorphous regions will exhibit a temperature depend-

Pag e 63
ency for Mm and viscoelastic properties that is unusually large. The Mm is quite intense at Tm and is very subdued for mostmolecules at or below Tg. This temperature range encompasses product consistencies termed “rubbery” and “glassy” (althoughthe “rubbery” term applies only when large polymers are present). Qualitative relationships between substance properties andsubstance temperature, including the range Tm-Tg, are depicted in Figure 27.
The temperature dependence of Mm, and that of food properties that depend strongly on Mm (most physical properties andsome chemical properties), is far greater in zone Tm-Tg than it is at temperatures above or below this zone. Thus, one usuallyfinds a change in slope (change in activation energy) of Arrhenius plots upon passage from temperatures outside zone Tm-Tg totemperatures inside. Estimating the temperature dependence of reaction rates in zone Tm-Tg has been the subject of considerableresearch, and an equation that applies accurately to all types of reactions and conditions has not been devised. In zone Tm-Tg,rates of many physical events conform more closely to the WLF equation [27,130], and to similar equations, than they do to theArrhenius equation. Because the dependency of chemical reactions on Mm can vary greatly depending on reactant type, neitherWLF nor the Arrhenius equation applies to all chemical reactions in zone Tm-Tg. Conformance of physical and chemical eventsto WLF or Arrhenius
FIGURE 27Schematic interrelations among temperature,
appropriate type of kinetics, viscosity, molecular mobility,free volume, and relative rates of diffusion-dependent
events. W LF kinetics based on mean constants. Other termsare defined in leg end of Fig ure 25.

Pag e 64
relationships is much less satisfactory in the presence of ice than in its absence because the concentrative effects of ice formationare not accommodated by either approach.
Because the WLF equation is a useful tool for estimating rates of physical events in zone Tm-Tg, it deserves further discussion.The WLF equation expressed in terms of viscosity is
where h is viscosity at product temperature T(K) (Note: h can be replaced by 1/Mm, or any other diffusion-limited relaxationprocess), hg is viscosity at product temperature Tg (K), and C1 (dimensionless) and C2(K) are constants [27,130]. The Tg isgenerally accepted as the reference temperature in the WLF equation when ice is not present. In the presence of ice,
disagreement still exists as to whether Tg or is more appropriate [93,111]. This point will be discussed further in the sectiondealing with technological aspects of freezing preservation.
The terms C1 and C2 are substance-specific constants (i.e., not temperature dependent). They have mean (sometimes called“universal”) values of 17.44 and 51.6, respectively, for many synthetic, totally amorphous polymers that are pure (no diluent).The numerical values of these constants vary substantially with water content and substance type, so values appropriate forfoods often differ appreciably from the mean values. Constants specific for the food under study must be used if reasonableconformance of data to the equation is desired [49,111].
The WLF equation specifies a very large temperature dependence of substance properties in zone Tm-Tg. If one assumesconformance to WLF kinetics (mean constants), the absence of ice, and an initial substance temperature Tg, then warming willresult in the following sequence of changes in viscosity (or 1/Mm) [115,117]:
1. An approximate 103-fold decrease in viscosity and increase in Mm during an isotemperature conversion from a glass to asupersaturated liquid.
2. An approximate 105-fold decrease in viscosity and increase in Mm with warming through the 20°C interval immediatelyabove Tg. (In the unfrozen fraction of frozen samples, the change in these properties per °C is even greater.)
3. An approximate 1012-fold decrease in viscosity and increase in Mm with warming through the entire range from Tg to Tm.
With respect to diffusion-limited food stability in the WLF region (Tm-Tg), two terms are of key importance: T-Tg (or T- )and Tm/Tg. T-Tg, where T is product temperature, defines the location of the food in the WLF region. The log(h/hg) (or anyother viscosity-related property, such as Mm) varies curvilinearly with T-Tg. The term Tm/Tg (calculated on the basis of K)provides a rough estimate of product viscosity (inverse relationship with Mm) at Tg. Knowledge of product viscosity at Tg isimportant because viscosity at Tg is the reference value in the WLF equation, and this value can vary considerably with changesin product composition.
Valuable concepts pertaining to Tm-Tg, T-Tg, and Tm/Tg have been developed based largely on diffusion-limited properties ofcarbohydrates [62,112-114,117]:
1. The magnitude of the Tm-Tg region can vary from about 10 to about 100°C, depending on product composition.
2. Product stability depends on product temperature, T, in the zone Tm-Tg, that is, it is inversely related to DT=T-Tg.
3. At a given value of Tg and constant solids content, Tm/Tg varies inversely with Mm. Thus, Tm/Tg is directly related to bothdiffusion-limited product stability and product rigidity (viscosity) at both Tg and temperatures > Tg in the WLF region. Forexample, at any given T in the WLF zone, substances with small Tm/Tg values (e.g., fructose)

Pag e 65
result in larger values of Mm and greater rates of diffusion-limited events than do substances with large Tm/Tg values (e.g.,glycerol [113]). Small differences in the value of Tm/Tg result in very large differences in both Mm and product stability[113].
4. Tm/Tg is highly dependent on solute type (Table 8).
5. For equal Tm/Tg at a given product temperature, an increase in solids content results in decreased Mm and increasedproduct stability.
At this point it is appropriate to mention two approaches that have been used to study the interrelations between Mm, Tg, andfood properties/stability. One approach, as just discussed, involves testing whether physical and chemical changes in foods overthe temperature range Tm-Tg conform to WLF kinetics. Some studies of this kind have resulted in good conformity (physicalproperties) to WLF kinetics and others poor (some chemical reactions) (Fig. 28).
A second approach is simply to determine whether food stability differs markedly above and below Tg (or , with littleattention given to characterization of kinetics. With this approach, the expectation is not so demanding and the results are oftenmuch more favorable; that is, it is found that desirable food properties, especially physical properties, are typically retained muchbetter below Tg than they are above. Tg appears to be much less reliable for predicting stability of chemical properties than it isfor physical properties. The temperature below which oxidation of ascorbic acid exhibits greatly reduced temperature
dependency (practical termination temperature) appears to correspond fairly well to , at least under the conditions used inFigure 29. However, the same is not true for non enzymatic browning. In Figure 30, the practical termination temperature fornon enzymatic browning is well above sample Tg, whereas in Figure 31 the termination temperature is well below sample Tg.Differences in sample composition probably account for the dissimilar results in the two browning studies.
In closing this section, it is appropriate to note that an algebraic equation is available to interrelate food texture, temperature, andmoisture content in the vicinity of Tg (or other critical temperatures) [88]. Although the equation cannot be used to predicttextural changes, it can be used to create quantitative, three-dimensional graphs that effectively display these interrelationshipsnear Tg. Large differences exist among products with respect to dependency of a given textural property on temperature andmoisture, and these differences are clearly evident on graphs of this kind.
2.11.3.6 Concept 6. Water is a Plasticizer of Great Effectiveness and it Greatly Affects T g
This is especially true with regard to polymeric, oligomeric, and monomeric food substances that are hydrophilic and containamorphous regions. This plasticizing action results in enhanced Mm, both above and below Tg. As water increases, Tg decreasesand free volume increases (Fig. 32). This occurs because the average molecular weight of the mixture decreases. In general, Tg
decreases about 5–10°C per wt% water added [118]. One should be aware, however, that the presence of water does notassure that plasticization has occurred; water must be absorbed in amorphous regions to be effective.
Water, because of its small molecular mass, can remain surprisingly mobile within a glassy matrix. This mobility no doubtaccounts, as previously noted, for the ability of some chemical reactions involving small molecules to continue at measurablerates somewhat below the Tg of a polymer matrix, and for water to be desorbable during the secondary phase of freeze dryingat temperatures <Tg.

Pag e 66

Pag e 67
FIGURE 28Comparison of the temperature dependence (T - T g) of viscosity (log hT/hT g; inverse of molecular mobility)as estimated from the W LF equation using mean constants, with the temperature dependencies of the rates
at which various foods deteriorate. Note: Curves for rate of deterioration of foods have been adjustedvertically to avoid overlap; thus the values shown are relative values and meaning should be attachedonly to the slopes of these curves. Curve a is W LF viscosity, which is usually assumed to be inversely
proportional to the rates of diffusion-dependent reactions. Curve b is the pseudo-first-order rate constant forloss of ascorbic acid in frozen peas. Curve c is the rate of enzyme-catalyzed hydrolysis of disodium p-nitrophenyl
phosphate in aqueous maltodextrin. Curve d is the rate constant for the decrease in protein solubility in frozen cod.Curve e is the rate constant for the increase in “Instron peak force” for frozen cod. Curve f is the mean rate
of increase in the apparent viscosity of eg g yolk (during cooling , the early stag es of freezing account for thesteep slope at the rig ht end of the curve). Curve g is the “kinetic constant” for the g rowth of ice crystals
in frozen beef. (Compiled from various sources by Simatos and Blond [110].)
2.11.3.7 Concept 7. Solute Type Greatly Affects T g and
These relationships are important for predicting the behavior of compounds, but they are not simple. Thus, the discussion here isfar from complete. For further information the reader is referred to Slade and Levine 113]. Tg is strongly dependent on both
solute type and moisture content, except for observed , which depends primarily on solute type and only slightly on watercontent (initial).
Attention will first be given to the relationship between solute molecular weight (MW) and Tg or . Figure 33 is a plot of
versus MW for sugars, glycosides, and polyols with maximum MW of about 1200. (and Tg) increase proportionately withincreases in solute MW

Pag e 68
FIGURE 29Loss of ascorbic acid with time at various temperatures.
Initial samples contained L-ascorbic acid (40 mg /100ml) and 10% w/w maltodextrin (M100) in deg assed
acetate buffer, pH 5.8. is -10°C. Upper three lines aredata for temperatures of -11.5, -14.3, and -17.7°C,
is -8.0°C, and is -5.6°C. (From Ref. 70.)
over the range of MW shown. This is an expected relationship because translational mobility of molecules decreases withincreasing size, so that a large molecule requires a higher temperature for movement than does a smaller one. However, withMW greater than 3000 (dextrose equivalent, DE, of <~6 for starch hydrolysis products) Tg becomes independent of MW, as isshown in Figure 34. An exception occurs when time and large-molecule concentration are sufficient to allow “entanglementnetworks” (see later section) to form. In this instance, Tg continues to rise somewhat with increasing MW. A noteworthy aspectof Figure 34 is the relationship shown between functional properties of solutes and their DE (or MWn). Compounds on thesmall-MW portion (vertical leg) of the curve serve, for example, as sweeteners,
FIGURE 30Rate of nonenzymatic browning in cabbag e and
potato as a function of product water content andT - T g. (From Ref. 49.)

Pag e 69
FIGURE 31Rate of nonenzymatic browning in a model
system as a function of T - T g. Maltodextrin (DE10), L-lysine, and D-xylose were used at ratios of13:1:1. Storag e temperature was held constant at
each of the temperatures indicated and T - T g wasaltered by chang ing water content of the sample.
(From Ref.99.)
FIGURE 32T g of wheat g luten as a function of water content.
(From Ref. 42.)

Pag e 70
FIGURE 33
as influenced by solute molecular weig ht. values weredetermined from 20 wt% solutions of sug ars (O), g lycosides(x), and polyols (*) that were maximally freeze concentrated.
(From Ref. 61.)
FIGURE 34
as influenced by number-averag e molecular weig ht anddextrose equivalent (DE) of commercial starch hydrolysis
products. values were determined from maximallyfreeze-concentrated solutions that initially contained 80 wt%
water. (Adapted from Ref. 60.)

Pag e 71
humectants, participants in the Maillard reaction, and cryoprotectants. Compounds on the plateau region of the curve haveentirely different functions, as indicated.
Plots of MW versus Tg that are linear and provide greater insight to the relationship between MW and Tg have been developedfor solutes with MW of less than about 3000 [113]. For dry solutes, the appropriate plot is Tg versus -1/MWn of the solute. For
samples containing significant amounts of water, the appropriate plot is versus -1/MWw of the water-solute solution that
exists at of the sample. It should be noted that the good linearity of these plots deteriorates significantly when members ofnonhomologous series are incorporated on the same plot. This indicates that solute attributes other than MW have an influence
on Tg and . Thus, one cannot expect to obtain the same product properties (stability, processability) when chemicals of thesame MW (or same DE) are interchanged. This failure to achieve uniform performance among compounds of the same MW isespecially true when the interchange involves different chemical families. For example, for different sugars of equal MW, the
difference in can be as much as 10°C. Different performance can also occur between molecules of the same type if fractions
of different configurations are present [114]. Tg and values for selected pure carbohydrates, along with associated values formolecular weight and several other properties of importance, are listed in Table 8.
A final point should be mentioned before closing this section. Most, perhaps all, bio-polymers of high MW have very similar
glass curves and exhibit values near -10°C. Those with values in this range include polysaccharides such as starch,maltodextrin, cellulose, hemicellulose, carboxymethylcellulose, dextran, and xanthan; and proteins such as gluten, glutenin,gliadin, zein, collagen, gelatin, elastin, keratin, albumins, globulins, and casein [117].
2.11.3.8 Concept 8. Solute Type Has a Profound Effect on Wg
The term Wg is the water content of the sample at Tg, and is the unfrozen water content at . The terms Cg and are
the solids content of the sample at Tg and respectively ( =100 - , and the same relationship applies to Cg and Wg at
a given temperature). The following important relationships were derived for of carbohydrates but are believed to apply toWg and to substances other than carbohydrates:
1. The value of varies directly with Mm and inversely with product stability at . Increases in product water content
above or Wg cause product stability to decrease and Mm to increase.
2. The values vary greatly with solute type as is apparent from data in Table 8. The value of generally varies
inversely with and MWw, but these are qualitative relationships and are not suitable for predictive purposes, except for
members of a homologous series of compounds. Generally, the most reliable values of solute or product are obtainedby measurement. However, the experimental procedure chosen can greatly affect the value obtained, and the proceduremost likely to give values of greatest relevance to food is still a matter of controversy [114].
Based on what has been said, one should not expect the same performance within the WLF zone when compounds are
interchanged on an equal weight or equal p/p0 basis, because these compounds may have different values for and (or
Wg and Tg). Compare, for example, the values of glucose versus fructose and lactose versus trehalose (Table 8). Althougheach pair member has the same molecular weight, their effect on product stability usually is quite different, and this is at least
partly attributable to the difference in .

Pag e 72
2.11.3.9 Concept 9. Molecular Entanglement Can Greatly Affect the Properties of Food
Macromolecule entanglement (see glossary) can lead to the formation of entanglement networks (EN) when solute molecularsize is sufficient (>~3,000 MW, <DE of ~6 for carbohydrates), when solute concentration exceeds a critical value, and sufficienttime elapses. Besides carbohydrates, proteins can form EN, examples being gluten in wheat flour dough and sodium caseinate inimitation mozzarella cheese.
ENs have a profound effect on the properties of food. For example, it has been suggested, based on some supporting evidence,that ENs can slow rates of crystallization in frozen foods, retard moisture migration in baked goods, help retain crispness ofbreakfast cereals, help reduce sogginess of pastries and pie crusts, and facilitate drying, gel formation, and encapsulation
processes [114]. Once conditions result in an EN, further increases in MW will not only cause further increases in Tg or , butwill also result in firmer networks [64].
2.11.4 Technological Aspects: Freezing
Although freezing is regarded as the best method of long-term preservation for most kinds of foods, the benefits of thispreservation technique derive primarily from low temperature as such, not from ice formation. The formation of ice in cellularfoods and food gels has two important adverse consequences: (a) nonaqueous constituents become concentrated in the unfrozenphase (an unfrozen phase exists in foods at all storage temperatures used commercially), and (b) all water converted to iceincreases 9% in volume. Both occurrences deserve further comment.
During freezing of aqueous solutions, cellular suspensions, or tissues, water from solution is transferred into ice crystals ofvariable but high degree of purity. Nearly all of the nonaqueous constituents are therefore concentrated in a diminishing quantityof unfrozen water. The net effect is similar to conventional dehydration except in this instance the temperature is lower and theseparated water is deposited locally as ice. The degree of concentration is influenced mainly by the final temperature, and to alesser degree by agitation, rate of cooling, and formation of eutectics (crystallization of solutes—uncommon).
Because of the freeze-concentration effect, the unfrozen phase changes significantly in properties such as pH, titratable acidity,ionic strength, viscosity, freezing point (and all other colligative properties), surface and interfacial tension, and oxidation-reduction potential. In addition, solutes sometimes crystallize, supersaturated oxygen and carbon dioxide may be expelled fromsolution, water structure and water-solute interactions may be drastically altered, and macromolecules will be forced closertogether, making interactions more probable. These changes in concentration-related properties often favor increases in reactionrates. Thus, freezing can have two opposing effects on reaction rate: lowering temperature, as such, will always decreasereaction rates, and freeze-concentration, as such, will sometimes increase reaction rates. It should not be surprising, therefore,that reaction rates at subfreezing temperatures do not conform well to either Arrhenius or WLF kinetics, and that thesedeviations sometimes can be very large. In fact, it is not uncommon to find reactions that accelerate during freezing [22,23].
With this background, specific examples of freezing and the importance of Mm to the stability of frozen foods can be presented.Slow freezing of a complex food will be considered first. Very slow freezing results in close conformance to solid-liquidequilibrium and maximal freeze-concentration. Starting at A in Figure 35, removal of sensible heat moves the product to B, theinitial freezing point of the sample. Because nucleation is difficult, further removal of heat results in undercooling and nucleationbegins at point C. Nucleation is immediately followed by crystal growth, release of latent heat of crystallization and a rise intemperature to D. Further

Pag e 73
FIGURE 35State diag ram of a binary system showing possible paths for freezing
(unstable sequence ABCDE; stable sequence , drying(unstable sequence AHIJK; stable sequence AHIJLG) and freeze drying
(unstable sequence ABCDEG; stable sequence .Temperatures during drying are lower than would occur in practice tofacilitate entry of data on the g raph. Assumptions stated in Fig ure 25
apply here.
removal of heat causes additional ice formation, concentration of the unfrozen phase, depression of its freezing point, andalteration of its composition in conformance with path D to TE. The TE in the complex food being considered represents TEmax forthe solute with the highest eutectic point (temperature at which saturation of the least soluble solute is achieved). Solutes incomplex frozen foods seldom crystallize at or below their eutectic points. An occasional exception of commercial importance isformation of a lactose eutectic in frozen desserts. This results in a textural defect known as “sandiness.”
Assuming eutectics do not form, further ice formation leads to metastable supersaturation of many solutes (an amorphous liquidphase) and compositional changes of the unfrozen fraction in accord with path TE to E. Point E is the recommended storagetemperature (-20°C) for most frozen foods. Unfortunately, point E is above the glass transition temperature of most foods,indicating that Mm will be moderately intense and the food's diffusion-limited physical and chemical properties will be relativelyunstable and highly temperature-dependent. Exact conformance with WLF kinetics should not be expected because freeze-concentration effects during cooling, and melt-dilution effects during warming, are not accounted for in the WLF equation.
If cooling is continued below point E, additional ice formation and freeze concentration occur, causing composition of the
unfrozen fraction to change from that at E to that at [77a,97,102,111]. At , most of the supersaturated unfrozen phase
converts to a glass, encompassing the ice crystals. The is a quasi-invariant Tg that applies only to the maximally freeze-
concentrated unfrozen phase. The observed depends primarily on solute composition of the sample and secondarily on
initial water content of the sample (Tg is strongly dependent on both solute composition and water content). Observed is nottotally invari-

Pag e 74
TABLE 9 Glass Transition and DE Values for Commercial Starch HydrolysisProducts (SHP)
SHP Manufacturer Starch source DE
Staley 300 Staleya Corn -24 35
Maltrin M250 GPCb (1982) Dent corn -18 25
Maltrin M150 GPC Dent corn -14 15
Paselli SA-10 Avebe c Potato (Ap) -10 10
Star Dri 5 Staley (1984) Dent corn -8 5
Crystal g um Nationald Tapioca -6 5
Stadex 9 Staley Dent corn -5 3.4
AB 7436 Anheuser-Busch W axy maize -4 0.5
aA. E. Staley Manufacturing Co.
bGrain Processing Corp.
cAvebe America.
dNational Starch and Chemical.
Source: From Ref. 114.
ant because maximum ice formation is seldom obtained during procedures typically used for its determination.
Further cooling causes no further freeze-concentration, simply removal of sensible heat and alteration of product temperature in
the direction of point F. Below , Mm is greatly reduced and diffusion-limited properties usually exhibit excellent stability.
Some values for starch hydrolysis products, amino acids, proteins, and foods are listed in Tables 9–11. These values should
be regarded as “observed” or “apparent” in values because maximum ice formation would be almost impossible under the
measurement circumstances employed. These observed values are, however, probably of greater relevance to practical
situations than the true (somewhat lower) values. The range of values for foods, and the variation of with location in
a tissue, should be noted. More than one can occur in a product when, for example, the product contains a major chemicalconstituent that exists in two conformational forms, or when different domains in the product contain different ratios of
macromolecules to small-solute molecules. In this instance the highest is usually considered most important.
Because most fruits have very low values, and storage temperature is typically > , texture stability during frozen storage
is often poor. One would expect that vegetables, with values that are typically quite high, would exhibit storage lives that arelonger than those of fruits. This is sometimes but not always true. The quality attribute that limits the storage life of vegetables (orany kind of food) can differ from one vegetable to another, and it is likely that some of these attributes are influenced less by Mmthan others.

The values for fish (cod, mackerel) and beef in Table 11 were determined in 1996 and they differ markedly from earlierdata (cod, -77°C [84]; beef, -60°C [91]). The earlier data are probably in error because the dominance of large protein
polymers in muscle should result in values similar to those of other proteins (Table 10). Based on the muscle values inTable 11, one would be expect (as is generally observed) that all physical changes and all chemical changes that are diffusionlimited would be effectively retarded during typical commercial frozen storage. Because storage lipids exist in domains separatefrom that of myofibrillar proteins, they probably are not protected by a glassy matrix during frozen storage and typically exhibitinstability.
Values of for several solutes are shown in Tables 8, 10, and 11, but these values are subject to some uncertainty. values determined recently using altered techniques tend to be smaller than earlier values (mainly those of Slade and Levine).Consensus on what type of

Pag e 75
TABLE 10 Glass Transition Values and Associated Properties of Amino Acids and Proteins
Substance MW pH (20wt%) (°C) (wt%)a (g UFW /g dry AA)b
Amino acids
Glycine 75.1c 9.1 -58 63 1.7
DL-Alanine 89.1d,e 6.2 -51
DL-Threonine 119.1d 6.0 -41 51 1.0
DL-Aspartic acid 133.1c 9.9 -50 66 2.0
DL-Glutamic acid · H2O 147.1c 8.4 -48 61 1.6
DL-Lysine · HCl 182.7d 5.5 -48 55 1.2
DL-Arg inine · HCl 210.7d 6.1 -44 43 0.7
Proteins
Bovine serum albumin -13 25-31 0.33-0.44
a-Casein -13 38 0.6
Collag en (bovine, Sig ma C9879) f -6.6 ± 0.1
Caseinate, sodium -10 39 0.6
Gelatin (175 bloom, pig skin) -12 34 0.5
Gelatin (300 bloom, pig skin) -10 40 0.7
Gluten (Sig ma, wheat) -7 28 0.4
Gluten (''vital wheat g luten,'' commercial sample) -5 to -10 7-29 0.07-0.4
is unfrozen water existing in sample at .
bUFW is unfrozen water.
cSolubilized with NaOH.
d"As is" pH.
eUnderg oes solute crystallization.
fFrom N. Brake and O. Fennema (unpublished). Determined by DSC; scanned from -60°C to 25°C at 5°C/min after tempering the sample for 1 hr at -10°C.
Mean of 2 replicates ± SD.
Source: Ref. 118.

Pag e 76
measurement yields values most relevant to food stability has not yet been achieved [39,92,97]. It is important to note,however, that the Slade and Levine values reported here were determined using initial sample compositions close to those ofhigh-moisture foods, and this has an important influence on the value obtained.
Two points need to be made about the term “unfrozen” as used in the definition of . First, unfrozen refers to a practical time
scale. The unfrozen fraction will decrease somewhat over very long periods of time because water is not totally immobile at and equilibrium between the unfrozen phase and the glass phase is a metastable equilibrium, not a global one (not lowest freeenergy). Second, the term “unfrozen” has often been regarded as synonymous with “bound” water; however, bound water has
been defined in so many other ways that the term has fallen into disrepute. A significant amount of water is engaged ininteractions, mainly hydrogen bonds, that do not differ significantly in strength from water-water hydrogen bonds.

Pag e 77
This water is unfrozen simply because local viscosity in the glass state is sufficiently great to preclude, over a practical time span,the translational and rotation motions required for further ice and solute crystallization (formation of eutectics). Thus, most of the
water should be regarded as metastable and severely “hindered” in mobility.
Even though foods are frozen commercially at relatively slow rates (a few minutes to about 1 hr to attain -20°C) compared totypical rates for small samples of biological materials, maximal freeze concentration is unlikely. Increased rates of freezing affectthe temperature-composition relationship, as shown schematically in Figure 36. This leads to the obvious question as to what is
the appropriate reference temperature for foods frozen under commercial conditions—Tg or ? This is another area of
disagreement. Slade and Levine [114] argue that is the appropriate value. However, choice of this value is open to question
because initial Tg (immediately following freezing) will always be < and the approach of Tg to during frozen storage(caused by additional ice formation) will be slow and probably incomplete.
The choice of initial Tg as the reference Tg, as some have suggested, is also open to question because (a) initial Tg is influencednot only by product type but also by freezing rate [43], and (b) initial Tg does not remain constant with time of frozen storage,but rather it increases at a commercially important rate at storage temperatures in the Tm-Tg zone, and more slowly, but at a
significant rate, at storage temperatures < Tg [10,93,101]. The same considerations apply to Wg and .
Unfortunately, the important matter of selecting an appropriate reference Tg for frozen foods cannot be resolved unambiguously
because appropriate data are not available. In the meantime, the best that can be done is to suggest that be regarded as atemperature zone rather than as a specific temperature. The lower boundary of the zone will depend on freezing rate andtime/temperature of storage, but in commercially important situations it is reasonable
FIGURE 36State diag ram of a binary system showing the effects of increasing rates of
freezing (rate a<b<c<d) on T g. The curve is the only onewhere maximal freeze-concentration occurs. Assumptions stated in Fig ure 25
apply here.

Pag e 78
to suggest that this boundary (initial Tg) probably will not extend below -10°C. The mean Tg for a food product marketed
through retail channels, because of the relatively high mean storage temperature, is likely to be closer to than to initial Tg
[43,101]. The term will continue to be used here with the understanding that it should be regarded as a temperature zone.
Several additional points regarding rates of diffusion-limited events in frozen foods deserve mentioning:
1. Product stability (diffusion-limited) can be increased by (a) lowering the storage temperature closer to, or preferably
below, , and/or (b) raising by incorporating high-molecular weight-solutes in the product. The latter is beneficial
because it increases the probability that the storage temperature will be below , and it reduces Mm at any given product
temperature above .
2. The rate of recrystallization is explicitly related to (recrystallization refers to an increase in the mean size of ice crystalsand a simultaneous decrease in their number). Provided maximum ice crystallization has occurred, the critical temperature of
recrystallization (Tr) is the highest temperature at which ice recrystallization can be avoided (often Tr ; see Fig. 37). Rates
of recrystallization in zone Tm to sometimes conform reasonably well to WLF kinetics (Fig. 37). If ice crystallization isnot maximal, then the highest temperature at which ice recrystallization can be avoided is approximately equal to Tg.
Generally, T must be somewhat greater than or Tg for rates to become of practical significance.
3. In general, high (achieved by adding water-soluble macromolecules) and low values are associated with firmfrozen texture and good storage stability at a given
FIGURE 37Rate of ice recrystallization in ice cream as a function of storag etemperature (T s), type of sweetener, and presence or absence of
stabilizer. The solid curve is plotted from the W LF equation basedon a nominal recrystallization rate of 30 mm/day 1/3 at D T=25°C.
is “apparent” . HFCS is hig h-fructose corn syrup, SUC issucrose, CS is corn syrup, DE is dextrose equivalent, d is days, and
numerals in the body of the fig ure refer to dextrose equivalent.W hen sing le sweeteners were used they are indicated by arrows.
Symbols without arrows represent ice creams made from 1:1 mixturesof two sweeteners selected from the sweeteners shown and 42DECS.Stabilizer, when used, was a 20–80 blend of carrag eenan and locustbean g um at a combined concentration of 0.1 wt%. (From Ref. 37.)

Pag e 79
subfreezing storage temperature. Conversely, low and high values (achieved by adding monomeric substances) areassociated with soft frozen texture and relatively poor storage stability [65].
2.11.5 Technological Aspects: Air Drying
The paths (temperature-composition) of a product during air dehydration at a constant air temperature can also be followed onFigure 35. Indicated temperatures are lower than those used commercially simply to allow entry of data on the standardized
state diagram used here. The example chosen for discussion is a complex food, and its curve is based on a foodcomponent that has a dominating influence on the location of this curve. Starting at point A, air drying will elevate producttemperature and remove moisture, causing the product soon to acquire properties commensurate with point H (wet bulbtemperature of air). Further moisture removal causes the product to arrive at and pass through I, the saturation point of thedominating solute (DS) present, with little or no solute crystallization (none is assumed). This sequence results in creation ofmajor regions of liquid amorphous DS, in addition to smaller regions of liquid amorphous substances that may already have beenpresent because of minor solutes with saturation temperatures higher than that of the DS. As drying continues to point J, producttemperature approaches the dry bulb temperature of the air. If drying is terminated at point J and the product is cooled to pointK then the product will be above the glass transition curve, Mm will be comparatively intense, and stability of diffusion-limitedproperties will be relatively poor and strongly temperature-dependent (WLF kinetics). Alternatively, if drying is continued frompoint J to L and the product is then cooled to G, it will be below the Tg curve, Mm will be greatly subdued, and diffusion-limitedproperties will be stable and only weakly temperature-dependent.
2.11.6 Technological Aspects: Vacuum Freeze-Drying (Lyophilization)
Product paths during vacuum freeze-drying can also be followed on Figure 35. The first stage of freeze-drying coincides fairlyclosely with the path for slow freezing, ABCDE. If product temperature is not allowed to go below temperature E during icesublimation (primary freeze drying), path EG would be a typical path. The early part of EG would involve ice sublimation(primary drying), during which collapse of the product cannot occur because of the presence of ice crystals. However, at somepoint along path E to G, ice sublimation is completed and the desorption period (secondary phase) ensues. This can (and oftendoes) occur before the product passes the glass transition curve. Collapse during this phase of freeze drying is likely, not only forproducts that were initially fluid, but also to a lesser degree for food tissues. Collapse is likely because no ice is present toprovide structural support and product T is > Tg so Mm is sufficient to preclude rigidity. This scenario is not uncommon duringfreeze-drying of food tissues and it results in less than optimum product quality. Product collapse results in decreased productporosity (slower drying) and poorer rehydration characteristics. To prevent collapse, path ABCDEFG must be followed.
Provided maximum ice crystallization has occurred, the critical temperature for structural collapse (Tc) is the highest temperature
at which collapse can be avoided during the primary stage of freeze drying ( ). The Tc values for some carbohydratesare shown in Table 8 [49,87,102]. If ice crystallization is not maximal then the highest temperature at which collapse can be
avoided during primary freeze drying is approximately equal to Tg. Generally, T must be somewhat greater than or Tg forrates to become of practical significance.

Pag e 80
If a product's composition can be altered, it is desirable to raise (Tg) and lower as much as possible. This can beaccomplished by the addition of high-molecular-weight polymers and will enable higher freeze-drying temperatures to be used(less energy, greater rate of drying) without danger of product collapse [31].
2.11.7 Technological Aspects: Other Applications of the Mm Approach (Partial Listing)
1. Crystallization. Knowledge of Tg and Tm/Tg ratios allows accurate predictions of whether nucleation of solutes will occur, and
if it does, the rate at which subsequent crystal growth will occur over the zone of Tm to Tg (or ) [97,102,104,114].
2. Enzyme activity [114]. The rates of many enzyme-catalyzed interactions are diffusion-limited, and in these instances, reaction
rates are greatly slowed at T<Tg or <T .
3. Thermal resistance of bacterial spores. Thermal inactivation of spores of Bacillus stearothermophilus occurs in accord withWLF kinetics, and higher Tg values are associated with greater resistance [105].
4. Color of gluten. For heat-treated gluten, plots of Tg versus moisture content (0–15%) and “critical temperature for colorchange” versus moisture content are virtually identical [32].
5. Other miscellaneous properties. Valuable information about gelation [97,114], caking [87], sticky point [87,97], and texture,including texture of bakery goods [67,82,114], can be obtained from knowledge of Tg and state diagrams.
2.11.8 Technological Aspects: Estimation of Relative Shelf Life
This topic will be dealt with in only a cursory manner. Shown on the temperature-composition state diagram in Figure 38 are
zones of differing product stability. The reference line is derived from the Tg curve in the absence of ice and the zone in thepresence of ice. Below this line (zone) physical properties are generally quite stable, and the same is true of those chemical
properties for which stability is diffusion-limited. Above this line (zone) and below the intersecting curves for and ,physical changes often conform to WLF kinetics. Product stability declines greatly as product conditions move upward or to theleft in the WLF zone. This occurs with increases in product temperature and/or increases in moisture content. Above the Tm
curves, attributes that depend on diffusion (Mm) are relatively unstable and become more so with movement to the upper leftcorner of the graph.
It should be reemphasized that storage below Tg or is highly desirable because this will stabilize food properties that are
diffusion-limited. However, this is not an all-or-none situation. When storage temperatures <Tg or < are not feasible,
minimizing temperature deviations above Tg or will greatly help.
2.11.9 Technological Aspects: Relationship of T g and Mm to Relative Vapor Pressure (p/p0) and Moisture SorptionIsotherms
It should come as no surprise that a product-specific, consistent relationship exists between Tg and p/p0 (RVP). This ariseslogically from two other well-established relationships: that of water content versus Tg, and water content versus p/p0 (moisturesorption isotherm, MSI). Plots of Tg versus p/p0 exhibit a large central zone of linearity and curvilinear tails. Examples for severalmaltodextrins are shown in Figure 39 [97].

Pag e 81
FIGURE 38State diag ram of a binary system showing stabilities of diffusion-dependent
properties of food. It is assumed that the “ zone” is the appropriateT g for frozen foods, but this is still a matter of some disag reement. Other
assumptions stated in Fig ure 25 apply here.
FIGURE 39Relationship between calculated g lass transition temperature
and p/p0 (25°C) for several carbohydrates of differingmolecular weig ht. M is maltodextrin and numeralsfollowing M are molecular weig ht. T g values in the
linear rang e are calculated from the equation of Fox and
Flora , where is the T g value ofhig hest molecular weig ht substance. (From Ref. 100.)

Pag e 82
Of greater interest is an isotemperature comparison between the p/p0 value required to produce Tg (RVPTg) and the p/p0 at theBET monolayer value (RVPmono). Some data relating RVPTg and RVPmono, both at 25°C, are shown in Figure 40 (note:maltodextrins were prepared using ultrapure water). In these examples, RVPTg and RVPmono are never the same (note, however,that values for Tg and monolayer moisture are zones rather than precise values). Assuming that future studies establish thegeneral applicability of these results, three conclusions can be suggested: (a) RVPTg tends to be greater than RVPmono in samplescontaining primarily water and macromolecules, whereas the reverse tends to be true in samples containing water and soluteswith molecular weights that are small and/or of mixed size; (b) because RVPmono is often a good predictor of the RVP at whichmany chemical reactions attain a practical minimum rate during drying (see Fig. 23) and because RVPTg differs from themonolayer RVP, it follows that Tg is not a reliable indicator of this practical rate minimum for many chemical reactions (e.g., seeFig. 31); and (c) because Tg is often a good indicator of the point at which rates of diffusion-limited events become highlysensitive to temperature during sample warming or hydration, and because RVPTg and RVPmono often differ, it follows thatRVPmono is not a reliable indicator of the critical point for diffusion-limited events.
2.11.10 Summary Statements Regarding the Mm Approach to Food Stability
1. Molecular mobility, Mm, as reflected by Tg, the magnitude of Tm-Tg, and the product location in the WLF zone Tm-Tg (i.e.,deviations in product T above Tg, and W above Wg), provides a promising and potentially powerful tool for assessing thestability of important properties of food that are diffusion-dependent.
2. In general, the original diffusion-dependent properties of food are well retained during storage at T<Tg ( or ).
FIGURE 40Comparisons of RVPs at 25°C required toproduce a T g of 25°C or a BET monolayer
moisture value. M-DE is maltodextrin-dextroseequivalent. (Data from Ref. 98.)

Pag e 83
3. The two key constituents with respect to Mm are water and the dominant solute or solutes (solute or solutes comprising themajor fraction of the solute portion).
4. A solute's ability to reduce Mm usually varies inversely with (a) molecular weight (macromolecules effectively decrease Mm
and raise Tg; water has the reverse effect) and (b) the amount of water, , associated with the solute at (or Wg at Tg).
5. As compared to the RVP approach, the Mm approach appears (a) to be significantly more useful for estimating rates ofoccurrences that are diffusion-limited, such as the physical properties of frozen foods (RVP is not useful for predicting eitherphysical or chemical properties of frozen foods), optimum conditions for freeze drying, and physical changes involvingcrystallization, recrystallization, gelatinization and starch retrogradation, (b) to be about equally useful for estimating conditionscausing caking, stickiness, and crispness in products stored at near-ambient temperatures, and (c) to be significantly less usefulor unreliable, in products free of ice, for estimating growth of vegetative microorganisms [12,13] and for estimating rates ofchemical reactions that are not diffusion-limited (inherently slow reactions, e.g., those with high activation energies, and thoseoccurring in a relatively low-viscosity medium such as high-moisture foods).
6. The Mm approach will not be brought to a level of usefulness that equals or exceeds that of the p/p0 approach until methodsthat are rapid, accurate, and economical are developed for determining Mm and glass transitions in foods.
2.12 Combined Methods Approach to Food Stability
At this point, it is hoped that the reader will have realized that RVP and Mm are useful estimators of food stability but thatneither is totally sufficient by itself. It has been mentioned several times that factors not accommodated by either of theseapproaches can have important influences on food stability and safety. The “combined methods approach” to controllingmicrobial growth in foods was developed specifically to deal with this reality. This approach is mentioned in a book on foodchemistry because it demonstrates convincingly that (a) the RVP approach to controlling microbial growth is often inadequatewhen used alone, (b) the RVP approach, because it is based on a single parameter, is not a totally reliable predictor of chemicalstability, and (c) the Mm approach, because it too is based on a single parameter, is unlikely to be a totally reliable predictor ofchemical stability.
The combined methods approach (originally called “hurdle approach”) was developed by Professor L. Leistner and others todetermine conditions needed to limit the growth of microorganisms in nonsterile foods [57,58,59]. This approach involvesmanipulating various growth-controlling parameters in a manner such that growth will not occur; each parameter is a “hurdle” tomicrobial growth. The approach is best illustrated by several examples in Figure 41. The dashed, undulating line is meant torepresent the progress of a microorganism in its attempt to overcome the inhibitory hurdles, with growth occurring only after allhurdles have been overcome. Size of the hurdle indicates relative inhibitory effectiveness. Obviously, a microorganism in real lifewould confront all hurdles simultaneously rather than in sequence as is shown, and some of the factors would act synergistically.
In example 1, six hurdles are present and growth is satisfactorily controlled because the microorganisms are unable to overcomeall hurdles. Example 2 is a more realistic one in which a typical microbial population is present and the various hurdles differ intheir inhibitory effectiveness, with RVP and preservatives being the most potent ones. This example also results

Pag e 84
FIGURE 41The combined methods approach to controlling g rowth of microorg anisms
in nonsterilized food. F is heating , t is chilling , RVP is relative vapor pressure,pH is acidification, Eh is redox potential, pres. is chemical preservative, and N
is nutrients. (Adapted from Ref. 58.)
in satisfactory control of microbial growth. Example 3 represents the same product and the same hurdles with a small startingpopulation of microorganisms that result from good sanitary practices. In this example, fewer hurdles suffice. Example 4represents the same product and the same hurdles with a large starting population of microorganisms that result from poorsanitary practices. Here, the hurdles are insufficient to provide satisfactory control of microbial growth. Example 5 represents thesame hurdles and population of organisms as in Example 2, but in this instance the sample is rich in nutrients. Because of thenutrients, the hurdles that were adequate in Example 2 now are inadequate. In example 6, the product and hurdles remainunchanged but the microorganisms are given a substerilizing treatment before storage. The surviving but damaged organisms areless able to overcome the hurdles and fewer hurdles suffice.
The lesson to be learned is this: Although RVP and Mm are powerful tools for predicting and controlling the properties andstability of food, there are many occasions when neither is

Pag e 85
sufficient alone and other factors, such as chemical properties of the solute, pH, and oxidation—reduction potential, must be alsoconsidered.
2.13 Concluding Comments About Water
Water is typically the most abundant constituent in food, is of critical importance to the desirable qualities of food, is the cause offood's perishable nature, is a rate determinant of many chemical reactions, both desirable and undesirable, is a strong causativeagent of undesirable side effects during freezing, is associated with nonaqueous food constituents in ways so complex that oncethese associations are disturbed by drying or freezing they can never again be completely restored, and, above all else, isfrustratingly complex in behavior, inadequately studied, and poorly understood.
Glossary: Molecular Mobility and Food Stability
Amorphous This refers to a nonequilibrium, noncrystalline state of a substance. When saturation conditions prevail and a soluteremains noncrystalline the supersaturated solution can be regarded as amorphous. An amorphous solid is generally called a glassand is characterized by a viscosity of greater than about 1012 Pa sec.
Collapse This refers to both visibly evident collapse, such as the collapse of foods during freeze drying, and to collapse at themolecular level that consists of conversion from a nonequilibrium state to a lower state of free energy (relaxation). The kinetics ofcollapse is governed by molecular mobility, Mm, of the system.
Eutectic temperature (TE) An invariant point on a temperature—composition phase diagram of a binary solution wheresolution can exist in equilibrium with both crystalline solute and crystalline solvent. Under equilibrium conditions, cooling at TE
results in simultaneous crystallization of solvent and solute in constant proportion and at constant temperature until maximumsolidification has occurred. The TE is, therefore, the highest temperature at which maximum crystallization can (but usually doesnot) occur.
Free volume Free volume is space not occupied by molecules. A useful mental image can be created by imagining a containerfilled with the maximum number of bees that can be accommodated in hovering flight. “Filled” means no more bees can beaccommodated in a hovering state, not that all space is occupied. The analogous space in liquids is called “free volume” and itaccounts for the fact that liquids can be compressed if the pressure is great enough. Free volume can also be thought of as the“elbow room” molecules require to undergo vibrational, rotational and translational motions [41]. Both free volume andmolecular mobility increase with increasing temperature. Temperature dependence of free volume is small below Tg, and largebetween Tm and Tg.
Glass state (glassy) A substance existing as an amorphous (noncrystalline) solid is said to be in a glassy state. The Stokesviscosity (local viscosity, not bulk viscosity) is appropriate for characterizing glasses, and this value, at the temperature ofincipient glass formation (Tg), ranges from 1010 to 1014 Pa sec, depending on the solute. This viscosity is sufficient to reducetranslational and rotational mobility of most large molecules to a point of practical insignificance. In complex, polymer-dominatedsystems, very small molecules, most notably water, retain significant translational and rotational mobility at temperatures wellbelow sample Tg. Vibrational mobility, of course, does not cease until the temperature is reduced to absolute zero.

Pag e 86
Glass transition temperature (T g, ) The glass transition temperature, Tg, is the temperature at which a supersaturatedsolution (amorphous liquid) converts to a glass. This is a second-order transition involving a step change in specific heat at thetransition temperature, allowing this transition to be measured by differential scanning calorimetry (first-order transitions involvechanges in physical state among gases, liquids, and crystalline solids). Tg values are observed in substances that contain sizeableregions that are amorphous or partially amorphous (all food tissues and many other foods), regardless of whether they containice. For partially crystalline polymeric substances, only the amorphous regions exhibit a glass transition. The Tg is dependent on
solute type and water content. is a special Tg that applies only to samples containing ice, and only when ice has been formed
so maximum freeze-concentration occurs (very slow cooling). For a given solute, the observed is a quasi-invariant point ona temperature-composition state diagram (not invariant because maximum ice formation is extremely difficult to obtain during
typical measurement techniques, thus causing the observed to drift slightly lower with extended storage time). Below Tg or
of a complex sample, all but small molecules lose their translational mobility while retaining limited rotational and vibrationalmobility.
Macromolecular entanglement This refers to the interaction of large polymers in a random fashion without chemical bondingand with or without hydrogen bonding. When entanglement of macromolecules is sufficiently extensive (requires a minimumcritical concentration of the macromolecule and time), a visoelastic entanglement network forms. This type of amorphousnetwork can be dispersed by dilution, and can exist in conjunction with microcrystalline gels, which cannot be dispersed bydilution.
Metastable state This refers to a state of pseudo-equilibrium or apparent equilibrium that is stable over practical times. Ametastable state is not, however, the most stable equilibrium because it possesses free energy that is greater than that of theglobal equilibrium state under the same conditions of pressure, temperature and composition. A metastable state can exist—thatis, conversion to a more stable equilibrium state of lower free energy will not occur—if the activation energy is sufficiently high toprevent conversion to an equilibrium state of lower free energy during the period of interest.
Molecular mobility (Mm) This refers to either translational or rotational motion of molecules (vibrational mobility is not ofconcern in the context of food stability).
Molecular weight, number average (MWn)
where n is the number of molecules of a given molecular species and M is the molecular weight of the same species, with ikinds of molecules present.
Molecular weight, weight average (MWw)
Plasticizer A substance incorporated into a polymeric material to increase its deformability. A true solvent is always aplasticizer, but a plasticizer is not always a true solvent [106,117]. A plasticizer decreases the Tg of a polymer. Water is a highlyeffective plasticizer of hydrophilic, amorphous polymers. Its low molecular weight leads to increased free volume, decreasedlocal viscosity, and increased Mm.

Pag e 87
Relaxation Relaxation refers to passage from a nonequilibrium state to a more stable (lower free energy) state. This term is alsoused to indicate the decay of a stress.
Rubbery state A term used to describe the viscoelastic nature of large polymers in the temperature range Tm to Tg, that is,when the substance or a part of the substance is between the glassy and liquid states. Small polymers and solutes of lowmolecular weight that exist in this temperature zone are highly viscous but not elastic, and are not called rubbery [27].
State diagram A phase diagram supplemented with lines depicting boundaries of various nonequilibrium and metastable states.Such a diagram is sometimes called a “supplemented phase diagram.”
Temperature of solute crystallization/dissolution ( ) for simple and complex aqueous samples is the highesttemperature at which a crystalline solute can exist in equilibrium with an aqueous solution of a given composition. The highest
temperature at which this can occur for a given sample is the sample's initial crystallization temperature. The also can bethought of as the incipient saturation temperature during cooling, or the temperature at which the last of a crystalline solute,present in a saturated solution, melts or dissolves upon warming. On a temperature—composition phase diagram for a binary
aqueous solution, values for samples with differing temperatures constitute the curve.
Temperature of ice melting/crystallization ( ) for simple and complex aqueous samples This is the temperature atwhich ice can exist in equilibrium with an aqueous solution of a given composition. The highest temperature at which this can
occur is the initial freezing point. On a temperature—composition phase diagram for a binary aqueous solution, values for
samples with differing initial ratios of solute to water constitute the curve.
Vitrification Solidification of an entire sample as a glass, that is, no crystallization of solvents or solutes.
Acknowledgments
This chapter was reviewed totally or in part by Larry Beuchat, Nicole Brake, Kenneth Connors, Theodore Labuza, MarcusKarel, George Zografi, David Reid, Pieter Walstra, Harry Levine, and Richard Hartel. The helpful suggestions of theserespected colleagues and good friends are acknowledged with deep appreciation.
Abbreviations and Symbols
C1C2 Constants for the WLF equation
Cg Solute concentration (wt%) existing in sample at Tg
Solute concentration (wt%) existing in sample at
DE Dextrose equivalent
DS Dominating solute
ERH Percent equilibrium relative humidity
Mm Molecular mobility
MSI Moisture sorption isotherm
MWn Number-average molecular weight (see glossary)

MWw Weight-average molecular weight (see glossary)
h Viscosity of sample at temperature T
Pag e 88
hgViscosity of sample at Tg (or )
p Vapor pressure of the sample
p0 Vapor pressure of pure water
T Sample temperature
Tc Collapse temperature
TE Eutectic temperature
Tg Glass transition temperature of the sample
Glass transition temperature of a maximally freeze-concentrated sample
Tm Either or
Melting or freezing temperature of water in a solution
Crystallization or melting (dissolution) temperature of solute in a solution
Tr Recrystallization temperature
W Water content of sample (wt%)
Wg Water (wt%) existing in sample at Tg
Unfrozen water (wt%) existing in sample at
Wm (or m1) “Monolayer” water content
Bibliography
Blanshard, J. M. V., and P. J. Lillford (1933). The Glassy State in Foods, Nottingham University Press, Loughborough, U.K.
Franks, F., ed. (1972–1982). Water—A Comprehensive Treatise, 7 vols., Plenum Press, New York.
Iglesias, H. A., and J. Chirife (1982). Handbook of Food Isotherms: Water Sorption Parameters for Food and FoodComponents, Academic Press, Boca Raton, FL.
Rockland, L. B., and L. R. Beuchat, eds. (1987). Water Activity: Theory and Applications to Food, Marcel Dekker, NewYork.
Rupley, J. A., and G. Careri (1991). Protein hydration and function. Adv. Protein Chem. 41:37–172.

Simatos, D., and J. L. Multon (1985). Properties of Water in Foods in Relation to Quality and Stability, Martinus Nijhoff,Dordrecht, The Netherlands.
Slade, L., and H. Levine (1991). Beyond water activity: Recent advances based on an alternative approach to the assessment offood quality and safety. Crit. Rev. Food Sci. Nutr. 30:115–360.
Troller, J. A., and J. H. B. Christian (1978). Water Activity and Food, Academic Press, New York.
References
1. Ablett, S., M. J. Izzard, and P. J. Lillford (1992). Differential scanning calorimetric study of frozen sucrose and glycerolsolutions. J. Chem. Soc. Faraday Trans. 88(6):789–794.
2. Anderson, R. B. (1946). Modifications of the Brunauer, Emmett and Teller equation. J. Amer. Chem. Soc. 68:686–691.
2a. Bell, L. N., and M. J. Hageman (1994). Differentiating between the effect of water activity and glass transition dependentmobility on a solid state chemical reaction: Aspartame degradation. J. Agric. Food Chem. 42:2398–2401.
3. Berendsen, H. J. C. (1971). The molecular dynamics of water in biological systems. Proc. First European BiophysicsCongress 1:483–488.
4. Berendsen, H. J. C. (1975). Specific interactions of water with biopolymers, in Water—A Comprehensive Treatise, vol. 5(F. Franks, ed.), Plenum Press, New York, pp. 293–349.
5. Bertoluzza, A., C. Fagnano, M. A. Morelli, A. Tinti, and M. R. Tosi (1993). The role of water in biological systems. J.Molec. Struct. 297:425–437.
6. Beuchat, L. R. (1981). Microbial stability as affected by water activity. Cereal Foods World 26(7):345–349.

Pag e 89
7. Brady, G. W., and W. J. Romanov (1960). Structure of water. J. Chem. Phys. 32:106.
8. Brunauer, S., H. P. Emmett, and E. Teller (1938). Adsorption of gases in multi-molecular layers. J. Am. Chem. Soc.60:309–319.
9. Bull, H. B. (1964). An Introduction to Physical Biochemistry, F. A. Davis, Philadelphia.
10. Chang, Z. H., and J. G. Baust (1991). Physical aging of glassy state: DSC study of vitrified glycerol systems. Cryobiology28:87–95.
11. Chirife, J. (1994). Specific solute effects with special reference to Staphylococcus aureus. J. Food Eng. 22:409–419.
12. Chirife, J., and M. P. Buera (1994). Water activity, glass transition and microbial stability in concentrated and semimoistfood systems. J. Food Sci. 59:921–927.
13. Chirife, J., and M. P. Buera (1995). A critical review of the effect of some nonequilibrium situations and glass transitions onwater activity values of foods in the microbiological growth range. J. Food Eng. 25:531–552.
14. Connors, K. A. (1990). Chemical Kinetics: The Study of Reaction Rates in Solution, VCH, New York.
15. Davidson, D. W. (1973). Clathrate hydrates, in Water—A Comprehensive Treatise. vol. 2 (F. Franks, ed.), PlenumPress, New York, pp. 115–234.
16. DeBoer, J. H., ed. (1968). The Dynamical Character of Adsorption, 2nd ed., Clarendon Press, Oxford, UK, pp.200–219.
17. Duckworth, R. B., J. Y. Allison, and H. A. A. Clapperton (1976). The aqueous environment for chemical change inintermediate moisture foods, in Intermediate Moisture Foods (R. Davies, G. G. Birch, and K. J. Parker, eds.), AppliedScience, London, pp. 89–99.
18. Eagland, D. (1975). Nucleic acids, peptides and proteins, in Water—A Comprehensive Treatise, vol. 5 (F. Franks, ed.),Plenum Press, New York, pp. 305–518.
19. Edelhoch, H., and J. C. Osborne, Jr. (1976). The thermodynamic basis of the stability of proteins, nucleic acids, andmembranes. Adv. Protein Chem. 30:183–250.
20. Eichner, K. (1975). The influence of water content on non-enzymic browning reactions in dehydrated foods and modelsystems and the inhibition of fat oxidation by browning intermediates, in Water Relations of Foods (R. B. Duckworth, ed.),Academic Press, London, pp. 417–434.
21. Fennema, O. (1973). Water and ice, in Low-Temperature Preservation of Foods and Living Matter (O. Fennema, W.D. Powrie, and E. H. Marth, eds.), Marcel Dekker, New York, pp. 1–77.
22. Fennema, O. (1975). Activity of enzymes in partially frozen aqueous systems, in Water Relations of Foods (R. B.Duckworth, ed.), Academic Press, London, pp. 397–413.
23. Fennema, O. (1975). Reaction kinetics in partially frozen aqueous systems, in Water Relations of Foods (R. B.Duckworth, ed.), Academic Press, London, pp. 539–556.
24. Fennema, O. (1978). Enzyme kinetics at low temperature and reduced water activity, in Dry Biological Systems (J. H.Crowe and J. S. Clegg, eds.), Academic Press, New York, pp. 297–322.
25. Fennema, O., and L. A. Berny (1974). Equilibrium vapor pressure and water activity of food at subfreezing temperatures, inProc. IVth Int. Congress of Food Science and Technology, Madrid, Spain, 2:27–35.
26. Ferro Fontan, C., and J. Chirife (1981). The evaluation of water activity in aqueous solutions from freezing point depression.J. Food Technol. 16:21–30.
27. Ferry, J. D. (1980). Viscoelastic Properties of Polymers, 3rd ed., John Wiley & Sons, New York.

28. Franks, F. (1975). The hydrophobic interaction, in Water—A Comprehensive Treatise, vol. 4 (F. Franks, ed.), PlenumPress, New York, pp. 1–94.
29. Franks, F. (1982). The properties of aqueous solutions at subzero temperatures, in Water—A Comprehensive Treatise,vol. 7 (F. Franks, ed), Plenum Press, New York, pp. 215–338.
30. Franks, F. (1988). Protein hydration, in Characterization of Proteins (F. Franks, ed.), Humana Press, Clifton, NJ, pp.127–154.
31. Franks, F. (1989). Improved freeze-drying. An analysis of the basic scientific principles. Proc. Biochem. 24(1):iii–vii.
32. Fujio, Y., and J. -K. Lim (1989). Correlation between the glass transition point and color change of heat-treated gluten.Cereal Chem. 66:268–270.

Pag e 90
33. Gal, S. (1981). Recent developments in techniques for obtaining complete sorption isotherms, in Water Activity: Influenceon Food Quality (L. B. Rockland and G. F. Steward, eds.), Academic Press, New York, pp. 89–110.
34. Gordon, M., and J. S. Taylor (1952). Ideal copolymers and the second-order transitions of synthetic rubbers. I. Non-crystalline copolymers. J. Appl. Chem. 2:493–500.
35. Görling, P. (1958). Physical phenomena during the drying of foodstuffs, in Fundamental Aspects of the Dehydration ofFoodstuffs, Society of Chemical Industry, London, pp. 42–53.
36. Guggenheim, E. A., ed. (1966). Applications of Statistical Mechanics, Clarendon Press, Oxford, UK, pp. 186–206.
37. Hagiwara, T., and R. W. Hartel (1996). J. Dairy Sci. (in press).
38. Hancock, B. C., and G. Zografi (1994). The relationship between the glass transition temperature and water content ofamorphous pharmaceutical solids. Pharm. Res. 11:471–477.
39. Hatley, R. H. M., and A. Mant (1993). Determination of the unfrozen water content of maximally freeze-concentratedcarbohydrate solutions. Int. J. Macromol. 15:227–232.
40. Haynes, J. T. (1985). The theory of reactions in solution, in Theory of Chemical Reaction Dynamics, vol. IV (M. Baer,ed.), CRC Press, Boca Raton, FL, p. 172.
41. Hiemenz, P. (1984). Polymer Chemistry—The Basic Concepts, Marcel Dekker, New York, NY.
42. Hoseney, R. C., K. Zeleznak, and C. S. Lai (1986). Wheat gluten: A glassy polymer. Cereal Chem. 63:285–286.
43. Izzard, M. J., S. Ablett, and P. J. Lillford (1991). Calorimetric study of the glass transition occurring in sucrose solutions, inFood Polymers, Gels, and Colloids (E. Dickinson, ed.), Royal Society of Chemistry, London, pp. 289–300.
44. Johnson, M. R., and R. C. Lin (1987). FDA views on the importance of aw in good manufacturing practice, in WaterActivity: Theory and Applications to Food (L. B. Rockland and L. R. Beuchat, eds.), Marcel Dekker, New York, pp.287–294.
45. Kapsalis, J. G. (1981). Moisture sorption hysteresis, in Water Activity: Influences on Food Quality (L. B. Rockland andG. F. Steward, eds.), Academic Press, New York, pp. 143–177.
46. Kapsalis, J. G. (1987). Influences of hysteresis and temperature on moisture sorption isotherms, in Water Activity: Theoryand Applications to Food (L. B. Rockland and L. R. Beuchat, eds.), Marcel Dekker, New York, pp. 173–213.
47. Karel, M. (1988). Role of water activity, in Food Properties and Computer-Aided Engineering of Food ProcessingSystems (R. P. Singh and A. G. Medina, eds.), Kluwer Academic, Dordrecht, The Netherlands, pp. 135–155.
48. Karel, M., and S. Yong (1981). Autoxidation-initiated reactions in food, in Water Activity: Influences on Food Quality(L. B. Rockland and G. F. Stewart, eds.), Academic Press, New York, pp. 511–529.
49. Karel, M., M. P. Buera, and Y. Roos (1993). Effects of glass transitions on processing and storage, in The Glassy State inFoods (J. M. V. Blanshard and P. J. Lillford, eds.), Nottingham University Press, Loughborough, pp. 13–34.
50. Kopelman, R., and Y. -E. Koo (1992). Diffusion controlled elementary reactions in low dimensions. Adv. Chem. Kinet.Dynam. 1:113–138.
51. Kuntz, I. D., Jr., and W. Kauzmann (1974). Hydration of proteins and polypeptides. Adv. Protein Chem. 28:239–345.
52. Labuza, T. P. (1968). Sorption phenomena in foods. Food Technol. 22(3):15–24.
53. Labuza, T. P., and R. Contreras-Medellin (1981). Prediction of moisture protection requirements for foods. Cereal FoodsWorld 26(7):335–344.
54. Labuza, T. P., and M. Saltmarch (1981). The nonenzymatic browning reaction as affected by water in foods, in WaterActivity: Influences on Food Quality (L. B. Rockland and G. F. Stewart, eds.), Academic Press, New York, pp. 605–650.

55. Labuza, T. P., L. McNally, D. Gallagher, J. Hawkes, and F. Hurtado (1972). Stability of intermediate moisture foods. I.Lipid oxidation. J. Food Sci. 37:154–159.
56. Labuza, T. P., S. Cassil, and A. J. Sinskey (1972). Stability of intermediate moisture foods. 2. Microbiology. J. Food Sci.37:160–162.

Pag e 91
57. Leistner, L. (1978). Hurdle effect and energy saving, in Food Quality and Nutrition (W. K. Downey, ed.), Elsevier,Essex, UK, pp. 553–557.
58. Leistner, L. (1987). Shelf-stable products and intermediate moisture foods based on meat, in Water Activity: Theory andApplications to Food (L. B. Rockland and L. R. Beuchat, eds.), Marcel Dekker, New York, pp. 295–327.
59. Leistner, L., W. Rödel, and K. Krispien (1981). Microbiology of meat and meat products in high-and intermediate-moistureranges, in Water Activity: Influences on Food Quality (L. B. Rockland and G. F. Stewart, eds.), Academic Press, Orlando,FL, pp. 855–916.
60. Levine, H., and L. Slade (1986). A polymer physico-chemical approach to the study of commercial starch hydrolysisproducts (SHPs). Carbohydrate Polymers 6:213–244.
61. Levine, H., and L. Slade (1988). “Collapse” phenomena—a unifying concept for interpreting the behaviour of low moisturefoods, in Food Structure—Its Creation and Evaluation (J. M. V. Blanshard and J. R. Mitchell, eds.), Butterworths, London,pp. 149–180.
62. Levine, H., and L. Slade (1988). Water as a plasticizer: Physico-chemical aspects of low-moisture polymeric systems.Water Sci. Rev. 3:79–185.
63. Levine, H., and L. Slade (1988). Principles of “cryostabilization” technology from structure/property relationships ofcarbohydrate/water systems—A review. Cryo-Letters 9:21–45.
64. Levine, H., and L. Slade (1989). Interpreting the behavior of low-moisture foods, in Water and Food Quality (T. M.Hardman, ed.), Elsevier, London, pp. 71–134.
65. Levine, H. and L. Slade (1989). A food polymer science approach to the practice of cryostabilization technology. Comm.Agric. Food Chem. 1:315–396.
66. Levine, H., and L. Slade (1990). Cryostabilization technology: Thermoanalytical evaluation of food ingredients and systems,in Thermal Analysis of Foods (V. R. Harwalkar and C. -Y. Ma, eds.), Elsevier Applied Science, London, pp. 221–305.
67. Levine, H., and L. Slade (1993). The glassy state in applications for the food industry, with an emphasis on cookie andcracker production, in The Glassy State in Foods (J. M. V. Blanshard and P. J. Lillford, eds.), Nottingham University Press,Loughborough, pp. 333–373.
68. Lewin, S. (1974). Displacement of Water and Its Control of Biochemical Reactions, Academic Press, London.
69. Lide, D. R., ed. (1993/1994). Handbook of Chemistry and Physics, 74th ed., CRC Press, Boca Raton, FL.
70. Lim, M. H., and D. S. Reid (1991). Studies of reaction kinetics in relation to the Tg' of polymers in frozen model systems, inWater Relationships in Foods (H. Levine and L. Slade, eds.), Plenum Press, New York, pp. 103–122.
71. Lounnas, V., and B. M. Pettitt (1994). A connected-cluster of hydration around myoglobin: Correlation between moleculardynamics simulations and experiment. Proteins: Structure, Function Genet. 18: 133–147.
72. Lounnas, V., and B. M. Pettitt (1994). Distribution function implied dynamics versus residence times and correlations:Solvation shells of myoglobin. Proteins: Structure, Function Gent. 18:148–160.
73. Luck, W. A. P. (1981). Structures of water in aqueous systems, in Water Activity: Influences on Food Quality (L. B.Rockland and G. F. Stewart, eds.), Academic Press, New York, pp. 407–434.
74. Luyet, B. (1960). On various phase transitions occurring in aqueous solutions at low temperatures. Ann. NY Acad. Sci.85:549–569.
75. Luyet, B. J. (1966). Anatomy of the freezing process in physical systems, in Cryobiology (H. T. Meryman, ed.), AcademicPress, New York, pp. 115–138.
76. Luyet, B. J., and P. M. Gehenio (1940). Life and Death at Low Temperatures, Biodynamica, Normandy, MO.
77. Luyet, B. J., and G. Rapatz (1958). Patterns of ice formation in some aqueous solutions. Biodynamica 8:1–68.

77a. MacInnes, W. M. (1993). Dynamic mechanical thermal analysis of sucrose solutions, in The Glassy State of Foods (J. M.V. Blanshard and P. J. Lillford, eds.), Nottingham University Press, Loughborough, pp. 223–248.
Pag e 92
78. MacKenzie, A. P. (1966). Basic principles of freeze-drying for pharmaceuticals. Bull. Parenteral Drug Assoc.20:101–129.
79. Mason, B. J. (1957). The Physics of Clouds, Clarendon, Oxford, p. 445.
80. Morgan, J., and B. E. Warren (1938). X-ray analysis of the structure of water. J. Chem. Phys. 6:666–673.
81. Nelson, K. A. (1993). Reactions Kinetics of Food Stability: Comparison of Glass Transition and Classical Modelsfor Temperature and Moisture Dependence, PhD thesis, University of Minnesota, Minneapolis, MN.
82. Nelson, K. A., and T. P. Labuza (1993). Glass transition theory and the texture of cereal foods, in The Glassy State inFoods (J. M. V. Blanshard and P. J. Lillford, eds.), Nottingham University Press, Loughborough, pp. 513–517.
83. Nelson, K. A., and T. P. Labuza (1994). Water activity and food polymer science: Implications of state on Arrhenius andWLF models in predicting shelf life. J. Food Eng. 22:271–289.
84. Nesvadba, P. (1993). Glass transitions in aqueous solutions and foodstuffs, in The Glassy State in Foods (J. M. V.Blanshard and P. J. Lillford, eds.), Nottingham University Press, Loughborough, pp. 523–526.
85. Oakenfull, D., and D. E. Fenwick (1977). Thermodynamics and mechanism of hydrophobic interaction. Aust. J. Chem.30:741–752.
86. Otting, G., E. Liepinsh, and K. Wuthrich (1991). Protein hydration in aqueous solution. Science 254:974–980.
87. Peleg, M. (1993). Mapping the stiffness-temperature-moisture relationship of solid biomaterials at and around their glasstransition. Rheol. Acta 32:575–580.
88. Peleg, M. (1994). Mathematical characterization and graphical presentation of the stiffness-temperature-moisturerelationship of gliadin. Biotechnol. Prog. 10:652–654.
89. Pilling, M. J. (1975). Reaction Kinetics, Clarendon Press, Oxford.
90. Prior, B. A. (1979). Measurement of water activity in foods: A review. J. Food Protect. 42:668–674.
91. Rasmussen, D. (1969). A note about “phase diagrams” of frozen tissue. Biodynamica 10:333–339.
92. Reid, D. S., J. Hsu, and W. Kerr (1993). Calorimetry, in The Glassy State in Foods (J. M. V. Blanshard and P. J.Lillford, eds.), Nottingham University Press, Loughborough, pp. 123–132.
93. Reid, D. S., W. Kerr, and J. Hsu (1994). The glass transition in the freezing process, in Water in Foods (P. Fito, A. Mulet,and B. McKenna, eds.), Elsevier Applied Science, London, pp. 483–494.
94. Rey, L. R. (1958). Etude Physiologique et Physico-chimique de l-Action des Basses Température sur les TissuesAnimaux Vivants, PhD thesis, Université de Paris, France.
95. Rice, S. A. (1985). Diffusion-Limited Reactions. Vol. 25 of Chemical Kinetics (C. H. Bamford, C. F. H. Tipper, and R.G. Compton, eds.), Elsevier, Amsterdam, The Netherlands.
96. Röntgen, W. C. (1882). VIII. Ueber die Constitution des flüssigen Wassers. Ann. Phy. Chem. 281:91–97.
97. Roos, Y. H. (1992). Phase transitions and transformations in food systems, in Handbook of Food Engineering (D. R.Heldman and D. B. Lund, eds.), Marcel Dekker, New York, pp. 145–197.
98. Roos, Y. H. (1993). Water activity and physical state effects on amorphous food stability. J. Food Proc. Preserv.16:433–447.
99. Roos, Y. H., and M. -J. Himberg (1994). Nonenzymatic browning behavior, as related to glass transition of a food model atchilling temperatures. J. Agric. Food Chem. 42:893–898.
100. Roos, J. H., and M. Karel (1991). Phase transitions of mixtures of amorphous polysaccharides and sugars. Biotechnol.Prog. 7:49–53.

101. Roos, J. H., and M. Karel (1991). Amorphous state and delayed ice formation in sucrose solutions. Int. J. Food Sci.Technol. 26:553–566.
102. Roos, Y., and M. Karel (1993). Effects of glass transitions on dynamic phenomena in sugar containing food systems, inThe Glassy State in Foods (J. M. V. Blanshard and P. J. Lillford, eds.), Nottingham University Press, Loughborough, pp.207–222.
103. Rupley, J. A., and G. Careri (1991). Protein hydration and function. Adv. Protein Chem. 41 :37–172.

Pag e 93
104. Saleki-Gerhardt, A., and G. Zografi (1994). Non-thermal and isothermal crystallization of sucrose from the amorphousstate. Pharm. Res. 11:1166–1173.
105. Sapru, V., and R. P. Labuza (1993). Temperature dependence of thermal inactivation rate constants of Bacillusstearothermophilus spores, in The Glassy State in Foods (J. M. V. Blanshard and P. J. Lillford, eds.), Nottingham UniversityPress, Loughborough, pp. 499–505.
106. Sears, J. K., and J. R. Darby (1982). The Technology of Plasticizers, Wiley-Interscience, New York.
107. Sceats, M. G., and S. A. Rice (1982). Amorphous solid water and its relationship to liquid water: A random networkmodel for water, in Water—A Comprehensive Treatise, vol. 7 (F. Franks, ed.), Plenum Press, New York, pp. 83–214.
108. Scott, W. J. (1953). Water relations of Staphylococcus aureus at 30°C. Aust. J. Biol. Sci. 6:549–556.
109. Scott, W. J. (1957). Water relations of food spoilage microorganisms. Adv. Food Res. 7:83–127.
110. Simatos, D., and G. Blond (1991). DSC studies and stability of frozen foods, in Water Relationships in Foods (H. Levineand L. Slade, eds.), Plenum Press, New York, pp. 139–155.
111. Simatos, D., and G. Blond (1993). Some aspects of the glass transition in frozen foods, in The Glassy State in Foods (J.M. V. Blanshard and P. J. Lillford, eds.), Nottingham University Press, Loughborough, pp. 395–415.
112. Slade, L., and H. Levine (1988). Structural stability of intermediate moisture foods—a new understanding, in FoodStructure—Its Creation and Evaluation (J. M. V. Blanshard and J. R. Mitchell, eds.), Buttersworths, London, pp. 115–147.
113. Slade, L., and H. Levine (1988). Non-equilibrium behavior of small carbohydrate-water systems. Pure Appl. Chem.60:1841–1864.
114. Slade, L., and H. Levine (1991). Beyond water activity: Recent advances based on an alternate approach to theassessment of food quality and safety. Crit. Rev. Food Sci. Nutr. 30:115–360.
115. Slade, L., and H. Levine (1993). Water relationships in starch transitions. Carbohydrate Polymers 21:105–131.
116. Slade, L., and H. Levine (1993). The glassy state phenomenon in food molecules, in The Glassy State in Foods (J. M. V.Blanshard and P. J. Lillford, eds.), Nottingham University Press, Loughborough, pp. 35–101.
117. Slade, L., and H. Levine (1995). Glass transitions and water-food structure interactions. Adv. Food Nutr. Res.38:103–269.
118. Slade, L., H. Levine, and J. W. Finley (1989). Protein-water interactions: Water as a plasticizer of gluten and other proteinpolymers, in Protein Quality and the Effects of Processing (R. D. Phillips and J. W. Finley, eds.), Marcel Dekker, NewYork, pp. 9–124.
119. Spiess, W. E. L., and W. Wolf (1987). Critical evaluation of methods to determine moisture sorption isotherms, in WaterActivity: Theory and Applications to Food (L. B. Rockland and L. R. Beuchat, eds.), Marcel Dekker, New York, pp.215–233.
120. Stillinger, F. H. (1980). Water revisited. Science 209:451–457.
121. Storey, R. M., and G. Stainsby (1970). The equilibrium water vapour pressure of frozen cod. J. Food Technol.5:157–163.
122. Suggett, A. (1976). Molecular motion and interactions in aqueous carbohydrate solutions. III. A combined nuclearmagnetic and dielectric-relaxation strategy. J. Solut. Chem. 5:33–46.
123. Taborsky, G. (1979). Protein alterations at low temperatures: An overview, in Proteins at Low Temperatures (O.Fennema, ed.), Advances in Chemistry Series 180, American Chemical Society, Washington, DC, pp. 1–26.
124. Teeter, M. M. (1991). Water-protein interactions: Theory and experiment. Annu. Rev. Biophys. Biophys. Chem.20:577–600.

125. van den Berg, C. (1981). Vapour Sorption Equilibria and Other Water-Starch Interactions; A Physico-ChemicalApproach, PhD thesis, Wageningen Agricultural University, Wageningen, The Netherlands.
126. van den Berg, C. (1986). Water activity, in Concentration and Drying of Foods (D. MacCarthy, ed.), Elsevier, London,pp. 11–36.
127. van den Berg, C., and S. Bruin (1981). Water activity and its estimation in food systems: Theoretical

Pag e 94
aspects, in Water Activity: Influences on Food Quality (L. B. Rockland and G. F. Stewart, eds.), Academic Press, NewYork, pp. 1–61.
128. van den Berg, C., and H. A. Leniger (1978). The water activity of foods, in Miscellaneous Papers 15, WageningenAgricultural University, Wageningen, The Netherlands, pp. 231–244.
129. White, G. W., and S. H. Cakebread (1966). The glassy state in certain sugar-containing food products. J. Food Technol.1:73–82.
130. Williams, M. L., R. F. Landel, and J. D. Ferry (1955). The temperature dependence of relaxation mechanisms inamorphous polymers and other glass-forming liquids. J. Am. Chem. Soc. 77:3701–3707.
131. Wolanczyk, J. P. (1989). Differential scanning calorimetry analysis of glass transitions. Cryo-Letters 10;73–76.

Pag e 95
3Dispersed Systems: Basic Considerations
PIETER WALSTRA
Wageningen Agricultural University, Wageningen, The Netherlands
3.1. Introduction 96
3.1.1. Foods as Dispersed Systems 96
3.1.2. Characterization of Dispersions 97
3.1.3. Effects on Reaction Rates 100
3.2. Surface Phenomena 101
3.2.1. Interfacial Tension and Adsorption 101
3.2.2. Surfactants 103
3.2.3. Contact Angles 107
3.2.4. Curved Interfaces 108
3.2.5. Interfacial Rheology 110
3.2.6. Surface-Tension Gradients 111
3.2.7. Functions of Surfactants 112
3.3. Colloidal Interactions 112
3.3.1. Van der Waals Attraction 113
3.3.2. Electric Double Layers 113
3.3.3. DLVO Theory 115
3.3.4. Steric Repulsion 116
3.3.5. Depletion Interaction 117
3.3.6. Other Aspects 118
3.4. Liquid Dispersions 118
3.4.1. Description 118
3.4.2. Sedimentation 119
3.4.3. Aggregation Kinetics 121

3.4.4. Reversibility of Aggregation 122
3.5 Gels 122
3.5.1. Description 122
3.5.2. Functional Properties 126
3.5.3. Some Food Gels 129

Pag e 96
3.6. Emulsions 133
3.6.1. Description 133
3.6.2. Emulsion Formation 134
3.6.3. Types of Instability 138
3.6.4. Coalescence 139
3.6.5. Partial Coalescence 141
3.7. Foams 143
3.7.1. Formation and Description 144
3.7.2. Stability 146
Acknowledgments 150
Frequently Used Symbols 150
Bibliography 151
References 151
3.1 Introduction
The subjects discussed in this chapter are rather different from most of the material in this book, in the sense that true chemistry,that is, reactions involving electron transfer, is hardly involved. Nevertheless, many aspects of dispersed systems are important toan understanding of the properties of most foods and the manufacture of “fabricated foods.”
3.1.1 Foods as Dispersed Systems
Most foods are dispersed systems. A few are homogeneous solutions, like cooking oil and some drinks, but even beer—asconsumed—has a foam layer. The properties of a dispersed system cannot be fully derived from its chemical composition, sincethey also depend on physical structure. The structure can be very intricate, as is the case with foods derived from animal orvegetable tissues; these are discussed in Chapters 15 and 16. Manufactured foods, as well as some natural foods, may have asomewhat simpler structure: Beer foam is a solution containing gas bubbles; milk is a solution containing fat droplets and proteinaggregates (casein micelles); plastic fats consist of an oil containing aggregated triacylglycerol crystals; a salad dressing may bejust an emulsion; several gels consist of a network of polysaccharide molecules that immobilize a solution. But othermanufactured foods are structurally complicated in that they contain several different structural elements of widely varying sizeand state of aggregation: filled gels, gelled foams, materials obtained by extrusion or spinning, powders, margarine, doughs,bread, and so forth.
The existence of a dispersed state has some important consequences:
1. Since different components are in different compartments, there is no thermodynamic equilibrium. To be sure, even ahomogeneous food may not be in equilibrium, but for dispersed systems this is a much more important aspect. It may havesignificant consequences for chemical reactions, as is briefly discussed in Section 3.1.3.

2. Flavor components may be in separate compartments, which may slow down their release during eating. Probably moreimportant, compartmentalization of flavor components may lead to fluctuations in flavor release during eating, therebyenhancing flavor, because it offsets to some extent adaptation of the senses to flavor components. Thus, most“compartmentalized” foods taste quite different from the same food that has been homogenized before eating.

Pag e 97
3. If, as is often the case, attractive forces act between structural elements, the system has a certain consistency, which isdefined as its resistance against permanent deformation. This may be an important functional property as it is related toattributes such as stand-up, spreadability, or ease of cutting. Moreover, consistency affects mouth feel, as does any physicalinhomogeneity of the food; food scientists often lump these properties under the word texture.
4. If the product has significant consistency, any solvent present—in most foods, water—will be immobilized against bulkflow. Transport of mass (and mostly of heat also) then has to occur by diffusion rather than convection. This may have aconsiderable effect on reaction rates.
5. The visual appearance of the system may be greatly affected. This is due to the scattering of light by structural elements,provided they are larger than about 50 nm. Large inhomogeneities are visible as such and give rise to what is the dictionarymeaning of texture.
6. Since the system is physically inhomogeneous, at least at a microscopic scale, it may be physically unstable. Several kindsof change may occur during storage, which may be perceived as the development of macroscopic inhomogeneity, such asseparation into layers. Moreover, during processing or usage, changes in the dispersed state may occur, which may bedesirable—as in the whipping of cream—or undesirable—as in overwhipping of cream, where butter granules are formed.
In this chapter, some of the foregoing aspects will be discussed. Large-scale mechanical properties will be largely left out, and sowill aspects of hydrodynamics and process engineering. Of course, most foods show highly specific behavior, but treating themall would take too much space and provide little understanding. Therefore, some general aspects of fairly simple modeldispersions will be emphasized.
3.1.2 Characterization of Dispersions
A dispersion is a system of discrete particles in a continuous fluid phase. Various types exist and these are given in Table 1.Foods never exist as fog, and aerosols and powders will not be discussed. In addition to the dispersions listed in the table, solidfoams, emulsions, or suspensions may exist: After the liquid systems have been made, the continuous phase may in some waysolidify. In a foam omelette, the continuous protein solution has gelled; in margarine, the continuous oil phase now contains acontinuous network of aggregated crystals; in chocolate much the same has happened and it thus contains solid particles (sugar,cacao) in a largely crystallized fat matrix.
There are two types of food emulsions, oil-in-water (o/w) and water-in-oil (w/o). For emulsions, as well as for otherdispersions, the nature of the continuous phase determines some
TABLE 1 Various Types of Dispersions
Dispersed phase Continuous phase Dispersion type
Gas Liquid Foam
Liquid Gas Fog , aerosol
Liquid Liquid Emulsion
Solid Gas Smoke, powder
Solid Liquid Suspension, sol

Pag e 98
FIGURE 1Approximate size of some structural elements in
foods.
important properties of the dispersion, for instance, the type of liquid (aqueous or apolar) that can mix with the dispersion. Inprinciple, there may be more than one continuous phase. The prime example is a wet sponge, where matrix and water both arecontinuous. Several foods are bicontinuous; for instance, in bread both the gas and solid phases are continuous. If not, the breadwould lose most of its volume after baking, since the gas cells would shrink considerably on cooling, the more so as they partlyconsist of water vapor.
The term phase needs some clarification. A phase is commonly defined as a domain bounded by a closed surface, at whichsurface at least some properties (e.g., pressure, refractive index, density, heat capacity, chemical composition) change abruptly.The surface contains free energy and it thus resists enlargement; in other words, it requires energy to make the surface (orinterface). Since changes in properties mostly occur over a distance of a few molecular diameters, the criterion of abruptnessimplies that the dimensions of structural elements constituting a phase must be far larger than a single molecule in any direction.For instance, protein aggregates that float in a solution do not constitute a phase, since the aggregates are small and containsolvent. The particles may even sediment (certainly in a centrifuge) and form separate layers, but even these layers are notphases, since there is no phase boundary. The constituents water and polysaccharide that form a gel do not constitute phases:The polysaccharide strands in the gel are only about 1 nm in thickness.
This brings us to the term colloid. A colloid is usually defined as a dispersion containing particles that are clearly larger than smallmolecules (say, solvent molecules), yet too small to be visible. This would imply a size range from about 10 nm to almost 1 mm.Two types of colloids are usually distinguished: reversible (or lyophilic) and irreversible (or lyophobic). The latter type consists oftwo (or more) phases of the types shown in Table 1 and these do not form spontaneously.
A reversible colloid forms by “dissolving” a material in a suitable solvent. The main examples are macromolecules(polysaccharides, proteins, etc.) and association colloids. The latter are formed from amphiphilic molecules, like soaps. Thesehave a fairly long hydrophobic “tail” and a smaller, very polar (i.e., hydrophilic) “head.” In an aqueous environment, themolecules tend to associate in such a way that the tails are close to each other and the heads are in contact with water. In thisway, micelles or liquid crystalline structures are formed.

Pag e 99
Micelles will be briefly discussed in Section 3.2.2; liquid crystalline phases [33] are not very prominent in foods.
In foods, the difference between reversible and irreversible colloids is not always clear. For instance, an oil-in-water emulsion iscertainly irreversible in the sense that it will never form spontaneously. But if the oil droplets are covered by a protein layer, theinteractions between droplets may be like that of protein particles in solution, that is, like a reversible colloid. This means that forsome properties of the emulsion macroscopic considerations are appropriate, whereas for other properties molecularconsiderations may be more suitable.
The size scale of structural elements in foods can vary widely, spanning a range of six decades (Fig. 1). A water molecule has adiameter of about 0.3 nm. Also the shape of the particles is important, as is their volume fraction j (i.e., the proportion of thevolume of the system that is taken up by the particles). All these variables affect product properties. Some effects of size or scaleare:
1. Visual appearance. An o/w emulsion, for example, will be almost transparent if the droplets have a diameter of 0.03 mm;blueish white if 0.3 mm; white if 3 mm; and the color of the oil (usually yellow) will be discernable for 30-mm droplets.
2. Surface area. For a collection of spheres each with a diameter d (in m), the specific surface area is given by
A = 6j/d (1)
in square meters per cubic meter. The area can thus be large. For an emulsion of j=0.1 and d=0.3 mm, A=2m2 per mlemulsion; if 5 mg protein is adsorbed per square meter of oil surface, the quantity of adsorbed protein would amount to 1%of the emulsion.
3. Pore size. Between particles, regions of continuous phase exist and their size is proportional to particle size and smallerfor a larger j. If the dispersed phase forms a continuous network, pores in this network follow the same rules. Thepermeability, that is, the ease with which solvent can flow through the pores, is inversely proportional to pore size squared.This is why a polymer gel is far less permeable than a gel made of fairly large particles (Sec. 3.5.2).
4. Time scales involved. (Note: Time scale is defined as the characteristic time needed for an event to occur—for instance,for two molecules to react, for a particle to rotate, for a bread to be baked.) The larger the particles, the longer are the timescales involved. For example, the root mean square value of the diffusion distance (z) of a particle of diameter d as afunction of time t is.
<z2> (t/d)0.5 (2)
In water, a particle of 10 nm diameter will diffuse over a distance equal to its diameter in 1 ms; a particle of 1 mm in 1 sec;and one of 0.1 mm in 12 days. Considering diffusion of a material into a structural element, the relation between diffusioncoefficient D, distance l, and time t0.5 needed to halve a difference in concentration (or temperature) is
l2 = Dt0.5 (3)
The D of small molecules in water is approximately 10-9 m2.sec-1 and in most cases (larger molecules, more viscoussolution) it is smaller; D for evening out a temperature difference (by heat conduction) equals approximately 10-7 m2.sec-1.Taking, for instance, D=10-10, we find a halving time of about 0.01 sec for a distance of 1 mm, and of 3 hr for a distance of1 mm.

Pag e 100
5. Physical stability. Most interaction forces between particles are roughly proportional to their diameter, and sedimentationrate to diameter squared. This implies that almost all dispersions become inhomogeneous more readily if the particles arelarger.
6. Effect of external forces. Most external forces acting on particles are proportional to diameter squared, and most internalforces within or between particles are proportional to diameter. This implies that small particles are virtually impervious toexternal influences, like shearing forces or gravity. Large particles often can be deformed or even be disrupted by externalforces.
7. Ease of separation. Some of the points raised earlier imply that it is much more difficult to separate small particles from aliquid than large ones.
Particles rarely are all of the same size. The subject of size distributions is a complicated one [2,58] and it will not be discussedhere. Suffice it to say that mostly a size range may be used to characterize the size distribution and that the volume/surfaceaverage diameter dvs or d32 is often a suitable estimate of the center of the distribution. However, different properties may needdifferent types of averages. The wider the size distribution—width being defined as standard deviation divided by average—thegreater the differences between average types (an order of magnitude is not exceptional). It is often very difficult to accuratelydetermine a size distribution [2]. Difficulties in determination and interpretation increase with particles that are more anisometricor otherwise different in properties.
3.1.3 Effects on Reaction Rates
As already mentioned, components in a dispersed food may be compartmentalized, and this can greatly affect reaction rates. Ina system containing an aqueous (a) and an oil phase (b), a component often is soluble in both. Nernst's distribution orpartitioning law then states that the ratio of concentrations (c) in both phases is constant:
ca/cb = constant (4)
The constant will depend on temperature and possibly other conditions. For instance, pH has a strong effect on the partitioningof carboxylic acids, since these acids are oil soluble only when they are in a neutralized state. At high pH, where acids are fullyionized, almost all acid will be in the aqueous phase, whereas at low pH the concentration in the oil phase may be considerable.Note that the quantity of a reactant in a phase also depends on the phase volume fraction.
When a reaction occurs in one of the phases present, it is not the overall concentration of a reactant but its concentration in thatphase that affects the reaction rate [87]. This concentration may be higher or lower than the overall concentration, depending onthe magnitude of the partitioning constant (Eq. 4). Since many reactions in foods actually are cascades of several differentreactions, the overall reaction pattern, and thereby the mix of components formed, may also depend on partitioning. Chemicalreactions will often involve transport between compartments and will then depend on distances and molecular mobility. ApplyingEquation 3, it follows that diffusion times for transport into or out of fairly small structural elements, say emulsion droplets, wouldmostly be very short. However, if the solvent is immobilized in a network of structural elements, this may greatly slow downreactions, especially if reactants, say O2, have to diffuse in from outside. Moreover, reactions may have to take place at theboundary between phases. An example is fat autoxidation, where the oxidizable material (unsaturated oil) is in oil droplets, and acatalyst, say Cu ions, is in the aqueous phase. Another example is that of an enzyme present in one structural element and thecomponent on which it acts in another one. In such cases, the specific surface area may be rate-determining.

Pag e 101
Adsorption of reactive substances onto interfaces between structural elements may diminish their effective concentration andthereby reactivity. On the other hand, if two substances that may react with each other are both adsorbed, their effectiveconcentrations in the adsorption layer may be much greater, thereby enhancing reaction rate.
Thus, rates of chemical reactions and the mix of reaction products may be quite different in a dispersed system than in ahomogeneous one. Examples in vegetable and animal tissues are well known, but other cases have not been studied in greatdetail, except for the activity of some additives [87] and, of course, for enzymatic lipolysis.
3.2 Surface Phenomena
As mentioned earlier, most foods have a large phase boundary or interfacial area. Often, substances adsorb onto interfaces, andthis has a considerable effect on static and dynamic properties of the system. In this section basic aspects are discussed;applications are discussed later [see Refs. 1 and 51 for general literature].
3.2.1 Interfacial Tension and Adsorption
An excess of free energy is present at a phase boundary and the amount is conveniently expressed in joules per square meter.The interface can be solid or fluid; the latter is the case if both phases are fluid. A fluid interface is deformable and the interfacialfree energy then becomes manifest as a two-dimensional interfacial tension, expressed in newtons per meter; it is usually denotedg . Note that g numerically equals the interfacial free energy (1 J=1 N). In foods, we may have air (A), aqueous (W), oil (O), orsolid (S) phases; if one of the phases is air, g (e.g., gAW) is commonly called surface tension. The interfacial tension acts in thedirection of the interface and resists enlargement of the interface. This provides a method to measure g . For example, one maymeasure the force to pull a plate out of the interface and divide the force by the contour length of the interface-plate contact (Fig.2).
Substances that lower g adsorb onto the interface because this leads to a lower total free energy. Such substances are calledsurfactants. Reference 36 gives a detailed treatment of adsorption to fluid interfaces and the consequences thereof. The amountadsorbed is expressed as the surface excess G (mol.m-2 or mg.m-2), loosely called surface load. According to Gibbs, for oneadsorbing solute in one of the phases and at equilibrium conditions
dg = -RT G d(ln a) (5)
where R and T have their usual meaning and a is the activity of the solute. The latter is not equal to the total concentration of thesolute because (a) part of the solute is adsorbed and a refers only to the surfactant in solution (usually called “the bulk”), and (b)the activity may be smaller than the bulk concentration, especially above the critical micelle concentration (see later). Whetheradsorption does occur and g is thus lowered depends on the properties of the solute (Sec. 3.2.2). The lowering is expressed in
the surface pressure , which can be envisaged as a two-dimensional pressure exerted by the adsorbed molecules ontoany boundary that confines a certain interfacial area (Fig. 2). Interfacial tensions of some systems are given in Table 2.
The Gibbs equation shows that g will be lower for a larger bulk concentration of an adsorbing solute, but it does not give therelation between g or P and G, nor the relation between G and bulk concentration. The former relation, a surface equation ofstate, will not be discussed here. The latter relation may be seen as an adsorption isotherm, if equilibrium is attained. Examplesare shown later, in Fig. 5. Usually a plateau value of G is reached, at which the

Pag e 102
FIGURE 2Surface (interfacial) tension measurements. (a)General principle: The surface tension pulls the
W ilhelmy plate downward. (b) Surfactant moleculesin the surface exert a two-dimensional pressureP = g 0 - g on the movable barriers confining the
surfactant-containing surface.
interface is more or less fully packed with surfactant molecules. For most surfactants, the plateau value is a few milligrams persquare meter.
Adsorption naturally takes time, since adsorbing molecules have to be transported, often by diffusion, to the interface. If the bulkconcentration of surfactant is c, the layer of solution needed to provide the surfactant is given by G/c. Using Equation 3, the timeneeded for adsorption would be approximately
(6)
This means that the time needed for adsorption would typically be <1 sec for a surfactant concentration of 0.1%.
TABLE 2 Some Interfacial Tensions, Approximate Values (mN -1) atRoom Temperature
Material Ag ainst air Ag ainst water
W ater 72 0
Saturated NaCl solution 82 0
Ethanol 22 0
Paraffin oil 30 50a
Triacylg lycerol oil 34 27a
Mercury 484 415
aSome buffer solutions g ive a lower interfacial tension than does purewater.

Pag e 103
3.2.2 Surfactants
Surfactants come in two types, polymers and soap-like substances. The latter are fairly small amphiphilic molecules, thehydrophobic (lipophilic) part being typically an aliphatic chain. The hydrophilic part can vary widely; in the classical surfactant,common soap, it is an ionized carboxyl group. Most amphiphilic substances are not highly soluble either in water or oil, and theyfeel the least repulsive interaction from these solvents when they are partly in a hydrophilic environment (water, a hydrophilicsubstance) and partly in a hydrophobic one (oil, air, a hydrophobic substance), that is, at an interface. In solution, they tend toform micelles to lessen repulsive interaction with solvent. (Note on terminology: Some workers use the word surfactant forsmall-molecule surfactants only. Also, surfactants are often called emulsifiers, even when the surfactant is not involved in makingan emulsion.)
Some small-molecule surfactants of importance to the food scientist are listed in Table 3 [32,53]. They are categorized asnonionic, anionic, and cationic, according to the nature of the hydrophilic part. Also, distinction is made between naturalsurfactants (e.g., soaps, monoacylglycerols, phospholipids) and synthetic ones. The Tweens are somewhat different from theother ones in that the hydrophilic part contains three or four polyoxyethylene chains of about five monomers in length.Phospholipids come in a wide range of composition and properties.
An important characteristic of a small-molecule surfactant is its HLB value, where HLB stands for hydrophile-lipophile balance.It is defined so that a value of 7 means that the substance has about equal solubility in water and oil. Lower values imply greatersolubility in oil. Surfactants range in HLB value from about 1 to 40. The relation between HLB value and solubility is in itselfuseful, but it also relates to the suitability of the surfactant as an emulsifier: Surfactants with HLB > 7 are generally suitable formaking o/w emulsions, and those with HLB <7 for w/o emulsions (see also Sec. 3.6.2 about Bancroft's rule). Surfactantssuitable as cleaning agents (detergents) in aqueous solutions have a high HLB number. Several other relations with HLB valueshave been claimed, but most of these are questionable.
In general, a longer aliphatic chain yields a lower HLB and a more polar (especially an
TABLE 3 Some Small-Molecule Surfactants and Their Hydrophile-Lipophile Balance (HLB) Values
Type Example of surfactant HLB value
Nonionics
Aliphatic alcohol Hexadecanol 1
Monoacylg lycerol Glycerol monostearate 3.8
Esters of monoacylg lycerols Lactoyl monopalmitate 8
Spans Sorbitan monostearate 4.7
Sorbitan monooleate 7
Sorbitan monolaurate 8.6
Tween 80 Polyoxyethylene sorbitan monooleate 16
Anionics
Soap Na oleate 18
Lactic acid esters Na stearoyl-2-lactoyl lactate 21
Phospholipids Lecithin Fairly larg e
Teepola Na lauryl sulfate 40
Cationics a Large
aNot used in foods but as deterg ents.


Pag e 104
ionized) or a larger polar group a higher HLB. For most surfactants, the HLB number decreases with increasing temperature.This implies that some surfactants exhibit a HLB temperature or phase inversion temperature (PIT), at which a value of 7 isreached. Above the PIT the surfactant tends to make a w/o emulsion, and below it an o/w emulsion. Near the PIT, gOW isgenerally very small.
Figure 3 shows the effect of concentration of surfactant on surface tension. Breaks in the curves occur at the critical micelleconcentration (CMC). Beyond that concentration the surfactant molecules form micelles and their activity barely increases;hence, g becomes essentially independent of concentration (see Eq. 5). At a concentration slightly below the CMC the surfaceload reaches a plateau value. In a homologous series of surfactants, a longer chain length results in a lower CMC and a lowerconcentration to obtain a given lowering of g . This means that larger surfactant molecules sare more surface active. Also, smallersurfactant molecules give a somewhat less steep slope near the CMC. This implies, according to Equation 5, that the plateauvalue of the surface load is somewhat smaller than it is for larger surfactant molecules. For ionic surfactants, the CMC markedlydecreases and surface activity increases with increasing ionic strength. Both of these properties can also depend on pH.
At the oil-water interface much the same pattern is observed, but since g 0 is lower and P is roughly the same, g is much smaller.The smallest value of g obtained at the air-water interface is about 35 mN-1, whereas at the triacylglycerol oil—water interface itvaries from < 1 to about 5 mN-1 for most small-molecule surfactants. The mode of adsorption of various surfactants is depictedin Figure 4.
It should be realized that commercially available surfactants generally are mixtures of several components, varying in chain lengthand possibly in other properties. These components may differ, for example, in the plateau value of g (Fig. 3). In these instances,Equation 5 is no longer applicable and plots of the type in Figure 3 have a different shape, often with a local minimum in g .Especially, some trace components may be present that give a lower g than the main components, and at equilibrium thesurfactants yielding the smallest g will dominate in the interface. Because of their small concentration, it will, however, take a longtime for them to reach the interface; see Equation 6. This implies that it will take a long time before an equilibrium composition,and thus a steady g , is reached. Another complication is that in actual
FIGURE 3Surface tension g (at the air—water
interface) ag ainst bulk concentration cof sodium soaps of normal fatty acidsof various chain leng th. Approximate
values; various sources

Pag e 105
FIGURE 4Mode of adsorption of various surfactants at an
oil-water or air-water interface: 1, soap; 2, Tween; 3,a fairly small polymer molecule; 4, a g lobular
protein. To the left is a scale of nanometers. Hig hlyschematic.
dispersions the surface to volume ratio is very large, whereas this ratio is quite small in situations where g is commonly measured,that is, at a macroscopic interface between the phases. This means that the result of such measurements of g may not berepresentative for the actual values in a foam or emulsion. Finally, the CMC may not be clearly evident in mixtures of surfactants,especially for nonionics.
Macromolecules can be very surface active. Several synthetic polymers are used as surfactants, and a mass of experimentalevidence as well as theory is available [22]. Copolymers, where part of the segments are fairly hydrophobic and othershydrophilic, are especially suitable. They tend to adsorb with “trains,” “loops,” and “tails” (Fig. 4). Actually, at an oil-waterinterface, parts of the molecule can also protrude for some instances into the oil phase (not into air). There are few naturalpolymers that adsorb in this way. Surface activity of polysaccharides still is controversial. Most workers assume that surface-active polysaccharides contain a protein moiety that is responsible for this attribute, and this is clearly the case for gum arabic[15]. On the other hand, it is believed that at least some galactomannans adsorb as such onto the o/w interface [24].
Proteins often are the surfactants of choice, especially for foams and o/w emulsions (because of their water solubility they arenot suitable for w/o emulsions) [16,44,85]. The mode of adsorption of proteins varies. There always is a change ofconformation, often considerably so. For instance, most enzymes completely lose their activity after adsorption at an oil-waterinterface due to conformational change. Some enzymes retain part of their activity after adsorption at an air-water interface.Most globular proteins appear to retain an approximately globular conformation at interfaces (Fig. 4), though not the native one.Proteins with little secondary structure, like gelatin and caseins, tend to adsorb more like a linear polymer (Fig. 4). Formsintermediate between those mentioned also occur. At high bulk protein concentration, multilayer adsorption may occur, but thesecond and more remote layers are only weakly adsorbed.
In Figure 5 adsorption of a protein and adsorption of a soap-like surfactant are compared. It is apparent that proteins (likesynthetic high polymers) are much more surface active than soap-like surfactants. Even if the concentration scale in Figure 5were in kilograms per cubic meter, the concentration needed for a certain adsorption to occur would differ by two decades.However, the “soap” yields a greater surface pressure (lower interfacial tension) than the protein at the plateau adsorption. Forsmall-molecule surfactants, the Gibbs relation (Eq. 5) holds, but for most proteins (and most high polymers) this is not so.Desorption of adsorbed protein cannot

Pag e 106
FIGURE 5Surface pressure (P) and surface load (G) as afunction of the bulk concentration of a proteinand a small-molecule surfactant (“soap”). CMC
is critical micelle concentration. Typicalexamples. (After Ref. 85.)
be or barely can be achieved by dilution or “washing,” at least over time scales of interest. The difficulty of desorption may beenhanced by cross-linking reactions between adsorbed protein molecules; this has been clearly shown for proteins containing afree thiol group, where cysteine-cystine interchange can occur [20].
As exemplified in Figure 5, small-molecule surfactants generally yield a greater surface pressure, that is, a lower interfacialtension, than proteins, if the former are present in sufficient
FIGURE 6Surface load (G) in an o/w emulsion and
interfacial tension (g) at the o/winterface
for b-casein in the presence ofincreasing concentration of Na laurylsulfate (SDS); g is also g iven for SDS
only. (From Ref. 85, after Ref. 13.)

Pag e 107
concentration. This implies that they will displace proteins from the interface [13]. This is illustrated in Figure 6. Proteins mayalso adsorb on top of an adsorbed monolayer of a displacing surfactant, especially if the monolayer is phospholipid. These areimportant aspects in relation to foam and emulsion stability. Many foods naturally contain some surfactants (fatty acids,monoacylglycerols, phospholipids), and these can modify the properties of adsorbed protein layers. To some extent, proteinscan also displace each other in a surface layer, depending on concentration, surface activity, molar mass, molecular flexibility,etc. Although protein adsorption is irreversible in the sense that it is mostly not possible to lower G by diluting the system, theoccurrence of mutual displacement nevertheless implies that individual protein molecules in the interfacial layer may interchangewith those in solution, albeit slowly.
3.2.3 Contact Angles
When two fluids are in contact with a solid and with each other, there is a contact line between the three phases [1]. An exampleis given in Figure 7a for the system air-water-solid. There must be a balance between the surface forces acting in the plane of thesolid surface and this leads to Equation 7, called the Young equation:
gSA = gSW + gAW cos q (7)
The contact angle q is conventionally taken in the densest fluid phase. It depends on the three interfacial tensions. However, gSA
and gSW cannot be measured, but their difference can be derived from the contact angle. If (gSA-gSW)/gAW> 1, Equation 7 hasno solution, q=0, and the solid is completely wetted by the liquid; an example is water on clean glass. If the quotient
FIGURE 7Contact ang les (q), shown as cross
sections throug h three-phasesystems.
A=air, W =water, O=oil, S=solid. (a)W ater drop on a solid substrate; (b)
solidparticle located in an oil-water
interface;(c) oil droplet in an air-water
interface; (d)air pocket in a crevice in a solidsubmerg ed in water. See text.

Pag e 108
mentioned is <-1, there is no wetting at all; an example is water on Teflon or other strongly hydrophobic materials.
Figure 7b depicts, in fact, the same situation. In case b1 the contact angle is about 150 degrees, and this would be fairly typicalfor a triacylglycerol crystal in a triacylglycerol oil-water interface. The contact angle can in such a case be lowered by adding asuitable surfactant, such as Na lauryl sulfate, to the water phase. Addition of a large quantity of surfactant can even lead to q=0,and thus to complete wetting of the crystal by the aqueous phase. This is accomplished in some processes to separate fatcrystals from oil. Adherence of crystals to the w/o interface and the associated contact angle may be of importance for emulsionstability (e.g., Section 3.6.5).
In Figure 7c the more complicated situation of contact between three fluids is shown. Now there has to be a balance of surfaceforces in the horizontal as well as in the vertical plane, giving two contact angles. Equation 8 defines the spreading pressures:
pS = gAW - (gAO + gOW)
In Figure 7c, pS <0. If it is greater than zero, the sum of the surface free energies of the a/o and the o/w interfaces is smaller thanthat of the a/w interface alone, and the oil will spread over the water surface. Use of the values in Table 2 leads to the conclusionthat for paraffin oil pS=-8 mN.m-1, implying that the droplet will not spread (but it does adhere to the a/w interface). Fortriacylglycerol oil, it follows that pS = 11 mN.m-1, and spreading does occur. These aspects are of importance for theinteractions between emulsion droplets and foam bubbles. The spreading pressures can, of course, be altered by surfactants.However, most proteins lower gAW and gOW by roughly the same amount, and the spreading pressure then is not greatly altered.
It should be noted that the action of gravity can alter the situations depicted in Figure 7. If the droplets are smaller than about 1mm, the effect of gravity is small.
3.2.4 Curved Interfaces [1]
The pressure at the concave side of a curved phase boundary (interface) always is greater than that at the convex side. Thedifference is called the Laplace pressure. For a spherical surface of radius r, the Laplace pressure rL is
pL = 2g /r
An important consequence is that drops and bubbles tend to be spherical and that it is difficult to deform them, the more sowhen they are smaller. If a drop is not spherical, the radius of curvature differs with location, which implies a pressure differencewithin the drop. This causes material in the drop to move from regions with a high pressure to those with a lower one, until aspherical shape is obtained. Only if an outside stress is applied can the drop (or bubble) be deformed from the spherical shape.Some examples may be enlightening. For an emulsion droplet of radius 0.5 mm and interfacial tension 0.001 N.m-1, the Laplacepressure would be 4 × 10⁴ Pa and a considerable external pressure would be needed to cause substantial deformation. For anair bubble of 1 mm radius and g=0.05 N.m-1, pL would be 100 Pa, allowing deformation to occur more easily. These aspectswill be discussed further in Sections 3.6.2, 3.6.4, and 3.7.1.
Another consequence of the Laplace pressure is capillary rise. If a vertical capillary contains a liquid that gives zero contactangle, such as water in a glass tube, a concave meniscus is formed, implying a pressure difference between the water just belowthe meniscus and that

Pag e 109
outside the tube at the same height. The liquid in the tube will then rise, until the pressure due to gravity (g times density timesdifference in height) balances the capillary pressure. For example, pure water in a cylindrical capillary of 0.1 mm internaldiameter would rise 29 cm. If the contact angle is larger, the rise will be less; if it is > 90°, capillary depression occurs.
These aspects are relevant to the dispersion of powders in water. If a heap of powder is placed on water, capillary rise of thewater through the pores (voids) between the powder particles must occur for wetting of the particles to occur, and this isprerequisite for dispersion. It requires a contact angle (between powder material, water, and air) <90°. The effective contactangle in the powder is quite a bit smaller than that at a smooth surface of the powder material, so the angle must be distinctlysmaller than 90° [see further in Ref. 65].
A third consequence of Laplace pressure is that the solubility of the gas in a bubble in the liquid around it is enhanced. Accordingto Laplace (Eq. 9), the pressure of a gas in a (small) bubble is enhanced and, according to Henry's law, the solubility of a gas isproportional to its pressure. The effect of curvature of a particle on the solubility of the material in the particle is not restricted togas bubbles and is in general given by the Kelvin equation:
(10)
where s is solubility, solubility at a plane surface (i.e., “normal” solubility), and M and r are molar mass and mass density,respectively, of the material in the particle. Examples of calculations according to Equation 10 are in Table 4. It is seen that formost systems, particle radius has to be very small (e.g., <0.1 mm) for a significant effect. However, gas in bubbles of 1 mm hasperceptibly enhanced solubility. If the surface is concave rather than convex, the solubility is, of course, decreased (Fig. 7d).
The increased solubility gives rise to Ostwald ripening, that is, the growth of large particles in a dispersion at the expense ofsmall ones, and thus the eventual disappearance of the smallest particles. However, this only occurs if the material of the particlesis at least somewhat soluble in the continuous phase. It may thus occur in foams and in water-in-oil emulsions, but not intriacylglycerol oil-in-water emulsions. The rate of Ostwald ripening is governed by several factors (see, e.g., Sec. 3.7.2).
Ostwald ripening will always occur with crystals in a saturated solution, albeit slowly if the crystals are large. Another effect isthat it causes “rounding” of small crystals. At the edge of a crystal, the radius of curvature may be very small, say somenanometers, and this will lead to a greatly enhanced solubility (Table 4, fat crystal). The material near the edge will thus
TABLE 4 Examples of the Increase in Solubility of the Material in a Particle Due to Curvature, CalculatedAccording to Equation 10 for Some Arbitrary Particle Radii and Some Reasonable Values of the InterfacialTension (Temperature 300 K)
Variable W ater in oil Air in water Fat crystal in oil Sucrose crystal insaturated solution
r (m) 10-6 10-4 10-8 10-8
g (N .m -1) 0.005 0.05 0.005 0.005
r (kg .m-3 990 1.2 1075 1580
M (kg .mol -1 0.018 0.029 0.70 0.342
1.000073 1.010 1.30 1.091

Pag e 110
dissolve and be deposited somewhere else. In some systems, this leads to sintering of aggregated crystals (Section 3.4.4).
3.2.5 Interfacial Rheology [37,85]
If an interface contains surfactant, it has rheological properties. Two kinds of surface rheology can be distinguished, in shear andin dilation (Fig. 8). When the interface is sheared (leaving both area and amount of surfactant in the interface constant), one canmeasure the force in the plane of the interface needed to do this. Often this is done as a function of the shear rate, and a surfaceshear viscosity hss (units N.sec.m-1) is obtained. For most surfactants hss is negligibly small, but not for several macromolecularsurfactants. For most systems, shear rate thinning occurs and the observed viscosity is an apparent viscosity.
If the interfacial area is enlarged, leaving its shape unaltered, one measures an increase of interfacial tension, because now Gbecomes smaller. This is usually expressed in the surface dilational modulus, defined as
(11)
where A is the interfacial area. Esd is finite for all surfactants, although it will be very small if surfactant activity is high and the rateof surface enlargement is small. In such a case surfactant rapidly diffuses to the enlarged surface, thereby increasing G and thuslowering g . In other words, the Gibbs equilibrium (Eq. 5) will be rapidly restored. Esd therefore strongly decreases withdecreasing rate of deformation. For proteins Esd may be large and less dependent on time scale, because proteins adsorb moreor less irreversibly. Besides the interfacial concentration of protein, changes in its conformation can affect the modulus.
Surface rheological properties in dilation and in shear are fundamentally different. Essentially, hss is due to the viscosity of thematerial in the interfacial layer, which implies that it is a bulk property, but of a layer of unknown thickness; hence it is expressedas a two-dimensional quantity. On the other hand, Esd is a real interfacial property, which appears in several equations relating tointerfacial phenomena. A problem is, however, that measurement of Esd is difficult or even impossible, except at fairly long timescales and/or at small deformation. By and large, for globular proteins at the a/w interface, values of about 30–100 mN.m-1 havebeen observed and for b-casein about 10–20 m‘-1 [25,63]. Surface rheological parameters of protein layers naturally depend onpH, ionic strength, solvent quality, temperature, etc. Often moduli and viscosities are at maximum near the isoelectric pH. Itshould further be noted that one can also measure a surface dilational viscosity and a surface shear modulus.
FIGURE8lllustration of the g eometrical chang es broug ht
about in an interfacial element whenperforming interfacial rheolog y in simple shear
and in dilation. (From Ref. 85.)

Pag e 111
3.2.6 Surface-Tension Gradients
If a fluid interface contains a surfactant, surface-tension gradients can be created. This is illustrated for the case of an a/winterface in Figure 9. In Figure 9A a velocity gradient (G=dny/dc) sweeps surfactant molecules downstream (one may also saymoves the surface), thereby producing a surface tension gradient; g will now be smaller downstream. This implies a stressDg/Dx, which must be equal and opposite to the shearing stress hG (h = viscosity of the liquid). If there were no surfactant, thesurface would move with the flowing liquid; in the case of an o/w interface, the flow velocity would be continuous across theinterface. This has important consequences, especially for foams, as is seen by comparing Figure 9C with D. In the absence ofsurfactant, the liquid between two foam bubbles rapidly streams downward, like a falling drop. In the presence of surfactant,flow is very much slower. In other words, development
FIGURE 9Surface-tension g radients at the a/w
interface. (A) Streaming of liquidalong a
surface causes a surface-tensiong radient.
(B) A surface-tension g radientcauses
streaming of the adjacent liquid:Marang oni effect. (C) Drainag e of
liquidfrom a vertical film in the absence or
(D)presence of surfactant. (E) Gibbsmechanism of film stability. (From
Ref. 79.)

Pag e 112
of surface-tension gradients is essential to formation of a foam. It also means that an air bubble or emulsion droplet movingthrough the surrounding liquid in virtually all cases has an immobile surface; that is, it behaves like a rigid particle.
Figure 9B illustrates that liquid adjacent to an interface will move with the interface when the latter exhibits (for some reason, saylocal adsorption of surfactant) an interfacial tension gradient. This is called the Marangoni effect. It is seen in a glass of wine,where wine drops above the liquid level tend to move upward; here evaporation of ethanol produces the g gradient. Animportant consequence is the mechanism for stability of a thin film, illustrated in Figure 9E. If the film somehow acquires a thinspot, the surface area of the film is locally increased; hence G is lowered, g is increased, and a g gradient is established. TheMarangoni effect ensues, causing liquid to flow to the thin spot, thereby restoring film thicknesses. This Gibbs mechanismprovides the basis for the stability of films, as in a foam.
Another consequence is the Gibbs-Marangoni effect, which allows formation of emulsions (see Section 3.6.2). In all thesesituations, the effects depend on film or Gibbs elasticity, which is defined as twice the surface dilational modulus (twice becausea film has two surfaces). Thin films typically have a large elasticity, because of the scarcity of dissolved surfactant. In a thick filmcontaining a fairly high concentration of surfactant, surfactant molecules can rapidly diffuse toward a spot with a low surface loadand restore the original surface tension. This cannot occur or occurs only very slowly, in a thin film, implying a large elasticity,except at very long time scale.
3.2.7 Functions of Surfactants
Surfactants in a food, whether small-molecule amphiphiles or proteins, can produce several effects, and these are brieflysummarized next.
1. Due to the lowering of g , the Laplace pressure is lowered and the interface can be more easily deformed. This is important foremulsion and foam formation (Sec. 3.6.2) and for the avoidance of coalescence (Sec. 3.6.4).
2. Contact angles are affected, which is important for wetting and dispersion events. The contact angle determines whether aparticle can adsorb on a fluid interface and to what extent it then sticks out in either fluid phase. These aspects have an importantbearing on stability of some emulsions (Sec. 3.6.5) and foams (Sec. 3.7.2).
3. A decrease in interfacial free energy will proportionally slow Ostwald ripening. The rate of Ostwald ripening may also beaffected by the surface dilational modulus (Sec. 3.7.2).
4. The presence of surfactants allows the creation of surface-tension gradients and this may be their most important function. It isessential for formation and stability of emulsions and foams (Secs. 3.6.2, 3.6.4, 3.7.1, and 3.7.2).
5. Adsorption of surfactants onto particles may greatly modify (colloidal) interparticle forces, mostly enhancing repulsion andthereby stability. This is discussed in Section 3.3.
6. Small-molecule surfactants may undergo specific interactions with macromolecules. They often associate with proteins,thereby materially altering protein properties. Another example is the interaction of some polar lipids with amylose.
3.3 Colloidal Interactions
In Section 3.1.2 colloids were defined and classified. Generally, between particles forces act that originate from materialproperties of the particles and the interstitial fluid. These colloidal

Pag e 113
interaction forces act in a direction perpendicular to the particle surface, contrary to the surface forces discussed in Section 3.2,which act in the direction of the surface. Colloidal interaction has important consequences:
1. It determines whether particles will aggregate (Sec. 3.4.3), which, in turn, may determine further physical instability, forinstance, sedimentation rate. (Note on terminology: The terms flocculation and coagulation are also used, often with a morespecific connotation; the former would, for instance refer to reversible aggregation, and the latter to irreversible.)
2. Aggregating particles may form a network (Sec. 3.5), and the rheological properties and the stability of systems containingnetworks strongly depend on colloidal interaction.
3. It may greatly affect susceptibility of emulsion droplets to (partial) coalescence (Secs. 3.6.4–5).
Literature on colloid science can be found in textbooks mentioned in the Bibliography.
3.3.1 Van der Waals Attraction
Van der Waals forces between molecules are ubiquitous, and they also act between larger entities such as colloidal particles.Since these forces are additive, it turns out that, within certain limits, the dependence of the interaction force on interparticledistance (as measured between the outer surfaces) is much weaker between particles than between molecules. For two identicalspherical particles the van der Waals interaction free energy is
VA -Ar/12h h < ~10 nm(12)
where r is particle radius, h is interparticle distance, and A is the Hamaker constant. The last depends on the material of theparticles and the fluid in between, and it increases in magnitude as the differences in the properties of the two materials increase.For most particles in water, A is between 1 and 1.5 times kT (4-–6 × 10-21 J). Tabulated values are available [27,72].
If both particles are of the same material and the fluid in between is different, A always is positive and the particles attract eachother. If the two particles are of different materials, A may be negative and there would be van der Waals repulsion, but this isfairly uncommon.
3.3.2 Electric Double Layers
Most particles in an aqueous solution exhibit an electric charge, because of adsorbed ions or ionic surfactants. In most foods,charges predominantly are negative. Since the system must be electroneutral, the particles are accompanied by a cloud ofoppositely charged ions, called counterions. An example of the distribution of counterions and coions is given in Figure 10a. It isapparent that at a certain distance from the surface, the concentrations of positive and negative charges in the solution becomeequal. Beyond that distance, the charge on the particle is neutralized, due to an excess of counterions in the electric double layer.The latter is defined as the zone between the particle surface and the plane at which neutralization is achieved. The double layershould not be envisaged as being immobilized, because solvent molecules and ions diffuse in and out of the layer.
The electrical effects are usually expressed in the electric potential y. Its value, as a function of the distance h, from the surface,is given by
y = y0e-kh (13)

Pag e 114
FIGURE 10The electric double layer: (a) the distribution of counterionsand coions as a function of the distance from the charg ed
surface, and (b) the potential y as a function of distance forthree values of the ionic streng th l; the broken lines indicate the
Debye leng th.
where y0 is the potential at the surface and the nominal thickness of the electric double layer or Debye length 1/k is given by
(13a)
for dilute aqueous solutions at room temperature. The ionic strength I is defined as
(14)
where m is molar concentration and z is valence of each of the ionic species present. Note that for a salt like NaCl, I equalsmolarity of the solution, but this is not so if ions of higher valence are present. For CaCl2, I is three times the molarity.
Calculations of the potential as a function of distance are given in Figure 10b. Ionic strengths in aqueous foods vary from 1 mM(a typical tap water) to more than 1 M (pickled materials). The I of milk is about 0.075 M, and of blood about 0.14.Consequently, the thickness of the double layer is often only about 1 nm or less. This has important consequences when bothnegative and positive charges occur on one particle. If the distance between charged groups (or clusters of charged groups) on asurface (or on a macromolecule) is less than, say, 2/k, only the average potential is sensed from a distance. If, on the other hand,the distance between charges is greater than 2/k, the charges can be sensed separate from each other, enabling positive groupson one particle or macromolecule to react with negative groups on another one, forming salt bridges. This is, of course, relevantfor proteins, which often are amphipolar.
Electrical interactions depend on the surface potential, and this, in turn, is often influenced by pH. For most food systems, valuesof ¦y0¦ are below 30 mV. At a high concentration of counterions (especially if these are divalent), ion pairs can be formedbetween counterions and charged groups on the particle surface thereby lowering ¦y0¦.
In a nonaqueous phase, the dielectric constant generally is much smaller than in water, and Equation 13a is no longer valid.Moreover, the ionic strength in this situation generally will be negligible. This means that even if there is a charged surface (asmay be the case for aqueous droplets floating in oil), electrical interaction forces will usually be unimportant.

Pag e 115
3.3.3 DLVO Theory
If electrically charged particles having the same sign come very close to each other, their electric double layers overlap. This issensed and the particles repulse each other. The repulsive electric interaction free energy VE can be calculated. For spheres ofequal size it is
(15)
which would be valid for h <10 nm, ¦y0¦ <40 mV, kr> 1, in water at room temperature.
The interaction energies VA (due to van der Waals attraction) and VE can be added, and this has led to the first useful theory forcolloid stability, the DLVO (Deryagin-Landau, Verwey-Overbeek) theory. This theory enables calculation of the total freeenergy V needed to bring two particles from infinite distance to a distance h. Particle radius can be determined, several Hamakerconstants are known, k is derived from the ionic strength and the electrokinetic (or zeta) potential, which often is assumed to beequal to y0, can be experimentally determined by electrophoresis. The total interaction energy is usually divided by kT, that is,the average free energy involved in an encounter between two particles by Brownian (heat) motion.
Some plots of V/kT versus h are presented in Figure 11. If V is negative for all h, the particles will aggregate. If there is amaximum in the curve (as in Fig. 11a near x) that is much larger than kT, particles may never overcome this free energy barrier;if, on the other hand the maximum is somewhat lower, say 10kT, two particles may occasionally reach the “primary minimum”(as in Fig. 11a near y) and become irreversibly aggregated. If there is a sufficiently deep “secondary minimum” (Fig. 11a bear z),the particles readily become aggregated, but not fully irreversibly. It is seen that y0 (Fig. 11b) and ionic strength (Fig. 11c) havelarge effects on stability. Also the effect of particle radius seems to be large (Fig. 11d), but the DLVO theory appears to beincorrect in predicting the effect of size.
Quite generally, the DLVO theory—though very successful for many inorganic systems—seems to be inadequate for predictingstability of biogenic systems. Milk fat globules, for example, are stable against aggregation at their isoelectric pH (3.8), wherethey have zero surface
FIGURE 11Examples of the colloidal interaction free energ y V (in units of kT) as afunction of interparticle distance h according to the DLVO theory forspherical particles in water. Illustrated are effects of the mag nitude of(a) the Hamaker constant A (b) surface potential y 0; (c) ionic streng th
l; and (d) particle radius r. Unless indicated otherwise, A=1.25 kT; y 0=15mV; l=10 mM; r=1 mm.

Pag e 116
potential, so that the DLVO theory would predict zero repulsion [84]. Consequently, interaction forces other than thoseconsidered in this theory must be important.
3.3.4 Steric Repulsion
As depicted in Figure 4, some adsorbed molecules (polymers, Tweens©, etc.) have flexible molecular chains (“hairs”) thatprotrude into the continuous phase. These may cause steric repulsion. Two mechanisms can be distinguished. First, if the surfaceof another particle comes close, the hairs are restricted in the conformations they can assume, which implies loss of entropy, thatis, increase of free energy, and repulsion occurs. This volume-restriction effect can be very large, but it can be of importanceonly if the surfaces have a very low hair density (number of hairs per unit area). This is because the hairy layers start to overlapon approach of the particles and then a second mechanism will act before the first one comes into play. The overlap causes anincreased concentration of protruding hairs and thereby an increased osmotic pressure; this would lead to water moving to theoverlap region, which results in repulsion. However, this is true only if the continuous phase is a good solvent for the hairs; if it isnot, attraction may result. For example, emulsion droplets covered by casein have protruding hairs, providing stability to thedroplets. If ethanol is added to the emulsion, the solvent quality is strongly decreased and the droplets aggregate [16].
In some cases, steric repulsion free energy can be calculated with reasonable accuracy [22]. If these values are added to the vander Waals attraction, curves for total interaction versus interparticle distance are obtained. Schematic examples are shown inFigure 12. The solvent quality usually is of overriding importance and if it is good, repulsion can be very strong; see curve cversus d. Only for large particles (strong van der Waals attraction) and a fairly thin adsorbed layer (short hairs) will aggregationoccur in a good solvent (curve a, which shows a minimum free energy of about -12 kT).
FIGURE 12Hypothetical examples of theeffects of particle size, thickness of the layer ofprotruding molecular chains, and the quality of the solvent for those chainson the colloidal interaction free energ y (V in units of kT) between identical
spherical particles as a function of the interparticle distance h. The interactionis supposed to be due to van der W aals attraction and steric repulsion. Curves:
(a) g ood solvent, thin layer, particle diameter 2.5 mm; (b) same, but diameter0.5 mm; (c) relatively poor solvent, thick layer diameter 2.5 mm; (d)
same, but g ood solvent.

Pag e 117
In practical food systems calculation of steric repulsion usually is not possible because the situation can be complex. Forexample, the nature of the adsorbing molecules can vary greatly [18,22,81].
It should also be mentioned that adsorbing polymers may cause bridging aggregation, by becoming simultaneously adsorbedonto two particles [22,81]. This may happen if too little polymer is present to fully cover the particle surface area or with certainmethods of processing.
3.3.5 Depletion Interaction
Nonadsorbing polymers are depleted near an interface, because the center of a molecule cannot come closer to the interfacethan the effective radius of the (random coil) molecule. Close to the interface, there is thus a layer with a polymer concentrationlower than in the bulk. This depletion layer has a thickness (d) that is about equal to the radius of the gyration (Rg) of the polymermolecules (Fig. 13). If the particles come close to each other, the depletion layers overlap, implying that the polymerconcentration in the bulk becomes lower. This leads to a larger mixing entropy, that is, to a lower free energy and to a drivingforce for particle aggregation. An estimate of the depletion free energy can be obtained from
(16)
where Posm is the osmotic pressure caused by the dissolved polymer. It is, in first approximation, proportional to the molarconcentration of the polymer, but it will be more concentration dependent in a good solvent. Thus polysaccharides at lowconcentrations can cause depletion aggregation in foods; for example, 0.03% xanthan may be sufficient [16]. Fairly highconcentrations of polymer often lead to immobilization of the particles (Section 3.4.2), thereby causing the system to be fairlystable.
FIGURE 13Schematic depiction of the depletion of non adsorbing
macromolecules (radius of g yration R g, depicted—except forone example of a random coil—by small open circles) from the
surface of colloidal particles (radius r, depicted by larg ecircles), and of the overlap of the depletion zones (bounded
by broken lines) if the particles are ag g reg ated. (From Ref. 81).

Pag e 118
TABLE 5 Factors Affecting the Mag nitude of theContribution to the Interaction Free Energ y BetweenParticles by Van der W aals Forces (V A), ElectrostaticForces (V E), and Steric Interactions (V S): +, Effect; -,No Effect; (+), Effect Under Some Conditions
Variable VA VE VS
Particle size + + (+)
Particle material + - -
Adsorbed layer (+) + +
pH - + -a
Ionic streng th - + -a
Solvent quality - - +
aIn the absence of electrical charg es.
3.3.6 Other Aspects
It should now be clear that several kinds of colloidal interactions can occur in foods and that the kind and concentration ofsurfactants present strongly influence these interactions. Even in the simplest cases, several variables are important (Table 5).
Several additional complications may be mentioned. The DLVO theory does not apply at very small distances. One cause maybe surface roughness. Another may be solvation repulsion. If solvent molecules are attracted by the material on the outside ofthe particle, this may cause some repulsion at short distance [28]. This may affect the depth of the primary minimum (in plots ofV vs. h) and thereby the irreversibility of aggregation.
Hydrophobic interactions also may occur, and they generally cause attraction. The effect is the result of poor solvent quality(Sec. 3.3.4 and Chap. 2). This type of interaction has a strong temperature dependence, being very weak near 0°C andincreasing with increasing temperature.
Such hydrophobic interactions may, in principle, occur if a protein is the surfactant. However, repulsion is more likely in thiscase. Usually this is caused by a'combination of steric and electrostatic repulsion, but calculation of the interaction free energygenerally is not possible.
Another aspect is double adsorption, that is, adsorption of a substance onto a layer of surfactant. There are many examples ofpolysaccharides adsorbing onto particles that are already covered with small-molecule surfactants or proteins [3]. General rulescannot be given, but a kind of bridging aggregation occurs in many cases. It thus turns out that added polysaccharides can act invarious ways. If they adsorb they can provide steric repulsion, but under other conditions they can cause bridging aggregation. Ifthey do not adsorb they may cause depletion aggregation, but at high concentration they may stabilize the system.
3.4 Liquid Dispersions
3.4.1 Description
Several types of liquid dispersions exist. The discussions here will be limited to suspensions (solid particles in a liquid) and tothose aspects of emulsions that follow the same rules. Foods

Pag e 119
that are suspensions include skim milk (casein micelles in serum); fat crystals in oil; many fruit and vegetable juices (cells, cellclusters, and cell fragments in an aqueous solution); and some fabricated foods, such as soups. During processing (foodfabrication), suspensions are also encountered, such as starch granules in water, sugar crystals in a saturated solution, andprotein aggregates in an aqueous phase.
Dispersions are subject to several kinds of instability, and these are schematically illustrated in Figure 14. Changes in particle sizeand in their arrangement are distinguished. Formation of small aggregates of particles may be considered to belong to bothcategories. Dissolution and growth of particles depend on concentration of the material, on its solubility, and on diffusion. In asupersaturated solution nucleation must occur before particles can be formed. Dissolution, nucleation, and growth will not bediscussed further. Ostwald ripening is discussed in Sections 3.2.4 and 3.7.2 and coalescence in Section 3.6.4. The otherchanges are discussed next.
The various changes may affect each other, as is illustrated in Figure 14. Moreover, sedimentation is enhanced by any growth inparticle size, and sedimentation will enhance the rate of aggregation if the particles tend to aggregate. Agitation of the liquid mayenhance the rate of some changes, but it can also disturb sedimentation and disrupt large aggregates.
3.4.2 Sedimentation
If there is a difference in density (r) between the dispersed phase (subscript D) and the continuous phase (subscript C), there is abuoyancy force acting on the particles. According to Archimedes, this is for spheres apd3 (rD-rC)/6, where a is acceleration.The sphere now
FIGURE 14Illustration of the various chang es in dispersity. Hig hly schematic.

Pag e 120
FIGURE 15Schematic examples of non-Newtonian
flow behavior of liquids: apparentviscosity h * as a function of shearing
stress s. Curve 1 is typical for apolymer
solution. Curve 2 is typical for aslig htly
ag g reg ating dispersion of very smallparticles. Curve 3 is typical for a
systemexhibiting a yield stress.
sediments at a linear velocity n and feels a friction force, which is, according to Stokes, 3pdhCn, where hC is the viscosity of thecontinuous phase. By putting both forces equal, the equilibrium or Stokes sedimentation velocity is obtained:
nS = a(rD - rC)d2/18hC (17)
If the particles show a size distribution, d2 should be replaced by , where ni is the number of particles per unitvolume in class i with diameter di.
For gravity sedimentation a=g=9.81 m.sec-2, and for centrifugal sedimentation a=Rw2, where R is the effective radius of thecentrifuge and w its rotation rate in radians per second. To give an example: If the sphere diameter is 1 mm, the densitydifference is 100 kg.m-3, and the viscosity of the continuous phase is 1 mPa.sec (i.e., water), the spheres would sediment undergravity at a rate of 55 nm.sec-1 or 4.7 mm per day. Sedimentation greatly depends on particle size, and spheres of 10 mm wouldmove 47 cm in a day. Normally, viscosity decreases and sedimentation rate increases with increasing temperature. If the densitydifference in Equation 17 is negative, sedimentation is upward, and one commonly speaks of creaming.
Equation 17 is very useful to predict trends, but it is almost never truly valid. Among the many factors causing deviation fromEquation 17 [83], the following are the most important for foods:
1. The particles are not homogenous spheres. Any anisometric particle tends to sediment more slowly, because it orientsitself during sedimentation in such a way as to maximize friction; that is, a plate-shaped particle will adopt a “horizontal”orientation. An aggregate of particles, even if spherical, sediments more slowly than a homogeneous sphere of the same size,since the interstitial liquid in the aggregate causes the effective density difference to be smaller.
2. Convection currents in the dispersion, caused, for instance, by slight temperature fluctuations, may strongly disturbsedimentation of small particles (<~1 mm).

Pag e 121
3. If the volume fraction of particles j is not very small, sedimentation is hindered. For j=0.1, the sedimentation rate isalready reduced by about 60%.
4. If particles aggregate, sedimentation velocity increases: The increase in d2 is always larger than the decrease in Dr.Moreover, as larger aggregates sediment faster they overtake smaller ones, and thus become ever larger, leading to an evengreater acceleration of sedimentation rate. This may enhance sedimentation by orders of magnitude. A good example israpid creaming in cold raw milk, where fat globules aggregate due to the presence of cryoglobulins [84].
5. An assumption implicit in Equation 17 is that viscosity is Newtonian, that is, independent of shear rate (or shear stress),and this is not true for many liquid foods. Figure 15 gives some examples of the dependence of apparent viscosity on shearstress. The stress caused by a particle is given by the buoyancy force over the particle cross section, that is, 2/3g Drd forspheres under gravity. The stress is on the order of a millipascal for many particles. This then is the stress that the particlessense during sedimentation. Viscosity should be measured at that stress (or the corresponding shear rate, given by h*/s),whereas most viscometers apply stresses of well over 1 Pa. Figure 15 shows that the apparent viscosity can differ by ordersof magnitude, according to the shear stress applied.
Also shown in Figure 15 is an example of a liquid exhibiting a small yield stress. Below that stress the liquid will not flow.However, this is never noticed during handling, because the yield stress is so very small (a stress of 1 Pa corresponds to awater “column” of 0.1 mm height). Nevertheless, such a small stress often is sufficient to prevent sedimentation (orcreaming), as well as aggregation. Among liquid foods exhibiting a yield stress are soya milk, many fruit juices, chocolatemilk, and several dressings. These aspects are discussed further in Section 3.5.2 and in Ref. 71.
3.4.3 Aggregation Kinetics
Particles in a liquid exhibit Brownian motion and thereby frequently encounter each other. Such encounters may lead toaggregation, defined as a state in which the particles stay close together for a much longer time than they would in the absence ofattractive colloidal interaction. The rate of aggregation is usually calculated according to Smoluchowski's theory of perikineticaggregation [54]. The initial aggregation rate in a dilute dispersion of spheres of equal size is
-dN /dt = 4kTN2/3hW (18)
where N is the number of particles, that is, unaggregated particles plus aggregates, per unit volume. The stability factor W wasassumed to equal unity by Smoluchowski. The time needed to halve the number of particles then is
t0.5 = ph/8kTj (18a)
where j is the particle volume fraction. This results in d3/10j seconds for particles in water at room temperature where d is inmicrometers. For d=1 mm and j=0.1, this would be 1 sec, implying that aggregation is very rapid.
In most practical situations, aggregation is much slower, because W often has a large value. If it is desired to increase the halvingtime from 1 sec to 4 months, this would need a W of 107. The magnitude of the stability factor is primarily determined by thecolloidal repulsion between the particles (Sec. 3.3).
Direct use of Equation 18 to predict stability is rarely possible in food systems. There are numerous complications. Some of themore important ones are that (a) it is mostly impossible

Pag e 122
to establish the value of W, (b) the stability factor may change with time, (c) there are other encounter mechanisms, due tostreaming (agitation) or to sedimentation, and (d) aggregation may take various forms, leading to coalescence or to aggregates,which may be compact or tenuous. There are even more complications. Nevertheless, application of aggregation theory often ispossible and useful, but it is far more intricate than can be discussed here [8,81,83].
3.4.4 Reversibility of Aggregation
According to the nature of the interaction forces between aggregated particles (Sec. 3.3), agents can be added to causedeaggregation. This can occur during processing, or can be done in the laboratory to establish the nature of the forces. Itshould be realized that often more than one type of force is acting. Diluting with water may cause deaggregation (a) due tolowering of osmotic pressure (if depletion interaction was the main cause of aggregation), (b) due to lowering ionic strength(which enhances electrostatic repulsion), or (c) due to enhancing solvent quality (which can increase steric repulsion). Electricforces can also be manipulated by altering pH. Bridging by divalent cations can often be undone by addition of a chelating agent,say ethylenediamine tetraacetic acid (EDTA). Bridging by adsorbed polymers or proteins can mostly be undone by addition of asuitable small-molecule surfactant (Sec. 3.2.2). Reversal of specific interactions, such as -S-S- bridges, requires specificreagents. Also, a change in temperature can affect aggregate stability, by altering solvent quality.
If the forces between the particles in an aggregate are not very strong, deaggregation can be achieved by shear forces. Theseexert a stress hG, where G is the shear rate. In water, G=103 sec-1 would be needed to achieve a shear stress of 1 Pa, whichdoes not seem very large. However, the shear force acting on an aggregate is proportional to aggregate diameter squared, andlarge aggregates often have weak spots, because of their inhomogeneity. This means that aggregates often are degraded to acertain size by a given shear rate.
Another aspect is that bonds may strengthen after aggregation. It may be better to speak of junctions between particles, sinceany such junction may represent many (often hundreds of) separate bonds. The strengthening may occur by several mechanisms[81].
3.5 Gels
Many foods are “soft solids,” and these can often be said to be gels or gel-like. Some general aspects of idealized modelsystems will be discussed here, with principles being emphasized. Especially the mechanical (i.e., rheological and fracture)properties [e.g., 47] cannot be discussed in depth, because it would take far too much space and is outside the realm of thisbook. Nevertheless, some basic facts involving rheology are needed to understand gel properties.
3.5.1 Description
From a rheological viewpoint a typical gel is a material that exhibits a yield stress, has viscoelastic properties and has a moderatemodulus (say, <106 Pa). This is illustrated in Figure 16a. When a small stress acts on the material, it behaveselastically: It instantaneously deforms, keeps the shape obtained as long as the stress acts, and returns instantaneously to itsoriginal shape as soon as the stress is removed. For a greater stress, the material may show viscoelastic behavior: It first deformselastically but then starts to flow; after removal of the stress it only partly regains its original shape. Figure 16b illustrates thedifferences between a liquid, a solid, and a viscoelastic material. Strain (e) means relative deformation, and strain rate is itschange with time (de/dt) (the latter may be equal to the shear rate or to some other parameter, according to the type ofdeformation). Figure 16 also explains what yield stress
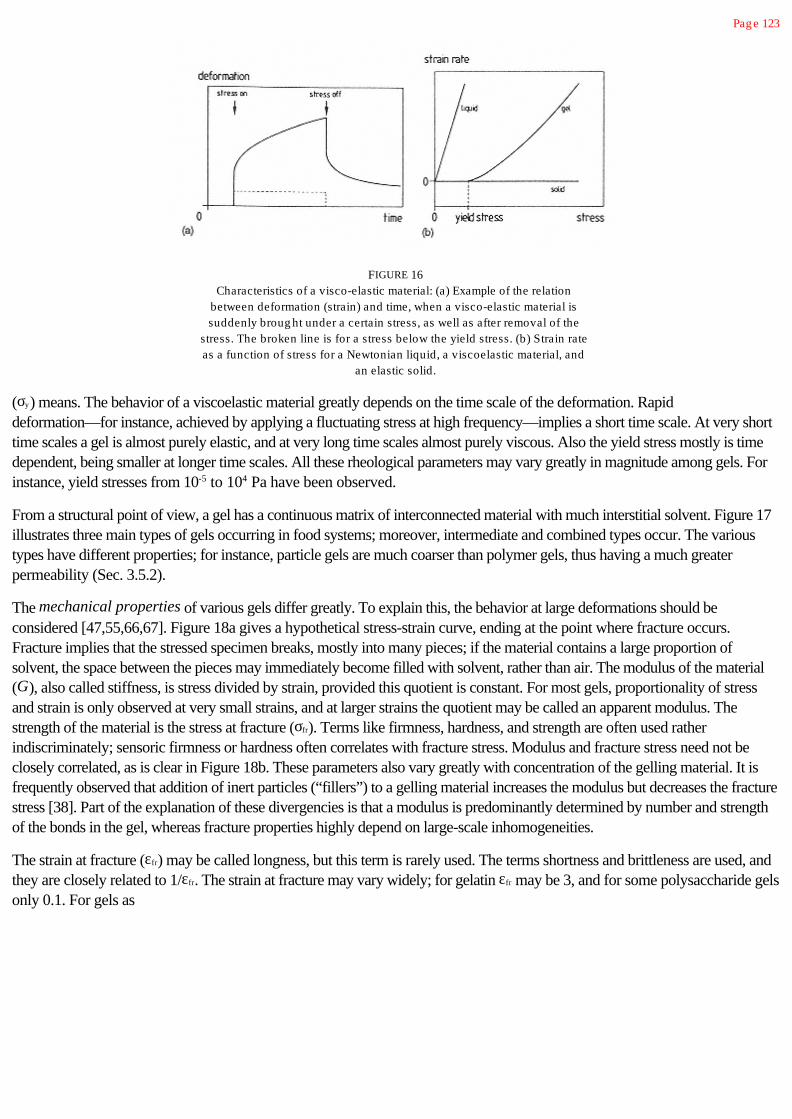
Pag e 123
FIGURE 16Characteristics of a visco-elastic material: (a) Example of the relation
between deformation (strain) and time, when a visco-elastic material issuddenly broug ht under a certain stress, as well as after removal of the
stress. The broken line is for a stress below the yield stress. (b) Strain rateas a function of stress for a Newtonian liquid, a viscoelastic material, and
an elastic solid.
(sy) means. The behavior of a viscoelastic material greatly depends on the time scale of the deformation. Rapiddeformation—for instance, achieved by applying a fluctuating stress at high frequency—implies a short time scale. At very shorttime scales a gel is almost purely elastic, and at very long time scales almost purely viscous. Also the yield stress mostly is timedependent, being smaller at longer time scales. All these rheological parameters may vary greatly in magnitude among gels. Forinstance, yield stresses from 10-5 to 104 Pa have been observed.
From a structural point of view, a gel has a continuous matrix of interconnected material with much interstitial solvent. Figure 17illustrates three main types of gels occurring in food systems; moreover, intermediate and combined types occur. The varioustypes have different properties; for instance, particle gels are much coarser than polymer gels, thus having a much greaterpermeability (Sec. 3.5.2).
The mechanical properties of various gels differ greatly. To explain this, the behavior at large deformations should beconsidered [47,55,66,67]. Figure 18a gives a hypothetical stress-strain curve, ending at the point where fracture occurs.Fracture implies that the stressed specimen breaks, mostly into many pieces; if the material contains a large proportion ofsolvent, the space between the pieces may immediately become filled with solvent, rather than air. The modulus of the material(G), also called stiffness, is stress divided by strain, provided this quotient is constant. For most gels, proportionality of stressand strain is only observed at very small strains, and at larger strains the quotient may be called an apparent modulus. Thestrength of the material is the stress at fracture (sfr). Terms like firmness, hardness, and strength are often used ratherindiscriminately; sensoric firmness or hardness often correlates with fracture stress. Modulus and fracture stress need not beclosely correlated, as is clear in Figure 18b. These parameters also vary greatly with concentration of the gelling material. It isfrequently observed that addition of inert particles (“fillers”) to a gelling material increases the modulus but decreases the fracturestress [38]. Part of the explanation of these divergencies is that a modulus is predominantly determined by number and strengthof the bonds in the gel, whereas fracture properties highly depend on large-scale inhomogeneities.
The strain at fracture (efr) may be called longness, but this term is rarely used. The terms shortness and brittleness are used, andthey are closely related to 1/efr. The strain at fracture may vary widely; for gelatin efr may be 3, and for some polysaccharide gelsonly 0.1. For gels as

Pag e 124
FIGURE 17Schematic illustrations of three main types of g el. The dots in
frame (a) denote cross-links. Note the differences inapproximate scale.
depicted in Figure 17a and b, efr greatly depends on length and stiffness of the polymer chains between cross links.
Another parameter is the toughness or work of fracture Efr. This is derived from the area under the curve in Figure 18a andexpressed in joules per cubic meter.
All these parameters depend on time scale or rate of deformation, but in various manners. Several gels do not fracture at allwhen deformed slowly, but do so when deformation is rapid. In some cases, it is even difficult to distinguish between yieldingand fracture. For some gels, fracture itself takes a long time.
Gels may be formed in various ways, according to the kind of gelling material. Polymer molecules in solution [e.g., 4] behavemore or less as random coils, effectively immobilizing a large amount of solvent (water), thereby increasing viscosityconsiderably. If the polymer concentration is not very low, the individual molecules tend to interpenetrate and formentanglements. This gives the solution some elasticity, but no yield stress. Gelation is caused by formation of intermolecularcross-links. These can be covalent bonds, salt bridges, or microcrystalline regions. Covalent bonds are provoked by addedreagents or by increased temperature. The latter can occur with some proteins, where -S—S- bridges form during heating. Forpolyelectrolytes,

Pag e 125
FIGURE 18(a) Hypothetical example of the relation between stress and strain
when deforming a viscoelastic material until it fractures. The modulusequals tan a. See text. (b) Relation between modulus and fracture stress
for g els of various materials (curdlan is a bacterial b-1,3-g lucan) at varyingconcentration. (After Ref. 31.)
that is, charged polymers such as proteins, formation of salt bridges may induce gelation. Other polymers gel by formingmicrocrystalline regions that act as cross-links. These are commonly formed on cooling, because then a reversible transitionoccurs that involves stiffening and localized crystallization of polymer chains.
Polymer gels are often discussed in terms of the so-called rubber theory, where it is assumed that the polymer chains betweencross-links are very long and can assume a large number of conformations. Deforming the gel leads to a decrease in the possiblenumber of conformations and thereby to a decrease in entropy. In such an ideal entropic gel, the elastic modulus is simply
G = nkT (19)
where n is the number of effective cross-links per unit volume. As will be seen later, only a few food polymer gels behave likethis.
Particle gels may form because of aggregation, induced by a change in pH, ionic strength, solvent quality, etc. (Section 3.3). Inthese gels, the entropy loss on deformation is negligible and they derive their elastic modulus from deformation of bonds, anenthalpic effect. Particle gels are often fractal in nature [86]. If attractive particles encounter each other at random they formaggregates, and as these aggregates encounter other aggregates, larger aggregates form. This is called cluster-clusteraggregation. The relation between the average number of particles in an aggregate Np and the radius of the aggregate R then is
Np = (R/r)D (20)
where r is the radius of the primary (component) particles and D is a constant < 3 and is called the fractal dimensionality.Because it is smaller than 3, aggregates become more tenuous (rarefied) when they increase in size. The average volume fractionof particles in an aggregate is given by

Pag e 126
(21)
where Nm is the number of primary particles that a sphere of the same radius can contain assuming close packing. It is apparentthat jag decreases as R increases. When jag becomes equal to the volume fraction of primary particles in the system, j, theaggregates touch each other and a gel forms. This implies an unequivocal gel point. It also implies that a gel is formed for any j,however small, although the gel may be extremely weak. The critical radius of the aggregates at gelation is given by
Rcr = rj1/(D-3) (22)
The size of the largest holes in the gel network equals about Rcr. Often, it is found that D 2.2 and it then follows that for j =0.01, Rcr/r=316. For j=0.1 the ratio is 18, and for j=0.4 it is about 3.
Although particles gels may seem to be rather disordered structures, simple scaling laws hold. Such relations can be given forrheological properties and permeability (see later). Such simple relations do not exist for most polymer gels.
3.5.2 Functional Properties
Food technologists make gels for a purpose, often to obtain a certain consistency or to provide physical stability. The propertiesdesired and the means of achieving those are summarized in Tables 6 and 7. Consistency has already been briefly discussed,but the message of Table 6 is an important one: According to the purpose in mind, the rheological measurements must be of arelevant type and conducted at the relevant time scale or strain rate. This need not be difficult. For instance, to evaluate stand-up(i.e., the propensity of a piece of gel, say, a pudding, to keep its shape under its own weight), measurement of a modulus makesno sense. The proper experiment is simply watching the piece, and possibly measuring the height of a specimen that will just startyielding. To ensure stand-up, the yield stress must be greater than g×r×H, where H is specimen height. For a piece 10 cm tall,this would be about 10×103×0.1=103 Pa. It should be realized that yield stress often is smaller when time scale is longer.
Very weak gels were briefly discussed in Section 3.4.2. In daily life, such a system appears to be liquid—that is, it will readilyflow out of a bottle if its yield stress is <10 Pa or so; but it nevertheless has elastic properties at extremely small stresses. Thissmall yield stress may be sufficient to prevent sedimentation. A good example is soya milk (Fig. 19). Soya milk contains smallparticles, consisting of cell fragments and organelles. These particles aggregate, forming
TABLE 6 Consistency of Gels: Specification of the Mechanical Characteristics Desired of Gels Made for aGiven Purpose
Property desired Relevant parameters Relevant conditions
“Stand-up” Yield stress Time scale
Firmness Modulus or fracture stress or yield stress Time scale, strain
Shaping Yield stress + restoration time Several
Handling , slicing Fracture stress and work of fracture Strain rate
Eating characteristics Yield or fracture properties, or both Strain rate
Streng th (e.g ., of film) Fracture properties Stress, time scale

Pag e 127
TABLE 7 Gel Properties Needed to Provide Physical Stability
Prevent or impede Gel property needed
Motion of particles
Sedimentation Hig h viscosity; or sig nificant yield stress + short restoration time
Ag g reg ation Hig h viscosity or sig nificant yield stress
Local volume chang es
Ostwald ripening Very hig h yield stress
Coalescence Very hig h yield stress
Motion of liquid
Leakage Low permeability and sig nificant yield stress
Convection Hig h viscosity or sig nificant yield stress
Motion of solute
Diffusion Small diffusivity
a weak reversible gel. If processing conditions are appropriate, the yield stress is sufficient to prevent these particles, and evenlarger particles, from sedimenting.
Also, some mixtures of polysaccharides, such as solutions of xanthan gum and locust bean gum, even if very dilute, can exhibit asmall yield stress (Fig. 15, curve 3). This yield stress can prevent sedimentation of any particles present [39].
Sometimes it is desired to arrest the motion of liquid, in which a case permeability is an essential parameter. According toDarcy's law, the superficial velocity n of a liquid through a porous matrix, for instance a gel, is
FIGURE 19Flow curves (shear stress vs. shear
rate) of soya milk. The yield stress isg iven by the y intercept of the lines.Curves 1 and 2 are for milk made fromdehulled soya beans, about 6% drymatter; 3 and 4 from whole beans,
about 7% dry matter. Curves 1 and 3,soaking of the beans overnig ht atroom temperature; curves 2 and 4,soaking 4 h at 60°C. (From Ref. 45.)


Pag e 128
(23)
where Q is the volume flow rate (m3.sec-1) through a cross-sectional area A and Dr is the pressure difference over distance x.The permeability B (m2) is a material constant that varies greatly among gels. A particle gel like renneted milk (built of paracaseinmicelles) has a permeability of the order of 10-12 m2, whereas a polymer gel (e.g., gelatin) typically would have a B of 10-17. Inthe latter case, leakage of liquid from the gel would be negligibly slow.
Swelling and syneresis are additional properties of gels. Syneresis refers to expulsion of liquid from the gel, and it is theopposite of swelling. There are no general rules governing their occurrence. In a polymer gel, lowering of solvent quality (e.g., bychanging temperature), adding salt (in the case of polyelectrolytes), or increasing the number of cross-links or junctions maycause syneresis. However, because both the pressure difference in Equation 23 and B are usually very small, syneresis (orswelling) often is very slow. In particle gels, syneresis may occur much faster, due to the far greater permeability. It is wellknown that renneted milk is prone to syneresis, an essential step in cheese making. The combination of variables influencingsyneresis is intricate [68].
Transport of a solute through the liquid in a gel has to occur by diffusion, because convection generally is not possible. Thediffusion coefficient D is not greatly different from that in solution, at least for small molecules in a not very concentrated gel. TheStokes relation for diffusivity D=kT/6phr, where r is molecule radius, cannot be applied. The macroscopic viscosity of thesystem is irrelevant, since it concerns here the viscosity as sensed by the diffusing molecules, which would be the viscosity of thesolvent. On the other hand, the solute has to diffuse around the strands of the gel matrix, and the hindrance will be greater forlarger molecules and smaller pores between strands in the gel. These aspects are illustrated in Figure 20.
FIGURE 20Diffusion of solutes in polysaccharideg els. Hig hly schematic examples afterresults by Muhr and Blanshard [42].

Pag e 129
3.5.3 Some Food Gels
The fairly theoretical points discussed earlier will now be illustrated by discussing some food gels.
3.5.3.1 Plastic Fats [60,77]
If a triacylglycerol oil is cooled, fat crystals can form and these will aggregate. There is van der Waals attraction between thecrystals and no repulsion (except at very small distance). The crystals form a fractal gel, at least under some conditions [75].Subsequently, the aggregated crystals may to some extent grow together (fuse) by local accretion of solid material, because itmay take a long time before fat crystallization has reached an equilibrium state. This results in a rigid and brittle network. Themodulus is fairly high (e.g., 106 Pa), the proportionality between stress and strain extends only for a strain of at most 0.01, andyielding occurs at a strain of about 0.1; the yield stress in this case is about 105 Pa. These values greatly increase as the fractionsolid increases. Permeability ranges from about 10-16 to 10-13 m2, according to crystal size and fraction solid. These propertiesare characteristic of what is known as a plastic fat.
3.5.3.2 Caseinate Gels [70,82,86]
Milk contains casein micelles, proteinaceous aggregates of about 120 nm average diameter, each containing some 104 caseinmolecules (see Chap. 14). The micelles can be made to aggregate, by lowering the pH to about 4.6 (thereby decreasing electricrepulsion) or by adding a proteolytic enzyme that removes the parts of k-casein molecules that protrude into the solvent (therebydecreasing steric repulsion). Fractal gels are formed with a fractal dimensionality of about 2.3. The permeability, which is about2 × 10-13m2 for average casein concentration (c), is thus strongly dependent on the latter, being about proportional to c-3. Forcasein gels (Fig. 21a) a linear relation exists between log modulus and log casein concentration, in accordance with their fractalnature. The different slopes imply a difference in structure. Apparently, the initially tortuous strands in rennet gels becomestraightened soon after formation, whereas the strands in acid gels remain tortuous.
The building blocks of the gel, that is, the casein micelles, are themselves deformable, and
FIGURE 21Dependence of the modulus of various g els on mass concentration of g elling
material. Note that some of the abscissas are log arithmic, others linear. (a) Caseing els, made by slow acidification or by renneting . (b) Ag ar and g elatin g els. (c)
Gels of k-carrag eenan of two molar masses in 0.1 molar KCI. (d) Heat-set g els ofbovine serum albumin; the fig ures near the curves denote pH/added NaCl (molar).
Approximate results, only meant to illustrate trends. From various sources.

Pag e 130
the junctions between them are flexible. Thus, the gel is rather weak and deformable. For acid casein gels, fracture stress isabout 100 Pa, and fracture strain about 1.1; for rennet gels, these values are about 10 Pa and 3, respectively. The acid gel isthus shorter (more brittle). These results apply to long time scales, say 15 min; at shorter time scales, the fracture stress is muchgreater. Applying a stress of slightly over 10 Pa to a rennet gel will cause flow (there is no detectable yield stress), and afterconsiderable time fracture will occur. Applying a stress of 100 Pa leads to fracture within 10 sec. Similar behavior is found forsome other types of particle gels but is by no means universal.
All these values depend on conditions applied, especially temperature. It is seen that the modulus of a casein gel is larger atlower temperature (Fig. 22a). This may appear strange, since hydrophobic bonds between casein molecules are considered toplay a major part in keeping the gel together, and these bonds decrease in strength with decreasing temperature. Presumably, adecrease of hydrophobic bond strength (low T) leads to swelling of the micelles, to a large contact area between adjoiningmicelles, and to a greater number of bonds per junction. Conversely, a higher temperature of gel formation leads to a largermodulus (at least for acid gels; Fig. 22a), and this is due to a somewhat different network geometry, not to a difference in type ofbonds.
At temperatures above about 20°C, rennet gels show syneresis. Syneresis accompanies rearrangement of the network ofparticles, which implies that some deaggregation occurs. In a region where no liquid can be expelled, that is, internally in the gel,rearrangement occurs as well, leading to both denser and less dense regions. This is called microsyneresis; it goes along with anincrease in permeability and causes the straightening of the network strands mentioned above.
3.5.3.3 Gelatin [10,34]
Of all food gels, gelatin is closest to an ideal entropic gel. The flexible molecular strands between cross-links are long and thiscauses the gel to be very extensible. It is also predominantly elastic because the cross-links are fairly permanent (at least at lowtemperature). The dependence of modulus on concentration (Figure 21b) is in reasonable agreement with Equation 19 (data not
FIGURE 22Dependence of the modulus of various g els on temperature of measurement. Arrows
indicate the temperature sequence. (a) Acid casein g els (2.5%); fig ures on curves denotetemperature of formation and ag eing . (b) Gelatin (2.5%); the broken line indicates therelation according to Equation 19. (c) k-carrag eenan (1%); fig ures on curves denote
concentration of CaCl2. (d) b-Lactog lobulin (10%) at two pH values. Data represent trends;results may vary g reatly depending on heating or cooling rate and other conditions.
After various sources.
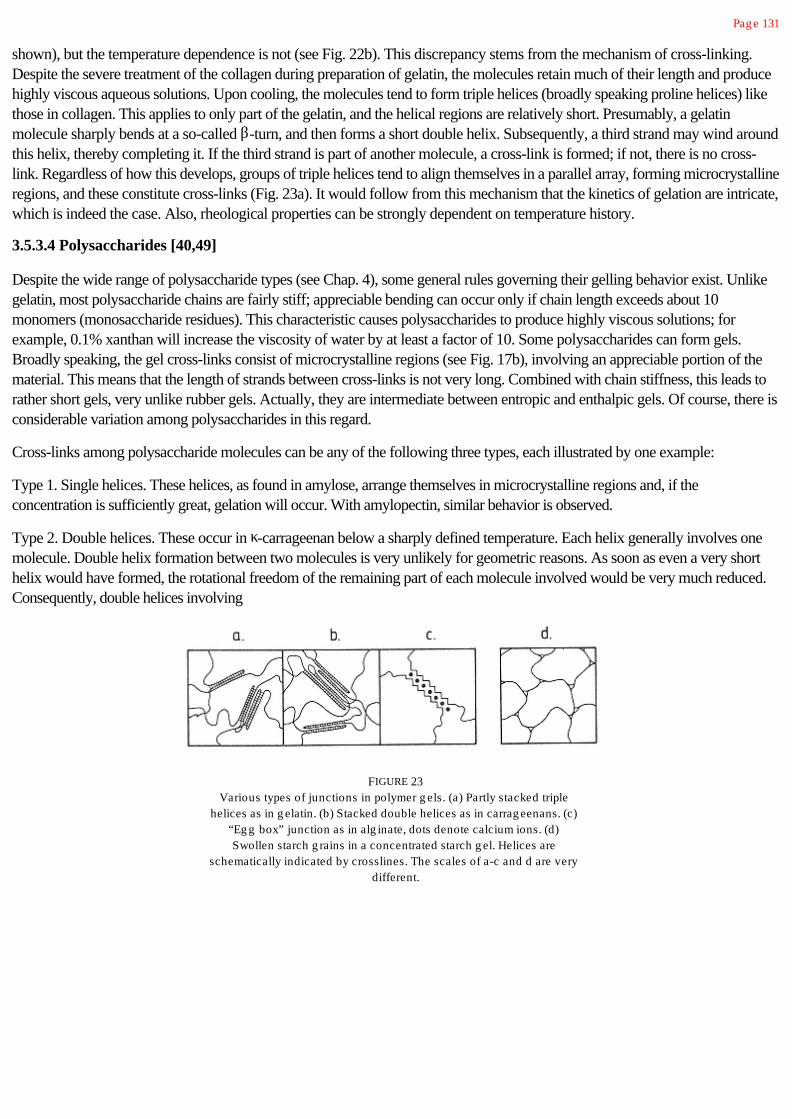
Pag e 131
shown), but the temperature dependence is not (see Fig. 22b). This discrepancy stems from the mechanism of cross-linking.Despite the severe treatment of the collagen during preparation of gelatin, the molecules retain much of their length and producehighly viscous aqueous solutions. Upon cooling, the molecules tend to form triple helices (broadly speaking proline helices) likethose in collagen. This applies to only part of the gelatin, and the helical regions are relatively short. Presumably, a gelatinmolecule sharply bends at a so-called b-turn, and then forms a short double helix. Subsequently, a third strand may wind aroundthis helix, thereby completing it. If the third strand is part of another molecule, a cross-link is formed; if not, there is no cross-link. Regardless of how this develops, groups of triple helices tend to align themselves in a parallel array, forming microcrystallineregions, and these constitute cross-links (Fig. 23a). It would follow from this mechanism that the kinetics of gelation are intricate,which is indeed the case. Also, rheological properties can be strongly dependent on temperature history.
3.5.3.4 Polysaccharides [40,49]
Despite the wide range of polysaccharide types (see Chap. 4), some general rules governing their gelling behavior exist. Unlikegelatin, most polysaccharide chains are fairly stiff; appreciable bending can occur only if chain length exceeds about 10monomers (monosaccharide residues). This characteristic causes polysaccharides to produce highly viscous solutions; forexample, 0.1% xanthan will increase the viscosity of water by at least a factor of 10. Some polysaccharides can form gels.Broadly speaking, the gel cross-links consist of microcrystalline regions (see Fig. 17b), involving an appreciable portion of thematerial. This means that the length of strands between cross-links is not very long. Combined with chain stiffness, this leads torather short gels, very unlike rubber gels. Actually, they are intermediate between entropic and enthalpic gels. Of course, there isconsiderable variation among polysaccharides in this regard.
Cross-links among polysaccharide molecules can be any of the following three types, each illustrated by one example:
Type 1. Single helices. These helices, as found in amylose, arrange themselves in microcrystalline regions and, if theconcentration is sufficiently great, gelation will occur. With amylopectin, similar behavior is observed.
Type 2. Double helices. These occur in k-carrageenan below a sharply defined temperature. Each helix generally involves onemolecule. Double helix formation between two molecules is very unlikely for geometric reasons. As soon as even a very shorthelix would have formed, the rotational freedom of the remaining part of each molecule involved would be very much reduced.Consequently, double helices involving
FIGURE 23Various types of junctions in polymer g els. (a) Partly stacked triple
helices as in g elatin. (b) Stacked double helices as in carrag eenans. (c)“Eg g box” junction as in alg inate, dots denote calcium ions. (d)Swollen starch g rains in a concentrated starch g el. Helices are
schematically indicated by crosslines. The scales of a-c and d are verydifferent.

Pag e 132
two molecules will be rare. Cross-links arise because the stiff helices form microcrystalline regions (Fig. 23b). Helixformation is very rapid (milliseconds), whereas gelation takes longer (several seconds). As soon as the helices “melt,” sodoes the gel.
Type 3. “Egg-box” junctions. These occur with some charged polysaccharides, such as alginate, when divalent cations arepresent (Fig. 23c). Alginate has negative charges, often spaced at regular distances, allowing divalent cations, such as Ca2+, toestablish bridges between two parallel polymer molecules. In this way, fairly rigid junctions are formed. It is likely that thejunctions further arrange themselves in microcrystalline regions. The junctions do not readily “melt” unless the temperature is near100°C.
Many factors may affect gelation and gel properties of polysaccharides. These include molecular structure, molar mass (Fig.21c), temperature (Fig. 22c), solvent quality, and, for polyelectrolytes, pH and ionic strength (Fig. 22c).
3.5.3.5 Globular Proteins [11,56,57]
Several globular proteins form irreversible heat-setting gels (Fig. 22d). The proteins denature, that is, unfold, and then mutuallyreact. The gel bonds formed may be -S-S- linkages (or possibly other covalent bonds), salt bridges, and/or hydrophobic bonds.A fairly large concentration of protein is needed to obtain stiff gels (Fig. 21d). The structures, and thereby rheological propertiesof the gels, vary greatly with type of protein, pH, ionic strength and rate of heating. Although proteins are polymers, the gels arenot typical polymer gels, nor are they quite like casein gels. At pH values far from the isoelectric pH, fairly weak fine-strandedgels are typically formed. The strands of these gels have a thickness of ~ 10 nm and their structure is somewhat irregular. Nearthe isoelectric pH, stiffer gels form and they look like particle gels. The particles are about 1 mm in diameter or more, and thuscontain numerous molecules, at least 106. These gels are often fractal-like [74]. The two types should differ greatly inpermeability, though substantiating determinations appear not to have been made.
Structure formation during extrusion is comparable to heat-setting of globular proteins. An important example involves protein-rich products from soya [35]. Spinning of proteins, however, may involve different mechanisms [73].
3.5.3.6 Concentrated Starch Gels [30]
Starch (see Chap. 4) occurs naturally in rigid granules, mostly between 5 and 100 mm in diameter, that are insoluble in water.Part of the amylopectin is present in microcrystalline regions, which gives the granules considerable rigidity. If starch granules areheated in excess water, they gelatinize. This involves swelling, as water up to several times their own weight is taken up; meltingof microcrystallites; and leaching of some amylose. The swollen granules remain intact upon cooling, unless vigorous agitation isapplied. Dilute gelatinized starch suspensions gel in roughly the same way as does amylose; that is, leached amylose forms a gelnetwork in which the swollen granules are trapped.
A concentrated, gelatinized starch solution—above 5–15%, depending on starch type—forms a very different kind of gel. Thegranules swell until they virtually fill the whole volume, deforming each other in the process (Fig. 23d). Especially for potatostarch, the swollen granules interlock, as in a jig-saw puzzle. A very thin layer of gelled amylose solution is present between thegranules and may act as intergranule glue. The rheological properties of the gel are dominated by those of the granules. A freshlymade gel can be deformed very much and it is purely elastic (like a rubber ball) if deformation is very fast. Slower deformationmay lead to fracture. Presumably, the individual granules are rubber-like.
During storage of concentrated starch gels, considerable rearrangement of the molecules

Pag e 133
occurs. This is like partial crystallization and happens faster at a lower nonfreezing temperature. This leads to an increase innumber and particularly strength of microcrystalline junctions. The granules and the gel become stiffer (the modulus increases). Italso results in an increase of the fracture stress and a decrease of the fracture strain of the gel upon aging. These “retrogradation”phenomena are of great importance in the staling of bread.
3.5.3.7 Mixed Gels
It should now be clear that the structure and properties of gels can vary greatly. The modulus of a 1% gel can vary by almost 5orders of magnitude and the strain at fracture by a factor of 100. The preceding discussion of starch gels gives one example ofhow the various rheological and fracture properties can be related to each other. In that case most relations can be explained,even semiquantitatively. However, nearly every system exhibits specific relations that are often poorly understood.
The situation becomes even more complicated when mixed gels are considered. Some mixtures of polysaccharides may showenhanced gelation at a lower concentration [9,41]. For instance, dilute xanthan or locust bean gum solutions do not show anappreciable yield stress, but dilute mixed solutions do. Filled systems may also have greatly altered properties from unfilled[9,38]. Phase separation can also occur if the polymers are thermodynamically incompatible. For instance, mixed solutions of ahighly soluble polysaccharide and a protein can separate into two phases, one rich in protein and the other rich in polysaccharide[61,62]. In other cases, a mixed polymer solution forms a coacervate, that is, a phase containing a high concentration of both,leaving another phase that is depleted of polymers. This can occur if the polymers have opposite charge.
Complete foods are still more complicated than the systems so far discussed [26]. Nevertheless, knowledge of the principlesprovided can be of great help in understanding food behavior and for designing experiments to study it.
3.6 Emulsions
3.6.1 Description
Emulsions are dispersions of one liquid in another. The most important variables determining emulsion properties are:
1. Type, that is, o/w or w/o. This determines, among other things, with what liquid the emulsion can be diluted (Section 3.1.2).The o/w emulsions are most common, examples being milk and milk products, sauces, dressings, and soups. Butter andmargarine are w/o emulsions, but they contain other structural elements as well.
2. Droplet size distribution. This has an important bearing on physical stability, smaller drops generally giving more stableemulsions. Also the energy and the amount of emulsifier needed to produce the emulsion depend on the droplet size desired. Atypical mean droplet diameter is 1 mm, but it can range between 0.2 and several micrometers. Because of the great dependenceof stability on droplet size, the width of the size distribution is also important.
3. Volume fraction of dispersed phase (j). In most foods, j is between 0.01 and 0.4. For mayonnaise it may be 0.8, which isabove the value for maximum packing of rigid spheres, roughly 0.7; this means that the oil droplets are somewhat distorted.
4. Composition and thickness of the surface layer around the droplets. This determines interfacial tension, colloidal interactionforces, etc. (Section 3.2.7).
Pag e 134
5. Composition of the continuous phase. This determines solvent conditions for the surfactant and thereby colloidal interactions.The viscosity of the continuous phase has a pronounced effect on creaming.
Unlike the solid particles in a suspension, emulsion droplets are spherical (greatly simplifying many predictive calculations) anddeformable (allowing droplet disruption and coalescence), and their interface is fluid (allowing interfacial tension gradients todevelop). Nevertheless, in most conditions, emulsion droplets behave like solid particles. From Equation 9, the Laplace pressureof a droplet of 1 mm radius and interfacial tension g=5 mN.m-1 is 104 Pa. For a liquid viscosity of h=10-3 Pa.sec (water) and avelocity gradient achieved by stirring of G=106 sec-1 (this is extremely vigorous), the shear stress hG acting on the droplet wouldbe 103 Pa. This implies that the droplet would be deformed only slightly. Also, the surfactant at the droplet surface allows thissurface to withstand a shear stress (Section 3.2.6). For the conditions mentioned, an interfacial tension difference between twosides of the droplet of 1 mN . m-1 would suffice to prevent lateral motion of the interface, and a difference of this magnitude canbe achieved readily. It can be concluded that emulsion droplets behave like solid spheres, unless stirring is extremely vigorous ordroplets are very large.
3.6.2 Emulsion Formation [76,80]
In this section the size of the droplets and the surface load obtained during making of emulsions are discussed, especially whenprotein is used as a surfactant.
To make an emulsion, one needs oil, water, an emulsifier (i.e., a surfactant), and energy (generally mechanical energy). Makingdrops is easy, but to break them up into small droplets mostly is difficult. Drops resist deformation and thereby break upbecause of their Laplace pressure, which becomes larger as droplet size decreases. This necessitates a large input of energy.The energy needed can be reduced if the interfacial tension, hence the Laplace pressure, is reduced by adding an emulsifier,though this is not the latter's main role.
The energy needed to deform and break up droplets is generally provided by intense agitation. Agitation can cause sufficientlystrong shear forces if the continuous phase is very viscous. This is common when making w/o emulsions, resulting in dropletswith diameters down to a few micrometers (which is not very small). In o/w emulsions the viscosity of the continuous phasetends to be low, and to break up droplets inertial forces are needed. These are produced by the rapid, intensive pressurefluctuations occurring in turbulent flow. The machine of choice is the high-pressure homogenizer, which can produce droplets assmall as 0.2 mm. The average droplet size obtained is about proportional to the homogenization pressure to the power -0.6.When using high-speed stirrers, faster stirring, longer stirring, or stirring in a smaller volume result in smaller droplets; however,average droplet diameters below 1 or 2 mm usually cannot be obtained.
However, this is not the whole story. Figure 24 shows the various processes that occur during emulsification. Besides disruptionof droplets (Fig. 24a), emulsifier has to be transported to the newly created interface (Fig. 24b). The emulsifier is nottransported by diffusion but by convection, and this occurs extremely quickly. The intense turbulence (or the high shear rate, ifthat is the situation) also leads to frequent encounters of droplets (Fig. 24c and d). If these are as yet insufficiently covered bysurfactant, they may coalesce again (Fig. 24c). All these processes have their own time scales, which depend on severalconditions, but a microsecond is fairly characteristic. This means that all processes occur numerous times, even during onepassage through a homogenizer valve, and that a steady state—where break-up and coalescence balance each other—is moreor less obtained.
The role of the emulsifier is not yet fully clear, but it is fairly certain that the Gibbs-

Pag e 135
FIGURE 24Important processes occurring during emulsification. The
drops are depicted by thin lines and the emulsifier byheavy lines and dots. Hig hly schematic and not to scale.
Marangoni effect is crucial (Fig. 25). If two drops move toward each other (Fig. 25a), which they frequently do at great speedduring emulsification, and if they are insufficiently covered by emulsifier, they will acquire more emulsifier during their approach,but the least amount of emulsifier will be available where the film between droplets is thinnest. This lead to an interfacial tensiongradient, with interfacial tension (g) being largest where the film is thinnest (Fig. 25b).
FIGURE 25Diag ram of the
Gibbs-Marang oni effect actingon two approaching emulsiondroplets during emulsification.Emulsifier molecules indicated
by Y. See text for furtherdiscussion. (After Ref. 80.)

Pag e 136
The gradient causes the emulsifier, and thereby the droplet surfaces, to move in the direction of large g , carrying liquid along withit (Fig. 25b). This is the Marangoni effect (see also Fig. 9). The streaming liquid will thus drive the droplets away from eachother (Fig. 25c), thereby providing a self-stabilizing mechanism. The magnitude of the effect depends on the Gibbs elasticity ofthe film, which is twice the surface dilational modulus (Sec. 3.2.5). The Gibbs elasticity generally increases with increasing molarconcentration of surfactant in the continuous phase. It therefore decreases during emulsification, because the interfacial areaincreases, whereby the adsorbed amount of surfactant increases.
The Gibbs-Marangoni effect occurs only if the emulsifier is in the continuous phase, since otherwise a g gradient cannot develop.This is the basis of Bancroft's rule: The phase in which the emulsifier is (most) soluble becomes the continuous phase. Hence theneed for a surfactant with high HLB number for o/w emulsions and a low HLB for w/o emulsions (Sec. 3.2.2).
Proteins are the emulsifiers of choice for o/w food emulsions because they are edible, surface active, and provide superiorresistance to coalescence [78]. They cannot be used for w/o emulsions because of their insolubility in oil. Proteins do not give avery low interfacial tension (Section 3.2.2, Fig. 5) and their Gibbs-Marangoni effect is not very strong, presumably because oftheir low molar concentration. Therefore, the droplets obtained are typically not very small for given conditions. However,droplets can be made smaller by applying more intense emulsification, such as a greater homogenization pressure. Someexamples of average droplet size (dvs) are given in Figure 26. At large emulsifier concentration, dvs reaches a plateau value. Thisvalue is smaller for the nonionic surfactant than for the proteins, because the former produces a lower interfacial tension. Thenonionic is also more effective at low concentration than the proteins, presumably because of a stronger Gibbs-Marangonieffect.
It is also seen that the various proteins give about the same plateau value for dvs. This is not strange because they producecomparable values for the interfacial tension (about 10 mN.m-1). However, at low concentrations large differences in dvs areapparent. Several tests
FIGURE 26Influence of emulsifier concentration
(%w/w)on volume/surface averag e dropletdiameter d vs for various emulsifiers.
Emulsions contained about 20%triacylg lycerol oil in water and wereprepared under constant conditions
(moderate emulsification intensity). B,blood protein; C, sodium caseinate; N,nonionic small-molecule surfactant; S,
soya protein; W , whey protein.Approximate results from various
sources.The broken line indicates approximatelythe conditions during determination ofthe so-called emulsifying activity index.

Pag e 137
have been developed to evaluate the suitability of proteins as emulsifiers. The well-known emulsifying activity index (EAI)involves emulsifying a large quantity of oil in a dilute protein solution [46]. This test corresponds roughly to the conditionsindicated by the broken line in Figure 26. This is not realistic for most practical situations, because the protein/oil ratio normallywould be much larger. Consequently, EAI values are often irrelevant.
Attempts have been made to explain differences in EAI of various proteins by differences in their surface hydrophobicity [29].However, the correlation is poor and other workers have refuted this concept [e.g., 52]. In the author's view, proteins differprimarily in emulsifying efficiency because they differ in molar mass. For a larger molar mass and the same mass concentration,the molar concentration is smaller, and the latter is presumably the most important variable in providing a strong Gibbs-Marangoni effect. Proteins of a smaller molar mass would thus be more efficient emulsifiers. (However, a very small molar mass,as obtained, for instance, by partial hydrolysis of the protein, would not be desirable, because emulsions obtained with fairlysmall peptides usually show rapid coalescence.) It should be realized that several protein preparations, especially industrialproducts, contain molecular aggregates of various size, thereby greatly increasing effective molar mass and decreasingemulsifying efficiency. By and large, protein preparations that are poorly soluble are poor emulsifiers. As a rule, well-solubleproteins are about equally suitable to make an emulsion (i.e., obtain small droplets), if present at not too low a concentration.
Another important variable is the surface load (G). If an emulsifier tends to give a high G, relatively much of it is needed toproduce an emulsion. Compare, for instance, whey protein and soya protein in Figures 26 and 27. Moreover, a fairly high G isusually needed to obtain a stable emulsion. In the case of small-molecule surfactants, equilibrium is reached between G and bulkconcentration of surfactant according to the Gibbs relation (Eq. 5). Consequently, knowledge of total surfactant concentration,of o/w interfacial area, and of the adsorption isotherm (e.g., Fig. 5, lower part) allows calculation of G, irrespective of themanner of formation of the emulsion. This
FIGURE 27Protein surface load (G) as a
function of protein concentration(c) per unit oil surface area (A)created by emulsification. The
broken line indicates 100%adsorption. (From Ref. 85.)
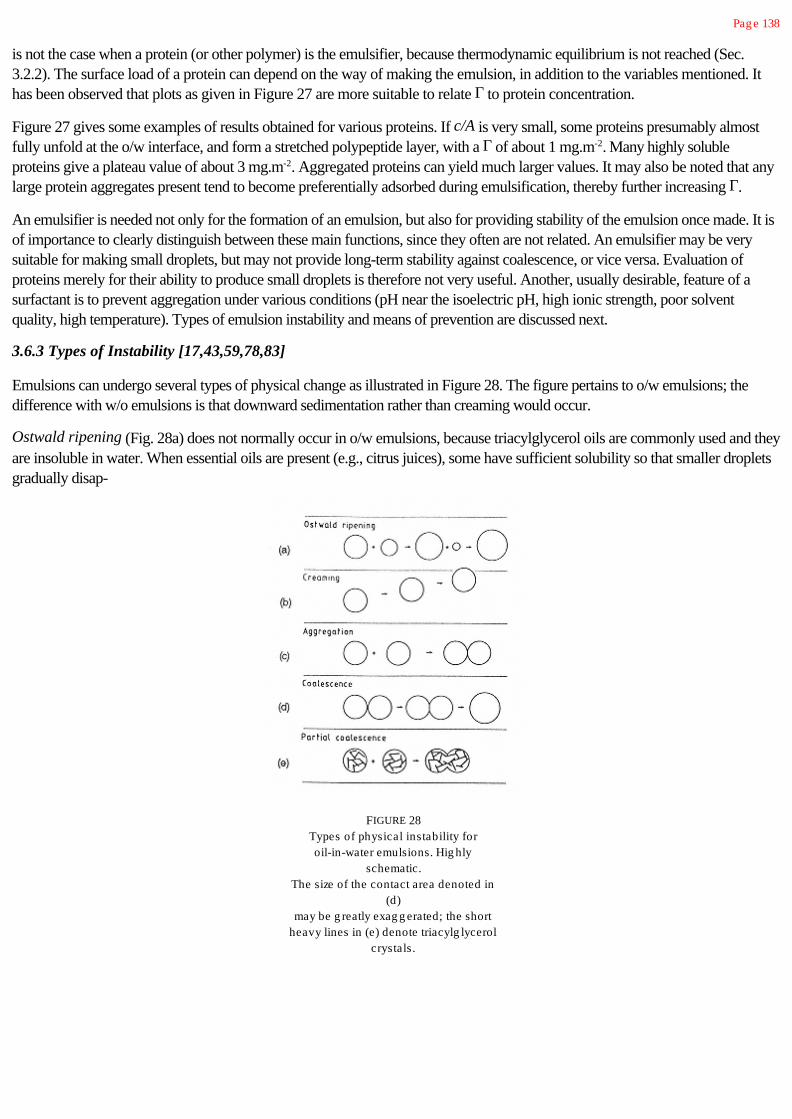
Pag e 138
is not the case when a protein (or other polymer) is the emulsifier, because thermodynamic equilibrium is not reached (Sec.3.2.2). The surface load of a protein can depend on the way of making the emulsion, in addition to the variables mentioned. Ithas been observed that plots as given in Figure 27 are more suitable to relate G to protein concentration.
Figure 27 gives some examples of results obtained for various proteins. If c/A is very small, some proteins presumably almostfully unfold at the o/w interface, and form a stretched polypeptide layer, with a G of about 1 mg.m-2. Many highly solubleproteins give a plateau value of about 3 mg.m-2. Aggregated proteins can yield much larger values. It may also be noted that anylarge protein aggregates present tend to become preferentially adsorbed during emulsification, thereby further increasing G.
An emulsifier is needed not only for the formation of an emulsion, but also for providing stability of the emulsion once made. It isof importance to clearly distinguish between these main functions, since they often are not related. An emulsifier may be verysuitable for making small droplets, but may not provide long-term stability against coalescence, or vice versa. Evaluation ofproteins merely for their ability to produce small droplets is therefore not very useful. Another, usually desirable, feature of asurfactant is to prevent aggregation under various conditions (pH near the isoelectric pH, high ionic strength, poor solventquality, high temperature). Types of emulsion instability and means of prevention are discussed next.
3.6.3 Types of Instability [17,43,59,78,83]
Emulsions can undergo several types of physical change as illustrated in Figure 28. The figure pertains to o/w emulsions; thedifference with w/o emulsions is that downward sedimentation rather than creaming would occur.
Ostwald ripening (Fig. 28a) does not normally occur in o/w emulsions, because triacylglycerol oils are commonly used and theyare insoluble in water. When essential oils are present (e.g., citrus juices), some have sufficient solubility so that smaller dropletsgradually disap-
FIGURE 28Types of physical instability foroil-in-water emulsions. Hig hly
schematic.The size of the contact area denoted in
(d)may be g reatly exag g erated; the short
heavy lines in (e) denote triacylg lycerolcrystals.

Pag e 139
pear [19]. W/o emulsions may exhibit Ostwald ripening. Data in Table 4 show only a very small solubility excess for a 1-µmdroplet, but it would be sufficient to produce marked Ostwald ripening during prolonged storage. This can easily be preventedby adding a suitable solute to the water phase, that is, one that is insoluble in oil. A low concentration of salt (say, NaCl) will do:As soon as a small droplet shrinks, its salt concentration and osmotic pressure increase, thereby producing a driving force forwater transport in the opposite direction. The net result is a stable droplet size distribution.
The other instabilities are discussed in other sections: creaming in 3.4.2, aggregation in 3.3 and 3.4.3, coalescence in 3.6.4, andpartial coalescence in 3.6.5.
The various changes may affect each other. Aggregation greatly enhances creaming, and if this occurs, creaming further enhancesaggregation rate, and so on. Coalescence can only occur if the droplets are close to each other, that is, in an aggregate or in acream layer. If the cream layer is more compact, which may occur if individual, fairly large droplets cream, coalescence will befaster. If partial coalescence occurs in a cream layer, the layer may assume characteristics of a solid plug.
It is often desirable to establish what kind of instability has occurred in an emulsion. Coalescence leads to large drops, not toirregular aggregates or clumps. Clumps due to partial coalescence will coalesce into large droplets when heated sufficiently tomelt the triacylglycerol crystals. A light microscope can be used to establish whether aggregation, coalescence, or partialcoalescence has occurred. Section 3.4.4 gives some hints for distinguishing among various causes of aggregation. It is fairly usualthat coalescence or partial coalescence leads to broad size distributions, and then the larger droplets or clumps cream veryrapidly.
Agitation can disturb creaming and may disrupt aggregates of weakly held droplets, but not clumps formed by partialcoalescence. Slow agitation tends to prevent any true coalescence.
If air is beaten in an o/w emulsion, this may lead to adsorption of droplets onto air bubbles. The droplets may then be disruptedinto smaller ones, due to spreading of oil over the a/w interface (Sec. 3.2.3). If the droplets contain crystalline fat, clumping mayoccur; beating in of air thus promotes partial coalescence. This is what happens during churning of cream to make butter andalso during whipping of cream. In the latter case, the clumped, partially solid droplets form a continuous network thatencapsulates and stabilizes the air bubbles and lends stiffness to the foam.
A way to prevent or retard all changes except Ostwald ripening is to cause the continuous phase to gel (Sec. 3.5). Examples arebutter and margarine. Here, the water droplets are immobilized by a network of fat crystals. Moreover, some crystals becomeoriented at the oil/water interface because of the favorable contact angle (Sec. 3.2.3). In this way, the droplets cannot closelyencounter each other. If the product is heated to melt the crystals, the aqueous droplets readily coalesce. Often, a suitablesurfactant is added to margarine to prevent rapid coalescence during heating, since this would cause undesirable spattering.
3.6.4 Coalescence [21,78,83]
This discussion will focus on o/w emulsions. The theory is still in a state of some confusion. As a preliminary remark it should benoted that factors governing coalescence during emulsion formation (Sec. 3.6.2) differ completely from those that are importantin “finished” emulsions. The latter are considered here.
Coalescence is induced by rupture of the thin film (lamella) between close droplets. If a small hole is somehow formed in thefilm, the droplets will immediately flow together. Film rupture is a chance event and this has important consequences: (a) Theprobability of coalescence, if possible, will be proportional to the time that the droplets are close to each other. Hence,

Pag e 140
it is especially likely in a cream layer or in aggregates. (b) Coalescence is a first-order rate process, unlike aggregation, which isin principle second order with respect to time and concentration. (c) The probability that rupture of a film occurs will beproportional to its area. This implies that flattening of the droplets on approach leading to formation of a greater film area, willpromote coalescence. Oil droplets normally found in food emulsions do not show such flattening, because their Laplacepressures are too high (Fig. 28d is thus misleading in this respect).
There is no generally accepted coalescence theory, but the author feels that the following principles are valid. Coalescence is lesslikely for:
1. Smaller droplets. They lead to a smaller film area between droplets, and hence a lower probability of rupture of the film;more coalescence events are needed to obtain droplets of a certain size; the rate of creaming is decreased. In practice,average droplet size often is the overriding variable.
2. A thicker film between droplets. This implies that strong or far-reaching repulsive forces between droplets (Sec. 3.3)provide stability against coalescence. For DLVO-type interactions, it turns out that coalescence will always occur if thedroplets are aggregated in the primary minimum (Fig. 11). Steric repulsion is especially effective against coalescence,because it keeps the droplets relatively far apart (Fig. 12).
3. A greater interfacial tension. This may appear strange, because a surfactant is needed to make an emulsion and asurfactant decreases g . Moreover, a smaller g implies a smaller surface free energy of the system. However, it is theactivation free energy for film rupture that counts and that is larger for a larger g . This is because a larger g makes it moredifficult to deform this film (bulging, development of a wave on it), and deformation is needed to induce rupture.
Based on these principles, proteins appear to be very suitable for preventing coalescence, and this agrees with observation.Proteins do not produce a very small g , and they often provide considerable repulsion, both electric and steric. Figure 29 showsresults of experiments in which
FIGURE 29Time (tc) for coalescence of droplets ofvarious diameter (d) with a planar o/winterface, in 20-min-old 1 ppm protein
solutions. , b-Casein; , k-casein; lysozyme. (From Ref. 21.)

Pag e 141
small droplets in a dilute protein solution were allowed to cream to planar o/w interfaces of various age and the time needed forcoalescence was observed. A strong effect of droplet size is apparent. The results were obtained under conditions (proteinconcentration and adsorption time) where the surface load of the proteins would have been only about 0.5 mg.m-2, implying veryweak repulsion. In cases where a thicker adsorbed layer was allowed to form, the authors found virtually no coalescence ofsmall droplets.
Figure 29 shows no significant difference between proteins in their ability to prevent coalescence. This is also the generalexperience in practice, except for gelatin, which is less effective than most other proteins. Under severe conditions (see later),differences among proteins may be observed, with caseinates tending to be superior. Partial hydrolysis of proteins can severelyimpair their ability to prevent coalescence. Attempts have been made to relate the coalescence inhibiting ability of proteins (andof other surfactants) to various properties, particularly surface shear viscosity of the adsorbed protein layer (Section 3.2.5).Unfortunately, this quantity often is named “film strength,” a misleading term. In some cases a positive correlation betweensurface shear viscosity and coalescence stability is observed, but there are several instances where deviation from thisrelationship are very large. Some positive correlations may have been due to a relation between surface shear viscosity andsurface load.
Most small-molecule surfactants yield a small interfacial tension. Because a small g favors coalescence, surfactants that provideconsiderable steric repulsion, such as the Tweens©, are among the most effective. Ionic surfactants are effective againstcoalescence only at very low ionic strength.
Small-molecule surfactants present in (added to) protein-stabilized emulsions tend to displace protein from the droplet surface(Sec. 3.2.2, Fig. 6), and this generally leads to less resistance to coalescence. If coalescence is desired, this provides a methodto achieve it; for example, add sodium lauryl sulfate and some salt (to lower double layer thickness), and rapid coalescence willusually occur.
Food emulsions may exhibit coalescence under extreme conditions. For example, during freezing, formation of ice crystals willforce the emulsion droplets closer together, often causing copious coalescence on thawing. Something similar happens upondrying and subsequent redispersion; here coalescence is alleviated by a relatively high concentration of “solids not fat.” In suchcases, best stability is obtained by having small droplets and a thick protein layer, such as of Na caseinate.
Another extreme condition is centrifuging. This causes a cream layer to form rapidly, a pressing of droplets together withsufficient force to cause considerable flattening even of small droplets, and likely coalescence. This implies that centrifugationtests to predict coalescence stability of emulsions are usually not valid, since the conditions during centrifugation differ so greatlyfrom those during handling of emulsions. (This does not mean that centrifugation tests to predict creaming are useless. They canbe quite helpful, provided that the complications discussed in Sec. 3.4.2 are taken into account.)
Predicting coalescence rate is always very difficult. The best approach is to use a sensitive method to estimate average dropletsize (e.g., turbidity at a suitable wavelength) and establish the change over time (perhaps 1 day). Even then, extrapolation mayresult in error: protein layers around droplets tend to age (Sec. 3.2.2) and become better inhibitors of coalescence.
3.6.5 Partial Coalescence [5–7,12,64]
In many o/w food emulsions part of the oil in the droplets can crystallize. The proportion of fat solid, y, depends on thecomposition of the triacylglycerol mixture and on temperature (Chap. 5). In emulsion droplets, y can also depend ontemperature history, since a finely

Pag e 142
emulsified oil can show considerable and long-lasting supercooling [77]. If an emulsion droplet contains fat crystals, they usuallyform a continuous network (Sec. 3.5.3). These phenomena greatly affect emulsion stability.
Oil droplets containing a network of fat crystals cannot fully coalesce (Fig. 28e). If the film between them ruptures, they form anirregular clump, held together by a “neck” of liquid oil. True and partial coalescence thus have rather different consequences.Partial coalescence causes an increase in the apparent volume fraction of dispersed material, and if the original volume fraction ismoderate or high and shear rate is fairly small, a solid or gel-like network of partially coalesced clumps can form. This is desired,for instance, in ice cream, where it gives the product a desirable texture (“dryness,” lack of stickiness, melt-down resistance).
Rupture of the film between close droplets containing some solid fat can be triggered by a crystal that protrudes from the dropletsurface and pierces the film. This happens particularly in a shear field, and then it may occur very much faster, for instance, aboutsix orders of magnitude faster than true coalescence (same emulsion, no fat crystals). This implies that partial coalescence is farmore important than true coalescence in o/w emulsions that are subject to fat crystallization.
The kinetics of particle coalescence are complicated and variable. This is due to the numerous variables affecting it. In manyemulsions, large particles (original droplets or clumps already formed) are more prone to partial coalescence than small ones,leading to a self-accelerating process, which soon leads to very large clumps that cream very rapidly. The remaining layer maythen exhibit a decreased average droplet size. Other emulsions may simply show a gradual increase in average particle size withtime.
The most important factors affecting the rate of partial coalescence generally are (Fig. 30):
1. Shear rate. This has various effects. (a) Because of the shear, droplets encountering each other tend to roll over each other,thereby greatly enhancing the probability that
FIGURE 30Schematic depiction of rate of partial
coalescence (Q) in protein-stabilized emulsionsas influenced by: (a) shear rate G (sec -1); (b)
volume fraction j; (c) proportion of fat solid y;(d) mean droplet diameter d (mm); (e) protein
surface load G (mg .m -2); and (f) concentrationof added small-molecule surfactant c (%), onpartial coalescence rate Q. Various sources.
Pag e 143
a protruding crystal can pierce the film between them. (b) The encounter rate between particles is proportional to shear rate(Section 3.4.3). (c) The shear force tends to press approaching droplets closer together, thereby enhancing the possibility that aprotruding crystal can pierce the film. Thus, shear rate has a very large effect on the rate of partial coalescence, and this influenceis accentuated when flow is turbulent.
2. Volume fraction of droplets. For a higher j, the rate of partial coalescence is obviously greater, being about second orderwith respect to j.
3. Fat crystallization. If the fraction solid, y, is 0 partial coalescence is impossible, and it also can not occur for y=1. For fairlylow y, partial coalescence rate generally increases with increasing y, as this causes more crystals to protrude. However, therelation between y and rate is variable, and the curve in Figure 30c only provides an example. The variability is largely due tovariation in crystal size and arrangement. An important aspect is that the crystals must form a network throughout the droplet tosupport protruding crystals. The minimum y needed for such a network often is of the order 0.1. If most of the oil is crystallizedand the crystals are very small, the crystal network may tenaciously hold the remaining oil, thereby preventing partialcoalescence, even if the film is pierced. The protrusion distance may also depend on y, temperature history, crystal size, andcrystal shape.
4. Droplet diameter. A relation as depicted in Figure 30d is usually observed, but the scale of droplet size may vary amongemulsions. The effect of d presumably is due to (a) larger droplets sensing a larger shearing force; (b) larger droplets exhibiting alarger film area between two droplets; and (c) a positive correlation between droplet size and crystal size.
5. Surfactant type and concentration. Two effects are of major importance. First, these variables will determine the oil-crystal-water contact angle (Sec. 3.2.3) and thereby affect the distance a given crystal can protrude. Second, these variables determinerepulsion (strength and range) between the droplets. The weaker the repulsion, the easier it is for two droplets to closelyapproach each other, thus increasing the likelihood that a protruding crystal will pierce the film between them. The repulsion,together with the droplet size, will thus determine what minimum shear rate is needed for partial coalescence to occur; valuesbetween 5 and 120 sec-1 have been observed. Some emulsions show no partial coalescence at all at the shear rates studied. Thebest type of surfactant to achieve this is, again, a protein, if the surface load is large enough (Fig. 30e). Addition of a small-molecule surfactant generally leads to displacement of the protein from the interface (Sec. 3.2.2), thereby greatly enhancingpartial coalescence (Fig. 30f). This approach is commonly used in ice cream mixes.
3.7 Foams
In a sense, foams are much like o/w emulsions; both are dispersions of a hydrophobic fluid in a hydrophilic liquid. However,because of considerable quantitative differences, their properties also are qualitatively different. Quantitative information is givenin Table 8. It is evident that bubble diameter is so large as to exclude foam bubbles from the realm of colloids. Large diameters,combined with large density difference, cause foam bubbles to cream faster than emulsion droplets by several orders ofmagnitude. The relatively high solubility of air in water causes rapid Ostwald ripening (often called disproportionation in foams).If the gas phase is CO2, as it is in some foods (bread, carbonated beverages), the solubility is even higher, by a factor of about50. The characteristic time scales during formation are two or three orders of magnitude longer for

Pag e 144
TABLE 8 Comparison of Foams and Emulsions: Order of Mag nitude of Some Quantities
Property Foam Emulsion o/w Emulsion w/o Units
Drop/bubble diameter 10-3 10-6 10-6 m
Volume fraction 0.9 0.1 0.1 -
Drop/bubble number 109 1017 1017 m-3
Interfacial tension 0.04 0.006 0.006 N .m-1
Laplace pressure 102 104 104 Pa
Solubility D in C 2.2 0 0.15 vol%
Density difference D-C -103 -102 102 kg .m-3
Viscosity ratio D/C 10-4 102 10-2 -
Time scale a 10-3 10-6 10-5 sec
Key: D, dispersed phase (air in the case of foam); C, continuous phase.
aCharacteristic times during formation.
foams than for emulsions. Because creaming and Ostwald ripening occur so fast, formation and instabilities often cannot beseparated, which makes the study of foams rather difficult.
Several aspects of foams will be briefly discussed here. A few have already been mentioned in Section 3.1.2. Surfacephenomena are of overriding importance to foam production and properties, and background information is provided in Section3.2. Further sources of literature are Refs. 23, 48, and 79. For churning and whipping of cream see Ref. 43. Also, some of thebooks mentioned in the bibliography, especially Dickinson's, have chapters on foam.
3.7.1 Formation and Description
In principle, foams can be made in two ways, by supersaturation or mechanically.
3.7.1.1 Via Supersaturation
A gas, usually CO2 or N2O because of their high solubility, is dissolved in the liquid at high pressure (a few bars). When thepressure is released, gas bubbles form. They do not form by nucleation; a spontaneously formed gas bubble would have a radiusof, say, 2 nm, which would imply a Laplace pressure (Eq. 9) of about 108 Pa, or 103 bar. To achieve this, the gas would have tobe brought to this pressure, which is, of course, impractical. Instead, gas bubbles always grow from small air pockets that arealready present at the wall of the vessel or on boiling chips. The contact angle gas/water/solid may be as high as 150 degrees fora fairly hydrophobic solid, and this allows small air pockets to remain in crevices or sharp dents in the solid (Fig. 7d). For anegative curvature, air could even remain there if less than saturated.
To give an example, if a pressurized bottle of a carbonated liquid is opened, the overpressure is released, CO2 becomessupersaturated, and it diffuses toward small air pockets in the bottle wall. These grow, and become dislodged when largeenough, leaving a remnant from which another bubble can grow. The bubbles rise while growing further, and a creamed layer ofbubbles is formed, that is, a foam. These bubbles always are fairly large, say 1 mm.
Another example is the formation of CO2 in a leavened dough. Excess CO2 collects at sites of tiny entrapped small air bubbles,and these sites grow in size. Some of them grow to form visible gas cells, creating a macroscopic foam structure.

Pag e 145
3.7.1.2 By Mechanical Forces
A gas stream can be led through narrow openings into the aqueous phase (sparging); this causes bubbles to form, but they arefairly large. Smaller bubbles can be made by beating air into the liquid. At first, large bubbles form, and these are broken up intoprogressively smaller ones. Shear forces are typically too weak to obtain small bubbles and the breakup mechanism presumablyinvolves pressure fluctuations in a turbulent field, as is true during formation of o/w emulsions (Sec. 3.6.2). Bubbles of about 0.1mm can be obtained in this way, which is the method of choice in industrial processing. The method also enables the amount ofair incorporated to be controlled. This is often expressed as percent overrun, that is, the relative increase in volume, which isequal to 100j/(1-j), where j is the volume fraction of air (or gas) in the system.
3.7.1.3 Foam Formation and Structure
To make a foam, a surfactant is needed. Almost any type will do, since the only criterion for its functionality is that a certain ggradient be created. This does not mean that any surfactant is suitable to make a stable foam, as will be discussed later. A fairlylow concentration of surfactant suffices. During beating, a surface area of, say 105 m2 per m3 aqueous phase is produced.Assuming a surface load of 3 mg surfactant per m2, about 0.1% of surfactant would be more than sufficient.
Figure 31 illustrates the stages in foam formation after creation of initial bubbles. For most surfactants, Ostwald ripening will besubstantial even during foam formation, implying that very small bubbles will soon disappear and the bubble size distribution willbecome fairly narrow. As soon as beating stops, bubbles rise rapidly and form a foam layer (unless liquid viscosity is quite high).The buoyancy force soon is sufficient to cause mutual deformation of bubbles, causing the formation of flat lamellae betweenthem. The stress due to buoyancy is roughly equal to rwatergH, where H is the height in the foam layer, about 100 Pa for H=1cm.
However, there is marked stress concentration as spherical bubbles come into contact, and this means that bubbles with aLaplace pressure of 103 Pa would become significantly flattened. Further drainage of interstitial liquid causes the bubbles toattain a polyhedral shape. Where three lamellae meet (never > 3, because that would yield an unstable conformation), a prism-shaped water volume, bounded by cylindrical surfaces, is formed. This structural element is called a Plateau border. Residualsmall bubbles usually disappear by Ostwald ripening. In this way, a fairly regular polyhedral foam is formed, not unlike ahoneycomb structure. In the lower part of a foam layer, bubbles remain more or less spherical.
FIGURE 31Subsequent stag es (a, b, and c) in the formation of a foam,once bubbles have been created. Thickness of the lamellae
between bubbles is too small to be shown on this scale (bubblediameter <1 mm).

Pag e 146
As the foam keeps draining (see also the following section), the volume fraction of air increases. The Laplace pressure in thePlateau borders is lower that in the lamellae, and this causes liquid to flow to the Plateau borders. Because the latter areinterconnected, they provide pathways through which the liquid can drain. As drainage continues, a j value of 0.95 can readilybe reached, which corresponds to an “overrun” of 2000%. Such a foam is not very substantial as a food. To avoid excessivedrainage, small filler particles may be incorporated, but they should be hydrophilic; otherwise, considerable coalescence ofbubbles can occur (Sec. 3.7.2). Small protein-coated emulsion droplets will function well, and they are incorporated in severalwhipped toppings. Another approach is gelation of the aqueous phase. This is employed in many aerated food products, such asmeringues, foam omelets, bavarois, bread, and cakes. By letting the system gel in an early stage, it is also possible to make afoam with spherical rather than polyhedral bubbles (“Kugelschaum”). Otherwise, only small bubbles in a fairly thin layer of foamcan retain a spherical shape.
A polyhedral foam itself may be considered a gel. Deformation of the foam causes an increase in curvature of bubbles, acorresponding increase in Laplace pressure, and elastic behavior at small deformation. Then, at greater stress, bubbles slip pasteach other and viscoelastic deformation occurs. There is thus a yield stress, which is readily observed, since even fairly largeportions of foam retain shape under their own weight. The yield stress usually exceeds 100 Pa.
3.7.2 Stability
Foams are subject to three main types of instability:
1. Ostwald ripening (disproportionation), which is the diffusion of gas from small to larger bubbles (or to the atmosphere).This occurs because the pressure in a small bubble is greater than in larger ones.
2. Drainage of liquid from and through the foam layer, due to gravity.
3. Coalescence of bubbles due to instability of the film between them.
These changes are to some extent interdependent: Drainage may promote coalescence, and Ostwald ripening or coalescencemay affect drainage rate.
These instabilities are governed by fundamentally different factors, as will be made clear next. Unfortunately, most studies havefailed to distinguish between the three types of instability. One reason for this may be the lack of suitable methods to followbubble size distribution.
3.7.2.1 Ostwald Ripening*
This is often by far the most important type of instability. Within minutes after formation, noticeable coarsening of the bubble sizedistribution often occurs. It happens most rapidly at the top of a foam layer, because the air can diffuse directly to theatmosphere and the layer of water between bubbles and atmosphere is very thin. Ostwald ripening also occurs inside a foam at asignificant rate.
The classical treatment of Ostwald ripening rate, based on Equation 10 and the diffusion laws, is by de Vries [14]. Heconsidered a small bubble of radius r0 surrounded by very much larger bubbles at an average distance d. The change in radiuswith time t then would be given by
(24)
where D is the diffusion coefficient of the gas in water, is solubility for (mol · m-3 · P-1), g is interfacial tension (mostlyabout 0.05 N.m-1) and p is ambient pressure (Pa). It follows
*See Sec. 3.2 for fundamental aspects.

Pag e 147
from Equation 24 that a bubble will shrink ever faster as it becomes smaller. Furthermore, since g and solubility for most gases inwater are high, shrinkage is fast as illustrated by the following examples. A nitrogen bubble of radius of 0.1 mm at d=1 mm inwater will disappear in about 3 min, and a CO2 bubble in about 4 sec. This is not quite realistic, since the geometric assumptionsunderlying Equation 24 are not fully met in practice, and also because the process is somewhat slower if a mixture of gases, likeair, is present. Moreover, as the remaining bubbles become larger, the rate of change decreases with time. Nevertheless,Ostwald ripening can occur very fast.
Can Ostwald ripening be stopped or retarded? If a bubble shrinks, its area decreases and its surface load (G) increases,provided the surfactant does not desorb. If no desorption occurs, g is lowered, the Laplace pressure (Eq. 9) is lowered, and thedriving force for Ostwald ripening decreases. It will even stop as soon as the surface dilational modulus, Esd, which is a measureof the change in g with change in area (see Eq. 11), becomes equal to g /2. However, surfactant normally desorbs and Esd
therefore decreases, at a rate that depends on several factors, especially surfactant type. For a foam made with small-moleculesurfactants, desorption occurs readily and retardation of Ostwald ripening is never great. Proteins, however, desorb verysluggishly (see Sec. 3.2.2), Esd remains high (Section 3.2.6), and Ostwald ripening will be greatly retarded [50].
Some proteins produce tenacious layers at the a/w interface because of cross-linking reactions between adsorbed molecules(Section 3.2.2). Egg white especially is a good foam stabilizer. During foaming, strong surface denaturation occurs, leading tofairly large protein aggregates. These remain irreversibly adsorbed, resulting in a very strong resistance to Ostwald ripening.Something similar can be achieved with solid particles, if they have a suitable contact angle (Fig. 7). An example is provided bythe partially solid fat globules in whipped cream, which completely coat the air bubbles, and also form a network throughout thesystem (see Sec. 3.6.5).
Many complex systems contain at least some solid particles that act in this manner (being small and fairly hydrophilic). Bubbleshrinkage occurs until the adsorbed solid particles touch each other. Then a small but stable bubble remains. This is presumablythe cause of many undesirable persistent foams. Another example is the gas cells in bread dough [69]. They show extensiveOstwald ripening, and the number of visible cells in the final product is less than 1% of those originally present. This does notmean that all the others have disappeared. In fact, many tiny cells remain, presumably stabilized by solid particles. They are notvisible but scatter light sufficiently to give the bread its white appearance.
It should be mentioned that Ostwald ripening can be prevented by a yield stress in the aqueous phase, but it would need to behigh, at least about 104 Pa.
3.7.2.2 Drainage
As mentioned in Sec. 3.2.6, immobilization of the a/w interface by means of a g gradient is essential to prevent almostinstantaneous drainage (Figure 9C and D). The maximum height that a vertical film (lamella) between two bubbles can havewhile preventing motion of the film surfaces is given by
Hmax = 2 Dg/rgd (25)
The maximum value that Dg (between top and bottom of a vertical film) can assume equals the surface pressure P, which wouldbe about 0.03 N.m-1. For an aqueous film of thickness d=0.1 mm, Hmax would be 6 cm, far more than needed in food foams (6cm is, indeed, about the height of the largest foam bubbles floating on a detergent solution).
Pag e 148
The drainage time of a single vertical film with immobilized surfaces is given by
(26)
where t(d) is the time needed for the film to drain to a given thickness d. For a water film of a 1 mm height, only 6 sec ofdrainage is required to achieve a thickness of 10 mm. However, the drainage rate diminishes with decreasing thickness, and itwould take 17 days of drainage to achieve d=20 nm. The latter is the approximate thickness at which colloidal interaction forcesbetween the two film surfaces come into play, and it appears that this point is usually not reached within the lifetime of a foam.
Predicting the drainage rate in a real foam is far more difficult, and accurate calculations cannot be made. Equation 26 will serveto provide approximate (order of magnitude) values. Drainage can, of course, be slowed down considerably by increasing theviscosity. For this purpose, viscosity should be measured at fairly low shear stress. A yield stress of about gHrwater (where H isthe height of the foam layer) will also arrest drainage.
3.7.2.3 Coalescence
The mechanism differs with circumstances. Three cases are important.
1. Thick films. This refers to films thick enough so that colloidal interaction between the two surfaces is negligible. In this sectionthe Gibbs stabilizing mechanism is essential (Sec. 3.2.6, especially Fig. 9E). Film rupture, and thereby bubble coalescence, willoccur only when surfactant concentration is very low, and only during foam formation. If a film is rapidly stretched, as will alwaysoccur during whipping, rupture occurs more readily (it causes Esd to decrease). Thus, it is observed that there is an optimumwhipping speed for foam formation, that is, one that achieves greatest air incorporation.
2. Thin films. As mentioned earlier, drainage will almost never lead to films thin enough for colloidal interactions to becomeimportant. However, water may evaporate from the film, especially at the top of a foam. If so, film rupture may, and often will,occur. The considerations given in Section 3.6.4 roughly apply. Compared to emulsions, g is large (more stable), but film area isvery large (less stable). Again, proteins may yield the most stable films, especially if they form thick adsorbed layers.
3. Films containing extraneous particles. It is often observed that the presence of extraneous particles, especially lipids, is verydetrimental to foam stability. Such particles can cause rupture of relatively thick films, and possible mechanisms are indicated inFigure 32. In cases a and b, a hydrophobic particle becomes trapped in a thinning film, coming into contact with both airbubbles. Because of the obtuse contact angle (Fig. 7), the curvature of the film surface where it reaches the particle results in ahigh Laplace pressure. Hence, the water flows away from this high pressure region and the film breaks. Hydrophilic particles, onthe other hand, may adsorb and not induce film rupture.
In cases c and d, contact with one air bubble would suffice. An oil droplet reaching the a/w interface (case c) will suddenly alterits shape. It may greatly flatten, depending on the three interfacial tensions (Fig. 7). This induces water to flow away from theflattening droplet, and if the film is fairly thin, it can lead to film rupture. In case d the contact angle as measured in the oil is zero.This is equivalent to the existence of a positive spreading pressure Ps. Oil then spreads over the a/w interface, dragging wateralong with it, which may, again, lead to film rupture.

Pag e 149
FIGURE 32Mechanisms of rupture of an aqueous film (lamella) between airbubbles, as induced by extraneous particles; 1, 2, and 3 denote
subsequent stag es. (a) Solid particle; (b and c) oil droplets; (d) oildroplet or composite particle. A is air; W is water; q is contact
ang le (measured in the water phase); h is viscosity; P s isspreading pressure. See text for further discussion.
The surface pressure usually is negative if the foaming agent is a small-molecule surfactant, but for many proteins it can bepositive—hence the detrimental effect of fat on the stability of beer foam, which is primarily stabilized by proteins and otherpolymers.
The situation can even be more complicated. For a droplet to come into contact with air, the thin aqueous film between dropletand air bubble has to break. Since both bubble and droplet are covered by surfactants that may provide colloidal repulsion,rupture of this film may not readily occur. If the droplet contains fat crystals, something similar to the induction of partialcoalescence may happen (Sec. 3.6.5)—that is, a protruding crystal can pierce the film. It is indeed observed, that partialcrystallization of the oil in the droplets may greatly enhance their destabilizing activity.
Finally, the number concentration of particles should be considered. A typical foam (Table 8) contains about 1011 lamellae percubic meter of liquid phase. Presumably, 1010 particles per cubic meter would suffice to cause overwhelming coalescence,provided the particles can induce film rupture. If the concentration of extraneous particles is much smaller, the foam may remainfairly stable.
In a typical whipping cream, the number of particles, that is, partially solid fat globules, is very large, about 1016/m3. Theseglobules can induce film rupture according to mechanism d (Fig. 32). However, their large concentration causes almostsimultaneous adsorption of many globules very close to each other. Spreading of liquid oil over any distance then is not possible,and film rupture will rarely occur. However, if whipping goes on, the fat globules undergo extensive partial coalescence, largeclumps are formed, and eventually their number becomes so small that film rupture can occur. In other words, overwhippingdestroys the foam made at an earlier stage.

Pag e 150
Acknowledgments
The author gratefully acknowledges the cooperation on subjects as discussed in this chapter with his Wageningen colleaguesDrs. A. Prins and T. van Vliet.
Frequently Used Symbols
A (Specific) surface area (m-1, m2)
Hamaker constant (J)
a Thermodynamic activity (mole fraction)
Acceleration (m. sec-2)
B Permeability (m2)
c Concentration (kg. m-3; mol. m-3; moles per liter)
D Diffusion coefficient (m-1.sec-1)
Fractal dimensionality (—)
d Particle diameter (m)
Esd Surface dilational modulus (N.m-1)
F Force (N)
G Velocity gradient, shear rate (sec-1)
Elastic shear modulus (Pa)
g Acceleration due to gravity (9.81 m.sec-2)
H Height (m)
h Interparticle distance (m)
I Ionic strength (moles per liter)
k Boltzmann constant (1.38×10⁻²³ J. K-1)
l Distance, length (m)
m Concentration (moles per liter)

N Total number concentration (m-3)
ni Number of particles in class i (m-3)
p Pressure (Pa)
pL Laplace pressure (Pa)
Q Volume flow rate (m3 .sec-1)
R Universal gas constant (8.314J. mol-1 . K-1)
Radius of aggregate (floc) (m)
Rcr Critical radius (m)
Rg Radius of gyration (m)
r Particle radius (m)
s Solubility of gas (mol.m-3.Pa-1)
T Temperature (absolute) (K)
t Time (sec)
t0.5 Halving time (sec)
V Interaction free energy (J)
VA Part of V due to van der Waals attraction
VE Part of V due to electrostatic repulsion
VR Part of V due to steric repulsion
v Velocity (m.sec-1)
vs Stokes velocity of particle (m.sec-1)
W Stability ratio (—)
x Distance (m)
z Valence (—)


Pag e 151
Greek Symbols
G Surface excess (load) (mol.m-2, kg.m-2)
g Surface (interfacial) tension (N . m-1)
d Layer (film) thickness (m)
e Strain (relative deformation) (—)
efr Strain at fracture (—)
q Contact angle (rad)
k Reciprocal Debye length (m-1)
h Viscosity (Pa . sec)
hss Surface shear viscosity (N.sec.m-1)
P Surface pressure (N.m-1)
Ps Spreading pressure (N .m-1)
Posm Osmotic pressure (Pa)
r Mass density (kg.m-3)
s Stress (Pa)
sfr Fracture stress (Pa)
sy Yield stress (Pa)
j Volume fraction (—)
y Fraction solid (—)
Subscripts

A Air
C Continuous phase
D Dispersed phase
O Oil
S Solid
W Water (aqueous phase)
Bibliography
Blanshard, J. M. V. and P. Lillford, eds. (1987). Food Structure and Behaviour, Academic Press, London.
Blanshard, J. M. V., and J. R. Mitchell, eds. (1988). Food Structure—Its Creation and Evaluation, Butterworth, London.
Dickinson, E. (1992). An Introduction into Food Colloids, Oxford Science, Oxford.
Dickinson, E., and G. Stainsby, (1982). Colloids in Foods, Applied Science Publishers, London.
Larsson, K., and S. E. Friberg, eds. (1990). Food Emulsions, 2nd. ed., Marcel Dekker, New York.
Mitchell, J. R., and D. A. Ledward, eds. (1986). Functional Properties of Food Macromolecules, Elsevier, London.
P. Walstra (In preparation). Physical Chemistry of Foods, Marcel Dekker, New York.
References
1. Adamson, A. W. (1976). Physical Chemistry of Surfaces, 3rd ed., Interscience, New York.
2. Allen, T. (1981). Particle Size Measurement, 3rd ed., Chapman & Hall, London.
3. Bergenståhl, B. (1988). Gums as stabilizers of emulsifier covered emulsion droplets, in Gums and Stabilizers for the FoodIndustry, Volf. 4 (G. O. Phillips, P. A. Williams, and D. J. Wedlock, eds.), IRL Press, Oxford, pp. 363–372.
4. Blanshard, J. M. V. (1982). Hydrocolloid water interactions. Progr. Food Nutr. Sci. 6:3–20.
5. Boode, K., and P. Walstra (1993). Kinetics of partial coalescence in oil-in-water emulsions, in Food

Pag e 152
Colloids and Polymers: Stability and Mechanical Properties (eds. E. Dickinson and P. Walstra), Royal SocietyChemistry, Cambridge, pp. 23–30.
6. Boode, K., and P. Walstra (1993). Partial coalescence in oil-in-water emulsions 1. Nature of the aggregation. Colloids Surf.81:121–137.
7. Boode, K., P. Walstra, and A. E. A. de Groot-Mostert (1993). Partial coalescence in oil-in-water emulsions 2. Influence ofthe properties of the fat. Colloids Surf 81:139–151.
8. Bremer, L. G. B., P. Walstra, and T. van Vliet (1995). Aggregation kinetics related to the observation of instability ofcolloidal systems. Colloids Surf. A99:121–127.
9. Brownsey, G. J., and V. J. Morris (1988). Mixed and filled gels—Models for foods, in Functional Properties of FoodMacromolecules (J. R. Mitchell and D. A. Ledward, eds.), Elsevier, London, pp. 7–23.
10. Busnell, J. P., S. M. Clegg, and E. R. Morris (1988). Melting behaviour of gelatin: Origin and control, in Gums andStabilizers for the Food Industry, Vol. 4 (G. O. Phillips, D. J. Wedlock, and P. A. Williams, eds.), IRL Press, Oxford, pp.105–115.
11. Clark, A. H., and C. D. Lee-Tufnell (1986). Gelation of globular proteins, in Functional Properties of FoodMacromolecules (J. R. Mitchell and D. A. Ledward, eds.), Elsevier, London, pp. 203–272.
12. Darling, D. F. (1982). Recent advances in the destabilization of dairy emulsions. J. Dairy Res. 49:695–712.
13. De Feijter, J. A., J. Benjamins, and M. Tamboer (1987). Adsorption displacement of proteins by surfactants in oil-in-wateremulsions. Colloids Surf. 27:243–266.
14. De Vries, A. J. (1958). Foam stability. II. Gas diffusion in foams. Rec. Trav. Chim. 77:209–225.
15. Dickinson, E. (1988). The role of hydrocolloids in stabilising particulate dispersions and emulsions, in Gums and Stabilizersfor the Food Industry, Vol. 4 (G. O. Phillips, D. J. Wedlock, and P. A. Williams, eds.), IRL Press, Oxford, pp. 249–263.
16. Dickinson, E. (1992). Structure and composition of adsorbed protein layers and the relation to emulsion stability. J. Chem.Soc. Faraday Trans. 88: 2973–2983.
17. Dickinson, E. (1994). Protein-stabilized emulsions. J. Food Eng. 22:59–74.
18. Dickinson, E., and L. Eriksson (1991). Particle flocculation by adsorbing polymers. Adv. Colloid Interf. Sci. 34: 1–29.
19. Dickinson, E., V. B. Galazka, and D. M. W. Anderson (1991). Emulsifying behaviour of gum arabic. Part 1:Effect of thenature of the oil phase on the emulsion droplet-size distribution. Carbohydrate Polym. 14:373–383.
20. Dickinson, E., and Y. Matsumura (1991). Time-dependent polymerization of b-lactoglobulin through disulphide bonds atthe oil-water interface in emulsions. Int. J. Biol. Macromol. 13:26–30.
21. Dickinson, E., B. S. Murray, and G. Stainsby (1988). Coalescence stability of emulsion-sized droplets at a planar oil-waterinterface and the relation to protein film surface rheology. J. Chem. Soc., Faraday Trans. 1 84:871–883.
22. Fleer, G. J., M. A. Cohen Stuart, J. M. H. M. Scheutjens, T. Cosgrove, and B. Vincent (1993). Polymers at Interfaces,Chapman & Hall, London.
23. Garrett, P. R. (1993). Recent developments in the understanding of foam generation and stability. Chem. Eng. Sci.48:367–392.
24. Garti, N., and D. Reichman (1994). Surface properties and emulsification activity of galactomannans. Food Hydrocolloids8:155–173.
25. Graham, D. E., and M. C. Phillips (1980). Proteins at liquid interfaces IV. Dilational properties. J. Colloid Interface Sci.76:227–239.

26. Hermansson, A.-M. (1988). Gel structure of food biopolymers, in Functional Properties of Food Macromolecules (J. R.Mitchell and D. A. Ledward, eds.), Elsevier, London, pp. 25–40.
27. Hough, D. B., and L. R. White (1980). The calculation of Hamaker constants from Lifshitz theory with application towetting phenomena. Adv. Colloid Interface Sci. 14:3–41.
28. Israelachvilli, J. N. (1992). Intermolecular and Surface Forces, 2nd ed., Academic Press, London.
29. Kato, A., and S. Nakai (1980). Hydrophobicity determined by a fluorescent probe method and its correlation with surfaceproperties of proteins. Biochim. Biophys. Acta 624:13–20.
30. Keetels, C., T. van Vliet, and H. Luyten (1995). The effect of retrogradation on the structure and

Pag e 153
mechanics of concentrated starch gels, in Food Macromolecules and Colloids (E. Dickinson and D. Lorient, eds.), Roy.Soc. Chem., Cambridge, pp. 472–479.
31. Kimura, H., S. Morikata, and M. Misaki (1973). Polysaccharide 13140: A new thermo-gelable polysaccharide. J. FoodSci. 38:668–670.
32. Krog, N. J. (1990). Food emulsifiers and their chemical and physical properties, in Food Emulsions (K. Larsson and S. E.Friberg, eds.), 2nd. ed., Marcel Dekker, New York, pp. 127–180.
33. Larsson, K., and P. Dejmek (1990). Crystal and liquid crystal structure of lipids, in Food Emulsions (K. Larsson and S. E.Friberg, eds.), 2nd ed., Marcel Dekker, New York, pp. 97–125.
34. Ledward, D. A. (1986). Gelation of Gelatin, in Functional Properties of Food Macromolecules (J. R. Mitchell and D. A.Ledward, eds.), Elsevier, London, pp. 171–201.
35. Ledward, D. A. and J. R. Mitchell (1988). Protein extrusion—More questions than answers?, in Food Structure—ItsCreation and Evaluation (J. M. V. Blanshard and J. R. Mitchell, eds.), Butterworths, London, pp. 219–229.
36. Lucassen-Reynders, E. H. (1981). Adsorption at fluid interfaces, in Anionic Surfactants: Physical Chemistry ofSurfactant Action (E. H. Lucassen-Reynders, ed.), Marcel Dekker, New York, pp.1–54.
37. Lucassen-Reynders, E. H. (1981). Surface elasticity and viscosity in compression/dilation, in Anionic Surfactants:Physical Chemistry of Surfactant Action (E. H. Lucassen-Reynders, ed.), Marcel Dekker, New York, pp. 173–216.
38. Luyten, H., and T. van Vliet (1990). Influence of a filler on the rheological and fracture properties of food materials, inRheology of Foods, Pharmaceutical and Biological Materials with General Rheology (R. E. Carter, ed.), Elsevier,London, pp. 43–56.
39. Luyten, H., T. van Vliet, and W. Kloek (1991). Sedimentation in aqueous xanthan + galactomannan mixtures, in FoodPolymers, Gels and Colloids (E. Dickinson, ed.), Royal Society of Chemistry, Cambridge, pp. 527–530.
40. Morris, V. J. (1986). Gelation of polysaccharides, in Functional Properties of Food Macromolecules (J. R. Mitchell, andD. A. Ledward, eds.), Elsevier, London, pp. 121–170.
41. Morris, V. J. (1992). Designing polysaccharides for synergistic interactions, in Gums and Stabilizers for the FoodIndustry, Vol. 6 (G. O. Phillips, P. A. Williams and D. J. Ledward, eds.) IRL Press, Oxford, pp. 161–172.
42. Muhr, A. H., and J. M. V. Blanshard (1982). Diffusion in gels. Polymer 23 (suppl.):1012–1026.
43. Mulder, H., and P. Walstra (1974). The Milk Fat Globule: Emulsion Science as Applied to Milk Products andComparable Foods, PUDOC, Wageningen, The Netherlands, and CAB, Farnham Royal.
44. Norde, W., and J. Lyklema (1991). Why proteins prefer interfaces. J. Biomater. Sci. Polymer Ed. 2: 183–202.
45. Oguntunde, A. O., P. Walstra, and T. van Vliet (1989). Physical characterization of soymilk, in Trends in FoodBiotechnology (Ang How Ghee, ed.), Proc. 7th World Congr. Food Sci. Technol., 1987, pp. 307–308.
46. Pearce, K. N., and J. E. Kinsella (1978). Emulsifying properties of proteins: Evaluation of a turbidimetric technique. J.Agric. Food Chem. 26: 716–723.
47. Peleg, M. (1987). The basics of solid food rheology, in Food Texture (H. R. Moskowitz, ed.), Marcel Dekker, NewYork, pp.3–33.
48. Prins, A. (1988). Principles of foam stability, in Advances in Food Emulsions and Foams (E. Dickinson and G. Stainsby,eds.), Elsevier, London, pp. 91–122.
49. Rinaudo, M. (1992). The relation between the chemical structure of polysaccharides and their physical properties, in Gumsand Stabilizers for the Food Industry, vol. 6 (G. O. Phillips, P. A. Williams, and D. J. Wedlock, eds.), IRL Press, Oxford,pp. 51–61.

50. Ronteltap, A. D., and A. Prins (1990). The role of surface viscosity in gas diffusion in aqueous foams. II. Experimental.Colloids Surf. 47:285–298.
51. Shaw, D. J. (1970). Introduction to Colloid and Surface Chemistry, 2nd. ed., Butterworth, London.
52. Shimizu, M., M. Saito, and K. Yamauchi (1986). Hydrophobicity and emulsifying activity of milk proteins. Agric. Biol.Chem. 50:791–792.
53. Shinoda, K., and H. Kunieda (1983). Phase properties of emulsions: PIT and HLB, in Encyclopedia of EmulsionTechnology, Vol. 1, Basic Theory (P. Becher, ed.), Marcel Dekker, New York, pp. 337–367.

Pag e 154
54. Spielman, L. A. (1978). Hydrodynamic aspects of flocculation, in The Scientific Basis of Flocculation (K. J. Ives, ed.),Sijthoff & Noordhoff, Alphen aan den Rijn, pp. 63–88.
55. Stading, M., and A.-M. Hermansson (1991). Large deformation properties of b-lactoglobulin gel structures. FoodHydrocolloids 5:339–352.
56. Stading, M., M. Langton, and A.-M. Hermansson (1992). Inhomogeneous fine-stranded b-lactoglobulin gels. FoodHydrocolloids 6:455–470.
57. Stading, M., M. Langton, and A.-M. Hermansson (1993). Microstructure and rheological behaviour of particulate b-lactoglobulin gels. Food Hydrocolloids 7: 195–212.
58. Stockham, J. D., and E. G. Fochtman (1977). Particle Size Analysis, Ann Arbor Science, Ann Arbor, MI.
59. Tadros, T. F., and B. Vincent (1983). Emulsion stability, in Encyclopedia of Emulsion Technology, vol. 1, Basic Theory(P. Becher, ed.), Marcel Dekker, New York, pp. 129–286.
60. Timms, R. E. (1994). Physical chemistry of fats, in Fats in Food Products (D. P. J. Morgan and K. K. Rajah, eds.),Blackie, London, pp. 1–27.
61. Tolstoguzov, V. B. (1986). Functional properties of protein-polysaccharide mixtures, in Functional Properties of FoodMacromolecules (J. R. Mitchell and D. A. Ledward, eds.), Elsevier, London, pp. 385–415.
62. Tolstoguzov, V. B. (1993). Thermodynamic incompatibility of food macromolecules, in Food Colloids and Polymers:Stability and Mechanical Properties (eds. E. Dickinson and P. Walstra) Royal Society of Chemistry, Cambridge, pp.94–102.
63. Van Aken, G. A., and M. T. E. Merks, (1993). [Surface-active properties of milk proteins], Voedings-middelentechnologie 27 (9):11–13.
64. Van Boekel, M. A. J. S., and P. Walstra (1981). Stability of oil-in-water emulsions with crystals in the disperse phase.Colloids Surf. 3:109–118.
65. Van Kreveld, A. (1974). Studies on the wetting of milk powder. Neth. Milk Dairy J. 28: 23–45.
66. Van Vliet, T., H. Luyten, and P. Walstra (1991). Fracture and yielding of gels, in Food Polymers, Gels and Colloids (E.Dickinson, ed.), Royal Society of Chemistry, Cambridge, pp. 392–403.
67. Van Vliet, T., H. Luyten, and P. Walstra (1993). Time dependent fracture behavior of food, in Food Colloids andPolymers: Stability and Mechanical Properties (eds. E. Dickinson and P. Walstra), Royal Society of Chemistry, Cambridge,pp. 175–190.
68. Van Vliet, T., H. J. M. van Dijk, P. Zoon, and P. Walstra (1991). Relation between syneresis and rheological properties ofparticle gels. Colloid Polym. Sci. 269: 620–627.
69. Van Vliet, T., A. M. Janssen, A. H. Bloksma, and P. Walstra (1992). Strain hardening of dough as a requirement for gasretention. J. Texture Studies 23:439–460.
70. Van Vliet, T., S. P. F. M. Roefs, P. Zoon, and P. Walstra (1989). Rheological properties of casein gels. J. Dairy Res.56:529–534.
71. Van Vliet, T., and P. Walstra (1989). Weak particle networks, in Food Colloids (R. D. Bee, P. Richmond, and J. Mingins,eds.), Royal Society of Chemistry, Cambridge, pp. 206–217.
72. Visser, J. (1972). On Hamaker constants: A comparison between Hamaker constants and Lifshitz-van der Waals constants.Adv. Colloid Interface Sci. 3:331–363.
73. Visser, J. (1988). Dry spinning of milk proteins, in Food Structure—Its Creation and Evaluation (J. M. V. Blanshard andJ. R. Mitchell, eds.) Butterworths, London, pp. 197–218.

74. Vreeker, R., L. L. Hoekstra, D. C. den Boer, and W. G. M. Agterof (1992). Fractal aggregation of whey proteins. FoodHydrocolloids 6:423–435.
75. Vreeker, R., L. L. Hoekstra, D. C. den Boer, and W. G. M. Agterof (1993). The fractal nature of fat networks, in FoodColloids and Polymers: Stability and Mechanical Properties (E. Dickinson and P. Walstra, eds.), Royal Society ofChemistry, Cambridge, pp. 16–23.
76. Walstra, P. (1983). Formation of emulsions, in Encyclopedia of Emulsion Technology, Vol. 1, Basic Theory (P. Becher,ed.), Marcel Dekker, New York, pp. 57–127.
77. Walstra, P. (1987). Fat crystallization, in Food Structure and Behaviour (J. M. V. Blanshard and P. Lillford, eds.),Academic Press, London, pp. 67–85.
78. Walstra, P. (1988). The role of proteins in the stabilization of emulsions, in Gums and Stabilizers for
Pag e 155
the Food Industry, Vol. 4 (G. O. Phillips, D. J. Wedlock, and P. A. Williams, eds.), IRL Press, Oxford, pp. 323–336.
79. Walstra, P. (1989). Principles of foam formation and stability, in Foams: Physics, Chemistry and Structure (A. J. Wilson,ed.), Springer, London, pp. 1–15.
80. Walstra, P. (1993). Principles of emulsion formation. Chem. Eng. Sci. 48:333–349.
81. Walstra, P. (1993). Introduction to aggregation phenomena in food colloids, in Food Colloids and Polymers: Stabilityand Mechanical Properties (eds. E. Dickinson and P. Walstra), Royal Society of Chemistry, Cambridge, pp. 1–15.
82. Walstra, P. (1993). Syneresis of curd, in Cheese: Chemistry, Physics and Microbiology, Vol. 1, General Aspects (P. F.Fox, ed.), Chapman & Hall, London, pp. 141–191.
83. Walstra, P. (1996). Emulsion stability, in Encyclopedia of Emulsion Technology, Vol. 4 (ed. P. Becher), Marcel Dekker,New York, in press.
84. Walstra, P., and R. Jenness (1984). Dairy Chemistry and Physics, Wiley, New York.
85. Walstra, P., and A. L. De Roos (1993). Proteins at air-water and oil-water interfaces: Static and dynamic aspects. FoodRev. Int. 9:503–525.
86. Walstra, P., T. van Vliet, and L. G. B. Bremer (1991). On the fractal nature of particle gels, in Food Polymers, Gels andColloids (E. Dickinson, ed.), Royal Society of Chemistry, Cambridge, pp. 369–382.
87. Wedzicha, B. L. (1988). Distribution of low-molecular-weight food additives in dispersed systems, in Advances in FoodEmulsions and Foams (E. Dickinson and G. Stainsby, eds.), Elsevier, London, pp. 329–371.
Pag e 157
4Carbohydrates
JAMES N. BEMILLER AND ROY L. WHISTLER
Purdue University, West Lafayette, Indiana
4.1. Monosaccharides 158
4.1.1. Monosaccharide Isomerization 161
4.1.2. Monosaccharide Ring Forms 162
4.1.3. Glycosides 165
4.1.4. Monosaccharide Reactions 165
4.2. Oligosaccharides 174
4.2.1. Maltose 174
4.2.2. Lactose 175
4.2.3. Sucrose 176
4.3. Polysaccharides 178
4.3.1. Polysaccharide Solubility 179
4.3.2. Polysaccharide Solution Viscosity and Stability 181
4.3.3. Gels 184
4.3.4. Polysaccharide Hydrolysis 185
4.4. Starch 191
4.4.1. Amylose 191
4.4.2. Amylopectin 191
4.4.3. Starch Granules 192
4.4.4. Granule Gelatinization and Pasting 195
4.4.5. Uses of Unmodified Starches 196
4.4.6. Retrogradation and Staling 198
4.4.7. Starch Complexes 198
4.4.8. Hydrolysis of Starch 199

4.4.9. Modified Food Starch 201
4.4.10. Cold-Water-Soluble (Pregelatinized) Starch 204
4.4.11. Cold-Water-Swelling Starch 204
4.5. Cellulose: Modifications and Derivatives 205
4.5.1. Microcrystalline Cellulose 205

Pag e 158
4.5.2. Carboxymethylcellulose 206
4.5.3. Methylcelluloses and Hydroxpropylmethylcelluloses 206
4.6. Guar and Locust Bean Gums 207
4.7. Xanthan 208
4.8. Carrageenans 211
4.9. Algins 214
4.10. Pectins 216
4.11. Gum Arabic 217
4.12. Dietary Fiber and Carbohydrate Digestibility 218
Bibliography 220
References 221
Carbohydrates comprise more than 90% of the dry matter of plants. They are abundant, widely available, and inexpensive. Theyare common components of foods, both as natural components and as added ingredients. Their use is large in terms of both thequantities consumed and the variety of products in which they are found. They have many different molecular structures, sizes,and shapes and exhibit a variety of chemical and physical properties. They are amenable to both chemical and biochemicalmodification, and both modifications are employed commercially in improving their properties and extending their use. They arealso safe (nontoxic).
Starch, lactose, and sucrose are digestible by humans, and they, along with D-glucose and D-fructose, and human energysources, providing 70–80% of the calories in the human diet worldwide. In the United States, they supply less than thatpercentage, in fact only about 50%, of the human caloric intake. Health organizations recommend that the percentage of the totalcalories the average American consumes in the form of fat (about 37%) be reduced to no more than 30% and that the differencebe made up with carbohydrate, especially starch.
The term carbohydrate suggests a general elemental composition, namely Cx(H2O)y,) which signifies molecules containing carbonatoms along with hydrogen and oxygen atoms in the same ratio as they occur in water. However, the great majority of naturalcarbohydrate compounds produced by living organisms do not have this simple empirical formula. Rather, most of the naturalcarbohydrate is in the form of oligomers (oligosaccharides) or polymers (polysaccharides) of simple and modified sugars.*
Lower molecular weight carbohydrates are often obtained by depolymerization of the natural polymers. This chapter begins witha presentation of the simple sugars and builds from there to larger and more complex structures.
4.1 Monosaccharides [8,27]
Carbohydrates contain chiral carbon atoms. A chiral carbon atom is one that can exist in two different spatial arrangements(configurations). Chiral carbon atoms are those that have four different groups attached to them. The two different arrangementsof the four groups in space (configurations) are nonsuperimposable mirror images of each other. In other words, one is the
*Carbohydrates that cannot be broken down to lower molecular weig ht carbohydrates by hydrolysis are monosaccharides, a term thatindicates that they are the monomeric building units of the olig o- and polysaccharides. Monosaccharides are commonly referred tosimply as sug ars. However, as will be explained later, table sug ar (sucrose) is not a monosaccharide.

Pag e 159
FIGURE 1Chiral carbon atom. A, B, D, and E represent differentatoms, functional g roups, or other g roups of atoms
attached to carbon atom C. W edg es indicatechemical bonds projecting outward from the plane ofthe pag e; dashes indicate chemical bonds projecting
into or below the plane of the pag e.
reflection of the other that we would see in a mirror, with everything that is on the right in one configuration on the left in the otherand vice versa (Fig. 1).
D-Glucose, the most abundant carbohydrate and the most abundant organic compound (if all its combined forms areconsidered), belongs to the class of carbohydrates called monosaccharides. Monosaccharides are carbohydrate molecules thatcannot be broken down to simpler carbohydrate molecules by hydrolysis, so they are sometimes referred to as simple sugars.They can be joined together to form larger structures, namely, oligosaccharides and polysaccharides (see Secs. 4.2 and 4.3),that can be converted into monosaccharides by hydrolysis.
D-Glucose is both a polyalcohol and an aldehyde. It is classified as an aldose, a designation for sugars containing an aldehydegroup (Table 1). The ending -ose signifies a sugar; and-signifies an aldehyde group. When D-glucose is written in an open orvertical, straight-chain fashion, known as an acyclic structure to organic chemists, with the aldehyde group (position 1) at the topand the primary hydroxyl group (position 6) at the bottom, it is seen that all secondary hydroxyl groups are on carbon atomshaving four different substituents attached to them.
TABLE 1 Classification of Monosaccharides
Kind of carbonyl g roup
Number of carbonatoms
Aldehyde Ketone
3 Triose Triulose
4 Tetrose Tetrulose
5 Pentose Pentulose
6 Hexose Hexulose
7 Heptose Heptulose
8 Octose Octulose
9 Nonose Nonulose

Pag e 160
These carbon atoms are therefore chiral. Glucose has four chiral carbon atoms: C-2, C-3, C-4, and C-5. Naturally occurringglucose is designated as the D form, specifically D-glucose. It has a molecular mirror image, termed the L form, specifically L-glucose. Since each chiral carbon atom has a mirror image, there are 2n arrangements for these atoms. Therefore, in a six-carbon aldose, there are 24 or 16 different arrangements of the carbon atoms containing secondary hydroxyl groups, allowingformation of 16 different six-carbon sugars with an aldehyde end. Eight of these belong to the D-series (see Fig. 3); eight aretheir mirror images and belong to the L-series. All sugars that have the hydroxyl group on the highest numbered chiral carbonatom (C-5 in this case) positioned on the right-hand side are arbitrarily called D-sugars, and all with a left-hand positionedhydroxyl group on the highest numbered chiral carbon atom are designed L-sugars. Two structures of D-glucose in its open-chain, acyclic form (called the Fischer projection) with the carbon atoms numbered in the conventional manner are given inFigure 2. In this convention, each horizontal bond projects outward from the plane of the page and each vertical bond projectsinto or below the plane of the page. It is customary to omit the horizontal lines for covalent chemical bonds to the hydrogenatoms and hydroxyl groups as in the structure on the right. Because the lowermost carbon atom is nonchiral, it is meaningless todesignate the relative positions of the atoms and groups attached to it. Thus, it is usually written as -CH2OH.
D-Glucose and all other sugars containing six carbon atoms are called hexoses, the most common group of aldoses. Thecategorical names are often combined, with a six-carbon-atom aldehyde sugar being termed an aldohexose.
There are two aldoses containing three carbon atoms. They are D-glycerose (D-glyceraldehyde) and L-glycerose (L-glyceraldehyde), each possessing only one chiral carbon atom. Aldoses with four carbon atoms, the tetroses, have two chiralcarbon atoms; aldoses with five carbon atoms, the pentoses, have three chiral carbon atoms and comprise the second mostcommon group of aldoses. Extending the series above six carbon atoms gives heptoses, octoses, and nonosese, which is thepractical limit of naturally occurring sugars. Development of the eight D-hexoses from D-glycerose is shown in Figure 3. In thisfigure, the circle represents the aldehyde group; the horizontal lines designate the location of each hydroxyl group on its chiralcarbon atom, and at the bottoms of the vertical lines are the terminal, nonchiral primary hydroxyl groups. This
FIGURE 2D-Glucose (open-chain or acyclic structure).

Pag e 161
FIGURE 3Rosanoff structure of the D-aldoses containing from three to six carbon atoms.
shorthand way of indicating monosaccharide structures is called the Rosanoff method. Sugars whose names are in italics inFigure 3 are commonly found in plants, almost exclusively in combined forms. They therefore are present in our diets incombined froms. D-Glucose is the only free aldose usually present in natural foods, and then only in small amounts.
L-Sugars are less numerous and less abundant in nature than are the D forms but nevertheless have important biochemical roles.Two L-sugars found in foods are L-arabinose and L-galactose, both of which occur as units in carbohydrate polymers(polysaccharides).
In the other type of monosaccharide, the carbonyl function is a ketone group. These sugars are termed ketoses. (Ket- signifiesthe ketone group.) The suffix designating a ketose in systematic carbohydrate nomenclature is -ulose (Table 1). D-Fructose (Fig.4) is the prime example of this sugar group. It is one of the two monosaccharide units of the disaccharide sucrose (see Sec.4.2.3) and makes up about 55% of high-fructose corn syrup and about 40% of honey. D-Fructose has only three chiral carbonatoms, C-3, C-4, and C-5. Thus, there are only 23 or 8 D-ketohexoses. D-Fructose is the principal commercial ketose and theonly one found free in natural foods, but, like D-glucose, only in small amounts.
4.1.1 Monosaccharide Isomerization
Simple aldoses and ketoses containing the same number of carbon atoms are isomers of each other; that is, a hexose and ahexulose both have the empirical formula C6H12O6 and can

Pag e 162
FIGURE 4D-Fructose (open-chain or acyclic structure).
be interconverted by isomerization. Isomerization of monosaccharides involves both the carbonyl group and the adjacenthydroxyl group. By this reaction, an aldose is converted into another aldose (with opposite configuration of C-2) and thecorresponding ketose, and a ketose is converted into the corresponding two aldoses. Therefore, by isomerization, D-glucose, D-mannose, and D-fructose can be interconverted (Fig. 5). Isomerization can be catalyzed by either a base or an enzyme.
4.1.2 Monosaccharide Ring Forms
Carbonyl groups of aldehydes are reactive and easily undergo nucleophilic attach by the oxygen atom of a hydroxyl group toproduce a hemiacetal. The hydroxyl group of a hemiacetal can react further (by condensation) with a hydroxyl group of analcohol to produce an acetal (Fig. 6). The carbonyl group of a ketone reacts similarly.
Hemiacetal formation can occur within the same aldose or ketose sugar molecule wherein the carbonyl function reacts with oneof its own properly positioned hydroxyl groups, as illustrated in Figure 7 with D-glucose laid coiled on its side. The resulting six-membered sugar ring is called a pyranose ring. Notice that for the oxygen atom of the hydroxyl group at C-5 to react to form thering, C-5 must rotate to bring its oxygen atom upward. This rotation brings the hydroxymethyl group (C-6) to a position abovethe ring. The representation of the D-glucopyranose ring used in Figure 7 is termed a Haworth projection.
Sugars occur less frequently in five-membered (furanose) rings (Fig. 8).
FIGURE 5Interrelationship of D-g lucose, D-mannose, and D-fructose via isomerization.

Pag e 163
FIGURE 6Formation of an acetal by reaction of an aldehyde with
methanol.
To avoid clutter in writing the ring structures, common conventions are adopted wherein ring carbon atoms are indicated byangles in the ring and hydrogen atoms attached to carbon atoms are eliminated altogether. A mixture of chiral forms is indicatedby a wavy line (Fig. 9).
When the carbon atom of the carbonyl group is involved in ring formation, leading to hemiacetal (pyranose or furanose ring)development, it becomes chiral. With D-sugars, the configuration that has the hydroxyl group located below the ring is the alphaform. For example, therefore, a-D-glucopyranose is D-glucose in the pyranose (six-membered) ring from with the configurationof the new chiral carbon atom, C-1, termed the anomeric carbon atom, alpha. When the newly formed hydroxyl group at C-1 isabove the ring, it is in the beta position, and the structure is named b-D-glucopyranose. This designation holds for all D-sugars.For sugars in the L-series, the opposite is true—that is, the anomeric hydroxyl group is up in the alpha anomer and down in thebeta anomer. * (See, for example, Fig. 8.) This is so because, for example, a-D-glucopyranose and a-L-glucopyranose aremirror images of one another.
However, pyranose rings are not flat with the attached groups sticking straight up and straight down as the Haworth structuresuggests. Rather, they occur in a variety of shapes (conformations), most commonly in one of two chair conformations, so calledbecause they are shaped somewhat like a chair. In this shape, one bond on each carbon atom does project either up or downfrom the ring; these are called axial bonds or axial positions. The other bond not involved in ring formation is either up or downwith respect to the axial bonds but with respect to the ring projects out around the perimeter in what is called an equatorialposition (Fig. 10).
Using b-D-glucopyranose as an example, C-2, C-3, C-5, and the ring oxygen atom remain in a plane, but C-4 is raised slightlyabove the plane and C-1 is positioned slightly below the plane as in Figures 10 and 11. This conformation is designated 4C1. Thenotation C indicates that the ring is chair-shaped; the superscript and subscript numbers indicate that C-4 is above the plane ofthe ring and C-1 below the plane. There are two chair forms. The second, 1C4, has
FIGURE 7Formation of a pyranose hemiacetal ring from D-g lucose.
*The a and b ring forms of a sug ar are known as anomers. The two anomers comprise an anomeric pair.

Pag e 164
FIGURE 8L-Arabinose in the furanose ring
from and a-L-config uration.
all the axial and equatorial groups reversed. The six-membered ring distorts the normal carbon and oxygen atom bond anglesless than do rings of other sizes. The strain is further lessened when the bulky hydroxyl groups are separated maximally fromeach other by the ring conformation that arranges the greatest number of them in equatorial rather than axial positions. Theequatorial position is energetically favored, and rotation of carbon atoms takes place on their connecting bonds to swivel thebulky groups to equatorial positions in so far as possible.
As noted, b-D-glucopytanose has all its hydroxyl groups in the equatorial arrangement, but each is bent either slightly above orslightly below the true equatorial position. In b-D-glucopyranose, the hydroxyl grouse, all of which are in an equatorial position,alternate in an up-and-down arrangement, with that at C-1 positioned slightly up, that on C-2 slightly down, and continuing withan up-and-down arrangement. The bulky hydroxymethyl group, C-6 in hexoses, is almost always in a sterically free equatorialposition. If D-glucopyranose were in a
FIGURE 9D-Glucopyranose as a mixture of two chiral forms.

Pag e 165
FIGURE 10A pyranose ring showing the equatorial (solid line) and
axial (dashed line) bond positions.
1C4 conformation, all the bulky groups would be axial; so very little D-glucopyranose exists in the 1C4 conformation, a muchhigher energy form.
Six-membered sugar rings are than quite stable if bulky groups, such as hydroxyl groups and the hydroxymethyl group, are inequatorial positions. Thus, b-D-glucopyranose dissolves in water to give a rapidly equilibrating mixture containing the open chainform and its five, six-, and seven-membered ring forms. At room temperature, the six-membered (pyranose) ring formspredominate, followed by the five-membered (furanose) ring forms and only a trace of the seven-membered ring forms. Theanomeric arrangement of each ring may be alpha or beta. The open-chain, aldehydo form constitutes only about 0.003% of thetotal forms (Fig. 12).
4.1.3 Glycosides
The hemiacetal form of sugars can react with an alcohol to produce a full acetal, called a glycoside. The acetal linkage at theanomeric carbon atom is indicated by the -ide ending. In the case of D-glucose reacting with methanol, the product is mainlymethyl a-D-glucopyranoside, with less methyl b-D-glucopyranoside (Fig. 13).
The two anomeric forms of the five-membered-ring furanosides are also formed, but being higher energy structures, theyreorganize into more stable forms and are present at equilibrium in comparatively low quantities. The methyl group in this case,and any other group bonded to a sugar to make a glycoside, is termed an aglycon. Glycosides undergo hydrolysis to yield areducing sugar (see Sec. 4.1.4.1) and a hydroxylated compound in the presence of warm or hot aqueous acid.
4.1.4 Monosaccharide Reactions
All carbohydrate molecules have hydroxyl groups available for reaction. Simple monosaccharide and most other low-molecular-weight carbohydrate molecules also have carbonyl groups available for reaction. Formation of pyranose and furanose rings(cyclic hemiacetals) and of glycosides (acetals) of Monosaccharides has already been presented.
FIGURE 11b-D Glucopyranose inthe 4C1 conformation.
All bulky g roups are inequatorial positions,
and all hydrog en atomsare in axial positions.
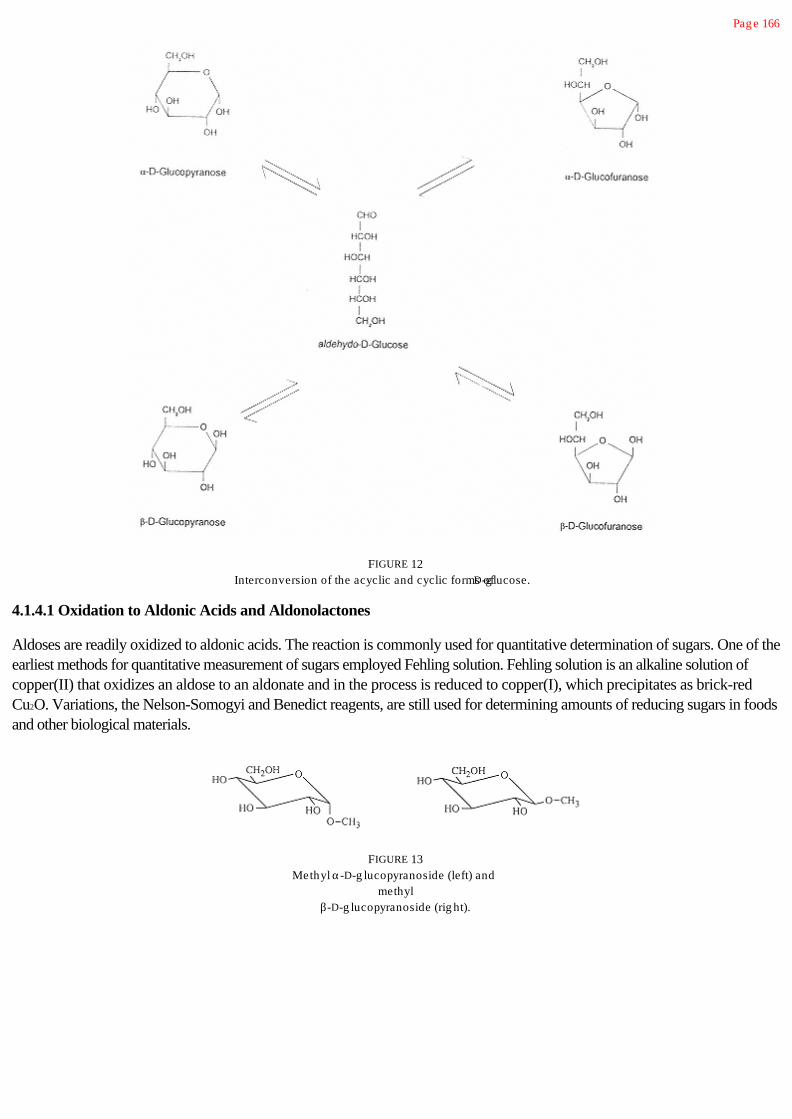
Pag e 166
FIGURE 12Interconversion of the acyclic and cyclic forms of D-g lucose.
4.1.4.1 Oxidation to Aldonic Acids and Aldonolactones
Aldoses are readily oxidized to aldonic acids. The reaction is commonly used for quantitative determination of sugars. One of theearliest methods for quantitative measurement of sugars employed Fehling solution. Fehling solution is an alkaline solution ofcopper(II) that oxidizes an aldose to an aldonate and in the process is reduced to copper(I), which precipitates as brick-redCu2O. Variations, the Nelson-Somogyi and Benedict reagents, are still used for determining amounts of reducing sugars in foodsand other biological materials.
FIGURE 13Methyl a-D-g lucopyranoside (left) and
methylb-D-g lucopyranoside (rig ht).

Pag e 167
(1)
Because, in the process of oxidizing the aldehyde group of an aldose to the salt of a carboxylic acid group, the oxidizing agent isreduced, aldoses are called reducing sugars. Ketoses are also termed reducing sugars because, under the alkaline conditions ofthe Fehling test, ketoses are isomerized to aldoses. Benedict reagent, which is not alkaline, will react with aldoses but not withketoses.
A simple and specific method for quantitative oxidation of D-glucose to D-gluconic acid uses the enzyme glucose oxidase, withthe initial product being the 1,5,-lactone (an intramolecular ester) of the acid (Fig. 14). The reaction is commonly employed tomeasure the amount of D-glucose in foods and other biological materials, including the D-glucose level of blood. D-Gluconic acidis a natural constituent of fruit juices and honey.
The reaction given in Figure 14 is also used for the manufacture of commercial D-gluconic acid and its lactone. D-Glucono-delta-lactone (GDL), D-glucono-1,5-lactone according to systematic nomenclature, hydrolyzes to completion in water in about 3 hr atroom temperature, effecting a decrease in pH. Its slow hydrolysis, slow acidification, and mild taste set GDL apart from otherfood acidulants. It is used in meats and dairy products, but particularly in baked goods as a component of chemical leaveningagents for preleavened products.
4.1.4.2 Reduction of Carbonyl Groups [9]
Hydrogenation is the addition of hydrogen to a double bond. When applied to carbohydrates, it most often entails addition ofhydrogen to the double bond between the oxygen atom and the carbon atom of the carbonyl group of an aldose or ketose.Hydrogenation of D-glucose is easily accomplished with hydrogen gas under pressure in the presence of Raney nickel. Theproduct is D-glucitol, commonly known as sorbitol, where the -itol suffix denotes a sugar alcohol (an alditol) (Fig. 15). Alditolsare also known as polyhydroxy alcohols and as polyols. Because it is derived from a hexose, D-glucitol (sorbitol) is specifically ahexitol. It is found widely distributed throughout the plant world, ranging from algae to higher orders where it is found in fruitsand berries, but the amounts present are generally small. It is 50% as sweet as sucrose, is sold both as a syrup and as crystals,and is used as a general humectant.
D-Mannitol can be obtained by hydrogenation of D-mannose. Commercially, it is obtained along with sorbitol fromhydrogenolysis of sucrose. It develops from hydrogenation of the D-fructose component of sucrose and from isomerization of D-glucose, which can be controlled
FIGURE 14Oxidation of D-g lucose catalyzed by g lucose oxidase.

Pag e 168
FIGURE 15Reduction of D-g lucose.
by the alkalinity of the solution undergoing catalytic hydrogenation (Fig. 16). D-Mannitol, unlike sorbitol, is not a humectant.Rather, it crystallizes easily and is only moderately soluble. It has been used as a nonsticky coating on candies. It is 65% assweet as sucrose and is used in sugar-free chocolates, pressed mints, cough drops, and hard and soft candies.
Xylitol (Fig. 17) is produced from hydrogenation of D-xylose obtained from hemicelluloses, especially from birch trees. Itscrystals have an endothermic heat of solution and give a cool feel when placed in the mouth. It is used in dry hard candies and insugarless chewing gum. It is about 70% as sweet as sucrose. When xylitol is used in place of sucrose, there is a reduction indental caries because xylitol is not metabolized by the microflora of the mouth to produce plaques.
4.1.4.3 Uronic Acids
The terminal carbon atom (at the other end of the carbon chain from the aldehyde group) of a monosaccharide unit of an oligo-or polysaccharide may occur in an oxidized (carboxylic acid) form. Such an aldohexose with C-6 in the form of a carboxylicacid group is called a uronic acid. When the chiral carbon atoms of a uronic acid are in the same configuration as they are in D-galactose, for example, the compound is D-galacturonic acid (Fig. 18), the principal component of pectin (see Sec. 4.10).
FIGURE 16Reduction of D-fructose.

Pag e 169
FIGURE 17Xylitol.
4.1.4.4 Hydroxyl Group Esters
The hydroxyl groups of carbohydrates, like the hydroxyl groups of simple alcohols, form esters with organic and some inorganicacids. Reaction of hydroxyl groups with a carboxylic acid anhydride or chloride (an acyl chloride) in the presence of a suitablebase produces an ester.
(2)
Acetates, succinate half-esters, and other carboxylic acid esters of carbohydrates occur in nature. They are found especially ascomponents of polysaccharides. Sugar phosphates are common metabolic intermediates (Fig. 19).
Monoesters of phosphoric acid are also found as constituents of polysaccharides. For example, potato starch contains a smallpercentage of phosphate ester groups. Corn starch contains even less. In producing modified food starch, corn starch is oftenderivatized with one or the other or both of mono- and distarch ester groups (see Sec. 4.4.9). Other esters of starch, mostnotably the acetate, succinate and substituted succinate half-esters, and distarch adipates, are in the class of modified foodstarches (see Sec. 4.4.9). Sucrose (see Sec. 4.2.3) fatty acid esters are produced commercially as emulsifiers. Members of thefamily of red seaweed polysaccharides, which includes the carrageenans (see Sec. 4.8), contain sulfate groups (half-esters ofsulfuric acid, R-OSO3¯).
4.1.4.5 Hydroxyl Group Ethers
The hydroxyl groups of carbohydrates, like the hydroxyl groups of simple alcohols, can from ethers as well as esters. Ethers ofcarbohydrates are not as common in nature as are esters. However, polysaccharides are etherified commercially to modify theirproperties and make them more useful. Examples are the production of methyl (-O-CH3), sodium carboxy-
FIGURE 18D-Galacturonic acid.

Pag e 170
FIGURE 19Examples of sug ar phosphate metabolic
intermediates.
methyl (-O-CH2-CO2¯Na+), and hydroxypropyl (-O-CH2-CHOH-CH3) ethers of cellulose and hydroxypropyl ethers of starch,all of which are approved for food use.
A special type of ether, an internal ether formed between carbon atoms 3 and 6 of a D-galactosyl unit, is found in the redseaweed polysaccharides, specifically agar, furcellaran, kappa-carrageenan, and iota-carrageenan (see Sec. 4.8) (Fig. 20). Suchan internal ether is known
FIGURE 20A 3,6-anhydro-a-D-g alactopyranosyl unit found in red
seaweed polysaccharides.
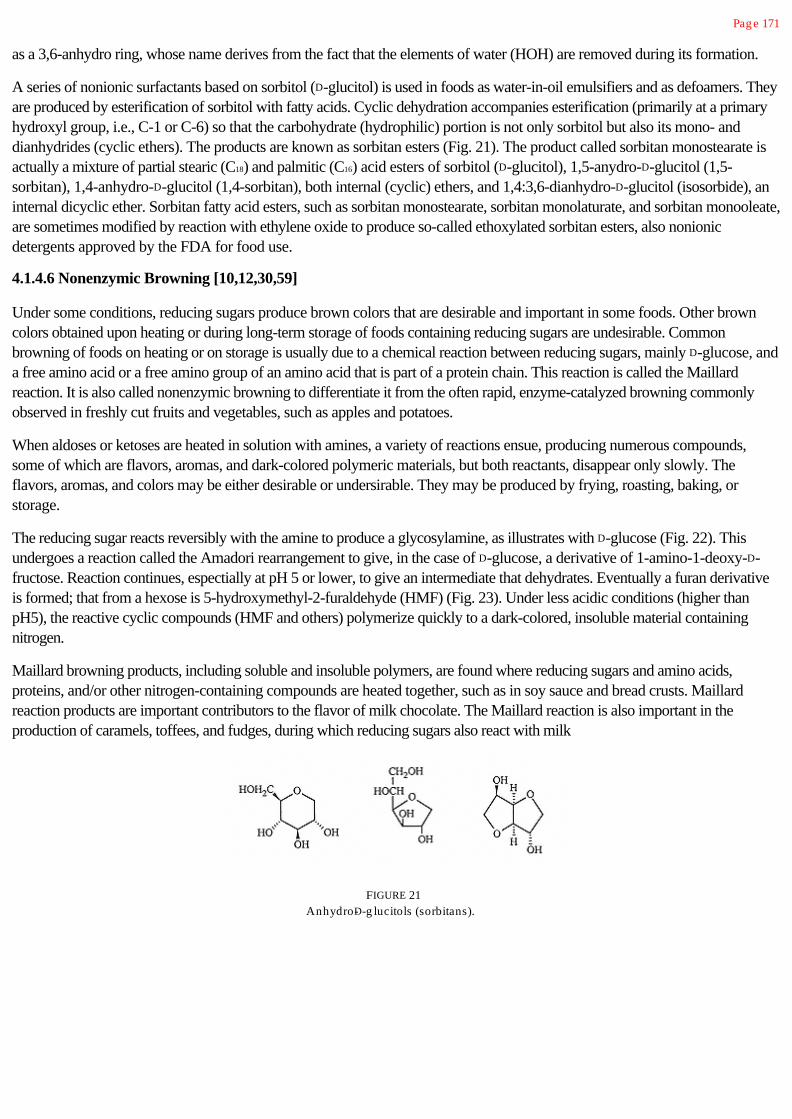
Pag e 171
as a 3,6-anhydro ring, whose name derives from the fact that the elements of water (HOH) are removed during its formation.
A series of nonionic surfactants based on sorbitol (D-glucitol) is used in foods as water-in-oil emulsifiers and as defoamers. Theyare produced by esterification of sorbitol with fatty acids. Cyclic dehydration accompanies esterification (primarily at a primaryhydroxyl group, i.e., C-1 or C-6) so that the carbohydrate (hydrophilic) portion is not only sorbitol but also its mono- anddianhydrides (cyclic ethers). The products are known as sorbitan esters (Fig. 21). The product called sorbitan monostearate isactually a mixture of partial stearic (C18) and palmitic (C16) acid esters of sorbitol (D-glucitol), 1,5-anydro-D-glucitol (1,5-sorbitan), 1,4-anhydro-D-glucitol (1,4-sorbitan), both internal (cyclic) ethers, and 1,4:3,6-dianhydro-D-glucitol (isosorbide), aninternal dicyclic ether. Sorbitan fatty acid esters, such as sorbitan monostearate, sorbitan monolaturate, and sorbitan monooleate,are sometimes modified by reaction with ethylene oxide to produce so-called ethoxylated sorbitan esters, also nonionicdetergents approved by the FDA for food use.
4.1.4.6 Nonenzymic Browning [10,12,30,59]
Under some conditions, reducing sugars produce brown colors that are desirable and important in some foods. Other browncolors obtained upon heating or during long-term storage of foods containing reducing sugars are undesirable. Commonbrowning of foods on heating or on storage is usually due to a chemical reaction between reducing sugars, mainly D-glucose, anda free amino acid or a free amino group of an amino acid that is part of a protein chain. This reaction is called the Maillardreaction. It is also called nonenzymic browning to differentiate it from the often rapid, enzyme-catalyzed browning commonlyobserved in freshly cut fruits and vegetables, such as apples and potatoes.
When aldoses or ketoses are heated in solution with amines, a variety of reactions ensue, producing numerous compounds,some of which are flavors, aromas, and dark-colored polymeric materials, but both reactants, disappear only slowly. Theflavors, aromas, and colors may be either desirable or undersirable. They may be produced by frying, roasting, baking, orstorage.
The reducing sugar reacts reversibly with the amine to produce a glycosylamine, as illustrates with D-glucose (Fig. 22). Thisundergoes a reaction called the Amadori rearrangement to give, in the case of D-glucose, a derivative of 1-amino-1-deoxy-D-fructose. Reaction continues, espectially at pH 5 or lower, to give an intermediate that dehydrates. Eventually a furan derivativeis formed; that from a hexose is 5-hydroxymethyl-2-furaldehyde (HMF) (Fig. 23). Under less acidic conditions (higher thanpH5), the reactive cyclic compounds (HMF and others) polymerize quickly to a dark-colored, insoluble material containingnitrogen.
Maillard browning products, including soluble and insoluble polymers, are found where reducing sugars and amino acids,proteins, and/or other nitrogen-containing compounds are heated together, such as in soy sauce and bread crusts. Maillardreaction products are important contributors to the flavor of milk chocolate. The Maillard reaction is also important in theproduction of caramels, toffees, and fudges, during which reducing sugars also react with milk
FIGURE 21Anhydro-D-g lucitols (sorbitans).

Pag e 172
FIGURE 22Products of reaction of D-g lucose with an amine (RNH 2).
proteins. D-Glucose undergoes the browning reaction faster than does D-fructose. Application of heat is generally required fornonenzymic browning. While Maillard reactions are useful, they also have a negative side. Reaction of reducing sugars withamino acids destroys the amino acid. This is of particular importance with L-lysine, an essential amino acid whose e-amino groupcan react when the amino acid is part of a protein molecule. Also, a relationship has been found between formation of mutageniccompounds and cooking of protein-rich foods. Mutagenic heterocyclic amines have been isolated from broiled and fried meatand fish, and from beef extracts.
Heating of carbohydrates, in particular sucrose (see Sec. 4.2.3) and reducing sugars, without nitrogen-containing compoundseffects a complex group of reactions termed caramelization. Reaction is facilitated by small amounts of acids and certain salts.Mostly thermolysis causes dehydration of the sugar molecule with introduction of double bonds or formation of anhydro rings.Introduction of double bonds leads to unsaturated rings such as furans. Conjugated double bonds absorb light and producecolor. Often unsaturated rings will condense to polymers yielding useful colors. Catalysts increase the reaction rate and are oftenused to direct the reaction to specific types of caramel colors, solubilities, and acidities.
Brown caramel color made by heating a sucrose (see Sec. 4.2.3) solution with ammonium bisulfite is used in cola soft drinks,other acidic beverages, baked goods, syrups, candies, pet

Pag e 173
FIGURE 23Conversion of the Amadori product into HMF.
foods, and dry seasonings. Its solutions are acidic (pH 2–4.5) and contain colloidal particles with negative charges. The acidicsalt catalyzes cleavage of the glycosidic bond of sucrose; the ammonium ion participates in the Amadori rearrangement. Anothercaramel color, also made by heating sugar with ammonium salts, is reddish brown, imparts pH values of 4.2–4.8 to water,contains colloidal particles with positive charges, and is used in baked goods, syrups, and puddings. Caramel color made byheating sugar without an ammonium salt is also reddish brown, but contains colloidal particles with slightly negative charges andhas a solution pH of 3–4. It is used in beer and other alcoholic beverages. The nonenzymic browning caramel pigments are largepolymeric molecules with complex, variable, and unknown structures. It is these polymers that form the colloidal particles. Theirrate of formation increases with increasing temperature and pH.
Certain pyrolytic reactions of sugars (Fig. 24) produce unsaturated ring systems that have unique flavors and fragrances inaddition to the coloring materials. Maltol (3-hydroxy-2-methylpyran-4-one) and isomaltol (3-hydroxy-2-acetylfuran) contributeto the flavor of bread. 2H-4-Hydroxy-5-methylfuran-3-one can be used to enhance various flavors and sweeteners.

Pag e 174
FIGURE 24Some pyrolytic reaction products of sug ars.
4.2 Oligosaccharides
An oligosaccharide contains 2 to 20 sugar units joined by glycosidic bonds. When a molecule contains more than 20 units, it is apolysaccharide.
Disaccharides are glycosides in which the aglycon is a monosaccharide unit. A compound containing three monosaccharide unitsis a trisaccharide. Structures containing from 4 to 10 glycosyl units, whether linear or branched, are tetra-, penta-, hexa-, octa-,nona-, and decasaccharides, and so on.
Because glycosidic bonds are part of acetal structures, they undergo acid-catalyzed hydrolysis, that is, cleavage in the presenceof aqueous acid and heat. Only a few oligosaccharides occur in nature. Most are produced by hydrolysis of polysaccharides intosmaller units.
4.2.1 Maltose
Maltose (Fig. 25), which can be obtained by hydrolysis of starch, is an example of a disaccharide. The end unit on the right (ascustomarily written) has a potentially free aldehyde group; therefore, it is the reducing end and will be in equilibrium with alphaand beta six-membered ring forms, as described earlier for monosaccharides. Since O-4 is blocked by attachment of the secondD-glucopyranosyl unit, a furanose ring cannot form. Maltose is a reducing sugar because its aldehyde group is free to react withoxidants and, in fact, to undergo almost all reactions as though it were present as a free aldose.
Maltose is readily produced by hydrolysis of starch using the enzyme b-amylase (see Sec. 4.4.8). It occurs only rarely in plants,and even then, it results from partial hydrolysis of starch. Maltose is produced during malting of grains, especially barley, andcommercially by the specific enzyme-catalyzed hydrolysis of starch using b-amylase from Bacillus bacteria, although the b-amylases from barley seed, soybeans, and sweet potatoes may be used. Maltose is used sparingly as a mild sweetner for foods.
FIGURE 25Maltose.

Pag e 175
4.2.2 lactose
The disaccharide lactose (Fig. 26) occurs in milk, mainly free, but to a small extent as a component of higher oligosaccharides.The concentration of lactose in milk varies with the mammalian source from 2.0 to 8.5%. Cow and goat milks contain4.5–4.8%, and human milk about 7%. Lactose is the primary carbohydrate source for developing mammals. In humans, lactoseconstitutes 40% of the energy consumed during nursing. Utilization of lactose for energy must be preceded by hydrolysis to theconstituent monosaccharides, D-glucose and D-galactose. Milk also contains 0.3–0.6% of lactose-containing oligosaccharides,many of which are important as energy sources for growth of a specific variant of Lactobacillus bifidus, which, as a result, isthe predominant microorganism of the intestinal flora of breast-fed infants.
Lactose is ingested in milk and other unfermented dairy products, such as ice cream. Fermented dairy products, such as mostyogurt and cheese, contain less lactose because during fermentation some of the lactose is converted into lactic acid. Lactosestimulates intestinal adsorption and retention of calcium. Lactose is not digested until it reaches the small intestine, where thehydrolytic enzyme lactase is located. Lactase (a b-galactosidase) is a membrane-bound enzyme located in the brush borderepithelial cells of the small intestine. It catalyzes the hydrolysis of lactose into its constituent monosaccharides, D-glucose and D-galactose. Of the carbohydrates, only monosaccharides are absorbed from the intestines. Both D-glucose and D-galactose arerapidly absorbed and enter the blood stream.
(3)
If for some reason the ingested lactose is only partially hydrolyzed, that is, only partially digested, or is not hydrolyzed at all, aclinical syndrome called lactose intolerance results. If there is a deficiency of lactase, some lactose remains in the lumen of thesmall intestine. The presence of lactose tends to draw fluid into the lumen by osmosis. This fluid produces abdominal distentionand cramps. From the small intestine, the lactose passes into the large intestine (colon) where it undergoes anaerobic bacterialfermentation to lactic acid (present as the lactate anion) and other short-chain acids (Fig. 27). The increase in the concentrationof molecules, that is, the increase in osmolality, results in still greater retention of fluid. In addition, the acidic products offermentation lower the pH and irritate the lining of the colon, leading to an increased movement of the contents. Diarrhea iscaused both by the retention of fluid and the increased movement of the intestinal contents. The gaseous products offermentation cause bloating and cramping.
Lactose intolerance is not usually seen in children until after about 6 years of age. At this
FIGURE 26Lactose.

Pag e 176
FIGURE 27The fate of lactose in the larg e intestine of persons with
lactase deficiency.
point, the incidence of lactose-intolerant individuals beings to rise and increases throughout the life span, with the greatestincidence in the elderly. Both the incidence and the degree of lactose intolerance very by ethnic group, indicating that thepresence or absence of lactase is under genetic control.
There are two ways to overcome the effects of lactase deficiency. One is to remove the lactose by fermentation; that producesyogurt and buttermilk products. Another is to produce reduced-lactose milk by adding lactase to it. However, both products ofhydrolysis, D-glucose and D-galactose, are sweeter than lactose, and at about 80% hydrolysis, the taste change becomes tooevident. Therefore, most reduced-lactose, milk has the lactose reduced as close as possible to the 70% government-mandatedlimit for a claim. In a technology under development, live yogurt cultures are added to refrigerated milk. The bacteria remaindormant in the cold and do not change the flavor of the milk, but upon reaching the small intestine, release lactase.
Other carbohydrates that are not completely broken down into monosaccharides by intestinal enzymes and are not absorbedalso pass into the colon. There they also are metabolized by microorganisms, producing lactate and gas. Again diarrhea andbloating result. This problem can occur from eating beans, because beans contain a trisaccharide (raffinose) and atetrasaccharide (stachyose) (see Sec. 4.2.3) that are not hydrolyzed to monosaccharides by intestinal enzymes and thus passinto the colon, where they are fermented.
4.2.3 Sucrose [35,39]
The per person daily utilization of sucrose, usually called simply sugar or table sugar, in the United States averages about 160 g,but sucrose is also used extensively in fermentations, in bakery products where it is also largely used up in fermentation, and inpet food, so the actual average daily amount consumed by individuals in foods and beverages in about 55 g (20 kg or 43Ib/year). Sucrose is composed of an aD-glucopyranosyl unit and a b-D-fructofursanosyl unit linked head to head (reducing endto reducing end) rather than by the usual head-to-tail linkage (Fig. 28). Since it has no reducing end, it is a nonreducing sugar.
There are two principal sources of commercial source—sugar cane and sugar beets. Also present in sugar beet extract are atrisaccharide, raffinose, which has a D-galactopyranosyl unit attached to sucrose, and a tetrasaccharide, stachyose, whichcontains another D-galactosyl unit (Fig. 29). These oligosaccharides are also found in beans, are nondigestible, and are thesource of the flatulence associated with eating beans.
Commercial brown sugar is made by treating white sugar crystals with molasses to leave a coating of desired thickness. Gradesrange from light yellow to dark brown. Confection, or

Pag e 177
FIGURE 28Sucrose.
powdered, sugar is pulverized sucrose. It usually contains 3% corn starch as an anticaking agent. To make fondant sugar, whichis used in icings and confections, very fine sucrose crystals are surrounded with a saturated solution of invert sugar, corn syrup,or maltodextrin.*
For many food product applications, sucrose is not crystallized; rather, it is shipped as a refined aqueous solution known asliquid sugar. Sucrose and most other low-molecular-weight carbohydrates (for example, monosaccharides, alditols,disaccharides, and other low-molecular-weight oligosaccharides), because of their great hydrophilicity and solubility, can formhighly concentrated solutions of high osmolality. Such solutions, as exemplified by pancake and waffle syrups and honey, needno preservatives themselves and can be used not only as sweeteners (although not all such carbohydrate syrups need have muchsweetness) but also as preservatives and humectants.
A portion of the water in any carbohydrate solution is nonfreezable. When the freezable water crystallizes, that is, forms ice, theconcentrations of solute in the remaining liquid phase increases, and the freezing point decreases. There is a consequentialincrease in viscosity of the remaining solution. Eventually, the liquid phase solidifies as a glass in which the mobility of allmolecules becomes greatly restricted and diffusion-dependent reactions become very slow
FIGURE 29Sucrose, raffinose, and stachyose. (For
explanation of the shorthand desig nations of structures,see Sec. 4.3.)
*See Section 4.4.8 for a description of the latter two products. Invert sug ar is the equimolar mixture of D-g lucose and D-fructose formedby hydrolysis of sucrose.

Pag e 178
(see Chap. 2); because of the restricted motion, these glass-state water molecules cannot crystallize. In this way, carbohydratesfunction as cryoprotectants and protect against the dehydration that destroys structure and texture caused by freezing.
The sucrase of the human intestinal tract catalyzes hydrolysis of sucrose into D-glucose and D-fructose, making sucrose one ofthe three carbohydrates (other than monosaccharides) humans can utilize for energy, the other two being lactose and starch.Monosaccharides (D-glucose and D-fructose being the only significant ones in our diets) do not need to undergo digestion beforeabsorption.
4.3 Polysaccharides [42,47,55]
Polysaccharides are polymers of monosaccharides. Like the oligosaccharides, they are composed of glycosyl units in linear orbranched arrangements, but most are much larger than the 20-unit limit of oligosaccharides. The number of monosaccharideunits in a polysaccharide, termed its degree of polymerization (DP), varies. Only a few polysaccharides have a DP less than 100;most have DPs in the range 200–3000. The larger ones, like cellulose, have a DP of 7000–15,000. It is estimated that morethan 90% of the considerable carbohydrate mass in nature is in the form of polysaccharides. Polysaccharides can be either linearor branched. The general scientific term for polysaccharides is glycans.
If all the glycosyl units are of the same sugar type, they are homogeneous as to monomer units and are called homoglycans.Examples of homoglycans are cellulose (see Sec. 4.5) and starch amylose (see Sec. 4.4.1), which are linear, and starchamylopectin (see Sec. 4.4.2), which is branched. All three are composed only of D-glucopyranosyl units.
When a polysaccharide is composed of two or more different monosaccharide units, it is a heteroglycan. A polysaccharide thatcontains two different monosaccharide units is diheteroglycan, a polysaccharide that contains three different monosaccharideunits is a triheteroglycan, and so on. Diheteroglycans generally are either linear polymers of blocks of similar units alternatingalong the chain, or consist of a linear chain of one type of glycosyl unit with a second present as single-unit branches. Examplesof the former type are algins (see Section 4.9) and of the latter guar and locust bean gums (see Sec. 4.6).
In the shorthand notations of oligo-and polysaccharides, the glycosyl units are designated by the first three letters of their nameswith the first letter being capitalized, except for glucose, which is Glc. If the monosaccharide unit is that of a D-sugar, the D isomitted; only L sugars are so designated, such as LAra. The size of the ring is designated by an italicized p for pyranosyl or ƒ forfuranosyl. The anomeric configuration is designated with a or b as appropriate; for example, an a-D-glucopyranosyl unit isindicated as aGlcp. Uronic acids are designated with a capital A; for example, an L-gulopyranosyluronic acid unit (see Sec. 4.9)is indicated as LGulpA. The position of linkages are designated either as, for example, 1 3 or 1,3, with the latter being morecommonly used by biochemists and the former more commonly used by carbohydrate chemists. Using the shorthand notation,the structure of lactose is represented as bGalp(1 4)Glc or bGalp1,4Glc and maltose as aGlcp)1 4)Glc oraGlcp1,4Glc. (Note that the reducing end cannot be designated as a or b or as pyranose or furanose because the ring can openand close; that is, in solutions of lactose and maltose and other oligo-and polysaccharides, the reducing end unit will occur as amixture of a-and b-pyranose ring forms and the acyclic form, with rapid interconversion between them; see Fig. 12.)

Pag e 179
4.3.1 Polysaccharide Solubility
Most polysaccharides contain glycosyl units that, on average, have three hydroxyl groups. Polysaccharides are thus polyols inwhich each hydroxyl group has the possibility of hydrogen bonding to one or more water molecules. Also, the ring oxygen atomand the glycosidic oxygen atom connecting one sugar ring to another can form hydrogen bonds with water. With every sugar unitin the chain having the capacity to hold water molecules avidly, glycans possess a strong affinity for water and readily hydratewhen water is available. In aqueous systems, polysaccharide particles can take up water, swell, and usually undergo partial orcomplete dissolution.
Polysaccharides modify and control the mobility of water in food systems, and water plays an important role in influencing thephysical and functional properties of polysaccharides. Together polysaccharides and water control many functional properties offoods, including texture.
The water of hydration that is naturally hydrogen-bonded to and thus solvates polysaccharide molecules is often described aswater whose structure has been sufficiently modified by the presence of the polymer molecule so that it will not freeze. The waterhas also been referred to as plasticizing water. The molecules that make up this water are not energetically bound in a chemicalsense. While their motions are retarded, they are able to exchange freely and rapidly with other water molecules. This water ofhydration makes up only a small part of the total water in gels and fresh tissue foods. Water in excess of the hydration water isheld in capillaries and cavities of various sizes in the gel or tissue.
Polysaccharides are cryostabilizers rather than cryoprotectants, because they do not increase the osmolality or depress thefreezing point of water significantly, since they are large, high-molecular-weight molecules and these are colligative properties. Asan example, when a starch solution is frozen, a two-phase system of crystalline water (ice) and a glass consisting of about 70%starch molecules and 30% nonfreezable water is formed. As in the case of solutions of low-molecular-weight carbohydrates, thenonfreezable water is part of a highly concentrated polysaccharide solution in which the mobility of the water molecules isrestricted by the extremely high viscosity. However, while most polysaccharides provide cryostabilization by producing thisfreeze-concentrated matrix, which severely limits molecular mobility, there is evidence that others provide cryostabilization byrestricting ice crystal growth by adsorption to nuclei or active crystal growth sites. Other polysaccharides may be ice nucleators.
Thus both high-and low-molecular-weight carbohydrates are generally effective in protecting food products stored at freezertemperatures (typically -18°C) from destructive changes in texture and structure. In both cases, the improvement in productquality and storage stability is a result of controlling both the amount (particularly in the case of low-molecular-weightcarbohydrates) and the structural state (particularly in the case of polymeric carbohydrates) of the freeze-concentrated,amorphous matrix surrounding ice crystals.
Most, if not all, polysaccharides, except those with very bushlike, branch-on-branch structures, exist in some sort of helicalshape. Certain linear homoglycans, like cellulose (see Sec. 4.5), have flat, ribbon-like structures. Such uniform linear chainsundergo hydrogen bonding with each other so as to form crystallites separated by amorphous regions. Crystalline arrangementsof this sort are called fringed micelles (Fig. 30). It is these crystallites of linear chains that give cellulose fibers, like wood andcotton fibers, their great strength, insolubility, and resistance to breakdown, the latter because the crystalline regions are nearlyinaccessible to

Pag e 180
FIGURE 30Fring ed micelles. The crystallinereg ions are those in which thechains are parallel and ordered.
enzyme penetration. These highly ordered polysaccharides with orientation and crystallinity comprise the exception, rather thanthe rule. Most polysaccharides are not so crystalline as to impart water insolubility, but are readily hydrated and dissolved.
Most unbranched diheteroglycans containing nonuniform blocks of glycosyl units and most branched glycans cannot formmicelles because chain segments are prevented from becoming closely packed over lengths necessary to form strongintermolecular bonding. Hence, these chains have a degree of solubility that increases as chains become less able to fit closelytogether. In general, polysaccharides become more soluble in proportion to the degree of irregularity of the molecular chains,which is another way of saying that, as the ease with which molecules fit together decreases, the solubility of the moleculesincreases.
Water-soluble polysaccharides and modified polysaccharides used in food and other industrial applications are known as gumsor hydrocolloids. Gums are sold as powers of varying particle size.

Pag e 181
4.3.2 Polysaccharide Solution Viscosity and Stability [13]
Polysaccharides (gums, hydrocolloids) are used primarily to thicken and/or gel aqueous solutions and otherwise to modifyand/or control the flow properties and textures of liquid food and beverage products and the deformation properties of semisolidfoods. They are generally used in food products at concentrations of 0.25–0.50%, indicating their great ability to produceviscosity and to form gels.
The viscosity of a polymer solution is a function of the size and shape of its molecules and the conformations they adopt in thesolvent. In foods and beverages, the solvent is an aqueous solution of other solutes. The shapes of polysaccharide molecules insolution are a function of oscillations around the bonds of the glycosidic linkages. The greater the internal freedom at eachglycosidic linkage, the greater the number of conformations available to each individual segment. Chain flexibility thus provides astrong entropic drive, which generally overcomes energy considerations and induces the chain to approach disordered orrandom coil states in solution (Fig. 31). However, most polysaccharides exhibit deviations from strictly random coil states,forming stiff coils, with the specific nature of the coils being a function of the monosaccharide composition and linkages, somebeing compact, some expanded.
Linear polymer molecules in solution gyrate and flex, sweeping out a large space. They frequently collide with each other,creating friction, consuming energy, and thereby producing viscosity. Linear polysaccharides produce highly viscous solutions,even at low concentrations. Viscosity depends both on the DP (molecular weight) and the extension and rigidity, that is, theshape and flexibility, of solvated polymer chain.
A highly branched polysaccharide molecule will sweep out much less space than a linear polysaccharide of the same molecularweight (Fig. 32). As a result, highly branched molecules will collide less frequently and will produce a much lower viscosity thanwill linear molecules of the same DP. This also implies that highly branched polysaccharide molecules must be significantly largerthan linear polysaccharide molecules to produce the same viscosity at the same concentration.
Likewise, linear polysaccharide chains bearing only one type of ionic charge (always a negative charge derived from ionization ofcarboxyl or sulfate half-ester groups) assume an extended configuration due to repulsion of the like charges, increasing the end-to-end chain length and thus the volume swept out by the polymer. Therefore, these polymers tend to produce solutions of highviscosity.
FIGURE 31Randomly coiled polysaccharide
molecules.

Pag e 182
FIGURE 32Relative volumes occupied by a linear polysaccharide and a hig hly branched
polysaccharide of the same molecular weig ht.
Unbranched, regular glycans, which dissolve in water by heating, form unstable molecular dispersions that precipitate or gelrapidly. This occurs as segments of the long molecules collide and form intermolecular bonds over the distance of a few units.Initial short alignments then extend in a zipper-like fashion to greatly strengthen intermolecular associations. Other segments ofother chains colliding with this organized nucleus bind to it, increasing the size of the ordered, crystalline phase. Linear moleculescontinue to bind to fashion a fringed micelle that may reach a size where gravitational forces cause precipitation. For example,starch amylose, when dissolved in water with the aid of heat followed by cooling the solution, undergoes molecular aggregationand precipitates, a process called retrogradation. During cooling of bread and other baked products, amylose moleculesassociate to produce a firming. Over a longer storage time, the branches of amylopectin associate to produce staling (see Sec.4.4.6).
In general, molecules of all unbranched, neutral homoglycans have an inherent tendency to associate and partially crystallize.However, if linear glycans are derivatized, or occur naturally derivatized, as does guar gum (see Sec. 4.6), which has single-unitglycosyl branches along a backbone chain, their segments are prevented from association and stable solutions result.
Stable solutions are also formed if the linear chains contain charged groups where coulombic repulsions prevent segments fromapproaching each other. As already mentioned, charge repulsion also causes chains to extend, which provides high viscosities.Such highly viscous, stable solutions are seen with sodium alginate (see Sec. 4.9), where each glycosyl unit is a uronic acid unithaving a carboxylic acid group in the salt form, and in xanthan (see Sec. 4.7), where one out of five glycosyl units is a uronic acidunit and another carboxylate group may be present. But if the pH of an alginate solution is lowered to 3, where ionization ofcarboxylic acid groups is somewhat repressed because the pKa values of the constituent monomers are 3.38 and 3.65, theresulting less ionic molecules can associate and precipitate or form a gel as expected for unbranched, neutral glycans.

Pag e 183
FIGURE 33The log arithm of viscosity as a function
of the shear rate for a pseudoplasticshear-thinning fluid.
Carrageenans are mixtures of linear chains that have a negative charge due to numerous ionized sulfate half-ester groups alongthe chain (see Sec. 4.8). These molecules do not precipitate at low pH because the sulfate group remains ionized at all practicalpH values.
Solutions of gums are dispersions of hydrated molecules and/or aggregates of hydrated molecules. Their flow behavior isdetermined by the size, shape, ease of deformation (flexibility), and presence and magnitude of charges on these hydratedmolecules and/or aggregates. There are two general kinds of flow exhibited by polysaccharide solutions: pseudoplastic (by farthe most common) and thixotropic.
Pseudoplastic fluids are shear-thinning. In pseudoplastic flow, a more rapid increase in flow results from an increase in shearrate; that is, the faster a fluid flows, the less viscous it becomes (Fig. 33). The flow rate can be increased by increasing theapplied force by pouring, chewing, swallowing, pumping, mixing, etc. The change in viscosity is independent of time; that is, therate of flow changes instantaneously as the shear rate is changed. Linear polymer molecules form shear-thinning, usuallypesudoplastic, solutions. In general, higher molecular weight gums are more pseudoplastic.
Gum solutions that are less pseudoplastic are said to give long flow;* such solutions are generally perceived as being slimy. Morepseudoplastic solutions are described as having short flow and are generally perceived as being nonslimy. In food science, aslimy material is one that is thick, coats the mouth, and is difficult to swallow. Sliminess is inversely related to pseudoplasticity;that is, to be perceived as being nonslimy, there must be marked thinning at the low shear rates produced by chewing andswallowing.
Thixotropic flow is a second type of shear-thinning flow. In this case, the viscosity reduction that results from an increase in therate of flow does not occur instantaneously. The viscosity of thixotropic solutions decreases under a constant rate of shear in atime-dependent manner and regains the original viscosity after cessation of shear, but again only after a clearly
*“Short flow” is exhibited by shear-thinning , primarily pseudoplastic, viscous solutions and “long flow” by viscous solutions thatexhibit little or no shear thinning . These terms were applied long before there were instruments to determine and measure rheolog icalphenomena. They were arrived at in this way. W hen a g um or starch solution is allowed to drain from a pipette or a funnel, those thatare not shear-thinning come out in long string s, while those that shear-thin form short drops. The latter occurs because, as more andmore fluid exists the orifice, the weig ht of the string becomes g reater and g reater, which causes it to flow faster and faster, which causesit to shear-thin to the point that the string breaks into drops.

Pag e 184
defined and measured time interval. This behavior is due to a gel solution gel transition. In other words, a thixotropicsolution is at rest a weak (pourable) gel (see Sec. 4.3.3).
For solutions of most gums, an increase in temperature results in a decrease in viscosity. (Xanthan gum is an exception between0 and 100°C; sec Sec. 4.7.) This is often an important property, for it means that higher solids can be put into solution at ahigher temperature; then the solution can be cooled for thickening.
4.3.3 Gels [6,18]
A gel is a continuous, three-dimensional network of connected molecules or particles (such as crystals, emulsion droplets, ormolecular aggregates/fibrils) entrapping a large volume of a continuous liquid phase, much as does a sponge. In many foodproducts, the gel network consists of polymer (polysaccharide and/or protein) molecules or fibrils formed from polymermolecules joined in junction zones by hydrogen bonding, hydrophobic associations (van der Waals attractions), ionic crossbridges, entanglements, or covalent bonds, and the liquid phase is an aqueous solution of low-molecular-weight solutes andportions of the polymer chains.
Gels have some characteristics of solids and some of liquids. When polymer molecules or fibrils formed from polymer moleculesinteract over portions of their lengths to form junction zones and a three-dimensional network (Fig. 34), a fluid solution ischanged into a material that
FIGURE 34A diag rammatic representation of the type of
three-dimensional network structure found in g els.This type of structure is known as a fring ed micelle
structure. Parallel side-by-side chains indicate the ordered,crystalline structure of a junction zone. The holes betweenjunction zones contain an aqueous solution of dissolved
seg ments of polymer chains and other solutes.

Pag e 185
has a sponge-like structure and can retain its shape. The three-dimensional network structure offers significant resistance to anapplied stress causing it to behave in some respects as an elastic solid. However, the continuous liquid phase, in which moleculesare completely mobile, makes a gel less stiff than an ordinary solid, causing it to behave in some respects as a viscous liquid.Therefore, a gel is a viscoelastic semisolid; that is, the response of a gel to stress is partly characteristic of an elastic solid andpartly characteristic of a viscous liquid.
Although gel-like or salve-like materials can be formed by high concentrations of particles (much like tomato paste), to form atrue gel, the polymer molecules or aggregates of molecules must first be in solution, then partially come out of solution in junctionzone regions to form the three-dimensional gel network structure. In general, if junction zones grow larger after formation of thegel, the network becomes more compact, the structure contracts, and syneresis results. (The appearance of fluid droplets on thegel surface is called syneresis.)
Although polysaccharide gels generally contain only about 1% polymer—that is, they may contain as much as 99% water—theycan be quite strong. Examples of polysaccharide gels are dessert gels, aspics, structured fruit pieces, structured onion rings,meat-analog pet foods, and icings.
Choice of a specific gum for a particular application depends on the viscosity or gel strength desired, desired rheology, pH of thesystem, temperatures during processing, interactions with other ingredients, desired texture, and cost of the amount needed toimpart the desired properties. In addition, consideration is also given to desired functional characteristics. These include a gum'sability to function as a binder, bodying agent, bulking agent, crystallization inhibitor, clarifying agent, cloud agent, coatingagent/film former, fat mimetic, flocculating agent, foam stabilizer, mold release agent, suspension stabilizer, swelling agent,syneresis inhibitor, and whipping agent and as an agent for water absorption and binding (water retention and migration control),adhesion, emulsification, emulsion stabilization, and encapsulation. Each food gum tends to have one or more outstanding uniqueproperty related to this list, and this property is often the basis for its choice (Table 2).
4.3.4 Polysaccharide Hydrolysis
Polysaccharides are relatively less stable to hydrolytic cleavage than are proteins and may, at times, undergo depolymerizationduring food processing and/or storage of foods. Often, food gums are deliberately depolymerized so a relatively highconcentration can be used to provide body without producing undesirable viscosity.
Hydrolysis of glycosidic bonds joining monosaccharide (glycosyl) units in oligo- and polysaccharides can be catalyzed by eitheracids (H+) or enzymes. The extent of depolymerization, which has the effect of reducing viscosity, is determined by the acidstrength, time, temperature, and structure of the polysaccharide. Generally, hydrolysis occurs most readily during thermalprocessing, because many foods are somewhat acidic. Defects associated with depolymerization during processing can usuallybe overcome by using more of the polysaccharide (gum) in the formulation to compensate for breakdown, using a higherviscosity grade of the gum, again to compensate for any depolymerization, or using a more acid-stable gum. Depolymerizationcan also be an important determinant of shelf life.
Polysaccharides are also subject to enzyme-catalyzed hydrolysis. The rate and end products of this process are controlled bythe specificity of the enzyme, pH, time, and temperature. Polysaccharides, like any and all other carbohydrates, are subject tomicrobial attack because of their susceptibility to enzyme-catalyzed hydrolysis. Furthermore, gum products are very seldomdelivered sterile, and this fact must be considered when using them as ingredients.

Pag e 186

Pag e 187

Pag e 188

Pag e 189

Pag e 190

Pag e 191
4.4 Starch [32,33,38,56,61]
Starch unique chemical and physical characteristics and nutritional quality set it apart from all other carbohydrates. Strach is thepredominant food reserve substance in plants and provides 70–80% of the calories consumed by humans worldwide. Starchand starch hydrolysis products constitute most of the digestible carbohydrate in the human diet. Also, the amount of starch usedin the preparation of food products, without conunting that present in flours used to make bread and other bakery products, thatnaturally occurring in grains used to make breakfast cereals, or that naturally consumed in fruits and vegetables, greatly exceedsthe combined use of all other food hydrocolloids.
Commercial starches are obtained from cereal grain seeds, particulary from corn, waxy corn (waxy maize), high-amylose corn,wheat, and various rices, and from tubers and roots, particulary potato, sweet potato, and tapioca (cassava). Starches andmodified starches have an enormous number of food uses, including adhesive, binding, clouding, dusting, film forming, foamstrengthening, antistaling, gelling, glazing, moisture retaining stabilizing, texturizing, and thickening applications.
Starch is unique among carbohydrates because it occurs naturally as directly particules (granules). Starch granules are relativelydense ad insoluble and hydrate only slightly in cold water. They can be dispersed in water, producing low-viscovity slurries thatcan be easily mixed and pumped, even at concentrations of greater than 35%. The viscosity-building (thickening) power ofstarch is realized only wen a slurry of granules is cooked. Heating a 5% slurry of unmodified starch granules to about 80°C(175°F) with stirring produces very high viscosity. A second uniqueness is that most starch granules are composed of a mixtureof two polymers: an essentially linear polysaccharide called amylose, and a highly branched polysaccharide called amylopectin.
4.4.1 Amylose
While amylose is essentially a linear chain og (1 4)-linked a-D-glucopyranosyl units, many amylose molecules have a few a-D-(1 6) branches, perhaps 1 in 180–320 units, or 0.3–0.5% of the linkages [49]. The branches in branced amylosemolecules are either very long or very short, and the branch points are separatd by large distances so that the physical propertiesof amylose molecules are essentials those of linear molecules. Amylose molecules have molecular weights of about10(sup>6(/sup>.
The axial equatorial position coupling of the (1 4)-linked a-D-glucopyraosy units in amylose chains gives the molecules aright-handed sprial or helical shape (Fig. 35). The interior of the helix contains only hydrogen atoms and is liophilic, while thehydroxyl groups are positioned on the exterior of the coil.
Most starches contain about 25% amylose (Table 3). The two so-called high-amylose corn starches that are commerciallyavailable have apparent amylose contents of about 52% and 70–75%.
4.4.2 Amylopectin [21,22,34]
Amylopectin is a very large, very highly branched molecule, with branch-point linkages constituting 4–5% of the total linkages.Amylopectin consists of a chain containing the only reducing end-group, called a C-chain, which has numerous branches, termedB-chains, to which one to several third-layer A-chains are attached.* The branches of amylopectin mole-
*A-chains are unbranched. B-chains are branched with A-chairs or other B-chains.

Pag e 192
FIGURE 35
A trisaccharide seg ment of an unbranched portion ofan amylose or amylopectin molecule.
cules are clustered (Fig. 36) and occur as double helics. Molecular weights of from 107 to 5 × 10⁸ make amylopectin moleculesamong the largest, if not the largest, molecules found in nature.
Amylopectin is present in all starches, constituting about 75% of most common starches (Table 3.). Some starches consistentirely of amylopectin and are called waxy starches. Waxy corn (waxy maize), the first grain recognized as one in which thestarch consists only of amylopectin, is so termed because when the kernel is cut the new surface appears vitreous or waxy.Other all-amylopectin starches are also called waxy although, as in corn, there is no wax content.
Potato amylopectin is unique in having phosphate ester groups, attached most often (60%-70%) at an O-6 position, with theother third at O-3 positions. These phosphate ester groups occur about once in every 215-560 a-D-glucopyranosyl units, andabout 88% of them are on B chains.
4.4.3 Starch Granules [2,21,24,37,44]
Starch granules are made up of amylose and/or amylopectin molecules arranged radially. They contain both crystalline andnoncrystalline regions in alternating layers. *The clustered branches of amylopectin occur as packed double helices. It is thepacking together of these double-helical structures that forms the many small crystalline areas comprising the dense layers ofstarch granuels that alternate with less dense amorphous layers. Because the crystallinity is produced by ordering of theamylopectin chains, waxy starch granules, that is, granules without amylose, have about the same amount of crystallinity as donormal starches. Amylose molecules occur among the amylopectin molecules, and some diffuse from partially water-swollengranules. The radial, ordered arrangement of starch molecules in a granule is evident from the polarization cross (white cross ona black background) seen in a polarizing microscope with the polarizers set 90° to each other. The center of the cross is at thehilum, the origin of growth of the granule.
Corn starch granules, even from a single source, have mixed shapes, with some being almost spherical, some angular, and someidented. (For the size, see Table 3.) Wheat starch granules are lenticular and have a bimodal or timodal size distribution (> 14µm, 5–14 µm, 1–5 µm).
*Starch g ranules are composed of layers somewhat like the layers of an onion, except that the layers cannot be peeled off.

Pag e 193
TABLE 3 General Properties of Some Starch Granules and Their Pastes
Common cornstarch W axy maize starch
Hig h-amylosecorn starch
Potato starch Tapioca starch W heat starch
Granule size (major axis, µm) 2–30 2–30 2–24 5–100 4–35 2–55
Amylose (%) 28 <2 50–70 21 17 28
Gelatinization/pasting temperature(°C)a
62–80 63–72 66–170b 58–65 52–65 52–85
Relative viscosity Medium Medium hig h Very lowb Very hig h Hig h Low
Paste rheolog yc Short Long (cohesive) Short Very long Long (cohesive) Short
Paste clarity Opaque Very Slig htly cloudy Opaque Clear Clear Opaque
Tendency to g el/retrog rade Hig h Very low Very hig h Medium to low Medium Hig h
Lipid (%DS) 0.8 0.2 — 0.1 0.1 0.9
Protein (%DS) 0.35 0.25 0.5 0.1 0.1 0.4
Phosphorus (%DS) 0.00 0.00 0.00 0.08 0.00 0.00
Flavor Cereal (slig ht) “Clean” Slig ht Bland Cereal (slig ht)
aFrom the initial temperature of g elatinization to complete pasting .
bUnder ordinary cooking conditions, where the slurry is heated to 95–100°C, hig h-amylose corn starch produces essentially no viscosity. Pasting does not occuruntil the temperature reaches 160–170°C (320–340°F).
cFor a description of long and short flow, see Section 4.3.2.

Pag e 194
FIGURE 36A diag rammatic representation of a
portionof an amylopectin molecule.

Pag e 195
Rice granules, on average, are the smallest of the commercial starch granules (1.5–9 µm), although the small granules of wheatstarch are almost the same size. Many of the granules in tuber and root starches, such as potato and tapioca starches, tend to belarger than those of seed starches and are generally less dense and easier to cook. Potato starch granules may be as large as100 µm along the major axis.
All starches retain small amounts of ash, lipid, and protein (Table 3). The phosphorus content of potato starch (0.06–0.1%) isdue to the presence of the phosphate ester groups on amylopectin molecules. The phosphate ester groups give potato starchamylopectin a slight negative charge, resulting in some coulombic repulsion that may contribute to the rapid swelling of potatostarch granules in warm water and to several properties of potato starch pastes, namely, their high viscosities, good clarity(Table 3), and low rate of retrogradation (see Sec. 4.4.6). Cereal starch molecules either do not have phosphate ester groups orhave very much smaller amounts than occurs in potato starch. Only the cereal starches contain endogenous lipids in the granules.These internal lipids are primarily free fatty acids (FFA) and lysophospholipid (LPL), largely lysophosphatidyl choline (89% incorn starch), with the ratio of FFA to LPL varying from one cereal starch to another.
4.4.4 Granule Gelatinization and Pasting
Undamaged starch granules are insoluble in cold water, but can imbibe water reversibly; that is, they can swell slightly, and thenreturn to their original size on drying. When heated in water, starch granules undergo a process called gelatinization.Gelatinization is the disruption of molecular order within granules. Evidence for the loss of order includes irreversible granuleswelling, loss of birefringence, and loss of crystallinity. Leaching of amylose occurs during gelatinization, but some leaching ofamylose can also occur prior to gelatinization. Total gelatinization usually occurs over a temperature range (Table 3), with largergranules generally gelatinizing first. The apparent temperature of initial gelatinization and the range over which gelatinizationoccurs depend on the method of measurement and on the starch:water ratio, granule type, and heterogeneities within the granulepopulation under observation. Several stages of gelatinization can be determined using a polarizing microscope equipped with ahot stage. These are the initiation temperature (first observed loss in birefringence), the midpoint temperature, the completion orbirefringence endpoint temperature (BEPT, the temperature at which the last granule in the field under observation loses itsbirefringence), and the gelatinization temperature range.
Continued heating of starch granules in excess water results in further granule swelling, additional leaching of soluble components(primarily amylose), and eventually, especially with the application of shear forces, total disruption of granules. This phenomenonresults in the formation of a starch paste. (In starch technology, what is called a paste is what results from heating a starchslurry.) Granule swelling and disruption produce a viscous mass (the paste) consisting of a continuous phase of solubilizedamylose and/or amylopectin and a discontinuous phase of granule remnants (granule ghosts* and fragments). Completemolecular dispersion is not accomplished except, perhaps, under conditions of high temperature, high shear, and excess water,conditions seldom, if ever, encountered in the preparation of food products. Cooling of a hot corn-starch paste results in aviscoelastic, firm, rigid gel.
Because gelatinization of starch is an endothermic process, differential scanning calorimetry (DSC), which measures both thetemperature and the enthalpies of gelatinization, is
*The g ranule g host is the remnant remaining after cooking under no to moderate shear. It consists of the outer portion of the g ranule. Itappears as an insoluble, outer envelope, but is not a membrane.

Pag e 196
widely used. Although there is not complete agreement on the interpretation of DSC data and the events that take place duringgelatinization of starch granules, the following general picture is widely accepted. Water acts as a plasticizer. Its mobility-enhancing effect is first realized in the amorphous regions, which physically have the nature of a glass. When starch granules areheated in the presence of sufficient water (at least 60%), and a specific temperature (Tg, the glass transition temperature) isreached, the plasticized amorphous regions of the granule undergo a phase transition from a glassy state to a rubbery state.*.However, the peak for absorption of energy associated with this transition is not often seen by DSC because the regions ofcrystallinity, that is, the ordered, packed, double-helical branches of amylopectin, are contiguous and connected by covalentbonds to the amorphous regions and melting of the crystallites immediately follows the glass transition. Because the enthalpy ofinitial melting (Tm) is so much larger than that of the glass transition, the latter is usually not evident.
Melting of lipid-amylose complexes occurs at much higher temperatures (100–120°C in excess water) than does melting of theamylopectin double-helical branches packed in crystalline order. These complexes are made with single-helical segments ofamylose molecules when a starch paste containing monoacyl lipids is cooled. A DSC peak for this event is absent in waxystarches (without amylose).
Under normal food processing conditions (heat and moisture, although many food systems contain limited water as far as starchcooking is concerned), starch granules quickly swell beyond the reversible point. Water molecules enter between chains, breakinterchain bonds, and establish hydration layers around the separated molecules. This plasticizes (lubricates) chains so theybecome more fully separated and solvated. Entrance of large amounts of water causes granules to swell to several times theiroriginal size. When a 5% starch suspension is gently stirred and heated, granules imbibe water until much of the water isabsorbed by them, forcing them to swell, press against each other, and fill the container with a highly viscous starch paste. Suchhighly swollen granules are easily broken and disintegrated by stirring, resulting in a decrease in viscosity. As starch granulesswell, hydrated amylose molecules diffuse through the mass to the external phase (water), a phenomenon responsible for someaspects of paste behavior. Results of starch swelling can be recorded using a Brabender Visco/amylo/graph, which records theviscosity continuously as the temperature is increased, held constant for a time, and then decreased (Fig. 37).
By the time peak viscosity is reached, some granules have been broken by stirring. With continued stirring, more granulesrupture and fragment, causing a further decrease in viscosity. On cooling, some starch molecules partially reassociate to form aprecipitate or gel. This process is called retrogradation (see Sec. 4.4.6). The firmness of the gel depends on the extent ofjunction zone formation (see Sec. 4.3.3). Junction zone formation is influenced (either facilitated or hindered) by the presence ofother ingredients such as fats, proteins, sugars, and acids and the amount of water present.
4.4.5 Uses of Unmodified Starches
Starches serve a variety of roles in food production. Principally they are used to take up water and to produce viscousfluids/pastes and gels and to give desired textural qualities (see also Sec. 4.4.9). The extent of starch gelatinization in bakedgoods strongly affects product properties, including storage behavior and rate of digestion. In some baked products, manystarch granules remain ungelatinized. In certain cookies and pie crust that are high in fat and low in
*A g lass is a mechanical solid capable of supporting its own weig ht ag ainst flow. A rubber is an undercooled liquid that can exhibitviscous flow. (See Chap. 2 for further details.)

Pag e 197
FIGURE 37Representative Brabender Visco/amylo/g raph curve showing viscosity chang es related to
typical starch g ranule swelling and disinteg ration as a g ranule suspension is heatedto 95°C and then held at that temperature. (The instrument imparts moderate shear to
the system.) Tp is the pasting temperature, that is, the temperature at which a viscosityincrease is recorded by the instrument.
water, about 90% of the wheat starch granules remain ungelatinized (as observed microscopically and as evidenced by theirslow rate of attack by amylases). In other products, such as angel food cake and white bread, which are higher in moisture,about 96% of the wheat starch granules are gelatinized and many become deformed.
Food companies value the clear, cohesive pastes produced from waxy maize starch. Potato starch is used in extruded cerealand snack food products and in dry mixes for soups and cakes. Rice starch produces opaque gels useful for baby food. Waxyrice starch gels are clear and cohesive. Wheat starch gels are weak; their slight flavor may be due to residual flour components.Tuber (potato) and root (tapioca) starches have weak intermolecular bonding and swell greatly to give high-viscosity pastes.Because the highly swollen granules break easily, the viscosity quickly decreases with only moderate shear. Starches are oftenmodified (see Sec. 4.4.9) before use in foods.

Pag e 198
4.4.6 Retrogradation and Staling [36,37,44]
As already pointed out, cooling a hot starch paste generally produces a viscoelastic, firm, rigid gel. The formation of the junctionzones of a gel can be considered to be the first stage of an attempt by starch molecules to crystallize. As starch pastes arecooled and stored, the starch becomes progressively less soluble. In dilute solution, starch molecules will precipitate, with theinsoluble material being difficult to redisolve by heating. The collective processes of dissolved starch becoming less soluble arecalled retrogradation. Retrogradation of cooked starch involves both the two constituent polymers, amylose and amylopectin,with amylose undergoing retrogradation at a much more rapid rate than does amylopectin. The rate of retrogradation dependson several variables, including the molecular ratio of amylose to amylopectin; structures of the amylose and amylopectinmolecules, which are determined by the botanical source of the starch; temperature; starch concentration; and presence andconcentration of other ingredients, such as surfactants and salts. Many quality defects in food products, such as bread staling andloss of viscosity and precipitation in soups and sauces, are due, at least in part, to starch retrogradation.
Staling of baked goods is noted by an increase in crumb firmness and a loss in product freshness. Staling begins as soon asbaking is complete and the product begins to cool. The rate of staling is dependent on the product formulation, the bakingprocess, and storage conditions. Staling is due, at least in part, to the gradual transition of amorphous starch to a partiallycrystalline, retrograded state. In baked goods, where there is just enough moisture to gelatinize starch granules (while retaining agranule identity), amylose retrogradation (insolubilization) may be largely complete by the time the product has cooled to roomtemperature. Retrogradation of amylopectin is believed to involve primarily association of its outer branches and requires a muchlonger time than amylose retrogradation, giving it prominence in the staling process that occurs with time after the product hascooled.
Most polar lipids with surfactant properties retard crumb firming. Compounds such as glyceryl monopalmitate (GMP), othermonoglycerides and their derivatives, and sodium stearoyl 2-lactylate (SSL) are incorporated into doughs of bread and otherbaked goods, in part to increase shelf life.
4.4.7 Starch Complexes [3]
Amylose chains are helical with hydrophobic (lipophilic) interiors and are able to form complexes with linear hydrophobicportions of molecules that can fit in the hydrophobic tube. Iodine (as I3-) complexes with both amylose and amylopectinmolecules. Again, the complexing occurs within the hydrophobic interior of helical segments. With amylose, the long helicalsegments allow long chains of poly (I3-) to form and produce the blue color used as a diagnostic test for starch. The amylose-iodine complex contains 19% iodine, and determination of the amount of complexing is used to measure the amount of apparentamylose present in a starch. Amylopectin is colored a reddish-purple by iodine because the branches of amylopectin are tooshort for formation of long chains of poly (I3¯).
Polar lipids (surfactants/emulsifiers and fatty acids) can affect starch pastes and starch-based foods in one or more of three waysas a result of complex formation: (a) by affecting the processes associated with starch gelatinization and pasting (that is, the lossof birefringence, granular swelling, leaching of amylose, melting of the crystalline regions of starch granules, and viscosityincreases during cooking), (b) by modifying the rheological behavior of the resulting pastes, and (c) by inhibiting thecrystallization of starch molecules associated with the retrogradation process. The specific changes observed upon addition oflipid depend on its structure, the starch employed, and the product to which it is added.

Pag e 199
4.4.8 Hydrolysis of Starch [43,48,52]
Starch molecules, like all other polysaccharide molecules, are depolymerized by hot acids. Hydrolysis of the glycosidic bondsoccurs more or less randomly to produce, initially, very large fragments. Commercially, hydrochloric acid is sprayed onto well-mixed starch, or stirred moist starch is treated with hydrogen chloride gas; the mixture is then heated until the desired degree ofdepolymerization is obtained. The acid is then neutralized, and the product is recovered, washed, and dried. The products arestill granular, but break up (cook out) easily. They are called acid-modified or thin-boiling starches, and the process of makingthem is called thinning. Even though only a few glycosidic bonds are hydrolyzed, the starch granules disintegrate much moreeasily during heating in water. Acid-modified starches form gels with improved clarity and increased strength, even though theyprovide less solution viscosity. Thin-boiling starches are used as film formers and adhesives in products such as pan-coated nutsand candies and whenever a strong gel is desired, such as in gum candies like jelly beans, jujubes, orange slices, and spearmintleaves and in processed cheese loaves. To prepare especially strong and fast-setting gels, a high-amylose corn starch is used asthe base starch.
More extensive modification with acid produces dextrins. Low-viscosity dextrins can be used at high concentrations in foodprocessing. They have film-forming and adhesive properties and are used in products such as pan-coated roasted nuts andcandy. They are also used as fillers, encapsulating agents, and carriers of flavors, especially spray-dried flavors. They areclassified by their cold water solubility and color. Dextrins that retain large amounts of linear chains or long chain fragments formstrong gels.
Hydrolysis of starch dispersions with either an acid or an enzyme produces first maltodextrins. Maltodextrins are usuallydescribed by their dextrose equivalency (DE). The DE is related to the degree of polymerization (DP) through the followingequation: DE = 100/DP. (Both DE and DP are average values for populations of molecules.) Therefore, the DE of a product ofhydrolysis is its reducing power as a percentage of the reducing power of pure dextrose (D-glucose); thus, DE is inverselyrelated to average molecular weight. Maltodextrins are defined as products with DE values that are measurable, but less than 20.Maltodextrins of lowest DE are nonhygroscopic, while those of highest DE (that is, lowest average molecule weight) tend toabsorb moisture. Maltodextrins are bland with virtually no sweetness and are excellent for contributing body or bulk to foodsystems. Hydrolysis to DE values of 20–60 gives mixtures of molecules that, when dried, are called corn syrup solids. Cornsyrup solids dissolve rapidly and are mildly sweet. Table 4 lists functional properties of starch hydrolysis products.
Continued hydrolysis of starch produces a mixture of D-glucose, maltose, and other
TABLE 4 Functional Properties of Starch Hydrolysis Products
Properties enhanced by g reaterhydrolysis a
Properties enhanced in products ofless conversion b
Sweetness Viscosity production
Hyg roscopicity and humectancy Body formation
Freezing point depression Foam stabilization
Flavor enhancement Sug ar crystallization prevention
Fermentability Ice crystal g rowth prevention
Browning reaction
aHig h-conversion (hig h-DE) syrups.
bLow-DE syrups and maltodextrins.

Pag e 200
malto-oligosaccharides. Syrups of this composition are produced in enormous quantities. One of the most common has a DE of42. These syrups are stable because crystallization does not occur easily in such complex mixtures. They are sold inconcentrations of high osmolality, high enough that ordinary organisms cannot grow in them. An example is waffle and pancakesyrup, which is colored with caramel coloring and flavored with maple flavoring.
Three to four enzymes are used for the industrial hydrolysis of starch to D-glucose. a-Amylase is an endo-enzyme that cleavesboth amylose and amylopectin molecules internally, producing oligosaccharides. The larger oligosaccharides may be singly,doubly, or triply branched via (1 6) linkages, since a-amylase acts only on the (1 4) linkages of starch. a-Amylase doesnot attack double-helical starch polymer segments or polymer segments complexed with a polar lipid (stabilized single helicalsegments).
Glucoamylase (amyloglucosidase) is used commercially, in combination with an a-amylase, for producing D-glucose (dextrose)syrups and crystalline D-glucose. The enzyme acts upon fully gelatinized starch as an exo-enzyme, sequentially releasing single D-glucosyl units from the nonreducing ends of amylose and amloypectin molecules, even those joined through (1 6) bonds.Consequently, the enzyme can completely hydrolyze starch to D-glucose, but is used on starch that has been previouslydepolymerized with a-amylase to generate small fragments and more nonreducing ends.
b-Amylase releases the disaccharide maltose sequentially from the nonreducing end of amylose. It also attacks the nonreducingends of amylopectin, sequentially releasing maltose, but it cannot cleave the (1 6) linkages at branch points, so it leaves apruned amylopectin residue termed a limit dextrin, specifically a beta-limit dextrin.
There are several debranching enzymes that specifically catalyze hydrolysis of (1 6)-linkages in amylopectin, producingnumerous linear but low-molecular-weight molecules. One such enzyme is isoamylase; another is pullulanase.
Cyclodextrin glucanotransferase is a unique Bacillus enzyme that forms rings of (1 4)- linked a-D-glucopyranosyl units fromstarch polymers. The enzyme can form six-, seven-, and eight-membered rings, which are respectively alpha-, beta-, andgamma-cyclodextrins. Since the normal helical conformation of a linear portion of a starch molecule contains six to sevenglucosyl units per turn of the helix, this transfer of a glycosidic bond from one that joins adjacent segments of a spiral to one thatforms a doughnut-like circular structure is easy to picture. These products, originally called Schardinger dextrins after theirdiscoverer, are now known as cyclodextrins or cycloamyloses. They have the ability to complex with hydrophobic substancesthat are held in the center of the ring. Through such complexing of guest molecules, volatile essential oils can be converted intodry powders in which the flavoring or aromatic substance is protected from light and oxygen but is readily released when thecomplex is added to an aqueous system because of the water solubility of the cyclodextrin. Cyclodextrins are not yet approvedfor food use in the United States. However, chiral supports that are useful for chromatographic separations are made byconverting cyclodextrins into insoluble polymeric materials. In a similar application, insoluble polymeric beads of cyclodextrinshave been shown to be useful for removal of bitter components of citrus juices.
Corn syrup is the major source of D-glucose and D-fructose. To make a corn syrup, a slurry of starch in water is mixed with athermally stable a-amylase and put through a cooker where rapid gelatinization and enzyme-catalyzed hydrolysis (liquefaction)takes place. After cooling to 55–60°C (130–140°F), hydrolysis is continued with glucoamylase, whereupon the syrup isclarified, concentrated, carbon-refined, and ion-exchanged. If the syrup is properly refined and combined with seed crystals,crystalline D-glucose (dextrose) or its monohydrate can be obtained.
For production of D-fructose, a solution of D-glucose is passed through a column con-

Pag e 201
taining bound (immobilized) glucose isomerase. The enzyme catalyzes the isomerization of D-glucose to D-fructose (see Fig. 5) toan equilibrium mixture of approximately 58% D-glucose and 42% D-fructose. Higher concentrations of D-fructose are usuallydesired. [The high-fructose corn syrup (HFCS) most often used as a soft drink sweetener is approximately 55% D-fructose.] Sothe isomerized syrup is passed through a bed of cation-exchange resin in the calcium salt form. The resin binds D-fructose, whichcan be recovered to provide an enriched syrup fraction.
4.4.9 Modified Food Starch [1,56,58]
Food processors generally prefer starches with better behavioral characteristics than provided by native starches. Nativestarches produce particularly weak-bodied, cohesive, rubbery pastes when cooked and undesirable gels when the pastes arecooled. The properties of starches can be improved by modification. Modification is done so that resultant pastes can withstandthe conditions of heat, shear, and acid associated with particular processing conditions and to introduce specific functionalities.Modified food starches are functional, useful, and abundant food macroingredients and additives.
Types of modifications that are most often made, sometimes singly, but often in combinations, are crosslinking of polymer chains,non-crosslinking derivatization, depolymerization (see Sec. 4.4.8), and pregelatinization (see Sec. 4.4.10). Specific propertyimprovements that can be obtained by proper combinations of modifications are reduction in the energy required to cook(improved gelatinization and pasting), modification of cooking characteristics, increased solubility, either increased or decreasedpaste viscosity, increased freeze-thaw stability of pastes, enhancement of paste clarity, increased paste sheen, inhibition of gelformation, enhancement of gel formation and gel strength, reduction of gel syneresis, improvement of interaction with othersubstances, improvement in stabilizing properties, enhancement of film formation, improvement in water resistance of films,reduction in paste cohesiveness, and improvement of stability to acid, heat, and shear.
Starch, like all carbohydrates, can undergo reactions at its various hydroxyl groups. In modified food starches, only a very fewof the hydroxyl groups are modified. Normally ester or ether groups are attached at very low DS values (degrees ofsubstitution).* DS values are usually <0.1 and generally in the range 0.002–0.2. Thus, there is, on average, one substituent groupon every 500-5 D-glucopyranosyl units. Small levels of derivatization change the properties of starches dramatically and greatlyextend their usefulness. Starch products that are esterified or etherified with monofunctional reagents resist interchainassociations. Derivatization of starches with monofunctional reagents reduces intermolecular associations, the tendency of thestarch paste to gel, and the tendency for precipitation to occur. Hence this modification is often called stabilization, and theproducts are called stabilized starches. Use of difunctional reagents produces crosslinked starches. Modified food starches areoften both cross-linked and stabilized.
Chemical reactions currently both allowed and used to produce modified food starches in the United States are as follows:esterification with acetic anhydride, succinic anhydride, the mixed anhydride of acetic and adipic acids, 1-octenylsuccinicanhydride, phosphoryl chloride, sodium trimetaphosphate, sodium tripolyphosphate, and monosodium orthophosphate;etherification with propylene oxide; acid modification with hydrochloric and sulfuric acids; bleaching
*The deg ree of substitution (DS) is defined as the averag e number of esterified or etherified hydroxyl g roups per monosaccharide unit.Both branched and unbranched polysaccharides composed of hexopyranosyl units have an averag e of three hydroxyl g roups permonomeric unit. Therefore, the maximum DS for a polysaccharide is 3.0.

Pag e 202
FIGURE 38Structures of starch monoester phosphate (left)and diester phosphate (rig ht). The diester joinstwo molecules tog ether, resulting in crosslinked
starch g ranules.
with hydrogen peroxide, peracetic acid, potassium permanganate, and sodium hypochlorite; oxidation with sodium hypochlorite;and various combinations of these reactions.
Modified waxy maize starches are especially popular in the U.S. food industry. Pastes of unmodified common corn starch willgel, and the gels will generally be cohesive, rubbery, long textured, and prone to syneresis (that is, to weep or exude moisture).However, pastes of waxy maize starch show little tendency to gel at room temperature, which is why waxy maize starch isgenerally preferred as the base starch for food starches. But pastes of waxy maize starch will become cloudy and chunky andexhibit syneresis when stored under refrigerator or freezing conditions, so even waxy maize starch is usually modified to increasethe stability of its pastes. The most common and useful derivatives employed for starch stabilization are the hydroxypropyl ether,the monostarch phosphate ester, and the acetate ester.
Acetylation of starch to the maximum allowed in foods (DS 0.09) lowers the gelatinization temperature, improves paste clarity,and provides stability to retrogradation and freeze-thaw stability (but not as well as hydroxypropylation). Starch phosphatemonoesters (Fig. 38) made by drying starch in the presence of sodium tripolyphosphate or monosodium orthophosphate can beused to make pastes that are clear and stable, have emulsifying properties, and have freeze-thaw stability. Monostarchphosphates have a long, cohesive texture. Paste viscosity is generally high and can be controlled by varying the concentration ofreagent, time of reaction, temperature, and pH. Phosphate esterification lowers the gelatinization temperature. In the UnitedStates, the maximum allowable DS with phosphate groups is 0.002.
Preparation of an alkenylsuccinate ester of starch attaches a hydrocarbon chain to its polymer molecules (Fig. 39). Even at verylow degrees of substitution, starch 1-octenylsuccinate molecules concentrate at the interface of an oil-in-water emulsion becauseof the hydrophobicity of the alkenyl group. This characteristic makes them useful as emulsion stabilizers. Starch 1-octenylsuccinate products can be used in a variety of food applications where emulsion
FIGURE 39Preparation of starch 2-(1-octenyl)succinyl ester.

Pag e 203
stability is needed, such as in flavored beverages. The presence of the aliphatic chain tends to give the starch derivative a sensoryperception of fattiness, so it is possible to use the derivatives as a partial replacement for fat in certain foods.
Hydroxypropylstarch (starch-O-CH2-CHOH-CH3), prepared by reacting starch with propylene oxide to produce a low level ofetherification (DS 0.02–0.2, 0.2 being the maximum allowed) is a product with properties similar to those of starch acetatebecause it similarly has “bumps” along the starch polymer chains—that is, it is a stablized starch. Hydroxypropylation reducesthe gelatinization temperature. Hydroxypropylstarches form clear pastes that do not retrograde and withstand freezing andthawing. They are used as thickeners and extenders. To improve viscosity, particularly under acidic conditions, acetylated andhydroxypropylated starches are often also crosslinked with phosphate groups.
The majority of modified food starch is crosslinked. Crosslinking occurs when starch granules are reacted with difunctionalreagents that react with hydroxyl groups on two different molecules within the granule. Crosslinking is accomplished most oftenby producing distarch phosphate esters. Starch is reacted with either phosphoryl chloride, PO3Cl2, or sodium trimetaphosphatein an alkaline slurry, then dried. Linking together of starch chains with phosphate diester or other crosslinks reinforces the granuleand reduces both the rate and the degree of granule swelling and subsequent disintegration. Thus, granules exhibit reducedsensitivity to processing conditions (high temperature; extended cooking times; low pH; high shear during mixing, milling,homogenization, and/or pumping). Cooked pastes of crosslinked starches are more viscous, *heavier bodied, shorter textured,and less likely to break down during extended cooking or during exposure to low pH and/or severe agitation than are pastes ofnative starches from which they are prepared. Only a small amount of crosslinking is required to produce a noticeable effect;with lower levels of crosslinking, granules exhibit hydration swelling in inverse proportion to DS. As crosslinking is increased, thegranules become more and more tolerant to physical conditions and acidity, but less and less dispersible by cooking. Energyrequirements to reach maximum swelling and viscosity are also increased. For example, treatment of a starch with only 0.0025%of sodium trimetaphosphate greatly reduces both the rate and the degree of granule swelling, greatly increases paste stability, andchanges dramatically the Brabender Visco/amylo/graph viscosity profile and textural characteristics of its paste. Treatment with0.08% of trimetaphosphate produces a product in which granule swelling is restricted to the point that a peak visosity is neverreached during the hot holding period in a Brabender Visco/amylo/graph. As the degree of crosslinking increases, the starch alsobecomes more acid stable. Though hydrolysis of glycosidic bonds occurs during heating in aqueous acid, chains tied to eachother through phosphate crosslinks continue to provide large molecules and an elevated viscosity. The only other crosslinkpermitted in a food starch is the distrach ester of adipic acid.
Most crosslinked food starches contain less than one crosslink per 1000 a-D-glucopyranosyl units. Trends toward continuouscooking require increased shear resistance and stability to hot surfaces. Storage-stable thickening is also provided bycrosslinked starches. In retort sterilization of canned foods, crosslinked starches, because of their reduced rate of gelatinizationand swelling, maintain a low initial viscosity long enough to facilitate the rapid heat transfer and temperature rise that is needed toprovide uniform sterilization before granule swelling brings about the ultimately desired viscosity, texture, and suspendingcharacteristics. Crosslinked
*Note in Fig ure 37 that maximum viscosity is reached when the system contains hig hly swollen g ranules. Crosslinked g ranules holdtog ether. Thus, there is minimal loss of viscosity after the peak is reached.

Pag e 204
starches are used in canned soups, gravies, and puddings and in batter mixes. Crosslinking of waxy maize starch gives the clearpaste sufficient rigidity so that, when used in pie fillings, cut sections of pie hold their shape.
Starches that are both crosslinked and stabilized are used in canned, frozen, baked, and dry foods. In baby foods and fruit andpie fillings in cans and jars, they provide long shelf life. They also allow frozen fruit pies, pot pies, and gravies to remain stableunder long-term storage.
Modified food starches are tailor-made for specific applications. Properties that can be controlled by combinations ofcrosslinking, stabilization, and thinning of corn, waxy maize, potato, and other starches include, but are not limited to, thefollowing: adhesion, clarity of solutions/pastes, color, emulsion stabilization ability, film-forming ability, flavor release, hydrationrate, moisture holding capacity, stability to acids, stability to heat and cold, stability to shear, temperature required to cook, andviscosity (hot paste and cold paste). Some characteristics imparted to the food product include, but are not limited to, thefollowing: mouth feel, reduction of oil migration, texture, sheen, stability, and tackiness.
4.4.10 Cold-Water-Soluble (Pregelatinized) Starch
Once starch has been pasted and dried without excessive retrogradation, it can be redissolved in cold water. The largestcommercial quantity of such starch is made by flowing a starch-water slurry into the nip between two nearly touching andcounterrotating, steam-heated rolls. The starch slurry is gelatinized and pasted almost instantaneously, and the paste coats therolls where it dries quickly. The dry film is scraped from the roll and ground. The resulting products, known as pregelatinizedstarches or instant starches, are precooked starches. They are also prepared using extruders.
Both chemically modified and unmodified starches can be used to make pregelatinized starches. If chemically modified starchesare used, properties introduced by the modification(s) carry through to the pregelatinized products; thus, paste properties suchas stability to freeze-thaw cycling can also be characteristics of pregelatinized starches. Pregelatinized, slightly crosslinked starchis useful in instant soup, pizza topping, and extruded snacks and in breakfast cereals.
Pregelatinized starches can be used without cooking. Finely ground pregelatinized starch forms small gel particles like a water-soluble gum, but when properly dissolved gives solutions of high viscosity. Coarsely ground products “dissolve” much morereadily and produce dispersions of lower viscosity and with graininess or pulpiness that is desirable in some products. Manypregelatinized starches are used in dry mixes such as instant pudding mixes; they disperse readily with high-shear stirring or whenmixed with sugar or other dry ingredients.
4.4.11 Cold-Water-Swelling Starch
Granular starch that swells extensively in cold water is made by heating common corn starch in 75–90% ethanol or by a specialspray-drying process. The product is dispersible in sugar solutions or corn syrups by rapid stirring; the resulting dispersion canbe poured into molds, where it sets to a rigid gel that can be sliced easily. The result is a gum candy. Cold-water-swelling starchis also useful in making desserts and in muffin batters containing particles, such as blueberries, that otherwise would settle to thebottom before the batter is thickened by heating during baking.

Pag e 205
4.5 Cellulose: Modifications and Derivatives [60]
Cellulose is the most abundant organic compound, and therefore the most abundant carbohydrate, on earth because it is theprincipal cell-wall component of higher plants. (It can be argued that D-glucose is the most abundant carbohydrate and organiccompound if we consider cellulose as a combined form of this monomeric building block.) Cellulose is a high-molecular-weight,linear, insoluble homopolymer of repeating b-D-glucophyranosyl units joined by (1 4) glycosidic linkages (Fig. 40). Becauseof their linearity and stereoregular nature, cellulose molecules associate over extended regions, forming polycrystalline, fibrousbundles. Crystalline regions are held together by large numbers of hydrogen bonds. They are separated by, and connected to,amorphous regions. Cellulose is insoluble because, in order for it to dissolve, most of these hydrogen bonds would have to bereleased at once. Cellulose can, however, through substitution, be converted into water-soluble gums.
Cellulose and its modified forms serve as dietary fiber because they do not contribute significant nourishment or calories as theypass through the human digestive system. Dietary fiber does, however, serve important functions (see Sec. 4.12).
A purified cellulose powder is available as a food ingredient. High-quality cellulose can be obtained from wood through pulpingand subsequent purification. Chemical purity is not required for food use because cellulosic cell-wall materials are components ofall fruits and vegetables and many of their products. The powdered cellulose used in foods has negligible flavor, color, andmicrobial contamination. Powdered cellulose is most often added to bread to provide noncaloric bulk. Reduced-calorie bakedgoods made with powdered cellulose, not only have an increased content of dietary fiber, but also stay moist and fresh longer.
4.5.1 Microcrystalline Cellulose [51]
A purified, insoluble cellulose termed microcrystalline cellulose (MCC) is useful in the food industry. It is made by hydrolysis ofpurified wood pulp, followed by separation of the constituent microcrystals of cellulose. Cellulose molecules are fairly rigid,completely linear chains of about 3000 b-D-glucopyranosyl units and associate easily in long junction zones. However, the longand unwieldy chains do not align over their entire lengths. The end of the crystalline region is simply the divergence of cellulosechains away from order into a more random arrangement. When purified wood pulp is hydrolyzed with acid, the acid penetratesthe lower density, amorphous regions, effects hydrolytic cleavage of chains in these regions, and releases individual, fringedcrystallites. The released crystallites grow larger because the chains that constitute the fringes now have greater freedom ofmotion and can order themselves.
Two types of microcrystalline cellulose are produced, both of which are stable to both heat
FIGURE 40Cellulose (repeating unit).

Pag e 206
and acids. Powdered MCC is a spray-dried product. Spray-drying produces agglomerated aggregates of microcrystals that areporous and sponge-like. Powdered MCC is used primarily as a flavor carrier and as an anticaking agent for shredded cheese.The second type, colloidal MCC, is water dispersible and has functional properties similar to those of water-soluble gums. Tomake colloidal MCC, considerable mechanical energy is applied after hydrolysis to tear apart the weakened microfibrils andprovide a major proportion of colloidal-sized aggregates (<0.2 µm in diameter). To prevent rebonding of the aggregates duringdrying, sodium carboxymethylcellulose (CMC) is added (see Sec. 4.5.2). CMC aids in redispersion and acts as a barrier toreassociation by giving the particles a stabilizing negative charge.
The major functions of colloidal MCC are to stabilize foams and emulsions, especially during high-temperature processing; toform gels with salve-like textures (MCC does not dissolve, nor does it form intermolecular junction zones; rather it forms anetwork of hydrated microcrystals); to stabilize pectin and starch gels to heat; to improve adhesion; to replace fat and oil, and tocontrol ice crystal growth. MCC stabilizes emulsions and foams by adsorbing at interfaces and strengthening interfacial films. It isa common ingredient of reduced-fat ice cream and other frozen dessert products.
4.5.2 Carboxymethylcellulose [11,26]
Carboxymethylcellulose (CMC) is widely and extensively used as a food gum. Treatment of purified wood pulp with 18%sodium hydroxide solution produces alkali cellulose. When alkali cellulose is reacted with the sodium salt of chloroacetic acid,the sodium salt of the carboxymethyl ether (cellulose-O-CH2-CO2-Na+) is formed (Table 2). Most commercial sodiumcarboxymethylcellulose (CMC) products have a degree of substitution (DS) in the range 0.4–0.8. The most widely sold type foruse as a food ingredient has a DS of 0.7.
Since CMC consists of long, fairly rigid molecules that bear a negative charge due to numerous ionized carboxyl groups,electrostatic repulsion causes its molecules in solution to be extended. Also, adjacent chains repel each other. Consequently,CMC solutions tend to be both highly viscous and stable. CMC is available in a wide range of viscosity types.
CMC stabilizes protein dispersions, especially near their isoelectric pH value. Thus, egg white is stabilized with CMC for co-drying or freezing, and milk products are given improved stability against casein precipitation.
4.5.3 Methylcelluloses and Hydroxypropylmethylcelluloses [16,17]
Alkali cellulose is treated with methyl chloride to introduce methyl ether groups (cellulose-O-CH3). Many members of this classof gums also contain hydroxypropyl ether groups (cellulose-O-CH2-CHOH-CH3). Hydroxypropylmethylcelluloses (HPMC) aremade by reacting alkali cellulose with both propylene oxide and methyl chloride. The degree of substitution with methyl ethergroups of commercial methylcelluloses (MC) ranges from 1.1 to 2.2. The moles of substitution (MS) *values with hydroxypropylether groups in commercial hydroxypropylmethylcelluloses range from 0.02 to 0.3. (Both the methylcellulose andhydroxypropylmethyl-
*The moles of substitution or molar substitution (MS) is the averag e number of moles of substituent attached to a g lycosyl unit of apolysaccharide. Because reaction of a hydroxyl g roup with propylene oxide creates a new hydroxyl g roup with which propylene oxidecan react further, poly(propylene oxide) chains, each terminated with a free hydroxyl g roup, can form. Thus, because more than threemoles of propylene oxide can react with a sing le hexopyranosyl unit, MS rather than DS must be used.
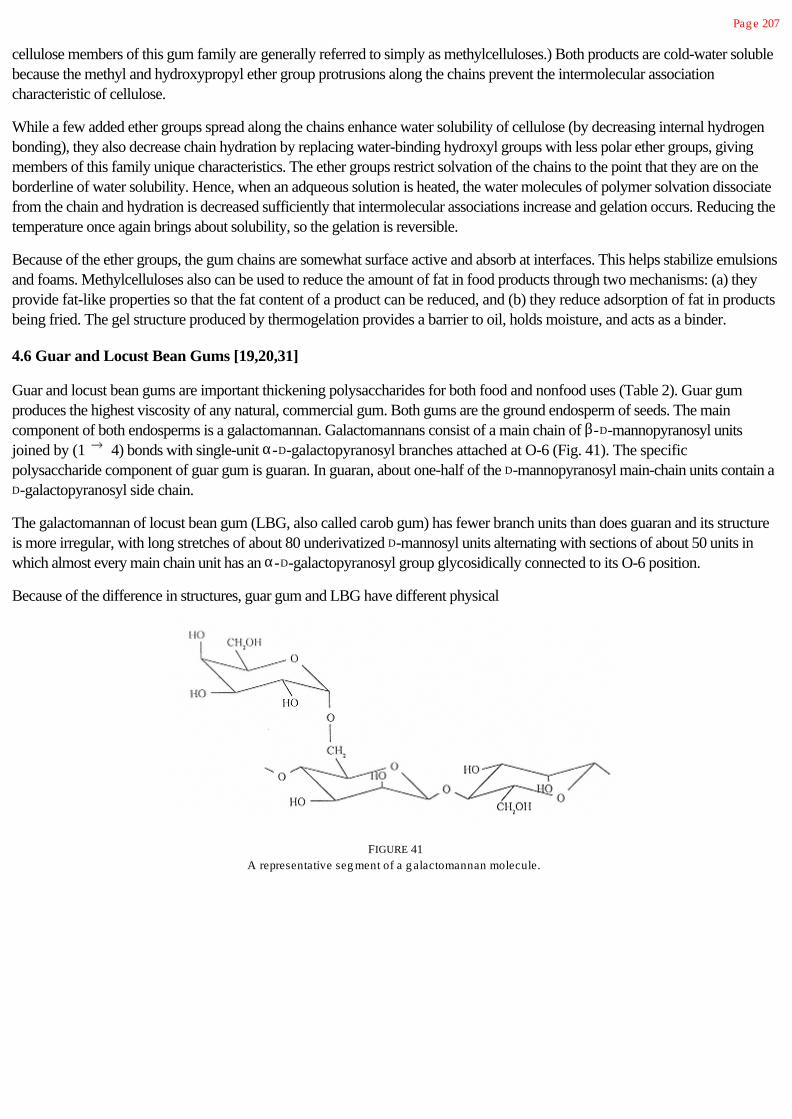
Pag e 207
cellulose members of this gum family are generally referred to simply as methylcelluloses.) Both products are cold-water solublebecause the methyl and hydroxypropyl ether group protrusions along the chains prevent the intermolecular associationcharacteristic of cellulose.
While a few added ether groups spread along the chains enhance water solubility of cellulose (by decreasing internal hydrogenbonding), they also decrease chain hydration by replacing water-binding hydroxyl groups with less polar ether groups, givingmembers of this family unique characteristics. The ether groups restrict solvation of the chains to the point that they are on theborderline of water solubility. Hence, when an adqueous solution is heated, the water molecules of polymer solvation dissociatefrom the chain and hydration is decreased sufficiently that intermolecular associations increase and gelation occurs. Reducing thetemperature once again brings about solubility, so the gelation is reversible.
Because of the ether groups, the gum chains are somewhat surface active and absorb at interfaces. This helps stabilize emulsionsand foams. Methylcelluloses also can be used to reduce the amount of fat in food products through two mechanisms: (a) theyprovide fat-like properties so that the fat content of a product can be reduced, and (b) they reduce adsorption of fat in productsbeing fried. The gel structure produced by thermogelation provides a barrier to oil, holds moisture, and acts as a binder.
4.6 Guar and Locust Bean Gums [19,20,31]
Guar and locust bean gums are important thickening polysaccharides for both food and nonfood uses (Table 2). Guar gumproduces the highest viscosity of any natural, commercial gum. Both gums are the ground endosperm of seeds. The maincomponent of both endosperms is a galactomannan. Galactomannans consist of a main chain of b-D-mannopyranosyl unitsjoined by (1 4) bonds with single-unit a-D-galactopyranosyl branches attached at O-6 (Fig. 41). The specificpolysaccharide component of guar gum is guaran. In guaran, about one-half of the D-mannopyranosyl main-chain units contain aD-galactopyranosyl side chain.
The galactomannan of locust bean gum (LBG, also called carob gum) has fewer branch units than does guaran and its structureis more irregular, with long stretches of about 80 underivatized D-mannosyl units alternating with sections of about 50 units inwhich almost every main chain unit has an a-D-galactopyranosyl group glycosidically connected to its O-6 position.
Because of the difference in structures, guar gum and LBG have different physical
FIGURE 41A representative seg ment of a g alactomannan molecule.

Pag e 208
properties, even though both are composed of long, rather rigid chains that provide high solution viscosity. Because guaran hasits galactosyl units fairly evenly placed along the chain, there are few locations on the chains that are suitable for formation ofjunction zones. However, LBG, with its long “naked chain” sections, can form junction zones. LBG molecules can interact withbare portions of cellulose derivatives to form junctions. This produces an increase in viscosity. LBG also interacts with xanthan(see Sec. 4.7) and carrageenan (see Sec. 4.8) helices to form rigid gels.
Guar gum provides economical thickening to numerous food products. It is used frequently in combination with other food gums,such as in ice cream, where it is used in combination with carboxymethylcellulose (see Sec. 4.5.2), carrageenan (see Sec. 4.8),xanthan (see Sec. 4.7), and LBG.
Typical products in which LBG is found are the same as those for guar gum. About 85% of LBG is used in dairy and frozendessert products. It is rarely used alone, but in combination with other gums such as CMC, carrageenan, xanthan, and guar gum.A typical use level is 0.05–0.25%.
4.7 Xanthan [25,40]
Xanthomonas campestris, a bacterium commonly found on leaves of plants of the cabbage family, produces a polysaccharide,termed xanthan, that is widely used as a food gum. The polysaccharide is known commercially as xanthan gum (Table 2).
Xanthan has a backbone chain identical to that of cellulose (Fig. 43; compare with Fig. 40). In the xanthan molecule, every otherb-D-glucopyranosyl unit in the cellulose backbone has attached, at the O-3 position, a b-D-mannopyranosyl-(1 4)-b-D-glucuronopyranosyl-(1 2)-6-O-acetyl-b-D-mannopyranosyl trisaccharide unit (Fig. 42).* About half of the terminal b-D-mannopyranosyl units have pyruvic acid attached as a 4,6-cyclic acetal. The trisaccharide side chains interact, by secondarybonding forces, with the main chain and make the molecule rather stiff. The molecular weight is probably in the order of 2 × 10⁶,although much larger values, presumably due to aggregation, have been reported.
Xanthan interacts with guar gum, giving a synergistic increase in solution viscosity. The interaction with LBG produces a heat-reversible gel (Fig. 42).
Xanthan is widely used as a food gum because of the following important characteristics: solubility in hot or cold water; highsolution viscosity at low concentrations; no discernible change in solution viscosity in the temperature range from 0 to 100°C,which makes it unique among food gums; solubility and stability in acidic systems; excellent compatibility with salt; interactionwith other gums such as LBG; ability to stabilize suspensions and emulsions; and good solution stability when exposed tofreezing and thawing. The unusual and very useful properties of xanthan undoubtedly result from the structural rigidity andextended nature of its molecules, which in turn result from its linear, cellulosic backbone, which is stiffened and shielded by theanionic trisaccharide side chains.
Xanthan is ideal for stabilizing aqueous dispersions, suspensions, and emulsions. The fact that the viscosity of its solutionschanges very little with temperature—that is, its solutions do not thicken upon cooling—makes it irreplaceable for thickening andstabilizing such products as pourable salad dressings and chocolate syrup, which need to pour as easily when taken from therefrigerator as they do at room temperature, and gravies, which should
*Bacterial heterog lycans, unlike plant heterog lycans, usually have reg ular, repeating -unit structures.

Pag e 209
FIGURE 42Representation of the hypothesized interaction of a
locust bean g um molecule with double-helical portionsof xanthan or carrag eenan molecules to form a
three-dimensional network and a g el.
neither thicken appreciably as they cool nor thin too much when hot. In regular salad dressings, xanthan is at the same time athickener and a stabilizer for both the suspension of particulate materials and the oil-in-water emulsion. It is also a thickener andsuspending agent in no-oil (reduced-calorie) dressings. In both oil-containing and no-oil salad dressings, xanthan is almostalways used in combination with propylene glycol alginate (PGA) (see Sec. 4.9). PGA decreases solution viscosity andpseudoplasticity. Together they give the desired pourability associated with the pseudoplastic xanthan and the creaminesssensation associated with a nonpseudoplastic solution.
Blends of xanthan and LBG and/or guar gum are excellent ice cream stabilizers. Carrageenan is added to the mix to preventwhey separation.

Pag e 210
FIGURE 43Structure of the pentasaccharide repeating unit of xanthan. Note the 4,6-O-pyruvyl-D-mannopyranosyl nonreducing end
unit of the trisaccharide side chain. About half of the side chains are normally pyruvylated.

Pag e 211
4.8 Carrageenans [15,50]
The carrageenans are mixtures of several related galactans having sulfate half-ester groups attached to the sugar units (Table 2).They are extracted from red seaweeds with a dilute alkaline solution; the sodium salt of a carrageenan is normally produced.Also prepared and used is an alkali-modified seaweed flour called processed Euchema seaweed (PES) or Phillippine naturalgrade (PNG) carrageenan. To prepare PES/PNG carrageenan, red seaweed is treated with a potassium hydroxide solution.Because the potassium salts of the types of carrageenans found in these seaweeds are insoluble, they are not extracted out.Primarily low-molecular-weight soluble components are removed from the plants during this treatment. The remaining seaweedis dried and ground to a powder. PES/PNG carrageenan is, therefore, a composite material that contains not only the moleculesof carrageenan that would be extracted with dilute sodium hydroxide, but also other cell wall materials.
The term carrageenan denotes a group or family of sulfated galactans extracted from red seaweeds. Carrageenans are linearchains of D-galactopyranosyl units joined with alternating (1 3)-a-D- and (1 4)-b-D-glycosidic linkages, with most sugarunits having one or two sulfate groups esterified to a hydroxyl group at carbon atoms C-2 or C-6. This gives a sulfate contentranging from 15 to 40%. Units often contain a 3,6-anhydro ring. The principal structures are termed kappa (k), iota, (i), andlambda (l) (Fig. 44). The disaccharide units shown in Figure 44 represent the predominant building block of each type but arenot repeating unit structures. Carrageenans, as extracted, are mixtures of nonhomogeneous polysaccharides. Carrageenanproducts, of which there may be well more than 100 for different specific applications from a single supplier, contain differentproportions of the three main behavioral types: kappa, iota, and lambda.
Carrageenan products dissolve in water to form highly viscous solutions. The viscosity is quite stable over a wide range of pHvalues because the sulfate half-ester groups are always ionized, even under strongly acidic conditions, giving the molecules anegative charge.
Segments of molecules of kappa- and iota-type carrageenans exist as double helices of parallel chains. In the presence ofpotassium or calcium ions, thermoreversible gels form upon cooling a hot solution containing such double-helical segments.Gelation can occur in water at concentrations as low as 0.5%. When kappa-type carrageenan solutions are cooled in thepresence of potassium ions, a stiff, brittle gel results. Calcium ions are less effective in causing gelation. Potassium and calciumions together produce a high gel strength. Kappa-type gels are the strongest of the carrageenan gels. These gels tend to synereseas junction zones extend within the structure. The presence of other gums retards syneresis.
Iota types are a little more soluble than are kappa-type carrageenans, but again only the sodium salt form is soluble in coldwater. Iota types gel best with calcium ions. The resulting gel is soft and resilient, has good freeze-thaw stability, and does notsynerese, presumably because iota-type carrageenans are more hydrophilic and form fewer junction zones than do kappa-typecarrageenans.
During cooling of solutions of kappa- or iota-type carrageenans, gelation occurs because the linear molecules are unable to formcontinuous double helices due to the presence of structural irregularities. The linear helical portions then associate to form arather firm three-dimensional, stable gel in the presence of the appropriate cation (Fig. 45). All salts of lambda-typecarrageenans are soluble and nongelling.
Under conditions in which double helical segments occur, carrageenan molecules, particularly those of the kappa type, formjunction zones with the naked segments of LBG to produce rigid, brittle, syneresing gels. This gelation occurs at a concentrationone-third that needed to form a pure kappa-type carrageenan gel.

Pag e 212
FIGURE 44Idealized unit structures of kappa-, iota-, and lambda-type
carrag eenans.
Carrageenans are most often used because of their ability to form gels with milk and water. Blending provides a wide range ofproducts that are standardized with various amounts of sucrose, glucose (dextrose), buffer salts, or gelling aids, such aspotassium chloride. The available commercial products form a variety of gels: gels that are clear or turbid, rigid or elastic, toughor tender, heat-stable or thermally reversible, and do or do not undergo syneresis. Carrageenan gels do not require refrigerationbecause they do not melt at room temperature. They are freeze-thaw stable.
A useful property of carrageenans is their reactivity with proteins, particularly those of milk. Kappa-type carrageenans complexwith kappa-casein micelles of milk, forming a weak, thixotropic, pourable gel. The thickening effect of kappa-carrageenans inmilk is 5–10 times greater than it is in water. This property is used in the preparation of chocolate milk where the thixotropic gelstructure prevents settling of cocoa particles. Such stabilization requires only about 0.025% gum. This property is also utilized inthe preparation of ice cream, evaporated

Pag e 213
FIGURE 45A representation of the hypothesized mechanism of g elation of kappa- and
iota-type carrag eenans. In a hot solution, the polymer molecules are in a coiled state.As the solution is cooled, they intertwine in double-helical structures. As the solution
is cooled further, the double helices are believed to nest tog ether with the aid of potassiumor calcium ions.
milk, infant formulas, freeze-thaw stable whipped cream, and emulsions in which milk fat is replaced with a vegetable oil.
The synergistic effect between kappa-carrageenan and locust bean gum (LBG) (Fig. 42) produces gels with greater elasticityand gel strength, and less syneresis than gels of potassium kappa-carrageenan alone. As compared to kappa-type carrageenanalone, the kappa-type carrageenan-LBG combination provides greater stabilization and air bubble retention (overrun) in icecream, but also a little too much chewiness, so guar gum is added to soften the gel structure.
Cold hams and poultry rolls take up 20–80% more brine when they contain 1–2% of a kappa-type carrageenan. Improvedslicing also results. Carrageenan coatings on meats can serve as a mechanical protection and a carrier for seasonings and flavors.Carrageenan is sometimes added to meat analogs made from casein and vegetable proteins. A growing use of carrageenan is tohold water and maintain water content, and therefore softness of meat products, such as wieners and sausages, during thecooking operation. Addition of a kappa- or iota-type carrageenan in the Na+ form or PES/PNG carrageenan to low-fat groundbeef improves texture and

Pag e 214
hamburger quality. Normally, fat serves the purpose of maintaining softness, but because of the binding power of carrageenanfor protein and its high affinity for water, carrageenans can be used to replace in part this function of natural animal fat in leanproducts.
Two other food gums, agar and furcellaran (also called Danish agar), also come from red seaweeds and have structures andproperties that are closely related to those of the carrageenans.
4.9 Algins [5,28]
Commercial algin is a salt, most often the sodium salt, of a linear poly (uronic acid), alginic acid, obtained from brown seaweeds(Table 2). Alginic acid is composed of two monomeric units, b-D-mannopyranosyluronic acid and a-L-gulopyranosyluronic acidunits. These two monomers occur in homogeneous regions (composed exclusively of one unit or the other) and in regions ofmixed units. Segments containing only D-mannuronopyranosyl units are referred to as M blocks and those containing only L-guluronopyranosyl units as G blocks. D-Mannuronopyranosyl units are in the 4C1 conformation, while L-guluronopyranosyl unitsare in the 1C4 conformation (see Sec. 4.1.2 and Fig. 46), which gives the different blocks quite different chain conformations. M-Block regions are flat and ribbon-like, similar to the conformation of cellulose (see Sec. 4.5), because of the equatorial equatorial bonding. G-block regions have a pleated (corrugated) conformation as a result of its axial axial glycosidic bonds.Different percentages of the different block segments cause algins (alginates) from different seaweeds to have differentproperties. Algins with high G-block contents produce gels of high strength.
Solutions of sodium alginates are highly viscous. The calcium salt of alginates is insoluble. The insoluble salt results from theautocooperative reaction between calcium ions and the G-block regions of the chain. The holes formed between two G-blockchains are cavities that bind calcium ions. The result is a junction zone that has been called an “egg box” arrangement
FIGURE 46Units of b-D-mannopyranosyluronic
acid (bManpA) in the 4C1 conformationand a-L-g ulopyranosyluronic acid(aLGulpA) in the 1C4 conformation.

Pag e 215
with the calcium ions being likened to eggs in the pockets of an egg carton (Fig. 47). The strength of the gel depends on thecontent of G blocks in the alginate used and the concentration of calcium ions.
Propylene glycol alginates are made by reacting moist alginic acid with propylene oxide to produce a partial ester with 50–85%of the carboxyl groups esterified. Solutions of propylene alginates (PGA) are much less sensitive to low pH values andpolyvalent cations, including calcium ions and proteins, than are solutions of nonesterified alginates, because esterified carboxylgroups cannot ionize. Also, the propylene glycol group introduces a bump on the chain that prevents close association of chains.Therefore, PGA solutions are quite stable. Because of its tolerance to calcium ions, propylene glycol alginates can be used indairy products. The hydrophobic propylene glycol groups also give the molecule mild interfacial activity, that is, foaming,emulsifying, and emulsion-stabilizing properties.
Algin is widely used to provide high viscosity at low concentrations. Even greater viscosity under low-shear conditions can beachieved by introducing a small amount of calcium ions. If PGA is used, some calcium ion cross-linking of chains still occursthrough the remaining carboxylate groups, and results in thickening of solutions (rather than gelling).
Calcium alginate gels are obtained by diffusion setting, internal setting, and setting by cooling. Diffusion setting can be used toprepare structured foods. Perhaps the best example is the structured pimento strip. In the production of pimento strips forstuffing green olives, pimento puree is first mixed with water containing a small amount of guar gum as an immediate thickener,and then with sodium alginate. The mixture is pumped onto a conveyor belt and gelled by the addition of calcium ions. The setsheet is cut into thin strips and stuffed into olives. Internal setting for fruit mixes, purees, and fruit analogs involves slow release ofcalcium ions within the mixture. Setting by cooling involves dissolving a calcium salt, a slightly soluble acid, and a sequestrant inhot water and allowing the mixture to set on cooling. Gels produced in this way are quite stable. Alginate gels are reasonablyheat stable and show little or no syneresis; those containing fruit can be used for fillings that remain stable through pasteurizationand cooling. Unlike gelatin gels, alginate gels are not thermoreversible and can be used as dessert gels that do not requirerefrigeration.
Alginic acid, an alginate solution whose pH has been lowered, with and without addi-
FIGURE 47A representation of the proposed formation of a junction between G-block reg ions
of three alg inate molecules promoted by calcium ions.

Pag e 216
tion of some calcium ions, is employed in the preparation of soft, thixotropic, nonmelting gels (Table 2).
Propylene glycol alginate is used when stability to acid, nonreactivity with calcium ions (for example, in milk products), or itssurface-active property is desired. Accordingly, it finds use as a thickener in salad dressings (Table 2). In low-calorie dressings,it is often used in conjunction with xanthan (see Sec. 4.7).
4.10 Pectins [4,41]
Commercial pectins are galacturonoglycans [poly(a-D-galactopyranosyluronic acids) with various contents of methyl estergroups (Table 2). Native pectins found in the cell walls and intercellular layers of all land plants are more complex molecules thatare converted into commercial products during extraction with acid. Commercial pectin is obtained from citrus peel and applepomace. Pectin from lemon and lime peel is the easiest to isolate and is of the highest quality. Pectins have an unique ability toform spreadable gels in the presence of sugar and acid or in the presence of calcium ions and are used almost exclusively inthese types of applications.
The compositions and properties of pectins vary with source, the processes used during preparation, and subsequent treatments.During extraction with mild acid, some hydrolytic depolymerization and hydrolysis of methyl ester groups occurs. Therefore, theterm pectin denotes a family of compounds, and this family is part of a still larger family called pectic substances. The term pectinis usually used in a generic sense to designate those water-soluble galacturonoglycan preparations of varying methyl estercontents and degrees of neutralization that are capable of forming gels. In all natural pectins, some of the carboxyl groups are inthe methyl ester form. Depending on the isolation conditions, the remaining free carboxylic acid groups may be partly or fullyneutralized, that is, partly or fully present as sodium, potassium, or ammonium carboxylate groups. Typically, they are present inthe sodium salt form.
By definition, preparations in which more than half of the carboxyl groups are in the methyl ester form (-COOCH3) are classifiedas high-methoxyl (HM) pectins (Fig. 48); the remainder of the carboxyl groups will be present as a mixture of free acid (-COOH) and salt (-COO-Na+) forms. Preparations in which less than half of the carboxyl groups are in the methyl ester form arecalled low-methoxyl (LM) pectins. The percentage of carboxyl groups esterified with methanol is the degree of esterification(DE). Treatment of a pectin preparation with ammonia dissolved in methanol converts some of the methyl ester groups intocarboxamide groups (15–25%). In the process, a low-methoxyl (LM) pectin (by definition) is formed. These products areknown as amidated LM pectins.
The principal and key feature of all pectin molecules is a linear chain of (1 4)-linked a-D-galactopyranosyluronic acid units.Neutral sugars, primarily L-rhamnose, are also present. In citrus and apple pectins, the a-L-rhamnopyranosyl units seem to beinserted into the polysaccharide chain at rather regular intervals. The inserted L-rhamnopyranosyl units may
FIGURE 48The most prevalentmonomeric unit of a
hig h-methoxyl pectin.

Pag e 217
provide the necessary irregularities in the structure required to limit the size of the junction zones and effect gelation. At leastsome pectins contain covalently attached, highly branched arabinogalactan chains and/or short side chains composed of D-xylosyl units. The presence of side chains may also be a factor that limits the extent of chain association. Junction zones areformed between regular, unbranched pectin chains when the negative charges on the carboxylate groups are removed (additionof acid), when hydration of the molecules is reduced (by addition of a cosolute, almost always sugar, to a solution of HMpectin), and/or when pectinic acid polymer chains are bridged by calcium cations.
HM pectin solutions gel when sufficient acid and sugar are present. As the pH of a pectin solution is lowered, the highly hydratedand charged carboxylate groups are converted into uncharged, only slightly hydrated carboxylic acid groups. As a result oflosing some of their charge and hydration, the polymer molecules can now associate over a portion of their length, formingjunctions and a network of polymer chains that entraps the aqueous solution of solute molecules. Junction zone formation isassisted by the presence of a high concentration (~65%, at least 55%) of sugar, which competes for water of hydration andreduces solvation of the chains, allowing them to interact with one another.
LM pectin solutions gel only in the presence of divalent cations, which provide crossbridges. Increasing the concentration ofdivalent cations (only calcium ion is used in food applications) increases the gelling temperature and gel strength. The samegeneral egg-box model used to describe the formation of calcium alginate gels (see Sec. 4.9) is used to explain gelation ofsolutions of LM and amidated LM pectins upon addition of calcium ions. LM pectin, since it does not require sugar for gelation,is used to make dietetic jams, jellies, and marmalades.
4.11 Gum Arabic [14,53]
When the bark of some trees and shrubs is injured, the plants exude a sticky material that hardens to seal the wound and giveprotection from infection and desiccation. Such exudates are commonly found on plants that grow in semiarid climates. Allrequire cleaning and pasteurization, since they are sticky when freshly exuded and trap dust, sand particles, insects, bacteria,and/or pieces of bark. Gum arabic (gum acacia), gum karaya, and gum ghatti are exudates of trees; gum tragacanth is theexudate of a shrub. Their overall use has diminished and continues to diminish because of their uncertain and restrictedavailability and their increasing cost. Only gum arabic still has a good market in its traditional food applications.
Gum arabic (gum acacia) is an exudate of acacia trees, of which there are many species distributed over tropical and subtropicalregions (Table 2). The most important growing areas for species that give the best gum are the Sudan and Nigeria.
Gum arabic is a heterogeneous material, but generally consists of two fractions. One, which accounts for about 70% of the gum,is composed of polysaccharide chains with little or no nitrogenous material. The other fraction contains molecules of highermolecular weight that have protein as an integral part of their structures. The protein-polysaccharide fraction is itselfheterogeneous with respect to protein content. The polysaccharide structures are covalently attached to the protein componentby linkage to hydroxyproline and, perhaps, serine units, the two predominant amino acids in the polypeptide. The overall proteincontent is about 2 wt%, but specific fractions may contain as much as 25 wt% protein.
The polysaccharide structures, both those attached to protein and those that are not, are highly branched, acidicarabinogalactans with the following approximate composition: D-galactose, 44%; L-arabinose, 24%; D-glucuronic acid, 14.5%;L-rhamnose, 13%; 4-O-methyl-D-glucuronic acid, 1.5%. They contain main chains of (1 3)-linked b-D-galactopyranosylunits

Pag e 218
having two- to four-unit side chains consisting of (1 3)-b-D-galactopyranosyl units joined to it by (1 6)-linkages. Both themain chain and the numerous side chains have attached a-L-arabinofuranosyl, a-L-rhamnopyranosyl, b-D-glucuronopyranosyl,and 4-O-methyl-b-D-glucuronopyranosyl units. The two uronic acid units occur most often as ends of chains.
Gum arabic dissolves easily when stirred in water. It is unique among the food gums because of its high solubility and the lowviscosity of its solutions. Solutions of 50% concentration can be made. At this concentration, the dispersion is somewhat gel-like.
Gum arabic is both a fair emulsifying agent and a very good emulsion stabilizer for flavor oil-in-water emulsions. It is the gum ofchoice for emulsification of citrus, other essential oils, and limitation flavors used as baker's emulsions and concentrations for softdrinks. The soft drink industry consumes about 30% of the gum supply as an emulsifier and stabilizer. For a gum to have anemulsion-stabilizing effect, it must have anchoring groups with a strong affinity for the surface of the oil and a molecular size largeenough to cover the surfaces of dispersed droplets. Gum arabic has surface activity and forms a thick, sterically stabilizing,macromolecular layer around oil droplets. Emulsions made with flavor oils and gum arabic can be spray-dried to produce dryflavor powders that are nonhygroscopic and in which the flavor oil is protected from oxidation and volatization. Rapid dispersionand release of flavor without affecting product viscosity are other attributes. These stable flavor powders are used in drypackage products such as beverage, cake, dessert, pudding, and soup mixes.
Another important characteristic is its compatibility with high concentrations of sugar. Therefore, it finds widespread use inconfections with a high sugar content and a low water content. More than half the world's supply of gum arabic is used inconfections such as caramels, toffees, jujubes, and pastilles. Its functions in confections are to prevent sucrose crystallization andto emulsify and distribute fatty components. Avoidance of surface accumulation of lipids is important because this occurrenceresults in a greasy surface whitening, called bloom. Another use is as a component of the glaze or coating of pan-coated candies.
4.12 Dietary Fiber and Carbohydrate Digestibility [7,23,29,45,46,54,57]
Dietary fiber is not necessarily fibrous in nature. Dietary fiber is a nutritional term that has nothing to do with its physical orchemical nature, although both chemical and physical properties are involved in its determination. Dietary fiber is actually definedby the method used to measure it, of which there are several. Both insoluble plant cell-wall materials, primarily cellulose andlignin, and nonstarch, water-soluble polysaccharides are components of dietary fiber. The only common feature of thesesubstances is that they are nondigestible polymers. Therefore, not only do natural components of foods contribute dietary fiber,but so also do gums that are added to modify rheological properties, to provide bulk, and/or to provide other functionalities asalready described.
One natural component of dietary fiber is a water-soluble polysaccharide, commonly known as b-glucan, but more properly b-D-glucan, that is present in oat and barley brans. Oat b-glucan has become a commercial food ingredient because it has beenshown to be effective in reducing the level of serum cholesterol. Oat b-glucan is a linear chain of b-D-glucopyranosyl units.About 70% are linked (1 4) and about 30% (1 3). The (1 3) linkages occur singly and are separated by sequencesof two or three (1 4) linkages. Thus, the molecule is composed of (1 3)-linked b-cellotriosyl [ 3)-bGlcp-(1 4)-bGlcp-(1 4)-

Pag e 219
FIGURE 49Representative structure of a seg ment of
oatand barley b-g lucans where n usually is
1 or 2,but occasionally may be larg er
(shorthandnotation).
bGlcp-(1 ] and b-cellotetraosyl units (Fig. 49). Such (1 4,1 3)-b-glucans are often called mixed-linkage b-glucans.
When taken orally in foods, b-glucans reduce postprandial serum glucose levels and the insulin response—that is, they moderatethe glycemic response—in both normal and diabetic human subjects. This effect seems to be correlated with viscosity. They alsoreduce serum cholesterol concentrations in rats, chicks, and humans. These physiological effects are typical of those of solubledietary fiber. Other soluble polysaccharides have similar effects but to differing degrees. The mechanism(s) of action remains tobe determined.
Carbohydrates have always been the principal source of metabolic energy for humans and the means for maintaining health ofthe human gastrointestinal tract. Carbohydrates are the principal providers of the bulk and body of food products.
The higher saccharides may be digestible (most starch-based products), partially digestible (retrograded amylose, the so-calledresistant starch), or nondigestible (essentially all other polysaccharides). When digestive hydrolysis to monosaccharides occurs,the products of digestion are absorbed and catabolized. [Only D-glucose is produced by digestion of polysaccharides (starch) inhumans.] Those carbohydrates not digested to monosaccharides by human enzymes in the small intestine (all others exceptsucrose, lactose, and those related to starch) may be metabolized by microorganisms in the large intestine, producing substancesthat are absorbed and catabolized for energy. Therefore, carbohydrates may be caloric, partially caloric, or essentiallynoncaloric. They may be soluble or insoluble, and they may produce high or low viscosities. Naturally occurring plantcarbohydrates are nontoxic.
The most common bulking agents in natural food are remnants of plant cells resistant to hydrolysis by enzymes in the alimentarytract. This material includes cellulose, hemicelluloses, pectin, and lignin. Dietary fiber bulking agents are important in humannutrition because they maintain normal functioning of the gastrointestinal tract. They increase intestinal and fecal bulk, whichlowers intestinal transit time and helps prevent constipation. Their presence in foods induces satiety at meal time. Nutritionists setrequirements of dietary fiber at 25–50 g/day. Insoluble fiber bulking agents are claimed to decrease blood cholesterol levels,lessening the chance of heart disease. They also reduce the chances of colonic cancer, probably due to their sweeping action.
Soluble gums other than b-glucans have similar effects in the gastrointestinal tract and on the level of cholesterol in blood, but todifferent extents. Some gums that have been specifically examined in this regard are pectin, guar gum, xanthan, andhemicelluloses. [For example, guar gum ingested at a rate of 5 g/day results in an improved glycemic index, a 13% lowering ofserum cholesterol, and no decrease in the high-density lipoprotein (HDL) fraction, the beneficial cholesterol carrier.] In additionto cereal brans, kidney and navy beans are especially good sources of dietary fiber. A product based on psyllium seed hulls hashigh water-binding properties, leading to rapid transit time in the gastrointestinal tract, and is used to prevent constipation. Aproduct with a methylcellulose base is sold for the same purpose.

Pag e 220
The starch polysaccharides are the only polysaccharides that can be hydrolyzed by human digestive enzymes. They, of course,provide D-glucose, which is absorbed by microvilli of the small intestine to supply the principal metabolic energy of humans.Other polysaccharides consumed normally as natural components of edible vegetables, fruits, and other plant materials, andthose food gums added to prepared food products, are not digested in the upper digestive tract of humans, but pass into thelarge intestine (colon) with little or no change. (The acidity of the stomach is not strong enough, nor is the residence time ofpolysaccharides in the stomach sufficiently long, to cause significant chemical cleavage.) When the undigested polysaccharidesreach the large intestine, they come into contact with normal intestinal microorganisms, some of which produce enzymes thatcatalyze hydrolysis of certain polysaccharides or certain parts of polysaccharide molecules. The consequence of this is thatpolysaccharides not cleaved in the upper intestinal tract may undergo cleavage and microbial metabolism within the largeintestine.
Sugars that are split from the polysaccharide chain are used by the microorganisms of the large intestine as energy sources inanaerobic fermentation pathways that produce lactic, propionic, butyric, and valeric acids. These short-chain acids can beabsorbed through the intestinal wall and metabolized, primarily in the liver. In addition, a small, though significant in some cases,fraction of the released sugars can be taken up by the intestinal wall and transported to the portal bloodstream where they areconveyed to the liver and metabolized. It is calculated that, on average, 7% of human energy is derived from sugars split frompolysaccharides by microorganisms in the large intestine and/or from the acid by-products produced from them by thesemicroorganisms via anaerobic fermentation. The extent of polysaccharide cleavage depends on the abundance of the particularorganism(s) producing the specific enzymes required. Thus, when changes occur in the type of polysaccharide consumed,utilization of the polysaccharide by colonic microorganisms may be temporarily reduced until organisms capable of splitting thenew polysaccharide proliferate.
Some polysaccharides survive almost intact during their transit through the entire gastrointestinal tract. These, plus largersegments of other polysaccharides, give bulk to the intestinal contents and lower transit time. They can be a positive factor inhealth through a lowering of blood cholesterol concentration, perhaps by sweeping out bile salts and reducing their chances forreabsorption from the intestine. In addition, the presence of large amounts of hydrophilic molecules maintains a water content ofthe intestinal contents that results in softness and consequent easier passage through the large intestine.
Bibliography
Dey, P. M., and R. A. Dixon, eds. (1985). Biochemistry of Storage Carbohydrates in Green Plants, Academic Press,London.
Eliason, A.-C., ed. (1996). Carbohydrates in Food, Marcel Dekker, New York.
El Khadem, H. S. (1988). Carbohydrate Chemistry, Academic Press, San Diego.
Glicksman, M., ed. (1982–1984). Food Hydrocolloids, vols. I–III, CRC Press, Boca Raton, FL.
Kennedy, J. F., ed. (1988). Carbohydrate Chemistry, University Press, New York.
Lineback, D. R., and G. E. Inglett, eds. (1982). Food Carbohydrates, AVI, Westport, CT.
Mathlouthi, M., and P. Reiser, eds. (1995). Sucrose: Properties and Applications, Blackie, Glasgow.
Stephen, A. M., ed. (1995). Food Polysaccharides and Their Applications, Marcel Dekker, New York.
Whistler, R. L., and J. N. BeMiller, eds. (1993). Industrial Gums, 3rd ed., Academic Press, San Diego.
Whistler, R. L., J. N. BeMiller, and E. F. Paschall, eds. (1994). Starch: Chemistry and Technology, 2nd ed., AcademicPress, New York.
Wurzburg, O. B., ed. (1986). Modified Starches: Properties and Uses, CRC Press, Boca Raton, FL.

Pag e 221
References
1. BeMiller, J. N. (1993). Starch-based gums, in Industrial Gums (R. L. Whistler and J. N. BeMiller, eds.), Academic Press,San Diego, pp. 579–600.
2. Biliaderis, C. G. (1990). Thermal analysis of food carbohydrates, in Thermal Analysis of Foods (V. R. Harwalkar and C. -Y. Ma, eds.), Elsevier Science, New York, pp. 168–220.
3. Biliaderis, C. G. (1991). The structure and interactions of starch with food constituents. Can. J. Physiol. Pharmacol.69:60–78.
4. Christensen, S. H. (1984). Pectins, in Food Hydrocolloids, vol. III (M. Glicksman, ed.), CRC Press, Boca Raton, FL, pp.205–230.
5. Clare, K. (1993). Algin, in Industrial Gums (R. L. Whistler and J. N. BeMiller, eds.), Academic Press, San Diego, pp.105–143.
6. Dickinson, E., ed. (1991). Food Polymers, Gels, and Colloids, Royal Society of Chemistry, London.
7. Dixon, R. A. (1985). b-(1 3)-Linked glucans from higher plants, in Biochemistry of Storage Carbohydrates in GreenPlants (P. M. Dey and R. A. Dixon, eds.), Academic Press, London, pp. 229–264.
8. El Khadem, H. S. (1988). Carbohydrate Chemistry, Academic Press, San Diego.
9. Emodi, A. (1982). Polyols: chemistry and application, in Food Carbohydrates (D. R. Lineback and G. E. Inglett, eds.),AVI, Westport, CT, pp. 49–61.
10. Feather, M. S. (1982). Sugar dehydration reactions, in Food Carbohydrates (D. R. Lineback and G. E. Inglett, eds.),AVI, Westport, CT, pp. 113–133.
11. Feddersen, R. L., and S. N. Thorp (1993). Sodium carboxymethylcellulose, in Industrial Gums (R. L. Whistler and J. N.BeMiller, eds.), Academic Press, San Diego, pp. 537–578.
12. Fujimaki, M., M. Namiki, and H. Kato, eds. (1986). Amino-Carbonyl Reactions in Food and Biological Systems,Elsevier, Amsterdam.
13. Glicksman, M. (1982). Functional properties of hydrocolloids, in Food Hydrocolloids, Vol. I (M. Glicksman, ed.), CRCPress, Boca Raton, FL, pp. 47–99.
14. Glicksman, M. (1983). Gum arabic (gum acacia), in Food Hydrocolloids, vol. II (M. Glicksman, ed.), CRC Press, BocaRaton, FL, pp. 7–29.
15. Glicksman, M. (1983). Red seaweed extracts (agar, carrageenan, furcellaran), in Food Hydrocolloids, vol. II (M.Glicksman, ed.), CRC Press, Boca Raton, FL, pp. 73–113.
16. Grover, J. A. (1984). Methylcellulose (MC) and hydroxypropylmethylcellulose (HPMC), in Food Hydrocolloids, vol. III(M. Glicksman, ed.), CRC Press, Boca Raton, FL, pp. 121–154.
17. Grover, J. A. (1993). Methylcellulose and its derivatives, in Industrial Gums (R. L. Whistler and J. N. BeMiller, eds.),Academic Press, San Diego, pp. 475–504.
18. Harris, P., ed. (1990). Food Gels, Elsevier Applied Science, London.
19. Herald, C. T. (1984). Locust/carbo bean gum, in Food Hydrocolloids, vol. III (M. Glicksman, ed.), CRC Press, BocaRaton, FL, pp. 161–170.
20. Herald, C. T. (1984). Guar gum, in Food Hydrocolloids, vol. III (M. Glicksman, ed.), CRC Press, Boca Raton, FL, pp.171–184.
21. Hizukuri, S. (1985). Relationship between the distribution of the chain length of amylopectin and the crystalline structure ofstarch granules. Carbohydr. Res. 141:295–306.

22. Huzukuri, S. (1986). Polymodal distribution of the chain lengths of amylopectins and its significance. Carbohydr. Res.147:342–347.
23. Johnson, I. T., and Southgate, D. A. T. (1994). Dietary Fibre and Related Substances, Chapman & Hall, London.
24. Kainuma, K. (1988). Structure and chemistry of the starch granule, in The Biochemistry of Plants (J. Preiss, ed.),Academic Press, San Diego, pp. 141–180.
25. Kang, K. S., and D. J. Pettitt (1993). Xanthan, gellan, welan, and rhamsan, in Industrial Gums (R. L. Whistler and J. N.BeMiller, eds.), Academic Press, San Diego, pp. 341–397.
26. Keller, J. D. (1984). Sodium carboxymethylcellulose (CMC), in Food Hydrocolloids, vol. III (M. Glicksman, ed.), CRCPress, Boca Raton, FL, pp. 43–109.

Pag e 222
27. Kennedy, J. F., ed. (1988). Carbohydrate Chemistry, University Press, New York.
28. King, A. H. (1983). Brown seaweed extracts (alginates), in Food Hydrocolloids, vol. II (M. Glicksman, ed.), CRC Press,Boca Raton, FL, pp. 115–188.
29. Kritchevsky, D., and Bonfield, C., eds. (1995). Dietary Fiber in Health and Disease, Eagan Press, St. Paul, MN.
30. Labuza, T. P., Reineccius, G. A., Monnier, V., O'Brien, J., and Baynes, J., eds. (1995). Maillard Reactions in Chemistry,Food, and Health, CRC Press, Boca Raton, FL.
31. Maier, H., M. Anderson, C. Karl, K. Magnuson, and R. L. Whistler (1993). Guar, locust bean, tara and fenugreek gums, inIndustrial Gums (R. L. Whistler and J. N. BeMiller, eds.), Academic Press, San Diego, pp. 181–226.
32. Manners, D. J. (1985). Some aspects of the structure of starch. Cereal Foods World 30461–467.
33. Manners, D. J. (1985). Starch, in Biochemistry of Storage Carbohydrates in Green Plants (P. M. Dey and R. A. Dixon,eds.), Academic Press, London, pp. 149–203.
34. Manners, D. J. (1989). Recent developments in our understanding of amylopectin structure. Carbohydr. Polym.11:87–112.
35. Mathlouthi, M., and Reiser, P., eds. (1995). Sucrose: Properties and Applications, Blackie, Glasgow.
36. Miles, M. J., V. J. Morris, P. D. Orford, and S. G. Ring (1985). The roles of amylose and amylopectin in the gelation andretrogradation of starch. Carbohydr. Res. 135:271–281.
37. Morris, V. J. (1994). Starch gelation and retrogradation. Trends Food Sci. Technol. 1:2–6.
38. Morrison, W. R., and J. Karkaas (1990). Starch, in Methods in Plant Biochemistry, vol. 2, Carbohydrates (P. M. Dey,ed.), Academic Press, San Diego, pp. 323–352.
39. Pennington, N. L., and C. W. Baker, eds. (1990). Sugar, A User's Guide to Sucrose, Van Nostrand Reinhold, NewYork.
40. Pettitt, D. (1982). Xanthan gum, in Food Hydrocolloids, vol. I (M. Glicksman, ed.), CRC Press, Boca Raton, FL, pp.127–149.
41. Rolin, C. (1993). Pectin, in Industrial Gums (R. L. Whistler and J. N. BeMiller, eds.), Academic Press, San Diego, pp.257–293.
42. Sand, R. E. (1982). Nomenclature and structure of carbohydrate hydrocolloids, in Food Hydrocolloids, vol. I (M.Glicskman, ed.), CRC Press, Boca Raton, FL, pp. 19–46.
43. Schenck, F. W., and R. E. Hebeda, eds. (1992). Starch Hydrolysis Products, VCH, New York.
44. Slade, L., and H. Levine (1989). A food polymer science approach to selected aspects of starch gelatinization andretrogradation, in Frontiers in Carbohydrate Research—1, (R. P. Millane, J. N. BeMiller, and R. Chandrasekaran, eds.),Elsevier Applied Science, London, pp. 215–270.
45. Spiller, G. A. (1993). CRC Handbook of Dietary Fiber in Human Nutrition, 2nd ed., CRC Press, Boca Raton, FL.
46. Staub, H. W., and R. Ali (1982). Nutritional and physiological value of gums, in Food Hydrocolloids, vol. I (M. Glicksman,ed.), CRC Press, Boca Raton, FL, pp. 101–121.
47. Stephen, A. M., ed. (1995). Food Polysaccharides and Their Applications, Marcel Dekker, New York.
48. Strickler, A. J. (1982). Corn syrup selections in food applications, in Food Carbohydrates (D. R. Lineback and G. E.Inglett, eds.), AVI, Westport, CT, pp. 12–24.
49. Takeda, Y., T. Shitaozono, and S. Hizukuri (1990). Structures of subfractions of corn amylose. Carbohydr. Res.199:207–214.

50. Therkelsen, G. H. (1993). Carrageenan, in Industrial Gums (R. L. Whistler and J. N. BeMiller, eds.), Academic Press,San Diego, pp. 145–180.
51. Thomas, W. R. (1984). Microcrystalline cellulose (MCC or cellulose gel), in Food Hydrocolloids, vol. III (M. Glicksman,ed.), CRC Press, Boca Raton, FL, pp. 9–42.
52. Van Beynum, G. M. A., and J. A. Roels, eds. (1985). Starch Conversion Technology, Marcel Dekker, New York.
53. Whistler, R. L. (1993). Exudate gums, in Industrial Gums (R. L. Whistler and J. N. BeMiller, eds.), Academic Press, SanDiego, pp. 309–339.
54. Whistler, R. L. (1993). Hemicelluloses, in Industrial Gums (R. L. Whistler and J. N. BeMiller, eds.), Academic Press, SanDiego, pp. 295–308.

Pag e 223
55. Whistler, R. L., and J. N. BeMiller, eds. (1993). Industrial Gums, 3rd ed., Academic Press, San Diego.
56. Whistler, R. L., J. N. BeMiller, and E. F. Paschall, eds. (1984). Starch: Chemistry and Technology, 2nd ed., AcademicPress, New York.
57. Wood, P. J., ed. (1993). Oat Bran, American Association of Cereal Chemists, St. Paul, MN.
58. Wurzburg, O. B., ed. (1986). Modified Starches: Properties and Uses, CRC Press, Boca Raton, FL.
59. Yaylayan, V. A., and A. Huyghues-Despointes (1994). Chemistry of Amadori rearrangement products: Analysis, synthesis,kinetics, reactions, and spectroscopic properties. Crit. Rev. Food Sci. Nutr. 34:321–369.
60. Young, R. A., and R. M. Rowell, eds. (1986). Cellulose, John Wiley, New York.
61. Zobel, H. F. (1988). Molecules to granules: A comprehensive starch review. Starch/Stärke 40:44–50.

Pag e 225
5Lipids
WASSEF W. NAWARUniversity of Massachusetts, Amherst, Massachusetts
5.1. Introduction 226
5.2. Nomenclature 226
5.2.1. Fatty Acids 226
5.2.2. Acylglycerols 228
5.2.3. Phospholipids 231
5.3. Classification 232
5.3.1. Milk Fats 232
5.3.2. Lauric Acids 232
5.3.3. Vegetable Butters 232
5.3.4. Oleic-Linoleic Acids 233
5.3.5. Linolenic Acids 233
5.3.6. Animal Fats 233
5.3.7. Marine Oils 233
5.4. Physical Aspects 233
5.4.1. Theories of Triacylglycerol Distribution Patterns 233
5.4.2. Positional Distribution of Fatty Acids in Natural Fats 237
5.4.3. Crystallization and Consistency 239
5.5. Chemical Aspects 254
5.5.1. Lipolysis 254
5.5.2. Autoxidation 255
5.5.3. Thermal Decomposition 288
5.5.4. Chemistry of Frying 292
5.5.5. Effects of Ionizing Radiation on Fats 295

5.5.6. Concluding Thoughts on Lipid Oxidation in Food 299
5.6. Chemistry of Fat and Oil Processing 299
5.6.1. Refining 299
5.6.2. Hydrogenation 300
5.6.3. Interesterification 304

Pag e 226
5.7. Role of Food Lipids in Flavor 307
5.7.1. Physical Effects 307
5.7.2. Lipids as Flavor Precursors 308
5.8. Physiological Effects of Lipids 310
5.8.1. Consumption and Trends 310
5.8.2. Nutritional Functions 310
5.8.3. Safety of Lipids Exposed to Frying Conditions 310
5.8.4. Safety of Hydrogenated Fats 311
5.8.5. Safety of Irradiated Food 312
5.8.6. Dietary Lipids, Coronary Heart Disease, and Cancer 312
5.8.7. Concluding Thoughts on Dietary Lipids and Health 313
Acknowledgments 313
Bibliography 313
References 314
5.1 Introduction
Lipids consist of a broad group of compounds that are generally soluble in organic solvents but only sparingly soluble in water.They are major components of adipose tissue, and together with proteins and carbohydrates, they constitute the principalstructural components of all living cells. Glycerol esters of fatty acids, which make up to 99% of the lipids of plant and animalorigin, have been traditionally called fats and oils. This distinction, based solely on whether the material is solid or liquid at roomtemperature, is of little practical importance and the two terms are often used interchangeably.
Food lipids are either consumed in the form of “visible” fats, which have been separated from the original plant or animalsources, such as butter, lard, and shortening, or as constituents of basic foods, such as milk, cheese, and meat. The largestsupply of vegetable oil comes from the seeds of soybean, cottonseed, and peanut, and the oil-bearing trees of palm, coconut,and olive.
Lipids in food exhibit unique physical and chemical properties. Their composition, crystalline structure, melting properties, andability to associate with water and other non lipid molecules are especially important to their functional properties in many foods.During the processing, storage, and handling of foods, lipids undergo complex chemical changes and react with other foodconstituents, producing numerous compounds both desirable and deleterious to food quality.
Dietary lipids play an important role in nutrition. They supply calories and essential fatty acids, act as vitamin carriers, andincrease the palatability of food, but for decades they have been at the center of controversy with respect to toxicity, obesity,and disease.
5.2 Nomenclature

Lipid nomenclature can be understood more readily if simple nomenclature of the various classes of organic compounds isreviewed first. International recommendations for the nomenclature of lipids have been published [66].
5.2.1 Fatty Acids
This term refers to any aliphatic monocarboxylic acid that can be liberated by hydrolysis from naturally occurring fats.

Pag e 227
5.2.1.1 Saturated Fatty Acids
Five accepted naming systems exist for fatty acids.
1. The acids can be named after hydrocarbons with the same number of carbon atoms (CH3 replaced by COOH). The terminalletter e in the name of the parent hydrocarbon is replaced with oic. If the acid contains two carboxyl groups the suffix becomesdioic (e.g., hexanedioic). When a single carboxyl group is present it is regarded as carbon number 1, as shown here.
2. The acids can be called carboxylic acids with the prefix being the hydrocarbon to which the carboxyl group is attached. Thus,when a carboxyl group is attached to pentane, the fatty acid is 1-pentanecarboxylic acid. In this system carbon number 1 is thecarbon atom adjacent to the terminal carboxyl group. This convention corresponds to the long-practiced use of Greek letters a,b g , d, and so on, in which the a-carbon atom is that adjacent to the carboxyl carbon.
3. A common name can be used, such as butyric, stearic, or oleic.
4. Fatty acids can be represented by a simple numerical expression consisting of two terms separated by a colon, with the firstterm depicting the number of carbon atoms and the second the number of double bonds; for example, 4:0, 18:1, and 18:3represent butyric, oleic, and linolenic acids, respectively.
5. In abbreviated designations for triacylglycerols, each acid can be given a standard letter abbreviation such as P for palmiticand L for linoleic.
Thus, the fatty acid CH3CH2CH2COOH can be referred to as 4:0, n-butanoic, 1-propanecarboxylic, or butyric acid. Similarly,the compound here is named 3-methylbutanoic, 2-methyl-1-propanecarboxylic, or b-methylbutyric acid.
5.2.1.2 Unsaturated Fatty Acids
As in the case of the saturated fatty acids, unsaturated acids can be named after the parent unsaturated hydrocarbons.Replacement of the terminal anoic by enoic indicates unsaturation, and the di, tri, and so on represent the number of doublebonds present. Hence, we have hexadecenoic for 16:1, octadecatrienoic for 18:3, and so on.
The simplest way to specify the location of double bonds is to put, before the name of the acid, one number for each unsaturatedlinkage. Oleic acid, for example, with one double bond between carbons 9 and 10, is named 9-octadecenoic acid. In certaincases it is convenient to distinguish unsaturated fatty acids by the location of the first double bond from the methyl end

Pag e 228
of the molecule, that is, the omega carbon. Linoleic acid (9,12-octadecadienoic acid) is therefore an 18:2w6 (or n-6) acid.
The geometric configuration of double bonds is usually designated by the use of cis (Latin, on this side), and trans (Latin,across), indicating whether the alkyl groups are on the same or opposite sides of the molecule.
The cis configuration is the naturally occurring form, but the trans configuration is thermodynamically favored. Linoleic acid, withboth double bonds in the cis configuration, is named cis-9, cis-12-octadecadienoic acid. Difficulty arises, however, if the fourattached groups are all different as in this compound:
In this case the two atoms or groups attached to each carbon are assigned “priorities” in accord with the Cahn-Ingold-Prelogprocedure (described in Sec. 5.2.2.1, under R/S System). If the high-priority groups (greater atomic number) lie on the sameside of both carbons, the letter Z (German, zusammen) is used to designate the configuration. If the two high-priority groups areon opposite sides, the letter E (German, entgegen) is used.
Table 1 gives a list of some of the fatty acids commonly found in natural fats, with various designations for each. Table 2 listssome uncommon, naturally occurring, polyunsaturated fatty acids that are claimed to offer attractive applications in nutrition,cosmetics, and pharmacology.
5.2.2 Acylglycerols
Neutral fats are mono-, di-, and triesters of glycerol with fatty acids, and are termed monoacyl-glycerols, diacylglycerols, andtriacylglycerols, respectively. Use of the old terms mono-, di-, and triglycerides is discouraged. The compound shown here canbe named any of the following: tristearoylglycerol, glycerol tristearate, tristearin, or StStSt.
Although glycerol by itself is a completely symmetrical molecule, the central carbon atom acquires chirality (asymmetry) if one ofthe primary hydroxyl groups (on carbons 1 and 3) is esterified, or if the two primary hydroxyls) are esterified to different acids.Several methods have been used to specify the absolute configuration of glycerol derivatives.

Pag e 229
TABLE 1 Nomenclature of Some Common Fatty Acids
Abbreviation Systematic name Common name Symbol
4:0 Butanoic Butyric B
6.0 Hexanoic Caproic H
8:0 Octanoic Caprylic Oc
10:0 Decanoic Capric D
12:0 Dodecanoic Lauric La
14:0 Tetradecanoic Myris tic M
16:0 Hexadecanoic Palmitic P
16:1 (n-7) 9-Hexadecenoic Palmitoleic Po
18:0 Octadecanoic Stearic Sta
18:1 (n-9) 9-Octadecenoic Oleic O
18:2 (n-6) 9, 12-Octadecadienoic Linoleic L
18:3 (n-3) 9, 12,15-Octadecatrienoic Linolenic Ln
20:0 Arachidic Eicosanoic Ad
20:4 (n-6) 5,8,11,14-Eicosatetraenoic Arachidonic An
20:5 (n-3) 5,8,11,14,17-Eicosapentaenoic EPA
22:1 (n-9) 13-Docosenoic Erucic E
22:5 (n-3) 7,10,13,16,19-Docosapentaenoic
22:6 (n-6) 4,7,10,13,16,19-Docosahexaenoic DHA
aSome authors use S for stearic, but this can be confusing , since S is also used for “saturated”whenever triaclycerol composition is expressed in terms of saturated (S) and unsaturated (U) fattyacids. For example, S 3 or SSS=all three fatty acids saturated, SU 2 or SUU = diunsaturated-monosaturated, and so on.
5.2.2.1 R/S System
Use of the prefixes R and S was proposed by Cahn et al. [17]. A sequence of priority is assigned to the four atoms or groups ofatoms attached to a chiral carbon, with the atoms of greatest atomic number assigned the highest priority. The molecule isoriented so that the group of lowest priority is directed straight away from the viewer, and the remaining groups are directedtoward the viewer in a tripodal fashion. If the direction of decrease in order of priority is clockwise, the configuration is R (Latin,rectus); if counterclockwise, it is S (Latin, sinister). To apply this system to acylglycerols, it is helpful to consider the structuresin Figure 1. In both instances, the H atom on asymmetric carbon 2 is the substituent of lowest priority and thus is depicted asbeing beneath the plane of the paper. Among the substituents of carbon 2, oxygen has the highest rank. The remaining twosubstituents are -CO- (hydrogens on carbon 1 and 3 are disregarded since O

TABLE 2 Polyunsaturated Fatty Acids of Biolog ical Sig nificance in Oils fromVarious Plant Sources (%)
Fatty acid Black currant Borag e Evening primrose
18:2 n-6 (LA) 48 38 72
18:3 n-6 (GLA) 17 23 9
18:3 n-3 (a) 13 — —
18:4 n-3 (SA) 4 — —
Note: LA, linoleic; GLA, g amma-linolenic; a, alpha-linolenic; SA, stearidonic.

Pag e 230
FIGURE 1Application of the R/S system of nomenclature for
triacylg lycerols.
has a higher priority). Thus, a comparison must be made of the atoms attached to these -CO- groups. Long saturated acyls havehigher priority than short. Unsaturated chains outrank saturated chains, a double bond outranks single branching, two doublebonds outrank one, cis outranks trans, and a branched chain outranks an unbranched chain. Accordingly, the groupings inconfiguration I have a clockwise arrangement in order of decreasing priority, and thus configuration I is regarded as R. Similarly,configuration II is S.
Although the R/S system does convey the stereochemical configuration of acylglycerols, it is obvious that the designated structuredepends on the nature of the acyl groups in positions 1 and 3 of the triacylglycerol molecule. Consequently, this system cannotbe applied in situations in which these positions contain mixtures of fatty acids, as in the case of natural fats, unless individualtriacylglycerols are separated.
5.2.2.2 Stereospecific Numbering
The sn system, as proposed by Hirschmann [60], is simple, is applicable to both synthetic and natural fats and has now beenuniversally adopted. The usual Fischer planar projection of glycerol is utilized with the middle hydroxyl group positioned on theleft side of the central carbon. The carbon atoms are numbered 1 to 3 in the conventional top-to-bottom sequence, as shown:
If, for example, stearic acid is esterified at the sn-1 position, oleic at sn-2, and myristic at sn-3, the triacylglycerol would appearas:

Pag e 231
and can be designated any one of the following: 1-stearoyl-2-oleoyl-3-myristoyl-sn-glycerol, sn-glycerol-1-stearate-2-oleate-3-myristate, sn-StOM, or sn-18:0-18:1-16:0.
The following prefixes are now widely used with abbreviations to designate the positional distribution of fatty acids withintriacylglycerol molecules.
sn: Used immediately preceding the term “glycerol,” indicates that the sn-1, sn-2, and sn-3 positions are listed in that order.
rac: Racemic mixture of two enantiomers. This specifies that the middle acid in the abbreviation is attached at the sn-2 position,and that the remaining two acids are equally divided between sn-1 and sn-3 (e.g., rac-StOM indicates equal amounts of sn-StOM and sn-MOSt).
b-: Middle acid in the abbreviation is at the sn-2 position but positioning of the remaining two is unknown (e.g., b-StOMindicates a mixture of sn-StOM and sn-MOSt in any proportion).
No prefix is given in case of monoacid acylglycerols (e.g., MMM) or if the positional distribution of the acids is unknown, andhence any mixture of isomers is possible (e.g., StOM indicates a possible mixture of sn-StOM, sn-MOSt, sn-OStM, sn-MStO,sn-StMO, and sn-OMST in any proportion).
5.2.3 Phospholipids
The term “phospholipid” may be used for any lipid containing phosphoric acid as a mono- or diester. “Glycerophospholipid”signifies any derivative of glycerophosphoric acid that contains an O-acyl, O-alkyl, or O-alkenyl group attached to the glycerolresidue. Thus all phosphoglycerols contain a polar head (hence the term polar lipids) and two hydrocarbon tails. Thesecompounds differ from one another in the size, shape, and polarity of the alcohol component of their polar head. The two fattyacid substituents also vary. Usually one is saturated while the other unsaturated and mainly located in the sn-2 position.
The common glycerophospholipids are named as derivatives of phosphatidic acid, such as 3-sn-phosphatidylcholine (commonname, lecithin), or by their systematic name, similar to the system for triacylglycerols. The term “phospho” is used to indicate thephosphodiester bridge; for example, 1-stearoyl-2-linoleoyl-sn-glycero-3-phosphocholine is the designation for this compound:
In addition to phosphatidycholine, phosphatidylethanolamine, phosphatidylserine, and phosphatidylinositol are commonly foundin food.

Pag e 232
5.3 Classification
A general classification of lipids based on their structural components is presented in Table 3. Such a classification, however, ispossibly too rigid for a group of compounds so diverse as lipids, and should be used only as a guide. It should also berecognized that other classifications may sometimes be more useful. For example, the sphingomyelins can be classed asphospholipids because of the presence of phosphate. The cerebrosides and the gangliosides can also be classed as glycolipidsbecause of the presence of carbohydrate, and the sphingomyelins and the glycolipids can be classed as sphingolipids because ofthe presence of sphingosine.
The most abundant class of food lipids is the acylglycerols, which dominate the composition of depot fats in animals and plants.The polar lipids are found almost entirely in cellular membranes (phospholipids being the main components of the bilayer) withonly very small amounts in depot fats. In some plants, glycolipids constitute the major polar lipids in cell membranes. Waxes arefound as protective coatings on skin, leaves, and fruits. Edible fats are traditionally classified into the following subgroups.
5.3.1 Milk Fats (See also Chap. 14)
Fats of this group are derived from the milk of ruminants, particularly dairy cows. Although the major fatty acids of milk fat arepalmitic, oleic, and stearic, this fat is unique among animal fats in that it contains appreciable amounts of the shorter chain acidsC4 to C12, small amounts of branched and odd-numbered acids, and trans-double bonds.
5.3.2 Lauric Acids (See also Chap. 16)
Fats of this group are derived from certain species of palm, such as coconut and babasu. The fats are characterized by their highcontent of lauric acid (40–50%), moderate amounts of C6, C8, and C10 fatty acids, low content of unsaturated acids, and lowmelting points.
5.3.3 Vegetable Butters (See also Chap. 16)
Fats of this group are derived from the seeds of various tropical trees and are distinguished by their narrow melting range, whichis due mainly to the arrangement of fatty acids in the
TABLE 3 Classification of Lipids
Major class Subclass Description
Simple lipids Acylg lycerolsWaxes
Glycerol + fatty acidsLong -chain alcohol + long -chain fatty acid
Compound lipids Phosphoacylg lycerols (org lycerophospholipids)
Glycerol + fatty acids + phosphate + another g roupusually containing nitrog en
Sphing omyelins Sphing osine + fatty acid + phosphate + choline
Cerebrosides Sphing osine + fatty acid + simple sug ar
Gang liosides Sphing osine + fatty acid + complex carbohydratemoiety that includes sialic acid
Derived lipids Materials that meet the definitionof a lipid but are not simple orcompound lipids
Examples: carotenoids, steroids, fat-solublevitamins

Pag e 233
triacylglycerol molecules. In spite of their large ratio of saturated to unsaturated fatty acids, trisaturated acylglycerols are notpresent. The vegetable butters are extensively used in the manufacture of confections, with cocoa butter being the mostimportant member of the group.
5.3.4 Oleic-Linoleic Acids (See also Chap. 16)
Fats in this group are the most abundant. The oils are all of vegetable origin and contain large amounts of oleic and linoleic acids,and less than 20% saturated fatty acids. The most important members of this group are cottonseed, corn, peanut, sunflower,safflower, olive, palm, and sesame oils.
5.3.5 Linolenic Acids (See also Chap. 16)
Fats in this group contain substantial amounts of linolenic acid. Examples are soybean, rapeseed and flaxseed, wheat germ,hempseed, and perilla oils, with soybean being the most important. The abundance of linolenic acid in soybean oil is responsiblefor the development of an off-flavor problem known as flavor reversion.
5.3.6 Animal Fats (See also Chap. 15)
This group consists of depot fats from domestic land animals (e.g., lard and tallow), all containing large amounts of C16 andC18 fatty acids, medium amounts of unsaturated acids, mostly oleic and linoleic, and small amounts of odd-numbered acids.These fats also contain appreciable amounts of fully saturated triacylglycerols and exhibit relatively high melting points. Egg lipidsare of particular importance because of their emulsifying properties and their high content of cholesterol.
The lipid content of whole eggs is approximately 12%, almost exclusively present in the yolk, which contains 32–36% lipid. Themajor fatty acids in egg yolks are 18:1 (38%), 16:0 (23%), and 18:2 (16%). Yolk lipids consist of about 66% triacylglycerols,28% phospholipids, and 5% cholesterol. The major phopholipids of egg yolk are phosphatidylcholine (73%) andphosphatidylethanolamine (15%).
5.3.7 Marine Oils (See also Chap. 15)
These oils typically contain large amounts of long-chain omega-3-polyunsaturated fatty acids, with up to six double bonds, andthey are usually rich in vitamins A and D. Because of their high degree of unsaturation, they are less resistant to oxidation thanother animal or vegetable oils.
5.4 Physical Aspects
5.4.1 Theories of Triacylglycerol Distribution Patterns
5.4.1.1 Even or Widest Distribution
This theory resulted from a series of systematic studies initiated by Hilditch and Williams on the triacylglycerol composition ofnatural fats [59]. Component fatty acids in the triacylglycerol molecules of natural fats tend to be distributed as broadly aspossible. If this is conformed to, when an acid, S, forms less than one-third of the total fatty acids present, it should not appearmore than once in any triacylglycerol. If X refers to the other acids present only XXX and SXX species should be found. If anacid forms between one-third and two-thirds of the total fatty acids, it should, according to this theory, occur at least once butnever three times in any one

Pag e 234
molecule; that is, only SXX and SSX should be present. If an acid forms more than two-thirds of the total acids, it should occurat least twice in every molecule; that is, only SSX and SSS should be present.
Shortcomings of the even distribution theory were soon realized. Analysis of many natural fats, especially those of animal origin,revealed marked deviation from theory. Trisaturated acylglycerols were found in fats containing less than 67% saturated fattyacids. Also, the theory can be applied only to two component systems and does not take into account positional isomers. Thus,this theory is no longer considered valid.
5.4.1.2 Random (21,2,3-Random) Distribution
According to this theory, fatty acids are distributed randomly both within each triacylglycerol molecule and among all thetriacylglycerols. Thus, the fatty acid composition of all three positions should be the same and also equivalent to the fatty acidcomposition of the total fat. The proportion of any given fatty acid species expected on the basis of this theory can be calculatedaccording to the equation.
%sn-XYZ = (mol% X in total fat) × (mol% Y in total fat) × (mol% Z in total fat) × 10-4
where X, Y, and Z are the component fatty acids at positions 1, 2, and 3, respectively, of the acylglycerol. For example, if a fatcontains 8% palmitic acid, 2% stearic, 30% oleic, and 60% linoleic, 64% triacylglycerol species (n = 4, n3 = 64) would bepredicted. The following examples illustrate calculations for such species.
%sn-OOO = 30 × 30 × 30 × 10-4 = 2.7
%sn-PLSt = 8 × 60 × 2 × 10-4 = 0.096
%sn-LOL = 60 × 30 × 60 × 10-4 = 10.8
Most fats do not conform to a completely random distribution pattern. For example, the proportion of fully saturatedtriacylycerols expected on the basis of random distribution exceeds, in many cases, that found experimentally. Moderntechniques of analysis have revealed that in natural fats the fatty acid composition of the sn-2 position is always different fromthat of the combined 1,3 positions. Calculations of random distribution are, however, useful for understanding other hypothesesand for predicting distribution patterns of fatty acids in fats randomized by interesterification.
5.4.1.3 Restricted Random
According to this hypothesis, first proposed by Kartha [77], saturated and unsaturated fatty acids in animal fats are distributedrandomly. However, fully saturated triacylglycerols (SSS) can be present, but only to the extent that the fat can remain fluid invivo. Excess SSS, according to this theory, can be exchanged with UUS and UUU to form SSU and SUU. Kartha'scalculations do not account for positional isomers or positioning of individual acids.
5.4.1.4 1,3-Random-2-Random
The fatty acid composition at the 2 position is known to be different from that of the 1 or 3 positions. This theory assumes thattwo different pools of fatty acids are separately and randomly esterified to the 2 and 1,3 positions. Thus, composition atpositions 1 and 3 will, presumably, be identical.
On the basis of this hypothesis, the amount of a given triacylglycerol can be computed as
%sn-XYZ = (mol% X at 1,3) × (mol% Y at 2) × (mol% Z at 1,3) × 10-4

Pag e 235
Composition of the sn-2 and/or the combined 1,3 positions can be obtained by analysis of the mono- or diacylglycerols derivedfrom partial deacylation by chemical or enzymic methods [27,98].
Chemical Deacylation
Representative diacylglycerols are prepared by deacylation with a Grignard reagent (e.g., ethyl magnesium bromide). Thereagent reacts randomly with one of the ester linkages of the triacylglycerol molecules to produce a diacylglycerol and a tertiaryalcohol:
The reaction is stopped with acetic acid at a point of maximum diacylglycerol yield, and the sn-1,2(2,3)- and sn-1,3-diacylglycerols are separated by thin-layer chromatography. Fatty acid composition of the combined 1 and 3 positions can beobtained by direct analysis of the 1,3-diacylglycerols, while that of the sn-2 position can be deduced by difference.
Alternatively, the compositions of the sn-1,3 position can be calculated as follows:
Enzymatic Deacylation
Pancreatic lipase selectively hydrolyzes the primary ester bonds of triacylglycerols.
To achieve rapid hydrolysis and minimum acyl migration, the reaction is carried out at 37°C and pH 8 with vigorous agitation.Compositional requirements include the presence of calcium, an emulsifier, and a large enzyme:sample ratio [98].
Fatty acid composition of the monoacylglycerols produced gives the composition at the sn-2 position, allowing composition atthe combined 1,3 position to be calculated.
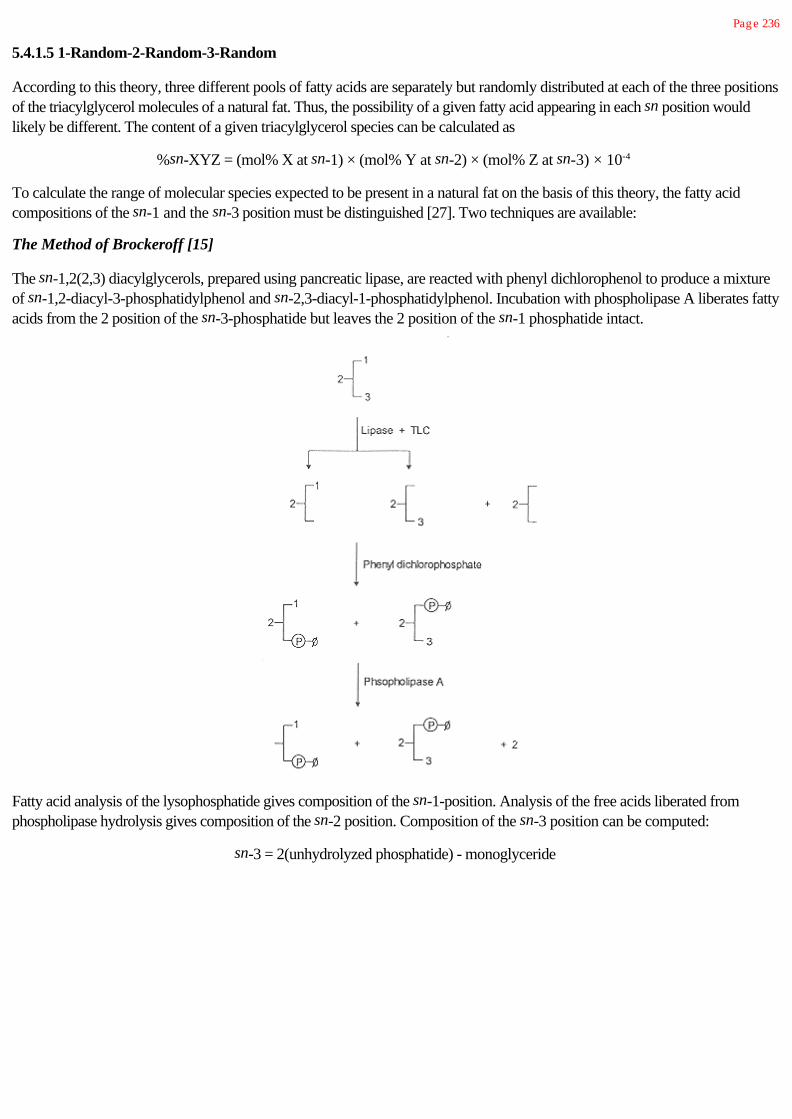
Pag e 236
5.4.1.5 1-Random-2-Random-3-Random
According to this theory, three different pools of fatty acids are separately but randomly distributed at each of the three positionsof the triacylglycerol molecules of a natural fat. Thus, the possibility of a given fatty acid appearing in each sn position wouldlikely be different. The content of a given triacylglycerol species can be calculated as
%sn-XYZ = (mol% X at sn-1) × (mol% Y at sn-2) × (mol% Z at sn-3) × 10-4
To calculate the range of molecular species expected to be present in a natural fat on the basis of this theory, the fatty acidcompositions of the sn-1 and the sn-3 position must be distinguished [27]. Two techniques are available:
The Method of Brockeroff [15]
The sn-1,2(2,3) diacylglycerols, prepared using pancreatic lipase, are reacted with phenyl dichlorophenol to produce a mixtureof sn-1,2-diacyl-3-phosphatidylphenol and sn-2,3-diacyl-1-phosphatidylphenol. Incubation with phospholipase A liberates fattyacids from the 2 position of the sn-3-phosphatide but leaves the 2 position of the sn-1 phosphatide intact.
Fatty acid analysis of the lysophosphatide gives composition of the sn-1-position. Analysis of the free acids liberated fromphospholipase hydrolysis gives composition of the sn-2 position. Composition of the sn-3 position can be computed:
sn-3 = 2(unhydrolyzed phosphatide) - monoglyceride
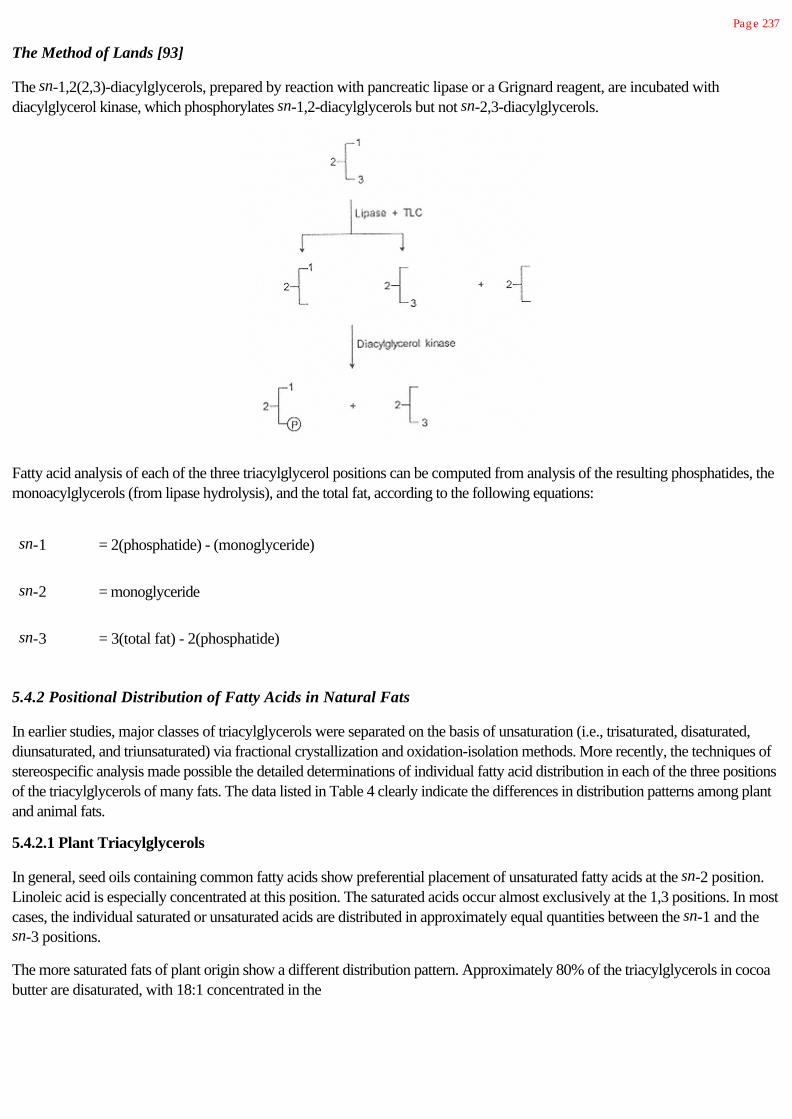
Pag e 237
The Method of Lands [93]
The sn-1,2(2,3)-diacylglycerols, prepared by reaction with pancreatic lipase or a Grignard reagent, are incubated withdiacylglycerol kinase, which phosphorylates sn-1,2-diacylglycerols but not sn-2,3-diacylglycerols.
Fatty acid analysis of each of the three triacylglycerol positions can be computed from analysis of the resulting phosphatides, themonoacylglycerols (from lipase hydrolysis), and the total fat, according to the following equations:
sn-1 = 2(phosphatide) - (monoglyceride)
sn-2 = monoglyceride
sn-3 = 3(total fat) - 2(phosphatide)
5.4.2 Positional Distribution of Fatty Acids in Natural Fats
In earlier studies, major classes of triacylglycerols were separated on the basis of unsaturation (i.e., trisaturated, disaturated,diunsaturated, and triunsaturated) via fractional crystallization and oxidation-isolation methods. More recently, the techniques ofstereospecific analysis made possible the detailed determinations of individual fatty acid distribution in each of the three positionsof the triacylglycerols of many fats. The data listed in Table 4 clearly indicate the differences in distribution patterns among plantand animal fats.
5.4.2.1 Plant Triacylglycerols
In general, seed oils containing common fatty acids show preferential placement of unsaturated fatty acids at the sn-2 position.Linoleic acid is especially concentrated at this position. The saturated acids occur almost exclusively at the 1,3 positions. In mostcases, the individual saturated or unsaturated acids are distributed in approximately equal quantities between the sn-1 and thesn-3 positions.
The more saturated fats of plant origin show a different distribution pattern. Approximately 80% of the triacylglycerols in cocoabutter are disaturated, with 18:1 concentrated in the

Pag e 238
TABLE 4 Positional Distribution of Individual Fatty Acids in Triacylg lycerols of Some Natural Fats
Fatty acid (mol%)
Source Position 4:0 6:0 8:0 10:0 12:0 14:0 16:0 18:0 18:1 18:2 18:3 20:0 20:1 22:0 24:0
Cow's milk 1 5 3 1 3 3 11 36 15 21 1
2 3 5 2 6 6 20 33 6 14 3
3 43 11 2 4 3 7 10 4 15 0.5
Coconut 1 1 4 4 39 29 16 3 4
2 0.3 2 5 78 8 1 0.5 3 2
3 3 32 13 38 8 1 0.5 3 2
Cocoa butter 1 34 50 12 1
2 2 2 87 9
3 37 53 9
Corn 1 18 3 28 50
2 2 27 70
3 14 31 52 1
Soybean 1 14 6 23 48 9
2 1 22 70 7
3 13 6 28 45 8
Olive 1 13 3 72 10 0.6
2 1 83 14 0.8
3 17 4 74 5 1
Peanut 1 14 5 59 19 1 1 1
2 2 59 39 0.5
3 11 5 57 10 4 3 6 3
Beef (depot) 1 4 41 17 20 4 1
2 9 17 9 41 5 1
3 1 22 24 37 5 1
Pig (outer back) 1 1 10 30 51 6
2 4 72 2 13 3
3 7 73 18

Pag e 239
2 position and saturated acids almost exclusively located in the primary positions (b-POSt constitutes the major species). Thereis approximately 1.5 times more oleic in the sn-1 than in the sn-2 position.
Approximately 80% of the triacylglycerols in coconut oil are trisaturated, with lauric acid concentrated at the sn-2 positions,octanoic at the sn-3, and myristic and palmitic at the sn-1 positions.
Plants containing erucic acid, such as rapeseed oil, show considerable positional selectivity in placement of their fatty acids.Erucic acid is preferentially located at the 1,3 position, but more of it is present at the sn-3 position than at the sn-1 position.
5.4.2.2 Animal Triacylglycerols
Distribution patterns of fatty acids in triacylglycerols differ among animals and vary among parts of the same animal. Depot fatcan be altered by changing dietary fat. In general, however, the saturated acid content of the sn-2 position in animal fats isgreater than that in plant fats, and the difference in composition between the sn-1 and sn-2 positions is also greater. In mostanimal fats the 16:0 acid is preferentially esterified at the sn-1 position and the 14:0 at the sn-2 position. Short-chain acids inmilk fat are selectively associated with the sn-3 position. The major triacylglycerols of beef fat are of the SUS type.
Pig fat is unique among animal fats. The 16:0 acid is significantly concentrated at the central position, the 18:0 acid is primarilylocated at the sn-1 position, 18:2 at the sn-3 position, and a large amount of oleic acid occurs at positions 3 and 1. Majortriacylglycerol species in lard are sn-StPSt, OPO, and POSt.
The long polyunsaturated fatty acids, characteristic of marine oils, are preferentially located at the sn-2 position.
5.4.3 Crystallization and Consistency
5.4.3.1 Nucleation and Crystal Growth
The formation of a solid from a solution or a melt is a complicated process in which molecules must first come in contact, orient,and then interact to form highly ordered structures known as nuclei. Nucleation can be encouraged by stirring, or the nucleationprocess can be circumvented by seeding the supercooled liquid with tiny crystals of the type ultimately desired. As with chemicalreactions, an energy barrier exists to hinder nucleation. The more complex and more stable polymorphic forms (i.e., highlyordered, compact, of high melting point) are more difficult to nucleate. Thus, stable crystals generally do not form attemperatures just below their melting points; rather, the liquid persists for some time in a supercooled state. On the other hand,the least stable, least ordered form (a) nucleates and crystallizes readily at a temperature just below its melting point.
Although the magnitude of the energy barrier to nucleation decreases as the temperature is lowered, the rate of nucleation doesnot increase indefinitely with decrease in temperature. At some point, decreasing the temperature increases the viscosity of thelipid sufficiently to slow the rate of nucleation.
Following nucleation, enlargement of these nuclei (crystal growth) progresses at a rate dependent mainly on the temperature.
5.4.3.2 Crystal Structure [8, 99, 131]
Most of our present knowledge regarding the crystalline structure and behavior of fats has resulted from x-ray diffraction studies.However, significant insights also have been gained from

Pag e 240
the application of other techniques, such as nuclear magnetic resonance, infrared spectroscopy, calorimetry, dilatometry,microscopy, and differential thermal analysis. Indeed recent advances in magnetic resonance imaging (MRI) will allow greaterinsight into the actual dynamics of the crystallization process [130].
In the crystalline state, atoms or molecules assume rigid positions forming a repeatable, highly ordered, three-dimensionalpattern. If reference points representing this regularity of structure are chosen (e.g., the center of a certain atom or a convenientpoint in a molecule), the resulting three-dimensional arrangement in space is known as a space lattice. This network of pointsembodies all the symmetry properties of the crystal. If the points of a space lattice are joined, a series of parallel-sided “unitcells” is produced, each of which contains all elements of the lattice. A complete crystal can thus be regarded as unit cellspacked side by side in space. In the example of the simple space lattice given in Figure 2, each of the 18 unit cells has an atomor molecule at each of its corners. However, since each corner is shared by eight other adjacent cells, there is only one atom (ormolecule) per unit cell. It can be seen that each point in the space lattice is equivalent in its environment to all other points. Theratios a:b:c (called axial ratios), as well as the angles between the crystallographic axes OX, OY, and OZ, are constant valuesused to distinguish different lattice arrangements.
Organic compounds having long chains pack side by side in the crystal to obtain maximum van der Waals interaction. In the unitcell, three spacings can be identified, two short and one long. Thus, the long spacing of normal alkanes increases steadily with anincrease in carbon number, but the short spacings remain constant. The molecular end groups (e.g., methyl or carboxyl)associate with each other to form planes. If the chains are tilted with respect to the base of the unit cell, the long spacing will besmaller to an extent dependent on the angle of tilt. Fatty acids tend to form double molecules oriented head to head by sharinghydrogen bonds between carboxyl groups. Consequently, the long spacings of fatty acids are almost twice as great as those ofhydrocarbons of equal carbon number (Fig. 3).
When lipid mixtures of different but similar compounds are present, crystals containing more than one kind of molecule can beformed. In the case of medium-or low-molecular-weight fatty acids differing in chain length by one carbon atom, compoundcrystals are formed in which dissimilar pairs are bound carboxyl to carboxyl but are otherwise arranged as in crystals containingonly one acid. Also common are solid solutions in which component molecules of one type are distributed at random into thecrystal lattice of another. Under certain conditions slow cooling can result in formation of layer crystals in which layers of onetype of crystal deposit on the surfaces of other crystals.
FIGURE 2Crystal lattice.

Pag e 241
FIGURE 3Unit cell of stearic acid. Long
spacing43.76 A, short spacing s 7.38 Å, 5.54
Å.(From Ref. 8.)
5.4.3.3 Polymorphism [8, 33, 53]
Polymorphic forms are crystalline phases of the same chemical composition that differ among themselves in structure but yieldidentical liquid phases upon melting. Each polymorphic form, sometimes termed polymorphic modification, is characterized byspecific properties, such as x-ray spacings, specific volume, and melting point. Several factors determine the polymorphic formassumed upon crystallization of a given compound. These include purity, temperature, rate of cooling, presence of crystallinenuclei, and type of solvent.
Depending on their particular stabilities, transformation of one polymorphic form into another can take place in the solid statewithout melting. Two crystalline forms are said to be “monotropic” if one is stable and the other metastable throughout theirexistence and regardless of temperature change. Transformation will take place only in the direction of the more stable form.Two crystalline forms are “enantiotropic” when each has a definite range of stability. Either modification may be the stable one,and transformation in the solid state can go in either direction depending upon the temperature. The temperature at which theirrelative stability changes is known as the transition point. Natural fats are invariably monotropic, although enantiotropism isknown to occur with some fatty acid derivatives.
With long-chain compounds, polymorphism is associated with different packing arrangements of the hydrocarbon chains ordifferent angles of tilt. The mode of packing can be described using the subcell concept.
Subcells
A subcell is the smallest spatial unit of repetition along the chain axis within the unit cell. The schematic in Figure 4 represents a“subcell lattice” in a fatty acid crystal. In this case, each subcell contains one ethylene group and the height of the subcell isequivalent to the distance between alternate carbon atoms in the hydrocarbon chain, that is, 2.54 Å. The methyl and acid groupsare not part of the subcell lattice.
Seven packing types (crystal systems) for hydrocarbon subcells are known to exist.

Pag e 242
FIGURE 4Subcell lattice in a fatty acid
crystal.(From Ref. 131.)
The most common types are the three shown in Figure 5. In the triclinic (T//) system, called b, the two methylene units togethermake up the ethylene repeat unit of which there is one per subcell, and all zigzag planes are parallel. This subcell packing occursin n-hydrocarbons, fatty acids, and triacylglycerols. It is the most stable polymorphic form.
In the common orthorhombic (O^) system, also called b there are two ethylene units in each subcell, and alternate chain planesare perpendicular to their adjacent planes. This packing occurs with n-paraffins and with fatty acids and their esters. The b formhas intermediate stability.
The hexagonal (H) system, generally called a, often occurs when hydrocarbons are rapidly cooled to just below their meltingpoints. The chains are randomly oriented and exhibit rotation about their long vertical axes. This type of packing is observed withhydrocarbons, alcohols, and ethyl esters. The a form is the least stable polymorphic form.
Fatty Acids
Even-numbered saturated fatty acids can be crystallized in any of the polymorphic forms. In decreasing length of long spacings(or increasing tilt of the chains), these forms are designated A, B, and C. Similarly, the acids with odd numbers of carbon atomsare designated A', B', and
FIGURE 5Common types of hydrocarbon subcell packing . (From Ref. 131.)

Pag e 243
C'. The A and A' forms have triclinic subcell chain packing (T//); the remaining forms are packed in the common orthorhombic(O^) manner.
The b form of stearic acid has been studied in detail. The unit cell is monoclinic and contains four molecules. Its axial dimensionsare a = 5.54 Å, b = 7.38 Å, and c = 48.84 Å. However, the c axis is inclined at an angle of 63°38' from the a axis, whichresults in a long spacing of 43.76 Å (Fig. 3).
In the case of oleic acid, the low-melting form has double molecules per unit cell length, and the hydrocarbon portions aroundthe cis double bond are tilted in opposite directions in the plane of molecules (Fig. 6).
Triacylglycerols
The nomenclature used in earlier literature to designate the different polymorphic forms of triacylglycerols is extremely confusing.Different authors used different criteria, such as melting points or x-ray spacings, as the basis for their nomenclature. Often thesame symbols were used by different investigators to designate different polymorphic forms, and much debate took placeregarding the number of forms exhibited by certain triacylglycerol species. Much of the disagreement was finally resolved basedon results from infrared spectroscopy. In general, triacylglycerols, due to their relatively long chains, take on many of the featuresof hydrocarbons. They exhibit, with some exceptions, three principal polymorphic forms: a, b',and b. Characteristics typical ofeach form are summarized in Table 5.
If a monoacid triacylglycerol, such as StStSt, is cooled from the melt, it crystallizes in the least dense, lowest melting form (a).On further cooling of the a form, the chains associate more compactly, and gradual transition into the b form takes place. If thea form is heated to its melting point, a transformation into the most stable b form occurs rapidly. The b form can also beobtained directly by cooling the melt and maintaining the temperature a few degrees above the melting point of the a form. Onheating the b form to its melting point, some melting takes place and transition to the stable b form occurs.
The general molecular arrangement in the lattice of monoacid triacylglycerols is a double-chainlength modified tuning fork, orchair structure, as shown in Figure 7 for trilaurin. The chains in the 1 and 3 positions are oriented in a direction opposite that ofthe chain in the 2 position. Because natural triacylglycerols contain a variety of fatty acids, departure from the simplepolymorphic classification outlined earlier is bound to occur. In the case of triacylglycerols containing different fatty acids, somepolymorphic forms are more difficult to obtain than others; for example, b' forms have been observed that have higher meltingpoints than the b' forms. PStP glycerides, as found in cottonseed hardstock, tend to crystallize in a b form of relatively highdensity. This form results in greater stiffening power when added to oils than does the expanded (snowlike) b form commonlyobtained from the StStSt glycerides of soybean hardstock.
The polymorphic structure of mixed triacylglycerols is further complicated by a tendency for carbon chains to segregateaccording to length or degree of unsaturation to form structures in which the long spacing is made up of triple chain lengths.Various tuning-fork structures have been proposed for mixed triacylglycerols containing fatty acids of different chain lengths. Ifthe middle chain is shorter or longer than the other two by four or more carbons, there may be a segregation of chains, as inFigure 8a. In the case of unsymmetrical triacylglycerols, a chair-type arrangement similar to Figure 8b may result. Sorting ofchains may also arise on the basis of unsaturation, as in Figure 8c. Such structures are designated by a number following theGreek letter. For example, b-3 would indicate the b modification with a triple chain length (Fig. 9). In the liquid state lamellarunits exist in which the triacylglycerols are arranged in a chair conformation with their hydrocarbon chains disordered. Aproposed model based on x-ray and
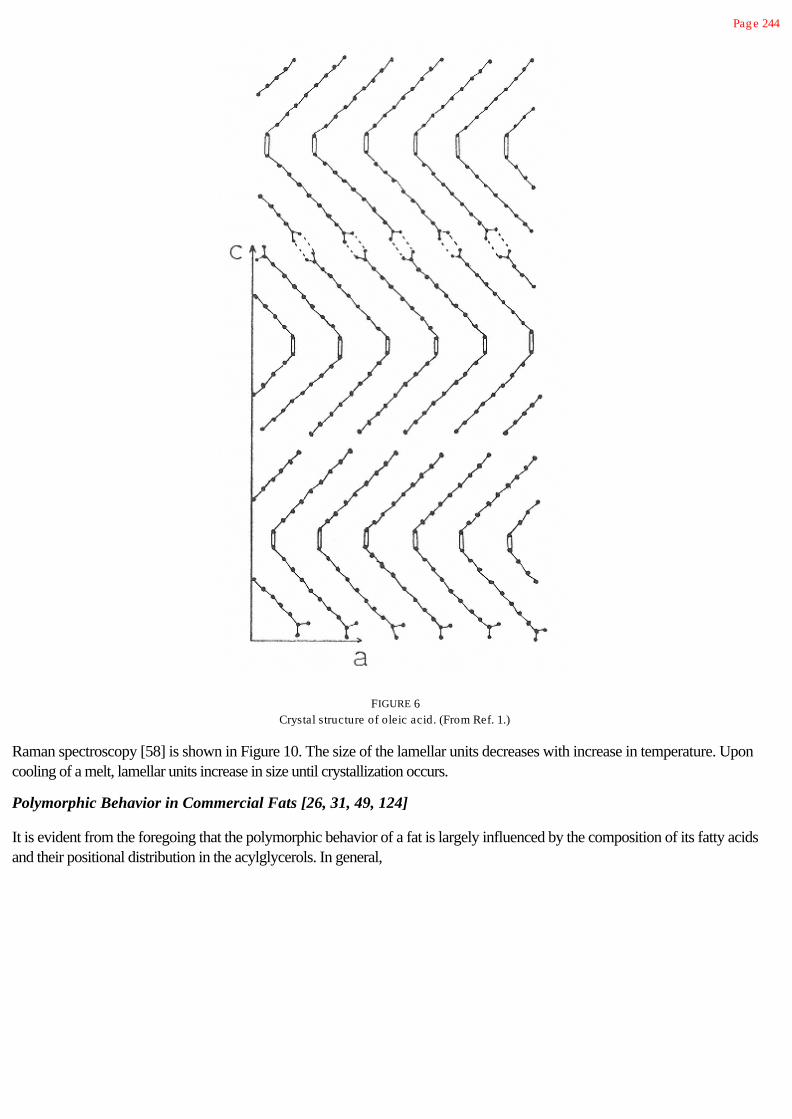
Pag e 244
FIGURE 6Crystal structure of oleic acid. (From Ref. 1.)
Raman spectroscopy [58] is shown in Figure 10. The size of the lamellar units decreases with increase in temperature. Uponcooling of a melt, lamellar units increase in size until crystallization occurs.
Polymorphic Behavior in Commercial Fats [26, 31, 49, 124]
It is evident from the foregoing that the polymorphic behavior of a fat is largely influenced by the composition of its fatty acidsand their positional distribution in the acylglycerols. In general,

Pag e 245
TABLE 5 Characteristics of the Polymorphic Forms of Monoacid Triacylg lycerols
Characteristic a Form b' Form b Form
Chain packing Hexagonal Orthorhombic Triclinic
Short spacing (Å) 4.15 4.2 and 3.8 4.6, 3.9, 3.7
Characteristic infraredspectrum
Sing le band at 720 cm -
1Doublet at 727 and719 cm-1
Sing le band at and717 cm-1
Density Least dense Intermediate Most dense
Melting point Lowest Medium Hig hest
fats that consist of relatively few closely related triacylglycerol species tend to transform rapidly to stable b forms. Conversely,heterogeneous fats tend to transform more slowly to stable forms. For example, highly randomized fats exhibit b' forms thattransform slowly.
Fats that tend to crystallize in b forms include soybean, peanut, corn, olive, coconut, and safflower oils, as well as cocoa butterand lard. On the other hand, cottonseed, palm, and rapeseed oils, milk fat, tallow, and modified lard tend to produce b crystalsthat tend to persist for long periods. The b' crystals are desirable in the preparation of shortenings, margarine, and bakedproducts since they aid in the incorporation of a large amount of air in the form of small air bubbles, giving rise to products ofbetter plastic and creaming properties.
In the food industry, emulsifiers are frequently added to stabilize certain metastable forms. It is believed that the action of suchagents, such as sorbitan esters, is not due to their surface activity, but rather to their unique chemical structure, which allowsthem to fit into the crystallographic structure with the hydrophobic parts of the surfactant molecules parallel to the triacylglycerolhydrocarbon chains, with their hydrophilic moieties forming hydrogen bonds with the carbonyl groups of the triacylglycerols—aphenomenon called the “Button syndrome” [6]. Transformation of the fat crystals into other polymorphic forms is thus preventedor delayed without altering the crystal lattice.
In the case of cocoa butter, in which the three main glycerides are POSt (40%), STOSt (30%), and POP (15%), sixpolymorphic forms (I–VI) have been recognized [102, 106, 124, 145]. Form I is the least stable and has the lowest meltingpoint. Form V is the most stable form that can be crystallized from the melted fat and is the desired structure since it producesthe bright glossy appearance of chocolate coatings. Form VI has a higher melting point than form V but cannot be crystallizedfrom the melt; it only forms by very slow transformation of form V. The V–VI transformation that occurs during storage is ofparticular importance since it usually coincides with the appearance of a defect called “chocolate bloom.” This defect usuallyinvolves a loss of desirable chocolate loss and the development of a dull appearance with white or grayish spots on the surface.
In addition to theories involving polymorphic transformation as a cause of chocolate bloom, it is believed that melted chocolatefat migrates to the surface and recrystallizes upon recooling, causing the undesirable appearance. Although it is clear that bloomdoes not depend on the appearance of a specific polymorphic form, polymorphic behavior of the cocoa fat is believed to play animportant role in bloom. To delay the appearance of bloom, proper solidification of the chocolate is necessary. This is achievedby a tempering process that involves heating the cocoa butter-sugar-cocoa powder mixture to 50°C, seeding with the stablecrystal “seeds,” slowly crystallizing it with continuous stirring as the temperature is reduced to 26–29°C, and then slowly heatingit to 32°C. Without the stable seeds, unstable crystal forms will form initially and these are likely to melt, migrate, and transformto more stable forms (bloom).

Pag e 246
FIGURE 7Molecular arrang ement in trilaurin lattice. (From Ref. 95.)

Pag e 247
FIGURE 8Arrang ement of molecules in
triacylg lycerolcrystals.
FIGURE 9Double and triple chair arrang ements of b form.

Pag e 248
FIGURE 10Lamellar units in the liquid. (From
Ref. 58.)
Furthermore, emulsifiers have been successfully used to retard undesirable polymorphic transformation and/or migration ofmelted fat to the surface.
5.4.3.4 Melting [8, 53]
Shown in Figure 11 are schematic heat content (enthalpy) curves for the stable b form and the metastable a form of a simpletriacylglycerol. Heat is absorbed during melting. Curve ABC represents the increase in heat content of the b form with increasingtemperature. At the melting point, heat is absorbed with no rise in temperature (heat of fusion) until all solid is transformed
FIGURE 11Heat content (H) melting curves of stable (b) and unstable (a) polymorphic forms.

Pag e 249
into liquid (final melting point, B). On the other hand, transformation from an unstable to a stable polymorphic form (beginning atpoint E in Fig. 11 and intersecting with curve AB) involves evolution of heat.
Fats expand upon melting and contract upon polymorphic transformation. Consequently, if the change in specific volume(dilation) is plotted against temperature, dilatometric curves very similar to calorimetric curves are obtained, with melting dilationcorresponding to specific heat. Since dilatometric measurements involve very simple instruments, they are often used inpreference to calorimetric methods. Dilatometry has been used widely to determine the melting behavior of fats. If severalcomponents of different melting points are present, melting takes place over a wide range of temperature, and dilatometric orcalorimetric curves similar to the schematic in Figure 12 are obtained.
Point X represents the beginning of melting; below this point the system is completely solid. Point Y represents the end ofmelting; above this point the fat is completely liquid. Curve XY represents the gradual melting of the solid components in thesystem. If the fat melts over a narrow range of temperature, the slope of the melting curve is steep. Conversely, a fat is said tohave a “wide plastic range” if the difference in temperature between the beginning and the end of melting is large. Thus, theplastic range of a fat can be extended by adding a relatively high-melting and/or a low-melting component.
Solid Fat Index [67, 96, 100]
The proportion of solids and liquids in a plastic fat at different temperatures can be estimated by constructing calorimetric ormelting dilation curves similar to that of Figure 12, or preferably by using nuclear magnetic resonance. Dilatometricmeasurements can be made starting at temperatures sufficiently low to establish a solid line, at other temperatures high enough toestablish a liquid line, and at intervals between these to determine the melting curve. The solid and liquid lines can then beextrapolated, and the solid or liquid fraction at any temperature can be calculated. As shown in Figure 12, ab/ac represents thesolid fraction, and bc/ac is the liquid fraction at temperature t. The ratio of solid to liquid is known as the solid fat index (SFI),and this has relevance to the functional properties of fats in foods.
FIGURE 12Heat content (H) or dilatometric (D) melting curve of a
g lyceride mixture.
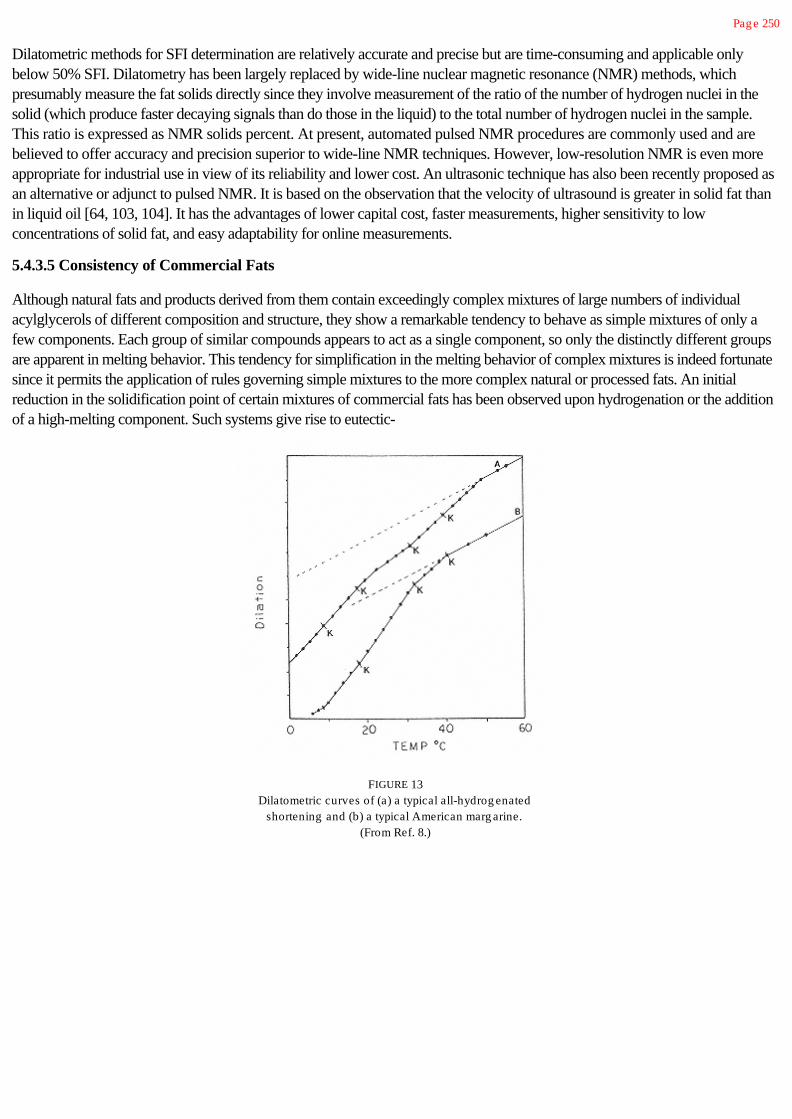
Pag e 250
Dilatometric methods for SFI determination are relatively accurate and precise but are time-consuming and applicable onlybelow 50% SFI. Dilatometry has been largely replaced by wide-line nuclear magnetic resonance (NMR) methods, whichpresumably measure the fat solids directly since they involve measurement of the ratio of the number of hydrogen nuclei in thesolid (which produce faster decaying signals than do those in the liquid) to the total number of hydrogen nuclei in the sample.This ratio is expressed as NMR solids percent. At present, automated pulsed NMR procedures are commonly used and arebelieved to offer accuracy and precision superior to wide-line NMR techniques. However, low-resolution NMR is even moreappropriate for industrial use in view of its reliability and lower cost. An ultrasonic technique has also been recently proposed asan alternative or adjunct to pulsed NMR. It is based on the observation that the velocity of ultrasound is greater in solid fat thanin liquid oil [64, 103, 104]. It has the advantages of lower capital cost, faster measurements, higher sensitivity to lowconcentrations of solid fat, and easy adaptability for online measurements.
5.4.3.5 Consistency of Commercial Fats
Although natural fats and products derived from them contain exceedingly complex mixtures of large numbers of individualacylglycerols of different composition and structure, they show a remarkable tendency to behave as simple mixtures of only afew components. Each group of similar compounds appears to act as a single component, so only the distinctly different groupsare apparent in melting behavior. This tendency for simplification in the melting behavior of complex mixtures is indeed fortunatesince it permits the application of rules governing simple mixtures to the more complex natural or processed fats. An initialreduction in the solidification point of certain mixtures of commercial fats has been observed upon hydrogenation or the additionof a high-melting component. Such systems give rise to eutectic-
FIGURE 13Dilatometric curves of (a) a typical all-hydrog enated
shortening and (b) a typical American marg arine.(From Ref. 8.)

Pag e 251
FIGURE 14Upper portions of dilatometric curvesof cottonseed oil mixed with 0–15%
hig hly hardened cottonseed oil. (FromRef. 8.)
type behavior and solid-liquid equilibrium curves of striking resemblance to those typical of simple binary systems.
The basic concepts involving the melting behavior of commercial fats can be simply illustrated by dilatometric curves such asthose in Figures 13–15. However, as already indicated, NMR techniques give comparable information more quickly and arenow the preferred methods. The dilatometric curves of plastic fats do not show a smooth melting line, but rather they exhibit aseries of somewhat linear segments with visible changes in slope (Fig. 13). The inflection points between the segments aresometimes designated K points, with K being the temperature of final melting. The K points obviously correspond to specificboundaries in the phase diagrams of the complex fat; that commercial fats give rise to only a few K points
FIGURE 15Dilatometric curves of lard and milk fat. (From
Ref. 8.)
Pag e 252
emphasizes the tendency for different individual components in a narrow melting range to behave like a single component.
If a high-melting fraction is added to a natural fat, melting of the “hard” component is clearly reflected in the dilatometric curve.The vertical distance (d in Fig. 14) provides a relative measure of the amount of the hard component. It can be seen fromFigures 13, 14, and 15 that much useful information regarding the melting characteristics of plastic fats can be obtained fromdilatometric curves.
Hard “butters” melt over a relatively narrow range of temperature because their triacylglycerols are mainly POSt, StOSt, andPOP. This abrupt melting, which occurs at the temperature of the mouth, makes such fats particularly suitable for confectionarycoatings.
A typical dilatometric curve for milk fat, showing almost complete melting at the temperature of the mouth, is quite different fromthat of lard, which exhibits a more gradual course of melting (Fig. 15). The difference in solid content of the two fats at any giventemperature is clearly evident.
5.4.3.6 Mesomorphic Phase (Liquid Crystals)
As discussed earlier, crystalline lipids are highly ordered structures with regular three-dimensional arrangements of theirmolecules. In the liquid state, the intermolecular forces are weakened and the molecules acquire freedom of movement andassume a state of disorder. In addition, phases with properties intermediate between those of the liquid and the crystalline statesare known to occur, and these mesomorphic phases consist of so-called liquid crystals. Typically, amphiphilic compounds giverise to mesomorphic phases. For example, when an amphiphilic crystalline compound is heated, the hydrocarbon region maymelt before the final melting point is reached. This occurs because relatively weak van der Waals forces exist among thehydrocarbon chains as compared with the somewhat stronger hydrogen bonding that exists among polar groups. Pure crystalsthat form liquid crystals upon heating are said to be thermotropic. In the presence of water, at temperatures above the meltingpoint of the hydrocarbon region (the so-called Krafft temperature), hydrocarbon chains of triacylglycerols transform into adisordered state and water penetrates among the ordered polar groups. Liquid crystals formed in this manner, that is, with theaid of a solvent, are said to be lyotropic.
Mesomorphic structure depends on factors such as concentration and chemical structure of the amphiphilic compound, watercontent, temperature, and the presence of other components in the mixture. The principal kinds of mesomorphic structures arelamellar, hexagonal, and cubic.
Lamellar or Neat
This structure corresponds to that existing in biological bilayer membranes. It is made up of double layers of lipid moleculesseparated by water (Fig. 16a). Structures of this kind are usually less viscous and less transparent than the other mesomorphicstructures.
The capacity of a lamellar phase to retain water depends on the nature of the lipid constituents. Lamellar liquid crystals ofmonoacylglycerols, for example, can accommodate up to approximately 30% water, corresponding to a water layer thickness ofabout 16 Å between the lipid bilayers. However, almost infinite swelling of the lamellar phase can occur if a small amount of anionic surface-active substance is added to the water. If the water content is increased above the swelling limit of the lamellarphase, a dispersion of spherical aggregates consisting of concentric, alternating layers of lipid and water gradually forms.
In general, a lamellar liquid crystalline phase tends to transform upon heating into hexagonal II or cubic mesophases. On theother hand, if the lamellar liquid-crystal phase is cooled below the Kraftt temperature, a metastable “gel” will form in whichwater remains between the lipid bilayers and the hydrocarbon chains recrystallize. During extended holding

Pag e 253
FIGURE 16Mesomorphic structures of lipids: (a) lamellar, (b) hexag onal l, (c)
hexag onal II, (d) cubic. (From Ref. 95.)
the water is expelled and the gel phase transforms into a microcrystalline suspension in water, called a coagel.
Hexagonal
In this structure the lipids form cylinders arranged in a hexagonal array. The liquid hydrocarbon chains fill the interior of thecylinders, and the space between the cylinders is taken up by water (Fig. 16b). This type of liquid crystal is termed “hexagonalI” or “middle.” A reversed hexagonal structure, “hexagonal II,” is also possible in which water fills the interior of the cylindersand is surrounded by the polar groups of the amphiphile. The hydrocarbon chains extend outward making up the continuousphase between the cylinders (Fig. 16c). If hexagonal I liquid crystals are diluted with water, spherical micelles form. However,dilution of hexagonal II liquid crystals with water is not possible.
Cubic or Viscous Isotropic
Although this state is encountered with many long-chain compounds, it is not as well characterized as are the lamellar andhexagonal liquid crystals. Cubic-phase structures were studied in

Pag e 254
monoacylglycerol-water systems by Larson [94, 95], who observed the existence of closed water regions in these systems andproposed a cubic-phase model based on space-filling polyhedra packed in a body-centered cubic lattice (Fig. 16d). Cubicphases are usually very viscous and completely transparent.
Mesomorphic states are of great importance in many physiological processes; for example, they influence the permeability of cellmembranes [148]. Liquid crystals also play a significant role with regard to the stability of emulsions.
5.4.3.7 Factors Influencing Consistency [8]
Several factors have important influences on the consistency of commercial fats:
Proportion of solids in the fat. In general, the greater the solids content, the firmer the fat. It has been estimated that plasticcommercial fats, at workable temperatures, increase in either firmness or viscosity by about 10% with each increment of crystals[8].
Number, size, and kind of crystals. At a given solids content, a large number of small crystals produces a harder fat than does asmall number of large crystals. Larger, soft crystals are typically produced by slow cooling. Crystals composed of highmeltingacylglycerols provide greater stiffening power than do those of lower melting acylglycerols.
Viscosity of the liquid. Oils differ in viscosity at a given temperature and this will influence viscosity of the melt, as well asconsistency of a solid-liquid lipid mixture.
Temperature treatment. If a fat tends to supercool excessively, this can be overcome by melting the crystalline fat at the lowestpossible temperature, holding it for an extended period of time at a temperature just above its melting point, and then cooling it.This facilitates formation of numerous crystal nuclei, numerous small crystals, and a firm consistency.
Mechanical working. Crystallized fats are generally thixotropic; that is, they become reversibly softer after vigorous agitation andonly gradually regain their original firmness. If a melted fat is mechanically agitated during solidification, it will be much softer thanif allowed to solidify in a quiescent condition. In the quiescent state the growing crystals form structures of relatively greatstrength. These structures can be deformed by mechanical working.
5.5 Chemical Aspects
5.5.1 Lipolysis
Hydrolysis of ester bonds in lipids (lipolysis) may occur by enzyme action [149] or by heat and moisture, resulting in theliberation of free fatty acids. Free fatty acids are virtually absent in fat of living animal tissue. They can form, however, by enzymeaction after the animal is killed. Since edible animal fats are not usually refined, prompt rendering is of particular importance. Thetemperatures commonly used in the rendering process are capable of inactivating the enzymes responsible for hydrolysis.
The release of short-chain fatty acids by hydrolysis is responsible for the development of an undersirable rancid flavor(hydrolytic rancidity) in raw milk. On the other hand, certain typical cheese flavors are produced by deliberate addition ofmicrobial and milk lipases. Controlled and selective lipolysis is also used in the manufacture of other food items, such as yogurtand bread.
In contrast to animal fats, oils in mature oil seeds may have undergone substantial

Pag e 255
hydrolysis by the time they are harvested, giving rise to significant amounts of free fatty acids. Neutralization with alkali is thusrequired for most vegetable oils after they are extracted.
Lipolysis is a major reaction occurring during deep-fat frying due to the large amounts of water introduced from the food, andthe relatively high temperatures used. Development of high levels of free fatty acids during frying is usually associated withdecreases in smoke point and surface tension of the oil and a reduction in quality of the fried food. Furthermore, free fatty acidsare more susceptible to oxidation than are fatty acids esterified to glycerol.
Phospholipase A and lipases from muscle tissues have been described. Significant phospholipid hydrolysis occurs in mostspecies of fish during frozen storage and is usually associated with deterioration in quality. A number of studies appear toindicate that while the hydrolysis of triacylglycerols leads to increased lipid oxidation, phospholipid hydrolysis inhibits theoxidation [123].
Enzymic lipolysis is used extensively as an analytical tool in lipid research. As discussed earlier in this chapter, pancreatic lipaseand snake venom phospholipase are used to determine the positional distribution of fatty acids in acylglycerol molecules. Thespecificities of these and numerous other enzymes make them particularly useful in the preparation of intermediates in thechemical synthesis of certain lipids, and in the manufacture of “structured fats” useful for specific nutritional, pharmaceutical, andcosmetic applications [2, 16, 141].
5.5.2 Autoxidation
Lipid oxidation is one of the major causes of food spoilage. It is of great economic concern to the food industry because it leadsto the development, in edible oils and fat-containing foods, of various off flavors and off odors generally called rancid (oxidativerancidity), which render these foods less acceptable. In addition, oxidative reactions can decrease the nutritional quality of food,and certain oxidation products are potentially toxic. On the other hand, under certain conditions, a limited degree of lipidoxidation is sometimes desirable, as in aged cheeses and some fried foods.
For these reasons, extensive research has been done not only to identify the products of lipid oxidation and the conditions thatinfluence their production, but also to study the mechanisms involved. Since oxidative reactions in food lipids are exceedinglycomplex, simpler model systems, such as oleate, linoleate, and linolenate, have been used to ascertain mechanistic pathways.Although this approach has provided useful information, extrapolation to the more complex food lipid systems must be done withcaution.
It is generally agreed that “autoxidation,” that is, the reaction with molecular oxygen via a self-catalytic mechanism, is the mainreaction involved in oxidative deterioration of lipids. Although photochemical reactions have been known for a long time, onlyrecently has the role of photosensitized oxidation and its interaction with autoxidation emerged. In foods, the lipids can beoxidized by both enzymic and nonenzymic mechanisms.
5.5.2.1 General Characteristics of the Autoxidation Reaction
Our present knowledge regarding the fundamental mechanisms of lipid oxidation resulted largely from the pioneering work ofFarmer and his coworkers [36], Bolland and Gee [12], and Bateman et al. [10].
Autoxidation of fats proceeds via typical free radical mechanisms as characterized by (a) marked inhibition in rate by chemicalsknown to interfere with other well-established free radical reactions, (b) catalytic effects of light and free radical-producingsubstances, (c) high yields of the hydroperoxide, ROOH, (d) quantum yields exceeding unity when the oxidation

Pag e 256
reaction is initiated by light, and (e) a relatively long induction period observed when starting with a pure substrate.
Based on experimental results, mostly with ethyl linoleate, the rate of oxygen absorption can be expressed as shown here,
where RH is the substrate fatty acid, H is an a-methylenic hydrogen atom easily detachable due to the influence of a neighboringdouble bond or bonds, ROOH is the hydroperoxide formed, p is oxygen pressure, and l and Ka are empirical constants.
To explain the experimenta l results, a three-step simplified, free-radical scheme has been postulated:
At high oxygen pressure (l[RH]/p<1), reactions (4) and (5) can be neglected to give this form:
In this situation, the rate of oxidation is independent of oxygen pressure.
At low oxygen pressure (l[RH]/p >1), steps (5) and (6) can be neglected to give this form:
Since the reaction RH + O2 free radicals is thermodynamically difficult (activation energy of about 35 kcal, or 146 kJ/mol),production of the first few radicals (initiation) necessary to start the propagation reaction must be catalyzed. It has beenproposed that initiation of oxidation may take place by hydroperoxide decomposition, by metal catalysis, or by exposure to light.More recently, it has been postulated that singlet oxygen is the active species involved, with tissue pigments such as chlorophylland myoglobin acting as sensitizers.
After initiation, oxidation is propagated by abstraction of hydrogen atoms at positions a to fatty acid double bonds, producing
free radical species . Oxygen addition then occurs at

Pag e 257
these locations, resulting in the production of peroxy radicals , and these in turn abstract hydrogen from a-methylenic
groups of other molecules (RH) to yield hydroperoxides (ROOH) and new free radicals . The new groups react withoxygen, and the sequence of reactions just described is repeated.
Due to resonance stabilization of these species, the reaction sequence is usually accompanied by a shift in position of thedouble bonds, resulting in the formation of isomeric hydroperoxides that often contain conjugated diene groups (atypical ofunoxidized, natural acylglycerols).
Hydroperoxides, the primary initial products of lipid autoxidation, are relatively unstable. They enter into numerous complexreactions involving substrate degradation and interaction, resulting in a myriad of compounds of various molecular weights, flavorthresholds, and biological significance.
A general scheme summarizing the overall picture of lipid autoxidation is given in Figure 17, and some aspects of the reactionsequence are discussed in more detail later.
FIGURE 17Generalized scheme for autoxidation of
lipids.

Pag e 258
5.5.2.2 Formation of Hydroperoxides
Qualitative and quantitative analyses of the isomeric hydroperoxides from oleate, linoleate, and linolenate have been conducted[22, 23, 39].
Oleate
Hydrogen abstraction at carbons 8 and 11 of oleate results in formation of two allylic radical intermediates. Oxygen attack at theend carbons of each radical produces an isomeric mixture of 8-, 9-, 10-, and 11-allylic hydroperoxides.
The amounts of 8- and 11-hydroperoxides formed are slightly greater than those of the 9- and 10-isomers. At 25°C theamounts of cis and trans 8- and 11-hydroperoxides are similar, but the 9- and 10-isomers are mainly trans.
Linoleate
The 1,4-pentadiene structure in linoleates makes them much more susceptible (by a factor of about 20) to oxidation than thepropene system of oleate. The methylene group at position 11 is doubly activated by the two adjacent double bonds.

Pag e 259
Hydrogen abstraction at this position produces a pentadienyl radical intermediate, which upon reaction with molecular oxygenproduces an equal mixture of conjugated 9- and 13-diene hydroperoxides. Evidence reported in the literature indicates that the9- and 13-cis, trans- hydroperoxides undergo interconversion, along with some geometric isomerization, forming trans,trans-isomers. Thus, each of the two hydroperoxides (9- and 13-) is found in both the cis,trans and the trans,trans forms.
Linolenate
In linolenate, two 1,4-pentadiene structures are present. Hydrogen abstraction at the two active methylene groups of carbons 11and 14 produces two pentadienyl radicals.
Oxygen attack at the end carbon of each radical results in the formation of a mixture of 9-, 12-, 13-, and 16-hydroperoxides.For each of the hydroperoxides, geometric isomers exist, each having a conjugated diene system in either the cis,trans or thetrans,trans configuration, and an isolated double bond that is always cis.
The 9- and 16-hydroperoxides are formed in significantly greater amounts than the 12- and 13-isomers. This has been attributedto (a) a preference of oxygen to react with carbons 9 and 16; (b) faster decomposition of the 12- and 13-hydroperoxides, or(c) a tendency of the 12- and 13-hydroperoxides to form six-membered peroxide hydroperoxides via 1,4-cyclization, as shownhere, or prostaglandin-like endoperoxides via 1,3-cyclization. The cyclization mechanisms are thought to be the most likelyexplanations.
5.5.2.3 Oxidation with Singlet Oxygen
As just discussed, the major pathway for oxidation of unsaturated fatty acids involves a self-catalytic free-radical mechanism(autoxidation) that accounts for the chain reaction of hydroperoxide (ROOH) formation and decomposition. However, the originof the initial free radicals necessary to begin the process has been difficult to explain. It is unlikely that initiation occurs by directattack of oxygen in its most stable form (triplet state) on double bonds of fatty acids (RH). This is because the C=C bonds inRH and ROOH are in singlet states and thus such reaction does not obey the rule of spin conservation. A more satisfactoryexplanation is that singlet oxygen (1O2), believed to be the active species in photooxidative deterioration, is responsible forinitiation.
Since electrons are charged , they act like magnets that can exist in two different orientations, but with equal magnitude of spin,+1 and -1. The total angular momentum of the electrons in an atom is described by the expression 2S + 1 where S is total spin.If an atom such as oxygen has two unpaired electrons in its outer orbitals, they can align their spins parallel or antiparallel witheach other, giving rise to two different multiplicities of state, that is, 2(½ + ½) + 1 = 3 and 2(½ - ½) + 1 = 1. These are calledthe triplet (3O2) and singlet state (1O2), respectively. In the triplet state, the two electrons in the antibonding 2p orbitals have thesame spin but are in

Pag e 260
different orbitals. These electrons are kept apart via “pauli exclusion” and therefore have only a small repulsive electrostaticenergy.
In the singlet state, the two electrons have opposite spins, and therefore electrostatic repulsion will be great, resulting in anexcited state. Singlet oxygen can be found in two energy states, 1d, with an energy of 22 kcal (94 kJ) above ground state, and1e, with an energy of 37 kcal (157 kJ) above ground state.
Singlet-state oxygen is more electrophilic than triplet state oxygen. It can thus react rapidly (1500 times faster than 3O2 withmoieties of high electron density, such as C=C bonds. The resulting hydroperoxides can then cleave to initiate a conventional,free-radical chain reaction.
Singlet oxygen can be generated in a variety of ways; probably the most important is via photosensitization by natural pigments infoods. Two pathways have been proposed for photosensitized oxidation [21]. In the type 1 pathway, the sensitizer presumablyreacts, after light absorption, with substrate (A) to form intermediates, which then react with ground-state (triplet) oxygen toyield the oxidation products.
In the type 2 pathway, molecular oxygen rather than the substrate is presumably the species that reacts with the sensitizer uponlight absorption.
Several substances are commonly found in fat-containing foods that can act as photosensitizers to produce 1O2. These includenatural pigments, such as chlorophyll-a, pheophytin-a, and hematoporphyrin, the pigment portion of hemoglobin, and myoglobin.The synthetic colorant erythrosine also acts as an active photosensitizer.
b-Carotene is a very effective 1O2 quencher, and tocopherols are also somewhat effective. Synthetic quenchers such asbutylated hydroxyanisole (BHA) and butylated hydroxytoluene (BHT) are also effective and permissible in foods.
The formation of hydroperoxides by singlet oxygen proceeds via mechanisms different from those of free-radical autoxidation.The most important of these is the “ene” reaction, which involves the formation of a six-membered ring transition state. Oxygenis thus inserted at the ends of the double bond, which then shifts to yield an allylic hydroperoxide in the trans configuration.Accordingly, oleate produces the 9- and 10-hydroperoxides (instead of the 8-, 9-, 10-, and 11-hydroperoxides occurring byfree radical autoxidation), and linoleate produces a mixture of 9-, 10-, 12-, 13-, 15-, and 16-hydroperoxides (instead of 9-, 12-, 13-, and 16-).
In addition to the role of singlet oxygen as an active initiator of free radicals, it has
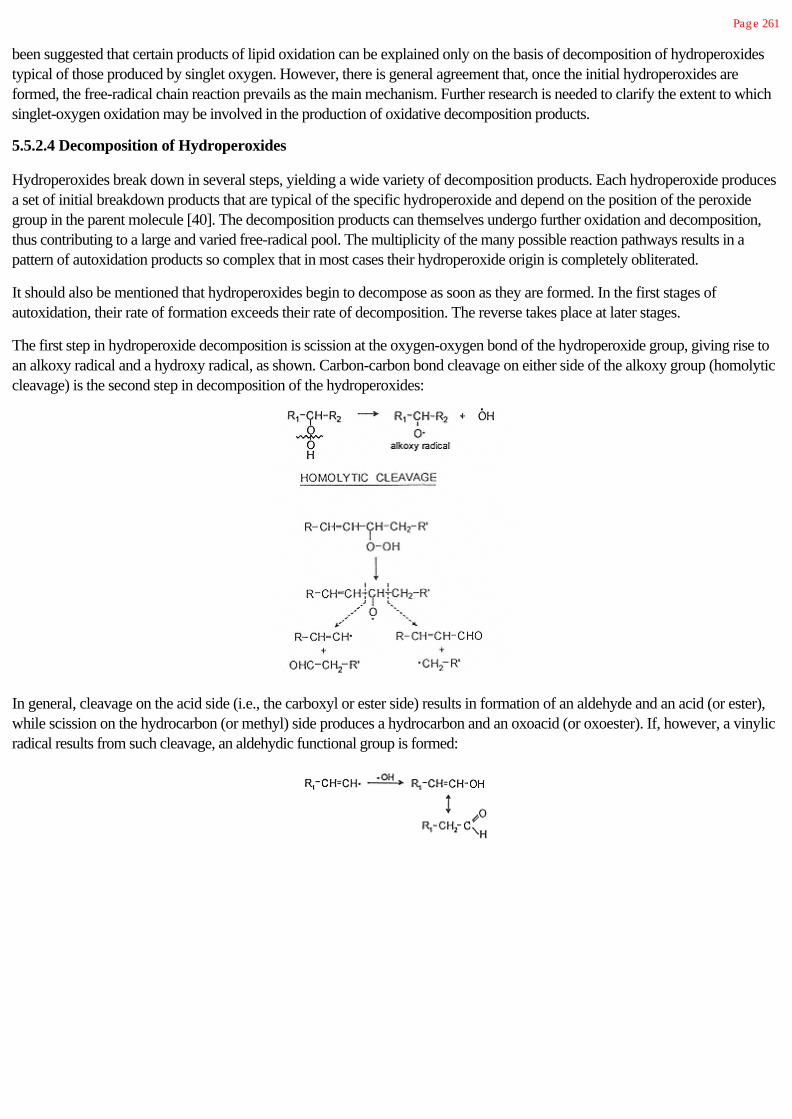
Pag e 261
been suggested that certain products of lipid oxidation can be explained only on the basis of decomposition of hydroperoxidestypical of those produced by singlet oxygen. However, there is general agreement that, once the initial hydroperoxides areformed, the free-radical chain reaction prevails as the main mechanism. Further research is needed to clarify the extent to whichsinglet-oxygen oxidation may be involved in the production of oxidative decomposition products.
5.5.2.4 Decomposition of Hydroperoxides
Hydroperoxides break down in several steps, yielding a wide variety of decomposition products. Each hydroperoxide producesa set of initial breakdown products that are typical of the specific hydroperoxide and depend on the position of the peroxidegroup in the parent molecule [40]. The decomposition products can themselves undergo further oxidation and decomposition,thus contributing to a large and varied free-radical pool. The multiplicity of the many possible reaction pathways results in apattern of autoxidation products so complex that in most cases their hydroperoxide origin is completely obliterated.
It should also be mentioned that hydroperoxides begin to decompose as soon as they are formed. In the first stages ofautoxidation, their rate of formation exceeds their rate of decomposition. The reverse takes place at later stages.
The first step in hydroperoxide decomposition is scission at the oxygen-oxygen bond of the hydroperoxide group, giving rise toan alkoxy radical and a hydroxy radical, as shown. Carbon-carbon bond cleavage on either side of the alkoxy group (homolyticcleavage) is the second step in decomposition of the hydroperoxides:
In general, cleavage on the acid side (i.e., the carboxyl or ester side) results in formation of an aldehyde and an acid (or ester),while scission on the hydrocarbon (or methyl) side produces a hydrocarbon and an oxoacid (or oxoester). If, however, a vinylicradical results from such cleavage, an aldehydic functional group is formed:
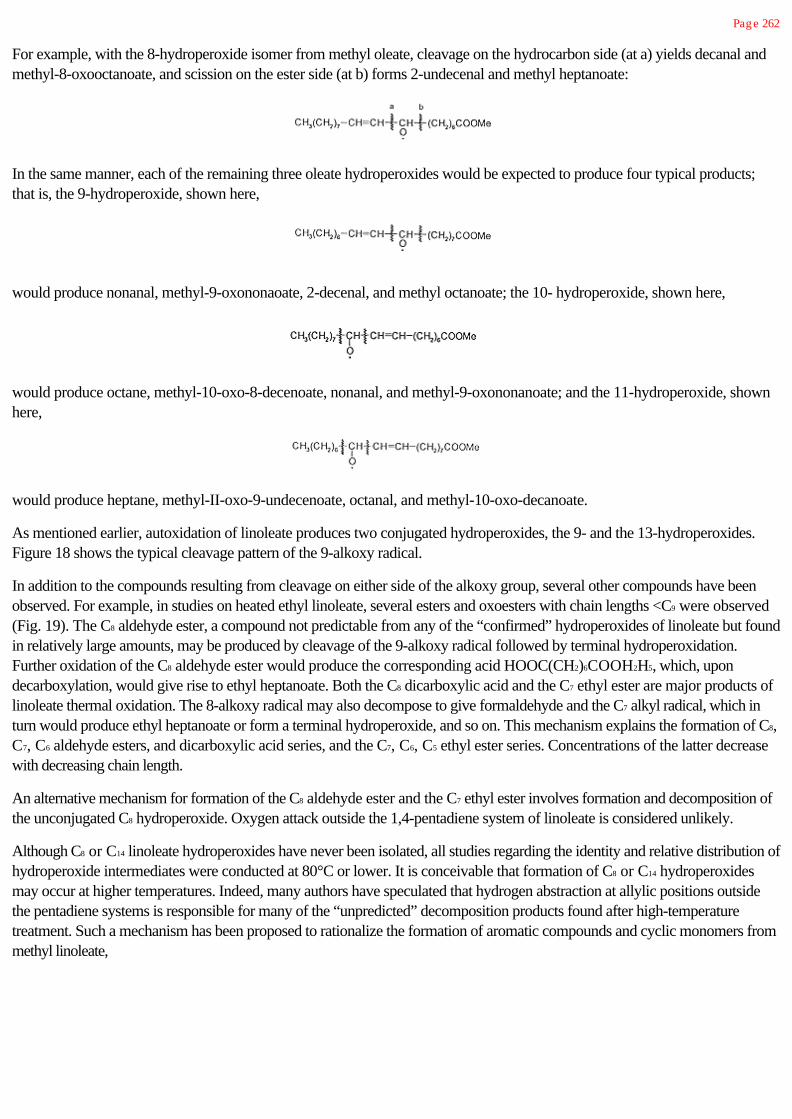
Pag e 262
For example, with the 8-hydroperoxide isomer from methyl oleate, cleavage on the hydrocarbon side (at a) yields decanal andmethyl-8-oxooctanoate, and scission on the ester side (at b) forms 2-undecenal and methyl heptanoate:
In the same manner, each of the remaining three oleate hydroperoxides would be expected to produce four typical products;that is, the 9-hydroperoxide, shown here,
would produce nonanal, methyl-9-oxononaoate, 2-decenal, and methyl octanoate; the 10- hydroperoxide, shown here,
would produce octane, methyl-10-oxo-8-decenoate, nonanal, and methyl-9-oxononanoate; and the 11-hydroperoxide, shownhere,
would produce heptane, methyl-II-oxo-9-undecenoate, octanal, and methyl-10-oxo-decanoate.
As mentioned earlier, autoxidation of linoleate produces two conjugated hydroperoxides, the 9- and the 13-hydroperoxides.Figure 18 shows the typical cleavage pattern of the 9-alkoxy radical.
In addition to the compounds resulting from cleavage on either side of the alkoxy group, several other compounds have beenobserved. For example, in studies on heated ethyl linoleate, several esters and oxoesters with chain lengths <C9 were observed(Fig. 19). The C8 aldehyde ester, a compound not predictable from any of the “confirmed” hydroperoxides of linoleate but foundin relatively large amounts, may be produced by cleavage of the 9-alkoxy radical followed by terminal hydroperoxidation.Further oxidation of the C8 aldehyde ester would produce the corresponding acid HOOC(CH2)6COOH2H5, which, upondecarboxylation, would give rise to ethyl heptanoate. Both the C8 dicarboxylic acid and the C7 ethyl ester are major products oflinoleate thermal oxidation. The 8-alkoxy radical may also decompose to give formaldehyde and the C7 alkyl radical, which inturn would produce ethyl heptanoate or form a terminal hydroperoxide, and so on. This mechanism explains the formation of C8,C7, C6 aldehyde esters, and dicarboxylic acid series, and the C7, C6, C5 ethyl ester series. Concentrations of the latter decreasewith decreasing chain length.
An alternative mechanism for formation of the C8 aldehyde ester and the C7 ethyl ester involves formation and decomposition ofthe unconjugated C8 hydroperoxide. Oxygen attack outside the 1,4-pentadiene system of linoleate is considered unlikely.
Although C8 or C14 linoleate hydroperoxides have never been isolated, all studies regarding the identity and relative distribution ofhydroperoxide intermediates were conducted at 80°C or lower. It is conceivable that formation of C8 or C14 hydroperoxidesmay occur at higher temperatures. Indeed, many authors have speculated that hydrogen abstraction at allylic positions outsidethe pentadiene systems is responsible for many of the “unpredicted” decomposition products found after high-temperaturetreatment. Such a mechanism has been proposed to rationalize the formation of aromatic compounds and cyclic monomers frommethyl linoleate,

Pag e 263
FIGURE 18Decomposition of methyl-9-hydroperoxy-10, 12-octadecadienoate.
and to explain the production of 2-cyclohexenyl acetate and 5-cyclohexenyl pentenoate from methyl docosahexaenoate.
In contrast to the homolytic cleavage described earlier, specific conditions will cause heterolytic cleavage to occur between thehydroperoxide group and the allylic double bond. Such cleavage results in a greater yield and more selective distribution ofcarbonyl compounds than that occurring with homolytic cleavage [84]. Hetrolytic cleavage of methyl linoleate hydroperoxides,for example, would give rise mainly to hexanal, nonanal, methyl9-oxononanoate and methyl 12-oxododecenoate [48,56]. Amechanism proposed for heterolytic cleavage is shown in Figure 20.
It was also pointed out that in the case of linoleate, oxidation by singlet oxygen leads to the formation of four isomerichydroperoxides, two of which are not typical of autoxidation. The 10-hydroperoxide would be expected to yield 2-octene,methyl-10-oxo-8-decenoate, 3-nonenal, and methyl-9-oxononanoate; the 12-hydroperoxide would give hexanal, methyl-12-oxo-9-dodecenoate, 2-heptenal, and methyl-9-undecenoate.
For linolenates, some of the cleavage products expected from classic scisson of the 9-, 12-, 13-, and 16-hydroperoxides havebeen reported; however, several others, particularly the longer chain and the polyunsaturated oxoesters, have not been detected.It is possible that these types of compounds rapidly undergo further decomposition.
The cyclic peroxides or the hydroperoxy cyclic peroxides, which are commonly formed during oxidation of polyunsaturated fattyacids, also decompose, yielding a variety of compounds. Formation of 3,5-octadiene-2-one is shown here:

Pag e 264
FIGURE 19Possible mechanism for the formation of the short-chain
esters, oxoesters, and dicarboxylic acids.
FIGURE 20Heterolytic hydroperoxide
cleavage.

Pag e 265
5.5.2.5 Further Decomposition of the Aldehydes
As demonstrated earlier, aldehydes are a major class of compounds typically arising from fat oxidation. Many of the aldehydesfound in oxidized fats, however, cannot be explained solely on the basis of the classic hydroperoxide cleavage just discussed.This is not surprising in view of the ease and variety of reactions that aldehydes can undergo.
Saturated aldehydes can easily oxidize to form the corresponding acids, and they can also participate in dimerization andcondensation reactions. Three molecules of hexanal, for example, can combine to form tripentyltrioxane:
Trialkyltrioxanes possessing relatively strong odors have been reported as secondary oxidation products of linoleate.
In a study of oleic acid and nonanal, a speculative but interesting mechanism was proposed to account for the aldehydes,alcohols, alkyl formates, and hydrocarbons produced from autoxidation of oleic acid [97]. Abstraction of hydrogen fromnonanal, the aldehyde formed from the 10-hydroperoxide of oleate, results in formation of a resonance equilibrium between twoforms of the carbonyl free radical (Fig. 21). This leads to formation of a peracid and an a-hydroperoxyaldehyde. Carbon-carbon and oxygen-oxygen cleavages can produce a variety of free radicals that can initiate chain reactions or combine to formoxidation products.
Unsaturated aldehydes can undergo classic autoxidation with oxygen attack at a-methylenic positions giving rise to short-chainhydrocarbons, alehydes, and dialdehydes:
FIGURE 21Speculative mechanism for the
autoxidationof nonanal. (From Ref. 97.)

Pag e 266
Formation of malonaldehyde is the basis for the well-known TBA method used for measuring fat oxidation, as is discussed later.
For oxidation of aldehydes with conjugated double bonds, the proposed mechanism involves formation of epoxides by oxygenattack at the olefinic centers [102]. In the case of 2,4-decadienal, the major aldehyde from the 9-hydroperoxide of linoleate,either the 2,3-epoxy or the 4,5-epoxy derivative, can be produced as an intermediate. Figure 22 shows the formation anddecomposition of the 2,3-epoxide. Similarly, hexanal, 2-butenal, hexane, and 2-butene-1,4-dial can be formed fromdecomposition of the 4,5-epoxide.
5.5.2.6 Cholesterol Oxidation [133]
Oxidation of cholesterol is of major concern because certain oxidation products have been reported to produce cytotoxic,angiotoxic, and carcinogenic effects. The products of choles-
FIGURE 22Formation and decomposition of the 2,3-epoxide
from 2,4-decadienal. (From Ref. 102.)

Pag e 267
terol oxidation and the mechanisms for their formation have been reviewed [133]. In general, the epimeric 7a- and 7b-hydroperoxides are recognized as the initial products, with the 7b-hydroperoxides being more abundant than the a-isomers.Decomposition of the hydroperoxides gives rise to the isomeric 7a- and 7b-hydroxycholesterols, cholesterol a- and b-epoxides, and 7-ketocholesterol, with the latter being a major product (Fig. 23). In addition, the 20- and 25-hydroxycholesterols may arise from side-chain derivatizations, whereas cholesta- 3,5-diene, cholesta-3,5-dien-7-one, andseveral other ketones arise from elimination reactions. Structures of some of these compounds are given here.
Other products, such as volatiles, relatively high-molecular-weight compounds, and numerous other minor oxides, have beenreported.
Cholesterol oxidation products have been identified in several processed foods including dried eggs, meat and dairy products,fried foods, and heated fats.
5.5.2.7 Other Reactions of the Alkyl and Alkoxy Radicals
The alkyl radical arising from cleavage on the methyl side of an alkoxy group can enter into a variety of reactions (Fig. 24). Itcan combine with a hydroxyl radical to give an alcohol, abstract a hydrogen to form 1-alkene, or peroxidize to form a terminalhydroperoxide. The hydroperoxide
FIGURE 23Mechanism of cholesterol
autoxidation.

Pag e 268
FIGURE 24Some reactions of the alkyl radical.
can decompose to the corresponding alkoxyradical, which in turn may form an aldehyde, or it can further cleave to yield anotheralkyl radical.
The alkoxy radical can also abstract a hydrogen atom from the a-methylene group of another molecule, producing a hydroxyacid, or it can lose a hydrogen to give a keto acid:
Reaction of alkoxy and peroxy radicals with double bonds can produce epoxides as follows:
5.5.2.8 Formation of Dimers and Polymers
Dimerization and polymerization are major reactions that occur in lipids during heating and/or oxidation. Such changes areusually accompanied by a decrease in iodine value and increases in molecular weight, viscosity, and refractive index.

Pag e 269
Diels-Alder Reactions Between a Double Bond and a Conjugated Diene to Produce a Tetrasubstituted Cyclohexene
Linoleate, for example, can develop a conjugated double-bond system during thermal oxidation and then react with anothermolecule of linoleate (or with oleate) to produce a cyclic dimer:
In the case of acylglycerols, dimerization can take place between acyl groups in two triacylglycerol molecules or between twoacyl groups in the same molecule.
Combination of Free Radicals to Give Noncyclic Dimers
Under conditions of low oxygen tension, carbon-carbon bond formation between two acyl groups can occur in several ways:Oleate, for example, can give rise to a mixture of dimers (dehydrodimers) coupled at the 8, 9, 10, or 11 positions.
Addition of Free Radical to Double Bonds
This yields a dimeric radical, which may abstract hydrogen from another molecule or attack other double bonds to produceacyclic or cyclic compounds. Figures 25 and 26 show dimerization of
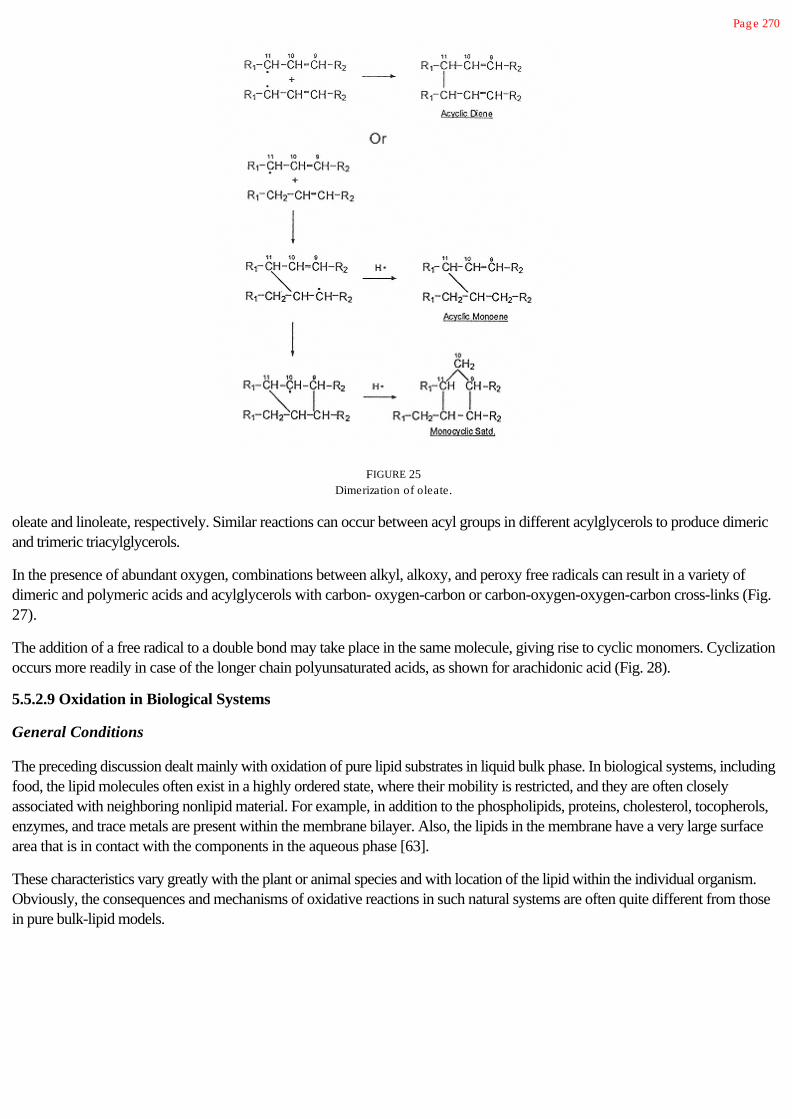
Pag e 270
FIGURE 25Dimerization of oleate.
oleate and linoleate, respectively. Similar reactions can occur between acyl groups in different acylglycerols to produce dimericand trimeric triacylglycerols.
In the presence of abundant oxygen, combinations between alkyl, alkoxy, and peroxy free radicals can result in a variety ofdimeric and polymeric acids and acylglycerols with carbon- oxygen-carbon or carbon-oxygen-oxygen-carbon cross-links (Fig.27).
The addition of a free radical to a double bond may take place in the same molecule, giving rise to cyclic monomers. Cyclizationoccurs more readily in case of the longer chain polyunsaturated acids, as shown for arachidonic acid (Fig. 28).
5.5.2.9 Oxidation in Biological Systems
General Conditions
The preceding discussion dealt mainly with oxidation of pure lipid substrates in liquid bulk phase. In biological systems, includingfood, the lipid molecules often exist in a highly ordered state, where their mobility is restricted, and they are often closelyassociated with neighboring nonlipid material. For example, in addition to the phospholipids, proteins, cholesterol, tocopherols,enzymes, and trace metals are present within the membrane bilayer. Also, the lipids in the membrane have a very large surfacearea that is in contact with the components in the aqueous phase [63].
These characteristics vary greatly with the plant or animal species and with location of the lipid within the individual organism.Obviously, the consequences and mechanisms of oxidative reactions in such natural systems are often quite different from thosein pure bulk-lipid models.

Pag e 271
FIGURE 26Dimerization of linoleate.
FIGURE 27Polymerization of acylg lycerols.

Pag e 272
FIGURE 28Cyclization of arachidonic acid.
Lipid Oxidation in Simple Nonbulk Lipid Systems
Because the mechanisms of lipid oxidation in intact biological systems are exceedingly difficult to determine, interest has focusedon simpler nonbulk lipid systems with the hope that the results obtained can be extrapolated to more complex biological systems.Such nonbulk lipid models include monolayers (on the surface of an aqueous phase or adsorbed on silica), artificial lipid vesicles,and phospholipid bilayers. In a study on the oxidation of monolayers of linoleic acid esters, it was concluded that cis and transepoxy compounds are the primary intermediates in oxidized bulk-phase lipids, rather than the hydroperoxides. Kinetically, themonolayer reaction is first order, whereas bulk-phase oxidation exhibits more complex kinetics. When the resistant saturatedchains are interposed between reactive unsaturated acids in the monolayer, the rate of peroxidation decreases provided thechains are long enough to interfere with oxygen transfer. Little is known about the influence of molecular orientation on themechanisms and products of lipid oxidation.
Enzyme-Catalyzed Oxidation of Lipids
Gardner [45–47] reviewed the enzymic oxidation of lipids. Sequential enzyme action starts with lipolysis. Releasedpolyunsaturated fatty acids are then oxidized by either lipoxygenase or cyclo- oxygenase to form hydroperoxides orendoperoxides, respectively. Until recently, lipoxygenases were thought to be restricted to plants. However, animal lipoxygenasesystems are now known to exist. Plant and animal lipoxygenases are both regiospecific (catalyze oxygenation at specific sites)and stereospecific (produce enantiomeric hydroperoxides). The next sequence of events involves enzymic cleavage of thehydroperoxides and endoperoxides to yield a variety of breakdown products, which are often responsible for the characteristicflavors of natural products.
Lipid Oxidation in Mixed-Lipid Complex Systems
In biological systems, various oxidizable lipids (e.g., triacylglycerols with different fatty acid constituents, phospholipids,cholesterol) often exist in proximity, and this makes the pattern of oxidation even more complex. These lipids also can exist inconjunction with, or sometimes bound to, nonlipid components such as proteins, carbohydrates, and water. This enablesinteractions to take place not only among lipids and the other nonlipid components, but also among the many oxidation products.
Much less clear is how mixtures of different oxidizable components affect oxidation of each other. In studies on oxidativeinteractions among cholesterol, triacylglycerols, and phos-
Pag e 273
pholipids in model systems, and among these same substances in membranes of the milk-fat globule and in red blood cells, it hasbeen shown that two neighboring lipids can accelerate and/or inhibit the oxidation of each other, depending on conditions thatprevail [81–83, 109]. Important conditions include chemical nature of the lipids, their concentrations, temperature and pH, andespecially their physical state. Furthermore, during oxidation, one component may switch from being an accelerator of oxidationto an inhibitor, or vice versa.
Lipid Oxidation as Influenced by the Presence of Nonlipid Substances
In the presence of other compounds (e.g., proteins, pro- and antioxidants), oxidative reactions (both enzymic and nonenzymic)can be terminated by reactions with compounds other than those originating from oxidation of the lipid substrate, and this caninfluence reaction rates. One example of importance involves the interaction between free amino groups, for example, in aminoacids, primary amines, or phosphatidylethanolamine, with aldehydes produced from oxidation of lipids. This can result inbrowning, the creation of antioxidant properties, and/or toxic effects. Also, the basic groups in proteins can catalyze aldolcondensation of carbonyls produced from lipid oxidation, resulting in formation of brown pigments. Furthermore, lipidhydroperoxides or secondary products of lipid oxidation can damage the nutritive value of proteins by oxidizing sulfur-containingproteins [76], by free radical reactions with proteins, or by formation of Schiff-base addition products with the S-amino groupsof lysine residues. It has also been reported that free carbohydrates can increase the rate of oxidation of lipids in emulsions.
Biological systems also contain a multitude of nonlipid pro- and antioxidants that are present at small concentrations. The overalleffect of these substances (pro- or antioxidant) on lipid oxidation is precarious, complex, and dictated by factors that are poorlyunderstood. As is true of some of the major oxidizable components, some of these substances can switch roles (pro, anti) asconditions change.
5.5.2.10 Factors Influencing Rate of Lipid Oxidation in Foods
Food lipids contain a variety of fatty acids that differ in chemical and physical properties and also in their susceptibility tooxidation. In addition, foods contain numerous nonlipid components that may co-oxidize and/or interact with the oxidizing lipidsand their oxidation products. Thus, oxidation of lipids in food is a dynamic, multifaceted series of events, often overlapping andcontinually interacting, which makes accurate description of oxidation kinetics almost impossible. Understandably, reviews onthe kinetics of lipid oxidation have not been able to go beyond the treatment of simple model systems [28, 75, 88–90].
Fatty Acid Composition
The number, position, and geometry of double bonds affect the rate of oxidation. Relative rates of oxidation for arachidonic,linolenic, and oleic acids are approximately 40:20:10:1, respectively. Cis acids oxidize more readily than their trans isomers, andconjugated double bonds are more reactive than nonconjugated. Autoxidation of saturated fatty acids is extremely slow; at roomtemperature, they remain practically unchanged when oxidative rancidity of unsaturates becomes detectable. At hightemperatures, however, saturated acids can undergo oxidation at significant rates (see Temperature).
Free Fatty Acids Versus the Corresponding Acylglycerols
Fatty acids oxidize at a slightly greater rate when free than when esterified to glycerol. Randomizing the fatty acid distribution ofa natural fat reduces the rate of oxidation.

Pag e 274
The existence in a fat or oil of a small amount of free fatty acids does not have a marked effect on oxidative stability. In somecommercial oils, however, the presence of relatively large amounts of free acids can facilitate incorporation of catalytic tracemetals from equipment or storage tanks and thereby increase the rate of lipid oxidation.
Oxygen Concentration
When oxygen is abundant, the rate of oxidation is independent of oxygen concentration, but at very low oxygen concentrationthe rate is approximately proportional to oxygen concentration. However, the effect of oxygen concentration on rate is alsoinfluenced by other factors, such as temperature and surface area.
Temperature
In general, the rate of oxidation increases as the temperature is increased. Temperature also influences the relationship betweenrate and oxygen partial pressure. As temperature is increased, changes in oxygen partial pressure have a smaller influence onrate because oxygen becomes less soluble in lipids and water as the temperature is raised.
Surface Area
The rate of oxidation increases in direct proportion to the surface area of the lipid exposed to air. Furthermore, as surface-volume ratio is increased, a given reduction in oxygen partial pressure becomes less effective in decreasing the rate of oxidation.In oil-in-water emulsions the rate of oxidation is governed by the rate at which oxygen diffuses into the oil phase.
Moisture
In model lipid systems and various fat-containing foods, the rate of oxidation depends strongly on water activity (see also Chap.2) [50, 72, 74]. In dried foods with very low moisture contents (aw values of less than about 0.1), oxidation proceeds veryrapidly. Increasing the aw to about 0.3 retards lipid oxidation and often produces a minimum rate. This protective effect of smallamounts of water is believed to occur by reducing the catalytic activity of metal catalysts, by quenching free radicals, and/or byimpeding access of oxygen to the lipid.
At somewhat higher water activities (aw = 0.55–0.85), the rate of oxidation increases again, presumably as a result of increasedmobilization of catalysts and oxygen.
Molecular Orientation
Molecular orientation of substrates has an important influence on the rate of lipid oxidation. For example, when oxidative stabilityof polyunsaturated fatty acids (PUFA) was studied in aqueous solutions at 37°C and pH 7.4 with Fe2+-ascorbic acid present asa catalyst, stability increased with increasing degree of unsaturation, contrary to what would be expected. This outcome wasattributed to the conformations of the PUFAs existing in the aqueous medium [107].
Further insight regarding the effect of molecular orientation of lipids on the rate of oxidation was gained from a study involvingethyl linoleate [56]. In this study, linoleate was present either in an ordered state (absorbed as a monolayer on silica) or in a bulkphase. At 60°C, oxidation of ethyl linoleate occurred more rapidly in the monolayer than it did in the bulk phase (expectedresult) because of greater access of the monolayer linoleate to oxygen. Surprisingly, at 180°C, the reverse was true. Apparently,the molecules of bulk-phase linoleate and associated free radicals were sufficiently more mobile than those in the monolayersample to offset the effect of differences in access to oxygen. For both bulk and monolayer samples, the major decompositionproducts, although not identical, were those typically arising from classical decomposition of hydroperoxides.

Pag e 275
Physical State
A recent study of cholesterol oxidation demonstrates the importance of physical state on rate of lipid oxidation. Fragments ofmicrocrystalline cholesterol films, both solid and liquid, were suspended in aqueous media, and oxidation was studied undervarious conditions of temperature, time, pH and buffer composition. The types and ratios of oxides differed depending onconditions, with physical state of the cholesterol having the most pronounced influence [83]. Indeed, many of the factorsconsidered in this section exert their effects on oxidation rates by influencing the physical state of both the substrate and/or themedium in which it exists [42, 129, 132].
Emulsification
In oil-in-water emulsions, or in foods where oil droplets are dispersed into an aqueous matrix, oxygen must gain access to thelipid by diffusion into the aqueous phase and passage through the oil-water interface. The rate of oxidation will depend on theinterplay between a number of factors including type and concentration of emulsifier, size of oil droplets, surface area ofinterface, viscosity of the aqueous phase, composition and porosity of the aqueous matrix, and pH.
Molecular Mobility and the Glass Transition
If the rate of lipid oxidation is diffusion limited (see Chap. 2), a low rate of oxidation would be expected below the glasstransition and the rate would exhibit a very large temperature dependence at temperatures above the glass transition [42].
Pro-Oxidants
Transition metals, particularly those possessing two or more valency states and a suitable oxidation-reduction potential betweenthem (e.g., cobalt, copper, iron, manganese, and nickel), are effective pro-oxidants. If present, even at concentrations as low as0.1 ppm, they can decrease the induction period and increase the rate of oxidation. Trace amounts of heavy metals arecommonly encountered in edible oils, and they originate from the soil in which the oil-bearing plant was grown, from the animal,or from metallic equipment used in processing or storage. Trace metals are also naturally occurring components of all foodtissues and of all fluid foods of biological origin (eggs, milk, and fruit juices), and they are present in both free and bound forms.
Several mechanisms for metal catalysis of oxidation have been postulated:
1. Acceleration of hydroperoxide decomposition:
2. Direct reaction with the unoxidized substrate:
3. Activation of molecular oxygen to give singlet oxygen and peroxy radical:
Hematin compounds, present in many food tissues, are also important pro-oxidants.
Pag e 276
Radiant Energy
Visible, ultraviolet, and g-radiation are effective promoters of oxidation.
Antioxidants
Because lipid antioxidants are of such great importance in food chemistry, this subject is treated separately in a later section.
5.5.2.11 Methods for Measuring Lipid Oxidation
It is obvious from the preceding discussion that lipid oxidation is an exceedingly complex process involving numerous reactionsthat cause a variety of chemical and physical changes. Although these reactions appear to follow recognized stepwise pathways,they often occur simultaneously and competitively. The nature and extent of each change is influenced by many variables thathave been mentioned previously. Since oxidative decomposition is of major significance in regard to both the acceptability andnutritional quality of food products, many methods have been devised for assessing this occurrence. However, a single testcannot possibly measure all oxidative events at once, nor can it be equally useful at all stages of the oxidative process, and for allfats, all foods, and all conditions of processing. At best, a test can monitor only a few changes as they apply to specific systemsunder specific conditions. For many purposes, a combination of tests is needed. These considerations should be kept in mind, asthe following commonly used methods are reviewed.
Peroxide Value
Peroxides are the main initial products of autoxidation. They can be measured by techniques based on their ability to liberateiodine from potassium iodide (iodimetry):
or to oxidize ferrous to ferric ions (thiocyanate method):
The peroxide value is usually expressed in terms of milliequivalents of oxygen per kilogram of fat [113]. Various othercolorimetric techniques are available. Although the peroxide value is applicable for following peroxide formation at the earlystages of oxidation, it is nevertheless highly empirical. Its accuracy is questionable, and the results vary with the specificprocedure used, and with test temperature. During the course of oxidation, peroxide values reach a peak and then decline.
Various attempts have been made to correlate peroxide values with development of oxidative off flavors. Good correlations aresometimes obtained, but often not. It should be pointed out that the amount of oxygen that must be absorbed, or peroxides thatmust be formed, to produce noticeable oxidative rancidity varies with composition of the oil (those that are more saturatedrequire less oxygen absorption to become rancid), the presence of antioxidants and trace metals, and the conditions of oxidation.
Thiobarbituric Acid Test
This is one of the most widely used tests for evaluating the extent of lipid oxidation. Oxidation products of unsaturated systemsproduce a color reaction with thiobarbituric acid (TBA). It is believed that the chromagen results from condensation of twomolecules of TBA with one molecule of malonaldehyde. However, malonaldehyde is not always present in all oxidized systems.Many alkanals, alkenals, and 2,4-dienals produce a yellow pigment (at 450 nm) in

Pag e 277
conjunction with TBA, but only dienals produce a red pigment (at 530 nm). It has been suggested that measurement at bothabsorption maxima is desirable.
In general, TBA-reactive material is produced in significant amounts only from fatty acids containing three or more doublebonds. The reaction mechanism shown in Figure 29 was offered by Dahle and coworkers [30]. They suggested that radicalswith a double bond b to the carbon bearing the peroxy groups (which can only arise from acids containing more than twodouble bonds) cyclize to form peroxides with five-membered rings. These then decompose to give malonaldehyde. Morerecently, however, Pryor et al. [120] concluded that malonaldehyde arises, at least in part, from decomposition of prostaglandin-like endoperoxides produced during autoxidation of polyunsaturated fatty acids.
Various compounds, other than those found in oxidized lipids, have been found to react with TBA to yield the characteristic redpigment. For example, sucrose and some compounds in wood smoke have been reported to give a red color upon reaction withTBA, and in these situations the observed results must be corrected for these interfering compounds. On the other hand,abnormally low TBA values can result if some of the malonaldehyde reacts with proteins in an oxidizing system. In addition,flavor scores for different systems cannot be consistently estimated from TBA values because the amount of TBA productsobtained from a given amount of oxidation varies from product to product. The TBA test is often useful for comparing samplesof a single material at different stages of oxidation.
Total and Volatile Carbonyl Compounds
Methods for determining total carbonyl compounds are usually based on measurement of hydrazones that arise from reaction ofaldehydes or ketones (oxidation products) with 2,4–
FIGURE 29Speculative mechanism for malonaldehyde formation.
(From Ref. 120.)

Pag e 278
dinitrophenylhydrazine. However, under the experimental conditions used for these tests, car-bonyl compounds may begenerated by decomposition of unstable intermediates, such as hydroperoxides, thus detracting from accuracy of the results.Attempts to minimize such interference have involved reduction of hydroperoxides to noncarbonyl compounds prior todetermination of carbonyls, or conducting the reaction at a low temperature.
Because the carbonyl compounds in oxidized fats are of relatively high molecular weight, they can be separated by a variety oftechniques from lower molecular weight volatile carbonyl compounds. The lower molecular weight volatile carbonyl compoundsare of interest because of their influence on flavor. The volatile carbonyls are usually recovered by distillation at atmospheric orreduced pressure and then determined by reaction of the distillate with appropriate reagents or by chromatographic methods.Quantitative measurement of hexanal by headspace analysis is a common technique [43].
Anisidine Value [136]
In the presence of acetic acid, p-anisidine reacts with aldehydes producing a yellowish color. The molar absorbance at 350 nmincreases if the aldehyde contains a double bond. Thus, the anisidine value is mainly a measure of 2-alkenals. An expressiontermed the Totox or oxidation value (OV), which is equivalent to 2 × peroxide value + anisidine value, has been suggested forthe assessment of oxidation in oils.
Kreis Test
This was one of the first tests used commercially to evaluate oxidation of fats. The procedure involves measurement of a redcolor that is believed to result from reaction with phloroglucinol (Kreis reagent). Deficiencies of this test include: (a) freshsamples free of oxidized flavor frequently develop some color upon reaction with the Kreis reagent, and (b) consistent resultsamong different laboratories are difficult to obtain.
Ultraviolet Spectrophotometry
Measurement of absorbance at 234 nm (conjugated dienes) and 268 nm (conjugated trienes) is sometimes used to monitoroxidation. However, the magnitude of the absorbance does not correlate well with the degree of oxidation except in the earlystages.
Oxirane Test
This method, which provides a measure of epoxide content, is based on the addition of hydrogen halides to the oxirane group.Epoxide content is determined by dissolving the sample in aqueous acetic acid in the presence of crystal violet, and titrating withHBr to a bluish green endpoint [113]. The test, however, has poor sensitivity, lacks specificity, and does not provide anaccurate quantitative result with some trans-epoxides. Hydrogen halides also react with b-unsaturated carbonyls andconjugated dienols. A colorimetric method for epoxides, based on the reaction of the oxirane group with picric acid, isreportedly more sensitive than the oxirane test and is not subject to the shortcomings mentioned [37].
Iodine Value
This test is a measure of the unsaturated linkages in a fat and is determined by reacting the fat with a solution of iodinemonochloride in a mixture of acetic acid and CC14, liberating excess iodine with KI, and titrating with Na2S2O3 (Wijs method).The results are expressed as grams of iodine absorbed by a 100-g sample [113]. In the Hanus method, an iodine bromidereagent is

Pag e 279
used instead of iodine monochloride. A decline in iodine value is sometimes used to measure the reduction of dienoic acidsduring the course of autoxidation.
Fluorescence
Fluorescent compounds may develop from interaction of carbonyl compounds (produced by lipid oxidation) with constituentspossessing free amino groups [32]. Fluorescence methods provide a relatively sensitive measure of oxidation products inbiological tissues.
Chromatographic Methods
Various chromatographic techniques, including liquid, thin-layer, high-performance liquid, size exclusion, and gas, have beenused to determine oxidation in oils or lipid-containing foods. This approach is based on the separation and quantitativemeasurement of specific fractions, such as volatile [34, 122], polar [11], or polymeric compounds [142, 143] or individualcomponents, such as pentane or hexanal [43], that are known to be typically produced during autoxidation.
Sensory Evaluation
The ultimate test for oxidized flavor in foods is a sensory one. The value of any objective chemical or physical method is judgedprimarily on how well it correlates with results from sensory evaluation. The testing of flavor is usually conducted by trained orsemitrained taste panels using highly specific procedures [69].
Several “accelerated” tests are also available to estimate resistance of a lipid to oxidation.
Schaal Oven Test
The sample is stored at about 65°C and periodically tested until oxidative rancidity is detected. Detection can be doneorganoleptically or by measuring the peroxide value.
Active Oxygen Method (AOM)
This test is widely used. It involves maintenance of the sample at 98°C while air is continuously bubbled through it at a constantrate. The time required to obtain a specific peroxide value is then determined [113].
Rancimat Method [55]
Air is bubbled through the oil as in the AOM test, and the increase in electrical conductivity due to generation of oxidationproducts is measured, usually at 100°C, and expressed in terms of “induction time.”
Oxygen Absorption
The sample is placed in a closed chamber and the amount of oxygen absorbed is determined and used as a measure of stability.This is done by measuring the time to produce a specific pressure decline, or by the time to absorb a preestablished quantity ofoxygen under specific oxidizing conditions. This test has been particularly useful in studies of antioxidant activity.
5.5.2.12 Antioxidants [14, 24, 62, 127]
Antioxidants are substances that can delay onset, or slow the rate, of oxidation of autoxidizable materials. Literally hundreds ofcompounds, both natural and synthesized, have been reported to possess antioxidant properties. Their use in foods, however, islimited by certain obvious requirements not the least of which is adequate proof of safety. The main lipid-soluble antioxidantscurrently used in food are monohydric or polyhydric phenols with vari-

Pag e 280
ous ring substitutions (Fig. 30). For maximum efficiency, primary antioxidants are often used in combination with other phenolicantioxidants or with various metal sequestering agents (see Table 6).
Although the mechanisms by which many antioxidants impart stability to pure oils are relatively well known, much remains to belearned about their action in complex foods.
FIGURE 30Major antioxidants used in food.

Pag e 281
Effectiveness and Mechanisms of Action
Several reviews of antioxidant kinetics and mechanism of action have been published [118, 125, 128, 139]. As should be clearfrom the autoxidative mechanisms outlined earlier, a substance delays the autoxidation reaction if it inhibits the formation of freeradicals in the initiation step, or if it interrupts propagation of the free radical chain. The initiation of free radicals can be retardedby using peroxide decomposers, metal chelating agents, or singlet-oxygen inhibitors. Because it is very difficult to eliminate tracesof peroxides and metal initiators, most studies have focused on the use of free radical acceptors.
The first detailed kinetic study of antioxidant action was conducted in 1947 by Bolland and ten Have using a model system ofautoxidizing ethyl linoleate containing hydroquinone as an inhibitor [13]. They postulated that antioxidants inhibit the chainreaction by acting as hydrogen donors or free radical acceptors and concluded that the free-radical acceptor (AH) reacts
primarily with and not with radicals.
These authors also concluded that the most probable number of oxidation chains terminated by one inhibitor molecule is two,and that the reaction can, therefore, be considered as occurring in two stages. Different versions of antioxidation mechanisms
were suggested by other workers. It was proposed, for example, that the free-radical intermediate, , forms stable productsby reacting with an radical or that a complex between the radical and the inhibitor is formed followed by reaction ofthe complex with another radical to yield stable products:
Although all of the preceding reactions may be taking place, the original concept of Bolland and ten Have is considered to be themost important, and the basic mechanism can thus be visualized as a competition between the “inhibitor reaction,”
and the chain propagation reaction,
The effectiveness of an antioxidant is related to many factors, including activation energy, rate constants, oxidation reductionpotential, ease of antioxidant loss or destruction, and solubility properties. For the two competing reactions discussed earlier(i.e., the inhibitor reaction and the chain propagation reaction), both of which are exothermic, the activation energy increaseswith increasing A-H and R-H bond dissociation energies, and therefore the efficiency of the antioxidant (AH) increases withdecreasing A-H bond strength. Ideally, however, the resulting antioxidant free radical must not itself initiate new free radicals orbe subject to rapid oxidation by a chain reaction. In this regard phenolic antioxidants occupy a favored status. They are excellenthydrogen or electron donors and, in addition, their radical intermediates are relatively stable due to resonance delocalization andto a lack of positions suitable for attack by molecular oxygen. Hydroquinones, for example, react with hydroperoxy radicals,forming stable semiquinone resonance hybrids.

Pag e 282
The semiquinone radical intermediates may undergo a variety of reactions forming more stable products. They can react withone another to form dimers, or dismutate to yield quinones with renewed formation of the original inhibitor molecule:
or they can react with another radical.
The monohydric phenols cannot form semiquinones or quinones, as such, but they give rise to radical intermediates withmoderate resonance delocalization, and they can be sterically hindered, as, for example, by the two t-butyl groups in BHT. Thet-butyl groups reduce further chain initiation (by the alkoxy radical) after the initial hydrogen donation. The net reaction betweenlinoleate and BHA can be represented as:
In addition to the innate chemical potency of an antioxidant, its solubility in oil and its volatility influence its effectiveness. Itssolubility affects accessibility to peroxy radical sites, and its volatility affects its persistence during storage or heating.
In the last few years, emphasis has shifted to the study of antioxidant action at surfaces, especially in such systems asmembranes, micelles, and emulsions. The importance of the amphiphilic character of antioxidant molecules to their effectivenessin biphasic and multiphasic systems is demonstrated in a provocative discussion by Porter [118].

Pag e 283
Synergism
Synergism occurs when a mixture of antioxidants produces greater activity than the sum of the activities of the antioxidants whentested individually. Two categories of synergism are recognized. One involves the action of mixed free-radical acceptors; theother involves the combined action of a free-radical acceptor and a metal chelating agent. Frequently, however, a so-calledsynergist may play more than one role. Ascorbic acid, for example, may function as an electron donor, a metal chelator, anoxygen scavenger, and a contributor to the formation of browning products that have antioxidant activity.
1. Mixed free radical acceptors. Uri [139] introduced a hypothesis to explain the action of two mixed free-radical acceptors,designated AH and BH, where it is assumed that the bond dissociation energy of B-H is smaller than that of A-H. It is furtherassumed that BH reacts slowly with because of steric hindrance. The following reaction would then take place:
Thus, the presence of BH will have a sparing effect since it results in regeneration of the primary antioxidant. In addition, thetendency of to disappear via a chain reaction is substantially diminished. An example of such a system is a phenolicantioxidant and ascorbic acid. Since the phenolic compound, if used by itself, is the more effective of the two, it is customarilytermed the primary antioxidant while ascorbic acid is called the synergist. In a similar way, it is also possible for two phenolicantioxidants to exhibit synergism.
2. Metal chelating agents. In general, metal chelating agents partly deactivate trace metals, which are often present as salts offatty acids. When the antioxidant property of a free radical acceptor is enhanced greatly by the presence of a metal complexingagent, a synergistic effect is said to occur. Citric and phosphoric acids, polyphosphates, and ascorbic acid are typical examplesof metal chelating agents.
Choice of Antioxidant
Due to differences in their molecular structure, various antioxidants exhibit substantial differences in effectiveness when used withdifferent types of oils or fat-containing foods, and when used under different processing and handling conditions. In addition tothe potency of an antioxidant(s) in a particular application, due consideration must be given to other factors, such as ease ofincorporation in the food, carry-through characteristics, sensitivity to pH, tendency to discolor or produce off flavors, availability,and cost. The problem of selecting the optimum antioxidant or combination of antioxidants is further complicated by the difficultyof predicting how the added antioxidant(s) will function in the presence of pro-oxidants and antioxidants already present in thefood or produced in the course of processing.
The hydrophilic-lipophilic properties of various antioxidants also have a bearing on their effectiveness in different applications.Porter [118] described two basic situations that call for two different types of antioxidants. The first involves lipids with a smallsurface-volume ratio, such as occurs with bulk oils. In this case antioxidants with relatively large values for hydrophilic-lipophilicbalance [e.g., propyl gallate (PG) or tert-butylhydroquinone) TBHQ)] are most effective since they concentrate at the surface ofthe oil where reaction of fat with molecular oxygen is most prevalent. The second situation involves lipids with a large surface-volume ratio, such as occurs with polar lipid membranes in intact tissue foods, with intracellular micelles of neutral lipids, andwith oil-in-water emulsions (e.g., salad dressing). These are multiphasic systems in which the concentration of water is large andthe lipid is often in a mesophasic state.

Pag e 284
For these situations, the more lipophilic antioxidants, such as, BHA, BHT, higher alkyl gallates, and tocopherols, are mosteffective.
Characteristics of Some Commonly Used Primarily Antioxidants
Tocopherols: These are the most widely distributed antioxidants in nature, and they constitute the principal antioxidants invegetable oils. The small amounts of tocopherols present in animal fats originate from vegetable components in the animal diet.Eight tocopherol structures, all methyl-substituted forms of tocol, are known. Of these tocopherols, 5,7,8-trimethyl-, 7,8-dimethyl-, and 8-methyltocol, respectively, predominate in vegetable oils.
A relatively high proportion of the tocopherols present in crude vegetable oils survives the oil processing steps and remains insufficient quantities to provide oxidative stability in the finished product. As antioxidants, tocopherols exert their maximumeffectiveness at relatively low levels, approximately equal to their concentration in vegetable oils. If used at a very highconcentration, they may actually act as pro-oxidants.
Mechanism of Action: Like all phenolic antioxidants, tocopherol exerts its antioxidant effect by competing with the reaction:
Tocopherol (TH2) reacts with peroxy radicals in the following manner:
The a-tocopherol radical is relatively stable due to delocalization of the unpaired electron and therefore is less reactive thanthe peroxyl radical. This is why a-tocopherol is an effective antioxidant. Figure 31 shows five resonance structures of thetocopherol radical. Resonance structure V is energetically favorable [9]. The a-tocopherol radical may quench another peroxylradical to yield methyltocopherylquinone (T), as shown,
or may react with another a-tocopheryl radical to give methyl tocopherylquinone and a regenerated molecule of tocopherol:
In general, tocopherols with high vitamin E activity are less effective antioxidants than those with low vitamin E activity. Theorder of antioxidant activity is thus d>g>b>a. However, the relative activity of these compounds is significantly influenced bytemperature and light.

Pag e 285
FIGURE 31Resonance structures of the a-tocopherol radical. (From Ref. 9.)
In biological systems, ascorbate is capable of “recycling” a-tocopherol by reducing the a-tocopherol radical [9].
Tocopherol as a Pro-Oxidant: It has been observed that under certain conditions tocopherol may act as a pro-oxidant. Undernormal circumstances, where lipid concentration greatly exceeds the concentration of tocopherol, progressive oxidation depletestocopherol, leaves the pool of lipid relatively unchanged and causes accumulation of ROOH. Accumulation of ROOH reversesthe equilibrium reaction,
thus stimulating the propagation reaction
When a-tocopherol is present at a relatively high concentration, a pro-oxidant effect can occur via radical formation accordingto the reaction
Gum guaiac is a resinous exudate from a tropical tree. Its antioxidant effectiveness, due mainly to its appreciable content ofphenolic acids, is more pronounced in animal fats than in vegetable oils. Gum guaic has a reddish brown color, is very slightlysoluble in oil, and gives rise to some off flavor.
Both butylated hydroxyanisole (BHA) which is commercially available as a mixture of two isomers (Fig. 27), and butylatedhydroxytoluene (BHT) have found wide commercial use in the food industry. Both are highly soluble in oil and exhibit weakantioxidant activity in vegetable oils, particularly those rich in natural antioxidants. BHT and BHA are relatively effective whenused in combination with other primary antioxidants. BHA has a typical phenolic odor that may become noticeable if the oil issubjected to high heat.

Pag e 286
Nordihydroquaiaretic acid (NDGA) is extracted from a desert plant, Larrea divaricata. Its solubility in oils is limited (0.5–1%),but greater amounts can be dissolved if the oil is heated. NDGA has poor carry-through properties and tends to darken slightlyon storage, in the presence of iron, or when subjected to high temperatures. The antioxidant activity of NDGA is markedlyinfluenced by pH, and it is readily destroyed in highly alkaline conditions. NDGA is reported to effectively retard hematin-catalyzed oxidation in fat-aqueous systems and in certain meats. In the United States NDGA is not permitted for use as a foodadditive. However, it can be used in food packaging material.
As would be expected from their phenolic structure and three hydroxyl groups, alkyl gallates and gallic acid exhibitconsiderable antioxidant activity. Gallic acid is soluble in water but nearly insoluble in oil. Esterification of the carboxyl groupwith alcohols of varying chain length produces alkyl gallates with increased oil solubility. Of these, propyl gallate is widely used inthe United States. This compound reportedly is effective for retarding lipoxygenase-cat-alyzed oxidation of linoleate. In thepresence of traces of iron and alkaline conditions, gallates will cause a blue-black discoloration. They are unstable during bakingor frying.
Tertiary Butylhydroquinone (TBHQ): TBHQ is moderately soluble in oil and slightly soluble in water. In many cases, TBHQ ismore effective than other common antioxidants in providing oxidative stability to crude and refined polyunsaturated oils, withoutproblems of color or flavor stability. TBHQ is also reported to exhibit good carry-through characteristics in the frying of potatochips.
As would be expected from their similarity in structure, 2,4,5-trihydroxybutyrophenone (THBP) and the gallates exhibit similarantioxidant properties. THBP is not widely used in the United States.
4-Hydroxymethyl-2,6-di-tertiary-butylphenol is produced by substituting a hydroxyl for one hydrogen in the methyl group ofBHT. It is therefore less volatile than BHT but otherwise behaves similarly as an antioxidant.
Decomposition of Antioxidants
Antioxidants may exhibit significant decomposition, particularly at elevated temperatures, and several degradation products canarise. The amounts of these products are very small because the concentrations of antioxidants allowed in food are small.However, some of these degradation products have antioxidative properties.
The stabilities of four phenolic antioxidants have been studied during heating for 1 hr at 185°C [54]. Apparent stability increasedin the order TBHQ<BHA<PG<BHT. This tendency is based partly on heat stability and partly on loss by evaporation(volatility). PG is the least volatile while BHT and TBHQ are the most volatile.
Figure 32 shows reaction mechanisms proposed for thermal decomposition of BHA. The antioxidant first loses a hydrogenatom, giving rise to the free radical species a, b, and c.

Pag e 287
FIGURE 32Thermal decomposition of BHA.
Oxidation of radical a produces compound 1, while various recombinations of the resonant hybrid result in formation of thedimeric products 2 and 3. The biological properties of these degradation products are not known.
Regulation
Antioxidants are food additives. In the United States their use is subject to regulation under the Federal Food Drug andCosmetic Act. Antioxidants for food products are also regulated under the Meat Inspection Act, the Poultry Inspection Act, andvarious state laws. Antioxidants permitted for use in foods are listed in Table 6. In most instances the total concentration ofauthorized antioxidants, added singly or in combination, must not exceed 0.02% by weight based on the fat content of the food.Certain exceptions exist in the case of standardized foods and products covered by special regulations. Under the MeatInspection Act, concentrations up to 0.01% are permitted for single antioxidants, based on fat content, with a combined total ofno more than 0.02%. Tocopherols and the major acid synergists are virtually unregulated. For some foods, however, thetocopherols are not permitted above certain concentrations: 0.0002% in milk products, 0.002% in infant formulas, 0.03% (lipid)in shellfish, and 0.05% (lipid) in herbs, spices, or flavorings. BHT and BHA are not allowed in fish products.

Pag e 288
TABLE 6 Antioxidants Permitted in Foods in the United States
Primary antioxidants Synerg ists
Tocopherols Citric acid and isopropyl citrate
Gum g uaiac Phosphoric acid
Propyl g allateButylated hydroxyanisole (BHA)
Thiodipropionic acid and its didodecyl,dilauryl, and dioctadecyl esters
Butylated hydroxytoluene (BHT) Ascorbic acid and ascorbyl palmitate
2,4,5-Trihydroxybutyrophenone (THBP) Tartaric acid
4-Hydroxymethyl-2,6-di-tert-butylphenol tert-Butylhydroquinone (TBHQ)
Lecithin
The general public concern with the safety of chemical additives has stimulated a continuing search for new antioxidants that mayoccur naturally in food or may form inadvertently during processing. Compounds with antioxidant properties have been found inmany spices, oil seeds, citrus pulp and peel, cocoa shells, oats, soybean, hydrolyzed plants, animal and microbial proteins, and inproducts that have been heated and/or have undergone nonenzymic browning.
Another result of the effort to achieve “antioxidant safety” is the development of non-absorbable polymeric antioxidants. Theseare generally hydroxyaromatic polymers with various alkyl and alkoxyl substitutions. These compounds are usually large andstable so absorption in the intestinal tract is practically nil. In addition to their reportedly high antioxidant activity they arenonvolatile under deep-fat frying conditions, which results in nearly quantitative carrythrough to the fried items. They have notyet, however, received FDA approval.
Modes of Application
Antioxidants can be added directly to vegetable oils or to melted animal fats after they are rendered. In some cases, however,better results are achieved when the antioxidant is administered in a diluent. Examples are mixtures of monoacylglycerols andglycerol in propylene glycol, monoacylglycerol-water emulsions, and mixtures of antioxidants in volatile solvents. Food productscan also be sprayed with or dipped in solutions or suspensions of antioxidants, or they can be packaged in films that containantioxidants.
5.5.3 Thermal Decomposition
Heating of food produces various chemical changes, some of which can be important to flavor, appearance, nutritive value, andtoxicity. Not only do the different nutrients in food undergo decomposition reactions, but these nutrients also interact amongthemselves in extremely complex ways to form a very large number of new compounds.
The chemistry of lipid oxidation at high temperatures is complicated by the fact that both thermolytic and oxidative reactions aresimultaneously involved. Both saturated and unsaturated fatty acids undergo chemical decomposition when exposed to heat inthe presence of oxygen. A schematic summary of these mechanisms is shown in Fig. 33.
5.5.3.1 Thermal Nonoxidative Reactions of Saturated Fats
In general, very high temperatures of heating are required to produce substantial nonoxidative decomposition of saturated fattyacids. Thus, heating of saturated triacylglycerols and methyl esters of fatty acids at temperatures of 200–700°C yields detectableamounts of decomposition products consisting mostly of hydrocarbons, acids, and ketones. However, using very sensitive

Pag e 289
FIGURE 33Generalized scheme for thermal decomposition of lipids.
measurement techniques, thermolytic products were detected in triacylglycerols after heating in vacuum for only 1 hr at 180°C[29].
Shown in Figure 34 are the products arising from anaerobic heating of tributyrin (Tri-4), tricaproin (Tri-6), and tricaprylin (Tri-8). Each triacylglycerol produces the following products (n is the number of carbons in the fatty acid molecule): a series ofnormal alkanes and alkenes with the Cn-1 alkane predominating; a Cn fatty acid; a C2n-1 symmetrical ketone; a Cn oxopropyl ester;Cn propene and propanediol diesters; and Cn diacylglycerols. Acrolein, CO, and CO2 are also formed. Quantitatively, theconstituent fatty acids are the major compounds produced from
FIGURE 34Nonoxidative decomposition products of triacylg lycerols: A, free
acid; S, symmetrical ketone; O, oxopropyl ester; Dioldi,propane- and propenediol diesters; Di, dig lycerides. Numbers
refer to hydrocarbon or fatty acid carbon chain.

Pag e 290
thermolytic decomposition of triacylglycerols. In the absence of moisture the free fatty acid can be formed via a “six-atom-ringclosure,” as follows:
This mechanism also explains the formation of propenedioldiesters. Expulsion of the acid anhydride from the triacylglycerolmolecule produces 1- or 2-oxopropyl esters and the acid anhydride:
Decomposition of the 1-oxopropyl gives rise to acrolein and the Cn fatty acid; decarboxylation of the acid anhydrideintermediate produces the symmetrical ketone. Free-radical mechanisms similar to those proposed for radiolysis oftriacylglycerols may also play a significant role in the formation of thermolytic products, particularly when relatively hightemperatures are used.
5.5.3.2 Thermal Oxidative Reactions of Saturated Fats
Saturated fatty acids and their esters are considerably more stable than their unsaturated analogs. However, when heated in airat temperatures higher than 150°C, they undergo oxidation, giving rise to a complex decomposition pattern. The major oxidativeproducts consist of a homologous series of carboxylic acids, 2-alkanones, n-alkanals, lactones, n-alkenes, and 1 -alkenes.
In a systematic study, triacylglycerols in a series containing the even-numbered fatty acid chains C6 to C16 were heated in air for1 hr at either 180 or 250°C and their oxidation products were examined [29]. The hydrocarbon series was the same as thatproduced in the absence of oxygen, but the amounts formed were much greater under the oxidative conditions. In all cases theCn-1 alkane was the major hydrocarbon produced.
In general, the 2-alkanones were produced in larger quantities during oxidative heating than the alkanals, with the Cn-1 methylketone being the most abundant carbonyl compound. All the lactones found were gamma-lactones, except for those with acarbon number equal to that of the parent fatty acid, in which case both Cn g- and d-lactones were produced in relatively largeamounts.
It is generally accepted that the thermal oxidation of saturated fatty acids involves the formation of monohydroperoxides as theprincipal mechanism, and that oxygen attack can occur at all methylene groups of the fatty acid. There is, however, controversyregarding whether hydroperoxide formation is favored at certain locations along the alkyl chain. Since the dominant oxidativeproducts of saturated fatty acids are those with chain lengths near or equal to the parent fatty acid, it is likely that oxidationoccurs preferentially at the a, b, and g positions.
Oxidative attack at the b-carbon of the fatty acid, for example, results in the formation of b-keto acids, which in turn yield Cn-1
methyl ketones upon decarboxylation. Cleavage between the a and b carbons of the alkoxy radical intermediate gives rise to Cn-
2 alkanal; scission between the b and g carbons produces Cn-3 hydrocarbons:

Pag e 291
Oxygen attack at the g position yields a Cn-4 hydrocarbon, a Cn-3 alkanal, and a Cn-2 methyl ketone.
In addition, hydroperoxide formation at the g position is believed to be responsible for the production of the Cn g-lactones viacyclization of the resulting hydroxy acids.
Oxygen attack at the a-carbon accounts for the production of a Cn-1 fatty acid (via formation of the a-keto acid), a Cn-1 alkanal,and a Cn-2 hydrocarbon.
Further stepwise oxidations give rise to a series of smaller acids, which may themselves undergo oxidation, producing typicaldecomposition products of their own. This may explain the formation, in small amounts, of the shorter chain hydrocarbons,lactones, and carbonyl compounds.
5.5.3.3 Thermal Nonoxidative Reactions of Unsaturated Fatty Acid Esters
Formation of dimeric compounds appears to be the predominant reaction of unsaturated fatty acids when heated in the absenceof oxygen. In addition, certain other substances of lower molecular weight are formed. Relatively severe heat treatment,however, is required for these reactions to take place. Thus, no significant decomposition of methyl oleate can be detected attemperatures below 220°C, but when samples are heated at 280°C for 65 hr under argon, hydrocarbons, short- and long-chainfatty acid esters, and straight-chain dicarboxylic dimethyl esters, as well as dimers, are produced. The occurrence of many ofthese compounds has been

Pag e 292
explained on the basis of the formation and/or combination of free radicals resulting from homolytic cleavage of C-C linkagesnear the double bond. The dimeric compounds, which include alicyclic monoene and diene dimers, as well as saturated dimerswith cyclopentane structure, are believed to arise via allyl radicals resulting from hydrogen abstraction at methylene groups a tothe double bond. Such radicals may undergo disproportionation into monoenoic and dienoic acids, or inter- and intramolecularaddition to C-C double bonds (Fig. 25).
Methyl linoleate, heated under the same conditions, produces a more complex mixture of dimers consisting of saturated tricyclic,monounsaturated bicyclic, diunsaturated monocyclic, and triunsaturated acyclic dimers, as well as dehydrodimers containing oneor two double bonds (Fig. 26). At a less severe heat treatment of 180°C for 1 hr under vacuum, ethyl linoleate yields only tracesof volatile decomposition products. These compounds appear to be hydrocarbons, but the amounts produced are so small thatpositive identification has not been accomplished.
5.5.3.4 Thermal Oxidative Reactions of Unsaturated Fatty Acid Esters
Unsaturated fatty acids are much more susceptible to oxidation than their saturated analogs. At elevated temperatures theiroxidative decomposition proceeds very rapidly. Although certain specific differences between high- and low-temperatureoxidations have been observed, the evidence accumulated to date indicates that in both cases the principal reaction pathwaysare the same. The formation and decomposition of hydroperoxide intermediates, predictable according to location of doublebonds, appear to occur over a wide temperature range. Many decomposition products have been isolated from heated fats. Themajor compounds produced at high temperature are qualitatively typical of those ordinarily produced at room-temperatureautoxidation. However, at elevated temperatures, hydroperoxide decomposition and secondary oxidations occur at extremelyrapid rates. The amount of a given decomposition product, at a given time during the autoxidation process, is determined by thenet balance between the complex effects of many factors. Hydroperoxide structure, temperature, the degree of unsaturation, andthe stability of the decomposition products themselves undoubtedly exert major influences on the final quantitative pattern. Thepicture is further complicated, since these factors influence not only C-C bond scission, but also a large number of other possibledecomposition reactions that occur simultaneously and in competition with C-C cleavage. The latter reactions include C-Oscission, which may lead to positional isomerization of hydroperoxides, epoxidation, formation of dihydroperoxides,intramolecular cyclization, and dimerization.
We have already discussed the basic mechanisms of thermal and oxidative polymerization of unsaturated fatty acids. Heating ofunsaturated fatty acids in air at elevated temperatures leads to the formation of oxydimers or polymers with hydroperoxide,hydroxide, epoxide, and carbonyl groups, as well as ether and peroxide bridges. The precise structures of many of thesecompounds, as well as the effects of the various oxidation parameters on reactions leading to their formation, are still ambiguous.However, with the development of highly efficient chromatographic techniques for the separation of high-molecular-weightcompounds, renewed interest has been generated in the study of oxidative polymerization.
5.5.4 Chemistry of Frying
Foods fried in fat make significant contributions to the calories in the average U.S. diet. In the course of deep-fat frying, foodcontacts oil at about 180°C and is partially exposed to air for various periods of time. Thus frying, more than any other standardfood process or handling method, has the greatest potential for causing chemical changes in fat, and sizeable amounts of this fatare carried with the food (5–40% fat by weight is absorbed).

Pag e 293
5.5.4.1 Behavior of the Frying Oil
The following classes of compounds are produced from the oil during frying.
Volatiles. During frying, oxidative reactions involving the formation and decomposition of hydroperoxides lead to suchcompounds as saturated and unsaturated aldehydes, ketones, hydrocarbons, lactones, alcohols, acids, and esters [25]. After oilis heated for 30 min at 180°C in the presence of air, the primary volatile oxidation products can be detected by gaschromatography. Although the amounts of volatiles produced vary widely, depending on oil type, food type, and the heattreatment, they generally reach plateau values, probably because a balance is achieved between formation of the volatiles andloss through evaporation or decomposition.
Nonpolymeric polar compounds of moderate volatility (e.g., hydroxy and epoxy acids). These compounds are producedaccording to the various oxidative pathways involving the alkoxy radical as discussed earlier.
Dimeric and polymeric acids, and dimeric and polymeric glycerides. These compounds occur, as expected, from thermaland oxidative combinations of free radicals. Polymerization results in a substantial increase in the viscosity of the frying oil.
Free fatty acids. These compounds arise from hydrolysis of triacylglycerols in the presence of heat and water.
The reactions just described are responsible for a variety of physical and chemical changes that can be observed in the oil duringthe course of frying. These changes include increases in viscosity and free fatty acid content, development of a dark color,decreases in iodine value and surface tension, changes in refractive index, and an increased tendency to foam.
5.5.4.2 Behavior of the Food During Frying
The following events occur during frying of food:
Water is continuously released from the food into the hot oil. This produces a steamdistillation effect, sweeping volatile oxidativeproducts from the oil. The released moisture also agitates the oil and hastens hydrolysis. The blanket of steam formed above thesurface of the oil tends to reduce the amount of oxygen available for oxidation.
Volatiles (e.g., sulfur compounds and pyrazine derivatives in potato) may develop in the food itself or from the interactionsbetween the food and oil.
Food absorbs varying amounts of oil during deep-fat frying (potato chips have a final fat content of about 35%), resulting in theneed for frequent or continuous addition of fresh oil. In continuous fryers, this results in rapid attainment of a steady-statecondition for oil properties.
The food itself can release some of its endogenous lipids (e.g., fat from chicken) into the frying fat and consequently the oxidativestability of the new mixture may be different from that of the original frying fat. The presence of food causes the oil to darken atan accelerated rate.
5.5.4.3 Chemical and Physical Changes
The changes that occur in the oil and food during frying should not be automatically construed as undesirable or harmful. In fact,some of these changes are necessary to provide the sensory qualities typical of fried food. On the other hand, extensivedecomposition, resulting from lack of adequate control of the frying operation, can be a potential source of damage not only tosensory quality of the fried food but also to nutritional value.
The chemical and physical changes in the frying fat are influenced by a number of frying parameters. Obviously, the compoundsformed depend on the composition of both the oil and the food being fried. High temperature, long frying times, and metalcontaminants favor

Pag e 294
extensive decomposition of the oil. The design and type of the fryer (pan deep-fat batch, or deep-fat continuous) is alsoimportant. Oxidation of the oil will occur faster at large surface-volume ratios. Other factors of concern are turnover rate of theoil, the heating pattern (continuous or intermittent), and whether antioxidants are present.
5.5.4.4 Tests for Assessing the Quality of Frying Oils
Several of the methods just discussed for determining fat oxidation are commonly used to monitor thermal and oxidativedecomposition of oils during the frying process. Measures of viscosity, free fatty acids, sensory quality, smoke point, foaming,polymer formation, and specific degradation products are also used with various degrees of success. In addition, severalmethods have been developed specifically to assess the chemical status of used frying oil. Some of these require standardlaboratory instruments, while others require special measurements.
Because changes occurring during frying are numerous and variable, one test may be adequate for one set of conditions buttotally unsatisfactory for another.
Petroleum Ether Insolubles
This method was developed in Germany and later recommended by the German Society for Fat Research. It is suggested that aused frying fat be regarded as “deteriorated” if the petroleum ether insolubles are 0.7% and the smoke point is less than 170°C,or if the petroleum ether insolubles are 1.0% regardless of the smoke point. The method is tedious and not very accurate, sinceoxidation products are partially soluble in petroleum ether.
Polar Compounds [11]
The heated fat is fractionated on a silica-gel column and the nonpolar fraction is eluted with a petroleum ether-diethyl ethermixture. The percentage weight of the polar fraction is calculated by difference. A value of 27% polar components is suggestedas the maximum tolerable for usable oil.
Dimer Esters [115]
This technique involves complete conversion of the oil to the corresponding methyl esters followed by separation and detectionon a short column in a gas chromatograph. The increase in dimer esters is used as a measure of thermal decomposition.
Quick Tests
Changes in the dielectric constant of the oil can be measured quickly in an instrument known as the Foodoil Sensor [44]. Thedielectric constant increases with an increase in polarity, and increased polarity is used as an indicator of deterioration. Thistechnique has several advantages. The unit is compact and portable, it can be operated in the field by unskilled personnel, andanalysis time is less than 5 min. However, caution must be exercised in interpreting the data obtained [114]. Dielectric-constantreadings represent the net balance between polar and nonpolar components, both of which develop upon frying. The increase inthe polar fraction usually predominates, but the net difference between the two fractions depends on a variety of factors, some ofwhich may be unrelated to oil quality (e.g., moisture).
“Diagnostic kits” are available for assessing oil deterioration. Most involve simple addition of a reagent to the sample andmatching the developed color with a color standard. Fritest©, based on the presence of carbonyl compounds, and Oxifrit©,based on the presence of oxidized compounds, are sold by Merck (Dramstadt, Germany). Verify-FAA. 500©, based on freefatty acids, and Verify-TAM.150©, based on “alkaline material,” are tests available from Libra Labs (Piscataway, NJ).

Pag e 295
5.5.4.5 Control Measures
From the standpoints of food acceptability and wholesomeness, it is desirable to minimize extensive oxidative decomposition,and to avoid development of objectionable flavors and excessive formation of cyclic or polymeric material during frying. Goodmanufacturing practices include:
1. Choice of frying oil of good quality and consistent stability.
2. Use of properly designed equipment.
3. Selection of the lowest frying temperature consistent with producing a fried product of good quality.
4. Frequent filtering of the oil to remove food particles.
5. Frequent shutdown and cleaning of equipment.
6. Replacement of oil as needed to maintain high quality.
7. Consideration of antioxidant use. When used, the level of antioxidant will sometimes decrease rapidly, and this is important tomonitor.
8. Adequate training of personnel.
9. Frequent testing of the oil throughout the frying process.
5.5.5 Effects of lonizing Radiation on Fats
The objective of food irradiation is comparable to that of other methods of preservation. Its primary purpose is to destroymicroorganisms and to prolong the shelf life of the food. The process is capable of sterilizing meats or meat products [at highdoses, e.g., 10–50 kGy (kilogray = 100 kilorads)]; extending the shelf life of refrigerated fresh fish, chicken, fruits, andvegetables (at medium doses, e.g., 1–10 kGy); preventing the sprouting of potatoes and onions; delaying fruit ripening; andkilling insects, in spices, cereals, peas, and beans (at low doses, e.g., up to 3 kGy). Radiation preservation of food is becomingincreasingly attractive to industry from both food stability and economic points of view.
As with heating, chemical changes are induced in food as a result of the irradiation. Indeed, in both cases, the primary objectiveof the treatment is achieved as a result of these chemical changes. On the other hand, treatment conditions must be controlledsuch that the nature and extent of the changes do not compromise the wholesomeness or quality of the food.
Considerable effort has been devoted to determining the effects of irradiation on various food components. Most of the earlywork on irradiation of lipids was concerned with the study of radiation-induced oxidation in natural fats or in certain model lipidsystems. More recently, strictly radiolytic (i.e., nonoxidative) changes in fats have been investigated.
5.5.5.1 Radiolytic Products
Listed in Table 7 are the classes of compounds found to result from irradiation of natural fats or model systems of fatty acids andtheir derivatives. This listing of compounds is derived from studies of beef and pork fats, mackerel oil, corn, soybean, olive,safflower, and cottonseed oils, and pure triacylglycerols, all treated under vacuum with radiation doses ranging from 0.5 to 600kGy [108]. Hydrocarbons, aldehydes, methyl and ethyl esters, and free fatty acids are the major volatile compounds producedby irradiation. Found in all irradiated fats studied are hydrocarbons consisting of complete homologous series of C1-C17 n-alkanes, C2-C17 1-alkenes, certain internally unsaturated monoenes, a series of alkadienes, and in some cases, several polyenes.The aldehydes and esters include normal alkanals containing 16 and 18 carbon atoms and the methyl and ethyl esters of C16 andC18 fatty acids. In these studies, unsaturated

Pag e 296
TABLE 7 Classes of Compounds Identified in Irradiated Fats
n-Alkanes Methyl and ethyl esters
I-Alkanes Propane and propenediol diesters
Alkadienes Ethanediol diesters
Alkynes Oxopropanediol diesters
Aldehydes Glyceryl ether diesters
Ketones Long -chain hydrocarbons
Fatty acids Long -chain alkyl esters
Lactones Long -chain alkyldioldiesters
Monoacylg lycerols Long -chain ketones
Diacylg lycerols Dimers
Triacylg lycerols Trimers
Note: Approximately 150 compounds were identified in variousstudies in the author's laboratory. Natural fats and model systemswere irradiated at various doses in the absence of oxyg en.
hydrocarbons larger than C17 arose only in irradiated fish oil, and aldehydes of chain length shorter than C16 were found only inirradiated coconut oil.
The quantitative pattern of the radiolytic products is strictly dependent on the fatty acid composition of the original fat. Althoughmost members of the hydrocarbon series are produced in only small amounts, those containing one or two carbon atoms lessthan the major component fatty acids of the original fat are formed in the greatest quantities. For example, in the case of pork fat,in which 18:1 is the major fatty acid, C17 and C16 hydrocarbons are the most abundant hydrocarbons; for coconut oil, in whichlauric acid is the main fatty acid, undecane and decene are the hydrocarbons produce in the greatest quantities. Based on theforegoing, and on the observation that the two major hydrocarbons produced from each fatty acid increase linearly with dose, amethod was developed for the detection of irradiated lipid-containing foods. The technique involves solvent extraction of thelipids, collection of volatiles, and quantitative measurement of the “key” hydrocarbon markers by gas chromatography [110].
The major aldehydes in the radiolytic mixture are those with the same chain length as those of the major component fatty acids ofthe original fat, and the methyl and ethyl esters produced in the largest quantity are those corresponding to the most abundantsaturated acids in the original fat. If the fats are partially hydrogenated before irradiation, the change in their original fatty acidcomposition results in a corresponding change in the composition of the radiolytic compounds. The radiolytic compounds ofrelatively high molecular weight have been identified in a study with beef fat [142].
5.5.5.2 Mechanisms of Radiolysis
General Principles
Ions and excited molecules are the first species formed when ionizing radiation is absorbed by matter. Chemical breakdown isbrought about by decomposition of the excited molecules and ions, or by their reaction with neighboring molecules. The fate ofthe excited molecules includes dissociation into free radicals. Among the reactions of ions is neutralization, producing excitedmolecules that may then dissociate into smaller molecules or free radicals. The free radicals formed by dissociation of excitedmolecules and by ion reactions may combine with each other

Pag e 297
in regions of high radical concentrations, or may diffuse into the bulk of the medium and react with other molecules.
Radiolysis of Fats
The reactions induced by irradiation are not the result of a statistical distribution of random cleavages of chemical bonds, butrather they follow preferred pathways largely influenced by molecular structure. In the case of saturated fats, as with all oxygen-containing compounds, the high localization of the electron deficiency on the oxygen atom directs the location of preferentialcleavage to the vicinity of the carbonyl group.
Based on the results available to date, the mechanisms of radiolysis in triacylglycerols appear to proceed in accord with theconcepts of Williams, regarding the primary ionization events in oxygen-containing compounds [147]. In a triacylglycerolmolecule, as shown here,
radiolytic cleavage occurs preferentially at five locations in the vicinity of the carbonyl group (wavy solid lines), and randomly atall the remaining carbon-carbon bonds in the fatty acid moiety (dashed lines).
These cleavages result in the formation of alkyl, acyl, acyloxy, and acyloxymethylene free radicals, and in addition, free radicalsrepresenting the corresponding glycerol residues. Free radical termination may occur by hydrogen abstraction, and to a lesserdegree by loss of hydrogen with the formation of an unsaturated linkage. Thus, scission of an acyloxy-methylene bond (locationa) produces a free fatty acid and a propanediol ester or propenediol diester; cleavage at the acyl-oxygen bond (at b) producesan aldehyde of equal chain length to the parent fatty acid and a diacylglycerol; cleavage at c or d produces a hydrocarbon withone or two carbon atoms less than the parent fatty acid and a triacylglycerol; and cleavage between carbons of the glycerolskeleton (e.g., at e) produces a methyl ester of the parent fatty acid and an ethanediol diester.
Alternatively, the free radicals may recombine, giving rise to a variety of radiolytic products. Thus, combination of alkyl radicalswith other alkyl radicals results in the production of longer chain or dimeric hydrocarbons:
combination of an acyl radical with an alkyl radical produces a ketone:
combination of an acyloxy radical with an alkyl radical produces an ester:
and combination of alkyl radicals with various glyceryl residues produces alkyl diglycerides:

Pag e 298
and glyceryl ether diesters.
It is indeed likely that other free-radical combinations take place to produce dimeric or high-molecular-weight compounds thatmay have escaped detection by current analytical techniques. Furthermore, mechanisms other than those presented here areprobably involved in the radiolysis of fats. In particular, radiolytic reactions resulting from unsaturation of the glyceride molecule(e.g., cross-linking, dimerization, and cyclization) have not been thoroughly investigated.
In the presence of oxygen, irradiation will accelerate the autoxidation of fats via one or more of the following reactions: (a)formation of free radicals, which may combine with oxygen to form hydroperoxides, (b) breakdown of hydroperoxides, givingrise to various decomposition products, particularly carbonyl compounds, and (c) destruction of antioxidants.
Complex Foods Containing Fats
The irradiation of isolated fats does not have a practical value in terms of industrial application. Food lipids are normally exposedto irradiation as constituents coexisting with other major and minor components of complex food systems. The radiolyticproducts obtained from an isolated fat are also obtained when the complex food containing such a fat is irradiated. However, theconcentration of these substances in the irradiated food will be considerably reduced by the diluting effect of the othersubstances present. Of course, additional changes can be anticipated from radiolysis of the nonlipid constituents and frominteraction between these constituents and the lipids.
Some researchers concluded that irradiation reduces the stability of fatty foods by destroying antioxygenic factors, andsuggested that irradiation be performed in the absence of air and that antioxidants be added after irradiation. On the other hand,others have found that, in certain cases, irradiation resulted in the formation of new protective factors that can improve productstability.
5.5.5.3 Comparison with Heat Effects
Although the mechanisms involved are different, many of the compounds produced from fats by irradiation are similar to thoseformed by heating. Far more decomposition products, however, have been identified from heated or thermally oxidized fats thanfrom irradiated fats. Recent research in our laboratory with fatty acid esters and triacylglycerols indicates that even whenirradiation is conducted at doses as high as 250 kGy, both the volatile and the nonvolatile

Pag e 299
patterns of products formed are much simpler than those obtained by heating at frying temperatures (180°C) for 1 hr.
5.5.6 Concluding Thoughts on Lipid Oxidation in Food
We are witnessing a revolution in the field of lipid oxidation caused by remarkable advances in the sciences, analyticalmethodology, and cross-disciplinary communication. Some of the long established theories, which in the past helped us todevelop an understanding of the basic mechanisms of lipid oxidation, must now give way to new thinking and a new approach tothe examination and control of oxidizing lipids in food.
It may not be too unreasonable to envision lipid oxidation in food in the same way one looks at the weather map in the UnitedStates. The atmospheric phenomena and weather activities vary from region to region and the weather map may changesignificantly from moment to moment:
1. Lipid oxidation is not a single process that proceeds according to a strict sequence. Rather, numerous events take place indifferent regions of the food matrix. The different reactions usually occur with considerable overlap, and the rate of each mayvary depending on conditions in each region.
2. The “conditions” in each region (oxidation parameters) are not static. They change continuously.
3. In food, oxidation involves oxidizable lipid substrates differing in composition, chemical and physical properties, and in theirsensitivity to oxidation (fatty acids, mixtures of acylglycerols, phospholipids).
4. The lipid substrates coexist in proximity with various other nonlipid, major (proteins, carbohydrates, water) and minor (tracemetals, vitamins, enzymes, pro- and antioxidants) components. A multitude of interactions take place.
5. Nearly all oxidative events are not “strictly chemical.” Instead, they are largely dictated by the physical state of both substrateand medium.
6. The minor components play a major role in a critical, delicate oxidative-antioxidative balance, the mechanism of which is notfully understood.
7. The same inhibitors (or accelerators) may play opposite roles depending on the oxidative event being considered. Forexample, a phenolic antioxidant may block the formation of volatile oxidation products while enhancing the accumulation ofperoxides.
It is clear that a realistic evaluation of lipid oxidation in food can only be achieved if the foregoing scenario, in all of its detail, isconsidered.
5.6 Chemistry of Fat and Oil Processing
5.6.1 Refining
Crude oils and fats contain varying amounts of substances that may impart undesirable flavor, color, or keeping quality. Thesesubstances include free fatty acids, phospholipids, carbohydrates, proteins and their degradation products, water, pigments(mainly carotenoids and chlorophyll), and fat oxidation products. Crude oils are subjected to several commercial refiningprocesses designed to remove these materials.

Pag e 300
5.6.1.1 Settling and Degumming
Settling involves heating the fat and allowing it to stand until the aqueous phase separates and can be withdrawn. This rids the fatof water, proteinaceous material, phospholipids, and carbohydrates. In some cases, particularly with oils containing substantialamounts of phospholipids (e.g., soybean oil), a preliminary treatment known as degumming is applied by adding 2–3% water,agitating the mixture at about 50°C, and separating the hydrated phospholipids by settling or centrifugation.
5.6.1.2 Neutralization
To remove free fatty acids, caustic soda in the appropriate amounts and strength is mixed with the heated fat and the mixture isallowed to stand until the aqueous phase settles. The resulting aqueous solution, called foots or soapstock, is separated and usedfor making soap. Residual soapstock is removed from the neutral oil by washing it with hot water, followed by settling orcentrifugation.
Although free fatty acid removal is the main purpose of the alkali treatment, this process also results in a significant reduction ofphospholipids and coloring matter.
5.6.1.3 Bleaching
An almost complete removal of coloring materials can be accomplished by heating the oil to about 85°C and treating it withadsorbants, such as fuller's earth or activated carbon. Precautions should be taken to avoid oxidation during bleaching. Othermaterials, such as phospholipids, soaps, and some oxidation products, are also absorbed along with the pigments. The bleachingearth is then removed by filtration.
5.6.1.4 Deodorization
Volatile compounds with undesirable flavors, mostly arising from oxidation of the oil, are removed by steam distillation underreduced pressure. Citric acid is often added to sequester traces of pro-oxidant metals. It is believed that this treatment alsoresults in thermal destruction of nonvolatile off-flavor substances, and that the resulting volatiles are distilled away.
Although the oxidative stability of oils is generally improved by refining, this is not always the case. Crude cottonseed oil, forexample, has a greater resistance to oxidation than its refined counterparts due to the greater amounts of gossypol andtocopherols in the crude oil. On the other hand, there can be little doubt as to the remarkable quality benefits that accrue fromrefining edible oils. An impressive example is the upgrading of palm oil quality that has occurred in recent years. Furthermore, inaddition to the obvious improvements in color, flavor, and stability, powerful toxicants (e.g., aflatoxins in peanut oil and gossypolin cottonseed oil) are effectively eliminated during the refining process.
5.6.2 Hydrogenation
Hydrogenation of fats involves the addition of hydrogen to double bonds in the fatty acid chains. The process is of majorimportance in the fats and oils industry. It accomplishes two major objectives. First, it allows the conversion of liquid oils intosemisolid or plastic fats more suitable for specific applications, such as in shortenings and margarine, and second, it improves theoxidative stability of the oil.
In practice, the oil is first mixed with a suitable catalyst (usually nickel), heated to the desired temperature (140-–225°C), thenexposed, while stirred, to hydrogen at pressures up to 60 psig. Agitation is necessary to aid in dissolving the hydrogen, toachieve uniform mixing of

Pag e 301
the catalyst with oil, and to help dissipate the heat of the reaction. The starting oil must be refined, bleached, low in soap, anddry; the hydrogen gas must be dry and free of sulfur, CO2, or ammonia; and the catalyst must exhibit long-term activity, functionin the desired manner with respect to selectivity of hydrogenation and isomer formation, and be easily removable by filtration.The course of the hydrogenation reaction is usually monitored by determining the change in refractive index, which is related tothe degree of saturation of the oil. When the desired end point is reached, the hydrogenated oil is cooled and the catalyst isremoved by filtration.
5.6.2.1 Selectivity
During hydrogenation, not only are some of the double bonds saturated, but some may also be relocated and/or transformedfrom the usual cis to the trans configuration. The isomers produced are commonly called iso acids. Partial hydrogenation thusmay result in the formation of a relatively complex mixture of reaction products, depending on which of the double bonds arehydrogenated, the type and degree of isomerization, and the relative rates of these various reactions. A simplistic schemeshowing the possible reactions that linolenate can undergo during hydrogenation is shown here:
In the case of natural fats, the situation is further complicated by the fact that they already contain an extremely complex mixtureof starting materials.
The term “selectivity” refers to the relative rate of hydrogenation of the more unsaturated fatty acids as compared with that of theless unsaturated acids. When expressed as a ratio (selectivity ratio), a quantitative measure of selectivity can be obtained in moreabsolute terms. The term “selectivity ratio,” as defined by Albright [3], is simply the ratio (rate of hydrogenation of linoleic tooleic)/(rate of hydrogenation of oleic to stearic). Reaction rate constants can be calculated from the starting and ending fatty acidcompositions and the hydrogenation time (Fig. 35). For the reactions just mentioned, the selectivity ratio (SR) is
FIGURE 35Reaction rate constants for hydrog enation of soybean oil.
(From Ref. 5.)

Pag e 302
FIGURE 36SR curves for soybean oil [3], DIV +
decrease iniodine value; L/L0 + fraction of linoleic
acidunhydrog enated.
K2/K3 = 0.159/0.013 = 12.2, which means that linoleic acid is being hydrogenated 12.2 times faster than oleic acid.
Since calculations of SR for every oil hydrogenated would be quite tedious, Albright [3] prepared a series of graphs for variousoils by calculation of the fatty acid composition at constant SR. In these graphs the decrease in iodine value (DIV) is plottedagainst the fraction of linoleic acid that remains unhydrogenated (L/L0). Although the curves are calculated with the assumptionthat the reaction rates are first order and that isooleic acid is hydrogenated at the same rate as oleic, they are nonetheless veryuseful for predicting selectivity. Selectivity ratio curves for soybean oil (K2/K3) are shown in Figure 36. Of course, linolenic acidselectivity can be similarly expressed; that is, LnSR = K1/K2 where K1 and K2 are as defined in Figure 30. This is relevant to thehydrogenation of soybean oil, since flavor reversion in this oil is believed to arise from its linolenate content.
Different catalysts result in different selectivities, and operating parameters also have a profound effect on selectivity. As shownin Table 8, larger SR values result from high temperatures, low pressures, high catalyst concentration, and low intensity ofagitation. The effects of processing conditions on the rate of hydrogenation and on the formation of trans acids are also
TABLE 8 Effects of Processing Parameters on Selectivity and Rate ofHydrog enation
Processing parameter SR Trans acids Rate
Hig h temperature Hig h Hig h Hig h
Hig h pressure Low Low Hig h
Hig h catalyst concentration Hig h Hig h Hig h
Hig h-intensity ag itation Low Low Hig h

Pag e 303
given. Several mechanistic speculations have been advanced to explain the observed influence of process conditions onselectivity and rate of hydrogenation, and these are discussed next.
5.6.2.2 Mechanism
The mechanism involved in fat hydrogenation is believed to be the reaction between unsaturated liquid oil and atomic hydrogenadsorbed on a metal catalyst. First, a carbon-metal complex is formed at either end of the olefinic bond (complex a in Fig. 37).This intermediate complex is then able to react with an atom of catalyst-adsorbed hydrogen to form an unstable half-hydrogenated state (b or c in Fig. 37) in which the olefin is attached to the catalyst by only one link and is thus free to rotate. Thehalf-hydrogenated compound now may either (a) react with another hydrogen atom and dissociate from the catalyst to yield thesaturated product (d in Fig. 37), or (b) lose a hydrogen atom to the nickel catalyst to restore the double bond. The regenerateddouble bond can be either in the same position as in the unhydrogenated compound, or a positional and/or geometric isomer ofthe original double bond (e and f in Fig. 37).
In general, evidence seems to indicate that the concentration of hydrogen adsorbed on the catalyst is the factor that determinesselectivity and isomer formation [5]. If the catalyst is saturated with hydrogen, most of the active sites hold hydrogen atoms andthe chance is greater that two atoms are in the appropriate position to react with any double bond upon approach. This results inlow selectivity, since the tendency will be toward saturation of any double bond approaching the two hydrogens. On the otherhand, if the hydrogen atoms on the catalyst are scarce, it is more likely that only one hydrogen atom reacts with the doublebonds, leading to the half-hydrogenation-dehydrogenation sequence and a greater likelihood of isomerization. Thus, operatingconditions (hydrogen pressure, intensity of agitation, temperature, and kind and concentration of catalyst) influence selectivitythrough their effect on the ratio of hydrogen to catalyst sites. An increase in temperature, for example, increases the speed of thereaction and causes faster removal of hydrogen from the catalyst, giving rise to increased selectivity.
The ability to change the SR by changing the processing conditions enables processors to exert considerable control over theproperties of the final oil. A more selective hydrogenation, for example, allows linoleic acid to be decreased and stability to beimproved while minimizing
FIGURE 37Half-hydrog enation-hydrog enation reaction scheme.
Asterisk indicates metal link.

Pag e 304
the formation of fully saturated compounds and avoiding excessive hardness. On the other hand, the more selective the reaction,the greater will be the formation of trans isomers, which are of concern from a nutritional standpoint. For many yearsmanufacturers of food fats have been trying to devise hydrogenation processes that minimize isomerization while avoiding theformation of excessive amounts of fully saturated material.
5.6.2.3 Catalysts
As indicated earlier, catalysts vary with regard to the degree of selectivity they provide. Nickel on various supports is almostinvariably used commercially to hydrogenate fats. Other catalysts, however, are available. These include copper,copper/chromium combinations, and platinum. Palladium has been found to be considerably more efficient (in terms of theamount of catalyst required) than nickel, although it produces a high proportion of trans isomers. The so-called homogenouscatalysts, which are soluble in oil, provide greater contact between oil and catalyst and better control of selectivity. A host ofdifferent compounds are capable of poisoning the catalyst used, and these compounds are often the major source of problemsencountered during commercial hydrogenation. Poisons include phospholipids, water, sulfur compounds, soaps, certain glycerolesters, CO2, and mineral acids.
5.6.3 Interesterification
It has been mentioned that natural fats do not contain a random distribution of fatty acids among the glyceride molecules. Thetendency of certain acids to be more concentrated at specific sn positions varies from one species to another and is influencedby factors such as environment and location in the plant or animal. The physical characteristics of a fat are greatly affected notonly by the nature of constituent fatty acids (i.e., chain length and unsaturation) but also by their distribution in the triacylglycerolmolecules. Indeed, unique fatty acid distribution patterns of some natural fats limit their industrial applications. Interesterificationis one of the processes that can be applied to improve the consistency of such fats and to improve their usefulness. This processinvolves rearranging the fatty acids so they become distributed randomly among the triacylglycerol molecules of the fat.
5.6.3.1 Principle
The term “interesterification” refers to the exchange of acyl radicals between an ester and an acid (acidolysis), or an ester and analcohol (alcoholysis), or an ester and an ester (transesterfication). It is the latter reaction that is relevant to industrialinterestification of fat, also known as randomization, since it involves ester interchange within a single triacylglycerol molecule(intraesterification) as well as ester exchange among different molecules.
If a fat contains only two fatty acids (A and B), eight possible triacylglycerol species n3 are possible according to the rule ofchance:
Regardless of the distribution of the two acids in the original fat (e.g., AAA and BBB or ABB, ABA, BBA), interesterificationresults in the “shuffling” of fatty acids within a single molecule and among triacylglycerol molecules until an equilibrium is achievedin which all possible combinations are formed. The quantitative proportions of the different species depend on the

Pag e 305
amount of each acid in the original fat and can be predicted by simple calculation, as already discussed under the 1,2,3-randomdistribution hypothesis.
5.6.3.2 Industrial Process
Interesterification can be accomplished by heating the fat at relatively high temperatures (<200°C) for a long period. However,catalysts are commonly used that allow the reaction to be completed in a short time (e.g., 30 min) at temperatures as low as50°C. Alkali metals and alkali metal alkylates are effective low-temperature catalysts, with sodium methoxide being the mostpopular. Approximately 0.1% catalyst is required. Higher concentrations may cause excessive losses of oil resulting from theformation of soap and methyl esters.
The oil to be esterified must be extremely dry and low in free fatty acids, peroxides, and any other material that may react withsodium methoxide. Minutes after the catalyst is added the oil acquires a reddish brown color due to the formation of a complexbetween the sodium and the glycerides. This complex is believed to be the “true catalyst.” After esterification, the catalyst isinactivated by addition of water or acid and removed.
5.6.3.3 Mechanisms
Two mechanisms for interesterification have been proposed [135].
Enolate Ion Formation
According to this mechanism, an enolate ion (II), typical of the action of a base on an ester, is formed. The enolate ion reactswith another ester group in the triacylglycerol molecule to produce a b-keto ester (III), which in turn reacts further to giveanother b-keto ester (IV). Intermediate IV yields the intramolecularly esterified product V.
The same mode of action applies to ester interchange between two or more triacylglycerol molecules. The intra-ester-esterinterchange is believed to predominate in the initial stages of the reaction.
Carbonyl Addition
In this proposed mechanism, the alkylate ion adds onto a polarized ester carboxyl, producing a diglycerinate intermediate:

Pag e 306
This intermediate reacts with another glyceride by abstracting a fatty acid, thus forming a new triacylglycerol and regenerating adiglycerinate for further reaction. Ester interchange between fully saturated S3 and unsaturated U3 molecules is shown here:
5.6.3.4 Directed Interesterification
A random distribution, such as that produced by intersterification, is not always the most desirable. Interesterification can bedirected away from randomness if the fat is maintained at a temperature below its melting point. This results in selectivecrystallization of the trisaturated glycerides, which has the effect of removing them from the reaction mixture and changing thefatty acid equilibrium in the liquid phase. Interesterification proceeds with the formation of more trisaturated glycerides thanwould have otherwise occurred. The newly formed trisaturated acylglycerols crystallize and precipitate, thus allowing theformation of still more trisaturated glycerides, and the process continues until most of the saturated fatty acids in the fat haveprecipitated. If the original fat is a liquid oil containing a substantial amount of saturated acids, it is possible, by this method, toconvert the oil into a product with the consistency of shortening without resorting to hydrogenation or blending with a hard fat.The procedure is relatively slow due to the low temperature used, the time required for crystallization, and the tendency of thecatalyst to become coated. A dispersion of liquid sodium-potassium alloy is commonly used to slough off the coating as it forms.
Rearrangement can also be selectively controlled during interesterification by adding excess fatty acids and continuously distillingout the liberated acids that are highly volatile. This impoverishes the fat of its acids of lower molecular weight. The content ofcertain acids in a fat also can be reduced by using suitable solvents to extract appropriate acids during the interesterificationprocess.

Pag e 307
FIGURE 38Effect of interesterification on solid
content index. (From Ref. 135.)
5.6.3.5 Applications
Interesterification finds its greatest application in the manufacture of shortenings. Lard, due to its high proportion of disaturatedtriacylglycerols with palmitic acid in the 2 position, forms relatively large and coarse crystals, even when rapidly solidified incommercial chilling machines. Shortenings made from natural lard possess a grainy consistency and exhibit poor performance inbaking. Randomization of lard improves its plastic range and makes it a better shortening. Directed interesterification, however,produces a product with a higher solids content at high temperatures (Fig. 38) and thus extends its plastic range.
Salad oil of a relatively low cloud point can be made from palm oil by fractionation after directed interesterification. The use ofinteresterification has also been applied to the production of high-stability margarine blends and hard butters that have highlydesirable melting qualities.
Using a column with countercurrent flow of dimethylformamide, a process has been developed to selectively reduce the contentof linolenic acid in soybean oil by direct interesterification.
5.7 Role of Food Lipids in Flavor
5.7.1 Physical Effects
Pure food lipids are nearly odorless. However, apart from their major contributions as precursors of flavor compounds, theymodify the overall flavor of many foods through their effect on mouth feel (e.g., the richness of whole milk and the smooth orcreamy nature of ice cream) and on the volatility and threshold value of the flavor components present.

Pag e 308
5.7.2 Lipids as Flavor Precursors
In the preceding discussion we have seen that lipids can undergo a variety of reactions and give rise to a multitude ofintermediates and decomposition end products. These compounds vary widely in their chemical and physical properties. Theyalso vary in their impact on flavor. Some are responsible for pleasant aromas, as is typical in fresh fruits and vegetables; othersproduce offensive odors and flavors, often causing major problems in the storage and processing of foods. A review by Forss[38] provides detailed information regarding the characteristics of volatile flavor compounds derived from lipids. In the following,some typical off flavors of lipid origin are discussed (see also Chap. 11).
5.7.2.1 Rancidity
Hydrolytic rancidity results from the release of free fatty acids by lipolysis. Since only the shortchain fatty acids have unpleasantodors, the problem is typically encountered in milk and dairy products.
The word rancid, however, is a general term that also commonly refers to off flavors resulting from lipid oxidation. Thequalitative nature of oxidation flavors, however, varies significantly from product to product and even in the same food item. Forexample, the rancid off flavors developed from oxidation of fat in meat, walnuts, or butter are not the same. Fresh milk developsvarious off flavors described as rancid, cardboard, fishy, metallic, stale, or chalky; all are believed to be oxidative. Althoughconsiderable advances have been made in understanding the basic mechanisms of lipid oxidation and the flavor significance ofmany individual compounds, progress in correlating specific descriptions of rancid flavors with individual compounds orcombinations of selected compounds has been slow. This is not surprising if one considers (a) the vast number of oxidativedecomposition products identified so far (literally in the thousands), (b) their wide range of concentrations, volatiles, and flavorpotencies, (c) the many possible interactions among the lipid decomposition products or between these products and othernonlipid food components, (d) the different food environments in which these flavor compounds reside, (e) the subjective natureof flavor description, (f) the complex influence of oxidative conditions on the multitude of possible reaction pathways andreaction products, and (g) the persisting suspicion that some trace but important flavor components may still escape detection bythe most elegant analysis. Unfortunately, much more extensive research has been done on identification of volatiles in oxidizedfats than on correlating these volatiles with flavor. With the continuous improvements of sensitivity and resolution in analyticalinstrumentation the detection of whole series of new compounds is made possible, and interpretations regarding flavor becomemore complex. Perhaps new approaches are needed to establish more precise relationships between volatile (and pertinentnonvolatile) lipid-derived components and specific oxidized flavors. An interesting technique, aimed at identifying the mostimportant volatile oxidation products, is one in which a flavor dilution factor (FD factor) is determined by gas chromatographicanalysis and effluent sniffing of a dilution series of the original aroma extract [138].
5.7.2.2 Flavor Reversion
This problem is unique to soybean oil and other linolenate-containing oils. The off flavor has been described as beany and grassyand usually develops at low peroxide values (about 5 mEq/kg). Several compounds have been suggested as responsible for orcontributing to reversion flavors.
Smouse and Chang [134] postulated that 2-n-pentylfuran, one of the compounds identified in reverted soybean oil and found toproduce reversion-like flavors in other oils if added at 2 ppm levels, is formed from the autoxidation of linoleate by the followingmechanism:

Pag e 309
The cis- and trans-2-(1-pentenyl) furans were also reported as possible contributors to the reversion flavor.
Presence of the 18:3 acid catalyzes this reaction. It should be pointed out that the hydroperoxide intermediate involved here isthe 10-hydroperoxide, which is not typical of linoleate autoxidation. It can arise, however, from singlet oxygen oxidation. Analternative mechanism involving singlet oxygen and the formation of a hydroperoxy cyclic peroxide [40] is given:
Other compounds reported by various workers to be significant in soybean reversion are 3-cis- and 3-trans-hexenals,phosphatides, and nonglyceride components.

Pag e 310
5.7.2.3 Hardening Flavor
This off flavor develops in hydrogenated soybean and marine oils during storage. Compounds reported to contribute to thisdefect include 6-cis- and 6-trans-nonenal, 2-trans-6-trans-octadecadienal, ketones, alcohols, and lactones. These compoundsare presumed to arise from autoxidation of the isomeric dienes, known as isolinoleates, formed during the course ofhydrogenation.
5.8 Physiological Effects of Lipids
5.8.1 Composition and Trends
Intakes of lipids in the United States have been estimated in several national surveys. The 1985 and 1986 USDA ContinuingSurvey of Food Intakes of Individuals [140, 141] indicated that fat provided an average of 36–37% of total calories for menand women 19–50 years of age. A mean of 13% of total calories were consumed from saturated fatty acids, 14% frommonounsaturated fatty acids, and 7% from polyunsaturated fatty acids.
The daily intake of cholesterol averaged 280 mg for women and 439 mg for men. Dietary cholesterol came mainly from meat,eggs, and dairy products. Recent trends in the United States include greater consumption of vegetable fats, especially salad andcooking oils; decreased consumption of animal fats; increased consumption of seafood; and a shift from lard to shortenings, frombutter to margarine, and from whole milk to skim and low-fat milks. Low-fat and fat-free desserts and snack-food items arebecoming more and more available.
5.8.2 Nutritional Functions
Fats are a concentrated source of energy. As compared with proteins and carbohydrates, they supply more than twice as manycalories per gram, that is, 9 kcal/g (37.7 kJ/g). They confer a feeling of satiety and contribute to the palatability of food. Theessential fatty acids linoleic and arachidonic, as well as fat-soluble vitamins A, D, E, and K, are obtained from the lipid fractionof the diet. Only recently have the biological functions of the n-3 fatty acids been recognized [85, 92]. Linoleic acid (18:2, n-6)and a-linolenic acid (18:3, n-3) are recognized as the parent fatty acids of the n-6 and the n-3 series, respectively. Theyundergo successive desaturations and elongations, giving rise to various metabolites with important biological functions (Fig. 39).A nutritional strategy to provide optimum amounts and ratios of the n-6 and n-3 fatty acid series is being vigorously pursued.
5.8.3 Safety of Lipids Exposed to Frying Conditions
The various changes induced in fats by heating and oxidation, and the factors that influence such changes were discussed earlierin this chapter. The possibility that consumption of heated and/or oxidized fats may produce adverse effects has been a majorconcern and has stimulated extensive research. Several reports and reviews on this subject are available [4, 7, 20, 68, 111, 117,121, 137]. Nutritional and toxicity studies have been conducted with animals fed heated or oxidized fats, used frying oils, orcertain fractions or pure compounds typical of those identified in such oils. Unfortunately, some information reported fromlaboratory experiments has been misleading because oils were heated continuously at abusive temperatures in the absence offood, or because fractions of heated oils were fed to animals at unreasonably high levels. For example, cyclic monomers thatform in thermally abused oils cause acute toxicity when

Pag e 311
FIGURE 39Metabolic pathways of the n-6 and n-3 fatty
acids.
administered to rats in large doses. Results from studies of these kinds are inapplicable to “real-life” frying situations.
The current consensus is that toxic compounds can be generated in fat by abusive heating and/or oxidation, but that moderateingestion of foods fried in high quality oils using recommended practices is unlikely to pose a significant hazard to health.
5.8.4 Safety of Hydrogenated Fats [135, 51, 65, 71, 86, 101, 119, 126, 146]
As pointed out earlier, some double-bond migration occurs during hydrogenation of oils, and this results in the formation ofpositional and geometric isomers. Trans fatty acids constitute 20–40% of the total acids of some margarines and shortenings.Trans fatty acids are not biologically equivalent to their cis isomers, and precise knowledge of their physiological properties,metabolism, and long-term effects on health remains controversial.

Pag e 312
5.8.5 Safety of Irradiated Food
Irradiation results in partial destruction of fat-soluble vitamins, with tocopherol being particularly sensitive. Extensive research,conducted over several decades, indicates that radiation pasteurization of food, conducted under proper conditions, is safe andwholesome [144]. However, widespread acceptance of this novel process has been hampered by fears, misconceptions,politics, false association with nuclear reactors or weapons, and lack of education.
In November 1980 the Joint FAO/WHO/IAEA Expert Committee on Wholesomeness of Irradiated Food concluded that “theirradiation of any food commodity up to an overall average dose of 10 kGy causes no toxicological hazard and hencetoxicological testing of foods so treated is no longer required.” In 1986 the U.S. Food and Drug Administration approvedirradiation of fresh food at up to a maximum dose of 1 kGy to inhibit growth and maturation. Also, irradiation of spices wasapproved to a maximum dose of 30 kGy for disinfestation. Irradiation of raw poultry was approved by the Food and DrugAdministration to control foodborne pathogens in 1990, and by the U.S. Department of Agriculture to control salmonellosis in1992.
5.8.6 Dietary Lipids, Coronary Heart Disease, and Cancer [18, 19, 52, 57, 61, 70, 73, 78–80, 87, 91, 92, 105, 112,116, 140, 141]
The type and amount of lipids in the diet is one of several factors believed to have an influence on the incidence of coronaryheart disease. Lipid intake can, in some individuals, have a moderately adverse influence on serum cholesterol concentration andon the ratios of low- and high-density lipoproteins, both factors affecting the likelihood of coronary heart disease (CHD). It isgenerally agreed that persons in the U.S. population consume greater amounts of lipids, especially saturated lipids andcholesterol, than is desirable. The fatty acid composition of lipids has thus received considerable attention with respect to itsinfluence on risk of CHD. Fatty acid attributes that have received particular attention are chain length, degree and position (n-3,n-6, n-9) of unsaturation, geometric configuration (cis, trans), and sn position. The effects of these attributes on human healthare frequently the subject of considerable controversy, and the reader is referred to the many sources of information on thissubject.
With respect to cancer, epidemiologic and animal data support a relationship between total fat intake and risk [101]. Somestudies on humans suggest that high intake of saturated fatty acids is associated with increased risk of colon, prostate, and breastcancers. Results of some animal studies indicated increased risk caused by injection of n-3 fatty acids, whereas others suggestthat diets with a high content of n-3 fatty acids may decrease the risk of cancers of the mammary gland, intestine, and pancreas.
5.8.7 Concluding Thoughts on Dietary Lipids and Health
The relationship between dietary fats and health and disease is one of the most active areas of biochemical, nutritional, andmedical research. This field is advancing rapidly, and the consumer is bombarded daily with information and advice that are oftencontradictory and confusing. Exceedingly complex metabolic interrelationships are involved, and therefore it is quiteunderstandable that experimental work in this field is complicated and difficult. I do not, however, wish to leave the impressionthat published material should be dismissed, or that all recommendations should be ignored. One cannot quarrel with dietarymodifications directed at correcting dietary excesses or nutritional imbalances, or with appropriate adjustments in total caloricintake. A proper balance among mono-unsaturated, n-3, and n-6 unsaturated fatty acids is justified.

Pag e 313
But it should be understood that the role of dietary fat in health and disease remains one of considerable controversy. Thus, thegeneral public would be advised not to engage in dietary practices without proper consideration of potential adverseconsequences. Probably the best advice for the majority of human subjects remains as it has been for years: a well-balanced dietthat includes ample amounts of all essential nutrients, fresh fruits and vegetables, and regular exercise. Finally, it is highlydesirable that intensive, well-coordinated research efforts continue for the purpose of determining more fully the role of lipids inhuman health, and that appropriate nutrition education programs for all age groups be conducted simultaneously.
Acknowledgments
The author thanks Michelle Nawar, Yinhuai Chen, and Wen Zhang for their kind assistance in the preparation of this chapter.
Bibliography
Allen, R. R. (1978). Principles and catalysts for hydrogenation of fats and oils. J. Am. Oil Chem. Soc. 55:792–795.
Bailey, A. E. (1950). Melting and Solidification of Fats, Interscience, New York.
Brisson, G. J. (1981). Lipids in Human Nutrition, J. K. Burgess, Englewood Cliffs, NJ.
Frankel, E. N. (1979). Autoxidation, in Fatty Acids (E. H. Pryde, ed.), American Oil Chemists Society, Champaign, IL, pp.353–390.
Garti, N., and K. Sato, eds. (1988). Crystallization and Polymorphism of Fats, Marcel Dekker, New York.
Hamilton, R. J., and J. B. Rossell (1986). Analysis of Oils and Fats, Elsvier, New York.
Hudson, B. J. D., ed. (1990). Food Antioxidants, Elsevier, Amsterdam.
Labuza, T. P. (1971). Kinetics of lipid oxidation. CRC Crit. Rev. Food Technol. October, 355–404.
Lichfield, C. (1972). Analysis of Triglycerides, Academic Press, New York.
Lundberg, W. O., ed. (1961, 1962). Autoxidation and Antioxidants, vols. I and II, John Wiley & Sons, New York.
Markley, K. S. (1960). Fatty Acids: Their Chemistry, Properties, Production, and Uses, Interscience, New York.
Pryde, E. H. (ed.) (1979). Fatty Acids, American Oil Chemists Society, Champaign, IL.
Richardson, T., and J. W. Finley (1985). Chemical Changes in Food During Processing, AVI, Westport, CT. Schultz, H.W., E. A. Day, and R. O. Sinnhuber, eds. (1962). Symposium on Foods: Lipids and Their Oxidation, AVI, Westport, CT.
Sebedio, J. L., and E. G. Perkins, eds. (1995). New Trends in Lipid and Lipoprotein Analysis, AOCS Press, Champaign,IL.
Simic, M. G., and M. Karel (1980). Autoxidation in Food and Biological Systems, Plenum Press, New York, p. 659.
Small, D. M. (1986). The physical chemistry of lipids, in Handbook of Lipid Research, vol. 4, Plenum Press, New York.
Swern, D., ed. (1979). Bailey's Industrial Oil and Fat Products, John Wiley & Sons, New York.
U.S. Department of Agriculture (1986). Nationwide food consumption survey. Continuing Survey of Food Intakes ofIndividuals. 1985 report no. 85-3. Nutrition Monitoring Division, Human Nutrition Service, Hyattsville, MD.
U.S. Department of Agriculture (1987). Nationwide food consumption survey. Continuing Survey of Food Intakes ofIndividuals. 1985 report no. 85-4. Nutrition Monitoring Division, Human Nutrition Service, Hyattsville, MD.
Weiss, T. J. (1983). Food Oils and Their Uses, 2nd ed., AVI, Westport, CT.

Pag e 314
References
1. Abrahamsson, S., and I. Ryderstedt-Nahringbauer (1962). The crystal structure of the low-melting form of oleic acid. ActaCrystallogr. 15:1261–1268.
2. Alberghina, L., R. D. Schmid, and R. Verger, eds. (1991). Lipases: Structure, Mechanism and Genetic Engineering.GBF Monographs, vol. 16, VCH, Weinheim.
3. Albright, L. F. (1965). Quantitative measure of selectivity of hydrogenation of triglycerides. J. Am. Oil Chem. Soc.42:250–253.
4. Alexander, J. C. (1978). Biological effects due to changes in fats during heating. J. Am. Oil Chem. Soc. 55:711–717.
5. Allen, R. R. (1978). Principles and catalysts for hydrogenation of fats and oils. J. Am. Oil Chem. Soc. 55:792–795.
6. Aronhime, J. S., S. Sarig, and N. Garti (1988). Dynamic control of polymorphic transformation in triglycerides by surfactants:The Button syndrome. J. Am. Oil Chem. Soc. 65:1144–1159.
7. Artman, N. R. (1969). The chemical and biological properties of heated and oxidized fats. Adv. Lipid Res. 7:245–330.
8. Bailey, A. E. (1950). Melting and Solidification of Fats, Interscience, New York.
9. Bast, A., G. Haenen, and C. Doelman (1991). Oxidants and antioxidants: State of the art. Am. J. Med. 91 (suppl.3C):2–13S
10. Bateman, L., H. Hughes, and A. L. Morris (1953). Hydroperoxide decomposition in relation to the initiation of radical chainreactions. Disc. Faraday Soc. 14:190–199.
11. Billek, G., G. Guhr, and J. Waibel (1978). Quality assessment of used frying fats: A comparison of four methods. J. Amer.Oil Chem. Soc. 55:728–733.
12. Bolland, J. L., and G. Gee (1946). Kinetic studies in the chemistry of rubber and related materials. Trans. Faraday Soc.42:236–252.
13. Bolland, J. L., and P. ten Have (1947). Kinetic studies in the chemistry of rubber and related materials. IV. The inhibitoryeffect of hydroquinone on the thermal oxidation of ethyl linoleate. Trans. Faraday Soc. 43:201–210.
14. Bracco, U., J. Loliger, and J. L. Viret (1981). Production and use of natural antioxidants. J. Am. Oil Chem. Soc.68:669–671.
15. Brockerhoff, H. (1965). A stereospecific analysis of triglycerides. J. Lipid Res. 6:10–15.
16. Brockerhoff, H., and R. G. Jensen (1974). Lipolytic Enzymes, Academic Press, New York, pp. 330.
17. Cahn, R. S., C. K. Ingold, and V. Prelog (1956). The specification of asymmetric configuration in organic chemistry.Experientia 12:81–94.
18. Carroll, K. K. (1991). Dietary fats and cancer. Am. J. Clin. Nutr. 53:1064S–1067S.
19. Carroll, K. K., and G. J. Hopkins (1978). Dietary polyunsaturated fat versus saturated fat in relation to mammarycarcinogenesis. Lipids 14(2):155–158.
20. Causert, J. (1982). Chauffage des corps gras et risques de toxicité. (1). Cahiers Nutr. Diet 17:19–23.
21. Chan, H. W. S. (1977). Photo-sensitized oxidation of unsaturated fatty acid methyl esters. The identification of differentpathways. J. Am. Oil Chem. Soc. 54:100–104.
22. Chan, H. W. S., and G. Levett (1977). Autoxidation of methyl linoleate: Separation and analysis of isomeric mixtures ofmethyl linoleate hydroperoxides and methyl hydroxylinoleates. Lipids 12:99–104.

23. Chan, H. W. S., and G. Levett (1977). Autoxidation of methyl linoleate: Analysis of methyl hydroxylinoleate isomers by highperformance liquid chromatography. Lipids 12:837–840.
24. Chang, S. S., and B. Matijasevic, O. Hsieh, and C. Huang (1977). Natural antioxidants from rosemary and sage. J. FoodSci. 42:1102–1106.
25. Chang, S. S., R. J. Peterson, and C. T. Ho (1978). Chemistry of deep fat fried flavor, in Lipids as a Source of Flavor (M.K. Supton, ed.), ACS Symposium Series 75, ACS, Washington, DC, pp. 18–41.
26. Chapman, G. M., E. E. Akenhurst, and W. B. Wright (1971). Cocoa butter and confectionary fats. Studies usingprogrammed temperature x-ray diffraction and differential scanning calorimetry. J. Am. Oil Chem. Soc. 48:824–830.
Pag e 315
27. Christie, W. W., and J. H. Moore (1969). A semimicro method for the stereospecific analysis of triglycerides. Biochim.Biophys. Acta 176:445–452.
28. Cosgrove, J. P., D. F. Church, and W. A. Pryor (1987). The kinetics of the autoxidation of polyunsaturated fatty acids.Lipids 22:299–304.
29. Crnjar, E. D., A. Witchwoot, and W. W. Nawar (1981). Thermal oxidation of a series of saturated triacylglycerols. J.Agric. Food Chem. 29:39–42.
30. Dahle, L. K., E. G. Hill, and R. T. Holman (1962). The thiobarbituric acid reaction and the autoxidations of polyunsaturatedfatty acid methyl esters. Arch. Biochem. Biophys. 98:253–267.
31. De Man, L., J. M. de Man, and B. Blackman (1989). Physical and textural evaluation of some shortenings and margarines.J. Am. Oil Chem. Soc. 66:128–132.
32. Dillard, C. J., and A. L. Tappel (1971). Fluorescent products of lipid peroxidation and mitochondria and microsomes.Lipids 6:715–721.
33. D'Souza, V., J. M. de Man, and L. de Man (1990). Short spacings and polymorphic forms of natural and commercial solidfats: A review. J. Am. Oil Chem. Soc. 67:835–843.
34. Dupuy, H. P., E. T. Rayner, J. I. Wadsworth, and M. L. Legendre (1977). Analysis of vegetable oils for flavor quality bydirect gas chromatography. J. Am. Oil Chem. Soc. 54:445–449.
35. Enig, M. G. (1993). Trans-fatty acids—An update. Nutr. Q. 17:79–95.
36. Farmer, E. H., G. F. Bloomfield, A. Sundralingam, and D. A. Sutton (1942). The course and mechanism of autoxidationreactions in olefinic and polyolefinic substances, including rubber. Trans. Faraday Soc. 38:348–356.
37. Fioriti, J. A., A. P. Bentz, and R. J. Sims (1966). The reaction of picric acid with epoxides. II, The detection of epoxides inheated oils, J. Am. Oil Chem. Soc. 43:487–490.
38. Forss, D. A. (1972). Odor and flavor compounds from lipids, in Progress in the Chemistry of Fats and Other Lipids,vol. 13 (R. T. Holman, ed.), Pergamon Press, London, pp. 177–258.
39. Frankel, E. N. (1979). Autoxidation, in Fatty Acids (E. H. Pryde, ed.), American Oil Chemists Society, Champaign, IL,pp. 353–390.
40. Frankel, E. N. (1982). Volatile lipid oxidation products. Prog. Lipid Res. 22:1–33.
41. Frankel, E. N., W. E. Neff, and E. Selke (1984). Analysis of autoxidized fats by gas chromatography—mass spectrometry.IX. Homolytic cleavage vs. heterolytic cleavage of primary and secondary oxidation products. Lipids 19:790–800.
42. Fritsch, C. W. (1994). Lipid oxidation—The other dimensions. Inform 5:423–436.
43. Fritsch, C. W., and J. A. Gale (1977). Hexanal as a measure of rancidity in low fat foods. J. Am. Oil Chem. Soc.54:225–228.
44. Fritsch, C. W., D. C. Egberg, and J. S. Magnuson (1979). Changes in dielectric constant as a measure of frying oildeterioration. J. Am. Oil Chem. Soc. 56:746–750.
45. Gardner, H. W. (1975). Decomposition of linoleic acid hydroperoxides. Enzymatic reactions compared with nonenzymic. J.Agric. Food Chem. 23:129–136.
46. Gardner, H. W.(1980). Lipid enzymes: Lipases, lipoxygenases and hydroperoxides, in Autoxidation in Food andBiological Systems (M. G. Simic and M. Karel, eds.), Plenum Press, New York, pp. 447–504.
47. Gardner, H. W. (1985). Oxidation of lipids in biological tissue and its significance, in Chemical Changes in Food DuringProcessing (T. Richardson and J. W. Finley, eds.), AVI Publishing, Westport, CT, pp. 177–203.

48. Gardner, H. W., and R. D. Plattner (1984). Linoleate hydroperoxides are cleaved heterolytically into aldehydes by a Lewisacid in aprotic solvent. Lipids 19:294–299.
49. Garti, N., and Sato, K., eds. (1988). Crystallization and Polymorphism of Fats, Marcel Dekker, New York.
50. Gopala Krishna, A. G., and J. V. Prabhakar (1992). Effect of water activity on secondary products formation inautoxidizing methyl linoleate. J. Am. Oil Chem. Soc. 69:178–183.
51. Grundy, S. M. (1990). Trans-monounsaturated fatty acids and serum cholesterol levels. N. Engl. J. Med. 323:480–481.
52. Grundy, S. M., and G. V. Vega (1988). Plasma cholesterol responsiveness to saturated fatty acids. Am. J. Clin. Nutr.47:822–824.

Pag e 316
53. Hagemann, J. W. (1988). Thermal behavior of acylglycerides, in Crystallization and Polymorphism of Fats and FattyAcids (N. Garti and K. Sato, eds.), Marcel Dekker, New York, pp. 9–95.
54. Hamama, A. A., and W. W. Nawar (1991). Thermal decomposition of some phenolic antioxidants. J. Agric. Food Chem.39:1063–1069.
55. Hamilton, R. J., and J. B. Rossell (1986). Analysis of Oils and Fats, Elsevier, New York.
56. Hau, L. B., and W. W. Nawar (1988). Thermal oxidation of lipids in monolayers. Unsaturated fatty acid esters. J. Am. OilChem. Soc. 65:1307–1310.
57. Hegsted, D. M., R. B. McGandy, M. L. Myers, and F. J. Stare (1965). Quantitative effects of dietary fat on serumcholesterol in man. Am. J. Clin. Nutr. 17:281–295.
58. Hernqvist, L. (1984). Structure of triglycerides in the liquid state and fat crystallization. Fette Seifen Anstrich86(8):297–300.
59. Hilditch, T. P., and P. N. Williams (1964). The Chemical Constitution of Natural Fats, 4th ed., Chapman & Hall,London.
60. Hirschmann, H. (1960). The nature of substrate asymmetry in stereoselective reactions. J. Biol. Chem. 235:2762–2767.
61. Holman, R. T., and S. B. Johnsen (1983). Essential fatty acid deficiencies in man, in Dietary Fats and Health (E. G.Perkings and W. J. Visek, eds.), American Oil Chemists' Society, Champaign, IL, pp. 247–266.
62. Hudson, B. J. D., ed. (1990). Food Antioxidants, Elsevier, Amsterdam.
63. Hultin, H. O. (1995). Role of membranes in fish quality. Proc. Nordic Conf. Fish Quality—Role of BiologicalMembranes, Hillerod, Denmark.
64. Hussein, A. B. B. H., and M. J. W. Povey (1984). Study of dilation and acoustic propagation in solidifying fats and oils:Experimental. J. Am. Oil Chem. Soc. 61:560–564.
65. Hunter, J. E., and T. H. Applewhite (1986). Isomeric fatty acids in the U.S. diet: Levels and health perspectives. Am. J.Clin. Nutr. 44:707–717.
66. IUPAC-IUB Commission on Biochemical Nomenclature (1977). The nomenclature of lipids. Recommendations (1976).Lipids 12:445–468.
67. IUPAC (1979). Standard Methods for the Analysis of Oils, Fats and Derivatives, Pergamon Press, Oxford.
68. Iwaoka, W. T., and E. G. Perkins (1978). Metabolism and lipogenic effects of the cyclic monomers of methyl linolenate inthe rat. J. Am. Oil. Chem. Soc. 55:734–738.
69. Jackson, H. W. (1981). Techniques for flavor and odor evaluation. J. Am. Oil Chem. Soc. 58:227–231.
70. Jackson, R. L., O. D. Taunton, J. D. Morrissett, and A. M. Gotts (1978). The role of dietary polyunsaturated fat inlowering blood cholesterol in man. Circ. Res. 42:447–453.
71. Judd, J. T. (1994). Dietary trans-fatty acids: Effects on plasma lipids and lipoproteins of healthy men and women. Am. J.Clin. Nutr. 59:861–868.
72. Kahl, J. L., W. E. Artz, and E. G. Schanus (1988). Effects of relative humidity on lipid autoxidation in a model system.Lipids 23:275–279.
73. Kannel, W. B., D. McGee, and T. Gordon (1976). A general cardiovascular risk profile: The Framingham study. Am. J.Cardiol. 38:46–51.
74. Karel, M. (1980). Lipid oxidation, secondary reactions, and water activity of foods, in Autoxidation in Food andBiological Systems (M. S. Simic and M. Karel, eds.), Plenum Press, New York, pp. 191–206.

75. Karel, M. (1985). Environmental effects on chemical changes in foods, in Chemical Changes in Food During Processing(T. Richardson and J. W. Finley, Eds.), AVI Publishing, Westport, CT, pp. 483–501.
76. Karel, M., K. Schaich, and B. R. Roy (1975). Interaction of peroxidizing methyl linoleate with some proteins and aminoacids. J. Agric. Food Chem. 23:159–163.
77. Kartha, A. R. S. (1953). The glyceride structure of natural fats. II. The rule of glyceride type distribution of natural fats. J.Am. Oil Chem. Soc. 30:326–329.
78. Keys, A. (1974). Bias and misrepresentation revisited: Perspective on saturated fat. Am. J. Clin. Nutr. 27:188–212.
79. Keys, A., J. T. Anderson, and F. Grande (1965). Serum cholesterol response to changes in the diet. IV. Particularsaturated fatty acids in the diet. Metab. Clin. Exp. 14:776–787.
Pag e 317
80. Keys, A., J. T. Anderson, O. Mickelson, S. F. Adelson, and F. Fidanza (1956). Diet and serum cholesterol in man: Lack ofeffect of dietary cholesterol. J. Nutr. 59:39–56.
81. Kim, S. K., and W. W. Nawar (1991). Oxidation interactions of cholesterol with triacylglycerols. J. Am. Oil Chem. Soc.68:931–934.
82. Kim, S. K., and W. W. Nawar (1992). Oxidative interactions of cholesterol in the milk fat globule membrane. Lipids27:928–932.
83. Kim, S. K., and W. W. Nawar (1993). Parameters influencing cholesterol oxidation. Lipids 28:917–920.
84. Kimoto, W. I., and A. M. Gaddis (1969). Precursors of alk-2,4-dienals in autoxidized lard. J. Am. Oil Chem. Soc.46:403–408.
85. Kinsella, J. E. (1987). Seafoods and Fish Oils in Human Health and Disease. Marcel Dekker, New York.
86. Kinsella, J. E., G. Bruckner, J. Mai, and J. Shimp (1981). Metabolism of trans fatty acids with emphasis on the effects oftrans, trans, octadecadienoate on lipid composition, essential fatty acid, and prostaglandins: An overview, Am. J. Clin. Nutr.34:2307–2318.
87. Kritchersky, D. (1976). Diet and atherosclerosis. Am. J. Pathol. 84:615–632.
88. Labuza, T. P. (1971). Kinetics of lipid oxidation. In CRC Crit. Rev. Food Technol. October, 355–404.
89. Labuza, T. P., L. McNally, D. Gallagher, J. Hawekes, and F. Hurtado (1972). Stability of intermediate moisture foods. 1.Lipid oxidation. J. Food Sci. 37:154–159.
90. Labuza, T. P., H. Tsuyuki, and M. Karel (1969). Kinetics of linoleate oxidation in model systems. J. Am. Oil Chem. Soc.46:409–416.
91. Lambert-Legace, L., and M. Laflame (1995). Good Fat, Bad Fat, Stoddart, Toronto.
92. Lands, W. E. M. (1986). Fish and Human Health, Academic Press, New York.
93. Lands, W. E. M., R. A. Pieringer, P. M. Slakey, and A. Zschoke (1966). A micro-method for the stereospecificdetermination of triglyceride structure. Lipids J. 1:444–448.
94. Larsson, K. (1972). On the structure of isotropic phases in lipid-water systems. Chem. Phys. Lipids 9:181–195.
95. Larsson, K. (1976). Crystal and liquid crystal structures of lipids, in Food Emulsions (S. Friberg, ed.), Marcel Dekker,New York, pp. 39–66.
96. Link, W. E., ed. (1974). Official and Tentative Methods of the American Oil Chemists' Society, AOCS, Champaign,IL.
97. Loury, M. (1972). Possible mechanisms of autoxidative rancidity. Lipids 7:671–675.
98. Luddy, F. E., R. A. Barford, S. F. Herb, P. Magidman, and R. Riemenschneider (1964). Pancreatic lipase hydrolysis oftriglycerides by a semimicro technique. J. Am. Oil Chem. Soc. 41:693–696.
99. Luzatti, V. (1968). in X-ray Diffraction Studies of Lipid-Water Systems in Biological Membranes (D. Chapman, ed.),Academic Press, London, pp. 71–123.
100. Madison, B. L., and R. C. Hill (1978). Determination of solid fat content of commercial fats by pulsed nuclear magneticresonance. J. Am. Oil Chem. Soc. 55:328–331.
101. Mann, G. (1994). Metabolic consequences of dietary trans-fatty acids. Lancet 343:1268–1271.
102. Matthews, R. F., R. A. Scanlon, and L. M. Libbey (1971). Autoxidation products of 2,4-decadienal. J. Am. Oil Chem.Soc. 48:745–747.

103. McClements, D. J., and M. J. W. Povey (1987). Solid fat content determination using ultrasonic velocity measurements.Int. J. Food Sci. Technol. 22:491–499.
104. McClements, D. J., and M. J. W. Povey (1988). Comparison of pulsed NMR and ultrasonic velocity techniques fordetermining solid fat contents. Int. J. Food Sci. and Technol. 23:159–170.
105. McGill, H. C. Jr. (1979). The relationship of dietary cholesterol to serum cholesterol concentration and to atherosclerosisin man. Am. J. Clin. Nutr. 32:2664–2702.
106. Minifie, B. W. (1980). Chocolate, Cocoa and Confectionary, 2d ed., AVI, Westport, CT.
107. Miyashita, K., E. Nara, and T. Ota (1993). Oxidation stability of polyunsaturated fatty acids in an aqueous solution.Biosci. Biotechnol. Biochem. 57(10):1638–1640.
108. Nawar, W. W. (1977). Radiation chemistry of lipids, in Radiation Chemistry of Major Food Components (P. S. Eliasand A. J. Cohen, eds.), Elsevier, Amsterdam, pp. 26–61.
109. Nawar, W. W., S. K. Kim, and M. Vajdi (1991). Measurement of oxidative interactions of cholesterol. J. Am. Oil Chem.Soc. 68:496–498.

Pag e 318
110. Nawar, W. W., Z. R. Zhu, and Y. J. Yoo (1990). Radiolytic products of lipids as markers for the detection of irradiatedmeats, in Food Irradiation and the Chemist (D. E. Johnston, M. H. Stevenson, eds.) Royal Society of Chemists, Cambridge,pp. 13–24.
111. Nolen, G. A., J. C. Alexander, and N. R. Artman (1967). Long-term rat feeding study with used frying fats. J. Nutr.93:337–348.
112. NRC Committee on Diet and Health (1990). Diet and Health: Implications for Reducing Chronic Disease Risk,National Academy Press, Washington, DC.
113. Official and Tentative Methods of the American Oil Chemists Society (1980). Peroxide value, Cd 8–53; oxirane test, Cd9–57; iodine value Cd 1–25; AOM, CD 12–57. J. Am. Oil Chem. Soc.
114. Paradis, A. J., and W. W. Nawar (1981). Evaluation of new methods for the assessment of used frying oils. J. Food Sci.46:449–451.
115. Paradis, A. J., and W. W. Nawar (1981). A gas chromatographic method for the assessment of used frying oils:Comparison with other methods. J. Am. Oil Chem. Soc. 58:635–638.
116. Parker, R. S. (1989). Dietary and biochemical aspects of vitamin E. Adv. Food Nutr. Res. 33:157–232.
117. Perkins, E. G. (1976). Chemical, nutritional and metabolic studies of heated fats. II. Nutritional aspects. Rev. Fr. CorpsGras 23:313–322.
118. Porter, W. L. (1980). Recent trends in food applications of antioxidants, in Autoxidation in Food in Biological Systems(M. G. Simic and M. Karel, eds.), Plenum Press, New York, pp. 295–365.
119. Privett, O. S., F. Phillips, H. Shimasaki, T. Nazawa, and E. C. Nickell (1977). Studies of effects of trans fatty acids on thediet on lipid metabolism in essential fatty acid deficient rats. Am. J. Clin. Nutr. 30:1009–1017.
120. Pryor, W. A., J. P. Stanley, and E. Blair (1976). Autoxidation of polyunsaturated fatty acids. II. A suggested mechanismfor the formation of TBA-reactive materials from prostaglandin-like endoperoxides. Lipids 11:370–379.
121. Scheutwinkel-Reich, M., G. Ingerowski, and H. J. Stan (1980). Microbiological studies investigating mutagenicity of deepfrying fat fractions and some of their components. Lipids 15:849–852.
122. Selke, E., and E. N. Frankel (1987). Dynamic headspace capillary gas chromatographic analysis of soybean oil volatiles.J. Am. Oil Chem. Soc. 64:749–753.
123. Shewfelt, R. L. (1981). Fish muscle lipolysis—A review. J. Food Biochem. 5:79–100.
124. Schlicter-Aronhime, J., and N. Garti (1988). Solidification and polymorphism in cocoa butter and the blooming problems,in Crystallization and Polymorphism of Fats and Fatty Acids. (N. Garti and K. Sato, eds.), Marcel Dekker, New York.
125. Schuler, P. (1990). Natural antioxidants exploited commercially, in Food Antioxidants (B. J. F. Hudson, ed.), Elsevier,Amsterdam, pp. 99–170.
126. Senti, F. R., ed. (1985). Health Aspects of Dietary Trans Fatty Acids, Federation of American Societies forExperimental Biology, Bethesda, MD.
127. Shahidi, F., P. K. Janitha, and P. D. Wanasundara (1992). Phenolic antioxidants. Crit. Rev. Food Sci. Nutr. 32:67–103.
128. Sherwin, E. R. (1976). Antioxidants for vegetable oils. J. Am. Oil Chem. Soc. 53:430–436.
129. Shimada, Y., Y. Roos, and M. Karel (1991). Oxidation of methyl linoleate encapsulated in amorphous lactose-based foodmodel. J. Agric. Food Chem. 39:637–641.
130. Simoneau, C., M. J. McCarthy, R. J. Kauten, and J. B. German (1991). Crystallization dynamics in model emulsions frommagnetic resonance imaging. J. Am. Oil Chemists' Soc. 68:481–487.

131. Simpson, T. D. (1979). Crystallography, in Fatty Acids (E. H. Pryde, ed.), American Oil Chemists Society, Champaign,IL, pp. 157–172.
132. Sims, R. (1994). Oxidation of fats in food products. Inform 5:1020–1028.
133. Smith, L. L. (1981). Cholesterol Autoxidation. Plenum Press, New York.
134. Smouse, T. H., and S. S. Chang (1967). A systematic characterization of the reversion flavor of soybean oil. J. Am. OilChem. Soc. 44:509–514.
135. Sreenivasan, B. (1978). Interesterification of fats. J. Am. Oil Chem. Soc. 55:796–805.
136. Standard Methods for the Analysis of Oils, Fats, and Derivatives (1979). Determination of the p-anisidine value.Method 2.504, 6th ed. Pergamon Press, London, pp. 143–144.

Pag e 319
137. Taylor, S. L., C. M. Berg, N. H. Shoptaugh, and E. Traisman (1983). Mutagen formation in deep-fat fried foods as afunction of frying conditions. J. Am. Oil Chem. Soc. 60:576–580.
138. Ullrich, F., and W. Grosch (1987). Identification of the most intense volatile flavor compounds formed during autoxidationof linoleic acid. Z. Lebensm. Unters. Fortsch. 184:277–282.
139. Uri, N. (1961). Mechanism of antioxidation, in Autoxidation and Antioxidants (W. O. Lundberg, ed.), Interscience,New York, pp. 133–169.
140. U.S. Department of Agriculture (1986). Nationwide food consumption survey. Continuing Survey of Food Intakes ofIndividuals. 1985 report no. 85-3. Nutrition Monitoring Division, Human Nutrition Service, Hyattsville, MD.
141. U.S. Department of Agriculture (1987). Nationwide food consumption survey. Continuing Survey of Food Intakes ofIndividuals. 1985 report no. 85-4. Nutrition Monitoring Division, Human Nutrition Service, Hyattsville, MD.
142. Vajdi, M., and W. W. Nawar (1979). Identification of radiolytic compounds from beef. J. Am. Oil Chem. Soc.56:611–615.
143. Waltking, A. E., W. E. Seery, and G. W. Bleffert (1975). Chemical analysis of polymerization products in abused fats andoils. J. Am. Oil Chem. Soc. 52:96–100.
144. WHO (1994). Safety and Nutritional Adequacy of Irradiated Food, World Health Organization, Geneva, pp. 161.
145. Wille, R. L., and E. S. Lutton (1966). Polymorphism of cocoa butter. J. Am. Oil Chem. Soc. 43:491–496.
146. Willet, W. C., and A. Ascherio (1994). Trans-fatty acids: are the effects only marginal? Am. J. Public Health 84(5):1–3.
147. Williams, T. F. (1962). Specific elementary processes in the radiation chemistry of organic compounds. Nature (Lond.)194:348–351.
148. Williams, R. M., and D. Chapman (1970). in Progress in the Chemistry of Fats and Other Lipids (P. T. Holman, ed.),vol. 11, part 1, pp. 1–79, Phosophlipids, Liquid Crystals, and Cell Membranes, Pergamon Press, London.
149. Woolley, P., and S. Petersen, eds. (1994). Lipases: Their Structure, Biochemistry, and Application, CambridgeUniversity Press, Cambridge.

Pag e 321
6Amino Acids, Peptides, and Proteins
SRINIVASAN DAMODARANUniversity of Wisconsin—Madison, Madison, Wisconsin
6.1. Introduction 322
6.2. Physicochemical Properties of Amino Acids 323
6.2.1. General Properties 323
6.2.2. Chemical Reactivity of Amino Acids 331
6.3. Protein Structure 335
6.3.1. Structural Hierarchy in Proteins 335
6.3.2. Forces Involved in the Stability of Protein Structure 346
6.3.3. Conformational Stability and Adaptability of Proteins 352
6.4. Protein Denaturation 353
6.4.1. Thermodynamics of Denaturation 354
6.4.2. Denaturing Agents 356
6.5. Functional Properties of Proteins 365
6.5.1. Protein Hydration 366
6.5.2. Solubility 370
6.5.3. Interfacial Properties of Proteins 373
6.5.4. Flavor Binding 385
6.5.5. Viscosity 389
6.5.6. Gelation 391
6.5.7. Dough Formation 394
6.6. Nutritional Properties of Proteins 396
6.6.1. Protein Quality 396
6.6.2. Digestibility 398
6.6.3. Evaluation of Protein Nutritive Value 399

6.7. Processing-Induced Physical, Chemical, and Nutritional Changes inProteins
402
6.7.1. Changes in Nutritional Quality and Formation of ToxicCompounds
402
6.7.2. Changes in the Functional Properties of Proteins 416

Pag e 322
6.8. Chemical and Enzymatic Modification of Proteins 417
6.8.1. Chemical Modifications 417
6.8.2. Enzymatic Modifications 422
Bibliography 424
References 425
6.1 Introduction
Proteins play a central role in biological systems. Although the information for evolution and biological organization of cells iscontained in DNA, the chemical and biochemical processes that sustain the life of a cell/organism are performed exclusively byenzymes. Thousands of enzymes have been discovered. Each one of them catalyzes a highly specific biological reaction in cells.In addition to functioning as enzymes, proteins (such as collagen, keratin, elastin, etc.) also function as structural components ofcells and complex organisms. The functional diversity of proteins essentially arises from their chemical makeup. Proteins arehighly complex polymers, made up of 20 different amino acids. The constituents are linked via substituted amide bonds. Unlikethe ether and phosphodiester bonds in polysaccharides and nucleic acids, the amide linkage in proteins is a partial double bond,which further underscores the structural complexity of protein polymers. The myriad of biological functions performed byproteins might not be possible but for the complexity in their composition, which gives rise to a multitude of three-dimensionalstructural forms with different biological functions. To signify their biological importance, these macromolecules were namedproteins, derived from the Greek word proteois, which means of the first kind.
At the elemental level, proteins contain 50–55% carbon, 6–7% hydrogen, 20–23% oxygen, 12–19% nitrogen, and 0.2–3.0%sulfur. Protein synthesis occurs in ribosomes. After the synthesis, some amino acid constituents are modified by cytoplasmicenzymes. This changes the elemental composition of some proteins. Proteins that are not enzymatically modified in cells arecalled homoproteins, and those that are modified or complexed with nonprotein components are called conjugated proteins orheteroproteins. The nonprotein components are often referred to as prosthetic groups. Examples of conjugated proteinsinclude nucleoproteins (ribosomes), glycoproteins (ovalbumin, k-casein), phosphoproteins (a- and b-caseins, kinases,phosphory-lases), lipoproteins (proteins of egg yolk, several plasma proteins), and metalloproteins (hemoglobin, myoglobin,and several enzymes). Glyco- and phosphoproteins contain covalently linked carbohydrate and phosphate groups, respectively,whereas the other conjugated proteins are noncovalent complexes containing nucleic acids, lipids, or metal ions. Thesecomplexes can be dissociated under appropriate conditions.
Proteins also can be classified according to their gross structural organization. Thus, globular proteins are those that exist inspherical or ellipsoidal shapes, resulting from folding of the polypeptide chain(s) on itself. On the other hand, fibrous proteinsare rod-shaped molecules containing twisted linear polypeptide chains (e.g., tropomyosin, collagen, keratin, and elastin). Fibrousproteins also can be formed as a result of linear aggregation of small globular proteins, such as actin and fibrin. A majority ofenzymes are globular proteins, and fibrous proteins invariably function as structural proteins.
The various biological functions of proteins can be categorgized as enzyme catalysts, structural proteins, contractile proteins(myosin, actin, tubulin), hormones (insulin, growth hormone), transfer proteins (serum albumin, transferrin, hemoglobin),antibodies (immuno-
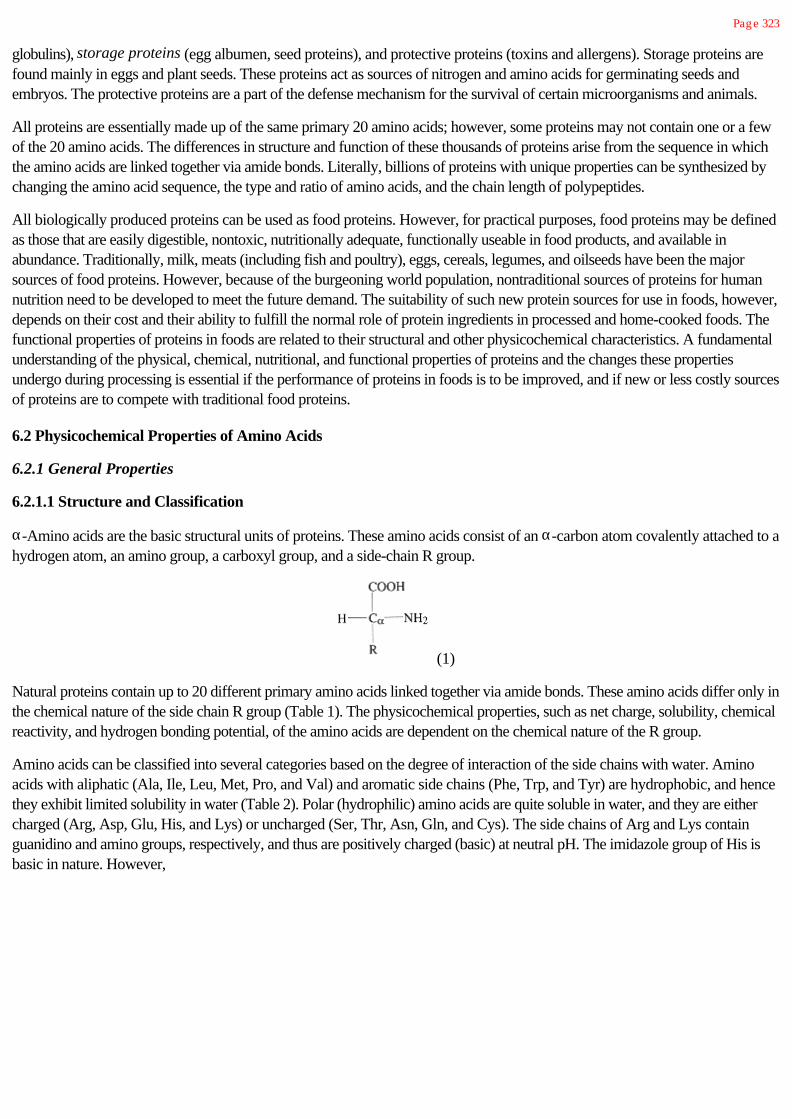
Pag e 323
globulins), storage proteins (egg albumen, seed proteins), and protective proteins (toxins and allergens). Storage proteins arefound mainly in eggs and plant seeds. These proteins act as sources of nitrogen and amino acids for germinating seeds andembryos. The protective proteins are a part of the defense mechanism for the survival of certain microorganisms and animals.
All proteins are essentially made up of the same primary 20 amino acids; however, some proteins may not contain one or a fewof the 20 amino acids. The differences in structure and function of these thousands of proteins arise from the sequence in whichthe amino acids are linked together via amide bonds. Literally, billions of proteins with unique properties can be synthesized bychanging the amino acid sequence, the type and ratio of amino acids, and the chain length of polypeptides.
All biologically produced proteins can be used as food proteins. However, for practical purposes, food proteins may be definedas those that are easily digestible, nontoxic, nutritionally adequate, functionally useable in food products, and available inabundance. Traditionally, milk, meats (including fish and poultry), eggs, cereals, legumes, and oilseeds have been the majorsources of food proteins. However, because of the burgeoning world population, nontraditional sources of proteins for humannutrition need to be developed to meet the future demand. The suitability of such new protein sources for use in foods, however,depends on their cost and their ability to fulfill the normal role of protein ingredients in processed and home-cooked foods. Thefunctional properties of proteins in foods are related to their structural and other physicochemical characteristics. A fundamentalunderstanding of the physical, chemical, nutritional, and functional properties of proteins and the changes these propertiesundergo during processing is essential if the performance of proteins in foods is to be improved, and if new or less costly sourcesof proteins are to compete with traditional food proteins.
6.2 Physicochemical Properties of Amino Acids
6.2.1 General Properties
6.2.1.1 Structure and Classification
a-Amino acids are the basic structural units of proteins. These amino acids consist of an a-carbon atom covalently attached to ahydrogen atom, an amino group, a carboxyl group, and a side-chain R group.
(1)
Natural proteins contain up to 20 different primary amino acids linked together via amide bonds. These amino acids differ only inthe chemical nature of the side chain R group (Table 1). The physicochemical properties, such as net charge, solubility, chemicalreactivity, and hydrogen bonding potential, of the amino acids are dependent on the chemical nature of the R group.
Amino acids can be classified into several categories based on the degree of interaction of the side chains with water. Aminoacids with aliphatic (Ala, Ile, Leu, Met, Pro, and Val) and aromatic side chains (Phe, Trp, and Tyr) are hydrophobic, and hencethey exhibit limited solubility in water (Table 2). Polar (hydrophilic) amino acids are quite soluble in water, and they are eithercharged (Arg, Asp, Glu, His, and Lys) or uncharged (Ser, Thr, Asn, Gln, and Cys). The side chains of Arg and Lys containguanidino and amino groups, respectively, and thus are positively charged (basic) at neutral pH. The imidazole group of His isbasic in nature. However,

Pag e 324

Pag e 325
at neutral pH its net charge is only slightly positive. The side chains of Asp and Glu acids contain a carboxyl group. These aminoacids carry a net negative charge at neutral pH. Both the basic and acidic amino acids are strongly hydrophilic. The net charge ofa protein at physiological conditions is dependent on the relative numbers of basic and acidic amino acids residues in the protein.
TABLE 2 Solubilities of Amino Acids in W ater at 25°C
Amino acid Solubility (g /L) Amino acid Solubility (g /L)
Alanine 167.2 Leucine 21.7
Arg inine 855.6 Lysine 739.0
Asparag ine 28.5 Methionine 56.2
Aspartic acid 5.0 Phenylalanine 27.6
Cysteine — Proline 1620.0
Glutamine 7.2 (37°C) Serine 422.0
Glutamic acid 8.5 Threonine 13.2
Glycine 249.9 Tryptophan 13.6
Histidine — Tyrosine 0.4
Isoleucine 34.5 Valine 58.1

Pag e 326
The polarities of uncharged neutral amino acids fall between those of hydrophobic and charged amino acids. The polar nature ofSer and Thr is attributed to the hydroxyl group, which is able to hydrogen bond with water. Since Tyr also contains an ionizablephenolic group that ionizes at alkaline pH, it is also considered to be a polar amino acid. However, based on its solubilitycharacteristics at neutral pH, it should be regarded as a hydrophobic amino acid. The amide group of Asn and Gln is able tointeract with water through hydrogen bonding. Upon acid or alkaline hydrolysis, the amide group of Asn and Gln is converted toa carboxyl group with release of ammonia. A majority of the Cys residues in proteins exists as cystine, which is a Cys dimercreated by oxidation of thiol groups to form a disulfide cross-link.
Proline is a unique amino acid because it is the only imino acid in proteins. In proline, the propyl side chain is covalently linked toboth the a-carbon atom and the a-amino group, forming a pyrrolidine ring structure.
The amino acids listed in Table 1 have genetic codes. That is, each one of these amino acids has a specific t-RNA that translatesthe genetic information on m-RNA into an amino acid sequence during protein synthesis. Apart from the 20 primary amino acidslisted in Table 1, several proteins also contain other types of amino acids that are derivatives of the primary amino acids. Thesederived amino acids are either cross-linked amino acids or simple derivatives of single amino acids. Proteins that contain derivedamino acids are called conjugated proteins. Cystine, which is found in most proteins, is a good example of a cross-linked aminoacid. Other cross-linked amino acids, such as desmosine, isodesmosine, and di- and trityrosine, are found in structural proteinssuch as elastin and resilin. Several simple derivatives of amino acids are found in several proteins. For example, 4-hydroxyproline and 5-hydroxylysine are found in collagen. These are the result of posttranslational modification duringmaturation of collagen fiber. Phosphoserine and phosphothreonine are found in several proteins, including caseins. N-Methyllysine is found in myosin, and g-carboxyglutamate is found in several blood clotting factors and calcium binding proteins.
(2)
6.2.1.2 Stereochemistry of Amino Acids
With the exception of Gly, the a-carbon atom of all amino acids is asymmetric, meaning that four different groups are attachedto it. Because of this asymmetric center, amino acids exhibit optical activity; that is, they rotate the plane of linearly polarizedlight. In addition to the asym-

Pag e 327
metric a-carbon atom, the b-carbon atoms of Ile and Thr are also asymmetric, and thus both Ile and Thr can exist in fourenantiomeric forms. Among the derived amino acids, hydroxyproline and hydroxylysine also contain two asymmetric carboncenters. All proteins found in nature contain only L-amino acids. Conventionally, the L- and D-enantiomers are represented as
(3)
This nomenclature is based on D- and L-glyceraldehyde configurations, and not on the actual direction of rotation of linearlypolarized light. That is, the L-configuration does not refer to levorotation as in the case of L-glyceraldehyde. In fact most of theL-amino acids are dextrorotatory, not levorotatory.
6.2.1.3 Acid-Base Properties of Amino Acids
Since amino acids contain a carboxyl group (acidic) and an amino group (basic), they behave both as acids and bases; that is,they are ampholytes. For example, Gly, the simplest of all amino acids, can exist in three different ionized states, depending onthe pH of the solution.
(4)
At around neutral pH, both the a-amino and a-carboxyl groups are ionized, and the molecule is a dipolar ion or a zwitterion.The pH at which the dipolar ion is electrically neutral is called the isoelectric point (pI). When the zwitterion is titrated with anacid, the COO- group becomes protonated. The pH at which the concentrations of COO- and COOH are equal is known as
pKa1 (i.e., negative logarithm of the dissociation constant Ka1). Similarly, when the zwitterion is titrated with a base, the
group becomes deprotonated. As before, the pH at which = [NH2] is known as pKa2. A typical electrometric titrationcurve for a dipolar ion is shown in Figure 1. In addition to the a-amino and a-carboxyl groups, the side chains of Lys, Arg, His,Asp, Glu, Cys, and Tyr also contain ionizable groups. The pKa values of all the ionizable groups in amino acids are given inTable 3. The isoelectric points of amino acids can be estimated from their pKa1, pKa2, and pKa3 values, using the followingexpressions:
For amino acids with no charged side chain, pI=(pKa1 + pKa2)/2.
For acidic amino acids, pI = (pKa1 + pKa3)/2.
For basic amino acids, pI = (pKa2 + pKa3)/2.
The subscripts 1,2, and 3 refer to a-carboxyl, a-amino, and side-chain ionizable groups, respectively.
In proteins, the a-COOH of one amino acid is coupled to the a-NH2 of the next amino acid through an amide bond; thus theonly ionizable groups are the N-terminus amino group, the C-terminus carboxyl group, and ionizable groups on side chains. ThepKa of these ionizable groups in proteins are different from those of free amino acids (Table 3). In protein, the pKa3

Pag e 328
FIGURE 1Titration curve of a typical amino
acid.
TABLE 3 pK a and pl Values of Ionizable Groups in Free Amino Acids and Proteins at 25°C
pKaR
Amino acid
pKa1
(a-COOH)pKa2
a-
AA Side chain a pl
Alanine 2.34 9.69 — 6.00
Arg inine 2.17 9.04 12.48 > 12.00 10.76
Asparag ine 2.02 8.80 — 5.41
Aspartic acid 1.88 9.60 3.65 4.60 2.77
Cysteine 1.96 10.28 8.18 8.80 5.07
Glutamine 2.17 9.13 — 5.65
Glutamic acid 2.19 9.67 4.25 4.60 3.22
Glycine 2.34 9.60 5.98
Histidine 1.82 9.17 6.00 7.00 7.59
Isoleucine 2.36 9.68 — 6.02
Leucine 2.30 9.60 — 5.98
Lysine 2.18 8.95 10.53 10.20 9.74
Methionine 2.28 9.21 — 5.74
Phenylalanine 1.83 9.13 — 5.48
Proline 1.94 10.60 — 6.30
Serine 2.20 9.15 — 5.68
Threonine 2.21 9.15 — 5.68

Tryptophan 2.38 9.39 — 5.89
Tyrosine 2.20 9.11 10.07 9.60 5.66
Valine 2.32 9.62 — 5.96
apKa values in proteins.

Pag e 329
values of acidic side chains (Glu and Asp) are larger and those of basic side chains are lower than those of the correspondingfree amino acids.
The degree of ionization of a group at any given solution pH can be determined by using the Henderson-Hasselbach equation:
(5)
The net charge of a protein at a given pH can be estimated by determining the degree of ionization of individual ionizable groupsusing this equation, and then adding up the total number of negative and positive charges.
6.2.1.4 Hydrophobic Properties of Amino Acids
One of the major factors affecting physicochemical properties, such as structure, solubility, fat-binding properties, etc., ofproteins and peptides is the hydrophobicity of the constituent amino acid residues. Hydrophobicity can be defined as the excessfree energy of a solute dissolved in water compared to that in an organic solvent under similar conditions. The most direct andsimplest way to estimate relative hydrophobicities of amino acid side chains involves experimental determination of free energychanges for dissolution of amino acid side chains in water and in an organic solvent, such as ethanol. The chemical potential of anamino acid dissolved in water can be expressed by the equation
(6)
where is the standard chemical potential of the amino acid, gAA is the activity coefficient, CAA is concentration, T isabsolute temperature, and R is the gas constant. Similarly, the chemical potential of an amino acid dissolved in ethanol can beexpressed as
(7)
In saturated solutions, in which CAA,W and CAA,Et represent solubilities in water and ethanol, respectively, the chemical potentialsof the amino acid in water and in ethanol are the same, that is,
(8)
Thus
(9)
The quantity which represents the difference between the chemical potentials arising from the interaction of theamino acid with ethanol and with water, can be defined as the free energy change (DGt,Et w) of transfer of the amino acid fromethanol to water. Thus, assuming that the ratio of activity coefficients is one, the preceding equation can be expressed as
(10)
where SAA,Et and SAA,w represent solubilities of the amino acid in ethanol and water, respectively.
As is true of all other thermodynamic parameters, DGt is an additive function. That is, if a molecule has two groups, A and B,covalently attached, the DGt for transfer from one solvent to another solvent is the sum of the free energy changes for transfer ofgroup A and group B. That is,

Pag e 330
DGt,AB = DGt,A + DGt,B (11)
The same logic can be applied to the transfer of an amino acid from water to ethanol. For example, Val can be considered as aderivative of Gly with an isopropyl side chain at the a-carbon atom.
(12)
The free energy change of transfer of valine from ethanol to water can then be considered as
DGt,val = DGt,glycine + DGt,side chain
(13)
or
DGt,side chain = DGt,val - DGt,glycine
(14)
In other words, the hydrophobicities of amino acid side chains can be determined by subtracting DGt,gly from DGt,AA.
The hydrophobicity values of amino acid side chains obtained in this manner are given in Table 4. Amino acid side chains withlarge positive DGt values are hydrophobic; they would prefer to be in an organic phase rather than in an aqueous phase. Inproteins, these residues tend to locate themselves in the protein interior. Amino acid residues with negative DGt values arehydrophilic, and these residues tend to locate themselves on the surface of protein molecules. It should be noted that althoughLys is considered to be a hydrophilic amino acid residue, it has a positive DGt; this is due to the four -CH2- groups, which preferto be in an organic environment. In fact, with proteins, part of this chain is usually buried with the e-amino group protruding atthe protein surface.
TABLE 4 Hydrophobicity of Amino Acid Side Chains at 25°C
Amino acid
DG t
(ethanol water)(kJ/mol) Amino acid
DG t
(ethanol water)(kJ/mol)
Alanine 2.09 Leucine 9.61
Arg inine — Lysine —
Asparag ine 0 Methionine 5.43
Aspartic acid 2.09 Phenylalanine 10.45
Cysteine 4.18 Proline 10.87
Glutamine -0.42 Serine -1.25
Glutamic acid 2.09 Threonine 1.67
Glycine 0 Tryptophan 14.21
Histidine 2.09 Tyrosine 9.61
Isoleucine 12.54 Valine 6.27
Source: Refs. 80 and 104.

Pag e 331
TABLE 5 Ultraviolet Absorbance and Fluorescence of Aromatic Amino Acids
Amino acidlmax
of absorbance (nm)
Molar extinctioncoefficient (1 cm-1 mol-
1)lmax of fluorescence
(nm)
Phenylalanine 260 190 282ª
Tryptophan 278 5500 348b
Tyrosine 275 1340 304b
ªExcitation at 260 nm.
bExcitation at 280 nm.
6.2.1.5 Optical Properties of Amino Acids
The aromatic amino acids Trp, Tyr, and Phe absorb light in the near-ultraviolet region (250–300 nm). In addition, Trp and Tyralso exhibit fluorescence in the ultraviolet region. The maximum wavelengths of absorption and fluorescence emission of thearomatic amino acids are given in Table 5. Since both absorption and fluorescence properties of these amino acids areinfluenced by the polarity of their environment, changes in their optical properties are often used as a means to monitorconformational changes in proteins.
6.2.2 Chemical Reactivity of Amino Acids
The reactive groups, such as amino, carboxyl, sulfhydryl, phenolic, hydroxyl, thioether (Met), imidazole, and guanyl, in freeamino acids and proteins are capable of undergoing chemical reactions that are similar to those that would occur if they wereattached to other small organic molecules. Typical reactions for various side-chain groups are presented in Table 6. Several ofthese reactions can be used to alter the hydrophilic and hydrophobic properties and the functional properties of proteins andpeptides. Some of these reactions also can be used to quantify amino acids and specific amino acid residues in proteins. Forexample, reaction of amino acids with ninhydrin, O-phthaldialdehyde, or fluorescamine is regularly used in the quantification ofamino acids.
Reaction with Ninhydrin
The ninhydrin reaction is often used to quantify free amino acids. When an amino acid is reacted with an excess amount ofninhydrin, the following products are formed. For every mole of amino acid reacted with ninhydrin, one mole each of ammonia,aldehyde, CO2, and hydrindantin are formed as intermediates. The liberated ammonia subsequently reacts with one mole ofninhydrin and one mole of hydrindantin, forming a purple product known as Ruhemann's purple, which has maximumabsorbance at 570 nm. Proline and hydroxyproline give a yellow product that has a maximum absorbance at 440 nm. Thesecolor reactions are the bases for colorimetric determination of amino acids.
(15)
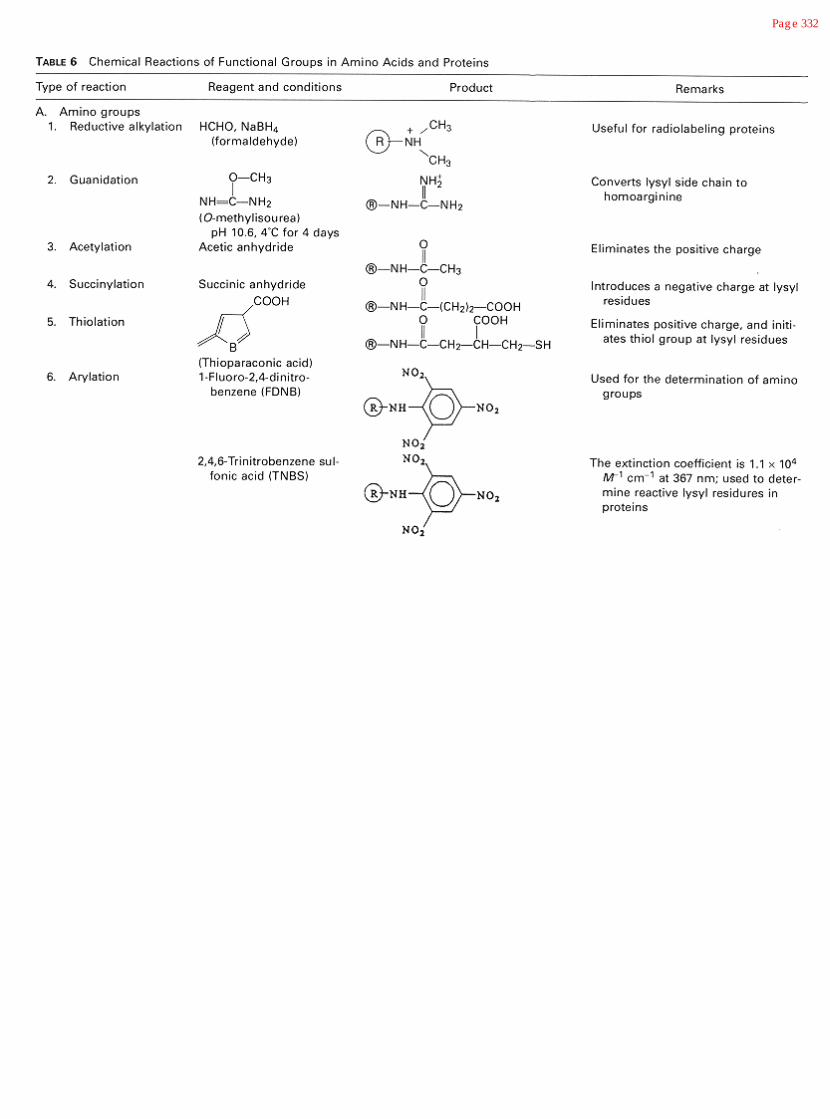
Pag e 332

Pag e 333

Pag e 334

Pag e 335
The ninhydrin reaction is usually used to help determine the amino acid composition of proteins. In this case, the protein is firstacid hydrolyzed to the amino acid level. The freed amino acids are then separated and identified using ion exchange/hydrophobicchromatography. The column eluates are reacted with ninhydrin and quantified by measuring absorbance at 570 and 440 nm.
Reaction with O-phthaldialdehyde
Reaction of amino acids with O-phthaldialdehyde (1,2-benzene dicarbonal) in the presence of 2-mercaptoethanol yields a highlyfluorescent derivative that has an excitation maximum at 380 nm and a fluorescence emission maximum at 450 nm.
(16)
Reaction with Fluorescamine
Reaction of amino acids, peptides, and proteins containing primary amines with fluorescamine yields a highly fluorescentderivative with fluorescence emission maximum at 475 nm when excited at 390 nm. This method can be used to quantify aminoacids as well as proteins and peptides.
(17)
6.3 Protein Structure
6.3.1 Structural Hierarchy in Proteins
Four levels of protein structure exist: primary, secondary, tertiary, and quaternary.
6.3.1.1 Primary Structure
The primary structure of a protein refers to the linear sequence in which the constituent amino acids are covalently linked throughamide bonds, also known as peptide bonds. The peptide linkage results from condensation of the a-carboxyl group of the ithamino acid and the a-amino group of the i + 1th amino acid with removal of a water molecule. In this linear sequence, all theamino acid residues are in the L-configuration. A protein with n amino acid residues

Pag e 336
(18)
contains n-1 peptide linkages. The terminus with the free a-amino group is known as the N-terminal, and that with the free a-COOH group is known as the C-terminal. By convention, N represents the beginning and C the end of the polypeptide chain.
The chain length (n) and the sequence in which the n residues are linked determine the physicochemical, structural, andbiological properties and functions of a protein. The amino acid sequence acts as the code for formation of secondary andtertiary structures, and ultimately determines the protein's biological functionality. The molecular mass of proteins ranges from afew thousand daltons to over a million daltons. For example, titin, which is a single-chain protein found in muscle, has amolecular weight of over one million, whereas secretin has a molecular weight of about 2300. Many proteins have molecularmasses in the range of 20,000 to 100,000 daltons.
(19)
The backbone of polypeptides can be depicted as repeating units of -N-C-C- or -C-C-N-. The expression -NH-CHR-CO-relates to an amino acid residue, whereas -CHR-CO-NH- represents a peptide unit. Although the CO-NH bond is depicted asa single covalent bond, in reality it has a partial double bond character because of the resonance structure caused bydelocalization of electrons.
(20)
This has several important structural implications in proteins. First, the resonance structure precludes protonation of the peptideN-H group. Second, because of the partial double bond character, the rotation of the CO-NH bond is restricted to a maximumof 6°, known as the w angle. Because of this restriction, each six-atom segment (-Ca-CO-NH-Ca-) of the peptide

Pag e 337
backbone lies in a single plane. The polypeptide backbone, in essence, can be depicted as a series of -Ca-CO-NH-Ca- planesconnected at the Ca atoms (Figure 2). Since peptide bonds constitute about one-third of the total covalent bonds of thebackbone, their restricted rotational freedom drastically reduces backbone flexibility. Only the N-Ca and the Ca-C bonds haverotational freedoms, and these are termed f (phi) and y (psi) dihedral angles, respectively. These are also known as main-chaintorsion angles. Third, delocalization of electrons also imparts a partial negative charge to the carbonyl oxygen atom and a partialpositive charge to the hydrogen atom of the N-H group. Because of this, hydrogen bonding (dipole-dipole interaction) betweenthe C=O and N-H groups of the peptide backbone is possible under appropriate conditions.
Another consequence of the partial-bond nature of the peptide bond is that the four atoms attached to the peptide bond canexist either in cis or trans configuration.
(21)
However, almost all protein peptide bonds exist in the trans configuration. This is due to the fact that the trans configuration isthermodynamically more stable than the cis configuration. Since trans cis transformation increases the free energy of thepeptide bond by 34.8 kJ/mol, isomerization of peptide bonds does not occur in proteins. One exception to this is peptide bonds
FIGURE 2Planar config uration of the atoms of peptide units of a polypeptide
backbone. f and y are the dihedral (torsional) ang les of C a-Nand Ca-C bonds. The side chains are located above or below
the planes.
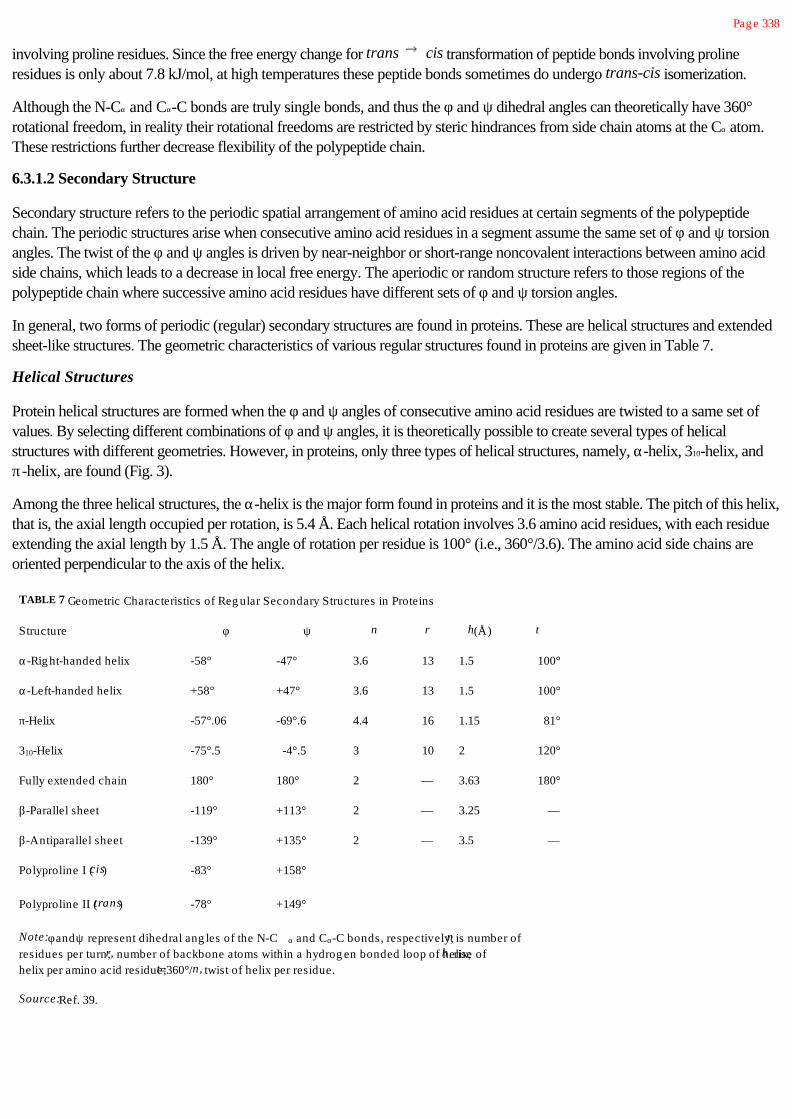
Pag e 338
involving proline residues. Since the free energy change for trans cis transformation of peptide bonds involving prolineresidues is only about 7.8 kJ/mol, at high temperatures these peptide bonds sometimes do undergo trans-cis isomerization.
Although the N-Ca and Ca-C bonds are truly single bonds, and thus the f and y dihedral angles can theoretically have 360°rotational freedom, in reality their rotational freedoms are restricted by steric hindrances from side chain atoms at the Ca atom.These restrictions further decrease flexibility of the polypeptide chain.
6.3.1.2 Secondary Structure
Secondary structure refers to the periodic spatial arrangement of amino acid residues at certain segments of the polypeptidechain. The periodic structures arise when consecutive amino acid residues in a segment assume the same set of f and y torsionangles. The twist of the f and y angles is driven by near-neighbor or short-range noncovalent interactions between amino acidside chains, which leads to a decrease in local free energy. The aperiodic or random structure refers to those regions of thepolypeptide chain where successive amino acid residues have different sets of f and y torsion angles.
In general, two forms of periodic (regular) secondary structures are found in proteins. These are helical structures and extendedsheet-like structures. The geometric characteristics of various regular structures found in proteins are given in Table 7.
Helical Structures
Protein helical structures are formed when the f and y angles of consecutive amino acid residues are twisted to a same set ofvalues. By selecting different combinations of f and y angles, it is theoretically possible to create several types of helicalstructures with different geometries. However, in proteins, only three types of helical structures, namely, a-helix, 310-helix, andp-helix, are found (Fig. 3).
Among the three helical structures, the a-helix is the major form found in proteins and it is the most stable. The pitch of this helix,that is, the axial length occupied per rotation, is 5.4 Å. Each helical rotation involves 3.6 amino acid residues, with each residueextending the axial length by 1.5 Å. The angle of rotation per residue is 100° (i.e., 360°/3.6). The amino acid side chains areoriented perpendicular to the axis of the helix.
TABLE 7 Geometric Characteristics of Reg ular Secondary Structures in Proteins
Structure f y n r h(Å) t
a-Rig ht-handed helix -58° -47° 3.6 13 1.5 100°
a-Left-handed helix +58° +47° 3.6 13 1.5 100°
p-Helix -57°.06 -69°.6 4.4 16 1.15 81°
310-Helix -75°.5 -4°.5 3 10 2 120°
Fully extended chain 180° 180° 2 — 3.63 180°
b-Parallel sheet -119° +113° 2 — 3.25 —
b-Antiparallel sheet -139° +135° 2 — 3.5 —
Polyproline I (cis) -83° +158°
Polyproline II (trans) -78° +149°
Note: f and y represent dihedral ang les of the N-C a and Ca-C bonds, respectively; n is number ofresidues per turn; r, number of backbone atoms within a hydrog en bonded loop of helix; h, rise ofhelix per amino acid residue; t=360°/n, twist of helix per residue.
Source: Ref. 39.

Pag e 339
FIGURE 3Spatial arrang ement of polypeptides in (a) a-helix, (b) 3 10-helix,
and (c) p-helix forms. (From Ref. 8; courtesy of AcademicPress.)
a-Helices are stabilized by hydrogen bonding. In this structure, each backbone N-H group is hydrogen bonded to the C=Ogroup of the fourth preceding residue. Thirteen backbone atoms are in this hydrogen-bonded loop; thus the a-helix is sometimescalled the 3.613 helix. The hydrogen bonds are oriented parallel to the helix axis, and the N, H, and O atoms of the hydrogenbond lie almost in a straight line; that is, the hydrogen bond angle is almost zero. The hydrogen bond length, that is, the N-H …O distance, is about 2.9 Å, and the strength of this bond is about 18.8 kJ/mol. The a-helix can exist in either a right- or left-handed orientation. However, the right-handed orientation is the more stable than the two.
The details for a-helix formation are embedded as a binary code in the amino acid sequence [52]. The binary code is related tothe arrangement of polar and nonpolar residues in the sequence. Polypeptide segments with repeating heptet sequences of -P-N-P-P-N-N-P-, where P and N are polar and nonpolar residues, respectively, readily form a-helices in aqueous solutions. It isthe binary code, and not the precise identities of the polar and nonpolar residues in the heptet sequence, that dictates a-helixformation. Slight variations in the binary code of the heptet are tolerated, provided other inter- or intramolecular interactions arefavorable for a-helix formation. For example, tropomyosin, a muscle protein, exists entirely in a coiled-coil a-helical rod form.The repeating heptet sequence in this protein is -N-P-P-N-P-P-P-, which is slightly different from the preceding sequence. Inspite of this variation, tropo-myosin exists entirely in the a-helix form because of other stabilizing interactions in the coiled-coilrod [69].
Most of the a-helical structures found in proteins are amphiphilic in nature; that is, one side of the helical surface is occupied byhydrophobic side chains, and the other side by hydrophilic residues. This is schematically shown in the form of a helical wheel inFigure 4. In most proteins, the nonpolar surface of the helix faces the protein interior, and is generally engaged in hydrophobicinteractions with other nonpolar surfaces.
Other types of helical structures found in proteins are the p-helix and the 310-helix. The p- and 310-helices are about 2.1 kJ/moland 4.2 kJ/mol, respectively, less stable than the a-helix. These helices exist only as short segments involving a few amino acidresidues, and they are not of major importance to the structures of most proteins.
In proline residues, because of the ring structure formed by covalent attachment of the

Pag e 340
FIGURE4Cross-sectional view of the helical structure of
residues 110–127 of bovine g rowth hormone. The top ofthe helical wheel (unfilled) represents the hydrophilic
surface, and the bottom (filled) represents thehydrophobic surface of the amphiphilic helix. (FromRef. 10; courtesy of American Association for the
Advancement of Science.)
propyl side chain to the amino group, rotation of the N-Ca bond is not possible, and therefore the f angle has a fixed value of70°. In addition, since there is no hydrogen at the nitrogen atom, it cannot form hydrogen bonds. Because of these twoattributes, segments containing proline residues cannot form a-helices. In fact, proline is considered to be an a-helix breaker.Proteins containing high levels of proline residues tend to assume a random or aperiodic structure. For example, proline residuesconstitute about 17% of the total amino acid residues in b-casein, and 8.5% of the residues in as1-casein, and because of theuniform distribution of these residues in the primary structures of these proteins, a-helices are not present and the proteins haverandom structures. However, polyproline is able to form two types of helical structures, termed polyproline I and polyprolineII. In polyproline I, the peptide bonds are in the cis-configuration, and in polyproline II they are in trans. Other geometriccharacteristics of these helices are given in Table 7. Collagen, which is the most abundant animal protein, exists as polyproline II-type helix. In collagen, every third residue is a glycine, which is preceded usually by a proline residue. Three polypeptide chainsare entwined to form a triple helix, and the stability of the triple helix is maintained by interchain hydrogen bonds.
b -Sheet Structure
The b-sheet structure is an extended structure with specific geometries given in Table 7. In this extended form, the C=O and N-H groups are oriented perpendicular to the direction of the chain, and therefore hydrogen bonding is possible only betweensegments (i.e., intersegment), and not within a segment (i.e., intrasegment). The b-strands are usually about 5–15 amino acidresidues long. In proteins, two b-strands of the same molecule interact via hydrogen bonds, forming a sheet-like structure knownas b-pleated sheet. In the sheet-like structure, the side chains are

Pag e 341
oriented perpendicular (above and below) to the plane of the sheet. Depending on the N C directional orientations of thestrands, two types of b-pleated sheet structures, namely parallel b-sheet and antiparallel b-sheet, can form (Figure 5). In parallelb-sheet the directions of the b-strands run parallel to each other, whereas in the other they run opposite to each other. Thesedifferences in chain directions affect the geometry of hydrogen bonds. In antiparallel b-sheets the N-H … O atoms lie in astraight line (zero H-bond angle), which enhances the stability of the hydrogen bond, whereas in parallel b-sheets they lie at anangle, which reduces the stability of the hydrogen bonds. Antiparallel b-sheets are, therefore, more stable than parallel b-sheets.
The binary code that specifies formation of b-sheet structures in proteins is -N-P-N-P-N-P-N-P-. Clearly, polypeptidesegments containing alternating polar and nonpolar residues have a high propensity to form b-sheet structures. Segments rich inbulky hydrophobic side chains, such as Val and Ile, also have a tendency to form a b-sheet structures. As expected, somevariation in the code is tolerated.
The b-sheet structure is generally more stable than the a-helix. Proteins that contain large fractions of b-sheet structure usuallyexhibit high denaturation temperatures. Examples are b-lactoglobulin (51% b-sheet) and soy 11S globulin (64% b-sheet), whichhave thermal denaturation temperatures of 75.6 and 84.5°C, respectively. On the other hand, the denaturation temperature ofbovine serum albumin, which has about 64% a-helix structure, is only about 64°C [19,20]. When solutions of a-helix-typeproteins are heated and cooled, the a-helix is usually converted to b-sheet [19]. However, conversion from b-sheet to a-helixhas not been observed in proteins.
Another common structural feature found in proteins is the b-bend or b-turn. This arises as a result of 180° reversal of thepolypeptide chain involved in b-sheet formation (Fig. 6). The hairpin bend is the result of antiparellel b-sheet formation, and thecrossover bend is the result of parallel b-sheet formation. Usually a b-bend involves a four residue segment folding
FIGURE 5Anti-parallel (left) and parallel (rig ht) b-sheets. The dotted
lines represent hydrog en bonds between peptideg roups. The arrows indicate N C chain direction. The
side chains at Ca atoms are oriented perpendicular (upor down) to the direction of the backbone. (From Ref.
99; courtesy of Spring er-Verlag New York, Inc.)
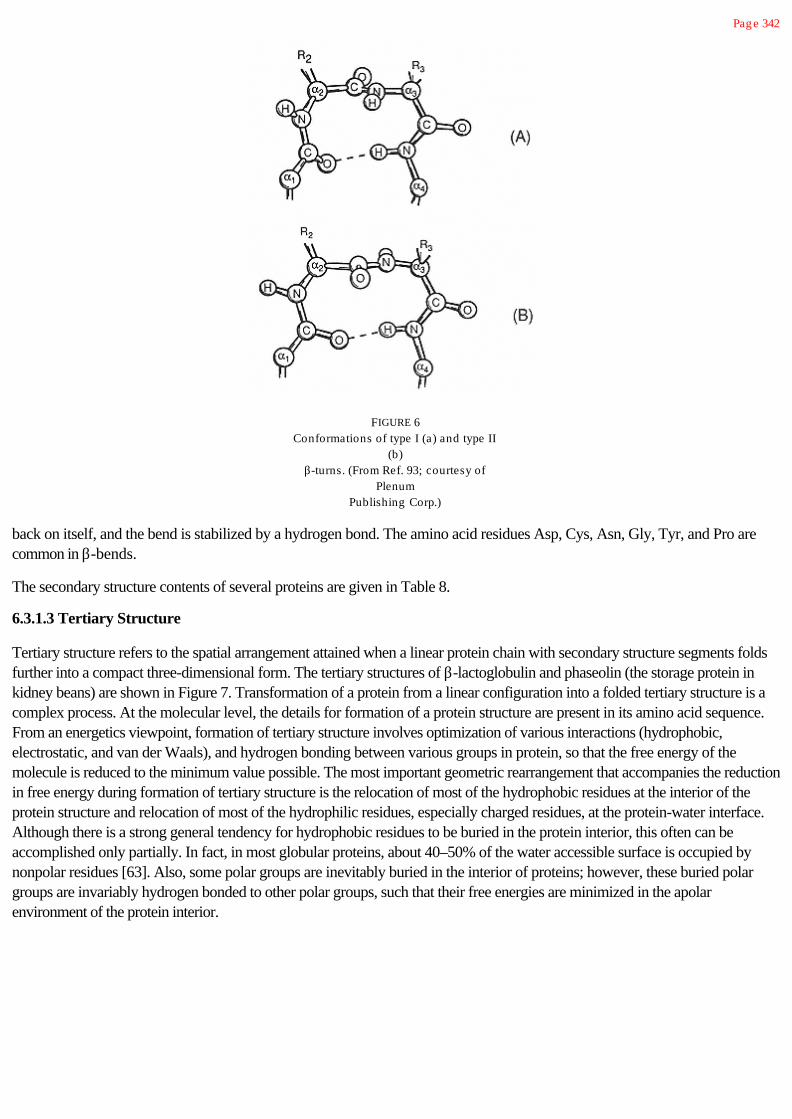
Pag e 342
FIGURE 6Conformations of type I (a) and type II
(b)b-turns. (From Ref. 93; courtesy of
PlenumPublishing Corp.)
back on itself, and the bend is stabilized by a hydrogen bond. The amino acid residues Asp, Cys, Asn, Gly, Tyr, and Pro arecommon in b-bends.
The secondary structure contents of several proteins are given in Table 8.
6.3.1.3 Tertiary Structure
Tertiary structure refers to the spatial arrangement attained when a linear protein chain with secondary structure segments foldsfurther into a compact three-dimensional form. The tertiary structures of b-lactoglobulin and phaseolin (the storage protein inkidney beans) are shown in Figure 7. Transformation of a protein from a linear configuration into a folded tertiary structure is acomplex process. At the molecular level, the details for formation of a protein structure are present in its amino acid sequence.From an energetics viewpoint, formation of tertiary structure involves optimization of various interactions (hydrophobic,electrostatic, and van der Waals), and hydrogen bonding between various groups in protein, so that the free energy of themolecule is reduced to the minimum value possible. The most important geometric rearrangement that accompanies the reductionin free energy during formation of tertiary structure is the relocation of most of the hydrophobic residues at the interior of theprotein structure and relocation of most of the hydrophilic residues, especially charged residues, at the protein-water interface.Although there is a strong general tendency for hydrophobic residues to be buried in the protein interior, this often can beaccomplished only partially. In fact, in most globular proteins, about 40–50% of the water accessible surface is occupied bynonpolar residues [63]. Also, some polar groups are inevitably buried in the interior of proteins; however, these buried polargroups are invariably hydrogen bonded to other polar groups, such that their free energies are minimized in the apolarenvironment of the protein interior.

Pag e 343
Table 8 Secondary Structure Content of Selected Proteins
Protein a-Helix (%) b-Sheet (%) b-Turns (%) Aperiodic (%)
Deoxyhemog lobin 85.7 0 8.8 5.5
Bovine serum albumin 67.0 0 0 33.0
Chymotrypsinog en 11.0 49.4 21.2 18.4
Immunog lobulin G 2.5 67.2 17.8 12.5
Insulin (dimer) 60.8 14.7 10.8 15.7
Bovine trypsin inhibitor 25.9 44.8 8.8 20.5
Ribonuclease A 22.6 46.0 18.5 12.9
Lysozyme 45.7 19.4 22.5 12.4
Papain 27.8 29.2 24.5 18.5
a-Lactalbumin 26.0 14.0 — 60.0
b-Lactog lobulin 6.8 51.2 10.5 31.5
Soy 11S 8.5 64.5 0 27.0
Soy 7S 6.0 62.5 2.0 29.5
Phaseolin 10.5 50.5 11.5 27.5
Note: Compiled from various sources. The values represent percent of total number of amino acid residues.
The folding of a protein from a linear structure to a folded tertiary structure is accompanied by a reduction in interfacial area. Theaccessible interfacial area of a protein is defined as the total interfacial area of a three-dimensional space occupied by theprotein, as determined by figuratively rolling a spherical water molecule of radius 1.4Å over the entire surface of the proteinmolecule. For native globular proteins, the accessible interfacial area (in Å2) is a simple function of their molecular weight, asgiven by the equation [71]
As = 6.3M0.73 (22)
The total accessible interfacial area of a nascent polypeptide in its extended linear state (i.e., fully stretched molecule with nosecondary, tertiary, or quaternary structure) is also correlated to its molecular weight, M, by the equation [71]
At = 1.48M + 21 (23)
The initial area (Ab) of a protein that has folded during formation of a globular tertiary structure (i.e., buried area) can beestimated from Equations 22 and 23.
The fraction and distribution of hydrophilic and hydrophobic residues in the primary structure affects several physicochemicalproperties of the protein. For instance, the shape of a protein molecule is dictated by its amino acid sequence. If a proteincontains a large number of hydrophilic residues distributed uniformly in its sequence, it will assume an elongated or rod-likeshape. This is because, for a given mass, an elongated shape has a large surface are to volume ratio so that more hydrophilicresidues can be placed on the surface. On the other hand, if a protein contains a large number of hydrophobic residues, it willassume a globular (roughly spherical) shape. This minimizes the surface-area-to-volume ratio, enabling more hydrophobicresidues to be buried in the protein interior. Among globular proteins, it is generally found that larger molecules contain largerfractions of nonpolar amino acids than do smaller molecules.
The tertiary structures of several single polypeptide proteins are made up of domains. Domains are defined as those regions ofthe polypeptide sequence that fold up into a tertiary form independently. These are, in essence, miniproteins within a singleprotein. The structural


Pag e 344
FIGURE 7Tertiary structures of (A) phaseolin subunit and (B) b-lactog lobulin. Thearrows indicate b-sheet strands, and the cylinders indicate a-helix (From
Ref. 62a and Ref. 85, respectively).
stability of each domain is largely independent of the others. In most single-chain proteins, the domains fold independently andthen interact with each other to form the unique tertiary structure of the protein. In some proteins, as in the case of phaseolin(Fig. 7), the tertiary structure may contain two or more distinct domains (structural entities) connected by a segment of thepolypeptide chain. The number of domains in a protein usually depends on its molecular weight. Small proteins (e.g., lysozyme,b-lactoglobulin, and a-lactalbumin) with 100–150 amino acid residues usually form a single domain tertiary structure. Largeproteins, such as immunoglobulin,

Pag e 345
contain multiple domains. The light chain of immunoglobulin G contains two domains, and the heavy chain contains four domains.The size of each of these domains is about 120 amino acid residues. Human serum albumin, which is made up of 585 amino acidresidues, has three homologous domains, and each domain contains two subdomains [47].
6.3.1.4 Quaternary Structure
Quaternary structure refers to the spatial arrangement of a protein when it contains more than one polypeptide chain. Severalbiologically important proteins exist as dimers, trimers, tetramers, etc. Any of these quaternary complexes (also referred to asoligomers) can be made up of protein subunits (monomers) that are the same (homogeneous) or different (heterogeneous). Forexample, b-lactoglobulin exits as a dimer in the pH range 5–8, as an octomer in the pH range 3–5, and as a monomer above pH8, and the monomeric units of these complexes are identical. On the other hand, hemoglobin is a tetramer made up of twodifferent polypeptide chains that is, a and b chains.
Formation of oligomeric structures is the result of specific protein-protein interactions. These are primarily noncovalentinteractions, such as hydrogen bonds, and both hydrophobic and electrostatic interactions. The fraction of hydrophobic aminoacids appears to influence the tendency to form oligomeric proteins. Proteins that contain more than 30% hydrophobic aminoacid residues exhibit a greater tendencey to form oligomeric structures than do those that contain fewer hydrophobic amino acidresidues.
Formation of quaternary structure is primarily driven by the thermodynamic requirement to bury exposed hydrophobic surfacesof subunits. When the hydrophobic amino acid content of a protein is greater than 30%, it is physically impossible to form astructure that will bury all of the nonpolar residues. Consequently, there is a greater likelihood of hydrophobic patches to exist onthe surface, and interaction of these patches between adjacent monomers can lead to the formation of dimers, trimers, etc. (Fig.8).
Many food proteins, especially cereal proteins, exist as oligomers of different polypeptides. As would be expected, theseproteins typically contain more than 35% hydrophobic amino acid residues (Ile, Leu, Trp, Tyr, Val, Phe, and Pro). In addition,they also contain 6–12% proline [12]. As a consequence, cereal proteins exist in complex oligomeric structures. The majorstorage proteins of soybean, namely, b-conglycinin and glycinin, contain about 41% and 39% hydrophobic amino acid residues,respectively. b-Conglycinin is a trimeric protein made up of three different subunits, and it exhibits complex association-dissociation phenomenon as a
FIGURE 8Schematic representation of formation of dimers
and olig omers in proteins.

Pag e 346
function of ionic strength and pH [76]. Glycinin is made up of 12 subunits, six of the subunits being acidic and the others basic.Each basic subunit is cross-linked to an acid subunit via a disulfide bond. The six acidic-basic pairs are held together in theoligomeric state by non-covalent interactions. Glycinin also exhibits complex association-dissociation behavior as a function ofionic strength [76].
In oligomeric proteins, the accessible surface area, AS, is correlated to the molecular weight of the oligomer [71] by the equation
AS = 5.3M0.76 (24)
This relationship is different from that which applies to monomeric proteins. The surface area buried when the native oligomericstructure is formed from its constituent polypeptide subunits can be estimated from the equation
Ab = At - AS = (1.48M + 21) - 5.3M0.76 (25)
where At is the total accessible interfacial area of the nascent polypeptide subunits in their linear state.
6.3.2 Forces Involved in the Stability of Protein Structure
The process of folding of a random polypeptide chain into a unique three-dimensional structure is quite complex. As mentionedearlier, the basis for the biologically native conformation is encoded in the amino acid sequence of the protein. In the 1960s,Anfinsen and co-workers showed that when denatured ribonuclease was added to a physiological buffer solution, it refolded toits native conformation and regained almost 100% of its biological activity. A majority of enzymes have been subsequentlyshown to exhibit similar propensity. The slow but spontaneous transformation of an unfolded state to a folded state is facilitatedby several intramolecular noncovalent interactions. The native conformation of a protein is a thermodynamic state in whichvarious favorable interactions are maximized and the unfavorable ones are minimized such that the overall free energy of theprotein molecule is at the lowest possible value.
The forces that contribute to protein folding may be grouped into two categories: (a) intramolecular interactions emanating fromforces intrinsic to the protein molecule, and (b) intramolecular interactions affected by the surrounding solvent. van der Waalsand steric interactions belong the former, and hydrogen bonding, electrostatic, and hydrophobic interactions belong to the latter.
Steric Strains
Although the f and y angles theoretically have a 360° rotational freedom, their values are very much restricted because of sterichindrance from side-chain atoms. Because of this, segments of a polypeptide chain can assume only a limited number ofconfigurations. Distortions in the planar geometry of the peptide unit, or stretching and bending of bonds, will cause an increasein the free energy of the molecule. Therefore, folding of the polypeptide chain can occur only in such a way that deformation ofbond lengths and bond angles are avoided.
van der Waals Interactions
These are dipole-induced dipole and induced dipole-induced dipole interactions between neutral atoms in protein molecules.When two atoms approach each other, each atom induces a dipole in the other via polarization of the electron cloud. Theinteractions between these induced dipoles have an attractive as well as a repulsive component. The magnitudes of these forcesare dependent on the interatomic distance. The attractive energy is inversely proportional to the sixth
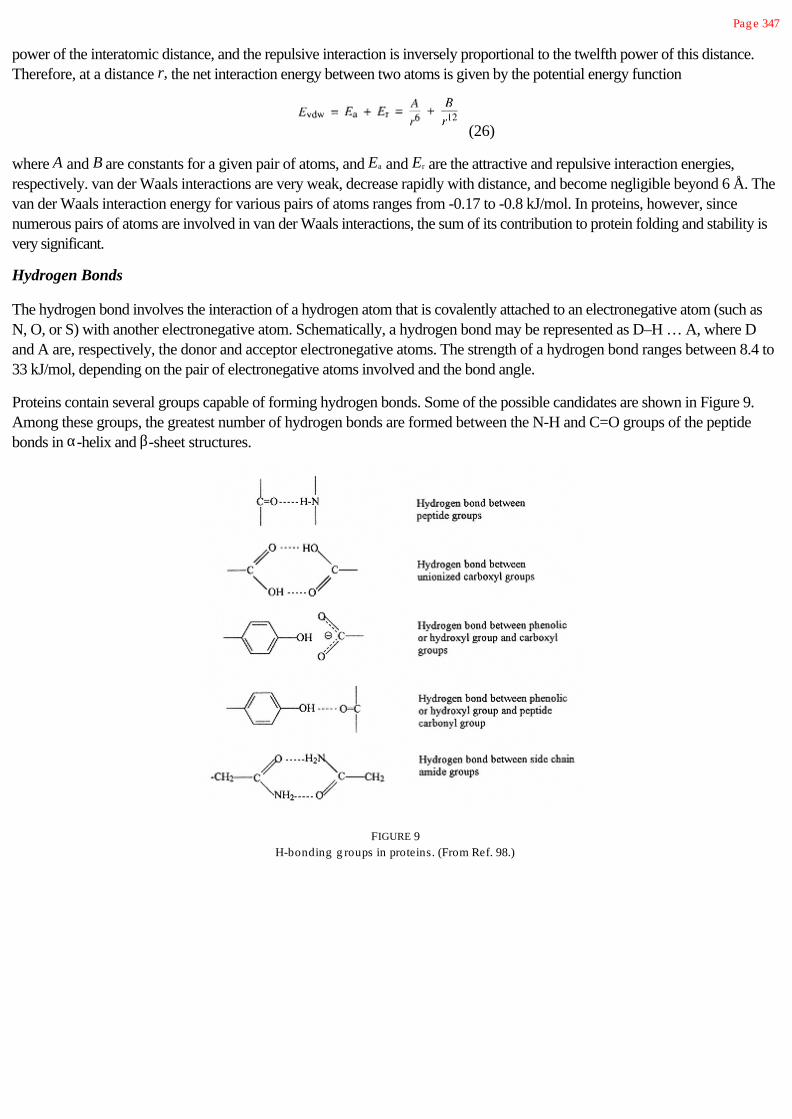
Pag e 347
power of the interatomic distance, and the repulsive interaction is inversely proportional to the twelfth power of this distance.Therefore, at a distance r, the net interaction energy between two atoms is given by the potential energy function
(26)
where A and B are constants for a given pair of atoms, and Ea and Er are the attractive and repulsive interaction energies,respectively. van der Waals interactions are very weak, decrease rapidly with distance, and become negligible beyond 6 Å. Thevan der Waals interaction energy for various pairs of atoms ranges from -0.17 to -0.8 kJ/mol. In proteins, however, sincenumerous pairs of atoms are involved in van der Waals interactions, the sum of its contribution to protein folding and stability isvery significant.
Hydrogen Bonds
The hydrogen bond involves the interaction of a hydrogen atom that is covalently attached to an electronegative atom (such asN, O, or S) with another electronegative atom. Schematically, a hydrogen bond may be represented as D–H … A, where Dand A are, respectively, the donor and acceptor electronegative atoms. The strength of a hydrogen bond ranges between 8.4 to33 kJ/mol, depending on the pair of electronegative atoms involved and the bond angle.
Proteins contain several groups capable of forming hydrogen bonds. Some of the possible candidates are shown in Figure 9.Among these groups, the greatest number of hydrogen bonds are formed between the N-H and C=O groups of the peptidebonds in a-helix and b-sheet structures.
FIGURE 9H-bonding g roups in proteins. (From Ref. 98.)

Pag e 348
The peptide hydrogen bond can be considered as a strong permanent dipole-dipole interaction between the Nd- -Hd+ and Cd+ =Od- dipoles as shown:
(27)
The strength of the hydrogen bond is given by the potential energy function
(28)
where m1 and m2 are the dipole moments, e is the dielectric constant of the medium, r is the distance between the electronegativeatoms, and q is the hydrogen bond angle. The hydrogen bond energy is directly proportional to the product of the dipolemoments and to the cosine of the bond angle, and is inversely proportional to the third power of the N … O distance and to thedielectric constant of the medium. The strength of the hydrogen bond is maximum when q is zero (cos 0 = 1), and it is zero whenq is 90°. The hydrogen bonds in a-helix and antiparallel b-sheet structures have a q value very close to zero, whereas those inparallel b-sheets have larger q values. The optimum N … O distance for maximum hydrogen bond energy is 2.9 Å. At shorterdistances the electrostatic repulsive interaction between the Nd- and Od- atoms causes a significant decrease in the strength of thehydrogen bond. At longer distances weak dipole-dipole interaction between the N-H and C=O groups decreases the strengthof the hydrogen bond. The strength of N-H … O=C hydrogen bonds in proteins is typically about 18.8 kJ/mol. The “strength”refers to the amount of energy needed to break the bond.
The existence of hydrogen bonds in proteins is well established. Since each hydrogen bond decreases the free energy of theprotein by about -18.8 kJ/mol, it is commonly believed that they may act not only as the driving force for protein folding but alsomay contribute enormously to the stability of the native structure. However, this is not a valid assumption. Because water cancompete for hydrogen bonding with N-H and C=O groups in proteins, hydrogen bonding between these groups cannot occurspontaneously, nor can formation of N-H … O=C hydrogen bonds be the driving force for formation of a-helix and b-pleatedsheets in proteins. The hydrogen bonding interactions in a-helix and b-sheets are, therefore, a consequence of other favorableinteractions that drive formation of these secondary hydrogen-bonded structures.
The hydrogen bond is primarily an ionic interaction. Like other ionic interctions, its stability also depends upon the dielectricconstant of the environment. The stability of hydrogen bonds in secondary structures is mainly due to a local environment with alow permittivity (low dielectric constant) created by interaction between nonpolar residues. These bulky side chains preventaccess of water to the N-H … O=C hydrogen bonds. They are only stable as long as they are protected from water.
Electrostatic Interactions
As noted earlier, proteins contain several amino acid residues with ionizable groups. At neutral pH, Asp and Glu residues arenegatively charged, and Lys, Arg, and His are positively charged. At alkaline pH, Cys and Tyr residues assume a negativecharge.
Depending upon the relative number of negatively and positively charged residues,

Pag e 349
proteins assume either a net negative or a net positive charge at neutral pH. The pH at which the net charge is zero is called theisoelectric pH (pI). The isoelectric pH is different from the isoionic point. The isoionic point is the pH of the protein solution inthe absence of electrolytes. The isoelectric pH of a protein can be estimated from its amino acid composition and the pKa valuesof the ionizable groups using the Hendersen-Hasselbach equation (Eq. 5).
With few exceptions, almost all charged groups in proteins are distributed on the surface of the protein molecule. Since at neutralpH proteins assume either a net positive or a net negative charge, one might expect that the net repulsive interaction between likecharges would destabilize protein structure. It is also reasonable to assume that attractive interactions between oppositelycharged groups at certain critical locations might contribute to the stability of the protein structure. In reality, however, thestrength of these repulsive and attractive forces is minimized in aqueous solutions because of the high permittivity of water. Theelectrostatic interaction energy between two fixed charges q1 and q2 separated by distance r is given by
(29)
where e is the permittivity of the medium. In vacuum or air (e = 1), the electrostatic interaction energy between two charges at adistance of 3 to 5 Å is about ±460 to ±277 kJ/mol. In water, however, this interaction energy is reduced to ±5.8 to ±3.5kJ/mol, which is of the order of the thermal kinetic energy (RT) of the protein molecule at 37°C. Therefore, the attractive andrepulsive electrostatic interactions between charges located on the protein surface do not contribute significantly to proteinstability. However, charged groups partially buried in the protein interior, where the permittivity is lower than that of water,usually form salt bridges with strong interaction energy. The electrostatic interaction energy ranges between ±3.5 and ±460kJ/mol depending on the distance and the local permittivity.
Although electrostatic interactions may not act as the primary force for protein folding, their penchant to remain exposed to theaqueous environment certainly would influence the folding pattern.
Hydrophobic Interactions
It is obvious from the foregoing discussions that in aqueous solutions the hydrogen bonding and electrostatic interactionsbetween various polar groups in a polypeptide chain do not posses sufficient energy to act as driving forces for protein folding.These polar interactions in proteins are not very stable, and their stabilities depend on maintenance of an apolar environment.The major force driving protein folding comes from hydrophobic interactions among nonpolar groups.
In aqueous solutions, the hydrophobic interaction between nonpolar groups is the result of thermodynamically unfavorableinteraction between water and nonpolar groups. When a hydrocarbon is dissolved in water, the free energy change (DG) ispositive and the volume (DV) and enthalpy change (DH) are negative. Even though DH is negative, meaning that there isfavorable interaction between water and the hydrocarbon, DG is positive. Since DG = DH - T DS (where T is the temperatureand DS is the entropy change), the positive change in DG must result from a large negative change in entropy, which offsets thefavorable change in DH. The decrease in entropy is caused by formation of a clathrate or cage-like water structure around thehydrocarbon. Because of the net positive change in DG, interaction between water and nonpolar groups is highly restricted.Consequently, in aqueous solutions, nonpolar groups tend to aggregate, so that the area of direct contact with water is minimized(see Chap. 2). This water structure-induced interaction between nonpolar groups in aqueous solutions is known as hydrophobicinteraction. In proteins, hydrophobic interaction between nonpolar side chains of amino acid residues is the

Pag e 350
major reason that proteins fold into unique tertiary structures in which a majority of the nonpolar groups are removed from theaqueous environment.
Since the hydrophobic interaction is the antithesis of solution of nonpolar groups in water, DG for hydrophobic interaction isnegative, and DV, DH, and DS are positive. Unlike other noncovalent interactions, hydrophobic interactions are endothermic;that is, hydrophobic interactions are stronger at high temperatures and weaker at low temperatures (opposite to that forhydrogen bonds). The variation of hydrophobic free energy with temperature usually follows a quadratic function, that is,
DGHf = a + bT + cT2 (30)
where a, b, and c are constants, and T is absolute temperature.
The hydrophobic interaction energy between two spherical nonpolar molecules can be estimated from the potential energyequation [50]
(31)
where R1 and R2 are the radii of the nonpolar molecules, D is the distance (nm) between the molecules, and D0 is the decaylength (1 nm). Unlike electrostatic, hydrogen bonding, and van der Waals interactions, which follow a power-law relationshipwith distance between interacting groups, the hydrophobic interaction follows an exponential relationship with distance betweeninteracting groups. Thus, it is effective over relatively long distances, such as 10 nm.
The hydrophobic free energy of proteins cannot be quantified using the preceding equation because of involvement of severalnonpolar groups. It is possible, however, to estimate the hydrophobic free energy of a protein using other empirical correlations.The hydrophobic free energy of a molecule is directly proportional to the nonpolar surface area that is accessible to water (Fig.10). The proportionality constant, that is, the slope, varies between 92 J mol-1 Å-2
FIGURE 10The relationship between hydrophobicity and accessible surfacearea of amino acid side chains (open circles) and hydrocarbons
(filled circles); 1 kcal = 4.18 kJ. (From Ref. 92;courtesy of
Annual Reviews, Inc.)

Pag e 351
for Ala, Val, Leu, and Phe and 109 J mol-1 Å-2 for Ser, Thr, Trp, and Met. On average, the hydrophobicity of apolar groups inamino acids or amino acid residues is about 100 J mol-1 Å-2. This is close to the 104.5 J mol-1 Å-2 value for alkanes. What thismeans is that for the removal of every 1 Å2 area of nonpolar surface from the water environment, a protein will decrease its freeenergy by about 100 J/mol. Thus, the hydrophobic free energy of a protein can be estimated simply by multiplying the totalburied surface area by 100 J mol-1 Å-2.
The buried surface area in several globular proteins and the estimated hydrophobic free energies are shown in Table 9. It isevident that hydrophobic free energy contributes significantly to the stability of protein structure. The average hydrophobic freeenergy per amino acid residue in globular proteins amounts to about 10.45 kJ/mol.
Disulfide Bonds
Disulfide bonds are the only covalent side-chain cross-links found naturally in proteins. They can occur both intramolecularly andintermolecularly. In monomeric proteins, disulfide bonds are formed as a result of protein folding. When two Cys residues arebrought into proximity with proper orientation, oxidation of the sulfhydryl groups by molecular oxygen results in disulfide bondformation. Once formed, disulfide bonds help stabilize the folded structure of proteins.
Protein mixtures containing cystine and Cys residues are able to undergo sulfhydryl-disulfide interchange reactions as shown:
(32)
This interchange reaction also can occur within a single protein if it contains a free sulfhydryl group and a disulfide bond. Theinterchange reaction often leads to a decrease in stability of the protein molecule.
TABLE 9 Accessible Surface Area (A s), Buried Surface Area (A b), and Hydrophobic Free Energ yof Proteins
ProteinMolecular mass
(daltons) As (Å2) Ab (Å2)DG Hf
(kJ/mol)
Parvalbumin 11,450 5,930 11,037 1108
Cytochrome c 11,930 5,570 12,107 1212
Ribonuclease A 13,960 6,790 13,492 1354
Lysozyme 14,700 6,620 15,157 1521
Myog lobin 17,300 7,600 18,025 1810
Retinol binding protein 20,050 9,160 20,535 2061
Papain 23,270 9,140 25,535 2541
Chymotrypsin 25,030 10,440 26,625 2671
Subtilsin 27,540 10,390 30,390 3047
Carbonic anhydrase B 28,370 11,020 30,988 3110
Carboxypeptidase A 34,450 12,110 38,897 3900
Thermolysin 34,500 12,650 38,431 3854
Note: A s values are from Ref. 71. A b was calculated from Equations 22 and 23.
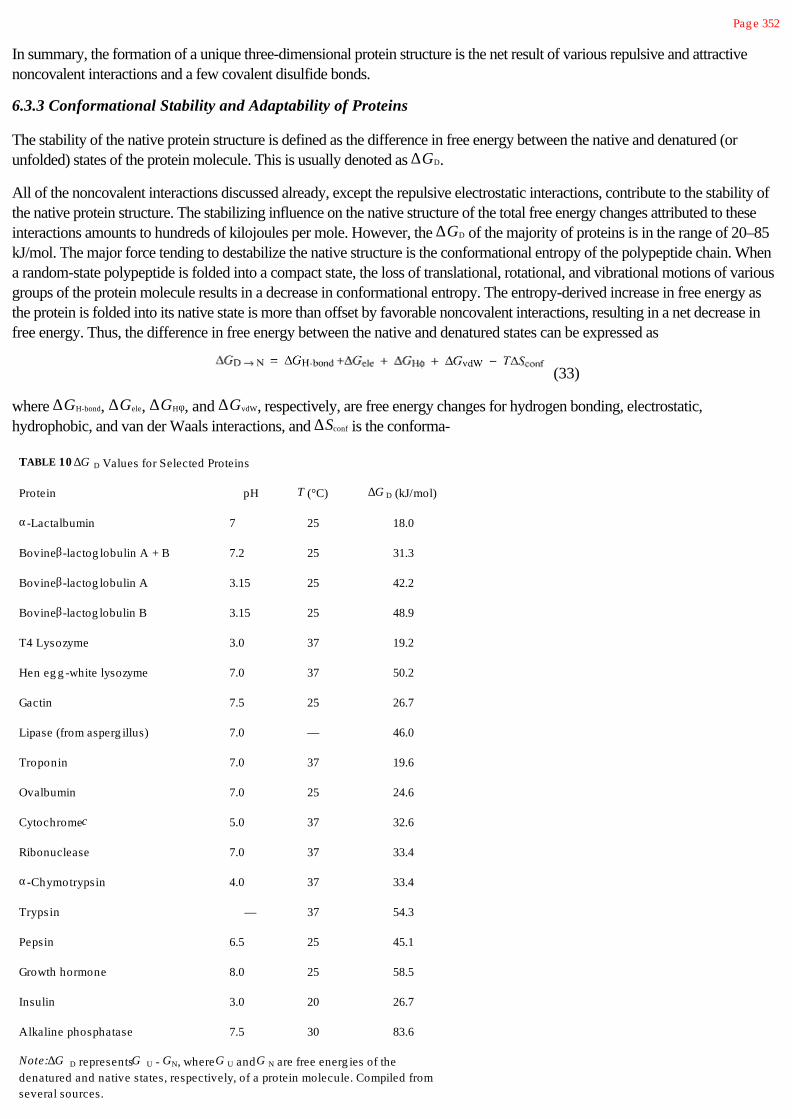
Pag e 352
In summary, the formation of a unique three-dimensional protein structure is the net result of various repulsive and attractivenoncovalent interactions and a few covalent disulfide bonds.
6.3.3 Conformational Stability and Adaptability of Proteins
The stability of the native protein structure is defined as the difference in free energy between the native and denatured (orunfolded) states of the protein molecule. This is usually denoted as DGD.
All of the noncovalent interactions discussed already, except the repulsive electrostatic interactions, contribute to the stability ofthe native protein structure. The stabilizing influence on the native structure of the total free energy changes attributed to theseinteractions amounts to hundreds of kilojoules per mole. However, the DGD of the majority of proteins is in the range of 20–85kJ/mol. The major force tending to destabilize the native structure is the conformational entropy of the polypeptide chain. Whena random-state polypeptide is folded into a compact state, the loss of translational, rotational, and vibrational motions of variousgroups of the protein molecule results in a decrease in conformational entropy. The entropy-derived increase in free energy asthe protein is folded into its native state is more than offset by favorable noncovalent interactions, resulting in a net decrease infree energy. Thus, the difference in free energy between the native and denatured states can be expressed as
(33)
where DGH-bond, DGele, DGHf, and DGvdW, respectively, are free energy changes for hydrogen bonding, electrostatic,hydrophobic, and van der Waals interactions, and DSconf is the conforma-
TABLE 10 DG D Values for Selected Proteins
Protein pH T (°C) DG D (kJ/mol)
a-Lactalbumin 7 25 18.0
Bovine b-lactog lobulin A + B 7.2 25 31.3
Bovine b-lactog lobulin A 3.15 25 42.2
Bovine b-lactog lobulin B 3.15 25 48.9
T4 Lysozyme 3.0 37 19.2
Hen eg g -white lysozyme 7.0 37 50.2
Gactin 7.5 25 26.7
Lipase (from asperg illus) 7.0 — 46.0
Troponin 7.0 37 19.6
Ovalbumin 7.0 25 24.6
Cytochrome c 5.0 37 32.6
Ribonuclease 7.0 37 33.4
a-Chymotrypsin 4.0 37 33.4
Trypsin — 37 54.3
Pepsin 6.5 25 45.1
Growth hormone 8.0 25 58.5
Insulin 3.0 20 26.7
Alkaline phosphatase 7.5 30 83.6
Note: DG D represents G U - GN, where G U and G N are free energ ies of thedenatured and native states, respectively, of a protein molecule. Compiled fromseveral sources.


Pag e 353
tional entropy of the polypeptide chain. The DSconf of a protein in the unfolded state is about 8–42 J mol-1 K-1 per residue.Usually, an average value of 21.7 J mol-1 K-1 per residue is assumed. A protein with 100 amino acid residues at 310 K will havea conformational entropy of about 21.7 × 100 × 310 = 672.7 kJ/mol. This destabilizing conformational energy will reduce thenet stability of the native structure resulting from noncovalent interactions.
The DGD values, that is, energy required to unfold, of various proteins are presented in Table 10. These values clearly indicatethat in spite of numerous intramolecular interactions, proteins are only marginally stable. For example, DGD values of mostproteins correspond to an energy equivalent of one to three hydrogen bonds or about two to five hydrophobic interactions,suggesting that breakage of a few noncovalent interactions would destabilize the native structure of many proteins.
Conversely, it appears that proteins are not designed to be rigid molecules. They are highly flexible, their native state is in ametastable state, and breakage of one to three hydrogen bonds or a few hydrophobic interactions can easily cause aconformational change in proteins. Conformational adaptability to changing solution conditions is necessary to enable proteins tocarry out several critical biological functions. For example, efficient binding of substrates or prosthetic ligands to enzymesinvariably involves reorganization of polypeptide segments at the binding sites. Proteins that require high structural stability tofunction as catalysts usually are stabilized by intramolecular disulfide bonds, which effectively reduce conformational entropy(i.e., the tendency of the polypeptide chain to unfold).
6.4 Protein Denaturation
The native structure of a protein is the net result of various attractive and repulsive interactions emanating from variousintramolecular forces as well as interaction of various protein groups with surrounding solvent water. However, native structure islargely the product of the protein's environment. The native state (of a single protein molecule) is thermodynamically the moststable with lowest feasible free energy at physiological conditions. Any change in its environment, such as pH, ionic strength,temperature, solvent composition, etc., will force the molecule to assume a new equilibrium structure. Subtle changes instructure, which do not drastically alter the molecular architecture of the protein, are usually regarded as “conformationaladaptability,” whereas major changes in the secondary, tertiary, and quaternary structures without cleavage of backbone peptidebonds are regarded as “denaturation.” From a structural point of view, the denatured state of a protein molecule is an ill-definedstate. “A major change” in structure may mean an increase in a-helix and b-sheet structure at the expense of random structureor vice versa. However, in most instances, denaturation involves a loss of ordered structure. Depending on the conditions ofdenaturation, proteins may assume several “denatured states,” each differing only slightly in free energy. This is shownschematically in Figure 11. Some denatured states possess more residual folded structure than others. When fully denatured,globular proteins resemble a random coil. The intrinsic viscosity of a fully denatured protein is a function of the number of aminoacid residues, and is expressed by the equation [105]
[h] = 0.716n0.66 (34)
where n is the number of amino acid residues in the protein.
Often denaturation has a negative connotation, because it indicates loss of some properties. For example, many biologicallyactive proteins lose their activity upon denaturation. In the case of food proteins, denaturation usually causes insolublization andloss of some functional properties. In some instances, however, protein denaturation is desirable. For example, thermal

Pag e 354
FIGURE 11Schematic representation of the energ y of a protein
molecule as a function of its conformation. Theconformation with the lowest energ y is usually the
native state. (Adapted from Ref. 107; courtesy of AVIPublishing Co.)
denaturation of trypsin inhibitors in legumes markedly improves digestibility and biological availability of legume proteins whenconsumed by some animal species. Partially denatured proteins are more digestible and have better foaming and emulsifyingproperties than do native proteins. Thermal denaturation is also a prerequisite for heat-induced gelation of food proteins.
6.4.1 Thermodynamics of Denaturation
Denaturation is a phenomenon that involves transformation of a well-defined, folded structure of a protein, formed underphysiological conditions, to an unfolded state under nonphysiological conditions. Since structure is not an easily quantifiableparameter, direct measurement of the fractions of native and denatured protein in a solution is not possible. However,conformational changes in proteins invariably affect several of its chemical and physical properties, such as ultraviolet (UV)absorbance, fluorescence, viscosity, sedimentation coefficient, optical rotation, circular dichroism, reactivity of sulfhydryl groups,and enzyme activity. Thus, protein denaturation can be studied by monitoring changes in these physical and chemical properties.
When changes in a physical or chemical property, y, are monitored as a function of denaturant concentration or temperature,many monomeric globular proteins exhibit denaturation profiles as shown in Figure 12. The terms yN and yD are y values for thenative and denatured states, respectively, of the protein.
For most proteins, as denaturant concentration (or temperature) is increased, the value of y remains unchanged initially, andabove a critical point its value changes abruptly from yN to yD within a narrow range of denaturant concentration ortemperature. The steepness of the transition curve observed for a majority of monomeric globular proteins indicates that proteindenaturation is a cooperative process. That is, once a protein molecule begins to unfold, or once a few interactions in the proteinare broken, the whole molecule completely unfolds with a further slight increase in denaturant concentration or temperature. Thiscooperative nature of unfolding suggests that globular proteins can exist only in the native and denatured states; that

Pag e 355
FIGURE 12Typical protein denaturation curves; y represents any
measurable physical or chemical property of the proteinmolecule that varies with protein conformation; yN and
yD are the values of y for the native and denatured states,respectively.
is, intermediate states are not possible. This is known as a “two-state transition” model. For this two-state model, the equilibriumbetween the native and the denatured state in the cooperative transition region can be expressed as
(35)
where KD is the equilibrium constant. Since the concentration of denatured protein molecules in the absence of a denaturant (orcritical input of heat) is extremely low (about 1 in 109), estimation of KD is not possible. However, in the transition region, that is,at sufficiently high denaturant concentration (or sufficiently high temperature), an increase in the population of the denaturedprotein molecule permits determination of the apparent equilibrium constant, Kapp. In the transition region, where both native anddenatured protein molecules are present, the value of y is given by
y = ƒNyN + ƒDyD (36)
where ƒN and ƒD are the fractions of the protein in the native and denatured states, and yN and yD are y values for the nativeand denatured states, respectively. From Figure 12,
ƒN = (yD - y)/(yD - yN) (37)
ƒD = (y - yN)/(yD - yN) (38)
The apparent equilibrium constant is given by

Pag e 356
Kapp = ƒD/ƒN = (y - yN)/(y - yD) (39)
and the free energy of denaturation is given by
DGapp = -RT ln kapp (40)
A plot of -RT ln Kapp versus denaturant concentration in the transition region results in a straight line. The KD and DGD of theprotein in pure water (or in buffer in the absence of denaturant) are obtained from the y-intercept. The enthalpy of denaturation,DHD, is obtained from variation of the free energy change with temperature using the van't Hoff equation,
(41)
Monomeric proteins that contain two or more domains with different structural stabilities usually exhibit multiple transition stepsin the denaturation profile. If the transition steps are well separated, the stabilities of each domain can be obtained from thetransition profile by using the preceding two-state model. Denaturation of oligomeric proteins proceeds via dissociation ofsubunits, followed by denaturation of the subunits.
Protein denaturation is reversible. When the denaturant is removed from the protein solution (or the sample is cooled), mostmonomeric proteins (in the absence of aggregation) refold to their native conformation under appropriate solution conditions,such as pH, ionic strength, redox potential, and protein concentration. Many proteins refold when the protein concentration isbelow 1 mM. Above 1 mM protein concentration, refolding is partially inhibited because of greater intermolecular interaction atthe cost of intramolecular interactions. A redox potential comparable to that of biological fluid facilitates formation of the correctpairs of disulfide bonds during refolding.
6.4.2 Denaturing Agents
6.4.2.1 Physical Agents
Temperature and Denaturation
Heat is the most commonly used agent in food processing and preservation. Proteins undergo varying degrees of denaturationduring processing. This can affect their functional properties in foods, and it is therefore important to understand the factorsaffecting protein denaturation.
When a protein solution is gradually heated above a critical temperature, it undergoes a sharp transition from the native state tothe denatured state. The temperature at the transition midpoint, where the concentration ratio of native and denatured states is 1,is known either as the melting temperature Tm, or the denaturation temperature Td. The mechanism of temperature-induceddenaturation is highly complex and involves primarily destabilization of the major noncovalent interactions. Hydrogen bonding,electrostatic, and van der Waals interactions are exothermic (enthalpy driven) in nature. Therefore, they are destabilized at hightemperatures and stabilized at low temperatures. However, since peptide hydrogen bonds in proteins are mostly buried in theinterior, they remain stable over a wide range of temperature. On the other hand, hydrophobic interactions are endothermic(entropy driven). They are stabilized at high temperatures and destabilized at low temperatures. Therefore, as the temperature isincreased, the changes in the stabilities of these two groups of noncovalent interactions oppose each other. However, thestability of hydrophobic interactions cannot increase infinitely with increasing temperature, because above a certain temperature,gradual breakdown of water structure will

Pag e 357
eventually destabilize hydrophobic interactions as well. The strength of hydrophobic interactions reaches a maximum at about60–70°C[9].
Another major force that affects conformational stability of proteins is the conformational entropy, -T DSConf, of the polypeptidechain. As temperature is increased, the increase in thermal kinetic energy of the polypeptide chain greatly facilitates unfolding ofthe polypeptide chain. The relative contributions of the major forces to stability of a protein molecule as a function oftemperature are depicted in Figure 13. The temperature at which the sum of the free energies is zero (i.e., KD = 1) is thedenaturation temperature of the protein. The Td values of some proteins are listed in Table 11.
It is often assumed that the lower the temperature, the greater will be the stability of a protein. This is not always true. Forexample (Fig. 14), the stability of lysozyme increases with lowering of temperature, whereas those of myoglobin and a mutantphage T4 lysozyme show maximum stability at about 30 and 12.5°C, respectively. Below and above these temperatures,myoglobin and T4 lysozyme are less stable. When stored below 0°C, these two proteins undergo cold-induced denaturation.The temperature of maximum stability (minimum free energy) depends on the relative magnitude of contributions from polar andnonpolar interactions. Those proteins in which polar interactions dominate over nonpolar interactions are more stable at orbelow refrigeration temperatures than they are at higher temperatures. On the other hand, proteins that are primarily stabilized byhydrophobic interactions are more stable at about ambient temperature than they are at refrigeration temperature.
Several food proteins undergo reversible dissociation and denaturation at low temperature.
FIGURE 13Relative chang es in free energ y contributions by
hydrog en bonding , hydrophobic interactions, andconformational entropy to the stability of proteins
as a function of temperature.

Pag e 358
TABLE 11 Thermal Denaturation Temperatures (T d) and MeanHydrophobicities of Proteins
Protein Td
Mean hydrophobicity(kJ mol-1 residue -1)
Trypsinog en 55 3.68
Chymotrypsinog en 57 3.78
Elastase 57
Pepsinog en 60 4.02
Ribonuclease 62 3.24
Carboxypeptidase 63
Alcohol dehydrog enase 64
Bovine serum albumin 65 4.22
Hemog lobin 67 3.98
Lysozyme 72 3.72
Insulin 76 4.16
Egg albumin 76 4.01
Trypsin inhibitor 77
Myog lobin 79 4.33
a-Lactalbumin 83 4.26
Cytochrome c 83 4.37
b-Lactog lobulin 83 4.50
Avidin 85 3.81
Soy g lycinin 92
Broadbean 11S protein 94
Sunflower 11S protein 95
Oat g lobulin 108
Source: Data were compiled from Ref. 11.
Glycinin, one of the storage proteins of soybean, aggregates and precipitates when stored at 2°C [58], then becomes solublewhen returned to ambient temperature. When skim milk is stored at 4°C, b-casein dissociates from casein micelles, and thisalters the physicochemical and rennetting properties of the micelles. Several oligomeric enzymes, such as lactate dehydrogenaseand glyceraldehyde phosphate dehydrogenase, lose most of their enzyme activity when stored at 4°C, and this has beenattributed to dissociation of the subunits. However, when warmed to and held at ambient temperature for a few hours, theyreassociate and completely regain their activity [111].

The amino acid composition affects thermal stability of proteins. Proteins that contain a greater proportion of hydrophobic aminoacid residues, especially Val, Ile, Leu, and Phe, tend to be more stable than the more hydrophilic proteins [118]. Proteins ofthermophilic organisms usually contain large amounts of hydrophobic amino acid residues. However, this positive correlationbetween mean hydrophobicity and thermal denaturation temperature of proteins is only an approximate one (Table 11),suggesting that other factors, such as disulfide bonds and the presence of salt bridges buried in hydrophobic clefts, may alsocontribute to thermostability. A strong positive correlation also exists between thermostability and the number percent of certainamino acid residues. For example, statistical analysis of 15 different proteins has shown that thermal denaturation temperaturesof these proteins are positively correlated (r = 0.98) to the number percent of Asp, Cys, Glu, Lys, Leu, Arg, Trp, and Tyrresidues. On the other hand, thermal denaturation temperatures of the same set of proteins are negatively correlated

Pag e 359
FIGURE 14Variation of protein stability (DG D) with temperature formyog lobin (…), ribonuclease A (----), and a mutant ot T4
phag e lysozyme (O). K is the equilibrium constant. (Compiledfrom Refs. 15 and 62.)
(r = -0.975) to the number percent of Ala, Asp, Gly, Gln, Ser, Thr, Val, and Tyr (Fig. 15) [88]. Other amino acid residues havelittle influence on Td. The underlying causes of these correlations are not clear. It seems, however, that thermostability of proteinsis not simply dependent on either polar or nonpolar content, but on an optimum distribution of these two groups in the proteinstructure. An optimum distribution may maximize intramolecular interactions, decrease chain flexibility, and thus enhancethermostability. Thermostability is inversely correlated with protein flexibility [107].
Thermal denaturation of monomeric globular proteins is mostly reversible. For example, when many monomeric enzymes areheated above their denaturation temperatures, or even briefly held at 100°C, and then are immediately cooled to roomtemperature, they fully regain their activities [62]. However, thermal denaturation can become irreversible when the protein isheated at 90–100°C for a prolonged period even at neutral pH [2]. This irreversibility occurs because of several chemicalchanges in the protein, such as deamidation of Asn residues, cleavage of peptide bonds at Asp residues, destruction of Cys andcystine residues, and aggregation [2,109].
Water greatly facilitates thermal denaturation of proteins [37,95]. Dry protein powders are extremely stable to thermaldenaturation. The value of Td decreases rapidly as the water content is increased from 0 to 0.35 g water/g protein (Fig. 16). Anincrease in water content from 0.35 to 0.75 g water/g protein causes only a marginal decrease in Td. Above 0.75 g water/gprotein, the Td of the protein is the same as in a dilute protein solution. The effect of hydration on thermostability is fundamentallyrelated to protein dynamics. In the dry state, proteins have a static structure, that is, the mobility of polypeptide segments isrestricted. As the water content is increased, hydration and partial penetration of water into surface cavities cause swelling of
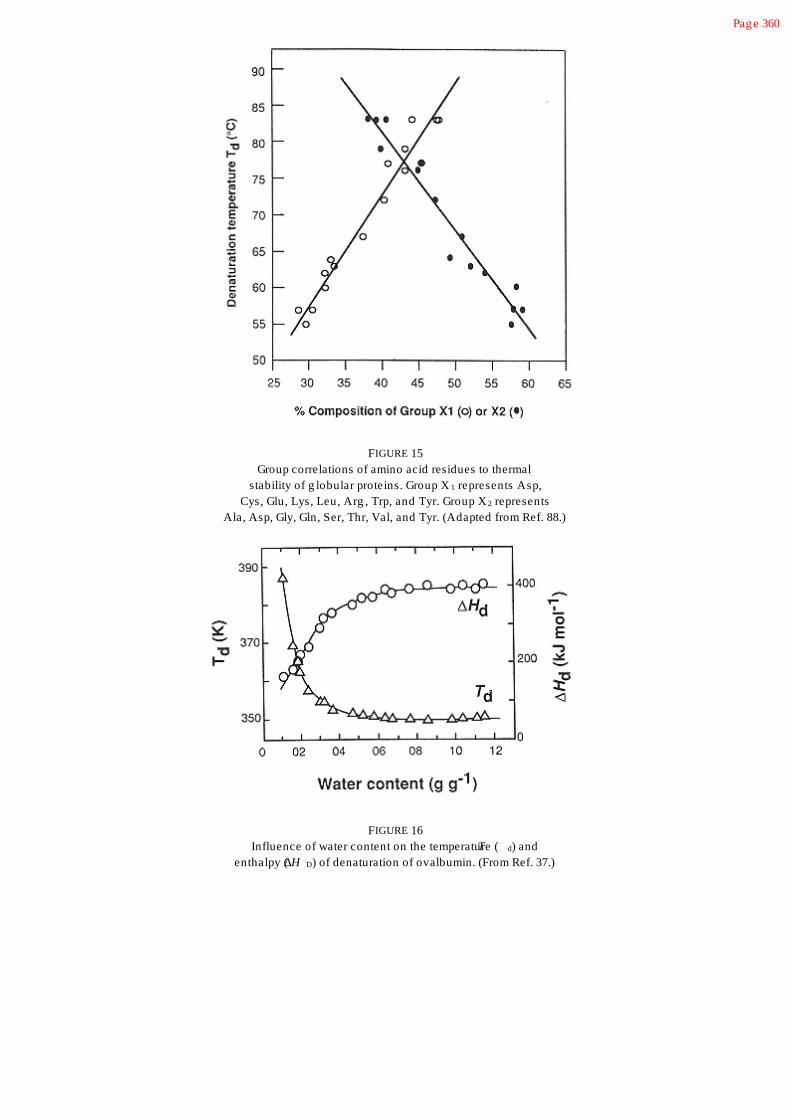
Pag e 360
FIGURE 15Group correlations of amino acid residues to thermal
stability of g lobular proteins. Group X 1 represents Asp,Cys, Glu, Lys, Leu, Arg , Trp, and Tyr. Group X 2 represents
Ala, Asp, Gly, Gln, Ser, Thr, Val, and Tyr. (Adapted from Ref. 88.)
FIGURE 16Influence of water content on the temperature (T d) and
enthalpy (DH D) of denaturation of ovalbumin. (From Ref. 37.)

Pag e 361
the protein. This swollen state presumably reaches a maximum value at a water content of 0.3–0.4 g/g protein at roomtemperature. The swelling of the protein increases chain mobility and flexibility, and the protein molecule assumes a moredynamic molten structure. When heated, this dynamic flexible structure provides greater access of water to salt bridges andpeptide hydrogen bonds than is possible in the dry state, resulting in a lower Td.
Additives such as salts and sugars affect thermostability of proteins in aqueous solutions. Sugars such as sucrose, lactose,glucose, and glycerol stabilize proteins against thermal denaturation [3,44]. Addition of 0.5 M NaCl to proteins such as b-lactoglobulin, soy proteins, serum albumin, and oat globulin significantly increases their Td [19,20,44].
Hydrostatic Pressure and Denaturation
One of the thermodynamic variables that affects conformation of proteins is hydrostatic pressure. Unlike temperature-induceddenaturation, which usually occurs in the range of 40–80°C at 1 atmospheric pressure (atm); pressure-induced denaturation canoccur at 25°C if the pressure is sufficiently great. Most proteins undergo pressure-induced denaturation in the range of 1–12kbar as evidenced from changes in their spectral properties. The midpoint of pressure-induced transition occurs at 4–8 kbar[48,112].
Pressure-induced denaturation of proteins occurs mainly because proteins are flexible and compressible. Although amino acidresidues are densely packed in the interior of globular proteins, some void spaces invariably exist and this leads tocompressibility. The average partial specific volume of globular proteins in the hydrated state, vº, is about 0.74 ml/g. The partialspecific volume can be considered as the sum of three components:
vº=VC + VCav + DVSol (42)
where VC is the sum of the atomic volumes, VCav is the sum of the volumes of the void spaces in the interior of the protein, andDVSol is the volume change due to hydration [38]. The larger the vº of a protein, the larger is the contribution of void spaces topartial specific volume, and the more unstable the protein will be when pressurized. Fibrous proteins are mostly devoid of voidspaces, and hence they are more stable to hydrostatic pressure than globular proteins.
Pressure-induced denaturation of globular proteins is usually accompanied by a reduction in volume of about 30–100 ml/mol.This decrease in volume is caused by two factors: elimination of void spaces as the protein unfolds, and hydration of thenonpolar amino acid residues that become exposed during unfolding. The later event results in a decrease in volume (see Sec.6.3.2). The volume change is related to the free energy change by the expression
DV = d(DG)/dp (43)
where p is the hydrostatic pressure.
If a globular protein completely unfolds during pressurization, the volume change should be about 2%. However, theexperimental value of 30–100 ml/mol volume decrease obtained with pressurized globular proteins corresponds to only about0.5% volume decrease. This indicates that proteins only partially unfold even at hydrostatic pressure as high as 10 kbar.
Pressure-induced protein denaturation is highly reversible. Most enzymes, in dilute solutions, regain their activity once thepressure is decreased to atmospheric pressure. However, regeneration of near complete activity usually takes several hours. Inthe case of pressure-denatured oligomeric proteins and enzymes, subunits first dissociate at 0.001–2 kbar, and then subunitsdenature at higher pressures [111]; removal of pressure results in subunit reassociation and almost complete restoration ofenzyme activity after several hours.
Pag e 362
High hydrostatic pressures are being investigated as a food processing tool, for example, for microbial inactivation or gelation.Since high hydrostatic pressure (2–10 kbar) irreversibly damages cell membranes and causes dissociation of organelles inmicroorganisms, it will inactivate vegetative microorganisms [46]. Pressure gelation of egg white, 16% soy protein solution, or3% actomyosin solution can be achieved by application of 1–7 kbar hydrostatic pressure for 30 min at 25°C. These pressure-induced gels are softer than thermally induced gels [82]. Also, exposure of beef muscle to 1–3 kbar hydrostatic pressure causespartial fragmentation of myofibrils, which may be useful as a means of tenderizing meat [102]. Pressure processing, unlikethermal processing, does not harm essential amino acids or natural color and flavor, nor does it cause toxic compounds todevelop. Thus, processing of foods with high hydrostatic pressure may prove advantageous (except for cost) for certain foodproducts.
Shear and Denaturation
High mechanical shear generated by shaking, kneading, whipping, etc. can cause denaturation of proteins. Many proteinsdenature and precipitate when they are vigorously agitated [81]. In this circumstance, denaturation occurs because ofincorporation of air bubbles and adsorption of protein molecules to the air-liquid interface. Since the energy of the air-liquidinterface is greater than that of the bulk phase, proteins undergo conformational changes at the interface. The extent ofconformational change depends on the flexibility of the protein. Highly flexible proteins denature more readily at an air-liquidinterface than do rigid proteins. The nonpolar residues of denatured protein orient toward the gas phase and the polar residuesorient toward the aqueous phase.
Several food processing operations involve high pressure, shear, and high temperature, for example, extrusion, high-speedblending, and homogenization. When a high shear rate is produced by a rotating blade, subsonic pulses are created andcavitation also occurs at the trailing edges of the blade. Both of these events contribute to protein denaturation. The greater theshear rate, the greater is the degree of denaturation. The combination of high temperature and high shear force causesirreversible denaturation of proteins. For example, when a 10–20% whey protein solution at pH 3.5–4.5 and at 80–120°C issubjected to a shear rate of 7,500–10,000/sec, it forms insoluble spherical macrocolloidal particles of about 1 mm diameter. Ahydrated material produced under these conditions, “Simplesse,” has a smooth, emulsion-like organoleptic character [101].
6.4.2.2 Chemical Agents
pH and Denaturation
Proteins are more stable against denaturation at their isoelectric point than at any other pH. At neutral pH, most proteins arenegatively charged, and a few are positively charged. Since the net electrostatic repulsive energy is small compared to otherfavorable interactions, most proteins are stable at around neutral pH. However, at extreme pH values, strong intramolecularelectrostatic repulsion caused by high net charge results in swelling and unfolding of the protein molecule. The degree ofunfolding is greater at extreme alkaline pH values than it is at extreme acid pH values. The former behavior is attributed toionization of partially buried carboxyl, phenolic, and sulfhydryl groups, which cause unraveling of the polypeptide chain as theyattempt to expose themselves to the aqueous environment. pH-induced denaturation is mostly reversible. However, in somecases, partial hydrolysis of peptide bonds, deamidation of Asn and Gln, destruction of sulfhydryl groups at alkaline pH, oraggregation can result in irreversible denaturation of proteins.

Pag e 363
Organic Solvents and Denaturation
Organic solvents affect the stability of protein hydrophobic interactions, hydrogen bonding, and electrostatic interactions indifferent ways. Since nonpolar side chains are more soluble in organic solvents than in water, hydrophobic interactions areweakended by organic solvents. On the other hand, since the stability and formation of peptide hydrogen bonds are enhanced ina low-permittivity environment, certain organic solvents may actually strengthen or promote formation of peptide hydrogenbonds. For example, 2-chloroethanol causes an increase in a-helix content in globular proteins. The action of organic solventson electrostatic interactions is twofold. By decreasing permittivity, they enhance electrostatic interactions between oppositelycharged groups and also enhance repulsion between groups with like charge. The net effect of an organic solvent on proteinstructure, therefore, usually depends on the magnitude of its effect on various polar and nonpolar interactions. At lowconcentration, some organic solvents can stabilize several enzymes against denaturation [5]. At high concentrations, however, allorganic solvents cause denaturation of proteins because of their solubilizing effect on nonpolar side chains.
Organic Solutes and Denaturation
Organic solutes, notably urea and guanidine hydrochloride (GuHCl), induce denaturation of proteins. For many globular proteinsthe midpoint of transition from the native to denatured state occurs at 4–6 M urea and 3–4 M GuHCl at room temperature.Complete transition often occurs in 8 M urea and in about 6 M GuHCl. GuHCl is a more powerful denaturant than urea becauseof its ionic character. Many globular proteins do not undergo complete denaturation even in 8 M urea, whereas in 8 M GuHClthey usually exist in a random coil state (completely denatured).
Denaturation of proteins by urea and GuHCl is thought to involve two mechanisms. The first mechanism involves preferentialbinding of urea and GuHCl to the denatured protein. Removal of denatured protein as a protein-denaturant complex shifts the N
D equilibrium to the right. As the denaturant concentration is increased, continuous conversion of the protein to protein-denaturant complex eventually results in complete denaturation of the protein. Since binding of denaturant to denatured protein isvery weak, a high concentration of denaturant is needed to cause complete denaturation. The second mechanism involvessolubilization of hydrophobic amino acid residues in urea and GuHCl solutions. Since urea and GuHCl have the potential to formhydrogen bonds, at high concentration these solutes break down the hydrogen-bonded structure of water. This destructuring ofsolvent water makes it a better solvent for nonpolar residues. This results in unfolding and solubilization of apolar residues fromthe interior of the protein molecule.
Urea or GuHCl-induced denaturation can be reversed by removing the denaturant. However, complete reversibility of proteindenaturation by urea is sometimes difficult. This is because some urea converts to cyanate and ammonia. Cyanate reacts withamino groups and alters the charge of the protein.
Detergents and Denaturation
Detergents, such as sodium dodecyl sulfate (SDS), are powerful protein denaturing agents. SDS at 3–8 mM concentrationdenatures most globular proteins. The mechanism involves preferential binding of detergent to the denatured protein molecule.This causes a shift in equilibrium between the native and denatured states. Unlike urea and GuHCl, detergents bind strongly todenatured proteins, which is the reason complete denaturation occurs at a relatively low detergent concentration of 3–8 mM.Because of this strong binding, detergent-induced denaturation is irreversible. Globular proteins denatured by SDS do not existin a random coil state; instead, they assume an a-helical rod shape in SDS solutions. This rod shape is properly regarded asdenatured.

Pag e 364
Chaotropic Salts and Denaturation
Salts affect protein stability in two different ways. At low concentrations, ions interact with proteins via nonspecific electrostaticinteractions. This electrostatic neutralization of protein charges usually stabilizes protein structure. Complete charge neutralizationby ions occurs at or below 0.2 ionic strength, and it is independent of the nature of the salt. However, at higher concentrations(> 1 M), salts have ion specific effects that influence the structural stability of proteins. Salts such as Na2SO4 and NaF enhance,whereas NaSCN and NaClO4 weaken it. Protein structure is influenced more by anions than by cations. For example, the effectof various sodium salts on the thermal denaturation temperature of b-lactoglobulin is shown in Figure 17. At equal ionic strength,Na2SO4 and NaCl increase Td, whereas NaSCN and NaClO4 decrease it. Regardless of their chemical makeup andconformational differences, the structural stability of macromolecules, including DNA, is adversely affected by highconcentrations of salts [108]. NaSCN and NaClO4 are strong denaturants. The relative ability of various anions at isoionicstrength to influence the structural stability of protein (and DNA) in general follows the series
. This ranking is known as the Hofmeister series or chaotropic series.Fluoride, chloride, and sulfate salts are structure stabilizers, whereas the salts of other anions are structure destabilizers.
The mechanism by which salts affect the structural stability of proteins is not well understood; however, their relative ability tobind to and alter hydration properties of proteins is probably involved. Salts that stabilize proteins enhance hydration of proteinsand bind weakly, whereas salts that destabilize proteins decrease protein hydration and bind strongly [4]. These effects areprimarily the consequence of energy perturbations at the protein-water
FIGURE 17Effects of various sodium salts on the temperature
of denaturation, T d, of b-lactog lobulin at pH 7.0.
, NaCl; , NaBr; , NaClO4; , NaSCN; , urea.(From Ref. 20.)

Pag e 365
interface. On a more fundamental level, protein stabilization or denaturation by salts is related to their effect on bulk waterstructure. Salts that stabilize protein structure also enhance the hydrogen-bonded structure of water, and salts that denatureproteins also break down bulk water structure and make it a better solvent for apolar molecules. In other words, the denaturingeffect of chaotropic salts might be related to destabilization of hydrophobic interactions in proteins.
6.5 Functional Properties of Proteins
Food preferences by human beings are based primarily on sensory attributes such as texture, flavor, color, and appearance. Thesensory attributes of a food are the net effect of complex interactions among various minor and major components of the food.Proteins generally have a great influence on the sensory attributes of foods. For example, the sensory properties of bakeryproducts are related to the viscoelastic and dough-forming properties of wheat gluten; the textural and succulence characteristicsof meat products are largely dependent on muscle proteins (actin, myosin, actomyosin, and several water-soluble meat proteins);the textural and curd-forming properties of dairy products are due to the unique colloidal structure of casein micelles; and thestructure of some cakes and the whipping properties of some dessert products depend on the properties of egg-white proteins.The functional roles of various proteins in different food products are listed in Table 12. “Functionality” of food proteins isdefined as “those physical and chemical properties which affect the behavior of proteins in food systems during processing,storage, prepartion and consumption”[55].
The sensory attributes of foods are achieved by complex interactions among various functional ingredients. For instance, thesensory attributes of a cake emanate from gelling/heat-setting, foaming, and emulsifying properties of the ingredients used.Therefore, for a protein to be useful as an ingredient in cakes and other such products, it must possess multiple functionalities.Proteins of animal origin, such as milk (caseins), egg and meat proteins, are widely used in fabricated foods. These proteins aremixtures of several proteins with wide-ranging physico-chemical properties, and they are capable of performing multiplefunctions. For example, egg white possesses multiple functionalities such as gelation, emulsification, foaming, water binding, andheat coagulation, which makes it a highly desirable protein in many foods. The multiple functionalities of egg white arise fromcomplex interactions among its protein constituents, namely, ovalbumin, conalbumin, lysozyme, ovomucin, and other albumin-type proteins. Plant proteins (e.g., soy and other legume and oilseed proteins), and other proteins, such as whey proteins, areused to a limited extent in conventional foods. Even though these proteins are also mixtures of several proteins, they do notperform as well as animal proteins in most food products. The exact molecular properties of proteins that are responsible for thevarious desirable functionalities in food are poorly understood.
The physical and chemical properties that govern protein functionality include size; shape; amino acid composition and sequence;net charge and distribution of charges; hydrophobicity/hydrophilicity ratio; secondary, tertiary, and quaternary structures;molecular flexibility/rigidity; and ability to interact/react with other components. Since proteins possess a multitude of physicaland chemical properties, it is difficult to delineate the role of each of these properties with respect to a given functional property.
On an empirical level, the various functional properties of proteins can be viewed as manifestations of two molecular aspects ofproteins: (a) hydrodynamic properties, and (b) protein surface-related properties [23]. The functional properties such asviscosity (thickening), gelation, and texturization are related to the hydrodynamic properties of proteins, which depend on size,shape, and molecular flexibility. Functional properties such as wettability, dispersibility, solubil-
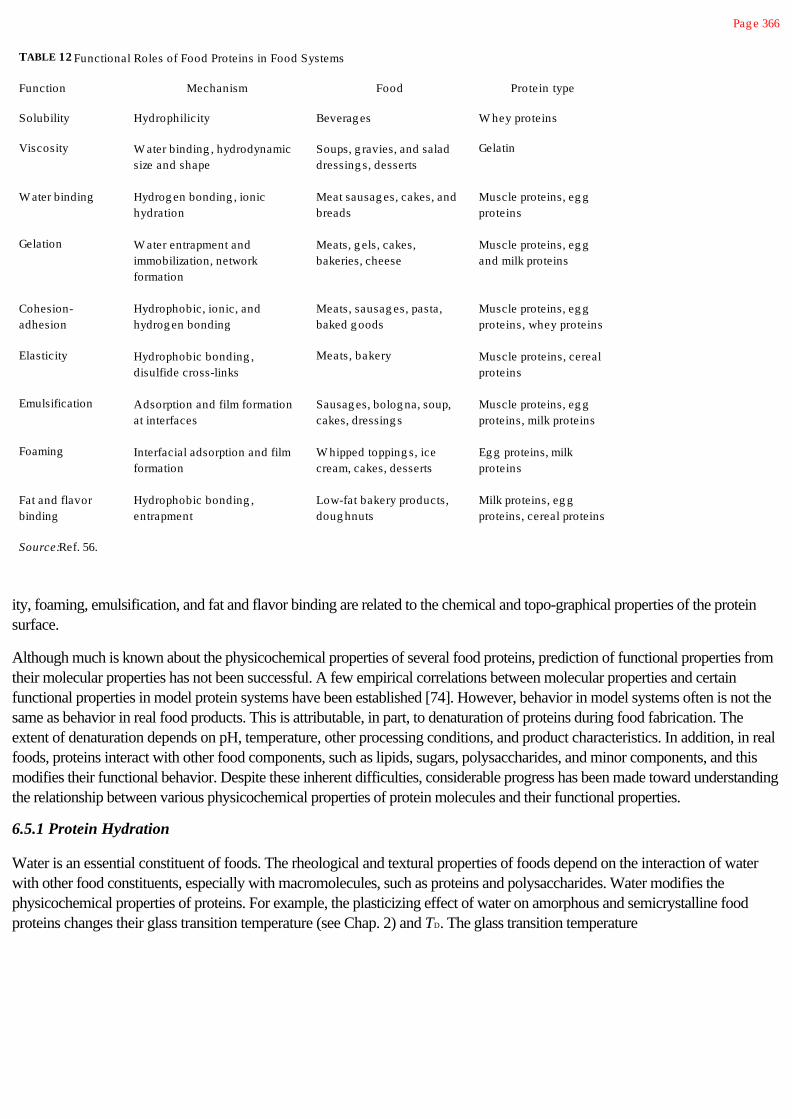
Pag e 366
TABLE 12 Functional Roles of Food Proteins in Food Systems
Function Mechanism Food Protein type
Solubility Hydrophilicity Beverag es W hey proteins
Viscosity W ater binding , hydrodynamicsize and shape
Soups, g ravies, and saladdressing s, desserts
Gelatin
W ater binding Hydrog en bonding , ionichydration
Meat sausag es, cakes, andbreads
Muscle proteins, eg gproteins
Gelation W ater entrapment andimmobilization, networkformation
Meats, g els, cakes,bakeries, cheese
Muscle proteins, eg gand milk proteins
Cohesion-adhesion
Hydrophobic, ionic, andhydrog en bonding
Meats, sausag es, pasta,baked g oods
Muscle proteins, eg gproteins, whey proteins
Elasticity Hydrophobic bonding ,disulfide cross-links
Meats, bakery Muscle proteins, cerealproteins
Emulsification Adsorption and film formationat interfaces
Sausag es, bolog na, soup,cakes, dressing s
Muscle proteins, eg gproteins, milk proteins
Foaming Interfacial adsorption and filmformation
W hipped topping s, icecream, cakes, desserts
Eg g proteins, milkproteins
Fat and flavorbinding
Hydrophobic bonding ,entrapment
Low-fat bakery products,doug hnuts
Milk proteins, eg gproteins, cereal proteins
Source: Ref. 56.
ity, foaming, emulsification, and fat and flavor binding are related to the chemical and topo-graphical properties of the proteinsurface.
Although much is known about the physicochemical properties of several food proteins, prediction of functional properties fromtheir molecular properties has not been successful. A few empirical correlations between molecular properties and certainfunctional properties in model protein systems have been established [74]. However, behavior in model systems often is not thesame as behavior in real food products. This is attributable, in part, to denaturation of proteins during food fabrication. Theextent of denaturation depends on pH, temperature, other processing conditions, and product characteristics. In addition, in realfoods, proteins interact with other food components, such as lipids, sugars, polysaccharides, and minor components, and thismodifies their functional behavior. Despite these inherent difficulties, considerable progress has been made toward understandingthe relationship between various physicochemical properties of protein molecules and their functional properties.
6.5.1 Protein Hydration
Water is an essential constituent of foods. The rheological and textural properties of foods depend on the interaction of waterwith other food constituents, especially with macromolecules, such as proteins and polysaccharides. Water modifies thephysicochemical properties of proteins. For example, the plasticizing effect of water on amorphous and semicrystalline foodproteins changes their glass transition temperature (see Chap. 2) and TD. The glass transition temperature
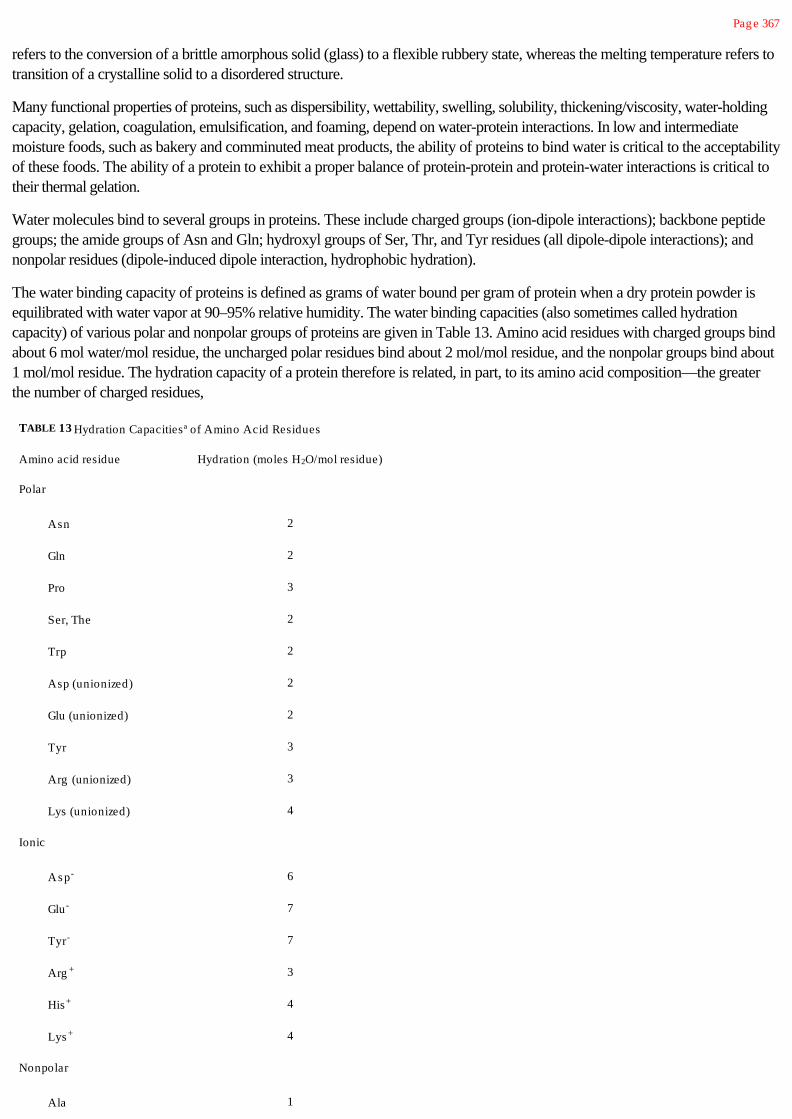
Pag e 367
refers to the conversion of a brittle amorphous solid (glass) to a flexible rubbery state, whereas the melting temperature refers totransition of a crystalline solid to a disordered structure.
Many functional properties of proteins, such as dispersibility, wettability, swelling, solubility, thickening/viscosity, water-holdingcapacity, gelation, coagulation, emulsification, and foaming, depend on water-protein interactions. In low and intermediatemoisture foods, such as bakery and comminuted meat products, the ability of proteins to bind water is critical to the acceptabilityof these foods. The ability of a protein to exhibit a proper balance of protein-protein and protein-water interactions is critical totheir thermal gelation.
Water molecules bind to several groups in proteins. These include charged groups (ion-dipole interactions); backbone peptidegroups; the amide groups of Asn and Gln; hydroxyl groups of Ser, Thr, and Tyr residues (all dipole-dipole interactions); andnonpolar residues (dipole-induced dipole interaction, hydrophobic hydration).
The water binding capacity of proteins is defined as grams of water bound per gram of protein when a dry protein powder isequilibrated with water vapor at 90–95% relative humidity. The water binding capacities (also sometimes called hydrationcapacity) of various polar and nonpolar groups of proteins are given in Table 13. Amino acid residues with charged groups bindabout 6 mol water/mol residue, the uncharged polar residues bind about 2 mol/mol residue, and the nonpolar groups bind about1 mol/mol residue. The hydration capacity of a protein therefore is related, in part, to its amino acid composition—the greaterthe number of charged residues,
TABLE 13 Hydration Capacitiesª of Amino Acid Residues
Amino acid residue Hydration (moles H2O/mol residue)
Polar
Asn 2
Gln 2
Pro 3
Ser, The 2
Trp 2
Asp (unionized) 2
Glu (unionized) 2
Tyr 3
Arg (unionized) 3
Lys (unionized) 4
Ionic
Asp- 6
Glu- 7
Tyr- 7
Arg + 3
His+ 4
Lys + 4
Nonpolar
Ala 1

Gly 1
Phe 0
Val, Ile, Leu, Met 1
ªRepresents unfrozen water associated with amino acid residues basedon nuclear mag netic resonance studies of polypeptide.
Source: Ref. 59.

Pag e 368
the greater is the hydration capacity. The hydration capacity of a protein can be calculated from its amino acid composition usingthe empirical equation [59]
a = ƒC + 0.4ƒP + 0.2ƒN (44)
where a is g water/g protein, and ƒC, ƒP, and ƒN are the fractions of the charged, polar, and nonpolar residues, respectively, inthe protein. The experimental hydration capacities of several monomeric globular proteins agree very well with those calculatedfrom the preceding equation. This, however, is not true for oligomeric proteins. Since oligomeric structures involve partial burialof the protein surface at the subunit-subunit interface, calculated values are usually greater than experimental values. On the otherhand, the experimental hydration capacity of casein micelles (~4 g water/g protein) is much larger than that predicted by thepreceding equation. This is because of the enormous amount of void space within the casein micelle structure, which imbibeswater through capillary action and physical entrapment.
On a macroscopic level, water binding to proteins occurs in a stepwise process. The high-affinity ionic groups are solvated firstat low water activity, followed by polar and nonpolar groups. The sequence of steps involved at increasing water activity ispresented in Figure 18 (see also Chap 2). The sorption isotherm of proteins, that is, the amount of water bound per gram ofprotein as a function of relative humidity, is invariably a sigmoidal curve (see Chap. 2).
FIGURE 18Sequence of steps involved in hydration of a protein.
(A) Unhydrated protein. (B) Initial hydration ofcharg ed g roups. (C) W ater cluster formation near polarand charg ed sites. (D) Completion of hydration at thepolar surfaces. (E) Hydrophobic hydration of nonpolar
patches; completion of monolayer coverag e. (F)Bridg ing between protein-associated water and
bulk water. (G) Completion of hydrodynamichydration. (From Ref. 96.)

Pag e 369
For most proteins, so-called monolayer coverage occurs at a water activity (aW) of 0.05–0.3, and multilayers of water areformed in the water activity range of 0.3–0.7. Water present in the monolayer associates primarily with ionic groups. This wateris unfreezable, does not take part as a solvent in chemical reactions, and is often referred to as “bound” water, which should beunderstood to mean water with “hindered” mobility. The free energy change for desorption of water (i.e., for transfer from theprotein surface to the bulk phase) in the monolayer hydration range of 0.07–0.27 g water/g protein is only about 0.75 kJ/mol at25°C. Since the thermal kinetic energy of water at 25°C is about 2.5 kJ/mol (which is greater than the free energy change fordesorption), water molecules in the monolayer are reasonably mobile.
At aW = 0.9, proteins bind about 0.3–0.5 g water/g protein (Table 14). Much of this water is unfreezable at 0°C. At aW > 0.9,liquid (bulk) water condenses into the clefts and crevices of protein molecules, or in the capillaries of insoluble protein systems,such as myofibrils. The properties of this water are similar to those of bulk water. This water is known as hydrodynamic water,and moves with the protein molecule.
Several environmental factors, such as pH, ionic strength, type of salts, temperature, and protein conformation, influence thewater binding capacity of proteins. Proteins exhibit the least hydration at their isoelectric pH, where enhanced protein-proteininteractions result in minimal interaction with water. Above and below the isoelectric pH, because of the increase in the netcharge and repulsive forces, proteins swell and bind more water. The water binding capacity of most proteins is greater at pH9–10 than at any other pH. This is due to ionization of sulfhydryl and tyrosine residues. Above pH 10, the loss of positivelycharged e-amino groups of lysyl residues results in reduced water binding.
At low concentrations (< 0.2 M), salts increase the water binding capacity of proteins. This is because hydrated salt ions bind(weakly) to charged groups on proteins. At this low concentration, binding of ions to proteins does not affect the hydration shellof the charged
TABLE 14 Hydration Capacities of Various Proteins
ProteinHydration capacity(g water/g protein)
Pure proteinsª
Ribonuclease 0.53
Lysozyme 0.34
Myog lobin 0.44
b-Lactog lobulin 0.54
Chymotrypsinog en 0.23
Serum albumin 0.33
Hemog lobin 0.62
Collag en 0.45
Casein 0.40
Ovalbumin 0.30
Commercial protein preparations b
W hey protein concentrates 0.45–0.52
Sodium caseinate 0.38–0.92
Soy protein 0.33
ªAt 90% relative humidity.
bAt 95% relative humidity.

Source: Refs. 57 and 60.

Pag e 370
groups on the protein, and the increase in water binding essentially comes from water associated with the bound ions. However,at high salt concentrations, much of the existing water is bound to salt ions, and this results in dehydration of the protein.
The water binding capacity of proteins generally decreases as the temperature is raised, because of decreased hydrogen bondingand decreased hydration of ionic groups. The water binding capacity of a denatured protein is generally about 10% greater thanthat of the native protein. This is due to an increase in surface area to mass ratio with exposure of some previously buriedhydrophobic groups. However, if denaturation leads to aggregation of the protein, then its water binding capacity may actuallydecrease because of the protein-protein interactions. It should be pointed out that most denatured food proteins exhibit very lowsolubility in water. Their water binding capacities, however, are not drastically different from those in the native state. Thus,water binding capacity cannot be used to predict the solubility characteristics of proteins. In other words, the solubility of aprotein is dependent not only on water binding capacity, but also on other thermodynamic factors.
In food applications, the water-holding capacity of a protein preparation is more important than the water binding capacity.Water-holding capacity refers to the ability of the protein to imbibe water and retain it against gravitational force within a proteinmatrix, such as protein gels or beef and fish muscle. This water refers to the sum of the bound water, hydrodynamic water, andthe physically entrapped water. The contribution of the physically entrapped water to water holding capacity is much larger thanthose of the bound and hydrodynamic water. However, studies have shown that the water-holding capacity of proteins ispositively correlated with water binding capacity. The ability of protein to entrap water is associated with juiciness andtenderness of comminuted meat products and desirable textural properties of bakery and other gel-type products.
6.5.2 Solubility
The functional properties of proteins are often affected by protein solubility, and those most affected are thickening, foaming,emulsifying, and gelling. Insoluble proteins have very limited uses in food.
The solubility of a protein is the thermodynamic manifestation of the equilibrium between protein-protein and protein-solventinteractions.
Protein-Protein + Solvent-Solvent Protein-Solvent (45)
The major interactions that influence the solubility characteristics of proteins are hydrophobic and ionic in nature. Hydrophobicinteractions promote protein-protein interactions and result in decreased solubility, whereas ionic interactions promote protein-water interactions and result in increased solubility. Ionic residues introduce two kinds of repulsive forces between proteinmolecules in solution. The first involves electrostatic repulsion between protein molecules owing to a net positive or negativecharge at any pH other than the isoelectric pH; the second involves repulsion between hydration shells around ionic groups.
Bigelow [6] proposed that the solubility of a protein is fundamentally related to the average hydrophobicity of the amino acidresidues and the charge frequency. The average hydrophobicity is defined as
(46)
where Dgresidue is the hydrophobicity of each
amino acid side chain obtained from the free energy change for
transfer from ethanol to water, and n is the total number of
residues in the protein. The charge frequency is defined as

Pag e 371
s = (n+ + n-)/n (47)
where n+ and n- are the total number of positively and negatively charged residues, respectively, and n is the total number ofresidues. According to Bigelow [6], the smaller the average hydrophobicity and the larger the charge frequency, the greater willbe the solubility of the protein. Although this empirical correlation is true for most proteins, it is not an absolute one. The Bigelowapproach is faulty because the solubility of a protein is dictated by the hydro-philicity and hydrophobicity of the protein surfacethat contacts with the surrounding water, rather than the average hydrophobicity and charge frequency of the molecule as awhole. The fewer the number of surface hydrophobic patches, the greater the solubility.
Based on solubility characteristics, proteins are classified into four categories. Albumins are those that are soluble in water at pH6.6 (e.g., serum albumin, ovalbumin, and a-lactalbumin), globulins are those that are soluble in dilute salt solutions at pH 7.0(e.g., glycinin, phaseolin, and b-lactoglobulin), glutelins are those that are soluble only in acid (pH 2) and alkaline (pH 12)solutions (e.g., wheat glutelins), and prolamines are those soluble in 70% ethanol (e.g., zein and gliadins). Both prolamines andglutelins are highly hydrophobic proteins.
In addition to these intrinsic physicochemical properties, solubility is influenced by several solution conditions, such as pH, ionicstrength, temperature, and the presence of organic solvents.
pH and Solubility
At pH values below and above the isoelectric pH, proteins carry a net positive or a net negative charge, respectively.Electrostatic repulsion and hydration of charged residues promote solubilization of the protein. When solubility is plotted againstpH, most food proteins exhibit a U-shaped curve. Minimum solubility occurs at about the isoelectric pH of proteins. A majorityof food proteins are acidic proteins; that is, the sum of Asp and Glu residues is greater than the sum of Lys, Arg, and Hisresidues. Therefore, they exhibit minimum solubility at pH 4–5 (isoelectric pH) and maximum solubility at alkaline pH. Theoccurrence of minimum solubility near the isoelectric pH is due primarily to the lack of electrostatic repulsion, which promotesaggregation and precipitation via hydrophobic interactions. Some food proteins, such as b-lactoglobulin (pI 5.2) and bovineserum albumin (pI 5.3), are highly soluble at their isoelectric pH. This is because these proteins contain a large ratio of surfacehydrophilic residues to surface nonpolar groups. It should be remembered that even though a protein is electrically neutral at itspI, it is still charged, but the positive and negative charges on the surface are equal. If the hydrophilicity and the hydrationrepulsion forces arising from these charged residues are greater than the protein-protein hydrophobic interactions, then theprotein will still be soluble at the pI.
Since most proteins are highly soluble at alkaline pH (8–9), protein extraction from plant sources, such as soybean flour, iscarried out at this pH. The protein is then recovered from the extract by isoelectric precipitation at pH 4.5–4.8.
Heat denaturation changes the pH-solubility profile of proteins (Fig. 19). Native whey protein isolate is completely soluble in thepH range 2–9, but when heated at 70°C for 1 min to 10 min a typical U-shaped solubility profile develops with a solubilityminimum at pH 4.5. The change in the solubility profile upon heat denaturation is due to an increase in the hydrophobicity of theprotein surface as a consequence of unfolding. Unfolding alters the balance between protein-protein and protein-solventinteractions in favor of the former.
Ionic Strength and Solubility
The ionic strength of a salt solution is given by
(48)

Pag e 372
FIGURE 19pH-solubility profile of whey protein isolate solutions
heated at 70°C for various times. (from Ref. 119.)
where Ci is concentration of an ion, and Zi is its valance. At low ionic strength (< 0.5), ions neutralize charges at the surface ofproteins. This charge screening affects solubility in two different ways, depending on the characteristics of the protein surface.Solubility decreases for those proteins that contain a high incidence of nonpolar patches, and it increases for those that don't.The former behavior is typical for soy proteins, and the latter behavior is exhibited by b-lactoblobulin. While the decrease insolubility is caused by enhanced hydrophobic interactions, the increase in solubility is caused by a decrease in the ionic activity ofthe protein macroion. At ionic strength > 1.0, salts have ion specific effects on protein solubility. As salt concentration isincreased up to m = 1; sulfate and fluoride salts progressively decrease solubility (salting out), whereas thiocyanate andperchlorate salts increase solubility (salting in). At constant m, relative effectiveness of various ions on solubility follows the
Hofmeister series, with anions promoting solubility in the order , and cations decreasing
solubility in the order . This behavior is analogous to the effects of salts on the thermaldenaturation temperature of proteins (see Sec. 6.4).
Generally, solubility of proteins in salt solutions follows the relation
log(S/S0) = b - KSCS (49)
where S and S0 are solubilities of the protein in the salt solution and in water, respectively, KS is the salting out constant, CS ismolar concentration of salt, and b is a constant. KS is positive for salting-out type of salts and negative for salting-in type of salts.
Temperature and Solubility
At constant pH and ionic strength, the solubility of most proteins generally increases with temperature between 0 and 40°C.Exceptions occur with highly hydrophobic proteins, such as b-casein and some cereal proteins, which exhibit a negativerelationship with temperature.

Pag e 373
Above 40°C, the increase in thermal kinetic energy causes protein unfolding (denaturation), exposure of nonpolar groups,aggregation, and precipitation, that is, decreased solubility.
Organic Solvents and Solubility
Addition of organic solvents, such as ethanol or acetone, lowers the permittivity of an aqueous medium. This increases intra- andintermolecular electrostatic forces, both repulsive as well as attractive. The repulsive intramolecular electrostatic interactionscause unfolding of the protein molecule. In the unfolded state, the permittivity promotes intermolecular hydrogen bondingbetween the exposed peptide groups and attractive intermolecular electrostatic interactions between oppositely charged groups.These intermolecular polar interactions lead to precipitation of the protein in organic solvents or reduced solubility in an aqueousmedium. The role of hydrophobic interactions in causing precipitation in organic solvents is minimal because of the solubilizingeffect of organic solvents on nonpolar residues. However, even in aqueous media containing a low concentration of organicsolvent, hydrophobic interactions between exposed residues may also contribute to insolublization.
Since solubility of proteins is intimately related to their structural states, it is often used as a measure of the extent of denaturationduring extraction, isolation, and purification processes. It is also used as an index of the potential applications of proteins.Commercially prepared protein concentrates and isolates show a wide range of solubility. The solubility characteristics of theseprotein preparations are expressed as protein solubility index (PSI) or protein dispersibility index (PDI). Both of these termsexpress the percentage of soluble protein present in a protein sample. The PSI of commercial protein isolates varies from 25 to80%.
6.5.3 Interfacial Properties of Proteins
Several natural and processed foods are either foam- or emulsion-type products. These types of dispersed systems are unstableunless a suitable amphiphilic substance is present at the interface between the two phases (see Chap. 3). Proteins are amphiphilicmolecules, and they migrate spontaneously to an air-water interface or an oil-water interface. This spontaneous migration ofproteins from a bulk liquid to an interface indicates that the free energy of proteins is lower at the interface than it is in the bulkaqueous phase. Thus, when equilibrium is established, the concentration of protein in the interfacial region is always much greaterthan it is in the bulk aqueous phase. Unlike low-molecular-weight surfactants, proteins from a highly viscoelastic film at aninterface, which has the ability to withstand mechanical shocks during storage and handling. Thus, protein-stabilized foams andemulsions are more stable than those prepared with low-molecular-weight surfactants, and because of this, proteins areextensively used for these purposes.
Although all proteins are amphiphilic, they differ significantly in their surface-active properties. The differences in the surface-active properties among proteins cannot be attributed to differences in the ratio of hydrophobic to hydrophilic residues. If a largehydrophobicity/hydrophilicity ratio were the primary determinant of the surface activity of proteins, then plant proteins, whichcontain more than 40% hydrophobic amino acid residues, should be better surfactants than albumin-type proteins, such asovalbumin and bovine serum albumin, which contain less than 30% hydrophobic amino acid residues. On the contrary,ovalbumin and serum albumin are better emulsifying and foaming agents than are soy proteins and other plant proteins.Furthermore, average hydrophobicities of most proteins fall within a narrow range [7], yet they exhibit remarkable differences intheir surface activity. It must be concluded, therefore, that differences in surface activity are related primarily to differences inprotein conformation. The conformational factors of importance include stability/flexibility of the polypeptide chain, ease ofadaptability to changes in the environment, and distribution pattern of hydrophilic and

Pag e 374
hydrophobic groups on the protein surface. All of these conformational factors are inter-dependent, and they collectively have alarge influence on the surface activity of proteins.
It has been shown that desirable surface-active proteins have three attributes: (a) ability to rapidly adsorb to an interface, (b)ability to rapidly unfold and reorient at an interface, and (c) an ability, once at the interface, to interact with the neighboringmolecules and form a strong cohesive, viscoeleastic film that can withstand thermal and mechanical motions [26,87].
The first and most critical event in the creation of stable foams and emulsions during whipping or homogenization is thespontaneous and rapid adsorption of proteins at the newly created interface. The rapidity with which a protein can adsorb to air-water or oil-water interfaces depends on the distribution pattern of hydrophobic and hydrophilic patches on its surface. If theprotein surface is extremely hydrophilic and contains no discernable hydrophobic patches, adsorption probably will not takeplace because its free energy will be lower in the aqueous phase than either at the interface or in the nonpolar phase. As thenumber of hydrophobic patches on the protein surface is increased, spontaneous adsorption to an interface becomes moreprobable (Fig. 20). Single hydrophobic residues randomly distributed on the protein surface do not constitute a hydrophobicpatch, nor do they possess sufficient interaction energy to strongly anchor the protein at an interface. Even though more than40% of a protein's overall accessible surface is covered with nonpolar residues, they will not enhance protein adsorption unlessthey exist as segregated regions or patches. In other words, the molecular characteristics of the protein surface have anenormous influence on whether a protein will spontaneously adsorb to an interface and how effective it will be as a stabilizer ofdispersions.
The mode of adsorption of proteins at an interface is different from that of low-molecular-weight surfactants. In the case of low-molecular-weight surfactants, such as phospholipids and monoacylglycerols, conformational constraints for adsorption andorientation do not exist because hydrophilic and hydrophobic moieties are present at the ends of the molecule. In the case ofproteins, however, the distribution pattern of hydrophobic and hydrophilic patches on the surface and the structural rigidity of themolecule cause constraints to adsorption and orientation. Because of the bulky, folded nature of proteins, once adsorbed, alarge portion of the molecule remains in the bulk phase and only a small portion is anchored at the interface. The tenacity with
FIGURE 20Schematic representation of the role of surface hydrophobic patcheson the probability of adsorption of proteins at the air-water interface.
(From Ref. 22.)
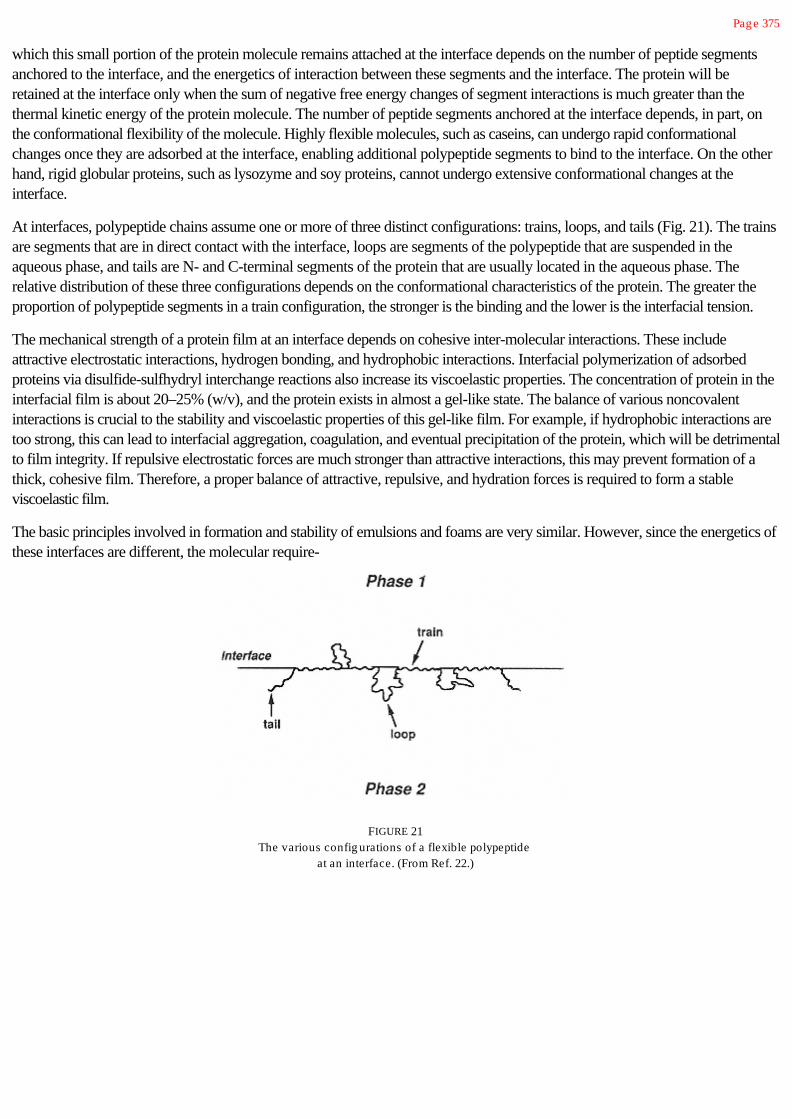
Pag e 375
which this small portion of the protein molecule remains attached at the interface depends on the number of peptide segmentsanchored to the interface, and the energetics of interaction between these segments and the interface. The protein will beretained at the interface only when the sum of negative free energy changes of segment interactions is much greater than thethermal kinetic energy of the protein molecule. The number of peptide segments anchored at the interface depends, in part, onthe conformational flexibility of the molecule. Highly flexible molecules, such as caseins, can undergo rapid conformationalchanges once they are adsorbed at the interface, enabling additional polypeptide segments to bind to the interface. On the otherhand, rigid globular proteins, such as lysozyme and soy proteins, cannot undergo extensive conformational changes at theinterface.
At interfaces, polypeptide chains assume one or more of three distinct configurations: trains, loops, and tails (Fig. 21). The trainsare segments that are in direct contact with the interface, loops are segments of the polypeptide that are suspended in theaqueous phase, and tails are N- and C-terminal segments of the protein that are usually located in the aqueous phase. Therelative distribution of these three configurations depends on the conformational characteristics of the protein. The greater theproportion of polypeptide segments in a train configuration, the stronger is the binding and the lower is the interfacial tension.
The mechanical strength of a protein film at an interface depends on cohesive inter-molecular interactions. These includeattractive electrostatic interactions, hydrogen bonding, and hydrophobic interactions. Interfacial polymerization of adsorbedproteins via disulfide-sulfhydryl interchange reactions also increase its viscoelastic properties. The concentration of protein in theinterfacial film is about 20–25% (w/v), and the protein exists in almost a gel-like state. The balance of various noncovalentinteractions is crucial to the stability and viscoelastic properties of this gel-like film. For example, if hydrophobic interactions aretoo strong, this can lead to interfacial aggregation, coagulation, and eventual precipitation of the protein, which will be detrimentalto film integrity. If repulsive electrostatic forces are much stronger than attractive interactions, this may prevent formation of athick, cohesive film. Therefore, a proper balance of attractive, repulsive, and hydration forces is required to form a stableviscoelastic film.
The basic principles involved in formation and stability of emulsions and foams are very similar. However, since the energetics ofthese interfaces are different, the molecular require-
FIGURE 21The various config urations of a flexible polypeptide
at an interface. (From Ref. 22.)

Pag e 376
ments for protein functionality at these interfaces are not the same. In other words, a protein that is a good emulsifier may not bea good foaming agent.
It should now be clear that the behavior of proteins at interfaces is very complex and not well understood. Therefore, thefollowing discussion of the emulsifying and foaming properties of food proteins will be largely qualitative in nature.
6.5.3.1 Emulsifying Properties
The physical chemistry of emulsion formation and the factors affecting creaming, flocculation, coalescence, and stability werereviewed in Chapter 3.
Several natural and processed foods, such as milk, egg yolk, coconut milk, soy milk, butter, margarine, mayonnaise, spreads,salad dressings, frozen desserts, frankfurter, sausage, and cakes, are emulsion-type products where proteins play an importantrole as an emulsifier. In natural milk, the fat globules are stabilized by a membrane composed of lipoproteins. When milk ishomogenized, the lipoprotein membrane is replaced by a protein film comprised of casein micelles and whey proteins.Homogenized milk is more stable against creaming than is natural milk because the casein micelle-whey protein film is strongerthan the natural lipoprotein membrane.
6.5.3.2 Methods for Determining the Emulsifying Properties of Proteins
The emulsifying properties of food proteins are evaluated by several methods such as size distribution of oil droplets formed,emulsifying activity, emulsion capacity, and emulsion stability.
Emulsifying Activity Index
The physical and sensory properties of a protein-stabilized emulsion depend on the size of the droplets formed and the totalinterfacial area created.
The average droplet size of emulsions can be determined by several methods, such as light microscopy (not very reliable),electron microscopy, light scattering (photon correlation spectroscopy), or use of a Coulter counter. Knowing mean droplet size,total interfacial area can be obtained from the relation
(50)
where f is the volume fraction of the dispersed phase (oil) and R is the mean radius of the emulsion particles. If m is the mass ofthe protein, then the emulsifying activity index (EAI), that is, the interfacial area created per unit of mass protein, is
(51)
Another simple and more practical method to determine EAI of proteins is the turbidimetric method [86]. The turbidity of anemulsion is given by
(52)
where A is absorbance and l is path length. According to the Mie theory of light scattering, the interfacial area of an emulsion istwo times its turbidity. If f is the volume fraction of the oil and C is the weight of protein per unit volume of the aqueous phase,then the EAI of the protein is given by

Pag e 377
(53)
It should be mentioned that in the original article [86], f instead of (1 - f) was used in the denominator of this equation. Theexpression as given in Equation 53 is the correct one because f is defined as the oil volume fraction, and thus (1 - f)C is thetotal mass of protein in a unit volume of the emulsion [13]. Although this method is simple and practical, the main drawback isthat it is based on measurement of turbidity at a single wavelength, 500 nm. Since the turbidity of food emulsions is wavelengthdependent, the interfacial area obtained from turbidity at 500 nm is not very accurate. Therefore, use of this equation to estimatemean particle diameter or the number of emulsion particles present in the emulsion gives results that are not very reliable.However, the method can be used for qualitative comparison of emulsifying activities of different proteins, or changes in theemulsifying activity of a protein after various treatments.
Protein Load
The amount of protein adsorbed at the oil-water interface of an emulsion has a bearing on its stability. To determine the amountof protein adsorbed, the emulsion is centrifuged, the aqueous phase is separated, and the cream phase is repeatedly washed andcentrifuged to remove any loosely adsorbed proteins. The amount of protein adsorbed to the emulsion particles is determinedfrom the difference between the total protein initially present in the emulsion and the amount present in the wash fluid from thecream phase. Knowing the total interfacial area of the emulsion particles, the amount of protein adsorbed per square meter ofthe interfacial area can be calculated. Generally, the protein load is in the range of about 1–3 mg/m2 of interfacial area. As thevolume fraction of the oil phase is increased the protein load decreases at constant protein content in the total emulsion. Forhigh-fat emulsions and small-sized droplets, more protein is obviously needed to adequately coat the interfacial area and stabilizethe emulsion.
Emulsion Capacity
Emulsion capacity (EC) is the volume (ml) of oil that can be emulsified per gram of protein before phase inversion (a changefrom oil-in-water emulsion to water-in-oil) occurs. This method involves addition of oil or melted fat at a constant rate andtemperature to an aqueous protein solution that is continuously agitated in a food blender. Phase inversion is detected by anabrupt change in viscosity or color (usually a dye is added to the oil), or by an increase in electrical resistance. For a protein-stabilized emulsion, phase inversion usually occurs when f is about 0.65–0.85. Inversion is not instantaneous, but is preceded byformation of a water-in-oil-in-water double emulsion. Since emulsion capacity is expressed as volume of oil emulsified per gramprotein at phase inversion, it decreases with increasing protein concentration once a point is reached where unadsorbed proteinaccumulates in the aqueous phase. Therefore, to compare emulsion capacities of different proteins, EC versus proteinconcentration profiles should be used instead of EC at a specific protein concentration.
Emulsion Stability
Protein-stabilized emulsions are often stable for days. Thus, a detectable amount of creaming or phase separation is usually notobserved in a reasonable amount of time when samples are stored at atmospheric conditions. Therefore, drastic conditions, suchas storage at elevated temperature or separation under centrifugal force, is often used to evaluate emulsion stability. Ifcentrifugation is used, stability is then expressed as percent decrease in interfacial area (i.e., turbidity) of the emulsion, or percentvolume of cream separated, or as the fat content of the cream layer. More often, however, emulsion stability is expressed as

Pag e 378
(54)
where the volume of the cream layer is measured after a standardized centrifugation treatment. A common centrifugationtechnique involves centrifugation of a known volume of emulsion in a graduated centrifuge tube at 1300 × g for 5 min. Thevolume of the separated cream phase is then measured and expressed as a percentage of the total volume. Sometimescentrifugation at a relatively low gravitational force (180 × g) for a longer time (15 min) is used to avoid coalescence of droplets.
The turbidimetric method (discussed earlier) can also be used to evaluate emulsion stability. In this case stability is expressed asemulsion stability index (ESI), which is defined as the time to achieve a turbidity of the emulsion that is one-half of the originalvalue.
The methods used to determine emulsion stability are very empirical. The most fundamental quantity related to stability is thechange in interfacial area with time, but this is difficult to measure directly.
6.5.3.3 Factors Influencing Emulsification
The properties of protein-stabilized emulsions are affected by several factors. These include intrinsic factors, such as pH, ionicstrength, temperature, presence of low-molecular-weight surfactants, sugars, oil-phase volume, type of protein, and the meltingpoint of the oil used; and extrinisic factors, such as type of equipment, rate of energy input, and rate of shear. Standardizedmethods for systematically evaluating the emulsifying properties of proteins have not been agreed upon. Therefore, results amonglaboratories cannot be accurately compared, and this has hampered the understanding of the molecular factors that affectemulsifying properties of proteins.
The general forces involved in the formation and stabilization of emulsion were discussed in Chapter 3. Therefore, only themolecular factors that affect protein-stabilized emulsions need be discussed here.
Solubility plays a role in emulsifying properties, but 100% solubility is not an absolute requirement. While highly insolubleproteins do not perform well as emulsifiers, no reliable relationship exists between solubility and emulsifying properties in the25–80% solubility range [64]. However, since the stability of a protein film at the oil-water interface is dependent on favorableinteractions with both the oil and aqueous phases, some degree of solubility is likely to be necessary. The minimum solubilityrequirement for good performance may vary among proteins. In meat emulsions, such as in sausage and frankfurter,solubilization of myofibrillar proteins in 0.5 M NaCl enhances their emulsifying properties. Commercial soy protein isolates,which are isolated by thermal processing, have poor emulsifying properties because of their very low solubility.
The formation and stability of protein-stabilized emulsions are affected by pH. Several mechanisms are involved. Generally,proteins that have high solubility at the isoelectric pH (e.g., serum albumin, gelatin, and egg-white proteins) show maximumemulsifying activity and emulsion capacity at that pH. The lack of net charge and electrostatic repulsive interactions at theisoelectric pH helps maximize protein load at the interface and promotes formation of a highly viscoelastic film, both of whichcontribute to emulsion stability. However, the lack of electrostatic repulsive interactions among emulsion particles can, in someinstances, promote flocculation and coalescence, and thus decrease emulsion stability. On the other hand, if the protein is highlyhydrated at the isoelectric pH (unusual), then hydration repulsion forces between emulsion particles may prevent flocculation andcoalescence, and thus stabilize the emulsion. Because most food proteins (caseins, commercial whey proteins, meat proteins,soy proteins) at their isoelectric pH are sparingly soluble, poorly hydrated, and lack electrostatic

Pag e 379
repulsive forces, they are generally poor emulsifiers at this pH. These proteins may, however, be effective emulsifiers whenmoved away from their isoelectric pH.
The emulsifying properties of proteins show a weak positive correlation with surface hydrophobicity, but not with meanhydrophobicity (i.e., Jmol-1residue-1). The ability of various proteins to decrease interfacial tension at the oil-water interface andto increase the emulsifying activity index is related to their surface hydrophobicity values (Fig. 22). However, this relationship isby no means perfect. The emulsifying properties of several proteins, such as b-lactoglobulin, a-lactalbumin, and soy proteins, donot show a strong correlation with surface hydrophobicity.
The surface hydrophobicity of proteins is usually determined by measuring the amount of a hydrophobic fluorescent probe, suchas cis-parinaric acid, that can bind to the protein [53]. Although this method provides some information on the nonpolarity of theprotein surface, it is questionable whether the measured value truly reflects the “hydrophobicity” of the protein surface. The truedefinition of surface hydrophobicity is that portion of the nonpolar surface of the protein that makes contact with the surroundingbulk water. However, cis-parinaric acid is capable of binding only to hydrophobic cavities formed at the surface by associationof nonpolar residues. These protein cavities are accessible to nonpolar ligands, but they are not accessible to water and may notbe accessible to either phase in an oil-water emulsion, unless the protein is able to undergo rapid conformational rearrangementat the interface. The poor correlation of surface hydrophobicity (as measured by cis-parinaric acid binding) with the emulsifyingproperties of some proteins may be related to the fact that cis-parinaric acid provides no indication of molecular flexibility.Molecular flexibility at the oil-water interface may be the most important determinant of the emulsifying properties of proteins.
Partial denaturation (unfolding) of proteins prior to emulsification, which does not result
FIGURE 22Correlations of surface hydrophobicity of various proteinswith (A) oil/water interfacial tension, and (B) emulsifyingactivity index. Surface hydrophobicity was determined
from the amount of hydrophobic fluorescent probe boundper unit weig ht of protein. The numbers in the plots represent
(1) bovine serum albumin; (2) b-lactoblobulin; (3) trypsin;(4) ovalbumin; (5) conalbumin; (6) lysozyme; (7) k-casein;
(8–12) ovalbumin denatured by heating at 85°C for 1, 2,3, 4, or 5 min, respectively; (13–18) lysozyme denatured by
heating at 85°C for 1, 2, 3, 4, 5, or 6 min, respectively;(19–23) ovalbumin bound to 0.2, 0.3, 1.7, 5.7, or 7.9 mol
dodecyl sulfate/mol protein, respectively; (24–28)ovalbumin bound to 0.3, 0.9, 3.1, 4.8 or 8.2 mol linoleate/mol
protein, respectively. (From Ref. 53.)

Pag e 380
in insolublization, usually improves their emulsifying properties. This is due to increased molecular flexibility and surfacehydrophobicity. The rate of unfolding at an interface depends on the flexibility of the original molecule. In the unfolded state,proteins containing free sulfhydryl groups and disulfide bonds undergo slow polymerization via disulfide-sulfhydryl interchangereaction [27]. This leads to formation of a highly viscoelastic film at the oil-water interface. Heat denaturation that is sufficient tocause insolublization impairs emulsifying properties of proteins.
6.5.3.4 Foaming Properties
Foams consist of an aqueous continuous phase and a gaseous (air) dispersed phase. Many processed foods are foam-typeproducts. These include whipped cream, ice cream, cakes, meringue, bread, souffles, mousses, and marshmallow. The uniquetextural properties and mouthfeel of these products stem from the dispersed tiny air bubbles. In most of these products, proteinsare the main surface-active agents that help in the formation and stabilization of the dispersed gas phase.
Generally, protein-stabilized foams are formed by bubbling, whipping, or shaking a protein solution. The foaming property of aprotein refers to its ability to form a thin tenacious film at gas-liquid interfaces so that large quantities of gas bubbles can beincorporated and stabilized. Foaming properties are evaluated by several means. The foamability or foaming capacity of aprotein refers to the amount of interfacial area that can be created by the protein. It can be expressed in several ways, such asoverrun(or steady-state foam value), or foaming power (or foam expansion). Overrun is defined as
(55)
(56)
Foaming power generally increases with protein concentration until a maximum value is attained. It is also affected by the methodused for foam formation. FP at a given protein concentration is often used as a basis for comparing the foaming properties ofvarious proteins. The foaming powers of various proteins at pH 8.0 are given in Table 15.
Foam stability refers to the ability of protein to stabilize foam against gravitational and mechanical stresses. Foam stability isoften expressed as the time required for 50% of the liquid to drain from a foam or for a 50% reduction in foam volume. Theseare very empirical methods, and they do not provide fundamental information about the factors that affect foam stability. Themost direct measure of foam stability is the reduction in foam interfacial area as a function of time. This can be done as follows.According to the Laplace principle, the internal pressure of a bubble is greater than the external (atmospheric) pressure, andunder stable conditions the pressure difference, DP, is
(57)
where Pi and Po are the internal and external pressures, respectively, r is radius of the foam bubble, and g is surface tension.According to this equation the pressure inside a closed vessel containing foam will increase when the foam collapses. The netchange in

Pag e 381
TABLE 15 Comparative Foaming Power of Protein Solutions
Protein typeFoaming powerª at 0.5%
protein concentration (w/v)
Bovine serum albumin 280%
W hey protein isolate 600%
Egg albumen 240%
Ovalbumin 40%
Bovine plasma 260%
b-Lactog lobulin 480%
Fibrinog en 360%
Soy protein (enzyme hydrolyzed) 500%
Gelatin (acid-processed pig skin) 760%
ªCalculated according to Equation 56.
Source: Ref. 89.
(58)
where V is the total volume of the system, DP is the pressure change, and DA is the net change in interfacial area resulting fromthe fraction of collapsed foam. The initial interfacial area of the foam is given by
(59)
where dP is the net pressure change when the entire foam is collapsed. The A0 value is a measure of foamability, and therate of decrease of A with time can be used as a measure of foam stability. This approach has been used to study the foamingproperties of food proteins [117,119].
The strength or stiffness of the foam refers to the maximum weight a column of foam can withstand before it collapses. Thisproperty is also assessed by measuring foam viscosity.
6.5.3.5 Environmental Factors Influencing Foam Formation and Stability
pH
Several studies have shown that protein-stabilized foams are more stable at the isoelectric pH of the protein than at any otherpH, provided there is no insolublization of the protein at pI. At or near the isoelectric pH region, the lack of repulsive interactionspromotes favorable protein-protein interactions and formation of a viscous film at the interface. In addition, an increased amountof protein is adsorbed to the interface at the pI because of lack of repulsion between the interface and adsorbing molecules.These two factors improve both foamability and foam stability. If the protein is sparingly soluble at pI, as most food proteins are,then only the soluble protein fraction will be involved in foam formation. Since the concentration of this soluble fraction is verylow, the amount of foam formed will be less, but the stability will be high. Although the insoluble fraction does not contribute tofoamability, adsorption of these insoluble protein particles may stabilize the foam, probably by increasing cohesive forces in theprotein film. Generally, adsorption of hydrophobic particles increases the stability of foams. At pH other than

Pag e 382
pI, foamability of proteins is often good, but foam stability is poor. Egg-white proteins exhibit good foaming properties at pH8–9 and at their isoelectric pH 4–5.
Salts
The effects of salts on the foaming properties of proteins depends on the type of salt and the solubility characteristics of theprotein in that salt solution. The foamability and foam stability of most globular proteins, such as bovine serum albumin, eggalbumin, gluten, and soy proteins, increase with increasing concentration of NaCl. This behavior is usually attributed toneutralization of charges by salt ions. However, some proteins, such as whey proteins, exhibit the opposite effect: Bothfoamability and foam stability decrease with increasing concentration of NaCl (Table 16) [120]. This is attributed to salting-in ofwhey proteins, especially b-lactoglobulin, by NaCl. Proteins that are salted out in a given salt solution generally exhibit improvedfoaming properties, whereas those that are salted in generally exhibit poor foaming properties. Divalent cations, such as Ca2+
and Mg2+, dramatically improve both foamability and foam stability at 0.02–0.4 M concentration. This is primarily due to cross-linking of protein molecules and creation of films with better viscoelastic properties [121].
Sugars
Addition of sucrose, lactose and other sugars to protein solutions often impairs foamability, but improves foam stability. Thepositive effect of sugars on foam stability is due to increased bulk-phase viscosity, which reduces the rate of drainage of thelamella fluid. The depression in foam overrum is mainly due to enhanced stability of protein structure in sugar solutions. Becauseof this, the protein molecule is less able to unfold upon adsorption at the interface. This decreases the ability of the protein toproduce large interfacial areas and large foam volume during whipping. In sugar-containing, foam-type dessert products, such asmeringues, souffles, and cakes, it is preferable to add sugar after whipping when possible. This will enable the protein to adsorb,unfold, and form a stable film, and then the added sugar will increase foam stability by increasing the viscosity of the lamella fluid.
Lipids
Lipids, especially phospholipids, when present at concentrations greater than 0.5%, markedly impair the foaming properties ofproteins. Because lipids are more surface-active than proteins, they readily adsorb at the air-water interface and inhibitadsorption of proteins during foam formation. Since lipid films lack the cohesive and viscoelastic properties necessary towithstand
TABLE 16 Effect of NaCl on Foamability and Stability of W hey Protein Isolate
NaCl concentration (M)Total interfacial area
(cm2/ml of foam)Time for 50% collapse of
initial area (sec)
0.00 333 510
0.02 317 324
0.04 308 288
0.06 307 180
0.08 305 165
0.10 287 120
0.15 281 120
Source: Compiled from Ref. 120.

Pag e 383
the internal pressure of the foam bubbles, the bubbles rapidly expand, then collapse during whipping. Thus, lipid-free wheyprotein concentrates and isolates, soy proteins, and egg proteins without egg yolk display better foaming properties than dolipid-contaminated preparations.
Protein Concentration
Several properties of foams are influenced by protein concentration. The greater the protein concentration, the stiffer the foam.Foam stiffness results from small bubble size and high viscosity. The stability of the foam is enhanced by greater proteinconcentration because this increases viscosity and facilitates formation of a multilayer, cohesive protein film at the interface.Foamability generally reaches a maximum value at some point during an increase in protein concentration. Some proteins, suchas serum albumin, are able to form relatively stable foams at 1% protein concentration, whereas proteins such as whey proteinisolate and soy conglycinin require a minimum of 2–5% to form a relatively stable foam. Generally, most proteins displaymaximum foamability at 2–8% concentration. The interfacial concentration of proteins in foams is about 2–3 mg/m2.
Partial heat denaturation improves the foaming properties of proteins. For instance, heating of whey protein isolate (WPI) at70°C for 1 min improves, whereas heating at 90°C for 5 min decreases foaming properties even though the heated proteinsremain soluble in both instances [119]. The decrease in foaming properties of WPI heated at 90°C was attributed to extensivepolymerization of the protein via disulfide-sulfhydryl interchange reactions. These very highmolecular-weight polymers are unableto adsorb to the air-water interface during foaming.
The method of foam generation influences the foaming properties of proteins. Air introduction by bubbling or sparging usuallyresults in a “wet” foam with a relatively large bubble size. Whipping at moderate speed generally results in foam with small-sizedbubbles because the shearing action results in partial denaturation of the protein before adsorption occurs. However, whipping athigh shear rate or “overbeating” can decrease foaming power because of aggregation and precipitation of proteins.
Some foam-type food products, such as marshmallow, cakes, and bread, are heated after the foam is formed. During heating,expansion of air and decreased viscosity can cause bubble rupture and collapse of the foam. In these instances, the integrity ofthe foam depends on gelation of the protein at the interface so sufficient mechanical strength is developed to stabilize the foam.Gelatin, gluten, and egg white, which display good foaming and gelling properties, are highly suitable for this purpose.
6.5.3.6 Molecular Properties Influencing Foam Formation and Stability
For a protein to perform effectively as a foaming agent or an emulsifier it must meet the following basic requirements: (a) it mustbe able to rapidly adsorb to the air-water interface, (b) it must readily unfold and rearrange at the interface, and (c) it should beable to form a viscous cohesive film through intermolecular interactions. The molecular properties that affect foaming propertiesare molecular flexibility, charge density and distribution, and hydrophobicity.
The free energy of an air-water interface is significantly greater than that of an oil-water interface. Therefore, to stabilize an air-water interface, the protein must have the ability to rapidly adsorb to the freshly created interface, and instantaneously decreasethe interfacial tension to a low level. The lowering of interfacial tension is dependent on the ability of the protein to rapidly unfold,rearrange, and expose hydrophobic groups at the interface. Studies have shown that b-casein, which is a random-coil-typeprotein, performs in this manner. On the other hand, lysozyme, which is a tightly folded globular protein with four intramolecular

Pag e 384
disulfide bonds, adsorbs very slowly, only partially unfolds, and reduces the surface tension only slightly (Fig. 23) [115].Lysozyme is, therefore, a poor foaming agent. Thus, molecular flexibility at the interface is quintessential for good performanceas a foaming agent.
Apart from molecular flexibility, hydrophobicity plays an important role in foamability of proteins. The foaming power of proteinsis positively correlated with mean hydrophobicity
FIGURE 23
Variation of surface concentration ( ) and surface
pressure ( ) with time during adsorption of b-casein(A) and eg g -white lysozyme (B) at the air-water
interface from a 1.5-mg /ml protein solution.(From Ref. 115.)

Pag e 385
(Fig. 24A). However, the foaming power of proteins varies curvilinearly with surface hydrophobicity, and a significantcorrelation does not exist between these two properties at hydrophobicity values of greater than 1000 [54]. This indicates that asurface hydrophobicity of at least 1000 is needed for initial adsorption of proteins at the air-water interface, whereas, onceadsorbed, the ability of the protein to create more interfacial area during foam formation depends on the mean hydrophobicity ofthe protein.
A protein that displays good foamability need not be a good foam stabilizer. For example, although b-casein exhibits excellentfoamability, the stability of the foam is poor. On the other hand, lysozyme exhibits poor foamability, but its foams are very stable.Generally, proteins that possess good foaming power do not have the ability to stabilize a foam, and proteins that produce stablefoams often exhibit poor foaming power. It appears that foamability and stability are influenced by two different sets of molecularproperties of proteins that are often antagonistic. Whereas foamability is affected by rate of adsorption, flexibility, andhydrophobicity, stability depends on the rheological properties of the protein film. The rheological properties of films depend onhydration, thickness, protein concentration, and favorable intermolecular interactions. Proteins that only partially unfold andretain some degree of folded structure usually form thicker, denser films, and more stable foams (e.g., lysozyme and serumalbumin) than do those that completely unfold (e.g., b-casein) at the air-water interface. In the former case, the folded structureextends into the subsurface in the form of loops. Noncovalent interactions, and possibly disulfide cross-linking, between theseloops promote formation of a gel network, which has excellent viscoelastic and mechanical properties. For a protein to possessgood foamability and foam stability it should have an appropriate balance between flexibility and rigidity, should easily undergounfolding, and should engage in abundant cohesive interactions at the interface. However, what extent of unfolding is desirablefor a given protein is difficult, if not impossible, to predict. In addition to these factors, foam stability usually exhibits an inverserelationship with the charge density of proteins (Fig. 24B). High charge density apparently interferes with formation of cohesivefilm.
Most food proteins are mixtures of various proteins, and therefore their foaming properties are influenced by interaction betweenthe protein components at the interface. The excellent whipping properties of egg white are attributed to interactions between itsprotein components, such as ovalbumin, conalbumin, and lysozyme. Several studies have indicated that the foaming properties ofacidic proteins can be improvd by mixing them with basic proteins, such as lysozyme and clupeine [89]. This enhancing effectseems to be related to the formation of an electrostatic complex between the acidic and basic proteins.
Limited enzymatic hydrolysis of proteins generally improves their foaming properties. This is because of increased molecularflexibility and greater exposure of hydrophobic groups. However, extensive hydrolysis impairs foamability because low-molecular-weight peptides cannot form a cohesive film at the interface.
6.5.4 Flavor Binding
Proteins themselves are odorless. However, they can bind flavor compounds, and thus affect the sensory properties of foods.Several proteins, especially oilseed proteins and whey protein concentrates, carry undesirable flavors, which limits theirusefulness in food applications. These off flavors are due mainly to aldehydes, ketones, and alcohols generated by oxidation ofunsaturated fatty acids. Upon formation, these carbonyl compounds bind to proteins and impart characteristic off flavors. Forexample, the beany and grassy flavor of soy protein preparations is attributed to the presence of hexanal. The binding affinity ofsome of these carbonyls is so strong that they resist even solvent extraction. A basic understanding of the mechanism of

Pag e 386
FIGURE 24Correlations between foaming power and averag ehydrophobicity (A), and foam stability and charg e
density (B) of proteins. See orig inal article foridentities of the proteins; 1 kcal = 4. 18 kJ.
(From Ref. 106.)

Pag e 387
binding of off flavors to proteins is needed so that appropriate methods can be developed for their removal.
The flavor-binding property of proteins also has desirable aspects, because they can be used as flavor carriers or flavormodifiers in fabricated foods. This is particularly useful in meat analogues containing plant proteins, where successful simulationof a meat-like flavor is essential for consumer acceptance. In order for a protein to function as a good flavor carrier, it shouldbind flavors tightly, retain them during processing, and release them during mastication of food in the mouth. However, proteinsdo not bind all flavor compounds with equal affinity. This leads to uneven and disproportionate retention of some flavors andundesirable losses during processing. Because protein-bound flavorants do not contribute to taste and aroma unless they arereleased readily in the mouth, knowledge of the mechanisms of interaction and binding affinity of various flavorants is essential ifeffective strategies for producing flavor-protein products or for removing off flavors from protein isolates are to be devised.
6.5.4.1 Thermodynamics of Protein-Flavor Interactions
In water-flavor model systems, addition of proteins has been shown to reduce the headspace concentration of flavor compounds[35]. This is attributed to binding of flavors to proteins. The mechanism of flavor binding to proteins depends upon the moisturecontent of the protein sample, but interactions are normally noncovalent. Dry protein powders bind flavors mainly via van derWaals, hydrogen bonding, and electrostatic interactions. Physical entrapment within capillaries and crevices of dry proteinpowders may also contribute to flavor properties of dry protein powders. In liquid or high-moisture foods, the mechanism offlavor binding by proteins primarily involves interaction of the nonpolar ligand with hydrophobic patches or cavities on theprotein surface. In addition to hydrophobic interactions, flavor compounds with polar head groups, such as hydroxyl andcarboxyl groups, may also interact with proteins via hydrogen bonding and electrostatic interactions. After binding to the surfacehydrophobic regions, aldehydes and ketones may be able to diffuse into the hydrophobic interior of the protein molecule.
Flavor interactions with proteins are usually completely reversible. However, aldehydes can covalently bind to the amino groupof lysyl side chains, and this interaction is nonreversible. Only the noncovalently bound fraction can contribute to aroma and tasteof the protein product.
The extent of flavor binding by hydrated proteins depends on the number of hydrophobic binding regions available on the proteinsurface. The binding sites are usually made up of groups of hydrophobic residues segregated in the form of a well-defined cavity.Single nonpolar residues on the protein surface are less likely to act as binding sites. Under equilibrium conditions, the reversiblenoncovalent binding of a flavor compound with proteins follows the Scatchard equation,
(60)
where n is moles of ligand bound per mole of protein, n is the total number of binding sites per mole of protein, [L] is the freeligand concentration at equilibrium, and K is the equilibrium binding constant (M-1). According to this equation, a plot of n/[L]versus n will be a straight line; the values of K and n can be obtained from the slope and the intercept, respectively. The freeenergy change for binding of ligand to protein is obtained from the equation DG = -RT ln K, where R is the gas constant and T isabsolute temperature. The thermodynamic constants for the binding of carbonyl compounds to various proteins are presented inTable 17. The binding constant increases by about threefold for each methylene group increment in chain length, with

Pag e 388
TABLE 17 Thermodynamic Constants for Binding of Carbonyl Compounds to Proteins
ProteinCarbonyl
compoundn
(mol/mol) K (M -1)DG
(kJ/mol)
Serum albumin 2-Nonanone 6 1800 -18.4
2-Heptanone 6 270 -13.8
b-Lactog lobulin 2-Heptanone 2 150 -12.4
2-Octanone 2 480 -15.3
2-Nonanone 2 2440 -19.3
Soy protein
Native 2-Heptanone 4 110 -11.6
2-Octanone 4 310 -14.2
2-Nonanone 4 930 -16.9
5-Nonanone 4 541 -15.5
Nonanal 4 1094 -17.3
Partially denatured 2-Nonanone 4 1240 -17.6
Succinylated 2-Nonanone 2 850 -16.7
Note: n, number of binding sites in native state; K, equilibrium binding constant.
Source: Refs. 24, 25, 83.
a corresponding free energy change of -2.3 kJ/mol per CH2 group. This indicates that the binding is hydrophobic in nature.
It is assumed in the Scatchard relationship that all ligand binding sites in a protein have the same affinity, and that noconformational changes occur upon binding of the ligand to these sites. Contrary to the latter assumption, proteins generally doundergo a conformational change upon binding of flavor compounds. Diffusion of flavor compounds into the interior of theprotein may disrupt hydrophobic interactions between protein segments, and thus destabilize the protein structure. Flavor ligandswith reactive groups, such as aldehydes, can covalently bind the e-amino groups of lysyl residues, change the net charge of theprotein, and thus cause protein unfolding. Unfolding generally results in exposure of new hydrophobic sites for ligand binding.Because of these structural changes, Scatchard plots for protein are generally curvilinear. In the case of oligomeric proteins, suchas soy proteins, conformational changes may involve both dissociation and unfolding of subunits. Denatured proteins generallyexhibit a large number of binding sites with weak association constants. Methods for measuring flavor binding can be found inReferences 24 and 25.
6.5.4.2 Factors Influencing Flavor Binding
Since volatile flavors interact with hydrated proteins mainly via hydrophobic interactions, any factor that affects hydrophobicinteractions or surface hydrophobicity of proteins will influence flavor binding. Temperature has very little effect on flavorbinding, unless significant thermal unfolding of the protein occurs. This is because the association process is primarily entropydriven, not enthalpy driven. Thermally denatured proteins exhibit increased ability to bind flavors; however, the binding constantis usually low compared to that of native protein. The effect of salts on flavor binding are related to their salting-in and salting-outproperties. Salting-in-type salts, which destabilize hydrophobic interactions, decrease flavor binding, whereas salting-out-typesalts increase flavor binding. The effect of pH on flavor binding is generally related to pH-induced conformational changes inproteins. Flavor binding is


Pag e 389
usually enhanced more at alkaline pH that at acid pH; this is because proteins tend to denature more extensively at alkaline pHthan at acid pH.
Breakage of protein disulfide bonds, which causes unfolding of proteins, usually increases flavor binding. Extensive proteolysis,which disrupts and decreases the number of hydrophobic regions, decreases flavor binding. This can be used as a way ofremoving off flavors from oilseed proteins. However, protein hydrolysis sometimes liberates bitter peptides. Bitterness ofpeptides is often related to hydrophobicity. Peptides with a mean hydrophobicity of less than 5.3 kJ/mol do not have a bittertaste. On the other hand, peptides with a mean hydrophobicity of greater than 5.85 kJ/mol often are bitter. Formation of bitterpeptides in protein hydrolysates depends on the amino acid composition and sequence, and the type of enzyme used. Caseinsand soy proteins hydrolyzed with several commercial proteases result in bitter peptides. The bitterness can be reduced oreliminated by using endo- and exo-peptidases, which further breakdown bitter peptides into fragments that have less than 5.3kJ/mol mean hydrophobicity.
6.5.5 Viscosity
The consumer acceptability of several liquid and semisolid-type foods (e.g., gravies, soups, beverages, etc.) depends on theviscosity or consistency of the product. The viscosity of a solution relates to its resistance to flow under an applied force (orshear stress). For an ideal solution, the shear stress (i.e, force per unit area, F/A) is directly proportional to the shear rate (i.e.,the velocity gradient between the layers of the liquid, dv/dr). This is expressed as
(61)
The proportionality constant h is known as the viscosity coefficient. Fluids that obey this expression are called Newtonian fluids.
The flow behavior of solutions is greatly influenced by solute type. High-molecular-weight soluble polymers greatly increaseviscosity even at very low concentrations. This again depends on several molecular properties such as size, shape, flexibility, andhydration. Solutions of randomly coiled macromolecules display greater viscosity than do solutions of compact foldedmacromolecules of the same molecular weight.
Most macromolecular solutions, including protein solutions, do not display Newtonian behavior, especially at high proteinconcentrations. For these systems, the viscosity coefficient decreases when the shear rate increases. This behavior is known aspseudoplastic or shear thinning, and follows the relationship
(62)
where m is the consistency coefficient and n is an exponent known as the “flow behavior index.” The pseudoplastic behavior ofprotein solutions arises because of the tendency of protein molecules to orient their major axes in the direction of flow.Dissociation of weakly held dimers and oligomers into monomers also contributes to shear thinning. When shearing or flow isstopped, the viscosity may or may not return to the original value, depending on the rate of relaxation of the protein molecules torandom orientation. Solutions of fibrous proteins, such as gelatin and actomyosin, usually remain oriented, and thus do notquickly regain their original viscosity. On the other hand, solutions of globular proteins, such as soy proteins and whey proteins,rapidly regain their viscosity when flow is stopped. Such solutions are called thixotropic.

Pag e 390
The viscosity (or consistency) coefficient of most protein solutions follows an exponential relationship with protein concentrationbecause of both protein-protein interactions and interactions between the hydration spheres of protein molecules. An exampleinvolving soy protein fractions is shown in Figure 25 [91]. At high protein concentrations or in protein gels, where protein-protein interactions are numerous and strong, proteins display plastic viscoelastic behavior. In these cases, a specific amount offorce, known as “yield stress,” is required to initiate flow.
The viscosity behavior of proteins is a manifestation of complex interactions among several variables, including size, shape,protein-solvent interactions, hydrodynamic volume, and molecular flexibility in the hydrated state. When dissolved in water,proteins absorb water and swell. The volume of the hydrated molecules, that is, their hydrodynamic size or volume, is muchlarger than their unhydrated size or volume. The protein-associated water induces long-range effects on the flow behavior of thesolvent. The dependence of viscosity on shape and size of protein molecules follows the relationship
hsp = bC(n2 + d1n1) (63)
where hsp is specific viscosity, b is the shape factor, C is concentration, n2 and n1 are specific volumes of unhydrated protein andsolvent, respectively, and d1 is grams of water bound per
FIGURE 25Effect of concentration on viscosity (or consistency index)
of 7S and 11S soy protein solutions at 20°C (FromRef. 91.)

Pag e 391
gram of protein. Here, n2 is also related to molecular flexibility; the greater the specific volume of the protein, the greater itsflexibility.
The viscosity of dilute protein solutions is expressed in several ways. Relative viscosity, hrel refers to the ratio of viscosity of theprotein solution to that of the solvent. It is measured in an Ostwald-Fenske type capillary viscometer, and is expressed as
(64)
where r and ro are densities of protein solution and solvent, respectively, and t and to are times of flow for a given volume ofprotein solution and solvent, respectively, through the capillary. Other forms of expressing viscosity can be obtained from therelative viscosity. Specific viscosity is defined as
hsp = hrel - 1 (65)
Reduced viscosity is
(66)
where C is the protein concentration, and intrinsic viscosity is
(67)
The intrinsic viscosity, [h], is obtained by extrapolating a plot of reduced viscosity versus protein concentration to zero proteinconcentration (Lim). Since protein-protein interactions are non-existent at infinite dilution, intrinsic viscosity accurately depictsthe effects of shape and size on the flow behavior of individual protein molecules. Changes in the hydrodynamic shape ofproteins that result from heat and pH treatment can be studied by measuring their intrinsic viscosities.
6.5.6 Gelation
A gel is an intermediate phase between a solid and a liquid. Technically, it is defined as “a substantially diluted system whichexhibits no steady state flow” [33]. It is made up of polymers cross-linked via either covalent or noncovalent bonds to form anetwork that is capable of entrapping water and other low-molecular-weight substances (see Chap. 3).
Protein gelation refers to transformation of a protein from the “sol” state to a “gel-like” state. This transformation is facilitated byheat, enzymes, or divalent cations under appropriate conditions. All these agents induce formation of a network structure;however, the types of covalent and noncovalent interactions involved, and the mechanism of network formation can differconsiderably.
Most food protein gels are prepared by heating a protein solution. In this mode of gelation, the protein in a sol state is firsttransformed into a “progel” state by denaturation. The progel state is usually a viscous liquid state in which some degree ofprotein polymerization has already occurred. This step causes unfolding of the protein and exposure of a critical number offunctional groups, such as hydrogen bonding and hydrophobic groups, so that the second stage, formation of a protein network,can occur. Creation of the progel is irreversible because many protein-protein interactions occur between the unfoldedmolecules. When the progel is cooled to ambient or refrigeration temperature, the decrease in the thermal kinetic energyfacilitates

Pag e 392
formation of stable noncovalent bonds among exposed functional groups of the various molecules and this constitutes gelation.
The interactions involved in network formation are primarily hydrogen bonds, and hydrophobic and electrostatic interactions.The relative contributions of these forces vary with the type of protein, heating conditions, the extent of denaturation, andenvironmental conditions. Hydrogen bonding and hydrophobic interactions contribute more than electrostatic interactions tonetwork formation except when multivalent ions are involved in cross-linking. Some proteins generally carry a net charge,electrostatic repulsion occurs among protein molecules and this is not usually conducive to network formation. However,charged groups are essential for maintaining protein-water interactions and water holding capacity of gels.
Gel networks that are sustained primarily by noncovalent interactions are thermally reversible; that is, upon reheating they willmelt to a progel state, as is commonly observed with gelatin gels. This is especially true when hydrogen bonds are the majorcontributor to the network. Since hydrophobic interactions are strong at elevated temperatures, gel networks formed byhydrophobic interactions are irreversible, such as egg-white gels. Proteins that contain both cysteine and cystine groups canundergo polymerization via sulfhydryl-disulfide interchange reactions during heating, and form a continuous covalent networkupon cooling. Such gels are usually thermally irreversible. Examples of gels of this type are ovalbumin, b-lactoglobulin, and wheyprotein gels.
Proteins form two types of gels, namely, coagulum (opaque) gels and translucent gels. The type of gel formed by a protein isdictated by its molecular properties and solution conditions. Proteins containing large amounts of nonpolar amino acid residuesundergo
(68)
(PN is native state, PD is unfolded state, and n is the number of protein molecules taking part in cross-linking)
hydrophobic aggregation upon denaturation. These insoluble aggregates then randomly associate and set into an irreversiblecoagulum-type gel. Since the rate of aggregation and network formation is faster than the rate of denaturation, proteins of thistype readily set into a gel network even while being heated. The opaqueness of these gels is due to light scattering caused by theunordered network of insoluble protein aggregates.
Proteins that contain small amounts of nonpolar amino acid residues form soluble complexes upon denaturation. Since the rate ofassociation of these soluble complexes is slower than the rate of denaturation, and the gel network is predominantly formed byhydrogen bonding interactions, they often do not set into a gel until heating followed cooling has occurred (8–12% proteinconcentration assumed). Upon cooling, the slow rate of association of the soluble complexes facilitates formation of an orderedtranslucent gel network.
At the molecular level, coagulum-type gels tend to form when the sum of Val, Pro, Leu, Ile, Phe, and Trp residues of the proteinexceeds 31.5 mole percent [100]. Those that contain less

Pag e 393
than 31.5 mole percent of the above hydrophobic residues usually form translucent gels when water is the solvent. There areseveral exceptions to this empirical rule. For example, the hydrophobic amino acid content of b-lactoblobulin is 32 molepercent, yet it forms a translucent gel in water. However, when NaCl is included, it forms a coagulum-type gel even when thesalt concentration is as low as 50 mM. This occurs because of charge neutralization by NaCl, which promotes hydrophobicaggregation upon heating. Thus, gelation mechanism and gel appearance are fundamentally controlled by the balance betweenattractive hydrophobic interactions and repulsive electrostatic interactions. These two forces in effect control the balancebetween protein-protein and protein-solvent interactions in a gelling system. If the former is much greater than the latter, aprecipitate or a coagulum is likely to form. If protein-solvent interactions predominate, the system may not gel. A coagulum gelor a translucent gel results when the hydrophobic and hydrophilic forces are somewhere in-between these two extremes.
Protein gels are highly hydrated systems, containing up to 98% water. The water entrapped in these gels has chemical potential(activity) similar to that in dilute aqueous solutions, but lacks fluidity and cannot be easily squeezed out. The mechanisms bywhich liquid water can be held in a nonflowable semisolid state in gels are not well understood. The fact that translucent gels,formed primarily by hydrogen-bonding interactions, hold more water than coagulum-type gels and are less prone to syneresissuggests that much of the water is hydrogen bonded to C=O and N-H groups of the peptide bonds, is associated with chargedgroups in the form of hydration shells, and/or exists in extensively hydrogen-bonded water-water networks. It is also possiblethat within the restricted environment of each cell of the gel structure, water may act as an hydrogen-bonding cross-linkerbetween C=O and N-H groups of peptide segments (see Chap. 2). This may restrict the flowability of water within each cell,the more so as the cell size decreases. It is also likely that some water may be held as capillary water in the pores of the gelstructure, especially in coagulum gels.
The stability of a gel network against thermal and mechanical forces is dependent on the number of types of cross-links formedper monomer chain. Thermodynamically, a gel network would be stable only when the sum of the interaction energies of amonomer in the gel network is greater than its thermal kinetic energy. This is dependent on several intrinsic (such as the size, netcharge, etc.) and extrinsic factors (such as pH, temperature, ionic strength, etc.). The square root of the hardness of protein gelsexhibits a linear relationship with molecular weight [110]. Globular proteins with molecular weight < 23,000 cannot form a heat-induced gel at any reasonable protein concentration, unless they contain at least one free sulfhydryl group or a disulfide bond.The sulfhydryl groups and disulfide bonds facilitate polymerization, and thus increase the effective molecular weight ofpolypeptides to > 23,000. Gelatin preparations with effective molecular weights of less than 20,000 cannot form a gel.
Another critical factor is protein concentration. To form a self-standing gel network, a minimum protein concentration, known asleast concentration endpoint (LCE), is required. The LCE is 8% for soy proteins, 3% for egg albumin, and about 0.6% forgelatin. Above this mimimum concentration, the relationship between gel strength, G, and protein concentration, C, usuallyfollows a power law,
(69)
where Co is the LCE. For proteins, the value of n varies from 1 to 2.
Several environmental factors, such as pH, salts, and other additives, also affect gelation of proteins. At or near isoelectric pH,proteins usually form coagulum-type gels. At extremes of pH, weak gels are formed because of strong electrostatic repulsion.The optimum pH for gel formation is about 7–8 for most proteins.

Pag e 394
Formation of protein gels can sometimes be facilitated by limited proteolysis. A well-known example is cheese. Addition ofchymosin (rennin) to casein micelles in milk results in the formation of a coagulum-type gel. This is achieved by cleavage of k-casein, a micelle component, causing release of a hydrophilic portion, known as the glycomacropeptide. The remaining so-calledpara-casein micelles possess a highly hydrophobic surface that facilitates formation of a weak gel network.
Enzymic cross-linking of proteins at room temperature can also result in formation of a gel network. Transglutaminase is theenzyme often used to prepare these gels. This enzyme catalyzes formation of e-(g-glutamyl)lysyl cross-links between theglutamine and lysyl groups of protein molecules [77]. Using this enzymic cross-linking method, highly elastic and irreversible gelscan be formed even at low protein concentration.
Divalent cations, such as Ca2+ and Mg2+, can also be used to form protein gels. These ions form cross-links between negativelycharged groups of protein molecules. A good example of this type of gel is tofu from soy proteins. Alginate gels also can beformed by this means.
6.5.7 Dough Formation [67,68]
Among food proteins, wheat protein is very unique because of its exceptional ability to form a viscoelastic dough. When amixture of wheat flour and water (about 3:1 ratio) is kneaded, a dough with viscoelastic properties forms that is suitable formaking bread and other bakery products. These unusual dough characteristics are mainly attributable to the proteins in wheatflour.
Wheat flour contains soluble and insoluble protein fractions. The soluble proteins, comprising about 20% of the total proteins,are primarily albumin- and globulin-type enzymes and certain minor glycoproteins. These proteins do not contribute to thedough-forming properties of wheat flour. The major storage protein of wheat is gluten. Gluten is a heterogeneous mixture ofproteins, mainly gliadins and glutenins, with limited solubility in water. The formation of a viscoelastic dough capable ofentrapping gas during fermentation is attributed entirely to the gluten proteins.
Gluten has a unique amino acid composition, with Glu/Gln and Pro accounting for more than 50% of the amino acid residues.The low water solubility of gluten is attributable to its low content of Lys, Arg, Glu, and Asp residues, which together amount toless than 10% of the total amino acid residues. About 30% of gluten's amino acid residues are hydrophobic, and the residuescontribute greatly to its ability to form protein aggregates by hydrophobic interactions and to bind lipids and other nonpolarsubstances. The high glutamine and hydroxyl amino acid (~10%) contents of gluten is responsible for its water bindingproperties. In addition, hydrogen bonding between glutamine and hydroxyl residues of gluten polypeptides contributes to itscohesion-adhesion properties. Cysteine and cystine residues account for 2–3% of gluten's total amino acid residues. Duringformation of the dough, these residues undergo sulfhydryl-disulfide interchange reactions resulting in extensive polymerization ofgluten proteins.
Several physical and chemical transformations occur during mixing and kneading of a mixture of wheat flour and water. Underthe applied shear and tensile forces, gluten proteins absorb water and partially unfold. The partial unfolding of protein moleculesfacilitates hydrophobic interactions and sulfhydryl-disulfide interchange reactions, which result in formation of thread-likepolymers. These linear polymers in turn are believed to interact with each other, presumably via hydrogen bonding, hydrophobicassociations, and disulfide cross-linking, to form a sheet-like film capable of entrapping gas. Because of these transformations ingluten, the resistance of the dough increases with time until a maximum is reached, and this is followed by a decrease inresistance, indicative of a breakdown in the network structure. The breakdown involves alignment of polymers in the direction ofshear and some scission of disulfide

Pag e 395
cross-links, which reduces the polymer size. The time it takes to reach maximum dough strength during kneading is used as ameasure of wheat quality for bread making—a longer time indicating better quality.
The development of a viscoelastic dough is thought to be related to the extent of sulfhydryl-disulfide interchange reactions. Thisis supported by the fact that when reductants, such as cysteine, or sulfhydryl blocking agents, such as N-ethylmaleimide, areadded to dough, viscoelasticity decreases greatly. On the other hand, addition of oxidizing agents, such as iodates and bromates,increase the elasticity of the dough. This implies that wheat varieties that are rich is SH and S-S groups might possess superiorbread-making qualities, but this relationship is unreliable. Thus, the role of sulfhydryl-disulfide interchange reactions in thedevelopment of viscoelastic doughs is poorly understood.
Differences in bread-making qualities of different wheat cultivars may be related to the differences in the structure of gluten itself.As mentioned earlier, gluten is made up of gliadins and glutenins. Gliadins are comprised of four groups, namely a, b, g , and w-gliadins. In gluten these exist as single polypeptides with molecular weight ranging from 30,000 to 80,000. Although gliadinscontain about 2–3% half-cystine residues, they apparently do not undergo extensive polymerization via sulfhydryl-disulfideinterchange reactions. The disulfide bonds appear to remain as intramolecular disulfides during dough making. Dough made fromisolated gliadins and starch is viscous but not viscoelastic.
Glutenins, on the other hand, are heterogeneous polypeptides with molecular weight ranging from 12,000 to 130,000. These arefurther classified into high-molecular-weight (M.W. >90,000, HMW) and low-molecular-weight (M.W. <90,000, LMW)glutenins. In gluten, these glutenin polypeptides are present as polymers joined by disulfide cross-links, with molecular weightsranging into the millions. Because of their ability to polymerize extensively via sulfhydryl-disulfide interchange reactions, gluteninscontribute greatly to the elasticity of dough. Therefore, an optimum ratio of gliadins and glutenins seems to be necessary to forma viscoelastic dough. Some studies have shown a significant positive correlation between HMW glutenin content and bread-making quality in some wheat varieties, but not in others. Available information indicates that a specific pattern of disulfide cross-linked association among LMW and HMW glutenins in gluten structure may be far more important to bread quality than theamount of this protein. For example, association/polymerization among LMW glutenins gives rise to a structure similar to thatformed by HMW gliadin. This type of structure contributes to viscosity of the dough, but not to elasticity. In contrast, if LMWglutenins link to HMW glutenins via disulfide cross-links (in gluten), then this is believed to contribute to dough elasticity. It ispossible that in good-quality wheat varieties, more of the LMW glutenins may polymerize with HMW, whereas in poor-qualitywheat varieties, most of the LMW glutenins may polymerize among themselves. These differences in associated states ofglutenins in gluten of various wheat varieties may be related to differences in their conformational properties, such as surfacehydrophobicity, and reactivity of sulfhydryl and disulfide groups.
In summary, hydrogen bonding among amide and hydroxyl groups, hydrophobic interactions, and sulfhydryl-disulfideinterchange reactions all contribute to the development of the unique viscoelastic properties of wheat dough. However,culmination of these interactions into good dough-making properties may depend on the structural properties of each protein andthe proteins with which it associates in the overall gluten structure.
Because polypeptides of gluten, especially the glutenins, are rich in proline, they have very little folded structure. Whateverfolded structure initially exists in gliadins and glutenins is lost during mixing and kneading. Therefore, no additional unfoldingoccurs during baking.
Supplementation of wheat flour with albumin- and globulin-type proteins, such as whey proteins and soy proteins, adverselyaffects the viscoelastic properties and baking quality of the

Pag e 396
dough. These proteins decrease bread volume by interfering with formation of the gluten network. Addition of phospholipids orother surfactants to dough counters the adverse effects of foreign proteins on loaf volume. In this case, the surfactant/protein filmcompensates for the impaired gluten film. Although this approach results in acceptable loaf volume, the textural and sensoryqualities of the bread are less desirable than normal.
Isolated gluten is sometimes used as a protein ingredient in nonbakery products. Its cohesion-adhesion properties make it aneffective binder in comminuted meat and surimitype products.
6.6 Nutritional Properties of Proteins
Proteins differ in their nutritive value. Several factors, such as content of essential amino acids and digestibility, contribute tothese differences. The daily protein requirement therefore depends on the type and composition of proteins in a diet.
6.6.1 Protein Quality
The “quality” of a protein is related mainly to its essential amino acid composition and digestibility. High-quality proteins arethose that contain all the essential amino acids at levels greater than the FAO/WHO/UNU [30] reference levels, and adigestibility comparable to or better than those of egg-white or milk proteins. Animal proteins are better “quality” than plantproteins.
Proteins of major cereals and legumes are often deficient in at least one of the essential amino acids. While proteins of cereals,such as rice, wheat, barley, and maize, are very low in lysine and rich in methionine, those of legumes and oilseeds are deficientin methionine and rich or adequate in lysine. Some oilseed proteins, such as peanut protein, are deficient in both methionine andlysine contents. The essential amino acids whose concentrations in a protein are below the levels of a reference protein aretermed limiting amino acids. Adults consuming only cereal proteins or legume proteins have difficulty maintaining their health;children below 12 years of age on diets containing only one of these protein sources cannot maintain a normal rate of growth.The essential amino acid contents of various food proteins are listed in Table 18.
Both animal and plant proteins generally contain adequate or more than adequate amounts of His, Ile, Leu, Phe + Tyr, and Val.These amino acids usually are not limiting in staple foods. More often, either Lys, Thr, Trp, or the sulfur-containing amino acidsare the limiting amino acids.
The nutritional quality of a protein that is deficient in an essential amino acid can be improved by mixing it with another proteinthat is rich in that essential amino acid. For example, mixing of cereal proteins with legume proteins provides a complete andbalanced level of essential amino acids. Thus, diets containing appropriate amounts of cereals and legumes (pulses) andotherwise nutritionally complete are often adequate to support growth and maintenance. The poor-quality protein also can benutritionally improved by supplementing it with essential free amino acids that are under-represented. Supplementation oflegumes with Met and of cereals with Lys usually improves their quality.
The nutritional quality of a protein or protein mixture is ideal when it contains all of the essential amino acids in proportions thatproduce optimum rates of growth and/or optimum maintenance capability. The ideal essential amino acid patterns for childrenand adults are given in Table 19. However, because actual essential amino acid requirements of individuals in a given populationvary depending on their nutritional and physiological status, the essential amino acid requirements of preschool children (age2–5) are generally recommended as a safe level for all age groups [31].
Overconsumption of any particular amino acid can lead to “amino acid antagonism” or

Pag e 397
TABLE 18 Essential Amino Acid Contents and Nutritional Value of Proteins from Various Sources (mg /g Protein)
Protein source
Property (mg /g protein) EggCow'smilk Beef Fish W heat Rice Maize Barley Soybean
Field bean(boiled) Pea Peanut
Frenchbean
Amino acid concentration
(mg /g protein)
His 22 27 34 35 21 21 27 20 30 26 26 27 30
Ile 54 47 48 48 34 40 34 35 51 41 41 40 45
Leu 86 95 81 77 69 77 127 67 82 71 70 74 78
Lys 70 78 89 91 23ª 34ª 25ª 32ª 68 63 71 39ª 65
Met + Cys 57 33 40 40 36 49 41 37 33 22b 24b 32 26
Phe + Tyr 93 102 80 76 77 94 85 79 95 69 76 100 83
Thr 47 44 46 46 28 34 32b 29b 41 33 36 29b 40
Trp 17 14 12 11 10 11 6b 11 14 8ª 9ª 11 11
Val 66 64 50 61 38 54 45 46 52 46 41 48 52
Total essential amino acids 512 504 480 485 336 414 422 356 466 379 394 400 430
Protein content, % 12 3.5 18 19 12 7.5 — — 40 32 28 30 30
Chemical score (%) (based onFAO/W HO [30] pattern)
100 100 100 100 40 59 43 55 100 73 82 67
PER 3.9 3.1 3.0 3.5 1.5 2.0 — — 2.3 — 2.65 — —
BV (on rats) 94 84 74 76 65 73 — — 73 — — — —
NPU 94 82 67 79 40 70 — — 61 — — — —
Note: Chemical score is defined as the ratio of the amount of a limiting essential amino acid in 1 g of a test protein to the amount of the same amino acid in 1 g of areference protein. PER, protein efficiency ratio; BV, biolog ical value; NPU, net protein utilization.
ªPrimary limiting acid.
bSecond limiting acid.
Source: Refs. 28 and 30.

Pag e 398
TABLE 19 Recommended Essential Amino Acid Pattern for Food Proteins
Recommended pattern (mg /g protein)
Amino acidInfant
(2–5 years)Preschool child(10–12 years) Preschool child Adult
Histidine 26 19 19 16
Isoleucine 46 28 28 13
Leucine 93 66 44 19
Lysine 66 58 44 16
Met + Cys 42 25 22 17
Phe + Tyr 72 63 22 19
Threonine 43 34 28 9
Tryptophan 17 11 9 5
Valine 55 35 25 13
Total 434 320 222 111
Source: Ref. 30.
toxicity. Excessive intake of one amino acid often results in an increased requirement for other essential amino acids. This is dueto competition among amino acids for absorption sites on the intestinal mucosa. For example, when the Leu level is relativelyhigh, this decreases absorption of Ile, Val, and Tyr even if the dietary levels of these amino acids are adequate. This leads to anincreased dietary requirement for the latter three amino acids. Overconsumption of other essential amino acids also can inhibitgrowth and induce pathological conditions.
6.6.2 Digestibility
Digestibility is defined as the proportion of food nitrogen that is absorbed after ingestion. Although the content of essential aminoacids is the primary indicator of protein quality, true quality also depends on the extent to which these amino acids are utilized inthe body. Thus, digestibility of amino acids can affect the quality of proteins. Digestibilities of various proteins in humans arelisted in Table 20. Food proteins of animal origin are more completely digested than those of plant origin. Several factors affectdigestibility of proteins.

TABLE 20 Dig estibility of Various Food Proteins in Humans
Protein source Dig estibility (%) Protein source Dig estibility (%)
Egg 97 Millet 79
Milk, cheese 95 Peas 88
Meat, fish 94 Peanut 94
Maize 85 Soy flour 86
Rice (polished) 88 Soy protein isolate 95
W heat, whole 86 Beans 78
W heat flour, white 96 Corn, cereal 70
W heat g luten 99 W heat, cereal 77
Oatmeal 86 Rice cereal 75
Source: Ref. 30.

Pag e 399
1. Protein conformation: The structural state of a protein influences its hydrolysis by proteases. Native proteins are generally lesscompletely hydrolyzed than partially denatured ones. For example, treatment of phaseolin (a protein from kidney beans) with amixture of proteases results only in limited cleavage of the protein, resulting in liberation of a 22,000 MW polypeptide as themain product. When heat-denatured phaseolin is treated under similar conditions, it is completely hydrolyzed to amino acids andipeptides. Generally, insoluble fibrous proteins and extensively denatured globular proteins are difficult to hydrolyze.
2. Antinutritional factors: Most plant protein isolates and concentrates contain trypsin and chymotrypsin inhibitors (Kunitz typeand Bowman-Birk type) and lectins. These inhibitors impair complete hydrolysis of legume and oilseed proteins by pancreaticproteases. Lectins, which are glycoproteins, bind to intestinal mucosa cells and interfere with absorption of amino acids. Lectinsand Kunitz-type protease inhibitors are thermolabile, whereas the Bowman-Birk type inhibitor is stable under normal thermalprocessing conditions. Thus, heat-treated legume and oilseed proteins are generally more digestible than native protein isolates(despite some residual Bowman-Birk type inhibitor). Plant proteins also contain other antinutritional factors, such as tannins andphytate. Tannins, which are condensed products of polyphenols, covalently react with e-amino groups of lysyl residues. Thisinhibits trypsin-catalyzed cleavage of the lysyl peptide bond.
3. Binding: Interaction of proteins with polysaccharides and dietary fiber also reduces the rate and completeness of hydrolysis.
4. Processing: Proteins undergo several chemical alterations involving lysyl residues when exposed to high temperatures andalkaline pH. Such alterations reduce their digestibility. Reaction of reducing sugars with e-amino groups also decreasesdigestibility of lysine.
6.6.3 Evaluation of Protein Nutritive Value
Since the nutritional quality of proteins can vary greatly and is affected by many factors, it is important to have procedures forevaluating quality. Quality estimates are useful for (a) determining the amount required to provide a safe level of essential aminoacids for growth and maintenance, and (b) monitoring changes in the nutritive value of proteins during food processing, so thatprocessing conditions that minimize quality loss can be devised.
The nutritive quality of proteins can be evaluated by several biological, chemical, and enzymatic methods.
Biological Methods
Biological methods are based on weight gain or nitrogen retention in test animals when fed a protein-containing diet. A protein-free diet is used as the control. The protocol recommended by FAO/WHO [31] is generally used for evaluating protein quality.Rats are the usual test animal, although humans are sometimes used. A diet containing about 10% protein on a dry weight basisis used to ensure that the protein intake is below daily requirements. Adequate energy is supplied in the diet. Under theseconditions, protein in the diet is used to the maximum possible extent for growth. The number of test animals used must besufficient to assure results that are statistically reliable. A test period of 9 days is common. During each day of test period, theamount (g) of diet consumed is tabulated for each animal, and the feces and urine are collected for nitrogen analysis.
The data from animal feeding studies are used in several ways to evaluate protein quality.

Pag e 400
The protein efficiency ratio (PER) is the weight (in grams) gained per gram protein consumed. This is a simple and commonlyused expression. Another useful expression is net protein ratio (NPR). This is calculated as follows:
(70)
NPR values provide information on the ability of proteins to support both maintenance and growth. Rats are generally used astest animals in these methods. Since rats grow much faster than humans, and a larger percentage of protein is used formaintenance in growing children than in rats, it is often questioned whether PER and NPR values derived from rat studies areuseful for estimating human needs [94]. Although this argument is a valid one, appropriate correction procedures are available.
Another approach to evaluating protein quality involves measuring nitrogen uptake and nitrogen loss. This allows two usefulprotein quality parameters to be calculated. Apparent protein digestibility or coefficient of protein digestibility is obtainedfrom the difference between the amount of nitrogen ingested and the amount of nitrogen excreted in the feces. However, sincetotal fecal nitrogen also includes metabolic or endogenous nitrogen, correction should be made to obtain true proteindigestibility. True digestibility (TD) can be calculated in the following manner:
(71)
where I is nitrogen ingested, FN is total fecal nitrogen, and Fk,N is endogenous fecal nitrogen. Fk,N is obtained by feeding a protein-free diet.
TD gives information on the percentage of nitrogen intake absorbed by the body. However, it does not provide information onhow much of the absorbed nitrogen is actually retained or utilized by the body.
Biological value, BV, is calculated as follows:
(72)
where UN and Uk,N are the total and endogenous nitrogen losses, respectively, in the urine.
Net protein utilization (NPU), the percentage of nitrogen intake retained as body nitrogen, is obtained from the product of TDand BV. Thus,
(73)
The PER, BVs, and NPUs of several food proteins are presented in Table 18.
Other bioassays that are occasionally used to evaluate protein quality include assays for enzyme activity, changes in the essentialamino acid content of plasma, levels of urea in the plasma and urine, and rate of repletion of plasma proteins or gain in bodyweight of animals previously fed a protein-free diet.
Chemical Methods
Biological methods are expensive and time-consuming. Quick assessment of a protein's nutritive value can be obtained bydetermining its content of amino acids, and comparing this with the essential amino acid pattern of an ideal reference protein. Theideal pattern of essential amino

Pag e 401
acids in proteins (reference protein) for preschool children (2–5 years) is given in Table 19 [30], and this pattern is used as thestandard for all age groups except infants. Each essential amino acid in a test protein is given a chemical score, which is definedas
(74)
The essential amino acid that shows the lowest score is the most limiting amino acid in the test protein. The chemical score of thislimiting amino acid provides the chemical score for the test protein. As mentioned earlier, Lys, Thr, Trp, and sulfur amino acidsare often the limiting amino acids in food proteins. Therefore, the chemical scores of these amino acids are often sufficient toevaluate the nutritive value of proteins. The chemical score enables estimation of the amount of a test protein or protein mixneeded to meet the daily requirement of the limiting amino acid. This can be calculated as follows.
(75)
One of the advantages of the chemical score method is that it is simple and allows one to determine the complementary effects ofproteins in a diet. This also allows one to develop high-quality protein diets by mixing various proteins suitable for variousfeeding programs. There are, however, several drawbacks to use of the chemical score method. An assumption underlyingchemical score is that all test proteins are fully or equally digestible, and that all essential amino acids are fully absorbed. Becausethis assumption is often violated, correlation between results from bioassays and chemical scores is often not good. However,the correlation improves when chemical scores are corrected for protein digestibility. The apparent digestibility of proteins canbe rapidly determined in vitro using a combination of three or four enzymes, such as trypsin, chymotrypsin, peptidase, andbacterial protease.
Another shortcoming of chemical score is that it does not distinguish between D- and L-amino acids. Since only L-amino acidsare usable in animals, the chemical score overestimates the nutritive value of a protein, especially in proteins exposed to high pHlevels, which causes racemization. The chemical score method is also incapable of predicting the negative effects of highconcentrations of one essential amino acid on the bioavailability of other essential amino acids, and it does not account for theeffect of antinutritional factors that might be present in the diet. Despite these major drawbacks, recent findings indicate thatchemical scores, when corrected for protein digestibility, correlate well with biological assays for those proteins having biologicalvalues above 40%; when the BV is below 40%, the correlation is poor [31].
Enzymic and Microbial Methods
In vitro enzymic methods are sometimes used to measure the digestibility and release of essential amino acids. In one method,test proteins are first digested with pepsin and then with pancreatin (freeze-dried powder of pancreatic extract) [70]. In anothermethod, proteins are digested with three enzymes, namely, pancreatic trypsin, chymotrypsin, and porcine intestinal peptidase,under standard assay conditions [31]. These methods, in addition to providing information on innate digestibility of proteins, areuseful for detecting processing-induced changes in protein quality.
Growth of several microorganisms, such as Streptococcus zymogenes, Streptococcus faecalis, Leuconostoc mesenteroides,Clostridium perfringens, and Tetrahymena pyriformis (a protozoan) also have been used to determine the nutritional value ofproteins [34]. Of these

Pag e 402
microorganisms, Tetrahymena pyriformis is particularly useful, because its amino acid requirements are similar to those of ratsand humans.
6.7 Processing-Induced Physical, Chemical, and Nutritional Changes in Proteins
Commercial processing of foods can involve heating, cooling, drying, application of chemicals, fermentation, irradiation, orvarious other treatments. Of these, heating is most common. This is commonly done to inactivate microorganisms, to inactivateendogenous enzymes that cause oxidative and hydrolytic changes in foods during storage, and to transform an unappealing blendof raw food ingredients into a wholesome and organoleptically appealing food. In addition, proteins such as bovine b-lactoglobulin, a-lactalbumin, and soy protein, which sometimes cause allergenic or hypersensitive responses, can sometimes berendered innocuous in this regard. Unfortunately, the beneficial effects achieved by heating proteinaceous foods are generallyaccompanied by changes that can adversely affect the nutritive value and functional properties of proteins. In this section, bothdesirable and undesirable effects of food processing on proteins will be discussed.
6.7.1 Changes in Nutritional Quality and Formation of Toxic Compounds
6.7.1.1 Effect of Moderate Heat Treatments
Most food proteins are denatured when exposed to moderate heat treatments (60–90°C, 1 h or less). Extensive denaturation ofproteins often results in insolublization, which can impair those functional properties that are dependent on solubility. From anutritional standpoint, partial denaturation of proteins often improves the digestibility and biological availability of essential aminoacids. Several purified plant proteins and egg protein preparations, even though free of protease inhibitors, exhibit poor in vitroand in vivo digestibility. Moderate heating improves their digestibility without developing toxic derivatives.
In addition to improving digestibility, moderate heat treatment also inactivates several enzymes, such as proteases, lipases,lipoxygenases, amylases, polyphenoloxidase, and other oxidative and hydrolytic enzymes. Failure to inactivate these enzymescan result in development of off-flavors, rancidity, textural changes, and discoloration of foods during storage. For instance,oilseeds and legumes are rich in lipoxygenase. During crushing or cracking of these beans for extraction of oil or protein isolates,this enzyme, in the presence of molecular oxygen, catalyzes oxidation of polyunsaturated fatty acids to initially yieldhydroperoxides. The hydroperoxides subsequently decompose and liberate aldehydes and ketones, which impart off-flavor tosoy flour and soy protein isolates and concentrates. To avoid off-flavor formation, it is necessary to thermally inactivatelipoxygenase prior to crushing.
Moderate heat treatment is particularly beneficial for plant proteins, because they usually contain proteinaceous antinutritionalfactors. Legume and oilseed proteins contain several trypsin and chymotrypsin inhibitors. These inhibitors impair efficientdigestion of proteins, and thus reduce their biological availability. Furthermore, inactivation and complexation of trypsin andchymotrypsin by these inhibitors induce overproduction and secretion of these enzymes by the pancreas, which can lead topancreatic hypertropy (enlargement of the pancreas) and pancreatic adenoma. Legume and oilseed proteins also contain lectins,which are glycoproteins. These are also known as phytohemagglutinins because they cause agglutination of red blood

Pag e 403
cells. Lectins exhibit a high binding affinity for carbohydrates. When consumed by humans, lectins impair protein digestion [90]and cause intestinal malabsorption of other nutrients. The latter consequence results from binding of lectins to membraneglycoproteins of intestinal mucosa cells, which alters their morphology and transport properties [84]. Both protease inhibitorsand lectins found in plant proteins are thermolabile. Toasting of legumes and oilseeds or moist heat treatment of soy flourinactivates both lectins and protease inhibitors, improves the digestibility and PER of these proteins (Fig. 26), and preventspancreatic hypertropy [43]. These antinutritional factors do not pose problems in home-cooked or industrially processedlegumes and flour-based products when heating conditions are adequate to inactivate them.
Milk and egg proteins also contain several protease inhibitors. Ovomucoid, which possesses antitryptic activity, constitutes about11% of egg albumen. Ovoinhibitor, which inhibits trypsin, chymotrypsin, and some fungal proteases, is present at a 0.1% level inegg albumen. Milk contains several protease inhibitors, such as plasminogen activator inhibitor (PAI) and plasmin inhibitor (PI),derived from blood. All of these inhibitors lose their activity when subjected to moderate heat treatment in the presence of water.
The beneficial effects of heat treatment also include inactivation of proteinaceous toxins, such as botulinum toxin fromClostridium botulinum (inactivated by heating at 100°C) and enterotoxin from Staphylococcus aureaus.
6.7.1.2 Compositional Changes During Extraction and Fractionation
Preparation of protein isolates from biological sources involves several unit operations, such as extraction, isoelectricprecipitation, salt precipitation, thermocoagulation, and ultrafiltration/diafiltration. It is very likely that some of the proteins in thecrude extract might be lost during these operations. For example, during isoelectric precipitation, some sulfur-rich albumin-type
FIGURE 26
Effect of toasting on trypsin inhibitory activity ( ) and
PER ( ) of soy flour. Adapted from Ref. 36.

Pag e 404
proteins, which are usually soluble at isoelectric pH, might be lost in the supernatant fluid. Such losses can alter the amino acidcomposition and nutritional value of protein isolates compared to those of crude extracts. For example, the chemical scores ofMet and Trp in crude coconut meal are about 100 and 89, respectively, whereas they are almost zero in coconut protein isolateobtained by isoelectric precipitation [42,61]. Similarly, whey protein concentrate (WPC) prepared by ultrafiltration/diafiltrationand ion-exchange methods undergoes marked changes in their proteose-peptone contents. This markedly affects their foamingproperties.
6.7.1.3 Chemical Alteration of Amino Acids
Proteins undergo several chemical changes when processed at high temperatures. These changes include racemization,hydrolysis, desulfuration, and deamidation. Most of these chemical changes are irreversible, and some of these reactions result information of amino acid types that are potentially toxic.
Racemization
Thermal processing of proteins at alkaline pH, as is done to prepare texturized foods, invariably leads to partial racemization ofL-amino acid residues to D-amino acids [66]. Acid hydrolysis of proteins also causes some racemization of amino acids [32], asdoes roasting of proteins or protein containing foods above 200°C[45]. The mechanism at alkaline pH involves initial abstractionof the proton from the a-carbon atom by a hydroxyl ion. The resulting carbanion loses its tetrahedral asymmetry. Subsequentaddition of a proton from solution can occur either from the top or bottom of the carbanion. This equal probability results inracemization of the amino acid residue [66]. The rate of racemization of a residue is affected by the electron-withdrawing powerof the side chain. Thus, residues such as Asp, Ser, Cys, Glu, Phe, Asn, and Thr are racemized at a faster rate than are otheramino acid residues [65]. The rate of racemization is also dependent on hydroxyl ion concentration, but is independent of proteinconcentration. Interestingly, the rate of racemization is about 10 times faster in proteins than in free amino acids [65], suggestingthat intramolecular forces in a protein reduce the activation energy of racemization. In addition to racemization, the carbanionformed under alkaline pH also can undergo b-elimination reaction to yeild dehydroalanine. Cysteine and
(76)
phosphoserine residues display greater propensity for this route than do other amino acid residues. This is one of the reasonswhy a significant amount of D-cysteine is not found in alkali-treated proteins.
Racemization of amino acid residues causes a reduction in protein digestibility because

Pag e 405
the peptide bonds involving D-amino acid residues are less efficiently hydrolyzed by gastric and pancreatic proteases. This leadsto loss of essential amino acids that have racemized, and impairs the nutritional value of the protein. D-Amino acids are also lessefficiently absorbed through intestinal mucosa cells, and even if absorbed, they cannot be utilized in in vivo protein synthesis.Moreover, some D-amino acids, such as D-proline, have been found to be neurotoxic in chickens [16].
In addition to racemization and b-elimination reactions, heating of proteins at alkaline pH destroys several amino acid residues,such as Arg, Ser, Thr, and Lys. Arg decomposes to ornithine.
When proteins are heated above 200°C, as is commonly encountered on food surfaces during broiling, baking, and grilling,amino acid residues undergo decomposition and pyrolysis. Several of the pyrolysis products have been isolated and identifiedfrom broiled and grilled meat, and they are highly mutagenic as determined by the Ames test. The most carcinogenic/mutagenicproducts are formed from pyrolysis of Trp and Glu residues [14]. Pyrolysis of Trp residues gives rise to formation of carbolinesand their derivatives. Mutagenic compounds are also produced in meats at moderate temperatures (190–200°C). These areknown as aminoimidazoazaarenes (AIAs). One of the classes of compounds is imidazo quinolines (IQ compounds), which arecondensation products of creatinine, sugars, and certain amino acids, such as Gly, Thr, Ala, and Lys [51]. The three most potentmutagens formed in broiled fish are shown here.
(77)
Following heating of foods according to recommended procedures, IQ compounds are generally present only at very lowconcentrations (microgram amounts).
6.7.1.4 Protein Cross-Linking
Several food proteins contain both intra- and intermolecular cross-links, such as disulfide bonds in globular proteins, desmosine,and isodesmosine; and di- and trityrosine-type cross-links in fibrous proteins such as keratin, elastin, resilin, and collagen.Collagen also contains e-N-(g-glutamyl)lysyl and/or e-N-(g-aspartyl)lysyl cross-links. One of the functions of these cross-linksin native proteins is to minimize metabolic proteolysis. Processing of food proteins, especially at alkaline pH, also includes cross-link formation. Such unnatural covalent bonds between polypeptide chains reduce digestibility and biological availability ofessential amino acids that are involved in, or near, the cross-link.
As discussed in the previous section, heating of protein at alkaline pH, or heating above 200°C at neutral pH, results inabstraction of the proton from the a-carbon atom, resulting in formation of a carbanion. The carbanion derivative of Cys,cystine, and phosphoserine undergoes b-elimination reaction, leading to formation of a highly reactive dehydroalanine residue(DHA). DHA formation can also occur via a one-step mechanism without formation of the carbanion.

Pag e 406
(78)
Once formed, the highly reactive DHA residues react with nucleophilic groups, such as the e-amino group of a lysyl residue, thethiol group of Cys residue, the d-amino group of ornithine (formed by decomposition of arginine), or a histidyl residue, resultingin formation of lysinoalanine, lanthionine, ornithoalanine, and histidinylalanine cross-links, respectively, in proteins. Lysinoalanineis the major cross-link commonly found in alkali treated proteins because of the abundance of readily accessible lysyl residues.
(79)

Pag e 407
The formation of protein-protein cross-links in alkali-treated proteins decreases their digestibility and biological value. Bothdigestibility (and PER) and net protein utilization (NPU) decrease with an increase in lysinoalanine content. The decrease indigestibility is related to the inability of trypsin to cleave the peptide bond in the lysinoalanine cross-link. Moreover, the stericconstraints imposed by the cross-links also prevent hydrolysis of other peptide bonds in the neighborhood of the lysinoalanineand similar cross-links. Evidence suggests that free lysinoalanine is absorbed in the intestine, but it is not utilized by the body andmost of it is excreted in the urine. Some lysinoalanine is metabolized in the kidney.
Rats fed 100 ppm pure lysinoalanine or 3000 ppm protein-bound lysinoalanine exhibit nephrocytomegaly (i.e., kidney disorder).However, such nephrotoxic effects have not been observed in other animal species, such as quails, mice, hamsters, andmonkeys. This has been attributed to differences in the types of metabolites formed in rats versus other animals. At levelsencountered in foods, protein-bound lysinoalanine apparently does not cause nephrotoxicity in humans. Nevertheless,minimization of lysinoalanine formation during alkali processing of proteins is a desirable goal.
The lysinoalanine contents of several commercial foods are listed in Table 21. The extent of formation of lysinoalanine isdependent on pH and temperature. The higher the pH, the greater is the extent of lysinoalanine formation. High-temperature heattreatment of foods, such as milk, causes a significant amount of lysinoalanine to form even at neutral pH. Lysinoalanine formationin proteins can be minimized or inhibited by adding low-molecular-weight nucleophilic compounds, such as cysteine, ammonia,or sulfites. The effectiveness of cysteine results because the
Table 21 Lysinoalanine (LAL) Content of Processed Foods
Food LAL (mg /g protein)
Corn chips 390
Pretzels 500
Hominy 560
Tortillas 200
Taco shells 170
Milk, infant formula 150–640
Milk, evaporated 590–860
Milk, UHT 160–370
Milk, HTST 260–1030
Milk, spray-dried powder 0
Skim milk, evaporated 520
Simulated cheese 1070
Eg g -white solids, dried 160–1820
Calcium caseinate 370–1000
Sodium caseinate 430–6900
Acid casein 70–190
Hydrolyzed veg etable protein 40–500
W hipping ag ent 6500–50,000
Soy protein isolate 0–370
Yeast extract 120
Source: Ref. 103.


Pag e 408
nucleophilic SH group reacts more than 1000 times faster than the e-amino group of lysine. Sodium sulfite and ammonia exerttheir inhibitory effect by competing with the e-amino group of lysine for DHA. Blocking of e-amino groups of lysine residues byreaction with acid anhydrides prior to alkali treatment also decreases the formation of lysinoalanine. However, this approachresults in loss of lysine activity and may be unsuitable for food applications.
Under normal conditions used for processing of several foods, only small amounts of lysinoalanine are formed. Thus, toxicity oflysinoalanine in alkali-treated foods is not believed to be a major concern. However, reduction in digestibility, loss ofbioavailability of lysine, and racemization of amino acids (some of which are toxic) all are undesirable.
Excessive heating of pure protein solutions or proteinaceous foods low in carbohydrate content also results in formation of e-N-(g-glutamyl)lysyl and e-N-(g-aspartyl)lysyl cross-links. These involve a transamidation reaction between Lys and Gln or Asnresidues. The resulting cross-links are termed isopeptide bonds because they are foreign to native proteins. Isopeptides resistenzymatic hydrolysis in the gut, and these cross-linkages therefore impair digestibility of proteins and bioavailability of lysine.
(80)
Ionizing radiation of foods results in the formation of hydrogen peroxide through radiolysis of water in the presence of oxygen,and this, in turn, causes oxidative changes in, and polymerization of, proteins. Ionizing radiation also may directly produce freeradicals via ionization of water.
(81)
(82)
The hydroxyl free radical can induce formation of protein free radicals, which in turn may cause polymerization of proteins.
(83)
(84)
Heating of protein solutions at 70–90°C and at neutral pH generally leads to sulfhydryl-disulfide interchange reactions (if thesegroups are present), resulting in polymerization of

Pag e 409
proteins. However, this type of heat-induced cross-link generally does not have an adverse effect on the digestibility andbioavailability of proteins and essential amino acids because these bonds can be broken in vivo.
6.7.1.5 Effects of Oxidizing Agents
Oxidizing agents such as hydrogen peroxide and benzoyl peroxide are used as bactericidal agents in milk, as bleaching agents incereal flours, protein isolates, and fish protein concentrate, and for detoxification of oilseed meals. Sodium hypochlorite is alsocommonly used as a bactericidal and detoxifying agent in flours and meals. In addition to oxidizing agents that are sometimesadded to foods, several oxidative compounds are endogenously produced in foods during processing. These include freeradicals formed during irradiation of foods, during peroxidation of lipids, during photooxidation of compounds such as riboflavinand chlorophyll, and during nonenzymatic browning of foods. In addition, polyphenols present in several plant proteins can beoxidized by molecular oxygen to quinones at neutral to alkaline pH, and this will lead ultimately to peroxides. These highlyreactive oxidizing agents cause oxidation of several amino acid residues and polymerization of proteins. The amino acid residuesmost susceptible to oxidation are Met, Cys/cystine, Trp, and His, and to a lesser extent Tyr.
Oxidation of Methionine
Methionine is easily oxidized to methionine sulfoxide by various peroxides. Incubation of protein bound mehtionine or freemethionine with hydrogen peroxide (0.1 M) at elevated temperature for 30 min results in complete conversion of methionine tomethionine sulfoxide [18]. Under strong oxidizing conditions, methionine sulfoxide is further oxidized to methionine sulfone, andin some cases to homocysteic acid.
(85)
Methionine becomes biologically unavailable once it is oxidized to methionine sulfone or homocysteic acid. Methionine sulfoxide,on the other hand, is reconverted to Met under acidic conditions in the stomach. Further, evidence suggests that any methioninesulfoxide passing through the intestine is absorbed and reduced in vivo to methionine. However, in vivo reduction of methioninesulfoxide to methionine is slow. The PER or NPU of casein oxidized with 0.1 M hydrogen peroxide (which completelytransforms methionine to methionine sulfoxide) is about 10% less than that of control casein.
Oxidation of Cysteine and Cystine
Under alkaline conditions, cysteine and cystine follow the b-elimination reaction pathway to produce dehydroalanine residues.However, at acidic pH, oxidation of cysteine and cystine in simple systems results in formation of several intermediate oxidationproducts. Some of these derivatives are unstable.

Pag e 410
(86)
Mono- and disulfoxides of L-cystine are biologically available, presumably because they are reduced back to L-cystine in thebody. However, mono- and disulfone derivatives of L-cystine are biologically unavailable. Similarly, while cysteine sulfenic acidis biologically available, cysteine sulfenic acid and cysteic acid are not. The rate and extent of formation of these oxidationproducts in acidic foods are not well documented.
Oxidation of Tryptophan
Among the essential amino acids, Trp is exceptional because of its role in several biological functions. Therefore, its stability inprocessed foods is of major concern. Under acidic, mild, oxidizing conditions, such as in the presence of performic acid,dimethylsulfoxide, or N-bromosuccinimide (NBS), Trp is oxidized mainly to b-oxyindolylalanine. Under acidic, severe, oxidizingconditions, such as in the presence of ozone, hydrogen peroxide, or peroxidizing lipids, Trp is oxidized to N-formylkynurenine,kynurenine, and other unidentified products.
(87)
Exposure of Trp to light in the presence of oxygen and a photosensitizer, such as riboflavin, leads to formation of N-formylkynurenine and kynurenine as major products and several other minor ones. Depending upon the pH of the solution, otherderivatives, such as 5-hydroxyformylkynurenine (pH > 7.0) and a tricyclic hydroperoxide (pH 3.6–7.1), are also formed [73].In addition to the photoxidative products, Trp forms a photoadduct with riboflavin.

Pag e 411
Both protein-bound and free tryptophan are capable of forming this adduct. The extent of formation of this photoadduct isdependent on availability of oxygen, being greater under anaerobic conditions [97].
The oxidation products of Trp are biologically active. In addition, kynurenines are carcinogenic in animals, and all other Trpphotooxidative products as well as the carbolines formed during broiling/grilling of meat products exhibit mutagenic activities andinhibit growth of mammalian cells in tissue cultures. The tryptophan-riboflavin photoadduct shows cytotoxic effects onmammalian cells, and exerts hepatic dysfunctions during parenteral nutrition.
(88)
These undesirable products are normally present in extremely low concentration in foods unless an oxidation environment ispurposely created.
Among the amino acid side chains, only those of Cys, His, Met, Trp, and Tyr are susceptible to sensitized photooxidation. In thecase of Cys, cysteic acid is the end product. Met is photooxidized first to methionine sulfoxide, and finally to methionine sulfoneand homocysteic acid. Photooxidation of histidine leads to the formation of aspartate and urea. The photooxidation products oftyrosine are not known. Since foods contain endogenous as well as supplemented riboflavin (vitamin B2), and usually areexposed to light and air, some degree of sensitized photooxidation of the preceding amino acid residues would be expected tooccur. At equimolar concentrations, the rates of oxidation of the sulfur amino acids and Trp are likely to follow the order Met>Cys> Trp.

Pag e 412
Oxidation of Tyrosine
Exposure of tyrosine solutions to peroxidase and hydrogen peroxide results in oxidation of tyrosine to dityrosine. Occurrence ofthis type of cross-link has been found in natural proteins, such as resilin, elastin, keratin, and collagen.
(89)
6.7.1.6 Carbonyl-Amine Reactions
Among the various processing-induced chemical changes in proteins, the Maillard reaction (nonenzymatic browning) has thegreatest impact on its sensory and nutritional properties. The Maillard reaction refers to a complex set of reactions initiated byreaction between amines and carbonyl compounds, which, at elevated temperature, decompose and eventually condense intoinsoluble brown products known as melanoidins (see Chap. 4). This reaction occurs not only in foods during processing, butalso in biological systems. In both instances, proteins and amino acids typically provide the amino component, and reducingsugars (aldoses and ketoses), ascorbic acid, and carbonyl compounds generated from lipid oxidation provide the carbonylcomponent.
Some of the carbonyl derivatives from the nonenzymatic browning sequence react readily with free amino acids. This results indegradation of the amino acids to aldehydes, ammonia, and carbon dioxide, and the reaction is known as Streckerdegradation. The aldehydes contribute to aroma development during the browning reaction. Strecker degradation of eachamino acid produces a specific aldehyde with a distinctive aroma (see Chap. 11).
(90)
The Maillard reaction impairs protein nutritional value, and some of the products may be toxic, but probably are not hazardousat concentrations encountered in foods. Because the e-amino group of lysine is the major source of primary amines in proteins, itis frequently involved in the carbonyl-amine reaction, and it typically suffers a major loss in bioavailability when this reactionoccurs. The extent of Lys loss depends on the stage of the browning reaction. Lysine involved in the early stages of browning,including the Schiff's base, is biologically

Pag e 413
available. These early derivatives are hydrolyzed to lysine and sugar in the acidic conditions of the stomach. However, beyondthe stage of ketosamine (Amadori product) or aldosamine (Heyns product), lysine is no longer biologically available. This isprimarily because of poor absorption of these derivatives in the intestine [29]. It is important to note that no color has developedat this stage. Although sulfite inhibits formation of brown pigments [113], it cannot prevent loss of lysine availability, because itcannot prevent formation of Amadori or Heyns products.
Biological activity of lysine at various stages of the Maillard reaction can be determined chemically by addition of 1-fluoro-2,4-dinitrobenzene (FDNB), followed by acid hydrolysis of the derivatized protein. FDNB reacts with available e-amino groups oflysyl residues. The hydrolysate is then extracted with ethyl ether to remove unreacted FDNB, and the concentration of e-dinitrophenyl-lysyl (e-DNP-lysine) in the aqueous phase is determined by measuring absorbance at 435 nm. Available lysinealso can be determined by reacting 2,4,6-trinitrobenzene sufonic acid (TNBS) with the e-amino group. In this case, theconcentration of e-trinitrophenyl-lysine (e-TNP-lysine) derivative is determined from absorbance at 346 nm.
Nonenzymatic browning not only causes major losses of lysine, but reactive unsaturated carbonyls and free radicals formedduring the browning reaction cause oxidation of several other essential amino acids, especially Met, Tyr, His, and Trp. Cross-linking of proteins by dicarbonyl compounds produced during browning decreases protein solubility, and impairs digestibility ofproteins.
Some Maillard browning products are suspected mutagens. Although mutagenic compounds are not necessarily carcinogenic, allknown carcinogens are mutants. Therefore, the formation of mutagenic Maillard compounds in foods is of concern. Studies withmixtures of glucose and amino acids have shown that the Maillard products of Lys and Cys are mutagenic, whereas those ofTrp, Tyr, Asp, Asn, and Glu are not, as determined by the Ames test. It should be pointed out that pyrolysis products of Trpand Glu (in grilled and broiled meat) also are mutagenic (Ames test). As discussed earlier, heating of sugar and amino acids inthe presence of creatine produces the most potent IQ-type mutagens (see Eq. 77). Although results based on model systemscannot be reliably applied to foods, it is possible that interaction of Maillard products with other low-molecular-weightconstituents in foods may produce mutagenic and/or carcinogenic substances.
On a positive note, some Maillard reaction products, especially the reductones, do have antioxidative activity [75]. This is due totheir reducing power, and their ability to chelate metals, such as Cu and Fe, which are pro-oxidants. The amino reductonesformed from the reaction of triose reductones with amino acids such as Gly, Met, and Val show excellent antioxidative activity.
Besides reducing sugars, other aldehydes and ketones present in foods can also take part in the carbonyl-amine reaction.Notably, gossypol (in cotton seed), glutaraldehyde (added to protein meals to control deamination in the rumen of ruminants),and aldehydes (especially malonaldehyde) generated from the oxidation of lipids may react with amino groups of proteins.Bifunctional aldehydes, such as malonaldehyde, can cross-link and polymerize proteins.
(91)
This may result in insolublization, loss of digestibility and bioavailability of lysine, and loss of functional properties of proteins.Formaldehyde also reacts with the e-amino group of lysyl residues; the toughening of fish muscle during frozen storage isbelieved to be due to reactions of formaldehyde with fish proteins.
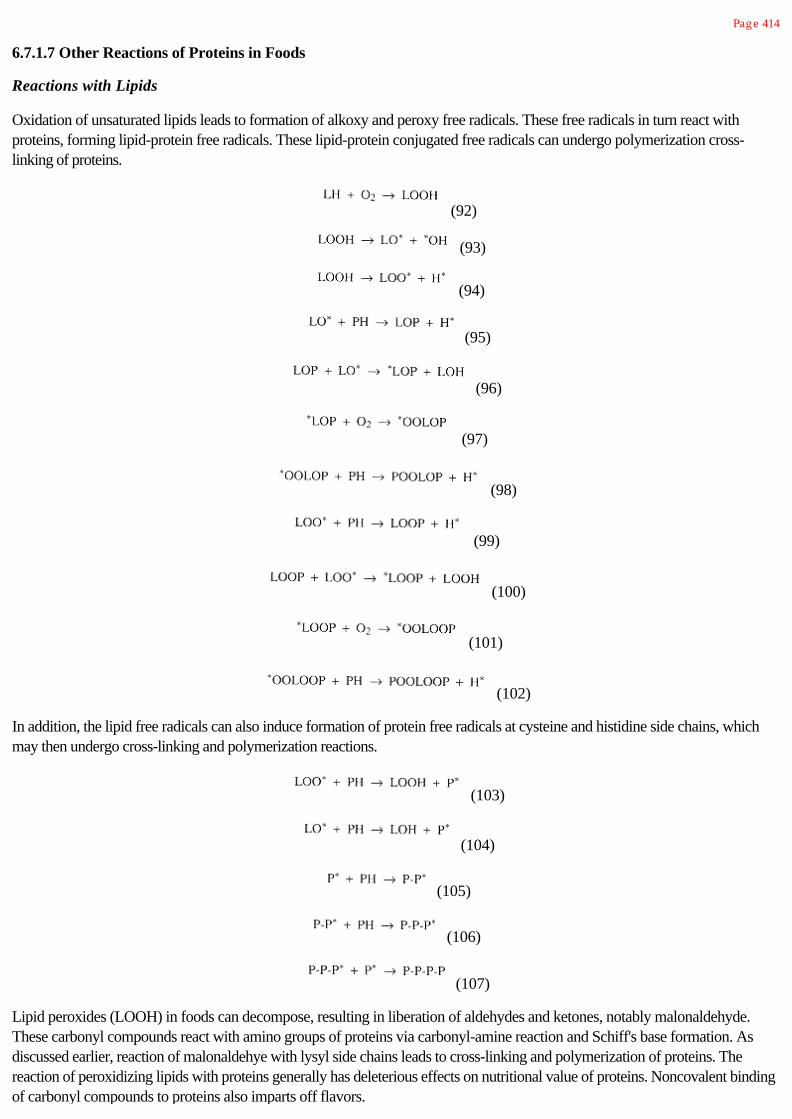
Pag e 414
6.7.1.7 Other Reactions of Proteins in Foods
Reactions with Lipids
Oxidation of unsaturated lipids leads to formation of alkoxy and peroxy free radicals. These free radicals in turn react withproteins, forming lipid-protein free radicals. These lipid-protein conjugated free radicals can undergo polymerization cross-linking of proteins.
(92)
(93)
(94)
(95)
(96)
(97)
(98)
(99)
(100)
(101)
(102)
In addition, the lipid free radicals can also induce formation of protein free radicals at cysteine and histidine side chains, whichmay then undergo cross-linking and polymerization reactions.
(103)
(104)
(105)
(106)
(107)
Lipid peroxides (LOOH) in foods can decompose, resulting in liberation of aldehydes and ketones, notably malonaldehyde.These carbonyl compounds react with amino groups of proteins via carbonyl-amine reaction and Schiff's base formation. Asdiscussed earlier, reaction of malonaldehye with lysyl side chains leads to cross-linking and polymerization of proteins. Thereaction of peroxidizing lipids with proteins generally has deleterious effects on nutritional value of proteins. Noncovalent bindingof carbonyl compounds to proteins also imparts off flavors.

Reactions with Polyphenols
Phenolic compounds, such as p-hydroxybenzoic acid, catechol, caffeic acid, gossypol, and quercein, are found in all planttissues. During maceration of plant tissues, these phenolic compounds can be oxidized by molecular oxygen at alkaline pH toquinones. This can also occur by the action of polyphenoloxidase, which is commonly present in plant tissues. These highlyreactive quinones can irreversibly react with the sulfhydryl and amino groups of proteins.

Pag e 415
Reaction of quinones with SH and a-amino groups (N-terminal) is much faster than it is with e-amino groups. In addition,quinones the oxidation products of phenolic compound, can also undergo condensation reactions, resulting in formation of highmolecular weight brown color pigments sometimes referred to as tannins. Tannins remain highly reactive and readily combinewith SH and amino groups of proteins. Quinone-amino group reactions decrease the digestibility and bioavailability of protein-bound lysine and cysteine.
Reactions with Halogenated Solvents
Halogenated organic solvents are often used to extract oil and some antinutritive factors from oilseed products, such as soybeanand cottonseed meals. Extraction with trichloroethylene results in formation of a small amount of S-dichlorovinyl-L-cysteine,which is toxic. On the other hand, the solvents dichloromethane and tetrachloroethylene do not seem to react with proteins. 1,2-Dichloroethane reacts with Cys, His, and Met residues in proteins. Certain fumigants, such as methyl bromide, can alkylate Lys,His, Cys, and Met residues. All of these reactions decrease the nutritional value of proteins, and some are of concern from asafety standpoint.
Reactions with Nitrites
Reaction of nitrites with secondary amines, and to some extent with primary and tertiary amines, results in formation of N-nitrosoamines, which are among the most carcinogenic compounds formed in foods. Nitrites are usually added to meat productsto improve color and to prevent bacterial growth. The amino acids (or residues) primarily involved in this reaction are Pro, His,and Trp. Arg, Tyr, and Cys also can react with nitrites. The reaction occurs mainly under acidic conditions and at elevatedtemperatures.
(108)
The secondary amines produced during the Maillard reaction, such as Amadori and Heyns products, also can react with nitrites.Formation of N-nitrosamines during cooking, grilling, and broiling of meat has been a major concern, but additives, such asascorbic acid and erythorbate, are effective in curtailing this reaction.
Reaction with Sulfites
Sulfites reduce disulfide bonds in proteins to yield S-sulfonate derivatives. They do not react with cysteine residues.
(109)
In the presence of reducing agents, such as cysteine or mecaptoethanol, the S-sulfonate deriva-

Pag e 416
tives are converted back to cysteine residues. S-Sulfonates decompose under acidic (as in stomach) and alkaline pH todisulfides. The S-sulfonation does not decrease the bioavailability of cysteine. The increase in electronegativity and the breakageof disulfide bonds in proteins upon S-sulfonation causes unfolding of protein molecules, which affects their functional properties.
6.7.2 Changes in the Functional Properties of Proteins
The methods or processes used to isolate proteins can affect their functional properties. Minimum denaturation during variousisolation steps is generally desired because this helps retain acceptable protein solubility, which is often a prerequisite tofunctionality of these proteins in food products. In some instances, controlled or partial denaturation of proteins can improvecertain functional properties.
Proteins are often isolated using isoelectric precipitation. The secondary, tertiary, and quaternary structures of most globularproteins are stable at their isoelectric pH, and the proteins readily become soluble again when dispersed at neutral pH. On theother hand, protein entities such as casein micelles are irreversibly destabilized by isoelectric precipitation. The collapse ofmicellar structure in isoelectrically precipitated casein is due to several factors, including solubilization of colloidal calciumphosphate and the change in the balance of hydrophobic and electrostatic interactions among the various casein types. Thecompositions of isoelectrically precipitated proteins are usually altered from those of the raw materials. This is because someminor protein fractions are reasonably soluble at the isoelectric pH of the major component and are therefore do not precipitate.This change in composition affects the functional properties of the protein isolate.
Ultrafiltration (UF) is widely used to prepare whey protein concentrates (WPC). Both protein and nonprotein composition ofWPC are affected by removal of small solutes during UF. Partial removal of lactose and ash strongly influences the functionalproperties of WPC. Furthermore, increased protein-protein interactions occur in the UF concentrate during exposure tomoderate temperatures (50–55°C), and this decreases solubility and stability of the ultrafiltered protein, which in turn changes itswater binding capacity and alters its properties with respect to gelation, foaming, and emulsification. Among the ash constituents,variations in calcium and phosphate content significantly affect the gelling properties of WPC. Whey protein isolates prepared byion exchange contain little ash, and because of this they have functional properties that are superior to those of isolates obtainedby ultrafiltration/diafiltration.
Calcium ions often induce aggregation of proteins. This is attributable to formation of ionic bridges involving Ca2+ ions and thecarboxyl groups. The extent of aggregation depends on calcium ion concentration. Most proteins show maximum aggregation at40–50 mM Ca2+ ion concentration. With some proteins, such as caseins and soy proteins, calcium aggregation leads toprecipitation, whereas in the case of whey protein isolate a stable colloidal aggregate forms (Fig. 27).
Exposure of proteins to alkaline pH, particularly at elevated temperatures, causes irreversible conformational changes. This ispartly because of deamidation of Asn and Gln residues, and b-elimination of cystine residues. The resulting increase in theelectronegativity and breakage of disulfide bonds causes gross structural changes in proteins exposed to alkali. Generally, alkali-treated proteins are more soluble and possess improved emulsification and foaming properties.
Hexane is often used to extract oil from oilseeds, such as soybean and cottonseed. This treatment invariably causes denaturationof proteins in the meal, and thus impairs their solubility and other functional properties.
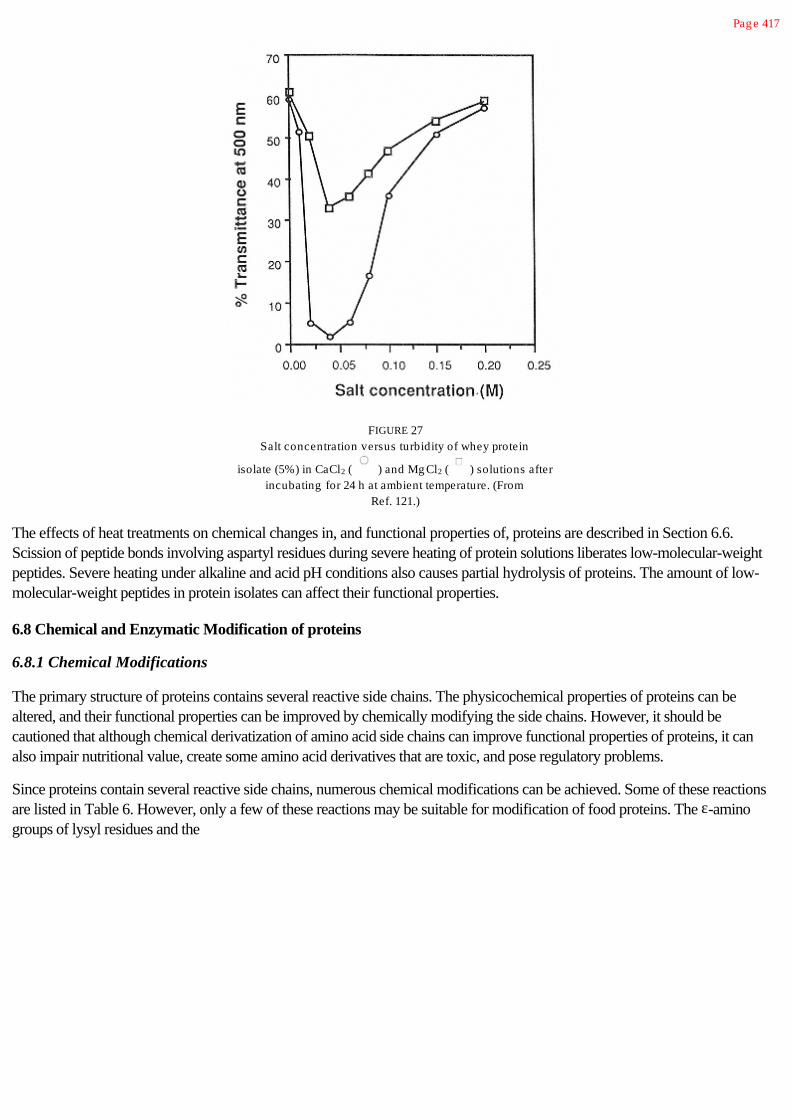
Pag e 417
FIGURE 27Salt concentration versus turbidity of whey protein
isolate (5%) in CaCl2 ( ) and Mg Cl2 ( ) solutions afterincubating for 24 h at ambient temperature. (From
Ref. 121.)
The effects of heat treatments on chemical changes in, and functional properties of, proteins are described in Section 6.6.Scission of peptide bonds involving aspartyl residues during severe heating of protein solutions liberates low-molecular-weightpeptides. Severe heating under alkaline and acid pH conditions also causes partial hydrolysis of proteins. The amount of low-molecular-weight peptides in protein isolates can affect their functional properties.
6.8 Chemical and Enzymatic Modification of proteins
6.8.1 Chemical Modifications
The primary structure of proteins contains several reactive side chains. The physicochemical properties of proteins can bealtered, and their functional properties can be improved by chemically modifying the side chains. However, it should becautioned that although chemical derivatization of amino acid side chains can improve functional properties of proteins, it canalso impair nutritional value, create some amino acid derivatives that are toxic, and pose regulatory problems.
Since proteins contain several reactive side chains, numerous chemical modifications can be achieved. Some of these reactionsare listed in Table 6. However, only a few of these reactions may be suitable for modification of food proteins. The e-aminogroups of lysyl residues and the

Pag e 418
SH group of cyteine are the most reactive nucleophilic groups in proteins. The majority of chemical modification proceduresinvolve these groups.
Alkylation
The SH and amino groups can be alkylated by reacting them with iodoacetate or iodoacetamide. Reaction with iodoacetateresults in elimination of the positive charge of the lysyl residue, and introduction of negative charges at both lysyl and cyteineresidues.
(110)
The increase in the electronegativity of the iodoacetate-treated protein may alter its pH-solubility profile, and may also causeunfolding. On the other hand, reaction with iodoacetamide results only in the elimination of positive charges. This will also causea local increase in electronegativity, but the number of negatively charged groups in proteins will remain unchanged. Reactionwith iodoacetamide effectively blocks sulfhydryl groups so disulfide-induced protein polymerization cannot occur. Sulfhydrylgroups also can be blocked by reaction with N-ethylmaleimide (NEM).
(111)
Amino groups can also be reductively alkylated with aldehydes and ketones in the presence of reductants, such as sodiumborohydride (NaBH4) or sodium cyanoborohydride (NaCNBH3). In this case, the Schiff base formed by reaction of thecarbonyl group with the amino group is subsequently reduced by the reductant. Aliphatic aldehydes and ketones or reducingsugars can be used in this reaction. Reduction of the Schiff base prevents progression of the Maillard reaction, resulting in aglycoprotein as the end product (reductive glycosylation).
(112)
The physicochemical properties of the modified protein will be affected by the reactant used. Hydrophobicity of the protein canbe increased if an aliphatic aldehyde or ketone is selected for the reaction, and the degree of hydrophobicity can be varied bychanging the chain length of the aliphatic group. On the other hand, if a reducing sugar is selected as the reactant, then the proteinwill become more hydrophilic. Since glycoproteins exhibit superior foaming and emulsifying

Pag e 419
properties (as in the case of ovalbumin), reductive glycosylation of proteins should improve solubility and interfacial properties ofproteins.
Acylation
Amino groups can by acylated by reacting them with several acid anhydrides. The most common acylating agents are aceticanhydride and succinic anhydride. Reaction of protein with acetic anhydride results in elimination of the positive charges of lysylresidues, and a corresponding increase in electronegativity. Acylation with succinic or other dicarboxylic anhydrides results inreplacement of positive charge with a negative charge at lysyl residues. This causes an enormous increase in the theelectronegativity of proteins, and causes unfolding of the protein if extensive reaction is allowed to occur.
(113)
(114)
Acylated proteins are generally more soluble than native proteins. In fact, the solubility of caseins and other less soluble proteinscan be increased by acylation with succinic anhydride. However, succinylation, depending on the extent of modification, usuallyimpairs other functional properties. For example, succinylated proteins exhibit poor heat-gelling properties, because of the strongelectrostatic repulsive forces. The high affinity of succinylated proteins for water also lessens their adsorptivity at oil-water andair-water interfaces, thus impairing their foaming and emulsifying properties. Also, because several carboxyl groups areintroduced, succinylated proteins are more sensitive to calcium induced precipitation than is the parent protein.
Acetylation and succinylation reactions are irreversible. The succinyl-lysine isopeptide bond is resistant to cleavage catalyzed bypancreatic digestive enzymes. Furthermore, succinyl-lysine is poorly absorbed by the intestinal mucosa cells. Thus, succinylationand acetylation greatly reduce the nutritional value of proteins.
The amphiphilicity of proteins can be increased by attaching long-chain fatty acids to the e-amino group of lysyl residues. Thiscan be accomplished by reacting a fatty acylchloride or N-hydroxysuccinimide ester of a fatty acid with a protein. This type ofmodification can enhance lipophilicity and fat binding capacity of proteins, and can also facilitate formation of novel micellarstructures and other types of protein aggregates.

Pag e 420
(115)
(116)
Phosphorylation
Several natural food proteins, such as caseins, are phosphoproteins. Phosphorylated proteins are highly sensitive to calcium-ion-induced coagulation, which may be desirable in simulated cheese-type products. Proteins can be phosphorylated by reactingthem with phosphorus oxychloride POCl3. Phosphorylation occurs mainly at the hydroxyl group of seryl and threonine residuesand at the amino group of lysyl residues. Phosphorylation greatly increases protein electronegativity. Phosphorylation of aminogroups results in addition of two negative charges for each positive charge eliminated by the modification. Under certain reactionconditions, especially at high protein concentration, phosphorylation with POCl3 can lead to polymerization of proteins, as shownhere. Such polymerization reactions tend to minimize the increases in electronegativity and calcium sensitivity of the modifiedprotein. The N-P bond is acid labile. Thus, under the conditions prevailing in the stomach, the N-phosphorylated proteins wouldbe expected to undergo dephosphorylation and regeneration of lysyl residues. Thus, digestibility of lysine is probably notsignificantly impaired by chemical phosphorylation.
(117)
(118)

Pag e 421
Sulfitolysis
Sulfitolysis refers to conversion of disulfide bonds in proteins to the S-sulfonate derivative using a reduction-oxidation systeminvolving sulfite and copper (CuII) or other oxidants. The mechanism is shown here. Addition of sulfite to protein initially cleaves
the disulfide bond, resulting in the formation of one and one free thiol group. This is a reversible reaction, and theequilibrium constant is very small. In the presence of an oxidizing agent, such as copper (II), the newly liberated SH groups areoxidized back to either intra- or intermolecular disulfide bonds, and these, in turn, are again cleaved by sulfite ions present in thereaction mixture. The reduction-oxidation cycle repeats itself until all of the disulfide bonds and sulfhydryl groups are convertedto the S-sulfonate derivative [41].
(119)
Both cleavage of disulfide bonds and incorporation of groups cause conformational changes in proteins, which affect theirfunctional properties. For example, sulfitolysis of proteins in cheese whey dramatically changes their pH-solubility profiles (Fig.28) [41].
Amino acids
Several plant proteins are deficient in lysine and methionine. The nutritional value of such proteins can be improved by covalentattachment of methionine and lysine at the e-amino group of lysyl residues. This can be accomplished by using the carbodiimidemethod or by reaction of N-carboxy anhydride of methionine or lysine with protein. Of these two approaches, the N-carboxyanhydride coupling method is preferable, because use of the carbodiimide is regarded as too toxic. N-Carboxy anhydrides ofamino acids are extremely unstable in aqueous solutions, and they readily convert to the corresponding amino acid form even atlow moisture levels. However, covalent coupling of amino acids with proteins can be achieved by mixing the protein directly withthe anhydride. The isopeptide bond formed with the lysyl residues is susceptible to hydrolysis by pancreatic peptidases; thus,lysyl residues modified in this manner are biologically available.
(120)
Esterification
Carboxyl groups of Asp and Glu residues in proteins are not highly reactive. However, under acidic conditions, these residuescan be esterified with alcohols. These esters are stable at acid pH; but are readily hydrolyzed at alkaline pH.

Pag e 422
FIGURE 28
The pH versus protein solubility profile of ( ) raw sweet whey
and ( ) sulfonated sweet whey. (From Ref. 40.)
6.8.2 Enzymatic Modifications
Several enzymatic modifications of proteins/enzymes are known to occur in biological systems. These modifications can begrouped into six general categories: glycosylation, hydroxylation, phosphorylation, methylation, acylation, and cross-linking. Suchenzymatic modifications of proteins in vitro can be used to improve their functional properties. Although numerous enzymaticmodifications of proteins are possible, only a few of them are practical for modifying proteins intended for food use.
Enzymatic Hydrolysis
Hydrolysis of food proteins using proteases, such as pepsin, trypsin, chymotrypsin, papain, and thermolysin, alters theirfunctional properties. Extensive hydrolysis by nonspecific proteases, such as papain, causes solubilization of even poorly solubleproteins. Such hydrolysates usually contain low-molecular-weight peptides of the order of two to four amino acid residues.Extensive hydrolysis damages several functional properties, such as gelation, foaming, and emulsifying properties. Thesemodified proteins are useful in liquid-type products, such as soups and sauces, where solubility is a primary criterion, and also infeeding persons who might not be able to digest solid foods. Partial hydrolysis of proteins either by using site-specific enzymes(such as trypsin or chymotrypsin) or by control of hydrolysis time often improves foaming and emulsification properties, but notgelling properties. With some proteins, partial hydrolysis may cause a transient decrease in solubility because of exposure ofburied hydrophobic regions.
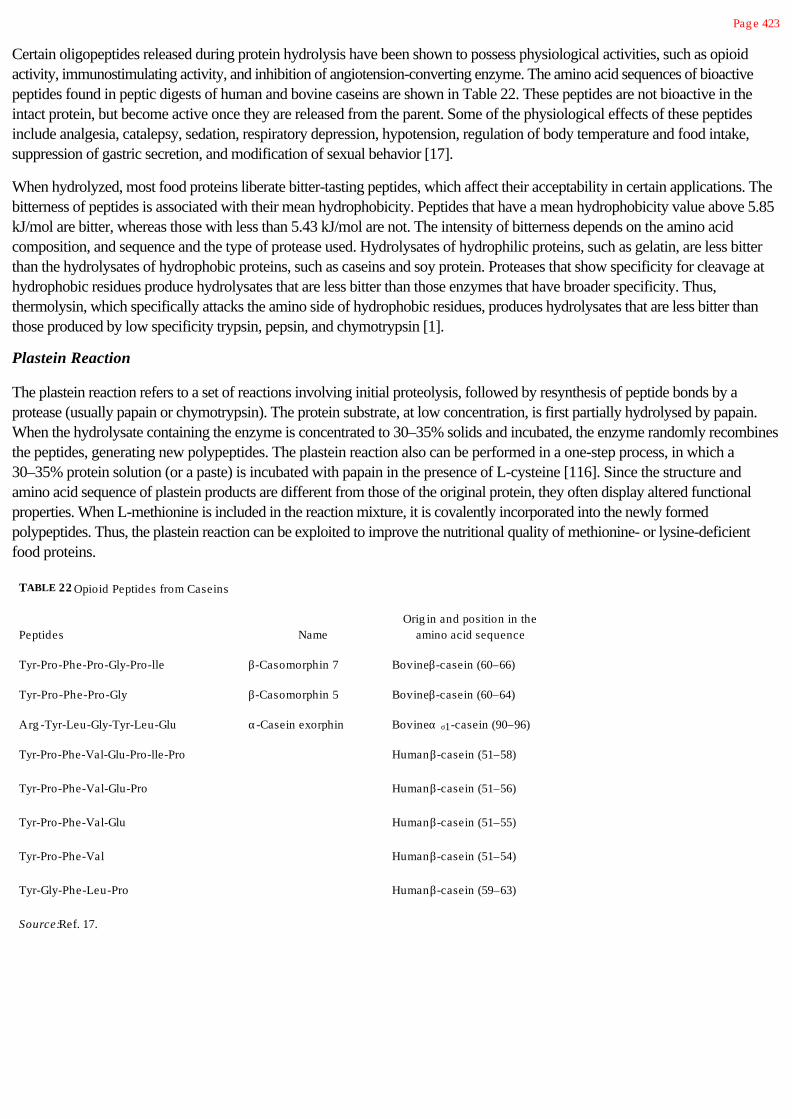
Pag e 423
Certain oligopeptides released during protein hydrolysis have been shown to possess physiological activities, such as opioidactivity, immunostimulating activity, and inhibition of angiotension-converting enzyme. The amino acid sequences of bioactivepeptides found in peptic digests of human and bovine caseins are shown in Table 22. These peptides are not bioactive in theintact protein, but become active once they are released from the parent. Some of the physiological effects of these peptidesinclude analgesia, catalepsy, sedation, respiratory depression, hypotension, regulation of body temperature and food intake,suppression of gastric secretion, and modification of sexual behavior [17].
When hydrolyzed, most food proteins liberate bitter-tasting peptides, which affect their acceptability in certain applications. Thebitterness of peptides is associated with their mean hydrophobicity. Peptides that have a mean hydrophobicity value above 5.85kJ/mol are bitter, whereas those with less than 5.43 kJ/mol are not. The intensity of bitterness depends on the amino acidcomposition, and sequence and the type of protease used. Hydrolysates of hydrophilic proteins, such as gelatin, are less bitterthan the hydrolysates of hydrophobic proteins, such as caseins and soy protein. Proteases that show specificity for cleavage athydrophobic residues produce hydrolysates that are less bitter than those enzymes that have broader specificity. Thus,thermolysin, which specifically attacks the amino side of hydrophobic residues, produces hydrolysates that are less bitter thanthose produced by low specificity trypsin, pepsin, and chymotrypsin [1].
Plastein Reaction
The plastein reaction refers to a set of reactions involving initial proteolysis, followed by resynthesis of peptide bonds by aprotease (usually papain or chymotrypsin). The protein substrate, at low concentration, is first partially hydrolysed by papain.When the hydrolysate containing the enzyme is concentrated to 30–35% solids and incubated, the enzyme randomly recombinesthe peptides, generating new polypeptides. The plastein reaction also can be performed in a one-step process, in which a30–35% protein solution (or a paste) is incubated with papain in the presence of L-cysteine [116]. Since the structure andamino acid sequence of plastein products are different from those of the original protein, they often display altered functionalproperties. When L-methionine is included in the reaction mixture, it is covalently incorporated into the newly formedpolypeptides. Thus, the plastein reaction can be exploited to improve the nutritional quality of methionine- or lysine-deficientfood proteins.
TABLE 22 Opioid Peptides from Caseins
Peptides NameOrig in and position in the
amino acid sequence
Tyr-Pro-Phe-Pro-Gly-Pro-lle b-Casomorphin 7 Bovine b-casein (60–66)
Tyr-Pro-Phe-Pro-Gly b-Casomorphin 5 Bovine b-casein (60–64)
Arg -Tyr-Leu-Gly-Tyr-Leu-Glu a-Casein exorphin Bovine a s1-casein (90–96)
Tyr-Pro-Phe-Val-Glu-Pro-lle-Pro Human b-casein (51–58)
Tyr-Pro-Phe-Val-Glu-Pro Human b-casein (51–56)
Tyr-Pro-Phe-Val-Glu Human b-casein (51–55)
Tyr-Pro-Phe-Val Human b-casein (51–54)
Tyr-Gly-Phe-Leu-Pro Human b-casein (59–63)
Source: Ref. 17.

Pag e 424
TABLE 23 Covalent Attachment of Lysine and Methionine into Food Proteins by theTransg lutaminase-Catalyzed Reaction
Amino acid content (g /100 g protein)
Protein Control Trang lutaminase-treated
Incorporation of methionine
as1-Casein 2.7 5.4
b-Casein 2.9 4.4
Soybean 7S protein 1.1 2.6
Soybean 11S protein 1.0 3.5
Incorporation of lysine
W heat g luten 1.5 7.6
Source: Ref. 49.
Protein Cross-Linking
Transglutaminase catalyzes an acyl-transfer reaction that leads to covalent cross-linking of lysyl residues (acyl acceptor) withglutamine residues (acyl donor) via an isopeptide bond. This reaction can be used to cross-link different proteins, and toproduce new forms of food proteins that might have improved functional properties. At high protein concentration,transglutaminase-catalyzed cross-linking leads to formation of protein gels and protein films at room temperature [72,77,78].This reaction also can be used to improve nutritional quality of proteins by cross-linking lysine and/or methionine at the glutamineresidues (Table 23) [49].
(121)
Bibliography
Bodwell, C. E., J. S., Adkins, and D. T. Hopkins (eds.)(1981). Protein Quality in Humans: Assessment and In VitroEstimation„ AVI Publishing Co., Westport, CT.
Ghelis, C., and J. Yon (1982). Protein Folding, Academic Press, New York.
Hettiarachchy, N. S., and G. R. Ziegler (eds.)(1994). Protein Functionality in Food systems, Marcel Dekker, New York.
Kinsella, J. E., and W. G. Soucie (eds.)(1989). Food Proteins, American Oil Chemists' Society, Champaign, IL.
Mitchell, J. R., and D. A. Ledward (eds.)(1986). Functional Properties of Food Macromolecules, Elsevier Applied Science,New York.
Parris, N., and R. Barford (1991). Interactions of Food Proteins„ ACS Symposium Series 454, American Chemical Society,Washington, DC.
Phillips, R. D., and J. W. Finley (eds.) (1989). Protein Quality and the Effects of Processing, Marcel Dekker, New York.
Schulz, G. E., and R. H. Schirmer (1980). Principles of Protein Structure, Springer-Verlag, New York.
Whitaker J. R., and S. R. Tannenbaum (1977). Food Proteins, AVI Publishing Co., Westport, CT.

Whitaker, J. R., and M. Fujimaki (eds.) (1980). Chemical Deterioration of Proteins, ACS Symposium Series, AmericanChemical Society, Washington, DC.

Pag e 425
References
1. Adler-Nissen, J. (1986). Relationship of structure to taste of peptides and peptide mixtures. In Protein Tailoring for Foodand Medical Uses R. E. Feeney, and J. R. Whitaker, (eds.), Marcel Dekker, New york, pp. 97–122.
2. Ahren, T. J. and A. M. Klibanov (1985). The mechanism of irreversible enzyme inactivation at 100°C. Science228:1280–1284.
3. Arakawa, T., and S. N. Timasheff (1982). Stabilization of protein structure by sugars. Biochemistry 21:6536–6544.
4. Arakawa, T., and S. N. Timasheff (1984). Mechanism of protein salting in and salting out by divalent cation salts: Balancebetween hydration and salt binding. Biochemistry 23:5912–5923.
5. Asakura, T., K. Adachi, and E. Schwartz (1978). Stabilizing effect of various organic solvents on protein. J. Biol. Chem253:6423–6425.
6. Bigelow, C. C. (1967). On the average hydrophobicity of proteins and the relation between it and protein structure. J. Theor.Biol. 16:187–211.
7. Bigelow, C. C., and M. Channon (1976). Hydrophobicities of amino acids and proteins, in Handbood of Biochemistry andMolecular Biology (G. D. Fasman, ed.), 3rd ed. CRC Press, Boca Raton, FL pp. 209–243.
8. Blundell, T. L., and L. N. Johnson (1976). Protein Crystallography, Academic Press, London, p. 32.
9. Brandts, J. F. (1967). In Thermobiology (A. H. Rose, ed.), Academic Press, New York, pp. 25–72.
10. Brems, D. N. (1990). Folding of bovine growth hormone, in Protein Folding (L. M. Gierasch and J. King, eds.), AmericanAssociation for the Advancement of Science, Washington, DC, p. 133.
11. Bull, H. B., and K. Breese (1973). Thermal stability of proteins. Arch. Biochem. Biophys. 158:681–686.
12. Bushuk, W., and F. MacRitchie (1989. Wheat Proteins: Aspects of structure that determine bread-making quality, inProtein Quality and the Effects of Processing (R. Dixon Phillips and J. W. Finley, eds.) Marcel Dekker, New York, pp.345–369.
13. Cameron, D. R., M. E., Weber, E. S. Idziak, R. J. Neufeld, and D. G. Cooper (1991). Determination of interfacial areas inemulsions using turbidimetric and droplet size data: Correction of the formula for emulsifying activity index. J. Agric. FoodChem. 39:655–659.
14. Chen, C., A. M. Pearson, and J. I. Gray (1990). Meat mutagens. Adv. Food Nutr Res. 34: 387–449.
15. Chen, B., and J. A. Schellman (1989). Low Temperature unfolding of a mutant of phage T4 lysozyme. 1. Equilibriumstudies. Biochemistry 28:685–691.
16. Cherkin, A. D., J. L. Davis, and M. W. Garman (1978). D-Proline: Sterospecific-sodium chloride dependent lethalconvulsant activity in the chick. Pharmacol. Biochem. Behav. 8:623–625.
17. Chiba, H., and M. Yoshikawa (1986). Biologically functional peptides from food proteins: New opioid peptides from milkproteins, in Protein Tailoring for Food and Medical Uses (R. E. Feeney and J. R. Whitaker, eds.), Marcel Dekker, NewYork, pp. 123–153.
18. Cuq, J. L., M. Provansal, F. Uilleuz, and C. Cheftel (1973). Oxidation of methionine residues of casein by hydrogenperoxide. Effects on in vitro digestibility. J. Food Sci. 38:11–13.
19. Damodaran, S. (1988). Refolding of thermally unfolded soy proteins during the cooling regime of the gelation process: Effecton gelation. J. Agric. Food Chem. 36:262–269.
20. Damodaran, S. (1989). Influence of protein conformation on its adaptability under chaotropic conditions. Int. J. Biol.Macromol. 11:2–8.

21. Damodaran, S. (1989). Interrelationship of molecular and functional properties of food proteins, in Food Proteins (J. E.Kinsella and W. G. Soucie, eds.), American Oil Chemists' Society, Champaign, IL, pp. 21–51.
22. Damodaran, S. (1990). Interfaces, protein films, and foams. Adv. Food Nutr. Res. 34:1–79.
23. Damodaran, S. (1994). Structure-function relationship of food proteins, in Protein Functionality in Food Systems (N. S.Hettiarachchy and G. R. Ziegler, eds.), Marcel Dekker, New York, pp. 1–38.
24. Damodaran, S., and J. E. Kinsella (1980). Flavor-protein interactions: Binding of carbonyls to bovine serum albumin:Thermodynamic and conformational effects. J. Agric. Food Chem. 28:567–571.
25. Damodaran, S., and J. E. Kinsella (1981). Interaction of carbonyls with soy protein: Thermodynamic effects. J. Agric.Food Chem. 29:1249–1253.
Pag e 426
26. Damodaran, S., and K. B. Song (1988). Kinetics of adsorption of proteins at interfaces: Role of protein conformation indiffusional adsorption. Biochim. Biophys. Acta 954:253–264.
27. Dickinson, E., and Y. Matsummura (1991). Time-dependent polymerization of b-lactoglobulin through disulphide bonds atthe oil-water interface in emulsions. Int. J. Biol. Macromol. 13:26–30.
28. Eggum, B. O., and R. M. Beames (1983). The nutritive value of seed proteins, in Seed Proteins (W. Gottschalk and H. P.Muller, eds.), Nijhoff/Junk, The Hague, pp. 499–531.
29. Erbersdobler, H. F., M. Lohmann, and K. Buhl (1991). Utilizaiton of early Maillard reaction products by humans, inNutritional and Toxicological Consequences of Food Processing (M. Friedman, ed.), Advances in Experimental Medicineand Biology, vol. 289, Plenum Press, New York, pp. 363–370.
30. FAO/WHO/UNU (1985). Energy and Protein Requirements, Report of a Joint FAO/WHO/UNU Expert Consultation.World Health Organization Technical Rep. Ser. 724, WHO, Geneva.
31. FAO/WHO (1991). Protein Quality Evaluation, Report of a Joint FAO/WHO Expert Consultation. FAO Food Nutr.Paper 51, FAO, Geneva, pp. 23–24.
32. Fay, L., U. Richli, and R. Liardon (1991). Evidence for the absence of amino acid isomerization in microwave-heated milkand infant formulas. J. Agric. Food Chem. 39:1857–1859.
33. Ferry, J. D. (1961). Viscoelastic Properties of Polymers, Wiley, New York, p. 391.
34. Ford, J. E. (1981). Microbiological methods for protein quality assessment, in Protein Quality in Humans: Assessmentand in vitro estimation (C. E. Bodwell, J. S. Adkins, and D. T. Hopkins, eds.), AVI Publishing Co., Westport, CT. pp.278–305.
35. Fransen, K., and J. E. Kinsella (1974). Parameters affecting the binding of volatile flavor compounds in model food system.I. Proteins. J. Agric. Food Chem. 22:675–678.
36. Friedman, M., and M. R. Gumbmann (1986). Nutritional improvement of legume proteins through disulfide interchange.Adv. Exp. Med. Biol. 199:357–390.
37. Fujita, Y., and Y. Noda (1981). The effect of hydration on the thermal stability of ovalbumin as measured by means ofdifferential scanning calorimetry. Bull. Chem. Soc. Jpn. 54:3233–3234.
38. Gekko, K., and Y. Hasegawa (1986). Compressibility-structure relationship of globular proteins. Biochemistry25:6563–6571.
39. Ghelis, C., and J. Yon (1982). Protein Folding, Academic Press, New York, p. 51.
40. Gonzalez, J. M., and S. Damodaran (1990). Recovery of proteins from raw sweet whey using a solid state sulfitolysis. J.Food Sci. 55:1559–1563.
41. Gonzalez, J. M., and S. Damodaran (1990). Sulfitolysis of disulfide bonds in proteins using a solid state copper carbonatecatalyst. J. Agric. Food Chem. 38:149–153.
42. Gonzalez, O. N., and R. H. Tanchuco (1977). Chemical composition and functional properties of coconut protein isolate.Phil. J. Coco. Studies. 11:21–29.
43. Gumbmann, M. R., W. L. Spangler, G. M. Dugan, and J. J. Rackis (1986). Safety of trypsin inhibitors in the diet: Effects onthe rat pancreas of long-term feeding of soy flour and soy protein isolate. Adv. Exp. Med. Biol. 199:33–79.
44. Harwalkar, V. R. and C.-Y. Ma (1989). Effects of medium composition, preheating, and chemical modification uponthermal behavior of oat globulin and b-lactoglobulin, in Food Proteins (J. E. Kinsdella, and W. G. Soucie, eds.), American OilChemists' Society, Champaign, IL, pp. 210–231.
45. Hayase, F., H. Kato, and M. Fujimaki (1973). Racemization of amino acid residues in proteins during roasting. Agric. Biol.Chem. 37:191–192.

46. Hayashi, R. (1989). In Engineering and Food (W. E. L. Spiess and Schubert, H, eds.), Elsevier Applied Science,London, pp. 815–826.
47. He, X. M., and D. C. Carter (1992). Atomic structure and chemistry of human serum albumin. Nature 358:209–214.
48. Heremans, K. (1982). High pressure effects on proteins and other biomolecules. Annu. Rev. Biophys. Bioeng. 11:1–21
49. Ikura, K., M. Yoshikawa, R. Sasaki, and H. Chiba (1981). Incorporation of amino acids into food proteins bytransglutaminase. Agric. Biol. Chem. 45:2587–2592.
50. Israelachvili, J., and R. Pashley (1982). The hydrophobic interaction is long range, decaying exponentially with distance.Nature 300:341–342.

Pag e 427
51. Jagerstad, M., and K. Skog (1991). Formation of meat mutagens, in Nutritional and Toxicological Consequences ofFood Processing, M. Friedman (ed.), Advances in Experimental Medicine and Biology, vol. 289, Plenum Press, New York,pp. 83–105.
52. Kamtekar, S., J. Schiffer, H. Xiong, J. M. Babik, and M. H. Hecht (1993). Protein design by binary patterning of polar andnonpolar amino acids. Science 262:1680–1685.
53. Kato, A., and S. Nakai (1980). Hydrophobicity determined by a fluorescence probe method and its correlation with surfaceproperties of proteins. Biochim. Biophys. Acta 624:13–20.
54. Kato, S., Y. Osako, N. Matsudomi, and K. Kobayashi (1983). Changes in emulsifying and foaming properties of proteinsduring heat denaturation. Agric. Biol. Chem. 47:33–38.
55. Kinsella, J. E. (1976). Functional properties of food proteins: A review. CRC Crit. Rev. Food Sci. Nutr. 7:219–280.
56. Kinsella, J. E., S. Damodaran, and J. B. German (1985). Physicochemical and functional properties of oilseed proteins withemphasis on soy proteins, in New Protein Foods: Seed Storage Proteins (Altshul, A. M., and H. L. Wilcke, eds.), AcademicPress, London, pp. 107–179.
57. Kinsella, J. E., and P. F. Fox (1986). Water sorption by proteins: Milk and whey proteins. CRC Crit. Rev. Food Sci.Nutr. 24:91–139.
58. Koshiyama, I. (1972). Purification and physicochemical properties of 11S globulin in soybean seeds. Int. J. PeptideProtein Res. 4:167–171.
59. Kuntz, I. D. (1971). Hydration of macromolecules. III. Hydration of polypeptides. J. Am. Chem. Soc. 93:514–516.
60. Kuntz, I. D., and W. Kauzmann (1974). Hydration of proteins and polypeptides. Adv. Protein Chem. 28:239–345.
61. Lachance, P. A., and M. R. Molina (1974). Nutritive value of a fiber-free coconut protein extract obtained by an enzymic-chemical method. J. Food Sci. 39:581–585.
62. Lapanje, S. (1978). Physicochemical Aspects of Protein Denaturation, Wiley-Intercience, New York.
62a. Lawrence, M. C., E. Suzuki, J. N. Varghese, P. C. Davis, A. Van Donkelaar, P. A. Tulloch, and P. M. Colman (1990).The three-dimensional structure of the seed storage protein phaseolin at 3 Å resolution. EMBO J. 9:9–15.
63. Lee, B., and F. M. Richards (1971). The interpretation of protein structure: Estimation of static accessibility. J. Mol. Biol.55:379–400.
64. Liao, S. Y., and M. E. Mangino (1987). Characterization of the composition, physicochemical and functional properties ofacid whey protein concentrates. J. Food Sci. 52:1033–1037.
65. Liardon, R. and D. Ledermann (1986). Racemization kinetics of free and protein-bound amino acids under moderatealkaline treatment. J. Agric. Food Chem. 34:557–565.
66. Liardon, R., and M. Friedman (1987). Effect of peptide bond cleavage on the racemization of amino acid residues inproteins. J. Agric. Food Chem. 35:661–667.
67. MacRitchie, F. (1992). Physicochemical properties of wheat proteins in relation to functionality. Adv. Protein Chem.36:2–89.
69. Mak, A., L. B. Smillie, and G. Stewart (1980). A comparison of the amino acid sequences of rabbit skeletal muscle a- andb-tropomyosins. J. Biol. Chem. 255:3647–3655.
70. Marable, N. L., and G. Sanzone (1981). In vitro assays of protein quality assays utilizing enzymatic hydrolyses, in ProteinQuality in Humans: Assessment and In Vitro Estimation (C. E. Bodwell, J. S. Adkins, and D. T. Hopkins, eds.), AVIPublishing Co., Westport, CT pp. 261–277.
71. Miller, S., J. Janin, A. M. Lesk, and C. Chothia (1987). Interior and surface of monomeric proteins. J. Mol. Biol.196:641–656.

72. Motoki, M., H. Aso, K. Seguro, and N. Nio (1987). as1-Casein film prepared using transglutaminase. Agric. Biol. Chem.51:993–996.
73. Nakagawa, M., Y. Yokoyama, S. Kato, and T. Hino (1985). Dye-sensitized photooxygenation of tryptophan.Tetrahedron 41:2125–2132.
74. Nakai, S., E. Li-Chan, M. Hirotsuka, M. C. Vazquez, and G. Arteaga (1991). Quantitation of hydrophobicity forelucidating the structure-activity relationships of food proteins, in Interactions of Food Proteins (N. Parris, and R. Barford,eds.), ACS Symposium Series 454, American Chemical Society, Washington, DC, pp. 42–58.

Pag e 428
75. Namiki, M. (1988). Chemistry of Maillar reactions: Recent studies on the browning reaction mechanism and thedevelopment of antioxidants and mutagens. Adv. Food Res. 32:115–184.
76. Nielsen, N. C. (1985). Structure of soy proteins, in New Protein Foods: Seed Storage Proteins, vol. 5 (A. M. Altshuland H. L. Wilcke, eds.), Academic Press, New York, pp. 27–64.
77. Nio, N., Motoki, M., and K. Takinami (1985). Gelation of casein and soybean globulins by transglutaminase. Agric. Biol.Chem. 49:2283–2286.
78. Nio, N., Motoki, M., and K. Takinami (1986). Gelation mechanims of protein solution by transglutaminase. Agric. Biol.Chem. 50:851–855.
79. Nishioka, G. M., and S. Ross (1981). A new method and apparatus for measuring foam stability. J. Colloid Interface Sci.81:1–7.
80. Nozaki, Y., and C. Tanford (1972). The solubility of amino acids and two glycine peptides in aqueous ethanol and dioxanesolutions. J. Biol. Chem. 246:2211–2217.
81. Ohnishi, T., and T. Asakura (1976). Denaturation of oxyhemoglobin S by mechanical shaking. Biochim. Boiophys. Acta453:93–100.
82. Okomoto, M., Y. Kawamura, and R. Hayashi (1990). Application of high pressure to food processing: Texturalcomparison of pressure- and heat-induced gels of food proteins. Agric. Biol. Chem. 54:183–189.
83. O'Neill, T. E., and J. E. Kinsella (1987). Binding of alkanone flavors to b-lactoglobulin: Effects of conformational andchemical modification. J. Agric. Food Chem. 35:770–774.
84. Ortiz, R., R. Sanchez, A. Paez, L. F. Montano, and E. Zenteno (1992). Induction of intestinal malabsorption syndrome inrats fed with Agaricus bisporus mushroom lectin. J. Agric. Food Chem. 40:1375–1378.
85. Papiz, M. Z., L. Sawyer, E. E. Eliopoulos, A. C. T. North, J. B. C. Findlay, R. Sivaprasadarao, T. A. Jones, M. E.Newcomer, and P. J. Kraulis (1986). The structure of b-lactoglobulin and its similarity to plasma retinol-binding protein. Nature324:383–385.
86. Pearce, K. N., and J. E. Kinsella (1978). Emulsifying properties of proteins: Evaluation of a turbidimetric technique. J.Agric. Food Chem. 26:716–722.
87. Phillips, M. C. (1981). Protein conformation at liquid interfaces and its role in stabilizing emulsions and foams. FoodTechnol. (Chicago) 35:50–57.
88. Ponnuswamy, P. K., R. Muthusamy, and P. Manavalan (1982). Amino acid composition and thermal stability of proteins.Int. J. Biol. Macromol. 4:186–190.
89. Poole, S., S. I. West, and C. L. Walters (1984). Protein-protein interactions: Their importance in the foaming ofheterogeneous protein systems. J. Sci. Food Agric. 35:701–711.
90. Pusztai, A., E. M. W. Clarke, G. Grant, and T. P. King (1981). The toxicity of Phaseolus vulgaris lectins. Nitrogenbalance and immunochemicals studies. J. Sci. Food Agric. 32:1037–1046.
91. Rao, M. A., S. Damodaran, J. E. Kinsella, and H. J. Cooley (1986). Flow properties of 7S and 11S soy protein fractions.In Food Engineering and Process Applications (M. Le Maguer and P. Jelen, eds.), Elsevier Applied Science, New York,pp. 39–48.
92. Richards, F. M. (1977). Areas, volumes, packing, and protein structure. Annu. Rev. Biophys. Bioeng. 6:151–176.
93. Richardson, J. S., and D. C. Richardson (1989). In Prediction of Protein Structure and the Principles of ProteinConformation (G. D. Fasman, ed.), Plenum Press, New York, p. 24.

94. Ritchey, S. J. and L. J. Taper (1981). Estimating protein digestibility for humans from rat assays, in Protein Quality inHumans: Assessment and In Vitro Estimation (C. E. Bodwell, J. S. Adkins, and D. T. Hopkins, eds.), AVI Publishing Co.,Westport, CT. pp. 306–315.
95. Ruegg, M., U. Moor, and B. Blanc (1975). Hydration and thermal denaturation of b-lactoglobulin. A calorimetric study.Biochim. Biophys. Acta 400:334–342.
96. Rupley, J. A., P.-H. Yang, and G. Tollin (1980). Thermodynamic and related studies of water interacting with proteins, inWater in Polymers (S. P. Rowland, ed.), ACS Symp. Ser. 127, American Chemical Society, Washington, DC, p. 91–139.
97. Salim-Hanna, M., A. M. Edwards, and E. Silva (1987). Obtention of a photo-incuded adduct between a vitamin and anessential amino acid: Binding of riboflavin to tryptophan. Int. J. Vit. Nutr. Res. 57:155–159.
Pag e 429
98. Scheraga, H. A. (1963). In The Proteins, 2nd ed., Vol. 1 (H. Neurath, ed.), Academic Press, New York, pp. 478–594.
99. Schulz, G. E., and R. H. Schirmer (1979). Principles of Protein Structure, Springer-Verlag, New York, p. 76.
100. Shimada, K., and S. Matsushita (1980). Relationship between thermo-coagulation of proteins and amino acidcompositions. J. Agric. Food Chem. 28:413–417.
101. Singer, N. S., J. Latella, and Y. Shoji (1990). Fat emulating protein products and processes. U.S. Patent No. 4,961,953.
102. Suzuki, A., M. Watanabe, K. Iwamura, Y. Ikeuchi, and M. Saito (1990). Effect of high pressure treatment on theultrastructure and myofibrillar protein of beef skeletal muscle. Agric. Biol. Chem. 54:3085–3091.
103. Swaisgood, H. E., and G. L. Catignani (1991). Protein digestibility: In vitro methods of assessment. Adv. Food Nutr. Res.35:185–236.
104. Tanford, C. (1962). Contribution of hydrophobic interactions to the stability of the globular conformation of proteins. J.Am. Chem. Soc. 84:4240–4247.
105. Tanford, C. (1957). Theory of protein titration curves. I. General equations for impenetrable spheres. J. Am. Chem. Soc.79:5333–5339.
106. Townsend, A., and S. Nakai (1983). Relationship between hydrophobicity and foaming characteristics of food proteins. J.Food Sci. 48:588–594.
107. Vihinen, M. (1987). Relationship of protein flexibility to thermostability. Protein Eng. 1:477–480.
108. von Hippel, P. H. and T. Schleich (1969). The effects of neutral salats on the structure and conformational stability ofmacromolecules in solution, in Structure and Stability of Biological Macromolecules (S. N. Timasheff and G. D. Fasman,eds.), Marcel Dekker, New York, pp. 417–574.
109. Wang, C.-H., and S. Damodaran (1990). Thermal destruction of cysteine and cystine residues of soy protein underconditions of gelation. J. Food Sci 55:1077–1080.
110. Wang, C.-H. and S. Damodaran (1990). Thermal gelation of globular proteins: Weight average molecular weightdependence of gel strength. J. Agric. Food Chem. 38:1154–1164.
111. Weber, G. (1992). Protein Interactions, Chapman and Hall, New York, pp. 235–270.
112. Weber, G., and H. G. Drickamer (1983). The effect of high pressure upon proteins and other biomolecules. Q. Rev.Biophys. 16:89–112.
113. Wedzicha, B. L., I. Bellion, and S. J. Goddard (1991). Inhibition of browning by sulfites, in Nutritional andToxicological Consequences of Food Processing (M. Friedman, ed.), Advances in Experimental Medicine and Biology, vol.289, Plenum Press, New York, pp. 217–236.
114. Van Holde, K. E. (1977). Effect of amino acid composition and environment on protein structure, in Food Proteins (J. R.Whitaker, and S. R. Tannenbaum, eds.), AVI Publishing Co., Westport, CT. pp. 1–13.
115. Xu, S., and S. Damodaran (1993). Comparative adsorption of native and denatured egg-white, human and T4 phagelysozymes at the air-water interface. J. Colloid Interface Sci. 159:124–133.
116. Yamashita, M., S. Arai, Y. Imaizumi, Y. Amano, and M. Fujimaki (1979). A one-step process for incorporation of L-methionine into soy protein by treatment with papain. J. Agric. Food Chem. 27:52–56.
117. Yu, M.-A., and S. Damodaran (1991). Kinetics of protein foam destabilization: Evaluation of a method using bovine serumalbumin. J. Agric. Food Chem. 39:1555–1562.
118. Zuber, H. (1988). Temperature adaptation of lactate dehydrogenase. Structural, functional and genetic aspects. Biophys.Chem. 29:171–179.

119. Zhu, H., and S. Damodaran (1994). Heat-induced conformational changes in whey protein isolate and its relation tofoaming properties. J. Agric. Food Chem. 42:846–855.
120. Zhu, H., and S. Damodaran (1994). Proteose peptones and physical factors affect foaming properties of whey proteinisolate. J. Food Sci. 59:554–560.
121. Zhu, H., and S. Damodaran (1994). Effects of calcium and magnesium ions on aggregation of whey protein isolate and itseffect on foaming properties. J. Agric. Food Chem. 42:856–862.

Pag e 431
7Enzymes
JOHN R. WHITAKERUniversity of California, Davis, California
7.1. Introduction 433
7.1.1. Chemical Nature of Enzymes 433
7.1.2. Catalysis 434
7.1.3. Regulation of Enzyme Reactions 435
7.1.4. Historical Aspects 435
7.1.5. Literature on Enzymology 437
7.2. Enzyme Nomenclature 438
7.2.1. The Enzyme Commission 438
7.2.2. Numbering and Classification of Enzymes 440
7.3. Enzymes in Organisms 441
7.3.1. Location of Enzymes 441
7.3.2. Compartmentation and Access to Substrate 444
7.3.3. Typical Concentrations of Enzymes in Some Foods 445
7.4. Rates of Enzyme-Catalyzed Reactions 447
7.4.1. Rate Determination 447
7.4.2. Steady-State Rates 448
7.4.3. Pre-Steady-State Reactions 451
7.4.4. Immobilized Enzyme Reactions 452
7.5. Factors Influencing Enzyme Reactions 453
7.5.1. Substrate Concentration 454
7.5.2. Enzyme Concentration 459
7.5.3. Effect of pH 460
7.5.4. Effect of Temperature 464

7.5.5. Water Activity/Concentration 469
7.5.6. Why Enzymes Are Effective Catalysts 472
7.6. Enzyme Cofactors 473
7.6.1. Distinguishing Features of Organic Cofactors 474
7.6.2. Coenzymes 476

Pag e 432
7.6.3. Prosthetic Group 477
7.6.4. Inorganic Ions 478
7.7. Enzyme Inactivation and Control 478
7.7.1. Reversible Inhibitors 479
7.7.2. Irreversible Inhibitors 485
7.7.3. Naturally Occurring Inhibitors 486
7.7.4. Inactivation and/or Control by Physical Methods 489
7.7.5. Removal of Substrate and/or Cofactor 492
7.8. Food Modification by Enzymes 492
7.8.1. Role of Endogenous Enzymes in Food Quality 492
7.8.2. Enzymes Used as Processing Aids and Ingredients 499
7.9. Immobilized Enzymes in Food Processing 504
7.9.1. Advantages and Disadvantages 504
7.9.2. Methods of Immobilizing Enzymes 506
7.9.3. Applications 507
7.9.4. Immobilized Cells 507
7.10. Solvent-Partitioned Enzyme Systems 509
7.10.1. Activity and Stability of Enzymes in Organic Solvents 509
7.10.2. Advantages of Solvent-Partitioned Enzyme Systems 511
7.10.3. Applications 511
7.11. Enzymes in Waste Management 512
7.11.1. Starch and Amylases 513
7.11.2. Cellulose and Cellulases 513
7.11.3. Hemicelluloses and Pentosanases 514
7.11.4. Proteins and Proteolytic Enzymes 514
7.11.5. Lipids and Lipases 514

7.12. Enzymes in Food Analysis 514
7.12.1. Enzyme Concentration 515
7.12.2. Compounds That Are Substrates 516
7.12.3. Other Assays 517
7.12.4. Immobilized Enzymes in Food Analysis 518
7.12.5. Indicators of Adequate Blanching or Pasteurization 518
7.13. Recombinant DNA Technology and Genetic Engineering 518
7.13.1. Introduction 518
7.13.2. Applications: Raw Food Materials 521
7.13.3. Applications: Control of Endogenous Enzymes 522
7.13.4. Applications: Tailoring Enzymes for Food Uses 522
7.14. Enzymes and Health/Nutrition/Food Issues 523
7.14.1. Enzyme Deficiencies 523
7.14.2. Special Foods for Infants and the Elderly 523
7.14.3. Toxicants and Antinutrients 524
7.14.4. Allergenic Substances 525
Bibliography 525
References 526

Pag e 433
7.1 Introduction
7.1.1 Chemical Nature of Enzymes
Enzymes are proteins with catalytic activity due to their power of specific activation and conversion of substrates to products:
(1)
Some of the enzymes are composed only of amino acids covalently linked via peptide bonds to give proteins that range in sizefrom about 12,000 MW to those that are near 1,000,000 MW (Table 1). Other enzymes contain additional components, suchas carbohydrate, phosphate, and cofactor groups. Enzymes have all the chemical and physical characteristics of other proteins(see Chap. 6). Composition-wise, enzymes are not different from all other proteins found in nature and they comprise a smallpart of our daily protein intake in our foods. However, unlike other groups of proteins, they are highly specific catalysis for thethousands of chemical reactions required by living organisms.
Enzymes are found in all living systems and make life possible, whether the organisms are adapted to growing near 0°C, at 37°C(humans), or near 100°C (in microorganisms found in some hot springs). Enzymes accelerate reactions by factors of 103 to 1011
times that of non-enzyme-catalyzed reactions (108 to 1020 over uncatalyzed reactions; Table 2). In addition, they are highlyselective for a limited number of substrates, since the substrate(s) must bind stereospecifically and correctly into the active sitebefore any catalysis occurs. Enzymes also control the direction of reactions, leading to stereospecific product(s) that can be veryvaluable by-products for foods, nutrition, and health or the essential compounds of life.
Enzymes are synthesized in vivo by living organisms, based on expression (translation) of specific genes. They are wild type(“nature” dictated sequences) enzymes that fit the definition already given. A few enzymes, such as ribonuclease, have beensynthesized in the laboratory from the amino acids. However, the time, cost, and inefficiency of the process are prohibitive.Isozymes are enzymes from a single organism that have qualitatively the same enzymatic activity but differ quantitatively inactivity and structure because of differences in amino acid sequences (different gene products) or differ quantitatively due toposttranslational modification (glycosylation, proteolytic activation, etc). They are found very frequently in organisms. There arealso a few naturally occurring ribozymes, composed of ribonucleic acids, that slowly catalyze (one or two bonds per minute) thespecific hydrolysis of phosphodiester bonds within the same
TABLE 1 Molecular W eig hts of a Few Selected Enzymes
EnzymeMolecular
weig ht EnzymeMolecular
weig ht
Ribonuclease 13,683 Fumarase 194,000
Lysozyme 14,100 Catalase 232,000
Chymotrypsinog en 23,200 Aspartate transcarbamylase 310,000
b-Lactog lobulin 35,000 Urease 483,000
Alkaline phosphatase 80,000 b-Galactosidase 520,000
Polyphenol oxidase (mushrooom) 128,000 Glutamate dehydrog enase 2,000,000
Source:Adapted from Ref. 111, p. 41.

Pag e 434
TABLE 2 Nature of Effect of Catalyst on E a and on Relative Rates of Some Reactions
Substrate Catalyst Ea (kcal/mol) n´/na (25°C) Relative rates (25°C)
H2O2 None 18.0 5.62 × 10⁻¹⁴ 1.00
I- 13.5 1.16 × 10⁻¹⁰ 2.07 × 10³
Catalase 6.4 1.95 × 10⁻⁵ 3.47 × 10⁸
Sucrose H+ 25.6 1.44 × 10⁻¹⁹ 1.00
Invertase 11.0 8.04 × 10⁻⁹ 5.58 × 10¹⁰
Carbonic acid None 20.5 8.32 × 10⁻¹⁶ 1.00
Carbonic anhydrase 11.7 2.46 × 10⁻⁹ 2.98 × 10⁶
Urea H+ 24.5 9.33 × 10⁻¹⁹ 1.00
Urease 8.7 3.96 × 10⁻⁷ 4.25 × 10¹¹
aFraction of molecules with E a or g reater.
Source: Ref. 111, p. 324.
ribonucleic acid or in different ribonucleic and deoxyribonucleic acids. These are important in vivo catalysts, but they will not bediscussed further in this chapter.
Some enzymes result from in vivo or in vitro chemical modification of one or more nucleotide bases in genes of the wild-typeenzymes or by chemical synthesis. These mutated enzymes may result from environmentally caused random in vivo modification(by free radicals, for example) of one or more nucleotide bases of a gene or in vitro by selective and deliberate chemical changesin the DNA nucleotide sequence of a gene. The latter is accomplished using specific restriction enzymes and ligases or by thepolymerase chain reaction (PCR). When deliberately modified or synthesized in the laboratory, enzyme mimics are calledsynzymes. Other types of synzymes include the abzymes and the pepzymes. The abzymes are laboratory- made catalyticantibodies. The binding sites of catalytic antibodies are tailored in vivo by use of a specific hapten, while the catalytic groups areadded in vitro by specific chemical modification of one or more of the amino acid side chains. The pepzymes are synthesized inthe laboratory to mimic the sequence and stereochemistry of the active site of an enzyme. Enzymes may also be chemicallymodified by deliberate or unintentional changes (Maillard reaction, for example) in one or more side chain groups of a specificamino acid. This can lead to qualitatively different multiple forms of enzymes or total loss of activity.
7.1.2 Catalysis
Enzymes are positive catalysts; that is, they increase the rates of reactions by 103 to 1011 that of non-enzyme-catalyzed reactions(Table 2). A minimum of two events must occur for enzyme activity to be observed. First, the enzyme must bind (noncovalently)a compound stereo- specifically into the active site. Second, there must be chemical conversion of the initial compound into anew compound. This is shown in Equation 2, where E is free enzyme, S is free substrate, E.S is a noncovalent complex ofenzyme and substrate, and P is the new compound (product) formed.
(2)
The E is generated and participates repeatedly in the reaction. Some compounds only bind to the

Pag e 435
active site of the enzyme; they are not converted to new products. They are called competitive inhibitors, and no chemicalchanges occur in I.
(3)
7.1.3 Regulation of Enzyme Reactions
Enzyme activity can be controlled in a number of ways that are very important to food scientists. The velocity of an enzyme-catalyzed reaction is usually directly proportional to the active enzyme concentration, and dependent (in a complex way) onsubstrate, inhibitor, and cofactor concentrations, and on temperature and pH [111]. As an example, it is well known thatenzyme-catalyzed reactions occur more slowly when a food is placed in a refrigerator (~4°C). But the reactions do not stop at4°C (or at 0°C). Most enzyme-catalyzed reactions decrease 1.4–2 times/10°C decrease in temperature. Therefore, at 5°C, thevelocities would be 0.5 to 0.25 times the velocity at 25°C.
Changing the pH of the system by 1 or 2 pH units from the pH-activity optimum can decrease enzymatic velocity to 0.5 or 0.1,respectively, of that at the pH optimum. Decreasing (by heating, breeding, or genetic engineering) the concentration of enzyme to0.1 that normally present would decrease the enzyme activity to 0.1 that originally present.
7.1.4 Historical Aspects
Enzymes are essential for all living organisms; therefore, they have existed since the beginning of life. They are important inripening of fruits, fermentation of fruit juices, souring of milk, tenderization of meat, etc., and humans were aware of thesechanges early on.
7.1.4.1 Nature of Enzymes
During the 1870–1890 period, there was a major debate between Pasteur [85], who believed that enzymes functioned onlywhen associated with living organisms, and Liebig [72], who believed that enzymes continued to function in the absence of cells.This argument was settled in 1897 when Büchner [19] separated enzymes, including invertase, from yeast cells and showed thatthey were still active. The debate between Pasteur and Liebig had resulted in the terms organized ferments and unorganizedferments to differentiate between enzymes in yeasts and enzymes in the stomach. In 1878 Kühne proposed use of en zyme(Greek, “in yeast”) to describe both types of enzymes [68].
7.1.4.2 Enzyme Specificity
During the period of 1890–1940 much work was done on the specificity of enzymes. Emil Fischer and his students, Bergmann,Fruton, and others, synthesized many carbohydrates, peptides, and other compounds of known structures and determinedwhether they were hydrolyzed, and at what rate, by carbohydrases and proteases. They found that small changes, such asremoval or change in configuration of one group, could lead to marked effects on rates of hydrolyses. This led Fischer [38] tohypothesize the lock-and-key analogy of enzyme- substrate interactions in 1894 in which the active site of the enzyme wasconsidered to be rigid. This concept remained essentially unchallenged until 1959, when Koshland [65] suggested the induced fithypothesis to be better supported by currently available data, since there appeared to be some flexibility in accommodationbetween enzyme and substrate when they complexed. The induced fit hypothesis retained the concept of a stereospecificcomplex

Pag e 436
formation between enzyme and substrate, but it rejected the idea that the binding locus of the active site is rigid structure thatretains its exact shape even in the absence of substrate. Much data subsequently proved the induced fit concept to be moreappropriate than the lock-and-key concept [78].
7.1.4.3 Enzyme Kinetics
Study of enzyme activities requires kinetic approaches, not equilibrium approaches. Therefore, the development of the kineticsto deal with these reactions was very important. In 1902 Henri [46;46a] and Brown [18] independently suggested that thehyperbolic relationship between velocity (-dS/dt or dp/dt) and substrate concentration (Fig. 1) was due to an obligatoryenzyme-substrate complex intermediate prior to conversion of the substrate to product (Eq. 2). When all the enzyme is saturatedwith substrate, the enzyme is operating at its maximum capacity and further increase in substrate concentration cannot increasethe velocity further (Fig. 1). In 1913, Michaelis and Menten [79] showed that the hyperbolic relationship between velocity andsubstrate concentration (Fig. 1) can be expressed by
(4)
where n is the measured velocity, Vmax is the maximum velocity when enzyme is saturated with substrate, Km [=(k -1+k2)/k1 forEq. 2] is the substrate concentration at which n=0.5Vmax, and [S]t is the substrate concentration at any time t in the reaction. Forreasons that will be detailed later, the initial velocity, no, determined early in the reaction (5% substrate conversion to product) isused, so that [S]t@[S]o, the starting substrate concentration.
Lineweaver and Burk [76] in 1934 developed a reciprocal transform (1/n vs. 1/[S]) of Equation 4 that gives a linear rather thana hyperbolic relationship, making it easier to determine Km and Vmax. Beginning in 1958, kinetic equations dealing withmultisubstrate-multiproduct
Fig ure 1Variation of observed velocity with substrate
concentration [A o] for an enzyme-catalyzed reaction thatfollows Michaelis-Menten kinetics. (From Ref. 111, p. 168.)
Pag e 437
enzyme-catalyzed reactions were developed for more complex cases than that of Equation 2 [22, 27, 115]. However, Equation4 still fits all Michaelis-Menten type reactions, where steady-state concepts are valid. The numerical definitions of Vmax and Km
change as the complexity of the reaction changes. In 1965, Monod et al. [80] and Koshland et al. [66] developed equations forallosteric-behaving enzymes. Other workers [44] developed equations for pre-steady-state treatment of enzyme-catalyzedreactions.
7.1.4.4 Enzyme Purification
Purification of enzymes began only after 1920. Before 1920, it was generally thought that enzymes were proteins. However,during the period of 1922–1928, Willstätter and his colleagues purified horseradish peroxidase to the point where it hadappreciable activity even when no protein could be detected by existing methods. Therefore, they concluded, incorrectly, thatenzymes could not be proteins. In 1926, Sumner [98], at Cornell University, crystallized urease from jack beans and showed itto be a protein. This led to much debate between Willstätter, a noted German chemist, and Summer, with many Europeanbiochemists and chemists siding with Willstätter. Sumner was later awarded the Noble prize for crystallization of the first enzymeand for showing that enzymes are proteins. Beginning in the 1930s, and continuing to the present, much work has been devotedto enzyme purification using techniques such as chromatography (ion exchange, gel filtration, chromatofocusing, affinity,hydrophobic), several types of electrophoresis [regular polyacrylamide gel electrophoresis (PAGE), SDS-PAGE, isoelectricfocusing], and techniques based on solubility and stability differences. Now nearly 3000 enzymes have been purified. All areproteins.
7.1.4.5 Enzyme Structure
The first primary sequence of a protein, insulin (of 6000 MW), was determined by Sanger and co-workers in 1955 [90] afteralmost 10 years of methods development and application. In 1960 [49, 95], the primary sequence of the first enzyme,ribonuclease (13,683 MW), was determined. Many primary sequences of enzymes are now known, many via gene sequencing.The secondary and tertiary structures of ribonuclease were determined in 1967 [58]. Now several hundred secondary andtertiary structures of enzymes are known, including structures in solutions, by nuclear magnetic resonance (NMR). The firstenzyme, ribonuclease, was completely synthesized chemically from amino acids in 1969 by two groups. Now, wild-type andmutant enzymes can be synthesized almost overnight by the PCR (polymerase chain reaction) method, once the gene has beenisolated. Those of us who have observed advances in protein and enzyme chemistry since the 1940s are astounded and awedby the remarkable ease and speed at which enzyme sequences and structures can now be determined.
7.1.5 Literature on Enzymology
Perhaps no other single topic has received so much attention from researchers as enzymes. Papers on enzymes can be found inalmost any journal in the physical, chemical, or biological sciences, since they are of interest to chemists, physicists,mathematicians, chemical engineers, and the life scientists, including food scientists and nutritionists. The bibliography at the endof this chapter includes selected journals, books, and monographs on enzymes. Obviously, no scientist can keep up completelyin this field. Food scientists should, by all means, be familiar with current progress in fundamental aspects of enzymes, as well aswith applications.

Pag e 438
7.2 Enzyme Nomenclature
The first enzyme to be named was catalase, which converts hydrogen peroxide to water and O2 (Eq. 5). Its name was derivedby using the stem of catalyst and adding ase. This generic type name is unfortunate considering the many enzymes that have sincebeen discovered.
(5)
The name of the second enzyme, diastase, was derived from the Greek word diastasis, meaning to separate. The name of thethird enzyme, peroxidase, was based on one of the substrates being peroxide. Polyphenol oxidase was so named because itoxidizes numerous phenols, while invertase inverts the optical rotation of a solution of sucrose ([a]=+66.5°) to [a]=-19.7° dueto formation of equimolar concentrations of glucose ([a]=+52.7°) and fructose ([a]=-92°). Note that two general principlesbegan to be used in naming some enzymes: -ase to designate an enzyme, while in two cases the stem was derived from the nameof one of the substrates (polyphenol oxidase from phenols and peroxidase from peroxide). In the case of polyphenol oxidase, itis clear the enzyme catalyzes oxidation of phenols.
7.2.1 The Enzyme Commission
As more enzymes were discovered nomenclature became an increasingly severe problem. Therefore, an InternationalCommission on Enzymes of the International Union of Biochemistry was established and its charge was “to consider theclassification and nomenclature of enzymes and coenzymes, their units of activity and standard methods of assays, together withthe symbols used in the description of enzyme kinetics.” The Report of the Commission (1961) contained 712 enzymes.Subsequent updates were issued, the most recent being Enzyme Nomenclature (1992), which contains 3,196 enzymes [35].
7.2.1. Rules for Naming
The basis for the classification adopted by the Enzyme Commission was to divide the enzymes into groups on the basis of thetype of reaction catalyzed, and this, together with the name(s) of the substrate(s), provided a basis for naming individualenzymes.
There are six types of reactions catalyzed by enzymes: (a) oxidoreduction, (b) transfer, (c) hydrolysis, (d) formation of doublebonds without hydrolysis, (e) isomerization, and (f) ligation. The names of the type of enzymes are formed by adding -ase to thestem of the type of reaction catalyzed. Thus the corresponding six groups of enzymes are (a)oxidoreductases, (b) transferases,(c) hydrolases, (d) lyases, (e) isomerases, and (f) ligases.
7.2.1.2 Overall Reaction as Basis of Nomenclature
The overall reaction, as expressed by the formal chemical equation (eq. 6), is the basis for the nomenclature. Intermediate stepsin the reaction reflecting the mechanism are not taken into account. Therefore, an enzyme cannot be named properly by thissystem until the substrate(s) and chemical nature of the reaction catalyzed are known.
(6)

Pag e 439
7.2.1.3 Three-Tier Classification
The Enzyme Commission assigned each enzyme three designations: a systematic name, a trivial name, and an EnzymeCommission (EC) number. Generally, the systematic name is composed of two principal parts. The first consists of the name(s)of the substrate(s); in the case of two or more substrates (or reactants), the name of the substrates are separated by a colon.The second part of the systematic name, ending in -ase, is based on one of the six types of chemical reactions catalyzed (seeSec. 7.2.1.1). When the overall reaction involves two different chemical reactions, such as oxidative demethylation, the secondtype of reaction is listed in parenthesis following the first chemical reaction—for example, “sarcosine:oxygen oxidoreductase(demethylating).”
The trivial name is one that is generally recognized and in common use such as a-amylase, cellulase, trypsin, chymotrypsin,peroxidase, or catalase. It is usually a shorter name than the systematic name.
The number system derives directly from the classification scheme, and each number contains four digits, separated by periodsand preceded by EC. The numbers are permanent. Newly discovered enzymes are placed at the end of the list underappropriate headings. If the classification of an enzyme is changed, the number remains in the listing, but the user is directed tothe new listing, including the new number of the enzyme.
7.2.1.4 Six Main Types of Enzymes
The six main types of enzymes, based on the chemical reaction catalyzed, are further explained in this section.
Oxidoreductases
Oxidoreductases are enzymes that oxidize or reduce substrates by transfer of hydrogens or electrons or by use of oxygen. Thesystematic name is formed as “donor:acceptor oxidoreductase.” An example, including systematic name followed by trivial nameand EC number in parenthesis, is [35]
H2O2 + H2O2 = O2 + 2H2O
which gives hydrogen peroxide:hydrogen peroxide oxidoreductase (catalase, EC 1.11.1.6).
Transferases
Transferases are enzymes that remove groups (not including H) from substrates and transfer them to acceptor molecules (notincluding water). The systematic name is formed as “donor:acceptor group-transferred-transferase.” An example is:
ATP + D-glucose = ADP + D-glucose 6-phosphate
which gives ATP:D-glucose 6-phosphotransferase (glucokinase, EC 2.7.1.2). Note that the position to which the group istransferred is given in the systematic name when more than one possibility exists.
Hydrolases
Hydrolases are enzymes in which water participates in the breakage of covalent bonds of the substrate, with concurrent additionof the elements of water to the principles of those bonds. The systematic name is formed as “substrate hydrolase.” Water is notlisted as a substrate, even though it is, because it is 55.6 M and the concentration does not change significantly during the

Pag e 440
reaction. When the enzyme specificity is limited to removal of a single group, the group is named as a prefix, for example,“adenosine aminohydrolase.” Another example is
Triacylglycerol + H2O = diacylglycerol + a fatty acid anion
catalyzed by triacylglycerol acylhydrolase (triacylglycerol lipase, EC 3.1.1.3).
Lyases
Lyases are enzymes that remove groups from their substrates (not by hydrolysis) to leave a double bond, or which converselyadd groups to double bonds. The systematic name is formed as “substrate prefix-lyase.” Prefixes such as “hydro-” and“ammonia-” are used to indicate the type of reaction—for example, “L-malate hydro-lyase” (EC 4.2.1.2). Decarboxylases arenamed as carboxy-lyases. A hyphen is always written before “lyase” to avoid confusion with hydrolases, carboxlases, etc. Anexample is:
(S)-Malate = fumarate + H2O
using the enzyme (S)-malate hydro-lyase (fumarate hydratase, EC 4.2.1.2; formerly known as fumarase).
Isomerases
Isomerases are enzymes that bring about an isomerization of substrate. The systematic name is formed as “substrate prefix-isomerase.” The prefix indicates the types of isomerization involved, for example, “maleate cis-trans- isomerase” (EC 5.2.1.) or“phenylpyruvate keto-enolisomerase” (EC 5.3.2.1). Enzymes that catalyze and aldose-ketose interconversion are known as“ketol-isomerases,” for example, “L-arabinose ketol-isomerase” (EC 5.3.1.4). When the isomerization consists of anintramolecular transfer of a group, such as 2-phospho-D-glycerate = 3-phospho-D-glycerate, the enzyme is named a “mutase,”for example, “D-phosphoglycerate 2,3-phosphomutase” (EC 5.4.2.1). Isomerases that catalyze inversions of asymmetric groupsare termed “racemases” or “epimerases,” depending on whether the substrate contains one or more than one center ofasymmetry, respectively. A numerical prefix is attached to the word “epimerase” to show the position of inverstion. An exampleis
L-Alanine = D-alanine
with alanine racemase (alanine recemase, EC 5.1.1.1).
Ligases
Ligases are enzymes that catalyze the covalent linking together of two molecules, coupled with the breaking of a pyrophosphatebond as in ATP. This group of enzymes has previously been referred to as the “synthetases.” The systematic name is formed as“X:Y ligase (Z),” where X and Y are the two molecules to be joined together. The compound Z is the product formed from thetriphosphate during the reaction.
An example is:
ATP + L-aspartate + NH3 = AMP + pyrophosphate + L-asparagine
with L-aspartate:ammonia ligase (AMP-forming) (aspartate-ammonia ligase, EC 6.3.1.1).
7.2.2 Numbering and Classification of Enzymes
A key to the numbering and classification of enzymes, in the extensive listings in Enzyme Nomenclature (1992) [35], is given inTable 3. The subclassification of the enzymes is best

Pag e 441
determined from this type of key. For example, it is easy to see how the number system is derived. As noted previously, the firstEC number indicates one of the six types of chemical reactions catalyzed by enzymes of that type. Using the EC 1. catagory, thesecond number indicates the nature of the donor substrate, the third number the nature of the acceptor molecule (not shown inTable 3) and the fourth number (not shown in Table 3) is the number of the specific enzyme. For example, EC 1.1.1.1 is alcoholdehydrogenase (alcohol:NAD+ oxidoreductase), where the second number indicates the donor substrate is a primary alcohol,the third number that the acceptor molecule is NAD+, or NADP+, and the fourth number is the specific enzyme alcoholdehydrogenase. EC 1.6.2.x would be NADH (or NADPH): cytochrome oxidoreductases.
7.3 Enzymes in Organisms
All organisms contain many enzymes. The raw materials that are converted to foods contain hundreds dreds of differentenzymes. These enzymes are important in the growth and maturation of the raw materials, and the enzymes continue to be activeafter harvest until all the substrate is exhausted, or the pH changes to one where the enzyme is no longer active, or the enzyme isdenatured by an imposed treatment (pH, heating, chemicals, etc.). Often, enzyme activity increases during storage because ofdistintegration of cellular structure that separates enzymes and their substrates. As an example, softening of tomatoes aceleratesfollowing optimum maturity due to increased enzyme activity. Plant tissues contaminated with microorganisms, such as brown rotfungi containing polyphenol oxidase, can literally be lost overnight due to the rapid growth and multiplication of enzyme-containing microorganisms. Bruising of a fruit (i.e. apple) or vegetable (i.e. potato) leads to rapid browning due to polyphenoloxidase. This is because O2 from the atmosphere, one of the required substrates, can more easily penetrate the damaged skin ofthe fruit or vegetable. An intact skin is one of the best protections against browning. Unfortunately, up to 50% of tropical fruitsare lost due to improper handling, shipping, and storage, and this is caused by uncontrolled activity of endogenous enzymes orexogenous enzymes present in attached microorganisms.
7.3.1 Location of Enzymes
Enzymes are not uniformly distributed in organisms. A particular enzyme sometimes is found only in one type of organelle withina cell, as shown in Table 4. The nucleus (Fig. 2 and Table 4) contains primarily enzymes involved with nucleic acid biosynthesisand hydrolytic degradation. The mitochondria (Fig. 2) contain oxidoreductases associated with oxidative phosphorylation andformation of ATP, and the lysosomes and the pancreatic zymogen granules contain primarily hydrolases (Table 4). Each type oforganelle in a cell is specialized in carrying out limited types of enzyme-catalyzed reactions.
Organs may also be specialized in the types of enzymes found. In animals, the gastrointestinal tract contains primarily hydrolasesdesigned to hydrolyze complex a-1,4-glucose-type carbohydrates, lipids, proteins, and nucleic acids to glucose, glycerol andfatty acids, amino acids, and purine and pyrimidines, respectively. Hydrolysis (digestion) of starch and glycogen by a-amylasebegins in the mouth and is completed in the small intestine. Hydrolysis of proteins begins in the stomach (with pepsin) and iscompleted in the small intestine (with trypsin, chymotrypsin, carboxypeptidases A and B, aminopeptidases, and di- andtripeptidases). The first four proteolytic enzymes are synthesized in and secreated by the pancreas into the small intestine. Lipidsare hydrolyzed by gastric (stomach) lipases and small-intestinal lipases. Nucleic acids are hydrolyzed by nucleases in the smallintestine. Plant organs also contain specialized enzymes. For example, the seed contains substantial amounts of hydrolyticenzymes to hydrolyze starch and proteins, especially to feed the new seedling following seed germination.

Pag e 442
TABLE 3 Key to Numbering and Classification of Enzymes a
1. Oxidoreductases
1.1 Acting on the CH—OH g roup of donors
1.2 Acting on the aldehyde or oxo g roup of donors
1.3 Acting on the CH—CH g roup of donor
1.4 Acting on the CH—NH2 g roup of donors
1.5 Acting on the CH—NH g roup of donors
1.6 Acting on NADH or NADPH
1.7 Acting on other nitrog enous compounds as donors
1.8 Acting on a sulfur g roup of donors
1.9 Acting on a heme g roup of donors
1.10 Acting on diphenols and related substances as donors
1.11 Acting on hydrog en peroxide as acceptor
1.12 Acting on hydrog en as donor
1.13 Acting on sing le donors with incorporation of molecular oxyg en (oxyg enases)
1.14 Acting on paired donors with incorporation of molecular oxyg en
1.15 Acting on superoxide radicals as acceptor
1.16 Oxidizing metal ions
1.17 Acting on CH2 g roups
1.18 Acting on reduced ferredoxin as donor
1.19 Acting on reduced flavodoxin as donor
1.97 Other oxidoreductases
2. Transferases
2.1 Transferring one-carbon g roups
2.2 Transferring aldehyde or ketone residues
2.3 Acyltransferases
2.4 Glycosyltransferases
2.5 Transferring alkyl or aryl g roups, other than methyl g roups
2.6 Transferring nitrog enous g roups
2.7 Transferring phosphorus-containing g roups
2.8 Transferring sulfur-containing g roups
3. Hydrolases

3.1 Acting on ester bonds
3.2 Glycosidases
3.3 Acting on ether bonds
3.4 Acting on peptide bonds (peptidases)
3.5 Acting on carbon-nitrog en bonds, other than peptide bonds
3.6 Acting on acid anhydrides
3.7 Acting on carbon-carbon bonds
3.8 Acting on halide bonds
3.9 Acting on phosphorus-nitrog en bonds
3.10 Acting on sulfur-nitrog en bonds
3.11 Acting on carbon-phosphorus bonds
4. Lyases
4.1 Carbon-carbon lyases
4.2 Carbon-oxyg en lyases
4.3 Carbon-nitrog en lyases
4.4 Carbon-sulfur lyases
4.5 Carbon-halide lyases
4.6 Phosphorus-oxyg en lyases
4.99 Other lyases
(table continued on next page)

Pag e 443
(table continued from previous page)
5. Isomerases
5.1 Racemases and epimerases
5.2 cis-trans-Isomerases
5.3 Intramolecular oxidoreductases
5.4 Intramolecular transferases (mutases)
5.5 Intramolecular lyases
5.99 Other isomerases
6. Lig ases
6.1 Forming carbon-oxyg en bonds
6.2 Forming carbon-sulfur bonds
6.3 Forming carbon-nitrog en bonds
6.4 Forming carbon-carbon bonds
6.5 Forming phosphoric ester bonds
aThe third and fourth levels of classification are g iven in Ref. 35.
Source: Ref.35, pp. v-xi, by courtesy of Academic Press.
If we want to find a particular enzyme in plants, animals, and microorganisms, it is important to know in which organelle or organan enzyme is located. Two techniques are important for this. The organs containing a particular enzyme can be determined byhistochemical techniques (Fig. 3). As shown in Figure 3, alkaline phosphatase and polyphenol oxidase are not distributeduniformly in cells of porcine logissimus muscle and the beet, respectively. These sensitive enzyme histochemical techniques areused routinely by medical and veterinary histologists and pathologists [100]. Unfortunately, they are rarely used by foodscientists.
TABLE 4 Subcellular Location of Several Enzymes in Animal Cells
Location Enzymes
Nucleus DNA-dependent RNA polymerase, a polyadenylate synthetase
Mitochondria Succinate dehydrogenase, cytochrome oxidase, g lutamate dehydrog enase,malate dehydrog enase, a-ketog lutarate dehydrog enase, a-g lyerol phosphatedehydrog enase, pyruvate decarboxylase
Lysosomes Cathepsins A, B, C, D, and E, collag enase, acid ribonuclease, acidphosphatase, b-g alactosidase, sialidase, lysozyme, trig lyceride lipase
Peroxisomes (microbodies) Catalase, urate oxidase, D-amino acid oxidase
Reticulum, g olg i, etc. Glucose 6-phosphatase, nucleoside diphosphatase, TPNH-linked lipidperoxidase, nucleoside phosphatases
Soluble Lactate dyhydrogenase, phosphofructokinase, glucose 6-phosphatedehydrogenase, transketolase, transaldolase
Pancreatic zymog eng ranules
Trypsinogen,b chymotrypsinogen,b lipase, amylase, ribonuclease

aEnzymes in italics are most frequently used as indicator enzymes for type of cellular org anelles present in ahomog enate.
bZymog ens activated to trypsin and chymotrypsin, respectively.
Source: Ref. 111, p. 68.

Pag e 444
Fig ure 2“Typical” cell. Diag ram of a typical cell based on data from electron
microg raphs. (From Ref. 14, p. 55, by courtesy of Scientific American, Inc.)
The second method used to determine which organelle contains a particular enzyme is to use differential centrifugation, followingcareful disintegration of the tissue in a buffer to control pH and osmotic pressure so that the organelles remain intact. Theseparated organelles are then disintegrated and the enzymes present are determined by use of specific substrates to detect theirpresence and concentration. The results of this type of study are shown in Table 4.
7.3.2 Compartmentation and Access to Substrate
The activities of enzymes in intact cells are controlled by compartmentation in subcellular membranes, by organelles, bymembrane-or cell-wall-bound enzymes and/or substrates, and by
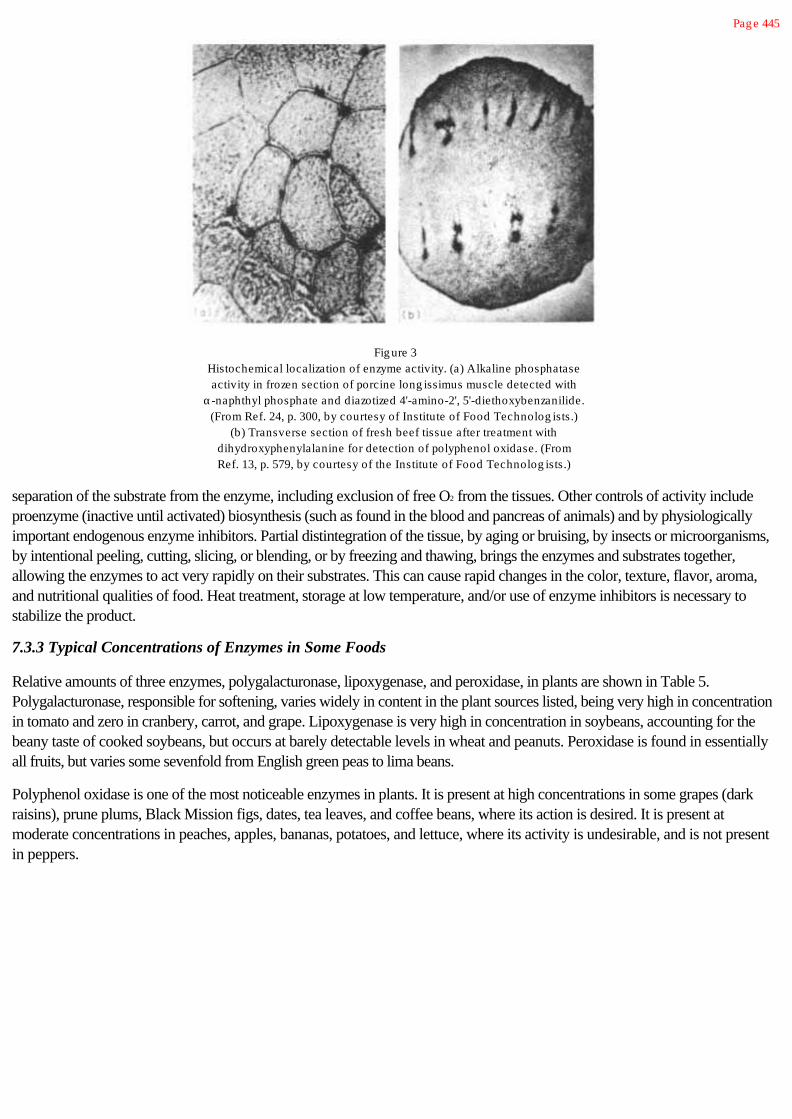
Pag e 445
Fig ure 3Histochemical localization of enzyme activity. (a) Alkaline phosphataseactivity in frozen section of porcine long issimus muscle detected with
a-naphthyl phosphate and diazotized 4'-amino-2', 5'-diethoxybenzanilide.(From Ref. 24, p. 300, by courtesy of Institute of Food Technolog ists.)
(b) Transverse section of fresh beef tissue after treatment withdihydroxyphenylalanine for detection of polyphenol oxidase. (FromRef. 13, p. 579, by courtesy of the Institute of Food Technolog ists.)
separation of the substrate from the enzyme, including exclusion of free O2 from the tissues. Other controls of activity includeproenzyme (inactive until activated) biosynthesis (such as found in the blood and pancreas of animals) and by physiologicallyimportant endogenous enzyme inhibitors. Partial distintegration of the tissue, by aging or bruising, by insects or microorganisms,by intentional peeling, cutting, slicing, or blending, or by freezing and thawing, brings the enzymes and substrates together,allowing the enzymes to act very rapidly on their substrates. This can cause rapid changes in the color, texture, flavor, aroma,and nutritional qualities of food. Heat treatment, storage at low temperature, and/or use of enzyme inhibitors is necessary tostabilize the product.
7.3.3 Typical Concentrations of Enzymes in Some Foods
Relative amounts of three enzymes, polygalacturonase, lipoxygenase, and peroxidase, in plants are shown in Table 5.Polygalacturonase, responsible for softening, varies widely in content in the plant sources listed, being very high in concentrationin tomato and zero in cranbery, carrot, and grape. Lipoxygenase is very high in concentration in soybeans, accounting for thebeany taste of cooked soybeans, but occurs at barely detectable levels in wheat and peanuts. Peroxidase is found in essentiallyall fruits, but varies some sevenfold from English green peas to lima beans.
Polyphenol oxidase is one of the most noticeable enzymes in plants. It is present at high concentrations in some grapes (darkraisins), prune plums, Black Mission figs, dates, tea leaves, and coffee beans, where its action is desired. It is present atmoderate concentrations in peaches, apples, bananas, potatoes, and lettuce, where its activity is undesirable, and is not presentin peppers.

Pag e 446
Table 5 Relative Amounts of Some Enzymes in Various Sources
Enzyme Source Relative amounts
Polyg alacturonase a Tomato 1.00
Avocado 0.065
Medlar 0.027
Pear 0.016
Pineapple 0.024
Cranberry 0
Carrot 0
Grape 0
Lipoxyg enase b Soybeans 1.00
Urd beans 0.60
Mung beans 0.47
Peas 0.35
W heat 0.02
Peanuts 0.01
Peroxidase c Green peas 1.00
Pea pods 0.72
String beans 0.62
Spinach 0.32
Lima beans 0.15
aAdapted from Ref. 51.
bAdapted from Ref. 93.
cAdapted from Ref. 54.

The levels of a given enzyme activity can be highly variable in raw foods, since a cultivar of the same fruit, for example, can bebred to have more or less enzyme. The age (maturity) of an organism (Fig. 4), and the environmental conditions of growing(especially plants), including temperature, water supply, soil, and fertilization, all affect the level of enzyme activity. This makes itvery difficult for the food processor to produce uniform-quality food products. Fortunately, the rate of denaturation of enzymesis generally first order; therefore, the time required to inactivate a fixed percentage of the enzyme is independent of itsconcentration. However, at different initial concentrations of active enzyme, the absolute concentrations of active enzyme left willbe different. For example, at 5 half-lives, there will be 3.13% of the original active enzyme left regardless of initial active enzymeconcentration. But at initial concentrations of 1 × 10⁻³M and 1 × 10⁻⁵M active enzyme, after 5 half-lives there will be 3.13 × 10-
5M and 3.13 × 10⁻⁷ Mactive enzyme left, respectively. So both the two initial and two final concentrations of active enzyme differby 100. It takes longer to inactivate all the enzyme with higher initial concentration. The conditions just listed also affect therelative levels of isozymes (for example, those of peroxidase or lipoxygenase). These isozymes often have different temperaturestabilities, as shown for the isoenzymes of peroxidase and lipoxygenase (Fig. 5). The presence of two or more isozymes isindicated by the inability to inactivate completely each enzyme at 60°C; at 70°C, lipoxygenase is completely inactivated butperoxidase still retains about 40% activity.

Pag e 447
Fig ure 4Chang es in the polyg alacturonic acid lyase activity of Bacilus pumilis
as a function of ag e of culture: , absorbance at 600 nm of a 1:20 dilution
as a measure of cell population; , activity of enzyme (units/ml). (From Ref.28, p. 41, by courtesy of B.A. Dave.)
7.4 Rates of Enzyme-Catalyzed Reactions
7.4.1 Rate Determination
The distinguishing feature of enzymes from other proteins is that enzymes bind their substrates stereospecifically into the activesite and convert the substrates to products. Therefore, the presence of an enzyme is determined by whether it converts acompound to a product faster than that which occurs in its absence. Assays for enzyme activity are based on physical orchemical
FIGURE 5Rates of inactivation of peroxidase and
lipoxyg enase in Eng lish g reen pea homog enatesincubated at 60 and 70°C. (From Ref. 114, p.132, with permission of the Institute of Food
Technolog ists.)

Pag e 448
changes in substrate(s) and products(s) in the reaction mixture. Continuous methods (change in absorbance, fluorescence, orpH) are very much preferred over methods that require taking aliquots at selected times, stopping the reaction by inactivating theenzyme, and adding one or more reagents to form a measurable derivative of either the substrate or product (preferable).
Since an enzyme is highly specific for only one or a few substrates, it follows that it is relatively easy to measure that enzymeselectively even among hundreds of other enzymes of different specificities. The enzyme activity can be used to determine notonly the presence of an enzyme (qualitative), but also how much enzyme is present (quantitative), based on its rate undercontrolled conditions.
Some substrates and products do not differ greatly in physical and/or chemical properties; therefore it is difficult to determine thefirst-order rate constant, k1 (Eq. 7). In these cases, coupled enzyme assays should be considered, where the product, P1, of thefirst enzyme is a substrate of an added second enzyme. The product, P2, of the second enzyme is then chosen for measurement(Eq. 7). In order to measure k1 correctly, the relation k2[E2] @ 100 k1[E1] should be used.
(7)
7.4.2 Steady-State Rates
The velocity of a typical enzyme-catalyzed reaction is shown in Fig. 6, where concentration of product formed is plotted versustime. In the first few milliseconds, the velocity (dP/dt) of product formation accelerates depending on how fast the enzyme andsubstrate combine to give the enzyme. substrate complex (Eq. 2). This is the pre-steady-state period (0.1–2 msec) and canonly be measured by very fast mixing and measuring system (i.e., stopped-flow spectrophotometers). After ~2 msec, theconcentration of enzyme-substrate complex [E.S] reaches a steady
FIGURE 6Typical enzyme-catalyzed reaction showing the
pre-steady-state (msec), the constant rate, and thedeclining rate parts of the prog ress curve. (From Ref.
111, p. 161.)

Pag e 449
state where d[E.S]/dt =-d[E.S]/dt over the time required to measure a change in [P] or [S]. The steady-state concept appliesfrom the end of the pre-steady-state period to the end of conversion of all substrate. Enzyme activity is measured under steady-state conditions in most laboratories (see later discussion). Why then does the velocity of the reaction becomes slower andapproach zero as shown in Figure 6? The decrease in velocity with time can be a result of these: (a) the [S] becomes the rate-limiting factor (i.e., [S] < 100Km); (b) as [P] increases it may partially inhibit the enzyme; (c) the reaction is reversible and thereverse reaction becomes more noticeable as [P] increases; and/or (d) instability of the enzyme. These possible causes can bedistinguished by appropriate methods [111].
Since steady-state velocities of enzyme-catalyzed reactions decreases with reaction time, often in a complex manner for thereasons already given, enzymologists generally determine the initial velocity, no, of enzyme-catalyzed reactions. This is done asshown in Figure 7. If done with proper control(s), all reactions should begin at zero time with zero [P]. The no is determine froma tangent drawn (dashed lines) to the initial part of the reaction. No more than 5% of the substrate should be converted toproduct during the time required to obtain the tangent. Note that accurate tangents are easier to obtain when the velocity isrelatively slow. Experimentally, the velocity can be controlled by controlling the enzyme concentration, and this must be done ifaccurate, reproducible no values are expected. Please note that the slope of two point assays (zero at zero time and anotherpoint later on) does not yield accurate values of no!
7.4.2.1 Kinetics and Reaction Order
Reaction order is determined from the dependence of velocity (dP/dt, or -dS/dt) on the concentration(s) of the reactant(s).Therefore, we begin with an equation. For an enzyme.
FIGURE 7Method of determining initial velocities of reactions.
The solid lines are the experimentally determineddata, and the dashed lines are tang ents drawn to theinitial slope of the experimental data. Note the marked
difference between the actual concentration of productformed at the time indicated by vertical dashed line forreactions (A o) 4 and (A o)5 compared with that predicted
from initial rates. (From Ref. 111, p. 163.)

Pag e 450
appropriate kinetic description is given by Equation 8 (same as Eq. 1), where E is enzyme, S is substrate, E.S is the enzyme-substrate complex, and P is product. The velocity of
(8)
formation of E.S (d[E.S]/dt) isk1 [E][S], while the velocity of disappearance of E.S (-d[E.S]/dt) is k -1(E.S) + k2 [E.S]. Steady-state conditions exist when ever d(E.S)/dt =-d(E.S)/dt for ~5 msec. The Michaelis-Menten equation (Eq. 9), derived fromEquation 8, is based on the
(9)
following assumptions [111]:
1. Initial velocity, no, is used so that [S]o [S]. As discussed earlier, this is common practice.
2. [S]o>>[E]o, so that there is little change is [S] o. Practically, this is the case with most enzymes where [S]o is of the order of 10-
4 to 10-2M since Km is generally within this range and [E]o is on the order of 10-8 -10-6M.
3. The step controlled by k2 (Eq. 8) is irreversible in reality or because no is used in ([P] is essentially zero). Therefore, k -2 is ~0.
4. d(E.S/dt=-d(E.S)/dt, so steady-state conditions prevail.
5. k2 controls the velocity of formation of product (dP/dt). If k2 > k1 then k1 controls velocity of product formation. Note thatVmax is not really a constant in Equation 9, since it is dependent on [E]o (Vmax = k2 [E]o); k2 is a constant, but Vmax will changewhen [E]o is changed.
6. If any one of these assumptions is not true then the form of the Michaelis-Menten equation will be more complex, eventhrough a plot of no versus [S]o will be hyperbolic (Fig. 1). For example, if there is an additional intermediate in the reaction, suchas an acylenzyme (Eq. 10); [111], then Equation 10 applies:
(10)
and the Michaelis-Menten equation is
(11)
In the preceding equations, [E]o is total enzyme concentration, [E] is free enzyme concentration, [E.S] is enzyme-substrateconcentration, [S]o is initial substrate concentration, [S] is substrate concentration at any time t, and Km = (k2 + k -1)/k -1 forEquation 9 and (k -1 + k2)k3/k1 (k2 + k3) for Equation 11.
What is the order of an enzyme-catalyzed reaction and how does one determine the order? Since [E]o is constant throughout thereaction, assuming it is stable, the order of an enzyme-catalyzed reaction is determined by the relationship between [S]o and Km
(as long as [S]o >> [E]o; see assumption 2). When [S] o<0.01 Km, the order of the reaction is first order with respect to [S]o.This can be readily seen from Equation 9. When [S]o <0.01 Km, [S]o in the denominator can be ignored and no=Vmax[S]o/Km
,(no=k´[S]o), where k´ = Vmax/Km, showing direct dependence on [S]o. A plot of In([S]o/[S]) versus time gives a straight-line plotover several half-lives

Pag e 451
of substrate concentration disappearance, with the slope equal to Vmax/Km, and the half-life time independent of [S]o.
When [S]o >100Km, the order of the reaction with respect to [S]o is zero. This also can be seen from Equation 9. When [S]o >>Km, Equation 9 reduces to no = Vmax, indicating that no is independent of [S]o and all enzyme is saturated with substrate. A plot of[P] versus time gives a straight-line plot, with a slope Vmax (=k2[E]o).
When [S]o > 0.01 Km, but < 100 Km the order of the reaction with respect to [S]o is a mixture of first and zero order and theintegrated form of the Michaelis-Menten equation is:
k2[E]ot = Km In([S]o/[S]) + ([S]o - [S]) (12)
The relative contributions of the terms In([S]o/[S]) and ([S]o - [S]) will depend on the relation of [S]o to Km. Section 7.5 onfactors influencing enzyme reactions will provide experimental procedures for evaluating the effect of [S]o on no.
Some typical rate constants of enzyme-catalyzed reactions are given in Table 6. The value of k1, the rate constant for formationof the enzyme-substrate complex, ranges from 109 to 104 M-1sec-1 (where 109 is the limiting rate of diffusion-controlledreactions). The value of k -1, the rate constant for dissociation of the enzyme-substrate complex, ranges from about 4.5 × 10⁴ toabout 1.4 sec-1. The value of ko, the observed rate constant for conversion of enzyme-substrate complex to product, rangesfrom 107 to 101 sec-1. In reactions that follow Equation 8 ko = k2,
but not for those that follow Equation 10.
7.4.3 Pre-Steady-State Reactions [17, 44]
Pre-steady-state kinetic experiments are rarely done in food science, yet they provide details regarding additional intermediatesteps in enzyme reactions that are difficult to obtain by other
TABLE 6 Rate Constants for Some Selected Enzymes
Enzyme Substrate (M -1 (sec -1) (sec -1 (sec -1)
Fumarase Fumarate >109 >4.5 ×10⁴ 103
Acetylcholinesterase Acetylcholine 109 — 103
Liver alcohol NAD+ 5.3 × 10⁵ 74 103
dehydrog enase NADH 1.1 × 10⁷ 3.1
Ethanol >1.2 × 10⁴ >74
Catalase H2O2 5 × 10⁶ — 107
Peroxidase H2O2 9 × 10⁶ <1.4 106
Hexokinase Glucose 3.7 × 10⁶ 1.5 × 10³ 103
Urease Urea >5 × 10⁶ — 104
Chymotrypsin 102 to 103
Trypsin 102 to 103
Ribonuclease 102
Papain 101
aRate constant for formation of enzyme-substrate complex.
bRate constant for dissociation of enzyme-substrate complex.

cOrder of mag nitude of the turnover number in moles of substrate converted to product per second permole of enzyme: k o ( k cat) is the observed rate constant and may or may not involve a sing le rate-limiting step.
Source: Ref. 33, p. 14, courtesy of Academic Press.
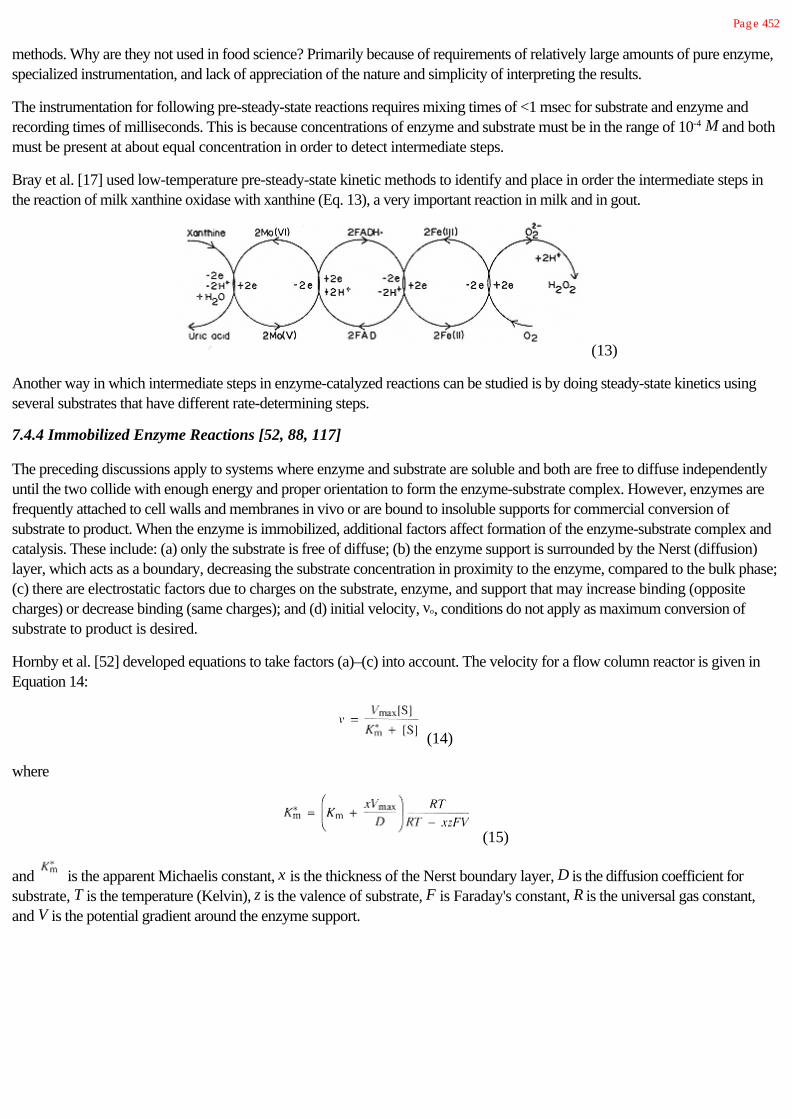
Pag e 452
methods. Why are they not used in food science? Primarily because of requirements of relatively large amounts of pure enzyme,specialized instrumentation, and lack of appreciation of the nature and simplicity of interpreting the results.
The instrumentation for following pre-steady-state reactions requires mixing times of <1 msec for substrate and enzyme andrecording times of milliseconds. This is because concentrations of enzyme and substrate must be in the range of 10-4 M and bothmust be present at about equal concentration in order to detect intermediate steps.
Bray et al. [17] used low-temperature pre-steady-state kinetic methods to identify and place in order the intermediate steps inthe reaction of milk xanthine oxidase with xanthine (Eq. 13), a very important reaction in milk and in gout.
(13)
Another way in which intermediate steps in enzyme-catalyzed reactions can be studied is by doing steady-state kinetics usingseveral substrates that have different rate-determining steps.
7.4.4 Immobilized Enzyme Reactions [52, 88, 117]
The preceding discussions apply to systems where enzyme and substrate are soluble and both are free to diffuse independentlyuntil the two collide with enough energy and proper orientation to form the enzyme-substrate complex. However, enzymes arefrequently attached to cell walls and membranes in vivo or are bound to insoluble supports for commercial conversion ofsubstrate to product. When the enzyme is immobilized, additional factors affect formation of the enzyme-substrate complex andcatalysis. These include: (a) only the substrate is free of diffuse; (b) the enzyme support is surrounded by the Nerst (diffusion)layer, which acts as a boundary, decreasing the substrate concentration in proximity to the enzyme, compared to the bulk phase;(c) there are electrostatic factors due to charges on the substrate, enzyme, and support that may increase binding (oppositecharges) or decrease binding (same charges); and (d) initial velocity, no, conditions do not apply as maximum conversion ofsubstrate to product is desired.
Hornby et al. [52] developed equations to take factors (a)–(c) into account. The velocity for a flow column reactor is given inEquation 14:
(14)
where
(15)
and is the apparent Michaelis constant, x is the thickness of the Nerst boundary layer, D is the diffusion coefficient forsubstrate, T is the temperature (Kelvin), z is the valence of substrate, F is Faraday's constant, R is the universal gas constant,and V is the potential gradient around the enzyme support.

Pag e 453
Since n is not no and as much substrate conversion as possible is desired, zero-, mixed-, and first-order rate kinetics areobserved in the reactor at different times of reaction. Therefore,
(16)
describes the kinetic process in the column reactor. The fraction p of S reacted at any time is
(17)
Also required is the void volume, Vo, of the column and the flow rate, Q, of the substrate through the column. The ratio of Vo/Qis equal to the residence time t in the reactor. Therefore, the reactor output can be expressed as
(18)
Equation 18 is the equation of a straight line, where y=[S]op and x=In(1-p). The slope of the plot is
Lilly and Sharp [73] developed an analogous kinetic equation applicable to a continuous- feed stirred tank reactor:
(19)
In some cases, such as the hydrolysis of insoluble cellulose, biomass, lipid micelles, and cell walls, the substrate is insoluble andthe soluble enzyme must diffuse to and bind to the insoluble substrate as shown in Equation 20 where E is the soluble enzymeand Es is the bound to the insoluble substrate:
(20)
The size of the insoluble substrate (micelle droplets or insoluble particles) also affects and Verger et al. [102] andothers have shown that the kinetics of soluble enzyme action on insoluble substrate fits Michaelis-Menten kinetics where
(21)
The value of [S] is dependent on the surface of the insoluble substrate and
(22)
where kd and kp are from Equation 20. The values of and can be determined from Lineweaver-Burk plots. The
and will be greatly dependent on experimental conditions.
7.5 Factors Influencing Enzyme Reactions
In the previous sections, we developed the basic concepts and kinetic equations required to quantify the velocity (no and n) ofenzyme-catalyzed equations. In developing Section 7.4, only the substrate concentration was considered as a variable. All otherconditions were assumed to

Pag e 454
be held constant. In Section 7.5, we will expand further on the effect of substrate concentration on the velocity of enzyme-catalyzed reactions. In addition, the effect of enzyme concentrations, pH, temperature, water activity, and organic solvents onvelocity of the reactions will be discussed. The effect of activators and inhibitors on velocity of enzyme-catalyzed reactions willbe discussed in Sections 7.6 and 7.7, respectively.
7.5.1 Substrate Concentration
The effect of substrate concentration on velocity of product formation is shown in Figure 1 for one-substrate reactions when thereactions follow Michaelis-Menten kinetics. Determination of Vmax and Km from data plotted as in Figure 1 is difficult at bestbecause Vmax is achieved only when [S]o > 100Km (zero order with respect to substrate concentration). The substrate may beinsoluble and/or expensive at the concentrations needed, the substrate may inhibit the reaction at high substrate concentrations(Fig.8), or it may activate the reaction at high substrate concentrations (Fig. 9).
For these and other reasons, Lineweaver and Burk [76] in 1934 showed that the Michaelis-Menten equation (Eq. 9) can betransformed from a right hyperbola to a straight line by taking the reciprocal to give
FIGURE 8Effect of substrate inhibition on the initial velocity of an
enzyme-catalyzed reaction. The dashed line shows the normalcurve in absence of inhibition, and the solid line showsinhibition by a second substrate molecule for which the
dissociation constant, is 10K m. The solid line is calculated
according to the equation v o = Vmax/{[1 + Km/(Ao)] + [Ao/ ]}.E.A2 does not form product. Larg e g raph plotted by
Line weaver-Burk method; the insert is a Michaelis-Mentenplot. (From Ref. 111, p. 193).

Pag e 455
FIGURE 9Effect of substrate activation on initial velocity of an
enzyme-catalyzed reaction. The dashed line shows a normalreaction in absence of activation, and the solid line shows a
reaction in the presence of activation. The solid line is calculated on
the assumptions that for the second substrate molecule is10Km, that Vmax is doubled when all the enzyme is saturated with a
second substrate molecule (i.e., E.S 2 g oes to product twiceas fast as E.S), and that the second substrate molecule does
not form product. The larg e g raph is plotted by theLine weaver-Burk method; the insert is a Michaelis-Menten
plot. (From Ref. 111, p. 194.)
(21)
where 1/no = y,1/[S]o = x, Km/Vmax is the slope and 1/Vmax is the y-intercept of the straight-line plot, and -1/Km is the x-intercept(Fig. 10). Therefore, Vmax and Km can be readily determined, using all the experimental data. For best results the [S]o used toobtain data for Figure 10 should range from 0.2Km to 5Km, if possible. The Lineweaver-Burk method for calculating Vmax andKm is, by far, the most used. Other linear transforms include the methods of Augustinsson (Eq. 22) [111] and of Eadie-Hofstee(Eq. 23) [111].
(22)
(23)
It is often useful to plot the experimental data by all three methods; easily done with available computer software programs forenzyme kinetics. Linear plots by all three methods are

Pag e 456
FIGURE 10Plot of substrate-velocity data according to theLineweaver-Burk method as shown in Equation
21. (From Ref. 111, p. 176.)
not always found, indicating complexities (multiple intermediate steps, etc.) not readily apparent from only one of the plots.
7.5.1.1 Multiple Substrate Reactions
Most enzyme-catalyzed reactions involve more than one substrate. Hydrolase-catalyzed reactions require water as the secondsubstrate, but under most conditions where the water concentration is 55.6 M, its effect is ignored in developing the kineticequations. However, in all other cases, the effect of concentration of the second substrate cannot be ignored. Severalinvestigators have developed kinetic equations for handling these multi-substrate reactions [22, 27, 115]. Whitaker [111] hassummarized the experimental procedures and kinetic approaches to be used. The experimental procedures are no more complexthan those described for the one substrate reactions, and most of the reactions fit Michaelis-Menten type kinetics. Experimentsmust be done so that the effects of all substrates can be determined, varying the concentration of one of them at a time. Theinterpretation of Vmax and Km is more complex but the individual rate constants can be determined readily by the King-Altmanmethod [62], among other methods.
The multiple substrate reactions that fit Michaelis-Menten kinetics belong to three main types [22]. Using examples for two-substrate/two-product reactions, two of these types are (a) ordered sequential bi bi mechanism, in which the two substratesmust bind with the active site of the enzyme in an ordered manner and the two products are released from the enzyme in anordered manner (Eq. 24), and (b) random sequential bi bi mechanism, in which the two substrates can bind into the active site ofan enzyme in either order and the two products come off the enzyme in either order (Eq. 25). In the sequential mechanisms, allsubstrates must bind into the active site of the enzyme before any products are formed. In the third type, (c) the ping-pong bi bimechanism, the first substrate must bind in the active site and one product is released before the second substrate can bind intothe active site and be catalyzed to product (Eq. 26). These different types of mechanisms are best determined by plotting 1/no
versus 1/[S]o according to the

Pag e 457
Lineweaver-Burk method. The two sequential mechanisms [(a) and (b)] are distinguished by use of equilibrium dialysis todetermine the order of substrate binding into the active site.
Ordered sequential bi bi mechanism
(24)
Random sequential bi bi mechanism
(25)
Ping-pong bi bi mechanism
(26)
The reader is referred to Whitaker [111] or Cleland [22] for further details on experimental procedures and analyses of data.
7.5.1.2 Substrate Inhibition
One substrate molecule binds into the active site of the enzyme and is catalytically converted to product according to normalkinetics. At higher substrate concentrations, a second molecule binds at a site different than the active site. It is not catalyzed toproduct, but its binding results in a decrease in catalytic efficiency of the enzyme (Fig. 8). Note that when plotted by theMichaelis-Menten method (insert), no reaches a maximum but is lower than the true Vmax, and no decreases as [S]o is increasedbeyond the maximum no The Lineweaver-Burk plot shows an upward deviation from linearity at high substrate concentrations.Isozymes sometimes show differences in substrate inhibition that appear to be a regulatory control of activity.
7.5.1.3 Substrate Activation
Binding of one substrate molecule into the enzyme active site results in product formation kinetics in the normal manner. Thebinding of a second substrate molecule at another site does not result in conversion of the substrate molecule to product, but itdoes enhance the rate of conversion of the substrate molecule in the active site to product (Fig. 9). Note that substrate activationresults in downward deviation of the line from linearity at higher substrate concentrations when plotted by the Lineweaver-Burkmethod.
Substrate activation can be confused when two enzymes act on the same substrate, if the Km values for the two enzymes aresomewhat different. This possibility can be verified by showing that two isozymes are present by electrophoretic separation (forexample) of the two.
7.5.1.4 Allosteric Behavior
Allosteric behavior is defined by a plot of no versus [S]o giving a sigmoidal shaped curve (Fig. 11; solid line), in contrast to a righthyperbola (Fig. 11; dashed line) found for Michaelis-Menten

Pag e 458
FIGURE 11Comparison of effect of substrate concentration on theintial velocities of two enzyme-catalyzed reactions, onethat obeys Michaelis-Menten kinetics (dashed line) and
one that shows allosteric behavior (solid line). The
desig nations and indicate the substrateconcentrations at which the initial velocity is 0.1 and 0.9
Vmax, respectively, for Michaelis-Menten kinetics, while
and have the same meaning for the allostericbehaving system. The Hill value was 4 in the calculationof the allosteric curve (solid line). (From Ref. 111, p. 195.)
behavior. There is a smaller than expected effect of increasing [S]o on no at [S]o < Km, followed by larger than expected effect of[S]o on no at [S] around Km. The example shown in Figure 11 is for positive allosteric kinetic behavior. In some cases, the effectof [S]o on no is greater than expected at lower [S]o, and then no does not increase as much as [S]o increases. This is negativeallosteric kinetic behavior.
Positive allosteric kinetic behavior was discovered by Monod et al. [80], who subsequently received the Nobel Prize. Koshlandet al. [66] discovered negative allosteric kinetic behavior, and developed methods for distinguishing allosteric behavior fromMichaelis-Menten behavior, including a mathematical verification for occurrence of allosteric behavior.
To distinguish allosteric behavior from Michaelis-Menten behavior, Koshland et al. [66] proposed an equation for measuringcooperativity:
Rs = [S]0.9Vmax/[S]0.1Vmax = cooperativity factor (27)
where [S]0.9 is the substrate concentration required to give no = 0.9Vmax and [S]0.1 is the substrate concentration required to give
vo = 0.1Vmax. These points are marked on Figure 11 for and for Michaelis-Menten behaving enzymes and and
for positive allosteric behavior. For all Michaelis-Menten behaving enzymes, Rs is 81, while for positive allosteric behavingenzymes Rs < 81 (often as low as 30–40), and for negative allosteric behaving enzymes Rs > 81.
Allosteric behavior is most often observed with multi-subunit enzymes. Koshland et al. [66] proposed that for allosteric behaviortwo or more subunits of an enzyme must show cooperativity:

Pag e 459
(28)
Consider K1 and K2 as binding constants. If K2 > K1 then the second substrate molecule binds more easily (tightly) than the firstsubstrate molecule and positive allosteric behavior is seen. If K1 > K2 the first substrate molecule binds more tightly than thesecond one, and negative allosteric behavior is seen. If K1 = K2, the two substrate molecules bind equally well with no effect oneach other's binding, and Michael-Menten behavior is observed.
Allosteric behavior is one method of regulating enzymatic activity by small changes in substrate concentration, especially aroundKm. The metabolic enzymes in the glycolytic and TCA cycles often show allosteric behavior. Allosteric behavior can also beelicited in some enzymes by non-substrate compounds that act as allosteric inhibitors or activators.
7.5.2 Enzyme Concentration
The relationship between no and [E]o is usually linear when all other factors, such as [S]o, pH, and temperature, are kept constant(Fig. 12). Doubling the [E]o doubles no; tripling the [E]o triples no. This is expected since no = k2[E.S] = dP/dt = -dS/dt (see Eq.2). This linear relationship between [E]o and no at all [S]o is very valuable, since we can determine how much enzyme is presentby measuring its activity under standard conditions without purifying the enzyme. Of course, the enzyme should be extractedfrom the tissues and should be free of any insoluble materials and/or other compounds that might interfere with determination ofactivity (such as those having intense absorbance at the same wavelength, in vivo activators and inhibitors that occur in variableamounts, or other enzymes that act on the same substrate). Enzyme activity determinations are important in clinical medicine,nutritional abnormalities, quality control in food processing, and in analytical uses of enzymes to determine concentration ofcompounds that are substrates, activators, or inhibitors (see Sec. 7.12).
There are at least five exceptions to the expected linear relationship between [E]o and no. [111]. Two of these are (a) limitationson solubility of a substrate, such as O2, and (b) conversion of substrates to products that either are less good substrates or arecompetitive inhibitors. Both lead to a decrease in no as [P] increases. The third (c) is coupled enzyme
FIGURE 12Expected relationship between enzymeconcentration and observed velocity ofreaction. Substrate concentration, pH,
temperature, and buffer are keptconstant.
(From Ref. 111, p. 202.)

Pag e 460
reactions where the product of enzyme-1 is the substrate of enzyme-2. In this instance, product-2 is measured to determine no,yet the concentration of enzyme-1 is desired:
(29)
To obtain linearity between no (dP2/dt) and [E1]o, k2[E2]o > 100k1[E1]o should be used. There may also be (d) irreversibleinhibitor, such as Hg2+, Ag+, or Pb2+ in the substrate, buffer, or water, which inactivates a fixed amount of the enzyme; and (e) adissociable essential cofactor in the enzyme solution.
7.5.3 Effect of pH
The pH has a marked effect on activity of most enzymes. As shown in Figure 13, pepsin, peroxides, trypsin, and alkalinephosphatase have optimal activity at about pH 2, 6, 8, and 10, respectively. All the activity-pH curves are bell-shaped, withactivity decreasing to near zero at 2 pH units below or above the pH optimum. Note that the left-hand side of the pepsin curveand the right-hand side of the alkaline phosphatase curve (Fig. 13) decrease abruptly as a function of pH (the bell-shaped curvesare skewed). The pH optima of several enzymes found in raw food products are listed in Table 7. The pH optima range from 2for pepsin to 10 for alkaline phosphatase. Catalase (Table 7) has maximum activity from pH 3 to 10.
The apparent complexity of the effect of pH on enzyme-catalyzed reactions is shown in Figure 14, with milk alkalinephosphatase as an example. Figures 14a and 14d illustrate the effect of different concentrations of the substrate phenylphosphate on the shape and height, respectively, of the pH versus no curves. The pH optimum shifts from pH 8.4 at 2.5 × 10⁻⁵
M phenyl phosphate to pH 10 at 2.5 × 10⁻² and 7.5 × 10⁻² M phenyl phosphate. The pH optimum also is different for differentsubstrates (Fig. 14c). The pH optima are 9.3, 9.5, and 9.8 for 0.02 M
FIGURE 13pH effect on activity of several enzymes. (a) Pepsinacting on N-acetyl-L phenylalanyl-L-diodotyrosine
at 36.7°C and 5 × 10⁻⁴ M pepsin; reaction time 15min. (b), Ficus g labrata peroxidase acting on 0.03 M
g uaiacol and 0.005 M H2O2 at 30.0°C. (c) Trypsin acting on0.1% casein. (d) Hydrolysis of 5 × 10 -4 M p-nitrophenylphosphate by crude milk alkaline phosphatase at 35°C in
0.1 M sodium g lycinate buffer; reaction time 15 min.Times of reaction are g iven for one-point assays, not when
no was determined. (From Ref. 111, p. 273.)

Pag e 461
TABLE 7 pH-Activity Optimum of Several Enzymes a
Enzyme pH optimum
Acid phosphatase (prostate g land) 5
Alkaline phosphatase (milk) 10
a-Amylase (human salivary) 7
b-Amylase (sweet potato) 5
Carboxypeptidase A (bovine) 7.5
Catalase (bovine liver) 3–10
Cathepsins (liver) 3.5–5
Cellulase (snail) 5
a-Chymotrypsin (bovine) 8
Dextransucrase (Leuconostoc mesenteroides) 6.5
Ficin (fig ) 6.5
Glucose oxidase (Penicillium notatum) 5.6
Lactate dehydrog enase (bovine heart) 7 (forward reaction)
9 (backward reaction)
Lipase (pancreatic) 7
Lipoxyg enase-1 (soybean) 9
Lipoxyg enase-2 (soybean) 7
Pectin esterase (hig her plants) 7
Pepsin (bovine) 2
Peroxidase (fig ) 6
Polyg alacturonase (tomato) 4
Polyphenol oxidase (peach) 6
Rennin (calf) 3.5
Ribonuclease (pancreatic) 7.7
Trypsin (bovine) 8
aThe pH optimum will vary with source and experimental conditions. These pH valuesshould be taken as approximate values.
Source: Ref. 111, p. 274.
b-glycerophosphate, 0.015 M phosphocreatine, and 0.025 M phenyl phosphate, respectively. The pH optimum of alkalinephosphatase is dependent on cofactor type, with pH optima of 8.0 for Mn2+ and 9.4 for Mg2+. The in vivo cofactor is Zn2+.
One can conclude from the data of Figures 13 and 14 that the pH optimum of an enzyme is dependent on the nature of theenzyme and the conditions used to measure the activity as a function of pH. But is it possible to get valuable information from pHversus no curves? The answer is yes, provided the experiments are properly done. The four factors that primarily affect thenature of the pH versus no curves are (a) whether no data are used, (b) pH stability of the enzyme, (c) equilibria (importantionizations and dissociations) of the system, and (d) the relationship of [S]o to Km. These factors deserve discussion.

7.5.3.1 How Velocity Data Are Obtained
The importance of obtaining initial velocities, no, in the kinetic investigations of enzymes cannot be overstressed. The data ofFigure 15 illustrate that the difference in determined pH optimum is about 0.5 pH unit when different times are used to measuren, for an enzyme that is unstable either below or above the pH optimum. Since the enzyme is more stable on the acid side of the

Pag e 462
FIGURE 14Effect of experimental conditions on the pH optimum of calf intestinal
mucosa alkaline phosphatase. (a) Effect of initial substrate concentrationon pH optimum. The curves are for the following substrate (phenyl
phosphate) concentrations (M): A, 2.5 × 10 -5; B, 5 ×10⁻⁵; C, 1 × 10⁻⁴; D, 5 ×10⁻⁴;; E, 7.5 × 10⁻⁴; F, 2.5 × 10⁻³; G, 2.5 × 10⁻²; H, 7.5 × 10⁻². (From Ref. 82, p.
675, by courtesy of the Biochemical Society.) (b) Effect of nature of activating
cation on pH optimum. The cations were: , 5 × 10⁻³ M Mg Cl2 and , 1 ×10⁻³ M MnCl2 with 2.5 × 10⁻⁴ M phenyl phosphate as substrate. (From Ref.82, p. 677, by courtesy of the Biochemical Society.) (c) Effect of nature of
substrate on pH optimum. The substrates were: , 0.015 M
phosphocreatine: , 0.02 M b-g lycerophosphate; +, 0.025 M phenylphosphate. (From Ref. 81, p. 235, by courtesy of the Biochemical Society.)
(d) pH optima from data of part (a) plotted ag ainst -log [A] o. The lowestsubstrate concentration is at the rig ht of the fig ure. (From Ref. 82, p. 675,by courtesy of the Biochemical Society.) The temperature was 38.0°C in
all cases.
optimum than on the alkaline side, the observed pH optimum shifts to the left as a function of time between no and nt.
7.5.3.2 Stability of the Enzyme
Enzymes generally are not stable at all pH levels. It is important to determine the pH range over which an enzyme is stablebefore determining the pH optimum. This can be done by at least three methods.
The best way is to incubate the enzyme under the same conditions (pH, temperature, buffer, enzyme concentration, time) to beused to determine no at different pH, but in the absence of substrate. At various times, aliquots are removed, added to tubescontaining substrate buffered at a pH at or near the pH optimum, and no is determined. The control (100% activity) is a sample

Pag e 463
FIGURE 15pH-activity curves for alkaline phosphatase. The
solid line is rate data from initial rates; thedashed line is rate data determined at 6-min
reaction times. (From Ref. 112, with permissionof authors.)
of the enzyme solution incubated at 0°C, rather than at the temperature used to measure stability. The no values of the samplesincubated at higher temperatures are compared with no for the sample held at 0°C.
Evidence for pH instability can also be obtained from plots of no versus pH. The pH-no curve will be skewed below or above thepH optimum, if there is instability (Fig. 15). This is the explanation for the skewed pH versus no curves for pepsin and alkalinephosphatase in Figure 13 and the pH versus no curve E in Figure 14a for alkaline phosphatase.
A third way to determine enzyme instability is to determine product formation (at different pH) as a function of time when [S]o
>> Km. If the enzyme is stable, n will be constant, while if it is unstable n will decrease with time.
7.5.3.3 Effect of Equilibria
Several of the constituents of an enzyme reaction system ionize or dissociate, depending on pH. Constituents that may ionizeinclude the buffer, the substrate, the cofactor (if required), and the essential ionizable groups in the active site of the enzyme.Association/dissociation occurs in the binding of substrate and cofactor into the active site. Nothing can be done with respect toionization of the buffer. Certainly, the ionic strength of the solution should be kept constant at all levels by use of NaCl or KCl.When different buffers must be used, it is essential to overlap the two buffers, for one or more pH levels. Alternatively, thebuffers can be combined at all pH levels.
For fundamental studies, the substrate should be neutral, so that ionization does not affect combination of substrate with enzyme.Practically, this may be impossible. The control of ionic strength is again very important. If a cofactor is required, the enzymeshould be saturated with the cofactor at all pH levels ([CoF] >> KCoF). For further details on this subject see Whitaker [111].
7.5.3.4 The Relationship of [S]o to Km
This is a major problem in most experiments reported in the literature. Consider the minimum steps involved in enzyme-catalyzedreactions (Eq. 7) and the possible effect of pH on these steps. First, there is binding of substrate and enzyme to form theenzyme-substrate complex (E.S) as

Pag e 464
controlled by k1. Second, there is the dissociation of the E.S complex to E + S (controlled by k -1) and there is the catalyticconversion of E.S complex to E + P, controlled by k2 (or more than one rate constant if there are additional intermediate steps).The ionization of each of the reactants (E, S, E.S, and P) will affect the pH versus no curve. The substrate should be selected (ifpossible) so as not to undergo ionization in the pH range used.
By proper design of the experiments, the effect of pH on stability of enzyme, the binding of substrate into the active site of theenzyme, and the pKa values of the ionizable groups in the active site of the free enzyme, the enzyme-substrate complex, and ofother intermediate species (such as acylenzyme) can be determined [111]. Improperly designed experiments give data, such asin Figure 14 for alkaline phosphatase, but the results are more confusing than enlightening as to what is going on between theenzyme and the substrate.
7.5.4 Effect of Temperature
Experimental data on the effect of temperature on velocities of enzyme-catalyzed reactions can be just as confusing anduninterpretable as the effect of pH, unless the experiments are designed properly. Temperature affects not only the velocity of
catalysis of , but also stability of the enzyme; the equilibria of all association/dissociation reactions (ionization ofbuffer, substrate, product and cofactors (if any); association/disassociation of enzyme- substrate complex; reversible enzyme
reactions ; solubility of substrates, especially gases; and ionization of prototropic groups in the active site of the enzymeand enzyme-substrate complex. To some extent, proper design of the experiments for temperature effects is easier than for pHeffects.
There are usually three reasons temperature effects on enzymes are studied: (a) to determine stability of the enzyme; (b) todetermine the activation energy, Ea, of the enzyme-catalyzed reaction; and (c) to determine the chemical nature of the essentialprototropic groups in the active site of the enzyme. The design of the experiments is not different, except the buffer must alwaysbe made up to have the same pH at all temperatures used. This requires the buffer to be made up at the temperature to be used.Otherwise, the pH of the buffer is an uncontrolled variable.
7.5.4.1 Stability of Enzyme
This can be determined in the following manner. Tubes with a fixed concentration of enzyme (similar to those to be used in thekinetic experiments), in the buffer adjusted to pH desired when made up at each temperature to be used, are incubated at theselected temperatures (usually starting at 25°C). Aliquots are removed at various times, substrate in a buffer near the pHoptimum is added, and the activity left is determined at a constant temperature and pH. The control enzyme activity (100%) isdetermined on enzyme maintained at 0°C. The data are plotted as shown in Figure 16, since the rate of loss of activity is usuallyfirst order for a pure enzyme (no isozymes present). The slope of the line is k, the rate constant for denaturation of the enzyme.
As shown (Fig. 16), the enzyme is stable at 20–35°C, but the rates of loss of activity increase as temperature increases. Withinthe temperature range where there is loss of activity, a plot of In k versus 1/T(K) should give a linear relationship with a slopeEa/R, where Ea is the activation energy for denaturation and R is the universal gas constant in cal mol-1 deg-1 (or J mol-1 deg-1).
Typical transition state denaturation constants for some enzymes are shown in Table 8 (where dH‡ = Ea - RT).

Pag e 465
FIGURE 16Rate of denaturation of an enzyme at varioustemperatures. The data are calculated for E a of
60,000 cal/mol, where the first-order rate constant,k, of denaturation is 0.005, 0.020, 0.090, 0.395,
and 1.80 min -1 at 40, 45, 50, 55, and 60°C,respectively. Calories × 4.186 = Joules. (From Ref.
111, p. 305.)
7.5.4.2 Activation Energy of the Enzyme-Catalyzed Reaction
To determine activation energies, two plots are required, the first is a plot of experimentally determined product concentrationversus time at various temperatures (Fig. 17), and the second a plot of log k, the zero-order reaction rate constant versus 1/T (inK; Fig. 18). For the first plot,
TABLE 8 Transition-State Denaturation Constants for Various Enzymes
SubstanceDH‡
(cal/mol)DS‡(eu)a
Number ofbonds broken b
dG‡ (25°C)(cal/mol)
Lipase, pancreatic 45,400 68.2 9 25,100
Amylase, malt 41,600 52.3 8 26,000
Pepsin 55,600 113.3 11 21,800
Peroxidase, milk 185,300 466.0 37 46,400
Rennin 89,300 208.0 18 27,300
Trypsin 40,200 44.7 8 26,900
Invertase, yeast
pH 5.7 52,400 84.7 10 27,200
pH 5.2 86,400 185.0 17 31,300
pH 4.0 110,400 262.5 22 32,200
pH 3.0 74,400 152.4 15 29,000
aDS‡ in cal/mol deg ree.
bNumber of noncovalent bonds broken on denaturation = DH‡/5000, where theaverag e DH‡ per bond is assumed to be 5000 cal/mol. Calories × 4. 186 = Joules.
Source: Modified from Ref. 96.


Pag e 466
FIGURE 17Effect of temperature on rate of product
formation. The solid lines are forexperimental
data; the dashed lines are based oninitial
rates (i.e., lines drawn tang ent toexperimental
data at time close to zero). The datashown
were calculated for the followingconditions:
[S]o >> Km; Ea for transformation ofreactant
to product, 12,000 cal/mol; Ea fordenaturation
of enzyme, 60,000 cal/mol; first-orderrate
constant, k, for denaturation of enzyme,9.0 ×
10-4 min-1 at 40°C. Calories × 4.186 =Joules.
(From Ref. 111, p. 303.)
temperatures must be low enough to obtain good no values before rate of denaturation of the enzyme becomes a problem, [S]o
must be >> Km so the enzyme is saturated with substrate at all temperatures, and the pH (same value at all temperatures) mustbe at the pH optimum. If all enzyme is not in the form E.S, then the temperature dependence will also include Ks
(association/dissociation of . If the pH is not at the pH optimum, then the effect of temperature on ionization of groups in theactive site of the E.S complex will also be measured. Each slope of a dashed line in Figure 17 is a k value.
Using the k values and temperatures from Figure 17, the second plot can be prepared (Fig. 18). Ea, the activation energy, isobtained from the slope of this plot (slope = -Ea/2.3R).

FIGURE 18Effect of temperatures on rate
constant of a reaction. Plotted aslog k versus 1/T(K) to permitdetermination of Ea as shown.
(From Ref. 111, p. 315.)

Pag e 467
Typical Ea values for enzyme-catalyzed reactions range from about 25,000 to 50,000 J/mol. A comparison of Ea values fornoncatalyzed, non-enzyme-catalyzed, and enzyme-catalyzed reactions are shown in Table 2.
The value of DH‡ at a fixed temperature can be determined from the relationship Ea = DH‡ + RT; DG‡ is calculated from
DG‡ = -RT In(kh/kBT) (30)
where kB is the Boltzman constant (1.380 × 10⁻¹⁶ erg deg-1) and h is the Planck constant (6.624 × 10⁻²⁷ erg sec). The DS‡, theentropy of activation, is calculated for a fixed temperature according to
DG‡ = DH‡ - T DS‡ (31)
7.5.4.3 Chemical Nature of Prototropic Group(s) in Active Site of Enzyme
The effect of temperature on ionization of prototropic groups in the active site of the free enzyme or E.S complex can bedetermined from the change in pKa values for the groups. This is important in determining the chemical nature of ionizablegroups. Shown in Figure 19 are the effects of temperature and pH on relative Vmax/Km for hydrolysis of a-N-benzoyl-L-
argininamide by papain [97]. There is no effect of temperature on ionization of the prototropic group of pKa1 = 4 in the activesite of the free enzyme, consistent with the group being a carboxyl group, active in the carboxylate form. The second prototropicgroup has pKa2 values of 9.0, 8.2, and 7.4 at 5, 38, and 66°C, respectively. The DHion calculated from a plot of -log Kion versus1/T(K) is 33,000 J/mol (Fig. 20 gives an example of this type of plot). Both pKa2 values and DHion (Table 9) indicate that thegroup is probably an -SH group of Cys25, known to be involved in activity of papain.
FIGURE 19Effect of temperature (and pH) on
relativek1 for papain-catalyzed hydrolysis ofa-N-benzoyl-L-arg ininamide. The k 1
values
were calculated from wherethe
maximum value at each temperature (5,38,
and 66°C) was set to 100. (From Ref. 97,p. 20,
by courtesy of the American Society ofBiolog ical Chemists.)

Pag e 468
FIGURE 20Effect of temperature on ionizationconstant, K ion, of Tris. pK (-log Kion)values are plotted as a function of
1/T(K)to permit calculation of DH ion. (From
Ref.111, p. 310.)
7.5.4.4 Enzyme Activity at Low Temperatures
(See also Chap. 2.) Intuitively, we might suppose that enzyme activity ceases at temperatures below 0°C, especially after thesolution appears to be frozen. If so, this would be an important way of preserving our food indefinitely. Also, perhaps enzymesare denatured by freezing. Figure 21 shows the effect of temperature on invertase-catalyzed hydrolysis of sucrose from 49.6 to -19.4°C, and b-galactosidase-catalyzed hydrolysis of o- and p-nitrophenyl-b-galactosides from 25 to -60.2°C. Note that thesetwo enzymes have activity over the temperature ranges studied,

Pag e 469
FIGURE 21Effect of temperature (49.6 to -60.2°C) onvelocities of enzyme-catalyzed reactions.
(A) Invertase-catalyzed hydrolysis of sucrosein Aqueous buffer system. (Adapted from Refs.61 and 94.) The intersection of the two dashedlines indicate the point of chang e in rates at the
freezing point of the solution. (B) b-Galactosidase-catalyzed hydrolysis of o-nitrophenyl-b-g alactoside,
pH 6.1. (C) , b-Galactosidase-catalyzed hydrolysis ofp-nitrophenyl-b-g alactoside,
pH 7.6. Solvent in (B) and (C) was 50% dimethylsulfoxide-water. (Adapted from Ref. 36.)
even though the activities decreased by 105 for invertase and 104.3 for b-galactosidase. There is a change in slope of plot A at -3°C, where the solution began to freeze. One interpretation for the change in slope is the phase change. Others [29,30] havesuggested that the change in slope is due to a change in the rate-determining step, formation or stabilization of intracellularhydrogen bonds in the enzyme, association of the enzyme into polymers, or increased hydrogen bonding between the substrateand water.
The b-galactosidase-catalyzed hydrolysis of o- and p-nitrophenyl-b-galactosides was performed in 50% dimethyl sulfoxide toprevent freezing. There were no changes in the slopes, and kcat and Km changed in a linear fashion. Therefore b-galactosidaseacted in a predictable fashion over the range of 25 to –60.2°C, provided ice was absent.
Storage of foods at or just below the freezing point of water should be avoided. As water freezes the enzyme and substratebecome more concentrated (solute is rejected from the ice phase), which may lead to enhanced activity. In addition, freezing andthawing disrupt the tissues, permitting greater access of enzyme to substrate. As shown in Figure 22, phospholipase activity incod muscle is about five times greater at -4°C, below the freezing point, than at -2.5°C.
7.5.5 Water Activity/Concentration
Enzyme activities usually occur in aqueous media in vitro although in vivo enzyme reactions can occur not only in the cytoplasmbut in cell membranes, in lipid depots, and in the electron

Pag e 470
FIGURE 22Rate constants (k) of phospholipase-
catalyzedhydrolysis of phospholipids in cod
muscle atsubfreezing temperatures. (From Ref. 77,
withpermission of Institute of Food
Technolog ists.)
transport system, where transfer of electrons is known to occur in a lipid matrix. There are three major ways of studying theeffect of water activity on enzyme activity. The first method is to carefully dry an unheated biological sample (or model system)containing active enzymes, then to equilibrate it to various water activities and measure the velocity of enzyme activity. Anexample of this approach is shown in Figure 23. Below 0.35aw (< 1% total water) there is no phospholipase activity on lecithin.Above 0.35aw there is a nonlinear increase in activity. Maximum activity was still not reached at 0.9aw (about 12% total watercontent). b-Amylase had no activity on starch until about 0.8aw (~2% total water); activity then increased 15 times
FIGURE 23
Enzyme activity as a function of a w (A) ,Phospholipase-catalyzed hydrolysis of lecithin
(adapted from data of Ref. 1). (B) , Percenttotal water content of soluble solids (50:50(w/w) protein and carbohydrate). (Adapted
from data of Ref. 32.) (C) , b-Amylase-catalyzedhydrolysis (as maltose equivalents) of starch.
(Adapted from data of Ref. 31.)

Pag e 471
FIGURE 24Effect of g lycerol concentration in water
on peroxidase and lipoxyg enase
reaction velocities. (Adapted from Ref.11.)
by 0.95 aw (~ 12% total water). From these examples, it can be concluded that the total water content must be < 1–2% toprevent enzyme activity.
The second method of determining the concentration of water needed for enzymatic activity is to replace some of the water withorganic solvents. Replacement of water with water-miscible glycerol reduces the activities of peroxidase and lipoxygenase whenwater content is reduced below 75% (Fig. 24). At 20% and 10% water, lipoxygenase and peroxidase have zero activity.Viscosity and specific effects of glycerol may have a bearing on these results.
In the third method, most of the water can be replaced by immiscible organic solvents in lipase-catalyzed transesterification oftributyrin with various alcohols [118]. The “dry” lipase particles (0.48% water), suspended in dry n-butanol at 0.3, 0.6, 0.9, and1.1% water (w/w) over- all, gave initial velocities of 0.8, 3.5, 5, and 4 mmol transesterification/h.100 mg lipase. Therefore,porcine pancreatic lipase had a maximum vo for transesterification at 0.9% water concentration.
Organic solvents can have two major effects on enzyme-catalyzed reactions: an effect on stability, and an effect on direction ofreversible reactions. These effects are different in water-immiscible and water-miscible solvents. In immiscible organic solventsthere is a shift in specificity form hydrolysis to synthesis. Rates of lipase-catalyzed lipid transesterification reactions are increasedmore than sixfold while there is up to 16 times decrease in rate of hydrolysis when “dry” (~1% water) enzyme particles aresuspended in the immiscible solvent [4,91, 118]. Alkylation of lipases and trypsin to make them more hydrophobic has similareffects in shifting from hydrolysis to synthesis as does the use of immiscible solvents [4, 91]. The rate of trypsincatalyzedesterification of sucrose by oleic acid was increased six times by alkylation of some of the amino groups of trypsin [4]. There isalso a change in the stereospecificity of the products formed in organic solvents [40]. The ratio of vR/vS chiral isomers was 75and 6 when lipasecatalyzed transesterification of vinyl butyrate with sec-phenethyl alcohol was performed in nitromethane versusdecane, respectively [40].
Enzymes can be more stable in organic solvents than in aqueous buffers. Ribonuclease and lysozyme become much more stableas the water content is reduced, whether this is done by drying (ribonclease) or by adding water-immiscible organic solvents(Table 10). At 6% water content, ribonuclease has a thermal transition temperature (Tm) of 124°C and a half-life of 2.0 h at145°C. The stability decreases as the water content increases; a dilute solution of ribonuclease has a Tm of 61°C and a half-lifetoo short to measure [103]. Lysozyme is nearly as stable in
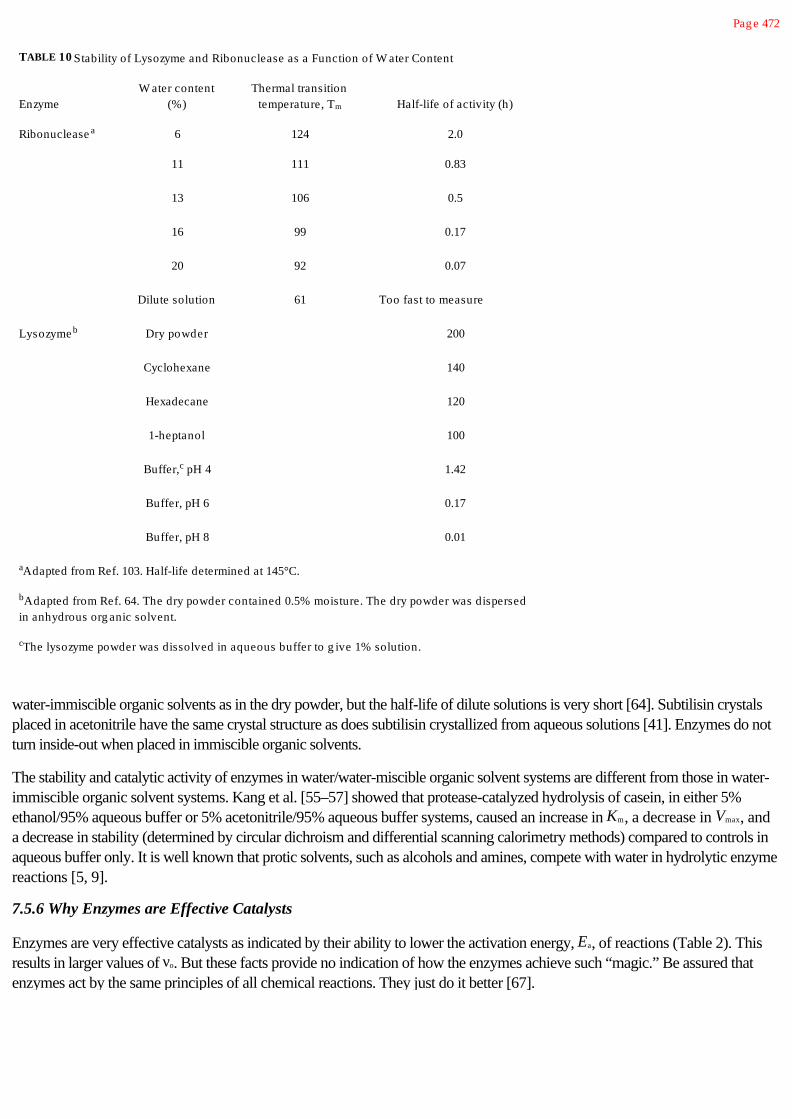
Pag e 472
TABLE 10 Stability of Lysozyme and Ribonuclease as a Function of W ater Content
EnzymeW ater content
(%)Thermal transition
temperature, Tm Half-life of activity (h)
Ribonuclease a 6 124 2.0
11 111 0.83
13 106 0.5
16 99 0.17
20 92 0.07
Dilute solution 61 Too fast to measure
Lysozyme b Dry powder 200
Cyclohexane 140
Hexadecane 120
1-heptanol 100
Buffer,c pH 4 1.42
Buffer, pH 6 0.17
Buffer, pH 8 0.01
aAdapted from Ref. 103. Half-life determined at 145°C.
bAdapted from Ref. 64. The dry powder contained 0.5% moisture. The dry powder was dispersedin anhydrous org anic solvent.
cThe lysozyme powder was dissolved in aqueous buffer to g ive 1% solution.
water-immiscible organic solvents as in the dry powder, but the half-life of dilute solutions is very short [64]. Subtilisin crystalsplaced in acetonitrile have the same crystal structure as does subtilisin crystallized from aqueous solutions [41]. Enzymes do notturn inside-out when placed in immiscible organic solvents.
The stability and catalytic activity of enzymes in water/water-miscible organic solvent systems are different from those in water-immiscible organic solvent systems. Kang et al. [55–57] showed that protease-catalyzed hydrolysis of casein, in either 5%ethanol/95% aqueous buffer or 5% acetonitrile/95% aqueous buffer systems, caused an increase in Km, a decrease in Vmax, anda decrease in stability (determined by circular dichroism and differential scanning calorimetry methods) compared to controls inaqueous buffer only. It is well known that protic solvents, such as alcohols and amines, compete with water in hydrolytic enzymereactions [5, 9].
7.5.6 Why Enzymes are Effective Catalysts
Enzymes are very effective catalysts as indicated by their ability to lower the activation energy, Ea, of reactions (Table 2). Thisresults in larger values of no. But these facts provide no indication of how the enzymes achieve such “magic.” Be assured thatenzymes act by the same principles of all chemical reactions. They just do it better [67].

Listed in Table 11 are the factors that account for the catalytic efficiency of enzymes. Not all enzymes use all possibilities listed,but all enzymes do bind substrates stereospecifically into the active site where essential groups (side chain of specific amino acidsor required cofactors) perform from the reaction chemistry either by general acid-general base or nucleophilic-electrophilicprocesses. It is apparent that the most impressive enhancement of the rate is due to formation of the enzyme-substrate complex,where the rate enhancement is on the order of 104 for a two-substrate reaction, 109 for a three-substrate reaction, and 1015 (ormore) for a four-substrate reaction.
The seven factors listed in Table 11 can account for 1018 to 1036 rate enhancements, if all

Pag e 473
TABLE 11 Factors Accounting for Catalytic Effectiveness of Enzymes
Factor Rate enhancementa
1. Formation of stereospecific enzyme-substrate complex (conversionform inter- to intramolecular reaction)
104; 109; 1015b
2. Decreased entropy of reaction 103
3. Concentration of reactive catalytic g roups 103–104
4. Distortion of substrate 102–104
5. General acid/g eneral base catalysis 102–103
6. Nucleophilic/electrophilic catalysis 102–103
7. Using several steps 102–104
Overall rate enhancement 1018–1036
aIn some cases, these values can be approximated by model experiments. In others, they are thebest estimates available.
Source: Adapted from Ref. 111, pp. 129–142.
factors are operative. An important factor not included is the role of the increased hydrophobicity of the active site when thesubstrates are bound. The role of hydrophobicity in the active site during catalysis is one of the least known and appreciatedfactors in enzyme catalysis. A good example is synthesis of glutathione from g-glutamylcysteine and glycine, using ATP as theenergy source (a three-substrate reaction). This reaction is catalyzed by glutathione synthetase. After the three substrates bindstereospecifically into the active site, the active site is closed by a “lid” consisting of a 17-amino-acid loop in the enzyme. Thisprotects the transition state intermediates from competition with water [60]. The rate constant ko is 151 sec-1 for the synthesis.Using recombinant DNA technology, Kato et al. [60] replaced the 17-amino-acid loop with a sequence of three glycineresidues, so that the active site could not close. The ko for the mutant enzyme is 0.163 sec-1, which is 1 × 10⁻³ that of the wild-type enzyme. Loop replacement did not appear to cause any other change in the physical structure of the enzyme.
7.6 Enzyme Cofactors
Some enzymes, especially the hydrolases, are composed only of amino acids. The catalytic activity of the active site is the resultof specific binding and catalysis due to specific side chains of amino acid residues (Table 9). These prototropic groups alone,such as the imidazole group of His57, carboxyl group of Asp102, and the hydroxyl group of Ser195 of chymotrypsin, are sufficientfor the catalytic performance of some enzymes (Fig. 25).
The pathway for chymotrypsin-catalyzed reactions has been described [10]. A stereospecific adsorptive complex is formedbetween the substrate and enzyme (Fig. 25, structure A). The imidazole group of His57 acts as a general base to stretch the H-Obond of the hydroxyl group of Ser195, thus facilitating the nucleophilic attack of the O of Ser-OH on the carbonyl carbon of thepeptide bond of the substrate. This leads initially to formation of a tetrahedral intermediate (structure B) followed by formation ofthe acylenzyme intermediate by expulsion of the R' group of the substrate (structure C). In the deacylation process, the imidazolegroup acts as a general base to extract a proton from water to facilitate the attack of the active site-generated hydroxide ion atthe carbonyl group of the acylenzyme (structure D). In formation of the second transition-state intermediate (structure E), theimidazole group acts as a general acid in deacylation of the acylenzyme (structure F). The action of His57 as a general base(acylation step) and

Pag e 474
FIGURE 25Proposed mechanism for a-chymotrypsin-catalyzed reactions. The topreactions show acylation of the Ser-OH of the enzyme by the substrate;
the bottom reactions show removal of the acyl g roup by hydrolysis.(Modified from Ref. 12.)
general acid (deacylation step) is facilitated by hydrogen bonding with the Asp102 carboxyl group. The acyl part of the substratediffuses away and the enzyme is ready to accept another substrate molecule (structure A). Each cycle requires about 10 msec tocomplete, with either the acylation (for amide bonds) or deacylation (for ester bonds) being the rate-determining step.
Many enzymes require cofactors (nonprotein organic compounds or inorganic ions) for activity. Cofactors include coenzymes,prosthetic groups, and the inorganic ions. Many of the coenzymes and prosthetic groups require a vitamin and often phosphate,ribose, and a nucleotide as part of the cofactor (Table 12). The nucleotide binds into the active site, specifically placing thecofactor so it can participate in the binding and/or catalytic step. Enzymes associated with these cofactors are also listed in Table12.
The essential vitamins, cations, and anions must come from our foods, since we cannot synthesize them. Zn2+, one of theessential cations, is part of the active site of at least 154 different enzymes in our bodies.
7.6.1 Distinguishing Features of Organic Cofactors
The coenzymes and prosthetic groups can be distinguished in two important ways. The coenzymes are loosely bound to theactive site and dissociate from the enzyme at the end of each catalytic cycle, as shown for the reaction catalyzed by alcoholdehydrogenase (Eq. 32). They also are lost during purification of coenzyme-requiring enzymes and must be added back to theenzymes in the in vitro systems.
(32)

Pag e 475
TABLE 12 Importance of Phosphate, Ribose, and Purine and Pyrimidine Bases in Cofactors
Enzyme Cofactor Vitamin Phosphate Ribose Base
Oxidoreductases NAD+ Niacin + + Adenine
Oxidoreductases NADP+ Niacin + + Adenine
Oxidoreductases FMN Riboflavin + + —
Oxidoreductases FAD Riboflavin + + Adenine
Lig ases ATP —a + + Adenine
Lig ases UTP — + + Uridine
Lig ases CTP — + + Cytidine
Transferases CoA Pantothenic acid + + Adenine
Transferases Acetyl phosphate — + — —
Transferases Carbamyl phosphate — + — —
Transferases S-Adenosyl methionine — — + Adenine
Adenosine-3'-phosphate-5'-phosphosulfate — + + Adenine
Transferases andlig ases
Pyridoxal phosphateThiamine pyrophosphate
PyridoxineThiamine
++
——
——
a—, Not present.
Source: Adapted from Ref. 111, p. 331.

Pag e 476
where
Kinetically, the NAD+ behaves as a second substrate in the reaction (Eq. 32). It forms the product NADH, which can berecycled back to NAD+ only by a second enzyme, not alcohol dehydrogenase. The velocity of the reaction is best followedspectrophotometrically based on absorbance of NADH at 340 nm (eM = 6.2 × 10³ M-1 cm-1).
In contrast to coenzymes, prosthetic groups are tightly bound (often covalently) to the enzyme, and they end up at the end of thecycle in the same oxidation state as they started. A typical example is flavin adenine dinucleotide (FAD), the prosthetic group ofglucose oxidase (Eq. 33).
(33)
7.6.2 Coenzymes
We shall continue with the role of NAD+ as coenzyme for alcohol dehydrogenase. Figure 26 is a schematic diagram of NAD+
bound in the active site of yeast alcohol dehydrogenase, with the adenine ribose phosphate (ADPR) moiety bound at the ADPR
binding site. The nicotinamide moiety, the functional part of NAD+ in accepting H from the ethanol , is bound into thelipophobic binding site. Zn2+, a cation cofactor, is required also; it is shown liganded to three amino acid side chains on theprotein and coordinately bound to the O of the OH group of ethanol. A tetrahedral intermediate is formed in step 2 followed bytransfer of the H from ethanol to from NADH. The turnover number is about 103 moles of substrate converted to productpermole enzyme per second. Therefore, the recycle time is about 1 msec.
The primary role of the alcohol dehydrogenase is as a specific template, binding ethanol, NAD+, and Zn2+ stereospecifically atthe active site. As discussed in Section 7.5.7, that is a very significant role, accounting for ~1015 rate enhancement. It must alsobe remembered that the enzyme provides stereospsecific treatment of the substrate. Even though ethanol does not have anasymmetric carbon atom, the enzyme always recognizes ethanol as being asymmetric because of the three-point attachment inthe transition state (Fig. 26). The protein also provides the environment, often hydrophobic, in which the reaction takes place.
FIGURE 26Schematic representation of binding NAD + and ethanol in the active site
of yeast alcohol dehydrog enase followed by oxidation of ethanol toacetaldehyde. (From Ref. 99, p. 552, by courtesy of Spring er-Verlag .)

Pag e 477
7.6.3 Prosthetic Group
Pyridoxal phosphate is selected as the prosthetic group to discuss because of its involvement in five types of reactions, one ofthem being the development of off aroma in broccoli and cauliflower and another the development of the desired aroma ofonions and garlic.
The reactions catalyzed by pyridoxal phosphate (PALP) are shown in Figure 27. The first step, common to all five reactions, isreaction of the aldehyde group of PALP with the a-amino group of serine (used as an example) to give a Schiff baseintermediate. This is stabilized by an acidic group B+ in the enzyme active site. Then, depending on the specific nature of theprotein to which PALP is bound, decarboxylation (decarboxylase), deamination (transaminase), a,b- elimination (lyase) orracemization (isomerase) of serine occurs. The intermediate of serine
FIGURE 27Schematic representation of reactions catalyzed by pyridoxal phosphate.
Acommon Schiff base intermediate between the amino g roup of serineand the carbonyl g roup of pyridoxal phosphate is shown in the uppercenter. This results in conversion of substrate to one of five types of
products, depending on the enzyme involved. The lower scheme showsb,g-elimination involving the-SH g roup of cysteine. The intermediate is also
a Schiff base. B+ is an acidic g roup on the enzyme. PALP and PAP arepyridoxal phosphate and pyridoxamine phosphate, respectively. (From Ref.
111, p. 351.)

Pag e 478
formed in the a,b-elimination reaction can react with indole to give tryptophan, or pyruvate and ammonia (one off-aromacompound in broccoli and cauliflower). If serine is replaced with cystine the products are H2S, NH3, pyruvate and thiolcysteine.H2S and NH3 are the two major off-aroma compounds of broccoli.
Alliinase is the key enzyme in aroma and flavor development in onions and garlic when they are cut or mashed. Alliinase is aPALP-requiring enzyme. The substrates S-1-propenyl-L- cysteine sulfoxide and S-allyl-L-cysteine sulfoxide undergo a,b-elimination by alliinase to produce 1-propenylsulfenic acid (a lachrymator) or allysulfenic acid which then nonenzymatically formsthe aroma and flavor components of onions and garlic, respectively [113].
7.6.4 Inorganic lons
Both cations and anions can serve as cofactors. The cations include Ca2+, Mg2+, Zn2+, Fe2+, Cu2+, Co2+, Ni2+, Na+, K+, andothers. The anions include Cl-, Br-, F-, and I-, among others.
The cations may be involved directly in catalysis, as shown earlier for yeast alcohol dehydrogenase (Fig. 26), in binding ofsubstrate to the active site, in maintaining the conformation and stability of the substrate, such as Ca2+ in a-amylase, or as part ofthe substrate, such as MgATP2- as required by kinases.
Zn2+ in Escherichia coli milk alkaline phosphatase (APase) will be used as an example because Zn+ is a major essential cationin enzyme systems. Alkaline phosphatase requires four Zn2+ ions per molecule of enzyme (80,000 MW). Two of the Zn2+ servea structural function, helping to hold the two subunits of the enzyme together (maintaining quaternary structure). The other twoZn2+ are located in the two active sites of the enzyme, where the role of the Zn2+ is as a “super acid” group to activate the Ser-OH group involved in the hydrolysis of the p-nitrophenylphosphate substrate:
(34)
The in vivo role of alkaline phosphatase is to help recycle phosphate, an essential compound. Alkaline phosphatase is ideallydesigned for this, as it is specific for the orthophosphate group only and it does not really matter what the other group (p-nitrophenyl here) is.
Chloride ion is an important anionic factor. Cl- is essential for the activity of salivary and pancreatic a-amylases of humans andother animals and for some microbial a-amylases. Its role in a-amylase appears to be twofold. The binding constant for Ca2+
(another cation cofactor) in pancreatic a-amylase is increased ~100 times in the presence of Cl-, thereby increasing theeffectiveness of Ca2+ as a stabilizer of the tertiary structure of the protein [71]. Cl- also causes a shift in the pH optimum ofhuman salivary a-amylase [83] from pH 6 in the absence of Cl- (much lower levels of activity) to pH 6.8 in the presence of Cl-
(0.005–0.04 M Cl- gives maximum activity). It is postulated that the pH shift results from Cl- masking an unwanted positivelycharged group in or near the active site of the enzyme [83]. Perhaps this represents a primitive control mechanism in some a-amylases.
7.7 Enzyme Inactivation and Control
Enzymes are responsible for the myriad reactions associated with reproduction, growth, and maturation of all organisms. In mostcases, these are desired activities. In some cases, too much enzyme activity, such as polyphenol oxidase-caused browning, canlead to major losses in fresh

Pag e 479
fruits and vegetables. In many humans, absence of or too little of an enzyme is responsible for many genetically related diseases[104].
Microbially caused diseases present another problem. The best way to treat these types of diseases is through inhibition of oneor more key enzymes of the microorganisms, resulting in their death. The inhibitors might compete reversibly with substrates orcofactors for binding to the active site, or the inhibitor might form a covalent bond with active site groups (affinity labelinginhibitor), or the compound might be treated as a substrate and be catalyzed to a product that, while still in the active site, formsa convalent bond with a group in the active site (kcat inhibitors) [8]. The last type is the most specific and desirable in medicineand in food because the inhibitor can be targeted specifically for the enzyme.
Enzymes continue to catalyze reactions in raw food materials after they reach maturity. These reactions can lead to loss of color,texture, flavor and aroma, and nutritional quality. Therefore, there is need for control of these enzymes to stabilize the product asfood. Enzyme inhibitors are also important in the control of insects and microorganisms that attack raw food. They also are usedas herbicides in the control of unwanted weeds, grasses, and shrubs.
Enzyme inhibitors are an important means of controlling enzyme activity. An enzyme inhibitors is any compound that decreasesvo when added to the enzyme-substrate reaction. There are many enzyme inhibitors, both naturally occurring and synthetic[106]. Some inhibitors bind reversibly to enzymes and others form irreversible, covalent bonds with the enzymes. Someinhibitors are large proteins or carbohydrates, and others are as small as HCN. Products of enzyme-catalyzed reactions can beinhibitory.
Change in pH can alter activity by making conditions less optimum for enzyme activity. Elevated temperatures can decreaseenzyme activity by denaturing some of the enzyme, but at the same time increasing the velocity of conversion of substrate toproduct by the active enzyme. Most enzymologists do not consider either of these variables to be enzyme inhibitors.
Denaturation of the enzyme eliminates its activity, and this can be accomplished by shear forces, very high pressures, irradiation,or miscible organic solvents. Enzyme activity can also be decreased by chemical modification of essential active site groups ofthe enzyme. Enzymes are also inactive when their substrate(s) are removed. All of these inhibitory approaches are valid ways ofcontrolling enzyme activities in foods.
7.7.1 Reversible Inhibitors
Reversible inhibitors are distinguished from irreversible inhibitors by the following criteria: (a) reversible inhibitors rapidly (withinmilliseconds) form noncovalent diffusion-controlled equilibrium complexes with enzymes; the complex can be dissociated andenzyme activity restored by displacing the equilibrium by dialysis or by gel filtration; (b) irreversible inhibitors slowly formcovalent derivatives of the enzyme that cannot be dissociated by dialysis or by gel filtration.
The reversible inhibitors can be treated kinetically by the methods described in Section 7.4 provided the equilibrium dissociationconstant (Ki) is not less then 10-8 M. Four types of reversible inhibitors can be identified based on their effects on the slopes andintercepts of Lineweaver-Burk plots, Vmax and Km, or allosteric effects: (a) competitive inhibitors, (b) noncompetitive inhibitors,(c) uncompetitive inhibitors, and (d) allosteric inhibitors. Allosteric #inhibitors not only decrease the velocity of the enzyme-catalyzed reactions, they cause allosteric (sigmoidal) plots of vo versus [I], similar to the effect of [S]o (Fig. 11).
The type of reversible inhibitor must be determined by kinetic methods. Fortunately, all the mathematical equations differ in slopeand/or y-intercept only by 1 + [I]o/Ki from the Michaelis-Menten and Lineweaver-Burk equations in the absence of inhibitor.
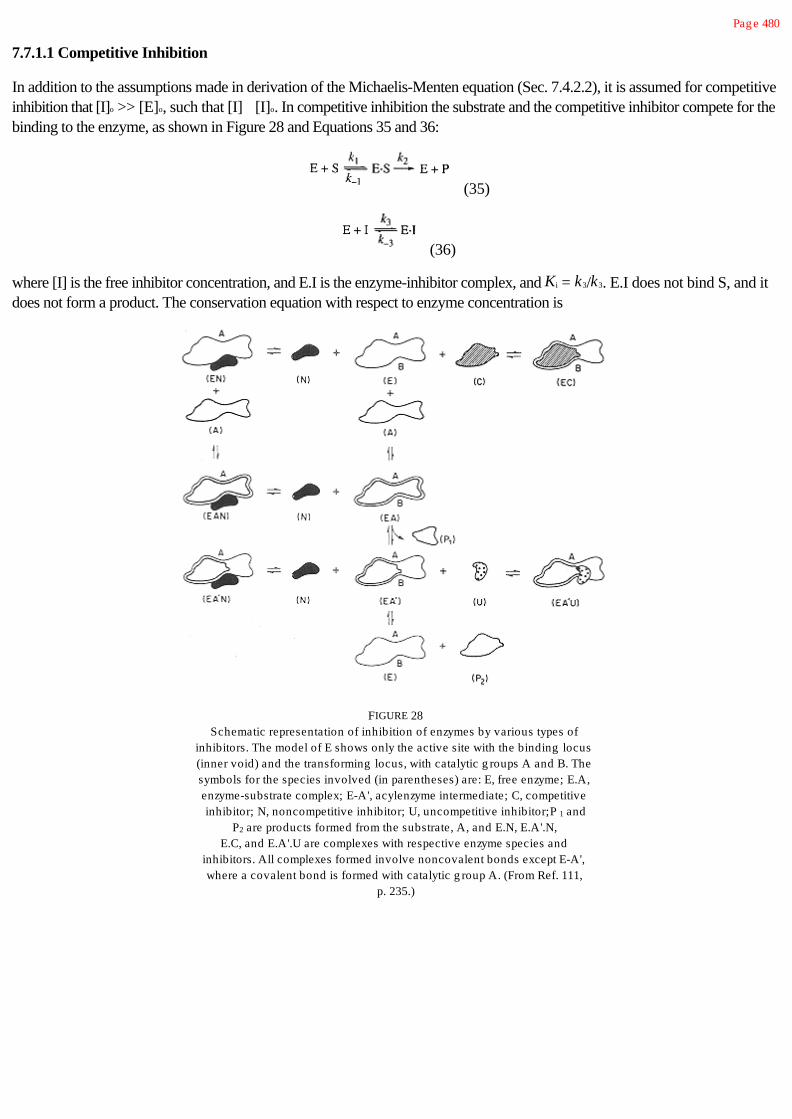
Pag e 480
7.7.1.1 Competitive Inhibition
In addition to the assumptions made in derivation of the Michaelis-Menten equation (Sec. 7.4.2.2), it is assumed for competitiveinhibition that [I]o >> [E]o, such that [I]@ [I]o. In competitive inhibition the substrate and the competitive inhibitor compete for thebinding to the enzyme, as shown in Figure 28 and Equations 35 and 36:
(35)
(36)
where [I] is the free inhibitor concentration, and E.I is the enzyme-inhibitor complex, and Ki = k3/k3. E.I does not bind S, and itdoes not form a product. The conservation equation with respect to enzyme concentration is
FIGURE 28Schematic representation of inhibition of enzymes by various types of
inhibitors. The model of E shows only the active site with the binding locus(inner void) and the transforming locus, with catalytic g roups A and B. Thesymbols for the species involved (in parentheses) are: E, free enzyme; E.A,enzyme-substrate complex; E-A', acylenzyme intermediate; C, competitiveinhibitor; N, noncompetitive inhibitor; U, uncompetitive inhibitor;P 1 and
P2 are products formed from the substrate, A, and E.N, E.A'.N,E.C, and E.A'.U are complexes with respective enzyme species and
inhibitors. All complexes formed involve noncovalent bonds except E-A',where a covalent bond is formed with catalytic g roup A. (From Ref. 111,
p. 235.)

Pag e 481
[E]o = [E] + [E.S] + [E.I] (37)
Inclusion of Equations 36 and 37 in derivation of the Michaelis-Menten equation gives
(38)
where vo' is the initial velocity in the presence of a fixed concentration of inhibitor. The Lineweaver-Burk equation derived fromEquation 38 is
(39)
A plot of experimental data in the presence and absence of a competitive inhibitor is shown in Figure 29. Reactions with variable[S]o must be run in the absence and presence of a fixed concentration of [I]o, and vo and vo' must be determined. Linearcompetitive inhibition is indicated experimentally when the y-intercept is the same in the presence and absence of inhibitor, butthe slope in the presence of inhibitor is greater than that in the absence of inhibitor by 1 + [I]o/Ki.
7.7.1.2 Noncompetitive Inhibition
In this type of inhibition, the inhibitor does not compete with the substrate for binding with enzyme, so the inhibitor and substratecan bind to the enzyme simultaneously (Fig. 28; Eqs. 40–43).
FIGURE 29Linear competitive inhibition. The 1/v o and 1/v o' values
are plotted versus 1/[A]o. Data are plotted in reciprocal formaccording to Equation 39. [I] o1 = Ki. [A]o is initialsubstrate concentration. (From Ref. 111, p. 228.)

Pag e 482
(40)
(41)
(42)
(43)
The assumptions are that k -1/k1 is the dissociation constant, KS, for both E.S and E.S.I, and k -3/k3 is the dissociation constant, Ki,for both E.I. and E.S.I. Further, E.S.I. does not form products from the substrate. These assumptions lead to simple linearnoncompetitive inhibition where
(44)
and the corresponding Lineweaver-Burk equation is
(45)
The enzyme conservation equation is
[E]o = [E] + [E.S] + [E.I.] + [E.S.I] (46)
In the case of simple linear noncompetitive inhibition, both the y-intercept and the slope are increased by 1 + [Io]/Ki (Fig. 30).
7.7.1.3 Uncompetitive Inhibition
Unlike the cases of competitive and noncompetitive inhibition, in uncompetitive inhibition, the inhibitor cannot bind to the freeenzyme but only with one or more of the intermediate complexes as shown in Fig. 28. Equations 47 and 48 apply:
(47)
(48)
where E.S.I does not form product from the substrate. The appropriate form of the Michaelis- Menten equation is

Pag e 483
FIGURE 30Simple linear noncompetitive inhibition. The 1/v o
and 1/v o' values are plotted versus 1/[A] o accordingto Equation 45. [Io]1 =K i, where k intercept' = k slope'
[A]o is initial substrate concentration. (From Ref.111, p. 229.)
(49)
and the corresponding Lineweaver-Burk and conservation equations are Equations 50 and 51:
(50)
[E]o = [E] + [E.S] + [E.S.I](51)
The associated plot is shown in Figure 31. The y-intercept changes by 1 + [I]o/Ki from the reaction with no inhibitor, while theslopes in the presence and absence of an uncompetitive inhibitor are the same.
7.7.1.4 Allosteric Inhibition
Allosteric inhibition usually results from the binding of inhibitor to multi-subunit enzymes, in the same way as described forallosteric behavior on substrate binding (Eq. 28). Whenever Ki2 and subsequent Ki values are smaller (tighter binding) than Ki1,positive allosteric inhibition results. Negative allosteric inhibition results when Kil, is smaller than Ki2 and subsequent Ki values.
Allosteric inhibition can be quantified by the methods of Monod et al. [80] and Koshland et al. [66] or by the modified Hillequation [47]. The Hill equation, developed for O2 or CO2 binding to hemoglobin, is applicable to substrate or inhibitor bindingto enzymes,

Pag e 484
FIGURE 31Linear uncompetitive inhibition. Data plotted in
reciprocal form according to Equation 49. [I o]1 = 2Ki.[A]o is initial substrate concentration. (From Ref. 111,
p. 232.)
to give allosteric kinetics. The Hill equation for effect of [S]o on an enzyme-catalyzed reaction is
(52)
where n is the apparent number of interacting binding sites. Equation 52 can be written in a linear transform as
FIGURE 32Effect of inhibitor concentration on
activity ofan allosteric-behaving enzyme system
plottedaccording to Equation 54. (From Ref.
111, p.233.)

Pag e 485
(53)
with the analogous equation for an inhibitor being
(54)
A plot of experimentally obtained v 'o values as a function of [S]o concentration is shown in Figure 32. The [I]0.5 for 50%inhibition of the enzyme is shown at the common cross point of two sets of data obtained at two different, not saturating, inhibitorconcentrations. The slope values, m indicate the number of apparent interacting binding sites with inhibitor, modified by thestrength of interaction, n.
7.7.2 Irreversible Inhibitors
Many inhibitors form covalent derivatives with enzymes; therefore, they should be treated by rate equations, not by Ki.Kinetically, irreversible inhibition also occurs when Ki<1 × 10⁻⁹ M, since the t0.5 of the dissociation rate (from k-1 of Eq. 55) ofthe E.I. is 1.2 min. So very tight-binding inhibitors cannot be treated by the methods described in Section 7.7.1. Sometimesthere is confusion about this because some inhibitors bind very rapidly to enzymes, but form very tight noncovalent complexes orcovalent derivatives at slower rates (Eq. 55). These are called slow, tight-binding inhibitors.
(55)
One needs to know which step(s) leads directly to loss of enzyme activity (rate = k1[E]o[I]o or k2 [E.I]) in order to interpret thedata and identify the mechanism of the reaction. The reaction shown by Equation 55 is typical of affinity labeling inhibitors.
Sometimes when compounds bind into the active site of an enzyme they are catalyzed to products, which then react covalentlywith the enzyme to irreversibly inactivate it:
(56)
When k3 > k4 the enzyme is rapidly inactivated. Should the substrate be called an inhibitor or a substrate? These types ofinhibitors are called kcat inhibitors and are among the most specific inhibitors known. They are highly valued in medicine, andcould be very useful in control of enzymes of foods.
Other irreversible enzyme inhibitors are specific for certain amino acid side-chain groups of the enzyme, such as the sulfhydrylgroup, the amino group, the carboxyl group, and the imidazole group. Generally, these types of reactions are called proteinmodification. A lot of different compounds have been studied in this connection, in an attempt to determine the nature of one ormore groups in the active site of enzyme or to label a specific group so that its location in the primary amino acid sequence canbe determined. Some examples are given in Table 13. They are often not specific for a single type of group and may react alsowith the same type of specific group outside the active site, unless the one in the active site is more reactive than the

Pag e 486
TABLE 13 Some Reag ents Used in Chemical Modification of Enzymes
Group modified
Ser
Reag ent Amino Carboxyl Sulfhydryl Thr His Trp Tyr Met
Acetic anhydride + + + +
Acetyl imidazole ± + +
Aryl sulfonylchlorides + + ± + +
NN-Bromosuccinimide + + + +
Carbodiimides +
Diazomethane + + + +
2,4-Dinitrofluorobenzene + + + +
N-Ethyl maleimide ± + ±
Haloacetate, haloamide + + + +
Hydrog en peroxide ± ± +
Hydroxylamine +
Hydroxynitrobenzylbromide +
Mercuribenzoate ± + ±
Photooxidation + + + + ±
Tetranitromethane + + ±
Trinitrobenzene sulfonate +
Source: Adapted from Ref. 48.
same groups outside the active site. The reader is referred to Whitaker [111] for more detailed discussion of these types ofinhibitors.
7.7.3 Naturally Occurring Inhibitors
Some organisms have evolved enzyme inhibitors as metabolic and physiological regulatory systems. They also produce inhibitorsto prevent premature activation of proenzymes and to protect the organism against insect and microbial attacks. Ryan [89] hasshown that insect larvae feeding on leaves or stems of tomatoes and potatoes stimulates rapid protease inhibitor production,which causes the larvae to quit feeding. The elicitors appear to be pectin fragments produced by action of pectic enzymes, inresponse to tissue damage. Most of the elicited protease inhibitors are proteins.
7.7.3.1 Protease Inhibitors
Trypsin inhibitors appear to be ubiquitous in all tissues, and they have been most intensively studied in the legumes and cereals.Soybean seeds contain two types of trypsin inhibitors, the Kunitz inhibitor of 21,000 MW that is specific for trypsin only (1:1complex) and the Bowman-Birk inhibitor of 8300 MW that binds independently and simultaneously to trypsin and chymotrypsin(1:1:1 complex). Most legumes contain the Bowman-Birk type inhibitors, with considerable homology among them, while mostlegumes do not produce the Kunitz-type


Pag e 487
inhibitor. The Kunitz inhibitor, with two disulfide bonds, is much more heat labile than the Bowman-Birk inhibitors, with sevendisulfide bonds. About 1 h of cooking is required to completely inactivate the Bowman-Birk inhibitor, unless a reducingcompound, such as cysteine, is added [39]. Several isoinhibitors of trypsin are often found in higher plants [116].
The legume inhibitors are known to be significant, nutritionally, at least in some animals. As shown in Fig. 33, the PER (proteinefficiency ratio) increases as the amount of inhibitor decreases. As stated earlier, the inhibitor can be inactivated by prolongedcooking. The four red kidney bean protease inhibitors have Ki values for bovine trypsin ranging from 3.4 × 10⁻¹⁰ to 8.4 × 10⁻¹⁰
M, while Ki for bovine chymotrypsin is 5.5 × 10⁻¹⁰ to 4.0 × 10⁻⁹ M [116]. These are slow, very tight-binding inhibitors. The Ki
values can differ significantly with trypsin from different sources.
Chicken egg white contains three types of protease inhibitors, the ovomucoids specific for trypsin, the ovoinhibitor withspecificity for trypsin, chymotrypsin, subtilisin, and Aspergillus oryzae protease, and the papain inhibitor (cystatin) withspecificity for papain and ficin [107]. Protease inhibitors are found in the pancreas and in the blood, where they protect againstpremature activation of the pro-forms of the digestive proteases and the blood clotting proteases, respectively.
Microorganisms contain a variety of low-molecular-weight peptide inhibitors of proteases. These inhibitors include the leupeptinsactive against trypsin, plasmin, papin, and cathepsin B, the chymostatins active against chymotrypsin and papain, elastatinalactive against elastase, pepstatins active against pepsin and several other carboxyl proteases and phosphoramidon active againstthermolysin. The reader is referred to Whitaker [107] for more detailed information. These small peptide inhibitors are verystable and can be produced economically by fermentation. Therefore, they could be used to control some enzyme activities infoods.
7.7.3.2 a -Amylase Inhibitors
There are three types of a-amylase inhibitors: (a) proteins produced by higher plants, (b) small polypeptides produced byseveral species of Streptomyces, and (c) small N-containing carbohydrates produced by Streptomyces [50].
Several higher plants contain inhibitors of aamylases of mammals and insects, with a few
FIGURE 33Effect of heat treatment on the
tryps ininhibitory activity and nutritive
value, asmeasured by the protein efficiency
ratio(PER), of soybean meal. (From Ref.
87, p.164A, with permission of American
OilChemists Society.)

Pag e 488
of the inhibitors active on microbial a-amylases and host-specific a-amylases. Sources include wheat, corn, barley, millet,sorghum, peanut, and beans. The proteins range from 9000 to 63,000 MW. Most slowly form 1:1 stoichiometric complexeswith the a-amylases. The Ki values for the been a-amylase inhibitors are 10-10 to 10-11 M; therefore, these inhibitors are slow,tight-binding inhibitors. They are quite heat stable, so that some of the inhibitor can survive breadmaking (for example) and up to1 h cooking of the seeds.
Whether these a-amylase inhibitors are nutritionally important is controversial. They certainly slow down the rate of digestion ofstarch in saliva and small intestine of humans and rats, and some undigested starch is present in the feces of rats fed theinhibitors. Glucose is not released as rapidly from starch digestion into the blood of humans and rats in the presence of theinhibitors. However, there is little effect of the inhibitor on growth of rats and chickens.
Relatively small polypeptide inhibitors of aamylase ranging from 3936 to 8500 MW are produced by several species ofStreptomyces. There is much homology among the five polypeptide inhibitors that have received the most attention. Themicrobially derived polypeptide a-amylase inhibitors do not appear to have been tested with plant, insect, and most animal a-amylases. Their reaction with human a-amylases has been studied extensively at a clinical level.
The Streptomyces also produce three types of N-containing carbohydrates that are effective a-amylase and a-glucosidaseinhibitors. These are the oligostatins, the amylostatins, and the trestatins. All have in common a pseudodisaccharide unit,oligobioamine or dehydro-oligobioamine, a variable number of a-D-glucose units linked a-1,4, and in one type a-1,1.Substantial clinical research has been done on their effects in modulating the effects of diabetes and hyperglycemia.
7.7.3.3 Invertase Inhibitors
Irish potatoes and sweet potatoes (yams) contain invertase inhibitors [107]. Invertase inhibitor in the Irish potato is a 17,000-MW protein. It inhibits potato invertase and several other plant invertases [86]. The level of invertase inhibitor in stored potatoesis temperature dependent, increasing at higher temperatures and decreasing at lower temperatures. The in vivo function of theinhibitor in potatoes is thought to be regulation of invertase activity. Potatoes stored at lower, nonfreezing temperatures aresweeter (more sucrose) than those stored at higher temperatures (where the potato is more starchy). These enzymatically causedchanges are important both for quality and cost.
7.7.3.4 Other Enzyme Inhibitors
Inhibitors against several other enzymes have been reported [107]. Probably the best understood, physiologically, are theprotein phosphatase inhibitors and the protein kinase inhibitors. Phosphorylase and glycogen synthase are the key enzymesinvolved in the metabolic breakdown of glycogen to glucose, and biosynthesis of glucose glycogen in animal tissues, respectively.The role of the protein phosphatase inhibitors and the protein kinase inhibitors appears to be regulation of the amount ofphosphorylase a present by the mechanism shown in Equation 57.
(57)
Pag e 489
7.7.3.5 Chemically Tailored Inhibitors
Chemical tailoring of inhibitors is a major activity in pharmaceutical research laboratories. In the 1950–1970 era the affinitylabeling inhibitors (Eq. 55) were the big thing because of the increased specificity in covalent binding to the enzyme that neededto be inhibited. Then came the kcat-type inhibitors (Eq. 56) with their double specificity of binding selectively to the active site,and catalytic conversion to a product that irreversibly inactivates the enzyme while still in the active site. Now two new thrustsare to target malignant cells, as in cancer, specifically with appropriate antibodies, and to destroy the cells either by a radio labelor by tailoring the target molecule to enter the cell and inhibit a key enzyme(s) in the cell division process. The other major areais the use of antisense mRNA designed to “turn off” a specific gene [25], as is done in the Flavr Savr tomato in suppressing thetranslation of the polygalacturonase gene. This is a general method that, in theory, can be used to suppress the production of anydetrimental enzyme in our raw food products or those responsible for diseases of plants and animals. This method is much morespecific than decreasing the level of an enzyme by breeding, as has been done, for example, with polyphenol oxidase in peaches.
7.7.4 Inactivation and/or Control by Physical Methods
Several handling methods used in food processing inactivate enzymes, intentionally or not. These include exposure to interfacesformed along the walls of transport tubes or the effects of stirring, whipping, shearing, high temperatures, pressure, and heat.However, not all of these lead to “instantaneous” or complete inactivation, and there can be an initial period when the activity ofthe enzyme, in contact with its substrate, can be enhanced. Chemical changes, enzymatically catalyzed or not, intended or not,are of major importance to the quality and safety of foods.
7.7.4.1 Interfacial Inactivation of Enzymes
Air/water and lipid/water interfaces are regions of high energy in which proteins tend to align themselves, with hydrophilicsegments oriented into the water phase and hydrophobic segments oriented into the air or lipid phase. Unfolding of the protein atthe interface is thermodynamically favored. Proteins are ideal surface-active molecules and very important in foaming andemulsifying in foods (see Chaps. 3 and 6). Mild shaking of a solution of enzyme can cause rapid denaturation. This effect can bea disadvantage in orange and tomato juice products and in the cold break process in tomato paste production. Sometimes,foaming is used in enzyme or protein purification, where one protein is more stable to foaming than the other. For example, thepurification of invertase inhibitor from Irish potatoes is a problem because the inhibitor complexes with the invertase present. Bycontrolled foaming the invertase can be denatured, enhancing recovery of undenatured inhibitor [15].
7.7.4.2 Pressure Effect on Enzymes
Normal food processing practices do not create high enough pressures alone to inactivate enzymes. In combination processes,such as pressure combined with high-temperature treatment and/or high shear rates, the latter two aspects are primarilyresponsible for any enzyme inactivation. Extruders operate at pressures greater than those normally encountered during foodprocessing, and this results in greater fluidity, texturization of the food through shear forces, chemical reactions, and hightemperatures. It is doubtful that most enzymes would survive extruder conditions.
Research has been done on the use of high pressures to inactivate microorganisms.

Pag e 490
Hydrostatic pressures that are compatible with intact food tissues almost certainly will not completely inactivate enzymes ofinterest.
It is anticipated that pressure treatment of food will have greater effect on multi-subunit enzymes than on single polypeptideenzymes, since pressure, if high enough, will favor the monomer form of a protein, that is, will cause more dissociation to themonomer. Gutfreund and his colleagues [44] studied the effect of a pressure jump on the dissociation of hemoglobin. Theyreported that 107 Pa pressure caused 4% dissociation into two a,b-dimers, a relatively easy dissociation (i.e., 0.1 M NaCl willdo this).
7.7.4.3 Inactivation of Enzymes by Shearing
Considerable shearing occurs in food processing during mixing, transfer through tubes, and extrusion. Some attention has beengiven to the shear conditions required for enzyme inactivation. Charm and Matteo [20] determined that when the shear value[shear rate (sec-1) times the exposure time (sec)] is greater than 104 some inactivation of rennet is detectable (Fig. 34), and therate of inactivation is very much faster at 7 × 10⁵.
About 50% inactivation of catalase, rennet and carboxypeptidase was found at shear values of about 107 [20]. Rennet regainedsome activity after shear inactivation, similar to regaining of activity following heat inactivation.
7.7.4.4 lonizing Radiation and Enzyme Inactivation
Much attention has been given to the effect of ionizing radiation of food on the inactivation of enzymes [34]. It soon becameclear that about 10 times greater dose of ionizing radiation is required to inactivate enzymes than is needed to destroy microbialspores. For example, irradiated meat in which the microbial population was reduced to quite low numbers still developedtextural defects due to protease activity during storage.
Some of the factors that influence the rate of trypsin inactivation by irradiation are shown in Figure 35. Trypsin is more stable inthe dry state than in the wet state, because the indirect effect of free radicals (HO. and H.) produced from water are veryimportant in enzyme
FIGURE 34Inactivation of rennet by shearing at4°C. (Reprinted from Ref. 20, p. 505,
couurtesy of Academic Press.)

Pag e 491
FIGURE 35Inactivation of trypsin by irradiation
undervarious conditions: (1) dry trypsin, (2)
10mg /ml of trypsin solution at pH 8 and -
78°C,(3) 80 mg /ml of trypsin solution at pH
8 andambient temperature, (4) 10 mg /ml
of trypsin at pH 2.6 and -78°C, (5) 80mg /ml of trypsin at pH 2.7 and ambienttemperature, (6) 10 mg /ml of trypsin at
pH2.6 and ambient temperature, (7) 1
mg /ml oftrypsin at pH 2.6 and ambient
temperature.(Redrawn from Ref. 69.)
inactivation. In general, the more dilute the trypsin solution, the more effective the radiation treatment. A given dose of ionizingradiation is also more effective at ambient temperature than at -78°C. At least part of this difference in effect results fromimmobilization of water free radicals at -78°C (frozen state). Differences in pH do not seem to have a pronounced effect onirradiation inactivation of trypsin, but these differences have been shown to be important in activating enzymes by irradiation inmeat. Other factors that enhance inactivation by ionizing radiation are the presence of O2, metal ions such as Cu2+, unsaturatedlipids, fatty acids, and purity of the enzyme, since other proteins protect against inactivation. Individual enzymes differsubstantially in their resistance to inactivation by ionizing radiation, with catalase being about 60 times more resistant thancarboxypeptidase (both metal-containing enzymes; Fe3+ is the cofactor in catalase, Zn2+ is the cofactor in carboxypeptidase).
Ionizing radiation causes most damage to tyrosyl, histidyl, tryptophanyl, and cysteinyl residues in proteins. Sulfhydryl compoundsin food tend to protect enzymes against inactivation by ionizing radiation.
In order to avoid using higher doses of ionizing radiation than required to destroy microorganisms, heat treatment (to inactivateenzymes) is usually combined with ionizing radiation in those foods where this preservation method is permitted.
7.7.4.5 Solvent Inactivation of Enzymes
The effect of solvents on enzyme activity was discussed for model systems in Section 7.5.6. In general, water immisciblesolvents, by displacing water, stabilize enzymes, just as does removal of water by drying. However, water-miscible solvents,when present at concentrations exceeding about 5–10%, generally inactivate enzymes. This effect is, of course, temperaturedependent (more stable at lower temperatures).
Solvent treatment, for example with ethanol, can be quite effective in inactivating
Pag e 492
microorganisms on the surface of grains and legume seeds. However, the efficacy of this treatment probably does not depend oninactivation of enzymes.
7.7.5 Removal of Substrate and/or Cofactor
It is obvious that removal of one or more of the required substrates or a required cofactor will eliminate enzyme activity. It is wellknown that polyphenol oxidase browning can be prevented by excluding O2. This is effectively done by natural selectivepermeability of the surface of most fruits and vegetables. Browning catalyzed by polyphenol oxidase can also be prevented byremoving or altering the phenols (substrates). Binding of phenols to polyethylene glycol, polyvinylpyrrolidone, or Sephadex iseffective. Polyphenol oxidase activity can be prevented by enzymatic methylation of one or more of the hydroxyl groups of thephenolic substrate [37]. This might be effective in juice, for example.
Another approach to preventing browning caused by polyphenol oxidase is to reduce the initial product, o-benzoquinone, backto the substrate before the o-benzoquinone can undergo further (non-enzyme-catalyzed) oxidative polymerization to melanin.Compounds that reduce o-benzoquinone include ascorbic acid, sodium bisulfite, and thiol compounds. It has been shown thatthese compounds also directly inactivate polyphenol oxidase by free radical degradation of histidine residues at the active site(ascorbic acid and Cu2+), and by reducing Cu2+ to Cu+ in the active site of the enzyme, thereby causing Cu+ to dissociate morereadily from the enzyme [84].
Enzymes are generally more stable in the presence of substrates, cofactors and competitive inhibitors. The general conclusion isthat binding of these compounds into the active site of the enzyme has a stabilizing effect.
7.8 Food Modification By Enzymes
Enzymes have a very important inpact on the quality of our foods. In fact, without enzymes there would be no food. But thenthere would be no need for food, since no organism could live without enzymes. They are the catalysts that make life possible, aswe know it.
For any organism, life begins with enzyme action in the gestation and fertilization processes. The growth and maturation of ourfoods depend on enzyme actions. While we have known for some time that environmental conditions during growing affect thecomposition, including enzymes, of our plant foods, a recent review [16] has detailed just how much effect moisture deficiencyhas on the expression of genes during growth and maturation of plants.
Following maturation, the harvesting, storage, and processing conditions can markedly affect the rate of food deterioration.Enzymes can also be added to foods during processing to change their characteristics, and some of these changes will bediscussed. Microbial enzymes, left after destruction of the microorganisms, continue to affect the quality of processed andreformulated foods. For example, starch-based sauces can undergo undesirable changes in consistency because of heat-stablemicrobial a-amylases that survive a heat treatment sufficient to destroy the microorganisms. Because of their high specificity,enzymes are also the ideal catalysts for the biosynthesis of highly complex chemicals.
7.8.1 Role of Endogenous Enzymes in Food Quality
7.8.1.1 Color
(See also Chap. 10.) Color is probably the first attribute the consumer associates with quality and acceptability of foods. Asteak must be red, not purple or brown. Redness is due only to oxymyoglobin, the main pigment in meat. Deoxymyoglobin isresponsible for the purple color

Pag e 493
of meat. Oxidation of the Fe(II) present in oxymyoglobin and deoxymyoglobin, to Fe(III) producing metmyoglobin, isresponsible for the brown color of meat. Enzyme-catalyzed reactions in meat can compete for oxygen, can produce compoundsthat alter the oxidation-reduction state and water content, and can thereby influence the color of meat.
The quality of many fresh vegetables and fruits is judged on the basis of their “greenness.” On ripening, the green color of manyof our fruits decreases and is replaced with red, orange, yellow, and black colors. In green beans and English green peas,maturity leads to a decrease in chlorophyll level. All of these changes are a result of enzyme action. Three key enzymesresponsible for chemical alterations of pigments in fruits and vegetables are lipoxygenase, chlorophyllase, and polyphenoloxidase.
Lipoxygenase
Lipoxygenase (lineoleate:oxygen oxidoreductase; EC 1.13.11.12) has six important effects on foods, some desirable and othersundesirable. The two desirable functions are (a) bleaching of wheat and soybean flours and (b) formation of disulfide bonds ingluten during dough formation (eliminates the need to add chemical oxidizers, such as potassium bromate). The four undesirableactions of lipoxygenase in food are (a) destruction of chlorophyll and carotenes, (b) development of oxidative off flavors andaromas, often characterized as haylike, (c) oxidative damage to compounds such as vitamins and proteins, and (d) oxidation ofthe essential fatty acids, lineoleic, linolenic, and arachidonic acids.
All six of these reactions result from the direct action of lipoxygenase in oxidation of polyunsaturated fatty acids (free and lipid-bound) to form free radical intermediates (Fig. 36). In steps 2, 3, and 4 (Fig. 36) free radicals are formed, while in step 5 ahydroperoxide is formed. Further nonenzymatic reactions lead to formation of aldehydes (including malondialdehyde) and othercomponents that contribute to off flavors and off aromas. The free radicals and hydroperoxide are responsible for loss of color(chlorophyll; the orange and red colors of the carotenoids), disulfide bond formation in gluten of doughs, and damage to vitaminsand proteins. The most oxidation-sensitive amino acid residues in proteins are cysteine, tyrosine, histidine, and tryptophan.Antioxidants, such as vitamin E, propyl gallate, benzoylated hydroxytoluene, and nordihydroguaiacetic acid, protect foods fromdamage from free radicals and hydroperoxides.
Chlorophyllase
Chlorophyllase (chlorophyll chlorophyllido-hydrolase, EC 3.1.1.14) is found in plants and chlorophyll-containingmicroorganisms. It hydrolyzes the phytyl group from chlorophyll to give phytol and chlorophyllide (see Chap. 10). Although thisreaction has been attributed to a loss of green color, there is no evidence to support this as chlorophyllide is green. Furthermore,there is no evidence that the chlorophyllide is any less stable to color loss (loss of Mg2+) than is chlorophyll. The role ofchlorophyllase in vivo in plants is not known. Very few studies have been done on chlorophyllase-catalyzed hydrolysis ofchlorophyll during storage of raw plant foods (Chap. 10).
Polyphenol Oxidase
Polyphenol oxidase (1,2-benzenediol:oxygen oxidoreductase; EC 1.10.3.1) is frequently called tyrosinase, polyphenolase,phenolase, catechol oxidase, cresolase, or catecholase, depending on the substrate used in its assay or found in the greatestconcentration in the plant that serves as a source of the enzyme. Polyphenol oxidase is found in plants, animals and somemicroorganisms, especially the fungi. It catalyzes two quite different reactions with a large number of phenols, as shown inEquations 58 and 59.

Pag e 494
(58)
(59)
The 4-methyl-o-benzoquinone (Eq. 59) is unstable and undergoes further non-enzyme-catalyzed oxidation by O2, andpolymerization, to give melanins. The latter is responsible for the undesirable brown discoloration of bananas, apples, peaches,potatoes, mushrooms, shrimp, and humans (freckles), and the desirable brown and black colors of tea, coffee, raisins, prunes,and human skin pigmentation. The o-benzoquinone reacts with the e-amino group of lysyl residues of proteins, leading to loss ofnutritional quality and insolubilization of proteins. Changes in texture and taste also result from the browning reactions.
It is estimated that up to 50% of some tropical fruits are lost due to enzymatic browning. This reaction is also responsible fordeterioration of color in juices and fresh vegetables such as lettuce, and in taste and nutritional quality. Therefore, much effort hasgone into developing methods for control of polyphenol oxidase activity. As discussed earlier in Section 7.7.5, elimination of O2
and the phenols will prevent browning. Ascorbic acid, sodium bisulfite, and thiol compounds prevent browning due to reductionof the initial product, o-benzoquinone, back to the substrate, thereby preventing melanin formation. When all of the reducingcompound is consumed, browning still may occur, since the enzyme may still be active. Ascorbic acid, sodium sulfite, and thiolcompounds also have a direct effect in inactivating polyphenol oxidase due to destruction of the active-site histidines (ascorbicacid) or in removal by (sodium bisulfite and thiols) of the essential Cu2+ in the active site [84].
4-Hexylresorcinol, benzoic acid, and some other nonsubstrate phenols are effective inhibitors of some polyphenol oxidases, withKi values around 1–10mM. Most likely, inhibition results from competitive binding of this type of inhibitor into the reducingcompound (BH2) binding site (Eq. 58).
7.8.1.2 Texture
Texture is a very important quality attribute in foods. In fruits and vegetables, texture is due primarily to the complexcarbohydrates: pectic substances, cellulose, hemicelluloses, starch, and lignin. There are one or more enzymes that act on eachof the complex carbohydrates that are important in food texture. Proteases are important in the softening of animal tissues andhigh-protein plant foods.
Pectic Enzymes
Three types of pectic enzymes that act on pectic substances are well described. Two (pectin methylesterase andpolygalacturonase) are found in higher plants and microorganisms and one type (the pectate lyases) is found in microorganisms,especially certain pathogenic microorganisms that infect plants [109].

Pag e 495
FIGURE 36Reaction catalyzed by lipoxyg enase. See the test for a
description of the sequence of reactions. (From Ref. 111,p. 588.)
Pectin methylesterase (pectin pectylhydrolase, EC 3.1.1.11) hydrolyzes the methyl ester bond of pectin to give pectic acid andmethanol (Eq. 60).
(60)

Pag e 496
The enzyme is sometimes referred to as pectinesterase, pectase, pectin methoxylase, pectin demethoxylase, and pectolipase.Hydrolysis of pectin to pectic acid in the presence of divalent ions, such as Ca2+, leads to an increase in textural strength, due tothe cross bridges formed between Ca2+ and the carboxyl groups of pectic acid.
Polygalacturonase (poly-a-1,4-galacturonide glycano-hydrolase, EC 3.2.1.15) hydrolyzes the a-1,4-glycosidic bond betweenthe anhydrogalacturonic acid units (Eq. 61).
(61)
Both endo- and exo-polygalacturonases exist; the exo type hydrolyzes bonds at the ends of the polymer and the endo type actsin the interior. There are differences in opinion as to whether plants contain both polymethylgalacturonases (act on pectins) andpolygalacturonases (act on pectic acid), since pectin methylesterase in the plant rapidly converts pectin to pectic acid. Action ofpolygalacturonase results in hydrolysis of pectic acid, leading to important decreases in texture of some raw food materials, suchas tomatoes.
The pectate lyases [poly(1,4-aD-galacturonide) lyase, EC 4.2.2.2] split the glycosidic bond of both pectin and pectic acid, notwith water, but by b-elimination (Eq. 62). They are found in microorganisms, but not in higher plants.
(62)
Splitting of the glycosidic bond gives a product with a reducing group and another product with a double bond.Polygalacturonases and pectate lyases both produce reducing groups when the glycosidic bond is split, resulting in a decrease intexture, so they cannot be distinguished by this method. However, the double bond in the second product (Eq. 62) has anextinction coefficient of 4.80 ×10³ M-1 cm-1 at 235 nm. Therefore, a change in absorbance at 235 nm is the method of choice fordistinguishing between polygalacturonases and pectate lyases. There are both endo- and exo-splitting pectate lyases, as well aspectate lyases that act on either pectin or on pectic acid.
A fourth type of pectin-degrading enzyme, protopectinase, has been reported in a few microorganisms. Protopectinasehydrolyzes protopectin, producing pectin. However, it is not clear yet whether the protopectinase activity in plants is due to thecombined action of pectin methylesterase and polygalacturonase or to a true protopectinase. It is unlikely that protopectinase isan “H-bondase” as suggested by some researchers.

Pag e 497
Cellulases
Cellulose is abundant in trees and cotton. Fruits and vegetables contain small amounts of cellulose, which has a role in thestructure of cells. Whether cellulases are important in the softening of green beans and English green pea pods is still a matter ofcontroversy. Abundant information is available on the microbial cellulases because of their potential importance in convertinginsoluble cellulosic waste to glucose [70].
Pentosanases
Hemicelluloses, which are polymers of xylose (xylans), arabinose (arabans), or xylose and arabinose (arabinoxylans), with smallamounts of other pentoses or hexoses, are found in higher plants. Pentosanases in microorganisms [109], and in some higherplants, hydrolyze the xylans, arabans, and arabinoxylans to smaller compounds. The microbial pentosanases are bettercharacterized than those in higher plants.
Several exo- and endo-hydrolyzing pentosanases also exist in wheat at very low concentrations, but little is known about theirproperties. It is important that these pentosanases receive more attention from food scientists.
Amylases
Amylases, the enzymes that hydrolyze starches, are found not only in animals, but also in higher plants and microorganisms.Therefore, it is not surprising that some starch degradation occurs during maturation, storage, and processing of our foods. Sincestarch contributes in a major way to viscosity and texture of foods, its hydrolysis during storage and processing is a matter ofimportance. There are three major types of amylases: a-amylases, b-amylases, and glucoamylases. They act primarily on bothstarch and glycogen. Other starch-splitting enzymes also exist (Table 14).
The a-amylases, found in all organisms, hydrolyze the interior a-1,4-glucosidic bonds of starch (both amylose and amylopectin),glycogen, and cyclodextrins with retention of the a-configuration of the anomeric carbon. Since the enzyme is endo-splitting, itsaction has a major effect on the viscosity of starch-based foods, such as puddings, cream sauces, etc. The salivary andpancreatic a-amylases are very important in digestion of starch in our foods. Some microorganisms contain high levels of a-amylases. Some of the microbial a-amylases have high inactivation temperatures, and, if not activated, they can have a drasticundesirable effect on the stability of starch-based foods.
b-Amylases, found in higher plants, hydrolyze the a-1,4-glucosidic bonds of starch at the nonreducing end to give b-maltose.Since they are exo-splitting enzymes, many bonds must be hydrolyzed before an appreciable effect on viscosity of starch pasteis observed. Amylose can be hydrolyzed to 100% maltose by b-amylase, while b-amylase cannot continue beyond the first a-1,6-glycosidic bond encountered in amylopectin. Therefore, amylopectin is hydrolyzed only to a limited extent by b-amylasealone. “Maltose” syrups, of about DP 10, are very important in the food industry. b-Amylase, along with a-amylase, is veryimportant in brewing, since the maltose can be rapidly converted to glucose by yeast maltase. b-Amylase is a sulfhydryl enzymeand can be inhibited by a number of sulfhydryl group reagents, unlike a-amylase and glucoamylase. In malt, b-amylase is oftencovalently linked, via disulfide bonds, to other sulfhydryl groups; therefore, malt should be treated with a sulfhydryl compound,such as cysteine, to increase its activity in malt.
Proteases
Texture of food products is changed by hydrolysis of proteins by endogenous and exogenous proteases. Gelatin will not gelwhen raw pineapples is added, because the pineapples contains

Pag e 498
TABLE 14 Some Starch- and Glycog en-Deg rading Enzymes
Type
Config urationof g lucosidic
bond Comments
Endo-splitting (config uration retained)
a-Amylase (EC 3.2.1.1) a-1,4 Initial major products are dextrins; finalmajor products are maltose and maltotriose
Isoamylase (EC 3.2.1.68) a-1,6 Products are linear dextrins
Isomaltase (EC 3.2.1.10) a-1,6 Acts on products of a-amylase hydrolysisof amylopectin
Cyclomaltodextrinase (EC 3.2.1.54) a-1,4 Acts on cyclodextrins and linear dextrins tog ive maltose and maltotriose
Pullulanase (EC 3.2.1.41) a-1,6 Acts on pullulan to g ive maltotriose and onstarch to g ive linear dextrins
Isopullulanase (EC 3.2.1.57) a-1,4 Acts on pullulan to g ive isopanose and onstarch to g ive unknown products
Neopullulanase a-1,4 Acts on pullulan to g ive panose and onstarch to g ive maltose
Amylopullulanase a-1,6 Acts on pullulan to g ive maltotriose
a-1,4 Acts on starch to g ive DP 2–4 products
Amylopectin 6-g lucano hydrolase (EC3.2.1.41)
a-1,6 Acts only on amylopectin to hydrolyze a-1,6-g lucosidic linkag es
Exo-splitting (nonreducing end)
b-Amylase (EC 3.2.1.2) a-1,4 Product is b-maltose
a-Amylase a-1,4 Product is a-maltose; there are specific exo-a-amylases that produce maltotriose,maltotetraose, maltopentaose, andmaltohexaose, with retention ofconfig uration
Glucoamylase (EC 3.2.1.3) a-1,6 b-Glucose is produced
a-Glucosidase (EC 3.2.1.20) a-1,4 a-Glucose is produced; there are a numberof a-g lucosidases
Transferase
Cyclomaltodextrin g lucanotransferase(EC 2.4.1.19)
a-1,4 a- and b-Cyclodextrins formed from starchwith 6–12 g lucose units
bromelain, a protease. Chymosin causes milk to gel, as a result of its hydrolysis of a single peptide bond between Phe105-Met106
in k-casein. This specific hydrolysis of k-casein destabilizes the casein micelle, causing it to aggregate to form a curd (cottagecheese). Action of intentionally added microbial proteases during aging of brick cheeses assists in development of flavors(flavors in Cheddar cheese vs. blue cheese, for example). Protease activity on the gluten proteins of wheat bread doughs duringrising is important not only in the mixing characteristics and energy requirements but also in the quality of the baked breads.
Pag e 499
The effect of proteases in the tenderization of meat is perhaps best known and is economically most important. After death,muscle becomes rigid due to rigor mortis (caused by extensive interaction of myosin and actin). Through action of endogenousproteases (Ca2+-activated proteases, and perhaps cathepsins) on the myosin-action complex during storage (7–21 days) themuscle becomes more tender and juicy. Exogenous enzymes, such as papain and ficin, are added to some less choice meats totenderize them, primarily due to partial hydrolysis of elastin and collagen.
7.8.1.3 Flavor and Aroma Changes in Foods
Chemical compounds contributing to the flavor and aroma of foods are numerous, and the critical combinations of compoundsare not easy to determine. It is equally difficult to identify the enzymes instrumental in the biosynthesis of flavors typical of foodflavors and in the development of undesirable flavors.
Enzymes cause off flavors and off aromas in foods, particularly during storage. Improperly blanched foods, such as green beans,English green peas, corn, broccoli, and cauliflower, develop very noticeable off flavors and off aromas during frozen storage.Peroxidase, a relatively heat-resistant enzyme not usually associated with development of defects in food, is generally used as theindicator for adequate heat treatment of these foods. It is clear now that a higher quality product can be produced by using theprimary enzyme involved in off flavor and off aroma development as the indicator enzyme.
With this in mind, Whitaker and Pangborn [74, 75, 101] and their students determined that lipoxygenase is responsible for offflavor and off aroma development in English green peas, green beans, and corn, and that cystine lyase is the primary enzymeresponsible for off flavor and off aroma development in broccoli and cauliflower. Evidence to support the important role oflipoxygenase as a catalyst of off-flavor development in green beans is shown in Figure 37. Additional work indicated that theflavor stability of frozen food (of types mentioned above), blanched to the endpoint of the responsible enzyme, is better than thatof comparable samples blanched to the peroxidase endpoint.
Naringin is responsible for the bitter taste of grapefruit and grapefruit juice. Naringin can be destroyed by treating the juice withnaraginase. Some research is underway to eliminate naringin biosynthesis by recombinant DNA techniques.
7.8.1.4 Nutritional Quality
There is relatively little data available with respect to the effects of enzymes on nutritional quality of foods. Lipoxygenaseoxidation of linoleic, linolenic, and arachidonic acids certainly decreases the amounts of these essential fatty acids in foods. Thefree radicals produced by lipoxygenase-catalyzed oxidation of polyunsaturated fatty acids decrease the carotenoid (vitamin Aprecursors), tocopherols (vitamin E), vitamin C, and folate content of foods. The free radicals also are damaging to cysteine,tyrosine, tryptophan, and histidine residues of proteins. Ascorbic acid is destroyed by ascorbic acid oxidase found in somevegetables such as squash. Thiaminase destroys thiamine, an essential cofactor involved in amino acid metabolism. Ribo-flavinhydrolase, found in some microorganisms, can degrade riboflavin. Polyphenol oxidase-caused browning decreases the availablelysine content of proteins.
7.8.2 Enzymes Used as Processing Aids and Ingredients
Enzymes are ideal for producing key changes in the functional properties of food, for removal of toxic constituents, and forproducing new ingredients. This is because they are highly specific, act at low temperatures (25–45°C), and do not produce sidereactions. Full utilization of the high

Pag e 500
FIGURE 37Effect of added enzymes ondevelopment of undesirable
aroma descriptors in g reen beans.Averag e aroma differences areshown between sample and ablanched reference sample to
which no enzymes were added.An averag e aroma intensity of 50is the same as the reference. The
shaded bars indicate aromadescriptor intensity differencesstatistically different from the
reference. (From Ref. 114, p. 134,with permission of Institute of
Food Technolog ists.)
specificity of enzymes is compromised currently because relatively crude enzyme systems are used, because of cost. Crudepreparations contain other enzymes that may produce unwanted products. Of major concern is that the crude enzymepreparations often differ substantially from batch to batch. With recombinant DNA methods, the time is closer when pureenzymes can be used in food processing.
There are some major successes in the use of food-related enzymes. Production of high-fructose corn syrup is one example.This involves a relatively heat-stable a-amylase, glucoamylase, and glucose isomerase:

(63)
Starch is heated to 105°C, Bacillus licheniformis a-amylase is added, and dextrins of DP 10–12 are produced by the endo-splitting enzyme. The soluble digest is passed through giant columns (6–10 ft in diameter and 20 ft high) of immobilizedglucoamylase where glucose is produced. The glucose-containing stream is then run through giant columns of immobilizedglucose isomerase where approximately equimolar concentrations of glucose and fructose are produced. The fructose isseparated from glucose by differential crystallization and is used as a major sweetener in the food industry (~100 billiontons/year). The glucose or a mixture of

Pag e 501
TABLE 15 Biocatalytic Production of Sweeteners
Feedstock Product Enzyme(s)
Starch Corn syrups a-Amylases, pullulanases
Glucose a-Amylases, g lucoamylase
Fructose a-Amylase, g lucoamylase, g lucoseisomerase
Starch + sucrose Sucrose derivatives Cyclodextring lucosyltransferase andpullulanase (or isoamylase)
Sucrose Glucose + fructose Invertase
Sucrose Isomaltulose b-Glucosyltransferase and isomaltulosesynthetase
Sucrose + fructose Leucrose a-1,6-Glycosyltransferase
Lactose Glucose + g alactose b-Galactosidase
Galactose Galacturonic acid Galactose oxidase
Glucose Galactose epimerase
Several Aspartame Thermolysin, penicillinacylase
Stevioside a-Glycosylated stevioside a-Glucosidase
Ribaudioside-A b-Glycosyltransferase
Source: Ref. 110, p. 676.
glucose and fructose is used as sweetener, or the glucose is recycled to produce more fructose. Other sweeteners can also beproduced enzymatically (Table 15).
A second example is the use of aminoacylases to separate racemic mixtures of DL-amino acids, in multi-ton lots. A thirdexample is the use of specific lipases to tailor-make lipids with respect to melting point, unsaturation, or specific location of afatty acid in a triacylglycerol. This requires a beginning lipid, the required concentrations of free fatty acids, appropriate enzymes,and appropriate conditions (Table 16). For example, a 1,3-specific lipase catalyzes transesterification of fatty acids at the 1 -and 3-positions of glycerol, a 2-specific lipase catalyzes transesterification only at the 2-position of glycerol, and a nonspecificlipase catalyzes transesterification at the 1-, 2-, and 3-positions of glycerol. An example using 1,3-specific lipase is:
(64)
TABLE 16 Enzymes for Modifying Lipids
Enzyme Products
Lipases Rearrang ed trig lyceridesW axes via esterificationMonog lycerides
Phospholipase A Lysophospholipid
Phospholipase D Phosphotidylg lycerol
Source: Ref. 110, p. 685.


Pag e 502
7.8.2.1 Specialty Products and Ingredients via Enzymology
The following text and tables illustrate some of the current or potential uses of enzymes on an industrial scale.
Enzymatic Production of Valuable Compounds
Listed in Table 17 are 14 enzymes used to make specialty compounds as additives in foods.
Enzymatic Removal of Undersirable Compounds
Raw food materials often contain toxic or anti-nutrient compounds that are sometimes removed by proper heat treatment,extraction or by enzymatic reactions (Table 18). There are more than 12,000 plants in the world that may have potential as foodsources. Many are not used because of undesirable properties, some of which could be overcome by the proper use ofenzymes.
Enzymes in Milk and Dairy Products
Bovine milk contains many enzymes (see Chap. 14), and other enzymes are added during processing (Table 19). Of mostimportance economically is the use of chymosin (rennet) in production of several kinds of cheese. b-Galactosidase is potentiallyof great importance in the commercial hydrolysis of lactose in milk and dairy products, so that these products can be consumedby individuals who are deficient in b-galactosidase. b-Galactosidase is also used to convert whey lactose to glucose andgalactose, sweeteners with greater commercial demand.
Enzymes in Baking
Several enzymes are used in breadmaking (Table 20). Additions of amylases and proteases has been common for years. Severalenzyme preparations are available for the stated purpose of reducing the rate of staling in bread. These include (a) a debranchingenzyme (1,6-splitting;
TABLE 17 Enzymatic Production of W anted Compounds or Creation of Desirable Effects
Enzymes Purpose
Aminoacylases Resolve DL-amino acids
Aspartase Produce aspartate
Proteases Surfactants
Peroxidase Phenol resins
5'-Phosphodiesterases 5'-Nucleotides for flavor enhancers
5'-Adenylic deaminase Produce 5'-inosinic acid for flavor
Lipases (preg astric) Cheese/butter flavors
Proteases Decrease ripening time of cheesesTenderization of meat
Lipases/esterases Flavor esters
Proteases, nucleases Meaty flavors from yeast hydrolysis
Fumarase Fumaric acid as acidulant
Cyclomaltodextrin g lucanotransferase Cyclodextrins for inclusion complexation
Tannase Antioxidants, such as propylg allate
a-Galactosidase Modified food g ums
Source: Ref. 110, p. 674.


Pag e 503
TABLE 18 Enzymatic Removal of Unwanted Constituents
Enzymes Unwanted constituent
a-Galactosidase Raffinose
b-Galactosidase Lactose
Glucose oxidase GlucoseO2
Phytase Phytic acid
Thiog lycosidases Thiog lycosides
Oxalate oxidase O2
Alcohol oxidase O2
Oxyrase O2
Catalase H2O2
Sulfhydryl oxidase Oxidized flavors
Urease Carbamates
Cyanidase Cyanide
Pepsin, chymotrypsin, carboxypeptidase A Bitter peptides
Naring inase Bitter compounds in citrus
Proteases Phenylalanine
a-Amylases Amylase inhibitors
Proteases Protease inhibitors
Source: Ref. 110, p. 678
pullulanase-type) from Bacillus acidopullulyticus along with a-amylase; (b) a genetically engineered a-amylase from Bacillusmegaterium that rearranges the branched chains of amylopectin, via chain transfer, to give a linear polymer; (c) a mixture ofcellulase, b-glucanase, and pentosanase produced by Trichoderma reesei; and (d) a mixture of cellulase, hemicellulases, andpentosanases used in conjunction with fungal a-amylase. Preparations containing pentosanases are reported to increase themoisture content of rye bread products by decreasing the high pentosan content of rye flour.
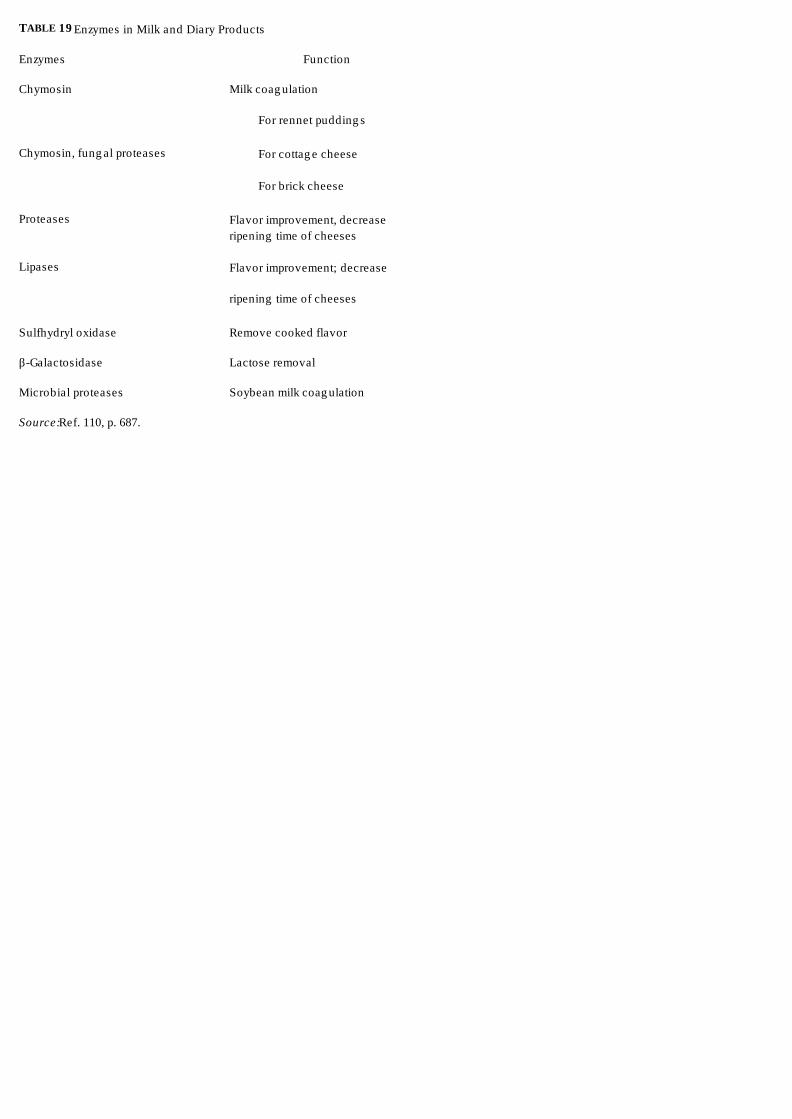
TABLE 19 Enzymes in Milk and Diary Products
Enzymes Function
Chymosin Milk coag ulation
For rennet pudding s
Chymosin, fung al proteases For cottag e cheese
For brick cheese
Proteases Flavor improvement, decreaseripening time of cheeses
Lipases Flavor improvement; decrease
ripening time of cheeses
Sulfhydryl oxidase Remove cooked flavor
b-Galactosidase Lactose removal
Microbial proteases Soybean milk coag ulation
Source: Ref. 110, p. 687.

Pag e 504
TABLE 20 Enzymes in Baking
Enzymes Purpose
Amylase To maximize fermentation process; prevent staling
Proteases Improve handling and rheolog ical properties
a-Glutamyl transferase, g lutathione oxidase,cysteinyl g lycine dipeptidase
Improve doug h elasticity, loaf volume, crumbstructure, and retention of bread softness on storag e
Pentosanases In rye bread products to decrease doug hdevelopment time and power requirements, increasemoistness
Sulfhydryl oxidase Streng then weak doug hs by -S-S- formation
Source: Ref. 110, p. 689.
Enzymes in Brewing
Several recent advances have been made with regard to the use of enzymes in brewing (Table 21). There is increasing interest inthe possible use of blended a-amylase and protease preparations as replacements for malt in brewing. This is attributable to theexpense and limited supplies of malt and the possibility that better quality control might be achieved. The industry has also usedamyloglucosidases recently to make “light” beer. Amyloglucosidases hydrolyze the a-1,6-glucosidic bonds of the amylopectinfraction, permitting the complete fermentation of starch. Use of b-glucanases may solve the high viscosity/slow filtration rateproblems caused by mannans from cell walls. The most exciting advance, however, is the use of acetolactate decarboxylase,now cloned into brewers yeast, to shorten the fermentation time by avoiding diacetyl formation (Eq. 65) [83a].
(65)
Enzymes for Control of Microorganisms
Enzymes have potential for destroying microorganisms by several means (Table 22). The means range from hydrolysis of cell-
wall compounds, such as b-glucans, chitin, and peptidoglycans, to production of H2O2 and which oxidize the essential -SHgroup of key sulfhydryl enzymes or polyunsaturated fatty acids in cell walls. These are interesting possibilities, worthy of beingtested at the commercial level.
7.9 Immobilized Enzymes in Food Processing
7.9.1 Advantages and Disadvantages
Why immobilized enzymes? The objectives of immobilizing enzymes are to permit their repeated use to make products, and atthe end, to have a product free of enzyme. In Section 7.8.2,

Pag e 505
TABLE 21 Enzymes in Brewing
Enzymes Purpose
Amylases (a and b) Convert nonmalt starch to maltose and dextrins; fermented by yeast toalcohol and CO2
Proteases (endo and exo) Hydrolyze proteins to amino acids; used by yeast to g row
Papain Chillproofing beer
Amylog lucosidase Hydrolyze 1,6-linkag es in amylopectin permitting complete fermentationof starch (lig ht beer)
b-Glucanases Hydrolyze g lucans to reduce viscosity and aid filitration
Acetolactate decarboxylase Decrease fermentation time, by avoiding diacetyl formation
Source: Ref. 110, p. 690.
the discussion focused on the many applications and potential applications of enzymes in food processing, their use in developingfood ingredients and in the removing of unwanted compounds. It was mentioned that crude enzyme preparations producenumerous side reactions because of contaminating enzymes. An example of this problem can occur during fruit juice production.Pectic enzyme preparations from Aspergillus niger are often used to increase yield and clarity. However, there are severalpolymer-hydrolyzing enzymes in the A. niger enzyme preparation (Table 23). The net effect observed after enzyme treatment ofthe juice is a composite of the activities of many of the enzymes present. For example, in apple juice an arabinosidase removesthe side chain arabinose units from the linear araban chain, which then aggregates to
TABLE 22 Enzymes for Control of Microorg anisms
Enzyme Function
OxidasesRemoval of O2, NADH or NADPH; produce H2O2 and whichoxidize -SH g roups and polyunsaturated lipids
Xylitol phosphorlase Conversion of xylitol to xylitol 5-phosphate, which kills microorg anism
Lipases Liberation of free fatty acids, which are toxic to protozoa Giardialamblia
LactoperoxidaseUses & H2O2, produced by oxidase, to convert SCN-to SCNO -
and -SH g roups to -S-S-, -S-SCN, or -S-OH
Myeloperoxidase W ith added H2O2 and CI-, produces HOCI and cholroamines
Lysozyme Effective ag anist a number of g ram-positive org anisms via hydrolysisof cell-wall peptidog lycans; hydrolysis of protein-mannan outer layerof yeast when added with and endo-b-1,3-g lucanase
Mannanase Lysis of b-g lucans-protein cell wall of yeast
Chitinase Effective ag anist chitin in cell wall of several fung i
Antienzymes Proteases, sulfhydryl oxidase, dehydrog enases, lipoxyg enases
Source: Adapted from Ref. 92.

Pag e 506
TABLE 23 Enzymes Produced by Aspergillus niger That Hydrolyze Ploymers
Substrate Enzymes
Arabinans a-L-Arabinofuranosidase
Cellulose Cellulases a
Dextran Dextranase
DNA, RNA Deoxyribonuclease, ribonuclease
b-Glucans b-Glucanase
Hemicellulose Hemicellulases (pentosanases)
Inulin Inulinase
Mannans b-Mannanase
Pectic substances Pectin methylesterase, pectate lyase, polyg alacturonase
Proteins Proteases
Starch a-Amylase, g lucoamylase
Xylans Xylanase
aAll types of cellulases (see Section 7.11.2).
Source: Ref. 110, p. 684.
give turbidity. Also, the next batch of A. niger pectic enzymes may perform differently unless the growth conditions arecontrolled exactly.
At the present time, the cost of a more purified enzyme preparation would be prohibitive if used only once. The advantage ofimmobilized enzymes is that they can be used repeatedly, greatly decreasing the overall cost. The cost of fructose productionfrom corn starch would be prohibitive if the glucoamylase and glucose isomerase where used for only one batch. Contrast thatwith the current system using immobilized glucoamylase and glucose isomerase where the cost of producing fructose is about65% of that of producing sucrose from sugar cane and sugar beets.
Why are immobilized enzyme systems not used more in food processing? The answer is that most food systems are toocomplex, physically. Chemical complexity is not a problem. Because of the high specificity of enzymes, a single compound suchas glucose, for example, can be selected from a complex mixture, bound by glucose oxidase, and converted to product. Thethousands of other compounds are not changed. In an immobilized enzyme system, special arrangements are necessary to bringthe enzyme and substrate into contact. This can be done by adding an immobilized enzyme preparation and providing thoroughcirculation, or by flowing the food past a stationary immobilized enzyme (column, coated tube wall, etc). The immobilizedenzyme can be used for several months.
Immobilized enzymes are especially valuable for analytical processes. This topic will be discussed in Section 7.12.4.
7.9.2 Methods of Immobilizing Enzymes
Enzymes can be immobilized by several methods: (a) covalent attachment to insoluble support materials such as metals, glass,ceramic, nylon, cellulose, Sepharose, or Sephadex; (b) entrapment in a gel matrix made from, for example, polyacrylamide,Sephadex or agar; (c) adsorption on an insoluble matrix by hydrophobic, electrostatic or other noncovalent affinity methods; (d)adsorption on an insoluble matrix and then covalent cross-linking to the matrix; (e) intermolecular cross-linking of enzymes toform an insoluble matrix that is used in granular form; (f) attachment to semipermeable membranes; and (g) suspension ofinsoluble enzyme particles in immiscible organic solvents.
Pag e 507
Some of the criteria used in deciding on the method of immobilization include: (a) stability of the enzyme during repeated use; (b)retention of activity of the enzyme following immobilization; (c) stability of the matrix to other enzymes, flow, pressure,temperature and other conditions encountered; (d) accessibility of the substrate to the enzyme (diffusion of substrate to theenzyme and products away); (e) susceptibility of the enzyme system to fouling by the substrate feed; (f) efficiency of convertingsubstrate to product; (g) compatibility of the system with subsequent steps in conversion and recovery of product; (h) need forcofactors; (i) compatibility of pure enzyme, crude enzyme, or cells to be immobilized; (j) susceptibility to microbialcontamination; (k) renewal efficiency; and (1) cost.
Ideally the immobilized enzyme system should be reusable hundreds of times (3–6 months) before there is 50% loss of enzymeactivity. Do such systems exist for food applications? Yes, they do. Three will be described.
One of the best types of systems might involve countercurrent flow of two immiscible liquids, one containing an enzyme able tofunction at an interface and the other containing a substrate that can concentrate at the interface. This type of system couldpotentially be used to transesterify triacylglycerols. The substrates (triacylglycerol and fatty acids) are soluble in organic phase,and the lipase is soluble in the aqueous phase and functions at the interface of micellular substrates. Such systems are now in use.
Another system potentially could involve enzymes immobilized to an insoluble magneticsensitive matrix. After reaction with thedesired food components in a stirred reactor, the insoluble magnetic matrix could easily be removed and reused. A third methodmight involve use of a semipermeable membrane through which the enzyme is circulated while immersed in the food. Thesubstrate must diffuse into the semipermeable membrane and the product must diffuse out.
7.9.3 Applications
The starch to fructose conversion described above is almost an ideal system. The starch granules are ruptured by heating at105°C to achieve solubility; however, the resulting solution is too viscous to manage. Hydrolysis of starch with the relativelyheat-stable Bacillus lichenformis a-amylase to DP 10 solves that problem. Also, heating at 105°C destroys anymicroorganisms in the starch and solvents. Therefore, the remainder of the hydrolysis and isomerization can be carried out ingiant columns of glucoamylase and glucose isomerase, which are also relatively stable. Fouling and regeneration of the columnsare not major problems. Other major commercial applications of immobilized enzymes also have similar features (Table 24).
How many other applications of enzymes are awaiting commercial application? Immobilized b-galactosidase for hydrolysis oflactose in milk is being considered in the United States. Column-based systems would be hampered by fouling, but it issurprising that some of the other ways in which immobilized enzymes can be used (discussed earlier) are not yet commerciallyacceptable. Only Italy commercially processes milk to hydrolyze lactose enzymatically.
7.9.4 Immobilized Cells
In some cases, immobilized microbial cells can be employed to produce useful compounds (Table 25) or to remove toxiccompounds from waste products (Table 26). Japanese scientists have contributed especially to developments in this area. Intheory, this should be a very important method, since the desired enzyme is already immobilized inside the cell, cofactors can beregenerated by appropriate metabolic enzymes, the cell is often living and can replenish enzyme losses, and complex reactionsrequiring several steps can be carried out. It has also been suggested that other enzymes required for hydrolysis of feedstock,cell metabolism, or cofactor

Pag e 508
TABLE 24 Commercial Applications of Immobilized Enzymes in the Food and Related Industries
Immobilized enzymes or cells Substrates Products
Aminoacylase Synthetic acyl-DL-amino acid +H2O
L-Amino acid + acyl-D-amino acid
Aspartase, Escherichia coli Fumarate + NH3 L-Aspartate
Fumarase, Brevibacterium ammoniagenes Fumarate + H2O L-Malate
Glucose isomerase D-Glucose D-Fructose
Sterptomyces sp.
Bacillus coagulans
Actinoplanes missouriensis
Arthrobacter sp.
a-Galactosidase (used to hydrolyzeraffinose in sug ar beet juice, which hinderscrystallization of sucrose)
Raffinose D-Galactose and sucrose
Source: Ref. 88, p. 436.
production might be immobilized on the surface of the microbial cell [45]. For example, if endocellulases were immobilized onmicrobial cells they would convert insoluble cellulose to soluble oligosaccharides; these would diffuse into the cell, be furtherhydrolyzed by exocellulases and cellobiase to glucose, and glucose would then be metabolized to ethanol and CO2, both usefulproducts.
However, there are formidable conditions that must be met before immobilized microbial
TABLE 25 Production of Useful Compounds by Immobilized Living Microbial Cells
Useful compounds Microbial cells Carriers for immobilization
Ethanol Saccharomyces carlsbergensis Carrag eenan
Saccharomyces cerevisiae Polyacrylamide
Saccharomyces carlsbergensis Polyvinyl chloride
Saccharomyces cerevisiae Calcium alg inate
L-Isoleucine Serratia marcescens Carrag eenan
Acetic acid Acetobacter sp. Hydrous titanium oxide
Lactic acid Mixed culture of lactobacilli and yeasts Gelatin
Arthrobacter oxidans Ployacrylamide
a-Ketog luconic acid Serratia marcescens Collag en
Bacitracin Bacillus sp. Polyacrylamide
Amylase Bacillus subtilis Polyacrylamide
Hydrog en g as Clostridium butyricum Polyacrylamide
Rhodospirillium rubrum Ag ar

Source: Ref. 21, p. 88, courtesy of International Union of Biochemistry and Elsevier/North-Holland.

Pag e 509
TABLE 26 Decomposition of Poisonous Compounds Using Immobilized Living Microbial Cells
ApplicationsPoisonouscompounds Microbial cells
Carriers forimmobilization
W aste treatment Phenol Candida tropicalis Polyacrylamide
Benzene Pseudomonas putida Polyacrylamide
W aste water Mixed culture of variousmicroorg anisms
Bentonite andMg 2+Polyurethanespong e
Denitrification Nitrate, nitrite Micrococcus denitrificans Liquid membrane
Pseudomonas sp. Active carbon
Source: Ref. 21, p. 89, courtesy of International Union of Biochemistry and Elsevier/North Holland.
cells can be used commercially: (a) the microorganisms must be approved for use in foods and/or in food ingredientmanufacture; (b) the substrate must diffuse readily into the cell and the product out (while cell walls can be made morepermeable by chemical treatments, there is a limit to how much can be done before the cell is killed and/or becomes too fragile);(c) the “living” cell must not duplicate, but must remain viable in terms of enzyme and cofactor generation; (d) the cell must berugged enough to permit repeated use; (e) the cell must not make toxic or significant amounts of unwanted products; and (f) thedesired product must not be a substrate for other enzymes.
It has been proposed repeatedly that plant cells might be immobilized and packed into columns to make flavor constituents,colorants, vitamins, and other valuable products, but this has not been done except in the laboratory. The advantage would be arelatively pure compound that needs little further purification to be of commercial use. Other advantages would be energyefficiency, small space requirement, and independence from climate. Problems with cell fragility, getting feed stock in andproduct out of the cells, long-term utilization, and efficient heat removal have not been solved. But one day, this approach will besuccessful and, hopefully, food scientists and the food industry will contribute greatly to this occurrence.
7.10 Solvent-Partitioned Enzyme Systems
Continuous-flow systems for mass manufacturing of all kinds of products have important advantages over batch systems. Thus,immobilized enzyme systems used in continuous systems have advantages over batch-wise use of enzymes. In solvent-partitioned enzyme systems, there are two phases, but unlike immobilized enzyme columns, both phases can be in motionsimultaneously, by counterflow or in stirred reactors. For success, substrates, products, and enzyme(s) must be easily separatedwhen appropriate. Two systems appear to meet these expectations: counterflow systems of two immiscible solutions, andsystems of “dry” enzyme suspended in an inert organic solvent.
7.10.1 Activity and Stability of Enzymes in Organic Solvents
Can hydrolases synthesize bonds? Do hydrolases have activity in water immiscible organic solvents? Are enzymes stable inwater-immiscible organic solvents? Some years ago, it became clear to researchers that hydrolases can catalyze the biosynthesisof esters, amides, peptides, and carbohydrates under appropriate experimental conditions. Papain, for example, can formpeptide

Pag e 510
bonds during hydrolysis of proteins, provided the pH is about 6 and the peptide concentration is 30–35%. Later, it was shownthat this biosynthesis is consistent with the intermediate acylenzyme mechanism where an acyl group is transferred to anucleophilic acceptor molecule (usually water). However, if the concentration of another nucleophile, such as an amine group(amino acid), is high enough, the acyl group of the acylenzyme is partitioned between water and the amino group in accord withtheir nucleophilicity and relative concentrations. If some of the water is replaced by immiscible organic solvents, biosynthesisoccurs even more rapidly (Eqs. 66 and 67), since the concentration of water is decreased, relative to that of H2NR'.
(66)
(67)
It also helps to have the acid protonated. These competitive hydrolysis/biosynthesis reactions have been used successfully in theplastein reaction [6] to alter characteristics of soy protein. This is accomplished by adding methionine methyl ester to the reactionmixture and causing its incorporation into the soy protein. The result is a product that is firmer, chewier, and has improvednutritional quality. Similarly, superior surfactant products have been created by using a protease to form lauryl derivatives ofgelatin. Again, replacement of some of the water with immiscible organic solvents can facilitate the biosynthetic reaction.
The same considerations apply to reformation of triacylglycerols to yield better melting, greater solubility and unsaturation, andbetter nutritional properties than those of the original triacylglycerol. An example of reformation of a triacylglycerol by addition ofa fatty acid (L) and a 1,3-specific lipase is shown in Eq. 64. If a non-specific lipase is used, the triacylglycerol can bereformulated to several products (Eq. 68), where E is a nonspecific lipase.
(68)
By using two or more fatty acids in controlled amounts, many types of intermediate products with interesting functionalities canbe obtained.
Therefore, hydrolases can perform biosynthetic reactions under appropriate conditions (Section 7.5.5) [4, 91, 118], withbiosynthesis favored by a low water activity in conjunction with an organic solvent. Rates of lipase-catalyzed lipidtransesterification reactions can be increased more than sixfold with a simultaneous 16-fold decrease in the rate of hydrolysis.
If it is important not to use organic solvents in the biosynthesis, similar biosynthesis-favored reactions can be accomplished withalkylated lipases [91, 118]. Apparently, the increased hydrophobicity of the lipase surface is responsible for this shift in the ratioof biosynthesis to hydrolysis. Alkylated trypsin is a more effective catalyst for esterification of sucrose by oleic acid than istrypsin [4].
Are the enzymes stable enough to permit biosysthesis in organic solvents? This question was addressed in Section 7.5.6.Ribonuclease and lysozyme are more stable when suspended in immiscible organic solvents than when dissolved in water (Table10). Therefore, performing

Pag e 511
transesterification reactions with enzymes suspended in immiscible organic solvents is entirely feasible. An additional advantage isthe avoidance of microbial problems.
7.10.2 Advantages of Solvent-Partitioned Enzyme Systems
By now, several of the advantages of performing hydrolase-catalyzed reactions in solvent-parti-tioned systems rather thanaqueous systems should be obvious: (a) equilibrium is shifted toward biosynthesis; (b) the enzyme is more stable; (c) enzyme isreadily removed from the system; (d) product of high purity is more easily obtainable, particularly if it partitions into the organicphase; (e) product is not likely to be contaminated by the enzyme; and (f) microbial problems are minimized.
In some situations there is another advantage to enzyme-catalyzed reactions in immiscible organic solvents; that is, the systemcan favor one stereoisomeric form over another. Table 27 illustrates the enantioselectivity of transesterification between vinylbutyrate and sec-phenethyl alcohol as catalyzed by porcine pancreatic lipase in different immiscible solvents. Theenantioselectivity, uR/uS, (where uR and uS are chiralities) decreases from 75 in nitromethane to in decane. Therefore, theenantioselectivity is greater with greater polarity (dielectric constant) of the solvent.
7.10.3 Applications
Currently, the most important application of solvent-partitioned enzyme systems is in the restructuring of triacylglycerols for fooduse. Restructuring of triacylglycerols is important not only for changing physical properties but also for improving nutritionalattributes. This area is important enough that genetic engineering companies have invested millions of dollars into tailoring thegenes in higher plants to make specialty triacylglycerols.
Another application is in the manufacture of surfactants and detergents. Long-chain fatty acids can be covalently linked toamides, such as amino acids, or to glucose to give highly functional surfactants for use in soaps and shampoos, as well as infoods. This can result in improved foaming and emulsifying properties, and in easier incorporation of water, insoluble
TABLE 27 Enantioselectivity of Porcine Pancreatic Lipase in Transesterification Between VinylButyrate and sec-Phenethyl Alcohol a
Solvent nRb(mM//h) nSb(mM/h) Enantioselect, (n R/nS
Nitromethane 9.7 0.13 75
Dimethylformamide 2.3 0.038 61
Triethylamine 4.2 0.099 42
tert-Amyl alcohol 6.9 0.20 35
Butanone 8.6 0.32 27
Acetonitrile 14 0.64 22
Benzene 10 0.67 15
Cyclohexane 43 3.3 13
Decane 5.5 0.85 6
a100 mM sec-phenethyl alcohol and 100 mg /ml lipase
bChirality of product.
Source: Reprinted with permission from Ref. 40, p. 3170, copyrig ht 1991 AmericanChemicalSociety.

Pag e 512
flavors, colors and antioxidants in systems containing incompatible components. Similar advantages can accrue from usingenzymes to make totally biodegradable soaps, shampoos, and detergents from naturally occurring compounds, such as glucose.
The discovery that enzymes can efficiently catalyze reactions in immiscible solvents, including two-phase solvent systems, surelyis one of the major advances in application of enzymology in the last twenty years.
7.11 Enzymes in Waste Management
It is estimated that the annual production of major carbohydrate feedstock for use as potential fuels or for manufacturingchemicals in the United States is about 1160 million tons, versus 50 million tons of organic chemical feedstocks [42]. Thisnumber includes 160 million tons of municipal solid waste, 400 million tons of agricultural residue, 400 million tons of forestresidue, and 200 million tons of corn and grains. These residues pose major environmental problems, since a large amount of theagricultural residues are burned (where permitted), the forest residues result in major fires each year, and the massive municipallandfills are often sources of groundwater pollution. Therefore, if some of these materials could be converted to other forms offuel (ethanol and methanol) or to fermentation feedstock (glucose) to produce proteins, ethanol, and CO2, disposal problemswould be alleviated and nonrenewable fuel supplies would be conserved. The U.S. government is spending considerable moneyon research on how to efficiently tap these potential sources of fuel and chemicals.
What are the compounds that need to be converted? They are largely starch, cellulose, lignin, lipids, nucleic acids and proteins.What enzymes are needed? Primarily the amylases, cellulases, lignin peroxidases, lipases, nucleases, and proteases. These areenzymes we know quite a lot about. So, what is the problem? The major problems are the insolubility of the potential substratesjust listed, and the poor stability and catalytic inefficiency of the enzymes required. Some methods exist for increasing thesolubility of the substrates and thereby the rate of hydrolysis. But all methods require considerable energy expenditure thatmakes the process uneconomical at the moment, when petroleum and coal are relatively inexpensive.
Do commercially feasible solutions exist for converting biomass to valuable chemicals? Nature does this efficiently, given thehuge 1160 million tons to be converted annually. The natural conversion of these compounds occurs by action of the usualclasses of enzymes, but the process is slow. Improvements in rate are possible through redesign of enzymes with greaterefficiency and synergistic properties.
Rapid, economical biomass conversion is a difficult task so the approach taken must be multifaceted. More efficient enzymes areneeded, and this requires knowledge of why these enzymes are so inefficient in attacking insoluble substrates. Once this is betterunderstood, better enzymes can be searched for or developed by recombinant DNA techniques. One needed property isgreater stability, especially at temperatures sufficiently high microbial growth will not be a problem. The pentose-containingpolymers are especially difficult to hydrolyze and even more difficult to ferment to ethanol and CO2. Lignin severely limitshydrolysis and fermentation of cellulose, because it is so inert. Enzymes that efficiently attack these substrates are needed.
Solution of the biomass conversion problem is a must. Conversion processes must be environmentally acceptable, and allcomponents, even minor ones, must be economically converted to usable or innocuous products to meet waste minimizationgoals pursued by the U.S. Environmental Protection Agency.

Pag e 513
7.11.1 Starch and Amylases
Conversion of starch from wet-milled corn to usable products is a huge success story. Starch conversion from food-processingwaters should also be considered. The amylases, glucoamylases, and glucose isomerases (see Sections 7.8.1.4 and 7.8.2), eachof which represents a group of enzymes with similar catalytic properties yet quite diverse chemical and physical properties, arethe tools that allow starch to be commercially converted to other useful products. The products are food-grade syrups of variousDPs (degrees of polymerization), glucose, and fructose. This industry has over 1 billion dollars of sales per year in the UnitedStates alone, and all of this growth has occurred in the last 25 years.
There is also a fledging alcohol fuels industry based on corn starch, with the annual output being about 800 million gallons in1988. Why has starch conversion to useful products developed so well? In part this is because starch is a reasonably tractablesubstrate, becoming soluble, but viscous, on heating at 105°C. But also of major importance was the intense research that led toa fundamental understanding of the three major groups of enzymes needed and how these enzymes could be immobilized for usein continuous systems.
7.11.2 Cellulose and Cellulases
Belatedly, a major worldwide effort is underway to understand the structure and function of cellulases, to identifymicroorganisms that produce large amounts of cellulases with high efficiency, to determine their primary structures through geneidentification and cloning, and to genetically engineer cellulases that have highly desirable properties. Another major problemwith respect to cellulose conversion is its insolubility. It is also unknown whether crystalline cellulose, oligosaccharides, orsynthetic substrates, such as the o- and p-nitrophenyl oligosaccharides, are the best substrates to use as a standard forinterlaboratory comparisons of cellulose conversion methods.
The enzymes that act on cellulose and degradation intermediates can be divided into four groups [26].
The endoglucanases [1, 4(1,3;1,4)-b-D-glucan 4-glucanohydrolases, EC 3.2.1.4] are relatively inactive against crystallineregions of cotton and Avicel, but they hydrolyze amorphous regions of these substrates, including filter paper, and solublesubstrates such as carboxymethylcellulose and hydroxymethylcellulose. Endoglucanase activity is characterized by randomhydrolysis of b-glucosidic bonds, resulting in a rapid decrease in viscosity relative to the rate of increase in reducing groups. Theproducts, especially late in the reaction sequence, include glucose, cellobiose, and cellodextrins of various sizes.
2. The second group of cellulases is the cellobiohydrolases (1,4-b-D-glucan cellobiohydrolases, EC 3.2.1.91), which are exo-splitting enzymes. They degrade amorphous cellulose by consecutive removal of cellobiose from the nonreducing ends of thecellulose. When pure, they usually have little activity on cotton, but can hydrolyze about 40% of the hydrolyzable bonds inAvicel, a microcrystalline cellulose. The rate of decrease in viscosity is much lower in relation to the increase in reducing groupsthan it is for the endoglucanases. Endoglucanases and cellobiohydrolases show synergism in the hydrolysis of crystallinecellulose, for reasons not clearly understood.
3. The third group of cellulases is the exoglucohydrolases (1,4-b-D-glucan glucobiohydrolase, EC 3.2.1.74), which hydrolyzeconsecutively the removal of glucose units from the nonreducing end of cellodextrins. The rate of hydrolysis decreases as thechain length of the substrate decreases.

Pag e 514
4. The fourth group of enzymes is the b-glucosidases (b-D-glucoside glucohydrolase, EC 3.2.1.21), which cleave cellobiose toglucose and remove glucose from the nonreducing end of small cellodextrins. Unlike the exoglucohydrolases, the rate of b-glucosidase hydrolysis increases as the size of the substrate decreases, with cellobiose being the most rapidly hydrolyzedsubstrate.
7.11.3 Hemicelluloses and Pentosanases
Because of the complexity of the hemicelluloses, several endo- and exo-splitting (by hydrolysis) pentosanases exist. The endo-splitting enzymes are of two types: the arabanases that hydrolyze the 1,4-a-D-arabinopyranosyl glycosidic bonds in the linearbackbone of the arabans, and the xylanases that hydrolyze the 1,4-b-D-xylanopyranosyl glycosidic bonds in xylans andarabinoxylans. Exo-splitting enzymes of one type act at the non-reducing ends of arabans (the arabinosidases), xylans (thexylosidases), and the arabinoxylans (xylanosidases). Exo-splitting enzymes of a second type (arabinosidases) removearabinofuranosyl side-chain units from arabinoxylans.
Some fungi produce substantial amounts of pentosanases. Several endo- and exo-pentosanases also exist in wheat at very lowlevels. Some pentosanases increase 6–10 times in concentration during germination of seeds. The pentosanases are thought tobe located primarily in the bran, but it is not known where the enzymes newly synthesized during germination are located.
7.11.4 Proteins and Proteolytic Enzymes
All biomass contains proteins. The level of proteins is relatively low in most waste materials from higher plants, whereas wastefrom meat, beans, nuts, and cereal seed products contains about 20–35% protein. In general, proteins are at least partiallysoluble in water. Since they provide as source of essential amino acids for microorganisms, they are degraded rapidly by a hostof proteases found in plants and microorganisms.
All biological materials probably contain both endo-
and endo-proteases. The endo-proteases hydrolyze specific peptide bonds in the interior of the protein chain for which theyhave specificity. For example, trypsin-like enzymes hydrolyze peptide bonds where Arg and Lys residues furnish the carbonylgroup of the peptide bond. No other peptide bonds are hydrolyzed. The resulting peptides are acted on by carboxypeptidasesfrom the carboxyl-terminal end and by aminopeptidases from the amino-terminal end. Di- and tripeptidases are found in mostorganisms. Therefore, proteins are rapidly and specifically hydrolyzed to amino acids, in an efficient manner. There are no majorproblems in degradation of the protein in waste materials.
7.11.5 Lipids and Lipases
Lipases hydrolyze triacylglycerols to fatty acids, mono- and/or diacylglycerols and glycerol. As discussed in Section 7.8.2, thereare 1,3-type, 2-type, and nonspecific lipases that can efficiently hydrolyze lipids in waste materials. Lipases act on the micellularform of the lipid, preferably in a liquid form. Solid lipids are hydrolyzed slowly. There appears to be no restraint on the effectivehydrolysis of lipids in wastes, such as in household garbage. In fact, problems with hydrolysis of lipids are rarely mentioned indiscussions of waste product conversions.
7.12 Enzymes in Food Analysis [108]
Enzyme assays are often the method of choice for chemical analyses, because of high sensitivity and great specificity. The cost ofreagents, especially for the pure enzyme, is more than compensated for by savings in time and expense since there is no need todo partial or complete

Pag e 515
separation of a compound prior to analysis. For example, glucose can be determined in blood, urine, and plant extracts byglucose oxidase without any preparation other than removal of insoluble materials that interfere with measuring absorbance.Enzymatic reactions are usually performed near room temperature and neutral pH and only a few minutes are required, therebyminimizing non-enzyme-caused changes in the compounds. Undesirable enzyme-catalyzed side reactions are not a problemprovided other contaminating enzymes are removed or inactivated.
Enzyme assays of biological materials are used to assess adequacy of blanching or processing, maturity, storage time, stability,cultural practices, and breeding or genetic modifications. They are used to make quantitative determinations of foodcomposition, including compounds that function as substrates, activators, or inhibitors of specific enzymes. Many geneticallyrelated or environmentally induced diseases result in changes in levels of key enzyme systems in the human body, and this in turninfluences food choice. Two examples of human enzyme deficiency are the inability to tolerate phenylalanine (phenylketonuria)and lactose (b-galactosidase deficiency).
In using enzymes assays, it is important to be familiar with the factors that affect enzyme activity (Section 7.5), since all variablesmust be appropriately controlled. Standard curves and internal standards must be used, just as in any analytical analyses.
7.12.1 Enzyme Concentration
This is the easiest of all analytical determinations involving enzymes. There is usually a linear relationship between no and [E]o
(Fig. 12), regardless of [S]o, pH, and temperature (all three must be kept constant), provided there is sufficient activity tomeasure. For the majority of enzymes, loss of activity due to denaturation or reaction with product is not a problem if no isobtained with less than 5% conversion of substrate to product.
The relationship between no and [E]o (Fig. 12) becomes the basis of the analytical determination of enzyme concentration inbiological materials. Doubling the [E]o should double no. It is important, and easy, to verify this relationship, just by addingdifferent size aliquots of and enzyme extract using constant buffer and substrate concentrations. Don't assume a linearrelationship, as several factors can lead to nonlinearity [111].
Absence of contaminating enzymes that compete for the same substrate is important. So, use as specific a substrate as possible.For example, in determining trypsin concentration use N-tosyl-L-arginine ethyl ester, rather than casein, which is a substrate forall proteases.
Table 28 lists a few examples of assays for enzyme concentration. For a complete list see Reference 108.
TABLE 28 Analytical Determination of Some Enzyme Concentrations
Enzyme Substrate Detection a
Alcohol dehydrog enase Ethanol S;NAD+ NADH
Catalase Hydrog en Peroxide E; O2
b-Galactosidase o-Nitrophenyl-b-D-g alactoside S; o-nitrophenol
Peroxidase H2o2o-diansidine S; oxidized o-dianisidine
Polyphenol oxidase Pyrocatechol S; benzoquinone
aE, electrometric method; S, spectrophotometric method.
Source: Adapted from Ref. 108, pp. 331–335.

Pag e 516
7.12.2 Compounds that are Substrates
The relationship between no and [S]o is not linear, but rather is a right hyperbolic one (Fig. 1). As discussed earlier (Section7.4.2), when [S]o >> 100 Km the rate of and enzyme-catalyzed reaction is independent of [S]o, so this condition cannot be usedto determine the concentration of a compound that serves as a substrate. Therefore, the concentration of the compound must beless than 100Km, preferably less than 5Km. When [S]o < 100 Km then Equation 69,
(69)
can be used to calculate [S]o. Better yet, a standard curve of no versus [S]o should be prepared, and plotted in reciprocal form,according to Figure 13. The standard curve can be used to determine 1/[S]o required to give 1/no. The Lineweaver–Burkequation (Eq. 21) can also be used.
The concentration of compounds that the are substrates can also be determined by the total change method (Fig. 38). Thereaction is required to go to completion; then the concentration of the product is determined by the total change in absorbanceor fluorescence. Such assays are less demanding in terms of precise control of pH and temperature; however, they require more
FIGURE 38Effect of substrate concentration on chang ein absorbance by the total chang e method.
(A) Effect of three concentrations, C A,
CB, and CC, of substrate on chang e inabsorbance. Note that the initial chang e
in absorbance is very fast so the reactionis completed within a few minutes. It is
only necessary to know the initial and finalabsorbance in the total chang e method.
(B) Relationship between substrate concentrationand total chang e in absorbance, as replotted
from A. (From Ref. 108, p. 318)

Pag e 517
enzyme in order to complete the reaction within a reasonable time (2–10 min). In some cases, the reaction does not go tocompletion because an equilibrium is reached. In this instance two options are available. One is to prepare the standard curveunder exactly the same conditions used for assay of the compound. The second method is to trap one or more of the productsas they are formed so that the reaction goes to completion (such as trapping pyruvate with oxamate in the lactate dehyrogenasereaction, using lactate and NAD+ as substrates).
A few examples of compounds than can be quantitatively determined by enzymatic assay are shown in Table 29. For a morecomplete list, the reader is referred to Reference 108.
7.12.3 Other Assays
Some enzymes, but not all, require cofactors for activity (see Section 7.6). The cofactors may be organic compounds, such aspyridoxal phosphate or NAD+, or inorganic, such as Zn2+ or Mg2+. Therefore, whenever no of an enzyme-catalyzed reaction isincreased, in a reproducible manner, by addition of a compound, the extent of this increase can be used to determine theeconcentration of that compound. The principle of this determination is shown by Equation 70 where Act is activator:
(70)
Two types of relationships between activator concentration and no are found. If the activator binds tightly to the enzyme(prosthetic group, for example; Kd<10-9M), then a plot of no versus [activator] is linear. If the activator binds loosely to theenzyme (Kd >> 10-8 M), then the relationship between no and [activator] is hyperbolic. Determination of compounds that areloose-binding activators is quite similar to the determination of substrate concentration. For more examples, the reader isreferred to Reference 108.
Concentrations of compounds in foods that inhibit enzymes (inhibitors) can also be determined analytically by use of enzymes.An inhibitor is any compound that, when added to an enzyme-catalyzed reaction, decreases the no of that reaction. Inhibitorsmay be inorganic compounds such as Pb2+, Hg2+, or Ag2+, or organic compounds that bind reversibly to the enzyme(competitive, noncompetitive, uncompetitive inhibitors) or irreversibly to the enzyme (see Sec. 7.7). Because of the diversity oftypes of enzyme inhibitors, the design of experiments and interpretation of the results can be more complex than for determiningenzyme, substrate, or activator concentrations. Analytical methods are described in Reference 108.
TABLE 29 Analytical Determination of Some Compounds That Serve as EnzymeSubstrates
Compound Enzyme Detection a
Ammonia Glutamate dehydrog enase S; NADH NAD+
Ethanol Alcohol dehydrog enase S; NAD+ NADH
D-Glucose Glucose oxidase S; H2O2 with peroxidase
Nitrate Nitrate reductase E; NH3 electrode
Urea Urease E; NH3 electrode
aE, electrometric method; S, spectrophotometric method.
Source: Adapted from Ref. 108, pp. 340–344.
Pag e 518
7.12.4 Immobilized Enzymes in Food Analysis
Immobilized enzymes permit repeated use of the same enzyme, thus reducing the cost per analysis. The immobilized enzyme canmake the assays faster and easier. There are at least four possible arrangements that work well. These are immobilized enzymecolumns, enzyme electrodes, enzyme-containing chips, and enzyme-linked immunosorbent assay (ELISA) type assay systems[43, 105, 108].
7.12.5 Indicators of Adequate Blanching or Pasteurization
Blanching is a mild heat treatment of raw fruits and vegetables conducted primarily to stabilize them against enzymaticdeterioration and/or microbial growth during storage. The products may be minimally processed foods that will maintain safetyand quality for 1 or 2 weeks of refrigerated storage, or after frozen or dry storage for 1 to 2 years. Vegetative microorganismsare destroyed at lower temperatures than are most enzymes. An analogous heat treatment of milk and some other food productsis called pasteurization.
Indicators of blanching adequacy are needed. The most used indicators are peroxidase in fruits and vegetables, and alkalinephosphatase in milk, dairy products and ham. b-Acetylgluco-saminidase has been used for eggs. Why are peroxidase andalkaline phosphatase used? Because they are the most heat-stable enzymes found in fruits/vegetables and milk, respectively.Although they are not the cause of quality loss, their activities do correlate with the stability of the stored foods. Better indicatorsof storage stability are sometimes available, and these were discussed in Section 7.8. Table 30 is a summary of various uses ofenzymes as indices of food quality.
7.13 Recombinant DNA Technology and Genetic Engineering
7.13.1 Introduction
Recombinant DNA technology and genetic engineering are of major importance to food scientists because they are powerfultools for altering the properties and processing conditions for foods. The Flavr Savr tomato, in which polygalacturonaseexpression is repressed, has received final approval and is on the market. There are more than 80 other changes in the geneticcomposition of our food crops poised to be on the market in less than 5 years.
Genetic engineering involves the alteration of one or more genes (removal or addition, suppression or enhancement ofexpression, modification of functionality) in an organism to achieve improvements in quality and/or to lengthen the storage life ofraw food crops. Breeders have done this for many decades, by crosses among plants combined with field trials. Breedingchanges several genes simultaneously, and not all changes are desirable. Genetic engineering permits change of one gene at atime, as desired. This gene, for example, may control properties of an enzyme such as concentration or stability, as well asexpression level.
Recombinant DNA technology involves a change in one or more of the thousands of nucleotides of the gene in order to changeproperties of the expressed protein. For example, the change may result in more or less stability, increased catalytic efficiency ormore or less strict substrate specificity (see also Sec. 7.13.4).
The process of inserting genetic material (for chymosin, for example) from a donor (calf) into a host plasmid (from amicroorganism, for example) is shown in Figure 39. The donor gene is replicated in the host, and the product of that gene issecreted and can be obtained in high yield (for example, chymosin, which is already on the market).
Two groups of enzymes that make genetic engineering and recombinant DNA technology

Pag e 519
TABLE 30 Use of Enzymes to Determine Indices of Food Quality
Purpose Enzyme Food material
Proper heat treatment PeroxidaseAlkaline phosphataseb-Acetylg lucosaminidase
Fruits and veg etablesMilk, dairy products, hamEggs
Freezing and thawing Malic enzyme
Glutamate oxaloacetate transaminase
OystersMeat
Bacterial contamination Acid phosphataseCatalaseReductaseGlutamate decarboxylaseCatalase
Meat, eg g sMilkMilkMilkGreen beans
Insect infestation UricaseUricase
Stored cerealsFruit products
Freshness LysolecithinaseXanthine oxidase
FishHypoxanthine in fish
Maturity Sucrose synthetasePectinase
PotatoesPears
Sprouting AmylasePeroxidase
FlourW heat
Color Polyphenol oxidasePolyphenol oxidaseSuccinic dehydrog enase
Coffee, wheatPeaches, avocadoMeat
Flavor AlliinaseGlutaminyl transpeptidase
Onions, g arlicOnions
Nutritional quality Proteases
Dig estibility
Proteases
Protein inhibitors
L-Amino acid decarboxylases Essential amino acids
Lysine decarboxylase Lysine
Source: Ref. 108, p. 337.
possible are the Type II DNA restriction endonucleases (EC 3.1.21.4) and the DNA ligases (polymerases; E. coli enzyme EC6.5.1.2 and T4 enzyme EC 6.5.1.1).
7.13.1.1 Restriction Enzymes
As shown in Figure 39, foreign DNA is obtained from the donor by cutting the double-stranded DNA in two places by twohighly specific DNA restriction endonucleases. A segment is cut out of the host donor DNA of the plasmid, using the same tworestriction enzymes, and is replaced by the donor DNA containing the desired gene. The segment is covalently attached to thehost DNA by one of the DNA ligases, to reform the phosphodiester linkage. The reactions involved are shown in Figures 40and 41.
Shown in Figure 40 are details of how the restriction endonuclease catalyzes hydrolysis of the 3'-O-P bond between twonucleotides in the donor and host DNAs (Fig. 39). More than 600 restriction endonucleases are known, and more than 100 ofthem are commercially available in pure from. The restriction endonucleases are highly specific, recognizing a sequence ofseveral nucleotides, both along the DNA chain and on the complementary DNA chain. They act only on double-stranded DNA.


Pag e 520
FIGURE 39Schematic diag ram of insertion of a foreig n DNA frag ment (from donor) into a
plasmid vector (from host) and cloning of DNA molecules in host cells.(From Ref. 111, p. 462.)
7.13.1.2 DNA Polymerases
DNA polymerases reform the phosphodiester bonds when all the appropriate reactants (Fig. 41) are present. The reactants arethe primer strand, one or more of the four nucleotide triphosphates, a template (pattern giving sequence of nucleotides to becopied; Eq. 71), the DNA polymerase, and Mg2+ (required cofactor). If all the nucleotide triphosphates are supplied, thepolymerase can copy the entire DNA template chain (the polymerase chain reaction, known as PCR).
(71)

Pag e 521
FIGURE 40Restriction endonuclease-catalyzed hydrolysis of the 3'-O-P
bond between two nucleotides. (From Ref. 111, p. 462.)
7.13.2 Applications: Raw Food Materials
Many possibilities exist for improving our raw food materials by genetic engineering. Proteins from legumes are deficient in theessential amino acid methionine, while the cereal proteins are deficient in lysine. As an example, the gene for a high-methionine-containing protein could be incorporated into the genome for the legume (common beans, for example) to improve its nutritionalquality. Researchers are working on incorporating a high-methionine-containing protein from Brazil nuts or from soybeans intocommon beans. In practice, the nucleotide sequence of a gene of an existing protein in common beans might be modified tocontain more methionine. A potential problem is that the functional properties might be changed such that the
FIGURE 41Proposed mechanism for DNA polymerase l-catalyzed reaction.
(From Ref. 111, p. 467.)

Pag e 522
protein could not perform the expected physiological functions and/or would be hydrolyzed rapidly in vivo by proteases.
Some plants contain naturally occurring protease and a-amylase inhibitors, which protect them against insects andmicroorganisms. It has already been shown that genes for these inhibitors can be expressed in other host plants, protecting themagainst specific types of insects. In other instances, it may be desirable to reduce the level of protease inhibitors (~2% of totalproteins in soybeans, for example), since protease inhibitors can have a negative effect on protein digestibility in animals (Fig.33).
The functional properties of proteins can be modified by changing as few as one amino acid residue [59]. Some proteins are toostable and do not unfold readily at air/water (foaming) or lipid/water (emulsifying) interfaces. Potentially, this shortcoming can beovercome by genetic engineering. Some companies now supply partial protein hydrolysates as functional ingredients. In the nearfuture, functional ingredients, including proteins, carbohydrates, and gums, will be genetically engineered.
The triacylglycerol compounds of plants can be genetically engineered to alter the type and location of the fatty acids on theglycerol, to provide better nutrition, or to alter the freezing and melting points. The opportunity also exists, through geneticengineering, to remove unwanted flavors (bitterness of naringin) and colors, and to alter other quality factors of plant and animalproducts. Resistance of plants to pesticides and herbicides, tolerance to salt, and perhaps nitrogen-fixation capability also areproperties potentially achievable by genetic engineering. This is by no means a complete listing of possibilities.
7.13.3 Applications: Control of Endogenous Enzymes
Unwanted endogenous enzyme activities that affect the color, flavor and aroma, texture, and nutritional qualities of our foodswere mentioned in Section 7.8.2. Of particular importance are polyphenol oxidase, lipoxygenase, and polygalacturonase.Calgene has developed the Flav Savr tomato in which less polygalacturonase is expressed, using the RNA-antisense approachto prevent expression of one or more of the genes for polygalacturonase. It is important to not turn off all of thepolygalacturonase expression, since this is an important enzyme for plant growth and maturation.
Researchers are also working on other techniques that might control the rate of maturation of fruits and vegetables. In manyplants, ethylene production is essential. By modifying (decreasing) one or more of the enzymes involved in ethylene production,the rate of maturation and ripening can be delayed and the fruits and vegetables could then be stored longer.
Control of gene expression by antisense RNA is as general tool that can be used to modify the expression of any enzyme, inprinciple. Most likely, methods of controlling polyphenol oxidase and lipoxygenase expression will appear soon. Already,soybeans have been bred to contaion much less lipoxygenase [63].
The level of production of enzymes (and any other compound) is controlled by the number of copies of the gene in cells, andregulation of expression of that gene. By decreasing the number of copies, the level of expression can be lowered; by increasingthe number of copies, the level of expression can be increased. This ability is very important in the production of ingredients,including enzymes, for food use.
7.13.4 Applications: Tailoring Enzymes for Food Uses
It is important to have adequate supplies of reasonably pure enzymes for food uses. The cost of preparing reasonably pureenzymes for industrial use is prohibitive, unless very large amounts (low cost per unit) are used efficiently. This occurs, forexample, in sweetener production from

Pag e 523
starch, production of amino acids, and resolution of racemic amino acid mixtures. The cost of reasonably pure enzymes isdependent on the enzyme's expression level by the organism. When the organism is genetically engineered to produce a 100-foldgreater concentration of a desired enzyme than it normally does, a great reduction in cost is achieved.
There is another advantage to having reasonably pure enzymes—that is, fewer unwanted side reactions occur. There is noreason why some of these side reactions that are catalyzed by other enzymes cannot be reduced by genetic engineering.
Other enzyme properties that are potentially altered by genetic engineering include (a) stability, (b) pH for optimum activity, (c)cofactor binding and regeneration characteristics, (d) substrate specificity, (e) efficiency (increased rate of conversion ofsubstrate to product), and (f) ease of immobilization (for example, extra amino acid residues at the N- or C-terminal end topermit easier covalent coupling to insoluble supports).
7.14 Enzymes And Health/Nutrition/Food Issues
In the recent past most of us ate foods primarily for their sensory properties, as dictated by individual experience andpreferences. Now much greater attention is given to the nutritional content of the diet and the number of calories consumed.Enzymes play an important role in the development of foods that the are nutritionally better and safer.
7.14.1 Enzyme Deficiencies
The levels of enzymes produced by our bodies are controlled by our genetic make up, by age and by diet. A surprisingly largeamount of enzymes is produced each day by our bodies. Our digestive system alone produces 15–20 g of proteases,carbohydrates, lipases, and nuclease to digest our foods. Myosin, 55% of the protein of our muscle, is an enzyme, and asignificant percentage of it is turned over each day. The liver is the major enzyme-requiring “factory” of the body. It is fortunatethat most of the enzymes produced each day are hydrolyzed by proteases, and returned as amino acids for biosynthesis into newenzymes, and other proteins. This system recycles 50–100 g protein/day, as compared to about 70 g/day provided by foodintake.
There are more than 100 known genetic defects that result in less than normal enzyme production (Table 31) [104] or theproduction of defective enzymes that undergo proteolysis. Some of these enzyme deficiencies, such as alcaptonuria,phenylketonuria, galactosemia, Gaucher's disease, etc., are life-threatening. Others, such as lactase deficiency and gout, requiremodification of the diet. Food allergies/intolerances are poorly understood, but they affect many individual and involve foodproducts including milk, wheat, and eggs. The food industry and food scientists do not give appropriate attention tounderstanding these genetically caused food intolerances and developing specialty foods to help alleviate them.
Several of these diseases can be prevented by increasing the level of the deficit enzyme in the affected individual. In some casesthe means for doing this is known. However, ethical issues must be resolved before this approach becomes common. In themeantime, we should, as food scientists, help meet the special dietary needs of these individuals.
7.14.2 Special Foods for Infants and the Elderly
The enzyme composition of our bodies changes with age. Infants produce chymosin in the stomach to coagulate milk, so that it isretained in the stomach long enough to begin the digestion of proteins and lipids. Later the chymosin is replaced with pepsin, alsoa protease for digestion of proteins. Most infants also have relatively high levels of b-galactosidase in the mucosa of the smallintestine. This is present to hydrolyze lactose to glucose and galactose, both important for

Pag e 524
TABLE 31 Some Genetic Diseases Caused by Enzymatic Defects
Disease Defective enzymes
Alcaptonuria Homog entisic acid oxidase
Phenylketonuria Phenylalanine hydroxylase
Hyperammonemia Ornithine transcarbamylase
Hemolytic anemia Erythrocyte g lucose-6-phosphate dehydrog enase
Acatalasia Erythrocyte catalase
Cong enital lysine intolerance L-Lysine-NAD-oxidoreductase
Gaucher's disease Glucocerebrosidase
Refsum's disease Phytanic acid oxidase
McArdle's syndrome Muscle phosphorylase
Hypophosphatasia Alkaline phosphatase
Cong enital lactase deficiency Lactase
Gout Hypoxanthine-g uanine phosphoribosyl transferase
Xanthinuria Xanthine oxidase
Hereditary fructose intolerance Fructose 1-phosphate aldolase
Source: Adapted from Ref. 104, p. 22.
energy, but also important for biosynthesis of cerebrosides. With advancing age the level of b-galactosidase decreases. It isestimated that 80% of all adults cannot consume milk and several dairy foods without some discomfort. Some ethnic groups aremuch less tolerant to milk and dairy products than are other ethnic groups. There are well-known examples of how levels ofsome enzymes change with age and ethnicity. Other examples undoubtedly exist, but the number is not known accurately.
Elderly people often develop food intolerances. Some of these intolerances may relate to changes in biosynthesis of enzymes.Food scientists need to work closely with nutritionists and medical scientists to better understand these changes in metabolismduring aging and to provide appropriate diets that fully meet the nutritional requirements of this segment of the population.
The adequacy of enzyme biosynthesis is also related to diet. More than 150 enzymes require Zn2+ as an essential factor. Manyother enzymes require other cofactors. Biosynthesis of enzymes requires that essential amino acids be present. Theseconstituents must be available in appropriate amounts in the diet.
7.14.3 Toxicants and Antinutrients [7, 23, 53]
Raw plant materials contain substances necessary to survival of the plant but not desirable in food. These substances includeinhibitors against enzymes, especially proteases and amylases, a variety of alkaloids, such as solanine in potatoes, cyanogenicglycosides, hemagglutinins (lectins), and avidin of egg white. Ames [2, 3] determined that these naturally occurring substancesare more toxic and should be of more concern than the pesticide residues at concentrations found in foods.
In some instances, the concentrations of these undesirable, naturally occurring substances must be reduced before the food canbe safely consumed. Some processing treatments stimulate enzyme action to degrade the unwanted constituent, or inactivateenzymes that catalyze formation of unwanted substances (e.g., HCN in cassava).

Pag e 525
7.14.4 Allergenic Substances
We know very little about what makes individuals respond adversely to food constituents, especially proteins. Wheat gluten,egg-whit protein, and milk proteins all cause significant allergenic reactions in susceptible individuals. Do these individualsbecome sensitive to these proteins because they “leak” across the intestinal mucosa, building up sensitivity by immune reactionsto these compounds? Do peptide fragments that accumulate from action of proteases have allergenic properties? Canprehydrolyzed proteins be consumed safely by these individuals? We need much more research on these and other questions,before we can determine the role, if any, that enzymes, especially proteases, play in causing allergenic reactions and foodintolerances.
Bibliography
Food Enzymology
Bergmeyer, H. U., ed. (1983–1986). Methods of Enzymatic Analysis, Academic Press, New York.
Fogarty, W. M., and C. T. Kelly, eds.(1990). Microbial Enzymes and Biotechnology, 2nd. ed., Elsevier
Applied Science, New York.
Fox, P. F., ed. (1991). Food Enzymology, vols. 1 and 2, Elsevier Applied Science, New York.
Guilbault, G. G. (1984). Analytical Uses of Immobilized Enzymes, Marcel Dekker, New York.
Leatham, G. F., and M. E. Himmel, eds. (1991). Enzymes in Biomass Conversion, ACS Symposium Series 460, AmericanChemical Society, Washington, DC.
Nagodawithana, T., and G. Reed (1993). Enzymes in Food Processing, Academic Press, San Diego.
Robinson, D. S., and N. A. M. Eskin, eds. (1991). Oxidative Enzymes in Foods, Elsevier Applied Science, New York.
Schwimmer, S. (1981). Source Book of Food Enzymology, Avi Publishing Co., Westport, CT.
Wagner, G., and G. G. Guilbault (1994). Food Biosensor Analysis, Marcel Dekker, New York.
Whitaker, J. R. (1994). Principles of Enzymology for the Food Sciences, 2nd ed., Marcel Dekker, New York.
Enzyme Chemistry, Kinetics, and Mechanisms
Kuby, S. A. (1991). A Study of Enzymes, vols. 1 and 2, CRC Press, Boca Raton, FL.
Page, M. I., and A. Williams, eds. (1987). Enzyme Mechanisms, Royal Society of Chemistry, London.
Silverman, R. B. (1988). Mechanism-Based Enzyme Inactivation: Chemistry and Enzymology, vols. 1 and 2, CRC Press,Boca Raton, FL.
Problem Solving, Enzyme Kinetics
Cleland, W. W. (1963). The kinetics of enzyme-catalyzed reactions with two or more substrates or products.
I. Nomenclature and rate equations. II. Inhibition: Nomenclature and theory. III. Prediction of initial velocity and inhibition byinspection. Biochim. Biophys. Acta 67: 104–137, 173–187, 188–196.
Segel, I. H. (1976). Biochemical Calculations, 2nd ed., John Wiley and Sons, New York.
Journals
Archives of Biochemistry and Biophysics
Biochemical and Biophysical Research Communications
Biochemical Journal

Biochemistry
Biochimica et Biophysica Acta
Bioenzymolgy
European Journal of Biochemistry

Pag e 526
FEBS Letters
Journal of Biochemistry
Journal of Biological Chemistry
Journal of Food Biochemistry
References
1. Acker, L., and H. Kaiser (1961). Uber den Einfluss der Feuchtigkeit auf den Ablauf Enzymatischer Reaktioner inWasserarmenr Lebensmiteln. III. Mitt: Uber das Verhalten der Phosphatase in Modellgemischen. Zietschrift Leberns.-Unter:-Forsch. 115:201–210.
2. Ames, B. N. (1983). Dietary carcinogens and anticarcinogens. Science 221: 1256–1264.
3. Ames, B. N., R. Magaw, and L. S. Gold (1987). Ranking possible carcinogenic hazards. Science 236:271–280.
4. Ampon, K., A. B. Salleh, A. Teoh, W. M. Z. Wan Yunus, C. N. A. Razak, and M. Basri (1991). Sugar esterificationcatalyzed by alkylated trysin in dimethyl formamide. Biotechnol. Lett. 13:25–30.
5. Arai, S., M. Yamashita, and M. Fujimaki (1981). Protease action on proteins at low water concentration, in Water Activity:Influence on Food Quality (L. B. Rockland and C. F. Stewart, eds.), Academic Press, New York, pp. 489–510.
6. Arai, S., M. Watanabe, and N. Hirao (1986). Modification to change physical and functional properties of food proteins, inProtein Tailoring for Food and Medical Uses (R. E. Feeney and J. R. Whitaker, eds.), Marcel Dekker, New York, pp.75–95.
7. Ayres, J. C., and J. C. Kirschman (1981). Impact on Toxicology on Food Processing, Avi, Westport, CT.
8. Baker, B. R. (1967). Design of Active-Site-Directed Irreversible Enzyme Inhibitors, Wiley, New York.
9. Bender, M. L., and W. A. Glasson (1960). The kinetics of the a-chymotrypsin-catalyzed hydrolysis and methanolysis ofacetyl-L-phenylalanine methyl ester. Evidence for the specific binding of water on the enzyme surface. J. Am. Chem. Soc.82:3336–3342.
10. Bender, M. L., G. E. Clement, F. J. Kezdy, and H. D' A. Heck (1964). The mechanism of action of proteolytic enzymes.XXIX. The correlation of the pH (PD) dependence and the stepwise mechanism of a-chymotrypsin-catalyzed reactions. J. Am.Chem. Soc. 86:3680–3690.
11. Blain, J. A. (1962). Moisture levels and enzyme activity. Recent Adv. Food. Sci., Papers, Glasgow 1960,2:41–45.
12. Blow, D. M., J. J. Birktoft, and B. S. Hartley (1969). Role of a buried group in the mechanism of action of chymotrypsin.Nature 221:337–340.
13. Boscan. L., W. D. Powrie, and O. Fennema (1962). Darkening of red beets, beta vulgaris. J. Food Sci. 27:574–582.
14. Brachet, J. (1961). The living cell. Sci. Am. 205 (3):50–62.
15. Bracho, G., and J. R. Whitaker (1990). Purification and partial characterization of potato (Solanum tuberosum) invertaseand its endogenous proteinaceous inhibitor. Plant Physiol. 92:386–394.
16. Bray, E. A. (1993). Molecular responses to water deficit. Plant Physiol. 103:1035–1040.
17. Bray, R. C., G. Palmer, and H. Beinert (1964). Direct studies on the electron transfer sequence in xanthine oxidase byelectron paramagnetic resonance spectroscopy. J. Biol. Chem. 239: 2667–2676.
18. Brown, A. J. (1902). Enzyme action. J. Chem. Soc. 81:373–388.
19. Büchner, E. (1897). Alkoholische Gahrung ohne Hefezellen. Ber: 30:117–124, 335, 1110–1113.

20. Charm, S. E., and S. E. Matteo (1971). Scale up of protein isolation, in Methods in Enzymology, Vol. 22 (W. B. Jakoby,ed.), Academic Press, New York, pp. 476–556.
21. Chibata, I., and T. Tosa (1980). Immobilized microbial cells and their applications. Trends Biochem. Sci. 5:88–90.
22. Cleland, W. W. (1963). The kinetics of enzyme-catalyzed reactions with two or more substrates or products. I
Nomenclature and rate questions. II. Inhibition: Nomenclature and theory. III. Prediction of initial velocity and inhibition byinspection. Biochim. Biophys. Acta 67:104–137; 173–187; 188–196.

Pag e 527
23. Committee on Food Protection (1973). Toxicants Occurring Naturally in Foods, 2nd. ed., National Academy ofSciences, Washington, DC.
24. Cooper, C. C., R. G. Cassens, and E. J. Briskey (1969). Capillary distribution and fiber characterisitics in skeletal muscle ofstress-susceptible animals. J. Food Sci. 34:299–302.
25. Crooke, S. T., and B. Lebleu, eds. (1993). Antisense Research and Applications, CRC Press, Boca Raton, FL.
26. Coughlan, M. D. (1990). Cellulose degradation by fungi, in Microbial Enzymes and Biotechnology, 2nd ed. (W. M.Fogarity and C. T. Kelley, eds.), Elsevier Applied Science, New York, pp. 1–36.
27. Dalziel, K. (1957). Initial steady state velocities in the evaluation of enzyme-coenzyme-substrate reaction mechanisms. ActaChem. Scand. 11:1706–1723.
28. Dave, B. A. (1968). Studies on polygalacturonic acid trans-eliminase produced by Bacillus pumulis, Ph. D. Dissertation,University of California, Davis, CA.
29. Douzou, P. (1971). Aqueous-organic solutions of enzymes at subzero temperatures. Biochemie 53:1135–1145.
30. Douzou, P. (1973). Enzymology at sub-zero temperatures. Mol. Cell. Biochem. 1:15–27.
31. Drapon, R. (1972). Enzymic reactions in systems with a low amount of water. Ann. Technol. Agric. 21:487–499.
32. Duckworth, R. B., J. Y. Allison, and J. A. Clapperton (1976). The aqueous environment for chemical changes inintermediate moisture foods, in Intermediate Moisture Foods (R. Davies, G. G. Birch, and K. J. Parker, eds.), AppliedScience Publishers, London, pp. 89–99.
33. Eigen, M., and G. G. Hammes (1963). Elementary steps in enzyme reactions. Adv. Enzymol. 25:1–38.
34. Elias, P. S., and A. J. Cohen (1977). Radiation Chemistry of Major Food Components, Elsevier Scientific, New York.
35. Enzyme Nomenclature (1992). Recommendations of the Nomenclature Committee of the International Union ofBiochemistry, published for the International Union of Biochemistry, Academic Press, San Diego.
36. Fink, A. L., and K. Magnusdottir (1984). Cryoenzymology of b-galactosidase: Effect of cryosolvents. J. Protein Chem.3:229–241.
37. Finkle, B. J., and R. F. Nelson (1963). Enzyme reactions with phenolic compounds: Effect of O-methyltransferase on anatural substrate of fruit polyphenoloxidase. Nature 197:902–903.
38. Fischer, E. (1984). Einfluss der Configuration auf die Wirkung der Enzyme. Berichte der Chemische Gesselschaft27:2985–2993.
39. Friedman, M., O. K. K. Grosjean, and J. C. Zahnley (1982). Inactivation of soybean trypsin inhibitors by thiols. J. Sci.Food Agric. 33:165–172.
40. Fitzpatrick, P. A., and A. M. Klibanov (1991). How can solvent affect enzyme enantioselectivity? J. Am. Chem. Soc.113:3166–3171.
41. Fitzpatrick, P. A., A.C. U. Steinmetz, D. Ringe, and A. M. Klibanov (1993). Enzyme crystal structure in a near organicsolvent. Proc. Natl. Acad. Sci. USA 90:8653–8657.
42. Grohmann, K., and M. E. Himmel (1991). Enzymes for fuels and chemical feedstocks, in Enzymes in Biomass Conversion(G. R. Leatham and M. E. Himmel, eds.), ACS Symposium Series 460, American Chemical Society, Washington, DC.
43. Guilbault, G. G. (1984). Analytical Uses of Immobilized Enzymes, Marcel Dekker, New York.
44. Gutfreund, H. (1972). Enzymes: Physical Principles, Wiley-Interscience, London.
45. Hagerdal, B. (1980). Enzyme co-immobilized with microorganisms for the microbial conversion on non-metabolizablesubstrates. Acta Chem. Scand. B34:611–613.

46a. Henri, V. (1902). Action de quelques sels neutres sur I; inversion du saccharose par la sucrase. C. R. Soc. Biol. 54,353–354.
46a. Henri, V. (1903). Lois generales de I' action des diastases, Hermann, Paris.
47. Hill, A. V. (1913). XLVII. The combinations of haemoglobin with oxygen and with carbon dioxide. Biochem. J.7:471–480.
48. Hirs, C. H. W. and S. N. Timasheff, eds. (1972). Enzyme Structure: Part B. Methods Enzymol. 25.
49. Hirs, C. H. W., S. Moore, and W. H. Stein (1960). The sequence of the amino acid residues in performic acid-oxidizedribonuclease. J. Biol. Chem. 235:633–647.

Pag e 528
50. Ho, M. F., X. Yin, F. F. Filho, F. Lajolo, and J. R. Whitaker (1994). Naturally occurring a-amylase inhibitors:Structure/function relationships, in Protein Structure-Function Relationships in Foods (R.Y. Yada, R. L. Jackman, and J. L.Smith, eds.), Blackie Academic and Professional, Glasgow, pp. 89–119.
51. Hobson, G. E. (1962). Determination of polygalacturonase in fruits. Nature 1995:804–805.
52. Hornby, W. E., M. D. Lilley, and E. M. Crook (1968). Some changes in the reactivity of enzymes resulting from theirchemical attachment of water-insoluble derivatives of cellulose. Biochem. J. 107:669–674.
53. Jelliffe, E. F. P., and D. B. Jelliffe, eds. (1982). Adverse Effects of Foods, Plenum, New York.
54. Joslyn, M. A., and E. Zuegg (1956). Report on peroxidase in frozen vegetables. Ascorbic acid oxidation method fordetermining peroxidase activity. J. Assoc. Offic. Agric. Chem. 39:267–283.
55. Kang, Y., A. G. Marangoni, and R. Y. Yada (1994). Effect of two polar organic-aqueous solvent systems on the structure-function relationships of proteases. I. Pepsin. J. Food Biochem. 17:353–369.
56. Kang, Y., A. G. Maragoni, and R. Y. Yada (1994). Effect of two polar organic-aqueous solvent systems on the structure-function relationships of proteases. II. Chymosin and Mucor miehei Proteinase. J. Food Biochem. 17:371–387.
57. Kang, Y., A. G. Marangoni, and R. Y. Yada (1994). Effect of two polar organic-aqueous solvent systems on the structure-function relationship of proteases. III. Papain and trypsin. J. Food Biochem. 17:389–405.
58. Kartha, G., J. Bello, and D. Harker (1967). Tertiary structure of ribonuclease. Nature 213:862–865.
59. Kato, A., and K. Yutani (1988). Correlation of surface properties with conformational stabilities of wild-type and six mutanttryptophan synthase a-subunits substituted at the same position. Protein Eng. 2:153–156.
60. Kato, H., T. Tanaka, H. yamaguchi, T. Hara, T. Nishioka, Y. Katsube, and J. Oda (1994). Flexible loop that is novelcatalytic machinery in a ligase. Atomic structure and function of the loopless glutathione synthetase. Biochemistry33:4995–4999.
61. Kavanau, J. L. (1950). Enzyme kinetics and rate of biological processes. J. Gen. Physiol. 34:193–209.
62. King, E. L., and C. Altman (1956). A schematic method of deriving the rate laws for enzyme-catalyzed reactions. J. Phys.Chem. 60:1375–1378.
63. Kitamura, K. (1984). Biochemical characterization of lipoxygenase lacking mutants, L-1-less, L-2-less, and L-3-llesssoybeans. Agric. Biol. Chem. 48:2339–2346.
64. Klibanov, A. M., and T. J. Ahern (1987). Thermal stability of proteins, in Protein Engineering (D. L. Oxender and C. F.Fox, eds.), Alan R. Liss, New York, pp. 213–218.
65. Koshland, D. E., Jr. (1959). Mechanisms of transfer enzymes, in The Enzymes, 1st ed. (P. D. Boyer, H. Lardy and K.Myrback, eds.), vol. 1, Academic Press, New York, pp. 305–346.
66. Koshland, D. E., Jr., G. Nemethy, and D. Filmer (1966). Comparison of experimental data and theoretical models inproteins containing subunits. Biochemistry 5:365–385.
67. Knowles, J. R. (1991). Enzyme catalysis: Not different, just better. Nature 350:121–124.
68. Kuhne, W. (1877). Ueber das Verhalten verschiedener organisirter und sog. ungeformter fermente. Nat. Med. Verhandl.1:190–193.
69. Kuzin, A. M. (1964). Radiation Biochemistry, D. Davey, New York.
70. Leatham, G. F., and M. E. Himmel, eds. (1991). Enzymes in Biomass Conversion, ACS Symposium Series 460,American Chemical Society, Washington, DC.
71. Levitzki, A., and M. L. Steer (1974). Allosteric activation of mammalian a-amylase by chloride. Eur. J. Biochem.41:171–180.

72. von Liebig, J. (1872). Ueber den Kochsalzgehalt des Extractum carnis. Anal. Chem. Pharm. 157:369–373.
73. Lilly, M. D., and A. K. Sharp (1968). The kinetics of enzymes attached to water-insoluble polymers. Chem. Eng. (Long.)215:CE12–CE18.
74. Lim, M. H., A. O. Chen, R. M. Pangborn, and J. R. Whitaker (1989). Effect of enzymes on aroma changes in vegetablesduring frozen storage, in Trends in Food Biotechnology (A. H. Ghee, N.B. Hen, and L. K. Kong, eds.), Singapore Institute ofFood Science and Technology, Singapore, pp. 169–176.

Pag e 529
75. Lim, M. H., P. J. Velasco, R. M. Pangborn, and J. R. Whitaker (1989). Enzymes involved in off-aroma formation inbroccoli, in Quality Factors of Fruits and Vegetables (J. J. Jen, eds.), ACS Symp. Ser. 405:72–83.
76. Lineweaver, H., and D. Burk (1934). Determination of enzyme dissociation constants. J. Am. Chem. Soc. 56:658–666.
77. Lovern, J. A., and J. Olley (1962). Inhibition and promotion of post-mortem lipid hydrolysis in the flesh of fish. J. Food Sci.27:551–559.
78. Maehler, R., and J. R. Whitaker (1982). Dynamics of ligand binding to a-chymotrypsin and to N-methyl a-chymotrypsin.Biochemistry 21:4621–4633.
79. Michaelis, L., and M. L. Menten (1913). Kinetics of invertase action. Biochem. Z. 49:333–369.
80. Monod, J., J. Wyman, and J. P. Changeux (1965). On the nature of allosteric transitions: a plausible model. J. Mol. Biol.12:88–118.
81. Morton, R. K. (1955). The substrate specificity and inhibition of alkaline phosphatases of cow's milk and calf intestinalmucosa. Biochem. J. 61:232–240.
82. Morton, R. K. (1957). The kinetics of hydrolysis of phenyl phosphate by alkaline phosphatases. Biochem. J. 65:674–682.
83. Myrback, K. (1926). Uber verbindungen einiger enzyme mit inaktivierenden stoffen. II. Z. Physiol. Chem. 159:1–84.
83a. Olsen, F., and K. Aunstrup (1986). Alpha-acetolactate decarboxylase enzyme and preparation there of. U. S. Patent4,617,273.
84. Osuga, D., and J. R. Whitaker (1994). Mechanisms of some reducing compounds that inactivate polyphenol oxidase, inEnzymatic Browning and Its Prevention (C. Y. Lee and J. R. Whitaker, eds.), ACS Symp. Ser. 600:210–222.
85. Pasteur, L. (1875). Nouvelles observations sur la nature de la fermentation alcoolique. C. R. Acad. Sci. 80:452–457.
86. Pressey, R. (1967). Invertase inhibitor from potatoes: Purification, characterization and reactivity with plant invertases. PlantPhysiol. 42:1780–1786.
87. Rackis, J. J. (1974). Biological and physiological factors in soybeans. J. Am. Oil Chem. Soc. 51:161A–174A.
88. Richardson, T., and D. B. Hyslop (1985). Enzymes, in Food Chemistry, 2nd ed. (O. R. Fennema, ed.), Marcel Dekker,New York, pp. 390–393.
89. Ryan, C. A. (1973). Proteolytic enzymes and their inhibitors in plants. Annu. Rev. Plant Physiol. 24:173–196.
90. Ryle, A. P., F. Sanger, L. F. Smith, and R. Kitai (1955). The disulfide bonds of insulin. Biochem. J. 60:541–556.
91. Salleh, A. B., K. Ampon, F. Salam, W. M. Z. Wan Yunus, C. N. A. Rozak, and M. Basri (1990). Modification of lipasefor reactions in organic solvents. Ann. NY Acad. Sci. 613:521–522.
92. Scott, D. (1989). Specialty enzymes and products for the food industry, in Biocatalysis in Agricultural Biotechnology (J.R. Whitaker and P. E. Sonnet, eds.), ACS Symposium Ser. 389, American Chemical Society, Washington, DC, pp. 176–192.
93. Siddiqi, A. M. and A. L. Tappel (1957). Comparison of some lipoxidases and their mechanism of action. J. Am. Oil Chem.Soc. 34:529–533.
94. Sizer, I. W., and E. S. Josephson (1942). Kinetics as a function of temperature of lipase, trypsin and invertase activity from-70 to 50°C (-94 to 122°F). Food Res. 7:201–209.
95. Spackman, D. H., W. H. Stein, and S. Moore (1960). The disulfide bonds of ribonuclease. J. Biol. Chem.235:648–659.
96. Stearn, A. E. (1949). Kinetics of biological reactions with specific reference to enzyme processes. Adv. Enzymol. 9:25–74.
97. Stockwell, A., and E. L. Smith (1957). Kinetics of papain action. I. Hydrolysis of benzoyl-L- argininamide. J. Biol. Chem.227:1–26.

98. Summer, J. B. (1926). The isolation and crystallization of the enzyme urease. J. Biol. Chem. 69:435–441.
99. Theorell, H., and T. Yonetani (1963). Liver alcohol dehydrogenase-diphosphopyridine nucleotide

Pag e 530
(DPN)-pyrazole complex; A model of a ternary intermediate in the enzyme reaction. Biochem. Z. 338:537–553.
100. Van Noorden, C. J. F., and W. M. Fredericks (1992). Enzyme Histochemistry. A Laboratory Manual of CurrentMethods, Oxford University Press, New York.
101. Velasco, P. J., M. H. Lim, R. M. Pangborn, and J. R. Whitaker (1989). Enzymes responsible for off-flavor and off-aromain blanched and frozen-stored vegetables. Biotechnol. Appl. Biochem. 11:118–127.
102. Verger, R., J. Rietsch, F. Pattus, F. Ferrato, G. Peroni, G. H. deHaase, and P. Desneulle (1978). Studies of lipase andphospholipase A2 acting on lipid monolayers. Adv. Exp. Med. Biol. 101:79–94.
103. Volkin, D. B., A. Staubli, R. Langer, and A. M. Klibanov (1991). Enzyme thermoinactivation in anhydrous organicsolvents. Biotech. Bioeng. 37:843–853.
104. Wacher, W. E. C., and T. L. Coombs (1969). Clinical biochemistry: Enzymatic methods: Automation and atomicabsorption spectroscopy. Annu. Rev. Biochem. 38:539–568.
105. Wagner, G., and G. G. Guilbault, eds. (1994). Food Biosensor Analysis, Marcel Dekker, New York.
106. Webb, J. L. (1967). Enzyme and Metabolic Inhibitors, vol. I-III, Academic Press, New York.
107. Whitaker, J. R. (1981). Naturally occurring peptide and protein inhibitors of enzymes, in Impact of Toxicology on FoodProcessing (J. C. Ayres and J. C. Kirschman, eds.) Avi, Westport, CT, pp. 57–104.
108. Whitaker, J. R. (1984). Analytical uses of enzymes, in Food Analysis: Principles and Techniques, vol. 3, BiologicalTechniques (D. W. Gruenwedel and J. R. Whitaker, eds.), Marcel Dekker, New York, pp. 297–377
109. Whitaker, J. R. (1990). Microbial pectolytic enzymes, in Microbial Enzymes and Biotechnology, 2nd ed. (W. M.Fogarty and C. T. Kelly, eds.), Elsevier Applied Science, London, pp. 133–176.
110. Whitaker, J. R. (1990). New and future uses of enzymes in food processing. Food Biotechnol. 4:669–697.
111. Whitaker, J. R. (1994). Principles of Enzymology for the Food Sciences, 2nd ed., Marcel Dekker, New York
112. Whitaker, J. R., and R. A, Bernhard (1991). Experiments for an Introduction to Enzymology, University of California,Davis, p. 83
113. Whitaker, J. R., and M. Mazelis (1991). Enzymes important in flavor development in the alliums, in Food Enzymology,vol. 1 (P. F. Fox, ed.), Elsevier, London, pp. 479–497
114. Williams, D. C., M. H. Lim, A. O. Chen, R. M. Pangborn, and J. W. Whitaker (1986). Balanching of vegetables forfreezing. Which indicator enzyme to choose. Food Technol. 40:130–140
115. Wong, J. T. F., and C. S. Hanes (1962). Kinetic formulations for enzymic reactions involving two substrates. Can. J.Biochem. Physiol. 40:763–804
116. Wu, C., and J. R. Whitaker (1990). Purification and partial characterization of four trypsin/chymotrypsin inhibitors fromred kidney beans (Phaseolus vulgaris, var. Linden), J. Agric. Food Chem. 38:1523–1529.
117. Zaborsky, O. R. (1973). Immobilized Enzymes, CRC Press, Boca Raton, FL.
118. Zaks, A., and A. M. Klibanov (1984). Enzymatic catalysis in organic media at 100°C. Science 224:1249–1251.

Pag e 531
8Vitamins
JESSE F. GREGORY IIIUniversity of Florida, Gainesville, Florida
8.1 Introduction 532
8.1.1 Objectives 532
8.1.2 Summary of Vitamin Stability 532
8.1.3 Toxicity of Vitamins 534
8.1.4 Sources of Vitamins 534
8.2 Addition of Nutrients to Foods 534
8.3 Dietary Recommendations 536
8.4 Analytical Methods and Sources of Data 537
8.5 Bioavailability of Vitamins 539
8.6 General Causes of Variation/Losses of Vitamins in Food 539
8.6.1 Inherent Variation in Vitamin Content 539
8.6.2 Postharvest Changes in Vitamin Content of Foods 540
8.6.3 Preliminary Treatments: Trimming, Washing, Milling 541
8.6.4 Effects of Blanching and Thermal Processing 541
8.6.5 Losses of Vitamins Following Processing 543
8.6.6 Influence of Processing Chemicals and Other Food Components 544
8.7 Fat-Soluble Vitamins 545
8.7.1 Vitamin A 545
8.7.2 Vitamin D 552
8.7.3 Vitamin E 553
8.7.4 Vitamin K 557
8.8 Water-Soluble Vitamins 559
8.8.1 Ascorbic Acid 559

8.8.2 Thiamin 568
8.8.3 Riboflavin 574
8.8.4 Niacin 578
8.8.5 Vitamin B6 580
8.8.6 Folate 590

Pag e 532
8.8.7 Biotin 600
8.8.8 Pantothenic Acid 602
8.8.9 Vitamin B12 603
8.9 Conditionally Essential Vitamin-Like Compounds 606
8.9.1 Choline 606
8.9.2 Carnitine 606
8.9.3 Pyrroloquinolone Quinone 607
8.10 Optimization of Vitamin Retention 607
8.10.1 Optimization of Thermal Processing Conditions 608
8.10.2 Prediction of Losses 608
8.10.3 Effects of Packaging 609
8.11 Summary 609
Bibliography 609
References 610
8.1 Introduction
8.1.1 Objectives
Since the discovery of the basic vitamins and their many forms, a wealth of information has been generated and published ontheir retention in foods during postharvest handling, commercial processing, distribution, storage, and preparation, and manyreviews have been written on this topic. A good summary of this information is Nutritional Evaluation of Food Processing[61, 62, 72], to which the reader is encouraged to refer.
The major objective of this chapter is to discuss and critically review the chemistry of the individual vitamins and ourunderstanding of the chemical and physical factors that influence vitamin retention and bioavailability in foods. A secondaryobjective is to indicate gaps in our understanding and to point out factors that affect the quality of data with respect of ourunderstanding of vitamin stability. It should be noted that there is an unfortunate state of inconsistency of nomenclature in thevitamin literature, with many obsolete terms still being used. Throughout this chapter, terminology recommended by theInternational Union of Pure and Applied Chemistry (IUPAC) and the American Institute of Nutrition [1] will be used.
8.1.2 Summary of Vitamin Stability
The vitamins comprise a diverse group of organic compounds that are nutritionally essential micronutrients. Vitamins function invivo in several ways, including (a) as coenzymes or their precursors (niacin, thiamin, riboflavin, biotin, pantothenic acid, vitaminB6, vitamin B12, and folate); (b) as components of the antioxidative defense system (ascorbic acid, certain carotenoids, andvitamin E); (c) as factors involved in genetic regulation (vitamins A, D, and potentially several others); and (d) in specializedfunctions such as vitamin A in vision, ascorbate in various hydroxylation reactions, and vitamin K in specific carboxylationreactions.

Vitamins are quantitatively minor constituents of foods. From the viewpoint of food chemistry, we are mainly interested inmaximizing vitamin retention by minimizing aqueous extraction (leaching) and chemical changes such as oxidation and reactionwith other food constituents. In addition, several of the vitamins influence the chemical nature of food, by functioning as reducingagents, radical scavengers, reactants in browning reactions, and flavor

Pag e 533
precursors. Although much is known about the stability and properties of vitamins, our knowledge of their behavior in thecomplex milieu of food is limited. Many published studies have, sometimes by necessity, involved the use of chemically definedmodel systems (or even just buffer solutions) to simplify the investigation of vitamin stability. Results of such studies should beinterpreted with caution because, in many cases, the degree to which these model systems simulate complex food systems is notknown. While these studies have provided important insight into chemical variables affecting retention, they are sometimes oflimited value for predicting the behavior of vitamins in complex food systems. This is so because complex foods often differmarkedly from model systems in terms of physical and compositional variables including water activity, ionic strength, pH,enzymatic and trace metallic catalysts, and other reactants (protein, reducing sugars, free radicals, active oxygen species, etc.).Throughout this chapter, emphasis will be placed on the behavior of vitamins under conditions relevant to actual foods.
Most of the vitamins exist as groups of structurally related compounds exhibiting similar nutritional function. Many attempts havebeen made to summarize the stability of the vitamins, such as that shown in Table 1 [60]. The major limitation of such exercisesis the marked variation in stability that can exist among the various forms of each vitamin. Various forms of each vitamin canexhibit vastly different stability (e.g., pH of optimum stability and susceptibility to oxidation) and reactivity. For example,tetrahydrofolic acid and folic acid are two folates that exhibit nearly identical nutritional properties. As described later,tetrahydrofolic acid (a naturally occurring form) is extremely susceptible to oxidative degradation, while folic acid (a syntheticform used in food fortification) is very stable. Thus, attempts to generalize or summarize the properties of the vitamins are at bestimprecise and at worst highly misleading.
TABLE 1 Summary of Vitamin Stability
Nutrient Neutral Acid Alkaline Air or oxyg en Lig ht Heat
Maximumcooking
loss
Vitamin A S U S U U U 40
Ascorbic acid U S U U U U 100
Biotin S S S S S U 60
Carotenes S U S U U U 30
Choline S S S U S S 5
Vitamin B12 S S S U U S 10
Vitamin D S S U U U U 40
Folate U U U U U U 100
Vitamine K S U U S U S 5
Niacin S S S S S S 75
Pantothenic acid S U U S S S 50
Vitamin B6 S S S S U U 40
Riboflavin S S U S U U 75
Thiamin U S U U S U 80
Tocopherols S S S U U U 55
Note: S, stable (no important destruction); U, unstable (sig nificant destruction). Caution: These conclusionsare oversimplifications and may not accurately represent stability under all circumstances.
Source: Adapted from Ref. 60.
Pag e 534
8.1.3 Toxicity of Vitamins
In addition to the nutritional role of vitamins, it is important to recognize their potential toxicity. Vitamins A, D, and B6 are ofparticular concern in this respect. Episodes of vitamin toxicity are nearly always associated with overzealous consumption ofnutritional supplements. Toxic potential also exists from inadvertent excessive fortification, as has occurred in an incident withvitamin D-fortified milk. Instances of intoxication from vitamins occurring endogenously in food are exceedingly rare.
8.1.4 Sources of Vitamins
Although vitamins are consumed in the form of supplements by a growing fraction of the population, the food supply generallyrepresents the major and most critically important source of vitamin intake. Foods, in their widely disparate forms, providevitamins that occur naturally in plant, animal, and microbial sources as well as those added in fortification. In addition, certaindietetic and medical foods, enteric formulas, and intravenous solutions are formulated so that the entire vitamin requirements ofthe individual are supplied from these sources.
Regardless of whether the vitamins are naturally occurring or added, the potential exist for losses by chemical or physical(leaching or other separations) means. Losses of vitamins are, to some degree, inevitable in the manufacturing, distribution,marketing, home storage, and preparation of processed foods, and losses of vitamins, can also occur during the post-harvesthandling and distribution of fruits and vegetables and during the post-slaughter handling and distribution of meat products. Sincethe modern food supply is increasingly dependent on processed and industrially formulated foods, the nutritional adequacy of thefood supply depends, in large measure, on our understanding of how vitamins are lost and on our ability to control these losses.
Although considerable information is available concerning the stability of vitamins in foods, our ability to use such information isfrequently limited by a poor understanding of reaction mechanisms, kinetics, and thermodynamics under various circumstances.Thus, it is frequently difficult on the basis of our present knowledge to predict the extent to which given processing, storage, orhandling conditions will influence the retention of many vitamins. Without accurate information regarding reaction kinetics andthermodynamics, it is also difficult to select conditions and methods of food processing, storage, and handling to optimize vitaminretention. Thus, there is a great need for more thorough characterization of the basic chemistry of vitamin degradation as itoccurs in complex food systems.
8.2 Addition of Nutrients to Foods
Throughout the early 20th century, nutrient deficiency represented a major public health problem in the United States. Pellagrawas endemic in much of the rural South, while deficiencies of riboflavin, niacin, iron, and calcium were widespread. Thedevelopment of legally defined standards of identity under the 1938 Food, Drug, and Cosmetic Act provided for the directaddition of several nutrients to foods, especially certain dairy and cereal-grain products. Although technological and historicalaspects of fortification are beyond the scope of this chapter, the reader is referred to Nutrient Additions to Food: Nutritional,Technological and Regulatory Aspects [7] for a comprehensive discussion of this topic. The nearly complete eradication ofovert vitamin-deficiency disease provides evidence of the exceptional effectiveness of fortification programs and the generalimprovement in the nutritional quality of the U.S. food supply.

Pag e 535
Definitions of terms associated with the addition of nutrients of foods include:
1. Restoration: Addition to restore the original concentration of key nutrients.
2. Fortification: Addition of nutrients in amounts significant enough to render the food a good to superior source of the addednutrients. This may include addition of nutrients not normally associated with the food or addition to levels above that present inthe unprocessed food.
3. Enrichment: Addition of specific amounts of selected nutrients in accordance with a standard of identity as defined by the U.S.Food and Drug Administration (FDA).
4. Nutrification: This is a generic term intended to encompass any addition of nutrients to food.
The addition of vitamins and other nutrients to food, while clearly beneficial in current practice, also carries with it the potentialfor abuse and, thus, risk to consumers. For these reasons, important guidelines have been developed that convey a reasonableand prudent approach. These U.S. Food and Drug Administration guidelines [21 CFR Sec. 104.20(g)] state that the nutrientadded to a food should be:
1. Stable under customary conditions of storage, distribution, and use.
2. Physiologically available from the food.
3. Present at a level where there is assurance that there will not be excessive intake.
4. Suitable for its intended purpose and in compliance with provisions (i.e., regulations) governing safety.
Further, it is stated in these guidelines that “the FDA does not encourage the indiscriminate addition of nutrients to foods.”Similar recommendations have been developed and endorsed jointly by the Council on Foods and Nutrition of the AmericanMedical Association (AMA), the Institute of Food Technologists (IFT) and the Food and Nutrition Board (FNB) of theNational Academy of Sciences-National Research Council [4].
Additionally, AMA-IFT-FNB guidelines recommend that the following prerequisites be met to justify fortification: (a) the intakeof the particular nutrient is inadequate for a substantial portion of the population; (b) the food (or category) is consumed by mostindividuals in the target population; (c) there is reasonable assurance that excessive intake will not occur; and (d) the cost isreasonable for the intended population. The joint statement also included the following endorsement of enrichment programs:
Specifically the following practices in the United States continue to be endorsed: The enrichment of flour, bread, deg erminated andwhite rice (with thiamin, riboflavin, niacin, and iron); the retention or restoration of thiamin, riboflavin, niacin, and iron in processed foodcereals; the addition of vitamin D to milk, fluid skimmed milk, and nonfat dry milk, the addition of vitamin A to marg arine, fluid skim milk,and nonfat dry milk, and the addition of iodine to table salt. The protective action of fluoride ag ainst dental caries is recog nized and thestandardized addition of fluoride is endorsed in areas in which the water supply has a low fluoride content.
At the time of this writing, the merits of the proposed addition of folic acid to foods are being evaluated by the FDA with respectto inclusion of this vitamin in enriched cereal-grain products (i.e., wheat flours, rice, corn meals, breads, and pastas). Enrichmentappears to be a viable approach to providing supplemental folic acid for the purpose of reducing the risk of certain birth defects(spina bifida and anencephaly); however, excessive intake of total folate must be avoided in order to avoid masking thediagnosis of vitamin B12 deficiency.
The stability of vitamins in fortified and enriched foods has been thoroughly evaluated. As

Pag e 536
TABLE 2 Stability of Vitamins Added to Cereal Grain Products
Storag e time (months at 23°C)
Vitamin Claim Found 2 4 6
In 1 lb of white flour
Vitamin A (IU) 7500 8200 8200 8020 7950
Vitamin E (IU)a 15.0 15.9 15.9 15.9 15.9
Pyridoxine (mg ) 2.0 2.3 2.2 2.3 2.2
Folate (mg ) 0.30 0.37 0.30 0.35 0.3
Thiamin (mg ) 2.9 3.4 – – 3.4
In 1 lb of yellow corn meal
Vitamin A (IU) – 7500 7500 – 6800
Vitamin E (IU)a – 15.8 15.8 – 15.9
Pyridoxine (mg ) – 2.8 2.8 – 2.8
Folate (mg ) – 0.30 0.30 – 0.29
Thiamin (mg ) – 3.5 – – 3.6
After baking 5 Days of storag e (23°C)
In 740 g of bread
Vitamin A (IU) 7500 8280 8300
Vitamin E (IU) a 15 16.4 16.7
Pyridoxine (mg ) 2 2.4 2.5
Folate (mg ) 0.3 0.34 0.36
aVitamin E is expressed as dl-a-tocopherol acetate.
Source: Ref. 25.
shown in Table 2, the stability of added vitamins in enriched cereal grain products under conditions of accelerated shelf-lifetesting is excellent [3, 25]. Similar results have been reported with fortified breakfast cereals (Table 3). This excellent retention isdue, in part, to the stability of the chemical forms of these vitamins used, as well as the favorable environment with respect towater activity and temperature. The stability of vitamins A and D in fortified milk products also has been shown to besatisfactory.
8.3 Dietary Recommendations

To assess the impact of food composition and intake patterns on the nutritional status of individuals and populations, and todetermine the nutritional effects of particular food processing and handling practices, a nutritional reference standard is essential.In the United States, the Recommended Dietary Allowances (RDA) have been developed for these purposes. The RDA valueshave been defined as “the level of intake of essential nutrients considered, in the judgement of the Committee on DietaryAllowances of the Food and Nutrition Board on the basis of available scientific knowledge, to be adequate to meet the knownnutrition needs of practically all healthy persons” [44]. To the extent possible, the RDA values are formulated to includeallowances for variability within the population with respect to nutrient requirements as well as the potential for incompletebioavailability of nutrients. However, limitations in our current knowledge of the bioavailability of vitamins in foods render suchallowances highly uncertain. Many other countries and several international organizations such as the FAO/WHO havedeveloped reference values similar to the RDAs, and these differ quantitatively because of differences in scientific judgement orphilosophy.

Pag e 537
TABLE 3 Stability of Vitamins Added to Breakfast Cereal Products
Storag e time
Vitamin content (per g ram of product) Initial value 3 months, 40°C 6 months, 23°C
Vitamin A (IU) 193 168 195
Ascorbic acid (mg ) 2.6 2.4 2.5
Thiamin (mg ) 0.060 0.060 0.064
Riboflavin (mg ) 0.071 0.074 0.67
Niacin (mg ) 0.92 0.85 0.88
Vitamin D 17.0 15.5 16.6
Vitamin E (IU) 0.49 0.49 0.46
Pyridoxine (mg ) 0.085 0.088 0.081
Folate (mg ) 0.018 0.014 0.018
Vitamin B12 (mg) 0.22 0.21 0.21
Pantothenic acid (mg ) 0.42 0.39 0.39
Source: Ref. 3.
For food labeling to be meaningful, the concentration of micronutrients is best expressed relative to reference values. In theUnited States, nutrition labeling data for micronutrients has been traditionally expressed as a percentage of a “U.S. RDA” value,a practice that was originated at the onset of nutrition labeling. These were derived from the 1968 RDA values and differsomewhat from the current RDA values reported by the Food and Nutrition Board (Table 4). These differences, although notreadily evident to the consumer, should be recognized and understood. Federal regulations permit modification of U.S. RDAs bythe FDA “from time to time as more information on human nutrition becomes available” [21 CFR Sec. 101.0(c)(7)(b)(ii)],although no changes were implemented. Under the revised labeling regulation implemented by the Food and Drug Administrationin 1994, the U.S. RDA term has been replaced by the “Reference Daily Intake (RDI),” which is currently equivalent to theprevious U.S. RDAs. In the current nutrition labeling format, vitamin content is expressed as a percentage of the RDI and islisted as “% Daily Value.”
8.4 Analytical Methods and Sources of Data
The major sources of information regarding the content of vitamins in U.S. foods are the U.S. Department of Agriculture'sNational Nutrient Data Bank and the Agricultural Handbook No. 8 series. An important limitation of these data and most otherdata bases is the uncertain adequacy of the analytical methods used. It is frequently unclear how the data were obtained, whatmethods were used, and whether the results were based on truly representative samples. Issues regarding the merits ofinformation in nutrient databases have been discussed in several reviews [8, 9].
The adequacy of analytical methods is a serious problem with respect to many vitamins. While current analytical methods aregenerally acceptable for some vitamins (e.g., ascorbic acid, thiamin, riboflavin, niacin, vitamin B6, vitamin A, and vitamin E), theyare less adequate for others (e.g., folate, pantothenic acid, biotin, carotenoids, vitamin B12, vitamin D, and vitamin K). Factorsthat limit the suitability of analytical methods may involve a lack of specificity of traditional chemical methods, interferences inmicrobiological assays, incomplete extraction of the analyte(s) from the food matrix, and incomplete measurement of complexedforms of a vitamin. Improvement of analytical data for vitamins will require additional support for methods

Pag e 538
TABLE 4 Comparison of Recommended Dietary Allowances for Vitamins and “Reference Daily Intake” (RDI) Currently Used in Nutritional Labeling in the United States
Categ ory Ag e (years)Vitamin A(mg RE)a
Vitamin D(mg)
Vitamin E(mg a-TE)
Vitamin K(mg)
Vitamin C(mg)
Thiamin(mg)
Riboflavin(mg)
Niacin(mg NE)
VitaminB6
(mg)Folate(mg)
VitaminB12(mg)
Infants 0.0–0.5 375 7.5 3 5 30 0.3 0.4 5 0.3 25 0.3
0.5–1.0 375 10 4 10 35 0.4 0.5 6 0.6 35 0.5
Children 1–3 400 10 6 15 40 0.7 0.8 9 1.0 50 0.7
4–6 500 10 7 20 45 0.9 1.1 12 1.1 75 1.0
7–10 700 10 7 30 45 1.0 1.2 13 1.4 100 1.4
Males 11–14 1000 10 10 45 50 1.3 1.5 17 1.7 150 2.0
15–18 1000 10 10 65 60 1.5 1.8 20 2.0 200 2.0
19–24 1000 10 10 70 60 1.5 1.7 19 2.0 200 2.0
25–50 1000 5 10 80 60 1.5 1.7 19 2.0 200 2.0
51+ 1000 5 10 80 60 1.2 1.4 15 2.0 200 2.0
Females 11–14 800 10 8 45 50 1.1 1.3 15 1.4 150 2.0
15–18 800 10 8 55 60 1.1 1.3 15 1.5 180 2.0
19–24 800 10 8 60 60 1.1 1.3 15 1.6 180 2.0
25–50 800 5 8 65 60 1.1 1.3 15 1.6 180 2.0
51+ 800 5 8 65 60 1.0 1.2 13 1.6 180 2.0
Preg nant 800 10 10 65 70 1.5 1.6 17 2.2 400 2.2
Lactating 0–0.5c 1300 10 12 65 95 1.6 1.8 20 2.1 280 2.6
0.5–1.0c 1200 10 11 65 90 1.6 1.7 20 2.1 260 2.6
RDIb(used infoodlabeling )
1000(5000 IU)
10(400 IU)
20(30 IU)
no RDI 60 1.5 1.7 20 2.0 400 6.0
aUnits: RE, retinol equivalent (1 RE = 1 mg retinol or 6 mg b-carotene); a-TE, a-tocopherol equivalent (1 mg a-TE = 1 mg d-a-tocopherol); NE, niacin equivalent (1 mg NE = 1mg niacin or 60 mg tryptophan).
b Reference Daily Intake (RDI) is the reference unit used in U.S. nutrition labeling of foods, formerly termed the U.S. RDA.
c Duration of lactation.
Source: Ref. 44.

Pag e 539
development research, improved training of analysts, development of quality control protocols (i.e., validation andstandardization of procedures), and development of standard reference materials for vitamin analysis. The strengths andlimitations of analytical methods for each vitamin will be briefly addressed in this chapter.
8.5 Bioavailability of Vitamins
The term bioavailability refers to the degree to which an ingested nutrient undergoes intestinal absorption and metabolic functionor utilization within the body. Bioavailability involves both absorption and utilization of the nutrient as consumed; this conceptdoes not refer to losses that may occur prior to consumption. For a complete description of the nutritional adequacy of a food,three factors must be known: (a) the concentration of the vitamin at the time of consumption; (b) the identity of various chemicalspecies of the vitamin present; (c) and the bioavailability of these forms of the vitamin as they exist in the meal consumed.
Factors that influence the bioavailability of vitamins include (a) composition of the diet, which could influence intestinal transittime, viscosity, emulsion characteristics, and pH; (b) form of the vitamin [forms may differ in rate or extent of absorption, ease ofconversion to metabolically (e.g., coenzymic) active form, or metabolic functionality]; and (c) interactions between a vitamin andcomponents of the diet (e.g., proteins, starches, dietary fiber, lipids) that interfere with intestinal absorption of the vitamin.Although our understanding of the relative bioavailability of the various species of each vitamin is rapidly improving, the complexinfluences of food consumption on vitamin bioavailability remain poorly understood. In addition, the effects of processing andstorage on vitamin bioavailability have been only partially determined.
The application of information regarding bioavailibility of vitamins is limited at this time. Bioavailibility is generally considered inthe development of dietary recommendations (e.g., RDA values), but this involves only the use of estimated mean bioavailabilityvalues. At the present time, our knowledge is too fragmentary to permit vitamin bioavailability data to be included in foodcomposition tables. However, even if our understanding of the bioavailability of vitamins in individual foods were much morecomplete, such data regarding individual foods may be of little use. A far greater need is for a better understanding of vitaminbioavailability in the diet as a whole (including interactive effects of individual foods) and the sources of variation in this respectamong individual people.
8.6 General Causes of Variation/Losses of Vitamins in Food
Beginning at the time of harvesting, all foods inevitably undergo some loss of vitamins. The nutritional significance of partial lossof vitamins depends on the nutritional status of the individual (or population) for the vitamin of interest, the importance of theparticular food as a source of that vitamin, and the bioavailability of the vitamin. Most processing, storage, and handling methodsare intended to minimize vitamin losses. The following is a summary of the various factors responsible for variation in the vitamincontent of foods.
8.6.1 Inherent Variation in Vitamin Content
The concentration of vitamins in fruits and vegetables often varies with stage of maturity, site of growth, and climate. Duringmaturation of fruits and vegetables, vitamin concentration is determined by the rates of synthesis and degradation. Information onthe time course of vitamin concentration in most fruits and vegetables is not available except for ascorbic acid and b-carotene

Pag e 540
in a few products. In the example shown in Table 5, the maximum concentration of ascorbic acid in tomatoes occurred prior tofull maturity. A study of carrots showed that carotenoid concentration varied markedly with variety but was not influencedsignificantly by stage of maturity.
Little is known about developmental changes in vitamin content of cereal grains and legumes. In contrast to fruits and vegetables,cereal grains and legumes are harvested at a fairly uniform stage of maturity.
Agricultural practices and environmental conditions undoubtedly influence the content of vitamins in plant-derived foods, but fewdata are available on this subject. Klein and Perry [78] determined the content of ascorbic acid and vitamin A activity (fromcarotenoids) in selected fruits and vegetables sampled from six different locations across the United States. In their study, widevariation was found among sampling sites, possibly as a result of geographic/climatic effects, varietal differences, and effects oflocal agricultural practices. Agricultural practices including type and amount of fertilizer and irrigation regimen can influencevitamin content of plant-derived foods.
The vitamin content of animal products is governed both by biological control mechanisms and the diet of the animal. In the caseof many B vitamins, the concentration of the vitamin in tissues is limited by the capacity of the tissues to take up the vitamin fromthe blood and to convert it to the conezymic form(s). A nutritionally inadequate animal diet can yield reduced tissueconcentrations of both water-soluble and fat-soluble vitamin(s) involved. In contrast to the situation with water-soluble vitamins,dietary supplementation with fat-soluble vitamins can more readily increase tissue concentrations. This has been examined as ameans of increasing the vitamin E concentration of certain animal products to improve oxidative stability and color retention.
8.6.2 Postharvest Changes in Vitamin Content of Foods
Fruits, vegetables, and animal tissues retain enzymes that contribute to postharvest changes in the vitamin content of foods. Therelease of oxidative and hydrolytic enzymes, as a result of deterioration of cellular integrity and enzymatic compartmentation, cancause changes in the distribution of chemical forms and activity of vitamins. For example, dephosphorylation of vitamin B6,thiamin, or flavin coenzymes, deglycosylation of vitamin B6 glucosides, and the deconjugation of polyglutamyl folates can causedifferences between postharvest distributions and those occurring naturally in the plant or animal prior to harvest or slaughter.The extent of such changes will depend on physical damage encountered during handling, possible temperature abuse, and lengthof time between harvest and processing. Such changes will have little influence on the net concentration of a vitamin but mayinfluence its bioavailability. In contrast,
TABLE5 Influence of Deg ree of Maturity on Ascorbic Acid Content of Tomatoes
W eeks from anthesis Mean weig ht (g ) Color Ascorbic acid (mg /100 g )
2 33.4 Green 10.7
3 57.2 Green 7.6
4 102 Green-yellow 10.9
5 146 Yellow-red 20.7
6 160 Red 14.6
7 168 Red 10.1
Source: Ref. 89.

Pag e 541
oxidative changes caused by the action of lipoxygenases can reduce the concentration of many vitamins, while ascorbic acidoxidase can specifically reduce the concentration of ascorbic acid.
Changes in vitamin concentration appear to be small but significant when proper procedures are followed during postharvesthandling fruit and vegetables. The mishandling of plant products through prolonged holding or shipment at ambient temperaturescan contribute to major losses of labile vitamins. Continued metabolism of plant tissues postharvest can be responsible forchanges in total concentration as well as distribution of chemical forms of certain vitamins depending on the storage conditions.Postharvest losses of vitamins in meat products are usually minimal under typical conditions of refrigerated storage.
8.6.3 Preliminary Treatments: Trimming, Washing, Milling
The peeling and trimming of fruits and vegetables can cause losses of vitamins to the extent that they are concentrated in thediscarded stem, skin, or peel fractions. Although this can be a source of significant loss relative to the intact fruit or vegetable, inmost cases this must be considered to be an inevitable loss regardless of whether it occurs in industrial processing or homepreparation.
Alkaline treatments to enhance peeling can cause increased losses of labile vitamins such as folate, ascorbic acid, and thiamin atthe surface of the product. However, losses of this kind tend to be small compared to the total vitamin content of the product.
Any exposure of cut or otherwise damaged tissues of plant or animal products to water or aqueous solutions causes the loss ofwater-soluble vitamins by extraction (leaching). This can occur during washing, transportation via flumes, and exposures tobrines during cooking. The extent of such losses depends on factors that influence the diffusion and solubility of the vitamin,including pH (can affect solubility and dissociation of vitamins from binding sites within the tissue), ionic strength of the extractant,temperature, the volume ratio of food to aqueous solution, and the surface-to-volume ratio of the food particles. Extractantproperties that affect destruction of the vitamin once extracted include concentration of dissolved oxygen, ionic strength,concentration and type of catalytic trace metals, and the presence of solutes that are destructive (e.g., chlorine) or protective(e.g., certain reducing agents).
The milling of cereal grains involves grinding and fractionation to remove the bran (seed coat) and embryo. Because manyvitamins are concentrated in the embryo and bran, major losses of vitamins can occur during their removal (Fig. 1). Such losses,as well as the prevalence of vitamin deficiency diseases, provided the rationale for the legalization of enriched cereal grainproducts containing several added nutrients (riboflavin, niacin, thiamin, iron and calcium). The beneficial impact of this enrichmentprogram on public health has been enormous.
8.6.4 Effects of Blanching and Thermal Processing
Blanching, a mild heat treatment, is an essential step in the processing of fruits and vegetables. The primary purposes are toinactivate potentially deleterious enzymes, reduce microbial loads, and decrease interstitial gasses prior to further processing.Inactivation of enzymes often has a beneficial effect on the stability of many vitamins during subsequent food storage.
Blanching can be accomplished in hot water, flowing steam, hot air, or with microwaves. Losses of vitamins occur primarily byoxidation and aqueous extraction (leaching), with heat being a factor of secondary importance. Blanching in hot water can causelarge losses of water-soluble vitamins by leaching. An example is shown in Figure 2.
It has been well documented that high-temperature, short-time treatments improve retention of labile nutrients during blanchingand other thermal processes. Specific effects of blanching have been thoroughly reviewed by Selman [118].
Change in the vitamin content of foods during processing has been the topic of extensive

Pag e 542
FIGURE 1Retention of selected nutrients as a function ofdeg ree of refining in production of wheat flour.
Extraction rate refers to the percentag e recovery offlour from whole g rain during milling (redrawn by
Ref. 98).
FIGURE 2Retention of ascorbic acid in peas during
experimental water blanching for 10 min at varioustemperatures (redrawn from Ref. 118.)

Pag e 543
study and thorough review [61, 62, 72, 113]. The elevated temperature of thermal processing accelerates reactions that wouldotherwise occur more slowly at ambient temperature. Thermally induced losses of vitamins depend on the chemical nature of thefood, its chemical environment (pH, relative humidity, transition metals, other reactive compounds, concentration of dissolvedoxygen, etc.), the stabilities of the individual forms of vitamins present, and the opportunity for leaching. The nutritionalsignificance of such losses depends on the degree of loss and the importance of the food as a source of the vitamin in typicaldiets. Although subject to considerable variation, representative data for losses of vitamins during the canning of vegetables areshown in Table 6.
8.6.5 Losses of Vitamins Following Processing
Compared to loss of vitamins during thermal processing, subsequent storage often has a small but significant effect on vitamincontent. Several factors contribute to small postprocessing losses: (a) reaction rates are relatively slow at ambient or reducedtemperature, (b) dissolved oxygen may be depleted, and (c) pH may change during processing (pH usually declines) because ofthermal effects or concentrative effects (drying or freezing), and this can have a favorable effect on the stability of vitamins suchas thiamin and ascorbic acid. For example, Figure 3 illustrates how vitamin C retention in potatoes can be affected by thermalprocessing. The relative importance of leaching, chemical degradation, and the type of container (cans or pouches) is apparentfrom these data.
In reduced-moisture foods, vitamin stability is strongly influenced by water activity in addition to the other factors to bediscussed. In the absence of oxidizing lipids, water-soluble vitamins generally exhibit little degradation at water activity less thanor equal to monolayer hydration (~0.2–0.3 aw). Degradation rates increase in proportion to water activity in regions of multilayerhydration, which reflects greater solubility of the vitamin, potential reactants and catalysts. In contrast, the influence of wateractivity on the stability of fat-soluble vitamins and carotenoids parallels the pattern for unsaturated fats, that is, a minimum rate atmonolayer hydration and increased rates above or below this value (see Chap. 2). Substantial losses of oxidation-sensitivevitamins can occur if foods are overdried.
TABLE 6 Typical Losses of Vitamins during canning a
Product Biotin Folate B6Pantothenic
acid A Thiamin Riboflavin Niacin C
Asparag us 0 75 64 - 43 67 55 47 54
Lima beans - 62 47 72 55 83 67 64 76
Green beans - 57 50 60 52 62 64 40 79
Beets - 80 9 33 50 67 60 75 70
Carrots 40 59 80 54 9 67 60 33 75
Corn 63 72 0 59 32 80 58 47 58
Mushrooms 54 84 - 54 - 80 46 52 33
Green peas 78 59 69 80 30 74 64 69 67
Spinach 67 35 75 78 32 80 50 50 72
Tomatoes 55 54 - 30 0 17 25 0 26
aIncludes blanching .
Source: From various sources, compiled by Lund [87].

Pag e 544
FIGURE 3Retention and distribution of ascorbic acid in
potatoes thermally processed in cans or flexiblepouches. Values show the content of ascorbic acid,
relative to that present prior processing , in thepotatoes and liquid of the containers. Lethality values
(Fo) were not provided. (Redrawn from Ref. 113.Orig inal data from Ref. 32a.)
8.6.6 Influence of Processing Chemicals and Other Food Components
The chemical composition of food can strongly influence the stability of vitamins. Oxidizing agents directly degrade ascorbic acid,vitamin A, carotenoids, and vitamin E and may indirectly affect other vitamins. The extent of their impact is dictated byconcentration of the oxidant and its oxidation potential. In contrast, reducing agents such as ascorbic and isoascorbic acids andvarious thiols add to the stability of oxidizable vitamins, like tetrahydrofolates, by their reducing action and as scavengers ofoxygen and free radicals. The following is a brief discussion of the influence of several other processing chemicals on vitamins.See later sections for vitamin-specific details.
Chlorine is applied to foods as hypochlorous acid (HOCI), hypochlorite anion (OCI-), molecular chlorine (Cl2), or chlorinedioxide (ClO2). These compounds can interact with vitamins by electrophilic substitution, by oxidation or by chlorination ofdouble bonds. The extent of vitamin loss caused by treatments of food with chlorinated water has not been thoroughly studied;however, one would predict relatively minor effects if the application is confined to the product surface. Chlorination of cakeflour presumably has little influence on vitamins in other ingredients used in baking because residual chlorine would be negligible.Reaction products of various forms of chlorine with vitamins are, for the most part, unknown.
Sulfite and other sulfiting agents (SO2, bisulfite, metabisulfite), as used in wines for antimicrobial effects and in dried food toinhibit enzymatic browning, have a protective effect on ascorbic acid and a deleterious effect on several other vitamins. Sulfiteions directly react with thiamin, causing its inactivation. Sulfite also reacts with carbonyl groups and is known to

Pag e 545
convert vitamin B6 aldehydes (pyridoxal and pyridoxal phosphate) to their presumably inactive sulfonated derivatives. Theextent to which sulfiting agents affect other vitamins has not been extensively studied.
Nitrite is used in the preservation and curing of meats and may develop through microbial reduction of naturally occurring nitrate.Ascorbic acid or isoascorbic acid is added to nitrite-containing meats to prevent formation of N-nitrosamines. This isaccomplished by forming NO and preventing formation of undesirable nitrous anhydride (N2O3, the primary nitrosating agent).The proposed reactions [84] are:
Formation of NO is desirable because it is the desired ligand for binding to myoglobin to form the cured meat color. The residualsemidehydroascorbate radical retains partial vitamin C acitivity.
Chemical sterilants are used in highly specific applications such as treating spices with ethylene and propylene oxides fordeinfestation. The biocidal function of these compounds occurs by alkylation of proteins and nucleic acids. Similar effects havebeen observed to occur with some vitamins, although loss of vitamin activity by this means is insignificant in the overall foodsupply.
Chemicals and food ingredients that influence pH will directly affect the stability of vitamins such as thiamin and ascorbic acid,particularly in the neutral to mildly acidic pH range. Acidulation increases the stability of ascorbic acid and thiamin. In contrast,alkalizing compounds reduce the stability of ascorbic acid, thiamin, pantothenic acid, and certain folates.
8.7 Fat-Soluble Vitamins
8.7.1 Vitamin A
8.7.1.1 Structure and General Properties
Vitamin A refers to a group of nutritionally active unsaturated hydrocarbons, including retinol and related compounds (Fig. 4)and certain carotenoids (Fig. 5). Vitamin A activity in animal tissues is predominantly in the form of retinol or its esters, retinal,and to a lesser extent, retinoic acid. The concentration of vitamin A is greatest in liver, the major body pool, in which retinol andretinol esters are the primary forms present. The term retinoids refers to the class of compounds including retinol and its chemicalderivatives having four isoprenoid units. Several retinoids that are analogues of the nutritionally active forms of vitamin A exhibituseful pharmocological properties. In addition, synthetic retinyl acetate and retinyl palmitate are used widely in synthetic form forfood fortification.
Carotenoids may contribute significant vitamin A activity to foods of both plant and animal origin. Of approximately 600 knowncarotenoids, ~50 exhibit some provitamin A activity (i.e., are partially converted to vitamin A in vivo). Preformed vitamin A doesnot exist in plants and fungi; their vitamin A activity is associated with certain carotenoids. The structure of selected carotenoids,along with their vitamin A activities determined by rat bioassay, are presented in Figure 5. The reader is referred to Chapter 10for further discussion of the properties of the carotenoids in the context of their role as food pigments.
For a compound to have vitamin A or provitamin A activity, it must exhibit certain structural similarities to retinol, including (a) atleast one intact nonoxygenated b-ionone ring, and (b) an isoprenoid side chain terminating in an alcohol, aldehyde, or carboxylfunction (Fig. 4). The vitamin A-active carotenoids such as b-carotene (Fig. 5) are considered to have pro-vitamin A activityuntil they undergo oxidative enzymatic cleavage of the central C15-C15'

Pag e 546
FIGURE 4Structures of common retinoids.
bond in the intestinal mucosa to release two molecules of active retinal. Among the carotenoids, b-carotene exhibits the greatestpro-vitamin A activity. Carotenoids with ring hydroxylation or the presence of carbonyl group exhibit less pro-vitamin A activitythan b-carotene if only one ring is affected, and have no activity if both rings are oxygenated. Although two molecules of vitaminA are potentially producted from each molecule of dietary b-carotene, the inefficiency of the process accounts for the fact thatb-carotene exhibits only ~50% of the vitamin A activity exhibited by retinol, on a mass basis. Considerable variation existsamong various animal species and humans with respect to the efficiency of utilization of carotenoids and the extent of absorptionof carotenoid molecules in intact form. The in vivo antioxidative function attributed to dietary carotenoids requires absorption ofthe intact molecule [18].
The retinoids and pro-vitamin A carotenoids are very lipophilic compounds because of their nonpolar structures. Consequently,they associate with lipid components, specific organelles, or carrier proteins in foods and living cells. In many food systems,retinoids and carotenoids are found associated with lipid droplets or micelles dispersed in an aqueous environment. Forexample, both retinoids and carotenoids are present in the fat globules of milk, while in orange juice the carotenoids associatewith dispersed oils. The conjugated double bond systems of retinoids gives strong and characteristic ultraviolet absorptionspectra, while the additional conjugated double bond system of carotenoids causes absorption in the visible spectrum and theyellow-orange color of these compounds. All-trans isomers exhibit the greatest vitamin A activity and are the predominantnaturally occurring forms of retinoids and carotenoids

Pag e 547
FIGURE 5Structures and provitamin A activities of selected carotenoids.
in foods (Table 7 and 8). Conversion to cis isomers, which can occur during thermal processing, causes a loss of vitamin Aactivity.
8.7.1.2 Stability and Modes of Degradation
The degradation of vitamin A (retinoids and vitamin A-active cartenoids) generally parallels the oxidative degradation ofunsaturated lipids. Factors that promote oxidation of unsaturated lipids enhance degradation of vitamin A, either by directoxidation or by indirect effects of free radicals. Changes in the b-carotene content of cooked dehydrated carrots illustrate typicalextents of degradation during processing and typical exposure to oxygen during associated handling (Table 9). It should benoted, however, that extended storage of vitamin A in foods such as fortified breakfast cereal products, infant formulas, fluidmilk, fortified sucrose, and condiments is usually not highly detrimental to the retention of added vitamin A.
Losses of vitamin A activity of retinoids and carotenoids in foods occur mainly through reactions involving the unsaturatedisoprenoid side chain, by either autoxidation or geometric isomerization. Retinoid and carotenoid molecules remain chemicallyintact during thermal processing, although they do undergo some isomerization. High-performance liquid chromatography(HPLC) analysis has revealed that many foods contain a mixture of all-trans and cis isomers of retinoids and carotenoids. Assummarized in Table 10, conventional canning of fruits and vegetables is sufficient to induce isomerization and ensuing losses ofvitamin A activity. In addition

Pag e 548
TABLE 7 Relative Vitamin A Activity of StereoisomericForms of Retinol Derivatives
Relative vitamin A activitya
Isomer Retinyl acetate Retinal
All-trans 100 91
13-cis 75 93
11-cis 23 47
9-cis 24 19
9,13-Di-cis 24 17
11,13-Di-cis 15 31
aMolar vitamin A activity relative to all-trans-retinyl acetatein rat bioassays.
Source: Ref. 2.
to thermal isomerization, the conversion of all-trans forms of retinoids and carotenoids to various cis isomers can be induced byexposure to light, acid, chlorinated solvents (e.g., chloroform), or dilute iodine. Chlorinated solvents often used in lipid analysisenhance the photochemical isomerization of retinyl palmitate and, presumably, other retinoids and carotenoids.
The occurrence of cis isomers of carotenoids has been known for many years (Fig. 6). Previous nomenclature for b-caroteneisomers was derived from chromatographic separations and included neo-b-carotene U (9-cis-b-carotene) and neo-b-caroteneB (13-cis-b-carotene). Confusion exists in the literature because neo-b-carotene B was originally identified incorrectly as 9, 13'-di-cis-b-carotene [133]. Analogous isomerization occurs with other carotenoids. The maximum extent of thermal isomerizationgenerally observed in canned fruits and vegetables is about 40% 13-cis-b-carotene and 30% 9-cis-b-carotene (Table 10). Thevalues observed for cis isomers of b-carotene in processed foods are similar to the equilibrium values observed in the iodinecatalyzed isomerization of b-carotene, which suggests that the extent and specificity of isomerization is similar regardless of themechanism.
Photochemical isomerization of vitamin A compounds occurs both directly and indirectly
TABLE 8 Relative Vitamin A Activity of Stereoisomeric Forms ofCarotenes
Compound and isomer Relative vitamin A activitya
B-Carotene
All-trans 100
9-cis (neo-U) 38
13-cis (neo-B) 53
n-Carotene
All-trans 53
9-cis (neo-U) 13
13-cis(neo-B) 16
aActivity relative to that of all-trans-b-carotene in rat bioassays.
Source: Ref. 145.

Pag e 549
TABLE 9 Concentration of b-Carotene in Cooked DehydratedCarrots
Sampleb-Carotene concentration
(mg /g solids)
Fresh 980–1860
Explosive puff-dried 805–1060
Vacuum freeze-dried 870–1125
Conventional air-dried 636–987
Source: Ref.30.
via a photosensitizer. The ratios and quantities of cis isomers produced differ with the means of photoisomerization.Photoisomerization of all-trans--b-carotene involves a series of reversible reactions, and each isomerization is accompanied byphotochemical degradation (Fig. 7). Similar rates of photoisomerization and photodegradation have been observed in aqueousdispersions of b-carotene and in carrot juice. These photochemical reactions also have been observed when retinoids in foodsare exposed to light (e.g., milk). The type of packaging material can have a substantial effect on net retention of vitamin Aactivity in food exposed to light during storage.
Oxidative degradation of vitamin A and carotenoids in foods can occur by direct peroxida-
TABLE 10 Distribution of b-Carotene Isomers in Selected Fresh and ProcessedFruits and Veg etables
Percentag e of total b-carotene
Product Status 13-cis All-trans 9-cis
Sweet potato Fresh 0.0 100.0 0.0
Sweet potato Canned 15.7 75.4 8.9
Carrot Fresh 0.0 100.0 0.0
Carrot Canned 19.1 72.8 8.1
Squash Fresh 15.3 75.0 9.7
Squash Canned 22.0 66.6 11.4
Spinach Fresh 8.8 80.4 10.8
Spinach Canned 15.3 58.4 26.3
Collard Fresh 16.3 71.8 11.7
Collard Canned 26.6 46.0 27.4
Cucumber Fresh 10.5 74.9 14.5
Pickle Pasteurized 7.3 72.9 19.8
Tomato Fresh 0.0 100.0 0.0
Tomato Canned 38.8 53.0 8.2
Peach Fresh 9.4 83.7 6.9
Peach Canned 6.8 79.9 13.3
Apricot Dehydrated 9.9 75.9 14.2
Apricot Canned 17.7 65.1 17.2
Nectarine Fresh 13.5 76.6 10.0
Plum Fresh 15.4 76.7 8.0
Source: Ref.23.


Pag e 550
FIGURE 6Structures of selected cis isomers of b-carotene: (I) all-trans; (II) 11,
15-di-cis; (III) 9-cis; (IV) 13-cis; (V) 15-cis.
tion or by indirect action of free radicals produced during oxidation of fatty acids. b-Carotene and probably other carotenoidshave the ability to act as antioxidants under conditions of reduced oxygen concentration (<150 torr O2), although they may actas pro-oxidants at higher oxygen concentrations [19]. b-Carotene can act as an antioxidant by scavenging single oxygen,hydroxyl, and superoxide radicals, and by reacting with peroxyl radicals ROO. Peroxyl radicals attack b-carotene to form andadduct postulated to be ROO-b-carotene, in which the peroxyl radical bonds to the C7 position of b-carotene, while theunpaired electron is delocalized across the conjugated double bond system. b-Carotene apparently does not act as an chain-breaking radical (donating H as do phenolic antioxidants. This antioxidant behavior of b-carotene, and
FIGURE 7Model of photochemically
induced reactions of b-carotene.(From Ref. 104.)

Pag e 551
presumably other carotenoids, causes a reduction or total loss of vitamin A activity regardless of the mechanisms by which freeradical initiation occurs. For retinol and retinyl esters, however, the attack of free radicals occurs at the C14 and C15 positions.
Oxidation of b-carotene involves the formation of the 5,6-epoxide, which may isomerize to the 5,8-epoxide (mutachrome).Photochemically induced oxidation yields mutachrome as the primary degradation product. Fragmentation of b-carotene tomany lower molecular weight compounds can occur especially during high-temperature treatments. Resulting volatiles can have asignificant effect on flavor. Such fragementation also occurs during oxidation of retinoids. An overview of these reactions andother aspects of the chemical behavior of vitamin A is shown in Figure 8.
8.7.1.3 Bioavailability
Retinoids are absorbed effectively except under conditions in which malabsorption of fat occurs. Retinyl acetate and palmitateare as effectively utilized as nonesterified retinol. Diets containing nonabsorable hydrophobic materials such as certain fatsubstitutes may contribute to malab-
FIGURE 8Overview of vitamin A deg radation.

Pag e 552
sorption of vitamin A. The bioavailability of vitamin A added to rice has been demonstrated in human subjects.
Aside from the inherent difference in utilization between retinol and the provitamin. A carotenoids, carotenoids in many foodsundergo markedly less intestinal absorption. Absorption may be impaired by the specific binding of carotenoids ascarotenoproteins or by entrapment in poorly digestible vegetable matrices. In studies with human subjects, b-carotene fromcarrots yielded only ~21% of the plasma b-carotene response obtained from an equivalent does of pure b-carotene, while b-carotene in broccoli exhibited a similarly low bioavailability [15].
8.7.1.4 Analytical Methods
Early methods of vitamin A analysis centered on the reactions of retinoids with Lewis acids such as antimony trichloride andtrifluoroacetic acid to yield a blue color. In addition, fluorometric methods have been used to measure vitamin A [13].Interferences often occur when these methods are applied to foods. Furthermore, these methods do not detect trans-cisisomerization that may occur during processing or storage of foods. Because the cis isomers exhibit less nutritional activity thanthe all-trans compound, it is inaccurate to regard total vitamin A or provitamin A activity simple as the sum of all isomeric forms.HPLC is the method of choice because it enables individual retinoids to be determined with considerable accuracy [131].Accurate measurement of carotenoids is a very complex task in view of the many naturally occurring chemical forms present infoods [73].
8.7.2 Vitamin D
8.7.2.1 Structure and General Properties
Vitamin D activity in foods is associated with several lipid-soluble sterol analogues including cholecalciferol (vitamin D3) fromanimal sources and ergocalciferol (vitamin D2) produced synthetically (Fig. 9). Both of these compound are used in syntheticform for food fortification. Cholecalciferol forms in human skin upon exposure to sunlight, and this is a multistep processinvolving photochemical modification of 7-dehydrocholesterol followed by nonenzymatic isomerization. Because of this in vivosynthesis, the requirement for dietary vitamin D will depend on the extent of exposure to sunlight. Ergocalciferol is an exclusivelysynthetic form of vitamin D that, is formed by commercial irradiation of phytosterol (a plant sterol) with UV light. Severalhydroxylated metabolites of vitamin D2 and D3 form in vivo. The 1,25-dihydroxy derivative of cholecalciferol is the mainphysiologically active form, and it is involved in the regulation of calcium absorption and metabolism. 25-Hydroxycholecalciferol,in addition to cholecalciferol,
FIGURE 9Structure of erg ocalciferol (vitamin D2) and cholecalciferol
(Vitamin D3).

Pag e 553
comprises a significant amount of the naturally occurring vitamin D activity in meat and milk products.
Fortification of most fluid milk products with either ergocalciferol or cholecalciferol D makes a significant contribution to dietaryneeds. Vitamin D is susceptible to degradation by light, and this may occur in glass-packaged milk during retail storage. Forexample, approximately 50% of cholecalciferol added to skim milk is lost during 12 days of continual exposure to fluorescentlight at 4°C. It is not known whether this degradation involves direct photochemical degradation or occurs as an indirect effect oflight-induced lipid oxidation. Like other unsaturated fat-soluble components of foods, vitamin D compounds are susceptible tooxidative degradation. Overall, however, the stability of vitamin D in foods, especially under anaerobic conditions, is not a majorconcern.
8.7.2.2 Analytical Methods
Measurement of vitamin D is performed primarily by HPLC methods [135]. Alkaline conditions yield rapid degradation ofvitamin D; thus, saponification as used widely in the analysis of lipid-soluble materials cannot be employed. Various preparativechromatographic methods have been developed for the purification of food extracts prior to HPLC analysis.
8.7.3 Vitamin E
8.7.3.1 Structure and General Properties
Vitamin E is the generic term for tocols and tocotrienols that exhibit vitamin activity similar to that of a-tocopherol. Tocols are 2-methyl-2(4',8',12'-trimethyltridecyl)chroman-6-ols, while tocotrienols are identical except for the presence of double bonds atpositions 3', 7', and 11' of the side chain (Fig. 10). Tocopherols, which are typically the main compounds having vitamin Eactivity in foods, are derivatives of the parent compound tocol, and have one or more methyl groups at position 5, 7, or 8 of thering structure (chromanol ring) (Fig. 10). The a, b, g forms of tocopherol and tocotrienol differ according to the number andposition of the methyl groups and thus differ significantly in vitamin E activity (Table 10).
There are three asymmetric carbons (2, 4', and 8') in the tocopherol molecule, and the stereochemical configuration at thesepositions influences the vitamin E activity of the compound. Early nomenclature for vitamin E compounds is confusing with regardto the vitamin activity of the stereoisomers. The naturally occurring configuration of a-tocopherol exhibits the greatest vitamin Eactivity and is now designated RRR-a-tocopherol; other terminology, such as the term d-a-tocopherol, should be discontinued.Synthetic forms of a-tocopheryl acetate are used widely in food fortification. The presence of the acetate ester greatly improvesthe stability of the compound. Synthetic forms that are racemic mixtures consisting of eight possible combinations of geometricisomers involving positions 2, 4', and 8' should be designated all-rac-a-tocopheryl acetate rather than the previously used termdl-a-tocopheryl-acetate. Vitamin E activity of tocopherols and tocotrienols varies according to the particular form present (a,b, g , or d) (Table 11), in addition to stereochemical nature of the tocopherol side chain (Table 12). The lower vitamin E activityof all-rac-a-tocopheryl acetate, relative to naturally occurring RRR isomers of the vitamin, should be recognized andcompensated for when using these compounds for food fortification. While a-tocopherol is the major form of vitamin E in mostanimal products, other tocopherols and tocotrienols occur in varying proportions in plant products (Table 13).
The tocopherols and tocotrienols are very nonpolar and exist mainly in the lipid phase of foods. All tocopherols and tocotrienols,when not esterified, have the ability to act as antioxi-

Pag e 554
FIGURE 10Structures of tocopherols. The structures of tocotrienols are
identical to the corresponding tocopherols, except for thepresence of double bonds at positions 3', 7', and 11'.
dants; they quench free radicals by donating the phenolic H and an electron. Tocopherols are a natural constituent of allbiological membranes and are thought to contribute to membrane stability through their antioxidant activity. Naturally occurringtocopherols and tocotrienols also contribute to the stability of highly unsaturated vegetable oils through this antioxidant action. Incontrast, a-tocopheryl acetate added in food fortification has no antioxidant activity because the acetate ester has replaced thephenolic hydrogen atom. a-Tocopheryl acetate does exhibit vitamin E activity and in vivo antioxidant effects as a result ofenzymatic cleavage of the ester. The concentration of dietary vitamin E in animals has been shown to influence the oxidativestability of meats after slaughter. For example, it has been shown that the susceptibility of pork muscle products to oxidation ofcholesterol and other lipids is inversely related to a-tocopheryl acetate intake of the pigs.
8.7.3.2 Stability and Mechanism of Degradation
Vitamin E compounds exhibit reasonably good stability in the absence of oxygen and oxidizing lipids. Anaerobic treatments infood processing, such as retorting of canned foods, have little effect on vitamin E activity. In contrast, the rate of vitamin Edegradation increases in the presence of molecular oxygen and can be especially rapid when free radicals are also present.Oxidative degradation of vitamin E is strongly influenced by the same factors that influence oxidation of unsaturated lipids. The aw
dependence of a-tocopherol degradation is similar to that

Pag e 555
TABLE 11 Relative Vitamin E Activity of Tocopherols and Tocotrienols
Bioassay method
CompoundRat fetal
resorptionRat erythrocyte
hemolysisMuscular dystrophy
(chicken)Muscular dystrophy
(rat)
a-Tocopherol 100 100 100 100
b-Tocopherol 25-40 15-27 12
g-Tocopherol 1-11 3-20 5 11
d-Tocopherol 1 0.3-2
a-Tocotrienol 27-29 17-25 28
b-Tocotrienol 5 1-5
Source: Adapted from Ref.88.
of unsaturated lipids, with a rate minimum occurring at the monolayer moisture value and greater rates at either higher or loweraw (see Chap. 2). The use of international oxidative treatments, such as the bleaching of flour, can lead to large losses of vitaminE.
An interesting nonnutritional use of a-tocopherol in foods is in the curing of bacon to reduce formation of nitrosamines. It isthought that a-tocopherol serves as a lipid-soluble phenolic compound to quench nitrogen free radicals (NO.,NO.2, in a radical-mediated nitrosation process.
Reactions of vitamin E compounds, especially a-tocopherol, in foods have been studied extensively. As summarized in Figure11, a-tocopherol can react with a peroxyl radical (or other free radicals) to form a hydroperoxide and an a-tocopheryl radical.As with other phenolic radicals, this is relatively unreactive because the unpaired electron resonates across the phenolic ringsystem. Radical termination reactions can occur to form covalently linked tocopheryl dimers and trimers, while additionaloxidation and rearrangement can yield tocopheroxide, tocopheryl hydroquinone, and tocopheryl quinone (Fig. 11).Rearrangement and further oxidation can yield many other products. Although a-tocopheryl acetate and other vitamin E estersdo not participate
TABLE 12 Vitamin E Activity of Isomeric Forms of a-Tocopheryl Acetate
Form of a-tocopheryl acetate a Relative vitamin E activity (%)
RRR 100
All-rac 77
RRS 90
RSS 73
SSS 60
RSR 57
SRS 37
SRR 31
SSR 21
aR and S refer to the chiral config uration of the 2, 4', and 8' positions,respectively. R is the naturally occuring chiral form. All-rac sig nifies fullyracemic.
Source: Adapted from Ref. 139.


Pag e 556
TABLE 13 Concentration of Tocopherols and Tocotrienols in Selected Veg etable Oils and Foods
Food a-T a-T3 b-T b-T3 g-T g-T3 d-T d-T3
Veg etable oils (mg /100 g )
Sunflower 56.4 .013 2.45 0.207 0.43 0.023 0.087
Peanut 14.1 0.007 0.396 0.394 13.1 0.03 0.922
Soybean 17.9 0.021 2.80 0.437 60.4 0.078 37.1
Cottonseed 40.3 0.002 0.196 0.87 38.3 0.089 0.457
Corn 27.2 5.37 0.214 1.1 56.6 6.17 2.52
Olive 9.0 0.008 0.16 0.417 0.471 0.026 0.043
Palm 9.1 5.19 0.153 0.4 0.84 13.2 0.002
Other foods (m/ml or g )
Infant formula(saponified)
12.4 0.24 14.6 7.41
Spinach 26.05 9.14
Beef 2.24
W heat flour 8.2 1.7 4.0 16.4
Barley 0.02 7.0 6.9 2.8
Note: T, tocopherol; T3, tocotrienol.
Source: Adapted from Refs. 132 and 135.
in radical quenching, they are subject to oxidative degradation but at a slower rate than that of nonesterified compounds. Thedegradation products of vitamin E exhibit little or no vitamin activity. Through their ability to act as phenolic antioxidants,nonesterified vitamin E compounds contribute to the oxidative stability of food lipids.
Vitamin E compounds also can contribute indirectly to oxidative stability of other compounds by scavenging singlet oxygen whilebeing concurrently degraded. As shown in Figure 12, singlet oxygen directly attacks the tocopherol molecule ring system to forma transient hydroperoxydieneone derivative. This can rearrange to form both the tocopheryl quinone and the tocopheryl quinone2,3-oxide, which have little vitamin E activity. The order of reactivity toward singlet oxygen is a>b>g>d, and antioxidativepotency is in the reverse order. Tocopherols also can physically quench singlet oxygen, which involves deactivation of thesinglet-state oxygen without oxidation of the tocopherol. These attributes of tocopherols are consistent with the fact that thetocopherols are potent inhibitors of photosensitized, singlet-oxygen-mediated oxidation of soybean oil.
8.7.3.3 Bioavailability
The bioavailability of vitamin E compounds is usually quite high in individuals who digest and absorb fat normally. On a molarbasis, bioavailability of a-tocopheryl acetate is nearly equivalent to that of a-tocopherol [19] except at high doses, where theenzymatic deesterification of a-tocopheryl acetate acetate can be limiting. Previous studies indicating that a-tocopheryl acetatewas more potent than a-tocopherol on a molar basis may have been biased by the susceptibility of a-tocopherol to undergooxidation prior to testing.
8.7.3.4 Analytical Methods
HPLC methods for determination of vitamin E have largely superseded previous spectrophotometric and direct fluorometricprocedures. The use of HPLC permits the measurement of

Pag e 557
FIGURE 11Overview of the oxidative deg radation of vitamin E. In addition to the initialoxidation products shown, many other compounds are formed as a result
of further oxidation and rearrang ement.
specific forms of vitamin E (e.g., a-,b-, g-, d-tocopherols and tocotrienols) and, thus, estimation of total vitamin E activity in aproduct based on relative potencies of the specific compounds [26]. Detection can be accomplished using either ultraviolet (UV)absorbance of fluorescence. When saponification is used to aid in the separation of lipids from vitamin E, any vitamin E ester willbe hydrolyzed to free a-tocopherol. Care must be taken to prevent oxidation during extraction, saponification, and otherpreliminary treatments.
8.7.4 Vitamin K
8.7.4.1 Structure and General Properties
Vitamin K consists of a group of naphthoquinones that exist with or without a terpenoid side chain in the 3-position (Fig. 13).The unsubstituted form of vitamin K is menadione, and it is of primary significance as a synthetic form of the vitamin that is usedin vitamin supplements and food fortification. Phylloquinone (vitamin K1) is a product of plant origin, while menaquinones(vitmain K2) of varying chain length are products of bacterial synthesis, mainly by intestinal microflora. Phylloquinones occur inrelatively large quantities in leafy vegetables including spinach, kale, cauliflower, and cabbage, and they are present, but lessabundant, in tomatoes and certain vegetable oils. Vitamin K deficiency is rare in healthy individuals because of the widespreadpresence of phylloquinones in the diet and because microbial menoquinones are absorbed from the lower intestine. Vitamin Kdeficiency is ordinarily associated with malabsorp-

Pag e 558
FIGURE 12Reaction of sing let oxyg en and a-tocopherol.
FIGURE 13Structure of various forms of
vitamin K.

Pag e 559
tion syndromes or the use of pharmacological anticoagulants. Although the use of certain fat substitutes has been reported toimpair vitamin K absorption, moderate intakes of these substitutes have no significant effect on vitamin K utilization.
The quinone structure of vitamin K compounds can be reduced to the hydroquinone form by certain reducing agents, but vitaminK activity is retained. Photochemical degradation can occur, but the vitamin is quite stable to heat.
8.7.4.2 Analytical Methods
Spectrophotometric and chemical assays based on measurement of oxidation-reduction properties of vitamin K lack thespecificity required for food analysis. Various HPLC methods exist that provide satisfactory specificity and permit individualforms of vitamin K to be measured [135].
8.8 Water-Soluble Vitamins
8.8.1 Ascorbic Acid
8.8.1.1 Structure and General Properties
L-Ascorbic acid (AA) (Fig. 14) is a carbohydrate-like compound whose acidic and reducing properties are contributed by the2,3-enediol moiety. This compound is highly polar; thus, it is readily soluble in aqueous solution and insoluble in less nonpolarsolvents. AA is acidic in character as a result of ionization of the C-3 hydroxyl group (pKa1 = 4.04 at 25°C). A secondionization, dissociation of the C-2 hydroxyl, is much less favorable (pKa2=11.4). Two-electron oxidation and hydrogendissociation convert L-ascorbic acid to L-dehydroascorbic acid (DHAA).
FIGURE 14Structures of L-ascorbic acid and
L-dehydroascorbic acid and their isomericforms. (Asterisk indicates vitamin C
activity.)

Pag e 560
DHAA exhibits approximately the same vitamin activity as AA because it is almost completely reduced to AA in the body.
L-Isoascorbic acid, the C-5 optical isomer, and D-ascorbic acid, the C-4 optical isomer (Fig. 14), behave in a chemicallysimilar manner to AA, but these compounds have essentially no vitamin C activity. L-Isoascorbic acid and AA are widely usedas food ingredients for their reducing and antioxidative activity (e.g., in the curing of meats and for inhibiting enzymatic browningin fruits and vegetables), but isoascorbic acid (or D-ascorbic acid) has no nutritional value.
AA occurs naturally in fruits and vegetables and, to a lesser extent, in animal tissues and animal-derived products. It occursnaturally almost exclusively in the reduced L-ascorbic acid (i.e., AA) form. The concentration of DHAA found in foods is almostalways substantially lower than AA and is a function of the rates of ascorbate oxidation and DHAA hydrolysis to 2,3-diketogulonic acid. Dehydroascorbate reductase and ascorbate free radical reductase activity exists in certain animal tissues.These enzymes are believed to conserve the vitamin through recycling and contribute to low DHAA concentrations. A significantbut currently unknown fraction of the DHAA in foods and biological materials appears to be an analyctical artifact that arisesfrom oxidation of AA to DHAA during sample preparation and analysis. The instability of DHAA further complicates thisanalysis.
AA may be added to foods as the undissociated acid or as the neutralized sodium salt (sodium ascorbate). Conjugation of AAwith hydrophobic compounds confers lipid solubility to the ascorbic acid moiety. Fatty acid esters such as ascorbyl palmitateand ascorbic acid acetals (Fig. 15) are lipid soluble and can provide a direct antioxidative effect in lipid environments.
Oxidation of AA takes place as either two one-electron transfer processes or as a single two-electron reaction without detectionof the semihydroascorbate intermediate (Fig. 16). In one-electron oxidations, the first step involves transfer of an electron toform the free radical semidehydroascorbic acid. Loss of an additional electron yields dehydroascorbic acid, which is highlyunstable because of the susceptibility to hydrolysis of the lactone bridge. Such hydrolysis, which irreversibly forms 2,3-diketogulonic acid (Fig. 16), is responsible for loss of vitamin C activity.
AA is highly susceptible to oxidation, especially when catalyzed by metal ions such as Cu2+ and Fe3+. Heat and light alsoaccelerate the process, while factors such as pH, oxygen concentration, and water activity strongly influence the rate of reaction.Since hydrolysis of DHAA occurs very readily, oxidation to DHAA represents an essential and frequently rate-limiting aspect ofthe oxidative degradation of vitamin C.
A frequently overlooked property of AA is its ability, at low concentrations, to act as a pro-oxidant with high oxygen tension.Presumably this occurs by ascorbate-mediated generation of hydroxyl radicals (OH.) or other reactive species. This appears tobe of minor importance in most aspects of food chemistry.
FIGURE 15Structures of ascorbyl palmitate and acetals.

Pag e 561
FIGURE 16Sequential one-electron oxidations of L-ascorbic acid. All have vitamin C activity
except 2,3-diketog ulonic acid.
8.8.1.2 Stability and Modes of Degradation
Overview
Because of the high solubility of AA aqueous solutions, the potential exists for significant losses by leaching from freshly cut orbruised surfaces of fruits and vegetables. Chemical degradation primarily involves oxidations to DHAA, followed by hydrolysisto 2,3-diketogulonic acid and further oxidation, dehydration, and polymerization to form a wide array of other nutritionallyinactive products. The oxidation and dehydration processes closely parallel dehydration reactions of sugars that lead to manyunsaturated products and polymers. The primary factor affecting the rate, mechanism, and qualitative nature of the AAgeneration products include pH, oxygen concentration, and the presence of trace metal catalysts.
The rate of oxidative degradation of the vitamin is a nonlinear function of pH because of the various ionic forms of the AA differin their susceptibility to oxidation: fully protonated (AH2) <ascorbate monoanion (AH-) <ascorbate dianion (A2-) [16]. Underconditions relevant to most foods, pH dependence of oxidation is governed mainly by the relative concentration of AH2 and AH-
species, and this, in turn, is governed by pH (pKa1 4.04). The presence of significant concentrations of the A2- form, ascontrolled by pKa2 of 11.4, yields an increase in rate at pH > 8.
Catalytic Effects of Metal Ions
The overall scheme of AA degradation depicted in Figure 17 is an integrated view of the effects of metal ions and the presenceor absence of oxygen on the mechanism of ascorbic acid degradation. The rate of oxidative degradation of AA is generallyobserved to be first order with respect to the concentration of the ascorbate monoanion (HA-), molecular oxygen, and the metalion. It was once believed that oxidative degradation of AA at neutral pH and in the absence of metal ions (i.e., the “uncatalyzed”reaction) occurred at a rate that was slow but significant. For example, a first-order rate constant of 5.87 × 10⁻⁴ sec-1 has beenreported for the assumed spontaneous uncatalyzed oxidation of ascorbate at neutral pH. However, more recent evidenceindicates a much smaller rate constant of 6 × 10⁻⁷ sec-1 for AA oxidation in an air-saturated solution at pH 7.0 [16]. Thisdifference suggests that uncatalyzed oxidation is essentially negligible and that trace metals in foods or experimental solutions areresponsible for much of the oxidative degradation. Rate constants obtained in the presence of metal ions at concentrations

Pag e 562
FIGURE 17Overview of mechanisms for the oxidative and anaerobic deg radation of ascorbic acid.
Structures with bold lines are primary sources of vitamin C activity. Abbreviations:AH2, fully protonated ascorbic acid; AH -, ascorbate monoanion;AH .;
semidehydroascorbate radical; A, dehydroascorbic acid; FA, 2-furoic acid; F,2-furaldehyde;DKG, diketog ulonic acid; DP, 3-deoxypentosone, X, xylosone; Mn +, metal catalyst;
HO2, perhydroxyl radical. (Based on Refs. 16, 17, 74, 75, 84, and 128.)
of several parts per million are several orders of magnitude greater than those obtained in solutions nearly devoid of metal ions.
The rate of metal-catalyzed oxidation of AA is proportional to the partial pressure of dissolved oxygen over the range of1.0–0.4 atm, and is independent of oxygen concentration at partial pressures <0.20 atm [74]. In contrast, the oxidation of AAcatalyzed by metal chelates is independent of oxygen concentration [75].
The potency of metal ions in catalyzing ascorbate degradation depends on the metal involved, its oxidation state, and thepresence of chelators. Catalytic potency is as follows: Cu(II) is about 80 times more potent than Fe(III), and the chelate ofFe(III) and ethylenediamine-tetraacetic acid (EDTA) complex is ~4 times more catalytic than free Fe(III) [16]. When the rateexpression of ascorbate oxidation is presented as
-d[TA]/dt = kcat × [AH-] × [Cu(II) or Fe(III)]

Pag e 563
the metal ion and concentration and the kcat for metal ions can be used to estimate the rate of AA degradation (where [TA] =concentration of total ascorbic acid). In pH 7.0 phosphate buffers (20°C), kcat values for Cu(II), Fe(III), and Fe(III)-EDTA are880, 42, and 10 (M-1 sec-1), respectively. It should be noted that the relative and absolute values of these catalytic rate constantsin simple solutions may differ from those of actual food systems. This is likely because trace metals may associate with otherconstitutents (e.g., amino acids) or may participate in other reactions, some of which may generate reactive free radicals oractive oxygen species that may hasten oxidation of ascorbic acid.
In contrast to the enhanced catalytic potency of Fe(III) when chelated by EDTA, Cu(II)- catalyzed oxidation of ascorbate islargely inhibited in the presence of EDTA [16]. Thus, the influence of EDTA or other chelators (e.g., citric acid andpolyphosphates) on the oxidation of ascorbic acid in foods is not fully predictable.
Mechanisms of AA Degradation
Oxidation of AA can be initiated by formation of a ternary complex (ascorbate monoanion, metal ion, and O2), as describedalready, or by a variety of one-electron oxidations. As reviewed by Buettner [17], there are many ways in which the one-electron oxidation of AH- to AH-., and A-. to DHAA can occur. A ranking of the reduction potential, that is, reactivity, ofrelevant oxidants is summarized in Table 14. This illustrates the interrelationships in antioxidative function of several vitaminsincluding ascorbic acids, a-tocopherol, and riboflavin.
The mechanism of AA degradation may differ depending on the nature of the food system or reaction medium. Metal-catalyzeddegradation of AA has been proposed to occur through formation of a ternary complex of ascorbate monoanion, O2, and ametal ion (Fig. 17). The ternary complex of ascorbate, oxygen, and metal catalyst appears to yield directly DHAA as theproduct, without detectable formation of the product of one-electron oxidation, semidehydroascorbate radical.
The loss of vitamin C activity during oxidative degradation of AA occurs with the hydrolysis of the DHAA lactone to yield 2,3-diketogulonic acid (DKG). This hydrolysis is favored by alkaline conditions, and DHAA is most stable at pH 2.5–5.5. Thestability of DHAA at pH > 5.5 is very poor, and becomes more so as pH increases. For example, half-time values for DHAAhydrolysis at 23°C are 100 and 230 min at pH 7.2 and 6.6, respectively [11]. The rate of DHAA hydrolysis markedly increaseswith increasing temperature but is unaffected by the presence or absence of oxygen. In view of the labile nature of DHAA atneutral pH, analytical data showing significant quantities of DHAA in foods should be viewed with caution because elevatedDHAA concentrations may also reflect uncontrolled oxidation during the analysis.
Although the ternary complex, as proposed by Khan and Martell [74], is apparently an accurate model of AA oxidation, recentfindings have expanded our knowledge of the mechanism. Scarpa et al. [117] observed that metal-catalyzed oxidation of the
ascorbate monoanion forms superoxide in the rate-determining step:
Subsequent steps of the reaction involve superoxide as a rate enhancer, effectively doubling the overall rate ascorbate oxidation:

Pag e 564
As shown in Figure 17, termination also can occur through the reaction of two ascorbate radicals as
Anaerobic degradation of AA (Fig. 17) is relatively insignificant as a means of loss of the vitamin in most foods. The anaerobicpathway becomes most significant in canned products, such as vegetables, tomatoes, and fruit juices, after depletion of residualoxygen, but even in these products loss of AA through anaerobic means typically occurs very slowly. Surprisingly, the anaerobicpathway has been identified as the predominant mechanism for loss of AA during storage of dehydrated tomato juice in thepresence or absence of oxygen. Trace-metal catalysis of anaerobic degradation has been demonstrated, with the rate increasingin proportion to copper concentration.
The mechanism of anaerobic degradation of AA has not been fully established. Direct cleavage of the 1,4-lactone bridge withoutprior oxidation to DHAA appears to be involved, perhaps following an enol-keto tautomerization as shown in Figure 17. Unlikedegradation of AA under oxidative conditions, anaerobic degradation exhibits a maximum rate at pH~3–4. This maximum rate inthe mildly acidic range may reflect the effects of pH on the opening of the lactone ring and on the concentration of themonoanionic ascorbate species.
Pag e 565
The complexity of the anaerobic degradation mechanism, and the influence of food composition, is suggested by the significantchange in activation energy at 28°C for the loss of total vitamin C from single strength orange juice during the storage. Incontrast, the Arrhenius plot for the degradation of total vitamin C during the storage of canned grapefruit juice is linear over thesame range (~4–50°C), which suggests that a single mechanism predominates [101]. The reasons for this kinetic and/ormechanistic difference in such similar products are not known.
In view of the residual oxygen present in many food packages, degradation of ascorbic acid in sealed containers, especially cansand bottles, would typically occur by both oxidative and anaerobic pathways. In most cases, rate constants for anaerobicdegradation of ascorbic acid will be two to three orders of magnitude less than those for the oxidative reaction.
Products of AA Degradation
Regardless of the mechanism of degradation, opening of the lactone ring irreversibly destroys vitamin C activity. Although devoidof nutritional relevance, the many reactions involved in the terminal phases of ascorbate degradation are important because oftheir involvement in producting flavor compounds or precursors and through their participation in nonenzymatic browning.
Over 50 low-molecular-weight products of ascorbic acid degradation have been identified. The kinds and concentrations ofsuch compounds, and the mechanisms involved are strongly influenced by factors such as the temperature, pH, water activity,concentrations of oxygen and metal catalysts, and presence of active oxygen species. Three general types of decompositionproducts have been identified: (a) polymerized intermediates, (b) unsaturated carboxylic acids of five- and six-carbon chainlength, and (c) fragmentation products having five or fewer carbons. Generation of formaldehyde during thermal degradation ofascorbate at neutral pH also has been reported. Some of these compounds are likely contributors to the changes in flavor andodor that occur in citrus juices during storage or excessive processing.
The degradation of sugars and ascorbic acid is strikingly similar, and in some cases mechanistically identical. Qualitativedifferences between aerobic and anaerobic conditions occur in the pattern of AA degradation, and pH exerts an influence in allcircumstances. The major AA breakdown products in neutral and acidic solution include L-xylosone, oxalic acid, L-threonicacid, tartaric acid, 2-furaldehyde (furfural), and furoic acid, as well as a wide variety of carbonyls and other unsaturatedcompounds. As with sugar degradation, the extent of fragmentation increases under alkaline conditions.
AA degradation is associated with discoloration reactions in both the presence and absence of amines. DHAA as well as thedicarbonyls formed during its degradation can participate in Strecker degradation with amino acids. Following Streckerdegradation of DHAA with an amino acid, the sorbamic acid product (Fig. 18) can form dimers, trimers, and tetramers, severalof which are reddish or yellowish in color. In addition, 3,4-dihydroxy-5-methyl-2(5H)-furanone, an intermediate product ofdehydration following decarboxylation during anaerobic degradation of AA, has a brownish color. Further polymerization ofthese or other unsaturated products forms either melanoidins (nitrogenous polymers) or nonnitrogenous caramel-like pigments.Although the nonenzymatic browing of citrus juices and related beverages is a complex process, the contribution of AA tobrowning has been clearly demonstrated [69].
Other Environmental Variables
Aside from the factors affecting ascorbate stability as discussed previously (e.g., oxygen, catalysts, pH, etc.), many othervariables influence retention of this vitamin in foods. As with many other water-soluble compounds, the rate of oxidation of AAin low-moisture food systems simulating breakfast cereals has been found to increase progressively over the range of~0.10–0.65 water activity [31, 71, 80] (Fig. 19). This apparently is associated with increased availability of

Pag e 566
FIGURE 18Participation of dehydroascorbic acid in the Strecker deg radation
reaction.
water to act as a solvent for reactants and catalysts. The presence of certain sugars (ketoses) can increase the rate of anaerobicdegradation. Sucrose has a similar effect at low pH, consistent with its pH-dependent generation of fructose. In contrast, somesugars and sugar alcohols exert a protective effect against the oxidative degradation of AA, possibly by binding metal ions andreducing their catalytic potency. The significance of these observations to actual foods remains to be determined.
8.8.1.3 Functions of Ascorbic Acid in Foods
In addition to its function as an essential nutrient, AA is widely used as a food ingredient/additive because of its reducing andantioxidative properties. As discussed elsewhere in this book, AA effectively inhibits enzymatic browning by reducing ortho-quinone products. Other functions include (a) reductive action in dough conditioners, (b) protection of certain oxidizable com-
FIGURE 19Deg radation of ascorbic acid as a function of storag etemperature and water activity in dehydrated modelfood systems simulating breakfast cereal products.
Data (means ±SD) are expressed as apparentfirst-order rate constants for the loss of total
ascorbic acid (AA + DHAA). (Data from Ref. 77).
Pag e 567
pounds (e.g., folates) by reductive effects, free radical scavenging, and oxygen scavenging, (c) inhibition of nitrosamine formationin cured meats, and (d) reduction of metal ions.
The antioxidative role of ascorbic acid is multifunctional, with ascorbate inhibiting lipid autoxidation by several mechanisms [17,84, 122]. These include (a)scavenging singlet oxygen, (b) reduction of oxygen- and carbon-centered radicals, with formation ofa less reactive semidehydroascorbate radical or DHAA, (c) preferential oxidation of ascorbate, with concurrent depletion ofoxygen, and (d) regeneration of other antioxidants, such as through reduction of the tocopherol radical.
AA is a very polar compound and is, therefore, essentially insoluble in oils. However, AA is surprisingly effective as anantioxidant when dispersed in oils as well as in emulsions [46]. Combinations of ascorbic acid and tocopherol are especiallyeffective in oil-based systems, while the combination of a-tocopherol and the lipophilic ascorbyl palmitate is more effective inoil-in-water emulsions. Similarly, ascorbyl palmitate has been shown to act synergistically with a-tocopherol and other phenolicantioxidants.
8.8.1.4 Bioavailability of Ascorbic Acid in Foods
The principal dietary sources of AA are fruits, vegetables, juices, and fortified foods (e.g., breakfast cereals). The bioavailabilityof AA in cooked broccoli, orange sections, and orange juice has been shown to be equivalent to that of vitamin-mineral tabletsfor human subjects [90]. Bioavailability of AA in raw broccoli is 20% lower than that in cooked broccoli. This may be causedby incomplete chewing and/or digestion. The relatively small difference in AA bioavailability in raw broccoli and potentially otherraw vegetables, relative to their cooked forms, may have little nutritional significance. Based on a recent review of the literature,it is clear that AA in most fruits and vegetables is highly available to humans [50].
8.8.1.5 Analytical Methods
Many procedures exist for the measurement of AA in foods, and selection of a suitable analytical method is essential to obtainaccurate results [103]. Ascorbic acid absorbs UV light strongly (lmax 245 nm), although direct spectrophotometric analysisis precluded by the many other chromophores found in most foods. DHAA absorbs only weakly at its lmax 300 nm.Traditional analytical procedures involve redox titration of the sample with a dye such as 2,6- dichlorophenolindophenol, duringwhich oxidation of AA accompanies reduction of the redox dye to its colorless form. A limitation of this approach is theinterference by other reducing agents and the lack of a response to DHAA. Sequential analysis of the sample before and aftersaturation with H2S gas or treatment with a thiol reagent to reduce DHAA to L-ascorbic acid permits the measurement of totalascorbic acid. Measurement of DHAA by difference lacks the precision of direct analysis, however.
An alternative approach involves condensation of DHAA (formed by controlled oxidation of L-ascorbic acid in the sample) withvarious carbonyl reagents. Direct treatment with phenylhydrazine to form the spectrophotometrically detectable ascorbyl-bis-phenylhydrazine derivative permits the simple measurement of L-AA in pure solution. Many carbonyl compounds in foods willinterfere with this procedure. A similar method involves the reaction of DHAA with o-phenylenediamine, which forms a tricyclic,highly fluorescent condensation product. Although more specific and sensitive than the phenylhydrazine method, the o-phenylenediamine procedure is also subject to interference by certain dicarbonyls in foods. Foods containing isoascorbic acidcannot be analyzed for vitamin C by redox titration or condensation with carbonyl reagents because these methods respond tothis nutritionally inactive compound.
Many HPLC methods permit accurate and sensitive measurement of total ascorbic acid (before and after treatment with areducing agent), and certain methods permit direct measure-
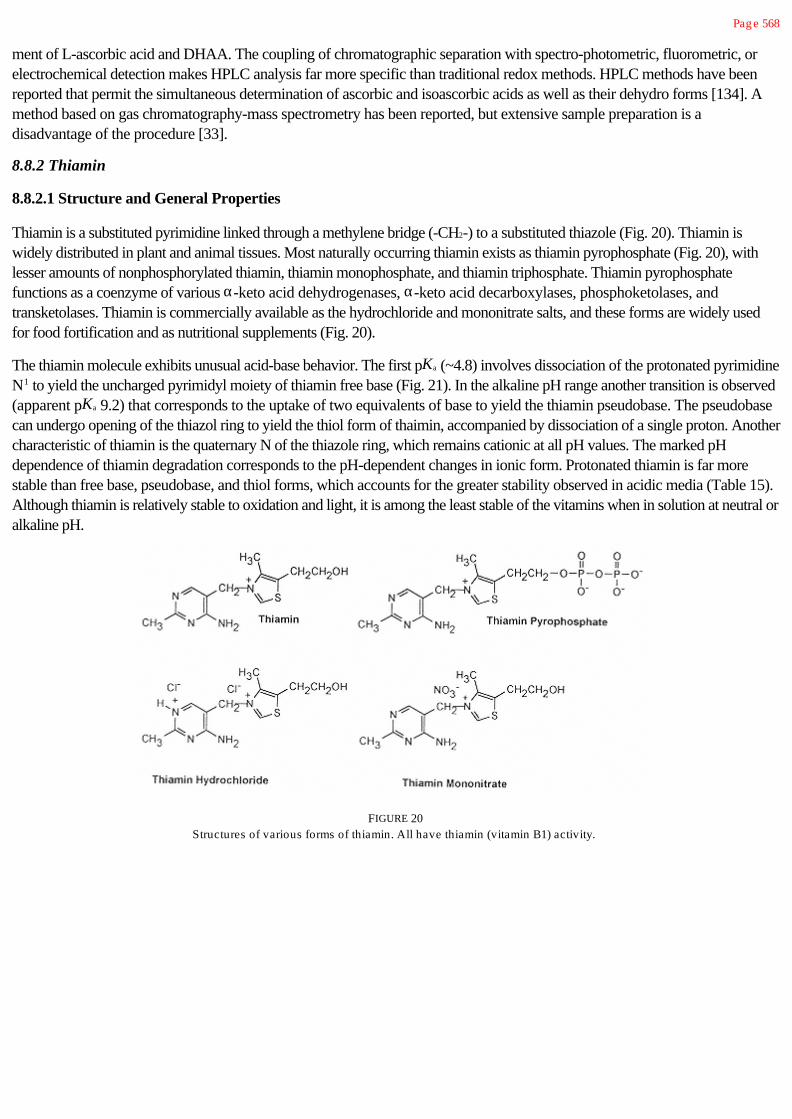
Pag e 568
ment of L-ascorbic acid and DHAA. The coupling of chromatographic separation with spectro-photometric, fluorometric, orelectrochemical detection makes HPLC analysis far more specific than traditional redox methods. HPLC methods have beenreported that permit the simultaneous determination of ascorbic and isoascorbic acids as well as their dehydro forms [134]. Amethod based on gas chromatography-mass spectrometry has been reported, but extensive sample preparation is adisadvantage of the procedure [33].
8.8.2 Thiamin
8.8.2.1 Structure and General Properties
Thiamin is a substituted pyrimidine linked through a methylene bridge (-CH2-) to a substituted thiazole (Fig. 20). Thiamin iswidely distributed in plant and animal tissues. Most naturally occurring thiamin exists as thiamin pyrophosphate (Fig. 20), withlesser amounts of nonphosphorylated thiamin, thiamin monophosphate, and thiamin triphosphate. Thiamin pyrophosphatefunctions as a coenzyme of various a-keto acid dehydrogenases, a-keto acid decarboxylases, phosphoketolases, andtransketolases. Thiamin is commercially available as the hydrochloride and mononitrate salts, and these forms are widely usedfor food fortification and as nutritional supplements (Fig. 20).
The thiamin molecule exhibits unusual acid-base behavior. The first pKa (~4.8) involves dissociation of the protonated pyrimidineN1 to yield the uncharged pyrimidyl moiety of thiamin free base (Fig. 21). In the alkaline pH range another transition is observed(apparent pKa 9.2) that corresponds to the uptake of two equivalents of base to yield the thiamin pseudobase. The pseudobasecan undergo opening of the thiazol ring to yield the thiol form of thaimin, accompanied by dissociation of a single proton. Anothercharacteristic of thiamin is the quaternary N of the thiazole ring, which remains cationic at all pH values. The marked pHdependence of thiamin degradation corresponds to the pH-dependent changes in ionic form. Protonated thiamin is far morestable than free base, pseudobase, and thiol forms, which accounts for the greater stability observed in acidic media (Table 15).Although thiamin is relatively stable to oxidation and light, it is among the least stable of the vitamins when in solution at neutral oralkaline pH.
FIGURE 20Structures of various forms of thiamin. All have thiamin (vitamin B1) activity.

Pag e 569
FIGURE 21Summary of major pathways for ionization and deg radation of thiamin (Adapted in modified form from
Refs. 128 and 38.)
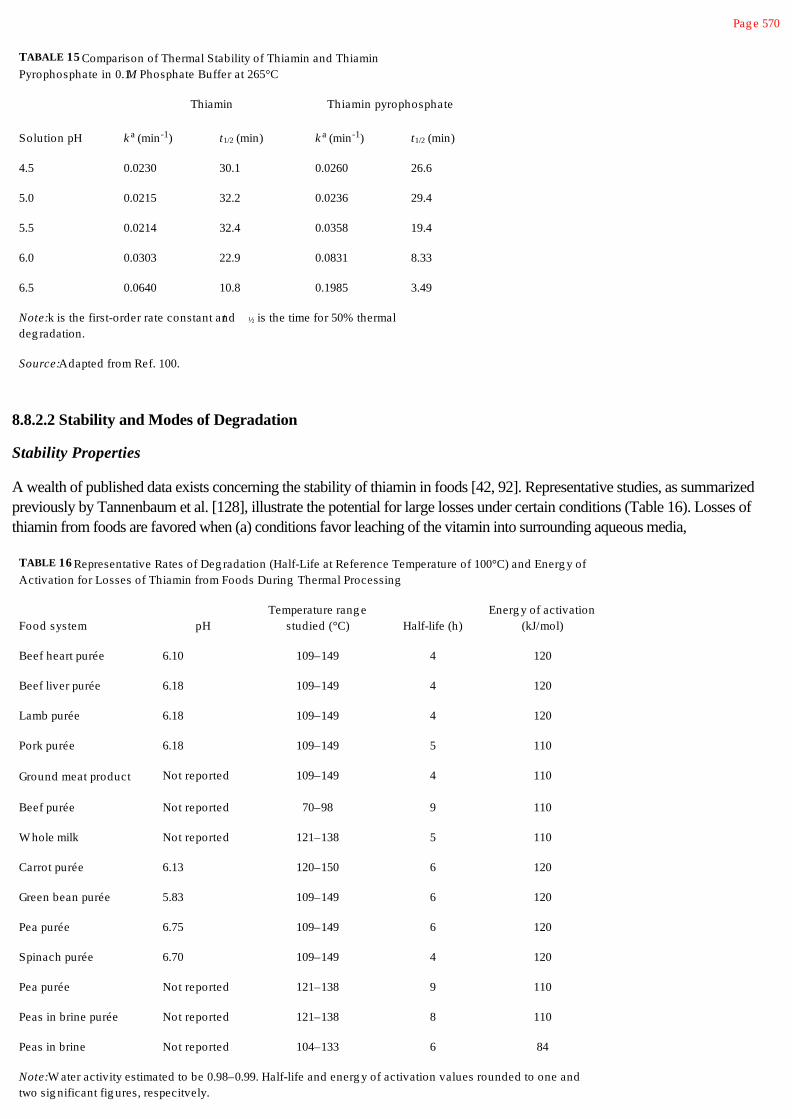
Pag e 570
TABALE 15 Comparison of Thermal Stability of Thiamin and ThiaminPyrophosphate in 0.1 M Phosphate Buffer at 265°C
Thiamin Thiamin pyrophosphate
Solution pH k a (min-1) t1/2 (min) k a (min-1) t1/2 (min)
4.5 0.0230 30.1 0.0260 26.6
5.0 0.0215 32.2 0.0236 29.4
5.5 0.0214 32.4 0.0358 19.4
6.0 0.0303 22.9 0.0831 8.33
6.5 0.0640 10.8 0.1985 3.49
Note: k is the first-order rate constant and t ½ is the time for 50% thermaldeg radation.
Source: Adapted from Ref. 100.
8.8.2.2 Stability and Modes of Degradation
Stability Properties
A wealth of published data exists concerning the stability of thiamin in foods [42, 92]. Representative studies, as summarizedpreviously by Tannenbaum et al. [128], illustrate the potential for large losses under certain conditions (Table 16). Losses ofthiamin from foods are favored when (a) conditions favor leaching of the vitamin into surrounding aqueous media,
TABLE 16 Representative Rates of Deg radation (Half-Life at Reference Temperature of 100°C) and Energ y ofActivation for Losses of Thiamin from Foods During Thermal Processing
Food system pHTemperature rang e
studied (°C) Half-life (h)Energ y of activation
(kJ/mol)
Beef heart purée 6.10 109–149 4 120
Beef liver purée 6.18 109–149 4 120
Lamb purée 6.18 109–149 4 120
Pork purée 6.18 109–149 5 110
Ground meat product Not reported 109–149 4 110
Beef purée Not reported 70–98 9 110
W hole milk Not reported 121–138 5 110
Carrot purée 6.13 120–150 6 120
Green bean purée 5.83 109–149 6 120
Pea purée 6.75 109–149 6 120
Spinach purée 6.70 109–149 4 120
Pea purée Not reported 121–138 9 110
Peas in brine purée Not reported 121–138 8 110
Peas in brine Not reported 104–133 6 84
Note: W ater activity estimated to be 0.98–0.99. Half-life and energ y of activation values rounded to one andtwo sig nificant fig ures, respecitvely.

Source: Ref. 92 (data compiled from multiple sources).

Pag e 571
(b) the pH is approximately neutral or greater, and/or (c) exposure to a sulfiting agent occurs. Losses of thiamin also can occurin fully hydrated foods during storage at moderate temperatures, although at predictably lower rates than those observed duringthermal processing (Table 17). Thiamin degradation in foods almost always follows first-order kinetics. Because degradation ofthiamin can occur by several possible mechanisms, multiple mechanisms sometimes occur simultaneously. The occurrence ofnonlinear Arrhenius plots for thermal losses of thiamin in certain foods is evidence of multiple degradation mechanisms that havedifferent temperature dependence.
Thiamin exhibits excellent stability under conditions of low water activity at ambient temperature. Thiamin in dehydrated modelsystems simulating breakfast cereals underwent little or no loss at temperatures less than 37°C at aw 0.1–0.65 (Fig. 22). Incontrast, thiamin degradation was markedly accelerated at 45°C, especially at aw 0.4 or greater (i.e., above the monomolecularmoisture value of aw 0.24). In these model systems, the maximum rate of thiamin degradation occurred at water activities of0.5–0.65 (Fig. 23). In similar model systems, the rate of thiamin degradation declined as the aw was increased from 0.65 to 0.85[5].
Thiamin is somewhat unstable in many fish and crustaceans postharvest, and this has been attributed to the presence ofthiaminases. However, at least part of this thiamin degradation activity is caused by heme proteins (myoglobin and hemoglobin)that are thermostable nonenzymatic catalysts of thiamin degradation [106]. The presence of thiamin-degrading heme proteins intuna, pork, and beef muscle suggests that denatured myoglobin may be involved in the degradation of thiamin during foodprocessing and storage. This nonenzymatic, thiamin- modifying activity apparently does not cause cleavage of the thiaminmolecule, as is common in thiamin degradation. The antithiamin component of fish viscera, previously reported to be athaiminase, is now believed to be a thermostable and probably nonenzymatic catalyst.
Other components of food can influence degradation of thiamin in foods. Tannins can inactivate thiamin apparently by theformation of several biologically inactive adducts. Various flavonoids may alter the thiamin molecule, but the apparent product offlavonoid oxidation in the presence of thiamin is thiamin disulfide, a compound that has thiamin activity. Proteins andcarbohydrates can reduce the rate of thiamin degradation during heating or in the presence of bisulfite, although the extent of thiseffect is difficult to predict in complex food systems. A part of the stabilizing effect of protein may occur through the formation ofmixed disulfides with the thiol form of thiamin, a reaction that appears to retard further modes of degradation. Chlorine
TABLE 17 Typical Losses of Thiamin fromCanned Foods During Storag e
Retention after 12months of storag e(%)
Food 38°C 1.5°C
Apricots 35 72
Green beans 8 76
Lima beans 48 92
Tomato juice 60 100
Peas 68 100
Orang e juice 78 100
Source: Ref. 47.

Pag e 572
FIGURE 22Influence of water activity and temperature on theretention of thiamin in a dehydrated model food
system simulating a breakfast cereal product.Percentag e retention values apply to an 8-month
storag e period. (From Ref. 32.)
FIGURE 23Influence of water activity on the first-order rateconstant of thiamin deg radation in a dehydratedmodel food system simulating a breakfast cereal
product stored at 45°C. (From Ref. 32.)

Pag e 573
(as hypochlorite ion), at levels present in water used in food formulation and processing, can cause rapid degradation of thiaminby a cleavage process that is apparently identical to the thermal cleavage of thiamin under acidic conditions.
Another complicating factor in the assessment and prediction of thiamin stability is the inherent difference in stability and pHdependence between free thiamin and the major naturally occurring form, thiamin pyrophosphate. Although thiamin and thiaminpyrophosphate exhibit nearly equivalent rates of thermal degradation at pH 4.5, thiamin pyrophosphate degrades almost threetimes faster at pH 6.5 (Table 15).
Significant differences exist in the stability of hydrochloride and mononitrate forms of synthetic thiamin. Thiamin HCI is moresoluble than the mononitrate, and this is advantageous for fortification of liquid products. Because of differing energies ofactivation, thiamin mononitrate is more stable at temperatures less than 95°C, while the hydrochloride exhibits greater stability attemperatures > 95–110°C (Table 18).
Mechanisms of Degradation
The rate and mechanism of thermal degradation of thiamin are strongly influenced by pH of the reaction medium, but degradationusually involves cleavage of the molecule at the central methylene bridge.
In acidic conditions (i.e., pH < 6) thermal degradation of thiamin occurs slowly and involves cleavage of the methylene bridge torelease the pyrimidine and thiazole moieties largely in unchanged form. Between pH 6 and 7, thiamin degradation acceleratesalong with a large increase in the extent of fragmentation of the thiazole ring, and at pH 8 intact thiazole rings are not foundamong the products. Thiamin degradation is known to yield a large number of sulfur-containing compounds that presumablyarise from fragmentation and rearrangement of the thiazole ring. These compounds have been shown to contribute to meatflavor. Products from
TABLE 18 Kinetic Values for Thiamin Loss in Semolina Doug h Subjected to Hig h Temperatures
aw
Temperature(°C)
k ( × 104 min-1)±95% Cla Half-life (min)
Energ y of activation(kcal/mol)b
Hydrochloride
0.58 75 3.72 ±0.01 1863 95.4
85 11.41± 3.64 607
95 22.45 ± 2.57 309
0.86 75 5.35 ± 2.57 1295 92.1
85 12.20 ± 4.45 568
95 30.45 ± 8.91 228
Mononitrate
0.58 75 2.88 ±0.01 2406 109
85 7.91 ±0.01 876
96 22.69 ±2.57 305
0.86 75 2.94 ±0.01 2357 111
85 8.31 ±0.01 834
95 23.89 ± 0.01 290
aFirst-order rate constant ± 95% confidence interval.
bkcal × 4.186 = kJ.

Source: Ref. 81.

Pag e 574
thiazole fragmentation are thought to arise from the small amounts of thiamin that exist in the thiol or pseudobase forms at pH>6.
Thiamin degrades rapidly in the presence of bisulfite ions, a phenomenon that stimulated federal regulations prohibiting the use ofsulfiting agents in foods that are significant sources of dietary thiamin. The cleavage of thiamin by bisulfite is similar to thatoccurring at pH <6, although the pyrimidine product is sulfonated (Fig. 21). This reaction is described as a base exchange ornucleophilic displacement at the methylene carbon, by which the bisulfite ion displaces the thiazole moiety. It is unclear whetherother nucleophiles relevant to foods can have a similar effect. Cleavage of thiamin by bisulfite occurs over a broad pH range,with the maximum rate occurring at pH 6 [146]. A bell-shaped pH profile of this reaction occurs because the sulfite ionprimarily reacts with the protonated form of thiamin.
Several researchers have noted a correspondence of the conditions (e.g., pH and water activity) favoring degradation of thiaminand progress of the Maillard reaction. Specifically, thiamin has a primary amino group on its pyrimidyl moiety, shows a maximumrate of degradation at an intermediate water activity, and exhibits greatly increased reaction rates at neutral and alkaline pHvalues. Early studies demonstrated the ability of thiamin to react with sugars under certain conditions; however, sugars often tendto increase the stability of thiamin. Despite the similarity of conditions favoring thiamin degradation and Maillard browning, thereappears to be little or no direct interaction of thiamin with the reactants or intermediates of the Maillard reaction in foods.
8.8.2.3 Bioavailability
Although the bioavailability of thiamin has not been fully evaluated, its utilization appears to be nearly complete in most foodsexamined. As mentioned previously, formation of thiamin disulfide and mixed thiamin disulfides during food processingapparently has little effect on thiamin bioavailability. Thiamin disulfide exhibits 90% of the activity of thiamin in animal bioassays.
8.8.2.4 Analytical Methods
Although microbiological growth methods exist for measurement of thiamin in foods, they are rarely used because of theavailability of fluorometric and HPLC procedures [43]. Thiamin is generally extracted from the food by heating (e.g.,autoclaving) a homogenate in dilute acid. For analysis of total thiamin, treatment of the buffered extract with a phosphatasehydrolyzes phosphorylated forms of the vitamin. Following chromatographic removal of nonthiamin fluorophores, treatment withan oxidizing agent converts thiamin to the highly fluorescent thiochrome that is easily measured (Fig. 21).
Total thiamin can be determined by HPLC following phosphatase treatment. Fluorometric HPLC analysis can be used followingconversion of thiamin to thiochrome or, alternatively, postcolumn oxidation to thiochrome can permit fluorometric detection.Individual phosphate esters of thiamin can be determined simultaneously by HPLC.
8.8.3 Riboflavin
8.8.3.1 Structure and General Properties
Riboflavin, formerly known as vitamin B2, is the generic term for the group of compounds that exhibit the biological activity ofriboflavin (Fig. 24). The parent compound of the riboflavin family is 7,8-dimethyl- 10(1'-ribityl)isoalloxazine, and all derivativesof riboflavin are given the generic name flavins. Phosphorylation of the 5'-position of the ribityl side chain yields flavin

Pag e 575
FIGURE 24Structures of riboflavin, flavin
mononucleotide,and flavin adenine dinucleotide.
mononucleotide (FMN), whereas flavin adenine dinucleotide (FAD) has an additional 5'- adenosyl monophosphate moiety (Fig.24). FMN and FAD function as conezymes in a large number of flavin-dependent enzymes that catalyze various oxidation-reduction processes. Both forms are readily convertible to riboflavin by action of phosphatases that are present in foods andthose of the digestive system. A relatively minor (< 10%) of the FAD in biological materials exists in a covalently bound enzymeform in which position 8a is covalently linked to an amino acid residue of the enzyme protein.
The chemical behavior of riboflavin and other flavins is complex, with each form able to exist in several oxidation states as wellas multiple ionic forms [93]. Riboflavin, as the free vitamin and during coenzymic function, undergoes redox cycling among threechemical species. These include the native (fully oxidized) yellow flavoquinone (Fig. 25), the flavosemiquinone (red or bluedepending on pH), and the colorless flavohydroquinone. Each conversion in this sequence involves a one-electron reduction andH+ uptake. The flavosemiquinone N5 has a pKa of ~8.4, while the flavohydroquinone N1 has a pKa of ~6.2.
Several minor forms of riboflavin also exist in foods, although their chemical origin and quantitative significance in human nutritionhave not been fully determined. As shown in Table 19, FAD and free riboflavin account for over 80% of the total flavins incow's and human milk [111, 112]. Of the minor forms present, most interesting is 10-hydroxyethylflavin, a product of bacterialflavin metabolism. 10-Hydroxyethylflavin is a known inhibitor of mammalian flavokinase and may inhibit the uptake of riboflavininto tissues. Other minor derivatives (such as lumiflavin) may also act as antagonists. Thus, foods contain flavins such asriboflavin, FAD, and FMN that exhibit vitamin activity, but in addition they may contain compounds that act as antagonists ofriboflavin transport and metabolism. This illustrates the need for a through analysis of the forms of riboflavin and other vitamins inorder to assess accurately the nutritional properties of foods.
8.8.3.2 Stability and Modes of Degradation
Riboflavin exhibits its greatest stability in acidic medium, is somewhat less stable at neutral pH, and rapidly degrades in alkalineenvironments. Retention of riboflavin in most foods is moderate

Pag e 576
FIGURE 25Oxidation-reduction behavior of
flavins.

Pag e 577
TABLE 19 Distribution of Riboflavin Compounds in Fresh Human andCow's Milk
Compound Human milk (%) Cow's milk (%)
FAD 38–62 23–46a
Riboflavin 31–51 35–59
10-Hydroxyethylflavin 2–10 11–19
10-Formylmethyflavin Trace Trace
7a-Hydroxyriboflavin Trace–0.4 0.1–0.7
8a-Hydroxyriboflavin Trace Trace–0.4
aFollowing pasteurization, FAD in bulk raw milk decreases from 26 to13%, with a corresponding increase in the percentag e of riboflavin.
Source: Adapted from Refs. 111 and 112.
to very good during conventional thermal processing, handling, and preparation. Losses during storage of riboflavin in variousdehydrated food systems (breakfast cereals and model systems) are usually negligible. Rates of degradation increase measurablyat aw above the monolayer value when temperatures are above ambient [32].
The typical mechanism of degradation of riboflavin is photochemical, which yields two biologically inactive products, lumiflavinand lumichrome (Fig. 26), and an array of free radicals [142]. Exposure of solutions of riboflavin to visible light has been usedfor many years as an experimental technique to generate free radicals. Photolysis of riboflavin yields superoxide and riboflavinradicals (R.), and the reaction of O2 with R. provides peroxy radicals and a wide range of other products. The extent to whichphotochemical degradation of riboflavin is responsible for photosensitized oxidation reactions in food has not been quantitativelydetermined, although this process assuredly contributes significantly. Sunlight-induced off flavor in milk, which is no longercommon, is a riboflavin-mediated photochemical process. Although the mechanism of off-flavor formation has not been fullydetermined, light-induced (probably radical-mediated) decarboxylation and deamination of methionine to form methional (CH3-S-CH2-CH2=O is at least partially responsible. Concurrent mild oxidation of milk lipids also occurs. Changes in packaging andcommercial distribution have minimized this problem.
FIGURE 26Photochemical conversion of riboflavin
tolumichrome and lumiflavin.

Pag e 578
8.8.3.3 Bioavailability
Relatively little is known regarding the bioavailability of naturally occurring forms of riboflavin; however, there is little evidence ofproblems associated with incomplete bioavailability. The covalently bound forms of FAD coenzymes have been shown to exhibitvery low availability when administered to rats, although these are minor forms of the vitamin. The nutritional significance ofdietary riboflavin derivatives that have potential antivitamin activity has not yet been determined in animals or humans.
8.8.3.4 Analytical Methods
Flavins are highly fluorescent compounds in their fully oxidized flavoquinone form (Fig. 25), and this property serves as the basisfor most analytical methods. The traditional assay procedure for the measurement of total riboflavin in foods involvesmeasurement of fluorescence before and after chemical reduction to the nonfluorescent flavohydroquinone [120]. Fluorescenceis a linear function of concentration in dilute solution, although certain food components can interfere with accurate measurement.Several HPLC methods are also suitable for measurement of total riboflavin in food extracts [43, 135]. These HPLCprocedures and the fluorometric method require extraction by autoclaving in dilute acid followed by a phosphatase treatment torelease riboflavin from FMN and FAD. HPLC can also be used to measure the individual riboflavin compounds in foods [111].
8.8.4 Niacin
8.8.4.1 Structure and General Properties
Niacin is the generic term for pyridine 3-carboxylic acid (nicotinic acid) and derivatives that exhibit similar vitamin activity (Fig.27). Nicotinic acid and the corresponding amide (nicotinamide; pyridine 3-carboxamide) are probably the most stable of thevitamins. The coenzyme forms of niacin are nicotinamide adenine dinucleotide (NAD) and nicotinamide adenine dinucleotidephosphate (NADP), either of which can exist in oxidized or reduced form. NAD and NADP function as coenzymes (in thetransfer of reducing equivalents) in many dehydrogenase reactions. Heat, especially under acid or alkaline conditions, convertsnicotinamide to nicotinic acid without loss of vitamin activity. Niacin is not affected by light, and no thermal losses occur underconditions relevant to food processing. As with other water-soluble nutrients, losses can occur by leaching during washing,blancing, and processing / preparation and by exudation of fluids from tissues (i.e., drip). Niacin is widely distributed invegetables and foods of animal origin. Niacin deficiency is rare in the United States, partially as a result of programs to enrichcereal grain products with this nutrient. Diets high in protein reduce the requirement for dietary niacin because of the metabolicconversion of tryptophan to nicotinamide.
In certain cereal grain products, niacin exists in several chemical forms that, unless hydrolyzed, exhibit no niacin activity. Theseinactive niacin forms include poorly characterized complexes involving carbohydrates, peptides, and phenols. Analysis of thesenutritionally unavailable, chemically bound forms of niacin has revealed chromatographic heterogeneity and variation in chemicalcomposition, indicating that many bound forms of niacin exist naturally. Alkaline treatments release niacin from these complexderivatives, which permits measurement of total niacin. Several esterified forms of nicotinic acid exist naturally in cereal grains,and these compounds contribute little to niacin activity in foods.
Trigonelline, or N-methyl-nicotinic acid, is a naturally occurring alkaloid found at relatively high concentrations in coffee and atlower concentrations in cereal grains and legumes.

Pag e 579
FIGURE 27Structures of nicotinic acid, nicotinamide, and nicotinamide
adenine dinucleotide (phosphate).
Under the mildly acidic conditions that prevail during roasting of coffee, trigonelline is demethylated to form nicotinic acid,yielding a 30-fold increase in the niacin concentration and activity of coffee.
Cooking also changes the relative concentration of certain niacin compounds through interconversion reactions [137, 138]. Forexample, heating releases free nicotinamide from NAD and NADP during the boiling of corn. In addition, the distribution ofniacin compounds within a product varies as a function of variety (e.g., sweet corn vs. field corn) and stage of maturity.
8.8.4.2 Bioavailability
The existence of nutritionally unavailable forms of niacin in many foods of plant origin has been known for many years, althoughthe chemical identities of the unavailable forms of the vitamin are poorly characterized. In addition to the chemically bound formsdiscussed earlier, several other forms of niacin contribute to its incomplete availability in foods of plant origin [137]. NADH, thereduced form of NAD, and presumably NADPH exhibit very low bioavailability because of their instability in the gastric acidenvironment. This may be of little nutritional significance because of the low concentration of these reduced forms in many foods.The primary factor affecting niacin bioavailability is the proportion of the total niacin that is chemically bound. As shown in Table20, there is often much more niacin measurable following alkaline extraction than there is by rat bioassays (biological availableniacin) or by direct analysis (free niacin).
8.8.4.3 Analytical Methods
Niacin can be measured by microbiological assay. The principal chemical assay involves a reaction of niacin with cyanogenbromide to yield an N-substituted pyridine that is then coupled to an aromatic amine to form a chromophore [39]. SeveralHPLC methods are available for measurement of nicotinic acid and nicotinamide in foods [43, 135], and HPLC has been usedto determine individual free and bound forms of niacin in cereal grains [137, 138].

Pag e 580
TABLE 20 Concentration of Niacin in Selected Foods as Determined by Chemical Assay (Acidic orAlkaline Extraction Methods) or Rat Bioassay
Type of chemical assay
FoodFree niacin
(mg/g)aTotal niacin (alkaline
extraction, mg/g) aRat bioassay
(mg/g)a
Corn 0.4 25.7 0.4
Boiled corn 3.8 23.8 6.8
Corn after alkaline heating (liquidretained)
24.6 24.6 22.3
Tortillas 11.7 12.6 14
Sweet corn (raw) – 54.5 40
Steamed sweet corn 45 56.4 48
Boiled sorg hum g rain 1.1 45.5 16
Boiled rice 17 70.7 29
Boiled wheat – 57.3 18
Baked potatoes 12 51 32
Baked liver 297 306 321
Baked beans 19 24 28
Note: Analysis of HCI extract yields a measure of “free niacin,” assay of the alkaline extract provides ameasure of total niacin, and the rat bioassay is a measure of biolog ically available niacin.
aW et weig ht basis.
Source: Adapted from Ref. 137.
8.8.5 Vitamin B6
8.8.5.1 Structure and General Properties
Vitamin B6 is a generic term for the group of 2-methyl-3-hydroxy-5-hydroxymethylpyridines having the vitamin activity ofpyridoxine. The various forms of vitamin B6 differ according to the nature of the one-carbon substituent at the 4-position, asshown in Figure 28. For pyridoxine (PN) the substituent is an alcohol, for pyridoxal (PL) it is an aldehyde, and for pyridoxamine(PM) it is an amine. These three basic forms can also be phosphorylated at the 5'-hydroxymethyl group, yielding pyridoxine 5'-phosphate (PNP), pyridoxal 5'-phosphate (PLP), or pyridoxamine 5'-phosphate (PMP). Vitamin B6, in the form of PLP, and toa lesser extent PMP, functions as a coenzyme in over 100 enzymatic reactions involved in the metabolism of amino acids,carbohydrates, neurotransmitters and lipids. All of the mentioned forms of vitamin B6 possess vitamin activity because they canbe converted in vivo to these conenzymes. The use of “pyridoxine” has a generic term for vitamin B6 has been discontinued.Similarly, the term “pyridoxol” has been discontinued in favor of pyridoxine.
Glycosylated forms of vitamin B6 are present in most fruits, vegetables, and cereal grains, generally as pyridoxine-5'-b-D-glucoside (Fig. 28) [55, 144]. These comprise 5–75% of the total vitamin B6 and account for 15–20% of the vitamin B6 intypical mixed diets. Pyridoxine glucoside becomes nutritionally active only after hydrolysis of the glucoside by the action of b-glucosidases in the intestine or other organs. Several other glycosylated forms of vitamin B6 are also found in certain plantproducts.
Vitamin B6 compounds exhibit complex ionization that involves several ionic sites (Table 21). Because of the basic character ofthe pyridinium N (pKa 8) and the acidic nature


Pag e 581
FIGURE 28Structures of vitamin B6 compounds.
of the 3-OH (pKa 3.5–5.0), the pyridine system of vitamin B6 molecules mainly exists in Zwitterionic form at neutral pH. Thenet charge on vitamin B6 compounds varies markedly as a function of pH. The 4'-amino group of PM and PMP (pKa 10.5)and the 5'-phosphate ester of PLP and PMP (pKa <2.5, ~6, and ~12) also contribute to the charge of these forms of thevitamin.
All chemical forms of vitamin B6 exist in foods, although the distribution varies markedly. PN glucoside exists only in the plantproducts, although most plant products also contain all other forms of the vitamin. Vitamin B6 in muscle and organ meats ispredominantly (>80%) PLP and PMP, with minor amounts of the nonphosphorylated species. Disruption of raw plant tissues byfreeze-thaw cycling or homogenization releases phosphatases and b-glucosidases that can alter the forms of vitamin B6compounds by catalyzing dephosphorylation and deglycosylation reactions. Similarly, disruption of animal tissues prior tocooking can cause extensive dephosphorylation of PLP and PMP. PNP is a transient intermediate in vitamin B6 metabolism andis usually a negligible component of the total vitamin B6 content. Pyridoxine (as the HCI salt) is the form of vitamin B6 used forfood fortification and in nutritional supplements because of its good stability.
TABLE 21 pK a Valuesof Vitamin B6Compounds
pKa
Ionization PN PL PM PLP PMP
3–OH 5.00 4.20–4.23 3.31–3.54 4.14 3.25–3.69
Pyridinium N 8.96–8.97 8.66–8.70 7.90–8.21 8.69 8.61
4'-Amino g roup 10.4–10.63 ND
5'-Phosphate ester
pKa1 <2.5 <2.5
pKa2 6.20 5.76
pKa3 ND ND
Note: PN, pyridixine; PL, pyridoxal; PM, pyridoxamine; PLP, pyridoxal 5' -phosphate; PMP, pyridoxamine5' -phosphate. ND, not determined.
Source: Ref. 123.

Pag e 582
The aldehyde and amine forms of vitamin B6 readily participate in carbonyl-amine reactions: PLP or PL with amines, and PMPor PM with aldehydes or ketones (Fig. 29). The coenzymic action of PLP in most B6-dependent enzymes involves a carbonyl-amine condensation. PLP and PL readily form Schiff bases with the neutral amino groups of amino acids, peptides, or proteins.Coordinate covalent bonding to a metal ion increases the stability of the Schiff base in nonenzymatic systems, although Schiffbases can exist in solutions devoid of metal ions. PLP forms Schiff bases much more readily than PL because the phosphategroup of PLP blocks the formation of an internal hemiacetal and maintains the carbonyl in reactive form (Fig. 30) [141]. As withother carbonyl-amine reactions, the nonenzymatic formation of a vitamin B6 Schiff base is strongly pH dependent and exhibits analkaline pH optimum. The stability of the Schiff base complexes is also strongly pH dependent, with dissociation occurring inacidic environments. Thus, Schiff-base forms of vitamin B6 would be expected to dissociate fully in acidic media such as thepostprandial gastric contents. In addition to the Schiff base in Figure 29, several other tautomeric and ionic forms exist in anequilibrium situation.
Depending on the chemical nature of the amino compound condensing with PLP or PL in the Schiff base, further rearrangementto various cyclic structures can occur. For example, cysteine condenses with PL or PLP to form a Schiff-base; then the SHgroup attacks the Schiff base 4'-C to form the cyclic thiazolidine derivative (Fig. 31). Histidine, tryptophan, and several relatedcompounds (e.g., histamine and tryptamine) can form similar cyclic complexes with PL or PLP bases through reactions of theimidazolium and indolyl side chains, respectively.
FIGURE 29Formation of Schiff base structures frompyridoxal (PL) and pyridoxamine (PM).
Analog ous reactions occur with PLP and PMP.

Pag e 583
FIGURE 30Formation of pyridoxal hemiacetal.
8.8.5.2 Stability and Modes of Degradation
Thermal processing and storage of foods can influence the vitamin B6 content in several ways. As with other water-solublevitamins, exposure to water can cause leaching and consequent losses. Chemical changes can involve interconversion ofchemical forms of vitamin B6, thermal or photochemical degradation, or irreversible complexation with proteins, peptides, oramino acids.
The interconversion of vitamin B6 compounds occurs mainly by nonenzymatic transamination, which involves formation of aSchiff base and migration of the Schiff base double bond, followed by hydrolysis and dissociation. Nonenzymatic transaminationhas been studied extensively as a model of PLP-mediated enzymatic transaminations. This process occurs extensively during thethermal processing of foods that contain the aldehyde or amine forms of vitamin B6. For example, increases in the proportion ofPM and PMP are frequently observed in the cooking or thermal processing of meat and dairy products [14, 56] and in studiesof protein-based liquid model systems [54]. The occurrence of such transamination has no adverse nutritional effect. Similartransamination has been shown to occur during the storage of intermediate moisture, model-food systems (aw 0.6). PL-mediated nonenzymatic elimination of H2S and methyl mercaptan from sulfur-containing amino acids can also occur during foodprocessing. This can be a significant source of flavor and can cause discoloration in canned foods through formation of blackFeS [57].
All vitamin B6 compounds are susceptible to light-induced degradation, which can cause losses during food processing,preparation and storage and during analysis. The mechanism of vitamin B6 degradation by light is not well understood and therelationship between reaction rate and wavelength is not known. Light-mediated oxidation appears to be involved, presumablywith a free radical intermediate. Exposure of vitamin B6 to light causes formation of the nutritionally inactive derivatives 4-pyridoxic acid (from PL and PM) and 4-pyridoxic acid
FIGURE 31Formation of the Schiff base and thiazolidine complexes of pyridoxal
(PL) and cysteine.

Pag e 584
5'-phosphate (from PLP and PMP), providing evidence of susceptibility to photochemical oxidation [108, 114]. However, therates of photochemical degradation of PLP, PMP, and PM and the amounts of degradation products obtained differ only slightlyin the presence or absence of air, suggesting that initiation of oxidation does not require direct attack by O2. Photochemicaldegradation of PL in low-moisture model food systems occurs at a greater rate than that of PL and PN. The reactions are first-order in PL concentration, are strongly influenced by temperature, but are affected only slightly by water activity (Table 22).
The rate of nonphotochemical degradation of vitamin B6 is strongly dependent on the form of the vitamin, temperature, pH ofthe solution, and the presence of other reactive compounds (e.g., proteins, amino acids, and reducing sugars). All forms ofvitamin B6 exhibit excellent stability at very low pH (e.g., 0.1 M HCI), a condition used during extraction for vitamin B6analysis. During incubation of vitamin B6 compounds at 40 or 60°C in aqueous solutions buffered at pH 4–7 for up to 140 days,PN exhibited no loss, PM exhibited the greatest loss at pH 7, and PL, showned its greatest loss at pH 5 (Table 23) [114].Degradation of PL and PM followed first-order kinetics in these studies. In contrast, in similar studies of the degradation of PL,PN, and PM at 110–145°C in aqueous solution buffered at pH 7.2, these compounds exhibited kinetics best described assecond order, 1.5 order, and pseudo-first order, respectively [102]. In parallel studies, thermal degradation of vitamin B6 incauliflower purée also did not conform to first-order kinetics. The reasons responsible for the kinetic differences of these studiesare not clear, although the initial concentration of the vitamin B6 compounds may be a factor of importance. Under conditions ofdry heat simulating toasting processes, degradation of PN in dehydrated model systems exhibited consistent first-order kinetics[41].
Studies of the thermal stability of vitamin B6 in foods are complicated because the multiple forms of the vitamin can undergovarious degradation reactions, and interconversions can also occur among the various forms of the vitamin. Losses of totalvitamin B6 in food processing or storage are similar to those observed with other water-soluble vitamins. For example, garbanzoand lima beans exhibit approximately 20–25% loss of total vitamin B6 during the balanching and canning process.
The development of HPLC methods has facilitated studies of the chemical behavior of vitamin B6 compounds during processingand storage. The simultaneous interconversion of PL and PM, along with first-order loss of total vitamin B6, has been observedin studies of thermal processing and storage of intermediate-moisture model food systems and in liquid model systems simulatinginfant formula (Fig. 32 and Table 24) [54]. PN exhibited greater stability than PL or
TABLE 22 Influence of Temperature, W ater Activity, and Lig ht Intensity on Deg radation of Pyridoxalin a Dehydrated Model Food System
Lig ht intensity (lumens/m2) aw Temperature, (°C) k (day -1) t½ (days)
4300 0.32 5 0.092 7.4
28 0.1085 6.4
37 0.2144 3.2
55 0.3284 2.1
4300 0.44 5 0.0880 7.9
28 0.1044 6.6
55 0.3453 2.0
2150 0.32 27 0.0675 10.3
Note: k, First-order rate constant; t1/2, time for 50% deg radation.
Source: Adapted from Ref. 114.

Pag e 585
TABLE 23 Influence of pH and Temperature on the Deg radation of Pyridoxal andPyridoxamine in Aqueous Solution
Compound Temperature(°C) pH k (day -1) t1/2 (days)
Pyridoxal 40 4 0.0002 3466
5 0.0017 407
6 0.0011 630
7 0.0009 770
Pyridoxal 60 4 0.0011 630
5 0.0225 31
6 0.0047 147
7 0.0044 157
Pyridoxamine 40 4 0.0017 467
5 0.0024 289
6 0.0063 110
7 0.0042 165
Pyridoxamine 60 4 0.0021 330
5 0.0044 157
6 0.0110 63
7 0.0108 64
Note: No sig nificant deg radation of pyridoxine was found at pH 4–7 at 40 or 60°C for upto 140 days. k, First-order rate constant; t 1/2 time for 50% deg radation.
Source: Adapted from Ref. 114.
PM, although the magnitude of the difference varied with temperature (Table 24). Although differences in energy of activationsuggest a difference in degradation mechanism for these three forms of the vitamin, calculation of the activation entropy,enthalpy, and free energy provides evidence of a common rate-limiting step for loss of PL, PM, and PN [51]. There is a needfor further kinetic and thermodynamic studies of this type of assess more fully the behaviour of naturally occurring vitamin B6 invarious foods.
Extensive examination of the thermal stability of vitamin B6 in milk products was prompted by an unfortunate incident involvinginfant formulas. In the early 1950s over 50 cases of convulsive seizures occurred in infants that had consumed a commerciallyavailable milk-based infant formula [27], whereas thousands of infants consumed the same formula without ill effects. Theseconvulsive disorders were corrected by administration of PN to the infants. The problem of inadequate vitamin B6 content in theprocessed formulas was corrected by fortification with PN, which is much more stable than PL, the major naturally occurringform of the vitamin in milk [63]. Commercial sterilization of evaporated milk or unfortified infant formula causes 40–60% loss ofthe naturally occurring vitamin B6. Little or no loss of added PN was found during a comparable thermal process. This incidenthighlights the need for complete and thorough assessment of the nutritional quality of foods, especially when new formulationsand processing methods are employed.

The occurrence of vitamin B6 deficiency in the case of these unfortified infant formulas has been attributed, at least in part, to theinteraction of PL with milk proteins during processing to form a sulfur-containing derivative, bis-4-pyridoxyl-disulfide (Fig. 33).Bis-4-pyridoxyl-disulfide has been observed to form slowly after heating a concentrated solution of PL and cysteine [140], andit exhibits only partial (~20%) vitamin activity in rat bioassays. Evidence of involvement of sulfhydryl groups in the interaction ofPL with milk proteins also has been

Pag e 586
FIGURE 32Deg radation and interconversion of vitamin B6 compoundsduring thermal processing at 118°C of a liquid model food
system simulating infant formula. Orig inal vitamin B6 content100% pyridoxal (PL) (a), 100% pyridoxine (PN) (b), and 100%
pyridoxamine (PM) (c). (From Ref. 54.)
observed [124]. However, HPLC analysis of thermal processing of milk containing radiolabeled PL and PLP revealed noevidence of the formation of bis-4-pyridoxyl-disulfide [56]. In this same study, PL and PLP were found to undergo extensivebinding to lysyl e-amino groups of milk proteins by reduction of the Schiff base -C=N-linkage (Fig. 34). The formation of suchpyridoxyllysyl residues also has been detected in thermally processed muscle and liver and during storage of intermediate-moisture model food systems. The mechanism by which the reduction of the Schiff base linkage occurs has not been determined.
Pyridoxyllysyl residues associated with food proteins have been shown to exhibit approximately 50% of the vitamin B6 activityof PN [48]. When administered to vitamin B6-deficient rats, this compound exacerbates the deficiency. This effect may havebeen involved in the deficiencies associated with consumption of an unfortified thermally processed infant formula mentionedearlier.
The role of protein sulfhydryl groups in the interaction of PL with protein has not been fully resolved. Sulfhydryls, as is ture of e-amino or imidazolium groups of amino acid side chains, can reversibly interact with the Schiff base linkage of protein-bound PLto form a substituted aldamine in a manner analogous to that shown in Figure 31.
Vitamin B6 also can be converted to biologically inactive compounds by reactions with free radicals. Hydroxyl radicalsgenerated during degradation of ascorbic acid can directly attack the C6 position of PN to form the 6-hydroxy derivative [126].Presumably this reaction could occur with all other forms of vitamin B6. 6-Hydroxypyridoxine totally lacks vitamin B6 activity.

Pag e 587

Pag e 588
TABLE 24 Rate Constants and Energ ies of Activation for the Thermal Loss of Total Vitamin B6 in LiquidModel System Simulating Infant Formula
Form of vitamin B6added Temperature (°C) k (min -1 t1/2 (min)
Energ y of activation(KJ/mol)
Pyridoxine 105 0.0006 1120 114
118 0.0025 289
133 0.0083 62
Pyridoxamine 105 0.0021 340 99.2
118 0.0064 113
133 0.0187 35
Pyridoxal 105 0.0040 179 87.0
118 0.0092 75
133 0.0266 24
Note: k, First-order rate constant; t 1/2, time for 50% deg radation.
Source: Ref. 54.
8.8.5.3 Bioavailability of Vitamin B6
The bioavailability of the total vitamin B6 content of a typical mixed diet has been estimated to be approximately 75% for adulthumans [129]. Dietary PL, PN, PM, PLP, PMP, and PNP, if the latter is present, appear to be efficiently absorbed andeffectively function in vitamin B6 metabolism. Schiff base forms a PL, PLP, PM, and PMP dissociate in the acidic environmentof the stomach and exhibit high bioavailability.
PN glucoside and other glycosylated forms of vitamin B6 are inefficiently utilized in humans. The bioavailability of PN glucosideis approximately 60% relative to PN, although wide variation is observed among individuals. The importance of the incompletebioavailability of PN glucoside in human diets depends largely on the total quantity of vitamin B6 consumed and the selection offoods. However, even foods with high percentages of PN glucoside can be quite effective sources of dietary vitamin B6 becauseof this reasonably good bioavailability. PN glucoside bioavailability varies markedly among animal species. It is essential thatanalytical methods for vitamin B6 are able to detect the glycosylated forms and, ideally, provide a specific measurement of theirrelative quantities.
Determining the bioavailability of PL or PLP in the form of a pyridoxylamino compound (e.g., pyridoxyllysine, Fig. 34) is notsimple. In contrast to the Schiff base forms, pyridoxylamino
FIGURE 33Structure of bis-4-pyridoxyl-
disulfide.

Pag e 589
FIGURE 34Interaction of PL with the e-amino g roup
of a lysyl residue of a food protein toform
a Schiff base, followed by reduction to apyridoxylamino complex.
forms have a very stable reduced linkage between PL or PLP and the lysine e-amino group. Because of this stable covalentlinkage, there is little or no dissociation of the B6 moiety of pyridoxylamino compounds during extraction conditions typicallyused in vitamin B6 analysis. Thus, the reductive binding of PL or PLP to protein appears in most food analyses to be a mode ofvitamin B6 degradation and is seen as a loss of measurable vitamin B6. However, studies of the bioavailability of PLP boundreductively (pyridoxyllysyl residues) to dietary protein have indicated a bioavailability of approximately 50% [48]. Mammals canpartially utilize enzymatic phosphorylation and oxidative cleavage, which frees the PLP moiety. Pyridoxyllsine can exert a weakantivitamin B6 activity, although this contributes to vitamin B6 deficiency only when the diet is marginal with respect to totalvitamin B6 content [48].
8.8.5.4 Measurement of Vitamin B6
Vitamin B6 can be measured by microbiological assay methods or by HPLC [52]. Microbiological assays for total vitamin B6can be performed using the yeasts Saccharomyces uvarum or Kloeckera brevis. Yeast growth assays involve a prior acidhydrolysis to extract vitamin B6 from food, and to hydrolyze phosphate esters and b-glucosides. Care must be taken when usingmicrobiological assays because the organisms used may underestimate PM. HPLC methods are based mainly on reverse-phaseor ion-exchange separation with fluorometric detection, and direct measurement of each form of the vitamin can be achieved.
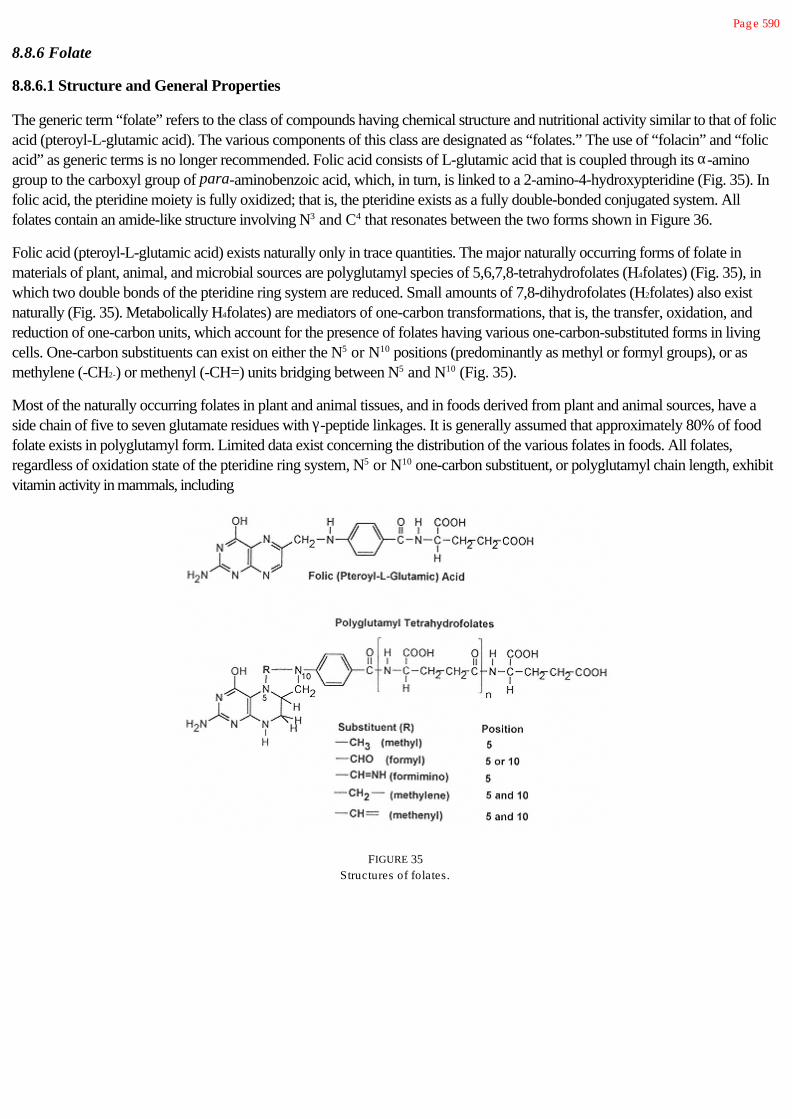
Pag e 590
8.8.6 Folate
8.8.6.1 Structure and General Properties
The generic term “folate” refers to the class of compounds having chemical structure and nutritional activity similar to that of folicacid (pteroyl-L-glutamic acid). The various components of this class are designated as “folates.” The use of “folacin” and “folicacid” as generic terms is no longer recommended. Folic acid consists of L-glutamic acid that is coupled through its a-aminogroup to the carboxyl group of para-aminobenzoic acid, which, in turn, is linked to a 2-amino-4-hydroxypteridine (Fig. 35). Infolic acid, the pteridine moiety is fully oxidized; that is, the pteridine exists as a fully double-bonded conjugated system. Allfolates contain an amide-like structure involving N3 and C4 that resonates between the two forms shown in Figure 36.
Folic acid (pteroyl-L-glutamic acid) exists naturally only in trace quantities. The major naturally occurring forms of folate inmaterials of plant, animal, and microbial sources are polyglutamyl species of 5,6,7,8-tetrahydrofolates (H4folates) (Fig. 35), inwhich two double bonds of the pteridine ring system are reduced. Small amounts of 7,8-dihydrofolates (H2folates) also existnaturally (Fig. 35). Metabolically H4folates) are mediators of one-carbon transformations, that is, the transfer, oxidation, andreduction of one-carbon units, which account for the presence of folates having various one-carbon-substituted forms in livingcells. One-carbon substituents can exist on either the N5 or N10 positions (predominantly as methyl or formyl groups), or asmethylene (-CH2-) or methenyl (-CH=) units bridging between N5 and N10 (Fig. 35).
Most of the naturally occurring folates in plant and animal tissues, and in foods derived from plant and animal sources, have aside chain of five to seven glutamate residues with g-peptide linkages. It is generally assumed that approximately 80% of foodfolate exists in polyglutamyl form. Limited data exist concerning the distribution of the various folates in foods. All folates,regardless of oxidation state of the pteridine ring system, N5 or N10 one-carbon substituent, or polyglutamyl chain length, exhibitvitamin activity in mammals, including
FIGURE 35Structures of folates.

Pag e 591
FIGURE 36Resonance of the 3,4-amide site of folate pteridine ring
system. The fully oxidized pteridine system of folic acid isshown; H4folates and H2folates exhibit identical behavior.
humans. Folate analogues with a 4-amino group or other modifications frequently are potent antagonists used in chemotherapyfor cancer and autoimmune disease.
Folates undergo changes in ionic form as a function of pH (Table 25). Changes in charge of the pteridine ring system account, inpart, for the pH dependence of folate stability, and for the pH-dependent behavior of folates during chromatographic separation.
Asymmetric carbons (glutamyl a-carbon of all folates and pteridine C6 of H4folates) can each exist in either of twoconfigurations. The glutamic acid moiety must be in the L isomeric form for vitamin activity, while C6 must be in the 6S isomericform for tetrahydrofolates to exhibit vitamin activity. Tetrahydrofolates synthesized by chemical reduction of folic acid contain aracemic carbon at C6,, while those reduced enzymatically are fully in the 6S configuration. Since the 6S configuration is requiredfor vitamin activity in animals (including humans) and in microbiological assays for folate, racemic (6R + 6S) preparations ofH4folates only exhibit 50% nutritional activity.
The 5-formyl or 10-formyl folates have an aldehyde group as the one-carbon substituent. Formyl forms of H4folate areinterconvertible through the 5, 10-methenyl intermediate. Formation of the methenyl species from either 5-formyl or 10-formyl-H4folate is favored only at pH <2; thus this form is but a minor constituent of folates in most foods. The transient existence of5,10-methenyl H4folate at pH > 2 accounts for the conversion of 10-formyl-H4folate to the more stable 5-formyl-H4folate whenheated in weak acid, and for the pH-dependent formation of 10-formyl-H4folate from 5-formyl-H4folate [110].
Large differences in stability exist among the various H4folates as a result of the influence of the one-carbon substituent onsusceptibility to oxidative degradation. In most cases, folic acid (with the fully oxidized pteridine ring system) exhibitssubstantially greater stability than the H4folates or H2folates. The order of stability of the H4folates is 5-formyl-H4folate > 5-methyl-H4folate > 10-formyl-H4folate > H4folate. Stability of each folate is dictated only by the chemical nature of the pteridinering system, with no influence of polyglutamyl chain length. The inherent differences in stability among folates, as well as chemicaland environmental variables influencing folate stability, will be discussed further in the next subsection.
TABLE 25 pK a Values for lonizable Groups of Folates
Folate compound Amide N1 N5 N10 a-COOH g-COOH
5, 6, 7, 8-H4folate 10.5 1.24 4.82 -1.25 3.5 4.8
7, 8-H2folate 9.54 1.38 3.84 0.28 ND ND
Folic acid 8.38 2.35 <-1.5 0.20 ND ND
Note: ND, not determined due to insufficient solubility. It is assumed that the pK a values of thesecarboxyl g roups are similar for all folates. Amide refers to dissociation of the N 3-C4 amide-like site.
Source: Adapted from Ref. 105.

Pag e 592
All folates are subject to oxidative degradation, although the mechanism and the nature of the products varies among the variouschemical species of the vitamin. Reducing agents such as ascorbic acid and thiols exert multiple protective effects on folatesthrough their actions as oxygen scavengers, reducing agents, and free radical scavengers.
Aside from molecular oxygen, other oxidizing agents found in foods can have deleterious effects on folate stability. For example,at concentrations similar to those used for antimicrobial treatments, hypochlorite causes oxidative cleavage of folic acid, H2folate,and H4folate to nutritionally inactive products. Under the same oxidizing conditions, certain other folates (e.g., 5-methyl-H4folate)are converted to forms that may retain at least partial nutritional activity. Light is also known to promote the cleavage of folates,although the mechanism has not been determined.
Relative to the nutritional needs of humans, folate is frequently among the most limiting of the vitamins. This is probably due to (a)poor diet selection, especially with respect to foods rich in folate (e.g., fruits, especially citrus, green leafy vegetables, and organmeats), (b) losses of folate during food processing and/or home preparation by oxidation, leaching, or both, and (c) incompletebioavailability of folate in many human diets.
Folic acid, because of its excellent stability, is the sole form of the folate added to foods, albeit in relatively few types of itsproducts (e.g., many breakfast cereals, infant formulas, nutritional supplements, and meal replacements), and it is also used invitamin pills. In clinical situations requiring use of a reduced folate, 5-formyl-H4folate is employed because of its stability (similarto folic acid).
8.8.6.2 Stability and Modes of Degradation
Folate Stability
Folic acid exhibits excellent retention during the processing and storage of fortified foods and premixes [49]. As shown in Tables2 and 3, little degradation of this form of the vitamin occurs during extended low-moisture storage. Similar good retention ofadded folic acid has been observed during the retorting of fortified infant formulas and medical formulas.
Many studies have shown the potential for extensive losses of folate during processing and home preparation of foods. Inaddition to susceptibility to oxidative degradation, folates are readily extracted from foods by aqueous media (Table 26). Byeither means, large losses of naturally occurring folate can occur during food processing and preparation. The overall loss offolate from a food depends on the extent of extraction, forms of folate present, and the nature of
TABLE 26 Effect of Cooking on Folate Content of Selected Veg etables
Total folate a (mg /100 g fresh weig ht)
Veg etable (boiled 10 min in water) Raw Cooked Folate in cooking water
Asparag us 175 ± 25 146 ± 16 39 ± 10
Broccoli 169 ± 24 65 ± 7 116 ± 35
Brussels sprouts 88 ± 15 16 ± 4 17 ± 4
Cabbag e 30 ± 12 16 ± 8 17 ± 4
Cauliflower 56 ± 18 42 ± 7 47 ± 20
Spinach 143 ± 50 31 ± 10 92 ± 12
aMean ± SD, n = 4.
Source: Adapted from Ref. 82
Pag e 593
the chemical environment (catalysts, oxidants, pH, buffer ions, etc.) Thus, folate retention is difficult to predict for a given food.
Degradation Mechanisms
The mechanism of folate degradation depends on the form of the vitamin and the chemical environment. As mentionedpreviously, folate degradation generally involves changes at the C9-N10 bond, the pteridine ring system, or both. Folic acid,H4folate, and H2folate can undergo C9-N10 cleavage and resulting inactivation in the presence of either oxidants or reductants[91]. Dissolved SO2 has been found to cause cleavage of certain folates, although few other reducing agents relevant to foodscan induce such cleavage. There is little direct oxidative conversion of H4folate or folic acid.
It is well known that oxidative cleavage of H4folate, H2folate and, to a lesser extent, folic acid yields nutritionally inactiveproducts (p-aminobenzoylglutamate and a pterin). The mechanism of oxidation and the exact nature of the pterin producedduring oxidative cleavage of H4folate vary with pH, as shown in Figure 37.
The major naturally occurring form of folate in many foods is 5-methyl-H4folate. Oxidative degradation of 5-methyl-H4folateoccurs by conversion to at least two products (Fig. 38). The first has been identified tentatively as 5-methyl-5,6-dihydrofolate(5-methyl-H2folate), which retains vitamin activity since it can be readily reduced back to 5-methyl-H4folate by weak reductantssuch as thiols or ascorbate. 5-Methyl-H2folate undergoes cleavage of the C9-N10 bond in acidic medium, which causes losses ofvitamin activity. The alternate product of 5-methyl-H4folate degradation was originally identified as 4a-hydroxy-5-methyl-H4folate, although spectral data are more consistent with a pyrazino-s-triazine structure formed by rearrangement of the pteridinering (Fig. 38) [68]. Whether 5-methyl-H2folate is an intermediate in the formation of the pyrazino-s-triazine has not beendetermined.
Blair et al. [10] reported that the pH dependence of 5-methyl-H4folate oxidation is pronounced. Stability (as monitored byoxygen uptake) increases as pH is reduced from 6 to 4, this range corresponding to the range of protonation of the N5 position.Contrary results have been reported [95], and factors responsible for this contradiction have not been determined.
In certain animal products, such as liver, 10-formyl-H4folate may account for as much as one-third of the total folate. Oxidativedegradation of 10-formyl-H4folate can occur either by oxidation of the pteridine moiety to yield 10-formyl-folic acid or byoxidative cleavage to form a pterin and N-formyl-p-aminobenzoylglutamate (Fig. 39). 10-Formyl-folic acid has nutritionalacitivity while the cleavage products do not. Factors that influence the relative importance of these oxidative patheways in foodshave not been determined. In contrast to 10-formyl-H4folate, 5-formyl-H4folate exhibits excellent thermal and oxidative stability.
Factors Affecting Folate Stability
Many studies have been conducted to compare the relative stability of folates in buffered solution as a function of pH, oxygenconcentration, and temperature. Stability of folates in complex foods is less well understood.
Folic acid is generally the most stable form. It is resistant to oxidation, although reduced stability occurs in acidic media. H4folateis the least stable form of the vitamin. Maximal stability of H4folate is observed between pH 8 and 12, and 1 and 2, while thestability is minimal between pH 4 and 6. However, even in the favorable pH zones, H4folate is extremely unstable. H4folateshaving a substituent at the N5 position exhibit much greater stability than does unsubstituted H4folate. This suggests that thestabilizing effect of the N5 methyl group is due, at lest in part, to steric hindrance in restricting access of oxygen or other oxidantsto the pteridine ring. The stabilizing effect of the N5 -substituent is more pronounced with 5-formyl-H4folate than with

Pag e 594
FIGURE 37Oxidative deg radation of H 4folate. (Adapted from Ref. 107)
5-methyl-H4folate, and both exhibit much greater stability than H4folate or 10-formyl-H4folate. Under conditions of low oxygenconcentration, 5-methyl-H4folate and folic acid exhibit similar stability during thermal processing.
The influence of oxygen concentration on the stability of folates in foods, buffer solutions, and model food systems has beenwidely studied. As menthioned previously, the rate of oxidation

Pag e 595
of 5-methyl-H4folate is dependent on the concentration of dissolved oxygen in accord with a pseudo-first-order relationship. Inrelatively anaerobic conditions, the presence of added components such as ascorbate, ferrous iron, and reducing sugar tends toimprove the oxidative stability of folic acid and 5-methyl-H4folate. These components apparently function by reducing theconcentration of dissolved oxygen through their own oxidation reactions (Fig. 40). These findings indicate that complex foodscan contain components that influence folate stability by consuming oxygen, acting as reducing agents, or both.
Barrett and Lund [6] studied thermal degradation of 5-methyl-H4folate in neutral buffer solution and observed both aerobic andanaerobic degradation. Surprisingly, rate constants for aerobic and anaerobic degradation reactions are of similar magnitude(Table 27). The extent to which other folates conform to this behavior has not been determined.
The ionic composition of the medium also significantly influences the stability of most folates. Phosphate buffers have beenreported to accelerate oxidative degradation of folates, while this effect can be overcome by addition of citrate ions. Thefrequent presence of Cu(II) as a contaminant in phosphate buffer salts may explain this effect because metal catalysts are known

Pag e 596
FIGURE 38Oxidative deg radation of 5-methyl-
H4folate
to accelerate folate oxidations. For example, in aerobic solutions of 5-methyl-H4folate in water, addition of 0.1 mM Cu(II)causes nearly a 20-fold acceleration in oxidation rate, although Fe(III) causes only a 2-fold increase [10]. Under anaerobicconditions, Fe(III) catalyzes oxidation of H4pteridines (e.g., H4folate) H2pteridines (e.g., H2folate) fully oxidizedpteridines (e.g., folic acid). The reason for the differences in the catalytic efficiency of these metals is not known. Folatesundergo degradation by superoxide ions [121, 127], although the extent of such radicalmediated losses of folates in foods hasnot been determined.
Several reactive components of foods may accelerate degradation of folates. Dissolved SO2 can cause reductive cleavage offolates, as stated previously. Exposure to nitrite ions
FIGURE 39Oxidative deg radation of 10-formyl-
H4folate.

Pag e 597
contributes to the oxidative cleavage of 5-methyl-H4folate and H4folate. In contrast, nitrite reacts with folic acid to yield 10-nitroso-folic acid, a weak carcinogen. The significance of the latter reaction in foods is minimal because folic acid does not occursignificantly in foods containing nitrite. Oxidative degradation of folates by exposure to hypochlorite may yield significant lossesof folates in certain foods.
8.8.6.3 Bioavailability of Folate in Foods
The absorption of folates takes place mainly in the jejunum and requires hydrolysis of the polyglutamyl chain by a specificpeptidase (pteroylpolyglutamate hydrolase), followed by absorption via a carrier-mediated transport process [49, 53].Bioavailability of naturally occurring folate in foods is incomplete, often averaging 50% or less [115]. Moreover, thebioavailability of naturally occurring folates in most foods has not been fully determined under conditions of actual consumption,including the consequences of interactions among various foods. The mean bioavailability of polyglutamyl folates is typically 70%relative to the monoglutamyl species, which indicates the rate-limiting nature of intestinal deconjugation. In addition, thebioavailability of folic acid added to cereal grain products has been reported to be only 30–60% [24].
Factors responsible for incomplete bioavailability include (a) effects of the food matrix, presumably through noncovalent bindingof folates; (b) possible degradation of labile H4folates in the acidic gastric environment; and (c) incomplete intestinal enzymaticconversion of polyglutamyl folates to the absorbable monoglutamyl forms. Many foods contain compounds that inhibit intestinalpterolypolyglutamate hydrolase when studied in vivo; however, the significance of these effects with respect to in vivo folatebioavailability is unclear. Many raw fruits, vegetables, and meats also contain active hydrolases capable of deconjugatingpolyglutamyl folates. Homogenization, freezing and thawing, and other procedures that disrupt cells may release these enzymesand promote the deconjugation process. The extent to which this would improve bioavailability of dietary folates has not beendetermined. Little or no deconjugation of polyglutamyl folates occurs during food preparation and processing, unlessendogenous conjugases are present.
8.8.6.4 Analytical Methods
Techniques potentially suitable for the measurement of folate in foods include microbiological growth methods, HPLC methods,and competitive-binding radioassay procedures [49]. Measurement of folate is complicated by the need to account for all formsof the vitamin, which could easily included several dozen compounds if each form of the folate nucleus existed in all possiblecombinations with several different polyglutamate chain lengths. Prior to the early 1960s, folate assays yielded grossly inaccurateresults because a necessary reducing agent in the extraction buffer and in the microbiological assay medium was not included.Either ascorbate, a thiol reagent such as mercaptoethanol, or a combination of ascorbate and thiol is needed to stabilize folatesduring extraction and analysis.
Extraction of folate from food samples involves (a) disruption of the food matrix and cellular structure by homogenization in abuffer solution; (b) heat (typically 100°C) to release folate from folate-binding proteins, to inactivate enzymes capable ofcatalyzing interconversion of folates, and to deproteinate the sample; (c) centrifugation to yield a clarified extract; and (d)treatment with a pteroylglutamate hydrolase (“conjugase”), if the assay responds only to monolglutamyl or other short-chainfolates. Other enzymes such as a protease or amylase may be useful in improving extraction of folate from certain foods. A needexists to standardize extraction and enzymatic pretreatment methods so interlaboratory precision and accuracy of folate assayscan be improved.

Pag e 598
FIGURE 40Thermal processing effects on (a) folic acid and (b)
5-methyl-H4folate in liquid model food systems simulatinginfant formula. The model system consisted of 1.5% (w/v)
potassium caseinate and 7% (w/v) lactose in 0.1 M phosphatebuffer, pH 7.0. W hen present, iron was added at 6.65 mg /100ml ferrous sulfate heptahydrate and ascorbate was added at
6.38 mg /100 ml sodium ascorbate. Initial concentration offolates was 10mg /ml. (From Ref. 29.)
Microbiological growth assays serve as the traditional method of folate analysis and are based on the nutritional requirements ofmicroorganisms (Lactobacillus casei, Pediococcus cerevisiae, and Streptococcus faecium). Pediococcus cerevisiae and S.faceium (used in the Association of Official Analytical Chemists official method) have little use in food analysis because they donot respond to all forms of the vitamin. In contrast, L. casei responds to all forms of folate and serves as the most appropriatetest organism for microbiological assays of total folate in food. With appropriate control of pH in the growth medium, L. caseiyields equivalent response to all forms of folate. Since foods typically contain several folates, verification of equivalent responsein microbiological assasys is essential.
Competitive-binding assays involve competition between folate in the sample or standard, with radiolabeled folate for the bindingsite of a folate-binding proteing, typically from milk. In spite of the speed and convenience of these assays, their application tofood analysis is limited because of varying affinity for different forms of folate. Comparisons of competitive-binding assays withthe L. casei methods have yielded poor agreement, presumably for this reason.
Several HPLC methods have been developed for measurement of folates in foods and other biological materials. Severalapproaches to HPLC analysis are potentially suitable, although extractions, enzymatic pretreatments, and sample cleanup mustbe optimized to permit application to various types of foods. An important advance in HPLC is the use of affinitychromatography with a folate-binding protein column to yield a highly purified extract that is amenable to HPLC analysis [119].HPLC analysis can be performed on extracted folates in intact polyglutamyl form or following enzymatic deconjugation to themonoglutamyl form [49, 119].

Pag e 599
The folate content of foods is highly variable, presumably as a function of climate, agricultural practices, and postharvesthandling, and of susceptibility to losses by leaching and oxidation. Thus, mean values for folate content in food composition databases must be considered only as rough approximations. Furthermore, because of analytical limitations, especially with respectto extraction methods, much of the data used in such databases is of questionable accuracy.
TABLE 27 Reaction Rate Constants for the Deg radation of 5-Methyl-H 4folate by Oxidative andNonoxidative Processes in 0.1 M Phosphate Buffer, pH 7.0
Temperature(°C)
k(O2 + N2) (combined oxidative+ nonoxidative, min -1)
kN 2 (nonoxidative, min -1 kO 2 (oxidative,min-1)
40 0.004 ± 0.00002 0.0004 ± 0.00001 0.004 ± 0.00005
60 0.020 ± 0.0005 0.009 ± 0.00004 0.011 ± 0.0001
80 0.081 ± 0.010 0.046 ± 0.003 0.035 ± 0.009
92 0.249 ± 0.050 0.094 ± 0.009 0.155 ± 0.044
Note: Values are means ±95% confidence intervals. Values for apparent first-order rate
constants: deg radation by nonoxidative process (in N 2-saturated environment);
deg radation by oxidative process (in O 2-saturated environment); deg radation by bothoxidative and nonoxidative processes.
Source: Ref. 6.

Pag e 600
8.8.7 Biotin
8.8.7.1 Structure and General Properties
Biotin is a bicyclic, water-soluble vitamin that functions coenzymatically in carboxylation and transcarboxylation reactions. Thetwo naturally occurring forms are free D-biotin and biocytin (e-N-biotinyl-L-lysine) (Fig. 41). Biocytin functions as thecoenzyme form and actually consists of a biotinylated lysyl residue covalently incorporated in a protein chain of variouscarboxylases. The ring system of biotin can exist in eight possible stereoisomers, only one of which (D-biotin) is the natural,biologically active form. Both free biotin and protein-bound biocytin exhibit activity when consumed in the diet. Biotin is widelydistributed in plant and animal products, and biotin deficiency is rare in normal humans.
8.8.7.2 Stability of Biotin
Biotin is very stable to heat, light, and oxygen. Extremes of high or low pH can cause degradation, possibly because theypromote hydrolysis of an -N-C=O (amide) bond of the biotin ring system. Oxidizing conditions such as exposure to hydrogenperoxide can oxidize the sulfur to form biologically inactive biotin sulfoxide or sulfone. Reaction of the biotin ring carbonyl withamines also may occur, although this has not been examined. Losses of biotin during food processing and subsequent storagehave been documented and summarized [12, 67, 86]. Such losses may occur by chemical degradation processes as mentionedearlier and by leaching of free biotin. Little degradation of biotin occurs during low-moisture storage of fortified cereal products.Overall, biotin is quite well retained in foods.
The stability of biotin during storage of human milk also has been examined [174]. The biotin concentration of the milk samplesdid not change over 1 week at ambient temperature, 1 month at 5°C, or at -20°C or lower for 1.5 years.
8.8.7.4 Analytical Methods
Measurement of biotin in foods is performed by microbiological assay (usually with Lactobacillus plantarum) or by variousligand binding procedures involving avidin as the binding
FIGURE 41Structures of biotin and biocytin.

Pag e 601
protein. Several HPLC methods also have been developed but their applicability to foods has not been fully established. Themicrobiological and ligand binding assays respond to free biotin and biocytin, but biocytin cannot be determined unless it is firstreleased from the protein by cleavage of the peptide bond by enzymatic or acid hydrolysis [96]. Care should be taken becauseacid hydrolysis can degrade a substantial proportion of the biotin [97]. The existence of nutritionally inactive biotin analogs, suchas bis-norbiotin and biotin sulfoxide detected in human urine, may complicate analyses. Such analogs may respond in avidinbinding procedures and certain microbiological assays.
8.8.7.3 Bioavailability
Relatively little is known about the bioavailability of biotin in foods. There appears to be sufficient biotin in normal diets so thatincomplete bioavailability usually has little adverse nutritional impact. Bacterial synthesis of biotin in the lower intestine providesan additional source of partially available biotin for humans. The majority of biotin in many foods exists as protein-boundbiocytin. This is released by biotinidase in pancreatic juice and in the intestinal mucosa to convert the bound biotin to thefunctionally active free form; however, some absorption of biotinyl peptides also may occur [96].
Absorption of biotin is almost totally prevented by the consumption of raw egg albumen which contains the biotin-binding proteinavidin. Avidin is a tetrameric glycoprotein in egg albumen that is capable of binding one biotin per subunit. This protein bindsvery tightly (dissociation constant 10-15 M) and resists digestion. Little or no avidin-bound biotin is absorbed. Chronicconsumption of raw eggs or egg albumen will thus impair biotin absorption and can lead to deficiency. Small amounts of avidin inthe diet have no nutritional consequence. The use of dietary avidin (or egg albumen) permits the experimental development ofbiotin deficiency in laboratory animals. Cooking denatures avidin and eliminates its biotin-binding properties.
While little information exist regarding the bioavailability of biotin in humans, much more is known about its bioavailability inanimal feedstuffs. As shown in Table 28, bioavailability of biotin is low in some materials.
TABLE 28 Bioavailabiliy of Biotin in Feedstuffs for Pig s andTurkeys
Biotin bioavailability (%)
Material Pig s [116] Turkeys [94]
Soybean meal 55.4 76.8
Meat and bone meal 2.7 ND
Canola meal 3.9 65.4
Barley 4.8 19.2
Corn 4.0 95.2
W heat 21.6 17.0
Supplemental biotin 93.5 ND
Sorg hum ND 29.5
Note: ND, not determined.

Pag e 602
8.8 Pantothenic Acid
8.8.8.1 Structure and General Properties
Pantothenic acid, or D-N--(2,4-dihydroxy-3,3-dimethyl-butyryl)-b-alanine, is a water soluble vitamin comprised of b-alanine inamide linkage to 2,4-dihydroxy-3,3-dimethyl-butyric (pantoic) acid (Fig. 42). Pantothenic acid functions metabolically as acomponent of a coenzyme A (Fig. 42) and as a covalently bound prosthetic group (without the adenosyl moiety of coenzyme A)of acyl carrier proteins in fatty acid synthesis. Formation of a thioester derivative of coenzyme A (CoA) with organic acidsfacilitates a wide variety of metabolic processes, mainly involving addition or removal of acyl groups, in an array of biosyntheticand catabolic reactions. Pantothenic acid is essential for all living things and is distributed widely among meats, cereal grains,eggs, milk, and many fresh vegetables.
Pantothenic acid in many foods and most biological materials is mainly in the form of coenzyme A, the majority of which exists asthioester derivatives of a wide variety of organic acids. Although analytical data are quite limited with respect to the free andcoenzyme A forms of pantothenic acid in foods, free pantothenic acid has been found to account for only half of the total of thisvitamin in beef muscle and peas [58]. Coenzyme A is fully available as a source of pantothenic acid because it is converted tofree pantothenic acid in the small intestine by the action of alkaline phosphatase and an amidase. Intestinal absorption occursthrough a carrier-mediated absorption process.
Synthetic pantothenic acid is used in food fortification and in vitamin supplements in the
FIGURE 42Structure of various forms of pantothenic acid.

Pag e 603
form of calcium pantothenate. This compound is a white crystalline material that exhibits greater stability and is less hygroscopicthan the free acid. Panthenol, the corresponding alcohol, also has been used as a feed supplement for animals.
8.8.8.2 Stability and Modes of Degradation
In solution, pantothenic acid is most stable at pH 5–7. Pantothenic acid exhibits relatively good stability during food storage,especially at reduced water activity. Losses occur in cooking and thermal processing in proportion to the severity of thetreatment and extent of leaching and range from 30 to 80%. Leaching of pantothenic acid or its loss in tissue fluids can be verysignificant. Although the mechanism of thermal loss of pantothenic acid has not been fully determined, an acid-catalyzedhydrolysis of the linkage between b-alanine and the 1,4-dihydroxy,3,3-butyryl- carboxylic acid group appears likely. Thepantothenic acid molecule is otherwise quite unreactive and interacts little with other food components. Coenzyme A issusceptible to the formation of mixed disulfides with other thiols in foods; however, this exerts little effect on the net quantity ofavailable pantothenic acid.
Degradation of pantothenic acid during thermal processing conforms to first-order kinetics [58]. Rate constants for degradationof free pantothenic acid in buffered solutions increase with decreasing pH over the range of pH 6.0–4.0, while the energy ofactivation decreases over this range. The rates of degradation reported for pantothenic acid are substantially less than those forother labile nutrients (e.g., thiamin). These findings suggest that losses of pantothenic acid reported in other studies of foodprocessing may be predominantly due to leaching rather than actual destruction. The net result would be the same, however.
8.8.8.3 Bioavailability
The mean bioavailability of pantothenate for humans consuming a mixed diet has been reported to be 51% [129]. There is littleconcern regarding any adverse consequences of this incomplete bioavailability. No evidence of nutritionally significant problemsof incomplete bioavailability has been reported, and the complexed coenzymic forms of the vitamin are readily digested andabsorbed.
8.8.8.4 Analytical Methods
Pantothenic acid in foods may be measured either by microbiological assay using Lactobacillus plantarum or byradioimmunoassay [143]. A key factor that affects the validity of pantothenic acid analysis is the pretreatment needed to releasebound forms of the vitamin. Various combinations of proteases and phosphatases have been used to release pantothenic acidfrom the many coenzyme A derivatives and protein-bound forms.
8.8.9 Vitamin B12
8.8.9.1 Structure and General Properties
Vitamin B12 is the generic term for the group of compounds having vitamin activity similar to that of cyanocobalamin. Thesecompounds are corrinoids, tetrapyrrole structures in which a cobalt ion is chelated by the four pyrrole nitrogens. The fifthcoordinate covalent bond to Co is with a nitrogen of the dimethylbenzimidazole moiety, while the sixth position may be occupiedby cyanide, a 5' -deoxyadenosyl group, a methyl group, water, a hydroxyl ion, or other ligands such as nitrite, ammonia or sulfite(Fig. 43). All forms of vitamin B12 shown in Figure 43 exhibit vitamin B12 activity. Cyanocobalamin, a synthetic form of vitaminB12 used in food fortification and nutrient supplements, exhibits superior stability and is readily available commercially. Thecoenzyme forms of vitamin B12 are methylcobalamin and 5' -deoxyadenosylcobalamin. Methylcobalamin

Pag e 604
FIGURE 43Structure of various forms of
vitamin B12.
functions coenzymatically in the transfer of a methyl group (from 5-methyltetrahydrofolate) in methionine synthetase, while 5' -deoxyadenosylcobalamin serves as the coenzyme in an enzymatic rearrangement reaction catalyzed by methylmalonyl-CoAmutase. Little or no naturally occurring cyanocobalamin exists in foods; in fact, the original identification of vitamin B12 ascyanocobalamin involved its formation as an artifact of the isolation procedure. Cyanocobalamin has a reddish color in thecrystalline state and in solution. This coloration may pose a limitation in the possible addition of cyanocobalamin to certain foods,especially light colored products (e.g., white bread).
Unlike other vitamins that are synthesized primarily in plants, cobalamins are produced only by microbial biosynthesis. Certainlegumes have been reported to absorb small amounts of vitamin B12 produced by bacteria associated with root nodules, butlittle enters the seeds [99] Most plant-derived foods are devoid of vitamin B12 unless contaminated by fecal material, such asfrom fertilizer [64, 65]. The vitamin B12 in most animal tissues consists mainly of the coenzyme forms, methylcobalamin and 5' -deoxyadenosylcobalamin, in addition to aquocobalamin. Herbert [65] has classified foods according to their vitamin B12content, as shown in Table 29.
Approximately 20 naturally occurring analogs of vitamin B12 have been identified. Some of these have no biological activity inmammals, while others exhibit at least partial vitamin activity but are often poorly absorbed.
8.8.9.2 Stability and Modes of Degradation
Under most conditions of food processing, preservation, and storage, there is little nutritionally significant loss of vitamin B12.Cyanocobalamin added to breakfast cereal products has been reported to undergo an average loss of 17% during processing,with an additional 17% loss during storage for 12 months at ambient temperature [125]. In studies of the processing of fluidmilk, 96% mean retention has been observed during high-temperature, short-time (HTST) pasteurization, and similar retention(>90%) was found in milk processed using various modes of ultra-high-temperature (UHT) processing [45]. Althoughrefrigerated storage of milk has little impact on vitamin B12 retention, storage of UHT-processed milk at ambient temperaturefor up to 90 days causes progressive losses that can approach 50% of the initial vitamin B12

Pag e 605
TABLE 29 Classification of Foods According to Their Vitamin B12Concentration
FoodVitamin B12 (mg /100 g
wet weig ht)
Rich sources: org an meats (liver, kidney, heart),bivalves (clams and oysters)
>10
Moderately rich sources: nonfat dry milk, some fishand crabs, eg g yolks
3–10
Moderate sources: muscle meats, some fish,fermenting cheeses
1–3
Other: fluid milk, cheddar cheese, cottag e cheese <1
Source: Adapted from Ref. 65.
concentration [20]. Sterilization of milk for 13 min at 120°C has been reported to cause 77% loss of vitamin B12 [71], andprior concentration (as in production of evaporated milk) contributes to more severe losses. This indicates the potential forsubstantial losses of vitamin B12 during prolonged heating of foods at or near neutral pH. Typical oven heating of commerciallyprepared convenience dinners has been shown to yield 79–100% retention of vitamin B12.
Ascorbic acid has long been known to accelerate the degradation of vitamin B12, although this may be of little practicalsignificance because foods containing vitamin B12 usually do not contain significant amounts of ascorbic acid. Douglass et al.[37] examined the influence of the use of ascorbate or erthyorbate in curing solutions for ham and found that these compoundshave no influence on vitamin B12 retention. Thiamin and nicotamide in solution can accelerate degradation of vitamin B12, butthe relevance of this phenomenon to foods is unclear.
The mechanism of vitamin B12 degradation has not been fully determined, in part because of the complexity of the molecule andthe very low concentration in foods. Photochemical degradation of vitamin B12 coenzymes yields aquocobalamin. Such areaction interferes with experimental studies of B12 metabolism and function, but this conversion has no influence on the totalvitamin B12 activity of foods because aquocobalamin retains vitamin B12 activity. The overall stability of vitamin B12 is greatestat pH 4–7. Exposure to acid causes the hydrolytic removal of the nucleotide moiety, and additional fragmentation occurs as theseverity of the acidic conditions increases. Exposure to acid or alkaline conditions causes hydrolysis of amides, yieldingbiologically inactive carboxylic acid derivatives of vitamin B12.
Interconversions among cobalamins can occur through exchange of the ligand bonded to the Co atom. For example, bisulfiteions cause conversion of aquocobalamin to sulfitocobalamin, while similar reactions can occur to form cobalamins substitutedwith ammonia, nitrite, or hydroxyl ions. These reactions have little influence on the net vitamin B12 activity of foods.
8.8.9.3 Bioavailability
The bioavailability of vitamin B12 has been examined mainly in the context of the diagnosis of vitamin B12 deficiency associatedwith malabsorption. Little is known about the influence of food composition on the bioavailability of vitamin B12. Several studieshave shown that pectin and, presumably, similar gums reduce vitamin B12 bioavailability in rats. The significance of this effect inhumans is unclear, however. Although little vitamin B12 is present in most plants, certain forms of algae do contain significantquantities of the vitamin. Algae is not recommended as a source of vitamin B12 because of its very low bioavailability [28].

Pag e 606
In normal human beings, absorption of vitamin B12 from eggs has been shown to be less than half that of cyanocobalaminadminstered in the absence of food [35]. Similar results have been obtained regarding vitamin B12 bioavailability in studies withfish and various meats [34, 36]. Certain individuals are marginally deficient in vitamin B12 because of poor digestion andincomplete release of cobalamins from the food matrix even though they absorb the pure compound normally [21].
8.8.9.4 Analytical Methods
The concentration of vitamin B12 in foods is determined primarily by microbiological growth assays using Lactobacillusleichmannii or by radioligand binding procedures [40]. Although the various forms of vitamin B12 can be separatedchromatographically, HPLC methods are not readily suitable for food analysis because of the very low concentrations typicallyfound. Early types of radioligand binding assays for vitamin B12 in clinical specimens and foods were often inaccurate becausethe binding protein employed could bind to active forms of vitamin B12 as well as biologically inactive analogues. The specificityof such assays has been greatly improved through the use of a vitamin B12-binding protein (generally porcine intrinsic factor)that is specific for the biologically active forms of the vitamin. Microbiological assays with L. leichmannii may be subject tointerference if samples contain high concentration of deoxyribonucleosides.
Food samples are generally prepared by homogenization in a buffered solution, followed by incubation at elevated temperature(~60°C) in the presence of papain and sodium cyanide. This treatment releases protein-bound forms of vitamin B12 andconverts all cobalamins to the more stable cyanocobalamin form. Conversion to cyanocobalamin also improves the performanceof assays that may differ in response to the various forms of the vitamin.
8.9 Conditionally Essential Vitamin-Like Compounds
8.9.1 Choline
Choline (Fig. 44) exists in all living things as the free compound and as a constituent of a number of cellular components includingphosphatidylcholine (the most prevalent dietary source of choline), sphingomyelin, and acetylcholine. Although choline synthesisoccurs in humans and other mammals, there is a growing body of evidence that dietary choline is also required [22]. Choline isused as chloride and bitartrate salts in fortification of infant formulas. Choline is not ordinarily added to other foods except as aningredient, for example, phosphatidylcholine as an emulsifier. Choline is a very stable compound. No significant loss of cholineduring food storage, handling, processing, or preparation.
8.9.2 Carnitine
Carinitine (Fig. 45) can be synthesized by the human body; however, certain individuals appear to benefit from additional dietarycarnitine [13]. No nutritional requirements have been estab-
FIGURE 44Structure of choline.

Pag e 607
FIGURE 45Structure of carnitine.
lished for carnitine. Although little or no carnitine is found in plants and plant products, it is widely distributed in foods of animalorigin. Carnitine functions metabolically in the transport of organic acids across biological membranes and thus facilitates theirmetabolic utilization and/or disposal. Carnitine also facilitates transport of certain organic acids to lessen the potential for toxicityin certain cells. In animal-derived foods, carnitine exists in free and acylated form. The acyl carnitines occur with various organicacids esterified to the C-3 hydroxyl group. Carnitine is highly stable and undergoes little or not degradation in foods.
Synthetic carnitine is used in certain clinical applications as the biologically active L-isomer. D-Carnitine has no biologicalactivity. L-Carnitine is added to infant formulas to raise their carnitine concentration to that of human milk [13].
8.9.3 Pyrroloquinoline Quinone
Pyrroloquinoline quinione (PQQ) is a tricylic quinone (Fig. 46) that functions as a coenzyme in several bacterial oxidoreductasesand has been reported to be a coenzyme in mammalian lysyl oxidase and amine oxidases. However, recent findings indicate thatthe coenzyme originally identified as PQQ in these mammalian enzymes was misidentified and is probably 6-hydroxy-dihydroxyphenylalanine quinone [59]. Although no function of PQQ is currently known in mammals, several studies have showna very small nutritional requirement for rats and mice that appears to be associated with the formation of connective tissue andnormal reproduction [76]. Thus, the function of PQQ in mammalian species is an enigma. Because of the ubiquitous nature ofPQQ and its synthesis by intestinal bacteria, the development of spontaneous deficiency of PQQ in rodents or humans isunlikely.
8.10 Optimization of Vitamin Retention
To varying degrees, inevitable losses of nutritional value occur during the course of the postharvest handling, cooking,processing, and storage of foods. Such losses occur in the food processing industry, in food service establishments, and in thehome. Optimization of nutrient retention is a responsibility of food manufacturers and processors and is in the mutual interest
FIGURE 46Structure of pyrroloquinoline
quinone.

Pag e 608
of the industry and the public. Likewise, maximization of nutrient retention in the home, and in institutional and retail food service,is an opportunity that should not be overlooked.
Many approaches to optimization of vitamin retention are based on the chemical and physical properties of the particularnutrients involved. For example, the use of acidulants, if compatible with the product, would promote the stability of thiamin andascorbic acid. Reduction in pH would decrease the stability of certain folates, however, which illustrates the complexity of thisapproach. Cooking or commercial processing under conditions that minimize exposure to oxygen and excess liquid lessens theoxidation of many vitamins and the extraction (i.e., leaching) of vitamins and minerals. High-temperature, short-time (HTST)conditions will, in many instances, cause less vitamin degradation than will conventional thermal processes of equal thermalseverity (based on microbial inactivation). In addition, certain combinations of ingredients can enhance retention of severalnutrients (e.g., the presence of natural antioxidants would favor retention of many vitamins).
Several examples of nutrient optimization follow. The reader is referred to additional discussions of this topic [70, 85].
8.10.1 Optimization of Thermal Processing Conditions
Losses of nutrients frequently occur during thermal processing procedures intended to provide a shelf-stable product. Suchlosses often involve both chemical degradation and leaching. The kinetics and thermodynamics of chemical changes involving thedestruction of microorganisms and vitamins differ markedly. Thermal inactivation of microorganisms occurs largely bydenaturation of essential macromolecules and involves large energies of activation (typically 200–600 kJ/mol). In contrast,reactions associated with the degradation of vitamins generally exhibit activation energies of 20–100 kJ/mol. Thus, rates ofmicrobial inactivation and rates of vitamin degradation have temperature dependencies that differ significantly. Consequently, therate of microbial inactivation increases as a function of temperature much more rapidly than does the rate of vitamin degradation.These principles of reaction kinetics and thermodynamics form the basis of enhancement of nutrient retention when HTSTconditions are used. Classical studies of Teixeira et al. [130] involved a variety of thermal processing conditions, all of whichprovided equivalent microbial lethality. These authors showed that thiamin retention during thermal processing of pea puré couldbe enhanced at least 1.5-fold through selection of the proper time-temperature combination. Although many other vitamins areless labile than thiamin during the processing of low-acid foods, a similar enhancement of their retention would be predicted.
8.10.2 Prediction of Losses
Predicting the magnitude of losses of vitamins requires accurate knowledge of degradation kinetics and temperature dependenceof the particular form(s) of the vitamin(s) considered in the chemical milieu of the food(s) of interest. Different chemical forms ofvitamins react differently to various food compositions and to specific processing conditions. One must first determine whetherkinetic studies of total content (i.e., sum of all forms) of the vitamin of interest yield useful information, or whether more specificinformation on the various forms of the vitamin is needed [54]. Processing studies must be conducted under conditions identicalto those prevailing during the actual commercial processing or storage condition being modeled because of the sensitivity ofmany nutrients to their chemical and physical environments. As summarized previously [66, 83], reaction kinetics should beobtained at several temperatures to permit calculation of rate constants and an energy of activation. In addition, the experimentalconditions should be selected to provide sufficient loss of the vitamin being studied so that the rate constant can be determinedwith appropriate accuracy [66]. Accelerated storage studies may be performed

Pag e 609
if the kinetics and mechanisms at elevated temperature are consistent with those occurring under the actual storage conditions.Because temperature fluctuates during actual storage and transportation of foods, models of vitamin stability should includetemperature fluctuation [79].
8.10.3 Effects of Packaging
Packaging influences vitamin stability in several ways. In canning, foods that transmit heat energy primarily by conduction (solidsor semisolids) will undergo greater overall loss of nutrients than will foods that transmit heat by convection, especially if largecontainers are used. This difference is caused by the requirement that the thermal process must be based on the “slowest toheat” portion of the product, which, for conduction-heating foods, is the geometric center of the container. Such losses areminimized by using containers with a large surface-to- mass ratio, that is, small cans and noncylindrical containers such aspouches [109]. Pouches also offer the advantage of requiring less liquid for filling; thus, leaching of nutrients during theprocessing of particulate foods can be minimized.
The permeability of packaging material also can have a substantial effect on the retention of vitamins during food storage.Ascorbic acid in juices and fruit beverages has been shown to exhibit much greater stability when packages with lowpermeability to oxygen are used [69]. In addition, use of opaque packaging materials prevents the photochemical degradation ofphotolabile vitamins such as vitamin A and riboflavin.
8.11 Summary
As discussed in this chapter, vitamins are organic chemicals that exhibit a wide range of properties with respect to stability,reactivity, susceptibility to environmental variables, and influence on other constituents of foods. Prediction of net vitaminretention or mechanisms of degradation under a given set of circumstances is often fraught with difficulty because of the multipleforms of most vitamins. With that caveat, the reader is referred to Table 1 as an overview of the general characteristics of eachvitamin.
Bibliography
Augustin, J., B. P. Klein, D. A. Becker, and P. B. Venugopal (eds.) (1985). Methods of Vitamin Assay, 4th ed., John Wiley& Sons, New York.
Bauerfeind, J. C., and P. A. Lachance (1992). Nutrient Additions to Food. Nutritional, Technological and RegulatoryAspects, Food and Nutrition Press, Trumbull, CT.
Brody, T. (1994). Nutritional Biochemistry, Academic Press, Orlando, FL.
Brown, M. L. (ed.) (1990). Present Knowledge in Nutrition, International Life Sciences Institute-Nutrition Foundation,Washington, DC.
Chytyl, F., and D. B. McCormick (eds.) (1986). Methods in Enzymology, vols. 122 and 123, Parts G and H (respectively),Vitamins and Coenzymes, Academic Press, San Diego.
Davidek, J., J. Velisek, and J. Pokorny (eds.) (1990). Vitamins, in Chemical Changes During Food Processing, Elsevier,Amsterdam, pp. 230–301.
Harris, R. S., and E. Karmas (1975). Nutritional Evaluation of Food Processing, 2nd. ed., AVI, Westport, CT.
Harris, R. S., and H. von Loesecke (1971). Nutritional Evaluation of Food Processing, AVI, Westport, CT.
Institute of Medicine (1990). Nutrition Labeling. Issues and Directions for the 1990s (D. V. Porter and R. O. Earl, eds.),National Academy Press, Washington, DC.
Karmas, E., and R. S. Harris (1988). Nutritional Evaluation of Food Processing, 3rd ed., Van Nostrand Reinhold, NewYork.
Machlin, L. J. (ed.) (1991). Handbook of Vitamins, 2nd ed., Marcel Dekker, New York.

Pag e 610
McCormick, D. B. (1991). Coenzymes, biochemistry, in Encyclopedia of Human Biology, vol. 2, Acad. Press, San Diego,pp. 527–545.
Zapsalis, C., and R. A. Beck (1985). Vitamins and vitamin-like substances, in Food Chemistry and Nutritional Biochemistry,John Wiley and Sons, New York, pp. 189–313.
References
1. American Institute of Nutrition (1987). Nomenclature policy: generic descriptions and trivial names for vitamins and relatedcompounds. J. Nutr. 120:12–19.
2. Ames, S. R. (1965). Bioassay of vitamin A compounds. Fed. Proc. Fed. Am. Soc. Exp. Biol. 24:917–923.
3. Anderson, R. H., D. L. Maxwell, A. E. Mulley, and C. W. Fritsch (1976). Effects of processing and storage onmicronutrients in breakfast cereals. Food Technol. 30:110–114.
4. Anonymous (1982). The nutritive quality of processed food. General policies for nutrient addition. Nutr. Rev. 40:93–96.
5. Arabshahi, A., and D. B. Lund (1988). Thiamin stability in simulated intermediate moisture food. J. Food Sci. 53:199–203.
6. Barrett, D. M., and D. B. Lund (1989). Effect of oxygen on thermal degradation of 5-methyl-5,6,7,8- tetrahydrofolic acid. J.Food Sci. 54:146–149.
7. Bauernfeind, J. C., and P. A. Lachance (1992). Nutrient Additions to Food Nutritional Technological and RegulatoryAspects, Food and Nutrition Press, Trumbull, CT.
8. Beecher, G. R., and R. H. Matthews. 1990. Nutrient composition of foods, in Present Knowledge in Nutrition, 6th ed. (M.L. Brown, ed.), International Life Sciences Institute-Nutrition Foundation, Washington, DC, pp. 430–439.
9. Bergstr¨m, L. (1988). Nutrient data banks for nutrient evaluation in foods, in Nutritional Evaluation of Food Processing,3rd ed. (E. Karmas and R. S. Harris, eds.), Van Nostrand Reinhold, New York, pp. 745–764.
10. Blair, J. A., A. J. Pearson, and A. J. Robb (1975). Autoxidation of 5-methyl-5,6,7,8-tetrahydrofolate. J. Chem. Soc.Perkin Trans. II:18–21.
11. Bode, A. M., L. Cunningham, and R. C. Rose. (1990). Spontaneous decay of oxidized ascorbic acid (dehydro-L-ascorbicacid) evaluated by high-pressure liquid chromatography. Clin. Chem. 36:1807–1809.
12. Bonjour, J. -P. (1991). Biotin, in Handbook of Vitamins, 2nd ed. (L. J. Machlin, ed.), Marcel Dekker, New York, pp.393–427.
13. Borum, P. R. (1991). Carnitine, in Handbook of Vitamins, 2nd ed. (L. J. Machlin, ed.), Marcel Dekker, New York, pp.557–563.
14. Bowers, J. A., and J. Craig (1978). Components of vitamin B6 in turkey breast muscle. J. Food Sci. 43:1619–1621.
15. Brown, E. D., M. S. Micozzi, N. E. Craft, J. G. Bieri, G. Beecher, B. K. Edwards, A. Rose, P. R. Taylor, and J. C. Smith(1989). Plasma carotenoids in normal men after a single ingestion of vegetables or purified b-carotene. Am. J. Clin. Nutr.49:1258–1265.
16. Buettner, G. R. (1988). In the absence of catalytic metals ascorbate does not autoxidize at pH 7: Ascorbate as a test forcatalytic metals. J. Biochem. Biophys. Methods 16:27–40.
17. Buettner, G. R. (1993). The pecking order of free radicals and antioxidants: Lipid peroxidation, a-tocopherol, andascorbate. Arch. Biochem. Biophys. 300:535–543.
18. Burton, G. W., and K. U. Ingold (1984). b-Carotene: An unusual type of lipid antioxidant. Science 224:569–573.
19. Burton, G. W., and M. G. Traber (1990). Vitamin E: Antioxidant activity, biokinetics, and bioavailability. Annu. Rev. Nutr.10:357–382.

20. Burton, H., J. E. Ford, J. G. Franklin, and J. W. G. Porter (1967). Effects of repeated heat treatments on the levels of somevitamins of the B-complex in milk. J. Dairy Res. 34:193–197.
21. Carmel, R., R. M. Sinow, M. E. Siegel, and I. M. Samloff (1988). Food cobalamin malabsorption
Pag e 611
occurs frequently in patients with unexplained low serum cobalamin levels. Arch. Intern. Med. 148:1715–1719.
22. Chan, M. M. (1991). Choline, in Handbook of Vitamins, 2nd. ed. (L. J. Machlin, ed.), Marcel Dekker, New York, pp.537–556.
23. Chandler, L. A., and S. J. Schwartz (1987). HPLC separation of cis-trans carotene isomers in fresh and processed fruitsand vegetables. J. Food Sci. 52:669–672.
24. Colman, N., R. Green, and J. Metz (1975). Prevention of folate deficiency by food fortification. II. Absorption of folic acidfrom fortified staple foods. Am. J. Clin. Nutr. 28:459–464.
25. Cort, W. M., B. Borenstein, J. H. Harley, M. Osadca, and J. Scheiner (1976). Nutrient stability of fortified cereal products.Food Technol 30:52–62.
26. Cort, W. M., T. S. Vicente, E. H. Waysek, and B. D. Williams (1983). Vitamin E content of feedstuffs determined by high-performance liquid chromatography. J. Agric. Food Chem. 31:1330–1333.
27. Coursin, D. B. (1954). Convulsive seizures in infants with pyridoxine deficient diet. J. Am. Med. Assoc. 154:406–408.
28. Dagnelie, P. C., W. A. van Staveren, and H. van den Berg (1991). Vitamin B12 from algae appears not to be bioavailable.Am. J. Clin. Nutr. 53:695–697.
29. Day, B. P. F., and J. F. Gregory 1983. Thermal stability of folic acid and 5-methyltetrahydrofolic acid in liquid model foodsystems. J. Food Sci. 48:581–587, 599.
30. Dellamonica, E. S., and P. E. McDowell (1965). Comparison of beta-carotene content of dried carrots prepared by threedehydrated processes. Food Technol. 19:1597–1599.
31. Dennison, D. B., and J. R. Kirk (1978). Oxygen effect on the degradation of ascorbic acid in a dehydrated food system. J.Food Sci. 43:609–618.
32. Dennison, D., J. Kirk, J. Bach, P. Kokoczka, and D. Heldman (1977). Storage stability of thiamin and riboflavin in adehydrated food system. J. Food Proc. Preserv. 1:43–54.
32a. De Saucedo, S. M. U. (1982). Losses of thiamin, ascorbic acid and lysine in thermally sterilized foods. PhD thesis,University of Leeds (UK).
33. Deutsch, J. C., and J. F. Kolhouse (1993). Ascorbate and dehydroascorbate measurements in aqueous solutions andplasma determined by gas chromatography-mass spectrometry. Anal. Chem. 65:321–326.
34. Doscherholmen, A., J. McMahon, and P. Economon (1981). Vitamin B12 absorption from fish. Proc. Soc. Exp. Biol.Med. 167:480–484.
35. Doscherholmen, A., J. McMahon, and D. Ripley (1975). Vitamin B12 absorption from eggs. Proc. Soc. Exp. Biol. Med.149:987–990.
36. Doscherholmen, A., J. McMahon, and D. Ripley (1978). Vitamin B12 assimilation from chicken meat. Am. J. Clin. Nutr.31:825–830.
37. Douglass, J. S., F. D. Morrow, K. Ono, J. T. Keeton, J. T. Vanderslice, R. C. Post, and B. W. Willis (1989). Impact ofsodium ascorbate and sodium erthorbate use in meat processing on the vitamin B12 content of cured ham. J. Food Sci54:1473–1474.
38. Dwivedi, B. K., and R. G. Arnold (1973). Chemistry of thiamine degradation in food products and model systems: Areview. J. Agric. Food Chem. 21:54–60.
39. Eitenmiller, R. R., and S. de Souza (1985). Niacin, in Methods of Vitamin Assay, 4th ed. (J. Augustin, B. P. Klein, D. A.Becker, and P. B. Venugopal, eds.), John Wiley & Sons, New York, pp. 385–398.
40. Ellenbogen, L., and B. A. Cooper (1992). Vitamin B12, in Handbook of Vitamins, Second Edition (L. J. Machlin, ed.),Marcel Dekker, New York, pp. 491–536.

41. Evans, S. R., J. F. Gregory, and J. R. Kirk (1981). Thermal degradation kinetics of pyridoxine hydrochloride in dehydratedmodel food systems. J. Food Sci. 46:555–558, 563.
42. Farrer, K. T. H. (1955). The thermal destruction of vitamin B1 in foods. Adv. Food Res. 6:257–311.
43. Finglas, P. M., and R. M. Faulks (1987). Critical review of HPLC methods for the determination of thiamin, riboflavin andniacin in food. J. Micronutr. Anal. 3:251–283.
44. Food and Nutrition Board (1989). Recommended Dietary Allowances, 10th ed., National Research Council, NationalAcademy of Sciences, Washington, DC.
45. Ford, J. E., J. W. G. Porter, S. Y. Thompson, J. Toothill, and J. Edwards-Webb (1969). Effects of

Pag e 612
ultra-high-temperature (UHT) processing and of sequence storage on the vitamin content of milk. J. Dairy Res.36:447–454.
46. Frankel, E. N., S.-W. Huang, J. Kanner, and J. B. German (1994). Interfacial phenomena in the evaluation of antioxidants:Bulk oils vs. emulsions. J. Agric. Food Chem. 42:1054–1059.
47. Freed, M., S. Brenner, and V. O. Wodicka. (1948). Prediction of thiamine and ascorbic acid stability in canned storedfoods. Food Technol. 3:148–151.
48. Gregory, J. F. (1980). Effects of e-pyridoxyllysine bound to dietary protein on the vitamin B-6 status of rats. J. Nutr.110:995–1005.
49. Gregory, J. F. (1989). Chemical and nutritional aspects of folate research: analytical procedures, methods of folatesynthesis, stability, and bioavailability of dietary folates. Adv. Food Nutr. Res. 33:1–101.
50. Gregroy, J. F. (1993). Ascorbic acid bioavailability in foods and supplements. Nutr. Rev. 51:301–309.
51. Gregory, J. F. (1985). Chemical changes of vitamins during processing, in Chemical Changes in Food During Processing(T. Richardson and J. W. Finley, eds.), AVI, Westport, CT., pp. 373–408.
52. Gregory, J. F. (1993). Methods for determination of vitamin B6 in foods and other biological materials: A critical review. J.Food Comp. Anal. 1:105–123.
53. Gregory, J. F. (1995). The bioavailability of folate, in Folate in Health and Disease (L. B. Bailey, ed.), Marcel Dekker,New York, pp. 195–235.
54. Gregory, J. F., and M. E. Hiner (1983). Thermal stability of vitamin B6 compounds in liquid method food systems. J. FoodSci. 48:1323–137, 1339.
55. Gregroy, J. F., and S. L. Ink (1987). Identification and quantification of pyridoxine-b-glucoside as a major form of vitaminB6 in plant-derived foods. J. Agric. Food Chem. 35:76–82.
56. Gregory, J. F., S. L. Ink, and D. B. Sartain (1986). Degradation and binding to food proteins of vitamin B-6 compoundsduring thermal processing. J. Food Sci. 51:1345–1351.
57. Greundwedel, D. W., and R. K. Patnaik (1971). Release of hydrogen sulfide and methyl mercaptan from sulfur-containingamino acids. J. Agric. Food Chem. 19:775–779.
58. Hamm, D. J., and D. B. Lund (1978). Kinetics parameters for thermal inactivation of pantothenic acid. J. Food Sci.43:631–633.
59. Harris, E. D. (1992). The pyrroloquinoline quinone (PQQ) coenzymes: a case of mistaken identity. Nutr. Rev.50:263–274.
60. Harris, R. S. (1971). General discussion on the stability of nutrients, in Nutritional Evaluation of Food Processing (R. S.Harris and H. von Loesecke, eds.), AVI, Westport, CT, pp. 1–4.
61. Harris, R. S., and E. Karmas (1975). Nutritional Evaluation of Food Processing, 2nd. ed., AVI, Westport, CT.
62. Harris, R. S., and H. von Loesecke (1971). Nutritional Evaluation of Food Processing, AVI, Westport, CT.
63. Hassinen, J. B., G. T. Durbin, and F. W. Bernhart (1954). The vitamin B6 content of milk products. J. Nutr. 53:249–257.
64. Herbert, V. (1988). Vitamin B12: Plant sources, requirements, and assay. Am. J. Clin. Nutr. 48:852–858.
65. Herbert, V. (1990). Vitamin B-12, in Present Knowledge in Nutrition, 6th ed. (M. L. Brown, ed.), International LifeSciences Institute, Nutrition Foundation, Washington, DC, pp. 170–178.
66. Hill, M. K., and R. A. Grieger-Block (1980). Kinetic data: Generation, interpretation, and use. Food Technol. 34:56–66.
67. Hoppner, K., and B. Lampi (1993). Pantothenic acid and biotin retention in cooked legumes. J. Food Sci. 58:1085, 1089.

68. Jongehan, J. A., H. I. X. Mager, and W. Berends (1979). Autoxidation of 5-alkyl-tetrahydropteridines. The oxidationproduct of 5-methyl-THF, in The Chemistry and Biology of Pteridines (R. Kisliuk, ed.), Elsevier North Holland, pp.241–246.
69. Kacem, B., J. A. Cornell, M. R. Marshall, R. B. Shireman, and R. F. Matthews (1987). Nonenzymatic browing inaseptically packaged orange juice and orange drinks. Effect of ascorbic acid, amino acids and oxygen. J. Food Sci.52:1668–1672.

Pag e 613
70. Karel, M. (1979). Prediction of nutrient losses and optimization of processing conditions, in Nutritional and SafetyAspects of Food Processing (S. R. Tannenbaum, ed.), Marcel Dekker, New York, pp. 233–263.
71. Karlin, R., C. Hours, C. Vallier, R. Bertoye, N. Berry, and H. Morand (1969). Sur la teneur en folates des laits de grandmélange. Effects de divers traitment thermiques sur les taux de folates, B12 et B6 de ces laits. Int. Z. Vitaminforsch.39:359–371.
72. Karmas, E., and R. S. Harris. (1988). Nutritional Evaluation of Food Processing, 3rd ed., Van Nostrand Reinhold,New York.
73. Khachik, F., G. R. Beecher, and W. R. Lusby (1989). Separation, identification, and quantification of the major carotenoidsin extracts of apricots, peaches, cantaloupe, and pink grapefruit by liquid chromatography. J. Agric. Food Chem.37:1465–1473.
74. Khan, M. M. T., and A. E. Martell (1967). Metal ion and metal chelate catalyzed oxidation of ascorbic acid by molecularoxygen. I. Cupric and ferric ion oxidation. J. Am. Chem. Soc. 89:4176–4185.
75. Khan, M. M. T., and A. E. Martell (1967). Metal ion and metal chelate catalyzed oxidation of ascorbic acid by molecularoxygen. II. Cupric and ferric chelate catalyzed oxidation. J. Am. Chem. Soc. 89:7104–7111.
76. Kilgore, J., C. Smidt, L. Duich, N. Romero-Chapman, D. Tinker, M. Melko, D. Hyde, and R. Rucker (1989). Nutritionalimportance of pyrroloquinoline quinone. Science 245:850–852.
77. Kirk, J., D. Dennison, P. Kokoczka, and D. Heldman (1977). Degradation of ascorbic acid in a dehydrated food system. J.Food Sci. 42:1274–1279.
78. Klein, B. P., and A. K. Perry (1982). Ascorbic acid and vitamin A activity in selected vegetables from differentgeographical areas of the United States. J. Food Sci. 47:941–945.
79. Labuza, T. P. (1979). A theoretical comparison of losses in foods under fluctuating temperature sequences. J. Food Sci.44:1162–1168.
80. Labuza, T. P. (1980). The effect of water activity on reaction of kinetics of food deterioration. Food Technol. 34:36–41,59.
81. Labuza, T. P., and J. F. Kamman (1982). A research note. Comparison of stability of thiamin salts at high temperature andwater activity. J. Food Sci. 47:664–665.
82. Leichter, J., V. P. Switzer, and A. F. Landymore (1978). Effect of cooking on folate content of vegetables. Nutr. Rep. Int.18:475–479.
83. Lenz, M. K., and D. B. Lund (1980). Experimental procedures for determining destruction of kinetics of food components.Food Technol. 34:51–55.
84. Liao, M.-L, and P. A. Seib (1987). Selected reactons of L-ascorbic acid related to foods. Food Technol. 41:104–107,111.
85. Lund, D. B. (1977). Designing thermal processes for maximizing nutrient retention. Food Technol. 31:71–78.
86. Lund, D. (1979). Effect of commercial processing on nutrients. Food Technol 33:28–34.
87. Lund, D. (1988). Effects of heat processing on nutrients, in Nutritional Evaluation of Food Processing, 3rd. ed. (E.Karmas and R. S. Harris, eds.), Van Nostrand Reinhold, New York, pp. 319–354.
88. Machlin, L. J. (1991). Vitamin E, in Handbook of Vitamins, 2nd ed. (L. J. Machlin, ed.), Marcel Dekker, New York, pp.99–144.
89. Malewski, W., and P. Markakis (1971). A research note. Ascorbic acid content of developing tomato fruit. J. Food Sci.36:537–539.

90. Mangels, A. R., G. Block, C. M. Frey, et al. (1993). The bioavailability to humans of ascorbic acid from oranges, orangejuice and cooked broccoli is similar to that of synthetic ascorbic, J. Nutr. 123:1054–1061.
91. Maruyama, T., T. Shiota, and C. L. Krumdieck (1978). The oxidative cleavage of folates. A critical study. Anal. Biochem.84:277–295.
92. Mauri, L. M., S. M. Alzamora, J. Chirife, and M. J. Tomio (1989). Review: Kinetic parameters for thiamine degradation infoods and model solutions of high water activity. Int. J. Food Sci. Technol. 24:1–9.
Pag e 614
93. McCormick, D. B. (1990). Riboflavin, in Present Knowledge in Nutrition (M. L. Brown, ed.), International Life SciencesInstitute-Nutrition Foundation, Washington, DC, pp. 146–154.
94. Misir, R., and R. Blair (1988). Biotin, bioavailability of protein supplements and cereal grains for starting turkey poults.Pout. Sci. 67:1274–1280.
95. Mnkeni, A. P., and T. Beveridge 1983. Thermal destruction of 5-methyltetrahydrofolic acid in buffer and model foodsystems. J. Food Sci. 48:595–599.
96. Mock, D. M. (1990). Biotin, in Present Knowledge in Nutrition, 6th ed. (M. L. Brown, ed.), International Life SciencesInstitute, Nutrition Foundation, Washington, DC, pp. 189–207.
97. Mock, D. M., N. I. Mock, and S. E. Langbehn (1992). Biotin in human milk: methods, location, and chemical form. J.Nutr. 122:535–545.
98. Moran, R. (1959). Nutritional significance of recent work on wheat flour and bread. Nutr. Abstr. Rev. 29:1–10.
99. Mozafar, A., and J. J. Oertli (1992). Uptake of a microbially-produced vitamin (B12) by soybean roots. Plant Soil139:23–30.
100. Mulley, E. A., C. R. Strumbo, and W. M. Hunting (1975). Kinetics of thiamine degradation by heat. Effect of pH and formof the vitamin on its rate of destruction. J. Food Sci. 40:989–992.
101. Nagy, S. (1980). Vitamin C contents of citrus fruit and their products: A review. J. Agric. Food Chem. 28:8–18.
102. Navankasattusas, S., and D. B. Lund (1982). Thermal destruction of vitamin B6 vitamers in buffer solution and cauliflowerpuree. J. Food Sci. 47:1512–1518.
103. Pelletier, O. (1985). Vitamin C, in Methods of Vitamin Assay, 4th ed. (J. Augustin, B. P. Klein, D. A. Becker, and P. B.Venugopal, eds.), John Wiley & Sons, New York, pp. 303–347.
104. Pesek, C. A., and J. J. Warthesen (1990). Kinetic model for photoisomerization and concomitant photodegradation of b-carotenes. J. Agric. Food Chem. 38:1313–1315.
105. Poe, M. (1977). Acidic dissociation constants of folic acid, dihydrofolic acid, and methotrexate. J. Biol. Chem.252:3724–3728.
106. Porzio, M. A., N. Tang, and D. M. Hilker (1973). Thiamine modifying properties of heme proteins from skipjack tuna,pork, and beef. J. Agric. Food Chem. 21:308–310.
107. Reed, L. S., and M. C. Archer (1980). Oxidation of tetrahydrofolic acid by air. J. Agric. Food Chem. 28:801–805.
108. Reiber, H. (1972). Photochemical reactions of vitamin B6 compounds, isolation and properties of products. Biochim.Biophys. Acta 279:310–315.
109. Rizvi, S. S. H., and J. C. Acton (1982). Nutrient enhancement of thermostabilized foods in retort pouches. Food Technol36:105–109.
110. Robinson, D. R. (1971). The nonenzymatic hydrolysis of N5,N10-methenyltetrahydrofolic acid and related reactions, inMethods in Enzymology (F. Chytyl, ed.), vol. 18B, Academic Press, San Diego, pp. 716–725.
111. Roughead, Z. K., and D. B. McCormick (1991a). Qualitative and quantitative assessment of flavins in cow's milk. J. Nutr.120:382–388.
112. Roughead, Z. K., and D. B. McCormick (1990b). Flavin composition of human milk. Am. J. Clin. Nutr. 52:854–857.
113. Ryley, J., and P. Kajda (1993). Vitamins in thermal processing. Food Chem. 49:119–129.
114. Saidi, B., and J. J. Warthesen (1983). Influence of pH and light on the kinetics of vitamin B6 degradation. J. Agric. FoodChem. 31:876–880.

115. Sauberlich, H. E., M. J. Kretsch, J. H. Skala, H. L. Johnson, and P. C. Taylor (1987). Folate requirements andmetabolism in nonpregnant women. Am. J. Clin. Nutr. 46:1016–1028.
116. Sauer, W. C., R. Mosenthin, and L. Ozimek (1988). The digestibility of biotin in protein supplements and cereal grains forgrowing pigs. J. Anim. Sci. 66:2583–2589.
117. Scarpa, M., R. Stevanato, P. Viglino, and A. Rigo (1983). Superoxide ion as active intermediate in the autoxidation ofascorbate by molecular oxygen. J. Biol. Chem. 258:6695–6697.
118. Selman, J. D. (1993). Vitamin retention during blanching of vegetables. Food Chem. 49:137–147.

Pag e 615
119. Seyoum, E., and J. Selhub 1993. Combined affinity and ion pair column chromatographies for the analysis of food folate.J. Nutr. Biochem. 4:488–494.
120. Shah, J. J. (1985). Riboflavin, in Methods of Vitamin Assay, 4th ed. (J. Augustin, B. P. Klein, D. A. Becker, and P. B.Venugopal, eds.), John Wiley & Sons, New York, pp. 365–383.
121. Shaw, S., E. Jayatilleke, V. Herbert, and N. Colman (1989). Cleavage of folates during ethanol metabolism. Biochem. J.257:277–280.
122. Sies, H., W. Stahl, and A. R. Sundquist (1992). Antioxidant functions of vitamins. Vitamins E and C, beta-carotene, andother carotenoids, in Beyond Deficiency. New Views on the Functions and Health Effects of Vitamins (H. E. Sauberlichand L. J. Machlin, eds.), Ann. N. Y. Acad. Sci. 669:7–20.
123. Snell, E. E. (1963). Vitamin B6. Comp. Biochem. 2:48–58.
124. Srncova, V., and J. Davidek (1972). Reaction of pyridoxal and pyridoxal-5-phosphate with proteins. Reaction ofpyridoxal with milk serum proteins. J. Food Sci. 37:310–312.
125. Steele, C. J. (1976). Cereal fortification—Technological problems. Cereal Foods World 21:538–540.
126. Tadera, K., M. Arima, and F. Yagi (1988). Participation of hydroxyl radical in hydroxylation of pyridoxine by ascorbicacid. Agric. Biol. Chem. 52:2359–2360.
127. Taher, M. M., and N. Lakshmaiah (1987). Hydroperoxide-dependent folic acid degradation by cytochrome c. J. Inorg.Biochem. 28:133–141.
128. Tannenbaum, S. R., V. R. Young, and M. C. Archer (1985). Vitamins and minerals, in Food Chemistry, Second Edition,Revised and Expanded (O. R. Fennema, ed.), Marcel Dekker, New York, pp. 477–544.
129. Tarr, J. B., T. Tamura, and E. L. R. Stokstad (1981). Availability of vitamin B6 and pantothenate in an average Americandiet in man. Am. J. Clin. Nutr. 34:1328–1337.
130. Teixeira, A. A., J. R. Dixon, J. W. Zahradnik, and G. E. Zinsmeister (1969). Computer optimization of nutrient retention inthe thermal processing of conduction-heating foods. Food Technol 23:845.
131. Thompson, J. N. (1986). Problems of official methods and new techniques for analysis of foods and foods for vitamin A.J. Assoc. Offic. Anal. Chem. 69:727–738.
132. Thompson, J. N., and G. Hatina (1979). Determination of tocopherols and tocotrienols in foods and tissues by highperformance liquid chromatography. J. Liq. Chromatogr. 2:327–344.
133. Tsukida, K., K. Saiki, and M. Suguira (1981). Structural elucidation of the main cis-b-carotenes. J. Nutr. Sci. Vitaminol.27:551–556.
134. Vanderslice, J. T., and D. J. Higgs (1988). Chromatographic separation of ascorbic acid, isoascorbic acid, anddehydroascorbic acid and dehydro-isoascorbic acid and their quantitation in food products. J. Micronutr. Anal. 4:109–118.
135. Van Niekerk, P. J. (1988). Determination of vitamins, in HPLC in Food Analysis 2nd ed. (R. Macrae, ed.), AcademicPress, San Diego, pp. 133–184.
136. Van Niekerk, P. J., and A. E. C. Burger (1985). The estimation of the composition of edible oil mixtures. J. Am. OilChem. Soc. 62:531–538.
137. Wall, J. S., and K. J. Carpenter (1988). Variation in availability of niacin in grain products. Changes in chemicalcomposition during grain development and processing affect the nutritional availability of niacin. Food Technol. 42:198–204.
138. Wall, J. S., M. R. Young, and K. S. Carpenter (1987). Transformation of niacin-containing compounds in corn duringgrain development. Relationship of niacin nutritional availability. J. Agric. Food Chem. 35:752–758.
139. Weiser, H., and M. Vecchi (1982). Stereoisomers of a-tocopheryl acetate. II. Biopotencies of all eight stereoisomers,individually or in mixtures, as determined by rat resorption-gestation tests. Int. J. Vit. Nutr. Res. 32:351–370.

140. Wendt, G., and F. W. Bernhart (1960). The structure of a sulfur-containing compound with vitamin B6 activity. Arch.Biochem. Biophys. 88:270–272.
141. Weisinger, H., and H.-J. Hinz (1984). Kinetic and thermodynamic parameters for Schiff base formation of vitamin B6derivatives with amino acids. Arch. Biochem. Biophys. 235:34–40.
142. Woodcock, E. A., J. J. Warthesen, and T. P. Labuza (1982). Riboflavin photochemical degradation in pasta measured byhigh performance liquid chromatography. J. Food Sci. 47:545–555.

Pag e 616
143. Wyse, B. W., W. O. Song, J. H. Walsh, and R. G. Hansen (1991). Pantothenic acid in Methods of Vitamin Assay, 4thed. (J. Augustin, B. P. Klein, D. A. Becker, and P. B. Venugopal, eds.), John Wiley & Sons, New York, pp. 399–416.
144. Yasumoto, K., H. Tsuji, K. Iwami, and H. Mitsuda (1977). Isolation from rice bran of a bound form of vitamin B6 and itsidentification of 5'-O-(b-D-glucopyranosyl)pyridoxine. Agri. Biol. Chem. 41:1061–1067.
145. Zechmeister, L. (1949). Stereoisomeric provitamins A. Vitam. Hormones (NY) 7:57–81.
146. Zoltevicz, J. A., and G. M. Kauffman (1977). Kinetics and mechanism of the cleavage of thiamin, 2-(1-hydroxyethyl)thiamin, and a derivative by bisulfite ion in aqueous solution. Evidence for an intermediate. J. Am. Chem. Soc. 99:3134–3142.

Pag e 617
9Minerals
DENNIS D. MILLERCornell University, Ithaca, New York
9.1. Introduction 618
9.2. Principles of Mineral Chemistry 618
9.2.1. Solubility of Minerals in Aqueous Systems 619
9.2.2. Minerals and Acid/Base Chemistry 619
9.3. Nutritional Aspects of Minerals 625
9.3.1. Essential Mineral Elements 625
9.3.2. Recommended Dietary Allowances for Mineral Nutrients(U.S.)
626
9.3.3. Bioavailability 627
9.3.4. Minerals of Particular Nutritional Concern 631
9.4. Mineral Composition of Foods 632
9.4.1. Ash 632
9.4.2. Individual Minerals 632
9.4.3. Factors Affecting the Mineral Composition of Foods 632
9.4.4. Fortification 633
9.4.5. Effects of Processing 639
9.5. Chemical and Functional Properties of Minerals in Foods 640
9.5.1. Calcium 640
9.5.2. Phosphates 641
9.5.3. Iron 641
9.5.4. Nickel 645
9.5.5. Copper 646
9.6. Summary 647

Bibliography 647
References 647

Pag e 618
9.1 Introduction
Ninety chemical elements occur naturally in the earth's crust. About 25 of them are known to be essential to life and thus arepresent in living cells (Fig. 1). Since our food is ultimately derived from living plants or animals, we can expect to find these 25elements in foods as well. Foods also contain other elements, since living systems can accumulate nonessential elements fromtheir environment. Moreover, elements may enter foods as contaminants during harvest, processing, and storage, or they may bepresent in intentional food additives.
While there is no universally accepted definition of “mineral” as it applies to food and nutrition, the term usually refers to elementsother than C, H, O, and N that are present in foods. These four nonmineral elements are present primarily in organic moleculesand water, and constitute about 99% of the total number of atoms in living systems [10]. Thus mineral elements are present inrelatively low concentrations in foods. Nevertheless, they play key functional roles in both living systems and foods.
Historically, minerals have been classified as either major or trace, depending on their concentrations in plants and animals. Thisclassification arose at a time when analytical methods were not capable of measuring small concentrations of elements with muchprecision. Thus the term “trace” was used to indicate the presence of an element that could not be measured accurately. Today,modern methods and instruments allow for extremely precise and accurate measurement of virtually all of the elements in theperiodic table (Fig. 1) [28]. Nevertheless, the terms major and trace continue to be used to describe mineral elements inbiological systems. Major minerals include calcium, phosphorus, magnesium, sodium, potassium, and chloride. Trace elementsinclude iron, iodine, zinc, selenium, chromium, copper, fluorine, lead, and tin.
9.2 Principles of Mineral Chemistry
Many different chemical forms of mineral elements are present in foods. These forms are commonly referred to as species andinclude compounds, complexes, and free ions [44]. Given the diversity of chemical properties among the mineral elements, thenumber and diversity of nonmineral compounds in foods that can bind mineral elements, and the chemical changes that occur infoods during processing and storage, it is not surprising that the number of different mineral species in foods is large indeed.Moreover, since foods are so complex and since many mineral species are unstable, it is very difficult to isolate and characterizemineral species in
FIGURE 1Periodic table of the naturally occurring elements. Shaded elements are believed to be
essential nutrients for animals and humans.

Pag e 619
foods. Thus, our understanding of the exact chemical forms of minerals in foods remains limited. Fortunately, principles andconcepts from the vast literature in inorganic, organic, and biochemistry can be very useful in guiding predictions about thebehavior of mineral elements in foods.
9.2.1 Solubility of Minerals in Aqueous Systems
All biological systems contain water, and most nutrients are delivered to and metabolized by organisms in an aqueousenvironment. Thus the availabilities and reactivities of minerals depend, in large part, on solubility in water. This excludes theelemental form of nearly all elements (dioxygen and nitrogen are exceptions) from physiological activity in living systems sincethese forms, such as elemental iron, are insoluble in water and therefore are unavailable for incorporation into organisms orbiological molecules.
The species (forms) of elements present in food vary considerably depending on the chemical properties of the element.Elements in groups IA and VIIA (Fig. 1) exist in foods predominantly as free ionic species (Na+, K+, Cl-, and F-). These ionsare highly water soluble and have low affinities for most ligands; thus they exist primarily as free ions in aqueous systems. Mostother minerals are present as complexes, chelates, or oxygen-containing anions (see later discussion of complexes and chelates).
The solubilities of mineral complexes and chelates may be very different from that of inorganic salts. For example, if ferricchloride is dissolved in water, the iron will soon precipitate as ferric hydroxide. On the other hand, ferric iron chelated withcitrate is quite soluble. Conversely, calcium as calcium chloride is quite soluble, while calcium chelated with oxalate ion isinsoluble.
9.2.2 Minerals and Acid/Base Chemistry
Much of the chemistry of the mineral elements can be understood by applying the concepts of acid/base chemistry. Moreover,acids and bases may profoundly influence functional properties and stabilities of other foods components by altering the pH ofthe food. Thus acid/base chemistry is of critical importance to food scientists. A brief review of acid/base chemistry follows. Fora more complete treatment of this topic, see Shriver et al. [38] or other textbooks on inorganic chemistry.
9.2.2.1 Bronsted Theory of Acids and Bases
A Bronsted acid is any substance capable of donating a proton.
A Bronsted base is any substance capable of accepting a proton.
Many acids and bases occur naturally in foods, and they may be used as food additives or processing aids. Common organicacids include acetic, lactic, and citric acids. Phosphoric acid is an example of a mineral acid present in foods. It is used as anacidulant and flavoring agent in some carbonated soft drinks. It is a tribasic acid (contains three available protons).
Other common mineral acids include HCl and H2SO4. They are not added to foods directly, although they may be generated infoods during processing or cooking. For example,

Pag e 620
H2SO4 is produced when the common leavening acid sodium aluminum sulfate is heated in the presence of water:
Some of the intermediate steps in this reaction are:
Aluminum ions may then form complexes with water to produce hydrated aluminum ions:
The Bronsted acidity of the coordinated water molecules is increased as a result of the electron-withdrawing capabilities of themetal ion:
Acid strength varies as a function of the electronegativity of the metal ion. The acid strength of a hydrated aluminum ion is about
the same as that of acetic acid; pKa values of and acetic acid are 5.0 and 4.8, respectively.
9.2.2.2 Lewis Theory of Acids and Bases
An alternative, and more general, definition of an acid and a base was developed by G. N. Lewis in the 1930s [38]:
A Lewis acid is an electron pair acceptor.
A Lewis base is an electron pair donor.
By convention, Lewis acids are often represented as “A” and Lewis bases as “B.” The reaction between a Lewis acid and aLewis base then becomes:
It is important to remember that this reaction does not involve a change in the oxidation state of either A or B; that is, it is not aredox reaction. Thus, A must possess a vacant low-energy orbital and B must possess an unshared pair of electrons. Thebonding results from the interaction of orbitals from the acid and the base to form new molecular orbitals. The stability of thecomplex depends in large part on the reduction of electronic energy that occurs when orbitals from A and :B interact to formbonding molecular orbitals. The electronic structures of these complexes are very intricate since multiple atomic orbitals may beinvolved. The d,-metals for example, can contribute up to nine atomic orbitals (1s, 3p, and 5d orbitals) to the formation ofmolecular orbitals. See Shriver et al. [38] for an excellent discussion of molecular orbital theory. The product of the reactionbetween a Lewis acid and a Lewis base is commonly referred to as a complex where A and :B are bonded together through thesharing of the electron pair donated by :B.
The Lewis acid/base concept is key to understanding the chemistry of minerals in foods because metal cations present are Lewisacids and they are bound to Lewis bases. The complexes resulting from reactions between metal cations and food moleculesrange from metal hydrates, to metal-containing pigments such as hemoglobin and chlorophyll, to metalloenzymes.
The number of Lewis base molecules that may bind to a metal ion is more or less independent of the charge on the metal ion.This number, usually referred to as the coordination number, may range from 1 to 12 but is most commonly 6. For example,Fe3+ binds six water molecules to form hexaaquo iron, which takes on an octahedral geometry (Fig. 2).

Pag e 621
FIGURE 2Ferric iron with six coordinated
water molecules. This is thepredominant form of Fe 3+ in
acidic (pH < 1) aqueous solutions.
The electron-donating species in these complexes are commonly referred to as ligands. The principal electron donating atoms inligands are oxygen, nitrogen, and sulfur. Thus many food molecules including proteins, carbohydrates, phospholipids, andorganic acids are ligands for mineral ions. Ligands may be classified according to the number of bonds they can form with ametal ion. Those that form one bond are monodentate ligands; those that form two bonds are bidentate; and so on. Ligands thatform two or more bonds are referred to collectively as multidentate ligands. Some common examples of ligands are shown inFigure 3.
Stabilities of metal complexes may be expressed as the equilibrium constant for the reaction representing the formation of thecomplex. The terms “stability constant,” k, and “formation constant” are often used interchangeably. The generalized reaction forformation of a complex of a metal ion (M) and a ligand (L) is [38]:
FIGURE 3Examples of lig ands coordinated with a metal ion (M +)

Pag e 622
TABLE 1 Stability Constants(log K) for Selected MetalComplexes and Chelates
Ligand Cu2+ Fe3+
OH- 6.3 11.8
Oxalate 4.8 7.8
Histidine 10.3 10.0
EDTA 18.7 25.1
Note: Values are corrected toa constant ionic streng th.
Source: Adapted from Ref.10.
When more than one ligand is bound to one metal ion, the overall formation constant may be expressed as:
where bn = K1K2 … Kn.
The brackets indicate the equilibrium activities of the bracketed species. Thus K (or b) is an expression of the affinity of ligandsfor metal ions. Ligands forming complexes with large stability constants will displace metals from complexes with smaller stabilityconstants. Most stability constants are very large, so values for K are often expressed as the logarithms of the actual values.Table 1 shows some stability constants for Cu2+ and Fe3+.
9.2.2.3 Activity Versus Concentration
The behavior of ions in solution is influenced by ionic strength. At high ionic strength the “activity” of an ion with respect to itsparticipation in complex formation or other chemical reactions will be different than it would be at the same concentration in asimilar solution of lower ionic strength. Recall that the ionic strength of a solution is given by
where m1, m2, and m3 are the molar concentrations of various ions in solution and Z is the ionic charge.
In order to account for the effect of ionic strength on stability constants, activities rather than actual concentrations should beused in making equilibrium calculations. Activity in this regard is defined as:
aA = fA[A]
where aA is the activity of species A, fA is the activity coefficient, and [A] is the concentration of species A. In general, fA
decreases as ionic strength increases. At very low ionic strengths, fA approaches 1 and activity equals concentration. Data inFigure 4 indicate that ionic strength can have a marked effect on activity coefficients, especially when the charge on the ion islarge.

Pag e 623
FIGURE 4The effect of ionic streng th on activity coefficients of
selected ions. (From Ref. 39.)
Unfortunately, it is difficult to determine activity coefficients, especially in complex systems like foods, so activity coefficientsgenerally are assumed, improperly, to be 1. This being the case, one may wonder about the utility of stability constants forpredicting the forms of metal ionic in foods. The problem can be partly overcome by expressing stability constants at a givenionic strength and assuming that effects of ionic strength will be similar for all species. Thus, it is reasonable to conclude from thelarge stability constant for the Fe(EDTA) complex (Table 1) that EDTA (ethylenediamine tetraacetic acid) added to a food willcomplex much of the iron in that food. On the other hand, it may not be reasonable to conclude that copper will displace ironfrom a histidine complex since the stability constants, while different, are similar in magnitude.
9.2.2.4 The Chelate Effect
The stabilities of complexes resulting from reactions between Lewis acids and bases are proportional to the driving force of thereaction. This can be described quantitatively by the Gibbs equation for free energy:
DG = DH - T DS
where DG is the free energy change in a system undergoing transformation, DH is the enthalpy change, T is absolutetemperature, and DS is the entropy change.
Reactions will occur spontaneously (but at unspecified rates) when DG is negative, and as DG becomes more negative, thereaction becomes more favorable. Note that for a spontaneous reaction to occur, enthalpy of the system must decrease orentropy must increase. A decrease in enthalpy means that the total electronic energy of the system decreases. An increase inentropy means the randomness of the system increases.
A chelate is a complex resulting from the combination of a metal ion and a multidentate ligand such that the ligand forms two ormore bonds with the metal, resulting in a ring structure that includes the metal ion. The term chelate is derived from chele, theGreek word for claw. Thus a chelating ligand (also called a chelating agent) must contain at least two functional groups capableof donating electrons. In addition, these functional groups must be spatially arranged so that a ring containing the metal ion canform. Chelates have greater thermodynamic stabilities than similar complexes that are not chelates, a phenomenon referred to asthe “chelate effect.” Several factors interact to affect the stability of a chelate. Kratzer and Vohra [23] summarized these factorsas follows:
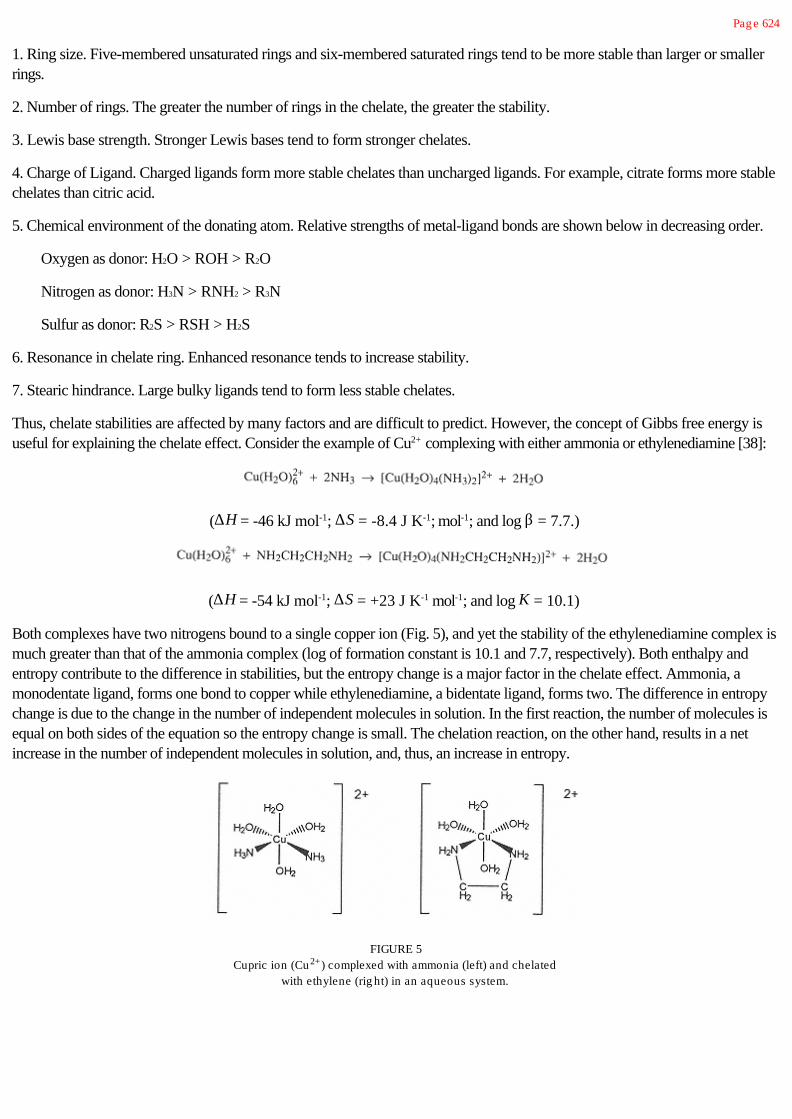
Pag e 624
1. Ring size. Five-membered unsaturated rings and six-membered saturated rings tend to be more stable than larger or smallerrings.
2. Number of rings. The greater the number of rings in the chelate, the greater the stability.
3. Lewis base strength. Stronger Lewis bases tend to form stronger chelates.
4. Charge of Ligand. Charged ligands form more stable chelates than uncharged ligands. For example, citrate forms more stablechelates than citric acid.
5. Chemical environment of the donating atom. Relative strengths of metal-ligand bonds are shown below in decreasing order.
Oxygen as donor: H2O > ROH > R2O
Nitrogen as donor: H3N > RNH2 > R3N
Sulfur as donor: R2S > RSH > H2S
6. Resonance in chelate ring. Enhanced resonance tends to increase stability.
7. Stearic hindrance. Large bulky ligands tend to form less stable chelates.
Thus, chelate stabilities are affected by many factors and are difficult to predict. However, the concept of Gibbs free energy isuseful for explaining the chelate effect. Consider the example of Cu2+ complexing with either ammonia or ethylenediamine [38]:
(DH = -46 kJ mol-1; DS = -8.4 J K-1; mol-1; and log b = 7.7.)
(DH = -54 kJ mol-1; DS = +23 J K-1 mol-1; and log K = 10.1)
Both complexes have two nitrogens bound to a single copper ion (Fig. 5), and yet the stability of the ethylenediamine complex ismuch greater than that of the ammonia complex (log of formation constant is 10.1 and 7.7, respectively). Both enthalpy andentropy contribute to the difference in stabilities, but the entropy change is a major factor in the chelate effect. Ammonia, amonodentate ligand, forms one bond to copper while ethylenediamine, a bidentate ligand, forms two. The difference in entropychange is due to the change in the number of independent molecules in solution. In the first reaction, the number of molecules isequal on both sides of the equation so the entropy change is small. The chelation reaction, on the other hand, results in a netincrease in the number of independent molecules in solution, and, thus, an increase in entropy.
FIGURE 5Cupric ion (Cu 2+) complexed with ammonia (left) and chelated
with ethylene (rig ht) in an aqueous system.

Pag e 625
Ethylenediamine tetraacetate ion (EDTA) provides an even more dramatic illustration of the chelate effect [34]. EDTA is anhexadentate ligand. When it forms a chelate with a metal ion in solution, it displaces six water molecules from the metal, and thishas a large effect on the entropy of the system (Fig. 6):
Moreover, EDTA chelates contain five-membered rings, which also enhance stability. EDTA forms stable chelates with manymetal ions and is widely used as a food additive.
Chelates are very important in foods and in all biological systems. Chelating agents may be added to foods to sequester mineralions, such as iron or copper, to prevent them from acting as prooxidants. Furthermore, most complexes resulting from metal ionsand food molecules are chelates.
9.3 Nutritional Aspects of Minerals
9.3.1 Essential Mineral Elements
What do we mean when we say an element is “essential for life?” Several definitions have been proposed. A widely accepteddefinition is: An element is essential for life if its removal from the diet or other route of exposure to an organism “results in aconsistent and reproducible impairment of a physiological function” [42]. Thus, essentiality can be demonstrated by feeding dietslow in a particular element to humans or experimental animals and watching for signs of impaired function.
Human requirements for essential minerals vary from a few micrograms per day up to about 1 g/day. If intakes are low for someperiod of time, deficiency signs will develop. Conversely, excessively high intakes can result in toxicity. Fortunately, for mostminerals the range of safe and adequate intake is fairly wide, so deficiency or toxicity is relatively rare provided a varied diet isconsumed. This concept is illustrated in Figure 7.
This broad range of safe and adequate intakes is possible because higher organisms have homeostatic mechanisms for dealingwith both low and high exposures to essential nutrients.
FIGURE 6Ethylenediamine tetraacetic acid (EDTA) and calcium (Ca 2+) chelated with EDTA.

Pag e 626
FIGURE 7Dose-response relationship between mineral intake (dose) and an
associated physiolog ical function. Function is impaired at both excessivelylow and excessively hig h intakes of most mineral nutrients. (From Ref. 42.)
Homeostasis may be defined as the processes whereby an organism maintains tissue levels of nutrients within a narrow andconstant range. In higher organisms, homeostasis is a highly complex set of processes involving regulation of absorption,excretion, metabolism, and storage of nutrients. Without homeostatic mechanisms, intakes of nutrients would have to be verytightly controlled to prevent deficiency or toxicity. Homeostasis can be overridden when dietary levels are excessively low orhigh for extended periods of time. Persistently low intakes of mineral nutrients is not uncommon, especially in poor populationswhere access to a variety of foods is often limited. Toxicities caused by high dietary intakes of minerals are less common,although much has been made recently of possible links between chronic diseases and high dietary levels of iron.
9.3.2 Recommended Dietary Allowances for Mineral Nutrients (U.S.)
Recommended dietary allowances (RDAs) are defined as “the levels of intake of essential nutrients that, on the basis of scientificknowledge, are judged by the Food and Nutrition Board to be adequate to meet the known nutrient needs of practically allhealthy persons” [14]. RDAs are established by estimating the requirement for the absorbed nutrient, adjusting for incompleteutilization of the ingested nutrient, and incorporating a safety factor to account for variability among individuals. Thus RDA valuesare greater than the requirement, usually by two standard deviations above the mean. This means that individuals with nutrientintakes below the RDA do not necessarily have an inadequate intake. However, when a significant fraction of a population hasan intake that is significantly below the RDA for an extended period of time, the probability that deficiency will occur in someindividuals increases.
The RDA committee has published RDAs for only 7 of the 20 known essential minerals (Table 2). An RDA is established onlywhen data are sufficient to determine a reliable value. The RDA Committee has, however, published “estimated minimumrequirements” for several minerals where data to support an RDA are not adequate. These are sodium, chloride, and potassium(Table 3). “Estimated safe and adequate intakes” have been published for copper, manganese, fluoride, chromium, andmolybdenum (Table 4).
Deficiencies of the minerals listed in Table 3 and 4 are rare in the United States. However, for many people, intakes of sodiumtend to be higher than desirable for optimal health. Epidemiological data show that blood pressure is positively associated withlevel of salt intake. Populations with salt intakes greater than 6 g/day have progressively increasing blood pressure with age,while blood pressure rise with age is not seen in populations with salt intakes below 4.5 g/day [8]. Thus, dietary guidelines forthe prevention on chronic disease usually include the recommendation that intakes of salt be less than 6 g/day. Sodium chloride is40% sodium by weight, so 6 g salt provides 2400 mg sodium.

Pag e 627
TABLE 2 Recommended Dietary Allowances (RDAs) for the Mineral Nutrients
Minerals
Categ oryAg e (years) orcondition
Calcium(mg)
Phosphorus(mg)
Mag nesium(mg)
Iron(mg)
Zinc(mg)
Iodine(mg)
Selenium(mg)
Infants 0.0–0.5 400 300 40 6 5 40 10
0.5–1.0 600 500 60 10 5 50 15
Children 1–3 800 800 80 10 10 70 20
4–6 800 800 120 10 10 90 20
7–10 800 800 170 10 10 120 30
Males 11–14 1200 1200 270 12 15 150 40
15–18 1200 1200 400 12 15 150 50
19–24 1200 1200 350 10 15 150 70
25–50 800 800 350 10 15 150 70
51+ 800 800 350 10 15 150 70
Females 11–14 1200 1200 280 15 12 150 45
15–18 1200 1200 300 15 12 150 50
19–24 1200 1200 280 15 12 150 55
25–50 800 800 280 15 12 150 55
51+ 800 800 280 10 12 150 55
Preg nant 1200 1200 320 30 15 175 65
Lactating 1st 6 months 1200 1200 355 15 19 200 75
2nd 6 months 1200 1200 340 15 16 200 75
Source: Adapted from Ref. 14.
9.3.3 Bioavailability
It has been recognized for at least a century that the concentration of a nutrient in a food is not necessarily a reliable indicator ofthe value of that food as a source of the nutrient in question. This led nutritionists to develop the concept of nutrientbioavailability. Bioavailability may be defined as the proportion of a nutrient in ingested food that is available for utilization inmetabolic processes. In the case of mineral nutrients, bioavailability is determined primarily by the efficiency of absorption fromthe intestinal lumen into the blood. In some

TABLE 3 Estimated Minimum Requirements for Electrolytes
Age W eig ht (kg ) Sodium (mg ) Chloride (mg ) Potassium (mg )
Months
0.–5 4.5 120 180 500
6–11 8.9 200 300 700
Years
1 11.0 225 350 1000
2–5 16.0 300 500 1400
6–9 25.0 400 600 1600
10–18 50.0 500 750 2000
>18 70.0 500 50 2000
Source: Adapted from Ref. 14.

Pag e 628
TABLE 4 Estimated Safe and Adequate Daily Dietary Intakes of Selected Minerals
Categ ory Ag e (years) Cu (mg ) Mn (mg ) F (mg ) Cr (mg) Mo (mg)
Infants 0.–0.5 0.4–0.6 0.3–0.6 0.1–0.5 10–40 15–30
0.5–1 0.6–0.7 0.6–1.0 0.2–1.0 20–60 20–40
Children andadolescents
1–3 0.7–1.0 1.0–1.5 0.5–1.5 20–80 25–50
4–6 1.0–1.5 1.5–2.0 1.0–2.5 30–120 30–75
7–10 1.0–2.0 2.0–3.0 1.5–2.5 50–200 50–150
11+ 1.5–2.5 2.0–5.0 1.5–2.5 50–200 5–250
Adults 1.5–3.0 2.0–5.0 1.5–4.0 50–200 75–250
Source: Adapted from Ref. 14.
cases, however, absorbed nutrients may be in a form that cannot be utilized. For example, iron is bound so tightly in somechelates that even if the iron chelate is absorbed, the iron will not be released to cells for incorporation into iron proteins; rather,the intact chelate will be excreted in the urine.
Bioavailabilities of mineral nutrients vary from less than 1 % for some forms of iron to greater than 90% for sodium andpotassium. The reasons for this wide range are varied and complex, since many factors interact to determine the ultimatebioavailability of a nutrient.
9.3.3.1 Nutritional Utilization of Minerals
The process of mineral nutrient utilization may be described as follows [29]. In the mouth, the food is masticated while salivaryamylase begins the process of starch digestion. At this stage, only limited changes in mineral species occur. Next, the food isswallowed and enters the stomach where the pH is gradually lowered to about 2 by gastric acid. At this stage, dramatic changesoccur in mineral species. Stabilities of complexes are changed by the altered pH and by protein denaturation and hydrolysis.Minerals may be released into solution and may reform complexes with different ligands. In addition, transition metals such asiron may undergo a valance change when the pH is reduced. The redox behavior of iron is strongly pH dependent. At neutralpH, even in the presence of excess reducing agents like ascorbic acid, ferric iron will not be reduced. However, when the pH islowered, ascorbic acid rapidly reduces Fe3+ to Fe2+ Since Fe2+ has lower affinity than Fe3+ for most ligands, this reduction willpromote the release of iron from complexes in food.
In the next stage of digestion, the partially digested food in the stomach is emptied into the proximal small intestine, wherepancreatic secretions containing sodium bicarbonate and digestive enzymes raise the pH and continue the process of protein andstarch digestion. In addition, lipases begin digesting triacylglycerols. As digestion proceeds, more new ligands are formed andexisting ligands are altered in ways that undoubtedly affect their affinities for metal ions. Thus a further reshuffling of mineralspecies occurs in the lumen of the small intestine, resulting in a complex mixture of soluble and insoluble and high and lowmolecular weight species. Soluble species may diffuse to the brush boder surface of the intestinal mucosa where they may betaken up by the mucosal cell or pass between cells (the paracellular route). Uptake can be facilitated by a membrane carrier orion channel; may be an active, energy requiring process; may be saturable; and may be regulated by physiological processes.
Clearly, the process of mineral absorption and the factors that affect it are extremely complex. Moreover, speciation of mineralsin the gastrointestinal tract, although known to occur,

Pag e 630
TABLE 6 Calcium Content and Bioavailability in Selected Foods
FoodServing size
(g )
Calciumcontent
(mg)
Fractionalabsorption a(%)
Estimatedabsorbable
Ca/serving (mg )
Serving s toequal 240 ml milk
(n)
Milk 240 300 32.1 96.3 1.0
Almonds 28 80 21.2 17.0 5.7
Pinto beans 86 44.7 17.0 7.6 12.7
Broccoli 71 35 52.6 18.4 5.2
Cabbag e, g reen 75 25 64.9 16.2 5.9
Cauliflower 62 17 68.6 11.7 8.2
Citrus punch, withCCMb
240 300 50.0 150 0.064
Kale 65 47 58.8 27.6 3.5
Soy milk 120 5 31.0 1.6 60.4
Spinach 90 122 5.1 6.2 15.5
Tofu, Ca set 126 258 31.0 80.0 1.2
Turnup g reens 72 99 51.6 31.1 1.9
W ater cress 17 20 67.0 13.4 7.2
aPercent absorption adjusted for calcium load.
bCalcium-citrate-maleate.
Source: Ref. 45.
poor bioavailability of calcium from spinach and pinto beans is probably due to high concentrations of oxalate and phytate,respectively.
9.3.3.3 Iron Bioavailability
Iron bioavailability is determined almost totally by the efficiency of iron absorption in the intestine. Total iron intake, compositionof the diet, and iron status of the individual consuming the diet all play a role in determining the amount of iron absorbed.
Diets in industrialized countries like the United States consistently provide about 6 mg iron per 1000 kcal (4186 kJ) [6]. Ironspecies in foods may be broadly grouped as either heme or nonheme. Heme iron is firmly bound in the center of a porphyrin ringand does not dissociate from this ligand until after it is taken up by intestinal mucosal cells. It occurs primarily as hemoglobin ormyoglobin and thus is found exclusively in meat, poultry, and fish. Virtually all of the iron in plant foods and approximately40–60% of the iron in animal tissues is nonheme iron. It is bound primarily to proteins but may also be complexed with citrate,phytate, oxalate, polyphenolics, or other ligands.
The bioavailability of heme iron is relatively unaffected by composition of the diet and is generally significantly greater than that ofnonheme iron. The bioavailability of nonheme iron varies markedly depending on composition of the diet. It is widely assumedthat nonheme iron from all sources in a meal (foods as well as fortification iron) enters a common pool during digestion and thatabsorption of iron from this pool is determined by the totality of ligands present in the small intestine at the site of absorption.
Several enhancers and inhibitors of nonheme iron absorption have been identified. Enhancers include meat, poultry, fish,ascorbic acid, and EDTA (in diets where bioavailabilities are low). Inhibitors include polyphenolics (tannins in tea, legumes, andsorghum), phytates (present


Pag e 631
in legumes and whole-grain cereals), some plant proteins (especially legume proteins), calcium, and phosphates.
The overall bioavailability of iron in a diet is determined by complex interactions of the enhancers and inhibitors present. Ironabsorption from diets composed primarily of roots, tubers, legumes, and cereals, with limited meat and ascorbic acid, may beonly about 5% even in people with poor iron status. Such a diet would provide only about 0.7 mg absorbable iron per day, aquantity too small to meet the needs of many individuals. Iron absorption from diets based on roots, cereals, and legumes thatcontain some meat, poultry, or fish and some foods high in ascorbic acid may be about 10%. These diets provide about 1.4 mgof absorbable iron per day, an amount that is adequate for most men and postmenopausal women but inadequate for up to 50%of women of child-bearing age. Diets composed of generous quantities of meat, poultry, fish, and foods high in ascorbic acidprovide over 2 mg absorbable iron per day, an amount sufficient to meet the needs of nearly all healthy persons [6].
9.3.4 Minerals of Particular Nutritional Concern
For various reasons, deficiencies are common for some mineral elements and rare or nonexistent for others. Moreover, there arelarge variations in prevalences of specific deficiencies across geographical and socioeconomic divisions. Human dietarydeficiencies have been reported for calcium, cobalt (as vitamin B12), chromium, iodine, iron, selenium, and zinc [17]. Calcium,chromium, iron, and zinc occur in bound form in foods, and bioavailabilities may be low depending on the composition of thefood or meal. Thus, deficiencies of these minerals result from a combination of poor bioavailability and low intakes.
Iodine is present in foods and water predominantly as the ionic, unbound form and has high bioavailability. Iodine deficiency iscaused primarily by low intakes. Selenium is present in foods as selenomethionine, a chelate, but it is efficiently utilized sodeficiency is caused by low intakes. Vitamin B12 deficiency is a problem only with persons on strict vegetarian diets, which arelow in this vitamin. These observations further illustrate the complexities of the mineral bioavailability story. Some bound formshave low bioavailability while other bound forms have high bioavailability. Unbound forms generally have high bioavailability.Current thinking on bioavailability and mineral deficiencies is summarized in Figure 8.
In the United States, deficiencies of calcium and iron have received the most attention. In
FIGURE 8Essential minerals g rouped by chemical form (free ions in solution
or bound to food lig ands), bioavailability, and occurrance of nutritionaldeficiency. *As vitamin B12. (From Ref. 17.)
Pag e 632
developing countries, iron and iodine have been targeted because of high prevalences of deficiencies among these populations.
9.4 Mineral Composition of Foods
9.4.1 Ash
“Ash” is included in nutrient data bases as one of the proximate components of foods. It provides an estimate of the total mineralcontent of foods [16]. Methods for determination of ash in specific foods and food groups are described in official publications[3]. Minerals in the ash are in the form of metal oxides, sulfates, phosphates, nitrates, chlorides, and other halides. Thus, ashcontent overestimates total mineral content by a considerable extent since oxygen is present in many of the anions. It does,however, provide a crude idea of mineral content and it is required for calculation of total carbohydrate in the proximate analysisscheme.
9.4.2 Individual Minerals
Individual minerals in foods are determined by ashing the food, dissolving the ash (usually in acid), and measuring mineralconcentrations in the resulting solution [16, 19]. Both chemical and instrumental methods are used to measure mineralconcentrations, but instrumental methods are generally more rapid, precise, and accurate. Atomic absorption spectroscopy hasbeen available since the 1960s and is still widely used. It is a reliable technique but can measure only one mineral at a time.Inductively coupled plasma spectrometers have gained popularity in recent years primarily because they are capable ofquantifying several mineral elements simultaneously from a single sample [28].
Listed in Table 7 are concentrations of some minerals in selected foods. Sources include the U.S. Department of Agriculturedatabase, journal articles, and manufacturers' data. Values are means; data from individual foods may vary substantially from thedata reported.
9.4.3 Factors Affecting the Mineral Composition of Foods
Many factors interact to affect the mineral composition of foods, so compositions can vary greatly.
9.4.3.1 Factors Affecting the Mineral Composition of Plant Foods
In order for plants to grow, they must take up water and essential mineral nutrients from the soil. Once taken up by plant roots,nutrients are transported to other parts of the plant. The ultimate composition of the edible parts of plants is influenced andcontrolled by fertility of the soil, genetics of the plant, and the environment in which it grows (Fig. 9). The degree to whichmineral content can vary even within a plant species is illustrated by wheat grain. For grain grown in Australia, North America,an the United Kingdom, zinc concentrations range from 4.5 to 37.2 mg/kg and iron from 23.6 to 74.7 mg/kg [5].
9.4.3.2 Adequacy of Plant Foods for Supplying the Nutrient Needs of Animals and Humans
Several questions are pertinent. Do plants and humans require the same mineral nutrients? Are the concentrations of mineralnutrients in plants sufficient to meet human requirements? Can mineral concentrations in plants be altered by agricultural orgenetic means to enhance the nutritional quality of plants? Are plants grown on depleted soils nutritionally inferior to plants grownon more fertile soils?
The list of essential minerals for plants is similar but not identical to the list for humans.
Pag e 633
F, Se, and I are essential for humans but not for most plants. Thus, we might expect to see human deficiencies of these elementsin populations that depend on plants grown locally where soil concentrations of these elements are low. In fact, serious humandeficiencies of selenium and iodine do exist in several areas of the world [41].
For nutrients required by both plants and animals, we might expect human deficiencies to be less of a problem because theelements will necessarily be present in plant foods. Unfortunately, concentrations of minerals in plants are sometimes too low tomeet human needs, or the minerals may be present in forms that cannot be efficiently utilized by humans (see earlier section onbioavailability). These situations apply, respectively, to calcium an iron. The calcium content of some plants is extremely low.Rice, for example, contains only about 10 mg calcium per 100 kcal. Thus, persons consuming rice-based diets must depend onother foods to meet calcium requirements. Iron is more uniformly distributed in plant foods than calcium but its bioavailability canbe extremely poor, so diets based on cereals and legumes are often inadequate in iron.
While it is possible in some cases to enhance the nutritional quality of crops through agronomic practices and plant breeding, themovement of mineral nutrients from the soil to the plant and from the plant to the animal or human is an extremely complicatedprocess. Soils differ considerably in their mineral composition. Moreover, the concentration of an element in the soil may not bea good indicator of the amount that can be taken up by plant roots, since the chemical form of the element and soil pH havemarked effects on mineral bioavailability to plants. For example, increasing soil pH by ading lime will lower availability of iron,zinc, manganese, and nickel to plants and will increase availability of molybdenum and selenium [47]. Also, plants generallypossess physiological mechanisms for regulating amounts of nutrients taken up from the soil. Therefore, we might expect thatattempts to alter the mineral composition of food crops would meet with mixed results. For example, application of fertilizerdoes not significantly increase iron, manganese, or calcium content of food crops [47]. On the other hand, fertilization with zincat levels in excess of the zinc requirement of the plant has been shown to increase the level of zinc in pea seeds [48].
9.4.3.3 Factors Affecting the Mineral Composition of Animal Foods
Mineral concentrations in animal foods vary less than mineral concentrations in plant foods. In general, changes in dietary intakeof the animal have only a small effect on mineral concentrations in meat, milk, and eggs. This is because homeostatic mechanismsoperating in the animal regulate tissue concentrations of essential nutrients.
9.4.3.4 Adequacy of Animal Foods for Supplying the Nutrient Needs of Humans
The composition of animal tissues is similar to that of humans; thus we might expect animal foods to be good sources ofnutrients. Meat, poultry, and fish are good sources of iron, zinc, phosphate, and cobalt (as vitamin B12). These products are notgood sources of calcium unless bones are consumed, which is usually not the case. Also, the iodine content of animal foods maybe low. Dairy products are excellent sources of calcium. Thus, consumption of a variety of animal foods along with a variety ofplant foods is the best way to ensure adequate intakes of all essential minerals.
9.4.4 Fortification
Fortification of the U.S. food supply began in 1924 with the addition of iodine to salt to prevent goiter, a prevalent public healthproblem in the United States at the time. In 1933, the American

Pag e 634
TABLE 7 Mineral Composition of Selected Foods
Quantity Food W eig ht (g ) kcal2 Ca Mg P Na K Fe Zn Cu Se
1 egg Scrambled 100 157 57 13 269 290 138 2.1 2.0 0.06 8
1 slice W hite bread 28 75 35 6 30 144 31 0.8 0.2 0.04 8
1 slice W hole wheat bread 28 70 20 26 74 180 50 1.5 1.0 0.10 16
0.5 cup Spag hetti, cooked without salt 70 99 5 13 38 1 22 1.0 0.4 0.07 19.0
0.5 cup Brown rice, cooked 98 108 10 42 81 5 42 0.4 0.6 0.01 13.0
0.5 cup W hite rice, parboiled, cooked 88 100 17 11 37 3 32 1.0 0.3 0.08 8.30
0.5 cup Black beans, cooked 86 113 24 61 120 1 305 2.0 1.0 0.18 6.9
0.5 cup Red kidney beans 89 112 25 40 126 2 356 3.0 0.9 0.21 1.9
1 cup W hole milk 244 150 291 33 228 120 370 0.1 0.9 0.05 3.0
1 cup Skim milk/nonfat milk 245 86 302 28 247 126 406 0.1 0.9 0.05 6.6
1.5 oz. American cheese, processed 43 159 261 10 316 608 69 0.2 1.3 0.01 3.8
1.5 cup Cheddar cheese 43 171 305 12 219 264 42 0.3 1.3 0.01 6.0
0.5 cup Cottag e cheese, creamed, small curd 105 108 63 6 139 425 89 0.1 0.4 0.03 6.3
1 cup Yog urt, low-fat, plain 227 144 415 10 326 159 531 0.2 2.0 0.10 5.5
0.5 cup Ice cream, reg ular vanilla 67 134 88 9 67 58 128 0.1 0.7 0.01 4.7
1 each Baked potato with skin 202 220 20 55 115 16 844 2.8 0.7 0.62 1.8

Pag e 635
Quantity Food W eig ht (g ) kcal2 Ca Mg P Na K Fe Zn Cu Se
1 each Peeled potato, boiled 135 116 10 26 54 7 443 0.4 0.4 0.23 1.2
3 each Broccoli, raw spears 453 126 216 114 297 123 1470 4.0 2.0 0.40 0.9
3 each Broccoli spear, cooked from fresh 540 151 249 130 318 141 1575 4.5 2.1 0.23 1.1
0.5 cup Raw carrot, g rated 55 24 15 8 24 19 178 0.3 0.1 0.03 0.8
0.5 cup Cooked carrots, from frozen 73 26 21 7 19 43 115 0.4 0.2 0.05 0.9
1 each Tomato, fresh, whole, averag e 123 26 6 14 30 11 273 0.6 0.1 0.09 0.6
0.75 cup Tomato juice, canned 183 31 17 20 35 661 403 1.0 0.3 0.18 0.4
0.75 cup Orang e juice prepared from frozen 187 83 17 18 30 2 356 0.2 0.1 0.08 0.4
1 each Orang e, averag e, 2 5/8 in diameter 131 60 52 13 18 0 237 0.1 0.1 0.06 1.2
1 each Apple with peel, 2.75 in diameter 138 80 10 6 10 1 159 0.3 0.1 0.06 0.6
1 each Banana (peeled weig ht) 114 85 7 32 22 1 451 0.4 0.2 0.12 1.1
3 oz. Beef round, roasted 85 205 5 21 176 50 305 1.6 3.7 0.08 –
3 oz. Veal, round, roasted 85 160 6 28 234 68 389 0.9 3.0 0.13 –
3 oz. Chicken, white meat, roasted 85 140 13 25 194 63 218 0.9 0.8 0.04 –
3 oz. Chicken, leg meat, roasted 85 162 10 20 156 77 206 1.1 2.4 0.07 –
3 oz. Salmon, cooked 85 183 6 26 234 56 319 0.5 0.4 0.06 –
3 oz. Salmon, canned, with bones 85 130 203 25 277 458 231 0.9 0.9 0.07 –
2kcal × 4.186 = kJ.
Note: Values are mg per serving , except Se is mg per serving .
Source: Refs. 12 and 43.

Pag e 636
FIGURE 9Plants obtain mineral nutrients from the soil solution surrounding theroots. Sources of these minerals include fertilizer, decaying org anic
materials, and weathering rocks. The minerals are taken up in the roots by aselective process and transported upward to all parts of the plant. The
whole process is reg ulated according to instructions encodedin the plants g enetic material. (From Ref. 1.)
Medical Association recommended that vitamin D be added to milk to prevent rickets. In the early 1940s, food fortification wasexpanded further when it became apparent that many young adults were failing Army physical exams due to poor nutritionalstatus. In 1943, the government issued an order making enrichment of flour with iron, riboflavin, thiamin, and niacin mandatory.
Since the introduction of fortification back in the 1920s there has been a dramatic reduction in the prevalences of many nutrientdeficiency diseases in the United States, including iron deficiency and goiter. While general improvements in diets were majorfactors in this improvement in nutritional status, fortification undoubtedly deserves much of the credit for the low prevalences ofnutrient deficiency diseases in the United States today.

Pag e 637
In the United States, fortification of foods with iron and iodine remains widespread. In addition, calcium, zinc, and other traceminerals are sometimes added to breakfast cereals and other products. Infant formulas contain the largest number of addedminerals since they must be nutritionally complete.
Iron has received far more attention than the other minerals because of the high prevalences of iron deficiency anemia andbecause of technological and stability problems associated with the addition of iron to foods. Thus, iron fortification deservesdetailed attention here.
The first recorded recommendation for iron fortification was made in 4,000 BC by a Persian physician named Melampus [35].He recommended that sailors consume sweet wine laced with iron filings to strengthen their resistance to spears and arrows andto enhance sexual potency. Widespread iron fortification began in the United States in 1943 when War Food Order No. 1made enrichment of white flour sold in interstate commerce mandatory. Federal regulations no longer require flour enrichment,but many state regulations do. If flour and other cereal products are enriched, permissible levels of addition are specified in FDAregulations (Table 8).
Addition of iron to foods is a difficult balancing act because some forms of iron catalyze oxidation of unsaturated fatty acids andvitamins A, C, and E. In many cases, forms that are highly bioavailable are also the most active catalytically, and forms that arerelatively chemically inert tend to have poor bioavailability. Numerous iron sources have been studied for their effect on oxidativestability and nutritional efficacy. These sources are listed in Table 9.
Ferrous sulfate is the cheapest, most bioavailable, and most widely used iron source for food fortification. It is routinely used asthe reference standard in iron bioavailability studies because of its high bioavailability (Table 9). Results of several studies haveindicated that off odors and off flavors occur in bakery products made from flour that was heavily fortified with ferrous sulfateand stored for extended periods of time [4]. Barrett and Ranum [4] made the following recommendations for minimizingoxidation problems in bakery products that have been fortified with ferrous sulfate:
1. Ferrous sulfate is the preferred iron source for addition at the bakery.
2. Ferrous sulfate may be used to fortify wheat flour provided iron levels are kept below 40 ppm and the flour is stored atmoderate temperatures and humidities for periods not to exceed 3 months.
3. Ferrous sulfate should not be used to fortify flour that may be stored for extended
TABLE 8 FDA Standards for the Enrichment of Cereal Products with Iron and Calcium
FoodIron (mg /lb) (shall
contain)Calcium (mg /lb) (may
contain)
Enriched flour 20 960
Enriched rice Not less than 16 Not less than 500
Not more than 32 Not more than 750
Enriched corn g rits Not less than 13 Not less than 500
Not more than 26 Not more than 1000
Enriched macaroni products Not less than 13 Not less than 500
Not more than 16.5 Not more than 625
Enriched bread, rolls, and buns 12.5 600
Note: Forms of iron and calcium used must be harmless and assimilable.
Source: Ref. 13.
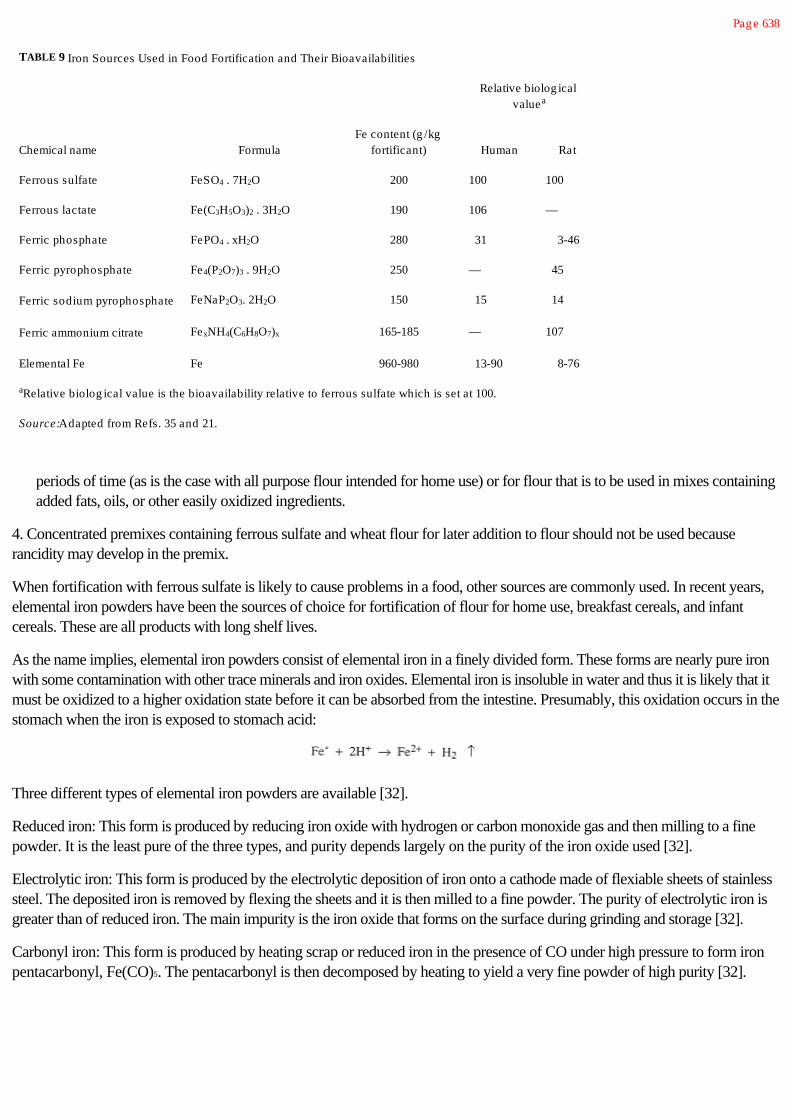
Pag e 638
TABLE 9 Iron Sources Used in Food Fortification and Their Bioavailabilities
Relative biolog icalvaluea
Chemical name FormulaFe content (g /kg
fortificant) Human Rat
Ferrous sulfate FeSO4 . 7H2O 200 100 100
Ferrous lactate Fe(C3H5O3)2 . 3H2O 190 106 —
Ferric phosphate FePO4 . xH2O 280 31 3-46
Ferric pyrophosphate Fe4(P2O7)3 . 9H2O 250 — 45
Ferric sodium pyrophosphate FeNaP2O3. 2H2O 150 15 14
Ferric ammonium citrate FexNH4(C6H8O7)x 165-185 — 107
Elemental Fe Fe 960-980 13-90 8-76
aRelative biolog ical value is the bioavailability relative to ferrous sulfate which is set at 100.
Source: Adapted from Refs. 35 and 21.
periods of time (as is the case with all purpose flour intended for home use) or for flour that is to be used in mixes containingadded fats, oils, or other easily oxidized ingredients.
4. Concentrated premixes containing ferrous sulfate and wheat flour for later addition to flour should not be used becauserancidity may develop in the premix.
When fortification with ferrous sulfate is likely to cause problems in a food, other sources are commonly used. In recent years,elemental iron powders have been the sources of choice for fortification of flour for home use, breakfast cereals, and infantcereals. These are all products with long shelf lives.
As the name implies, elemental iron powders consist of elemental iron in a finely divided form. These forms are nearly pure ironwith some contamination with other trace minerals and iron oxides. Elemental iron is insoluble in water and thus it is likely that itmust be oxidized to a higher oxidation state before it can be absorbed from the intestine. Presumably, this oxidation occurs in thestomach when the iron is exposed to stomach acid:
Three different types of elemental iron powders are available [32].
Reduced iron: This form is produced by reducing iron oxide with hydrogen or carbon monoxide gas and then milling to a finepowder. It is the least pure of the three types, and purity depends largely on the purity of the iron oxide used [32].
Electrolytic iron: This form is produced by the electrolytic deposition of iron onto a cathode made of flexiable sheets of stainlesssteel. The deposited iron is removed by flexing the sheets and it is then milled to a fine powder. The purity of electrolytic iron isgreater than of reduced iron. The main impurity is the iron oxide that forms on the surface during grinding and storage [32].
Carbonyl iron: This form is produced by heating scrap or reduced iron in the presence of CO under high pressure to form ironpentacarbonyl, Fe(CO)5. The pentacarbonyl is then decomposed by heating to yield a very fine powder of high purity [32].

Pag e 639
Elemental iron powders are relatively stable and do not appear to cause serious problems with oxidation in foods. However, thebioavailability of the powders is variable, probably due to differences in particle size. Iron powders are dark gray in color anddo cause a slight darkening of white flour, but this is not considered to be a problem [4].
Sodium iron EDTA has not yet been approved by the U.S. Food and Drug Administration for use as an iron fortificant in theUnited States. However, disodium and calcium disodium EDTA have been approved and are widely used. Sodium iron EDTAis attractive as an iron fortificant because it is relatively stable in foods, it does not catalyze the formation of undesirable flavorsand odors in most foods, it is not markedly affected by dietary inhibitors of iron absorption, and it may actually enhance thebioavailability of intrinsic food iron in some low-bioavailability foods [49].
There has been reluctance to used iron EDTA in foods because of concern over possible adverse effects of excessive levels ofEDTA in the diet. However, recent surveys have shown that dietary levels of EDTA in the United States are substantially lowerthan previously thought. This finding may cause the FDA to approve iron EDTA for use in the United States [49].
9.4.5 Effects of Processing
Mineral elements, unlike vitamins and amino acids, cannot be destroyed by exposure to heat, light, oxidizing agents, extremes inpH, or other factors that affect organic nutrients. In essence, minerals are indestructible. Minerals can, however, be removedfrom foods by leaching or physical separation. Also, the bioavailabilities of minerals may be altered by the factors mentionedearlier.
The most important factor causing mineral loss in foods is milling of cereals. Mineral elements in grain kernels tend to beconcentrated in the bran layers and the germ. Thus, removal of bran and germ leaves pure endosperm, which is mineral poor.Mineral concentrations in whole wheat, white flour, wheat bran, and wheat germ are shown in Table 10. Similar losses occurduring milling of rice and other cereals. These are substantial losses. During fortification of milled products in the United States,iron is the only mineral commonly added.
Retention of calcium in cheese can be dramatically affected by manufacturing conditions. In cheeses where the pH is low,substantial losses of calcium occur when the whey is drained. Calcium contents of various cheeses are shown in Table 11.Compositions are expressed both as mg/100 g cheese and as a Ca:protein ratio. The latter expression gives a better comparsionof Ca losses because the water content of cheeses varies from one variety to another. Cottage cheese has the smallest calciumconcentration because the pH at time of whey removal is typically less than 5 [15]. In
TABLE 10 Concentrations of Selected Trace Minerals in W heat and Milled W heat Products
MineralW hole heat W hite
flourW heatgerm
Millfeeds(bran)
Loss from wheatto flour (%)
Iron 43 10.5 67 47–78 76
Zinc 35 8 101 54–130 78
Mang anese 46 6.5 137 64–119 86
Copper 5 2 7 7–17 68
Selenium 0.6 0.5 1.1 0.5–0.8 16
Note: Values are mg mineral/kg product.
Source: Adapted from Ref. 36.

Pag e 640
TABLE 11 Protein, Calcium, and Phosphate Contents of Selected Cheeses
Cheese varietyProtein (%) Ca (mg /100 g ) Ca:protein
(mg:g)PO4 (mg /100 g ) PO4:protein
(mg:g)
Cottag e 15.2 80 5.4 90 16.7
Cheddar 25.4 800 31.5 860 27.3
Emmenthal 27.9 920 33.1 980 29.6
Source: Adapted from Refs. 15 and 25.
cheddar and Emmenthal cheeses, the whey is normally drained at pH 6.1 and 6.5, respectively, and this causes the calciumcontent of Emmenthal cheese to be greater than that of cheddar [25].
Since many minerals do have significant solubility in water, it is reasonable to expect that cooking in water would result in somelosses of minerals. Unfortunately, few controlled studies have been done. In general, boiling in water causes greater loss ofminerals from vegetables than steaming [24]. Mineral losses during cooking of pasta are minimal for iron but more than 50% forpotassium [24]. This is predictable because potassium is present in foods as the free ion while iron is bound to proteins andother high-molecular-weight ligands in the food.
9.5 Chemical and Functional Properties of Minerals in Foods
Even though minerals are present in foods at relatively low concentrations, they often have profound effects on physical andchemical properties of foods because of interactions with other food components. Details of mineral-food interactions for thebroad array of minerals found in foods are given mainly in other chapters, and these interactions as well as their roles aresummarized in Table 12. A more detailed treatment of selected minerals follows.
9.5.1 Calcium
Besides its structural role in plants and animals, calcium plays a major regulatory role in numerous biochemical and physiologicalprocesses. For example, calcium is involved in photosyntheses, oxidative phosphorylation, blood clotting, muscle contraction,cell division, transmission of nerve impulses, enzyme activity, cell membrane function, and hormone secretion.
Calcium is a divalent cation with a radius of 0.95 Å. Its multiple roles in living cells are related to its ability to form complexeswith proteins, carbohydrates, and lipids. Calcium binding is selective. Its ability to bind to neutral oxygens, including those ofalcohols and carbonyl groups, and to bind to two centers simultaneously allow it to function as a cross-linker of proteins andpolysaccharides [10]. This property has numerous consequences in foods.
The functional role of calcium in milk and milk products has been studied extensively and serves as an example of mineralinteractions in a food system (see Chap. 14). Milk contains a complex mixture of minerals including calcium, magnesium,sodium, potassium, chloride, sulfate, and phosphate. Calcium in milk is distributed between the milk serum and the caseinmicelles. The calcium in serum is in solution and comprises about 30% of the total milk calcium. The remainder of the calcium isassociated with casein micelles and is present primiarily as colloidal calcium phosphate. It is likely that association of submicellesinvolves calcium bridges between phosphate groups esterified to serine residues in casein and inorganic phosphate ions.
Calcium and phosphate play an important functional role in the manufacture of cheese.

Pag e 641
Addition of calcium prior to renneting shortens coagulation time [25]. Curds with lower Ca contents tend to be crumbly, whilecheeses higher in Ca are more elastic.
9.5.2 Phosphates
Phosphates occur in foods in many different forms, both as naturally occurring components of biological molecules and as foodadditives with specific functions.
In living systems, phosphates serve a variety of functions. For example adenosine triphosphate (ATP) is the principle source ofenergy in cells. Phosphoproteins (ferritins) are involved in iron storage. Phospholipids are major components of membranes.Hydroxyapatite, Ca10(PO4)6(OH)2, comprises the mineral phase of bone. Sugar phosphates, such as glucose 6-phosphate, arekey intermediates in carbohydrate metabolism.
A voluminous literature exists on the use of phosphates in foods. See Ellinger [11] and Molins [30] for in-depth treatments ofthis topic. Several phosphates are approved food additives. These include phosphoric acid, the orthophosphates,pyrophosphates, tripolyphosphates, and higher polyphosphates. Structures are shown in Figure 10.
Phosphate food additives serve many functions including acidification (soft drinks), buffering (various beverages), anticaking,leavening, stabilizing, emulsifying, water binding, and protection against oxidation. The chemistry responsible for the wide arrayof functional properties of phosphates is not fully understood but undoubtedly is related to the acidity of protons associated withphosphates an the charge on phosphate ions. At pH levels common in foods, phosphates carry negative charges andpolyphosphates behave as polyelectrolytes. These negative charges give phosphates strong Lewis-base character and thusstrong tendencies to bind metal cations. An ability to bind metal ions may underlie several of the functional properties notedearlier. It should be mentioned, however, that there is considerable controversy about mechanisms of phosphate functionality,particularly as it relates to enhanced water-holding capacity in meats and fish.
9.5.3 Iron
Iron is the fourth most abundant element in the earth's crust and is an essential nutrient for nearly all living species. In biologicalsystems, iron is present almost exclusively as chelates with proteins. Iron plays many key roles in biological systems, includingoxygen transport and storage in higher animals (hemoglobin and myoglobin), ATP generation (iron-sulfur proteins andcytochromes), DNA synthesis (ribonucleotide reductase), and chlorophyll synthesis. Unfortunately, free iron can be toxic toliving cells. Presumably, this toxicity results from the generation of activated species of oxygen, which in turn can promote lipidoxidation or attack DNA molecules (see later discussion).
In order to avoid the toxic consequences of free iron, virtually all living cells have a mechanism for storing extra ironintracellularly in a nontoxic form. The iron is sequestered in the interior of a hollow protein shell called apoferritin. This proteinshell is composed of 24 polypeptide subunits arranged as a sphere. Iron is deposited in the cavity of the shell as polymeric ferricoxyhydroxide. Up to 4500 atoms of iron can be stored in one ferritin shell [46]. Ferritin iron is essentially a cellular reserve thatcan be mobilized when iron is needed for the synthesis of hemoglobin, myoglobin, or other iron proteins.
In spite of its abundance in the environment, iron deficiency in human, some farm animals, and crops grown on some soils is aproblem of major proportions. For example, Schrimshaw [37] estimated that two-thirds of children and women of childbearingage in most developing countries suffer from iron deficiency. The presence of iron deficiency in the United

Pag e 642
TABLE 12 Nutritional and Functional Roles of Minerals and Mineral Salts/Complexes in Foods
Mineral Food sources Function
Aluminum Low and variable infoods, component ofsome antacids andleavening ag ents
Essential nutrient: Possibly essential, evidence not conclusive.Deficiency unknown.
Leavening ag ent: As sodium aluminum sulfate (Na 2SO4 .Al2(SO4)3)Texture modifier
Bromine Brominated flour Essential nutrient: Not known to be essential to humans.
Doug h improver: KBrO3 improves baking quality of wheat flour.It is the most used doug h improver.
Calcium Dairy products, g reenleafy veg etables, tofu,fish bones
Essential nutrient: Deficiency leads to osteoporosis in later life.
Texture modifier: Forms g els with neg atively charg edmacromolecules such as alg inates, low-methoxy pecitns, soyproteins, caseins, etc. Firms canned veg etables when added tocanning brine.
Copper Org an meats, seafoods,nuts, seeds
Essential nutrient: Deficiency rare.
Catalyst: Lipid peroxidation, ascorbic acid oxidation,nonenzymatic oxidative browning .
Color modifier: May cause black discoloration in canned, curedmeats.Enzyme cofactor: Polyphenoloxidase.Texture stabilizer: Stabilizes eg g -white foams.
Iodine Iodized salt, seafood,plants and animalsg rown in areas wheresoil iodine is notdepleted
Essential nutrient: Deficiency produces g oiter and cretinism.
Doug h improver: KIO3 improves baking quality of wheat flour.
Iron Cereals, leg umes, meat,contamination from ironutensils and soil,enriched products
Essential nutrient: Deficiency leads to anemia, impaired immuneresponse, reduced worker productivity, impaired cog nitivedevelopment in children. Excessive iron stores may increase riskof cancer and heart disease.
Catalyst: Fe 2+ and Fe3+ catalyze lipid peroxidation in foods.
Color modifier: Color of fresh meat depends on valence of Fe inmyog lobin and hemog lobin: Fe 2+ is red, Fe3+ is brown. Formsg reen, blue, or black complexes with polyphenoloc compounds.Reacts with S 2- to form black FeS in canned foods.
Enzyme cofactor: Lipoxyg enase, cytochromes, ribonucleotidereductase, etc.
Mag nesium W hole g rains, nuts,leg umes, g reen leafy,veg etables
Essential nutrient: Deficiency rare.
Color modifier: Removal of Mg from chlorophyll chang es colorfrom g reen to olive-brown
(Table continued on next page)

Pag e 643
TABLE 12 Continued
Mineral Foods sources Function
Mang anese W hole g rains, fruits,veg etables
Essential nutrient: Deficiency extremely rare.
Enzyme cofactor: pyruvate carboxylase, superoxide dismutase.
Nickel Plant foods Essential nutrient: Deficiency in humans unknown.
Catalyst: Hydrog enation of veg etable oils-finely divided,elemental Ni is the most widely used catalyst for this process.
Phosphates Ubiquitous, animalproducts tend to beg ood sources
Essential nutrient: Deficiency rare due to presence in virtuallyall foods.Acidulent: H3PO4 in soft drinks.
Leavening acid: Ca(HPO4)2 is a fast-acting leavening acid.
Moisture retention in meats: Sodium tripolyphosphate improvesmoisture retention in cured meats.
Emulsification aid: Phosphates are used to aid emulsification incomminuted meats and in process cheeses.
Potassium Fruits, veg etables,meats
Essential nutrient: Deficiency rare.
Salt substitute: KCl may be used as a salt substitute. May causebitter flavor.Leavening ag ent: Potassium acid tartrate.
Selenium Seafood, org an meats,cereals (levels varydepending on soillevels)
Essential nutrient: Keshan disease (endemic cardiomyopathy inChina) was associated with selenium deficiency. Low seleniumstatus may be associated with increased risk for cancer andheart disease.Enzyme cofactor: Glutathione peroxidase.
Sodium NaCl, MSG, other foodadditives, milk; low inmost raw foods
Essential nutrient: Deficiency is rare; excessive intakes may leadto hypertension.
Flavor modifier: NaCl elicits the classic salty taste in foods.
Preservative: NaCl may be used to lower water activity in foods.
Leavening ag ents: Many leaving ag ents are sodium salts, e.g .,sodium bicarbonate, sodium aluminum sulfate, sodium acidpyrophosphate .
Sulfur W idely distributed Essential nutrient: A constituent of the essential amino acidsmethionine and cystine. Sulfur amino acids may be limiting insome diets.
Browning inhibitor: Sulfur dioxide and sulfites inhibit bothenzymatic and nonenzymatic browning . W idely used in driedfruits.
Antimicrobial: Prevents, controls microbial g rowth. W idely usedin wine making .
Zinc Meats, cereals Essential nutrient: Deficiency produces loss of appetite, g rowthretardation, skin chang es. Marg inal deficiency exists in UnitedStates but extent is unknown. Pronounced deficiency wasdocumented in populations in th Middle East.
ZnO is used in the lining of cans for proteinaceous foods tolessen formation of black FeS during heating . Zn can be addedto g reen beans to help stabilize the color during canning .

Pag e 644
FIGURE 10Structures of phosphoric acid and phosphate ions
important in foods.
States and other industrialized countries is lower than that in many developing countries but remains a persistent problem.
The paradox of high prevalences of nutritional deficiency of a nutrient present in such abundance in the environment may beexplained by the behavior of iron in aqueous solutions. Iron is a transition element, which means that it has unfilled d orbitals. Itsoxidation state in most natural forms is either +2 (ferrous) or +3 (ferric). Ferrous iron has six d electrons while ferric iron hasfive. In aqueous solutions under reducing conditions, the ferrous form preominates. Ferrous iron is quite soluble in water atphysiological pH levels. In the presence of molecular oxygen, however, aqueous Fe2+ may be oxidized to Fe3+.
The hydrated Fe3+ will then undergo progressive hydrolysis to yield increasingly insoluble ferric hydroxide species [7]:
Because this hydrolysis reaction occurs readily except at very low pH, the concentration of free ferric ions in aqueous systems isvanishingly small. The predominance of low-solubility forms of iron explains why it is so poorly available.

Pag e 645
It is well established that iron can promote lipid peroxidation in foods. Iron appears to catalyze both the initiation andpropagation stages of lipid peroxidation. The chemistry is exceedingly complex, but several probable mechanisms hae beensuggested. In the presence of thiol groups, ferric iron promotes the formation of the superoxide anion [50]:
The superoxide anion may then react with protons to form hydrogen peroxide or reduce ferric iron to the ferrous form:
Ferrous ion promotes decomposition of hydrogen peroxide to hydroxyl radicals by the Fenton reaction:
The hydroxyl radical is highly reactive and may rapidly generate lipid free radicals by abstracting hydrogen atoms fromunsaturated fatty acids. This initiates the lipid peroxidation chain reaction.
Iron can also catalyze lipid peroxidation by accelerating decomposition of lipid hydroperoxides present in foods:
or
The rate of the first reaction is greater than the second by an order of magnitude. This explains why ascorbic acid may functionas a prooxidant in some food systems since it can reduce ferric iron to the ferrous form.
9.5.4 Nickel
While nickel deficiency has never been documented in humans, there is substantial evidence of its essentiality in several animalspecies [14]. The primary significance of nickel from a food processing perspective is its use as a catalyst for the hydrogenationof edible oils [31] (see Chap. 5). The hydrogenation reaction takes place on the surface of the catalyst. Thus catalytic activity isa function of the surface area of the catalyst. For this reason, catalysts are prepared as a finely divided power of elemental Nidispersed in a solid support. When the catalyst is mixed with the oil, and hydrogen gas is introduced, double bonds in the fattyacid residues in the triacylglycerol molecules attach to the surface of the Ni through a p-bonding interaction and the bond opens.H2 also binds to the Ni and the H-H bond is cleaved. Thereafter, several possibilities exist (Fig. 11): (a) transfer of twohydrogens form the Ni to carbons on the fatty acid and subsequent dissociation of the fatty acid from the Ni leaving a saturatedC-C bond; (b) dissociation of the fatty acid from the Ni before transfer of hydrogens, leaving the original CIS-unsaturatedspecies; (c) rotation around the C-C bond on the carbon attached to the catalyst followed by dissociation from the catalystbefore transfer of hydrogens, leaving a trans double bond; or (d) transfer of hydrogens to the double bond followed by removalof different hydrogens

Pag e 646
FIGURE 11Possible products of hydrog enation of a monounsaturated fatty acid using a
nickel catalyst. R denotes hydrocarbon chain with methyl or carboxyl end g roup.
before the fatty acid disassociates, leaving a double bond (either cis or trans) shifted one position. Thus hyrogenation results in amixture of products.
The situation is even more complicated when the fatty acid contains two or more double bonds. This is because methylenehydrogens are labile and may be easily removed by the catalyst. Rearrangement of electrons then results in conjugation of doublebonds, and subsequent hydrogenation of one of the double bonds yields a mixture of cis and trans isomers in different positionsin the molecule.
The physical and nutritional properties of the hydrogenated oil are determined by the degree of saturation, the location of thedouble bonds, and the fraction of trans double bonds. Thus, it is important to adjust operating conditions (mainly hydrogenpressure and temperature) to achieve a desirable final product [2].
9.5.5 Copper
Copper, like iron, is a transition element and exists in foods in two oxidation states Cu1+ and Cu2+. It is a cofactor in manyenzymes including phenolase and is at the active center of hemocyanin, an oxygen carrying protein in some arthropods. BothCu1+ and Cu2+ bind tightly to organic molecules and thus exist primarily as complexes and chelates in foods. On the negativeside, copper is a potent catalyst of lipid oxidation in foods.
An intriguing functional role of copper has been exploited in Western cuisine for at least 300 years [26]. Many recipes formeringues specify copper bowls as the preferred vessel for whipping egg whites. A common problem with egg white foams iscollapse resulting from overwhipping. Presumably, foam stability is reduced when the proteins at the air-liquid interface

Pag e 647
are excessively denatured by whipping. Egg white contains conalbumin, a protein analogous to the plasma iron-binding proteintransferrin. Conalbumin binds Cu2+ as well as Fe3+, and the presence of bound copper or iron stabilizes conalbumin againstexcessive denaturation [33].
9.6 Summary
Minerals are present in foods at low but variable concentrations and in multiple chemical forms. These species undergo complexchanges during processing, storage, and digestion of foods. With the exception of group IA and VIIA elements, minerals exist infoods as complexes, chelates, or oxyanions. While understanding of the chemical forms and properties of many of these mineralspecies remains limited, their behavior in foods often can be predicted by applying principles of inorganic, organic, physical, andbiological chemistry.
The primary role of minerals in foods is to provide a reliable source of essential nutrients in a balanced and bioavailable form. Incases where concentrations and/or bioavailabilities in the food supply are low, fortification has been used to help assureadequate intakes by all members of the population. Fortification with iron and iodine has dramatically reduced deficiencydiseases associated with these nutrients in the United States and other industrialized countries. Unfortunately, it has not beenpossible to fortify appropriate staple foods in many developing countries, leaving hundreds of millions of poeople in thesecountries to suffer the tragic consequences of iron and/or iodine deficiency.
Minerals also play key functional roles in foods. For example, minerals may dramatically alter the color, texture, flavor, andstability of foods. Thus minerals may be added to or removed from foods to achieve a particular functional effect. Whenmanipulation of concentrations of minerals in foods is not practical, chelating agents such as EDTA (when allowed) can be usedto alter their behavior.
Bibliography
da Silva, J. J. R. F., and R. J. P. Williams (1991). The Biological Chemistry of the Elements: The Inorganic Chemistry ofLife, Clarenon Press, Oxford.
Hazell, T. (1985). Minerals in foods: Dietary sources, chemical forms, interactions, bioavailability. World Rev. Nutr. Diet46:1–123.
Mertz, W. (1987). Trace Elements in Human and Animal Nutrition, 5th ed., vols. 1 and 2. Academic Press, San Diego.
Shriver, D. F., P. W. Atkins, and C. H. Langford (1994). Inorganic Chemistry, 2nd ed., W. H. Freeman, New York.
Smith, K. T., ed. (1988) Trace Minerals in Foods, Marcel Dekker, New York.
References
1. Allaway, W. H. (1975). The Effect of Soils and Fertilizers on Human and Animal Nutrition. Agriculture InformationBulletin No. 378. U.S. Department of Agriculture. Washington, DC.
2. Allen, R. R. (1987). Theory of hydrogenation and isomerization, in Hydrogenation: Proceedings of an AOCS Colloquium(R. Hastert, ed.), American Oil Chemists' Society, Champaign, IL, pp. 1–10.
3. AOAC (1990). Official Methods of Analysis, 15th ed., Association of Official Analytical Chemists, Washington, DC.
4. Barrett, F., and P. Ranum (1985). Wheat and blended cereal foods, in Iron Fortification of Foods (F. M. Clydesdale andK. L. Wiemer, eds.), Academic Press, Orlando, FL, pp. 75–109.
5. Batten, G. D. (1994). Concentrations of elements in wheat grains grown in Australia, North America, and the UnitedKingdom. Austr. J. Exp. Agric. 34:51–56.

Pag e 648
6. Bayners, R. D., and T. H. Bothwell (1990). Iron deficiency. Annu. Rev. Nutr. 10:133–148.
7. Chrichton, R. R. (1991). Inorganic Biochemistry of Iron Metabolism, Ellis Horwood Series in Inorganic Chemistry (J.Burgess, series ed.), Ellis Horwood, New York.
8. Committee on Diet and Health (1989). Diet and Health: Implications for Reducing Chronic Disease Risk, NationalAcademy Press, Washington, DC.
9. Dallman, P. R. (1990). Iron, in Present Knowledge in Nutrition (M. L. Brown, ed.), International Life Sciences Institute,Washington, DC, pp. 241–250.
10. da Silva, J. J. R. F., and R. J. P. Williams (1991). The Biological Chemistry of the Elements: The Inorganic Chemistryof Life, Clarendon Press, Oxford.
11. Ellinger, R. H. (1972). Phosphates in food processing, in Handbook of Food Additives, 2nd ed. (T. E. Furia, ed.), CRCPress, Cleveland, pp. 617–780.
12. ESHA Research (1992). The Food Processor Plus, ESHA Research, Salem, OR.
13. Food and Drug Administration (1994). Code of Federal Regulations. U.S. Government Printing Office, Washington, DC.
14. Food and Nutrition Board. National Research Council (1989). Recommended Dietary Allowances, 10th ed., NationalAcademy Press, Washington, DC.
15. Guinee, T. P., P. D. Pudja, and N. Y. Farkye. (1993). Fresh acid-curd cheese varieties, in Cheese: Chemistry, Physicsand Microbiology, vol. 2, 2nd ed. (P. F. Fox, ed.), Chapman & Hall, London, pp. 369–371.
16. Harbers, L. H. (1994). Ash analysis, in Introduction to the Chemical Analysis of Foods (S. S. Nielson, ed.), Jones andBartlett, Boston, pp. 113–121.
17. Hazell, T. (1985). Minerals in foods: Dietary Sources, Chemical Forms, Interactions, Bioavailability. World Rev. Nutr. Diet46:1–123.
18. Heaney, R. P., C. M. Weaver, and M. L. Fitzsimmons (1990). Influence of calcium load on absorption fraction. J. BoneMiner. Res. 5:1135–1138.
19. Hendricks, D. G. (1994). Mineral analysis by traditional methods, in Introduction to the Chemical Analysis of Foods (S.S. Nielson, ed.), Jones and Bartlett, Boston, pp. 123–135.
20. Hetzel, B. S. (1993). The control of iodine deficiency. Am. J. Public Health 83:494–495.
21. Hurrell, R. F. (1985). Nonelemental sources, in Iron Fortification of Foods (F. M. Clydesdale and K. L. Wiemer, eds.),Academic Press, Orlando, FL, pp. 39–53.
22. Hurrell, R. F., and J. D. Cook (1990). Strategies for iron fortification of foods. Trends in Food Sci. Technol. 1(3):56–61.
23. Kratzer, F. H. and P. Vohra (1986). Chelates in Nutrition, CRC Press, Boca Raton, FL.
24. Lachance, P. A., and M. C. Fisher (1988). Effects of food preparation procedures in nutrient retention with emphasis onfood service practices, in Nutritional Evaluation fo Food Processing (E. Karmas and R. S. Harris, eds.), Van NostrandReinhold, New York, pp. 505–556.
25. Lucey, J. A., and P. F. Fox (1993). Importance of calcium and phosphate in cheese manufacture: a review. J. Dairy Sci.76(6):1714–1724.
26. McGee, H. J., S. R. Long, an W. R. Briggs (1984). Why whip egg whites in copper bowls? Nature 308:667–668.
27. Miller, D. D. (1989) Calcium in the diet: Food sources, recommended intakes, and nutritional bioavailability. Adv. FoodNutr. Res. 33:103–156.

28. Miller, D. D. (1994). Atomic absorption an emission spectroscopy, in Introduction to the Chemical Analysis of Foods(S. S. Nielson, ed.), Jones and Bartlett, Boston, pp. 353–370.
29. Miller, D. D., and L. A. Berner (1989). Is solubility in vitro a reliable predictor of iron bioavailability? Biological TraceElem. Res. 19:11–24.
30. Molins, R. A. (1910). Phosphates in Food, CRC Press, Boca Raton, FL.
31. Mounts, T. L. (1987). Alternative catalysts for hydrogenation of edible oils, in Hydrogenation: Proceedings of an AOCSColloquium (R. Hastert, ed.), American Oil Chemists' Society, Champaign, IL.
32. Patrick, J. (1985). Elemental sources, in Iron Fortification of Foods (F. M. Clyesdale and K. L. Wiemer, eds.),Academic Press, Orlando, FL, pp. 31–38.
33. Phillips, L. G., Z. Haque, and J. E. Kinsella (1987). A method for measurement of foam formation and stability. J. FoodSci. 52:1047–1049.

Pag e 649
34. Porterfield, W. (1993). Inorganic Chemistry: A Unified Approach, 2nd ed., Academic Press, San Diego.
35. Richardson, D. P. (1990). Food fortification. Proc. Nutr. Soc. 49:39–50.
36. Rotruck, J. T. (1982). Effect of processing on nutritive value of food: Trace elements, in Handbook of Nutritive Value ofProcessed Food (M. Rechcigl, Jr., ed.) CRC Press, Boca Raton, Fl, vol. I, pp. 521–528.
37. Scrimshaw, N. S. (1991). Iron deficiency. Sci. Am. 265(1):46–52.
38. Shriver, D. F., P. W. Atkins, and C. H. Langford (1994). Inorganic Chemistry, 2nd ed., W. H. Freeman, New York.
39. Skoog, D. A., and D. M. West. (1976). Fundamentals of Analytical Chemistry, 3rd ed., Holt, Rinehart, an Winston,New York.
40. Smallwood, N. J. (1987). Edible oil hydrogenation process design and operation, in Hydrogenation: Proceedings of anAOCS Colloquium (R. Hastert, ed.), American Oil Chemists' Society, Champaign, IL.
41. Trowbridge, F. L., S. S. Harris, J. Cook, J. T. Dunn, R. F. Florentino, B. A. Kodyat, B. A. Underwood, and R. Yip(1993). Coordinated strategies for controlling micronutrient malnutrition: a technical workship. J. Nutr. 123:775–787.
42. Underwood, E. J., and W. Mertz (1987). Introduction in Trace Elements in Human and Animal Nutrition, 5th ed. (W.Mertz, ed.), Academic Press, San Diego, pp. 1–19.
43. U.S. Department of Agriculture (1976–1986). Composition of Foods. Agriculture Handbook Nos. 8-1 to 8–16. HumanNutrition Information Service, USDA, Hyattsville, MD.
44. van Dokkum, W. (1989). The significance of speciation for predicting mineral bioavailability, in Nutrient Availability:Chemical and Biological Aspects (D. Southgate, I. Johnson, and G. R. Fenwick, eds.), Royal Society of Chemistry,Cambridge, pp. 89–96.
45. Weaver, C. M., an K. L. Plawecki (1994). Dietary calcium: Adequacy of a vegetarian diet. Am. J. Clin. Nutr. 59(suppl.):1238S–1241S.
46. Weinberg, E. D. (1991). Cellular iron metabolism in health and disease. Drug Metab. Rev. 22(5):531–579.
47. Welch, R. M., and W. A. House (1984). Factors affecting the bioavailability of mineral nutrients in plant foods, in Crops asSources of Nutrients for Humans (R. M. Welch, ed.), Soil Science Society of America, Madison, WI, pp. 37–54.
48. Welch, R. M., W. A. House, and W. H. Allaway (1974). Availability of zinc from pea seeds to rats. J. Nutr.104:733–740.
49. Whittaker, P., J. E. Vanderveen, M. J. Dinovi, P. M. Kuznesof, and V. C. Dunkel (1993). Toxicological profile, currentuse, and regulatory issues on EDTA compounds for assessing use of sodium iron EDTA for food fortification. Regul. Toxicol.Pharmacol. 18:419–427.
50. Wong, D. W. S. (1989). Food Chemistry, Van Nostrand Reinhold, New York.

Pag e 651
10Colorants
J. H. VON ELBEUniversity of Wisconsin—Madison, Madison, WisconsinSTEVEN J. SCHWARTZ*North Carolina State University, Raleigh, North Carolina
10.1. Introduction 651
10.2. Pigments in Animal and Plant Tissue 653
10.2.1. Heme Compounds 653
10.2.2. Chlorophyll 659
10.2.3. Carotenoids 673
10.2.4. Flavonoids and Other Phenols 681
10.2.5. Betalaines 697
10.3. Food Colorants 703
10.3.1. Regulatory Aspects 703
10.3.2. Properties of Certified Dyes 708
10.3.3. Use of Certified Dyes 711
10.3.4. Colors Exempt from Certification 713
10.3.5. Use of Colors Exempt from Certification 717
Bibliography 718
References 718
10.1 Introduction
To understand colorants in foods some terms need to be defined. Color refers to human perception of colored materials—red,green, blue, etc. A colorant is any chemical, either natural or synthetic, that imparts color. Foods have color because of theirability to reflect or emit different quantities of energy at wavelengths able to stimulate the retina in the eye. The energy
*Present affiliation: The Ohio State University, Columbus, Ohio.
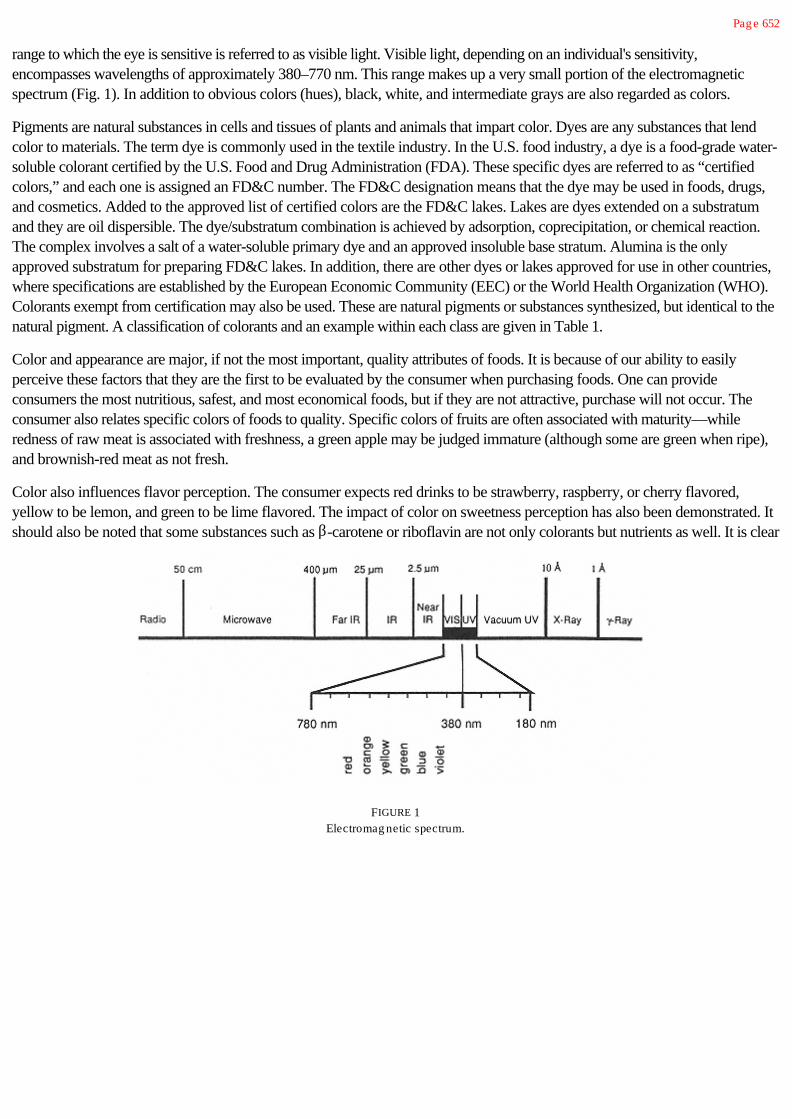
Pag e 652
range to which the eye is sensitive is referred to as visible light. Visible light, depending on an individual's sensitivity,encompasses wavelengths of approximately 380–770 nm. This range makes up a very small portion of the electromagneticspectrum (Fig. 1). In addition to obvious colors (hues), black, white, and intermediate grays are also regarded as colors.
Pigments are natural substances in cells and tissues of plants and animals that impart color. Dyes are any substances that lendcolor to materials. The term dye is commonly used in the textile industry. In the U.S. food industry, a dye is a food-grade water-soluble colorant certified by the U.S. Food and Drug Administration (FDA). These specific dyes are referred to as “certifiedcolors,” and each one is assigned an FD&C number. The FD&C designation means that the dye may be used in foods, drugs,and cosmetics. Added to the approved list of certified colors are the FD&C lakes. Lakes are dyes extended on a substratumand they are oil dispersible. The dye/substratum combination is achieved by adsorption, coprecipitation, or chemical reaction.The complex involves a salt of a water-soluble primary dye and an approved insoluble base stratum. Alumina is the onlyapproved substratum for preparing FD&C lakes. In addition, there are other dyes or lakes approved for use in other countries,where specifications are established by the European Economic Community (EEC) or the World Health Organization (WHO).Colorants exempt from certification may also be used. These are natural pigments or substances synthesized, but identical to thenatural pigment. A classification of colorants and an example within each class are given in Table 1.
Color and appearance are major, if not the most important, quality attributes of foods. It is because of our ability to easilyperceive these factors that they are the first to be evaluated by the consumer when purchasing foods. One can provideconsumers the most nutritious, safest, and most economical foods, but if they are not attractive, purchase will not occur. Theconsumer also relates specific colors of foods to quality. Specific colors of fruits are often associated with maturity—whileredness of raw meat is associated with freshness, a green apple may be judged immature (although some are green when ripe),and brownish-red meat as not fresh.
Color also influences flavor perception. The consumer expects red drinks to be strawberry, raspberry, or cherry flavored,yellow to be lemon, and green to be lime flavored. The impact of color on sweetness perception has also been demonstrated. Itshould also be noted that some substances such as b-carotene or riboflavin are not only colorants but nutrients as well. It is clear
FIGURE 1Electromag netic spectrum.

Pag e 653
TABLE 1 Classification of Colorants
Colorant Example
A Certified
1. Dye FD&C Red No. 40
2. Lake Lake of FD&C Red No. 40
B Exempt from certification
1. Natural pig ments Anthocyanin, juice concentrate, annatto extract
2. Synthetic (nature identical) b-Carotene
therefore that color of foods has multiple effects on consumers, and it is wrong to regard color as being purely cosmetic.
Many food pigments are, unfortunately, unstable during processing and storage. Prevention of undesirable changes is usuallydifficult or impossible. Depending on the pigment, stability is impacted by factors such as the presence or absence of light,oxygen, heavy metals, and oxidizing or reducing agents; temperature and water activity; and pH. Because of the instability ofpigments, colorants are sometimes added to foods.
The purpose of this chapter is to provide an understanding of colorant chemistry—an essential prerequisite for controlling thecolor and color stability of foods.
10.2 Pigments in Animal and Plant Tissue
10.2.1 Heme Compounds
Heme pigments are responsible for the color of meat. Myoglobin is the primary pigment and hemoglobin, the pigment of blood,is of secondary importance. Most of the hemoglobin is removed when animals are slaughtered and bled. Thus, in properly bledmuscle tissue myoglobin is responsible for 90% or more of the pigmentation. The myoglobin quantity varies considerably amongmuscle tissues and is influenced by species, age, sex, and physical activity. For example, pale-colored veal has a lowermyoglobin content than red-colored beef. Muscle-to-muscle differences within an animal also are apparent, and thesedifferences are caused by varying quantities of myoglobin present within the muscle fibers. Such is the case with poultry, wherelight-colored breast muscle is easily distinguished from the dark muscle color of leg and thigh muscles. Listed in Table 2 are themajor pigments found in fresh, cured, and cooked meat. Other minor pigments present in muscle tissue include the cytochromeenzymes, flavins, and vitamin B12.
10.2.1.1 Myoglobin/hemoglobin
Structure of Heme Compounds
Myoglobin is a globular protein consisting of a single polypeptide chain. Its molecular mass is 16.8 kD and it is comprised of153 amino acids. This protein portion of the molecule is known as globin. The chromophore component responsible for lightabsorption and color is a porphyrin known as heme. Within the porphyrin ring, a centrally located iron atom is complexed withfour tetrapyrrole nitrogen atoms. Thus, myoglobin is a complex of globin and heme. The heme porphyrin is present within ahydrophobic pocket of the globin protein and bound to a histidine residue (Fig. 2). The centrally located iron atom shownpossesses six coordination sites, four of which are occupied by the nitrogen atoms within the tetrapyrrole ring. The fifthcoordination site

Pag e 654
TABLE 2 Major Pig ments Found in Fresh, Cured, and Cooked Meat
Pig ment Mode of formation State of iron State of hematin nucleus State of g lobin Color
1. Myog lobin Reduction of metmyog lobin;deoxyg enation of oxymyog lobin
Fe2+ Intact Native Purplish-red
2. Oxymyog lobin Oxyg enation of myog lobin Fe2+ Intact Native Brig ht red
3. Metmyog lobin Oxidation of myog lobin,oxymyog lobin
Fe3+ Intact Native Brown
4. Nitric oxide myog lobin(nitrosomyog lobin)
Combination of myog lobin withnitric oxide
Fe2+ Intact Native Brig ht red (pink)
5. Nitric oxide metmyog lobin(nitrosometmyog lobin)
Combination of metmyog lobin withnitric oxide
Fe3+ Intact Native Crimson
6. Metmyog lobin nitrite Combination of metmyog lobin withexcess nitrite
Fe3+ Intact Native Reddish-brown
7. Globin myohemochromog en Effect of heat, denaturing ag entson myog lobin, oxymog lobin;irradiation of g lobinhemichromog en
Fe2+ Intact (usually bound todenatured protein other thang lobin)
Denatured(usuallydetached)
Dull red
(table continued on next page)

Pag e 655
(table continued from previous page)
Pig ment Mode of formation State of iron State of hematin nucleus State of g lobin Color
8. Globin myohemichromog en Effect of heat, denaturing ag entson myog lobin, oxymog lobin,metmyog lobin, hemochromog en
Fe3+ Intact (usually bound todenatured protein other thang lobin)
Denatured(usuallydetached)
Brown(sometimesg reyish)
9. Nitric oxide myohemochromog en Effect of heat, denaturing ag entson nitric oxide myog lobin
Fe2+ Intact Denatured Brig ht red (pink)
10. Sulfmyog lobin Effect of H2S and oxyg en onmyog lobin
Fe3+ Intact but one double bondsaturated
Native Green
11. Metsulfmyog lobin Oxidation of sulfmyog lobin Fe3+ Intact but one double bondsaturated
Native Red
12. Choleg lobin Effect of hydrog en peroxide onmyog lobin or oxymyog lobin; effectof ascorbine or other reducingag ent on oxymyog lobin
Fe2+ or Fe3+ Intact but one double bondsaturated
Native Green
13. Nitrihemin Effect of larg e excess nitrite andheat on 5
Fe3+ Intact but reduced Absent Green
14. Verdohaem Effect of reag ents as in 7–9 inexcess
Fe3+ Porphyrin ring opened Absent Green
15. Bile pig ments Effect of reag ents as in 7–9 in larg eexcess
Fe absent Porphyrin ring destroyed Chainof porphyrins
Absent Yellow orcolorless
From Lawrie (61) courtesy of Perg ammon Press, New York

Pag e 656
FIGURE 2Tertiary structure of myog lobin. (Ref.
35.)
is bound by the histidine residue of globin, leaving the sixth site available to complex with electronegative atoms donated byvarious ligands.
Hemoglobin consists of four myoglobins linked together as a tetramer. Hemoglobin, a component of red blood cells, formsreversible complexes with oxygen in the lung. This complex is distributed via the blood to various tissues throughout the animalwhere oxygen is absorbed. It is the heme group that binds molecular oxygen. Myoglobin within the cellular tissue acts in a similarfashion, accepting the oxygen carried by hemoglobin. Myoglobin thus stores oxygen within the tissues, making it available formetabolism.
Chemistry and Color—Oxidation
Meat color is determined by the chemistry of myoglobin, its state of oxidation, type of ligands bounds to heme, and state of theglobin protein. The heme iron within the porphyrin ring may exist in two forms: either reduced ferrous (+2) or oxidized ferric(+3). This state of oxidation for the iron atom within heme should be distinguished form oxygenation of myoglobin. Whenmolecular oxygen binds to myoglobin, oxymyoglobin (MbO2) is formed and this is referred to

Pag e 657
as oxygenation. When oxidation of myoglobin occurs, the iron atom is converted to the ferric (+3) state, forming metmyoglobin(MMb). Heme iron in the +2 (ferrous) state, which lacks a bound ligand in the sixth position, is called myoglobin.
Meat tissue that contains primarily myoglobin (also referred to as deoxymyoglobin) is purplish-red in color. Binding of molecularoxygen at the sixth ligand yields oxymyoglobin (MbO2) and the color of the tissue changes to the customary bright red. Both thepurple myoglobin and the red oxymyoglobin can oxidize, changing the state of the iron from ferrous to ferric. If this change instate occurs through autooxidation, these pigments acquire the undesirable brownish-red color of metmyoglobin (MMb). In thisstate, metmyoglobin is not capable of binding oxygen and the sixth coordination position is occupied by water [25]. Shown inFig. 3 are the various reactions of the heme pigment. Color reactions in fresh meat are dynamic and determined by conditions inthe muscle and the resulting ratios of myoglobin (Mb), metmyoglobin (MMb), and oxymyoglobin (MbO2). Interconversionamong these forms can occur readily.
Shown in Fig. 4 is the relationship between oxygen partial pressure and the percentage of each type of heme pigment. A highpartial pressure of oxygen favors oxygenation, forming bright-red oxymyoglobin. Conversely, at low oxygen partial pressuresmyoglobin and metmyoglobin are favored. In order to enhance oxymyoglobin formation, saturation levels of oxygen in theenvironment are useful. The rate of metmyoglobin formation, caused by heme oxidation (Fe2+ Fe3+), can be minimized ifoxygen is totally excluded. Muscles have varying oxygen partial pressures, causing the ratios of each of the pigment forms tovary.
Presence of the globin protein is known to decrease the rate of heme oxidation (Fe2+ Fe3+). In addition, oxidation occursmore rapidly at lower pH values. Furthermore, the rate of autoxidation of oxymyoglobin occurs more slowly than that ofmyoglobin. The presence of trace metals, especially copper ions, is known to promote autoxidation.
FIGURE 3Myog lobin reactions in fresh and curedmeats. ChMb = cholemyg lobin (oxidizedporphyrin ring ); O2Mb = oxymyog lobin
(Fe2+); MMb = metmyog lobin (Fe 3+); Mb =myog lobin (Fe 2+); MMb-NO2 =
metmyog lobin nitrite; NOMMb =nitrosylmetmyog lobin; NOMb =
nitrosylmyog lobin; NMMb =nitrometmyog lobin; NMb =
nitromyog lobin, the latter twobeing reaction products of nitrous acid and
the heme portion of the molecule; R =reductant; O = strong oxidizing conditions.
(From Ref. 31.)

Pag e 658
FIGURE 4Influence of oxyg en partial pressure
on thethree chemical states of myog lobin.
(From Ref. 29.)
Chemistry and Color—Discoloration
Two different reactions can cause green discoloration of myoglobin [61]. Hydrogen peroxide can react with either the ferrous orferric site of heme, resulting in choleglobin, a green-colored pigment. Also, in the presence of hydrogen sulfide and oxygen,green sulfomyoglobin can form. It is thought that hydrogen peroxide and/or hydrogen sulfide arise from bacterial growth. A thirdmechanisms for green pigmentation occurs in cured meats and is mentioned later.
10.2.1.2 Cured Meat Pigments
During the curing process, specific reactions occur that the responsible for the stable pink color of cured meat products. Thesereactions are outlined in Fig. 3 and the compounds responsible for the reactions are listed in Table 2.
The first reaction occurs between nitric oxide (NO) and myoglobin to produce nitric oxide myoglobin (MbNO2), also know asnitrosylmyoglobin. MbNO2 is bright red and unstable. Upon heating, the more stable nitric oxide myohemochromogen(nitrosylhemochrome) forms. This product yields the desirable pink color of cured meats. Heating of this pigment denaturesglobin, but the pink color persists. If metmyoglobin is present, it has been postulated that reducing agents are required to convertmetmyoglobin to myoglobin before the reaction with nitric oxide can take place. Alternatively, nitrite can interact directly withmetmyoglobin. In the presence of excess nitrous acid, nitrimyoglobin (NMb) will form. Upon heating in a reducing environment,NMb is converted to nitrihemin, a green pigment. This series of reactions causes a defect known as “nitrite burn.”
In the absence of oxygen, nitric oxide complexes of myoglobin are relatively stable. However, especially under aerobicconditions, these pigments are sensitive to light. If reductants are added, such as ascorbate or sulfhydryl compounds, thereductive conversion of nitrite to nitric oxide is favored. Thus, under these conditions, formation of nitric oxide myoglobin occursmore readily. Detailed reviews on the chemistry of cured meat pigments are available [31,32].
10.2.1.3 Stability of Meat Pigments
Many factors operative in a complex food system can influence the stability of meat pigments. In addition, interactions betweenthese factors are critical and make it difficult to determine cause

Pag e 659
and effect relationships. Some environmental conditions that have important effects on meat color and pigment stability includeexposure to light, temperature, relative humidity, pH, and the presence of specific bacteria. Review papers on this subject areavailable [25,57].
Specific reactions, such as lipid oxidation, are known to increase the rate of pigment oxidation [26]. Similarly, color stability canbe improved by the addition of antioxidants such as ascorbic acid, vitamin E, butylated hydroxyanisole (BHA), or propyl gallate[38]. These compounds have been shown to delay lipid oxidation and improve retention of color in tissues. Other biochemicalfactors, such as the rate of oxygen consumption prior to slaughter and activity of metmyoglobin reductase, can influence thecolor stability of fresh meat [67].
10.2.1.4 Packaging Considerations
An important means of stabilizing meat color is to store it under appropriate atmospheric conditions. The problem ofdiscoloration caused by heme oxidation (Fe2+ Fe3+) can be resolved by using modified atmosphere (MA) packaging. Thistechnique requires the use of packaging films with low gas permeabilities. After packaging, air is evacuated from the packageand the storage gas is injected. By employing oxygen-enriched or -devoid atmospheres, color stability can be enhanced [75].Muscle tissue stored under conditions devoid of O2 (100% CO2 and in the presence of an oxygen scavenger also exhibits goodcolor stability [86]. Use of modified atmosphere packaging techniques may, however, result in other chemical and biochemicalalterations that can influence the acceptability of meat products. Part of the influence of modified atmospheres on pigmentstability no doubt relates to its influence on microbial growth. Further information on use of MA for fresh meat storage can befound in a review article by Seideman and Durland [96].
10.2.2 Chlorophyll
10.2.2.1 Structure of Chlorophylls and Derivatives
Chlorophylls are the major light-harvesting pigments in green plants, algae, and photosynthetic bacteria. They are magnesiumcomplexes derived from porphin. Porphin is a fully unsaturated macrocyclic structure that contains four pyrrole rings linked bysingle bridging carbons. The rings are numbered I through IV or A through D according to the Fisher numbering system (Fig. 5).Pyrrole carbon atoms on the periphery of the porphin structure are numbered 1 through 8. Carbon atoms of the bridgingcarbons are designated alpha, beta, gamma, and delta. The IUPAC numbering system for porphin is shown in Figure 5b. Themore common numbering system is the Fisher system.
Substituted porphins are name porphyrins. Phorbin (Fig. 5c) is considered to be the nucleus of all chlorophylls and is formed bythe addition of a fifth isocyclic ring (V) to porphin. A porphyrin is any macrocyclic tetrapyrrole pigment in which the pyrrole ringsare joined by methyne bridges and the system of double bonds forms a closed, conjugated loop. Chlorophylls, therefore, areclassified as porphyrins.
Several chlorophylls are found in nature. Their structures differ in the substituents around the phorbin nucleus. Chlorophyll a andb are found in green plants in an approximate ratio of 3:1. They differ in the carbon C-3 substituent. Chlorophyll a contains amethyl group while chlorophyll b contains a formyl groups (Fig. 5d). Both chlorophylls have a vinyl and an ethyl group at the C-2 and C-4 position, respectively; a carbomethoxy group at the C-10 position of the isocylic rings, and a phytol group esterfiedto propionate at the C-7 position. Phytol is a 20-carbon monounsaturated isoprenoid alcohol. Chlorophyll c is found inassociation with chlorophyll a in marine algae, dinoflagellates, and diatoms. Chlorophyll d is a minor constituent accompanyingchlorophyll a in red algae. Bacteriochlorophylls and chlorobium chlorophylls are principal chlorophylls found in purplephotosynthetic bacteria and green sulfur bacteria, respec-

Pag e 660
FIGURE 5Structure of porphin (a,b), phorbin (c), and chlorophyll [chl] (d).
TABLE 3 Nomenclature of Chlorophyll Derivatives
Phyllins: Chlorophyll derivatives containing mag nesium
Pheophytins: The mag nesium-free derivatives of the chlorophylls
Chlorophyllides: The products containing a C-7 propionic acid resulting from enzymic or chemicalhydrolysis of the phytyl ester
Pheophorbides: The products containing a C-7 propionic acid resulting from removal ofmag nesium and hydrolysis of the phytyl ester
Methyl or ethylpheophorbides:
The corresponding 7-propionate methyl of ethyl ester
Pyro compounds: Derivatives in which the C-10 carbomethoxy g roup has been replaced byhydrog en
Meso compounds: Derivatives in which the C-2 vinyl g roup has been reduced to ethyl
Chlorins e: Derivatives of pheophorbide a resulting from cleavag e of the isocyclic ring
Rhodins g : The corresponding derivatives from pheophorbide b

Pag e 661
tively. Trivial names are widely used for chlorophylls and their derivatives [49]. Listed in Table 3 are the names used most often.Figure 6 is a schematic representation of the structural relationships of chlorophyll and some of its derivatives.
10.2.2.2 Physical Characteristics
Chlorophylls are located in the lamellae of intercellular organelles of green plants known as chloroplasts. They are associatedwith carotenoids, lipids, and lipoproteins. Weak linkages (non-covalent bonds) exist between these molecules. The bonds areeasily broken; hence chlorophylls can be extracted by macerating plant tissue in organic solvents. Various solvents have beenused. Polar solvents such as acetone, methanol, ethanol, ethyl acetate, pyridine, and dimethylformamide are most effective forcomplete extraction of chlorophylls. Nonpolar solvents such as hexane or petroleum ether are less effective. High-performanceliquid chromatography (HPLC) today is the method of choice for separating individual chlorophylls and their derivatives. In thecase of chlorophyll a and b, for example, the increase in polarity contributed by the C-3 formyl substituent of chlorophyll bcauses it to be more strongly adsorbed on a normal-phase column and more weakly absorbed on a reverse-phase column thanchlorophyll a [14].
Identification of chlorophyll and its derivatives is, to a large extent, based on absorption characteristics of visible light. Visiblespectra of chlorophyll a and b and their derivatives are characterized by sharp light absorption bands between 600 and 700 nm(red regions) and between 400 and 500 nm (blue regions) (Table 4). The wavelength of maximum absorption for chlorophylls aand b dissolved in ethyl ether are, respectively, 660.5 and 642 nm in the red region, and 428.5 and 452.5 nm in the blue region[100].
10.2.2.3 Alterations of Chlorophyll
Enzymatic
Chlorophyllase is the only enzyme known to catalyze the degradation of chlorophyll. Chlorophyllase is an esterase, and in vitro,it catalyzes cleavage of phytol from chlorophylls and its Mg-free derivatives (pheophytins), forming chlorophyllides andpheophorbides, respectively (Fig. 6). Its activity is limited to porphyrins with a carbomethoxy groups at C-10 and hydrogens atpositions C-7 and C-8 [73]. The enzyme is active in solutions containing water, alcohols, or acetone. In the presence of largeamounts of alcohols such as methanol or ethanol, the phytol group is removed and the chlorophyllide is esterified to form eithermethyl or ethyl chlorophyllide. Formation of chlorophyllides in fresh leaves does not occur until the enzyme has been heatactivated postharvest. The optimum temperature for chlorophyllase activity in vegetables ranges
FIGURE 6Chlorophyll and its derivatives.

Pag e 662
TABLE 4 Spectral Properties in Ethyl Ether of Chlorophyll a and b and Their Derivatives
Absorption maxima (nm)
Compound“Red”reg ion
“Blue”reg ion
Ratio ofabsorption
(“blue”/“red”)
Molarabsorptivity
(“red” reg ion)
Chlorophyll a 660.5 428.5 1.30 86,300ª
Methyl chlorophyllide a 660.5 427.5 1.30 83,000b
Chlorophyll b 642.0 452.5 2.84 56,100ª
Methyl chlorophyllide b 641.5 451.0 2.84 —b
Pheophytin a 667.0 409.0 2.09 61,000b
Methyl pheophorbide a 667.0 408.5 2.07 59,000b
Pheophytin b 655 434 — 37,000c
Pyropheophytin a 667.0 409.0 2.09 49,000b
Zinc pheophytin a 653 423 1.38 90,300d
Zinc pheophytin b 634 446 2.94 60,200d
Copper pheophytin a 648 421 1.36 67,900d
Copper pheopytin b 627 438 2.53 49,800d
ªStrain et al. [99].
bPenning ton et al. [80].
cDavidson [20].
dJones et al. [55].
between 60 and 82.2°C [64]. Enzyme activity decreases when plant tissue is heated above 80°C, and chlorophyllase loses itsactivity if heated to 100°C. Chlorophyllase activity in spinach during growth and fresh storage is shown in Figure 7. Maximumactivity is observed at the time the plant begins flowering (solid line). Postharvest storage of fresh spinach at 5°C decreasesenzyme activity compared to activities measured at the time of harvest (broken line) [122].

FIGURE 7Chlorophyllase activity, expressed aspercent conversion of chlorophyll to
chloro phyllide, in spinach duringg rowth (solid line) and after storag eat 5°C (broken line). (From Ref. 112.)

Pag e 663
Heat and Acid
Chlorophyll derivatives formed during heating or thermal processing can be classified into two groups based on the presence orabsence of the magnesium atom in the tetrapyrrole center. Mg-containing derivatives are green in color, while Mg-freederivatives are olive-brown in color. The latter are chelators and when, for example, sufficient zinc or copper ions are availablethey will form green zinc or copper complexes.
The first change observed when the chlorophyll molecule is exposed to heat is isomerization. Chlorophyll isomers are formed byinversion of the C-10 carbomethoxy group. The isomers are designated as a' and b'. They are more strongly absorbed on a C-18 reverse-phase HPLC column than are their parent compounds, and clear separation can be achieved. Isomerization occursrapidly in heated plant tissue or in organic solvents. Establishment of equilibrium in leaves results in conversion of 5–10% ofchlorophyll a and b to a' and b' after heating for 10 min at 100°C [3, 92, 113]. Chromatograms of a spinach extract of freshversus blanched spinach in Figure 8 show isomer formation during heating.
The magnesium atom in chlorophyll is easily displaced by two hydrogen ions, resulting in the formation of olive-brownpheophytin (Fig. 9). The reaction is irreversible in aqueous solution. Compared to their parent compounds, pheophytin a and bare less polar and more strongly absorbed on a reverse-phase HPLC column. Formation of the respective pheophytins occurmore rapidly from chlorophyll a than from chlorophyll b. Chlorophyll b is more heat stable
FIGURE 8Hig h-performance liquid chromatog raphy (HPLC)
chromatog rams of chlorophylls (chl) and derivatives in fresh,blanched, frozen, and canned spinach. Phe = pheophytin, Pyro
= pyropheophytin. (From Ref. 92.)

Pag e 664
FIGURE 9Formation of pheophytin and pyropheophytin from chlorophyll.

Pag e 665
than is chlorophyll a. The greater stability of b is attributed to the electron-withdrawing effect of its C-3 formyl group. Transferof electrons away from the center of the molecule occurs because of the conjugated structure of chlorophyll. The resultingincrease in positive charge on the four pyrrole nitrogens reduces the equilibrium constant for the formation of the reactionintermediate. Results of rate studies of chlorophyll degradation to pheophytin in heated plant tissue also have shown greater heatstability of chlorophyll b. Reported activation energies for the reaction range from 12.6 to 35.2 kcal/mol. This variance has beenattributed to differences in media composition, pH, temperature range, and method of analysis. With respect to the latter, usingspectrophometric methodology, for example, would not allow individual compounds to be distinguished, whereas HPLC will.
Chlorophyll degradation in heated vegetable tissue is affected by tissue pH. In a basic media (pH 9.0) chlorophyll is very stabletoward heat, whereas in an acidic media (pH 3.0) it is unstable. A decrease of 1 pH unit can occur during heating of plant tissuethrough the release of acids, and this has an important detrimental effect on the rate of chlorophyll degradation. Pheophytinformation in intact plant tissue, postharvest, appears to be mediated by cell membranes. In a study by Haisman and Clarke [41],chlorophyll degradation in sugar beet leaves held in heated buffer was not initiated until the temperature reached 60°C or higher.Conversion of chlorophyll to pheophytin after holding for 60 min at 60 or 100°C was 32 and 97%, respectively. It wasproposed that pheophytin formation in plant cells is initiated by a heat-induced increase in permeability of hydrogen ions acrosscell membranes. The critical temperature for initiation of pheophytin formation coincided with gross changes in membraneorganization as observed with an electron microscope.
The addition of chloride salts of sodium, magnesium, or calcium decreases pheophytinization in tobacco leaves heated at 90°Cby about 47, 70, and 77%, respectively. The decrease in chlorophyll degradation was attributed to the electrostatic shieldingeffect of the salts. It was proposed that the addition of cations neutralizes the negative surface charge of the fatty acids andprotein in the chloroplast membrane and thereby reduces the attraction of hydrogen ions to the membrane surface [74].
The permeability of hydrogen across the membrane can also be affected by the addition of detergents that absorb on the surfaceof the membrane. Cationic detergents repel hydrogen ions at the membrane surface, limiting their diffusion into the cell andthereby decreasing chlorophyll degradation. Anionic detergents attract hydrogen ions, increasing their concentration at themembrane surface, increasing the rate of hydrogen diffusion, and increasing the degradation of chlorophyll. In the case of neutraldetergents, the negative surface charge on the membrane is diluted and therefore the attraction for hydrogen ions and consequentdegradation of chlorophyll is decreased [17, 41].
Replacement of the C-10 carbomethoxy group of pheophytin with a hydrogen atom results in the formation of olive-coloredpyropheophytin. The wavelengths of maximum light absorption by pyropheophytin are identical to those for pheophytin in boththe red and blue regions (Table 4). Retention times for pyropheophytin a and b using reverse-phase HPLC are greater thanthose for the respective pheophytins.
Chlorophyll alteration during heating is sequential, and proceeds according to the following kinetic sequence:
The data in Table 5 show that during heating for the first 15 min, chlorophyll decreases rapidly and pheophytin increases rapidly.With further heating pheophytin decreases and phyropheophytin rapidly increases, although a small amount of pyropheophytin isevident after 4 min of heating. Accumulation does not become appreciable until after 15 min, thus supporting a sequen-

Pag e 666
TABLE 5 Concentration (mg /g Dry W eig ht)ª of Chlorophylls a and b and Pyropheophytins aand b in Fresh, Blanched, and Heated Spinach Processed at 121°C for Various Times
Chlorophyll Pheophytin Pyropheophytin
a b a b a b pHb
Fresh 6.98 2.49
Blanched 6.78 2.47 7.06
Processed (min)c
2 5.72 2.46 1.36 0.13 6.90
4 4.59 2.21 2.20 0.29 0.12 6.77
7 2.81 1.75 3.12 0.57 0.35 6.60
15 0.59 0.89 3.32 0.78 1.09 0.27 6.32
30 0.24 2.45 0.66 1.74 0.57 6.00
60 1.01 0.32 3.62 1.24 5.65
ªEstimated error ±2%; each value represents a mean of 3 determinations.
bThe pH was measured after processing and before pig ment extraction.
cTimes listed were measured after the internal product temperature reached 121°C.
Source: Ref. 90.
tial mechanism. First-order rate constant for conversion of pheophytin b to pyropheophytin b are 25–40% greater than those forconversion of pheophytin a to pyropheophytin a [91]. Activation energies for removal of the C-10 carbomethoxy group fromeither pheophytin a and b are smaller than those for formation of pheophytin a and b, from chlorophyll a and b, indicating aslightly lower temperature dependency for formation of the pyropheophytins.
Listed in Table 6 are the concentrations of pheophytins a and b and pyropheophytins a and b in commercially canned vegetableproducts. These data indicate that pyropheophytins a and b are the major chlorophyll derivatives responsible for the olive-greencolor in many canned vegetables. It is also significant that the amount of pyropheophytin derivatives formed is an indication of theseverity of the heat treatment. Comparative heat treatments for commercial sterility of spinach, green beans, cut asparagus, andgreen peas in 303 cans processed at 121°C are approximately 51, 11, 13, and 17 min, respectively. From Table 6, the percentsof pyropheo-

TABLE 6 Pheophytins a and b in Commercially CannedVeg etables
Pheophytinª (mg /g dryweig ht)
Pyropheophytin(mg /g dry weig ht)
Product a b a b
Spinach 830 200 4000 1400
Beans 340 120 260 95
Asparag us 180 51 110 30
Peas 34 13 33 12
ªEstimated error = ±2%.
Source: Ref. 90.

Pag e 667
phytin compared to the total pheo compounds are 84, 44, 38, and 49%, respectively, corresponding fairly well to the heatingtimes.
Replacement of the magnesium atom in chlorophyllide (green) with hydrogen ions results in the formation of olive-brownpheophorbide. Pheophorbide a and b are more water-soluble than the respective pheophytins and have the same spectralcharacteristics. Removal of the C-10 phytol chain appears to affect the rate of loss of magnesium from the tetrapyrrole center.Degradation of chlorophyllides a and b and their respective methyl and ethyl esters in acidic acetone increases as the length ofthe chain is decreased, suggesting that steric hindrance from the C-10 chain affects the rate of hydrogen ion attack [87].
Past rate studies using green plant tissue have generally supported the view that chlorophyllides are slightly more heat stable thanchlorophylls. More recently [15], however, it was shown that the reverse is true. Chlorophyllide a degraded 3.7 times fasterthan chlorophyll a at 145°C. The more water-soluble chlorophyllide apparently is more likely to contact hydrogen ions insolution and is likely to react more rapidly. The latter result is believed to be the correct one because, in this study,chlorophyllase was activated more completely, and therefore greater amounts of chlorophyllides were available for kineticstudies, and a very sensitive HPLC technique was used.
Metallo Complex Formation
The two hydrogen atoms within the tetrapyrrole nucleus of the magnesium-free chlorophyll derivative are easily displaced by zincor copper ions to form green metallo complexes. Formation of metallo complexes from pheophytins a and b causes the redmaximum to shift to a shorter wavelength and the blue maximum to a longer wavelength (Table 4) [53]. Spectral characteristicsof the phytol-free metal complexes are identical to their parent compounds.
The Zn and Cu complexes are more stable in acid solutions than in alkaline. Magnesium, as has been pointed out, is easilyremoved by the addition of acid at room temperature, while zinc pheophytin a is stable in solution at pH 2. Removal of copper isachieved only at pH values sufficiently low to begin degradation of the porphyrin ring.
Incorporation of metal ions into the neutral porphyrin is a bimolecular reaction. It is believed that the reaction begins withattachment of the metal ion to a pyrrole nitrogen atom, followed by the immediate and simultaneous removal of two hydrogenatoms. Formation of metallo complexes is affected by substituent groups because of the highly resonant structure of thetetrapyrrole nucleus. [24].
Metallo complexes are known to form in plant tissue, and the a complexes form faster than do b complexes. The slowerformation of the b complexes has been attributed to the electron-withdrawing effect of the C-3 formyl group. Migration ofelectrons through the conjugated porphyrin ring system causes pyrrole nitrogen atoms to become more positively charged andtherefore less reactive with metal cations. Steric hindrance of the phytol chain also decreases the rate of complex formation.Pheophorbide a in ethanol reacts four times faster with copper ions than does pheophytin a [52].
The kinetics of zinc complex formation have been studied. Formation of Zn2+ pyropheoporbide a occurs most rapidly inacetone/water (80/20), followed by pheophorbide a, methyl pheophorbide a, ethyl pheophorbide a, pyropheophytin a, andpheophytin a. Reaction rates decrease as the length of the alkyl chain esterified at the C-7 carbon increases, suggesting thatsteric hindrance is important. Similarly, the greater rate of formation of zinc pyropheophytin a as compared to pheophytin a isattributed to interference from the C-10 carbomethoxy group of pheophytin a [81,108].
Comparative studies on the formation of metallo complexes in vegetable purées indicate copper is chelated more rapidly thanzinc. Copper complexes are detectable in pea purée when

Pag e 668
the concentration of copper is as low as 1–2 ppm. In contrast, zinc complex formation under similar conditions does not occur inpurée containing less than 25 ppm Zn2+. When both Zn2+ and Cu2+ are present, formation of copper complexes dominates [88].
The pH is also a factor in the rate of complex formation. Increasing the pH of spinach purée from 4.0 to 8.5 results in an 11-foldincrease in the amount of zinc pyropheophytin a formed during heating for 60 min at 121°C. A decrease in complex formationoccurs when the pH is raised to 10, presumably because of precipitation of Zn2+ [58].
These metallo complexes are of interest because the copper complexes, based on their stability under most conditionsexperienced in food processing, are used as colorants in the European Economic Community. This technology is not approvedin the United States. A process that improves the green color of canned vegetables is based on the formation of zinc metallocomplexes. Green vegetables canned with this process were introduced into the United States in 1990.
Allomerization
Chlorophylls oxidize when dissolved in alcohol or other solvents and exposed to air. This process is referred to asallomerization. It is associated with uptake of oxygen equimolar to the chlorophylls present [94]. The products are blue-green incolor and do not give a yellow-brown ring in the Molisch phase test [42]. The lack of a color response indicates that thecyclopentanone ring (ring V, figure 5c) has been oxidized or that the carbomethoxy group at C-10 has been removed. Theproducts of allomerization have been identified as 10-hydroxychlorophylls and 10-methoxylactones (Fig. 10). The principalallomerization product of chlorophyll b is the 10-methoxylactone derivative.
Photodegradation
Chlorophyll is protected from destruction by light during photosynthesis in healthy plant cells by surrounding carotenoids andother lipids. Once this protection is lost by plant senescence, by pigment extraction from the tissue, or by cell damage causedduring processing, chlorophylls are susceptible to photodegradation [62, 63]. When these conditions prevail and light andoxygen are present, chlorophylls are irreversibly bleached.
Many researchers have tried to identify colorless photodegradation products of chlorophylls. Methyl ethyl maleimide has beenidentified by Jen and Mackinney [50, 51]. In a study by Llewllyn et al. [62, 63] glycerol was found to be the major breakdownproduct, with lactic, citric, succininc and malonic acids, and alanine occurring in lesser amounts. The reacted pigments werecompletely bleached.
It is believed that photodegradation of chlorophylls results in opening of the tetrapyrrole ring and fragmentation into lowermolecular weight compounds. It has been suggested that photodegradation begins with ring opening at one of the methinebridges to form oxidized linear tetrapyrroles [102]. Singlet oxygen and hydroxyl radicals are known to be produced duringexposure of chlorophylls or similar porphyrins to light in the presence of oxygen [28]. Once formed, singlet oxygen or hydroxylradicals will react further with tetrapyrroles to form peroxides and more free radicals, eventually leading to destruction of theporphyrins and total loss of color.
10.2.2.4 Color Loss During Thermal Processing
Loss of green color in thermally processed vegetables results from formation of pheophytin and pyropheophytin. Blanching andcommercial heat sterilization can reduce chlorophyll content by as much as 80–100% [92]. Evidence that a small amount ofpheophytin is formed during blanching before commercial sterilization is provided in Figure 8. The greater amount of pheophytindetected in frozen spinach as compared to spinach blanched for canning is most

Pag e 669
FIGURE 10Structure of 10-hydroxychlorophyll a (a) and 10-methoxylactone
of chlorophyll (b).
likely attributable to the greater severity of the blanch treatment that is generally applied to vegetables intended for freezing. Oneof the major reason for blanching of spinach prior to canning is to wilt the tissue and facilitate packaging, whereas blanching priorto freezing must be sufficient not only to wilt the tissue but also to inactivate enzymes. The pigment composition shown for thecanned sample indicated that total conversion of chlorophylls to pheophytins and pyropheophytins has occurred.

Pag e 670
Degradation of chlorophyll within plant tissues postharvest is initiated by heat-induced decompartmentalization of cellular acidsas well as the synthesis of new acids [41]. In vegetables several acids have been identified, including oxalic, malic, citric, acetic,succinic, and pyrrolidone carboxylic acid (PCA). Thermal degradation of glutamine to form PCA is believed to be the majorcause of the increase in acidity of vegetables during heating [18]. Other contributors to increased acidity may be fatty acidsformed by lipid hydrolysis, hydrogen sulfide liberated from proteins or amino acids, and carbon dioxide from browningreactions. The pH decrease occurring during thermal processing of spinach purée is shown in Table 5.
10.2.2.5 Technology of Color Preservation
Efforts to preserve green color in canned vegetables have concentrated on retaining chlorophyll, forming or retaining greenderivatives of chlorophyll, that is, chlorophyllides, or creating a more acceptable green color through the formation of metallocomplexes.
Acid Neutralization to Retain Chlorophyll
The addition of alkalizing agents to canned green vegetables can result in improved retention of chlorophylls during processing.Techniques have involved the addition of calcium oxide and sodium dihydrogen phosphate in blanch water to maintain productpH or to raise the pH to 7.0. Magnesium carbonate or sodium carbonate in combination with sodium phosphate has been testedfor this purpose. However, all of these treatments result in softening of the tissue and an alkaline flavor.
Blair in 1940 recognized the toughening effect of calcium and magnesium when added to vegetables. This observation led to theuse of calcium or magnesium hydroxide for the purpose of raising pH and maintaining texture. This combination of treatmentsbecame known as the “Blair process” [7]. Commercial application of these processes has not been successful because of theinability of the alkalizing agents to effectively neutralize interior tissue acids over a long period of time, resulting in substantialcolor loss after less than 2 months of storage.
Another technique involved coating the can interior with ethycellulose and 5% magnesium hydroxide. It was claimed that slowleaching of magnesium oxide from the lining would maintain the pH at or near 8.0 for a longer time and would therefore helpstabilize the green color [68, 69]. These efforts were only partially successful, because increasing the pH of canned vegetablescan also cause hydrolysis of amides such as glutamine or asparagine with formation of undesirable ammonia-like odors. Inaddition, fatty acids formed by lipid hydrolysis during high-pH blanching may oxidize to form rancid flavors. In peas an elevatedpH (8.0 or above) can cause formation of struvite, a glass-like crystals consisting of a magnesium and ammonium phosphatecomplex. Struvite is believed to result from the reaction of magnesium with ammonium generated from the protein in peas duringheating.
High-Temperature Short-Time Processing
Commercially sterilized foods processed at a higher than normal temperature for a relatively short time (HTST) often exhibitbetter retention of vitamins, flavor and color than do conventionally processed foods. The greater retention of these constituentsin HTST foods results because their destruction is more temperature dependent than that for inactivation of Clostridiumbotulinum spores. Temperature dependence can be expressed in terms of z-value or activation energy. The z-value is thechange in °C required to effect a tenfold change in the destruction rate. The z-values for the formation of pheophytins a and b inheated spinach purée have been determined to be 51 and 98°C, respectively [40]. The large values for both as compared tothat for Clostridium botulinum spores (z = 10°C), result in greater color retention when HTST

Pag e 671
processing is used [90]. However, this advantage of HTST processing is lost after about 2 months of storage, apparentlybecause of a decrease in product pH during storage [66, 106].
Other studies of vegetable tissue have combined HTST processing with pH adjustment. Samples treated in this manner wereinitially greener and contained more chlorophyll than control samples (typical processing and pH). However, the improvement incolor, as previously mentioned, was generally lost during storage [40, 11].
Enzymatic Conversion of Chlorophyll to Chlorophyllides to Retain Green Color
Blanching at lower temperatures than conventionally used to inactivate enzymes has been suggested as a means of achievingbetter retention of color in green vegetables, in the belief that the chlorophyllides produced have greater thermal stability thantheir parent compounds. Early studies showed that when spinach was blanched for canning at 71°C (160°F) for a total of 20min better color retention resulted. This occurred as long as the blanch temperature was maintained between 54°C (130°F) and76°C (168°F). It was concluded that the better color of processed spinach blanched under low temperature conditions (65°Cfor up to 45 min) was caused by heat-induced conversion of chlorophyll to chlorophyllides by the enzyme chlorophyllase [64].However, the improvement in color retention achieved by this approach was insufficient to warrant commercialization of theprocess [17].
The progress of conversion of chlorophyll to chlorophyllides in heated spinach leaves is shown in Figure 11. The extract ofunblanched spinach contained only chlorophylls a and b. Activation of chlorophyllase in spinach blanched at 71°C is illustratedby the formation of chlorophyllides (Figure 11b), while the absence of almost all chlorophyllides in spinach blanched at 88°Cresults from inactivation of the enzyme. These data also illustrate the previously mentioned point that isomerization of chlorophylloccurs during heating.
Commercial Application of Metallo Complex
Current efforts to improve the color of green processed vegetables and to prepare chlorophylls that might be used as foodcolorants have involved the use of either zinc or copper complexes of chlorophyll derivatives. Copper complexes of pheophytinand pheophorbide are available commercially under the names copper chlorophyll and copper chlorophyllin, respectively. Thechlorophyll derivatives cannot be used in foods in the United States. Their use in canned foods, soups, candy, and dairyproducts is permitted in most European countries under regulatory control of the European Economic Community. The Foodand Agriculture Organization (FAO) of the United Nations has certified their use as safe in foods, provided no more than 200ppm of free ionizable copper is present.
Commercial production of the Cu pigments was described by Humphry [45]. Chlorophyll is extracted from dried grass or alfalfawith acetone or chlorinated hydrocarbons. Sufficient water is added, depending on the moisture content of the plant material, toaid penetration of the solvent while avoiding activation of chlorophyllase. Some pheophytin forms spontaneously duringextraction. Copper acetate is added to form oil-soluble copper chlorophyll. Alternatively, pheophytin can be acid hydrolyzedbefore copper ion is added, resulting in formation of water-soluble copper chlorophyllin. The copper complexes have greaterstability than comparable Mg complexes; for example, after 25 hr at 25°C, 97% of the chlorophyll degrades while only 44% ofthe copper chlorophyll degrades.
Regreening of Thermal Processed Vegetables
It has been observed that when vegetables purées are commercially sterilized, small bright-green areas occasionally appear. Itwas determined that pigments in the bright-green areas contained

Pag e 672
FIGURE 11Chlorophyll and chlorophyll
derivatives of spinach: (a) unblanched,(b) blanched 3 min at 71°C, (c)blanched 3 min at 88°C. Ca =
chlorophyll a, Cb = chlorophyll b,Pa = pheophytin a, CDa = chlorophyllide
a, CDb, = chlorophyllide b, PDa =pheophorbide a. (From Ref. 112.)
zinc and copper. This formation of bright-green areas in vegetable purées was termed “regreening.” Regreening of commerciallyprocessed vegetables has been observed when zinc and/or copper ions are present in process solutions. Okra when processedin brine solution containing zinc chloride retains its bright green color, and this is attributed to the formation of zinc complexes ofchlorophyll derivatives [27, 103, 105].
A patent was issued to Continental Can Company (now Crown Cork & Seal Company) for the commercial canning ofvegetables with metal salts in blanch or brine solution. The process involved blanching vegetables in water containing sufficientamounts of Zn2+ or Cu2+ salts to raise the tissue concentration of the metal ions to between 100 and 200 ppm. The directaddition of zinc chloride to the canning brine has no significant effect on the color of vegetables (green beans and peas). Greenvegetables processed in modified blanch water were claimed to be greener than conventionally processed vegetables. Other bi-or trivalent metal ions were either less effective or ineffective [95]. This approach is known as the Veri-Green process. Pigmentspresent in canned green beans processed by the Veri-Green process were identified as zinc pheophytin and zinc pyropheophytin[111].
Commercial production of zinc-processed green beans and spinach is presently conducted

Pag e 673
by several processors, but results have been mixed. Shown in Figure 12 is the sequence of pigment changes occurring when peapurée is heated in the presence of 300 ppm Zn2+. Chlorophyll a decreases to trace levels after only 20 min of heating.Accompanying this rapid decrease in chlorophyll is the formation of zinc complexes of pheophytin a and pyropheophytin a.Further heating increases the zinc pyropheophytin concentration at the expense of a decrease in zinc pheophytin. In addition, zincpyropheophytin may form through decarboxymethylation of zinc pheophytin or by reaction of pyropheophytin with Zn2+. Theseresults suggest that the green color in vegetables processed in the presence of zinc is largely due to the presence of zincpyropheophytin.
Shown in Figure 13 is a proposed sequence of reactions for conversion of chlorophyll a to zinc pyropheophytin a. Formation ofZn-complexes occurs most rapidly between pH 4.0 and 6.0, and the rate decreases markedly at pH 8.0. The reason for thedecrease is that chlorophyll is retained at the high pH, thereby limiting the amount of chlorophyll derivatives available for complexformation (Figure 14) [59]. It has further been shown that zinc complex formation can be influenced by the presence of surface-active anionic compounds. Such compounds adsorb onto the chloroplast membranes, increasing the negative surface charge andthereby increasing complex formation.
Currently, the best process for attaining a desirable green color in canned vegetables involves adding zinc to the blanch solution,increasing membrane permeability by heating the tissue prior to blanching at or slightly above 60°C, choosing a pH that favorsformation of metallo complexes, and using anions to alter surface charge on the tissue.
10.2.3 Carotenoids
Carotenoids are nature's most widespread pigments, with the earth's annual biomass production estimated at 100 million tons. Alarge majority of these pigments are biosynthesized by the ocean algae population. In higher plants, carotenoids in chloroplastsare often masked by the more dominant chlorophyll pigments. In the autumn season when chloroplasts decompose during plantsenescene, the yellow-orange color of carotenoids becomes evident [4].
For several decades, it has been known that carotenoids play important functions in
FIGURE 12Pig ments in pea purée containing 300 ppm of Zn 2+
after heating at 121°C for up to 150 min. Chl =chlorophyll, ZnPhe = zinc pheophytin, ZnPyr = zinc
pyropheophytin, Phe = pheophytin, Pyr = pyropheotphyin.(From Ref. 112.)

Pag e 674
FIGURE 13Chemical reactions occurring in heated g reen veg etables
containing zinc.
photosynthesis and photoprotection in plant tissues [37]. In all chlorophyll-containing tissues, carotenoids function as secondarypigments in harvesting light energy. The photoprotection role of carotenoids stems from their ability to quench and inactivatereactive oxygen species formed by exposure to light and air. In addition, specific carotenoids present in roots and leaves serveas precursors to abscisic acid, a compound that functions as a chemical messenger and growth regulator [22, 78].
The most prominent role of carotenoid pigments in the diet of humans and other animals is their ability to serve as precursors ofvitamin A. Although the carotenoid beta-carotene possesses the greatest provitamin A activity because of its two b-ionone rings(Fig. 15), other commonly consumed carotenoids, such as a-carotene and b-cryptoxanthin, also possess provi-
FIGURE 14Conversion of chlorophyll a (chl) to total zinc
complexes (ZnPa) and chang e in pH in peapuree heated at 121°C for up to 60 min (From
Ref. 58.)

Pag e 675
tamin A activity. Provitamin A carotenoids present in fruits and vegetables are estimated to provide 30–100% of the vitamin Arequirement in human populations. A prerequisite to vitamin A activity is the existence of the retinoid structure (with the b-iononering) in the carotenoid. Thus, only a few carotenoids possess vitamin activity. This topic is covered thoroughly in Chapter 8.
In 1981, Peto et al. [83] drew attention to these pigments because of their epidemiological findings that consumption of fruitsand vegetables high in carotenoid content is associated with a decreased incidence of specific cancers in humans. More recently,interest has focused on the presence of processing-induced cis isomeric carotenoids in the diet and on their physiologicalsignificance. These findings have stimulated a substantial increase in carotenoid research.
10.2.3.1 Structures of Carotenoids
Carotenoids are comprised of two structural groups: the hydrocarbon carotenes and the oxygenated xanthophylls. Oxygenatedcarotenoids (xanthophylls) consist of a variety of derivatives frequently containing hydroxyl, epoxy, aldehyde, and keto groups.In addition, fatty acid esters of hydroxylated carotenoids are also widely found in nature. Thus, over 560 carotenoid structureshave been identified and compiled [101]. Furthermore, when geometric isomers of cis (Z) or trans (E) forms are considered, agreat many more configurations are possible.
The basic carotenoid structural backbone consists of isoprene units linked covalently in either a head-to-tail or a tail-to-tailfashion to create a symmetrical molecule (Fig. 16). Other carotenoids are derived from this primary structure of forty carbons.Some structures contain cyclic end groups (b-carotene, Fig. 15) while others possess either one or no cyclization (lycopene, theprominent red pigment in tomatoes) (Fig. 16). Other carotenoids may have shorter carbon skeletons and are known asapocarotenals. Although rules exist for naming and numbering all carotenoids [46, 47] the trivial names are commonly used andpresented in this chapter.
The most common carotenoid found in plant tissues is b-carotene. This carotenoid is also used as a colorant in foods. Both thenaturally derived and synthetic forms can be added to food products. Some carotenoids found in plants are shown in Figure 15,and they include a-carotene (carrots), capsanthin (red peppers, paprika), lutein, a diol of a-carotene, its esters (marigoldpetals), and bixin (annatto seed). Other common carotenoids found in foods include zeaxanthin (a diol of b-carotene),violaxanthin (an epoxide carotenoid), neoxanthin (an allenic triol), and b-cryptoxanthin (a hydroxylated derivative of b-carotene).
Animals derive carotenoids pigments by consumption of carotenoid-containing plant materials. For example, the pink color ofsalmon flesh is due mainly to the presence of astaxanthin, which is obtained by ingestion of carotenoid-containing marine plants.It is also well known that some carotenoids in both plants and animals are bound to or associated with proteins. The redastaxanthin pigment of shrimp and lobster exoskeletons is blue in color when complexed with proteins. Heating denatures thecomplex and alters the spectroscopic and visual properties of the pigment, thus changing the color from blue to red. Otherexamples of carotenoid-chlorophyll-protein complexes are ovoverdin, the green pigment found in lobster eggs, and thecarotenoid-chlorophyll-protein complexes in plant chloroplasts. Other unique structures include carotenoid glycosides, some ofwhich are found in bacteria and other microorganisms. One example of a carotenoid glycoside present in plants is the carotenoidcrocein found in saffron.
10.2.3.2 Occurrence and Distribution
Edible plant tissues contain a wide variety of carotenoids [39]. Red, yellow, and orange fruits, root crops, and vegetables arerich in carotenoids. Prominent examples include tomatoes

Pag e 676
FIGURE 15Structures of commonly occurring carotenoids. Lutein (yellow) fromg reen leaves, corn, and marig old; zeaxanthin (yellow) from corn and
saffron; b-cryptoxanthin (yellow) from corn; b-carotene (yellow) fromcarrots; b-carotene (yellow) from carrots and sweet potatoes; neoxanthin
(yellow) from g reen leaves; capsanthin (red) from red peppers; violaxanthin(yellow) from g reen leaves; and bixin (yellow) from annatto seeds.

Pag e 677
(lycopene), carrots (a- and b-carotenes), red peppers (capsanthin), pumpkins (b-carotene), squashes (b-carotene), corn (luteinand zeaxanthin), and sweet potatoes (b-carotene). All green leafy vegetables contain carotenoids but their color is masked bythe green chlorophylls. Generally, the largest concentrations of carotenoids exist in those tissues with the largest amount ofchlorophyll pigments. For example, spinach and kale are rich in carotenoids, and peas, green beans, and asparagus containsignificant concentrations.
Many factors influence the carotenoid content of plants. In some fruits, ripening may bring about dramatic changes incarotenoids. For example, in tomatoes, the carotenoid content,

Pag e 678
FIGURE 16Joining of isoprenoid units to form lycopene (primary red pig ment
of tomatoes) (From Ref. 39.)
especially lycopene, increases significantly during the ripening process. Thus, concentrations differ depending on the stage ofplant maturity. Even after harvest, tomato carotenoids continue to be synthesized. Since light stimulates biosynthesis ofcarotenoids, the extent of light exposure is known to affect their concentration. Other factors that alter carotenoid occurrence oramount include growing climate, pesticide and fertilizer use, and soil type [39].
10.2.3.3 Physical Properties, Extraction, and Analysis
All classes of carotenoids (hydrocarbons: carotenes and lycopene, and oxygenated xanthophylls) are lipophilic compounds andthus are soluble in oils and organic solvents. They are moderately heat stable and are subject to loss of color by oxidation.Carotenoids can be easily isomerized by heat, acid, or light. Since they range in color from yellow to red, detection wavelengthsfor monitoring carotenoids typically range from approximately 430 to 480 nm. The higher wavelengths are usually used for somexanthophylls to prevent interference from chlorophylls. Many carotenoids exhibit spectral shifts after reaction with variousreagents, and these spectral changes are useful to assist in identification.
The complex nature and diversity of carotenoid compounds present in plant foods necessitate chromatographic separation [89].Extraction procedures for quantitative removal of carotenoids from tissue utilize organic solvents that must penetrate ahydrophilic matrix. Hexane-acetone mixtures are commonly employed for this purpose, but special solvents and treatments aresometimes needed to achieve satisfactory separation [54].
Many chromatographic procedures, including HPLC, have been developed for separating

Pag e 679
carotenoids [107, 93]. Special analytical challenges occur when carotenoid esters, cis/trans isomers, and optical isomers needto be separated and identified.
10.2.3.4 Chemical Properties
Oxidation
Carotenoids are easily oxidized because of the large number of conjugated double bonds. Such reactions cause color loss ofcarotenoids in foods and are the major degradation mechanisms of concern. The stability of a particular pigment to oxidation ishighly dependent on its environment. Within tissues, the pigments are often compartmentalized and protected from oxidation.However, physical damage to the tissue or extraction of the carotenoids increases their susceptibility to oxidation. Furthermore,storage of carotenoid pigments in organic solvents will often accelerate decomposition. Because of the highly conjugated,unsaturated structure of carotenoids, the products of their degradation are very complex. These products are largelyuncharacterized, except for b-carotene. Shown in Figure 17 are various degradation products of b-carotene during oxidationand thermal treatments. During oxidation, epoxides and carbonyl compounds are initially formed. Further oxidation results information of short-chain mono- and dioxygenated compounds including epoxy-b-ionone. Generally, epoxides form mainly withinthe end rings, while oxidative scission can occur at a variety of sites along the chain. For provitamin A carotenoids, epoxideformation in the ring results in loss of the provitamin activity. Extensive autoxidation will result in bleaching of the carotenoidpigments and loss in color. Oxidative destruction of b-carotene is intensified in the presence of sulfite and metal ions [82].
Enzymatic activity, particularly lipoxygenase, hastens oxidative degradation of carotenoid pigments. This occurs by an indirectmechanisms. Lipoxygenase first catalyzes oxidation of unsaturated or polyunsaturated fatty acids to produce peroxides, andthese in turn react readily with carotenoid pigments. In fact, this coupled reaction scheme is quite efficient, and the loss of
FIGURE 17Deg radation of all-trans-b-carotene.

Pag e 680
carotene color and decreased absorbance in solution are often used as an assay for lipoxygenase activity [5].
Antioxidative Activity
Because carotenoids can be readily oxidized, it is not surprising that they have antioxidant properties. In addition to cellular andin vitro protection against singlet oxygen, carotenoids, at low oxygen partial pressures, inhibit lipid peroxidation [12]. At highoxygen partial pressures, b-carotene has pro-oxidant properties [13]. In the presence of molecular oxygen, photosensitizers(i.e., chlorophyll), and light, singlet oxygen may be produced, which is a highly reactive active oxygen species. Carotenoids areknown to quench singlet oxygen and thereby protect against cellular oxidative damage. Not all carotenoids are equally effectiveas photochemical protectors. For example, lycopene is known to be especially efficient in quenching singlet oxygen relative toother carotenoid pigments [23, 98].
It has been proposed that the antioxidant functions of carotenoids play a role in limiting cancer, cataracts, atherosclerosis, andthe processes of aging [16]. A detailed overview on the antioxidant role of carotenoid compounds is beyond the scope of thisdiscussion, and the reader is referred to several excellent reviews [13, 34, 56, 77].
Cis/Trans Isomerization
In general, the conjugated double bonds of carotenoid compounds exist in an all-trans configuration. The cis isomers of a fewcarotenoids can be found naturally in plant tissues, especially in algae sources, which are currently being harvested as a source ofcarotenoid pigments. Isomerization reactions are readily induced by thermal treatments, exposure to organic solvents, contact forprolonged periods with certain active surfaces, treatment with acids, and illumination of solutions (particularly with iodinepresent). Iodine-catalyzed isomerization is a useful means in the study of photoisomerization because an equilibrium mixture ofisomeric configurations is formed. Theoretically, large numbers of possible geometrical configurations could result fromisomerization because of the extensive number of double bonds present in carotenoids. For example, b-carotene has potentially272 different cis forms. Because of the complexity of various cis/trans isomers within a single carotenoid, only recently haveaccurate methods been developed to study these compounds in foods [76]. Cis/trans isomerization affects the provitamin Aactivity of carotenoids. The provitamin A activity of b-carotene cis isomers ranges, depending on the isomeric form, from 13 to53% as compared to that of all-trans-b-carotene [114]. The reason for this reduction in provitamin A activity is not known [4,114].
10.2.3.6 Stability During Processing
Carotenoids are relatively stable during typical storage and handling of most fruits and vegetables. Freezing causes little change incarotene content. However, blanching is known to influence the level of carotenoids. Often blanched plant products exhibit anapparent increase in carotenoid content relative to raw tissues. This is caused by inactivation of lipoxygenase, which is known tocatalyze oxidative decomposition of carotenoids, the loss of soluble constituents into the blanch water, or the mild heattreatments traditionally used during blanching may enhance the efficiency of extraction of the pigments relative to fresh tissue. Lyepeeling, which is commonly used for sweet potatoes, causes little destruction or isomerization of carotenoids.
Although carotene historically has been regarded as fairly stable during heating, it is now known that heat sterilization inducescis/trans isomerization reactions as shown in Figure 17. To lessen excessive isomerization, the severity of thermal treatmentsshould be minimized when possible. In the case of extrusion cooking and high-temperature heating in oils, not only willcarotenoids isomerize but thermal degradation will also occur. Very high temperatures can yield

Pag e 681
fragmentation products that are volatile. Products arising from severe heating of b-carotene in the presence of air are similar tothose arising from severe heating of b-carotene oxidation (Fig. 17). In contrast, air dehydration exposes carotenoids to oxygen,which can cause extensive degradation of carotenoids. Dehydrated products that have large surface-to-mass ratios, such ascarrot or sweet potato flakes, are especially susceptible to oxidative decomposition during drying and storage in air.
When cis isomers are created, only slight spectral shifts occur and thus color of the product is mostly unaffected; however, adecrease in provitamin A activity occurs. These reactions have important nutritional effects that should be considered whenselecting analytical measurements for provitamin A. The older methods for vitamin A determination in foods did not account forthe differences in the provitamin A activity of individual carotenoids or their isomeric forms. Therefore, older nutritional data forfoods are in error, especially for foods that contain high proportions of provitamin A carotenoids other than b-carotene andthose that contain a significant amount of cis isomers.
10.2.4 Flavonoids and Other Phenols
10.2.4.1 Anthocyanins
Phenolic compounds comprise a large group of organic substances, and flavonoids are an important subgroup. The flavonoidsubgroup contains the anthocyanins, one of the most broadly distributed pigment groups in the plant world. Anthocyanins areresponsible for a wide range of colors in plants, including blue, purple, violet, magenta, red, and orange. The word anthocyaninis derived from two Greek words: anthos, flower, and kyanos, blue. These compounds have attracted the attention of chemistsfor years, two of the most notable investigators being Sir Robert Robinson (1886–1975) and Professor Richard Willstätter(1872–1942). Both were awarded Nobel prizes in chemistry, in part for their work with plant pigments.
Structure
Anthocyanins are considered flavonoids because of the characteristic C6C3C6 carbon skeleton. The basic chemical structure ofthe flavonoid group and the relationship to anthocyanin are shown in Figure 18. Within each group there are many differentcompounds with their color depending on the substituents on rings A and B.
The base structure of anthocyanin is the 2-phenylbenzopyrylium of flavylium salt (Figure 19). Anthocyanins exist as glycosides ofpolyhydroxy and/or polymethoxy derivatives of the salt. Anthocyanins differ in the number of hydroxyl and/or methoxy groupspresent, the types, numbers, and sites of attachment of sugars to the molecule, and the types and numbers of aliphatic oraromatic acids that are attached to the sugars in the molecule. The most common sugars are glucose, galactose, arabinose,xylose, and homogenous or heterogeneous di- and trisaccharides formed by combining these sugars. Acids most commonlyinvolved in acylation of sugars are caffeic, p-coumaric, sinapic, p-hydroxybenzoic, ferulic, malonic, malic, succinic, and acetic.
When the sugar moiety of an anthocyanin is hydrolyzed, the aglycone (the nonsugar hydrolysis product) is referred to as ananthocyanidin. The color of anthocyanins and anthocyanidins results from excitation of a molecule by visible light. The ease withwhich a molecule is excited depends on the relative electron mobility in the structure. Double bonds, which are abundant inanthocyanins and anthocyanidins, are excited very easily, and their presence is essential for color. Anthocyanins occurring innature contain several anthocyanidins, but only six occur commonly in foods (Figure 20). It should be noted that increasingsubstitution on the molecule results in a deeper hue. The deepening of hue is the result of a bathochromic change (longerwavelength), which means that the light absorption band in the visible spectrum

Pag e 682
FIGURE 18Carbon skeleton of the flavonoid
g roup.

Pag e 683
FIGURE 19The flavylium cation. R1 and R2 = -H, -OH,
or OCH3, R3 = -g lycosyl, R4 = -H or -g lycosyl.
FIGURE 20Most common anthocyanidins in foods, arrang ed in increasing redness and
blueness.

Pag e 684
shifts from violet through red to blue. An opposite change is referred to as a hypsochromic shift. Bathochromic effects arecaused by auxochrome groups, groups that by themselves have no chromophoric properties but cause deepening in the huewhen attached to the molecule. Auxochrome groups are electron-donating groups, and in the case of anthocyanidins they are thehydroxyl and methoxy groups. The methoxy groups, because their electron-donating capacity is greater than that of hydroxylgroups, cause a greater bathochromic shift than do hydroxyl groups. The effect of the number of methoxy groups on redness isillustrated in Figure 20. In anthocyanin, several other factors, such as change in pH, metal complex formation, andcopigmentation, cause changes in hue. These will be discussed later.
Anthocyanidins are less water soluble than their corresponding glycosides (anthocyanins) and they are not, therefore, found freein nature. Those reported, other than the 3-deoxy form, which is yellow, are most likely hydrolysis products formed duringisolation procedures. The free 3-hydroxyl group in the anthocyanidin molecule destabilizes the chromophore; therefore, the 3-hydroxyl group is always glycosylated. Additional glycosylation is most likely to occur at C-5 and can also occur at C-7, -3', -4', and/or -5' hydroxyl group (Fig. 19). Steric hindrance precludes glycosylation at both C-3' and C-4' [10].
With this structural diversity, it is not surprising that more than 250 different anthocyanins have been identified in the plant world.Plants not only contain mixtures of anthocyanins but the relative concentrations vary among cultivars and with maturity. Totalanthocyanin content varies among plants and ranges from about 20 mg/100 g fresh weight to as high as 600. The reader isreferred to a book by Mazza and Miniali [72] for a more detailed account of anthocyanins in fruits, vegetables, and grains.
Color and Stability of Anthocyanins
Anthocyanin pigments are relatively unstable, with greatest stability occurring under acidic conditions. Both the hue of thepigment and its stability are greatly impacted by substituents on the aglycone. Degradation of anthocyanins occurs not onlyduring extraction from plant tissue but also during processing and storage of foods tissues.
Knowledge of the chemistry of anthocyanins can be used to minimize degradation by proper selection of processes and byselection of anthocyanin pigments that are most suitable for the intended application. Major factors governing degradation ofanthocyanins are pH, temperature, and oxygen concentration. Factors that are usually of less importance are the presence ofdegradative enzymes, ascorbic acid, sulfur dioxide, metal ions, and sugars. In addition, copigmentation may affect or appear toaffect the degradation rate.
Structural Transformation and pH Degradation rates vary greatly among anthocyanins because of their diverse structures.Generally, increased hydroxylation decreases stability, while increased methylation increases stability. The color of foodscontaining anthocyanins that are rich in pelargonidin, cyanidin, or delphinidin aglycones is less stable than that of foods containinganthocyanins that are rich in petunidin or malvidin aglycones. The increased stability of the latter group occurs because reactivehydroxyl groups are blocked. It follows that increased glycosylation, as in monoglucosides and diglucosides, increases stability.It has also been shown, although it is not fully understood why, that the type of sugar moiety influences stability. Starr andFrancis [99] found that cranberry anthocyanins that contained galactose were more stable during storage than those containingarabinose. Cyanidin 3-2 glucosylrutinoside at pH 3.5, 50°C, has a half-life of 26 hr compared to 16 hr for cyanidin-3-rutinoside[110]. These examples illustrate that substituents have a marked effect on anthocyanin stability although they themselves do notreact.
In an aqueous medium, including foods, anthocyanins can exist in four possible structural forms depending on pH (Fig. 21, I): theblue quinonoidal base (A), the red flavylium cation

Pag e 685
(AH+), the colorless carbinol pseudobase (B), and the colorless chalcone (C). Shown in Figure 21 are the equilibriumdistributions of these four forms in the pH range 0–6 for malvidin-3-glucoside (Fig. 21, II) dihydroxyflavylium chloride (Fig. 21,III) and 4 methoxy-4-methyl-7-hydroxyflavylium chloride (Fig. 21, IV). For each pigment only two of the four species areimportant over this pH range. In a solution of malvidin-3-glucoside at low pH the flavylium
FIGURE 21(I) The four anthocyanin structures present in aqueous acidic solution at room
temperatures: A, quinonoidal base (blue); (AH +) flavylium salt (red); B, pseudobase orcarbinol (colorless); C, chalcone (colorless). (II–IV) Equilibrium distribution at 25°C of AH +,A, B, and C as a function of pH: (II) for malvidin 3- g lucoside; (III) for 4',7-hydroxyflavylium
chloride; (IV) for 4'-methoxyl-4-methyl-7-hydroxy flavylium chloride. (From Ref. 10.)

Pag e 686
structure dominates, while at pH 4–6 the colorless carbinol dominates. A similar situation exists with 4',7-hydroxyflavyliumexcept the equilibrium mixture consists mainly of the flavylium and the chalcone structure. Thus, as the pH approaches 6 thesolution becomes colorless. In a solution of 4'-methoxy-4-methyl-7-hydroxyflavylium chloride an equilibrium exists between theflavylium cation and the quinonoidal base. This solution therefore is colored throughout the 0–6 pH range, turning from red toblue as pH is increased in this range.
To further demonstrate the effect of pH on the color of anthocyanins, the spectra for cyanidin-3-rhamnoglucoside in buffersolutions at pH levels between 0.71 to 4.02 are shown in Figure 22. Although the absorption maximum remains the same overthis pH range, the intensity of absorption decreases with increasing pH. Color changes in a mixture of cranberry anthocyanins asa function of pH are shown in Figure 23. In aqueous medium, as in cranberry cocktail, changes in pH can cause major changesin color. Anthocyanins show their greatest tinctorial strength at approximately pH 1.0, when the pigment molecules are mostly inthe unionized form. At pH 4.5 anthocyanins in fruit juices are nearly colorless (slightly bluish) if yellow flavonoids are not present.If yellow pigments are present, as is common in fruits, the juice will be green.
Temperature Anthocyanin stability in foods is greatly affected by temperature. Rates of degradation are also influenced by thepresence or absence of oxygen and, as already pointed out, by pH and structural conformation. In general, structural featuresthat lead to increased pH stability also lead to increased thermal stability. Highly hydroxylated anthocyanidins are less stable thanmethylated, glycosylated, or acylated anthocyanidins. For example, the half-life of 3,4',5,5',7-pentahydroxyflavylium at pH 2.8 is0.5 days compared to 6 days for the 3,4',5,5',7-pentamethoxyflavylium [72]. Under similar conditions the half-life for cyanidin-3-rutinoside is 65 days compared to 12 hr for cyanidin [70].
It should be noted that comparison of published data for pigment stability is difficult because of differing experimental conditionsused. One of the errors in published data involves
FIGURE 22Absorption spectra of cyanidin-3-rhamnog lucosde in buffer
solutions at pH 0.71–4.02. Pig ment concentration 1.6 × 10 -2 g /L.(From Ref. 33).

Pag e 687
FIGURE 23Absorbance of cranberry anthocyanins versus pH. (Adapted
from Ref. 33.)
a failure to consider the equilibrium reactions among the four known anthocyanin structures (Figure 21, I).
Heating shifts the equilibria toward the chalcone and the reverse reaction is slower than the forward reaction. It takes, forexample, 12 hr for the chalcone of 1, 3, 5-diglycoside to reach equilibrium. Since determination of the amount of pigmentremaining is generally based on measurement of the flavylium salt, an error is introduced if insufficient time is allowed forequilibrium to be attained [70].
The exact mechanism of thermal degradation of anthocyanin has not been fully elucidated. Three pathways have been suggested.Coumarin 3, 5-diglycoside is a common degradation product for anthocyanidin (cyanidin, peonidin, delphinidin, petunidin, andmalvidin) 3,5-diglycoside (Fig. 24). In path (a) the flavylium cation is first transformed to the quinonoidal base, then to severalintermediates, and finally to the coumarin derivative and a compound corresponding to the B-ring.
In path (b) (Fig. 24) the flavylium cation is first transformed to the colorless carbinol base, than to the chalcone and finally tobrown degradation products. Path (c) (Fig. 24) is similar except degradation products of chalcone are first inserted. These threeproposed mechanisms suggest that thermal degradation of anthocyanins depends on the type of anthocyanin involved and thedegradation temperature.
Oxygen and Ascorbic Acid The unsaturated nature of the anthocyanidin structure makes

Pag e 688
FIGURE 24Mechanisms of deg radation for anthocyanidin 3,5-dig lycoside and for anthocyanidin 3-dig lucosides. R 3', R5' = -OH, -H -OCH3
or -OGL; GL = g lucosyl g roup. (From Ref. 48.)
Pag e 689
it susceptible to molecular oxygen. It has been known for many years that when grape juice is hot-filled into bottles, complete fillingof the bottles will delay degradation of the color from purple to dull brown. Similar observations have been made with otheranthocyanin-containing juices. The positive effect of oxygen removal on retention of anthocyanin color has been furtherdemonstrated by processing anthocyanin-pigmented fruit juices under nitrogen or vacuum [20, 99]. Also, the stability of pigmentsfrom Concord grape juice in a dry beverage is greatly enhanced when the product is packaged in a nitrogen atmosph
Though little information exists relating aw to anthocyanin stability, stability was found to be greatest at aw values in the range of 0.63to 0.79 (Table 7).
It is known that ascorbic acid and anthocyanins disappear simultaneously in fruit juices, suggesting some direct interaction betweenthe two molecules. This, however, has been discounted, and it is believed instead that ascorbic acid-induced degradation ofanthocyanin results indirectly from hydrogen peroxide that forms during oxidation of ascorbic acid [48]. The latter reaction isaccelerated by the presence of copper and inhibited by the presence of flavonols such as quercetin and quercitrin [97]. Conditionsthat do not favor formation of H2O2 during oxidation of ascorbic acid therefore account for anthocyanin stability in some fruit juices.H2O2 cleavage of the pyrylium ring by a nucleophilic attack at the C-2 position of the anthocyanin produces colorless esters andcoumarin derivatives. These breakdown products may further degrade or polymerize and ultimately lead to a brown precipitate thatis often observed in fruit juices.
Light It is generally recognized that light accelerates degradation of anthocyanins. This adverse effect has been demonstrated inseveral fruit juices and red wine. In wine it has been determined that acylated, methylated diglycosides are more stable thannonacylated diglycosides, which are more stable than monoglycosides [109]. Copigmentation (anthocyanin condensation withthemselves or other organic compound) can either accelerate or retard the degradation, depending on the circumstances.Polyhydroxylated flavone, isoflavone, and aurone sulfonates exert a protective effect against photodegradation [104]. The protectiveeffect is attributable to the formation of intermolecular ring interactions between the negatively charged sulfonate and the positivelycharged flavylium ion (Fig. 25). Anthocyanins substituted at the C-5 hydroxyl groups are more susceptible to photodegradation thanthose unsubstituted at this position. Unsubstituted or monosubstituted anthocyanins are susceptible to nucleophilic attack at the C-2and/or C-4 positions.

Other forms of radiant energy such as ionizing radiation can also result in anthocyanin degradation [71].
TABLE 7 Effect of a w on Color Stability of Anthocyaninsª During Heating as Measured by Absorbance
Absorbance at water activities of:
Holding time at 43°C (min) 1.00 0.95 0.87 0.74 0.63 0.47 0.37
0 0.84 0.85 0.86 0.91 0.92 0.96 1.03
60 0.78 0.82 0.82 0.88 0.88 0.89 0.90
90 0.76 0.81 0.81 0.85 0.86 0.87 0.89
160 0.74 0.76 0.78 0.84 0.85 0.86 0.87
Percent chang e in absorbance (0–160min)
11.9 10.5 9.3 7.6 7.6 10.4 15.5
ªConcentration 700 mg /100 ml (1g commercially dried pig ment powder).
Source: Adapted from Ref. 54.

Pag e 690
FIGURE 25Molecular complex between
anthocyanin and apolyhydroxyflavone sulfonate.
(From Ref. 104.)
Sugars and Their Degradation Products Sugars at high concentrations, as in fruit preserves, stabilize anthocyanins. This effectis believed to result from a lowering of water activity (see Table 7). Nucleophilic attack of the flavylium cation by water occursat the C-2 position, forming the colorless carbinol base. When sugars are present at concentrations sufficiently low to have littleeffect on aw, they or their degradation products sometimes can accelerate anthocyanin degradation. At low concentrations,fructose, arabinose, lactose, and sorbose have a greater degradative effect on anthocyanins than do glucose, sucrose, andmaltose. The rate of anthocyanin degradation follows the rate of sugar degradation to furfural. Furfural, which is derived fromaldo-pentoses, and hydroxylmethylfurfural, which is derived from keto-hexoses, result from the Maillard reaction or fromoxidation of ascorbic acid. These compounds readily condense with anthocyanin, forming brown compounds. The mechanism ofthis reaction is unknown. The reaction is very temperature dependent, is hastened by the presence of oxygen, and is verynoticeable in fruit juices.
Metals Metal complexes of anthocyanin are common in the plant world and they extend the color spectrum of flowers. Coatedmetal cans have long been found to be essential for retaining typical colors of anthocyanins of fruits and vegetables duringsterilization in metal cans. Anthocyanins with vicinal, phenolic hydroxyl groups can sequester several multivalent metals.Complexation produces a bathochromic shift toward the blue. Addition of AlCl3 to anthocyanin solutions has been used as ananalytical tool to differentiate cyanidin, petunidin, and delphinidin from pelargonidin, peonidin, and malvidin. The latter group ofanthocyanidins does not possess vicinal phenolic hydroxyls and will not react with Al3+ (Fig. 20). Some studies have shown thatmetal complexation stabilizes the color of anthocyanin-containing foods. Ca, Fe, Al, and Sn have been shown to offer someprotection to anthocyanins in cranberry juice; however, the blue and brown discoloration produced by tannin-metal complexesnegates any beneficial effect [33].
A fruit discoloration problem referred to as “pinking” has been attributed to formation of metal anthocynin complexes. This typeof discoloration has been reported in pears, peaches, and lychees. It is generally believed that pinking is caused by heat-inducedconversion of colorless proanthocyanidins to anthocyanins under acid conditions, followed by complex formation with metals[65].
Sulfur Dioxide One step in the production of maraschino, candied and glacé cherries involves bleaching of anthocyanins by SO2
at high concentrations (0.8–1.5%). The bleaching effect can be reversible or irreversible. An example of reversible bleachingoccurs when fruits containing anthocyanins are preserved against microbial spoilage by holding them in a solution containing500–2000 ppm SO2. During storage the fruit loses its color, but the color can be restored by “desulfuring” (thorough washing)before further processing. In the reversible reac-

Pag e 691
tion a colorless complex is first formed. This reaction has been extensively studied, and it is believed that the reaction involvesattachment of SO2 at position C-4 (Fig. 26). The reason for suggesting involvement of the 4 position is that SO2 in this positionresults in loss of color. The rate constant (k) for the discoloration reaction of cyanidin 3-glucoside has been calculated as 25,7001/µAmps.
The large rate constant means that a small amount of SO2 can quickly decolorize a significant amount of anthocyanin.Anthocyanins that are resistant to SO2 bleaching either have the C-4 position blocked or exist as dimers linked through their 4position [9]. The bleaching that occurs during production of maraschino or candied cherries is irreversible. The reason for this isnot known.
Copigmentation Anthocyanins are known to condense with themselves (self-association) and other organic compounds(copigmentation). Weak complexes form with proteins, tannins, other flavonoids, and polysaccharides. Although most of thesecompounds themselves are not colored, they augment the color of anthocyanins by causing bathochromic shifts and increasedlight absorption at the wavelength of maximum light absorption. These complexes also tend to be more stable during processingand storage. The stable color of wine is believed to result from self-association of anthocyanin. Such polymers are less pHsensitive and, because the association occurs through the 4 position, are resistant to discoloration by SO2.
Absorption of the flavylium cation and/or the quinonoidal base on a suitable substrate, such as pectins or starches, can stabilizeanthocyanins. This stabilization should enhance their utility as potential food color additives. Other condensation reactions canlead to color loss. Certain nucleophiles, such as amino acids, phloroglucinol, and catechin, can condense with flavylium cationsto yield colorless 4-substituted flav-2-enes [70]. Proposed structures are shown in Figure 27.
Enzyme Reactions
Enzymes have been implicated in the decolorization of anthocyanins. Two groups have been identified: glycosidases andpolyphenol oxidases. Together they are generally referred to as anthocyanases. Glycosidases, as the name implies, hydrolyzeglycosidic linkages, yielding sugars(s) and the agylcone. Loss of color intensity results from the decreased solubility of theanthocyanidins and their transformation to colorless products. Polyphenol oxidases act in the presence of o-diphenols andoxygen to oxidize anthocyanins. The enzyme first oxidizes the o-diphenol to o-benzoquinone, which in turn reacts with theanthocyanins by a nonenzymatic mechanism to form oxidized anthocyanins and degradation products (Fig. 28) [70].
Although blanching of fruits is not a general practice, anthocyanin destroying enzymes can be inactivated by a short blanchtreatment (45–60 sec at 90–100°C). This has been suggested for sour cherries before freezing.
Very low concentrations of SO2 (30 ppm) have been reported to inhibit enzymatic
FIGURE 26Colorless anthocyanin-sulfate
(-SO2) complex.

Pag e 692
FIGURE 27Colorless 4-substituted flav-2-enes resulting from the condensation of
flavylium with (a) ethylg lycine, (b) phlorog lucinol, (c) catechin, and(d) ascorbic acid. (From Ref. 70.)
FIGURE 28Proposed mechanisms of anthocyanin deg radation by polyphenol
oxidase. (From Ref. 80.)

Pag e 693
degradation of anthocyanin in cherries [36]. Similarly, a heat-stabilization effect on anthocyanin has been noted when Na2SO3 ispresent [1].
10.2.4.2 Other Flavonoids
Anthocyanins, as previously mentioned, are the most prevalent flavonoids. Although most yellow colors in food are attributableto the presence of carotenoids, some are attributable to the presence of nonanthocyanin-type flavonoids. In addition, flavonoidsalso account for some of the whiteness of plant materials, and the oxidation products of those containing phenolic groupscontribute to the browns and blacks found in nature. The term anthoxanthin (Gr. anthos, flower; xanthos, yellow) is alsosometimes used to designate certain groups of yellow flavonoids. Differences among classes of flavonoids relate to the state ofoxidation of the 3-carbon link (Fig. 18). Structures commonly found in nature vary from flavan-3-ols (catechin) to flavonols (3-hydroxyflavones) and anthocyanins. The flavonoids also include flavanone, flavononols or dihydroflavonol, and flavan-3, 4-diols(proanthocyanidin). In addition, there are five classes of compounds that do not possess the basic flavonoid skeleton, but arechemically related, and therefore are generally included in the flavonoid group. These are the dihydrochalcones, chalcones,isoflavones, neoflavones, and aurones. Individual compounds within this group are distinguished, as with anthocyanins, by thenumber of hydroxyl, methoxyl, and other substituents on the two benzene rings. Many flavonoid compounds carry a namerelated to the first source from which they were isolated, rather than being named according to the substituents of the respectiveaglycone. This inconsistent nomenclature has brought about confusion in assigning compounds to various classes.
Physical Properties
The light absorption characteristics of flavonoid classes clearly demonstrates the relationship of color and unsaturation within amolecule and the impact of auxochromes (groups present in a molecule which deepens the color). In the hydroxy-substitutedflavans catechin and proanthocyanin, the unsaturation is interrupted between the two benzene rings, and therefore, the lightabsorption is similar to that of phenols, which exhibit maximum light absorption between 275 and 280 nm (Fig. 29a). In theflavanone naringenin, the hydroxyl groups only occur in conjunction with the carbonyl group at C-4 and therefore do not exerttheir auxochromic characteristics Fig. 29b. Therefore its light absorption is similar to that of flavans. In the case of the flavoneluteolin (Fig. 29c), the hydroxyl groups associated with both benzene rings exert their auxochormic characteristics through theconjugation of C-4. Light absorption of longer wavelength (350 nm) is associated with the B-ring, while that of shorterwavelength is associated with the A-ring. The hydroxyl group at C-3 in the flavonol quercetin causes a further shift to a stilllonger wavelength (380 nm) for maximum light absorption, compared to that of the flavones (Fig. 29c). The flavonols thereforeappear yellow if present at high enough concentration. Acylation and/or glycosylation results in further shifts in light absorptioncharacteristics.
As previously mentioned, flavonoids of these types can become involved in copigmentation, and this occurrence has a majorimpact on many hues in nature. In addition, flavonoids, like anthocyanins, are chelators of metals. Chelation with iron oraluminum increases the yellow saturation. Luteolin when chelated with aluminum is an attractive yellow (390 nm).
Importance in Foods
Non-anthocyanin (NA) flavonoids make some contribution to color in foods; however, the paleness of most NA-flavonoidsgenerally restricts their overall contribution. The whiteness of vegetables such as cauliflower, onion, and potato is attributablelargely to NA- flavonoids, but their contribution to color through copigmentation is more important. The chelation characteris-

Pag e 694
FIGURE 29Absorption spectra of specific
flavonoids.
tics of these compounds can contribute both positively or negatively to the color of foods. For example, rutin (3-rutiniside ofquercetin) causes a greenish-black discoloration in canned asparagus when it complexes with ferric-state iron. The addition of achelator such as ethylenediamine tetraacetic acid (EDTA) will inhibit this undesirable color. The tin complex of rutin has a veryattractive yellow color, which contributed greatly to the acceptance of yellow wax beans until the practice of canning wax beansin plain tin cans was eliminated. The tin-rutin complex is more stable than the iron complex; thus the addition or availability ofonly very small amounts of tin would favor formation of the tin complex.
The color of black ripe olives is due in part to the oxidative products of flavonoids. One of the flavonoids involved is luteolin 7-glucoside. Oxidation of this compound and formation of the black color occur during fermentation and subsequent storage [8].Other very important functions of flavonoids in foods are their antioxidant properties and their contribution to flavors, particularlybitterness.
Proanthocyanadins
Consideration of proanthocyanidins under the general topic of anthocyanins is appropriate. Although these compounds arecolorless they have structural similarities with anthocyanidins. They
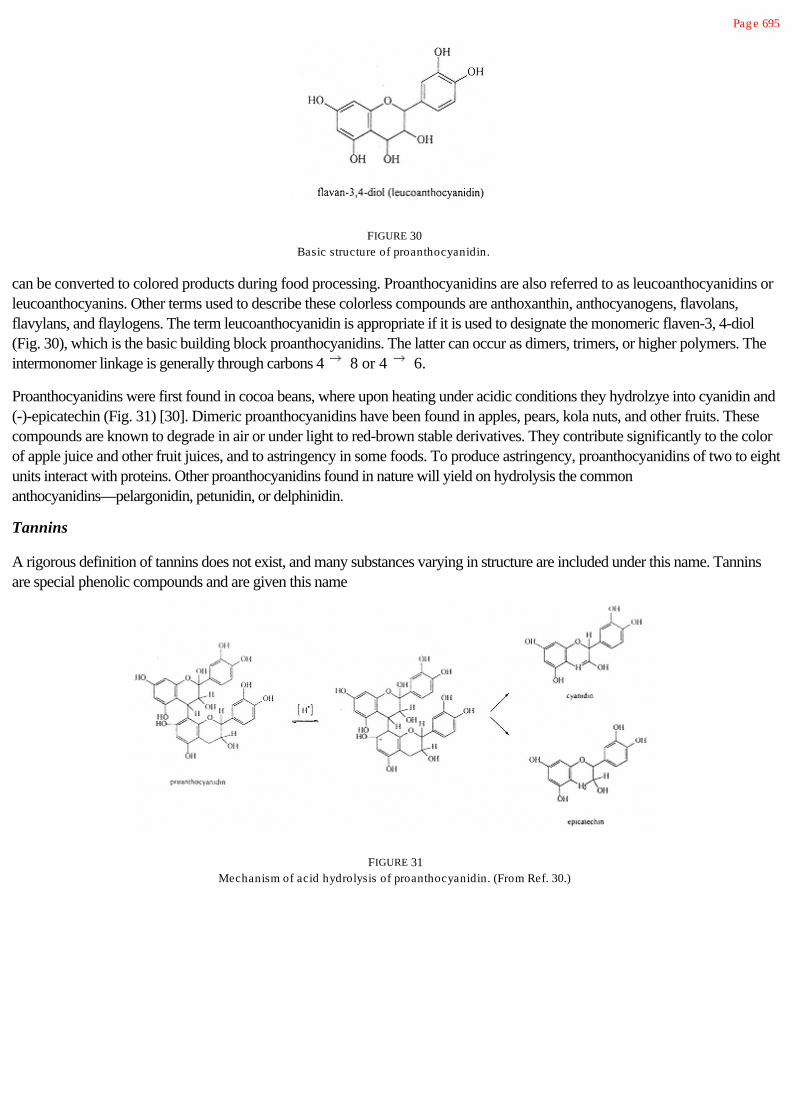
Pag e 695
FIGURE 30Basic structure of proanthocyanidin.
can be converted to colored products during food processing. Proanthocyanidins are also referred to as leucoanthocyanidins orleucoanthocyanins. Other terms used to describe these colorless compounds are anthoxanthin, anthocyanogens, flavolans,flavylans, and flaylogens. The term leucoanthocyanidin is appropriate if it is used to designate the monomeric flaven-3, 4-diol(Fig. 30), which is the basic building block proanthocyanidins. The latter can occur as dimers, trimers, or higher polymers. Theintermonomer linkage is generally through carbons 4 8 or 4 6.
Proanthocyanidins were first found in cocoa beans, where upon heating under acidic conditions they hydrolzye into cyanidin and(-)-epicatechin (Fig. 31) [30]. Dimeric proanthocyanidins have been found in apples, pears, kola nuts, and other fruits. Thesecompounds are known to degrade in air or under light to red-brown stable derivatives. They contribute significantly to the colorof apple juice and other fruit juices, and to astringency in some foods. To produce astringency, proanthocyanidins of two to eightunits interact with proteins. Other proanthocyanidins found in nature will yield on hydrolysis the commonanthocyanidins—pelargonidin, petunidin, or delphinidin.
Tannins
A rigorous definition of tannins does not exist, and many substances varying in structure are included under this name. Tanninsare special phenolic compounds and are given this name
FIGURE 31Mechanism of acid hydrolysis of proanthocyanidin. (From Ref. 30.)
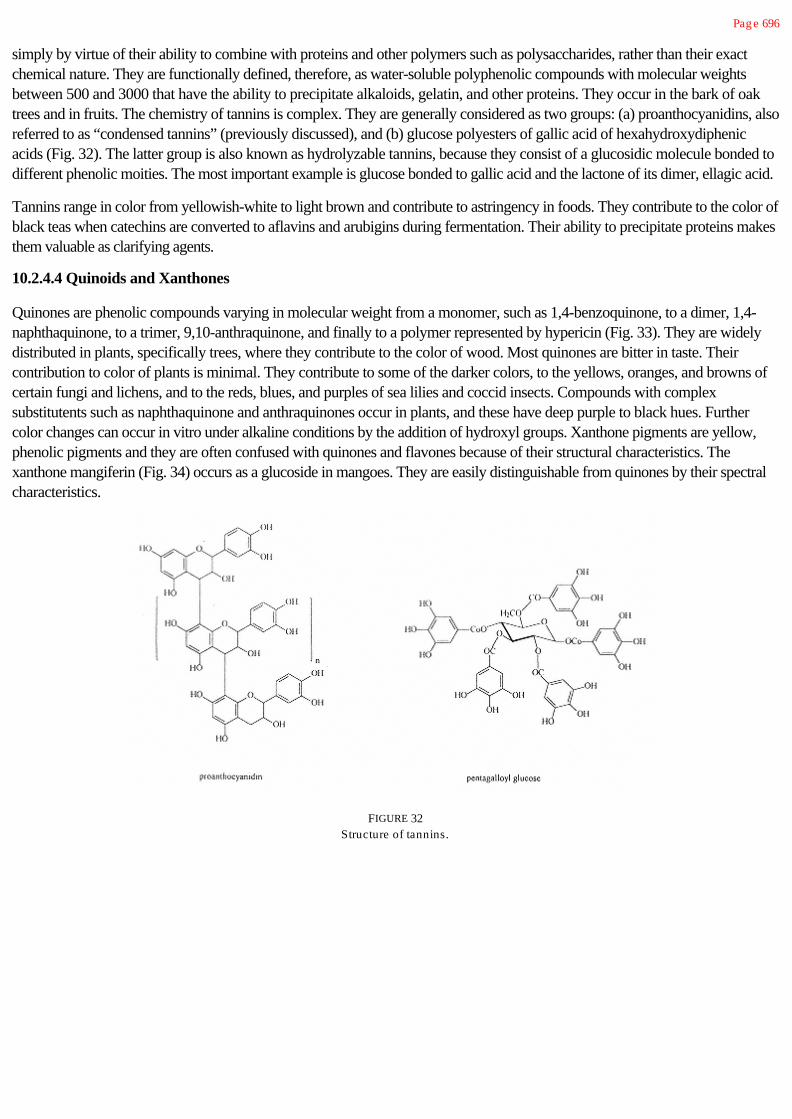
Pag e 696
simply by virtue of their ability to combine with proteins and other polymers such as polysaccharides, rather than their exactchemical nature. They are functionally defined, therefore, as water-soluble polyphenolic compounds with molecular weightsbetween 500 and 3000 that have the ability to precipitate alkaloids, gelatin, and other proteins. They occur in the bark of oaktrees and in fruits. The chemistry of tannins is complex. They are generally considered as two groups: (a) proanthocyanidins, alsoreferred to as “condensed tannins” (previously discussed), and (b) glucose polyesters of gallic acid of hexahydroxydiphenicacids (Fig. 32). The latter group is also known as hydrolyzable tannins, because they consist of a glucosidic molecule bonded todifferent phenolic moities. The most important example is glucose bonded to gallic acid and the lactone of its dimer, ellagic acid.
Tannins range in color from yellowish-white to light brown and contribute to astringency in foods. They contribute to the color ofblack teas when catechins are converted to aflavins and arubigins during fermentation. Their ability to precipitate proteins makesthem valuable as clarifying agents.
10.2.4.4 Quinoids and Xanthones
Quinones are phenolic compounds varying in molecular weight from a monomer, such as 1,4-benzoquinone, to a dimer, 1,4-naphthaquinone, to a trimer, 9,10-anthraquinone, and finally to a polymer represented by hypericin (Fig. 33). They are widelydistributed in plants, specifically trees, where they contribute to the color of wood. Most quinones are bitter in taste. Theircontribution to color of plants is minimal. They contribute to some of the darker colors, to the yellows, oranges, and browns ofcertain fungi and lichens, and to the reds, blues, and purples of sea lilies and coccid insects. Compounds with complexsubstitutents such as naphthaquinone and anthraquinones occur in plants, and these have deep purple to black hues. Furthercolor changes can occur in vitro under alkaline conditions by the addition of hydroxyl groups. Xanthone pigments are yellow,phenolic pigments and they are often confused with quinones and flavones because of their structural characteristics. Thexanthone mangiferin (Fig. 34) occurs as a glucoside in mangoes. They are easily distinguishable from quinones by their spectralcharacteristics.
FIGURE 32Structure of tannins.

Pag e 697
FIGURE 33Structure of quinones.
10.2.5 Betalaines
10.2.5.1 Structure
Plants containing betalaines have colors similar to plants containing anthocyanins. Betalaines are a group of pigments containingbetacyanins (red) and betaxanthins (yellow) and their color is not affected by pH, contrary to the behavior of anthocyanins. Theyare water soluble and exist as internal salts (zwitterions) in the vacuoles of plant cells. Plants containing these pigments arerestricted to 10 families of the order Centrospermae. The presence of betalaines in plants is mutually exclusive of theoccurrence of anthocyanins. The general formula for betalaines (Fig. 10.35a) represents condensation of a primary or secondaryamine with betalamic acid (Fig. 35b). All betalaine pigments can be described as a 1,2,4,7,7-pentasubstituted 1,7-diazaheptamethin system (Fig. 35c). When R' does not extend conjugation of the 1,7-diazaheptamethine system, the compoundexhibits maximum light absorption at about 480 nm, characteristic of yellow
FIGURE 34Structure of mang iferin.

Pag e 698
FIGURE 35General formulas of betalaines.
betaxanthins. If the conjugation is extended at R' the maximum light absorption shifts to approximately 540 nm, characteristic ofred betacyanines.
Betacyanins are optically active because of the two chiral carbons C-2 and C-15 (Fig. 36). Hydrolysis of betacyanin leads toeither betanidin (Fig. 36), or the C-15 epimer isobetanidine (Fig. 36d), or a mixture of the two isomeric aglycones. Theseaglycones are shared by all betacyanines. Differences between betacyanins are found in their glucoside residue. Commonvegetables containing betalaines are red beet and amaranth. The latter is either consumer fresh as “greens” or at the mature stateas grain. The most studied betalaines are those of the red beet. The major betacyanins in the red beet are betanin and isobetanin(Fig. 36b,e), while in amaranth they are amarathin and isoamaranthin (Fig. 36c,f).
The first betaxanthin isolated and characterized was indicaxanthin (Fig. 37a). Structurally these pigments are very similar tobetacyanins. Betaxathins differ from betacyanins in that the indole nucleus is replaced with an amino acid. In the case ofindicaxanthin the amino acid is proline. Two betaxanthines have been isolated from beet, vulgaxanthin I and II (Fig. 37b). Theydiffer from indicaxanthine in that the proline has been replaced by glutamine or glutamic acid, respectively. Although only a fewbetaxanthines have been characterized to date, considering the number of amino acids available, it is likely a large number ofdifferent betaxanthins exist.
10.2.5.2 Physical Properties
Betalaines absorb light strongly. The absorptivity value is 1120 for betanin and 750 for vulgaxanthine, suggesting hightinctorial strength in the pure state. The spectra of betanine solutions at pH values between 4.0 and 7.0 do not change, and theyexhibit maximum light absorbance at 537–538 nm. No change in hue occurs between these pH values. Below pH 4.0, theabsorption maximum shifts toward a slightly shorter wavelength (535 nm at pH 2.0). Above pH 7.0, the absorption maximumshifts toward a longer wavelength (544 nm at pH 9.0).

Pag e 699
FIGURE 36Structure of betacyanins.
10.2.5.3 Chemical properties
Like other natural pigments, betalaines are affected by several environmental factors.
Heat and/or Acidity
Under mild alkaline conditions betanin degrades to betalamic acid (BA) and cyclodopa-5-O-glucoside (CDG) (Fig. 38). Thesetwo degradation products also form during heating of acidic betanin solutions or during thermal processing of productscontaining beet root, but more slowly.
FIGURE 37Structure of betaxanthins.

Pag e 700
FIGURE 38Deg radation reaction of betanin.
The reaction is pH dependent (Table 8), and the greatest stability is in the pH range of 4.0–5.0. It should be noted that thereaction requires water; thus when water is unavailable or limited, betanine is very stable. It follows that a decrease in wateractivity will cause a decrease in the degradation rate of betanin [79]. An aw of 0.12 (moisture content of about 2%; dry weightbasis), is recommended for optimal storage stability of the pigments in beet powder [19].
No studies have been done concerning the degradation mechanism of betaxanthines. Since both betacyanines and betaxanthinespossess the same general structure, the mechanisms for degradation of betanin is likely to apply.
Degradation of betanin to BA and CDG is reversible, and therefore partial regeneration of the pigment occurs following heating.The mechanism proposed for regeneration involves a Schiff-base condensation of the aldehyde group of BA and the nucleophilicamine of CDG (Fig. 38). Regeneration of betanin is maximized at an intermediate pH range (4.0–5.0) [43]. It is of interest thatcanners traditionally, for reasons not necessarily known to them, examine canned beets several hours after processing toevaluate color, thus taking advantage of regeneration of the pigment(s).
Betacyanins, because of the C-15 chiral center (Fig. 36), exist in two epimeric forms.

Pag e 701
TABLE8 Effect of Oxyg en and pH on the Half-LifeValues of Betanine in Aqueous Solution at 90°C
Half-life values of betanine (min)
pH Nitrog en Oxyg en
3.0 56 ± 6 11.3 ± 0.7
4.0 115 ± 10 23.3 ± 1.5
5.0 106 ± 8 22.6 ± 1.0
6.0 41 ± 4 12.6 ± 0.8
7.0 4.8 ± 0.8 3.6 ± 0.3
Source: Adapted from Ref. 43.
Epimerization is brought about by either acid or heat. It would therefore be expected that during heating of a food containingbetanine the ratio of isobetanine to betanine would increase.
It has also been shown that when betanine in aqueous solution is heated, decarboxylation can occur. Evidence for this evolutionof carbon dioxide is loss of the chiral center. The rate of decarboxylation increases with increasing acidity [44]. Degradationreactions of betanin under acid and/or heat are summarized in Figure 39.
Oxygen and Light
Another major factor that contributes to degradation of betalaines is the presence of oxygen. Oxygen in the head space ofcanned beets has long been known to accelerate pigment loss. In solutions containing a molar excess of oxygen over betanin,betanin loss follows apparent first-order kinetics. Betanin degradation deviates from first-order kinetics when the molar oxygenconcentration is reduced to near that of betanin. In the absence of oxygen, stability is
FIGURE 39Deg radation of betanin under acid and/or heat.

Pag e 702
increased. Molecular oxygen has been implicated as the active agent in oxidative degradation of betanine. Active oxygen speciessuch as singlet oxygen or superoxide anion are not involved. Degradation of betanine in the presence of oxygen is influenced bypH (Table 8).
Oxidation of betalaines accelerates in the presence of light. The presence of antioxidants, such as ascorbic acid and isoascorbicacid, improves their stability. Because copper and iron cations catalyze oxidation of ascorbic acid by molecular oxygen, theydetract from the effectiveness of ascorbic acid as a protector of betalaines. The presence of metal chelators (EDTA or citricacid) greatly improves the effectiveness of ascorbic acid as a stabilizer of betalaines [2, 6].
Several phenolic antioxidants, including butylated hydroxyanisole, butylated hydroxytoluene, catechin, quercetin,nordihydroguaiartic acid, chlorogenic acid, and alpha-tocopherol, inhibit free-radical chain autoxidation. Since free-radicaloxidation does not seem to be involved in betalaine oxidation, these antioxidants are, not surprisingly, ineffective stabilizers ofbetanine. Similarly, sulfur-containing antioxidants such as sodium sulfite and sodium metabisulfite are not only ineffectivestabilizers, they hasten loss of color. Sodium thiosulfite, a poor oxygen scavenger, has no effect on betanine stability.Thioproprionic acid and cysteine also are ineffective as stabilizers of betanine. These observations confirm that betanine does notdegrade by a free-radical mechanism. The susceptibility of betalaines to oxygen has limited their use as food colorants.
Conversion of Betacyanin to Betaxanthin
In 1965 it was shown that the betaxanthin indicaxanthin could be formed from betacyanin, betanine, and an excess of proline inthe presence of 0.6 N ammonium hydroxide under vacuum. This was the first conclusive evidence of a structural relationshipbetween betacyanin and betaxanthin. It was further demonstrated that formation of betaxanthin from betanin involvedcondensation of the betanin hydrolysis product betalamic acid, and an amino acid (Fig. 40) [84, 85].
Information on the stability of betaxanthins is limited. Similar to betacyanins, their stability is pH dependent. Shown in Figure 41are the heat stability differences between the betacyanin, betanin, and the betaxanthin vulgaxanthin under similar experimentalconditions. The mechanism in Figure 40 suggests that an excess of the appropriate amino acid will shift the equilibrium towardthe corresponding betaxanthin and will reduce the quantity of betalamic acid in solution. An excess of an amino acid increasesthe stability of the betaxanthin formed by reducing the amount
FIGURE 40Formation of indicaxanthin from betanin in excess of proline.
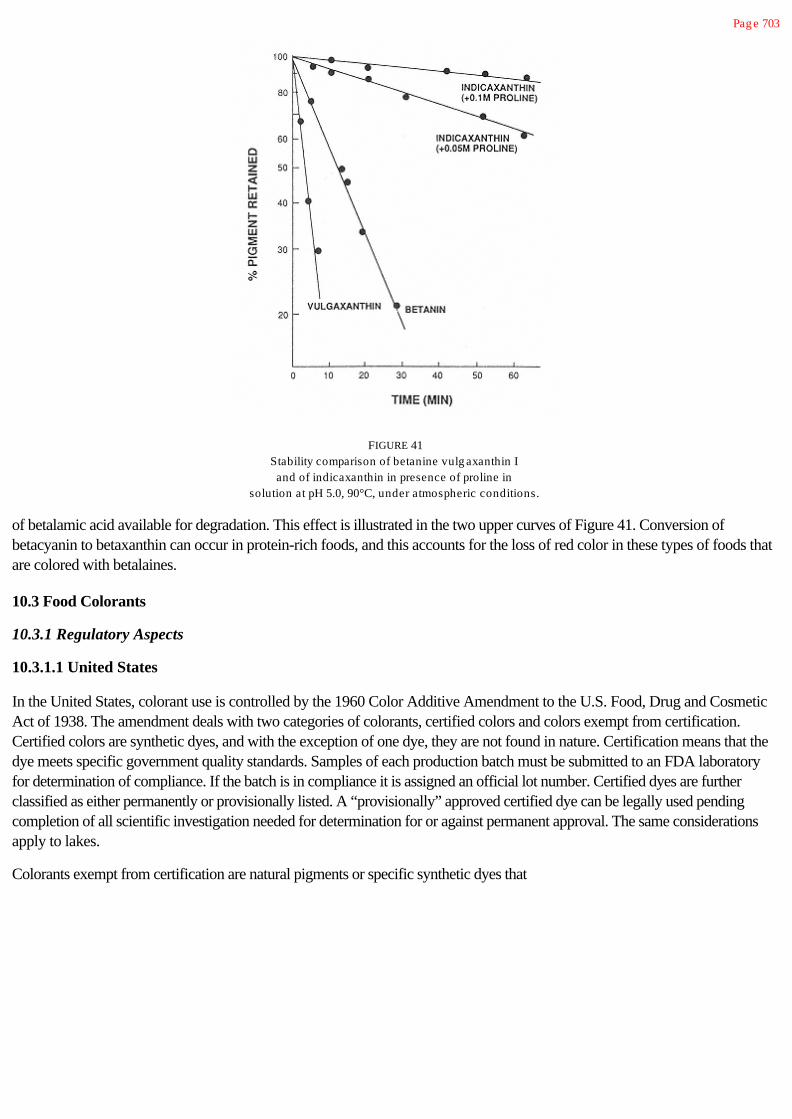
Pag e 703
FIGURE 41Stability comparison of betanine vulg axanthin Iand of indicaxanthin in presence of proline in
solution at pH 5.0, 90°C, under atmospheric conditions.
of betalamic acid available for degradation. This effect is illustrated in the two upper curves of Figure 41. Conversion ofbetacyanin to betaxanthin can occur in protein-rich foods, and this accounts for the loss of red color in these types of foods thatare colored with betalaines.
10.3 Food Colorants
10.3.1 Regulatory Aspects
10.3.1.1 United States
In the United States, colorant use is controlled by the 1960 Color Additive Amendment to the U.S. Food, Drug and CosmeticAct of 1938. The amendment deals with two categories of colorants, certified colors and colors exempt from certification.Certified colors are synthetic dyes, and with the exception of one dye, they are not found in nature. Certification means that thedye meets specific government quality standards. Samples of each production batch must be submitted to an FDA laboratoryfor determination of compliance. If the batch is in compliance it is assigned an official lot number. Certified dyes are furtherclassified as either permanently or provisionally listed. A “provisionally” approved certified dye can be legally used pendingcompletion of all scientific investigation needed for determination for or against permanent approval. The same considerationsapply to lakes.
Colorants exempt from certification are natural pigments or specific synthetic dyes that

Pag e 704
are nature identical. An example of the latter is b-carotene, which is widely distributed in nature but also can be synthesized toachieve a “nature identical” substance.
The Color Additive Amendment includes a simplified nomenclature for certified dyes. Rather than the use of long and difficultcommon names, certified dyes are referred to by a number and the abbreviation FD&C, D&C, or Ext. (external) D&C. FD&Cstands for food, drugs, and cosmetics, and these colorants may be used in either foods, drugs, or cosmetics. D&C and Ext.(external) D&C dyes can be used only in drugs or cosmetics. Thus, the certified dye sunset yellow FC has the designationFD&C Yellow No. 6. The current list of permitted certified dyes contains seven colorants for general use (Table 9). Twoadditional dyes, FD&C Orange B and FD&C Citrus No. 2, may be used; however, their use is restricted to specificapplications. FD&C Orange B may be used only for coloring the casings or surfaces of frankfurters and sausages, and its use inthese applications is restricted to no more than 150 ppm by weight of the finished product. FD&C Citrus Red No. 2 may beused only for coloring the skins of oranges not intended or used for processing, and its use in this application is restricted to nomore than 2 ppm based on the whole fruit.
The amendment further requires that when colorants are used, the foods to which they are added must be labeled with “coloradded.” The Nutritional Labeling Regulations of 1973 require that if a food contains FD&C Yellow No. 5, the dye must appearon the label by name; for all other dyes the collective term “color added” is acceptable. The reason yellow no. 5 received specialtreatment is because a small percentage of the population is allergic to the dye. The regulation also allows use of abbreviatedFD&C color designation as listed in Table 9. Adoption of the Nutritional Labeling and Education Act of 1990, which becameeffective in 1994, makes mandatory the individual listing of certified colors, by their abbreviated names, as well as the listing ofcolors exempt from certification. Color additives currently exempt form certification are listed in Table 10.
10.3.1.2 International
Colors are added to foods in many countries of the world, but the type of colorants permitted for use varies greatly amongcountries. Since international trade is becoming increasingly important, color legislation is now of international concern.Unfortunately, a worldwide list of permitted color additives does not exist; therefore, color additives have, in some instance,become trade barriers for foods. In the United States, for example, FD&C Red No. 40 is permitted for food use, whereasFD&C Red No. 2, since 1976, is no longer permitted. The United States and
TABLE 9 Certified Color Additives Currently Permitted for General Use
Status
Federal nameDye Lake Abbreviated
name
FD&C Blue No. 1 Permanent Provisional Blue 1
FD&C Blue No. 2 Permanent Provisional Blue 2
FD&C Green No. 3 Permanent Provisional Green 3
FD&C Red No. 3 Permanent ª Red 3
FD&C Red No. 40 Permanent Provisional Red 40
FD&C Yellow No. 5 Permanent Provisional Yellow 5
FD&C Yellow No. 6 Permanent Provisional Yellow 6
ªUse of lake of FD&C Red No. 3 was terminated effective January 29, 1990.

Pag e 705
TABLE 10 U.S. Color Additives Currently Exempt from Certification
Color Use limitationª
Annatto extract —
Dehydrated beet (beet powder) —
Canthaxanthin Not to exceed 66 mg /kg of solid or pint of liquidfood
b-Apo-8'-carotenal Not to exceed 15 mg /lb or liter of food
b-Carotene —
Caramel 33 mg /kg
Cochineal extract; carmine —
Toasted, partially defatted, cooked cottonseed flour —
Ferrous g luconate Colorant for ripe olives
Grape-skin extract (enocianina) Colorant for beverag es only
Synthetic iron oxide Not to exceed 0.25% by weig ht of pet food
Fruit juice —
Veg etable juice —
Dried alg ae metal Chicken feed only; to enhance yellow color of skinand eg g s
Tagetes (Aztec marig old) and extract Chicken feed only; to enhance yellow color of skinand eg g s
Carrot oil —
Corn endosperm oil Chicken feed only; to enhance yellow color of skinand eg g s
Paprika —
Paprika oleoresin —
Riboflavin —
Saffron —
Titanium dioxide Not to exceed 1% by weig ht of food
Turmeric —
Turmeric oleoresin —
ªUnless otherwise stated the colorant may be used in an amount consistent with g ood manufacturingpractices, except for foods where use is specified by a standard of identity.
Canada are currently the only nations in which FD&C red no. 40 is a legal color additive. At the other extreme, Norwayprohibits the use of any synthetic dye in the manufacturing of foods.

Legislative authorities of the European Economic Community (EEC) have attempted to achieve uniform color additive legislationfor Common Market Countries. Each permitted color additive has been assigned an E-number (E = Europe). Listed in Table 11are the currently permitted synthetic dyes, their E-number, equivalent FD&C number, if applicable, and the current regulatorystatus in various countries. Similar information for EEC natural colorants is given in Table 12. In reviewing these tables, it mustbe remembered that a colorant may be restricted to one or more specific products. An EEC general-use colorant also may notbe approved by every country in the EEC. It is apparent that greater latitude of use of both synthetic and natural colorants iscurrently allowed among EEC countries than in the United States, Canada, and Japan. The student is referred to the FoodAdditives Tables (Elsevier, Amsterdam) for further details. These tables are periodically updated, and Appendix I of these tablesis a list of all permitted colorants for countries having specific color additive legislation.

Pag e 706
TABLE 11 Synthetic Color Additives Currently Permitted by the European Economic Community (EEC)
Reg ulatory leg al status ªb
Name EEC number FDA number EEC United States Canada Japan
Erythrosine E123 FD&C Red No. 3 + + + +
Brilliant blue FCF - FD&C Blue No. 1 -c + + +
Indig otine E132 FD&C Blue No. 2 + + + +
Tartrazine E102 FD&C Yellow No. 5 +d + + +
Quinoline yellow E104 FD&C Yellow No. 6 +e - - -
Allura red - FD&C Red No. 40 - + + -
Yellow 2G E107 - +f - - -
Ponceau 4R E124 - +d - - +
Carmoisine E122 - +d,e,g - - -
Amaranth E123 FD&C Red No. 2 +d - + -
Red 2G E128 - +f - - -
Patent blue E131 - +e - - -
Green S E142 - +d,e,g - - -
Brown FK E154 - +f - - -
Chocolate brown HT E155 - +h - - -
Black PN E151 - +d,e - - -
ª+, Permitted for food use, (in some countries limited to specific foods); -, prohibited for food use.
bNo synthetic colorants permitted in Norway.
cPermitted in Denmark, Ireland, Netherlands.
dNot permitted in Finland.
eNot permitted in Portug al.
fPermitted in Ireland only.
gNot permitted in Sweden.
hPermitted in Ireland and Netherlands.
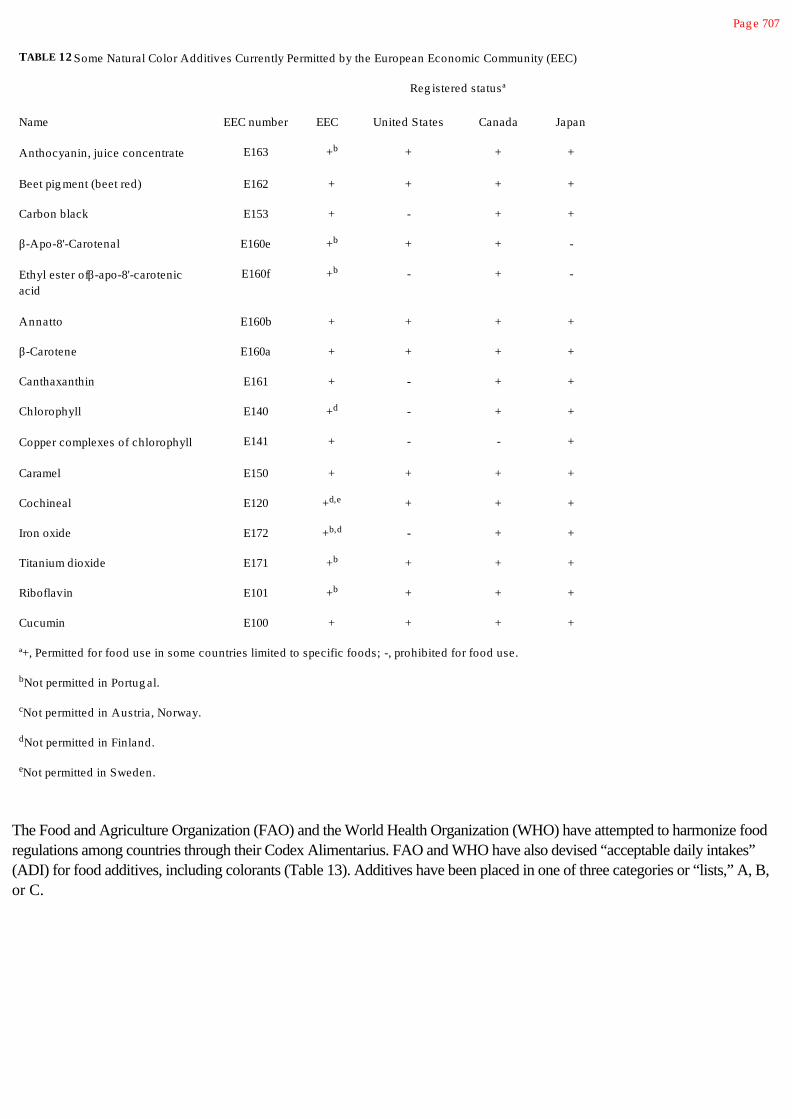
Pag e 707
TABLE 12 Some Natural Color Additives Currently Permitted by the European Economic Community (EEC)
Reg istered statusª
Name EEC number EEC United States Canada Japan
Anthocyanin, juice concentrate E163 +b + + +
Beet pig ment (beet red) E162 + + + +
Carbon black E153 + - + +
b-Apo-8'-Carotenal E160e +b + + -
Ethyl ester of b-apo-8'-carotenicacid
E160f +b - + -
Annatto E160b + + + +
b-Carotene E160a + + + +
Canthaxanthin E161 + - + +
Chlorophyll E140 +d - + +
Copper complexes of chlorophyll E141 + - - +
Caramel E150 + + + +
Cochineal E120 +d,e + + +
Iron oxide E172 +b,d - + +
Titanium dioxide E171 +b + + +
Riboflavin E101 +b + + +
Cucumin E100 + + + +
ª+, Permitted for food use in some countries limited to specific foods; -, prohibited for food use.
bNot permitted in Portug al.
cNot permitted in Austria, Norway.
dNot permitted in Finland.
eNot permitted in Sweden.
The Food and Agriculture Organization (FAO) and the World Health Organization (WHO) have attempted to harmonize foodregulations among countries through their Codex Alimentarius. FAO and WHO have also devised “acceptable daily intakes”(ADI) for food additives, including colorants (Table 13). Additives have been placed in one of three categories or “lists,” A, B,or C.

TABLE 13 Acceptable Daily Intake of Some Synthetic and Natural Colorants
Synthetic color Intakeª (mg /kg ) Natural color Amount (mg /kg )
Tartrazine 7.5 b-Apo-8'-carotenal 2.5
Sunset yellow FCF 5.0 b-Carotene 5.0
Amaranth 1.5 Canathaxanthin 25.0
Erythrosine 1.25 Riboflavin 0.5
Brilliant blue FCF 12.5 Chlorophyll GMPb
Indig otine 2.5 Caramel GMP
ªDaily intake over lifetime without risk.
bAmount consistent with “g ood manufacturing practice.”

Pag e 708
List A has two subparts: A-1 and A-2. Listed in subpart A-1 are those additives for which an ADI value has been establishedand approved. This list contains 15 colorants, including six artificial dyes. Additives in this list are considered not to present ahazard to consumers. Listed in subpart A-2 are those additives for which the safety evaluation is not complete, and thereforethese additives have a provisional use status. Included in this category are colorants derived from beet, annatto, and turmeric, allof which are approved for use in the United States.
List B includes additives for which evaluation is pending. List C, like list A, has two subparts. Listed in subpart C-1 are thoseadditives that, in the opinion of the FAO/WHO, are unsafe for use in foods. Listed in subpart C-2 are additives for which use isrestricted and specific limitations have been established.
Worldwide efforts toward establishing safety of colorants hopefully will lead to internationally accepted regulations for colorantuse in foods.
10.3.2 Properties of Certified Dyes
The safety of certified colors has received much public attention in recent years. The root of the concern can in part be attributedto the unfortunate association of synthetic colors to the original term “coal-tar” dyes. The public's concept of coal-tar is a thickblack substance unsuitable for use in foods. The fact is that raw materials for synthesis of colors are highly purified before use.The final product is a specific chemical that bears little relationship to the term coal tar.
Certified dyes fall into four basic chemical classes: azo, triphenylmethane, xanthine, or indigo type dyes. Listed in Table 14 arethe FD&C dyes, their chemical class, and some of their properties. The structures are shown in Figure 42. Listed in Table 15are solubility and stability data for EEC dyes.
A simplified sequence for chemical synthesis of FD&C Green No. 3, a triphenylmethane dye, is given in Figure 43. Inmanufacturing any dye the major difficulty is to meet the specifications of purity given for certification in the United States (Codeof Federal Regulations, Title 21, Part 70–83). The color manufacturing industry not only meets these purity specifications, butmost manufacturers exceed them.
The pure dye content of a typical certified colorant is 86–96%. Variation of 2–3% in total dye content of a basic color is of littlepractical significance since such variation has no significant effect on the ultimate color of a product. The moisture content of dyepowders is between 4 and 5%. The salt (ash) content of the dye powder is approximately 5%. The high ash content comes fromthe salt used to crystallize (salt out) the colorant. Although it would be technically possible to remove the sodium chloride used,such steps would be costly and would have minimal benefit.
All water-soluble FD&C azo dyes are acidic, and their physical properties are quite similar. Chemically they are reduced easilyby strong reducing agents and therefore are susceptible to oxidizing agents. FD&C triphenylmethane dyes (FD&C Green No. 3and FD&C Blue No. 1) are similar in structure, differing only in one -OH group. Differences in solubility and stability aretherefore minor. Substitution of a sulfonic acid group for a hydroxyl group in either of these dyes improves stability to light andresistance to alkali. Alkali decolorization of a triphenylmethane dye involves formation of a colorless carbinol base (Figure 44).The ortho-substituted sulfonic acid group sterically hinders access of the hydroxyl ion to the central carbon atom, thuspreventing formation of the carbinol base.
FD&C Red No. 3 is the only xanthine type-dye. The structure of red 3 suggests that the dye is insoluble in acids, quite stable toalkali, and exhibits strong fluorescence. The lake of red 3 is no longer permitted for use in foods because of toxicologicconcerns. Although the dye is permanently listed, its long term future is questionable.

Pag e 709

Pag e 710
FIGURE 42Structures of certified color additives currently permitted for g eneral use in the United States.

Pag e 711
FD&C Blue No. 2 is the only indigoid-type dye. It is made from indigo, one of the oldest known and most extensively utilizednatural pigments. The pigment is derived from various species of the indigo plant found in India. Until its synthesis, extracted dyewas a major product of commerce. Blue 2 is made by sulfonating indigo, yielding 5,5'-indigotin disulfonate (Fig. 45). The coloris a deep blue, compared to the greenish-blue of FD&C blue no. 1. The dye has the lowest water solubility and poorest lightresistance of any of the FD&C dyes, but is relatively resistant to reducing agents.
In general, conditions most likely to cause discoloration or precipitation of certified dyes are the presence of reducing agents orheavy metals, exposure to light, excessive heat, or exposure to acid or alkali. Many of the conditions causing failure of the dyescan be prevented in foods. Reducing agents are most troublesome. Reduction of the chromophores of azo and triphenylmethanedyes is shown in Figure 46. Azo dyes are reduced to the colorless hydrazo form or sometimes to the primary amine.Triphenylmethane dyes are reduced to the colorless leuco base. Common reducing agents in foods are monosaccharides(glucose, fructose), aldehydes, ketones, and ascorbic acid.
Free metals can combine chemically with many dyes causing loss of color. Of most concern are iron and copper. The presenceof calcium and/magnesium can result in the formation of insoluble salts and precipitates.
10.3.3 Use of Certified Dyes
Better uniformity in incorporating a water-soluble dye in foods is achieved if the dye is first dissolved in water. Distilled watershould be used to prevent precipitation. Liquid colors of various strengths can be purchased from manufacturers. Dyeconcentration in these preparations usually does not exceed 3% to avoid overcoloring. Citric acid and sodium benzoate arecommonly added to liquid preparations to prevent spoilage.
Many foods contain low levels of moisture making it impossible to completely dissolve and uniformly distribute a dye. The resultis a weak color and/or a speckled effect. This is a potential problem in hard candy that has a moisture content of < 1%. Theproblem is averted by using solvents other than water, such as glycerol or propylene glycol (Table 14). A second approach toovercoming problems of poor dispersion of dyes in foods with low moisture contents is the use of “lakes.” Lakes exist asdispersions in food rather than in solution. They range in dye content from 1 to 40%. A large dye content does not necessarilylead to intense color. Particle size is of key importance—the smaller the particle size, the finer will be the dispersion and themore intense will be the color. Special grinding techniques used by color manufacturers have made it possible to prepare lakeswith a mean particle size of less than 1 µm.
As with dyes, predispersion of lakes in glycerol, propylene glycol, or edible oils is often required. Predispersion helps preventagglomeration of particles, and thereby helps develop full color intensity and reduces the incidence of speckled products. Lakedispersions vary in dye content from 15 to 35%. A typical lake dispersion may contain 20% FD&C lake A, 20% FD&C lakeB, 30% glycerol, and 30% propylene glycol, resulting in a final dye content of 16%.
Color manufacturers also prepared color pastes or solid cubes of dyes or lakes. A paste is made with the addition, for example,of glycerol as a solvent and powdered sugar to increase viscosity. Colorants, in the form of cubes, are achieved by adding gumsand emulsifiers to color dispersions in the manufacturing process.

Pag e 712
TABLE 15 Chemical and Physical Properties of Common EEC Dyes
Solubility (g /100 ml) at 16°C Stabilityª
pH
Name and EEC number W ater Propylene g lycol Alcohol Glycerine Lig ht Heat SO2 3.5/4.0 8.0/9.0
Quinoline yellow, E104 14 <0.1 <0.1 <0.1 6 5 4 5 2
Ponceau 4R, E124 30 4 <0.1 0.5 4 5 3 4 1
Carmoisine, E122 8 1 <0.1 2.5 5 5 4 4 3
Amaranth, E123 5 0.4 <0.1 1.5 5 5 3 4 3
Patent blue, E131 6 2 <0.1 3.5 7 5 3 1 2
Green S, E142 5 2 0.2 1.5 3 5 4 4 3
Chocolate brown HT, E156 20 15 insoluble 5 5 5 3 4 4
Brilliant black BN, E151 5 1 <0.1 <0.5 6 1 1 3 4
ª1 = fades; 2 = considerable fade; 3 = appreciable fade; 4 = slig ht fade; 5 = very slig ht fade; 6 = no chang e.

Pag e 713
FIGURE 43Synthesis of FD&C Green No. 3 (fast g reen).
10.3.4 Colors Exempt from Certification
A brief description of each of the colorants listed in Table 10 follows.
Annatto extract is the extract prepared from Annatto seed, Bixa orellana L. Several food-grade solvents can be used forextraction. Supercritical carbon dioxide extraction has been tested as an alternative to using standard organic solvents. Thistechnology, however, has not yet
FIGURE 44Formation of a colorless carbinol base from a triphenylmethane dye.

Pag e 714
FIGURE 45Structures of indig oid type dyes.
been commercialized. The main pigment in annatto extract is the carotenoid bixin. Upon saponification of bixin the methyl estergroup is hydrolyzed and the resulting diacid is called norbixin (Fig. 47). Bixin and norbixin differ in solubility and form the basisfor oil- and water-soluble annatto colors, respectively.
Dehydrated beet is obtained by dehydrating the juice of edible whole beets. The pigments in beet colorants are betalains[betacyanins (red) and betaxanthins (yellow)]. The ratio of betacyanin/betaxanthin will vary depending on the cultivar andmaturity of beets. Beet colorant can also be produced under the category of “vegetable juice.” This type of beet colorant isobtained by concentrating beet juice under vacuum to a solid content sufficient to prevent spoilage (about 60% solids).
Canthaxanthin (b-carotene-4,4'dione), b-apo-8'-carotenal, and b-carotene are synthesized carotenoids and are regarded as“nature identical.” Structures of these compounds are shown in Figure 48.
FIGURE 46Reduction of azo or triphenylmethane dyes to colorless products.

Pag e 715
FIGURE 47Formation of norbixin from bixin.

Pag e 716
FIGURE 48Structure of “nature identical”
carotenoids.
Cochineal extract is the concentrate produced from an aqueous-alcoholic extract of the cochineal insect, Dactylopius coccuscosta. The coloring is principally due to carminic acid, a red pigment (Figure 49). The extract contains about 2–3% carminicacid. Colorants with carminic acid concentrations of up to 50% are also produced. These colorants are sold under the namecarmine colors.
Caramel is a dark-brown liquid produced by heat-induced caramelization of carbohydrates.
Toasted, partially defatted, cooked cottonseed flour is prepared as follows: Cottonseed is delineated and decorticated; themeats are screened, aspirated, and rolled; moisture is adjusted;

Pag e 717
FIGURE 49Structure of carminic acid.
the meats are heated and the oil is expressed; and the cooked meats are cooled, ground, and reheated to obtain a productvarying in shade from light brown to dark brown.
Ferrous gluconate is a yellowish-gray powder with a slight odor resembling that of burnt sugar.
Grape skin extract is a purplish-red liquid prepared from an aqueous extract of pomace remaining after grapes have beenpressed to remove the juice. The coloring matter of the extract consists mainly of anthocyanins. It is sold under the name“enocianina” and is restricted for coloring noncarbonated and carbonated drinks, beverage bases, and alcoholic beverages.
Fruit and vegetable juices are acceptable color additives, and they can be used at single strength or as concentrated liquids.Depending on the source of the juice, pigments from many of the previously described classes can be involved. Beet and grapejuice concentrates have been produced and marketed as colorants in this category. Grape juice concentrate, in contrast to grapeskin extract, may be used in nonbeverage foods.
Carrot oil is produced by extracting edible carrots with hexane. The hexane is subsequently removed by vacuum distillation. Thecolorant is mainly a- and b-carotene and other minor carotenoids found in carrots.
Paprika or paprika oleoresin is either the ground dried pods of paprika (Capsicum annum L.) or an extract of this plant. In theproduction of oleoresin, several solvents may be used. The main colorant is paprika is capxanthin, a carotenoid.
Riboflavin or vitamin B2 is an orange-yellow powder.
Saffron is the dried stigma of Crocus sativul L. Its yellow color is attributable to croxin, the digentiobioside of crocetin.
Titanium oxide is synthetically prepared. It often contains silicon dioxide and/or aluminum oxide to aid dispersion in foods. Thesediluents may not exceed 2% of the total.
Turmeric and turmeric oleoresin are the ground rhizomes or an extract of turmeric (Curcuma longa L.). The coloring matter inturmeric is curcumin. Several organic solvents may be used in the production of turmeric oleoresin.
Other Iron oxide, dried algae meal (dried algae cells of the genus Spongiococcum), tagetes meal (dried ground flower petals ofthe Aztic marigold, Tagetes erecta L.), and corn endosperm oil are of little interest here since these colorants are restricted touse in animal feeds. They can, however, indirectly affect the color of foods.
The labeling declaration of added colors that are exempt from certification is somewhat illogical. Although colors exempt fromcertification are natural or nature-identical, they must be listed as “artificial color added.” This is required because, in the vastmajority of uses, the colorant added is not natural to the food product. Similar to certified colors, colors exempt fromcertification must be declared by name when used in foods in the United States.
10.3.5 Use of Colors Exempt from Certification
With the exception of synthetic, nature-identical pigments, exempt-from-certification colorants are chemically crudepreparations. They are either totally unpurified materials or crude plant or

Pag e 718
animal extracts. Because of their impurity, relatively large amounts are needed to achieve the desired color. This has causedsome to suggest that these pigments lack tinctorial strength and contribute undesirable flavors to a product. Neither criticism isnecessarily true. Many pure natural pigments have high tinctorial strengths. This can be illustrated by comparing the 1%
absorptivity values of a natural pigment with that of a synthetic dye. At wavelengths of maximum light absorption, the
values for FD&C red no. 40 and yellow no. 6 are 586 and 569, respectively, whereas the for betanin, the mainpigment component in beet powder, and b-carotene are 1120 and 2400, respectively.
Furthermore, most pure pigments do not contribute to product flavor. The lack of tinctorial strength and the possible contributionto flavor by the unpurified natural colorants can easily be overcome by applying available technologies of separating andpurification. Unfortunately, these advances in technology have not been sanctioned.
Bibliography
Bauernfeind, J. B., ed. (1981). Carotenoids as Colorants and vitamin A Precursors, Academic Press, New York.
Counsell, J. N. ed. (1981). Natural Colours for Food and Other Uses, Applied Science, Essex.
Hendry, G. A. F., and J. D. Haughton, eds. (1992). Natural Food Colorants, Van Nostrand Reinhold, New York.
Hutchings, J. B. (1994). Food Colour and Appearance, Blackie, London.
Marmion, D. M. (1979). Handbook of U.S. Colorants for Foods, Drugs and Cosmetics, John Wiley & Sons, New York.
Mazza, G., and E. Miniati (1993). Anthocyanins in Fruits, Vegetables and Grains, CRC Press, Boca Raton, FL.
Walford, J., ed. (1980). Developments in Food Colours—1, Applied Science, London.
Walford, J., ed. (1984). Development in Food Colours—2, Elsevier Applied Science, London.
Schwartz, S. J., and T. V. Lorenzo (1990). Chlorophylls in Foods. Food Science and Nutrition. CRC Press, Boca Raton,FL.
References
1. Adams, J. B. (1973). Colour stability of red fruits. Food Manufact. 48 (2):19–20, 41.
2. Attoe, E. L., and J. H. von Elbe (1984). Oxygen involvement in betanine degradation: Effect of antioxidants. J. Food Sci.50:106–110.
3. Bacon, M. F., and M. Holden (1967). Changes in chlorophylls resulting from various chemical and physical treatments of leafextracts. Phytochemistry 6:193–210.
4. Bauernfeind, J. C. (1972). Carotenoid vitamin A precursors and analogs in foods and feeds. J. Agric. Food Chem.20:456–473.
5. Ben Aziz, A., S. Grossman, I. Ascarelli, and P. Budowski (1971). Carotene-bleaching activities of lipoxygenase and hemeproteins as studied by a direct spectrophotometric method. Phytochemistry. 10:1445–1452.
6. Bilyk, A., M. A. Kolodijand, and G. M. Sapers (1981). Stabilization of red beet pigments with isoascorbic acid. J. FoodSci., 46:1616–1617.
7. Blair, J. S. (1940). Color stabilization of green vegetables. U. S. Patent 2, 186, 003, March 3, 1937.
8. Brenes, P., M. C. Garcia Duran, and A. Garrido (1993). Concentration of phenolic compounds in storage brines or ripeolives. J. Food Sci. 58:347–350.
9. Bridle, P., K. G. Scott, and C. F. Timberlake (1973). Anthocyanins in Salix species. A new anthocyanin in Salix purpureabark. Phytochemistry 12:1103–1106.

10. Brouillard, R. (1982). Chemical structures of anthocyanins, in Anthocyanins as Food Colors (P. Markakis, ed.),Academic Press, New York, pp. 1–40.

Pag e 719
11. Buckle, K. A., and R. A. Edwards (1979). Chlorophyll: Color and pH changes in HTST processed green pea puree. J.Food Technol. 5:173–186.
12. Burton, G. W. (1989). Antioxidant action of carotenoids. J. Nutr. 119:109–111.
13. Burton, G. W., and K. U. Ingold (1984). Beta-carotene: An unusual type of lipid antioxidant. Science 224:569–573.
14. Canjura, F. L., and S. J. Schwartz (1991). Separation of chlorophyll compounds and their polar derivatives by high-performance liquid chromatography. J. Agric. Food Chem. 39:1102–1105.
15. Canjura, F. L., S. J. Schwartz, and R. V. Nunes (1991). Degradation kinetics of chlorophylls and chlorophyllides. J. FoodSci. 56:1639–1643.
16. Canfield, L. M., N. I. Krinsky, and J. A. Olson (1993). Carotenoids in Human health, (vol. 691), New York Academyof Sciences, New York.
17. Clydesdale, F. M., D. L. Fleischmann, and F. J. Francis (1970). Maintenance of color in processed green vegetables. FoodProd. Dev. 4:127–138.
18. Clydesdale, F. M., Y. D. Lin, and F. J. Francis (1972). Formation of 2-pyrroldone-S-carboxylic acid from glutamine duringprocessing and storage of spinach puree. J. Food Sci. 37:45–47.
19. Cohen, E., and I. Saguy (1983). Effect of water activity and moisture content on the stability of beet powder pigments. J.Food Sci. 48:703–707.
20. Daravingas, G., and R. F. Cain (1965). Changes in anthocyanin pigments of raspberries during processing and storage. J.Food Sci. 33:400–405.
21. Davidson, J. (1954). Procedure for the extraction, separation, and estimation of major fat-soluble pigments of hay. J. Sci.Food Agric. 5:1–7.
22. Davies, W. J., and J. Zhang (1991). Root signals and the regulation of growth and development of plants in drying soil.Annu. Rev. Plant Mol. Biol. 42:55–76.
23. Di Mascio, P., S. Kaiser, and H. Sies (1989). Lycopene as the most efficient biological carotenoid singlet oxygen quencher.Arch. Biochem. Biophys. 274:532–538.
24. Falk, J. E., and J. N. Phillips (1964). Physical and coordination chemistry of the tetrapyrrole pigments, in Chelating Agentsand Metal Chelates (F. P. Dwyer and D. P. Mellor, eds.), Academic Press, New York, pp. 441–490.
25. Faustman, C., and R. G. Cassens (1990). The biochemical basis of discoloration in fresh meat: A review. J. Muscle Foods1:217–243.
26. Faustman, C., R. G. Cassens, D. M. Schaeffer, D. R. Buege, and K. K. Scheller (1989). Improvement of pigment and lipidstability in Holstein steer beef by dietary supplementation with vitamin E. J. Food Sci. 54:858–862.
27. Fischbach, H. (1943). Microdeterminations for organically combined metal in pigment of okra. J. Assoc. Off. Agric. Chem.26:139–143.
28. Foote, C. S. (1968). Mechanisms of photosensitized oxidation. Science 162:963–970.
29. Forrest, J. C., E. D. Aberle, H. B. Hedrick, M. D. Judge, and R. A. Merkel (1975). Principles of Meat Science, W. H.Freeman, San Francisco.
30. Forsyth, W. G. C., and J. B. Roberts (1958). Cocoa “leucocyanidin.” Chem. Ind. (Lond.) 755.
31. Fox, J. B., Jr. (1966). The chemistry of meat pigments. J. Agric. Food Chem. 14:207–210.
32. Fox, J. B., Jr., and S. A. Ackerman (1968). Formation of nitric oxide myoglobin: Mechanisms of the reaction with variousreductants. J. Food Sci. 33:364–370.

33. Franics, F. J. (1977). Anthocyanins, Current Aspects of Food Colorants (T. E. Furia, ed.), CRC Press, Cleveland, OH,pp. 19–27.
34. Frankel, E. N. (1989). The antioxidant and nutritional effects of tocopherols, ascorbic acid and b-carotene in relation toprocessing of edible oils, in Nutritional Impact of Food Processing (J. C. Somogyi and H. R. Muller, eds.), Bibl. Nutr. Dieta.,Karger, Basel, pp. 297–312.
35. Geis, I. (1983). Biochemistry, 2nd ed. (F. B. Armstrong), Oxford University Press, New York, p. 108.
36. Goodman, L. P., and P. Markakis (1965). Sulfur dioxide inhibition of anthocyanin degradation by phenolase. J. Food Sci.130:135–137.
37. Goodwin, T. W. (1980). Functions of carotenoids, in The Biochemistry of the Carotenoids, vol. 1, 2nd ed. (T. W.Goodwin, ed.), Chapman and Hall, New York, pp. 77–95.

Pag e 720
38. Govindarajan, S., H. O. Hultin, and A. W. Kotula (1977). Myoglobin oxidation in ground beef: Mechanistic studies. J.Food Sci. 42:571–577, 582.
39. Gross, J. (1991). Pigments in Vegetables: Chlorophylls and Carotenoids, Van Nostrand Reinhold, New York.
40. Gupte, S. M., H. M. El-Bisi, and F. J. Francis (1964). Kinetics of thermal degradation of chlorophyll in spinach puree. J.Food Sci. 29:379–382.
41. Haisman, D. R., and M. W. Clarke (1975). The interfacial factor in heat induced conversion of chlorophyll to pheophytin ingreen leaves. J. Sci. Food Agric. 26:1111–1126.
42. Holt, A. S. (1958). The phase test intermediate and the allomerization of chlorophyll a. Can J. Biochem. Physiol.36:439–456.
43. Huang, A. S., and J. H. von Elbe (1985). Kinetics of the degradation and regeneration of betanine. J. Food Sci.50:1115–1120, 1129.
44. Huang, A. S., and J. H. von Elbe (1987). Effect of pH on the degradation and regeneration of betanine. J. Food Sci.52:1689–1693.
45. Humphry, A. M. (1980). Chlorophyll. Food. Chem. 5:57–67.
46. Isler, O. (1971). Carotenoids, Birkhauser Verlag, Basel.
47. IUPAC-IUB (International Union of Pure and Applied Chemistry-International Union of Biochemistry) (1975).Nomenclature of carotenoids. Pure Appl. Chem. 41:407–419.
48. Jackman, R. L., and J. L. Smith (1992). Anthocyanins and betalains, in Natural Food Colorants. (G. A. F. Hendry and J.D. Houghton, eds.), Van Norstrand Reinhold, New York, pp. 183–231.
49. Jackson, A. H. (1976). Structure, properties and distribution of chlorophyll, in Chemistry and Biochemistry of PlantPigments, vol. 1, 2nd ed. (T. W. Goodwin, ed.), Academic Press, New York, pp. 1–63.
50. Jen, J. J., and G. Mackinney (1970). On the photodecomposition of chlorophyll in vitro. I. Reaction rates. Photochem.Photobiol. 11:297–302.
51. Jen, J. J., and G. Mackinney (1970). On the photodecomposition of chlorophyll in vitro. II. Intermediates and breakdownproducts. Photochem. Photobiol. 11:303–308.
52. Jones, I. D., R. C. White, E. Gibbs, L. S. Butler, and L. A. Nelson (1977). Experimental formation of zinc and coppercomplexes of chlorophyll derivatives in vegetable tissue by thermal processing. J. Agric. Food Chem. 25:149–153.
53. Jones, I. D., R. C. White, E. Gibbs, and C. D. Denard (1968). Absorption spectra of copper and zinc complexes ofpheophytins and pheophorbides. J. Agric. Food Chem. 16:80–83.
54. Khachik, F., G. R. Beecher, and N. F. Whittaker (1986). Separation, identification, and quantification of the majorcarotenoid and chlorophyll constituents in extracts of several green vegetables by liquid chromatography. J. Agric. Food Chem.34:603–616.
55. Kearsley, M. W., and N. Rodriguez (1981). The stability and use of natural colours in foods: anthocyanin, b-carotene, andriboflavin. J. Food Technol. 16:421–431.
56. Krinsky, N. I. (1989). Antioxidant functions of carotenoids. Free Radical Biol Med. 7:617–635.
57. Kropf, D. H. (1980). Effects of retail display conditions on meat color. Proc. Recip. Meat Conf. 33:15–32.
58. La Borde, L. F., and J. H. von Elbe (1990). Zinc complex formation in heated vegetable purees. J. Agric. Food Chem.38:484–487.
59. La Borde, L. F., and J. H. von Elbe (1994). Chlorophyll degradation and zinc complex formation with chlorophyllderivatives in heated green vegetables. J. Agric. Food Chem. 42:1100–1102.

60. La Borde, L. F., and J. H. von Elbe (1994). Effect of solutes on zinc complex formation in heated green vegetables. J.Agric. Food Chem. 42:1096–1099.
61. Lawrie, R. A. (1985). Meat Science, 4th ed., Pergamon Press, New York.
62. Llewellyn, C. A., R. F. C. Mantoura, and R. G. Brereton (1990). Products of chlorophyll photodegradation. 1. Detectionand separation. Photochem. Photobiol. 52:1037–1041.
63. Llewellyn, C. A., R. F. C. Mantoura, and R. G. Brereton (1990). Products of chlorophyll photodegradation. 2. Structuralidentification. Photochem. Photobiol. 52:1043–1047.
64. Loef, H. W. and S. B. Thung (1965). Ueber den Einfluss von Chlorophyllase auf die Farbe von Spinat waehrend und nachder Verwertung. Z. Lebensm. Unters. Forsch. 126:401–406.
Pag e 721
65. Luh, B. S., S. J. Leonard, and D. S. Patel (1960). Pink discoloration in canned Barlett pears. Food Technol. 14:53–56.
66. Luh, B. S., S. Leonard, M. Simone, and F. Villarreal (1964). Aseptic canning of foods. VII. Strained lima beans. FoodTechnol. 18:363–366.
67. Madhavi, D. L., and C. E. Carpenter 91993). Aging and processing affect color, metmyoglobin reductase and oxygenconsumption of beef muscles. J. Food. Sci., 58:939–942, 947.
68. Malecki, G. J. (1965). Blanching and canning process for green vegetables. U. S. Patent 3, 183, 102, June 19, 1961.
69. Malecki, G. J. 1978. Processing of green vegetables for color retention in canning, U. S. Patent 4, 104, 410, September 9,1976.
70. Markakis, P. (1982). Stability of anthocyanins in foods, in Anthocyanins as Food Colors (P. Markakis, ed.), AcademicPress, New York, pp. 163–180.
71. Markakis, P., G. E. Livingstone, and R. C. Fellers (1957). Quantitative aspects of strawberry-pigment degradation. FoodRes. 22:117–130.
72. Mazza, G., and E. Miniati (1993). Anthocyanins in Fruits, Vegetables, and Grains, CRC Press, Boca Raton, FL.
73. McFeeters, R. F. (1975). Substrate specificity of chlorophyllase. Plant Physiol. 158:377–381.
74. Nakatani, H. Y., J. Barber, and J. A. Forrester (1979). Surface charges on chloroplast membranes as studied by particleelectrophoresis. Biochim. Biophys. Acta 504:215–225.
75. Okayama, T. (1987). Effect of modified gas atmosphere packaging after dip treatment on myoglobin and lipid oxidation ofbeef steaks. Meat Sci. 19:179–185.
76. O'Neil, C. A., and S. J. Schwartz (1992). Chromatographic analysis of cis/tran carotenoid isomers. J. Chromatogr.624:235–252.
77. Palozza, P., and N. I. Krinsky (1992). Antioxidant effects of carotenoids in vivo and in vitro: An overview. MethodsEnzymol. 213:403–421.
78. Parry, A. D., and R. Horgan (1992). Abscisic acid biosythesis in roots: The identification of potential abscisic acidprecursors, and other carotenoids. Planta 187:185–191.
79. Pasch, J. H., and J. H. von Elbe (1975). Betanine degradation as influenced by water activity. J. Food Sci. 44:72–73.
80. Peng, C. Y., and P. Markakis (1963). Effect of prenolase on anthocyanins. Nature (Lond.) 199:597–598.
81. Pennington, F. C., H. H. Strain, W. A. Svec, and J. J. Katz (1964). Preparation and properties of pyrochlorophyll a, methylpyrochlorophyllide a, pyropheophytin a, and methyl pyropheophorbide a derived from chlorophyll by decarbomethoxylation. J.Am. Chem. Soc. 86:1418–1426.
82. Peiser, G. D., and S. F. Yang (1979). Sulfite-mediated destruction of b-carotene. J. Agric. Food Chem. 27:446–449.
83. Peto, R., R. Doll, J. D. Buckley, and M. B. Sporn (1981). Can dietary betacarotene materially reduce human cancer rates?Nature 290:201–208.
84. Piatelli, M., L. Minale, and G. Prota (1965). Pigments of Centospermae—III. Betaxanthines from Beta vulgaris L.Phytochemistry 4:121–125.
85. Piatelli, M., L. Minale, and R. A. Nicolaus (1965). Pigments of Centrospermae—V. Betaxanthines from Mirabilis jalapaL. Phytochemistry 4:817–823.
86. Sante, V., M. Renerre, and A. Lacourt (1994). Effect of modified gas atmosphere packaging on color stability and onmicrobiology of turkey breast meat. J. Food Qual. 17:177–195.

87. Schanderl. S. H., C. O. Chichester, and G. L. Marsh (1962). Degradation of chlorophyll and several derivatives in acidsolution. J. Org. Chem. 27:3865–3868.
88. Schanderl, S. H., G. L. Marsh, and C. O. Chichester (1965). Color reversion in processed vegetables. I. Studies onregreened pea puree. J. Food Sci. 30:312–316.
89. Schwartz, S. J. (1994). Pigment analysis, in Introduction to the Chemical Analysis of Foods, (S. Nielson, ed.), Jones andBartlett, Boston, pp. 261–271.
90. Schwartz, S. J., and T. V. Lorenzo (1991). Chlorophyll stability during aseptic during processing and storage. J. Food Sci.56:1056–1062.
91. Schwartz, S. J., and J. H. von Elbe (1983). Kinetics of chlorophyll degradation to pyropheophytin in vegetables. J. FoodSci. 48:1303–1306.

Pag e 722
92. Schwartz, S. J., S. L. Woo, and J. H. von Elbe (1981). High performance liquid chromatography of chlorophylls and theirderivatives in fresh and processed spinach. J. Agric. Food Chem. 29:533–535.
93. Scott, K. J. (1992). Observations on some of the problems associated with the analysis of carotenoids in foods by HPLC.Food Chem. 45:357–364.
94. Seely, G. R. (1996). The structure and chemistry of functional groups, in The Chlorophylls (L. P. Vernon and G. R. Seely,eds.), Academic Press, New York, pp. 67–109.
95. Segner, W. P., T. J. Ragusa, W. K. Nank, and W. C. Hayle (1984). Process for the preservation of green color in cannedvegetables. U.S. Patent 4, 473, 591, December 15, 1982.
96. Seidman, S. C., and P. R. Durland (1984). The utilization of modified gas atmosphere packaging in fresh meat: A review. J.Food Qual. 6:239–252.
97. Shrikhande, A. J., and F. J. Francis (1974). Effect of flavonols on ascorbic acid and anthocyanin stability in model systems.J. Food Sci. 39:904–906.
98. Sies, H. (1992). Antioxidant functions of vitamins: vitamins E and C, beta-carotene and other carotenoids. Ann. NY Acad.Sci., 669:7–20.
99. Starr, M. S., and F. J. Francis (1968). Oxygen and ascorbic acid effect on the relative stability of four anthocyaninspigments in cranberry juice. Food Technol. 22:1293–1295.
100. Strain, H. H., M. F. Thomas, and J. J. Katz (1963). Spectral absorption properties of ordinary and fully deuteriatedchlorophylls a and b. Biochim. Biophys. Acta 75:306–311.
101. Straub, O. (1987). Key to Carotenoids, 2nd ed. (H. Pfander, M. Gerspacher, M. Rychener, and R. Schwabe, eds.),Birkhauser Verlag, Boston.
102. Struck, A., E. Cmiel, S. Schneider, and H. Scheer (1990). Photochemical ring-opening in mesochlorinated chlorophylls.Photochem. Photobiol. 51:217–222.
103. Sweeny, J. G., and M. E. Martin (1958). Determination of chlorophyll and pheophytin in broccoli heated by variousprocedures. Food Res. 23:635–647.
104. Sweeny, J. G., M. M. Wilkinson, and G. A. Iacobucci (1981). Effect of flavonoid sulfonates on the photobleaching ofanthocyanins in acid solution. J. Agric. Food Chem. 29:563–567.
105. Swiski, M. A., R. Alloug, A. Fuimard, and H. Cheftel (1969). A water-soluble green pigment, originating duringprocessing of canned brussels sprouts picked before the first autumn frost. J. Agric. Food Chem. 17:799–801.
106. Tan, C. T., and F. J. Francis (1962). Effect of processing temperature on pigments and color of spinach. J. Food Sci.27:232–240.
107. Tee, E. -S., and C. -L. Lim (1991). Carotenoid composition and content of Malaysian vegetables and fruits by the AOACand HPLC methods. Food Chem. 41:309–339.
108. Tonucci, L. H., and J. H. von Elbe (1991). Kinetics of the formation of zinc complexes of chlorophyll derivatives. J. Agric.Food Chem. 40:2341–2344.
109. Van Buren, J. P., J. J. Bertino, and W. B. Robinson (1968). The stability of wine anthocyanins on exposure to heat andlight. Am. J. Enol. Vitic. 19:147–154.
110. von Elbe, J. H. (1963). Factors affecting the color stability of cherry pigments and cherry juice. PhD thesis, University ofWisconsin, Madison.
111. von Elbe, J. H., A. S. Huang, E. L. Attoe, and W. K. Nank (1986). Pigment composition and color of conventional andVeri-Green canned peas. J. Agric. Food Chem. 34:52–54.

112. von Elbe, J. H., and L. F. LaBorde (1989). Chemistry of color improvement in thermally processed green vegetables,Quality Factors of Fruit and Vegetables Chemistry and Technology (J. J. Jen, ed.), Am. Chem. Soc. Symp. Ser. 405,Washington, DC, pp. 12–28.
113. Watanaba, T., M. Nakazato, H. Mazaki, A. Hongu, M. Kono, S. Saitoh, and H. Kenichi (1985). Chlorophyll a epimerand pheophytin a in green leaves. Biochim. Biophys. Acta 807:110–117.
114. Zechmeister, L. (1962). Cis-Trans Isomeric Carotenoids, Vitamins A and Arylpolyenes, Academic Press, New York.

Pag e 723
11Flavors
ROBERT C. LINDSAY
University of Wisconsin—Madison, Madison, Wisconsin
11.1 Introduction 724
11.1.1 General Philosophy 724
11.1.2 Methods for Flavor Analysis 724
11.1.3 Sensory Assessment of Flavors 725
11.2 Taste and Nonspecific Saporous Sensations 726
11.2.1 Taste Substances: Sweet, Bitter, Sour, and Salty 726
11.2.2 Flavor Enhancers 734
11.2.3 Astringency 735
11.2.4 Pungency 736
11.2.5 Cooling 738
11.3 Vegetable, Fruit, and Spice Flavors 738
11.3.1 Sulfur-Containing Volatiles in Allium sp. 738
11.3.2 Sulfur-Containing Volatiles in Cruciferae 739
11.3.3 Unique Sulfur Compound in Shiitake Mushrooms 740
11.3.4 Methoxy Alkyl Pyrazine Volatiles in Vegetables 741
11.3.5 Enzymically Derived Volatiles from Fatty Acids 741
11.3.6 Volatiles from Branched-Chain Amino Acids 742
11.3.7 Flavors Derived from the Shikimic Acid Pathway 743
11.3.8 Volatile Terpenoids in Flavors 745
11.3.9 Citrus Flavors 746
11.3.10 Flavors of Herbs and Spices 747
11.4 Flavors from Lactic Acid-Ethanol Fermentations 749
11.5 Flavor Volatiles from Fats and Oils 751

11.6 Flavor Volatiles in Muscle Foods and Milk 751
11.6.1 Species-Related Flavors of Meats and Milk from Ruminants 752
11.6.2 Species-Related Flavors of Meats from Nonruminants 753
11.6.3 Volatiles in Fish and Seafood Flavors 754

Pag e 724
11.7 Development of Process or Reaction Flavor Volatiles 755
11.7.1 Thermally Induced Process Flavors 756
11.7.2 Volatiles Derived from Oxidative Cleavage of Carotenoids 759
11.8 Future Directions of Flavor Chemistry and Technology 761
Bibliography 761
References 762
11.1 Introduction
11.1.1 General Philosophy
Knowledge of the chemistry of flavors is commonly perceived as a relatively recent development in food chemistry that evolvedfrom the use of gas chromatography and fast-scan mass spectrometry. Although the availability of these instrumental tools hasprovided the means to definitively investigate the entire range of flavor substances, classic chemical techniques were elegantlyapplied in early studies, especially for essential oils and spice extractives [25]. This extensive and somewhat separate focus ofattention to perfumery, combined with a rapid, seemingly disorganized development about the chemistry of food flavorsbeginning in the early 1960s, has contributed to the slow evolution of a discipline-oriented identity for the field of flavors. Eventhough flavor substances represent an extremely wide range of chemical structures derived from every major constituent offoods, their common feature of “stimulating taste or aroma receptors to produce an integrated psychological response known asflavor” remains adequate as a definition of this applied discipline.
Generally, the term “flavor” has evolved to a usage that implies an overall integrated perception of all of the contributing senses(smell, taste, sight, feeling, and sound) at the time of food consumption. The ability of specialized cells of the olfactory epitheliumof the nasal cavity to detect trace amounts of volatile odorants accounts for the nearly unlimited variations in intensity and qualityof odors and flavors. Taste buds located on the tongue and back of the oral cavity enable humans to sense sweetness, sourness,saltiness, and bitterness, and these sensations contribute to the taste component of flavor. Nonspecific or trigeminal neuralresponses also provide important contributions to flavor perception through detection of pungency, cooling, umami, or deliciousattributes, as well as other chemically induced sensations that are incompletely understood. The nonchemical or indirect senses(sight, sound, and feeling) influence the perception of tastes and smells, and hence food acceptances, but a discussion of theseeffects is beyond the scope of this chapter. Thus, materials presented in this chapter will be confined to discussions aboutsubstances that yield taste and/or odor responses, but a clear distinction between the meaning of these terms and that of flavorwill not always be attempted.
11.1.2 Methods for Flavor Analysis
As noted at the beginning of this chapter, flavor chemistry often has been equated with the analysis of volatile compounds usinggas chromatography combined with fast-scan mass spectrometry, but this impression is much too restrictive. Here, only limitedattention will be directed to this topic although extensive discussions can be found elsewhere [45, 57, 66].
Several factors make the analysis of flavors somewhat demanding, and these include their presence at low concentrations (ppm,1 × 106; ppb, 1 × 10⁹; ppt, 1 × 10¹²), complexity of mixtures (e.g., over 450 volatiles identified in coffee), extremely highvolatility (high vapor pressures), and instability of some flavor compounds in dynamic equilibria with other constituents
Pag e 725
in foods. Identification of flavor compounds requires initial isolation from the bulky constituents of foods combined withsubstantial concentration, and this should occur with minimal distortion of the native composition if flavor quality is being studied.The adsorption of flavor compounds on porous polymers followed by either thermal desorption or solvent elution has provided ameans to minimize destruction of sensitive compounds during isolation. However, higher boiling compounds and somecompounds present in very low concentrations still require distillation techniques to assure adequate recovery for identification.Successful identifications of compounds also require separation of flavor isolates into individual components, and advances in thetechnology of preparing fused-silica capillary columns for gas chromatography have proven highly successful in achieving thisgoal. Similarly, advances in high-performance liquid chromatography have provided powerful means for separating many higherboiling compounds and precursors.
11.1.3 Sensory Assessment of Flavors
Sensory assessments of flavor compounds and foods are essential for achieving objectives of flavor investigations regardless ofultimate goals. Some situations call for sensory characterization of samples by skilled individuals (experienced flavorists orresearchers). In other instances, it is necessary to use formal panels for sensory analysis followed by statistical analysis of data.Excellent reviews and books are available on this subject [1, 2, 14, 53, 62], and these should be consulted for detailedinformation on this extremely important aspect of flavor assessment.
Sensory assessments are essential for the determination of detection thresholds, which provide a measure of the potency offlavor provided by individual compounds. Threshold values are usually determined using individuals representative of the generalpopulation. A range of concentrations of a selected flavor compound in a defined medium (water, milk, air, etc.) is presented tosensory panelists, and each panelist indicates whether or not the compound can be detected. The concentration range where atleast half (sometimes greater) of the panelists can detect the compound is designated as the flavor threshold [18]. Compoundsvary greatly in their flavor or odor potency, and thus, a minute amount of a compound having a very low threshold will havesubstantially greater influence on the flavor of a food than one that is quite abundant but that possesses a high flavor threshold.The calculation of the odor units (OU) involves dividing the concentration of the flavor compound by its flavor threshold (OU =concentration present/threshold concentration), and provides an estimate of the contribution by a flavor compound. Morerecently, aroma extract dilution analysis (AEDA) has been used extensively to identify the most potent odorants in foods [24],and this involves sensory detection of individual compounds (flavor dilution factor) in gas-chromatographic effluents resultingfrom serial dilutions of aroma extracts from foods. Such methods provide information about the most potent flavor compoundspresent in foods and beverages, but provide this information in the absence of influences of food matrices and interactivepsychophysical effects of the perception of mixtures of flavor compounds. Therefore, extrapolation of such data to actual foodsystems is severely limited.
Measurement of chemical flavor parameters to provide definitive information about flavor intensity and quality of foods has longbeen an idealized goal of flavor investigations [55]. Much progress has been made in the application of methods for correlationof subjective sensory information with objective flavor chemical data, but routine assessment of flavor quality by purely analyticalmeans remains limited.
Attention is usually directed to important flavor compounds that provide the “characterizing” or “character-impact” features of aparticular flavor. These substances are reasonably limited in number, but are frequently present in extremely low concentrations,and they may be extremely unstable. The seemingly impossible task of defining character impact compounds led,

Pag e 726
early on, to the so-called component balance theory for explaining the chemical basis of certain flavors. However, as methods ofanalysis have become more sensitive, more and more foods with different flavors but similar low-resolution flavor-compoundprofiles have been found to contain one or more character-impact compounds responsible for the principal flavor. Identificationof character-impact compounds can be expected for many flavors that remain a mystery for the present, but for some transient,unstable flavor compounds, identification by the methods currently available may not be possible. For example, the key flavorcompounds responsible for cheddar cheese aroma, the dihydropyrazines of freshly roasted nuts, and furfuryl thioaldehydebelieved present in freshly brewed coffee may not yield themselves to isolation and identification techniques used now, and theirdefinition must await the development of new techniques.
This chapter deals primarily with the chemistry of important character-impact compounds that have been selected to illustrate thechemistry of food systems and the chemical basis for the existence of flavor compounds in foods. Where appropriate, and wheninformation is available, structure-activity relationships for flavor compounds are noted. Limited attention is given to listings ofprofiles of flavor compounds present in various foods. Comprehensive lists of flavor compounds for foods are availableelsewhere [42, 69], as are tabulations of threshold concentrations for individual compounds [18]. These sources of informationshould prove useful in searches for further details about specific flavor compounds. Finally, a choice exists on whetherinformation pertaining to the flavor chemistry of major food constituents is dealt with here or in the chapters devoted to thosemajor food constituents. It has been deemed appropriate to conduct these discussions in the major-constituent chapters. Forexample, flavors deriving from the Maillard reaction are discussed in Chapter 4 and those deriving from free radical oxidation oflipids are discussed in Chapter 5. Information on low-calorie sweeteners and on binding of flavors by macromolecules is, ofnecessity, partly covered here and partly covered in Chapters 4 and 6 (binding by macromolecules) and in Chapter 12 (low-calorie sweeteners).
11.2 Taste and Nonspecific Saporous Sensations
Frequently, substances responsible for these components of flavor perception are water soluble and relatively nonvolatile. As ageneral rule, they are also present at higher concentrations in foods than those responsible for aromas, and have been oftentreated lightly in coverages of flavors. Because of their extremely influential role in the acceptance of food flavors, it isappropriate to examine the chemistry of substances responsible for taste sensations as well as those responsible for some of theless defined flavor-taste sensations.
11.2.1 Taste Substances: Sweet, Bitter, Sour, and Salty
Sweet substances have been the focus of much attention because of interest in sugar alternatives and the desire to find suitablereplacements for the low-calorie sweeteners saccharin and cyclamate (see Chaps. 4 and 12). The bitterness sensation appearsto be closely related to sweetness from a molecular structure-receptor relationship, and as a result much has been learned aboutbitterness in studies directed primarily toward sweetness. Development of bitterness in protein hydrolysates and aged cheeses isa troublesome problem, and this problem has stimulated research on the causes of bitterness in peptides. With regard tosaltiness, national policies that encourage a reduction of sodium in diets have stimulated renewed interest in the mechanisms ofthe salty taste.
11.2.1.1 Structural basis of the sweet modality
Before modern sweetness theories were advanced, it was popular to deduce that sweetness was associated with hydroxyl (-OH) groups because sugar molecules are dominated by this feature.

Pag e 727
However, this view was soon subject to criticism because polyhydroxy compounds vary greatly in sweetness, and many aminoacids, some metallic salts, and unrelated compounds, such as chloroform (CHCl3) and saccharin (Chap. 12), also are sweet.Still, it was apparent that some common characteristics existed among sweet substances, and over the past 75 years a theoryrelating molecular structure and sweet taste has evolved that satisfactorily explains why certain compounds exhibit sweetness.
Shallenberger and Acree [59] first proposed the AH/B theory for the saporous (taste eliciting) unit common to all compoundsthat cause a sweet sensation (Fig. 1). The saporous unit was initially viewed as a combination of a covalently bound H-bondingproton and an electronegative orbital positioned at a distance of about 3 Å from the proton. Thus, vicinal electronegative atomson a molecule are essential for sweetness. Further, one of the atoms must possess a hydrogen bonding proton. Oxygen,nitrogen, and chlorine atoms frequently fulfill these roles in sweet molecules, and hydroxyl-group oxygen atoms can serve eitherthe AH or B function in a molecule. Simple AH/B relationships are shown for chloroform (I), saccharin (II), and glucose (III).
FIGURE 1Schematic showing the relationship
betweenAH/B and g sites in the saporous sweet
unit forb-D-fructopyranose.

Pag e 728
As indicated in Figure 1, however, stereochemical requirements are also imposed on the AH/B components of the saporous unitso that they will align suitably with the receptor site. The interaction between the active groups of the sweet molecule and thetaste receptor is currently envisioned to occur through H-bonding of the AH/B components to similar structures in the tastereceptor. A third feature also has been added to the theory to extend its validity to intensely sweet substances. This additionincorporates appropriate stereochemically-arranged lipophilic regions of sweet molecules, usually designated as g , which areattracted to similar lipophilic regions of the taste receptor. Lipophilic portions of sweet molecules are frequently methylene (-CH2-), methyl (-CH3), or phenyl (-C6H5) groups. The complete sweet saporous structure is geometrically situated so thattriangular contact of all active units (AH, B, and g) with the receptor molecule occurs for intensely sweet substances, and thisarrangement forms the rationale for the tripartite structure theory of sweetness.
The g-site is an extremely important feature of intensely sweet substances, but plays a lesser role in sugar sweetness [7]. Itappears to function through facilitating the accession of certain molecules to the taste receptor site, and as such, effects theperceived intensity of sweetness. Since sugars are largely hydrophilic, this feature comes into play in a limited sense only forsome sugars, such as fructose. This component of the saporous sweet unit probably accounts for a substantial portion of thevariation in sweetness quality that is observed between different sweet substances. Not only is it important in the time-intensity ortemporal aspects of sweetness perception, but it also appears to relate to some of the interactions between sweet and bittertastes observed for some compounds.
Sweet-bitter sugar structures possess features that apparently allow them to interact with either or both types of receptors, thusproducing the combined taste sensation. Bitterness properties in structures depress sweetness even if the concentration in a testsolution is below that for the bitter sensation. Bitterness in sugars appears to be imparted by a combination of effects involvingthe configuration of the anomeric center, the ring oxygen, the primary alcohol group of hexoses, and the nature of anysubstituents. Often, changes in the structure and stereography of a sweet molecule lead to the loss or suspension of sweetness orthe induction of bitterness.
11.2.1.2 The Bitter Taste Modality
Bitterness resembles sweetness because of its dependence on the stereochemistry of stimulus molecules, and the two sensationsare triggered by similar features in molecules, causing some molecules to yield both bitter and sweet sensations. Although sweetmolecules must contain two polar groups that may be supplemented with a nonpolar group, bitter molecules appear to have arequirement for only one polar group and a hydrophobic group [8]. However, some [4, 6, 11] believe that most bittersubstances possess an AH/B entity identical to that found in sweet molecules as well as the hydrophobic group. In this concept,the orientation of AH/B units within specific receptor sites, which are located on the flat bottom of receptor cavities, provides thediscrimination between sweetness and bitterness for molecules possessing the required molecular features. Molecules that fit intosites that were oriented for bitter compounds give a bitter response; those fitting the orientation for sweetness elicit a sweetresponse. If the geometry of a molecule were such that it could orient in either direction, it would give bitter-sweet responses.Such a model appears especially attractive for amino acids where D-isomers are sweet and

Pag e 729
L-isomers are bitter [37]. Since the hydrophobic or g-site of the sweet receptor is nondirectional lipophilicity, it could participatein either sweet or bitter responses. Molecular bulkiness factors serve to provide stereochemical selectivity to the receptor siteslocated in each receptor cavity. It can be concluded that there is a very broad structural basis for the bitter taste modality, butmost empirical observations about bitterness and molecular structure can be explained by current theories.
11.2.1.3 Bitter Compounds that are Important in Foods
Bitterness may be desirable or undesirable in food flavors, and because of genetic differences in humans, individuals vary in theirability to perceive certain bitter substances. A compound may be bitter or bitter-sweet depending on the individual. Saccharin isperceived as purely sweet by some individuals, but others find it to range from only slightly bitter and sweet to quite bitter andsweet. Many other compounds also show marked variations in the manner which individuals perceive them, and frequently eithertaste bitter or are not perceived at all. Phenylthiocarbamide or PTC (IV) is one of the most notable compounds in this category[1]:
For PTC, about 40% of the Caucasian American population is taste-blind to the bitterness attribute that is perceived by theother 60% of the Caucasian American population. Although PTC is a novel compound that does not occur in foods, creatine(V), shown here,
is a constituent of muscle foods that exhibits similar properties of varied taste sensitivity in the population. Creatine may occur atlevels up to about milligrams per gram in lean meats [1], and this is adequate to make soups taste bitter to sensitive individuals.As with other bitter substances, these molecules contain AH/B sites suitable for inducing the bitter sensation. Genetic variation inthe perception of specific molecules appears to relate to the size of receptor site cavities and to the arrangement and nature ofatoms on cavity walls, with these atoms governing which molecules are allowed in the site and which are rejected.
Quinine is an alkaloid that is generally accepted as the standard for the bitter taste sensation. The detection threshold for quininehydrochloride (VI) is about 10 ppm. In general, bitter substances have lower taste thresholds than other taste substances, andthey also tend to be less soluble in water than taste-active materials. Quinine is permitted as an additive in beverages,
such as soft drinks, that also have tart-sweet attributes. The bitterness blends well with the other tastes and provides a refreshinggustatory stimulation in these beverages. The practice of mixing

Pag e 730
quinine into soft-drink beverages apparently stems from efforts to suppress or mask the bitterness of quinine when it wasprescribed as a drug for malaria.
In addition to soft drinks, bitterness is an important flavor attribute of several other beverages consumed in large quantities,including coffee, cocoa, and tea. Caffeine (VII) is moderately bitter at 150–200 ppm in water, and occurs in coffee, tea, andcola nuts. Theobromine (VIII) is very
similar to caffeine and is present most notably in cocoa, where it contributes to bitterness. Caffeine is added in concentrations upto 200 ppm to soft cola beverages, and much of the caffeine employed for this purpose is obtained from extractions of greencoffee beans, which is carried out in the preparation of decaffeinated coffee.
Large amounts of hops are employed in the brewing industry to provide unique flavors to beer. Bitterness, contributed by someunusual isoprenoid-derived compounds, is a very important aspect of hop flavor. These substances can generally be categorizedas derivatives of humulone or lupulone, that is, a-acids or b-acids, respectively, as they are known in the brewing industry.Humulone is the most abundant substance, and it is converted during wort boiling to isohumulone by an isomerization reaction(Eq. 1) [13].
(1)
Isohumulone is the precursor for the compound that causes the sunstruck or skunky flavor in beer exposed to light. In thepresence of hydrogen sulfide from yeast fermentation, a photocatalyzed reaction occurs at the carbon adjacent to the keto groupin the isohexenyl chain. This gives rise to 3-methyl-2-butene-1-thiol (prenylmercaptan), which has a skunky aroma [38].Selective reduction of the ketone in preisomerized hop extracts prevents this reaction and allows packaging of beer in clear glasswithout development of the skunky or sunstruck flavor. Whether volatile hop aroma compounds survive the wort-boilingprocess was a controversial topic for a number of years. However, it is now well documented that influential compounds dosurvive the wort-boiling process and others are formed from hop bitter substances; together they contribute to the kettle-hoparoma of beer.
The development of excessive bitterness is a major problem of the citrus industry,

Pag e 731
especially in processed products. In the case of grapefruit, some bitterness is desirable and expected, but frequently the intensityof bitterness in both fresh and processed fruit exceeds that preferred by many consumers. The principal bitter component innavel and Valencia oranges is a triterpenoid dilactone (A- and D-rings) called limonin, and it is also found as a bittering agent ingrapefruit. Limonin is not present to any extent in intact fruits, but rather a flavorless limonin derivative produced by enzymichydrolysis of limonin's D-ring lactone is the predominant form (Fig. 2). After juice extraction, acidic conditions favor the closingof the D-ring to form limonin, and the phenomenon of delayed bitterness occurs, yielding serious economic consequences.
Methods for debittering orange juice have been developed using immobilized enzymes from Arthrobacter sp. andAcinetobacter sp. [30]. Enzymes that simply open the D-ring lactone provide only temporary solutions to the problem becausethe ring closes again under acidic conditions. However, the use of limonoate dehydrogenase to convert the open D-ringcompound to nonbitter 17-dehydrolimonoate A-ring lactone (Fig. 2) provides an irreversible means to debitter orange juice,although the process has not yet been commercialized. Methods to debitter citrus juices also include the use of polymericadsorbants, which are the preferred methods for commercial processors [34].
Citrus fruits also contain several flavonone glycosides, and naringen is the predominant flavonone found in grapefruit and bitterorange (Citrus auranticum). Juices that contain high levels of naringen are extremely bitter, and are of little economic valueexcept in instances where they can be extensively diluted with juices containing low bitterness levels. The bitterness of naringen isassociated with the configuration of the molecule that develops from the 1 to 2 linkage between rhamnose and glucose.Naringenase is an enzyme that has been isolated from commercial citrus pectin preparations and from Aspergillus sp., and thisenzyme hydrolyzes the 1 to 2 linkage (Fig. 3) to yield nonbitter products. Immobilized enzyme systems have also beendeveloped to debitter grapefruit juices containing excessive levels of naringen. Naringen has also been commercially recoveredfrom grapefruit peels and is used instead of caffeine for bitterness in some food applications.
Pronounced, undesirable bitterness is frequently encountered in protein hydrolysates and cured cheeses, and this effect is causedby the overall hydrophobicity of amino acid side chains in peptides. All peptides contain suitable numbers of AH-type polargroups that can fit the polar receptor site, but individual peptides vary greatly in the size and nature of their hydrophobicgroupings and thus in the ability of these hydrophobic groups to interact with the essential hydrophobic sites of bitternessreceptors. Ney [50] has shown that the bitter taste of peptides can
FIGURE 2Structure of limonin and reactionsleading to enzymatically induced
nonbitter derivatives (the remainder ofthe
molecule, including the A ring , remainsunchang ed).

Pag e 732
FIGURE 3Structure of naring en showing siteof enzymatic hydrolysis leading to
nonbitter derivatives.
be predicted by calculation of a mean hydrophobicity value, termed Q. The ability of a protein to engage in hydrophobicassociations is related to the sum of the individual hydrophobic contributions of the nonpolar, amino acid side chains, and theseinteractions contribute mainly to the free energy (DG) associated with protein unfolding. Thus, by summation of DG values forthe individual amino acid side chains in a peptide, it is possible to calculate the mean hydrophobicity Q using Equation 2:
(2)
where n is the number of amino acid residues. Individual DG values for amino acids have been determined from solubility data[65], and these are summarized in Table 1. The Q values above
TABLE 1 Calculated DG Values for IndividualAmino Acids
Amino acids DG valueª (kJ mol -1)
Glycine 0 (0)
Serine 167.3 (40)
Threonine 1839.9 (440)
Histidine 2090.8 (500)
Aspartic acid 2258.1 (540)
Glutamic acid 2299.9 (550)
Arg inine 3052.6 (730)
Alanine 3052.6 (730)
Methionine 5436.1 (1300)
Lysine 6272.4 (1500)
Valine 7066.9 (1690)
Leucine 10,119.5 (2420)
Proline 10,955.8 (2620)
Phenylalanine 11,081.2 (2650)
Tyrosine 12,001.2 (2870)
Isoleucine 12,419.4 (2970)
Tryptophan 12,544.8 (3000)
ªDG values in kcal mol -1 are shown inparentheses; 1 kcal = 4.1814 kJ.Source: From Ref. 50.


Pag e 733
5855 based on kJ (1400 based on kcal) indicate that the peptide will be bitter; values below 5436 based on kJ (1300 based onkcal) assure that the peptide will not be bitter. The molecular weight of a peptide also influences its ability to produce bitterness,and only those with molecular weights below 6000 have a potential for bitterness. Peptides larger than this apparently are deniedaccess to receptor sites because of their bulkiness (also see Chap. 6).
The peptide shown in Figure 4 is derived from the cleavage of as1 -casein between residue 144–145 and residue 10–151 [50],and has a calculated Q value of 9576 based on kJ (2290 based on kcal). This peptide is very bitter, and is illustrative of thestrongly hydrophobic peptides that can be derived readily from as1 -casein. Such peptides are responsible for bitterness thatdevelops in aged cheeses.
Ney [51] has also extended this general approach to predict the bitterness of lipid derivatives and sugars. Hydroxylated fattyacids, particularly some trihydroxy derivatives, are frequently bitter. The ratio of the number of C atoms to the number of OHgroups, or the R value (nC/nOH), of a molecule gives an indication of the bitterness of these substances. Sweet compounds yield Rvalues of 1.00–1.99, bitter compounds 2.00–6.99, and nonbitter compounds have values above 7.00.
Bitterness in salts appears to involve a different mechanism of reception that seems to be related to the sum of the ionicdiameters of the anion and cation components [4, 5]. Salts with ionic diameters below 6.5 Å are purely salty in taste (LiCl =4.98 Å; NaCl = 5.56 Å; KCI = 6.28 Å), although some individuals find KCI to be somewhat bitter. As the ionic diameterincreases (CsCl = 6.96 Å; CsI = 7.74 Å), salts become increasingly bitter. Magnesium chloride (8.50 Å) is therefore quitebitter.
11.2.1.4 The Salty and Sour Taste Modalities
Classic salty taste is represented by sodium chloride (NaCl), and is also given by lithium chloride (LiCl). National policiesencouraging reduction in sodium consumption have stimulated interest in foods in which sodium salts have been replaced byalternative substances, particularly those containing potassium and ammonium ions. Since these foods have different, usually lessdesirable, tastes than those flavored with NaCl, renewed efforts are being expended to better understand mechanisms of thesalty taste, in the hope that low-sodium products with near normal salty taste can be devised.
Salts have complex tastes, consisting of psychological mixtures of sweet, bitter, sour, and salty perceptual components.Furthermore, it has been shown recently that the tastes of salts often fall outside the traditional taste sensation [56] and aredifficult to describe in classic terms. Nonspecific terms, such as chemical and soapy, often seem to more accurately describe thesensations produced by salts than do the classic terms.
Chemically, it appears that cations cause salty tastes and anions modify salty tastes [3].
FIGURE 4Structure of bitter peptide
(phe-tyr-pro-g lu-leu-phe) derivedfrom a s 1-casein, showing strong
nonpolar features.

Pag e 734
Sodium and lithium produce only tastes, while potassium and other alkaline earth cations produce both salty and bitter tastes.Among the anions commonly found in foods, the chloride ion is least inhibitory to the salty taste, and the citrate anion is moreinhibitory than orthophosphate anions. Anions not only inhibit tastes of cations, but also contribute tastes of their own. Thechloride ion does not contribute a taste, and the citrate anion contributes less than the orthophosphate anion. Anion taste effectsimpact the flavor of foods, such as processed cheese, where citrate and phosphate anions contained in emulsifying salts (Chap.12) suppress perceived saltiness contributed by sodium ions. Similarly, soapy tastes caused by sodium salts of long-chain fattyacids (IX) and detergents or long-chain sulfates (X) result from specific tastes elicited by the anions, and these tastes cancompletely mask the taste of the cation.
The most acceptable model for describing the mechanism of salty taste perception involves the interaction of hydrated cation-anion complexes [4] with AH/B-type receptor sites (discussed earlier). The individual structures of such complexes varysubstantially, so that both water OH groups and salt anions or cations associate with receptor sites.
Similarly, the perception of sour compounds is believed to involve an AH/B- type receptor site [4]. However, data are notsufficient to determine whether hydronium ions (H3O+), dissociated inorganic or organic anions, or nondissociated molecularspecies are most influential in the sour response. Contrary to popular belief, the acid strength in a solution does not appear to bethe major determinant of the sour sensation; rather, other poorly understood molecular features appear to be of primaryimportance (e.g., molecular weight, size, and overall polarity).
11.2.2 Flavor Enhancers
Compounds eliciting this unique effect have been utilized by humans since the inception of food cooking and preparation, but theactual mechanism of flavor enhancement remains largely a mystery. These substances contribute a delicious or umami taste tofoods when used at levels in excess of their independent detection threshold, and they simply enhance flavors at levels belowtheir independent detection thresholds. Their effects are prominent and desirable in the flavors of vegetables, dairy products,meats, poultry, fish, and other seafoods. The best known members of this group of substances are the 5' -ribonucleotides, ofwhich 5' -inosine monophosphate or 5' -IMP (XI) serves as a suitable example, and monosodium L-glutamate (MSG) (XII).

Pag e 735
D-Glutamate and the 2'- or the 3'-ribonucleotides do not exhibit flavor enhancing activity. Although MSG and 5'-IMP and 5'-guanosine monophosphate are the only flavor enhancers used commercially, 5'-xanthine monophosphate and a few naturalamino acids, including L-ibotenic acid and L-tricholomic acid, are potential candidates for commercial use [74]. Much of theflavor contributed to foods by yeast hydrolysates results from the 5'-ribonucleotides present. Large amounts of purified flavorenhancers employed in the food industry are derived from microbial sources, including phosphorylated (in vitro) nucleosidesderived from RNA [37].
Several synthetic derivatives of the 5' -ribonucleotides have strong flavor-enhancing properties [37]. Generally, these derivativeshave substitutions on the purine moiety in the 2-position. The strong dependence of flavor-enhancement activity on specificstructural characteristics suggests the involvement of a receptor site for these substances, or possible a joint occupancy ofreceptor sites usually involved in perception of sweet, sour, salty, and bitter sensations. It is well documented that a synergisticinteraction occurs between MSG and the 5' -ribonucleotides in providing both the umami taste and in enhancing flavors. Thissuggests that some common structural features exist among active compounds. Undoubtedly, efforts will remain concentrated ongaining an understanding of the fundamental mechanisms involved in this extremely important component of taste.
Although most attention has been directed toward the 5' -ribonucleotides and MSG, other flavor-enhancing compounds havebeen claimed to exist. Maltol and ethyl maltol are worthy of mention because they are used commercially as flavor enhancers forsweet goods and fruits. At high concentrations maltol possesses a pleasant, burnt caramel aroma. It provides a smooth, velvetysensation to fruit juices when it is employed in concentrations of about 50 ppm. Maltol belongs to a group of unique compoundsthat exist in a planar enolone form [52]. The planar enolone is completely favored over the cyclic diketone form because theenolone form allows strong intramolecular H-bonding to occur (Eq. 3).
(3)
Maltol and ethyl maltol (-C2H5 instead of -CH3 on the ring) both could fit the AH/B portion of the sweet receptor (Fig. 1), butethyl maltol is more effective as a sweetness enhancer than maltol. Maltol lowers the detection threshold concentration forsucrose by a factor of two. The actual mechanism for the enhancing effects of these compounds is unknown. Similar compoundsof this type are derived naturally from browning reactions and are noted later in the chapter in the section on the development of“reaction” flavors.
Excellent discussions on flavor enhancement can be found in several reviews [37, 74].
11.2.3 Astringency
Astringency is a taste-related phenomenon, perceived as a dry feeling in the mouth along with a coarse puckering of the oraltissue [39]. Astringency usually involves the association of tannins
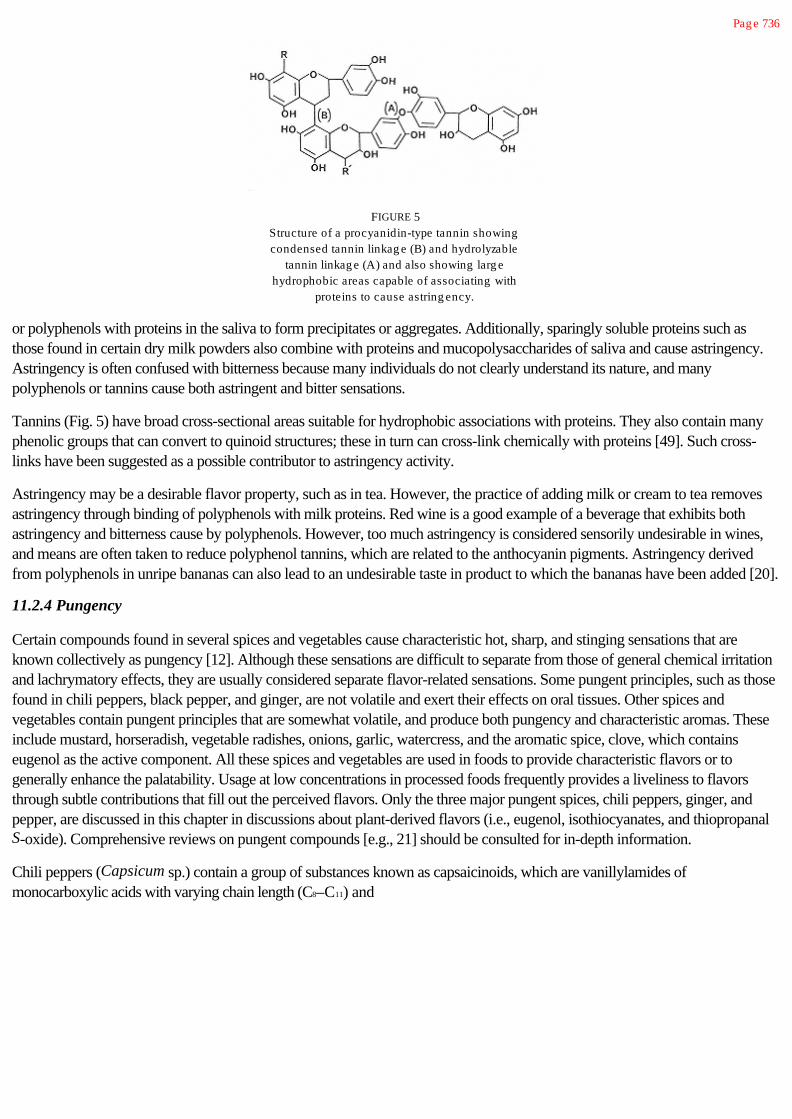
Pag e 736
FIGURE 5Structure of a procyanidin-type tannin showingcondensed tannin linkag e (B) and hydrolyzable
tannin linkag e (A) and also showing larg ehydrophobic areas capable of associating with
proteins to cause astring ency.
or polyphenols with proteins in the saliva to form precipitates or aggregates. Additionally, sparingly soluble proteins such asthose found in certain dry milk powders also combine with proteins and mucopolysaccharides of saliva and cause astringency.Astringency is often confused with bitterness because many individuals do not clearly understand its nature, and manypolyphenols or tannins cause both astringent and bitter sensations.
Tannins (Fig. 5) have broad cross-sectional areas suitable for hydrophobic associations with proteins. They also contain manyphenolic groups that can convert to quinoid structures; these in turn can cross-link chemically with proteins [49]. Such cross-links have been suggested as a possible contributor to astringency activity.
Astringency may be a desirable flavor property, such as in tea. However, the practice of adding milk or cream to tea removesastringency through binding of polyphenols with milk proteins. Red wine is a good example of a beverage that exhibits bothastringency and bitterness cause by polyphenols. However, too much astringency is considered sensorily undesirable in wines,and means are often taken to reduce polyphenol tannins, which are related to the anthocyanin pigments. Astringency derivedfrom polyphenols in unripe bananas can also lead to an undesirable taste in product to which the bananas have been added [20].
11.2.4 Pungency
Certain compounds found in several spices and vegetables cause characteristic hot, sharp, and stinging sensations that areknown collectively as pungency [12]. Although these sensations are difficult to separate from those of general chemical irritationand lachrymatory effects, they are usually considered separate flavor-related sensations. Some pungent principles, such as thosefound in chili peppers, black pepper, and ginger, are not volatile and exert their effects on oral tissues. Other spices andvegetables contain pungent principles that are somewhat volatile, and produce both pungency and characteristic aromas. Theseinclude mustard, horseradish, vegetable radishes, onions, garlic, watercress, and the aromatic spice, clove, which containseugenol as the active component. All these spices and vegetables are used in foods to provide characteristic flavors or togenerally enhance the palatability. Usage at low concentrations in processed foods frequently provides a liveliness to flavorsthrough subtle contributions that fill out the perceived flavors. Only the three major pungent spices, chili peppers, ginger, andpepper, are discussed in this chapter in discussions about plant-derived flavors (i.e., eugenol, isothiocyanates, and thiopropanalS-oxide). Comprehensive reviews on pungent compounds [e.g., 21] should be consulted for in-depth information.
Chili peppers (Capsicum sp.) contain a group of substances known as capsaicinoids, which are vanillylamides ofmonocarboxylic acids with varying chain length (C8–C11) and

Pag e 737
unsaturation. Capsaicin (XIII) is representative of these pungent principles. Several capsaicinoids containing
saturated straight-chain acid components are synthesized as substitutes for natural chili extractives or oleorisins. The totalcapsaicinoid content of world Capsicum species vary widely [21]; for example, red pepper contains 0.06%, cayenne redpepper, 0.2%, Sannam (India), 0.3%, Uganda (Africa), 0.85%. Sweet paprika contains a very low concentration of pungentcompounds and is used mainly for its coloring effects and subtle flavor. Chili peppers also contain volatile aroma compounds thatbecome part of the overall flavor of foods seasoned with them.
Black and white pepper are made from the berries of Piper nigrum, and differ only in that black pepper is prepared fromimmature, green berries and white pepper is made from more mature berries usually harvested at the time they are changing fromgreen to yellow in color, but before they become red. The principal pungent compound in pepper is piperine (XIV), an amide.The trans geometry of the alkyl unsaturation is necessary for strong pungency, and loss of
pungency during exposure to light and storage is attributed mainly to isomerizations of these double bonds [21]. Pepper alsocontains volatile compounds, including 1-formylpiperdine and piperonal (heliotropin), which contribute to flavors of foodsseasoned with pepper spice or oleoresins. Piperine is also synthesized for use in flavoring foods.
Ginger is a spice derived from the rhizome of a tuberous perennial, Zingiber officinale Roscoe, and it possesses pungentprinciples as well as some volatile aroma constituents. The pungency of fresh ginger is caused by a group of phenylalkyl ketonescalled gingerols, and [6]-gingerol (XV) is most active of these compounds. Gingerols vary in chain length (C5–C9)
external to the hydroxyl substituted C atom. During drying and storage gingerols tend to dehydrate to form an external doublebond that is in conjugation with the keto group. The reaction results in a group of compounds known as shogoals, which areeven more potent than the gingerols. Exposure of [6]-gingerol to an elevated temperature leads to cleavage of the alkyl chainexternal to the keto group, yielding a methyl ketone, zingerone, which exhibits only mild pungency.
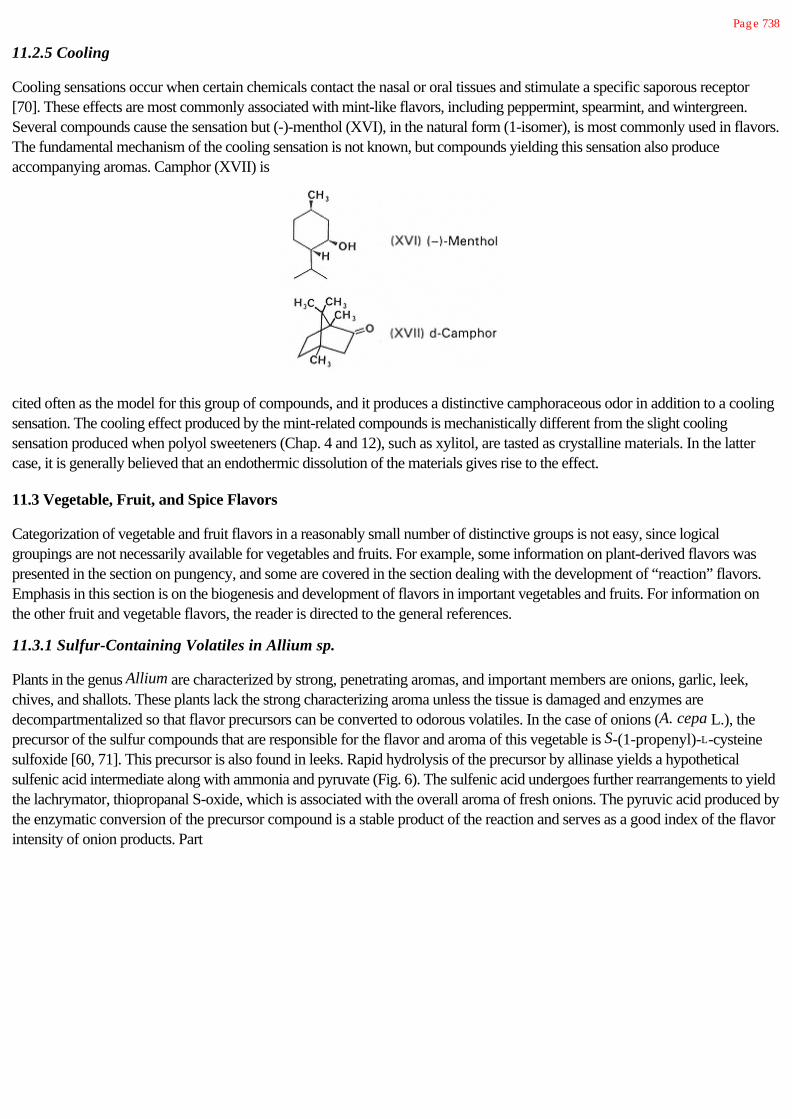
Pag e 738
11.2.5 Cooling
Cooling sensations occur when certain chemicals contact the nasal or oral tissues and stimulate a specific saporous receptor[70]. These effects are most commonly associated with mint-like flavors, including peppermint, spearmint, and wintergreen.Several compounds cause the sensation but (-)-menthol (XVI), in the natural form (1-isomer), is most commonly used in flavors.The fundamental mechanism of the cooling sensation is not known, but compounds yielding this sensation also produceaccompanying aromas. Camphor (XVII) is
cited often as the model for this group of compounds, and it produces a distinctive camphoraceous odor in addition to a coolingsensation. The cooling effect produced by the mint-related compounds is mechanistically different from the slight coolingsensation produced when polyol sweeteners (Chap. 4 and 12), such as xylitol, are tasted as crystalline materials. In the lattercase, it is generally believed that an endothermic dissolution of the materials gives rise to the effect.
11.3 Vegetable, Fruit, and Spice Flavors
Categorization of vegetable and fruit flavors in a reasonably small number of distinctive groups is not easy, since logicalgroupings are not necessarily available for vegetables and fruits. For example, some information on plant-derived flavors waspresented in the section on pungency, and some are covered in the section dealing with the development of “reaction” flavors.Emphasis in this section is on the biogenesis and development of flavors in important vegetables and fruits. For information onthe other fruit and vegetable flavors, the reader is directed to the general references.
11.3.1 Sulfur-Containing Volatiles in Allium sp.
Plants in the genus Allium are characterized by strong, penetrating aromas, and important members are onions, garlic, leek,chives, and shallots. These plants lack the strong characterizing aroma unless the tissue is damaged and enzymes aredecompartmentalized so that flavor precursors can be converted to odorous volatiles. In the case of onions (A. cepa L.), theprecursor of the sulfur compounds that are responsible for the flavor and aroma of this vegetable is S-(1-propenyl)-L-cysteinesulfoxide [60, 71]. This precursor is also found in leeks. Rapid hydrolysis of the precursor by allinase yields a hypotheticalsulfenic acid intermediate along with ammonia and pyruvate (Fig. 6). The sulfenic acid undergoes further rearrangements to yieldthe lachrymator, thiopropanal S-oxide, which is associated with the overall aroma of fresh onions. The pyruvic acid produced bythe enzymatic conversion of the precursor compound is a stable product of the reaction and serves as a good index of the flavorintensity of onion products. Part

Pag e 739
FIGURE 6Reactions involved in the formation of onion flavor (chem. =
nonenzymic).
of the unstable sulfenic acid also rearranges and decomposes to a rather large number of compounds in the classes ofmercaptans, disulfides, trisulfides, and thiophenes. These compounds also comprise the flavor substances which provide cookedonion flavors.
The flavor of garlic (Allium sativum L.) is formed by the same general type of mechanism that functions in onion, except that theprecursor is S-(2-propenyl)-L-cysteine sulfoxide [60]. Diallyl thiosulfinate (allicin) (Fig. 7) contributes to flavor of garlic, and anS-oxide lachyramator similar to that formed in onion is not formed. The thiosulfinate flavor compound of garlic decomposes andrearranges in much the same manner as indicated for the sulfenic acid of onion (Fig. 6). This results in methyl allyl and diallyldisulfides and other principles in garlic oil and cooked garlic flavors.
11.3.2 Sulfur-Containing Volatiles in the Cruciferae
The Cruciferae family contains Brassica plants such as cabbage (Brassica oleracea capitata L.), brussel sprouts (Brassicaoleracea var. gemmifera L.), turnips (Brassica rapa var. rapa L.), and brown mustard (Brassica juncea Coss.), as well aswatercress (Nasturtium officinale R. Br.), radishes (Raphanus sativus L.), and horseradish (Armoracia lapathifolia Gilib).As noted in the discussion about pungent compounds, the active pungent principles in the Cruciferae are also volatile andtherefore contribute to characteristic aromas. Further, the pungency sensation frequently involves irritation sensations, particularlyin the nasal cavity, and lachrymatory effects. The flavor compounds in these plants are formed through enzymic processes indisrupted tissues and through cooking. The fresh flavors of the disrupted tissue are caused mainly by isothio-
FIGURE 7Formation of the principal fresh g arlic flavor compounds.
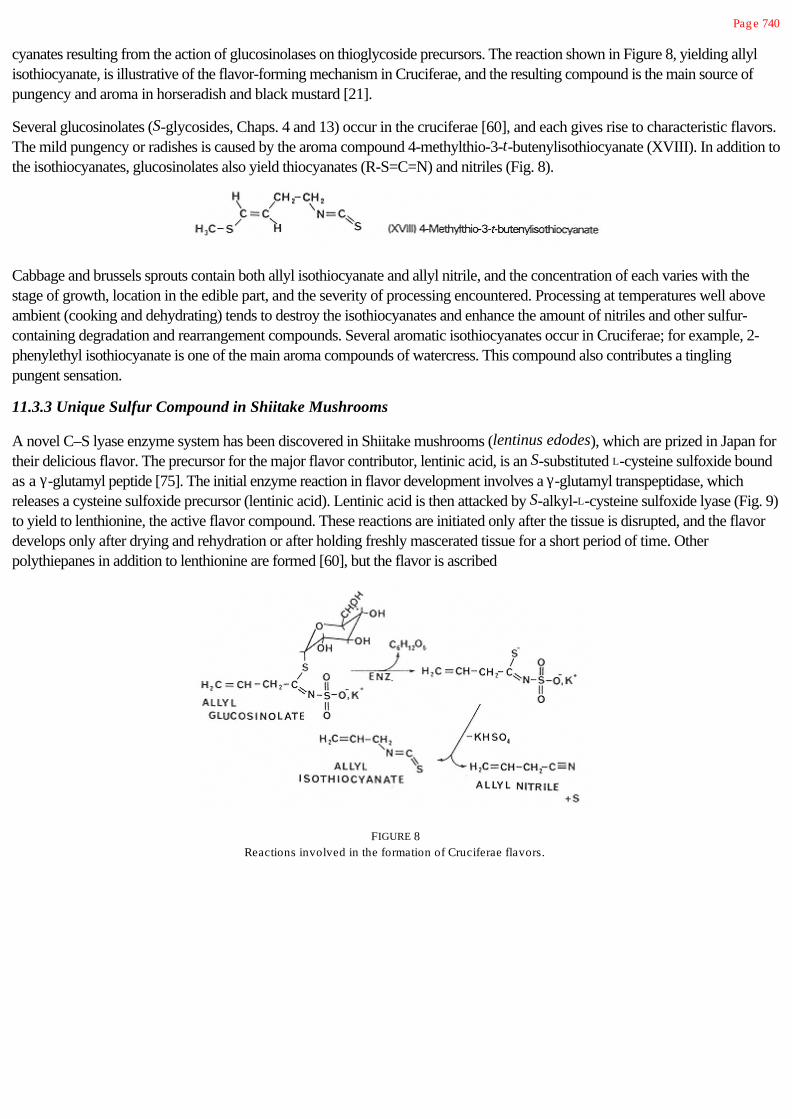
Pag e 740
cyanates resulting from the action of glucosinolases on thioglycoside precursors. The reaction shown in Figure 8, yielding allylisothiocyanate, is illustrative of the flavor-forming mechanism in Cruciferae, and the resulting compound is the main source ofpungency and aroma in horseradish and black mustard [21].
Several glucosinolates (S-glycosides, Chaps. 4 and 13) occur in the cruciferae [60], and each gives rise to characteristic flavors.The mild pungency or radishes is caused by the aroma compound 4-methylthio-3-t-butenylisothiocyanate (XVIII). In addition tothe isothiocyanates, glucosinolates also yield thiocyanates (R-S=C=N) and nitriles (Fig. 8).
Cabbage and brussels sprouts contain both allyl isothiocyanate and allyl nitrile, and the concentration of each varies with thestage of growth, location in the edible part, and the severity of processing encountered. Processing at temperatures well aboveambient (cooking and dehydrating) tends to destroy the isothiocyanates and enhance the amount of nitriles and other sulfur-containing degradation and rearrangement compounds. Several aromatic isothiocyanates occur in Cruciferae; for example, 2-phenylethyl isothiocyanate is one of the main aroma compounds of watercress. This compound also contributes a tinglingpungent sensation.
11.3.3 Unique Sulfur Compound in Shiitake Mushrooms
A novel C–S lyase enzyme system has been discovered in Shiitake mushrooms (lentinus edodes), which are prized in Japan fortheir delicious flavor. The precursor for the major flavor contributor, lentinic acid, is an S-substituted L-cysteine sulfoxide boundas a g-glutamyl peptide [75]. The initial enzyme reaction in flavor development involves a g-glutamyl transpeptidase, whichreleases a cysteine sulfoxide precursor (lentinic acid). Lentinic acid is then attacked by S-alkyl-L-cysteine sulfoxide lyase (Fig. 9)to yield to lenthionine, the active flavor compound. These reactions are initiated only after the tissue is disrupted, and the flavordevelops only after drying and rehydration or after holding freshly mascerated tissue for a short period of time. Otherpolythiepanes in addition to lenthionine are formed [60], but the flavor is ascribed
FIGURE 8Reactions involved in the formation of Cruciferae flavors.

Pag e 741
FIGURE 9Formation of lenthionine in Shiitake mushrooms (chem. = nonenzymic).
to lenthionine. Flavor roles for other mixed-atom polysulfides with related structural features, remain largely unexplored.
11.3.4 Methoxy Alkyl Pyrazine Volatiles in Vegetables
Many fresh vegetables exhibit green-earthy aromas that contribute strongly to their recognition, and it has been found that themethoxy alkyl pyrazines are frequently responsible for this property [71]. These compounds have unusually potent andpenetrating odors, and they provide vegetables with strong identifying aromas. 2-Methoxy-3-isobutylpyrazine was the first ofthis class discovered, and it exhibits a powerful bell pepper aroma detectable at a threshold level of 0.002 ppb. Much of thearoma of raw potatoes and green pea pods is contributed by 2-methoxy-3-isopropyl pyrazine, and 2-methoxy-3-s-butylpyrazine contributes to the aroma of raw red beet roots. These compounds arise biosynthetically in plants, and some strainsof microorganisms (Pseudomonas perolens and Pseudomonas tetrolens) also actively produce these unique substances [44].Branched-chain amino acids serve as precursors for methoxy alkyl pyrazine volatiles, and the mechanistic scheme shown inFigure 10 has been proposed.
11.3.5 Enzymically Derived Volatiles from Fatty Acids
Enzymically generated compounds derived from long-chain fatty acids play an extremely important role in the characteristicflavors of fruits and vegetables. In addition, these types of reactions can lead to important off flavors, such as those associatedwith processed soybean proteins. Further information about these reactions can be found in the discussions about lipids (Chap.5) and enzymes (Chap. 7).
FIGURE 10Proposed enzymatic scheme for the formation of methoxy alkyl pyrazines.

Pag e 742
11.3.5.1 Lipoxygenase-Derived Flavors in Plants
In plant tissues, enzyme-induced oxidative breakdown of unsaturated fatty acids occurs extensively, and this yields characteristicaromas associated with some ripening fruits and disrupted tissues [16]. In contrast to the random production of lipid-derivedflavor compounds by purely autoxidizing systems, very distinctive flavors occur when the compounds produced are enzymedetermined. The specificity for flavor compounds is illustrated in Figure 11, where the production of 2-t-hexenal and 2-t,6-c-nonadienal by site-specific hydroperoxidation of a fatty acid is dictated by a lipoxygenase and a subsequent lyase cleavagereaction. Upon cleavage of the fatty acid molecule, oxoacids are also formed, but they do not appear to influence flavors.Decompartmentalization of enzymes is required to initiate this and other reactions, and since successive reactions occur, overallaromas change with time. For example, the lipoxygenase-derived aldehydes and ketones are converted to correspondingalcohols (Fig. 12), which usually have higher detection thresholds and heavier aromas than the parent carbonyl compounds.Although not shown, cis-trans isomerases are also present that convert cis-3 bonds to trans-2 isomers. Generally, C6
compounds yield green plant-like aromas like fresh-cut grass, C9 compounds smell like cucumbers and melons, and C8
compounds smell like mushrooms or violet and geranium leaves [67]. The C6 and C9 compounds are primary alcohols andaldehydes; the C8 compounds are secondary alcohols and ketones.
11.3.5.2 Volatiles from b -Oxidation of Long-Chain Fatty Acids
The development of pleasant, fruity aromas is associated with the ripening of pears, peaches, apricots, and other fruits, and thesearomas are frequently dominated by medium chain-length (C6–C12) volatiles derived from long-chain fatty acids by b-oxidation[68]. The formation of ethyl deca-2-t, 4-c-dienoate by this means is illustrated in Figure 13. This ester is the impact orcharacterizing aroma compound in the Bartlett pear. Although not included in the figure, hydroxy acids (C8–C12) are alsoformed through this process, and they cyclize to yield g and d-lactones. Similar reactions occur during degradation of milk fat,and these reactions are discussed in more detail in Section 11.5. The C8–C12 lactones possess distinct coconut-like and peach-like aromas characteristic of these respective fruits.
11.3.6 Volatiles from Branched-Chain Amino Acids
Branched-chain amino acids serve as important flavor precursors for the biosynthesis of compounds associated with someripening fruits. Bananas and apples are particularly good
FIGURE 11Formation of lipoxyg enase-directed aldehydes fromlinolenic acid: (A) important in fresh tomatoes; (B)
important in cucumbers.

Pag e 743
FIGURE 12Conversion of aldehyde to alcohol resulting in subtle flavor
modification.
examples for this process because much of the ripe flavor of each is caused by volatiles from amino acids [68]. The initialreaction involved in flavor formation (Fig. 14) is sometimes referred to as enzymic Strecker degradation because transaminationand decarboxylation occur that are parallel to those occuring during non-enzymatic browning. Several microorganisms, includingyeast and malty flavor-producing strains of Streptoccus lactis, can also modify most of the amino acids in a fashion similar tothat shown in Figure 14. Plants can also produce similar derivatives from amino acids other than leucine, and the occurrence of2-phenethanol with a rose- or lilac-like aroma in blossoms is attributed to these reactions.
Although the aldehydes, alcohols, and acids from these reactions contribute directly to the flavors of ripening fruits, the esters arethe dominant character-impact compounds. It has long been known that isoamyl acetate is important in banana flavor, but othercompounds are also required to give full banana flavor. Ethyl 2-methylbutyrate is even more apple-like than ethyl 3-methylbutyrate, and is the dominant note in the aroma of ripe Delicious apples.
11.3.7 Flavors Derived from the Shikimic Acid Pathway
In biosynthetic systems, the shikimic acid pathway provides the aromatic portion of compounds related to shikimic acid, and thepathway is best known in its role in the production of phenylalanine and the aromatic amino acids. In addition to flavorcompounds derived from aromatic amino acids, the shikimic acid pathway provides other volatile compounds that are frequentlyassociated with essential oils (Fig. 15). It also provides the phenyl propanoid skeleton to lignin polymers that are the mainstructural elements of plants. As indicated in Figure 15, lignin yields many phenols during pyrolysis [72], and the characteristicaroma of smokes used in foods is largely caused by compounds developed from precursors in the shikimic acid pathway.
Also apparent from Figure 15 is that vanillin, the most important characterizing compound in vanilla extracts, can be obtained viathis pathway or as a lignin by-product during processing of wood pulp and paper. Vanillin is also biochemically synthesized inthe vanilla bean, where it initially is present largely as vanillin glucoside until the glycoside is hydrolyzed during fermentation. Themethoxylated aromatic rings of the pungent principles in ginger, pepper, and
FIGURE 13Formation of a key aroma substance in pears throug h b-oxidation of
linoleic acid followed by esterification.

Pag e 744
FIGURE 14Enzymatic conversion of leucine to volatiles illustrating the aroma
compounds formed from amino acids in ripening fruits.
FIGURE 15Some important flavor compounds derived from shikimic acid pathway
precursors (chem. = nonenzymic).

Pag e 745
chili peppers, discussed earlier in this chapter, also contain the essential features of those compounds in Figure 15. Cinnamylalcohol is an aroma constitutent of cinnamon spice, and eugenol is the principal aroma and pungency element in cloves.
11.3.8 Volatile Terpenoids in Flavors
Because of the abundance of terpenes in plant materials used in the essential oil and perfumery industries, their importance inother plant-associated flavors is sometimes underestimated. They are largely responsible, however, for the flavors of citrus fruitsand many seasonings and herbs. Terpenes are present in low concentrations in several fruits, and are responsible for much of theflavor of raw carrot roots. Terpenes are biosynthesized through the isoprenoid (C5) paths (Fig. 16), and monoterpenes contain10 C atoms; the sesquiterpenes contain 15 C atoms.
Sesquiterpenes are also important characterizing aroma compounds, and b-sinensal (XIX) and nootkatone (XX) serve as goodexamples because they provide characterizing flavors to oranges and grapefruit, respectively. The diterpenes (C20) are too largeand nonvolatile to contribute directly to aromas.
Terpenes frequently possess extremely strong character-impact properties, and many can be easily identified by oneexperienced with natural product aromas. Optical isomers of terpenes,
FIGURE 16Generalized isoprenoid scheme for the biosynthesis of monoterpenes.

Pag e 746
as well as optical isomers of other nonterpenoid compounds, can exhibit extremely different odor qualities [10, 36]. In the caseof terpenes, the carvones have been studied extensively from this perspective, and the aroma of d-carvone [4S-(+)carvone](XXI) has the characteristic aroma of caraway spice; l-carvone [4R-(-)carvone] (XXII) possesses a strong, characteristicspearmint aroma. Studies on such pairs of compounds are of interest since they provide information on the fundamental processof olfaction and structure-activity relationships for molecules.
11.3.9 Citrus Flavors
Citrus flavors are among the most popular fresh fruits as well as flavors for beverages, and most information about the flavorchemistry of natural citrus flavors stems from research on processed juices, peel essential oils, essential oils, and aqueousessences used to flavor juice products. Several classes of flavor components serve as major contributors to citrus flavors,including terpenes, aldehydes, esters, and alcohols, and large numbers of volatile compounds have been identified in the variousextracts from each citrus fruit [61]. However, the important flavor compounds, including character-impact compounds, for citrusfruits generally are limited to relatively few, and those considered important to some major citrus fruits are shown in Table 2.
The flavors of orange and mandarin (tangerine is used interchangeably with mandarin in the United States) are delicate, and quiteeasily changed. As can be noted from Table 2, relatively few aldehydes and terpenes are considered essential for these flavors,although a large number of other compounds are present. Both a- and b-sinensal (XIX) are present in orange and mandarinflavors, and a-sinensal is considered especially important to providing a ripe orange-
TABLE 2 Some Volatile Compounds Considered Important in Citrus Flavors
Orang e Mandarin Grapefruit Lemon
Ethanal Ethanal Ethanal Neral
Octanal Octanal Decanal Geranial
Nonanal Decanal Ethyl acetate b-Pinene
Citral a-Sinensal Methyl butanoate Geraniol
Ethyl butanoate g-Terpinene Ethyl butanoate Geranyl acetate
d-Limonene b-Pinene d-Limonene Neryl acetate
a-Pinene Thymol Nootkatone Berg amotene
Methyl-N-methylanthranilate
1-p-Menthene-8-thiol Caryophyllene
Carvyl ethyl etherLinalyl ethyl etherFenchyl ethyl etherMethyl epijasmonate
Source: From Ref. 61.

Pag e 747
citrus flavor to mandarin flavors. Grapefruit contains two character-impact compounds, nootkatone (XX) and 1-p-methene-8-thiol, that provide much of the easily recognized flavor to this fruit. Nootkatone is used extensively to provide artificial grapefruitflavor, and p-menthene-8-thiol is one of a few sulfur compounds that are influential in citrus flavors.
Lemon flavor requires contributions from a large number of important compounds, and lemon flavors benefit from the present ofseveral terpene ethers. Similarly, the number of essential compounds in lime flavor is large, and two types of lime oil arecommonly used. The major lime oil in commerce is distilled Mexican lime oil, which possesses a harsh, strong lime flavor that ispopular in lemon-lime and cola soft drinks. Cold-pressed Persian lime oil and centrifuged Mexican lime oils are becoming morepopular because they possess a more natural flavor. The less rigorous processing involved in cold-pressing and centrifugation,compared to distillation, results in the survival of some of the more sensitive but important fresh lime flavor compounds. Forexample, citral, which has a desirable more fresh aroma, is degraded to p-cymene and a-p-dimethylstyrene, which have harshflavors, under acidic distillation conditions, and this leads to the more harsh flavors of distilled lime oil [61].
Citrus essential oils, or flavor extracts containing terpenes, can be separated into non oxygenated (hydrocarbon) and oxygenatedfractions using silicic acid chromatography and nonpolar and polar solvent elutions, respectively. Terpeneless orange oil, forexample, contains principally the oxygenated terpenes, aldehydes, and alcohols, that have been recovered from orange oils.Oxygenated fractions are frequently more desired in flavors than nonoxygenated fractions.
11.3.10 Flavors of Herbs and Spices
Although some variations occur between industrial and the various domestic and international regulatory agencies regardingdefinitions, spices and herbs are known and regulated as spices and condiments, which are natural vegetable products used forflavoring, seasoning, and imparting aroma to foods. The U. S. Food and Drug Administration excludes alliaceous products, suchas onions and garlic, from classification as spices, but international and industrial spice classifications commonly include thesematerials. The term condiments has been retained in regulatory definitions, and is defined as something to enhance the flavor offood, or a pungent seasoning. It has been argued that the term should be dropped from usage, but some favor retention of theterm for certain situations. However, the term generally does not provide a basis for inclusion in classification schemes foraromatic plant materials.
In some botanically based classification schemes, culinary herbs are separated from spices, and include such aromatic, soft-stemmed plants as basil, marjoram, mints, oregano, rosemary, and thyme, as well as aromatic shrub (sage) and tree (laurel)leaves. In such classifications, spices comprise all other aromatic plant materials used in the flavoring or seasoning of foods. Suchspices generally lack chlorophyll, and include rhizomes or roots (ginger), barks (cinnamon), flower buds (cloves), fruits (dill,pepper) and seeds (nutmeg, mustard).
Spices and herbs have been used since antiquity for adding savoriness, tanginess, and zestiness, as well as characterizing flavorsto foods and beverages. Some also have been used extensively in perfumery and for medicinal purposes, and many exhibitantioxidant or microbial inhibitory effects. While many herbs and spices exist throughout the world, some of which are used forperfumery and herbal medicines, only about 70 are officially recognized as useful ingredients for foods. However, the flavorcharacteristics often vary for a given spice depending on location of growth and genetic variations; thus this group provides awide range of flavors for foods. Here, only those spices and herbs that are commonly used in the food industry for flavoring areconsidered.
Spices generally are derived from tropical plants, while herbs are generally derived from subtropical or nontropical plants.Spices also generally contain high concentrations of phenyl-

Pag e 748
propanoids from the shikimic acid pathway (e.g., eugenol in cloves; XXIII), herbs generally contain higher concentrations of p-menthanoids from terpene biosynthesis (e.g, menthol in peppermint; XXIV).
Typically, spices and herbs contain a large number of volatile compounds, but in most instances certain compounds, eitherabundant or minor volatile constituents, provide character-impact aromas and flavor to the material. Important flavor compoundsfound in the principal herbs and spices used by the food industry are summarized in Tables 3 and 4, respectively. Successfulapplications of herbs and spices in foods and beverages require either a personal knowledge of the materials or knowledge ofthe dominant and subtle flavor notes provided by flavor chemicals. Evaluation of the important flavor compounds listed in Table3 and 4 for spices and herbs shows which spices and herbs provide related flavors, and also indicates the type of flavors
TABLE 3 Important Flavor Compounds Found in Some Culinary Herbs Commonly Used for Flavoring inthe Food Industry
Herbs Plant part Important flavor compounds
Basil, sweet Leaves Methylchavicol, linalool, methyl eug enol
Bay laurel Leaves 1,8-Cineole
Marjoram Leaves, flowers c- and t-Sabinene hydrates, terpinen-4-ol
Oreg ano Leaves, flowers Carvacrol, thymol
Orig anum Leaves Thymol, carvacrol
Rosemary Leaves Verbenone, 1,8-cineole, camphor, linalool
Sag e, clary Leaves Salvial-4(14)-en-1-one, linalool
Sag e, Dalmation Leaves Thujone, 1,8-cineole, camphor
Sag e, Spanish Leaves c- and t-Sabinyl acetate, 1,8-cineole, camphor
Savory Leaves Carvacrol
Tarrag on Leaves Methyl chavicol, anethole
Thyme Leaves Thymol, carvacrol
Peppermint Leaves l-Menthol, menthone, menthofuran
Spearmint Leaves l-Carvone, carvone derivatives
Source: From Refs. 10 and 54.

Pag e 749
TABLE 4 Important Flavor Compounds Found in Some Spices Commonly Used for Flavoring inthe Food Industry
Spice Plant part Important flavor compounds
Allspice (pimento) Berry, leaves Eug enol, b-caryophyllene
Anise Fruit (E)-Anethole, methyl chavicol
Capsicum peppers Fruit Capsaicin, dihydrocapsaicin
Caraway Fruit d-Carvone, carvone derivatives
Cardamom Fruit a-Terpinylacetate, 1,8-cineole, linalool
Cinnamon, cassia Bark, leaves Cinnamaldehyde, eug enol
Clove Flower bud Eug enol, eug enylacetate
Coriander Fruit d-Linalool, C 10–C14 2-alkenals
Cumin Fruit Cuminaldehyde, p-1,3-menthadienal
Dill Fruit, leaves d-Carvone
Fennel Fennel (E)-Anethole, fenchone
Ging er Rhizome Ging erol, shog aol, neral, g eranial
Mace Aril a-Pinene, sabinene, 1-terpenin-4-ol
Mustard Seed Allyl isothiocyanate
Nutmeg Seed Sabinine, a-pinene, myristicin
Parsley Leaves, seed Apiol
Pepper Fruit Piperine, d-3-carene, b-carophyllene
Saffron Stigma Safranal
Turmeric Rhizome Turmerone, zing eriberene, 1,8-cineole
Vanilla Fruit, seed Vanillin, p-OH-benzyl methyl ether
Source: From Refs. 10 and 54.
to be expected from their usage. Still, it must be remembered that a large number of compounds of lesser influence are presentand also contribute to the unique flavors of herbs and spices.
11.4 Flavors from Lactic Acid-Ethanol Fermentations
Involvement of microorganisms in flavor production is extensive, but often their specific or definitive role in the flavor chemistryof fermentations is not well known or the flavor compounds do not have great character impact. Much attention has been givento cheese flavor, but apart from the distinctive flavor properties given by certain sulfur compounds to surface-ripened cheeses,microbially derived flavor compounds cannot be classified in the character-impact category. Similarly, yeast fermentations,carried out extensively for beer, wines, spirits, and yeast-leavened breads, do not appear to yield strong, distinctive character-impact flavor compounds. Ethanol in alcoholic beverages, however, should be considered as having character impact.
The primary fermentation products of heterofermentative lactic acid bacteria (e.g., Leuconostoc citrovorum) are summarized inFigure 17, and the combination of acetic acid, diacetyl, and acetaldehyde provides much of the characteristic aroma of culturedbutter and buttermilk. Homofermentative lactic acid bacteria (e.g., Lactococcus lactis, Streptococcus thermophilus) produceonly lactic acid, acetaldehyde, and ethanol in milk cultures. Acetaldehyde is the character-impact compound found in yogurt, aproduct prepared by a homofermentative process.


Pag e 750
FIGURE 17Principal volatile fermentation products from
heterofermentative lactic acid bacterial metabolism.
Diacetyl is the character-impact compound in most mixed-strain lactic fermentations, and has become universally known as adairy or butter-type flavorant. Lactic acid contributes sourness to cultured or fermented dairy products. Acetoin, althoughessentially odorless, can undergo oxidation to diacetyl.
Viewed in general terms, lactic acid bacteria produce very little ethanol (parts per million levels), and they use pyruvate as theprincipal final H receptor in metabolism. On the other hand, yeast produce ethanol as a major end product of metabolism. Maltystrains of Streptococcus lactis and all brewer's yeast (Saccharomyces cerevisiae, Saccharomyces carlsbergensis) alsoactively convert amino acids to volatile compounds through transaminations and decarboxylations (Figure 18). These reactionsare analogous to those discussed for branched-chain amino acids in Section 11.3.6. However, these organisms tend to producemainly the reduced forms of the derivative (alcohols), although some oxidized compounds (aldehydes and acids) also appear.Wine and beer flavors, which can be ascribed directly to fermentations, involve complex mixtures of these volatiles andinteraction products of these compounds with ethanol, such as mixed esters and acetals. These mixtures give rise to familiaryeasty and fruity flavors associated with fermented beverages.
FIGURE 18Enzymatic formation of volatiles from amino acids by microorg anisms
using phenylalanine as a model precursor compound.

Pag e 751
11.5 Flavor Volatiles from Fats and Oils
Fats and oils are notorious for their role in the development of off flavors through autoxidation and the chemistry of lipid-derivedflavors has been well summarized [23, 33]. Details of lipid autoxidation and other degradations are also presented in Chapter 5.Aldehydes and ketones are the main volatiles from autoxidation, and these compounds can cause painty, fatty, metallic, papery,and candle-like flavors in foods when their concentrations are sufficiently high. However, many of the desirable flavors ofcooked and processed foods derive from modest concentrations of these compounds.
Hydrolysis of plant acyglycerols and animal depot fats leads mainly to the formation of potentially soapy-tasting fatty acids.Milkfat, on the other hand, serves as a rich source of volatile flavor compounds that are influential in the flavor of dairy productsand foods prepared with milkfat or butter. The classes of volatiles obtained by hydrolysis of milkfat are shown in Figure 19, withspecific compounds selected to illustrate each class. The even C-numbered, short-chain fatty acids (C4–C12) are extremelyimportant in the flavor of cheese and other dairy products, with butyric acid being the most potent and influential of the group.Hydrolysis of hydroxy fatty acids leads to the formation of lactones, which provide desirable coconut-like or peach-like flavornotes to baked goods, but cause staling in stored, sterile concentrated milks. Methyl ketones are produced from b-ketoacids byheating after hydrolysis, and they contribute to the flavor of dairy products in much the same manner as the lactones. In blue-mold cheeses, however, methyl ketones are much more abundantly produced by the metabolic activities of Penicilliumroquefort on fatty acids than by the conversion of those bound in acylglycerols.
Although hydrolysis of fats other than milkfat does not yield distinct flavors as noted earlier, animal fats are believed to beinextricably involved in the species-related flavors of meats. The role of lipids in determining species-related aspects of meatflavors is discussed in the next section.
11.6 Flavor Volatiles in Muscle Foods and Milk
The flavor of meats have attracted much attention, but in spite of considerable research, knowledge about the flavor compoundscausing strong character impacts for meats of various species is limited [58]. Nevertheless, the concentrated research efforts onmeat flavors have produced a wealth of information about compounds that contribute to cooked meat flavors. The
FIGURE 19Formation of influential volatile flavor compounds from milk fat
obtained throug h hydrolytic cleavag e of acylg lycerols.

Pag e 752
somewhat distinctive flavor qualities of meat flavor compounds that are not species-related are very valuable to the food andflavor industry, but chemical functions of lightly cooked and species-related flavors are still eagerly sought. Some details of thechemistry relating to the flavors of well-cooked meat are discussed in Section 11.7.
11.6.1 Species-Related Flavors of Meats and Milk from Ruminants
The characterizing flavors of at least some meats are inextricably associated with the lipid fraction. Progress on defining species-related flavors was initiated by Wong and coworkers [73] in relation to lamb and mutton flavors. These workers showed that acharacteristic sweat-like flavor of mutton was closely associated with some volatile, medium chain-length fatty acids of whichsome methyl-branched members are highly significant. The formation of one of the most important branched-chain fatty acids inlamb and mutton, 4-methyloctanoic acid, is shown in Figure 20. Ruminal fermentations yield acetate, propionate, and butyrate,but most fatty acids are biosynthesized from acetate, which yields nonbranched chains. Some methyl branching occurs routinelybecause of the presence of propionate, but when dietary and other factors enhance the propionate concentrations in the rumen,greater methyl branching occurs [63]. Ha and Lindsay [26, 27] have shown that several medium-chain, methyl-branched fattyacids are important contributors to species-related flavors, and 4-ethyloctanoic acid (threshold = 1.8 ppb in water) isparticularly important for conveying goat-like flavors to both meat and milk products. Additionally, several alkylphenols(methylphenol isomers, isopropylphenol isomers, and methyl-isopropylphenol isomers) contribute very characteristic cow-likeand sheep-like species-related flavors to meats and milks [28, 41]. Alkylphenols are present as free and conjugate-boundsubstances in meat and milk, and are derived from shikimic acid pathway biochemical intermediates found in forages. Sulfate(XXV), phosphate (XXVI), and glucuronide (XXVII) conjugates of alkylphenols are formed in vivo, and are distributed via thecirculatory system. Both enzymic and thermal hydrolysis of conjugates release phenols that enhance flavor development duringfermentation and cooking of meat and dairy products.
FIGURE 20Ruminant biosynthesis of methyl-branched, medium-chain
fatty acids.ldehydes and acids.
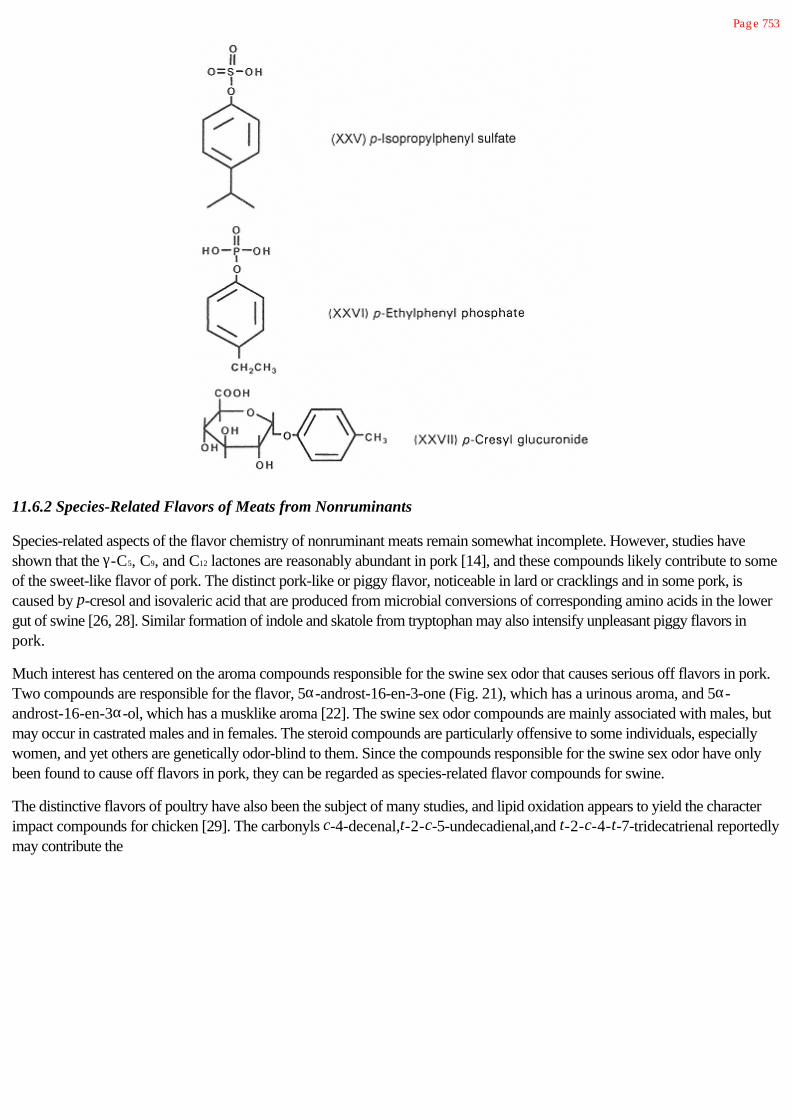
Pag e 753
11.6.2 Species-Related Flavors of Meats from Nonruminants
Species-related aspects of the flavor chemistry of nonruminant meats remain somewhat incomplete. However, studies haveshown that the g-C5, C9, and C12 lactones are reasonably abundant in pork [14], and these compounds likely contribute to someof the sweet-like flavor of pork. The distinct pork-like or piggy flavor, noticeable in lard or cracklings and in some pork, iscaused by p-cresol and isovaleric acid that are produced from microbial conversions of corresponding amino acids in the lowergut of swine [26, 28]. Similar formation of indole and skatole from tryptophan may also intensify unpleasant piggy flavors inpork.
Much interest has centered on the aroma compounds responsible for the swine sex odor that causes serious off flavors in pork.Two compounds are responsible for the flavor, 5a-androst-16-en-3-one (Fig. 21), which has a urinous aroma, and 5a-androst-16-en-3a-ol, which has a musklike aroma [22]. The swine sex odor compounds are mainly associated with males, butmay occur in castrated males and in females. The steroid compounds are particularly offensive to some individuals, especiallywomen, and yet others are genetically odor-blind to them. Since the compounds responsible for the swine sex odor have onlybeen found to cause off flavors in pork, they can be regarded as species-related flavor compounds for swine.
The distinctive flavors of poultry have also been the subject of many studies, and lipid oxidation appears to yield the characterimpact compounds for chicken [29]. The carbonyls c-4-decenal,t-2-c-5-undecadienal,and t-2-c-4-t-7-tridecatrienal reportedlymay contribute the

Pag e 754
FIGURE 21Formation of the steroid compound responsible for the
urinous aroma associated with the swine sex odor defectof pork.
characteristic flavor of stewed chicken, and they are derived from lineolic and arachidonic acids. Chickens accumulate a-tocopherol (an antioxidant), but turkeys do not, and during cooking, such as roasting, carbonyls are formed to a much greaterextent in turkey than in chicken. Additionally, certain chemical environments greatly affect the outcome of some lipidautoxidations. For example, Swoboda and Peers [64] have shown that the presence of copper ions and a-tocopherol results inselective oxidations of milkfat, producing octa-1,c-5-dien-3-one, the cause of metallic faints found in butter. Directed lipidoxidations may also occur in the development of species-related poultry flavors, leading to species-related flavors.
11.6.3 Volatiles in Fish and Seafood Flavors
Characterizing flavors in seafoods cover a somewhat broader range of flavor qualities than those occurring in other musclefoods. The broad range of animals involved (finfish, shellfish, and crustaceans) and the variable flavor and aroma qualities relatedto freshness each account for the different flavors encountered. Historically, trimethylamine has been associated with fish andcrab-like aromas, and alone it exhibits an ammoniacal, fishy aroma. Trimethylamine and dimethylamine are produced throughenzymic degradation of trimethylamine oxide (Fig. 22), which is found in significant quantities only in saltwater species ofseafoods. Since very fresh fish contain essentially no trimethylamine, this compound modifies and contributes to the aroma ofstaling fish, in which it enhances fishhouse-type aromas. Trimethylamine oxide serves as part of the buffer system in marine fishspecies [32]. The formaldehyde produced concurrently with dimethylamine is believed to facilitate protein cross-linking, andthereby contributes to the toughening of fish muscle during frozen storage.
Fishy aromas characterized by such terms as “oxidized fish oil” and “cod liver oil-like” are largely caused by carbonylcompounds produced from the autoxidation of long-chain
FIGURE 22Microbial formation of principal volatile amines in fresh
saltwater fish species.

Pag e 755
w-3-unsaturated fatty acids. These characteristic aromas result from 2,4,7-decatrienal isomers, and c-4-heptenal potentiates thefishy character of the decatrienals [40].
Because the fresh flavors and aromas of seafoods frequently have been greatly diminished or lost from fresh, frozen, andprocessed products available through commercial channels, many consumers associate the fishy flavors just described with allfish and seafoods. However, very fresh seafoods exhibit delicate aromas and flavors quite different from those usually evident in“commercially fresh” seafoods. It has been discovered that a group of enzymatically derived aldehydes, ketones, and alcoholsprovides the characterizing aroma of fresh fish [40], and these are very similar to the C6, C8, and C9 compounds produced byplant lipoxygenases (see Sec. 11.3.5.1). Collectively, these compounds provide melony, heavy plant-like, and fresh fish aromas,and they are derived through a lipoxygenase system. The lipoxygenase systems found in fish and seafoods perform enzymicoxidations related to leukotriene synthesis, and flavor compound production is a by-product of those reactions.Hydroperoxidation followed by disproportionation reactions apparently leads first to the alcohol (Fig. 23), and then to thecorresponding carbonyl. Some of these contribute to the distinctive flavors of very fresh cooked fish, either directly or asreactants that lead to new flavors during cooking.
The flavors of crustaceans and mollusks rely heavily on nonvolatile taste substances in addition to contributions from volatiles.For example, the taste of cooked snow crab meat has been largely duplicated with a mixture of 12 amino acids, nucleotides, andsalt ions [35]. Good imitation crab flavors can be prepared from the taste substances just mentioned, along with somecontributions from carbonyls and trimethylamine. Dimethyl sulfide provides a characterizing top-note aroma to cooked clamsand oysters, and it arises principally from the thermal degradation of dimethyl-b-propiothetin present in ingested marinemicroflora [47].
11.7 Development of Process or Reaction Flavor Volatiles
Many flavor compounds found in cooked or processed foods occur as the result of reactions common to all types of foods,regardless of whether they are of animal, plant, or microbial derivation. These reactions take place when suitable reactants arepresent and appropriate conditions (heat, pH, light) exist. Process or reaction flavors are discussed separately in this sectionbecause of their broad importance to all foods, and because they comprise a large volume of natural flavor concentrates that areused widely in foods, especially when meat or savory
FIGURE 23Enzymatic formation of influential volatiles in fresh fish aroma from
long -chain w-3-unsaturated fatty acid.

Pag e 756
flavors are desired. Related information can be found in discussions dealing with carbohydrates (Chap. 4), lipids (Chap. 5), andvitamins (Chap. 8).
11.7.1 Thermally Induced Process Flavors
Traditionally, these flavors have been broadly viewed as products from browning reactions because of early discoveries showingthe role of reducing sugars and amino acid compounds in the induction of a process that ultimately leads to the formation ofbrown pigments (see Chap. 4 for details of Maillard browning reactions). Although browning reactions are almost alwaysinvolved in the development of process flavors in foods, the interactions between (a) degradation products of the browningreaction and (b) other food constituents are also important and extensive. By taking a broad approach to discussions ofthermally induced flavors, the aforementioned interactions, as well as reactions that occur following heat treatment, can beappropriately considered.
Although many of the compounds associated with process flavors possess potent and pleasant aromas, relatively few of thesecompounds seem to provide truly distinguishing character-impact flavor effects. Instead they often contribute general nutty,meaty, roasted, toasted, burnt, floral, plant, or caramel odors. Some process flavor compounds are acyclic, but many areheterocyclic, with nitrogen, sulfur, or oxygen substituents common (Fig. 24). These process flavor compounds occur in manyfoods and beverages, such as roasted meats, boiled meats, coffee, roasted nuts, beer, bread, crackers, snack foods, cocoa, andmost other processed foods. The distribution of individual compounds does, however, depend on factors such as the availabilityof precursors, temperature, time, and water activity.
Production of process flavor concentrates is accomplished by selecting reaction mixtures and conditions so that those reactionsoccurring in normal food processing are duplicated. Selected ingredients (Table 5), usually including a reducing sugar, aminoacids, and compounds with sulfur atoms, are processed under elevated temperatures to produce a distinctive profile of flavorcompounds [31]. Thiamin is a popular ingredient because it provides both nitrogen and sulfur atoms already in ring structures(see Chap. 8).
Because of the large number of process flavor compounds produced during normal food processing or process simulation, it isunrealistic to cover the chemistry of their formation
FIGURE 24Some heterocyclic skeletons found commonly in flavor
componds associated with thermally-induced orbrowning flavors.

Pag e 757
TABLE 5 Some Common Ing redients Used in Process FlavorReaction Systems of the Development of Meat-Like Flavors
Hydrolyzed veg etable protein Thiamin
Yeast autolysate Cysteine
Beef extract Glutathione
Specific animal fats Glucose
Chicken eg g solids Arabinose
Glycerol 5'-Ribonucleotides
Monosodium g lutamate Methionine
in depth. Rather, examples are given to illustrate some of the more important flavor volatiles formed and the mechanisms of theirformation. Alkyl pyrazines were among the first compounds to be recognized as important contributors to the flavors of allroasted, toasted, or similarly thermally processed foods. The most direct route of their formation results from the interaction ofa-dicarbonyl compounds (intermediate products in the Maillard reaction) with amino acids through the Stecker degradationreaction (Fig. 25). Transfer of the amino group to the dicarbonyl provides a means for integrating amino acids nitrogen into smallcompounds destined for any of the condensation reaction mechanisms envisioned in these reactions. Methionine has beenselected as the amino acid involved in the Strecker degradation reaction because it contains a sulfur atom and it leads toformation of methional, which is an important characterizing compound in boiling potatoes and cheese-cracker flavors.Methional also readily decomposes further to yield methanethiol (methyl mercaptan), which oxidizes to dimethyl disulfide, thusproviding a source of reactive, low-molecular-weight sulfur compounds that contribute to the overall system of flavordevelopment.
Hydrogen sulfide and ammonia are very reactive ingredients in mixtures intended for the development of process flavors, andthey are often included in model systems and assist in determining reaction mechanisms. Thermal degradation of cysteine (Fig.26) yields both ammonia and hydrogen sulfide as well as acetaldehyde. Subsequent reaction of acetaldehyde with a
FIGURE 25Formation of an alkyl pyrazine and small sulfur compounds throug h
reactions occurring in the development of process flavors.

Pag e 758
FIGURE 26Formation of a thiazoline found in cooked beef throug hthe reaction of frag ments from cysteine and sug ar-amino
browning (chem. = nonenzymic).
mercapto derivative of acetoin (from the Maillard reaction) gives rise to thiazoline, which contributes to the flavor of boiled beef[48].
Some heterocyclic flavor compounds are quite reactive and tend to degrade or interact further with components of foods orreaction mixtures. An interesting example of flavor stability and carry-through in foods is provided by the compounds shown inEquation 4, both of which provide distinct but different meat-like aromas [17]. A roasting meat aroma is exhibited by
(4)
2-methyl-3-furanthiol (reduced form), but upon oxidation to the disulfide form, the flavor becomes more characteristics of fullycooked meat that has been held for some time. Chemical reactions, such as the one just mentioned, are responsible for thesubtle changes in meat flavor that occur because of the degree of cooking and the time interval after cooking.
During processing of complex systems, sulfur as such, or as thiols or polysulfides, can be incorporated in various compounds,resulting in the generation of new flavors. However, even though dimethyl sulfide is often found in processed foods, it does notreact readily. In plants, dimethyl sulfide originates from biologically synthesized molecules, especially S-methylmethioninesulfonium salts (Fig. 27). S-Methylmethionine is quite labile to heat, and dimethyl sulfide is readily released. Dimethyl sulfideprovides characterizing top-note aromas to fresh and canned sweet corn, tomato juice, and stewing oysters and clams.
Some of the most pleasant aromas derived from process reactions are provided by the compounds shown in Figure 28. Thesecompounds exhibit caramel-like aromas and have been found in many processed foods. The planar enol-cyclic-ketone structure(see also Eq. 3) is usually derived from the sugar precursors, and this structural component appears responsible for the caramel-like aroma quality [52]. Cyclotene is used widely as a synthesized maple syrup flavor substance, and maltol is used widely as aflavor enhancer for sweet foods and beverages (see Sec. 11.2.2). Both furanones have been found in boiled beef where theyappear to enhance meatiness. 4-Hydroxy-2,5-dimethyl-3(2H)-furanone is sometimes known as the “pineapple

Pag e 759
FIGURE 27Formation of dimethyl sulfide from thermal deg radation of
S-methylmethionine sulfonium salts.
compound” because it was first isolated from processed pineapple, where it contributes strongly to its characteristic flavor.
The flavor of chocolate and cocoa has received much attention because of the high demand for these flavors. After harvesting,cocoa beans are fermented under somewhat poorly controlled conditions. The beans are then roasted, sometimes with anintervening alkali treatment that darkens the color and yields a less harsh flavor. The fermentation hydrolyzes sucrose to reducingsugars, frees amino acids, and oxidizes some polyphenols. During roasting, many pyrazines and other heterocyclics are formed,but the unique flavor of cocoa is derived from an interaction between aldehydes from the Strecker degradation reaction. Thereaction shown in Figure 29 between phenylacetaldehye (from phenylalanine) and 3-methylbutanal (from leucine) constitutes animportant flavor-forming reaction in cocoa. The product of this aldol condensation, 5-methyl-2-phenyl-2-hexenal, exhibits acharacterizing persistent chocolate aroma. This example also serves to show that reactions in the development of process flavorsdo not always yield heterocyclic aroma compounds.
11.7.2 Volatiles Derived from Oxidative Cleavage of Carotenoids
Oxidations focusing on triacylglycerols and fatty acids are discussed in another section, but some extremely important flavorcompounds that are oxidatively derived from carotenoid precursors
FIGURE 28Structures of some important caramel-like flavor
compounds derived from reactions occurring duringprocessing .

Pag e 760
FIGURE 29Formation of an important cocoa aroma volatilethroug h an aldol condensation of two Strecker
reaction-derived aldehydes (chem. = nonenzymic).
have not been covered and deserve attention here. Some of these reactions require singlet oxygen through chlorophyllsensitization; others are photooxidation processes. A large number of flavor compounds, derived from oxidizing carotenoids (orisoprenoids), have been identified in curing tobacco [15], and many of these are considered important for characterizing tobaccoflavors. However, relatively few compounds in this category (three representative compounds are shown in Fig. 30) arecurrently considered highly important as food flavors. Each of these compounds exhibits unique sweet, floral, and fruit-likecharacteristics that vary greatly with concentration. They also blend nicely with aromas of foods to produce subtle effects thatmay be highly desirable or very undesirable. b-Damascenone exerts very positive effects on the flavors of wines, but in beer thiscompound at only a few parts per billion results in a stale, raisin-like note. b-Ionone also exhibits a pleasant violet, floral aromacompatible with fruit-type flavors, but it is also the principal off-flavor compound present in oxidized, freeze-dried carrots.Furthermore, these compounds have been found in black tea, where they make positive contributions to the flavor. Theaspiraneand related derivatives contribute importantly to the sweet, fruity, and earthy notes of tea aroma. Although usually present in lowconcentrations, these compounds and related ones appear to be widely distributed, and it is likely that they contribute to the full,well-blended flavors of many foods.
FIGURE 30Formation of some important tea flavor compounds throug h
oxidative cleavag es of carotenoids.

Pag e 761
11.8 Future Directions of Flavor Chemistry and Technology
Knowledge about the chemistry and technology of flavors has expanded greatly in the past 35 years, and information hasaccumulated at this point where control and manipulation of many flavors in foods is possible. However, some of the areas ofresearch likely to be fruitful in the foreseeable future are binding of flavors to macromolecules (see Chap. 4 and 6), structure-activity relationships in taste and olfaction as determined using computer techniques, control of glycoside precursors of plant-derived flavors, control of reaction flavor chemistry, and flavor development as related to genetics of plant cultivars and culturedcells (microbial and tissue cultures).
The issue of authenticity of natural flavors continues to attract considerable attention, and research on the various aspects ofanalysis and structural relationships of closely related molecules can be expected to enhance knowledge about subtle molecularinfluences on the flavor quality of such optical isomers. Isotopic mass spectrometry (carbon-13 and deuterium) techniques havemade it possible in many cases to differentiate between natural and synthetic molecules, but carbon-13 enrichment alterations ofsynthetic molecules can render such approaches for detecting adulteration invalid. However, site-specific natural isotopefractionation measured by nuclear magnetic resonance is developing to the point where it provides an isotropic fingerprint thatmakes it possible to detect adulteration of natural origin flavors [43].
The chemical accuracy of nature-identical synthetic substances continues to be challenged by new information that isaccumulating on the unique odor and flavor properties of enantiomers and other chiral compounds [46]. Such differences in odorquality between enantiomers not only have relevance to nature-identical issues, but also impact strongly on basic understandingsof structure-function relationships in the olfaction of molecules, and new information should further this field.
Enzymic production of flavors within foods and ingredients will undoubtedly form a significant area of flavor technology in thefuture. Early in the modern era of analytical flavor chemistry, that is, 35 years ago, the flavorese concept was offered as a meansfor regenerating flavors in processed foods, and this type of approach is certain to become more important. However, becauseof the complex nature of natural flavors as they are now understood, it becomes apparent that the flavorese concept as initiallydeveloped would meet with great difficulties when applied to foods. Still, with recent developments in making encapsulatedflavor enzyme systems, it is possible to maintain substrate-enzyme proximity and to control the amounts of flavor compoundsproduced so that unbalanced flavors can be avoided. With the increasing emphasis on high-quality formulated, complex foods,flavor development by enzymes should find a role of increasing importance. Finally, efforts to identify flavor compounds willcontinue, particularly in cases in which important characterizing flavor compounds appear to be present.
Bibliography
Amerine, M. A., R. M. Pangborn, and E. B. Roessler (1965). Principles of Sensory Evaluation of Food, Academic Press,New York.
Beets, M. G. J. (1978). Structure-Activity Relationships in Human Chemoreception, Applied Science, London.
Fazzalari, F. A. (ed.) (1978). Compilation of Odor and Taste Threshold Values Data, American Society for TestingMaterials, Philadelphia.
Furia, T. E., and N. Bellanca (eds.) (1975). Fenaroli's Handbook of Flavor Ingredients, Chemical Rubber Co., Cleveland.
Pag e 762
Ho, C. T., and T. G. Hartman (eds.) (1994). Lipids in Food Flavors, ACS Symposium Series 558, American ChemicalSociety, Washington, DC.
Maarse, H. (1991). Volatile Compounds in Foods and Beverages, Marcel Dekker, New York.
Morton, I. D., and A. J. Macleod (eds.) (1982). Food Flavours, Part A, Introduction, Elsevier, New York.
O'Mahony, M. (1986). Sensory Evaluation of Food: Statistical Methods and Procedures, Marcel Dekker, New York.
Parliment, T. H., M. J. Morello, and R. J. McGorrin (1994). Thermally Generated Flavors: Maillard, Microwave, andExtrusion Processes, American Chemical Society, ACS Symposium Series 543, Washington, D. C.
Rouseff, R. L. (ed.) (1990). Bitterness in Foods and Beverages, Elsevier, Amsterdam.
Shahidi, F. (ed.) (1994). Flavor of Meat and Meat Products, Blackie, London.
Stone, H., and J. L. Sidel (1985). Sensory Evaluation Practices, Academic Press, New York.
Teranishi, R., G. R. Takeoka, and M. Guntert (eds.) (1992). Flavor Precursors: Thermal and Enzymatic Conversions,ACS Symposium Series 490, American Chemical Society, Washington, DC.
References
1. Amerine, M. A., R. M. Pangborn, and E. B. Roessler (1965). Principles of Sensory Evaluation of Food, Academic Press,New York, p. 106.
2. ASTM Manual of Sensory Testing Methods, STP 434 (1968). American Society of Testing Materials, Philadelphia.
3. Bartoshuk, L. M. (1980). Sensory analysis in the taste of NaCl, in Biological and Behaviorial Aspects of Salt Intake (R.H. Cagen and M. R. Kare, eds.), Academic Press, New York, pp. 83–96.
4. Beets, M. G. J. (1978). The sweet and bitter modalities, in Structure-Activity Relationships in Human Chemoreception,Applied Science, London, pp. 259–303.
5. Beets, M. G. J. (1978). The sour and salty modalities, in Structure-Activity Relationships in Human Chemoreception,Applied Science, London, pp. 348–362.
6. Belitz, H. D., and H. Wieser (1985). Bitter compounds: Occurrence and structure-activity relationships. Food Rev. Int.1(2):271–354.
7. Birch, G. G. (1981). Basic tastes of sugar molecules, in Criteria of Food Acceptance (J. Solms and R. L Hall, eds.),Forster Verlag, Zurich, pp. 282–291.
8. Birch, G. G., C. K. Lee, and A. Ray (1978). The chemical basis of bitterness in sugar derivatives, in Sensory Properties ofFoods (G. G. Birch, J. G. Brennan, and K. J. Parker, eds.), Applied Science, London, pp. 101–111.
9. Boelens, M. H. (1991). Spices and condiments II, in Volatile Compounds in Foods and Beverages (H. Maarse, ed.),Marcel Dekker, New York, pp. 449–482.
10. Boelens, M. H., H. Boelens, and L. J. van Gemert (1993). Sensory properties of optical isomers. Perfumer Flavorist18(6):1–16.
11. Brieskorn, C. H. (1990). Physiological and therapeutical aspects of bitter compounds in Bitterness in Foods andBeverages (R. L. Rouseff, ed.), Elsevier, Amsterdam, pp. 15–33.
12. Cliff, M., and H. Heymann (1992). Descriptive analysis of oral pungency. J. Sensory Studies 7:279–290.
13. DeTaeye, D. DeKeukeleire, E. Siaeno, and M. Verzele (1977). Recent developments in hop chemistry, in EuropeanBrewery Convention Proceedings, European Brewing Congress, Amsterdam, pp. 153–156.
14. Dwivedi, B. K. (1975). Meat flavor. Crit. Rev. Food Technol. 5:487–535.

15. Enzell, C. R. (1981). Influence of curing on the formation of tobacco flavour, in Flavour '81 (P. Schreier, ed.), Walter deGruyer, Berlin, pp. 449–478.
16. Eriksson, C. E. (1979) Review of biosynthesis of volatiles in fruits and vegetables since 1975, in Progress in FlavourResearch (D. G. Land and H. E. Nursten, eds.), Applied Science, London, pp. 159–174.
17. Evers, W. J., H. H. Heinsohn, B. J. Mayers, and A. Sanderson (1976). Furans substituted at the three positions with sulfur,in Phenolic, Sulfur, and Nitrogen Compounds in Food Flavors (G. Charalambous and I. Katz, eds.), American ChemicalSociety, Washington, DC, pp. 184–193.

Pag e 763
18. Fazzalari, F. A. (ed.) (1978). Compilation of Odor and Taste Threshold Values Data, American Society for TestingMaterials, Philadelphia.
19. Forss, D. A. (1981). Sensory characterization, in Flavor Research, Recent Advances (R. Teranishi, R. A. Flath, and H.Sugisawa, eds.), Marcel Dekker, New York, pp. 125–174.
20. Forsyth, W. G. C. (1981). Tannins in solid foods, in The Quality of Foods and Beverages, vol. 1, Chemistry andTechnology (G. Charalambous and G. Inglett, eds.), Academic Press, New York, pp. 377–388.
21. Govindarajan, V. S. (1979). Pungency: The stimuli and their evaluation, in Food Taste Chemistry (J. C. Boudreau, ed.),American Chemical Society, Washington, DC, pp. 52–91.
22. Gower, D. B., M. R. Hancock, and L. H. Bannister (1981). Biochemical studies on the boar pheromones, 5a-androst-16-en-3-one and 5a-androst-16-en-3a-ol, and their metabolism by olfactory tissue, in Biochemistry of Taste and Olfaction (R.H. Cagan and M. R. Kare, eds.), Academic Press, New York, pp. 7–31.
23. Grosch, W. (1982). Lipid degradation products and flavour, in Food Flavours, Part A, Introduction (I. D. Morton and A.J. Macleod, eds.), Elsevier, Amsterdam, pp.325–398.
24. Grosch, W. (1994). Determination of potent odourants in foods by aroma extract dilution analysis (AEDA) and calculationof odour activity values (OAVs). Flavour Fragrance J. 9:147–158.
25. Guenther, E., (1948). The Essential Oils, vols. 1–6, Van Nostrand, Reinhold, New York.
26. Ha, J. K., and R. C. Lindsay (1990). Distribution of volatile branched-chain fatty acids in perinephric fats of various redmeat species. Lebensm. Wissen. Tech. 23:433–439.
27. Ha, J. K., and R. C. Lindsay (1991). Contributions of cow, sheep, and goat milks to characterizing branched-chain fattyacid and phenolic flavors in varietal cheeses. J. Dairy Sci. 74:3267–3274.
28. Ha, J. K., and R. C. Lindsay (1991). Volatile alkylphenols and thiophenol in species-related characterizing flavors of redmeats. J. Food Sci. 56:1197–1202.
29. Harkes, P. D., and W. J. Begemann (1974). Identification of some previously unknown aldehydes in cooked chicken. J.Am. Oil Chem. Soc. 51:356–359.
30. Hasegawa, S., M. N. Patel, and R. C. Snyder (1982). Reduction of limonin bitterness in navel orange juice serum withbacterial cells immobilized in acrylamide gel. J. Agric. Food Chem. 30:509–511.
31. Heath, H. B. (1981). Source Book of Flavors, AVI, Westport, CT, p. 110.
32. Hebard, C. E., G. J. Flick, and R. E. Martin (1982). Occurrence and significance of trimethylamine oxide and its derivativesin fish and shellfish, in Chemistry and Biochemistry of Marine Products (R. E. Martin, G. J. Flick, and D. R. Ward, eds.),AVI, Westport, CT, pp. 149–304.
33. Ho, C. T., and T. G. Hartmann (eds.) (1994). Lipids in Food Flavors, American Chemical Society, Washington, DC, pp.1–333.
34. Kimball, D. A., and S. I. Norman (1990). Processing effects during commercial debittering of California navel orange juice.J. Agric. Food Chem. 38:1396–1400.
35. Konosu, S. (1979). The taste of fish and shellfish, in Food Taste Chemistry (J. C. Boudreau, ed.), American ChemicalSociety, Washington, DC, pp. 203–213.
36. Koppenhoefer, B., R. Behnisch, U. Epperlein, H. Holzschuh, and R. Bernreuther (1994). Enantiomeric odor differences andgas chromatographic properties of flavors and fragrances. Perfumer Flavorist 19(5):1–14.
37. Kuninaka, A. (1981). Taste and flavor enhancers, in Flavor Research Recent Advances (R. Teranishi, R. A. Flath, and H.Sugisawa, eds.), Marcel Dekker, New York, pp. 305–353.

38. Kuroiwa, Y., and N. Hashimoto (1961). Composition of sunstruck flavor substance and mechanism of its evolution, ASBCProc. 19:28–36.
39. Lee, C. B., and H. T. Lawless (1991). Time-course of astringent sensations. Chem. Senses 16:225–238.
40. Lindsay, R. C. (1990). Fish flavors. Food Rev. Int. 6(4):437–455.
41. Lopez, V., and R. C. Lindsay (1993). Metabolic conjugates as precursors for characterizing flavor compounds in ruminantmilks. J. Agric. Food Chem. 41:446–454.
42. Maarse, H. (1991). Volatile Compounds in Foods and Beverages, Marcel Dekker, New York.
43. Martin, G., G. Remaud, and G. J. Martin (1993). Isotopic methods for control of natural flavours authenticity. FlavorFragrance J.8: 97–107.

Pag e 764
44. Morgan, M. E., L. M. Libbey, and R. A. Scanlan (1972). Identity of the musty-potato aroma compound in milk cultures ofPseudomonas taetrolens. J. Dairy Sci. 55. 666.
45. Morton, I. D., and A. J. Macleod (eds.), (1982). Food Flavours, Part A, Introduction. Elsevier, Amsterdam.
46. Mosandl, A. (1988). Chirality in flavor chemistry—Recent developments in synthesis and analysis. Food Rev. Int.4(1):1–43.
47. Motohito, T. (1962). Studies on the petroleum odor in canned chum salmon. Mem. Fac. Fisheries, Hokkaido Univ.10:1–5.
48. Mussinan, C. J., R. A. Wilson, I. Katz, A. Hruza, and M. H. Vock (1976). Identification and some flavor properties ofsome 3-oxazolines and 3-thiazolines isolated from cooked beef, in Phenolic, Sulfur, and Nitrogen Compounds in FoodFlavors (G. Charalambous and I. Katz, eds.), American Chemical Society, Washington, DC, pp. 133–145.
49. Neucere, N. J., T. J. Jacks, and G. Sumrell (1978). Interactions of globular proteins with simple polyphenols. J. Agric.Food Chem.26: 214–216.
50. Ney, K. H. (1979). Bitterness of peptides: Amino acid composition and chain length, in Food Taste Chemistry (J. C.Boudreau, ed.), American Chemical Society, Washington, DC, pp. 149–173.
51. Ney, K. H. (1979). Bitterness of lipids. Fette. Seifen. Anstrichm.81: 467–469.
52. Ohloff, G. (1981). Bifunctional unit concept in flavor chemistry, in Flavour '81 (P. Schreier, ed.), Walter de Gruyter, Berlin,pp. 757–770.
53. O'Mahony, M. (1986). Sensory Evaluation of Food: Statistical Methods and Procedures, Marcel Dekker, New York.
54. Richard, H. M. J. (1991). Spices and condiments I, in Volatile Compounds in Foods and Beverages (H. Maarse, ed.),Marcel Dekker, New York, pp. 411–447.
55. Scanlan, R. A. (ed.) (1977). Flavor Quality: Objective Measurement, American Chemical Society, Washington, DC.
56. Schiffman, S. S. (1980). Contribution of the anion to the taste quality of sodium salts, in Biological and BehaviorialAspects of Salt Intake (R. H. Cagan and M. R. Kare, eds.), Academic Press, New York, pp. 99–114.
57. Schreier, P. (ed.) (1981). Flavour '81, Walter de Gruyter, Berlin, 1981.
58. Shahidi, F.(ed.) (1994). Flavor of Meat and Meat Products, Blackie, London, pp. 1–298.
59. Shallenberger, R. S., and T. E. Acree (1967). Molecular theory of sweet taste. Nature (Lond.) 216:480–482.
60. Shankaranarayana, M. L., B. Raghaven, K. O. Abraham, and C. P. Natarajan (1982). Sulphur compounds in flavours, inFood Flavours, Part A, Introduction (I. D. Morton and A. J. Macleod, eds.), Elsevier, Amsterdam, pp. 169–281.
61. Shaw, P. E. (1991). Fruits II, in Volatile Compounds in Foods and Beverages (H. Maarse, ed.), Marcel Dekker, NewYork, pp. 305–327.
62. Stone, H., and J. L. Sidel (1985). Sensory Evaluation Practices, Academic Press, New York.
63. Smith, A., and W. R. H. Duncan (1979). Characterization of branched-chain lipids from fallow deer perinephrictriacylglycerols by gas chromatography-mass spectrometry. Lipids 14:350–355.
64. Swoboda, P. A. T., and K. E. Peers (1979). The significance of octa-1, cis 5-dien-3-one, in Progress in FlavourResearch (D. G. Land and H. E. Nursten, eds.), Applied Science Publishers, London, pp. 275–280.
65. Tanford, C. (1960). Contribution of hydrophobic interactions to the stability of globular conformations of proteins. J. Amer.Chem. Soc.84: 4240–4247.
66. Teranishi, R., R. A. Flath, and H. Sugisawa (eds.) (1981). Flavor Research: Recent Advances, Marcel Dekker, NewYork.

67. Tressl, R., D. Bahri, and K. H. Engel (1982). Formation of eight-carbon and ten-carbon components in mushrooms(Agaricus campestris). J. Agric. Food Chem. 30:89–93.
68. Tressl, R., M. Holzer, and M. Apetz (1975). Biogenesis of volatiles in fruits and vegetables, in Aroma Research:Proceedings of the International Symposium on Aroma Research, Zeist (H. Maarse and P. J. Groenen, eds.), Centre forAgricultural Publishing and Documentation, PUDOC, Wageningen, pp. 41–62.

Pag e 765
69. van Straten, S., F. de Vrijer, and J. C. de Beauveser (eds.) (1977). Volatile Compounds in Food, 4th ed., CentralInstitute for Nutrition and Food Research, Ziest.
70. Watson, H. R. (1978). Flavor characteristics of synthetic cooling compounds, in Flavor: Its Chemical, Behavioral, andCommercial Aspects (C. M. Apt, ed.), Westview Press, Boulder, CO, pp. 31–50.
71. Whitfield, F. B., and J. H. Last (1991). Vegetables, in Volatile Compounds in Foods and Beverages (H. Maarse, ed.),Marcel Dekker, New York, pp. 203–269.
72. Wittkowski, R., J. Ruther, H. Drinda, and F. Rafiei-Taghanaki (1992). Formation of smoke flavor compounds by thermallignin degradation, in Flavor Precursors: Thermal and Enzymatic Conversions (R. Teranishi, G. R. Takeoka, and M.Guntert, eds.), American Chemical Society, Washington, DC, pp. 232–243.
73. Wong, E., L. N. Nixon, and C. B. Johnson (1975). Volatile medium chain fatty acids and mutton flavor. J. Agric. FoodChem.23: 495–498.
74. Yamaguchi, S. (1979). The umami taste, in Food Taste Chemistry (J. C. Boudreau, ed.), American Chemical Society,Washington, DC. pp. 33–51.
75. K. Yashimoto, K., K. Iwami, and H. Mitsuda (1971). A new sulfur-peptide from Lentinus edodes acting as a precursor forlenthionine.Agric. Biol. Chem. 35:2059–2069.
Pag e 767
12Food Additives
ROBERT C. LINDSAY
University of Wisconsin—Madison, Madison, Wisconsin
12.1. Introduction 768
12.2. Acids 769
12.2.1. General Attributes 769
12.2.2. Chemical Leavening Systems 771
12.3. Bases 775
12.4. Buffer Systems and Salts 776
12.4.1. Buffers and pH Control in Foods 776
12.4.2. Salts in Processed Dairy Foods 777
12.4.3. Phosphates and Water Binding in Animal Tissues 778
12.5. Chelating Agents (Sequestrants) 778
12.6. Antioxidants 780
12.7. Antimicrobial Agents 782
12.7.1. Sulfites and Sulfur Dioxide 782
12.7.2. Nitrite and Nitrate Salts 784
12.7.3. Sorbic Acid 785
12.7.4. Natamycin 787
12.7.5. Glyceryl Esters 787
12.7.6. Propionic Acid 788
12.7.7. Acetic Acid 788
12.7.8. Benzoic Acid 788
12.7.9. p-Hydroxybenzoate Alkyl Esters 789
12.7.10. Epoxides 790
12.7.11. Antibiotics 791

12.7.12. Diethyl Pyrocarbonate 792
12.8. Intensely Sweet Nonnutritive and Low-Calorie Sweeteners 793
12.8.1. Cyclamate 793
12.8.2. Saccharin 794
12.8.3. Aspartame 794

Pag e 768
12.8.4. Acesulfame K 795
12.8.5. Sucralose 796
12.8.6. Alitame 796
12.8.7. Other Intensely Sweet Nonnutritive or Low-CalorieSweeteners
797
12.9. Polyhydric Alcohol Texturizers and Reduced-Calorie Sweeteners 798
12.10. Stabilizers and Thickeners 800
12.11. Fat Replacers 801
12.11.1. Carbohydrate Fat Mimetics 802
12.11.2. Protein Fat Mimetics 802
12.11.3. Reduced-Calorie Synthetic Triacylglycerol Fat Substitutes 803
12.11.4. Synthetic Fat Replacers 804
12.12. Masticatory Substances 805
12.13. Firming Texturizers 806
12.14. Appearance Control and Clarifying Agents 806
12.15. Flour Bleaching Agents and Bread Improvers 808
12.16. Anticaking Agents 810
12.17. Gases and Propellants 810
12.17.1. Protection from Oxygen 811
12.17.2. Carbonation 811
12.17.3. Propellants 811
12.18. Tracers 812
12.19. Summary 812
Bibliography 821
References 821
12.1 Introduction

Many substances are incorporated into foods for functional purposes, and in many cases these ingredients also can be foundoccurring naturally in some food. However, when they are used in processed foods, these chemicals have become known as“food additives.” From a regulatory standpoint, each of the food additives must provide some useful and acceptable function orattribute to justify its usage. Generally, improved keeping quality, enhanced nutritional value, functional property provision andimprovement, processing facilitation, and enhanced consumer acceptance are considered acceptable functions for foodadditives. The use of food additives to conceal damage or spoilage to foods or to deceive consumers is expressly forbidden byregulations governing the use of these substances in foods. Additionally, food additive usages are discouraged where similareffects can be obtained by economical, good manufacturing practices.
Since natural counterparts exist for many food additives, and frequently they are derived commercially from natural sources,further discussions about the chemistry of this group of substances can be found in the appropriate chapters of this book. Forexample, natural substances sometimes used as food additives are discussed in Chapter 5 (antioxidants), Chapter 8 (vitamins),Chapter 9 (minerals), Chapter 10 (colorants), and Chapter 11 (flavors). This chapter focuses on the role of both natural andsynthetic substances that are added to foods and provides an integrating view of their functionalities. Emphasis is given tosubstances not covered elsewhere in this book.

Pag e 769
12.2 Acids
12.2.1 General Attributes
Both organic and inorganic acids occur extensively in natural systems, where they function in a variety of roles ranging fromintermediary metabolites to components of buffer systems. Acids are added for numerous purposes in foods and foodprocessing, where they provide the benefits of many of their natural actions. One of the most important functions of acids infoods is participation in buffering systems, and this aspect is discussed in a following section. The use of acids and acid salts inchemical leavening systems, the role of specific acidic microbial inhibitors (e.g., sorbic acid, benzoic acid) in food preservation,and the function of acids as chelating agents are also discussed in subsequent sections of this chapter. Acids are important in thesetting of pectin gels (Chap. 4), they serve as defoaming agents and emulsifiers, and they induce coagulation of milk proteins(Chaps. 6 and 14) in the production of cheese and cultured dairy products such as sour cream. In natural culturing processes,lactic acid (CH3-CHOH-COOH) produced by streptococci and lactobacilli causes coagulation by lowering the pH to near theisoelectric point of casein. Cheeses can be produced by adding rennet and acidulants such as citric acid and hydrochloric acidsto cold milk (4–8°C). Subsequent warming of the milk (to 35°C) produces a uniform gel structure. Addition of acid to warmmilk results in a protein precipitate rather than a gel.
d-Gluconolactone also can be used for slow acid production in cultured dairy products and chemical leavening systems becauseit slowly hydrolyzes in aqueous systems to form gluconic acid (Fig. 1). Dehydration of lactic acid yields lactide, a cylic dilactone(Fig. 2), which also can be used as a slow-release acid in aqueous systems. The dehydration reaction occurs under conditions oflow water activity and elevated temperature. Introduction of lactide into foods with high water activity causes a reversal of theprocess with the production of two moles of lactic acid.
Acids such as citric are added to some moderately acid fruits and vegetables to lower the pH to a value below 4.5. In cannedfoods this permits sterilization to be achieved under less severe thermal conditions than is necessary for less acid products andhas the added advantage of precluding the growth of hazardous microorganisms (i.e., Clostridium botulinum).
Acids, such as potassium acid tartrate, are employed in the manufacture of fondant and fudge to induce limited hydrolysis(inversion) of sucrose (Chap. 4). Inversion of sucrose yields fructose and glucose, which improve texture through inhibition ofexcessive growth of sucrose crystals. Monosaccharides inhibit crystallization by contributing to the complexity of the syrup andby lowering its equilibrium relative humidity.
One of the most important contributions of acids to foods is their ability to produce a sour or tart taste (Chap. 11). Acids alsohave the ability to modify and intensify the taste perception of other flavoring agents. The hydrogen ion or hydronium ion (H3O+)is in-
FIGURE 1Formation of g luconic acid from the
hydrolysis of d-g luconolactone.

Pag e 770
FIGURE 2Equilibrium reaction showing
formationof lactic acid from the hydrolysis of
lactide.
volved in the generation of the sour taste response. Furthermore, short-chain free fatty acids (C2-C12) contribute significantly tothe aroma of foods. For example, buytric acid at relatively high concentrations contributes strongly to the characteristic flavor ofhydrolytic rancidity, but at lower concentrations contributes to the typical flavor of products such as cheese and butter.
Numerous organic acids are available for food applications [19]. Some of the more commonly used acids are acetic(CH3COOH), lactic (CH3-CHOH-COOH), citric [HOOC-CH2-COH(COOH)-CH2-COOH], malic (HOOC-CHOH-CH2-COOH), fumaric (HOOC-CH=CH-COOH), succinic (HOOC-CH2-CH2-COOH), and tartaric (HOOC-CHOH-CHOH-COOH). Phosphoric acid (H3PO4) is the only inorganic acid extensively employed as a food acidulant. Phosphoric acid is animportant acidulant in flavored carbonated beverages, particularly in colas and root beer. The other mineral acids (e.g., HCl,H2SO4) are usually too highly dissociated for food applications, and their use may lead to problems with quality attributes offoods. Dissociation constants for some food acids are shown in Table 1.
TABLE 1 Dissociation Constants at 25°C for Some Acids Used in Foods
Acid Step pKa Acid Step pKa
Org anic acids
Acetic 4.75 Propionic 4.87
Adipic 1 4.43 Succinic 1 4.16
2 5.41 2 5.61
Benzoic 4.19 Tartaric 1 3.22
n-Butyric 4.81 2 4.82
Citric 1 3.14 Inorg anic acids
2 4.77 Carbonic 1 6.37
3 6.39 2 10.25
Formic 3.75 o-Phosphoric 1 2.12
Fumaric 1 3.03 2 7.21
2 4.44 3 12.67
Hexanoic 4.88 Sulfuric 2 1.92
Lactic 3.08
Malic 1 3.40
2 5.10

Source: From Ref. 56.

Pag e 771
12.2.2 Chemical Leavening Systems
Chemical leavening systems are composed of compounds that react to release gas in a dough or batter under appropriateconditions of moisture and temperature. During baking, this gas release, along with expansion of entrapped air and moisturevapor, imparts a characteristic porous, cellular structure to finished goods. Chemical leavening systems are found in self-risingflours, prepared baking mixes, household and commercial baking powders, and refrigerated dough products [22].
Carbon dioxide is the only gas generated from currently used chemical leavening systems, and it is derived from a carbonate orbicarbonate salt. The most common leavening salt is sodium bicarbonate (NaHCO3), although ammonium carbonate[(NH4)2CO3] and bicarbonate (NH4HCO3) are sometimes used in cookies. Both of the ammonium salts decompose at bakingtemperatures and thus do not require, as does sodium bicarbonate, an added leavening acid for functionality. Potassiumbicarbonate (KHCO3) has been employed as a component of leavening systems in reduced-sodium diets, but its application issomewhat limited because of its hygroscopic nature and slightly bitter flavor.
Sodium bicarbonate is quite soluble in water (619 g/100 ml), and ionizes completely (Eqs. 1, 2, and 3).
(1)
(2)
(3)
These reactions, of course, apply only to simple water solutions. In dough systems the ionic distribution becomes much morecomplex since proteins and other naturally occurring ionic species are available to participate in the reactions. In the presence ofhydrogen ions provided mainly by leavening acids, and to some extent by the dough, sodium bicarbonate reacts to releasecarbon dioxide (Eq. 4).
(4)
The proper balance of acid and sodium bicarbonate is essential because excess sodium bicarbonate imparts a soapy taste tobakery products; an excess of acid leads to tartness and sometime bitterness. The neutralizing power of leavening acids is notuniform and the relative activity of an acid is given by its neutralizing value. The neutralizing value of an acid is determined bycalculating the parts by weight of sodium bicarbonate that will neutralize 100 parts by weight of the leavening acid [50].However, in the presence of natural flour ingredients, the amount of leavening acid required to give neutrality or any otherdesired pH in a baked product may be quite different from the theoretical amount determined for a simple system. Still,neutralizing values are useful in determining initial formulations for leavening systems. Residual salts from a properly balancedleavening process help stabilize the pH of finished products.
Leavening acids are often not easily recognized as acids in the usual sense, yet they must provide hydrogen ions to releasecarbon dioxide. The phosphates and potassium acid tartrate are metal salts of partially neutralized acids; sodium aluminumsulfate reacts with water to yield sulfuric acid (Eq. 5).
(5)
As mentioned earlier, d-gluconolactone is an intramolecular ester (or lactone) that hydrolyzes slowly in aqueous systems to yieldgluconic acid.

Pag e 772
Leavening acids generally exhibit limited water solubility at room temperature, but some are less soluble than others. Thisdifference in solubility or availability accounts for the initial rate of carbon dioxide release at room temperature and is the basisfor classifying leavening acids according to speed. For example, if the compound is moderately soluble, carbon dioxide is rapidlyevolved and the acid is referred to as fast-acting. Conversely, if the acid dissolves slowly, it is a slow-acting leavening acid.Leavening acids usually release a portion of the carbon dioxide prior to baking and the remainder under elevated temperaturesof the baking process.
General patterns of carbon dioxide release at 27°C for fast-acting monocalcium phosphate monohydrate [Ca(HPO4)2 · H2O]and slow-acting 1-3-8 sodium aluminum phosphate [NaH14Al3(PO4)8 · 4H2O] are shown in Figure 3. Over 60% of the carbondioxide is released very quickly from the more soluble monocalcium phosphate monohydrate; only 20% of the potential carbondioxide is released from the slow-acting 1–3–8 sodium aluminum phosphate during a 10-min reaction period. Because of ahydrated alumina coating, the latter leavening acid reacts to only a small extent until activated by heat. Also shown in Figure 3 isthe low-temperature release pattern of carbon dioxide from coated anhydrous monocalcium phosphate [Ca(HPO4)2]. Thecrystals of this leavening acid were coated with compounds of slightly soluble alkali metal phosphates. The gradual release ofcarbon dioxide over the 10-min reaction period corresponds to the time required for water to penetrate the coating. Thisbehavior is very desirable in some products that encounter a delay prior to baking.
The release of the remainder of the carbon dioxide from leavening systems during baking provides the final modifying action ontexture. In most leavening systems the rate at which carbon dioxide is released greatly accelerates as the temperature is elevated.The effect of elevated temperatures on the release rate of carbon dioxide from slow-acting sodium acid pyrophosphate(Na2H2P2O7) is presented in Figure 4. Even a slight increase in temperature (from 27 to 30°C) noticeably accelerates gasproduction. Temperatures near 60°C cause a complete release of carbon dioxide within 1 min. Some leavening acids are lesssensitive to high temperatures and do not exhibit vigorous activity until temperatures near the maximum baking
FIGURE 3Carbon dioxide production at 27°C from the reactionof NaHCO3 with (A) monocalcium phosphate ·H 2O,
(B) coated anhydrous monocalcium phosphate,and (C) 1-3-8 sodium aluminum phosphate.
Data from Ref. 50.

Pag e 773
FIGURE 4Effect of temperature on the rate of carbon dioxide
evolution from the reaction of NaHCO 3 and slow-speedacid pyrophosphate. Reprinted from Ref. 50, p.
201.
temperature are obtained. Dicalcium phosphate (CaHPO4) is unreactive at room temperature because it forms a slightly alkalinesolution at this temperature. However, upon heating above approximately 60°C, hydrogen ions are released, thereby activatingthe leavening process. This slow action confines its use to products requiring long baking times, such as some types of cakes.Formulations of leavening acids employing one or more acidic components are common, and systems are often tailored forspecific dough or batter applications.
Leavening acids currently employed include potassium acid tartrate, sodium aluminum sulfate, d-gluconolatone, and ortho- andpyrophosphates. The phosphates include calcium phosphate, sodium aluminum phosphate, and sodium acid pyrophosphate.Some general properties of commonly used leavening acids are given in Table 2. It must be remembered that these are onlyexamples, and that an extensive technology has developed for modification and control of the phosphate leavening acids [50].
Baking powders account for a large part of the chemical leaveners used both in the home and in bakeries. These preparationsinclude sodium bicarbonate, suitable leavening acids, and starch and other extenders. Federal standards for baking powderrequire that the formula must yield at least 12% by weight of available carbon dioxide, and most contain 26–30% by weight ofsodium bicarbonate. Traditional baking powders of the potassium acid tartrate type have been largely replaced by double-actingpreparations. In addition to NaHCO3 and starch, these baking powders usually contain monocalcium phosphate monohydrate[Ca(HPO4)2 · H2O], which provides rapid action during the mixing stage, and sodium aluminum sulfate [Na2SO4 · Al2(SO4)3],which does not react appreciably until the temperature increases during baking.
The increase in convenience foods has stimulated sales of prepared baking mixes and refrigerated dough products. In white andyellow cake mixes, the most widely used blend of leavening acids contains anhydrous monocalcium phosphate [Ca(HPO4)2] andsodium aluminum phosphate [NaH14Al3(PO4)8 · 4H2O]; chocolate cake mixes usually contain anhydrous monocalcium phosphateand sodium acid pyrophosphate (Na2H2P2O7) [50]. Typical blends of acids

Pag e 774
TABLE 2 Some Properties of Common Leavening Acids
Acid FormulaNeutralizing
valueª
Relative reactionrate at roomtemperature b
Sodium aluminum sulfate Na2SO4· Al2(SO4)3 100 Slow
Dicalcium phosphate dihydrate CaHPO4 · 2H2O 33 None
Monocalciumphosphatemonohydrate
Ca(HPO4)2 · H2O 80 Fast
1–3–8 Sodium aluminumphosphate
NaH14AI3(PO4)8 · 4H2O 100 Slow
Sodium acidpyrophosphate (s low-type)
Na2H2P2O7 72 Slow
Potassium acid tartrate KHC4H4O6 50 Medium
d-Gluconolactone C6H10O6 55 Slow
ªIn simple model systems; parts by weig ht of NaHCO 3 that will neutralize 100 parts by weig ht of the leaveningacid.
bRate of CO2 evolution in the presence of NaHCO 3.
Source: Ref. 50.
contain 10–20% fast-acting anhydrous monophosphate compounds and 80–90% of the slower acting sodium aluminumphosphate or sodium acid pyrophosphate. The leavening acids in prepared biscuit mixes usually consist of 30–50% anhydrousmonocalcium phosphate and 50–70% sodium aluminum phosphate or sodium acid pyrophosphate. The earliest self-rising floursand cornmeal mixes contained monocalcium phosphate monohydrate [Ca(HPO4)2 · H2O], but coated anhydrous monocalciumphosphate and sodium aluminum phosphate are in common use [50].
Refrigerated doughs for biscuit and roll products require limited initial carbon dioxide release during preparation and packaging,and considerable gas release during baking. Formulations for biscuits usually contain 1.0–1.5% sodium bicarbonate and1.4–2.0% slow-acting leavening acids, such as coated monocalcium phosphate and sodium acid pyrophosphate, based on totaldough weight. The pyrophosphates are useful in dough because they can be manufactured with a wide range of reactivities. Forexample, pyrophosphatase in flour is capable of hydrolyzing sodium acid pyrophosphate to orthophosphate (Fig. 5), and thereaction of sodium bicarbonate and pyrophosphate yields some trisodium monohydrogen pyrophosphate, which also can behydrolyzed to orthophosphates. This enzymic action leads to gas production that assists in sealing
FIGURE 5Enzymic hydrolysis of sodium acid pyrophosphate.

Pag e 775
packages of refrigerated dough, but it can also lead to formation of large crystals of orthophosphates that may be mistaken forbroken glass by the consumer.
12.3 Bases
Basic or alkaline substances are used in a variety of applications in foods and food processing. Although the majority ofapplications involve buffering and pH adjustments, other functions include carbon dioxide evolution, enhancement of color andflavor, solubilization of proteins, and chemical peeling. The role of carbonate and bicarbonate salts in carbon dioxide productionduring baking has been discussed previously.
Alkali treatments are imposed on several food products for the purpose of color and flavor improvement. Ripe olives are treatedwith solutions of sodium hydroxide (0.25–2.0%) to aid in the removal of the bitter principal and to develop a darker color.Pretzels are dipped in a solution of 1.25% sodium hydroxide at 87–88°C (186–190°F) prior to baking to alter proteins andstarch so that the surface becomes smooth and develops a deep-brown color during baking. It is believed that the NaOHtreatment used to prepare hominy and tortilla dough destroys disulfide bonds, which are base labile, and improves the flavor.Soy proteins are solubilized through alkali processing, and concern has been expressed about alkaline-induced racemization ofamino acids (Chap. 6) and losses of other nutrients. Small amounts of sodium bicarbonate are used in the manufacture of peanutbrittle candy to enhance caramelization and browning, and to provide, through release of carbon dioxide, a somewhat porousstructure. Bases, usually potassium carbonate, are also used in cocoa processing for the production of dark (Dutched) chocolate[38]. The elevated pH enhances sugar-amino browning reactions and polymerization of flavonoids (Chap. 10), resulting in asmoother, less acid and less bitter chocolate flavor, a darker color, and a slightly improved solubility.
Food systems sometime require adjustment to higher pH values to achieve more stable or more desirable characteristics. Forexample, alkaline salts, such as disodium phosphate, trisodium phosphate, and trisodium citrate are used in the preparation ofprocessed cheese (1.5–3%) to increase the pH (from 5.7 to 6.3) and to effect protein (casein) dispersion. This salt-proteininteraction improves the emulsifying and water-binding capabilities of the cheese proteins [45] because the salts bind the calciumcomponents of the casein micelles forming chelates.
Popular instant milk-gel puddings are prepared by combining dry mixes containing pregelatinized starch with cold milk, andallowing them to stand for a short time at refrigerator temperatures. Alkaline salts, such as tetrasodium pyrophosphate (Na4P2O7)and disodium phosphate (Na2HPO4), in the presence of calcium ions in milk cause milk proteins to gel in combination with thepregelatinized starch. The optimum pH for acceptable puddings falls between 7.5 and 8.0. Although some of the necessaryalkalinity is contributed by alkaline phosphate salts, other alkalizing agents are often added [10].
The addition of phosphates and citrates changes the salt balance in fluid milk products by forming complexes with calcium andmagnesium ions from casein. The mechanism is incompletely understood, but depending on the type and concentration of saltadded, the milk protein system can undergo stabilization, gelation, or destabilization.
Alkaline agents are used to neutralize excess acid in the production of foods such as cultured butter. Before churning, the creamis fermented by lactic acid bacteria so that it contains about 0.75% titratable acidity expressed as lactic acid. Alkalis are thenadded to achieve a titratable acidity of approximately 0.25%. The reduction in acidity improves churning efficiency and retardsthe development of oxidative off flavors. Several materials, including sodium bicarbonate (NaHCO3), sodium carbonate(Na2CO3), magnesium carbonate (MgCO3), magnesium oxide (MgO), calcium hydroxide [Ca(OH)2], and sodium hydroxide(NaOH), are utilized alone or in combination as neutralizers for foods. Solubility, foaming as a result of carbon

Pag e 776
dioxide release, and strength of the base influence the selection of the alkaline agent. The use of alkaline agents or bases inexcessive amounts leads to soapy or neutralizer flavors, especially when substantial quantities of fatty acids are present.
Strong bases are employed for peeling various fruits and vegetables. Exposure of the product to hot solutions at 60–82°C(140–180°F) of sodium hydroxide (about 3%), with subsequent mild abrasion, effects peel removal with substantial reductionsin plant wastewater as compared to the conventional peeling techniques. Differential solubilization of cell and tissue constituents(pectic substances in the middle lamella are particularly soluble) provides the basis for caustic peeling processes.
12.4 Buffer Systems and Salts
12.4.1 Buffers and pH Control in Foods
Since most foods are complex materials of biological origin, they contain many substances that can participate in pH control andbuffering systems. Included are proteins, organic acids, and weak inorganic acid-phosphate salts. Lactic acid and phosphatesalts, along with proteins, are important for pH control in animal tissue; polycarboxylic acids, phosphate salts, and proteins areimportant in plant tissues. The buffering effects of amino acids and proteins and the influence of pH and salts on theirfunctionalities are discussed in Chapter 6. In plants, buffering systems containing citric acid (lemons, tomatoes, rhubarb), malicacid (apples, tomatoes, lettuce), oxalic acid (rhubarb, lettuce), and tartaric acid (grapes, pineapple) are common, and theyusually function in conjunction with phosphate salts in maintaining pH control. Milk acts as a complex buffer because of thiscontent of carbon dioxide, proteins, phosphate, citrate, and several other minor constituents.
In situations where the pH must be altered, it is usually desirable to stabilize the pH at the desired level through a buffer system.This is accomplished naturally when lactic acid is produced in cheese and pickle fermentations. Also, in some instances wheresubstantial amounts of acids are used in foods and beverages, it is desirable to reduce the sharpness of acid tastes, and obtainsmoother product flavors without inducing neutralization flavors. This usually can be accomplished by establishing a buffersystem in which the salt of a weak organic acid is dominant. The common ion effect is the basis for obtaining pH control in thesesystems, and the system develops when the added salts contain an ion that is already present in an existing weak acid. Theadded salt immediately ionizes resulting in repressed ionization of the acid with reduced acidity and a more stable pH. Theefficiency of a buffer depends on the concentration of the buffering substances. Since there is a pool of undissociated acid anddissociated salt, buffers resist changes in pH. For example, relatively large additions of a strong acid, such as hydrochloric acid,to an acetic-sodium acetate system causes hydrogen ions to react with the acetate ion pool to increase the concentration ofslightly ionized acetic acid, and the pH remains relatively stable. In a similar manner, addition of sodium hydroxide causeshydroxyl ions to react with hydrogen ions to form undissociated water molecules.
Titration of buffered systems and resulting titration curves (i.e., pH vs. volume of base added) reveal their resistance to pHchange. If a weak acid buffer is titrated with a base, there is a gradual but steady increase in the pH as the system approachesneutralization; that is, the change in pH per milliliter of added base is small. Weak acids are only slightly dissociated at thebeginning of the titration. However, the addition of hydroxyl ions shifts the equilibrium to the dissociated species and eventuallythe buffering capacity is overcome.
In general, for an acid (HA) in equilibrium with ions (H+) and (A-), the equilibrium is expressed as in Equation 6.

Pag e 777
(6)
(7)
The constant is the apparent dissociation constant, and is characteristic of the particular acid. The apparent dissociation
constant becomes equal to the hydrogen ion concentration [H+] when the anion concentration [A-] becomes equal to theconcentration of undissociated acid [HA]. This situation gives rise to an inflection point on a titration curve, and the pH
corresponding to this point is referred to as the p of the acid. Therefore, for a weak acid, pH is equal to p when theconcentration of the acid and conjugate base are equal:
pH = p = -log10[H+] (8)
A convenient method for calculation the approximate pH of a buffer mixture, given the p of the acid, is provided by Equation11. This equation is arrived at by first solving Eq. 12.7 for [H+] to yield Equation 9.
(9)
Since the salt in solution is almost completely dissociated, it is almost equal to the concentration of the conjugate base [A-]. The
negative logarithms of the terms yield Equation 10. By substituting pH for -log[H+] and p for -log , Equation 11 isobtained. The pH of a buffer system derived from any weak acid that dissociates to H+ and A- can be calculated by usingEquation 11.
(10)
(11)
In calculating the pH values of buffer solutions, it is important to recognize that the apparent dissociation constant differs from
Ka, the true dissociation constant. However, for any buffer, the value of remains constant as the pH is varied, provided thetotal ionic strength of the solution remains unchanged.
The sodium salts of gluconic, acetic, citric, and phosphoric acids are commonly used for pH control and tartness modification inthe food industry. The citrates are usually preferred over phosphates for tartness modification since they yield smoother sourflavors. When low-sodium products are required, potassium buffer salts may be substituted for sodium salts. In general, calciumsalts are not used because of their limited solubilities and incompatibilities with other components in the system. The effectivebuffering ranges for combinations of common acids and salts are pH 2.1–4.7 for citric acid-sodium citrate, pH 3.6–5.6 foracetic acid-sodium acetate, and pH 2.0–3.0, 5.5–7.5, and 10–12, respectively for the three ortho- and pyrophosphate anions.
12.4.2 Salts in Processed Dairy Foods
Salts are used extensively in processed cheeses and imitation cheeses to promote a uniform, smooth texture. These additives aresometimes referred to as emulsifying salts because of their ability to aid in dispersion of fat. Although the emulsifying mechanismremains somewhat less than fully defined, anions from the salts when added to processed cheese combine with and

Pag e 778
remove calcium from the para-casein complex, and this causes rearrangement and exposure of both polar and nonpolar regionsof the cheese proteins. It is also believed that the anions of these salts participate in ionic bridges between protein molecules, andthereby provide a stabilized matrix that entraps the fat in processed cheese [45]. Salts used for cheese processing include mono-, di-, and trisodium phosphate, dipotassium phosphate, sodium hexametaphosphate, sodium acid pyrophosphate, tetrasodiumpyrophosphate, sodium aluminum phosphate and other condensed phosphates, trisodium citrate, tripotassium citrate, sodiumtartrate, and sodium potassium tartrate.
The addition of certain phosphates, such as trisodium phosphate, to evaporated milk prevents separation of the milkfat andaqueous phases. The amount required varies with the season of the year and the source of milk. Concentrated milk that issterilized by a high-temperature, short-time method frequently gels upon storage. The addition of polyphosphates, such assodium hexametaphosphate and sodium tripolyphosphate, prevents gel formation through a protein denaturation andsolubilization mechanism that involves complexing of calcium and magnesium by phosphates.
12.4.3 Phosphates and Water-Binding in Animal Tissues
The addition of appropriate phosphates increases the water-holding capacity of raw and cooked meats [24], and thesephosphates are used in the production of sausages, in the curing of ham, and to decrease drip losses in poultry and seafoods.Sodium tripolyphosphate (Na5P3P10) is the most common phosphate added to processed meat, poultry, and seafoods. It is oftenused in blends with sodium hexametaphosphate [(NaPO3)n, n = 10–15] to increase tolerance to calcium ions that exist in brinesused in meat curing. Ortho- and pyrophosphates often precipitate if used in brines containing substantial amounts of calcium.
The mechanism by which alkaline phosphates and polyphosphates enhance meat hydration is not clearly understood despiteextensive studies. The action may involve the influence of pH changes (Chap. 6), effects of ionic strength, and specificinteractions of phosphate anions with divalent cations and myofibrillar proteins. Many believe that calcium complexing and aresulting loosening of the tissue structure is a major function of polyphosphates. It is also believed that binding of polyphosphateanions to proteins and simultaneous cleavage of cross-linkages between actin and myosin results in increased electrostaticrepulsion between peptide chains and a swelling of the muscle system. If exterior water is available, it then can be taken up in animmobilized state within the loosened protein network. Further, because the ionic strength has been increased, the interactionbetween proteins is perhaps reduced to a point where part of the myofibrillar proteins form a colloidal solution. In communitedmeat products, such as bologna and sausage, the addition of sodium chloride (2.5–4.0%) and polyphosphate (0.35–0.5%)contributes to a more stable emulsion, and after cooking to a cohesive network of coagulated proteins.
If the phosphate-induced solubilization occurs primarily on the surface of tissues, as is the case with polyphosphate-dipped(6–12% solution with 0.35–0.5% retention) fish fillets, shellfish, and poultry, a layer of coagulated protein is formed duringcooking, and this improves moisture retention [35].
12.5 Chelating Agents (Sequestrants)
Chelating agents or sequestrants play a significant role in food stabilization through reactions with metallic and alkaline earth ionsto form complexes that alter the properties of the ions and their effects in foods. Many of the chelating agents employed in thefood industry are natural substances, such as polycarboxylic acids (citric, malic, tartaric, oxalic, and succinic), poly-

Pag e 779
phosphoric acids (adenosine triosphate and pyrophosphate), and macromolecules (porphyrins, proteins). Many metals exist in anaturally chelated state. Examples, include magnesium in chlorophyll; copper, zinc, and manganese in various enzymes; iron inproteins such as ferritin; and iron in the porphyrin ring of myoglobin and hemoglobin. When these ions are released by hydrolyticor other degradative reactions, they are free to participate in reactions that lead to discoloration, oxidative rancidity, turbidity,and flavor changes in foods. Chelating agents are sometimes added to form complexes with these metal ions, and therebystabilize the foods.
Any molecule or ion with an unshared electron pair can coordinate or form complexes with metal ions. Therefore, compoundscontaining two or more functional groups, such as -OH, -SH, -COOH, -PO3H2, C=O, -NR2, -S-, and -O-, in propergeometrical relation to each other, can chelate metals in a favorable physical environment. Citric acid and its derivatives, variousphosphates, and salts of ethylenediamine tetraacetic acid (EDTA) are the most popular chelating agents used in foods. Usuallythe ability of a chelating agent (ligand) to form a five- or six-membered ring with a metal is necessary for stable chelation. Forexample, EDTA forms chelates of high stability with calcium because of an initial coordination involving the electron pairs of itsnitrogen atoms and the free electron pairs of the anionic oxygen atoms of two of the four carboxyl groups (Fig. 6). The spatialconfiguration of the calcium-EDTA complex is such that it allows additional coordination of the calcium with the free electronpairs of the anionic oxygen atoms of the remaining two carboxyl groups, and this results in an extremely stable complex utilizingall six electron donor groups.
In addition to steric and electronic considerations, factors such as pH influence the formation of strong metal chelates. Thenonionized carboxylic acid group is not an efficient donor group, but the carboxylate ion functions effectively. Judicious raising ofthe pH allows dissociation of the carboxyl group and enhances chelating efficiency. In some instances hydroxyl ions compete formetal ions and reduce the effectiveness of chelating agents. Metal ions exist in solution as hydrated complexes (metal·H2OM+),and the rate at which these complexes are disrupted influences the rate which they can be complexed with chelating agents. Therelative attraction of chelating agents for different ions can be determined from stability or equilibrium constants (K =[metal·chelating agent]/[metal][chelating agent]) (Chap. 9). For example, for calcium the stability constant (expressed as log K)is 10.7 with EDTA, 5.0 with pyrophosphate, and 3.5 with citric acid [17]. As the stability constant (K) increases, more of themetal is complexed, leaving less metal in cation form (i.e., the metal in the complex is more tightly bound).
Chelating agents are not antioxidants in the sense that they arrest oxidation by chain termination or serve as oxygen scavengers.They are, however, valuable antioxidant synergists since they remove metal ions which catalyze oxidation (Chap. 5). Whenselecting a chelating agent for an antioxidant synergist role, its solubility must be considered. Citric acid and citrate esters(20–200 ppm) in propylene glycol solution are solubilized by fats and oils and thus are effective synergists in all-lipid systems.On the other hand, Na2EDTA and Na2Ca-EDTA dissolve to only a limited extent, and are not effective in pure fat systems. TheEDTA salts (to 500 ppm),
FIGURE 6Schematic representation of chelation of calcium by EDTA.

Pag e 780
however, are very effective antioxidants in emulsion systems. Such as salad dressings, mayonnaise, and margarine, because theycan function in the aqueous phase.
Polyphosphates and EDTA are used in canned seafoods to prevent the formation of glassy crystals of struvite or magnesiumammonium phosphate (MgNH4PO4·6H2O). Seafoods contain substantial amounts of magnesium ions, which sometimes reactwith ammonium phosphate during storage to give crystals that may be mistaken as glass contamination. Chelating agentscomplex magnesium and minimize struvite formation. Chelating agents also can be used to complex iron, copper, and zinc inseafoods to prevent reactions, particularly with sulfides, that lead to product discoloration.
The addition of chelating agents to vegetables prior to blanching can inhibit metal-induced discolorations, and can removecalcium from pectic substances in cell walls and thereby promote tenderness.
Although citric and phosphoric acids are employed as acidulants in soft drink beverages, they also chelate metals that otherwisecould promote oxidation to flavor compounds, such as terpenes, and catalyze discoloration reactions. Chelating agents alsostabilize fermented malt beverages by complexing copper. Free copper catalyzes oxidation of polyphenolic compounds, whichsubsequently interact with proteins to form permanent hazes or turbidity.
The extremely efficient chelating abilities of some agents, notably EDTA, has caused speculation that excessive usage in foodscould lead to the depletion of calcium and other minerals in the body. To deal with this concern, levels and applications areregulated, and in some instances calcium is added to food systems through the use of the Na2Ca salt of EDTA rather than theall-sodium (Na, Na2, Na3, or Na4EDTA) or acid forms. However, there appears to be little concern about using these chelatorsin the amounts permitted, considering the natural concentrations of calcium and other divalent cations that are present in foods.
12.6 Antioxidants
Oxidation occurs when electrons are removed from an atom or group of atoms. Simultaneously, there is a correspondingreduction reaction that involves the addition of electrons to a different atom or group of atoms. Oxidation reactions may or maynot involve the addition of oxygen atoms or the removal of hydrogen atoms from the substance being oxidized. Oxidation-reduction reactions are common in biological systems, and also are common in foods. Although some oxidation reactions arebeneficial in foods, others can lead to detrimental effects including degradation of vitamins (Chap. 8), pigments (Chap. 10), andlipids (Chap. 5), with loss of nutritional value and development of off flavors. Control of undesirable oxidation reactions in foodsis usually achieved by employing processing and packaging techniques that exclude oxygen or involve the addition of appropriatechemical agents.
Before the development of specific chemical technology for the control of free-radical-mediated lipid oxidation, the termantioxidant was applied to all substances that inhibited oxidation reactions regardless of the mechanism. For example, ascorbicacid was considered an antioxidant and was employed to prevent enzymic browning of the cut surfaces of fruits and vegetables(Chap. 7). In this application ascorbic acid functions as a reducing agent by transferring hydrogen atoms back to quinones thatare formed by enzymic oxidation of phenolic compounds. In closed systems ascorbic acid reacts readily with oxygen andthereby serves as an oxygen scavenger. Likewise, sulfites are readily oxidized in food systems to sulfonates and sulfate, andthereby function as effective antioxidants in foods such as dried fruits (Sec. 12.7.1). The most commonly employed foodantioxidants are phenolic substances. More recently the term “food antioxidants” often has been applied to those compoundsthat interrupt the free-rad-

Pag e 781
ical chain reaction involved in lipid oxidation and those that scavenge singlet oxygen; however, the term should not be used insuch a narrow sense.
Antioxidants often exhibit variable degrees of efficiency in protecting food systems, and combinations often provide greateroverall protection than can be accounted for through the simple additive effect [52]. Thus, mixed antioxidants sometimes have asynergistic action, the mechanisms for which are not completely understood. It is believed, for example, that ascorbic acid canregenerate phenolic antioxidants by supplying hydrogen atoms to the phenoxy radicals that form when the phenolic antioxidantsyield hydrogen atoms to the lipid oxidation chain reaction. In order to achieve this action in lipids ascorbic acid must be madeless polar so it will dissolve in fat. This is done by esterification to fatty acids to form compounds such as ascorbyl palmitate.
The presence of transition-state metal ions, particularly copper and iron, promotes lipid oxidation through catalytic actions(Chap. 5 and 9). These metallic pro-oxidants are frequently inactivated by adding chelating agents, such as citric acids or EDTA(Sec. 12.5). In this role chelating agents are also referred to as synergists since they greatly enhance the action of the phenolicantioxidants. However, they are often ineffective as antioxidants when employed alone.
Many naturally occurring substances possess antioxidant capabilities, and the tocopherols are noted examples that are widelyemployed (Chap. 5). Recently, extractives of spices, particularly rosemary, also have been successfully commercially exploitedas natural antioxidants. Gossypol, which occurs naturally in cottonseed, is an antioxidant, but it has toxic properties (Chap. 13).Other naturally occurring antioxidants are coniferyl alcohol (found in plants) and guaiaconic and guaiacic acid (from gum guaiac).All of these are structurally related to butylated hydroxyanisole (BHA), butylated hydroxytoluene (BHT), propyl gallate, and di-t-butylhydroquinone (TBHQ), which are synthetic phenolic antioxidants currently approved for use in foods (Chap. 5).Nordihydroguaiaretic acid, a compound related to some of the constituents of gum guaiac, is an effective antioxidant, but its usedirectly in foods has been suspended because of toxic effects. All of these phenolic substances serve as oxidation terminators byparticipating in the reactions through resonance stabilized free-radical forms [52], but they also are believed to serve as singletoxygen scavengers. However, b-carotene is considered to function more efficiently as a singlet oxygen scavenger than phenolicsubstances.
Thiodipropionic acid and dilauryl thiodiproprionate remain as approved food antioxidants, even though removal of thesecompounds from the approved list was recently proposed because they were not being used in foods. The presence of a sulfuratom in the thiodipropionates has led to speculation that they could cause off flavors, but this view is unfounded. A morecompelling reason that the thiodipropionates have not been used in foods is their failure to inhibit lipid oxidation in foods, asmeasured by peroxide value, when used at permitted levels (to 200 ppm) [29]. The classic role of thiodipropionates is assecondary antioxidants, where at high concentrations (> 1000 ppm) they degrade hydroperoxides formed during olefin oxidationto relatively stable end products, and when used as such, they are useful in stabilizing synthetic polyolefins.
Although thiodipropionates, at levels allowed in foods, are ineffective in reducing peroxide values, they are highly effective indecomposing peracids (Fig. 7) found in oxidizing lipids [29]. Peracids are very efficient substances for mediating the oxidation ofdouble bonds to epoxides, and in the presence of water, epoxides formed by this reaction readily hydrolyze to form diols. Whenthese reactions occur with cholesterol, both cholesterol epoxide and the cholesterol-triol derivative are formed, and thesecholesterol oxides are widely considered potentially mutagenic and atherogenic, respectively, to humans [39]. Because thethiodipropionates readily inhibit the accumulation of peracids, they have been retained as approved antioxidants by the US Foodand Drug Administration.

Pag e 782
FIGURE 7Mechanism of hydroperoxide decomposition by thiodipropionic acid.
A chemical structure similar to that in the thiodipropionates occurs in methionine (Chap. 6), and accounts, presumably by ananalogous mechanism, for some of the antioxidant properties shown by proteins. Reaction of a sulfide with one peracid orhydroperoxide yields a sulfoxide, while reactions with two peracids or hydroperoxides yields a sulfone. Additional aspects ofantioxidant chemistry are presented in Chapter 5.
12.7 Antimicrobial Agents
Chemical preservatives with antimicrobial properties play an important role in preventing spoilage and assuring safety of manyfoods. Some of these are discussed in this section.
12.7.1 Sulfites and Sulfur Dioxide
Sulfer dioxide (SO2) and its derivatives long have been used in foods as general food preservatives. They are added to food toinhibit nonenzymic browning, to inhibit enzyme catalyzed reactions, to inhibit and control microorganisms, and to act as anantioxidant and a reducing agent. Generally, SO2 and its derivatives are metabolized to sulfate and excreted in the urine withoutany obvious pathologic results [57]. However, because of somewhat recently recognized severe reactions to sulfur dioxide andits derivatives by some sensitive asthmatics, their use in foods is currently regulated and subject to rigorous labeling restrictions.Nonetheless, these preservatives serve key roles in contemporary foods.
The commonly used forms in foods include sulfur dioxide gas and the sodium, potassium, or calcium salts of sulfite ( ),
bisulfite ( ), or metabisulfite ( ). The most frequently used sulfiting agents are the sodium and potassium metabisulfitesbecause they exhibit good stability toward autoxidation in the solid phase. However, gaseous sulfur dioxide is employed whereleaching of solids causes problems or where the gas may also serve as an acid for the control of pH.
Although the traditional names for the anions of these salts are still widely used (sulfites, bisulfites, and metabisulfites), they have
been designated by IUPAC as the sulfur(IV) oxoanions, sulfites ( ), hydrogen sulfites ( ), and disulfites ( ),respectively. The oxoacids, H2SO3 and H2S3O5, are designated as sulfurous and disulfurous acids, respectively [57].
Widely held views also have changed somewhat on the existence of sulfurous acid in aqueous solutions. Earlier, it was presumedthat when sulfur dioxide was dissolved in water, it formed sulfurous acid, because the salts of simple oxoanions of sulfur(IV)(valence +4) are salts of this acid (H2SO3; sulfurous acid). However, evidence for the existence of free sulfurous acid has notbeen found, and it has been estimated that it accounts for less than 3% of nondissociated dissolved SO2. Instead, solution of SO2
yields only weak interactions with water, which results in a nondissociated complex that is particularly abundant below pH 2.This complex has been denoted SO2· H2O, and a distinction between this complex and sulfurous acid is not generally made [57](see Eq. 12).
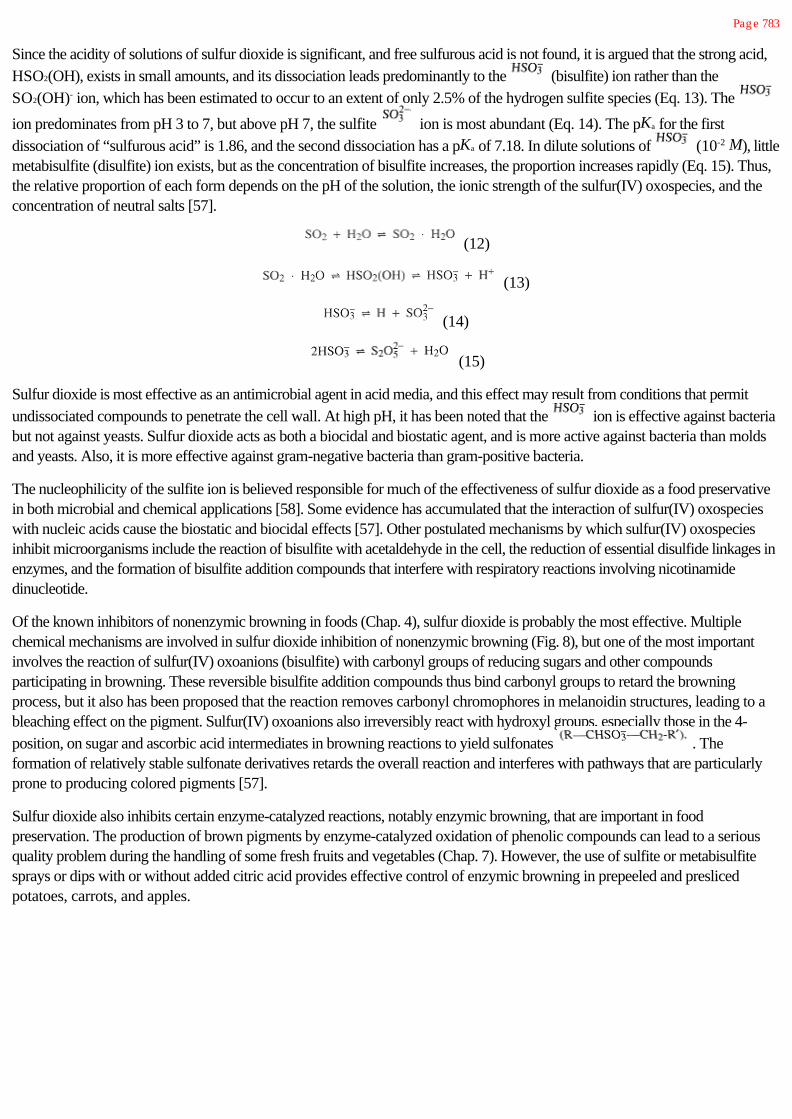
Pag e 783
Since the acidity of solutions of sulfur dioxide is significant, and free sulfurous acid is not found, it is argued that the strong acid,
HSO2(OH), exists in small amounts, and its dissociation leads predominantly to the (bisulfite) ion rather than the
SO2(OH)- ion, which has been estimated to occur to an extent of only 2.5% of the hydrogen sulfite species (Eq. 13). The
ion predominates from pH 3 to 7, but above pH 7, the sulfite ion is most abundant (Eq. 14). The pKa for the first
dissociation of “sulfurous acid” is 1.86, and the second dissociation has a pKa of 7.18. In dilute solutions of (10-2 M), littlemetabisulfite (disulfite) ion exists, but as the concentration of bisulfite increases, the proportion increases rapidly (Eq. 15). Thus,the relative proportion of each form depends on the pH of the solution, the ionic strength of the sulfur(IV) oxospecies, and theconcentration of neutral salts [57].
(12)
(13)
(14)
(15)
Sulfur dioxide is most effective as an antimicrobial agent in acid media, and this effect may result from conditions that permit
undissociated compounds to penetrate the cell wall. At high pH, it has been noted that the ion is effective against bacteriabut not against yeasts. Sulfur dioxide acts as both a biocidal and biostatic agent, and is more active against bacteria than moldsand yeasts. Also, it is more effective against gram-negative bacteria than gram-positive bacteria.
The nucleophilicity of the sulfite ion is believed responsible for much of the effectiveness of sulfur dioxide as a food preservativein both microbial and chemical applications [58]. Some evidence has accumulated that the interaction of sulfur(IV) oxospecieswith nucleic acids cause the biostatic and biocidal effects [57]. Other postulated mechanisms by which sulfur(IV) oxospeciesinhibit microorganisms include the reaction of bisulfite with acetaldehyde in the cell, the reduction of essential disulfide linkages inenzymes, and the formation of bisulfite addition compounds that interfere with respiratory reactions involving nicotinamidedinucleotide.
Of the known inhibitors of nonenzymic browning in foods (Chap. 4), sulfur dioxide is probably the most effective. Multiplechemical mechanisms are involved in sulfur dioxide inhibition of nonenzymic browning (Fig. 8), but one of the most importantinvolves the reaction of sulfur(IV) oxoanions (bisulfite) with carbonyl groups of reducing sugars and other compoundsparticipating in browning. These reversible bisulfite addition compounds thus bind carbonyl groups to retard the browningprocess, but it also has been proposed that the reaction removes carbonyl chromophores in melanoidin structures, leading to ableaching effect on the pigment. Sulfur(IV) oxoanions also irreversibly react with hydroxyl groups, especially those in the 4-
position, on sugar and ascorbic acid intermediates in browning reactions to yield sulfonates . Theformation of relatively stable sulfonate derivatives retards the overall reaction and interferes with pathways that are particularlyprone to producing colored pigments [57].
Sulfur dioxide also inhibits certain enzyme-catalyzed reactions, notably enzymic browning, that are important in foodpreservation. The production of brown pigments by enzyme-catalyzed oxidation of phenolic compounds can lead to a seriousquality problem during the handling of some fresh fruits and vegetables (Chap. 7). However, the use of sulfite or metabisulfitesprays or dips with or without added citric acid provides effective control of enzymic browning in prepeeled and preslicedpotatoes, carrots, and apples.

Pag e 784
FIGURE 8Mechanisms of inhibition of Maillard (carbonyl-amino) browning by some
sulfur (IV) oxoanions (bisulfite, sulfite).
Sulfur dioxide also functions as an antioxidant in a variety of food systems, but it is not usually employed for this purpose. Whensulfur dioxide is added to beer, the development of oxidized flavors is inhibited significantly during storage. The red color of freshmeat also can be effectively maintained by the presence of sulfur dioxide. However, this practice is not permitted because of thepotential for masking deterioration in abused meat products.
When added during manufacture of wheat flour doughs, sulfur dioxide effects a reversible cleavage of protein disulfide bonds. Inthe instance of cookie manufacture, the addition of sodium bisulfite reduces mixing time and the elasticity of the dough thatfacilitates dough sheeting, and it also reduces variations caused by different lots of flour [57]. Prior to drying of fruits, gaseoussulfur dioxide is often applied, and this is sometime done in the presence of buffering agents (i.e., NaHCO3). This treatmentprevents browning and induces oxidative bleaching of anthocyanin pigments. The resulting properties are desired in products,such as those used to make white wines and maraschino cherries. Levels of sulfur dioxide encountered in dried fruits immediatelyfollowing processing sometimes approach 2000 ppm. However, much lower amounts are found in most other foods becauseconcentrations above 500 ppm give noticeably disagreeable flavors, and because sulfites tend to volatilize and/or react duringstorage and cooking.
12.7.2 Nitrite and Nitrate Salts
The potassium and sodium salts of nitrite and nitrate are commonly used in curing mixtures for meats to develop and fix thecolor, to inhibit microorganisms, and to develop characteristic
Pag e 785
flavors. Nitrite rather than nitrate is apparently the functional constituent. Nitrites in meat form nitric oxide, which reacts withheme compounds to form nitrosomyoglobin, the pigment responsible for the pink color of cured meats (Chap. 10). Sensoryevaluations also indicate that nitrite contributes to cured meat flavor, apparently through an antioxidant role, but the details of thischemistry are poorly understood [43]. Furthermore, nitrites (150–200 ppm) inhibit clostridia in canned-comminuted and curedmeats. In this regard, nitrite is more effective at pH 5.0–5.5 than it is at higher pH values. The antimicrobial mechanism of nitriteis unknown, but it has been suggested that nitrite reacts with sulfhydryl groups to create compounds that are not metabolized bymicroorganisms under anaerobic conditions.
Nitrites have been shown to be involved in the formation of low, but possibly toxic, levels of nitrosamines in certain cured meats.The chemistry and health implications of nitrosamines are discussed in Chapter 13. Nitrate salts also occur naturally in manyfoods, including vegetables such as spinach. The accumulation of large amounts of nitrate in plant tissues grown on heavilyfertilized soils is of concern, particularly in infant foods prepared from these tissues. The reduction of nitrate to nitrite in theintestine, with subsequent absorption, could lead to cyanosis due to methemoglobin formation. For these reasons, the use ofnitrites and nitrates in foods has been questioned. The antimicrobial capability of nitrite provides some justification for its use incured meats, especially where growth of Clostridium botulinum is possible. However, in preserved products where botulismdoes not present a hazard, there appears to be little justification for adding nitrates and nitrites.
12.7.3 Sorbic Acid
Straight-chain, monocarboxylic, aliphatic fatty acids exhibit antimycotic activity, and a-unsaturated fatty acid analogs areespecially effective. Sorbic acid (C-C=C-C=C-COOH) and its sodium and potassium salts are widely used to inhibit mold andyeasts in a wide variety of foods including cheese, baked products, fruit juices, wine, and pickles. Sorbic acid is particularlyeffective in preventing mold growth, and it contributes little flavor at the concentrations employed (up to 0.3% by weight). Themethod of application may involve direct incorporation, surface coatings, or incorporation in a wrapping material. The activity ofsorbic acid increases as the pH decreases, indicating that the undissociated form is more inhibitory than the dissociated form. Ingeneral, sorbic acid is effective up to pH 6.5, which is considerably above the effective pH ranges for propionic and benzoicacids.
The antimycotic action of sorbic acid appears to arise because molds are unable to metabolize the a-unsaturated diene systemof its aliphatic chain. It has been suggested that the diene structure of sorbic acid interferes with cellular dehyrogenases thatnormally dehydrogenate fatty acids as the first step in oxidation. Saturated short-chain (C2–C12) fatty acids are also moderatelyinhibitory to many molds, such as Penicillium roqueforti. However, some of these molds are capable of mediating b-oxidationof saturated fatty acids to corresponding b-ketoacids, especially when the concentration of the acid is only marginally inhibitory.Decarboxylation of the resulting b-keto acid yields the corresponding methyl ketone (Fig. 9) which does not exhibit antimicrobialproperties. A few molds also have been shown to metabolize sorbic acid, and it has been suggested that this metabolismproceeds through b-oxidation, similar to that in mammals. All evidence indicates that animals and humans metabolize sorbic acidin much the same ways as they do other naturally occurring fatty acids.
Although sorbic acid might at first appear quite stable and unreactive, it is quite often microbiologically or chemically altered infoods. Two other mechanisms for deactivating the antimicrobial properties of sorbic acid are shown in Figure 10. The reactionlabeled “a” in Figure 10 has been demonstrated in molds, especially P. roqueforti. This involves direct decarboxylation

Pag e 786
FIGURE 9Formation of a methyl ketone via mold-mediated enzymic
oxidation of a fatty acid followed by a decarboxylationreaction.
of sorbic acid to yield the hydrocarbon 1,3-pentadiene. The intense aroma of this compound can cause gasoline orhydrocarbon-like off flavors when mold growth occurs in the presence of sorbic acid, especially on the surface of cheese treatedwith sorbate.
If wine containing sorbic acid undergoes spoilage in the bottle by lactic acid bacteria, an off flavor described as geranium-likedevelops [8]. Lactic acid bacteria reduce sorbic acid to sorbyl alcohol, and then, because of the acid conditions they havecreated, cause a rearrangement to a secondary alcohol (Fig. 10,b). The final reaction involves the formation of an ethoxylatedhexadiene, which has a pronounced, easily recognized aroma of geranium leaves.
Sorbic acid is sometimes used in combination with sulfur dioxide, and this leads to reactions that deplete both sorbic acid andsulfur(IV) oxoanions (Fig. 11) [20]. Under aerobic conditions, especially in the presence of light, · radicals are formed,and these radicals sulfonate olefin bonds as well as promote oxidation of sorbic acid. This reaction, uniquely involving sorbicacid, is not noticeably affected by the presence of conventional antioxidants, and aerobically held foods containing sulfur dioxideand sorbic acid are very susceptible to autoxidation. Under anaerobic conditions, the combination of sorbic acid and sulfurdioxide in foods results in a much slower nucleophilic reaction of the sulfite ion with the diene (1,4-addition) in sorbic acidto yield 5-sulfo-3-hexenoic acid (Fig. 11).
Reactions between sorbic acid and proteins occur when sorbic acid is used in certain foods, such as wheat dough, whoseproteins contain substantial amounts of oxidized or reduced thiol
FIGURE 10Enzymic conversions destroying the antimicrobial propertiesof sorbic acid: (a) decarboxylation carried out by Penicilliumsp.; (b) formation of ethoxylated diene hydrocarbon in wineresulting from a reduction of the carboxyl g roup followed by
rearrang ement and development of an ether.

Pag e 787
FIGURE 11Reactions of sorbic acid with sulfur dioxide [sulfur(IV) anions].
groups (R-S-S-R in cystine and R-SH in cysteine, respectively). The thiol groups (R-SH) dissociate to thiolate ions (R-S-) thatare reactive nucleophiles, and they react mainly by 1,6-addition to the conjugated diene of sorbic acid. This reaction binds theprotein to the sorbic acid, and the reaction readily occurs at higher pH (>5) and elevated temperatures, such as occur duringbread baking. Although the reaction is reversible under very acidic conditions (pH <1), the usual consequence at the higher pHvalues of foods is the loss of the preservative action of sorbic acid [30].
While sorbic acid and potassium sorbate have gained wide recognition as antimycotics, more recent research has establishedthat sorbate has broad antimicrobial activity that extends to many bacterial species that are involved in spoilage of fresh poultry,fish and meats. It is especially effective in retarding toxigenesis of Clostridium botulinum in bacon and refrigerated fresh fishpackaged in modified atmospheres.
12.7.4 Natamycin
Natamycin or pimaricin (CAS No. 768-93-8) is a polyene macrolide antimycotic (I) that has been approved in the UnitedStates for use against molds on cured cheeses. This mold inhibitor is
highly effective when applied to surfaces of foods exposed directly to air where mold has a tendency to proliferate. Natamycin isespecially attractive for application on fermented foods, such as cured cheeses, because it selectively inhibits molds whileallowing normal growth and metabolism of ripening bacteria.
12.7.5 Glyceryl Esters
Many fatty acids and monoglycerides show pronounced antimicrobial activity against gram-positive bacteria and some yeasts[28]. Unsaturated members, especially those with 18 carbon atoms, show strong activity as fatty acids; the medium chain-lengthmembers (12 carbon atoms) are most inhibitory when esterified to glycerol. Glyceryl monolaurate (II), also known under thetradename of Monolaurin, is inhibitory against several potentially pathogenic staphylococcus

Pag e 788
and streptococcus when present at concentrations of 15–250 ppm. It is commonly used in cosmetics, and because of its lipidnature can be used in some foods.
Lipophilic agents of this kind also exhibit inhibitory activity against C. botulinum, and glyceryl monolaurate, serving this function,may find applications in cured meats and in refrigerated, packaged fresh fish. The inhibitory effect of lipophilic glyceridederivatives apparently relates to their ability to facilitate the conduction of protons through the cell membranes, which effectivelydestroys the proton motive force that is needed for substrate transport [15]. Cell-killing effects are observed only at highconcentrations of the compounds, and death apparently results form the generation of holes in cell membranes.
12.7.6 Propionic Acid
Propionic acid (CH3-CH2-COOH) and its sodium and calcium salts exert antimicrobial activity against molds and a few bacteria.This compound occur naturally in Swiss cheese (up to 1% by weight), where it is produced by Propionibacterium shermanii[5]. Propionic acid has found extensive use in the bakery field where it not only inhibits molds effectively, but also is activeagainst the ropy bread organism, Bacillus mesentericus. Levels of use generally range up to 0.3% by weight. As with othercarboxylic acid antimicrobial agents, the undissociated form of propionic acid is active, and the range of effectiveness extends upto pH 5.0 in most applications. The toxicity of propionic acid to molds and certain bacteria is related to the inability of theaffected organisms to metabolize the three carbon skeleton. In mammals, propionic acid is metabolized in a manner similar tothat of other fatty acids, and it has not been shown to cause any toxic effects at the levels utilized.
12.7.7 Acetic Acid
The preservation of foods with acetic acid (CH3COOH) in the form of vinegar dates to antiquity. In addition to vinegar (4%acetic acid) and acetic acid, also used in food are sodium acetate (CH3COONa), potassium acetate (CH3COOK), calciumacetate [(CH3COO)2Ca], and sodium diacetate (CH3COONa · CH3-COOH ·
½H2O). The salts are used in bread and other baked goods (0.1–0.4%) to prevent ropiness and the growth of molds withoutinterfering with yeasts [5]. Vinegar and acetic acid are used in pickled meats and fish products. If fermentable carbohydrates arepresent, at least 3.6% acid must be present to prevent growth of lactic acid bacilli and yeasts. Acetic acid is also used in foodssuch as catsup, mayonnaise, and pickles, where it serves a dual function of inhibiting microorganisms and contributing to flavor.The antimicrobial activity of acetic acid increases as the pH is decreased, a property analogous to that found for other aliphaticfatty acids.
12.7.8 Benzoic Acid
Benzoic acid (C6H5COOH) has been widely employed as an antimicrobial agent in food [5], and it occurs naturally incranberries, prunes, cinnamon, and cloves. The undissociated acid is the form with antimicrobial activity, and it exhibits optimumactivity in the pH range of 2.5–4.0,
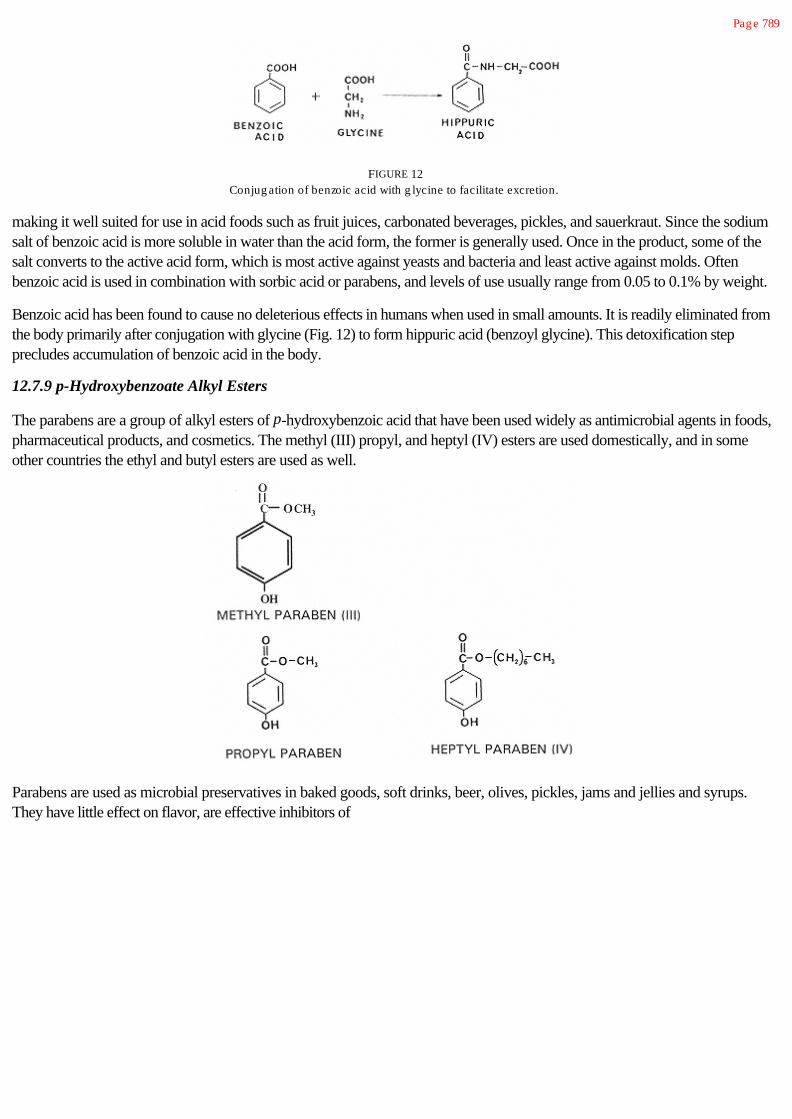
Pag e 789
FIGURE 12Conjug ation of benzoic acid with g lycine to facilitate excretion.
making it well suited for use in acid foods such as fruit juices, carbonated beverages, pickles, and sauerkraut. Since the sodiumsalt of benzoic acid is more soluble in water than the acid form, the former is generally used. Once in the product, some of thesalt converts to the active acid form, which is most active against yeasts and bacteria and least active against molds. Oftenbenzoic acid is used in combination with sorbic acid or parabens, and levels of use usually range from 0.05 to 0.1% by weight.
Benzoic acid has been found to cause no deleterious effects in humans when used in small amounts. It is readily eliminated fromthe body primarily after conjugation with glycine (Fig. 12) to form hippuric acid (benzoyl glycine). This detoxification stepprecludes accumulation of benzoic acid in the body.
12.7.9 p-Hydroxybenzoate Alkyl Esters
The parabens are a group of alkyl esters of p-hydroxybenzoic acid that have been used widely as antimicrobial agents in foods,pharmaceutical products, and cosmetics. The methyl (III) propyl, and heptyl (IV) esters are used domestically, and in someother countries the ethyl and butyl esters are used as well.
Parabens are used as microbial preservatives in baked goods, soft drinks, beer, olives, pickles, jams and jellies and syrups.They have little effect on flavor, are effective inhibitors of

Pag e 790
molds and yeasts (0.5-0.1% by weight), and are relatively ineffective against bacteria, especially gram-negative bacteria [5]. Theantimicrobial activity of parabens increases and their solubility in water decreases with increases in the length of the alkyl chain.The shorter chain members often are used because of their solubility characteristics. In contrast to other antimycotic agents, theparabens are active at pH 7 and higher, apparently because of their ability to remain undissociated at these pH values. Thephenolic group provides a weak acid character to the molecule. The ester linkage is stable to hydrolysis even at temperaturesused for sterilization. The parabens have many properties in common with benzoic acid and they are often used together.Parabens exhibit a low order of toxicity to humans and are excreted in the urine after hydrolysis of the ester group andsubsequent metabolic conjugation.
12.7.10 Epoxides
Most antimicrobial agents used in foods exhibit inhibitory rather than lethal effects at the concentrations employed. However,exceptions occur with ethylene (V) and propylene oxides (VI). These chemical sterilants are used to treat certain low-moisturefoods and to sterilize
aseptic packaging materials. In order to achieve intimate contact with microorganisms the epoxides are used in a vapor state,and after adequate exposure, most of the residual unreacted epoxide is removed by flushing and evacuation.
The epoxides are reactive cyclic ethers that destroy all forms of microorganisms, including spores and even viruses, but themechanism of action of epoxides is poorly understood. In the case of ethylene oxide it has been proposed that alkylation ofessential intermediary metabolites having a hydroethyl group (-CH2-CH2-OH) could account for the lethal results [5]. The site ofattack would be any labile hydrogen in the metabolic system. The epoxides also react with water to form corresponding glycols(Fig. 13). However, the toxicity of the glycols is low, and therefore cannot account for the inhibitory effect.
Since the majority of the active epoxide is removed from the treated food, and the glycols formed are of low toxicity, it mightappear that these gaseous sterilants would be used extensively. Their use, however, is limited to dry items, such as nutmeats andspices, because reaction with water rapidly depletes the concentration of epoxides in high-moisture foods. Spices often containhigh microbial loads and are destined for incorporation into perishable foods. Thermal sterilization of spices is unsuitable becauseimportant flavor compounds are volatile and the product is generally unstable to heat. Thus, treatment with epoxides is a suitablemethod for reducing the microbial load.
The potential formation of relatively toxic chlorohydrins as a result of reactions between epoxides and inorganic chlorides (Fig.13) is a point of some concern. However, there are reports that dietary chlorohydrin in low concentrations causes no ill effect[59]. another consideration in the use of epoxides is their possible adverse effects on vitamins, including riboflavin, niacin, andpyridoxine.

Pag e 791
FIGURE 13Reactions of ethylene oxide with
water and chloride ion, respectively.
Ethylene oxide (boiling point 13.2°C) is more reactive than propylene oxide and is also more volatile and flammable. For safetypurposes, ethylene oxide is often supplied as a mixture consisting of 10% ethylene oxide and 90% carbon dioxide. The productto be sterilized is placed in a closed chamber, and the chamber is evacuated, then pressurized to 30 lb with the ethylene oxide-carbon dioxide mixture. This pressure is needed to provide a concentration of epoxide sufficient to kill microorganisms in areasonable time. When propylene oxide (boiling point 34.3°C) is used, sufficient heat must be applied to maintain the epoxide ina gaseous state.
12.7.11 Antibiotics
Antibiotics comprise a large group of antimicrobial agents produced naturally by a variety of microorganisms. They exhibitselective antimicrobial activity, and their applications in medicine have contributed significantly to the field of chemotherapy. Thesuccesses of antibiotics in controlling pathogenic microorganisms in living animals have led to extensive investigations into theirpotential applications in food preservation. However, because of the fear that routine use of antibiotics will cause resistantorganisms to evolve, their application to foods, with one exception (nisin), is not currently permitted in the United States. Thedevelopment of resistant strains of organisms would be of particular concern if an antibiotic proposed for use in food is also usedin a medical application.
Nisin, a polypeptide antibiotic, is produced by lactic streptococci, and in the United States, it is now permitted in high-moistureprocessed cheese products where it is used to prevent potential outgrowth of C. botulinum. Nisin has been exploredextensively for applications in food preservation. It is active against gram-positive organisms, especially in preventing theoutgrowth of spores [46], and it is not used in medical applications. Nisin is also used in other parts of the world for preventionof spoilage of dairy products, such as processed cheese and condensed milk. Nisin is not effective against gram-negativespoilage organisms, and some strains of clostridia are resistant. However, nisin is essentially nontoxic to humans, does not leadto cross-resistance with medical antibiotics, and is degraded harmlessly in the intestinal tract.
Some other countries allow limited use of a relatively few other antibiotics. These include chlortetracycline and oxytetracycline[5]. Most actual or proposed applications of antibiotics in foods involve their use as adjuncts to other methods of foodpreservation. Notably, this includes delaying spoilage of refrigerated, perishable foods, and reducing the severity of thermalprocesses. Fresh meats, fish, and poultry comprise a group of perishable products that could benefit from the action of broad-spectrum antibiotics. In fact, many years ago, the U.S. Food and Drug Administration permitted dipping whole poultry carcassesinto solutions of chlortetra-

Pag e 792
cycline or oxytetracycline. This increased the shelf life of the poultry, and residual antibiotics were destroyed by usual cookingmethods.
The biochemical modes of actions for antibiotics are just coming into focus, with research effort emphasizing molecularmechanisms. In addition, there is a continuing search for natural preservatives, which hopefully will be suitable for application tofoods. However, the necessarily stringent requirements placed on substances for food applications indicate that acceptablesubstances will be difficult to find.
12.7.12 Diethyl Pyrocarbonate
Diethyl pyrocarbonate has been used as an antimicrobial food additive for beverages such as fruit juices, wine, and beer. Theadvantage of diethyl pyrocarbonate is that it can be used in a cold pasteurization process for aqueous solutions, following whichit readily hydrolyzes to ethanol and carbon dioxide (Fig. 14). Usage levels between 120 and 300 ppm in acid beverages (belowpH 4.0) cause complete destruction of yeasts in about 60 min. Other organisms, such as lactic acid bacteria, are more resistantand sterilization is achieved only when the microbial load is low (less than 500 ml-1) and the pH is below 4.0. The low pHretards the rate of diethyl pyrocarbonate decomposition and intensifies its effectiveness.
Concentrated diethyl pyrocarbonate is an irritant. However, since hydrolysis is essentially complete within 24 hr in acidbeverages, there is little concern for direct toxicity. Unfortunately, diethyl pyrocarbonate reacts with a variety of compounds toform carbethoxy derivatives and ethyl esters. Specifically, diethyl pyrocarbonate reacts readily with ammonia to yield urethane(ethyl carbamate; Fig. 14). Ostensibly this reaction was considered responsible for urethane found in foods treated with diethylpyrocarbonate, and a ban on the use of diethyl pyrocarbonate was issued in 1972 because urethane is a known carcinogen.Since ammonia is ubiquitous in plant and animal tissues, it seemed reasonable that foods treated with diethyl pyrocarbonate willcontain some urethane.
However, it was shown later that urethane occurs intrinsically in fermented foods and beverages, and it is usually present below10 parts per billion in most fermented foods, including bread, wine, and beer [23]. It has been suggested that the major pathwayfor its production in these foods is the reaction of urea, from arginine metabolism, with ethanol. Alcoholic beverages containmuch higher levels of urethane than nonalcoholic foods, and levels to 10 parts per million have been reported in stone fruitbrandies. In spite of these natural occurrences of urethane, diethyl pyrocarbonate is no longer permitted in foods in the UnitedStates because of the potential for elevating levels of a carcinogen in foods.
FIGURE 14Reactions showing the hydrolysis and amidization
of diethyl pyrocarbonate.

Pag e 793
12.8 Intensely Sweet Nonnutritive and Low-Calorie Sweeteners
Nonnutritive and low-calorie sweeteners encompass a broad group of substances that evoke a sweet taste or enhance theperception of sweet tastes (see Chap. 11). The ban on the use of cyclamates in the United States along with questions raisedabout the safety of saccharin initiated an intensive search for alternate low-calorie sweeteners to meet the demand for low-calorie foods and beverages. This has led to the discovery of many new sweet molecules, and the number of viable potentiallycommercially useful, low-calorie sweeteners is growing. The relative sweetness values for some of these substances are given inTable 3.
12.8.1 Cyclamate
Cyclamate (cyclohexyl sulfamate) was approved as a food additive in the United States in 1949, and before the substanceswere prohibited by the U.S. Food and Drug Administration in late 1969, the sodium and calcium salts and the acid form ofcyclamic acid were widely employed as sweeteners. Cyclamates are about 30 times sweeter than sucrose, taste much likesucrose without significant interfering taste sensations, and are heat stable. Cyclamate sweetness has a slow onset, and persistsfor a period of time that is longer than that for sucrose.
Some early experimental evidence with rodents had suggested that cyclamate and its hydrolysis product, cyclohexylamine (Fig.15), caused bladder cancer [3, 42]. However, extensive testing subsequently has not substantiated the early reports, andpetitions have been filed in the United States for reinstatement of cyclamate as an approved sweetener [36]. Currently,cyclamate is permitted for use in low-calorie foods in 40 countries and Canada. Still, for various reasons, even though extensivedata supporting the conclusion that neither cyclamate nor cyclohexylamine are carcinogen or genotoxic [2], the U.S. Food andDrug Administration has chosen not to reapprove cyclamates for use in foods.
TABLE 3 Relative Sweetness of Some Intensely Sweet Substances
SubstanceRelative sweetness valuesª(sucrose = 1, weig ht basis)
Acesulfame K 200
Alitame 2000
Aspartame 180–200
Cyclamate 30
Glycyrrhizin 50–100
Monellin 3000
Neohesperitin dihydrochalcone 1600–2000
Saccharin 300–400
Stevioside 300
Sucralose 600–800
Thaumatin 1600–2000
ªCommonly cited relative sweetness values are listed; however, theconcentration and the food or beverag e matrix may g reatly influence actualrelative sweetness values for sweeteners.

Pag e 794
FIGURE 15Formation of cyclohexylamine by the hydrolysis of
cyclamate.
12.8.2 Saccharin
The calcium and sodium salts and free acid form of saccharin (3-oxo-2,3-dihydro-1,2-benzisothiazole-1, 1 dioxide) areavailable as nonnutritive sweeteners (VII).
The commonly accepted rule of thumb is that saccharin is about 300 times as sweet as sucrose in concentrations up to theequivalent of a 10% sucrose solution, but the range is from 200 to 700 times the sweetness of sucrose depending on theconcentration and the food matrix [44]. Saccharin exhibits a bitter, metallic aftertaste, especially to some individuals, and thiseffect becomes more evident with increasing concentration.
The safety of saccharin has been under investigation for over 50 years, and it has been found to cause a low incidence ofcarcinogenesis in laboratory animals. However, many scientists argue that the animal data are not relevant to humans. In humanssaccharin is rapidly absorbed, and then is rapidly excreted in the urine. Although current regulations in the United States prohibitthe use of food additives that cause cancer in any experimental animals, a ban on saccharin in the United States, proposed by theFDA in 1977, has been stayed by congressional legislation pending further research. However, a health warning statement isrequired on packages of saccharin-containing foods. Saccharin is approved for use in more than 90 countries around the world.
12.8.3 Aspartame
Aspartame or L-aspartyl-L-phenylalanine methyl ester (Fig. 16) is a caloric sweetener because it is a dipeptide that is completelydigested after consumption. However, its intense sweetness (about 200 times as sweet as sucrose) allows functionality to beachieved at very low levels that provide insignificant calories. It is noted for a clean, sweet taste that is similar to that of sucrose.Aspartame was first approved in the United States in 1981, and now is approved for use in over 75 countries where it is used inover 1700 products.
Two disadvantages of aspartame are its instability under acid conditions, and its rapid degradation when exposed to elevatedtemperatures. Under acid conditions, such as carbonated soft drinks, the rate of loss of sweetness is gradual and depends on thetemperature and pH. The peptide nature of aspartame makes it susceptible to hydrolysis, and this feature also permits otherchemical interactions and microbial degradations. In addition to loss of sweetness resulting from hydrolysis of either the methylester on phenylalanine or the peptide bond between the two amino

Pag e 795
FIGURE 16Steriochemical config uration of
aspartame.
acids, aspartame readily undergoes an intramolecular condensation, especially at elevated temperatures, to yield thediketopiperazine (5-benzyl-3,6-dioxo-2-piperazine acetic acid) shown in Figure 17. This reaction is especially favored at neutraland alkaline pH values because nonprotonated amine groups on the molecule are more available for reaction under theseconditions. Similarly, alkaline pH values promote carbonyl-amino reactions, and aspartame has been shown to react readily withglucose and vanillin under such conditions. With the glucose reaction, loss of aspartame's sweetness during storage is theprincipal concern, while loss of vanilla flavor is the main concern in the latter case.
Even though aspartame is composed of naturally-occurring amino acids and its daily intake is projected to be very small (0.8g/person), concern has been expressed about its potential safety as a food additive. Aspartame-sweetened products must belabelled prominently about their phenylalanine content to allow avoidance of consumption by phenylketonuric individuals wholack 4-monooxygenase that is involved in the metabolism of phenylalanine. However, aspartame consumption of aspartame bythe normal population is not associated with adverse health effects. Extensive testing has similarly shown that thediketopiperazine poses no risk to humans at concentrations potentially encountered in foods [26].
12.8.4 Acesulfame K
Acesulfame K [6-methyl-1,2,3-oxathiazine-4(3H)-one-2,2-dioxide] was discovered in Germany, and was first approved foruse as a nonnutritive sweetener in the United States in 1988. The complex chemical name of this substance led to the creation ofthe trademarked common name,
FIGURE 17Intramolecular condensation of aspartame yielding a
diketopiperazine deg radation product.

Pag e 796
FIGURE 18Structurally related compounds that form thebasis for the derived name of the nonnutritive
sweetener Acesulfame K.
Acesulfame K, which is based on its structural relationships to acetoacetic acid and sulfamic acid, and to its potassium saltnature (Fig. 18).
Acesulfame K is about 200 times as sweet as sucrose at a 3% concentration in solution, and it exhibits a sweetness qualitybetween that of cyclamates and saccharin. Since acesulfame K possesses some metallic and bitter taste notes at higherconcentrations, it is especially useful when blended with other low-calorie sweeteners, such as aspartame. Acesulfame K isexceptionally stable at elevated temperatures encountered in baking, and it is also stable in acidic products, such as carbonatedsoft drinks. Acesulfame K is not metabolized in the body, thus providing no calories, and is excreted by the kidneys unchanged.Extensive testing has shown no toxic effects in animals, and exceptional stability in food applications.
12.8.5 Sucralose
Sucralose (1,6-dichloro-1,6-dideoxy-b-fructofuranosyl-4-chloro-a-D-galactopyranoside) (VIII) is a noncaloric sweetenerproduced by the selective chlorination of the sucrose molecule, and it is
about 600 times sweeter than sucrose. Food additive petitions for use of sucralose were filed in the United States in 1987 and1989, but sucralose has not yet been approved in this country. Sucralose, however, was approved for some applications inCanada in 1991.
Sucralose exhibits a high degree of crystallinity, high water solubility, and very good stability at high temperatures, thus making itan excellent ingredient for bakery applications. It is also quite stable at the pH of carbonated soft drinks, and only limitedhydrolysis to monosaccharide units occurs during usual storage of these products. Sucralose possesses a sweetness time-intensity profile similar to sucrose, and exhibits no bitterness or other unpleasant aftertastes. Extensive studies have beenconducted on the safety of sucralose, and these have generally demonstrated that the substance is safe at the expected usagelevels.
12.8.6 Alitame
Alitame [L-a-aspartyl-N-(2,2,4,4-tetramethyl-3-thietanyl)-D-alaninamide] (IX) is an amino acid-based sweetener thatpossesses a sweetening power of about 2000 times that of

Pag e 797
sucrose, and it exhibits a clean sweet taste similar to sucrose. It is highly soluble in water and has good thermal stability and shelflife, but prolonged storage in some acidic solutions may result in off flavors. Generally, alitame has the potential for use in mostfoods where sweeteners are employed, including baked goods.
Alitame is prepared from the amino acids L-aspartic acid and D-alanine and a novel amine. Although the aspartic acidcomponent of alitame is metabolized, its caloric contribution is insignificant because alitame is such an intense sweetener. Thealanine amide moiety of alitame passes through the body with minimal metabolic changes. Extensive testing indicates that alitameis safe for human consumption, and a petition for its use in foods was filed in 1986 with the U.S. Food and Drug Administration.Although not yet approved for use in foods in the United States, alitame has been approved in Australia, New Zealand, China,and Mexico.
12.8.7 Other Intensely Sweet Nonnutritive or Low-Calorie Sweeteners
The intensive search for alternative sweeteners over the past decade has led to the discovery of a large number of new sweetcompounds, and many of these are undergoing further development and safety studies to determine if they are suitable for futurecommercialization. Included are b-substituted b-amino acids that are up to 20,000 times as sweet as sucrose, and trisubstitutedguanidines with sweetness potencies up to 170,000 times that of sucrose. These compounds join a substantial list of less wellknown but emerging intensely sweet compounds, and some of the latter group are discussed here.
Glycyrrhizin (glycyrrhizic acid) is a triterpene saponin that is found in licorice root, and is 50–100 times sweeter than sucrose.Glycyrrhizin is a glycoside that on hydrolysis yields two moles of glucuronic acid and one mole of glycyrrhetinic acid, a triterpenerelated to aleanolic acid. Ammonium glycyrrhizin, the fully ammoniated salt of glycyrrhizic acid, is commercially available, and isapproved for use only as a flavor and as a surfactant, but not as a sweetener. Glycyrrhizic acid is used primarily in tobaccoproducts and to some extent in foods and beverages. Its licorice-like flavor influences its suitability for some applications.
A mixture of glycosides found in the leaves of the South American plant Stevia rebaudiana Bertoni is the source of steviosideand rebaudiosides. Pure stevioside is about 300 times as sweet as sucrose. Stevioside exhibits some bitterness and undesirableaftertastes at higher concentrations, and rebaudioside A exhibits the best taste profile of the mixture. However, extractsproduced from S. rebaudiana are used as commercial forms of this sweetener, and they are employed extensively in Japan.Extensive safety and toxicological testing has indicated that the extracts are safe for human consumption, but they are notapproved in the United States.
Neohesperidin dihydrochalcone is a nonnutritive sweetener that is 1500–2000 times as

Pag e 798
sweet as sucrose, and it is derived from the bitter flavonones of citrus fruits. Neohesperidin dihydrochalcone exhibits a slowonset in sweetness and a lingering sweet aftertaste, but it decreases the perception of concurrent bitterness. This intensely sweetsubstance and other similar compounds are produced by hydrogenation of (1) naringin to yield naringin dihydrochalcone, (2)neohesperidin to yield neohesperidin dihydrochalcone, or (3) hesperidin to yield hesperidin dihydrochalcone 4'-O-glucoside[41]. Neohesperidin dihydrochalcone has been extensively tested for safety, and the studies have generally confirmed its safety.It is approved for use in Belgium and Argentina, but the U.S. Food and Drug Administration has requested additional toxicologytesting.
Several sweet proteins are now known, and thaumatins I and II obtained from the tropical African fruit katemfe(Thaumatococcus daniellii) have been well characterized. Thaumatins I and II are alkaline proteins, each with a molecularweight of about 20,000 [55], and on a mass basis they are about 1600–2000 times as sweet as sucrose. An extract of katemfefruit is marketed under the tradename of Talin in the United Kingdom, and its use as a sweetener and flavor enhancer has beenapproved in Japan and Great Britain. It is also permitted as a flavor enhancer in chewing gum in the United States. Talin exhibitsa long-lasting sweetness with a slight licorice-like taste, which limits it use along with its high cost.
Another sweet protein, monellin, is obtained from the serendipity berry, and it has a molecular weight of about 11,500. Monellinis about 3000 times as sweet as sucrose on a mass basis, and the sweetness of natural monellin is destroyed by boiling. Thepotential use of sweet proteins is limited because the compounds are expensive, unstable to heat, and lose sweetness when heldin solution below pH 2 at room temperature.
Another basic protein, miraculin, has been isolated from miracle fruit (Richadella dulcifica,) and this protein is tasteless.However, it has the peculiar property of changing sour taste into sweet taste; that is, it makes lemons taste sweet. Miraculin is aglycoprotein with a molecular weight of 42,000 [55], and, similar to other protein sweeteners, miraculin is heat labile andinactivated at low pH values. The sweetness induced by 0.1 M citric acid after tasting 1 µM miraculin solution is equivalent to a0.4 M sucrose solution; thus, the sweetness of a miraculin solution induced by 0.1 M citric acid solution has been calculated tobe 400,000 times that of a sucrose solution. The taste effects of miraculin persist for over 24 hrs after placing it in the mouth, andthis limits its potential use. In the 1970s, miraculin was introduced in the United States as a sweetening aid for diabetics, but itwas banned by the U.S. Food and Drug Administration because of insufficient safety data.
12.9 Polyhydric Alcohol Texturizers and Reduced-Calorie Sweeteners
Polyhydric alcohols are carbohydrate derivatives that contain only hydroxyl groups as functional groups (Chap. 4), and as aresult, they are generally water-soluble, hygroscopic materials that exhibit moderate viscosities at high concentrations in water.While the number of available polyhydric alcohols is substantial, relatively few have been important in food application.However, the usage of some polyhydric alcohols is growing because of demands for their reduced-calorie sweetener properties.
This class of substances includes synthetic propylene glycol (CH2OH-CHOH-CH3) and naturally produced glycerol (CH2OH-CHOH-CH2OH). Additionally, xylitol (CH2-OH-CHOH- CHOH-CHOH-CH2OH), sorbitol, and mannitol (CH2-CHOH-CHOH-CHOH-CHOH-CH2OH isomers) are produced by hydrogenation of xylose, glucose, and mannose, respectively. Morerecently, hydrogenated starch hydrolysates have entered the market, and these contain sorbitol

Pag e 799
from glucose, maltitol from maltose, and various polymeric polyols from oligosaccharides. Many polyhydric alcohols occurnaturally, but because of their limited concentrations, they usually do not exhibit functional roles in food. For example, freeglycerol exists in wine and beer as a result of fermentation, and sorbitol occurs in fruits such as pears, apples, and prunes.
The polyhydroxy structures of these compounds provide water-binding properties that have been exploited in foods. Specificfunctions of polyhydric alcohols include control of viscosity and texture, addition of bulk, retention of moisture, reduction ofwater activity, control of crystallization, improvement or retention of softness, improvement of rehydration properties ofdehydrated foods, and use as a solvent for flavor compounds [21].
Sugars and polyhydric alcohols are structurally similar, except that sugars also contain aldo or keto groups (free or bound) thatadversely affect their chemical stability, especially at high temperatures. Many applications of polyhydric alcohols in foods relyon concurrent contributions of functional properties from sugars, proteins, starches and gums. Polyhydric alcohols generally aresweet, but less so than sucrose (Table 4). Short-chain members, such as glycerol, are slightly bitter at high concentrations. Whenused in the dry form, sugar alcohols (polyols) contribute a pleasant cooling sensation because of their negative heat of solution.
Historically, the energy value of simple polyols derived from sugars, like sugars, has been considered to be 16.7 kJ (4 kcal) g-1
(joules = calories × 4.1814) for labeling purposes in the United States. However, this view has changed very recently followinga 1990 European Union lead of assigning an energy value of 10 kJ (2.4 kcal) g-1 to polyols as a group. The U.S. Food and DrugAdministration has accepted caloric contents ranging from 6.7 to 12.5 kJ (1.6–3.0 kcal)
TABLE 4 Relative Sweetness and Energ y Values of Some Polyols and Sug ars
SubstanceRelative sweetnessª (Sucrose = 1,weig ht basis)
Energ y value b
(kJ g -1)
Polyols
Mannitol 0.6 6.69
Lactitol 0.3 8.36
Isomaltc 0.4–0.6 8.36
Xylitol 1.0 10.03
Sorbitol 0.5 10.87
Maltitol 0.8 12.54
Hydrog enated corn syrup 0.3–0.75 12.54
Sug ars
Xylose 0.7 16.72
Glucose 0.5–0.8 16.72
Fructose 1.2–1.5 16.72
Galactose 0.6 16.72
Mannose 0.4 16.72
Lactose 0.2 16.72
Maltose 0.5 16.72
Sucrose 1.0 16.72
ªCommonly cited relative sweetness values are listed; however, the concentration and thefood or beverag e matrix may g reatly influence actual relative sweetness values forsweeteners.

b Energ y values accepted by the U.S. Food and Drug Administration; 1 kcal = 4.1814 kJ.
cEquimolar mixture of a-D-g lucopyranosyl-1 -mannitol and a-D-g lucopyranosyl-1 -sorbitol derived by enzymic conversion of sucrose and followed by hydrog enation.

Pag e 800
g-1 for the various commercially available polyols (Table 4). This has markedly changed the positioning of polyols as foodingredients, and it can be anticipated that their presence in low-calorie, reduced-fat and sugar-free foods will markedly increasein the future. Although there is some controversy relating to the influence of polyols on diabetics, there also appears to be anemerging philosophy that they are suitable for diets of these individuals.
Attention also has been given to the development of polymeric forms of polyhydric alcohols for food applications. Whereasethylene glycol (CH2OH-CH2OH) is toxic, polyethylene glycol 6000 is allowed in some food coating and plasticizingapplications. Polyglycerol [CH2OH-CHOH-CH2-(O-CH2CHOH-CH2)n-O-CH2-CHOH-CH2OH], formed from glycerolthrough an alkaline-catalyzed polymerization, also exhibits useful properties. It can be further modified by esterification with fattyacids to yield materials with lipid-like characteristics. These polyglycerol materials have been approved for food use because thehydrolysis products, glycerol and fatty acids, are metabolized normally.
Intermediate moisture (IM) foods deserve some discussion since polyhydric alcohols can make an important contribution to thestability of these products. IM foods contain substantial moisture (15–30%), yet are stable to microbiological deteriorationwithout refrigeration. Several familiar foods, including dried fruits, jams, jellies, marshmallows, fruit cake, and jerky, owe theirstability to IM characteristics. Some of these items may be rehydrated prior to consumption, but all possess a plastic texture andcan be consumed directly. Although moist shelf-stable pet foods have found ready acceptance, new forms of intermediatemoisture foods for human consumption have not as yet become popular. Nevertheless, meat, vegetable, fruit, and combinationprepared dishes are under development and may eventually become important forms of preserved foods.
Most IM foods possess water activities of 0.70–0.85 and those containing humectants contain moisture contents of about 20 gof water per 100 g of solids (82% H2O by weight). If IM foods with a water activity of about 0.85 are prepared by desorption,they are still susceptible to attack by molds and yeasts. To overcome this problem, the ingredients can be heated duringpreparation and an antimycotic agent, such as sorbic acid, can be added.
To obtain the desired water activity it is usually necessary to add a humectant that binds water and maintains a soft palatabletexture. Relatively few substances, mainly glycerol, sucrose, glucose, propylene glycol, and sodium chloride, are sufficientlyeffective in lowering the water activity while being tolerable organoleptically to be of value in preparing IM foods. Figure 19illustrates the effectiveness of the polyhydric alcohol glycerol on the water activity of a cellulose model system. Note that in a10% glycerol system, a water activity of 0.9 corresponds to a moisture content of only 25 g H2O/100 g solids, whereas thesame water activity in a 40% glycerol systems corresponds to a moisture content of 75 g H2O/100 g solids.
The principal flavor criticism of glycerol is its sweet-bitter sensation. Similarly, a problem of excessive sweetness exists forsucrose and glucose when used in IM foods. However, many IM foods show promise when combinations of glycerol, salt,propylene glycol, sucrose, and other bulking substances are employed.
12.10 Stabilizers and Thickeners
Many hydrocolloid materials are widely used for their unique textural, structural, and functional characteristics in foods wherethey provide stabilization for emulsions, suspensions and foams, and general thickening properties. Most of these materials,sometimes classes as gums, are derived from natural sources although some are chemically modified to achieve desiredcharacteristics. Many stabilizers and thickeners are polysaccharides, such as gum arabic, guar gum,

Pag e 801
FIGURE 19Moisture sorption isotherms of
cellulose model systems containingvarious amounts of g lycerol at 37°C.
Reprinted from Ref. 32, p. 86.
carboxymethycellulose, carrageenan, agar, starch, and pectin. The chemical properties of these and related carbohydrates arediscussed in Chapter 4. Gelatin, a protein derived from collagen, is one of the few noncarbohydrate stabilizers used extensively,and it is discussed in Chapter 6. All effective stabilizers and thickeners are hydrophilic and are dispersed in solution as colloids,which leads to the designation hydrocolloid. General properties of useful hydrocolloids include significant solubility in water, acapability to increase viscosity, and in some cases an ability to form gels. Some specific functions of hydrocolloids includeimprovement and stabilization of texture, inhibition of crystallization (sugar and ice), stabilization of emulsions and foams,improvement (reduced stickiness) of icings on baked goods, and encapsulation of flavors [31]. Hydrocolloids are generally usedat a concentration of about 2% or less because many exhibit limited dispersibility, and the desired functionality is provided atthese levels. The efficacy of hydrocolloids in many applications is directly dependent on their ability to increase viscosity. Forexample, this is the mechanism by which hydrocolloids stabilize oil-in-water emulsions. They cannot function as true emulsifierssince they lack the necessary combination of strong hydrophilic and lipophilic properties in single molecules.
12.11 Fat Replacers
Although fat is an essential dietary component, too much fat in the diet has been linked with a higher risk of coronary heartdisease and certain types of cancer. Consumers are being advised to eat lean meats, especially fish and skinless poultry, low-fatdairy products, and to restrict their consumption of fried foods, high-fat baked goods, and sauces and dressings. However,consumers want substantially reduced-calorie foods that possess the sensory properties of traditional high-fat foods.
Pag e 802
Although the increasing availability of complex prepared foods has contributed to the overabundance of fat in the diets ofdeveloped countries, it also has provided an opportunity to develop the complex technologies required for the manufacture andmass marketing of reduced-fat foods that simulate full-fat counterparts. Over the past two decades, a great deal of progress hasbeen made in the adaptation and development of ingredients for use in reduced-fat foods. The types of ingredients suggested forvarious reduced-fat food applications vary widely, and are derived form several chemical groups, including carbohydrates,proteins, lipids, and purely synthetic compounds.
When fat is either partially or completely omitted from foods, the properties of the foods are altered, and it is necessary toreplace it by some other ingredient or component. Hence, the term “fat replacers” has been spawned to broadly indicate theingredients that are functionally used in this capacity. When the substances provide identical physical and sensory properties tofats, but without calories, they are designated “fat substitutes.”. These ingredients both convey fat-like sensory properties infoods and perform physically in various applications, such as frying foods.
Other ingredients, which do not possess full functional equivalency to fats, are termed “fat mimetics,” because they can be madeto mimic the effects of fat in certain applications. An example of this is the simulation of pseudomoistness provided by fat tocertain high-fat bakery products. Certain substances, such as specially modified starches, can be used to provide the desiredsimulated fat properties by contributing to sensory properties arising from bulking and moisture retention.
12.11.1 Carbohydrate Fat Mimetics
Modestly processed starches, gums, hemicelluloses, and cellulose are used in many forms for providing partial fat functionality inreduced fat functionality in reduced fat foods, and the chemistry of these substances is discussed in Chapter 4 and in Sections12.9 and 12.10 (this chapter). Additional information about their applications in reduced fat foods also can be found in recentreviews [1, 34]. Generally, some carbohydrate fat mimetics provide essentially no calories (for example, gums, celluloses), whileothers provide up to 16.7 kJ (4 kcal) g-1 (for example, modified starches) rather than the 37.6 kJ (9kcal) g-1 of traditional fats.These substances mimic the smoothness or creaminess of fats in foods primarily by moisture retention and bulkiness of theirsolids, which assist in providing fat-like sensations, such as moistness in baked goods and the textural bite of ice cream.Tradenames for some of these products are Avicel, Oatrim, Kelcogel, Stellar, and Slendid.
12.11.2 Protein Fat Mimetics
Several proteins (Chap. 6) have been exploited as fat mimetics [36], and have GRAS (generally recognized as safe; UnitedStates) approval. However, the functionality of these proteins as fat mimetics is limited because they do not perform like fats athighly elevated temperatures, such as is required in frying applications. Nevertheless, these protein [16.7 kJ (4kcal) g-1]ingredients are valuable for replacing fat in foods, especially in oil-in-water emulsions. For these applications, they can bevariously prepared into microparticulates (<3 µm) diameter), where they simulate the physical nature of fats through a means thathas been described as being similar to flexible ball bearings. Proteins in solution also provide thickening, lubricity, and mouth-coating effects. Gelatin is quite functional in reduced-fat, solid products, such as margarine, where it provides thermallyreversible gelation during manufacture, and subsequently it provides thickness to the margarine mass.
The manufacture of protein-based fat mimetics involves several strategies that each utilize
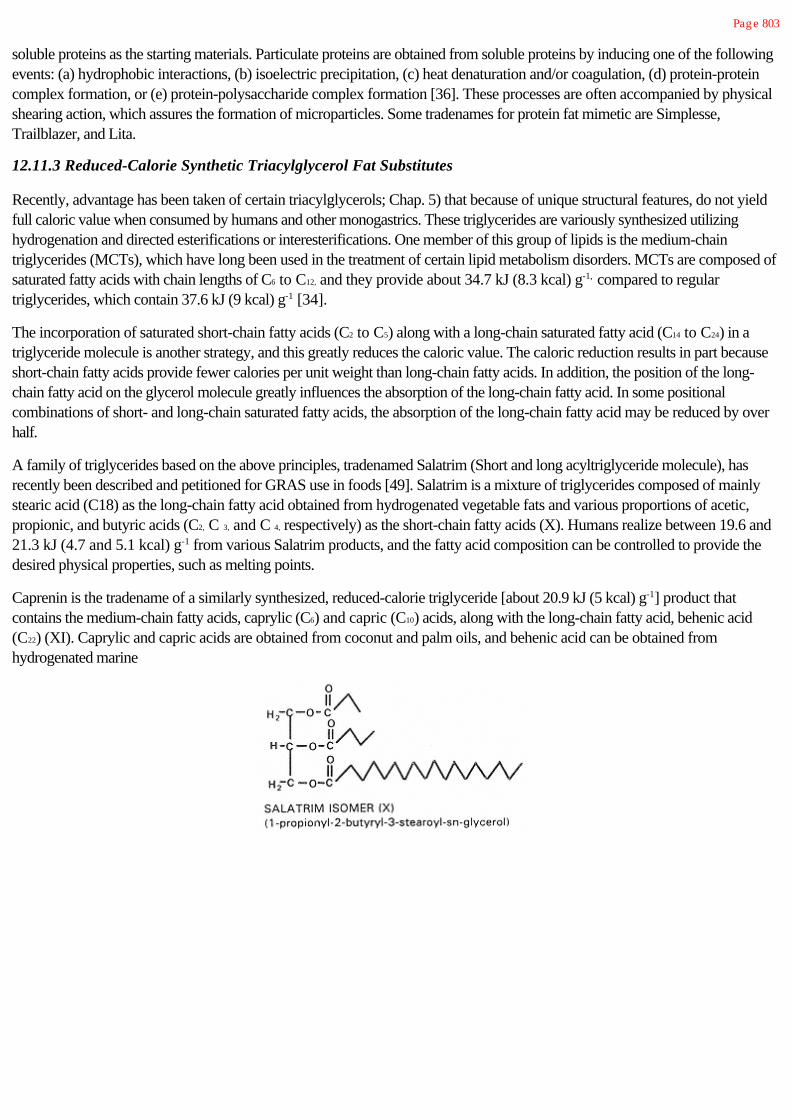
Pag e 803
soluble proteins as the starting materials. Particulate proteins are obtained from soluble proteins by inducing one of the followingevents: (a) hydrophobic interactions, (b) isoelectric precipitation, (c) heat denaturation and/or coagulation, (d) protein-proteincomplex formation, or (e) protein-polysaccharide complex formation [36]. These processes are often accompanied by physicalshearing action, which assures the formation of microparticles. Some tradenames for protein fat mimetic are Simplesse,Trailblazer, and Lita.
12.11.3 Reduced-Calorie Synthetic Triacylglycerol Fat Substitutes
Recently, advantage has been taken of certain triacylglycerols; Chap. 5) that because of unique structural features, do not yieldfull caloric value when consumed by humans and other monogastrics. These triglycerides are variously synthesized utilizinghydrogenation and directed esterifications or interesterifications. One member of this group of lipids is the medium-chaintriglycerides (MCTs), which have long been used in the treatment of certain lipid metabolism disorders. MCTs are composed ofsaturated fatty acids with chain lengths of C6 to C12, and they provide about 34.7 kJ (8.3 kcal) g-1, compared to regulartriglycerides, which contain 37.6 kJ (9 kcal) g-1 [34].
The incorporation of saturated short-chain fatty acids (C2 to C5) along with a long-chain saturated fatty acid (C14 to C24) in atriglyceride molecule is another strategy, and this greatly reduces the caloric value. The caloric reduction results in part becauseshort-chain fatty acids provide fewer calories per unit weight than long-chain fatty acids. In addition, the position of the long-chain fatty acid on the glycerol molecule greatly influences the absorption of the long-chain fatty acid. In some positionalcombinations of short- and long-chain saturated fatty acids, the absorption of the long-chain fatty acid may be reduced by overhalf.
A family of triglycerides based on the above principles, tradenamed Salatrim (Short and long acyltriglyceride molecule), hasrecently been described and petitioned for GRAS use in foods [49]. Salatrim is a mixture of triglycerides composed of mainlystearic acid (C18) as the long-chain fatty acid obtained from hydrogenated vegetable fats and various proportions of acetic,propionic, and butyric acids (C2, C 3, and C 4, respectively) as the short-chain fatty acids (X). Humans realize between 19.6 and21.3 kJ (4.7 and 5.1 kcal) g-1 from various Salatrim products, and the fatty acid composition can be controlled to provide thedesired physical properties, such as melting points.
Caprenin is the tradename of a similarly synthesized, reduced-calorie triglyceride [about 20.9 kJ (5 kcal) g-1] product thatcontains the medium-chain fatty acids, caprylic (C6) and capric (C10) acids, along with the long-chain fatty acid, behenic acid(C22) (XI). Caprylic and capric acids are obtained from coconut and palm oils, and behenic acid can be obtained fromhydrogenated marine

Pag e 804
oils, hydrogenated rapeseed oil, and peanut oil. Peanut oil contains about 3% behenic acid whereas rapeseed oil contains about35% erucic acid (C22:1), which is converted to behenic acid by hydrogenation. Marine oils often contain over 10% ofdocosahexaenoic acid (DHA), which also is converted to behenic acid by hydrogenation. Caprenin has been used in candybars, and a petition has been made for its GRAS use in foods.
12.11.4 Synthetic Fat Replacers
A great number of synthetic compounds have been found to provide either fat mimetic or fat substitute properties [1]. Many ofthem contain triacylglycerol-like structural and functional groups, such as the trialkoxycarballates, which in effect have the estergroups reversed compared to conventional fats (i.e., a tricarboxylic acid is esterified to saturated alcohols rather than glycerolbeing esterified to fatty acids). Because of their synthetic nature, these compounds are resistant to enzymic hydrolysis, and arelargely undigested in the gut. U.S. Food and Drug Administration approval for many of these substances is proving to be difficultto obtain, and it remains to be seen whether some of these compounds will find an ultimate role in the food supply.
12.11.4.1 Polydextrose
Although principally used as a reduced-calorie, carbohydrate bulking ingredient, polydextrose behaves as a fat mimetic in someapplications. Since polydextrose yields only 4.18 kJ (1kcal) g-1, it is especially attractive as a dual purpose ingredient whichreduces calories from carbohydrates as well as fats. Contemporary polydextrose (tradename Litesse) is manufactured byrandomly polymerizing glucose (minimum 90%), sorbitol (maximum 2%), and citric acid, and it contains minor amounts ofglucose monomer and 1,6-anhydroglucose [1] (Fig. 20). To maintain suitable water solubility, the molecular weights ofpolydextrose polymers are controlled below 22,000.
12.11.4.2 Sucrose Polyester
Sucrose polyester (tradename Olestra) is a member of a family of carbohydrate fatty acid polyesters that are lipophilic,nondigestible, nonabsorbable fat-like molecules with physical and chemical properties of conventional fats. Sucrose polyester ismanufactured by using various means of esterification of sucrose with long-chain fatty acids obtained from vegetable fats (XII).Sucrose polyesters intended for fat substitute applications have a high degree of esterification, while those intended for emulsifierapplications have a lower degree of esterification. Sucrose polyester emulsifiers have been approved in the United States since1983. Sucrose polyester has been extensively studied for safety and health aspects for over two decades and it has recently(1996) been approved for limited use in foods in the U.S.

Pag e 805
FIGURE 20Structural features of polydextrose; R = g lucose, remainder of polymer,
sorbitol, or citric acid; note that linkag es are random.
12.12 Masticatory Substances
Masticatory substances are employed to provide the long-lasting, pliable properties of chewing gum. These substances are eithernatural products or the result of organic synthesis, and both kinds are quite resistant to degradation. Synthetic masticatorysubstances are prepared by the Fischer-Tropsch process involving carbon monoxide, hydrogen, and a catalyst, and after furtherprocessing to remove low-molecular-weight compounds, the product is hydrogenated to yield synthetic paraffin [7]. Chemicallymodified masticatory substances are prepared by partially hydrogenating wood rosin, which is largely composed of diterpenes,and then esterifying the products with pentaerythritol or glycerol. Other polymers similar to synthetic rubbers have also beenprepared for use as masticatory substances, and these substances are prepared from ethylene, butadiene, or vinyl monomers.
Much of the masticatory base employed in chewing gum is derived directly from plant gums. These gums are purified byextensive treatments involving heating, centrifuging, and filtering. Chicle from plants in the Sapotaceae (Sapodilla) family, gumsfrom Gutta Katiau from Palaquium sp., and latex solids (natural rubber) from Henea brasiliensis are widely used, naturallyderived, masticatory substances.
Pag e 806
12.13 Firming Texturizers
Thermal processing or freezing of plant tissues usually causes softening because the cellular structure is modified. Stability andintegrity of these tissues are dependent on maintenance of intact cells and firm molecular bonding between constituents of cellwalls. The pectic substances (Chaps. 4 and 16) are extensively involved in structure stabilization through cross-linking of theirfree carboxyl groups via polyvalent cations. Although considerable amounts of polyvalent cations are naturally present, calciumsalts (0.1-0.25% as calcium) are frequently added. This increases firmness since the enhanced cross-linking results in increasedamounts of relatively insoluble calcium pectinate and pectate. These stabilized structures support the tissue mass, and integrity ismaintained even through heat processing. Fruits, including tomatoes, berries, and apple slices, are commonly firmed by addingone or more calcium salts prior to canning or freezing. The most commonly used salts include calcium chloride, calcium citrate,calcium sulfate, calcium lactate, and monocalcium phosphate. Most calcium salts are sparingly soluble, and some contribute abitter flavor at higher concentrations.
Acidic alum salts, sodium aluminum sulfate [NaAl(SO4)2 · 12H2O], potassium aluminum sulfate, ammonium aluminum sulfate,aluminum sulfate [Al2(SO4)3 · 18H2O], potassium aluminum sulfate, ammonium aluminum sulfate, and aluminum sulfate [Al2(SO4)3
· 18H2O], are added to fermented, salt-brined pickles to make cucumber products that are crisper and firmer than thoseprepared without these salts. The trivalent aluminum ion is believed to be involved in the crisping process through the formationof complexes with pectin substances. However, some investigations have demonstrated that aluminum sulfate has a softeningeffect on fresh-pack or pasteurized pickles and should not be included in these products [11]. The reasons for the softening arenot understood, but the presence of aluminum sulfate counteracts the firming effects normally provided by adjusting the pH tonear 3.8 with acetic or lactic acids.
The firmness and texture of some vegetables and fruits can be manipulated during processing without the use of direct additives.For example, an enzyme, pectin methylesterase, is activated during low-temperature blanching (70–82°C for 3–15 min), ratherthan inactivated as is the case during usual blanching (88–100°C for 3 min). The degree of firmness produced following low-temperature blanching can be controlled by the holding time prior to retorting [54]. Pectin methylesterase hydrolyzes esterifiedmethanol (sometimes referred to as methoxyl groups) from carboxyl groups on pectin to yield pectinic and pectic acids. Pectin,having relatively few free carboxyl groups, is not strongly bound, and because it is water soluble, it is free to migrate from the cellwall. On the other hand, pectinic acid and pectic acid possess large numbers of free carboxyl groups and they are relativelyinsoluble, especially in the presence of endogenous or added calcium ions. As a result they remain in the cell wall duringprocessing and produce firm textures. Firming effects through activation of pectin methylesterase have been observed for snapbeans, potatoes, cauliflower, and sour cherries. Addition of calcium ions in conjunction with enzyme activation leads toadditional firming effects.
12.14 Appearance Control and Clarifying Agents
In beer, wine, and many fruit juices the formation of hazes or sediments and oxidative deterioration are long-standing problems.Natural phenolic substances are involved in these phenomena. The chemistry of this important group, including anthocyanins,flavonoids, proanthocyanidins, and tannins, is discussed in Chapter 10. Proteins and pectic substances participate withpolyphenols in the formation of haze-forming colloids. Specific enzymes have been utilized to partially hydrolyze high-molecular-weight proteins (Chap. 7), and thereby reduce the

Pag e 807
tendency toward haze formation. However, in some instances excess enzymic activity can adversely affect other desirableproperties, such as foam formation in beer.
An important means of manipulating polyphenolic composition to control both its desirable and undesirable effects is to usevarious clarifying (“fining”) agents and adsorbents. Preformed haze can be at least partially removed by filter aids, such asdiatomaceous earth. Many of the clarifying agents that have been used are nonselective and they affect the polyphenolic contentmore or less incidentally. Adsorption is usually maximal when solubility of the adsorbate is minimal, and suspended or nearlyinsoluble materials such as tannin-protein complexes tend to collect at any interface. As the activity of the adsorbent increases,the less soluble substances still tend to be adsorbed preferentially, but more soluble compounds are also adsorbed.
Bentonite, a montmorillonite clay, is representative of many similar and moderately effective minerals that have been employed asclarifying agents. Montmorillonite is a complex hydrated aluminum silicate with exchangeable cations, frequently sodium ions. Inaqueous suspension bentonite behaves as small platelets of insoluble silicate. The bentonite platelets have a negative charge anda very large surface area of about 750 m2 g-1. Bentonite is a rather selective adsorbent for protein, and evidently this adsorptionresults from an attraction between the positive charges of the protein and the negative charges of the silicate. A particle ofbentonite covered with adsorbed protein will adsorb some phenolic tannins on or along with the protein [48]. Bentonite is usedas a clarifying or fining agent for wines to preclude protein precipitation. Doses of the order of a few pounds per thousandgallons usually reduce the protein content of wine from 50–100 mg/L to a stable level of less than 10 mg/L. Bentonite rapidlyforms a heavy compact sediment and is often employed in conjunction with final filtration to remove precipitated colloids.
The important clarifying agents that have a selective affinity for tannins, proanthocyanidins, and other polyphenols includeproteins and certain synthetic resins, such as the polyamides and polyvinylpyrrolidone (PVP). Gelatin and isinglass (obtainedform the swim bladder of fish) are the proteins most commonly used to clarify beverages. It appears that the most important typeof linkage between tannins and proteins, although probably not the only type, involves hydrogen bonding between phenolichydroxyl groups and amide bonds in proteins. The addition of a small amount of gelatin (40–170 g per 380 L) to apple juicecauses aggregation and precipitation of a gelatin-tannin complex, which on settling enmeshes and removes other suspendedsolids. The exact amount of gelatin for each use must be determined at the time of processing. Juices containing low levels ofpolyphenolics are supplemented with added tannin or tannic acid (0.005–0.01%) to facilitate flocculation of the gelatin.
At low concentrations, gelatin and other soluble clarifying agents can act as protective colloids, at higher concentrations they cancause precipitation, and at still higher concentrations they can again fail to cause precipitation. Hydrogen bonding between thecolloidal clarifying agents and water accounts for their solubilities. Molecules of the clarifying agent and polyphenol can combinein different proportions to either neutralize or enhance the hydration and solubility of a given colloidal particle. The most nearlycomplete disruption of H bonding between water and either the protein or the polyphenol gives the most complete precipitation.This would be expected to occur when the amount of dissolved clarifying agent roughly equals the weight of the tannin beingremoved.
The synthetic resins (polyamides and polyvinylpyrrolidone or PVP) have been used to prevent browning in white wines [4] andto remove haze for beers [9]. These polymers are available in both soluble and insoluble forms, but requirements for little or noresidual polymer in beverages has stimulated use of the high-molecular-weight cross-linked forms that are insoluble. Thesynthetic resins have been particularly useful in the brewing industry where reversible refrigeration-induced haze (chill haze) andpermanent haze (that which is associated

Pag e 808
with the development of oxidized flavors) are serious problems. These hazes are caused by formation of complexes betweennative proteins and proanthocyanidins from malted barley. Excessive removal of proteins leads to defective foam character, butthe selective removal of polyphenols extends the stability of beer. Initial applications involved polyamides (nylon 66), but greaterefficiency has been achieved with cross-linked polyvinylpyrrolidone (XIII). Treatment with 1.4–2.3 kg of insoluble PVP per 100barrels of beer provides control of chill haze and improves storage stability
[9]. PVP is added after fermentation and prior to filtration, and it rapidly adsorbs polyphenols. Just as bentonite removes sometannins along with preferentially adsorbed protein, selective tannin adsorbents remove some proteins along with the phenolics.
In addition to the adsorbents already discussed, activated charcoal and some other materials have been employed. Activatedcharcoal is quite reactive but it adsorbs appreciable amounts of smaller molecules (flavors, pigments) along with the largercompounds that contribute to haze formation. Tannic acid (tannin) is used to precipitate proteins, but its addition can potentiallylead to the undesirable effects described previously. Other proteins with low solubility (keratin, casein, and zein) and solubleproteins (sodium caseinate, egg albumen, and serum albumin) also have selective adsorptive capacities for polyphenols, but theyhave not been extensively employed.
12.15 Flour Bleaching Agents and Bread Improvers
Freshly milled wheat flour has a pale yellow tint, and yields a sticky dough that does not handle or bake well. When the flour isstored, it slowly becomes white and undergoes an aging or maturing process that improves its baking qualities. It is a usualpractice to employ chemical treatments to accelerate these natural processes [51], and to use other additives to enhance yeastleavening activity and to retard the onset of staling.
Flour bleaching involves primarily the oxidation of carotenoid pigments. This results in disruption of the conjugated double bondsystem of carotenoids to a less conjugated colorless system. The dough-improving action of oxidizing agents is believed toinvolve the oxidation of sulfhydryl groups in gluten proteins. Oxidizing agents employed may participate in bleaching only, in bothbleaching and dough improvement, or in dough improvement only. One commonly used flour bleaching agent, benzoyl peroxide[(C6H5CO)2O2], exhibits a bleaching or decolorizing action but does not influence baking properties. Materials that act as bothbleaching and improving agents include chlorine gas (Cl2), chlorine dioxide (ClO2), nitrosyl chloride (NOCl), and oxides ofnitrogen (nitrogen dioxide, NO2, and nitrogen tetroxide, N2O4) [40]. These

Pag e 809
oxidizing agents are gaseous and exert their action immediately upon contact with flour. Oxidizing agents that serve primarily asdough improvers exert their action during the dough stages rather than in the flour. Included in this group are potassium bromate(KBrO3), potassium iodate (KIO3), calcium iodate [Ca(IO3)2], and calcium peroxide (CaO2).
Benzoyl peroxide is usually added to flour (0.25-0.075%) at the mill. It is a powder and is usually added along with diluting orstabilizing agents such as calcium sulfate, magnesium carbonate, dicalcium phosphate, calcium carbonate, and sodium aluminumphosphate. Benzoyl peroxide is a free radical initiator (see Chap. 5), and it requires several hours after addition to decomposeinto available free radicals for initiation of carotenoid oxidation.
The gaseous agents for oxidizing flour show variable bleaching efficiencies, but effectively improve baking qualities of suitableflours. Treatment with chlorine dioxide improves flour color only slightly, but yields flour with improved dough handlingproperties. Chlorine gas, often containing a small amount of nitrosyl chloride, is used extensively as a bleach and improver forsoft wheat cake flour. Hydrochloric acid is formed from oxidation reactions of chlorine, and the resulting slightly lowered pHvalues lead to improved cake baking properties. Nitrogen tetroxide (N2O4) and other oxides of nitrogen, produced by passingair through an intense electric arc, are only moderately effective bleaching agents, but they produce good baking qualities intreated flours.
Oxidizing agents that function primarily as dough improvers can be added to flour (10–40 ppm) at the mill. They are, however,often incorporated into a dough conditioner mix containing several inorganic salts, and then added at the bakery. Potassiumbromate, an oxidizing agent used extensively as a dough improver, remains unreactive until yeast fermentation lowers the pH ofthe dough sufficiently to activate it. As a result it acts rather late in the process and causes increased loaf volume, improved loafsymmetry, and improved crumb and texture characteristics.
Early investigators proposed that the improved baking qualities resulting from treatment with oxidizing agents were attrituable toinhibition of the proteolytic enzymes present in flour. However, a more recent belief is that dough improvers, at an appropriatetime, oxidize sulfhydryl groups (-SH) in the gluten to yield an increased number of intermolecular disulfide bonds (-S-S-). Thiscross-linking would allow gluten proteins to form thin, tenacious networks of protein films that comprise the vesicles forleavening. The result is a tougher, drier, more extensible dough that gives rise to improved characteristics in the finishedproducts. Excessive oxidation of the flour must be avoided since this leads to inferior products with gray crumb color, irregulargrain, and reduced load volume.
The addition of a small amount of soybean flour to wheat flour intended for yeast-leavened doughs has become a commonpractice. The addition of soybean lipoxygenase (see Chaps. 5 and 7) is an excellent way to initiate the free radical oxidation ofcarotenoids [12]. Addition of soybean lipoxygenase also greatly improves the rheological properties of the dough by amechanism not yet elucidated. While it has been suggested that lipid hydroperoxides become involved in the oxidation of gluten -SH groups, evidence indicates that other protein-lipid interactions are also involved in dough improvement by oxidants [12].
Inorganic salts incorporated into dough conditioners include ammonium chloride (NH4Cl), ammonium sulfate [(NH4)2SO4],calcium sulfate (CaSO4), ammonium phosphate [(NH4)3PO4], and calcium phosphate (CaHPO4). They are added to dough tofacilitate growth of yeast and to aid in control of pH. The principal contribution of ammonium salts is to provide a ready sourceof nitrogen for yeast growth. The phosphate salts apparently improve dough by buffering the pH at a slightly lower than normalvalue. This is especially important when water supplies are alkaline.
Other types of material are also used as dough improvers in the baking industry. Calcium stearoyl-2 lactylate[(C17H35COOC(CH3)HCOOC(CH3)HCOO)2Ca] and similar emulsifying agents are used at low levels (up to 0.5%) to improvemixing qualities of dough and to promote

Pag e 810
increased loaf volume [53]. Hydrocolloid gums have been used in the baking industry to improve the water-holding capacity ofdoughs and to modify other properties of doughs and baked products [31]. Carrageenan, carboxymethylcellulose, locust beangum, and methylcellulose are among the more useful hydrocolloids in baking applications. Methylcellulose andcarboxymethylcellulose have been found to retard retrogradation and staling in bread, and they also retard migration of moistureto the product surface during subsequent storage. Carrageenan (0.1%) softens the crumb texture of sweet dough products.Several hydrocolloids (e.g., carboxymethylcellulose at 0.25%) may be incorporated into doughnut mixes to significantlydecrease the amount of fat absorbed during frying. This benefit apparently arises because of improvement in the dough andbecause a more effective hydrated barrier is established on the surface of the doughnuts.
12.16 Anticaking Agents
Several conditioning agents are used to maintain free-flowing characteristics of granular and powdered forms of foods that arehygroscopic in nature. In general, these materials function by readily absorbing excess moisture, by coating particles to impart adegree of water repellency, and/or by providing an insoluble particulate diluent. Calcium silicate (Ca SiO3 · XH2O) is used toprevent caking in baking powder (up to 5%), in table salts (up to 2%), and in other foods and food ingredients. Finely dividedcalcium silicate absorbs liquids in amounts up to 2½ times its weight and still remains free flowing. In addition to absorbingwater, calcium silicate also effectively absorbs oils and other nonpolar organic compounds. This characteristic makes it useful incomplex powdered mixes and in certain spices that contain free essential oils.
Food-grade calcium and magnesium salts of long-chain fatty acids, derived from tallow, are used as conditioning agents indehydrated vegetable products, salt, onion and garlic salt, and in a variety of other food ingredients and mixes that exist inpowder form. Calcium stearate is often added to powdered foods to prevent agglomeration, to promote free flow duringprocessing, and to insure freedom from caking during the shelf life of the finished product. Calcium stearate is essentiallyinsoluble in water but adheres well to particles and provides a partial water-repellent coating for the particles. Commercialstearate powders have a high bulk density (about 27 kg/m3) and possess large surface areas that make their use as conditioners(0.5–2.5%) reasonably economical. Calcium stearate is also used as a release lubricant (1%) in the manufacture of pressedtablet-form candy.
Other anticaking agents employed in the food industry include sodium silicoaluminate, tricalcium phosphate, magnesium silicate,and magnesium carbonate. These materials are essentially insoluble in water and exhibit variable abilities to absorb moisture.Their use levels are similar to those for other anticaking agents (e.g., about 1% sodium silicoaluminate is used in powderedsugar). Microcrystalline cellulose powders are used to prevent grated or shredded cheese from clumping. Anticaking agents areeither metabolized (starch, stearates) or exhibit no toxic·actions at levels employed in food applications [16].
12.17 Gases and Propellants
Gases, both reactive and inert, play important roles in the food industry. For example, hydrogen is used to hydrogenateunsaturated fats (Chap. 5), chlorine is used to bleach flour (see bleaching agents and dough improvers in this chapter) andsanitize equipment, sulfur dioxide is used to inhibit enzymic browning in dried fruits (see sulfites and sulfur dioxide in this chapter),ethylene gas is used to promote ripening of fruits (Chap. 16), ethylene oxide is used as a sterilant for spices (see epoxides in thischapter), and air is used to oxidize ripe olives for color development. However, the functions and properties of essentially inertgases used in food will be the topics of primary concern in the following sections.

Pag e 811
12.17.1 Protection from Oxygen
Some processes for oxygen removal involve the use of inert gases such as nitrogen or carbon dioxide to flush a headspace, tostrip or sparge a liquid, or to blanket a product during or after processing. Carbon dioxide is not totally without chemicalinfluence because it is soluble in water and can lead to a tangy, carbonated taste in some foods. The ability of carbon dioxide toprovide a dense, heavier-than-air, gaseous blanket over a product makes it attractive in many processing applications. Nitrogenblanketing requires thorough flushing followed by a slight positive pressure to prevent rapid diffusion of air into the system. Aproduct that is thoroughly evacuated, flushed with nitrogen, and hermetically sealed will exhibit increased stability againstoxidative deterioration [27].
12.17.2 Carbonation
The addition of carbon dioxide (carbonation) to liquid products, such as carbonated soft drinks, beer, some wines, and certainfruit juices causes them to become effervescent, tangy, slightly tart, and somewhat tactual. The quantity of carbon dioxide usedand the method of introduction varies widely with the type of product [27]. For example, beer becomes partially carbonatedduring the fermentation process, but is further carbonated prior to bottling. Beer usually contains 3–4 volumes of carbon dioxide(1 volume of beer at 16°C and 1 atm pressure contains 3–4 volumes of carbon dioxide gas at the same temperature andpressure). Carbonation is often carried out at lowered temperatures (4°C) and elevated pressures to increase carbon dioxidesolubility. Other carbonated beverages contain from 1.0 to 318 volumes of carbon dioxide, depending upon the effect desired.The retention of large amounts of carbon dioxide in solutions at atmospheric pressure has been ascribed to surface adsorptionby colloids and to chemical binding. It is well established that carbamino compounds are formed in some products by rapid,reversible reactions between carbon dioxide and free amino groups of amino acids and proteins. In addition, formation of
carbonic acid (H2CO3) and bicarbonate ions also aids in stabilizing the carbon dioxide system. Spontaneous release ofcarbon dioxide from beer, that is gushing, has been associated with trace metallic impurities and with the presence of oxalatecrystals, which provide nuclei for nucleation of gas bubbles.
12.17.3 Propellants
Some fluid food products are dispensed as liquids, foams, or sprays from pressurized aerosol containers. Since the propellantusually comes into intimate contact with the food, it becomes an incidental food component or ingredient. The principalpropellants for pressure dispensing of foods are nitrous oxide, nitrogen, and carbon dioxide [27]. Foam and spray type productsare usually dispensed by nitrous oxide and carbon dioxide because these propellants are quite soluble in water and theirexpansion during dispensing assists in the formation of the spray or foam. Carbon dioxide is also employed for products such ascheese spreads where tanginess and tartness are acceptable characteristics. Nitrogen, because of its low solubility in water andfats, is used to dispense liquid streams in which foaming should be avoided (catsup, edible oils, syrups). The use of all of thesegases in foods is regulated, and the pressure must not exceed 100 psig at 21°C or 135 psig at 54°C. At these conditions, noneof the gases liquify and a large portion of the container is occupied by the propellant. Thus as the product is dispensed, thepressure drops, and this can lead to difficulties with product uniformity and completeness of dispensing. The gaseous propellantsare nontoxic, nonflammable, economical, and usually do not cause objectionable color or flavors. However, carbon dioxide,when used alone, imparts an undesirable taste to some foods.
Liquid propellants also have been developed and approved for food use, but environmental concerns regarding ozone depletionin the upper atmosphere has led to restrictions of these sub-

Pag e 812
stances. Those approved for foods are octafluorocyclobutane or Freon C-318 (CF2-CF2-CF2-CF2) andchloropentafluoroethane or Freon 115 (CCIF2-CF3). When used, these propellants exist in the container as a liquid layersituated on top of the food product, and an appropriate headspace containing vaporized propellant is also present. Use of aliquified propellant enables dispensing to occur at a constant pressure, but the contents first must be shaken to provide anemulsion that will foam or spray upon discharge from the container. Constant pressure dispensing is essential for goodperformance of spray-type aerosols. These propellants are nontoxic at levels encountered and they do not impart off flavors tofoods. They give particularly good foams because they are highly soluble in any fat that may be present, and they can beeffectively emulsified.
12.18 Tracers
Substances in this category are added to food constituents that are difficult to detect in finished foods when routine monitoring ofthe constituent's concentration in a food is desired and when normal analytical procedures are inadequate. Although the conceptseems attractive from a regulatory standpoint, this practice has become unnecessary because analytical procedures of adequatespecificity and sensitivity for individual substances in finished foods have been satisfactorily developed in response to needs.Currently in the United States, titanium dioxide (0.1%) must be added to vegetable proteins that are used as meat extenders.However, removal of this requirement has been requested because gel electrophoresis techniques can quantitatively distinguishbetween soy and meat protein fractions in foods [15]. Adequate regulation of soy protein additions to meat should be possibleby monitoring inventory and processing records and by analyzing meat products with electrophoretic techniques.
12.19 Summary
Summarized in Table 5 are various kinds of food additives and their functions in food.

Pag e 813

Pag e 814

Pag e 815

Pag e 816

Pag e 817

Pag e 818

Pag e 819

Pag e 820

Pag e 821
Bibliography
Akoh, C. C., and B. G. Swanson (eds.) (1994). Carbohydrate Polyester as Fat Substitutes, Marcel Dekker, New York.
Branen, A. L., and P. M. Davidson (eds.) (1983). Antimicrobials in Foods, Marcel Dekker, New York.
Committee on Food Protection, Food and Nutrition Board (1965). Chemicals Used in Food Processing, Publ.
1274, National Acadmy of Sciences Press, Washington, D C.
Food Chemicals Codex (1981). Food and Nutrition Board, National Research Council, National Academy Press, WashingtonDC. 3rd ed.
Furia, T. E. (ed.) (1972). Handbook of Food Additives, CRC Press, Cleveland, OH.
Furia, T. E., and N. Bellecana (eds.) (1976). Fenaroli's Handbook of Flavor Ingredients, CRC Press, Cleveland, OH.
Furia, T. E., (ed.) (1980). Regulatory Status of Direct Food Additives, CRC Press, Boca Raton, FL.
Gould, G. W. (1989). Mechanisms of Action of Food Preservation Procedures, Elsevier Applied Science, Londson.
Heath, H. B. (1981). Source Book of Flavors, AVI, Westport, CT.
Lewis, R. J., Sr. (1989). Food Additives Handbook, Van Nostrand Reinhold, New York.
Lueck, E. (1980). Antimicrobial Food Additives, Springer-Verlag, Berlin.
Molins, R. A. (1991). Phosphates in Food, CRC Press, Boca Raton, FL.
Nabors, L. O., and R. C. Geraldi (eds.) (1991). Alternative Sweeteners, Marcel Dekker, New York, 2nd. ed.
Phillips, G. O., D. J. Wedlock, and P. A. Williams (eds.) (1990). Gums and Stabilizers for the Food Industry, IRL Press,Oxford University Press, Oxford.
Taylor, R. J. (1980). Food Additives, John Wiley and Sons, New York.
References
1. Artz, W. E., and S. L. Hansen (1994). Other fat substitutes, in Carbohydrate Polyesters as Fat Substitutes (C. C. Akohand B. G. Swanson, eds)., Marcel Dekker, New York, pp. 197–236.
2. Brusick, D., M. Cifone, R. Young, and S. Benson (1989). Assessment of the genotoxicity of calcium cyclamate andcyclohexylamine. Environ. Mol. Mutagen. 14:188–199.
3. Bryan, G. T., and E. Erturk (1970). Production of mouse urinary bladder carcinomas by sodium cyclamate. Science167:996–998.
4. Caputi, A., and R. G. Peterson (1965). The browning problem in wines. Am J. Enol. Viticult 16(1):9–13.
5. Chichester, D. F, and F. W. Tanner (1972). Antimicrobial food additives, in Handbook of Food Additives (T. E. Furia,ed.), CRC Press, Cleveland, Ohio, pp. 115–184.

6. Committe on Food protection, Food and Nutrition Board (1965). Chemicals Used in Food Processing, Publ. 1274,National Academy of Sciences Press, Washington, DC.
7. Considine, D. M. (ed.) (1982). Masticatory substances, in Foods and Food Production Encyclopedia, Van NostrandReinhold, New York, pp. 1154–1155.
8. Crowell, E. A., and J. F. Guyman (1975). Wine constituents arising from sorbic acid addition, and

Pag e 822
identification of 2-ethoxyhexa -3,5-diene as source of geranium-like off-odor. Am. J. Enol. Viticult. 26(2):97–102.
9. Dahlstrom, R. W., and M. R. Sfat (1972). The use of polyvinylpyrrolidone in brewing. Brewer's Dig. 47(5):75–80.
10. Ellinger, R. H. (1972). Phosphates in food processing, in Handbook of Food Additives (T. E. Furia, ed.), CRC Press,Cleveland, OH, pp. 617–780.
11. Etchells, J. L., T. A. Bell, and L. J. Turney (1972). Influence of alum on the firmness of fresh-pack dill pickles. J. Food Sci.37:442–445.
12. Faubian, J. M., and R. C. Hoseny (1981). Lipoxygenase: Its biochemistry and role in breadmaking. Cereal Chem.58:175–180.
13. Food Chemicals Codex. (1981). 3rd ed., Food and Nutrition Board, National Research Council, National AcademyPress, Washington, DC.
14. Food Chemical News.(1983). USDA petitioned to remove titanium dioxide marker requirements for soy protein. March21, pp.37–38.
15. Freese, E., and B. E. Levin (1978). Action mechanisms of preservatives and antiseptics, in Developments in IndustrialMicrobiology (L. A. Underkofler, ed.), Society of Industrial Microbiology, Washington, DC, pp. 207–227.
16. Furia, T. E. (1972). Regulatory status of direct food additives, in Handbook of Food Additives (T. E. Furia, ed.), CRCPress, Cleveland, OH, pp. 903–966.
17. Furia, T. E. (1972). Sequestrants in food, in Handbook of Food Additives (T. E. Furia, ed.), CRC Press, Cleveland, OH,pp. 271–294.
18. Furia, T. E., and N. Bellanca (eds.) (1976). Fenaroli's Handbook of Flavor Ingredients, 2 vols., Chemical Rubber Co.,Cleveland, OH.
19. Gardner, W. H. (1972). Acidulants in food processing, in Handbook of Food Additives (T. E. Furia, ed.), CRC Press,Cleveland, OH, pp.225–270.
20. Goddard, S. J., and B. L. Wedzicha (1992). Kinetics of the reaction of sorbic acid with sulphite species. Food AdditivesContam. 9:485–492.
21. Griffin, W. C., and M. J. Lynch (1972). Polyhydric alcohols, in Handbook of Food Additives (T. E. Furia, ed.), 2nd. ed.,CRC Press, Cleveland, OH, pp. 431–455.
22. Griswold, R. M. (1962). Leavening agents, in The Experiment Study of Foods (R. M. Griswold, ed.), Houghton Mifflin,Boston, pp. 330–352.
23. Haddon, W. F., M. L. Mancini, M. McLaren, A. Effio, L. A. Harden, R. L. Degre, and J. L. Bradford (1994). Occurrenceof ethyl carbamate (urethane) in U.S. and Canadian breads: Measurements by gas chromatography-mass spectrometry. CerealChem. 71:297–215.
24. Hamm, R. (1971). Interactions between phosphates and meat proteins, in Symposium: Phosphates in Food Processing(J. M. DeMan and P. Melnychyn, eds.), AVI, Westport, CT, pp. 65–84.
25. Heath, H. B. (1981). Source Book of Flavors, AVI, Westport, CT.
26. Ishii, H., and T. Koshimizu (1981). Toxicity of aspartame and its diketopiperazine for Wistar rats by dietary administrationof 104 weeks. Toxicoloy 21:91–94.
27. Joslyn, M. A. (1964). Gassing and deaeration in food processing, in Food Processing Operations: Their Management,Machines, Materials, and Methods (M. A. Joslyn and J. L. Heid, eds.), vol. 3, AVI, Westport, CT, pp. 335–368.
28. Kabara, J. J., R. Varable, and M. S. Jie (1977). Antimicrobial lipids: Natural and synthetic fatty acids and monoglycerides.Lipids 12:753–759.

29. Karahadian, C., and R. C. Lindsay (1988). Evaluation of the mechanism of dilaurly thiodipropionate antioxidant activity. J.Am. Oil Chem. Soc. 65:1159–1165.
30. Khandelwal, G. D., Y. L. Rimmer, and B. L. Wedzicha (1992). Reaction of sorbic acid in wheat flour doughs. FoodAdditives Contam. 9:493–497.
31. Klose, R. E., and M. Glicksman (1972). Gums, in Handbook of Food Additives (T. E. Furia, ed.), CRC Press, Cleveland,OH, pp. 295–359.
32. Labuza, T. P., N. D. Heidelbaugh, M. Silver, and M. Karel (1971). Oxidation at intermediate moisture contents. J. Am. OilChem. Soc. 48:86–90.
33. Lewis, R. J., Sr. (1989). Food Additives Handbook, Van Nostrand Reinhold, New York.

Pag e 823
34. Lucca, P. A., and Tepper, B. J. (1994). Fat replacers and the functionality of fat in foods. Trends Food Sci. Technol.5:12–19.
35. Mahon, J. H., K. Schlamb, and E. Brotsky (1971). General concepts applicable to the use of polyphosphates in red meat,poultry, seafood processing, in Symposium: Phosphates in Food Processing (J. M. DeMan and P. Malnychyn, eds.), AVI,Westport, CT, pp. 158–181.
36. Miller, M. S. (1994). Proteins as fat substitutes, in Protein Functionality in Food Systems (N. S. Hettiarachchy and G. R.Ziegler, eds.), Marcel Dekker, New York, pp. 435–465.
37. Miller, W. T. (1987). The legacy of cyclamate. Food Technol. 41(1):116.
38. Minifie, B. W. (1970). Chocolate, Cocoa and Confectionary: Science and Technology, AVI, Westport, CT, pp.38–41.
39. Peng, S. K., C. Taylor, J. C. Hill, and R. J. Marin (1985). Cholesterol oxidation derivatives and arterial endothelial damage.Arteriosclerosis 54:121–136.
40. Pomeranz, Y., and J. A. Shallenberger (1971). Bread Science and Technology, AVI, Westport, CT.
41. Pratter, P. J. (1980). Neohesperidin dihydrochalcone: An updated review on a naturally derived sweetener and flavorpotentiator. Perfumer Flavorist 5(6):12–18.
42. Price, J. M., C. G. Biana, B. L. Oser, E. E. Vogin, J. Steinfeld, and H. L. Ley (1970). Bladder tumors in rats fedcyclohexylamine or high doses of a mixture of cyclamate and saccharin. Science 167:1131–1132.
43. Ramarathnam, N., and L. J. Rubin (1994). The flavor of cured meat, in Flavor of Meat and Meat Products (F. Shahidi,ed.), Blackie, London, pp. 174–198.
44. Salant, A. (1972). Nonnutritive sweeteners, in Handbook of Food Additives (T. E. Furia, ed.), 2nd ed., CRC Press,Cleveland, OH, pp. 523–586.
45. Scharpf, L. G. (1971). The use of phosphates in cheese processing, in Symposium Phosphates in Food Processing (J. M.deMan and P. Melnychyn, eds.), AVI, Westport, CT, pp. 120–157.
46. Scott, U. N., and S. L. Taylor (1981). Effect of nisin on the outgrowth of Clostridium botulinum spores. J. Food Sci.46:117–126.
47. Sebranek, J. G., and R. G. Cassens (1973). Nitrosamines: A review. J. Milk Food Technol. 36:76–88.
48. Singleton, V. L. (1967). Adsorption of natural phenols from beer and wine. MBAA Tech. Q. 4(4):245–253.
49. Smith, R. E., J. W. Finley, and G. A. Leveille (1994). Overview of Salatrim, a family of low-calorie fats. J. Agric. FoodChem. 42:432–434.
50. Stahl, J. E., and R. H. Ellinger (1971). The use of phosphates in the baking industry, in Symposium: Phosphates in FoodProcessing (J. M. Deman and P. Melnychyn, eds.), AVI, Westport, CT., pp. 194–212.
51. Stauffer, C. E. (1983). Dough conditioners. Cereal Foods World 28:729–730.
52. Stukey, B. N. (1972). Antioxidants as food stabilizers, in Handbook of Food Additives (T. E. Furia, ed.), CRC Press,Cleveland, OH, pp. 185–224.
53. Thompson, J. E., and B. D. Buddemeyer (1954). Improvement in flour mixing characteristics by a steryl lactylic acid salt.Cereal Chem. 31:296–302.
54. van Buren, J. P., J. C. Moyer, D. E. Wilson, W. B. Robinson, and D. B. Hand (1960). Influence of blanching conditions onsloughing, splitting, and firmness of canned snap beans. Food Technol. 14:233–236.
55. van der Wel, H. (1974). Miracle fruit, katemfe, and serendipity berry, in Symposium: Sweeteners (G. Inglett, ed.), AVI,Westport, CT., pp. 194–215.

56. Weast, R. C. (ed.) (1988). Handbook of Chemistry and Physics, CRC Press, Boca Raton, FL. pp. D161–D163.
57. Wedzicha, R. L. (1984). Chemistry of Sulphur Dioxide in Foods, Elsevier, London.
58. Wedzicha, R. L. (1992). Chemistry of sulphiting agents in foods. Food Additives Contam. 9:449–459.
59. Wesley, F., F. Rourke, and O. Darbishire (1965). The formation of persistent toxic chlorohydrins in foodstuffs by fumigationwith ethylene oxide and with propylene oxide. J. Food Sci. 30:1037–1042.

Pag e 825
13Toxic Substances
MICHAEL W. PARIZA
Food Research Institute, University of Wisconsin—Madison, Madison, Wisconsin
13.1. Introduction 825
13.2. Food Toxicology and the Law 826
13.3. Terms in Food Toxicology 827
13.4. Evaluating Safety: The Traditional Approach 828
13.5. Evaluating Safety: New Approaches 829
13.6. Comparative Toxicology and Inherent Toxicants 830
13.7. Contaminants 834
13.8. Food Toxicology and Public Health: Setting Priorities 838
Bibliography 839
References 839
13.1 Introduction
We should begin with a few words about “food toxicology.” It does not refer to foods per se but rather to the study of toxicsubstances—particularly naturally occurring toxic substances—that may be associated with food [9]. Certain nonconventionalfoods (the kinds you don't usually find in supermarkets, for example, puffer fish and bracken fern) contain levels of naturallyoccurring toxins that many would consider unacceptably high. Conventional foods (the kinds found typically in supermarkets) areon rare occasions contaminated with unacceptably high levels of naturally occurring toxins, but this is not the usual case. Hence,food toxicologists are not generally concerned with foods themselves but rather with toxic substances that may sometimes befound in foods. The two general types of toxicants—inherent toxicants, and contaminants—are described in Table 1.
That being said, we should now distinguish between “toxic substance” and “toxic effect”

Pag e 826
TABLE 1 Types of Food Toxicants
Inherent toxicants
Metabolites produced via biosynthesis by food org anisms under normal g rowthconditions
Metabolites produced via biosynthesis by food org anisms that are stressedContaminants
Toxicants that directly contaminate foods
Toxicants that are absorbed from the environment by food-producing org anisms
Toxic metabolites produced by food org anisms from substances that are absorbedfrom the environment
Toxicants that are formed during food preparation
[9, 23]. It goes almost without saying that toxic substances induce toxic effects. What is not said as often is that a toxicsubstance will induce a toxic effect only if its concentration is sufficiently high. Hence the terms toxic substance (toxicant) andtoxic effect are not synonymous.
This distinction takes the form of a principle that underlies the science of toxicology. It was first presented as follows: “Everythingis poison. There is nothing without poison. Only the dose makes a thing not a poison. For example, every food and every drink,if taken beyond its dose, is poison” [10, 15].
This observation is remarkable enough on its merits, but perhaps most surprising is that the author, an alchemist namedParacelsus, penned it in 1564!
What we have learned of toxicology in the intervening 450 years has served only to reinforce Paracelsus' extraordinary insight.We recognize today that all chemicals are potentially toxic, and that the dose alone determines whether or not a toxic effectoccurs. Indeed, toxicant (or toxin) was recently defined as a “substance that has been shown to present some significant degreeof possible risk when consumed in sufficient quantity by humans or animals” [16]. We differ with Paracelsus only in reserving theterm “poison” for the most potent substances (those that induce adverse effects at exposure levels of a few milligrams perkilogram body weight).
One expects drugs and household chemicals to exhibit at least some degree of toxicity; hence these materials are ordinarilytreated with the deference due them. However, even the most sophisticated might find it difficult to fully accept the notion thatpotentially toxic substances are commonly present, much less possibly desirable, in conventional foods. And yet we know thatsome required nutrients, for example, vitamins A and D, induce toxic effects at intake levels not too much greater than thoseneeded for optimal health. The safety margins for these and many other naturally occurring dietary substances are far smallerthan the 100-fold safety factor customarily employed for synthetic food additives [9].
The purpose of this chapter, then, is to provide an overview of toxicology as it relates to food. It is hoped that the reader willcarry from this an understanding that while all food chemicals (naturally occurring as well as synthetic) are potentially toxic, it israre indeed to encounter a toxic effect induced as a result of consuming conventional foods.
13.2 Food Toxicology and the Law
One cannot fully appreciate the relationship between food safety and the science of toxicology without first understanding whysuch research is done. It is done for two basic reasons: the pursuit of new knowledge, and the evaluation of safety. The former isa true scientific goal, while the latter is a hybrid of science, politics, and law [16].

Pag e 827
By law, substances that are intentionally added to food must be shown to be safe under their intended conditions of use. Themethods and procedures for evaluating safety are matters of science; however, additional considerations outside the purview ofscience also bear on the ultimate decision.
For example, substances may be classified GRAS (generally regarded as safe). The decision as to whether something is GRASis left to the scientific community—specifically, those persons qualified as experts by training and experience. However, theFood and Drug Administration (FDA) reserves the right to challenge or affirm a GRAS determination [16].
There are special considerations in the U.S. Food, Drug and Cosmetics Act (FD&C Act) for color additives, pesticide residues,prior sanctioned ingredients (those in use prior to 1958, the year in which the FD&C Act was last amended), and substances forwhich FDA has issued formal food additive regulations. There is also the “constituents policy,” which governs unavoidablecontaminants.
Perhaps the best known provision of the FD&C Act is the “Delaney Clause,” so-named for the Congressman who chaired theCongressional subcommittee that added the amendment to the FD&C Act. The Delaney Clause, which bars the use of foodadditives shown to cause cancer in humans or animals, actually appears in the FD&C Act three times. They are Sections 409(Food Additives), 706 (Color Additives), and 612 (Animal Feeds and Drugs).
Pesticide residues on raw agricultural products are not subject to the Delaney Clause. However, concentrated residues thatremain after a food is processed are subject to this legislation. In other words, it is legal to sell an apple that contains traces of acarcinogenic pesticide approved by the Environmental Protection Agency (EPA), but one could not sell applesauce made fromthat apple. It is not even necessary to show that the applesauce actually contains the pesticide residue. Under the law, aprocessed food may be banned if a concentrated pesticide residue might theoretically be present.
By contrast, the Delaney Clause does not apply to unavoidable contaminants that are present in a food or a food additive, evenif the contaminants are carcinogens. Examples are traces of aflatoxin in peanuts, and certain minor impurities that may occur insome chemically synthesized colors. For such contaminants, the courts have held that the FDA may use risk assessmentmethodologies coupled with a legal concept called “de minimis.” (De minimis means that the law does not deal with trifles [16,21].)
The result of all this is that an additive, for example, saccharine, that is very weakly carcinogenic in certain animal experimentsbut for which there is no evidence of human carcinogenicity would be banned. (In fact, the only reason saccharine wasn't bannedis because of a special congressional exemption.) At the same time, theoretically “riskier” naturally occurring or syntheticcarcinogens, which unavoidably contaminate food, or otherwise innocuous food or color additives, are exempt from Delaney.For these, FDA sets limits on the amount of the contaminant that is to be tolerated.
Virtually all foods contain traces of carcinogenic substances, mostly from natural sources [1, 9, 13]. Examples are urethane infermented beverages, and certain naturally occurring components of spices such as safrole (the natural root beer flavor, bannedas an intentional food additive in the 1960s), which is present in sassafras, sweet basil, and cinnamon [20]. Hence, a practicalconsequence of the federal law is that foods may be legally sold in the United States even if some of the constituents they containcannot be intentionally added to a food.
13.3 Terms in Food Toxicology
Like all scientific disciplines, toxicology has a vocabulary of its own. Terms used by food toxicologists include acute toxicity,chronic toxicity, subchronic feeding test, MTD, NOAEL, and ADI.

Pag e 828
Acute toxicity refers to a toxic response, often immediate, induced by a single exposure. A lethal dose of hydrogen cyanide(50–60 mg) induces death within minutes; cicutoxin, the toxic principal of water hemlock, kills so rapidly that cattle that haveeaten it often die before the implicated feedstuff has passed beyond the esophageal groove [24]. These are poignant examples ofacute toxicity. The acute toxicity of a substance is defined by its LD50, the dose of the substance that will kill 50% of a group ofexposed animals.
Chronic toxicity refers to an effect that requires some time to develop, for example, cancer. Testing for chronic toxicity involvescontinuously feeding the test substance to rodents for 20–24 months. By analogy to LD50, the amount of a carcinogen requiredto induce cancer in 50% of a group of exposed animals is referred to as the TD50 (tumor dose50) [13].
Subchronic feeding test is a “ninety day toxicology study in an appropriate animal species” [16]. It is often used to define theMTD and, for noncarcinogens, the NOAEL.
MTD is the acronym for “maximum tolerated dose.” It is the highest level of a test substance that can be fed to an animal withoutinducing obvious signs of toxicity [6]. In chronic toxicity tests, the test substance is typically fed at its MTD and perhaps one ortwo lower doses. The MTD concept has been criticized because it is based soley on gross measures of toxicity, for example,weight loss. Subtle biochemical indicators of cellular toxicity, which may occur at lower doses, are ignored [22].
NOAEL is the acronym for “no observable adverse effect level.” For substances that induce a toxic response (other thancancer) in chronic feeding tests, the NOAEL is used to determine an acceptable daily intake (ADI) [21, 22].
ADI is the acronym for “acceptable daily intake.” By convention, for noncarcinogens, it is set at 1/100th of the NOAEL.
Potential food additives found to induce cancer are of course subject to the Delaney Clause. The practical result is that suchsubstances are assumed, legally, not to have a NOAEL. Hence, no amount can be added to food. (Whether this assumption isscientifically accurate is open to question.)
13.4 Evaluating Safety: The Traditional Approach
Subchronic and chronic rodent feeding tests are at the heart of traditional safety evaluations for new food ingredients. These testswere developed for the assessment of single chemicals, which could be fed at large multiples (100-fold or more) of proposedhuman consumption. High-dose feeding was needed, so the thinking went, to compensate for the relatively small number of testanimals that practical considerations dictate must be used. (Small, that is, relative to the total number of potentially exposedhumans. For example, the population of the United States is about 250 million persons, yet one would be hard pressed toconduct a study with more than a few hundred rats. Hence each rat subject is a surrogate for a very large number of potentiallyexposed humans.)
The trade-off of feeding relatively small numbers of animals subjects relatively large amounts of test substances begged anotherquestion: How high should the exposure to test materials be? Thus was born the MTD, the greatest amount of a test substancethat can be fed to a rat or mouse before overt signs of toxicity appear. Overt signs of toxicity were defined by a set of grossmeasurements, for example, failure of test animals to maintain at least 90% of the weight of controls [6].
The traditional approach, then, is to determine the MTD for the test substance, and feed the test substance at its MTD torodents for 2 years. If the test group develops cancer in excess

Pag e 829
of the controls, then the substance may be judged a carcinogen and banned as a food additive under the Delaney Clause.
If the substance is found not to induce cancer (or to induce it through secondary mechanisms that are not relevant to humanexperience), then its NOAEL is determined. The substance may then be permitted as a food additive at a concentration that islow enough so that humans will consume no more than 1/100th of the rodent NOAEL.
13.5 Evaluating Safety: New Approaches
The procedures discussed to this point were designed to evaluate the safety of substances, typically single chemicals butsometimes simple mixtures, that are intended to be used in food at relatively low levels. The qualification “relatively low levels” iscritical in that the test substance is fed to experimental animals at large multiples of projected human exposure, usually 100-foldor more. Hence, by definition, the projected human exposure cannot exceed 1% of the diet, since at that point animals receivinga 100-fold multiple of human exposure would be consuming only the pure compound and nothing else. (In practice, theprojected human dietary exposure must be considerably less than 1%, since feeding a substance to animals at more than a fewpercent of their diet risks creating a nutritional imbalance.) Obviously, a new approach is required for the evaluation of novelfoods and “macro ingredients” that are likely to represent 1% or more of the diets of at least some persons (for example,genetically engineered tomatoes and novel edible oils).
In evaluating such materials, plausible substitutes for the standard high-dose animal feeding tests are required. One approach hasits origins in the safety evaluation of enzymes used in food processing [23]. Enzymes and their use in food processing arediscussed in Chapter 7; here we are considering the issue of safety evaluation.
Food-grade enzymes are in fact complex mixtures, not single entities. Typically there is little purification, so virtually everythingthe source organism produces may be present in a commercial enzyme preparation. Given this, one may reasonably ask howsafety evaluation should be conducted. Should one focus on the active enzyme, or on all the components that comprise theproduct as it is marketed? Is it necessary to consider all possible adverse effects, or can the task be simplified by concentratingon those possible adverse effects that might reasonably occur as a result of the use of the specific source organism?
Fortunately, there is a sizable data set for microbial toxins on which to base an evaluation system. It is possible, then, to evaluatea microbial enzyme preparation for its potential to produce adverse effects that might be anticipated given the productionorganism [23].
A safety evaluation system based on these considerations [23] begins with a thorough literature review to determine what (if any)adverse effects have been associated with the source organism and related organisms of the same species or genus. Particularattention is directed to finding reports of toxins active via the oral route (enterotoxins and certain neurotoxins). If such reports arefound, it is then necessary to ensure that the enzyme preparation is free of the undesirable material.
The usual case, however, is that the production organism will have been selected from those species with a prior history of safeuse in food or food ingredient manufacture. In this case it is most probable that no adverse effects will have been reported forthe organism. Limited animal testing may still be required, however, to ensure that the proposed production organism does notproduce unknown enterotoxins or other undesirable substances active via the oral route.
With slight modification, this decision tree approach can accommodate enzymes produced by genetically engineered organisms[16]. Moreover, the proposition of focusing on potentially adverse substances that might be produced by the source organism(in contrast to a broader and

Pag e 830
largely unworkable approach of searching for any conceivable adverse effect via high-dose animal feeding tests) also forms thebasis of safety evaluation systems for genetically engineered crops endorsed by government and industry [16, 19].
13.6 Comparative Toxicology and Inherent Toxicants
It is important to keep in mind the historical framework of the science underlying the “traditional” and “new” approaches tosafety evaluation, as described earlier. The traditional approach is based on concepts developed in the middle of this century,some of which are now difficult to justify [21, 22]. In particular, a basic assumption of the traditional approach, that dietarycarcinogens are rare and therefore avoidable, is decidedly untenable [1, 13, 22].
In contrast, the nontraditional approaches are more recent attempts to wed safety evaluation to the emerging realization that aquest for absolute safety is not only scientifically naive but also counter to the need to rationally prioritize public health objectivesin light of funding constraints [1, 13, 22].
The focus of the new approaches proposed by the International Food Biotechnology Council [16] and the FDA [19] iscomparative toxicology. In this context, comparative toxicology refers to comparing the concentration of inherent toxins(e.g., those that are naturally and endogenously present) in the new food with the concentration of inherent toxins in thetraditional counterpart of the new food. This is a fundamental conceptual shift from the traditional approach, which stresses theabsence of toxicity over a wide safety margin (set, arbitrarily at 100-fold). The new approach allows inherent toxicants in thenew food if their levels do not exceed those contained in the traditional counterpart of the new food (the traditional counterpart isthe food in current use that the new food will replace). Safety margins for the inherent toxicants would not ordinarily be ofconcern as long as the traditional counterpart is considered safe to eat.
Obviously, the credibility of this approach [16, 19] depends on the existence of reliable, comprehensive databases of toxicantsthat occur naturally in commonly consumed foods. Fortunately such databases exist, thanks to basic research that wasconducted largely for the pursuit of knowledge without regard to the legal and regulatory aspects of food toxicology [16]. Forexample, we know that many kinds of inherent toxicants occur in plants (Table 2), and we also know that some of thesesubstances are carcinogens in animal experiments (Table 3). However, we also know that only a few such inherent toxicantshave actually caused harm to persons consuming normal human diets (Table 4).
Inherent toxicants are of course a subset of the naturally occurring chemicals, a broad category that includes all substancesexcept those that are not of biosynthetic origin and that are intentionally or accidently introduced into food through human activity[16]. By this definition mycotoxins are naturally occurring, even if they developed through mold growth due to careless handlingof stored grain, but residues of synthetic pesticides used to kill insects harboring the mold spores are not naturally occurring.Arsenic is naturally occurring when in seafood (it is a natural component of seawater), but arsenic is not naturally occurring whenpresent in produce from a field to which the element was intentionally applied as a pesticide (a custom no longer practiced in theUnited States).
Most chemicals in the environment (and of course this includes food) are naturally occurring in that they are not intentionalproducts of synthetic chemistry. Very few substances are solely synthetic in that they are not known to exist in nature. Hence thenumber, variety, and concentration of naturally occurring chemicals in food far outweighs, by many orders of
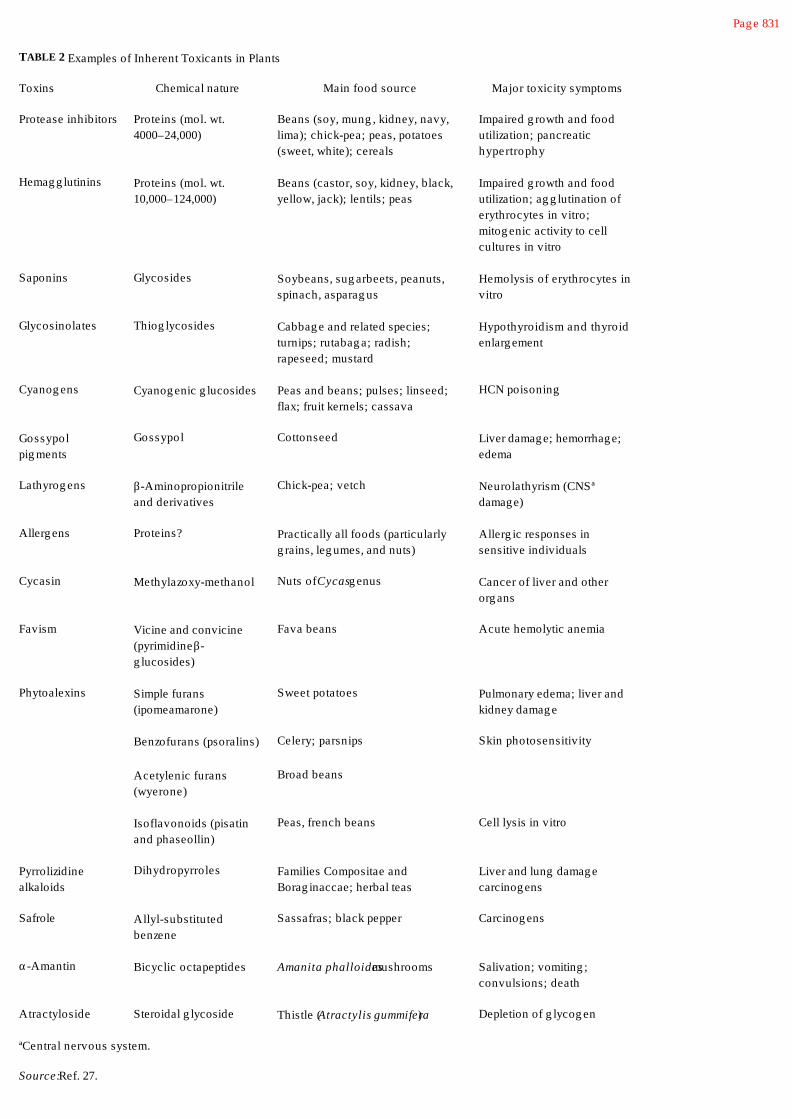
Pag e 831
TABLE 2 Examples of Inherent Toxicants in Plants
Toxins Chemical nature Main food source Major toxicity symptoms
Protease inhibitors Proteins (mol. wt.4000–24,000)
Beans (soy, mung , kidney, navy,lima); chick-pea; peas, potatoes(sweet, white); cereals
Impaired g rowth and foodutilization; pancreatichypertrophy
Hemag g lutinins Proteins (mol. wt.10,000–124,000)
Beans (castor, soy, kidney, black,yellow, jack); lentils; peas
Impaired g rowth and foodutilization; ag g lutination oferythrocytes in vitro;mitog enic activity to cellcultures in vitro
Saponins Glycosides Soybeans, sug arbeets, peanuts,spinach, asparag us
Hemolysis of erythrocytes invitro
Glycosinolates Thiog lycosides Cabbag e and related species;turnips; rutabag a; radish;rapeseed; mustard
Hypothyroidism and thyroidenlarg ement
Cyanog ens Cyanog enic g lucosides Peas and beans; pulses; linseed;flax; fruit kernels; cassava
HCN poisoning
Gossypolpig ments
Gossypol Cottonseed Liver damag e; hemorrhag e;edema
Lathyrog ens b-Aminopropionitrileand derivatives
Chick-pea; vetch Neurolathyrism (CNSªdamage)
Allerg ens Proteins? Practically all foods (particularlyg rains, leg umes, and nuts)
Allerg ic responses insensitive individuals
Cycasin Methylazoxy-methanol Nuts of Cycas g enus Cancer of liver and otherorg ans
Favism Vicine and convicine(pyrimidine b-g lucosides)
Fava beans Acute hemolytic anemia
Phytoalexins Simple furans(ipomeamarone)
Sweet potatoes Pulmonary edema; liver andkidney damag e
Benzofurans (psoralins) Celery; parsnips Skin photosensitivity
Acetylenic furans(wyerone)
Broad beans
Isoflavonoids (pisatinand phaseollin)
Peas, french beans Cell lysis in vitro
Pyrrolizidinealkaloids
Dihydropyrroles Families Compositae andBorag inaccae; herbal teas
Liver and lung damag ecarcinog ens
Safrole Allyl-substitutedbenzene
Sassafras; black pepper Carcinog ens
a-Amantin Bicyclic octapeptides Amanita phalloides mushrooms Salivation; vomiting ;convulsions; death
Atractyloside Steroidal g lycoside Thistle (Atractylis gummifera) Depletion of g lycog en
ªCentral nervous system.
Source: Ref. 27.


Pag e 832
TABLE 3 Some Naturally Occurring Carcinog ens Inherent in Food
Rodent carcinog en Plant food Concentration (ppm)
5-/8-Methoxypsoralen ParsleyParsnip, cookedCeleryCelery, new cultivarCelery, stressed
14320.86.225
p-Hydrazinobenzoate Mushrooms 11
Glutamyl p-hydrazinobenzoate
Mushrooms 42
Sinig rin (allyl isothiocyanate) Cabbag eCollard g reensCauliflowerBrussels sproutsMustard (brown)Horseradish
35–590250–78812–66110–156016,000–72,0004500
Estrag ole BasilFennel
38003000
Safrole NutmegMacePepper, black
300010,000100
Ethyl acrylate Pineapple 0.07
Sesamol Sesame seeds (heated oil) 75
a-Methylbenzyl alcohol Cocoa 1.3
Benzyl acetate BasilJasmine teaHoneyCoffee (roasted beans)
8223015100
Caffeic acid Apple, carrot, celery, cherry, eg g plant, endive,g rapes, lettuce, pear, plum, and potato
Absinthe, anise, basil, caraway, dill, marjoram,rosemary, sag e, savory, tarrag on, and thymeCoffee (roasted beans)Apricot, cherry, peach, and plum
50–200>1000180050–500
Chlorog enic acid (caffeicacid)
Coffee (roasted beans) 21,600
Neochlorog enic acid (caffeicacid)
Apple, apricot, broccoli, brussels sprouts,cabbag e, cherry, kale, peach, pear, and plumCoffee (roasted beans)
50–50011,600
Source: Ref. 1.
magnitude, synthetic substances. None of this will surprise anyone who has examined the other chapters in this textbook.
A vast number of naturally occurring chemicals are present in food. No one knows precisely how many naturally occurringchemicals a typical consumer ingests each day, but an estimate of one million compounds is probably conservative. Cooking nodoubt amplifies the

Pag e 833
TABLE 4 Plant Toxicants Documented as Causing Harm in Normal Human Diets
Substance (categ ory/name/number ofsubstances) Plant source Methods of risk reduction
Honey toxicants (7) Rhododendron/andromeda/azaleafamily
Monitoring ; prohibition ofbeekeeping
Acetylandromedel, andromedol,anhydroandromedol, and desacetylpireistoxinB
Gelsamine Yellow jasmine
Tutin Tutu tree
Hyenanchin
Forag e and meat/milk toxicants (4)Cicutoxin
W ater hemlock Proper g razing and forag epractices;avoidance
Coniine Hemlock
Methylconiine
Conhydrine
Toxicants from poor choice, handling , orprocessing of local diet (5+)
Hypog lycin A Ackee fruit (immature) Avoidance
Linamarin and Lotaustralin Lima beans and cassava root Selection and breeding (andproper processing for cassava)
b-N-Oxalylamino-L-alanine Chick-pea Reduced usag e
(-)-Sparteine and related alkaloids Lupine Proper processing
Plant g enetic factors/poor handling (1)Solanine
Potato Selection and breeding ,monitoring , properhandling
Human g enetic factors (2)VicineConvicine
Fava bean Reduced usag e
Other (2)
Cucurbitacin E
Squash, cucumber Breeding isolation
Nitrates Spinach and other g reen, leafyveg etables
Proper fertilizing practices andhandling ; monitoring
Total (21+)
Source: Refs. 14, and 16.
total number so that the more one cooks, the more chemicals one encounters. Again, none of this will surprise anyone familiarwith the subject.

Earlier we noted that all chemicals, whether synthetic or naturally occurring, exhibit toxicity at some level of exposure. Even purewater drunk to excess will kill through the induction of an electrolyte imbalance; there is, in fact, a condition of the elderly called“water

Pag e 834
toxicity” that is due in part to decreased renal capacity to excrete water [5]. Hence, the innumberable naturally occurringchemicals in food are all potentially capable of inducing toxic effects, but few are ordinarily present in sufficient concentration toactually do so [9, 16].
By one standard, a substance is of concern if it occurs in food within a narrow margin of safety, say 25 or less (in other words, ifa toxic effect results from ingesting no more than 25 times the amount typically found in food) [16]. By this standard only a tinyfraction of food constituents—estimated to be less than 0.1%—are “toxicants.”
Even so, the list of such toxicants is daunting. Table 2 is but a partial depiction; the reader is referred to a comprehensive list[16] of 209 plant-derived food constituents qualifying by these criteria as toxicants and/or carcinogens. Many of these areinherent toxicants that form the basis for the comparative toxicology safety evaluation proposals [16, 19].
Hall [14] discusses 21 plant-derived toxicants that are documented to have harmed humans who were eating “ordinary” diets(as opposed to the consumption of toxic herbs or poisonous mushrooms, which are not ordinary dietary items). These areshown in Table 4. Of these 21 toxicants, only five are inherent toxicants of foods that are common in Western countries: solaninein potatoes (arguably the most important), cucurbitacin E in squash and cucumber, nitrites in spinach and other green leafyvegetables, and linamarin and lotaustralin in lima beans.
13.7 Contaminants
Inherent toxicants are, of course, not the only undesirable food constituents. One must also be concerned with contaminants.Food contaminants may be synthetic or naturally occurring; FDA makes few distinctions between these in terms of regulation.However, there is general agreement among experts that the most important are naturally occurring contaminants, in particularthose produced by microorganisms [22]. This is not to minimize the potential consequences of contamination of food bysynthetic toxicants, but rather to emphasize that contamination by pathogenic microorganisms or their toxins occurs far morefrequently.
Two general kinds of microbial toxins are especially important: mycotoxins (mold toxins), and bacterial food poisoning toxins.
Mycotoxins are relatively low-molecular-weight organic molecules; almost all are smaller in mass than 500 D. The chemicalstructures of four important mycotoxins are shown in Figure 1. In some cases the common name (e.g., patulin) signifies a singlesubstance, while in other cases the common name (e.g., trichothecenes) signifies a class of chemically related substances.
Mycotoxins induce a wide range of acute and chronic toxic effects in humans and livestock, depending on the compound orcompound class, the level of exposure, and the duration of exposure. Among the effects induced by different mycotoxins aretremors and hemorrhaging, immunological suppression, kidney toxicity, fetal toxicity, and cancer [3, 7].
Toxigenic molds may enter the food and feed supply at numerous points, including production, processing, transport and storage[3]. Substrate, moisture, pH, temperature, and crop stress are the major environmental factors that affect mold growth andmycotoxin production [3]. Corn, peanuts, and cotton are the principal crops affected by mycotoxin contamination in the UnitedStates [3].
Numerous mold species, belonging to more than 50 genera, are reported to produce toxic metabolites [16]. However, most ofthese toxic metabolites have not been associated with human or animal disease [3]. Species belonging to three genera producethe most important mycotoxins known to cause illness in humans and animals. Those genera are Aspergillus, Fusarium, andPenicillium [3].
A great number of mycotoxins have been identified; however, they are not all equally

Pag e 835
FIGURE 1Chemical structures of four important mycotoxins. (From Ref. 3.)
important in terms of degree of toxicity and likelihood of human or animal exposure. Those that pose the greatest potential riskto human and animal health [7] are listed in Table 5.
In the United States and other countries with advanced food production systems, incidences of human illness induced bymycotoxins are extemely rare and virtually never traced to commercially processed foods [3]. This is because food processorstypically set strict specifications for the amounts mycotoxins that will be accepted on grains and other ingredients used in foodmanufacture. The specifications are based in part on tolerances established by regulatory agencies. Acceptable levels ofmycotoxin contamination are determined using extremely conservative risk assessment analyses; hence public health is protectedby wide safety margins.
By contrast, the chance contamination of animal feeds with harmful levels of mycotoxins is documented to occur in the UnitedStates and other developed countries [3]. Crop stress is an important contributing factor. For example, drought-induced stressenhances the probability of aflatoxin contamination of corn, whereas cold wet weather that slows harvest may lead to thecontamination of grain with harmful levels of trichothecenes. Grain judged to be unacceptable for human consumption may endup being fed to livestock.
There is concern that mycotoxins in feeds might pass through to humans who consume animals products. For example, aflatoxinM is found in milk from cows that are fed aflatoxin-
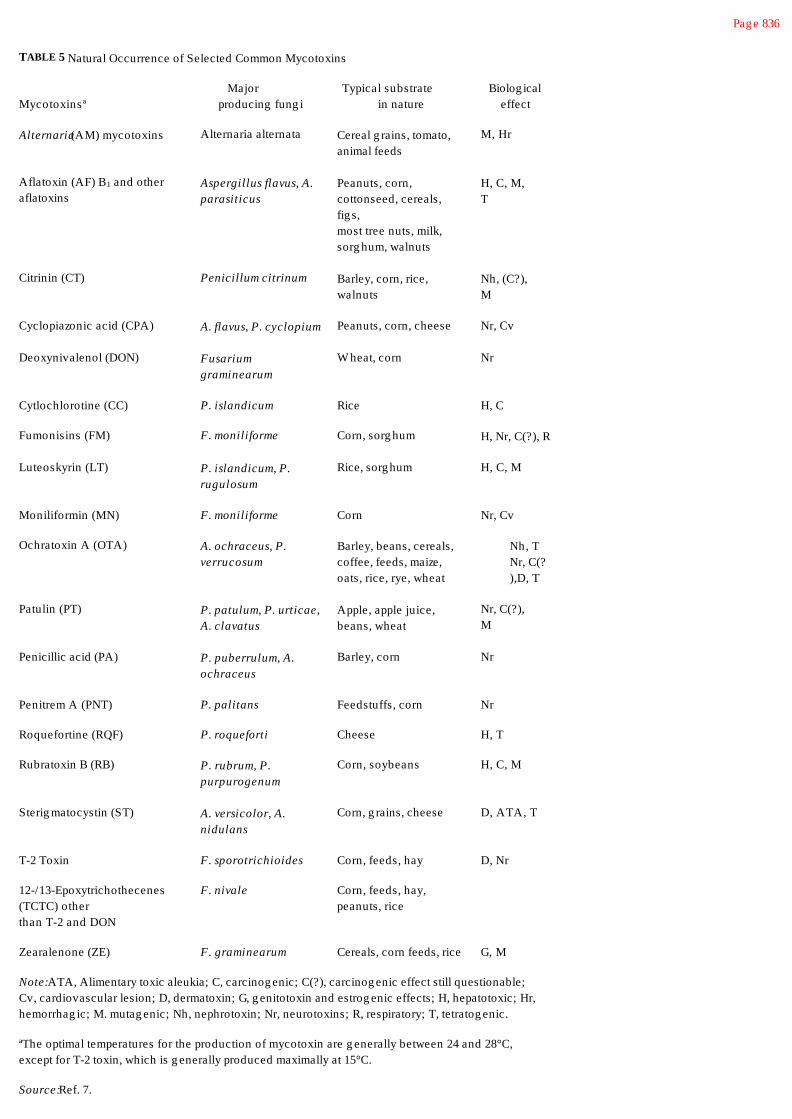
Pag e 836
TABLE 5 Natural Occurrence of Selected Common Mycotoxins
MycotoxinsªMajor
producing fung iTypical substrate
in natureBiolog ical
effect
Alternaria (AM) mycotoxins Alternaria alternata Cereal g rains, tomato,animal feeds
M, Hr
Aflatoxin (AF) B1 and otheraflatoxins
Aspergillus flavus, A.parasiticus
Peanuts, corn,cottonseed, cereals,fig s,most tree nuts, milk,sorg hum, walnuts
H, C, M,T
Citrinin (CT) Penicillum citrinum Barley, corn, rice,walnuts
Nh, (C?),M
Cyclopiazonic acid (CPA) A. flavus, P. cyclopium Peanuts, corn, cheese Nr, Cv
Deoxynivalenol (DON) Fusariumgraminearum
W heat, corn Nr
Cytlochlorotine (CC) P. islandicum Rice H, C
Fumonisins (FM) F. moniliforme Corn, sorg hum H, Nr, C(?), R
Luteoskyrin (LT) P. islandicum, P.rugulosum
Rice, sorg hum H, C, M
Moniliformin (MN) F. moniliforme Corn Nr, Cv
Ochratoxin A (OTA) A. ochraceus, P.verrucosum
Barley, beans, cereals,coffee, feeds, maize,oats, rice, rye, wheat
Nh, TNr, C(?),D, T
Patulin (PT) P. patulum, P. urticae,A. clavatus
Apple, apple juice,beans, wheat
Nr, C(?),M
Penicillic acid (PA) P. puberrulum, A.ochraceus
Barley, corn Nr
Penitrem A (PNT) P. palitans Feedstuffs, corn Nr
Roquefortine (RQF) P. roqueforti Cheese H, T
Rubratoxin B (RB) P. rubrum, P.purpurogenum
Corn, soybeans H, C, M
Sterig matocystin (ST) A. versicolor, A.nidulans
Corn, g rains, cheese D, ATA, T
T-2 Toxin F. sporotrichioides Corn, feeds, hay D, Nr
12-/13-Epoxytrichothecenes(TCTC) otherthan T-2 and DON
F. nivale Corn, feeds, hay,peanuts, rice
Zearalenone (ZE) F. graminearum Cereals, corn feeds, rice G, M
Note: ATA, Alimentary toxic aleukia; C, carcinog enic; C(?), carcinog enic effect still questionable;Cv, cardiovascular lesion; D, dermatoxin; G, g enitotoxin and estrog enic effects; H, hepatotoxic; Hr,hemorrhag ic; M. mutag enic; Nh, nephrotoxin; Nr, neurotoxins; R, respiratory; T, tetratog enic.
ªThe optimal temperatures for the production of mycotoxin are g enerally between 24 and 28°C,except for T-2 toxin, which is g enerally produced maximally at 15°C.
Source: Ref. 7.


Pag e 837
contaminated feed. The potential or actual extent of human harm from aflatoxin M or other mycotoxin metabolites in edibleanimal tissues is not known.
Bacterial food poisoning toxins are different from mycotoxins in three important ways. First, bacterial food poisoning toxinswith rare exception are proteins, not low-molecular-weight organic molecules. Second, bacterial food poisoning toxins are acutetoxins. The onset of symptoms occurs a few hours to a few days after exposure. There is no counterpart among bacterial foodpoisoning toxins to, for instance, the induction of liver cancer in rats by aflatoxin B1. Finally, while bacterial food poisoning toxinsare important causes of human illness, such toxins are rarely associated with animal feeds. (Feeds can, however, harborpathogenic bacteria that may infect livestock and be passed on to humans.) No doubt the absence of bacterial toxins in feedshas to do with low moisture content. Bacteria require higher moisture levels for growth and toxin synthesis than do molds [8].
Bacterial toxins that cause food poisoning when ingested are listed in Table 6.
Staphylococcus aureus is the most common toxigenic food-borne bacterium. This organism is estimated to be responsible forover 1 million cases of food poisoning in the United States each year [4]. (Salmonella are estimated to produce almost 3 millioncases of foodborne illness, but they do so via infection, not intoxication. Staphylococcus aureus is also an important infectiousagent of humans and other mammals, but staphylococcal food poisoning is caused by the ingestion of food containing preformedenterotoxin.)
Staphylococcal enterotoxin is not a single entity but rather a group of more than seven single-chain proteins with molecular massranging from 26,000 to 29,000 D [2]. The enterotoxins are antigenic, and are detected using serological methods. Toxigenicstrains of S. aureus may produce more than one enterotoxin. Symptoms of intoxication often include severe diarrhea andvomiting in addition to abdominal pain, headache, muscular cramping, and sweating. The mechanism(s) of action of theenterotoxins is not known.
The amount of a staphylococcal enterotoxin necessary to cause illness is not accurately known but is probably no more than afew hundred nanograms [2]. In general, it requires a million or more staphylococci to produce this amount of toxin. Foods mostat risk for staphylococcal growth and enterotoxin production are those that are rich, moist, and subject to temperatureabuse—in particular custard or cream-filled baked goods, cured meats such as ham, and salads containing egg, seafood, ormeat.
The most feared toxigenic food-borne bacterium is Clostridium botulinum, the cause of botulism. Fortunately it is relativelyuncommon, estimated at less than 300 cases per year in the United States [4].
Clostridium botulinum food poisoning is caused by a series of neurotoxins; the symptoms of botulism include paralysis anddeath. Seven different botulinal neurotoxins have been identified; each is a protein with a molecular weight of about 150,000 andwith subunits linked
TABLE 6 Bacterial Toxins That Cause Food-Borne Illness
ToxinEstimated cases of illness per year in
United States
Staphylococcal enterotoxins 1,155,000
Bacillus cereus enterotoxins 84,000
Botulinal neurotoxins 270
All food-borne causes 12,581,270
Source: Ref. 4.

Pag e 838
by disulfide bonds. Botulinal neurotoxins are the most potent acute poisons known: Toxic potency ranges from 107 to 108 mouseLD50 units per milligram of protein [25].
Clostridium botulinum is an anaerobic spore former, so it survives moderate heat treatments that will kill vegetative cells. Bycontrast, the neurotoxins are readily destroyed by heating. Early in this century the canning industry developed procedures toensure the complete destructon of C. botulinum spores. This was a necessary prerequisite to producing safe canned foods. Inthe United States today botulism is almost always associated with mishandling that occurs in food service establishments or thehome [4].
Bacillus cereus is a food borne pathogen that produces two distinct enterotoxins. One of the enterotoxins causes diarrhea, whilethe other induces vomiting. The mechanisms of action of these toxins are not known [17].
As its name implies, B. cereus is a common soil microorganism that frequently contaminates cereal products. It is not a majorcause of food poisoning in the United States [4] but appears to be more common in Europe, particularly Great Britain.
Some less common forms of food poisoning are associated with bacterial metabolites that are not proteins. Examples includehistamine poisoning, nitrite poisoning, and bongkrek food poisoning (caused by a toxic fatty acid produced by Pseudomonascocovenenans and Flavobacterium farinofermentans) [26].
There are also several food borne bacterial pathogens that produce toxins in association with gastrointestinal infections.Examples include certain strains of Escherichia coli [11] and Clostridium perfringens [8]. In these cases toxin that isperformed in food does not appear to be associated with illness. Rather, illness is induced wholly or in part by toxin synthesizedin situ following ingestion of the pathogenic microorganism.
13.8 Food Toxicology and Public Health: Setting Priorities
It is estimated that 12.5 million cases of food-associated illness occur each year in the United States, at a cost of about 8.5billion dollars [4]. The great majority of these are due to infectious agents: pathogenic bacteria like Salmonella, viruses such ashepatitis A virus, and parasites such as Toxoplasma gondii. Food borne toxins are estimated to account for no more than 1.5million of these cases. Of these cases, more than 1 million are due to the staphylococcal enterotoxins [4]. Hence the science offood toxicology indicates that while we should be vigilant in protecting foods against contamination by naturally occurring andsynthetic toxins, by far the most common food borne toxicologic risks in the United States and other developed countries comefrom certain bacterial toxins. Moreover, a great deal of scientific data is available to assist in controlling such contamination.
That being said, there still remains the dilemma of public perception, often fueled by activist groups, that the toxicologic risk toour food supply is much greater than these scientifically derived estimates indicate. Concern over perceived risks typicallyfocuses on synthetic contaminants, pesticide residues, and food additives [12].
There have been few attempts to address these concerns in a systematic, science-based manner. One such approach wasdeveloped by Ames and colleagues [13]. It involves ranking carcinogenic risks according to a ratio known by the acronymHERP (human exposure rodent potency). A HERP can be calculated for any carcinogen so long as its human exposure leveland potency in a rodent bioassay are known. In calculating a HERP, the human exposure level (mg/kg body weight) is dividedby the TD50 (mg/kg body weight), and the result is then multiplied by 100 [13].

Pag e 839
TABLE 7 Prioritizing Commonly Encountered Carcinog en Exposures
Daily human exposure HERP (%)
PCBs, daily dietary intake 0.0002
EDBª, daily dietary intake 0.0004
Alarª, 1 apple (230 g ) 0.0002
Tap water, 1 L (chloroform) 0.001
Cooked bacon, 100 g (nitrosamines) 0.003
W orst well water in Silicon Valley (trichloroethylene) 0.004
Peanut butter (one sandwich) (aflatoxin) 0.03
One g lass of wine (ethanol) 4.7
Note: EDB refers to ethylene dibromide, a pesticide.
ªBanned because of health concerns; HERP value based on exposure prior to ban.
Source: Ref. 13 (data).
Some HERP values for common exposures to food substances are given in Table 7. As is evident, synthetic pesticide residuesand contaminants represent a far lower risk than many naturally occurring carcinogens. This is largely a function of concentration.Ames and colleagues [1, 13] estimate that 99.99% of the total mass of carcinogens typically ingested is of natural origin.
It is important that these conclusions be interpreted correctly. One should not infer that the level of exposure to naturallyoccurring dietary carcinogens is necessarily excessive, especially in developed countries. Rather, the level of exposure tosynthetic pesticide residues and contaminants is ordinarily so low as to be of no health significance whatever.
These considerations are of great importance in properly applying the results of food toxicology science to reducing public healthrisk.
Bibliography
Committee on Food Protection (1973). Toxicants Occurring Naturally in Foods, 2nd ed., National Academy of Sciences,Washington, DC.
Council on Agricultural Science and Technology (1989). Mycotoxins: Economic and Health Risks. Task Force Report No.116, Council on Agricultural Science and Technology, Ames, IA.
Council on Agricultural Science and Technology (1994). Foodborne Pathogens: Risks and Consequences. Task ForceReport No. 122, Council on Agricultural Science and Technology, Ames, IA.
Gold, L. S., T. H. Slone, B. R. Stern, N. B. Manley, and B. N. Ames (1992). Rodent carcinogens: Setting priorities. Science258:261–265.
Hall, R. L. (1992). Toxicological burdens and the shifting burden of toxicology. Food Technol. 46(3):109–112.
International Food Biotechnology Council (1990). Biotechnologies and food: Assuring the safety of foods produced by geneticmodification. Regul. Toxicol. Pharmacol. 12(3), part 2 of 2:S1–S196.
Pariza, M. W. (1992). A new approach to evaluating carcinogenic risk. Proc. Natl. Acad. Sci. USA 89:860–861.
References
1. Ames, B. N., M. Profet, and L. S. Gold (1990). Dietary pesticides (99.99% all natural). Proc. Natl. Acad. Sci. USA87:7777–7781.

2. Bergdoll, M. S. (1990). Staphylococcal food poisoning, in Foodborne Diseases (D. O. Cliver, ed.), Academic Press, SanDiego, pp. 85–106.

Pag e 840
3. Council on Agricultural Science and Technology (1989). Mycotoxins: Economic and Health Risks. Task Force Report No.116, Council on Agricultural Science and Technology, Ames, IA.
4. Council on Agricultural Science and Technology (1994). Foodborne Pathogens: Risks and Consequences. Task ForceReport No. 122, Council on Agricultural Science and Technology, Ames, IA.
5. Chernoff, R. (1994). Thirst and fluid requirements. Nutr. Rev. 52(8, part 2):s3–s5
6. Chhabra, R. S., J. E. Huff, B. S. Schwetz, and J. Selkirk (1990). An overview of prechronic and chronictoxicology/carcinogenicity experimental study designs and criteria used by the National Toxicology Program. Environ. HealthPerspect. 86:313–321.
7. Chu, F. S. (1995). Mycotoxin analysis, in Analyzing Food for Nutrition Labeling and Hazardous Contaminants (I. J.Jeon and W. G. Ikins, eds.), Marcel Dekker, New York, pp. 283–332.
8. Cliver, D. O. (ed.) (1990). Foodborne Diseases, Academic Press, San Diego.
9. Coon, J. M. (1973). Toxicology of natural food chemicals: A perspective, in Toxicants Occurring Naturally in Foods, 2nded., National Academy of Sciences, Washington DC, pp. 573–591.
10. Deichmann, W. B., D. Henschler, B. Holmstedt, and G. Keil (1986). What is there that is not poison? A study of the ThirdDefense by Paracelsus. Arch. Toxicol. 58:207–213.
11. Doyle, M. P., and D. O. Cliver (1990). Escherichia coli, in Foodborne Diseases (D. O. Cliver, ed.), Academic Press,San Diego, pp. 209–215.
12. Foster, E. M. (1990). Perennial issues in food safety, in Foodborne Diseases (D. O. Cliver, ed.), Academic Press, SanDiego, pp. 127–135.
13. Gold, L. S., T. H. Slone, B. R. Stern, N. B. Manley, and B. N. Ames (1992). Rodent carcinogens: Setting priorities.Science 258:261–265.
14. Hall, R. L. (1992). Toxicological burdens and the shifting burden of toxicology. Food Technol. 46(3):109–112.
15. Holmstedt, B., and G. Liljestrand (1981). Readings in Pharmacology. Raven Press, New York, p. 29.
16. International Food Biotechnology Council (1990). Biotechnologies and food: Assuring the safety of foods produced bygenetic modification. Regul. Toxicol. Pharmacol. 12(3), part 2 of 2:S1–S196.
17. Johnson, E. A. (1990). Bacillus cereus food poisoning, in Foodborne Diseases (D. O. Cliver, ed.), Academic Press, SanDiego, pp. 127–135.
18. Johnson, E. A. (1990). Clostridium perfringens food poisoning, in Foodborne Diseases (D. O. Cliver, ed.), AcademicPress, San Diego, pp. 1229-240.
19. Kessler, D. A., M. R. Taylor, J. H. Maryanski, E. L. Flamm, and L. S. Kahl (1992). The safety of foods developed bybiotechnology. Science 256:1747–1749, 1932.
20. Miller, E. C., A. B. Swanson, D. H. Phillips, T. L. Fletcher, A. Liem, and J. A. Miller (1983). Structure-activity studies ofthe carcinogenicities in the mouse and rat of some naturally occurring and synthetic alkenylbenzene derivatives related to safroleand estragole. Cancer Res. 43:1124–1134.
21. Pariza, M. W. (1992). Risk assessment. Crit. Rev. Food Sci. Technol. 31:205–209.
22. Pariza, M. W. (1992). A new approach to evaluating carcinogenic risk. Proc. Natl. Acad. Sci. USA 89:860–861.
23. Pariza, M. W., and E. M. Foster (1983). Determining the safety of enzymes used in food processing. J. Food Prot.46:453–468.
24. Smith, R. A. (1994). Poisonous plants, in Foodborne Disease Handbook (Y. H. Hui, J. R. Gorham, K. D. Murrell, and D.O. Cliver, eds.), Marcel Dekker, New York, pp. 187–226.

25. Sugiyama, H. (1990). Botulism, in Foodborne Diseases (D. O. Cliver, ed.), Academic Press, San Diego, pp. 85–106.
26. Taylor, S. L. (1990). Other microbial intoxications, in Foodborne Diseases (D. O. Cliver, ed.), Academic Press, SanDiego, pp. 159–170.
27. Wogan, G. N., and M. A. Marletta (1985). Undesirable or potentially undesirable constituents of foods, in FoodChemistry (O. R. Fennema, ed.), Marcel Dekker, New York, pp. 694–695.

Pag e 841
14Characteristics of Milk
HAROLD E. SWAISGOOD
North Carolina State University, Raleigh, North Carolina
14.1. Introduction 842
14.2. Milk Biosynthesis 842
14.3. Chemical Composition 845
14.3.1. Milk Proteins 846
14.3.2. Milk Lipids 850
14.3.3. Milk Salts and Sugar 853
14.3.4. Enzymes 854
14.4. Structural Organization of Milk Components 854
14.4.1. Structure of Milk Proteins 854
14.4.2. Casein Micelles and Milk Salts 861
14.4.3. The Fat Globule 863
14.5. Use of Milk Components As Food Ingredients 864
14.5.1. Effects of Processing on Milk Components 864
14.5.2. Use in Formulated Foods 867
14.6. Nutritive Value of Milk 871
14.6.1. Nutrient Composition of Milk and Milk Products 871
14.6.2. Lactose Tolerance 872
14.6.3. Effect of Processing on Nutritive Value 873
Bibliography 876
References 876

Pag e 842
14.1 Introduction
For the young of mammals, including humans, milk is the first and, for most, only food ingested for a considerable period of time.With the domestication of animals, it became possible to include milk in the diet of adult humans as well. For much of the world,particularly in the West, milk from cattle (Bos taurus) accounts for nearly all the milk processed for human consumption. In theUnited States the dairy industry is primarily based on cow's milk. Therefore, this discussion focuses on the properties of bovinemilk.
The total production of milk and major processed dairy products for selected years between 1970 and 1992 is given in Table 1.Most of the milk produced is processed as fluid or beverage milk (36–46%). However, the consumption pattern of individualproducts has changed considerably during the past 20 years. In 1970 plain whole milk represented 78% and plain low-fat milk12% of the beverage milk sold, but in 1992 the consumption pattern was 37% plain whole milk, 46% plain low-fat milk, and12% plain skim milk. Furthermore, although the amount of beverage milk consumed has remained relatively constant, itspercentage of the total milk consumed in all forms has fallen. Other noteworthy trends are the large increases in cheese andyogurt consumption.
During the past 20 years a new fluid milk product known as ultra-high-temperature (UHT) processed and aseptically packagedmilk has appeared in the U.S. market. This product, which is commercially sterile and can be distributed and merchandizedwithout refrigeration, has not yet gained acceptance in the United States; however, it represents a large share of the fluid milkmarket in many other countries. The biological origin and chemical nature of milk are considered next.
14.2 Milk Biosynthesis
In the early years of dairy chemistry, the product of the mammary gland was more thoroughly investigated and characterizedthan the gland itself because of the economic importance of milk products. More recently, however, with advances in molecularand cellular biology, the mammary gland has been the subject of intensive research. Several excellent reviews on milkbiosynthesis have appeared and the reader is referred to these for more complete information [27, 30, 34, 42, 45]. Somepeople have argued that animal agriculture will disappear as the human population expands and competition for available grainintensifies. The fallacy of this argument, however, lies in the presence of a rumen in the cow's digestive system. The rumen allowsthe cow to synthesize nutrients from crude cellulosic and fibrous plant materials and from simple forms of nitrogen, such as urea.Consequently, these animals should be viewed as a unique means of producing high-quality foods from otherwise unusablefeedstocks, rather than as inefficient and unnecessary.
The bovine mammary gland, resulting from years of genetic selection, is an amazingly productive organ for biosynthesis. In 1993the average cow in the United States produced 7055 kg (15,554 lb) of milk in a 305-day lactation [2]. Some high producinganimals yielded as much as 22,700 kg of milk (over 50,000 lb). The cellular machinery of this gland is shown at various levels ofmagnification in Figure 1. Milk originating in the secretory tissue collects in ducts that increase in size as the teat region isapproached. The smallest complete milk factory, which includes a storage area, is the alveolus. It is a roughly spherical micro-organ consisting of a central storage volume (the lumen) surrounded by a single layer of secretory epithelial cells, which isconnected to the duct system. These cells are directionally oriented such that the apical end with its unique membrane ispositioned next to the lumen, and the basal end is separated from blood and lymph by a basement membrane. Consequently, adirectional flow of metabolites
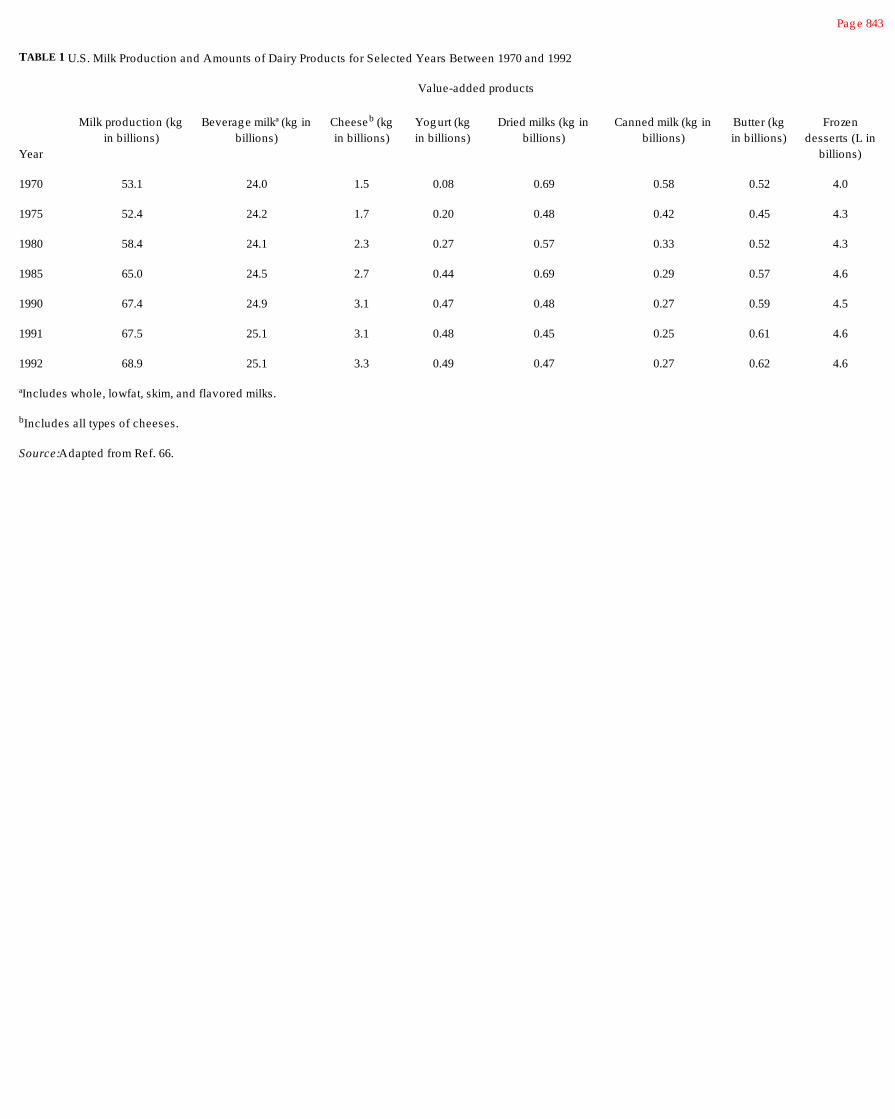
Pag e 843
TABLE 1 U.S. Milk Production and Amounts of Dairy Products for Selected Years Between 1970 and 1992
Value-added products
Year
Milk production (kgin billions)
Beverag e milkª (kg inbillions)
Cheeseb (kgin billions)
Yog urt (kgin billions)
Dried milks (kg inbillions)
Canned milk (kg inbillions)
Butter (kgin billions)
Frozendesserts (L in
billions)
1970 53.1 24.0 1.5 0.08 0.69 0.58 0.52 4.0
1975 52.4 24.2 1.7 0.20 0.48 0.42 0.45 4.3
1980 58.4 24.1 2.3 0.27 0.57 0.33 0.52 4.3
1985 65.0 24.5 2.7 0.44 0.69 0.29 0.57 4.6
1990 67.4 24.9 3.1 0.47 0.48 0.27 0.59 4.5
1991 67.5 25.1 3.1 0.48 0.45 0.25 0.61 4.6
1992 68.9 25.1 3.3 0.49 0.47 0.27 0.62 4.6
ªIncludes whole, lowfat, skim, and flavored milks.
bIncludes all types of cheeses.
Source: Adapted from Ref. 66.

Pag e 844
FIGURE 1Bovine mammary g land at increasing levels of mag nification.
occurs through the cell, with the building blocks of milk entering from the blood through the basolateral membrane. These basiccomponents are synthesized into milk components on the production lines of the endoplasmic reticulum, which is supplied withenergy by oxidative metabolism in the mitochondria. The components are then packaged in secretory vesicles by the Golgiapparatus or as lipid droplets in the cytoplasm. Finally, the vesicles and lipid droplets pass through the apical plasma membraneand are stored in the lumen. The layer of secretory epithelial cells surrounding the lumen of the alveolus is in turn surrounded by alayer of myoepithelial
Pag e 845
cells and blood capillaries. When oxytocin, a pituitary hormone circulating in the blood, binds to the myoepithelial cells, thealveolus contracts, expelling the milk stored in the lumen into the duct system.
It is currently thought that the intracellular membranes (endomembranes) also exhibit directional flow to the apical plasmamembrane, with concurrent transformation of membranes from endoplasmic reticulum to Golgi, to secretory vesicles, to apicalplasma membrane within the epithelial secretory cell. The endoplasmic reticulum, the endomembrane production line whereactive synthesis occurs, appears to be like a cellular plumbing system, with the inside of these tubes, known as the cisternae,emptying into the Golgi apparatus. The Golgi apparatus transforms into Golgi vesicles, the packages that carry the aqueousphase milk components to the apical plasma membrane.
Ribosomes, the machinery for protein synthesis, exist both free in the cytoplasm and bound to the endoplasmic reticulum. Nearthe basolateral membrane, the endoplasmic reticulum is covered with ribosomes, making this membrane appear “rough.”However, moving in the direction of the apical end, amino acids are depleted and synthesis slows, allowing ribosomes todissociate. Hence, this membrane becomes smooth as it is transformed into Golgi membrane. Synthesis is completed in thelumen of the Golgi; for example, proteins are glycosylated and phosphorylated and lactose is synthesized. It is here and in theGolgi vesicles that casein micelles first appear. Furthermore, this membrane is impermeable to lactose, so that the majorsecretory products of the cell are now segregated from all other cellular constituents. Secretion of the products of synthesis iscompleted when the Golgi vesicles merge with the apical plasma membrane, fuse to become part of that membrane, and emptythe contents of the package into the alveolar lumen for storage. Note that in the membrane transformation, the inside or lumenside of the vesicle membrane becomes the outside of the cell plasma membrane. The caseins, b-lactoglobulin, and a-lactalbuminare synthesized in the mammary epithelial cells. Serum albumin and immunoglobulins are not synthesized in these cells, butspecific receptors for these proteins appear on the basolateral membrane. Hence, these proteins are transported from blood tothe alveolar lumen by internalization of the protein-receptor complex and passage through the cell in membrane vesicles.
Fat, which is also synthesized by the endoplasmic reticulum, is directed to the cytoplasmic side of the membrane where itcollects as lipid droplets. These droplets move to the apical plasma membrane, where they are expelled into the alveolar lumenby pinocytosis, thus acquiring on their surface a coat of plasma membrane. The presence of this membrane has importantconsequences for the processing characteristics of milk products. Apical plasma membrane, lost in this process, is continuallyreplenished, at least in part, by the fusion of vesicles as previously described. Electrolytes in milk appear to be transported fromblood by pumps or channels in the basolateral membrane. The proportion of sodium and potassium in milk resembles thecomposition of the cytoplasm. However, because milk is isosmotic with blood plasma and because a large portion of thatosmolality is contributed by lactose, the concentration of electrolytes is lower in milk than in the cytoplasm or in plasma.
It should be appreciated that many, if not all, of the characteristics of milk and its constituents are a consequence of themechanism of synthesis and secretion.
14.3 Chemical Composition
The composition of milk reflects the fact that it is the sole source of food for the very young mammal. Hence, it is composed of acomplex mixture of lipids, proteins, carbohydrates, vitamins, and minerals. In addition, milk contains minor components derivedfrom the cellular synthetic “machinery.” The average composition of milk with respect to major classes of

Pag e 846
compounds and the range of average values for milks of Western cattle are given in Table 2. The greatest variability incomposition is exhibited by the lipid fraction. In the past, breeders have selected cows for high fat production because of theeconomic value of this constituent. Currently, more importance is being placed on protein content, and breeders are beginning toselect for higher protein/fat ratios and higher protein yield.
Because of the major contribution of lactose and milk salts to osmolality, and the required matching of milk's osmotic pressurewith that of blood, very little variability is observed in the sum of these constituents. It should be noted that ash does not trulyrepresent milk salts because organic salts are destroyed by ashing; for example, various salts of citrate are principal componentsof the milk salt system. The pH of freshly drawn milk is 6.6–6.8, which is slightly lower than that of blood.
Most of the constituents of milk are not present as individual molecules in solution. Instead, they exist in large complexassociated structures (Table 3). This is especially true for the caseins, which are present as large spherical micelles, and thelipids, which form even larger spherical globules. Because of the spherical shape and the reduction in the effective number ofmolecules (kinetic units), both the viscosity and the osmotic pressure are much less than would be observed if these structureswere not formed.
14.3.1. Milk Proteins
Milk contains 30–36 g/L of total protein and it rates very high in nutritive quality. There are six major gene products of themammary gland: as1-caseins, as2-caseins, b-caseins, k-caseins, b-lactoglobulins, and a-lactalbumins (Table 4). Each of theseproteins exhibits genetic polymorphism because they are products of codominant, allelic, autosomal genes. Milk proteins areclassified as either caseins or whey proteins. All the caseins exist with calcium phosphate in a unique, highly hydrated sphericalcomplex known as the casein micelle. Such complexes vary in size from 30 to 300 nm in diameter, with a small percentageapproaching 600 nm.
Milk proteins can be readily separated into casein and whey protein fractions. Casein comprises 80% of the bovine milkproteins; consequently, curd formed by agglomeration of casein micelles during cheese manufacture retains most of the total milkprotein. The other proteins pass into the cheese whey, hence the designation whey protein. Historically, separation of caseinsfrom other proteins by means of precipitation at their isoelectric point (around pH 4.6), yielding so-called “acid casein,” or byenzyme induced agglomeration of casein micelles (renneting), as in cheesemaking, has formed the basis for many milk productssuch as cheese, whey protein products, and other protein ingredients. In the past whey was often discarded;
TABLE 2 Composition of Bovine Milk from W estern Cattle
ComponentAverag e
percentag eRang e for W estern breedsª
(averag e percentag es)
W ater 86.6 85.4–87.7
Fat 4.1 3.4–5.1
Protein 3.6 3.3–3.9
Lactose 5.0 4.9–5.0
Ash 0.7 0.68–0.74
ªW estern breeds include Guernsey, Jersey, Ayshire, Brown Swiss,Shorthorn, and Holstein.
Source: Adapted from Ref. 9.

Pag e 847
TABLE 3 Numbers and Sizes of Major Milk Constituents
Constituent Size (diameter, nm) Number/ml
Lactose 0.5 1019
W hey protein 4–6 1017
Casein micelles 50–300 1014
Milk fat g lobule 2000–6000 1010
however, it is now economically feasible to concentrate or isolate the whey proteins, which exhibit excellent functionality andnutritional properties.
In addition to b-lactoglobulin and a-lactalbumin, which are gene products of the mammary gland, whey also contains serumalbumin and immunoglobulins that are derived from blood. Milk also contains several “protein” components that are actuallylarge polypeptides. These result from posttranslational proteolysis of milk proteins by the indigenous milk proteinase plasmin,which is derived from blood. Thus, the g-caseins that fractionate with the caseins, and most of the proteose-peptones that arepresent in whey, are derived by limited proteolysis of b-casein.
The amino acid compositions and covalent molecular weights of the major milk proteins are very accurately known from aminoacid analyses and from determination of primary structure by chemical sequencing and by inference from gene sequencing (Table5). A key distinction of the caseins is their large content of phosphoseryl residues and their moderately large proline content.Although the caseins are rather low in half-cystine, the whey proteins contain considerably more of this residue.
For a more complete discussion of the characteristics of individual milk proteins, the reader is referred to several excellentreviews [7, 8, 21, 32, 33, 35–37, 53, 60–62, 64, 68, 69].
TABLE 4 Concentrations of the Major Proteins in Milk
ProteinConcentration (g /L) Approximate percentag e of
total protein
Caseins 24–28 80
as-Caseins 15–19 42
as1 12–15 34
as2 3–4 8
b-Caseins 9–11 25
k-Caseins 3–4 9
g-Caseins 1–2 4
W hey proteins 5–7 20
b-Lactog lobulins 2–4 9
a-Lactalbumin 1–1.5 4
Proteose-peptones 0.6–1.8 4
Blood proteins
Serum albumin 0.1–0.4 1
Immunog lobulins 0.6–1.0 2

Total 100 100

Pag e 848
TABLE 5 Amino Acid Composition of the Major Proteins in the Milk of W estern Cattle
Number of amino acids in
Acidas1-Casein
B-8Pas2-Casein
A-11Pk-Casein
B-1Pb-Casein A 2-
5P
b-Casein A 2-1P(f29–209)(formerly g 1)
b-Casein A 2-1P(f106–209)(formerly g 2)
b-CaseinA(F108–209)(formerly g 3)
b-Lactog lobulin
A
a-Lactalbumin
B
Nonpolar
Pro 17 10 20 35 34 21 21 8 2
Ala 9 8 15 5 5 2 2 14 3
Val 11 14 11 19 17 10 10 10 6
Met 5 4 2 6 6 4 4 4 1
Ile 11 11 13 10 7 3 3 10 8
Leu 17 13 8 22 19 14 14 22 13
Phe 8 6 4 9 9 5 5 4 4
Trp 2 2 1 1 1 1 1 2 4
Polar, neutral
Asn 8 14 8 5 3 1 1 5 12
Thr 5 15 14 9 8 4 4 8 7
(table continued on next page)

Pag e 849
(table continued from previous page)
Number of amino acids in
Acidas1-Casein
B-8Pas2-Casein
A-11Pk-Casein
B-1Pb-Casein
A 2-5P
b-Casein A 2-1P(f29–209)(formerly g 1)
b-Casein A 2-1P(f106–209)(formerly g 2)
b-CaseinA(F108–209)(formerly g 3)
b-Lactog lobulin
A
a-Lactalbumin
B
Ser 8 6 12 11 10 7 7 7 7
Gln 14 16 14 20 20 10 10 9 5
Gly 9 2 2 5 4 2 2 3 6
Tyr 10 12 9 4 4 3 3 4 4
Cystine 0 1 1 0 0 0 0 2 4
Cysteine 0 0 0 0 0 0 0 1 0
Pyr Glu 0 0 1 0 0 0 0 0 0
Polar, acidic
Asp 7 4 3 4 4 2 2 11 9
0:Ser P 8 11 1 5 1 0 0 0 0
Glu 25 24 12 9 2 5 5 16 8
Polar, basic
Lys 14 24 9 11 10 4 3 15 12
His 5 3 3 5 5 4 3 2 3
Arg 6 6 5 4 2 2 2 3 1
Total residue 199 207 169 209 181 104 102 162 123
Molecular weig ht 23,623 25,238 19,006 23,988 20,523 11,824 11,559 18,363 14,174
Source: Adapted from Ref. 61 and 62.

Pag e 850
TABLE 6 Lipid Composition of Bovine Milk
Lipid W eig ht percent g /Lª
Triacylg lycerols (trig lycerides) 95.80 30.7
1,2-Diacylg lycerols (dig lycerides) 2.25 0.72
Monoacylg lycerols (monog lycerides) 0.08 0.03
Free fatty acids 0. 28 0.09
Phospholipids 1.11 0.36
Cholesterol 0.46 0.15
Cholesterol ester 0.02 0.006
Hydrocarbons Trace Trace
ªBased on the usual butterfat percentag e of commercial pasteurized whole milk,3.2%.
Source: Adapted from Ref. 23.
14.3.2 Milk Lipids
Bovine milk contains the most complex lipids known. For detailed characteristics of the various lipids and a discussion of theirbiosynthesis, the reader should consult one of the reviews [3, 6, 22–24, 45]. Triacylglycerols (triglycerides) represent by far thegreatest proportion of the lipids, comprising 96–98% of the total (Table 6). In milk, the triacylglycerols are present as globules2–6 µm in diameter surrounded by membrane material derived from the apical cell membrane. The concentrations listed in Table6 are representative of fresh milk. Some lipolysis occurs during storage, giving higher concentrations of free fatty acids andmono- and diacylglycerols.
Triacylglycerols containing three different fatty acids have a chiral carbon at the sn-2 position of the glycerol skeleton. Over 400different fatty acids have been identified in bovine lipids. Consequently, if positional isomers are considered, 4003 or 64 milliontriacylglycerol species are theoretically possible. However, only 13 fatty acids are present at concentrations exceeding 1%(w/w) (Table 7), corresponding to a theoretical maximum number of isomers of 133 = 2197. If only compositional species,rather than positional isomers, are considered, then the possible number of triacylglycerols with different fatty acid compositionsis n!/3!(n - 1)! + n(n - 1) + n, where n is the number of different fatty acids. With 13 different fatty acids, this results in 455triacylglycerols with different fatty acid compositions. Recently [16], 223 triacylglycerols with different compositions accountingfor 80% of the total triacylglycerols were isolated by reversed-phase liquid chromatography and identified. The total molepercent of each
TABLE 7 Major Fatty Acid Constituents of Bovine Milk Fat
Fatty acid W eig ht percent Fatty acid W eig ht percent
4:0 3.8 15:0 1.1
6:0 2.4 16:0 43.7
8:0 1.4 18:0 11.3
10:0 3.5 14:1 1.6
12:0 4.6 16:1 2.6
14:0 12.8 18:1 11.3
18:2 1.5
Source: Adapted from Refs. 23 and 65.


Pag e 851
class of triacylglycerols and eight of the most abundant compositional species (concentrations exceeding 2 mol%) are listed inTable 8. Saturated and monounsaturated triacylglycerols comprise the bulk of the lipids (65 mol%), and the eight most prevalenttriacylglycerols represent nearly one-fourth of the total.
A nonrandom distribution of fatty acids in the triacylglycerols is observed. The nonrandomness results from the specificities ofthe acyltransferase enzymes involved in synthesis. Thus, long-chain acylcoenzyme A is the preferred substrate for theacyltransferase specific for sn positions 1 and 2. Conversely, esterification by short-chain fatty acids is much faster with theenzyme specific for sn-3. As a result, triacylglycerols with one short-chain and two medium- or long-chain fatty acids arepreferentially synthesized, whereas simple or mixed saturated long-chain triacylglycerols are present at low concentrations.These observations are clearly supported by the data in Table 9. For example, 85% of butyrate and 58% of caproate are atposition sn-3, while only 13% of palmitate and 16% of stearate are located in this position.
In addition to exhibiting the greatest percent variability, milk lipids and fatty acids in particular are the most subject of all milkconstituents to alteration by environmental factors, such as diet. Because synthesis of short-chain fatty acids andbiohydrogenation occurs in the rumen, the ratio of saturated to unsaturated fatty acids does not vary greatly. However, ifunsaturated fatty acids are fed in a protected form by encapsulation in denatured protein, they will pass through the rumenunaltered, resulting in greater incorporation of unsaturated acids in the triacylglycerols. Such alteration of triacylglycerolcomposition is currently attractive because of the reported health benefits of unsaturated fatty acids; however, the possibleeffects on the oxidative stability of the lipid and the resulting flavor instability have not been fully assessed,
The phospholipid and cholesterol fraction of milk lipids exist in the membrane material
TABLE 8 Composition of Major Triacylg lycerols in Milk
TypeCarbonnumber
Molecular speciesª Molepercent
Saturated triacylg lycerols (total) b 32.4
34 4:0 14:0 16:0 3.1
36 4:0 16:0 16:0 3.2
38 4:0 16:0 18:0 2.5
Monounsaturated triacylg lycerols (total) b 32.6
38 4:0 16:0 18:1 4.2
40 6:0 16:0 18:1 2.0
48 14:0 16:0 18:1 2.8
50 16:0 16:0 18:1 2.3
52 16:0 18:0 18:1 2.2
Diunsaturated triacylg lycerols (class 011) (total) c 10.6
Diunsaturated triacylg lycerols (class 002)(total) c 2.5
Polyunsaturated triacylg lycerols (all classes)(total) c 5.2
ªCarbon chain leng th: number of double bonds present. Position of acyl chains in the g lycerol skeleton wasnot determined.
bThis row g ives the total mole percent of the specified triacylg lycerol type. Sublisting s under each type arespecific triacylg lycerols present in concentrations exceeding 2.0 mol%.
cClass 011 indicates two monounsaturated fatty acids in the triacylg lycerol, while class 002 indicates onediunsaturated fatty acid present.

Source: Adapted from Ref. 16. Note that 80% of the triacylg lycerols were identified in this study; for example,triacylg lycerols containing odd-numbered fatty acids were not quantified.

Pag e 852
TABLE 9 Positional Distribution of the Individual Fatty Acids inBovine Milk Triacylg lycerols
sn Position (mol%)
Fatty acid 1ª 2ª 3ª
4:0 5.0 (10) 2.9 (5) 43.3 (85)
6:0 3.0 (16) 4.8 (26) 10.8 (58)
8:0 0.9 (17) 2.3 (42) 2.2 (41)
10:0 2.5 (21) 6.1 (50) 3.6 (29)
12:0 3.1 (25) 6.0 (47) 3.5 (28)
14:0 10.5 (27) 20.4 (54) 7.1 (19)
16:0 35.9 (45) 32.8 (42) 10.1 (13)
16:1 (48) (36) (16)
18:0 14.5 (58) 6.4 (26) 4.0 (16)
18:1 20.6 (42) 13.7 (28) 14.9 (30)
18:2 1.2 (28) 2.5 (60) 0.5 (12)
ªNumber in parentheses represents the percent of a particular fattyacid occupying the desig nated position.
Source: Refs. 20, 23, 45, and 47.
introduced into the milk during pinocytosis of lipid droplets through the plasma membrane into the lumen of the aveolus. Lipids ofthe milk fat globule membrane (Table 10), which are similar to those of cellular plasma membrane, consist of more than 20%phospholipids, the major types being phosphatidylethanolamine (22.3%), phosphatidylcholine (33.6%), and sphingomyelin(35.3%).
Due to a correlation between cholesterol and atherosclerosis, the content of this sterol in foods has received much attention.Milk contains relatively little cholesterol; for example, an 8-oz glass of milk (227 g) contains 27 mg cholesterol. To put this inperspective, one large egg contains 275 mg cholesterol, 10 small shrimp contain 125 mg, and 100 g of freshwater fish contain70 mg. Because cholesterol occurs in the fat globule membrane, its concentration in a dairy food is related to fat content.

TABLE 10 Composition of the Lipid Portion of the Milk FatGlobule Membrane
Component Percentag e of membrane lipids
Carotenoids 0.45
Squalene 0.61
Cholesterol esters 0.79
Triacylg lycerolsª 53.41
Free fatty acids 6.30
Cholesterol 5.20
Diacylg lycerols 8.14
Monoacylg lycerols 4.70
Phospholipids 20.40
ªContains a larg e portion of hig h-melting g lycerides (meltingpoint, 52–53°C).
Source: Ref. 63.

Pag e 853
14.3.3 Milk Salts and Sugar
The salts in milk consist principally of chlorides, phosphates, citrates, and bicarbonates of sodium, potassium, calcium andmagnesium [19, 48]. Thus, both inorganic and organic salts are present in milk, and these should not be confused with quantitiesgiven for “ash”, which represents oxides of the minerals resulting from combustion. Milk salt complexes have sizes ranging fromthose that are ultrafilterable, including free ions and ion complexes, to those that are of colloidal size. Some of the latter typeparticipate in the structure of casein micelles (Table 11).
The ultrafilterable species, which are in equilibrium with colloidal forms, may be obtained in the permeate by dialysis orultrafiltration. Analysis of the latter permeate provided the basis for formulation of a “simulated milk salt ultrafiltrate” [19], whichis commonly used to simulate the milk environment for research on milk components. The multivalent ions Ca2+ and Mg2+ existprincipally as complexes, including large amounts of Ca.citrate and Mg.citrate and lesser quantities of CaH2PO4 [19]. Thus, only20–30% of the total Ca and Mg present as ultrafilterable species exists as free divalent cations. For example, milk contains only2–3 mM Ca2+. Likewise, most of the citrate is present as complex ions, whereas most of the phosphate exists as and
. Univalent ions such as Na+, K+, and Cl¯ are present almost entirely as free ions.
Colloidal species of the milk salts bind to milk proteins both as individual ions and as complex structures in casein micelles.These interactions affect the stability and functionality of milk proteins; hence, milk salts play an important role in the propertiesof dairy foods.
Because of the biosynthetic requirement of isosmolality with blood, one would expect a reciprocal relationship between milksalts and lactose. Such as inverse relationship has been documented between sodium and lactose contents and between sodiumand potassium contents [19, 48]. Consequently, milk has an essentially constant freezing point (-0.53 to -0.57°C), and thiscolligative property is used to detect illegal dilution with water.
Lactose (4-O-b-D-galactopyranosyl-D-glucopyranose) is the predominant carbohydrate in bovine milk, accounting for 50% ofthe solids in skim milk. Its synthesis is associated with that of a major whey protein, a-lactalbumin, which acts as a modifierprotein for UDP galactosyl-tranferase. Thus, a-lactalbumin changes the specificity of this enzyme such that the galactosyl groupis transferred to glucose rather than to glycoproteins. Lactose occurs in both a and b forms,
TABLE 11 Concentration and Size of the Principal Salts and Lactose in Milk
Total in milk (mg /100 ml)
Component Mean Rang e of valuesPercentag e
ultrafilterablePercentag e
colloidal
Total calcium 121 114–124 33 67
Calcium ion 8 6–16 100 0
Mag nesium 12.5 11.7–13.4 64 36
Citrate 181 171–198 94 6
Inorg anic
Phosphorus 65 53–72 55 45
Sodium 60 48–79 96 4
Potassium 144 116–176 94 6
Chloride 108 92–131 100 0
Lactose 4800 4600–4900 100 0
Source: Refs. 11, 19, and 67.

Pag e 854
with an equilibrium ratio of b/a = 1.68 at 20°C [43]. The b form is far more soluble than the a form, and the rate ofmutarotation is rapid at room temperature but very slow at 0°C. The a-hydrate crystal form, which crystallizes under ordinaryconditions, occurs in a number of shapes, but the most familiar is the “tomahawk” shape, which imparts a “sandy” mouth feel todairy products, as in “sandy” ice cream. Lactose, with a sweetness about one-fifth that of sucrose, contributes to thecharacteristic flavor of milk.
14.3.4. Enzymes
Although present in small amounts, enzymes can have important influences on the stability of dairy foods. Their effects willbecome even more important as the industry moves toward high-temperature or ultra-high-temperature processing and longstorage periods sometimes at room temperature. These conditions favor survival of enzyme activity or reactivation, and thelonger period of storage allows more time for enzyme-catalyzed reactions to occur. The discussion here is limited to enzymesindigenous to milk, but it should be recognized that enzymes are also introduced into milk as a result of microbial growth. Themore important enzymes that have been identified are listed in Table 12. For a more complete discussion the reader shouldconsult several reviews [13, 25, 55].
Many of the enzymes are associated primarily with the membranes in milk, such as the fat globule membrane or skim milkmembrane vesicles, or with casein micelles. For example, xanthine oxidase, sulfhydryl oxidase and g-glutamyltransferase areprimarily associated with the membrane fractions, plasmin and lipase are associated with casein micelles, and catalase andsuperoxide dismutase occur primarily in the milk serum. However, the distribution of enzymes between these constituents isaffected by processing and storage conditions, and this can have substantial effects on their activities. Thus, cold-inducedlipolysis of milk may be caused by transfer of lipase from micelles to fat globules, and cold storage may cause some dissociationof proteinase from casein micelles. These enzymes can have significant effects on flavor and protein stability in dairy foods. Theoxidoreductases also can have effects on flavor stability, particularly in the lipid fraction, because of their influence on theoxidative state.
Milk also contains many vitamins, which are enzyme cofactors or precursors of cofactors, and these are discussed in a latersection.
14.4 Structural Organization of Milk Components
14.4.1 Structure of Milk Proteins
The primary structures of all of the major milk proteins have been determined; thus our scientific knowledge of milk holds aunique position among foods [7, 60–62, 68, 69]. Moreover, the three-dimensional structures of the major whey proteins arealso known. Although the relationship between protein structure and food functionality is not well understood, significantprogress in this area is occurring. This relationship must be born in mind by the food scientist while examining the structures offood proteins.
14.4.1.1 The Caseins
Caseins exhibit unique interactions with calcium ions and calcium salts, which may be the most important feature of theirphysiological and nutritional role. Because of their unique primary and tertiary structures, these proteins undergo posttranslationalphosphorylation. Such modification results in the formation of anionic clusters in the “calcium-sensitive” caseins, while a single

Pag e 855
TABLE 12 Enzymes Indig enous to Bovine Milk, Partial List
Oxidoreductasesª
Xanthine oxidase (xanthine:O 2 oxidoreductase) Catalase (H2O2:H2O2 oxidoreductase)
Sulfhydryl oxidase (protein, peptide-SH:O 2
oxidoreductase)Diaphorase (NADH:lipoamide oxidoreductase)
Lactoperoxidase (donor:H 2O2 oxidoreductase) Cytochrome c reductase (NADH: cytochrome coxidoreductase)
Superoxide dismutase ( ) oxidoreductase)
Glutathione peroxidase (GSH:H2O2 oxidoreductase)
Lactate dehydrog enase (L-lactate:NADoxidoreductase)
Transferasesª
UDP-Galactosyltransferase (UDP g alactose:D-g lucose-1-g alactosyltransferase)
Ribonuclease (polyribonucleotide 2-olig onucleotidetransferase)g-Glutamyltransferase
Hydrolasesª
Proteinases (plasmin, thrombin, aminopeptidase) (peptidylpeptide hydrolase)
b-Esterase (carboxylic ester hydrolase)
Lipase (g lycerol ester hydrolase) Cholinesterase (acylcholine acylhydrolase)
Lysozyme (mucopeptideN-acetylneuraminyl hydrolase) a-Amylase (a-1,4-g lucan-4-g lucanohydrolase)
Alkaline phosphatase (orthophosphoric monoesterphospholydrolase)
b-Amylase (b-1,4-g lucan maltohydrolase)
Phosphoprotein phosphatase or acid phosphatase(phosphoprotein phosphohydrolase)
5'-Nucleotidase (5'-ribonucleotidephosphohydrolase)
ATPase (ATP phosphohydrolase) N-Acetyl-b-D-g lucosaminidase
Lyasesª
Aldolase (fructose-1,6-diphosphate D-g lyceraldehyde-3-phosphate lyase)
Carbonic anhydrase (carbonate hydrolyase)
ªThe systematic name is g iven in parentheses.
Source: Compiled in part from Refs. 13, 25, and 55.

Pag e 856
unique characteristic of these proteins, namely, the distribution of polar and hydrophobic residues. Clustering of polar residuesand hydrophobic residues in separate regions of the primary structure suggests the formation of distinct polar and hydrophobicdomains and a resulting amphipathic structure [60–62]. In solutions of the isolated individual protein, both b-caseins and k-caseins self-associate to form large spherical complexes much like a detergent micelle.
The polar domains of the calcium-sensitive caseins are dominated by the phosphoseryl residues and thus carry a large netnegative charge at the pH of milk (Fig. 2). For example, the 40-residue polar domain of as1-casein encompassing residues41–80 exhibits a net charge of -20.6 at pH 6.6, which represents almost the total net charge of the entire molecule (Table 13).The N-terminal 40 residues and the C-terminal 100 residues are rather hydrophobic. Although the net charge for the entiremolecule of as2-casein is less than that of as1-casein, it contains several regions of very high net charge density (Table 13 and Fig.2). Thus, as2-caseins are more hydrophilic than other caseins and contain three regions of anionic clusters. Hydrophobic regionsare confined to residues 90–120 and 160–207. Furthermore, although the C-terminal region is hydrophobic, it also exhibits alarge net positive charge, +9.5, while the N-terminal 68-residue region has a net negative charge, -21. Hence, the properties ofthis protein are very sensitive to ionic strength. b-Caseins, on the other hand, are the most hydrophobic of the caseins. Theprotein has a small 21-residue N-terminal polar domain with a net charge of -11.5 and a single anionic cluster (Table 13 andFig. 2). The remainder of the molecule is rather hydrophobic. Hence, this molecule is very amphipathic with a polar domaincomprising one-tenth of the total residues in the chain but carrying one-third of the total charge at pH 6.6 (the net charge of thispolar domain is nearly equal to that for the entire molecule). The large hydrophobic domain of this molecule makes the overallproperties of b-caseins very sensitive to temperature.
The calcium-insensitive k-caseins are also very amphipathic with distinct hydrophobic and polar domains; however, the polardomain of k-caseins does not contain an anionic cluster. k-Casein is essential to the formation of casein micelle structure. Hence,the physiological functional restraints placed on the structure of this protein are (a) the requirement for interaction with calcium-sensitive caseins to form micelles, thus stabilizing calcium-sensitive proteins in the presence of Ca2+, (b) an amphipathic structurewith an inert polar domain that is not precipitated by Ca2+, and (c) a recognition sequence that is specific for limited proteolysisby chymosin,
FIGURE 2Anionic clusters of calcium-sensitive caseins.

Pag e 857
TABLE 13 Charg e Characteristics of the Milk Proteins
Protein Charg e at pH 6.6 IsoionicpH
as1-Casein B-8P -21.9 4.94
as2-Casein A-11P -13.8 5.37
b-Casein A 2-5P -13.3 5.14
k-Casein B-1P -2.0 5.90
b-Lactog lobulin B -10.0 5.34
a-Lactalbumin B -2.6 4.8
Note: The nomenclature of the caseins indicates the g eneticvariant and the number of phosphoseryl residues. For example,as1-casein B-8P indicates the B g enetic variant containing eig htphosphoseryl residues.Source: Refs. 61 and 62.
allowing release of the polar domain and coagulation of micelles. Instead of the anionic phosphoseryl clusters characteristic ofcalcium-sensitive caseins, k-casein's polar domain contains seryl and threonyl residues that often are glycosylated. Thisposttranslational modification results in attachment of tri- or tetrasaccharide moieties that include anionic N-acetylneuraminic acid(AcNeu) residues (Fig. 3). There are no cationic residues in the C-terminal 53-residue polar domain, and the nonglycosylateddomain has a net charge of -11 at pH 6.6; however, k-casein A-1P(3AcNeu), representing the A variant with one phosphoserylresidue and three AcNeu residues, has a net charge of -14. Because k-casein does not contain phosphoseryl anionic clusters, itdoes not bind Ca2+ like the calcium-sensitive caseins. The polar domain does, however, have many polar amino acids, a largenegative charge, and eight evenly spaced prolyl residues creating a highly dehydrated, open and flexible structure. This polardomain is attached to a large, very hydrophobic domain with many sites that are potentially able to interact with other caseins.Moreover, the Phe-Met peptide bond at position 105–106, which is the N-terminus of the polar domain, is very susceptible toproteolytic cleavage by chymosin, probably because prolyl residues on either side cause these residues to protrude from thesurface and increase chain flexibility.
Although the three-dimensional structures of the caseins have not been directly determined, global aspects of their structures canbe inferred from their physico-chemical characteristics and their primary structures. Spectral properties, including circulardichroisim (CD) and Raman spectra, as well as predictions based on the primary structures, indicate that all of the caseinspossess significant quantities of secondary structure [62]. In fact, supersecondary struc-
FIGURE 3Trisaccharide and tetrasaccharide
structurestypical of the carbohydrate moieties
attached to k-casein.

Pag e 858
tures have also been suggested such as b a b motifs in the hydrophobic domain of k-casein, a turn-b-strand-turn motif centeredon the Phe-Met region of k-casein, and a helix-loop-helix motif with the loop containing the anionic clusters of the calcium-sensitive caseins. Extended secondary structures may also contribute to casein interactions, leading to submicelle formation.However, these structures may be marginally stable and may actually fluctuate during the flexing of the casein chains in solution.Furthermore, physicochemical properties, as well as the proteolytic susceptibilities of isolated caseins, all suggest that theirtertiary structures are rather open and flexible. The prevalence of prolyl residues, which interrupt secondary structure andpromote turns, may in part be responsible for this openness and flexibility.
14.4.1.2 The Whey Proteins
The structures of b-lactoglobulin and a-lactalbumin are typical of those of other globular proteins [5, 17]. Like the caseins, theyhave a net negative charge at the pH of milk (Table 13); however, unlike the caseins, the sequence distribution of hydrophobic,polar, and charged residues is rather uniform. Consequently, these proteins fold intramolecularly, thereby burying most of theirhydrophobic residues so that extensive self-association or interaction with other proteins does not occur. Their three-dimensionalstructures have been determined by x-ray crystallography and are shown in Figures 4 and 5.
The tertiary structure of b-lactoglobulin contains a b-barrel structural motif, similar to that of retinol-binding proteins, and a singleshort a-helix lying on its surface (Fig. 4). The center of the b-barrel forms a hydrophobic pocket, and a pocket may also existon the surface between the a-helix and the b-barrel. As a result, b-lactoglobulin binds many small hydrophobic molecules withvarying affinities.
The functionality of b-lactoglobulin is governed by these hydrophobic pockets and surface patches, and perhaps even moreimportantly, by the presence of disulfide bonds and a partially buried sulfhydryl group. Thus, under appropriate conditions thisprotein readily participates in sulfhydryl-disulfide interchange reactions with itself or with other proteins such as k-casein.
The interactions of b-lactoglobulin are dependent upon pH. At the pH of milk it forms dimers with a geometry resembling twoimpinging spheres, below pH 3.5 the dimer dissociates to a slightly expanded monomer, between pH 3.5 and 5.2 the dimertetramerizes to give an octamer, and above pH 7.5 the dimer dissociates with a concomitant conformational change to give anexpanded monomer.
The structural stability of b-lactoglobulin is such that irreversible structural changes occur in the temperature range of manythermal processes for milk and dairy foods, and hence its functionality is very sensitive to precise control of these treatments.
The three-dimensional structure of a-lactalbumin (Fig. 5) is very similar to that of lysozyme [5]. It is a very compact, nearlyspherical globular protein containing four a-helices, several 310-helices, and an antiparallel b-sheet. The recent discovery that a-lactalbumin is a calcium metalloprotein has identified the most unique aspect of its structure; thus, a single Ca2+ is bound with highaffinity in a “calcium binding elbow” composed of 10 residues in a helix-turn-helix motif with coordinating oxygens provided byside-chain carboxyls of Asp 82, 87, and 88 and by peptide carbonyl groups of Lys 79 and Asp 84. In vitro folding studies haveindicated that the reduced protein, which when oxidized contains four disulfide bonds, does not fold properly in the absence ofCa2+. Also, the holoprotein has less surface hydrophobicity than the apoprotein. Hence, the Ca2+ binding is believed to assistprotein folding in vivo and to aid release of the protein from the endoplasmic reticulum.
With the disulfide bonds intact, as the protein occurs in milk, the tertiary structure unfolds and refolds reversibly. Although a-lactalbumin denatures at a lower temperature than b-lactoglobulin, the transition is reversible except at very high temperatures.Thus, a-lactal-
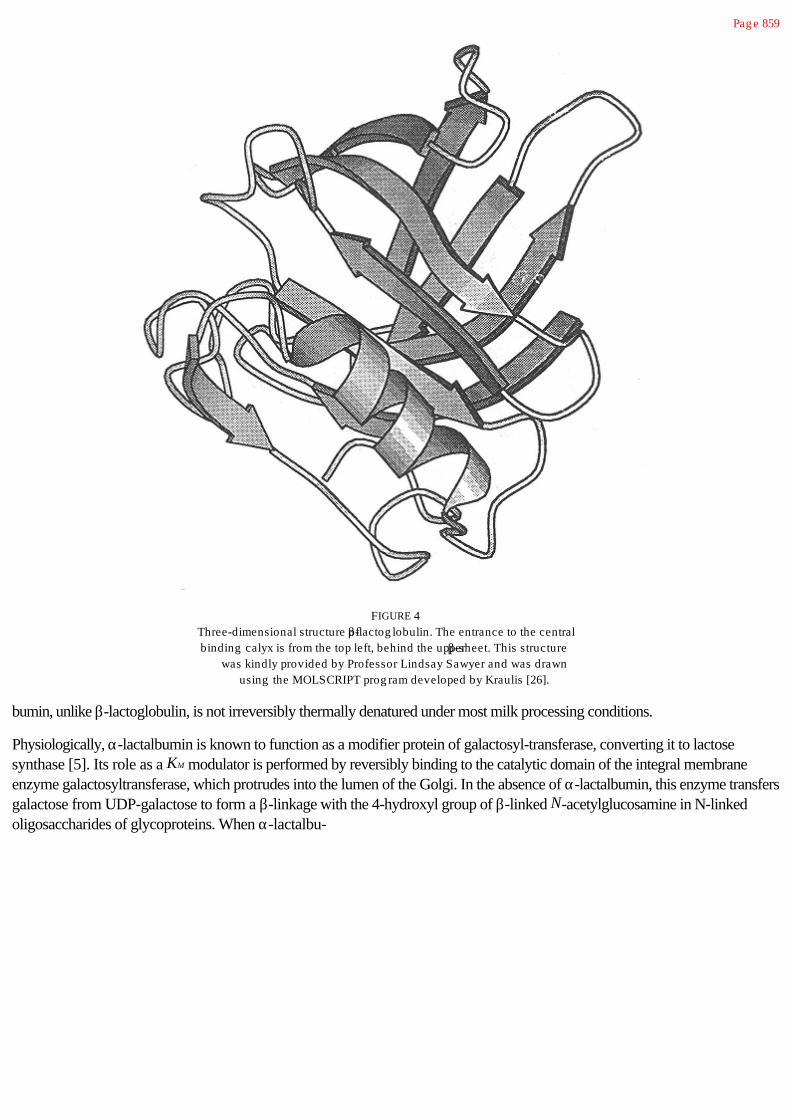
Pag e 859
FIGURE 4Three-dimensional structure of b-lactog lobulin. The entrance to the centralbinding calyx is from the top left, behind the upper b-sheet. This structure
was kindly provided by Professor Lindsay Sawyer and was drawnusing the MOLSCRIPT prog ram developed by Kraulis [26].
bumin, unlike b-lactoglobulin, is not irreversibly thermally denatured under most milk processing conditions.
Physiologically, a-lactalbumin is known to function as a modifier protein of galactosyl-transferase, converting it to lactosesynthase [5]. Its role as a KM modulator is performed by reversibly binding to the catalytic domain of the integral membraneenzyme galactosyltransferase, which protrudes into the lumen of the Golgi. In the absence of a-lactalbumin, this enzyme transfersgalactose from UDP-galactose to form a b-linkage with the 4-hydroxyl group of b-linked N-acetylglucosamine in N-linkedoligosaccharides of glycoproteins. When a-lactalbu-
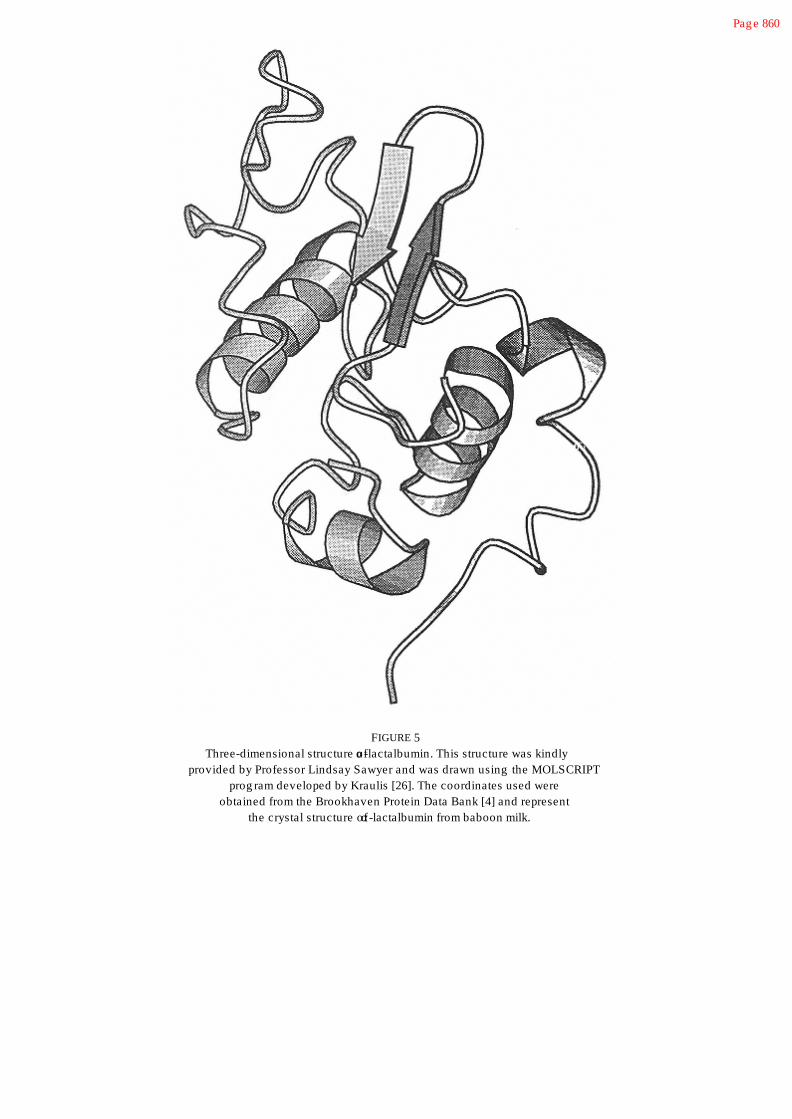
Pag e 860
FIGURE 5Three-dimensional structure of a-lactalbumin. This structure was kindly
provided by Professor Lindsay Sawyer and was drawn using the MOLSCRIPTprog ram developed by Kraulis [26]. The coordinates used were
obtained from the Brookhaven Protein Data Bank [4] and representthe crystal structure of a-lactalbumin from baboon milk.

Pag e 861
min is bound, however, the specificity for glucose is increased 1000-fold by reducing the KM for this substrate. Consequently,lactose is synthesized at the physiological concentrations of glucose in the Golgi.
14.4.2 Casein Micelles and Milk Salts
As a result of their phosphorylation and amphiphilic structure, caseins interact with each other and calcium phosphate to formlarge spherical micelles of varying size (Table 3) with mean diameters of approximately 90–150 nm. Light scattering by thesecomplexes is responsible for the white appearance of milk. Most evidence suggests that they are formed by association of nearlyspherical submicelles having diameters of 10–20 nm. Hence, electron micrographs of casein micelles have a raspberry-likeappearance (Fig. 6). Micelles contain 92% protein, composed of aS1:aS2:b:k-caseins in an approximate mole ratio of 3:1:3:1, and8% milk salts composed primarily of calcium phosphate but also significant amounts of Mg2+ and citrate. The characteristics ofmicelles determine the behavior of milk and milk products during industrial processes and storage; therefore, the properties ofnatural micelles and model micelle systems have received considerable study [10, 46, 51, 54, 57–59].
Micelles have a porous, “spongy” structure with a large voluminosity, approximately 4 ml/g of casein, and exceptional hydrationof 3.7 g H2O/g casein. This hydration is an order of magnitude larger than that of typical globular proteins. Hence, largemolecules, even proteins, have access to and can equilibrate with all parts of the micelle structure. All components of the micelleapparently are in slow equilibria with milk serum. Thus, under appropriate conditions, various caseins and milk salts can bereversibly dissociated from the micelle. Surprisingly, such dissociation may occur to a limited extent without any apparent changein micelle size. Lowering the temperature to near 0°C causes some b-casein, k-casein, and colloidal calcium phosphate toreversibly dissociate. However, at physiological temperature the amount of individual caseins or submicelles in the serum isextremely small.
Because the structure of the micelle has not been directly determined, the precise location of individual caseins is not known.Nevertheless, all evidence points to a predominately surface location for k-casein, while aS- and b-caseins are predominately inthe interior. The distribution is not exclusive, however, because the calcium-sensitive caseins are also accessible on the surface.Thus, the amount of k-casein in the micelle increases linearly with the surface/volume ratio, whereas the amount of k-caseindecreases linearly (Note: The surface/volume ratio for a sphere increases with decreasing size.) Because serum componentsslowly equilibrate with the micelle, addition of k-casein causes a decrease in micelle size, while addition of b-casein causesmicelle size to increase. A variable composition of the submicelle is supported by these and other observations, such thatsubmicelles rich in the calcium-sensitive caseins have a predominate interior location.
A fundamental characteristic of micelles is their resistance to irreversible association upon close approach; for example, pelletsformed by sedimentation redisperse spontaneously upon standing. Hence, the micelle surface must be highly solvated andunreactive, a key to its stability under many harsh processing conditions.
Recently, a “hairy” layer has been identified on the surface of the micelle, and this layer is presumed to represent the polardomain of k-casein. The presence of this flexible, highly hydrated polar polypeptide chain provides an inert surface and stericstabilization to the micelle. Cleavage of this domain from k-casein by chymosin and release of this macropeptide to the milkserum completely changes the surface characteristics of the micelle, causing its destabilization. The modified surface is veryactive, leading to association of micelles and formation of gels, such as those in cheese.

Pag e 862
FIGURE 6Electron mig rog raph of a casein micelle. The picture is a transmissionelectron microg raph of a micelle fixed with 2% g lutaraldehyde. This
photomicrog raph was kindly provided by Dr. M. Kalab.
Calcium phosphate is the other key component required for formation of natural casein micelles [19, 51]. Although micelle-likecomplexes can be formed with just Ca2+, inorganic phosphate is required to provide temperature stability. The structure ofcolloidal calcium phosphate, composed of Ca, inorganic phosphate, Mg, and citrate in fairly fixed proportions, has long been asubject of controversy. Recent x-ray absorption and infrared spectroscopy studies have shown that its structure in micellesclosely resembles that of brushite [19]. Ester phosphates

Pag e 863
in the anionic clusters of submicelles may be an integral part of the calcium phosphate-Mg2+-citrate matrix.
Various models of micelle structure have been proposed to account for experimental observations and stimulate furtherinvestigation. In general, these can be classified as core coat, internal structure, and subunit models [51]. The first subunit modelwas proposed by Morr. This model was modified by Slattery and coworkers, by Schmidt and coworkers, and finally byWalstra. Current thinking based on all available observations favors a subunit model in which the submicelles have a varyingcomposition. Hydrophobic interactions are the predominant force binding the individual caseins together in the submicelle. Thismay occur through specific interactions between b-sheet structures in the hydrophobic domains of k-casein and the calcium-sensitive caseins. Hydrophobic interactions cannot be the only force holding the submicelle together because they do notdissociate at low temperatures where such interactions are greatly weakened. A nonuniform distribution of k-casein in thesubmicelles allows for interior submicelles rich in calcium-sensitive caseins and surface submicelles rich in k-casein. When thepolar domain of k-casein, which cannot interact with calcium phosphate, occupies a sufficient amount of the micelle surface area,micelle growth stops; thus, a larger number of submicelles rich in k-casein yields smaller micelles. In this model, the submicellesinteract by incorporation of the anionic phosphoseryl clusters into the brushite-like structure of the colloidal calcium phosphate.However, the relative importance of the salt bridge and protein-protein interactions between submicelles is not clear. It appearsthat the salt bridge interaction between submicelles is the predominant one; however, the relative importance is probablydependent on temperature.
14.4.3 The Fat Globule
To lessen the surface free energy of lipids in an aqueous medium, the lipid molecules associate to form large spherical globules,thereby minimizing the interfacial area. Milk fat globules are the largest particles in milk (Table 3), ranging in diameter from 2 to 6µm. Light scattering by these large globules is responsible for the “creamy” appearance of whole milk. Fat globules in milk havea mean diameter approximately 25-fold larger than the mean diameter of casein micelles. During secretion of fat globules throughthe plasma membrane, the globules acquire a coat of the plasma membrane, which serves to stabilize the oil-in-water emulsion.This membrane coat contains cell membrane proteins, including the enzymes, and nearly 70% of the phospholipid and 85% ofthe cholesterol in milk. Many of the enzymes having activities of importance to milk properties are associated with the fat globulemembrane. These include alkaline phosphatase, xanthine oxidase, 5'-nucleotidase, sulfhydryl oxidase, and phosphodiesterase.
The milk fat globule therefore consists of a lipid core composed almost exclusively of triacylglycerols, a layer of somecytoplasmic proteins adsorbed prior to secretion, and an outer covering of plasma membrane. Apparently, however, the plasmamembrane does not completely cover the globule because some of the cytoplasmic proteins also appear in the outer surface.
Because fat globules have a lower density than the aqueous phase of milk, they rise and cause “creaming” of unhomogenizedmilk. However, creaming occurs much more rapidly than would be predicted from the size of individual fat globules. Thisincreased creaming rate is due to the clustering of globules caused by interaction of membrane proteins with immunoglobulin(IgM) and protein in the skim milk membrane vesicles. The large clusters, as theory predicts, rise much more rapidly than singleglobules.

Pag e 864
14.5 Use of Milk Components as Food Ingredients
14.5.1 Effects of Processing on Milk Components
14.5.1.1 The Fat Phase
Milk fat is utilized in three major forms: (a) homogenized, as in whole milk, (b) concentrated, as in creams obtained bycentrifugal separation, and (c) isolated, as in butter fat obtained by churning. Excellent reviews of the fat phase and productsderived from it are available [6, 23]. Homogenization prevents the fat globules from forming a cream layer. The globules arereduced in size from 3–10 µm to less than 2 µm in diameter by forcing the liquified fat through restricted passages under highpressure (~2500 psi) at high velocity. As a result the surface area is increased 5- to 10-fold from 2 m2/g to 10–20 m2/g. Thenewly formed surface exhibits high interfacial free energy and rapidly adsorbs protein by hydrophobic interaction. Thus, caseinmicelles or submicelles and, to a lesser extent, whey proteins are adsorbed (approximately 10 mg/m2), and these substancesprevent coalescence of the newly formed small globules. As a result, these homogenized fat globules are somewhat like largecasein micelles with respect to their surface properties. For example, any operation that will cause micelles to aggregate, such astreatment with chymosin (renneting in cheesemaking), acidification, or excessive heating, will also cause these fat globules toaggregate. Consequently, fermented dairy foods made with homogenized milk have different rheological properties than those ofcomparable foods made from unhomogenized milk, and the heat stability of homogenized cream is less than that ofunhomogenized cream and is, therefore, more prone to feathering in coffee.
The major benefit of homogenization is the prevention of creaming. This results from a reduction in fat globule size and adecreased tendency for fat globule coalescence. Resistance to coalescence occurs because of the previously mentionedadsorption of casein micelles, casein submicelles, and whey proteins to the fat globule surface, and the denaturation of immuno-globulins and disruption of skim milk membrane vesicles. A secondary benefit of homogenization is increased whiteness thatoccurs because the increased number of fat globules scatters light more effectively.
Homogenization also has several disadvantages in addition to the previously mentioned reduced heat stability of homogenizedcream as compared with unhomogenized cream. Homogenized milk has a blander flavor, fat globules are more susceptible tolight-induced oxidation and to lipolysis when active lipase is present, and protein gels have a lower curd tension.
Cream can be obtained by centrifugal separation of cold (5–10°C) or warm unhomogenized milk. Cold separation is lessdisruptive of the fat globule membrane, and the resulting cream contains more immunoglobulins and is more viscous than creamobtained at a higher temperature. Churning of cream causes disruption of the fat globule membrane, resulting in clumping andcoalescence of the exposed triacylglycerol globules. About 50% of the membrane is released into the buttermilk phase duringchurning. Clumping and coalescence of newly exposed fat globules does not occur properly when the fat is either all solid or allliquid; therefore, the temperature of churning must be carefully controlled to give an appropriate ratio of solid to liquid fat. Thechurning process causes a phase inversion from an oil-in-water emulsion to a water-in-oil emulsion (butter). The continuous fatphase contains some intact fat globules amounting to 2–46% of the total fat. Butter also contains 16% water as finely disperseddroplets.
14.5.1.2. The Protein Micelle and Milk Salt System
Conditions imposed by processing, such as changes in temperature, pH, and concentration, alter equilibria within the salt system,within the protein system, and between salts and proteins. Often

Pag e 865
these changes are not completely reversible even if the original conditions are restored, so the final characteristics of a dairy fooddepend upon the processing conditions.
The milk serum is saturated or supersaturated with respect to various calcium phosphates and calcium citrate; consequently,small changes in environmental conditions cause significant shifts in these equilibria [19]. Micellar casein is much less stable thansodium caseinate. In general, changes that decrease micelle voluminosity or increase micellar calcium phosphate will cause adecrease in stability. For example, micelles become less stable in the presence of alcohol or with an increase in Ca2+ activity.Pasteurization (71.7°C for 15 sec) or UHT processing (142–150°C for 3–6 sec) irreversibly increases the amount of colloidalcalcium phosphate at the expense of both soluble and ionized calcium and soluble phosphate. Consequently, the pH alsodecreases, due to release of protons from primary and secondary phosphates. The calcium transformed to tertiary calciumphosphate does not come entirely from the serum because heating also causes dissociation of calcium bound to protein. Thus,pasteurization, and especially sterilization, affects the size distribution of micelles, leading to an increase in the abundance of bothlarge and small micelles. Cooling to 0–4° has the opposite effect, causing an increase of soluble calcium and phosphate and anincrease in pH. As previously noted, some b-and k-casein also dissociates from the micelle upon cooling. However, thesechanges induced by cooling are largely reversible.
Individual milks have been classified according to their pH-dependent heat stability (duration of heating required for proteincoagulation) [56]. Type A milk exhibits an optimum in the stability curve between pH 6.6 to 6.9, while Type B milk steadilyincreases in stability as the pH is raised above pH 6.6. This phenomenon appears to be related to the ratio of b-lactoglobulin tok-casein and the heat-induced interaction between these two proteins. Addition of k-casein will convert a Type A milk to TypeB, and the reverse can be achieved by addition of b-lactoglobulin to Type B milk.
Pasteurization or UHT processing causes partial, irreversible unfolding of b-lactoglobulin, thereby exposing hydrophobic surfaceand the lone sulfhydryl group. The subsequent interaction with k-casein, stabilized by a sulfhydryl-disulfide interchange, alters thesurface properties of casein micelles. Preheating unconcentrated milk at 90°C for 10 min reduces its stability to subsequenttreatments at higher temperatures. However, the same treatment, when applied to concentrated milk, nearly doubles the abilityof the micelles to resist coagulation during subsequent processing at higher temperature. Concentrating milk lowers pH andincreases both Ca2+ activity and the concentration of colloidal calcium phosphate, thus lowering micelle stability. In concentratedmilk, the destabilizing effect of micelle interaction with denatured b-lactoglobulin is more than compensated for by heat-inducedreduction of Ca2+ activity. Thus, concentrated milks cannot be sterilized without a preheat treatment.
Heat treatments of increasing severity are accompanied by increased production of dehydroalanyl residues, due to b-eliminationof disulfide bonds and phosphoseryl residues, increased deamidation of aspartamyl and glutaminyl residues, and increasedMaillard browning. Crosslinking of protein during heating can result from reaction of dehydroalanyl residues with e-amino groupsof lysyl residues to form lysinoalanine, or reaction with sulfhydryl groups of crysteinyl residues to form lanthionine. Continuedheating (e.g., 20–40 min at 140°C) destabilizes micelles, leading to gel formation. Micelle destabilization results from acombination of factors, the most important being a decrease in pH. This decrease is caused by degradation of lactose, a shift inequilibria from primary and secondary phosphates to hydroxyapatite, and hydrolysis of phosphoserine [14]. The shift in calciumphosphate equilibria occurs rapidly, lowering the pH from about 6.7 to 5.5. Lactose degradation and phosphoserine hydrolysiscontinue more slowly, yielding an estimated pH of 4.9 at the point of milk coagulation. The colloidal calcium phosphate thatforms upon heating is not the brushite-like calcium phosphate-
Pag e 866
magnesium citrate that occurs in natural micelles; consequently, this change in salt equilibria is mostly irreversible. It should benoted that at pH 4.9 the original colloidal calcium phosphate would be completely dissolved and the high temperature (140°C)and declining pH would cause progressive dissociation of the micelle. Thus, the coagulum that eventually forms most likelyconsists of a matrix of interacting individual protein chains or submicelles, rather than whole micelles as occurs in rennet curd.Sulfhydryl-disulfide interchange and covalent cross-linking may contribute to the stability of such protein-protein interactions.
Addition of salts, acids, or alkalis to milk affects Ca2+ activity and hence the calcium phosphate equilibria. This alters the bindingof Ca2+ and colloidal calcium phosphate to the micelle, which changes micelle stability. For example, addition of secondaryphosphate stabilizes the micelle system by (a) increasing pH, which increases micellar net charge, (b) reducing the solublecalcium concentration by shifting the equilibria toward tertiary calcium phosphate, and (c) competitive displacement of micellarcalcium by sodium. Consequently, this salt may be used as a milk stabilizer. Likewise, polyvalent anions, such as citrate orpolyphosphates, that bind and increase micellar net charge and lower soluble calcium are excellent milk stabilizers. Conversely,addition of calcium salts increases Ca2+ activity and hence colloidal calcium phosphate, which results in a lower pH and lessstable micelles. As previously noted, concentration of milk has a similar effect because the salt equilibrium shifts toward colloidalcalcium phosphate and the pH falls; for example, 11-fold concentration of milk increases the soluble calcium and phosphateconcentration only 8-fold, and the Ca2+ concentration only 6-fold, while the pH is lowered from 6.7 to 5.9.
These principles must be taken into account in the processing of milk and in the incorporation of milk into formulated foods.Because of the instability of micelles in concentrated milk, stabilizers are usually added prior to concentration. Also, milk ispreheated prior to concentration or drying to shift the calcium phosphate equilibria (thereby reducing Ca2+ activity) and topromote micelle interaction with denatured b-lactoglobulin. On the other hand, curdsetting properties of milk can be improvedby adding calcium salts.
14.5.1.3 The Whey Proteins
Because denaturation of whey proteins occurs rapidly at temperatures above 70°C, normal commercial heat treatments denatureat least a portion of these proteins. Major whey proteins exhibit thermostability to structural unfolding in the order a-lactalbumin< albumin < immunoglobulin < b-lactoglobulin. However, thermal unfolding of a-lactalbumin is reversible so that denaturation asmeasured by irreversible changes indicates an order of increasing thermostability of IgG < serum albumin < b-lactoglobulin < a-lactalbumin. Denatured whey proteins, particularly b-lactoglobulin, are considerably less soluble and more sensitive toprecipitation by calcium ions than are their native counterparts. Hence, denatured whey proteins become partially incorporatedinto cheese curd; however, extensive binding of b-lactoglobulin to micellar k-casein interferes with chymosin-catalyzed curdformation, so conditions of cheese making must be carefully chosen.
As noted previously, heat-induced association of whey protein (especially b-lactoglobulin) with casein micelles alters micelleproperties and increases heat stability. The functionality of whey proteins is very sensitive to the extent of denaturation. Forexample, if whey proteins have not been heat denatured they are quite soluble at acid pH, a characteristic that facilitates theirincorporation into carbonated beverages. The extent of denaturation is also extremely important and thus must be carefullycontrolled to optimize their performance as fat mimetics.
14.5.1.4 Lactose
Reaction of the aldehyde group of lactose with the e-amino group of lysine (onset of Maillard reactions) occurs even under verymild heat treatment, and the reaction continues slowly during

Pag e 867
storage. The degree of Maillard reaction and attendant browning is very sensitive to the severity of heat treatment, and theeffects are desirable in some products and undesirable in others. Very severe heat treatments, such as those used for an in-cansterilization of concentrated milks, causes lactose to partially degrade via Maillard reactions to yield organic acids, principallyformic acid. This source of acidity is one of the major causes of protein destabilization in such products.
The very low solubility of the a-anomer of lactose can result in its crystallization in frozen products. Crystallization of a-lactosein frozen milk is typically accompanied by prompt destabilization and precipitation of casein, the reasons for which are not fullyunderstood. Soluble lactose may have a direct stabilizing effect on casein, and if so, this is lost with lactose crystallization.Lactose crystallization may also have an indirect effect on casein stability, because its removal from the unfrozen phasedecreases solute concentration, resulting in additional ice formation. The effect is similar to that observed during concentration ofmilk. Thus, calcium ion concentration in the unfrozen phase increases and more tertiary calcium phosphate precipitates, yielding adecline in pH and casein instability.
A common defect in ice cream, known as sandiness, is caused by the formation of large a-lactose crystals. This defect has beenlargely overcome by the use of stabilizers of plant origin that impede formation of lactose nuclei.
14.5.2 Use in Formulated Foods
14.5.2.1 Functionality of Proteins
Proteins from traditional sources are being increasingly utilized as ingredients in a growing number of formulated foods. Thebenefits of milk proteins as ingredients in other foods stem from their excellent nutritional properties and their ability to contributeunique and essential functional properties to the final foods [12, 38, 39, 41]. The functional properties of a food protein areobviously related to its structure; however, the relationship is currently not understood in sufficient detail to allow the design ofprotein structure to achieve a specific functionality. Nevertheless, some general features of the relationship between structure andfunctionality can be outlined.
Protein functional properties are related to several general molecular characteristics such as hydration, surface activity, and thetype of protein-protein interactions favored by partially unfolded structures. The functional characteristics associated with thesemolecular properties are listed in Table 14. Hydration is a particularly important parameter because solubility is a requirement formany excellent functional properties and water binding is an essential function in many foods. Surface activity is a complexfunction of the protein's surface hydrophobicity
TABLE 14 Relationship Between Protein Molecular Properties and Functionality
Molecular property Associated functional properties
Hydration Solubility, dispersibility, swelling , viscosity, g elation,water absorption
Surface activity Emulsification, fat adsorption, foaming , whipping
Protein-protein interactive potential Ag g reg ation, cohesion, texturization, g elation, elasticity,extrudability
Molecular structure or architectureyielding org anoleptic properties
Color, flavor, odor
Source: Adapted from Ref. 39.

Pag e 868
and its flexibility, which allows it to unfold and spread at an interface. The order of surface activity for various milk proteincomponents is b-casein > monodispersed casein micelles > serum albumin > a-lactalbumin > aS-casein-k-casein > b-lactoglobulin [41]. The intermolecular interactions that occur between partially unfolded protein structures are extremelyimportant to functionality, but they are a complex function of protein stability and structure and the type of surface or surfacestructure exposed in the partially unfolded protein. Caseins are unique because their flexible structures allow interaction withmany partially unfolded structures of other proteins by hydrophobic interaction and/or by extension of secondary structure.Thermally unfolded proteins appear to be “molten globules” lacking tertiary structure but having secondary structure. Caseins areknown to compete with chaperonins for binding of these molten globule states.
Advances in biotechnology have triggered interest in designing protein functionality for specific applications either by geneticmanipulation or by enzymatic modification. Potentially, protein functionality can be altered, and perhaps designed, by specificlimited proteolysis. Of course, this is exactly what occurs in the coagulation of milk by chymosin. It is extremely important tocarefully control the extent of such reactions to optimize desirable properties and prevent off flavors. Control of the reaction canbe most readily accomplished by using bioreactors containing immobilized enzymes.
Because milk proteins have evolved as the primary source of nutrition for very young mammals, excellent nutritional and flavorproperties and freedom from antinutritional factors are ensured.
14.5.2.2 The Caseins
Caseins have excellent solubility and heat stability above pH 6. These proteins also have very good emulsifying propertiesbecause of their amphiphilic structure. Example compositions of several types of commercial casein products are given in Table15, and the types of products that use casein as a protein ingredient are given in Table 16. The functionality of these commercialproducts depends upon the product type; hence careful consideration of the requirements for the
TABLE 15 Compositions of Some Casein and W hey Protein Products CommerciallyAvailable
Composition (% dry weig ht)
Protein products Protein Ash Lactose Fat
Casein products
Sodium caseinate 94 4.0 0.2 1.5
Acid casein 95 2.2 0.2 1.5
Rennet casein 89 7.5 — 1.5
Coprecipitate 89–94 4.5 1.5 1.5
W hey protein concentrates
Normal UF W PC 59.5 4.2 28.2 5.1
Neutral UF/DF W PC 80.1 2.6 5.9 7.1
W hey protein isolates
Spherosil QMA W PI 77.1 1.8 4.6 0.9
Spherosil S W PI 96.4 1.8 0.1 0.9
Vistec W PI 92.1 3.6 0.4 1.3
tSource: Adapted from Refs. 39 and 40.

Pag e 869
TABLE 16 Some Applications of Milk Protein Products in Formulated Foods
Food categ ory
Specific food in whichcasein/caseinates/coprecipitates
are useful
Specific foods in whichwhey proteins are useful
Bakery products Bread, biscuits/cookies, breakfastcereals, cake mixes, pastries, frozencakes, pastry g laze
Breads, cakes, muffins,croissants
Dairy-type foods Imitation cheeses, coffee creamers,cultured milk products, milkbeverag es
Yog urt, cheeses, cheesespreads
Beverag es Chocolate, fizzy drinks and fruitbeverag es, cream liqueurs, wineaperitifs, wine and beer
Soft drinks, fruit juices,powdered or frozen orang ebeverag es, milk-basedflavored beverag es
Desserts Ice cream, frozen desserts,mousses, instant pudding ,whipped topping
Ice cream, frozen juice bars,frozen dessert coating s
Confectionery Toffee, caramel, fudg es,marshmallow and noug at
Aerated candy mixes,mering ues, spong e cakes
Meat products Comminuted products Frankfurters, luncheon rolls,injection brine forfortification
Source: Adapted from Ref. 41.
ingredient must enter into its selection. Four types of casein products are available; acid caseins, rennet caseins, caseinates, andcoprecipitates. Roughly 250,000 metric tons of casein products are produced annually worldwide.
Acid (hydrochloric, lactic, sulfuric) caseins are simply isoelectric precipitates (pH 4.6), and they are not very soluble. Likewise,rennet casein, which is produced by treatment with chymosin (rennet), is not very soluble, especially in the present of Ca2+,because the polar domain of k-casein has been removed. Rennet casein has a high mineral content because colloidal calciumphosphate-citrate is included in the clotted micelles, whereas, acid casein has a lower mineral content because the calciumphosphate is solubilized and passes into the whey. Coprecipitates of casein and denatured whey proteins are more soluble thanacid or rennet casein but are not as soluble as the caseinates. Solubilization of coprecipitates can be achieved by adjustment toalkaline pH and addition of polyphosphates. Because of their low solubility, these products are best suited for products such asbreakfast cereals, snack and pasta products and baked foods, to which they contribute texture and dough-formingcharacteristics.
The caseinates (sodium, potassium, and calcium) are prepared by neutralizing acid casein with the appropriate alkali prior todrying. These isolates, especially sodium and potassium caseinates, are very soluble and extremely heat stable over a wide rangeof conditions. Because of their amphiphilic structure, these proteins are useful for emulsification, water binding, thickening,whipping/foaming, and gel formation. Thus, these isolates have found wide acceptance as emulsifiers and water binders informulated meat products, texturized vegetable protein products, margarine, toppings, cream substitutes, and coffee whiteners.

Pag e 870
14.5.2.3 The Whey Proteins
Whey protein concentrates (WPC) or isolates (WPI) are very desirable as nutritional ingredients because of their highconcentration of sulfur-containing amino acids. The annual worldwide production of whey protein products is roughly 600,000metric tons. In the past, these products [lactalbumin (not to be confused with the protein a-lactalbumin), protein-metaphosphatecomplex, or protein-carboxymethylcellulose complex] had limited functionality because of extensive protein denaturation or thepresence of precipitating reagents. Commercial adoption of membrane technology, including ultrafiltration (UF) and diafiltration(DF), and ion-exchange adsorption (IEA) has resulted in development of a variety of products with varied and excellentfunctionalities [40, 41]. Three currently used IEA processes are the Vistec process, based on a cellulosic ion exchanger, theSpherosil S process, based on a porous silica cation exchanger, and the Spherosil QMA process, which uses a porous silicaanion exchange material. Compositions of these whey protein products are listed in Table 15. Example applications of wheyprotein ingredients in formulated foods are given in Table 16.
Key factors that determine the functionality of a product are the amount of protein denaturation, the lactose content, and theamounts of lipids and minerals present. Generally, protein denaturation lowers the solubility and adversely affects functionsrequiring high surface activity such as emulsification and foaming. Thus, UF WPC, UF/DF WPC, and Spherosil QMA WPIhave excellent solubilities and emulsifying properties consistent with low values of protein denaturation. The presence of lipidinterferes with foaming/whipping; thus, UF WPC must be defatted to function well, while Spherosil QMA WPI is a very goodfoaming/whipping product. More than 50% of the protein is denatured in Vistec and Spherosil S WPIs; however, Vistec WPI isa good emulsifier, perhaps because b-lactoglobulin when thermally denatured at alkaline pH remains soluble at pH 6.Differences between Vistec and Spherosil S WPI point to the importance of the structure and/or composition of the denaturedstate in determination of functionality. Because undenatured forms of whey proteins are soluble under acid condition, they shouldhave applications in acid-type food formulations requiring solubility, such as carbonated fortified beverages.
In some applications, aggregation of the protein is important to texture and rheological properties, for example, in baking ortextured food products. Again, however, the importance of the structure of the denatured, associated state must be emphasized.The recent development of fat mimetics using whey proteins illustrates the importance of control of the extent and type of proteindenaturation to achieve a desired functionality in the final state.
14.5.2.4 Lactose
Uses of lactose depend on its low relative sweetness, protein stabilizing properties, crystallization habit, ability to accentuateflavor, nutritional attributes (inclusion of lactose in the diet improves utilization of calcium and other minerals), and ability toengage in Maillard browning [44]. The relative sweetness of lactose is commonly reported as being one-sixth that of sucrose;however, more recent studies indicate that its relative sweetness varies with concentration, ranging from one-half to one-fourththat of sucrose. Since sugars are often used to increase viscosity and/or mouth feel, or to improve texture, lactose can function inthese capacities without being too sweet. Thus, lactose can replace a portion of the sucrose in toppings and icings to improveappearance and stability and to reduce sweetness. Unlike many other food sugars, addition of lactose does not reduce thesolubility of sucrose. Furthermore, as the concentration of lactose is increased, the crystal habits of both sucrose and lactosechange. Crystals of both become smaller, thereby yielding a softer, smoother product. Hence, the quality of certain candy andconfectionery products can be substantially improved by the addition of lactose.

Pag e 871
One of the principal functions of lactose in baked goods is to improve crust color and toasting qualities via the Maillard browningreactions. When added to biscuits, it also increases volume and tenderness and improves texture. Moreover, in baked goodscontaining yeast, lactose is not utilized by the yeast, thus remaining available for browning.
In common with other polyols, lactose stabilizes protein structure in solution. Thus, it has been used, for example, to reduceinsolubilization of lipovitellin during freeze-drying and to preserve the activity of such enzymes as chymosin during spray-drying.
14.5.2.5 Functionality of Milk Lipids
Milk lipids contribute unique characteristics to the appearance, texture, flavor and satiability of dairy foods. Consequently, it isdifficult to find suitable substitutes for milkfat in nonfat or low-fat foods. Currently, protein- or carbohydrate-based fat mimeticsprovide some but not all of the functions of the fat replaced. Fat mimetics that possess desirable flavor and satiability areespecially difficult to find.
Structures of triacylglycerols in a composite fat are responsible for its melting point, crystallization behavior, and rheologicalproperties. Consequently, alteration in the triacylglycerol composition will affect these properties. Fractionation of milk fat, forexample, by supercritical fluid technology, can yield lipid fractions with unique functionalities desirable for specific applications inproducts such as spreads, pastries, or confectionery products. Fatty acid composition of the triacylglycerol can be altered byinteresterification in the presence of specific added fatty acids. This reaction, catalyzed by immobilized lipase, and perhapscombined with lipid fractionation, offers an opportunity for modifying milk fat to achieve specific functionalities.
14.6 Nutritive Value of Milk
14.6.1 Nutrient Composition of Milk and Milk Products
Dairy foods make a significant contribution to the total nutrient diet of the U.S. population. For example, Americans obtain one-fourth or more of their protein, calcium, phosphorus, and riboflavin from dairy foods (Fig. 7). The nutrient composition of milk isshown in Table 17. The composition listed, which applies to fresh raw or pasteurized whole milk, does not include vitamin Dbecause this nutrient is usually added to fluid milk at a level of 41 IU per 100 g, which is equivalent to about 35% of the RDA(recommended dietary allowance) per 250 ml.
Calculation of nutrient density, that is, the percent of RDA provided in a specified caloric portion or weight of a food product,provides a meaningful method of comparing the nutritive quality of various foods [18, 31]. Choosing 2000 kcal (8372 kJ) as thebasis for comparison, which is roughly the average recommendation for adults in the U.S. population, the percentages of theRDA contained in 2000-kcal portions of various milk products can be calculated. Both 2000 and 2500 kcal (10,465 kJ) areused as a basis of nutrient density calculations on food labels (Fig. 8). Although several nutrients are no longer listed on the label,milk is obviously an excellent source of protein, riboflavin, vitamin B12, calcium, and phosphorus, and a good source of vitaminA, thiamin, niacin equivalents, and magnesium. Removal of fat from milk removes most of the fat-soluble vitamins originallypresent (A, D, and E), but the nutrient density of other nutrients is significantly increased. In the preparation of cheese, thewater-soluble vitamins are significantly lowered due to their partial elimination in whey. Calcium, however, is not reduced isrenneted cheeses, as opposed to acid cheeses, because it remains in the clotted casein micelles.
The nutritional quality of a protein is usually a more important consideration than its quantity. Milk proteins correspond very wellto human requirements and therefore are regarded as a high quality. The biological value of protein in raw milk is 0.9, based on avalue of 1.0 for

Pag e 872
FIGURE 7Contribution of dairy foods to total nutrient consumption in the United
States. (From Ref. 31.)
whole egg protein [52]. Milk proteins are slightly deficient in the sulfur amino acids, methionine and cysteine, causing thebiological value to be slightly less than ideal. Since sulfur amino acids are present in greater amounts in whey proteins than incaseins, the former have a higher biological value (1.0) than the latter (0.8). It is also noteworthy that caseins are readilydigestible as a result of their structure.
14.6.2 Lactose Tolerance
A rather high percentage of African and Asian populations produce less intestinal b-galactosidase (lactase) than do Europeansor North Americans. Consequently, lactose maldigestion is encountered more frequently in African and Asian populations than inother populations. Symptoms of lactose maldigestion are diarrhea, bloating, and abdominal cramps [18]. Lactase deficiency,however, is usually one of degree rather than totality [15, 18, 31]. Since the common lactose intolerance test is conducted byadministering a very large dose of 1–2 g lactose/kg body weight, the reported frequency of lactose intolerance is overestimated.Thus, intolerance to a 240-ml glass of milk is infrequently observed among individuals classified as lactose intolerant [15].Furthermore, in certain cases milk intolerance is apparently not caused by lactose maldigestion. Nevertheless, a significantpercentage of the population benefits from preconsumption hydrolysis of lactose in milk. The means for doing this industrially,using soluble or immobilized microbial

Pag e 873
TABLE 17 Nutrient Composition of W hole Milk (3.3% Fat)
Nutrientª Amount in 100 g %RDAb in 250 ml
Protein 3.29 g 17.2
Vitamin A 31 RE>c 8.9
Vitamin C 0.94 mg 4.2
Thiamine 0.038 mg 8.2
Riboflavin 0.162 mg 30.0
Niacin 0.85 NEd 13.9
Vitamin B6 0.042 mg 6.5
Folacin 5 µg 6.4
Vitamin B12 0.357 µg 46.1
Calcium 119 mg 32.0
Phosphorous 93 mg 25.0
Mag nesium 13 mg 10.2
Iron 0.05 mg 0.9
Zinc 0.38 mg 6.5
Note: Values calculated from the recommended daily allowances (RDA)g iven by the National Academy of Sciences [49] and the composition g ivenin USDA Handbook No. 8-1 [1].
ªIncludes all nutrients for which RDA are available, with the exception ofvitamin D, vitamin E, and iodine, for which compositional data were notg iven in USDA Handbook No. 8-1.
bAverag e RDA for all males and females above ag e 11. A 250 mL volume isslig htly more than 1 cup.
cRetinol equivalents: 1 µg retinol or 6 µg b-carotene.
dNiacin equivalents: 1 mg niacin or 60 mg dietary tryptophan.
Only 10% of the NE in milk is in the form of niacin.
lactase, have been developed. Because relatively few persons are intolerant to lactose in low doses, and because those who arecan be provided with either lactose-hydrolyzed milk or commercially available lactase in liquid or tablet form, milk productsshould be regarded as an important part of a varied and balanced diet and as an excellent food for remedying dietarydeficiencies on a worldwide basis.
14.6.3 Effect of Processing on Nutritive Value
14.6.3.1 Effect on Proteins

Heating is involved in most types of processing, including pasteurization, sterilization, concentration, and dehydration. Effects ofprocessing can be divided into two categories: (a) those that alter secondary, tertiary, and quaternary structure of proteins, and(b) those that alter the primary structure of proteins. The former effects, which lead to protein unfolding, may actually improvethe biological value of a protein because peptide bonds become more accessible to digestive enzymes. However, modification ofthe primary structure may lower digestibility and produce residues that are not biologically available. Heat treatment of milk cancause b-elimination of cystinyl and phosphoseryl residues forming dehydroalanine. This substance readily reacts with lysylresidues to give lysinoalanine cross-links in the protein chain. Lysinoalanine is not biologically available, and the cross-linkinglowers digestibility of the protein. Furthermore, because the nutritive value of milk proteins is limited by the low content of sulfuramino acids, such changes are particularly significant. Fortunately, pasteurization or UHT

Pag e 874
FIGURE 8Typical new food labels for several dairy foods.
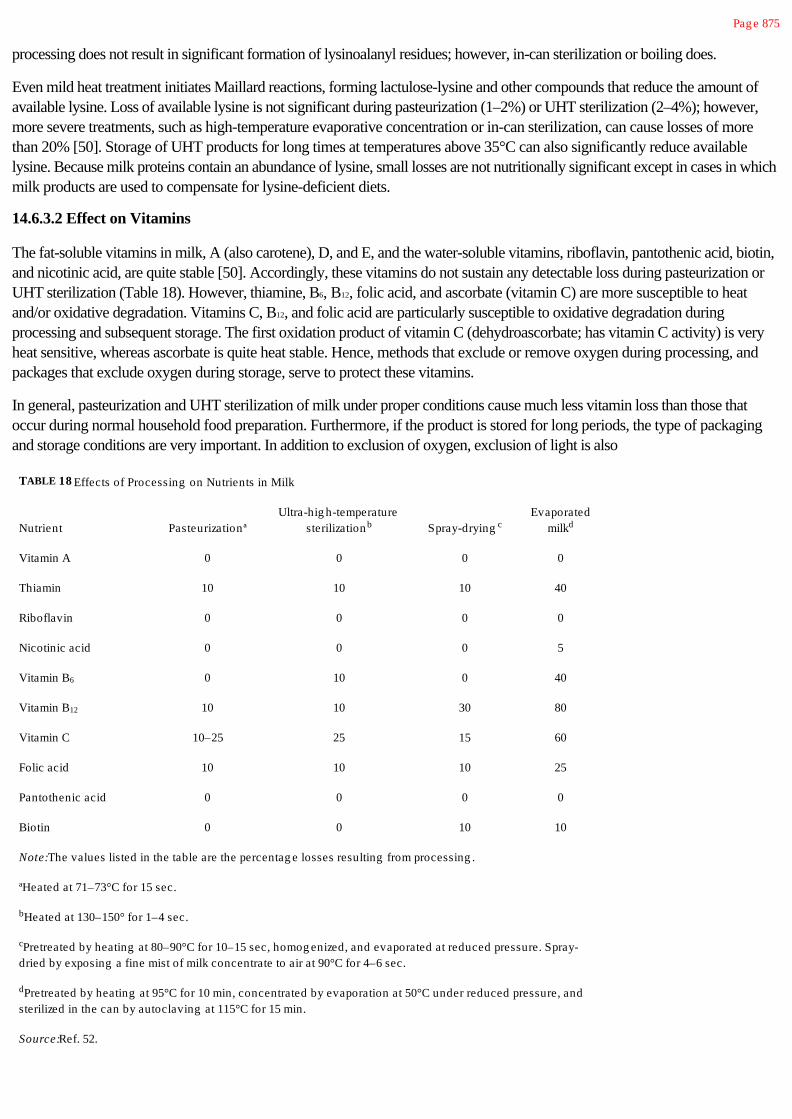
Pag e 875
processing does not result in significant formation of lysinoalanyl residues; however, in-can sterilization or boiling does.
Even mild heat treatment initiates Maillard reactions, forming lactulose-lysine and other compounds that reduce the amount ofavailable lysine. Loss of available lysine is not significant during pasteurization (1–2%) or UHT sterilization (2–4%); however,more severe treatments, such as high-temperature evaporative concentration or in-can sterilization, can cause losses of morethan 20% [50]. Storage of UHT products for long times at temperatures above 35°C can also significantly reduce availablelysine. Because milk proteins contain an abundance of lysine, small losses are not nutritionally significant except in cases in whichmilk products are used to compensate for lysine-deficient diets.
14.6.3.2 Effect on Vitamins
The fat-soluble vitamins in milk, A (also carotene), D, and E, and the water-soluble vitamins, riboflavin, pantothenic acid, biotin,and nicotinic acid, are quite stable [50]. Accordingly, these vitamins do not sustain any detectable loss during pasteurization orUHT sterilization (Table 18). However, thiamine, B6, B12, folic acid, and ascorbate (vitamin C) are more susceptible to heatand/or oxidative degradation. Vitamins C, B12, and folic acid are particularly susceptible to oxidative degradation duringprocessing and subsequent storage. The first oxidation product of vitamin C (dehydroascorbate; has vitamin C activity) is veryheat sensitive, whereas ascorbate is quite heat stable. Hence, methods that exclude or remove oxygen during processing, andpackages that exclude oxygen during storage, serve to protect these vitamins.
In general, pasteurization and UHT sterilization of milk under proper conditions cause much less vitamin loss than those thatoccur during normal household food preparation. Furthermore, if the product is stored for long periods, the type of packagingand storage conditions are very important. In addition to exclusion of oxygen, exclusion of light is also
TABLE 18 Effects of Processing on Nutrients in Milk
Nutrient PasteurizationªUltra-hig h-temperature
sterilizationb Spray-drying cEvaporated
milkd
Vitamin A 0 0 0 0
Thiamin 10 10 10 40
Riboflavin 0 0 0 0
Nicotinic acid 0 0 0 5
Vitamin B6 0 10 0 40
Vitamin B12 10 10 30 80
Vitamin C 10–25 25 15 60
Folic acid 10 10 10 25
Pantothenic acid 0 0 0 0
Biotin 0 0 10 10
Note: The values listed in the table are the percentag e losses resulting from processing .
ªHeated at 71–73°C for 15 sec.
bHeated at 130–150° for 1–4 sec.
cPretreated by heating at 80–90°C for 10–15 sec, homog enized, and evaporated at reduced pressure. Spray-dried by exposing a fine mist of milk concentrate to air at 90°C for 4–6 sec.
dPretreated by heating at 95°C for 10 min, concentrated by evaporation at 50°C under reduced pressure, andsterilized in the can by autoclaving at 115°C for 15 min.
Source: Ref. 52.


Pag e 876
important, not only to protect against development of off flavor, but also to prevent loss of riboflavin.
Severe heat treatments, such as in-can sterilization or dehydration, can cause significant losses of many of the vitamins. This is ofspecial concern for vitamin B12, because milk is an important dietary source of this vitamin. Knowledge of the causes of milkdegradation and the use of methods to minimize degradation, such as the use of high-temperature-short-time processing andexclusion of oxygen and light during processing and storage, should, in the future, lead to milk products that are shelf stable,microbiologically safe, and almost unchanged with respect to original nutrients.
Bibliography
Fox, P. F. (1982). Developments in Dairy Chemistry. 1. Proteins, Applied Science, London.
Fox, P. F. (1983). Developments in Dairy Chemistry. 2. Lipids, Applied Science, London.
Fox, P. F. (1985). Developments in Dairy Chemistry. 3. Lactose and Minor Constituents, Elsevier Applied Science,London.
Fox, P. F. (1989). Developments in Dairy Chemistry. 4. Functional Milk Proteins, Elsevier Applied Science, London.
Fox, P. F. (1992). Advanced Dairy Chemistry. 1. Proteins, Elsevier Applied Science, London.
Walstra, P., and R. Jenness (1984). Dairy Chemistry and Physics, John Wiley & Sons, New York.
References
1. Agriculture Handbook No. 8-1 (1976). Composition of Foods, Dairy and Egg Products, U.S. Department ofAgriculture, Agricultural Research Service.
2. Anonymous (1994). Hoards Dairyman 139(6):271.
3. Bauman, D. E., and C. L. Davis (1974). Biosynthesis of milk fat, in Lactation—A Comprehensive Treatise, vol. II (B. L.Larson and V. R. Smith, eds.), Academic Press, New York, pp. 31–75.
4. Bernstein, F. C., T. F. Koetzle, G. J. B. Williams, E. F. Meyer, Jr., M. D. Brice, J. R. Rodgers, O. Kennard, T.Shimanouchi, and M. Tasumi (1977). The protein data bank: A computer-based archival file for macromolecular structures. J.Mol. Biol. 112:535–542.
5. Brew, K., and J. A. Grobler (1992). a-Lactalbumin, in Advanced Dairy Chemistry 1. Proteins (P. F. Fox, ed.), ElsevierApplied Science, London, pp. 191–229.
6. Brunner, J. R. (1965). Physical equilibria in milk: The lipid phase, in Fundamentals of Dairy Chemistry (B. H. Webb andA. H. Johnson, eds.), AVI, Westport, CT, pp. 403–505.
7. Brunner, J. R. (1981). Cow milk proteins: Twenty-five years of progress. J. Dairy Sci. 64:1038–1054.
8. Brunner, J. R., C. A. Estrom, R. A. Hollis, B. L. Larson, R. McL. Whitney, and C. A. Zittle (1960). Nomenclature of theproteins of bovine milk—First revision. J. Dairy Sci. 43:901–911.
9. Corbin, E. A., and E. O. Whittier (1965). The composition of milk, in Fundamentals of Dairy Chemistry (B. H. Webb andA. H. Johnson, eds.), AVI, Westport, CT, pp. 1–36.
10. Creamer, L. K., G. P. Berry, and O. E. Mills (1977). A study of the dissociation of b-casein from the bovine casein micelleat low temperature. N. Z. J. Dairy Sci. Technol. 12:58–66.
11. Davies, D. T., and J. C. D. White (1960). The use of ultrafiltration and dialysis in isolating and in determining the partition ofmilk constituents between the aqueous and disperse phases. J. Dairy Res. 27:171–190.
12. De Wit, J. N. (1989). Functional properties of whey proteins, in Development in Dairy Chemistry. 4. Functional MilkProteins (P. F. Fox, ed.), Elsevier Applied Science, London, pp. 285–321.

13. Farkye, N. Y. (1992). Other enzymes, in Advanced Dairy Chemistry. 1. Proteins (P. F. Fox, ed.), Elsevier AppliedScience, London, pp. 339–367.
14. Fox, P. F. (1981). Heat-induced changes in milk preceding coagulation. J. Dairy Sci. 64:2127–2137.
15. Garza, C. (1979). Appropriatenss of milk use in international supplementary feeding programs. J. Dairy Sci.62:1673–1684.

Pag e 877
16. Gresti, J. M., M. Bugant, C. Maniongui, and J. Bezard (1993). Composition of molecular species of triacylglycerols inbovine milk fat. J. Dairy Sci. 76:1850–1869.
17. Hambling, S. G., A. S. McAlpine, and L. Sawyer (1992). b-Lactoglobulin, in Advanced Dairy Chemistry. I. Proteins (P.F. Fox, ed.), Elsevier Applied Science, London, pp. 141–190.
18. Hansen, R. G. (1974). Milk in human nutrition, in Lactation—A Comprehensive Treatise, vol. III (B. L. Larson and V. R.Smith, eds.), Academic Press, New York, pp. 281–308.
19. Holt, C. (1985). The milk salts: Their secretion, concentrations and physical chemistry, in Developments in DairyChemistry. 3. Lactose and Minor Constituents (P. F. Fox, ed.), Elsevier Applied Science, London, pp. 143–181.
20. Jenness, R. (1974). The composition of milk, in Lactation—A Comprehensive Treatise, vol. III (B. Larson and V. R.Smith, eds.), Academic Press, New York, pp. 3–107.
21. Jenness, R., B. L. Larson, T. L. McMeekin, A. M. Swanson, C. H. Whitnah, and R. McL. Whitney (1956). Nomenclatureof the proteins of bovine milk. J. Dairy Sci. 39:536–541.
22. Jensen, R. G., J. G. Quinn, D. L. Carpenter, and J. Sampugna (1967). Gas-liquid chromatographic analysis of milk fattyacids: A review. J. Dairy Sci. 50:119–125.
23. Jensen, R. G., A. M. Ferris, and C. J. Lammi-Keefe (1991). The composition of milk fat. J. Dairy Sci. 74:3228–3243.
24. Kinsella, J. E., and J. P. Infante (1978). Phospholipid synthesis in the mammary gland, in Lactation—A ComprehensiveTreatise, vol. IV (B. L. Larson and V. R. Smith, eds.), Academic Press, New York, pp. 475–502.
25. Kitchen, B. J. (1985). Indigenous milk enzymes, in Developments in Dairy Chemistry. 3. Lactose and MinorConstituents (P. F. Fox, ed.), Elsevier Applied Science, London, pp. 239–279.
26. Kraulis, P. (1991). MOLSCRIPT: A program to produce both detailed and schematic plots of protein structures. J. Appl.Crystallogr. 24:946–950.
27. Larson, B. L. (ed.) (1978). Lactation—A Comprehensive Treatise, vol. IV, Academic Press, New York.
28. Larson, B. L. and V. R. Smith, (eds.) (1974). Lactation—A Comprehensive Treatise, vol. 1, Academic Press, NewYork.
29. Larson, B. L., and V. R. Smith (eds.) (1974). Lactation—A Comprehensive Treatise, vol. II, Academic Press, NewYork.
30. Larson, B. L., and V. R. Smith, (eds.) (1974). Lactation—A Comprehensive Treatise, vol. III, Academic Press, NewYork.
31. Leveille, G. A. (1979). United States food and nutrition issues—Roles of dairy foods. J. Dairy Sci. 62:1665–1672.
32. Lindquist, B. (1963). Casein and the action of rennin, Part 1. Dairy Sci. Abstr. 25:257–265.
33. Lindquist, B. (1963). Casein and the action of rennin, Part 2. Dairy Sci. Abstr. 25:299–308.
34. Lizell, J. L., and M. Peaker (1971). Mechanism of milk secretion. Physiol. Rev. 51:564–597.
35. McKenzie, H. A. (1967). Milk proteins. Adv. Protein Chem. 22:55–234.
36. McKenzie, H. A. (ed.) (1970). Milk Proteins, vol. I, Academic Press, New York.
37. McKenzie, H. A. (ed.) (1970). Milk Proteins, vol. II, Academic Press, New York.
38. Morr, C. V. (1979). Utilization of milk proteins as starting materials for other foodstuffs. J. Dairy Res. 46:369–376.
39. Morr, C. V. (1982). Functional properties of milk proteins and their use as food ingredients, in Developments in DairyChemistry. I. Proteins (P.F. Fox, ed.), Applied Science, London, pp. 375–399.

40. Morr, C. V. (1989). Whey proteins: Manufacture, in Developments in Dairy Chemistry. 4. Functional Milk Proteins (P.F. Fox, ed.), Elsevier Applied Science, London, pp. 245–284.
41. Mulvihill, D. M. (1992). Production, functional properties and utilization of milk protein products, in Advanced DairyChemistry. 1. Proteins (P. F. Fox, ed.), Elsevier Applied Science, London, pp. 369–404.
42. Neville, M. C. (1990). The physiological basis of milk secretion. Ann. NY Acad. Sci. 586:1–11.
43. Nickerson, T. A. (1965). Lactose, in Fundamentals of Dairy Chemistry (B. H. Webb and A. H. Johnson, eds.), AVI,Westport, CT, pp. 224–260.
44. Nickerson, T. A. (1976). Use of milk derivative, lactose, in other foods. J. Dairy Sci. 59:581–587.
45. Patton, S., and R. G. Jensen (1976). Biomedical Aspects of Lactation, Pergamon Press, New York.

Pag e 878
46. Payens, T. A. J. (1979). Casein micelles: The colloid-chemical approach. J. Dairy Res. 46:291–306.
47. Pitas, R. E., J. Sampugna, and R. G. Jensen (1967). Triglyceride structure of cow's milk fat. I. Preliminary observations onthe fatty acid composition of positions 1, 2 and 3. J. Dairy Sci. 50:1332–1336.
48. Pyne, G. T. (1962). Some aspects of the physical chemistry of the salts of milk. J. Dairy Res. 29:101–130.
49. Recommended Dietary Allowances (1989). 10th ed., National Academy of Sciences, Washington, DC.
50. Renner, E. (1980). Nutritional and biochemical characteristics of UHT milk, in Proceedings of the InternationalConference on UHT Processing and Aseptic Packaging of Milk and Milk Products, Department of Food Science, NorthCarolina State University, Raleigh, pp. 21–52.
51. Rollema, H. S. (1992). Casein association and micelle formation, in Advanced Dairy Chemistry. 1. Proteins (P. F. Fox,ed.), Elsevier Applied Science, London, pp. 111–140.
52. Rolls, B. A. (1982). Effect of processing on nutritive value of food: Milk and milk products, in Handbook of NutritiveValue of Processed Food, vol. I (M. Rechcigl, ed.), CRC Press, Boca Raton, FL, pp. 383–399.
53. Rose, D., J. R. Brunner, E. B. Kalan, B. L. Larson, P. Melnychyn, H. E. Swaisgood, and D. F. Waugh (1970).Nomenclature of the protein's of cow milk: Third revision. J. Dairy Sci. 53:1–17.
54. Schmidt, D. G. (1980). Colloidal aspects of casein. Neth. Milk Dairy J. 34:42–46.
55. Shahani, K. M., W. J. Harper, R. G. Jensen, R. M. Parry, Jr., and C. A. Zittle (1973). Enzymes in bovine milk: A review.J. Dairy Sci. 56:531–543.
56. Singh, H., and L. K. Creamer (1992). Heat stability of milk, in Advanced Dairy Chemistry. I. Proteins (P. F. Fox, ed.),Elsevier Applied Science, London, pp. 621–656.
57. Slattery, C. W. (1976). Review: Casein micelle structure; and examination of models. J. Dairy Sci. 59:1547–1556.
58. Slattery, C. W. (1979). A phosphate-induced sub-micelle equilibrium in reconstituted casein micelle systems. J. Dairy Res.46:253–258.
59. Slattery, C. W., and R. Evard (1973). A model for the formation and structure of casein micelles from subunits of variablecomposition. Biochim. Biophys. Acta 317:529–538.
60. Swaisgood, H. E. (1973). The caseins. CRC Crit. Rev. Food Technol. 3:375–414.
61. Swaisgood, H. E. (1982). Chemistry of milk protein, in Developments in Dairy Chemistry. I. Proteins (P. F. Fox, ed.),Applied Science, London, pp. 1–59.
62. Swaisgood, H. E. (1992). Chemistry of caseins, in Advanced Dairy Chemistry. I. Proteins (P. F. Fox, ed.), ElsevierApplied Science, London, pp. 63–110.
63. Thompson, M. P., J. R. Brunner, C. M. Stine, and K. Lindquist (1961). Lipid components of the fat-globule membrane. J.Dairy Sci. 44:1589–1596.
64. Thompson, M. P., N. P. Tarassuk, R. Jenness, H. A. Lillevik, U. S. Ashworth, and D. Rose (1965). Nomenclature of theproteins of cow's milk-second revision. J. Dairy Sci. 48:159–169.
65. Timmen, H., and S. Patton (1989). Milk fat globules: fatty acid composition, size and in vivo regulation of fat liquidity.Lipids 23:685–689.
66. U.S. Department of Agriculture (1993). Dairy S&O Yearbook, DS-441, August, Washington, D.C., pp. 1–39.
67. White, J. C. D., and D. T. Davies (1958). The relation between the chemical composition of milk and the stability of thecaseinate complex. J. Dairy Res. 25:236–255.
68. Whitney, R. (1977). Milk proteins, in Food Colloids (H. D. Graham, ed.), AVI, Westport, CT, pp. 66–151.

69. Whitney, R. M., J. R. Brunner, K. E. Ebner, H. M. Farrell, R. V. Josephson, C. V. Morr, and H. E. Swaisgood (1976).Nomenclature of the proteins of cow's milk: Fourth revision. J. Dairy Sci. 59:785–815.

Pag e 879
15Characteristics of Edible Muscle Tissues
E. ALLEN FOEGEDING AND TYRE C. LANIER
North Carolina State University, Raleigh, North CarolinaHERBERT O. HULTIN
University of Massachusetts, Amherst, Massachusetts
15.1. Introduction 880
15.2. Similarities and Differences Among Muscles of Various AnimalSpecies
881
15.3. Nutritive Value 882
15.4. Muscle Structure and Composition 884
15.4.1. Structure of Skeletal Muscle 884
15.4.2. Structure of Smooth or Involuntary Muscle 890
15.4.3. Structure of Cardiac (Heart) or Striated Involuntary Muscle 890
15.4.4. Proteins of the Muscle Cell 891
15.4.5. Muscle Fiber Types 898
15.4.6. Connective Tissue 901
15.4.7. Fat Cells 906
15.5. Biochemical Changes in Muscle Postmortem 907
15.5.1. Biochemical Changes Related to Energy Metabolism 907
15.5.2. Consequences of ATP Depletion 909
15.5.3. ATP Breakdown to Hypoxanthine 910
15.5.4. Loss of Calcium-Sequestering Ability 910
15.5.5. Loss of Enzymic Regulation 913
15.6. Natural and Induced Postmortem Biochemical Changes AffectingMeat Quality
914
15.6.1. Physicochemical Basis for Meat Texture and Water-HoldingCapacity
914
15.6.2. Effects of Rate and Extent of pH Change on Quality 916

15.6.3. Effects of Actin-Myosin Interaction and Contraction onQuality
919
15.6.4. Changes Induced by Proteolysis 923
15.6.5. Changes in Lipids and Interaction of Lipids with OtherComponents
924
15.7. Chemical Aspects of Meat Stability 925
15.7.1. Heating 925
15.7.2. Refrigeration 926
15.7.3. Freezing 928
15.7.4. Dehydration 931

Pag e 880
15.7.5. Pressure 932
15.8. Chemistry of Processed Meats 932
15.8.1. Curing 933
15.8.2. Chemistry of Adhesion Between Meat Particles or Pieces 933
15.8.3. Functionality of Muscle Proteins in Gel Formation 935
15.8.4. Effects of pH and Ionic Ingredients on Gelling of MeatProteins
936
15.8.5. Processing Factors 937
Bibliography 938
References 938
15.1 Introduction
The discovery in Florida of 12,200-year-old mastodon bones showing signs of butchering is evidence that meat has been part ofthe human diet since prehistoric times. With the progression of time, meat animals were domesticated and animal husbandry,rather than animal hunting, became the predominant way to put meat on the table. Today fish is the only meat source that ispredominantly hunted rather than raised. However, rapidly growing aquaculture practices, and concerns about depleting variousfish species, may change our source and variety of consumable fish. As with any biological tissue, the food quality of meat ishighly connected with biological function and loss of homeostasis in converting muscle to meat. Muscles are designed to providelocomotion. The process of contraction consumes large amounts of energy (ATP) and is precisely regulated so thatcontraction/relaxation cycles produce motility.
Individual muscles are specialized for contraction speed and/or force, such that there are more similarities in muscles found incoinciding anatomical locations among species than there are among different muscles within one species. The specializedfunctions of various muscles are achieved by differences in the proteins responsible for contraction and structure, and bydifferences in the metabolic pathways and primary substrates (lipids or carbohydrate) used to generate energy. Biologicalfunction is the first major factor affecting meat quality. This becomes evident when comparing the white and dark muscles ofchickens and turkeys. Meat animals that are poikilothermic, such as fish and crustaceans, also have to adjust biochemical factorsto accomodate changes in body temperature. This is accomplished by periodically removing old muscle proteins and replacingthem with new ones that may differ slightly in function. The process of protein turnover requires an array of proteinases that mustbe highly regulated to prevent autolysis in the live animal.
When viewed as a whole, the biological image of muscle is one of a dynamic tissue that is highly specialized to provide individualcontraction requirements in a variety of environments. This results in a variety of sensory properties for muscles within andamong species.
The majority of the biological controls are removed with death and bleeding (exsanguination) of the animal. Therefore, thesecond major factor affecting meat quality is the loss of biological regulation upon death. The chemical processes active in theconversion of muscle to meat determine the quality of fresh meat and the functional properties of meat used to manufactureprocessed meat products. Addressed in this chapter are the major chemical reactions associated with muscle contractions,converting muscle to meat, and manufacturing meat products. The term “meat” is used to indicate the contractive tissues from allspecies of animals used for food. While this omits animal products such as kidney and liver, it is inclusive for beef, pork, lamb,turkey, chicken, fish, and crustaceans. The ultimate goal is to understand the chemistry relevant to the texture, color, flavor,nutritional attributes, and processing properties of meat.

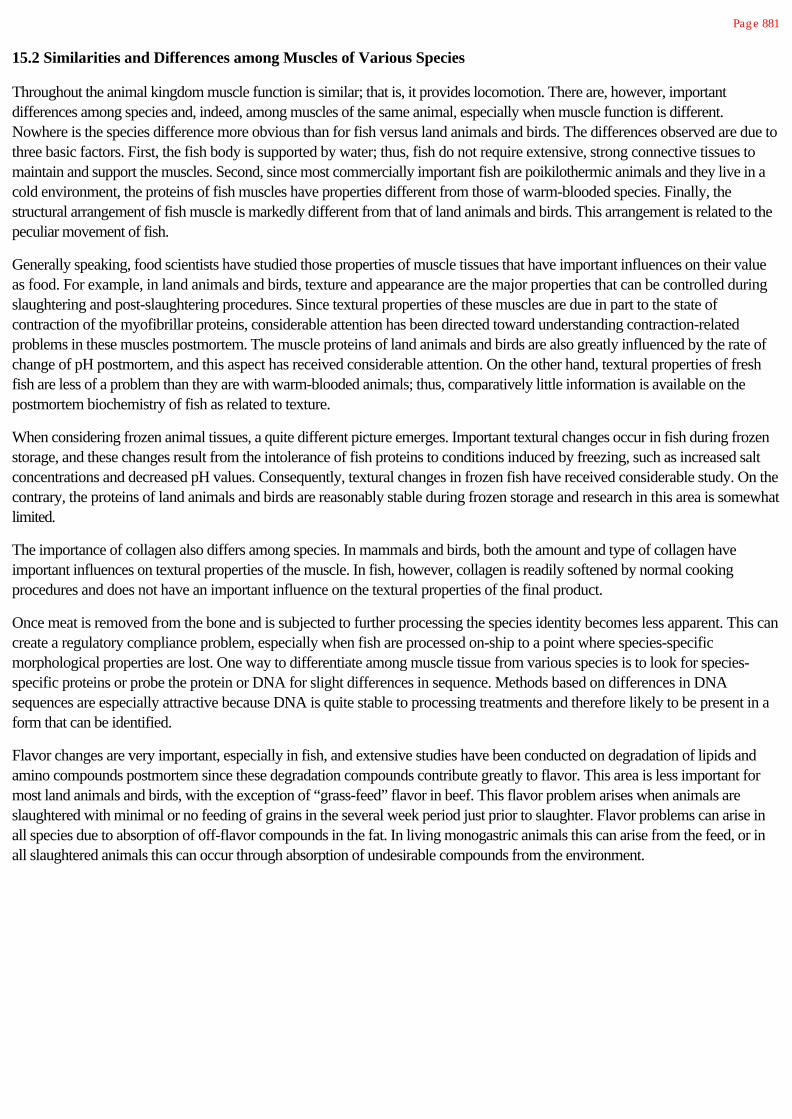
Pag e 881
15.2 Similarities and Differences among Muscles of Various Species
Throughout the animal kingdom muscle function is similar; that is, it provides locomotion. There are, however, importantdifferences among species and, indeed, among muscles of the same animal, especially when muscle function is different.Nowhere is the species difference more obvious than for fish versus land animals and birds. The differences observed are due tothree basic factors. First, the fish body is supported by water; thus, fish do not require extensive, strong connective tissues tomaintain and support the muscles. Second, since most commercially important fish are poikilothermic animals and they live in acold environment, the proteins of fish muscles have properties different from those of warm-blooded species. Finally, thestructural arrangement of fish muscle is markedly different from that of land animals and birds. This arrangement is related to thepeculiar movement of fish.
Generally speaking, food scientists have studied those properties of muscle tissues that have important influences on their valueas food. For example, in land animals and birds, texture and appearance are the major properties that can be controlled duringslaughtering and post-slaughtering procedures. Since textural properties of these muscles are due in part to the state ofcontraction of the myofibrillar proteins, considerable attention has been directed toward understanding contraction-relatedproblems in these muscles postmortem. The muscle proteins of land animals and birds are also greatly influenced by the rate ofchange of pH postmortem, and this aspect has received considerable attention. On the other hand, textural properties of freshfish are less of a problem than they are with warm-blooded animals; thus, comparatively little information is available on thepostmortem biochemistry of fish as related to texture.
When considering frozen animal tissues, a quite different picture emerges. Important textural changes occur in fish during frozenstorage, and these changes result from the intolerance of fish proteins to conditions induced by freezing, such as increased saltconcentrations and decreased pH values. Consequently, textural changes in frozen fish have received considerable study. On thecontrary, the proteins of land animals and birds are reasonably stable during frozen storage and research in this area is somewhatlimited.
The importance of collagen also differs among species. In mammals and birds, both the amount and type of collagen haveimportant influences on textural properties of the muscle. In fish, however, collagen is readily softened by normal cookingprocedures and does not have an important influence on the textural properties of the final product.
Once meat is removed from the bone and is subjected to further processing the species identity becomes less apparent. This cancreate a regulatory compliance problem, especially when fish are processed on-ship to a point where species-specificmorphological properties are lost. One way to differentiate among muscle tissue from various species is to look for species-specific proteins or probe the protein or DNA for slight differences in sequence. Methods based on differences in DNAsequences are especially attractive because DNA is quite stable to processing treatments and therefore likely to be present in aform that can be identified.
Flavor changes are very important, especially in fish, and extensive studies have been conducted on degradation of lipids andamino compounds postmortem since these degradation compounds contribute greatly to flavor. This area is less important formost land animals and birds, with the exception of “grass-feed” flavor in beef. This flavor problem arises when animals areslaughtered with minimal or no feeding of grains in the several week period just prior to slaughter. Flavor problems can arise inall species due to absorption of off-flavor compounds in the fat. In living monogastric animals this can arise from the feed, or inall slaughtered animals this can occur through absorption of undesirable compounds from the environment.

Pag e 882
15.3 Nutritive Value
In addition to its aesthetic appeal, meat is important because of its excellent nutritive properties. The composition of lean muscletissue is given in Table 1, and it is similar for a wide variety of animals. Lipid is the most variable component of meat. The muscletissues of fatty fish show large seasonal variations in lipid, based in large part on the reproductive cycle of the fish. For example,the lipid content of mackerel is known to vary between 5.1 and 22.6% during the course of a year [48]. Fluctuations in lipidcontent in fish are compensated for by changes in water content; that is, the percentage of lipid plus water remains essentiallyconstant in fatty fish [55]. The composition of meat varies considerably depending on the amount of fat, bone, and skin includedin the sample.
As shown in Table 1, about 18–23% of the lean portion of meat is protein. A significant exception to this occurs in starving fishor in fish in certain stages of the reproductive cycle. The latter is a form of starvation since sufficient dietary protein cannot beprovided to compensate for protein synthesis in gonadal tissue. Fish utilize muscle tissue during starvation, and it is replaced bywater. The muscle from a living but severely starved cod can contain as much as 95% water [55]. In meat animals starvation is aproblem only in animals that are hunted.
The protein content of muscle tissue is very large and the quality of this protein is very high, containing kinds and ratios of aminoacids that are similar to those required for maintenance and growth of human tissue. Of the total nitrogen content of muscle,approximately 95% is protein and 5% is smaller peptides, amino acids, and other compounds.
Lipid components of muscle tissue vary more widely than do the amino acids [3]. As seen in Table 2, there are differencesamong species, between muscles of one species, and among animals of different ages. In fish muscle, the differences have been“institutionalized” in the concept of lean versus fatty fish. In lean fish, storage fat is carried in the liver. Muscle of lean fish containsless than 1% lipid, mostly phospholipid located in membranes. In fatty fish, depot fat apparently occurs as extracellular dropletsin the muscle tissue [42]. In white muscle, fat is apparently well dispersed outside the muscle cells; in red muscle, distinct fatdroplets exist within the cells. In addition to species variations, the lipid components of muscle can be markedly influenced bydiet.
The lipids of mammalian and avian muscle can be categorized as to location, that is, that in muscle tissue and that in adiposetissue. The composition of lipids in these two locations can be quite different. Lipids in muscle contain greater contents ofphospholipids than do lipids in
TABLE 1 Composition of Lean Muscle Tissue
Composition (%)
Species W ater Protein Lipid Ash
Beef 70–73 20–22 4–8 1
Pork 68–70 19–20 9–11 1.4
Chicken 73.7 20–23 4.7 1
Lamb 73 20 5–6 1.6
Cod 81.2 17.6 0.3 1.2
Salmon 64 20–22 13–15 1.3
Source: Ref. 95.

Pag e 883
TABLE 2 Lipid Content of Various Meats
Contenta
Species Muscle or type Lipid (%) Neutral Lipids (%) Phospholipids (%)
Chicken W hite 1.0 52 48
Red 2.5 79 21
Turkey W hite 1.0 29 71
Red 3.5 74 26
Fish W hite 1.5 76 24
(Sucker) Red 6.2 93 7
Beef Long issimus dorsi 2.6 78 22
Pork Long issimus dorsi 4.6 79 21
Psoas major 3.1 63 37
Lamb Long issimus dorsi 5.7 83 10
Semitendinosus 3.8 79 17
aPercentag e of g ross muscle composition
Source: Ref. 3.
adipose tissue. Lean muscle contains about 0.5–1% phospholipids, and the fatty acids of phospholipids are more unsaturatedthan those of adipose triacylglycerols. Oxidation of the highly unsaturated fatty acid constituents found in the membranes ofmuscle can be very important contributors to the deterioration of meat.
Within a species, red muscle contains more lipid than white muscle (Table 2). The type of fatty acids present in muscle tissue isalso species dependent. Fatty acids in cold-blooded fish are much less saturated than those in avian and mammalian muscles(Table 3). Presumably, the high concentration of polyunsaturated fatty acids in fish is necessary to keep lipids fluid at the lowmuscle temperatures sometimes encountered. The much greater percentage of polyenic fatty acids in lean fish (cod) comparedwith that of fatty fish (mackerel) reflects differences in
TABLE 3 Deg ree of Saturation of Fatty Acid Components of Lipid from MuscleTissue of Various Species
Fatty acids (%)
Species Saturated Monenoic Polyenoic
Beef 40–71 41–53 0–6
Pork 39–49 43–70 3–18
Mutton 46–64 36–47 3–5
Poultry 28–33 39–51 14–23
Cod (Iean fish) 30 22 48
Mackerel (fatty fish) 30 44 26

Pag e 884
phospholipid-triacylglycerol ratios, as mentioned earlier. Poultry fat is more unsaturated than pork fat, which in turn is moreunsaturated than beef or mutton fat.
Muscle tissue is an excellent source of some of the B-complex vitamins, especially thiamin, riboflavin, niacin, B6, and B12.However, the B-vitamin content of muscle varies considerably depending on the species and on the type of muscle within aspecies. In addition, the levels of the B vitamins are also influenced by breed, age, sex, and general health of the animal. Lesswork has been performed on the fat-soluble vitamins in meat than on the water-soluble vitamins in meat, but the levels ofvitamins D, E, and K in meats are generally rather low, although the amount of vitamin E (tocopherols) can be influenced by thediet of the animal. The content of vitamin A in muscle foods is somewhat greater than that of the other fat-soluble vitamins.Ascorbic acid is present in meat only at very low levels.
Meat is a good source of iron and phosphorus and a rather poor source of calcium, except in certain deboned or mechanicallyseparated meats in which the calcium content may be greatly increased due to the presence of small bone fragments in the edibleproduct (Table 4). Meat typically contains from 40 to 90 mg sodium per 100 g and about 250–420 mg potassium per 100 glean tissue. Minerals and the water-soluble B-complex vitamins are found in the lean portion of the meat. The concentration ofthese substances in the whole muscle is therefore dependent on the amount of fat tissue and bone in a particular cut of meat, aswell as on the cooking process.
15.4 Muscle Structure and Composition
15.4.1 Structure of Skeletal Muscle
Skeletal muscle is composed of long, narrow, multinucleated cells (fibers) that range from a few to several centimeters in lengthand from 10 to 100 mm in diameter. Although there are differences in muscle fibers with regard to the amount of sarcoplasm andthe amount and location of cellular membrane components, there is a close similarity, at the cellular level, of skeletal musclesfrom a wide variety of organisms. There are, however, different arrangements of muscle cells and connective tissue depending onthe means of locomotion of the animal and its environment.
Figure 1 represents a typical arrangement of muscle components in mammals and birds. The fibers are arranged in parallelfashion to form bundles, and groups of bundles form a muscle. Surrounding the whole muscle is a heavy sheath of connectivetissues, called the epimysium. From the inner surface of the epimysium, other connective tissues penetrate the interior of themuscle, separating the groups of fibers into bundles. This connective tissue layer surrounding groups of fibers is termed theperimysium, and extending from this are finer sheaths of connective tissue that surround each muscle fiber. These last sheathsare termed endomysium. The connective tissue sheaths merge with large masses of connective tissue tendons at the termini ofthe muscle, with these merger points serving to anchor the muscle to the skeleton. The long components of the circulatory systemare located in the perimysium, whereas the smaller units (capillaries) are within the endomysium.
The arrangement of muscle fibers in fish is quite different from that in birds and mammals and is based on the need to flex theirbodies for propulsion through water. The arrangement of the muscle tissue in a typical bony fish is shown in Figure 2. The W-shaped segments (Fig. 2) are called myotomes, and they have one forward and two backward flexures. These myotomes arenot perpendicular to the vertical midplane of the fish but typically intercept this plane at sharp angles [45]. Thus, if a cut is madeat right angles to the central skeleton, multiple myotomes are exposed. The myotomes are one cell deep, and the muscle cells areroughly perpendicular to the

Pag e 885
TABLE 4 Mean Mineral Content of Selected Avian, Bovine, and Porcine Muscles
Minerals (mg /g meat)
Muscle and meat product Calcium Phosphorus Mag nesium Potassium Sodium Zinc Iron
Chicken
Red (leg )
6-week-old 3.90 181 20.2 252 72.7 1.44 1.06
1-year-old 3.30 170 20.5 237 77.2 1.51 1.32
W hite (breast)
6-week-old 2.83 200 25.9 265 42.8 0.62 0.64
1-year-old 3.21 214 30.5 294 54.6 0.41 0.99
Beef
Semimembranosus 4.62 202 26.9 380 70.4 2.99 2.78
Semitendinosus 4.28 216 27 417 55.2 2.92 2.00
Pork
Semimembranosus
Boars 5.47 167 21.3 283 82.8 2.09 1.54
Sows 5.53 211 26.7 398 68.2 1.87 1.50
Semitendinosus 5.87 190 21.5 341 88.7 5.47 3.00
Source: Ref. 99.

Pag e 886
FIGURE 1Muscle cross section, illustrating the arrang ement of connective tissue into
epimysium, perimysium, and endomysium and the relationship to muscle fibersand fiber bundles. The typical position of blood vessels is also shown.
surface of the myotome. The myotomes are connected one to another by thin layers of collagenous connective tissue calledmyosepta (myocommata).
In squid, a cephalopod, the mantle (external body wall) is made up of circular muscle fibers. At more or less regular intervals,these fibers are interrupted by sections of radially oriented fibers that function to “thin” the mantle and cause the mantle cavity toexpand following the power stroke of the circular fibers [9]. In some species of squid, superficial fibers also run longitudinallyalong the mantle. The myofibrils of squid mantle muscle are helically wound and are referred to as obliquely striated [36].

Pag e 887
FIGURE 2Myotome pattern of musculature of bony fish, with detailed lateral views of a sing le
myotome.
Figure 3 is a diagrammatic view of a typical muscle fiber, with the major components being the sarcolemma, the contractilefibrils, the cell fluid (sarcoplasm), and the organelles. The surface of the muscle fiber consists of three layers: an outer network ofcollagen fibrils, a middle basement lamina composed of type IV collagen and proteoglycans, and an inner plasma membranecalled the sarcolemma. Invaginations of the sarcolemma form the transverse system called T tubules. The ends of the T tubulesmeet in the interior of the cell close to two terminal sacs of the sarcoplasmic reticulum. This is shown in Figure 4. Thesarcoplasmic reticulum is a membranous system located in the cell (fiber) and generally arranged parallel to the main axis of thecell. The meeting of the T system and the sarcoplasmic reticulum (triad) occurs at different intrafiber locations in differentmuscles. The triadic joint appears to exist most frequently at or near the Z disks or lines (Fig. 5) in fish and frog muscle and atthe junction of the A and I bands in reptiles, birds, and mammals. The terminal cisternae of the longitudinal elements(sarcoplasmic reticulum) surround each sarcomere like a hollow collar. The collar is perforated with holes and is termed afenestrated collar.
The T tubules extend the sarcolemma into the interior of the muscle cell, and it is this phenomenon that allows the muscle cell torespond as a unit (essentially no lag period in the interior of the cell). Depolarization of the sarcolemma and its intracellularextension (T tubules)

Pag e 888
FIGURE 3Cutaway of a muscle fiber showing the outer membrane and itsinvag inations (T system), which run horizontally and meet withtwo terminal sacs of the long itudinal sarcoplasmic reticulum in
the triad. Repetitive cross sections are also indicated. (Adaptedfrom Ref. 75).
triggers liberation of calcium from terminal sacs of the sarcoplasmic reticulum via a protein commonly called the calcium channel.This liberation of calcium activates ATPase of the contractile proteins and allows contraction to occur. Relaxation is achieved inpart by a reversal of the process and by sequestering of calcium by the sarcoplasmic reticulum [37].
Mitochondria serve as prime energy transducers for the muscle cell, and these organelles are located throughout the cell. Insome cases there is a concentration of mitochondria near the Z line or near the plasma membrane. Nuclei are distributed near thesurface of the muscle cell and have an important role in protein synthesis.
Lysosomes are subcellular organelles that contain large quantities of hydrolytic enzymes and serve a digestive role in the cell.Lysosomes exist as part of the muscle cell per se and also originate from phagocytic cells present in the circulatory system. Theproteolytic enzymes of these organelles are termed cathepsins and various cathepsins, with differing activities, have beenisolated. Glycogen particles and lipid droplets also occur in some muscle cells, depending on the state of the muscle. All thesecellular components are bathed in the sarcoplasm, a semifluid material that contains soluble components, such as myoglobin,some enzymes, and some metabolic intermediates of the cell.
The major inner components of the muscle fiber are the fibrils (myofibrils), which constitute the contractile apparatus. Themyofibrils are surrounded by the sarcoplasm and some of the elements discussed earlier, such as mitochondria, the T tubules,and the sarcoplasmic reticulum.

Pag e 889
FIGURE 4Diag ram showing myofibrils and surrounding sarcoplasmic reticulumand transverse tubule membranous systems. The terminal cisternae,
fenestrated collar, and long itudinal tubule are components of thesarcoplasmic reticulum. (From Ref. 25.)
FIGURE 5Striated muscle fibril in long itudinal section. The I-band consists only
of thin filaments. The A-band is darker where it consists of overlappingthick and thin filaments and lig hter in the H-zone, where it consists
solely of thick filaments. The M-line is caused by a bulg e in the centerof each thick filament, and the pseudo-H-zone is a bare reg ion on either
side of the M-line. (From Ref. 25).

Pag e 890
The characteristic striated appearance of skeletal muscle is due to a specific repetitive arrangement of proteins in the myofibrils.This arrangement is shown in Figure 5. The dark bands of the fibrils are anisotropic or birefringent when viewed in polarizedlight. Being anisotropic, they are termed “A bands.” The bands that appear lighter are isotropic and are therefore termed “Ibands.” In the center of each of the I bands is a dark line, called the Z line or Z disk. The term Z is derived from the Germanzwischen, meaning between. In the center part of each A band is a light zone, and this is called the H zone. Frequently, at thecenter of the H zone there exists a darker M line. The contractile unit of the fibril is termed the sarcomere, defined as thematerial located between and including two adjacent Z disks.
A sarcomere is comprised of thick and thin longitudinal filaments. The A band is comprised of thick (mostly myosin) and thinfilaments (mostly actin), whereas the I band is composed of thin filaments. The thin filaments extend outward from the Z disks inboth directions, and the thin filaments overlap in the thick filaments in parts of the A band. The lighter zone of the A band, the Hzone, is that area where thin filaments do not overlap thick filaments. The contractile state of the muscle has an important bearingon the size of these various bands and zones, since during contraction the thin and thick filaments slide past each other. Duringcontraction, the length of the A band remains constant, but the I band and the H zone both shorten.
Thin filaments are imbedded in or connected to the Z disk, and because of this, the Z disk presumably serves as an anchorduring the contractile process. Each thin filament in the I band is linked to the four closest thin filaments in the adjacentsarcomere. This linkage laterally offsets the thin filaments from one sarcomere to the next. The major protein found in the Z diskis alpha-actinin.
The M line is located in the area of the myosin thick filaments where projections of the myosin headpieces are not present (Fig.5). The M line probably serves to keep the filaments in the correct geometric position.
Striated muscle from other vertebrates as well as invertebrates has essentially the same structure as that discussed already formammalian muscle. However, there may be some differences in the arrangement of myofibrils, amount of sarcoplasm,relationship of nuclei and mitochondria to other components in the muscle cell, arrangement of the sarcoplasmic reticulum, andlocation of the triadic joint. In fish muscle cells, peripheral myofibrils are perpendicular to the sarcolemma (surface) but the innermyofibrils have a normal arrangement parallel to the long axis of the cell. Some molluskan muscles, such as scallop adductor andsquid muscles, are obliquely striated instead of cross-striated [66].
15.4.2 Structure of Smooth or Involuntary Muscle
Smooth muscle fibers do not show the characteristic striations of voluntary or skeletal muscle. Certain organs containing smoothmuscle, such as the gizzards of birds, intestinal tissue, and the meat of many mollusks (clams, oysters), are used for food.
15.4.3 Structure of Cardiac (Heart) or Striated Involuntary Muscle
Heart tissue is used as food directly or may be incorporated into sausage products. The myofibrillar structure of heart muscle issimilar to that of striated skeletal muscles, but cardiac fibers contain larger numbers of mitochondria than do skeletal fibers. Thefiber arrangement of cardiac muscle is also somewhat less regular than that observed in skeletal muscle.

Pag e 891
15.4.4 Proteins of the Muscle Cell
The proteins/enzymes of muscle can be categorized based on biological function or chemical properties. Biological classes relateto energy metabolism, contraction, and structure. Chemical classes are water soluble, salt soluble, and insoluble. The water-soluble fraction can be extracted from muscle with water or dilute salt solutution and is made up of enzymes, such as thoseinvolved in glycolysis, and the muscle pigment myoglobin. Many of the proteins are connected to the cytoskeleton [8] and arenot soluble per se; however, they are easily extractable. The contractile proteins have classically been considered only soluble insalt solutions of high ionic strength, and not in water. However, some contractile proteins can be extracted by water, and therequired extraction conditions are species dependent [85].
Extractability of salt soluble proteins depends strongly on salt concentrationa and pH. The insoluble fraction remains aftertreatment with salt solutions of high ionic strength, and it consists of connective tissue proteins, membrane proteins, and usuallysome unextracted contractile proteins.
15.4.4.1 Contractile Proteins
Proteins involved in the physical process of contraction are those contained in the sarcomere. These can be divided based onlocation, such as thick or thin filaments, or on function, such as force-generating or regulating proteins. The scientific study ofmuscle has progressed from an almost exclusive focus on skeletal muscle to a strong interest in motility processes. The latterincludes not only cardiac and smooth muscle but also invertebrate contraction systems. This has led to the discovery of newmuscle proteins; therefore, Table 5 provides only a partial listing of the proteins involved in motility.
Myosin
The major protein of the thick filaments is myosin, which comprises 45% of the myofibrillar proteins. It is an elongated proteinmolecule about 160 nm in length with a molecular mass of approximately 480,000 D. Myosin contains a total of six polypeptidechains, two heavy chains and four light chains. Myosin heavy chains have “head” and “tail” regions, reflecting the respectiveglobular and rod portions of the molecules. The biological functions of myosin reside in the heavy chains.
The six polypeptide chains of myosin are assembled in a quaternary structure that resembles a stick (tail) with two pear-shapedheads (Fig. 6). The tail region consists of two alpha-helical heavy chains coiled together into a coiled-coil alpha-helicalsupersecondary structure. This structure terminates at the head region. The myosin head is 16.5 nm long, 6.5 nm wide, andapproximately 4.0 nm thick [76]. The main secondary structure in the head is alpha-helix, accounting for approximately 48% ofthe amino acids. The top of the head contains the actin binding site; then following down the molecule are the ATPase site, alkalilight chain site, and DTNB [(5,5'-dithiobis)-2-(nitrobenzoic acid)] light chain site. The light chains bind to the alpha-helicalregions of the heavy chain. The tail portion of the heavy chain molecule is responsible for its association into thick filaments, andthe head region contains actin binding and ATPase sites.
Associated with each myosin head section are two light chains, so that four light chains are associated with each myosinmolecule. The light chains exist in two distinct chemical classes. One class consists of DTNB light chains, so called becausetreatment of myosin with the thiol reagent DTNB causes its removal. It is also called the regulatory light chain because it isresponsible for calcium-mediated regulation of contraction in molluscan muscles, and phosphorylation-mediated regulation insmooth muscle. The second class of light chain consists of alkali

Pag e 892
TABLE 5 Sarcomeric Proteins
Muscle type
Number ofamino acids
Molecularweig ht
Thin filament
Actin Rabbit 374 42,000
b-Actinin
BI Chicken/fast twitch 35,000
BII 31,000
Tropomyosin
a-tropomyosin Chicken/fast twitch 284 33,000
b-tropomyosin Chicken/fast twitch 284 36,000
Troponin
C Chicken/fast twitch 18,000
I Rabbit 179 20,900
T Chicken/fast twitch 274 30,500
Thick filament
Myosin
Heavy chain Chicken/fast twitch 1938 220,000
Alkali lig ht chain 16,000–22,000
DTNB lig ht chain 18,000
C-Protein Human/fast twitch 1142 128,000
H-Protein Rabbit 69,000
X-Protein Rabbit 152,000
Sarcomere structure
a-Actinin Rabbit/fast twitch 100,000
Desmin 55,000
Nebulin Rabbit 700,000–900,000
Titin Rabbit 1,000,000
Myomesin 170,000
I-Protein Chicken/fast twitch 50,000
Source: Ref. 78 and several other sources.

light chains, so called because they are released under alkaline conditions. Alkali light chains were once considered essential forATPase, and were therefore termed “essential” light chains. It was later discovered that the isolation process was inactivatingATPase associated with the heavy chains.
Each globular head of heavy-chain myosin contains one alkali light chain and one DTNB light chain. The two types of light chainsare made from different genes. The DTNB light chain has a molecular mass of 18,000–19,000 D. The alkali light chains areproduced from a single gene that is differentially spliced to produce two polypeptides with different molecular weights. Alkalilight chain-1 and light chain-3 from rabbit fast muscle have respective molecular masses of 20,950 and 16,660 D [61].
The large size and salt solubility of myosin made it difficult for early researchers to conduct molecular studies. Therefore, theydeveloped ways to split myosin into smaller parts, which were more amenable to analytical techniques. Myosin can be cleaved inthe middle region by proteolytic enzymes, such as trypsin, producing two fractions of the protein. One of these is called lightmeromyosin (Fig. 6) and the other, which contains the globular head structures of the myosin molecule, is called heavymeromyosin. Separated heavy meromyosin retains its

Pag e 893
FIGURE 6Myosin. Top shows three-dimensional structure of the myosin subfrag ment 1.
The bars attached to each subfrag ments 1 represent the coiled-coil a-helical rod reg ion.The bottom shows seg ments of the molecule created by limited proteolysis at specific
amino acids from the chicken myosin heavy chain. (From Ref. 57.0)
ability to interact with actin and its ATPase activity. The head section of heavy meromyosin, designated subfragment 1, S1 orSF1, is attached to the rod section with rather flexible linkages, and can assume a wide variety of positions in relation to the rodsection.
When separated from subfragment 1, the rod-like tail section of heavy meromyosin, called subfragment 2, S2 or SF2, shows notendency to associate with itself or with light meromyosin. This indicates that light meromysin (which associates readily) isresponsible for forming the backbone structure of the thick filament. The SF2 portion of myosin is free to swing out from thesurface to allow the globular heads to make contact with the thin filaments.
Each thick filament contains some 400 molecules of myosin. These molecules polarize when they interact, joining in head-to-tailfashion in two directions, as illustrated in Figure 7. It is undoubtedly this polarity that allows contraction to occur.
Actin
The major protein of the thin filaments is actin, which comprises 20% of myofibrillar protein of muscle [78]. Actin is bound to thestructure of the muscle much more firmly than is myosin. Extraction of actin can be accomplished by prolonged exposure of amuscle powder (obtained by acetone extraction) with an aqueous solution of ATP.
Actin's shape can be described as two peanut-shaped domains of equal size lying side-

Pag e 894
FIGURE 7Possible arrang ement of myosin molecules in a filament. Globular reg ions are
shown as zig -zag s and tails as lines. The polarities of the myosin molecules are reversedon either side of the center, but all molecules on the same side have the same polarity.
by-side. Actin monomers, called globular actin or G-actin, are assembled in a double-helical structure called fibrous actin, or F-actin (see Fig. 8). This constitutes the main portion of the thin filament. G-actin is composed of 374–375 amino acids and has amolecular mass of 42,000–48,000 D. It is stable in water, where it can also exist as a dimer. Globular actin binds ATP veryfirmly and, in the presence of magnesium, spontaneously polymerizes to form F-actin with the concurrent hydrolysis of boundATP to give bound ADP and inorganic phosphate. Globular actin also polymerizes in the presence of neutral salts at aconcentration of approximately 0.15 M. Filaments of F-actin interact with the head portion of myosin. When negatively stainedand examined in the electron microscope, myosin or its subfragments bound to F-actin appear as long strings of arrowheadspointing in the same direction. This indicates that the actin monomers in the F-actin filament have polarity. Actin filaments areassembled with opposite polarity, relative to myosin binding, on each side of the Z-disk, which allow the thick filaments inadjacent sarcomeres to move toward the Z-disk.
Actomyosin
When actin and myosin are mixed in vitro, a complex, called actomyosin, is formed. This complex can be dissociated byaddition of ATP, as would be the case in living muscle. Actomyosin is the main state of actin and myosin in postmortem musclebecause ATP is depleted by postmortem metabolism. However, unlike prerigor muscle, simple addition of ATP and othersolubilizing compounds such as Mg2+ to meat does not dissociate all the myosin from actin, and extraction of myosin frompostrigor meat is therefore difficult. Myosin and actomyosin are found in extracts of postmortem muscle.
Tropomyosin and Troponin
Tropomyosin, representing 5% of myofibrillar protein, is composed of two alpha-helical polypeptides wound together into atwo-stranded, coiled-coil supersecondary structure. It resembles
FIGURE 8Thin filament complex with tropomyosin lying in g rooves of the actin double
helix. Troponin complex is spaced at 400 Å. From Ref. 20, p. 364.)

Pag e 895
the tail or rod portion of the myosin molecule. In skeletal muscle two polypeptides, alpha- and beta-tropomyosin, can combineto form a tropomyosin dimer. The alpha- and beta-tropomyosin polypeptides have molecular masses of 37,000 and 33,000 D,respectively. They are found in muscle as the alpha-alpha or beta-beta homodimers and the alpha-beta heterodimer.Tropomyosin aggregates end-to-end and binds to actin filaments along each groove of the actin double helix such that eachmolecule interacts with seven G-actin monomers (Fig. 8). Tropomyosin and troponin are combined in a complex that regulatesinteractions of myosin with the thin filament.
Troponin, accounting for 5% of myofibrillar protein, consists of three subunits designated troponin C (for calcium binding),troponin I (for inhibitory), and troponin T (for binding with tropomyosin). Each subunit of troponin has distinct functions.Troponin C is a calcium binding protein and confers calcium regulation to the contractile process via the thin filament. Troponin I,when tested without the other subunits, strongly inhibits the ATPase activity of actomyosin. Troponin T functions to provide astrong association site for binding of troponin to tropomyosin.
Thick Filament Proteins
Myosin is the major protein of the thick filament and has a primary function in muscle contraction. However, other proteins withless definitive biological functions are also found in thick filaments. C-, H-, and X-proteins are found in bands spacedperiodically on the thick filament. They appear to be wrapped around the thick filament surface with their major axes in a planenormal to that of the thick filament. This has provoked the thought that these protein rings may protect the filament againstdestruction by tensile forces or changes in the ionic environment; however, this has not been established as a biological function.Phosphofructokinase (F-protein) is also found on thick filaments. This enzyme is responsible for the conversion of fructose 6-phosphate to fructose 1,6-diphosphate in the glycolytic pathway.
Sarcomeric Structural Proteins
Alpha-actinin is located exclusively in the Z disk. It has a molecular mass of 200,000 D and consists of two polypeptide subunitsof similar mass. Alpha-actinin is a member of a family of F-actin-binding proteins. The apparent function of alpha-actinin is toprovide a structure to the Z line.
Beta-actinin is a dimeric protein made up of polypeptides of 35,000 and 31,000 D. It binds of F-actin and inhibits therecombination of fragmented F-actin. It is located at the free end of the thin filaments and may be involved in regulating the lengthof thin filaments.
Desmin is a 55,000 D protein that forms filaments that are 10 nm (intermediate) in length. This protein is part of the cellularframework known as the cytoskeleton [8]. The desmine intermediate filaments are found at the periphery of each Z line and theyform the connecting link between adjacent myofibrils.
The main protein in the M-line is myomesin. It is 165,000 D and accounts for 3% of the myofibrillar protein [78]. The proposedfunction of the M-line is holding thick filaments in proper register.
One of the proteins of the M line has turned out, suprisingly, to be creatine kinase, an enzyme involved in ATP regeneration.That such a catalytic agent may also be an important structural component of the myofibril has important implications withrespect to operating mechanisms of the contractile protein system.
Titin (connectin) is a high-molecular-mass, ~1,000,000 D, elastic protein that is long enough (0.9-1 mm) to extend from the Zline to the M line, spanning half of the sarcomere. It is the third most abundant myofibrillar protein, representing 10% of the total.It interacts with myosin, M-line proteins, and alpha-actinin. Titin is thought to have a role in regulating the length of thick filamentsand in maintaining mechanical continuity of myofibrils of striated muscle.

Pag e 896
Titin-containing filaments appear to be identical to the “gap filaments” observed between thin and thick filaments when muscle isstretched beyond the point of filament overlap [51].
Nebulin is another large, 700,000–900,000 D, myofibrillar protein, which accounts for 5% of myofibrillar protein. This proteinhas multiple actin binding sites, and various lengths in accord with the length of thin filaments. It appears to function in regulatingthe length of the thin filament.
Paramyosin is found in muscles of mollusks and other invertebrates, accounting for as much as 50% of the total structural proteinof these muscle fibers. It has a molecular mass of 220,000 D and is essentially 100% alpha-helical. It forms the central core ofthe myosin-containing thick filaments in these systems.
15.4.4.2 Contraction and Relaxation
Contraction
Although it is not the purpose of this chapter to delve into the physiology of living muscle, it is necessary to have someknowledge of the normal functioning and interactions of contractile proteins in the living cell to understand postmortem changes.Indeed, the chemical reactions that occur in postmortem muscle are the same as those in the live animal, except biologicalregulation is lacking.
Contraction occurs when muscle is stimulated by an electrical nervous impulse that depolarizes the muscle cell membrane(sarcolemma). The transverse tubular system of the muscle is an extension of the sarcolemma, providing a link between theoutside and inside of the cell. The stimulus (depolarization) is transmitted to the interior of the muscle cell so that the whole cellcan react as a unit. The transverse tubules are adjacent to, but not connected with, the calcium-containing sarcoplasmic reticulumwhich surrounds the myofibrils. The depolarization of the transverse tubular system is conveyed to the sarcoplasmic reticulum bythe dihydropyridine receptor protein. This protein is a member of a group that is generally termed “calcium channel proteins”. Itcontains voltage and calcium binding portions. Calcium is released from the sarcoplasmic reticulum by a calcium channel proteintermed the ryanodine receptor [53]. This increases the calcium concentration in the sarcoplasm from 0.1 to 10 mM. The calciumbinds to troponin C, causing a structural transition. This changes the troponin-tropomyosin-actin complex so that tropomyosinmoves into the groove of the F-actin superhelix. By this process the thin filament is “turned on”, that is, it is able to interact with athick filament and cause contraction. It was previously thought that the troponin-tropomyosin complex regulated contraction byblocking interaction between actin and myosin. This has been disproved, and it is now believed that the actin filament has adirect role in contraction, implying that troponin-tropomyosin may function by altering F-actin flexibility.
Roles of Thick and Think Filaments in Contraction
Our current understanding of muscle contraction originates with the “sliding filament hypothesis” proposed in 1954 [38, 40]. Itwas observed that the length of the A-band remains constant during contraction while the H-zone and I-bands decrease (Fig. 5).Furthermore, electron micrographs had shown that the sarcomere is composed of thick and think filaments that, when viewed incross section, show six thin filaments around each thick filament. From these and other observations, the sliding filamenthypothesis was formulated: Muscle contraction involves chemical interactions between thick and thin filaments, causing them toslide past each other in a manner that shortens the sarcomere.
Since the origin of the sliding filament hypothesis, literally thousands of experiments have been done to better understand themolecular mechanism for muscle contraction. Each finding

Pag e 897
has caused the model for contraction to be revised. Major contributions that allowed the sliding filament hypothesis to be refinedare the elucidation of the three-dimensional structures of that portion of the myosin molecule responsible for contraction (thehead), and of the actin (thin) filament [35, 76]. The current model for contraction relies heavily on knowledge of these structures.Each myosin head interacts with two actin monomers of the thin filament at strong and weak binding sites. Starting with myosinstrongly bound to actin in a rigor complex at the end of a contraction cycle, the triphosphate portion of an ATP molecule bindsto the ATPase site on the myosin head. This causes an opening (widening) of two segments of the myosin head, which results indecoupling at the strong binding site while maintaining associations at the weak binding site. The myosin head continues to moveand closes around the ATP molecule, resulting in dissociation of myosin from actin. ATP is hydrolyzed and the ADP andgamma-phosphate remain bound to the myosin head. Myosin then starts to recombine with actin, first with weak ionicinteractions. As more of the myosin head associates with actin the binding progresses from weak to strong, and with release ofthe gamma-phosphate, the contraction (power) stroke is initiated. At the end of the power stroke ADP is released and themyosin head is back to the starting state. Thin filament regulation by troponin-tropomyosin most likely involves the transitionfrom weak to strong binding of myosin to actin.
Relaxation
Relaxation in most skeletal muscle involves “turning off” the thin filament. This is done by decreasing sarcoplasmic calciumconcentration from 10 to 0.1 mM, and requires active transport of calcium back into ther sarcoplasmic reticulum. The “calciumpump” is a 100,000 D protein that exists in the sarcoplasmic reticulum. One molecule of ATP and two calciums bind to thepump proteins on the sarcoplasmic side. Through structural transitions and ATP hydrolysis, calcium is transported to the interiorof the sarcoplasmic reticulum where it is bound to calsequestrin, the protein responsible for calcium storage. Without thisbinding, more calcium could not be transported into the sarcoplasmic reticulum, and the sarcoplasmic concentration of calciumcould not be lowered.
It is important to note that energy (ATP) is required for contraction, via myosin ATPase, and to stop contraction, by action ofthe calcium pump. When energy is depleted postmortem, the muscle goes into a state of rigor mortis.
15.4.4.3 Soluble Components of the Muscle Cell
Soluble proteins of the muscle cell are known by various terms, for example, myogen, which is a water extract of muscle, orsimply sarcoplasmic extract. In any case, the soluble proteins of the muscle cell constitute a very significant portion of theproteins of the cell, usually from 25 to 30% of the total proteins.
Most of these soluble proteins are enzymes, principally glycolytic enzymes, but other enzymes are present as well, includingthose of the pentose shunt and such auxiliary enzymes as creatine kinase and AMP deaminase. The oxygen storage componentof the muscle cell, myoglobin, is also a water-soluble protein. The high viscosity of the sarcoplasm is probably attributable to thepresence of soluble proteins in concentrations as high as 20–30%. In some species, glyceraldehyde-3-phosphatedehydrogenase comprises approximately 10% of this soluble protein. As noted, some of these proteins are attached to thecytoskeleton, in which case they are not soluble in vivo but are easily solubilized.
Other soluble nonprotein constituents of the sarcoplasm include various nitrogen-containing compounds, such as amino acidsand nucleotides; some soluble carbohydrates (intermediates in glycolysis); lactate, which is the major end product of glycolysis; anumber of enzyme

Pag e 898
cofactors; and inorganic ions, including inorganic phosphate, potassium, sodium, magnesium, and calcium.
15.4.4.4 Insoluble Components of the Muscle Cell
Some components of the muscle cell are not soluble in water or in dilute or concentrated salt solutions that are encounteredduring muscle foods processing. This category includes unextractable contractile proteins, such as titin and desmin, portions ofmembrane systems, glycogen granules, fat droplets, and the largest fraction, connective tissue proteins. The principal neutrallipids in muscles are triacylglycerols and cholesterol. Proteins of the membrane fractions are usually very insoluble unless they aretreated with detergents (surface-active agents). These fractions are therefore usually not extractable with most aqueous solvents.
Most of the lipid material in the cell is associated with membranes, and these lipids are typically rich in phospholipids. Thephospholipid content varies among different membranes. Phospholipids comprise approximately 90% of the lipids inmitochondria and about 50% of the lipids in plasma membrane. The total lipid content of the muscle cell is small, only about3–4% of the total weight of mammalian cells and less than 1% of the muscle cells of lean fish [1]. These lipids are, however,extremely important because they are involved in the structure and function of membranes, and as we shall see later, they arevery important in some deteriorative reactions.
The major phospholipids of muscle are lecithin (phosphatidylcholine), phosphatidyl-ethanolamine, phosphatidylserine,phosphatidylinositol, and some of the acidic glycerol phosphatides, such as cardiolipin (Table 6). The amounts of each of thesesubstances vary depending on the particular subcellular fraction examined. This is true also to a somewhat lesser degree for thekinds of fatty acids that make up the phospholipids. Furthermore, compositional differences of the sort just mentioned also existamong muscles of a given species and among comparable muscles of different species.
15.4.5 Muscle Fiber Types
Individual muscles are historically the “smallest unit” used in assigning taxonomical classification relative to physiological activity.According to this approach all muscles are classified as either fast-twitch or slow-twitch. Fast-twitch (white or light inappearance) muscles have a more rapid progression to peak tension and decline to resting tension than do slow-twitch (red ordark appearance) muscles. Fast-twitch muscles are found in anatomical locations where forceful movement is needed, whereaseslow-twitch muscles are associated with long sustained contraction, that is, for maintenance of posture. Their appearance, redversus white, is related to their energy metabolism. Fast-twitch muscles require a rapid source of energy, so glycolysis is thepredominant pathway used by these muscles. Slow-twitch muscles rely primarily on oxidative metabolism. This requires a largeamount of myoglobin for oxygen storage, and these muscles are therefore redder (or darker) than fast-twitch (white) muscles.Although the differences between white (fast-twitch) breast muscles of poultry and red (slow-twitch) thigh muscles are easy todistinguish based on appearance, twitch types of muscles are more difficult to distinguish in beef. Indeed, a white beef musclemay appear as dark as a red poultry muscle.
Individual fibers can be classified histochemically with respect to enzyme activity (ATPase) related to twitch speed, and types ofenergy metabolism. Three classes are generally recognized: type I, slow twitch oxidative; type IIA, fast-twitch oxidative; andtype IIB, fast-twitch glycolytic [74]. Alternative names for these classes are red or bR for type I, intermediate or bW for type

Pag e 899
TABLE 6 Intramuscular Phospholipid Distribution
Phospholipid distribution a
Turkey Fish
Phospholipid W hite Dark W hite Dark Pig Beef Sheep
Phosphatidylethanolamine 20.8 26.0 22.5 18.0 28.1 26.6 21.3
Phosphatidylinositol+ 10.3 9.0 8.0 19.0 9.5 9.7 6.4
Phosphatidylserine
Phosphatidylcholine 49.7 48.6 50.7 27.9 51.0 46.5 42.2
Sphing omyelin 12.2 11.2 4.8 11.7 5.8 4.5 6.4
Lysophophatidyl choline 7.0 5.2 2.9 5.8 - 0.7 -
Phosphatidic acid - - 2.2 4.9 - 0.3 -
Cardiolipin - - 3.8 9.11 5.0 8.9 7.0
Phosphatidylg lycerol - - - - - 0.3 -
Lysobisphosphatidic acid - - - - - 0.1 -
Total 100 100 94.9 96.4 99.4 97.6 83.3
aExpressed as a percentag e of total intramuscular phospholipid
Source: Ref. 3.
IIA, and white or aW for type IIB. Turkey breast meat contains 95% IIB fibers, whereas muscles from the leg and thigh have50–70% type IIA and I fibers combined [96]. Many muscles used for meat contain a variety of fibers; therefore the distinctdifferences seen between poultry breast and thigh meat should be considered an exception rather than the rule.
As compared to white fibers, red fibers (type I) tend to be smaller; richer in mitochondria, myoblogin, and lipid; more generouslysupplied with blood; and more dependent on the tricarboxylic acid cycle and oxidative metabolism. Therefore, glycogen andmany of the enzymes related to glycolysis tend to be less abundant in red fibers than in white. In addition, red fibers have athicker sarcolemma, much less extensive and more poorly developed sarcoplasmic reticulum, less sarcoplasm, and a lessgranular appearance than do white fibers. The sarcoplasmic reticulum is more developed in white fibers to accomodate therapid-twitch respone. The Z disks of red muscle fibers also tend to be thicker than those in white muscle fibers. The Z disks ofwhite (pectoralis major) and red (semitendinosus) turkey sarcomeres are 39.0 and 53.0 nm thick, respectively [16].
Histochemical stains have commonly been used to detect biochemical differences for fiber classification, because measurementof twitch speed was impossible. It is now known that there are specific fast and slow isoforms for the majority of sarcomericproteins. Isoforms are proteins with similar structure, names, and functions, but with small differences in the primary sequence ofamino acids. For many myofibrillar proteins, there are several fast or slow isoforms. This allows an organism to have acontinuum of contraction speeds and precise regulation of movement, but makes classification of fibers more difficult. Adult ratmuscle contains three fast myosin heavy-chain isoforms (types IIa, IIb, and IId) and one slow isoforms (type I) [84]. These fourisoforms are found in various combinations in individual fibers, producing 10 different fiber types. The number of fiber types areeven greater if one considers differences in energy metabolism.
In fish muscle, fiber types are more distinctive than in mammalian or avian muscles. The

Pag e 900
arrangement of these muscles in codfish is shown in Figure 9. The dark muscle is concentrated superficially, particularly near thelateral line—a group of skin sensory organs extending in a single row, from head to tail, along the surface of each side of thebody. In a few fish, such as tuna, which are very active and fast swimmers, deep-seated dark muscle also is present. A thin layerof intermediate (type IIA) muscle fibers separates the dark from the light fibers. In some species of fish, particularly salmonids, afew isolated dark fibers are scattered throughout the main bulk of the white muscle. Some deviation from the pattern in Figure 9is not uncommon.
Generally, the proportion of dark muscle in fish increases toward the tail region. The fraction of red muscle fibers in the totalmuscle tissue varies greatly among species. Migratory (fatty) fish have abundant red tissue. At a point one-third the way forwardfrom the tail, red fibers constitute 15–30% of the total. For bottom-feeding lean fish, the percentage of red fibers is low, rangingfrom 2 to 12% at this same location [29], and some fish species have no detectable red fibers at this location.
White muscle from fish is very uniform in composition no matter where it is located. Dark muscle, however, varies incomposition as a function of its location, containing more lipid in the anterior part of the fish and more water and protein in theposterior part [55]. Also, when fish fatten, lipids accumulate mostly in the anterior dark muscle. A larger fraction of dark muscletissue is present in fish that live in a low-temperature environment than in fish accustomed to higher temperatures [55]. Like otheranimals, the white muscle in fish appears to be used mostly for short, intense expenditures of energy, whereas the dark muscle isused for longer term exertion (swimming), which is why one finds more dark muscle tissue in migratory fish.
It has been suggested that red muscle tissue in fish serves many of the same functions as the liver in warm-blooded vertebrates.although this hypothesis is not widely accepted, the red muscle tissue of fish does have characteristics that give this hypothesissome validity. for example, unlike warm-blooded vertebrates, the content of glycogen is greater in red muscle
FIGURE 9Transverse section of cod at point ofmaximal flexure: W F, white fibers; RF,red fibers; IF, intermediate fibers; VC,
vertebral column, LLC, lateral linecanal
(From Ref. 29, p. 229.)

Pag e 901
tissue than in white. Another characteristic worth noting is that the content of trimethylamine oxide in migratory fish is greater indark muscle than in white, but the reverse is true in the muscle of nonmigratory lean fish [55].
Muscle fiber types can be changed by exercise. This is most evident in humans who spend extensive time lifting weights.Exercise can be used to change the fiber type in meat animals such as sheep [2]. Shown in Table 7 are contraction propertiesand myosin isoforms found in four rabbit muscles, and changes in these properties caused by chronic electrical stimulation. Acomparision of the psoas and tibialis anterior fibers shows that a change in twitch speed of type IIB fibers is associated with anincreased ratio of LC3 to LC1 in the myosin head. Chronic stimulation of tibialis anterior fibers changes the myosin heavy chainfrom type IIB to type IIA and changes the ratio of LC1 to LC3.
An understanding of the differences among muscle fibers and factors that control fiber types is important in food science sincemany of the characteristics of muscle postmortem are a function of fiber type. For example, muscle color and susceptibility tocold shortening (Sec. 15.6) are influenced greatly by fiber type; that is, muscles with a preponderance of white fibers generallyare much less susceptible to cold shortening than are muscles that have a majority of red fibers.
The molecular switch that turns on different muscle genes is a family of proteins called helix-loop-helix (indicating their secondarystructure) transcription factors. If these could be controlled by breeding or recombinant DNA approaches, one could modifyanimals with respect to meat quality.
15.4.6 Connective Tissue
Connective tissue consists of various fibers, several different cell types, and amporphous ground substances (also calledbasement lamina). Connective tissues hold and support the muscles by means of the component tendons, epimysium,perimysium, and endomysium. The relationship between connective tissue and muscle cells is so intimate that most likely allsubstances passing in or out of the muscle cell diffuse through some type of connective tissue.
Several types of cells are found in the connective tissue. These include fibroblasts, mesenchyme cells, macrophages, lymphoidcells, mast cells, and eosinophilic cells.
TABLE 7 Contraction Properties and Myosin Isoforms in Rabbit Muscle
Muscle and fiber type
PropertiesPsoas(IIb)
Tibialisanterior (IIb)
Tibialisanterior (IIa)
(chronicstimulation)a
Vastusintermedius
(IIa) Soleus (I)
Velocityb 2.07 1.63 0.86 0.98 0.41
Force (N/m2) 12.45 11.97 10.00 10.88 10.68
Myosin heavy chainisoform
IIb IIb IIa IIa I
LC-1f content (%) 51.6 62.5 76.2 74.2
LC-3f content (%) 48.4 37.5 23.8 25.8
a10 Hz, 8 hr/day for 7 weeks.
bFiber leng ths/sec.
Source: Ref. 87.

Pag e 902
15.4.6.1 Collagen
The major fraction of connective tissue is collagen. This component is important because it contributes significantly to toughnessin mammalian muscle. Also, the partially denatured product of collagen, gelatin, is a useful ingredient in many food productsbecause it serves as the functional ingredient in temperature-dependent gel-type desserts. Collagen is abundant in tendons, skin,bone, the vascular system of animals, and the connective tissue sheaths surrounding muscle. Collagen comprises one-third ormore of the total protein of mammals. About 10% of mammalian muscle protein is collagen [6], but the amount in fish isgenerally much less [82]. Some of the collagen is soluble in neutral salt solution, some is soluble in acid, and some is insoluble.
The collagen monomer is a long cylindrical protein about 2800 Å long and 14–15 Å in diameter. It consists of three polypeptidechains wound around each other in a suprahelical fashion. Collagen occurs in several polymorphic forms. the most commoncollagen type is type I collagen and it contains two identical polypeptide chains, designated a1(I), and a third chain, a2, whichhas a different amino acid sequence [83]. Each chain has a molecular mass of about 100,000 D, yielding a total molecular massof about 300,000 D for collagen. The three chains are held together by hydrogen bonding. A second type of collagen, type III,is made up of three identical chains designated a1(III). This type of collagen is unusual in that intramolecular disulfide bonds existin the nonhelical, carboxy-terminal peptide.
A third type of collagen molecules, type IV, is about a third greater in length than types I and III and, like type III collagen,contains oxidizable cysteine residues. Type IV collagen is rich in hydroxyproline and hydroxylysine. It has a nonhelical, globularregion at its C terminus. It is thought to form gossamer lattice sheets of a “chicken wire” structure by interaction of two C-terminiand the overlapping of four adjacent N-termini through disulfide bonding [6].
A fourth type of collagen is type V collagen. Like type IV, it is rich in hydroxyproline and hydroxylysine content but contains nocysteine. It is about the same length as types I and II (the latter not found in meat) and consists of two or three different types ofpolypeptide chains.
The presence of type I collagen in the epimysium of muscle, types I and III in the perimysium, and types III, IV, and V in theendomysium has been reported [83]. Type III collagen appears to have an especially important role in imparting toughness tomammalian muscles. In some instances, the single strands of polypeptides that constitute collagen are cross-linked with covalentbonds. When two of the peptides are joined in this fashion it is called a b component; however, when all three are so joined, theproduct is known as a g component. The solubility of collagen decreases as intermolecular cross-linking increases.
Polypeptides of collagen are mostly helical with the exception of the few residues at each end. However, the helices differ fromthe typical a-helix due to the abundence of hydroxyproline and proline, which interfere with a-helical structure. Collagenmolecules link end to end and adjacently to form collagen fibers, as shown in Figure 10. There is a periodicity in the cross-striations of collagen at about 640–700 Å intervals. Collagen fibers are sometimes arranged in parallel fashion to give greatstrength, as in tendons, or they may be highly branched and disordered as in skin.
The amino acid composition of collagen is nutritionally unbalanced and is unusual in several other respects. Collagen is almostdevoid of tryptophan; it is rich in glycine, hydroxyproline, and proline; and it is one of the few proteins that containshydroxylysine. Glycine represents nearly one-third of the total residues, and it is distributed uniformly at every third positionthroughout most of the collagen molecule. The repetitive occurrence of glycine is absent in the first 14 or so amino acid residuesfrom the N-terminus and the first 10 or so from the C-terminus, with these end portions being termed “telopeptides” [37].Collagen is the only protein that is rich in hydroxproline (up to 10% in mammalian collagen); however, fish collagens contain lessof this

Pag e 903
FIGURE 10Illustration of the overlap structure of the
collag en fiber responsible for the banding patternof a neg atively stained collag en fiber as seen by
electron microscopy. (From Ref. 6.)
amino acid than do mammalian collagens. Because hydroxyproline is present in significant amounts in so few other proteins, it isoften used as a measure of the amount of collagen in food samples.
The presence of proline stabilizes the helix structure by preventing rotation of the N-C bond. Hydroxyproline also stabilizes thecollagen molecule, and collagens that contain small concentrations of both of these imino acids denature at lower temperaturesthan do those with large concentrations (Fig. 11). The imino acid content of fish collagens, and therefore their thermal stability,correlates with the water temperature of their normal habitat. Proteoglycan and glycoprotein contents can also affect collagenthermal stability.
Two important oxidations take place in collagens. These are conversion of proline to hydroxyproline and conversion of lysine tohydroxylysine. This latter compound and lysine can be oxidized, in some instances to 1-amino-1-carboxy-pentan-5-al.Oxidation of proline and lysine to their hydroxylated residues is catalyzed by proline hydroxylase and lysine hydroxylase,respectively. These enzyme systems utilize molecular oxygen, a-ketoglutarate, ferrous ion, and a reducing substance, such asascorbate. Production of the 1-amino-1-carboxy-pentan-5-al is catalyzed by a copper-containing enzyme called lysyl oxidase;this compound is involved in collagen cross-linking.
The covalent cross-links involved in the b and g components of collagen and the intermolecular cross-links between collagenmolecules form spontaneously by the condensation of aldehyde groups. This may involve an aldol condensation-type reaction, orformation of a Schiff base when the aldehyde, reacts with an amino group. When hydroxylysine reacts with hydroxylysinealdehyde the reaction product undergoes an Amadori-type rearrangement to form a “keto” structure, hydroxylysino-5-keto-norleucine. Examples of these reactions are shown in Figure 12.
As animals age, collagen cross-links are converted from a reducible form to a more stable nonreducible form. The nature of the“mature” nonreducible cross-link is not known, although

Pag e 904
FIGURE 11Relationship between the total imino acid content (proline +hydroxyproline) of various collag ens from different species
and the molecular melting temperatures (T m) of thesecollag ens. (From Ref. 6.)
several hypotheses have been proposed [6]. It is likely that nonreducible cross-links involve several functional groups and anextensive polymeric network. Intermolecular crosslinks are confined to the end-overlap region involving a lysine aldehyde in thetelopeptide of one chain and a hydroxylysine in the helical region of an adjacent chain (28 nm from the N-or C-terminus).Noncollagenase proteinases, because they can attack the telopeptide region of collagen, can effectively break these cross-links.
The number of cross-links in collagen also increases with increasing age, and this may partially explain why meat from oldermammalian animals is tougher than that from younger animals, even though muscles from younger animals generally contain morecollagen. In fish, the situation is very different. Collagens of the myocommata of older fish are weaker and have fewer cross-linksthan do the collagens of younger fish. On the other hand, older fish contain more collagen (evident as thicker myocommata) thanyounger fish.
As cross-linking of collagen increases it becomes less soluble in a variety of solvents, such as salt and acid solutions. Withadvancing age the amount of insoluble collagen often increases manyfold in mammalian muscle, whereas the amount of insolublecollagen of cod increases only slightly with age and the amount of soluble collagen actually increases [55]. Starving fish producemore collagen and collagen with a greater degree of cross-linking than do fish that are well fed.
Most proteolytic enzymes have little activity against native collagen, although they will readily degrade denatured collagen.Collagenase has been identified in several animal tissues. Its presence is difficult to detect because it exhibits low activity,apparently because of control mechanisms operative in the tissue.
For the most part, animal collagenases cleave a single bond in each of the three chains of the collagen molecule. Severalmicroorganisms, particularly Clostridium species, produce collagenases. These enzymes differ from the animal collagenases inthat they degrade collagen extensively. Noncollagenase proteinases can cleave the collagen molecule in the telopeptide region.They can contribute to destabilization of the collagen molecule by disrupting the region in which intermolecular cross-links areformed [10]. The importance of collagenase enzymes in

Pag e 905
FIGURE 12Cross-link formation in collag en by side chain g roups. (a) Aldol condensation
followed by loss of water. (b) Schiff base formation. Lysine reacts in a manner analog ousto hydroxylysine. (c) Schiff base formation followed by Amadori rearrang ement.
the breakdown of collagen in situ is not known, but they seem to be of some importance in postmortem tenderization.
15.4.6.2 Conversion of Collagen to Gelatin
Collagen fibrils shrink to less than one-third their original length at a critical temperature, known as the shrinkage temperature,characteristic of the species from which the collagen is derived [37]. This shrinkage involves a disassembly of fibers and acollapse of the triple-helical arrangement of polypeptide subunits in the collagen molecule. Essentially the same type of molecularchanges occur when collagen is heated in solution, but at a much lower temperature. The midpoint of the collagen-to-gelatintransition is defined as the melting temperature (see Fig.

Pag e 906
11). During the collagen to gelatin transition, many noncovalent bonds are broken along with some covalent inter- andintramolecular bonds (Schiff base and aldo condensation bonds) and a few peptide bonds. This results in conversion of thehelical collagen structure to a more amorphous form, known as gelatin [93]. These changes constitute denaturation of thecollagen molecule but not to the point of a completely unstructured product. If the latter event happens, glue instead of gelatin isproduced.
After gelatin is produced and the temperature is lowered to below the critical value, there is a partial renaturation of the collagenmolecule, involving what is called the “collagen fold” [93]. Apparently, those parts of collagen that are rich in proline andhydroxyproline residues regain some of their structure, following which they can apparently interact. When many molecules areinvolved, a three-dimensional structure is produced that is responsible for the gel observed at low temperatures (see Chap. 3).This collagen fold is absolutely dependent on temperature. Above the melting temperature, the structure degrades and so doesthe gel. The strength of the gel formed is proportional to the square of the concentration of gelatin and directly proportional tomolecular weight [93]. Ionic strength and pH normally have only small influences on gel structure over the range of valuesencountered in food products.
Processing of collagen into gelatin involves three major steps. There is first the removal of noncollagenous components from thestock (skin and bones), then the conversion of collagen to gelatin by heating in the presence of water, and finally recovery ofgelatin in the final form. The molecular properties of gelatin depend on the number of bonds that are broken in the parentcollagen molecules. Removal of noncollagenous material can be done with acid or with alkali, and the procedures used influencethe properties of the gelatins. Acid hydrolysis is a milder treatment that will effectively solubilize collagens of animals slaughteredat a young age, such as pigs. Gelatins produced in this manner are termed type A gelatins. Type B gelatins are produced byalkali hydrolysis of beef materials and results in deamidation and a greater range of molecular weight species. Type A and Bgelatins exhibit isoelectric points of pH 6–9 and about 5, respectively.
Conversion of collagen to gelatin occurs during normal cooking of meat, and this accounts for the gelatinous material that issometimes evident in meat after heating and cooling. An aspic type of product, for example, results from the conversion ofcollagen to gelatin. Also, conversion of the collagen molecule to the much less structured gelatin can play an important role intenderness of meat, especially in meat of poor quality. This kind of meat (e.g., pot roast or stew meat) has a high content ofcollagen and is usually cooked for a long time in liquid to achieve the desired tenderness, that is, the desired conversion ofcollagen to gelatin. The tenderness and flakiness of cooked fish are due to the relative ease with which their collagen is convertedto gelatin.
15.4.7 Fat Cells
The fat cell deserves special attention. Fat cells appear to arise from undifferentiated mesenchyme cells, usually developingaround the blood vessels in muscle. As a fat cell develops, it accumulates droplets of lipid. These droplets grow by coalescence,and eventually, in the mature fat cell, only a single large drop of fat exists. Cytoplasm surrounds the fat droplet, and subcellularorganelles are located in this thin cytoplasmic layer. Fat cells are located outside the primary muscle bundles, that is, in theperimysial spaces or subcutaneously, but not in the endomysial area. Lipid in the latter area is usually associated with membranesor it exists as tiny fat droplets distributed in the muscle fiber itself.
The amount of fat that accumulates in an animal depends on age, the level of nutrition, exercise, and other physiological factorsthat function in the specific muscle in question. Initially,

Pag e 907
fat tends to accumulate abdominally or under the skin, and only later does it accumulate around the muscle. The lateraccumulation leads to the so-called marbling of meat. Since this is the last fat to be deposited, a large quantity of feed isnecessary to develop marbling. The amount of fat surrounding and within muscles is not constant but can increase or decreasedepending on the food intake of the animal and other factors. The amount of fat surrounding the major muscles influences theappearance or “finish” of the meat.
The membranes surrounding fat cells contain small amounts of phospholipids and some cholesterol, but the most abundant lipidsin adipose tissue are triacylglycerols and free fatty acids. This fat can be extracted from the carcass by rendering or heating tomelt the fat and rupture fat cells. This fat can be used as such, as lard, for example, or it can be chemically modified for use in themanufacture of shortenings and margarines. The fat component of meat is very important since some is needed to produce asatisfactory flavor and mouth feel; however, excessive amounts decrease the usable lean portion without improving these qualityattributes.
15.5 Biochemical Changes in Muscle Postmortem
15.5.1 Biochemical Changes Related to Energy Metabolism
Muscle is a highly specialized tissue, and its functioning represents a classic example of conversion of chemical to mechanicalenergy in living systems. Muscle requires a large outlay of energy to rapidly operate the contractile apparatus. This energy israpidly derived from the high-energy compound ATP. Resting muscle is normally about 5 mM in ATP, which is not enough for along sustained contraction. The storage form of energy in muscle is creatine phosphate. Muscle contains 20 mM creatinephosphate, and this compound can rapidly transfer its high-energy phosphate to ADP to prevent excessive decreases in ATPlevels during periods of vigorous muscle activity. Resynthesis of ATP from ADP and creatine phosphate is catalyzed by theenzyme creatine kinase. The enzyme adenylate kinase converts two molecules of ADP to one molecule of ATP and onemolecule of AMP (see Fig. 14); this reaction also serves as a source of ATP in muscle cells.
For long-term activity, the living muscle must maintain a physiological level of ATP, and this is accomplished by oxidation ofstorage substrates, usually carbohydrate or lipids. Lipid metabolism seems to be an especially important source of utilizableenergy in muscles accustomed to sustained activity, for example, those that support prolonged running of animals or prolongedflights of birds. Carbohydrates are also an important energy source for muscle. Glycogen is the most important source ofcarbohydrate energy. In red muscles and in muscles that are not working extremely hard, it is likely that most of the energy issupplied via the tricarboxylic acid cycle and the mitochondrial electron transport system (aerobic respiration). This systemprovides a large quantity of ATP molecules per molecule of substrate utilized and allows for the complete conversion ofsubstrate to carbon dioxide and water.
The mitochondrial system, however, requires oxygen and in some instances, when the muscle is under heavy stress, oxygen isnot available in sufficient amounts to maintain mitochondrial function. The anaerobic glycolytic system then becomespredominant. This is especially likely in white muscles, which are generally involved in sporadic bursts of activity requiring verylarge amounts of energy.
During anaerobic glycolysis, glycogen is converted through a series of phosphorylated six-carbon and three-carbonintermediates to pyruvate, which is then reduced to lactate. This system requires the cofactor NAD+, and it continuallyregenerates the NAD+ required. The

Pag e 908
terminal enzyme of the sequence, lactate dehydrogenase, is principally responsible for regeneration of NAD+. In anaerobicglycolysis, ATP production is much less efficient than it is in aerobic respiration. For example, anaerobic glycolysis yields only 2or 3 moles ATP per mole of glucose, whereas aerobic respiration yields 36 or 37 moles ATP. Also, anaerobic glycolysis resultsin incomplete oxidation of substrates and accumulation of lactate. Lactate can penetrate the cell membrane, and much of it isremoved to the blood, where it goes to the liver and is used in the resynthesis of glucose. The glucose is then carried back to themuscle, where glycogen is eventually produced. Lactate transport out of fish muscle is very slow, and a very long period isrequired to deplete it [55].
Anaerobic glycolysis is favored only under conditions in which the mitochondrial system cannot function, that is, under conditionsof limited oxygen. The amount of anaerobic glycolysis that occurs in a muscle is, therefore, dependent on many factors, includingthe vascular system, the type of muscle, the amount of myoglobin, and the number of mitochondria present.
These reactions should be of interest to food chemists because many of them proceed after the death of the animal and have animportant bearing on food quality. Muscle tissue is often referred to as “dead,” as opposed to postharvest fruits and vegetables,which are said to be “alive.” This distinction arises mainly because of differences in the physiology and morphology of muscletissue as compared with plant tissue. Animal tissues are more highly organized than plant tissues, and life processes of animalsrely heavily on a highly developed circulatory system. After death, all circulation ceases, and this rapidly brings about importantchanges in the muscle tissue. The principal changes are attributable to a lack of oxygen (anaerobic conditions) and theaccumulation of certain waste products, especially lactate and hydrogen ions. Plant tissue is less dependent on a highlydeveloped circulatory system than animal tissue, and although certain substances are no longer available to the fruit or vegetableafter harvest (see Chap. 16), oxygen can diffuse in, carbon dioxide can diffuse out, and waste products can be removed fromthe cytoplasm by accumulation in the large vacuoles present in mature parenchymatous tissue. In contrast, enzymes of musclepostmortem are faced with an entirely different environment.
It is believed that cells in general try to maintain a high energy level. This is true for the muscle cell postmortem; however, it hasrestrictions imposed on it because the circulatory system has been disrupted. In a short time postmortem, the mitochondrialsystem ceases to function in all but surface cells, since internal oxygen is rapidly depleted. Oxidative metabolism of somesubstrates, such as lipids, ceases at this time. ATP is gradually depleted through the action of various ATPases, with somecontributed by the contractile proteins but most coming from the membrane systems. Some ATP is temporarily regenerated byconversion of creatine phosphate to creatine and the transfer of its phosphate to ADP. The adenylate kinase reaction discussedearlier may also function here. After the creatine phosphate has been used up, which occurs fairly rapidly postmortem, anaerobicglycolysis continues to regenerate some ATP with the end product, lactate, accumulating. Glycolytic activity may cease becauseof exhaustion of substrate or, more likely, because of the decrease in pH caused by ATP hydrolysis. Glycogen content ofchicken breast decreases from about 9.4 mg/g muscle at slaughter, to about 0.2 mg/g muscle 24 hr after slaughter [47]. Asglycolytic activity slows down, ATP concentration decreases, with most of the ATP being depleted in 24 hr or less, dependingon the species and the circumstances. Although the hydrogen ions generated in muscle come form hydrolysis of ATP and notfrom production of lactate, there is a close correlation between the amount of lactate produced and the pH decline. Thisrelationship occurs because there is an almost linear relationship between ATP produced by the glycolytic system (and hence theATP that may be hydrolyzed later) and the amount of lactate produced.
The decrease in pH that accompanies postmortem glycolysis has an important bearing on meat quality, which is discussed inSection 15.6.2. The rate and extent of pH decline are affected

Pag e 909
by metabolic rate and the buffering capacity of muscle. Generally, white muscles have relatively large contents of the amino acidscarnosine and serine, and these probably function as buffering agents in the muscle cell. Under ordinary circumstances, the factorthat limits the extent of postmortem glycolysis is pH. When the pH is low enough, certain critical enzymes, especiallyphosphofructokinase, are inhibited and glycolysis ceases. The final pH attained is called the “ultimate pH,” and this value has animportant influence on the textural quality of meat, its water-holding capacity, its resistance to growth of microorganisms, and itscolor.
Glycogen is depleted by several stress conditions, and in general, it is desirable to minimize these conditions as much as possible.Stress conditions include exercise, fasting, hot and cold temperatures, and fear [49]. Increased glycogenolysis and lipolysisgenerally accompany stress, but not all animals react in the same way or to the same degree to any one of these stresses. It isvery difficult, for example, to deplete cattle of glycogen by exercising, whereas significant lowering of glycogen in pig musclesoccurs with relatively mild exercise. Cattle must be subjected to both psychological and physical stress to achieve importantmodification of meat properties. Within a given species, the response to stress may vary among breeds or between sexes. It ispossible to literally frighten some stress-susceptible animals sufficiently to cause death. Heat stress affects the quality of chickenbreast muscle. Heat-stressed birds exhibit lower ultimate pH values and are tougher than unstressed birds [47], and they havelower water-holding properties [65].
The ultimate pH of fish is not related to stress or the exercise to which a fish is subjected prior to death. In living fish, lactateproduced during exercise, such as struggling during harvest, is only very slowly removed from the muscle; thus, when a fishstruggles extensively before death, much lactate can be produced and this lactate, for the most part, is present in the musclepostmortem. On the other hand, a fish that struggles only slightly prior to harvest will contain only a small amount of lactate at thepoint of death, but normal postmortem glycolysis will cause muscle lactate to increase to essentially the same level as that existingin fish that struggled vigorously prior to death. Since the amount of lactate formed is roughly proportional to the amount of ATPproduced by anaerobic glycolysis, and since all the ATP in postrigor fish is broken down to produce hydrogen ions, the neteffect is that struggling or stress prior to death does not affect its ultimate pH.
15.5.2 Consequences of ATP Depletion
The consequences of ATP depletion in a muscle cell are in part similar to those that presumably occur in any cell in which energysources become depleted. Biosynthetic reactions come to a halt, and there is a loss of the cell's ability to maintain its integrity,especially with respect to membrane systems. There is an additional unique phenomenon that occurs with muscle cells. ATP isrequired to disrupt the actin-myosin complex and fuel muscle relaxation by pumping calcium from the sarcoplasm reticulum. Theirreversible interaction of actin and myosin causes muscle to pass into a state known as rigor mortis. This means literally the“stiffness of death.” The stiffness is due to the tension developed by antagonistic muscles. Individual muscles may or may notbecome stiff, but all become inextensible when ATP is depleted. When there is sufficient ATP and/or ADP, muscle can bestretched considerably before it breaks. In the state of rigor, however, muscle ATP has been depleted and it consequentlycannot be stretched significantly without breaking.
The rate of loss of ATP postmortem is directly and causatively related to the decline in pH and is affected by factors such asspecies, animal-to-animal variation within a species, type of muscle, and temperature of the carcass. The ultimate pH of musclevaries with species and muscle type. Fast-twitch muscles from beef, chicken, and turkey have respective ultimate pH

Pag e 910
values of 5.5, 5.5, and 5.7, whereas slow-twitch muscle from these respective species have ultimate pH values of 6.3, 6.1, and6.4. The ultimate pH of red meat fish, like tuna and mackeral, is around 5.5; that of lean white fish is 6.2–6.6. At the moment ofslaughter or harvest, average ATP content of many muscles is in the range 3–5 mg/g of lean tissue, and the time at which most ofthe ATP is degraded can be used as rough indicator of the time of rigor onset. The time postmortem for rigor onset (incipientloss of extensibility) under normal processing conditions is 0.5 hr for chicken, 1 hr for turkey, 0.25–3 hr for pork, 6–12 hr forbeef muscle, and up to 50 hr for whale muscle [37]. The time for rigor onset is strongly dependent on temperature, and, ingeneral, extreme cold or heat will decrease the time from death to rigor.
The relationships between several chemical and physical properties of muscle postmortem are illustrated in Figure 13. Thedecrease in ATP, pH, and glucose proceed as the tissue tries to maintain a relaxed state. These reactions are clearly faster at25°C than 5°C. Finally a point is reached where the muscle contracts as it progresses into rigor mortis.
15.5.3 ATP Breakdown to Hypoxanthine
Another important consequence of loss of ATP in muscle postmortem is its conversion to hypoxanthine, as shown in Figure 14.Certain 5-mononucleotides, intermediates in the production of hypoxanthine, are important flavor enhancers in muscle foods.For these compounds to have flavor-enhancing properties, the ribose component must be phosphorylated at postion 5 and thepurine component must be hydroxylated at position 6. Compounds that fall into this category are IMP (phosphorylated inosinicacid) and GMP (phosphorylated guanylic acid). ATP is first converted to ADP and then to AMP by a disproportionationreaction. AMP is then deaminated to IMP (desirable), which can then degrade to inosine and eventually to hypoxanthine.Hypoxanthine has a bitter flavor, and it is suspected as a cause of off flavors in stored fish.
Hypoxanthine also may cause off flavors in unheated irradiated beef since some enzymes instrumental in its formation may remainactive (enzymes are more difficult to destroy by ionizing radiations than are microorganisms). Irradiated beef therefore should beexposed to a heat treatment sufficient to inactivate enzymes so that hypoxanthine production and other detrimental enzyme-catalyzed changes do not occur.
The kinetics of ATP breakdown to IMP, inosine, and hypoxanthine in cod muscle at 0°C are shown in Figure 15. In this figure,it is also possible to compare the aforementioned changes with those of glycogen, lactate, and pH at any given time. Theproduction of IMP from ATP (through AMP) is rapid, that of inosine is somewhat less so, and production of hypoxanthine frominosine is slow. Thus, measurement of the levels of different breakdown products at a given time can give an indication of thedegree of spoilage. The breakdown products can be measured individually; however, in some cases it is advantageous to knowthe concentrations of more than one component. For example, the K value, which is derived from values of inosine,hypoxanthine, and the total amount of ATP-related compounds, is often used to determine the freshness of fish. The K valuealso may have significance in canned muscle tissue, such as herring, mackerel, or salmon. Since enzymic reactions are stoppedduring processing, the K value should provide an indication of the quality of the raw fish used. The use of levels of ATPdegradation products to assess freshness has proven less successful for muscle tissues from warm-blooded animals than forthose from cold-blooded animals.
15.5.4 Loss of Calcium-Sequestering Ability
One reason for the tendency for muscle to contract postmorten is a loss in the ability of the sarcoplasmic reticulum andmitochondria to sequester calcium. The sarcoplasmic reticulum and mitochondria release calcium during aging postmortem. Theinability of these organelles to
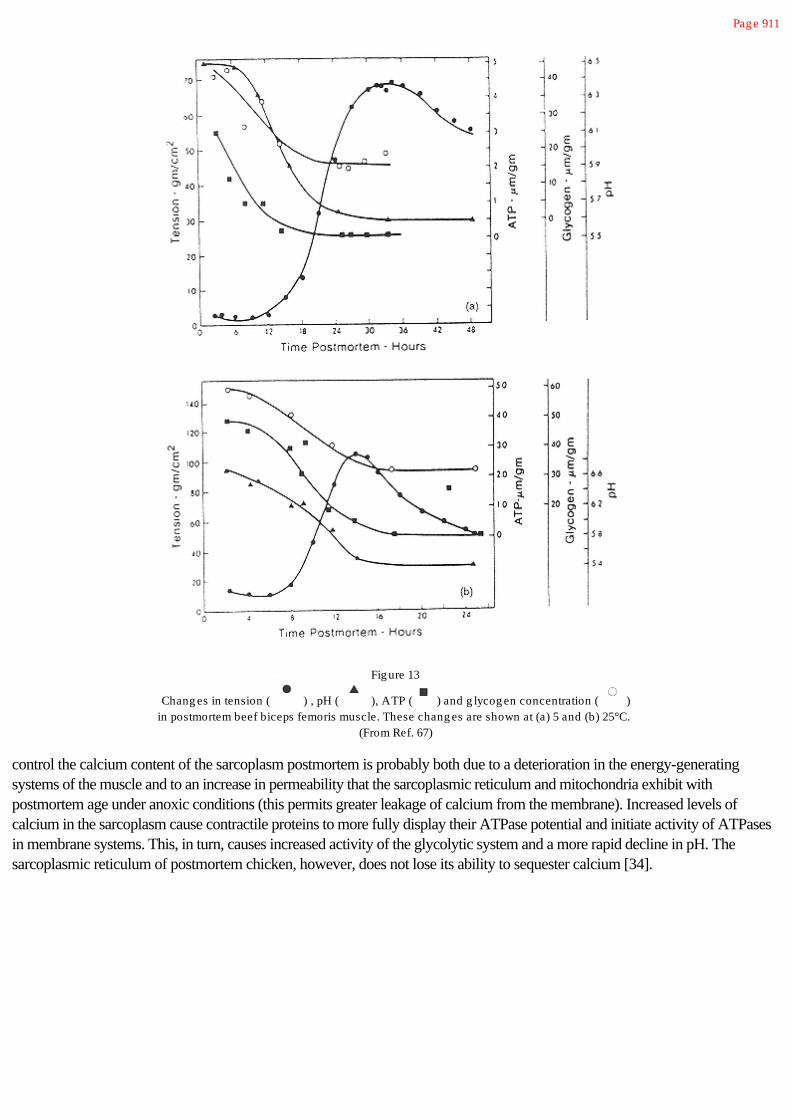
Pag e 911
Fig ure 13
Chang es in tension ( ) , pH ( ), ATP ( ) and g lycog en concentration ( )in postmortem beef biceps femoris muscle. These chang es are shown at (a) 5 and (b) 25°C.
(From Ref. 67)
control the calcium content of the sarcoplasm postmortem is probably both due to a deterioration in the energy-generatingsystems of the muscle and to an increase in permeability that the sarcoplasmic reticulum and mitochondria exhibit withpostmortem age under anoxic conditions (this permits greater leakage of calcium from the membrane). Increased levels ofcalcium in the sarcoplasm cause contractile proteins to more fully display their ATPase potential and initiate activity of ATPasesin membrane systems. This, in turn, causes increased activity of the glycolytic system and a more rapid decline in pH. Thesarcoplasmic reticulum of postmortem chicken, however, does not lose its ability to sequester calcium [34].
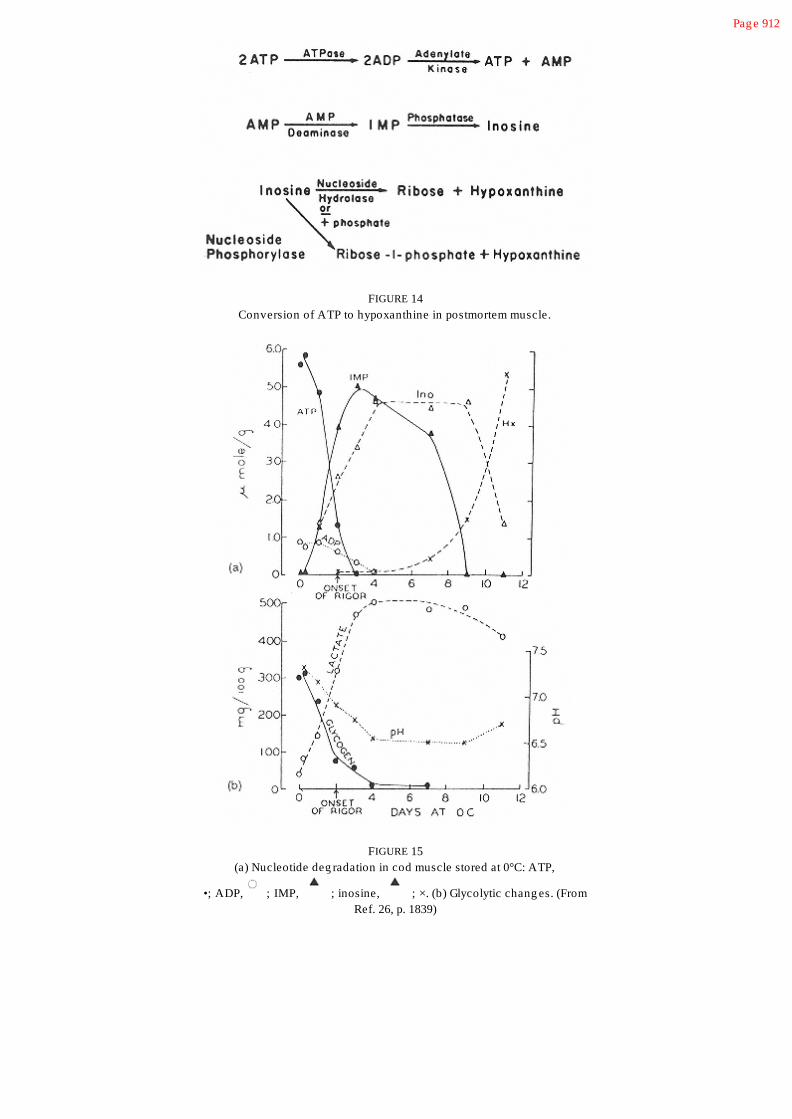
Pag e 912
FIGURE 14Conversion of ATP to hypoxanthine in postmortem muscle.
FIGURE 15(a) Nucleotide deg radation in cod muscle stored at 0°C: ATP,
•; ADP, ; IMP, ; inosine, ; ×. (b) Glycolytic chang es. (FromRef. 26, p. 1839)

Pag e 913
15.5.5 Loss of Enzymic Regulation
15.5.5.1 Lipolysis and Oxidation of Lipids
Changes occur in the lipid components of muscle tissue postmortem, and these changes have been more extensively studied infish than in warm-blooded animals. This is probably true for the following reasons: (a) fatty acids of fish lipids are much moreunsaturated than those of mammals and birds and thus would be expected to undergo more rapid oxidation with associateddevelopment of off-odors and flavors; (b) free fatty acids in fish tissues are expected to have a greater effect on contractileproteins since these proteins are less stable in fish muscle than they are in warm-blooded animals; and (c) a larger proportion offish tissue is marketed in the frozen state. Freezing can facilitate lipid oxidation, partly because the competing reactions ofmicrobiological spoilage are avoided and partly because of concentration effects. Thus, lipid oxidation is relatively moreimportant in frozen muscle tissue than in fresh tissue.
One important change that occurs in fish muscle lipids postmortem is hydrolysis of glycerol-fatty acid esters with release of freefatty acids. This is catalyzed by lipases and phospholipases. In general, lipase activity is greater in red muscle than in whitemuscle of the same fish species. In lean fish, the enzyme of principal concern is phospholipase, since most of the lipid in this typeof tissue is phospholipid. It is also possible that lipases and phospholipases produce free fatty acids during the early stages ofcooking. Hydrolysis of phospholipids appears to occur more rapidly than hydrolysis of triacylglycerols.
Oxidation of lipids also occurs during postmortem storge of muscle tissue, especially in fish muscle. The extent of oxidationdepends on the concentration of pro-oxidants, such as endogenous ferrous iron, and the fatty acid composition of the meat [17].Meats such as fish and poultry contain a high concentration of polyunsaturated fatty acids and are therefore more susceptable tooxidation. Furthermore, the concentration of ferrous iron, and the ability of that iron to be active in the lipid oxidation reaction,will be a key factor causing differences among species and cuts of meat. In general, dark meats tend to have more reactive iron[17]. Other constituents of meat can accelerate oxidation. Enzymatic (microsomal) and non-enzymatic (ascorbate) reducingsystems convert iron from the inactive ferric form to the active ferrous state, thereby promoting oxidation. Lipoxygenase can alsoaccelerate oxidation [14].
Meat also contains natural antioxidants. Compounds such as tocopherol, histidine-containing dipeptides (e.g., carnosine), andenzymes such as glutathione peroxidase contribute to the endogenous antioxidant activity of meats [14]. As with any food, lipidoxidation in meat can be inhibited by addition of exogenous antioxidants. For example, cattle fed a diet rich in vitamin E (a-tocopherol acetate) will yield meat with an elevated concentration of this vitamin and greater resistance to lipid oxidation [22].
15.5.5.2 Proteolytic Enzyme Activity
It has long been known that muscle tissue from freshly slaughtered animals is more tender prior to onset of rigor mortis than it isimmediately after. When muscle is allowed to stand postrigor at refrigerated temperatures it becomes more tender than muscle inrigor. This tenderization process, often called “resolution of rigor,” is extremely important and has been studied extensively. Themain factor in resolution of rigor appears to be loss of biological regulation of proteinases that function in muscle protein turnoverin the live animal. These proteinases hydrolyze muscle proteins, apparently weakening the structure of the myofibril andpromoting tenderness.
Many proteinases exist in muscle, and defining the precise role that each has, if any, in the tenderization process has been achallenging task. Proteinases in meat can be endogenous to muscle, or they may originate from other cells associated withmuscles such as fibroblasts, or

Pag e 914
could come from bacteria or residual blood cells. The activity of these enzymes in postmortem muscle will depend on the amountof active (undenatured) enzyme; the presence of inhibitors, activators, and required cofactors; and solution pH. For example, alarge amount of enzyme might be present but it could be inactive because of its association with a proteinase inhibitor. Activity,not quantity, is the key property that determines the importance of proteinases.
Cathepsins are lysosomal proteinases that show optimal activity at acid pH. Those known to occur in muscle and to act onmuscle proteins are (type, pH optimum) cathepsin B1, pH 3.5–6.0; cathpdin H, pH 6.0; cathepsin L, pH 5.0; and cathepsin D,pH 3.0–5.0.
Another group of proteinases found in muscle are the calcium-activated neutral proteinases called calpains. These enzymes werediscovered in rabbit skeletal muscle in 1972. It has since been shown that calpains are a ubiquitous class of proteinasesexpressed in almost every tissue. There are two types: m-calpain (calpain I), which requires 50–70 mM of Ca2+ for activity, andm-calpain (calpain II), which requires 1–5 mM of Ca2+ for activity. Muscles from various meat animals are expected to showvariation in amount and types of calpains.
Trypsin-like serine proteinases are found in fish [91]. These proteinases cause the undesirable breakdown of surimi-based fishproducts.
15.5.5.3 Reaction Products from Amino Acids
Microorganisms can utilize amino acids in muscle postmortem, leading to a large number of breakdown products, such ashydrocarbons, aldehydes, Ketones, sulfides, mercaptans, and amines (see Chap. 6). Microbial conversion of amino acids to avariety of di- and polymines is a particular problem in certain fatty fish, because these products have unpleasant sensorycharacteristics and have been implicated in an allergenic type of food poisoning called scombroid poisoning, the symptoms ofwhich often involve nausea and headaches. Although these symptoms are usually attributed to histamine, there is some evidencethat other di- and polyamines also may be involved [77].
15.5.5.4 Breakdown of Trimethylamine Oxide
Marine fish, and indeed most animals from the marine environment, contain a significant concentration of trimethylamine oxide(TMAO). In certain species of fish the content of trimethylamine oxide in the aqueous phase of the muscle tissue can exceed 0.1M. In postmortem fish muscle, microorganisms can reduce TMAO to trimethylamine, a compound responsible in part for the“fishy” odor that develops in fish on storage.
Trimethylamine oxide also decomposes in fish to dimethylamine and formaldehyde. This reaction is catalyzed by an enzyme, andthe rate is particularly great in muscle tissue from gadoid species, such as cod, haddock, and hakes. The rate of this reaction isalso increased by freezing or disrupting the muscle. It has been hypothesized that the formaldehyde produced in this reactioncross-links the muscle proteins, contributing to toughening that occurs in gadoid fish during frozen storage.
15.6 Natural and Induced Postmortem Biochemical Changes Affecting Meat Quality
15.6.1 Physicochemical Basis for Meat Texture and Water-Holding Capacity
Lean meat is about 75% water. Retention of this water is important for several reasons. First, loss of water is of economicimportance because it is economically equivalent to loss of meat. Second, water loss during storage of fresh or cooked meat(known as “purge”) is unattractive to

Pag e 915
consumers when it accumulates in the product package. Third, soluble nutrients are lost in the exuded fluid if this fluid is notcollected and consumed with the final product. Amino acids and vitamins, especially those of the B complex, are most affected.Fourth, water retention is important to meat texture. Higher water content in muscle reduces its mechanical strength, otherfactors being equal.
Since myofibrils occupy ~ 70% of the volume of lean muscle, most of the tissue water is located in the myofibrils [31]. Thus,lateral expansion or shrinking of the filament lattice would greatly influence water holding ability of the muscle (Fig. 16).Migration of water out of the muscle cell, as can occur during freezing, facilitates loss of water from muscle. Cooking induceswater loss due to shrinkage of both the filament lattice and the collagen of the endomysial sheath.
Meat toughness arises partly from water loss during cooking. During heating, at 40–50°C an increase in toughness occurs,evidenced by an increase in shear force required to rupture the muscle (Fig. 17). This is caused by aggregation of the denaturedmyofibrillar proteins, primarily actomyosin. Although this aggregation results in shrinkage of the muscle fibers, the water releasedis still retained within the endomysial sheath. At 60–70°C a second increase in shear value occurs due to shrinkage of theendomysium and (primarily) perimysium collagens. Heat-induced collagen contraction generates a tension, the magnitudedepending on the nature and extent of collagen cross-linking. The older the animal (for species other than fishes), the higher theproportion of heat-stable cross-links and the greater the tension generated on shrinkage. This shrinkage of the perimysium andendomysium forces water out and increases toughness. Although lateral shrinkage of muscle fibers and connective tissue occurindependently, their longitudinal shrinkage is functionally coupled because of linkages between them [68]. Extended cookingdecreases toughness, and this is associated with conversion of collagen to gelatin and degradation of myofibrillar proteins.
At least 60% of the resistance of cooked mammalian muscle to shear is due to connective tissues and the remainder to myofibrils[50]. The contribution of the myofibrils to toughness is greater in raw muscle than in cooked. However, both collagen contentand its degree of cross-linking markedly affect texture of raw and cooked meat. For example, a high content of collagen (near2%) renders fish muscle too tough for consumption as sashimi (raw fish meat) [11].
However, in fish muscle, where collagen is more soluble, less thermally stable, and present at lower levels than in mammalianmuscle, connective tissue differences do not relate to cooked texture. The relative firmness of cooked fish meats has beenrelated primarily to muscle pH and water content, and to species differences in muscle fiber size and the amount of coagulatedsarcoplasmic proteins in the interstitial region between individual muscle fibers. Smaller fibers, especially when they areimmobilized in a coagulum of exuded sarcoplasmic proteins, impart a firm cooked texture [33].
FIGURE 16Proposed mechanism of water-holding in muscle. On the
left is shown schematically a transverse section of amyofibril; on the rig ht, the same myofibril is shown with an
expanded filament lattice. (From Ref. 68.)

Pag e 916
FIGURE 17Diag rammatic representation of the chang es in the muscle fibers and connectivetissues during cooking in a cross section of muscle, as related to the chang e in
maximum force during shearing . Calf muscle; , ox muscle. (From Refs. 5 and 6.)
15.6.2 Effects of Rate and Extent of pH Change on Quality
One of the important biochemical events in muscle tissue postmortem is the reduction in pH brought about principally by ATPhydrolysis. Both the extent and the rate of pH change are important. The rate of change of pH is important because if the pHdrops low enough while the temperature of the carcass is still high, for example pH 6.0 and 35°C [52], considerabledenaturation of contractile and/or sarcoplasmic proteins may occur. If the sarcoplasmic proteins are denatured they may adsorbto contractile proteins, thus modifying the physical properties of the contractile proteins. This phenomenon, along withdenaturation of the contractile proteins, decreases the ability of contractile proteins to bind water. An excessively rapid decreasein pH postmortem is associated

Pag e 917
with the pale-soft-exudative (PSE) condition that is especially troublesome in pork. A similar condition can occur in red-meatfish, like tuna. The Japanese term this “yakeniku.” Characteristic attributes of this condition are a soft texture, poor water-holding capacity, and a pale color.
Also, lysosomal enzymes are released at high (ambient) temperatures, and if this is accompanied by low pH these lysosomalenzymes can act on contractile or connective tissue proteins producing a tenderizing effect. The contraction that may occur atelevated temperatures (see later) and the resulting increase in toughness will usually obscure the tenderizing by lysosomalenzymes in a low pH-high temperature environment.
The “ultimate” or final pH that a muscle tissue attains is also important. A low ultimate pH in beef provides resistance to thegrowth of microorganisms and a normal color. Sometimes a high ultimate pH occurs. This may be produced by someantemortem stress, usually prolonged in nature, that depletes glycogen reserves and limits postmortem glycolysis. This is fairlycommon in beef, causing the meat to be dark, firm, and dry (DFD). These “dark-cutting” muscles exhibit excellent water-holdingproperties but have poor resistance to the growth of microorganisms.
The ultimate pH of fish meat is generally higher than that of land animals and birds. It is affected by season, primarily becausefeeding patterns change with the season. Low ultimate pH values in muscle are occasionally observed, and this generally occursin fish that recently resumed feeding following a period of starvation. This usually occurs in early summer and may lead to adefect known as “gaping.”.
Gaping (Fig. 18) occurs when the myotomes of fish muscle separate. Normally, the myotomes (see Fig. 2) are conected to thecollagen fibers of the myocommata by collagenous microtubules. When these microtubules break, gaping occurs. Gaping iscaused by one or more of several independent factors. Low pH and/or high temperature weaken the collagen at the myotome-myocommata junction. Onset of rigor at a high temperature leads to elevated tension in the muscle and the myocommata, and anincreased tendency to gape. Gaping is particularly troublesome when fish are frozen, thawed, and then filleted, since freezingmay produce ice crystals that are physically disruptive to the connective tissue [56, 54]. Depleted (starved) fish, which exhibitrelatively higher moisture and lower protein contents, have no tendency to gape when fresh, nor do fillets that are removed fromthe skeleton of such fish prior to rigor mortis. Larger fish, which have proportionately thicker myocommata, gape less thansmaller fish of the same species and physiological condition. Fish species that exhibit a stronger skin, like catfish, also have lesstendency to gape, indicating that the collagens of these species are more highly cross-linked than that of other species [54].
The texture of cooked fish is closely related to the postmortem pH of the flesh; that is, the lower the ultimate pH, the tougher thetexture. The pH apparently exerts its effect on the texture of fish muscle by influencing the contractile elements, since fishcollagen is disrupted by normal cooking. In meats of all species, decreasing meat pH results in shrinkage of the filament latticedue to the equalization of charge. Attachment of the myosin heads to action at rigor causes further shrinkage. Denaturation ofmyosin at lower pH (near its isoelectric point of about pH 5.5) can account for an additional 12% reduction in myofibrillarvolume [68].
Color of muscle is affected principally by pH. The pH controls the physical state of the myofibrils and hence the scattering oflight from muscle. The swollen fibers of high-pH DFD meat scatter less light than normal, while the shrunken fibers of PSE meatscatter more light than normal; hence the “dark” and “pale” aspects of DFD and PSE meats, respectively. The dark color ofhigh-pH meat may also be due in part to the continuance of mitochondrial activity for a longer than normal period postmortem.Active mitochondria might compete with myoglobin for oxygen at the surface of the meat, thus reducing the amount ofoxymyoglobin (bright red) formed. If the metmyoglobin-reducing systems in muscle are inactivated by low pH, more rapidoxidation of

Pag e 918
FIGURE 18Cod fillets exhibiting g aping (rig ht) and no g aping (left). (From
Ref. 15.)
bright red oxymyoglobin to brown metmyoglobin can be expected. Low pH can also result in denaturation of myoglobin andhemoglobin, rendering the heme group susceptible to oxidation.
During most slaughtering procedures, some hemoglobin from the blood remains in the muscle. Estimates of the amount rangefrom 5 to 40% of the total pigment. With respect to meat color, the principal difference between myoglobin and hemoglobin isthat binding of O2 to hemoglobin is pH sensitive, whereas with myoglobin it is not. The colors formed from each type

Pag e 919
of pigment and the reactions required to produce these colors are identical. Total heme pigment content can vary with muscletype and with animal activity; for example, the color of dark muscle intensifies when fish become more active [55]. Meatpigments are discussed more fully in Chapter 10.
15.6.3 Effects of Action-Myosin Interaction and Contraction on Quality
A major phenomenon affecting the texture of meat is the interaction of actin and myosin after the depletion of ATP and ADP. Ifmeat is cooked and eaten before it passes into rigor, that is, before actin and myosin interact, it is very tender. However, onceactin and myosin interact, the meat exhibits increased toughness. Meat is sometimes aged to partially overcome this effect (seefollowing section).
The development of toughness in meat is particularly influenced by the state of the sarcomere when actomyosin is formed, that is,the extent to which thin and thick filaments overlap. This is controlled by several factors in the early postmortem period. Sincechanges in sarcomere length require ATP to provide energy and to enable thick and thin filaments to slide along each other, it isappropriate to focus on the prerigor period when ATP is still abundant. Three temperature conditions of prerigor muscle canadversely affect the state of the sarcomere and toughness of the muscle: low nonfreezing temperatures (cold shortening), prerigorfreezing (causes thaw rigor), and failure to cool the muscle immediately postmortem (high-temperature rigor).
15.6.3.1 Cold Shortening
If muscle is excised in a prerigor state, it is susceptible to rapid contraction. The extent of shortening depends on many factors,including the nature of the specific muscle, elapsed time between death and excision, and the physiological state of the muscle atthe time of death. At high physiological temperatures, postmortem contraction is great. As the temperature is reduced,contraction of excised, prerigor muscle decreases, and for some muscles, minimal contraction occurs at about 10–20°C. If thesemuscles are exposed to still lower temperatures in the range 0–10°C, increased contraction again occurs (Fig. 19) [52]. Thisbehavior, termed “cold shortening,” is particularly noticeable and of commercial importance with muscles that consist primarily ofred fibers, such as beef and lamb. Muscles that are highly susceptible to cold shortening (beef and lamb) should be maintained attemperatures above 10°C until they pass into rigor. Otherwise, the shortening results in undesirable increases in toughness.
The occurrence of a minimum in the contraction-temperature curve indicates that at least two processes are involved in thephenomenon of cold shortening. One of these is the normal decrease in contraction that is expected as the temperature islowered, similar in nature to the behavior of most chemical reactions. At some point, however, it appears an additional factorcomes into play that overcomes the normal effect of temperature. This phenomenon is believed to be the release of calcium intothe sarcoplasm in sufficient amount to induce contraction. It has been suggested that calcium ions are released from themitochondria as a response to anoxia postmortem. In addition, low, nonfreezing temperatures may impair the ability of thesarcoplasmic reticulum to regulate calcium concentration in the sarcoplasm, thus allowing calcium levels to rise to activatinglevels.
It has been shown (Fig. 20) that toughness increases as shortening increases, up to a point at which the muscle is approximately60% of its rest length (40% contraction) [58]. This length represents the point at which the myosin filaments just touch the Zdisk, that is, the I-band just disappears. At this state of contraction, 94–100% of the myosin heads are bound to actin in rabbitskeletal muscle. With greater shortening, the muscle loses toughness rapidly. The reason for this

Pag e 920
FIGURE 19Relation between shortening of excised beef muscleand storag e temperature postmortem. Vertical linesrepresent standard deviations (From Ref. 52, p. 788.)
FIGURE 20Relationship between shortening ofprerig or beef muscle and tendernessfollowing cooking . Shortening wasproduced by treatments of varying
temperature and time and byfreezing -thawing . (From Ref. 58, p.
635.)

Pag e 921
tenderization is not clear, but it may result because thin and thick filaments slide past each other to an extent exceeding thatwhich occurs in vivo, thus leading to severe, irreversible disruption of the sarcomere.
Muscles attached to the skeleton also can undergo some cold shortening. The extent to which this occurs depends on whetherthe muscle has been severed during slaughter (e.g., sternomandibularis or neck muscle), whether the temperature is conducive tocold shortening, whether a temperature gradient exists along the muscle during prerigor cooling causing some parts to contractand other parts to stretch, whether the muscle is naturally anchored at both ends or at one end only (e.g., longissimus dorsi), thespecies being handled, and how the carcass is positioned during the prerigor phase. With regard to the last point, improvementsin tenderness can be accomplished by holding the carcass so that muscles are stretched during the postmortem prerigor period.The success of this approach is in accord with the known existence of a strong positive correlation between sarcomere lengthand degree of tenderness. Excision of a muscle prerigor, of course, removes the physical restraint to contraction, and the muscleis then much more susceptible to substantial shortening, sometimes leading to final lengths only 30–40% of the original rest length(60–70% contraction) [59]. This results in muscle that is highly disrupted (tender), misshapen, highly exudative (poor water-holding capacity), and of poor consumer acceptability.
Data relating muscle shortening and “drip” (inverse of water-holding capacity) are shown in Figure 21. Drip losses do notbecome excessive until shortening exceeds about 40% of the original length. This behavior is in accord with the previously statedbelief that severe disruption of the muscle fiber occurs when contraction exceeds about 40%.
To prevent cold shortening, it is important that rigor occur before the carcass is cooled to temperatures that would stimulatecontraction of sensitive, prerigor tissue. This may be achieved by subjecting the carcass to an electrical current before the musclegoes into rigor, a procedure
FIGURE 21Relation between “drip” exudation (as percentag e of frozen sample
weig ht) and extent of thaw shortening (as percentag e of initialexcised leng th). (From Ref. 59, p. 456.)
Pag e 922
known as electrical stimulation. Typical conditions are 500–600 V, 2–6 A, applied in 16–20 pulses of 1.5–2.0 sec durationwithin 1 hr after slaughter. The electrical current functions in the same way as an electrical nerve impulse in the living animal andcauses strong contraction of the muscles. This process leads to faster development of rigor mortis, a more rapid postmortemdecline in pH, and improved color and tenderness of some muscles. High-energy phosphate intermediates, such as creativephosphate, ATP, and ADP, decrease more rapidly during electrical stimulation [12]. Electrically stimulated muscles displaycontracture bands in certain areas and stretched sarcomeres in other areas.
Three major theories have been advanced to explain the increased tenderness of muscle tissue that has been electricallystimulated: (a) the stimulation occurs before the temperature of the carcass is lowered; thus, cold-shortening is markedlyreduced; (b) the more rapid glycolysis causes the pH to fall rapidly, causing release of lysosomal hydrolases that can thenweaken structural components of the muscle; and (c) there is a physical disruption of the myofibrils caused by supercontractions, and this disruption prevents the toughening that would ordinarily occur with contraction. These hypotheses are notmutually exclusive, and more than one phenomenon may occur simultaneously.
It has also been reported that electrical stimulation lowers the shrinkage temperature of collagen, which is an indication of areduction in its thermal stability [41]. White fibers are more susceptible to electrical stimulation than red fibers, and intermediatefibers respond in an intermediate fashion [86].
Electrical stimulation is used principally for those species that undergo cold shortening, that is, beef and lamb. If carcasses arehot boned, electrical stimulation lessens toughening and the increased drip (before and after subsequent freezing) that couldeasily occur due to contraction of the muscle without skeletal restraint. Hot boning is the removal of warm meat from theskeleton. It can be accomplished after a short period of storage postmortem (minimum of about 3 hr), which allows for partialcooling of the carcass (to 14–20°C, at which shortening is minimal) and the occurrence of early postmortem biochemical events.This practice results in energy savings during cooling as compared to the cooling of intact carcasses. The holding time at14–20°C has a beneficial effect on tenderness (possibly due to proteolysis) that tends to overcome the small degree oftoughening that usually accompanies hot boning. This small amount of toughening could be due to “rigor shortening” that occursjust before depletion of ATP in muscle held at a temperature that minimizes cold-shortening. This rigor shortening is thought tobe caused by the inability of the sarcoplasmic reticulum to maintain low calcium levels as the ATP concentration begins to rapidlydecrease. Enough ATP remains, however, for some contraction to occur. Electrical stimulation can also be useful in preventingthaw rigor, discussed next.
15.6.3.2 Thaw Rigor
A phenomenon related to cold shortening is freeze-thaw contraction, or “thaw rigor.” If a muscle is frozen prerigor it oftenundergoes considerable shortening during thawing. This can be accompanied by toughening of the muscle (if contraction is lessthan 40%) and poor water-holding capacity (if contraction exceeds 40%). For this reason meat that is to be frozen generallyshould be in rigor or postrigor if optimal quality is desired. However, thaw rigor can be avoided in fish frozen prerigor if theproduct is held at normal temperatures of frozen storage for about 2 months prior to thawing. Thaw rigor in frozen prerigorlamb, beef, or poultry can be avoided by electrical stimulation prior to freezing, or by holding the frozen muscle at -3°C for atime equal to that normally used during chilling. Thaw rigor presumably occurs because ice crystals, by direct or indirect means,disable the sarcoplasmic reticulum and/or mitochondria in prerigor muscle, thus destroying the muscle's ability to maintain lowlevels of calcium in the sarcoplasm and causing contraction to occur during thawing.

Pag e 923
15.6.4 Changes Induced by Proteolysis
Postrigor beef muscle is sometimes held at refrigerated temperatures for 1–2 weeks to improve tenderness, a process known asaging or conditioning. Tenderization due to aging has been attributed to proteolytic degradation of the muscle structure. Arelationship among proteolytic activity, changes in myofibrillar protein or collagen structure, and mechanical properties of meat isintuitively reasonable but has not been conclusively established. Disruption of the Z disk is one of the primary processes in thedevelopment of tenderness in poultry and in beef. Disintegration of the Z disk renders myofibrils more susceptible tofragmentation during homogenization [88], and results of this technique, expressed as the myofibril fragmentation index, are usedas an indicator of meat tenderness. Destruction of the Z disk comes about by the action of calpain. Treatment of muscle orisolated myofibrils with calpain leads to the disappearance of the Z disk and release, but not degradation, of a-actinin.
Dissolution and disintegration of the Z disk, while related to increased tenderness of meat during postmortem aging, is probablynot the only factor of importance, since the Z disk is intact in tender prerigor muscle. Furthermore, disintegration of the Z diskappears to occur well in advance of substantial tenderization during aging. Changes in the interaction of the thin and thickfilaments or changes in the networks of desmin and connecting filaments are also likely involved in postmortem tenderization.Titin, nebulin, and desmin are degraded during postmortem holding of muscle from chicken, pork, and beef. Since these proteinsare intimately involved with the structure of myofibrils, they may be important in the tenderizing process.
Calpains appear to be more important than cathepsins in typical postmortem tenderization reactions. The activity of calpain isgreater in beef muscles, which show an age-dependent increase in tenderness [43], and loss of calpain activity upon prolongedstorage of beef is correlated with a decrease in the tenderizing effect [19]. In contrast, the activity of cathepsins B, L, and Hremains constant while tenderization occurs at different rates in different muscles during aging. Furthermore, infusion of calciumchloride into lamb muscles at slaughter causes a major increase in tenderness with no change in cathepsin B, H, and L activity[44]. The susceptibility of muscle to calpain degradation varies in direct relation to its thermal stability; thus myosin from fishes,especially those of cold water origin, is more easily degraded by calpain [62]. While calpain is the main enzyme responsible fortenderness in the normal processing of beef and lambs, it may not be as important in other species, or under food processingconditions that favor cathepsin activity.
In contrast to the action of proteinases on myofibrillar proteins, proteases have more subtle effects on connective tissues of mostspecies during aging. In unaged meat, the perimysium is the last structure to break, however this may not be so in aged muscle[68]. Very limited proteolytic cleavage of cross-links in the nonhelical regions of collagen would partially depolymerize the fiber,and this would probably result in less tension development during cooking and improve tenderness [6]. Electrophoretic studieshave shown that proteolytic cleavage of collagen does occur during aging even when there is little detectable effect on itssolubility. Effects of aging on solubility of collagen can vary markedly among muscles. For example, the increase in collagensolubility is very small in gastrocnemius muscle during postmortem aging whereas in psoas major the increase is usuallysubstantial (Table 8). This may reflect differences in proteolytic activity, final muscle pH, susceptibility of collagen to proteases,or other factors [6].
Postmortem proteolysis of collagen by collagenases seems to contribute to softening of fillets from some fish species.Breakdown of type IV (basement membrane) collagen has been shown to occur in several species concomitant withtenderization. Type I collagen is not degraded during iced storage of rockfish [13], but at temperatures above 15–20°C (nearthe temperature of collagen melting in this species) degradation is quite rapid and complete, and this results in flesh softening.Increased collagen solubility during iced storage, rather than being

Pag e 924
TABLE 8 Solubility of Perimysium Collag en inFresh and Ag ed Bovine Muscles
Solubilizedcollag en (%)
Fresh Ag ed
Gastrocnemius 0.8 1.7
Psoas major 0.8 10.5
Pectoralis profundus 0.4 1.3
Gluteus medius 0.6 2.3
Supraspinatus 0.4 4.6
Source: Ref. 6.
attributable to collagenase activity, is more likely associated with degradation of polysaccharide chains of proteoglycans whichcomprise the extracellular matrix [30]. Increased collagen insolubility in hake flesh during frozen storage has been associatedwith increased toughness. This may result from protein cross-linking induced by formaldehyde, with the latter compound arisingfrom breakdown of trimethylamine oxide [11].
Postrigor meat subjected to high pressure (150 MPa) at elevated temperatures (40–60°C) undergoes rapid tenderization (within30–60 min). The effect has been attributed entirely to proteolytic degradation of myofibrillar proteins, and is sufficient toeliminate the toughening of meat that normally occurs upon subsequent heating at 60–80°C [32]. Presumably the elevatedpressure denatures myofibrillar proteins to some extent, increasing their susceptibility to proteolysis.
Proteolytic enzymes are often incorporated into marinades or sauces applied to meats before and during cooking. Thethermostable protease papain is often used as a meat tenderizing agent, exhibiting its greatest activity during the early stages ofcooking the meat. A limitation of using currently available proteases for meat tenderization is their inability to selectivelyhydrolyze bonds that are critical for proper tenderization.
Proteolysis and nucleotide metabolism may produce compounds that contribute significantly to meat flavor or that react oncooking to produce flavor [73]. Five oligopeptide hydrolases, active at neutrality, are present in rabbit muscle. These enzymes, ifpresent in other muscles, could contribute substantially to the development of flavor in cooked meat by releasing amino acidsfrom oligopeptides. The major flavor components of haddock muscle have low molecular weights, similar to those of aminoacids [89].
15.6.5 Changes in Lipids and Interaction of Lipids with Other Components
If fatty acids are produced during meat storage (e.g., by the action of lipases or phospholipases), they can cause off-flavors andthey can also interact with contractile proteins and denature them. The latter occurrence may be an important cause oftoughening of fish muscle during frozen storage. Oxidation products of fatty acids, including free radicals, can also interact withproteins, causing their insolubilization by intermolecular cross-linking, thereby decreasing water-holding ability and increasingmuscle toughness.
The development of oxidized “cold-store” flavor in fish is attributable mainly to the compound cis-4-heptenal. This compound isproduced by oxidation of the phospholipid fraction

Pag e 925
of fish muscle in both lean and fatty fish. When a lean fish, such as cod, is starved, some of the phospholipid is utilized,presumably for energy. This reduces the concentration of the C22:6 fatty acid, the source of the cis-4-heptenal. Therefore, off-flavor development is less severe in starved cod than in well-fed cod. Meat flavors are also discussed in Chapter 11.
15.7 Chemical Aspects of Meat Stability
The purpose of many food-processing techniques is to slow down or prevent deleterious changes in food materials. Thesedeleterious changes are often caused by contaminating microorganisms, by chemical reactions among natural components of thefood tissues, or by simple physical occurrences (e.g., dehydration). The reactions may be chemically catalyzed by enzymesindigenous to the tissue.
The procedures used to prevent changes in muscle foods caused by microorganisms or chemical and physical reactions are (a)removal or immobilization of water, (b) removal of other active components, such as oxygen or glucose, (c) addition of chemicaladditives, (d) lowering of temperature, (e) input of energy, and (f) packaging. Very often when one desirable objective isachieved other undesirable consequences occur. This is especially true when the principal objective of the processing procedureis to inactivate the entire microbial population.
15.7.1 Heating
Heating of muscle tissue brings about extensive changes in its appearance and physical properties, and these changes aredependent on the time-temperature conditions imposed. a-Actinin is the most heat-labile muscle protein, becoming insoluble (inmuscle of warm-blooded animals) at 50°C. The heavy and light chains of mammalian myosin become insoluble at about 55°C,and action at 70–80°C. Tropomyosin and troponin are the most heat-resistant myofibrillar proteins of muscle, becominginsoluble at about 80°C.
Heating inactivates some enzymes, while others survive short times at temperatures of 60–70°C. Because proper cooking isimportant to the safety of meat, several methods for the determination of endpoint cooking temperature have been developedbased on inactivation of enzymes. These include asays of residual activity of catalase, peroxidase, lactate dehydrogenase,pyruvate kinase, glutamic-oxaloacetic transaminase, and glutamic-pyruvic transaminase. Other methods of assessing endpointtemperature include use of electrophoresis, differential scanning calorimetry, near infrared spectroscopy, color analysis, andenzyme-linked immunosorbent assays (ELISAs).
The enzymic activities of myosin and actomyosin are destroyed during conventional cooking. Myosin ATPase activity is asensitive indicator of myosin denaturation. Its heat stability varies with habitat temperature of fishes (Table 9), and it is moststable in muscle of warm-blooded animals. Acclimation of fishes to water temperatures different from that of their native habitathas been shown to alter the stability of myosin and actomyosin [92] but, interestingly, has no effect on the thermal stability ofcollagen [46]. This is odd given the relationship that exists between thermal stability of collagen and habitat temperature (Fig.11). Actomyosin from Antarctic krill has very low thermal stability, about 100 times lower than that of Alaska pollack [64].
Myoglobin also undergoes denaturation during heating. The susceptibility of the heme pigment to oxidation in the denaturedprotein is much greater than in undenatured myoglobin. On heating, therefore, red meat generally turns brown due to theformation of the oxidized pigment, hemin (see Chap. 10).
With severe heating of meat, there are further changes in proteins and free amino acids

Pag e 926
TABLE 9 Rate Constants (k D) of Thermal Inactivation of Myofibrillar Ca 2+-ATPase of Fishes Caug ht in Fishing Grounds Differing in BottomTemperature
Number ofspecies
Number ofFish
Temperature(°C)
KDA(× 10-5/sec)
32 79 28 20.3
16 26 25 18.6
18 54 17 48.3
4 11 9 63.5
9 33 2 283.00
Source: Ref. 92.
with production of some volatile breakdown products. Sulfur-containing compounds are produced, including hydrogen sulfide,mercaptans, sulfides, and disulfides, as well as aldehydes, ketones, alcohols, volatile amines, and others. Lipid components mayalso break down into volatile products, such as aldehydes, ketones, alcohols, acids, or hydrocarbons (see Chap. 5). Some ofthese volatile compounds, in both the fat and the lean portions of the meat, contribute to the flavor and odor of cooked meat.
Commercial heating generally has moderately detrimental effects on the vitamin content of meat. Thiamin is sensitive to heat, andit is partially destroyed during cooking or thermal processing. Certain amino acids may interact with glucose and/or ribose ofmeat (Maillard reaction), and the nutritional values of these amino acids can be impaired when this occurs (see Chap. 4 and 6).Lysine, arginine, histidine, and methionine seem to be particularly susceptible to degradation via this route. However, theconditions used during commercial sterilization generally have little detrimental effect on the nutritive value of proteins and lipids.
15.7.2 Refrigeration
Refrigeration is the most widely used technique to preserve meat. It preserves muscle tissue by retarding the growth ofmicroorganisms and by slowing many chemical and enzymic reactions. However, the greater rate of glycolysis in prerigor beefmuscle at 0°C than at 5°C and the occurrence of cold shortening in some muscle should be adequate warning that biologicalsystems do not always obey simple rules.
15.7.2.1 Effect of Temperature on Enzymic Activity
It should not be assumed that lowering the temperature to a value close to 0°C necessarily reduces the activity of all enzymes inmuscle tissue. Although a reduction in muscle temperature from about 40°C (close to that of living mammals or birds) to 0°Clowers the rate of most enzyme-catalyzed reactions, it should be realized that some fish live in a cold environment (bodytemperature equals that of the environment) and that their enzymes will be more active at low temperatures than will those ofwarm-blooded animals. This adaptation is not obvious, however, unless one measures the activity of the enzyme at low substrateconcentrations, similar to those that exist in tissue. Thus, the Michaelis constant Km, not the maximum initial velocity Vmax, is theappropriate value to monitor.
It has also been demonstrated that “adaptation” of enzymes to low temperature sometimes occurs in warm-blooded animals.For example, it has been demonstrated that the Michaelis

Pag e 927
constant of lactate dehydrogenase from chicken breast muscle is much smaller at refrigerated temperatures than it is at the bodytemperature of the bird, which is around 40°C [37]. Since a small Michaelis constant means that the enzyme retains a highproportion of its maximal activity at low substrate concentrations, lowering the temperature from 40 to 4°C combined with adecline in Km may have little effect on the activity of the enzyme in situ. This behavior may have a bearing on the temperaturedependence of cold shortening in beef muscle (shortening is minimal between 14° and 20°C [52]) and on the rate of ATP loss inchicken muscle (rate is minimal at 20°C [18]).
It should also be remembered that low temperature can trigger internal release of calcium, which not only stimulates contractionbut also increases the activity of calpains. The major point is that decreases in rates of enzyme-catalyzed reactions in situ maynot always correlate well with decreases in temperature.
15.7.2.2 Modified and Controlled Atmospheric Storage
Fresh meat (including fish) held at a refrigerated temperature has a limited shelf life, primarily because of microbial growth. It ispossible to slow down this growth by storing muscle foods in modified or controlled atmospheres. The term “modifiedatmosphere” refers to an initial adjustment in the composition of the atmosphere surrounding the product, with no further controlother than the package. In contrast, the term “controlled atmosphere” indicates that the atmosphere is continuously controlled.
Some studies have been conducted on animal tissue stored under hypobaric conditions, and this approach is effective butexpensive. Most studies have involved modification of atmospheric composition at normal pressures.
The preservative effect of CO2 on stored muscle tissue has been known for a century. The effect of CO2 is not due to a simpledisplacement of oxygen, since nitrogen atmospheres do not offer the same extension of storage life that CO2 does. It is knownthat CO2 lowers the internal pH of tissues, and it probably causes intracellular acidification of spoilage bacteria [72]. This couldupset the major H+/K+ transport systems in the cell, which would have marked effects on gross metabolism. One of these effectscould be a shift in equilibrium of the decarboxylating enzymes, such as isocitrate dehydrogenase, making them rate limiting. Adecrease in surface pH has been observed with rock cod fillets stored in an atmosphere containing 80% CO2 [72], but adecrease in pH was not observed in red hake and salmon flesh when an atmosphere containing 60% CO2 was used [23].
At high concentrations of CO2 surface browning of red meat is often observed. This presumably occurs because the myoglobinand hemoglobin pigments undergo oxidation to their ferric states. The most desirable concentration of CO2 to use for modifiedatmosphere storage of meat is a compromise between that needed to inhibit microorganisms (the more CO2 the greater theinhibition) and that which will not cause product discoloration.
Oxygen has an inhibitory effect on the breakdown of trimethylamine oxide to dimethylamine and formaldehyde in refrigerated redhake muscle. Thus, in species in which this is a potential problem, such as gadoids, conditions that exclude oxygen, whetherhypobaric, modified atmosphere, or vacuum storage, could be potentially harmful to the quality of the product (see Sec.15.5.5.4).
CO2 and its hydrated bicarbonate ion can directly affect membranes, causing hydration or dehydration of the surface. This canresult in changes in intermolecular distances of membrane components, making the membranes either more or less permeable[72]. This in turn could have major effects on spoilage microorganisms.

Pag e 928
15.7.2.3 Ionizing Radiation in Conjunction with Refrigeration
Although ionizing radiation has not been approved for processing of most food products, it does constitute a potentially usefulmeans of extending their refrigerated shelf life. Aside from its desirable ability to inactivate microorganisms, it also has theundesirable effect of altering meat pigments. If raw or cured meat is exposed to large doses of ionizing radiation, it turns brown.The color of cooked meat is not affected by ionizing radiation if air is present, but a pink color develops in the absence ofoxygen. However, on exposure to air the pink color reverts to the original brown color. The pink color of irradiated cookedmeat is attributable to a denatured globin-hemochrome pigment. In a model system, irradiation of NO-myoblobin causesdenitrosylation and formation of metmyoglobin. If the radiation dose is sufficiently high, the metmyoglobin is, in turn, degraded toother products, including a ferriperoxide derivative and small amounts of choleglobin-type pigments.
Sterilizing doses of ionizing radiation also result in the breakdown of various lipids and proteins to compounds that have distinctand often undesirable odors. Tenderization of muscle may also occur during this treatment. The odors vary with the particularmuscle tissue treated and range all the way from extremely unpleasant odors in beer to rather mild odors in pork and chicken.Furthermore, irradiated beef steak is sometimes bitter, and this may result from the conversion of ATP to hypoxanthine. Many ofthese reactions can be prevented by lowering the temperature during irradiation. Temperatures of -80°C or below greatly lessenundesirable side effects without seriously decreasing destruction of microorganisms. This occurs because microorganisms areprimarily destroyed by direct interaction with ionizing radiation, whereas most of the undesirable changes in chemicalcomponents result from the indirect effects of free-radicals produced during irradiation.
Generally, enzymes are not completely inactivated by irradiation treatments sufficient to sterilize the product. Therefore, for long-term storage it is necessary to heat the meat to approximately 70°C, that is, cook it prior to irradiation and storage.
15.7.3 Freezing
Freezing is an excellent process for preserving the quality of meat and fish for long periods. Its effectiveness stems from internaldehydration (ice crystal formation) or immobilization of water and lowering of temperature (see Chap. 2). Although somemicroorganisms survive storage at very low temperatures, there generally is no opportunity for growth of microorganisms ifrecommended storage temperatures are maintained. Quality retention (or loss) during freeze preservation of animal tissuesdepends on how the freezing process is conducted and/or on innate characteristics of the tissue.
15.7.3.1 Effect of Freezing Rate
A major problem arising from improper freezing (slow) and storage procedures (too long or too high a temperature) is excessivethaw exudate. When muscle tissue is frozen rapidly, small ice crystals form both intra- and extracellularly. When muscle is frozenslowly ice crystals form first in the extracellular space, presumably because the freezing point is higher there (concentration ofsolutes is lower) than it is inside the fibers. Since the vapor pressure of ice crystals is lower than that of supercooled water, thereis a tendency during further cooling for the water inside fibers to migrate to ice crystals that already exist in extracellular areas,resulting eventually in very large extracellular ice crystals and compacted muscle fibers. The increase in salt concentration and theconcomitant change in pH may cause extensive denaturation of muscle proteins

Pag e 929
[71]. If exposure to the high salt concentrations and unfavorable pH values occurs at a relatively high subfreezing temperature,the process of denaturation can be acelerated, with a resulting decrease in water-holding capacity of the tissue. This loss inwater-holding capacity of the protein, along with mechanical damage to cells by ice crystals, is responsible in large part for thethaw exudate.
The rate at which fish muscle is frozen influences the degree of protein denaturation [60]. Although rapid freezing generallyresults in less denaturation than slow freezing, intermediate freezing rates can be more detrimental than slow freezing as judgedby textural changes and solubility of actomyosin. Cod fillets frozen at intermediate rates develop intracellular ice crystals justlarge enough to damage cellular membranes.
Freezing rate also can influence the color of animal tissues in the frozen state. Rapid freezing causes tissues to become very pale.This is undesirable for red meats but desirable for poultry. This effect is apparently related to the number and size of ice crystalsproduced and the thickness and nature of the tissue matrix. Once thawed, the appearance of rapidly frozen and slowly frozentissues cannot be distinguished.
15.7.3.2 Effects of Freezing on Enzymic Activity
Enzymes generally are not inactivated by the freezing process, and some may continue to function in frozen animal tissue.Enzymes with low activation energies retain considerable activity in the frozen state, often more than expected by extrapolationof Arrhenius plots from above-freezing temperatures. Freezing damage to the tissue (enzyme delocalization), changes inenvironmental conditions (pH, ionic strength, and substrate concentration), and changes in the Michaelis constant may accountfor the retention of moderate enzymic activity, which sometimes exceeds that in the unfrozen tissue.
Freeze delocalization of mitochondrial isoenzymes of glutamate-oxaloacetate transaminase has been used to differentiate frozen-thawed beef, pork, and chicken from the unfrozen products. However, this procedure may not be suitable for pork sinceprocedures other than freezing and thawing can damage pig muscle mitochondria and cause redistribution of this enzyme [37].Freezing and thawing also cause release of cytochrome oxidase from muscle mitochondria. The soluble activity of this enzymeincreases more than twofold in frozen and thawed trout muscle and about fourfold in frozen and thawed beef muscle ascompared to the activity in unfrozen samples. Measurement of this enzyme might be useful in developing an improved method fordistinguishing unfrozen from frozen-thawed meat and fish [7].
A problem unique to marine species during frozen storage is the enzyme-catalyzed breakdown of trimethylamine oxide to yielddimethylamine and formaldehyde. As was mentioned, formaldehyde is believed to cause cross-linking of muscle proteins and anincrease in muscle toughness. It also has been suggested that the formation of new disulfide bonds in fish muscle proteins maycontribute to denaturation [60]. Cod actomyosin solutions, after sufficient frozen storage, form aggregates that are insoluble in asolution of sodium dodecyl sulfate and a disulfide reducing agent. This indicates that non-disulfide covalent bonds also maycontribute to aggregation of the protein during frozen storage, possibly arising through the action of endogenoustransglutaminase. An integrated scheme for some of the reactions that can cause denaturation of fish proteins and toughening offish muscle is shown in Figure 22.
Enzymes that act on lipids can contribute to quality deterioration of animal tissues during long-term frozen storage. Lipases andphospholipases release free fatty acids that can react with proteins. Reactions of oxidized lipids with proteins may be a majorcause of the undesirable toughening that codfish muscle undergoes during frozen storage (Fig. 22). There is evidence that themajor source of free fatty acids in lean fish is phospholipids of the membrane system, not triacylglycerols [37].

Pag e 930
FIGURE 22Some factors influencing the denaturation of fish proteins during
frozen storag e. (From Ref. 79.)
Generation of free fatty acids in either fish or beef inhibits the rate of oxidation [80]. The reason for this anomalous behavior isnot clear, but it might be that enzyme-catalyzed oxidation of membrane lipids is slowed either by direct inhibition of the enzymewith the fatty acids or, indirectly, by disruption of the membrane structure [81].
15.7.3.3 Other Effects of Freezing on Meat Quality
Fish may undergo extensive textural changes during frozen storage because of the very high sensitivity of fish proteins to thedenaturing factors active during frozen storage (Fig. 22). Meat of warm-blooded animals is also subject to freeze-induceddenaturation; salt-extractable proteins have been reported to decrease as much as 50% during frozen storage simulatingcommercial conditions [71]. During frozen storage, tropomyosin is the most stable protein, actin is the next most stable, andmyosin is the least stable, and myosin is the least stable. Note that this order of stability is the same as that toward heat [4].
Myofibrillar proteins can be stabilized during freezing and frozen storage by the infusion of cryoprotectants, these usually beingsugars, sugar alcohols, or starch hydrolysis products. Vacuum infusion shows promise as a means of effectively distributing low-molecular-weight carbohydrates throughout intact muscle.
As discussed in Section 15.6.3.2, the meat of warm-blooded animals generally should not be frozen prior to the development ofrigor, in order to avoid thaw rigor. However, when the meat is to be used for production of gelled meat products, such asfrankfurters, comminution of the meat from the frozen state in the presence of sufficient salt will avoid rigor development. Bindingof salt ions by proteins and the resulting increase in electrostatic repulsion between proteins apparently prevent the proteins frominteracting after ATP has been depleted. If rigor occurs prior to salt addition, then the proteins are irreversibly bound and cannotbe dissociated by treatment with salt. Salt addition prior to freezing is not advised, as this destabilizes the proteins during frozenstorage [71].
Dehydration of the surface of animal tissue during frozen storage (freezer burn) can occur if improper packaging techniques areemployed. Freezer burn occurs when the equilibrium water

Pag e 931
vapor pressure above the surface of the meat is greater than that in the air, causing ice crystals to sublime. Oxidation anddarkening of the heme pigments usually accompany freezer burn.
15.7.4 Dehydration
Drying can be successfully employed for both raw and cooked meat; however, the quality of the final reconstituted product isbetter when the meat is cooked prior to dehydration. The reason for this is not clear, but it may be that protein denaturation thatoccurs during heating in the presence of the original moisture is less severe than that which occurs during the combined processof heating and moisture removal.
The method of dehydration also has a very significant effect on the quality of the final product. Conventional air drying, which isdone at a relatively high temperature, is more detrimental to muscle tissue than is freeze dehydration, the latter process employinga low temperature and sublimation of ice. Maximal denaturation of myofibrillar proteins occurs when the temperature is high andthe moisture content of the tissue is reduced to a value below about 20–30% [79]. In addition to the difference in temperaturebetween two kinds of dehydration, there is also a difference in salt distribution. During drying an increase in salt concentrationoccurs. As moisture evaporates, more moisture is drawn to the surface, bringing salts with it. The resulting increase in ionicstrength (especially at the surface) and change in pH adversely affect protein stability. During freeze dehydration the increase insolute concentration is more evenly distributed, and the temperature is low. The extent of denaturation is greater when muscleproteins are exposed to high salt concentrations or unfavorable pH. Another low-temperature drying method involvescompressing meat strips between highly absorbent contact-dehydrant sheets.
Even freeze-dried meat, once rehydrated, shows a lower water-holding capacity than fresh tissue. If the flesh of freshlyslaughtered animals is freeze-dried before the onset of rigor, the breakdown of ATP and glycogen can be inhibited. Duringrehydration of this tissue, rapid hydrolysis of ATP occurs along with rapid glycolysis. This can result in strong rigor contractionand a considerable loss of water-holding capacity. However, if the muscle tissue is ground and salted prerigor and then freeze-dried, rigor is prevented during rehydration and the high-water-holding capacity of the tissue is retained. Unfortunately, saltaddition lowers the stability of the proteins, limiting storage life.
Texture is usually severely altered by dehydration. The change in texture is determined principally by the extent of denaturationof the muscle proteins, and this in turn is highly dependent on the pH of the meat at the start of dehydration. Even a very goodfreeze-drying procedure results in some lowering of the water-holding capacity of muscle if the process is carried out near theisoelectric points of the proteins (about pH 5.5). If one starts at a high ultimate pH (about 6.7), a relatively small decrease in thewater-holding capacity of muscle occurs during dehydration. As with freezing, an even distribution of a lyoprotectant canstabilize myofibrillar proteins during drying and subsequent storage [4]. Measurements of rehydration, extractability of proteins,and ATPase activity all have been used to estimate the amount of denatured protein in dehydrated muscle.
Lipid oxidation is a major factor limiting the shelf life of dehydrated muscle tissue. The highly unsaturated nature of pork lipidsand lipids from fatty fishes causes these products to be unstable in dehydrated form unless some kind of special protectivetreatment is applied. The addition of antioxidants and the use of appropriate packaging techniques are the most commonapproaches to retarding oxidation.
Lipid oxidation results principally in undesirable flavors that can make the animal tissue unacceptable. However, other effectsmay also occur: some destruction of oxidizable nutrients,

Pag e 932
such as essential fatty acids, some amino acids, and some vitamins; oxidation of heme pigments (discoloration); and proteincross-linking.
During high-temperature drying, tissue fat melts. Fat in excess of about 35–40% (fresh weight basis) usually cannot be retainedin dehydrated tissue.
Another major type of deteriorative reaction in dehydrated muscle tissues is nonenzymic browning. Carbonyl sources for thisreaction include glucose, phosphorylated sugar derivatives, and other aldehydes and ketones; amine groups for this reactioncome mainly from either free amino acids or the e-amino groups of lysine residues. The Maillard reaction (discussed in Chap. 4and 6) results in dark pigments and decreased nutritive value of amino acids and proteins. Moreover, when sugars react withproteins, the physical properties of the proteins can change, resulting in a toughening or hardening of the texture. Nonenzymicbrowning can also lead to desirable changes in flavors, some of which are typical of cooked meats.
15.7.5 Pressure
High pressures, applied isostatically, can have effects similar to heating on the destruction of microorganisms and denaturation ofmeat proteins. The mechanism whereby microbial destruction or protein denaturation is achieved by pressure treatment differsfrom that of heating, however. While the intramolecular hydrophobic interactions that stabilize protein native structure arestrengthened with temperature increases up to 60°C, these are weakened by increasing pressure. Pressure-induced denaturationcan be beneficial in creating new types of gelled meat products, but its occurrence is undesirable if the primary purpose ofpressure treatment is to stabilize fresh meat for storage.
Pressure treatment may also aid in freezing and/or thawing of muscle foods. As pressure increases, the freezing pointtemperature drops and the glass transition temperature (see Chap. 2) increases. Attempts to successfully freeze human organshave shown that high pressure, in concert with infusion of a cryoprotectant that additionally increases the glass transitiontemperature, can effectively repress ice formation during freezing, frozen storage, and thawing [21]. Damage to meat structureand water-holding properties caused by ice crystal formation, as well as the associated freeze concentration of salts andhydrogen ions (pH decrease) that can contribute to protein denaturation (see Fig. 22), can be avoided by the use of highpressure. To prevent pressure-induced denaturation of proteins, sugars and polyols are added as baroprotectants. Thesecompounds minimize the denaturing effects of heat, freezing, and pressure by enhancing intramolecular hydrophobic interactionsthat stabilize protein secondary and tertiary structure (see Sec. 15.8.4).
It was previously mentioned that pressures in the range of 150 MPa (1500 × atmospheric pressure) can induce rapid proteolytictenderization of muscle at 40–60°C [32]. At the present time the biggest barriers to commercial use of high pressures for meatprocessing are the high cost, low throughput, and potential hazards of such equipment on a commercial scale.
15.8 Chemistry of Processed Meats
The term “processed” implies that meat has been subjected to some process that adds value, such as precooking, portioning,and/or packaging. More specifically, however, the term “processed meats” commonly denotes products that have been pickledor cured, and/or possibly restructured or blended with other ingredients to yield products much different from cooked, intactmuscle. Pickled meats are stabilized in a salt and/or acid brine, whereby the salt and/or low pH and organic acids inhibitmicrobial growth. Such products are generally refrigerated to inhibit mold growth, stabilize flavor, and insure against growth andtoxin production by pathogens.

Pag e 933
15.8.1 Curing
Curing refers to the application of sodium chloride, usually in conjunction with a nitrite or nitrate salt. Curing is not used as muchtoday for preservation of meats (except in very salty items like country ham and proscuitto). Rather it provides for thedevelopment of a characteristic flavor and color (see Chap. 10 and 11), and also provides protection against Clostridiumbotulinum outgrowth.
During formation of the cured color, endogenous low-molecular-weight components in the sarcoplasm facilitate the reaction ofnitrite with myoglobin to yield nitric oxide myoglobin, which is stable and has a characteristic cured-meat color [69]. Reducedglutathione is active in this respect, and its effectiveness is enhanced by ATP, IMP, and ribose. Nitrite decomposition is alsofavored during this time. Curing appears to have little effect on either the quality of proteins or the stability of B vitamins.
Salt diffusion throughout the meat causes swelling of the myofibrillar matrix, though this is restricted in intact muscle by thesarcolemma. The presence of transition elements in salt used in cured meat enhances oxidation of lipid components, thusconsiderably reducing shelf life. Ascorbic acid in the presence of a metal chelating agent, such as polyphosphate, can effectivelyforestall this oxidative reaction. Antioxidative activity is also provided by nitric oxide myoglobin and S-nitrosocysteine, acompound formed during the curing process:
Many cured products are also smoked, or contain soluble components of wood smoke, mainly to add flavor. Many componentsof smoke are effective antioxidants.
Concerns have been expressed over the potential hazard of using nitrite in cured meats since this compound can react withamines, especially secondary amines, to form N-nitrosamines, which may be carcinogenic:
Although N-nitrosamines are not detectable in meat as marketed if the concentration of nitrite does not exceed U.S. federalregulations, commercial samples of frankfurters have occasionally been found that contain these compounds at low levels. Inseveral instances, it is suspected that improper mixing may have resulted in high local concentrations of nitrite, thereby favoringformation of nitrosamines. High temperatures can also induce nitrosamine formation so a product such as bacon, which issubjected to very high temperatures, is especially vulnerable. Use of nitrites at concentrations just high enough to inhibit C.botulinum is the current practice. Even lower levels of nitrite might suffice for this purpose if compounds in addition to NaCl arepresent to help inhibit clostridia. Sorbate has been suggested as one such compound. Reducing agents, such as ascorbate, andantioxidants, such as tocopherol, are effective in reducing conversion of nitrite to nitrosamines and are often added to cured meatproducts.
15.8.2 Chemistry of Adhesion between Meat Particles or Pieces
Pieces of meat, varying in size from chunks to flakes to particles, can be bonded together to simulate the appearance and textureof whole muscle products, or to create new products with unique textures. In all cases, adjacent meat surfaces are bonded by agel network. The gel may

Pag e 934
consist of gelatin, added or derived from collagenous tissues during cooking of the meat, as in aspic products. Patentedprocesses for forming “restructured” steaks involve use of either the calcium-alginate gelling reaction or clotting of plasmafibrinogen by a calcium-dependent transglutaminase in blood (factor XIII), activated by the protease thrombin. These are allprocesses for cold-forming of restructured products, although the latter two methods form heat-stable gels that will not meltupon subsequent cooking.
More commonly, the bond between meat pieces in restructured or reformed processed meats is effected by heat-inducedgelation of soluble myofibrillar protein. Salt (sodium chloride) and possibly polyphosphates are added to meat to solubilizemyofibrillar proteins prior to cooking. Products made from finely comminuted muscle, such as bologna-type sausages,frankfurters and imitation crabmeat, also rely on heat-induced gelation of myofibrillar proteins to build their structure and texture.These may contain added fat, starches/hydrocolloids, and non-meat proteins, and thus can be regarded as multicomponent gels,in which a gel network formed primarily by denatured myosin or actomyosin entraps other ingredients and plays the dominantrole in determining their textural properties.
15.8.2.1 Emulsion and Gel Theory as Applied to Finely Comminuted Muscle Tissue
The first step in preparing fine-particle meat products typically involves comminution of the muscle tissue in the presence of salt.Meats comminuted with salt consist of a matrix of swollen fibers, myofibrils, and solubilized myofibrillar proteins. Other meatcomponents, notably fat and connective tissue, plus any other ingredients added to the product formulation are embedded in thismatrix. Traditionally, products such as bologna and hot dogs had high fat contents (>30%). Retention of this fat in the cookedproduct was often a problem, and a means of improving fat retention (stabilization) was sought. It was found that the ability ofdifferent meats to stabilize fat was strongly correlated with the fat emulsification properties of their salt-solubilized myofibrillarprotein. This led to the theory that such products can be regarded as emulsions, and microscopy indicated the presence of fatglobules surrounded by an adsorbed protein layer [28]. It is likely that comminution produces a protein film around fat globules,similar to a classical emulsifier layer; however, upon heating the fat becomes entrapped in part of a continuous gelled proteinnetwork. This entrapment of fat thus prevents fat migration.
15.8.2.2 Multicomponent Gels
If one accepts that comminuted fat-containing meats are correctly viewed as multicomponent gels rather than as emulsions, it isimportant to understand how nonmeat components affect the properties of the gelled myofibrillar matrix. Some studies on thesubject have shown that the mechanical properties (measured both at small and fracture-causing deformations) of a compositegel are strongly dependent on the degree of interaction between the continuous (i.e., myofibrillar) protein phase and thedispersed phase (i.e., fat, nonmeat proteins and hydrocolloids), and on the distribution and phase volume of the dispersed phasewithin the gel matrix [27].
The composite filled gel is not the only possible model for the distribution of components in a muscle protein gel. Compositesystems termed mixed gels [90] may also exist. In these, the filler (nonmyofibrillar) component may form a second continuousmatrix within the muscle protein matrix, or may interact directly with the muscle protein to form a single mixed-compositionmatrix. Because of the difference in gelling temperature between muscle and most nonmyofibrillar gelling components (such asvegetable or milk proteins), cogelation of unlike proteins is less likely to occur than is the formation of an interpenetrating mixedgel.
The properties of mixed gels are influenced by the interaction energies of the component

Pag e 935
polymers [63]. When the net energy of interaction is favorable (exothermic) the polymers may associate into a single gel phaseor precipitate together. However, the interaction between two polymer types is usually far less intensive than that betweensegments of the same type. Therefore, there is a tendency for unlike polymers to form separate domains, resulting in an increasein the effective concentration of each phase since neither is diluted to a large extent by the other. Water can be unequallypartitioned between the two phases. Little is known about the phase compatibility of muscle proteins with other proteins or foodingredients or the consequences of these interrelationships on the quality of comminuted meat products.
15.8.3 Functionality of Muscle Proteins in Gel Formation
The ability of the myofibrillar constituents of meat to form a strong heat-induced gel requires good dispersion of these proteinsand surface reactivity, that is, the availability of sites for favorable protein-protein interactions. Dispersion is dependent uponswelling and dissolution of the proteins by salt, and use of suitable comminution/blending equipment. Gels that exhibit anirregular, coagulative structure are not as strong and cohesive as those that display a more uniform matrix. A two-dimensionalanalogy of this is the appearance of a fish net with knots at the junctions compared with that of a tightly woven fabric.
A reactive protein surface seems to depend on maintaining the muscle in a near physiological state prior to the comminution stepwith salt. The ability of muscle tissue to bind water and function well in comminuted animal tissue is greater when actomyosin is inthe dissociated state. This is the normal condition of prerigor muscle, and prerigor muscle has a very high gelling ability andwater-holding capacity.
The specific properties of any gelled meat product depend on many factors including source of the muscle, biochemical state ofthe muscle, and processing variables. Myosin is the most important component of muscle tissue with respect to gel-formingability. Actin assists in this process by forming F-actomyosin, which in turn interacts with free myosin [98]. The tail and headportions of the myosin molecule play different roles during heat-induced gelation of muscle minces. The head portion of themyosin molecule undergoes irreversible aggregation involving hydrophobic interactions and oxidation of -SH groups. Thisaggregation contributes to formation of the three-dimensional protein network. The tail portion of the myosin molecule undergoesa partially irreversible helix-to-coil transition during the heating process and then participates in the formation of a three-dimensional network.
Proteins of several fish species uniquely exhibit gelation of salted pastes or batters at temperatures below 40°C. When this gel isexposed to higher temperatures it exhibits greater strength than a gel cooked directly from the raw paste. The low-temperaturegelling reaction is attributed to the action of an endogenous Ca+2-dependent transglutaminase, which catalyzes an acyl transferreacton in which the g-carboxyamide groups of peptide-bound glutamine residues are the acyl donors. Primary amino groups ina variety of compounds, including the e-amino groups of peptide-bound lysine residues, may function as acyl acceptors. Whenthe latter reaction occurs, it yields an e-(g)-glutamyl) lysyl bond. The inability of mammalian and avian muscle pastes to gel in thisway may not reflect absence of the enzyme, but rather lower reactivity (greater stability) of the myosin of homeotherms attemperatures below 40°C.
The formation of a meat gel involves protein denaturation under specific conditions of heating. Denaturation of the muscleproteins, especially myosin, under other conditions, such as in the original tissue, can interfere with gel formation. Thus, anycondition that encourages incidental denaturation, such as low pH, freeze denaturation, or dehydration, will result in a weakheat-induced gel.

Pag e 936
15.8.3.1 Stabilizaton of Muscle Proteins by Additives
Minced fish is often stabilized for frozen storage by removal of water-soluble components and the addition of stabilizing agents.The product obtained by washing and adding stabilizers is called surimi, and is used in the manufacture of imitation crabmeat andJapanese kamaboko products. When water-soluble proteins are not removed by washing they apparently associate with thecontractile proteins as they denature, thereby interfering with the latter's ability to form a strong gel. Antioxidants andpolyhydroxy compounds, such as sorbitol and sugar, are used as protein stabilizers. These compounds promote the preferentialhydration of proteins which results in a positive free energy change. The positive free energy change increase with an increase insurface area of the protein. Therefore, the denatured form, which has a larger surface area, is thermodynamically less stable thanthe undenatured forms and so the latter is the preferred structure [4].
Polyhydroxy compounds are only one class of substances that impart stability to proteins under adverse conditions, such as thelow water and high salt concentrations encountered during freezing. Others stabilizing compounds are some free amino acids andamino acid derivatives, such as taurine and b-alanine, and certain nitrogen compounds, such as methylamines, includingtrimethylamine oxide, betaine, and sarcosine [97]. Presumably these compounds exert stabilizing effects whether presentnaturally or added during processing. High-molecular-weight compounds, such as polydextrose or maltodextrin, have also beenshown to protect fish myofibrillar proteins in frozen storage. These compounds may exert their cryoprotective effect by raisingthe glass transition temperature high enough to effectively immobilize reactants at conventional cold-store temperatures (seeChap. 2).
There has been much interest in drying muscle proteins so they may compete in the dry protein ingredients market.Disaccharides such as sucrose and trehalose exhibit the ability to protect proteins in both the frozen and dried states. Thesecompounds apparently bind to proteins in the dry state and stabilize their tertiary structure [4].
15.8.3.2 Importance of Muscle Protein Integrity to Gelling Ability
Proteolytic degradation, occurring either prior to or during processing, reduces the strength and cohesiveness of meat gels, andalso lowers fat and water binding. This can be a problem during manufacture of surimi-based foods, due to the presence insurimi pastes of heat-stable muscle proteases that become active during heating (optimally at 55–60°C). Problems withproteases vary with fish species, and many different proteolytic enzymes may be involved. Beef plasma has been found tocontain effective inhibitors of proteases, and this is a common additive to surimi derived from problematic species. Otherpotentially useful foodgrade inhibitors have been found in egg white, white potatoes, rice, bell pepper, and other natural sources[94].
15.8.4 Effects of pH and Ionic Ingredients on Gelling of Meat Proteins
During the comminution step of preparing a meat gel, the endomysium and sarcolemma are ruptured and the myofibrillar matrixis free to swell. The added salt partially solubilizes the myofibrillar proteins and yields a thick sol, or paste. It is theorized that thechloride ion selectively neutralizes positively charged sites on the protein molecules, effectively shifting the isoelectric pH to alower value, thus enhancing protein solubility at the existing pH [31]. Sodium
Pag e 937
chloride also has a “salting-in” effect on myofibrillar proteins based on its effects on the system free energy, as designated by thelyotropic series (see Chap.6).
If muscle tissue goes into rigor in either the intact or minced form, it loses much of its ability to bind water and exhibits poor gel-forming ability, and this loss cannot be completely restored by the addition of salt. However, if salt is added to minced muscletissue before rigor occurs, the water-holding capacity of the proteins is maintained at a high level. Binding salt to muscle proteinsresults in electrostatic repulsion among molecules, thus loosening the protein network and allowing it to bind more water. Theprotein interactions that occur during onset of rigor, that is, after the loss of ATP, hinder this swelling effect of salt. The extent towhich muscle sarcomeres shorten is irrelevant. Thus, very satisfactory sausage products can be made from prerigor muscle, butit must be ground and salted before the ATP level declines sufficiently to allow rigor mortis.
The gelling ability of postrigor meat can be improved by the addition of phosphates, particularly pyrophosphate. Apparently theprimary effect of the phosphate is to partially decouple the actin-myosin complex formed at rigor. Postrigor meat stored frozenwith an effective cryoprotectant additive performs equally well to fresh prerigor meat when polyphosphate is added during thecomminution step [70].
A secondary effect of phosphate addition is to slightly increase the pH and move it away from the isoelectric point of theproteins (about pH 5.5). While the water-holding ability of meats improves as the pH is moved away from the isoelectric pointtoward neutrality, gelling ability (in terms of gel strength and cohesiveness) is optimum near pH 6.0–6.4 for muscle ofhomeotherms. Apparently good gelation depends on adjusting the degree of charge repulsion to achieve good protein dispersionand structure formation. The ability of fish pastes to undergo transglutaminase-linked gelation at low temperatures decreases asthe pH is reduced below 7.0. Also, the innate ability of fish proteins to form heat-induced gels is optimal near neutrality.
15.8.5 Processing Factors
The successful production of comminuted meat products depends on the proper dispersion and gelation of the myofibrillarproteins. Therefore, manufacturing operations must maximize solubilization and swelling of the myofibrillar matrix early in theprocess with a minimum of protein denaturation. Added ingredients must also be well dispersed and of the optimum particle sizeto maximize their particular filler effect on the composite gel. In the case of higher fat-content products, fat particle size must bereduced, but continued comminution can lead to heat buildup unless cooling is provided. Excessive heating will lead to melting ofthe fat prior to protein gelation, with resultant poor fat stabilization.
Too high a heating rate during cooking can cause a similar problem. Gel formation is very sensitive to heating rate in that slowercooking generally allows a more rigid gel matrix to develop [24]. An exception to this is in the cooking of fish paste gels, wherea high heating rate is desired to inactivate heat-stable proteases that are often present. Fish pastes should always be kept cold(10°C) during comminution with salt to avoid premature gelation of the meat via transglutaminase activity. Meat and poultrybatters are generally chopped to relatively high temperatures to insure attainment of proper fat particle size and coating byproteins.
If dry components, such as hydrocolloids and nonmeat proteins, are added at levels that result in competition for water betweenthe components, there is poor solubilization of myofibrillar proteins and/or poor hydration of the added dry ingredients. Thiscauses a decrease in the quality of the cooked product. Hydrocolloids of exceptionally high water-holding ability, such asxanthan gum or pregelatinized starch, greatly interfere with development of a strong myofibrillar protein gel.

Pag e 938
Bibliography
Arakawa, N., Y.-J. Chu, M. Matsubara, and M. Takuno (1988). Effect of dehydration on meat.
Cross, H. R. (1979). Effects of electrical stimulation on meat tissue and muscle properties—A review. J. Food Sci.44:509–514.
Gros, F., and M. Buckingham (1987). Polymorphism of contractile proteins. Biopolymers 26:177–192.
Haard, N. F. (1992). Technological aspects of extending prime quality of seafood: A review. J. Aquatic Food Prod. Technol.1:9–27.
Hamm, R. (1981). Post-mortem changes in muscle affecting the quality of comminuted meat products, in Developments inMeat Science (R. Lawrie, ed.), Vol. 2., Applied Science, London, pp. 93–124.
Ledward, D. A. (1981). Intermediate moisture meats, in Developments in Meat Science, vol. 2 (R. Lawrie, ed.), AppliedScience, London, pp. 159–194.
Sikorski, Z. E. (1994). The myofibrillar proteins in seafoods. In Seafood Proteins (Z. E. Sikorski, B. S. Pan, and F. Shahidi,(eds.), Chapman and Hall, New York, pp. 40–57.
Syrovy, I. (1987). Isoforms of contractile proteins. Prog. Biophy. Molec. Biol. 49::1–27.
References
1. Ackman, R. G. (1980. Fish lipids, Part 1, in Advances in Fish Science and Technology (J. J. Connell, ed.), Fishing NewsBooks, Surrey, England, pp. 86–103.
2. Aalhus, J. L., and M. A. Price (1991). Endurance-exercised growing sheep: I. Postmortem and histological changes inskeletal muscles. Meat Sci. 29:43–56.
3. Allen, C. E., and E. A. Foegeding (1981). Some lipid characteristics and interactions in muscle foods-a review. FoodTechnol. 253–257.
4. Arakawa, T., S. J. Prestrelski, W. C. Denney, and J. F. Carpenter (1993). Factors affecting short-term and long-termstabilities of proteins. Adv. Drug Del. Rev. 10:1–28.
5. Bailey, A. J. (1988). Connective tissue and meat quality. Proc. 34th Intl. Cong. Meat Sci. Technol., Brisbane, Australia,pp. 152–160.
6. Bailey, A. J., and N. D. Light (1989). Connective Tissue in Meat and Meat Products, Elsevier Applied Science; NewYork.
7. Barbagli, C., and G. S. Crescenzi (1981). Influence of freezing and thawing on the release of cytochrome oxidase fromchicken's liver and from beef and trout muscle. J. Food Sci. 46:491–493.
8. Bershadsky, A. D., and J. M. Vasiliev (1988). Cytoskeleton, Plenum Press, New York.
9. Bone, Q., A. Pulsford, and A. D. Chubb (1981). Squid mantle muscle. J. Mar. Biol. Ass. U. K. 61:327–342.
10. Bornstein, P., and W. Traus (1979). The chemistry and biology of collagen, in The Proteins, vol. IV, 3rd ed. (h Neurathand R. L. Hill, eds.), Academic Press, New York, pp. 411–632.
11. Bremner, H. A. (1992). Fish flesh structure and the role of collagen—Its post-mortem aspects and implications for fishprocessing. In Quality Assurance in the Fish Industry (H. H. Huss et al., eds.), Elsevier Science, New York, pp. 39–62.
12. Calkins, C. R., T. R. Dutson, G. C. Smith and Z. L. Carpenter (1982). Concentration of creatine phosphate, adeninenucleotides and their derivatives in electrically stimulated and nonstimulated beef muscle. J. Food Sci. 47:1350–1353.

13. Cepeda, R., E. Chou, G. Bracho, and N. Haard (1990). An immunological method for measuring collagen degradation inthe muscle of fish. In Advances in Fisheries Technology and Biotechnology for Increased Profitability (M.N. Voigt and J.R. Botta, eds.), Technomic Pub.
14. Chan, K. M., and E. A. Decker (1994). Endogenous skeletal muscle antioxidants. Crit. Rev. Food Sci. Nutri,34:403–426.
15. Connell, J. J. (1975). Control of Fish Quality, Fishing News Lts., Surrey, UK.
16. Dahlin, K. J., C. E. Allen, E. S. Benson, and P. V. J. Hegarty (1976). Ultrastructural differences induced by heat in red andwhite avian muscles in rigor mortis. J. Ultrastructure Res. 56:96–106.
17. Decker, E. A., and H. O. Hultin (1992). Lipid oxidation in muscle foods via redox iron, in Lipid Oxidation in Food (A. J.St. Angelo, ed.), American Chemical Society, Washington, DC, pp. 34–54.

Pag e 939
18. DeFremery, D., and M. F. Pool (1963). Biochemistry of chicken muscle as related to rigor mortis and tenderization FoodRes. 25:73–87.
19. Dransfield, E., D. J. Etherington, and M. Taylor (1992). Modelling post-mortem tenderization—II: Enzyme changes duringstorage electrically stimulated and nonstimulated beef. Meat Sci. 31:75–84.
20. Ebashi, S., M. Endo, and I. Ohtsuki (1969). Control of muscle contraction. Q. Rev. Biophys. 2:351–384.
21. Fahy, G. M., D. R. MacFarlane, C. A. Angelland, and H. T. Meryman (1984). Vitrification as an approach tocryopreservation. Cryobiology 21:407–426.
22. Faustman, C., R. G. Cassens, D. M. Schaffer, D. R. Buege, S. N. Williams, and K. K. Scheller (1989). Improvement ofpigment and lipid stability in holstein steer beef by dietary supplementation with vitamin E. J. Food Sci. 54:858–862.
23. Fey, M. S., and J. M. Regenstein (1982). Extending shelf-life of fresh wet red hake and salmon using CO2-O2 modifiedatmosphere and potassium sorbate ice at 1°C. J. Food Sci. 47:1048–1070.
24. Foegeding, E. A., C. E. Allen, and W. R. Dayton (1986). Effect of heating rate on thermally formed myosin, fibrinogen andalbumin gels. J. Food Sco. 52:104–112.
25. Forrest, J. C., E. D. Aberle, H. B. Hedrick, M. D. Judge, and R. A. Merkel (1975). Principles of Meat Science, W. H.Freeman, San Francisco.
26. Fraser, D. I., J. R. Dingle, J. A. Hines, S. C. Nowlan, and W. J. Dyer (1967). Nucleotide degradation, monitored by thin-layer chromatography, and associated postmortem changes in relaxed cod muscle. J. Fish Res. Bd. Can. 23:1837–1841.
27. Goodwin, J. W., J. Hearn, C. C. Ho, and R. H. Ottewill (1974). Studies on the preparation and characterization fomonodisperse polystyrene lattices. Colloid and Polymer Sco. 252:464–471.
28. Gordon, A., and S. Barbut (1992). Mechanisms of meat batter stabilization: A review. Crit. Rev. Food Sci. Nutr.32:299–332.
29. Greer-Walker, M. (1970). Growth and development of the skeletal muscle fibers of the cod (Gadus morhua L.). J. Cons.Int. Explor. Mer. 33:228–244.
30. Haard, N. F. (1992). A review of proteolytic enzymes form marine organsims and their application in the food industry. J.Aquatic Food Prod. Technol. 1(1):17–35.
31. Hamm, R. (1986). Functional properties of the myofibrillar system and their measurements, in Muscle as Food (P.J.Bechtel, ed.), Academic Press, New York, pp. 130–200.
32. Harris, P., and W. R. Shorthouse (1988). Meat texture, in Developments in Meat Science—4, (R. Lawrie, ed.), ElsevierApplied Science, New York, pp. 245–296.
33. Hatae, K., F. Yoshimatsu, and J. J. Matsumoto (1990) Role of muscle fibers in contributing firmness of cooked fish. J.Food Sci. 55:693–696.
34. Hay, J. D., R. W. Currid, F. H. Wolfe, and E. J. Sanders (1973). Effect of postmortem aging on chicken breast musclesarcoplasmic reticulum. J. Food Sci. 38:700–704.
35. Holmes, K., D. Popp, W. Gebhard, and W. Kabsch (1990). Atomic model of the actin filament Nature 347:44–49.
36. Howgate, P. (1979). Fish, in Food Microscopy (J. g. Vaughan, ed.), Academic Press London, pp. 343–392.
37. Hultin, H. O. (1976). Characteristics of muscle tissue, in Principles of Food Science), Part I, Food Chemistry (O. R.Fennema, ed.), Marcel Dekker, New York, pp. 577–617.
38. Huxley, A. F., and R. Niedergerke (1954). Structural changes in muscle during contraction: interference microscopy of livingmuscle fibres. Nature 173:971–973.

39. Huxley, H. E. (1963). Electron microscope studies on the structure of natural and synthetic protein filaments from striatedmuscle. J. Mol. Biol. 7:281–308.
40. Huxley, H. E., and J. Hanson (1954). Changes in the cross striations of muscle during contraction and stretch and theirstructural interpretation. Nature 173:973–976.
42, Judge, M. D., and E. D. Aberle (1982). Effects of chronological age and postmortem aging on thermal temperature ofbovine intramuscular collagen. J. Anim. Sci. 54:68–71.
42. Ke., P., R. G. Ackman, B. A. Linke, and D. M. Nash (1977). Differential lipid oxidation in various parts of frozenmackerel. J. Food Technol. 12:37–47.

Pag e 940
43. Koohmaraie, M., S. C. Seideman, J. E. Schollmeyer, T. R. Dutson, and A. S. Babiker (1988). Factors associated with thetenderness of three bovine muscles. J. Food Sci. 53:407–410.
44. Koohmaraie, M., A. S. Babiker, A. L. Schroeder, R. A. Merkel, and T. R. Dutson (1988). Acceleration of postmortemtenderization in ovine carcasses through activiation of CA2+-dependent proteases. J. Food Sci. 53:1638–1641.
45. Lagler, K. F., J. E. Bardack, R. R. Miller, and D. R. M. Pasino (1977). Ichthyology, 2nd ed., John Wiley and Sons, NewYork.
46. Lavety, J., O. A. Afolabi, and R. M. Love (1988). The connective tissues of fish. IX. Gapin in farmed species. Int. J. FoodSci. Technol. 23:23–30.
47. Lee, Y. B., G. L. Hargus, E. C. Hagberg, and R. H. Forsythe (1976). Effect of antemortem environmental temperatures onpostmortem glycolysis and tenderness excised broiler breast muscle. J. Food Sci. 41:1466–1469.
48. Leu, S.-S., S. N. Jhaveri, P. A. Karakoltsidis, and S. M. Constantinides (1981). Atlantic mackerel (Scomber scombrus,L): Seasonal variation in proximate composition and distribution of chemical nutrients. J. Food Sci. 46:1635–1638.
49. Lister, D., N. G. Gregory, and D. D. Warriss (1981). Stress in meat animals, in Developments in Meat Science, vol. 2 (R.Lawrie, ed.), Applied Science, New York, pp. 61–92.
50. Locker, R. H., and W. A. Carse (1976). Extensibility, strength and tenderness of beef cooked to various degress. J. Sci.Food. Agric. 27:891–901.
51. Locker, R. H., G. J. Daines, W. A., Carse, and N. G. Leet (1977). Meat tenderness and the gap filaments. Meat Sci.1:87–104.
52. Locker, R. H. and C. J. Hagyard (1962). A cold-shortening effect in beef muscle. J. Sci. Food Agric. 14:787–793.
53. Louis, C. F., W. E. Rempel, and J. R. Mickelson (1994). Porcine stress syndrome: Biochemical basis of this inheritedsyndrome of skeletal muscle. Proc. 46th Annu. Reciprocal Meat Conf. National Live Stock and Meat Board, Chicago, pp.89–96.
54. Love, R. M. (1988). The Food Fishes. Intrinsic Variation and Its Practical Implications, Farrand Press, London.
55. Love, R. M. (1980. The Chemical Biology of Fishes, vol. 2, Advances 1968–1977, Academic Press, London.
56. Love, R. M., J. Lavety, and F. Vallas (1982). Unusual properties of the connective tissues of cod (Gadus morhua), inChemistry and Biochemistry of Marine Food Products (R. E. Martin, G. J. Flick, C. E. Hebard, and D. R. Ward, eds.),AVI, Westport, CT pp. 67–73.
57. Maita, T., E. Yajima, S. Nagata, T. Miyanishi, S. Nakayama, and G. Matsuda (1991). The primary structure of skeletalmuscle myosin heavy chain: IV. Sequence of the rod, and the complete 1,938-residue sequence of the heavy chain. J. Biochem.110:75–87.
58. Marsh, B. B., and N. G. Leet (1966). Resistance to shearing of heat-denatured muscle in relation to shortening. Nature221:635–636.
59. Marsh, B. B., and N. G. Leet (1966). Studies in meat tenderness. III. The effects of cold-shortening on tenderness. J. FoodSci. 31:450–459.
60. Matsumoto, J. J. (1979). Denaturation fo fish muscle proteins during frozen storage in Proteins at low Temperatures (O.Fennema, ed.), Advances in Chemistry Series 180, American Chemical Soc., Washington, DC, pp. 205–224.
61. Muller, B., D. Maeda, and A. Wittinghofer (1990). Sequence of the myosin light chain 1/3 isolated from a rabbit fastskeletal muscle lambda library. Nucleic Acids Res. 18:6688.
62. Muramoto, M., Y. Yamaoto, and N. Seki (1988). Comparison of calpain susceptibility of various fish myosins in relation totheir thermal stabilities. Nippon Suisan Gakkaishi 54:917–923.
63. Morris, E. R. (1990). Mixed polymer gels. In Food Gels, (P. Harris, ed.), Elsevier, London, pp. 291–359.

64. Nishita, K., Y. Takeda, and K. Arai (1981). Biochemical characteristics of actomyosin from Antarctic krill. Bull. Jpn. Soc.Sci. Fish. 47:1237–1244.
65. Northcutt, J. K., E. A. Foegeding, and F. W. Edens (1994). Water-holding properties of thermally preconditioned chickenbreast and leg meat. Poultry Sci. 73:308–316.

Pag e 941
66. Nunzi, M. G., and C. Franzini-Armstrong (1981). The structure of smooth and striated portions of the adductor muscle ofthe valves in a scallop. J. Ultrastruct. Res. 76:134–148.
67. Nuss, J. I., and F. H. Wolfe (1981). Effect of post-mortem storage temperatures on isometric tension, pH, ATP, glycogenand glucose-6-phosphate for selected bovine muscles. Meat Sci. 5:201–213.
68. Offer, G., P. Purslow, R. Almond, T. Cousins, J. Elsey, G. Lewis, N. Parsons, and A. Sharp (1988). Myofibrils and meatquality. Proc. 34th Int. Cong. Meat Sci. Technol., Brisbane, Australia, pp. 161–168.
69. Okayama, T., N. Ando, and Y. Nagata (1982). Low-molecular weight components in sarcoplasma promoting the colorformation of processed meat products. J. Food Sci. 47:2061–2063.
70. Park, J. W., T. C. Lanier, and D. H. Pilkington (1993). Cryostabilization of functional properties of pre-rigor and post-rigorbeef by dextrose polymer and/or phosphates. J. Food Sci. 58:467–472.
71. Park, J. W., Lanier, T. C., Keeton, J. T., and Hamann, D. D. (1987). Use of cryoprotectants to stabilize functionalproperties of prerigor salted beef during frozen storage. J. Food Sci. 52:537–542.
72. Parkin, K. L. and W. D. Brown (1982). Preservation of seafood with modified atmospheres, in Chemistry andBiochemistry of Marine Food Products (R. E. Martin, G. J. Flick, C. E. Hebard, and D. R. Ward, eds.), AVI, Westport, CTpp. 453–465.
73. Pearson, A. M., A. M. Wolzak, and J. I. Gray (1982). Possible role of muscle proteins in flavor and tenderness. J. FoodBiochem. 7:189–210.
74. Pette, D., and R. S. Staron (1990). Cellular and molecular diversities of mammalian skeletal muscles fibers. Rev. Physiol.Biochem. Pharmacol. 116:1–76.
75. Porte, K. R., and C. Franzini-Armstrong (1965). The sarcoplasmic reticulum. Sci. Am. 212:72–78,80.
76. Rayment, I., W. R. Rypniewski, K. Schmidt-Base, R. Smith, D. R. Tomchick, M. M. Benning, D. A. Windelmann, B.Wesenberg, and H. M. Holdon (1993). Three-dimensional structure of myosin subfragment-1: A molecular motor. Science261:50–58.
77. Ritchie, A. H., and I. M. Mackie (1980). The formation of diamines and polymines during storage of mackerel (Scomberscombrus), in Advances in Fish Science and Technology (JJ. Connell, ed.), Fishing News Books, Surrey, England, pp.489–494.
78. Robson, R. M., and T. W. Huiatt (1983). Roles of the cytoskeletal proteins desmin, titin and nebulin in muscle. Proc. 36thAnn. Reciprocal Meat Conf. National Live Stock and Meat Board, Chicago, pp. 116–124.
79. Shenouda, S. Y. K. (1980). Theories of protein denaturation during frozen storage of fish flesh, in Advances in FoodResearch, vol. 26 (C.O. Chichester, ed.), Academic Press, New York, pp. 275–311.
80. Shewfelt, R. L. (1981). Fish muscle lipolysis—A review. J. Food Biochem. 5:79–100.
81. Shewfelt, R. L., and H. O. Hultin (1983). Inhibition of enzymic and non-enzymic lipid peroxidation of flounder musclesarcoplasmic reticulum by pretreatment with phospholipase A2. Biochim. Biophiys. Acta 751:432–438.
82. Sikorski, Z. E., and J. A. Borderias (1994). Collagen in the muscles and skin of marine animals, in Seafood Proteins (Z. E.Sikorski, B. S. Pan and F. Shahidi, ed.), Chapman and Hall, New York, pp. 58–70.
83. Sims, T. J., and A. J. Bailey (1981). Connective tissue, in Developments in Meat Science, vol. 2 (R. Lawrie, ed.), AppliedScience, London, pp. 29–59.
84. Staron, R. S., and D. Pette (1993). The continum of pure and hybrid myosin heavy chain-based fibre types in rat skeletalmuscle. Histochemistry 100:149–153.
85. Stefansson, G., and H. O. Hultin (1994). On the solubility of cod muscle proteins in water. J. Agric. Food Chem.42:2656–2664.

86. Swatland, H. J. (1981). Cellular heterogeneity in the response of beef to electrical stimulation. Meat Sci. 5:451–455.
87. Sweeney, H. L., M. Kushmerick, K. Mabuchi, F. Sreter, and J. Gergely (1988). Myosin alkali light chain and heavy chainvariations correlate with altered shortening velocity of isolated skeletal muscle fibers. J. Biol. Chem. 263:9034–9039.
88. Takahashi, K., T. Fukazawa, and T. Yasui (1967). Formation of myofibrillar fragments and reversible contraction ofsarcomeres in chicken pectoral muscle. J. Food Sci. 32:409–413.
89. Thompson, A. B., A. S. McGill, J. Murray, R. Hardy, and P. F. Howgate (1980). The analysis of a

Pag e 942
range of non-volatile constituents of cooked haddock (Gadus aegle-finus) and the influence of these on flavor, inAdvances in Fish Science and Technology (J. J. Connell, ed.), Fishing News Books, Surrey, England, pp. 30–34.
90. Tolstogusov, V. B. (1986). Functional properties of protein-polysaccharide mixtures, in Functional Properties of FoodMacromolecules (J. R. Mitchell and D. A. Ledward, eds.), Elsevier, London, pp. 385–415.
91. Toyohara, H., M. Kinoshita, Y. Shimizu, and M. Sakaguchi (1991). A group of novel latent serine proteinases degradingmyosin heavy chain in fish muscle. Biomed. Bloc. 50:717–720.
92. Tsuchimoto, M., N. Tanaka, T. Misima, S. Yada, T. Senta, and M. Yasuda (1988). The influence of habitat watertemperature on the relative thermostability of myofibrillar CA2+-ATPase in fishes collected in the waters from tropical to frigidzones. Nippon Suisan Gakkaishi 54:787–793.
93. Veis, A. (1965). The Macromolecular Chemistry of Gelatin, Academic Press, New York.
94. Wasson, D. H., (1992). Fish muscle protease and heat-induced myofibrillar degradation: A reviw. J. Aquatic FoodProduct Technol. 1:23–41.
95. Watt, B. K., and A. L. Merrill (1963). Composition of Foods, Agriculture Handbook No. 8, U.S. Department ofAgriculture, Washington, DC.
96. Wiskus, K. J., P. B. Addis, and R. T. Ma (1976). Distribution of bR, aR and aW fibers in turkey muscles. Poultry Sci.55:562–57.
97. Yancey, P. H., M. E. Clark, S. C. Hand, R. D. Bowlus, and G. N. Somero (1982). Living with water stress: Evolution ofosmolyte systems. Science 217:1214–1222.
98. Yasui, T., M. Ishioroshi, and K. Samejima (1982). Effect of actomyosin on heat induced gelation of myosin. Agric. Biol.Chem. 46:1049–1059.
99. Zarkadas, C. G., W. D. Marshall, A. K. Khalili, Q. Nguyen, G. C. Zarkadas, C. N. Karatzas, and S. Khanizadeh (1987).Mineral composition of selected bovine porcine and avian muscles and meat. J. Food Sci. 52:520–525.

Pag e 943
16Characteristics of Edible Plant Tissues
NORMAN F. HAARD
University of California, Davis, CaliforniaGRADY W. CHISM
The Ohio State University, Columbus, Ohio
16.1. Introduction 944
16.2. Chemical Composition 945
16.2.1. Water 945
16.2.2. Carbohydrates 947
16.2.3. Proteins and Other N Compounds 952
16.2.4. Lipids and Related Compounds 955
16.2.5. Organic Acids 960
16.2.6. Pigments 965
16.2.7. Mineral Elements 965
16.2.8. Vitamins 966
16.3. Biological Structure 966
16.3.1. Organ Structure 967
16.3.2. Tissue and Cell Structure 969
16.3.3. Subcellular Structure 971
16.4. Physiology and Metabolism 973
16.4.1. Respiration 974
16.4.2. Gene Expression and Protein Synthesis 982
16.4.3. Other Metabolic Processes That Influence Food Quality 984
16.5. Control Mechanisms 992
16.5.1. Cell Disruption 992
16.5.2. Plant Hormones 994
16.6. Handling and Storage 997

16.6.1. Cereals, Pulses, and Oilseeds 997
16.6.2. Fruits and Vegetables 997
16.6.3. Controlled Atmospheres 1000
16.6.4. Humidity 1002
16.6.5. Ionizing Radiation 1003
16.6.6. Other Factors 1003

Pag e 944
16.7. Effects of Processing on Fruits and Vegetables 1004
16.7.1. Chemical Changes 1004
16.7.2. Enzyme-Catalyzed Reactions 1005
16.7.3. Cell Disruption 1005
16.7.4. Changes in Molecular Structures 1005
16.7.5. Other Factors Influencing Reaction Rates 1005
16.8. Conclusion 1007
Bibliography 1007
References 1007
16.1 Introduction
Plant tissues, through the agency of photosynthesis, are ultimately the supplier of all food for humans. An estimated 150 billiontons of carbon are fixed annually by more than 300,000 taxonomically distinct plant species. Worldwide, plant tissues directlyprovide about 70% of the protein consumed by humans. In affluent countries, like the United States, about 30% of dietaryprotein comes directly from plants. The annual food consumption of plant products in the United States remains somewhat lessthan that of animal products [21]. Per capita consumption of plant food products in the United States from 1980 to 1992 isshown in Figure 1. Consumption of plant products increased by more than 100 lb to 671 lb between 1980 and 1992. Duringthis same period of time, overall intake of animal products (i.e., red meats, poultry, eggs, fish, shellfish, and dairy products) byAmerican consumers remained constant at just under 900 lb per capita. Although thousands of crops fit into this dietary picture,some 100–200 species are of major importance in world trade. The major cultivated species produced in the world includesugar cane, wheat, maize, rice, potato, sugar beet, barley, cassava, sweet potato, and soybean. These crops directly orindirectly provide an estimated 80% of human dietary energy and protein.
The basic taxon of plants, the species, may be represented by hundreds or thousands of agricultural varieties or cultivarsdeveloped by plant breeders. An estimated 50,000 cultivars of
FIGURE 1Annual food consumption of food g roups derived from plant products.
Data are on a retail weig ht basis. Fresh veg etable data are forlettuce, tomatoes, onion, carrots celery, corn, broccoli, asparag us,
artichokes, cabbag e, cucumbers, eg g plant, g arlic, g reen beans, g reenpeppers, and cauliflower. (Data from Ref. 21).


Pag e 945
wheat have been derived from a few species of genus Triticum, namely, T. monococcum, T. dioccum, T. durum, and T.aestivum. Different species of plants are also grouped on the basis of taxonomic families [40]. Taxonomic families often havecommon biochemical characteristics. For example, members of the Cruciferae or “mustard” family contain aromatic sulfurcompounds derived from thioglucosides. Examples of some important families of plants that enter man's diet are listed in Table1. Special mention should be made of the Gramineae or “grass” family, which includes the major cereal crops wheat, corn, rice,and barley. The sustenance provided by cereals is frequently referred to in the Bible, and they are by many other criteria themost important group of crops produced in the world. Cereal grain contains 10,000–15,000 kJ/kg, about 10–20 times moreenergy per unit weight than most succulent fruits and vegetables. In 1986 world production of the cereals was almost 2 billionmetric tons. They are estimated to directly provide 50% of human calories in the world and 70–80% of all food caloriesconsumed in China and India. Worldwide, cereals are the direct or indirect source of about 75% of our dietary protein.
In addition to supplying protein and energy, plant products are also an important source of other dietary nutrients, as shown bythe relatively high “index of nutritional quality” (INQ) of several succulent crops [78]. The sum of INQ values for seven majornutrients is about 10 times greater for spinach, broccoli, or lettuce than it is for whole milk, egg, or meat (Table 2).
Many volumes have been written to describe the characteristics of edible plant tissues, and it is beyond the scope of this chapterto provide complete details on individual commodities, much less all these crops. The intent of this chapter is to outline thecompositional and physiological diversity of crop plants and to relate these properties to postharvest quality, storage, andprocessing. Postharvest physiology remains one of the most important and challenging sectors of science and technology.
16.2 Chemical Composition
Detached plant parts, like all living organisms, contain a wide range of different chemical compounds and show considerablevariation in composition. The proximate composition for the major economic groups of edible plants is summarized in Table 3.Apart from the obvious interspecies differences, an individual plant organ, largely composed of living tissues that aremetabolically active, is more or less constantly changing in composition. The rate and extent of chemical change can depend onthe growing conditions prior to harvest, the physiological role of the plant part, the genetic pool of the cell, and the postharvestenvironment.
16.2.1 Water
Given an unlimited supply of water, the moisture content of viable plant tissue assumes a characteristic maximum valueassociated with a state of complete turgor of the component cells. At turgor, the internal pressure (up to 900 mpa or more)developed by osmotic forces is balanced by the inward pressure of the extended cell wall [55]. Accordingly, the maximumwater content of a given tissue is influenced by its structural and chemical characteristics as well as extrinsic factors. Thesusceptibility of a commodity to water loss is dependent on the water vapor deficit of the surrounding atmosphere and the extentto which the external surface of the tissue is structurally and chemically modified to reduce transpiration (water loss). Watergenerally represents about 80–90% of the fresh weight of “wet” crops and less than 20% of the weight of “dry” crops such ascereals, nuts, and pulses. Apart from the influence of water loss on wilting and weight loss, one must recognize that moisturebalance can indirectly evoke undesirable or desirable physiological changes in some crops. The interaction of water with othermolecular constituents and its role in cellular metabolism are discussed in Chapter 2.

Pag e 946
TABLE 1 Some Families in the Plant King dom That Are Important Sources of Human Food
Family Examples Characteristics
Gramineae Grass family—cereals, sug ar cane, bamboo Directly and indirectly provide about 75% of food protein andenerg y; energ y dense with 10,000–15,000 kJ/kg
Leg uminosae Leg ume family—peas, lentils, soybean, peanuts Leg ume seeds averag e twice as much protein as cereals; soybeansare sing le larg est cash crop in United States
Palmaceae Palm family—coconut, date, palm Source of tropical oils
Rosaceae Rose family—many fruits, e.g ., apple, pear, peach, apricot, plum, cherry,raspberry, strawberry, rose hips
Includes several fruit structures, e.g ., pome fruits, stone fruits, andag g reg ate fruits; develop distinctive aromatic flavors and sweet tasteduring ripening
Curcurbitaceae Melon family—squash, cantaloupe, watermelon, cucumber, pumpkin History of cultivation is > 9000 years; fruit do not tend to sweeten asthey ripen
Cruciferae Mustard family—cabbag e, cauliflower, radish, turnip, canola,horseradish, mustard
Characterized by pung ent sulfur-containing compounds or “mustardoils” that are formed enzymatically from thiog lucosides
Labiatae Mint family—basil, marjoram, oreg ano, peppermint, rosemary, sag e,savory, thyme
Herb plants, most of which are native to Mediterranean reg ion; hair-like oil g lands on leaves and stems contain “essential oils”
Umbelliferae Parsnip family—celery, carrot, parsley, caraway, dill, fennel, coriander,anise, cumin
Herb and spice plants; seed-fruit are rich in “essential oils”
Solanaceae Nig htshade family—potato, tomato, eg g plant, pepper Characterized by toxic steroidal alkaloids in some nonedible species
Lilliacae Lily family—alliums (onion, shallot, chive, g arlic, leek), asparag us Alliums characterized by lachrimatory, flavorful sulfur compoundsthat are formed enzymatically from S-alkylcysteine sulfoxides
Compositae Daisy family—lettuce, endive, dandelion, chicory Latex contains triterpenoid alcohols that act as soporific herbs
Rutaceae Citrus family—lemon, orang e, g rapefruit, lime, citron, kumquat,mandarine
Flavanoid g lycosides and terpenes contribute to characteristic flavor

Pag e 947
TABLE 2 Index of Nutritional Quality (INQ) for Seven Major Nutrients in Selected Plant- andAnimal-Derived Food Products
Food INQ > 1, number of nutrients Total INQ (7 nutrients)
Spinach 7 185
Broccoli 7 180
Lettuce 7 148
Orang e 7 63
Apricot 7 45
Apple 2 8
Beans, navy 5 14
Potatoes 4 16
W hole wheat bread 5 8
W hole milk 4 17
Ground beef 4 13
Eggs 4 16
Tuna 3 17
Note: The INQ is the percent of nutrient need provided by the food divided by the percent ofcaloric need provided from food.
Source: Data from Ref. 78.
16.2.2 Carbohydrates
In general, approximately 75% of the solid matter of plants is carbohydrate. The total carbohydrate content can be as low as2% of the fresh weight in some fruits or nuts, more than 30% in starchy vegetables, and over 60% in some pulses and cereals.Total carbohydrates are generally regarded as consisting primarily of simple sugars and polysaccharides, but they also properlyinclude pectic substances and lignin. In plants, carbohydrates are localized in the cell wall and intracellularly in plastids, vacuoles,or the cytoplasm.
16.2.2.1 Cell Wall Constituents
The principal cell wall constituents are cellulose, hemicelluloses, pectins, and lignin. Cellulose is one of the most abundantsubstances in the biosphere, is largely insoluble, and is indigestible by human beings. The hemicelluloses are a heterogeneousgroup of polysaccharides that contain numerous kinds of hexose and pentose sugars and in some cases residues of uronic acids.These polymers are classified according to the types of sugar residues predominating and are individually referred to as xylans,arabinogalactans, glucommannans, etc. Pectin is generally regarded

TABLE 3 Rang es for Proximate Composition of Crops Represented in Major Economic Groups ofEdible Plants
Group W ater, % Carbohydrates, % Lipids, % Protein,%
Fruit 80–90 5–20 0.1–0.5 0.5–3
Fleshy veg etables 80–90 2–20 0.1–0.3 5–7
Pulses, seeds 10–50 6–60 1–18 5–25
Nuts 3–50 10–40 2–70 3–25
Cereals 12–14 65–75 2–6 7–12

Pag e 948
as a-1,4-linked galacturonic acid residues esterified to varying degrees with methanol. Pectins found in the primary wall have ahigher degree of methylation than do pectins in the middle lamella. Interaction of the carboxyl groups of pectin with calcium canform ionic cross-links between the polymer chains. Purified pectin invariably contains significant quantities of covalently linkednonuronide sugars, such as rhamnose, arabinose, and xylose, which result in the “hairy” region of the molecule. The albedo(white spongy layer) of citrus peel is an especially rich source of pectin, containing up to 50% of this constituent on a dry weightbasis. Commercially, apple and citrus peel are major sources of pectin, with the latter being used primarily as a gelation agent.Lignin, always associated with cell wall carbohydrates, is a three-dimensional polymer comprised of phenyl propane units, suchas syringaldehyde and vanillin, and these are linked through aliphatic three-carbon side chains. Lignification of cell walls, notablythose of xylem and sclerenchymatous tissues, confers considerable rigidity and toughness to the wall. While generally ignored,cell walls also contain small amounts of structural proteins and enzymes. The best characterized structural protein is extensin,which occurs in the wall, but not the middle lamella [19]. Most of the enzymes that have been identified in the wall areperoxidases and hydrolases.
Cell wall constituents are the primary components of “dietary fiber.” The biological availability of protein and other nutrients [83]can be reduced by these constituents, but there is considerable evidence for the beneficial role played by fiber in health anddisease [3]. The structure and chemistry of these substances are discussed in more detail in Chapter 3.
In spite of rapid advances in analytical methodology and molecular biology, the precise molecular details of cell walls that areneeded to explain softening during ripening and expansion during growth are still lacking. Pectin occupies a central location in themiddle lamella (see Fig. 18) located between the primary cell walls of adjacent cells. Hydrolysis of pectin by enzymes (seeChap. 6) can reduce intercellular adhesion and thus soften the tissue. Nonripening tomato mutants [43] and transgenic tomatoeswith drastically reduced polygalacturonase [18] demonstrate that polygalacturonase is necessary for significant softening tooccur. Solubilization of pectin [85] and the release of low-molecular-weight uronides from cell walls occur concomitantly withsoftening in many fruits. Identification of a xyloglucan endotransglycosylase that increases during the ripening [72] of kiwifruitsuggests that degradation of hemicellulose may also play an important role in softening. Calcium-pectin interactions alsocontribute substantially to the rigidity of the cell walls [27] (Section 16.5.1.4).
Cellulose is an important component of cell walls, but relatively little is known about its structure within the cell wall. Thecellulose in apple cell walls is composed of triclinic Ia and monoclinic b crystalline forms [60], with little amorphous cellulose.This combination is consistent with the crisp texture of an apple, as amorphous cellulose gives rise to toughness. Cellulases havebeen implicated via gene expression experiments as important parts of ethylene-induced softening, but chemical measurements ofcellulose have yet to confirm the role of cellulose degradation in softening of fruits [61].
The relative proportion and contents of cell wall constituents vary considerably among species, among cell types, with maturity atharvest, and with elapsed time and storage conditions after harvest. Hydrolysis of these components by carbohydrasesproduced during ripening along with removal of calcium leads to softening, while lignification and influx of calcium leads to“hardening.”
16.2.2.2 Starch and Other Polysaccharides
The principal carbohydrate of plant tissues, which is not associated with cell walls, is starch, a linear (a-1,4) or branched (a-1,4;1,6) polymer of D-glucose (see Chap. 3). In the developing plant, amylose is synthesized from adenosine diphosphoglucose(ADPG) or uridine diphosphoglucose (UDPG) by the enzyme starch synthetase. This occurs in organelles called amyloplasts.

Pag e 949
UDPG is formed from sucrose by the enzyme sucrose-UDP glucosyl transferase and ADPG, and ADPG is formed fromglucose-1-P by the enzyme ADPG-phosphorylase [75]. A branching enzyme, called Q-enzyme, introduces a-1,6 glucosidiclinkages into amylose chains to form amylopectin. Although most starches contain amylose and amylopectin in a ratio of 1:4,high-amylose and high-amylopectin (“waxy”) cultivars of cereals have been developed. Waxy starches are valued as industrialproducts for their bright transparent appearance, which is attributed to the absence of retrogradation. Likewise, short-grain riceis moist, firm, and sticky when cooked due to the high proportion of amylopectin in the starch. In mature plants, starch islocalized in intercellular plastids or granules that have species-specific shape, size, and optical properties. Industrially, starch isobtained from such crops as potato, sweet potato, or cereals that may contain up to 40% starch on a fresh weight basis [71].Although starch contributes more calories to the normal human diet than any other single substance, it is absent or negligible inmost ripe fruits and many vegetables.
The amount of nonstarch polysaccharides in edible plants is not accurately known because of limitations with analytical methods[23, 65]. Examples of other polysaccharides that occur as intracellular constituents of fruits and vegetables include a-D-1,4-linked glycopyranose of sweet corn, b-glucans of mango, and fructans. D-Fructose in the furanose form is the main unit offructans and the units are linked b(2 1) or b(2 6). Inulin is the main carbohydrate reserve found in plants that do notaccumulate starch (e.g., Jerusalem artichoke, sweet potato). An initial glucose on inulin indicates that a primer sucrose moleculeis built up by successive transfer of fructose units (40–100 residues) from sucrose (Fig. 2).
Oats, barley, and rye are examples of cereals that contain a relatively high percent (5–25% of total carbohydrates) of nonstarchpolysaccharides in the flour. The pentosan fraction of cereals is a complex mixture of branched polysaccharides with anarabinoxylan backbone containing small amounts of glucose and ferulic acid (Fig. 3). Some pentosans are conjugated withprotein, and they can be separated into water-soluble and water-insoluble fractions. Rye flour contains a relatively high content(6–8%) of pentosans; 15–25% of rye pentosans are water soluble. Pentosans contribute to gluten development in wheat flourand are especially important to the
FIGURE 2Inulin, a nonstarch
carbohydrate reserve foundin some plants. The b(2 1)
fructan is the majorpolysaccharide found inJerusalem artichoke. The
b(2 6) fructans have alsobeen identified in some plants.

Pag e 950
FIGURE 3Portion of a pentosan with ferulic acid cross-link. The arabinoxylan consists of
D-xylopyranose units with L-arabinofuranose g lycosidic linkag es inpositions 2 and 3. Covalent cross-links of this type may occur between
cell wall proteins and between polysaccharides and proteins.
bread-making characteristic of rye flour because of their ability to absorb large amounts of water and to form gels. Insolublepentosans appear to be formed by peroxidase-catalyzed cross-linking of ferulic acid residues [48] and “oxidative gelation.”Other nonstarch polysaccharides found in cereal flours are b(1 3) and b(1 4) linear polymers of D-glucopyranose calledb-glucans or lichenins. These slimy substances predominate in oats and barley (6–8%), and their high viscosity can cause wortfiltration problems in the brewing industry. Glucofructans are also present in significant amounts in durum wheat. Thesepolysaccharides are branched chain, water soluble, and contain a-D-glucopyranose (1 2), b-D-fructofuranose, b-D-fructofuranose(1 2), and b-D-fructofuranose(6 2) linkages.
Gums and mucilages are also obtained from some plants as tree exudates, seed gums or as algae extracts (Table 4). Thesecarbohydrates are chemically related to the hemicelluloses, and some, such as carrageenan, gum arabic, karaya gum, locust beangum, guar gum, fuicoidans, laminarins, carob gum, and gum tragacanth, are isolated and used as food additives for stabilization,emulsification, thickening and gelation (see Chap. 3).
16.2.2.3 Simple Sugars and Related Compounds
The sugar content of fruits and vegetables varies from negligible (e.g., avocado) to over 20% (e.g., ripe banana) on a freshweight basis. Sucrose, glucose, and fructose are the principal sugars of most commodities. In general, fruits and vegetablescontain more reducing sugars than sucrose, although in many cases the reverse is true. Other sugars, such a xylose, mannose,arabinose, galactose, maltose, sorbose, octulose, and cellobiose, may also be present, and in some instances they may constitutea major portion of the total sugars. For example, avocado fruit contains significant amounts of heptuloses, heptose, octose,octulose, and nonulose sugars. Branched sugars, such as D-adiose (Fig. 4), are sometimes constituents of plant glycosides, suchas in parsley. Fruit tissues also contain sugar alcohols (alditols), notably sorbitol (Fig. 4) and

Pag e 951
TABLE 4 Examples of Nonstarch Polysaccharides Obtained from Plants for Use as Food Additives
Polysaccharide Source Composition
Gum arabic Acacia treeexudate
Complex, branched, polymer of D-g alactose, L-arabinose, L-rhamnose, and D-g alacturonic acid
Carob Carob tree seeds Polymannose polymer, b(1 4) with sing le g alactosebranch every 4 or 5 mannose residues
Alg inates Brown alg ae D-Mannuronic acid with b(1 4) bond or L-g uluronic acidwith a(1 4) bond or copolymer
Carrag eenans Red alg ae Linear polymer g alactose and sulfated g alactose molecules,with b(1 4) and a(1 3) bonds
FIGURE 4Examples of monosaccharide derivatives
found in some plant tissues.
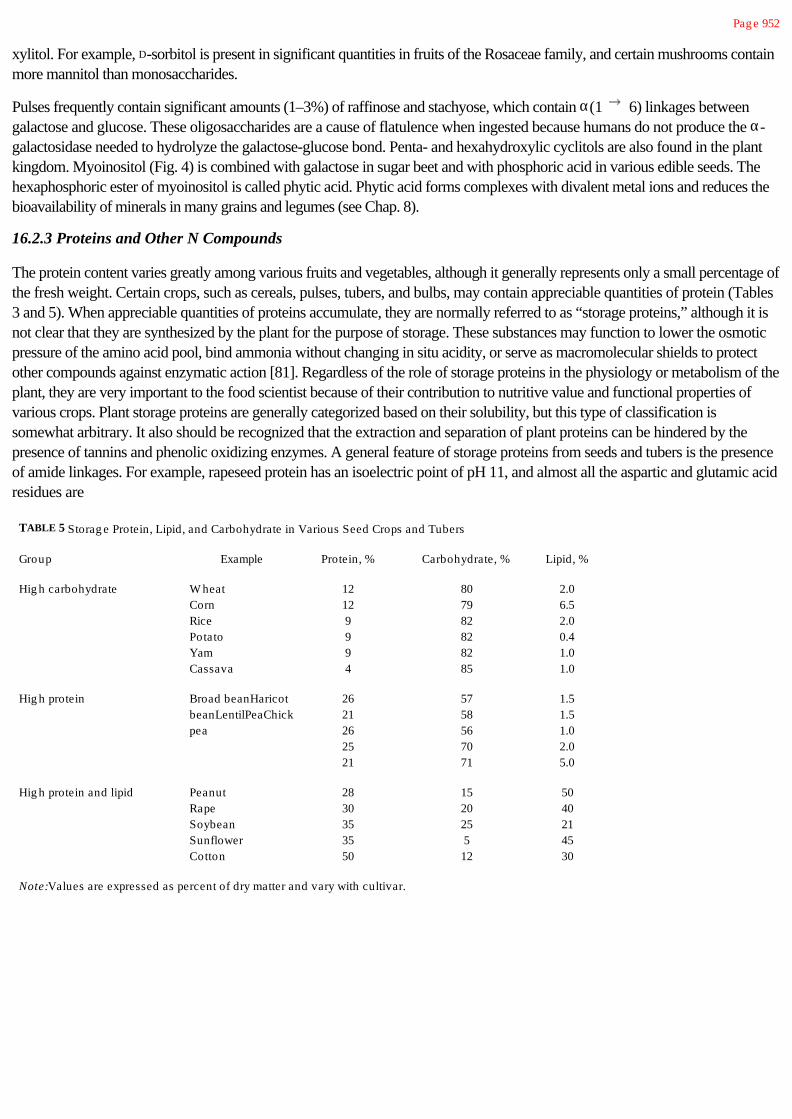
Pag e 952
xylitol. For example, D-sorbitol is present in significant quantities in fruits of the Rosaceae family, and certain mushrooms containmore mannitol than monosaccharides.
Pulses frequently contain significant amounts (1–3%) of raffinose and stachyose, which contain a(1 6) linkages betweengalactose and glucose. These oligosaccharides are a cause of flatulence when ingested because humans do not produce the a-galactosidase needed to hydrolyze the galactose-glucose bond. Penta- and hexahydroxylic cyclitols are also found in the plantkingdom. Myoinositol (Fig. 4) is combined with galactose in sugar beet and with phosphoric acid in various edible seeds. Thehexaphosphoric ester of myoinositol is called phytic acid. Phytic acid forms complexes with divalent metal ions and reduces thebioavailability of minerals in many grains and legumes (see Chap. 8).
16.2.3 Proteins and Other N Compounds
The protein content varies greatly among various fruits and vegetables, although it generally represents only a small percentage ofthe fresh weight. Certain crops, such as cereals, pulses, tubers, and bulbs, may contain appreciable quantities of protein (Tables3 and 5). When appreciable quantities of proteins accumulate, they are normally referred to as “storage proteins,” although it isnot clear that they are synthesized by the plant for the purpose of storage. These substances may function to lower the osmoticpressure of the amino acid pool, bind ammonia without changing in situ acidity, or serve as macromolecular shields to protectother compounds against enzymatic action [81]. Regardless of the role of storage proteins in the physiology or metabolism of theplant, they are very important to the food scientist because of their contribution to nutritive value and functional properties ofvarious crops. Plant storage proteins are generally categorized based on their solubility, but this type of classification issomewhat arbitrary. It also should be recognized that the extraction and separation of plant proteins can be hindered by thepresence of tannins and phenolic oxidizing enzymes. A general feature of storage proteins from seeds and tubers is the presenceof amide linkages. For example, rapeseed protein has an isoelectric point of pH 11, and almost all the aspartic and glutamic acidresidues are
TABLE 5 Storag e Protein, Lipid, and Carbohydrate in Various Seed Crops and Tubers
Group Example Protein, % Carbohydrate, % Lipid, %
Hig h carbohydrate W heatCornRicePotatoYamCassava
12129994
807982828285
2.06.52.00.41.01.0
Hig h protein Broad beanHaricotbeanLentilPeaChickpea
2621262521
5758567071
1.51.51.02.05.0
Hig h protein and lipid PeanutRapeSoybeanSunflowerCotton
2830353550
152025512
5040214530
Note: Values are expressed as percent of dry matter and vary with cultivar.

Pag e 953
amidated. Enzymatic deamidation of soybean protein with glutaminase can enhance solubility, emulsifying properties, andfoaming [31]. Generally, plant storage proteins decrease in molecular weight during senescence. This decrease in molecularweight is partly due to dissociation of larger complexes. Finally, it should be noted that the storage proteins from differentcultivars of a given species may exhibit different electrophoretic patterns. Accordingly, electrophoresis or isoelectric focusing canbe used to “fingerprint” or identify cultivars of unknown origin [52].
16.2.3.1 Cereal Proteins
The protein content of wheat is about 12%, and extensive research has shown that the baking performance of wheat flour isrelated to the properties of certain storage proteins. Early workers divided the proteins of wheat into four solubility classes:albumins, which are soluble in water; globulins, which are soluble in salt solutions but insoluble in water; gliadins, which aresoluble in 70–90% alcohol; and glutenins, which are insoluble in neutral aqueous solutions, saline solutions, or alcohol. In wheat,the principal storage proteins are the gliadin and glutenin fractions. These proteins represent about 80–85% of the endospermprotein.
The gliadins are a heterogeneous mixture containing as many as 40–60 components. The molecular masses of these proteins areapproximately 36 kD, the amino acid sequences are homologous, and they appear to exist as single polypeptide chains ratherthan as associated units. Glutamine is the most prevalent amino acid in the gliadin fraction [92], and with glutamic acid theyaccount for more than 40% of the amino acids on a mole basis. Proline constitutes about 15%.
Glutenin proteins consist of at least 15 distinct molecular mass fractions ranging from 12 to 133 kD for dissociated components.Associated forms of glutenin have average molecular masses of 150–3000 kD. Subunits associate by intra- and intermoleculardisulfide bonds. The glutenin fraction has somewhat less glutamine (~34%) and proline (~11%) than the gliadin fraction, but stillthese account for about half of the amino acids present.
The albumin and globulin protein fractions have relatively low molecular masses of approximately 12 kD and remain unchangedin size following reduction of disulfide bonds.
Although considerable progress has been made toward understanding the molecular basis of functionality of wheat proteins infoods, we still do not have a detailed understanding of the contributions of individual components of wheat to the properties ofwheat doughs and baked goods. Nonetheless, rapid advances in genetic technology have led to the identification of genes (andtheir chromosomal location) that are correlated with functional characteristics in foods, like cooking quality of pasta [5].Advances in the understanding of the genetic map for wheat will not only provide for improved and unique food ingredients, butwill also provide research tools that will advance our understanding of the functionality of this complex system at the molecularlevel.
The basics of dough formation are covered in Chapter 5. The major reactions in dough formation are sulfhydryl-disulfideinterchange (intra- and intermolecular), hydration of the protein, and other protein-protein interactions. Oxidizing agents areusually added during commercial bread making to improve the quality of the dough. Addition of oxidizing agents likeazodicarbonamide, bromate, and iodate promotes the formation of disulfide linkages, and addition of reducing agents likecysteine, bisulfite, and gluthathione promotes the breakage of disulfides. Ascorbic acid acts like an oxidizing agent because it israpidly converted to dehydroascorbic acid by ascorbic acid oxidase. In this state it serves to dissociate disulfide bonds.Depending on the agent used and when it is added to the flour, varying affects of these agents can be seen on dough strength,mixing tolerance, mechanical properties of the dough, and final product quality. Dough viscosity and elasticity can also bemodified by the addition of proteolytic enzymes. The use of such additives to control mixing times and product uniformity isstandard practice in continuous bread-making operations.

Pag e 954
16.2.3.2 Tuber Proteins
Approximately 70–80% of the extractable proteins in potato tuber (about 2–4% protein and amino acids on a fresh weightbasis) are classified as storage protein. Up to 40 individual proteins have been separated from potatoes by electrophoresis. Inmature potato tubers, the main group of proteins has subunit molecular weights of 17–20 kD. The heterogeneity of these storageproteins appears to be due to charge differences, and it is likely that this is a reflection of different amounts of amide in thepolypeptide chain. Protein patterns obtained by isoelectric focusing on polyacrylamide gel can also be used to differentiatepotato cultivars.
16.2.3.3 Pulse Storage Proteins
Pulses of major economic importance include peas, beans, lentils, peanuts, and soybeans. Legume seeds are characterized by arelatively high content (20–40%) of protein. The limiting essential amino acids in legumes are methionine and cysteine. Thestorage proteins in legumes or pulses, such as soybean, are also characterized by heterogeneity in molecular weight and charge.Separation of legume proteins by Osborne fractionation yields mostly globulins (60–90%). The albumins or water-solubleproteins have a molecular mass range of approximately 20–600 kD. Soybean proteins do not contain prolamines or glutelins,although peanuts, peas, and broad beans contain 10–15% glutelins. About 90% of soybean proteins are classified as globulinsbased on their solubility in salt. Soybean globulins can be separated into four fractions by sedimentation in the ultracentrifuge orby gel permeation chromatography. The small globulins (2S fraction) represent 6–8% of total protein and include two trypsininhibitors, Kunitz's inhibitor (21.7 kD) and Bowman-Birk inhibitor (7.9 kD). Pulses also contain proteins and glycoproteinscalled hemagglutinins or lectins. Certain glycan sites on erythrocytes bind to lectins, causing agglutination or precipitation of thecells.
The 7S fraction (190 kD) of soybean, about one-third of total soybean protein, contains a glycoprotein called conglycinin. Thisfraction consist of three glycoprotein subunits, which are devoid of cysteine and contain about 5% carbohydrate as mannose andglucosamine. Other pulses have a 7S globulin similar to soybean conglycinin, that is, phaseollin in beans and vicillin in peas.
The 11S globulin fraction (350 kD) represents about 40% of soybean protein and contains a protein called glycinin. This storageprotein contains six basic and six acidic subunits that show a complex pattern of association-dissociation involving disulfidebonds and hydrophobic bonding of the quaternary structure. Dissociation of subunits may be affected by appropriate conditionsof ionic strength, pH, or solvent [91]. The solubility and food-related functional properties of soybean proteins can be improvedby limited hydrolysis with proteolytic enzymes, such as trypsin. Excessive hydrolysis of soybean proteins is normally undesirablebecause it gives rise to bitter-tasting peptides (see Chaps. 5 and 6).
16.2.3.4 Nonprotein Nitrogen
Plant tissues may contain appreciable quantities (i.e., 20–75%) of nonprotein nitrogen. For example, more than two-thirds of thenitrogen in potato tuber or apple fruit may be in the form of free amino acids and other constituents. More than 60 differentamino acids that are not found in proteins have been identified in plants [12]. Although amino acids are the main nonproteinnitrogen components of most fruits and vegetables, plants may contain appreciable quantities of amines, purines, pyrimidines,nucleosides, betaines, alkaloids, porphyrins, and nonproteinogenic amino acids (Fig. 5). The contribution of nonprotein nitrogencompounds to quality and postharvest changes is incompletely understood. Some of their roles in fruits and vegetables areknown, however. For example, free amino acids probably contribute to the taste of fruits and vegetables, elevated levels ofsteroidal alkaloids (solanine and chaconine) in some cultivars of

Pag e 955
FIGURE 5Examples of nonprotein nitrog en
compounds found in edible plants.
potato contribute to bitter taste and toxicity, betanins are red pigments in red beets, and several amino acids and amino acidderivatives are important precursors of aroma compounds in fruits and vegetables. An interesting recent development is thatpolyamines, such as spermidine and spermine, increase during low-temperature storage of zucchini squash and appear toincrease resistance to chilling injury through their ability to stabilize membranes [87].
16.2.4 Lipids and Related Compounds
16.2.4.1 Polar Lipids
Lipids constitute less than 1% of the fresh weight of most fruits and vegetables (Table 3). These lipids are mostly polar, majorexamples being membrane phospholipids and glycolipids (Table

Pag e 956
6 and Fig. 6). The increase in respiration rate of climacteric fruit is accompanied by a large increase in phosphatidyl choline andphosphatidic acid, and during the postclimacteric stage there is sudden breakdown (peroxidation) of total lipids [28].
On the other hand, cereals and pulses can accumulate significant amounts of polar lipids, especially in the endosperm. Soybeanscontain up to 8% phospholipid. Total oat grain lipid includes 8–17% glycolipids and 10–20% phospholipid. The content of polarlipids is greater in oats than other cereals because they contain a relatively high content of lipid in the endosperm portion of theseed. The polar lipids of wheat flour include several glycolipids and phospholipids in both the starch and nonstarch fractions(Table 6). The glycolipids play an important role in gluten development during bread making [22]. Digalactosyl diacyglycerideappears to stabilize the starch-gluten network in wheat flour dough [68] (Fig. 7).
16.2.4.2 Triacyglycerols
Triacyglycerols of the neutral lipid fraction are the main reserve material in plant tissues such as nuts, oil seeds, pulses and cereals(Tables 3 and 5). Reserve triacylglycerols occur mainly as lipid droplets ( 10 mm) in the germ (embryo and associated tissue)and bran (aleurone surrounding endosperm) portions of the seed. The crude fat content of milling fractions from two cereals isshown in Table 7. Neutral fats account for 85–90% of rice bran oil and 60% of rice endosperm lipids. In wheat, neutral lipidspredominate in the germ (80%) and aleurone (72%), while polar lipids predominate in the nonstarch endosperm (67%) andstarch endosperm (95%)
TABLE 6 Lipid Composition of W heat Flour
FractionTotal flour
(mg %)Nonstarch
(mg %)Starch(mg %)
Triacylg lycerides 709 674 35
Diacylg lycerides 92 86 6
Free fatty acids 129 110 19
Sterol esters 90 90 18
Glycolipids 582 519 63
Esterified monog alactosyl DG and MG 73 66 7
Esterified steryl g lycoside 77 71 6
Monog alactosyl DG 93 87 6
Monog alactosyl MG 30 23 7
Dig alactosyl DG 226 214 12
Dig alactosyl MG 83 58 25
Phospholipids 1026 242 728
N-Acylphosphatidyl ethanolamine 72 72 —
N-Acyllysophosphatidyl ethanolamine 34 34 —
Phosphatidyl ethanolamine and phosphatidylg lycerol 19 13 3
Lysophosphatidyl ethanolamine andlysophosphatidylg lycerol
69 10 6
Phosphatidyl choline 104 66 38
Lysophosphatidyl choline 693 36 657
Phosphatidyl serine and related compounds 35 11 24
Total lipids 2628 1703 925

Note: MG, monoacylg lyceride; DG, diacylg lyceride.
Source: Adapted from Ref. 22.

Pag e 957
FIGURE 6Lipid fractions of apple flesh
(percent of total lipids).
fractions. Corn oil consists of about 95% triacylglycerols with 1.5% phospholipids, 1.7% free fatty acids, and 1.2% sterols. Themajor fatty acids in cereal grain and pulse lipids are linoleic (C18:2), oleic (C18:1), and palmitic (C16). Palm and copra seed oils areunique in containing a high percentage of lauric (C12), and myristic (C14) along with palmitic and oleic acids. Cocoa fat contains ahigh percentage of stearic along with palmitic and oleic acids. The distribution of principal fatty acids, as percent of the total, invarious vegetable oils is shown in Table 8.
16.2.4.3 Other Lipid Substances
Unsaponifiable lipids in seed oil include sterols, higher alcohols, and hydrocarbons like squalene. Several milligrams ofcarotenoids per 100 g of fresh weight are present in some fruits (e.g., pineapple, cantaloupe, orange) and vegetables (e.g.,tomato, red pepper, carrot). Different kinds of carotenoids accumulate in plant crops (discussed in Chap. 9). During plantsenescence, chloroplast carotenoids are degraded while chromoplast carotenoids are synthesized [38]. Bitter tastingtriterpenoids occur in the seeds and flesh of Rutaceae fruits (limonin) and Curcurbitaceae fruits (Curcabitacins) (Fig. 8).Phytosterols include compounds that are structurally similar to cholesterol, such as sitosterol, campesterol, and stigmasterol (Fig.8). The ratio of phytosterols to other sterols is characteristic of plant species and has been used to detect adulteration of plantoils.
Lipid substances are also prominent in the protective epidermal cells of certain plant organs. Some examples of these protectivesubstances are illustrated in Figure 9. Waxes that protect the surfaces of leaves and seeds from dehydration include esters oflong-chain alcohols and fatty acids. The waxy cuticle consists of a complex polymer of hydroxyl fatty acids called cutin (Fig. 9).
Other lipid or lipophilic substances, although present in trace quantities, may contribute to the characteristic flavor of ediblecrops. Odoriferous substances of fruits are mainly oxygenated compounds (esters, alcohols, acids, aldehydes, and ketones),many of which are derivatives of terpenoid hydrocarbons or lower aliphatic acids and alcohols. The range of such volatileconstituents present in vegetables is generally more limited than that found in fruits. In some instances, these substances aredissolved in terpenoid hydrocarbons and localized in special oil sacs (e.g., essential oils of peppermint leaf). In other cases, thecomponents are formed as a result of cellular decompartmentation during wounding, cooking, or chewing the tissue.

Pag e 958
FIGURE 7Model showing proposed role of dig alactosyl diacyg lyceride
instabilizing starch-protein network in bread doug h.
TABLE 7 Crude Fat Contents of Rice and W heatand TheirMilling Fractions
Grain fractionPercent crudefat(dry matter basis)
Rice
W hole g rain (brown rice) 2–4
Milled (endosperm) 1
Bran 15–22
Embryo 15–24
Polish 9–15
W heat
W hole g rain 2
Pericarp 1
Aleurone 9
Starch endosperm 1
Germ 10
Source: Adapted from Ref. 67.

Pag e 959
TABLE 8 Principal Fatty Acids of Veg etable Oils and Fats
Source<C12:0 (%) C12:0
(%)C14:0
(%)C16:0
(%)C18:0
(%)C18:1(%) C18:2(%) C18:3(%)
Cereals
Corn — — — 6 2 44 48 —
W heat — — 3 18 7 31 57 4
Rye — — 6 11 4 18 35 7
Rice — — 1 28 2 35 39 3
Pulses
Soybean — — — 11 2 20 64 3
Peanut — — — 9 6 51 26 —
Chick peas — — 1 9 2 35 51 2
Lentils — — 1 23 5 36 21 2
Tropical
Palm 8 50 15 8 2 15 1 —
Copra 15 46 18 9 3 8 1 —
Cocoa — — — 24 34 28 — —
Coconut — 45 20 5 3 6 — —
Other
Olive — — — 15 — 75 10 —
Cottonseed — — — 23 — 32 45 —
Canola — — — 5 2 55 20 8
Sunflower — — — 6 4 31 57 —
Note: Values are percent of total lipid.
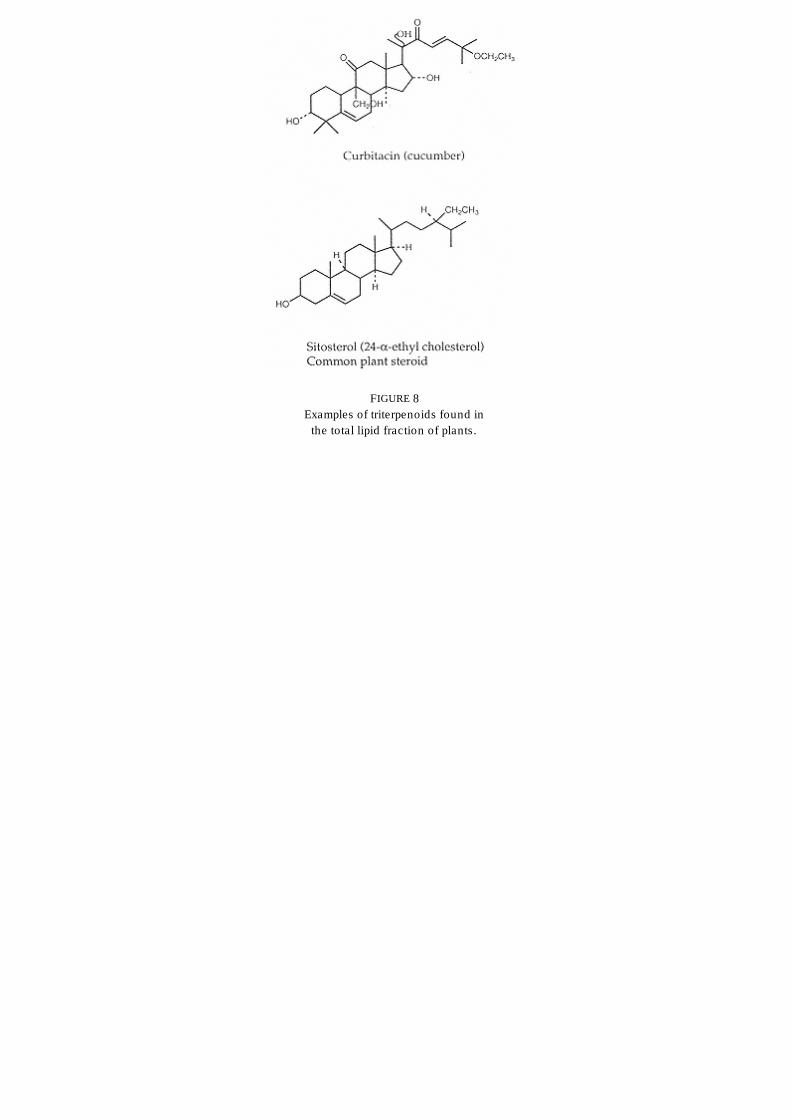
FIGURE 8Examples of triterpenoids found in
the total lipid fraction of plants.

Pag e 960
FIGURE 9W axy substances associated with plant epidermal cells.
16.2.5 Organic Acids
Small quantities of organic acids occur in plants as metabolic intermediates (e.g., in the tricarboxylic acid cycle, glyoxylate cycle,or shikimic acid pathway) and they may also accumulate in vacuoles. The accumulation of organic acids gives rise to an acidic orsour taste. Acid levels range from very low (e.g., sweet corn) to high in such crops as currant, cranberry, or spinach. An acidiccrop may contain over 50 mEq acid per 100 g of tissue, and a pH of less than 2.
16.2.5.1 Aliphatic Plant Acids
The most widely occurring and most abundant acids in plants are citric and malic, each of which can constitute up to 3% of thetissue on a fresh weight basis. Instances in which neither malic nor citric acids predominate include grapes and avocado(tartaric), spinach (oxalic), and blackberry (isocitric). The total acidity of many fruits declines during ripening, although specificacids may actually increase.

Pag e 961
16.2.5.2 Carbocyclic Plant Acids
Various aromatic acids are also found in plant tissues (Fig. 10). The alicyclic acids quinic and shikimic are widely distributed inthe plant kingdom as key intermediary metabolites. Some acids, such as chlorogenic, are important food constituents because oftheir contribution to both enzymatic and nonenzymatic browning reactions. Ferulic acid is involved with cross-linking ofpentosans in cereal flours (Fig. 3). Others, such as benzoic, are important antifungal agents in crops such as cranberry.
16.2.5.3 Phenolic Acids
Phenolic compounds in plant foods include a wide range of compounds and a broad spectrum of functional activities.Traditionally, these compounds have been considered important in plant foods because of their flavor and color (particularlyenzymatic browning; see Chap. 6), but there is substantial current interest in their potential health benefits [35], antioxidantactivity [70] (see Chap. 4), and antimicrobial [24] effects. In the most simple chemical terms, phenolic compounds include ahydroxylated aromatic ring such as phenol, p-cresol, and 3-ethylphenol. Phenolic acids like caffeic, coumaric, and ferulic occurwidely in the shikimic acid pathway of plant tissues,
FIGURE 10Examples of org anic acids in plant
tissues.
Pag e 962
which begins with condensation of phosphoenolpyruvate and erythrose 4-phosphate (Fig. 11). These compounds often occur asesters with sugars or other phenolics, or as a part of tannins, Chlorogenic acid is the ester of caffeic and quinic acid, occurs verywidely, and is the major phenolic substance in apples and pears [80]. Phenylalanine and tyrosine are synthesized in the shikimicacid pathway and they can serve as important precursors for the formation of phenolic acids, the latter resulting in increasedlignin biosynthesis and enzymatic browning.
Most of these compounds can serve as substrates for enzymatic browning, and they can also contribute to darkening by formingcomplexes with metal ions like copper and iron. Sequestrants like ethylenediamine tetraacetic acid (EDTA) or phosphates arefrequently used to reduce the formation of these undesirable metal-phenol complexes. Differences in rates and extent ofbrowning in different plant tissues are attributable to several factors, including availability of substrate (oxygen or the phenol),enzyme activity, compartmentation of enzymes and substrates, and available metal ions. Changes in phenolic substrates duringripening and storage can affect browning in a given tissue.
Fruits typically show a decline in phenolic compounds with ripening, and an increase in response to stresses like bruising andfungal infection. The extent and magnitude of these changes varies widely depending on the plant material and the conditions ofstorage. Shredded carrots accumulate trans-5'-caffeolyquinic acid rapidly when stored in air, but this is inhibited by highconcentrations of carbon dioxide or low concentrations of oxygen [6]. For example, shredded lettuce accumulates phenolicsmore slowly when stored in the type of atmosphere just mentioned [54].
16.2.5.4 Tannins (Polyphenolics)
Polyphenolics have traditionally been separated into “condensed” and “hydrolyzable” tannins. These terms are somewhatconfusing because both groups can be hydrolyzed. “Condensed” tannins are more correctly referred to as flavan-3,4-diol-derived tannins or proanthocyanidins, and the “hydrolyzable” tannins as gallotannins or ellagitannins (Fig. 12). Polyphenolicsprovide a number of different functionality's in foods, including color (see Chap. 9) and astringency. Tannins are a diverse groupof molecules that range up to 3000 D and are formed from carbocyclic acids, phenolic acids, and sugars. The exact structures ofthe larger molecules are not known.
The name tannin comes from the use of plant extracts to treat hides to make leather. Tannin-protein interactions are alsoimportant in foods like beer where the tannins from the hops react with protein to form “haze.” Complexation of tannins withproteins has been thought to reduce the nutritive value of tissues with high tannin content [76], but there is evidence to suggestthat the antinutritional effects may be caused by a more direct physiological effect of the tannins [17]. Tannin-protein complexesinvolve both hydrogen bonds and hydrophobic interactions and may generate covalent links through amide and sulfhydryl groupswhen the phenolics are oxidized [33]. Proteins with high proline content have a greater affinity for tannins than do other proteins.The astringency of many fruits is thought to be caused by tannins interacting with the mucous membranes of the mouth. Tanninsalso form complexes with caffeine resulting in the formation of a precipitate known as “tea cream” [69]. Gelatin, because of itsamino acid composition, can be used to complex tannins and reduce the astringency of wines.
Tea is the most widely consumed beverage in the world, and many of its characteristics are related to tannin content [7]. Whenconverting freshly picked tea leaves into tea, the major concern is controlling oxidation of polyphenols. For green teas, the leavesare blanched at the beginning of the process to reduce oxidation of polyphenols. Production of black teas, on the other hand,requires oxidation of polyphenols, and thus the processing steps are designed to enhance and control the enzymatic oxidation ofpolyphenols. The processing sequence includes reducing the moisture content of the leaves to concentrate the phenols(withering), followed by

Pag e 963
FIGURE 11Biosynthesis of some phenolic acids (shikimic acid pathway).

Pag e 964
FIGURE 12Structure of tannins found in plant tissues
and products. Tannins are normally classified as “condensed” and “hydrolyzable” (see text).
a crushing step that breaks down the cellular compartmentation and allows access of oxidizing enzymes to substrates. After thedesired degree of oxidation, it is terminated by blanching. For oolong tea (mildly oxidized) the oxidation process is stopped soonafter crushing.
Fresh green tea leaves contain about 40% (dry basis) polyphenols with epigallocatechin gallate, epigallocatechin, andgallocatechin being the major types. Oxidation of catechins and gallotannins with subsequent condensation leads to the formationof the flavins, which are re-

Pag e 965
sponsible for the reddish color of black teas. Epitheaflavic acids arise similarly from epicatechins and gallic acid. The arubigensare a complex group of polymeric procyanidins that are responsible for the brown color of tea.
16.2.6 Pigments
The principal pigments of plant tissues—the chlorophylls, carotenoids, and flavonoids—are discussed in Chapter 9. The extentof pigment synthesis and degradation in detached fruits and vegetables can be influenced by storage conditions, such as light,temperature, and relative humidity, and by volatile substances such as ethylene. Ethylene is formed in plant tissue during ripening,following wounding, or by exposure of the plant to air pollutants. By virtue of its hormone action, ethylene initiates thedegradation of chlorophyll in mature plant tissues like fruit and leafy vegetables. The exact mechanism by which ethylene actionleads to chlorophyll degradation is not completely known. Chlorophyllase (EC 3.1.1.14) is a thylakoid membrane glycoproteinthat catalyzes hydrolysis of the phytol side chain of chlorophyll (no change in color), although it appears that hydrolysis isfollowed by oxidative degradation of the tetrapyrrole involving a peroxidase (chlorophyll:H2O2 oxidoreductase). Theparticipation of different lipoxygenase isoenzymes has also been implicated in chlorophyll and carotenoid degradation in growingplants and seeds [42]. For example, soybean lipoxygenase 1, which is specific for free fatty acids, has been implicated inchlorophyll degradation in wheat [45]. The transformation of chloroplast to chromoplast is a major metabolic event in ripeningfruit. In citrus, this transformation appears to be influenced by the balance of nitrogen and sucrose in the peel tissue [37].
16.2.7 Mineral Elements
The total mineral content of plant tissues is sometimes expressed as ash content (residue remaining after incineration). The ashcontent of plant tissue varies from less than 0.1% to as much as 5% of the fresh weight. Mineral content is influenced by speciescharacteristics as well as by agronomic practices. The mineral composition of some edible plant tissues is shown in Table 9. Thedistribution of particular minerals in a given tissue is known to be nonuniform. In peas, phosphorus is many times richer incotyledons than in testa, whereas the difference is reversed for calcium. The most abundant mineral elements in plants arepotassium, calcium, magnesium, iron, phosphorus, sulfur, and nitrogen. Potassium is the single most abundant element in mostplants; for example, parsley contains over 1% on a fresh weight basis. Mineral
TABLE 9 Mineral Composition of Major Elements in Some Edible Plants
Mineral (mg /100 g fresh weig ht)
Crop K P Mg Ca Na Fe Cl Zn
Pulses
Soybean 1400 490 210 210 6 7 6 1
Peanut 710 370 160 59 5 2 7 3
Veg etables
Red beet 336 45 1 29 86 1 — 1
Tomato 297 26 20 14 6 1 60 —
Green beans 256 37 26 51 2 1 36 —
Cereals
W heat 454 433 183 45 — — — —

Pag e 966
elements occur mainly as salts of organic acids. During storage of fruits and vegetables, active exchange of minerals occursbetween different physiologically active centers (e.g., stem, inflorescence, storage organs, leaves) [88].
The mineral content of a given species can influence physiological disorders that arise preand postharvest. For example, ifcalcium is increased by agronomic practices or by postharvest treatments, this can result in improved storage life and productquality.
16.2.8 Vitamins
Plant tissues are an important source of several vitamins. The contribution of edible plant tissues to the recommended dailyallowance of some vitamins is summarized in Table 10. The vitamin content of a given species can vary considerably withvariety, growing conditions, postharvest storage conditions, and processing. For example, the vitamin C content of spinachvaries from 40 to 155 mg/100 g fresh weight. Oilseeds, notably soybean, are rich in vitamin E (> 10 mg/100 g fresh weight).Some fruits and vegetables are a particularly rich source of vitamin C (e.g., guava, black currant, strawberry, kale) andprovitamin A (e.g., lettuce, spinach, carrots). Cereal grains are very good dietary sources of vitamins B1, B2, and B6.
Vitamins are usually distributed nonuniformly in plant tissues. The old adage, “It's a sin to eat the potato and throw away theskin,” makes reference to the greater concentrations of thiamin and ascorbic acid in the cortex of the tuber as compared with theinterior. Separation of the starchy endosperm from the germ and aleurone during milling of cereals results in substantial loss of Bvitamins and minerals. The influence of postharvest storage on the vitamin content of different crops is incompletely understood,although it is known that levels of ascorbic acid and b-carotene can fluctuate considerably.
16.3 Biological Structure
Knowledge of the structure of edible plant tissues is important to the food chemist for several reasons. It is important torecognize that an excised mass of tissue is not necessarily homogeneous with respect to cell type, cellular organization, anddistribution of chemicals. In addition, the nature and extent of chemical changes that occur in the postharvest tissue are partly, ifnot wholly, dependent on cellular organization. Each tissue is structurally adapted to carry out a particular function. Much of themetabolic activity of the plant is carried out in relatively unspecialized tissue called parenchyma, which generally makes up thebulk of edible plant tissues. The outer layer of a plant is called the epidermis and is structurally adapted to provide protectionagainst biological or physical stress. Specialized tissues, called collenchyma and
TABLE 10 Contribution of Edible Plants to Vitamin Consumption in the U.S. Diet
Percent contribution to total intake
Group Vitamin A Thiamin Riboflavin Niacin Ascorbate
Fruits 7.3 4.3 2.0 2.5 35.0
Potatoes 5.7 6.7 1.9 7.6 20.9
Veg etables 36.4 8.0 5.6 6.8 38.3
Pulses TR 5.5 1.8 7.0 TR
Cereals 0.4 33.6 14.2 22.7 0.0
Total plant 49.8 58.1 25.5 46.6 94.2

Pag e 967
sclerenchyma, provide structural support. Water, minerals, and solute molecules are transported through the vascular tissues,xylem and phloem.
16.3.1 Organ Structure
Consideration is given to four categories of edible plant tissues, with categorization based on their appearance: roots, stems,leaves, and fruits. Foods are also classified on the basis of their economic use, for example, fruits, vegetables, nuts, grains,berries, bulbs, or tubers. However, the latter type of classification is based on custom rather than on botanical systematics, andaccordingly varies in different cultures, Indeed, there are legal precedents that the tomato is a vegetable and not a fruit, much tothe dismay of the botanist.
16.3.1.1 Roots
The economically important root crops include sugar beets, sweet potatoes, yams, and cassava. Some crops that appear to beroot tissue are mostly modified hypocotyl (e.g., radish) or stem (e.g., potato) tissue. The basic anatomical structure of root tissueis illustrated in Figure 13. Fleshy roots are formed by secondary growth of the cambia (Fig. 13b, c). The secondary vasculartissues of such crops consist of small groups of conducting elements scattered throughout a matrix of parenchyma tissue.Multiple cambia are formed in certain tissues, such as in beet root (Fig. 13c), and sweet potato.
16.3.1.2 Stems
Examples of stem crops are potato, sugarcane, asparagus, bamboo shoot, rhubarb, and kohlrabi. Underground stems (rhizomesand bulbs) are modified structures and are exemplified by potatoes and onions. Topographically, a stem consists of four distinctregions: the cortex, located between the epidermis and the vascular system, and the pith, which forms the central core of cells(Fig. 14a). The secondary tissues exhibit different forms as illustrated in Figure 16.14b
FIGURE 13(a) Diag rammatic illustration of anatomical structure of root tissue in cross section.
Fleshy roots are formed by secondary g rowth of meristematic tissue called cambia. (b) Atypical example is carrot, in which the cambia forms phloem on the outside and xylem
on the inside. The conducting elements are scattered throug hout a mass of parenchymatissue. (c) Beet root shows a different type of secondary g rowth, in which a series
of concentric cambia are formed.

Pag e 968
FIGURE 14(a) Diag rammatic illustration of anatomical structure of stem tissue.(b) In dicotyledonous stem structures, such as potato, the vascularbundles are arrang ed in a sing le ring , as seen in tranverse section.
(c) Monocotyledons, represented by asparag us, show a characteristicscattering of vascular bundles throug hout the parenchymatous g round tissue.
and c. In bulbs, such as onion and garlic, the organ consists of a short stem that bears a series of fleshy leaves above and aroundthe stem.
16.3.1.3 Leaf Crops
Lettuce, mustard greens, tea, chard, spinach, watercress, parsley, and cabbage are some examples of leaf crops. A leaf istypically a flat and expanded organ, primarily involved with photosynthesis, but deviations in morphology and function mayoccur. The leaf is composed of tissues that are fundamentally similar to those found in stem and root, but their organization isusually different. The epidermis contains a well-developed cuticle in most instances and stomata are characteristically present.Beneath the epidermal layer lies a series of elongated, closely packed palisade cells rich in chloroplasts. The vascular systemconsists of netlike veins in dicots and parallel veins in monocots.
16.3.1.4 Fruits
Botanically, a fruit is a ripened ovary or the ovary and adjoining parts; that is, it is the seed-bearing organ. The flesh of the fruitmay be developed from the floral receptacle, from carpellary tissue, or from extrafloral structures, such as bracts. Whatever itsorigin, it is generally largely composed of parenchymatous tissue. The anatomical features of some fruit types are illustrated inFigure 15. Fruit vegetables include crops like squash, tomato, green bean, and cucumber. Culinary fruits are usually eaten raw asa dessert item, and they possess characteristic aromas due to the presence of various organic esters.
Cereals are a type of fruit called a caryopsis in which the thin fruit shell is strongly bound to the seed coat (Fig. 16). Sunflowerseeds are actually a complete fruit called an achene. True nuts (e.g., acorns, hazelnuts, beechnuts, sweet chestnuts) are one-seeded fruit with a hardened fruit layer. Culinary nuts are processed and marketed as the seed portion only (e.g., Brazil, walnut,almond and pine nuts) or are not botanical nuts (e.g., peanut is a legume seed). Other

Pag e 969
FIGURE 15Diag rammatic illustrations of anatomical structures of different types of fruit:
(a) Pepo (cucumber, squash, and pumpkin) in cross section: (1) rind(receptacular), (2) flesh (ovary wall), (3) placenta, (4) seed, and (5) vascular
bundle. (b) Drupe (cherry, peach, and plum) in long itudinal section: (1) pedicel,(2) skin (ovary wall), (3) flesh (ovary wall), pit (stony ovary wall), and (5) seed.(c) Ag g reg ate (raspberry, strawberry, and blackberry) in long itudinal section:
(1) fleshy ovary wall, (2) seed (stony ovary wall plus seed), (3) fleshy receptacle,(4) sepal, and (5) pedicel. (d) Leg ume (pea, soybean, and lima bean) in
long itudinal section: (1) pedicel, (2) sepal, (3) vascular bundles, (4) seed,and (5) pod (ovary wall). (e) Pome (apple and pear) in long itudinal section:
(1) pedicel, (2) skin and flesh (receptacle), (3) leathery carpel (ovary wall), (4)seed, and (5) calyx (sepals and stamens). (f) Hespiridium (citrus) in crosssection: (1) collenchymatous exocarp (the falvedo), (2) parenchymatous
mesocarp (the albedo), (3) seed, and (4) endocarp of juice sacs formed bybreakdown of g roups of parenchyma-like cells.
legumes that are processed and marketed as the seed portion of the fruit include lentils, mung beans, soybeans, and chick peas.Soybean seeds have three major parts: the seed coat, embryo, and the cotyledons or seed leaves (Fig. 16). In developinglegume seeds, the endosperm is absorbed by the embryo, which repackages the nutrients in the cotyledons. The hull is made upof an outer layer of palisade cells, a layer of hourglass cells, and smaller compressed parenchyma cells.
16.3.2 Tissue and Cell Structure
Some of the food-related properties of plant organs are intimately related to their substructure. Accordingly, some of the salientfeatures of substructure are discussed briefly.
16.3.2.1 Parenchyma Tissue
The Greek word parenchyma, meaning “that which is poured in beside,” is descriptive of the soft or succulent tissue thatsurrounds the hardened or woody tissues. This tissue is the most abundant type present in edible plants. The mature parenchymacell possesses a thin cell wall,

Pag e 970
FIGURE 16Diag rammatic illustrations of cereal g rains called caryopsis fruit: (A) rice, (B) wheat, (C) corn, (D) barley, and (E) oat. An
example of a true seed crop that does not contain a thin fruit shell is soybean. (F). See also Fig . 15 (d), (4).

Pag e 971
is occupied by large vacuoles, and has a size and shape that vary with different species. The extent of cellular contact or lack ofsame also varies with different commodities and has an important influence on texture. The spaces between adjacent cells cancontain air (e.g., 25 vol% in some apples) or pectic substances. Pectins serve as intracellular cement, and the degree ofpolymerization, methylation, and interaction with wall components can account for the smooth (e.g., peach) or coarsecharacteristics of different parenchyma tissues.
16.3.2.2 Protective Tissues
Protective tissues develop at the surface of plant organs, forming the “peel” or “skin” of the commodity. The outermostmultilayer region of cells is called the epidermis. These cells usually fit together compactly with no air spaces, and their outerwalls are usually rich in wax or cutin (Fig. 9). An extracellular layer, called the cuticle, is usually present on the outer surface ofthe epidermis (Fig. 17). More elaborate structural modification of epidermal tissue is found in seed, such as cereals (Fig. 16),and in pericarps of some fruits, such as citrus and banana. The practical importance of protective tissues of fruits and vegetablesis evident when postharvest crop losses are measured as a function of surface abrasion. Accordingly, it is important to “woundheal” certain commodities (e.g., potatoes) under suitable conditions prior to storage.
16.3.2.3 Supporting Tissues
Collenchyma tissue is characterized by elongated cells that have unevenly thickened walls. This type of tissue is found particularlyin petioles, stems, and leaves, occupying the ridges that are often situated on the surface of the organ (e.g., strands on the outeredge of the celery petiole). Thickened primary walls are especially rich in pectin and hemicelluloses, giving the walls unusualplasticity. Collenchyma tissue, although relatively soft, resists degradation during cooking and mastication.
Sclerenchyma cells are uniformly thick-walled cells that are normally lignified. Mature sclerenchyma tissue is nonliving andconsists mainly of cell walls. The two main types of sclerenchyma cells are “fibers” and sclereids. These cells are not perturbedby cooking, and they give rise to stringy textures in asparagus and green beans or gritty textures in fruit, such as quince or pear.In certain commodities, rapid lignification is stimulated by the physical stresses associated with harvest, handling, orstorage—hence, the folklore that “water in the pot should be boiling before going to the garden for certain vegetables.”
16.3.2.4 Vascular Tissue
The vascular tissues, xylem and phloem, are complex tissues composed of simple and specialized cells. Although it is not clearwhether vascular tissue has significant direct impact on food quality, it is possible that the vascular system has an influence onphysiological events (e.g., storage disorders) in postharvest crops.
16.3.3 Subcellular Structure
The main components of typical plant cells are illustrated in Figure 18. The reader should refer to books on botany and plantphysiology for detailed information on the structural characteristics of organelles. Organelles such as nuclei, mitochondria,microsomes, plastids, vacuoles, and lysosomes have been studied to varying degrees in the context of postharvest events, andimportant findings from these studies are discussed in the next section.
Some plants also contain organelles that store reserves of polysaccharide, protein, or lipid. Amyloplasts are the site of amyloseand amylopectin in the developing plant, and they form the

Pag e 972
FIGURE 17Diag rammatic illustration of protective tissues. (a) Simpleepidermis, such as asparag us stem. (b) Periderm, such as
potato tuber. (c) Complex “skin,” such as testa of a pear: (1)stoma, (2) cuticle, (3) epidermis, (4) chlorpolast containing
parenchyma, (5) unspecialized parenchyma, (6) corky tissue,(7) parenchyma cells containing developed starch g ranules,(8) compact layer of elong ated epidermal cells with heavilythickened walls, (9) hypodermal layer of hourg lass-shaped
cells with larg e intercellular spaces, and (10) parenchymatousinner layer.
starch granules found in mature plants. The shape and size of the starch granule varies with plant species and thesecharacteristics are sometimes used to detect adulteration. Storage protein in endosperm and aleurone layer of seed tissue issynthesized in protein bodies that form from the association of golgi derived vesicles. As the cereal grain matures, these proteinbodies coalesce to form a protein matrix in the endosperm [63]. In legumes, protein bodies can vary from 2–20 mm in diameter.Spherosomes are small (0.2–0.5 mm) triacylglycerol-rich droplets found in the aleurone layer and endosperm.

Pag e 973
FIGURE 18Diag rammatic representation of a mature plant cell. (a) Lig ht microscope, (b)
lig ht microscope section, (c) electron microscope imag e. (From Ref. 40.)
16.4 Physiology and Metabolism
If we imagine that a circle encloses the set of all biochemical reactions occurring in plant tissues, we can, on the basis of currentknowledge, define a subset consisting of reactions that are basically identical in all plant tissues. This common subset of reactionsincludes basal events, such as activation of amino acids preparatory to protein synthesis, mitochondria-linked respiration, andanabolism of certain cell wall polysaccharides, In addition to the reactions common to all detached plant parts, we can imagineadditional subsets of reactions common to large groups of organs, such as photosynthesis in green plants, organic acidmetabolism, shikimic pathway, and the isoprene (mevalonic acid) pathway. Finally, there may be aspects of metabolism that are

Pag e 974
highly specific to individual families (Table 1), genera, species, or cultivars. Two examples of the latter type of subset arebiogenesis of aromatic sulfur compounds in the Lilliacae (Fig. 19) and biogenesis of mustard oils (thiocyanates andisothiocyanates) in the Cruciferae.
16.4.1 Respiration
Respiration is an aspect of basal metabolism that is of primary concern to postharvest physiologists. Plant respiration in detachedplant parts can involve several pathways, and can be described by the overall reaction:
Theoretically, 60% of the bond energy (2870 kJ/mol glucose) is lost as heat with the formation of 37 mol adenosine triphosphate(ATP). However, calorimetry studies have shown that respiration in postharvest tissues often results in even more dissipation ofenergy as heat loss (90% or more) and less ATP synthesis. Heat of respiration is a primary consideration in designingappropriate ways to store fruits and vegetables [34]. The stoichiometry of oxygen consumption and carbon dioxide formationmay also vary (see later discussion) depending on the oxidation and decarboxylation of other substrates (fatty acids, aminoacids, organic acids).
16.4.1.1 Respiration and Storage Life
The importance of respiration in postharvest crops is best illustrated by comparing the relationship between respiratory rate andstorage life of different crops (Fig. 20). Commodities that exhibit rapid rates of carbon dioxide evolution or oxygen consumptionare generally quite perishable, whereas those with slow respiratory rates may be stored satisfactorily for relatively
FIGURE 19Biog enesis of aroma compounds in g arlic. In onion, the precursor is
trans-(+S-(1-propenyl)-L-cysteine sulfoxide, apositional isomer of alliin, and the primary
product is 1-propenesulfenic acid.

Pag e 975
FIGURE 20Relationship between initial respiration rate and storag e life to
unsalable condition at 5°C.
long periods of time. Moreover, the shelf life of a given commodity can be greatly extended by placing it in an environment thatappropriately retards respiration (e.g., refrigeration, or controlled atmosphere).
16.4.1.2 Metabolic Pathways and Plant Respiration
The relative importance of different oxidation cycles (Krebs cycle, glyoxylate shunt, Embden Meyerhof pathway, and pentosephosphate cycle) appears to vary among species, among organs, and with the ontogeny of the plant. Metabolic pathwaysinvolving glycolysis and Krebs cycle oxidation are most common, although pentose phosphate (hexose monophosphate shunt)oxidation can account for approximately one-third of glucose metabolism in some instances (Fig. 21). The relative importance ofthe pentose cycle appears to increase in mature tissues, and it is known to be operative in such fruits as pepper, tomato,cucumber, lime, orange, and banana. It is possible that the reducing power (NADPH) generated by the shunt is required forvarious biosynthetic reaction (e.g., pigment and flavor biogenesis). Studies with ripening banana indicate that glycolysis andgluconeogenic carbon flow via the sucrose phosphate synthase reaction occur simultaneously [36]. Hexose phosphates arisefrom sucrose and ultimately exceed sucrose concentration. Thus, sucrose biosynthesis during ripening constitutes a significantsink for
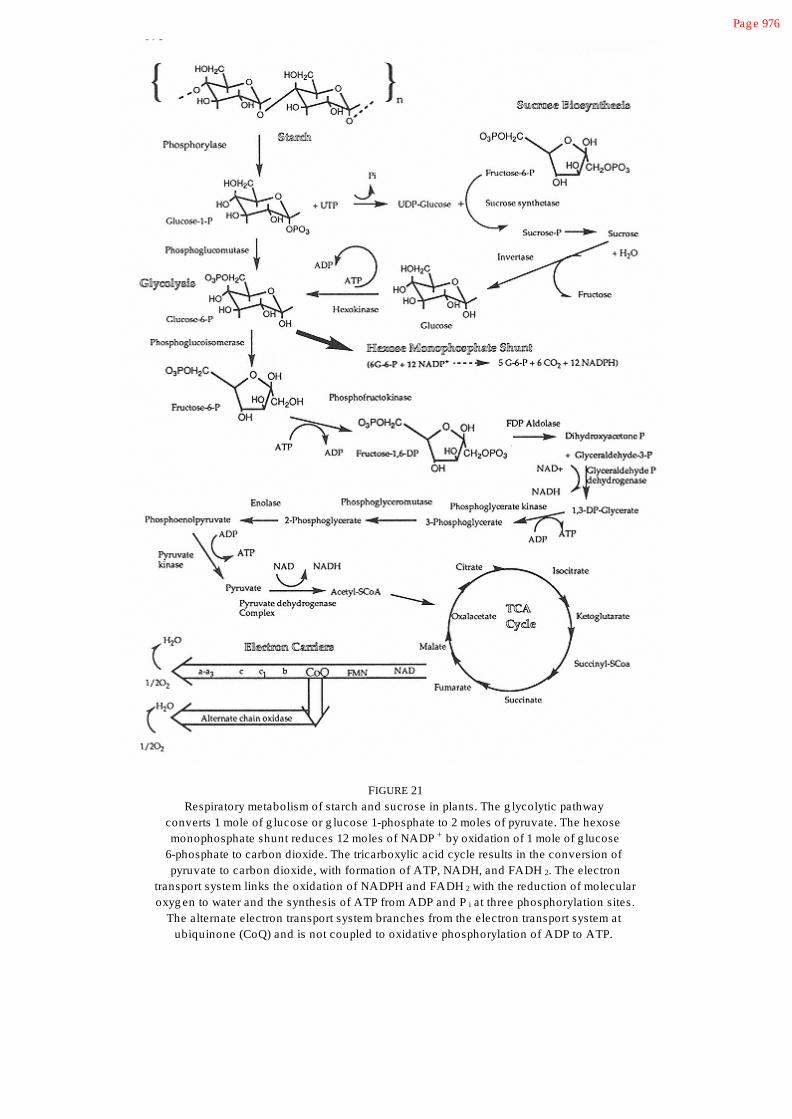
Pag e 976
FIGURE 21Respiratory metabolism of starch and sucrose in plants. The g lycolytic pathway
converts 1 mole of g lucose or g lucose 1-phosphate to 2 moles of pyruvate. The hexosemonophosphate shunt reduces 12 moles of NADP + by oxidation of 1 mole of g lucose
6-phosphate to carbon dioxide. The tricarboxylic acid cycle results in the conversion ofpyruvate to carbon dioxide, with formation of ATP, NADH, and FADH 2. The electron
transport system links the oxidation of NADPH and FADH 2 with the reduction of molecularoxyg en to water and the synthesis of ATP from ADP and P i at three phosphorylation sites.
The alternate electron transport system branches from the electron transport system atubiquinone (CoQ) and is not coupled to oxidative phosphorylation of ADP to ATP.

Pag e 977
TABLE 11 Respiratory Quotients for Some Detached Plant Parts
System Respiratory quotienta
Leaves rich in carbohydrate 1.00
Germinating starch seeds 1.00
W heat seedling s in 5–20% O 2 0.95
W heat seedling s in 3% O 2 3.34
Germinating linseeds 0.64
Germinating buckwheat seeds 0.48
Mature linseeds 1.22
Apples
Preclimacteric apples 1.00
Climacteric apples 1.50
Postclimacteric apples 1.30
Apples treated with HCN 2.00
Apples treated with CHCl3 vapor 0.25
aRatio of respiratory CO2 production to O2 consumption.
respiratory ATP. Ripening fruit also exhibit cyanide insensitive respiration via an alternate oxidase [49, 50]. Since the alternateelectron transfer chain is not coupled to oxidative phosphorylation (ATP synthesis), it is sometimes called “thermogenic”respiration.
The respiratory quotient (RQ) is a useful qualitative guide to changes in metabolic pathways or the emergence of nonrespiratorydecarboxylase or oxygenase systems (Table 11). The RQ is defined as the volume ratio of carbon dioxide evolved to oxygenconsumed during a given period of respiration. The RQ for fruit respiration increases at the climacteric stage of ripening. The risein RQ during climateric respiration is indicative of increased decarboxylation or decreased carboxylation. Decarboxylation hasbeen attributed to the increased activity of malic enzyme and pyruvate carboxylase in several ripening fruits. In ripening avocado,malate is oxidized by malic dehydrogenase via cytochrome oxidase, or by malic enzyme via the cyanide-insensitive alternatepathway [57].
Although respiratory rates of different commodities differ widely, it is not always clear why they do so. Cellular respiration maybe coupled to various metabolic reactions related to wounding, harvesting, normal cellular maintenance, or the normal ontogenyof the organ. Catabolism of sugars is clearly important in commodities such as sweet corn and peas, which undergo a dramaticloss in sweet taste within hours after harvest. Similarly, anabolic reactions (such as synthesis of lignin and sucrose), which aredependent on energy made available by respiration, are equally important in postharvest systems.

Pag e 978
Although much of the activity in postharvest plants is related to the energy-conserving reactions of oxidative phosphorylation,some of this activity results in generation of heat (thermogenesis). For example, the respiratory burst in senescing flowers and inwounded storage organs, such as potato tuber, is not completely coupled to ATP synthesis. Thermogenesis appears to operatevia an alternate electron transfer chain, which is insensitive to cyanide and other inhibitors of cytochrome oxidase (Fig. 21). Theplant hormone ethylene and cyanide evoke cyanide-insensitive respiration in a variety of postharvest crops [50, 79]. In ripeningfruit, increasing amounts of cyanide are produced concomitantly with ethylene synthesis. Evocation of the alternate electrontransfer chain may function to decontrol respiration, causing (a) rapid catabolism of storage polysaccharides, (b) electrontransfer without expenditure of reducing power, or (c) generation of heat. The latter event can differentially affect chemicalreactions (e.g., accelerate autolytic reactions) or cause volatilization of biologically active molecules.
16.4.1.3 Respiratory Patterns
Most fleshy fruits show a characteristic rise in respiratory rate more or less coincident with the obvious changes in color, flavor,and texture that typify ripening. Fruit that exhibit this respiratory rise are classified as “climacteric fruit” (Table 12). Thisrespiratory climacteric has been the subject of considerable study because it marks the end of optimum ripeness and the onset ofsenescence (deterioration or old age [47]). The relative magnitude of the climacteric burst varies considerably in different fruits,and many fruits (and all vegetables) fail to exhibit an autonomous rise after harvest [15] (Fig. 22). This latter group hastraditionally been categorized as nonclimacteric, although it may be that some of these fruits are
TABLE 12 Classification of Edible Fruits Accordingto Respiratory Patterns
Climacteric Nonclimacteric
Apple Blueberry
Apricot Cacao
Avocado Cherry
Banana Cucumber
Breadfruit Grape
Cherimoya Grapefruit
Feijoa Java plum
Fig Lemon
Guava Litchi
Mammee apple Melon
Mang o Olive
Muskmelon cantaloupe Orang e
Papaya Pineapple
Papaw Rin-tomato
Passion fruit Strawberry
Peach Tamarillo
Pear
Plum Sapote
Tomato
W atermelon

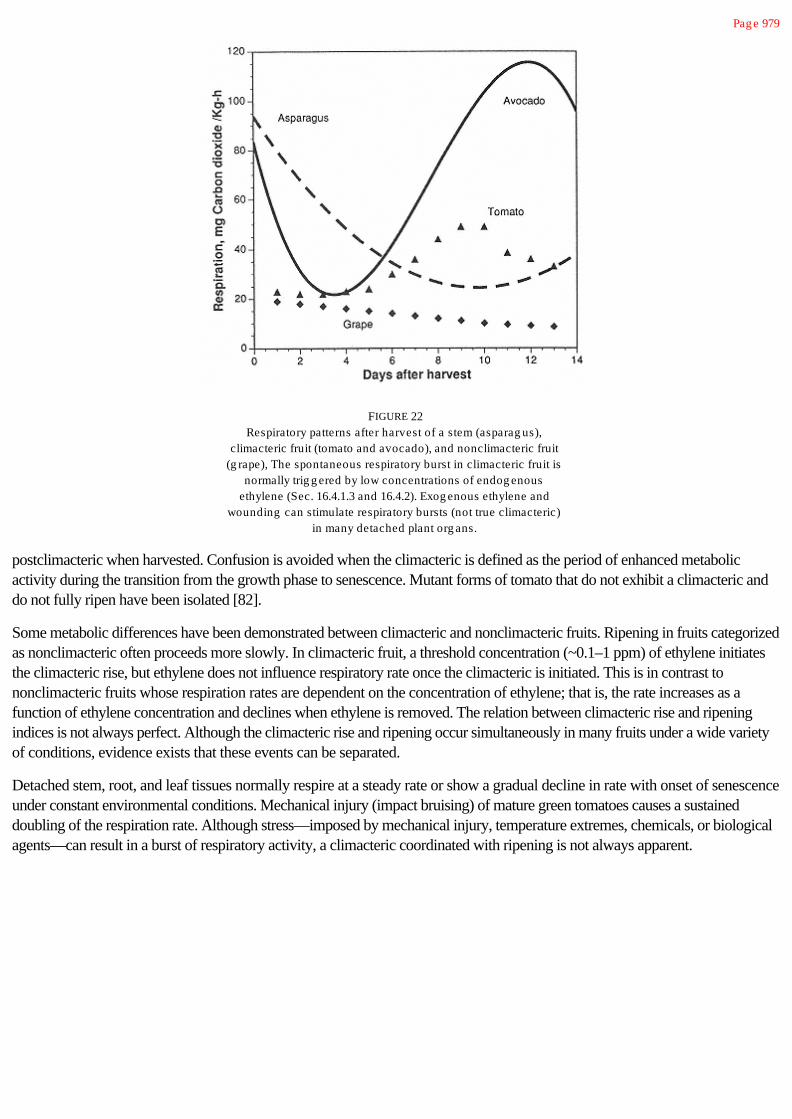
Pag e 979
FIGURE 22Respiratory patterns after harvest of a stem (asparag us),
climacteric fruit (tomato and avocado), and nonclimacteric fruit(g rape), The spontaneous respiratory burst in climacteric fruit is
normally trig g ered by low concentrations of endog enousethylene (Sec. 16.4.1.3 and 16.4.2). Exog enous ethylene and
wounding can stimulate respiratory bursts (not true climacteric)in many detached plant org ans.
postclimacteric when harvested. Confusion is avoided when the climacteric is defined as the period of enhanced metabolicactivity during the transition from the growth phase to senescence. Mutant forms of tomato that do not exhibit a climacteric anddo not fully ripen have been isolated [82].
Some metabolic differences have been demonstrated between climacteric and nonclimacteric fruits. Ripening in fruits categorizedas nonclimacteric often proceeds more slowly. In climacteric fruit, a threshold concentration (~0.1–1 ppm) of ethylene initiatesthe climacteric rise, but ethylene does not influence respiratory rate once the climacteric is initiated. This is in contrast tononclimacteric fruits whose respiration rates are dependent on the concentration of ethylene; that is, the rate increases as afunction of ethylene concentration and declines when ethylene is removed. The relation between climacteric rise and ripeningindices is not always perfect. Although the climacteric rise and ripening occur simultaneously in many fruits under a wide varietyof conditions, evidence exists that these events can be separated.
Detached stem, root, and leaf tissues normally respire at a steady rate or show a gradual decline in rate with onset of senescenceunder constant environmental conditions. Mechanical injury (impact bruising) of mature green tomatoes causes a sustaineddoubling of the respiration rate. Although stress—imposed by mechanical injury, temperature extremes, chemicals, or biologicalagents—can result in a burst of respiratory activity, a climacteric coordinated with ripening is not always apparent.

Pag e 980
16.4.1.4 Factors Influencing Respiration Rate
Several factors can influence the respiration rate of postharvest commodities, as illustrated for crisp head lettuce [41] (Fig. 23).The respiration process in plant tissues is markedly influenced by temperature. Within the “physiological” temperature range for aspecies, the rate of respiration usually increases as the temperature is raised, and the extent of the change in respiration rate canbe expressed in terms of Q10 value. Q10 is defined as the rate of a reaction at T°C divided by the rate at T - 10°C. For most fruitand vegetable species Q10 values range from 7 to less than 1, although values between 1 and 2 are most common. Lowering thetemperature of a climacteric fruit delays the time of climacteric onset, as well as its magnitude. In certain commodities, such aspotato tuber, transfer of the tissue from a cold to a warm environment results in a temporary burst in respiratory activity followedby equilibration to an intermediate level of activity. The cold sweetening of some potato cultivars does not appear to be causedby the lower respiration rate [9].
In general, either a reduction in oxygen tension (below 21%) or an increase in carbon dioxide tension (above 0.03%) slowsrespiration and associated deteriorative reactions. Certain commodities can be successfully held at very low oxygen tension(e.g., less than 1%) or at a very high partial pressure of carbon dioxide (e.g., greater than 50%), but most are adversely affectedby such extremes. Furthermore, it should be recognized that the concentration of a given gas inside the tissue may differconsiderably from that of the surrounding environment because of solubility, resistance to diffusion, and metabolic characteristicsof the tissue. Cytochrome oxidase, the final electron acceptor in “normal” respiratory metabolism, has a relatively high affinity foroxygen and is saturated at relatively low concentrations of oxygen. On the other hand, the affinity of the alternate chain oxidasefor oxygen is less than that of cytochrome oxidase, and accordingly respiration via the alternative oxidase is influenced moreprofoundly by low con-
FIGURE 23Relative effects of temperature, reduced oxyg en, CO, C 2H4, lettuce
mosaic virus, and physical damag e on respiration rate ofcrisphead lettuce in comparison to rate in air at 2.5°C. (Adapted
from Ref. 41.)

Pag e 981
centrations of oxygen in situ. Low concentrations of oxygen may cause accumulation of anaerobic end products that arephytotoxic. Pyruvate (Fig. 21) is converted to acetaldehyde and CO2 by the enzyme pyruvate carboxylase and the cofactorthiamin pyrophosphate; acetaldehyde is converted to ethanol by alcohol dehydrogenase. The oxygen concentration at which ashift from aerobic to anaerobic respiration occurs is called the “extinction point” and varies with plant species.
Certain chemical treatments have also been successfully employed to restrict aerobic respiration of postharvest plant organs, andthis lessens deteriorative reactions. Ventilation, scrubbing of storage atmospheres, or hypobaric storage to minimize atmosphericand tissue ethylene concentration can also be an effective means of maintaining low respiratory rates.
The respiration rate of different plant organs generally follows the following pattern: root, tuber, and bulb vegetables (e.g.,potato, onion, sweet potato) mature (unripe) fruit (e.g., tomato, apple) immature fruit (e.g., green beans, egg plant) growingstems and floral tissue (e.g., asparagus, broccoli). The nature of surface coatings (Sec. 16.3.2.2) and other morphologicalcharacteristics, such as the ratio of surface area to volume, can also influence respiration rate. Cereals and seed crops have verylow respiration rates; however, the respiration rate increases dramatically when the moisture content rises above about 14%.
16.4.1.5 Biochemical Control of Respiration
When cells shift gears in metabolism, changes occur in the concentration of metabolites. These changes in the cell serve assignals to regulate the activity of key enzymes in metabolic pathways in order to keep supply in pace with demand. The signalscontrolling the flow of respiration are numerous. According to the “energy charge” hypothesis, a cell shifting into a state of highATP consumption will be characterized by increased levels of ADP and AMP.
According to this hypothesis, cells are capable of maintaining an energy charge value within a narrow range of about 0.8–0.9.Key regulatory actions are activation of phosphorylase by ADP, or inhibition by ATP and inhibition of phosphofructokinase andpyruvate kinase by ADP and AMP (Fig. 21). Starch phosphorylase is also inhibited by glucose-6-P. Other agents of respiratorycontrol include the concentrations of NADH and NAD+.
The control of the climacteric rise has been the subject of considerable research. An early theory focused on the notion thatrelease of phenolics and other substances from “leaky” membranes caused an “uncoupling” of oxidative phsophorylation in themitochondrial electron transfer chain. Agents that uncouple oxidative phosphorylation facilitate a rapid respiratory rate. Since thelate 1960s it has become well known that protein synthesis attends the ripening process [16] and that mitochondria frompostclimacteric fruit retain the ability to synthesize ATP when protective agents are employed during isolation [30]. According toa second theory, the increase in respiration during the climacteric is caused by an increase in the turnover of ATP during proteinsynthesis. More recent studies indicate that sucrose biosynthesis is responsible for considerable ATP (or UTP) utilization inripening fruit (Fig. 21) [36]. A third theory to explain the climacteric rise is the evocation of “thermogenic” or cyanide-resistantrespiration (Fig. 21) [57, 79]. However, alternate chain respiration appears to make a small contribution to net oxygenconsumption in ripening fruit [73].
Respiratory control in climacteric fruit has also been linked to the activation of malic enzyme through the alternate pathway [57]and to the increased concentration of fructose 1,6-bisphosphate. According to one study [39], leakage of Pi and citrate fromvacuoles in ripening tomato causes dissociation of oligomeric to monomeric forms of phosphofructokinase.

Pag e 982
Another study [13] showed that fructose 1,6-bisphosphate accumulation can result from an enzyme activated by fructose 2,6-bisphosphate, pyrophosphate:fructose-6-phosphate phosphotransferase, which is activated during the early stages of climactericrespiration.
16.4.2 Gene Expression and Protein Synthesis
Expression of genetic information is an event of general and fundamental importance in postharvest crops. Physiologicalprocesses such as sprouting of tubers and bulbs, germination of seeds, fruit ripening, and plant senescence are developmentalcascades resulting from transcription of DNA and translation of mRNA to proteins (enzymes). Increased levels of specificenzymes have been noted to occur in numerous plant organs following harvest. For example, aldolase, carboxylase,chlorophyllase, phosphorylase, peroxidase, phenolase, transaminase, invertase, phosphatase, o-methyltransferase, catalase, andindoleacetic acid oxidase are among the enzymes known to emerge in ripening fruit. Many of these enzymes arise as a result ofde novo synthesis and have a relatively short half-life in situ. It is generally observed that plant senescence is accompanied byincreased RNA synthesis and an increased rate of transcription. Indeed, there appears to be an absolute requirement ofcontinued protein synthesis for ripening fruit. For example, cycloheximide, an inhibitor of protein synthesis, also inhibitsdegreening, softening, ethylene biosynthesis, and ripening of ethylene-treated banana fruit [16]. Increased protein synthesis andnucleic acid synthesis are most pronounced at the early stages of fruit ripening. The propagation of slow-to-ripen or ripening-impaired mutant varieties of fruit is consistent with findings that fruit ripening is under genetic control [82]. Moreover, genes forkey enzymes that promote plant senescence have been cloned and their expression blocked by anitsense technology [64] (Fig.24). These findings show that postharvest deterioration of plant tissues can be controlled by manipulation of gene expression.
16.4.2.1 Recombinant DNA (rDNA) Technology
The discovery of DNA restriction (cut) and ligase (join) enzymes in the 1970s opened the way to extensive application of rDNAmethods to alter the genome of plants. rDNA is DNA obtained
FIGURE 24Protein synthesis and prevention by antisense
technolog y. The first g enetically eng ineered foodapproved for use in the United States was
developed by applying this technique to the enzymepolyg alacturonase in tomato fruit.

Pag e 983
by cutting and recombining DNA molecules from different sources (Chap. 13). Isolated genes can be modified by site-directedmutagenesis to achieve a target protein with different properties (Chap. 7). Introduction of foreign DNA into an organism, suchas a plant, is called transformation, and the new plant is called a transgenic. In recent years there has been intensive interest ingenetically engineering plants for crop improvement [11, 26]. The basic steps in cloning a gene are (1) identify a target protein(e.g., enzyme or storage protein), (2) determine the sequence of the protein, (3) determine the corresponding DNA sequencefrom the triplet genetic code, (4) construct a DNA probe (single strand of DNA, with radiolabeled nucleotides, that encodes acomplimentary section of the target gene), (5) screen a genome library (pool of DNA segments that is likely to contain the geneof interest), (6) insert the isolated gene in a vector (a self-replicating high-molecular-weight DNA sequence that can be absorbedby the host cell and its progeny), (7) incorporate the vector in a microbial host that is easily transformed, such as Escherichiacoli, (8) propogate the microbial host and verify the DNA sequence of the cloned gene, and (9) transform a host plant to obtaina transgenic plant. The latter step is most often accomplished with a vector (disarmed plasmid) from the plant-tumor-inducingbacterium Agrobacterium tumefaciens. For plants that are difficult to transform with the A. tumefaciens plasmid, such ascereals and other monocots, a technique called “biolistics” has been used to shoot DNA-coated microprojectiles directly intoplant cells.
An alternate approach to gene cloning that is often used with plant and other eukaryote genes is the isolation of complementaryDNA. With this method, mRNA is isolated from the cytoplasm and is used as a template in conjunction with the enzyme reversetranscriptase to make a single strand of DNA. DNA polymerase is then used to make the complementary DNA strand. Anadvantage of the cDNA method is that the reverse transcriptase used does not copy introns or transcription signals (e.g.,promotors) and therefore the isolated gene can be transcribed by bacteria (step 7). The first genetic transformation of a plantoccurred in 1983 and involved introduction of the phaseollin gene from bean into sunflower plant.
16.4.2.2 Application of Genetic Engineering to Plant Crops
Various genetic engineering strategies have been used to improve plant crops. These include (1) antisense technology (a genewith reversed orientation with respect to its regulatory sequence so that it blocks normal gene expression) (Fig. 24), (2) geneamplification (introducing multiple gene copies with a combination of promotors to increase product yield), (3) metabolicpathway engineering (e.g., introducing genes that code for a regulatory enzyme that will increase or decrease a key metabolite,e.g., pigment biosynthesis), and (4) site-directed mutagenesis to modify the gene and gene product (e.g., alter the temperaturecoefficient or some other property of an enzyme).
In a May 1994 milestone decision, the U.S. Food and Drug Administration approved Calgene's Flavr Savr tomato, the firstgenetically engineered food. Tomatoes supplied to northern regions in the winter are normally harvested and transported in amature green stage of development, prior to the initiation of ripening. On arrival at local markets the fruit are treated withethylene gas to initiate ripening. Such fruit do not develop the intense flavor and pigmentation that are characteristic of vine-ripened fruit. This practice has been necessary since the ripening fruit have a limited market life and are readily damaged duringshipment. Falvr Savr tomatoes are genetically engineered to contain the anitsense gene for polygalacturonase. Polygalacturonaseis one of several enzymes synthesized during the ripening of tomato fruit. It catalyzes breakdown of pectin (Sec. 16.2.2.1) byhydrolysis of a-1,4-galacturonate linkages and thus causes softening of the tissue. During ripening of Flavr Savr the normalexpression of the tomato polygalacturonase gene is blocked (> 95%) and the softening process is delayed by several days, allthe extra time that is needed to ship “breaker” (initial ripening stage) fruit to

Pag e 984
markets. Calgene did extensive testing of the tomato to address concerns about consumer and environmental safety ofgenetically engineered crops. Important points established during the testing and approval were (1) the genetic modification wasstable, (2) the possibility of gene flow was remote, (3) the chemical composition (e.g., vitamins, glycoalkaloids) was within thenormal range for tomatoes, (4) results of rat feeding studies yielded no adverse effects, (5) agronomic traits of the crop weresatisfactory, and (6) control over quality assurance was satisfactory. Many other applications of genetic engineering to improvethe sensory, nutritive, and processing characteristics of fruits and vegetables are under development or review for approval(Table 13).
16.4.3 Other Metabolic Processes That Influence Food Quality
16.4.3.1 Changes in Cell Wall Constituents
Because the cell wall is the primary structural element in plant tissues it is central to the textural quality of plant foods. In somecases, like apples, celery, and lettuce, crispness is desired, while in others, like peaches, strawberries, and tomatoes, a softtexture is preferred. Changes in the cell wall have a major influence on softening of plant tissues. Softening may also occur from alack of turgor, but in most fruits and vegetables softening is the result of changes in cell wall polysaccharides cause bydepolymerization, demethylation, or loss of calcium. Hardening may also occur as a result of liginin formation in the wall;examples include asparagus, celery, and pears. In asparagus and celery, walls of vascular tissue are the primary sites for ligninsynthesis, whereas in pears it occurs mostly in the stone cells.
Softening is generally accompanied by solubilization of pectin and the release of polyuronides. Pectin methylesterase, whichcatalyzes removal of the methyl ester from pectin, occurs widely in plants and fungi. In the case of tomato fruit 90% of the pectinis methylated in “mature green” fruits, and as pectinesterase increases during ripening, this declines to about 30% in ripe fruit[44]. Pectin esterase in banana also increases with ripening. In apple, guava, mango, and strawberry, however, pectin esterasedecreases during ripening. Endopolygalacturonases, which would be expected to have a greater effect on pectin structure thanthe exopolygalacturonases (see Chap. 6), are not found universally in fruits and are notably absent in apples [10]. Apples docontain exopolygalacturonases. In most fruits, polygalacturonase and cellulase increase during ripening. Polygalacturonase andpectinesterase increase during ripening of tomato fruits, but this does not totally account for the softening that occurs.Hemicellulases and cellulases are also present during ripening and are thought to play an important role in softening. While mostof the information on cell wall changes during ripening is related to degradation, it must be noted that some synthesis also occurs[56].
The amounts and types of pectic enzymes in fruit have an important bearing on yield, clarity, and cloud stability of fruit juices andother beverages derived from them. In citrus and tomato juices, in which a stable colloidal suspension is desired, the presence ofpectin esterases and polygalacturonases is undesirable. In citrus juices, obtaining a stable cloud is made more difficult becauseone form of the pectinesterase is quite stable to heat [89]. The classic “hot break” process for tomato juice is based oninactivating pectinesterase before cellular disruption because the latter would otherwise result in substantial deesterification ofpectin. Polygalacturonase is added in some processes to solubilize pectin and increase the yield of soluble solids.
16.4.3.2 Starch-Sugar Transformations
Synthesis of starch and its degradation to simple sugars are important metabolic events in postharvest commodities. In potatoes,sugars are undesirable since they can cause poor texture after cooking, an undesirable sweet taste, and/or excessive browningduring frying. Conversion

Pag e 985
TABLE 13 Recombinant DNA Techniques to Improve the Quality Characteristics of Edible Plants
Crop rDNA strateg y Improvement(s)
Tomato Antisense DNA for polyg alacturonase (PG) g ene Decreased PG activity; increased viscosity, firmer texture, extended market life
Climacteric fruit ACC deaminase g ene or antisense DNA for ACCsynthase
Decreased ACC synthase activity and ethylene biosynthesis, extended marketlife
Potato and other crops Thaumatin g ene Add sweet tasting protein, enhance flavor
Seed crops, e.g ., rice andcanola
Storag e protein g ene(s) Improve protein content and amino acid score
Seed crops, e.g ., corn Modify existing g ene for storag e protein, e.g ., a-zein
Improve lysine content of major storag e protein
Oilseeds, e.g ., canola Antisense DNA for steroyl-acyl carrier proteinthioesterase g ene
Increase stearic acid content of oil, substitute for cocoa butter
Oilseeds, e.g ., canola Antisense DNA for lauryl-acyl carrier proteinthioesterase g ene
Increase lauric acid content of oil, use as tropical oil substitute, avoid need forhydrog enation process
Seeds, tubers, roots, e.g .,pota to
Bacterial g ene for ADP g lucosepyrophosphorylase
ADPG pool and starch content increase since bacterial enzyme not subject tofeedback inhibition; potatoes absorb less oil during frying
Seeds, tubers, roots Antisense DNA for starch synthetase Amylose-free potatoes
Potato Antisense DNA for invertase, etc. Prevent reducing sug ar accumulation (“cold sweetening ”); less Maillardbrowning during frying
Fruits and veg etables Bacterial “ice nucleating ” g ene Increased number of ice crystals during freezing ; less tissue damag e duringfreezing

Pag e 986
of starch to sucrose and reducing sugars occurs in most potato cultivars when they are stored at nonfreezing temperatures below5°C. Current evidence indicates that biosynthesis of sucrose, catalyzed by sucrose synthase (Fig. 21), at low temperature servesto utilize hexose 6-phosphates (via fructose-6-P), which would otherwise cause feedback inhibition of glycolysis. Glucose 6-phosphate is an inhibitor of phosphorylase-catalyzed degradation of starch. At a storage temperature above 10°C, sucrose, orperhaps sucrose phosphate, functions to limit starch hydrolysis via feedback control on phosphorylase or by promotion of starchsynthesis via ADP glucose-starch glucosyltranferase. In developing potato tubers preharvest, phosphorylase catalyze synthesisof a-1,4-glycosidic linkages, whereas in mature tubers postharvest it functions primarily to catalyze starch breakdown.Amylases, which are important in starch catabolism in germinating tubers, do not appear to be very active in the dormant tuber.Potato tubers contain a protein inhibitor of the enzyme invertase (Fig. 21) that becomes inactive at low, nonfreezing temperatures(cold stress). Thus sucrose is partially converted to fructose and glucose. In Norchip tubers stored for 6 weeks at 4°C, sucroseincreased from 0.70 to 3.27 mg/g fresh weight, while glucose increased from 0.05 to 1.31 mg/g and fructose increased from0.18 to 1.48 mg/g [9]. Theories to explain the reason for cold sweetening in potato cultivars include the cold lability ofphosphofructokinase and possibly pyruvate kinase [4], bypassing phosphofructokinase via the pentose phosphate cycle [86],and loss of starch granule integrity [8].
Inhibition of starch synthesis at low temperature may also play a role in cold sweetening. Blocking the expression of ADP-glucose pyrophosphorylase (ADPGP) with an antisense gene in transgenic potatoes results in the abolition of starch formationand massive accumulation of sucrose (30% of dry weight) [58]. ADPGP catalyzes formation of the nucleotide sugar (ADPG)that is incorporated into the polyglucan chain during amylose synthesis:
The transgenic tubers also shows a major increase in the mRNA for the enzyme sucrose phosphate synthase.
Regardless of how sugars accumulate during cold storage of plant commodities, this does represent a problem duringcommercial storage of potatoes. In practical situations, this problem is overcome by “reconditioning” (holding for several days atwarm temperatures to reduce the sugar content through catabolism and conversion to starch) or by leaching out unwanted sugarby exposure of cut potatoes to water.
In some commodities, notably seeds (peas, corn, and beans) and underground storage organs (sweet potato, potato, andcarrot), synthesis of starch, rather than degradation, may predominate after harvest. Starch synthesis is generally optimal attemperatures above ambient. Diminution of sugars accompanies starch synthesis in such crops and is normally detrimental toquality. For example, sucrose may serve as a substrate for sugar nucleotides used in starch synthesis as follows:

Pag e 987
The principal enzymes in starch synthesis appear to be those in photosynthetic tissues, namely, fructose transglycosidase,adenosine diphosphate glucose:starch glucosyltransferase, UDPG pyrophosphorylase, sucrose-UDPG glucosyl transferase, andADPG pyrophosphorylase. ADPGP is inhibited by pyrophosphate and PPi, and sprays containing these substances aresometimes applied to sweet corn to retard the conversion of sugar to starch [2]. Decreases in sugars may also result from theiroxidation via mitochondria-linked reactions. Details of starch synthesis in postharvest commodities are not completelyunderstood.
16.4.3.3 Metabolism of Organic Acids
Organic acids are in a constant state of flux in postharvest plant tissues and tend to diminish during senescence. Much of the lossis attributable to their oxidation in respiratory metabolism as suggested by the increase in respiratory quotient. The respiratoryquotient is approximately 1.0 when sugars are substrates, increases to 1.3 when malate or citrate are substrates, and furtherincreases to 1.6 when tartrate is the substrate. Some suggested pathways associating respiratory metabolism with organic acidmetabolism are shown in Fig. 25. Certain enzymes (e.g., malic enzyme and pyruvate decarboxylase) and the respiratory quotientincrease concomitantly with climacteric respiration of certain fruits.
The metabolism of aromatic organic acids via the shikimic acid pathway (Fig. 26) is important because of its relationship toprotein metabolism (aromatic amino acids), accumulation of precursors of enzymic browning (e.g., chlorogenic acid), and lignindeposition (phenyl propane residues). It also should be mentioned that acetyl coenzyme A (acetyl-CoA) participates in thesynthesis of phenolic compounds (Sec. 16.2.5.3), lipids, and volatile flavor substances. Apart from their general importance toflavor, texture, and color, certain organic acids appear to modify the action of plant hormones and are thereby implicated incontrol of ontogenic changes. For example, the finding that chlorogenic acid modifies the activity of indole-3-acetic acid oxidasemay well relate to the increased concentration of this acid in the green blotchy areas of defective tomatoes. The biosynthesis offlavor substances in fruits and vegetables sometimes involves organic acids. For example, the formation of isoamyl alcohol andglutamic acid in ripening tomato involves the enzyme L-leucine:2-ketoglutarate amino transferase (Fig. 27).
16.4.3.4 Lipid Metabolism
Although lipid components of most fruits and vegetables are normally present at relatively low levels, their metabolism isimportant during postharvest storage of plant tissues, especially when handling and processing conditions are not ideal. Changesin membrane lipids are also important in ontogenic events, such as stress response, ripening, and senescence [47]. The agingprocess in plant tissues is associated with a decline in polyunsaturated fatty acids, and such changes apparently accompanyautolysis of membranes and loss of cell integrity [53]. Phosphatidyllinolely (-enyl) cascades in plants also lead to formation of aprostaglandin-like substance, jasmonic acid. Free radicals resulting from lipid oxidation act at sensitive subcellular sites andappear to play an essential role in normal plant development [90]. Free radicals are kept in check by scavengers such assuperoxide dismutase, vitamins C and E, cytokinins, catalase, and glutathione peroxidase. Oxidative enzymes, such aslipoxygenase, hydroperoxide lyases, and hydrolytic enzymes, such as lipase and phospholipase, have also been shown to beimportant in postharvest metabolism. In fruits and vegetables, hydroperoxide lyases degrade specific hydroperoxides to formflavorful C6 and C9 volatile aldehydes and other products. Examples of flavor compounds formed by lipoxygenase cascades ininjured and senescing plants include t,6-cis-non-adienal in cucumber, 1-octen-3-(R)-ol and 10-oxo-t-8-decenoic acid inmushroom, 9-hydroxy-t-10,cis-12-octadecadienoic acid in oats, and cis-3-hexenal and other compounds in tomatoes.Processes such as freezing and dehydration can activate lipoxygenase in unheated plant tissues

Pag e 988
FIGURE 25Krebs cycle (Þ) with some other modes of org anic acid synthesis ( ) or
synthesis of other important constituents ( ). Abbreviation: AC, aconitase;Cond. enz., condensing enzyme; GPD, g lucose-6-phosphate dehydrog enase;ID, isocitric dehydrog e nase; MD, malate dehydrog enase; ME, malic enzyme;
PEPc, phosphoenolpyruvate car boxykinase; PGA, phosphog lyceric acid;PD, pyruvate decarboxylase; PK, pyrvuate kinase; PPP, pentose phosphate
pathway; SD, succinic dehydrog enase; TPP, thiamine pyrophosphate. (FromRef. 15, p. 89.)
and thus lead to off-flavor development. Hydroperoxides formed by lipoxygenase can also react with other constituents, such asproteins, and cause bleaching of carotenoids and chlorophylls.
The reserve lipids (e.g., in palm, olive, and avocado) have compositions markedly different from those that are part of thefunctional cell framework. Recent studies using rDNA techniques have helped explain metabolic control of triacylglycerolaccumulation in developing plant tissues [84]. Enzymic hydrolysis of triacylglycerols in postharvest oilseeds has an importantbearing on

Pag e 989
FIGURE 26Biosynthesis of some important cell constituents via the shikimic acid pathway.
(1) Phosphoenolpyruvate + D-erythrose 4-phosphate to3-deoxy-D-arabinoheptulosonic acid 7-phosphate, (2) to 5-dehydroquinic acid, (3)
to quinic acid, (4) to 5-dehydroshikimic acid, (5) to shikimic acid, (6) to5-phosphoshikimic acid, (7) to 3-(enolpyruvate ether) of phoshikimic acid,(8) to prephenic acid. This role of this pathway in the formation of phenolic
compounds is detailed in Fig . 11.
their quality. In comparison with other cereals, oats contain a high level of lipase, which together with lipoxygenase gives rise tobitter-tasting compounds (Fig. 28).
16.4.3.5 Pigment Metabolism
Extensive biosynthesis of carotenoids and related terpenoids occurs in many edible plant tissues. Biosynthesis of thesecompounds occurs through the universal system for isoprene compounds, and it involves the formation of mevalonic acid fromacetyl-CoA. Most carotenoids are made up of eight isoprene units (C40). Both biosynthesis and catabolism occur in detachedplant parts, and these reactions may be influenced by storage conditions such as oxygen concentration, light, and temperatures.Carotenoid metabolism is affected by hormones, such as ethylene and abscisic acid. Some fruits and vegetables, such asmandarin orange, accumulate significant amounts of apocarotenoids (C30). The most common catalytic agents for carotenoiddestruction appear to be

Pag e 990
FIGURE 27Biosynthesis of a tomato flavor compound from an org anic acid
and an amino acid.
FIGURE 28Formation of bitter trihydroxy fatty acidsfrom acyltrig lyceride in processed oats.

Pag e 991
the lipoxygenases (indirectly via lipid oxidation) and the peroxidases (apparently promote b-carotene degradation directly).
The pathway for synthesis of the basic C6:C3 structure that comprises the A phenyl ring of the flavonoids is shown in Fig. 26.Relatively little is known about reactions leading to formation of specific flavonoid pigments, although there have been recentadvances in this field. Synthesis of anthocyanins, colorants related to flavonoids (Chap. 9), occurs in postharvest plant organsand is stimulated by light and influenced by temperature. The purple anthocyanin pigments of red cabbage are synthesized andaccumulate in cabbage stored below 10°C. Preharvest treatments, such as application of N-dimethylaminosuccinamic acid, caninduce early formation of anthocyanins in certain crops.
Catabolism of anthocyanin pigments in situ is not very well understood. In processed foods—for example, during storage offrozen tissue that has not been blanched—anthocyanins can be co-oxidized by degradation products resulting from polyphenoloxidase or peroxidase-catalyzed oxidation of phenolic compounds. Decolorization of anthocyanins normally occurs followingdeglycosylation, and this is catalyzed by endogenous or fungal glycosidases called anthocyanases.
One of the more obvious changes that occurs in senescing plant tissues containing chlorophyll is the loss of a characteristic greencolor. Peel and sometimes pulp degreening is also associated with ripening of most fruit, and “yellowing” is a characteristic ofsenescing stem and leaf tissues consumed as vegetables. Chlorophyll degradation in situ is accompanied by synthesis of otherpigments in several kinds of detached plant tissues. Chlorophyll catabolism is markedly influenced by environmental parameters,such as light, temperature, and humidity, and the effects of these factors are specific for the tissue. For example, light acceleratesdegradation of chlorophyll in ripening tomatoes and promotes formation of this pigment in potato tubers.
Chlorophyll degradation in living plant tissues often can be promoted by application of parts per million levels of the hormoneethylene. It is common commercial practice to utilize this principle for degreening citrus fruit and other commodities such asbanana and celery. Chlorophyllase emergence in plant tissues is associated with the buildup of endogenous ethylene. However,the relationship between chlorophyllase action and degreening is not clear. Chlorophyllase is a hydrolytic enzyme that convertschlorophylls a and b to their respective chlorophyllides (see Chap. 9). Present evidence suggests that chlorophyllase does notcatalyze the initial step in chlorophyll degradation in senescing plant tissues. The initial steps in this process appear to requiremolecular oxygen, and removal of the phytol side chain occurs in later steps. Lipoxygenase and peroxidase (chlorophyll: H2O2
oxidoreductase) are known to contribute to the loss of chlorophyll in senescing plants as well as in frozen vegetables.Chlorophyll conversion to pheophytin is acid catalyzed (Chap. 9). This reaction is of primary importance in heat-processedfoods, but it also can occur in living vegetables when they are stored in a carbon dioxide-enriched atmosphere (Sec. 16.6.3).
16.4.3.6 Aroma Compounds—Biogenesis and Degradation
The characteristic flavor of fruits and vegetables is determined by a complex spectrum of organic compounds that form duringmaturation, senescence, and also sometimes during processing or wound injury (Sec. 16.5.1). Aroma compounds in fruits andvegetables are generally a complex mixture of esters, aldehydes, ketones, terpenes, and others (Chap. 10). For example, morethan 300 volatile compounds contribute to strawberry flavor. In some fruits and vegetables a single compound or class ofcompounds has the characteristic aroma, such as, 2,6-nonadienal in cucumber, amyl acetate in banana, sulfides in onion, andphthalides in celery. Biosynthesis of fruit and vegetable flavors involves many different reactions that can include the metabolismor aromatic and S-containing amino acids (e.g., Figs. 18 and 27), carbohydrates and their derivatives (Fig. 29), and unsaturatedfatty acids (Fig. 28; Sec. 16.4.4).

Pag e 992
FIGURE 29Biosynthesis of pung ent mustard
oils, characteristic of the Cruciferaefamily (Table 1).
16.5 Control Mechanisms
Chemical changes in postharvest fruits and vegetables are subject to a wide array of biochemical control mechanisms. Thephysiological orchestration of chemical change at the cellular level involves several strategies. These include biological clocks andenvironmental factors that elicit gene expression, metabolic feedback and feed-forward sites in pathways, changes in cellcompartmentation of reactants, and inhibitors and activators of enzyme-catalyzed reactions. In addition to cellular controlmechanisms, factors like temperature, oxygen concentration, pH, and cellular integrity can have an important influence onchemical changes in postharvest and processed plant tissues. The mere presence of an enzyme does not alone indicate itfunctions in association with a physiological event. For example, invertase is present in potato tubers, but its activity is sometimesarrested by a proteinaceous invertase inhibitor. Flavor precursors are not necessarily converted to flavor compounds in situ,despite the presence of appropriate flavorases, since the reactants may be physically separated within the cell microstructure.Similarly, subtle differences in microconstituents, such as inorganic ions, can profoundly influence the direction of metabolism bymodifying the activity of a particular enzyme. For example, calcium ions appear to influence association-dissociation ofperoxidase from cell walls and thereby limit peroxidase-catalyzed reactions associated with lignification of cell walls. Controlfactors for enzyme-catalyzed reactions are discussed in more detail in Chapter 6.
16.5.1 Cell Disruption
The importance of cell disruption in the biochemistry of processed fruits and vegetables cannot be over emphasized [77]. Inparticular, cell disruption influences the formation of flavors, off flavors, and browning reactions.

Pag e 993
16.5.1.1 Flavor Precursors
In certain tissues, such as Allium species and Cruciferae, flavor precursors are enzymically converted to flavor compoundswhen the cells are disrupted by chewing or other means of mechanical injury (Figs. 18 and 29). A patented process existswhereby flavor-potentiating enzymes are added to processed foods, just prior to consumption, to regenerate the fresh flavor thatwas lost during heating or dehydration. This method takes advantage of the fact that precursor molecules may be stable toprocessing, whereas flavor compounds and enzymes are often labile. Lipoxygenase cascades also give rise to “green”, “grassy”,“melon-like”, and other aromas. The spectrum of compounds formed varies with different crops and depends on type of fattyacid(s) and on positional specificity of lipoxygenases, hydroperoxide lyases, and/or peroxidases (Sec. 16.4.4; Fig. 29). Thepresence of flavor precursors and their conversion to flavor compounds also has an important bearing on characteristic flavorsthat may develop as a consequence of different cooking and food preparation techniques (see also Chap. 10).
16.5.1.2 Tea Fermentation
Black tea is made by withering leaves to reduce the moisture content from 75% to ~60%, and rolling the withered leaves togently crush the cells and attain release and uniform distribution of enzymes, notably polyphenol oxidase (Sec. 16.2.5.4). Theresulting cell disruption leads to a complex enzymatic and nonenzymatic cascade that includes oxidation of phenolics (~30% oftea leaf solids) by polyphenol oxidase. The disruption also leads to enzymic-catalyzed protein hydrolysis, yielding amino acids,enzymic-catalyzed transamination of amino acids to form keto acids, degradation of chlorophyll (Sec. 16.4.5.3), andlipoxygenase cascades that result in co-oxidation of carotenoids to form various aromatic compounds. o-Quinone products ofthe polyphenolase reaction also participate in a variety of coupled reactions that lead to formation of characteristic tea flavorsand colors.
16.5.1.3 Enzymatic Browning
Although enzymatic browning is a desired reaction in processes like tea fermentation, drying of dates, and cocoa fermentation, itis a cause of discoloration when other tissues are subject to cutting, bruising, disease, freezing, or other causes of cell disruption.Substrates for this reaction include simple phenols (e.g., catechol and gallic acid), cinnamic acid derivatives (e.g., chlorogenicacid and dopamine; Fig. 16.5), and flavonoids (e.g., catechin and epicatechin, Fig. 12). These reactions are discussed in detailelsewhere (Chap. 6). The propensity of a given tissue to brown varies considerably from one cultivar of a crop to another.These differences appear to relate to variations in enzyme content and sometimes to the kinds and amounts of phenolicsubstrates present. Methods used by the food processor to minimize this reaction include exclusion of oxygen, application ofacidulants, heat inactivation (blanching), and use of inhibitors like sulfites.
16.5.1.4 Calcium Redistribution
Moderate heating, for example, at 60–70°C, of tissues causes disruption of membranes and decompartmentation of cellconstituents. For some vegetables (e.g., potatoes, green beans) mild heating leads to firming of texture. Heat-induced firming isbelieved to start with damage to cell membranes that causes an increase in permeability. This leads to (1) liberation of Ca2+ (e.g.,from starch phosphate in potato) and its diffusion to the cell wall/middle lamella, (2) activation of pectin methylesterase anddeesterification of pectin, and (3) formation of Ca2+ (and/or Mg2+) ionic cross-linkages between carboxyl groups of pectin. Ca2+
redistribution may also be involved in the “hard to cook” problem of legume seeds. Although not proven [14], extended storageof beans at high temperature and relative humidity may allow phytate to catalyze

Pag e 994
conversion of calcium phytate to myoinositol (Fig. 4) and the migration of free Ca2+ to the middle lamella, where it causes cross-linkages to form. Other studies have suggested that postprocess softening of canned apricots is caused by relocation of structuralcalcium from the cell wall to organic acids, notably citric acid [25].
16.5.2 Plant Hormones
Specific mention should be made of the plant hormones, which are important regulators of physiological events in detached plantorgans. Of the five major categories of plant hormones (four are shown in Fig. 30), ethylene has received the most attention bypostharvest physiologists. The ability of this agent to “trigger” ripening of fruit and generally promote plant senescence in planttissues has led to the descriptive name “ripening hormone”. Ethylene can also induce sprouting in potato tubers and is alsodescribed as a “wound hormone” because stresses like physical or chemical damage, fungal elicitation, and g-irradiationstimulate ethylene production. Ethylene formation following wounding results from stimulation of existing mRNA for 1-aminocylopropane 1-car-boxylic acid (ACC) synthase [46] (Fig. 31). Because ethylene biogenesis is autocatalytic, it issometimes necessary, to avoid early fruit ripening, to remove even trace quantities of this gas from the storage environment.Climacteric fruit show a large increase in ethylene production during their ripening. It has long been recognized that ethylene actsto stimulate respiration, and this is of both practical and theoretical interest (Sec. 16.4.1; Fig. 23). Stimulation of respirationincreases heat output of produce in storage and hence increases refrigeration requirements. The development of transgenic plantsthat do not synthesize ethylene [62, 64] has unequivocally shown that ethylene is a trigger rather than a by-product of ripening.Ethylene is widely used commercially to ripen bananas and tomatoes and to “degreen” oranges. Gibberellin, which increasesamylase production in grains, is the only other plant hormone that has commercially important use with postharvest foods.
16.5.2.1 Ethylene Biosynthesis
Ethylene biogenesis in plant tissues involves conversion of S-adenosylmethionine (SAM) to 1-aminocyclopropane 1-carboxylicacid (ACC) by the enzyme ACC synthase, and the subsequent conversion of ACC to ethylene by ACC oxidase. Methionine isregenerated by the methionine cycle [93] (Fig. 31). ACC oxidase has been purified [66] and its gene has been cloned [32]. Thecyanide that is produced in conjunction with ethylene is detoxified in a reaction catalyzed by cyanoalanine synthase [49].
16.5.2.2 Ethylene Action
The membranes of specific organelles, as well as the plasma membrane, may be sites of ethylene action. However, determiningthe specific mechanism or mechanisms by which ethylene gas exerts its physiological effects remains a challenging problem topostharvest physiologists. The structural requirements for biological activity of ethylene suggest that metal ion is present in theethylene receptor site [1]. Cu(I) can apparently serve this role (Fig. 32). It has been postulated that bound ethylene is convertedto ethylene glycol in the presence of oxygen and water.
16.5.2.3 Interaction of Ethylene with Other Hormones
Fruit ripening is not always accompanied by a clearly defined increase in ethylene to threshold levels. The efficacy of exogenousethylene to stimulate such events as ripening can depend on the receptiveness of the tissue. For example, the concentration ofethylene required to initiate fruit

Pag e 995
FIGURE 30Some plant hormones and their structures. Other hormone and
hormone-like substances such as jasmonic acid, have recently beenidentified in plant tissues. (Sec. 16.3.4).
ripening declines as the fruit approaches full growth. Similarly, fruit attached to the plant (e.g., banana and avocado) display lesssensitivity to ethylene than detached fruit. Also, certain cultivars of pear are sensitized to ethylene only after the harvested fruitare stored at low, nonfreezing temperatures. These observations indicate that “juvenility factors” desensitize fruit to ethylene andmay otherwise control physiological events in immature fruits and vegetables. Application of exogenous sources of hormonesand plant growth regulators, including auxins, cytokinins, or gibberellins, can simulate the action of juvenility factors indesensitizing plants to exogenous or endogenous ethylene.
There is also evidence that the abscisins, which play a role in leaf or organ abscision from the parent plant, also act to promoteother senescence phenomena such as fruit ripening. As with other physiological events, such as seed germination, it appears thatplant hormones act in concert to control physiological events in postharvest commodities. Although it is clear that hormonesfrequently exert an influence on gene expression, it has not yet been possible to establish a definite corollary between a controlsite of DNA metabolism or protein synthesis and hormone action.

Pag e 996
FIGURE 31Biog enesis of ethylene. The amino acid methionine is recycled and is the carbon
source for the key intermediate 1-aminocyclopropane carboxylic acid (ACC).Ethylene biosynthesis in fruits and veg etables can be decreased by incorporationof antisense rDNA for ACC synthase or ACC oxidase into the plant g enome (Sec.
16.4.3.1).
16.5.2.4 Ethylene and Other Physiological Processes in Postharvest Crops
One of the important general effects of ethylene is to bleach the green color of leafy vegetables. A controlled atmosphere helpsretain the green color of vegetables, presumably through competitive inhibition of ethylene action by the elevated concentrationof carbon dioxide, and inhibition

Pag e 997
FIGURE 32Interaction of Cu(I) with potassiumhydrotris (3,5-dimethyl-1-pyrazolyl)borate, producing a neutral complex
withethylene.
of ethylene synthesis by the reduced concentration of oxygen. There is little evidence that ethylene directly affects pigments otherthan chlorophyll.
Ethylene also stimulates formation of isocoumarin and bitter taste in carrots, lignification of Brassica species and asparagus,production of phytoalexins in diseased crops, production of stress metabolites in sweet potato and white potato, onset of russetspotting in lettuce, and onset of hard core in sweet potato. It also reduces the incidence of chilling injury in muskmelons, and incabbage it accelerates losses of weight and sugar and promotes changes in organic acids.
16.6 Handling and Storage
16.6.1 Cereals, Pulses, and Oilseeds
Unlike fruits and vegetables, cereals, pulses, and oilseeds are relatively stable during storage, provided the moisture level isbelow a critical value—typically about 14%, but this varies somewhat with the crop. Above this moisture content, respiration,mold growth, and sprouting become problems. The higher the moisture content above the critical value, the greater are theproblems. Changes in quality of these crops during storage under proper conditions are quite subtle and sometimes may not beobvious. The hard-to-cook phenomenon in dried beans, which results in beans that need substantially more cooking time thannormal beans, is the result of membrane changes that occur during storage at higher than optimum humidities [74].
Milling, crushing, or extraction greatly reduces storage stability of cereals, pulses, and oilseeds. Destruction of cellularcompartmentation results in mixing of enzymes and substrates and exposure of cellular contents to oxygen and microorganisms.For products with a moisture content yielding optimum overall stability, the rate of lipid oxidation (see Chap. 4) is the limitingfactor for storage. The quality of wheat flour for baking increases after milling due to oxidative changes in the protein, but onceoptimum quality is achieved, further storage causes a slow reduction in quality [67].
16.6.2 Fruits and Vegetables
Throughout its life cycle, the intact plant must respond to various physical and chemical challenges from the environment. Aplant's reaction to stress or environmental change are normally in the direction of protection, for example, prevention of waterloss, adaptation to

Pag e 998
temperature extremes, or development of physical and chemical barriers to pathogens. When the challenge is such that the tissuecannot successfully adapt, the response may be one of hypersensitivity manifested as gene-directed death of particular groups ofcells. It is important to recognize that species of plants may differ markedly in response to physical, chemical, and biologicalchallenges. This is important because it means that no single condition or treatment is ideal for extending the storage lives of allfruits and vegetables. The following sections deal with the influence of physical and chemical factors on the physiologicalbehavior and storage life of fresh fruits and vegetables.
16.6.2.1 Mechanical Injury
Wounding of plant organs generally results in a temporary, localized burst of respiration and cell division, formation of ethylene, arapid turnover of certain cellular constituents, and sometimes accumulation of specific secondary metabolites or products thatappear to have a protective function. In flesh organs, wounded cells commence synthesis of messenger RNA and proteins.Although the impact of wound physiology on plant food commodities is not fully understood, sufficient examples exist to illustratethe general and practical significance of these events.
16.6.2.2 Protective Substances
The response of plant organs to stress may be accompanied by “wound healing,” that is, formation of a physical barrier ofprotective substances. Formation of a waxy or suberized barrier, or of a lignified layer, is important in certain commodities sincethese barriers can effectively prevent invasion by saprophytic microorganisms and subsequent spoilage. Accordingly, followingharvest of certain crops, such as potatoes, it is desirable to cure or store the crop under environmental conditions conducive torapid wound healing. These conditions usually differ from those yielding maximum storage life after wound healing is complete.Wound healing has become of increasing concern with the advent of mechanical harvesting techniques, since these procedurescan result in extensive surface abrasion. In certain crops, such as asparagus, the cut injury associated with harvesting may beespecially undesirable since the resulting stimulation of lignin deposition is directly associated with the losses in tenderness andsucculence.
16.6.2.3 Stress Metabolites
Wound injury can also lead to synthesis and accumulation of a diverse family of substances called “stress metabolites” [29]. Incertain cases, accumulation of a stress metabolite occurs only when mechanical injury is accompanied by other conditions suchas the presence of ethylene (sec. 16.4.1.4) or exposure to chilling temperatures. Stress metabolites encompass a broad family ofchemical compounds, including isoflavonoids, diterpenes, glycoalkaloids, and polyacetylenes (Fig. 33), and they appear to servea protective function for the plant by virtue of their antibiotic properties. However, they may also detract from food qualitybecause of their bitter taste (e.g., coumarins in carrot root, furanoterpenes in sweet potato root, or glycoalkaloids in white potatotuber) and because some have toxic properties. Certain stress metabolites are also precursors of enzymic browning reactions.
16.6.2.4 Temperature
Some of the reactions, such as respiration, that take place in postharvest crops are essential for maintenance of tissue integrity,and some are more or less incidental to this primary purpose. The latter category of reactions may, however, influence foodquality in desirable (e.g., flavor biogenesis) or undesirable (e.g., loss of free sugars) ways. These reactions may have slightlydifferent temperature dependencies, thus making the influence of temperature change on overall quality quite complex.Moreover, other tissue attributes that indirectly influence biochemical

Pag e 999
FIGURE 33Examples of stress metabolites identified in edible plants. The
compounds shown are representative of many other compounds thataccumulate in stressed plant tissues and are called “phytoalexins” (toward off) by plant patholog ists because of their antibiotic activity. Insufficient quantities some of these compounds are toxic to mammals.
transformation, such as membrane integrity and oxygen solubility and diffusivity, are influenced by temperature. Within certainlimits of temperature change, vegetative tissues accept the resulting balances, and though the metabolism alters, there is noobvious adverse reaction to this stress. Within these temperature limits, changes associated with ripening, senescence, orbreaking of dormancy proceed normally, albeit at different rates. Hence, lowering of temperature can retard some undesirablephysiological reactions as well as spoilage caused by growth of microorganisms. Generally, commodities that have relatively fastrespiratory rates respond best to lowered temperature, provided the nonfreezing temperature remains above that whichprovokes low-temperature injury in susceptible commodities. In such crops, precooling prior to shipping or storage can greatlyextend storage life.
16.6.2.5 Low-Temperature Injury
Exposure of a susceptible commodity to a temperature outside the tolerable range for more than short periods causes injury anda decrease in both quality and shelf life. The tolerable range varies significantly depending on the commodity; for example, forsome the range may be 0–35°C and for others 15–35°C. The disorders known as “low-temperature injuries” or “chillinginjuries” (CI) occur in some plant tissues at temperatures above the freezing point of the tissues but below the minimumrecommended storage temperature [51]. CI can result in substantial postharvest losses. The manifestations of CI vary with thecrop, are numerous and include surface lesions, water-soaking of tissues, woolly texture, internal discoloration, failure of fruits toripen, accelerate senescence, increased susceptibility to decay, and compositional changes that effect flavor. Some plant tissues,such as pear and lettuce, do not normally undergo CI at any

Pag e 1000
temperatures above freezing, but for most warm-season crops (sweet corn is an exception) and several temperate crops (e.g.,asparagus, cranberries, apples, and potatoes) there is a critical, nonfreezing temperature below which chilling injury occurs. Fora given species or cultivar, sensitivity to CI can be influenced by growing conditions and stage of physiological development. Theextent of CI is dependent on both temperature and duration of exposure. Recovery is known to take place from short exposuresto potentially harmful temperatures. In some cases, intermittent warming, controlled atmospheres, and hypobaric storage canhelp prevent symptoms of CI.
Whether or not there is a universal biochemical mechanism of CI is not known. CI is, nonetheless, generally attributed to animbalance in metabolic reactions resulting in underproduction of certain essentials and overproduction of metabolites thatbecome toxic to the tissue. For example, accumulation of ethanol, acetaldehyde, and oxaloacetic acid are associated with CI ofcertain fruits. Alteration of the integrity and permeability properties of biological membranes has been proposed as the primaryevidence of injury. There appears to be a relationship between sensitivity to CI and fluidity of membranes as temperature isreduced. These changes in cellular membranes have been observed to occur coincidentally with the onset temperatures for CI inintact plant organs. In some instances these phase changes may cause an alteration in the flow of metabolites through themembrane. In other instances, there is a direct relationship between a membrane phase change and the rate of a specific enzymicreaction. Oxidation of succinic acid via membrane-associated mitrochondrial enzymes is coupled to the electron transfer chainand respiratory metabolism. It is therefore reasonable to suggest that the influence of temperature on the fluidity of biologicalmembranes is one factor that can cause an imbalance in cellular metabolism. An increase in unsaturation of membranephosphatidylglycerol fatty acids has been achieved by over expression of glycerol-3-phosphate acyltransferase, and this hasbeen shown to result in reduced incidence of CI [59]. In view of the diverse ways in which CI can occur in postharvest crops, itis likely that the specific mechanisms underlying this disorder may vary in different tissues.
16.6.2.6 High-Temperature Injury
Exposure of plant tissues to abnormally high temperatures can also produce characteristic injuries in specific commodities. Forexample, storage of many fruits above 30°C results in failure to ripen normally, and exposure of apples to 55°C for a fewminutes gives the fruit an appearance similar to that resulting from CI.
16.6.3 Controlled Atmospheres
Controlled atmosphere (CA) storage usually refers to storage in which the composition of the atmosphere has been altered withrespect to the proportions of oxygen and/or carbon dioxide, and in which the proportions of these gases are carefully controlled,usually within ±1% of the desired value. Modified atmosphere storage does not differ in principle from CA, except that controlof gas concentration is less accurate. For example, carbon dioxide may be allowed to simply accumulate in railroad cars, eitherby normal respiratory activities of plant tissue of by sublimation of dry ice (solid CO2) used for cooling.
Hypobaric storage is another form of controlled atmosphere storage in the sense that the partial pressure of the gaseousenvironment is precisely controlled by reducing the pressure, and by continuously administering small amounts of gas (usuallyair). Typical pressure conditions prevailing in the chamber are 10–30 kPa air. In addition, hypobaric storage creates additionalbenefits by providing a saturated relative humidity, and by increasing diffusivity of gases within the internal spaces of the tissue.
The use of CA for maintenance of high-quality produce during storage and transportation

Pag e 1001
grew out of research by Kidd and West [15], who discovered over 70 years ago that certain varieties of apples remained inbetter condition in atmospheres that contained less oxygen and more carbon dioxide than air. Kader [41] described three levelsof barriers to gas exchange between the product and air: (1) the structure of the commodities dermal system and added surfacecoatings, (2) packages with semipermeable properties, and (3) the gas tightness of storage rooms or transit vehicle (determinescomposition of the atmosphere in these chambers) (Fig. 34).
16.6.3.1 Benefits
The efficacy of CA techniques for extending storage life has been demonstrated for many crops, but their commercial use hasbeen somewhat limited, either for economic reasons or because rapid turnover of a commodity in the marketplace lessens theneed for improved storage procedures. Conventional CA storage (large facilities) is used routinely for apples and pears, and useof modified atmospheres in retail packages has increased. The latter approach is achieved by product-generated gases and theuse of packaging materials with desired gas permeability.
Hypobaric storage has been employed successfully by commercial growers of cut flowers, but at the time of this writing it hasnot been employed commercially for the storage or transportation of fruits or vegetables.
Collectively, these techniques appear to retard respiration, reduce the autocatalytic production, accumulation, and activity ofethylene, and reduce decay caused by microorganisms. In effect, they generally retard ripening and senescence-relatedprocesses, such as degreening of vegetables.
16.6.3.2 Disorders
Closely related species, and even different cultivars of the same species, have different, very specific, and often unpredictabletolerances to low concentrations of oxygen and high concen-
FIGURE 34Model showing three levels of barriers to g as exchang e in controlled
atmosphere storag e of a commodity. B1 = commodities dermal system andadded barriers (e.g ., waxing , film wrap, edible coating ), B2 = packag ing
material or CA storag e room, B3 = storag e room or externalenvironment. (Adapted from Ref. 41.)

Pag e 1002
trations of carbon dioxide. The maturity of the tissue at harvest and the temperature of the tissue during storage can alsoinfluence the response to CA conditions. With respect to maturity, McIntosh apples, when stored in an atmosphere containing1% oxygen, exhibit less internal browning when immature than when mature.
If the composition of the storage atmosphere is not properly controlled it can have disastrous results, since the produce maydevelop physiological injuries. The degree of susceptibility to injury and the specific symptoms vary, not only among cultivars,but even among the same cultivars grown in different locations or different years in the same location. Some crops, such assweet cherries, plums, and peaches, are not very susceptible to carbon dioxide injury and can be stored at carbon dioxideconcentrations up to at least 20%, whereas other crops, such as lettuce, can show discoloration (“brown stain”) when exposedto carbon dioxide concentrations of 2% or greater. Similarly, atmospheres containing large amounts of carbon dioxide and smallamounts of oxygen interfere with wound healing of potato tubers. Thus, wounded potatoes, when exposed to CA immediatelyafter harvest, decay very rapidly.
The mechanism by which physiological disorders are induced by extremes in atmospheric composition is not entirely clear.However, available evidence indicates that the same principles discussed in reference to CI also apply to carbon dioxide injuryor damage caused by oxygen deprivation. Studies have shown that toxic levels of metabolites, such as succinic acid, ethanol,and acetaldehyde, accumulate in certain commodities prior to injury symptoms.
A further similarity to CI is that CO2 injury in pears has been attributed to alterations in the structure and function of organellemembranes. It is, of course, very difficult to distinguish primary sites of injury from secondary consequences of primary action.However, it is reasonable to believe that alterations in respiratory metabolism and the inability of the tissue to cope with theresulting imbalances are a primary event in such injuries.
Although the final electron acceptor for respiratory metabolism (cytochrome oxidase) has a relatively high affinity for oxygenconcentration, it is important to recognize that the gaseous concentrations in situ are not the same as those existing in the storageatmosphere. Thus, the diffusivity and solubility of a critical gas in the tissue may be determining factors. In view of recent findingsthat injury caused by a low oxygen concentration is minimal when carbon dioxide levels are retained at low levels, it appears thatdamage previously attributed to oxygen deprivation may, in fact, be caused by elevated levels of carbon dioxide. For example,apples can be successfully stored in an atmosphere consisting of only 1% oxygen and 99% nitrogen. Hybobaric storage alsoresults in a large decrease in oxygen with an accompanying reduction in the partial pressure of carbon dioxide. Reports thathypobaric storage extends the storage life of many commodities beyond that possible with conventional CA storage (low oxygenand high carbon dioxide) may relate to the markedly different concentrations of carbon dioxide used in the two techniques.However, other differences also exist; namely, plant tissues stored under hypobaric conditions contain very low concentrationsof ethylene, exhibit improved diffusion properties for gases, and are exposed to very high relative humidities.
16.6.4 Humidity
It is generally recommended that fruits and vegetables be stored at relative humidities sufficiently high to minimize water loss andto maintain cell turgor, but not so high as to cause condensation and accompanying microbial growth. The tendency of acommodity to lose moisture at a given relative humidity is related to the nature and amount of specialized cells at the tissuesurface. Techniques that use an atmosphere saturated with water without condensation have been developed and employedsuccessfully for vegetable storage in Canada and North European countries. Although such techniques are relatively expensive,they

Pag e 1003
can be very effective in minimizing both physiological deterioration and microbial decay. Successful use of storage atmospheresthat are saturated with water vapor requires a minimal temperature gradient throughout the storage chamber so that allatmospheric water remains in the vapor state.
Low relative humidity can influence physiological processes of postharvest crops. For example, when held in an atmosphere at25% relative humidity, banana fruit fails to ripen and undergo climacteric respiration, whereas green tomatoes and pears exhibit abimodal climacteric and intensification of ripening indices [40]. Atmospheric moisture levels can also influence the severity ofchilling injury in certain fruits. Core breakdown and scald of apples is minimized by storage at low relative humidity, whereas CIof citrus fruits is lessened when fruits are wrapped in waxed paper to minimize moisture loss.
16.6.5 Ionizing Radiation
Low doses of ionizing radiation have been successfully applied experimentally and commercially to prolong the storage life offresh fruits and vegetables. Inhibition of sprouting in potatoes, onions, and carrots, as well as destruction of insect pests in storedgrains, can be accomplished with 0.1–0.25 kGy doses. Control of mold growth requires doses in excess of 1 kGy, anddestruction of pathogenic bacteria necessitates doses of 5–10 kGy. Kilogram doses of ionizing radiation can temporarily orpermanently prevent the onset of fruit ripening. Studies indicate that delay in ripening is associated with the uncoupling andeventual de novo biosynthesis by mitochondria. High doses of radiation, which irreversibly prevent normal fruit ripening, appearto interfere with the ability of the tissue to repair radiation damage. Low doses of irradiation cause a temporary burst in woundethylene but they also inhibit the subsequent transcription-dependent stimulation of ethylene production and the activity of ACCoxidase [46].
Unfortunately, the quality of fruits and vegetables is usually adversely affected by doses of ionizing radiation in excess of 2 kGy.Moreover, low doses employed for sprout inhibition can interfere with wound healing, and this has created problems withcommercial attempts to use this technique to prevent sprouting of potatoes.
The physiological changes induced by irradiation, especially at high doses, can bring about the death of cells. Irradiatedcommodities often show characteristic symptoms of damage. For example, apples exposed to 10 kGy exhibit a ring of necrotictissues, not unlike core-flush, adjacent to the core. Citrus and banana exhibit peel lesions at doses as low as 0.25 kGy. Manycommodities also exhibit extensive pulp softening, and this has been related to activation of pectic enzymes. Despite thesedifficulties, there appears to be renewed interest in the use of ionizing radiation for preservation of fresh fruits and vegetables. Aswith other techniques, the preceding limitations can probably be overcome when the influences of variables such as maturity,temperature, and gaseous environment are more fully controlled.
16.6.6 Other Factors
Postharvest treatments with fungicides, bactericides, and senescence inhibitors can be applied to fruits and vegetables toindirectly or directly minimize decay. Various experimental studies indicate that senescence inhibitors, such as hormone analogs(e.g., cytokinins and auxins) and respiratory inhibitors (e.g., benzimidazole and vitamin K analogs), are effective in prolonging thestorage life of certain crops, although they are not approved for use commercially. Calcium treatment inhibits normal ripening ofseveral fruits and prevents the development of various physiological disorders. Calcium in plants is involved in a number offundamental physiological

Pag e 1004
processes that influence the structure of cell walls, membranes, and chromosomes, and the activity of enzymes. In addition, somestudies indicate that endogenous calcium may also serve an important regulatory function in fruit ripening. Little is known abouthow calcium exerts a beneficial effect when applied to detached plant tissues.
Exposure of fruits and vegetables to various other chemicals can influence physiological processes in an undesirable way. Forexample, postharvest commodities show different susceptibilities to air pollutants, and this can be of practical concern in urbanareas. Automobile emissions, especially ethylene, can accelerate tissue necrosis at parts per million levels. The volatilecomponents of photochemical smog (O3, peroxyacyl nitrates, and NO2) are known to create undesirable injury symptoms in awide array of fruits and vegetables. Other stresses to plants are caused by SO2 (e.g., from coal-fired plants for generatingelectricity) and by ammonia from leaks in refrigeration systems.
16.7 Effects of Processing on Fruits and Vegetables
The basic purpose of food processing is to curtail the activity of microorganisms and retard chemical changes that wouldotherwise adversely affect the edible quality of food, and to do so with minimal damage to quality attributes. Food processingtechniques differ in principle from the preservation techniques described in the previous section in that viability of the living tissuecells is lost during processing. An important advantage of processing is that it enables food to be stored in edible condition forlonger periods than would generally be possible by other means. However, because of the severity of these processes, theproduct usually undergoes rather extensive changes, and as a result the quality characteristics of a given commodity are oftenchanged. Such alterations may be desirable (e.g., inactivation of antinutritional factors by heat, softening of hard or tough tissues,creation of flavors) or undesirable (e.g., loss of vitamins by heat, loss of color, texture changes, production of off flavors) andmay be acceptable to consumers depending on local customs and eating preferences.
16.7.1 Chemical Changes
The rate of a chemical reaction in a foodstuff is a function of many factors, mainly reactant concentration, availability, andmobility; temperature; pH; oxidation—reduction potential; and inhibitors and catalysts. Therefore, the effects of processing onchemical changes in fruits and vegetables vary widely with the nature of the process and composition of plant tissue. Even withinthe same species, substantial differences may occur among different cultivars and for a single cultivar that has been grown orstored under different conditions. The reactions that occur in plant tissues are not unique to plants except for those that occurwhile the tissue is still “alive” and those that involve components that are specific to plants. Thus, chemical alterations in starchthat occur during canning of whole potatoes are not fundamentally different from those occurring when potato starch is cannedas a part of a soup. However, there are important physical differences that are related to whether or not the starch granule is apart of a complex cellular organization or simply dispersed in water and these physical differences may affect the rate and extentof chemical reactions. Some examples of reactions that occur during processing and storage of fruits and vegetables are shownin Table 14. Because of the complexity of fruit and vegetable tissues it is often difficult to predict the consequences of processingand storage conditions on chemical reactions that influence quality. The details of many of these chemical reactions can be foundin the chapters dealing with the individual components.

Pag e 1005
16.7.2 Enzyme-Catalyzed Reactions
The effects of cellular disruption on chemical reactions in living plant tissues were discussed previously (Sec. 16.4.1). Even whenfoods are to be thermally sterilized, cellular disruption during peeling, size reduction, etc. before the enzymes are inactivatedcontributes significantly to the chemical changes that occur. Many processing sequences are designed to minimize these changesby reducing the time between disruption and enzyme inactivation. This is one of the functions of blanching prior to thermalprocessing or freezing. The “hot break” process for tomatoes, which inactivates polygalacturonase before significant losses ofviscosity occur, is a good example of this type of strategy. However, in the processing of orange juice, some of thepolygalacturonase are quite heat stable, and substantial changes in flavor occur when all of the polygalacturonase is inactivatedby heat. Failure to inactivate polygalacturonase in orange juice results in an unstable “cloud” and a poor appearance.
16.7.3 Cell Disruption
Cellular disruption also contributes to nonenzymatic changes. Disruption of the central vacuole releases acid, which changes thepH of the tissue and alters the rates of numerous pH-dependent reactions. Color changes (see Chap. 10) are especiallynoticeable examples of this. Disruption may also increase the rate of nonenzymatic oxidation due to the increased concentrationof oxygen. When freezing plant tissues, it is generally agreed that ice formation directly causes physical disruption of the relativelyrigid plant cell structure and indirectly causes damage due to the concentration of solute molecules in the unfrozen phase (seeChap. 2). Tissues vary widely in their susceptibilities to these kinds of damage. Differences in freezing damage to a leaf ortomato as compared to that in a potato or wheat kernel illustrates this point. Due to the effects of temperature, rates of reactionfollowing cellular disruption during freezing are quite different from those that occur following disruption at higher temperatureswhere enzymatic and chemical reactions are rapid.
16.7.4 Changes in Molecular Structures
Chemical reactions during processing are influenced in many ways other than just cell disruption. Thermal processing denaturesproteins (see Chap. 6) and alters the interaction of proteins with lipids, water, etc. Inactivation of enzymes is essential forproducing foods with long shelf lives. Also, membrane structures like chloroplasts are irreversibly altered by heat processing andthe components (e.g., chlorophyll, lipids, proteins) become more available to participate in reactions. Destruction of the nativeenvironment surrounding pigments results in color changes.
Polysaccharides in plant cells are highly ordered in their native state, and the structural integrity of the cells is dependent on thisorder. Heating generally causes these large molecules to absorb water, to “swell,” and to become more mobile and moreavailable to participate in chemical reactions. Swelling may also disrupt the structure enough to cause changes in adjacentcomponents. Starch granules are a familiar example of this, but cell walls undergo similar changes, although to a much lessextent.
16.7.5 Other Factors Influencing Reaction Rates
In addition to structure-related changes discussed earlier, thermal processing has a wide range of effects on individualcomponents, and these effects depend on the time and temperature of processing and the activation energies of the individualreactions. Examples of these reactions are discussed throughout this volume. Drying of plant tissues causes an increase inconcentration

Pag e 1006
TABLE 14 Examples of Nonenzymic Reactions That Can Affect the Quality of Processed Fruits and Veg etables
Reactant(s) Product(s)/result Importance
Chlorophyll Pheophytin Conditions of low pH and hig h temperature favor this reaction, which results in olive-brown discoloration ofcanned g reen veg etables.
Glutamine Pyrrolidone carboxylic acid PCA formed during thermoprocessing of canned veg etables is believed to contribute to acid-catalyzed pheophytinformation and off flavor.
All-trans-carotenoids
cis, trans-Carotenoids Heat, lig ht, or dilute acid conditions cause isomerization of all-trans-carotenoids to various cis isomers. Thereaction results in loss of vitamin A activity and chang es in color.
Thiamin Pyrimidine and thiazole Heating at pH < 6 results in cleavag e of the methylene bridg e of vitamin B 1 to form indicated products.
Ascorbic acid Dehydroascorbic acid,diketog ulonic acid, etc.
Oxidation in the presence of molecular O 2 results in loss of vitamin C activity and may be coupled to otherreducing reactions, such as disulfide bond formation during g luten development, or conversion of ethanol toacetaldehyde in wine ag ing .
Ascorbic acid 3-Deoxypentosulose, 2-furaldehyde
Hig h-acid foods like lemon juice underg o nonoxidative deg radation of ascorbic acid. The reaction appears tocontribute to “ascorbate browning ” of these products.
Glycosides Hydrolysis products Mild acid conditions and heat cause hydrolysis of g lycosidic linkag es. Phenolic g lycosides are also hydrolyzedunder mild alkaline conditions. Such reactions can influence the texture and flavor of fruits and veg etables.
Reducing sug ar,amino acid
Maillard browning Concentration of reactants, hig h temperature, and alkaline pH can favor this important reaction that can impactnutrition (adverse), color, flavor, and safety of processed fruits and veg etables.
Org anic acid, Ca 2+ Ca2+ chelate Phytic or citric acids can sequester Ca 2+ from pectate and thereby cause softening of canned fruit.
Amylose Crystallization Alig nment of linear starch chains can form insoluble precipitates that contribute to processes like bread staling .
Methyl-methionine
Dimethylsulfide Thermal deg radation of sulfur-containing compounds g ives rise to many important flavor compounds.
Hydrog en sulfide Discoloration Iron sulfide appears as black spots both on the can and in potatoes.
Fe2+ Fe3+ Increased lipid oxidation and reduced iron absorption are two important consequences that can occur when iron isoxidized.
Org anic acids “Detinning ” Coating of cans with enamels g reatly reduces solubilization of metal by acid.
Anthocyanin, SO2 Decolorization The addition of SO2 to the 4-position of anthocyanins to form a bisulfite addition product causes decolorization.

Pag e 1007
of solutes, as well as migration of solutes, and, depending upon the type of the drying process utilized, may expose the tissue tohigh temperatures and oxygen. All of these changes favor increased rates of chemical reactions. Furthermore, migration andconcentration of solutes can have a profound effect on macromolecules and dramatically alter the rehydration behavior of theseproducts.
16.8 Conclusion
As the world population increases and utilizable agricultural lands diminish, the problems of food availability are certain toincrease and botanical sources of food will tend to supplant animal sources. Furthermore, increased emphasis on consumption ofplant tissues for general and specific health reasons is likely to substantially increase the demand for foods as derived fromplants. There are many gaps in our knowledge regarding postharvest physiological attributes of edible plant tissues, andcontinued research is needed to improve our ability to better utilize postharvest crops and to deliver the highest quality plantfoods to consumers. Totally new approaches to plant food production, quality improvement, and preservation will also evolvefrom basic research on plant physiology. Recombinant DNA technology offers the potential to dramatically improve the qualityof may plant products, but these advances will require a better understand the biochemical determinants of quality.
Bibliography
Eliasson, A.-C., and K. Larsson (1993). Cereals in Breadmaking, Marcel Dekker, New York.
Haard, N.F. (1984). Postharvest physiology and biochemistry of fruits and vegetables. J. Chem. Educ. 61:277–290.
Herregods, M. (ed.) (1989). International Symposium on Postharvest Handling of Fruits and Vegetables, Leuven,Belgium, August 29–September 2, 1988, International Society for Horticultural Science, Wageningen, The Netherlands.
Kays, S.J. (1991). Postharvest Physiology and Crop Protection, Plenum, New York.
Phan, C.T. (1984). Symposium on Post-Harvest Handling of Vegetables Montreal, Quebec, Canada, 3–8 June 1984, ISHSWorking Group, Postharvest Handling of Vegetables.
Richardson, T., and J.W. Finley (eds.) (1985). Chemical Changes in Food During Processing, AVI, Westport, CT.
Robinson, T. (1991). Organic Constituents of Higher Plants, 6th ed., Cordus Press, North Amherst, MA.
Snowdon, A.L., (1989). A Color Atlas of Post Harvest Diseases and Disorders of Fruit and Vegetables, CRC Press,Boca Raton, FL.
Weichmann, J. (1987). Postharvest Physiology of Vegetables, Marcel Dekker, New York.
Wilson, C. L., and E. Chalutz (eds.) (1991). Biological Control of Postharvest Diseases of Fruits and Vegetables,Workshop proceedings, Sherpherdstown, WV, September 12–14, 1990, U.S. Department of Agriculture, AgriculturalResearch Service, Beltsville, MD.
References
1. Ainscough, E. W., A. M. Brodie, and A. L. Wallace, (1992). Ethylene—An unusual plant hormone. J. Chem. Education69: 315–318.
2. Amir, J. and Cherry, J. H. (1971). Chemical control of sucrose conversion to polysaccharides in sweet corn after harvest. J.Agric. Food Chem.:954.
3. Anderson, J. W., D. A. Deakins, T. L. Floore, B. M. Smith, and S. E. Whitis (1990). Dietary fiber and coronary heartdisease. CRC Crit. Rev. Food Sci. Nutr. 29:95–147.
4. Ap-Rees, T.; Dixon, W. L.; Pollack, C. J. and Franks, F. (1981). Low temperature sweetening of higher

Pag e 1008
plants, in Recent Advances in the Biochemistry of Fruits and Vegetables (J. Friend and M. J. C. Rhodes, eds.),Academic Press, New York, pp. 41–60.
5. Autran, J. C. (1993). Recent perspectives on the genetics, biochemistry and functionality of wheat proteins. Trends FoodSci. Technol. 4:358–364.
6. Babic, I., M. J. Amiot, T. C. Nguyen, and S. Aubert (1993). Changes in phenolic content in fresh ready-to-use shreddedcarrots during storage. J. Food Sci. 58:351–356.
7. Ballentine, D. A. (1992). Manufacturing and chemistry of tea, in Phenolic compounds in food and their effects on health IAnalysis, Occurrence & Chemistry (C. T. Ho, C. Y. Lee, and M. T. Huang, and C. T. Ho, eds.), American ChemicalSociety, Wahsington, DC, pp. 102–117.
8. Barichello, V., R. Y. Yada, R. H. Coffin, and D. W. Stanley (1990). Low temperature sweeting in susceptible and resistantpotatoes. Starch structure and composition. J. Food Sci. 55:1054.
9. Barichello, V., R. Y. Yada, R. H. Coffin, and D. W. Stanley (1990). Respiratory enzyme activity in low temperaturesweetening of susceptible and resistant potatoes. J. Food Sci. 55:1060–1063.
10. Bartley, I. M., and M. Knee (1982). The chemistry of textural changes in fruit during storage. Food Chem. 9:47–58.
11. Beck, C. I., and T. Ultrich (1993). Biotechnology in the food industry. Bio/Technology 11:895–902.
12. Belitz, H.-D., and W. Grosch (1987). Food Chemistry, 1st English ed., Springer-Verlag, Berlin, p. 774.
13. Bennett, A. B., G. M. Smith, and B. G. Nichols (1987). Regulation of climacteric respiration in ripening avocado. PlantPhysiol. 83:973–976.
14. Bernal-Lugo, I., G. Prado, C. Parra, E. Moreno, J. Ramirez, and O. Velazco (1989). Phytic acid hydrolysis and beansusceptibility to storage induced hardening. J. Food Biochem. 14:253–261.
15. Biale, J., and R. E. Young (1981). Respiration and ripening of fruits retrospect and prospect, in Recent Advances in theBiochemistry of Fruits and Vegetables (J. Friend and M. J. C. Rhodes, eds.), Academic Press, New York, p. 89.
16. Brady, C. J., P. B. H. O'Connel, J. K. Palmer, and R. M. Smile (1970). An increase in protein synthesis during ripening ofthe banana fruit. Phytochemistry 9:1037–1047.
17. Butler, L. G. (1988). Effect of condensed tannins on animal nutrition, in Chemistry and Significance of CondensedTannins (R. W. Hemingway and J. J. Karchesy, eds.), Plenum Press, New York, pp. 343–396.
18. Carrington, C. M. S., L. C. Greve, and J. M. Labavitch (1993). Cell wall metabolism in ripening fruit. VI. Effect ofantisense polygalacturonase gene on cell wall changes accompanying ripening in transgenic tomatoes. Plant Physiol.103:429–434.
19. Cassab, G. I. and J. E. Varner (1988). Cell wall proteins. Annu. Rev. Plant Physiol. Plant Mol. Biol. 39:321–353.
20. Chung, O. K. (1991). Cereal lipids, in Handbook of Cereal Science and Technology (K. J. Lorenz and K. Kulp, eds.),Marcel Dekker, New York, Vol. 41, pp. 497–554.
21. Dunham, D. (1993). Food Cost Review, 1992, U. S. Department of Agriculture, Economic Research Service, Washington,DC.
22. Eliasson, A.-C., and K. Larsson, (1993). Cereals in Breadmaking, Marcel Dekker, New York, p. 376.
23. Englyst, H. N. V. Anderson,, and J. H. Cummings (1983). Starch and non-starch polysaccharides in some cereal foods. J.Sci. Food Agric 34:1434–1440.
24. Faith, N. G., A. E. Yousef, and J. B. Luchansky (1992). Inhibition of Listeria monocytogenes by liquid smoke andisoeugenol, a phenolic component found in smoke. J. Food Safety 12:263–314.

25. French, D. A., A. A. Kader, and J. M. Labavitch (1989). Softening of canned apricots: A chelation hypothesis. J. FoodSci. 54:86–89.
26. Gaser, C. S., and R. T. Fraley (1989). Genetically engineering plants for crop improvement. Science 244:1293–1299.
27. Glenn, G. W., and B. W. Poovaiah (1990). Calcium mediated postharvest changes in texture and cell wall structure andcomposition in golden delicious apples. J. Am. Soc. Hort. Sci. 115:962–968.
28. Guclu, R., A. Paulin, and P. Soudain (1989). Changes in polar lipids during ripening and senescence of cherry tomato(Lycopersicon esculentum): Relation to climacteric and ethylene increases. Physiol. Plant. 77:413–419.

Pag e 1009
29. Haard, N. F. (1983). Stress metabolites, in Postharvest Physiology and Crop Protection (M. Lieberman, ed.), Food andNutrition Press. Westport, CT, pp. 433–448.
30. Haard, N. F. and H. O. Hultin (1968). An improved method for isolation of mitochondria from plant tissue. Anal. Biochem.24:299–304.
31. Hamada, J. S. and W. E. Marshall (1989). Preparation and functional properties of enzymatically deamidated soy proteins.J. Food Sci. 54:595–601, 635.
32. Hamilton, A. J., M. Bouzayen, and D. Grierson (1991). Identification of a tomato gene for the ethylene-forming enzyme byexpression in yeast. Proceedings of the National Academy of Science 88:7434–7437.
33. Haslan, E., T. H. Lilley, E. Warminski, H. Liao, Y. Cai, R. Martin, S. H. Gaffney, P. N. Goudling and G. Luck (1992).Polyphenol complexation: A study in molecular recognition, in Phenolic compounds in Food and their Effects on Health I.Analysis, Occurrence & Chemistry (C. T. Ho, C. Y. Lee, and M. T. Huang, eds.), American Chemical Society, Wahsington,DC, pp. 8–50.
34. Hayakawa, K. I. (1987). Temerature:energy flux in stores, in Postharvest Physiology of Vegetables (J. Weichmann, ed.),Marcel Dekker, New York, pp. 181–202.
35. Ho, C. T., C. Y. Lee, and M. T. Huang (1992). Phenolic Compounds in Food and Their Effects on Health I. Analysis,Occurrence, & Chemistry, American Chemical Society, Washington, DC.
36. Hubbard, N. L., D. M. Pharr, and S. C. Huber (1990). Role of sucrose phosphate synthase in sucrose biosynthesis inripening bananas and its relationship to the respiratory climacteric. Plant Physiol 94:201–208.
37. Huff, A. (1984). Sugar regulation of plastid interconversion in epicarp of citrus fruit. Plant Phsyiol 76:307.
38. Ikemefura, J. and J. Adamson (1985). Chlorophyll and carotenoid changes in ripening palm fruit, Elacis guineesis,Phytochemistry 23:1413.
39. Isaac, J. E. and M. J. C. Rhodes (1987). Phosphofructokinase and ripening in Lycopersicum esculentum fruits.Phytochemistry 25:649.
40. Janick, J. R. W. Schery, F. W. Woods, and V. M. Ruttan (1969). Food and human needs, in Plant Science (J. Janick, R.W. Schery, F. W. Woods, and V. M. Ruttan, eds.), W. H. Freeman, San Francisco, pp. 37–52.
41. Kader, A. A. (1987). Respiration and gas exchange of vegetables, in Postharvest Physiology of Vegetables (J.Weichmann, Ed.,) Marcel Dekker, New York, pp. 25–43.
42. Klein, B. and S. Grossman (1985). Co-oxidation reaction of lipoxygenases in plant systems. Adv. Free Radical Biol. Med.1:309.
43. Koch, J. L. and D. E. Nevins (1990). The tomato fruit cell wall. II. Polyuronide metabolism in a non-softening tomatomutant. Plant Physiol. 92:642–647.
44. Koch, J. L. and D. J. Nevins (1989). Tomato fruit cell wall I. Use of purified tomato polygalacturonase andpectinmethylesterase to identify developmental changes in pectins. Plant Physiol. 91:816–822.
45. Kockritz, A., T. Schewe, B. Hieke, and N. Haas (1985). The effect of soybean lipoxygenase-1 on chloroplasts from wheat.Phytochemistry 24:381.
46. Larrigaudiere, C., A. Latche, J. C. Pech and C. Triantaphylides (1989). Short term effects of g-irradiation on 1-aminocyclopropane-1-carboxylic acid metabolism in early climacteric cherry tomatoes. Plant Physiol. 92:577–581.
47. Lesham, Y. Y. (1988). Plant senescence processes and free radicals. Free Radical Biology and Medicine 5:39–49.
48. Liyama, K., T. B.-T. Lam, and B. A. Stone (1994). Covalent cross-links in the cell wall. Plant Physiol. 104:315–320.
49. Lurie, S. and J. D. Klein (1989). Cyanide metabolism in relation to ethyelene production and cyanide insensitive respirationin climacteric and nonclimacteric fruits. J. Plant Physiol. 135:518–521.

50. Lurie, S., B. Shapiro, and S. Ben-Yehoshua (1989). Ethylene and cyanide insensitive respiration in ripening apples: Theeffect of calcium, in Biochemical and Physiological Aspects of Ethylene Production in Lower and Higher Plant (H.Clisters and R. Marcelle, eds.), Kluwer, Amsterdam, pp. 81–90.

Pag e 1010
51. Lyons, J. M. and R. W. Briedenbach (1987). Chilling injury, in Postharvest Physiology of Vegetables (J. Weichmann,ed.), Marcel Dekker, New York, pp. 305–326.
52. Macko, V. and H. Stegmann (1969). Mapping of potato proteins by combined electrofocusing and electrophoresis. Hoppe-Seyler's Z. Physiol. Chem. 350:917–919.
53. Maquire, Y. P. and Haard, N. F. (1975). Fluorescent product accumulation in ripening fruit. Nature 258:599–600.
54. Mateos, M., D. Ke, M. Cantwell, and A. A. Kader (1993). Phenolic metabolism and ethanolic fermentation of intact andcut lettuce exposed to CO2-enriched atmospheres. Postharvest Biol. Technol. 3:225–233.
55. McGarry, A. (1993). Influence of water status on carrot (Daucus carota L.) fracture properties. J. Hort Sci. 68:431–437.
56. Mitcham, E., K. Gross, and T. Ng (1989). Tomato fruit cell wall synthesis during development and senescence. PlantPhysiol 89:477–481.
57. Moreau, F., and R. Romani (1982). Malate oxidation and cyanide insensitive respiration in avocado mitochondria during theclimacteric cycle. Plant Physiol. 70:1385.
58. Muller-Rober, B., U. Sonnewald, and L. Willmitzer (1992). Inhibition of the ADP-glucose pyrophosphorylase in transgenicpotatoes leads to sugar-storing tubers and influences tuber formation and expression of tuber storage protein genes. EMBO J.11:1229–1238.
59. Murata, M., O. Ishizaki-Nishizawa, S. Higashi, H. Hyashi, Y. Tasaka, and I. Nishida (1992). Genetically engineeredalteration in the chilling sensitivity of plants. Nature 356:710–713.
60. Newman, R. H., M. A. Ha, and L. D. Melton (1994). Solid state 13C NMR investigation of molecular ordering in thecellulose of apple cell walls. J. Agric. Food Chem. 42:1402–1406.
61. O'Donoghue, E. M., and D. J. Huber (1992) Modification of matrix polysaccharides during avocado fruit ripening: anassessment of the role of Cx-cellulase. Physiol. Plant 86:33–42.
62. Oeller, P. W., L. M. Wong, L. P. Taylor, D. A. Pike and A. Theologis (1991). Reversible inhibition of tomato fruitsenescence by antisense RNA. Nature 254:437–439.
63. Pernollet, J. C. and J. Mosse (1983). Structure and location of legume and cereal seed storage proteins, in Seed Proteins(J. Daussant, J. Mosse, and J. Vaughan, eds.), Academic Press, New York, pp. 155–191.
64. Picton, S., S. L. Barton, M. Bouzayen, and A. J. Hamilton (1993). Altered fruit ripening and leaf senescence in tomatoesexpressing an antisense ethylene-forming enzyme transgene. Plant J. 3:469–481.
65. Pilnik, W. and A. G. J. Voragen (1984). Polysaccharides and food. Gordian 70:144–175.
66. Pirrung, M. C., L. M. Kaiser, and J. Chen (1993). Purification and properties of the apple fruit ethylene-forming enzyme.Biochemistry 32:7445–7450.
67. Pomeranz, Y. (1992). Biochemical, functional, and nutritive changes during sotrage, in Storage of Cereal Grains andTheir Products (D. B. Sauer, ed.), American Association of Cereal Chemists, St. Paul, MN, pp. 55–141.
68. Pomeranz, Y. and O. K. Chung (1978). Interaction of lipids with proteins and carbohydrates in breadmaking. J. Am. OilChem. Soc. 55:285–289.
69. Powell, C., M. N. Clifford, S. C. Opie, M. A. Ford, A. Robertson, and C. L. Gibson (1993). Tea cream formation: thecontribution of black tea phenolic pigments. J. Sci. Food Agric. 63:77–86.
70. Pratt, D. E. (1992). Natural antioxidants from plant material, in Phenolic compounds in Food and Their Effects onHealth I Analysis, Occurrence, & Chemistry (C. T. Ho, C. Y. Lee, and M. T. Huang, eds.), American Chemical Society,Washington, DC, pp. 54–71.
71. Radley, J. A. (1968). Starch and Its Derivatives, Chapman and Hall, London.

72. Redgewell, R. J. and S. C. Fry (1993). Xyloglucan endotransglycosylase activity increases during kiwi fruit ripening. PlantPhsyiol. 103:1399–1406.
73. Rich, P. R., A. Boveris, W. D. Bonner, and A. L. Moore (1976). Hydrogen peroxide generated by the alternate oxidase ofhigher plants. Biochem. Biophys. Res. Commun. 3:695.
74. Richardson, J. C. and D. W. Stanley 91991). Relationship of loss of membrane functionality and hard-to-cook defect inaged beans. J. Food Sci. 56:590–591.
75. Robyt, J.F. (1984). Enzymes in the hydrolysis and synthesis of starch, in Starch: Chemistry and
Pag e 1011
Technology, 2nd ed. (R. L. Whistler, J. N. BeMiller, and E. F. Paschall, eds.), Academic Press, New York, pp. 87–123.
76. Salunke, D. K., S. J. Jadhav, S. S. Kadam, and J. K. Chavan (1982). Chemical, biochemical and biological significance ofpolyphenols in cereals and legumes. CRC Crit. Rev. Food Sci. Nutr. 17:277–305.
77. Schwimmer, S. (1978). Enzyme action and modification of cellular integrity in fruits and vegetables: Consequences for foodquality during ripening, senescence and processing, in Postharvest Biology and Biotechnology (H. O. Hultin and M. Milner,eds.), Food and Nutrition Press, Westport, CT, p. 37.
78. Snook, J. T. (1984). Nutrition, Prentice-Hall, Englewood Cliffs, NJ, p. 521.
79. Solomos, T. and G. Laties (1976). Induction by ethylene of cyanide-resistant respiration. Biochem. Biophys. Res.Commun. 70:663–671.
80. Spanos, G. A. and R. E. Wrolstad (1994). Phenolics of apple, pear and white grape juices and their changes withprocessing and storage–A review. J. Agric. Food Chem. 40:1478–1487.
81. Stegemann, H. (1975). Properties and physiological changes in storage proteins, in The Chemistry and Biochemistry ofPlant Proteins (J. B. Harborne and C. F. van Sumere, Eds.), Academic Press, New York, Chap. 3.
82. Tigchelaar, E. C., W. B. McGlasson, and M. J. Franklin (1978). Genetic regulation of tomato fruit ripening. HortScience13:508.
83. Torre, M., and A. R. Rodriguez (1991). Effects of dietary fiber and phytic acid on mineral availability. CRC Crit. Rev.Food Sci. Nutr. 30:1–22.
84. Voekler, T. A. (1992). Fatty acid biosynthesis redirected to medium chains in transgenic oilseeds. Science 257:72–74.
85. Wade, N. L., S. H. Satyan, and E. E. Kavanagh (1993). Increase in low molecular size uronic acid in ripening banana fruit.J. Sci. Food Agric. 63:257–259.
86. Wagner, A. M., T. J. A. Kneppers, B. M. Kroon, and L. H W. Plas (1987). Enzymes of the pentose phosphate pathway incallus forming potato discs grown at various temperatures. Plant Sci. 57:159.
87. Wang, C. Y. (1993). Relation of chilling stress to polyamines in zucchini squash. Acta Hort. 343:288–289.
88. Weichmann, J. (1987). Minerals, in Postharvest Physiology of Vegetables (J. Weichmann, ed.), Marcel Dekker, NewYork, pp. 481–488.
89. Wicker, L., M. R. Vassallo, E. J. Echeverria (1988). Solubilization of cell wall bound, thermostable pectinesterase fromvalencia orange. J. Food Sci. 53:1171–1174.
90. Williams, R. J. P. (1985). The necessary and desirable production of radicals in biology. Phil. Trans. Royal Soc. Lond. B311:593–603.
91. Wolfe, W. J. (1972). Purification and properties of soybeans, in Soybeans Chemistry and Technology (A. K. Smith andS. J. Circle, eds.), AVI, Westport, CT, pp. 93–143.
92. Wrigley, C. W. and J. A. Bietz (1988). Proteins and amino acids, in Wheat Chemistry and Technology (Y. Pomeranz,eds.), American Association of Cereal Chemists, St. Paul, pp. 179–275.
93. Yang, S. F., and N. E. Hoffman (1984). Ethylene biosynthesis and its regulation in higher plants. Annu. Rev. Plant.Physiol. 35:155.

Pag e 1013
17Summary: Integrative Concepts
PETROS TAOUKIS
National Technical University of Athens, Athens, GreeceTHEODORE P. LABUZA
University of Minnesota, St. Paul, Minnesota
17.1. Introduction 1013
17.2. Chemical Changes During Processing and Storage 1014
17.3. Application of Kinetics to Shelf-Life Modeling 1016
17.3.1. Principles 1016
17.3.2. Food Quality Function—Order of Reaction 1018
17.3.3. Temperature Effects—Arrhenius Approach 1019
17.3.4. The Simple Shelf-Life Plot Approach 1023
17.3.5. Effects of Other Factors 1027
17.3.6. Steps in Shelf-Life Testing—ASLT Principles 1028
17.4. Case Studies of Shelf Life 1029
17.4.1. Dehydrated Products 1030
17.4.2. Frozen Pizza 1033
17.5. Distribution Effects: Time-Temperature Indicators 1037
Bibliography 1039
References 1039
17.1 Introduction
The need for fast assimilation and judicious synthesis of the state of the art scientific knowledge, from all food science relatedfields, is ever more apparent. An informed and assertive global food consumer, at the threshold of the 21st century, requiresmaximum “benefit,” that is, organoleptic superiority, high nutritional value, healthy image, convenience, and extended shelf life,with minimum “cost,” that is, less processing, minimum additives, and environmentally friendly packaging.

Pag e 1014
The objective of this final chapter is to illustrate the methodology through which the material presented in this book can beintegrated in a systematic approach to product development and food quality optimization. This multidisciplinary approachrequires input from fields such as food chemistry, food microbiology, analytical chemistry, physical chemistry, food engineering,polymer science, and food regulations.
17.2 Chemical Changes During Processing and Storage
Food processing subjects food to controlled conditions with the objective of altering it to a state of safety, durability andconvenience, and this is done by affecting targeted biological, physical and chemical parameters. Unavoidably, undesirablechanges also occur [13].
Changes that can be classified as desirable include:
1. Development or preservation of organoleptic properties such as color, flavor, and texture. Complex chemical reactionssuch as lipid oxidation, the Maillard reaction, Stecker degradation, caramelization, and enzyme-catalyzed reactions aremajor contributors to altered organoleptic properties. Chemical alteration of polymers by hydrogen bonding, hydrophobicclustering, and cross-linking via multivalent ions, can also have a profound effect on texture.
2. Improvement of food ingredient functionality, such as gelatinization and chemical modification of starch, glucoseisomerization to fructose, and alkali processing of soy proteins.
3. Control of enzymes, mainly by heat denaturation but also by pH control, chemical inhibition, reactant removal ormodification, and cofactor sequestering.
4. Improvement of digestibility and nutritional value, and inactivation of antinutritional agents.
The undesirable changes often involve:
1. Degradation of color, flavor, and texture. Notable examples are cooked notes in ultra-high-temperature (UHT) milk,chlorophyll and texture loss in canned or dehydrated vegetables, and toughening of frozen fish and seafood muscle.
2. Deterioration of functional properties of ingredients, such as loss of water binding, emulsifying, or foaming capacity ofheated proteins.
3. Loss of nutritional value and development of potentially toxic compounds. Certain vitamins are susceptible to heat (e.g.,C, thiamin, folate, B6), to oxidation (e.g., C,D,E,A), or to photodegradation (riboflavin) (Chap. 8). Proteins, carbohydrates,and lipids can undergo numerous reactions, discussed in detail in previous chapters. Depending on the severity of conditionsand the coexisting constituents, these can lead to a reduction of nutritional value and undesirable byproducts, sometimes oftoxicological significance. These reactions are schematically summarized in Figures 1, 2, and 3. A solid understanding of theirimplications is a prerequisite for successful optimization of processes.
Similar reactions continue to occur postprocessing, at a rate that is determined by the inherent properties of the food, the type ofpackaging, and conditions of storage and distribution. These factors determine the shelf life of the food. The fundamentals ofassessing food quality and designing shelf-life tests make-up the rest of this chapter.

Pag e 1015
FIGURE 1Major reactions that proteins can underg o during the processing and handling
of foods. Ag g reg ., ag g reg ation; alt., altered; antinutr., antinutrient; denat.,denaturation; inact., inactivation; nutr., nutritive; pot., potentially. Prepared by O. Fennema.

Pag e 1016
FIGURE 2Major reactions that carbohydrates can underg o during the processing and
handling of foods. Red., reduced; PME, pectin methylesterase; other terms aredefined in the leg end of Fig . 1. Prepared by O. Fennema.
17.3 Application of Kinetics to Shelf-Life Modeling
17.3.1 Principles
Despite the complexity of food systems, the systematic study of their deteriorative mechanisms can lead to sound methods ofdetermining shelf life. What should be made clear is that prediction of shelf life can be approached in two general ways. Themost common method involves selecting some single abuse condition, exposing the food product to this condition for several

Pag e 1017
FIGURE 3Major reactions that lipids can underg o during the processing and handling of
foods. aOxidation as catalyzed by enzymes, metals, myog lobin, chlorophyll, and/orirradiation. Deg rad., deg radation; flav., flavors; mod., moderate; P., pressure; pig .,is pig ments; sev., severe; vit., vitamins A, C, D, E, and folate; red., reduced; other
terms are defined in leg end of Fig . 1. Prepared by O. Fennema.
Pag e 1018
storage times, evaluating quality, generally by sensory methods, and then extrapolating the result (usually empirically) to normalstorage conditions. The alternative approach is to utilize a more elaborate design based on principles of chemical kinetics and todetermine the actual temperature dependency of various quality attributes. This is initially more costly but is likely to result inmore accurate predictions, more effective product formulation, and an ability to optimize the process. A detailed review of thefundamentals of food kinetics is outside the scope of this chapter and is available elsewhere [4, 37, 44]. Only the key principlesnecessary for the effective use of the proposed methodology are given in this chapter.
17.3.2 Food Quality Function—Order of Reaction
Quality loss can be represented by the loss of a quantifiable desirable quality attribute A (e.g., a nutrient or characteristic flavor)or by the formation of an undesirable attribute B (e.g., an off flavor or discoloration). The rates of loss of A and of formation ofB are expressed by the following equations:
(1)
(2)
where k and k' are the reaction rate constants and n and n' are the apparent reaction orders. Both Equations 1 and 2 can beintegrated to the expression:
F(A) = kt
That is, A (or B), with the appropriate transformation, can be expressed as a linear function of time t. The term F(A) is calledthe quality function [67] of the food and its expression for different apparent reaction orders is given in Table 1.
Most shelf-life data for change in a quality attribute, if based on a characteristic chemical reaction or microbial growth, followzero-order (e.g., frozen foods overall quality, Maillard browning) or first-order kinetics (e.g., vitamin loss, oxidative color loss,microbial growth and inactivation). For zero-order data, a linear plot is obtained using linear coordinates (Fig. 4), whereas forfirst-order data, a logarithmic ordinate is needed to produce a linear plot (Fig. 5). For second-order data, a plot of 1/A(or 1/B)versus time produces a linear relationship. Thus, on the basis of a few measurements the order can be defined by the plot thatgives the best linear fit, and the components of Equation (3) can be determined. One can then extrapolate to the value of As (orBs), the value the attribute reaches at the specified end of the shelf life, ts. The time, t, it takes for A to reach any specific valuecan be calculated or vice versa. Caution is advised in deciding the appropriate apparent reaction order and quality function [37].For example, when the reaction is not carried far enough (less than 50% conversion) both zero- and first-order kinetics might beindistinguishable from a goodness-of-fit point of view, as is illustrated in
TABLE 1 Form of Food Quality Function for Different Reaction Orders
Reaction order 0 1 n
Quality function F(A)Ao-A In(Ao/A)

Pag e 1019
FIGURE 4Chang e in quality versus time showing effect of order of
reaction on rate of chang e.
Figure 4. On the other hand, if the end of shelf life occurs within less than 20% conversion, as is often the case [36], eithermodel is adequate for practical purposes.
To determine the value of k (the slope) from the appropriate plot, various line-fitting statistical methods can be used. The betterthe precision of the method for measuring the attribute value, the smaller the extent of change needed in the attribute value toarrive at an accurate rate value of k. Generally, precision is defined as
Precision = ±s/X 100% (4)
where s is the standard deviation and X is the mean value of replicate analyses. Based on the calculations of Benson [4] in Table2, it is apparent that one must allow a sufficient change in the reactant species monitored or good precision to obtain a reliableestimate of the rate constant. Because of normal variabilities, many food reactions, such an nonenzymic browning, have aprecision error on the order of ±10%. Erroneous estimates of shelf life are often obtained if these matters are not taken intoaccount, especially if the data are used to extrapolate to longer times. Unfortunately, reactions involved in food quality loss areoften not monitored for a time (extent of reaction) that is sufficient to allow accurate determination of the rate constant and thereaction order. Thus, much of the data that have been collected on food quality deterioration are of limited usefulness foraccurately predicting shelf life.
17.3.3 Temperature Effects—Arrhenius Approach
Kinetic equations for shelf life are specific to the food studied and the environmental conditions used. Of the noncompositionalfactors that can affect the reactions, that is, temperature, relative humidity, partial pressure of packaging gases, light, andmechanical stresses, the one usually

Pag e 1020
FIGURE 5Semilog arithmic plot for a first-order reaction of quality
loss versus time.
incorporated in the shelf-life model is temperature. It strongly affects reaction rates and is the only factor among those mentionedthat is not influenced by the type of food packaging.
Most physical chemistry textbooks provide the fundamentals of the Arrhenius approach that interrelates temperature and the rateof chemical reactions. Labuza [34] has applied this approach to rates of deteriorative reactions in foods. The well-knownArrhenius relation is
TABLE 2 Effect of Analytical Precision of the Method on the Estimation of the Rate Constant forChemical Reactions
Percent error in reaction rate constant k at g iven percent chang e in reactionspecies monitored
Analyticalprecision(%)
1% 5% 10% 20% 30% 40% 50%
±0.1 14 2.8 1.4 0.7 0.5 0.4 0.3
±0.5 70 14 7 3.5 2.5 2 1.5
±1.0 >100 28 14 7 5 4 3
±2.0 >100 56 28 14 10 8 6
±5.0 >100 >100 70 35 25 20 15
±10.0 >100 >100 >100 70 50 40 30
Source: From Ref. 4.

Pag e 1021
(5)
where kA is the Arrhenius equation constant, EA, in joules or calories per mole, is the activation energy (the excess energy barrierthat attribute A needs to overcome to proceed to degradation products [or B to form]), T is absolute temperature (K), and R isthe universal gas constant (1.9872 cal/mol. K or 8.3144 J/mol. K). In practical terms it means that if values of k are obtained atdifferent temperature and In k is plotted against reciprocal absolute temperature, 1/T, a straight line is obtained with a slope of -EA/R. Under some instances, if two critical reactions occur in a food and they have different rates and activation energies, it ispossible that one predominates above some critical temperature Tc and the other below this temperature (Fig. 6). The main valueof the Arrhenius plot is that one can collect data at high temperatures (low 1/T) and then extrapolate for the rate constant atsome lower temperature, as shown in Figure 7.
When applying regression techniques, statistical analysis is used to determine the 95% confidence limits of the Arrheniusparameters. If only three k values are available, the confidence range is usually large. To obtain meaningfully narrow confidencelimits in EA and kA, rates at more temperatures are required. It was proposed [48] that five or six experimental temperatures givethe practical optimum ratio of accuracy versus amount of work. If one is limited to three experimental temperatures because ofcost and/or the difficulty of obtaining incubators at six constant temperatures, one can use several statistical methods to increaseaccuracy [39], one of which is to consider each data point as an independent estimation of k. This approach has worked well inseveral studies [5, 45, 62]. Alternatively, a linear regression including the 95% confidence limits of the reaction rates asindependent points will give narrower confidence limits for the
FIGURE 6Arrhenius plot of reaction rate
constant kversus inverse absolute temperature
for tworeactions exhibiting crossover at T c.

Pag e 1022
FIGURE 7Prediction of shelf life by extrapolation from a
hig her to a lower temperature on an Arrhenius plot.
Arrhenius parameters [39]. Also, one can use a one step method that requires nonlinear regression of the equation that resultsfrom substitution of Equation (5) in Equation (3) [1, 10, 19].
It should be noted that it is often possible to derive an EA value, with a satisfactory coefficient of determination (r2>.95), fromthree temperatures. However, the 95% confidence range obtained, especially if the aforementioned techniques are not used, isusually large (on the order of EA itself) because of the large t95% value. This does not mean the data are useless. In these casesthe mean EA is probably an adequate measure of the temperature dependence of the reaction. Whether using one's owngenerated data or data from the literature, it is important to consider the range and number of temperatures used to be able toestimate the validity of the data. One should also note that both kA and EA can depend on water activity [25, 35] thus, aw mustbe held constant.
Additionally, attention should be given to factors that can cause deviation from an Arrhenius behavior. Labuza and Riboh [41]discussed potential causes for nonlinear Arrhenius plots. These include (a) a change in aw or moisture, (b) a change of physicalstate such as ice formation or a glass transition, (c) a change in the critical reaction with a change in temperature, as noted inFigure 6, (d) a change in pH with a change in temperature, (e) a decrease in dissolved oxygen as the temperature is raised(slowing oxidation), (f) a partitioning of reactants between two phases, such as a concentration of reactants upon freezing, and(g) temperature history effects, that is, changes at high temperatures that irreversibly affect the rate of the reaction, when the foodis subsequently cooled [40].
Further comments regarding glass transitions are appropriate (see Chap. 2). Above the glass transition temperature, Tg, in therubbery state, the slope of the Arrhenius plot may gradually change. Williams, Landel, and Ferry [74] introduced the WLFequation to empirically model the temperature dependence of mechanical and dielectric relaxations within the rubbery

Pag e 1023
state. It has been proposed [65] that the same equation may describe the temperature dependence of chemical reaction rateswithin amorphous food matrices, above Tg. In diffusion-controlled systems where diffusion is free volume dependent, reactionrate constants can be expressed as a function of temperature by the WLF equation [63]:
(6)
where k ref is the rate constant at the reference temperature Tref(Tref > Tg) and C1, C2 are system-dependent coefficients. Williamset al [74], for Tref = Tg and using data then available for various polymers, calculated mean values of the coefficients: C1 = -17.44and C2 = 51.6. In the literature it has become common practice to use these as mean values to establish the applicability of theWLF equation for different systems. This simplification is problematic [8, 14, 55] and one should try to use system-specificvalues whenever possible.
Recently the relative validity of the Arrhenius and WLF equations as they apply to the rubbery state, namely in the range10–100°C above Tg, has been debated [27]. Viscosity-dependent changes in food quality (e.g., crystallization, textural changes)fit the WLF model. However, chemical reactions may be either kinetically and/or diffusion limited. In general the effectivereaction rate constant can be expressed as k/(1 + k/aD) (where D is the diffusion coefficient and a is a constant independent ofT). In most cases, k exhibits an Arrhenius-type temperature dependence and D has been shown in many studies either to followthe Arrhenius equation with a change in slope at Tg, or to follow the WLF equation in the rubbery state and especially in therange 10–100°C above Tg. The value of the ration k/aD defines the relative influence of k and D. If k/aD 0.1, the deteriorativereaction can be successfully modeled by a single Arrhenius equation for the whole temperature range of interest. Otherwise, anddepending on which of the aforementioned temperature dependencies D follows, a break in the slope of the Arrhenius plot of theeffective reaction rate constant occurs at Tg with either constant slope above Tg or with a gradually changing slope. In the lattercase the WLF equation is appropriate for the range 10–100°C above Tg. For complex food systems involving multiple reactionsteps and phases, application of either model has to be viewed as a practical tool rather than as a descriptor of the actualphenomenon or mechanism.
Based on the Arrhenius model developed from several constant-temperature shelf-life experiments, quality attribute loss can bepredicted for any variable-temperature exposure. Controlled-temperature functions like sine, square, and linear (spike) wavetemperature fluctuations can be used to verify the shelf-life model [5, 25, 45, 60, 61, 68]. For example, for lipid oxidation inpotato chips, the prediction is good to ±3% [5]. Accumulated shelf-life loss for known temperature conditions can be calculatedusing a series expansion approximation to calculate the value of the quality function at time t.
(7)
17.3.4 The Simple Shelf-Life Plot Approach
For a given extent of deterioration, translated to a value of the quality function (Eq. 3), the rate constant is inversely proportionalto the time to reach a specified degree of quality loss [29]. This holds also to ts, the time for the quality to reach an unacceptablelevel, that is, the shelf life. Thus, a plot of log shelf life (log ts) versus 1/T is a straight line, as shown in Figure 8A. Furthermore, ifonly a small temperature range is considered, then one finds that most food data
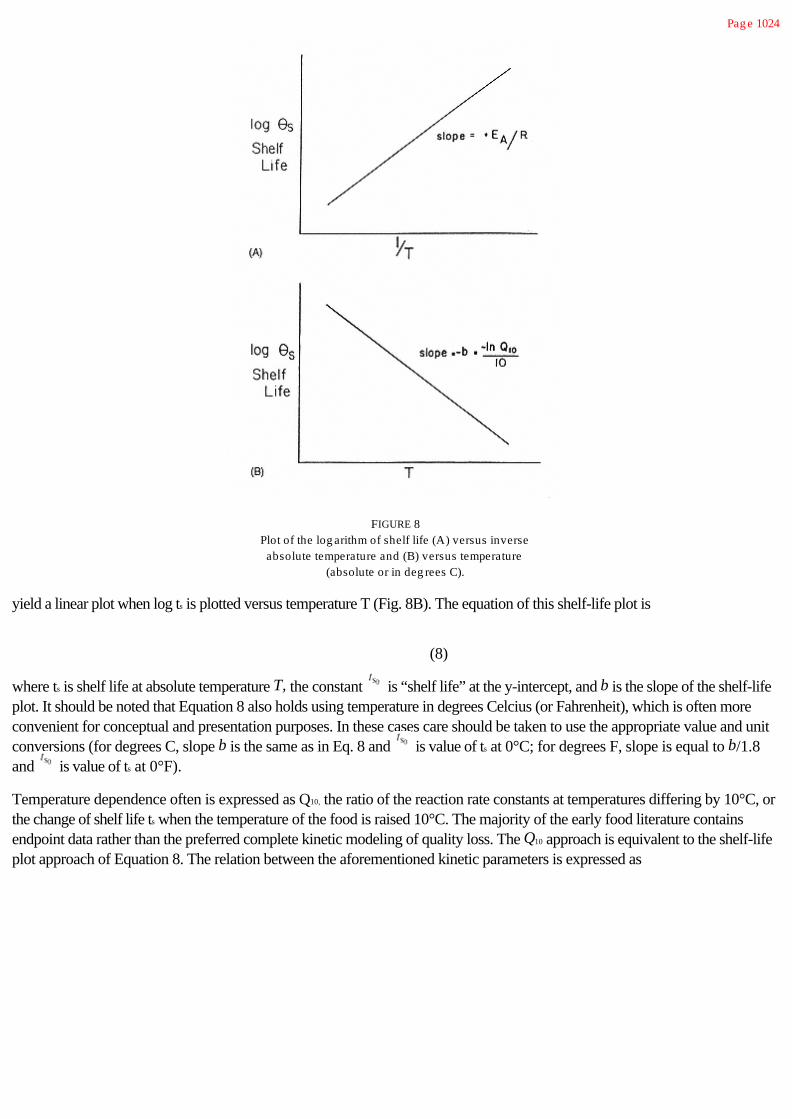
Pag e 1024
FIGURE 8Plot of the log arithm of shelf life (A) versus inverseabsolute temperature and (B) versus temperature
(absolute or in deg rees C).
yield a linear plot when log ts is plotted versus temperature T (Fig. 8B). The equation of this shelf-life plot is
(8)
where ts is shelf life at absolute temperature T, the constant is “shelf life” at the y-intercept, and b is the slope of the shelf-lifeplot. It should be noted that Equation 8 also holds using temperature in degrees Celcius (or Fahrenheit), which is often moreconvenient for conceptual and presentation purposes. In these cases care should be taken to use the appropriate value and unitconversions (for degrees C, slope b is the same as in Eq. 8 and is value of ts at 0°C; for degrees F, slope is equal to b/1.8and is value of ts at 0°F).
Temperature dependence often is expressed as Q10, the ratio of the reaction rate constants at temperatures differing by 10°C, orthe change of shelf life ts when the temperature of the food is raised 10°C. The majority of the early food literature containsendpoint data rather than the preferred complete kinetic modeling of quality loss. The Q10 approach is equivalent to the shelf-lifeplot approach of Equation 8. The relation between the aforementioned kinetic parameters is expressed as

Pag e 1025
(9)
The validity of the simple shelf-life plot and the Q10 approach is usually limited to narrow temperature ranges [33, 41]. The Q10
values based on a large temperature range will often be somewhat inaccurate. In addition, the factors that cause deviations in theArrhenius plot also influence the shelf-life plot. The value of Q10 is temperature dependent, as seen in Equation 9. Thisdependence is more pronounced with greater temperature “sensitivity” of the reaction that is, with higher activation energy.Shown in Table 3 are the dependence of Q10 on temperature and EA and important types of food reactions that correspond tovarious values of Q10 and EA.
The practical use of the shelf-life plot is shown in Figure 9. Suppose that the targeted shelf life of a product under development isat least 18 months at 23°C(73°F) and one wants to determine, using an accelerated test at 40°C(104°F), whether this has beenachieved. By placing a point on the plot at 18 months and 23°C and drawing a straight line to the 40°C vertical line, using slopesdictated by the Q10 values, a shelf life of 1 month is indicated if the Q10 is 5, and 5.4 months if the Q10 is 2. Caution should beexercised when estimating the true Q10. According to Labuza [36], canned products have Q10 values ranging from 1.1 to 4,dehydrated foods from 1.5 to 10, and frozen foods from about 3 to as much as 40. Thus, use of a mean Q10 for any of thesecategories, as is often done in the food industry, can result in highly inaccurate predictions. The only way to achieve reliableresults is to determine the Q10 by conducting shelf-life studies at two or more temperatures. One must also not forget to hold aw
constant for dehydrated foods, since aw affects Q10 values.
Even when proper shelf-life testing is conducted, one should be aware of how much the accuracy of the shelf-life prediction canbe influenced by the uncertainty of the Q10 value. As shown in Table 4, if a product has a Q10 of 2.5 and a measured shelf life of2 weeks at 50°C, the predicted shelf life at 20°C is 31 weeks. If the actual Q10, however, is 3, then the predicted shelf life at20°C is 54 weeks—a difference of about 5 months. Thus, substantial deviations in the predicted shelf life at low temperaturescan arise if slightly inaccurate Q10 values are used to make the extrapolation. A 0.5 difference in Q10 for the 40–50°Ctemperature range corresponds to a difference in EA of about 20 kJ/mol (at the 80 kJ/mol range). In the many studies in which agood estimate of the statistical variation of EA has been made, it has a 95% confidence limit, at best, of ±15–20 kJ/mol. Thus,although this simple approach to shelf-life prediction is sound, accuracy of the estimates is sometimes, poor. The inaccuracy ismuch smaller when extrapolating from lower temperatures. In practice one usually compromises among time, cost, andaccuracy. Additionally accelerated tests at temperatures of >40°C are not recommended because of the aforementionedpossibility that the reactions of critical importance may change between the high temperature and the normal storage temperatureof the product.
TABLE 3 Q 10 Dependence on E A and Temperature
EA, kJ/mol(kcal/mol) Q10 at 5°C Q10 at 20°C Q10 at 40°C Typical food reactions
41.8 (10) 1.87 1.76 1.64 Diffusion controlled, enzymic, hydrolytic
83.7 (20) 3.51 3.10 2.70 Lipid oxidation, nutrient loss
125.5 (30) 6.58 5.47 4.45 Nutrient loss, nonenzymic browning
209.2 (50) 23.1 20.0 12.0 Veg etative cell destruction

Pag e 1029
4. Select the storage temperatures (at least two). Commonly, the following are good choices.
Product Test temperatures (°C) Control (°C)
Canned 25, 30, 35, 40 4
Dehydrated 25, 30, 35, 40, 45 -18
Frozen -5, -10, -15 <-40
5. Using the shelf-life plot (Fig. 9) and knowing the desired shelf life at the mean distribution temperature, determine how longthe product must be held at each test temperature. If no information is available on the probable Q10 value, then more than twotemperatures are needed.
6. Decide which tests will be used and how often they will be conducted at each temperature. A good rule of thumb is that thetime interval between tests, at any temperature below the highest temperature, should be no longer than
(13)
where f1 is the time between tests (e.g., days, weeks) at the highest test temperature T1; f2 is the time between tests at any lowertemperature T2; and DT is the difference in degrees Celsius between T1 and T2. Thus, if a dry products is held at 45°C andtested once a month, then at 40°C (i.e., DT = 5) and a Q10 of 3, the product should be tested at least every 1.73 months. Ofcourse, more frequent testing is desirable, especially if the Q10 is not accurately known. Use of needlessly long intervals mayresult in an inaccurate determination of shelf life and thus a danger of rendering the experiment totally useless. At each storagecondition, at least six data points are needed to minimize statistical errors; otherwise, the statistical confidence in ts is significantlydiminished.
7. Plot the data as they are collected to determine the reaction order and to decide whether test frequency should be increasedor decreased. All too often the data are not analyzed until the experiment is over and then the scientist finds that nothing can beconcluded.
8. From each test storage condition, estimate k or ts, make the appropriate shelf-life plot, and estimate the potential shelf life atthe desired (final) storage condition. Of course, one can also store product at the final condition and determine its shelf life to testthe validity of the prediction. In academia this is commonly done; however, in industry this is uncommon because of timeconstraints. If a properly generated shelf-life plot indicates that the product meets stability expectations, then the product has agood chance of performing satisfactorily in the marketplace.
17.4 Case Studies of Shelf Life
In this section representative cases of shelf-life determination are presented. Attention is given to the factors influencing stability,and the design of the shelf-life test. The case of an artificially sweetened, dry dessert mix illustrates the straightforwardapplication of the ASLT approach and its obvious effectiveness in situations where a dominant, quantifiable quality attributeexists and the corresponding quality function can be defined. The methodology is further put into perspective with two otheractual shelf-life problems of increasing complexity: the case of another dehydrated product, mashed potato flakes, and frozenpizza.

Pag e 1030
17.4.1 Dehydrated Products
17.4.1.1 Dry Dessert Mix
The chosen product is a gelatin-based dessert mix, colored with a natural colorant (e.g., riboflavin; Chap. 10), flavored with afruit flavor (e.g., strawberry; Chap. 11), and sweetened with the intense sweetener aspartame. The shelf-life goal is 18 months at22°C. With proper packaging that keeps aw below 0.4, the basic modes of deterioration are loss of flavor intensity and loss ofsweetness. The rate of the latter far exceeds the rate of flavor loss, so aspartame deterioration is the reaction that limits shelf life.Aspartame loss can be easily and accurately quantified by high-performance liquid chromatography (HPLC) [66]. Alternatively(or additionally), organoleptic techniques (focusing on acceptability from a sweetness point of view) can be used. A particularlyefficient and suitable methodology for obtaining shelf-life data that can be used in an ASLT scheme is a graphical method calledWeibull hazard analysis or maximum likelihood procedure [16, 43, 44].
The initial product is overcompensated in aspartame, so it retains acceptable sweetness when only 60% of the initial quantityremains undegraded. Literature data indicated that aspartame degradation has a Q10 of about 4. This would result in a shelf life ofa little more than 40 days at 40°C (see Fig. 9). A testing frequency of 5 days at this temperature will give enough data points foraccurate determination of reaction order and rate. According to Equation 13 the appropriate testing frequency at 35, 30 and25°C will be 10, 20, and 40 days, respectively. Shown in Figure 10A are simulated aspartame degradation data for adehydrated system at aw of 0.33 and pH 5 [2]. In Figure 10B the quality function F(A) = In(A/A0) is plotted against time, andgood linearity occurs at all temperatures (r2 > .99). This indicates apparent first-order reaction kinetics and allows determinationof the reaction rate constants (k = -0.0120, -0.00620, -0.00297, and -0.00145 day-1 at 40, 35, 30 and 25°C, respectively).Constructing the Arrhenius plot (Fig. 11) of In k versus 1/T gives a very satisfactory fit for the pertinent temperature range. Theestimated activation energy is 110 kJ/mol (26.2 kcal/mol). Based on this temperature dependency the shelf
FIGURE 10(A) Plot of percent aspartame remaining (%A) versus time at various temperatures.
(B) Plot of quality function F(A) = In(A/A 0) versus time: at 40°C, at 35°C, at 30°C,
and at 25°C.

Pag e 1031
FIGURE 11Arrhenius plot of aspartame
deg radation inin a dry mix.
life at 22°C (i.e., time for 60% remaining aspartame) is predicted as 552 days, which satisfies the requirement of 18 months.
This case demonstrates the effectiveness of the ASLT methodology when an appropriate, dominant, and accurately quantifiablequality attribute can be identified. Note that, based on available information on aspartame degradation, showing a good fit toArrhenius kinetics for a wide range of temperatures, one could reliably test using only two temperatures (40 and 35°C), in whichcase a testing period of less than 3 months would suffice for determination of shelf life.
It should also be noted that for many food systems indirect indices (not primary quality factors, but ones whose changescorrelate well with a primary quality factor) can be used for modeling quality loss, for example, loss of vitamins can be used forfrozen foods [36], and oxidation of d-limonene for natural lemon flavor [70].
17.4.1.2 Dehydrated Mashed Potatoes
Dehydrated potatoes are made by drum drying a slurry of previously cooked, mashed potatoes that may include added sulfiteand antioxidants. Dehydrated potatoes are susceptible primarily to browning at temperatures above 30–32°C, and primarily tolipid oxidation below 30–32°C. In addition, the rate of vitamin C loss generally exceeds the rates of either of the otheraforementioned reactions if the aw is above the monolayer value (see Chap. 2).
Quality Aspects
Microbiological Changes Since this is a dehydrated product, aw should be in the range of 0.2–0.4, and growth ofmicroorganisms should not occur (see Chap. 2). Growth of typical spoilage organisms does not occur unless the productreaches an aw of at least 0.7. Most likely if product aw does increase to this level during storage, chemical reactions wouldrender the product unsatisfactory before microbial growth became a factor of importance.
Chemical Changes Potatoes may contain up to about 4% free reducing sugars, and almost 50% of the protein nitrogen is in theform of free amino acids. Thus, nonenzymic browning occurs, unless the product is dried and kept near or below the monolayervalue. Because free amino acids are abundant, both the Shiff's base-Amadori rearrangement sequence and the Streckerdegradation pathway occur. The latter reaction produces. CO2 and other volatile compounds, such as 2-methylpropanal, 2-and3-methylbutanal, and isovaleraldehyde, which are detectable in the parts per billion range as extremely charred off odors [6, 62].The browning reaction can utilize vitamin C as one of the substrates and it can also reduce the subsequent hydratability of thepotato.
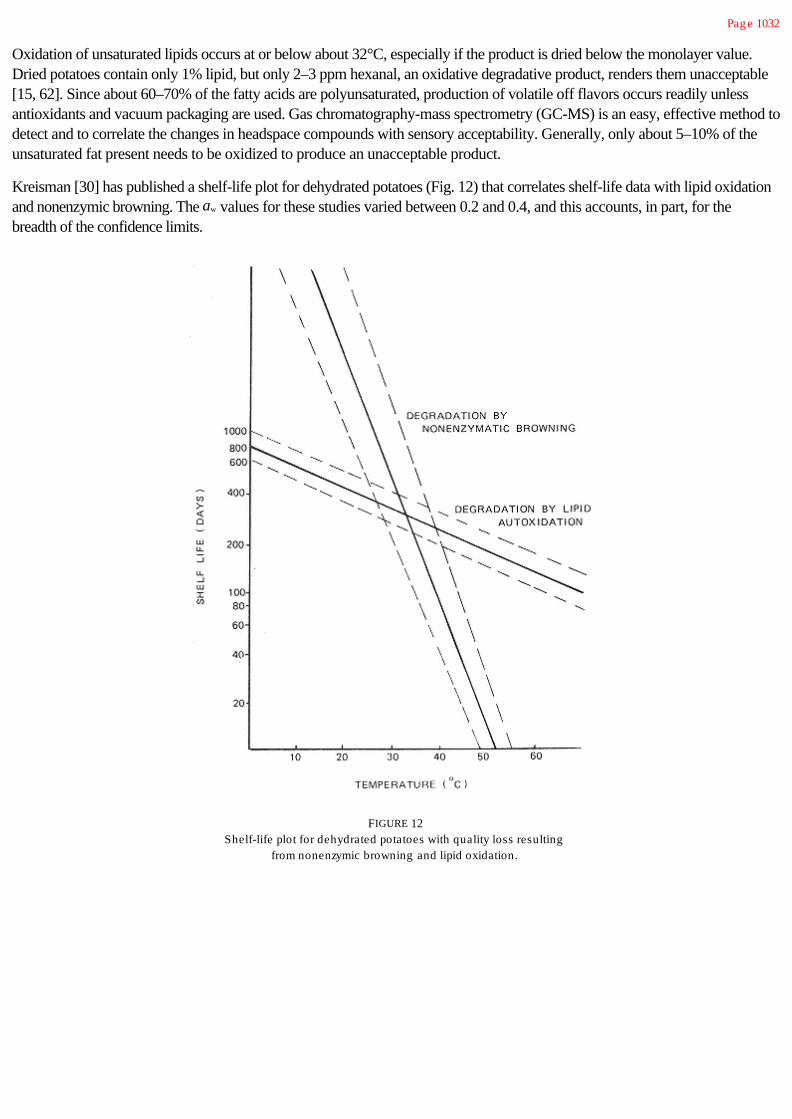
Pag e 1032
Oxidation of unsaturated lipids occurs at or below about 32°C, especially if the product is dried below the monolayer value.Dried potatoes contain only 1% lipid, but only 2–3 ppm hexanal, an oxidative degradative product, renders them unacceptable[15, 62]. Since about 60–70% of the fatty acids are polyunsaturated, production of volatile off flavors occurs readily unlessantioxidants and vacuum packaging are used. Gas chromatography-mass spectrometry (GC-MS) is an easy, effective method todetect and to correlate the changes in headspace compounds with sensory acceptability. Generally, only about 5–10% of theunsaturated fat present needs to be oxidized to produce an unacceptable product.
Kreisman [30] has published a shelf-life plot for dehydrated potatoes (Fig. 12) that correlates shelf-life data with lipid oxidationand nonenzymic browning. The aw values for these studies varied between 0.2 and 0.4, and this accounts, in part, for thebreadth of the confidence limits.
FIGURE 12Shelf-life plot for dehydrated potatoes with quality loss resulting
from nonenzymic browning and lipid oxidation.
Pag e 1033
Physical Changes In general, no physical changes should occur in stored dehydrated potatoes except loss of rehydratability.However, the extent of browning or oxidation needed to produce poor rehydration probably would make the dry productunacceptable from a flavor or color standpoint.
Shelf-Life Design
It is obvious from Figure 12 that the Arrhenius or shelf-life approach cannot be used over a wide temperature range because thechemical attribute that is shelf-life limiting changes at about 35°C. Thus, sensory acceptability must be used for determining shelflife. The following test conditions are reasonable when dehydrated potatoes are stored in moisture-impermeable pouches(*sensory test; chemical tests at all times).
Temperature (°C) Test times (months)
25 6, 9, 12,* 18*
30 6, 8, 10,* 12,* 14
35 1, 2, 3,* 4*
40 1, 2,* 3*
The frequency factor equation (Eq. 13) cannot be used with dehydrated potatoes because of the change in degradativemechanisms with a change in temperature. Obviously, 25°C is too low to achieve significant acceleration of the reactionscompared with normal storage conditions, but since the primary mode of degradation changes at about 35°C, tests at 25°C arealso advisable. Control samples in this instance should be nitrogen flushed, sealed in cans, and held at 0°C. Other than sensorytesting, GC-MS measurements of specific volatiles, and perhaps measurement of brown pigment development, are all that isneeded.
17.4.2 Frozen Pizza
17.4.2.1 General Aspects of Quality Loss
A frozen pizza consists of a crust and a topping containing tomato sauce, cheese, spices, vegetables, and sausage. The productis then partially baked, cooled, shrink-wrapped, and blastfrozen. The major problems that occur during storage are developmentof in-package ice, development of off flavors, loss of the deep-red tomato color, loss of spice impact, and development of crustsogginess. Each of these changes influences shelf life and must be considered in any test design.
17.4.2.2 Specific Changes That Limit Shelf Life
Microbiological Changes
Both the cheese and sausage, if naturally fermented, have high total counts of bacteria. Thus, standard plate counts are not goodpredictors of whether off flavors will arise from microbial causes. Since the product is prebaked and then frozen, the numbers ofvegetative microorganisms decline until thawing occurs. Unfortunately, pathogens such as Staphyloccus aureus are not totallyinactivated by these treatments. If the product is then abused during distribution (repeated freeze and thaw), the pathogens maygrow; however, the product would need to exceed 7°C near the surface for this to occur. Obviously, even moderately goodcontrol of the distribution system will avoid this problem.
Pag e 1034
In a shelf-life study, one can easily determine the potential magnitude of the problem with pathogens. This can be achieved bypreinoculating the meat and cheese with organisms of public health significance and abusing the product by cycling it through afreeze and thaw sequence. A typical test sequence used by some food companies is as follows:
Day Abuse temperature cycle No. packag es remaining
1 24 hr at-18°C 5
2 20 hr at-18°C, 4 hr at 38°C 4
3 20 hr at-18°C, 4 hr at 38°C 3
4 20 hr at-18°C, 4 hr at 38°C 2
5 20 hr at-18°C, 4 hr at 38°C 1
The study begins with five packages placed at-18°C for 1 day. At the end of the day a single package is removed and is testedfor microbiological indicators. All the other packages are returned to -18°C for the next 20 hr and then abused at 38°C.Another package is then removed for testing, and the cycle is repeated for the other packages. If there is no significant increasein spoilage or pathogenic organisms after day 5, the food is deemed safe microbiologically. Of course, since it takes some timebefore the analysis can be done, these products should not be tested for taste. This abuse sequence is rather severe, and someproduct development people feel that the tests can be terminated after the third day.
Chemical Changes
When pizza is frozen, temperature lowering usually causes reaction rates to decrease dramatically. The Q10 values for frozenfoods have been reported to vary from 3 to 40 [36]. However, as noted in Chapter 2, reactants may concentrate in the unfrozenaqueous phase, and this increase in concentration may cause some reactions to increase in rate or to decrease in rate less thanexpected as temperature is lowered. This type of behavior is most likely to occur just below the freeze-thaw point of the pizza (-5° to -3°C). This means that data collected under abuse conditions, for example at -5°C, may not abide by a straight-linerelationship assumed for shelf life and Arrhenius plots, and that straight-line extrapolation of -5°C data to lower temperaturesmay result in substantial errors. In addition, if the product is freeze—thaw abused, an inordinately great time is spent at or near -3 to -5°C, where uncommonly large reaction rates are often observed. This propensity for the product to tarry at -3 to -5°C,occurs because a large fraction of the ice-water transformation occurs in this range.
Another accelerating factor can arise during freezing. Because of freeze damage to cellular membranes, enzymes that arenormally compartmentalized can be released into cellular fluids (see Chap. 7). These enzymes can then contact substrate andaccelerate loss of quality.
In pizza, enzymes of the greatest potential concern are lipases and lipoxygenases. Lipases exist in natural cheese, and theseenzymes might produce sufficient amounts of fatty acids to cause a hydrolytic rancid flavor, especially if butyric acid is released(from milk-based products). One way to avoid this problem is to use an imitation cheese made with soybean oil. Lipases arealso present in vegetables (green peppers) and in the crust. Prebaking of the crust generally is not sufficient to destroy lipase, sothe crust could develop a soapy flavor or an off odor from the free fatty acids produced. The vegetables and tomato sauceshould not be a source of enzymes if they are blanched or cooked; however, spices contain many enzymes, including lipases. Itshould be noted that the standard catalase or peroxidase tests used to determine the adequacy of
Pag e 1035
vegetable blanching are not adequate tests of lipase activity. One approach to monitoring lipase activity is to measure total freefatty acids during storage of pizza. Alternatively, volatile fatty acids can be isolated and characterized by gas-liquidchromatography (GLC) or high-performance liquid chromatography techniques. The big problem is sampling. The food scientistmust decide whether to sample each ingredient, a slice, and/or an entire pizza.
Lipoxygenase, present in spices, sausage, wheat flour, and vegetables, catalyzes oxidation of unsaturated fats, producingperoxides as well as volatile breakdown products. As with lipase, it is quite heat stable and may survive baking or precooking.Several tests can be used to determine the consequences of lipoxygenase activity, including determination of peroxide value andmeasurement of volatile aldehydes or ketones by GLC (e.g., hexanal or pentanal). If peroxides are measured, this should bedone at least twice weekly; otherwise, substantial increases in oxidation may be missed. This is true since peroxides increase to amaximum and then fall to near zero soon thereafter. Thus, a low peroxide value does not necessarily mean a nonrancid food.The minimum perioxide value associated with a rancid taste varies from food to food. Because sausage is cured, it may becomerancid first. Thus, the addition of antioxidants may be desirable, and should be done if allowed. Addition of ethylenediaminetetraacetic acid (EDTA) may also be helpful.
In addition to causing off odors, oxidative rancidity can lead to a bleaching of the deep-red tomato color, giving rise to anorangish color. Thus, one should test for color changes either with a color meter or by extracting the pigments and measuringthem in a spectrophotometer (see Chap. 10). Obviously, to retard color loss and oxidative rancidity, lipoxygenase should bedestroyed during processing. Unfortunately, heat treatments needed to destroy lipoxygenase may also damage desirable flavorsand textures, so a balance must be sought. Vacuum packaging or nitrogen flushing is also helpful [64]. However, because of theirregular surface of a pizza (large headspace), this is difficult to adequately accomplish at high speeds.
Another cause of deterioration in pizza quality is loss of spice impact. This can result from volatilization and/or chemicalreactions. Since many flavor compounds are aldehydes and ketones, they can react with proteins or amino acids, therebydecreasing flavor. Others may be oxidized directly by oxygen or indirectly by free radicals produced during oxidative rancidity.Although sensory testing is the best approach to monitoring loss of spice impact. This approach is expensive. If available, GLCanalysis of the headspace coupled with mass spectroscopy to identify key volatile spice flavor compounds is a rapid, useful, butnot inexpensive alternative.
The last major chemical reaction leading to off flavors or color changes in pizza is nonenzymatic browning (NEB), and thecheese component is especially susceptible. NEB does occur at significant rates at subfreezing temperatures, but is not likely tobe the reaction that limits shelf life. It should, however, be monitored to determine its importance. Browning can be measuredeasily by extracting the pigments and measuring optical density at 400–450 nm, or by measuring the amount of available lysineby the fluorodinitrobenzene procedure [61]. Browning also could be significant in imitation cheese if high-fructose corn syrup isused as the sugar source.
In summary, tests for the following constituents or properties should be considered for monitoring chemical changes in pizzaduring frozen storage:
Total free fatty acids
Specific volatile free fatty acids by GLC
Peroxides
Oxidative volatiles (e.g., hexanal) by GLC
Spice volatiles by GLC
Lysine
Color (decrease in red color or increase in brown)
Sensory properties: taste and flavor

Pag e 1036
Nutrient Loss
Chemical reactions can also cause a loss of vitamins. Of special concern, if nutritional labeling is done, are vitamins C and A,both of which are subject to oxidation. Since vitamin C is quite unstable at pH values above 5.0, its loss is sometimes used as anindex of loss of overall quality. For example, when 15–20% of the vitamin C is lost from frozen vegetables, they becomeunacceptable from a sensory standpoint [36].
Physical Changes
One of the major complaints consumers have about frozen pizza is that the crust is not as crisp as that of fresh pizza. The reasonfor this is not entirely clear. If the crust has a high enough moisture content it certainly freezes when held at -18°C. Since all theother ingredients also contain ice, then at any temperature below about -18°C all pizza components have the same aw (seeChap. 2) and there should be no moisture migration from the sauce to the crust. At higher temperatures (-7 to -1°C), however,the crust thaws and achieves a lower aw than the other ingredients, and might absorb the water from the sauce by capillarysuction, leading to a higher moisture and loss of crispness.
For dry foods, crispness is lost at aw above about 0.4–0.5. Unfortunately, a pizza crust with that aw would not have a desirablechewiness. One way to impart chewiness while retaining crispness is to fry the crust in fat. Research is needed to determine if thestarch in flour can be chemically modified to yield a more desirable texture without losing other desirable functional properties. Ifsuccessful, this would overcome the need to fry the crust in fat.
Another undesirable physical change in pizza is a loss of meltability and functionality of the cheese. As the water in the cheesefreezes, concentration of the lactose and salts can cause irreversible chemical and structural changes in the protein. In addition,nonenzymic browning can lead to loss of protein functionality. These reactions reduce the ability of the protein to bind waterafter thawing. Furthermore, irreversible protein-interactions, occurring at the high solute concentrations in frozen cheese, tend toreduce the flow (meltability) of the cheese when heated. The concentrated solutes also affect the pectin and starches in thetomato sauce, resulting in loss of water binding and, thus, weeping (exudation of water) upon thawing.
Finally, in-package ice is a problem in stored frozen pizza. As it goes through inadvertent freeze-thaw cycles, the air space in thepackage warms up faster than the product, and the air then can hold more water. Water acquired by the air comes from thefrozen ingredients. As the air temperature declines again, the water vapor crystallizes out as ice particles on the product surface.Repeated cycling causes the crystals to grow, become visible, and eventually convey an undesirable appearance to the product.A freeze-thaw cycling test, such as for the microbiological test, is generally adequate to determine if in-package ice will be aproblem. The abuse temperature in this case should be at 20°C instead of 38°C.
To prevent in-package ice, the wrapper should be as tight as possible to minimize air spaces, something not easily done withpizza. The wrapper should also contain a release agent to prevent the topping from sticking to it.
17.4.2.3 Shelf-Life Test
Temperature Range
If a minimum shelf life of 12 months at-18°C is desired the product must, depending on the Q10 value, retain satisfactory qualityfor the following minimum times at-4°C.

Pag e 1037
Q10
Time at -4°C that equates to12 months at -18°C
2 4.5 months
5 1.2 months
10 14 days
20 6 days
Most published results suggest that Q10 values for vitamin C loss and quality loss in frozen vegetables range from 2 to 20 and thatthe shelf life of vegetables is only 6–8 months at -18°C. Considering these Q10 values, a product that does not retain good qualityfor 4.5 months at -4°C may not retain good quality for 12 months at -18°C. Given the preceding calculations, the followingsampling frequency is proposed (*sensory test times; chemical tests at all times):
Temperature Test times
-3.9°C (25°F) 1, 2*, 3, 4, 5, 8, 12, 14, 16*, 20* weeks
-6.7°C (20°F) 2, 4*, 10, 15*, 20* weeks
-9.4°C (15°F) 4*, 10, 15*, 20* weeks
The various temperatures are necessary to ascertain whether the Arrhenius relationship is conformed to. All simple tests shouldbe conducted at each sampling time; sensory testing should be concentrated mainly toward the end of the test sequence, with afew near the beginning. In addition to this simple, constant-temperature study, a variable-temperature (cycling) study, asdescribed before, should be done to determine freeze-thaw effects. Data should be analyzed as previously discussed.
Controls
Whenever sensory analysis is to be used or rates of change of some quality factors are to be determined, both initial values andvalues for stored control samples are needed. It is desirable, from a satistical standpoint, to perform numerous measurements(replicates) on the initial product so the precision of the method can be accurately established. Studies [5, 39, 45, 60, 61]suggest that 6–10 initial samples should be tested, but this is not reasonable for sensory testing because of the time and expense.For sensory tests involving a comparison triangle method, stored control samples are also needed. Whereas one can use suitablyprocessed, refrigerated controls for shelf-life studies on dehydrated and canned foods, this is not appropriate for frozen foods. Afresh product is also not appropriate for this purpose since it has not been frozen and thawed. Thus, pizza held at-40 to -70°C(to minimize change during storage) is a suitable control for shelf-life studies of frozen pizza. Temperature fluctuations in thefreezer used for control samples must also be kept to a minimum.
17.5 Distribution Effects: Time-Temperature Indicators
Determination of the quality function of a food product and its kinetic parameters not only allows estimation of shelf life, but alsopermits the effect on quality of any actual or assumed variable-temperature exposure to be calculated. Thus, the remaining shelflife at any point of a

Pag e 1038
monitored distribution can be estimated using Equation 7. Unfortunately, distribution conditions are not controlled by themanufacturer and are difficult to monitor. The effects of the presumed conditions that a packaged food can possibly face duringthe distribution chain were studied by Kreisman [30]. Assuming average storage times at each location of the assumeddistribution routes of a dehydrated product (mashed potatoes), the shelf-life loss ranged from 50% to about 300% for best andworst temperature scenario.
What would be desirable is a cost-effective way to individually monitor the conditions of the products during distribution and ameans to signal their remaining shelf life. This would lead to effective control of distribution, optimized stock rotation, reductionof waste, and meaningful information on product “freshness,”, which is demanded by the consumer. Time-temperature indicators(TTIs) are a potential solution.
A TTI can be defined as a simple, inexpensive device exhibiting an easily measurable time-temperature-dependent response thatreflects the full or partial temperature history of the product to which it is attached. It is based on mechanical, chemical,enzymatic, or microbiological systems that change (usually in the form of a visual signal) irreversibly from the time of theiractivation. The rate of change has a temperature dependence similar to the described physicochemical reactions that determinequality in foods. A TTI can be used to monitor the temperature history of cases or pallets up to the time they are displayed at thesupermarket and individual packages up to the time of product consumption. With quality loss being a function of temperaturehistory and with a TTI giving a measure of that history, their response can be correlated to the quality level of the food. Thus, theTTI can serve as an inventory management and stock rotation tool at the retail level. Also, TTIs attached to individual packagescan serve as dynamic or active shelf life devices. The TTI would indicate to the consumers whether the products were properlyhandled and what percent of the original shelf life remains. A thorough review of TTI systems and uses is given by Taoukis et al.[71].
A general scheme has been proposed that allows the correlation of the measurable response of a TTI, X, to the quality changeof a food product (i.e. the value of the quality attribute A) at any particular time during distribution [67]. This approach, based onthe kinetic principles described in this chapter, does not require previous simultaneous testing of the indicator and the food topreestablish a statistical correlation between X and A. In analogy to the food quality function (F(A), Eq. 3), the responsefunction of the TTI, R(X), is defined as
(14)
where t is the storage time, k is the response rate constant of the TTI, and the constant k I and the activation energy EA are theArrhenius parameters of the TTI. For a variable-temperature distribution, T(t), an effective temperature, Teff, is defined as theconstant temperature that causes the same response or change as the variable temperature T(t). For a TTI of established kineticparameters going through the same temperature distribution, T(t), as that of the monitored food, the measured response Xallows calculation of the value of R(X) and subsequently of Teff (from Eq. 14, for T = Teff). The Teff and knowledge of the kineticparameters of deterioration of the food allow the estimation of F(A) and the variable quality loss of the product (Eqs. 5 and 3).The reliability of the TTI under variable temperature conditions has been assessed and was judged satisfactory [68]. Applicationof the scheme was illustrated for refrigerated and dehydrated products [70], and these cases provide good examples of how theprinciples described in this chapter and throughout this book can be effectively and practically used.

Pag e 1039
Bibliography
Benson, S. W. (1960). Foundations of Chemical Kinetics, McGraw-Hill, New York.
Charalambous, G. (1986). Handbook of Food and Beverage Stability, Elsevier, Amsterdam.
Labuza, T. P. (1980). Temperature/enthalpy/entropy compensation in food reactions. Food Technol. 34(2):67.
Labuza, T. P. (1982). Shelf Life Dating of Foods, Food and Nutrition Press, Westport, CT.
Labuza, T. P. and P. S. Taoukis (1990). The relationship between processing and shelf life, in Foods for the 90's (G. G. Birch,G. Campbell-Platt, and M. G. Lindley, eds.), Developments Series, Elsevier Applied Science, New York, pp. 73–105.
Okos, M. R. (1986). Physical and Chemical Properties of Foods, American Society of Agricultural Engineering, St. Joseph,MI.
Richardson, T. and J. W. Finley (1985). Chemical Changes in Food During Processing, AVI, Westport, CT.
Villota, R., and J. G. Hawkes (1992). Reaction kinetics in food systems, in Handbook of Food Engineering (D. R. Heldmanand D. B. Lund, eds.), Marcel Dekker, New York, pp. 39–143.
References
1. Arabshashi, A. and D. B. Lund (1985). Considerations in calculating kinetic parameters from experimental data. J. FoodProc Eng. 7:239–251.
2. Bell, L. N., and T. P. Labuza (1991). Aspartame degradation kinetics as affected by pH in intermediate and low moisturefood systems. J. Food Sci. 56:17–20.
3. Bell L. N., and T. P. Labuza (1994). Influence of the low-moisture state on pH and its implications for reaction kinetics. J.Food Eng. 22:291–312.
4. Benson, S. W. (1960). Foundations of Chemical Kinetics, McGraw-Hill, New York.
5. Bergquist, S., and T. P. Labuza (1983). Kinetics of peroxide formation in potato chips undergoing a sine wave temperaturefluctuation. J. Food Sci. 43:712.
6. Boggs, M. M., R. G. Buttery, D. W. Venstrom, and M. L. Belote (1964). Relation of hexanal in vapor above stored potatogranules to subjective flavor estimates. J. Food Sci. 29:487.
7. Buchanan, R. L. (1993). Predictive food microbiology. Trends Food Sci. Technol. 4:6–11.
8. Buera, P., and M. Karel (1993). Application of the WLF equation to describe the combined effects of moisture, temperatureand physical changes on non-enzymatic browning rates in food systems. J. Food Proc. Preserv. 17:31–47.
9. Cardoso, G., and T. P. Labuza (1983). Effect of temperature and humidity on moisture transport for pasta packagingmaterial. Br. J. Food Technol. 18:587.
10. Cohen, E., and I. Saguy (1985). Statistical evaluation of Arrhenius model and its applicability in prediction of food qualitylosses. J. Food Proc. Pres. 9:273–290.
11. Davey, K. R. (1989). A predictive model for combined temperature and water activity on microbial growth during thegrowth phase. J. Appl. Bacteriol 67:483–488.
12. Feeney, R. E., and J. R. Whitaker (1982). The Maillard reaction and its preservation. In Food Protein Deterioration,Mechanisms and Functionality (J. P. Cerry, ed.), ACS Symposium Series 206, ACS, Washington, DC, pp. 201–229.
13. Fennema, O. (1985). Chemical changes in food during processing—An overview, in Chemical Changes in Food duringProcessing (T. Richardson and J. W. Finley, eds.), AVI, Westport, CT., pp. 1–16.
14. Ferry, J. D. (1980). Viscoelastic Properties of Polymers, 3rd ed., Wiley, New York.

15. Fritsche, C. W., and J. A. Gale (1977). Hexanal as a measure of oxidative deterioration in low fat foods. J. Am. Oil Chem.Sco. 54:225.
16. Fu, B. and T. P. Labuza (1993). Shelf-life prediction: Theory and application. Food Control 4:125–133.
17. Fu, B., P. S. Taoukis, and T. P. Labuza (1991). Predictive microbiology for monitoring spoilage of dairy products with timetemperature indicators. J. Food Sci. 56:1209–1215.
18. Guadagni, D. G. (1968). Cold storage life of frozen fruits and vegetables as a function of temperature

Pag e 1040
and time, in Low Temperature Biology of Foodstuffs (J Hawthorne and E. J. Rolfe, eds.), Pergamon Press, New York.
19. Haralampu, S. G., I. Saguy, and M. Karel. (1985). Estimation of Arrhenius model parameters using three least squaresmethods. J. Food Proc. Pres. 9:129–143.
20. Hayakawa, K. (1973). New procedure for calculating parametric values for evaluating cooling treatments applied to freshfoods. Can. Inst. Food Sci. Technol 6(3):197.
21. Holmer, B. (1984). Properties and stability of aspartame. Food Technol. 38:50.
22. Hong Y. C., C. M. Koelsch, and T. P. Labuza (1991). Using the L number to predict the efficacy of moisture barrierproperties of edible food coating materials. J. Food Proc Pres. 15:45–62.
23. Hoover, D. G. (1993). Pressure effects on biological systems. Food Technol. 47(6):150–155.
24. Institute of Food Science and Technology (UK) (1993). Shelf Life of Foods—Guidelines for Its Determination andPrediction, IFST, London.
25. Kamman, J., and T. P. Labuza (1981). Kinetics of thiamine and riboflavin loss in pasta as a function of constant and variablestorage conditions. J. Food Sci. 46:1457.
26. Karel, M. (1967). Use-tests. Only real way to determine effect of package on food quality. Food Can. 27:43.
27. Karel, M. (1993). Temperature-dependence of food deterioration processes [letter to the editor]. J. Food Sci. 58:(6):ii.
28. Knorr, D. (1993). Effects of high-hydrostatic-pressure processes on food safety and quality. Food Technol.47(6):155–161.
29. Kramer, A. (1974). Storage retention of nutrients. Food Technol. 28:5.
30. Kreisman, L. (1980) Application of the principles of reaction kinetics to the prediction of shelf life of dehydrated foods. M.S. thesis, University of Minnesota, Minneapolis.
31. Kwolek, W. F., and G. N. Bookwalter (1971). Predicting storage stability from time-temperature data. Food Technol.25:(10)51.
32. Labuza, T. P. (1971). Kinetics of lipid oxidation of foods. CRC Rev. Food Technol. 2:355.
33. Labuza, T. P. (1979). A theoretical comparison of losses in foods under fluctuating temperature sequences. J. Food Sci.44:1162.
34. Labuza, T. P. (1980). Temperature/enthalpy/entropy compensation in food reactions. Food Technol. 34(2):67.
35. Labuza, T. P. (1980). The effect of water activity on reaction kinetics of food deterioration. Food Technol. 34:36.
36. Labuza, T. P. (1982). Shelf-life Dating of Foods, Food & Nutrition Press, Westport, CT.
37. Labuza, T. P. (1984). Application of chemical kinetics to deterioration of foods. J. Chem. Educ. 61:348–358.
38. Labuza, T. P., and R. Contreras-Medellin (1981). Prediction of moisture protection requirements for foods. Cereal FoodsWorld 26:335–343.
39. Labuza, T. P., and J. Kamman (1983). Reaction kinetics and accelerated tests simulation as a function of temperature, inApplications of Computers in Food Research (I. Saguy, ed.), Marcel Dekker, New York, Chap. 4.
40. Labuza, T. P., and J. O. Ragnarsson (1985). Kinetic history effect on lipid oxidation of methyl linoleate in model system. J.Food Sci. 50(1):145.
41. Labuza, T. P., and D. Riboh (1982). Theory and application of Arrhenius kinetics to the prediction of nutrient losses in food.Food Technol. 36:66–74.
42. Labuza, T. P., and M. K. Schmidl (1985). Accelerated shelf-life testing of foods. Food Technol. 39(9):57–62, 64.

43. Labuza, T. P. and M. K. Schmidl (1988). Use of sensory data in the shelf life testing of foods: Principles and graphicalmethods for evaluation. Cereal Foods World 33(2):193–206.
44. Labuza, T. P. and P. S. Taoukis (1990). The relationship between processing and shelf life, in Foods for the 90's (G. G.Birch, G. Campbell-Platt, and M. G. Lindley, eds.), Developments Series, Elsevier Applied Science, New York, pp. 73–105.

Pag e 1041
45. Labuza, T. P., K. Bohnsack, and M. N. Kim (1982). Kinetics of protein quality loss stored under constant and squarewave temperature distributions. Cereal Chem. 59:142.
46. Labuza, T. P., B. Fu, and P. S. Taoukis (1992). Prediction for shelf life and safety of minimally processed CAP/MAPchilled foods. J. Food Prot. 55:741–750.
47. Labuza, T. P., S. Mizrahi, and M. Karel (1972). Mathematical models for optimization of flexible film packaging of foodsfor storage. Trans. Am. Soc. Agric. Eng. 15:150.
48. Lenz, M. K., and D. B. Lund (1980). Experimental procedures for determining destruction kinetics of food components.Food Technol. 34(2):51.
49. Mizrahi, S., T. P. Labuza, and M. Karel (1970). Computer aided predictions of food storage stability. J. Food Sci.35:799–803.
50. Mizrahi, S., T. P. Labuza, and M. Karel (1970). Feasibility of accelerated tests for browning in dehydrated cabbage. J.Food Sci. 35:804–807.
51. Nakabayashi, K., T. Shimamoto, and H. Mina (1981). Stability of package solid dosage forms. Chem. Pharm.28(4):1090; 29(7):2027, 2051, 2057.
52. Nelson, K., and T. P. Labuza (1994). Water activity and food polymer science: Implications of state on Arrhenius andWLF models in predicting shelf life. J. Food Eng. 22: 271–290.
53. Norwig, J. F., and D. R. Thompson (1986). Microbial population, enzyme and protein changes during processing, inPhysical and Chemical Properties of Foods (M. R. Okos, ed.), American Society of Agricultural Engineering, St. Joseph,MI.
54. Parkin, K. L., and W. D. Brown, (1982). Preservation of seafood with modified atmospheres, in Chemistry andBiochemistry of Marine Food Products (R. E. Martin, et al., eds.), AVI, Westport, CT. pp. 453–465.
55. Peleg, M. (1990). On the use of WLF model in polymers and foods. Crit. Rev. Food Sci. Nutr. 32:59–66.
56. Quast, D. G., and M. Karel (1972). Computer simulation of storage life of foods undergoing spoilage by two interactivemechanisms. J. Food Sci. 37:679.
57. Ramaswamy, H. S., F. R. Van de Voort, and S. Ghazala (1989). An analysis of TDT and Arrhenius methods for handlingprocess and kinetic data. J. Food Sci. 54:1322–1326.
58. Ratkowsky, D. A., J. Olley, T. A. McMeekin, and A. Ball (1982). Relationship between temperature and growth rate ofbacterial cultures. J. Bacteriol. 149:1–5.
59. Ratkowsky, D. A., R. K. Lowry, T. A. McMeekin, A. N. Stokes, and R. E. Chandler (1983). Model for bacterial culturegrowth rate throughout the entire biokinetic temperature range. J. Bacteriol. 154:1222–1226.
60. Riboh, D. K. and T. P. Labuza (1982). Kinetics of thiamine loss in pasta stored in a sine wave temperature condition. J.Food Proc. Pres. 6(4):253.
61. Saltmarch, M., and T. P. Labuza (1982). Kinetics of browning and protein quality loss in sweet whey powders under steadyand non-steady state storage conditions. J. Food Sci. 47:92.
62. Sapers, G. M. (1970). Flavor quality in explosion puffed dehydrated potato. J. Food Sci. 35:731.
63. Sapru, V., and T. P. Labuza (1992). Glassy state in bacterial spores predicted by glass transition theory. J. Food Sci.58:445–448.
64. Simon, I., T. P. Labuza, and M. Karel (1971). Computer aided prediction of food storage stability: Oxidation of a shrimpfood product. J. Food Sci. 36:280.

65. Slade, L., H. Levine, and J. Finey (1989). Protein-water interactions: Water as a plasticizer of gluten and other proteinpolymers, in Protein Quality and the Effects of Processing (R. D. Phillips and J. W. Finalay eds.), Marcel Dekker, NewYork, pp. 9–123.
66. Stamp, J. A., and T. P. Labuza (1989). An ion-pair high performance liquid chromatographic method for the determinationof aspartame and its decomposition products. J. Food Sci. 54:1043.
67. Taoukis, P. S. and T. P. Labuza (1989). Applicability of time-temperature indicators as shelf-life monitors of food products,J. Food Sci. 54:783–788.
68. Taoukis, P. S. and T. P. Labuza (1989). Reliability of time-temperature indicators as food quality monitors under nonisothermal conditions. J. Food Sci. 54:789–792.
69. Taoukis, P. S., A. El Meskine, and T. P. Labuza (1988). Moisture transfer and shelf life of packaged

Pag e 1042
foods, in Food and Packaging Interactions (J. H. Hotchkiss, ed.), ACS Symposium Series No. 365, pp. 243–262.
70. Taoukis, P. S., G. A. Reineccius, and T. P. Labuza (1990). Application of time-temperature indicators to monitor quality offlavors and flavored products, in Flavors and Off-Flavors'89 (G. Charalambus, ed.), Developments in Food Science Series,Elsevier Applied Science, New York, pp. 385–398.
71. Taoukis, P. S., B. Fu, and T. P. Labuza (1991). Time-temperature indicators. Food Technol. 45(10):70–82.
72. Tsoumbeli, M. N. and T. P. Labuza (1991). Accelerated kinetic study of aspartame degradation in the neutral pH range. J.Food Sci. 56:1671–1675.
73. Weissman, I., O. Ramon, I. J. Kopelman, and S. Mizrahi (1993). A kinetic model for accelerated tests of Maillardbrowning in a liquid model system. J. Food Proc. Pres. 17:455–470.
74. Williams, M. L., R. F. Landel, and J. D. Ferry (1955). The temperature dependence of relaxation mechanisms inamorphous polymers and other glass-forming liquids. J. Chem. Eng. 77:3701–3707.
75. Zwietering, M. H., J. De Koos, B. E. Hasenack, J. C. DeWilt, and K. Van't Riet (1991). Modeling of bacterial growth as afunction of temperature. Appl. Environ. Microbiol. 57:1094–1101.

Pag e 1043
Appendices
Appendix A: International System of Units (SI), the Modernized Metric System
SI is the form of the metric system that is preferred for all applications. All units associated with the various cgs systems(measurement systems based on centimeter, gram, and second) are to be avoided. The primary source of the followinginformation is Ref. 2, but two English translations [1,5] of the primary source and two ISO publications [3, 4] were also used toprepare this appendix.
Three Classes of SI Units
Base Units
These well-defined units are regarded as dimensionally independent, and only one base unit is defined for each basic quantity.
SI base unit
Quantitya Name Symbolb
Leng th meter m
Mass kilog ram kg
Time second s
Electric current ampere A
Thermodynamic temperature c kelvin K
Amount of substance mole mol
Luminous intensity candela cd
aMeasurable attributes of phenomena or matter.
bUnit symbols do not chang e in the plural.
cUse of deg ree Celcius (°C) is common and this is the SI unit usedfor the Celsius scale. °C = T-273.15, where T is temperature inkelvins. The unit “Celsius” is equal to the unit “kelvin.” An intervalor difference in temperature can be expressed in either kelvins ordeg rees Celsius, the former being customary in all thermodynamicexpressions.

Pag e 1044
Supplementary SI Units
SI supplementary unit
Quantity Name Symbol
Plane ang le radian rad
Solid ang le steradian sr
Derived Units
Derived units are formed by combining base units, supplementary units, and other derived units, and are expressed algebraicallyin accord with the relations existing among the corresponding quantities. The derived units are said to be coherent when they donot contain factors other than one. Because base units and coherently derived units do not always have a convenient size,subunits are sometimes constructed by using factors other than one (e.g., milligrams per cubic meter). These derived units aresaid to be noncoherent and the accepted prefixes and symbols are shown later in this section. Some coherently derived unitsalong with their special names are listed next.
SI derived unit
Quantitya Name Symbol Expression in SI base units
Expressionin other
units
Activity (of a radionuclide) becquerel Bq s -1
Area square meter m2
Celsius temperature deg ree Celsius °C See footnote c of base unittable
Dose (absorbed) g ray Gy m2 • s -2 J/kg
Dose rate (absorbed) g ray per second Gy/s m2 • s -3
Electric conductance siemens S A 2 • s3 • kg -1 • m-2 A/V
Electric field streng th volt per meter V/m m • kg • s -3 • A -1
Electric potential, potentialdifference, electromotiveforce
volt V kg • m-2 • s -3 • A -1 W /A
Electric resistance ohm W kg • m2 • A -2 • s -3 V/A
Electricity (quantity),electric charg e
coulomb C A • s
Energ y, work, quantity ofheat
joule J kg • m2 • s -2 N • m
Entropy joule per kelvin J/K m2 • kg • s -2 • K-1
Force newton N kg • m • s -2
(table continued on next page)

Pag e 1045
(table continued from previous page)
SI derived unit
Quantitya Name Symbol Expression in SI base units
Expressionin other
units
Frequency (of a periodicphenomenon)
hertz Hz s -1
Heat capacity joule per kelvin J/K m2 • kg • s -2 • K-1
Heat flux density watt per squaremeter
W/m2 kg • s -3
Mass density kilog ram per cubicmeter
kg /m3
Molar energ y joule per mole J/mol m2 • kg • s -2 • mol-1
Molar entropy joule per molekelvin
J/(mol • K) m2 • kg • s -2 • K-1 • mol-1
Molar heat capacity joule per molekelvin
J/(mol • K) m2 • kg • s -2 • K-1 • mol-1
Moment of force newton meter N • m m2 • kg • s -2
Permittivity farad per meter F/m m-3 • kg -1 • s4 • A2
Power, radiant flux watt W kg • m2 • s -3 J/s
Pressure, stress pascal Pa kg • m-1 • s -2 N/m2
Specific heat capacity joule per kilo-g ramkelvin
J/(kg • K) m2 • s -2 • K-1
Speed, velocity meter per second m/s
Surface tension newton per meter N/m kg • s -2
Thermal conductivity watt per meterkelvin
W /(m • K) m • kg • s -3 • K-1
Viscosity, dynamic pascal second Pa • s m-1 • kg • s -1
Viscosity, kinematic square meter persecond
m2/s
Volume cubic meter m3
aMeasurable attribute of phenomena or matter.
Prefix Names and Symbols
Prefix names and symbols representing decimal multiples and submultiples of SI units, except for kilogram, are listed below(partial listing). SI prefixes should be used to indicate orders of magnitude, thus eliminating nonsignificant digits and leading zerosin decimal fractions, and providing a convenient alternative to the powers-of-ten notation often used in computation. It ispreferable to chose a prefix so that the numerical value lies between 0.1 and 1000. Care should be taken to minimize the varietyof prefixes used even if this violates the previous statement.

Multiplication factor Prefix Symbol
1012 tera T
109 giga G
106 mega M
103 kilo k
102 hecto a h

Pag e 1046
Multiplication factor Prefix Symbol
101 dekaa da
10-1 decia d
10-2 centia c
10-3 milli m
10-6 micro m
10-9 nano n
10-12 pico p
10-15 femto f
10-18 atto a
aGenerally to be avoided (exceptions apply toexpressions of area and volume).
Some Rules of Style and Usage for SI Unit Symbols
1. Unit symbols should be printed in upright type, generally lower case, unless the unit is derived from a proper name, whenthe first letter of the symbol is upper case. The exception is the symbol for liter, where either “l” or “L” is acceptable.
2. Unit symbols remain unaltered in the plural.
3. Unit symbols are not followed by a period except when used at the end of a sentence.
4. When a quantity is expressed as a numerical value and a unit symbol, a space should be left between them, for example,35 mm, not 35 mm. Exceptions: No space is left between the numerical value and symbols for degree, minute, and secondof plane angle.
5. When a quantity is expressed as a number and a unit and is used in an adjectival manner, it is preferable to use a hypheninstead of a space between the number and the symbol, for example, a 35-mm film. Exception: a 60° angle.
6. Units formed by multiplication or division. For division, oblique strokes (/) or negative exponents can be used, but ifoblique strokes are used, these strokes must not be repeated in the same group unless ambiquity is avoided by a
parentheses (e.g., m/s/s is forbidden); m/s, , m • s-1 are equally acceptable. For multiplication, two or more units may beexpressed in either of the following ways: Pa • s or Pa s.
7. When names of units are used in quotients, use the word per and not an oblique stroke, for example, meter per second,not meter/second.
8. To avoid ambiguity in complicated expressions, symbols are preferred over words.
9. When writing numerals less than one, a zero should appear before the decimal marker.
10. For American usage, the dot is used for the decimal marker instead of the comma, and the spellings “meter,” “liter,” and“deka” are used instead of “metre,” “litre,” and “deca.”
References
1. ASTM (1991). Standard Practice for Use of the International System of Units (the Modernized Metric System),E380-91a, American Society for Testing Materials, Philadelphia, PA.
2. Bureau International des Poids et Mesures (BIPM) (1991). Le Système International d'Unités (SI), 6th ed., BIPM,Pavillon de Breteuil (Parc de Saint-Cloud), Paris.

3. ISO (1992). Quantities and Units—Part 0: General Principles, International Standard ISO 31-0, InternationalOrganization for Standardization, Geneva.

Pag e 1047
4. ISO (1992). SI Units and Recommendations for the Use of Their Multiples and of Certain Other Units, InternationalStandard ISO 1000, International Organization for Standardization, Geneva.
5. Taylor, B. N. (ed.). (1991). The International System of Units (SI), National Institute of Standards and TechnologySpecial Publication 330, U.S. Government Printing Office, Washington, DC (English translation of Ref. 2).
Appendix B: Conversion Factors (Non-SI Units to SI Units)
To convert from to (SI units) Multiply bya
Area
ft2 square meter (m2) 9.290304*E-02
hectare square meter (m2) 1.000000*E+04
in2 square meter (m2) 6.451600*E-04
yd 2 square meter (m2) 8.361274 E-01
Energ y
British thermal unit (mean) joule (J) 1.05587 E+03
calorie (kilog ram, International Table) joule (J) 4.186800*E+03
calorie (kilog ram, thermochemical) joule (J) 4.184000*E+03
electron volt joule (J) 1.60219 E-19
erg joule (J) 1.000000*E-07
kW • h joule (J) 3.600000*E+06
Force
dyne newton (N) 1.000000*E-05
kilog ram-force newton (N) 9.806650*E+00
poundal newton (N) 1.382550 E-01
Leng th
ang strom meter (m) 1.000000*E-10
foot (U.S. survey) meter (m) 3.048006 E-01
inch meter (m) 2.540000*E-02
mil meter (m) 2.540000*E-05
Mass
carat (metric) kilog ram (kg ) 2.000000*E-04
grain kilog ram (kg ) 6.479891*E-05
gram kilog ram (kg ) 1.000000*E-03
ounce (avoirdupois) kilog ram (kg ) 2.834952 E-02
ounce (troy or apothecary) kilog ram (kg ) 3.110348 E-02
pound (lb avoirdupois) kilog ram (kg ) 4.535924 E-01

pound (troy or apothecary) kilog ram (kg ) 3.732417 E-01
Pressure or stress (force per unit area)
atmosphere (standard) pascal (Pa) 1.013250*E+05
bar pascal (Pa) 1.000000*E+05
dyne/cm2 pascal (Pa) 1.000000*E-01
inch of mercury (32°F) pascal (Pa) 3.38638 E+03
inch of mercury (60°F) pascal (Pa) 3.37685 E+03
inch of water (39.2°F) pascal (Pa) 2.49082 E+02
inch of water (60°F) pascal (Pa) 2.4884 E+02
psi pascal (Pa) 6.894757 E+03
torr (mm Hg , 0°C) pascal (Pa) 1.33322 E+02
(table continued on next page)

Pag e 1048
(table continued from previous page)
To convert from to (SI units) Multiply bya
Radiation units
curie becquerel (Bq) 3.700000*E+10
rad g ray (Gy) 1.000000*E-02
rem sievert (Sv) 1.000000*E-02
roentg en coulomb per kilo-g ram (C/kg ) 2.580000*E-04
Temperature
deg ree Celsius kelvin (K) TK=tC+273.15
deg ree Fahrenheit deg ree Celsius (°C) tC=(tF-32)/1.8
deg ree Fahrenheit kelvin (K) TK=(tF+459.67)/1.8
deg ree Rankine kelvin (K) TK=TR/1.8
kelvin deg ree Celsius (°C) tC=TK-273.15
Viscosity
centipoise (dynamic viscosity) pascal second (Pa • s) 1.000000*E-03
centistokes (kinematic viscosity) square meter per second(m2/s)
1.000000*E-06
poise pascal second (Pa • s) 1.000000*E-01
stokes square meter per second(m2/s)
1.000000*E-04
Volume (includes capacity)
ft3 cubic meter (m3) 2.831685 E-02
g allon (Canadian liquid) cubic meter (m3) 4.546090 E-03
g allon (U.K. liquid) cubic meter (m3) 4.546092 E-03
g allon (U.S. liquid) cubic meter (m3) 3.785412 E-03
in3 cubic meter (m3) 1.638706 E-05
liter cubic meter (m3) 1.000000*E-03
ounce (U.K. fluid) cubic meter (m3) 2.841306 E-05
ounce (U.S. fluid) cubic meter (m3) 2.957353 E-05
pint (U.S. liquid) cubic meter (m3) 4.731765 E-04
quart (U.S. liquid) cubic meter (m3) 9.463529 E-04
yd 3 cubic meter (m3) 7.645549 E-01
aFactors with an asterisk are exact.
Source: American Society for Testing and Materials (1991), E380-91a, ASTM, Philadelphia, PA.

Appendix C: Greek Alphabet
Greek form
Upper case Lower case NameRoman or Eng lishequivalent
A a alpha a
B b beta b
G g gamma g
D d delta d
E e epsilon e (short)
Z z zeta z
H h eta e (long )
Q q theta th
(table continued on next page)

Pag e 1049
(table continued from previous page)
Greek form
Upper case Lower case Name
Roman or Eng lishequivalent
I i iota i
K k kappa k, c
L l lambda l
M m mu m
N n nu n
X x xi x
O o omicron o (short)
P p pi p
R r rho r
S s, z sigma s
T t tau t
U u upsilon u, y
F f phi ph
C c chi kh, ch
Y y psi ps
W w omega o (long )

Pag e 1051
Index
A
Accelerated shelf-life testing (ASLT) principles, 1028-1029
Accum, Frederick, 5
Acesulfame K, 795-796
Acetic acid and acetates, 788
Acid/base chemistry, minerals and, 619-625
activity versus concentration, 622-623
Bronsted theory of acids and bases, 619-620
chelate effect, 623-625
Lewis theory of acids and bases, 620-622
Acids, 769-775, 814
chemical leavening system, 773-775
dissociation constants, 770
functions in food, 769-770
Actin, 893-894
Active oxygen method (AOM), 279
Actomyosin, 894
Acylglycerols, 228-231
R/S naming system, 229-230
stereospecific numbering, 230-231
See also Triacylglycerols, Fats, Lipids
Adsorption, 101-102
double adsorption and colloids, 118
of various surfactants, 105
Adulteration of food, 4-6
Aggregation:
definition of, 121
kinetics, 121-122
reversibility, 122
Agriculture experiment stations, 6

Aldoses, 166-167
Alginic acid, 215-216
Algins, 214-216
Aliphatic plant acids, 260
Alitame, 796-797
Alkalies, 814
Alkoxy radicals, 267-268
Allium sp., flavor sensations from, 738-739
Aluminum, functions in food, 642
Amino acids, 6, 323-335, 421, 816
acid-base properties, 327-329
chemical alteration, 404-405
chemical reactivity, 331-335
with fluorescamine, 335
with ninhydrin, 331-335
with O-phthaldialdehyde, 335
composition of proteins in milk, 648-649
degradation in muscle postmortem, 914
flavor sensations from, 742-743
glass temperature values and associated properties of, 74, 75
hydration, 367
hydrophobic properties, 329-330
[Amino acids]
optical properties, 331
solubility, 325
stereochemistry of, 326-327
structure and classification, 323-326
Aminoimidazoazaarenes (AIAs), 405
Amorphous, definition of, 85
a-Amylase, 200, 487-488
b-Amylase, 200
Amylases, texture alteration by, 497
Amylopectin, 191-192, 194
Amylose, 191, 192

Animal cells, location of enzymes in, 443, 444
Animal fats, 233
Animal triacylglycerols, 239
Anisidine value, 278
Annatto extract, 713-714
Anthocyanins, 681-683
color and stability, 684-691
enzyme degradation, 691-693
pH versus structure, 684, 685
structure and composition, 681-684
types in food, 681, 683
Antibiotics, 791-792
Anticaking agents, 810
Antifoam agents, 812-813
Antimicrobial agents, 782-792, 815
acetic acid, 788
antibiotics, 791-792

Pag e 1052
[Antimicrobial agents]
benzoic acid, 788-789
diethyl pyrocarbonate, 792
epoxides, 790-791
glyceryl esters, 787-788
natamycin, 787
nitrite and nitrate salts, 784-785
parabens, 789-790
propionic acid, 788
sorbic acid, 785-787
sulfites and sulfur dioxide, 782-784
Antioxidants, 780-782, 815-816
See also Lipid antioxidants
b-Apo-8'-carotene, structure of, 716
Appearance control agents, 806-808, 816
Aromas. See Flavors
Arrhenius equation, food quality change and, 1019-1023
Ascorbic acid. See Vitamin C
Ash, 632
Aspartame, 794-795
Astringency, 735-736
B
Bacterial toxins, 837-838
Baking, enzymes in, 502-503, 504
Bancroft's rule, emulsions and, 136
Bases, 775-776, 814
See also Acid/base chemistry, minerals and
Beaumont, Dr. William, 2, 4
Benzoic acid, 788-789
Berzelius, Jons Jacob, 2, 3
Betacyanines:
conversion to betaxanthine, 702-703
structure of, 699

Betalaines, 697-703
chemical properties, 699-703
physical properties, 698
structure of, 697-698
Betaxanthine, conversion of betacyanine to, 702-703
BET monolayer:
equation for, 54, 55
water content in food, 38-39, 48
Biological alteration of food quality and safety, 7-10
Biological value (BV), 400
Biotin, 600-601
assays, 600-601
bioavailability, 601
stability of, 533, 600
structure and general properties, 600
Bitterness, 728-733
Bixin, structure of, 677
Bound water, 31-32
Bowman-Birk inhibitor, 486-487
Bread improvers, 808-810
Brewing, enzymes in, 504, 505
Bromine, functions in food, 642
Browning:
enzymatic, in plant tissues, 993
Maillard, 171-173
in dehydrated muscle, 932
effect on proteins, 412-413
flavors, 756-758
rate of lipid oxidation products, 273
Buffers, 776-778, 814
pH calculation, 776-777
Butylated hydroxyanisole (BHA), 285-288
Butylated hydroxytoluene (BHT), 285-286, 288

C
Caffeine, 730
Calcium:
bioavailability, 629-630
concentration in enriched cereals, 637
functions in food, 640-641, 642
in meat gels, 935
in milk, 853, 855-858, 865, 866
in muscle, 888
muscle cold shortening, 919-922
muscle contraction, 896, 897
sequestering ability, 910-911
RDAs for, 627
[Calcium]
redistribution in processed plant tissue, 993-994
in selected cheeses, 639-640
Calcium alginate gels, 215
Cancer, dietary lipids and, 312
Canthaxanthin, 714
structure of, 716
Capillary rise, 108-109
Capsanthin, structure of, 677
Caramel, 716
Carbocyclic plant acids, 961
Carbohydrates, 157-223
algins, 214-216
carrageenans. 211-214
cellulose, 205-207
changes during food handling and storage, 1016
dietary fiber, 218-220
digestibility of, 218-220
as fat mimetics, 802
glass temperature values and associated properties of, 66

guar gum, 207-208
gum arabic, 217-218
importance of, 158
locust bean gum, 207-208, 210
monosaccharides, 158-174
oligosaccharides, 175-178
pectins, 216-217
in plant tissues, 947-952
polysaccharides, 178-190
starch, 191-204
xanthan, 208-210
Carbonation, 811
Carboxymethylcellulose (CMC), 206
Carcinogens in food, 832
Carnitine, 606-607
a-Carotene, structure of, 676
b-Carotene, 716
structure of, 676
Carotenes, 533
Carotenoids, 673-781
chemical properties, 679-680
flavor sensations from, 759-760
function in plants, 673-674
occurrence and distribution, 675-678
physical properties, 678-679

Pag e 1053
[Carotenoids]
prevalence, 673
as source of vitamin A, 674-675, 681
stability during processing, 680-681
structure of, 675
Carrageenans, 183, 211-214
reaction with milk, 212-213
Carrot oil, 717
Caseinate gels, 129-130
Casein micelles, 861-663
Caseins, 846-849, 854-858
charge on, 856, 857
functionality in food, 868-869
Catalysts, 813
enzymes as effective catalysts, 434-435, 472-473
Cellulases, texture alteration by, 497
Cellulose, 205-207
carboxymethylcellulose, 206
as dietary fiber, 205
hydroxypropylmethylcellulose, 206-207
methylcellulose, 206-207
microcrystalline, 205-206
Cereal proteins, 953
Cereals:
grain structure of, 970
handling and storage, 997
mineral content, 965
Chelates, 623-825, 778-780, 818
Chemical additives, 4-5
Chemical leavening systems, 771-775, 820
types of acids, 773, 774
Chemical reactions leading to alterations of food quality and safety, 7-10
Chevreul, Michel Eugene, 2, 3-4

Chiral carbon atoms, 158-162, 168
Chlorophyll, 659-673
alterations of, 661-668
allomerization, 668
enzymatic, 661-662
heat and acid, 662-667
metallo complex formation, 667-668
photodegradation, 668
[Chlorophyll]
color loss during thermal processing, 668-670
derivatives, 659-661
physical properties, 661
structure of, 659-661
technology of color preservation, 670-673
Chlorophyllase, 661-662
food color alteration by, 493
Chlortetracycline, 791
Chocolate bloom, 245, 248
Cholesterol oxidation, 266-267
Choline, 606
stability of, 533
Chromium, safe and adequate daily dietary intake of (est.), 528
Citrus flavors, 746-747
Clarifying agents, 806-808, 813
Clathrate hydrates, 36
Climacteric fruits, 978, 979
Cochineal extract, 716
Coefficient of protein digestability, 400
Cold-water swelling starch, 204
Collagen, 902-906
conversion to gelatin, 905-906
Collapse, definition of, 85
Colloids, 112-118
definition of, 98

interactions of, 112-118
depletion interaction, 117-118
DLVO theory, 115-116
electric double layers, 113-114
interaction factors, 118
steric repulsions, 116-117
van der Waals' attraction, 113
types of, 98
See also Emulsions
Color:
definition of, 651
importance of, 652
influence on flavor, 652
role of enzymes in, 492-494
Colorants, 651-722
classification, 652, 653
definition of, 651-652
food colorants, 703-718
[Colorants]
acceptable daily intake, 707
colors exempt from certification, 713-717
EEC approval, 706, 707
international regulations, 704-708
properties of certified dyes, 708-711
U.S. regulations, 703-704, 705
use of certified dyes, 711-712
use of colors exempt from certification, 717-718
pigments in animal and plant tissue, 653-703
betalaines, 697-703
carotenoids, 673-681
chlorophyll, 659-673
flavonoids and other phenols, 681-696
Color control agents, 813
Conjugated proteins (heteroproteins), 322

Contact angles, 107-108, 112
Contaminants. See Toxicants
Continuum model (structure of water), 29
Contractile proteins, 891-896
actin, 893-894
actomyosin, 894
myosin, 891-893
sarcomeric proteins, 892, 895-896
thick filament proteins, 895
tropomyosin and troponin, 894-895
Cooling agents, 813
Copper:
functions in food, 642, 646-647
safe and adequate daily dietary intake (est.), 628
Corn syrup, 200-201
Coronary heart disease, dietary lipids and, 312
Critical micelle concentration (CMC), 104, 105, 106
Cross-linked amino acids, 326
Cruciferae family, flavor sensations from, 739-740

Pag e 1054
b-Cryptoxanthin, structure of, 676
Curbitacin, structure of, 959
Cured meat pigments, 654-655, 657, 658
myoglobin in, 658-659
Cyclamate, 793-794
Cyclodextrin glucanotransferase, 200
Cysteine, oxidation of, 409-410
Cystine, oxidation of, 409-410
D
Dairy products:
enzymes in, 502, 503
salts in, 777-778
Davy, Sir Humphrey, 2, 3
Delaney Clause of the FD&C Act, 827
de Saussure, Théodore, 2, 3
Dessert mix, dry (shelf-life determination case study), 1030-1031
Deuterium, 21-22
Dietary contribution of edible plants to vitamin consumption, 966
Dietary fibers, 218-220
effects on health, 219-220
Diethyl pyrocarbonate, 792
Dispered systems, 95-155
characterization of dispersions, 97-100
colloidal interactions, 112-118
effects on reaction rates, 100-101
emulsions, 133-143
foams, 143-149
foods as, 96-97
gels, 122-123
liquid dispersions, 118-122
aggregation kinetics, 121-122
description, 118-119
reversibility of aggregation, 122

sedimentation, 119-121
surface phenomena, 101-112
contact angles, 107-108, 112
curved interfaces, 108-110
functions of surfactants, 112
[Dispered systems]
interfacial rheology, 110
interfacial tension and adsorption, 101-102
surface-tension gradients, 111-112
surfactants, 103-107
DLVO theory, 115-116, 118
DNA polymerase, 520, 521
Double adsorption, colloids and, 118
Dough conditioners, 808-810
protein role in, 394-396
Dry dessert mix (shelf-life determination case study), 1030-1031
Duman, Jean Baptiste, 6
Dyes, 652, 653
properties of certified dyes, 708-711
used in food colorants, 711-712
E
“Egg-box” junction, 131, 132
Elderly, role of enzymes in special foods for, 523-524
Electric double layers of colloids, 113-114
Emulsifiers, 819
proteins as, 136-138, 376-380
Emulsions, 97, 133-143
coalescence, 139-141
compared with foams, 143-144
description, 133-134
formation, 134-138
Gibbs-Marangoni effect on, 134-135, 136, 137
instability, 138-139

partial coalescence, 141-143
surface-tension gradients and, 112
Encapsulating agents, 815
Endogenous enzymes, genetic engineering of, 522
Enhancers of flavor, 734-735
Entanglement networks, food properties and, 72
Environmental factors governing stability of food, 10
Enzymatic browning in plant tissues, 993
Enzymatic modifications of proteins, 422-424
enzymatic hydrolysis, 422-423
plastein reaction, 423
protein cross-linking, 424
Enzyme inhibition:
allosteric inhibition, 483-485
of a-amylase, 487-488
chemically tailored inhibitors, 489
competitive inhibition, 480-481
of invertase, 488
irrversible, 485-486
need for, 479
noncompetitive inhibition, 481-482
of proteases, 486-487
uncompetitive inhibition, 482-483
Enzymes, 431-530
catalysis of, 434-435
cathepsins, 888
chemical nature of, 433-434
cofactors, 473-478
coenzymes, 476
inorganic ions, 478
organic cofactors, 474-476
prosthetic group, 477-478
collagenases, 904
collagen oxidases, 903

factors influencing reactions, 453-473
catalysis, 472-473
effect of pH, 460-464
effect of temperature, 464-469
enzyme concentration, 459-460
substrate concentraction, 454-459
water activity/concentration, 469-472
in food analysis, 514-518, 519
food modification by, 492-504
color, 492-494
flavor and aroma changes, 499

Pag e 1055
[Enzymes]
nutritional quality, 499
processing aids and ingredients, 499-504
texture, 494-499
freezing of muscle tissue and, 929-930
health/nutrition/food issues and, 523-525
allergenic substances, 525
enzyme deficiencies, 523
special foods for infants and elderly, 523-524
toxicants and antinutrients, 524
heating of muscle tissue and, 925-296
historical aspects of, 435-437
immobilized enzymes in food processing, 504-509
inactivation and control, 478-492
irreversible inhibitors, 485-486
naturally occurring inhibitors, 486-489
removal of substrate and/or cofactor, 492
reversible inhibitors, 479-485
use of physical methods, 489-492
literature on, 437
in milk, 502, 503, 854, 855
molecular weights of, 433
in muscle, 913-914
nomenclature, 438-441
the Enzyme Commission, 438-440
numbering and classification, 440-441, 442-443
in organisms, 441-447
in plant cell wall changes, 984
in plant tissue metabolism, 987-989
rates of enzyme-catalyzed reactions, 447-453
in recombinant DNA technology, 518-523
applications, 521-523
DNA polymerases, 520, 521
[Enzymes]
restriction enzymes, 519
refrigeration of muscle tissue and, 926-927
regulation of reactions, 435
six main types of, 439-440
solvent-partitioned enzyme systems, 509-512
advantages, 511
applications, 511-512
in organic solevents, 509-511
in waste management, 512-514
Epoxides, 790-791
Ethylene biogenesis in plant tissues, 994, 996
Ethylenediamine tetraacetate (EDTA), 625
iron complex with, 639
Ethylene oxide, structure of, 790
European Economic Community (EEC):
dyes (or lakes) approved by, 652
chemical and physical properties, 712
food colorants approved by, 706, 707
Eutectic temperature (TE), definition of, 85
F
Fat globules in milk, 863
Fat replacers, 801-804, 805
carbohydrates, 802
proteins, 802-803
synthetic replacers, 804
triacylglycerol fat substitutes, 803-804
Fats:
effects of ionizing radiation on, 295-299
flavor sensations from, 751
See also Acylglycerols; Lipids; Triacylglycerols; types of fats
Fat-soluble vitamins. See Vitamin A; Vitamin D; Vitamin E; Vitamin K
Fatty acids, 6, 226-228

in cereal, pulse, plant fats, 959
cyclization of, 272
flavor sensations from, 751
[Fatty acids]
nomenclature, 227, 228, 229
polymorphism and, 242-243
positional distribution in fats, 237-239
subcells, 241-242
Fermentations, flavors from, 749-750
Fibrous proteins, 322
Filtration aids, 815
Firming agents, 820
Firming texturizers, 806
Fischer projection, monosaccharides and, 160
Fish:
collagenase activity in, 923-924
flavor sensations from, 754-755
Flavonoids, 681-696
anthocyanins, 681-683
importance in foods, 893-894
physical properties, 693
types, 681, 693-696
Flavors, 722-765, 816
analysis methods, 724-725
basic sensations, 724
binding by proteins, 385-389
definition of, 724
development of process or reaction flavor volatiles, 755-760
effect of food dispersion on, 99
enzymes as cause of off flavor in foods, 499
flavor volatiles from fats and oils, 751
flavor volaties in muscle foods and milk, 751-755
fish and seafood, 754-755
meat and milk from ruminants, 752

meat from non-ruminants, 753-754
future trends, 761
hypoxanthine in muscle and, 910
influence of color on, 652
from lactic acid-ethanol fermentation, 749-750

Pag e 1056
[Flavors]
in plant tissues, 987, 990, 991-992
role of enzymes in, 499
role of food lipids in, 307-310
sensory assessment of, 725-726
taste and nonspecific saporous sensations, 726-738
astringency, 735-736
bitter taste modality, 728-733
cooling, 738
flavor enhancers, 734-735
pungency, 736-737
salty and sour taste modality, 733-734
sweetness theories, 726-728
vegetable, fruit, and spice flavors, 738-749
Flocculating agents, 813
Flour bleaching agents, 808-810
Fluoride, safe and adequate daily dietary intake of (est.), 628
Foams, 97, 143-149
antifoam agents, 812-813
compared with emulsions, 143-144
formation and description, 144-146
by mechanical forces, 145
via supersaturation, 144
role of proteins, 380-385
environmental factors, 381-385
molecular properties required, 383-385
properties, 380-381
stability of, 146-149
coalescence, 148-149
drainage, 147-148
Ostwald ripening, 146-147
surface-tension gradients and, 111, 112
Folate, 590-599
assays, 597-599
bioavailability, 597
pKa values, 591
[Folate]
stability and degradation modes, 533, 592-597
structure and general properties, 590-592
Food additives, 767-823
acids, 769-775
anticaking agents, 810
antimicrobial agents, 782-792
antioxidants, 780-782
appearance control and clarifying agents, 806-808
bases, 775-776
buffer systems and salts, 776-778
chelating agents (sequestrants), 778-780
definition of, 768
fat replacers, 801-804, 805
firming texturizers, 806
flour bleaching agents and bread improvers, 808-810
functions of, 768
gases and propellants, 810-812
intensely sweet nonnutritive and low-calorie sweeteners, 793-798
masticatory substances, 805
polyhydric alcohol texturizers and reduced-calorie sweeteners, 798-800
stabilizers and thickeners, 800-801
table of food additives, 812-821
tracers, 812
Food and Drug Administration (FDA), dyes certifed by, 652
Food chemistry, definition of, 2
Food colorants, 703-718
acceptable daily intake, 707
colors exempt from certification, 713-717
EEC approval, 706, 707
international regulations, 704-708

properties of certified dyes, 708-711
[Food colorants]
U.S. regulations, 703-704, 705
use of certified dyes, 711-712
Food, Drug and Cosmetic (FD&C) Act, 827
Food processing:
carbohydrate changes, 1016
cause-and-effect relationship of food alteration during, 9
changes during processing and storage, 1014
classification of alterations that can occur during, 7, 8
factors governing stability during, 10
lipid changes and, 1017
protein changes and, 1015
situations encountered during, 10-12
undesirable changes during processing and storage, 1014
Food quality:
Arrhenius temperature dependence and, 1019-1023
attributes of, 7-9
chemical and biochemical reactions affecting, 7-10
enzymes in, 514-518, 519
nonthermal factors, 1027-1028
order of reaction, 1018-1019, 1020
temperature dependence and reaction kinetics, 1019-1027
time-temperature indicators, 1037-1038
WLF kinetics and, 1022-1023
Food science, definition of, 1-2
Free energy of repulsive electric interactions, 115
Free volume, definition of, 85
Freezing:
changes during, 72-79
freezing agents, 813
Frozen pizza (shelf-life determination case study), 1033-1037

Pag e 1057
Fruits, 968-969
classification according to resipiratory patterns, 978, 979
effects of processing, 1004-1007
cell disruption, 1005
changes in molecular structure, 1005
chemical changes, 1004
enzyme-catalyzed reactions, 1005
nonenzymic reactions affecting quality, 1004, 1006
flavors in, 738-742
handling and storage, 997-1000
high-temperature injury, 1000
low-temperature injury, 999-1000
mechanical injury, 998
protective substances, 998
stress metabolites, 998, 999
temperature, 998-999
water content of, 19
See also Plant tissues
Frying, chemistry of, 292-295
Fumigating agents, 815
G
GAB model, moisture sorption isotherms and, 48
Garlic, 739
Gases, 810-812
aerating and foaming agents, 812
carbonation, 811
propellants, 811-812
protection for oxygen, 811
Gay-Lusssac, Joseph Louis, 2, 3
Gelatin, 130-131
conversion of collagen to, 905-906
Gelation, 124-126, 182
Gels, 122-133, 184-185

description, 122-126
food types, 129-133
caseinate gels, 129-130
concentrated starch gels, 132-133
gelatin gels, 130-131
globular proteins, 132
[Gels]
mixed gels, 133
plastic fats, 129
polysaccharides, 131-132
functional properties, 126-128
junction types, 131-132
modulus vs. concentration of, 129
protein gelation, 391-394
Genetic diseases caused by enzymatic defects, 523, 524
Genetic engineering. See Recombinant DNA technology
Gibbs equation, 101-102
Gibbs-Marangoni effect, 112
on emulsions, 134-135, 136, 137
Gingerols, 737
Glass state (glassy), definition of, 85
Glass transition temperature, definition of, 86
Glass transition (Tg') values:
for amino acids and proteins, 74, 75
for carbohydrates, 66
for foods, 74, 76
for frozen foods, 73-79
solvent dependence and reaction rate, 67-69
Globular proteins, 132, 322
b-D-Glucan, 218-219
Glucoamylase, 200
Gluconic acid, 769
s-Gluconolactone, 769
D-Glucose, 159-161

D-Glutamate, 735
Gluten, 394-396
Glyceryl esters, 787-788
Glycoproteins, 322
Glycosides, 165
Gordon and Taylor equation, 62
Grape skin extract, 717
GRAS (generally regarded as safe) substances, 827
Guar gum, 207-208
serum cholesterol and, 219
Gum arabic, 217-218
Gum ghatti, 217
Gum karaya, 217
Gums, 183
[Gums]
properties, 186-190
uses, 186-190
See also types of gums, stabilizers, and thickeners
Gum tragacanth, 217
H
Handling of food:
alterations that can occur during, 7, 8, 9
See also Plant tissues, handling and storage
Hannenberg, W., 6
Hardening flavor, 310
Hatch, William H., 6
Hatch Act, 6
Helical structure of proteins, 338-340
Heme pigments, 653-659
Hemicelluloses, serum cholesterol and, 219
Hemoglobin, 653-658
Herbs, flavor sensations from, 747-749
HERP (human exposure rodent potency), 838-839

High-methoxyl (HM) pectins, 216
History of food chemistry, 2-6
Homoproteins, 322
Humulone, 739
Hurdle approach to food stability, 83-84
Hydration, 30
hydrophobic, 31, 35
Hydrogenation of lipids, 300-304
Hydrolases (enzyme type), 438, 439-440, 442
Hydrolysis of starch products, 199-201
Hydrophile-lipophile balance (HLB):
definition of, 103
for emulsions, 136
for surfactants, 103
Hydrophobic interactions, 31, 36-37
colloids and, 118
Hydroxyl group esters and ethers, 169-171
4-Hydroxymethyl-2,6-di-tertiarybutylphenol, 286, 288

Pag e 1058
Hydroxypropylmethylcellulose (HPMC), 206-207
Hypoxanthine, 910
Hysteresis of moisture sorption isotherms, 50-51
I
Ice:
physical properties, 19-20
structure of, 24-29
Immobilizing enzyumes:
applications, 507-509
methods of, 506-507
Infants, enzyme role in special foods for, 523-524
Interesterification of lipids, 304-307
Interfacial rheology, 110
Interfacial tension, 101-102
approximate values of (at room temperature), 102
measurement of, 101, 102
Internal Commission on Enzymes, 438
Interstitial model (structure of water), 29-30
Iodine:
fortification of foods, 633-636
functions in food, 642
RDAs for, 627
Iodine value, 278-279
Ionizing radiation:
effects on fats, 295-299
in handling and storage of plant tissues, 1003
Iron:
bioavailability, 630-631, 638-639
complex with EDTA, 639
concentration in enriched cereals, 637
fortification of foods, 636-639
functions in food, 641-645
RDAs for, 627

Iron oxide as a colorant, 717
Irradiated food, safety of, 312
Irreversible (lyophobic) colloid, 98
Isoamylase, 200
Isohumulone, 730
Isomerases (enzyme type), 438, 440, 443
Isoprene, structure of, 678
Isotopes of water, 21-22
K
Kinetics of enzyme reactions, 436-437
Lineweaver and Burke plot of, 454-456
Michaelis-Menten equation for, 436-437, 450, 451, 454, 455
pH effect on, 460-464
Krebs cycle, 987, 988
Kreis test, 278
Kunitz inhibitor, 486-487
L
a-Lactalbumin, 847-848, 858, 860
Lactic acid-ethanol fermentation, flavors from, 749-750
b-Lactoglobulin, 847-849, 858, 960
Lactose, 175-176
in milk, 853, 854
effects of processing, 866-867
functionality in foods, 870-871
particle size, 847
Lactose intolerance, 175-176, 872-873
Lakes, 652, 653
Land-Grant College Act (1862), 6
Laplace pressure, 108, 112 foams and, 144
Lauric acids, 232
Lavoisier, Antoine Laurent, 2, 3
Leaf crops, 968
Lectins, 402-403

Liebig, Justus von, 2, 4
Ligases (enzyme type), 438, 440, 443
Lineweaver and Burke plot of enzyme kinetics, 454-456
Linolenic acids, 233
Lipid antioxidants, 279-288
Lipid oxidation:
aldehyde products, 265-266
alkyl and alkoxy radicals, 267-268
autoxidation, 255-259
cholesterol oxidation and, 266-267
[Lipid oxidation]
enzyme-catalyzed, 272
formation of hydroperoxides from, 258-259
hydroperoxide decomposition, 261-264
methods for measuring, 276-279
in mixed-lipid complex systems, 272-273
perspective on, 299
polymerization during, 268-272
rate factors, 273-276
with singlet oxidation, 259-261
Lipids, 225-319
changes affecting meat quality, 924-925
changes during food processing and handling, 1017
chemical aspects, 254-299
autoxidation, 255-288
chemistry of frying, 292-295
effects of ionizing radiation on fats, 295-299
lipolysis, 253-255
thermal decomposition, 288-292
chemistry of fat and oil processing, 299-307
hydrogenation, 300-304
interesterification, 304-307
refining, 299-300
classification, 232-233

lauric acids, 232
milk fats, 232
vegetable butters, 232-233
functionality in foods of milk lipids, 871
importance of, 226
in milk, 850-852, 871
in muscle, 882, 883, 898
muscle dehydration effect on, 931-932
nomenclature, 226-231
acylglycerols, 228-231
fatty acids, 226-228
phospholipids, 231

Pag e 1059
[Lipids]
oxidation reactions on protein nutritive value, 414
physical aspects, 233-254
physiological effects, 310-313
composition and trends, 310
dietary lipids, coronary heart disease, and cancer, 312
nutritional functions, 310
safety after frying, 310-311
safety of hydrogenated fats, 311
safety of irradiated food, 312
in plant tissues, 955-959
polar lipids, 955-956
triacylglycerols, 956-957, 958
role of food lipids in flavor, 307-310
See also Triacylglycerols, Fatty acids
Lipoproteins, 322
Lipoxygenase, food color alteration by, 493
Liquid dispersions, 118-122
aggregation kinetics, 121-122
description, 118-119
reversibility of aggregation, 122
sedimentation, 119-121
Locust bean gum, 207-208, 210
Low-calorie sweeteners. See Sweeteners, low-calorie
Low-methoxyl (LM) pectins, 216
Lutein, structure of, 676
Lyases (enzyme type), 438, 440, 442
Lycopene, structure of, 678
Lysinoalanine, 406-408
Lysozyme hydration, 40-41
M
Macromolecular entanglement, 86
Macromolecules, 105

Magnesium:
functions in food, 642
RDAs for, 627
Maillard reaction. See Browning, Maillard
Malting and fermenting aids, 813
Maltose, 174
Manganese, safe and adequate daily dietary intake of (est.), 628
Marangoni effect, 111, 112
See also Gibbs-Marangoni effect
Marine oils, 233
Mashed potatoes, dehydrated (shelf-life determination case study), 1031-1033
Masticatory substances, 805, 820
Material handling aids, 813
Meat:
biochemistry postmortem affecting quality, 914-925
actin-myosin interaction and contraction, 919-922
changes induced by proteolysis, 923-924
lipid changes and interactions, 924-925
pH effect on quality, 916-919
water-holding capacity, 914-916
chemical aspects of quality, 925-934
dehydration, 931-934
freezing, 928-931
heating, 925-926
pressure, 934
refrigeration, 926-928
chemistry of processed meats, 932-937
adhesion technology, 933-935
curing, 933
effect of pH on gelling of meat proteins, 936-937
muscle proteins in gel formation, 935-936
processing factors, 937
composition by species, 882
definition of, 880

development of meat-like flavors, 756, 757
flavor sensations from, 751-755
[Meat:]
lipid content, 882, 883
minerals in, 884, 855
nutritive value of, 882-884
vitamins in, 884
water content of, 19
See also Muscle
Meat pigments:
cured, 654-655, 657, 658
stability of, 658-659
Metalloproteins, 322
Metastable state, definition of, 86
Methionine, oxidation of, 409
Methylcelluloses, 206-207
4-Methylthio-3-t-butenylisocyanate (aroma compound), 740
Michaelis-Menten equation expressing enzyme kinetics, 436-437, 450, 551, 454, 455
Microcrystalline cellulose (MCC), 205-206
Microorganisms in food:
enzymes for control of, 504, 505
relative vapor pressure and, 52, 53
Milk, 841-878
biosynthesis, 842-845
chemical composition, 845-854
enzymes, 502, 503, 854, 855
lipids, 850-852
proteins, 846-849, 854-861
salts and sugars, 853-854
consumption trends, 842, 843
distribution of vitamin B2 in, 577
effects of processing, 864-867
fat phase, 864
lactose, 866-867

micelle and salt system, 864-866
whey proteins, 866
flavor sensations from, 752-755
lactose tolerance, 872-873
minerals in, 872, 873
Pag e 1060
[Milk]
nutrient composition, 871-872
nutrient value, 871-876
structural organization of components, 854-863
casein micelles, 861-863
fat globules, 863
proteins, 854-861
use in formulated foods, 867-871
caseins, 868-869
lactose, 870-871
lipids, 871
proteins, 867-868
whey proteins, 870
Milk fat, 232
Minerals, 6, 617-649, 817
acid/base chemistry and, 619-625
activity values, 622-623
chelates and, 623-625
classification, 618
composition of selected foods, 634-635
factors affecting, 632-633
fortification, 633-639
processing effects, 639-640
definition of, 618
in food, 632-640
ash, 632
functions in food, 640-647
calcium, 640-641, 642
copper, 642, 646-647
iron, 641-645
nickel, 643, 645-646
phosphates, 641, 643, 644
in meat, 884, 885

in milk, 872, 873
nutritional aspects of, 625-631
bioavailability, 627-631
essential mineral elements, 625-626
minerals of particular concern, 631
minimum requirements, 627-628
recommended dietary allowances (RDAs), 626-627
[Minerals]
utilization in the body, 628-629
periodic table of, 618
in plant tissues, 965-966
solubility in aqueous solutions, 619
species of, 618-619
stability constants for complexes, 621-623
Mixture model (structure of water), 29
Moisture control agents, 816
Moisture sorption isotherms, 47-51
definition of, 48-50
hysteresis, 50-51
temperature dependence, 50
zones, 49-50
Molecular mobility and food stability
air drying, 79
amorphous regions, 59-60
color of gluten, 80
crystallization, 80
enzyme activity, 80
free volume, 61
freezing, 72-79
glass transition temperature or range, 62
molecular entanglement affecting food properties, 72
rates of physical and chemical reactions, 60-61
state diagrams, 57-58
temperature dependency, 62-63

thermal resistance of bacterial spores, 80
vacuum freeze-drying, 79
water as effective plasticizer, 65
Molybdenum, safe and adequate daily dietary intake of (est.), 628
Monosaccharides, 158-174
caramelization, 172-173
classification, 159
esterification, 169
etherification, 169-171
glycosides, 165
[Monosaccharides]
isomerization, 161-162
Maillard browning (nonenzymatic browning), 171-173
oxidation, 166-167
reduction, 167-168
ring forms, 162-165
Rosanoff structure of the D-aldose, 161
uronic acids, 168
Morrill, Justin Smith, 6
Muscle (muscle tissue), 879-942
comparative properties of various species, 881
composition of lean muscle tissues, 882, 883
flavor sensations from, 751-755
muscle biochemistry postmortem, 907-914
ATP depletion, 909-910, 911, 912
changes related to metabolism, 907-909
effect on meat quality, 914-925
loss of calcium sequestering ability, 910-911
loss of enzymic regulation, 913-914
nutritive value, 882-884
structure and composition of, 884-907
cardiac (heart) or striated involuntary muscle, 890
connective tissue, 901-906
fat cells, 906-907

muscle fiber types, 898-901
proteins of the muscle cell, 891-898
skeletal muscle, 884-890
smooth or involuntary muscle, 890
See also Meat
Mycotoxins:
natural occurrence of, 836
structures of, 835
Myoglobin, 653-658
in cured meat pigments, 658-659

Pag e 1061
[Myoglobin]
discoloration, 657-658
oxidation of, 656-657
structure of, 653-656
types in meat, 654-655
Myoglobin hydration, 39
Myosin, 891-893
N
Natamycin, 787
Natural food additives, 816-818
Neoxanthin, structure of, 677
Net protein utilization (NPU), 400
Niacin, 578-580
assays, 579
bioavailability, 579
concentration in foods, 580
stability of, 533
structure and general properties, 578-579
Nickel, functions in food, 643, 645-646
Nisin, 791
Nitrates, 784-785
in meat, 933
Nitrites, 784-785
Nitrogen, nonprotein, 954-955
N-Nitrosamines in meat, 933
Nonclimacteric fruits, 978, 979
Nonenzymic browning. See Browning, Maillard
Nonprotein nitrogen, 954-955
Nordihydroguaiaretic acid (NDGA), 286
Nucleoproteins, 322
Nutritional properties of proteins, 396-402, 882
digestability, 398-399
evaluation of, 399-402

chemical methods, 400-401
biological methods, 399-400
enzymic and microbial methods, 401-402
protein quality, 396-398
Nutritional quality of food, effects of enzymes on, 499, 523-525
Nutritive value of milk, 871-876
O
Oil-in-water (O/W) emulsions, physical instability of, 138-139
Oils. See Lipids; Triacylglycerols; types of oils
Oilseeds, handling and storage of, 997
Oleic-linoleic acids, 233
Oligosaccharides, 174-178
lactose, 175-176
maltose, 174
sucrose, 176-178
Organic acids in plant tissues, 960-965
aliphatic plant acids, 960
carbocyclic plant acids, 961
phenolic acids, 961-962
tannins, 962-965
Ostwald ripening, 109, 112
emulsion instability and, 138-139
foam instability and, 146-147
Oxidizing agents, 813-814
Oxidoreductases (enzyme type), 438, 439, 442
Oxirane test, 278
Oxytetracycline, 791
P
Pantothenic acid, 602-603
assays, 603
bioavailability, 603
stability and degradation modes, 533, 603
structure and general properties, 602-603

Paprika, 717
Parabens, 789-790
Parenchyma tissue, 969-971
Particle gels, 125-126
Pectin, 216-217
food texture alteration by pectin enzymes, 494-496
serum cholesterol and, 219
Pectin methylesterase, 984
Pentosanases, food texture alteration by, 497
Peptide bonds, 335-337
Peptides, bitterness vs. hydrophobicity, 732-733
Peroxide value, 276
Peroxy radicals, 267, 268
pH:
control in foods, 776-777
effect on enzyme kinetics, 460-464
[pH]
effect on gelling of meat proteins, 936-937
effect on muscle biochemistry postmortem, 916-918
protein denaturation and, 362
pH control agents, 814
Phase, definition of, 98
Phase inversion temperature (PIT), 104
Phenolic acids, 961-962
Phenylthiocarbamide (PTC), 729
Pheophytin, 663-667
Phosphates, 778, 780
functions in food, 641, 643, 644
Phospholipids, 231
Phosphoproteins, 322
Phosphorus:
RDAs for, 627
in selected cheeses, 639-640
Phytohemagglutinins. See Lectins

Pigments, 652, 653
in animal and plant tissue, 653-703, 965
betalaines, 697-703
carotenoids, 673-681
chlorophyll, 659-673
flavonoids and other phenols, 681-696
Pizza, frozen (shelf-life determination case study), 1033-1037
Plant hormones, 994-997
ethylene biosynthesis, 994, 996
hormone types, 994, 995
Plant respiration, postharvest:
biochemical control mechanisms, 981-982
biogenesis and degradation of flavors, 990, 991-992
control mechanisms, 992-997
effect of controlled atmosphere, 1001-1002
factors influencing rate, 980-981
general equation, 974
Pag e 1062
[Plant respiration, postharvest]
genetic control and protein synthesis, 982-984, 985
humidity effects, 1002-1003
lipid metabolism, 987-989
metabolic pathways and, 975-978
organic acid metabolism, 987
pigment metabolism, 989-991
radiation effect, 1002
respiratory patterns, 978-979
storage life and, 974-975
Plant tissues, 943-1011
biological structure, 966-973
organ structure, 967-969
subcellar structure, 971-973
tissue and cell structure, 969-971
chemical composition, 945-966
carbohydrates, 947-952
lipids and related compounds, 955-959
mineral elements, 965-966
organic acids, 960-965
pigments, 965
proteins, 952-955
vitamins, 966
water, 945-947
control mechanism, 992-997
cell disruption, 992-994
plant hormones, 994-997
effects of processing on fruits and vegetables, 1004-1007
cell disruption, 1005
changes in molecular structure, 1005
chemical changes, 1004
enzyme-catalyzed reactions, 1005
nonenzymic reactions affecting quality, 1004, 1006

handling and storage, 997-1004
cereals, pulses, and oilseeds, 997
controlled atmosphere storage, 1000-1002
fruits and vegetables, 997-1000
[Plant tissues]
humidity effects, 1002-1003
ionizing radiation, 1003
other factors, 1003-1004
importance as food source, 944-945, 946
physiology and metabolism, 973-991
pigments in, 653-703, 965
betalaines, 697-703
carotenoids, 673-681
chlorophyll, 659-673
flavonoids and other phenols, 681-696
toxicants in, 831, 833
See also Vegetables, Fruits
Plant triacylglycerols, 237-239
Plastic fats, 129
Plasticizer, definition of, 86
Polar lipids, 955-956
Polydextrose, 804, 805
Polymer gels, 124-125
Polymorphism, 241-249
commercial fats and, 244-249
fatty acids and, 242-243
subcells and, 241-242
triacylglycerols and, 243-244
Polyphenolics. See Tannins
Polyphenol oxidase, food color alteration by, 493-494
Polysaccharides, 131-132, 178-190, 220
gels, 184-185
hydrolysis, 185
properties, 186-190

solubility, 179-180
solution viscosity and stability, 181-184
uses, 186-190
Polyunsaturated fatty acids, 229
Polyvinyl pyrrolidone, structure of, 808
Postharvest plant respiration. See Plant respiration, postharvest
Potassium, functions in food, 643
Poultry, flavor sensations from, 753-754
Pregelatinized starch, 204
Proanthocyanadins, 694-695
Processed meats. See Meats, chemistry of processed meats
Pro-oxidants, 275
Propellants, 811-812, 820
Propionic acid and propionates, 788
propylene glycol alginates, 215-216
Propylene oxide, structure of, 790
Proteases:
food texture alteration by, 497-499
inhibitors, 402, 403, 486-487
Protein denaturation, 353-365
agents of, 356-364
chemotropic salts, 363-364
detergents, 363
hydrostatic pressure, 361-362
organic solutes, 363
organic solvents, 363
pH, 362
shear, 362
temperature, 356-361
thermodynamics of denaturation, 354-356
Protein efficiency ratio (PER), 400
Protein hydration, 36-42
Proteins, 105-106
biological functions, 322-323

changes during food processing and handling, 1015
chemical and enzymatic modification of, 417-424
acylation, 419
alkylation, 418-419
amino acids, 421
enzymatic hydrolysis, 422-423
esterification, 421
phosphorylation, 420
plastein reaction, 423
protein cross-linking, 424
sulfitolysis, 421
chemical reactions of functional groups in, 332-334
classification, 322

Pag e 1063
[Proteins]
conformational stability and adaptability, 352-353
as emulsifiers, 136-138, 376-380
emulsion coalescence and, 140-141
as fat mimetics, 802-803
forces involved in structural stability, 346-352
disulfide bonds, 351-352
electrostatic interactions, 348-349
hydrogen bonds, 347-348
hydrophobic interactions, 349-351
steric strains, 346
van der Waals' interactions, 346-347
functional properties, 365-396
dough formation, 394-396
emulsifying properties, 376-378
factors influencing emulsification, 378-380
flavor binding, 385-389
foaming properties, 380-385
gelation, 391-394
interfacial properties, 373-376
protein hydration, 366-370
solubility, 370-373
viscosity, 389-391
glass transition values and associated properties, 74, 75
globular proteins, 132
importance of, 322
in milk, 846-849, 854-861
amino acid composition, 848-849
casein micelles, 861-863
charge characteristics, 856-858
effect of processing, 864-867
functionality in foods, 867-868
nutritive changes during processing, 873-875

whey proteins, 858-861
[Proteins]
in muscle
collagen, 902-905
heating effects, 925-926
lean muscle tissue, 882
meat gels, 934-937
of the muscle cell, 891-898
contractile proteins, 891-896
contraction and relaxation, 896-897
soluble components, 897-898
nutritional properties, 396-402, 882
digestability, 398-399
evaluation of nutritional value, 399-402
protein quality, 396-398
in plant tissues, 952-955
cereal protein, 953
nonprotein nitrogen, 954-955
pulse storage proteins, 954
tuber proteins, 954
primary a-amino acids in, 324-325
processing-induced changes in, 402-417
changes in functional properties, 416-417
changes in nutritional quality, 402-416
formation of toxic compounds, 402-416
structural hierarchy, 335-346
primary structure, 335-338
quaternary structure, 345-346
secondary structure, 338-342, 343
tertiary structure, 342-345
terminology, 322
See also Amino acids
Pseudoplastic fluids, 183
Publications, credibility of data in, 13-14

Pullulanase, 200
Pulses:
handling and storage, 997
mineral content, 965
Pulse storage proteins, 954
Pungency, 736-737
Pyridoxal. See Vitamin B6
Pyridoxamine. See Vitamin B6
Pyridoxine. See Vitamin B6
Pyropheophytin, 663-667
Pyrroloquinoline quinone (PQQ), 609
Q
Q10 (temperature dependence) application to shelf life, 1024-1026
Quinine, 729-730
Quinoids, 696, 697
R
Racemization of proteins, 404-405
Rancimat method, 279
Raw food materials, genetic engineering of, 521-522
Recombinant DNA technology:
enzymes in, 518-523
applications, 521-523
DNA polymerases, 520, 521
restriction enzymes, 519
plant tissue applications, 982-984, 985
Recommended Dietary Allowances (RDAs), 536-538
for mineral nutrients (U.S.), 626-627
Reference Daily Intake (RDI), 537
Relative vapor pressure (RVP):
food stability and, 52-55
microorganisms in food and, 52, 53
water activity and, 42-47
Relaxation:

definition of, 87
muscle contraction and, 897
Release and antistick agents, 814-815
Restriction enzymes, 519, 520
Retinoids, 545, 546, 547
Retrogradation of starch, 196, 198
Reversible (lyophilic) colloid, 98
Reversion flavors, 308-309
Rheology at the interface, 110
Riboflavin:
as a colorant, 717
Pag e 1064
[Riboflavin]
stability of, 533
See also Vitamin B2
Rice, lipid content of, 958
Root crops, 967
Rosanoff structure of D-aldose, 161
Rubbery state, definition of, 87
S
Saccharin, 794
Safety of food, chemical and biochemical reactions affecting, 7-10
Saffron, 717
Salts, 776-778
in animal-based foods, 778
in meat gels, 936-937
in milk, 853-854
in processed dairy foods, 777-778
Salty taste, 733-734
Sanitizing agents, 815
Sarcomeric proteins, 892, 895-896
Saturated fatty acids, 227
Schaal oven test, 279
Schardinger dextrins, 200
Scheele, Carl Wilhelm, 2-3
Scientific knowledge, interpretation of, 13-14
Seafood, flavor sensations from, 754-755
Sedimentation, 119-121
Selenium:
functions in food, 643
RDAs for, 627
Sequestrants. See Chelates
b-Sheet structure of proteins, 340-342
Shelf life, estimation of, 80-81
Shelf-life case studies, 1028-1037

dehydrated products, 1030-1033
dry dessert mix, 1030-1031
mashed potatoes, 1031-1033
frozen pizza, 1033-1037
Shelf-life modeling, 1016-1029
food-quality function, 1018-1019
principles, 1016-1018
[Shelf-life modeling]
simple shelf-life plot approach, 1023-1027
temperature effects, 1019-1023
tests in shelf-life estimates (ASLT principles), 1028-1029
Shiitake mushrooms, flavor sensations from, 740-741
Shikimic acid pathway, flavor sensations from, 743-745
Sitosterol, 959
Small-molecule surfactants, 103
Smoluchowski equation, 61, 121
Smooth (involuntary) muscle, structure of, 890
Societal role of food chemists, 13-14
Sodium, functions in food of, 643
Solvation repulsion, colloids and, 118
Solvent-partitioned enzyme systems, 509-512
advantages, 511
applications, 511-512
in organic solvents, 509-511
Sorbic acid and sorbates, 785-787
Sour taste, 733-734
Spices, flavor sensations from, 747-749
Squid, muscle structure of, 886
Stability of foods:
during handling, processing, and storage, 10
estimation of shelf life and, 80-81
hurdle approach to, 83-84
molecular mobility and, 55-83
relative vapor pressure and, 52-55

WLF kinetics and, 81
Stabilizers and thickeners, 800-801, 810
See also Gums
Staling of baked goods, 198
Starch, 191-204
amylopectin, 191-192
[Starch]
amylose, 191, 192
cold-water swelling, 204
complexes, 198
dietary importance of, 191
granule gelatinization and pasting, 195-196
hydrolysis, 199-201
modified food starch, 201-204
pregelatinized, 204
retrogradation and stalling, 198
uses of, 191, 196-197
Starch gels, 132-133
Starch granules, 192-195
properties of, 102, 193
Starch-sugar transformations in plant tissues, 984-987
State diagram, definition of, 87
Stem crops, 967-968
Stereochemistry of amino acids, 326-327
Stohmann, F., 6
Stokes equation, 120
Stokes-Einstein equation, 61
Storage of food:
alterations that can occur during, 7, 8, 9
factors governing stability during, 10
situations encountered during, 10-12
See also Plant tissues, handling and storage
Strecker degradation, effect on proteins, 412
Striated (involuntary) muscle, structure of, 890

Structural proteins, 322
Sucrose, 176-178, 796
Sucrose polyester, 804, 805
Sugar:
in milk, 853-854
Starch-sugar transformations in plant tissues, 984-987
See also Monosaccharides
L-Sugars, 161
Sulfites, 782-784
Sulfur, functions in food, 643
Sulfur dioxide, 782-784
Surface dilational modulus, 110

Pag e 1065
Surfactants, 103-107
functions of, 112
mode of adsorption, 105
surface-tension gradients, 111-112
See also Emulsifiers
Sweeteners:
low-calorie, 793-798, 818-819
acesulfame K, 795-796
alitame, 796, 797
aspartame, 794-795
cyclamate, 793-794
glycyrrhizin, 797
miraculin, 798
monellin, 798
neohesperidin dihyrochalcone, 797-798
rebaudioside, 797
saccharin, 794
stevioside, 797
sucralose, 796
thaumatins, 798
reduced-calorie, 798-800
Sweetness theories, 725-728
Swelling of gels, 128
Syneresis of gels, 128, 185
T
Tannins, 695-696, 736, 962-965
Terpenoids, flavor sensations from, 745-746
Tertiary butylhydroquinone (TBHQ), 286
Texturizers, 820-821
firming types, 806
Thenard, Louis-Jacques, 2, 3
Thermal conductivity of water, 19-20
Thermally induced flavor sensations, 756-759

Thiamin. See Vitamin B1
Thickeners. See Stabilizers and thickeners
Thick filament proteins, 895
Thiobarbituric acid tests, 276-277
Thixotropic flow, 183-184
proteins and, 389-391
Thomson, Thomas, 2, 3
Time-temperature indicators of food quality, 1037-1038
Titanium oxide, 717
Tocopherols, 533
Tomato, biosynthesis of flavor, 990
Toxicants, 825-840
contaminants, 834-838
mycotoxins, 835, 836
definition of, 825-826
evaluating safety, 828-830
formation of toxic compounds in proteins, 402-416
inherent toxicants, 830-834
carcinogens in food, 832
in plants, 831
plant toxicants causing harm, 833
legal aspects, 826-827
public health and, 838-839
terms in food toxicology, 827-828
types of, 825, 826
Tracers, 812, 821
Transferases (enzyme type), 438, 439, 442
Treatise on Adulterations of Food, A (Accum), 5
Triacylglyercols fat substitutes, 803-804
Triacylglycerols, 239, 956-957, 958
autoxidation, 255-259
bleaching, 300
chemistry of frying and, 292-295
consistency, 250-252, 254

deodorization, 300
distribution of fatty acids in fat, 233-239
health and, 312-313
hydrogenation, 300-304
interesterification, 304-307
lipolysis, 254-255
melting behavior, 248-252
mesomorphic phase, 252-254
neutralization, 300
polymorphism and, 243-244
radiolysis, 296-298
safety after frying, 310-311
safety after irradiation, 312
safety of hydrogenated fats, 311
settling and degumming, 300
solid fat index, 249-250
thermal decomposition, 288-292
[Triacylglycerols]
See also Fats
2,4,5-Trihydroxybutyrophenone (THBP), 286, 288
Tritium, 22
Tropomyosin, 894-895
Troponin, 894-895
True (protein) digestibility (TD), 400
Tryptophan, oxidation of, 410-411
Tuber proteins, 954
Turmeric, 717
Tyrosine, oxidation of, 412
U
Ultraviolet spectrophotometry, 278
Unmodified starches, 196-197
Unsaturated fatty acids, 227-228
Uronic acids, 168

V
Vacuum freeze-drying (lyophilization), 79
Van der Walls' forces, 113, 115
protein stability and, 346-347
Vegetable butters, 232-233
Vegetables:
effects of processing, 1004-1007
cell disruption, 1005
changes in molecular structure, 1005
chemical changes, 1004
enzyme-catalyzed reactions, 1005
nonenzymic reactions affecting quality, 1004, 1006
flavors in, 738-742
handling and storage, 997-1000
high-temperature injury, 1000
low-temperature injury, 999-1000
mechanical injury, 998
protective substances, 998
stress metabolites, 998, 999
temperature, 998-999
mineral content of, 965
water content of, 19
See also Plant tissues

Pag e 1066
Violaxanthin, structure of, 677
Viscosity, role of proteins in, 389-391
Vitamin A, 545-552
assays, 552
bioavailability, 551-552
isomerization, 547-550
source, 545-548, 674-675, 681
stability and degradation modes, 533, 547-551
structure and general properties, 545-547
Vitamin B1, 568-574
assays, 574
bioavailability, 574
stability and degradation modes, 533, 570-574
structure and general properties, 568
Vitamin B2, 574-578
assays, 578
bioavailability, 578
distribution in milk, 577
stability and degradation modes, 575-577
structure and general properties, 574-575
Vitamin B6, 580-589
assays, 589
bioavailability, 588-589
pKa values, 581
sources, 580
stability and degradation modes, 533, 583-588
structure and general properties, 580-582
Vitamin B12, 603-606
assays, 605-606
bioavailability, 605-606
concentration in various foods, 605
stability and degradation modes, 533, 604-606
structure and general properties, 603-604
Vitamin C, 559-568
assays, 567-568
bioavailability, 567
functions in foods, 566-567
reduction potential, 564
sources, 560
[Vitamin C]
stability and degradation modes, 533, 561-566
structure and general properties, 559-560
Vitamin D, 552-553
assays, 553
stability, 533
structure and general properties, 552-553
Vitamin E, 553-557
assays, 556-557
bioavailability, 556
concentration in foods, 556
oxidative degradation, 557
stability and degradation mechanism, 554-555
structure and general properties, 553-554
Vitamin K, 557-559
assays, 559
stability and degradation modes, 553, 559
structure and general properties, 557-559
Vitamins, 6, 817-818
analytical methods and sources of data, 537-539
bioavailability, 539
causes of variation/loss in foods, 539-545
definition of, 532-533
dietary recommendations for, 536-537
fat-soluble vitamins, 545-559
fortification of foods, 534-536
in meat, 884
in milk, 872, 873

processing effects, 875-876
optimization of retention, 607-609
effects of packaging, 609
loss prediction, 608-609
thermal processing conditions, 608
in plant tissues, 966
sources of, 534
stability of, 532-533, 536, 537
toxicity, 534
vitamin-like compounds, 606-607
[Vitamins]
water-soluble vitamins, 559-606
See also types of vitamins
Vitrification, definition of, 87
W
Waste management, enzymes in, 512-514
Water, 17-94
abundance of, 18-19
combined methods approach to food stability, 83-84
content of various foods, 19
forms of, 18-19
glossary, 85-87
hydrogen bonding of, 22-23, 24
importance of, 18-19, 85
isotopes of, 21-22
moisture sorption isotherms, 47-51
definition, 48-50
hysteresis, 50-51
temperature dependence, 50
zones, 49-50
molecular association of, 20-24
molecular mobility and food stability, 55-83
physical properties, 19-20

in plant tissues, 945-947
relative vapor pressure and food stability, 52-55
-solute interactions, 30-42
structure of, 29-30
water activity and relative vapor pressure, 42-47
See also Ice
Water binding, 30
of proteins, 367-370
Water holding capacity, 30-31
Water-soluble vitamins. See Biotin; Folate; Niacin; Pantothenic acid; Vitamin B1; Vitamin B2; Vitamin B6; Vitamin B12; Vitamin C
Wax, structure of, 960
Wheat:
kernel structure, 970
lipid content of, 958
Wheat flour, 956, 958
Whey proteins, 858-861, 866

Pag e 1067
[Whey proteins]
functionality in foods, 870
Wiley, Harvey Washington 6
Williams-Landel-Ferry (WLF) equation, 60, 61, 64, 65
ice recrystallization and, 78
kinetic relevance to food quality, 67, 1022-1023
[Williams-Landel-Ferry (WLF) equation]
kinetics during freezing, 73
World Health Organization (WHO), dyes (or lakes) approved by, 652
X
Xanthan gum, 184, 208-210
serum cholesterol and, 219
Xanthones, 696, 697
Y
Young's equation, 107
Z
Zeaxanthin, structure of, 676
Zinc:
functions in food, 643
RDAs for, 627

Pag e 1069
About the Editor
Owen R. Fennema is a Professor of Food Chemistry in the Department of Food Science at the University ofWisconsin—Madison. He is coauthor of the books Low Temperature Foods and Living Matter (with William D. Powrie andElmer H. Marth) and Principles of Food Science, Part II: Physical Principles of Food Preservation (with Marcus Kareland Daryl B. Lund) (both titles, Marcel Dekker, Inc.), and the author or coauthor of over 175 professional papers that reflecthis research interests in food chemistry, low-temperature preservation of food and biological matter, the characteristics of waterand ice, edible films and coatings, and lipid-fiber interactions. A consulting editor for the Food Science and Technology series(Marcel Dekker, Inc.), he is a Fellow of the Institute of Food Technologists and of the Agriculture and Food Chemistry Divisionof the American Chemical Society, and a member of the American Institute of Nutrition, among other organizations. Dr.Fennema received the B.S. degree (1950) in agriculture from Kansas State University, Manhattan, and the M.S. degree (1951)in dairy science and Ph.D. degree (1960) in food science and biochemistry from the University of Wisconsin—Madison.