Ubiquitous Green Computing Techniques for High Demand Applications in Smart Environments
19
Sensors 2012, 12, 10659-10677; doi:10.3390/s120810659 OPEN ACCESS sensors ISSN 1424-8220 www.mdpi.com/journal/sensors Article Ubiquitous Green Computing Techniques for High Demand Applications in Smart Environments Marina Zapater 1,2, *, Cesar Sanchez 3 , Jose L. Ayala 4 , Jose M. Moya 2 and Jos´ e L. Risco-Mart´ ın 4 1 CEI Campus Moncloa, UCM-UPM, Madrid 28040, Spain 2 Electronic Engineering Department, ETSI Telecomunicaci´ on, Universidad Polit´ ecnica de Madrid, Madrid 28040, Spain; E-Mail: [email protected] 3 IMDEA Software Institute, and Institute for Applied Physics, CSIC, Madrid 28660, Spain; E-Mail: [email protected] 4 DACYA, Universidad Complutense de Madrid, Madrid 28040, Spain; E-Mails: [email protected] (J.L.A.); [email protected] (J.L.R.-M.) * Author to whom correspondence should be addressed; E-Mail: [email protected]; Tel.: +34-915-495-700 (ext. 4227); Fax: +34-913-367-323. Received: 19 March 2012; in revised form: 23 July 2012 / Accepted: 27 July 2012 / Published: 3 August 2012 Abstract: Ubiquitous sensor network deployments, such as the ones found in Smart cities and Ambient intelligence applications, require constantly increasing high computational demands in order to process data and offer services to users. The nature of these applications imply the usage of data centers. Research has paid much attention to the energy consumption of the sensor nodes in WSNs infrastructures. However, supercomputing facilities are the ones presenting a higher economic and environmental impact due to their very high power consumption. The latter problem, however, has been disregarded in the field of smart environment services. This paper proposes an energy-minimization workload assignment technique, based on heterogeneity and application-awareness, that redistributes low-demand computational tasks from high-performance facilities to idle nodes with low and medium resources in the WSN infrastructure. These non-optimal allocation policies reduce the energy consumed by the whole infrastructure and the total execution time. Keywords: ubiquitous sensor network; green computing; heterogeneous systems; data centers; high performance computing; smart cities; ambient intelligence
-
Upload
independent -
Category
Documents
-
view
4 -
download
0
Transcript of Ubiquitous Green Computing Techniques for High Demand Applications in Smart Environments

Sensors 2012, 12, 10659-10677; doi:10.3390/s120810659OPEN ACCESS
sensorsISSN 1424-8220
www.mdpi.com/journal/sensors
Article
Ubiquitous Green Computing Techniques for High DemandApplications in Smart EnvironmentsMarina Zapater 1,2,*, Cesar Sanchez 3, Jose L. Ayala 4, Jose M. Moya 2 andJose L. Risco-Martın 4
1 CEI Campus Moncloa, UCM-UPM, Madrid 28040, Spain2 Electronic Engineering Department, ETSI Telecomunicacion, Universidad Politecnica de Madrid,
Madrid 28040, Spain; E-Mail: [email protected] IMDEA Software Institute, and Institute for Applied Physics, CSIC, Madrid 28660, Spain;
E-Mail: [email protected] DACYA, Universidad Complutense de Madrid, Madrid 28040, Spain;
E-Mails: [email protected] (J.L.A.); [email protected] (J.L.R.-M.)
* Author to whom correspondence should be addressed; E-Mail: [email protected];Tel.: +34-915-495-700 (ext. 4227); Fax: +34-913-367-323.
Received: 19 March 2012; in revised form: 23 July 2012 / Accepted: 27 July 2012 /Published: 3 August 2012
Abstract: Ubiquitous sensor network deployments, such as the ones found in Smart citiesand Ambient intelligence applications, require constantly increasing high computationaldemands in order to process data and offer services to users. The nature of these applicationsimply the usage of data centers. Research has paid much attention to the energy consumptionof the sensor nodes in WSNs infrastructures. However, supercomputing facilities are theones presenting a higher economic and environmental impact due to their very high powerconsumption. The latter problem, however, has been disregarded in the field of smartenvironment services. This paper proposes an energy-minimization workload assignmenttechnique, based on heterogeneity and application-awareness, that redistributes low-demandcomputational tasks from high-performance facilities to idle nodes with low and mediumresources in the WSN infrastructure. These non-optimal allocation policies reduce the energyconsumed by the whole infrastructure and the total execution time.
Keywords: ubiquitous sensor network; green computing; heterogeneous systems; datacenters; high performance computing; smart cities; ambient intelligence
Sensors 2012, 12 10660
1. Introduction
In the last years, Ambient Intelligence has experienced a significant development, mainly because ofthe advances in the miniaturization of processors and the proliferation of embedded systems in manydifferent objects and applications (e.g., communications, industrial, automotive, defense and healthcareenvironments). The International Data Corporation (IDC) Semiconductor research team announced inits April 2011 preliminary report that smart systems would consume more than 12.5 billion processorcores representing more than $100 billion in revenue by 2015 [1]. This means that there will be over sixtimes more microprocessor cores in smart systems than in PCs.
The ambient intelligence paradigm was supported by these advances. Built mainly upon pervasiveand ubiquitous computing, sensor networks and artificial intelligence, ambient intelligence has alwayshad the goal of creating smart environments that aided people in their daily lives, reacting and adaptingto their needs in an unnoticed way [2]. The information and knowledge society, as well as the Internetof Things, is surrounding peoples’ lives with technology by the day, especially in urban areas. In 2008,about 50% of the world’s population lived in urban areas, whereas it is envisaged that a 70% will live incities by 2050 [3]. In this urban age cities are seen as places of prosperity and opportunities. Its citizenshave high expectations that represent a challenge for the cities, especially from the technological pointof view. Cities thus become the best candidate scenarios to develop the new technological challenges,giving birth to the concept of Smart Cities.
Smart Cities are cities that perform well on 6 characteristics: economy, people, governance, mobility,environment and living [4]. The goal of Smart Cities is to improve the way in which people interactwith each other and with the urban environment. Their management represents a challenge in the field ofUbiquitous Sensor Networks (USNs), computing and communications. Smart Cities can be understoodas a macro-scale case of the Ambient Intelligence paradigm, building upon the same principles andwith the goal of offering a broad range of services, mainly in the framework of the so-called Internetof Services (IoS). They offer a broad number of services, ranging from intelligent buildings to tourismrecommendations or tracking and monitoring systems. Because of the growth in population aging, one ofthe most common applications is healthcare, especially in the field of Ambient Assisted Living systemsthat provide services to elderly people [5]. The deployment of this kind of applications in a Smart Cityrequires the usage of a large number of heterogeneous sensors (in the order of tens of thousands of units).They usually have in common the specifications that apply to Wireless Sensor Networks (WSNs): theneed to be battery-powered, low power consumption, limited resources and small size.
Research has mainly paid attention to the communication and security challenges, as well as to theenergy consumption of the Ubiquitous Sensor Networks. However, the Internet of Services has to dealwith yet another computer paradigm: the High Performance Computing (HPC) infrastructures needed totackle the computing demands in order to offer these services to the citizens. As all the data collectedby the different sensors nodes has to be processed, converted and matched with other data so as togenerate useful information, the computational needs of these systems are huge. Because of the natureof their workloads (the kind of processing that must be performed), this demand is usually satisfied bydata centers.

Sensors 2012, 12 10661
Large data centers are composed of tens of thousands of servers with tens of peta bytes of storage, andmultiple hundreds of giga bit bandwidth to the Internet. The electric bill of the data centers (includingthe electricity needed for cooling and air conditioning in the data center) was projected to pass 7 billionUS dollars in the US alone, while the power density reached 60 kW/m2 for data centers by 2010. TheEnvironmental Protection Agency (EPA), in its August 2007 report to the US Congress, affirmed thatdata centers consumed about 61 billion kilowatt-hours (kWh) in 2006, roughly 1.5 percent of total U.S.electricity consumption, for a total electricity cost of about $4.5 billion [6]. The EPA report also statedthat the energy consumption of servers and data centers has doubled from 2002 to 2005. This rapid ratesof growth in data center electricity use slowed significantly from 2005 to 2010 [7], but it still represents1.3% of all the electricity use for the world, and 2% of all electricity use for the US, yielding worldwide to250 billion kWh per year. According to a 2008 Gartner report [8], 50% of data centers would soon haveinsufficient power and cooling capacity to meet the demands of high-density equipment. Nowadays,apart from data center energy consumption and associated costs, there is an increasing interest in theenvironmental impact of data centers, in terms of their carbon dioxide (CO2) footprint.
Until now, it has been assumed that the computation needed by the applications of the Internet ofServices would be performed “in the cloud”, without paying much attention to the inherent problemsof this assumption. Only recent works have begun to work on architectures that take into account thecomputational needs [9]. This kind of approaches often disregard the energy consumption derived fromthe computation and cooling in the HPC facilities. However, the high economical and environmentalimpact of the energy consumption in data centers requires aggressive energy optimization policies. Thesepolicies have been already detected but not successfully proposed.
Our research work proposes an energy management solution to tackle the computational needsof smart environments and ambient intelligence applications that makes use of energy-minimizationworkload assignment policies. The goal is to minimize the energy consumption (and thus, the electricitybill) of the data centers that process the data provided by the sensors, by redistributing part of thecomputational demand on the HPC servers to the idle resources of a WSN infrastructure. This WSNinfrastructure will be comprised of (i) a large amount of sensor nodes (in the order of thousands) withvery-low resources; (ii) a smaller number (in the order of hundreds) of base stations with low resourcesand (iii) a few gateway nodes (the order of tens) with medium resources. The proposed solution off-loadscomputation from the HPC facility to the base station and gateway nodes, taking profit from their idlecomputing times. It does so by profiling the different tasks of the workload to be executed, classifyingthem in the HPC facility and predicting their energy parameters for the other nodes. The solution is thusbased on application-awareness and node heterogeneity, and is built upon previous work, which provesthat the usage of node heterogeneity at the data center level can yield substantial energy reductions [10].In this case, however, the concept of heterogeneity is ported from the data center level to the smart serviceinfrastructure. The main idea behind this work is to reduce energy by allocating the lowest-demand tasksto the low-power and low-resource nodes, while sending the highest-demand tasks to the HPC servers.This way, the workload is scheduled in the devices where it has a better performance. These techniquesreduce considerably the amount of energy used by the High-Performance infrastructure while increasingperformance. This work advances in the technology of energy-efficient computing in IoS and Ambient
Sensors 2012, 12 10662
Intelligence applications, and in the mechanisms to place data centers in a more scalable and sustainableenergy-efficiency curve.
This paper is organized as follows: Section 2 gives further information on the motivation and therelated work on this topic. Section 3 presents an overview of the proposed solution. The allocationalgorithms are presented in Section 4. Results and evaluation are shown in Section 5. Finally, the mainconclusions of the paper are drawn in Section 6.
2. Related Work
A Smart City can be defined as a city that “uses information and communications technologiesto make the critical infrastructure components and services of a city more aware, interactive andefficient” [11]. There is an important and bidirectional relationship between the Internet of Things,Services and People—that is, the future Internet—and the applications for Smart Cities and AmbientIntelligence. All of them need to provide support for heterogeneity, mobility, scalability, security, privacyand trust. Because of these similarities in functionality, they face the same challenges. Amongst other,some of these challenges are: (i) the need to manage heterogeneity in a large number of dispersedsensors and servers; (ii) the huge amount of heterogeneous information to be processed; (iii) the needto have this information available everywhere and always and (iv) and the need to use a commoncommunication network.
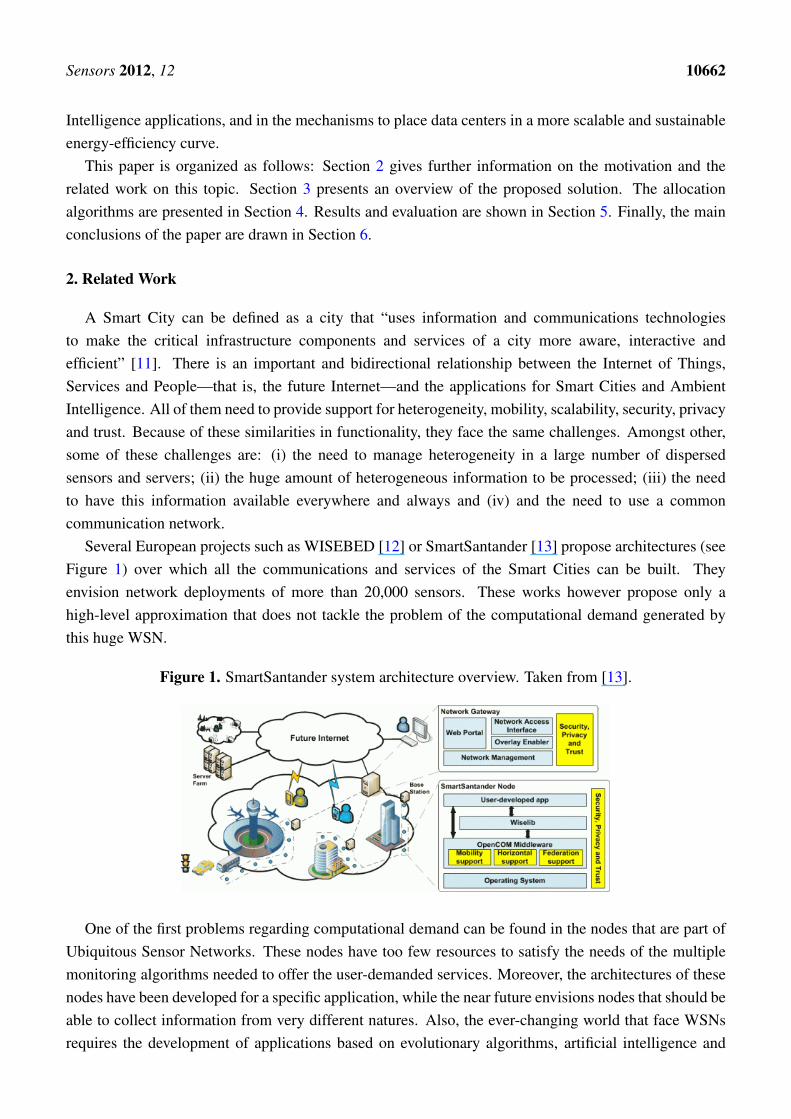
Several European projects such as WISEBED [12] or SmartSantander [13] propose architectures (seeFigure 1) over which all the communications and services of the Smart Cities can be built. Theyenvision network deployments of more than 20,000 sensors. These works however propose only ahigh-level approximation that does not tackle the problem of the computational demand generated bythis huge WSN.
Figure 1. SmartSantander system architecture overview. Taken from [13].
One of the first problems regarding computational demand can be found in the nodes that are part ofUbiquitous Sensor Networks. These nodes have too few resources to satisfy the needs of the multiplemonitoring algorithms needed to offer the user-demanded services. Moreover, the architectures of thesenodes have been developed for a specific application, while the near future envisions nodes that should beable to collect information from very different natures. Also, the ever-changing world that face WSNsrequires the development of applications based on evolutionary algorithms, artificial intelligence and

Sensors 2012, 12 10663
learning. The power consumption of WSNs is not ready either to tackle with the computational loadsneeded for the algorithms and still be low-power and battery-operated.
The amount of information generated by a global deployment of a WSN thus implies the usageof a data center in order to store and process the obtained data. Meanwhile, these data center willhave to provide the required infrastructure to perform all the computations needed by the executingapplications. These applications are very different in nature, ranging from medical diagnosis applicationsto weather forecasts.
On the other hand, supercomputing facilities present a huge economic and environmental impactdue to their very high power consumption. There are a number of different techniques to reducethe energy cost and power density in data centers in different levels of granularity: chip-level, serverlevel, rack level, data center level, etc. Over the last years, this problem has been addressed by thewell-known technique of Dynamic Voltage and Frequency Scaling (DVFS) [14], load monitoring [15],the introduction of heuristics to minimize the total power of a data center [16] or dynamic resourceprovisioning [17].
In spite of all these measures, the energy consumption of data centers keeps growing, mainlybecause of the dramatic increase of supercomputing facilities. Figure 2 shows the number of worldservers installed from 2000 to 2010. As it can be seen, the increase is currently reaching 5.75 millionnew servers per year. This translates into huge amounts of power consumption, mainly devoted to theinfrastructure of the data centers and the volume servers (see Figure 3. The total energy usage bydata centers is expected to exceed 400 GWh/year on 2015. Bearing this data in mind, it is clear thatcurrent effort is not enough, and that further research should be made to reduce power consumption ofsupercomputing facilities.
Figure 2. World servers installed (thousands).
Figure 3. Electricity use by data centers (billion kWh/year).

Sensors 2012, 12 10664
For data centers that have highly-variable loads, a very common technique for energy reduction isto move tasks from under-saturated servers to other servers and turn off the unused machines [18].As the idle power of a server sometimes accounts for more that 50% of the maximum power of theserver [19], great saving can come from using only the appropriate number of servers and turning offthe unused ones. This is not the case, however, of data centers for smart-environment services. In HPCdata centers with very stable workloads, occupancy levels are constantly high. This kind of data centersare usually dimensioned for the particular workload and the services they are using. These solutionswould be complementary to our work and could be applied once some of the computation of the datacenter has been off-loaded to the WSN infrastructure—thanks to our allocation algorithms—and, thus,the occupancy levels become lower.
Most of the works proposing allocation algorithms have traditionally applied Mixed-IntegerLinear Programming (MILP) or Mixed Integer Non-Linear Programming (MINLP) [20], Greedyalgorithms [21] or Markov Chain algorithms [22] in order to generate the best task allocations. Most ofthese approaches do not propose a precise objective function and/or accurate mathematical formulationof the optimization problem. Although some of these solutions behave well in homogeneous data centerlevel scenarios, they do not consider the heterogeneity inherent to smart environment applications. Inthis paper we consider, not only the heterogeneity that comes from the usage of different servers insidean HPC facility, but the usage of heterogeneous elements outside of the facility.
Moreover, for large deployments such as the ones of Smart Cities, linear minimization algorithmspresent scalability problems. This work proposes the usage of non-optimal fast scheduling solutionsfor the energy optimization problem, by the usage of Satisfiability Modulo Theories (SMT) solvers in ahybrid ambient made of data center HPC servers, PC-like servers and embedded base station systems ofWSN infrastructures.
Recently, some enterprises like BrightComputing [23] have begun to develop software tools thatallow to allocate tasks both in HPC facilities and in the cloud. This is clearly a response to the needof allocating HPC-workloads in HPC facilities and cloud-workloads in cloud servers. Slurm [24]resource manager will soon provide support for these features too. The application-awareness is thusrecognized to be a good way towards energy minimization. However, an accurate application-awarenessand energy-optimization allocation algorithm has not yet been proposed.
In this paper, we will be using a modified version of the Slurm resource manager in order to allocatethe workload not only in the HPC facility but also in the WSN infrastructure. To do so, we will formallypropose and implement a dynamic optimization algorithm that allows the allocation of the workload onruntime inside and outside of the HPC facility.
3. Proposed Solution
In this section, the architecture overview of the proposed solution is presented, as well as therequirements that the system has to accomplish. We also explain the different techniques used, and theirsimilarities and dissimilarities when compared to the most common data center allocation scenarios.

Sensors 2012, 12 10665
3.1. Heterogeneous Architecture Overview
First, in order to develop our solution, we will assume that the aforementioned Smart City architectureis representative. Taking its main elements as a reference, we can state that the services will bedeployed over a network with a topology like the one depicted in Figure 4, which is comprised of thefollowing components: (i) sensor nodes; (ii) base stations; (iii) gateways and (iv) HPC servers, organizedas follows.
Figure 4. Proposed network topology.
A Wireless Sensor Network (WSN) or a Ubiquitous Sensor Network (USN) is composed of a greatnumber of sensor nodes with very limited resources. A small part of these sensor nodes may have adirect connection to the Internet (via 3G, for example). The majority of them, however, situated inhighly dense sensor node areas, will not have a direct connection to the Internet, but will instead transmittheir information to a base station. Whereas the sensor node is low-power, battery-operated and has verylow resources (typically the sensor nodes have tiny microcontrollers, of tens of MHz of frequency), thebase station is usually a microprocessor-based embedded system with higher computational capabilities(working at frequencies of hundreds of MHz). The base stations are often connected via radio to thenodes (e.g., WiFi, Bluetooth, RF, Zigbee), via Ethernet to a gateway or directly to the Internet. They arealso usually AC powered. These kind of systems have much more sensor nodes than base stations (inthe order of 100–200 nodes per base station).
In some ubiquitous distributed systems, the base station could be the last step between the nodes andthe HPC infrastructure that provides and centralizes the services. In the real world, however, and forlarge deployments such as the ones in Smart Cities, the gateways are responsible for the interaction withthe real service provider. These gateways are often PC servers, with higher computing resources thanthe base stations (e.g., a dual core processor @2 GHz with 2 GB of memory). These PCs can be foundeither connected to the base stations or not, and usually provide graphical interfaces to end-users forconfiguration, process data and provide security and trust (see also Figure 1).
It must be noted that, during the normal 24/7 operation of the network, all the sensor nodes, gatewaysand PC servers will be turned on. The gateways and PC servers might be idle for part of their time;

Sensors 2012, 12 10666
however, they are not turned off. The HPC servers can be turned off or re-used to compute data for otherapplications. In Table 1 we summarize the approximate parameters of these elements.
Table 1. Network components.
Element Processor Frequency RAM Idle Power Max. Power
Sensor node Microcontroller 50 MHz 256 KB <30 mW <100 mW(<3 mV sleep)
Base station Embedded µP 500 MHz 256 MB 3 W 5 WGateway Dual-core 2 GHz 1 GB 75 W 150 W
HPC server 2 × Quad-core 2.6 GHz 8 GB 150 W 750 W
The computational demand of the services deployed in the network is often just processed in theHPC infrastructure. In this paper we propose to distribute this computation to the base stations andthe gateways of the network. These systems have much lower power consumption than the HPCserver and, in their idle times, can be used to process the non-intensive parts of the workload tobe executed. Moreover, even though in this paper we will not tackle the cooling costs of the HPCinfrastructure, it must be noted that cooling accounts for a 30%–50% of the total energy demand of theHPC infrastructure. Decreasing the computational energy of the HPC servers also decreases the coolingcost. The lower-resource nodes do not need cooling equipment and, thus, the savings are even greater.To distribute the computation towards all the available nodes, we will use the workload allocation andresource managing techniques that are explained in the next subsection.
3.2. Workload Allocation and Resource Manager
In order to allocate and manage the computational demands of the services deployed in Smart Citiesand ambient intelligence, we will use some scheduling concepts that come from the world of data centersand HPC.
The raw information collected by the WSN sensor nodes will have to be parsed and converted,algorithms will have to be applied and exhaustive processing will be performed to generate usefulinformation. This process comprises the execution of a lot of tasks. As long as the services providedto users do not change, all these tasks, very heterogeneous in nature, will be repeated through time withlittle changes: the algorithms to be performed each time will be the same, and the only variation will bethe data used.
Thus, we can assume that the workload exhibited during a period of time (i.e., one day) isrepresentative of the workload that the WSN and data center facility will have in any other period of time(i.e., the next day). This workload can be understood as a collection of job sets randomly distributed intime. Each job set is composed of a random number parallel tasks without data dependencies; however,the number of different tasks is fixed for all workloads and all the tasks in the job-set are labelled. Thismeans that, when a job-set arrives, the resource manager knows how many tasks of each type it has.As the tasks repeat through time, it will be possible to profile them (in terms of CPU usage, memory

Sensors 2012, 12 10667
usage, etc.) and measure the energetic demand (in kWh) of the tasks in the HPC servers, in order tocharacterize its computing needs. The data used by each of the tasks will be generated in different sensornodes across the WSN infrastructure. We understand that even though the tasks are the same, the datathey use will come from different sensor nodes each time. We assume, however, that the differences inthe dataset do not impact the energy profiling of the tasks, as what drives the energy consumption is thealgorithm used, not the dataset.
Moreover, once characterization is performed, we will be able to classify the tasks according to theircomputational demand. This way, tasks exhibiting low (and even medium) computational demands canbe allocated to outside the HPC facility.
In order to allocate the tasks to both inside and outside the HPC facility, we will make use of aResource Manager (Slurm, in this particular case, which is one of the most commonly used). Thetraditional functional system found in today’s data centers comprises: (i) a task scheduler, which queuesthe tasks in time, deciding their priority of execution; and (ii) a resource manager, which has theknowledge of the available resources of the system and decides where each task is going to be executed.
In our case, we assume that the workload entering the system has already been scheduled by acommercial scheduler, and we implement our solution in the resource manager.
The complete system is described by Figure 5, and works as follows:
• Cluster creation: Before a service starts, a cluster of machines is created. One of the HPC servers inthe facility acts as the Resource Manager (RM). The cluster is composed of an arbitrary number ofbase stations, gateways and HPC servers. Machines are divided into different partitions accordingto their resources and are assigned a different location identifier depending on the physical locationwhere they are deployed. Each gateway and base station will manage the tasks whose data comesfrom sensors in their same (or nearest) location.
• Profiling and classification: When a service is launched, the first job set arriving to the HPCfacility is used for profiling and classification purposes. Each different task that composes the jobset is sent to a node only in the HPC facility. While executing, the different tasks are profiledto obtain the following parameters: total execution time, memory usage, average CPU load andenergy consumption. They are classified by using a naive k-means algorithm in 3 different classesaccording to their computational demand: high-demand, mid-demand and low-demand. As thetasks of the job-set are labelled, the second and subsequent job-sets will be directly classified intoone of these three classes by the allocation algorithm.
• Ubiquitous Green Allocation techniques: the purpose of the allocation is to reduce the energyconsumption of the HPC infrastructure while tackling the computational demand of the servicesin the smart facility. To do so, the allocation algorithm will first identify and classify the newincoming tasks into one of the already-existing groups, which have already been assigned to oneof the three different classes. Next, according to the idle resources available, it will try to placehigh-demand tasks in the HPC servers, mid-demand tasks in gateways and low-demand tasks inbase stations. In order to tackle the data locality issues, tasks will be executed as near as possibleto where the data they need is generated. This way, data will not have to travel through the WSNinfrastructure to the HPC facility.

Sensors 2012, 12 10668
Figure 5. Energy Optimization System.
In Section 4, the Ubiquitous Green Allocation techniques are formally detailed and further explained.These algorithms will be implemented as a new Slurm plug-in and will be executed on runtime each timea new job set arrives.
4. Ubiquitous Green Allocation Algorithms
The idea behind this allocation algorithm is to minimize the total energy consumption of the smartinfrastructure (by using the processors of the HPC facility and the base stations and gateways of theWSN infrastructure). This goal can be described as follows:
Let us denote by P a set of processors and by T a set of tasks that must be executed. Each processor pbelongs to one machine m—a machine could be either a server, a gateway or a base station—denoted aspm, which consumes certain idle power πm. Every task t has a duration and consumes a certain amountof energy depending on the target processor, σtp and etp respectively. τmax is the time instant at which allthe tasks have been executed. The problem consists in finding the most appropriate allocation of tasks tin processors p, that minimizes the energy consumption, as expressed in Equation (1). In other words, toglobally minimize the energy consumption we have to minimize the sum of (i) the energy variation etpthat occurs when allocating a particular task t in a particular processor p and (ii) the energy that machinesconsume for the fact of being turned on, that is, the idle power they consume multiplied by the completeexecution time.
Minimize
{ ∑t∈T,p∈P
etp +∑m∈M
πm · τmax
}(1)
However, for our particular case, the allocation step has to take into account several more variables:(i) the number of idle gateways and base stations available when a new job set arrives; (ii) the resourcesof these nodes and the performance of each task in each node; (iii) the data locality issues; and (iv) thetotal amount of time to compute the solutions so as to improve performance.
Even though Equation 1 can be solved by means of a linear minimization [10] to obtain energy savingswhen allocating tasks to heterogeneous nodes, the new restrictions imposed in our case, as well as the

Sensors 2012, 12 10669
need to compute the allocation of a high number of tasks in a high number of nodes, suggest the usageof other solutions rather than an ILP solver. Because of the nature of linear minimization problems, theypresent good solutions for a relatively small number of nodes. In a deployment aimed to give serviceto thousands of users, this kind of algorithms does not scale, and it would be better to implement newalgorithms that speed-up the allocation process.
Because of its speed and versatility for adding new restrictions, in this work we have decided toimplement the solution by means of an SMT solver. Even though this kind of solver does not obtainan optimal solution, we will prove that, if iteratively executed for a small amount of time, it providessolutions that considerably reduce the energy consumed by the facility.
The proposed solution can be implemented in a two-step iterative algorithm:
• To calculate the best type of node for each task: this step comprises the assignment of differenttypes of tasks to different types of processors. Given the resulting 3 classes of the task classificationstep, we have to match different cpu-demand tasks to resources. The algorithm will take intoaccount the place where the dataset needed to perform the task was generated, as well as theamount of resources near the data generators. That is, depending on the number of processors ofeach type (base station, gateways, HPC), the number of tasks of each type, and the place wheredata was generated, we will get and idea of where should each type of task be executed. Thegeneral constraint here will be that: (i) a low-resource node can only execute a subset (or thewhole set) or low-demand tasks; (ii) a medium-resource node can execute a subset of low-demandand mid-demand tasks; and (iii) a high-resource node can execute all tasks. The SMT solverdecides which subset of tasks from the allowed ones does each node execute.
• To assign tasks to nodes: The second step consists in a greedy solution that tries to allocate themaximum number of tasks (without exceeding a maximum time) in the nearest lowest-resourcenodes first—which are the best from the energy-efficiency point of view. That is, it will try toallocate first the low-demand tasks in Base Stations nodes. The SMT solver checks whether theallocation is possible and obtains a solution. If the conditions are satisfiable, it proceeds to allocatemid-demand tasks in gateway nodes. If they are not, it allocates less tasks in base station nodes,and allocates the remaining tasks in medium-resource nodes. In order to decide which tasks shouldremain in low-resource nodes or be migrated to mid-resource nodes, we again make use of thealgorithm in the first step. All the tasks than can neither be executed in low-resource nodes nor inmedium-resource nodes are executed in the HPC facility.
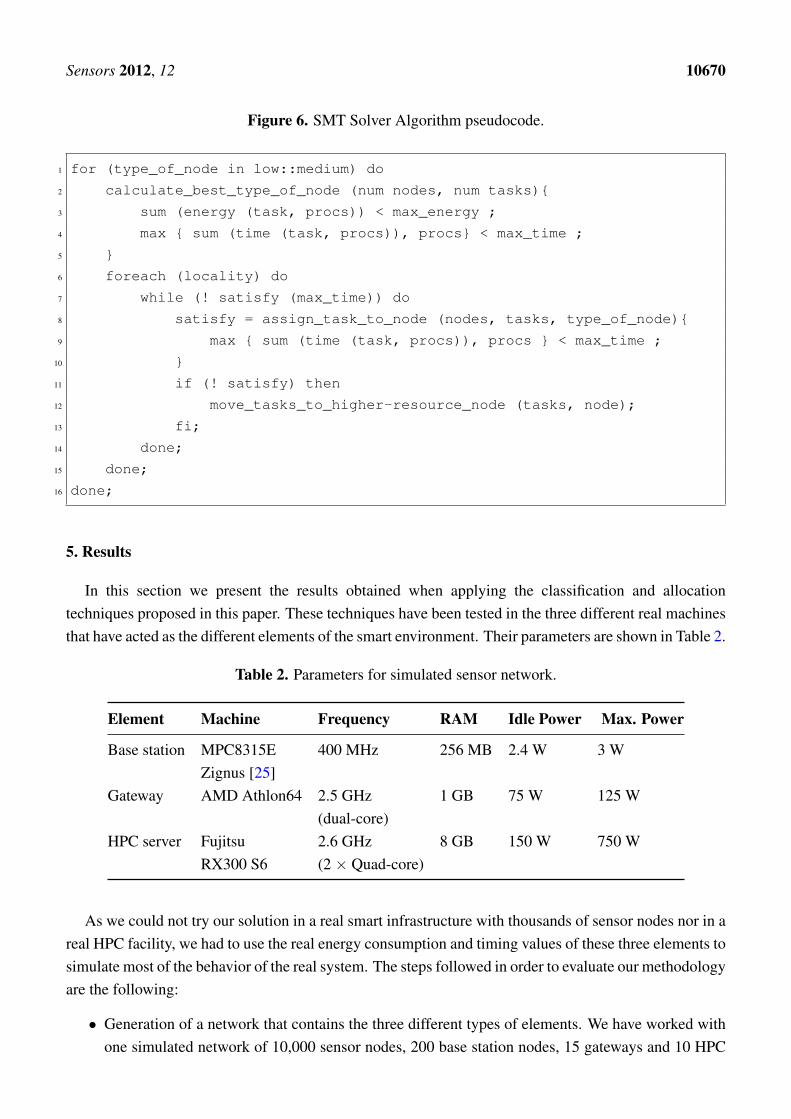
The pseudo-code for the complete algorithm is given in Figure 6.We choose the maximum time as the maximum for a similar scheduling in the HPC
infrastructure—that is, the case in which all tasks are allocated in high-resource nodes. That time isreduced by using the SMT solver to place low and medium demand tasks in low and medium resourcenodes. It must be noted that locality is managed in such a way that, if the algorithm is unable to allocatea task of, e.g., locality 1 into either the low or the medium-resource nodes, it will allocate the task intothe HPC facility, not into an element belonging to locality 2. This way, the algorithm minimizes thecommunication energy between nodes as well. The aforementioned algorithm will have to be executedeach time a new job set arrives, in order to allocate the workload.
Sensors 2012, 12 10670
Figure 6. SMT Solver Algorithm pseudocode.
1 for (type_of_node in low::medium) do
2 calculate_best_type_of_node (num nodes, num tasks){
3 sum (energy (task, procs)) < max_energy ;
4 max { sum (time (task, procs)), procs} < max_time ;
5 }
6 foreach (locality) do
7 while (! satisfy (max_time)) do
8 satisfy = assign_task_to_node (nodes, tasks, type_of_node){
9 max { sum (time (task, procs)), procs } < max_time ;
10 }
11 if (! satisfy) then
12 move_tasks_to_higher-resource_node (tasks, node);
13 fi;
14 done;
15 done;
16 done;
5. Results
In this section we present the results obtained when applying the classification and allocationtechniques proposed in this paper. These techniques have been tested in the three different real machinesthat have acted as the different elements of the smart environment. Their parameters are shown in Table 2.
Table 2. Parameters for simulated sensor network.
Element Machine Frequency RAM Idle Power Max. Power
Base station MPC8315E 400 MHz 256 MB 2.4 W 3 WZignus [25]
Gateway AMD Athlon64 2.5 GHz 1 GB 75 W 125 W(dual-core)
HPC server Fujitsu 2.6 GHz 8 GB 150 W 750 WRX300 S6 (2 × Quad-core)
As we could not try our solution in a real smart infrastructure with thousands of sensor nodes nor in areal HPC facility, we had to use the real energy consumption and timing values of these three elements tosimulate most of the behavior of the real system. The steps followed in order to evaluate our methodologyare the following:
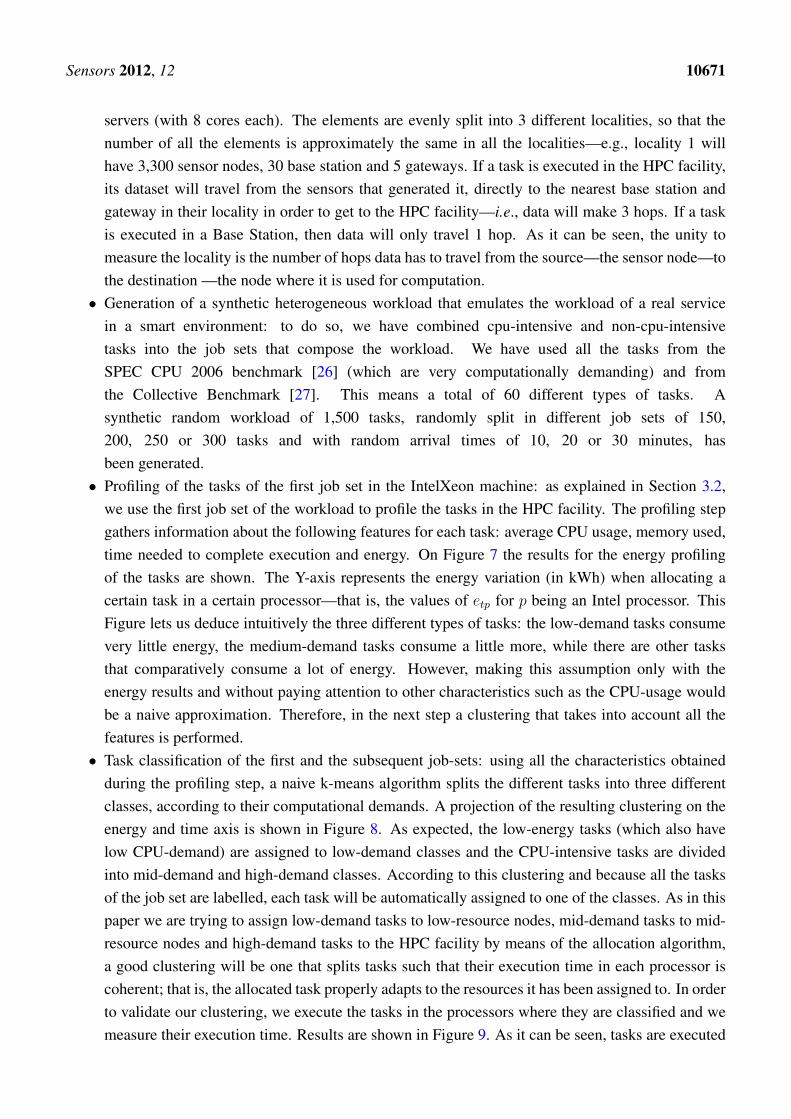
• Generation of a network that contains the three different types of elements. We have worked withone simulated network of 10,000 sensor nodes, 200 base station nodes, 15 gateways and 10 HPC
Sensors 2012, 12 10671
servers (with 8 cores each). The elements are evenly split into 3 different localities, so that thenumber of all the elements is approximately the same in all the localities—e.g., locality 1 willhave 3,300 sensor nodes, 30 base station and 5 gateways. If a task is executed in the HPC facility,its dataset will travel from the sensors that generated it, directly to the nearest base station andgateway in their locality in order to get to the HPC facility—i.e., data will make 3 hops. If a taskis executed in a Base Station, then data will only travel 1 hop. As it can be seen, the unity tomeasure the locality is the number of hops data has to travel from the source—the sensor node—tothe destination —the node where it is used for computation.
• Generation of a synthetic heterogeneous workload that emulates the workload of a real servicein a smart environment: to do so, we have combined cpu-intensive and non-cpu-intensivetasks into the job sets that compose the workload. We have used all the tasks from theSPEC CPU 2006 benchmark [26] (which are very computationally demanding) and fromthe Collective Benchmark [27]. This means a total of 60 different types of tasks. Asynthetic random workload of 1,500 tasks, randomly split in different job sets of 150,200, 250 or 300 tasks and with random arrival times of 10, 20 or 30 minutes, hasbeen generated.
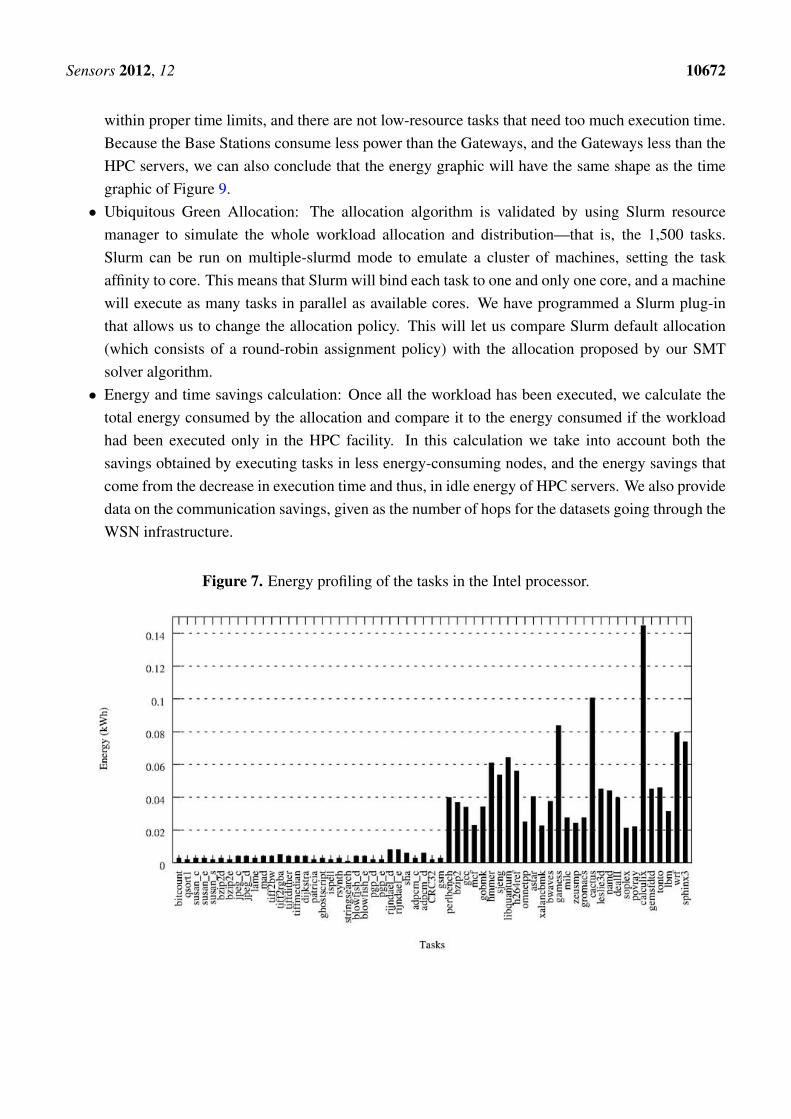
• Profiling of the tasks of the first job set in the IntelXeon machine: as explained in Section 3.2,we use the first job set of the workload to profile the tasks in the HPC facility. The profiling stepgathers information about the following features for each task: average CPU usage, memory used,time needed to complete execution and energy. On Figure 7 the results for the energy profilingof the tasks are shown. The Y-axis represents the energy variation (in kWh) when allocating acertain task in a certain processor—that is, the values of etp for p being an Intel processor. ThisFigure lets us deduce intuitively the three different types of tasks: the low-demand tasks consumevery little energy, the medium-demand tasks consume a little more, while there are other tasksthat comparatively consume a lot of energy. However, making this assumption only with theenergy results and without paying attention to other characteristics such as the CPU-usage wouldbe a naive approximation. Therefore, in the next step a clustering that takes into account all thefeatures is performed.
• Task classification of the first and the subsequent job-sets: using all the characteristics obtainedduring the profiling step, a naive k-means algorithm splits the different tasks into three differentclasses, according to their computational demands. A projection of the resulting clustering on theenergy and time axis is shown in Figure 8. As expected, the low-energy tasks (which also havelow CPU-demand) are assigned to low-demand classes and the CPU-intensive tasks are dividedinto mid-demand and high-demand classes. According to this clustering and because all the tasksof the job set are labelled, each task will be automatically assigned to one of the classes. As in thispaper we are trying to assign low-demand tasks to low-resource nodes, mid-demand tasks to mid-resource nodes and high-demand tasks to the HPC facility by means of the allocation algorithm,a good clustering will be one that splits tasks such that their execution time in each processor iscoherent; that is, the allocated task properly adapts to the resources it has been assigned to. In orderto validate our clustering, we execute the tasks in the processors where they are classified and wemeasure their execution time. Results are shown in Figure 9. As it can be seen, tasks are executed
Sensors 2012, 12 10672
within proper time limits, and there are not low-resource tasks that need too much execution time.Because the Base Stations consume less power than the Gateways, and the Gateways less than theHPC servers, we can also conclude that the energy graphic will have the same shape as the timegraphic of Figure 9.
• Ubiquitous Green Allocation: The allocation algorithm is validated by using Slurm resourcemanager to simulate the whole workload allocation and distribution—that is, the 1,500 tasks.Slurm can be run on multiple-slurmd mode to emulate a cluster of machines, setting the taskaffinity to core. This means that Slurm will bind each task to one and only one core, and a machinewill execute as many tasks in parallel as available cores. We have programmed a Slurm plug-inthat allows us to change the allocation policy. This will let us compare Slurm default allocation(which consists of a round-robin assignment policy) with the allocation proposed by our SMTsolver algorithm.
• Energy and time savings calculation: Once all the workload has been executed, we calculate thetotal energy consumed by the allocation and compare it to the energy consumed if the workloadhad been executed only in the HPC facility. In this calculation we take into account both thesavings obtained by executing tasks in less energy-consuming nodes, and the energy savings thatcome from the decrease in execution time and thus, in idle energy of HPC servers. We also providedata on the communication savings, given as the number of hops for the datasets going through theWSN infrastructure.
Figure 7. Energy profiling of the tasks in the Intel processor.

Sensors 2012, 12 10673
Figure 8. Clustering results. Projection over energy and time axis.
−1 −0.5 0 0.5 1 1.5 2 2.5 3 3.5 4−1
−0.5
0
0.5
1
1.5
2
2.5
3
3.5
Low−demandingMedium−demandingHigh−demandingVery−High−demandingCentroids
Figure 9. Execution time (in seconds) for tasks in their class.
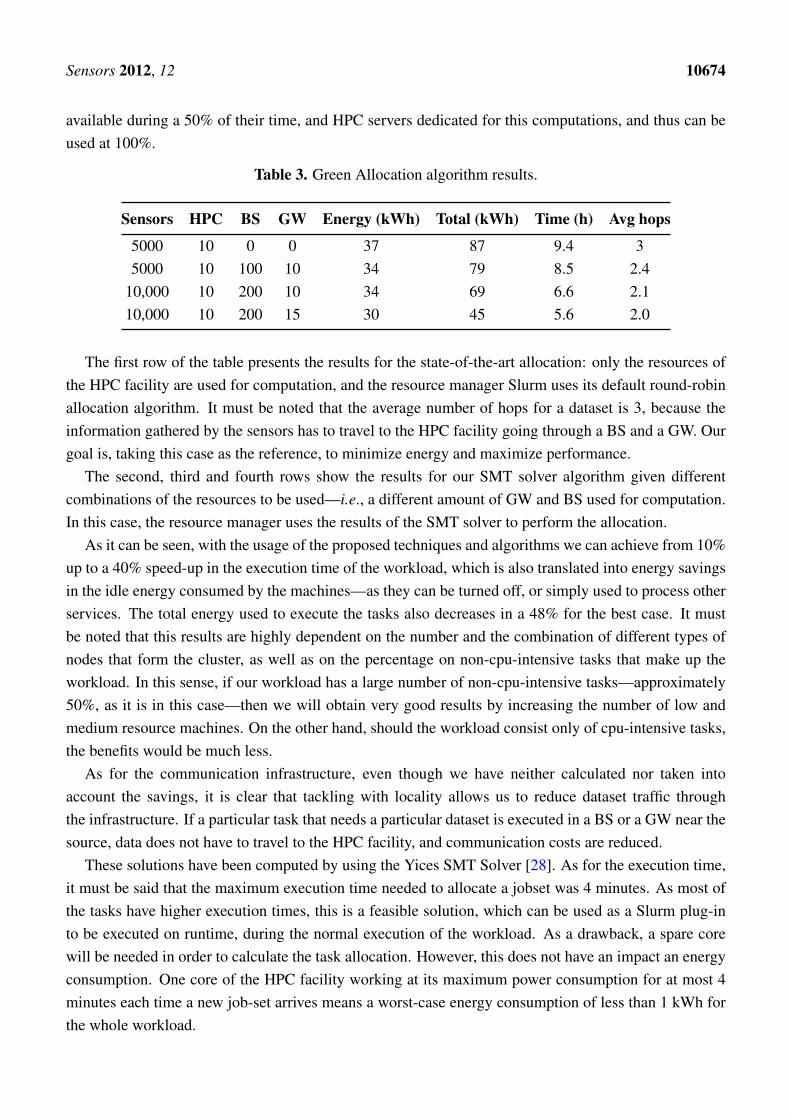
Table 3 shows the results, in terms of the energy used to execute tasks, the total energy consumed(energy to execute tasks plus idle energy of the HPC machines for the fact of being turned on), executiontime of the allocation for different configurations of HPC servers (HPC), Base stations (BS) and gateways(GW), and the average number of hops for the datasets (that is, the communication energy). We haveconsidered that BSs are idle and available to compute during a 25% of their time; GWs are idle and
Sensors 2012, 12 10674
available during a 50% of their time, and HPC servers dedicated for this computations, and thus can beused at 100%.
Table 3. Green Allocation algorithm results.
Sensors HPC BS GW Energy (kWh) Total (kWh) Time (h) Avg hops
5000 10 0 0 37 87 9.4 35000 10 100 10 34 79 8.5 2.4
10,000 10 200 10 34 69 6.6 2.110,000 10 200 15 30 45 5.6 2.0
The first row of the table presents the results for the state-of-the-art allocation: only the resources ofthe HPC facility are used for computation, and the resource manager Slurm uses its default round-robinallocation algorithm. It must be noted that the average number of hops for a dataset is 3, because theinformation gathered by the sensors has to travel to the HPC facility going through a BS and a GW. Ourgoal is, taking this case as the reference, to minimize energy and maximize performance.
The second, third and fourth rows show the results for our SMT solver algorithm given differentcombinations of the resources to be used—i.e., a different amount of GW and BS used for computation.In this case, the resource manager uses the results of the SMT solver to perform the allocation.
As it can be seen, with the usage of the proposed techniques and algorithms we can achieve from 10%up to a 40% speed-up in the execution time of the workload, which is also translated into energy savingsin the idle energy consumed by the machines—as they can be turned off, or simply used to process otherservices. The total energy used to execute the tasks also decreases in a 48% for the best case. It mustbe noted that this results are highly dependent on the number and the combination of different types ofnodes that form the cluster, as well as on the percentage on non-cpu-intensive tasks that make up theworkload. In this sense, if our workload has a large number of non-cpu-intensive tasks—approximately50%, as it is in this case—then we will obtain very good results by increasing the number of low andmedium resource machines. On the other hand, should the workload consist only of cpu-intensive tasks,the benefits would be much less.
As for the communication infrastructure, even though we have neither calculated nor taken intoaccount the savings, it is clear that tackling with locality allows us to reduce dataset traffic throughthe infrastructure. If a particular task that needs a particular dataset is executed in a BS or a GW near thesource, data does not have to travel to the HPC facility, and communication costs are reduced.
These solutions have been computed by using the Yices SMT Solver [28]. As for the execution time,it must be said that the maximum execution time needed to allocate a jobset was 4 minutes. As most ofthe tasks have higher execution times, this is a feasible solution, which can be used as a Slurm plug-into be executed on runtime, during the normal execution of the workload. As a drawback, a spare corewill be needed in order to calculate the task allocation. However, this does not have an impact an energyconsumption. One core of the HPC facility working at its maximum power consumption for at most 4minutes each time a new job-set arrives means a worst-case energy consumption of less than 1 kWh forthe whole workload.

Sensors 2012, 12 10675
6. Conclusions
This paper proposes novel energy management techniques to tackle the computational needs of smartcities and ambient intelligence applications, by making use of energy-minimization workload assignmentpolicies. These techniques are inspired by the solutions that come from the world of data centers.They use application-awareness and heterogeneity in order to assign low-demand and mid-demandcomputational tasks to idle nodes with low and medium resources in the WSN infrastructure, insteadof executing them in the HPC infrastructure. The proposed solution uses SMT solvers to generateenergy-efficient assignments that take into account several variables such as maximum execution timeand data locality. The results prove that this kind of non-optimal assignment can increase the energysavings of the smart infrastructure up to a 40%, mainly because of the savings that come from decreasedexecution times. Also, the usage of this kind of algorithms allows the implementation of energy-efficienttask assignments in large sensor deployments.
Future work will focus on the development of more accurate and efficient SMT solver algorithms,which contemplate more constraints of the problem, as well as on the usage of real smart environmentapplications, such as healthcare services. Also, an accurate comparison between the performance ofILP minimizations and SMT solvers for different sizes of the WSN deployment is envisioned. In thenear future a simulation framework will be developed that integrates all the components together—HPC infrastructure, WSNs, communications and Slurm RM—in order to evaluate more accurately thebeneficial impact of the data locality on energy savings and performance.
Acknowledgments
Research by Marina Zapater has been partly supported by a PICATA predoctoral fellowship of theMoncloa Campus of International Excellence (UCM-UPM).
The authors would like to thank the staff of Advanced Wireless Dynamics S.L., who kindly lent ustheir wireless nodes and Zignus base station boards to generate real data for the simulations performedin this paper.
References
1. IDC. IDC Predicts Smart Systems Microprocessor Cores to Double to Over 12 Billion by 2015;Technical Report; International Data Corporation Semiconductors Research Group: San Mateo,CA, USA, 2011.
2. Augusto, J.C. Past, Present and Future of Ambient Intelligence and Smart Environments. InAgents and Artificial Intelligence; Verlag, S., Ed.; Springer Verlag: Berlin/Heidelberg, Germany,2009; pp. 1–15.
3. Streitz, N. Smart Cities, Ambient Intelligence and Universal Access. Lect. Notes Comput. Sci.2011, 6767, 425–432.
4. Hernandez-Munoz, J.M.; Vercher, J.B.; Munoz, L.; Galache, J.A.; Presser, M.; Gomez, L.A.H.;Pettersson, J. Smart Cities at the Forefront of the Future Internet. In The Future Internet; Springer-Verlag: Berlin/Heidelberg, Germany, 2011; pp. 447–462.

Sensors 2012, 12 10676
5. Lezoray, J.B.; Segarra, M.T.; Phung-Khac, A.; Thepaut, A.; Gilliot, J.M.; Beugnard, A. A designprocess enabling adaptation in pervasive heterogeneous contexts. Pers. Ubiquitous Comput. 2011,15, 353–363.
6. EPA. EPA Report to Congress on Server and Data Center Energy Efficiency; Technical Report;U.S. Environmental Protection Agency: Santa Clara, CA, USA, 2007.
7. Koomey, J. Growth in Data Center Electricity Use 2005 to 2010; Technical Report; AnalyticsPress: Oakland, CA, USA, 2011.
8. Gartner. Meeting the DC Power and cooling Challenge. 2008.9. Bavier, A.C.; Yuen, M.; Blaine, J.; McGeer, R.; Young, A.A.; Coady, Y.; Matthews, C.; Pearson,
C.; Snoeren, A.; Mambretti, J. TRANSCLOUD: Design Considerations for a High-PerformanceCloud Architecture Across Multiple Administrative Domain. In Proceedings of the 1st Interna-tional Conference on Cloud Computing and Services Science (CLOSER 2011), Noordwijkerhout,The Netherlands, 7–9 May 2011.
10. Marina, Z.; Ayala, J.L.; Moya, J.M. Leveraging Heterogeneity for Energy Minimization in DataCenters. In Proceedings of the 2012 IEEE/ACM International Symposium on Cluster, Cloud andGrid Computing, Ottawa, ON, USA, 13–16 May 2012; pp. 752–757.
11. Belissent, J. Getting Clever About Smart Cities: New Opportunities Require New Business Models;Forrester Research, Inc.: Cambridge, MA, USA, 2010.
12. Chatzigiannakis, I.; Fischer, S.; Koninis, C.; Mylonas, G.; Pfisterer, D. WISEBED: An OpenLarge-Scale Wireless Sensor Network Testbed. Lect. Notes Inst. Comput. Sci. Soc. Inf.Telecommun. Eng. 2010, 29, 68–87.
13. Sanchez, L.; Galache, J.; Gutierrez, V.; Hernandez, J.; Bernat, J.; Gluhak, A.; Garcia, T.SmartSantander: The Meeting Point between Future Internet Research and Experimentation andthe Smart Cities. In Proceedings of the Future Network Mobile Summit (FutureNetw), Warsaw,Poland, 15–17 June 2011; pp. 1–8.
14. Pinheiro, E.; Bianchini, R.; Carrera, E.V.; Heath, T. Load Balancing and Unbalancing for Powerand Performance in Cluster-Based Systems. In Proceedings of the Workshop on Compilers andOperating Systems for Low Power, Barcelona, Spain, September 2001.
15. Elnozahy, E.N.; Kistler, M.; Rajamony, R. Energy-Efficient Server Clusters. In Proceedingsof the 2nd International Conference on Power-Aware Computer Systems, Cambridge, MA, USA,February 2002; pp. 179–197.
16. Tang, Q.; Gupta, S.K.S.; Varsamopoulos, G. Energy-efficient thermal-aware task scheduling forhomogeneous high-performance computing data centers: A cyber-physical approach. IEEE Trans.Parallel Distrib. Syst. 2008, 19, 1458–1472.
17. Pakbaznia, E.; Ghasemazar, M.; Pedram, M. Temperature-Aware Dynamic Resource Provisioningin a Power-Optimized Datacenter. In Proceedings of the Conference on Design, Automation andTest in Europe; European Design and Automation Association: 3001 Leuven, Dresden, Germany,8–12 March 2010; pp. 124–129.
18. Burge, J.; Ranganathan, P.; Wiener, J. Cost-Aware Scheduling for Heterogeneous EnterpriseMachines (CASH’EM). In Proceedings of the 2007 IEEE International Conference on ClusterComputing, Austin, TX, USA, 17–20 September 2007; pp. 481–487.

Sensors 2012, 12 10677
19. Meisner, D.; Gold, B.T.; Wenisch, T.F. PowerNap: Eliminating Server Idle Power. In Proceedingsof the ASPLOS’09, 14th International Conference on Architectural Support for ProgrammingLanguages and Operating Systems, Washington, DC, USA, 7–11 March 2009; pp. 205–216.
20. Bodenstein, C.; Schryen, G.; Neumann, D. Reducing Datacenter Energy Usage Through EfficientJob Allocation. In Proceedings of the 19th European Conference on Information Systems (ECIS2011), Helsinki, Finland, 9–11 June 2011.
21. Nathuji, R.; Isci, C.; Gorbatov, E. Exploiting Platform Heterogeneity for Power Efficient DataCenters. In Proceedings of the Fourth International Conference on Autonomic Computing, 2007.ICAC ’07, Jacksonville, FL, USA, 11–15 June 2007; p. 5.
22. Zheng, X.; Cai, Y. Markov Model Based Power Management in Server Clusters. In Proceedingsof the 2010 IEEEACM Intl Conference on Green Computing and Communications InternationalConference on Cyber Physical and Social Computing, Hangzhou, China, 18–20 December 2010;pp. 96–102.
23. Martijn, V. Cloud bursting with SLURM and Bright Cluster Manager. In Proceedings of theBirds of a Feather Session of the International Conference for High Performance Computing,Networking, Storage and Analysis, Seattle, WA, USA, 12–18 November 2011.
24. Yoo, A.B.; Jette, M.A.; Grondona, M. SLURM: Simple linux utility for resource management.Lect. Notes Comput. Sci. 2003, 2862, 44–60.
25. Advanced Wireless Dynamics. Pasarela Zignus. Available online: http://awdynamics.com/productos/pasarela (accessed on 3 August 2012).
26. Standard Performance Evaluation Corporation. SPEC CPU 2006. Available online: http://www.spec.org/cpu2006/ (accessed on 3 August 2012).
27. Collective Benchmark (cBench). Available online: http://ctuning.org/cbench/ (accessed on 3August 2012).
28. The Yices SMT Solver. Available online: http://yices.csl.sri.com/ (accessed on 3 August 2012).
c© 2012 by the authors; licensee MDPI, Basel, Switzerland. This article is an open access articledistributed under the terms and conditions of the Creative Commons Attribution license(http://creativecommons.org/licenses/by/3.0/).