TYPOLOGY OF SPATIAL PATTERNS SEASONALITY IN EUROPEAN RIVERS FLOW REGIME
21
QUAESTIONES GEOGRAPHICAE 27A/1 2008 TYPOLOGY OF SPATIAL PATTERNS SEASONALITY IN EUROPEAN RIVERS FLOW REGIME DARIUSZ WRZESIŃSKI Adam Mickiewicz University, Institute of Physical Geography and Environmental Planning, Poznań, Poland Manuscript received May 13, 2008 Revised version August 5, 2008 Wrzesiński D., 2008. Typology of spatial patterns seasonality in European rivers flow regime. Quaestiones Geographicae 27A/1, Adam Mickiewicz University Press, Poznań, 2008, pp. 87-98, Figs 10. ISBN 978-83-232-1967-5. ISSN 0137-477X. ABSTRACT. The article presents the way in which the North Atlantic Oscillation modifies the features of the hydrological regimes of European rivers. A river regime is defined here as the type and temporal structure of streamflow in an average hydrological cycle. The elements of the structure include so- called hydrological seasons, which were the instrument for the study of the regime as well as the basis of its characterisation and an assessment of its variability. Hydrological seasons were determined via the grouping of elementary time units of the year (pentads) on the basis of similarity of one of their features - the frequency distribution of the river discharge. The determination of the hydrological seasons was carried out on the basis of sets of 20 years with extremely high and extremely low values of Hurrell's NAO DJFM index. The analysis embraced 150 rivers of Europe flowing in a variety of environmental conditions. Use was made of daily discharge figures from at least 40-year observation periods spanning the years 1901-2000. The changing number, temporal structure and parameters of the hydrological seasons support the conclusion that each NAO stage produces a different impact on the hydrological regimes of European rivers. The article closes with a classification of the rivers under study in terms of differences in the properties of extreme hydrological seasons in the different NAO stages, followed by a spatial analysis of the results obtained. Key Words: Hydrological regime; typology of river regime; North Atlantic Oscillation impact Dariusz Wrzesiński, Institute of Physical Geography and Environmental Planning, Adam Mickiewicz University, Dzięgielowa 27, 61-680 Poznań, Poland, [email protected] Introduction Concepts and theories currently developed to account for present-day climate change commonly emphasise its hydrological consequences. The river discharge, treated as an element leaving the catchment's water cycle, is determined by climatic conditions and physico-geographical features of the catchment as well as the human
Transcript of TYPOLOGY OF SPATIAL PATTERNS SEASONALITY IN EUROPEAN RIVERS FLOW REGIME
QUAESTIONES GEOGRAPHICAE 27A/1 2008
TYPOLOGY OF SPATIAL PATTERNS SEASONALITY IN EUROPEAN RIVERS
FLOW REGIME
DARIUSZ WRZESIŃSKI
Adam Mickiewicz University, Institute of Physical Geography and Environmental Planning, Poznań, Poland
Manuscript received May 13, 2008 Revised version August 5, 2008
Wrzesiński D., 2008. Typology of spatial patterns seasonality in European rivers flow regime. Quaestiones Geographicae 27A/1, Adam Mickiewicz University Press, Poznań, 2008, pp. 87-98, Figs 10. ISBN 978-83-232-1967-5. ISSN 0137-477X. ABSTRACT. The article presents the way in which the North Atlantic Oscillation modifies the features of the hydrological regimes of European rivers. A river regime is defined here as the type and temporal structure of streamflow in an average hydrological cycle. The elements of the structure include so-called hydrological seasons, which were the instrument for the study of the regime as well as the basis of its characterisation and an assessment of its variability. Hydrological seasons were determined via the grouping of elementary time units of the year (pentads) on the basis of similarity of one of their features - the frequency distribution of the river discharge. The determination of the hydrological seasons was carried out on the basis of sets of 20 years with extremely high and extremely low values of Hurrell's NAODJFM index. The analysis embraced 150 rivers of Europe flowing in a variety of environmental conditions. Use was made of daily discharge figures from at least 40-year observation periods spanning the years 1901-2000. The changing number, temporal structure and parameters of the hydrological seasons support the conclusion that each NAO stage produces a different impact on the hydrological regimes of European rivers. The article closes with a classification of the rivers under study in terms of differences in the properties of extreme hydrological seasons in the different NAO stages, followed by a spatial analysis of the results obtained. Key Words: Hydrological regime; typology of river regime; North Atlantic Oscillation impact Dariusz Wrzesiński, Institute of Physical Geography and Environmental Planning, Adam Mickiewicz University, Dzięgielowa 27, 61-680 Poznań, Poland, [email protected]
Introduction
Concepts and theories currently developed to account for present-day climate
change commonly emphasise its hydrological consequences. The river discharge,
treated as an element leaving the catchment's water cycle, is determined by climatic
conditions and physico-geographical features of the catchment as well as the human
2
impact. Seasonal changes in the discharge are a natural effect of the prevailing
climatic conditions, but multi-year variations may suggest global environmental
changes. Hence, the river discharge can be their simple indicator. The issues often
discussed in works on hydrology are long-term variability, trends and cyclicity (Peel
et al. 2001, Pekárová et al. 2006), as well as stability of the hydrological regime
(Krasovskaia 1995, 1996, Krasovskaia and Sælthun 1997, Arnel 1999, Krasovskaia
and Gottschalk 2002, Wrzesiński 2004, 2005, 2007). Their results are commonly
employed in forecasting models defining the properties of the hydrological regime
under various scenarios of global climate change.
The hydrological regime defines the state and responses of a river system in
relation to the catchment's climatic system and physical-geographic characteristics.
Deviations of climatic elements from average levels caused by, e.g., changes in the
atmospheric circulation modify the streamflow formation conditions, and hence also
the characteristics of the river regime. It is controlled by both precipitation and air
temperature, whose magnitudes show a significant dependence on the intensity of
zonal circulation. A simple indicator characterising the atmospheric circulation over
the north Atlantic is the North Atlantic Oscillation Index (henceforth, NAO), Carleton
1988, Hurrell 1995. Its significance for the formation of the streamflow has been
emphasised by, e.g., Arnell (1997), Shorthouse and Arnell (1997), Kaczmarek (2002,
2003), Pociask-Karteczka et al. (2002-2003), Popova and Shmakin (2003), Pociask-
Karteczka (2006) and Rödel (2006). In winter, the discharges of north European
rivers are positively correlated with the winter NAO index, and those of Southern
Europe are correlated negatively. While in Northern Europe this relation can be
accounted for by an increase in precipitation in a positive stage of the NAO and in
Southern Europe by its decrease then, in Central and Western Europe the
3
dependence of winter precipitation on the NAO is rather weak. A strong relation does
exist, however, between the NAO indices and air temperatures. Air temperature
controls the magnitude of water loss through evaporation in summer and the
development and disappearance of snow cover in winter. In Central Europe during a
warm winter (NAO+) snow cover dwindles, hence meltwater floods are rare and carry
small discharge volumes. In a negative NAO stage, in turn, winters are severe with a
thick snow cover, thus contributing to high and large-volume flood waves
(Styszyńska and Tamulewicz 2004, Wrzesiński 2005, Danilovich et al., 2007,).
The observed effect of the atmospheric circulation on climatic conditions,
mostly precipitation and air temperature, makes also the discharges of European
rivers correlated, to a greater or lesser degree, with the winter NAO index. It follows
from an analysis of the temporal structure of hydrological phenomena and their
variations in a yearly cycle that the varying intensity of zonal circulation can
destabilise the hydrological regime as well. The aim of the paper is to present spatial
differences in hydrological regime variations of rivers in Europe, mainly extreme
phenomena: high- and low-water seasons, brought about by changes in the
atmospheric circulation in the North Atlantic sector.
Study area and source data
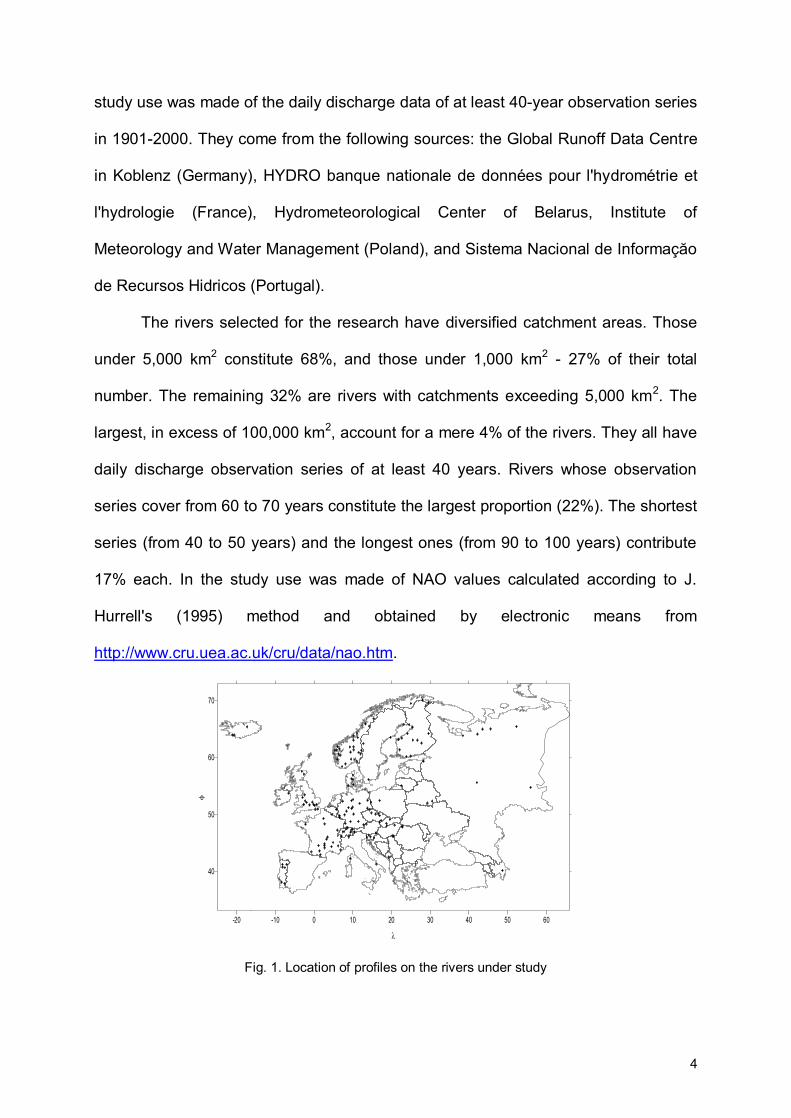
The analysis embraced 150 rivers flowing in a variety of climatic and physico-
geographical conditions (Fig. 1). This area is highly interesting due to its diversified
climatic conditions and a variety of conditions of river flow, which has produced five
types of hydrological regime. The changes in the conditions of atmospheric
circulation observed here affect the elements of climate, the consequence of which
are changes in the conditions of river runoff and destabilization of river regime. In the
4
study use was made of the daily discharge data of at least 40-year observation series
in 1901-2000. They come from the following sources: the Global Runoff Data Centre
in Koblenz (Germany), HYDRO banque nationale de données pour l'hydrométrie et
l'hydrologie (France), Hydrometeorological Center of Belarus, Institute of
Meteorology and Water Management (Poland), and Sistema Nacional de Informaçăo
de Recursos Hidricos (Portugal).
The rivers selected for the research have diversified catchment areas. Those
under 5,000 km2 constitute 68%, and those under 1,000 km2 - 27% of their total
number. The remaining 32% are rivers with catchments exceeding 5,000 km2. The
largest, in excess of 100,000 km2, account for a mere 4% of the rivers. They all have
daily discharge observation series of at least 40 years. Rivers whose observation
series cover from 60 to 70 years constitute the largest proportion (22%). The shortest
series (from 40 to 50 years) and the longest ones (from 90 to 100 years) contribute
17% each. In the study use was made of NAO values calculated according to J.
Hurrell's (1995) method and obtained by electronic means from
http://www.cru.uea.ac.uk/cru/data/nao.htm.
-20 -10 0 10 20 30 40 50 60
40
50
60
70
Fig. 1. Location of profiles on the rivers under study
5
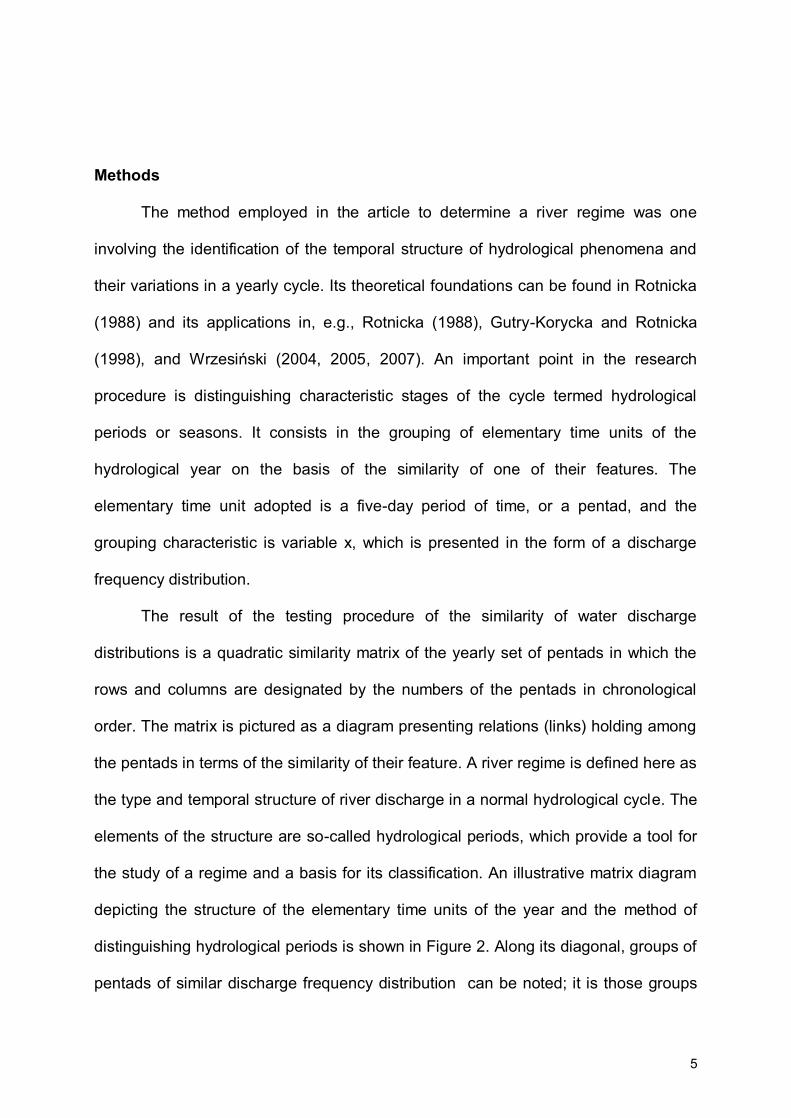
Methods
The method employed in the article to determine a river regime was one
involving the identification of the temporal structure of hydrological phenomena and
their variations in a yearly cycle. Its theoretical foundations can be found in Rotnicka
(1988) and its applications in, e.g., Rotnicka (1988), Gutry-Korycka and Rotnicka
(1998), and Wrzesiński (2004, 2005, 2007). An important point in the research
procedure is distinguishing characteristic stages of the cycle termed hydrological
periods or seasons. It consists in the grouping of elementary time units of the
hydrological year on the basis of the similarity of one of their features. The
elementary time unit adopted is a five-day period of time, or a pentad, and the
grouping characteristic is variable x, which is presented in the form of a discharge
frequency distribution.
The result of the testing procedure of the similarity of water discharge
distributions is a quadratic similarity matrix of the yearly set of pentads in which the
rows and columns are designated by the numbers of the pentads in chronological
order. The matrix is pictured as a diagram presenting relations (links) holding among
the pentads in terms of the similarity of their feature. A river regime is defined here as
the type and temporal structure of river discharge in a normal hydrological cycle. The
elements of the structure are so-called hydrological periods, which provide a tool for
the study of a regime and a basis for its classification. An illustrative matrix diagram
depicting the structure of the elementary time units of the year and the method of
distinguishing hydrological periods is shown in Figure 2. Along its diagonal, groups of
pentads of similar discharge frequency distribution can be noted; it is those groups

6
that form the so-called hydrological periods. Thus, a hydrological period is a time
segment displaying a uniform structure of links among pentads in terms of the
conformity of discharge distributions.
0
200
400
600
800Q [m3s -1]
SWQ
SSQ
GGSQ
DGSQSNQ
1%
5%
10%
25%
50%75%90%99%
A
B
1 2 3 4 5 6 7 8 9 10 11 12 13 14 15 16 17 18 19 20 21 22 23 24 25 26 27 28 29 30 31 32 33 34 35 36 37 38 39 40 41 42 43 44 45 46 47 48 49 50 51 52 53 54 55 56 57 58 59 60 61 62 63 64 65 66 67 68 69 70 71 72 731 1 4 7 7 8 # 7 # # # # # # # # # # # # # # # # # # # # # # # # # # # # # # # # # # # # # # # # # # # # # # # # # # # # # # # # # # # # 8 # 7 6 8 72 4 1 7 5 # # # # # # # # # # # # # # # # # # # # # # # # # # # # # # # # # # # # # # # # # # # # # # # # # # # # # # # # # # # # 8 6 6 7 # 5 6 # 93 7 7 1 9 # # # # # # # # # # # # # # # # # # # # # # # # # # 5 # # # # # # # # # # # # # # # # # # # # # # # # # # # # # # # # # # 7 7 # # # 6 # 94 7 5 9 1 7 # 8 # # # # # # # # # # # # # # # # # # # # # # # # # # # # # # # # # # # # # # # # # # # # # # # # # # # # # # # # # 9 6 6 8 9 8 5 9 85 8 # # 7 1 9 8 # # # # # # # # # # # # # # # # # # # # # # # # # # # # # # # # # # # # # # # # # # # # # # # # # # # # # # # # # 9 7 8 # # # # # #6 # # # # 9 1 # # # # # # # # # # # # # # # # # # # # # # # # # # # 8 # # # # # # # # # 7 # # # # # # # # # # # # # # # # # # # # # 9 9 # # # 9 # #7 7 # # 8 8 # 1 9 # # # # # # # # # # # # # # # # # # # # # # # # # # # # # # # # # # # # # # # # # # # # # # # # # # # # # # # # # # # 9 # # 6 6 78 # # # # # # 9 1 9 # # # # # # # # # # # # # # # # # # # # # # # # # # # # # # # # # # # # # # # # # # # # # # # # # # # # # # # # # # # # # # # #9 # # # # # # # 9 1 # # # # # # # # # # # # # # # # # # # # # # # # # # # # # # # # # # # # # # # # # # # # # # # # # # # # # # # # # # # # # # # #
10 # # # # # # # # # 1 # # # # # # # # # # # # # # # # # # # # # # # # # # # # # # # # # # # # # # # # # # # # # # # # # # # # # # # # # # # # # # #11 # # # # # # # # # # 1 6 # # # # # # # # # # # # # # # # # # # # # # # # # # # # # # # # # # # # # # # # # # # # # # # # # # # # # # # # # # # # #12 # # # # # # # # # # 6 1 # # # # # # # # # # # # # # # # # # # # # # # # # # # # # # # # # # # # # # # # # # # # # # # # # # # # # # # # # # # # #13 # # # # # # # # # # # # 1 9 # # # # # # # # # # # # # # # # # # # # # # # # # # # # # # # # # # # # # # # # # # # # # # # # # # # # # # # # # # #14 # # # # # # # # # # # # 9 1 # # # # # # # # # # # # # # # # # # # # # # # # # # # # # # # # # # # # # # # # # # # # # # # # # # # # # # # # # # #15 # # # # # # # # # # # # # # 1 8 # # # # # # # # # # # # # # # # # # # # # # # # # # # # # # # # # # # # # # # # # # # # # # # # # # # # # # # # #16 # # # # # # # # # # # # # # 8 1 # # # # # # # # # # # # # # # # # # # # # # # # # # # # # # # # # # # # # # # # # # # # # # # # # # # # # # # # #17 # # # # # # # # # # # # # # # # 1 # # 9 # # # # # # # # # # # # # # # # # # # # # # # # # # # # # # # # # # # # # # # # # # # # # # # # # # # # #18 # # # # # # # # # # # # # # # # # 1 7 4 # # # # # # # # # # # # # # # # # # # # # # # # # # # # # # # # # # # # # # # # # # # # # # # # # # # # #19 # # # # # # # # # # # # # # # # # 7 1 4 # # # # # # # # # # # # # # # # # # # # # # # # # # # # # # # # # # # # # # # # # # # # # # # # # # # # #20 # # # # # # # # # # # # # # # # 9 4 4 1 # # # # # # # # # # # # # # # # # # # # # # # # # # # # # # # # # # # # # # # # # # # # # # # # # # # # #21 # # # # # # # # # # # # # # # # # # # # 1 # # # # # # # # # # # # # # # # # # # # # # # # # # # # # # # # # # # # # # # # # # # # # # # # # # # #22 # # # # # # # # # # # # # # # # # # # # # 1 8 # # # # # # # # # # # # # # # # # # # # # # # # # # # # # # # # # # # # # # # # # # # # # # # # # #23 # # # # # # # # # # # # # # # # # # # # # 8 1 # # # # # # # # # # # # # # # # # # # # # # # # # # # # # # # # # # # # # # # # # # # # # # # # # #24 # # # # # # # # # # # # # # # # # # # # # # # 1 # # # # # # # # # # # # # # # # # # # # # # # # # # # # # # # # # # # # # # # # # # # # # # # # #25 # # # # # # # # # # # # # # # # # # # # # # # # 1 9 # # # # # # # # # # # # # # # # # # # # # # # # # # # # # # # # # # # # # # # # # # # # # # #26 # # # # # # # # # # # # # # # # # # # # # # # # 9 1 6 # # # # # # # # # # # # # # # # # # # # # # # # # # # # # # # # # # # # # # # # # # # # # #27 # # # # # # # # # # # # # # # # # # # # # # # # # 6 1 8 # # # # # # # # # # # # # # # # # # # # # # # # # # # # # # # # # # # # # # # # # # # # #28 # # # # # # # # # # # # # # # # # # # # # # # # # # 8 1 6 # # # # # # # # # # # # # # # # # # # # # # # # # # # # # # # # # # # # # # # # # # # #29 # # # # # # # # # # # # # # # # # # # # # # # # # # # 6 1 5 # # # # # # # # # # # # # # # # # # # # # # # # # # # # # # # # # # # # # # # # # # #30 # # # # # # # # # # # # # # # # # # # # # # # # # # # # 5 1 # # # # # # # # # # # # # # # # # # # # # # # # # # # # # # # # # # # # # # # # # # #31 # # 5 # # # # # # # # # # # # # # # # # # # # # # # # # # # 1 # # # # # # # # # # # # # # # # # # # # # # # # # # # # # # # # # # 8 8 # # # 7 # #32 # # # # # # # # # # # # # # # # # # # # # # # # # # # # # # # 1 # # # # # # # # # # # 8 # # # # # # # # # # # # # # # # # # # # # # # # # # # # #33 # # # # # # # # # # # # # # # # # # # # # # # # # # # # # # # # 1 8 8 9 # # # # # # # # 8 9 9 5 7 9 # # # # # # # # # # # # # # # # # # # # # # #34 # # # # # 8 # # # # # # # # # # # # # # # # # # # # # # # # # # 8 1 7 # # # # # # # 7 4 # # # 9 8 9 # # # # # # # # # # # # # # # # # # # # # # #35 # # # # # # # # # # # # # # # # # # # # # # # # # # # # # # # # 8 7 1 8 9 # # # # # # 8 5 8 8 7 # # # # # # # # # # # # # # # # # # # # # # # # #36 # # # # # # # # # # # # # # # # # # # # # # # # # # # # # # # # 9 # 8 1 4 # # # # # # # # 7 7 8 # # # # # # # # # # # # # # # # # # # # # # # # #37 # # # # # # # # # # # # # # # # # # # # # # # # # # # # # # # # # # 9 4 1 # # # # # # # # 8 8 5 7 7 9 # # # # # # # # # # # # # # # # # # # # # #38 # # # # # # # # # # # # # # # # # # # # # # # # # # # # # # # # # # # # # 1 1 3 4 # # # # # # 8 8 7 4 4 6 # # # # # # # # # # # # # # # # # # # #39 # # # # # # # # # # # # # # # # # # # # # # # # # # # # # # # # # # # # # 1 1 2 4 # # # # # # 8 9 8 5 5 7 # # # # # # # # # # # # # # # # # # # #40 # # # # # # # # # # # # # # # # # # # # # # # # # # # # # # # # # # # # # 3 2 1 6 # # # # # # 8 # # 7 7 9 # # # # # # # # # # # # # # # # # # # #41 # # # # # # # # # # # # # # # # # # # # # # # # # # # # # # # # # # # # # 4 4 6 1 # # # # # # # 9 9 7 4 4 # 9 9 # # # # # # # # # # # # # # # # #42 # # # # # # # # # # # # # # # # # # # # # # # # # # # # # # # # # # # # # # # # # 1 7 # # # # # 9 # # # # 5 5 5 1 0 5 2 6 8 # # # # # # # # # # #43 # # # # # # # # # # # # # # # # # # # # # # # # # # # # # # # # # 7 # # # # # # # 7 1 # # # # # # # # # # # 9 8 7 7 # 5 3 3 3 # # # # # # # # # #44 # # # # # 7 # # # # # # # # # # # # # # # # # # # # # # # # # 8 # 4 8 # # # # # # # # 1 # # # # # # # # # # # # # # # # # 9 8 8 # # # # # # # # #45 # # # # # # # # # # # # # # # # # # # # # # # # # # # # # # # # 8 # 5 # # # # # # # # # 1 6 6 9 # # # # # # # # # # # # # # # # # # # # # # # # #46 # # # # # # # # # # # # # # # # # # # # # # # # # # # # # # # # 9 # 8 7 8 # # # # # # # 6 1 4 7 # # # # # # # # # # # # # # # # # # # # # # # # #47 # # # # # # # # # # # # # # # # # # # # # # # # # # # # # # # # 9 # 8 7 8 # # # # # # # 6 4 1 6 # 9 8 # # # # # # # # # # # # # # # # # # # # # #48 # # # # # # # # # # # # # # # # # # # # # # # # # # # # # # # # 5 9 7 8 5 8 8 8 # # # # 9 7 6 1 4 5 5 8 8 # # 8 # # # # # # # # # # # # # # # # #49 # # # # # # # # # # # # # # # # # # # # # # # # # # # # # # # # 7 8 # # 7 8 9 # 9 9 # # # # # 4 1 4 5 5 5 # 7 7 8 9 # # # # # # # # # # # # # # #50 # # # # # # # # # # # # # # # # # # # # # # # # # # # # # # # # 9 9 # # 7 7 8 # 9 # # # # # 9 5 4 1 3 5 5 # 7 6 9 # # # # # # # # # # # # # # # #51 # # # # # # # # # # # # # # # # # # # # # # # # # # # # # # # # # # # # 9 4 5 7 7 # # # # # 8 5 5 3 1 3 3 # 8 8 # # # # # # # # # # # # # # # # #52 # # # # # # # # # # # # # # # # # # # # # # # # # # # # # # # # # # # # # 4 5 7 4 # # # # # # 8 5 5 3 1 2 # 8 8 # # # # # # # # # # # # # # # # #53 # # # # # # # # # # # # # # # # # # # # # # # # # # # # # # # # # # # # # 6 7 9 4 # # # # # # 8 5 5 3 2 1 9 6 6 # # # # # # # # # # # # # # # # #54 # # # # # # # # # # # # # # # # # # # # # # # # # # # # # # # # # # # # # # # # # 5 # # # # # # # # # # 9 1 3 5 5 5 5 7 # # # # # # # # # # # # #55 # # # # # # # # # # # # # # # # # # # # # # # # # # # # # # # # # # # # # # # # 9 5 9 # # # # # 7 7 8 8 6 3 1 2 4 5 5 5 8 # # # # # # # # # # # #56 # # # # # # # # # # # # # # # # # # # # # # # # # # # # # # # # # # # # # # # # 9 5 8 # # # # 8 7 6 8 8 6 5 2 1 4 5 5 5 6 # # # # # # # # # # # #57 # # # # # # # # # # # # # # # # # # # # # # # # # # # # # # # # # # # # # # # # # 1 7 # # # # # 8 9 # # # 5 4 4 1 1 5 3 6 8 # # # # # # # # # # #58 # # # # # # # # # # # # # # # # # # # # # # # # # # # # # # # # # # # # # # # # # 0 7 # # # # # 9 # # # # 5 5 5 1 1 5 2 6 8 # # # # # # # # # # #59 # # # # # # # # # # # # # # # # # # # # # # # # # # # # # # # # # # # # # # # # # 5 # # # # # # # # # # # 5 5 5 5 5 1 7 # # # # # # # # # # # # #60 # # # # # # # # # # # # # # # # # # # # # # # # # # # # # # # # # # # # # # # # # 2 5 # # # # # # # # # # 7 5 5 3 2 7 1 4 6 8 # # # # # # # # # #61 # # # # # # # # # # # # # # # # # # # # # # # # # # # # # # # # # # # # # # # # # 6 3 # # # # # # # # # # # 8 6 6 6 # 4 1 4 4 # # # # # # # # # #62 # # # # # # # # # # # # # # # # # # # # # # # # # # # # # # # # # # # # # # # # # 8 3 9 # # # # # # # # # # # # 8 8 # 6 4 1 2 # # # # # # # # # #63 # # # # # # # # # # # # # # # # # # # # # # # # # # # # # # # # # # # # # # # # # # 3 8 # # # # # # # # # # # # # # # 8 4 2 1 9 # # # # # # # # #64 # # # # # # # # # # # # # # # # # # # # # # # # # # # # # # # # # # # # # # # # # # # 8 # # # # # # # # # # # # # # # # # # 9 1 # # # # # # # # #65 # 8 # 9 9 # # # # # # # # # # # # # # # # # # # # # # # # # # # # # # # # # # # # # # # # # # # # # # # # # # # # # # # # # # # 1 5 # # # # # # #66 # 6 7 6 7 9 # # # # # # # # # # # # # # # # # # # # # # # # 8 # # # # # # # # # # # # # # # # # # # # # # # # # # # # # # # # # 5 1 5 9 # 8 8 # #67 # 6 7 6 8 9 # # # # # # # # # # # # # # # # # # # # # # # # 8 # # # # # # # # # # # # # # # # # # # # # # # # # # # # # # # # # # 5 1 9 # 7 5 8 868 8 7 # 8 # # 9 # # # # # # # # # # # # # # # # # # # # # # # # # # # # # # # # # # # # # # # # # # # # # # # # # # # # # # # # # # 9 9 1 4 5 # 8 769 # # # 9 # # # # # # # # # # # # # # # # # # # # # # # # # # # # # # # # # # # # # # # # # # # # # # # # # # # # # # # # # # # # # # # 4 1 6 # # #70 7 5 # 8 # # # # # # # # # # # # # # # # # # # # # # # # # # # # # # # # # # # # # # # # # # # # # # # # # # # # # # # # # # # # # 8 7 5 6 1 8 # 971 6 6 6 5 # 9 6 # # # # # # # # # # # # # # # # # # # # # # # 7 # # # # # # # # # # # # # # # # # # # # # # # # # # # # # # # # # # 8 5 # # 8 1 5 472 8 # # 9 # # 6 # # # # # # # # # # # # # # # # # # # # # # # # # # # # # # # # # # # # # # # # # # # # # # # # # # # # # # # # # # # 8 8 # # 5 1 473 7 9 9 8 # # 7 # # # # # # # # # # # # # # # # # # # # # # # # # # # # # # # # # # # # # # # # # # # # # # # # # # # # # # # # # # # 8 7 # 9 4 4 1
1
2
I II III V IIV
Fig. 2. Hydrological periods of the Warta river at Poznań A - Hydrograph of water discharges of specified probability of occurrance, with characteristic
discharge and boundaries of the middle discharge zone: SWQ - average high water, SSQ - average middle water, SNQ - average low water, GGSQ - upper boundary of the middle discharge zone, DGSQ - lower boundary of the middle discharge zone
B - Diagram of a similarity matrix: 1 - similar distributions, 2 - probably similar distributions, I, II ... V - successive hydrological periods.
Hydrological periods were determined twice: once on the basis of a 20-year
set of discharge from years with extremely low values of Hurrell's NAODJFM index
(NAO-), and then on the basis of a 20-year set from years with extremely high values
(NAO+). Each hydrological period was described by means of six variables: the start
and end of the period, its duration (T), the coefficient of variation (Cv), the coefficient
of skewness (S), and the coefficient of discharge (W) defining abundance of the
period. The types of hydrological period were established on the basis of the
7
coefficient of discharge (W) according to the following criteria: W < 0.5 - a deep low;
0.5<W<0.75 - an average low; 0.75<W<0.9 - a shallow low; 0.9<W<1.1 - a normal
period; 1.1<W<1.25 - a low flood; 1.25<W<1.50 - an average flood; 1.50<W<1.75 - a
high flood; and W<1.75 - a very high flood.
Next, average characteristics of high- and low-flow seasons in a positive and a
negative NAO stage were determined, compared, and the differences calculated.
The research closed with a classification of the rivers in question carried out in terms
of differences in the properties of the high- and low-flow seasons in the two NAO
stages. In the classification procedure, use was made of Ward's method of
hierarchical grouping. The variables describing hydrological periods were differences
in the flow magnitude, duration, and starting date of a given period. Their changes
made it possible to determine the areas with the most variable and most stable
parameters of the hydrological periods of European rivers in the different NAO
stages.
In the graphic presentation use was made of the Surfer 7 programme and the kriging
technique was applied to draw up the range and run of the isopleths showing
differences in the values of the analysed variables.
Features of hydrological seasons in the different NAO stages Features of low-water seasons
On almost half of the rivers under study, no significant differences are observed
in the starting dates of low-water seasons between a negative and a positive NAO
stage. The most stable starting dates, with differences ranging up to 15 days, are
noted on most of the rivers of Eastern Europe as far as the Urals, Finland, Ireland
and Scotland, western Germany, and southern France - mostly the western slope of
the Massif Central, the eastern Pyrenees, and Corsica, as well as the Balkans. In a
positive NAO stage, later starting dates of low-water seasons (up to a month) can be
8
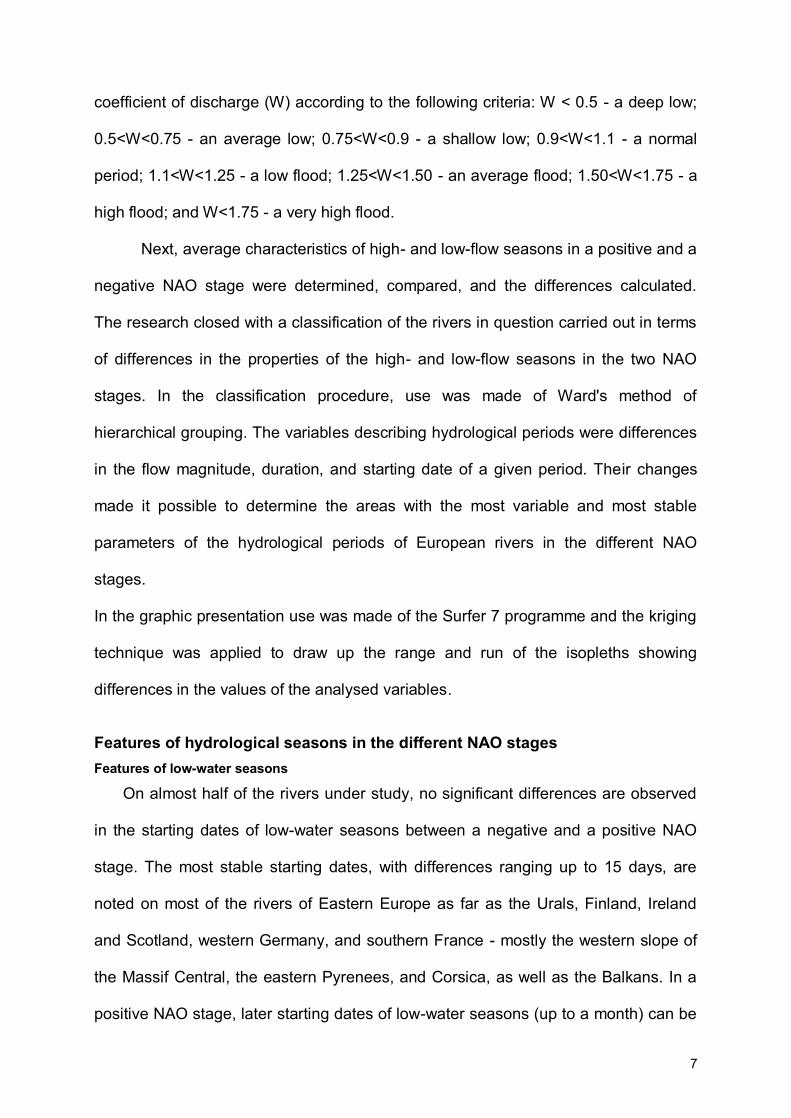
observed on the rivers of southern and northern Sweden, the Scandinavian
Mountains, the Alps, and Iceland. In turn, in this NAO stage low-water seasons begin
up to 60 days earlier in Central Europe (eastern Germany, south-western Poland, the
Czech Republic, and Slovakia) and even up to 90 days earlier on the Pyrenean
Peninsula (Fig. 3).
-20 -10 0 10 20 30 40 50 60
40
50
60
70
-90
-75
-60
-45
-30
-15
0
15
30
45
60
75
90
Difference[days]
Fig. 3. Differences in the starting dates of the low-water season between a negative and a positive
NAO stage in days
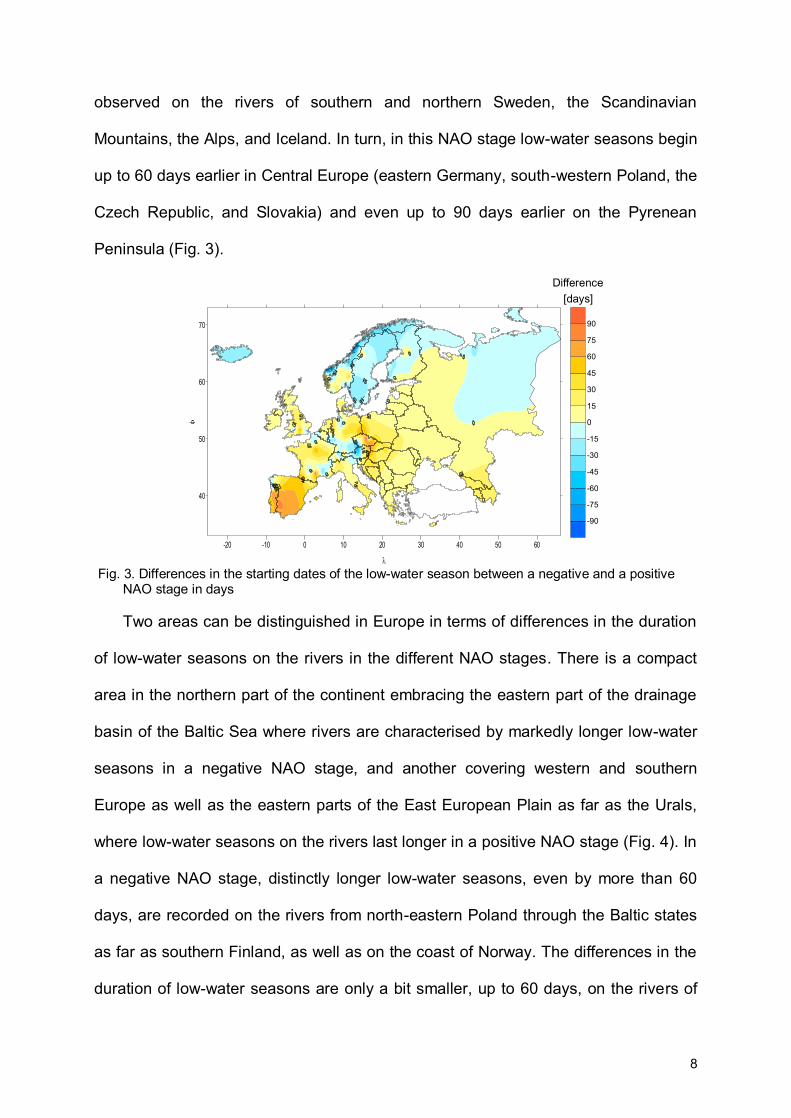
Two areas can be distinguished in Europe in terms of differences in the duration
of low-water seasons on the rivers in the different NAO stages. There is a compact
area in the northern part of the continent embracing the eastern part of the drainage
basin of the Baltic Sea where rivers are characterised by markedly longer low-water
seasons in a negative NAO stage, and another covering western and southern
Europe as well as the eastern parts of the East European Plain as far as the Urals,
where low-water seasons on the rivers last longer in a positive NAO stage (Fig. 4). In
a negative NAO stage, distinctly longer low-water seasons, even by more than 60
days, are recorded on the rivers from north-eastern Poland through the Baltic states
as far as southern Finland, as well as on the coast of Norway. The differences in the
duration of low-water seasons are only a bit smaller, up to 60 days, on the rivers of
9
western Russia and in Belarus. In a positive NAO stage, low-water seasons are
markedly longer, more than 60 days, on the rivers of the Iberian Peninsula and in the
belt extending from eastern Germany through the Czech Republic and eastern
Austria to Hungary and Croatia.
-20 -10 0 10 20 30 40 50 60
40
50
60
70
-150
-120
-90
-60
-30
0
30
60
90
120
150
180
Difference[days]
Fig. 4. Differences in the duration of low-water seasons between a negative and a positive NAO stage
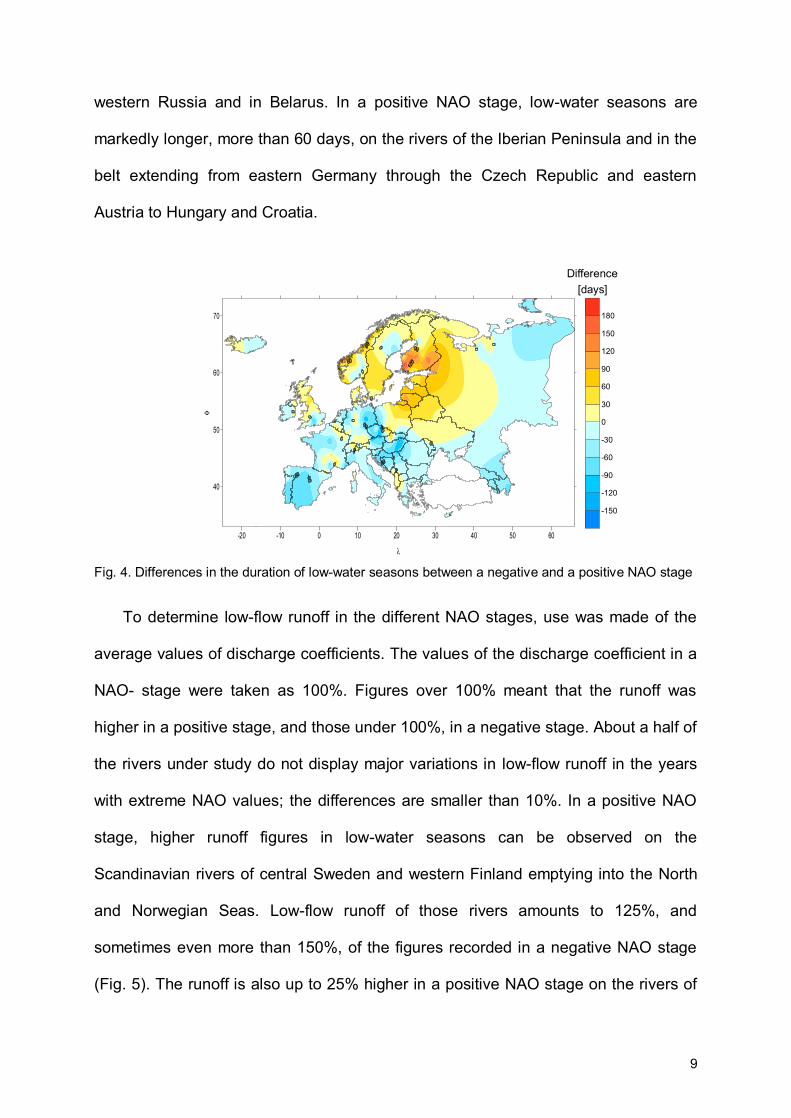
To determine low-flow runoff in the different NAO stages, use was made of the
average values of discharge coefficients. The values of the discharge coefficient in a
NAO- stage were taken as 100%. Figures over 100% meant that the runoff was
higher in a positive stage, and those under 100%, in a negative stage. About a half of
the rivers under study do not display major variations in low-flow runoff in the years
with extreme NAO values; the differences are smaller than 10%. In a positive NAO
stage, higher runoff figures in low-water seasons can be observed on the
Scandinavian rivers of central Sweden and western Finland emptying into the North
and Norwegian Seas. Low-flow runoff of those rivers amounts to 125%, and
sometimes even more than 150%, of the figures recorded in a negative NAO stage
(Fig. 5). The runoff is also up to 25% higher in a positive NAO stage on the rivers of
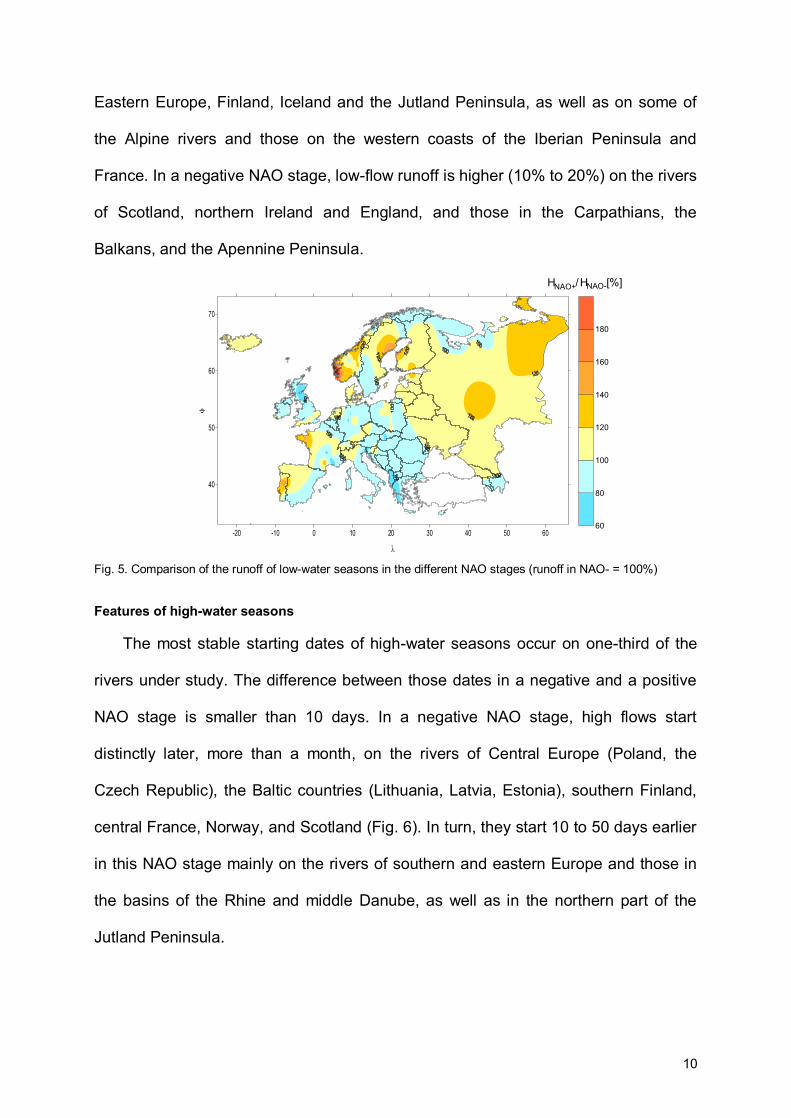
10
Eastern Europe, Finland, Iceland and the Jutland Peninsula, as well as on some of
the Alpine rivers and those on the western coasts of the Iberian Peninsula and
France. In a negative NAO stage, low-flow runoff is higher (10% to 20%) on the rivers
of Scotland, northern Ireland and England, and those in the Carpathians, the
Balkans, and the Apennine Peninsula.
-20 -10 0 10 20 30 40 50 60
40
50
60
70
60
80
100
120
140
160
180
H HNAO+ NAO-/ [%]
Fig. 5. Comparison of the runoff of low-water seasons in the different NAO stages (runoff in NAO- = 100%) Features of high-water seasons
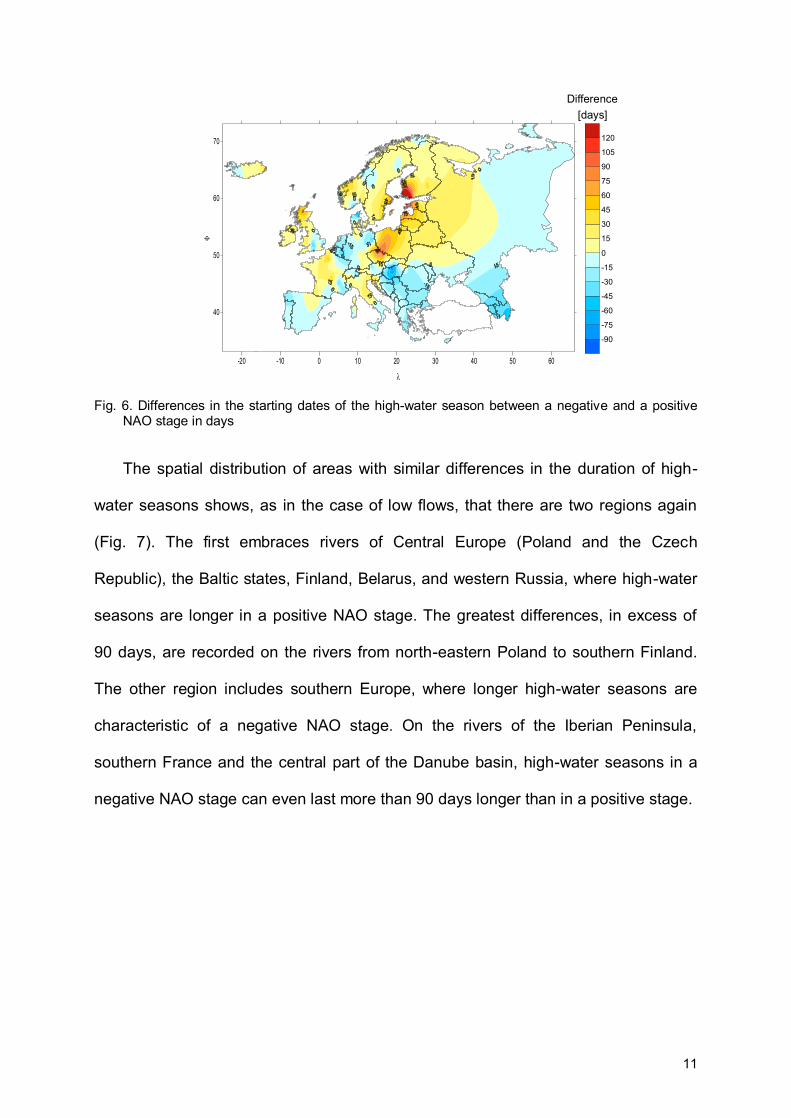
The most stable starting dates of high-water seasons occur on one-third of the
rivers under study. The difference between those dates in a negative and a positive
NAO stage is smaller than 10 days. In a negative NAO stage, high flows start
distinctly later, more than a month, on the rivers of Central Europe (Poland, the
Czech Republic), the Baltic countries (Lithuania, Latvia, Estonia), southern Finland,
central France, Norway, and Scotland (Fig. 6). In turn, they start 10 to 50 days earlier
in this NAO stage mainly on the rivers of southern and eastern Europe and those in
the basins of the Rhine and middle Danube, as well as in the northern part of the
Jutland Peninsula.
11
-20 -10 0 10 20 30 40 50 60
40
50
60
70
-90
-75
-60
-45
-30
-15
0
15
30
45
60
75
90
105
120
Difference[days]
Fig. 6. Differences in the starting dates of the high-water season between a negative and a positive NAO stage in days
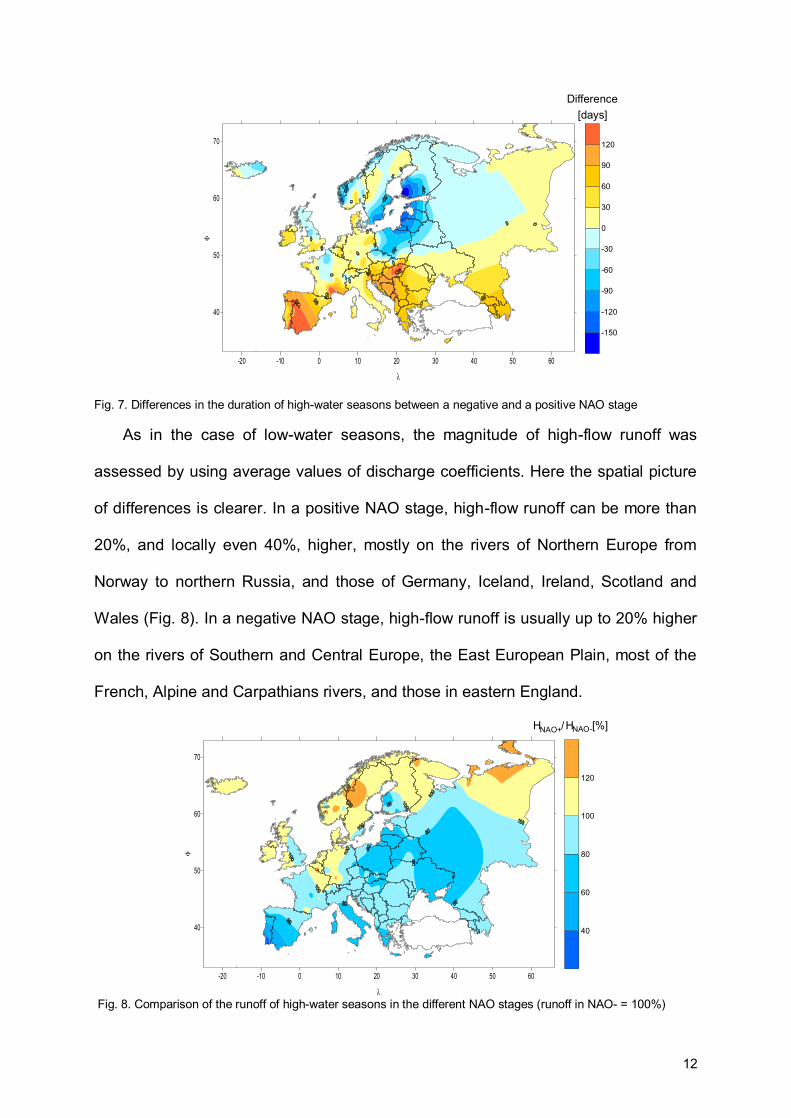
The spatial distribution of areas with similar differences in the duration of high-
water seasons shows, as in the case of low flows, that there are two regions again
(Fig. 7). The first embraces rivers of Central Europe (Poland and the Czech
Republic), the Baltic states, Finland, Belarus, and western Russia, where high-water
seasons are longer in a positive NAO stage. The greatest differences, in excess of
90 days, are recorded on the rivers from north-eastern Poland to southern Finland.
The other region includes southern Europe, where longer high-water seasons are
characteristic of a negative NAO stage. On the rivers of the Iberian Peninsula,
southern France and the central part of the Danube basin, high-water seasons in a
negative NAO stage can even last more than 90 days longer than in a positive stage.
12
-20 -10 0 10 20 30 40 50 60
40
50
60
70
-150
-120
-90
-60
-30
0
30
60
90
120
Difference[days]
Fig. 7. Differences in the duration of high-water seasons between a negative and a positive NAO stage
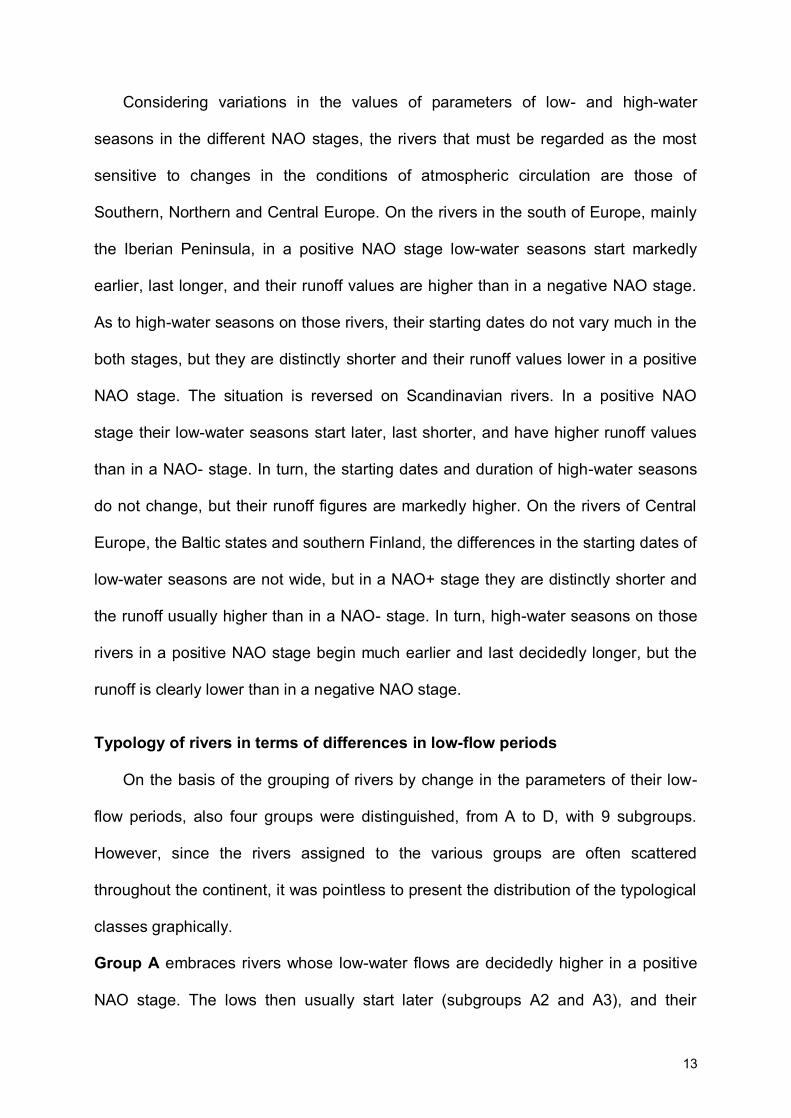
As in the case of low-water seasons, the magnitude of high-flow runoff was
assessed by using average values of discharge coefficients. Here the spatial picture
of differences is clearer. In a positive NAO stage, high-flow runoff can be more than
20%, and locally even 40%, higher, mostly on the rivers of Northern Europe from
Norway to northern Russia, and those of Germany, Iceland, Ireland, Scotland and
Wales (Fig. 8). In a negative NAO stage, high-flow runoff is usually up to 20% higher
on the rivers of Southern and Central Europe, the East European Plain, most of the
French, Alpine and Carpathians rivers, and those in eastern England.
-20 -10 0 10 20 30 40 50 60
40
50
60
70
40
60
80
100
120
H HNAO+ NAO-/ [%]
Fig. 8. Comparison of the runoff of high-water seasons in the different NAO stages (runoff in NAO- = 100%)
13
Considering variations in the values of parameters of low- and high-water
seasons in the different NAO stages, the rivers that must be regarded as the most
sensitive to changes in the conditions of atmospheric circulation are those of
Southern, Northern and Central Europe. On the rivers in the south of Europe, mainly
the Iberian Peninsula, in a positive NAO stage low-water seasons start markedly
earlier, last longer, and their runoff values are higher than in a negative NAO stage.
As to high-water seasons on those rivers, their starting dates do not vary much in the
both stages, but they are distinctly shorter and their runoff values lower in a positive
NAO stage. The situation is reversed on Scandinavian rivers. In a positive NAO
stage their low-water seasons start later, last shorter, and have higher runoff values
than in a NAO- stage. In turn, the starting dates and duration of high-water seasons
do not change, but their runoff figures are markedly higher. On the rivers of Central
Europe, the Baltic states and southern Finland, the differences in the starting dates of
low-water seasons are not wide, but in a NAO+ stage they are distinctly shorter and
the runoff usually higher than in a NAO- stage. In turn, high-water seasons on those
rivers in a positive NAO stage begin much earlier and last decidedly longer, but the
runoff is clearly lower than in a negative NAO stage.
Typology of rivers in terms of differences in low-flow periods
On the basis of the grouping of rivers by change in the parameters of their low-
flow periods, also four groups were distinguished, from A to D, with 9 subgroups.
However, since the rivers assigned to the various groups are often scattered
throughout the continent, it was pointless to present the distribution of the typological
classes graphically.
Group A embraces rivers whose low-water flows are decidedly higher in a positive
NAO stage. The lows then usually start later (subgroups A2 and A3), and their
14
duration does not change (subgroup A1) or is markedly shorter (subgroups A2 and
A3). This type is represented by some Portuguese rivers, those of western Norway,
northern France, as well as Finland, Sweden, Lithuania and Estonia.
In group B a distinction was made between subgroups B1 and B2. Subgroup B1
contains rivers with a slight, ca. 10%, domination of low-water flow and an earlier
low-flow starting date in a positive NAO stage. In both NAO stages the duration of
low-flow seasons is basically the same. The rivers of this group are found in Central
Europe, from the Warta to the Dnieper, some are in the Alps and Pyrenees, and on
the Jutland Peninsula. Flows in low-water seasons in subgroup B2 are distinctly
higher, more than 20%, in a positive NAO stage, and the seasons are 1 month longer
then. Most rivers showing this type of change are situated in central and southern
Norway.
Group C comprises rivers with higher flows in low-water seasons in a negative NAO
stage, in subgroup C1 even over 20%. No major differences in the starting dates and
duration of lows can be observed between the two NAO stages. It is only rivers of
subgroup C1 which are characterised by longer, up to 2 months, lows in a negative
NAO stage. They are situated in the British Isles, Germany, the Alps, and central
Norway. There is a distinct clustering of subgroup C2 rivers in northern Norway,
Russia and Iceland.
Rivers of group D (subgroups D1 and D2) display low-water flows statistically 10%
higher in a negative NAO stage, while the starting dates of lows are then decidedly
delayed, by more than 1 month. The duration of those periods is markedly shorter, by
more than 2 months in subgroup D1 and more than 1 month in subgroup D2. Rivers
of this group are largely located in Central Europe (Germany, Czech Republic,
Hungary), and also southern England, the Eastern Alps, and the south of Europe.
15
Typology of rivers in terms of differences in high-flow periods
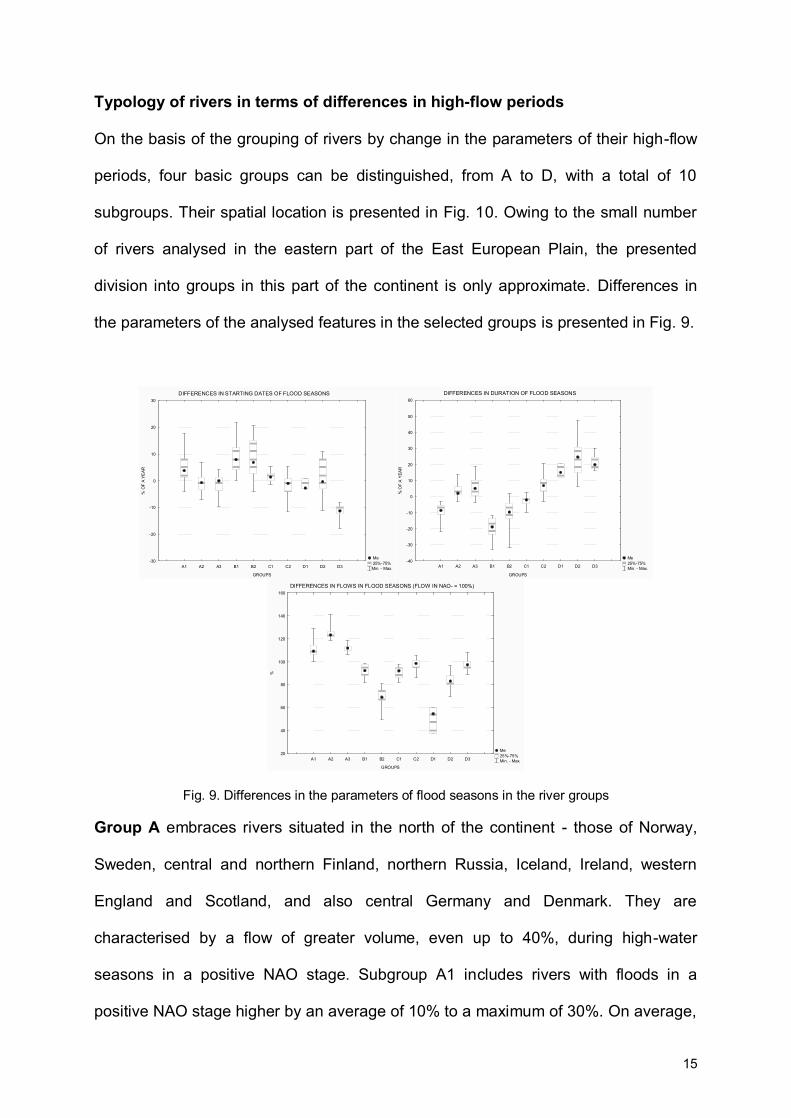
On the basis of the grouping of rivers by change in the parameters of their high-flow
periods, four basic groups can be distinguished, from A to D, with a total of 10
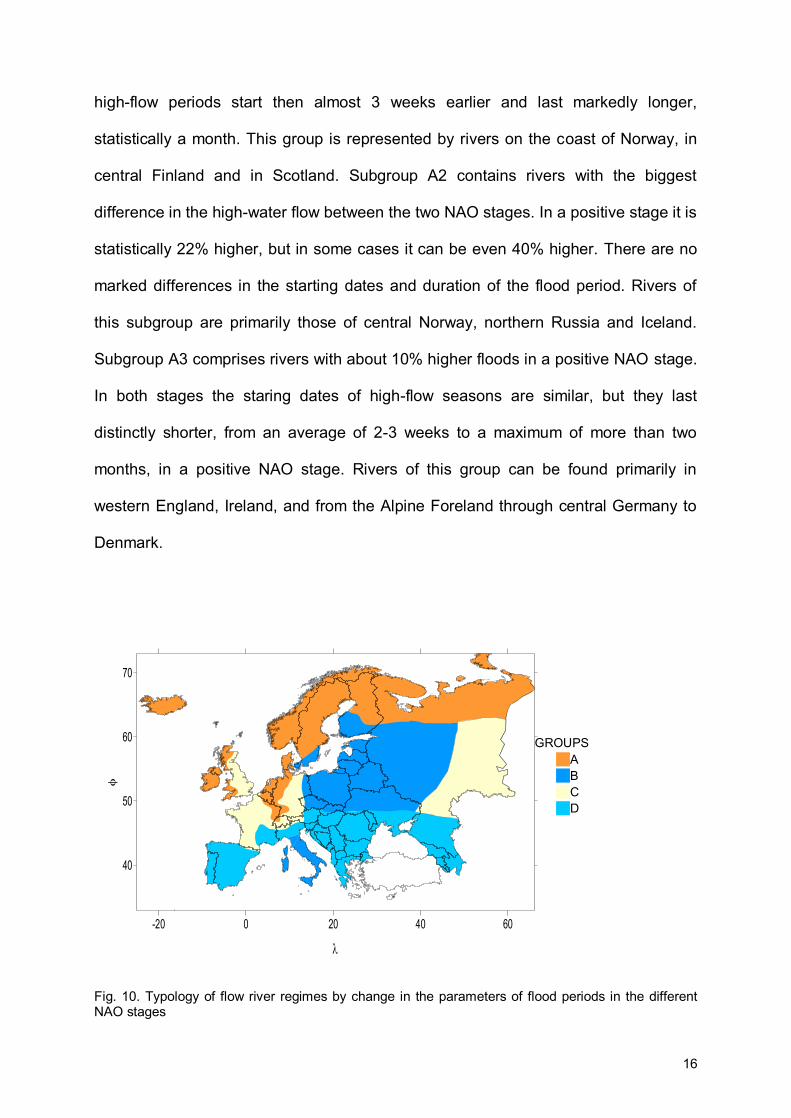
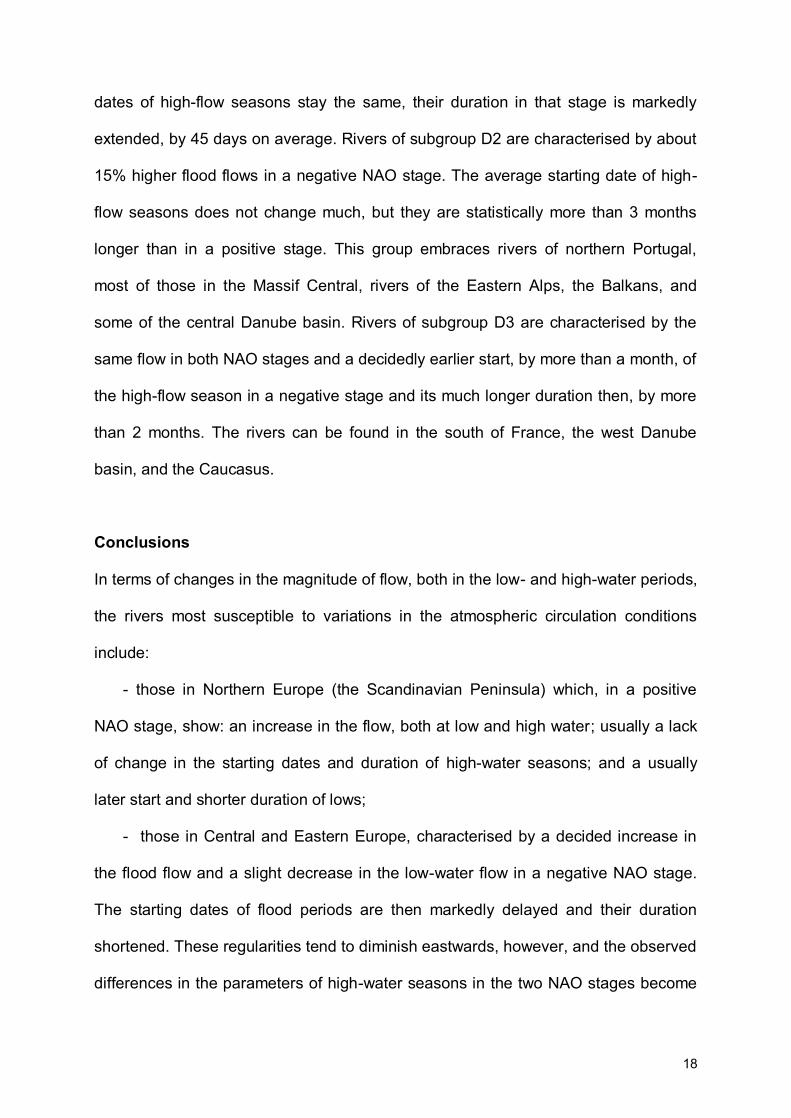
subgroups. Their spatial location is presented in Fig. 10. Owing to the small number
of rivers analysed in the eastern part of the East European Plain, the presented
division into groups in this part of the continent is only approximate. Differences in
the parameters of the analysed features in the selected groups is presented in Fig. 9.
DIFFERENCES IN STARTING DATES OF FLOOD SEASONS
Me 25%-75% Min. - Max.A1 A2 A3 B1 B2 C1 C2 D1 D2 D3
GROUPS
-30
-20
-10
0
10
20
30
% O
F A
YE
AR
DIFFERENCES IN DURATION OF FLOOD SEASONS
Me 25%-75% Min. - Max. A1 A2 A3 B1 B2 C1 C2 D1 D2 D3
GROUPS
-40
-30
-20
-10
0
10
20
30
40
50
60%
OF
A Y
EAR
DIFFERENCES IN FLOWS IN FLOOD SEASONS (FLOW IN NAO- = 100%)
Me 25%-75% Min. - Max.A1 A2 A3 B1 B2 C1 C2 D1 D2 D3
GROUPS
20
40
60
80
100
120
140
160
%
Fig. 9. Differences in the parameters of flood seasons in the river groups
Group A embraces rivers situated in the north of the continent - those of Norway,
Sweden, central and northern Finland, northern Russia, Iceland, Ireland, western
England and Scotland, and also central Germany and Denmark. They are
characterised by a flow of greater volume, even up to 40%, during high-water
seasons in a positive NAO stage. Subgroup A1 includes rivers with floods in a
positive NAO stage higher by an average of 10% to a maximum of 30%. On average,
16
high-flow periods start then almost 3 weeks earlier and last markedly longer,
statistically a month. This group is represented by rivers on the coast of Norway, in
central Finland and in Scotland. Subgroup A2 contains rivers with the biggest
difference in the high-water flow between the two NAO stages. In a positive stage it is
statistically 22% higher, but in some cases it can be even 40% higher. There are no
marked differences in the starting dates and duration of the flood period. Rivers of
this subgroup are primarily those of central Norway, northern Russia and Iceland.
Subgroup A3 comprises rivers with about 10% higher floods in a positive NAO stage.
In both stages the staring dates of high-flow seasons are similar, but they last
distinctly shorter, from an average of 2-3 weeks to a maximum of more than two
months, in a positive NAO stage. Rivers of this group can be found primarily in
western England, Ireland, and from the Alpine Foreland through central Germany to
Denmark.
-20 0 20 40 60
40
50
60
70
GROUPSABCD
Fig. 10. Typology of flow river regimes by change in the parameters of flood periods in the different NAO stages

17
Placed in group B are rivers of Central and Eastern Europe up to the Oka, as well as
those of Corsica and the Apennine Peninsula. Rivers of subgroup B1 do not occupy
a compact area; they are dispersed throughout southern Sweden and central
Norway. In a negative NAO stage their flood seasons display higher flows (about
10%), start statistically 1 month later and last shorter, sometimes even by 2-3
months. Subgroup B2 is represented by rivers of Central Europe, western and
southern Finland, Eastern Europe up to the Oka, Corsica, and the Apennine
Peninsula. They differ from rivers of subgroup B1 in having a distinctly higher flow in
a negative NAO stage, 30% on average, while high-flow seasons start then more
than 3 weeks later and are about 1 month shorter.
Group C comprises rivers displaying the smallest differences in the analysed
parameters of high-flow seasons between a negative and a positive NAO stage.
They can be found in eastern England as far as Scotland, western France, the
Pyrenees, the Alps, central Germany and the East European Plain, from the White
Sea coast to the Urals. High-flow periods of subgroup C1 rivers are characterised by
about 10% higher floods in a negative NAO stage. There are no major differences
between the two stages in the staring dates and duration of those periods. In
subgroup C2 flood flows and their staring dates are similar in the two NAO stages,
but their duration is markedly longer, up to an average of 1 month, in a negative NAO
stage. The group is represented mainly by Alpine and Pyrenean rivers, and those of
southern England and central Germany.
Group D includes rivers of the Iberian Peninsula, southern France and the Massif
Central, as well as the area extending from the Eastern Alps to the Balkans.
Subgroup D1 comprises rivers of central and southern Portugal. They stand out for
their much higher (40 to 60%) floods in a negative NAO stage, and while the starting
18
dates of high-flow seasons stay the same, their duration in that stage is markedly
extended, by 45 days on average. Rivers of subgroup D2 are characterised by about
15% higher flood flows in a negative NAO stage. The average starting date of high-
flow seasons does not change much, but they are statistically more than 3 months
longer than in a positive stage. This group embraces rivers of northern Portugal,
most of those in the Massif Central, rivers of the Eastern Alps, the Balkans, and
some of the central Danube basin. Rivers of subgroup D3 are characterised by the
same flow in both NAO stages and a decidedly earlier start, by more than a month, of
the high-flow season in a negative stage and its much longer duration then, by more
than 2 months. The rivers can be found in the south of France, the west Danube
basin, and the Caucasus.
Conclusions
In terms of changes in the magnitude of flow, both in the low- and high-water periods,
the rivers most susceptible to variations in the atmospheric circulation conditions
include:
- those in Northern Europe (the Scandinavian Peninsula) which, in a positive
NAO stage, show: an increase in the flow, both at low and high water; usually a lack
of change in the starting dates and duration of high-water seasons; and a usually
later start and shorter duration of lows;
- those in Central and Eastern Europe, characterised by a decided increase in
the flood flow and a slight decrease in the low-water flow in a negative NAO stage.
The starting dates of flood periods are then markedly delayed and their duration
shortened. These regularities tend to diminish eastwards, however, and the observed
differences in the parameters of high-water seasons in the two NAO stages become
19
smaller;
- those in Southern Europe whose flow in flood seasons is decidedly higher and
their duration markedly longer in a negative NAO stage.
The remaining area can be considered stable in terms of changes in high- and low-
water flows in the two NAO stages. Its eastern boundary runs roughly longitudinally
across eastern Germany south to northern Italy embracing the Alpine region, then
farther west to the Mediterranean coast. It bypasses southern France and the Massif
Central. The western boundary of this region is the Pyrenees.
The presented method of analysis of the hydrological regime is also possible to
employ in a research on the stability of regime parameters in the changing climatic
conditions brought about by both, natural factors and human activity.
REFERENCES Arnell N. W., 1997: Spatial and temporal variability in European river flows and the North
Atlantic Oscillation, in: FRIEND ’97 – Regional Hydrology, International Association of Hydrological Science Publications, 264, 77–85.
Arnell N. W., 1999: The effect of climate change on hydrological regimes in Europe: a
continental perspective. Global Environmental Change, 9, 5-23. Carleton A. M., 1988: Meridional transport of eddy sensible heat in winters marked by
extremes of the North Atlantic Oscillation, 1948/49-1979/80. Journal of Climate, 1, 212-223.
Danilovich I., Wrzesiński D., Nekrasova L., 2007: Impact of the North Atlantic Oscillation on
river runoff in the Belarus part of the Baltic Sea basin. Nordic Hydrology, 38(4-5), 413-423.
Gutry-Korycka M., Rotnicka J., 1998: The hydrological regime of rivers in the light of
scenarios of global climatic change, Geographia Polonica, Papers on Global Change series, 71, 61-78.
Hurrell J. W., 1995: Decadal trends in the North Atlantic Oscillation: regional temperatures
and precipitation, Science, 269, 676-679. Kaczmarek Z., 2002: Wpływ Oscylacji Północnoatlantyckiej na przepływy rzek europejskich.
In: Oscylacja Północnego Atlantyku i jej rola w kształtowaniu zmienności warunków
20
klimatycznych i hydrologicznych Polski. Akademia Morska w Gdyni, 163-172. Kaczmarek Z., 2003: The Impact Climate Variability on Flood Risk in Poland. Risk Analysis, 23, 559-566. Krasovskaia I., 1995: Quantification of the stability of river flow regimes, Hydrological
Sciences Journal, 40(5), 587-598.
Krasovskaia I., 1996: Sensitivity of the stability of river flow regimes to small fluctuations in temperature, Hydrological Sciences Journal, 41(2), 251-264.
Krasovskaia I., Gottshalk L., 2002: River flow regimes in a changing climate, Hydrological
Sciences Journal, 47(4), 597-609. Krasovskaia I., Sælthun N. R., 1997: Sensitivity of the stability of Scandinavian river flow
regimes to a predicted temperature rise, Hydrological Sciences Journal, 42(5), 693-
711.
Peel M.C., McMahon T.A., Finlayson B.L., Watson F.G.R., 2001: Identification and explanation of continental differences in the variability of annual runoff, Journal of Hydrology, 250, 224–240.
Pekarova P., Miklanek P., Pekar J., 2006: Long-term trends and runoff fluctuations of
European rivers, International Association of Hydrological Science Publications, 308, 520-525.
Pociask-Karteczka J., 2006: Regionalne zróżnicowanie wpływu Oscylacji
Północnoatlantyckiej na reżim rzek. In: Klimatyczne aspekty środowiska geograficznego, eds. J. Trepińska, Z. Olecki, IGiGP, Kraków, 261-269.
Pociask-Karteczka J., Milanówka D., Nieckarz Z., 2002-2003. Wpływ oscylacji
północnoatlantyckiej na przepływy rzek karpackich (1951-2000). Folia Geographica, series Geographica-Physica, 33-34, 89-104.
Popova V.V., Shmakin A. B., 2003: Influence of the North Atlantic Oscillation on multiyear
hydrological and thermal regime of northern Eurasia. I. Statistical analysis of observational data, Russian Meteorology and Hydrology, 5, 47–56.
Rotnicka J., 1988: Taksonomiczne podstawy klasyfikacji reżimu rzecznego (na przykładzie
zlewni Odry i rzek Przymorza) [Summary: Taxonomic foundations of the classification of river regime; the example of the catchments of the Odra and Polish coastal rivers], Wyd. UAM, Seria Geografia, 40.
Rotnicka J., 1993: A typology of hydrological periods for use in river regime studies’, Quaestiones Geographicae, 15/16, 77-95.
Rödel R., 2006: Influence of the North Atlantic Oscillation on spatial and temporal patterns in
Eurasian river flows, International Association of Hydrological Science Publications, 308, 526-532.
Shorthouse C.A., Arnell N.W., 1997: Spatial and temporal variability in European river flows and the North Atlantic Oscillation, FRIEND ‛97 : Concepts and Models for Sustainable Water Resource Management, International Association of Hydrological Science Publications, 246, 77-85.
21
Styszyńska A., Tamulewicz J., 2004: Warta river discharges in Poznań and atmospheric circulation in the North Atlantic region, Quaestiones Geographicae, 23, 63-81.
Wrzesiński D., 2004: Flow regimes of rivers of northern and central Europe in various
circulation periods of the North Atlantic Oscillation (NAO), Nordic Hydrological Conference, NHP Report, 48, 670-679.
Wrzesiński D., 2005: Changes of the hydrological regime of rivers of northern and central
Europe in various circulation periods of the North Atlantic Oscillation, Quaestiones Geographicae, 24, 97-109.
Wrzesiński D., 2007: Impact of the North Atlantic Oscillation on features of the hydrological
regimes in Europe. Proceedings The Third International Conference on Climate and Water. Finnish Environment Institute SYKE, Helsinki, 538-543.