Type-Specific Screen Time Associations with Cardiovascular Risk Markers in Children
28
1 Type-Specific Screen Time Associations with Cardiovascular Risk Markers in Children Emmanuel Stamatakis, PhD, Ngaire Coombs, PhD, Russell Jago, PhD, Augusta Gama, PhD, Isabel Mourão, PhD, Helena Nogueira, PhD, Vítor Rosado, Cristina Padez, PhD From the Department of Epidemiology and Public Health (Stamatakis, Coombs), the Population Health Division (Stamatakis, Coombs), University College London, London, the Centre for Exercise, Nutrition and Health Sciences (Jago), School for Policy Studies, University of Bristol, Bristol, United Kingdom; the Centre for Anthropology and Health (Gama, Rosado, Padez), Department of Geography (Nogueira), University of Coimbra, Coimbra, the Research Center in Health and Human Development (Nogueira), University of Tras-os-Montes and Alto Douro, Vila Real, Portugal Address correspondence to: Emmanuel Stamatakis, Department of Epidemiology and Public Health, University College London, 1-19 Torrington Place, London WC1E 6BT, UK. E-mail: [email protected].
-
Upload
independent -
Category
Documents
-
view
1 -
download
0
Transcript of Type-Specific Screen Time Associations with Cardiovascular Risk Markers in Children

1
Type-Specific Screen Time Associations with Cardiovascular Risk Markers
in Children
Emmanuel Stamatakis, PhD, Ngaire Coombs, PhD, Russell Jago, PhD, Augusta Gama, PhD,
Isabel Mourão, PhD, Helena Nogueira, PhD, Vítor Rosado, Cristina Padez, PhD
From the Department of Epidemiology and Public Health (Stamatakis, Coombs), the
Population Health Division (Stamatakis, Coombs), University College London, London, the
Centre for Exercise, Nutrition and Health Sciences (Jago), School for Policy Studies,
University of Bristol, Bristol, United Kingdom; the Centre for Anthropology and Health
(Gama, Rosado, Padez), Department of Geography (Nogueira), University of Coimbra,
Coimbra, the Research Center in Health and Human Development (Nogueira), University of
Tras-os-Montes and Alto Douro, Vila Real, Portugal
Address correspondence to: Emmanuel Stamatakis, Department of Epidemiology and Public
Health, University College London, 1-19 Torrington Place, London WC1E 6BT, UK.
E-mail: [email protected].

2
Background: There is evidence that TV time may have stronger associations with
cardiovascular risk markers than other types of screen time, but most studies focus on TV, or
total screen time.
Purpose: To examine associations between types of screen time and cardiovascular risk
markers in school-age children.
Methods: Cross-sectional study of 2515 school children in Portugal (aged 2–12 years, data
collected in 2009 and 2010). Three types of screen time (TV, electronic games, and PC time)
were collected through a questionnaire, and data on three cardiovascular risk markers (resting
heart rate; diastolic blood pressure [DBP]; and systolic blood pressure [SBP]) were collected
by a trained fieldworker. Complex-samples generalized linear models were run for each
combination of screen time predictor and cardiovascular risk outcome, and a clustered
cardiovascular risk score, adjusting for potential confounders (including physical activity).
Analyses were conducted in 2011 and 2012.
Results: TV viewing, but not PC or electronic games time, was positively associated with
clustered cardiovascular risk score, DBP and SBP after adjustment for all covariates.
Watching TV for >2 hours/day (compared to <1 hour/day) was associated with higher DBP
(coefficient, logged and back-transformed 0.02, 95% CI=0.00, 0.04, linear trend p=0.003);
SBP (logged and back-transformed 0.02, 95% CI= –0.01 to 0.05, p=0.009), and clustered
cardiovascular risk score (0.13, 95% CI=0.02, 0.24, p<0.001).
Conclusions: TV viewing, but no other type of screen time, was positively associated with
cardiovascular risk markers independently of physical activity. Studies using a single marker
of screen time or sedentary behavior may conceal screen time type-specific associations.

3
Introduction
Physical activity is important for children’s cardiovascular health.1–3 Recent evidence
suggests that the time children spend being sedentary (as characterized by activities involving
sitting) may also be associated with cardiovascular health, independently of time spent being
physically active.4,5 Screen time (e.g., TV viewing, playing electronic games (games), and
time spent at a PC) is one of the largest components of sedentary behavior. National clinical
and public health recommendations for physical activity have included screen time,6–9 with
the most common recommendation being that TV time be limited to 2 hours per day or less
for children and adolescents.6,9
Over 45% and 47% of boys and girls in England aged 2–15 years spent more than 2 hours a
day watching TV, and even more on weekends.10 TV viewing may have stronger associations
with cardiovascular risk indicators than other types of sedentary behavior for both children4
and adults.11 Evidence also indicates that TV viewing has stronger associations with
cardiovascular risk indicators in children than does total sedentary behavior, as measured by
accelerometers.12,13 However, associations are not consistent, and some studies focus on
either TV viewing alone,3,14 or an aggregate measure of screen time,5,15 potentially missing
type-specific associations between screen time and cardiovascular risk markers. Identifying
type-specific associations between screen time and cardiovascular risk markers is important
for the refinement of public health recommendations and the design of behavioral
interventions aimed at reducing screen time in children.
The aim of the present study was to examine the differential associations of three types of
screen time with cardiovascular risk indicators in a large population sample of schoolchildren
from Portugal. To the authors’ knowledge, this is the first study to examine the associations
4
between multiple indicators of screen time and cardiovascular risk in children living in
Southern Europe.
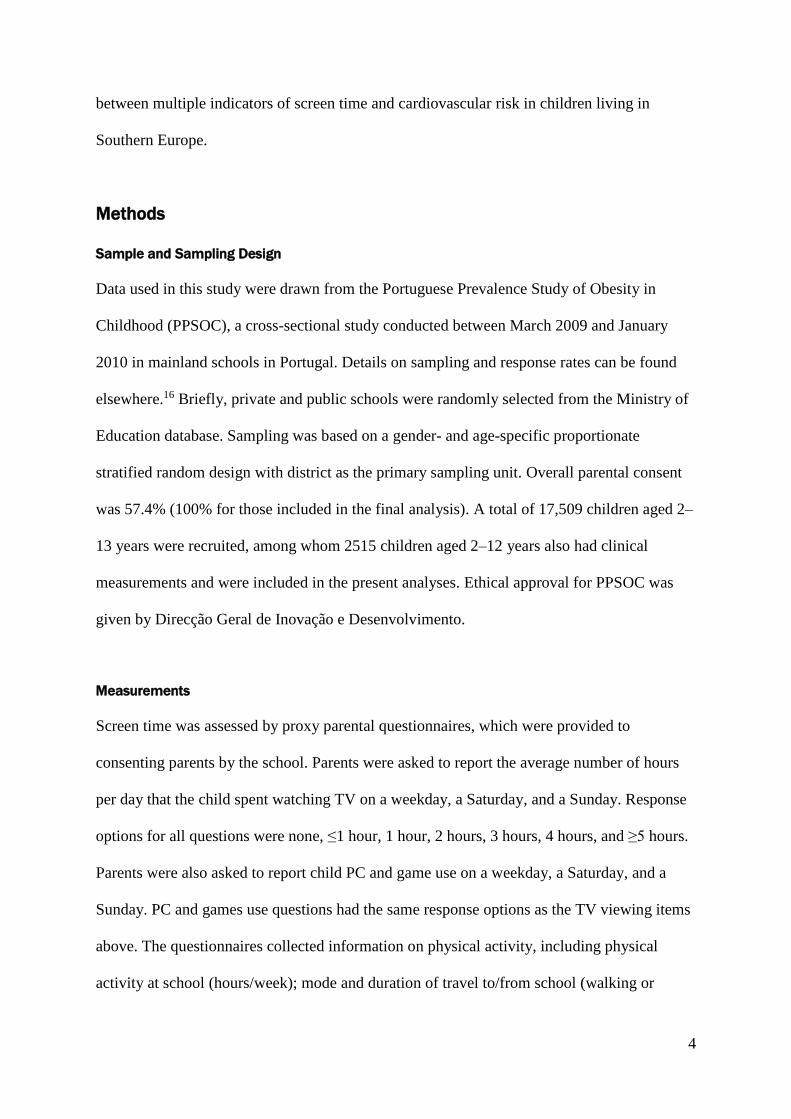
Methods
Sample and Sampling Design
Data used in this study were drawn from the Portuguese Prevalence Study of Obesity in
Childhood (PPSOC), a cross-sectional study conducted between March 2009 and January
2010 in mainland schools in Portugal. Details on sampling and response rates can be found
elsewhere.16 Briefly, private and public schools were randomly selected from the Ministry of
Education database. Sampling was based on a gender- and age-specific proportionate
stratified random design with district as the primary sampling unit. Overall parental consent
was 57.4% (100% for those included in the final analysis). A total of 17,509 children aged 2–
13 years were recruited, among whom 2515 children aged 2–12 years also had clinical
measurements and were included in the present analyses. Ethical approval for PPSOC was
given by Direcção Geral de Inovação e Desenvolvimento.
Measurements
Screen time was assessed by proxy parental questionnaires, which were provided to
consenting parents by the school. Parents were asked to report the average number of hours
per day that the child spent watching TV on a weekday, a Saturday, and a Sunday. Response
options for all questions were none, ≤1 hour, 1 hour, 2 hours, 3 hours, 4 hours, and ≥5 hours.
Parents were also asked to report child PC and game use on a weekday, a Saturday, and a
Sunday. PC and games use questions had the same response options as the TV viewing items
above. The questionnaires collected information on physical activity, including physical
activity at school (hours/week); mode and duration of travel to/from school (walking or
5
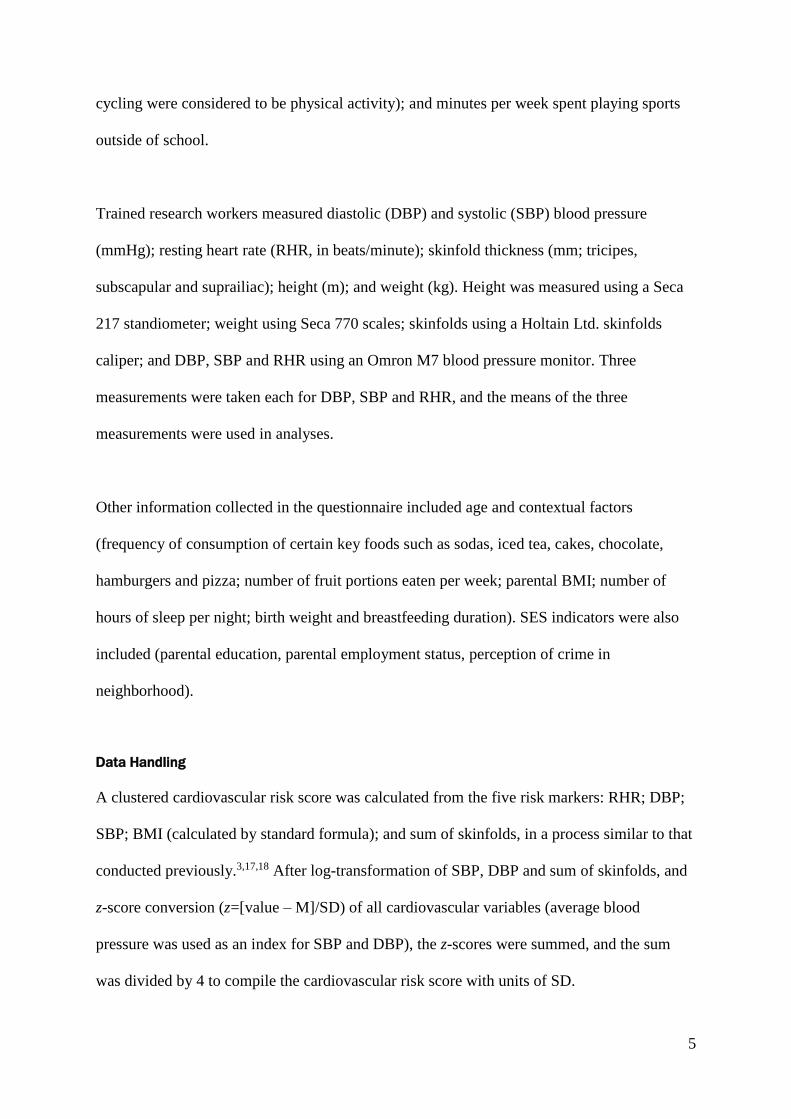
cycling were considered to be physical activity); and minutes per week spent playing sports
outside of school.
Trained research workers measured diastolic (DBP) and systolic (SBP) blood pressure
(mmHg); resting heart rate (RHR, in beats/minute); skinfold thickness (mm; tricipes,
subscapular and suprailiac); height (m); and weight (kg). Height was measured using a Seca
217 standiometer; weight using Seca 770 scales; skinfolds using a Holtain Ltd. skinfolds
caliper; and DBP, SBP and RHR using an Omron M7 blood pressure monitor. Three
measurements were taken each for DBP, SBP and RHR, and the means of the three
measurements were used in analyses.
Other information collected in the questionnaire included age and contextual factors
(frequency of consumption of certain key foods such as sodas, iced tea, cakes, chocolate,
hamburgers and pizza; number of fruit portions eaten per week; parental BMI; number of
hours of sleep per night; birth weight and breastfeeding duration). SES indicators were also
included (parental education, parental employment status, perception of crime in
neighborhood).
Data Handling
A clustered cardiovascular risk score was calculated from the five risk markers: RHR; DBP;
SBP; BMI (calculated by standard formula); and sum of skinfolds, in a process similar to that
conducted previously.3,17,18 After log-transformation of SBP, DBP and sum of skinfolds, and
z-score conversion (z=[value – M]/SD) of all cardiovascular variables (average blood
pressure was used as an index for SBP and DBP), the z-scores were summed, and the sum
was divided by 4 to compile the cardiovascular risk score with units of SD.

6
Sedentary behavior variables (TV, game, and PC time) were recorded separately for
weekdays, Saturdays and Sundays. To obtain an average daily value for TV, PC, and game
time, the original categories (0, <1, 1, 2, 3, 4, ≥5 hours) were recoded into a continuous
variable: none was coded as 0; ≤1 hour as 0.5; 1 hour as 1; 2 hours as 2; and so on. Five hours
or more was coded as 5. These proxy continuous variables were then weighted such that
weekdays accounted for five sevenths, and Saturdays and Sundays each accounted for one
seventh of the variable.
For the analyses, the continuous average daily TV viewing time variable was recategorized
into three categories: <1 hour/day, 1–2 hours/day, and >2 hours/day. Due to lower per-day
volumes than TV viewing and the resulting low numbers of observations in the higher
groups, different cut-offs were used for PC and game time (<0.5 hours/day, 0.5–1 hour/day,
>1 hour/day). The three physical activity variables (physical activity at school, time spent
walking or cycling to and from school, and time spent playing sports outside of school) were
converted into the same units (minutes per week) and summed into one total physical activity
variable. An unhealthy diet score was calculated by summing the frequency of consumption
of hamburgers, pizza, sodas, iced tea, cakes, and chocolate, with all groupings weighted
equally (weekly range: 6–36).
Due to a substantial proportion of cases with at least one missing value in at least one
covariable or exposure variable (>40%), multiple imputation was performed. No exposure
variable had more than 15.9% of values missing, and most had a considerably lower
percentage. Multiple imputation was performed using SPSS, version 18, with linear
regression as the type of imputation and five imputations. Outcome variables were not
7
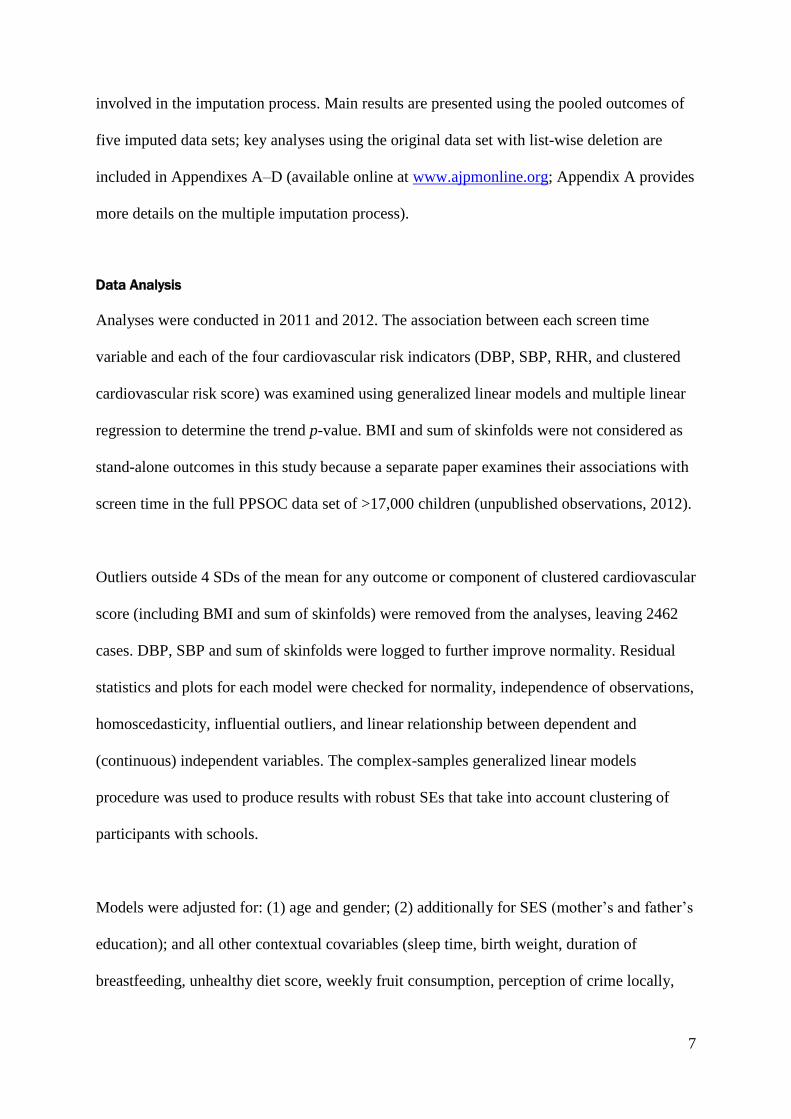
involved in the imputation process. Main results are presented using the pooled outcomes of
five imputed data sets; key analyses using the original data set with list-wise deletion are
included in Appendixes A–D (available online at www.ajpmonline.org; Appendix A provides
more details on the multiple imputation process).
Data Analysis
Analyses were conducted in 2011 and 2012. The association between each screen time
variable and each of the four cardiovascular risk indicators (DBP, SBP, RHR, and clustered
cardiovascular risk score) was examined using generalized linear models and multiple linear
regression to determine the trend p-value. BMI and sum of skinfolds were not considered as
stand-alone outcomes in this study because a separate paper examines their associations with
screen time in the full PPSOC data set of >17,000 children (unpublished observations, 2012).
Outliers outside 4 SDs of the mean for any outcome or component of clustered cardiovascular
score (including BMI and sum of skinfolds) were removed from the analyses, leaving 2462
cases. DBP, SBP and sum of skinfolds were logged to further improve normality. Residual
statistics and plots for each model were checked for normality, independence of observations,
homoscedasticity, influential outliers, and linear relationship between dependent and
(continuous) independent variables. The complex-samples generalized linear models
procedure was used to produce results with robust SEs that take into account clustering of
participants with schools.
Models were adjusted for: (1) age and gender; (2) additionally for SES (mother’s and father’s
education); and all other contextual covariables (sleep time, birth weight, duration of
breastfeeding, unhealthy diet score, weekly fruit consumption, perception of crime locally,

8
mother’s and father’s BMI); and (3) additionally for weekly physical activity time, and
mutually adjusted for TV, game, and PC time. Coefficients from the procedure indicate mean
differences (in values for each cardiovascular indicator) between the reference category and
each of the other screen-viewing categories. The lowest category (<1 hour/day for TV and
total screen time, <0.5 hours/day for PC and game time) is the reference category for the
mean difference in the outcome (and associated CI for the difference) in all complex-samples
generalized linear models (i.e., the presented coefficients compare the middle category with
the lowest category, and the highest category with the lowest category). All statistical models
were run for each combination of outcome (RHR, DBP, SBP, clustered cardiovascular risk
score) and predictor (TV, game, and PC time).
There was little evidence of gender or age interactions, so analyses were gender- and age-
adjusted but not stratified. Similarly, all main analyses were age-adjusted but not stratified.
Because of the broad age range of the sample, and although no evidence was found of age
interactions, age-stratified key results (using the median age of 7.1 years to form two age
strata) are included in Appendixes A–D (available online at www.ajpmonline.org).
Results
Sample Characteristics
Table 1 presents the sample characteristics by level of TV viewing (prior to multiple
imputation and exclusion of outliers) with case-wise deletion of missing values; Appendix B
(available online at www.ajpmonline.org) compares the part of the sample that had no
missing values in any variable and those who had at least one imputed variable. Participants
who watched >2 hours of TV per day were more likely to be older, have parents with <9
years of education, have parents who consider the local area unsafe due to crime, and have a

9
mother with a higher BMI than participants who watched ≤2 hours per day. They were also
more likely to have a higher RHR, DBP, SBP and a higher clustered cardiovascular risk
score. They were more likely to consume unhealthy foods more frequently, and to spend
more time on active travel to/from school and on school physical activity while at school, but
spend less time on sports outside of school.
Screen Time indicators and Cardiovascular Risk
Table 2 shows the results from the models with TV as the main exposure. There was
evidence of an association between average daily TV viewing time and increased DBP, SBP,
and clustered cardiovascular risk score, but not RHR. Tables 3 and 4 show the results from
the analyses with game time and PC time as the main exposure, respectively. No evidence for
an association between game time or PC time and any of the examined outcome variables
was found. Fewer associations were observed for the non-imputed, list-wise deleted data set
(Appendix C, available online at www.ajpmonline.org). PC time and game time were not
associated with any cardiovascular outcomes, and TV time was only associated with
cardiovascular score.
Age-Stratified Analysis
Results of the age-stratified analysis were largely in agreement with the age-adjusted results
(Appendix D, available online at www.ajpmonline.org). No associations were observed
between PC time or game time and any cardiovascular marker, for either age group. TV time
was associated with all cardiovascular outcomes for both age groups, with the exception of
SBP in the older age group (7.1–12.3 years) and RHR in the younger age group (2.8–7.1
years).
10
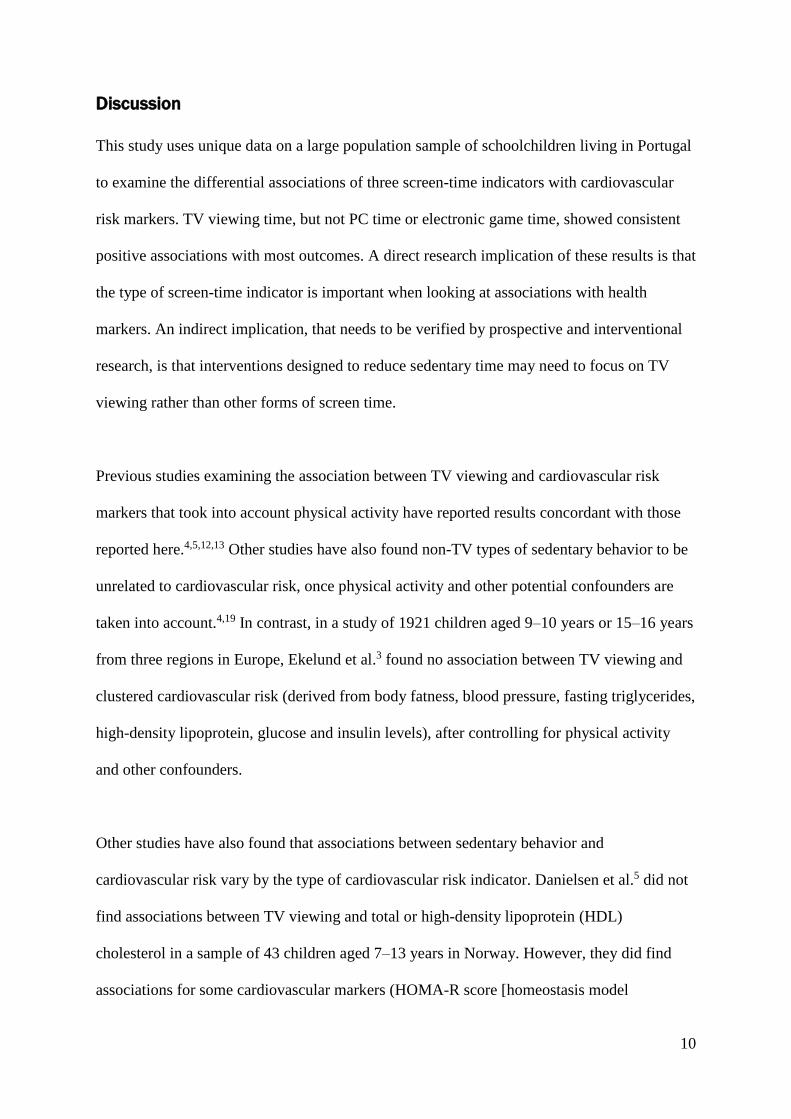
Discussion
This study uses unique data on a large population sample of schoolchildren living in Portugal
to examine the differential associations of three screen-time indicators with cardiovascular
risk markers. TV viewing time, but not PC time or electronic game time, showed consistent
positive associations with most outcomes. A direct research implication of these results is that
the type of screen-time indicator is important when looking at associations with health
markers. An indirect implication, that needs to be verified by prospective and interventional
research, is that interventions designed to reduce sedentary time may need to focus on TV
viewing rather than other forms of screen time.
Previous studies examining the association between TV viewing and cardiovascular risk
markers that took into account physical activity have reported results concordant with those
reported here.4,5,12,13 Other studies have also found non-TV types of sedentary behavior to be
unrelated to cardiovascular risk, once physical activity and other potential confounders are
taken into account.4,19 In contrast, in a study of 1921 children aged 9–10 years or 15–16 years
from three regions in Europe, Ekelund et al.3 found no association between TV viewing and
clustered cardiovascular risk (derived from body fatness, blood pressure, fasting triglycerides,
high-density lipoprotein, glucose and insulin levels), after controlling for physical activity
and other confounders.
Other studies have also found that associations between sedentary behavior and
cardiovascular risk vary by the type of cardiovascular risk indicator. Danielsen et al.5 did not
find associations between TV viewing and total or high-density lipoprotein (HDL)
cholesterol in a sample of 43 children aged 7–13 years in Norway. However, they did find
associations for some cardiovascular markers (HOMA-R score [homeostasis model

11
assessment insulin resistance score]; and C-peptide levels) after controlling for weight group,
fat and sugar intake, and physical activity, but not for total cholesterol, low-density
lipoprotein cholesterol, HDL cholesterol, triglycerides, or glycated hemoglobin.5
The lack of an association between screen time and RHR was not surprising given that
intensities in the higher end of the physical activity spectrum mainly are associated with
cardiorespiratory fitness,20 for which RHR is an indicator. It is unclear whether the observed
associations between TV viewing and blood pressure and overall cardiovascular risk score
were due to the sitting that TV viewing entails, or to other, residual causes. The lack of
association with other forms of screen time (PC, games) that are also typically performed
while sitting suggest that TV viewing might also reflect other behavioral risk factors, such as
consuming high-energy snack foods and/or the influence of TV advertisements on unhealthy
behaviors.9 This explanation is supported by two studies of children aged 3–8 years12 and
adolescents aged 13–17 years13 that found that total (objectively assessed [i.e., non–type
specific] sedentary behavior was not independently associated with cardiovascular risk
indicators, whereas self-reported TV viewing was.
In the present analyses, it was only possible to adjust for simple measurements of diet
(number of pieces of fruit eaten per week and a crude frequency-based index of unhealthy
foods consumption); hence, residual behavioral confounding might remain. The associations
between TV and overall cardiovascular risk reported here may be partly mediated by
adiposity, as recent results show that TV viewing is associated with BMI and sum of
skinfolds in the full PPSOC sample (unpublished observations, 2012). Prospective evidence
shows that higher adiposity predisposes people to higher levels of sedentary behavior in
general, and higher TV viewing might be a potential extension of this finding.21 Also, TV
12
viewing is associated with psychological distress in children.22 Given that psychological
factors are linked to the early pathogenesis of cardiovascular disease,23,24 this may be another
potential explanation of the associations observed in the present study.
An alternative explanation of the differential associations between types of screen time and
the cardiovascular risk indicators is differential measurement error of each screen time
indicator and behavior. That is, TV might be recalled and observed more accurately by the
parents than games and PC use, due to, for example, viewing of specific programs aiding
recall and accuracy. Although no information could be located that deals specifically with
parental proxy measures, TV-viewing measurement has shown the highest validity among all
sedentary behavior measures in adults.1 Although screen-time measures in children in general
have acceptable test–retest reliability, their validity remains unknown, mainly due to
difficulties in measuring them.
Strengths and Limitations
The strengths of this study are the large population sample and the availability of data on
multiple screen-related behaviors and cardiovascular risk markers. A major limitation of this
study is the cross-sectional design, which precludes causal inferences. Other limitations
include the absence of blood variables, such as lipids and indicators of glucose metabolism
that would allow more-comprehensive examination of the associations of the exposures with
cardiovascular risk.
Clinical definitions of cardiovascular risk in children are not developed, and thus, the results
should not be interpreted as identifying children with higher levels of clinical risk according
to their screen time. Screen time and physical activity reports were obtained by parental
13
proxy, which might be inaccurate, as it relies on accurate recall, and parents are not always
with their children. This is perhaps a more serious issue for physical activity that can be
performed outside the domestic environment and less so for screen time that is mostly
performed at home. Previous studies have shown that parental proxy questionnaires of
children’s physical activity have poor to fair agreement with accelerometer-based estimates.11
Nevertheless, the results of the models show that the relevant measuring methodologies had a
good degree of convergent validity. Finally, as the screen time data were categorized into
groups, it is possible that small associations were not detected, so the associations reported
here are conservative estimates.
Conclusion
TV viewing, but not PC time or game time, is associated with cardiovascular risk. Future
studies should investigate the role of TV viewing in cardiovascular health among youth,
using prospective designs.

14
Acknowledgements
This study was supported by a grant of the Fundação para a Ciência e Tecnologia FCOMP-
01-0124-FEDER-007483. This report is also research arising from Career Development
Fellowships (ES and RJ) supported by the National Institute for Health Research (NIHR).
The views expressed in this publication are those of the authors and not necessarily those of
the Nutrition and Health Sciences Department, NIHR, or the Department of Health.
No financial disclosures were reported by the authors of this paper.
15
References
1. Janssen I, LeBlanc AG. Systematic review of the health benefits of physical activity and
fitness in school-aged children and youth. Int J Behav Nutr Phys Act 2010;7(40).
2. Andersen LB, Harro M, Sardinha LB, et al. Physical activity and clustered cardiovascular
risk in children: a cross-sectional study (The European Youth Heart Study). Lancet
2006;368(9532):299-304.
3. Ekelund U, Brage S, Froberg K, et al. TV viewing and physical activity are independently
associated with metabolic risk in children: The European Youth Heart Study. PLoS Med
2006;3(12):e488.
4. Martinez-Gomez D, Eisenmann JC, Healy GN, et al. Sedentary behaviors and emerging
cardiometabolic biomarkers in adolescents. J Pediatr 2011;160(1):104-110.
5. Kang HT, Lee HR, Shin JY, Shin YH, Park BJ, Lee YJ. Association between screen time
and metabolic syndrome in children and adolescents in Korea: The 2005 Korean National
Health and Nutrition Examination Survey. Diabetes Res Clin Prac 2010;89:72-78.
6. American Academy of Pediatrics CoPE. Children, adolescents, and television. Pediatr
2001;107:423-6.
7. Tremblay MS, LeBlanc AG, Janssen I, et al. Canadian sedentary behavior guidelines for
children and youth. Appl Physiol Nutr Metab 2011;36:59-64.
8. Department of Health. Physical Activity, Health Improvement and Protection. Start
Active, Stay ActiveL A report on physical activity for health from the four home
counties. London: Chief Medical Officers; 2011.
9. Australian Government Department of Health and Ageing. Physical Activity
Recommendations for 5-12 Year Olds. Canberra, Australia: Department of Health and
Ageing; 2004.
16
10. Carlson V, Janssen I. Volume, patterns, and types of sedentary behavior and cardio-
metabolic health in children and adolescents: a cross-sectional study. BMC Public Health
2011;11:274.
11. Stamatakis E, Hamer M., Tilling K., Lawlor D. Sedentary time in relation to cardio-
metabolic risk factors: differential associations for self-report vs accelerometry in
working age adults. Int J Epidemiol 2012;41:1328-1337.
12. Cleland VJ, Schmidt MD, Dwyer T, Venn AJ. Television viewing and abdominal obesity
in young adults: is the association mediated by food and beverage consumption during
viewing time or reduced leisure-time physical activity? Am J Clin Nutr 2008;87:1148-
1155.
13. Martinez-Gomez D, Tucker J, Heelan KA, Welk GJ, Eisenmann JC. Associations
between sedentary behavior and blood pressure in young children. Arch Pediatr Adolesc
Med 2009;163(8):724-730.
14. Pardee PE, Norman GJ, Lustig RH, Preud'homme D, Schwimmer JB. Television viewing
and hypertension on obese children. Am J Prev Med 2007;33(6):439-443.
15. Tremblay MS, LeBlanc AG, Kho ME, et al. Systematic review of sedentary behavior and
health indicators in school-aged children and youth. Int J Behav Nutr Phys Act
2011;8(98).
16. Jago R, Stamatakis E, Gama A, et al. Parent and child screen-viewing time and home
media environment. Am J Prev Med 2012;43(2):150-158.
17. Lubans DR, Hesketh K, Cliff DP, et al. A systematic review of the validity and reliability
of sedentary behaviour measures used with children and adolescents. Obesity Reviews
2011;12(10):781-99.
17
18. Wijndaele K, Healy GN, Dunstan DW, et al. Increased Cardiometabolic Risk Is
Associated with Increased TV Viewing Time. Med Sci Sports Exerc 2010;42(8):1511-
1518.
19. Clark BK, Sugiyama T, Healy GN, Salmon J, Dunstan DW, Owen N. Validity and
reliability of measures of television viewing time and other non-occupational sedentary
behaviour of adults: a review. Obes Rev 2009;10(1):7-16.
20. Aires L, Silva P, Silva G, Santos M, Ribeiro JC, Mota J. Intensity of Physical Activity,
Cardiorespiratory Fitness, and Body Mass Index in Youth. J Phys Activity Health
2010;7(1):54-59.
21. Ekelund U LJSLB, et al. Moderate to vigorous physical activity and sedentary time and
cardiometabolic risk factors in children and adolescents. JAMA 2012;307(7):704-712.
22. Hamer M, Stamatakis E, Mishra G. Psychological distress, television viewing, and
physical activity in children aged 4 to 12 years. Pediatrics 2009;123(5):1263-1268.
23. Roemmich JN, Feda DM, Seelbinder AM, Lambiase MJ, Kala GK, Dorn J. Stress-
induced cardiovascular reactivity and atherogenesis in adolescents. Atherosclerosis
2011;215(2):465-470.
24. Roemmich JN, Lobarinas CL, Joseph PN, Lambiase MJ, Archer IIIFD, Dorn J.
Cardiovascular reactivity to psychological stress and carotid intima-media thickness in
children. Psychophysiology 2009;46(2):293-299.

18
Table 1: Sample characteristics by level of TV viewinga
Average TV viewing time per day (hours)
<1 1–2 >2
Categoric variablesa % (n) % (n) % (n) p-value
Gender (% male) 48.5 431 52.0 419 47.2 238 0.186
Father's education
(% ≥9 years) 86.1 738 83.0 632 70.6 329 <0.001
Mother's education
(% ≥9 years) 92.2 811 89.4 712 82.7 402 <0.001
Area crime (% strongly
disagree unsafe) 74.0 615 72.2 541 64.6 299 0.001
Continuous variablesc M (SD) n M (SD) n M (SD) n p
Age (years) 6.98 2.01 888 7.29 1.96 806 7.48 1.95 504 <0.001*
resting heart rate
(beats/minute) 89.48 12.46 888 88.44 11.72 806 90.15 12.90 504 0.040*
Diastolic blood
pressure (mmHg) 91.67 11.42 888 92.80 11.64 806 95.67 11.62 504 <0.001*
Systolic blood pressure
(mmHg) 57.13 8.30 888 57.71 8.81 806 59.37 8.84 504 <0.001*
cardiovascular risk
score -0.09 0.59 888 -0.01 0.64 806 0.16 0.72 504 <0.001*
active travel time
to/from school
(minutes/week) 12.09 35.50 844 15.31 42.15 764 25.54 51.51 475 <0.001*

19
school physical activity
time (minutes/wk) 68.69 29.11 784 73.26 29.18 727 77.96 27.86 449 <0.001*
time spent playing sport
(minutes/week) 87.09 104.90 876 79.15 96.20 796 58.42 87.53 491 <0.001*
Mother’s BMI 23.33 3.56 840 23.70 3.83 760 24.35 4.10 467 <0.001*
Father’s BMI 26.28 3.29 793 26.23 3.26 698 26.66 3.50 423 0.087
breastfeeding duration
(months)
4.18 2.92 784 4.15 3.50 699 4.13 3.26 417 0.969
birth weight (kg) 3.21 0.53 848 3.22 0.51 778 3.25 0.55 487 0.358
unhealthy diet score 15.09 3.14 807 15.63 2.97 705 16.50 3.95 443 <0.001*
portions of fruit per day 2.15 1.30 862 2.05 1.22 783 2.04 1.34 487 0.151
Note: Boldface indicates significance.
a Prior to multiple imputation, with case-wise deletion of missing values
b Chi-square test was used to test significance of association between categoric variables and
TV viewing.
c ANOVA was used to test significance of association between continuous variables and TV
viewing.
* p<0.05

20
20
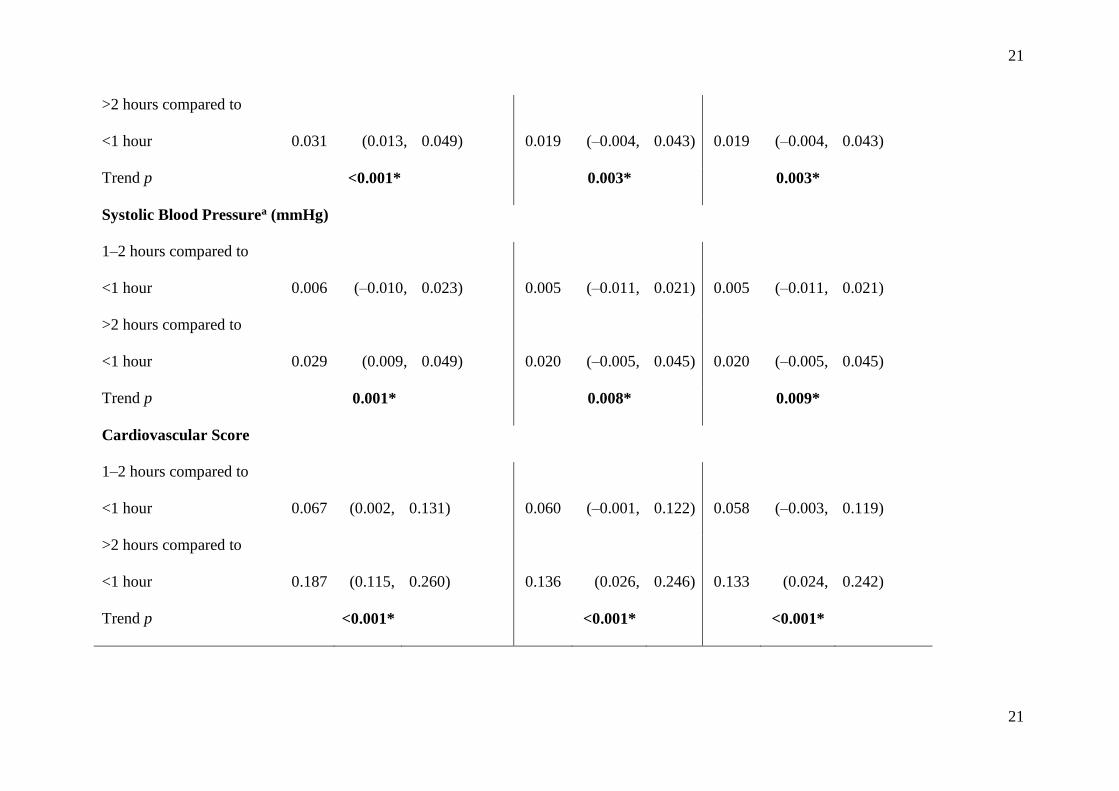
Table 2: Multivariable-adjusted Associations between TV Viewing Frequency and Cardiovascular Risk Markers in Portuguese Schoolchildren
(n=2462), coefficient (95% CI)
TV VIEWING TIME
PER DAY
Model 1 Model 2 Model 3
Resting heart rate
(beats/minute)
1–2 hours compared to
<1 hour –0.490 (–1.598, 0.618) –0.494 (–1.631, 0.643) –0.528 (–1.660, 0.604)
>2 hours compared to
<1 hour 1.182 (0.005, 2.360) 0.901 (–1.107, 2.909) 0.854 (–1.144, 2.852)
Trend p 0.131 0.151 0.176
Diastolic Blood Pressurea (mmHg)
1–2 hours compared to
<1 hour 0.006 (–0.007, 0.019) 0.004 (–0.009, 0.016) 0.003 (–0.009, 0.016)
21
21
>2 hours compared to
<1 hour 0.031 (0.013, 0.049) 0.019 (–0.004, 0.043) 0.019 (–0.004, 0.043)
Trend p <0.001* 0.003* 0.003*
Systolic Blood Pressurea (mmHg)
1–2 hours compared to
<1 hour 0.006 (–0.010, 0.023) 0.005 (–0.011, 0.021) 0.005 (–0.011, 0.021)
>2 hours compared to
<1 hour 0.029 (0.009, 0.049) 0.020 (–0.005, 0.045) 0.020 (–0.005, 0.045)
Trend p 0.001* 0.008* 0.009*
Cardiovascular Score
1–2 hours compared to
<1 hour 0.067 (0.002, 0.131) 0.060 (–0.001, 0.122) 0.058 (–0.003, 0.119)
>2 hours compared to
<1 hour 0.187 (0.115, 0.260) 0.136 (0.026, 0.246) 0.133 (0.024, 0.242)
Trend p <0.001* <0.001* <0.001*
22
22
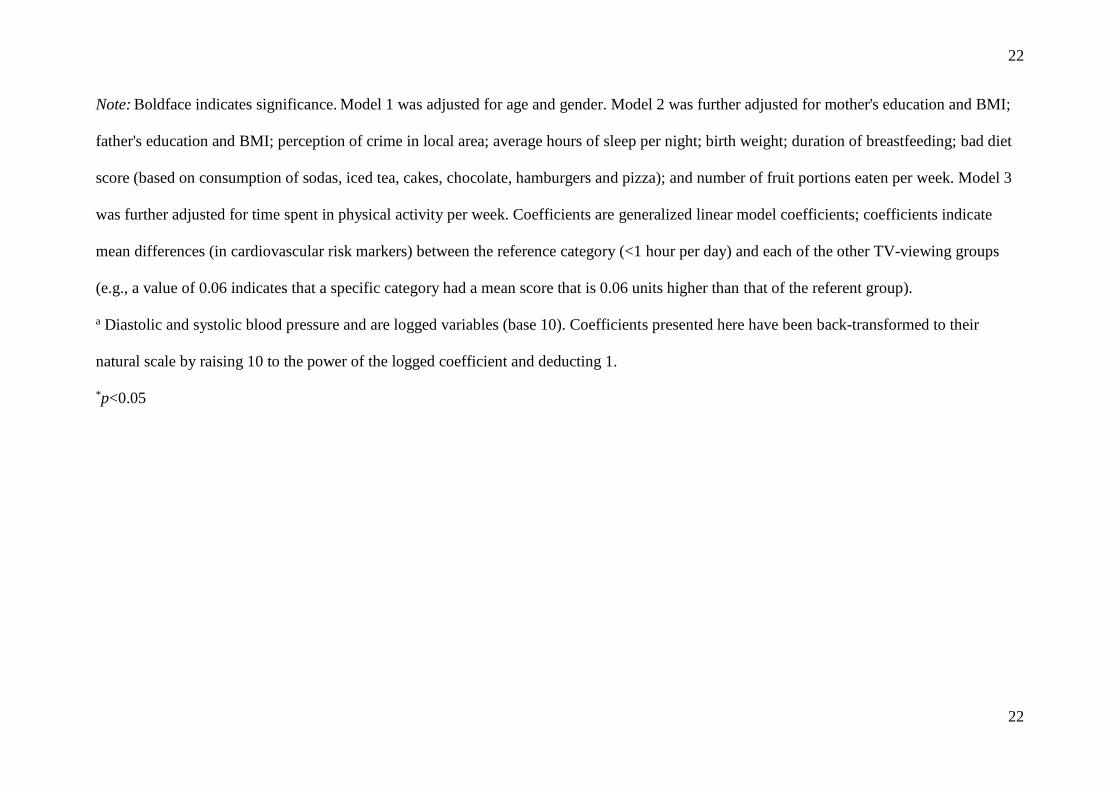
Note: Boldface indicates significance. Model 1 was adjusted for age and gender. Model 2 was further adjusted for mother's education and BMI;
father's education and BMI; perception of crime in local area; average hours of sleep per night; birth weight; duration of breastfeeding; bad diet
score (based on consumption of sodas, iced tea, cakes, chocolate, hamburgers and pizza); and number of fruit portions eaten per week. Model 3
was further adjusted for time spent in physical activity per week. Coefficients are generalized linear model coefficients; coefficients indicate
mean differences (in cardiovascular risk markers) between the reference category (<1 hour per day) and each of the other TV-viewing groups
(e.g., a value of 0.06 indicates that a specific category had a mean score that is 0.06 units higher than that of the referent group).
a Diastolic and systolic blood pressure and are logged variables (base 10). Coefficients presented here have been back-transformed to their
natural scale by raising 10 to the power of the logged coefficient and deducting 1.
*p<0.05

23
23
Table 3: Multivariable-adjusted associations between electronic games frequency and cardiovascular risk markers in Portuguese schoolchildren
(n=2462), coefficient (95% CI)
ELECTRONIC GAMES
TIME PER DAY
Model 1 Model 2 Model 3
Resting heart rate
(beats/minute)
0.5–1 hour compared to <0.5
hours 0.412 (–0.644, 1.468) 0.301 (–0.767, 1.370) 0.333 (–0.738, 1.403)
>1 hour compared to <0.5
hours 0.720 (–1.786, 3.227) 0.458 (–1.640, 2.556) 0.563 (–1.531, 2.657)
Trend p 0.421* 0.528* 0.470*
Diastolic blood pressure (mmHg)a
0.5–1 hour compared to <0.5
hours 0.000 (–0.011, 0.011) –0.002 (–0.013, 0.008) –0.002 (–0.013, 0.009)

24
24
>1 hour compared to <0.5
hours 0.003 (–0.023, 0.029) –0.004 (–0.027, 0.018) –0.004 (–0.026, 0.019)
Trend p 0.891* 0.655* 0.691*
Systolic blood pressure (mmHg)a
0.5–1 hour compared to <0.5
hours 0.000 (–0.015, 0.015) –0.003 (–0.017, 0.011) –0.003 (–0.017, 0.011)
>1 hour compared to <0.5
hours 0.027 (–0.010, 0.066) 0.017 (–0.021, 0.057) 0.018 (–0.021, 0.057)
Trend p 0.383* 0.609* 0.587*
Cardiovascular Score
0.5–1 hour compared to <0.5
hours 0.024 (–0.040, 0.088) 0.007 (–0.058, 0.072) 0.009 (–0.056, 0.075)
>1 hour compared to <0.5
hours 0.054 (–0.109, 0.217) 0.009 (–0.497, 0.514) 0.014 (–0.121, 0.149)
Trend p 0.354* 0.771* 0.682*

25
25
Note: Boldface indicates significance. Model 1 was adjusted for age and gender. Model 2 was further adjusted for mother's education and BMI;
father's education and BMI; perception of crime in local area; average hours sleep per night; birth weight; duration of breastfeeding; bad diet
score (based on consumption of sodas, iced tea, cakes, chocolate, hamburgers and pizza); and number of fruit portions eaten per week. Model 3
was further adjusted for time spent in physical activity per week. Generalized linear model coefficients; coefficients indicate mean differences
(in cardiovascular risk markers) between the reference category (<1 hour a day) and each of the other TV viewing groups (e.g., a value of 0.06
indicates that a specific category had a mean score that is 0.06 units higher than the referent group).
aDiastolic and systolic blood pressure are logged variables (base 10). Coefficients presented here have been back-transformed to their natural
scale by raising 10 to the power of the logged coefficient and deducting 1.
*p<0.05

26
26
Table 4: Multivariable-adjusted Associations between PC Frequency and Cardiovascular Risk Markers in Portuguese Schoolchildren (n=2462),
coefficient (95% CI)
PC TIME PER DAY
Model 1 Model 2 Model 3
Resting heart rate
(beats/minute)
0.5–1 hour compared to <0.5
hours 0.396 (–0.826, 1.617) 0.271 (–0.963, 1.505) 0.304 (–0.922, 1.531)
>1 hour compared to <0.5
hours 0.997 (–0.693, 2.687) 0.808 (–0.930, 2.546) 0.779 (–0.982, 2.541)
Trend p 0.310* 0.390* 0.389*
Diastolic blood pressurea (mmHg)
0.5–1 hour compared to <0.5
hours –0.005 (–0.019, 0.009) –0.006 (–0.020, 0.009) –0.005 (–0.019, 0.009)
>1 hour compared to <0.5
hours –0.003 (–0.021, 0.014) –0.009 (–0.026, 0.008) –0.009 (–0.026, 0.008)

27
27
Trend p 0.498* 0.264* 0.210*
Systolic blood pressurea (mmHg)
0.5–1 hour compared to <0.5
hours –0.005 (–0.019, 0.010) –0.006 (–0.022, 0.011) –0.006 (–0.022, 0.011)
>1 hour compared to <0.5
hours –0.006 (–0.026, 0.014) –0.011 (–0.031, 0.010) –0.011 (–0.032, 0.010)
Trend p 0.512* 0.313* 0.314*
Cardiovascular Score
0.5–1 hour compared to <0.5
hours 0.014 (–0.052, 0.081) 0.012 (–0.056, 0.079) 0.014 (–0.054, 0.081)
>1 hour compared to <0.5
hours –0.035 (–0.115, 0.045) –0.036 (–0.142, 0.070) –0.038 (–0.147, 0.071)
Trend p 0.860* 0.658* 0.663*
Note: Boldface indicates significance. Model 1 was adjusted for age and gender. Model 2 was further adjusted for mother's education and BMI;
father's education and BMI; perception of crime in local area; average hours sleep per night; birth weight; duration of breastfeeding; bad diet
score (based on consumption of sodas, iced tea, cakes, chocolate, hamburgers and pizza); and number of fruit portions eaten per week. Model 3

28
28
was further adjusted for time spent in physical activity per week. Coefficients are generalized linear model coefficients; coefficients indicate
mean differences (in adiposity markers) between the reference category (<0.5 hours a day) and each of the other PC frequency groups (e.g., a
value of 0.06 indicates that a specific category had a mean score that is 0.06 units higher than that of the referent group).
aDiastolic and systolic blood pressure are logged variables (base 10). Coefficients presented here have been back transformed to their natural
scale by raising 10 to the power of the logged coefficient and deducting 1.
*p<0.05
PC, personal computer