Client factors associated with psychotherapeutic process and ...
Upload
khangminh22Category
view
1download
0
1
TYPE 2 DIABETES AND ITS ASSOCIATED RISK FACTORS:
MAGNITUDE AMONG ADULT OBESE PATIENTS AT GOPC,
FETH ABAKALIKI, EBONYI STATE, NIGERIA.
A DISSERTATION SUBMITTED TO THE NATIONAL
POSTGRADUATE MEDICAL COLLEGE OF NIGERIA IN
PARTIAL FULFILMENT OF THE REQUIREMENT FOR THE
AWARD OF THE FELLOWSHIP IN FAMILY MEDICINE.
BY
DR. AMAZUE HENRY IKECHUKWU (MBBS, NIG.)
DEPARTMENT OF FAMILY MEDICINE
FEDERAL TEACHING HOSPITAL ABAKALIKI
EBONYI STATE, NIGERIA
NOVEMBER, 2016.

2
TABLE OF CONTENTS
Table of contents i
Declaration ii
Certification iii
Dedication iv
Preface and Acknowledgement v
List of tables vi
List of figures vii
List of abbreviations viii
Appendices x
Summary 1
Chapter one: Introduction 3
Chapter two: Review of the Literature 10
Chapter three: Materials and Method 23
Chapter four: Results 32
Chapter five: Discussion 64
Conclusion 78
Limitation of study 79
Recommendations 80
References 81
Appendices

3
DECLARATION
I, Dr. Amazue Henry Ikechukwu of the Department of Family Medicine, Federal Teaching
Hospital, Abakaliki, declare that the contents of this dissertation are my original work and
that none of its contents has ever been submitted to any professional body or Institution.
Signature/Date ………………………………………………………
Name: ………………………………………………………
Department: ………………………………………………………..
………………………………………………………………………
………………………………………………………………………

4
CERTIFICATION
This is to certify that the contents of this dissertation were conceptualized and developed
under our supervision. We undertook the supervision of the write up of the dissertation.
Trainer/Supervisor
Signature/Date: ……………………………………………………………………….
Dr. (Mrs.) Nwazor F.O.O
(FMCGP)
Consultant Adviser
Signature/Date: ……………………………………………………………………….
Dr. Imediegwu O.O
(FMCGP)
Head of Department
Signature/Date: ………………………………………………………………………
Dr, Oguejiofor N.C
FWACP (FM)

5
DEDICATION
This book is dedicated first to God the owner of my life; then to my adorable and beloved
wife Dr. (Mrs.) Chinelo Amazue who has been very supportive and taking very good care of
the home while I was busy with my residency training programme. Also to my children:
Ikechukwu, Chibuzo, and Chinedum who were always there to lighten my days and to my
parents Sir and Lady Lawrence Amazue who ensured that I took the path of academics early
in life.

6
PREFACE/ACKNOWLEDGEMENT
The epidemics of type 2 diabetes and obesity are increasing in the sub-Saharan Africa.
Nigeria and Ebonyi State are not an exception. This study was done with a view to assessing
the magnitude of type 2 diabetes and its associated risk factors in a hospital population in
Abakaliki, Ebonyi state. I wish to acknowledge the priceless efforts of my supervisor Dr.
(Mrs.) Nwazor F.O.O and My Consultant Adviser, Dr. Imediegwu O.O, in nudging me on to
complete this work and their painstaking efforts in supervising and proof reading this work
over and over to ensure good work. I will not fail to acknowledge my Head of Department
Dr. Oguejiofor N.C and many consultant Family Physicians in my institution who helped in
no small measure to see that this work was well done. I will not forget the uncommon
contribution of those who helped in typing this work.

7
LIST OF TABLES
Table 1: Sociodemographic / baseline characteristics of the subjects
Table 2: Prevalence of blood glucose categories in the non-obese and the obese
Table 3: Prevalence of known diabetes in the non-obese and the obese groups
Table 4: Assessment of blood glucose by age categories
Table 5: Family history of diabetes and blood glucose categories in the respondents
Table 6: Stratification of respondents’ family history of diabetes and the blood glucose
categories
Table 7: Sex and blood glucose categories in the respondents
Table 8: Blood glucose and waist circumference categories
Table 9: Blood glucose and BMI categories of the respondents
Table 10: Blood glucose categories and cigarette smoking in the respondents
Table 11: Alcohol consumption and blood glucose categories
Table 12: Blood glucose and units of alcohol consumed categories of the respondents
Table 13: Blood glucose categories and physical activity
Table 14: Blood glucose and blood pressure categories of the respondents
Table 15: Correlation of whole carpillary blood glucose and continuous variable risk factors
Table 16: Logistic regression of risk factors of diabetes
Table 17: Awareness of lifestyle modification and blood glucose categories
Table 18: Occupational status and blood glucose categories of the respondents
Table 19: Blood glucose categories and locality of the respondents
Table 20: Blood glucose and marital status categories of the respondents
Table 21: Blood glucose and educational status categories of the respondents

8
LIST OF FIGURES
Figure 1: Study flow chart
Figure 2: Scatter plot of whole capillary blood glucose (mg/dl) and age (years)
Figure 3: Scatter plot of whole capillary blood glucose (mg/dl) and waist circumference (cm)
Figure 4: Scatter plot of whole capillary blood glucose (mg/dl) and systolic blood pressure
(mm/Hg)

9
LIST OF ABBREVIATIONS
ABV: Alcohol by volume
ADA: America Diabetic Association
BMI: Body mass index
BP: Blood pressure
CAM: Complimentary and Alternative Medicine
DAWN: Diabetes Attitudes, Wishes and Needs
DBP: Diastolic blood pressure
EBSUTH: Ebonyi State University Teaching Hospital
FBG: Fasting blood glucose
FETHA: Federal Teaching Hospital Abakaliki
FMCA: Federal Medical Centre Abakaliki
GABA: Gamma amino butyric acid
GOPC: General Out-Patient Clinic
HDL: High density lipoprotien
IBM: International Business Machines
IDA: International Diabetic Association
ISO: International Standard Organization
JNC: Joint National Committee on Prevention, Detection, Evaluation and Treatment
of high blood pressure
MKS: System of units in physics based on measuring Length in metres, mass in
kilograms and time in seconds.

10
NCD: Non-communicable disease
NHANES: National Health and National Examination Surveys
NIH: National Institute of Health
RBG: Random blood glucose
REC: Research and Ethics Committee
RGZ: Residential Growth Zone
ROC: Receiver Operator Characteristic
SBP: Systolic blood pressure
SD: Standard deviation
SIGN: Scottish Intercollegiate Guideline Network
SPSS: Statistical Package for Social Sciences
USA: United States of America
WHO: World Health Organization

11
APPENDICES
Appendix I: Alcohol by volume of common alcoholic beverages in Abakaliki
Appendix 2: Ethical approval
Appendix 3: Letter of consent
Appendix 4: Research questionnaire

12
SUMMARY
Background: The epidemics of obesity and type 2 diabetes (diabetes) in sub-Saharan Africa
are increasing. Studies on the association of obesity and that of other risk factors with type 2
diabetes in hospital population study in this region of the country is not much. This study
evaluated the magnitude of type 2 diabetes and its associated risk factors in adults in a tertiary
hospital, primary care clinic in Abakaliki, Ebonyi State, Nigeria.
Objectives: To determine the prevalence of diabetes and of known diabetics in the obese and
non-obese groups. To assess the modifiable risk factors (waist circumference, tobacco use,
alcohol consumption, physical activity) and the non-modifiable risk factors (age, sex and
family history of diabetes) among study population. To correlate continuous variable risk
factors with the blood glucose.
Methods: This was a hospital-based cross-sectional comparative study of 280 adults (140
obese and 140 non-obese) selected through systematic random sampling. The association
between obesity, other risk factors and type 2 diabetes were also examined. Chi-square test,
Fisher’s exact test, t-test, correlation and logistic regression analysis were used for analysis.
Results: The crude prevalence of diabetes in the study population was 10.0% (28). The
prevalence of diabetes in the obese was 12.1% (17) compared to 7.9% (11) in the non-obese
group. The prevalence of known diabetics was slightly higher among the non-obese group
7.9% (11) when compared to the obese group 7.1% (10). When Spearman’s rho correlation
was run to determine the relationship between 280 subjects’ whole carpillary blood glucose
(RBG) and continuous risk factors; only age, waist circumference and average systolic blood
pressure had weak positive correlation and had statistically significant association with
diabetes (rs = .271, p = 0.0001), (rs = .175, p = 0.003) and (rs = .161, p = 0.007) respectively.
Family history of diabetes and age showed independent association with diabetes in logistic

13
regression (p = 0.007) and (p = 0.001) respectively. Age seemed to have a protective effect
in logistic regression (OR = 0.940)[CI = 0.906-0.976]. The lower the age the less chance a
subject has of having diabetes. This deduction is strong. Family history of diabetes had
higher odds for diabetes (OR = 3.718)[CI = 1.438-9.613]. Subjects with family history of
diabetes had 3.7 times chances of having diabetes than those without family history of
diabetes. Sex, smoking, alcohol consumption, BMI, physical activity had no association or
independent association with diabetes in the respondents.
Conclusion: The prevalence of diabetes was high and the prevalence of known diabetes was
relatively low. The findings from this study suggest that non-modifiable risk factors: age and
family history of diabetes and modifiable risk factors namely: WC and systolic blood
pressure had an association with types 2 diabetes in the respondents.

14
CHAPTER ONE
1.1 INTRODUCTION
Obesity and type 2 diabetes (diabetes) are important non-communicable health challenges
whose magnitude is increasing worldwide. Non–communicable disease (NCD) is a medical
condition or disease that is non-transmissible among people1. When compared with the year
2000, it is projected that there will be about 157% increase in prevalence of diabetes by the
year 2030 in developing countries, namely: Middle Eastern crescent, sub-Saharan Africa and
India 2.
The number of people with diabetes is increasing in every country3. The highest numbers
of undiagnosed cases of diabetics are found in Africans, about 80%. Some of the reasons
fuelling this crisis include: most are asymptomatic or with mild symptoms, poverty and poor
health insurance coverage which is mainly for government workers 3.
Type 2 diabetes is associated with many preventable risks and causative factors, such as
obesity, hypertension 4, 5, 6, dyslipidaemia, poor diet, physical inactivity 4,7,8,9 or irregular
exercise 3, increasing age 3 and family history of diabetes 10. Risk factors are factors whose
presence is associated with an increased probability that the disease will develop later. Some
are amenable to change (modifiable), while others are immutable (non-modifiable) 1.
Globally, diabetes was the cause of 1.5 million deaths in 2012 11.
1.2 DEFINITION OF TERMS
1. Diabetes: Subjects were diagnosed based on random blood glucose (RBG) of
200mg/dl(11.1mmol/L) or more who had symptoms of diabetes. Diagnosis was also
based on being a known diabetic and/or current use of anti-diabetic medication(s).

15
Subjects were grouped into normoglycaemia, impaired glucose and diabetes based on
result of RBG.
Normoglycaemia - < 140mg/dl (7.7mmol/l)
Impaired - 140-199mg/dl (7.7-11.0mmol/l)
Diabetes - ≥ 200mg/dl (≥11.1mmol/l)
2. Hypertension: Hypertension was defined as blood pressure ≥ 140mmHg systolic
(SBP) and/or ≥ 90mmHg diastolic (DBP). It was also defined as history of a known
hypertensive and/or current use of antihypertensive medication(s). The blood pressure
was classified using Joint National Committee on Prevention, Detection, Evaluation
and Treatment of high blood pressure JNC 7 report guideline 21. For easy analysis,
subjects were grouped into normotensive, SBP < 140mmHg and DBP < 90mmHg;
and hypertensive, SBP ≥ 140 mmHg and/or DBP ≥ 90 mmHg or history of being a
known hypertensive, and/or a current use of antihypertensive medication(s).
3. Known diabetes: Known diabetes was referred to as having a previous diagnosis of
diabetes before the study. This implies that the subject has been previously informed
by a medical professional of his or her diabetic status.
4. Obesity: Based on body mass index (BMI): BMI ≥ 30.0 kg/m2. It was further
categorized into
Class I (mild) = 30.0- 34.9kg / m2
Class II (moderate) = 35.0 – 39.9kg / m2
Class III (Severe) = ≥ 40.0kg / m2
5. Abdominal obesity: Normal abdominal waist circumference (WC) for women. WC <
80cm, while abnormal WC (abdominal obesity) for women WC ≥ 80cm. Normal WC
for men was WC < 94cm, while abnormal WC for men WC ≥ 94cm18.

16
6. The family history of risk factor of diabetes was captured as Yes or No for presence
or absence of type 2 diabetes in the subject’s family and was assessed in terms of
degree of relationship.
First degree: Affecting subject’s siblings
Second degree: Affecting subject’s parents, uncles and aunties
Third degree: Affecting subject’s grandparents and cousins.
7. Alcohol consumption: Was assessed on whether subject had ever consumed alcohol
or not. Those who had ever consumed alcohol were further graded as moderate or
heavy drinkers based on units of alcohol consumed in a week.
One unit of alcohol equals 10mls or 8g of pure alcohol. This is about the amount of
alcohol the average adult can process in one hour 22. Units of alcohol consumed were
calculated by multiplying the alcohol by volume (ABV), also known as percentage of
alcohol of the brand (Appendix I) consumed by the volume in milliliter (ml) of the
amount of alcohol consumed and divided by one thousand.
Units of alcohol = ABV × Volume (ml)
1000
Moderate intake < 21 units/week for men
< 15 units/week for women
Heavy intake ≥ 21 units/week for men
≥ 15 units/week for women
8. Tobacco use: It was assessed based on whether subjects had ever smoked cigarette or
not. Cigarette smoking was assessed using smoking index = number of sticks
smoked/day x number of years smoked. Where by >300 was significant.

17
9. Physical activity: It was assessed and coded based on the subject’s type of occupation
and involvement in sporting or recreational activity regularly 23.
Physically active: Manual labourer, artisans, farmers, and apprentice.
Moderate active: Traders, house workers or nanny, students, corpers,
seamstress/tailor.
Physically inactive: Office workers, unemployed, drivers and retirees.
Physically inactive + recreational activity or exercise regularly = moderately active
Moderately active + recreational activity or exercise regularly = physically active.
For analysis, subjects were grouped into physically active and physically inactive (this
include moderately active and physically inactive).
1.3 STATEMENT OF PROBLEM `
There has been tremendous increase in the number of people who are obese suffering from
such obesity-related morbidity as diabetes worldwide3. The situation in Abakaliki, Ebonyi
State seems not to be different as the number seen in General out-Patient Clinic (GOPC) of
Federal Teaching Hospital Abakaliki (FETHA), seems to be on the increase. This may be due
to adoption of western lifestyle such as eating more of high energy rich foods, saturated fats
following the proliferation of fast food shops and sedentary lifestyle. Obesity increases the
risks of developing a number of health conditions, whose consequences occur with greater
magnitude among obese subjects. The most important of these health conditions include type
2 diabetes, hypertension and dyslipidaemia12.
Surprisingly due to lack of education, most of these obese subjects do not understand their
condition and the risk they are exposed to. Unfortunately, most of these obese groups seem to
indulge in lifestyle and behaviours that endanger their lives4. These include sedentary

18
lifestyle, eating more high energy foods and saturated fats, smoking and heavy alcohol
consumption.
There are many complications associated with diabetes that are difficult to manage and
sometimes result in significant number of deaths and impairment of quality of life, both for
the patient and the care giver 13.
1.4 JUSTIFICATION OF THE STUDY
Obesity is associated with increased risk of cardiometabolic diseases such as diabetes.
When obesity and diabetes co-exist, the risk of cardiovascular disease is increased 14.
Most of the studies on this subject were community based study. Hospital based studies
were scarce to the best knowledge of the author. Since type 2 diabetes plays a major role in
the development of cardiovascular morbidity and mortality in obese subjects, it is essential
that this group should be screened for diabetes and other co-morbidities such as hypertension.
Lifestyle modification should be instituted, so as to prolong or prevent development of
diabetes for those who are at impaired glucose tolerance stage and complications in those
who are diabetic 15, 16, 17,18,19,20.
This study established the prevalence of diabetes in Abakaliki, the prevalence of known
type 2 diabetes and association of risk factors of diabetes with diabetes, among the study
population, hence has provided information on the burden of obesity related diabetes. It
highlighted the importance of family physicians using every encounter with the obese
patients as an opportunity to counsel, screen and control diabetes among them.
This study bridges the gap of studies and data on this subject within Abakaliki and Ebonyi
State by providing needed information.

19
The information provided by this study, will help family physicians, health professionals
and healthcare managers in the formulation and implementation of strategies for health
preventive and health promotive care.
1.5 RESEARCH QUESTION: 1) Is there significant difference between the magnitude of
type 2 diabetes in the obese and the non-obese?
2) Is there significant association between diabetes and its associated risk factors in the study
population?
1.6 AIM AND OBJECTIVES
1.6.1 AIM: To determine the magnitude of type 2 diabetes and its associated risk factors
among obese adult patients attending GOPC, FETH Abakaliki, Ebonyi State, with a view to
reducing the burden of the disease through advocating for lifestyle modification and
screening of the obese.
1.6.2 OBJECTIVES
1. To determine the prevalence of type 2 diabetes among the obese and the non-
obese subjects.
2. To determine the prevalence of known type 2 diabetics among the obese and the
non-obese groups.
3. To assess the modifiable (waist circumference, cigarette smoking, alcohol
consumption, physical activity) and non-modifiable (age, sex, and family history
of diabetes) risk factors among the study population.
4. To correlate the body mass index, waist circumference, age, units of alcohol
consumed and smoking index with random blood glucose.

20
1.7 RESEARCH HYPOTHESIS:
The null: There is no significant difference between magnitude of type 2 diabetes
and its associated risk factors in the obese and in the non-obese.
The alternative: There is significant difference between magnitude of type 2
diabetes and its associated risk factors in the obese and in the non-obese.
Test statistics such as Fisher’s exact test, Chi-square test and t-test will be
used to test for significance. P-value less than 0.05 will result in rejecting the null
hypotheses.

21
CHAPTER TWO
2.0 REVIEW OF LITERATURE
2.1 TYPE 2 DIABETES: PATHOGENESIS AND ITS PREVALENCE
Diabetes mellitus according to World Health Organisation (WHO) summary of technical
report recommendation is defined in part as fasting blood glucose(FBG) of more than or
equal to 126 mg/dl (7.0 mmol/l) or random blood glucose (RBG) of more than or equal to
200mg/dl (11.1 mmol/l) with symptoms of diabetes 24.
Diabetes is about the 4th largest contributor to mortality in the majority of low– and
middle–income countries. Presently, nearly two thirds of people with diabetes live in low–
and middle-income countries 25.
Non–communicable diseases are increasing tremendously in Africa. This has been
attributed to a number of factors such as demographic transition (increase in life expectancy,
resulting in greater number attaining old age), epidemiological transition and life style related
to urbanization and westernization 26, 27. Natural history of diabetes is a continuum from
normal glycaemia to impaired fasting glucose or impaired glucose tolerance and finally to
frank diabetes 15, 28, 29. Pathogenesis of diabetes has been largely attributed to factors which
include hyperplasia and hypertrophy of adiposities with release of proinflammatory cells
which result in metabolic derangement (insulin resistance). All these with the interplay of
genes, feeding habit and activity level determine the degree of abnormality manifested by an
individual 4, 28. Type 2 diabetes accounts for about 90% to 95% of those with diabetes
mellitus, while 5% or 10% are type 1 diabetes 10.
Prevalence of diabetes worldwide is between 1.2% and 15.1%. There are about 371 million
people with diabetes worldwide30. Africa has 4.3% prevalence of diabetes and has the highest

22
mortality rate due to diabetes. In Africa there was an estimated 10.8 million diabetics in the
year 200630. Nigeria has about 3.2 million people with diabetes and 2.5 million people are
undiagnosed 12.
In United States of America (USA), Cowie CC and colleagues in a community survey
reported highest prevalence of diabetes in non–Hispanic blacks (10.0%), and lowest
prevalence in non-Hispanic whites (5.6%) 31. The prevalence of diabetes varies in different
countries of the world. Aksu H and colleagues reported prevalence of 6.1% in an urban
population study in Nilufer district, Bursa, Turkey 32. In a rural population in Bangladesh
with 3.6% of overweight and obese subjects, a prevalence of 2.8% was reported 14. In an
urban population study in Chennai, India, a 12.0% prevalence of diabetes was reported 33.
WHO expert panel reported a prevalence of type 2 diabetes 20.8% in South Asians, 16.3% in
blacks, 9.5% in whites and 9.3% in Chinese 34.
In Africa, prevalence of diabetes varies from country to country. In an urban
population cohort study in South Africa, a prevalence of 14.3% was reported 35, while a rural
population in South Africa gave a prevalence of 4.6% 36. An urban population study in Futa
Jallon Guinea reported a prevalence of 10.3% 37. Most of the studies were community based,
while hospital based studies were scarce to the best knowledge of the author.
In Nigeria, a prevalence of 4.6% was reported3, though it varies from state to state. In
Port Harcourt, Rivers state, in an urban population study, the prevalence of diabetes was
6.8% 23. In Uyo, Akwa-Ibom state, in urban population study, a prevalence of 12.7% was
reported 26. In Ibadan, Oyo state, in an urban population study, a prevalence of 4.7 % was
reported38. In Naze, Owerri , Imo state, in a study of “August meeting women ” a prevalence
of 6.7% was reported among women 5. A study in a tertiary hospital in Owerri, Imo state
reported 15.1% prevalence of diabetes in an obese population39.

23
2.2 DIABETES SCREENING/SOCIOECONOMIC BURDEN/STRATEGY TO
REDUCE THE EPIDEMIC
America Diabetic Association (ADA) has recommended screening for abnormal glucose
tolerance using fasting blood glucose 16. Screening is the process of identifying those
individuals who are at risk of a specific disorder to warrant further investigation or direct
action. It is usually initiated by medical authorities 40.
Venous plasma glucose estimation is the best but Hemocue 201+ which uses glucose
dehydrogenase method, produced whole blood capillary blood glucose result which compares
well with venous plasma glucose 41. Accu check glucometer with compatible strip has been
shown to meet International Standard Organisation (ISO 15197) minimum criteria. It also
out-performed others when tighter limits were applied. Hemocue 201+ was defined as
reference method 42.
The cost of diabetes management which includes direct healthcare cost (sick leave,
early retirement and premature death) is quite enormous for low– and middle–income
countries of which Nigeria occupies a significant population13.
Complications of type 2 diabetes includes both microvascular complications such as
retinopathy, neuropathy and foot ulcers and macrovascular complications like heart attack,
stroke and amputations 13.

24
Diabetes to some extent and obesity are preventable health conditions since most of the risk
factors are modifiable. Studies have suggested that with lifestyle modification subjects with
impaired glucose can be prevented from developing type 2 diabetes 15, 16, 17, 18, 19.
In the sixty–second World Health Assembly in 2008, the Family Physician was recognized as
an important member of the primary healthcare team. Family Physician offers comprehensive
care and are most suited to lead the way in the strategy to preventing diabetes epidemic 43,
others that should be involved include government and its health department, food industry,
national and international diabetes organizations et cetera18. Culture in some parts of Africa
like eating from same food bowl, discourages dietary restrictions and will pose a setback in
the strategy of preventing diabetes hence regular education and involvement of family
members are vital in surmounting these challenges 18,44. Family Physicians practice
comprehensive and holistic care of patients and their family43. Biopsychosocial model is a
model of care advocated for by family physicians. The Diabetes Attitudes, wishes and Needs
(DAWN) study which involved thirteen (13) countries brought this to the fore 45. This study
looked at the psychological aspect of diabetes. Among those whose diabetes self-care was
affected, about 41.0 % of them had poor psychological well-being. Only ten percent received
psychological care. The study also observed that when diabetics have good relationship with
their family members, colleagues at place of work or group of friends that this improves
patient’s sense of wellbeing. Similarly, Chinenye S. and colleagues in Nigeria advocated for
incorporation of beneficial accepted socio-cultural practices such as traditional medicine,

25
religion and lifestyle practices to the care of diabetics46. This is due to the fact that a large
number of patients and their family members believe in and patronize them46. This fact
cannot be wished away.
Moreover, Family Physicians seem to be advocating for the formal recognition and regulation
of complementary and alternative medicine (CAM) and the practice of integrative medicine.
2.3 OBESITY PREVALENCE, PATHOGENESIS AND ASSOCIATION WITH
DIABETES
Overweight and obesity pose major risk factors for chronic diseases such as type 2
diabetes, cardiovascular disease, hypertension, stroke and certain cancers 12. There are about
1 billion overweight adults globally, out of which 300 million are obese. A 2005 WHO report
shows obesity was the fifth leading cause of mortality globally 47. Obesity is excess adipose
tissue in the body and has been identified as one of the most important risk factors of
diabetes.
In a survey of adult population in USA, in 2003, obesity was found to be significantly
associated with diabetes. Prevalence of obesity increased to 20.9 % in 2001; blacks had the
highest rate of obesity 31.1% 48.
Data from African studies show that obesity is most prevalent in urban middle aged
women 35. Prevalence of obesity in sub-Saharan Africa ranges from 0.4% to 43.0% 30. In a 20
year cohort study in South Africa , obesity prevalence of 50.1% and abdominal obesity

26
prevalence of 69.3% where reported 49. Obesity prevalence of 8.4% was reported in Futa
Jallon, Guinea and was found to be more in diabetics than non-diabetics 37. Obesity
prevalence of 22.0% in women and 7.0% in men and abdominal obesity prevalence of 67.0%
in women and 7.0% in men was reported among urban population in Cameroon 27. Ziraba AK
and colleagues in a ten-year systematic review of seven African countries reported increase in
urban prevalence of obesity of about 35.0% 50.
In Nigeria prevalence of obesity varies from state to state. Prevalence of 25.0% was reported
in general population study in Uyo, Akwa-Ibom state (South Southern Nigeria) 26. Obesity
prevalence of 23.3% and abdominal obesity prevalence of 20.1% were reported in Abuja.
Obesity was more in urban area (40.7%), than rural area (14.3%) 51. Obesity prevalence
22.2% was reported in Lagos 52, 8.1% in Maiduguri (North Eastern), Nigeria 53. In a rural
mission hospital in Imo state 6.0% was reported, 54 while in an urban tertiary hospital in
Owerri, Imo state (South Eastern), Nigeria, prevalence of 8.6% was reported 39.
Obesity is generally assessed using body mass index (BMI) or Quenelle’s index.
Body mass index is calculated using weight in kilogram (kg) divided by height in meters
squared (m2). Body mass index is a good predictor of general obesity while waist
circumference (WC) measured in centimetres (cm) is a good predictor of abdominal
obesity57. Waist circumference is not measured routinely in clinics55. Some of the reasons
include time, extra work load and inexperience 55.

27
The National Institute of Health (NIH), defined underweight as body mass index
(BMI) of less than 18.5kg/m2, normal weight as body mass index (BMI) of 18.5-24. 9kg/m2,
overweight as body mass index (BM1) of 25.0-29.9kg/m2 and obesity as (BMI) of more than
or equal to 30.0kg/m2 90. Obesity is further categorized as follows:
Class I (mild) obesity as (BMI: 30.0-34.9kg/m2).
Class II (moderate) obesity as (BMI: 35.0 – 39.9 kg/m2).
Class III (severe / extreme) obesity as (BMI: ≥ 40.0 kg/m2)90.
International Diabetes Association (IDA) recommended WC that is greater than or equal to
94 cm for men and greater than or equal to 80 cm for women as a measure of abdominal
obesity. These values should be used for black African subjects though derived using
Caucasian subjects56. On the other hand, a cohort study among black women in South Africa,
using Receiver Operator Characteristic (ROC) curve analysis suggested waist circumference
cut–off point of 91.5 cm as appropriate for black African women 35.Reciever operator curve
is the graph of sensitivity against false positive rate (1-specificity). The area under the curve
is used to calculate the diagnostic accuracy of the test.
The National Institute of Health and Scottish Intercollegiate Guideline Network (SIGN),
recommended use of BMI cut–off point for initial assessment of obesity and WC cut-off
point as alternative40. World Health Organization recommends concurrent use of BMI and

28
WC57. In a study that looked at various measures of heights and weights, body mass index
was reported as the most suitable assessment of obesity in Nigerian adult population 58.
The association between diabetes and body weight has been a subject of study especially in
developed countries and there is a strong positive correlation between obesity and diabetes.
It has been noted that glucose impairment (diabetes and impaired glucose tolerance) was
more in obese than normal BM1 subjects14. Hospital based studies on these are rare to the
best of the author’s knowledge.
Though many studies have found association between BMI and diabetes, some
observed graded association between different classes of obesity and diabetes. These findings
included studies outside and within sub-Saharan Africa 31,32,33,23. Some, other studies did not
find any association between BMI and diabetes 14,37,59,60. There are questions as to why these
discrepancies and what could have being responsible. World Health Organization had
recommended lower BMI cut-off point for Chinese and Asians of ≥ 23.0kg/m2 (22kg/m2 to
25kg/m2) as increased risk and ≥ 27.5kg/m2 (26kg/m2 to 31kg/m2) as high risk61. This is
consequent upon the fact that Asians generally have higher percentage of body fat than
whites. Again, obesity in this group does not directly correspond with diabetes rates61.
Most of the measures of obesity (BMI and WC) used for blacks were derived using
Caucasian subjects. Could this be responsible for the variations in studies in blacks?
Crowther CJ and colleagues in South Africa tend to suggest a possible reason35. They

29
observed that using Receiver Operator Curve (ROC), that women of black African descent,
have significant metabolic syndrome occurring in them at a higher WC of 91.5 cm and hence
advocated that in black women higher WC of ≥ 91.5cm will be appropriate as cut-off point
for diagnosing metabolic syndrome, instead of ≥ 80.0cm recommended by International
Diabetic Association (IDA)35.
The National Health and National Examination Surveys (NHANES) have shown that
BM1 increase is usually associated with increase in prevalence of diabetes and other
cardiovascular risk factors 62.
Chui M and colleagues reported significant increase in the risk of diabetes with
increasing body mass index in obese subjects when compared with subjects with normal body
mass index. The rate varied in different ethnicities, black 4.5, white 6.2, south Asia 6.3 and
Chinese 11.7 34. Iloh GUP and colleagues in a study in a tertiary hospital reported prevalence
of diabetes among obese subjects of 15.0%. Diabetes was the third most common morbidity
in these obese subjects 39.
The relationship between obesity and diabetes was for a long time perceived to be
strong. A general finding from majority of earlier studies suggested that obesity was central
to a common pathway linking non-communicable and other cardiovascular morbidities 4.
Again, obesity seems to play a causal role in the pathogeneses of type 2 diabetes 49.

30
2.4 PREVALENCE OF KNOWN DIABETES
This is the percentage of diabetic subjects that knew about their diabetic status prior to a
study. This knowledge may be attributed to a number of factors such as the level of health
education on diabetes a person has and also the manner of health seeking behaviour a person
has. Literacy level which may give insight to the socio-economic status of an individual has
been found to play a role in the development of diabetes. High socio-economic status has
been found to be associated with diabetes especially in the developing countries 27,63. There is
also high prevalence of poor education (no formal education and primary education) and poor
health seeking behavior. This may account for low knowledge of diabetic status among
diabetics63. Unlike in the developed countries, where high literacy level (secondary education
and above) may result in good knowledge and attitude of risk factors of diabetes. In
developed countries like Turkey with high literacy level, there is high prevalence of known
diabetes, when compared with low prevalence of known diabetes in developing countries like
Bangladesh 7.0% and 2.5% respectively14,32.
In USA, Cowie CC and colleague, reported prevalence of known diabetes of about
6.5%31. In Chennai, India, Mohan V and colleagues reported known diabetes prevalence of
7.2% 33. In Futa Jallon, Guinea 3.4% of known diabetes was reported among urban subjects,
while among rural subjects, none of them knew about their diabetic status prior to the study37.
In an urban population study in Port Harcourt, Rivers state about 5.5% of the subjects knew
of their diabetic status23.

31
2.5 NON-MODIFIABLE RISK FACTORS
A study in USA observed that type 2 diabetes was significantly high in men and non-
Hispanic blacks in the last decades 31. Also higher prevalence was seen in men until ≥ 65
years among blacks and Mexicans. Standardized prevalence was not significantly different
between men and women 31. Valdez R and colleagues reported that prevalence of diabetes
increased with age, body mass index and hypertension 64. Diabetes prevalence increased with
increasing age for males and females 14. In Africa, life expectancy seems to have increased
relatively and this may be attributed to relatively better healthcare, feeding habit and
economy which has made it possible for more people to attain old age27. Chronic diseases,
like diabetes has been shown to increase with age64 and the reason could be that mentioned
above. In South Africa, Motola AA and colleagues observed that diabetes increased with
age60. Balde NM and colleagues in Guinea found independent association between age and
diabetes, just like Oyegbade OO and colleagues in Nigeria, found independent association
between age and diabetes 37,65.
Family history of diabetes has been identified as a strong risk factor for developing
diabetes. Lysenko V and colleagues in prospective cohort study in Sweden showed that first
degree family history of diabetes is associated with two-fold increase in risk of developing
type 2 diabetes66. A cohort study of middle aged men and women observed that family
history of diabetes was independently associated with risk of incident diabetes67. They also
observed that risk was highest in subjects with maternal history of diabetes 67. When those

32
with family history of diabetes were compared, a graded increase in the risk of diabetes was
observed. The risk increased from those with no family history of diabetes to those with third
degree family history of diabetes then to those with second degree and finally, to those with
first degree family history of diabetes 64.
2.6 MODIFIABLE RISK FACTORS
Alcohol consumption is an old practice among black Africans. Alcohol is prepared in
different forms locally and consumed for different purposes. Some forms of locally made
alcoholic beverages include palm wine, ‘ogogoro’, ‘burukutu’, ‘kai kai’ etc. Anecdotal report
have cited some reasons for consuming alcohol to include: as medicine, to cure low mood,
enhance performance, to increase breast milk flow, to be able to sleep well among other
reasons. Unfortunately, alcohol has many disadvantages when compared with its advantages.
Alcohol acts in the pleasure area of the limbic system by altering the GABA and the
dopamine neurotransmitter levels88. One gets enough pleasure or feeling of being in a high
mood with a small quantity of alcohol, at the initial period of experimenting with alcohol88.
As time goes on, one would require larger amount of alcohol to achieve the same level of
pleasure, hence leading to alcohol abuse. At the point when one finds it difficult to cope
unless one has taken alcohol, this is known as alcohol dependence88. Alcohol abuse has
ruined many lives, jobs, families, caused accidents and chronic diseases, law breaking and
encounter with law enforcement agents among others88. Some tools may be used in clinics to
assess the level of alcohol misuse or abuse includes the CAGE questionnaire89. Where C

33
stands for: Have you ever felt like cutting down on the quantity of alcohol you consumed? A
stands for: Have you ever felt angry when people criticized your drinking? G stands for:
Have you ever felt guilty about your habit of drinking? While E stands for: Have you ever
gotten up to take alcohol as first thing in the morning “eye opening” so as to have your nerves
steadied? Any answer to two of the questions means positive response, hence needs further
assessment 89. Moderate alcohol consumption improves insulin sensitivity, increase HDL
cholesterol and adinopectin. While heavy alcohol on the other hand, result in excess calorie
intake and obesity, increased triglyceride and pancreatitis 61. Some studies have found a U-
shaped relationship between new cases of diabetes and alcohol consumption 68, 69, 61. This
implies that non-drinkers, light drinkers and heavy drinkers have increased risk of diabetes
unlike moderate drinkers that have decreased risk of diabetes68,69. Ekpenyong CE and
colleagues in Nigeria and Aksu H in Turkey did not find any association between alcohol
consumption and diabetes 26,32. Motola AA and colleagues in South Africa found independent
association between alcohol consumption and type 2 diabetes60. In a meta–analysis of 15
cohort studies on alcohol consumption and development of type 2 diabetes by Koppes LLJ
and colleagues, showed that thirty percent reduction in the risk of type 2 diabetes was
observed in moderate alcohol consumers when compared with heavy alcohol consumers and
abstainers. No risk reduction was observed in low and high BM1 categories 69. In New
Zealand, a study showed a U-shaped relationship between alcohol consumption and incident
cases of type 2 diabetes, impaired glucose tolerance and hypertension68. Moderate alcohol

34
drinkers had lower risk of diabetes in normal and overweight subjects but higher risks of
diabetes in obese individuals, even after adjusting for confounders 68. When one has multiple
lifestyle behaviours (factors) that reduce development of type 2 diabetes, moderate alcohol
consumption will further reduce the risk of developing diabetes by 40% when compared to
abstention 70.
Many people in sub-Saharan Africa seem to be adopting western lifestyle which
encourages sedentary lifestyle, at the same time not involving in regular exercise. This has
helped in no small measure in fuelling diabetes epidemic. Some of the factors encouraging
this type of life style include modernization of means of transportation, driving and time
spent watching television among others61. Physical activity has been shown to reduce risk of
diabetes 8,9, while sedentary lifestyle has an important association with diabetes through the
mechanism of encouraging weight gain. Regular exercise may delay or prevent the
progression of diabetes9. Weight reduction of 5-7% and moderate physical activity for at
least 30 minutes each day (150 minutes per week) was found to lower the risk of developing
diabetes by 58% in overweight people with pre-diabetes (impaired glucose) 71. The standard
method of assessing physical activity is through assessing energy expenditure or metabolic
equivalents (METs)8. Metabolic equivalent is the ratio of metabolic rate during a specific
physical activity to a reference metabolic rate8. Physical activity has inverse association with
type 2 diabetes 36, 72, 73. Cardio-respiratory fitness which is health–related component of
physical fitness: moderate to high level cardiorespiratory fitness is associated with a lower

35
risk of mortality from all–causes and cardiovascular diseases 8. It also seems to reduce the
higher risk of associated with obesity, even though it does not seem to reduce it completely 8.
Cigarette smoking seems to be common among blacks especially in the younger
population. Some of the reason people give for indulging in such lifestyle include peer group
influence, to prevent cold, to reduce weight74. It is cheap and readily available. Smoking is
not without its attendant health problems not only to the smokers but also to those around the
smoker through the influence of secondary smoke 74. Studies have suggested that nicotine
which is one of the active components of cigarette decreases insulin sensitivity causes
pancreatitis, causes disorder of glucose and lipid metabolism75. It worsens diabetes by the
above mechanism. Current smokers were observed to have 45% increased risk of diabetes
compared with the non-smokers 61. These effects seemed to have a dose response
relationship. Smoking more than 20 sticks of cigarette per day and a smoking duration of ≥
40 years were associated with increased risk of diabetes76.
Cigarette smoking was associated with increased risk of type 2 diabetes. The risk increased
with the number of sticks smoked per day 72, 73, 76, 77. This association was when smokers
were compared with people who never smoked. There was a little difference in risk between
light smokers and heavy smokers among the current smokers.
36
CHAPTER THREE
3.0 MATERIALS AND METHOD
3.1 STUDY AREA
This study was carried out at the General Out-Patient Clinic (GOPC) of Federal Teaching
Hospital Abakaliki, Ebonyi State between 10:00am and 4:00pm every working day. Ebonyi
State is located in South Eastern Nigeria. It has a population of about 2.2 million. Abakaliki
which is the state capital has an estimated population of 141,428 from 2006 census figure78.
Abakaliki hosts many farms, quarry factories, rice mills, luxurious hotels and higher
Institutions, federal and state government ministries, departments and agencies. Abakaliki is
inhabited by mainly farmers, professionals such as civil servants; skilled, semi-skilled,
unskilled workers and students. The economic activity in Abakaliki is low when compared to
industrial and commercial cities like Onitsha, Lagos, Abuja and Port-Harcourt.
Majority of the people in the city have igbo culture, in that most dwellers are Igbo,
reflecting the region of the country. The staple foods of inhabitants consist of carbohydrate
meals (derived from yam, rice, cassava, maize e.t.c).
3.2 HEALTH FACILITY
Federal Teaching Hospital Abakaliki (FETHA), is located in the state capital of Ebonyi
State. It is the only tertiary hospital in Abakaliki and Ebonyi State at present. In December
2011, the Federal Government of Nigeria acquired former Ebonyi State University Teaching
Hospital (EBSUTH), upgraded former Federal Medical Centre Abakaliki (FMCA) and
merged both to form the Federal Teaching Hospital Abakaliki (FETHA). This hospital serves
Ebonyi State and sizeable population from the four (4) surrounding states namely: Abia,
Enugu, Cross-River and Benue States.
37
The General Out-Patient Clinic (GOPC), of the hospital is manned by Family
Medicine Department. It is the gateway of undifferentiated patients into the hospital. From
the hospital records, about one hundred and twenty (120) adult patients are seen every
working day at GOPC.
3.3 STUDY POPULATION
This comprised of all adult obese patients aged 18 years and above that attended GOPC
of FETHA who gave consents to participate in the study and a non-obese comparison group.
3.4 STUDY DESIGN
This is a cross-sectional comparative study.
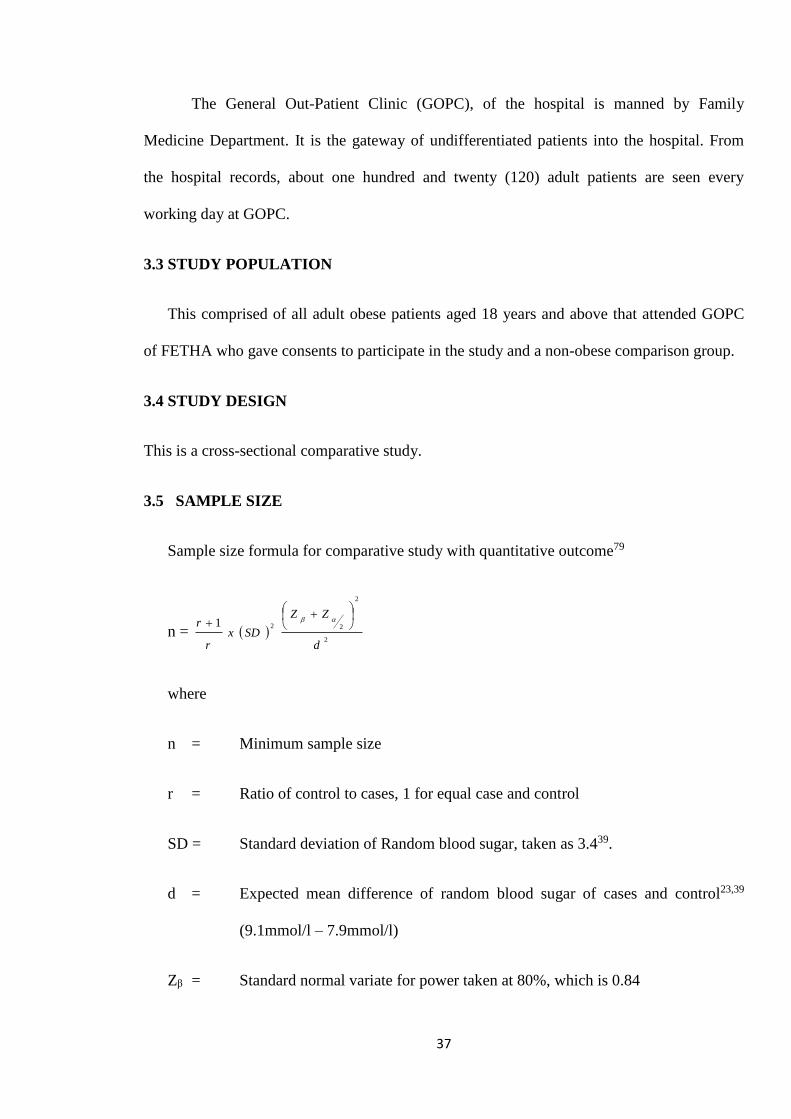
3.5 SAMPLE SIZE
Sample size formula for comparative study with quantitative outcome79
n = 2
2
221
d
ZZ
SDxr
r
where
n = Minimum sample size
r = Ratio of control to cases, 1 for equal case and control
SD = Standard deviation of Random blood sugar, taken as 3.439.
d = Expected mean difference of random blood sugar of cases and control23,39
(9.1mmol/l – 7.9mmol/l)
Zβ = Standard normal variate for power taken at 80%, which is 0.84

38
Zα = Standard normal variate of confidence level of 95% which is 1.96
n =
2
2
2
2.1
96.184.04.3
1
11 xx
= 2 x 44.1
84.756.11 x
= 128
Thirteen (13) which is 10% of minimum sample size was added as non-respondents
rate, hence; total sample size of 141 each for the obese and non-obese groups. The total
sample size expected was 282. The confidence level chosen was 95% and p-value less than
0.05.
3.6 INCLUSION CRITERIA
1. Patients aged 18 years and above presenting to GOPC of FETHA.
2. Obese patients; with BMI ≥ 30kg/m2 and non-obese with BMI < 30kg/m2 (<
18.5kg/m2 and 18.5-24.9kg/m2 and 25.0-29.9kg/m2).
3. Patients who gave consent to participate in the study.
3.7 EXCLUSION CRITERIA
1. Pregnant women
2. Patients with demonstrable ascites and other forms of oedema.
3. Patients who have physical deformities affecting the spine and/or the limbs.
4. Critically ill patients

39
3.8 SAMPLING METHOD
The sample size of 140 registered obese patients aged 18 years and above was recruited by
systematic random sampling based on inclusion and exclusion criteria. One (1) declined from
participating; hence response rate was 99.3%. First, balloting was done between odd
numbers and even numbers. Even numbers was chosen. Then every even number starting
with two were selected. Those, who refused to participate in the study, were exempted and
next other even number selected. Those who declined from participating or those who did not
meet the selection criteria were exempted and next even number sample chosen. Those who
refused to participate were accounted for by the 10% non-responders’ rate. GOPC had an
average of 4 new obese patients’ visit every working day (from one month census of all obese
patients without repetition by the researcher and average for one day of the five working days
taken). Height and weight was introduced as part of routine assessment of patients attending
GOPC, FETHA during the time of writing of the proposal, hence there was no record of such
prior to writing of the researcher’s proposal. This was the reason why one month census of all
obese patients by the author was used to estimate the number of obese seen in the GOPC
every working day. The study population will consist of 4 obese patients’ × 5 day/week x 4
weeks/ month x 3.5 months = 280. A sample size of 140 of non-obese comparison group was
chosen using systematic random sampling. Since an average of 116 non-obese patients’ visit
every working day and 8120 non-obese patients in 3.5 months. Balloting first was done
between odd numbers and even numbers. Even numbers was chosen. Every other 58th even
number was chosen starting with 2, since there are about 116 non-obese visits every working
day based on hospital records. Any sample which did not meet the selection criteria was
exempted and the next even sample that met selection criteria selected.

40
3.9 DURATION OF DATA COLLECTION
Data was collected for 3 months and two weeks between January 15th and April 30,
2015. The researcher attended to the obese patients and recruited subjects from them.
Comparison group was recruited from the non-obese patients by the researcher.
3.10 ETHICAL CONSIDERATION
This study was approved by the Research and Ethical Committee of Federal Teaching
Hospital Abakaliki (Appendix II). It complied with Helsinki Declaration 1975 (revised 1983,
1989 and 1996) on human experimentation. Permission to conduct the study was obtained
from the Head of Department of Family Medicine. Informed consent (appendix III) was
obtained from all participants and confidentiality was maintained in accordance with standard
practice.
3.11 METHOD OF DATA COLLECTION
A combination of structured interview and clinical and biochemical measurements were used
in data collection.
The structured interview of participants was done using researcher administered
questionnaire based on the modified WHO STEPwise80 (appendix IV), instrument approach
to surveillance of chronic non-communicable disease risk factors. Following the interview,
the clinical and biochemical measurement were done.
1. Blood pressure: Each patient was rested for 5 minutes. Thereafter; the blood pressure
was measured in sitting position with the right arm resting on the table. An adequate
cuff-size on the right arm, using a mercury sphygmomanometer (Dekamet Accoson,
made in England MKS) and a 3m Littman Stethoscope were used to measure blood
pressure. The first Korotkoff sound heard over the brachial artery on the cubital fossa,

41
was recorded as systolic blood pressure (SBP) and the fifth Korotkoff (the
disappearing) recorded as the diastolic blood pressure (DBP). Two measurements
were taken 5 minutes apart and the average calculated to the nearest 1mmHg was
reported as the blood pressure. Blood pressure criteria were based on Joint National
Committee on Prevention, Detection, Evaluation and Treatment of high blood
pressure JNC721.
2. Height (Ht) and weight (Wt): The height (Ht) and weight (Wt) of each subject were
measured using a stadiometre, that had a weighing scale (RGZ-160 health scale)
attached to it. This instrument was made by Lincoln Mark Medical England. Height
was recorded while subject was standing erect on stadiometre with the back and the
buttocks on stadiometre steel and subject looking straight ahead (an imaginary line
drawn from the angle of the eyes to the upper point of the attachment of the ear and a
vertical line through the vertex were perpendicular). Measurement was to the nearest
centimetres (cm) and then converted to metres (m) by dividing with one hundred.
Weight was measured with subject wearing light cloths and with bare feet.
Measurement was reported to the nearest 0.1kg. Zero mark calibration was ensured
before each measurement and standard weight of 10kg was used each day to ensure
accuracy of measurements. The body mass index (BMI) of each subject was
calculated by using
Body mass index categories were
< 18.5kg/m2 underweight
18.5-24.9kg/m2 normal weight

42
25-29.9kg/m2 overweight
kg/m2 obese
3. Waist circumference (WC): Was determined using dressmaker’s measuring tape,
while in standing position and breathing normally. Measurement was taken mid-way
between lowest ribs and iliac crest with the tape horizontal. Measurement was taken
to the nearest centimetre. For women subjects: normal WC was < 80cm, while
abnormal (abdominal obesity) was WC 80cm. Men subjects: normal WC was <
94cm, while abnormal was WC 94cm.
4. Blood glucose estimation: Subjects were diagnosed of diabetes based on RBG
200mg/dl (11.1mmol/l) with symptoms of diabetes. Also current history of using
anti diabetic medication and/or past medical history of being diabetic. Random blood
glucose was used due to the fact that it was by 10:00am that GOPC takes off actively
and after this time the hospital protocol would not accept blood glucose estimation as
fasting blood glucose. This is an epidemiologic survey; hence one abnormal RBG
was used to make diagnosis of diabetes40. Subjects were seated, tip of the middle
finger cleaned with spirit swab and dried. A prick was made with a fine lancet, a drop
of blood placed into the curvet of Accu chek Active Roche Laboratory glucometre
equipment with compatible strip and reading taken and recorded. The glucometre
was validated by ensuring that each compatible strip pack used the corresponding
code, since there was no control serum in the pack.
3.12 FUNDING OF THE STUDY
The cost of the relevant investigations and the logistics was borne by the researcher

43
3.13 STUDY PROTOCOL
1. Conceptualization of the study topic between February 10th, and May 5, 2013.
2. Literature review/writing of the proposal/ethical consideration between June 2nd, 2013
and March 5, 2014.
3. Proposal approval by the Faculty and the College between August 17th and December
10, 2014 respectively.
4. Printing of the questionnaire between December 12th and December 14, 2014.
5. Purchase of glucometre and other materials for the study on January 5th, 2015.
6. Collection of data between January 15th, and April 30, 2015.
7. Analysis of data and reporting between May 5th, and July 20, 2015.
3.14 DATA ANALYSIS
The data was analysed using IBM SPSS statistics 20 software version. Subjects’
characteristics were described by percentages, means and standard deviations (SD).
Comparison for continuous variable was done using Student’s t test. Chi-square test and
Fisher’s exact test were used when any of the expected in any of the cells is less than 5, for
discrete and categorical variables. These were used to assess association between Type 2
diabetes and the risk factors. Spearman’s rho correlation analysis was used to assess the
strength of association between continuous risk factor variables and the blood glucose.
Logistic regression was used to ascertain which risk factor had independent association with
type 2 diabetes. The statistical tests were considered significant at a probability level of less
than 5% (p-value < 0.05). Data was presented in tables, charts and graphs.

44
3.1
5 S
TUD
Y F
LOW
CH
AR
T
Figu
re 1
: St
ud
y Fl
ow
Ch
art
122
1
1
28
2
8
7
9
0
45
CHAPTER FOUR
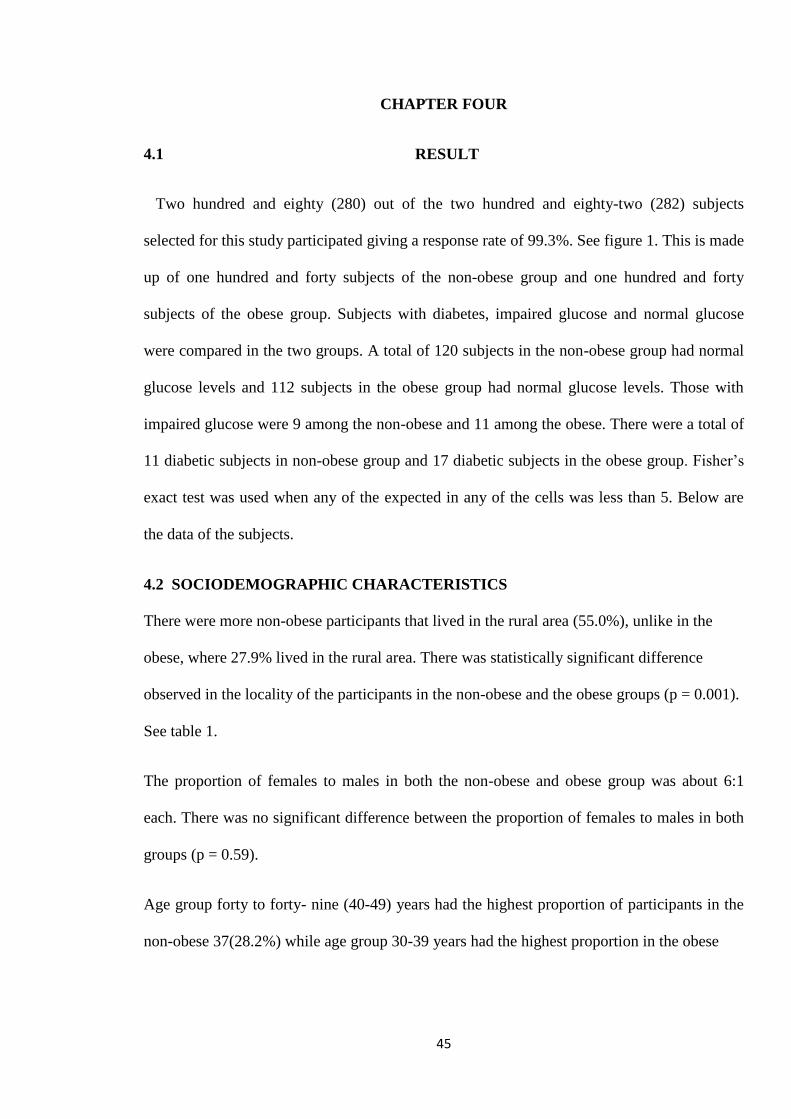
4.1 RESULT
Two hundred and eighty (280) out of the two hundred and eighty-two (282) subjects
selected for this study participated giving a response rate of 99.3%. See figure 1. This is made
up of one hundred and forty subjects of the non-obese group and one hundred and forty
subjects of the obese group. Subjects with diabetes, impaired glucose and normal glucose
were compared in the two groups. A total of 120 subjects in the non-obese group had normal
glucose levels and 112 subjects in the obese group had normal glucose levels. Those with
impaired glucose were 9 among the non-obese and 11 among the obese. There were a total of
11 diabetic subjects in non-obese group and 17 diabetic subjects in the obese group. Fisher’s
exact test was used when any of the expected in any of the cells was less than 5. Below are
the data of the subjects.
4.2 SOCIODEMOGRAPHIC CHARACTERISTICS
There were more non-obese participants that lived in the rural area (55.0%), unlike in the
obese, where 27.9% lived in the rural area. There was statistically significant difference
observed in the locality of the participants in the non-obese and the obese groups (p = 0.001).
See table 1.
The proportion of females to males in both the non-obese and obese group was about 6:1
each. There was no significant difference between the proportion of females to males in both
groups (p = 0.59).
Age group forty to forty- nine (40-49) years had the highest proportion of participants in the
non-obese 37(28.2%) while age group 30-39 years had the highest proportion in the obese

46
40(31.0%). There was no significant difference between the proportions of different age
groups in the non-obese and the obese (Fisher’s exact = 1.71, p = 0.85). See table 1.
The occupation with highest proportion of participants in the non-obese 43(30.7%) and obese
group 57(40.7%) was trading. There was significant difference between the occupational
status of the non-obese and the obese groups (Χ2 = 17.12, p = 0.007). See table 1.
There were more married participants in both the non-obese and the obese groups 98(70.0%)
and 111(79.3%) respectively. There was no statistically significant difference between
marital status of the obese and the non-obese (Χ2 = 5.38, p = 0.06). See table 1.

47
Table 1: Sociodemographic characteristics of the respondents
Characteristics Non-obese Obese Test statistics P-value
Locality
Rural
Urban
77(55.0%)
63(45.0%)
39(27.9%)
101(72.1%)
X2 = 21.25
0.001
Sex
Male
Female
20(14.3%)
120(85.7%)
17(12.9%)
123(87.1%)
X2 = 0.28
0.591
Age Group (years)
< 20
20 – 29
30 – 39
40 – 49
50 – 59
≥ 60
1(0.8%)
20(15.3%)
34(26.0%)
37(28.2%)
24(18.3%)
15(11.4%)
0(0.0%)
15(11.6%)
40(31.0%)
33(25.6%)
22(17.1%)
19(14.7%)
Fisher’s Exact =
1.71
0.85
Marital Status
Single
Married
Widowed
19(13.6%)
98(70.0%)
23(16.4%)
8(5.7%)
111(79.3%)
21(15.0%)
X2 = 5.38
0.068
Occupational Status
Employed
Student
7(5.0%)
9(6.5%)
8(5.7%)
6(3.6%)
Business Executive
Civil Servant
Farming
Trading
House help
Manual labourers
Artisan
Retiree
Others
0(0.0%)
34(24.3%)
29(20.7%)
43(30.7%)
2(1.4%)
0(0.0%)
9(6.4%)
1(0.7%)
6(4.3%)
1(0.7%)
41(29.3%)
16(11.4%)
57(40.7%)
0(0.0%)
1(0.7%)
1(0.7%)
6(4.3%)
4(2.9%)
Χ2 = 17.123
0.007

48
4.3 PREVALENCE OF TYPE 2 DIABETES AMONG THE OBESE AND NON-
OBESE
Out of the 280 people screened for diabetes, 11(7.9%) subjects that were diagnosed with
diabetes in the non-obese while 17(12.1%) had diabetes in the obese. Hence the crude
prevalence of diabetes in the two groups was 28(10.0%). Nine (6.4%) of the non-obese group
had impaired blood glucose when compared with 11(7.8%) of the obese which had impaired
blood glucose. There was no statistically significant difference between the magnitude of
diabetes in the obese and the non-obese (Χ2 = 1.762, p = 0.414). See table 2.
Table 2: Comparison of blood glucose in the obese and non-obese group
Group
Non-obese Obese Total
Normoglycaemia 120(85.7%) 112(80.0%) 232(82.9%)
Blood glucose
categories
Impaired glucose 9(6.4%) 11(7.9%) 20(7.1%)
Diabetes 11(7.9%) 17(12.1%) 28(10.0%)
Total 140(100%) 140(100%) 280(100%)
X2 1.762
P-value 0.414

49
4.4 PREVALENCE OF KNOWN DIABETICS IN THE OBESE AND THE NON-
OBESE GROUPS
Out of the 280 participants screened for diabetes, 11(7.9%) were known to have diabetes
among the non-obese prior to the study, while 10(7.1%) were known diabetics in the obese
group. The crude prevalence of known diabetes in the study population was 7.5%, average of
prevalence of known diabetics in obese and the non-obese. There was no statistically
significant difference between the magnitude of known diabetics in the obese and the non-
obese (Χ2 = 0.510, p = 0.821). See table 3.
Table 3: Prevalence of known diabetics in the non-obese and the obese group
Group
Non-obese Obese Total
Yes 11(7.9%) 10(7.1%) 21(7.5%)
Known diabetics No 129(92.1%) 130(92.9%) 259(92.5%)
Total 140(100%) 140(100%) 280(100%)
X2 0.510
P-value 0.821

50
4.5 AGE DISTRIBUTION
The subjects that participated in this study were aged between 18 years to 77 years. The mean
age of the study population was 43.4±11.9. The mean age of the non-obese group was 43.1±
12.2 years. The mean age of the obese group was 43.8 ± 11.7 years and there was no
statistically significant difference in the mean age of the obese group and the non-obese group
(t= 0.47, p = 0.63). The male to female ratio in the non-obese group was 1 : 6, while that of the
obese group was 1: 7. The male to female ratio in the obese and non-obese was about the same.
There was progressive increase in the proportion of those who have diabetes from age group
20-29 years 0.0%(0) to 60 years and above 23.9%(9). Diabetes started occurring from among
those who were 30 years and above. Impaired glucose increased gradually from age group 20-
29 years 2.8%(1) till age group 40-49 years 11.4%(9), and the declined progressively till age
group 60 years and above 5.7%(2). There was statistically significant association between age
group and diabetes (Χ2 = 26.572, p = 0.008). See table 4
72.7% 27.3%
%
52.9% 47.1%

51
Table 4: Assessment of blood glucose by age category
Blood Glucose categories A
ge
gro
up
(yea
rs)
Normoglycaemia Impaired Diabetes Total
< 20
20 – 29
30 – 39
40 – 49
50 – 59
≥ 60
1(100%)
35(97.2%)
69(89.6%)
62(78.5%)
40(78.4%)
25(70.4%)
0(0.0%)
1(2.8%)
3(3.9%)
9(11.4%)
5(9.8%)
2(5.7%)
0(0.0%)
0(0.0%)
5(6.5%)
8(10.1%)
6(11.8%)
9(23.9%)
1(100%)
36(100%)
77(100%)
79(100%)
51(100%)
36(100%)
Χ2 26.572
P – Value 0.008

52
4,6 FAMILY HISTORY OF DIABETES
Family history of diabetes was obtained from 56(20.0%) out of 280 subjects. Out of this
number, 11(19.6%) of those with family history of diabetes, had diabetes when compared
with 17(7.6%) in those who did not have family history of diabetes. There were more
subjects with impaired glucose who had no family history of diabetes 17(7.6%) when
compared with 3(5.4%) of those who had family history of diabetes. There was statistically
significant association between family history of diabetes and diabetes (Χ2 = 7.343, p =
0.025). See table 5.
Table 5: Family history of diabetes and Blood glucose categories in the respondents
Family history of diabetes
Yes No
B
lood g
luco
se c
ateg
ori
es Normoglycaemia 42(75.0%) 190(84.8%)
Impaired glucose 3(5.4%) 17(7.6%)
Diabetes 11(19.6%) 17(7.6%)
Total 56(100%) 224(100%)
Χ2 7.343
P – Value 0.025

53
When family history of diabetes was stratified based on degree of relative affected, diabetes
was more in subjects who had first degree relatives that had diabetes 4(30.8%), then followed
by those who had second degree relatives with family history of diabetes 7(18.9%). Impaired
glucose was found more in subjects that had family members of first and second degree
relatives that had diabetes 1(25.0%). There was no statistically significant association
between diabetes and the degree of relatives with history of diabetes (Fisher’s exact = 5.675,
p = 0.402). See table 6.
Table 6: Stratification of respondents’ family history of diabetes and the blood glucose
categories
Blood glucose categories
Normoglycaemia Impaired Diabetes
Str
ati
fica
tion
First degree relatives 9(69.2%) 0(0.0%) 4(30.8%)
Second degree
relatives
28(75.7%) 2(5.4%) 7(18.9%)
Third degree relatives 2(100%) 0(0.0%) 0(0.0%)
Both first and second
degree relatives
3(75.0%) 1(25.0%) 0(0.0%)
Total 42(75.0%) 3(5.4%) 11(19.6%)
Fisher’s exact 5.675
P – value 0.402

54
4.7 SEX
Diabetes was more in males 18.9%(7) than in females 8.6%(21), unlike in the impaired
glucose which was commoner in females 7.4%(17) compared to the males 5.4%(2). There
was no statistically significant association between diabetes and sex. (Fisher’s exact = 4.045,
p = 0.117). See table 7.
Table 7: Sex and blood glucose categories in the respondents
Sex
Male Female Total
B
lood g
luco
se c
ateg
ori
es Normoglycaemia 28(75.7%) 204(84.0%) 232(82.9%)
Impaired glucose 2(5.4%) 18(7.4%) 20(7.1%)
Diabetes 7(18.9%) 21(8.6%) 28(10.0%)
Total 37(100%) 243(100%) 280(100%)
Fisher’s Exact 4.045
P – Value 0.117

55
4.8 Waist Circumference
Diabetes and impaired blood glucose were commoner in those with abnormal waist
circumference 11.4%(23) and 7.9%(16) respectively. There was no statistically significant
association between diabetes and waist circumference. (Χ2 = 2.417, p = 0.299). See table 8.
Table 8: Blood glucose and waist circumference categories
Blo
od g
luco
se c
ateg
ori
es
Waist circumference
Normal WC Abnormal WC
Normoglycaemia 69(88.5%) 163(80.7%)
Impaired glucose 4(5.1%) 16(7.9%)
Diabetes 5(6.4%) 23(11.4%)
Total 78(100%) 202(100%)
X2 = 2.417
p – value = 0.299
56
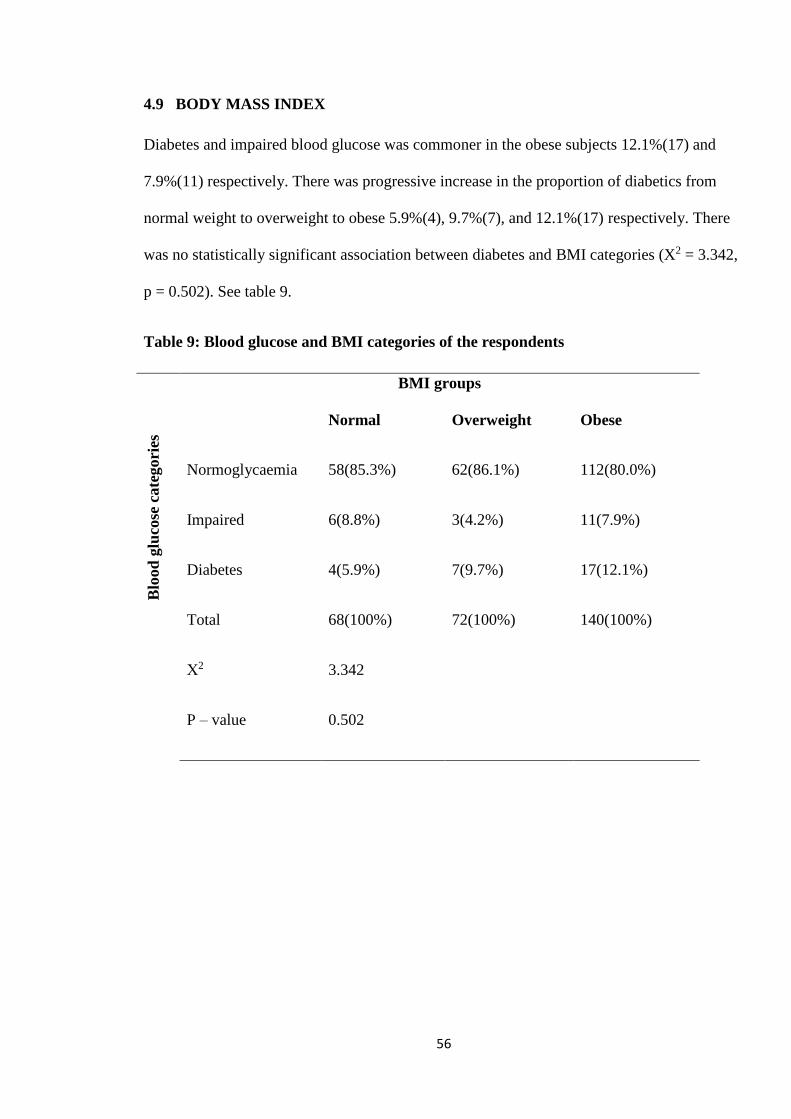
4.9 BODY MASS INDEX
Diabetes and impaired blood glucose was commoner in the obese subjects 12.1%(17) and
7.9%(11) respectively. There was progressive increase in the proportion of diabetics from
normal weight to overweight to obese 5.9%(4), 9.7%(7), and 12.1%(17) respectively. There
was no statistically significant association between diabetes and BMI categories (X2 = 3.342,
p = 0.502). See table 9.
Table 9: Blood glucose and BMI categories of the respondents
BMI groups
Blo
od
glu
cose
cate
gori
es
Normal Overweight Obese
Normoglycaemia 58(85.3%) 62(86.1%) 112(80.0%)
Impaired 6(8.8%) 3(4.2%) 11(7.9%)
Diabetes 4(5.9%) 7(9.7%) 17(12.1%)
Total 68(100%) 72(100%) 140(100%)
Χ2
P – value
3.342
0.502
57
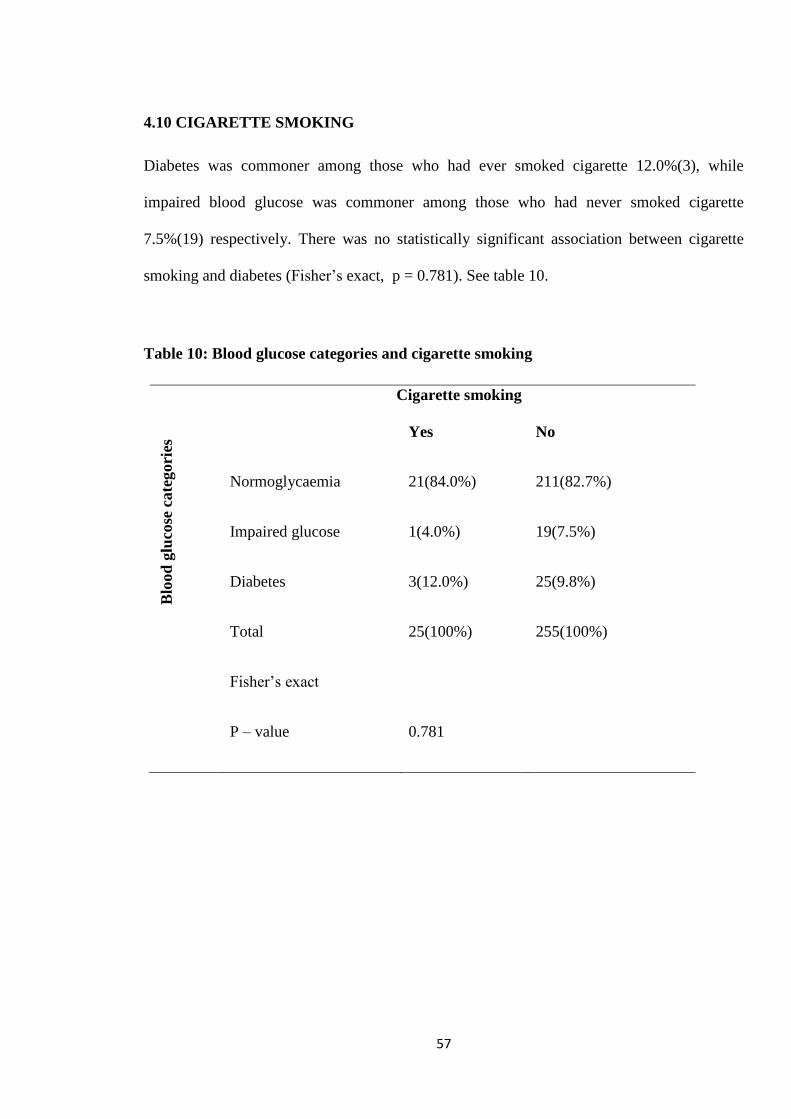
4.10 CIGARETTE SMOKING
Diabetes was commoner among those who had ever smoked cigarette 12.0%(3), while
impaired blood glucose was commoner among those who had never smoked cigarette
7.5%(19) respectively. There was no statistically significant association between cigarette
smoking and diabetes (Fisher’s exact, p = 0.781). See table 10.
Table 10: Blood glucose categories and cigarette smoking
Cigarette smoking
B
lood
glu
cose
cate
gori
es Yes No
Normoglycaemia 21(84.0%) 211(82.7%)
Impaired glucose 1(4.0%) 19(7.5%)
Diabetes
Total
3(12.0%)
25(100%)
25(9.8%)
255(100%)
Fisher’s exact
P – value
0.781

58
4.11 ALCOHOL CONSUMPTION
Diabetes was commoner among those who had ever consumed alcohol 12.4%(19), while
impaired glucose was commoner in those who had never consumed alcohol 8.7%(11). There
was no statistically significant association between alcohol consumption and diabetes (Χ2 =
2.474, p = 0.263). See table 11.
Table11: Alcohol Consumption and blood glucose categories
Alcohol consumption
B
lood
glu
cose
cate
gori
es Yes No
Normoglycaemia 125(81.7%) 107(84.3%)
Impaired glucose 9(5.9%) 11(8.7%)
Diabetes
Total
19(12.4%)
153 (100%)
9(7.0%)
127 (100%)
X2 = 2.474
P = 0.263

59
When those who had ever consumed alcohol were grouped into moderate and heavy
consumers, diabetes and impaired blood glucose were commoner among those who were
heavy alcohol consumers 20.0%(1) and 20.0%(1) respectively. There was no statistically
significant association between diabetes and the quantity of alcohol consumed (Fisher’s exact
= 2.221, p = 0.284). See table 12.
Table 12: Blood glucose and units of alcohol consumed categories of the respondents
Alcohol Intake
B
lood
glu
cose
cate
gori
es Moderate Heavy
Normoglycaemia 122(82.4%) 3(60.0%)
Impaired glucose 8(5.4%) 1(20.0%)
Diabetes
Total
18(12.2%)
148 (100%)
1(20.0%)
5 (100%)
Fisher’s Exact
P – value
2.221
0.284

60
4.12 PHYSICAL ACTIVITY:
Diabetes was commoner among those who were physically active 14.0%(8) and impaired
glucose which was commoner among those who were physically inactive 7.6%(17). There was
no statistically significant association between physical activity and diabetes (Χ2 = 1.559, p =
0.459) See table 13.
Table 13: Blood glucose categories and physical activity
Physical activity
Inactive Active
B
lood g
luco
se c
ateg
ori
es
Normoglycaemia 186(83.4%) 46(80.7%)
Impaired glucose 17(7.6%) 3(5.3%)
Diabetes
Total
20(9.0%)
233 (100%)
8(14.0%)
57 (100%)
Χ2
P – value
1.559
0.459

61
4.13 BLOOD PRESSURE:
Diabetes and impaired blood glucose was commoner among the hypertensives 12.4%(14) and
9.8%(11) respectively. There was no statistically significant association between blood
pressure groups and diabetes (Χ2 = 3.431. p = 0.193). See table 14.
Table 14: Blood glucose and blood pressure (BP) categories of the respondents
BP groups
B
lood g
luco
se c
ateg
ori
es
Normotensives Hypertensives
Normoglycaemia 144(86.2%) 88(77.8%)
Impaired glucose 9(5.4%) 11(9.8%)
Diabetes 14(8.4%) 14(12.4%)
Total 167(100%) 113(100%)
X2
P – value
3.431
0.193

62
4.14 BIVARIATE CORRELATION OF WHOLE CAPILLARY BLOOD GLUCOSE
(RBG) WITH QUANTITATIVE RISK FACTORS
There was a Spearman’s rho correlation used to determine the relationship between
capillary blood glucose (RBG) and the quantitative variables risk factors at significant
level of 1% which was lower than the significant level of 5% that was set for this
study. The findings were as follows:- There was a weak positive correlation between
RBG and age, which was statistically significant (rs = .271, p = 0.0001, n = 280).
There was a weak positive correlation between RBG and average systolic blood
pressure which was statistically significant (rs = .161, p = 0.007, n = 280). There was
a weak positive correlation between RBG and BMI, which was not statistically
significant (rs = .106, p = 0.076, n = 280). There was a very weak positive correlation
between RBG and average diastolic blood pressure which was not statistically
significant (rs = .093, p = 0.120, n = 280). There was a weak positive correlation
between RBG and WC, which was statistically significant (rs = .175, p = 0.003, n =
280). There was a weak positive correlation between RBG and smoking index, which
was not statistically significant (rs = .325, p = 0.113, n = 25). There was weak positive
correlation between RBG and units of alcohol consumed, which was not statistically
significant (rs = .115, p = 0.157, n = 153). See table 15.

63
Table 15: CORRELATIONS OF WHOLE CAPILLARY BLOOD GLUCOSE WITH CONTINUOUS VARIABLE RISK
FACTORS
Correlations
Whole capillary blood glucose
(mg/dl) Random (RBG) value
Age (yrs) SBP Average DBP Average Weight (kg) BMI (kg/m2) Waist circumference (WC)
Alcohol intake
(unit/week
Smoking index
Spearman's rho
Whole capillary blood glucose (mg/dl) Random (RBG) value
Correlation Coefficient 1.000 .271** .161** .093 .105 .106 .175** .115 .325
Sig. (2-tailed) . .000 .007 .120 .079 .076 .003 .157 .113
No of subjects 280 280 280 279 280 280 153 25
Age (yrs)
Correlation Coefficient 1.000 .378** .240** -.019 .069 .194** .114 -.098
Sig. (2-tailed) . .000 .000 .749 .247 .001 .159 .642
No of subjects 280 280 279 280 280 153 25
SBP Average
Correlation Coefficient 1.000 .779** .189** .215** .291** .015 -.113
Sig. (2-tailed) . .000 .002 .000 .000 .852 .591
No of subjects 280 279 280 280 153 25
DBP Average
Correlation Coefficient 1.000 .213** .237** .315** -.037 -.059
Sig. (2-tailed) . .000 .000 .000 .652 .780
No of subjects 279 280 280 153 25
Weight (kg)
Correlation Coefficient 1.000 .846** .791** .042 .019
Sig. (2-tailed) . .000 .000 .612 .928
No of subjects 279 279 152 25
BMI (kg/m2)
Correlation Coefficient 1.000 .865** -.051 -.140
Sig. (2-tailed) . .000 .531 .504
No of subjects 280 153 25
Waist circumference (WC)
Correlation Coefficient 1.000 .098 -.053
Sig. (2-tailed) . .228 .802
No of subjects 153 25
Alcohol intake (unit/week
Correlation Coefficient 1.000 .411
Sig. (2-tailed) . .051
No of subjects 23
Smoking index
Correlation Coefficient 1.000
Sig. (2-tailed) . No of sujects
**. Correlation is significant at the 0.01 level (2-tailed). * Correlation is significant at the 0.05 level (2-tailed).

64
4.15 CORRELATION SCATTER PLOTS OF CONTINUOUS RISK FACTORS WITH
RANDOM BLOOD GLUCOSE THAT WERE STATISTICALLY SIGNIFICANT
In further analysis of capillary blood glucose and the continuous variable risk factors that were
significant namely capillary blood glucose and age; capillary blood glucose and waist
circumference; and capillary blood glucose and systolic blood pressure. Scatter plot graphical
method was used to explain further the association between capillary blood glucose and these
risk factors.

65
Scatter plot of whole capillary blood glucose and age
Using the slope of the line of best fit, it was calculated using ruler that for every 20 years
increase in age the whole capillary blood glucose increases by about 30mg/dl. The dots that were
clustered below were far more than those that were above the line of best fit, showing that the
strength of the relationship between age and whole capillary blood glucose was weak. The
direction of line best fit is positive, showing that as age increases the whole capillary blood
glucose increases. See figure 2.
Figure 2: Scatter plot of whole capillary blood glucose and age
rs = .271
n = 280
p =0.0001
00000.000
1

66
Scatter plot of whole capillary blood glucose and waist circumference
Using the slope of the line of best fit, it was calculated using ruler that for every 20cm increase in
waist circumference, there was about 15mg/dl increase in whole capillary blood glucose. The
dots that were clustered below were far more than those above the line of best fit showing that
the strength of association between waist circumference and whole capillary blood glucose is
weak. The direction of the line of best fit was positive showing that as the waist circumference
increases, the whole capillary blood glucose increases as well. See figure 3.
Figure 3: Scatter plot of whole capillary blood glucose and waist circumference
rs = .175
n = 280
p = 0.003

67
Scatter plot of whole capillary blood glucose and systolic blood pressure
Using the slope of the line of best fit, it was calculated using ruler that for every 50mmHg
increase in the systolic blood pressure, there is about 40mg/dl increase in whole capillary blood
glucose. The dots that were clustered below were far more than those above the line of best fit,
between systolic blood pressure 80mmHg and 160mmHg, showing that the strength of
association between systolic blood pressure and whole capillary blood glucose was weak. The
direction of the line of best fit was positive, showing that as the systolic blood pressure increases
the whole blood capillary blood glucose increases too. See figure 4.
Figure 4: Scatter plot of whole capillary blood glucose and systolic blood pressure
rs = .093
n = 280
p = 0.007

68
4.16 LOGISTIC REGRESSION ANALYSIS OF RISK FACTORS OF DIABETES
The probability of not having diabetes is lower in those who live in urban areas than those who
live in rural areas by 44.3% (OR = 0.557) [CI = 0.210-1.475]. This deduction is not statistically
significant (p = 0.239).
The probability of having diabetes is higher in males than in females by 3.9 times (OR =
3.905)[CI = 1.001-15.244]. This deduction is not statistically significant (p = 0.05) because the
p-value set for this study was p < 0.05.
For every unit increase in age, the probability of not having diabetes will be lower by 0.6%(OR =
0.940)[CI = 0.906-0.976]. This deduction is statistically significant (p = 0.001).
The probability of having diabetes in those who have family history of diabetes is 3.7 times
higher than in those without family history of diabetes (OR = 3.718)[CI = 1.438-9.613]. This
deduction is statistically significant (p = 0.007).
The probability of not having diabetes among smokers is lower by about 68.9% than in the non-
smokers (OR = 0.311)[CI = 0.054-1.797]. This deduction is not statistically significant (p =
0.192).
The probability of having diabetes among alcohol consumers is higher by 1.6 times than in the
non-alcohol consumers (OR = 1.592)[CI = 0.614-4.123]. This deduction is not statistically
significant (p = 0.339).
The probability of not having diabetes among those with high blood pressure is lower by 21.3%
than in those without high blood pressure (OR = 0.787)[CI = 0.885-1.206]. This deduction is not
statistically significant (p = 0.616).

69
The probability of having diabetes among those with abnormal BMI (obese) is higher by 3.3%
than in the non-obese (OR = 1.033)[CI = 0.885-1.206] . This deduction is not statistically
significant (p = 0.681).
The probability of not having diabetes among those with abnormal WC is lower by 1.4% than
those with normal WC (OR = 0.986)[CI = 0.915-1.063]. This deduction is not statistically
significant (p = 0.716).
The probability of not having diabetes among the physically inactive is lower by 13.6% than in
those who are physically active (OR = 0.864)[CI = 0.519-1.437]. This deduction is not
statistically significant (p = 0.573).
Table 16: Logistic Regression of risk factors of diabetes
B S.E. Wald df p-value Exp(B)
or
OR
95% C.I.for
EXP(B)
Lower Upper
Locality -.586 .497 1.389 1 .239 .557 .210 1.475
Sex 1.362 .695 3.844 1 .050 3.905 1.001 15.244
Age -.061 .019 10.380 1 .001 .940 .906 .976
Family history 1.313 .485 7.344 1 .007 3.718 1.438 9.613
Smoking -1.168 .895 1.703 1 .192 .311 .054 1.797
Alcohol consumption .465 .486 .916 1 .339 1.592 .614 4.123
Blood pressure -.239 .478 .252 1 .616 .787 .309 2.007
BMI .032 .079 .169 1 .681 1.033 .885 1.206
WC -.014 .038 .129 1 .719 .986 .915 1.063
Physical activity -.146 .260 .318 1 .573 .864 .519 1.437
Constant 3.629 2.955 1.508 1 .219 37.675

70
4.17 AWARENESS OF LIFESTYLE MODIFICATION
Diabetes and impaired blood glucose was commoner among those who were not aware of at least
one lifestyle modification activity 14.7%(10) and 8.8%(6) respectively. There was no statistically
significant association between awareness of lifestyle modification and diabetes (Χ2 = 2.786, p =
0.248). See table 17.
Table 17: Awareness of lifestyle modification and blo1` od glucose categories
Awareness of lifestyle modification
Yes No
B
lood g
luco
se c
ateg
ori
es Normoglycaemia 180(84.9%) 52(76.5%)
Impaired glucose 14(6.6%) 6(8.8%)
Diabetes 18(8.5%) 10(14.7%)
Total 212(100%) 68(100%)
Χ2 2.786
P – value 0.248

71
4.18 OCCUPATIONAL STATUS
Diabetes was commoner in traders 42.9%(12), then followed by in farmers 17.9%(5). Impaired
blood glucose was commoner also in the traders 30.0%(6), then followed by in the civil servants
25.0%(5). There was no statistically significant association between occupational status and
diabetes (Fisher’s exact = 24.814, p = 0.176). See table 18.
Table 18: Occupational status and blood glucose categories in the respondents
Occupation Normoglycaemia Impaired
glucose
Diabetes Fisher’s
exact
P - value
Unemployed
Business executive
Students
Civil servant
Farming
Trading
Nanny
Manual labourers
Artisan
Retired
Others
Total
11(4.7%)
1(0.4%)
13(5.6%)
67(28.9%)
38(16.4%)
82(35.3%)
2(0.9%)
1(0.4%)
6(2.6%)
3(1.3%)
8(3.4%)
232(100%)
1(5.0%)
0(0.0%)
1(5.0%)
5(25.0%)
2(10.0%)
6(30.0%)
0(0.0%)
0(0.0%)
1(5.0%)
2(10.0%)
2(10.0%)
20(100%)
3(10.7%)
0(0.0%)
0(0.0%)
3(10.7%)
5(17.9%)
12(42.9%)
0(0.0%)
0(0.0%)
3(10.7%)
2(7.1%)
0(0.0%)
28(100%)
24.814
0.176

72
4.19 LOCALITY
Diabetes and impaired blood glucose was commoner in those who lived in the urban areas
11.0%(18) and 8.5%(14) respectively. There was no statistically significant association between
locality and diabetes (Χ2 = 1.722, p = 0.432). See table 19.
Table 19: Blood glucose categories and locality of the respondents
Locality
Rural Urban
B
lood g
luco
se c
ateg
ori
es Normoglycaemia 100(86.2%) 132(80.5%)
Impaired glucose 6(5.2%) 14(8.5%)
Diabetes 10(8.6%) 18(11.0%)
Total 116(100%) 164(100%)
Χ2
P – value
1.722
0.423

73
4.20 MARITAL STATUS
Diabetes was commoner among those who were widowed 15.6%(7), while impaired blood
glucose was commoner among the married 7.6%(16). There was no statistically significant
association between marital status and diabetes (Fisher’s exact = 2.950, p = 0.558). See table 20.
Table 20: Marital status and blood glucose categories
Blood glucose categories
Normoglycaemia Impaired Diabetes Total
M
ari
tal
Sta
tus Single
Married
Widowed
24(88.9%)
173(82.8%)
36(80.0%)
2(7.4%)
16(7.6%)
2(4.4%)
1(3.7%)
19(9.6%)
7(15.6%)
27 (100%)
208 (100%)
45 (100%)
Fisher’s exact
P – value
2.950
0.558

74
4.21 EDUCATIONAL STATUS
Diabetes was commoner among those with primary education 15.4%(12), then followed by those
with secondary education and tertiary education 6.3%(4) and 5.9%(6) respectively. Impaired
blood glucose was also commoner in those with primary education 11.5%(9) then followed by
those with tertiary education 6.9%(7). There was no statistically significant association between
educational status and diabetes (Fisher’s exact = 10.827, p = 0.080). See table 21.
Table 21: Blood glucose and educational status categories of the respondents
Blood glucose categories
Normoglycaemia Impaired Diabetes Total
Ed
uca
tion
al
Sta
tus No formal education
Primary
Secondary
Tertiary
29(93.6%)
59(73.1%)
59(90.5%)
91(87.2%)
1(3.2%)
9(11.5%)
2(3.2%)
7(6.9%)
1(3.2%)
12(15.4%)
4(6.3%)
6(5.9%)
31 (100%)
80 (100%)
65 (100%)
104 (100%)
Fisher’s exact
P – value
10.827
0.080

75
In this study, diabetes was higher in the obese (BMI ≥ 30kg/m2), urban dwellers, and males.
Diabetes was more in those with abnormal waist circumference, with family history of diabetes,
those who had ever smoked cigarette, those who had ever consumed alcohol and heavy alcohol
drinkers. Diabetes was commoner in the hypertensives. Diabetes was more in physically active,
and those with less literacy level. Diabetes was higher in the widowed, trader and among those
who were not aware of at least one lifestyle modification activity.

76
CHAPTER FIVE
5.0 DISCUSSION
5.1 PREVALENCE OF DIABETES
The crude prevalence of diabetes in this study population (obese and non-obese) was
10.0%. This was similar to 10.3% observed in an urban community population study in Futa
Jallon, Guinea37 and lower than that observed in an urban community population study in Uyo,
Akwa Ibom State, Nigeria of 12.7%26. However, the crude prevalence of diabetes in Nulifer
district Turkey was 6.1%34. The high prevalence of diabetes in Uyo community population study
may be attributed to urbanization and westernization of the lifestyle in the capital city, of an oil
rich state. The high prevalence in this study could be partly ascribed to the hospital population
studied. The low crude prevalence in Nulifer Turkey, an urban population community study,
could be partly attributed to ethnicity because blacks are more prone to diabetes compared with
the whites31. Again, better lifestyle modification attitudes like exercise and recreation activities
in whites could explain the low prevalence of diabetes in Turkey.
Prevalence of diabetes in the obese in this study was 12.1% which was lower than that observed
by Iloh GUP and colleagues in a study carried out among obese in a tertiary hospital in Owerri,
Imo State, of 15.1% 39. The prevalence of diabetes among obese in a rural mission hospital in
Imo State was 3.9% 54. The similarity of the Owerri study with this study could be due to

77
homogeneity of the study population, both being a hospital population study and from the same
ethnicity and in the same region of the country. The difference in prevalence between that of this
study and that of a mission hospital in Imo State could be largely due to difference in locality.
While the mission hospital study was among rural hospital population, this study was an urban
hospital population. Prevalence of diabetes in the rural population is usually lower than that of
the urban population, probably due to rural population where work is more physically demanding
unlike the urban population that may be involved with white collar jobs that are usually
sedentary in nature and may likely be feeding on refined foods some times.
5.2 PREVALENCE OF KNOWN DIABETES
The general prevalence of known diabetes in this study population was 7.5% (21). The
prevalence of known diabetes was more in the non-obese group 7.9% (11) than the obese group
7.1% (10) . In USA, Cowie CC and colleagues reported prevalence of known diabetes of about
6.5% in a community population study31. The similarity could be due to the fact that this is a
hospital-based study hence screening for diabetes as part of care of some patients could have
resulted in high hospital prevalence of known diabetes. Also, Mohan V and colleagues reported
prevalence of known diabetes in an urban community population study of 7.2% in Chennai,
India33. Similar reason as above could explain this similarity.

78
In Futa Jallon, Guinea, 3.4% prevalence of known diabetes was reported among urban
community population and none among rural community population knew about their diabetic
status prior to the study37. The difference could be due to possible poor health seeking behavior
in most low- and middle-income countries which could be a fall-out of low socio-economic
status and educational status of most populace. The situation was worse in the rural population.
In an urban community population study in Port Harcourt, Rivers state, Nigeria, prevalence of
known diabetes of 5.5% was reported23. The difference could be due to the fact that it was a
community population study while this is a hospital population study. The similarity with the
high prevalence of known diabetes in the Turkey study 7.0%32 could be due to their better health
seeking behavior. However, in the rural community populations study in Futa Jallon Guinea
none of the subjects knew their diabetic status prior to the study37.
5.3 NON-MODIFIABLE RISK FACTORS
Diabetes was more in those aged 60 years and above in this study. This could likely be
attributed to the fact that diabetes increases with age due to insulin resistance. On the other
hand, Oyegbade OO and colleagues in a community study in Ile Ife, Osun State65, observed that
diabetes was commoner in those aged 45 years and above and that sex had significant association
with type 2 diabetes. The difference in age at which diabetes prevalence was more could be due

79
to the difference in the age group cut-off point in both studies. While this study was a hospital
population study, that of Ile Ife was an urban community population study.
The age range of subjects in this study was 18 years to 77 years which was similar to that
of tertiary hospital in Owerri of 19 years to 76 years. The male/female ratio of the tertiary
hospital study in Owerri of 1:5.239 was similar to that of this study of 1:6.5. There was similarity
in the age range and male to female ratio of both study population.
In this study, age had an independent association with type 2 diabetes in the respondents,
in logistic regression analysis of the risk factors of diabetes. In Turkey, in a community
population study, an independent association was reported between type 2 diabetes and age32.
Hussain A. and colleagues, in a community population study in Bangladesh, reported significant
association between age, body mass index and diabetes30. In Uyo, Nigeria, Ekpenyong CE and
colleagues in a community population study, observed that age was significantly associated with
non-communicable diseases such as type 2 diabetes26. The similarity with these studies could be
due to the fact that insulin resistance increases with age and hence, diabetes is more likely to
occur with aging.
In this study, type 2 diabetes was commoner in male respondents. There was no
significant association between sex and type 2 diabetes in the respondents. Similarly, Valdez and
colleagues in USA in a community population study did not find significant association between
sex and type 2 diabetes64. In a meta-analysis study by Cowie CC and colleagues in USA31in a

80
community population study, the prevalence of diabetes was reported to be significantly higher
in males in the general population similar to the findings of this study though not statistically
significant. In the non-Hispanic blacks, prevalence was higher in females, unlike the findings in
this study. Hussain A and colleagues in Bangladesh in a community population study, observed
higher prevalence of type 2 diabetes in females though not statistically significant14, and when
other risk factors were adjusted for, sex showed statistically significant association with diabetes
in females, unlike in this study, where males had higher prevalence of diabetes and after
adjusting for other risk factors, sex showed no statistically significant association with diabetes
in the respondents. The similarity in the sex not been significant could be due to the low number
of male subjects in this study compared to that of the Bangladeshi study. Ekpenyong in Uyo,
Nigeria, reported slightly higher prevalence of diabetes in males26. This is similar to the findings
of this study. Possible reason could be similarity of race and region of the country of the
subjects.
In this study, diabetes was commoner in subjects with family history of diabetes in the
respondents. There was an independent significant association between family history and
diabetes in the respondents. The odds of having diabetes in those with family history of diabetes
was high in the respondents (OR = 3.718)[CI = 1.438-9.613]. Similarly, Mumu SJ and
colleagues in a community population study, found independent association between family
history of diabetes and diabetes in a Bangladesh population63. This was equally similar to that

81
observed by Oyegbade OO and colleagues in a community population study in Ile Ife, Osun
State, Nigeria65. The similarity between these studies and this study could likely be due to
similarity in race. Also, Motala AA and colleagues in a community population study in South
Africa; and Aksu H and colleagues in a community population study in Turkey had similar
observation in their studies32,60. Sukurai M and colleagues in a community population cohort
study in Japan observed that those with family history of diabetes had 80% greater risk of
incident diabetes compared with those without family history of diabetes72. In this study,
diabetes was commonest among respondents with first degree family relatives that had diabetes
30.8%(4). Most community population based studies found significant association between
family history of diabetes and diabetes bringing to the fore the strong part played by gene in
having diabetes. In USA in a community population study, when family history was graded into
high risk (subjects with two first degree relatives with diabetes); moderate risk (subjects with one
first degree relatives and one second degree relatives) and average risk (subjects with no family
history of diabetes), graded risk of type 2 diabetes was observed in decreasing order from high
risk to average risk64. This was similar to the finding in this study. First degree relative family
history of diabetes had highest prevalence 30.8%(4), followed by those with second degree
family relatives 718.9%(7). This study did not grade the risk of diabetes in similar fashion as that
of the American study. This brings to the fore the need to screen adult hospital clients with
family history of diabetes.

82
5.4 MODIFIABLE RISK FACTORS
In this study, locality had no association with diabetes in the respondents. Rural
respondents had less odds for diabetes (OR = 0.557)[CI = 0.210-1.475], though it is not
statistically significant. About 55.0% of the non-obese lived in the rural areas and they may
likely be doing manual jobs and eating natural food, unlike 72.1% of obese that lived in the
urban area with its attendant western lifestyle32. There was no independent statistically
significant association between locality and diabetes in this study. Balde and colleagues in a
community population study in Guinea, similarly, observed significant association between
diabetes and urban location37. The similarity between the finding in this study and that of the
above study could be largely attributed to similarity in race and socio-demographic factors. They
all belong to low- and middle-income countries. Also, Motola AA and colleagues in South
Africa, found significant association between the history of urban living and diabetes in males60,
though this effect was lost after adjusting for other risk factors.
In this study, diabetes was more in those with low literacy level (primary school education)
12(15.4%) then followed by those with secondary education 4(6.3%) in the respondents. There
was no association between educational status and diabetes. Mumu SJ and colleagues in a
community population cross-sectional analytical study in Bangladesh observed that high literacy
level was associated with good knowledge and attitude of risk factors of diabetes63. Another

83
study in Bangladesh observed that diabetes was more prevalent in those with high literacy level
and that high literacy level had independent association with diabetes14. This study on the
contrary found that diabetes was more in those with low literacy level. High socioeconomic
status and high literacy have been associated with increased risk of diabetes in developing
countries27. This could be partly attributed to belief that when one eats and puts on weight that it
is an evidence of wealth and good living unlike in developed countries, where high
socioeconomic status or high literacy result in more discretion in feeding habit and lifestyle32.
Again difference in locality of both populations could be a contributing factor. A rural
population study in Imo State observed that low literacy level was more in the obese54 just as
was observed in the Inter Act Consortium study72.
Diabetes was more prevalent among traders and civil servants and there was no
significant association between occupational status and diabetes in the responders. In this
environment, most traders sit down waiting for customers (sedentary lifestyle) most of the time,
eat a lot of junk food like snacks, soft drinks and when they want to eat food may likely
patronize the food vendors. The food vendors often spice their food with monosodium glutamate
and other spices to make it tasty. On the other hand, Azimi-Nezhad M and colleagues in a
community population study in Iran did observe significant association between occupation and
diabetes, which was highest among the retirees, followed by the unemployed and the

84
housewives81. This was similar to the finding by Peykari N and colleagues in a community
population study in Iran too82.
Diabetes was more prevalent in the widowed and the married in the responders. Marital
status had no significant association with diabetes in the responders. Similarly, Hwang J and
colleagues in a community population study in Korea observed higher prevalence of diabetes
among the married and the partners than in the singles83.The similarity could be due to the high
proportion of the married in both populations. Azimi-Nezhad M and colleagues in a community
population study in Iran observed significant association in the prevalence of diabetes among
married, singles, widowed and divorced subjects81, unlike this study which did not show any
statistically significant association between marital status and diabetes.
In this study, there was significant weak positive correlation between random blood
sugar and waist circumference in the respondents. Waist circumference is expected to correlate
positively with blood glucose. There was no significant association between BMI and type 2
diabetes in this study. Surprisingly, Frank LK and colleagues in a case–control tertiary hospital
population study in Ghana observed that neither BMI nor WC had any association with type 2
diabetes, even when those with poor glucose control among the cases were excluded 84. In this
study however, those with poor blood glucose control were not excluded. Park SW and
colleagues had suggested that in diabetics, poor glucose control was the underlying mechanism

85
for reduced BMI and mean body cell mass 85. Many studies within and outside Africa had found
significant association between high body mass index, increased waist circumference and type 2
diabetes 23,31,32,33 . In different regions of Africa, studies with different study designs, that used
different obesity measurements, different diabetes measurements, and different sample sizes had
observed different types of association between BMI and diabetes. In some, BMI was
consistently associated with diabetes both in males and females. In others, association differed in
males and females, while in other there was no association 14, 37, 59, 60. Extraneous confounders
may be possible explanation for the masking of the association between BMI and diabetes in this
study. On the other hand, it seems illogical for it to explain why family history of diabetes, age,
waist circumference, average systolic pressure had significant association with diabetes. The
likely explanation could be racial inappropriate cut-off point of BMI for the blacks. A different
body mass index cut-off point had been advocated for the Chinese and Asians. This was
consequent upon the fact that obesity does not directly correspond with diabetes in this group.
Chinese and Asians have higher waist circumference when compared with the whites61. The
recommended WHO body mass index cut-off point of ≥ 23 kg/m2 for public health action for
Asian represents increased risk and ≥ 27.5kg/m2 as high risk86. Crowther NJ and colleagues in a
prospective cohort study in South Africa suggested waist circumference of ≥ 91.5cm as
appropriate cut-off point for black women35, instead of ≥ 80cm advocated by International
Diabetes Association (IDA).

86
In this study, it was observed that blood glucose showed weak positive correlation with body
mass index in the respondents which was not significant. Body mass index is expected to
correlate with blood glucose positively. Bakari AG and colleagues in Zaria, Nigeria, observed
positive correlation between BMI and random blood glucose among the females, but no
correlation in the males91.
This study showed high degree of awareness of lifestyle modification with an average of
about 70.6% of all subjects having knowledge of at least one lifestyle modification. A similar
study in a rural population showed average awareness of 38.1% of subjects having knowledge of
at least one lifestyle modification54. The difference could be attributed to difference in locality of
the two populations. Generally rural population have low literacy level, Mumu SJ and colleagues
observed that high literacy level (secondary School and above education) is independently
associated with good knowledge and attitude of risk factors of diabetes63. The proportion of
diabetics who were not aware of at least one lifestyle modification activity was higher
14.5%(10), unlike those who were aware of at least one lifestyle modification activity 8.5%(18).
Diabetes was more in the respondents who had ever smoked 12.0%(3). The odds of not
having diabetes in smokers was low (OR = 0.311)[CI = 0.054-1.797). This effect was not
significant (p = 0.192). Similarly in a community population study in Turkey, no significant
association was found between cigarette smoking and diabetes 32. A community population study

87
in South Africa did not find any significant association between diabetes and smoking 60. This
was similar to finding in Inter Act consortium study82. The similarity with these studies could be
similarity in study design, since they were all observational cross-sectional or case-control
studies. However, a community population cohort prospective study in China observed that
smoking more than 20 sticks of cigarette per day and a smoking duration of 40 years or more
was associated with increased risk of diabetes69. The difference observed could be due to the
prospective study design. Nicotine which is one of the active components of cigarette decreases
insulin sensitivity, and causes disorder of glucose and lipid metabolism75. In a community
population meta-analysis study, it was observed that current smokers had 45% increased risk of
diabetes than non-smokers69. There seems to be a dose response relationship between risk of
diabetes and the number of sticks of cigarette smoked69. In this study, the lack of association
between cigarette smoking and diabetes may be due to the small number of the respondents that
smoked (25). Again, none of the subjects in this study smoked 20 sticks of cigarette per day and
none of the smoking index was significant.
In this study, diabetes was more prevalent in those that have ever consumed alcohol, in
the responders 12.4%(19). There was no significant association between alcohol consumption
and diabetes. Those who were heavy consumers had more diabetes 20.0%(1). The effect of
alcohol consumption seems to increase the odds for diabetes in the responders (OR = 1.592)[CI
= 0.614-4.123] though the deduction is not strong that it is not significant because the confidence

88
interval crossed one. Moderate alcohol consumption improves insulin sensitivity, increases HDL
cholesterol and adinopectin, while heavy alcohol intake results in excess calorie intake and
obesity, increased triglyceride and pancreatitis61. Some community population studies found
significant association between alcohol consumption and diabetes. Light and heavy alcohol
consumption increase risk of diabetes 68, 69. Similar to this study, Ekpenyong CE and colleagues
in a community population study in Uyo, Nigeria and Aksu H and colleagues in a community
population study in Bursa, Turkey did not find any association between alcohol consumption and
diabetes 26,32. The similarity between Uyo study and this study could be due to similarity in the
race of respondents.
Diabetes was commoner among those who were physically active. Physical activity did
not have significant association with diabetes. Physical activity seemed to lower the risk of
diabetes in the respondents (OR = 0.864)[CI = 0.915-1.063], this deduction is not strong because
the confidence interval crossed one. This effect was not statistically significant (p = 0.573).
Using occupation to assess physical activity in this study was not the best. Energy expenditure or
metabolic equivalents (METs) still remain the standard indices for assessing physical activity.
Using METs was not feasible in this study because very few subjects engaged in regular
exercise. The non-association observed could be due to non-standard method used for assessing
physical activity. However, physical activities have been shown to reduce the risk of diabetes by
58.0% in overweight prediabetic people. It improves glycaemic control and prevents

89
cardiovascular diseases73. Inactivity encourages weight gain. Hu HB and colleagues in a
community population study, observed that activities that reduce physical activity like
modernization of mode of transportation, driving and time spent watching television have been
associated with diabetes61. These are common practices in our environment. Aksu and colleagues
in Turkey did not observe any association between physical activity and diabetes32.
There was weak positive correlation between 280 subjects’ RBG and average systolic blood
pressure, which was statistically significant (rs = .161, p = 0.007). Diabetes was commoner in
the hypertensive subjects of the respondents 12.4%(14). There was no significant association
between blood pressure grouping and diabetes. Hypertension increased the risk of metabolic
syndrome and insulin resistance. Moreover, some antihypertensive drugs are diabetogenic6.
Giday A and colleagues in Ethiopia observed significant association between hypertension and
diabetes59. Motola AA and colleagues in a community study in South Africa equally observed
significant association between hypertension and diabetes60. However, Sukurai M and colleagues
in a community population study in Japan did not observe any association between hypertension
and other chronic diseases and diabetes67. This was similar to the findings of this study. Possibly
the no association observed in this study could be due to use of Random blood glucose to screen
for diabetes which might have resulted in fewer subjects being identified as newly diagnosed
diabetics.

90
5.5 CONCLUSION
The prevalence of diabetes was high in this population both in the obese and non-obese though
higher in the obese. There was no statistically significant difference between the prevalence of
diabetes in the obese and the non-obese. The prevalence of known diabetics was relatively low in
both groups, despite being a hospital population. The two independent associated risk factors in
the respondents namely: family history of diabetes and age were both non-modifiable risk
factors. Obesity (BMI) surprisingly did not show any association with diabetes in this study.
There was weak positive but statistically significant correlation of 280 subjects’ random blood
glucose and WC, age, and average systolic blood pressure in the respondents. There is need to
screen all adult hospital clients especially those who are 60 years and above, who have family
history of diabetes for diabetes since these risk factors were statistically significantly associated
with diabetes.

91
5.6 LIMITATIONS
1) This is a hospital-based study. Its findings may not be applied to the general population.
2) Cross-sectional study design has weakness of not being able to ascertain temporal
relationship and the strength of recommendation is low
3) Use of random blood glucose for screening for abnormal blood glucose is not ideal as
many with abnormal glucose could have been missed, unlike fasting glucose or glucose
tolerance tests.
4) All potential confounders may not have been completely detected and accounted for and
hence cannot be ruled out.
5) There was delay between the time of printing the questionnaire and collecting data due to
financial constraint.
5.7 STRENGTH OF THIS STUDY
There was homogeneity of the sources of the obese and the non-obese groups. They were all
from hospital-based subjects.

92
5.8 RECOMMENDATIONS
1. There is low prevalence of known type 2 diabetes among this hospital-based population, hence
the need to educate adults attending primary care clinics on diabetes and the need of screening
for type 2 diabetes.
2. Traders in this study had the highest number of diabetics. There is need to reach out to this
population with a view to finding out factors that predispose them to diabetes, educating them
and screening them for diabetes.
3. Hospital clients that are 60 years old and above, having family history of diabetes with
abnormal WC and high systolic blood pressure should be routinely screened for diabetes, since
these increase the risk of type 2 diabetes in them.
4. Diabetes and impaired blood glucose was commoner among those who are not aware of at
least one lifestyle modification activity. Emphasis should therefore be placed on counseling
patients on lifestyle modification activity during consultations so as to help increase awareness
of lifestyle modification, since it may help reduce prevalence of diabetes.

93
REFERRENCES
1 Kim HC, Oh SM. Non Communicable disease: Current Status of Major Modifiable Risk
Factors in Korea. Journal of Preventive Medicine and Public Health 2013; 46: 165-172.
2 Wild S, Roglic G, Green A, Sicree R, Kung H. Global Prevalence of Diabetes; Estimate
for the year 2000 and Projection for the year 2030. Diabetes Care 2004; 27(5): 1047-
1053.
3 Oputa RN, Chinenye S. Diabetes Mellitus: A global epidemic with potential solutions. A
review. African Journal of Diabetes Medicine 2012; 20(2): 33 – 35.
4 Schuster DD. A review on Obesity and the development of type 2 diabetes: the effects of
fatty tissue inflammation. Diabetes, metabolic syndrome and Obesity Targets and therapy
2010; 3:253-262.
5 Osuji CU, Nzerem BA, Dioka CE, Meludu SC, Onwubuya EI. Prevalence of Diabetes
Mellitus in a group of Women attending “August meeting” at Naze, South East Nigeria.
Journal of Diabetes Mellitus 2012; 2(3): 231 – 236.
6 Ulasi II, Ijoma CK, Onodugo OD. A community-based study of Hypertension and cardio-
metabolic syndrome in semi-urban and rural communities in Nigeria. BMC Health
Service Research 2011; 10:71 http://www.biomedcentral.com/1472-6963/10/71.
Accessed 5 May, 2013
7 Shiroma EJ, Lee IM. Physical Activity and Cardiovascular Health: Lessons Learned from
Epidemiological Studies across Age, Gender, and Race/ethnicity (Review) Circulation
2010; 122: 743 – 752.

94
8 Lee D, Artero EG, Sui X, Blair SN, mortality trends in General population: The
importance of Cardiorespiratory Fitness. Journal of Psychopharmacology 2013; 24(11):
supplement 4, 27 -35.
9 2008 Physical Activity Guidelines for Americans. US Department of Health and Human
Services. http:www.health.gov/paguidelines. Accessed December 20, 2013
10 American Diabetes Association: Diagnosis and Classification of Diabetes Mellitus.
Diabetes care 2007; 30: 542 – 547.
11 World Health Organization. Global Health Estimates: Deaths by cause, Age, Sex and
Country 2000-2012. Geneva. WHO. 2014.
12 Puska P, Nishda C, Porter D, WHO: Obesity and Overweight Facts. Global Strategy on
Diet, Physical activity and Health 2003.
13 Lee CMY, Colaguri R, Magliano DJ, Cameron AJ, Shaw J, Zimmet P. et al. The cost of
diabetes in Adults in Australia. Diabetes Research and Clinical Practice 2013; 9:385-390.
14 Hussain A, Vaaler MA, Sayeed MA, Malitab H, Keramat-Ali SM, Azad-Khan AK, Type
2 Diabetes and impaired fasting blood glucose in rural Bangladesh: a population based
study. European Journal of Public Health 2006; 17(3):291-296.
15 Nathan DM, Davidson MB, Defronzo RA, Heine RJ, Henry RR, Pratley R et al. Impaired
fasting glucose and impaired glucose tolerance (A Review). Diabetes Care 2007;
30(3):753-759.
16 Shobha SR, Philip D, Tamara M. Impaired Glucose Tolerance and Impaired Fasting
Glucose. American Family Physician 2004; 69(8): 161-168.

95
17 Swanson A, Watrin K, Wilder LQ. How can we keep impaired glucose tolerance and
impaired fasting glucose from progressing to diabetes? (Clinical Enquires). The Journal
of Family Practice 2010; 59(9):532-533.
18 International Diabetes Federation: A Guide to National Diabetes Programme.
International Diabetes Federation 2010.
19 Sambo BH, The diabetes Strategy for the WHO African Regions: A call to action.
Diabetes Voice 2007; 52(4):35-37.
20 Knowler WC, Barrett-Comor E, Fowler SE, Hamman RE, Lachin MJ, Walker EA et al.
Reduction in the incidence of Type 2 diabetes with lifestyle intervention or metformin.
The New England Journal of Medicine. 2002; 346:393-403.
21 Chobanian AV, Bakaris GI, Black HR, Cushman WC, Green LA, Izzo JL et al. the
seventh report of the joint National Committee on Prevention, Detection, Evaluation and
Treatment of high Blood Pressure. JNC7 Report. JAMA 2003; 289:256-272.
22 Units of Alcohol. Available on http://en.wikipedia.org/wiki units-of-alcohol. Accessed on
10th May, 2015
23 Nyenwe EA, Odia OJ, Ihekwaba AE, Ojule A, Babatunde S. Type 2 diabetes in Adult
Nigerians: a study of its prevalence and Risk factors in Port Harcourt, Nigeria. Diabetic
Research and Clinical Practice 2003; 62:177-185.
24 World Health Organization. Definition and Diagnosis of Diabetes mellitus and
Intermediate hyperglyceamia. Report of WHO and IDF consultation. WHO press,
Geneva 2006.

96
25 WHO, World Health Organization 2008-2013 Action Plan for the Global strategy for the
prevention and control for Non Communicable diseases, prevention and control of
cardiovascular diseases, Cancers and Chronic Respiration Disease. 2008
26 Ekpenyong CE, Udokan NE, Akpan EE, and Samson TK. Double burden: Non-
communicable Disease and Risk Factors evaluation in sub-Saharan, Africa: The Nigerian
Experience. European Journal of Sustainable Development 2012; 1(2):249-270.
27 Fezeu L, Minkoulou E, Balkau B, Kengire A-P, Awah P, Univin N, et al, Association
between Socioeconomic Status and Adiposity in Urban Cameroon. International journal
of Epidemiology 2005; 35: 105 -111.
28 Ramlo-Halsted BA, Edelman SV. The National History of Type 2 Diabetes; Practical
points to consider in developing prevention and Treatment strategies (practical pointers).
Clinical Diabetes 2000; 18(2). 80.
29 Petersen JL, McGuire DK. Impaired glucose tolerance and impaired fasting glucose-a
review of diagnosis, clinical implications and management. Diabetes and vascular
Disease Research 2005; 2(9): Doi:10.3132/dvdr.2005.07.
30 Dalal S, Benuza JJ, Volmik J, Adedamowo C, Bajunirwe F, Njeleela M et al. Non-
Communicable diseases in Sub-Saharan Africa: What we know now. International
Journal of Epidemiology 2011; 40: 885-901.
31 Cowie CC, Rust KF, Byrd-Hold DD, Ederherdt MS, Flegal M, En_Gelgu MM,
Prevalence of Diabetes and Impaired Fasting Glucose in Adults in U.S Population:
National Health and Nutrition Examination Survey 1999-2002. Diabetes Care 2006;
29(6): 1262 – 1268.

97
32 Aksu H, Pala K, Aksu H. Prevalence and associated risk factors of type 2 diabetes
mellitus in Nilufer District, Bursa Turkey. Int J Diabetes and Metab 2006; 14:98-102.
33 Mohan V, Shanthiraru CS, Deepa R, Glucose Intolerance (Diabetes and IGT) in a
selected South Indian population with Special Reference to Family History, Obesity and
lifestyle factors- The Chennai Urban Study (CUPS 14). JAPII 2003; 51: 771-777.
34 Chiu M, Austin PC, Manuel DG, Shah BR, Tu JV. Deriving ethnic specific BMI cut-off
points for Assessing Diabetes Risk. Diabetes care 2011; 34:1741-1748
35 Crowther NJ, Narris SA, The current waist circumference cut point used for diagnosis of
metabolic syndrome in sub-saharan African women is not
appropriate: PLos one 2012; 7(11): e48883.doi 10.1371/Journal. Pone.0048883.
Accessed 11 May, 2013.
36 Motala AA, Esterhuizein T, Pirie FJ, and Omar MAK. The prevalence of Metabolic
syndrome and Determination of Optimal waist circumference cut off point in Rural South
African Community. Diabetes Care 2011; 34:1032-1037.
37 Balde NM, Dialo I. Balde MD, Barry IS, Kaba L, Diallo MM, et al., Diabetes and
Impaired Fasting glucose in Rural and Urban population in Futa Jallon (Guinea):
Prevalence and associated risk factors. Diabetes and Metabolism 2007; 33: 114 – 120
38 Ojewale LY, Adejumo PO, Type 2 Diabetes Mellitus and impaired fasting Blood Glucose
in Urban South Western Nigeria. Int J diabetes and metabolism 2012; 21(1):9-12.
39 Iloh GUP, Ikwudinma AO, Obiegbu NP, Obesity and its cardio-metabolic Co-morbidities
among Adult Nigerians in a primary care clinic of a Tertiary Hospital in South Eastern
Nigeria. Journal of family Medicine and Primary care 2013; 2(1): 20 – 26.

98
40 Screening for Type 2 diabetes. Report of World Health Organization and International
Diabetes Federation Meeting. WHO/NMH/MNC/03.1 World Health Organization,
Department of Non-communicable Disease Management 2003. Geneva
41 Sandback A, Lauritzen T, Borch-Johnson K, Mai K, Christiansen JS. The comparison of
venous plasma glucose and whole blood capillary glucose in diagnosis of Type 2
diabetes: a population based screening study. Diabetic Medicine 2005; 22:1173-1177.
42 Zueger T, Schuler V, Stettler C, Diem P, Christ ER. Assessment of three frequently used
blood glucose monitoring devices in clinical routine Swiss Med Wkly 2012;
142:W13631.
43 WHO (2008) World Health Assembly 62: The World Health Report 2008. Primary Heath
Care-Now more than Ever.
44 Ogunbode AM, Ladipo M, Ajayi O, Fatiregu AA. Obesity: An Emerging Disease. Niger
J Clin Pract 2011; 14:390-394.
45 Peyrot M, Rubin RR, Lauritzen T, Snock FJ, Mathews DR, Skoland SE. Psychosocial
and barriers to improve diabetes management: Results of the Cross National Diabetes
Attitude, Wishes and Needs (DAWN) Study. Diabet Med 2005; 22: 1376-1385.
46 Chinenye S, Ogbera O. Socio-Cultural Aspects of diabetes mellitus in Nigeria. Journal of
Social Health and Diabetes. 2013; 1(1): 15-21.
47 WHO Global Health Risks: Mortality and burden of disease attributable to selected
major risk. Geneva. World Health Organization. 2009.
48 Mokdad AH, Ford ES, Bowman BA, Dietz WH, Vinicor F, Bales VS et al. Prevalence
of Obesity, Diabetes and Obesity–Related Risk Factors, 2001. JAMA 2003; 289(1): 76-
79

99
49 Kamath A, Shivaprakash G, Adhikari P. Body Mass index and waist circumference in
Type 2 diabetes mellitus patients attending a diabetic clinic. Int J Biol Med Res 2011;
2(3):636-638.
50 Ziraba AK, Fotso JC, Ochako R. Overweight and Obesity in Urban Africa: A problem
of the rich or the poor. BMC public Health 2009; 9: 465.
51 Adediran OS, Okpara IC, Adeniyi OS, Jimoh AK. Obesity prevalence and its associated
Factors in an Urban and Rural areas of Abuja Nigeria. Global Advance Research
Journal of Medicine and Medical Science 2012; 1(8):237-241.
52 Amira CO, Sokunbi DOB, Delapo D, Sokunbi A. Prevalence of Obesity, Overweight
and proteinuria in an Urban community in South West Nigeria. Nigerian Medical
Journal 2011; 52(2): 110 – 113.
53 Oyeyemi AL, Adegoke BO, Oyeyemi AY, Deforche B, Bourdeaudhuij ID, Sallis JF,
environmental factors Associated with Overweight among Adults in Nigeria.
International Journal of Behaviour, Nutrition and Physical Activity 2012; 9: 32.
54 Iloh GUP, Amadi AN, Nwankwo BO, Ugwu VC. Obesity in Adult Nigerians: A study
of its pattern and Common primary Co-morbidities in a rural mission General Hospital
in Imo State, South Eastern Nigeria. Nigerian Journal of Clinical Practice 2011; 14(2):
212 – 218
55 Dunkley AJ, Stone MA, Davies MJ, Kunti K. Waist circumference Measurement,
attitude and barrier in patient and practitioners in a multi-ethnic population. Family
practice 2009; 26:365-371
56 The IDF consensus worldwide definition of metabolic Syndrome: International Diabetes
Federation 2006.

100
57 Seidell JC, Kah HS, Williamson DF, Lissner L, Valdez R. Report from a center of
Disease Control and Prevention Workshop on use of Adult Anthropometry for public
Health and Primary Health Care1-4 (Report of a Meeting). Am J Clin Nutri 2001;
73:123-126.
58 Obikili EN, Nwoye LO, Indices of Obesity derived from height and weight in a
Nigerian adult population. Nigerian Journal of Medicine 2006; 15(3): 219 – 221.
59 Giday A, Wolde M, Yilidego D. Hypertension, Obesity and Central Obesity in
Diabetics and non Diabetics in Southern Ethiopia. Ethiopia Journal of Health
Development 2010; 24(2): 145-147.
60 Motola AA, Esterhiuzein T, Gouws E, Pirie FJ, Omar MAK. Diabetes and other
disorder of Glycaema in a rural South African Community: Prevalence aid Associated
Risk Factors. Diabetes Care 2008; 31(9): 1783-1788.
61 Hu FB, Globalization of Diabetes. Diabetes Care 2011; 34:1249-1257
62 Bays HE, Chapman RH, Grandy S. The relationship of body mass index to
hypertension, diabetes mellitus and dyslipidaemia: Comparism of data from two
national surveys. International Journal of Clinical practice 2007; 61(5): 737 – 747.
63 Mumu SJ, Saleh F, Ara F, Hague MR, and Ali L. Awareness regarding risk factors of
type 2 diabetes among individuals attending a tertiary care hospital in Bangladesh: A
cross sectional hospital study BMC Research Note 2014; 7;599 http: 11 www.
Biomedicentral. Com 0757-0800/7/599. Accessed on 30th June, 2014.
64 Valdez R, Yoon PW, Liu T, Khoury MJ, Family History and Prevalence of diabetes in
U.S population: the 6-year results from the National Health and Nutrition Examination
Survey (1999-2004). Diabetes Care 2007; 30:2517-2522.
101
65 Oyegbade OO, Abioye-Kuteyi EA, Kolawole BA, Ezeoma IT. Screening for diabetes
mellitus in a Nigerian Family Practice Population. South African Family Practices
2007; 49:8, 15-15d, doi:1080/20786204. 2007. 10873612. Accessed on 14th March,
2015.
66 Lyssenko V, Johson A, Almaran P, Pulizzi N, Isomaa D, Tuomi T et al Clinical risk
factors, DNA variants and the development of type 2 diabetes. N Engld J Med 2008;
359: 2220-2252.
67 Sakurai M, Nakamura K, Miura K, Takamura T, Tosluta K, Sasaki S et al. Family
history of diabetes, lifestyle factors, and the 7-year incident risk of type 2 diabetes
mellitus in middle-aged Japanese men and women. Journal of Diabetes Investigation
2013; 4(3): 261-268
68 Metacalf PA, Scragg RKR, Jockson R. Light to Moderate Alcohol Consumption is
protective for type 2 Diabetes Mellitus in Normal weight and Overweight Individuals
but Not the Obese. Journal of Obesity 2014, Article ID634587, 8page
http://dx.doi.org/10.1155/2014/634587. accessed June, 2014.
69 Koppes LLJ, Dekker JM, Hendriks HFT, Bouter LM and Heine RJ. Moderate Alcohol
Consumption Lowers the Risk of Type 2 Diabetes: A meta-analysis of Prospective
Observational studies. Diabetes Care 2005; 28: 719-925
70 Joosten MM, Grobbee DE, Vander A DL, Verschurem WMM, Hendriks HFJ, Beulevis
JWJ. Combined effect of alcohol consumption and lifestyle behavours on risk of type 2
diabetes1-3. AM J Clin Nutr 2010; 91: 1777-1783
71 National Heart Foundation of Australia, 2006. Available on
www.heartfoundation.com.au. Accessed on 2nd March, 2015.
102
72 The Inter Act Consortium (2012) Long-Term Risk of Incident Type 2 Diabetes and
Measures of Overall and Regional Obesity: The Epic-InterAct Case- Cohort Study.
PLos Med 2012; 9(6):e1001230.doi:10.1371/journal. PMed. 1001230.
73 Kriska AM, Saremi A, Hanson RL, Benett PH, Kobes S, Williams DE et al. Physical
Activity, Obesity and Incidence of type 2 diabetes in High risk population. American
Journal of Epidemiology 2003; 158(7): 669-675.
74 ASH Fact Sheet on Smoking and Diabetes 2012. Available on www.ash.org.uk.
Accessed on 21st March, 2015.
75 Xie X, Lui Q, Wu J, Wakui M. Impact of Cigarette Smoking in type 2 diabetes
development. Acta Pharmacol Sin 2009; 30(6): 784-787.
76 Shi L, Shu X, Li H. Physical Activity, Smoking and Alcohol Consumption in
Association with Incidence of type 2 Diabetes Among Middle aged and Elderly Chinese
Men. Plus One, 2010. 8(11): e77919.doi:10.1371/journal. Pone 0077919.
77 Willi C, Bodenmann P, Ghali WA, Fans PD, Comuz J. Active Smoking and the Risk of
Type 2 Diabetes: A systematic review and meta-analysis. Journal of the American
Medical Association 2007; 298: 2654-2664.
78 Priority Table Volume 111: Population Distribution by Sex, State, LGA and Senatorial
District. National population commission Abuja Nigeria, April 2010. Pg 52.
79 Charan J, Biswas T. How to Calculate Sample Size for Different Study Designs in
Medical Research? Indian Journal of Psychological Medicine 2013; 35(2): 121-126.
80 The WHO STEPWISE approach to surveillance of chronic non-communiticable disease
risk factors instrument V 2.0. Department of Chronic Disease and Health Promotion.
WHO 20 Avenue Appia, 1211.

103
81 Azimi-Nezhad M, Ghayour-Mobarhan M, Parizadah MR, Safarian M, Esmaeli H,
Parizadeh SMJ et al. Prevalence of type 2 Diabetes mellitus in Iran and its relationship
with gender., urbanization, education, marital status and occupation. Singapore Med J
2008; 49(7): 571-576.
82 Peykari N, Djalalma S, Qorbani M, Sobhani S, Farzodfar F, Larijani B. Socioeconomic
Inequalities and Diabetes: A Systematic review from Iran.
Journal of Diabetes and Metabolic Disorders 2015;14:8doi:10.11.86/540200-015-0135-
4. Accessed on 3rd July, 2015.
83 Hwang J, Shon C. Relationship Between Socioeconomic Status and type 2 Diabetes:
Results from Korea National Health and Nutrition Examination Survey (KNHANES)
2010-2012 BMJ Open 2014; 4: e005710.doi: 10.1136/bmj open -2014-005710.
Accessed on 5th July, 2015.
84 Frank LK, Heraclides A, Danguah I, Bedu-Addo G, Mokenhaupt FB and Schulze MB.
Measures of General and Central Obesity and Risk of type 2 Diabetes in a Ghanaian
Population. Tropical Medicine and International Health 2013; 8(2): 141-151.
85 Park SW, GoodPaster BH, Strotmeyer ES, de Rekeneire N, Harris TB, Schwartz AV et
al. Decreased Muscle Strength and Quality in Older Adults with Type 2 Diabestes: The
Health, Aging and Body Composition Study. Diabetes 2006; 55:1813-1818.
86 Nishida C, WHO Expert Consultation Appropriate body mass Index for Asian
Populations and its Implications for Policy and Intervention Strategies: Public Health.
Lancet 2004, 363:157-163.
87 Mbuagbaw L, Noorduyn SG. The Palm Wine Trade: Occupational and Health Hazards.
The International and Enviromeental Medicine 2012; 3(4): 157-164.

104
88 What is alcoholics? What is alcoholism? Available on www.medicalnewstoday.com-
what-is-alcoholics?-what-is-alcoholism? Accessed on 10th November, 2013.
89 Screening tests. National Institute on Alcohol Abuse and Alcoholism. Available on
http://pubs.niaaa.nih.gov.publications/alcoholscreeningtests.htm. Accessed on 15th
October, 2013.
90 Body Mass Index. Medline Plus. Available on www.nlm.nih.gov/me. Accessed on 20th
July, 2015.
91 Bakari AG, Onyemelukwe GC, Sani BG, Aliyu IS, Hassan SS, Aliyu TM. Relationship
between random blood glucose and body mass index in an African population. Int J
Diabetes and Metabolism 2006; 14: 144-145

105
APPENDICES
Appendix I
Common alcoholic beverages in Abakaliki and their alcohol by volume (ABV)
(1) Legend stout 33cl or 60cl 7.5%
(2) Harp larger 60cl 5.15%
(3) Star larger 60cl 5.1%
(4) “33” Export larger 60cl 5.0%
(5) Turbo king stout 60cl 6.5%
(6) Guinness stout 32.5cl or 60cl 7.5%
(7) Vodka lemon flavour (Redd’s) 37.5cl 5.0%
(8) Hero 60cl 5.2%
(9) Eagle larger 60cl 5.0%
(10) Snap 30cl 5.0%
(11) Origin spirit 60cl 6.0%
(12) Smirnoff premium 30cl 5.5%
(13) Gulder 60cl 5.2%
(14) Stazenbrau 45cl 5.0%
(15) Squard 5 Dark rum 50cl 45.0%
(16) Whisky 180ml 42.8%
(17) Baron Snap 50cl 40.0%
(18) Palm wine 4.0%87
A shot is about 30ml
A glass is about 150ml

106

107
APPENDIX II

108
APPENDIX III
INFORMED CONSENT FORM
TYPE 2 DIABETES AND ITS ASSOCIATED RISK FACTORS: MAGNITUDE AMONG
ADULT OBESE PATIENTS ATTENDING GOPC, FETHA, EBONYI STATE, NIGERIA.
Dear sir/Madam,
I am currently a part II candidate of the National Postgraduate Medical College of Nigeria in the
faculty of Family Medicine. I am conducting a research on the above mentioned topic. This is
aimed at improving our service delivery, adding to knowledge and inspiring others into more
research on surrounding issues.
The questionnaire will take about 20mins, and some measurements will be taken (height,
weight, blood pressure and waist circumference). Then fasting blood glucose or random blood
glucose, will be determined by making a fine lancet prick on your middle finger and using a drop
of blood on a glucometer strip. Lancet prick is done after cleaning the middle finger with a spirit
swab and drying. Lancet prick with a fine lancet is mildly painful. Pain usually stops after few
minutes.
Participation is voluntary and you are at liberty to decline anytime without offering any
reason. Withdrawal from research work will not in any way affect your being attended to as a
patient of this hospital at any time. All information given will be treated confidentially and will
not specifically be linked with you.
The study has been ethically approved by the research and Ethical Committee of the
Federal Teaching Hospital Abakaliki (FETHA) and they can be contacted via e-mail at
[email protected] or by phone +2348039558074 or +2783409650.
Should you have any enquiries please feel free to contact me at any time via e-mail at
[email protected], or by phone +2347030547313.
Your assistance would be much appreciated.
Yours sincerely,
DR. AMAZUE HENRY
By signing or thumb printing here, you consent to participate in this study
……………………. …………………….. ……………………..
Initials Sign/ Right thumb print Date

109
Appendix IV
RESEARCH QUESTIONNAIRE
INTRODUCTION
1. This is a research questionnaire on the dissertation topic; Type 2 diabetes and its
associated risk factors: magnitude among obese adult patients attending GOPC of
FETHA, Ebonyi State, Nigeria.
The dissertation is a requirement for the award of fellowship in the Faculty of Family
Medicine of the National Postgraduate Medical College of Nigeria.
To achieve this goal, your participation and cooperation is highly needed. You are please
required to provide information required in the consent form indicating your willingness
to participate in the study. The information you give will be treated with the highest level
of confidentiality and it will take you a few minutes to answer.
2. Kindly give only one response for each question or information required except where
otherwise instructed. Where a blank space exist, kindly give the appropriate answer(s)
3. Thank you for your cooperation
Serial number -----------------------------------------
Hospital number --------------------------------------
Address------------------------------------------------------------------------------------------------------
----------------------------------------------------------------------------------------------------------------
---------------------------------------------------
Rural Urban
SECTION A
Socio-Demographic Data
1. Sex
(a) Male (b) Female
2. Marital status

110
(a) Single (b) married (c) separated (d) divorced
(e) Widowed
3. Occupation
(a) Unemployed (b) student (c) business executive
(d) Civil servant (e) farming (f) trading
(g) Nanny (h) manual laborer (i) artisan (specify)--------------------
(j) Retiree (k) other (specify) -----------------------
4. Educational status
(a) No formal education (b) primary (c) secondary
(d) Tertiary
5. Date of Birth Age(years)
Age Group (years)
< 20
20-29
30-39
40-49
50-59
≥ 60
SECTION B
6. Have you been told previously by a doctor or other health worker that you have diabetes?
(a) Yes (b) No
If No, skip question 7, 8 and 9 and go to 10
7. How long have you had it?

111
(a) 1< year (b) 1-5years (c) 6-10years (d) 11-15year (e)
15-20 years (f) > 20yrs
8. Are you currently taking medication(s) for diabetes? (a) Yes (b) No
9. Name the drug (s) -----------------------------------------------------------------
10. Do any member(s) of your family have diabetes?
(a) Yes (b) No
If No, skip question 11 and go to 12
11. Which member(s) of your family? (specify)-----------------------------------
(a) Father (b) mother (c) brother (d) sister (e) uncle
(f) Aunty (g) cousins (h) grandfather (i) grand mother
Stratification
(a) first degree relative
(b) Second degree relative
(c) Third degree relative
(d) Both first and second degree relative
12. Do you have hypertension? (high blood pressure) (a)Yes (b) No
If No, skip question 13, 14 and 15 and go to 16
13. How long have you had it? (a) < 1 year (b) 1-5 years (c) 6-10years
(d) 11-15 years (e) 15-20 years (f) > 20yeras
14. Are you currently taking medication(s) for high blood pressure?
(a) Yes (b) No
15. Name the drug(s) (specify) -----------------------------------------------
SECTION C: HEALTH BEHAVIOURS
16. Have you ever smoked cigarette in any form? (a) Yes (b) No
If No skip question 17, 18 19, 20 and go to 21

112
17. When did you quit cigarette (a) < 1 year (b) 1-5 years (c) 6-10years (d)
11-15 years (e) 15-20 years (f) > 20years
18. How many sticks/packs of cigarette do you smoke per day? ------------------
19. Have you ever consumed alcohol? (a) Yes (b) No
If No, skip questions 22, 23, 24, 25 and go to 26.
20. What type of alcohol drink do you consume? (you can tick more than one) (a) Beer
(b) stout (c) palm wine (d) brandy (e) whiskey (f) Local gin
(g) Red wine
21. How much of the alcohol do you take at one episode? (specify) -------------
22. How frequently especially in the last 30days have you had at least one alcoholic drink?
(a) daily (b) 2days per week (c) 3days per week
(d) 4 days per week (e) 5days per week (f) 6 days per week
23. How long have you been drinking? (specify) (a) < 1 year (b) 1-5 years (c) 6-
10yeras (d) 11-15 years (e) 15-20 years (f) > 20yeras
24. Are you aware of lifestyle modification? (a) Yes (b) No
If No, skip No 27 and go to No 28.
25. What are the lifestyle modifications for preventing disease that you know?
(a) avoidance of excessive carbohydrate and/or fat intake
(b) Adequate physical activities/exercise
(c) Quitting alcohol
(d) Quitting smoking
(e) Others specify
26. Do you do any form of sports, fitness or recreational (Leisure) activities regularly?
Yes No
27. Which type? (specify).---------------------------------------------------------------
SECTION D: CLINICAL/BIOCHEMICAL MEASUREMENTS
28. Whole capillary blood glucose mg/dl(mmol/l)
Fasting (FBG) value ------------------------
Random (RBG) value ----------------------

113
Ask for symptoms of diabetes, if ≥ 200mg/dl(11.1mmol/l)
Blood glucose grouping
FBG RBG Log value
Normoglycaemia
Impaired glucose tolerance
Diabetes
29. Blood pressure reading SBP DBP
1 ------------ -------------
2 ------------ -------------
Average ------------ -------------
Blood press. Group (a) Normotensive (b) Hypertensive
SBP < 140 mmHg SBP ≥ 140 mmHg
DBP < 90 mmHg DBP ≥ 90 mmHg
30. Height (m) ----------------------- m2 ----------------------------
31. Weight (kg) -----------------------
32. BMI (Kg/m2)-----------------------
Normal
Overweight
OBESITY CLASSIFICATIUON
Class I
Class II
Class III

114
33. Waist Circumference (WC) -------------------------- cm
WC group Normal WC Abnormal WC
Women < 80cm ≥ 80cm
Men < 94cm ≥ 94cm
Copyright © 2022 FDOKUMEN