
Two-Level Systems and Boson Peak Remain Stable in 110-Million-Year-Old Amber Glass
22
Two-Level Systems and Boson Peak Remain Stable in 110-Million- Year-Old Amber Glass Tomás Pérez-Castañeda, 1 Rafael J. Jiménez-Riobóo, 2 and Miguel A. Ramos 1‡ 1 Laboratorio de Bajas Temperaturas, Departamento de Física de la Materia Condensada, Condensed Matter Physics Center (IFIMAC) and Instituto Nicolás Cabrera, Universidad Autónoma de Madrid, E-28049 Madrid, Spain. 2 Instituto de Ciencia de Materiales de Madrid, Consejo Superior de Investigaciones Científicas (ICMM-CSIC), E-28049 Madrid, Spain. Abstract The two most prominent and ubiquitous features of glasses at low temperatures, namely the presence of tunneling two-level systems and the so-called boson peak in the reduced vibrational density of states, are shown to persist essentially unchanged in highly stabilized glasses, contrary to what was usually envisaged. Specifically, we have measured the specific heat of 110 million-year-old amber samples from El Soplao (Spain), both at very low temperatures and around the glass transition T g . In particular, the amount of two-level systems, assessed at the lowest temperatures, was surprisingly found to be exactly the same for the pristine hyperaged amber as for the subsequently partially- and fully-rejuvenated samples. PACS numbers: 65.60.+a, 63.50.Lm, 64.70.P-, 81.40.Cd Amber has been appreciated by mankind for its color and natural beauty since the Neolithic era. It also has a well-known paleontological significance, being a unique preservational system where ancient bio-inclusions of animal and plant materials were stuck in the viscous resin and then fossilized for million years [1, 2]. Specifically, amber is a fossilized tree resin produced from the exudates of conifers or angiosperms which has undergone a maturation process over geological time, where progressive polymerization takes place as well as evaporation of volatile components, isomerization reactions, crosslinking and cyclization. As a result of all this, resins have been able to fossilize, after long periods of time that can exceed one hundred million years, into extremely stable materials: amber glasses. Several amber bearing deposits around the world with different types or chemical compositions of amber have proved invaluable for paleontology in the reconstruction of ecosystems and prehistoric life [1, 2].
-
Upload
independent -
Category
Documents
-
view
3 -
download
0
Transcript of Two-Level Systems and Boson Peak Remain Stable in 110-Million-Year-Old Amber Glass

Two-Level Systems and Boson Peak Remain Stable in 110-Million-Year-Old Amber Glass Tomás Pérez-Castañeda,1 Rafael J. Jiménez-Riobóo,2 and Miguel A. Ramos1‡ 1Laboratorio de Bajas Temperaturas, Departamento de Física de la Materia Condensada, Condensed Matter Physics Center (IFIMAC) and Instituto Nicolás Cabrera, Universidad Autónoma de Madrid, E-28049 Madrid, Spain. 2Instituto de Ciencia de Materiales de Madrid, Consejo Superior de Investigaciones Científicas (ICMM-CSIC), E-28049 Madrid, Spain. Abstract The two most prominent and ubiquitous features of glasses at low
temperatures, namely the presence of tunneling two-level systems and the so-called
boson peak in the reduced vibrational density of states, are shown to persist essentially
unchanged in highly stabilized glasses, contrary to what was usually envisaged.
Specifically, we have measured the specific heat of 110 million-year-old amber samples
from El Soplao (Spain), both at very low temperatures and around the glass transition
Tg. In particular, the amount of two-level systems, assessed at the lowest temperatures,
was surprisingly found to be exactly the same for the pristine hyperaged amber as for
the subsequently partially- and fully-rejuvenated samples.
PACS numbers: 65.60.+a, 63.50.Lm, 64.70.P-, 81.40.Cd
Amber has been appreciated by mankind for its color and natural beauty since the
Neolithic era. It also has a well-known paleontological significance, being a unique
preservational system where ancient bio-inclusions of animal and plant materials were
stuck in the viscous resin and then fossilized for million years [1, 2]. Specifically, amber
is a fossilized tree resin produced from the exudates of conifers or angiosperms which
has undergone a maturation process over geological time, where progressive
polymerization takes place as well as evaporation of volatile components, isomerization
reactions, crosslinking and cyclization. As a result of all this, resins have been able to
fossilize, after long periods of time that can exceed one hundred million years, into
extremely stable materials: amber glasses. Several amber bearing deposits around the
world with different types or chemical compositions of amber have proved invaluable
for paleontology in the reconstruction of ecosystems and prehistoric life [1, 2].

For physics and chemistry research, amber is a unique example of a glass that has been
aging for a very long time below its glass transition temperature, thus reaching a state
which is not accessible under normal experimental conditions. From a chemical point of
view, amber is a macromolecular solid resulting of free radical polymerization. From a
physical point of view, it is an amorphous solid or glass which has experienced an
extreme thermodynamic stabilization process (hyperaging). As a matter of fact, amber,
as many other natural or synthetic polymers, is a glass produced by chemical
vitrification [3], whereas standard chemically stable glass-forming liquids become
glasses by physical vitrification, i.e. by reducing temperature or increasing pressure.
Nevertheless, both kinds of glass have been shown to exhibit essentially the same
kinetic and thermodynamic properties characterizing the glassy behavior [3, 4].
Our understanding of the particularly rich phenomenology of glasses and supercooled
liquids continues to be a major unsolved scientific challenge [510]. Whether the glass
transition itself is only a purely kinetic event or the manifestation of an underlying
thermodynamic transition (occurring, for instance, at the Kauzmann [11] temperature TK
where the extrapolated entropy of the glass-forming liquid would equal that of the
crystal state, if much more slowly cooled) is still under debate [6, 7]. A very useful
framework for interpreting the complex phenomenology of glasses and supercooled
liquids is provided [12] by the potential-energy landscape (PEL). As depicted in Fig. 1,
the PEL is a topographic view of the (3N+1) potential-energy hypersurface of any glass-
forming substance of N particles, schematically projected on two dimensions for
convenience, which has many local minima and saddle points for thermal energies
below that of the melting point for the stable crystalline state (absolute minimum).
Thus, amber provides a unique benchmark to study the properties of a glass very close
to its “ideal-glass” limit (as if it could be brought in thermodynamic metastable
equilibrium down to TK), to be followed by a comparison with the canonical glass
obtained by subsequently erasing the thermal history of the amber glass (rejuvenation).
One could investigate, for example, which characteristic properties of glasses are robust
and inherent to the non-crystalline state, and which others are dependent on the degree
of frozen-in disorder at the glass transition and so might disappear on aging.

FIG. 1. Schematic potential energy landscape (PEL) for supercooled liquids and glasses, including the hypothetical absolute minimum for a crystal state. An ideal glass would be obtained after an infinitely long aging at the Kauzmann temperature TK. The likely level for the studied hyperaging process is indicated by Tage, tage. The successive states obtained with the gradual isothermal annealings (rejuvenation) at some Tann, tann applied to the pristine sample of amber, are illustrated with the path described by the circles and the arrows. The locations
labeled 16 in this PEL serve to identify the different samples throughout the Letter.
Specifically, our work has been aimed at studying the universal anomalous properties
exhibited by glasses at low temperatures [810], using amber as a model system. In
brief, glasses and other amorphous solids systematically exhibit at low temperature a
specific heat Cp much larger and a thermal conductivity orders of magnitude lower,
respectively, than the corresponding values found in their crystalline counterparts [13].
Furthermore, Cp was found [8, 13] to depend quasilinearly (CpT 1+) and almost
quadratically ( T 2) on temperature T, in clear contrast to the cubic dependences
observed in crystals for both properties, well understood in terms of Debye's theory of
lattice vibrations. These and related acoustic and dielectric properties of amorphous
solids at low temperatures [8] were soon well accounted for [14, 15] by the successful
Tunneling Model (TM), though some open questions remain unsolved [16].
On the other hand, the thermal behavior of glasses above 1 K and their corresponding
low-frequency vibrational properties around 1 THz, are much more poorly understood.
This frequency range is indeed dominated by another universal and much disputed
feature of glasses: the so-called “boson peak” [8, 10] arising from a noteworthy excess
in the vibrational density of states (VDOS) over that predicted by Debye’s theory g()
2. Such an excess in the low-frequency VDOS appears as a broad peak in g()/2,
which produces the broad maximum in Cp/T 3 observed in most glasses at a few K.
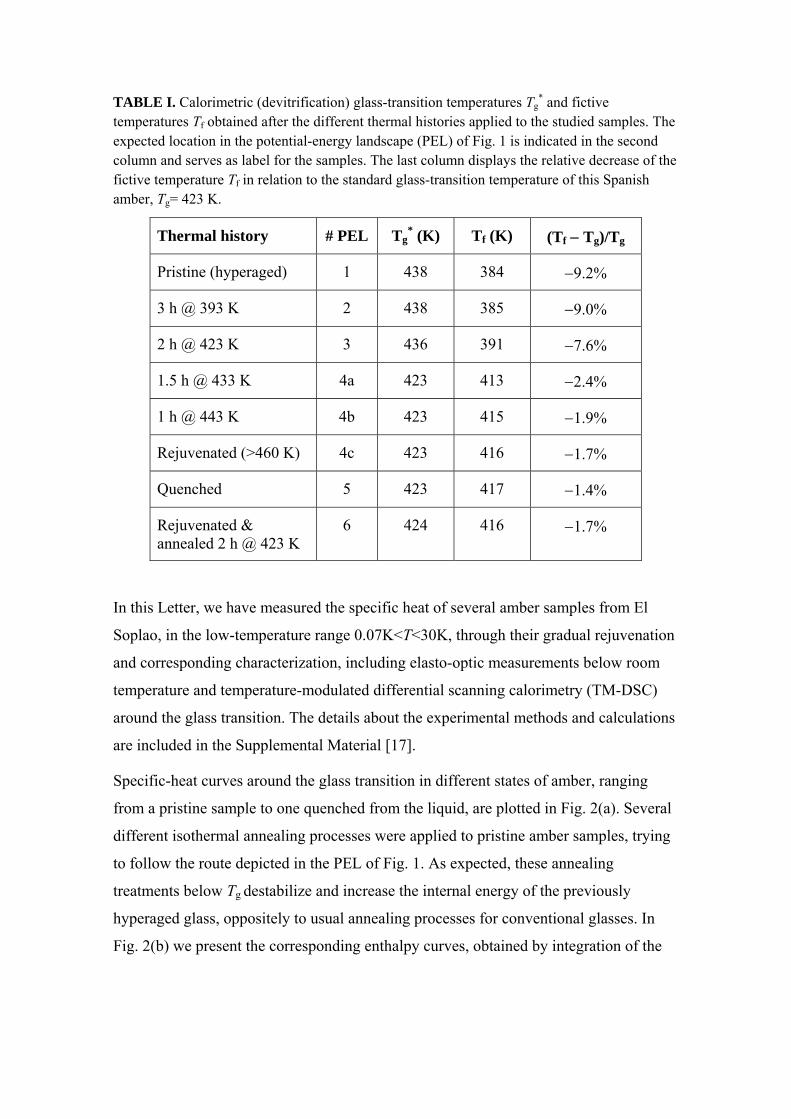
TABLE I. Calorimetric (devitrification) glass-transition temperatures Tg* and fictive
temperatures Tf obtained after the different thermal histories applied to the studied samples. The expected location in the potential-energy landscape (PEL) of Fig. 1 is indicated in the second column and serves as label for the samples. The last column displays the relative decrease of the fictive temperature Tf in relation to the standard glass-transition temperature of this Spanish amber, Tg= 423 K.
Thermal history # PEL Tg* (K) Tf (K) (Tf Tg)/Tg
Pristine (hyperaged) 1 438 384 9.2%
3 h @ 393 K 2 438 385 9.0%
2 h @ 423 K 3 436 391 7.6%
1.5 h @ 433 K 4a 423 413 2.4%
1 h @ 443 K 4b 423 415 1.9%
Rejuvenated (>460 K) 4c 423 416 1.7%
Quenched 5 423 417 1.4%
Rejuvenated & annealed 2 h @ 423 K
6 424 416 1.7%
In this Letter, we have measured the specific heat of several amber samples from El
Soplao, in the low-temperature range 0.07K<T<30K, through their gradual rejuvenation
and corresponding characterization, including elasto-optic measurements below room
temperature and temperature-modulated differential scanning calorimetry (TM-DSC)
around the glass transition. The details about the experimental methods and calculations
are included in the Supplemental Material [17].
Specific-heat curves around the glass transition in different states of amber, ranging
from a pristine sample to one quenched from the liquid, are plotted in Fig. 2(a). Several
different isothermal annealing processes were applied to pristine amber samples, trying
to follow the route depicted in the PEL of Fig. 1. As expected, these annealing
treatments below Tg destabilize and increase the internal energy of the previously
hyperaged glass, oppositely to usual annealing processes for conventional glasses. In
Fig. 2(b) we present the corresponding enthalpy curves, obtained by integration of the

former curves through dTTCHT
T
P )(0
, with T0 being a reference temperature in the
liquid state.
FIG. 2. (a) Specific heat of amber from El Soplao at different states, measured by TM-DSC with heating rates of 1 K/min and modulating amplitude ± 0.5 K/min every 80 s. Only the first upscan (see the Supplemental Material [17]) for each sample is presented. The devitrification temperature of the pristine sample is located at Tg
*=438 K, and then decreases with decreasing stability (rejuvenation). The aging signal is clearly seen as a huge endothermic peak at the glass transition, which is maximal in the case of the pristine sample 1. Rejuvenation of amber was done stepwise (Table I) by performing different isothermal treatments to the pristine sample near the glass transition. (b) Corresponding enthalpy curves from the specific-heat ones in (a), running from lower to upper solid curves when going from sample 1 to sample 5. The fictive temperature Tf for each sample (indicated by the arrows, going from left to right) is obtained as the intersection of the extrapolated liquid curve (+) and the glass curve extrapolated from temperatures well below its Tg
*(see the Supplemental Material [17]).
As can be seen in Fig. 2(a), a huge endothermic peak is observed for the pristine amber
(sample 1) at the calorimetric devitrification temperature Tg*= 438 K (determined by the
inflection point of the reversing Cp jump [17]). Tg* is well above the genuine glass
transition temperature Tg = 423 K obtained for the rejuvenated sample 4c, or
alternatively from the second or third heating runs for any sample [17], when the
cooling and heating rates are canonically the same. This unusual increase of the
calorimetric Tg* for the stabilized amber compared to the canonical glass, has been
ascribed to a high kinetic stability in the related case of ultrastable thin films of organic
glasses [18], indicating that much higher temperatures are needed to dislodge the
molecules from their glassy configurations.
The fictive temperature Tf is defined [19] as the temperature at which the
nonequilibrium (glass) state and its equilibrium (supercooled liquid) state would have

the same structure and properties, in particular enthalpy. As depicted in Fig. 2(b), we
have determined Tf as the intersection point (marked by the arrows) between the
extrapolated enthalpy of the liquid and that of the corresponding glass at temperatures
well below its Tg*. Obtained data are given in Table I. The observed extraordinary
decrease Tf = 32 K (thermodynamic stability) for the pristine amber compared to the
rejuvenated glass is similar or even superior to the effects seen in some ultrastable thin
films of organic glasses [18, 20, 21]. Such a reduction over 9% of the fictive
temperature with respect to the substance glass-transition is thus the consequence of
extremely prolonged sub-sub-Tg structural relaxations [22]. Notice that Tg*Tf even for
the canonical rejuvenated glass, what is mainly due to the specific calorimetric method
employed to determine Tg*[17].
Following the theoretical route upwards through the PEL (Fig. 1), we experimentally
see (Fig. 2) that applying an isothermal annealing for three hours at 393 K (sample 2),
well below the glass transition Tg=423 K, only produces a very slight change in the
pristine sample. When we further increase the annealing temperature, approaching it to
Tg, both the endothermic Cp peak and the enthalpy variation gradually decrease (sample
3, partial rejuvenation) until they completely disappear already for the thermal
annealing at 433 K (sample 4a). Calorimetric curves after isothermal annealings
(samples 4a and 4b) are indistinguishable from that for the fully-rejuvenated sample
(sample 4c), obtained after heating it up to 470 K, well in the liquid state. Moreover,
quenching the liquid at 50 K/min (sample 5) makes no significant difference from the
conventional glass in the specific-heat and enthalpy curves. We have also tried to re-
stabilize a rejuvenated amber glass, by annealing it for two hours at 423 K (sample 6),
but it again produced almost negligible effects on both the thermodynamic and kinetic
stability of the glass (Table I).
Finally, our main aim was to study the influence of the above-confirmed dramatic
stabilization of the hyperaged glass on its low-temperature properties. We present in
Fig. 3 our specific-heat measurements for pristine amber (sample 1), a partially
rejuvenated sample (sample 3) and the fully rejuvenated one (sample 4c). Fig. 3(a) is a
log-log plot at the lowest temperatures, which makes more clearly visible that the two-
level-systems (TLS)-dominated low-temperature specific heat, remains invariable
within experimental error. This is the main result of our work. On the other hand, above
1 K the specific heat moderately increases with rejuvenation around the “boson peak” in
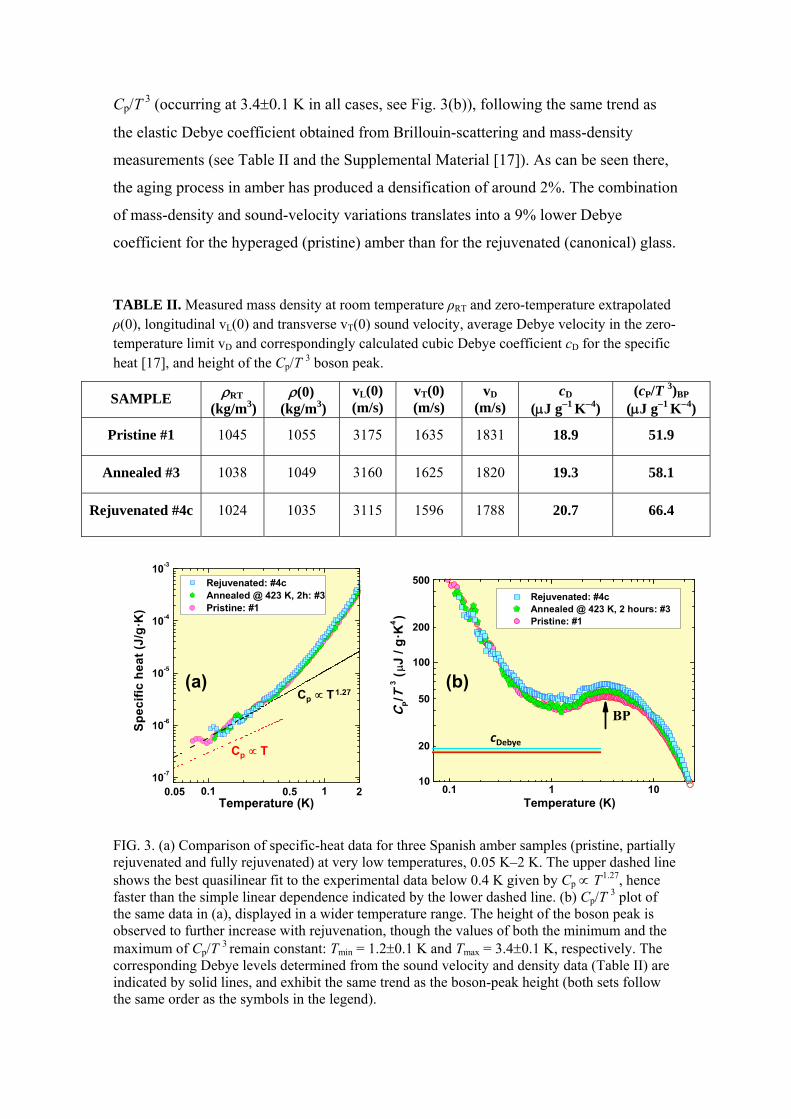
Cp/T 3 (occurring at 3.40.1 K in all cases, see Fig. 3(b)), following the same trend as
the elastic Debye coefficient obtained from Brillouin-scattering and mass-density
measurements (see Table II and the Supplemental Material [17]). As can be seen there,
the aging process in amber has produced a densification of around 2%. The combination
of mass-density and sound-velocity variations translates into a 9% lower Debye
coefficient for the hyperaged (pristine) amber than for the rejuvenated (canonical) glass.
TABLE II. Measured mass density at room temperature ρRT and zero-temperature extrapolated ρ(0), longitudinal vL(0) and transverse vT(0) sound velocity, average Debye velocity in the zero-temperature limit vD and correspondingly calculated cubic Debye coefficient cD for the specific heat [17], and height of the Cp/T 3 boson peak.
SAMPLE RT
(kg/m3) (0)
(kg/m3) vL(0) (m/s)
vT(0) (m/s)
vD (m/s)
cD (J g1 K4)
(cP/T 3)BP
(J g1 K4)
Pristine #1 1045 1055 3175 1635 1831 18.9 51.9
Annealed #3 1038 1049 3160 1625 1820 19.3 58.1
Rejuvenated #4c 1024 1035 3115 1596 1788 20.7 66.4
FIG. 3. (a) Comparison of specific-heat data for three Spanish amber samples (pristine, partially rejuvenated and fully rejuvenated) at very low temperatures, 0.05 K–2 K. The upper dashed line shows the best quasilinear fit to the experimental data below 0.4 K given by Cp T
1.27, hence faster than the simple linear dependence indicated by the lower dashed line. (b) Cp/T 3 plot of the same data in (a), displayed in a wider temperature range. The height of the boson peak is observed to further increase with rejuvenation, though the values of both the minimum and the maximum of Cp/T 3 remain constant: Tmin = 1.20.1 K and Tmax = 3.40.1 K, respectively. The corresponding Debye levels determined from the sound velocity and density data (Table II) are indicated by solid lines, and exhibit the same trend as the boson-peak height (both sets follow the same order as the symbols in the legend).

A strong Cp/T 3 peak was already observed by us [23] in pristine (20 million years old)
Dominican amber, though apparent residual curing or repolymerization, occurring
around the glass transition temperature when rejuvenating those amber samples,
hindered a reliable quantitative investigation. Also stress-relaxation experiments in
glass and supercooled-liquid states of Dominican amber have been recently reported
[24].
Whether or not the low-temperature universal “anomalies” of glasses (i.e. TLS and
boson peak) could be eventually suppressed by much stronger and longer annealing or
aging processes, and hence whether they are or not intrinsic properties of the glass state,
has been a long-standing question. During the last forty years, different experiments
[2530] have been reported about the possible influence of the thermal history on these
properties, with contradictory conclusions. Many of them were focused on the
paradigmatic vitreous silica. In brief, a modest decrease of the low-temperature specific
heat with annealing was usually found [26], both at the lowest temperatures and around
the Cp/T 3 maximum. However, the important role played by the different amounts of
water content, as well as the lack of measured elasto-optic data with thermal treatment
and hence of its variable contribution to the total heat capacity, makes their conclusions
unclear. The same applies to early low-temperature specific-heat measurements in
glassy glycerol [25], where the height of the Cp/T 3 maximum at 9 K was found to be a
7% lower in a slowly cooled glass than in a quenched glass. Also, a decrease with
annealing of both the Cp/T 3 maximum and the g()/2 boson peak inferred from Raman
scattering was reported in As2S3 glasses [27]. Nonetheless, later Raman and inelastic
neutron scattering experiments [28] in the same glasses suggested that the observed
changes in the total VDOS were caused by changes of sound velocity and density as a
result of quenching. A similar conclusion was reached in dry B2O3 glasses [29], where
very different Cp/T 3 peaks for different thermal treatments were found to merge into a
single curve after their corresponding Debye levels had been subtracted. Interestingly,
careful inelastic neutron scattering experiments in polybutadiene [30] showed a clear
absence of annealing effect in its VDOS (boson peak), though a slight decrease in the
boson peak was reported [31] after physical aging in another polymer, PMMA.
Indeed, some authors have tried to correlate the boson peak feature in glasses [32], and
even in crystals [33], with transformations of the elastic continuum only. In the case of

amber, however, such a Debye-scaling rule is not hold quantitatively. The height of the
Cp/T 3 boson peak in the hyperaged amber has decreased a 22% from the standard
rejuvenated glass, whereas a Debye scaling [32] ( D3, with D being the Debye
frequency) would predict only a 7.4% reduction. A similar relation was proposed by
Shintani and Tanaka [34]. From numerical simulations in 2D glass-forming systems,
they suggested that the boson peak height should scale with the inverse of the shear
modulus. From the data in Table II, one would expect a boson-peak reduction < 7%,
again well below the experimentally observed 22%.
Our experiments on hyperaged glasses of amber, far away from laboratory time-scale
annealing or quenching processes, undoubtedly demonstrate that these ideal-like
glasses, subjected to a dramatic thermodynamic stabilization, do exhibit the same low-
temperature properties of the conventional (rejuvenated) glass. Erasing the strong
structural relaxation and enthalpy reduction of pristine amber only produces a modest
quantitative increase in the height of the Cp/T 3 peak that could be qualitatively ascribed
to the corresponding variation of the elastic constants and the Debye coefficient.
Furthermore, the best fingerprint of the universal glassy anomalies is surely the density
of TLS, measured from the corresponding quasilinear contribution to the specific heat,
CpT 1+, since the influence of Debye-like lattice vibrations becomes less and less
important below 1 K. In this respect, our experimental results are conclusive: pristine,
partially-rejuvenated and fully-rejuvenated amber glasses have the same specific heat
below 1 K, within experimental error.
The boson peak and the tunneling TLS are therefore robust and intrinsic properties of
glasses which remain “fossilized” in 110-million-year stabilized glasses of amber, as
insects or other bio-inclusions do. We also expect that amber, a hyperaged glass, will
work as an extremely enlightening model glass to study many other puzzles involved in
the physics of the glass state.
This work was financially supported by the Spanish MINECO (FIS2011-23488 and
MAT2012-37276-C03-01 projects) and partially by the Autonomous Community of
Madrid (PHAMA S2009/MAT-1756 project). T.P.C. acknowledges financial support
from the Spanish Ministry of Education through the FPU grant AP2008-00030 for his
PhD thesis. The authors are especially grateful to Idoia Rosales and César Menor-
Salván for providing the El Soplao amber samples, to Tomás E. Gómez for his

collaboration with ultrasonic experiments and to Uli Buchenau for helpful discussions
and a critical reading of the manuscript. María José de la Mata is gratefully
acknowledged for her technical support with TM-DSC measurements conducted at
SIdIUAM. Pilar Miranzo is thanked for her help with mass-density measurements.
------------------------------------------------------------
‡ Corresponding author: [email protected]
[1] J. B. Lambert and G. O. Poinar, Jr., Acc. Chem. Res. 35, 628 (2002), and references
therein.
[2] D. Grimaldi, Science 326, 51 (2009), and references therein.
[3] S. Corezzi, D. Fioretto and P. Rolla, Nature 420, 653 (2002).
[4] S. Caponi, S. Corezzi, D. Fioretto, A. Fontana, G. Monaco and F. Rossi, Phys. Rev.
Lett. 102, 027402 (2009).
[5] C. A. Angell, K. L. Ngai, G. B. McKenna, P. F. McMillan and S. W. Martin, J. Appl.
Phys. 88, 3113 (2000).
[6] P. G. Debenedetti and F. H. Stillinger, Nature 410, 259 (2001).
[7] A. Cavagna, Physics Reports 476, 51 (2009).
[8] W. A. Phillips, Amorphous Solids: Low-temperature Properties (Springer, Berlin,
1981).
[9] P. Esquinazi, Tunnelling Systems in Amorphous and Crystalline Solids (Springer,
Berlin, 1998).
[10] R. Zorn, Physics 4, 44 (2011).
[11] W. Kauzmann, Chem. Rev. 43, 219 (1948).
[12] M. Goldstein, J. Chem. Phys. 51, 3728 (1969).
[13] R. C. Zeller and R. O. Pohl, Phys. Rev. B 4, 2029 (1971).
[14] W. A. Phillips, J. Low Temp. Phys. 7, 351 (1972).
[15] P. W. Anderson, B. I. Halperin and C. M. Varma, Philos. Mag. 25, 1 (1972).
[16] C. C. Yu and A. J. Leggett, Comments Cond. Mat. Phys. 14, 231 (1988).

[17] See Supplemental Material for the description of the samples, their calorimetric
characterization through TM-DSC, the method followed to determine the fictive
temperatures, the experimental methods and detailed calculations of the zero-temperature
extrapolations for the elasto-optic coefficients, and experimental details on low-
temperature heat capacity measurements.
[18] S. F. Swallen, K. L. Kearns, M. K. Mapes, Y. S. Kim, R. J. McMahon, M. D.
Ediger, T. Wu, L. Yu and S. Satija, Science 315, 353 (2007).
[19] A. Q. Tool, J. Am. Ceram. Soc. 29, 240 (1946).
[20] K. L. Kearns, S. F. Swallen, M. D. Ediger, T. Wu, Y. Sun and L. Yu, J. Phys.
Chem. B 112, 4934 (2008).
[21] A. Sepúlveda, E. León-Gutiérrez, M. González-Silveira, C. Rodríguez-Tinoco, M.
T. Clavaguera-Mora and J. Rodríguez-Viejo, Phys. Rev. Lett. 107, 025901 (2011).
[22] S. Brawer, Relaxation in viscous liquids and glasses (American Ceramic Society,
Columbus, 1985).
[23] T. Pérez-Castañeda, R. J. Jiménez-Riobóo and M. A. Ramos, J. Phys.: Condens.
Matter 25, 295402 (2013).
[24] J. Zhao, S. L. Simon and G. B. McKenna, Nat. Commun. 4, 1783 (2013).
[25] R. Calemczuk, R. Lagnier and E. Bonjour, J. Non-Cryst. Solids 34, 149 (1979).
[26] H. v. Löhneysen, H. Rüsing and W. Sander, Z. Phys. B 60, 323 (1985).
[27] N. Ahmad, K. Hutt and W. A. Phillips, J. Phys. C: Solid State Phys. 19, 3765 (1986).
[28] S. L. Isakov, S. N. Ishmaev, V. K. Malinovsky, V. N. Novikov, P. P. Parshin, S. N.
Popov, A. P. Sokolov and M. G. Zemlyanov, Physica A 201, 386 (1993).
[29] E. Pérez-Enciso, M. A. Ramos and S. Vieira, Phys. Rev. B 56, 32 (1997).
[30] R. Zorn and B. Frick, J. Chem. Phys. 108, 3327 (1998).
[31] E. Duval, L. Saviot, L. David, S. Etienne and J. F. Jal, Europhys. Lett. 63, 778
(2003).
[32] A. Monaco, A. I. Chumakov, Y.-Z. Yue, G. Monaco, L. Comez, D. Fioretto, W. A.
Crichton and R. Rüffer, Phys. Rev. Lett. 96, 205502 (2006).
[33] A. I. Chumakov et al., Phys. Rev. Lett. 112, 025502 (2014).

[34] H. Shintani and Y. Tanaka, Nat. Mater. 7, 870 (2008).
[35] C. Menor-Salván, M. Najarro, F. Velasco, I. Rosales, F. Tornos and B. R. T.
Simoneit, Organic Geochemistry 41, 1089 (2010).
[36] M. Najarro, E. Peñalver, I. Rosales, R. Pérez-de la Fuente, V. Daviero-Gómez, B.
Gómez and X. Delclòs, Geologica Acta 7, 363 (2009).
[37] J. K. Krüger, J. Baller, T. Britz, A. le Coutre, R. Peter, R. Bactavatchalou and J.
Schreiber, Phys. Rev. B 66, 012206 (2002).
[38] T. Pérez-Castañeda, J. Azpeitia, J. Hanko, A. Fente, H. Suderow and M. A. Ramos,
J. Low Temp.Phys. 173, 4 (2013).
[39] E. Pérez-Enciso and M. A. Ramos, Thermochimica Acta 461, 50 (2007).

Supplemental Material
1. Amber samples from El Soplao (Spain)
Type A Type B
(a)
(b)
FIG. S1. The two types of Spanish amber from El Soplao deposit have their botanical origin mainly in two resin producers, namely, the extinct Cuppresaceae (type A) and Cheirolepidiaceae (type B). The differences in composition are visible to the naked eye (a). Type A amber presents a strong brownish colour under artificial light, whereas type B samples have a honey-yellow colour. (b) Under ultraviolet illumination both amber types exhibit luminescence.
New amber deposits have been discovered quite recently in the northern region of
Spain, in Cantabria, within El Soplao territory [35]. These new deposits have provided a
big amount of this fossil resin, yielding a large number of bio-inclusions for
paleontological research [36]. Two types of amber samples have been found attending
to their chemical composition, indicating the presence of two main resin producers [35].
The differences in composition between the two amber types are evident prima facie
(Figure S1), exhibiting both of them luminescence under ultraviolet illumination.
For the studies presented in this work, aimed at looking for a possible correspondence
between the stability in amber and the excess density of states at low temperatures, only
the so-called “type B” [35] samples have been used, due to their better homogeneity and

less amount of impurities. When needed, raw pieces of amber were cleaved or slowly
cut with a diamond wheel, and then simply cleaned with distilled water.
2. Calorimetric characterization through TM-DSC
300 320 340 360 380 400 420 440 4601.2
1.4
1.6
1.8
2.0
2.2
2.4
2.6
2.8
3.0
3.2
3.4
448 452 456 460 464
2.20
2.22
2.24
2.26
2.28
2.30
First heating #1 Second heating #4c Third heating #4c
Sp
ecif
ic H
eat
(J/g
·K)
Temperature (K)
Sp
ecif
ic H
ea
t (
J /
g ·
K )
Temperature (K)
CP /CP < 1 %
FIG. S2. Typical TM-DSC curves on a pristine amber sample (type B) corresponding to the first three consecutive heating runs, systematically performed in all cases at rates ±1 K/min and modulating signal ±0.5 K every 80 s. The first heating shows the huge endothermic signal corresponding to the strong stabilization occurred after (110 million years) hyperaging. The two subsequent curves correspond to the rejuvenated glass, after heating it above the glass-transition temperature. Reproducibility among them also evidences that no further repolymerization process occurs when heating the sample. The inset shows a zoom in the liquid region, where the
reproducibility among different curves is determined to be 1%.
Calorimetric characterization of amber through the different stages of rejuvenation
(thermodynamic destabilization) was performed using a commercial DSC Q100 from
TA Instruments. The technique employed was Temperature-Modulated Differential
Scanning Calorimetry (TM-DSC), which allowed us to independently determine
thermodynamic and kinetic stability via reversing and nonreversing contributions to the
heat capacity, as well as the total heat capacity (Fig. S2). Heating and cooling rates
employed were always ±1 K/min, and modulating signals ±0.5 K every 80 s.
Obtaining accurate absolute values around 1% and high reproducibility of the specific
heat was possible by paying special attention to several aspects in the experiments: (i)
the standard aluminum pans (mass m ≈ 20 mg) used where chosen to deviate less than
0.1 mg from the reference; (ii) the sample mass was maximized to be approximately 10

mg; (iii) the sample was milled down to a homogeneous grain size of 50 – 60 µm, using
an agate mortar; (iv) calibration of the specific-heat curves was done by measuring
standard sapphire in the very same conditions as amber, and directly comparing it to the
theoretical values, what provides a temperature-dependent correction factor.
Accuracy of temperature data is estimated to be better than 0.1 K in the used TM-DSC
system. Among the different methods usually employed to assess the glass transition
temperature, we have determined the calorimetric (devitrification) glass transition Tg*,
displayed in Table I for each sample, from the maximum in the derivative of its
reversing heat-capacity curve (first heating scan). This is the same as the inflection
point of the truly (kinetic) specific-heat glass-liquid discontinuity, devoid of non-
reversing enthalpy release also occurring around the glass-transition temperature and
responsible for the (thermodynamic) fictive temperature Tf . The estimated error in the
determination of Tg* is below 1K, and mainly due to the statistical uncertainty in the
determination of the peak in the derivative of the reversing heat capacity.
Comparison between a sample annealed in the laboratory for two hours at 423 K after
rejuvenation and the pristine amber shows up the much bigger effectiveness (see the
huge endothermic overshoot in Fig. S3) of the natural hyperaging of amber than a
laboratory time-scale annealing to stabilize the glass, therefore supporting the relevance
of structural relaxation processes in glasses far below the glass transition.
390 400 410 420 430 440 450 4601.6
1.8
2.0
2.2
2.4
2.6
2.8
3.0
3.2
3.4 Pristine #1
Rejuv. + annealed @ 423 K, 2 h. #6
Rejuvenated #4c
Sp
ecif
ic H
eat
(J/g
·K)
Temperature (K)
FIG. S3. Specific-heat curves corresponding to fully-rejuvenated amber of type B (sample 4c) and after annealing such a rejuvenated glass at 423 K for 2 hours (sample 6). For comparison, the pristine amber (sample 1) is also shown. A slight overshoot in the annealed rejuvenated

amber is observed, essentially negligible compared to the effect of hyperaging observed in the pristine sample.

3. Determination of the fictive temperature
In order to account for the thermodynamic stability of amber, i.e. how deep each glass
(with a different thermal history) lies in the potential energy landscape, we have
obtained the fictive temperature from the enthalpy curves. Starting with the specific-
heat curves in Fig. 2a, we obtain the corresponding enthalpy curve H(T) (see Fig. 2b)
from direct integration , T0 being an arbitrary reference temperature
in the liquid. In our case, T0 = 465 K was taken, well above Tg = 423 K, and more
importantly, far from the huge aging signal (centered at Tmax = 437 K and width ∆T = 14
K).
After the enthalpy curves are obtained, we determine the fictive temperature from the
intersection between the extrapolations of the liquid (ergodic) and the glass (non-
ergodic) enthalpy curves, see Fig. S4. The calculation of the extrapolations was done
using experimental data far from the glass transition Tg = 423 K, by means of quadratic
polynomial fits, given the linear behavior of the specific-heat curves well in the liquid
and glass regions. Specifically, we used the temperature ranges 452 K ≤ T ≤ 465 K and
320 K ≤ T ≤ 355 K for the liquid and glass extrapolations, respectively. In Fig 2a we
can observe that specific-heat curves for all shown samples (regardless of their thermal
history) completely collapse for temperatures below 360 K and above 450 K.
The errors involved in the determination of Tf are estimated to be 1K. The main
source of error here are the (small) statistical errors arising from the extrapolations of
glass and liquid H(T) curves.
It is worth noticing that a clear difference Tg Tf = 7 K is observed in Table I for the
rejuvenated glass, well beyond experimental error, when one might expect Tf Tg for a
canonical glass obtained by cooling the liquid at the same rate than the employed
heating rate in the calorimetric measurement. The reason of this apparent mismatch is
simply that we are sticking here to a “kinetic” definition of Tg (the calorimetric
devitrification temperature Tg*, taken as the inflection point of the reversing heat-
capacity change). With such a decoupling between reversing and non-reversing
contributions to the specific heat, by means of TM-DSC, we are able to observe that the
pristine, highly-stable amber glass is much more stable than the rejuvenated one, both
kinetically (Tg* = 15 K, i.e. the hyperaged glass only devitrifies at higher

temperatures when heating) and thermodynamically (Tf = 32 K , implying a
remarkable descent in the potential-energy landscape).
FIG. S4. Determination of the fictive temperature for the pristine (Tf prs) and the fully-
rejuvenated (Tf rej) glass, by extrapolating the enthalpy curves from the liquid Hliq (T)
and the glass Hgl (T) regions, far from the glass transition. The corresponding extrapolations are obtained by fitting the Hliq (T) and Hgl (T) curves to quadratic polynomials in the temperature ranges 452 K ≤ T ≤ 465 K and 320 K ≤ T ≤ 355 K, respectively.
4. Elasto-optic measurements
The Debye contribution to the specific heat has been independently determined for the
three samples studied at low temperatures from the experimental values of the sound
velocity and mass density.

The longitudinal sound velocity was measured in the temperature range 80 K ≤ T ≤ 300
K using High Resolution Brillouin Spectroscopy (HRBS), with excitation wavelength λ0
= 514.5 nm, and extrapolated to 0 K with a least-squares fit, as shown in Fig. S4 and in
Table II. Polished plan-parallel slabs of amber, less than 0.5 mm thick were placed in
the same experimental setup described in Ref. [23]. Both backscattering (180º) and
right-angle (90ºA) geometries were simultaneously used, the former implying a
refractive-index dependent acoustic wave vector and the latter being independent of it.
Given the high background signal introduced by the luminescence of the samples at
these wavelenghts (see Fig. S1), the transverse sound velocities vT could not be
measured by HRBS. However, the zero-temperature value vT(0) was approximately
obtained by means of the generalized Cauchy equation , which
links longitudinal and transverse sound velocities since A is found to be independent of
temperature and aging in the case of polymers [37]. From ultrasonic data taken at room
temperature for our amber samples, A=2.062 km2/s2 is obtained and hence vT(0) can be
determined from vL(0), see Table II.
0 50 100 150 200 250 3002600
2700
2800
2900
3000
3100
3200 #1 Pristine #3 Ann. @ 423 K, 2h #4c Rejuvenated
v L (
m/s
)
Temperature (K)
FIG. S5. Temperature dependence of the longitudinal sound velocities in Spanish type B amber with decreasing stability. Least-squares fits of the experimental data in the temperature range 80 K ≤ T ≤ 300 K are used to calculate the zero-temperature extrapolation vL
prs (0K) = 3175 m/s, vL
ann (0K) = 3160 m/s and vLrej (0K) = 3115 m/s, for the pristine, annealed and fully rejuvenated
samples, respectively.
The mass density of the three samples was measured at room temperature by means of
the Archimedes method with a Mettler Toledo AB 265-S balance, using distilled water

as a fluid. Linear extrapolation of the mass densities to zero temperature were done by
recourse [23] to the Lorenz-Lorentz relation between mass density ρ(T) and refractive
index n(T) for a transparent medium, after our HRBS measurements as a function of
temperature in the range 80 K < T < 300 K. The best linear fit for the experimental data
was n(T) = 1.553 – (2.619·105 K1)·T , thus obtaining the ρ(0) values shown in Table
II. Therefore, the densification produced by the stabilization process of this amber from
El Soplao is around 2%.
Then, the average Debye velocity vD was obtained,
333
21
3
11
TLD vvv, and hence the
calorimetric Debye coefficient in the low-temperature limit:
33
42
5
2
D
BD v
kc
. As can
be seen in Table II, combining mass density and sound velocity variations, the
hyperaged, pristine amber has a 9% lower Debye level than the rejuvenated, canonical
glass. The gradual increase of the Debye coefficient with rejuvenation goes in parallel
with that exhibited by the boson-peak height, possibly suggesting that low-frequency
glassy excitations and phonon-like acoustic modes are somehow mixed or hybridized at
not too low temperatures. Nonetheless, it is to be remarked that even the highly-
stabilized pristine amber exhibits a strong boson peak, well above the corresponding
Debye level.
5. Low-temperature relaxation calorimetry
Low-temperature specific-heat measurements in the range 1.8K<T<30K were
performed in a double-chamber insert, placed in a 4He cryostat. Measurements in the
range 0.07K<T<3K were performed in a dilution refrigerator Oxford Instruments
MX400. Both calorimetric cells consisted of a sapphire disc, on which a small
calibrated thermometer (either Cernox or RuO2, respectively) and a resistive chip as a
Joule heater were glued diametrically opposed using cryogenic varnish GE7301. The
sapphire substrate is suspended from a copper ring acting as thermally-controlled sink.
The main thermal contact between them is a thin metallic wire through which heat is
released. The heat capacity of the empty addenda was independently measured and
subtracted from the total data points. Excellent agreement was found between
experimental data from both experimental setups in the overlapping temperature range.
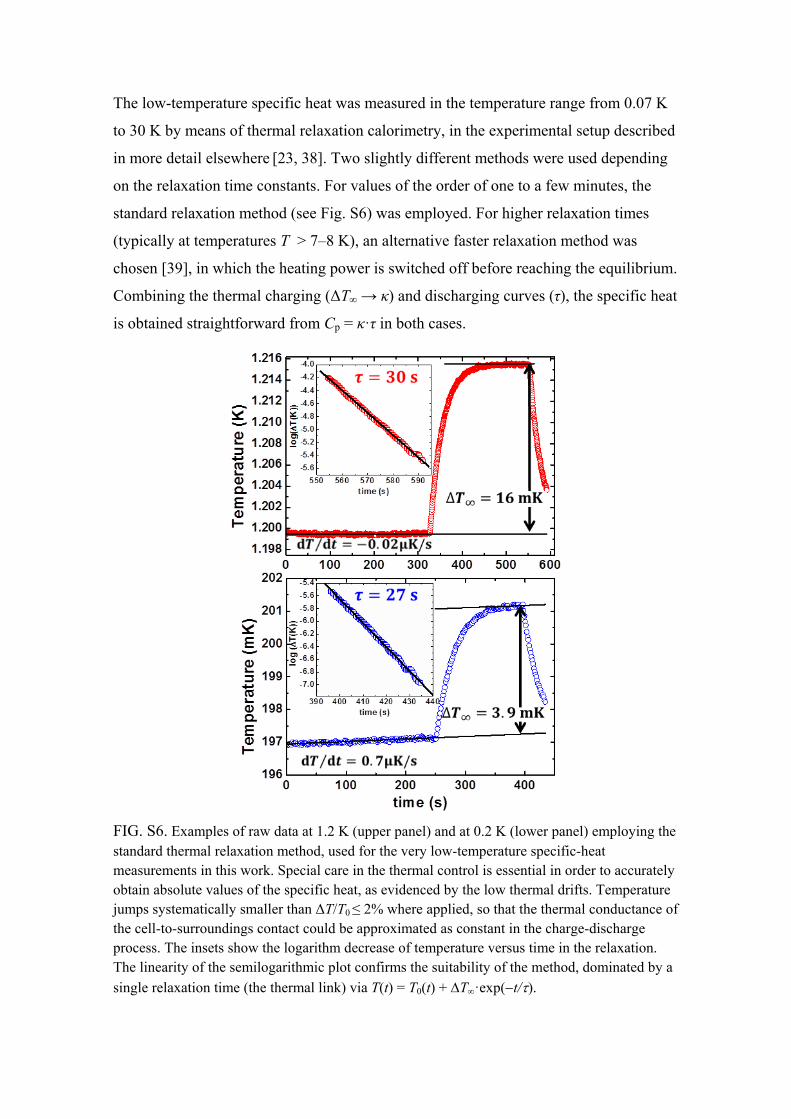
The low-temperature specific heat was measured in the temperature range from 0.07 K
to 30 K by means of thermal relaxation calorimetry, in the experimental setup described
in more detail elsewhere [23, 38]. Two slightly different methods were used depending
on the relaxation time constants. For values of the order of one to a few minutes, the
standard relaxation method (see Fig. S6) was employed. For higher relaxation times
(typically at temperatures T > 7–8 K), an alternative faster relaxation method was
chosen [39], in which the heating power is switched off before reaching the equilibrium.
Combining the thermal charging (ΔT∞ → κ) and discharging curves (τ), the specific heat
is obtained straightforward from Cp = κ·τ in both cases.
FIG. S6. Examples of raw data at 1.2 K (upper panel) and at 0.2 K (lower panel) employing the standard thermal relaxation method, used for the very low-temperature specific-heat measurements in this work. Special care in the thermal control is essential in order to accurately obtain absolute values of the specific heat, as evidenced by the low thermal drifts. Temperature jumps systematically smaller than ΔT/T0 ≤ 2% where applied, so that the thermal conductance of the cell-to-surroundings contact could be approximated as constant in the charge-discharge process. The insets show the logarithm decrease of temperature versus time in the relaxation. The linearity of the semilogarithmic plot confirms the suitability of the method, dominated by a
single relaxation time (the thermal link) via T(t) = T0(t) + T·exp(t/).

The accurate determination of the specific heat requires high thermal stability, given by
drifts of the order of few hundredths to few tenths of µK/s. For the thermal conductivity
of the contact to be considered constant during the whole process, temperature jumps
below 2% were always applied to the calorimeter. The correct performance of the
method is easily checked at every experimental point by analysing the temperature
decrease versus time to be strictly linear in a semi-logarithmic scale, as shown in the
insets of Fig. S6.


![L-nnn-yy-[LICENSEE]-ELPAC-VVV AMBER Sensitive information ...](https://static.fdokumen.com/doc/165x107/6326029f6d480576770c9276/l-nnn-yy-licensee-elpac-vvv-amber-sensitive-information-.jpg)


