
Two-dimensional synthetic aperture laser optical feedback imaging using galvanometric scanning
10
Two-dimensional synthetic aperture laser optical feedback imaging using galvanometric scanning Arnaud Witomski, 1 Eric Lacot, 1, * Olivier Hugon, 1 and Olivier Jacquin 1 Laboratoire de Spectrométrie Physique, Université Joseph Fourier de Grenoble, UMR CNRS 5588, B.P. 87, 38402 Saint Martin d’Hères, France *Corresponding author: [email protected] Received 20 September 2007; accepted 26 November 2007; posted 7 January 2008 (Doc. ID 87696); published 20 February 2008 We have improved the resolution of our laser optical feedback imaging (LOFI) setup by using a synthetic aperture (SA) process. We report a two-dimensional (2D) SA LOFI experiment where the unprocessed image (i.e., the classical LOFI image) is obtained point by point, line after line using full 2D galvano- metric scanning. The 2D superresolved image is then obtained by successively computing two angular SA operations while a one-dimensional angular synthesis is preceded by a frequency synthesis to obtain a 2D superresolved image conventionally in the synthetic aperture radar (SAR) method and their corre- sponding laser method called synthetic aperture ladar. The numerical and experimental results are com- pared. © 2008 Optical Society of America OCIS codes: 280.3420, 110.2970, 100.3010. 1. Introduction The degradation of the diffraction-limited spatial resolution with increasing distance is a leading problem for the characterization of remote targets. Synthetic aperture radars (SARs) operating at microwave wavelengths have successfully been de- veloped to obtain a higher resolution than the dif- fraction beam spot [1–3]. The laboratory extended versions of SAR to optical domain is called SALs for synthetic aperture ladars. SAL with an improved spatial resolution have been demonstrated for one- dimensional (1D) imaging, with a CO 2 laser source [4,5] and a Nd:YAG microchip laser source [6,7]. More recently, two-dimensional (2D) SAL have been reported using a frequency-swept waveform for the across-track location, and a linear scanning consist- ing of either a moving target in the laser beam spot [8] or a moving aperture illuminating a fixed light- scattering target [9]. For SAL operation, microchip laser sources seem to be relevant because of their compactness and their high temporal and spatial co- herence (laser linewidth less than 1 kHz and laser beam divergence close to the diffraction limit). More- over, microchip laser subject to frequency-shifted optical feedback can be used as high performance de- tectors [10]. Nowadays, the dynamical sensitivity of such lasers to frequency-shifted optical feedback is used in a self-mixing laser Doppler velocimetry (LDV) experiment [11] and in a laser optical feedback imaging (LOFI) experiment [12]. The main objective of this study is to combine the high resolution of a SAL experiment (i.e., beyond the diffraction spot size of the scanning laser beam) with the high sensitivity and the simplicity of the LOFI experiment to obtain a very efficient and compact device for 2D imaging. This device would be able to compensate the degradation of the diffraction- limited spatial resolution with increasing distance. To demonstrate how the resolution of our LOFI setup can be improved by using a synthetic aperture (SA) process, in this paper we report a 2D SA LOFI experi- ment where the unprocessed image (i.e., the classical LOFI image) is obtained point by point, line after line using full 2D galvanometric scanning. The 2D super- resolved image is then obtained by successively com- puting two SA operations: the first one from the Doppler frequency shift history induced in the along 0003-6935/08/060860-10$15.00/0 © 2008 Optical Society of America 860 APPLIED OPTICS / Vol. 47, No. 6 / 20 February 2008
-
Upload
independent -
Category
Documents
-
view
2 -
download
0
Transcript of Two-dimensional synthetic aperture laser optical feedback imaging using galvanometric scanning

Two-dimensional synthetic aperture laser opticalfeedback imaging using galvanometric scanning
Arnaud Witomski,1 Eric Lacot,1,* Olivier Hugon,1 and Olivier Jacquin1
Laboratoire de Spectrométrie Physique, Université Joseph Fourier de Grenoble, UMR CNRS 5588, B.P. 87,38402 Saint Martin d’Hères, France
*Corresponding author: [email protected]
Received 20 September 2007; accepted 26 November 2007;posted 7 January 2008 (Doc. ID 87696); published 20 February 2008
We have improved the resolution of our laser optical feedback imaging (LOFI) setup by using a syntheticaperture (SA) process. We report a two-dimensional (2D) SA LOFI experiment where the unprocessedimage (i.e., the classical LOFI image) is obtained point by point, line after line using full 2D galvano-metric scanning. The 2D superresolved image is then obtained by successively computing two angularSA operations while a one-dimensional angular synthesis is preceded by a frequency synthesis to obtain a2D superresolved image conventionally in the synthetic aperture radar (SAR) method and their corre-sponding laser method called synthetic aperture ladar. The numerical and experimental results are com-pared. © 2008 Optical Society of America
OCIS codes: 280.3420, 110.2970, 100.3010.
1. Introduction
The degradation of the diffraction-limited spatialresolution with increasing distance is a leadingproblem for the characterization of remote targets.Synthetic aperture radars (SARs) operating atmicrowave wavelengths have successfully been de-veloped to obtain a higher resolution than the dif-fraction beam spot [1–3]. The laboratory extendedversions of SAR to optical domain is called SALsfor synthetic aperture ladars. SAL with an improvedspatial resolution have been demonstrated for one-dimensional (1D) imaging, with a CO2 laser source[4,5] and a Nd:YAG microchip laser source [6,7].More recently, two-dimensional (2D) SAL have beenreported using a frequency-swept waveform for theacross-track location, and a linear scanning consist-ing of either a moving target in the laser beam spot[8] or a moving aperture illuminating a fixed light-scattering target [9]. For SAL operation, microchiplaser sources seem to be relevant because of theircompactness and their high temporal and spatial co-herence (laser linewidth less than 1kHz and laser
beam divergence close to the diffraction limit). More-over, microchip laser subject to frequency-shiftedoptical feedback can be used as high performance de-tectors [10]. Nowadays, the dynamical sensitivity ofsuch lasers to frequency-shifted optical feedback isused in a self-mixing laser Doppler velocimetry(LDV) experiment [11] and in a laser optical feedbackimaging (LOFI) experiment [12].
The main objective of this study is to combine thehigh resolution of a SAL experiment (i.e., beyond thediffraction spot size of the scanning laser beam) withthe high sensitivity and the simplicity of the LOFIexperiment to obtain a very efficient and compactdevice for 2D imaging. This device would be ableto compensate the degradation of the diffraction-limited spatial resolution with increasing distance.To demonstrate how the resolution of our LOFI setupcan be improved by using a synthetic aperture (SA)process, in this paper we report a 2D SA LOFI experi-ment where the unprocessed image (i.e., the classicalLOFI image) is obtained point by point, line after lineusing full 2D galvanometric scanning. The 2D super-resolved image is then obtained by successively com-puting two SA operations: the first one from theDoppler frequency shift history induced in the along
0003-6935/08/060860-10$15.00/0© 2008 Optical Society of America
860 APPLIED OPTICS / Vol. 47, No. 6 / 20 February 2008
line direction and the second one from the phasehistory spatially reconstructed in the across line di-rection. One can notice that our processing is a 2Dangular aperture synthesis, while conventionally,in SAR and SAL, a 1D angular synthesis is precededby a frequency synthesis to obtain a 2D superre-solved image [1–3,8].
2. LOFI Experiment
A. Experimental Setup
Figure 1 shows a description of the LOFI experi-mental setup. The laser is a cw Nd3�:YAG microchiplasing at the wavelength λ � 1064nmwith an outputpower of 1mW and a relaxation frequency FR �600kHz. The frequency shifter is composed of twoacousto-optic deflectors (AOD), respectively suppliedby an rf at 81:5MHz and 81:5MHz� Fe=2 where Feis the frequency shift. By selecting the diffractedbeam (order −1) of the first AOD and the diffractedbeam (order�1) of the second AOD, the resulting op-tical frequency shift of the laser beam is then givenby Fe=2. The laser beam is then sent to the bidimen-sional target located in the vertical plane (x, y, z � 0)using a galvanometric scanner composed of two ro-tating mirrors, respectively called Mx and My. Thefirst one allows us to scan the target in the horizontaldirection (x direction), and the second one allows usto scan the target in the vertical direction (y direc-tion). The angular orientations of the galvanometricmirrors are given by the angles αx and αy, respec-tively. In the target plane, the origin of our coordinatesystem (x � 0, y � 0, z � 0) is defined by the positionof the center of the Gaussian laser beam when αx � 0and αy � 0.For a classical LOFI experiment [Fig. 1(a)], the la-
ser is focused in the target plane with a focal spotradius given by r00 � λ
2NA0 where NA0 is the numericalaperture of the lens L30. For the SA LOFI experiment[Fig. 1(b)], the laser is focused in front of the tar-get plane with a focal spot radius given by r0, withr0 < r00 due to a higher numerical aperture (i.e., asmaller focal length). For the SA LOFI experiment,the Gaussian laser beam diameter in the targetplane is then given by D � 2 λ
πr0 �Lx � l� Ly�, where(Lx � l� Ly) is the distance between the focal spotand the target plane.In both cases [Figs. 1(a) and 1(b)], the beam dif-
fracted and/or scattered by the target is then rein-jected inside the laser cavity after a second pass inthe galvanometric scanner and the frequency shifter.The optical frequency of the reinjected beam is thenshifted by Fe. This frequency can be adjusted and istypically of the order of the laser relaxation fre-quency FR. A small fraction of the output beam ofthe microchip laser is sent to a photodiode. The de-livered voltage is analyzed by a lock-in amplifier,which gives the LOFI signal (i.e., the retrodiffusedelectric field) at the demodulation frequency Fe.
B. LOFI Signal
In the case of weak optical feedback, the coherentinteraction (beating) between the lasing electricfield and the frequency-shifted optical feedback fieldleads to an amplitude modulation of the laser outputpower [12]:
ΔPout�αx; αy�
� 2GR�Ωe�Xi
��������Re;i
qPout�αx; αy; xi; yi�
× cos�Ωet�Φ�αx; αy; xi; yi� �ΦR�Ωe��; �1�
where Pout is the photon output rate (number ofphoton per second) and Ωe � 2πFe is the frequencyshift. GR�Ωe� and ΦR�Ωe� are, respectively, the dyna-mical gain and the dynamical phase shift, which areonly dependent on the laser parameters [12]:
GR�Ωe� � γc���������������������������ηγ1�2 � Ω2
e
p��������������������������������������������������Ω2
R � Ω2e �2 � �ηγ1Ωe�2
q ; �2�
ΦR�Ωe� � arctan�Ωe�Ω2
R − Ω2e � �ηγ1�2�
ηγ1Ω2R
�; �3�
where ΩR � 2πFR �������������������������γ1γc�η � 1�
pis the laser relaxa-
tion frequency, γc is the laser cavity rate, γ1 is thepopulation inversion decay rate, and η is the normal-ized pumping parameter. Equation (2) clearly showsa resonance when Ωe � ΩR, which provides the sen-sitivity of our technique. For a microchip laser, wehave γc ≈ 1010 s−1, γ1 ≈ 5 × 10³ s�1, and for η � 2, weobtain GR�ΩR� � γc=ηγ1 ≈ 106. This gain allows usto detect very weak optical feedback [12].
In Eq. (1), we have assumed that the target underinvestigation could be decomposed as a discrete sumof punctual targets indexed by i and characterized bytheir effective power reflectivity Re;i and by the opti-cal phase shiftΦ�αx; αy; xi; yi� due to the optical roundtrip between the laser and the punctual target loca-tion (xi, yi, 0) for a given orientation (αx and αy) of thescanner's mirrors. Equation (1) also shows that theoptical feedback is formed by the coherent interac-tion (i.e., addition) of each punctual target point illu-minated by the Gaussian laser beam spot.
The demodulation of the laser modulation [Eq. (1)]at the frequency shift Fe by the means of a lock-inamplifier gives us the quadrature components ofthe LOFI signal:
p�αx; αy�
� 2GR�Ωe�Xi
��������Re;i
qPout�αx; αy; xi; yi�
× cos�Φ�αx; αy; xi; yi��; �4a�
20 February 2008 / Vol. 47, No. 6 / APPLIED OPTICS 861

q�αx; αy� � 2GR�Ωe�Xi
��������Re;i
qPout�αx; αy; xi; yi�
× sin�Φ�αx; αy; xi; yi��; �4b�
and thus the complex expressionof the LOFI signal:
s�αx; αy� � p�αx; αy� � jq�αx; αy�
� 2GR�Ωe�Xi
��������Re;i
qPout�αx; αy; xi; yi�
× exp�jΦ�αx; αy; xi; yi��� js�αx; αy�j exp�jΦs�αx; αy��; �5�
where the modulus js�αx; αy�j corresponds to the clas-sical LOFI amplitude image [13], while the argumentΦs�αx; αy� gives us the classical LOFI phase im-age [14].
C. Experimental Scanning Protocol
Experimentally, the LOFI images (amplitude andphase) are obtained pixel by pixel (i.e., point by point,line after line) by full 2D galvanometric scanning(αx, αy). The galvanometric mirrors Mx and My aredriven by the output channels of a National Instru-ment PCIE E Series board, which supplies twovoltage ramps: a slow ramp of duration Tx � 10 s,which drives Mx with an angular velocity _αx ≈10−3 rad=s and a fast ramp of duration Ty �100ms, which drives MY with an angular velocity_αY ≈ 10�1 rad=s.The scanning protocol follows two stages (accord-
ing that when a mirror is moving, the second oneis fixed). First, for a given x position, the angle αyis ranged continuously to scan the target along they direction. Second, the angle αx is incremented bya step δαx ≈ _αxTy to move the laser beam spot onthe target plane from the position x to the positionx� δx [with δx ≈ �l� Ly� 2 δαx]. These two successivestages of the scanning protocol are then looped untilthe target scanning is complete [i.e., when the wholecomplex signal s�αx; αy� is recorded].
3. Synthetic Aperture LOFI Experiment
The SA imaging is based on an adapted filtering pro-cess consisting of a correlation operation between thereturn signal from the whole target under investiga-tion and the impulse response of a punctual target[1–3].
A. Impulse Response
For the SA LOFI experiment showed in Fig. 1(b), theimpulse response of a punctual target located at theorigin of our coordinate system is given by
hx�αx; 0� � exp�� �αx � α̂x�2
Δα2x
�exp�jΦh�αx; 0��; �6a�
for the across line direction scanning (x direction)and by
hy�0; αy� � exp�� �αy � α̂y�2
Δα2y
�exp �jΦh�0; αy��; �6b�
for the along line direction scanning (y direction).In Eqs. (6a) and (6b), Φh�αx; αy� � Φ�αx; αy; 0; 0� is
the particular optical phase shift [see Eq. (1)] due tothe optical round trip between the laser and thepunctual target located at the origin of our coordi-nate system (x � 0, y � 0, z � 0) and where α̂x,Δαx, α̂y,Δαy allow us to define the interval of angularvalues for which the punctual target is illuminatedby the Gaussian laser beam during the galvano-metric scanning.
Assuming small angular scanning, Φh�αx; αy� canbe analytically approximated by
Φh�αx; αy� � Φ0 �ΔΦ� 2π�Kx
α2x2�Dxαx
�
� 2π�Ky
α2y2�Dyαy
�: �7�
At this point, one can notice that the rotations of thetwo mirrors are not coupled. As a result, they can beanalyzed separately and in the same way.
In Eq. (7), Φ0 � 2πλ 2 �L� Lx � l� Ly� is the first
order LOFI optical phase shift, where L is laser focalspot distance, Lx is the focal spot −Mx distance, l isthe Mx −My distance, and Ly is the My− target dis-tance [Fig. 1(b)]. ΔΦ � 2π
λ�Δx2�Δy2��Lx�l�Ly� is an additional
phase shift due to a possible laser beam misalign-ment �Δx;Δy; 0� with regard to the rotation axis ofthe galvanometric mirrors [15]. Kx , Ky, Dx, Dy, re-spectively, are the chirp rates and the Doppler fre-quency shifts for the across line direction (xdirection) and the along line direction (y direction)given by
Kx � � 8λ
Lx�l� Ly��Lx � l� Ly�
; Ky � � 8λ
�Lx � l�Ly
�Lx � l� Ly�;
�8a�
Dx � � 4λ
Δx�l� Ly��Lx � l� Ly�
; Dy � � 4λ
ΔyLy
�Lx � l� Ly�:
�8b�
Assuming small angular values, α̂x, Δαx, α̂y, Δαy aregiven by
α̂x �Δx
2�l� Ly�; Δαx �
λπr0
�Lx � l� Ly�2 �l� Ly�
;
α̂y �Δy2Ly
; Δαy �λπr0
�Lx � l� Ly�2Ly�
; �9�
where r0 is the radius of the focal spot located in frontof the target plane [see Fig. 1(b)].
862 APPLIED OPTICS / Vol. 47, No. 6 / 20 February 2008

B. Adapted Filter
For the SA process, the adapted filter is simply ob-tained by calculating the fourier transform (FT) ofthe impulse response. In the across line direction(x direction), the adapted filter is thus given by
Hx�f x� � FT�hx�αx; 0��; �10�
where f x is an angular frequency (i.e., the conjugatevariable of the angular variable αx).
By using the stationary phase theorem [16], oneobtains
Hx�f x� ≈�������jKx
sexp
�� �f x � Fx�2
W2x
�
× exp��j π�f x � Fx�2
Kx
�exp�jΦh�α̂x; 0��: �11�
The across line adapted filter is thus characterizedby its Doppler central frequency in the angular
Fig. 1. Description of the LOFI experimental setup. The target is located in the vertical plane (x, y, z � 0). L1, L2, L3, and L30; lenses; BS,beam splitter; Fe is the total optical frequency shift; and p and q are the quadrature components voltages delivered by the lock-in amplifierat the demodulation frequency Fe. Mx and My, respectively, are the rotating mirrors that allow to us scan the target in the horizontaldirection x and the vertical direction y. The angular orientation of the galvanometric mirrors Mx and My, respectively, is given by theangles αx and αy. (a) Classical LOFI experiment where the laser is focused in the target plane. (b) SA LOFI experiment. The laser is focusedin front of the target plane. L is the laser-focal spot distance, Lx is the focal spot −Mx distance, l is theMx −My distance,Ly is theMy− targetplane distance, and D is the Gaussian laser beam diameter in the target plane.
20 February 2008 / Vol. 47, No. 6 / APPLIED OPTICS 863

domain:
Fx � jDx �Kxα̂xj ������ 4Δx
λ
����; �12a�
and its Doppler bandwidth in the angular domain:
Wx � jKxΔαxj ������ 4Lx
πr0
����: �12b�
In a similar way, the across line adapted filterHy�f y� � FT�hy�0; αy�� is characterized by its Dopplercentral frequency in the angular domain:
Fy � jDy �Kyα̂yj ������ 4Δy
λ
����; �13a�
and its Doppler bandwidth in the angular domain:
Wy � jKyΔαyj ������ 4�Lx � l�
πr0
����: �13b�
Figures 2(a) and 2(b) show two typical LOFI signalspectrum obtained by performing an experimentalgalvanometric scanning of a quasi-punctual light-scattering target in the along line direction (y direc-tion) and the across line direction (x direction). Thecomparison between the experimental results andtheir corresponding adapted filters (jHy�f y�j andjHy�f y�j) allows us to more precisely adjust the ex-perimental parameters (r0, Lx, l, Ly) [see Eqs. (12a)and (12b)] and to determine the laser misalignment
parameters Δx and Δy from the Doppler central fre-quency measurement [see Eqs. (13a) and (13b)].
C. Synthetic Aperture Process
The SA LOFI image (i.e., our SAL image) is obtainedafter an adapted filtering process consisting of a cor-relation operation between the experimental returnsignal from the whole target under investigation [i.e.,the complex LOFI signal s�αx; αy�] given by Eq. (5)and the impulse responses [hx�αx; 0�hy�0; αy�] pre-viously studied. More precisely, for a 1D SA proces-sing in the across line direction the SAL image isgiven by
SAL1Dx�αx; αy� � s�αx; αy� ⊗ h�x��αx; 0�; �14a�
where ⊗ stands for a convolution product.For a 1D SA processing in the along line direction
the SAL image is given by
SAL1Dy�αx; αy� � s�αx; αy� ⊗ h�y�0; �αy�: �14b�
Finally the resulting LOFI image after a SA pro-cessing in both directions is given by
SAL2D�αx; αy� � SAL1Dx�αx; αy� ⊗ h�y�0; �αy�
� SAL1Dy�αx; αy� ⊗ h�x��αx; 0�:
�14c�
Fig. 2. Typical LOFI signal spectrum (solid curve) obtained by performing an experimental galvanometric scanning of a quasi-punctuallight-scattering target in the along line direction (y direction) and the across line direction (x direction). The corresponding adapted filters(Hy�f y� andHx�f y� ) are also plotted (dotted line). (a) Along line direction (y direction), angular velocity _αy � 8 × 10�2 rad=s, Doppler centralfrequency Fy _αy � 1000Hz, and Doppler bandwidth Wy _αy � 270Hz. (b) Across line direction (x direction), angular velocity_αx � 8 × 10�4 rad=s, Doppler central frequency Fx _αx � 4:5Hz, and Doppler bandwidth Wx _αx � 2:5Hz. Experimental parameters;r0 � 550 μm, λ � 1064nm, Lx � 145 cm, l � 2:5 cm, Ly � 40 cm, Δx � 1:5mm, and Δy � 3:3mm.
864 APPLIED OPTICS / Vol. 47, No. 6 / 20 February 2008

For comparison, let us recall that for amplitudemeasurement (i.e., reflectivity measurement) the un-processed (i.e., the classical) LOFI image is simplygiven by js�αx; αy�j.D. Synthetic Aperture Resolution
By using as a signal the across line impulse responsehx�αx; 0� given by Eq. (6a) and by doing the syntheticprocess defined previously by Eq. (14a), one obtains
gx�αx� � hx�αx; 0� ⊗ h�x��αx; 0�
� TF�jHx�f x�j2�
≈
���π2
rΔαx exp
�� π2W2
xα2x2
�exp�j2πFxαx�: �15�
In the along line direction, the SA resolution of ourLOFI experiment is given by
δαx �2
πWx� r0
2Lx; �16a�
which is simply the characteristic width of the Gaus-sian of Eq. (15).In a similar way, by using the along line impulse
response hy�0; αy� as a signal given by Eq. (6b) andby doing the synthetic process defined previouslyby Eq. (14b), one can determine the angular resolu-tion in the along line direction:
δαy �2
πWy� r0
2�Lx � l� : �16b�
Finally, the resolution in the target image plane isthen given by
δxSAL ≈ �l� Ly�2δαx � r0�l� Ly�
Lx; �17a�
δySAL ≈ Ly2δαy � r0Ly
Lx � l: �17b�
Assuming l ≪ Lx;Ly, Eqs. (17a) and (17b) show thatthe spatial resolution is almost the same in both di-rections (x and y).Contrary to a usual SA operation using linear
scanning [6,17], Eqs. (17a) and (17b) show that theSA resolution is not simply given by the optical aper-ture pinhole of our feedback detector (i.e., the focalspot radius r0 in our experiment), but is also depen-dent on the geometrical parameters of the experi-ment (Lx and Ly). For galvanometric scanning, it isthus possible to control the SAL resolution of the pro-cessed image by modifying the geometrical ratioLy=Lx. More precisely, the SA resolution is improvedwhen the geometrical ratio Ly=Lx decreases due tothe angular detection of higher spatial frequencyof the target.
By doing the SA processing, the LOFI image reso-lution is improved if the SA resolution is betterthan the diffraction spot size D in the target plane[Fig 1(b)], i.e., if
δxSAL ≈ δySAL ≈ r0Ly
Lx< D ≈
λπr0
�Lx � Ly�: �18�
More importantly, by doing the SA experiment[Fig. 1(b)], the LOFI image resolution is improvedif the SA resolution is better than the optical resolu-tion of a standard LOFI experiment given by thefocal spot size r00 in the target plane [see Fig 1(a)]:
δxSAL ≈ δySAL ≈ r0Ly
Lx< r00: �19�
The inequality given by Eq. (19) can be satisfied byexperimentally using a lens with a higher NA lead-ing to a smaller focal spot size (r0 < r00) and/or byplaying with the geometrical ratio Ly=Lx.
4. Results
A. Numerical Results
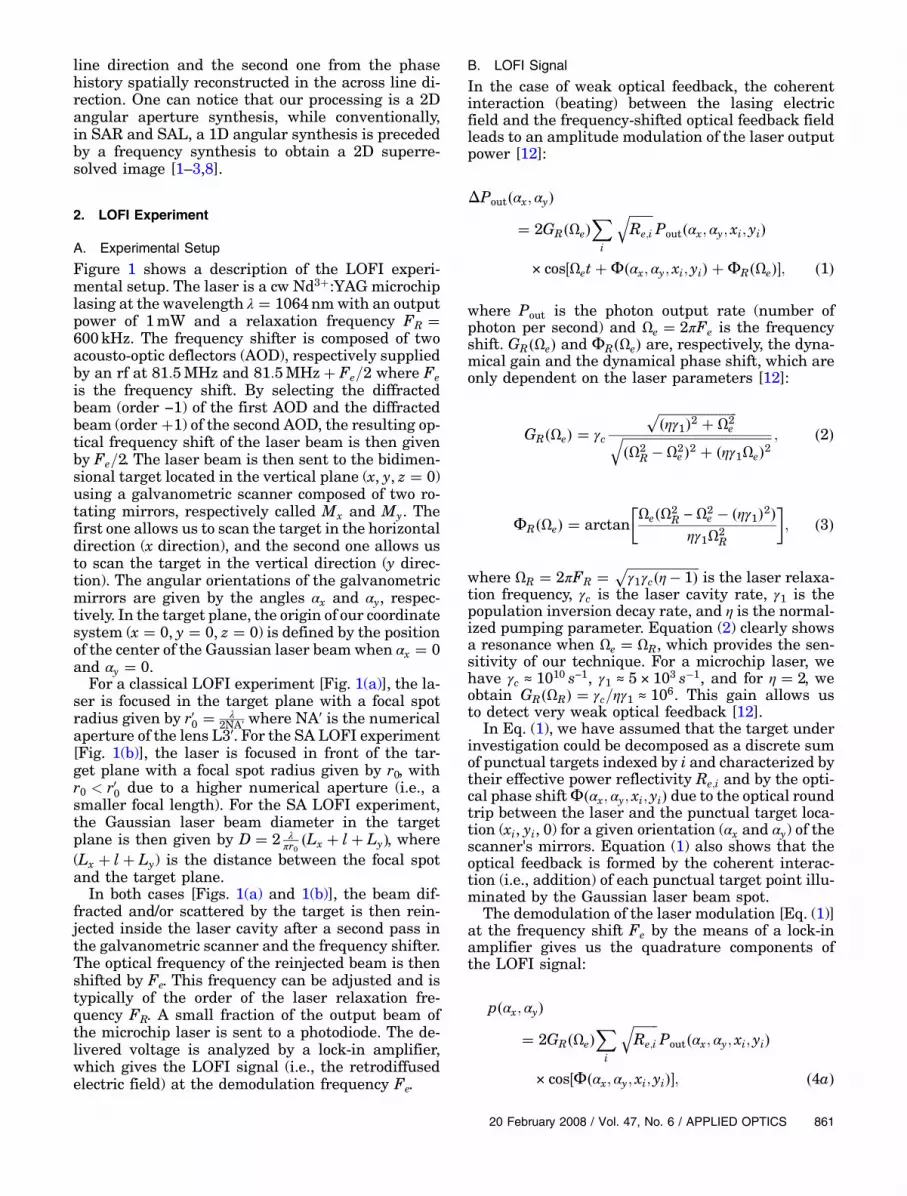
Figure 3 represents a 2D SA imaging using gal-vanometric scanning. The target is composed of fourpunctual reflectors, such as the laser beam spot sizeD is broader than the distance between each re-flectors. As a consequence, the reflectors cannotbe resolved and the classical (i.e., unprocessed)LOFI image (js�αx; αy�j) represented in Fig. 3(a)is not relevant. Figure 3(d) represents the sameimage after the SA processing in both directions(jSAL2D�αx; αy�j). The four reflectors are now clearlydistinguishable, hence the 2D SA operation has im-proved the resolution [Eq. (18)] of our LOFI imager.Figures 3(b) and 3(c) show the LOFI image afterprocessing an SA in only one direction (across linedirection jSAL1Dx�αx; αy�j or along line directionjSAL1Dy�αx; αy�j). In both cases, these images finallyconverge to the result represented on Fig. 3(d) afterthe second missing SA operation [Eq. (14c)]. In thealong line direction [Fig. 3(b)], we can observe twohorizontal lines due to the spatial location (y1;2 � 0)and (y3;4 � �2r0) in the y direction. On each line, onecan see the interference fringe pattern between thetwo individual reflectors. In the along line direction[Fig. 3(c)], the image shows three vertical lines dueto the spatial location (x1 � 0), (x2;4 � 2r0), and(x3 � �2r0) in the x direction. On the right line,one can also see the interference fringe pattern be-tween the two individual reflectors indexed 2 and 4.
For a given distance between the focal spot and tar-get plane (Lx � l� Ly � 101 cm), Fig. 4 shows the ef-fect of the length ratio Ly=Lx (i.e., of the scannerposition between the focal spot and the target) onthe optical resolution of a SAL experiment. Thetarget under investigation composed of four punctualreflectors is the same as in the previous case (Fig. 3).As predicted by Eqs. (17a) and (17b), the optical
20 February 2008 / Vol. 47, No. 6 / APPLIED OPTICS 865
resolution improves as the length ratio Ly=Lxdecreases. If we compare Figs. 4(a) and 4(b), wecan see that the resolution is better for Ly=Lx �1=2 than for Ly=Lx � 1. As well, if we compare Figs. 4(b) and 4(c), it is clear that the resolution is betterfor Ly=Lx � 1 than for Ly=Lx � 2. In this last case[Fig. 4(c)], the distance between the reflectors in-dexed by 1, 2, and 4 is approximately equal to theSAL resolution limit given by Eqs. (17a) and (17b)(i.e., ≈2r0). In this condition, this group of threereflectors are not resolved in Fig. 4(c), whereasthe target indexed by 3 is far enough to be stilldistinguished.
B. Experimental Result
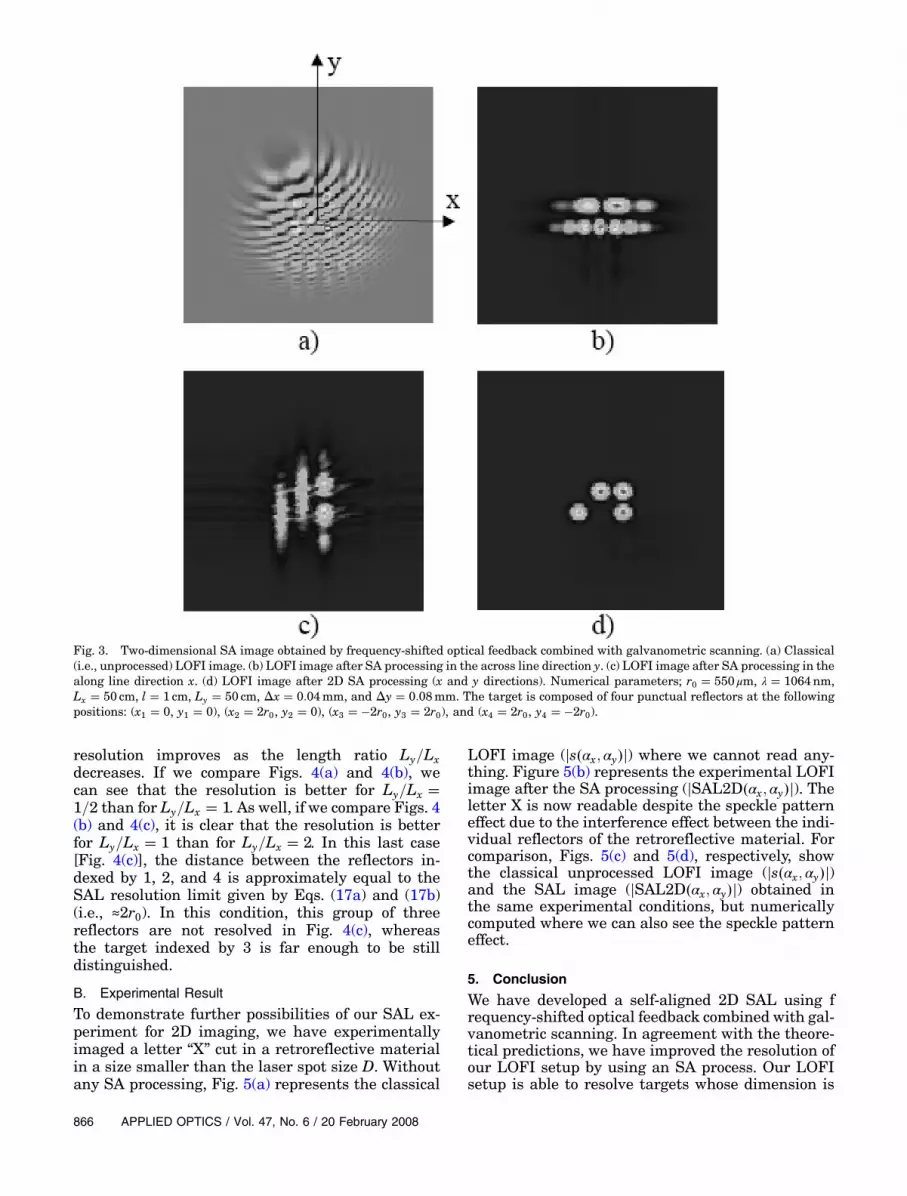
To demonstrate further possibilities of our SAL ex-periment for 2D imaging, we have experimentallyimaged a letter “X” cut in a retroreflective materialin a size smaller than the laser spot size D. Withoutany SA processing, Fig. 5(a) represents the classical
LOFI image (js�αx; αy�j) where we cannot read any-thing. Figure 5(b) represents the experimental LOFIimage after the SA processing (jSAL2D�αx; αy�j). Theletter X is now readable despite the speckle patterneffect due to the interference effect between the indi-vidual reflectors of the retroreflective material. Forcomparison, Figs. 5(c) and 5(d), respectively, showthe classical unprocessed LOFI image (js�αx; αy�j)and the SAL image (jSAL2D�αx; αy�j) obtained inthe same experimental conditions, but numericallycomputed where we can also see the speckle patterneffect.
5. Conclusion
We have developed a self-aligned 2D SAL using frequency-shifted optical feedback combined with gal-vanometric scanning. In agreement with the theore-tical predictions, we have improved the resolution ofour LOFI setup by using an SA process. Our LOFIsetup is able to resolve targets whose dimension is
Fig. 3. Two-dimensional SA image obtained by frequency-shifted optical feedback combined with galvanometric scanning. (a) Classical(i.e., unprocessed) LOFI image. (b) LOFI image after SA processing in the across line direction y. (c) LOFI image after SA processing in thealong line direction x. (d) LOFI image after 2D SA processing (x and y directions). Numerical parameters; r0 � 550 μm, λ � 1064nm,Lx � 50 cm, l � 1 cm, Ly � 50 cm, Δx � 0:04mm, and Δy � 0:08mm. The target is composed of four punctual reflectors at the followingpositions: (x1 � 0, y1 � 0), (x2 � 2r0, y2 � 0), (x3 � �2r0, y3 � 2r0), and (x4 � 2r0, y4 � �2r0).
866 APPLIED OPTICS / Vol. 47, No. 6 / 20 February 2008

below the diffraction spot size of the scanning laserbeam in the target plane after a 2D processing usingadapted filtering. The great benefit of operating SAwith our LOFI experiment is the self-aligned detec-tion, resulting in a significantly simplified setup and
the dynamical optical amplification providing a highsensitivity of detection. Compared to linear scan-ning, the galvanometric scanning exhibits a resolu-tion limit proportional to the optical aperture ofour experimental setup (i.e., the laser focal spot ra-
Fig. 4. Effect of the length ratio Ly=Lx on the optical resolution of a SAL experiment using galvanometric scanning. Left column: classical(i.e., unprocessed) LOFI image. Right column: LOFI image after SA processing. (a) Lx � 2
3 × 100 cm, l � 1 cm, and Ly � 13 × 100 cm.
(b) Lx � 12 × 100 cm, l � 1 cm, and Ly � 1
2 × 100 cm. (c) Lx � 13 × 100 cm, l � 1 cm, and Ly � 2
3 × 100 cm. Numerical parameters:r0 � 550 μm, λ � 1064nm, Δx � 0:04mm, and Δy � 0:08mm.
20 February 2008 / Vol. 47, No. 6 / APPLIED OPTICS 867
dius r0) multiplied by a length ratio Ly=Lx dependingonly on the geometrical parameters of the experi-ment. This ratio as well as r0 can be adjusted(Ly=Lx < 1 and r0 < r00) to improve still further theSAL resolution of our LOFI experiment. Our plansare first to increase the image quality of our experi-mental setup and second to build a high resolutionmicroscope (Ly=Lx ≪ 1) allowing us to obtain a veryhigh NA with a conventional lens . This microscopewill have to be able to compensate the degradation ofthe diffraction-limited spatial resolution with in-creasing depth in biological tissues.
References and Notes1. J. C. Curlander and R. N. McDonough, Synthetic Aperture
Radar: Systems and Signal Processing (Wiley, 1991).2. R. O. Harger, Synthetic Aperture Radar Systems: Theory and
Design (Academic, 1970).3. A. Ja. Pasmurov and J. S. Zimoview, Radar Imaging and
Holography (IEEE, 2005).4. T. S. Lewis and H. S. Hutchins, “A synthetic aperture at 10.6
Microns,” Proc. IEEE 58, 1781–1782 (1970).5. C. C. Aleksoff, J. S. Accetta, L. M. Peterson, A. M. Tai, A. Kloss-
ler, K. S. Schroeder, R. M. Majwski, J. O. Abshier, and M. Fee,
“Synthetic aperture imaging with a pulsed CO2 laser,” Proc.SPIE 783, 29–40 (1987).
6. S. Markus, B. D. Colella, and T. J. Green, Jr., “Solid-state lasersynthetic aperture radar,” Appl. Opt. 33, 960–964 (1994).
7. A. Witomski, E. Lacot, O. Hugon, and O. Jacquin, “Syntheticaperture laser optical feedback imaging using galvanometricscanning,” Opt. Lett. 31, 3031–3033 (2006).
8. M. Bashkansky, R. L. Lucke, E. Funk, L. J. Rickard, and J.Reintjes, “Two-dimensional synthetic aperture imaging inthe optical domain,” Opt. Lett. 27, 1983–1985 (2002).
9. S. M. Beck, J. R. Buck, W. F. Buell, R. P. Dickinson, D. A. Ko-zlowski, N. J. Marechal, and T. J. Wright, “Synthetic-apertureimaging laser radar: laboratory demonstration and signal pro-cessing,” Appl. Opt. 44, 7621–7629 (2005).
10. E. Lacot, R. Day, and F. Stoeckel, “Laser optical feedbacktomography,” Opt. Lett. 24, 744–746 (1999).
11. K. Otsuka, “Ultrahigh sensitivity laser Doppler velocimetrywith a microchip solid-state laser,” Appl. Opt. 33, 1111–1114 (1994).
12. E. Lacot, R. Day, and F. Stoeckel, “Coherent laser detection byfrequency-shifted optical feedback,” Phys. Rev. A 64, 043815(2001).
13. O. Hugon, I. A. Paun, C. Ricard, B. van der Sanden, E. Lacot,O. Jacquin, and A. Witomski, “Cell imaging by coherent back-scattering microscopy using frequency-shifted optical feed-back in a microchip laser,” Ultramicroscopy (2007).
Fig. 5. Left column: classical (i.e., unprocessed) LOFI image of the letter X. Right column: image after SA processing. Up: experimentalresults. Down: numerical results. Experimental parameters: r0 � 550 μm, λ � 1064nm, Lx � 145 cm, l � 2:5 cm, Ly � 40 cm,Δx � 1:5mm, Δy � 3:3mm, D ≈ 2:2mm, and dimensions of the letter X: 1mm× 1mm.
868 APPLIED OPTICS / Vol. 47, No. 6 / 20 February 2008

14. V. Muzet, E. Lacot, O. Hugon, and Y. Guillard, “Experimentalcomparison of shearography and laser optical feedback ima-ging for crack detection in concrete structures,” Proc. SPIE5856, 793–799 (2005).
15. When αx � 0 and αy � 0, if there is no misalignment, the cen-ter of the Gaussian laser beam successively reaches the twogalvanometric mirrors on their rotation axis and finally thetarget on the origin of our experimental coordinate system
(x � 0, y � 0, z � 0). If we consider a laser misalignment,the final position of the Gaussian laser beam center is givenby (Δx, Δy, z � 0).
16. A. Papoulis, Signal Analysis (McGraw-Hill, 1977), pp. 262–272.
17. D. Park and J. H. Shapiro, “Performance analysis of op-tical synthetic aperture radars,” Proc. SPIE 999, 100–116(1989).
20 February 2008 / Vol. 47, No. 6 / APPLIED OPTICS 869