Attitudes of Youth Towards Alcohol in Muslim Majority Countries
Upload
independentCategory
view
1download
0
Molecular Ecology (2012) 21, 1878–1896 doi: 10.1111/j.1365-294X.2011.05362.x
INVITED REVIEW
Two decades of describing the unseen majorityof aquatic microbial diversity
LUCIE ZINGER* 1 , ANGELIQUE GOBET†‡1 and THOMAS POMMIER§
*Microbial Habitat Group, Max Planck Institute for Marine Microbiology, Celsiusstrasse 1, 28359 Bremen, Germany,
†Evolution du Plancton et PaleoOceans (EPPO), Station Biologique de Roscoff, UMR7144 Centre National de la Recherche
Scientifique (CNRS) et Universite Pierre et Marie Curie (UPMC), Place Georges Teissier, 29680 Roscoff, France, ‡Genoscope
(CEA), CNRS UMR 8030, Universite d’Evry, 2 rue Gaston Cremieux, BP5706, 91057 Evry, France, §Microbial Ecology UMR
5557 CNRS-Universite Lyon 1; USC 1193 INRA, Bat G. Mendel, 43 bd du 11 novembre 1918, 69622 Villeurbanne, France
Corresponde
E-mail: lucie@1L. Zinger an
Abstract
Aquatic environments harbour large and diverse microbial populations that ensure their
functioning and sustainability. In the current context of global change, characterizing
microbial diversity has become crucial, and new tools have been developed to overcome
the methodological challenges posed by working with microbes in nature. The advent of
Sanger sequencing and now next-generation sequencing technologies has enabled the
resolution of microbial communities to an unprecedented degree of precision. However,
to correctly interpret microbial diversity and its patterns this revolution must also
consider conceptual and methodological matters. This review presents advances, gaps
and caveats of these recent approaches when considering microorganisms in aquatic
ecosystems. We also discuss potentials and limitations of the available methodologies,
from water sampling to sequence analysis, and suggest alternative ways to incorporate
results in a conceptual and methodological framework. Together, these methods will
allow us to gain an unprecedented understanding of microbial diversity in aquatic
ecosystems.
Keywords: aquatic ecosystems, high-throughput sequencing, microbial diversity, NGS
Received 21 June 2011; revision received 5 October 2011; accepted 11 October 2011
Studying microbial diversity: generalbackground
Aquatic ecosystems, referred here as any water body,
account for >70% of the Earth’s surface (excluding ice
and groundwater ecosystems) and provide various
goods and services for human populations, representing
gigantic economic value (Costanza et al. 1997). Plank-
tonic microorganisms (including Bacteria, Archaea, mem-
bers of Eukarya (protists and fungi) and viruses)
dominate these ecosystems in terms of both abundance
and biomass. A litre of sea water contains approxi-
mately �106 eukaryotic cells (Brown et al. 2009), �108
prokaryotic cells (Whitman et al. 1998) and �109–1011
virus-like particles (Wilhelm & Matteson 2008). Aquatic
microorganisms also represent a large and diverse pool
nce: Lucie Zinger, Fax: +49 421 2028 690;
zinger.fr
d A. Gobet contributed equally to this work.
of species (Slapeta et al. 2005; Wilhelm & Matteson
2008; Auguet et al. 2010); for instance, Bacteria within
the global ocean are estimated to consist of more than
�2.106 species (Curtis et al. 2002) and conduct a vast
array of metabolic functions (Venter et al. 2004; Rusch
et al. 2007). This biological pool sustains major biogeo-
chemical processes (Cotner & Biddanda 2002; Falkowski
et al. 2008): phytoplankton perform the majority of pri-
mary production in the Ocean and nearly half of the
net primary production on Earth (Field et al. 1998),
whereas virioplankton and heterotrophic prokaryotes
and protists, together forming the ‘microbial loop’, con-
tribute predominantly to organic matter and nutrient
recycling (Azam et al. 1983; Pernthaler 2005; Pomeroy
et al. 2007). As reported in ocean ecosystems (Behren-
feld 2011), primary productivity is likely to be affected
by global warming, which may impact the microbial
food web and diversity and thus threaten freshwater
and marine resources (Dudgeon et al. 2006; Worm et al.
� 2011 Blackwell Publishing Ltd

Box 1 Measures of biodiversity
Studying diversity provides different pictures depending from which angle it is looked at. A first fundamental distinction arises
from the consideration of species incidence, or their relative abundance. While the first aspect indicates the extent of resource
partitioning between species, the second rather gives information on the way species interact for sharing these resources
(Whittaker 1972). Second, diversity is a comparative science referring to spatially or temporally organized units (Magurran 2004).
This organization is expressed by the following notions (Whittaker 1972; Fig. 1).
Alpha diversity refers to the diversity within one location or sample. It is often measured as species richness (i.e. number of
species), seldom as species evenness (extent of species dominance). Species richness is strongly sensitive to sampling effort, and
requires standardized samples, or the use of estimators that corrects undersampling biases, such as Chao1 or ACE. Evenness is
less affected by undersampling biases and is usually assessed with Simpson’s or Pielou’s indices or rank abundance curves
(review in Magurran 2004).
Beta diversity consists in determining the difference in diversity or community composition between two or more locations
or samples (i) by considering species composition only, and use incidence data with associated metrics such as Jaccard or
Sorensen similarity indices or (ii) by taking species relative abundances into account, and use Bray–Curtis or Morisita–Horn
dissimilarity measures (Anderson et al. 2011). Using abundance data is, however, strongly discussed among microbiologists when
dealing with rRNA gene data because of variations in gene copy number among strains (Acinas et al. 2004b; Zhu et al. 2005) as
well as PCR artefacts.
Gamma diversity, or regional diversity, is similar to alpha diversity but applies for a larger area that encompasses the units
under study.
Finally, the spatial scale of investigation can produce very different results and should be consistent in cross-study
comparisons (Magurran 2004).
Site 1
Site 2Site 3
α1
α2α3
β
γRegion
Fig. 1 Schematic representation of alpha (colours), beta (black dotted line) and gamma (grey) diversity
SEQUENCI NG AQUATIC MICROBIA L DI VERSITY 1879
2006; Nogales et al. 2011). Higher biodiversity is
assumed to increase ecosystem capacity to resist and
recover from perturbation both by maintaining ecosys-
tem functioning despite species loss and by diversifying
the responses to this perturbation (Loreau et al. 2001).
For example, diversified freshwater microalgal commu-
nities improve buffering of nutrient pollution by occu-
pying a larger range of ecological niches (Cardinale
2011). Studying biodiversity of aquatic environments is
therefore necessary for assessing, monitoring and antic-
ipating their processes and sustainability (Duffy & Stac-
howicz 2006).
� 2011 Blackwell Publishing Ltd
In its broadest meaning, measuring biodiversity
consists of characterizing the number, composition and
variation in taxonomic or functional units over a wide
range of biological organizations (from genes to com-
munities; Green et al. 2008; Magurran 2004). Microbial
diversity has thus far been characterized extensively
from a taxonomic angle at the community level, using
different measures of diversity (Box 1). When describ-
ing microbial communities, numerous authors have
underlined the difficulty in choosing the appropriate
unit to measure diversity and this point has been exten-
sively discussed elsewhere (Rossello-Mora & Amann

Metagenome/transcriptome extraction,amplification/fragmentation
Molecular fingerprints(e.g. T-RFLP, DGGE...)
Background, issues, questions
NGS (e.g. 454, Illumina)
Water sampling
Clone libraries & Sanger sequencing
Sequence processing
Strain isolation & sequencing
Part 1–3
Part 5
Part 6
Part 4Community composition
Mostly rare taxa
Patterns of βdiversity
Dominant taxaCommunity composition
Patterns of α and β diversity α diversity estimates
Dominant and rare taxa
Community compositionPatterns of α and β diversity
Dominant taxa
In this review: Fig. 2 Methodological pipeline for
studying aquatic microbial diversity.
Grey boxes indicate the notion of diver-
sity (Box 1) that can be assessed with
the different methods.
1880 L. ZI NGER, A. G OBET and T. POMMIER
2001; Wilhelm & Matteson 2008; Caron et al. 2009). In
particular, microbes’ short generation time and capacity
for clonal reproduction results in a continuum of
genetic diversity in microbial genomes that greatly com-
plicates the identification of closely related microbial
taxa (Acinas et al. 2004a). Such biological characteristics,
together with the lack of clear morphological delinea-
tion and gene exchange among genetically unrelated
taxa (i.e. horizontal transfer, Ochman et al. 2000; and
multiple copies per genomes; Acinas et al. 2004b; Zhu
et al. 2005), make the classification of microorganisms
into discrete units difficult. This partly led microbial
ecologists to adopt barcoding approaches (sensu lato;
Valentini et al. 2009) where microbial species are equa-
ted to ‘operational taxonomic units’ (OTU), mostly
based on small subunit ribosomal RNA gene similarities
(Olsen et al. 1986). Although imperfect, this approach
has offered several new insights into biogeographical
patterns of aquatic microbial community, such as the
effect of ecosystem types, taxa–area relationships or lati-
tudinal gradients (Duffy & Stachowicz 2006; Pommier
et al. 2007; Zinger et al. 2011), as well as their response
to anthropogenic perturbations (Nogales et al. 2011).
Measuring microbial diversity: from cultureto pyrosequencing (Fig. 2)
Microbial diversity was initially studied through
microscopy, and cultivation by using specific liquid and
solid media (e.g. Zobell medium). Assigning taxonomy
of phytoplankton and protists required tedious observa-
tions that relied completely on morphological traits,
and bacterial diversity was assessed solely by morpho-
type description of the colony they would form on spe-
cific media. Rapidly, microbiologists realized that only
1% of the bacteria counted under the microscope could
be cultivated on solid or in liquid media, and called this
discrepancy the ‘Great plate count anomaly’ (Staley &
Konopka 1985). Advances in molecular biology partly
solved this problem using methods such as DNA–DNA
re-association (Stackebrandt & Goebel 1994) or flow
cytometry sorting of size-specific groups (Dorigo et al.
2005). Later on, the use of ribosomal RNA (Olsen et al.
1986) enabled the description of microbial taxonomic
diversity, (i) by means of fingerprinting methods, which
separate rDNA fragments according to their length
and ⁄ or their nucleotide composition [i.e. automated
rRNA intergenic spacer analysis (ARISA), terminal
restriction fragment length polymorphism (T-RFLP),
temperature or denaturing gradient gel electrophoresis
(TGGE or DGGE) and single-strand conformation poly-
morphism (SSCP)], (ii) by microscopy, using FISH (fluo-
rescence in situ hybridization) and derived methods
(CARD-FISH, MAR-FISH), or (iii) by cloning 16S rRNA
gene fragments and subsequently sequencing the clones
following the Sanger sequencing method (Fig. 2,
reviewed in Dorigo et al. 2005). Cloning ⁄ sequencing
may be preceded by a flow cytometry size-sorting step,
allowing an improved description of diversity, as
shown for eukaryotic picophytoplankton (Shi et al.
2009). Although fingerprinting technologies enable the
processing of many samples, they are inadequate for
taxonomic identification and suffer from a lack of reso-
lution. More importantly, calculating richness from
DNA fingerprinting techniques remains impossible
(Bent et al. 2007). Additionally, cloning ⁄ sequencing and
FISH are not directly compatible with high-throughput
approaches. The quest to describe microbial communi-
ties has now reached a new stage with the development
of next-generation sequencing techniques (NGS), lead-
ing towards a high-throughput description of the micro-
bial world at a higher level of detail than cloning or
sequencing (MacLean et al. 2009).
Water samples sequencing: gaps and caveats
An overview of the literature focusing on microbial
diversity in aquatic ecosystems through sequencing
� 2011 Blackwell Publishing Ltd

1993 1995 1997 1999 2001 2003 2005 2007 2009
454 pyrosequencingCloningFlow sortingFingerprint band sequencingIsolate
Year
Num
ber o
f pub
licat
ions
020
4060
8010
012
0(b)(a)
Non-saline waters
Mixed-salinity waters
Saline waters
Geothermal waters
Impacted waters
Activated sludgesAquiferCoastalCultureDrinking water systemEstuaryLakeOpen oceanRiverWaste waterAquiferLakeVentsCoastalLakeOpen oceanEstuaryLakeAquiferDrinking water system
LakeRiver
Bacteria Archaea Eukarya VirusesTotal
25 75 125 175
Ice
Number of publications
Fig. 3 Trends in number of publications between 1990 and 2010 according to the sequencing approach used (a) and ecosystems and
taxa described (b). Literature search was performed in May 2011 using ISI Web of Knowledge v5.2 and the following keywords:
(‘aquatic’ or ‘water’) and ‘micro*’ and ‘diversity’ and (‘sequence*’ or ‘librar*’). The consistency of the resulting 3169 publications was
then manually checked: reviews, meta-analyses, theoretical articles and studies that did not apply sequencing or where ecosystem
type was not provided were excluded, resulting in 885 articles. Each publication was then assigned to a given ecosystem type accord-
ing to its abstract content. Impacted waters included wastewaters, activated sludge water samples, as well as any contaminated water
bodies (e.g. containing heavy metals and hydrocarbons).
SEQUENCI NG AQUATIC MICROBIA L DI VERSITY 1881
approaches is illustrated in Fig. 3. Although not
exhaustive, this list still allows the identification of gen-
eral trends from the last two decades. An increasing
interest in microbial diversity in aquatic environments
combined with the decreasing cost of molecular meth-
ods has produced a noticeable surge in publications
since 2004 (Fig. 3a). Considering the methods used in
the selected literature (Fig. 3a), one-third of the studies
applied sequencing on isolates or selected bands of
molecular fingerprints only, suggesting that a large part
of the studies focused more on identifying selected
microbial taxa rather than on quantifying the diversity
of the overall community (Fig. 2). Cloning ⁄ sequencing
remains by far the most widely used method for assess-
ing microbial richness since 2004, although the use of
NGS methods such as 454 pyrosequencing is expected
to increase in the next few years (Fig. 3a). We consid-
ered four main water body classes: (i) saline and (ii)
nonsaline environments, because these two water
bodies harbour genetically distant organisms of Bacteria,
Archaea, microbial eukaryotes and viruses (Logares
et al. 2009); (iii) geothermal waters, which are character-
ized by high temperatures, high mineral concentrations,
highly variable fluids and chemical properties, and
where the food web revolves around autotrophs (e.g.
hot springs lakes) and ⁄ or chemotrophs (e.g. deep-sea
vents) depending on light availability (Rothschild &
Mancinelli 2001; Fisher et al. 2007); and (iv) impacted
� 2011 Blackwell Publishing Ltd
water bodies, although the pollution originated from
diverse sources (Fig. 3b). Considerable efforts have
been made to characterize coastal waters and surface
waters from the open ocean. Accordingly, patterns of
diversity for Bacteria, Archaea and microbial eukaryotes
have been identified in marine environments (Giovan-
noni & Stingl 2005; Pommier et al. 2007; Rusch et al.
2007; Wilhelm & Matteson 2008; Fuhrman 2009; Zinger
et al. 2011). In contrast, and despite their higher eco-
nomic value (Costanza et al. 1997), freshwater bodies
have received less attention. Recent meta-analyses in
both marine and freshwater environments revealed a
higher bacterial and archaeal diversity in inland fresh-
waters, which is suspected to result from the lower con-
nectivity and greater heterogeneity of these ecosystems
(Auguet et al. 2010; Barberan & Casamayor 2010). This
feature seems to also hold true for microbial eukaryotes
and viruses (Logares et al. 2009). Among the nonsaline
water bodies, lakes have been extensively studied
(Fig. 3b), with a particular focus on the monitoring of
blooms of certain microbial algae showing toxic ⁄ patho-
genic properties. However, sequencing-based descrip-
tions of microbial diversity remain scarce in the other
nonsaline ecosystems (i.e. rivers and groundwaters).
Considering lakes, rivers and coastal waters, only a few
studies described their response to global changes and
anthropogenic disturbances (see impacted sites in
Fig. 3b), even though these ecosystems are experiencing

1882 L. ZI NGER, A. G OBET and T. POMMIER
such pressures (Dudgeon et al. 2006; Halpern et al.
2008). A better picture of microbial community compo-
sition and diversity in these natural ecosystems is there-
fore urgently needed. In this regard, NGS could rapidly
provide significant insights. Finally, a fair number of
studies have been carried out on Bacteria and, to a lesser
extent, Archaea in geothermal ecosystems, aquifers and
activated sludge waters.
Among the microbial domains studied, Bacteria
undoubtedly have received most of the attention in
almost all of the ecosystems that we defined, represent-
ing 77.6% of the selected literature (Fig. 3b). In con-
trast, and despite their abundance, diversity and
significant role in aquatic ecosystems (Auguet et al.
2010), archaeal diversity was less studied, especially for
nonsaline waters. Similarly, based on sequencing
approaches, there are fewer descriptions of Eukarya and
most viruses despite their high abundance and diversity
(Finlay 2004; Slapeta et al. 2005; Fernandez-Alamo &
Farber-Lorda 2006; Wilhelm & Matteson 2008; Stoeck
et al. 2010). Both viral and eukaryotic diversity has
mostly been characterized in nonsaline lakes and mar-
ine ecosystems (Fig. 3b), whereas Eukarya also occur in
more extreme ecosystems (Rothschild & Mancinelli
2001). To conclude, the lack of reports regarding non-
bacterial domains constitutes a gap in our understand-
ing of microbial diversity. This emphasizes the need of
cross-domains surveys to better understand overall pat-
terns of diversity. So far, only 11.2% of the selected lit-
erature focused on at least two microbial domains,
2.2% on at least three of them.
Sampling issues and potential solutions
Community and sample representativeness
Our vision of the diversity and composition of any
biotic assemblage strongly depends on the sampling
procedure, which has to be established with careful
consideration (Magurran 2004). The obvious issue of
contamination will not be addressed here, but should
clearly be kept in mind. The sampling strategy applied
relies on the initial question being addressed: the esti-
mation of parameters, such as richness (or alpha diver-
sity, Box1), requires more extensive sampling effort so
as to increase the accuracy of parameter estimates. In
contrast, the resolution of patterns of diversity instead
requires standardized sampling strategies so as to
maximize the power to detect differences between sites
(Kenkel et al. 1989). However, there is debate over this
latter point, because obtaining a representative descrip-
tion of microbial communities may require different
degrees of sampling effort depending on habitat heter-
ogeneity and patchiness. If one attempts to compare
two habitats displaying contrasting heterogeneity,
using standardized sampling strategies might therefore
render an altered picture of diversity patterns (Cao
et al. 2002).
Marine, inland and groundwaters display various
degrees of heterogeneity on a broad range of spatial
and temporal scales in terms of particles, organic matter
and nutrient distribution, physico-chemistry and physi-
cal mixing (Karl 2007; Griebler & Lueders 2009; Gross-
art 2010). This also holds true for microbiological
properties. For instance, global estimates of prokaryote
cell density have been reported to be much lower in sea
water than in freshwater (Whitman et al. 1998). At a
regional scale, bacterial cell density has been observed
to be higher in coastal waters than in the open ocean
(Acinas et al. 1997). Furthermore, the scale of bacterio-
plankton community turnover varies, horizontally, ver-
tically and temporally in the ocean (reviewed in
Fuhrman 2009), and similarly, the taxa–area relationship
of aquatic microbes has been reported to be steeper in
island-like habitats, such as lakes, than in contiguous
habitats such as the open ocean (Prosser et al. 2007).
These properties emphasize the need to maximize the
community representativeness even in the case of pat-
tern recognition. Considering a given habitat or a given
environmental condition, community attributes will be
better characterized by increasing the community auto-
similarity, i.e. the average similarity in community com-
position and diversity among replicate samples (Cao
et al. 2002). This can be achieved by increasing the
number of replicate samples and ⁄ or the sampling vol-
ume. Replication is of particular concern for microbial
ecologists that are facing strong undersampling biases
when collecting samples on the field, representing only
a tiny portion of the ecosystem surveyed from a micro-
bial point of view. Such undersampling is a source of
great variability between samples originating from a
single habitat. For instance, based on microscopic obser-
vations, a recent study showed that seawater samples
collected only a few minutes and metres apart har-
boured planktonic protistan communities varying in
their composition and structure, mainly owing to rare
taxa (Dolan & Stoeck 2011). This renders the compari-
son of two different habitats impossible without suffi-
cient replication. Use of the appropriate number of
replicates is therefore of the utmost importance, and
this should be prioritized instead of obtaining many
sequences from a single sample (Magurran 2004; Pros-
ser 2010).
Besides replication, the sample size, or volume, may
enhance the community representativeness. According
to the taxa–area relationship detected in various aquatic
environments and for different microbial taxa (Fuhrman
2009; Prosser 2010), increasing sampling size would
� 2011 Blackwell Publishing Ltd

SEQUENCI NG AQUATIC MICROBIA L DI VERSITY 1883
inherently increase the likelihood of capturing higher
numbers of cells and ⁄ or to encompass a larger number
of microhabitats harbouring different taxa number and
abundance (Magurran 2004). This relationship is, how-
ever, not uniform among habitats (Prosser et al. 2007),
complicating the definition of a unique standard sample
volume. As a compromise, one could find a standard
sample volume that is technically feasible while at the
same time minimizes the variability of the attributes of
the ecological communities (Cao et al. 2002). This ques-
tion has received little attention so far in aquatic micro-
biology, and it is generally left to the discretion of the
investigators to choose the appropriate sample volume,
which typically ranges from 10 mL to more than 200 L.
Nevertheless, fingerprint profiles of increasing volumes
of water (from 10 to 1000 mL) showed no significant
differences in richness (Dorigo et al. 2006) and low vari-
ability of community structure when sampling more
than 50 mL of seawater (Ghiglione et al. 2005), but this
has not been broadly confirmed using sequencing-based
approaches. Gomez-Pereira et al. (2010) provided some
insights into the effect of water volume for detecting
rare flavobacterial clades by means of FISH, showing
that cell abundance variability was reduced by two
when using at least 250 mL of water. Hence, the sam-
pled volume effect remains to be determined when
using NGS approaches where the genetic diversity
revealed is much higher.
The same considerations hold when deciding the
sequencing effort to apply on each sample, as it consti-
tutes a second sampling step for which microbiologists
again struggle with under-representation. For instance,
Quince et al. (2008) estimated that assessing 90% of the
diversity based on 16S rRNA genes would require a
sequencing effort five times higher in surface open
ocean waters than in the case of the GOS survey (�7000
sequences initially used; Rusch et al. 2007) and 280
times higher in Sogin’s rare biosphere study on vent
fluids (�442 000 sequences initially used; Sogin et al.
2006). Nevertheless, sequencing effort does not appear
to affect the rankings of the observed and estimated
richness when comparing different conditions (Shaw
et al. 2008), and seems of importance only for parame-
ter estimation. It is worth mentioning here that the
sequencing effort required may also differ among taxa,
as Bacteria appear to have diversified an order of mag-
nitude more than Archaea and Eukarya (Amaral-Zettler
et al. 2011).
Aquatic microbiologists often resort to filtration to
concentrate diluted microbial cells from water. Usually,
sufficient amounts of DNA for subsequent molecular
analyses are obtained by using 0.22-lm polycarbonate
filters (see Bej et al. 1991 for an overview of filter types),
although this mainly depends on the filtered water vol-
� 2011 Blackwell Publishing Ltd
ume. Water filtration is the only option when process-
ing large volumes, as these cannot be readily handled
with centrifugation. However, filtration may also select
subsets of the existing microbial populations: as men-
tioned earlier, microbes inhabit, grossly, the free-living
and the attached fractions of the water (Grossart 2010).
The latter including ‘marine snows’ also recognized as
microscale environments may be lumped together dur-
ing filtration processes (Azam & Long 2001; Kiorboe
et al. 2003). Although the attached microbes likely
account for an important fraction of microbial diversity
in the water, most surveys only focus on the free-living
fraction, emphasizing the need to develop alternatives
to water filtration (Grossart 2010).
Disentangling the extracellular DNA from the dead,the dormant and the active cells
Microbial ecologists all share the frustration of dealing
with large communities mixing live, dormant and dead
cells. Although the dead cell DNA is substantially
involved in ecological and evolutionary processes (see
Lorenz & Wackernagel 1994; Vlassov et al. 2007 for
reviews), one may prefer to assess the actual, living
microbial cells for diversity estimation and pattern rec-
ognition. Because dissolved DNA is generally assumed
to pass through filtration, this issue is often overlooked
in environmental studies, despite the high concentration
of naked DNA in the aquatic environment, ranging
from 0.2 to 44 lg ⁄ L, with higher values especially in
estuarine and coastal ecosystems (reviewed in Lorenz &
Wackernagel 1994).
To focus on the living microbial fraction for diversity
assessment, one could subject the samples to treatment
with propidium monoazide (PMA; Nocker et al. 2007),
propidium iodide (Luna et al. 2002) or ethidium mono-
azide (Soejima et al. 2008) prior to DNA extraction (see
Cenciarini-Borde et al. 2009 for a review). These mole-
cules intercalate between DNA strands but cannot pen-
etrate intact cells, therefore rendering the naked DNA
nonamplifiable by PCR. The contribution of dead cells
in microbial community structure in both freshwater
and seawater samples was recently tested using PMA
and 454 pyrosequencing (Nocker et al. 2010). Slight
changes in bacterial phyla proportion were observed
with PMA treatment alone, but were enhanced with
the addition of an extra heating step, causing cell
membrane damage. These results prove the efficiency
of PMA and suggest that naked DNA hampers the
assessment of bacterial community structure at broad
taxonomic resolutions. However, more effort needs to
be invested in accounting for the effects of dead mate-
rial at finer taxonomic levels and for diversity estima-
tion.

1884 L. ZI NGER, A. G OBET and T. POMMIER
The mixing of DNA from both active and dormant
cells in a single DNA extract may also cause frustra-
tions. Dormancy is a common response of microbes to
cope with stressful conditions and has also important
ecological implications, especially regarding ecosystem
resilience (Lennon & Jones 2011). The proportion of
dormant cells within a sample represents up to �35%
and �50% of the total cell amount in marine and fresh-
waters, respectively (Lennon & Jones 2011). Here again,
depending on the initial question, one may assess the
active microbial cells only, so as to better link microbial
diversity to ongoing ecosystem processes. In this case,
the integration of dormant cells constitutes a potential
bias because this ‘seed bank’ may inflate alpha diver-
sity while decreasing beta diversity at the same time
(see Box 1 for definition of terms; Lennon & Jones
2011).
Sequencing the rDNA and reverse-transcribed rRNA
fragments so as to obtain both total DNA pool and met-
abolically active microbial populations is a solution for
excluding dormant cells. This approach is increasingly
used for seawater ecosystems (e.g. Moeseneder et al.
2005; Frias-Lopez et al. 2008; Ghiglione et al. 2009;
Rodriguez-Blanco et al. 2009), but to our knowledge,
has not been yet used for freshwater or groundwater.
Most of these studies reported some differences in
diversity and taxa proportions between total and active
prokaryotic communities, suggesting that metabolically
active taxa are not necessarily the most abundant
(Moeseneder et al. 2005). To our knowledge, the very
few studies focusing on active aquatic Eukarya revealed
similar trends (Stoeck et al. 2007; Not et al. 2009).
Another alternative to avoid both naked DNA and
dormant cells is provided by incubating samples with
bromodeoxyuridine (BrdU), a thymidine analogue,
which is incorporated into DNA of growing microbial
populations (Urbach et al. 1999). The resulting DNA
extract can then be processed in combination with BrdU
magnetic bead immunocapture and sequencing, giving
access to the active microbial diversity. By doing so,
Taniguchi & Hamasaki (2008) showed net differences in
community composition and structure between the
active and total microbial pool. Such differences may be
not only attributed to high mortality of particular
microbial taxa owing to grazing and viral lysis, but also
to lower growth rates of active microbial taxa. Although
a few microbial isolates have been reported to not
incorporate BrdU (Urbach et al. 1999), this approach
seems a good alternative to assess the active fraction of
microbial diversity. Finally, DNA stable-isotope probing
(DNA-SIP) relies on similar concepts but incorporates
stable-isotope-labelled compounds 13C, 15N in the newly
synthesized DNA, which can be further processed after
isopycnic centrifugation and the identification of
enriched DNA (see Chen & Murrell 2010; Morales &
Holben 2011 for reviews).
Pitfalls and potential solutions in molecularapproaches
Molecular-based studies intrinsically contain biases
that may introduce discrepancies in measures of
microbial diversity. First, in regard to DNA extraction
steps, there have been several reports of cultures and
samples recalcitrant to DNA and ⁄ or RNA extraction
because of cell resistance to lysis and the presence of
PCR inhibitors, such as humic acids or proteins (von
Wintzingerode et al. 1997). Consequently, a panel of
additional steps has been proposed to improve DNA
extraction, such as sample freeze–thaw, additional
chemical lyses or bead-beating to break down recalci-
trant cells (Bej et al. 1991; Ferrera et al. 2010). Simi-
larly, various methods and commercial kits for DNA
purification have been developed to reduce the
amount of PCR inhibitors in DNA extracts (Miller
et al. 1999; Jiang et al. 2005).
The second source of limitation is the PCR performed
to amplify targeted genes. Describing established pit-
falls and limitations of PCR is out of the scope of this
study (see von Wintzingerode et al. 1997 for a review),
and we will instead focus on issues arising from the
emergence of next-generation sequencing (NGS). First,
different universal PCR primers have been reported to
miss a large part of both prokaryote and protistan
diversity when using 454 pyrosequencing (Jeon et al.
2008; Hong et al. 2009). Hence, the degree of universal-
ity of the chosen primers (or cocktails of primers) ought
to be carefully considered when interpreting the result-
ing structure and diversity patterns (Huber et al. 2009).
Second, PCR does not represent the real community
structure as it unequally amplifies DNA fragments
according to the number of PCR cycles performed and
the DNA polymerase used. Further, polymerase
enzymes often produce errors such as mutations, chi-
meras or heteroduplexes (von Wintzingerode et al.
1997). Such wrongly amplified fragments may pollute
public databases and generate cascading mistakes
(Hugenholtz & Huber 2003).
Nevertheless, these biases can be corrected in the
‘wet’ laboratory using proof-reading enzymes (Acinas
et al. 2004a) and by adjusting PCR conditions (Acinas
et al. 2005). Further, the likelihood of observing these
errors is reduced by targeting shorter DNA fragments
(Liu et al. 2007; Huber et al. 2009), which is particularly
relevant in the context of NGS, which generates, for
now, relatively short DNA sequences (�100–400 bp).
Another alternative to PCR biases may be emulsion
PCR, where each fragment is amplified separately in a
� 2011 Blackwell Publishing Ltd

SEQUENCI NG AQUATIC MICROBIA L DI VERSITY 1885
microdroplet, thereby avoiding the formation of het-
eroduplexes and chimera (Nakano et al. 2003). This
method is systematically used prior to processing DNA
with NGS (MacLean et al. 2009) on crude DNA extracts
or PCR products. Finally, with the decrease in costs,
PCR-free approaches such as whole-genome amplifica-
tion (WGA; e.g. Gonzalez et al. 2005), whole-genome
sequencing (WGS, Rusch et al. 2007; Venter et al. 2004)
or direct sequencing (Shendure & Ji 2008; MacLean
et al. 2009) may become valuable approaches.
The emergence of NGS has great potential for assess-
ing microbial diversity (see extensive reviews on the
methods in (MacLean et al. 2009; Shendure & Ji 2008),
but the relative novelty of the technique precludes a
clear identification of their limitations. Currently,
Roche� 454 pyrosequencing technology has been the
most widely used NGS method for characterizing
microbial diversity (Fig. 3a). A recent comparison of
this technique with Illumina� technology for microbial
diversity assessment found both approaches to be simi-
lar, although the taxonomic assignment of 454 Titanium
reads provided longer fragments, whereas Illumina
allowed a greater coverage (Claesson et al. 2010). The
read quality generated by 454 pyrosequencing gener-
ated a debate in the microbial ecology community
because of inaccurate assessment of homopolymer
length in two strictly identical DNA fragments, leading
to an inflation of microbial diversity estimates (Quince
et al. 2009). On the other hand, 454 pyrosequencing
appears better for metagenomic surveys compared to
fosmid libraries coupled with Sanger sequencing, the
latter one tending to over-represent GC-rich fragments
(Temperton et al. 2009).
Current tools ⁄ pipelines available to assessdiversity in the ‘dry lab’
As mentioned previously, the DNA barcoding approach
(sensu lato; Valentini et al. 2009) has become fairly pop-
ular for the rapid assessment of microbial diversity
through the use of partial or complete ribosomal genes
(Olsen et al. 1986). Ideally, these barcodes have (i) to be
short enough and flanked by highly conserved regions
for targeting a given taxa in an order, (ii) to be suitable
for all taxonomic groups, (iii) to allow taxonomic
assignment and (iv) should permit the definition of tax-
onomic levels, e.g. OTUs as surrogates of species, from
sequence data sets (Valentini et al. 2009). Unfortunately,
the situation is not ideal in this regard given the lack of
‘universality’ of most primers currently used and lim-
ited databases, especially for microbial eukaryotes (Sto-
eck et al. 2010). Most importantly, the inherent
differences in evolution rates among microbial taxa
(Giovannoni & Stingl 2005; Thornhill et al. 2007) may
� 2011 Blackwell Publishing Ltd
make it difficult to choose a universal sequence similar-
ity threshold for defining taxonomically meaningful
OTUs. This issue applies differently according to the
rRNA hypervariable region chosen (Schloss 2010) and is
further clouded by the presence of artefact sequences
generated during PCR or sequencing. Cutting into the
similarity tree of DNA sequences for creating OTUs is
therefore a delicate task and requires making compro-
mises between all potential sources of genetic variability
in sequence data sets.
Postsequencing in silico approaches can handle some
of these issues (Table 1). First of all, errors because of
sequencing have to be removed to avoid artificial infla-
tion of diversity estimates (Reeder & Knight 2009) and
can be identified through sequence quality. For
instance, the per nucleotide-error rate of sequence data
(�0.25% for 454 pyrosequencing; Huse et al. 2007) may
be lowered by removing sequences containing one or
more unresolved nucleotides (N’s), errors in the primer
sequences, and sequences where length differs signifi-
cantly from the expected (Huse et al. 2007). Programs
to remove 454 pyrosequencing and PCR errors have
been developed: PyroNoise and the DeNoiser cluster
flowgrams (Quince et al. 2009; Reeder & Knight 2010),
whereas the single-linkage preclustering (slp) approach
(Huse et al. 2010) uses sequences. AmpliconNoise is a
development of PyroNoise that first clusters flowgrams
to remove 454 errors and then sequences to remove
PCR errors (Quince et al. 2011). AmpliconNoise and
PyroNoise are both iterative probabilistic methods,
whereas the DeNoiser and slp use faster agglomerative
strategies. AmpliconNoise is able to remove more noise
than the other programs without overclustering and
removing true variation which the agglomerative algo-
rithms are prone to do (Quince et al. 2011). Chimeric
DNA sequences constitute a second source of bias and
are harder to detect. Initially, several programs, e.g.
ChimeraCheck (Cole et al. 2005) or Bellerophon (Huber
et al. 2004), were developed for chimera detection and
have been extensively used on classical clone libraries.
More recently, algorithms adapted to the length and
large amount of sequences generated by NGS, such as
ChimeraSlayer and Perseus, have also been proposed
(Table 1).
After trimming, the data are then submitted to align-
ment algorithms in order to calculate dissimilarities
between sequences. The choice of the algorithm is of
prime importance and is dependent on the phylogenetic
inferences made, for which multiple sequence align-
ment tools (MSA) are necessary. However, recent con-
cerns have arisen regarding the alignment quality
provided by classical MSA (e.g. CLUSTALW or MUS-
CLE; Table 1). For instance, these algorithms have been
shown to result in different tree topologies even by

Tab
le1
Ex
amp
les
of
too
lsto
pro
cess
DN
Ase
qu
ence
s(m
ain
lyfo
rN
GS
dat
ase
ts)
Met
ho
ds
So
ftw
are
avai
lab
le(R
efer
ence
)
Web
site
Sh
ort
des
crip
tio
n
Nee
ds
in
com
pu
tin
gre
sou
rces
Seq
uen
cetr
imm
ing
Py
roN
ois
e(Q
uin
ceet
al.
2009
)
htt
p:/
/p
yro
no
ise.
sou
rcef
org
e.n
et/
Ag
glo
mer
ativ
eap
pro
ach
usi
ng
flo
wg
ram
alig
nm
ents
.F
low
gra
m
clu
ster
ing
bas
edo
nth
eas
sum
pti
on
that
seq
uen
ces
wit
her
rors
ten
dto
be
rare
and
sho
uld
be
sim
ilar
totr
ue
abu
nd
ant
seq
uen
ces.
Con
s:H
igh
lyco
mp
ute
r-in
ten
siv
e
++
+
DeN
ois
er(R
eed
er&
Kn
igh
t20
10)
htt
p:/
/w
ww
.mic
rob
io.m
e/d
eno
iser
/
Ag
glo
mer
ativ
eap
pro
ach
usi
ng
afl
ow
gra
mal
ign
men
t.F
low
gra
m
clu
ster
ing
bas
edo
nce
ntr
oid
app
roac
hp
rio
rto
clas
sica
l
clu
ster
ing
step
.
Pro
s:F
ast
toco
mp
ute
.
Con
s:M
isas
sig
nm
ent
of
read
sre
sult
ing
inlo
sso
fac
cura
teO
TU
clu
ster
ing
+
SL
P(s
ing
le-l
ink
age
pre
clu
ster
ing
)(H
use
etal
.20
10)
htt
p:/
/v
amp
s.m
bl.
edu
/re
sou
rces
/so
ftw
are.
ph
p
Ag
glo
mer
ativ
eap
pro
ach
usi
ng
seq
uen
ces
by
app
lyin
ga
pre
clu
ster
ing
at98%
seq
uen
cesi
mil
arit
yw
ith
asi
ng
le-l
ink
age
app
roac
hb
efo
reth
ecl
assi
cal
clu
ster
ing
step
.B
ased
on
pai
rwis
e
alig
nm
ents
.
Pro
s:Im
pro
ve
OT
Ucl
ust
erin
g.
Con
s:P
oss
ible
mis
assi
gn
men
to
fre
ads
resu
ltin
gin
inac
cura
te
div
ersi
tyes
tim
ates
.
+
Am
pli
con
No
ise-
Per
seu
sp
ipel
ine
(Qu
ince
etal
.20
11)
htt
p:/
/co
de.
go
og
le.c
om
/p
/am
pli
con
no
ise/
Imp
rov
edv
ersi
on
of
Py
roN
ois
e(A
mp
lico
nN
ois
e)w
ith
chim
era
det
ecti
on
(Per
seu
s).
Per
seu
su
ses
seq
uen
ceab
un
dan
ces
inth
e
clas
sifi
cati
on
of
PC
Rch
imer
as.
Pro
s:M
ore
accu
rate
than
DeN
ois
eran
dsl
pto
esti
mat
eO
TU
nu
mb
ers.
Do
esn
ot
req
uir
ea
set
of
no
nch
imer
icse
qu
ence
s.A
ble
tofi
nd
99%
chim
eras
(mo
reth
anC
him
eraS
lay
er)
++
Ch
imer
aSla
yer
(Haa
set
al.
2011
)
htt
p:/
/m
icro
bio
meu
til.
sou
rcef
org
e.n
et/
Ch
imer
are
mo
val
.
Pro
s:A
ble
toh
and
lesh
ort
seq
uen
ces
effe
ctiv
ely
.
Con
s:R
equ
ires
are
fere
nce
dat
ase
tw
ith
no
nch
imer
icse
qu
ence
s.
+
Seq
Tri
m(F
alg
uer
aset
al.
2010
)
htt
p:/
/w
ww
.scb
i.um
a.es
/cg
i-bin
/se
qtri
m/
seqt
rim
_log
in.c
gi
Pre
pro
cess
ing
alg
ori
thm
that
trim
s,fi
lter
s,d
erep
lica
tes
seq
uen
ce
read
san
dre
mo
ves
chim
eras
.
Pro
s:P
erfo
rms
equ
ally
wel
lw
ith
any
typ
eo
fse
qu
ence
dat
ase
t
(DN
Ali
bra
ries
or
py
rose
qu
enci
ng
read
s).
Kee
ps
am
axim
um
of
seq
uen
ces
(no
ov
ertr
imm
ing
).F
rien
dly
use
rin
terf
ace.
All
pre
pro
cess
ing
step
sca
nb
em
anu
ally
ver
ified
.
++
Ali
gn
men
t*N
Wp
airw
ise
alig
nm
ent
(Nee
dle
man
&
Wu
nsc
h19
70)
Pai
rwis
ese
qu
ence
alig
nm
ent.
Pro
s:N
ot
bia
sed
asin
mu
ltip
lese
qu
ence
alig
nm
ent
too
ls(M
SA
).
Con
s:P
hy
log
enet
icin
fere
nce
no
tp
oss
ible
.
++
Clu
stal
W(T
ho
mp
son
etal
.19
94)
htt
p:/
/w
ww
.eb
i.ac
.uk
/T
oo
ls/
msa
/cl
ust
alw
2/
MS
A.
Pai
rwis
eal
ign
men
tso
nse
qu
ence
san
dco
nst
ruct
ion
of
a
sim
ilar
ity
tree
for
com
bin
ing
the
alig
nm
ents
.U
se
nei
gh
bo
ur-
join
ing
alg
ori
thm
sfo
rtr
eeco
nst
ruct
ion
Pro
s:P
hy
log
enet
icin
fere
nce
s
Con
s:L
ow
-qu
alit
yal
ign
men
tsw
hen
pro
cess
ing
larg
ean
d
div
ersi
fied
seq
uen
ced
ata
sets
.
++
+
1886 L. ZI NGER, A. G OBET and T. POMMIER
� 2011 Blackwell Publishing Ltd

Tab
le1
Con
tin
ued
Met
ho
ds
So
ftw
are
avai
lab
le(R
efer
ence
)
Web
site
Sh
ort
des
crip
tio
n
Nee
ds
in
com
pu
tin
gre
sou
rces
MA
FF
T(K
ato
het
al.
2002
)
htt
p:/
/m
afft
.cb
rc.jp
/al
ign
men
t/so
ftw
are/
MS
A.
Pai
rwis
eal
ign
men
tso
np
arti
alse
qu
ence
san
dco
nst
ruct
ion
of
asi
mil
arit
ytr
eefo
rco
mb
inin
gth
eal
ign
men
ts.
Incl
ud
es
var
iou
sM
SA
stra
teg
ies.
Pro
s:M
SA
op
tim
ized
for
larg
ed
ata
sets
.C
ho
ice
inth
eal
ign
men
t
met
ho
d.
Con
s:L
ow
-qu
alit
yal
ign
men
tsd
epen
din
go
nth
eal
go
rith
mch
ose
n.
++
Ali
gn
men
t*M
US
CL
E(E
dg
ar20
04)
htt
p:/
/w
ww
.dri
ve5
.co
m/
mu
scle
/
MS
A.
Pai
rwis
eal
ign
men
tso
np
arti
alse
qu
ence
san
dco
nst
ruct
ion
of
asi
mil
arit
ytr
eefo
rco
mb
inin
gth
eal
ign
men
ts.
Iter
atio
ns
for
alig
nm
ent
imp
rov
emen
t.
Pro
s:M
SA
op
tim
ized
for
extr
emel
yla
rge
dat
ase
ts.
Con
s:L
ow
-qu
alit
yal
ign
men
tsw
hen
pro
cess
ing
larg
ean
d
div
ersi
fied
seq
uen
ced
ata
sets
.
++
SIN
A(P
rues
seet
al.
2007
)
htt
p:/
/w
ww
.arb
-sil
va.
de/
alig
ner
/
MS
Ab
ased
on
rRN
Ase
con
dar
yst
ruct
ure
.
Pro
s:P
erfo
rms
usu
ally
bet
ter
than
oth
erM
SA
alig
nm
ents
Con
s:R
estr
icte
dto
rib
oso
mal
gen
es
On
lin
ere
sou
rce
Clu
ster
ing
†C
D-H
IT(L
i&
Go
dzi
k20
06)
htt
p:/
/b
ioin
form
atic
s.lj
crf.
edu
/cd
-hi/
Clu
ster
ing
by
wo
rdco
un
tin
g.
Pro
s:F
ast
toco
mp
ute
.
Con
s:S
eed
the
alig
nm
ent
star
tin
go
nlo
ng
est
tag
s,le
ssad
apte
dto
sho
rtre
ads.
Des
ign
edto
clu
ster
pro
tein
cod
ing
seq
uen
ces.
++
Ucl
ust
(Ed
gar
2010
)
htt
p:/
/w
ww
.dri
ve5
.co
m/
use
arch
/
Clu
ster
ing
by
wo
rdco
un
tin
g
Pro
s:F
ast,
sen
siti
ve.
Clu
ster
ing
atlo
wid
enti
ties
.C
lass
ifica
tio
no
f
mu
chla
rger
dat
ase
tsth
anC
D-H
IT
+
MC
L(V
anD
on
gen
2000
)
htt
p:/
/m
ican
s.o
rg/
mcl
/
Fas
td
ivis
ive
clu
ster
ing
alg
ori
thm
for
gra
ph
sb
ased
on
sim
ula
tio
n
of
the
flo
win
the
gra
ph
.T
he
gra
ph
isco
mp
ose
do
fal
l
seq
uen
ces,
mo
reo
rle
ssco
nn
ecte
dac
cord
ing
toth
eir
sim
ilar
itie
s.
Pro
s:F
ast
and
sen
siti
ve.
Con
s:M
ayfa
ilto
accu
rate
lycl
ust
erto
od
ense
gra
ph
s.
+
CR
OP
(Hao
etal
.20
11)
htt
p:/
/co
de.
go
og
le.c
om
/p
/cr
op
-tin
gch
enla
b/
Un
sup
erv
ised
Bay
esia
ncl
ust
erin
g.
Pro
s:D
on
ot
req
uir
eh
ard
cut-
off
sim
ilar
ity
thre
sho
lds.
+
RA
MI
(Po
mm
ier
etal
.20
09)
htt
p:/
/w
ww
.acg
t.se
/o
nli
ne.
htm
l
Use
pat
rist
icd
ista
nce
s(g
enet
icch
ang
e).
Pro
s:Id
enti
fies
clu
ster
so
fev
olu
tio
nar
yre
late
dse
qu
ence
s.
Ph
ylo
gen
etic
infe
ren
ces.
Use
r-fr
ien
dly
web
inte
rfac
e.
On
lin
ere
sou
rce
SC
AT
Ah
ttp
://
scat
a.m
yk
op
at.s
lu.s
e/C
lust
erin
go
fla
rge
seq
uen
ced
ata
sets
Pro
s:E
ase-
to-u
se,
adap
ted
toh
igh
lyv
aria
ble
DN
Are
gio
ns
(e.g
.IT
S)
Con
s:L
ess
adap
ted
to16
SrR
NA
seq
uen
ces
On
lin
ere
sou
rce
Fu
llp
ipel
ines
Fas
tgro
up
II(Y
uet
al.
2006
)
htt
p:/
/b
iom
e.sd
su.e
du
/fa
stg
rou
p/
ind
ex.h
tm
Seq
uen
cep
roce
ssin
gin
teg
rati
ng
sev
eral
too
ls(e
.g.
low
-qu
alit
y
read
sre
mo
val
,cl
ust
erin
g(P
SI)
,C
lust
alW
,ta
xo
no
mic
ann
ota
tio
n)
and
alp
ha-
div
ersi
tyas
sess
men
t.
Pro
s:E
ase-
to-u
se
Con
s:sa
mp
les
hav
eto
be
anal
yse
dse
par
atel
y
On
lin
ere
sou
rce
SEQUENCI NG AQUATIC MICROBIA L DI VERSITY 1887
� 2011 Blackwell Publishing Ltd

Ta
ble
1C
onti
nu
ed
Met
ho
ds
So
ftw
are
avai
lab
le(R
efer
ence
)
Web
site
Sh
ort
des
crip
tio
n
Nee
ds
in
com
pu
tin
gre
sou
rces
Fu
llp
ipel
ines
MO
TH
UR
(Sch
loss
etal
.20
09)
htt
p:/
/w
ww
.mo
thu
r.o
rg/
Co
mm
and
sfr
om
sev
eral
too
lsfo
rse
qu
ence
pro
cess
ing
(e.g
.
chim
era
rem
ov
al,
seq
uen
ceal
ign
men
t,O
TU
clu
ster
ing
),al
ph
a
div
ersi
ty(e
.g.
rare
fact
ion
curv
es,
div
ersi
tyes
tim
ato
rs)
and
bet
a-d
iver
sity
anal
yse
s(e
.g.
dis
tan
cein
dic
es,
Un
ifra
c).
Pro
s:E
ase-
to-u
seco
mm
and
sw
ith
aw
ell-
des
crib
edW
iki.
Dif
fere
nt
met
ho
ds
avai
lab
le
Dep
end
so
nth
eco
mm
and
s
ES
PR
IT(S
un
etal
.20
09)
htt
p:/
/w
ww
.bio
tech
.ufl
.ed
u/
peo
ple
/su
n/
esp
rit.
htm
l
Seq
uen
cep
roce
ssin
gan
dd
iver
sity
asse
ssm
ent
(e.g
.lo
w-q
ual
ity
read
sre
mo
val
,p
airw
ise
seq
uen
ceal
ign
men
t,cl
ust
erin
g,
spec
ies
esti
mat
es).
Pro
s:P
aral
lel
stru
ctu
reim
ple
men
ted
,fo
rla
rge
dat
ase
ts.
Con
s:R
estr
icti
on
inan
aly
ses
avai
lab
le
Dep
end
so
nth
eco
mm
and
s
QII
ME
(Cap
ora
soet
al.
2010
)
htt
p:/
/q
iim
e.so
urc
efo
rge.
net
/
Inte
gra
tes
sev
eral
too
lsfo
rse
qu
ence
pro
cess
ing
(e.g
.q
ual
ity
filt
erin
g,
den
ois
ing
,se
qu
ence
alig
nm
ent,
clu
ster
ing
,ta
xo
no
mic
assi
gn
men
t,al
ph
ad
iver
sity
and
bet
ad
iver
sity
anal
yse
s).
Pro
s:E
ase-
to-u
se,
dat
av
isu
aliz
atio
n.
Con
s:R
estr
icti
on
inan
aly
ses
avai
lab
le
+
Py
roT
agg
er(K
un
in&
Hu
gen
ho
ltz
2010
)
htt
p:/
/p
yro
tag
ger
.jgi-
psf
.org
/cg
i-b
in/
ind
ex.p
l
Ag
glo
mer
ativ
eap
pro
ach
usi
ng
seq
uen
ces.
Qu
alit
yfi
lter
ing
at
0.2%
per
-bas
eer
ror
pro
bab
ilit
y.
Clu
ster
sse
qu
ence
sat
97%
by
usi
ng
Py
roC
lust
or
Ucl
ust
.T
axo
no
mic
assi
gn
men
tan
dch
imer
a
iden
tifi
cati
on
.
Pro
s⁄C
ons:
Dat
au
plo
ado
nth
ew
ebin
terf
ace
may
be
tim
e-co
nsu
min
g.
Th
ep
ipel
ine
can
be
run
loca
lly
.
Dep
end
so
nth
eco
mm
and
s
CA
NG
S(c
lean
ing
and
anal
ysi
ng
nex
t-g
ener
atio
n
seq
uen
ces)
(Pan
dey
etal
.20
10)
htt
p:/
/i1
22se
rver
.vu
-wie
n.a
c.at
/p
op
/so
ftw
are.
htm
l
Seq
uen
cere
ads
are
pro
cess
edin
two
step
s:(i
)se
qu
ence
trim
min
g
and
filt
erin
gan
d(i
i)an
aly
sin
gst
ep,
incl
ud
ing
NC
BI-
bas
e
tax
on
om
icas
sig
nm
ent
and
div
ersi
tyan
aly
sis
(e.g
.ra
refa
ctio
n
esti
mat
es).
Pro
s:C
lear
man
ual
lead
ing
the
use
r.
Con
s:C
ano
nly
be
run
ifei
gh
tad
dit
ion
alp
rog
ram
sar
e
do
wn
load
edlo
call
y.
So
me
bas
icP
erl
pro
gra
mm
ing
skil
lsm
ayb
e
nee
ded
.
Dep
end
so
nth
eco
mm
and
s
RD
P’s
py
rose
qu
enci
ng
pip
elin
e(C
ole
etal
.20
09)
htt
p:/
/p
yro
.cm
e.m
su.e
du
/
Man
yto
ols
for
seq
uen
cep
roce
ssin
g(e
.g.
seq
uen
ceal
ign
men
t,
clu
ster
ing
,ta
xo
no
mic
iden
tifi
cati
on
)an
dd
iver
sity
anal
yse
s
(alp
ha
and
bet
ad
iver
sity
).
Pro
s:E
ase-
to-u
se,
form
ats
dat
afo
ro
ther
app
lica
tio
ns
(e.g
.M
OT
HU
R,
Est
imat
eS)
Con
s:N
ose
qu
ence
trim
min
gto
ol
On
lin
ere
sou
rce
1888 L. ZI NGER, A. G OBET and T. POMMIER
� 2011 Blackwell Publishing Ltd

Tab
le1
Con
tin
ued
Met
ho
ds
So
ftw
are
avai
lab
le(R
efer
ence
)
Web
site
Sh
ort
des
crip
tio
n
Nee
ds
in
com
pu
tin
gre
sou
rces
Pan
gea
(Gio
ng
oet
al.
2010
)
htt
p:/
/w
ww
.mic
rog
ato
r.o
rg/
pan
gea
/
Seq
uen
cin
gp
roce
ssin
g(e
.g.
qu
alit
yfi
lter
ing
,se
qu
ence
alig
nm
ent,
clu
ster
ing
,ta
xo
no
mic
iden
tifi
cati
on
)an
dd
iver
sity
anal
yse
s
(alp
ha
and
bet
ad
iver
sity
).
Pro
s:E
ase-
to-u
se
Con
s:S
pli
tth
ed
ata
set
into
clas
sifi
edan
du
ncl
assi
fied
dat
ase
ts
bef
ore
clu
ster
ing
+
CL
OT
U(K
um
aret
al.
2011
)
htt
p:/
/w
ww
.bio
po
rtal
.uio
.no
/
Man
yto
ols
for
seq
uen
cep
roce
ssin
g(e
.g.
low
-qu
alit
yre
ads
rem
ov
al,
clu
ster
ing
,ta
xo
no
mic
iden
tifi
cati
on
)an
dd
iver
sity
anal
yse
s(a
lph
ad
iver
sity
).
Pro
s:E
ase-
to-u
se,
hig
hly
flex
ible
,o
utp
uts
are
gen
erat
edat
each
step
s
Con
s:N
oal
ign
men
tst
epis
use
d,
wh
ich
mig
ht
resu
ltin
less
accu
rate
clu
ster
s
On
lin
ere
sou
rce
*Ad
etai
led
list
of
alig
nm
ent
soft
war
esis
pro
vid
edat
htt
p:/
/en
.wik
iped
ia.o
rg/
wik
i/L
ist_
of_
seq
uen
ce_a
lig
nm
ent_
soft
war
e.
†Fu
rth
ercl
ust
erin
gal
go
rith
ms
are
pro
vid
edat
htt
p:/
/en
.wik
iped
ia.o
rg/
wik
i/S
equ
ence
_clu
ster
ing
.
SEQUENCI NG AQUATIC MICROBIA L DI VERSITY 1889
� 2011 Blackwell Publishing Ltd
excluding gapped sites, and perform poorly when large
and diversified sequence data sets are analysed (Wong
et al. 2008). Another study showed that Greengenes
and MUSCLE algorithms tended to misestimate both
alpha diversity and beta diversity (Schloss 2010). MSA
incorporating the rRNA gene secondary structure (e.g.
SINA, Pruesse et al. 2007) rely on biological concepts
and should be preferred (Schloss 2010), but the use of
pairwise algorithms alignments is still valid (Huse et al.
2010; Schloss 2010), especially when one focuses on
poorly referenced taxa or non-rRNA genes. Distance
matrices calculated from sequence alignments are then
used for clustering sequences into OTUs based on their
similarities (e.g. MOTHUR, Schloss et al. 2009) or
patristic distances from phylogenetic trees (Pommier
et al. 2009; Table 1). A large panel of clustering algo-
rithms (a few examples are given in Table 1) is avail-
able for this purpose, of which some are tested and
discussed in Schloss & Westcott (2011). These methods
still require an arbitrary cut-off similarity threshold, but
a promising alternative, CROP (Table 1), has been
recently proposed (Hao et al. 2011) and may cope better
with the differences in evolution rates among taxa. With
the routine use of sequencing technologies, an increas-
ing number of pipelines that include most or all afore-
mentioned steps are now available, are able to handle
NGS data sets and are user-friendly (Table 1).
The development of NGS provided access to the
microbial ‘rare biosphere’ and its patterns of diversity
(Sogin et al. 2006; Galand et al. 2009), but its existence
has been highly debated in the light of potential NGS
technology biases (Reeder & Knight 2009). In fact, more
than 50% of the OTUs obtained are represented by a
few or even one single sequence, even when sequence
trimming was applied (e.g. Gilbert et al. 2009; Pommier
et al. 2010; Agogue et al. 2011). These OTUs are often
suspected to be artefacts and may be discarded in fur-
ther analyses (Reeder & Knight 2009). By doing so, a
few studies have tested the effect of rare OTUs on the
resulting diversity patterns by removing an increasing
proportion of them in the whole sequence data set
(Galand et al. 2009; Pommier et al. 2010; Agogue et al.
2011), and a specific tool has been developed to test for
such an effect in complex data sets (Gobet et al. 2010).
The effect of rare OTU removal has not been described
for patterns of alpha diversity yet. Our analysis shown
in Fig. 4a–c suggests a negligible effect, but this might
change according to community evenness and would
require further work. Patterns of beta diversity
appeared conserved without singletons or rare OTUs
(Gobet et al. 2010; Pommier et al. 2010; Fig. 4d–f), but
the noise introduced by rare OTUs in the data may
reduce pattern detection in certain cases (Agogue et al.
2011). Finally, depending on the study, these rare OTUs
Coastal Deep Surface Coastal Deep Surface Coastal Deep Surface
NMDS1
NM
DS
2
NMDS1
NM
DS
2
NMDS1
NM
DS
2
(a)
(f)(e)(d)
All
Without singletons
Without OTU < 50 sequences
200
400
600
800
1000
Obs
erve
d R
ichn
ess
aa
b
Anosim‘s R = 0.72** Anosim‘s R = 0.73** Anosim‘s R = 0.73**
aa
a
b
a
b
(b) (c)
200
400
600
800
1000
200
400
600
800
1000
All
Without singletons
Without OTU < 50 sequences
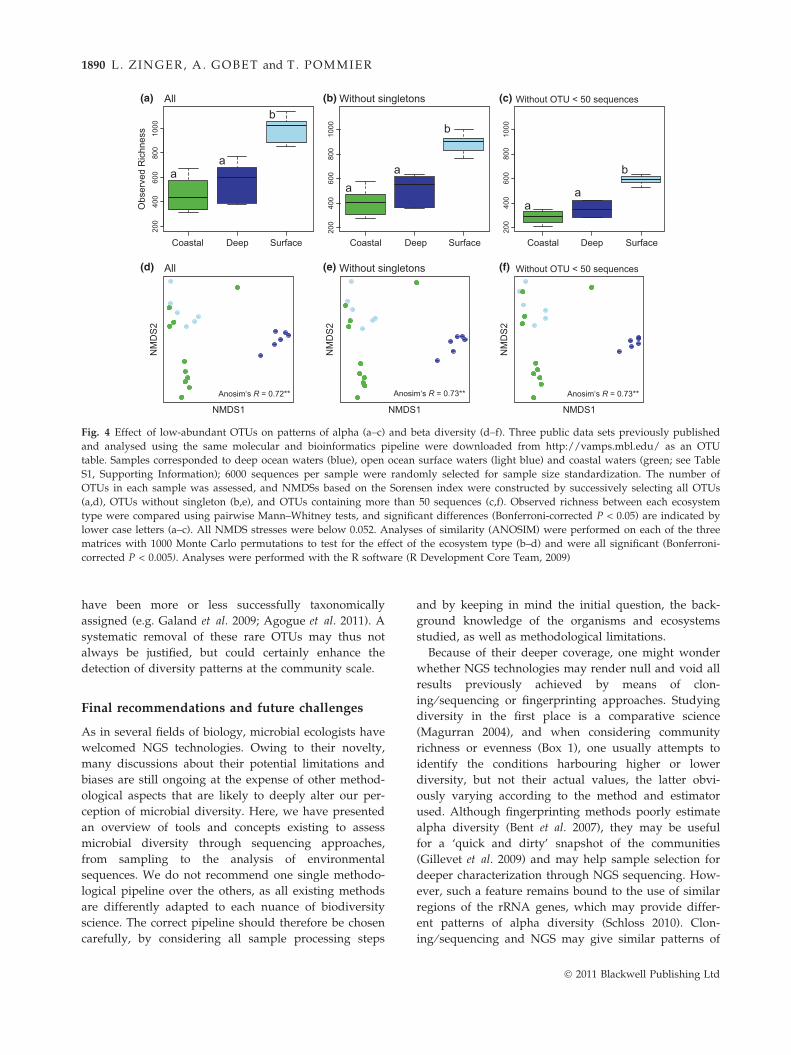
Fig. 4 Effect of low-abundant OTUs on patterns of alpha (a–c) and beta diversity (d–f). Three public data sets previously published
and analysed using the same molecular and bioinformatics pipeline were downloaded from http://vamps.mbl.edu/ as an OTU
table. Samples corresponded to deep ocean waters (blue), open ocean surface waters (light blue) and coastal waters (green; see Table
S1, Supporting Information); 6000 sequences per sample were randomly selected for sample size standardization. The number of
OTUs in each sample was assessed, and NMDSs based on the Sorensen index were constructed by successively selecting all OTUs
(a,d), OTUs without singleton (b,e), and OTUs containing more than 50 sequences (c,f). Observed richness between each ecosystem
type were compared using pairwise Mann–Whitney tests, and significant differences (Bonferroni-corrected P < 0.05) are indicated by
lower case letters (a–c). All NMDS stresses were below 0.052. Analyses of similarity (ANOSIM) were performed on each of the three
matrices with 1000 Monte Carlo permutations to test for the effect of the ecosystem type (b–d) and were all significant (Bonferroni-
corrected P < 0.005). Analyses were performed with the R software (R Development Core Team, 2009)
1890 L. ZI NGER, A. G OBET and T. POMMIER
have been more or less successfully taxonomically
assigned (e.g. Galand et al. 2009; Agogue et al. 2011). A
systematic removal of these rare OTUs may thus not
always be justified, but could certainly enhance the
detection of diversity patterns at the community scale.
Final recommendations and future challenges
As in several fields of biology, microbial ecologists have
welcomed NGS technologies. Owing to their novelty,
many discussions about their potential limitations and
biases are still ongoing at the expense of other method-
ological aspects that are likely to deeply alter our per-
ception of microbial diversity. Here, we have presented
an overview of tools and concepts existing to assess
microbial diversity through sequencing approaches,
from sampling to the analysis of environmental
sequences. We do not recommend one single methodo-
logical pipeline over the others, as all existing methods
are differently adapted to each nuance of biodiversity
science. The correct pipeline should therefore be chosen
carefully, by considering all sample processing steps
and by keeping in mind the initial question, the back-
ground knowledge of the organisms and ecosystems
studied, as well as methodological limitations.
Because of their deeper coverage, one might wonder
whether NGS technologies may render null and void all
results previously achieved by means of clon-
ing ⁄ sequencing or fingerprinting approaches. Studying
diversity in the first place is a comparative science
(Magurran 2004), and when considering community
richness or evenness (Box 1), one usually attempts to
identify the conditions harbouring higher or lower
diversity, but not their actual values, the latter obvi-
ously varying according to the method and estimator
used. Although fingerprinting methods poorly estimate
alpha diversity (Bent et al. 2007), they may be useful
for a ‘quick and dirty’ snapshot of the communities
(Gillevet et al. 2009) and may help sample selection for
deeper characterization through NGS sequencing. How-
ever, such a feature remains bound to the use of similar
regions of the rRNA genes, which may provide differ-
ent patterns of alpha diversity (Schloss 2010). Clon-
ing ⁄ sequencing and NGS may give similar patterns of
� 2011 Blackwell Publishing Ltd

SEQUENCI NG AQUATIC MICROBIA L DI VERSITY 1891
richness, but different pictures of species evenness, as
shown by in silico sequencing depth simulations (Shaw
et al. 2008). Regarding patterns of beta diversity, all
these methods seem to provide similar results for salt
marsh communities (Gillevet et al. 2009), but this pat-
tern ought to be confirmed in aquatic environments.
Finally, two main lessons can be learned from the last
two decades of water sequencing. First, the use of sam-
ple replicates and their individual sequencing is indis-
pensable. Lack of replication, or pooling replicate
samples prior to sequencing alter community represen-
tativeness, renders an inaccurate picture of microbial
diversity and further precludes comparisons of different
conditions in a statistically reliable way (Prosser
2010). We acknowledge that sample replication
might have been difficult when using cloning ⁄ sequenc-
ing approaches that are both costly and time-consum-
ing. However, NGS technologies are in essence
high-throughput methods and produce relatively good-
quality data when trimmed by appropriate bioinformat-
ic tools and have become as cheap (per sample cost) as
fingerprinting approaches when considering multiple
samples. Furthermore, in the case of diversity pattern
detection at the community scale, the main ecological
signal is not affected by the removal of rare taxa (Ago-
gue et al. 2011; Gobet et al. 2010; Pommier et al. 2010;
Fig. 4). In this context, deep sequencing is not neces-
sary and might allow processing of more replicate sam-
ples at reduced costs.
Second, our understanding of microbial diversity and
its underlying processes would be fruitless without
establishing correlation, or lack of correlation, between
microbial diversity and environmental parameters.
Through increasing awareness of this issue, robust and
standardized measurements of environmental parame-
ters have now become imperative, especially in the age
of vast sampling campaigns (e.g. the Sorcerer Global
Ocean Sampling Expedition http://camera.calit2.net/
about/gos.shtm, the International Census of Marine
Microbes, http://icomm.mbl.edu/ or the Tara Oceans
Expedition, http://oceans.taraexpeditions.org/) and the
increase in open access sequence data in concert with
cross-study meta-analyses. The Genomic Standards
Consortium initiative has consequently developed a list
of minimal information that should be provided with
any marker gene sequences deposited in international
databases (MIMARKS, Yilmaz et al. 2011), namely the
geographical xyz coordinates as well as a standardized
description of the environment (Environment Ontology,
http://gensc.org/gc_wiki/index.php/Habitat-Lite).
With geographical coordinates, additional environmen-
tal data can be easily retrieved from online databases
such as Megx (http://www.megx.net/, Kottmann et al.
2010) or Pangaea (http://www.pangaea.de/), but to
� 2011 Blackwell Publishing Ltd
our knowledge, these databases have exclusively been
developed for ocean and coastal waters, emphasizing
the need for similar development in freshwater ecosys-
tems.
Challenges remain in estimating microbial diversity
that cannot be reached even with NGS technologies
(Quince et al. 2008). The limitations in the characteriza-
tion of rare taxa or the ‘seed bank’ (Lennon & Jones
2011) reduce our ability to capture microbial commu-
nity responses to environmental changes and by exten-
sion, to understand ecosystem resilience. This supposes
an understanding of the functional diversity of
microbes as well, which is increasingly studied through
‘omics’ methods; these have so far allowed the discov-
ery of new functional genes, metabolic pathways and
their biogeographical patterns (Venter et al. 2004;
DeLong & Karl 2005; Rusch et al. 2007). Concepts and
methods are still evolving and propose promising per-
spectives for establishing a link between microbial
diversity, their functions and ecosystem processes and
stability (Green et al. 2008; Hofle et al. 2008; Morales &
Holben 2011).
What is the future of environmental sequencing?
As with the appearance of the Sanger method in the
early 1970s, two major recent progresses in molecular
biology, i.e. high-throughput sequencing and active-cell
probing, have revolutionized our perspective on cur-
rent aquatic microbial ecology (Hofle et al. 2008). Yet,
most studies fail to use both methods conjointly or
only target a single gene, with a clear preference for
16S rRNA genes (Chen & Murrell 2010). While the
adoption of NGS is continuously increasing (McCarthy
2010), single-cell sequencing approaches also bring
appealing perspectives to environmental biology (Wo-
yke et al. 2010). We foresee the development of new
approaches that will exploit these tools jointly, expand
their targets to full genomes and associate them with
quantitative measurements. This ‘Real-Time Metage-
nomic’ would target all active members (including
abundant and rare individuals) of the studied commu-
nity, measure the single-cell content of transcribed
genes and its full genome capability. Behind the con-
ceptual and methodological innovation, such an
approach ought to include strict sampling replication
and proper statistical analyses and would illuminate
one of the most complex and important trophic guilds
on the planet.
Acknowledgements
We are indebted to Fabrice Not, Alice Valentini, Benedicte N.
Poncet, Hannah Marchant, Tim Vines and two anonymous

1892 L. ZI NGER, A. G OBET and T. POMMIER
reviewers for valuable comments and suggestions that
improved the manuscript. LZ thanks Antje Boetius for the
opportunity to work in her group. Her work was financed by
the Leibniz program of the DFG to AB. Work from AG
was financed by the ANR project PROMETHEUS [ANR-09-
GENM-031].
References
Acinas SG, RodriguezValera F, PedrosAlio C (1997) Spatial and
temporal variation in marine bacterioplankton diversity as
shown by RFLP fingerprinting of PCR amplified 16S rDNA.
FEMS (Federation of European Microbiological Societies)
Microbiology – Ecology, 24, 27–40.
Acinas SG, Klepac-Ceraj V, Hunt DE et al. (2004a) Fine-scale
phylogenetic architecture of a complex bacterial community.
Nature, 430, 551–554.
Acinas SG, Marcelino LA, Klepac-Ceraj V, Polz MF (2004b)
Divergence and redundancy of 16S rRNA sequences in
genomes with multiple rrn operons. Journal of Bacteriology,
186, 2629–2635.
Acinas SG, Sarma-Rupavtarm R, Klepac-Ceraj V, Polz MF
(2005) PCR-induced sequence artifacts and bias: insights
from comparison of two 16S rRNA clone libraries
constructed from the same sample. Applied and Environmental
Microbiology, 71, 8966–8969.
Agogue H, Lamy D, Neal PR, Sogin ML, Herndl GJ (2011)
Water mass-specificity of bacterial communities in the North
Atlantic revealed by massively parallel sequencing. Molecular
Ecology, 20, 258–274.
Amaral-Zettler LA, Zettler ER, Theroux SM et al. (2011)
Microbial community structure across the tree of life in the
extreme Rio Tinto. The ISME Journal, 5, 42–50.
Anderson MJ, Crist TO, Chase JM et al. (2011) Navigating the
multiple meanings of beta diversity: a roadmap for the
practicing ecologist. Ecological Letters, 14, 19–28.
Auguet JC, Barberan A, Casamayor EO (2010) Global
ecological patterns in uncultured Archaea. The ISME Journal,
4, 182–190.
Azam F, Long RA (2001) Oceanography – sea snow
microcosms. Nature, 414, 495–498.
Azam F, Fenchel T, Field JG et al. (1983) The ecological role of
water-column microbes in the sea. Marine Ecology Progress
Series, 10, 257–263.
Barberan A, Casamayor EO (2010) Global phylogenetic
community structure and beta-diversity patterns in surface
bacterioplankton metacommunities. Aquatic Microbial Ecology,
59, 1–10.
Behrenfeld M (2011) Biology: uncertain future for ocean algae.
Nature Climate Change, 1, 33–34.
Bej AK, Mahbubani MH, Dicesare JL, Atlas RM (1991)
Polymerase chain reaction-gene probe detection of
microorganisms by using filter-concentrated samples. Applied
and Environmental Microbiology, 57, 3529–3534.
Bent SJ, Pierson JD, Forney LJ (2007) Measuring species
richness based on microbial community fingerprints: the
emperor has no clothes. Applied and Environmental
Microbiology, 73, 2399–2401.
Brown MV, Philip GK, Bunge JA et al. (2009) Microbial
community structure in the North Pacific ocean. The ISME
Journal, 3, 1374–1386.
Cao Y, Williams DD, Larsen DP (2002) Comparison of
ecological communities: the problem of sample
representativeness. Ecological Monographs, 72, 41–56.
Caporaso JG, Kuczynski J, Stombaugh J et al. (2010) QIIME
allows analysis of high-throughput community sequencing
data. Nature Methods, 7, 335–336.
Cardinale BJ (2011) Biodiversity improves water quality
through niche partitioning. Nature, 472, 86–89.
Caron DA, Countway PD, Savai P et al. (2009) Defining DNA-
based operational taxonomic units for microbial-eukaryote
ecology. Applied and Environmental Microbiology, 75, 5797–
5808.
Cenciarini-Borde C, Courtois S, La Scola B (2009) Nucleic acids
as viability markers for bacteria detection using molecular
tools. Future Microbiology, 4, 45–64.
Chen Y, Murrell JC (2010) When metagenomics meets stable-
isotope probing: progress and perspectives. Trends in
Microbiology, 18, 157–163.
Claesson MJ, Wang QO, O’Sullivan O et al. (2010) Comparison of
two next-generation sequencing technologies for resolving
highly complex microbiota composition using tandem variable
16S rRNA gene regions. Nucleic Acids Research, 38, e200.
Cole JR, Chai B, Farris RJ et al. (2005) The ribosomal database
project (RDP-II): sequences and tools for high-throughput
rRNA analysis. Nucleic Acids Research, 33, D294–D296.
Cole JR, Wang Q, Cardenas E et al. (2009) The
ribosomal database project: improved alignments and new
tools for rRNA analysis. Nucleic Acids Research, 37, D141–
D145.
Costanza R, dArge R, deGroot R et al. (1997) The value of the
world’s ecosystem services and natural capital. Nature, 387,
253–260.
Cotner JB, Biddanda BA (2002) Small players, large role:
microbial influence on biogeochemical processes in pelagic
aquatic ecosystems. Ecosystems, 5, 105–121.
Curtis TP, Sloan WT, Scannell JW (2002) Estimating
prokaryotic diversity and its limits. Proceedings of the National
Academy of Sciences of the United States of America, 99, 10494–
10499.
DeLong EF, Karl DM (2005) Genomic perspectives in microbial
oceanography. Nature, 437, 336–342.
Dolan JR, Stoeck T (2011) Repeated sampling reveals
differential variability in measures of species richness and
community composition in planktonic protists.
Environmental Microbiology Reports, Doi: 10.1111/j.1758-2229
.2011.00250.x.
Dorigo U, Volatier L, Humbert JF (2005) Molecular approaches
to the assessment of biodiversity in aquatic microbial
communities. Water Research, 39, 2207–2218.
Dorigo U, Fontvieille D, Humbert JF (2006) Spatial variability
in the abundance and composition of the free-living
bacterioplankton community in the pelagic zone of Lake
Bourget (France). FEMS (Federation of European Microbiological
Societies) Microbiology – Ecology, 58, 109–119.
Dudgeon D, Arthington AH, Gessner MO et al. (2006)
Freshwater biodiversity: importance, threats, status and
conservation challenges. Biological Review, 81, 163–182.
Duffy JE, Stachowicz JJ (2006) Why biodiversity is important to
oceanography: potential roles of genetic, species, and trophic
diversity in pelagic ecosystem processes. Marine Ecology
Progress Series, 311, 179–189.
� 2011 Blackwell Publishing Ltd

SEQUENCI NG AQUATIC MICROBIA L DI VERSITY 1893
Edgar RC (2004) MUSCLE: multiple sequence alignment with
high accuracy and high throughput. Nucleic Acids Research,
32, 1792–1797.
Edgar RC (2010) Search and clustering orders of magnitude
faster than BLAST. Bioinformatics, 26, 2460–2461.
Falgueras J, Lara A, Fernandez-Pozo N et al. (2010) SeqTrim: a
high-throughput pipeline for pre-processing any type of
sequence read. Bmc Bioinformatics, 11, 38.
Falkowski PG, Fenchel T, Delong EF (2008) The microbial
engines that drive Earth’s biogeochemical cycles. Science, 320,
1034–1039.
Fernandez-Alamo MA, Farber-Lorda J (2006) Zooplankton and
the oceanography of the eastern tropical Pacific: a review.
Progress in Oceanography, 69, 318–359.
Ferrera I, Massana R, Balague V et al. (2010) Evaluation of
DNA extraction methods from complex phototrophic
biofilms. Biofouling, 26, 349–357.
Field CB, Behrenfeld MJ, Randerson JT, Falkowski P (1998)
Primary production of the biosphere: integrating terrestrial
and oceanic components. Science, 21, 237–240.
Finlay BJ (2004) Protist taxonomy: an ecological perspective.
Philosophical Transactions of the Royal Society B: Biological
Sciences, 359, 599–610.
Fisher CR, Takai K, Le Bris N (2007) Hydrothermal vent
ecosystems. Oceanography, 20, 14–23.
Frias-Lopez J, Shi Y, Tyson GW et al. (2008) Microbial
community gene expression in ocean surface waters.
Proceedings of the National Academy of Sciences of the United
States of America, 105, 3805–3810.
Fuhrman JA (2009) Microbial community structure and its
functional implications. Nature, 459, 193–199.
Galand PE, Casamayor EO, Kirchman DL, Lovejoy C (2009)
Ecology of the rare microbial biosphere of the Arctic Ocean.
Proceedings of the National Academy of Sciences, 106, 22427–
22432.
Ghiglione JF, Larcher M, Lebaron P (2005) Spatial and
temporal scales of variation in bacterioplankton community
structure in the NW Mediterranean Sea. Aquatic Microbial
Ecology, 40, 229–240.
Ghiglione JF, Conan P, Pujo-Pay M (2009) Diversity of total and
active free-living vs. particle-attached bacteria in the euphotic
zone of the NW Mediterranean Sea. FEMS (Federation of
European Microbiological Societies) Microbiology Letters, 299, 9–21.
Gilbert JA, Field D, Swift P et al. (2009) The seasonal structure
of microbial communities in the Western English Channel.
Environmental Microbiology, 11, 3132–3139.
Gillevet PM, Sikaroodi M, Torzilli AP (2009) Analyzing salt-
marsh fungal diversity: comparing ARISA fingerprinting
with clone sequencing and pyrosequencing. Fungal Ecology,
2, 160–167.
Giongo A, Crabb DB, Davis-Richardson AG et al. (2010)
PANGEA: pipeline for analysis of next generation
amplicons. The ISME Journal, 4, 852–861.
Giovannoni SJ, Stingl U (2005) Molecular diversity and ecology
of microbial plankton. Nature, 309, 343–348.
Gobet A, Quince C, Ramette A (2010) Multivariate cutoff level
analysis (MultiCoLA) of large community data sets. Nucleic
Acids Research, 38, e155.
Gomez-Pereira PR, Fuchs BM, Alonso C et al. (2010) Distinct
flavobacterial communities in contrasting water masses of
the North Atlantic Ocean. The ISME Journal, 4, 472–487.
� 2011 Blackwell Publishing Ltd
Gonzalez JM, Portillo MC, Saiz-Jimenez C (2005) Multiple
displacement amplification as a pre-polymerase chain
reaction (pre-PCR) to process difficult to amplify samples
and low copy number sequences from natural environments.
Environmental Microbiology, 7, 1024–1028.
Green JL, Bohannan BJM, Whitaker RJ (2008) Microbial
biogeography: from taxonomy to traits. Science, 320, 1039–
1043.
Griebler C, Lueders T (2009) Microbial biodiversity in
groundwater ecosystems. Freshwater Biology, 54, 649–677.
Grossart HP (2010) Ecological consequences of
bacterioplankton lifestyles: changes in concepts are needed.
Environmental Microbiology Reports, 2, 706–714.
Haas BJ, Gevers D, Earl AM et al. (2011) Chimeric 16S
rRNA sequence formation and detection in Sanger and
454-pyrosequenced PCR amplicons. Genome Research, 21,
494–504.
Halpern BS, Walbridge S, Selkoe KA et al. (2008) A global map
of human impact on marine ecosystems. Science, 319, 948–
952.
Hao X, Jiang R, Chen T (2011) Clustering 16S rRNA for OTU
prediction: a method of unsupervised Bayesian clustering.
Bioinformatics, 27, 611–618.
Hofle MG, Kirchman DL, Christen R, Brettar I (2008)
Molecular diversity of bacterioplankton: link to a predictive
biogeochemistry of pelagic ecosystems. Aquatic Microbial
Ecology, 53, 39–58.
Hong SH, Bunge J, Leslin C, Jeon S, Epstein SS (2009)
Polymerase chain reaction primers miss half of rRNA
microbial diversity. The ISME Journal, 3, 1365–1373.
Huber T, Faulkner G, Hugenholtz P (2004) Bellerophon: a
program to detect chimeric sequences in multiple sequence
alignments. Bioinformatics, 20, 2317–2319.
Huber JA, Morrison HG, Huse SM et al. (2009) Effect of PCR
amplicon size on assessments of clone library microbial
diversity and community structure. Environmental
Microbiology, 11, 1292–1302.
Hugenholtz P, Huber T (2003) Chimeric 16S rDNA sequences
of diverse origin are accumulating in the public databases.
International Journal of Systematic and Evolutionary
Microbiology, 53, 289–293.
Huse SM, Huber JA, Morrison HG, Sogin ML, Mark Welch D
(2007) Accuracy and quality of massively parallel DNA
pyrosequencing. Genome Biology, 8, R143.
Huse SM, Welch DM, Morrison HG, Sogin ML (2010) Ironing
out the wrinkles in the rare biosphere through improved
OTU clustering. Environmental Microbiology, 12, 1889–1898.
Jeon S, Bunge J, Leslin C et al. (2008) Environmental rRNA
inventories miss over half of protistan diversity. Bmc
Microbiology, 8, 222.
Jiang JL, Alderisio KA, Singh A, Xiao LH (2005)
Development of procedures for direct extraction of
Cryptosporidium DNA from water concentrates and for
relief of PCR inhibitors. Applied and Environmental
Microbiology, 71, 1135–1141.
Karl DM (2007) Microbial oceanography: paradigms, processes
and promise. Nature Reviews. Microbiology, 5, 759–769.
Katoh K, Misawa K, Kuma Ki, Miyata T (2002) MAFFT: a
novel method for rapid multiple sequence alignment based
on fast Fourier transform. Nucleic Acids Research, 30, 3059–
3066.
1894 L. ZI NGER, A. G OBET and T. POMMIER
Kenkel NC, Juhasznagy P, Podani J (1989) On sampling
procedures in population and community ecology. Vegetatio,
83, 195–207.
Kiorboe T, Tang K, Grossart HP, Ploug H (2003) Dynamics of
microbial communities on marine snow aggregates:
colonization, growth, detachment, and grazing mortality of
attached bacteria. Applied and Environmental Microbiology, 69,
3036–3047.
Kottmann R, Kostadinov I, Duhaime MB et al. (2010) Megx.net:
integrated database resource for marine ecological genomics.
Nucleic Acids Research, 38, D391–D395.
Kumar S, Carlsen T, Mevik B-H et al. (2011) CLOTU: an online
pipeline for processing and clustering of 454 amplicon reads
into OTUs followed by taxonomic annotation. Bmc
Bioinformatics, 12, 182.
Kunin V, Hugenholtz B (2010) PyroTagger: a fast, accurate
pipeline for analysis of rRNA amplicon pyrosequence data.
The Open Journal, 1, 1.
Lennon JT, Jones SE (2011) Microbial seed banks: the ecological
and evolutionary implications of dormancy. Nature Reviews
Microbiology, 9, 119–130.
Li WZ, Godzik A (2006) Cd-hit: a fast program for clustering
and comparing large sets of protein or nucleotide sequences.
Bioinformatics, 22, 1658–1659.
Liu ZZ, Lozupone C, Hamady M, Bushman FD, Knight R (2007)
Short pyrosequencing reads suffice for accurate microbial
community analysis. Nucleic Acids Research, 35, e120.
Logares R, Brate J, Bertilsson S et al. (2009) Infrequent marine-
freshwater transitions in the microbial world. Trends in
Microbiology, 17, 414–422.
Loreau M, Naeem S, Inchausti P et al. (2001) Ecology –
biodiversity and ecosystem functioning: current knowledge
and future challenges. Science, 294, 804–808.
Lorenz MG, Wackernagel W (1994) Bacterial gene-transfer by
natural genetic-transformation in the environment.
Microbiological Reviews, 58, 563–602.
Luna GM, Manini E, Danovaro R (2002) Large fraction of dead
and inactive bacteria in coastal marine sediments:
comparison of protocols for determination and ecological
significance. Applied and Environmental Microbiology, 68, 3509–
3513.
MacLean D, Jones JDG, Studholme DJ (2009) Application of
‘next-generation’ sequencing technologies to microbial
genetics. Nature Reviews Microbiology, 7, 287–296.
Magurran AE (2004) Measuring Biological Diversity. Blackwell
Publishing, Oxford.
McCarthy A (2010) Third generation DNA sequencing: pacific
biosciences’ single molecule real time technology. Chemical
Biology, 17, 675–676.
Miller DN, Bryant JE, Madsen EL, Ghiorse WC (1999)
Evaluation and optimization of DNA extraction and
purification procedures for soil and sediment samples.
Applied and Environmental Microbiology, 65, 4715–4724.
Moeseneder MM, Arrieta JM, Herndl GJ (2005) A comparison
of DNA- and RNA-based clone libraries from the same
marine bacterioplankton community. FEMS (Federation of
European Microbiological Societies) Microbiology – Ecology, 51,
341–352.
Morales SE, Holben WE (2011) Linking bacterial identities and
ecosystem processes: can ‘omic’ analyses be more than the
sum of their parts? Fems Microbiology Ecology, 75, 2–16.
Nakano M, Komatsu J, Matsuura S et al. (2003) Single-
molecule PCR using water-in-oil emulsion. Journal of
Biotechnology, 102, 117–124.
Needleman S, Wunsch C (1970) A general method applicable to
the search for similarities in the amino acid sequence of two
proteins. Journal of Molecular Biology, 48, 443–453.
Nocker A, Sossa-Fernandez P, Burr MD, Camper AK (2007)
Use of propidium monoazide for live ⁄ dead distinction in
microbial ecology. Applied and Environmental Microbiology, 73,
5111–5117.
Nocker A, Richter-Heitmann T, Montijn R, Schuren F, Kort R
(2010) Discrimination between live and dead cells in
bacterial communities from environmental water samples
analyzed by 454 pyrosequencing. International Microbiology,
13, 59–65.
Nogales B, Lanfranconi MP, Pina-Villalonga JM, Bosch R (2011)
Anthropogenic perturbations in marine microbial
communities. FEMS (Federation of European Microbiological
Societies) Microbiology Reviews, 35, 275–298.
Not F, del Campo J, BalaguA� V, de Vargas C, Massana R
(2009) New insights into the diversity of marine
picoeukaryotes. PLoS ONE, 4, e7143.
Ochman H, Lawrence JG, Groisman EA (2000) Lateral gene
transfer and the nature of bacterial innovation. Nature, 405,
299–304.
Olsen GJ, Lane DJ, Giovannoni SJ, Pace NR, Stahl DA (1986)
Microbial ecology and evolution – a ribosomal-RNA
approach. Annual Review of Microbiology, 40, 337–365.
Pandey R, Nolte V, Schlotterer C (2010) CANGS: a user-
friendly utility for processing and analyzing 454 GS-FLX
data in biodiversity studies. BMC Research Notes, 3, 3.
Pernthaler J (2005) Predation on prokaryotes in the water
column and its ecological implications. Nature Reviews
Microbiology, 3, 537–546.
Pomeroy LR, Williams PJI, Azam F, Hobbie JE (2007) The
microbial loop. Oceanography, 20, 28–33.
Pommier T, Canback B, Riemann L et al. (2007) Global
patterns of diversity and community structure in marine
bacterioplankton. Molecular Ecology, 16, 867–880.
Pommier T, Canback B, Lundberg P, Hagstrom A, Tunlid A
(2009) RAMI: a tool for identification and characterization of
phylogenetic clusters in microbial communities.
Bioinformatics, 6, 736–742.
Pommier T, Neal PR, Gasol JM et al. (2010) Spatial patterns of
bacterial richness and evenness in the NW Mediterranean
Sea explored by pyrosequencing of the 16S rRNA. Aquatic
Microbial Ecology, 61, 212–224.
Prosser JI (2010) Replicate or lie. Environmental Microbiology, 12,
1806–1810.
Prosser JI, Bohannan BJM, Curtis TP et al. (2007) Essay – the
role of ecological theory in microbial ecology. Nature Reviews
Microbiology, 5, 384–392.
Pruesse E, Quast C, Knittel K et al. (2007) SILVA: a
comprehensive online resource for quality checked and
aligned ribosomal RNA sequence data compatible with ARB.
Nucleic Acids Research, 35, 7188–7196.
Quince C, Curtis TP, Sloan WT (2008) The rational exploration
of microbial diversity. The ISME Journal, 2, 997–1006.
Quince C, Lanzen A, Curtis TP et al. (2009) Accurate
determination of microbial diversity from 454
pyrosequencing data. Nature Methods, 6, 639–641.
� 2011 Blackwell Publishing Ltd

SEQUENCI NG AQUATIC MICROBIA L DI VERSITY 1895
Quince C, Lanzen A, Davenport RJ, Turnbaugh PJ (2011)
Removing noise from pyrosequenced amplicons. Bmc
Bioinformatics, 12, 38.
R Development Core Team (2009) R: a language and
environment for statistical computing. R. Foundation for
Statistical Computing. Vienna, Austria.
Reeder J, Knight R (2009) The ‘rare biosphere’: a reality check.
Nature Methods, 6, 636–637.
Reeder J, Knight R (2010) Rapidly denoising pyrosequencing
amplicon reads by exploiting rank-abundance distributions.
Nature Methods, 7, 668–669.
Rodriguez-Blanco A, Ghiglione JF, Catala P, Casamayor EO,
Lebaron P (2009) Spatial comparison of total vs. active
bacterial populations by coupling genetic fingerprinting and
clone library analyses in the NW Mediterranean Sea. FEMS
(Federation of European Microbiological Societies) Microbiology –
Ecology, 67, 30–42.
Rossello-Mora R, Amann R (2001) The species concept for
prokaryotes. FEMS (Federation of European Microbiological
Societies) Microbiology Reviews, 25, 39–67.
Rothschild LJ, Mancinelli RL (2001) Life in extreme
environments. Nature, 409, 1092–1101.
Rusch DB, Halpern AL, Sutton G et al. (2007) The sorcerer II
global ocean sampling expedition: Northwest Atlantic
through Eastern tropical pacific. PLoS Biology, 5, e77.
Schloss PD (2010) The effects of alignment quality, distance
calculation method, sequence filtering, and region on the
analysis of 16S rRNA gene-based studies. Plos Computational
Biology, 6, e1000844.
Schloss PD, Westcott SL (2011) Assessing and improving
methods used in operational taxonomic unit-based
approaches for 16S rRNA gene sequence analysis. Applied
and Environmental Microbiology, 77, 3219–3226.
Schloss PD, Westcott SL, Ryabin T et al. (2009) Introducing
mothur: open-source, platform-independent, community-
supported software for describing and comparing microbial
communities. Applied and Environmental Microbiology, 75,
7537–7541.
Shaw AK, Halpern AL, Beeson K et al. (2008) It’s all relative:
ranking the diversity of aquatic bacterial communities.
Environmental Microbiology, 10, 2200–2210.
Shendure J, Ji HL (2008) Next-generation DNA sequencing.
Nature Biotechnol., 26, 1135–1145.
Shi XL, Marie D, Jardillier L, Scanlan DJ, Vaulot D (2009)
Groups without cultured representatives dominate
eukaryotic picophytoplankton in the oligotrophic South East
Pacific Ocean. PLoS ONE, 4, e7657.
Slapeta J, Moreira D, Lopez-Garcia P (2005) The extent of
protist diversity: insights from molecular ecology of
freshwater eukaryotes. Proceedings Royal Society Section B,
272, 2073–2081.
Soejima T, Iida KI, Qin T et al. (2008) Method to detect only
live bacteria during PCR amplification. Journal of Clinical
Microbiology, 46, 2305–2313.
Sogin ML, Morrison HG, Huber JA et al. (2006) Microbial
diversity in the deep sea and the underexplored ‘‘rare
biosphere’’. Proceedings of the National Academy of Sciences of
the United States of America, 103, 12115–12120.
Stackebrandt E, Goebel BM (1994) Taxonomic note: a place for
DNA-DNA reassociation and 16S rRNA sequence analysis in
� 2011 Blackwell Publishing Ltd
the present species definition in bacteriology. International
Journal of Systematic Bacteriology, 44, 846–849.
Staley JT, Konopka A (1985) Measurement of in situ activities of
nonphotosynthetic microorganisms in aquatic and terrestrial
habitats. Annual Review of Microbiology, 39, 321–346.
Stoeck T, Zuendorf A, Breiner HW, Behnke A (2007) A
molecular approach to identify active microbes in
environmental eukaryote clone libraries. Microbial Ecology,
53, 328–339.
Stoeck T, Bass D, Nebel M et al. (2010) Multiple marker
parallel tag environmental DNA sequencing reveals a highly
complex eukaryotic community in marine anoxic water.
Molecular Ecology, 19, 21–31.
Sun YJ, Cai YP, Liu L et al. (2009) ESPRIT: estimating species
richness using large collections of 16S rRNA pyrosequences.
Nucleic Acids Research, 37, e76.
Taniguchi A, Hamasaki K (2008) Community structures of
actively growing bacteria shift along a north-south transect
in the western North Pacific. Environmental Microbiology, 10,
1007–1017.
Temperton B, Field D, Oliver A et al. (2009) Bias in assessments
of marine microbial biodiversity in fosmid libraries as
evaluated by pyrosequencing. The ISME Journal, 3, 792–796.
Thompson JD, Higgins DG, Gibson TJ (1994) Clustal-W –
improving the sensitivity of progressive multiple sequence
alignment through sequence weighting, position-specific gap
penalties and weight matrix choice. Nucleic Acids Research,
22, 4673–4680.
Thornhill DJ, Lajeunesse TC, Santos SR (2007) Measuring rDNA
diversity in eukaryotic microbial systems: how intragenomic
variation, pseudogenes, and PCR artifacts confound
biodiversity estimates. Molecular Ecology, 16, 5326–5340.
Urbach E, Vergin KL, Giovannoni SJ (1999) Immunochemical
detection and isolation of DNA from metabolically active
bacteria. Applied and Environmental Microbiology, 65, 1207–
1213.
Valentini A, Pompanon F, Taberlet P (2009) DNA barcoding
for ecologists. Trends in Ecology & Evolution, 24, 110–117.
Van Dongen S (2000) Graph clustering by flow simulation,
PhD thesis, University of Utrecht.
Venter JC, Remington K, Heidelberg JF et al. (2004)
Environmental genome shotgun sequencing of the Sargasso
Sea. Science, 304, 66–74.
Vlassov VV, Laktionov PP, Rykova EY (2007) Extracellular
nucleic acids. Bioessays, 29, 654–667.
Whitman WB, Coleman DC, Wiebe WJ (1998) Prokaryotes: the
unseen majority. Proceedings of the National Academy of
Sciences of the United States of America, 95, 6578–6583.
Whittaker RH (1972) Evolution and measurement of species
diversity. Taxon, 21, 213–251.
Wilhelm SW, Matteson AR (2008) Freshwater and marine
virioplankton: a brief overview of commonalities and
differences. Freshwater Biology, 53, 1076–1089.
von Wintzingerode F, Gobel UB, Stackebrandt E (1997)
Determination of microbial diversity in environmental
samples: pitfalls of PCR-based rRNA analysis. FEMS
(Federation of European Microbiological Societies) Microbiology
Reviews, 21, 213–229.
Wong KM, Suchard MA, Huelsenbeck JP (2008) Alignment
uncertainty and genomic analysis. Science, 319, 473–476.
1896 L. ZI NGER, A. G OBET and T. POMMIER
Worm B, Barbier EB, Beaumont N et al. (2006) Impacts of
biodiversity loss on ocean ecosystem services. Science, 314,
787–790.
Woyke T, Tighe D, Mavromatis K et al. (2010) One bacterial
cell, one complete genome. PLoS ONE, 5, e10314.
Yilmaz P, Kottmann R, Field D et al. (2011) Minimum
information about a marker gene sequence (MIMARKS) and
minimum information about any (x) sequence (MIxS)
specifications. Nature Biotechnology, 29, 415–420.
Yu Y, Breitbart M, McNairnie P, Rohwer F (2006) FastGroupII:
a web-based bioinformatics platform for analyses of large
16S rDNA libraries. BMC Bioinformatics, 7, 57.
Zhu F, Massana R, Not F, Marie D, Vaulot D (2005) Mapping
of picoeukaryotes in marine ecosystems with quantitative
PCR of the 18S rRNA gene. FEMS (Federation of European
Microbiological Societies) Microbiology – Ecology, 52, 79–92.
Zinger L, Amaral-Zettler LA, Fuhrman JA et al. (2011) Global
patterns of bacterial beta-diversity in seafloor and seawater
ecosystems. PLoS ONE, 6, e24570.
The authors have a long-standing experience in the production
and analysis of microbial diversity datasets based on sequen-
cing. They are interested in inferring the ecology, diversity and
biogeography of microbes, by using concepts of classical ecol-
ogy together with the development of molecular and bioinfor-
matic tools. L.Z. is a post-doctoral researcher whose research
focuses on soil and marine prokaryotic and fungal diversity.
A.G. is a post-doctoral researcher specialized in the diversity
of protists and bacteria in marine waters and sediments. T.P. is
a microbial ecologist whose research has long focused on mar-
ine diversity and distribution, he now focuses on the functional
diversity of bacteria involved in the N cycling in soil and in
the turnover of organic matter in aquatic environments.
Supporting information
Additional supporting information may be found in the online
version of this article.
Table S1 List of sample used in Fig. 4.
Please note: Wiley-Blackwell are not responsible for the content
or functionality of any supporting information supplied by the
authors. Any queries (other than missing material) should be
directed to the corresponding author for the article.
� 2011 Blackwell Publishing Ltd
Copyright © 2022 FDOKUMEN