Turkey:Macroeconomic Vulnerability,Competitiveness and the Labour Market
134
TURKISH ECONOMIC ASSOCIATION DISCUSSION PAPER 2005/5 http :// www.tek. org.tr TURKEY: MACROECONOMIC VULNERABILITY, COMPETITIVENESS AND THE LABOUR MARKET Josef Pöschl, Hermine Vidovic, Julia Wörz and Vasily Astrov May, 2005
-
Upload
independent -
Category
Documents
-
view
0 -
download
0
Transcript of Turkey:Macroeconomic Vulnerability,Competitiveness and the Labour Market
TURKISH ECONOMIC ASSOCIATION
DISCUSSION PAPER 2005/5 http ://www.tek. org.tr
TURKEY: MACROECONOMIC VULNERABILITY, COMPETITIVENESS
AND THE LABOUR MARKET
Josef Pöschl, Hermine Vidovic, Julia Wörz and Vasily Astrov
May, 2005
wiiw Current Analyses and Country Profiles | April 2005
Josef Pöschl, Hermine Vidovic, Julia Wörz and Vasily Astrov
Turkey: Macroeconomic Vulnerability, Competitiveness and the Labour Market
Josef Pöschl, Hermine Vidovic, Julia Wörz and Vasily Astrov are wiiw Research Economists.
This paper is based on a study commissioned by and written for the Austrian Federal Chancellery
Josef Pöschl, Hermine Vidovic,
Julia Wörz and Vasily Astrov
Turkey: Macroeconomic
Vulnerability,
Competitiveness and the
Labour Market
Contents
Summary......................................................................................................................................... i
A Macroeconomic dynamics.................................................................................................... 1
Population, size of the economy and income per capita compared to other countries .......... 1
Turkey’s macro-development: dynamic instability?................................................................. 3
Strong governments more the exception than the rule ........................................................... 6
Public sector debt..................................................................................................................... 8
Economic policy: challenges facing the fiscal and monetary authorities............................... 12
The structure of the current account...................................................................................... 13
Exchange rates and real appreciation ................................................................................... 14
Wages .................................................................................................................................... 16
Turkey’s international financial position ................................................................................ 19
Capital flight............................................................................................................................ 20
Banking sector ....................................................................................................................... 20
The macroeconomic situation after 2001 .............................................................................. 22
Outlook: critical years ahead ................................................................................................. 24
The Turkish economy in the context of the country’s candidature for accession.................. 26
B Major regional disparities within Turkey........................................................................... 29
Regional income distribution.................................................................................................. 29
Regional features of the labour market.................................................................................. 30
Regional wage disparities ...................................................................................................... 33
C The changing structure of the Turkish economy............................................................. 35
A predominance of small enterprises – at least in numerical terms...................................... 37
A contrast to the host of SMEs: three major international players ....................................... 38
Mixed degree of concentration in manufacturing................................................................... 41
The discreet presence of the transnational corporations ...................................................... 43
D Turkey’s foreign trade relations ........................................................................................ 48
Institutional framework ........................................................................................................... 48
Evolution of foreign trade ...................................................................................................... 49
Trade in goods: geographical structure....................................................................... 51
Trade in goods: commodity structure .......................................................................... 54
Trade in agriculture...................................................................................................... 56
Trade specialization patterns....................................................................................... 57
Trade in services.......................................................................................................... 61
Foreign direct investment ............................................................................................ 63
Impact of the customs union.................................................................................................. 66
General equilibrium effects of EU membership on trade....................................................... 68
Short-term prospects for Turkey’s foreign trade ................................................................... 69
The Turkish Straits – a chokehold on energy in transit ......................................................... 72
E Labour market ...................................................................................................................... 76
Population and internal migration .......................................................................................... 76
Employment ........................................................................................................................... 78
Informal sector employment ........................................................................................ 78
Decline in employment and activity rates .............................................................................. 79
Informal sector employment ........................................................................................ 81
Low share of part-time work ........................................................................................ 83
Employment structure well below European standards ........................................................ 83
Unemployment....................................................................................................................... 85
Child labour ............................................................................................................................ 87
Migration................................................................................................................................. 88
References.................................................................................................................................. 89
APPENDIX.........................................................................................................................................97
List of Tables, Figures and Boxes
Table 1 The size of the Turkish economy compared to neighbouring countries, 2002 .................. 2
Table 2 Current account flows and balances, 1990 to 2004 (% of GDP)...................................... 13
Table 3 Average weekly actual working hours and average monthly gross wages in industry by economic activity, state versus private sector status and periods............................... 17
Table 4 Average monthly gross wages in manufacturing, January to June 2003 in EUR at exchange rates............................................................................................................... 17
Table 5 Average monthly gross wages in industry, selected countries, 2003 in EUR at exchange rates............................................................................................................... 18
Table 6 External assets and liabilities, at end-2003 (USD million) ................................................ 19
Table 7 Economic situation prior to the announcement of negotiations: Turkey compared to selected other/former accession countries .................................................. 27
Table 8 Gross national product per capita in 2001......................................................................... 29
Table 9 Monthly gross wages in the private industrial sector: January-June 2003, by geographical regions and selected provinces.............................................................. 33
Table 10 Manufacturing enterprises in Turkey, by category of size and persons employed.......... 37
Table 11 Turkish companies ranked by Forbes Global 2000 among the 2000 largest companies worldwide measured by a composite of sales, profits, assets and market value in 2002....................................................................................... 38
Table 12 Sales revenues of the 25 largest companies in Turkey, 2003.......................................... 40
Table 13 Concentration in Turkish manufacturing industry, 2001 Industries with aggregate revenues of over EUR 1 billion or unpublished revenues, ranked by CR4 ratios............ 42
Table 14 Turkey's trade structure, by partner................................................................................... 52
Table 15 Importance of Turkey to selected trade partners .............................................................. 53
Table 16 Trade shares with EU-15 of total trade 2002 (in %).......................................................... 53
Table 17 Turkey's trade revenues in services (USD million) ........................................................... 62
Table 18 FDI overview for Turkey in comparison to Greece and EU-15......................................... 65
Table 19 Economy-wide net protection rates for Turkey (NPRs) .................................................... 66
Table 20 Projected oil pipelines by-passing the Turkish Straits....................................................... 74
Table 21 Employment development, by sector, in 1000.................................................................. 80
Table 22 Employment rates in selected EU countries/candidate countries, by gender employed in % of working age population 15-64............................................. 82
Table 23 Youth unemployment rates in selected EU countries/candidate countries, in %............. 86
Figure 1 GDP growth at constant prices, 1981 to 2003 (in %).......................................................... 4
Figure 2 Consumer prices, nominal exchange rate, nominal wages and discount rate, 1995 to 2004......................................................................................................................... 5
Figure 3 Public sector net debt in % of GDP, 2000 to 2003.............................................................. 8
Figure 4 Central government: expenditures including interest payments; expenditures, excluding interest payments; revenues, 1996 to 2003 (% of GDP) ................................. 10
Figure 5 Public sector borrowing requirements (PSBR), 1990 to 2003 (% of GDP)...................... 11
Figure 6 Inflation-adjusted currency appreciation, 1995 to 2004. Wholesale price index (2000 = 1) divided by YTL-EUR exchange rate index (2000 = 1) ................................... 14
Figure 7 Unit labour costs exchange-rate adjusted (43% EUR 56% USD basket), seasonally adjusted, private manufacturing companies, 1997 = 100 .............................. 16
Figure 8 Banking sector fragility indicator for Turkey, January 1979 to May 2004......................... 22
Figure 9 Gross monthly wages in EU candidate countries and selected NMS, in EUR, average 2003........................................................................................................ 26
Figure 10 Activity rates, employment and unemployment rates by region, 2003, in % ................... 32
Figure 11 Employment structures by region, 2003............................................................................ 32
Figure 12 Gross value-added at factor costs (GDP concept), selected sectors, 1987 prices ......... 35
Figure 13 Shares in total manufacturing, 1963 to 1967 and 1996 to 2000....................................... 36
Figure 14 Turkey’s trade volume, 1989 to 2003 ............................................................................... 50
Figure 15 Turkey’s trade volume with the EU-15, 1989 to 2003 ...................................................... 51
Figure 16 Turkey's export structure, by commodities ....................................................................... 55
Figure 17 Turkey's import structure, by commodities........................................................................ 55
Figure 18 Export specialization indices for Turkey ............................................................................ 58
Figure 19 Export specialization indices for Greece ........................................................................... 58
Figure 20 Export specialization indices for the EU-15....................................................................... 59
Figure 21 Revealed comparative advantages in trade in manufactures, 1995................................ 60
Figure 22 Revealed comparative advantages trade in manufactures, 2003.................................... 60
Figure 23 Turkey: population growth and birth rate population growth in %, birth rate: number of births per 1000 population................................................................................ 77
Figure 24 Employment rates in selected EU countries and Turkey, 1996 and 2003, in % of working-age population (15-64 years)................................................................... 81
Figure 25 Employment patterns in selected EU countries and Turkey, % of total ........................... 84
Figure 26 Unemployment rates in selected EU countries and Turkey, 1995, 2000 and 2003, in %................................................................................................ 86
Box 1 Tax issues............................................................................................................................. 8
Box 2 Exchange rate regime........................................................................................................ 15
Box 3 Regional inequality: rural-urban relations.......................................................................... 31
Box 4 Promotion of investment, research and development ...................................................... 34
Box 5 Privatization ........................................................................................................................ 44
Box 6 Free Trade Zones (FTZs) ..................................................................................................57
Appendix
Table A1 Macroeconomic overview................................................................................................98
Table A2 Southeast Europe: an overview of economic fundamentals, 2003 .............................100
Table A3 Gross Domestic Product at current prices: shares of economic sectors, 1980 to 2003..................................................................................................................101
Table A4 Balance of payments, 1990 to 2003, in % of GDP.......................................................102
Table A5 Economic and financial relations with the outside world, 1990 to 2005 ......................103
Table A6 Turkey’s foreign trade volume, 1989 to 2003...............................................................104
Table A7 Turkey’s trade structure by product groups..................................................................105
Table A8 Revealed Comparative Advantages in manufacturing, 1995 ......................................106
Table A9 Revealed Comparative Advantages in manufacturing, 2003 ......................................107
Table A10 Regional structure of Turkey’s manufacturing exports, 1995 ......................................108
Table A11 Regional structure of Turkey’s manufacturing imports, 1995 ......................................108
Table A12 Regional structure of Turkey’s manufacturing exports, 2003 ......................................109
Table A13 Regional structure of Turkey’s manufacturing imports, 2003 ......................................109
Table A14 Foreign Direct Investment figures for Turkey, 1980 to 2004........................................110
Table A15 Total outstanding external debt profile (USD million)...................................................111
Table A16 Currency composition of total outstanding external debt, in % of total........................112
Table A17 Total outstanding external debt by borrower, USD million, 1996 to 2004 ..................113
Table A18 Public sector borrowing requirement and consolidated government budget ..............114
Table A19 Military expenditures of Turkey compared to Austria, Greece and USA.....................115
List of abbreviations
AKP Justice and Development Party (Adalet ve Kalkınma Partisi) AP Accession Partnership ATC Agreement on Textiles and Clothing BIT Bilateral Investment treaty BSF Banking Sector Fragility CAP Common Agricultural Policy (EU) CBA Collective bargaining agreement CCT Common Customs Tariff CIS Commonwealth of Independent States DEM German Mark DIE State Institute of Statistics (Devlet İstatistik Enstitüsü) EEC European Economic Community EFTA European Free Trade Agreement EU European Union EU-15 EU Member states up to 30 April 2004 EU-25 EU Member states starting from 1 May 2004 EU-Ameco Annual macro-economic database (EU) FDI Foreign Direct Investment FTZ Free trade zone GATT General Agreement on Tariffs and Trade GDFI General Directorate of Foreign Investments GDP Gross Domestic Product GNI Gross National Income GVA Gross Value Added ILO International Labour Organisation IMF International Monetary Fund LFS Labour Force Survey LTA Long Term Agreement Regarding International Trade in Cotton Textiles MFA Multi Fibre Agreement NAFTA North American Free Trade Agreement NMS New Member States (EU) OECD Organization of Economic Cooperation and Development PPP Purchasing Power Parity PSBR Public Sector Borrowing Requirement RCA Revealed comparative advantage SEE State Economic Enterprise: Enterprise controlled and managed by the state SEE-8 The eight Southeast European countries Albania, Bosnia-Herzegovina, Bulgaria, Croatia, Greece, Macedonia, Romania Serbia and Montenegro SIS State Institute of Statistics (Turkish abbreviation: DIE) SPO State Planning Organization TRL Turkish Lira (Turkish Pound), legal tender up to 31 January 2004 UN United Nations UNCTAD United Nations Conference on Trade and Development UNDP United Nations Development Programme USD US Dollar VAT Value Added Tax WTO World Trade Organisation YASED Foreign Investors Association (Yabancı Sermaye Derneği) YTL New Turkish lira (starting from 1 January 2005)
i
Summary
Macroeconomic aspects
In terms of size, the Turkish economy is only about 4% of the EU-25 as a whole; however, Turkey is a major player, in economic terms as well, among its neighbours in South-East Europe and Asia. By regional standards, the Turkish economy is relatively developed. The country may well exert a greater influence over this part of the world further in the next few years. In the second quarter of 2004, Turkey achieved a real year-on-year GDP growth of 14.4%, re-affirming its capability as a highly dynamic economy. This high growth-rate, one of the highest worldwide, raised concerns of overheating. Observers started asking whether once again, high growth would be short-lived and then brought to an abrupt stop by yet another crisis. The upsurge in the second-quarter growth was the outcome of kick-factors relating to private consumption: something that cannot be repeated. In the third and fourth quarters, the growth rate was only 5.3% and 6.3% respectively, and the growth rate for the year 2004 as a whole was 8,9%. In all likelihood, GDP growth has returned to a band between 5% and 10%. That is what can be expected from 2005 and 2006, with rates not much above the lower limit. Quite possibly, growth will remain that strong for even longer. It seems that both the Turkish authorities and their advisors, the international financial institutions, have learnt their lesson from the crisis in 1999 – and more particularly 2001. The government is focused on achieving large primary surpluses, and the public debt-GDP ratio has already dropped close to 70%. The banking sector reform was an extremely costly, yet successful operation. GDP growth rates as high as 5% to 10% could well raise fears of a burgeoning current account deficit. The latter has increased, but hopefully not to an unsustainable extent, thanks to the strong dynamics in the export of both goods and services. As can be seen from the foreign trade-GDP ratios, the Turkish economy used to be comparatively closed; it is now turning into a fairly open economy. Over the past few years, dynamics came into play in many different respects and directions. There were periods when the GDP grew very rapidly for several years, only to enter into an abrupt recession and even GDP decline. Not for long, however, as the economy repeatedly demonstrated its ability to revert swiftly to high growth. Turkey’s population had also grown accustomed to dynamics in a nominal sense – most of the time, inflation ran to two digits, and efforts were more directed towards preventing it from running to three digits. Since 2001, however, price dynamics have decelerated; the annual rate of inflation is close to single digits with a corresponding slowdown in currency depreciation. From the first half of 2003 onwards, there have been periods without any depreciation – and some even with slight appreciation. The risk of an economic setback, generated by internal factors has not disappeared completely. The country’s macroeconomic weak spot is still to be found in the public sector’s fiscal sphere. No matter which government rules the country over the next decade or so, it will have to service high debt. Other expenditures will have to be cut back correspondingly; otherwise the public debt-GDP ratio will remain high or rise even further. This is a difficult task; it runs counter to the urgent need for public investment in areas of significance for the country’s future socio-economic development. Over the next few years in particular, a significant increase in the debt-GDP ratio would undermine the growing confidence in Turkey’s future economic prosperity. The present government envisages important reforms. The short-term consequences of those reforms will scarcely meet with broad
ii
public acceptance. Privatization is likely to increase unemployment, at least in the short term, while the agricultural reform package entails not only a shift to a new subsidy system, but also a cut in total subsidies. In other words, it is not certain that for the next legislative period Turkey will again have a government that enjoys a comfortable parliamentary backing. Parliamentary elections are due in November 2007 at the latest. The next few years will surely prove to be a difficult transitional phase. For the present government, coming through this phase successfully will be easier if the international business climate remains favourable and international lending rates low. The risk of an economic setback also looms in the transition from the previous state of high inflation and permanent or repeated devaluation to one of low inflation and exchange rate stability. Once the risk of devaluation disappears nominal interest rates start attracting the attention of international financial investors. Capital inflows can become massive and lead to currency appreciation. Given Turkey’s export specialization (see below), the country is vulnerable to currency appreciation: exporters can easily lose their competitive edge. The current account could start yielding deficits which, at some point in time, could give financial investors the jitters. Macroeconomic considerations are only one aspect. The structural characteristics of the economy are no less important. The share of agriculture in the Turkish economy is still high – not only in terms of employment, but also with regard to its contribution to GDP. Trade including tourism creates almost as much value added as the manufacturing sector. Small enterprises, most of them under-developed by EU standards, dominate the country’s manufacturing sector, as well as large parts of the services sector. At the same time, small and medium-sized enterprises were the seedbed for larger private companies. Most of them are now embedded in large holdings that have expanded their activities across the economy: in manufacturing, trade, tourism and finance. They have frequently entered into joint ventures with foreign companies, and extended their operations abroad, where they operate as traders – and frequently as direct investors as well. They have contributed to the change in the structure of Turkey’s corporate sector, especially in the structure of manufacturing. The production of machinery, transport equipment and durable consumer goods now accounts for an ever-increasing share in total value-added. Foreign trade
The customs union with the EU, which entered into force on 1 January 1996, has contributed greatly to opening up Turkey’s economy, bringing about major increases in the volume of foreign trade. Turkish exports have more than doubled: up from USD 21.6 billion worldwide in 1995 to 47.2 billion in 2003. Imports have also increased: up from USD 35.7 billion to 66.7 billion over the same period. The EU share in Turkish trade flows has remained constant at about 50% of exports and 47% of imports. Owing to an asymmetric abolition of trade barriers (the EU abolished tariffs on most industrial goods from Turkey in the early 1970s whereas Turkey only lifted tariffs on entering the customs union),the customs union initially had a greater impact on the country’s imports than on its exports. Textiles account for the lion’s share of Turkey’s exports, whereas the main import items are transport equipment, chemicals and manufactured goods. The Turkish economy faces the challenging task of increasing the international renown of its brands and designs, thus strengthening the country’s position in the higher value-added segments of the European market. The focus on undifferentiated, low-technology and low-skill-intensive goods persists, despite Turkish export patterns having improved somewhat over time: the share of
iii
manufacturing in total exports increased from 25% in 1979 to 52% in 1989 and accounted for 54% in 2003. Intra-industry trade has also gained in importance; however, it is often the result of vertical differentiation, with Turkey specializing in low-tech and low-skill-intensive activities. Following Turkey’s adoption in 2001 of the national programme for the adoption of the acquis, trade in services has increased noticeably in volume compared to the mid-1990s. The net contribution of services is positive and has risen to more than 5% of GDP. Travel services are the prominent feature of trade in services, even though trade in other business-related and financial services has also increased recently. With the entry into force of the customs union between the EU and Turkey, many of the features attributable to potential EU membership and the improved market access related thereto have already materialized (viz. customs controls, tariff and non-tariff barriers, competition law, industrial commercial and intellectual property rights, harmonization with EU technical standards, etc.), even though the customs union only covers industrial products. Turkey’s largest gains from further integration are expected to come about as a result of institutional reforms and reduced corruption stimulated by the prospects of EU membership. At present, Turkey continues to struggle with technical barriers to trade, while the EU still does not recognize the Turkish Accreditation Agency (European Round Table of Industrialists 2004). Labour market
Over the past decade, the main features of the Turkish labour market have been: persistent migration from rural to urban regions; changes in the composition of the workforce; and a decline in employment and activity rates, particularly those of women. In contrast to the EU-15 where employment rates have increased over recent years, they have continued to drop in Turkey. Thus, on entry into the EU, Turkey would find itself at the lower end of the EU scale, even behind the latecomer Poland. The female employment rate in Turkey is extremely low, less than half the EU average. In Turkey, employment is still heavily concentrated on the agricultural sector (34%), particularly in the eastern parts of the country. This is indicative of an ongoing transition towards an industry and service economy. The share of services in total employment is much lower than in the EU, yet higher than in Romania and similar to Bulgaria; this is attributable to Turkey’s well-developed tourist sector. Employment in high-skill services, such as financial intermediation and business services, is still under-developed. Informal sector employment is reportedly on the increase; estimates as to its size vary from the figure of 13% cited by the Statistical Office and the OECD assumed figure of close on 50% of all persons employed. In 2003 nearly half of all employees were not registered in any social security institution. Unemployment has been on the rise over the past few years; it is currently higher than in the EU, especially in urban regions and among young educated people. The yawning gap between urban and rural unemployment is mainly due to the widespread practice of family members working as unpaid labour in agriculture. Interestingly, the proportion of long-term unemployed is very low: only 24% in 2003, whereas it is close to 50% in Poland and 60% in Romania. Unemployment is particularly high among young educated people in urban areas: some 30% in 2003. As in the European Union, unemployment rates differ widely between regions. Southern Anatolia suffers most
iv
from high unemployment: a jobless rate of 21.6%, which is double the national average. By way of contrast, the Black Sea region and East Anatolia report the lowest jobless rates, while all other regions are close to the national average. As in other developing countries, child labour is very common in Turkey. The Accession Partnership (AP) has identified the strengthening of efforts to tackle the problem of child labour as one of the short-term priorities and objectives related to employment and social affairs. Initial steps towards reducing child labour were undertaken as far back as 1991 when Turkey joined the ILO International Programme on the Elimination of Child Labour. Since then child labour has decreased substantially; in 1999 it totalled some 500,000 6-14 year olds. Child labour is mostly to be found in agriculture, but it is also to be seen in the furniture and manufacturing industries, as well as in restaurants. The wave of internal migration dating back to the fifties is still underway. Most people migrate from the eastern to the western parts of Turkey; many of the migrants have only been to elementary school, if at all. Their job opportunities are limited to manual labour by virtue of their having worked previously in farming or some other low-skill activity. Lack of public security in the east and southeast of the country, the unequal distribution of job opportunities and regional income disparities are the main reasons for the massive scale of migration in Turkey. In the 1990s, the main targets for internal migrants from the agricultural areas in Anatolia were the Marmara region (an industrialized area) together with the Mediterranean region (a tourist area). Today some 3.2 million Turkish nationals live in the European Union, the bulk of whom (two thirds) are concentrated in Germany. Other important host countries are the Benelux countries, France and Austria. Many of these Turks were born and bred in EU countries. In most cases, the original immigrants came from rural areas and had little schooling. However, over the past few years migration has taken a new turn: an increased number of Turks with advanced professional qualifications and university degrees are emigrating to Europe and the CIS. Conclusion
Given the structure of industry, foreign trade and the labour market in Turkey, it is obvious that the country is lagging behind in comparison to the developed EU countries. However, except for the current state of the labour market, Turkey’s economy, including its macroeconomic performance, is by no means significantly or substantially inferior to other lesser-developed EU candidate countries, present and past. It has developed a remarkable dynamism in terms of economic growth and structural adjustment. The small size of its economy suggests that from an economic point of view, accepting Turkey as an EU member does not incur any major risk. The current fierce debate raging over Turkey’s future membership is directed mainly towards non-economic topics. Keywords: Turkey, macroeconomic vulnerability, trade competitiveness, labour markets JEL codes: F14, F22, F23, F30, F41, H60, L95, O11, O17, O52, O57

1
Josef Pöschl, Hermine Vidovic, Julia Wörz and Vasily Astrov*
Turkey: macroeconomic vulnerability, trade and competitiveness, and labour markets
A Macroeconomic dynamics
Population, size of the economy and income per capita compared to other countries
Turkey has a population of around 71 million (estimate for mid-2004): less than Germany (82.6 million), but more than the other EU member states. In recent years, the Turkish population has risen each year by about 1.1 million. However, its growth is expected to decelerate in the course of the next decades; in its medium variant, the UN Population Division (2004) has forecast a population of close to 89 million for 2025 and around 98 million for 2050. Whether these estimates prove accurate or not hinges on the country’s future economic development. In the case of strong long-term economic expansion encompassing most parts of the country, the population growth rate would probably be low. Turkish citizens with an income close or superior to the West European average tend towards low birth rates. Birth rates are high where people are relatively poor: in certain segments of urban agglomerations and less developed rural areas. As evidenced in various other countries, family-related government policies also have an appreciable impact on population growth (Neyer 2003). With a surface area of some 780,000 square kilometres, Turkey is larger than France, the largest EU country (547,000 sq km). Compared to the extent of its territory and the size of its population, the country’s economy is small in terms of the volume of productive capacity and total annual output. Compared to the EU-25, Turkey’s gross domestic product (GDP) was only 4.4% in 2003. Each year, Turkey’s economy produces a GDP and/or gross national income (GNI) similar in size to that of Poland, measured in purchasing power parities (PPPs).1 In terms of size, Turkey’s economy is large in comparison to its close or more remote Balkan neighbours: Albania, Bosnia and Herzegovina, Bulgaria, Croatia, Macedonia, Romania, Serbia and Montenegro – and even Greece, a EU member state. Table 1 compares those countries’ GDP, GDP per capita and price levels. In 2002, Turkey’s GDP amounted to EUR 415 billion (in PPPs) compared to 187 billion for Greece and 139 billion for Romania. Only one country in Turkey’s immediate neighbourhood boasts an economy of similar size: Iran, whose GNI stood at EUR 476 billion in 2002 (DEİK, 2004a). Of Turkey’s more remote neighbours, only one economy is much larger: Russia with a GDP of EUR 1031 billion. Ukraine’s economy is about half that of Turkey’s, while Israel’s economy is about one third. In terms of its national economy, territory and
* The authors would like to thank Ms Bengi Kibritçioğlu and Professor Aykut Kibritçioğlu, Turkish economists, for their
tireless support in collecting data, search of literature and providing valuable background information. 1 See Table 1 and for the countries of Central and Eastern Europe Gligorov, Pöschl and Richter (2004), where both the
gross domestic product and GDP per capita can be found; the difference between GDP and gross national income (GNI) is negligible in the given context. If measured in exchange rates, Poland’s and Turkey’s GDP are once again similar in size.
2
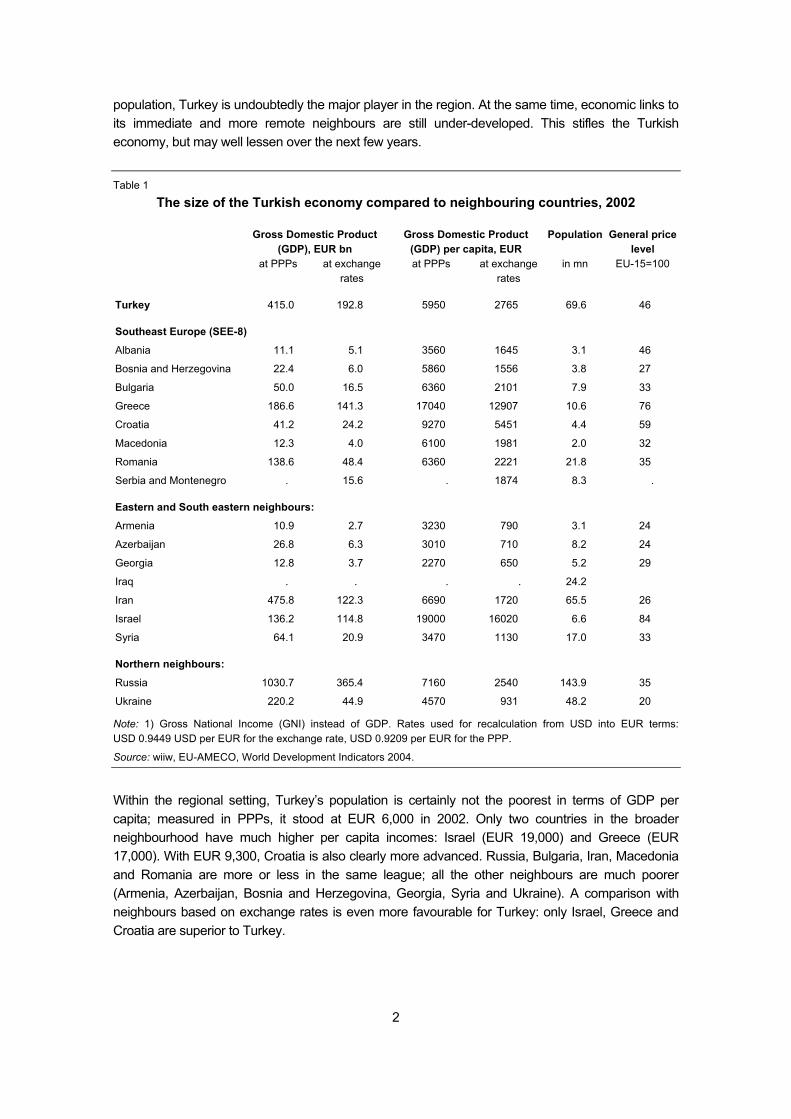
population, Turkey is undoubtedly the major player in the region. At the same time, economic links to its immediate and more remote neighbours are still under-developed. This stifles the Turkish economy, but may well lessen over the next few years. Table 1
The size of the Turkish economy compared to neighbouring countries, 2002
Gross Domestic Product (GDP), EUR bn
Gross Domestic Product (GDP) per capita, EUR
Population General price level
at PPPs at exchange rates
at PPPs at exchange rates
in mn EU-15=100
Turkey 415.0 192.8 5950 2765 69.6 46
Southeast Europe (SEE-8)
Albania 11.1 5.1 3560 1645 3.1 46
Bosnia and Herzegovina 22.4 6.0 5860 1556 3.8 27
Bulgaria 50.0 16.5 6360 2101 7.9 33
Greece 186.6 141.3 17040 12907 10.6 76
Croatia 41.2 24.2 9270 5451 4.4 59
Macedonia 12.3 4.0 6100 1981 2.0 32
Romania 138.6 48.4 6360 2221 21.8 35
Serbia and Montenegro . 15.6 . 1874 8.3 .
Eastern and South eastern neighbours:
Armenia 10.9 2.7 3230 790 3.1 24
Azerbaijan 26.8 6.3 3010 710 8.2 24
Georgia 12.8 3.7 2270 650 5.2 29
Iraq . . . . 24.2
Iran 475.8 122.3 6690 1720 65.5 26
Israel 136.2 114.8 19000 16020 6.6 84
Syria 64.1 20.9 3470 1130 17.0 33
Northern neighbours:
Russia 1030.7 365.4 7160 2540 143.9 35
Ukraine 220.2 44.9 4570 931 48.2 20
Note: 1) Gross National Income (GNI) instead of GDP. Rates used for recalculation from USD into EUR terms: USD 0.9449 USD per EUR for the exchange rate, USD 0.9209 per EUR for the PPP.
Source: wiiw, EU-AMECO, World Development Indicators 2004.
Within the regional setting, Turkey’s population is certainly not the poorest in terms of GDP per capita; measured in PPPs, it stood at EUR 6,000 in 2002. Only two countries in the broader neighbourhood have much higher per capita incomes: Israel (EUR 19,000) and Greece (EUR 17,000). With EUR 9,300, Croatia is also clearly more advanced. Russia, Bulgaria, Iran, Macedonia and Romania are more or less in the same league; all the other neighbours are much poorer (Armenia, Azerbaijan, Bosnia and Herzegovina, Georgia, Syria and Ukraine). A comparison with neighbours based on exchange rates is even more favourable for Turkey: only Israel, Greece and Croatia are superior to Turkey.
3
Table 1 also allows us to compare the general price levels in the different countries2. Turkey’s general price level is 46% compared to the EU-15, which is rather high for the neighbourhood. Once again, Israel, Greece and Croatia record higher ratios (84%, 76% and 59%, respectively). In all other countries listed in Table 1, price levels are lower than in Turkey – and in some cases even much lower, viz. the Ukraine with a ratio of 20%. The lower both GDP per capita and overall price levels tend to be, the less developed a country is. In other words, seen from a regional perspective, Turkey is relatively developed. Turkey’s macro-development: dynamic instability?
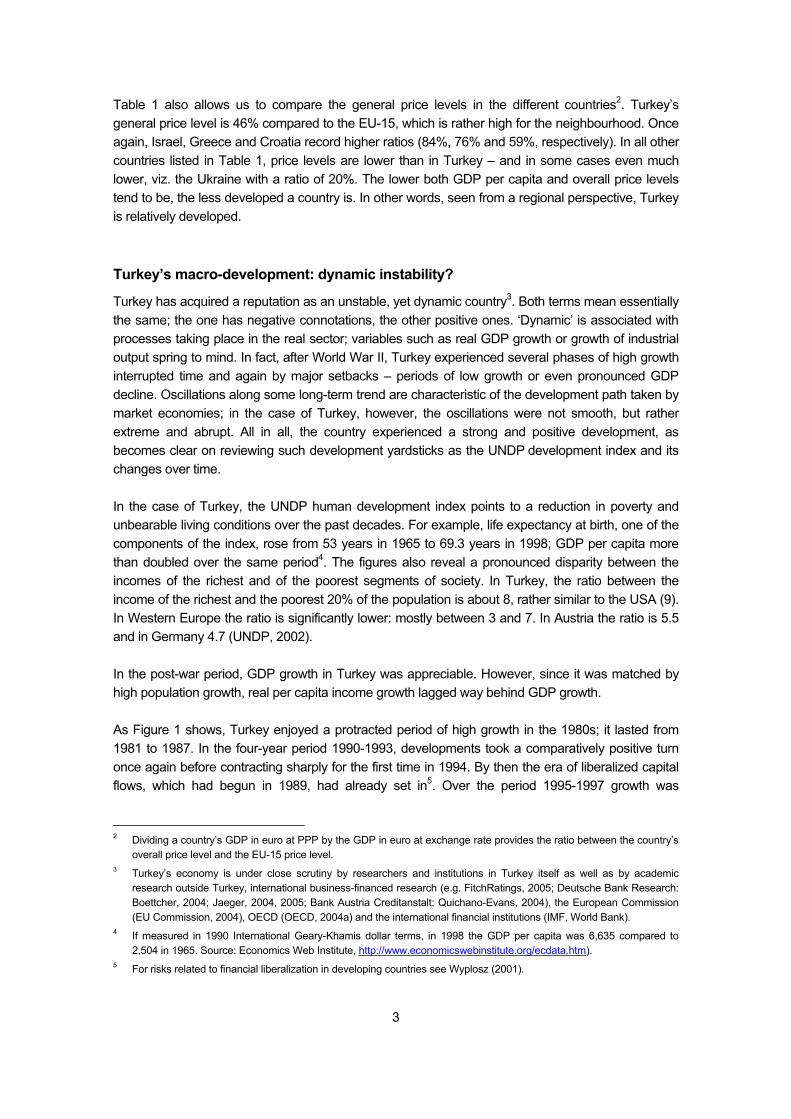
Turkey has acquired a reputation as an unstable, yet dynamic country3. Both terms mean essentially the same; the one has negative connotations, the other positive ones. ‘Dynamic’ is associated with processes taking place in the real sector; variables such as real GDP growth or growth of industrial output spring to mind. In fact, after World War II, Turkey experienced several phases of high growth interrupted time and again by major setbacks – periods of low growth or even pronounced GDP decline. Oscillations along some long-term trend are characteristic of the development path taken by market economies; in the case of Turkey, however, the oscillations were not smooth, but rather extreme and abrupt. All in all, the country experienced a strong and positive development, as becomes clear on reviewing such development yardsticks as the UNDP development index and its changes over time. In the case of Turkey, the UNDP human development index points to a reduction in poverty and unbearable living conditions over the past decades. For example, life expectancy at birth, one of the components of the index, rose from 53 years in 1965 to 69.3 years in 1998; GDP per capita more than doubled over the same period4. The figures also reveal a pronounced disparity between the incomes of the richest and of the poorest segments of society. In Turkey, the ratio between the income of the richest and the poorest 20% of the population is about 8, rather similar to the USA (9). In Western Europe the ratio is significantly lower: mostly between 3 and 7. In Austria the ratio is 5.5 and in Germany 4.7 (UNDP, 2002). In the post-war period, GDP growth in Turkey was appreciable. However, since it was matched by high population growth, real per capita income growth lagged way behind GDP growth. As Figure 1 shows, Turkey enjoyed a protracted period of high growth in the 1980s; it lasted from 1981 to 1987. In the four-year period 1990-1993, developments took a comparatively positive turn once again before contracting sharply for the first time in 1994. By then the era of liberalized capital flows, which had begun in 1989, had already set in5. Over the period 1995-1997 growth was
2 Dividing a country’s GDP in euro at PPP by the GDP in euro at exchange rate provides the ratio between the country’s
overall price level and the EU-15 price level. 3 Turkey’s economy is under close scrutiny by researchers and institutions in Turkey itself as well as by academic
research outside Turkey, international business-financed research (e.g. FitchRatings, 2005; Deutsche Bank Research: Boettcher, 2004; Jaeger, 2004, 2005; Bank Austria Creditanstalt: Quichano-Evans, 2004), the European Commission (EU Commission, 2004), OECD (OECD, 2004a) and the international financial institutions (IMF, World Bank).
4 If measured in 1990 International Geary-Khamis dollar terms, in 1998 the GDP per capita was 6,635 compared to 2,504 in 1965. Source: Economics Web Institute, http://www.economicswebinstitute.org/ecdata.htm).
5 For risks related to financial liberalization in developing countries see Wyplosz (2001).
4
satisfactory once more, whereas in both 1999 and 2001 GDP suffered another steep decline6. The interim year (2000) was marked by pronounced growth. 2002 and 2003 also yielded good results, while results in 2004 proved to be even better. Over the past decades, the real sector development has been clearly dynamic (Figure 1).
Figure 1
GDP growth at constant prices, 1981 to 2004 (in %)
-10
-8
-6
-4
-2
0
2
4
6
8
10
12
1981
1982
1983
1984
1985
1986
1987
1988
1989
1990
1991
1992
1993
1994
1995
1996
1997
1998
1999
2000
2001
2002
2003
2004
GDP
Source: State Office for Statistics.
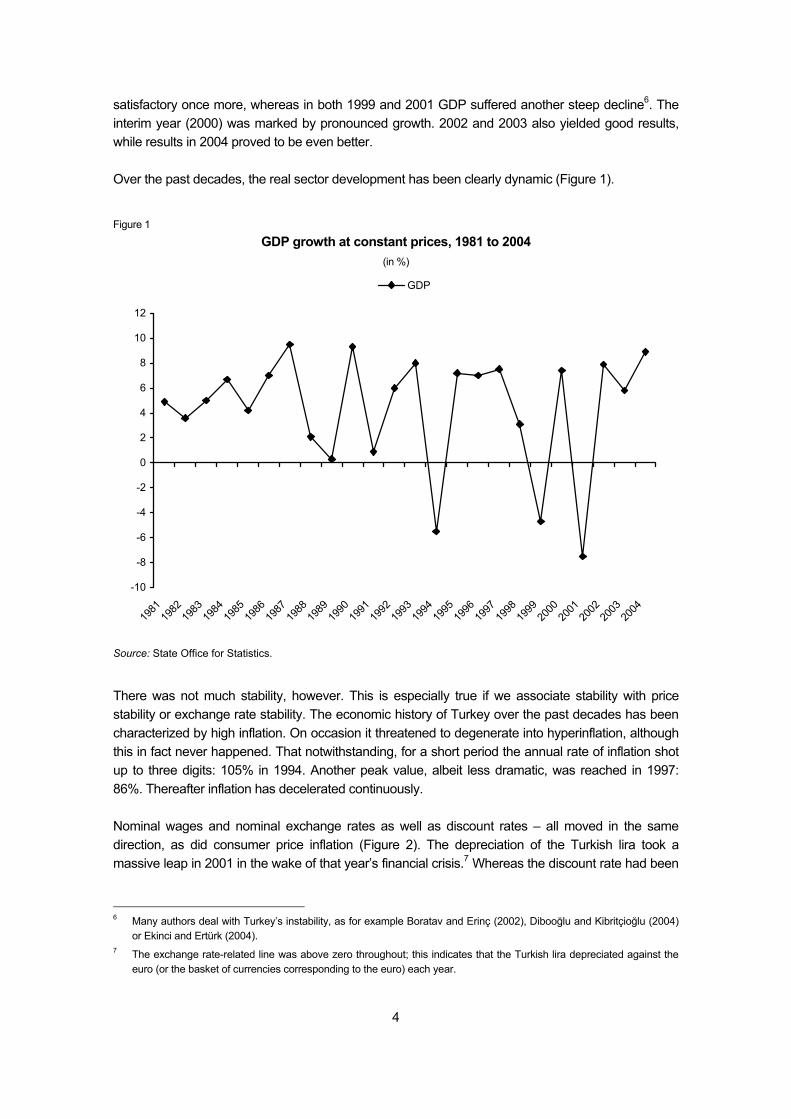
There was not much stability, however. This is especially true if we associate stability with price stability or exchange rate stability. The economic history of Turkey over the past decades has been characterized by high inflation. On occasion it threatened to degenerate into hyperinflation, although this in fact never happened. That notwithstanding, for a short period the annual rate of inflation shot up to three digits: 105% in 1994. Another peak value, albeit less dramatic, was reached in 1997: 86%. Thereafter inflation has decelerated continuously. Nominal wages and nominal exchange rates as well as discount rates – all moved in the same direction, as did consumer price inflation (Figure 2). The depreciation of the Turkish lira took a massive leap in 2001 in the wake of that year’s financial crisis.7 Whereas the discount rate had been
6 Many authors deal with Turkey’s instability, as for example Boratav and Erinç (2002), Dibooğlu and Kibritçioğlu (2004)
or Ekinci and Ertürk (2004). 7 The exchange rate-related line was above zero throughout; this indicates that the Turkish lira depreciated against the
euro (or the basket of currencies corresponding to the euro) each year.
5
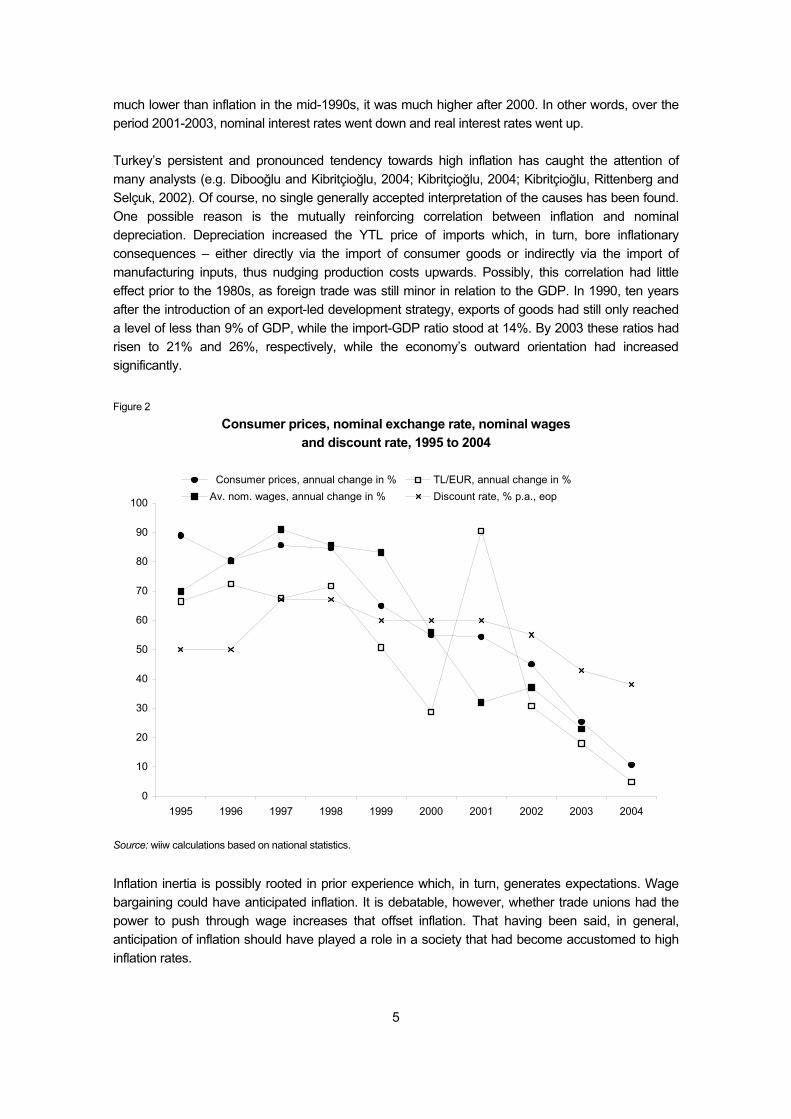
much lower than inflation in the mid-1990s, it was much higher after 2000. In other words, over the period 2001-2003, nominal interest rates went down and real interest rates went up. Turkey’s persistent and pronounced tendency towards high inflation has caught the attention of many analysts (e.g. Dibooğlu and Kibritçioğlu, 2004; Kibritçioğlu, 2004; Kibritçioğlu, Rittenberg and Selçuk, 2002). Of course, no single generally accepted interpretation of the causes has been found. One possible reason is the mutually reinforcing correlation between inflation and nominal depreciation. Depreciation increased the YTL price of imports which, in turn, bore inflationary consequences – either directly via the import of consumer goods or indirectly via the import of manufacturing inputs, thus nudging production costs upwards. Possibly, this correlation had little effect prior to the 1980s, as foreign trade was still minor in relation to the GDP. In 1990, ten years after the introduction of an export-led development strategy, exports of goods had still only reached a level of less than 9% of GDP, while the import-GDP ratio stood at 14%. By 2003 these ratios had risen to 21% and 26%, respectively, while the economy’s outward orientation had increased significantly. Figure 2
Consumer prices, nominal exchange rate, nominal wages and discount rate, 1995 to 2004
0
10
20
30
40
50
60
70
80
90
100
1995 1996 1997 1998 1999 2000 2001 2002 2003 2004
Consumer prices, annual change in % TL/EUR, annual change in %Av. nom. wages, annual change in % Discount rate, % p.a., eop
Source: wiiw calculations based on national statistics.
Inflation inertia is possibly rooted in prior experience which, in turn, generates expectations. Wage bargaining could have anticipated inflation. It is debatable, however, whether trade unions had the power to push through wage increases that offset inflation. That having been said, in general, anticipation of inflation should have played a role in a society that had become accustomed to high inflation rates.
6
Up to 1996, the first year of the customs union with the EU, protection against foreign competition played an important, even if diminishing role. Together with GDP growth, protectionism may have created internal bottlenecks in certain segments of the economy, thus fuelling inflation. In all likelihood, the state played an important role where inflation was concerned. For many countries, economists have tried to find evidence of a close link between government deficits and inflation. The relationship between these two variables may not be that simple, however. Kibritçioğlu (2004) argues that periods of deteriorating public governance are more likely to be accompanied by increasing inflation. In a country where the production of public utilities and key segments of manufacturing are dominated by public enterprises, state-regulated prices play an important role. Pushing prices upwards has a positive effect on public sector revenues. In Turkey, where inflation was endemic, permitting regulated prices to rise was by far the easiest way of supplementing government revenues – especially for weak governments. Strong governments more the exception than the rule
The state sector plays an important socio-economic role in Turkey. This fact may have deep historical roots. In a manner of speaking, the Ottoman Empire was an extension of the Byzantine Empire; it was engaged in ruling over a vast territory with a most diverse population. Its main pillars had always been the administration and the army. The more regulations there are, the more often civil servants have to be approached. If a person or company requires a service of a government body, the most practical first step is to seek direct support or intervention or mediated support from somebody who works in administration, ideally at a senior level. This strategy is common to many societies; in Turkey, however, it is extremely widespread. Once a senior civil servant has made a suggestion, however informal, to an official lower down on the scale, the latter is left with little choice. Without that backing, most Turks do not expect civil servants to treat them amicably – at least at no cost. There is little public confidence in complaints being treated equitably. In this respect, as in many others, Turkey is full of contrasts; in certain sectors of the civil service employees are efficient, skilful and incorruptible. Maintaining control over the public administration with all its subdivisions is a difficult enough task for governments across the globe. In Turkey public governance has been especially difficult over the past few decades. Governments with a comfortable majority in the parliament, similar to the current government, have been more the exception than the rule. However, even governments with strong parliamentary backing have had to be aware that they could be removed from office at any time – as soon as the military leaders determined that they had violated the fundamental principles of the state: the two most important tenets being laicism and the undividable national state. Large parts of the population have never identified with these principles, but nevertheless the army has always been held in high respect by most Turks. The constitution accords the military a custodian role: an assignment that the military has taken seriously. On several occasions, it has intervened not only behind the scenes, but also quite openly and rigorously.
7
In 1960 the military seized power, put the prime minister in gaol and started things anew – with a new constitution.8 In 1971, after three years of eroding public security due to politically motivated violence from different angles, the military leaders forced a change in government but did not impose direct rule. In 1980, the military seized power and introduced martial law throughout country, appointing a national security council and entrusting an assembly with the task of drafting a new constitution. Some 30,000 people were gaoled, including several top politicians who were subsequently banned from all political functions for ten years. 1980 also marked a turning point in economic policy: liberalization and export-orientation were introduced. In 1997, the National Security Council ousted the Islamist prime minister, Erbakan. The National Security Council has always had an influence on Turkish politics on a regular basis. Each month senior government ministers are called in to report to the heads of the various branches of the armed forces, who then pronounce on a whole range of issues. It used to be risky to ignore the views so presented. Most of the time, the Council had a problem with political parties with religious leanings. On several occasions, the military leadership introduced a ban of such parties only to have them resurface under another name with ever-increasing support from the electorate. The Justice and Development Party (Adalet ve Kalkınma Partisi – AKP) currently in power, which won a large majority in the general election in November 2002, came from this camp. Prime Minister Erdoğan’s government has one aim in common with the military leadership: paving the way for Turkey’s accession to the EU. This entails strengthening democratic institutions and, at the same time, consolidating laicism as one of the fundamentals, hardly something to be expected from that party. It also entails making concessions in terms of federalization and minority9 rights, hardly something that the military leadership can accept easily. Debate is raging in Turkey on whether the indivisible nation state will survive, should EU accession require that, at least in some districts, Kurdish be introduced as a second official language (Oran, 2004). In August 2004, President Ahmet Sezer confirmed the appointment of a civilian to head the National Security Council. Since the Council’s supremacy is not compatible with the European Union’s Copenhagen criteria, from mid-2003 onwards legislation has accorded the council the status of an advisory body, the counts of which are subject to scrutiny by the audit court (Schäfer, 2004). Over the past decades, Turkish governments, possibly more than their developed country counterparts, have usually been exposed to pressure from different quarters such as the military, armed resistance, opposition parties, coalition squabbles, the electorate, or economic imbalances. Public governance has been especially poor in some periods. As a consequence, little has been done to combat corruption, which has a long tradition in the region, similar to many other less developed countries. In the more remote past, Turkish government revenues were very low in relation to the GDP, whereas in the meantime this ratio has increased (Figure 4). There may well have been a link between poor public governance and low tax revenues. For example, it is quite possible that the application of taxation laws has been only fragmentary. In the early 1990s, tax revenues made up about 15% of GDP. Only after 1997 did they climb to over 20%; in recent years they have come close to 30%. To some extent, this may reflect, inter alia, more efficient tax collection.
8 For a chronology of political events see, e.g., Ecoi.net (2004). 9 For a discussion of minority issues (in Turkish language) see Baskın (2004).
8
Box 1
Tax issues
Turkey’s most important tax rates are the following (YASED, 2004):
• Corporate income tax: 30%;
• Dividend withholding tax: 10%;
• Personal income tax rate for: salaries: 15 to 40%, other income: 20 to 45%;
• Value-added tax: 18% for most domestically produced and imported goods and services; 8% for basic foodstuffs, books, natural gas and medical products; 1% for journals, newspapers, certain agricultural goods and most leasing transactions.
Exempt from VAT are e.g. exported goods and services, transhipment of goods through Turkey.
A recent reform of the tax system provides for inflation accounting applicable in the event of future high-inflation periods.
Turkey applies a two-tier corporate income tax system, this provides for both accelerated depreciation and investment allowances. As a result, the effective tax burden can be very low if a company’s purchases of new machinery and equipment exceed its profits in the same year.
Public sector debt
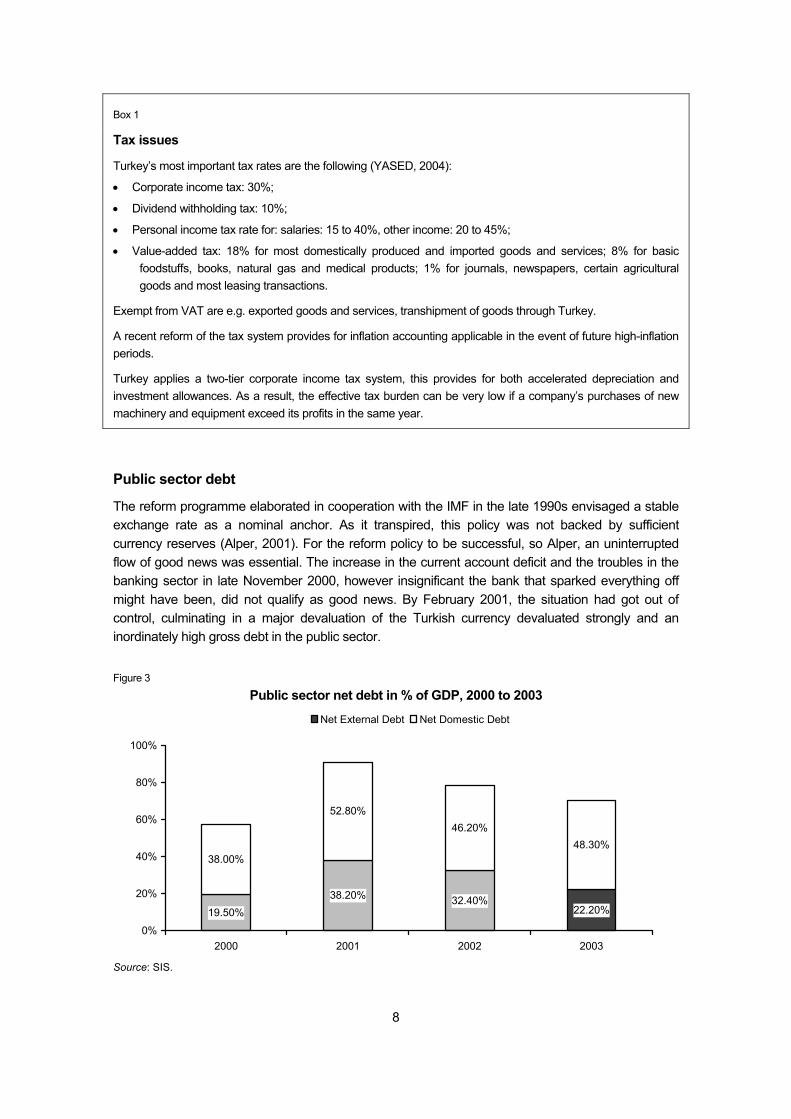
The reform programme elaborated in cooperation with the IMF in the late 1990s envisaged a stable exchange rate as a nominal anchor. As it transpired, this policy was not backed by sufficient currency reserves (Alper, 2001). For the reform policy to be successful, so Alper, an uninterrupted flow of good news was essential. The increase in the current account deficit and the troubles in the banking sector in late November 2000, however insignificant the bank that sparked everything off might have been, did not qualify as good news. By February 2001, the situation had got out of control, culminating in a major devaluation of the Turkish currency devaluated strongly and an inordinately high gross debt in the public sector. Figure 3
Public sector net debt in % of GDP, 2000 to 2003
19.50%38.20% 32.40%
22.20%
38.00%
52.80%46.20%
48.30%
0%
20%
40%
60%
80%
100%
2000 2001 2002 2003
Net External Debt Net Domestic Debt
Source: SIS.
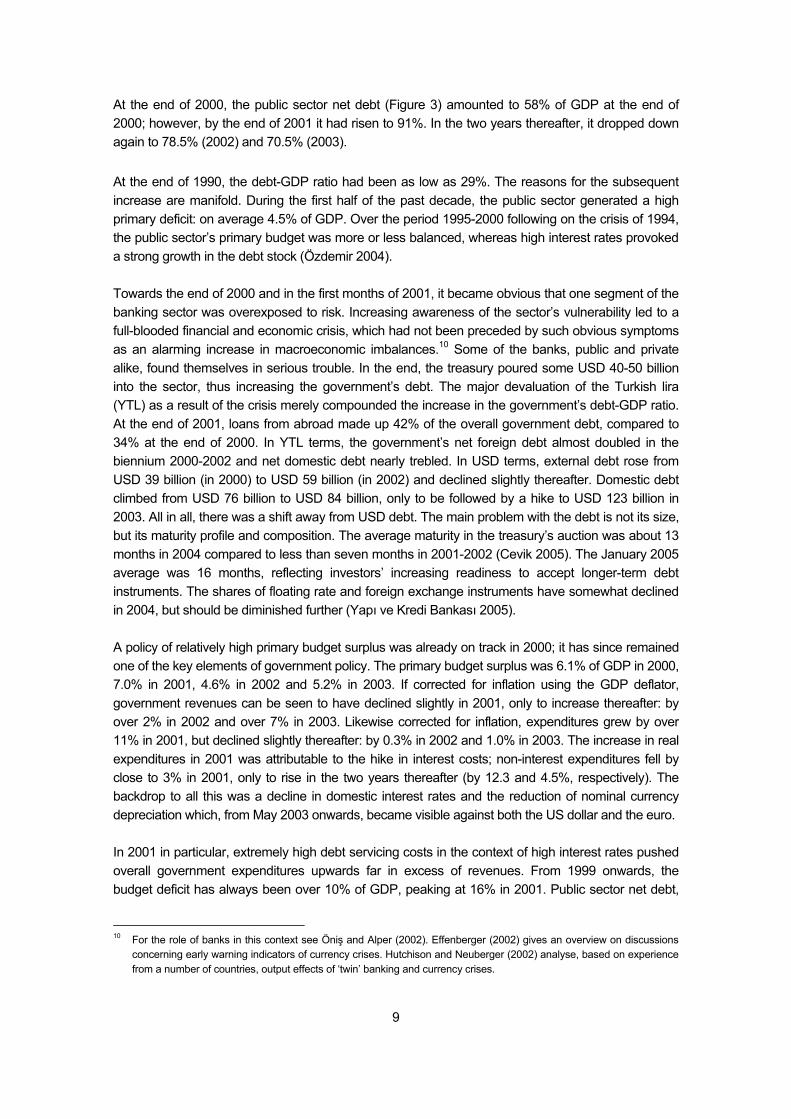
9
At the end of 2000, the public sector net debt (Figure 3) amounted to 58% of GDP at the end of 2000; however, by the end of 2001 it had risen to 91%. In the two years thereafter, it dropped down again to 78.5% (2002) and 70.5% (2003). At the end of 1990, the debt-GDP ratio had been as low as 29%. The reasons for the subsequent increase are manifold. During the first half of the past decade, the public sector generated a high primary deficit: on average 4.5% of GDP. Over the period 1995-2000 following on the crisis of 1994, the public sector’s primary budget was more or less balanced, whereas high interest rates provoked a strong growth in the debt stock (Özdemir 2004). Towards the end of 2000 and in the first months of 2001, it became obvious that one segment of the banking sector was overexposed to risk. Increasing awareness of the sector’s vulnerability led to a full-blooded financial and economic crisis, which had not been preceded by such obvious symptoms as an alarming increase in macroeconomic imbalances.10 Some of the banks, public and private alike, found themselves in serious trouble. In the end, the treasury poured some USD 40-50 billion into the sector, thus increasing the government’s debt. The major devaluation of the Turkish lira (YTL) as a result of the crisis merely compounded the increase in the government’s debt-GDP ratio. At the end of 2001, loans from abroad made up 42% of the overall government debt, compared to 34% at the end of 2000. In YTL terms, the government’s net foreign debt almost doubled in the biennium 2000-2002 and net domestic debt nearly trebled. In USD terms, external debt rose from USD 39 billion (in 2000) to USD 59 billion (in 2002) and declined slightly thereafter. Domestic debt climbed from USD 76 billion to USD 84 billion, only to be followed by a hike to USD 123 billion in 2003. All in all, there was a shift away from USD debt. The main problem with the debt is not its size, but its maturity profile and composition. The average maturity in the treasury’s auction was about 13 months in 2004 compared to less than seven months in 2001-2002 (Cevik 2005). The January 2005 average was 16 months, reflecting investors’ increasing readiness to accept longer-term debt instruments. The shares of floating rate and foreign exchange instruments have somewhat declined in 2004, but should be diminished further (Yapı ve Kredi Bankası 2005). A policy of relatively high primary budget surplus was already on track in 2000; it has since remained one of the key elements of government policy. The primary budget surplus was 6.1% of GDP in 2000, 7.0% in 2001, 4.6% in 2002 and 5.2% in 2003. If corrected for inflation using the GDP deflator, government revenues can be seen to have declined slightly in 2001, only to increase thereafter: by over 2% in 2002 and over 7% in 2003. Likewise corrected for inflation, expenditures grew by over 11% in 2001, but declined slightly thereafter: by 0.3% in 2002 and 1.0% in 2003. The increase in real expenditures in 2001 was attributable to the hike in interest costs; non-interest expenditures fell by close to 3% in 2001, only to rise in the two years thereafter (by 12.3 and 4.5%, respectively). The backdrop to all this was a decline in domestic interest rates and the reduction of nominal currency depreciation which, from May 2003 onwards, became visible against both the US dollar and the euro. In 2001 in particular, extremely high debt servicing costs in the context of high interest rates pushed overall government expenditures upwards far in excess of revenues. From 1999 onwards, the budget deficit has always been over 10% of GDP, peaking at 16% in 2001. Public sector net debt,
10 For the role of banks in this context see Öniş and Alper (2002). Effenberger (2002) gives an overview on discussions
concerning early warning indicators of currency crises. Hutchison and Neuberger (2002) analyse, based on experience from a number of countries, output effects of ‘twin’ banking and currency crises.
10
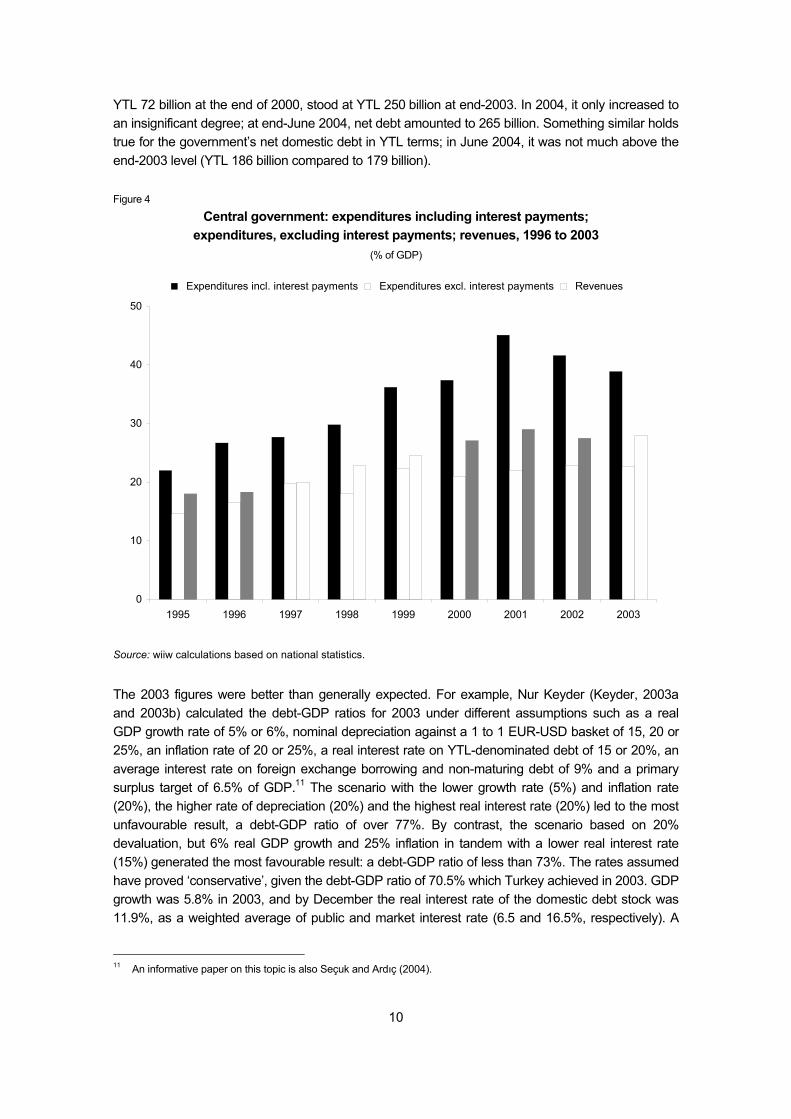
YTL 72 billion at the end of 2000, stood at YTL 250 billion at end-2003. In 2004, it only increased to an insignificant degree; at end-June 2004, net debt amounted to 265 billion. Something similar holds true for the government’s net domestic debt in YTL terms; in June 2004, it was not much above the end-2003 level (YTL 186 billion compared to 179 billion). Figure 4
Central government: expenditures including interest payments; expenditures, excluding interest payments; revenues, 1996 to 2003
(% of GDP)
0
10
20
30
40
50
1995 1996 1997 1998 1999 2000 2001 2002 2003
Expenditures incl. interest payments Expenditures excl. interest payments Revenues
Source: wiiw calculations based on national statistics.
The 2003 figures were better than generally expected. For example, Nur Keyder (Keyder, 2003a and 2003b) calculated the debt-GDP ratios for 2003 under different assumptions such as a real GDP growth rate of 5% or 6%, nominal depreciation against a 1 to 1 EUR-USD basket of 15, 20 or 25%, an inflation rate of 20 or 25%, a real interest rate on YTL-denominated debt of 15 or 20%, an average interest rate on foreign exchange borrowing and non-maturing debt of 9% and a primary surplus target of 6.5% of GDP.11 The scenario with the lower growth rate (5%) and inflation rate (20%), the higher rate of depreciation (20%) and the highest real interest rate (20%) led to the most unfavourable result, a debt-GDP ratio of over 77%. By contrast, the scenario based on 20% devaluation, but 6% real GDP growth and 25% inflation in tandem with a lower real interest rate (15%) generated the most favourable result: a debt-GDP ratio of less than 73%. The rates assumed have proved ‘conservative’, given the debt-GDP ratio of 70.5% which Turkey achieved in 2003. GDP growth was 5.8% in 2003, and by December the real interest rate of the domestic debt stock was 11.9%, as a weighted average of public and market interest rate (6.5 and 16.5%, respectively). A
11 An informative paper on this topic is also Seçuk and Ardıç (2004).
11
comparison of the average exchange rates in 2002 and 2003 yields 0.8% nominal appreciation against the US dollar, but 17.9% depreciation against the euro. The average rate of inflation, year-on-year, was 22.5%. The primary surplus achieved in 2003, 5.8% of GDP, remained somewhat below the target. In 2004, GDP growth was high (8,9%), given that it was 11,8% in the first and 14.4% in the second quarter. Depreciation against the euro was moderate (annual average 2004 over 2003). The real interest rate was also declining, and the primary budget balance was significantly positive again. In other words, in 2004 the debt-GDP ratio converged further towards the debt ceiling as defined in the Maastricht treaty. In all the years shown, government expenditures, excluding interest payments, were lower than revenues. From 2000 onwards, the primary surplus was very significant. At the same time, high debt-servicing requirements pushed the overall government deficit far above revenues.
Figure 5
Public sector borrowing requirements (PSBR), 1990 to 2003 (% of GDP)
-12
-8
-4
0
4
8
12
16
1995 1996 1997 1998 1999 2000 2001 2002 2003
PSBR PSBR excluding interest payment
Source: wiiw calculations based on national statistics.
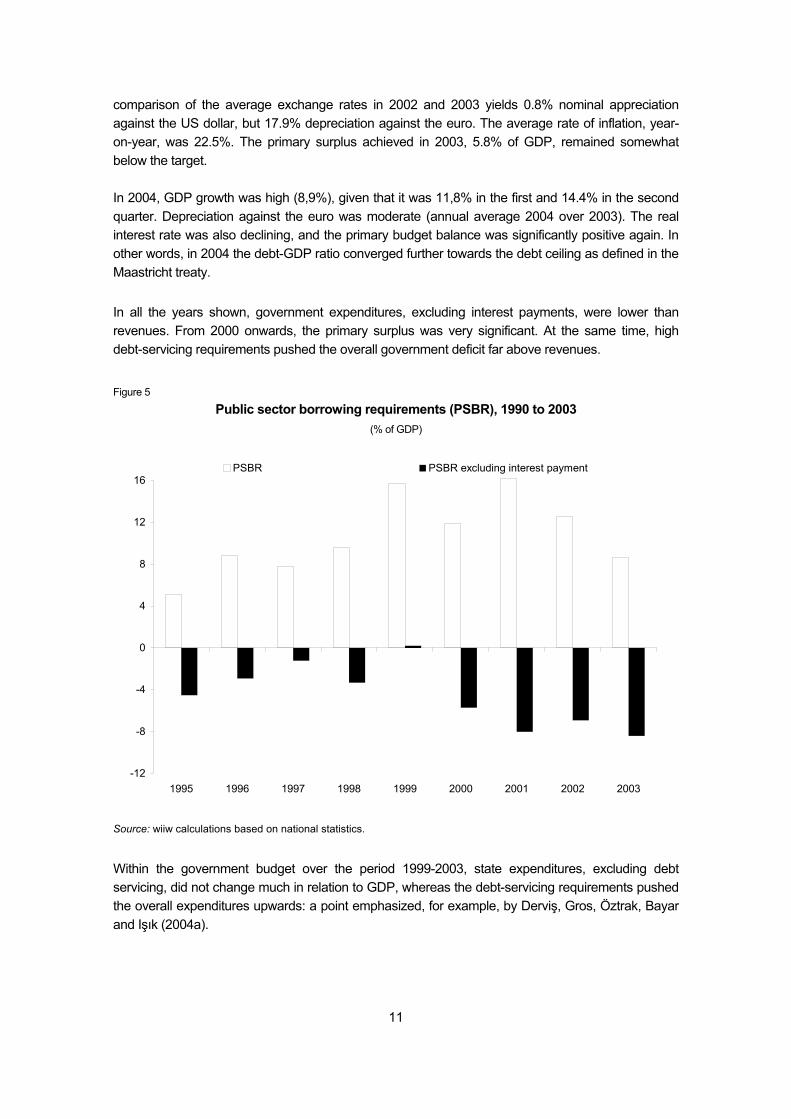
Within the government budget over the period 1999-2003, state expenditures, excluding debt servicing, did not change much in relation to GDP, whereas the debt-servicing requirements pushed the overall expenditures upwards: a point emphasized, for example, by Derviş, Gros, Öztrak, Bayar and Işık (2004a).
12
Turkish statistics not only provide data about the budget of the central government, but the statistics on public sector borrowing requirements (PSBR) also show the size of the of the public sector deficit in a comprehensive sense. They also record deficit data for the various public sector subdivisions such as state-run enterprises (state economic enterprises, SEEs), those SEEs transferred to the privatization agency, as well as the social security system and extra-budgetary funds. In those statistics, a positive sign indicates a borrowing requirement: it thus points to a deficit. The results derived from the PSBR statistics do not differ substantially from those shown in the central government statistics. The PSBR has been most positive in recent years: up to 16% of GDP in 2001. This indicates a very high deficit for the public sector as a whole. If debt servicing is left aside, the PSBR takes a markedly negative turn: down to –8% of GDP (see Figure 5). These negative figures reflect primary surpluses in the public sector as a whole. Economic policy: challenges facing the fiscal and monetary authorities
Combating high public indebtedness is a primordial objective of the government’s fiscal policy. It is important that it achieve a high primary budget surplus over the next few years. By pursuing such a policy, the government risks losing popularity. Thus, it will probably relax budgetary discipline somewhat when approaching the next elections. The government also runs the risk of dwindling popularity, at least among the less affluent electorate, if it relies mainly on cuts in expenditures to meet its budgetary goals. The arguments calling for this particular route to come from many directions: for many experts, cutting expenditures is always more popular than striving for higher revenues, being as it is quite in line with the ideal of a ‘slim’ state. If it economizes on transfers in the context of pensions and the health system, farming subsidies or job-seekers, the government may disappoint many of those who constitute their electoral base. In principle, in a democracy it should not matter too much if a ruling party loses popularity and is replaced by opposition parties. However, Turkey is now at a critical stage; it needs firm and professional political governance in the interest of economic consolidation. The constraints on the expenditure side are severe: the army is large and absorbs a significant part of the budget, the social security system is unbalanced, massive investment in infrastructure, education and research are required. The population has had to pay into a mandatory savings system from the late 1980s onwards; a court decision has committed the government to start repayments. In the case of Turkey, it would be important to improve tax collection, whence the public sector could gain much without increasing tax rates. However, it is difficult to achieve that aim, as it is also a question of combating corruption: an extremely difficult undertaking, especially in the short run. The main tax burden will continue to be borne by consumers and employees. The declared goal of monetary policy is achieving and maintaining almost stable prices. The recent achievements in this respect are impressive. Within a matter of months, the annual rate of inflation has dropped to below 10% (December 2004); it seems likely that this trend will continue. The exchange rate has stopped depreciating. The situation, however, is not without its dangers. Confidence in future exchange rate stability or gradual nominal appreciation could spread, in which case Turkey may prove very attractive for international financial investors. The key variable for them, in such circumstances, is nominal interest rates, which are still high. In other words, capital inflows could boost appreciation tendencies. They could place undue strain on the Turkish business sector,
13
whose international competitiveness would suffer.12 It will be difficult to chart the right course, given that the room for manoeuvre is in fact limited. The structure of the current account
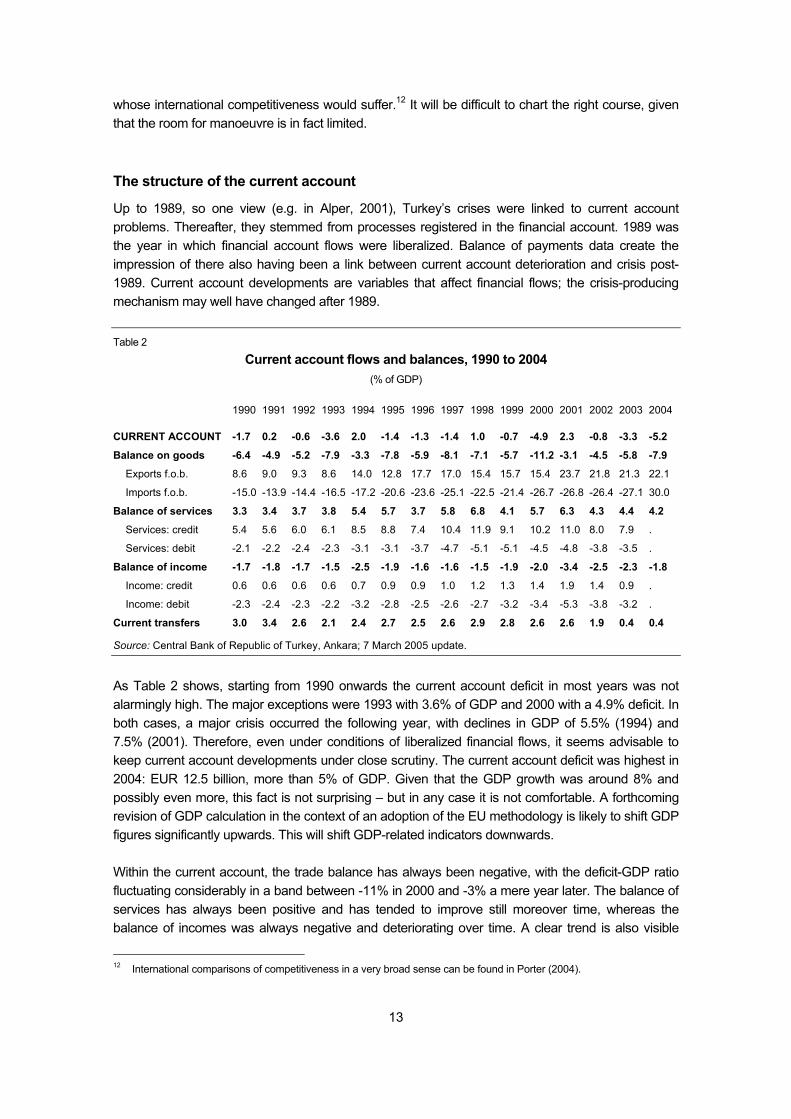
Up to 1989, so one view (e.g. in Alper, 2001), Turkey’s crises were linked to current account problems. Thereafter, they stemmed from processes registered in the financial account. 1989 was the year in which financial account flows were liberalized. Balance of payments data create the impression of there also having been a link between current account deterioration and crisis post-1989. Current account developments are variables that affect financial flows; the crisis-producing mechanism may well have changed after 1989. Table 2
Current account flows and balances, 1990 to 2004 (% of GDP)
1990 1991 1992 1993 1994 1995 1996 1997 1998 1999 2000 2001 2002 2003 2004
CURRENT ACCOUNT -1.7 0.2 -0.6 -3.6 2.0 -1.4 -1.3 -1.4 1.0 -0.7 -4.9 2.3 -0.8 -3.3 -5.2
Balance on goods -6.4 -4.9 -5.2 -7.9 -3.3 -7.8 -5.9 -8.1 -7.1 -5.7 -11.2 -3.1 -4.5 -5.8 -7.9
Exports f.o.b. 8.6 9.0 9.3 8.6 14.0 12.8 17.7 17.0 15.4 15.7 15.4 23.7 21.8 21.3 22.1
Imports f.o.b. -15.0 -13.9 -14.4 -16.5 -17.2 -20.6 -23.6 -25.1 -22.5 -21.4 -26.7 -26.8 -26.4 -27.1 30.0
Balance of services 3.3 3.4 3.7 3.8 5.4 5.7 3.7 5.8 6.8 4.1 5.7 6.3 4.3 4.4 4.2
Services: credit 5.4 5.6 6.0 6.1 8.5 8.8 7.4 10.4 11.9 9.1 10.2 11.0 8.0 7.9 .
Services: debit -2.1 -2.2 -2.4 -2.3 -3.1 -3.1 -3.7 -4.7 -5.1 -5.1 -4.5 -4.8 -3.8 -3.5 .
Balance of income -1.7 -1.8 -1.7 -1.5 -2.5 -1.9 -1.6 -1.6 -1.5 -1.9 -2.0 -3.4 -2.5 -2.3 -1.8
Income: credit 0.6 0.6 0.6 0.6 0.7 0.9 0.9 1.0 1.2 1.3 1.4 1.9 1.4 0.9 .
Income: debit -2.3 -2.4 -2.3 -2.2 -3.2 -2.8 -2.5 -2.6 -2.7 -3.2 -3.4 -5.3 -3.8 -3.2 .
Current transfers 3.0 3.4 2.6 2.1 2.4 2.7 2.5 2.6 2.9 2.8 2.6 2.6 1.9 0.4 0.4
Source: Central Bank of Republic of Turkey, Ankara; 7 March 2005 update.
As Table 2 shows, starting from 1990 onwards the current account deficit in most years was not alarmingly high. The major exceptions were 1993 with 3.6% of GDP and 2000 with a 4.9% deficit. In both cases, a major crisis occurred the following year, with declines in GDP of 5.5% (1994) and 7.5% (2001). Therefore, even under conditions of liberalized financial flows, it seems advisable to keep current account developments under close scrutiny. The current account deficit was highest in 2004: EUR 12.5 billion, more than 5% of GDP. Given that the GDP growth was around 8% and possibly even more, this fact is not surprising – but in any case it is not comfortable. A forthcoming revision of GDP calculation in the context of an adoption of the EU methodology is likely to shift GDP figures significantly upwards. This will shift GDP-related indicators downwards. Within the current account, the trade balance has always been negative, with the deficit-GDP ratio fluctuating considerably in a band between -11% in 2000 and -3% a mere year later. The balance of services has always been positive and has tended to improve still moreover time, whereas the balance of incomes was always negative and deteriorating over time. A clear trend is also visible
12 International comparisons of competitiveness in a very broad sense can be found in Porter (2004).
14
with regard to transfer figures: the balance has always been positive. However, whereas it reached over 3% of GDP in the early 1990s, it was down to less than 1% in 2003 and 2004; the significance of remittances from Turks living abroad is declining. The changes in the trade in goods have been remarkable. Exports and imports have grown much more than GDP – from less than 10% of GDP in the early 1990s to over 20% of GDP after 2000. The ratio is likely to climb much higher in the future. Turkey’s exports in 2004 amounted to EUR 53.6 billion, whereas Poland’s exports were EUR 64.6 billion; in terms of the size of the economy, Poland is similar to Turkey, and Poland too has a relatively low export-GDP ratio (33% in 2004). The Czech economy is small compared to Turkey, but its exports in 2004 were EUR 53.6 billion, and the export-GDP ratio was 62%. Not only has the export-GDP ratio improved over time, but the proportion of imports covered by export revenues has also gone up. It was between one half and two thirds in the early 1990s (and between 30% and 40% in the mid-1970s), but between 91% (2001) and 74% (2004) after 2000. Revenues from services as well as inflows of income have grown in relation to GDP; however, the same holds true for service expenditures and income outflows. Both aspects are but another hint of the country’s increasing integration in international structures. Exchange rates and real appreciation
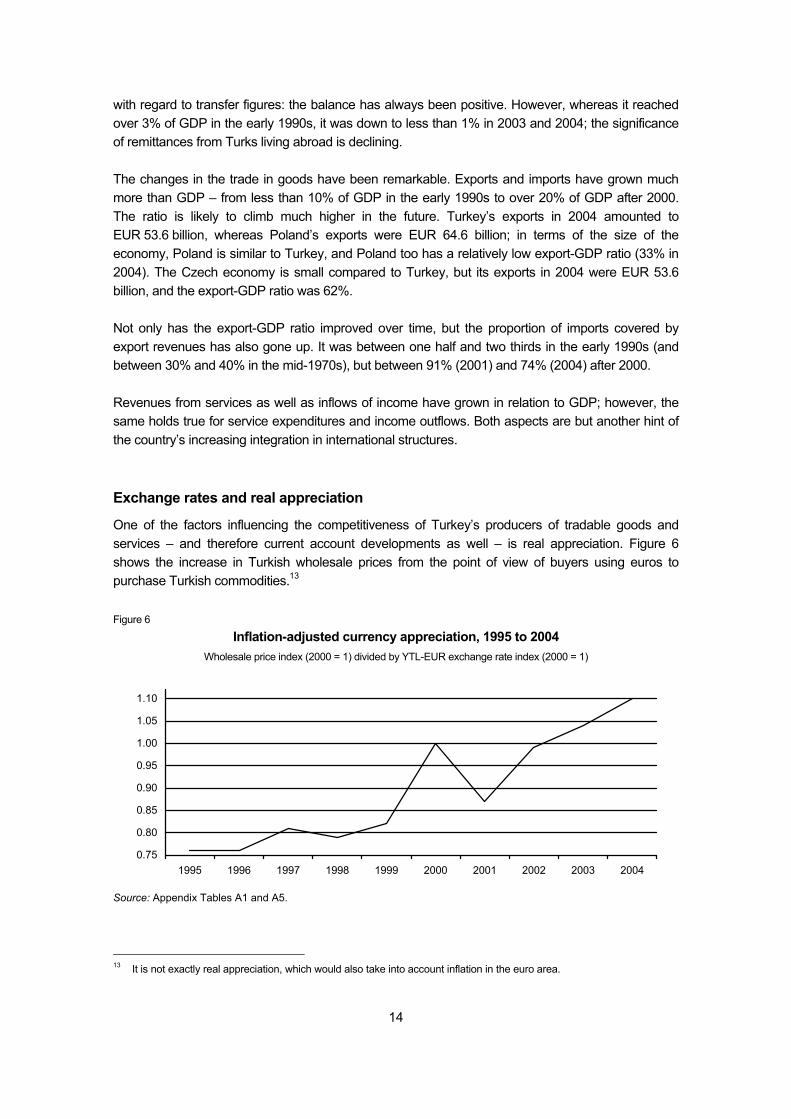
One of the factors influencing the competitiveness of Turkey’s producers of tradable goods and services – and therefore current account developments as well – is real appreciation. Figure 6 shows the increase in Turkish wholesale prices from the point of view of buyers using euros to purchase Turkish commodities.13 Figure 6
Inflation-adjusted currency appreciation, 1995 to 2004 Wholesale price index (2000 = 1) divided by YTL-EUR exchange rate index (2000 = 1)
0.75
0.80
0.85
0.90
0.95
1.00
1.05
1.10
1995 1996 1997 1998 1999 2000 2001 2002 2003 2004
Source: Appendix Tables A1 and A5.
13 It is not exactly real appreciation, which would also take into account inflation in the euro area.
15
In 2001, the current account was in surplus for two reasons: (a) the size of the real GDP was smaller than in the previous year and imports were correspondingly low; (b) devaluation meant that Turkish products were cheap on international markets – including Turkish tourism services – and at the same time imported products were expensive in Turkey. After 2001, the Turkish currency depreciated further, but depreciation was less pronounced than the increase in the wholesale price index.
Box 2
Exchange rate regime
Over the past ten years, Turkey has changed its exchange rate regime several times. The policy adopted in November 1995 linked the devaluation of the Turkish Lira systematically to the development of the Wholesale Price Index (against a basket consisting of 1 USD and 1.5 DEM or, later, 0.77 Euro). In 2000 a crawling peg regime was introduced. In 2001 already, after the crisis in February of that year, the country switched to a floating regime and starting learning to live with the float (Selçuk and Ardıç, 2004). The central bank now only intervenes to avoid extreme fluctuations, but does not try to exert an immediate impact on the trend.
Full convertibility has been established. Transfers of profits, fees and royalties are free. Banks are allowed to open foreign exchange deposit accounts for residents as well as for non-residents. Non-residents can buy and sell without any restrictions on the Istanbul Stock Exchange. Residents, if intending to export foreign currency capital in an amount of over USD 5 million, have to seek permission of the General Directorate of Banking and Foreign Exchange.
Exporters have to transfer their proceeds to Turkey within 180 days after delivery and convert them into YTL. Gains stemming from a failure to observe this time limit have to be transferred to the Support and Price Stability Fund. If exporters bring in 70% of the proceeds already within 90 days, the remaining amount can be left abroad.
Source: YASED (2004).
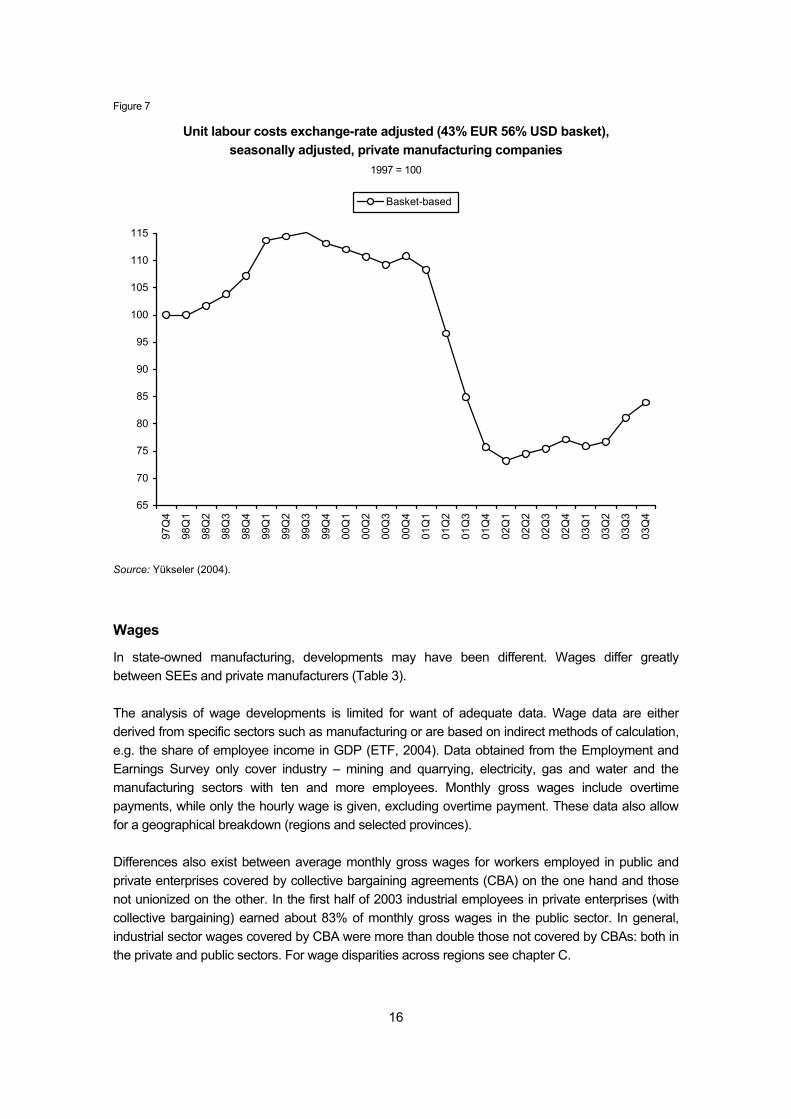
As shown in the chapter on foreign trade, by their very nature most Turkish tradables are competitive as long as they can be produced at low prices. Real appreciation definitely bears the potential of threatening the economy’s development. In the past, the main source of real appreciation was inflation rates in excess of nominal depreciation. Inflationary pressure has weakened. This may well become the basis for pressure in favour of nominal appreciation of the Turkish currency, given that interest rates are declining, but could remain high enough to attract the inflow of ‘hot money’ at some point in time. At least with regard to labour costs (Figure 7), the crisis in 2001 increased the Turkish firms’ competitiveness14, and subsequent years have witnessed only a minor reversal of this gain. As Figure 7 shows, after the crisis in February 2001, unit labour costs in private manufacturing, measured in foreign currency, fell drastically. Within a year, they dropped to 75% of the level in 1997. By the end of 2003, they had climbed back to 85% of the 1997 level.
14 In an empirical study dealing with dynamics of competition and FDI, Özler (2004) does not find evidence that foreign
ownership would matter for the companies’ survival and growth.
16
Figure 7
Unit labour costs exchange-rate adjusted (43% EUR 56% USD basket), seasonally adjusted, private manufacturing companies
1997 = 100
65
70
75
80
85
90
95
100
105
110
115
97Q
4
98Q
1
98Q
2
98Q
3
98Q
4
99Q
1
99Q
2
99Q
3
99Q
4
00Q
1
00Q
2
00Q
3
00Q
4
01Q
1
01Q
2
01Q
3
01Q
4
02Q
1
02Q
2
02Q
3
02Q
4
03Q
1
03Q
2
03Q
3
03Q
4
Basket-based
Source: Yükseler (2004).
Wages
In state-owned manufacturing, developments may have been different. Wages differ greatly between SEEs and private manufacturers (Table 3). The analysis of wage developments is limited for want of adequate data. Wage data are either derived from specific sectors such as manufacturing or are based on indirect methods of calculation, e.g. the share of employee income in GDP (ETF, 2004). Data obtained from the Employment and Earnings Survey only cover industry – mining and quarrying, electricity, gas and water and the manufacturing sectors with ten and more employees. Monthly gross wages include overtime payments, while only the hourly wage is given, excluding overtime payment. These data also allow for a geographical breakdown (regions and selected provinces). Differences also exist between average monthly gross wages for workers employed in public and private enterprises covered by collective bargaining agreements (CBA) on the one hand and those not unionized on the other. In the first half of 2003 industrial employees in private enterprises (with collective bargaining) earned about 83% of monthly gross wages in the public sector. In general, industrial sector wages covered by CBA were more than double those not covered by CBAs: both in the private and public sectors. For wage disparities across regions see chapter C.
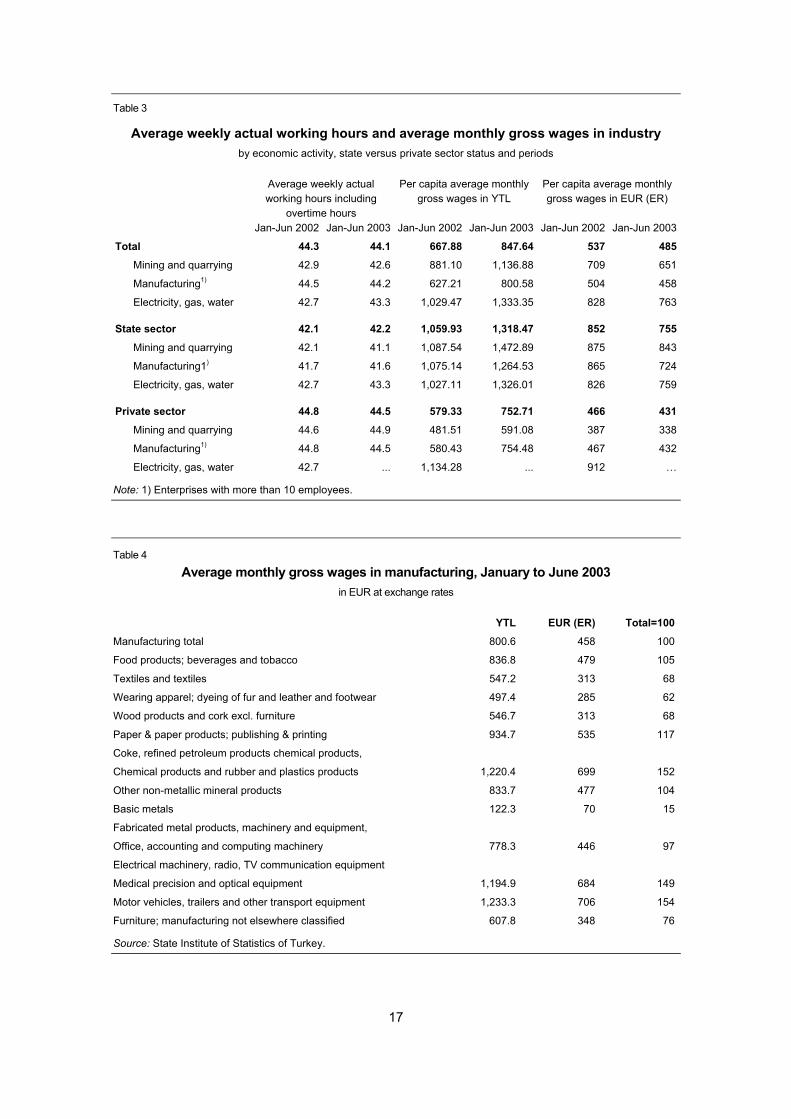
17
Table 3
Average weekly actual working hours and average monthly gross wages in industry by economic activity, state versus private sector status and periods
Average weekly actual working hours including
overtime hours
Per capita average monthly gross wages in YTL
Per capita average monthly gross wages in EUR (ER)
Jan-Jun 2002 Jan-Jun 2003 Jan-Jun 2002 Jan-Jun 2003 Jan-Jun 2002 Jan-Jun 2003
Total 44.3 44.1 667.88 847.64 537 485
Mining and quarrying 42.9 42.6 881.10 1,136.88 709 651
Manufacturing1) 44.5 44.2 627.21 800.58 504 458
Electricity, gas, water 42.7 43.3 1,029.47 1,333.35 828 763
State sector 42.1 42.2 1,059.93 1,318.47 852 755
Mining and quarrying 42.1 41.1 1,087.54 1,472.89 875 843
Manufacturing1) 41.7 41.6 1,075.14 1,264.53 865 724
Electricity, gas, water 42.7 43.3 1,027.11 1,326.01 826 759
Private sector 44.8 44.5 579.33 752.71 466 431
Mining and quarrying 44.6 44.9 481.51 591.08 387 338
Manufacturing1) 44.8 44.5 580.43 754.48 467 432
Electricity, gas, water 42.7 ... 1,134.28 ... 912 …
Note: 1) Enterprises with more than 10 employees.
Table 4
Average monthly gross wages in manufacturing, January to June 2003 in EUR at exchange rates
YTL EUR (ER) Total=100
Manufacturing total 800.6 458 100
Food products; beverages and tobacco 836.8 479 105
Textiles and textiles 547.2 313 68
Wearing apparel; dyeing of fur and leather and footwear 497.4 285 62
Wood products and cork excl. furniture 546.7 313 68
Paper & paper products; publishing & printing 934.7 535 117
Coke, refined petroleum products chemical products,
Chemical products and rubber and plastics products 1,220.4 699 152
Other non-metallic mineral products 833.7 477 104
Basic metals 122.3 70 15
Fabricated metal products, machinery and equipment,
Office, accounting and computing machinery 778.3 446 97
Electrical machinery, radio, TV communication equipment
Medical precision and optical equipment 1,194.9 684 149
Motor vehicles, trailers and other transport equipment 1,233.3 706 154
Furniture; manufacturing not elsewhere classified 607.8 348 76
Source: State Institute of Statistics of Turkey.
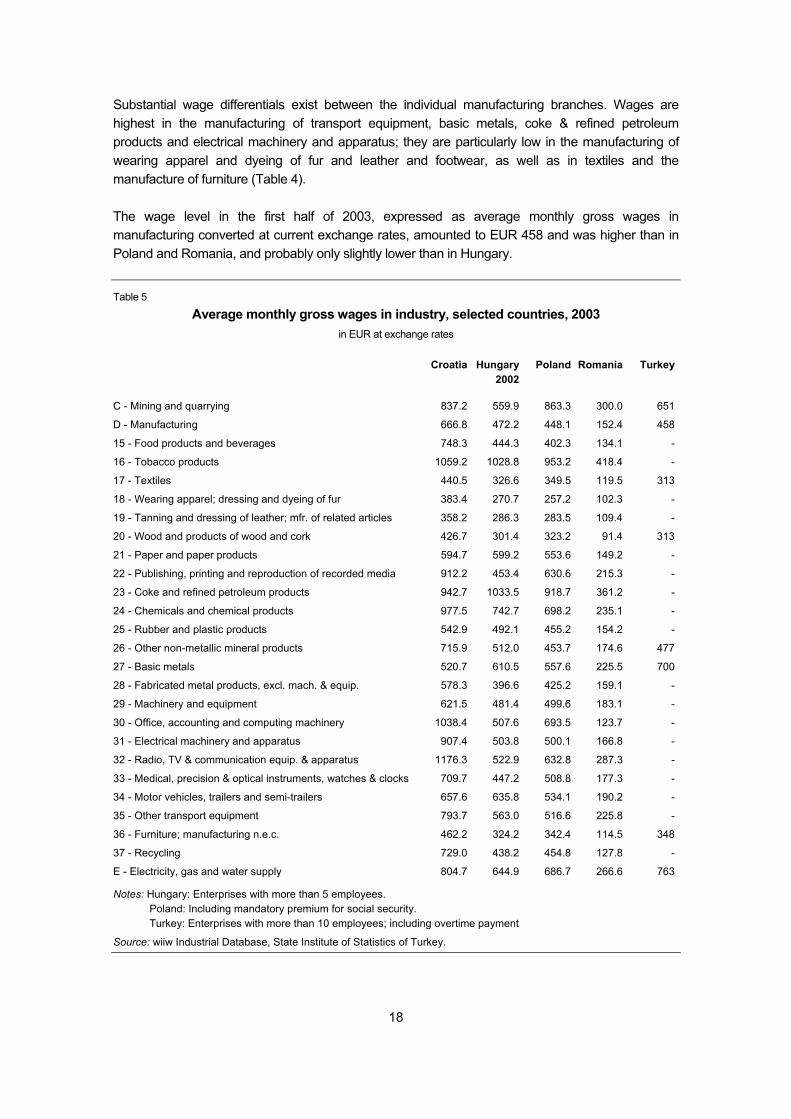
18
Substantial wage differentials exist between the individual manufacturing branches. Wages are highest in the manufacturing of transport equipment, basic metals, coke & refined petroleum products and electrical machinery and apparatus; they are particularly low in the manufacturing of wearing apparel and dyeing of fur and leather and footwear, as well as in textiles and the manufacture of furniture (Table 4). The wage level in the first half of 2003, expressed as average monthly gross wages in manufacturing converted at current exchange rates, amounted to EUR 458 and was higher than in Poland and Romania, and probably only slightly lower than in Hungary.
Table 5
Average monthly gross wages in industry, selected countries, 2003 in EUR at exchange rates
Croatia Hungary Poland Romania Turkey2002
C - Mining and quarrying 837.2 559.9 863.3 300.0 651
D - Manufacturing 666.8 472.2 448.1 152.4 458
15 - Food products and beverages 748.3 444.3 402.3 134.1 -
16 - Tobacco products 1059.2 1028.8 953.2 418.4 -
17 - Textiles 440.5 326.6 349.5 119.5 313
18 - Wearing apparel; dressing and dyeing of fur 383.4 270.7 257.2 102.3 -
19 - Tanning and dressing of leather; mfr. of related articles 358.2 286.3 283.5 109.4 -
20 - Wood and products of wood and cork 426.7 301.4 323.2 91.4 313
21 - Paper and paper products 594.7 599.2 553.6 149.2 -
22 - Publishing, printing and reproduction of recorded media 912.2 453.4 630.6 215.3 -
23 - Coke and refined petroleum products 942.7 1033.5 918.7 361.2 -
24 - Chemicals and chemical products 977.5 742.7 698.2 235.1 -
25 - Rubber and plastic products 542.9 492.1 455.2 154.2 -
26 - Other non-metallic mineral products 715.9 512.0 453.7 174.6 477
27 - Basic metals 520.7 610.5 557.6 225.5 700
28 - Fabricated metal products, excl. mach. & equip. 578.3 396.6 425.2 159.1 -
29 - Machinery and equipment 621.5 481.4 499.6 183.1 -
30 - Office, accounting and computing machinery 1038.4 507.6 693.5 123.7 -
31 - Electrical machinery and apparatus 907.4 503.8 500.1 166.8 -
32 - Radio, TV & communication equip. & apparatus 1176.3 522.9 632.8 287.3 -
33 - Medical, precision & optical instruments, watches & clocks 709.7 447.2 508.8 177.3 -
34 - Motor vehicles, trailers and semi-trailers 657.6 635.8 534.1 190.2 -
35 - Other transport equipment 793.7 563.0 516.6 225.8 -
36 - Furniture; manufacturing n.e.c. 462.2 324.2 342.4 114.5 348
37 - Recycling 729.0 438.2 454.8 127.8 -
E - Electricity, gas and water supply 804.7 644.9 686.7 266.6 763
Notes: Hungary: Enterprises with more than 5 employees. Poland: Including mandatory premium for social security. Turkey: Enterprises with more than 10 employees; including overtime payment
Source: wiiw Industrial Database, State Institute of Statistics of Turkey.
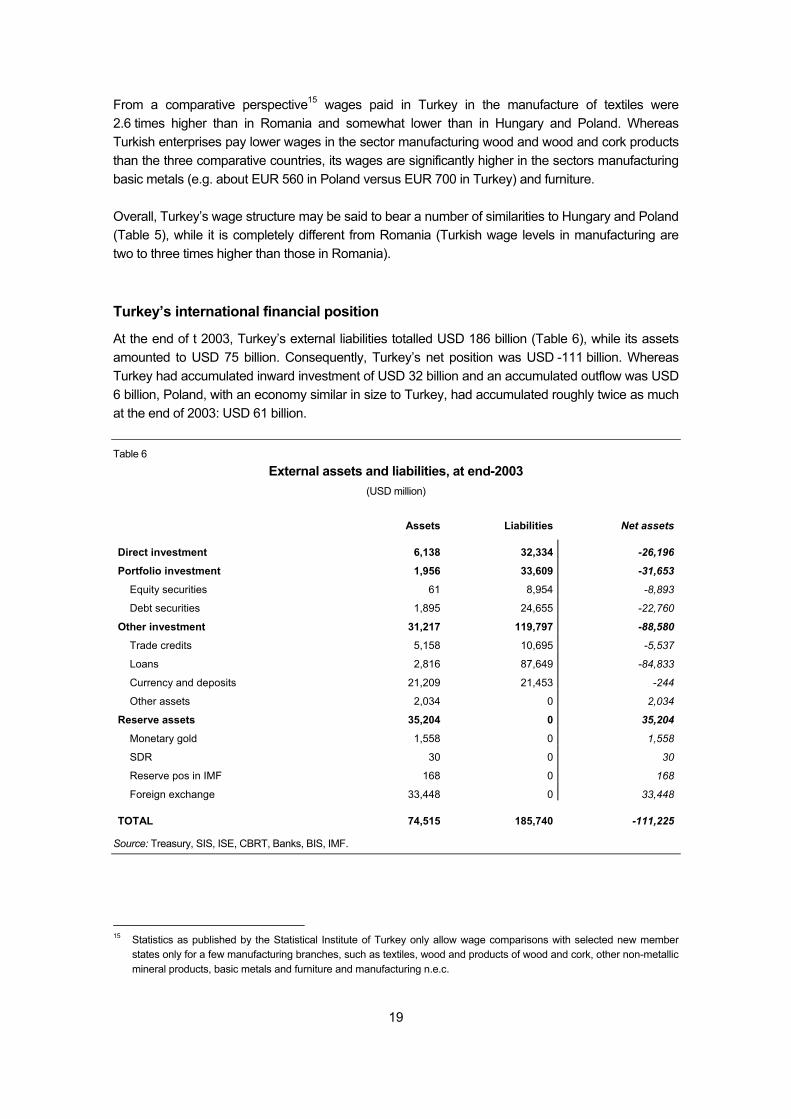
19
From a comparative perspective15 wages paid in Turkey in the manufacture of textiles were 2.6 times higher than in Romania and somewhat lower than in Hungary and Poland. Whereas Turkish enterprises pay lower wages in the sector manufacturing wood and wood and cork products than the three comparative countries, its wages are significantly higher in the sectors manufacturing basic metals (e.g. about EUR 560 in Poland versus EUR 700 in Turkey) and furniture. Overall, Turkey’s wage structure may be said to bear a number of similarities to Hungary and Poland (Table 5), while it is completely different from Romania (Turkish wage levels in manufacturing are two to three times higher than those in Romania). Turkey’s international financial position
At the end of t 2003, Turkey’s external liabilities totalled USD 186 billion (Table 6), while its assets amounted to USD 75 billion. Consequently, Turkey’s net position was USD -111 billion. Whereas Turkey had accumulated inward investment of USD 32 billion and an accumulated outflow was USD 6 billion, Poland, with an economy similar in size to Turkey, had accumulated roughly twice as much at the end of 2003: USD 61 billion. Table 6
External assets and liabilities, at end-2003 (USD million)
Assets Liabilities Net assets
Direct investment 6,138 32,334 -26,196
Portfolio investment 1,956 33,609 -31,653Equity securities 61 8,954 -8,893
Debt securities 1,895 24,655 -22,760
Other investment 31,217 119,797 -88,580Trade credits 5,158 10,695 -5,537
Loans 2,816 87,649 -84,833
Currency and deposits 21,209 21,453 -244
Other assets 2,034 0 2,034
Reserve assets 35,204 0 35,204
Monetary gold 1,558 0 1,558
SDR 30 0 30
Reserve pos in IMF 168 0 168
Foreign exchange 33,448 0 33,448
TOTAL 74,515 185,740 -111,225
Source: Treasury, SIS, ISE, CBRT, Banks, BIS, IMF.
15 Statistics as published by the Statistical Institute of Turkey only allow wage comparisons with selected new member
states only for a few manufacturing branches, such as textiles, wood and products of wood and cork, other non-metallic mineral products, basic metals and furniture and manufacturing n.e.c.
20
Taken together, the countries of South-east Europe (Albania, Bosnia-Herzegovina, Bulgaria, Croatia, Macedonia, Romania and Serbia and Montenegro) had accumulated about as much inward FDI as Turkey: USD 35 billion. With regard to the stock of outward FDI, Turkey’s figure, USD 6 billion, was much higher than that of Poland (USD 1.8 billion); of the new EU member states, Hungary was the only country with a comparable figure; USD 7 billion. Business leaders in Turkey were more eager than their counterparts in the new member states to have a second string to their bow. Foreigners held Turkish government bonds amounting USD 25 billion and held USD 88 billion claims on loans predominantly granted to the government and non-bank sectors. Reserve assets, mainly in the form of foreign exchange, were as high as USD 33 million at end-2003. Capital flight
In countries with a long history of economic volatility and political turmoil, more affluent people – and companies – tend to increase their economic standing by spending parts of their savings on purchases of foreign assets. Such capital outflow can be official or hidden, registered or unregistered. Derviş, Emerson, Gros and Ülgen (2004) have taken the period 1963-2002 and compared the size of Turkey’s net external debt at end-2002 (somewhat over USD 100 billion) to the accumulated current account deficit for the whole period (close to USD 42 billion). The difference (USD 59 billion) is interpreted as a proxy for capital flight. The last phase of this period (the years 1997 to 2002) was mainly responsible for the overall result: net foreign debt rose by USD 40.8 billion (from less than USD 60 billion to more than USD 100 billion), whereas the accumulated current account deficit was USD 7.3 billion. The difference (USD 33.5 billion) was capital flight. Duman, Erkin and Ünal (2005) chose a similar approach, but in a more sophisticated version which allowed them to filter out exchange rate fluctuations and trade misinvoicing. In order to secure comparability of estimates across periods, they deflated them on the basis of the producer price index. The authors focused not on the size of capital flight, but on its determinants: their findings support the hypothesis that economic imbalances and political turmoil stimulate capital flight. Once again, the finding was that the 1990s had been a period of extreme capital flight. Should Turkey now enter a longer period of economic prosperity, confidence will grow and capital flight will stop after a while. The process may even have started already, considering the pronounced growth in gross fixed investment. In recent years some Turkish companies or holdings have been eager to invest abroad; this is quite natural, but it may also have contained an element of legal capital flight. Banking sector
For the banking sector, the crisis of 2001 was a turn for the better in the sense of improved regulation, enhanced surveillance and greater economic soundness for the survivors.16 In fact, most of the reforms had been on track since 2000, based on legislation introduced in 1999.17 However, they would hardly have been imposed as strictly, had it not been for the very severe crisis of 2001.
16 Thompson, Totan and Scott (2002) stress that the reform implemented up to 2001 was too little and came too late. 17 Experience collected from a number of countries suggests, so İyigün and Rodrik (2004), that policy-makers have a
choice between a new draw from a pre-existing policy regime, and institutional reform imposing an adjustment cost on incumbent firms. Institutional reforms work best, so the authors, in settings where entrepreneurial activity is weak.
21
The latter crisis was final proof of the need for such reforms. The crisis also made it possible to push through the independence of the central bank: a step taken in May 2001. The Banking Regulatory and Supervisory Agency had started operations in autumn 2000 and within a few months it was already having to play a decisive role. The treasury took over USD 21.9 billion restructuring costs for public banks and 21.8 billion for private banks which were placed under the custody of the Savings and Deposits Insurance Fund. The burden assumed by the treasury was equivalent to about 30% of the GDP (Steinherr, Tukel and Ucer, 2004). The restructuring of the public banks was both comprehensive and swift.18 The strategy drawn up for the troubled private banks was to restructure first, and sell thereafter; the concept has not been actively promoted since. In mid-2004, seven large commercial banks, three of them public (Ziraat19, Halk and Vakıflar) and four of them private (Akbank, Is Bank, Garanti and Yapı ve Kredi), controlled about three quarters of the entire sector. This is ‘normal’ by European standards; concentration is somewhat lower than that in the EU-15, but higher than that in the new member states in Central Europe. Rather exceptional is the limited volume of loans granted to non-financial enterprises, amounting to merely 18% of GDP at end-2002.20 Prior to the crisis in 2001 it had fluctuated between 80 and 100%, a ratio comparable to Western Europe. In October 2004, the total number of domestically owned commercial banks was 21, excluding: (a) non-restructured banks under the custody of the Savings and Deposits Insurance Fund; and (b) non-depository banks. The number of foreign-owned banks was 15, of which 8 were branches of foreign banks and 3 were non-depository. Of the Turkish non-depository banks, three were public and eight were privately owned21. The market share of foreign banks is low: a feature that Turkey has in common with West European countries such as France, Germany, Italy or Spain. Public commercial banks account for about one third in the sector’s total assets, but hold over 40% of total deposits. Their strength is attracting YTL deposits, rather than foreign exchange deposits. In the past, the public banks were busy financing the governments’ deficits of the governments, and not so much granting loans to non-financial enterprises. At the end of 2002, government securities made up 60% of their assets compared to 15% used for enterprise loans. In the case of private banks, securities amounted to 36% of their assets and loans to 33%. Large enterprises with a high credit rating never experienced problems of access to fresh loans, unlike small and medium-sized enterprises. Lending to SMEs was originally the prime business of the state-owned Halk bank. But non-performing loans turned out to be a problem for public banks; they thus felt it advisable to allocate more assets to government securities as being a safer business. Figure 8 shows a banking sector fragility indicator developed by Kibritçioğlu (Kibritçioğlu, 2003). In one version, BSF3, it measures month-on-month changes in three variables: bank claims on the domestic private sector, foreign liabilities of banks; and bank deposits. They are taken as indicators
18 Pınar and Sak (2003) emphasize that the problem with publicly owned banks in Turkey has not been solved yet,
stressing that ‘the improvement in bank balance sheets and income statements looks to be illusory’. 19 Ziraaat Bank’s original task is financing agriculture. 20 The companies’ access to external finance is discussed in Bougheas, Mizen and Yalçın (2004). 21 Banks are listed, e.g., in http://www.turkishbanks.com; Swiss Export Risk Guarantee http://www.swiss-erg.com;,
Türkiye Bankalar Birligi, http://www.tbb.org; The Banker – The International Islamic Finance Forum, Top 1000 World Banks, 2 July 2004, http://www.thebanker.com.
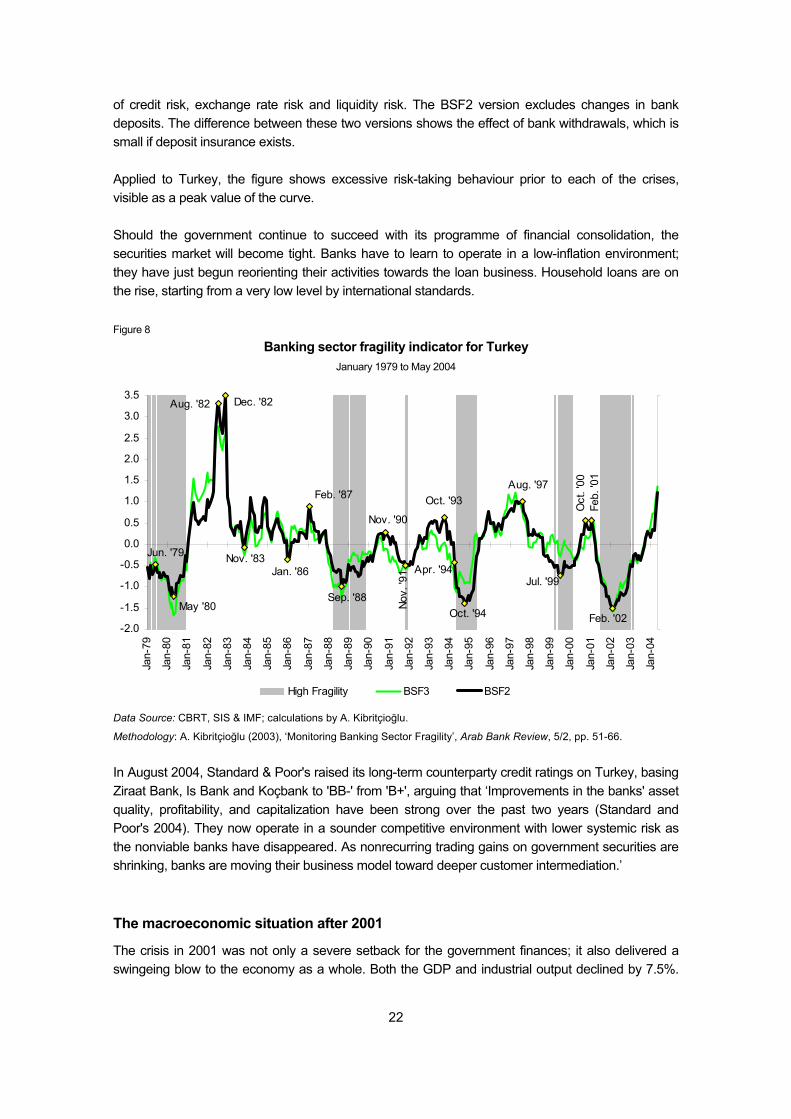
22
of credit risk, exchange rate risk and liquidity risk. The BSF2 version excludes changes in bank deposits. The difference between these two versions shows the effect of bank withdrawals, which is small if deposit insurance exists. Applied to Turkey, the figure shows excessive risk-taking behaviour prior to each of the crises, visible as a peak value of the curve. Should the government continue to succeed with its programme of financial consolidation, the securities market will become tight. Banks have to learn to operate in a low-inflation environment; they have just begun reorienting their activities towards the loan business. Household loans are on the rise, starting from a very low level by international standards. Figure 8
Banking sector fragility indicator for Turkey January 1979 to May 2004
Feb. '02
Aug. '97
Feb.
'01
Sep. '88
Feb. '87
Nov. '83
Aug. '82
May '80
Jun. '79
Dec. '82
Jan. '86
Nov. '90
Nov.
'91
Oct. '93
Apr. '94
Oct. '94
Jul. '99O
ct. '
00
-2.0
-1.5
-1.0
-0.5
0.0
0.5
1.0
1.5
2.0
2.5
3.0
3.5
Jan-
79
Jan-
80
Jan-
81
Jan-
82
Jan-
83
Jan-
84
Jan-
85
Jan-
86
Jan-
87
Jan-
88
Jan-
89
Jan-
90
Jan-
91
Jan-
92
Jan-
93
Jan-
94
Jan-
95
Jan-
96
Jan-
97
Jan-
98
Jan-
99
Jan-
00
Jan-
01
Jan-
02
Jan-
03
Jan-
04
High Fragility BSF3 BSF2
Data Source: CBRT, SIS & IMF; calculations by A. Kibritçioğlu.
Methodology: A. Kibritçioğlu (2003), ‘Monitoring Banking Sector Fragility’, Arab Bank Review, 5/2, pp. 51-66.
In August 2004, Standard & Poor's raised its long-term counterparty credit ratings on Turkey, basing Ziraat Bank, Is Bank and Koçbank to 'BB-' from 'B+', arguing that ‘Improvements in the banks' asset quality, profitability, and capitalization have been strong over the past two years (Standard and Poor's 2004). They now operate in a sounder competitive environment with lower systemic risk as the nonviable banks have disappeared. As nonrecurring trading gains on government securities are shrinking, banks are moving their business model toward deeper customer intermediation.’ The macroeconomic situation after 2001
The crisis in 2001 was not only a severe setback for the government finances; it also delivered a swingeing blow to the economy as a whole. Both the GDP and industrial output declined by 7.5%.
23
The rate of unemployment leapt to an annual average of 8.5% only to rise still further, up to a 10.5% average in 2004. As is often the case, the crisis also laid the foundations for a new upswing. The devalued exchange rate increased the Turkish manufacturers’ competitiveness vis-à-vis their foreign competitors. Exports rose by 15% in 2001: from EUR 33.4 billion in 2000 to 38.5 billion. At the same time, imports shrank by 24% from EUR 55.7 to 42.5 billion. The latter was also due to the drop in real GDP. After the crisis in February 2001, confidence in a future positive development started recovering. Part of this change in mood was attributable to Kemal Derviş, a former IMF official who became minister of economic affairs in the aftermath of the crisis. He negotiated a USD 16 billion IMF credit deal for Turkey. He promoted the independence of the central bank and a reform of the banking system. He was also skilful in convincing the public of the need for painful reforms. The key programme was not particularly original: macroeconomic stabilization combined with privatization and, of course, liberalization in many respects as well. The parliamentary elections of November 2002 gave a strong majority to a strong leader, who left no doubt about his intent to improve public governance, set the public sector’s finances straight and pave the way for Turkey’s EU accession. Determination of this kind underpinned economic recovery.
Currently, certain important features of the macroeconomic situation are highly satisfactory, as the State Institute for Statistics’ 2004 figures indicate:
– GDP growth (real), year-on-year, was 8.9% for the whole year 2004, resulting from 11.8% growth in the first, 14.4% in the second, but merely 5.3% and 6.3% in the third and fourth quarters. As for the individual sectors the main engines of high growth in 2004 were trade with a growth of 12.8% and industry with 9.4%. On the expenditure side, thanks to booming private investment gross fixed capital formation grew by 32,4% and private consumption by 10.1%. The growth rate for exports of goods and services was 12,5%, thus much less than that for imports (24,7%); hence, overall trade in goods and services had a negative impact on GDP growth. With government consumption nearly stagnating (+0.5%) and public gross fixed investment declining, the government’s GDP contribution was also strongly negative.
– Industrial output was up 9.8% in 2004.
– Inflation has come very close to single digits in 2004. The average rate of inflation was 10.6%, the December-on-December rate 9.3%.
Other figures are rather alarming:
– The current account deficit is on the rise (Table 6). Whereas it amounted to USD 8 billion or 3.3% of GDP in 2003, it was up to USD 15.6 billion or 5.2% of GDP in 2004.
– The rate of unemployment is high. Both in 2003 and 2004 it was 10.5% in average. Turkey is experiencing what is sometimes called ‘jobless growth’. It has attained a very high GDP growth rate without any indication of significant growth in employment. Hopes for a significant rise in employment in 2004 (Ercan, 2004) did not materialize. This spells doom for Turkey’s jobless; it is also something that cannot be so easily sold on the political trading floor. Economically, it points to a marked rise in labour productivity; this has to be seen in the context of strong investment growth. Serhan Cevik (2004) terms current developments in Turkey ‘productivity-led growth’. At least in some segments of the economy, a technological catching-up process may be underway.
24
The rise in the current account deficit is what one would expect to follow from an increase in GDP growth. Given that GDP grew 8.9% in 2004, the rise in the current account deficit up to EUR 12.5 billion was not stunning. However, the current account is a sensitive issue. It is something carefully followed by international financial investors, and they would prefer to see FDI inflows of approximately the same size as the deficit. This is not the case. Should the deficit climb high, nervousness is likely to spread among international financial investors. Outlook: critical years ahead
Turkey has demonstrated time and again that it is capable of expanding economic activities on a rapid and massive scale, provided the conditions are right. However, its economic system was invariably susceptible to crisis; some setbacks have been dramatic. In the first half of 2004, real GDP growth was exceptionally high by international standards; growth even accelerated from the first to the second quarter (from year-on-year 11.8% to 14.4%). This raised justified concerns whether such growth would be sustainable or overheated, possibly followed by sudden deterioration. In fact, growth did not remain that high for a longer period; it came down to 5.3% in the third and 6.3% in the fourth quarter. In the first half of 2004, the main reason for the high growth was a transitory boom in private consumption. For example, announcements of regulatory changes encouraged consumers to purchase motor vehicles; it was demand for consumer durables that has boosted private consumption growth. Moreover, the banking sector was looking for clients in the private sector, as household indebtedness is still low by international standards. Household credits are thus on the rise. The increase in private consumption took place despite stagnating real wage incomes – real wages dropped appreciably over the period 2001-2003, while employment declined in 2003 and increased only marginally (by about 2%) in 2004. It is likely that growth will revert to a band between 5 and 10%, oscillating around rates of 6 to 7%. The economy is in better shape than it was in the nineties. The situation in the banking sector is much improved; the exchange rate float offers the central bank an opportunity to influence the exchange rate as well as corporate sector competitiveness through its setting of interest rates. However, there are some traps. Let us assume that high growth continues for some time, inflation drops and remains below 10% and privatization gains momentum. In that case, FDI will increase quite significantly; while most administrative barriers fade away. It is likely that in such a scenario, the Turkish lira will come under pressure to appreciate. Capital account flows could start dominating exchange rate developments in a way that may harm the real sector. The competitiveness of Turkish manufacturers and tourist facilities could well suffer. This scenario is not unlikely. Nominal depreciation vis-à-vis the euro has slowed down already; periods of nominal appreciation occurred in both 2003 and 2004. Nominal interest rates are still high by international standards, so that short-term investment in Turkey could offer foreign financial investors promising prospects. Possibly, Turkey has started to become attractive for investors of Middle East profits from oil business (Michael Rubin, 2005). FitchRatings (2005) qualifies the external financing mix as unstable: the use of external financing, amounting to 22% of GDP in 2004, was almost entirely covered by borrowing (21% of GDP), most of it being of a short-term nature (13%). 2005 will not bring a substantial change in these ratios.
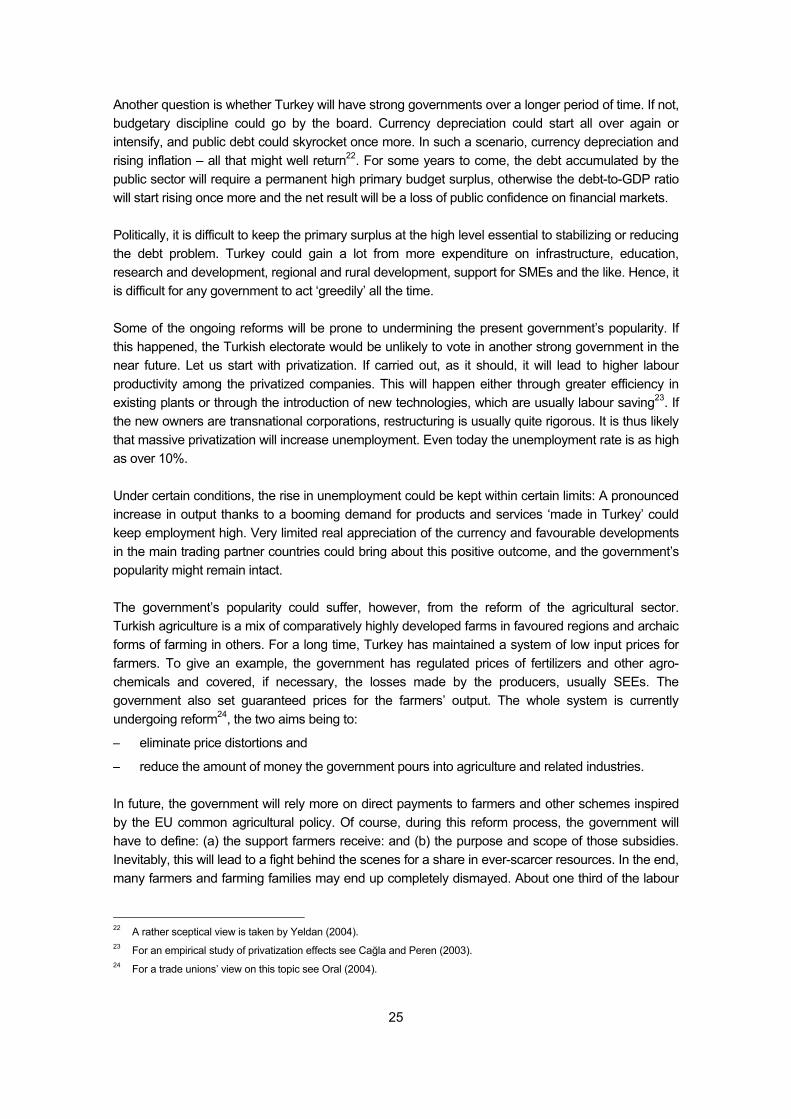
25
Another question is whether Turkey will have strong governments over a longer period of time. If not, budgetary discipline could go by the board. Currency depreciation could start all over again or intensify, and public debt could skyrocket once more. In such a scenario, currency depreciation and rising inflation – all that might well return22. For some years to come, the debt accumulated by the public sector will require a permanent high primary budget surplus, otherwise the debt-to-GDP ratio will start rising once more and the net result will be a loss of public confidence on financial markets. Politically, it is difficult to keep the primary surplus at the high level essential to stabilizing or reducing the debt problem. Turkey could gain a lot from more expenditure on infrastructure, education, research and development, regional and rural development, support for SMEs and the like. Hence, it is difficult for any government to act ‘greedily’ all the time. Some of the ongoing reforms will be prone to undermining the present government’s popularity. If this happened, the Turkish electorate would be unlikely to vote in another strong government in the near future. Let us start with privatization. If carried out, as it should, it will lead to higher labour productivity among the privatized companies. This will happen either through greater efficiency in existing plants or through the introduction of new technologies, which are usually labour saving23. If the new owners are transnational corporations, restructuring is usually quite rigorous. It is thus likely that massive privatization will increase unemployment. Even today the unemployment rate is as high as over 10%. Under certain conditions, the rise in unemployment could be kept within certain limits: A pronounced increase in output thanks to a booming demand for products and services ‘made in Turkey’ could keep employment high. Very limited real appreciation of the currency and favourable developments in the main trading partner countries could bring about this positive outcome, and the government’s popularity might remain intact. The government’s popularity could suffer, however, from the reform of the agricultural sector. Turkish agriculture is a mix of comparatively highly developed farms in favoured regions and archaic forms of farming in others. For a long time, Turkey has maintained a system of low input prices for farmers. To give an example, the government has regulated prices of fertilizers and other agro-chemicals and covered, if necessary, the losses made by the producers, usually SEEs. The government also set guaranteed prices for the farmers’ output. The whole system is currently undergoing reform24, the two aims being to:
– eliminate price distortions and
– reduce the amount of money the government pours into agriculture and related industries. In future, the government will rely more on direct payments to farmers and other schemes inspired by the EU common agricultural policy. Of course, during this reform process, the government will have to define: (a) the support farmers receive: and (b) the purpose and scope of those subsidies. Inevitably, this will lead to a fight behind the scenes for a share in ever-scarcer resources. In the end, many farmers and farming families may end up completely dismayed. About one third of the labour
22 A rather sceptical view is taken by Yeldan (2004). 23 For an empirical study of privatization effects see Cağla and Peren (2003). 24 For a trade unions’ view on this topic see Oral (2004).
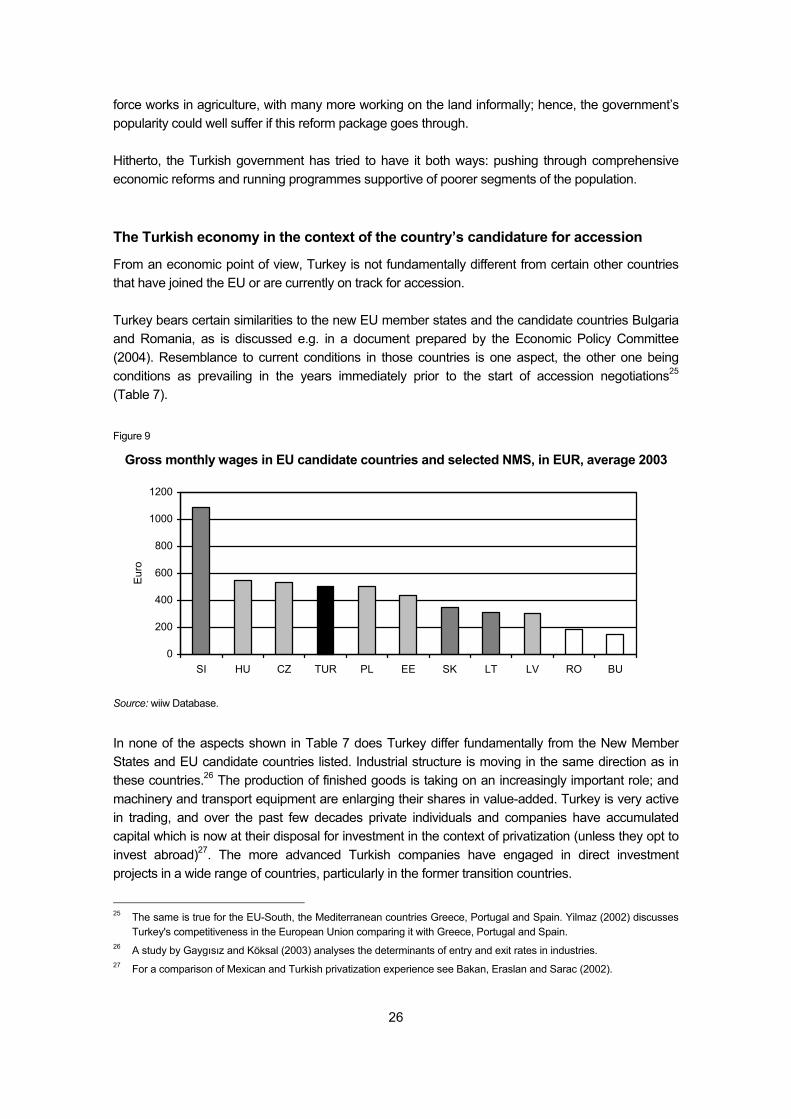
26
force works in agriculture, with many more working on the land informally; hence, the government’s popularity could well suffer if this reform package goes through. Hitherto, the Turkish government has tried to have it both ways: pushing through comprehensive economic reforms and running programmes supportive of poorer segments of the population. The Turkish economy in the context of the country’s candidature for accession
From an economic point of view, Turkey is not fundamentally different from certain other countries that have joined the EU or are currently on track for accession. Turkey bears certain similarities to the new EU member states and the candidate countries Bulgaria and Romania, as is discussed e.g. in a document prepared by the Economic Policy Committee (2004). Resemblance to current conditions in those countries is one aspect, the other one being conditions as prevailing in the years immediately prior to the start of accession negotiations25 (Table 7). Figure 9
Gross monthly wages in EU candidate countries and selected NMS, in EUR, average 2003
0
200
400
600
800
1000
1200
SI HU CZ TUR PL EE SK LT LV RO BU
Euro
Source: wiiw Database.
In none of the aspects shown in Table 7 does Turkey differ fundamentally from the New Member States and EU candidate countries listed. Industrial structure is moving in the same direction as in these countries.26 The production of finished goods is taking on an increasingly important role; and machinery and transport equipment are enlarging their shares in value-added. Turkey is very active in trading, and over the past few decades private individuals and companies have accumulated capital which is now at their disposal for investment in the context of privatization (unless they opt to invest abroad)27. The more advanced Turkish companies have engaged in direct investment projects in a wide range of countries, particularly in the former transition countries.
25 The same is true for the EU-South, the Mediterranean countries Greece, Portugal and Spain. Yilmaz (2002) discusses
Turkey's competitiveness in the European Union comparing it with Greece, Portugal and Spain. 26 A study by Gaygısız and Köksal (2003) analyses the determinants of entry and exit rates in industries. 27 For a comparison of Mexican and Turkish privatization experience see Bakan, Eraslan and Sarac (2002).
27
In common with most of the new EU member states, Turkey is a low-wage country compared to the EU average, irrespective of the fact that wage levels are significantly higher than those in Bulgaria and Romania (Figure 9).
Table 7
Economic situation prior to the announcement of negotiations: Turkey compared to selected other/former accession countries
Czech Republic
Hungary Poland Bulgaria Romania Turkey
Reference year (1) 1996 1996 1996 1998 1998 2003
1. Criteria addressed by the Maastricht Treaty
Inflation 8.8 23.6 19.9 18.7 59.1 25.3
Rate of interest (discount rate) 10.5 23.0 22.0 5.2 35.0 43.0
Budget deficit (% of GDP) -1.9 . -2.7 0.4 a . -8.7
Government debt (% of GDP) 12.9 b 64.2 b 44.0 b 79.3 a 18.0 87.4
Exchange rate variation (2) 0.9 -14.9 -7.2 -3.9 -19.0 -15.2
2. Competitiveness-related criteria GDP (PPP) p.c. in % of EU average in reference year 64.9 c 44.8 c 38.7 c 23.9 c 24.0 c 28.0 d
GDP growth, constant prices 4.3 1.3 6.0 4.0 -4.8 5.8
GDP growth, last 5 years' average 2.4 0.4 4.9 -1.4 0.7 1.6
GDP (EUR, PPP)/Employed 24929 23749 18443 12732 10132 20822 Growth of labour productivity (manufacturing), last 3 years' average 8.0 11.7 10.2 -2.5 -1.9 5.3
Exports in % of imports (goods) 79.4 90.5 79.1 91.9 76.0 78.5
Exports in % of imports (services) 130.7 147.4 153.7 128.3 67.0 223.3
Current account in % of GDP -7.1 -3.9 -2.1 -0.3 -7.0 -2.8
General Price Level, EU-15=100 37.2 42.1 44.3 20.4 23.8 47.9
3. Criteria related to economic structure
Exports in % of GDP 38.0 35.3 17.9 33.0 19.8 21.3
Imports in % of GDP 47.9 39.0 22.7 35.8 26.1 27.1
Share of EU in total exports 58.6 62.7 66.2 49.6 64.5 51.9
Share of EU in total imports 62.4 59.8 63.9 44.9 57.7 46.5
FDI stock in % of GDP 15.0 29.6 8.0 12.0 10.2 10.2 e
Share of agriculture in GVA 4.7 6.6 6.0 18.8 15.8 12.2
Share of industry in GVA 42.0 30.6 35.5 30.5 35.8 29.3
Share of services in GVA 53.3 62.8 58.5 50.7 48.4 58.6 Government expenditures in % of GDP (EU concept) 55.5 . 42.6 56.2 a . 38.9
Rate of unemployment (LFS) 3.9 9.9 12.3 14.1 6.3 10.5
Notes: a) 1999; b) 1997; c) compared to EU-15; d) compared to EU-25; e) 2002 data. - (1) Year prior to the announcement of accession negotiations. - (2) Exchange rate defined as ECU/EUR per national currency unit, % change over the rate registered two year before; a positive sign indicates nominal appreciation.
Turkey can thus be seen to be active in labour-intensive production, yet weak in terms of well-known international brands. One of Turkey’s specializations is textiles and clothing: a branch facing fierce
28
international competition. If real appreciation of the Turkish currency becomes excessive, that sector may lose its competitiveness28. The Turkish economy has undergone major fluctuations; in the future temporary setbacks are also quite conceivable. However, all of the countries that have recently joined the EU or will join in the near future have gone through similar crisis periods over the past ten years. Compared to the EU-25 as a whole, the Turkish economy is small. It is most unlikely that a temporary economic crisis could spill over to the EU as a whole. Perhaps this does not hold fully true for a financial crisis, where sensitivities are much higher. However, the 2001 crisis in Turkey, which started as a liquidity crisis in the banking sector, did not inflict much damage on international financial markets. Even the Argentine crisis, which was of a different dimension, had a limited impact internationally. Only a protracted crisis with the Turkey eventually re-emerging as the sick man of the EU would have a negative impact on the community as a whole. There is, however, no reason to expect a long-lasting future crisis of this kind – even less so from Turkey. With regard to Turkey’s accession to the EU, economic considerations provide no cause for alarm. A pre-accession period of ten or fifteen years, the duration most frequently mentioned, is likely to lead to a massive shift towards modernization in the Turkish economy. Europe’s concern over Turkey’s accession has more to do with the non-economic sphere29 30.
28 For a discussion of imbalances in the real exchange rate in the period from 1987 to 2003 see Kibritçioğlu and
Kibritçioğlu (2004). 29 See, e.g., Apap, Carrera and Kirişci (2004), Aydın and Keyman (2004), Bekmez and Genç (2002), Emerson and Tocci
(2004), Hughes (2004), Independent Commission on Turkey (2004), Krieger (2004), Kubicek (2004), Liberale Türkisch-Deutsche Vereinigung (2004), Quaisser and Wood (2004) or Vietor and Thompson (2004).
30 This study does not deal with consequences Turkey’s EU accession could possibly have in terms of a re-allocation of funds from the EU budget. It is difficult to foresee what the EU member states’ budgetary preferences will be in the years after 2010. For a discussion of possible budgetary consequences see Derviş, Gros, Öztrak and Işık (2004c); the topic also plays a role in Quaisser and Reppegather (2004).
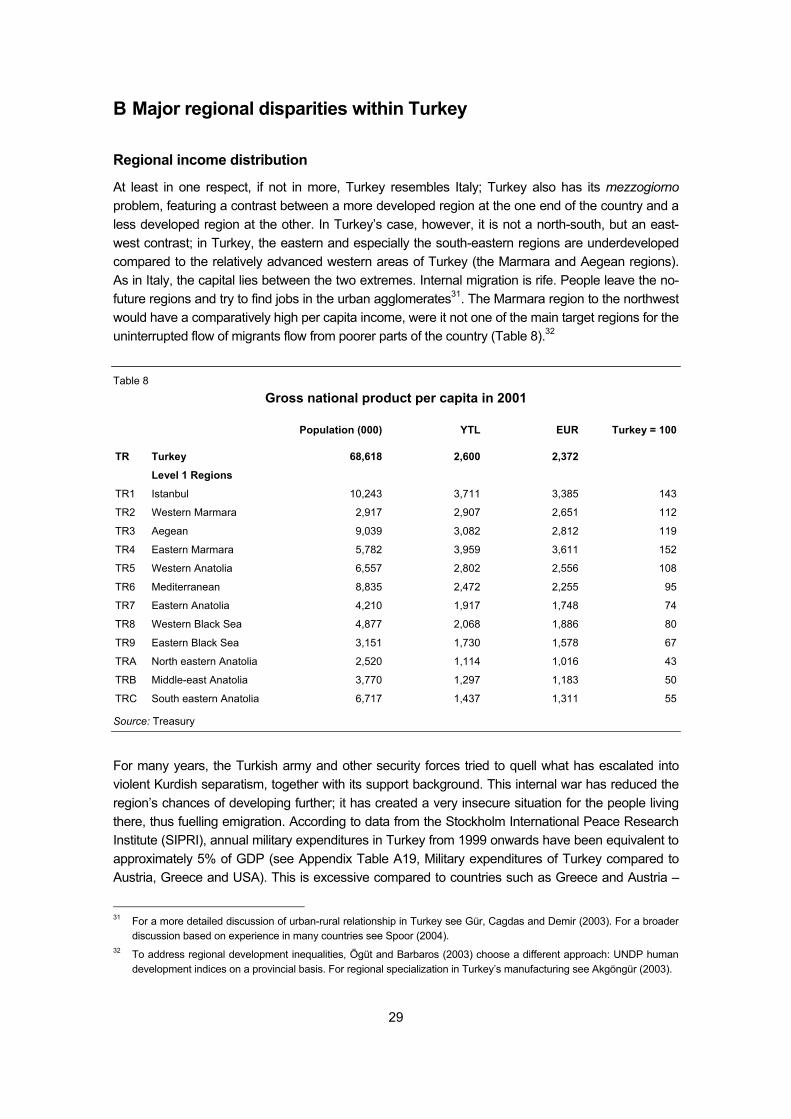
29
B Major regional disparities within Turkey
Regional income distribution
At least in one respect, if not in more, Turkey resembles Italy; Turkey also has its mezzogiorno problem, featuring a contrast between a more developed region at the one end of the country and a less developed region at the other. In Turkey’s case, however, it is not a north-south, but an east-west contrast; in Turkey, the eastern and especially the south-eastern regions are underdeveloped compared to the relatively advanced western areas of Turkey (the Marmara and Aegean regions). As in Italy, the capital lies between the two extremes. Internal migration is rife. People leave the no-future regions and try to find jobs in the urban agglomerates31. The Marmara region to the northwest would have a comparatively high per capita income, were it not one of the main target regions for the uninterrupted flow of migrants flow from poorer parts of the country (Table 8).32
Table 8
Gross national product per capita in 2001
Population (000) YTL EUR Turkey = 100
TR Turkey 68,618 2,600 2,372
Level 1 Regions
TR1 Istanbul 10,243 3,711 3,385 143
TR2 Western Marmara 2,917 2,907 2,651 112
TR3 Aegean 9,039 3,082 2,812 119
TR4 Eastern Marmara 5,782 3,959 3,611 152
TR5 Western Anatolia 6,557 2,802 2,556 108
TR6 Mediterranean 8,835 2,472 2,255 95
TR7 Eastern Anatolia 4,210 1,917 1,748 74
TR8 Western Black Sea 4,877 2,068 1,886 80
TR9 Eastern Black Sea 3,151 1,730 1,578 67
TRA North eastern Anatolia 2,520 1,114 1,016 43
TRB Middle-east Anatolia 3,770 1,297 1,183 50
TRC South eastern Anatolia 6,717 1,437 1,311 55
Source: Treasury
For many years, the Turkish army and other security forces tried to quell what has escalated into violent Kurdish separatism, together with its support background. This internal war has reduced the region’s chances of developing further; it has created a very insecure situation for the people living there, thus fuelling emigration. According to data from the Stockholm International Peace Research Institute (SIPRI), annual military expenditures in Turkey from 1999 onwards have been equivalent to approximately 5% of GDP (see Appendix Table A19, Military expenditures of Turkey compared to Austria, Greece and USA). This is excessive compared to countries such as Greece and Austria –
31 For a more detailed discussion of urban-rural relationship in Turkey see Gür, Cagdas and Demir (2003). For a broader
discussion based on experience in many countries see Spoor (2004). 32 To address regional development inequalities, Ögüt and Barbaros (2003) choose a different approach: UNDP human
development indices on a provincial basis. For regional specialization in Turkey’s manufacturing see Akgöngür (2003).
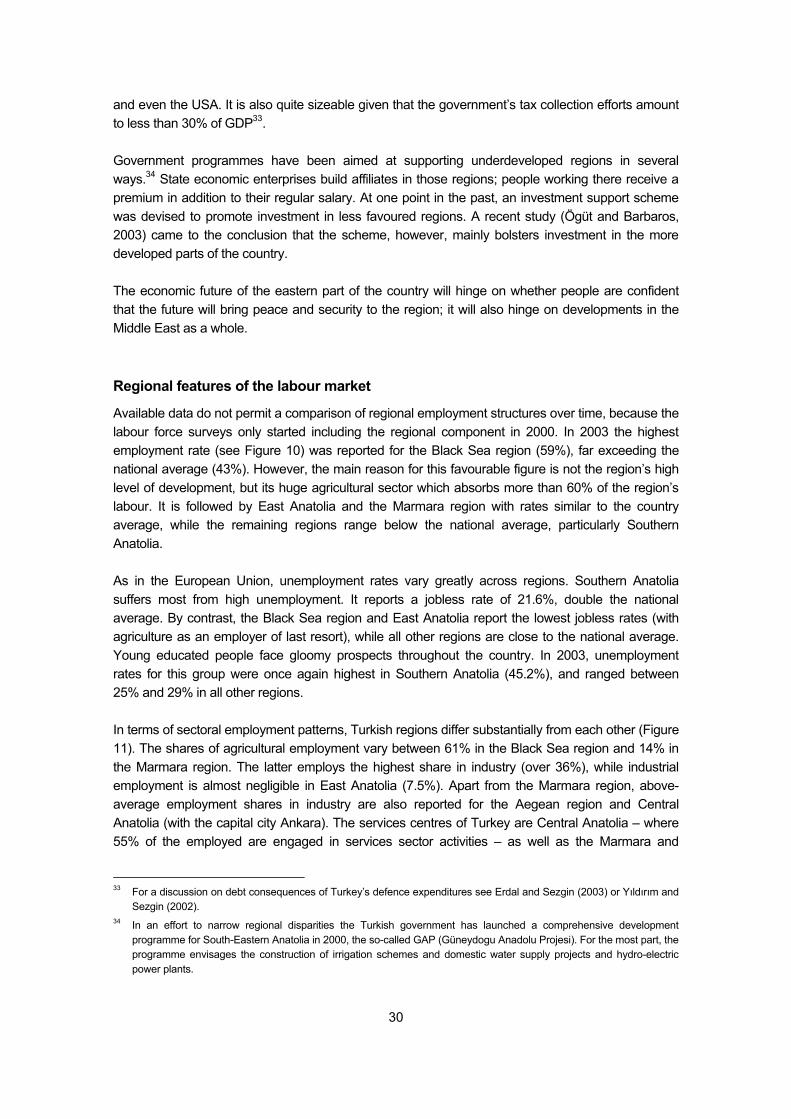
30
and even the USA. It is also quite sizeable given that the government’s tax collection efforts amount to less than 30% of GDP33. Government programmes have been aimed at supporting underdeveloped regions in several ways.34 State economic enterprises build affiliates in those regions; people working there receive a premium in addition to their regular salary. At one point in the past, an investment support scheme was devised to promote investment in less favoured regions. A recent study (Ögüt and Barbaros, 2003) came to the conclusion that the scheme, however, mainly bolsters investment in the more developed parts of the country. The economic future of the eastern part of the country will hinge on whether people are confident that the future will bring peace and security to the region; it will also hinge on developments in the Middle East as a whole. Regional features of the labour market
Available data do not permit a comparison of regional employment structures over time, because the labour force surveys only started including the regional component in 2000. In 2003 the highest employment rate (see Figure 10) was reported for the Black Sea region (59%), far exceeding the national average (43%). However, the main reason for this favourable figure is not the region’s high level of development, but its huge agricultural sector which absorbs more than 60% of the region’s labour. It is followed by East Anatolia and the Marmara region with rates similar to the country average, while the remaining regions range below the national average, particularly Southern Anatolia. As in the European Union, unemployment rates vary greatly across regions. Southern Anatolia suffers most from high unemployment. It reports a jobless rate of 21.6%, double the national average. By contrast, the Black Sea region and East Anatolia report the lowest jobless rates (with agriculture as an employer of last resort), while all other regions are close to the national average. Young educated people face gloomy prospects throughout the country. In 2003, unemployment rates for this group were once again highest in Southern Anatolia (45.2%), and ranged between 25% and 29% in all other regions. In terms of sectoral employment patterns, Turkish regions differ substantially from each other (Figure 11). The shares of agricultural employment vary between 61% in the Black Sea region and 14% in the Marmara region. The latter employs the highest share in industry (over 36%), while industrial employment is almost negligible in East Anatolia (7.5%). Apart from the Marmara region, above-average employment shares in industry are also reported for the Aegean region and Central Anatolia (with the capital city Ankara). The services centres of Turkey are Central Anatolia – where 55% of the employed are engaged in services sector activities – as well as the Marmara and
33 For a discussion on debt consequences of Turkey’s defence expenditures see Erdal and Sezgin (2003) or Yıldırım and
Sezgin (2002). 34 In an effort to narrow regional disparities the Turkish government has launched a comprehensive development
programme for South-Eastern Anatolia in 2000, the so-called GAP (Güneydogu Anadolu Projesi). For the most part, the programme envisages the construction of irrigation schemes and domestic water supply projects and hydro-electric power plants.
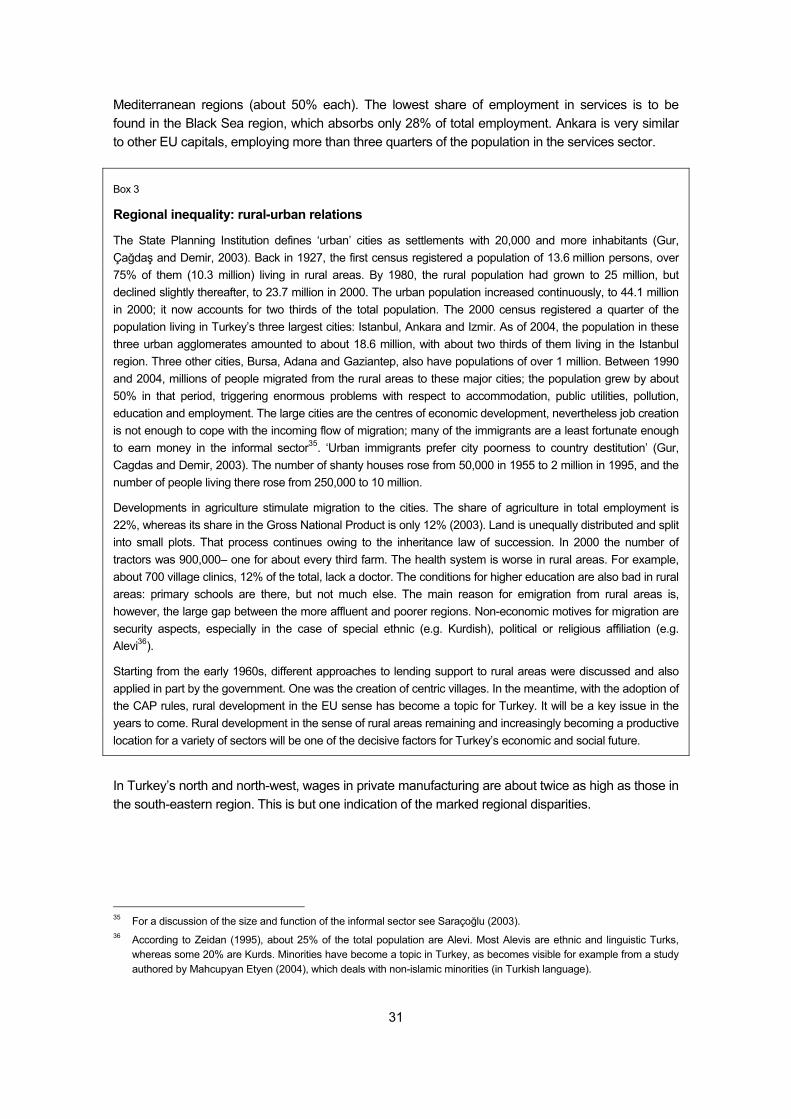
31
Mediterranean regions (about 50% each). The lowest share of employment in services is to be found in the Black Sea region, which absorbs only 28% of total employment. Ankara is very similar to other EU capitals, employing more than three quarters of the population in the services sector.
Box 3
Regional inequality: rural-urban relations
The State Planning Institution defines ‘urban’ cities as settlements with 20,000 and more inhabitants (Gur, Çağdaş and Demir, 2003). Back in 1927, the first census registered a population of 13.6 million persons, over 75% of them (10.3 million) living in rural areas. By 1980, the rural population had grown to 25 million, but declined slightly thereafter, to 23.7 million in 2000. The urban population increased continuously, to 44.1 million in 2000; it now accounts for two thirds of the total population. The 2000 census registered a quarter of the population living in Turkey’s three largest cities: Istanbul, Ankara and Izmir. As of 2004, the population in these three urban agglomerates amounted to about 18.6 million, with about two thirds of them living in the Istanbul region. Three other cities, Bursa, Adana and Gaziantep, also have populations of over 1 million. Between 1990 and 2004, millions of people migrated from the rural areas to these major cities; the population grew by about 50% in that period, triggering enormous problems with respect to accommodation, public utilities, pollution, education and employment. The large cities are the centres of economic development, nevertheless job creation is not enough to cope with the incoming flow of migration; many of the immigrants are a least fortunate enough to earn money in the informal sector35. ‘Urban immigrants prefer city poorness to country destitution’ (Gur, Cagdas and Demir, 2003). The number of shanty houses rose from 50,000 in 1955 to 2 million in 1995, and the number of people living there rose from 250,000 to 10 million.
Developments in agriculture stimulate migration to the cities. The share of agriculture in total employment is 22%, whereas its share in the Gross National Product is only 12% (2003). Land is unequally distributed and split into small plots. That process continues owing to the inheritance law of succession. In 2000 the number of tractors was 900,000– one for about every third farm. The health system is worse in rural areas. For example, about 700 village clinics, 12% of the total, lack a doctor. The conditions for higher education are also bad in rural areas: primary schools are there, but not much else. The main reason for emigration from rural areas is, however, the large gap between the more affluent and poorer regions. Non-economic motives for migration are security aspects, especially in the case of special ethnic (e.g. Kurdish), political or religious affiliation (e.g. Alevi36).
Starting from the early 1960s, different approaches to lending support to rural areas were discussed and also applied in part by the government. One was the creation of centric villages. In the meantime, with the adoption of the CAP rules, rural development in the EU sense has become a topic for Turkey. It will be a key issue in the years to come. Rural development in the sense of rural areas remaining and increasingly becoming a productive location for a variety of sectors will be one of the decisive factors for Turkey’s economic and social future.
In Turkey’s north and north-west, wages in private manufacturing are about twice as high as those in the south-eastern region. This is but one indication of the marked regional disparities.
35 For a discussion of the size and function of the informal sector see Saraçoğlu (2003). 36 According to Zeidan (1995), about 25% of the total population are Alevi. Most Alevis are ethnic and linguistic Turks,
whereas some 20% are Kurds. Minorities have become a topic in Turkey, as becomes visible for example from a study authored by Mahcupyan Etyen (2004), which deals with non-islamic minorities (in Turkish language).
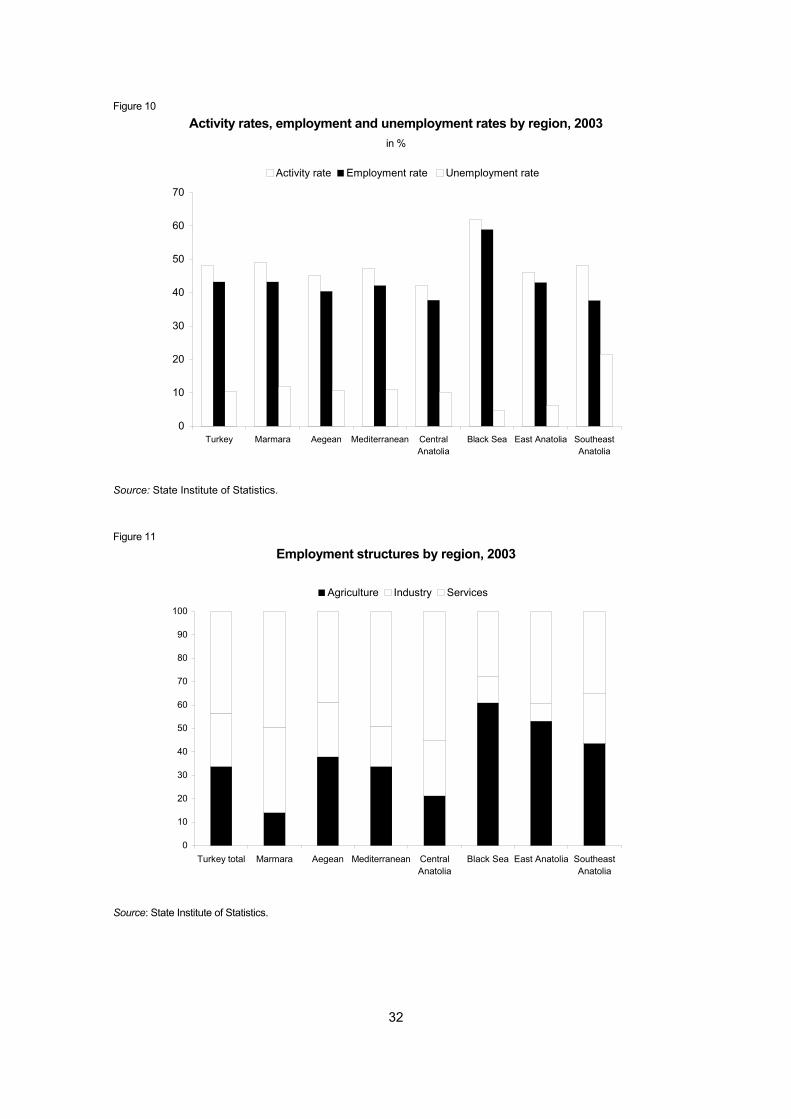
32
Figure 10
Activity rates, employment and unemployment rates by region, 2003 in %
0
10
20
30
40
50
60
70
Turkey Marmara Aegean Mediterranean CentralAnatolia
Black Sea East Anatolia SoutheastAnatolia
Activity rate Employment rate Unemployment rate
Source: State Institute of Statistics.
Figure 11
Employment structures by region, 2003
0
10
20
30
40
50
60
70
80
90
100
Turkey total Marmara Aegean Mediterranean CentralAnatolia
Black Sea East Anatolia SoutheastAnatolia
Agriculture Industry Services
Source: State Institute of Statistics.
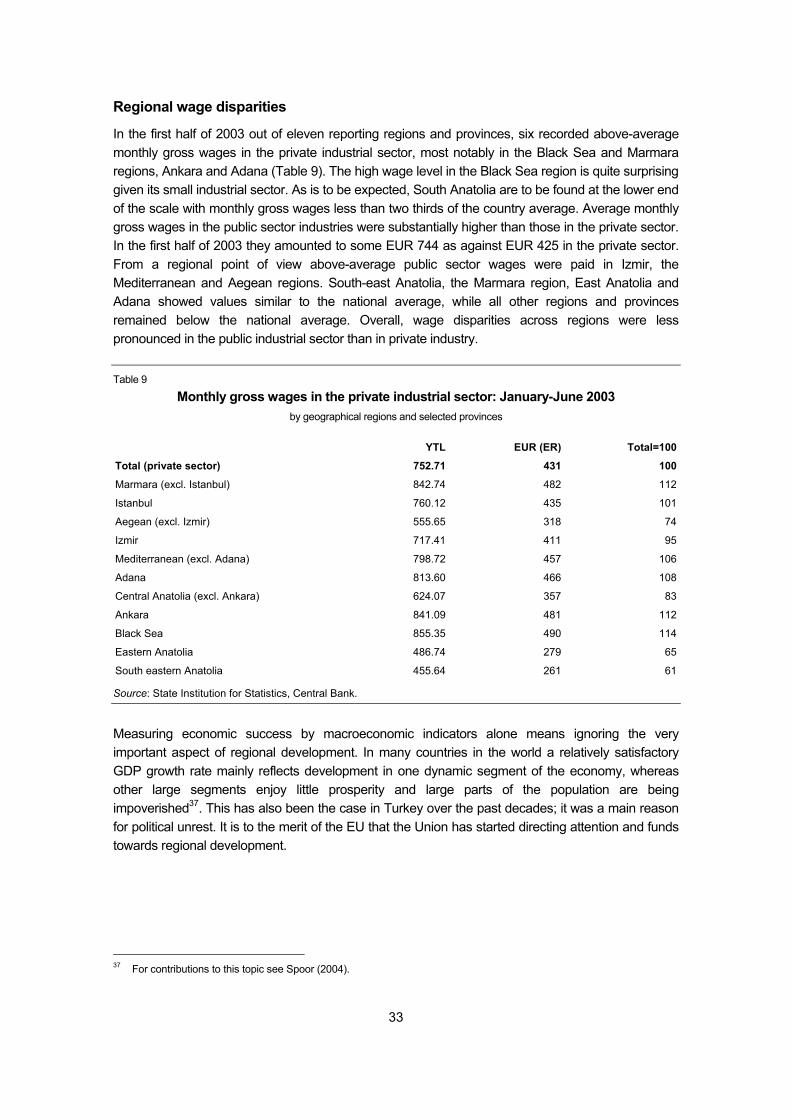
33
Regional wage disparities
In the first half of 2003 out of eleven reporting regions and provinces, six recorded above-average monthly gross wages in the private industrial sector, most notably in the Black Sea and Marmara regions, Ankara and Adana (Table 9). The high wage level in the Black Sea region is quite surprising given its small industrial sector. As is to be expected, South Anatolia are to be found at the lower end of the scale with monthly gross wages less than two thirds of the country average. Average monthly gross wages in the public sector industries were substantially higher than those in the private sector. In the first half of 2003 they amounted to some EUR 744 as against EUR 425 in the private sector. From a regional point of view above-average public sector wages were paid in Izmir, the Mediterranean and Aegean regions. South-east Anatolia, the Marmara region, East Anatolia and Adana showed values similar to the national average, while all other regions and provinces remained below the national average. Overall, wage disparities across regions were less pronounced in the public industrial sector than in private industry. Table 9
Monthly gross wages in the private industrial sector: January-June 2003 by geographical regions and selected provinces
YTL EUR (ER) Total=100
Total (private sector) 752.71 431 100
Marmara (excl. Istanbul) 842.74 482 112
Istanbul 760.12 435 101
Aegean (excl. Izmir) 555.65 318 74
Izmir 717.41 411 95
Mediterranean (excl. Adana) 798.72 457 106
Adana 813.60 466 108
Central Anatolia (excl. Ankara) 624.07 357 83
Ankara 841.09 481 112
Black Sea 855.35 490 114
Eastern Anatolia 486.74 279 65
South eastern Anatolia 455.64 261 61
Source: State Institution for Statistics, Central Bank.
Measuring economic success by macroeconomic indicators alone means ignoring the very important aspect of regional development. In many countries in the world a relatively satisfactory GDP growth rate mainly reflects development in one dynamic segment of the economy, whereas other large segments enjoy little prosperity and large parts of the population are being impoverished37. This has also been the case in Turkey over the past decades; it was a main reason for political unrest. It is to the merit of the EU that the Union has started directing attention and funds towards regional development.
37 For contributions to this topic see Spoor (2004).
34
Box 4
Promotion of investment, research and development
In December 2001, the government opted to establish measures aimed at the amelioration of the investment climate. A coordination council identified investment barriers and made proposals for their removal. As a result, a law was introduced in August 2004 facilitating company registration procedures, removing the screening and pre-approval requirements for domestic and foreign investors and making it easier for foreign investment companies to employ key personnel from abroad. In the context of privatization, these companies will now have the same access to tenders as domestic companies. The law also opened up the land market to foreign natural persons according to the principle of reciprocity.
In order to obtain access to investment incentives, investors have to go for an Incentive Certificate. Conditions vary depending on the region envisaged by the investment plan. Conditions are most favourable for the priority development regions. They are located towards the east. Incentives are less pronounced for medium developed regions. Not eligible for incentives are investments in the most developed regions. These are the regions around the Marmara Sea (Istanbul, Bursa, Izmir, Kocaeli), Antalya and Adana.
However, within the developed regions investments in certain areas, the so-called industrial and technology belts, also have access to incentives. Furthermore, some special sectors count as especially important, and investment in these fields qualify for incentives regardless of the location of the investment. These sectors are mining, ship and yacht building, shipyard, information technology, software development, infrastructure including energy, environmental protection, aircraft and helicopter production, electronics industry, education, health, tourism, research and development, rehabilitation centres, and priority technological investments.
Research and development promotion relies on a number of instruments such as corporate tax deferral or techno parks located near universities and other research institutions. They are open to both advanced technology firms and firms applying technological inventions to the development of new products. Earnings from such activities are exempt from income tax for several years (corporate profits for five years, salaries for ten years).
Source: YASED (2004).
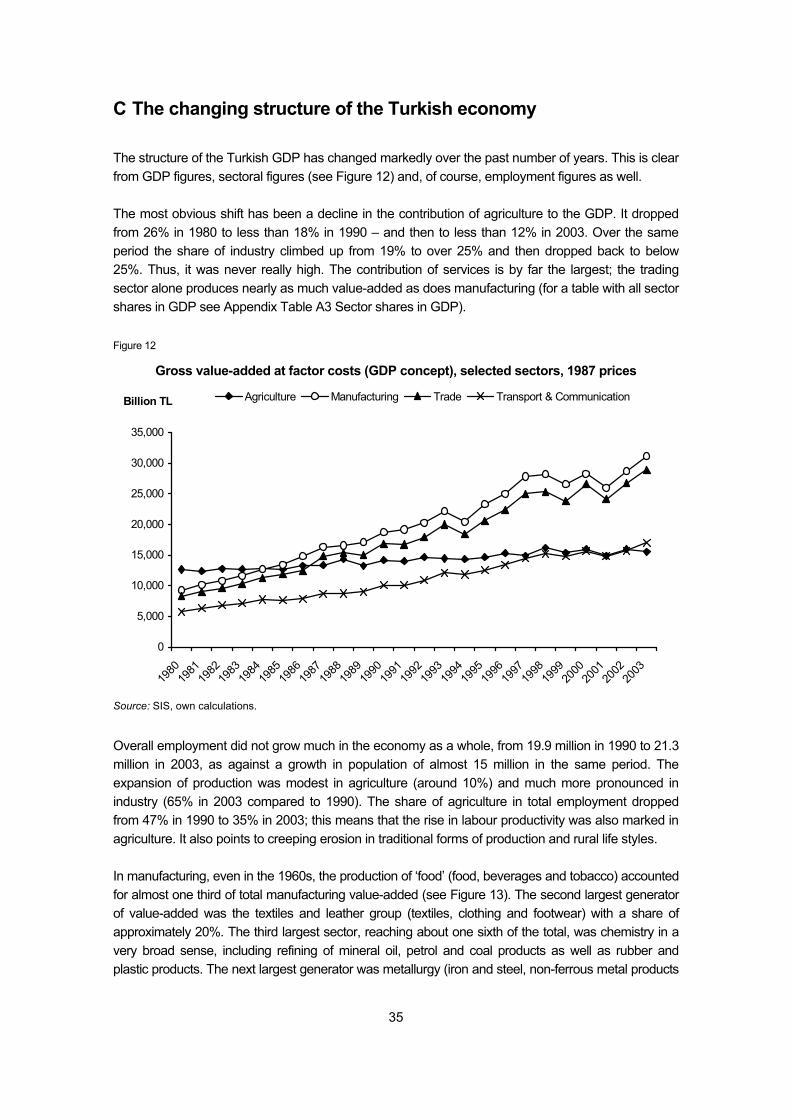
35
C The changing structure of the Turkish economy
The structure of the Turkish GDP has changed markedly over the past number of years. This is clear from GDP figures, sectoral figures (see Figure 12) and, of course, employment figures as well. The most obvious shift has been a decline in the contribution of agriculture to the GDP. It dropped from 26% in 1980 to less than 18% in 1990 – and then to less than 12% in 2003. Over the same period the share of industry climbed up from 19% to over 25% and then dropped back to below 25%. Thus, it was never really high. The contribution of services is by far the largest; the trading sector alone produces nearly as much value-added as does manufacturing (for a table with all sector shares in GDP see Appendix Table A3 Sector shares in GDP). Figure 12
Gross value-added at factor costs (GDP concept), selected sectors, 1987 prices
0
5,000
10,000
15,000
20,000
25,000
30,000
35,000
1980
1981
1982
1983
1984
1985
1986
1987
1988
1989
1990
1991
1992
1993
1994
1995
1996
1997
1998
1999
2000
2001
2002
2003
Billion TL Agriculture Manufacturing Trade Transport & Communication
Source: SIS, own calculations.
Overall employment did not grow much in the economy as a whole, from 19.9 million in 1990 to 21.3 million in 2003, as against a growth in population of almost 15 million in the same period. The expansion of production was modest in agriculture (around 10%) and much more pronounced in industry (65% in 2003 compared to 1990). The share of agriculture in total employment dropped from 47% in 1990 to 35% in 2003; this means that the rise in labour productivity was also marked in agriculture. It also points to creeping erosion in traditional forms of production and rural life styles. In manufacturing, even in the 1960s, the production of ‘food’ (food, beverages and tobacco) accounted for almost one third of total manufacturing value-added (see Figure 13). The second largest generator of value-added was the textiles and leather group (textiles, clothing and footwear) with a share of approximately 20%. The third largest sector, reaching about one sixth of the total, was chemistry in a very broad sense, including refining of mineral oil, petrol and coal products as well as rubber and plastic products. The next largest generator was metallurgy (iron and steel, non-ferrous metal products
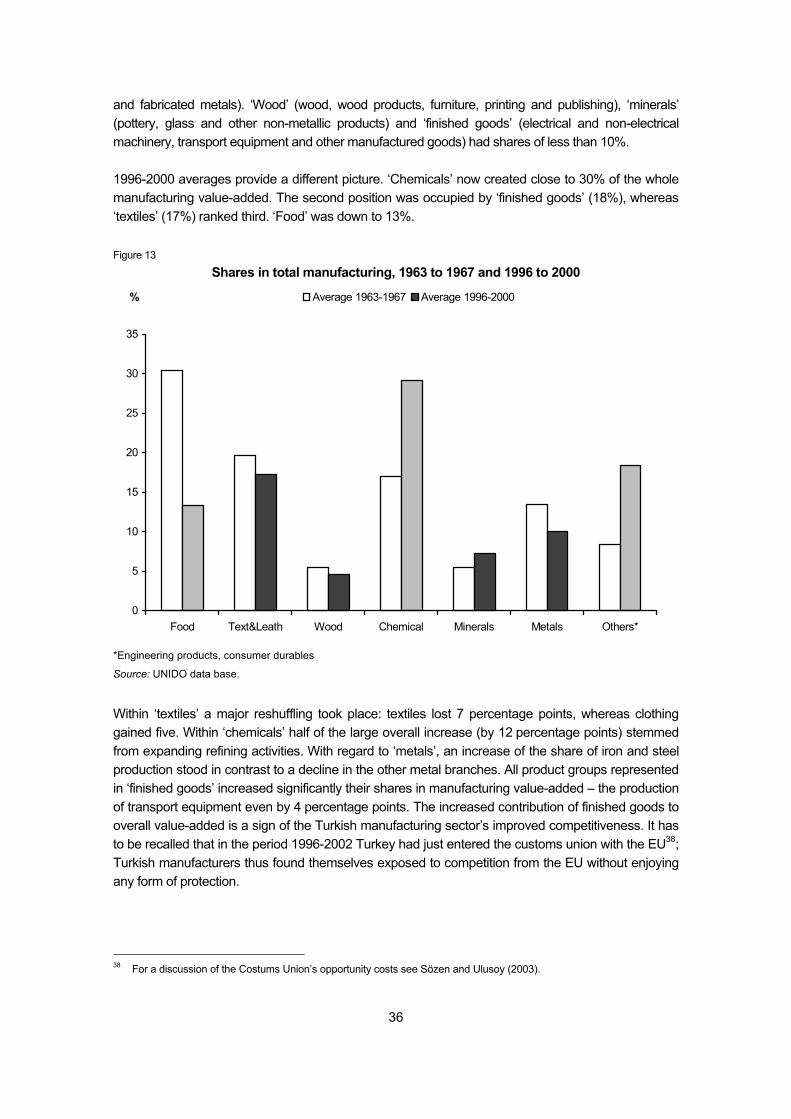
36
and fabricated metals). ‘Wood’ (wood, wood products, furniture, printing and publishing), ‘minerals’ (pottery, glass and other non-metallic products) and ‘finished goods’ (electrical and non-electrical machinery, transport equipment and other manufactured goods) had shares of less than 10%. 1996-2000 averages provide a different picture. ‘Chemicals’ now created close to 30% of the whole manufacturing value-added. The second position was occupied by ‘finished goods’ (18%), whereas ‘textiles’ (17%) ranked third. ‘Food’ was down to 13%. Figure 13
Shares in total manufacturing, 1963 to 1967 and 1996 to 2000
0
5
10
15
20
25
30
35
Food Text&Leath Wood Chemical Minerals Metals Others*
% Average 1963-1967 Average 1996-2000
*Engineering products, consumer durables
Source: UNIDO data base.
Within ‘textiles’ a major reshuffling took place: textiles lost 7 percentage points, whereas clothing gained five. Within ‘chemicals’ half of the large overall increase (by 12 percentage points) stemmed from expanding refining activities. With regard to ‘metals’, an increase of the share of iron and steel production stood in contrast to a decline in the other metal branches. All product groups represented in ‘finished goods’ increased significantly their shares in manufacturing value-added – the production of transport equipment even by 4 percentage points. The increased contribution of finished goods to overall value-added is a sign of the Turkish manufacturing sector’s improved competitiveness. It has to be recalled that in the period 1996-2002 Turkey had just entered the customs union with the EU38; Turkish manufacturers thus found themselves exposed to competition from the EU without enjoying any form of protection.
38 For a discussion of the Costums Union’s opportunity costs see Sözen and Ulusoy (2003).
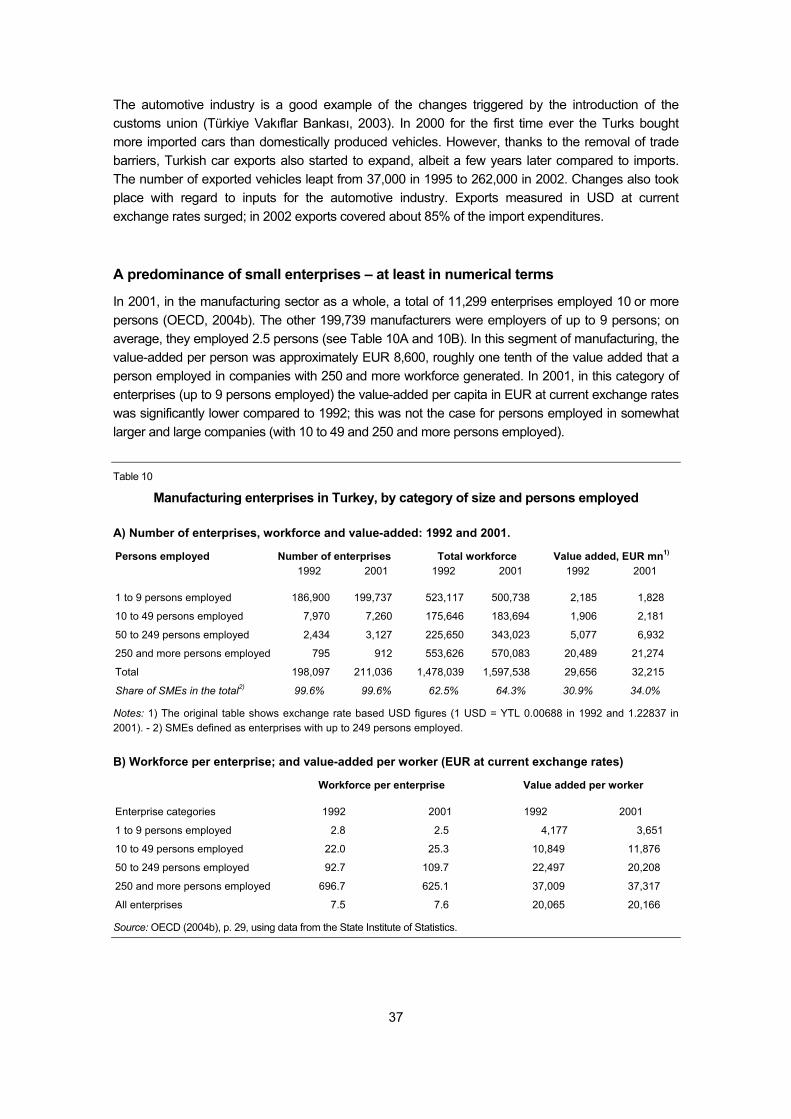
37
The automotive industry is a good example of the changes triggered by the introduction of the customs union (Türkiye Vakıflar Bankası, 2003). In 2000 for the first time ever the Turks bought more imported cars than domestically produced vehicles. However, thanks to the removal of trade barriers, Turkish car exports also started to expand, albeit a few years later compared to imports. The number of exported vehicles leapt from 37,000 in 1995 to 262,000 in 2002. Changes also took place with regard to inputs for the automotive industry. Exports measured in USD at current exchange rates surged; in 2002 exports covered about 85% of the import expenditures. A predominance of small enterprises – at least in numerical terms
In 2001, in the manufacturing sector as a whole, a total of 11,299 enterprises employed 10 or more persons (OECD, 2004b). The other 199,739 manufacturers were employers of up to 9 persons; on average, they employed 2.5 persons (see Table 10A and 10B). In this segment of manufacturing, the value-added per person was approximately EUR 8,600, roughly one tenth of the value added that a person employed in companies with 250 and more workforce generated. In 2001, in this category of enterprises (up to 9 persons employed) the value-added per capita in EUR at current exchange rates was significantly lower compared to 1992; this was not the case for persons employed in somewhat larger and large companies (with 10 to 49 and 250 and more persons employed).
Table 10
Manufacturing enterprises in Turkey, by category of size and persons employed
A) Number of enterprises, workforce and value-added: 1992 and 2001.
Persons employed Number of enterprises Total workforce Value added, EUR mn1)
1992 2001 1992 2001 1992 2001
1 to 9 persons employed 186,900 199,737 523,117 500,738 2,185 1,828
10 to 49 persons employed 7,970 7,260 175,646 183,694 1,906 2,181
50 to 249 persons employed 2,434 3,127 225,650 343,023 5,077 6,932
250 and more persons employed 795 912 553,626 570,083 20,489 21,274
Total 198,097 211,036 1,478,039 1,597,538 29,656 32,215
Share of SMEs in the total2) 99.6% 99.6% 62.5% 64.3% 30.9% 34.0%
Notes: 1) The original table shows exchange rate based USD figures (1 USD = YTL 0.00688 in 1992 and 1.22837 in 2001). - 2) SMEs defined as enterprises with up to 249 persons employed.
B) Workforce per enterprise; and value-added per worker (EUR at current exchange rates)
Workforce per enterprise Value added per worker
Enterprise categories 1992 2001 1992 2001
1 to 9 persons employed 2.8 2.5 4,177 3,651
10 to 49 persons employed 22.0 25.3 10,849 11,876
50 to 249 persons employed 92.7 109.7 22,497 20,208
250 and more persons employed 696.7 625.1 37,009 37,317
All enterprises 7.5 7.6 20,065 20,166
Source: OECD (2004b), p. 29, using data from the State Institute of Statistics.
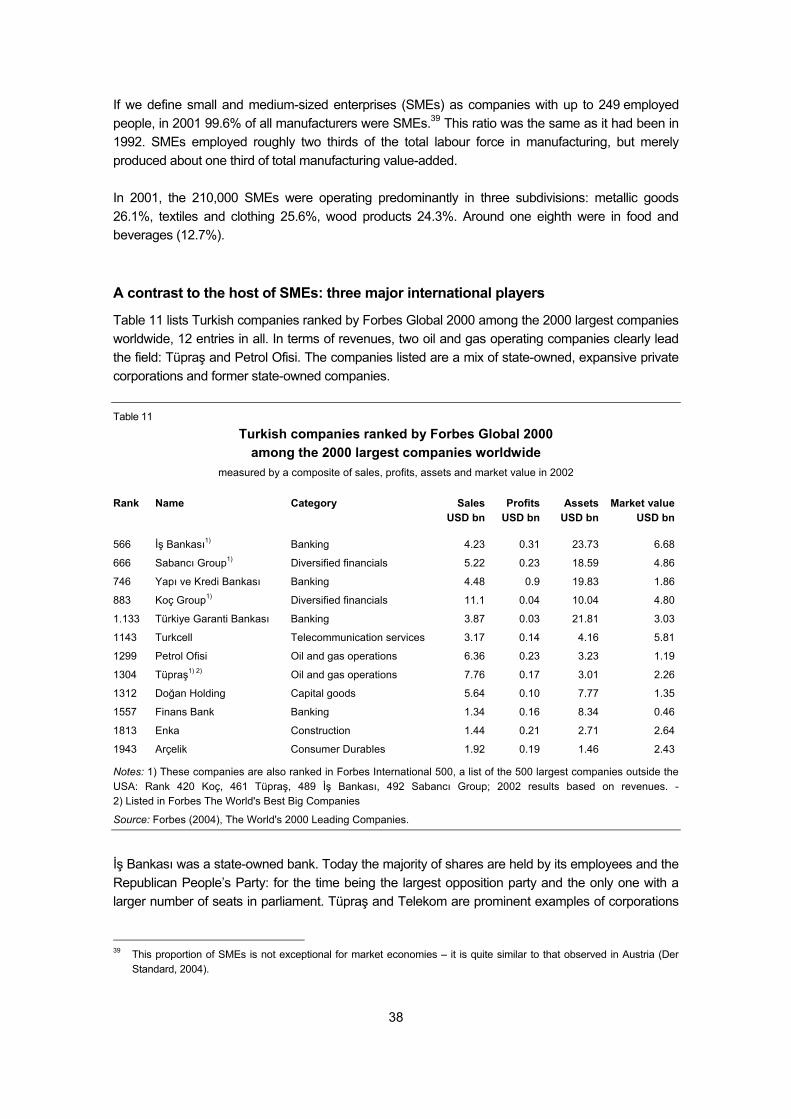
38
If we define small and medium-sized enterprises (SMEs) as companies with up to 249 employed people, in 2001 99.6% of all manufacturers were SMEs.39 This ratio was the same as it had been in 1992. SMEs employed roughly two thirds of the total labour force in manufacturing, but merely produced about one third of total manufacturing value-added. In 2001, the 210,000 SMEs were operating predominantly in three subdivisions: metallic goods 26.1%, textiles and clothing 25.6%, wood products 24.3%. Around one eighth were in food and beverages (12.7%). A contrast to the host of SMEs: three major international players
Table 11 lists Turkish companies ranked by Forbes Global 2000 among the 2000 largest companies worldwide, 12 entries in all. In terms of revenues, two oil and gas operating companies clearly lead the field: Tüpraş and Petrol Ofisi. The companies listed are a mix of state-owned, expansive private corporations and former state-owned companies. Table 11
Turkish companies ranked by Forbes Global 2000 among the 2000 largest companies worldwide
measured by a composite of sales, profits, assets and market value in 2002
Rank Name Category Sales Profits Assets Market value USD bn USD bn USD bn USD bn
566 İş Bankası1) Banking 4.23 0.31 23.73 6.68
666 Sabancı Group1) Diversified financials 5.22 0.23 18.59 4.86
746 Yapı ve Kredi Bankası Banking 4.48 0.9 19.83 1.86
883 Koç Group1) Diversified financials 11.1 0.04 10.04 4.80
1.133 Türkiye Garanti Bankası Banking 3.87 0.03 21.81 3.03
1143 Turkcell Telecommunication services 3.17 0.14 4.16 5.81
1299 Petrol Ofisi Oil and gas operations 6.36 0.23 3.23 1.19
1304 Tüpraş1) 2) Oil and gas operations 7.76 0.17 3.01 2.26
1312 Doğan Holding Capital goods 5.64 0.10 7.77 1.35
1557 Finans Bank Banking 1.34 0.16 8.34 0.46
1813 Enka Construction 1.44 0.21 2.71 2.64
1943 Arçelik Consumer Durables 1.92 0.19 1.46 2.43
Notes: 1) These companies are also ranked in Forbes International 500, a list of the 500 largest companies outside the USA: Rank 420 Koç, 461 Tüpraş, 489 İş Bankası, 492 Sabancı Group; 2002 results based on revenues. - 2) Listed in Forbes The World's Best Big Companies
Source: Forbes (2004), The World's 2000 Leading Companies.
İş Bankası was a state-owned bank. Today the majority of shares are held by its employees and the Republican People’s Party: for the time being the largest opposition party and the only one with a larger number of seats in parliament. Tüpraş and Telekom are prominent examples of corporations
39 This proportion of SMEs is not exceptional for market economies – it is quite similar to that observed in Austria (Der
Standard, 2004).
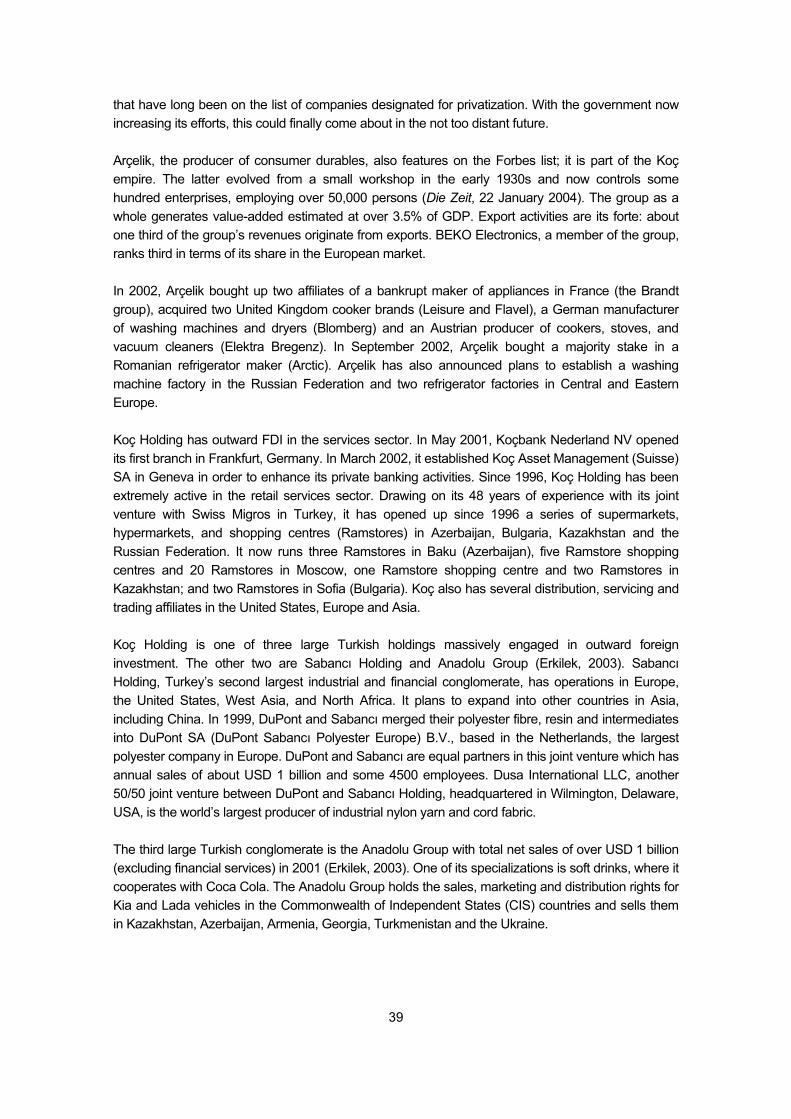
39
that have long been on the list of companies designated for privatization. With the government now increasing its efforts, this could finally come about in the not too distant future. Arçelik, the producer of consumer durables, also features on the Forbes list; it is part of the Koç empire. The latter evolved from a small workshop in the early 1930s and now controls some hundred enterprises, employing over 50,000 persons (Die Zeit, 22 January 2004). The group as a whole generates value-added estimated at over 3.5% of GDP. Export activities are its forte: about one third of the group’s revenues originate from exports. BEKO Electronics, a member of the group, ranks third in terms of its share in the European market. In 2002, Arçelik bought up two affiliates of a bankrupt maker of appliances in France (the Brandt group), acquired two United Kingdom cooker brands (Leisure and Flavel), a German manufacturer of washing machines and dryers (Blomberg) and an Austrian producer of cookers, stoves, and vacuum cleaners (Elektra Bregenz). In September 2002, Arçelik bought a majority stake in a Romanian refrigerator maker (Arctic). Arçelik has also announced plans to establish a washing machine factory in the Russian Federation and two refrigerator factories in Central and Eastern Europe. Koç Holding has outward FDI in the services sector. In May 2001, Koçbank Nederland NV opened its first branch in Frankfurt, Germany. In March 2002, it established Koç Asset Management (Suisse) SA in Geneva in order to enhance its private banking activities. Since 1996, Koç Holding has been extremely active in the retail services sector. Drawing on its 48 years of experience with its joint venture with Swiss Migros in Turkey, it has opened up since 1996 a series of supermarkets, hypermarkets, and shopping centres (Ramstores) in Azerbaijan, Bulgaria, Kazakhstan and the Russian Federation. It now runs three Ramstores in Baku (Azerbaijan), five Ramstore shopping centres and 20 Ramstores in Moscow, one Ramstore shopping centre and two Ramstores in Kazakhstan; and two Ramstores in Sofia (Bulgaria). Koç also has several distribution, servicing and trading affiliates in the United States, Europe and Asia. Koç Holding is one of three large Turkish holdings massively engaged in outward foreign investment. The other two are Sabancı Holding and Anadolu Group (Erkilek, 2003). Sabancı Holding, Turkey’s second largest industrial and financial conglomerate, has operations in Europe, the United States, West Asia, and North Africa. It plans to expand into other countries in Asia, including China. In 1999, DuPont and Sabancı merged their polyester fibre, resin and intermediates into DuPont SA (DuPont Sabancı Polyester Europe) B.V., based in the Netherlands, the largest polyester company in Europe. DuPont and Sabancı are equal partners in this joint venture which has annual sales of about USD 1 billion and some 4500 employees. Dusa International LLC, another 50/50 joint venture between DuPont and Sabancı Holding, headquartered in Wilmington, Delaware, USA, is the world’s largest producer of industrial nylon yarn and cord fabric. The third large Turkish conglomerate is the Anadolu Group with total net sales of over USD 1 billion (excluding financial services) in 2001 (Erkilek, 2003). One of its specializations is soft drinks, where it cooperates with Coca Cola. The Anadolu Group holds the sales, marketing and distribution rights for Kia and Lada vehicles in the Commonwealth of Independent States (CIS) countries and sells them in Kazakhstan, Azerbaijan, Armenia, Georgia, Turkmenistan and the Ukraine.
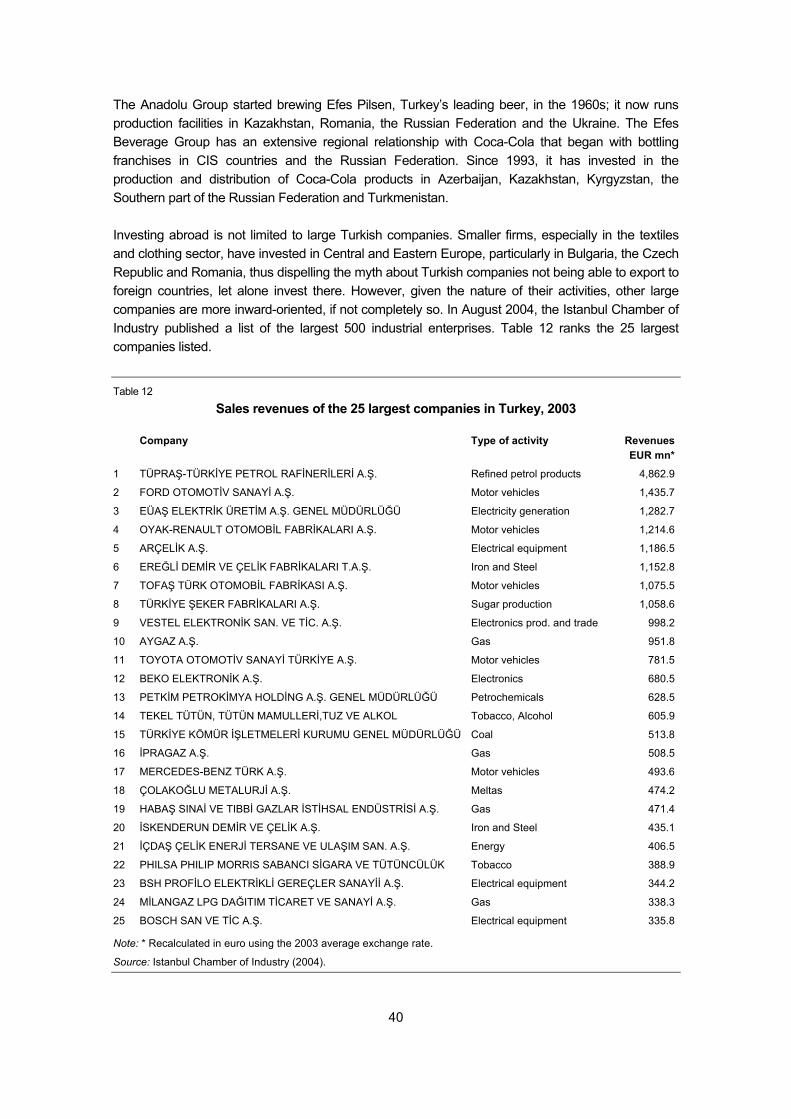
40
The Anadolu Group started brewing Efes Pilsen, Turkey’s leading beer, in the 1960s; it now runs production facilities in Kazakhstan, Romania, the Russian Federation and the Ukraine. The Efes Beverage Group has an extensive regional relationship with Coca-Cola that began with bottling franchises in CIS countries and the Russian Federation. Since 1993, it has invested in the production and distribution of Coca-Cola products in Azerbaijan, Kazakhstan, Kyrgyzstan, the Southern part of the Russian Federation and Turkmenistan. Investing abroad is not limited to large Turkish companies. Smaller firms, especially in the textiles and clothing sector, have invested in Central and Eastern Europe, particularly in Bulgaria, the Czech Republic and Romania, thus dispelling the myth about Turkish companies not being able to export to foreign countries, let alone invest there. However, given the nature of their activities, other large companies are more inward-oriented, if not completely so. In August 2004, the Istanbul Chamber of Industry published a list of the largest 500 industrial enterprises. Table 12 ranks the 25 largest companies listed.
Table 12
Sales revenues of the 25 largest companies in Turkey, 2003
Company Type of activity Revenues EUR mn*
1 TÜPRAŞ-TÜRKİYE PETROL RAFİNERİLERİ A.Ş. Refined petrol products 4,862.9
2 FORD OTOMOTİV SANAYİ A.Ş. Motor vehicles 1,435.7
3 EÜAŞ ELEKTRİK ÜRETİM A.Ş. GENEL MÜDÜRLÜĞÜ Electricity generation 1,282.7
4 OYAK-RENAULT OTOMOBİL FABRİKALARI A.Ş. Motor vehicles 1,214.6
5 ARÇELİK A.Ş. Electrical equipment 1,186.5
6 EREĞLİ DEMİR VE ÇELİK FABRİKALARI T.A.Ş. Iron and Steel 1,152.8
7 TOFAŞ TÜRK OTOMOBİL FABRİKASI A.Ş. Motor vehicles 1,075.5
8 TÜRKİYE ŞEKER FABRİKALARI A.Ş. Sugar production 1,058.6
9 VESTEL ELEKTRONİK SAN. VE TİC. A.Ş. Electronics prod. and trade 998.2
10 AYGAZ A.Ş. Gas 951.8
11 TOYOTA OTOMOTİV SANAYİ TÜRKİYE A.Ş. Motor vehicles 781.5
12 BEKO ELEKTRONİK A.Ş. Electronics 680.5
13 PETKİM PETROKİMYA HOLDİNG A.Ş. GENEL MÜDÜRLÜĞÜ Petrochemicals 628.5
14 TEKEL TÜTÜN, TÜTÜN MAMULLERİ,TUZ VE ALKOL Tobacco, Alcohol 605.9
15 TÜRKİYE KÖMÜR İŞLETMELERİ KURUMU GENEL MÜDÜRLÜĞÜ Coal 513.8
16 İPRAGAZ A.Ş. Gas 508.5
17 MERCEDES-BENZ TÜRK A.Ş. Motor vehicles 493.6
18 ÇOLAKOĞLU METALURJİ A.Ş. Meltas 474.2
19 HABAŞ SINAİ VE TIBBİ GAZLAR İSTİHSAL ENDÜSTRİSİ A.Ş. Gas 471.4
20 İSKENDERUN DEMİR VE ÇELİK A.Ş. Iron and Steel 435.1
21 İÇDAŞ ÇELİK ENERJİ TERSANE VE ULAŞIM SAN. A.Ş. Energy 406.5
22 PHILSA PHILIP MORRIS SABANCI SİGARA VE TÜTÜNCÜLÜK Tobacco 388.9
23 BSH PROFİLO ELEKTRİKLİ GEREÇLER SANAYİİ A.Ş. Electrical equipment 344.2
24 MİLANGAZ LPG DAĞITIM TİCARET VE SANAYİ A.Ş. Gas 338.3
25 BOSCH SAN VE TİC A.Ş. Electrical equipment 335.8
Note: * Recalculated in euro using the 2003 average exchange rate.
Source: Istanbul Chamber of Industry (2004).
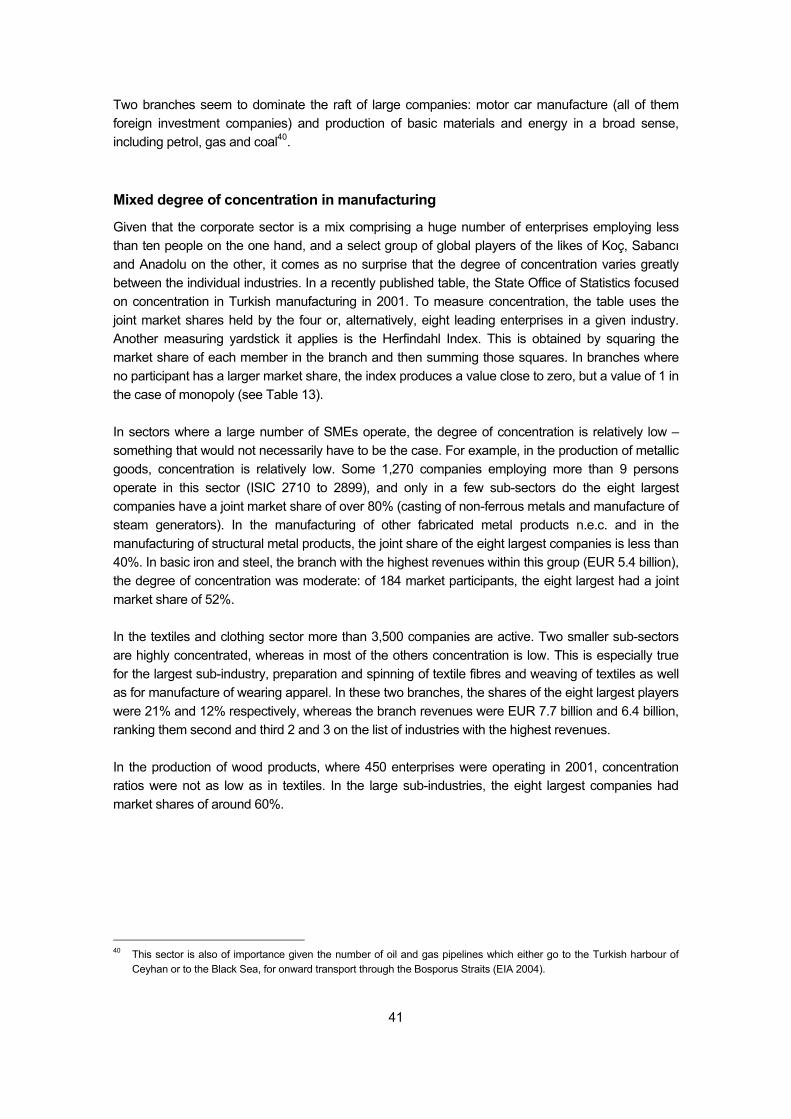
41
Two branches seem to dominate the raft of large companies: motor car manufacture (all of them foreign investment companies) and production of basic materials and energy in a broad sense, including petrol, gas and coal40. Mixed degree of concentration in manufacturing
Given that the corporate sector is a mix comprising a huge number of enterprises employing less than ten people on the one hand, and a select group of global players of the likes of Koç, Sabancı and Anadolu on the other, it comes as no surprise that the degree of concentration varies greatly between the individual industries. In a recently published table, the State Office of Statistics focused on concentration in Turkish manufacturing in 2001. To measure concentration, the table uses the joint market shares held by the four or, alternatively, eight leading enterprises in a given industry. Another measuring yardstick it applies is the Herfindahl Index. This is obtained by squaring the market share of each member in the branch and then summing those squares. In branches where no participant has a larger market share, the index produces a value close to zero, but a value of 1 in the case of monopoly (see Table 13). In sectors where a large number of SMEs operate, the degree of concentration is relatively low – something that would not necessarily have to be the case. For example, in the production of metallic goods, concentration is relatively low. Some 1,270 companies employing more than 9 persons operate in this sector (ISIC 2710 to 2899), and only in a few sub-sectors do the eight largest companies have a joint market share of over 80% (casting of non-ferrous metals and manufacture of steam generators). In the manufacturing of other fabricated metal products n.e.c. and in the manufacturing of structural metal products, the joint share of the eight largest companies is less than 40%. In basic iron and steel, the branch with the highest revenues within this group (EUR 5.4 billion), the degree of concentration was moderate: of 184 market participants, the eight largest had a joint market share of 52%. In the textiles and clothing sector more than 3,500 companies are active. Two smaller sub-sectors are highly concentrated, whereas in most of the others concentration is low. This is especially true for the largest sub-industry, preparation and spinning of textile fibres and weaving of textiles as well as for manufacture of wearing apparel. In these two branches, the shares of the eight largest players were 21% and 12% respectively, whereas the branch revenues were EUR 7.7 billion and 6.4 billion, ranking them second and third 2 and 3 on the list of industries with the highest revenues. In the production of wood products, where 450 enterprises were operating in 2001, concentration ratios were not as low as in textiles. In the large sub-industries, the eight largest companies had market shares of around 60%.
40 This sector is also of importance given the number of oil and gas pipelines which either go to the Turkish harbour of
Ceyhan or to the Black Sea, for onward transport through the Bosporus Straits (EIA 2004).
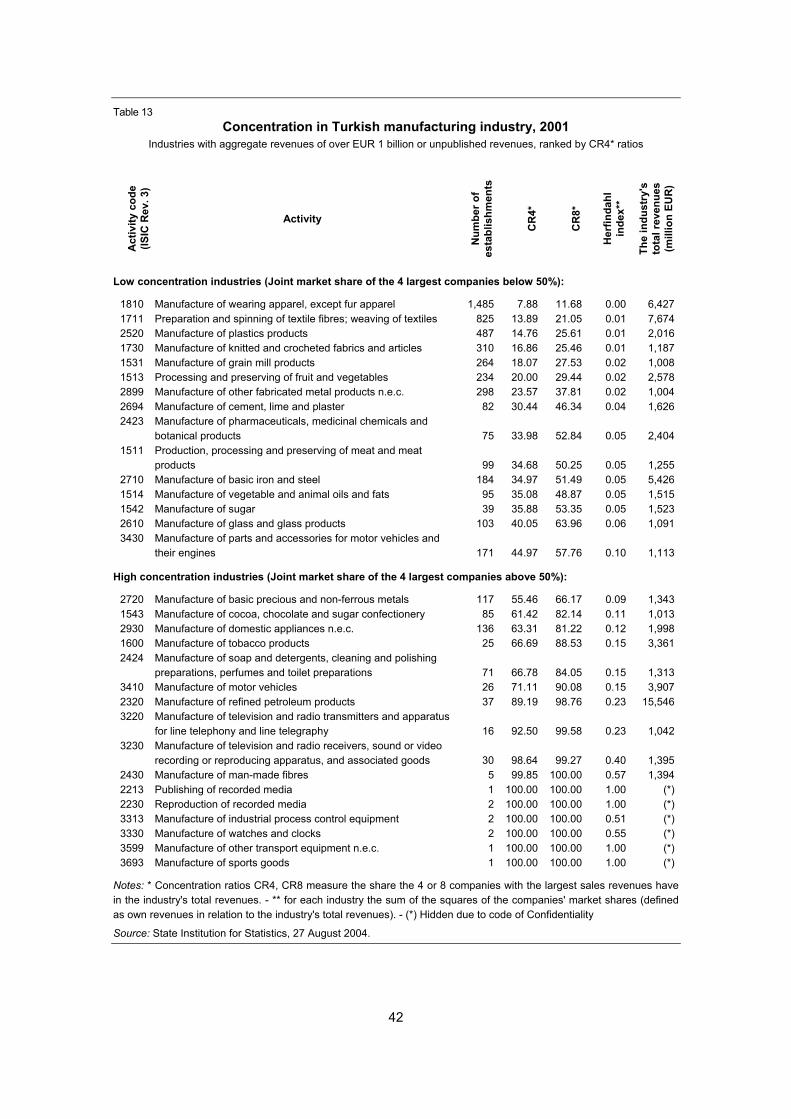
42
Table 13 Concentration in Turkish manufacturing industry, 2001
Industries with aggregate revenues of over EUR 1 billion or unpublished revenues, ranked by CR4* ratios A
ctiv
ity c
ode
(ISIC
Rev
. 3)
Activity
Num
ber o
f es
tabl
ishm
ents
CR
4*
CR
8*
Her
finda
hl
inde
x**
The
indu
stry
's
tota
l rev
enue
s (m
illio
n EU
R)
Low concentration industries (Joint market share of the 4 largest companies below 50%):
1810 Manufacture of wearing apparel, except fur apparel 1,485 7.88 11.68 0.00 6,4271711 Preparation and spinning of textile fibres; weaving of textiles 825 13.89 21.05 0.01 7,6742520 Manufacture of plastics products 487 14.76 25.61 0.01 2,0161730 Manufacture of knitted and crocheted fabrics and articles 310 16.86 25.46 0.01 1,1871531 Manufacture of grain mill products 264 18.07 27.53 0.02 1,0081513 Processing and preserving of fruit and vegetables 234 20.00 29.44 0.02 2,5782899 Manufacture of other fabricated metal products n.e.c. 298 23.57 37.81 0.02 1,0042694 Manufacture of cement, lime and plaster 82 30.44 46.34 0.04 1,6262423 Manufacture of pharmaceuticals, medicinal chemicals and
botanical products 75 33.98 52.84 0.05 2,4041511 Production, processing and preserving of meat and meat
products 99 34.68 50.25 0.05 1,2552710 Manufacture of basic iron and steel 184 34.97 51.49 0.05 5,4261514 Manufacture of vegetable and animal oils and fats 95 35.08 48.87 0.05 1,5151542 Manufacture of sugar 39 35.88 53.35 0.05 1,5232610 Manufacture of glass and glass products 103 40.05 63.96 0.06 1,0913430 Manufacture of parts and accessories for motor vehicles and
their engines 171 44.97 57.76 0.10 1,113
High concentration industries (Joint market share of the 4 largest companies above 50%):
2720 Manufacture of basic precious and non-ferrous metals 117 55.46 66.17 0.09 1,3431543 Manufacture of cocoa, chocolate and sugar confectionery 85 61.42 82.14 0.11 1,0132930 Manufacture of domestic appliances n.e.c. 136 63.31 81.22 0.12 1,9981600 Manufacture of tobacco products 25 66.69 88.53 0.15 3,3612424 Manufacture of soap and detergents, cleaning and polishing
preparations, perfumes and toilet preparations 71 66.78 84.05 0.15 1,3133410 Manufacture of motor vehicles 26 71.11 90.08 0.15 3,9072320 Manufacture of refined petroleum products 37 89.19 98.76 0.23 15,5463220 Manufacture of television and radio transmitters and apparatus
for line telephony and line telegraphy 16 92.50 99.58 0.23 1,0423230 Manufacture of television and radio receivers, sound or video
recording or reproducing apparatus, and associated goods 30 98.64 99.27 0.40 1,3952430 Manufacture of man-made fibres 5 99.85 100.00 0.57 1,3942213 Publishing of recorded media 1 100.00 100.00 1.00 (*)2230 Reproduction of recorded media 2 100.00 100.00 1.00 (*)3313 Manufacture of industrial process control equipment 2 100.00 100.00 0.51 (*)3330 Manufacture of watches and clocks 2 100.00 100.00 0.55 (*)3599 Manufacture of other transport equipment n.e.c. 1 100.00 100.00 1.00 (*)3693 Manufacture of sports goods 1 100.00 100.00 1.00 (*)
Notes: * Concentration ratios CR4, CR8 measure the share the 4 or 8 companies with the largest sales revenues have in the industry's total revenues. - ** for each industry the sum of the squares of the companies' market shares (defined as own revenues in relation to the industry's total revenues). - (*) Hidden due to code of Confidentiality
Source: State Institution for Statistics, 27 August 2004.
43
In the food, beverages and tobacco sector, the picture was mixed. 25 companies participated in tobacco production, the branch with by far the highest revenues in the whole sector: close to EUR 3.4 billion. The eight largest companies accounted for a joint market share of 89%. In the production of beverages with a total revenue of EUR 1.8 billion, concentration was also high. In all of them, the eight largest companies had market shares ranging between 80% and 100%. Among the larger sub-sectors of the food industry, the manufacture of cocoa, chocolate and sugar confectionery was highly concentrated, but less so the sugar industry where 39 companies were operating. The large food-processing branches with very low concentration ratios were processing and preserving of fruit and the vegetables and manufacture of grain mill products, each of them with a CR8 of somewhat less than 30%. With a branch revenue of EUR 15.5 billion, by far the most important activity among the highly concentrated industries was the manufacture of refined petroleum products. 37 companies were listed, but the largest four had a joint market share of close to 90%. Another important and highly concentrated branch was the manufacture of motor vehicles: the revenues of 26 participants totalled EUR 3.9 billion, but the joint market share was 71% for the four and 90% for the eight largest. Of the larger industries, other high levels of concentration were also to be observed in the manufacture of domestic appliances n.e.c., the manufacture of TV and radio receivers and video recorders, and the manufacture of man-made fibres. The discreet presence of the transnational corporations
Hitherto, Turkey has been one of those countries that did not extend all that warm a welcome to foreign investors. Japan and Korea display a similar attitude, as did Slovenia, albeit at a different stage. In Turkey, the reasons for this vary. First, throughout their history the Turks have been distrustful of foreigners’ intent upon gaining a foothold in the country. In its long period of agony, the Ottoman Empire had to face centuries of edicts and interference from foreign powers. After World War I, Turkish territory was on the verge of being reduced to Central Anatolia. The victory of the hastily formed new Turkish army helped to avert that fate and marked the starting point of the new state. Another feasible explanation is to be found in the upper echelons of the state institutions, including the army, who do not wish to abrogate much of the power and influence they have wielded so far. It could also be that the state administration simply follows its traditional habit of tending to complicate things, a ruse many might resort to as a rent-seeking strategy. Moreover, up to mid-2003 foreigners wishing to start an investment project had to seek the authorities’ permission. Thus, the low inflow of foreign direct investment may well be due to a lack of interest on the part of transnational companies. Finally, Turkey’s corporate sector is dominated by about 20 holdings (see above for a brief description of the largest three). The very existence of these holdings may contribute to the difficulty which large privatization projects face. While they may be interested in purchasing the more attractive companies listed for privatization, these holdings can hardly compete with foreign investors. They have thus been looking for opportunities to cooperate with transnational companies, both in Turkey and abroad. In sum, the involvement of transnationals in Turkey is strong: a fact that is not reflected in FDI data.
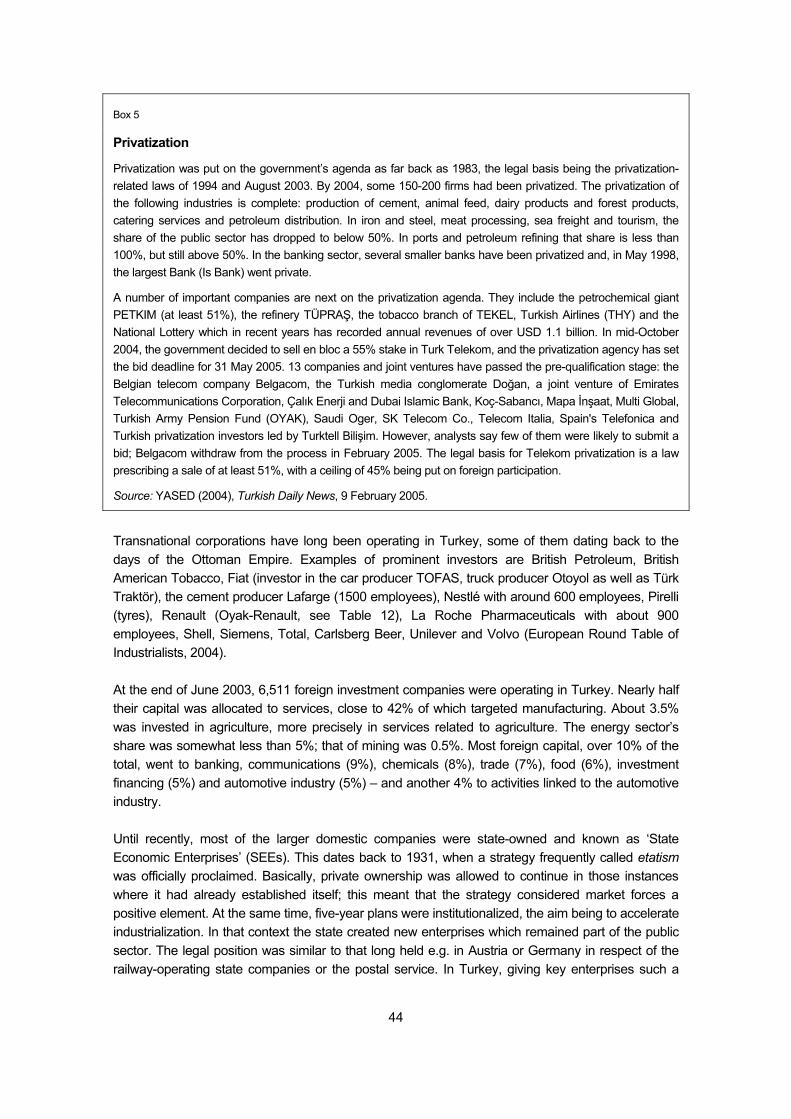
44
Box 5
Privatization
Privatization was put on the government’s agenda as far back as 1983, the legal basis being the privatization-related laws of 1994 and August 2003. By 2004, some 150-200 firms had been privatized. The privatization of the following industries is complete: production of cement, animal feed, dairy products and forest products, catering services and petroleum distribution. In iron and steel, meat processing, sea freight and tourism, the share of the public sector has dropped to below 50%. In ports and petroleum refining that share is less than 100%, but still above 50%. In the banking sector, several smaller banks have been privatized and, in May 1998, the largest Bank (Is Bank) went private.
A number of important companies are next on the privatization agenda. They include the petrochemical giant PETKIM (at least 51%), the refinery TÜPRAŞ, the tobacco branch of TEKEL, Turkish Airlines (THY) and the National Lottery which in recent years has recorded annual revenues of over USD 1.1 billion. In mid-October 2004, the government decided to sell en bloc a 55% stake in Turk Telekom, and the privatization agency has set the bid deadline for 31 May 2005. 13 companies and joint ventures have passed the pre-qualification stage: the Belgian telecom company Belgacom, the Turkish media conglomerate Doğan, a joint venture of Emirates Telecommunications Corporation, Çalık Enerji and Dubai Islamic Bank, Koç-Sabancı, Mapa İnşaat, Multi Global, Turkish Army Pension Fund (OYAK), Saudi Oger, SK Telecom Co., Telecom Italia, Spain's Telefonica and Turkish privatization investors led by Turktell Bilişim. However, analysts say few of them were likely to submit a bid; Belgacom withdraw from the process in February 2005. The legal basis for Telekom privatization is a law prescribing a sale of at least 51%, with a ceiling of 45% being put on foreign participation.
Source: YASED (2004), Turkish Daily News, 9 February 2005.
Transnational corporations have long been operating in Turkey, some of them dating back to the days of the Ottoman Empire. Examples of prominent investors are British Petroleum, British American Tobacco, Fiat (investor in the car producer TOFAS, truck producer Otoyol as well as Türk Traktör), the cement producer Lafarge (1500 employees), Nestlé with around 600 employees, Pirelli (tyres), Renault (Oyak-Renault, see Table 12), La Roche Pharmaceuticals with about 900 employees, Shell, Siemens, Total, Carlsberg Beer, Unilever and Volvo (European Round Table of Industrialists, 2004). At the end of June 2003, 6,511 foreign investment companies were operating in Turkey. Nearly half their capital was allocated to services, close to 42% of which targeted manufacturing. About 3.5% was invested in agriculture, more precisely in services related to agriculture. The energy sector’s share was somewhat less than 5%; that of mining was 0.5%. Most foreign capital, over 10% of the total, went to banking, communications (9%), chemicals (8%), trade (7%), food (6%), investment financing (5%) and automotive industry (5%) – and another 4% to activities linked to the automotive industry. Until recently, most of the larger domestic companies were state-owned and known as ‘State Economic Enterprises’ (SEEs). This dates back to 1931, when a strategy frequently called etatism was officially proclaimed. Basically, private ownership was allowed to continue in those instances where it had already established itself; this meant that the strategy considered market forces a positive element. At the same time, five-year plans were institutionalized, the aim being to accelerate industrialization. In that context the state created new enterprises which remained part of the public sector. The legal position was similar to that long held e.g. in Austria or Germany in respect of the railway-operating state companies or the postal service. In Turkey, giving key enterprises such a
45
position was supposed to be the better strategy – at least for a transitory period up until the economy reached a more developed stage. What followed was a massive industrialization drive in the 1930s, complemented by a system of highly protective tariffs. A long period of industrialization based on import substitution started, continuing well into the post-war period. In 1964 the government established the State Investment Bank; this aimed at providing long-term investment loans to SEEs. The latter had also access to other sources of financing, such as credit from the Central Bank of Turkey or transfers from the Treasury. There was, as Öniş and Alper (2002) show, a problem of soft budget constraint. The public sector’s economic activities were organized as follows:
– State Economic Enterprises (SEEs). They are fully state-owned and affiliated to a ministry in keeping with the inter-ministerial division of labour. They are split into
• State Economic Establishments, which operate in line with regular commercial conditions in the manufacturing sector, and
• State Economic Corporations, which usually are monopolies.
– Certain organizations equipped with a number of public functions. These enterprises and institutions are partners or affiliates of State Economic Enterprises, with the state’s share varying between 15% and 99%.
Persons employed in this sector count as ‘workers’, not as civil servants. Enterprises with a state holding of at least 50% can be regarded as part of the SEE structures. Their boards reflect the company’s ownership structure, and government representatives play the lead role. SEEs continue to dominate two spheres: sectors that have always been regarded as sensitive; and sectors where private investors have hesitated to get involved, given the high capital requirements or their doubts about profitability. SEEs have been set up in transportation (air, sea and rail) and communications, as well as energy production and distribution. They also used to be the rule for banks with shares in non-financial companies, in particular branches such as textiles or refining, or with shares in multi-sector conglomerates. In 1980, it became clear that promoting development by means of an import-substitution strategy was doomed to failure. For all the endeavours to achieve import substitution, imports had expanded rapidly in the context of GDP growth. Furthermore, Turkish manufacturers had been predominantly inward-oriented and exports could thus not keep pace. In that year, the military stepped in for the second time41; the military government launched a liberalization-cum-stabilization programme, but continued to rely on SEEs and development planning. After the military withdrew in 1983, privatization (at least of some of the SEEs) became a topic for discussion once more and major privatization steps were planned for 1987. In 1984, parliament passed a law that paved the way for the privatization of state-owned companies (amending it twice thereafter, in 1994 and again in August 2003). Most of the privatization planned for 1987 failed to materialize. In the mid-1990s, SEEs accounted for more than 40% of value-added in manufacturing and employed about 550,000 workers (about 20% of the industrial workforce).
41 Contrary to 1960, the intervention in 1971 was an indirect one.
46
One principle of Turkish etatism42 was that SEEs should not set their prices independently. For larger parts of the economy, the reform package of 1980 abolished price regulation. It remained intact, however, in certain sectors such as energy and public transport, and especially in the production of staple foods and agricultural outputs/inputs. It was an integral part of agricultural policy that was being reformed at the time. In that context, SEEs also had to serve a social function. The farm-support programme stabilized farmers' incomes, while low consumer prices for food, energy and transport helped the urban poor. SEEs were pressed to employ more people than necessary from the standpoint of efficiency. In the context of regional development programmes, the SEEs had to set up some of their production sites in remote areas, regardless whether this increased their transport costs and infrastructural investment. For a time at least, a number of the SEEs ran at a loss, while the state covered their losses in one way or another. From 1989 onwards, SEEs were required by law to borrow at market rates; the latter were high, thus merely serving to exacerbate the debt problem. Some enterprises accumulated an ever-increasing debt burden, vis-à-vis the Treasury and the National Bank and, to a lesser degree, vis-à-vis commercial banks. As a result, debt-servicing absorbed an ever greater share of those companies’ revenues. Over time, periodic crises in the economy as a whole led to a further erosion of confidence in SEEs. Finally, the situation worsened to such a degree that the government together with the military establishment had no choice but to yield to internal and, above all, external pressure to privatize. The privatization plans were comprehensive, yet up until early 2005 little has happened. Over the period 1986-2003, the state privatized 167 companies, many of which were parts of large SEEs. In 153 companies the state did not even retain a minority share. By end-2003, privatization revenues totalled USD 11.4 billion. In the first quarter of 2004, the state sold stakes worth USD 0.7 billion and possibly close to USD 1.1 billion for the whole year – almost twice the average of past years. The state has completely withdrawn from the following industries: production of cement, animal feed, milk-dairy products, forest products, earth moving and catering services and petroleum distribution sectors. In the tourism, iron and steel, textiles, sea freight and meat processing sectors, the state has privatized more than 50% of its previous shares. In ports and the petroleum refinery sector, the government has sold its minority stakes. The state has also started privatizing shares in banks (Sümerbank, Etibank, Denizbank and Anadolu Bank). In 1998, the government offered domestic and foreign investors a 12.3% stake in İş Bankası. The government offered a tranche of the shares on the Istanbul Stock Exchange (ISE). In fact, more recently the public sector has started offering shares in many companies on the stock exchange in an attempt to strengthen that institution. The promotion of privatization deals ranks high on the Turkish government’s agenda. It is the sole means of ensuring a swift exit from fiscal structures due to high indebtedness: the IMF strongly recommends applying such a strategy. The list of tenders projected for 2004 was long; it included the sale of shares in large companies such as refineries (Tüpraş), the petrochemicals producer Petkim, Türk Telekom, electricity generation and distribution plants, Turkish Airlines, the national
42 More on etatism and Kemalism – and its impact on development strategies in other developing countries – can be
found in Amin (1990).

47
lottery, sugar factories and the former state monopoly producer of cigarettes, alcoholic beverages and a number of other products (TEKEL). The ultimate decision-making body is the Privatization High Council headed by the prime minister; administration of the privatization process is part of the prime minister’s remit.
48
D Turkey’s foreign trade relations
Institutional framework
Today’s EU shares a long history of economic integration with Turkey. In 1959, Turkey applied for associate membership; this led to the Association Agreement in 1963. Called the Ankara Agreement, it envisaged three stages in preparation for full membership. During the preliminary stage (1964-1973), the EEC was to give direct financial aid to Turkey and establish preferential trade conditions. During the transition stage, tariffs and other trade barriers were to be eliminated over a period of 22 years in order to establish a customs union between Turkey and the EEC. Depending on whether the requisite progress was observed, the Community would then examine the possibility of Turkey acquiring full membership in the final stage. For economic and political reasons, neither side was enthusiastic about implementing the Agreement over such an extended period of time. While Turkey was reluctant to eliminate tariffs, the EEC started setting political conditions for further integration. The timetable was also prone to change. In 1967, Turkey applied to negotiate entry into the second stage of the process. The Additional Protocol to the Ankara Agreement was thus signed in 1970, the aim being establish a customs union. After Greece joined the EU in 1981, Turkey was faced mounting political obstacles with respect to further integration43. In 1987, Turkey surprisingly and prematurely applied for full membership to the EEC only to be politely rebuffed by the Commission. At the time, Turkey was confronted by two political problems: human rights and the Cyprus question. The major changes in the political landscape of Europe brought about by the end of the Cold War together with the transformation of the European Community from an economic to a political union also had an impact on EU-Turkish relations. Membership in the community took on increasing importance for Turkey. Moreover, pursuant to the Additional Protocol to the Ankara Agreement the customs union should have been up and running by 1995. Turkey’s wish to become a full member intensified against a background of worsening political circumstances. For its part, Turkey had failed to implement the prior steps set out in the Ankara Agreement, further to which it now faced a Greek veto.44 In this difficult situation, the Turkish government felt a fresh step towards integration should be taken. The customs union with the EU was thus concluded in 1995; it came into effect on 1 January 1996. It is important to note that the customs union only applied to industrial products: it did not extend to agricultural products and services. Owing to the legacy of the prior steps, with the Ankara Agreement unlike the Europe Agreement explicitly envisaging the formation of a customs union, both partners agreed on setting up a customs union instead of entering into a free-trade agreement as had been the case with the agreement between the EU and the countries of Central and Eastern Europe. Moreover, in this specific instance, the customs union that was finally concluded went beyond basic requirements. Turkey was required to introduce a broad swathe of legislation covering all aspects of trade, competition law, industrial commercial and intellectual property rights and harmonization with EU technical standards. Thus, the customs union already bears many
43 For a discussion about winners and loser from the customs union see Dimitri and Moutos (2002). 44 Greece laid down certain conditions that had to be met before it would lift its veto: Turkey should take the issue of its
conflict with Greece over the Aegean to the International Court of Justice (ICJ). Furthermore, the community should lend no financial aid until Turkey cleaned up its human rights record. Finally, Turkey should not oppose the opening of accession negotiations with the (Greek) Republic of Cyprus.
49
consequences that would normally follow on from full membership. The fields of public procurement and trade in services were omitted, but negotiations on the same were envisaged. Apart from those issues, the customs union called for the establishment and maintenance of a common commercial policy vis-à-vis third countries; this has inevitably led to a pronounced degree of asymmetry given the major differences between the two partners in term of size. At the time the customs union was concluded, the conditions for Turkey were less favourable than had been envisaged in the Ankara Agreement. In economic terms, Turkey had to forgo any claim to financial aid as well as the right of free movement of workers, to both of which Turkey would have been entitled under the Association Agreement. Following a further deterioration, the cool political relations between Turkey and the EU froze solid in 1997, when Turkey was officially dropped from the list of candidate countries. However, at the Helsinki Summit in 1999, Turkey was officially declared a candidate country. Three years later at the Copenhagen Summit, it was agreed that, if the European Council were to decide in December 2004 that Turkey met the Copenhagen criteria, the European Union would open up accession negotiations with Turkey without further delay. The questions to be answered in this part of the report are: (i) how has the customs union affected both the Turkish and European economies? (ii) how is further integration going to work and/or what impact will it have on the competitiveness of both partners? Before answering those questions, we will present an overview of Turkey’s foreign trade in 2003 and compare the situation in that year to the early and mid-1990s in terms of the external sector: trade in goods and services and FDI. We will then summarize the abundant empirical literature on the effects of the customs union and present the outcome of simulations using current computable general equilibrium models for various integration scenarios. The latter models permit us to shed light on welfare issues, which cannot be assessed in a partial econometric analysis of the external sector alone. Finally, we will try to evaluate the future prospects for Turkey’s external sector based on the analysis of current competitiveness against a backdrop of institutional change. Evolution of foreign trade
Turkey’s exports amounted to USD 11.6 billion in 1989; imports attained a level of USD 15.8 billion (see Figure 14 and Table A6 in the Appendix). Both exports and imports increased steadily over time, resulting in total trade volume doubling by 1995. The years immediately prior to the formation of the customs union were characterized by particularly high growth rates: close to 20% per annum. Greater volatility was observed on the import side: imports rose substantially in 1993, dropping by 20% in 1994 and soaring by 50% in 1995. It seems that the creation of the customs union had already been anticipated; its impact materialized even before it went into effect on 1 January 1996. Trade growth remained high in the second half of the 1990s, in particular on the import side, apart from a slump due to deteriorating global conditions in 1998 and 1999. By 2003, Turkish exports had more than quadrupled since 1989 (and doubled compared to 1995), reaching USD 47 billion. Developments in import levels were similar; total imports amounted to USD 67 billion in 2003.
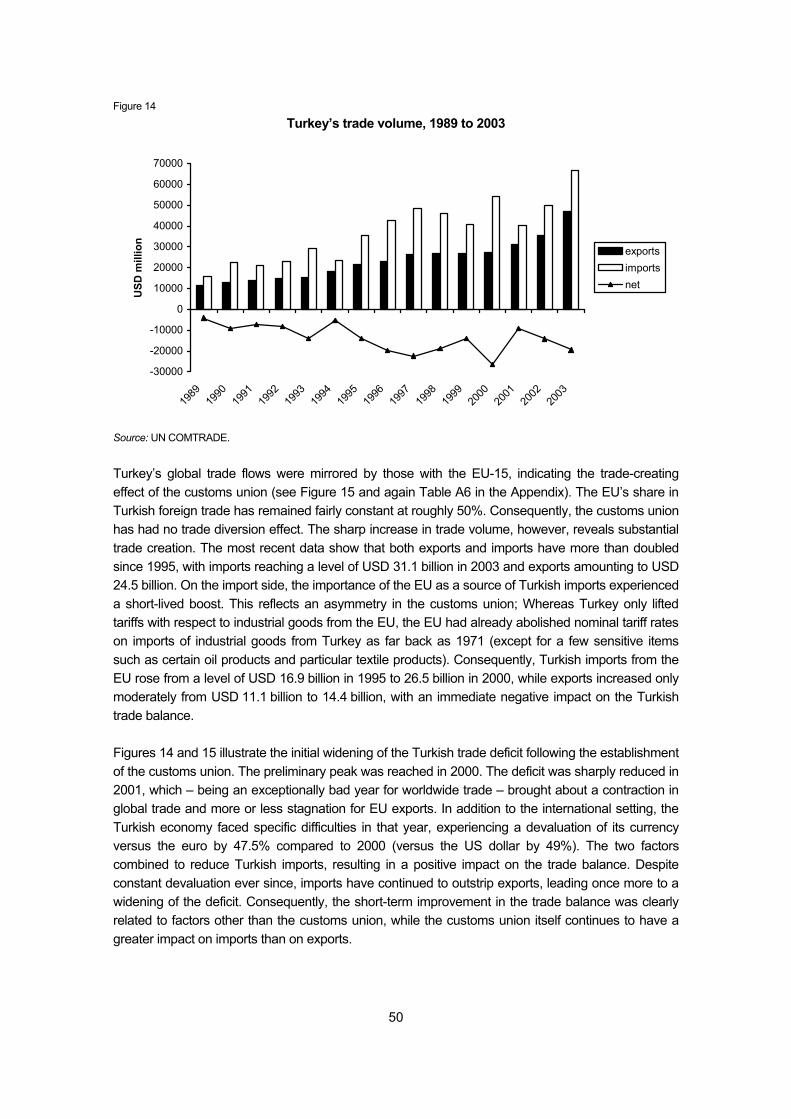
50
Figure 14
Turkey’s trade volume, 1989 to 2003
-30000
-20000
-10000
0
10000
20000
30000
40000
50000
60000
70000
1989
1990
1991
1992
1993
1994
1995
1996
1997
1998
1999
2000
2001
2002
2003
USD
mill
ion
exportsimportsnet
Source: UN COMTRADE.
Turkey’s global trade flows were mirrored by those with the EU-15, indicating the trade-creating effect of the customs union (see Figure 15 and again Table A6 in the Appendix). The EU’s share in Turkish foreign trade has remained fairly constant at roughly 50%. Consequently, the customs union has had no trade diversion effect. The sharp increase in trade volume, however, reveals substantial trade creation. The most recent data show that both exports and imports have more than doubled since 1995, with imports reaching a level of USD 31.1 billion in 2003 and exports amounting to USD 24.5 billion. On the import side, the importance of the EU as a source of Turkish imports experienced a short-lived boost. This reflects an asymmetry in the customs union; Whereas Turkey only lifted tariffs with respect to industrial goods from the EU, the EU had already abolished nominal tariff rates on imports of industrial goods from Turkey as far back as 1971 (except for a few sensitive items such as certain oil products and particular textile products). Consequently, Turkish imports from the EU rose from a level of USD 16.9 billion in 1995 to 26.5 billion in 2000, while exports increased only moderately from USD 11.1 billion to 14.4 billion, with an immediate negative impact on the Turkish trade balance. Figures 14 and 15 illustrate the initial widening of the Turkish trade deficit following the establishment of the customs union. The preliminary peak was reached in 2000. The deficit was sharply reduced in 2001, which – being an exceptionally bad year for worldwide trade – brought about a contraction in global trade and more or less stagnation for EU exports. In addition to the international setting, the Turkish economy faced specific difficulties in that year, experiencing a devaluation of its currency versus the euro by 47.5% compared to 2000 (versus the US dollar by 49%). The two factors combined to reduce Turkish imports, resulting in a positive impact on the trade balance. Despite constant devaluation ever since, imports have continued to outstrip exports, leading once more to a widening of the deficit. Consequently, the short-term improvement in the trade balance was clearly related to factors other than the customs union, while the customs union itself continues to have a greater impact on imports than on exports.
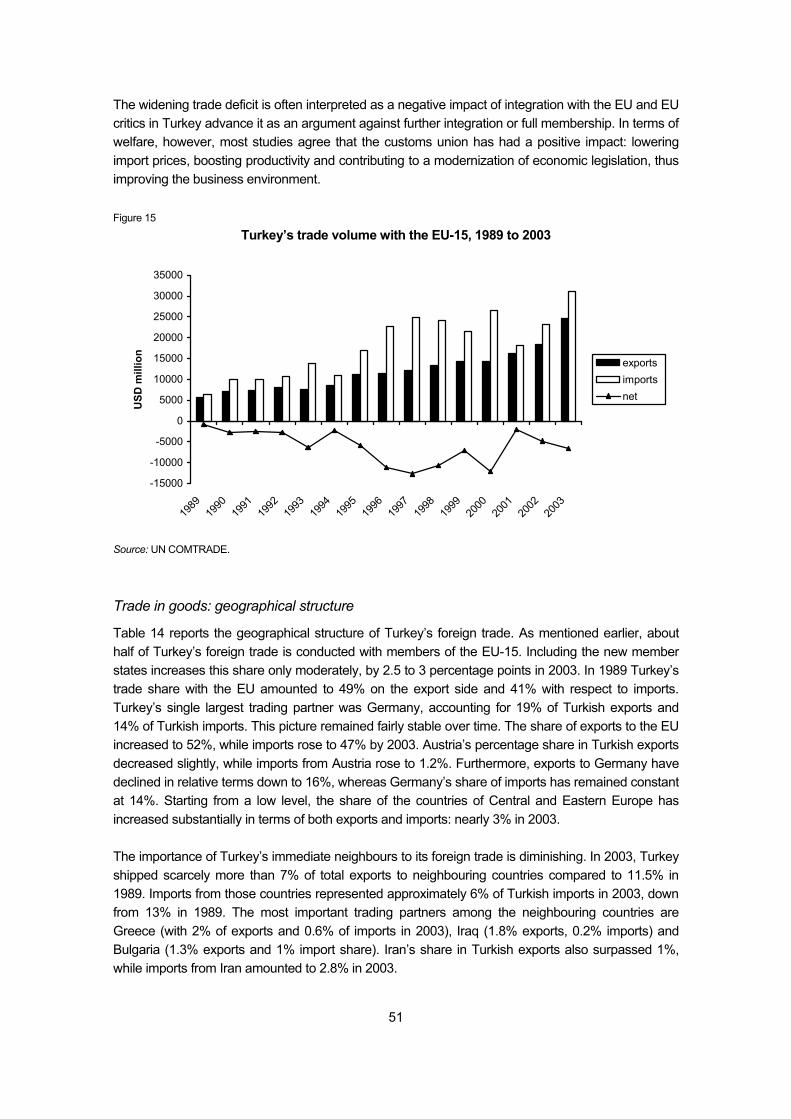
51
The widening trade deficit is often interpreted as a negative impact of integration with the EU and EU critics in Turkey advance it as an argument against further integration or full membership. In terms of welfare, however, most studies agree that the customs union has had a positive impact: lowering import prices, boosting productivity and contributing to a modernization of economic legislation, thus improving the business environment. Figure 15
Turkey’s trade volume with the EU-15, 1989 to 2003
-15000
-10000
-5000
0
5000
10000
15000
20000
25000
30000
35000
1989
1990
1991
1992
1993
1994
1995
1996
1997
1998
1999
2000
2001
2002
2003
USD
mill
ion
exports importsnet
Source: UN COMTRADE.
Trade in goods: geographical structure
Table 14 reports the geographical structure of Turkey’s foreign trade. As mentioned earlier, about half of Turkey’s foreign trade is conducted with members of the EU-15. Including the new member states increases this share only moderately, by 2.5 to 3 percentage points in 2003. In 1989 Turkey’s trade share with the EU amounted to 49% on the export side and 41% with respect to imports. Turkey’s single largest trading partner was Germany, accounting for 19% of Turkish exports and 14% of Turkish imports. This picture remained fairly stable over time. The share of exports to the EU increased to 52%, while imports rose to 47% by 2003. Austria’s percentage share in Turkish exports decreased slightly, while imports from Austria rose to 1.2%. Furthermore, exports to Germany have declined in relative terms down to 16%, whereas Germany’s share of imports has remained constant at 14%. Starting from a low level, the share of the countries of Central and Eastern Europe has increased substantially in terms of both exports and imports: nearly 3% in 2003. The importance of Turkey’s immediate neighbours to its foreign trade is diminishing. In 2003, Turkey shipped scarcely more than 7% of total exports to neighbouring countries compared to 11.5% in 1989. Imports from those countries represented approximately 6% of Turkish imports in 2003, down from 13% in 1989. The most important trading partners among the neighbouring countries are Greece (with 2% of exports and 0.6% of imports in 2003), Iraq (1.8% exports, 0.2% imports) and Bulgaria (1.3% exports and 1% import share). Iran’s share in Turkish exports also surpassed 1%, while imports from Iran amounted to 2.8% in 2003.
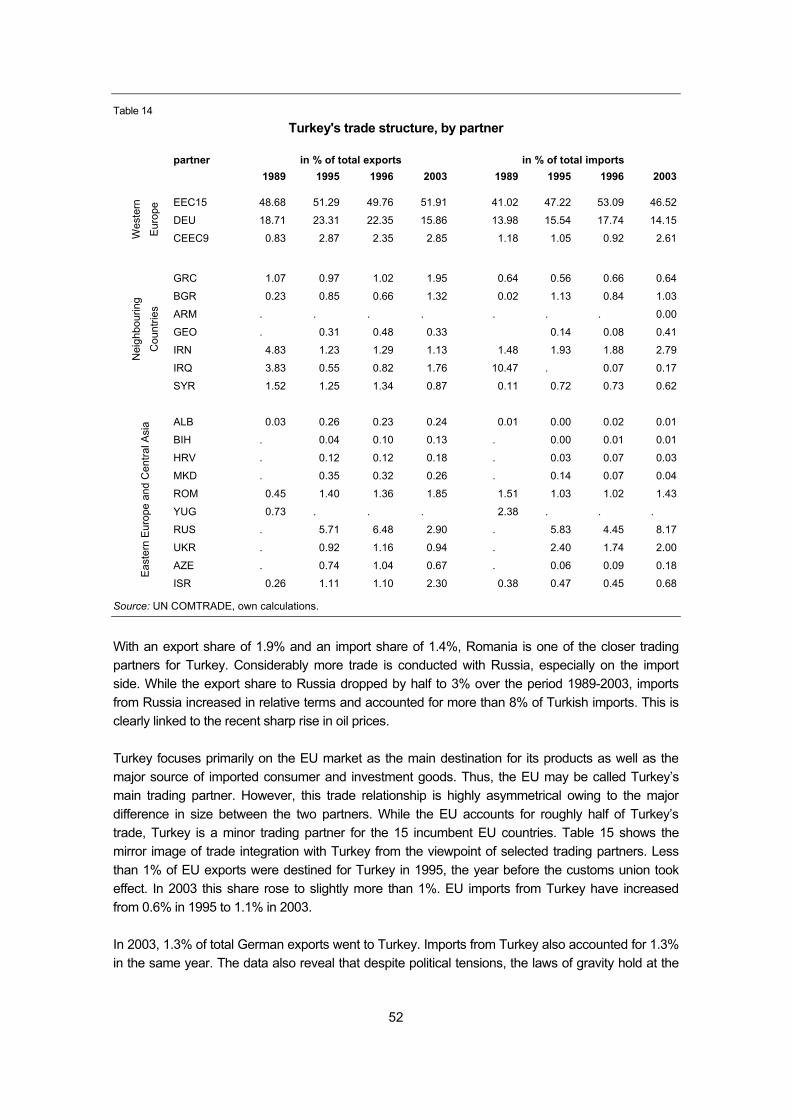
52
Table 14
Turkey's trade structure, by partner
partner in % of total exports in % of total imports 1989 1995 1996 2003 1989 1995 1996 2003
EEC15 48.68 51.29 49.76 51.91 41.02 47.22 53.09 46.52
DEU 18.71 23.31 22.35 15.86 13.98 15.54 17.74 14.15
Wes
tern
Eur
ope
CEEC9 0.83 2.87 2.35 2.85 1.18 1.05 0.92 2.61
GRC 1.07 0.97 1.02 1.95 0.64 0.56 0.66 0.64
BGR 0.23 0.85 0.66 1.32 0.02 1.13 0.84 1.03
ARM . . . . . . . 0.00
GEO . 0.31 0.48 0.33 0.14 0.08 0.41
IRN 4.83 1.23 1.29 1.13 1.48 1.93 1.88 2.79
IRQ 3.83 0.55 0.82 1.76 10.47 . 0.07 0.17
Nei
ghbo
urin
g
Cou
ntrie
s
SYR 1.52 1.25 1.34 0.87 0.11 0.72 0.73 0.62
ALB 0.03 0.26 0.23 0.24 0.01 0.00 0.02 0.01
BIH . 0.04 0.10 0.13 . 0.00 0.01 0.01
HRV . 0.12 0.12 0.18 . 0.03 0.07 0.03
MKD . 0.35 0.32 0.26 . 0.14 0.07 0.04
ROM 0.45 1.40 1.36 1.85 1.51 1.03 1.02 1.43
YUG 0.73 . . . 2.38 . . .
RUS . 5.71 6.48 2.90 . 5.83 4.45 8.17
UKR . 0.92 1.16 0.94 . 2.40 1.74 2.00
AZE . 0.74 1.04 0.67 . 0.06 0.09 0.18
Eas
tern
Eur
ope
and
Cen
tral A
sia
ISR 0.26 1.11 1.10 2.30 0.38 0.47 0.45 0.68
Source: UN COMTRADE, own calculations.
With an export share of 1.9% and an import share of 1.4%, Romania is one of the closer trading partners for Turkey. Considerably more trade is conducted with Russia, especially on the import side. While the export share to Russia dropped by half to 3% over the period 1989-2003, imports from Russia increased in relative terms and accounted for more than 8% of Turkish imports. This is clearly linked to the recent sharp rise in oil prices. Turkey focuses primarily on the EU market as the main destination for its products as well as the major source of imported consumer and investment goods. Thus, the EU may be called Turkey’s main trading partner. However, this trade relationship is highly asymmetrical owing to the major difference in size between the two partners. While the EU accounts for roughly half of Turkey’s trade, Turkey is a minor trading partner for the 15 incumbent EU countries. Table 15 shows the mirror image of trade integration with Turkey from the viewpoint of selected trading partners. Less than 1% of EU exports were destined for Turkey in 1995, the year before the customs union took effect. In 2003 this share rose to slightly more than 1%. EU imports from Turkey have increased from 0.6% in 1995 to 1.1% in 2003. In 2003, 1.3% of total German exports went to Turkey. Imports from Turkey also accounted for 1.3% in the same year. The data also reveal that despite political tensions, the laws of gravity hold at the
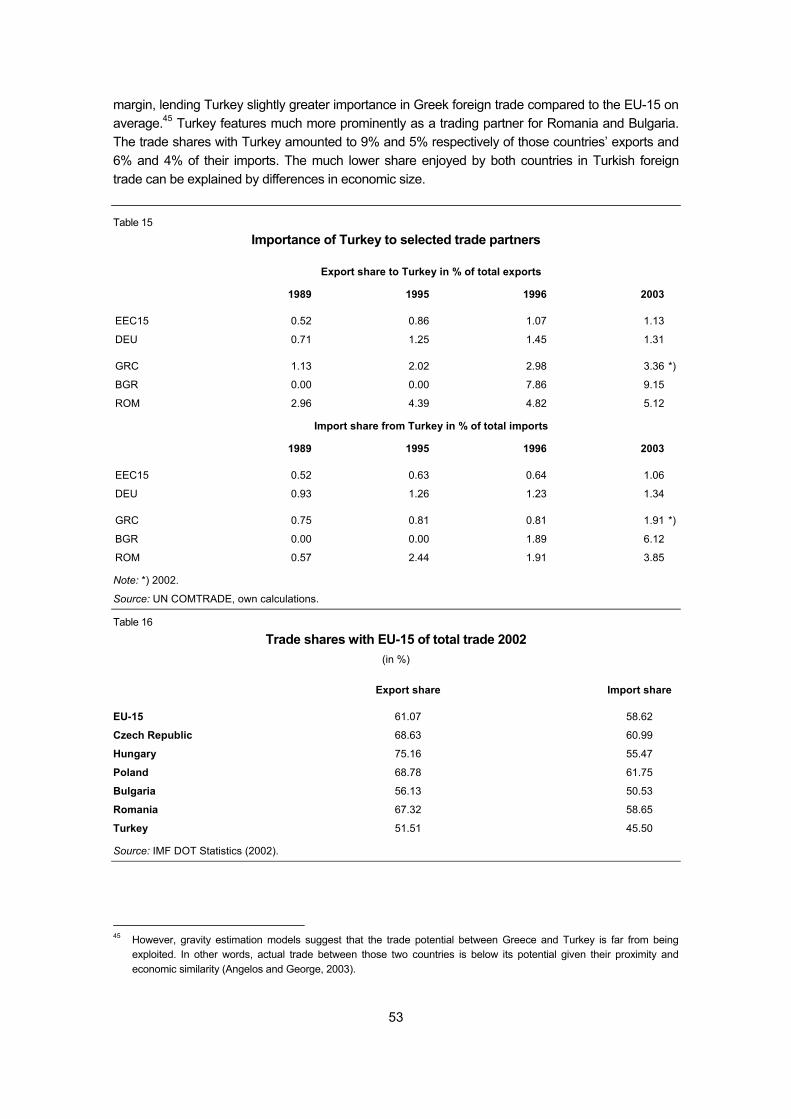
53
margin, lending Turkey slightly greater importance in Greek foreign trade compared to the EU-15 on average.45 Turkey features much more prominently as a trading partner for Romania and Bulgaria. The trade shares with Turkey amounted to 9% and 5% respectively of those countries’ exports and 6% and 4% of their imports. The much lower share enjoyed by both countries in Turkish foreign trade can be explained by differences in economic size.
Table 15
Importance of Turkey to selected trade partners
Export share to Turkey in % of total exports
1989 1995 1996 2003
EEC15 0.52 0.86 1.07 1.13
DEU 0.71 1.25 1.45 1.31
GRC 1.13 2.02 2.98 3.36 *)
BGR 0.00 0.00 7.86 9.15
ROM 2.96 4.39 4.82 5.12
Import share from Turkey in % of total imports
1989 1995 1996 2003
EEC15 0.52 0.63 0.64 1.06
DEU 0.93 1.26 1.23 1.34
GRC 0.75 0.81 0.81 1.91 *)
BGR 0.00 0.00 1.89 6.12
ROM 0.57 2.44 1.91 3.85
Note: *) 2002.
Source: UN COMTRADE, own calculations.
Table 16
Trade shares with EU-15 of total trade 2002 (in %)
Export share Import share
EU-15 61.07 58.62
Czech Republic 68.63 60.99
Hungary 75.16 55.47
Poland 68.78 61.75
Bulgaria 56.13 50.53
Romania 67.32 58.65
Turkey 51.51 45.50
Source: IMF DOT Statistics (2002).
45 However, gravity estimation models suggest that the trade potential between Greece and Turkey is far from being
exploited. In other words, actual trade between those two countries is below its potential given their proximity and economic similarity (Angelos and George, 2003).
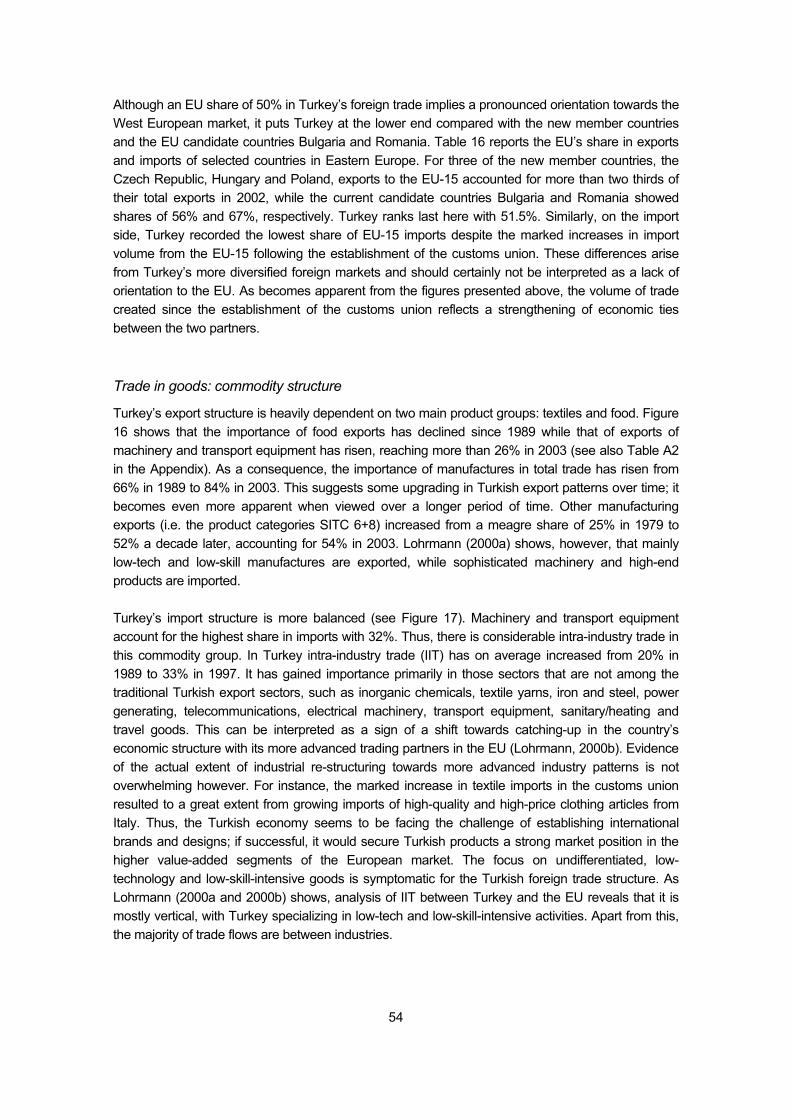
54
Although an EU share of 50% in Turkey’s foreign trade implies a pronounced orientation towards the West European market, it puts Turkey at the lower end compared with the new member countries and the EU candidate countries Bulgaria and Romania. Table 16 reports the EU’s share in exports and imports of selected countries in Eastern Europe. For three of the new member countries, the Czech Republic, Hungary and Poland, exports to the EU-15 accounted for more than two thirds of their total exports in 2002, while the current candidate countries Bulgaria and Romania showed shares of 56% and 67%, respectively. Turkey ranks last here with 51.5%. Similarly, on the import side, Turkey recorded the lowest share of EU-15 imports despite the marked increases in import volume from the EU-15 following the establishment of the customs union. These differences arise from Turkey’s more diversified foreign markets and should certainly not be interpreted as a lack of orientation to the EU. As becomes apparent from the figures presented above, the volume of trade created since the establishment of the customs union reflects a strengthening of economic ties between the two partners. Trade in goods: commodity structure
Turkey’s export structure is heavily dependent on two main product groups: textiles and food. Figure 16 shows that the importance of food exports has declined since 1989 while that of exports of machinery and transport equipment has risen, reaching more than 26% in 2003 (see also Table A2 in the Appendix). As a consequence, the importance of manufactures in total trade has risen from 66% in 1989 to 84% in 2003. This suggests some upgrading in Turkish export patterns over time; it becomes even more apparent when viewed over a longer period of time. Other manufacturing exports (i.e. the product categories SITC 6+8) increased from a meagre share of 25% in 1979 to 52% a decade later, accounting for 54% in 2003. Lohrmann (2000a) shows, however, that mainly low-tech and low-skill manufactures are exported, while sophisticated machinery and high-end products are imported. Turkey’s import structure is more balanced (see Figure 17). Machinery and transport equipment account for the highest share in imports with 32%. Thus, there is considerable intra-industry trade in this commodity group. In Turkey intra-industry trade (IIT) has on average increased from 20% in 1989 to 33% in 1997. It has gained importance primarily in those sectors that are not among the traditional Turkish export sectors, such as inorganic chemicals, textile yarns, iron and steel, power generating, telecommunications, electrical machinery, transport equipment, sanitary/heating and travel goods. This can be interpreted as a sign of a shift towards catching-up in the country’s economic structure with its more advanced trading partners in the EU (Lohrmann, 2000b). Evidence of the actual extent of industrial re-structuring towards more advanced industry patterns is not overwhelming however. For instance, the marked increase in textile imports in the customs union resulted to a great extent from growing imports of high-quality and high-price clothing articles from Italy. Thus, the Turkish economy seems to be facing the challenge of establishing international brands and designs; if successful, it would secure Turkish products a strong market position in the higher value-added segments of the European market. The focus on undifferentiated, low-technology and low-skill-intensive goods is symptomatic for the Turkish foreign trade structure. As Lohrmann (2000a and 2000b) shows, analysis of IIT between Turkey and the EU reveals that it is mostly vertical, with Turkey specializing in low-tech and low-skill-intensive activities. Apart from this, the majority of trade flows are between industries.
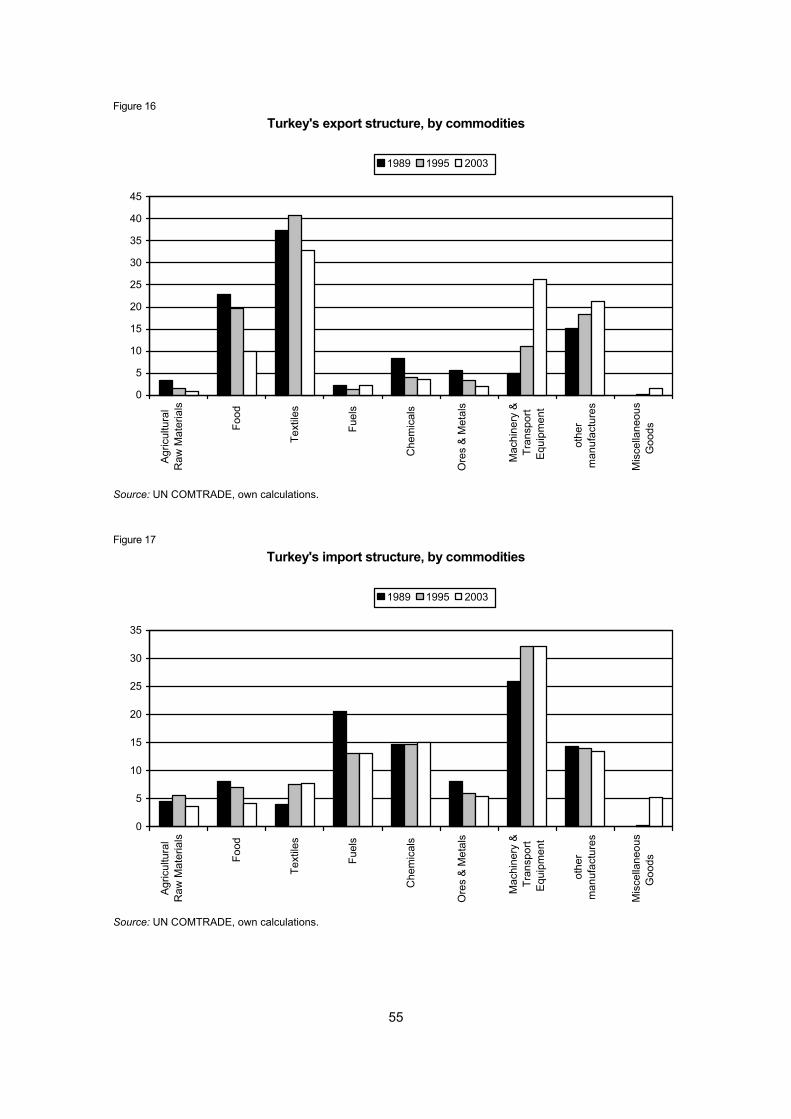
55
Figure 16
Turkey's export structure, by commodities
0
5
10
15
20
25
30
35
40
45
Agric
ultu
ral
Raw
Mat
eria
ls
Food
Text
iles
Fuel
s
Che
mic
als
Ore
s &
Met
als
Mac
hine
ry &
Tran
spor
tEq
uipm
ent
othe
rm
anuf
actu
res
Mis
cella
neou
sG
oods
1989 1995 2003
Source: UN COMTRADE, own calculations.
Figure 17
Turkey's import structure, by commodities
0
5
10
15
20
25
30
35
Agric
ultu
ral
Raw
Mat
eria
ls
Food
Text
iles
Fuel
s
Che
mic
als
Ore
s &
Met
als
Mac
hine
ry &
Tran
spor
tEq
uipm
ent
othe
rm
anuf
actu
res
Mis
cella
neou
sG
oods
1989 1995 2003
Source: UN COMTRADE, own calculations.
56
Trade in agriculture
Agriculture contributes roughly one eighth to the country’s overall GDP, whereas its contribution is less than 2% in the EU. In contrast to the EU-15, where animal production has a weight of more than 40%, about three quarters of the value generated by Turkey’s agriculture stems from plant production. Agricultural imports amount to about one eighth of domestic agricultural production in Turkey, but to one fifth in the EU. In 2001, 15% of agricultural revenues in Turkey stemmed from subsidies compared to 35% in the EU. In Turkey 70% of the subsidies took the form of price support, compared to 58% in the EU.46 Turkey is a net exporter of agricultural products (unprocessed agricultural products plus processed food; including beverages and tobacco products) and even has a positive agro-trade balance with the EU. In 2000/2001 agro-exports totalled EUR 4.3 billion, whereas imports amounted to a mere EUR 3 billion (Grethe, 2003). Almost half of those exports went to the EU, whereas somewhat over a quarter of Turkey’s agro-imports came from there. Throughout the 1990s, the EU share increased in Turkish agro-exports, but diminished in Turkish imports. Turkey’s most important export item is fruit: in 2000/2001 it had a share of close to 29% in Turkey’s overall agro-exports and a 45% share in exports to the EU. The second most important group within agro-exports is processed fruit with shares of 13% in the whole and 19% in exports to the EU. With a share of about one quarter ‘other products’ are the most important group within Turkish imports, both in general and with respect to the EU. Cotton ranks second in Turkey’s agro-imports. Agricultural products are exempt from the customs union between the EU and Turkey. To date, Turkey has granted very few preferential tariffs on agricultural imports from the EU. On the other hand, the EU has accorded imports from Turkey highly preferential treatment. An appreciable portion of the agricultural imports enters the EU duty-free. Import barriers exist mostly in the form of: (a) tariff-quota schemes, where imports within the quota are tariff-free; and (b) an entry price scheme, where specific duties are applied if the value of the consignment is below the entry price. It is estimated that about 70 per cent of the imports from Turkey enter the EU duty-free and without any other import barriers (Flam, 2004). However, high specific duties are applied to the core products of the CAP: cereals and processed cereals, sugar and sugar products, dairy products and meat. Olive oil is also highly protected. Turkish exports of vegetables and fruits receive export subsidies. From 1998 on, Turkey has also started granting preferential rates to an increasing number of EU agricultural products. In January 1998, Turkey introduced the trade quota system for 39 agricultural products from EU.47 For a number of products, farm gate prices are higher in Turkey than in the EU: In 2001, the price for wheat was EUR 123 per ton in the EU, but EUR 143 per ton in Turkey. Sugar prices are 6% lower compared to the EU. Farm-gate prices in Turkey, calculated in euro, were much higher in the years prior to the crisis in 2001. Apart from the exchange rate development, which has had a decisive impact on the ratio between EU and Turkish farm gate prices, the fact that Turkey’s agricultural
46 The calculation of subsidies is based on OECD methodology and is not equivalent to support from the EU or
government budget. To give an example, this methodology regards minimum import prices as a source of involuntary farm subsidies extracted from the consumer.
47 As an example, 3000 tons of butter were allowed to enter Turkey tariff-free, but a total of close to 3400 tons per year were delivered over the period 1998-2001 – despite an above-quota tariff of 100%.
57
policy has relied mainly on price support48 also plays a role, whereas the EU has committed itself to replacing price support gradually through direct payments to farmers. Even after the major currency devaluation in 2001 the farm-gate prices of some Turkish agricultural products are still above EU levels. Under such conditions, an extension of the tariff union to agricultural trade would not necessarily flood the EU market with cheap Turkish agricultural products. However, things may change in the future. Turkey wants to reshape its agricultural policy along CAP guidelines, and the CAP itself will continue its evolutionary process. The present agricultural reforms in Turkey are a result of the Uruguay Round agreement on agricultural trade and Turkey’s own efforts to adjust to the CAP. To some extent the reforms have also been prompted by an agreement with the IMF in 1999 to reform agricultural policy, i.e. to reduce costs, as a prerequisite for IMF support. Under the reform programme, output price supports and input subsidies and grants in various forms will be phased out and replaced by direct payments to farmers based on land holding, while tariffs will gradually be reduced. Income support is capped at 20 hectares; it is estimated that the total support will cost more than EUR 2 billion. The reforms are currently being implemented; it is planned to complete them in two years. Privatization of state enterprises in the agricultural sector is also part of the programme. Implementing the programme calls for extensive administrative reform. For example, substantial investments are needed to improve land registration, collect agricultural data and raise the veterinary and phytosanitary standards (Flam, 2004). Trade specialization patterns
Calculation of specialization indices sheds more light on Turkey’s competitive position in the global market. Export specialization is calculated as a country’s share of worldwide exports in a specific industry, corrected for relative country size. Indices are made symmetric around zero; a negative index thus points to below-average specialization in a certain commodity group and a positive index indicates a market share that lies above the world average. Figures 18 to 21 depict specialization patterns on the export side. Commodity groups are so arranged that specialization at the bottom and to the left in the diagram coincides with specialization in more technology- and skill-intensive and higher value-added products, while specialization at the top and to the right indicates specialization in more labour-intensive goods.
Box 6
Free-trade zones (FTZs)
Depending on their field of activity, at least some of the companies with FTZ licences issued after February 2004 will have to pay corporate income tax. Companies with licences dating further back will remain exempt from that tax – up to the expiry of the licence or, in the event of Turkey joining the EU, up to the date of accession. The salaries they pay will be exempt from income tax up to 2008.
Turkey’s legislation treats FTZs as being outside the Turkish customs territory. Sales from FTZs to Turkey count as Turkish imports. They are not subject to restrictions, but subject to VAT as well as to customs duties, depending on the origin of the goods’ content.
Source: YASED (2004).
48 Agricultural policy and its links to SEEs are discussed from the trade unions’ viewpoint in Oral Necdet (2004)
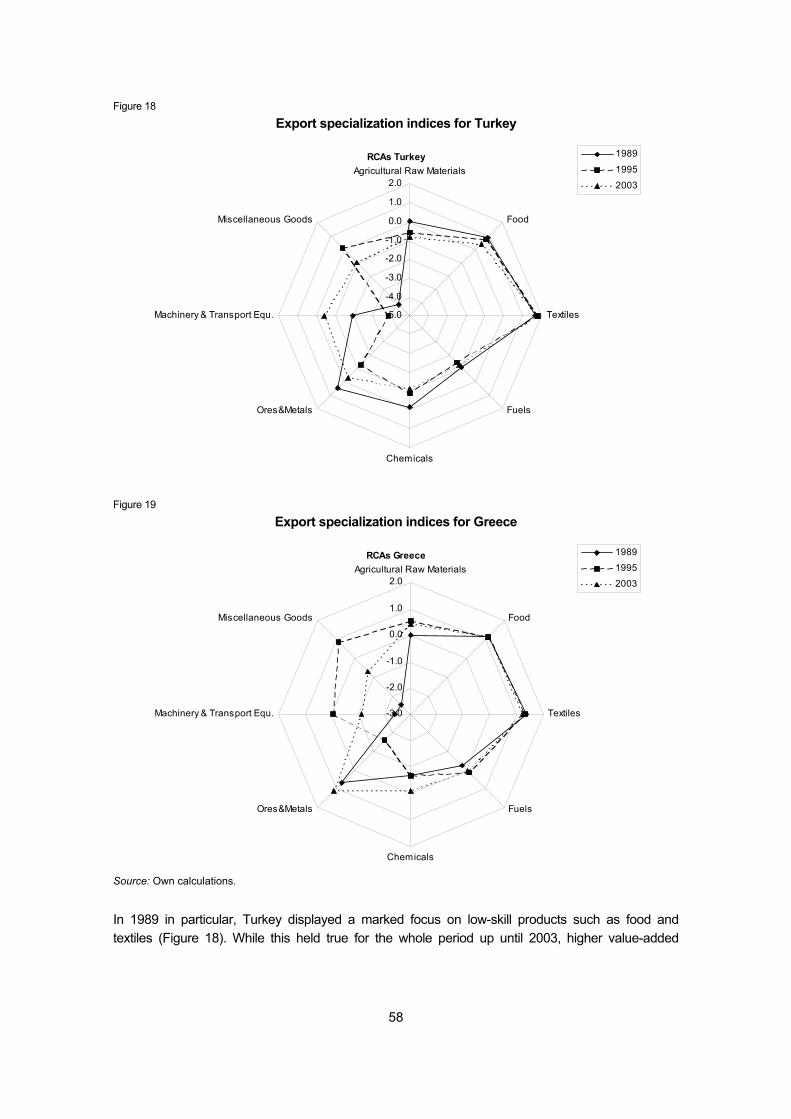
58
Figure 18
Export specialization indices for Turkey
RCAs Turkey
-5.0
-4.0
-3.0
-2.0
-1.0
0.0
1.0
2.0Agricultural Raw Materials
Food
Textiles
Fuels
Chemicals
Ores&Metals
Machinery & Transport Equ.
Miscellaneous Goods
1989
1995
2003
Figure 19
Export specialization indices for Greece
RCAs Greece
-3.0
-2.0
-1.0
0.0
1.0
2.0Agricultural Raw Materials
Food
Textiles
Fuels
Chemicals
Ores&Metals
Machinery & Transport Equ.
Miscellaneous Goods
1989
1995
2003
Source: Own calculations.
In 1989 in particular, Turkey displayed a marked focus on low-skill products such as food and textiles (Figure 18). While this held true for the whole period up until 2003, higher value-added
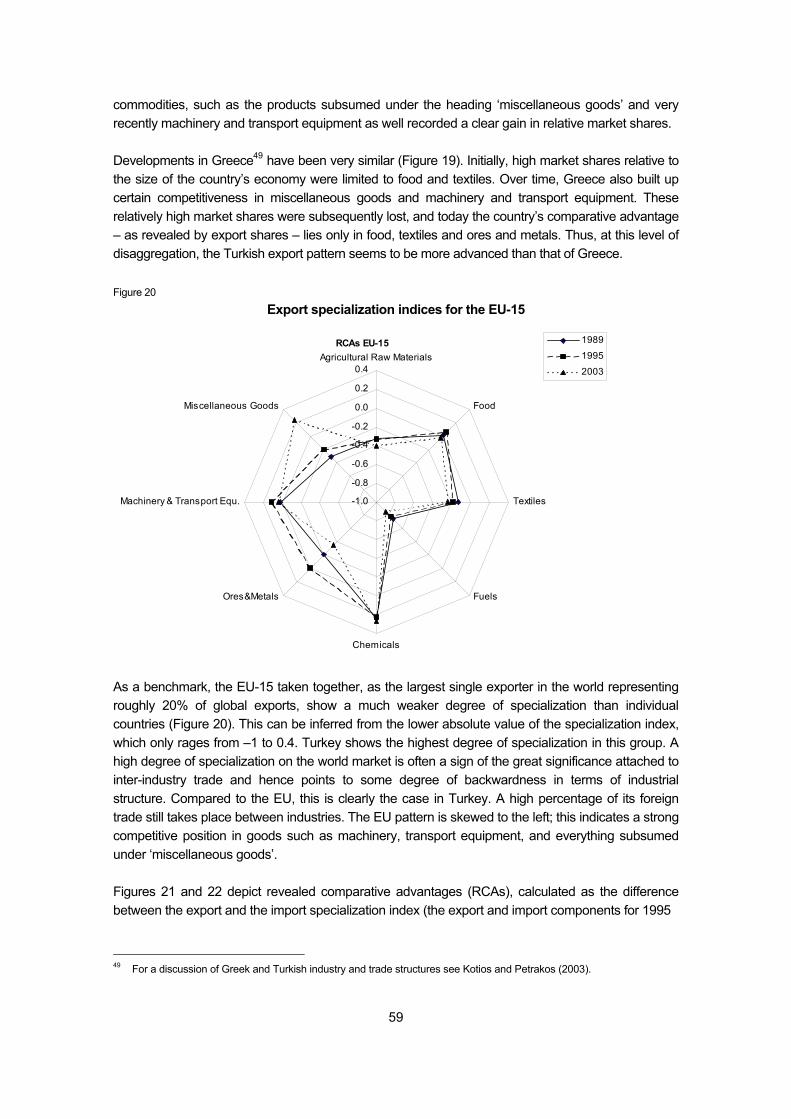
59
commodities, such as the products subsumed under the heading ‘miscellaneous goods’ and very recently machinery and transport equipment as well recorded a clear gain in relative market shares. Developments in Greece49 have been very similar (Figure 19). Initially, high market shares relative to the size of the country’s economy were limited to food and textiles. Over time, Greece also built up certain competitiveness in miscellaneous goods and machinery and transport equipment. These relatively high market shares were subsequently lost, and today the country’s comparative advantage – as revealed by export shares – lies only in food, textiles and ores and metals. Thus, at this level of disaggregation, the Turkish export pattern seems to be more advanced than that of Greece. Figure 20
Export specialization indices for the EU-15
RCAs EU-15
-1.0
-0.8
-0.6
-0.4
-0.2
0.0
0.2
0.4Agricultural Raw Materials
Food
Textiles
Fuels
Chemicals
Ores&Metals
Machinery & Transport Equ.
Miscellaneous Goods
1989
1995
2003
As a benchmark, the EU-15 taken together, as the largest single exporter in the world representing roughly 20% of global exports, show a much weaker degree of specialization than individual countries (Figure 20). This can be inferred from the lower absolute value of the specialization index, which only rages from –1 to 0.4. Turkey shows the highest degree of specialization in this group. A high degree of specialization on the world market is often a sign of the great significance attached to inter-industry trade and hence points to some degree of backwardness in terms of industrial structure. Compared to the EU, this is clearly the case in Turkey. A high percentage of its foreign trade still takes place between industries. The EU pattern is skewed to the left; this indicates a strong competitive position in goods such as machinery, transport equipment, and everything subsumed under ‘miscellaneous goods’. Figures 21 and 22 depict revealed comparative advantages (RCAs), calculated as the difference between the export and the import specialization index (the export and import components for 1995
49 For a discussion of Greek and Turkish industry and trade structures see Kotios and Petrakos (2003).
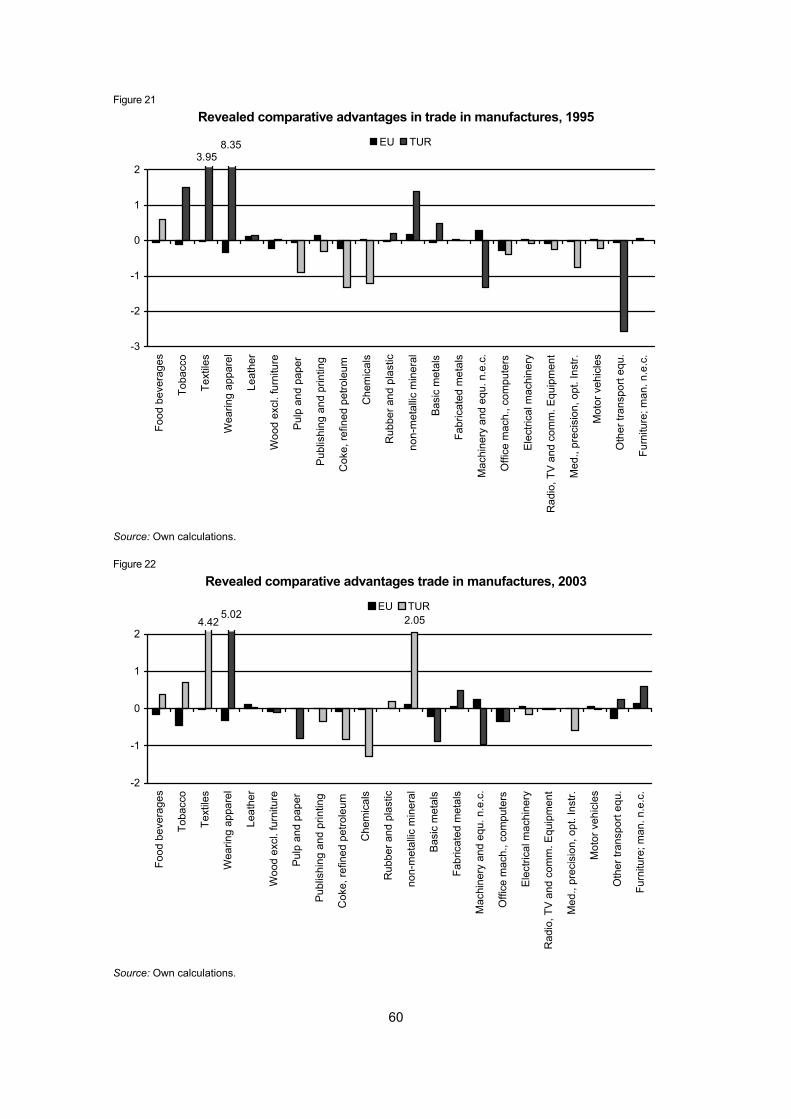
60
Figure 21
Revealed comparative advantages in trade in manufactures, 1995
3.958.35
-3
-2
-1
0
1
2Fo
od b
ever
ages
Toba
cco
Text
iles
Wea
ring
appa
rel
Leat
her
Woo
d ex
cl. f
urni
ture
Pulp
and
pap
er
Publ
ishi
ng a
nd p
rintin
g
Cok
e, re
fined
pet
role
um
Che
mic
als
Rub
ber a
nd p
last
ic
non-
met
allic
min
eral
Bas
ic m
etal
s
Fabr
icat
ed m
etal
s
Mac
hine
ry a
nd e
qu. n
.e.c
.
Offi
ce m
ach.
, com
pute
rs
Elec
trica
l mac
hine
ry
Rad
io, T
V an
d co
mm
. Equ
ipm
ent
Med
., pr
ecis
ion,
opt
. Ins
tr.
Mot
or v
ehic
les
Oth
er tr
ansp
ort e
qu.
Furn
iture
; man
. n.e
.c.
EU TUR
Source: Own calculations. Figure 22
Revealed comparative advantages trade in manufactures, 2003
2.054.425.02
-2
-1
0
1
2
Food
bev
erag
es
Toba
cco
Text
iles
Wea
ring
appa
rel
Leat
her
Woo
d ex
cl. f
urni
ture
Pulp
and
pap
er
Publ
ishi
ng a
nd p
rintin
g
Cok
e, re
fined
pet
role
um
Che
mic
als
Rub
ber a
nd p
last
ic
non-
met
allic
min
eral
Bas
ic m
etal
s
Fabr
icat
ed m
etal
s
Mac
hine
ry a
nd e
qu. n
.e.c
.
Offi
ce m
ach.
, com
pute
rs
Elec
trica
l mac
hine
ry
Rad
io, T
V an
d co
mm
. Equ
ipm
ent
Med
., pr
ecis
ion,
opt
. Ins
tr.
Mot
or v
ehic
les
Oth
er tr
ansp
ort e
qu.
Furn
iture
; man
. n.e
.c.
EU TUR
Source: Own calculations.
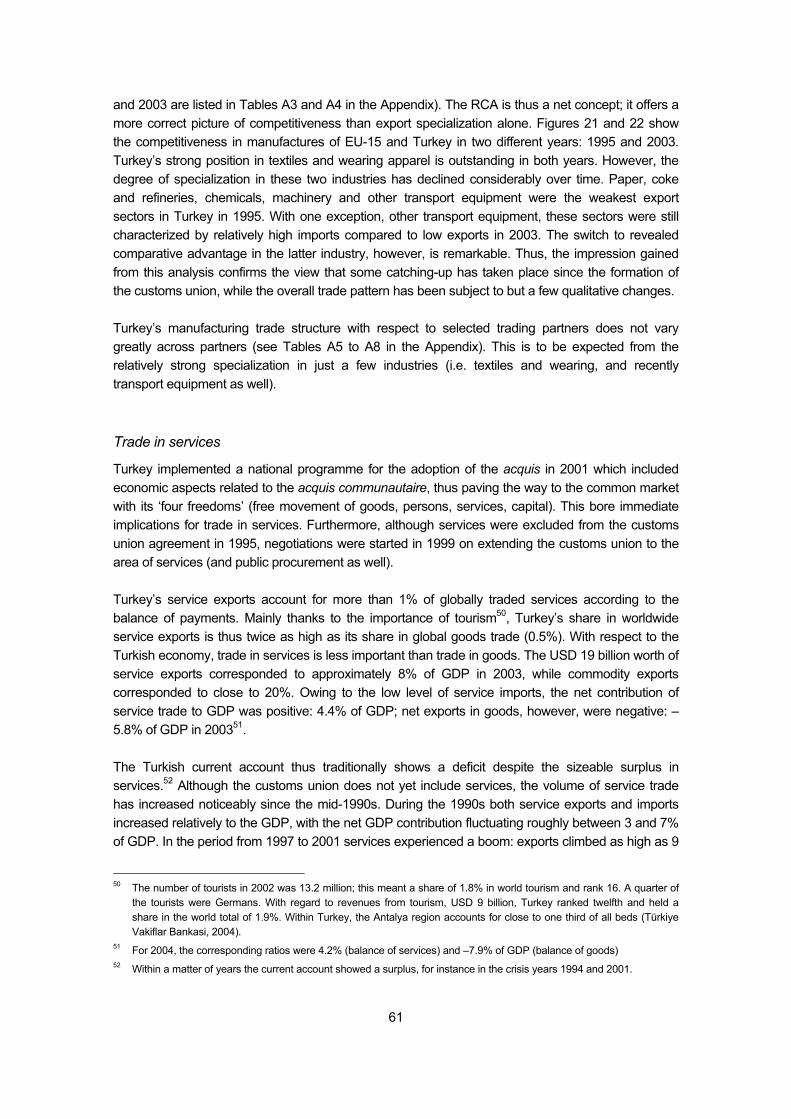
61
and 2003 are listed in Tables A3 and A4 in the Appendix). The RCA is thus a net concept; it offers a more correct picture of competitiveness than export specialization alone. Figures 21 and 22 show the competitiveness in manufactures of EU-15 and Turkey in two different years: 1995 and 2003. Turkey’s strong position in textiles and wearing apparel is outstanding in both years. However, the degree of specialization in these two industries has declined considerably over time. Paper, coke and refineries, chemicals, machinery and other transport equipment were the weakest export sectors in Turkey in 1995. With one exception, other transport equipment, these sectors were still characterized by relatively high imports compared to low exports in 2003. The switch to revealed comparative advantage in the latter industry, however, is remarkable. Thus, the impression gained from this analysis confirms the view that some catching-up has taken place since the formation of the customs union, while the overall trade pattern has been subject to but a few qualitative changes. Turkey’s manufacturing trade structure with respect to selected trading partners does not vary greatly across partners (see Tables A5 to A8 in the Appendix). This is to be expected from the relatively strong specialization in just a few industries (i.e. textiles and wearing, and recently transport equipment as well). Trade in services
Turkey implemented a national programme for the adoption of the acquis in 2001 which included economic aspects related to the acquis communautaire, thus paving the way to the common market with its ‘four freedoms’ (free movement of goods, persons, services, capital). This bore immediate implications for trade in services. Furthermore, although services were excluded from the customs union agreement in 1995, negotiations were started in 1999 on extending the customs union to the area of services (and public procurement as well). Turkey’s service exports account for more than 1% of globally traded services according to the balance of payments. Mainly thanks to the importance of tourism50, Turkey’s share in worldwide service exports is thus twice as high as its share in global goods trade (0.5%). With respect to the Turkish economy, trade in services is less important than trade in goods. The USD 19 billion worth of service exports corresponded to approximately 8% of GDP in 2003, while commodity exports corresponded to close to 20%. Owing to the low level of service imports, the net contribution of service trade to GDP was positive: 4.4% of GDP; net exports in goods, however, were negative: –5.8% of GDP in 200351. The Turkish current account thus traditionally shows a deficit despite the sizeable surplus in services.52 Although the customs union does not yet include services, the volume of service trade has increased noticeably since the mid-1990s. During the 1990s both service exports and imports increased relatively to the GDP, with the net GDP contribution fluctuating roughly between 3 and 7% of GDP. In the period from 1997 to 2001 services experienced a boom: exports climbed as high as 9
50 The number of tourists in 2002 was 13.2 million; this meant a share of 1.8% in world tourism and rank 16. A quarter of
the tourists were Germans. With regard to revenues from tourism, USD 9 billion, Turkey ranked twelfth and held a share in the world total of 1.9%. Within Turkey, the Antalya region accounts for close to one third of all beds (Türkiye Vakiflar Bankasi, 2004).
51 For 2004, the corresponding ratios were 4.2% (balance of services) and –7.9% of GDP (balance of goods) 52 Within a matter of years the current account showed a surplus, for instance in the crisis years 1994 and 2001.
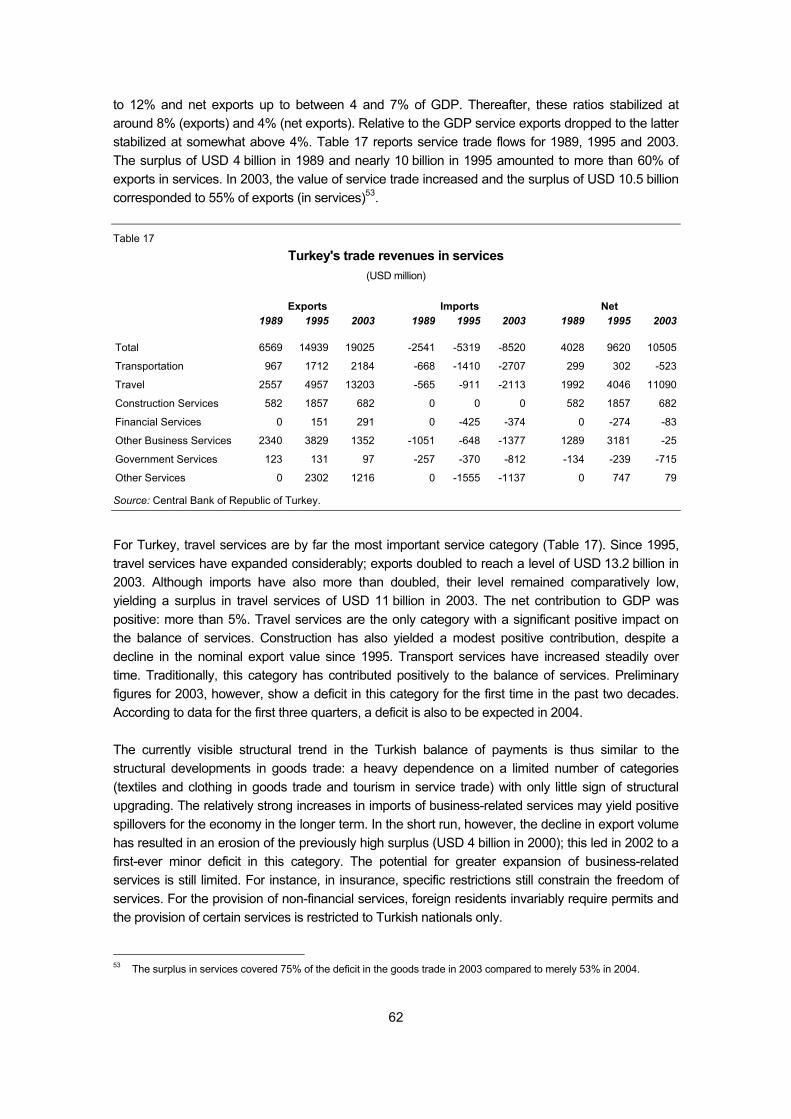
62
to 12% and net exports up to between 4 and 7% of GDP. Thereafter, these ratios stabilized at around 8% (exports) and 4% (net exports). Relative to the GDP service exports dropped to the latter stabilized at somewhat above 4%. Table 17 reports service trade flows for 1989, 1995 and 2003. The surplus of USD 4 billion in 1989 and nearly 10 billion in 1995 amounted to more than 60% of exports in services. In 2003, the value of service trade increased and the surplus of USD 10.5 billion corresponded to 55% of exports (in services)53. Table 17
Turkey's trade revenues in services (USD million)
Exports Imports Net 1989 1995 2003 1989 1995 2003 1989 1995 2003
Total 6569 14939 19025 -2541 -5319 -8520 4028 9620 10505
Transportation 967 1712 2184 -668 -1410 -2707 299 302 -523
Travel 2557 4957 13203 -565 -911 -2113 1992 4046 11090
Construction Services 582 1857 682 0 0 0 582 1857 682
Financial Services 0 151 291 0 -425 -374 0 -274 -83
Other Business Services 2340 3829 1352 -1051 -648 -1377 1289 3181 -25
Government Services 123 131 97 -257 -370 -812 -134 -239 -715
Other Services 0 2302 1216 0 -1555 -1137 0 747 79
Source: Central Bank of Republic of Turkey.
For Turkey, travel services are by far the most important service category (Table 17). Since 1995, travel services have expanded considerably; exports doubled to reach a level of USD 13.2 billion in 2003. Although imports have also more than doubled, their level remained comparatively low, yielding a surplus in travel services of USD 11 billion in 2003. The net contribution to GDP was positive: more than 5%. Travel services are the only category with a significant positive impact on the balance of services. Construction has also yielded a modest positive contribution, despite a decline in the nominal export value since 1995. Transport services have increased steadily over time. Traditionally, this category has contributed positively to the balance of services. Preliminary figures for 2003, however, show a deficit in this category for the first time in the past two decades. According to data for the first three quarters, a deficit is also to be expected in 2004. The currently visible structural trend in the Turkish balance of payments is thus similar to the structural developments in goods trade: a heavy dependence on a limited number of categories (textiles and clothing in goods trade and tourism in service trade) with only little sign of structural upgrading. The relatively strong increases in imports of business-related services may yield positive spillovers for the economy in the longer term. In the short run, however, the decline in export volume has resulted in an erosion of the previously high surplus (USD 4 billion in 2000); this led in 2002 to a first-ever minor deficit in this category. The potential for greater expansion of business-related services is still limited. For instance, in insurance, specific restrictions still constrain the freedom of services. For the provision of non-financial services, foreign residents invariably require permits and the provision of certain services is restricted to Turkish nationals only.
53 The surplus in services covered 75% of the deficit in the goods trade in 2003 compared to merely 53% in 2004.
63
Following the financial crises prior to 2001 and before all the crisis in February 2001, a programme entitled ‘Restructuring the banking sector’ was launched in May 2001. It aimed at accelerating the privatization of state-owned banks. Although specific restrictions on the freedom of services remain, trade in this category is increasing. Exports of financial services are expanding more than imports and the deficit in this category is gradually diminishing. That notwithstanding, this category’s significance is still very low: 1.5% of exports. In summary, Turkish trade in services is heavily dominated by travel services. Major potential for future increases would seem to exist (Lejour et al., 2004). Travel service imports have also increased in value (from USD 911 million to 2.1 billion); however, in relation to exports, they have fallen to 16%. Foreign direct investment
Inward FDI is relatively small in comparison to the size of Turkey’s economy and its stage of development. Given the macroeconomic developments outlined above, Turkey should offer considerable direct investment potential. Despite increases in the volume of FDI, the ratio of inward stocks to GDP has not tended to increase. This reflects: (a) slow (if any) progress in Turkey’s moves towards privatization: and (b) the country's economic structure. The latter is characterized by a large share of small and medium-sized enterprises on the one hand and powerful domestic holdings on the other. The major domestic players are reluctant to let large privatization projects materialize unless they are actively involved in their execution. Some of them have entered into various forms of cooperation with transnational companies, both at home and abroad. FDI figures fail to capture this aspect adequately and thus do not reflect the true extent of internationalization in Turkey. Part of the holdings' networking surfaces in the guise of relatively high Turkish outward investment. Up to very recently, Turkey created the impression of being reluctant to sell the legacy from its Kemalist past. Some large state companies (SEEs) now cooperate with foreign counterparts, but the state still retains its majority holding. For instance, the tobacco industry and the telecommunications sector have still not been privatized; large segments of the refining and banking industries are in public ownership. Furthermore, the cumbersome and bumbling bureaucracy discourages foreign investors. Much of the corporate sector that is not in the hands of the state is the domain of small and medium-sized enterprises. Thus, the low level of inward FDI is simply for want of acquisition objects unencumbered by the state and the highly fragmented economic structure. Other impediments also reduce the attraction of investing in Turkey. In the past, high inflation rates, compounded by major fluctuations in output, interest rates and exchange rates, might have had a negative impact. Since the most recent financial crisis in 2001, however, inflation has been reduced sharply and is no longer a matter for concern. Interest rates and exchange rates have also stabilized. Currently, the risks stemming from institutional factors and bad governance pose the greater problem. Uncertainty rules with respect to licenses and all kind of administrative requirements, market access and contract enforcement. Experts view these obstacles in the non-economic sphere (i.e. rule of law, regulatory quality, corruption) as imposing a further limitation on the potential for inward FDI. In this respect it is interesting to note that recent governance indicators used by the World Bank show Turkey to have deteriorated in terms of five out of six indicators (voice and accountability, government effectiveness, regulatory quality, rule of law, and control of corruption) over the period 1996-2002, whereas an
64
amelioration was visible with regard to the indicator ‘political stability and absence of violence’. In comparison to Central and Eastern Europe, Turkey ranks lower on all six World Bank governance indicators, especially with respect to political stability, voice and accountability and control of corruption. It is often emphasized that corruption distorts the investment climate, constrains competition, inhibits growth and forces entrepreneurs into the informal economy, especially in the case of small and medium-sized enterprises (World Bank, 2002). For Turkey it has been recognized that corruption is rooted in the structure of the public sector, its interactions with the private sector and the broader behavioural environment. Reforms have been started in the public sector, as well as more generally in the financial sector and the legal and regulatory framework. The impact of these reforms has yet to be seen. As mentioned, the level of FDI inward stocks in Turkey is extremely low: USD 18 billion in 2003. According to UNCTAD, inward FDI stock in the same year in Poland (a country of comparable economic size in terms of GDP at current exchange rates) amounted to USD 52 billion, while Hungary reported a stock of USD 42 billion. It seems appropriate to compare the Turkish figure to FDI stocks in other emerging markets at a similar stage of development. For the purposes of comparison, Mexico may thus serve as the upper limit, given its openness to foreign capital, and India as the lower limit, given its relatively closed economy. With an inward FDI stock of 7.6% in relation to GDP, Turkey ranges between the two (26.5% in Mexico and 5.4% in India). FDI, however, is far less important to Turkey than to the two most prominent recipients of FDI in Central and Eastern Europe, Hungary and Poland. In 2003, inward stock amounted to 25% of GDP in Poland and 52% in Hungary. In terms of UNCTAD yardsticks (FDI inward index and FDI potential index), Turkey falls short of exploiting its potential in attracting inward FDI. According to the inward FDI performance index, which calculates a country’s share in global FDI flows in relation to its economic size, Turkey ranks 110 worldwide, behind Hungary (rank 33), Mexico (rank 61), Poland (rank 68), and Austria (rank 78), but ahead of India (rank 114). A value of 0.4 on this index indicates that Turkey has attracted far less FDI than it could have given the size of its economy (UNCTAD, 2004). Apart from the (sluggish) implementation of its privatization programme, the government has tried to introduce additional measures in order to attract more FDI into the country. Since 1962, Turkey has concluded 67 bilateral investment treaties (BITs), 35 of which are currently in force. The first of these agreements was concluded with Germany and came into effect in December 1965. Future prospects are good given the institutional steps taken recently. A new FDI law was enacted in June 2003 (replacing the law dating from 1954); it has been designed to enhance substantially foreign investors’ market access and improve their legal and economic status (i.e. by granting full convertibility in their transfers of capital and earnings). Furthermore, in March 2004 the Investment Advisory Council was established and more efficient investment promotion is being planned54. The government has enacted a number of additional measures (inflation accounting, simplification of the commercial code, work permits for expatriates); attempts have also been made to speed up the privatization programme (for example the privatization of Türk Telekom is expected in 2005).
54 The entity in charge of FDI in the country is the General Directorate of Foreign Investments (GDFI), within the Treasury
Under Secretariat, based in Ankara. GDFI acts as a one-stop shop for major projects and may consider tax exemptions or other incentives. Its main tasks include preparing relevant legislation, allocating government support, promoting inward FDI and monitoring inward FDI development statistically.
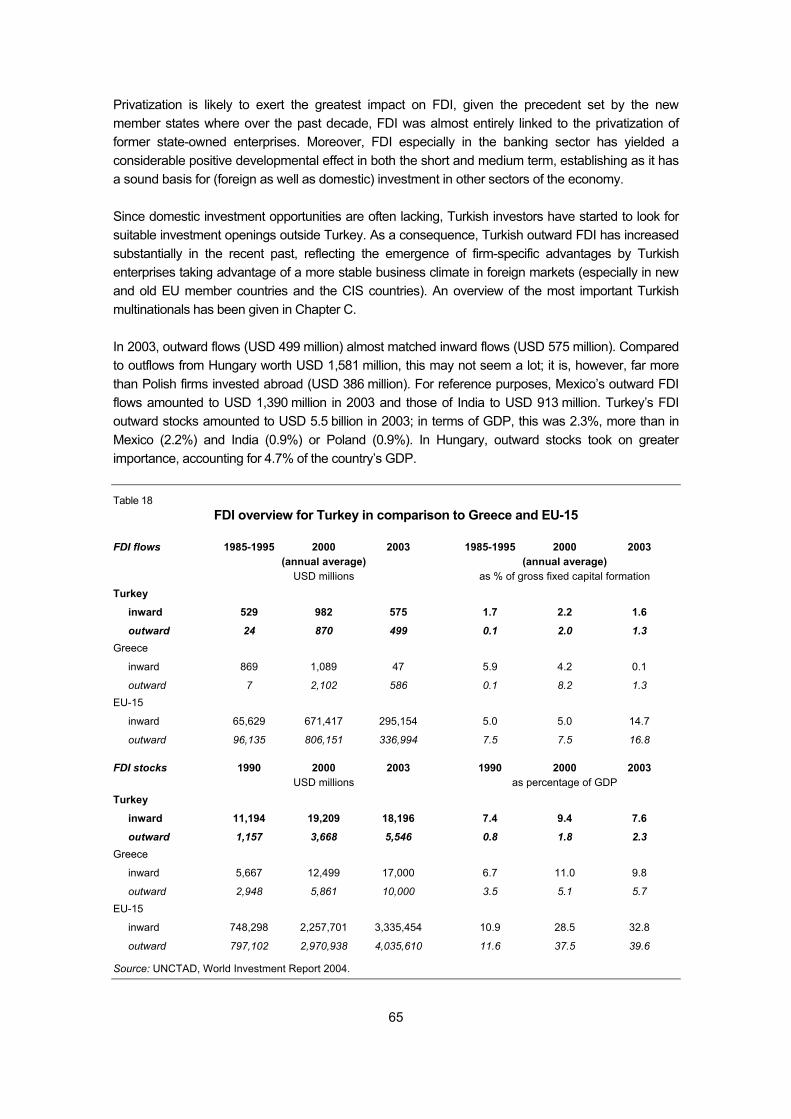
65
Privatization is likely to exert the greatest impact on FDI, given the precedent set by the new member states where over the past decade, FDI was almost entirely linked to the privatization of former state-owned enterprises. Moreover, FDI especially in the banking sector has yielded a considerable positive developmental effect in both the short and medium term, establishing as it has a sound basis for (foreign as well as domestic) investment in other sectors of the economy. Since domestic investment opportunities are often lacking, Turkish investors have started to look for suitable investment openings outside Turkey. As a consequence, Turkish outward FDI has increased substantially in the recent past, reflecting the emergence of firm-specific advantages by Turkish enterprises taking advantage of a more stable business climate in foreign markets (especially in new and old EU member countries and the CIS countries). An overview of the most important Turkish multinationals has been given in Chapter C. In 2003, outward flows (USD 499 million) almost matched inward flows (USD 575 million). Compared to outflows from Hungary worth USD 1,581 million, this may not seem a lot; it is, however, far more than Polish firms invested abroad (USD 386 million). For reference purposes, Mexico’s outward FDI flows amounted to USD 1,390 million in 2003 and those of India to USD 913 million. Turkey’s FDI outward stocks amounted to USD 5.5 billion in 2003; in terms of GDP, this was 2.3%, more than in Mexico (2.2%) and India (0.9%) or Poland (0.9%). In Hungary, outward stocks took on greater importance, accounting for 4.7% of the country’s GDP.
Table 18 FDI overview for Turkey in comparison to Greece and EU-15
FDI flows 1985-1995 2000 2003 1985-1995 2000 2003 (annual average) (annual average) USD millions as % of gross fixed capital formation
Turkey
inward 529 982 575 1.7 2.2 1.6
outward 24 870 499 0.1 2.0 1.3 Greece
inward 869 1,089 47 5.9 4.2 0.1
outward 7 2,102 586 0.1 8.2 1.3 EU-15
inward 65,629 671,417 295,154 5.0 5.0 14.7
outward 96,135 806,151 336,994 7.5 7.5 16.8
FDI stocks 1990 2000 2003 1990 2000 2003 USD millions as percentage of GDP
Turkey
inward 11,194 19,209 18,196 7.4 9.4 7.6
outward 1,157 3,668 5,546 0.8 1.8 2.3 Greece
inward 5,667 12,499 17,000 6.7 11.0 9.8
outward 2,948 5,861 10,000 3.5 5.1 5.7 EU-15
inward 748,298 2,257,701 3,335,454 10.9 28.5 32.8
outward 797,102 2,970,938 4,035,610 11.6 37.5 39.6
Source: UNCTAD, World Investment Report 2004.
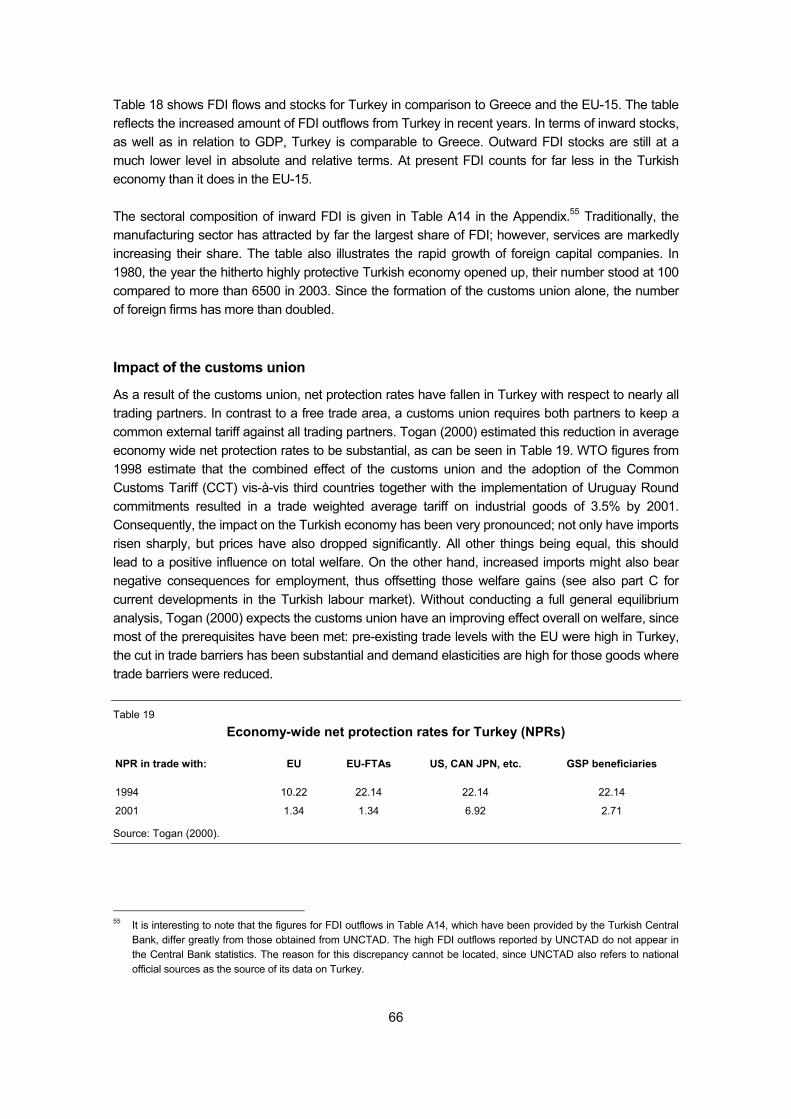
66
Table 18 shows FDI flows and stocks for Turkey in comparison to Greece and the EU-15. The table reflects the increased amount of FDI outflows from Turkey in recent years. In terms of inward stocks, as well as in relation to GDP, Turkey is comparable to Greece. Outward FDI stocks are still at a much lower level in absolute and relative terms. At present FDI counts for far less in the Turkish economy than it does in the EU-15. The sectoral composition of inward FDI is given in Table A14 in the Appendix.55 Traditionally, the manufacturing sector has attracted by far the largest share of FDI; however, services are markedly increasing their share. The table also illustrates the rapid growth of foreign capital companies. In 1980, the year the hitherto highly protective Turkish economy opened up, their number stood at 100 compared to more than 6500 in 2003. Since the formation of the customs union alone, the number of foreign firms has more than doubled. Impact of the customs union
As a result of the customs union, net protection rates have fallen in Turkey with respect to nearly all trading partners. In contrast to a free trade area, a customs union requires both partners to keep a common external tariff against all trading partners. Togan (2000) estimated this reduction in average economy wide net protection rates to be substantial, as can be seen in Table 19. WTO figures from 1998 estimate that the combined effect of the customs union and the adoption of the Common Customs Tariff (CCT) vis-à-vis third countries together with the implementation of Uruguay Round commitments resulted in a trade weighted average tariff on industrial goods of 3.5% by 2001. Consequently, the impact on the Turkish economy has been very pronounced; not only have imports risen sharply, but prices have also dropped significantly. All other things being equal, this should lead to a positive influence on total welfare. On the other hand, increased imports might also bear negative consequences for employment, thus offsetting those welfare gains (see also part C for current developments in the Turkish labour market). Without conducting a full general equilibrium analysis, Togan (2000) expects the customs union have an improving effect overall on welfare, since most of the prerequisites have been met: pre-existing trade levels with the EU were high in Turkey, the cut in trade barriers has been substantial and demand elasticities are high for those goods where trade barriers were reduced. Table 19
Economy-wide net protection rates for Turkey (NPRs)
NPR in trade with: EU EU-FTAs US, CAN JPN, etc. GSP beneficiaries
1994 10.22 22.14 22.14 22.14
2001 1.34 1.34 6.92 2.71
Source: Togan (2000).
55 It is interesting to note that the figures for FDI outflows in Table A14, which have been provided by the Turkish Central
Bank, differ greatly from those obtained from UNCTAD. The high FDI outflows reported by UNCTAD do not appear in the Central Bank statistics. The reason for this discrepancy cannot be located, since UNCTAD also refers to national official sources as the source of its data on Turkey.
67
As recent figures show, Turkey’s weighted average rates of protection through customs duties on industrial imports from EU and EFTA countries dropped from more than 10% to zero in 2004. The protection rates for products from third countries declined from approximately 16% to 4.2% (Turkish Foreign Trade Ministry, 2004). Akkoyunlu-Wigley and Mihci (2004) report that the customs union has had a pro-competitive impact on the Turkish economy. The increase in imports from the EU led to a decline in concentration in Turkey’s manufacturing industry. Furthermore, price-cost mark-ups fell in general, especially so in the following industries: petroleum (-68%), paper (-20%), metals (-15%), rubber and chemicals (-14%), machinery (-12%) and minerals (-11%). In most other industries (including textiles), the reduction was roughly 10%. The wood industry exhibited an increase in price-cost margins of 18%. All effects were statistically significant and related to rising imports. In terms of trade specialization or competitiveness, the customs union seems to have reinforced existing trade patterns with its specialization in labour-intensive, low-skill activities. Clothing, food and textiles remained the most important Turkish exports to both the EU and non-EU countries (Togan, 2000). However, growth in exports to the EU has been highest in power-generating machinery, other transport equipment and other non-electrical machinery. Growth in exports to non-EU partners has been strongest in power-generating machinery, automotive products, and other consumer goods. Taking this and other considerations into account – such as the progress achieved in eliminating technical barriers to trade, harmonizing customs procedures and commercial legislation and recognizing intellectual property rights – the customs union can be said to be progressing satisfactorily. There is also every expectation that non-tariff barriers to trade may be lifted in the near future. In her very detailed analysis of Turkey’s foreign trade structure, Lohrmann (2000a) concludes that Turkey did not sell the ‘right’ products to the ‘right’ markets. It persisted in specializing in textiles at a time when electronics was experiencing a global boom. Thus, Turkey failed to benefit from the enormous growth in world demand for electronic products. Moreover, Turkey increased its focus on the EU-15 as the market for its products, even though economic growth in that region has been depressed of late. Once again, Turkey ailed to switch swiftly to growing markets in East Asia. Lohrmann also posits that the increases in Turkish export market shares in the EU resulted from increased price competitiveness; they do not reflect modernization or structural adjustment of the Turkish economy. This finding is also borne out by the description of Turkey’s trade patterns in section 2 above. Despite some measure of catching-up, very little structural change was to be observed. On the contrary, it is clear that the shifts in the lira-euro exchange accelerated growth in exports and increased import prices. In a later paper (Lohrmann, 2002) it is shown that the bulk of Turkey’s trade with the EU is vertical or inter-industry trade. Despite a certain trend towards upgrading, especially in apparel and some glass and steel products, specialization in low-quality goods persists. Turkey is thus likely to face severe adjustment costs in the longer run. Furthermore, the recent enlargement of the EU has placed Turkey in a weak position; it now has to compete more with goods from Central and Eastern Europe which, in general, are better quality. Under the customs union between the EU and Turkey, both partners are required to consult each other prior to concluding preferential trade agreements with third parties, since future preferential
68
trading agreements entered into by one partner with third parties have repercussions for the other partner. Ideally, the other partner would agree to similar trade preferences with respect to the third party. In practice, however, the EU forged ahead and concluded free-trade agreements with third countries, ignoring the provisions of the customs union and failing to consult Turkey beforehand. This often bore negative implications or Turkey; goods from the third-party markets were now able to enter Turkey without any restrictions via the EU market, while Turkish goods were denied direct access to the same markets. The third-party countries in question were often unwilling to sign agreements with Turkey similar to those they had concluded with the EU. This has led the EU to introduce a ‘Turkish clause’ in its bilateral trade agreements. Thus, apart from the asymmetries relating to the different timing of tariff and quota restrictions between the EU and Turkey, the customs union features yet another major asymmetry in terms of establishing and maintaining a common commercial policy. Clearly, the major differences in size and global economic impact lie at the heart of these asymmetries. Over the period1971-2002, the EU signed free-trade agreements with ten countries (Malta, Cyprus, Tunisia, South Africa, Morocco, Israel, Mexico, Macedonia, Croatia and Jordan), of which only three also had a free trade agreement with Turkey (Cyprus, Israel and Macedonia). Ülgen and Zahariadis (2004) estimate that at the end of 2002 these discrepancies had resulted in a one-sided preferential trade volume of EUR 86 billion between the EU and third countries. EUR 36 billion worth of goods were granted preferential access to the EU, while the EU exported EUR 50 billion worth of goods on a preferential basis to the same third countries. As a baseline, it is generally agreed that the customs union has resulted in considerable trade creation. The customs union itself features numerous asymmetries; owing to the early abolition of most industrial tariffs in the EU (in the 1970s), the impact on Turkey was much stronger in terms of imports than exports. Despite the resultant growing trade deficit, the economy has gained from such factors as lower import prices, increased competition and an improved business climate. The expectation is that welfare will have improved as well. The structural impact on Turkey, however, has not been satisfactory in view of Turkey’s long-term growth potential. The specialization in the manufacture of labour-intensive, low-skill goods appears to persist and the amount of structural upgrading observed to date has been negligible. On the other hand, given the high recent growth rates and substantial efforts to improve legislation and the business climate, Turkey offers an increasingly interesting market opportunity for consumer and investment goods. General equilibrium effects of EU membership on trade
The Dutch Central Planning Bureau has conducted a study on the long-term impact of full membership on Turkey’s trade flows, using a computable general equilibrium model (Lejour et al., 2004). Although the analysis ignores the dynamic gains of accession to the EU, the static effects can be seen to have already yielded major welfare gains for Turkey and a negligible, yet positive welfare effect for the EU. The modelling exercise focuses on the long-term economic implications of three main components: Turkey’s accession to the internal market, internal reforms in Turkey, and free movement of people between Turkey and the EU. The analysis ignored Turkey’s potential membership in the EMU or the implications of transfers from the EU budget, since no realistic assumptions on these issues can be made at present. Not surprisingly, the impact on the internal market is small, since many aspects of the internal market have already been realized given the specific nature of the customs union. In that context, Francois (2003) also finds no noteworthy difference between the current customs union and a full membership scenario. He assumes no change with respect to the other two components mentioned above. Like Lejour et al. (2004), he
69
also arrives at positive welfare gains for Turkey in the long term, accompanied by trade increases and a positive impact on capital accumulation. The greater positive impact clearly stems from improvements in national institutions in Turkey. Were Turkey to move in the so-called Transparency International Corruption Perception Index to a position comparable to that of Portugal and France (i.e. from rank 64 worldwide to rank 25), it could yield a welfare gain of EUR 22.5 billion and expand GDP by 5.6%. Aggregate trade would increase by more than 50%. Thus, the macroeconomic effects accruing from improved institutions and less corruption are substantially larger than the impact of accession to the internal market. If EU membership serves as a catalyst for institutional reform, the associated benefits will go far beyond mere improvements in market access. Furthermore, the impact of better institutions and less corruption affects all sectors alike, while those of the internal market differ across sectors. In the latter case, textiles and wearing apparel would register the greatest scale of expansion and account for one quarter of total trade, yet generate only 3.6% of value-added. Trade in services and construction would record modest increases. Chemicals and metals and transport equipment would experience output losses. Here again, Francois (2003) reports similar findings. He suggests that motor vehicles would experience a drop in output; however, owing to increasing imports the volume of exports would expand as well. This mirrors Mexico’s experience in the NAFTA context. The motor vehicle sector in Turkey will have not choice but to restructure and enter into deeper integration with the European industry. In this simulation study, the free movement of people would lead to an expansion of potential GDP in the EU-15 and a contraction in Turkey.56 In per capita terms, the developments would be reversed, leading to increases in per-capita income in Turkey and a decline in GDP per capita in the EU-15, especially in Germany. The results hinge on the skill structure of Turkish immigrants. If migrants are primarily unskilled, wage inequality in the EU-15 is likely to rise. In summary, it is to be expected that the welfare effects of full membership will be positive and noticeable in Turkey, yet only marginal in the EU. The impact on the volume of trade will also be positive and larger than that on incomes or welfare. Accession to the internal market would boost mainly the textiles and clothing sector in Turkey. The largest and most widespread gains are to be expected from improvements in Turkish institutions as a result of full membership. Migration will have the expected effects on both sides, with some increases in per capita GDP in Turkey and a marginal decrease in the EU-15. The effects will not be distributed equally; they will be most apparent in Germany. Overall, accession will bring economic benefits to Turkey, yet exert only a marginal, yet positive effect on the current EU (including the new member states); the greatest impact will stem more from institutional reforms in Turkey than from improved market access. Short-term prospects for Turkey’s foreign trade
Turkey only started to open up its economy to international competition in the early 1980s. Especially after the country’s entry into the customs union with the EU in 1996, trade has increased substantially. None the less, Turkey is a relatively closed economy; its ratio of exports over GDP is quite low (19% in 2002). This puts it well below the average openness ratio in the EU-15, which
56 It has to be borne in mind that adjustment in employment is completely elastic, therefore rising unemployment is not a
concern here. In consequence, no need arises in such models for restrictions similar to those introduced in respect of the new member states during the most recent enlargement of the EU.
70
starts at roughly 35% (using an non-weighted average and including intra-EU trade). With 43% on average, the new member countries are substantially more integrated in the world economy; Bulgaria and Romania also show higher trade integration, with the ratio of exports over GDP standing at about 33%. Compared with other, even larger emerging economies, it also transpires that Turkey is a relatively closed economy. For instance, the export to GDP ratio in Mexico is 25%, in China 26% and in Russia more than 30%. On the other hand, the potential for further trade expansion is considered to be large. The economy is experiencing rapid income and population growth. Output growth in the industrial sector is strongly linked to high exports; the latter are based on increased competitiveness stemming from vast improvements in productivity levels in the export sector and low unit labour costs. On the other hand, exports in the industrial sector in particular depend heavily on imported inputs. This makes Turkey an increasingly interesting trading partner, primarily a factor of importance to the machinery and transport equipment industry. Thus, trade is most likely to increase further in the industrial sector, while services also display a pronounced potential for growth. Clearly, the share of agricultural products in trade has declined. Nevertheless, Turkey runs a sizeable surplus with the EU in this sector, despite the sector’s structural weakness within the Turkish economy (with its inefficient and costly domestic support system and low productivity) 57. The reason is that Turkey specializes in products to which the EU is relatively open, such as nuts, fruits and vegetables favoured by Turkey’s climate. These segments of the Turkish agricultural sector have been able to adapt to the requirements of the EU market. Another reason, of course, is the massive trade protection afforded to agriculture – on the Turkish side as well. Given the number of people working in agriculture, trade liberalization in this area is a highly sensitive issue and politically most burdensome. Implementation of the commitments under the Doha Round would have a severe impact, not only on the Turkish trade surplus in agriculture with the EU, but also – and much more so – on the Turkish economy and its labour market. In the industrial sector, two industries are expected to face the greatest changes in the short term: textiles for institutional reasons (phasing out the Agreement on Textiles and Clothing ATC); and machinery and transport equipment owing to increased Turkish competitiveness. The actual effects of the integration of the textile and clothing sector into the GATT, which is foreseen for 1 January 2005, are hard to assess at the moment. In principle, moving from a distorted system, where some countries are confronted with quotas while others are not, to a liberalized trade regime in line with WTO rules should bring about a great deal of restructuring with respect to the source countries of textiles and clothes on the EU market. Of the largest exporters to the EU in 2003, China, India, Hong Kong, Pakistan and the Republic of Korea faced quotas, while Turkey, together with countries such as Bangladesh, Romania and Tunisia did not. Phasing out these quotas should therefore re-distribute import shares in favour of the formerly restricted countries. However, it seems unlikely that the quotas will be fully eliminated without being replaced by trade barriers in another form58. The Agreement on Textiles and Clothing (ATC), introduced in 1995
57 Turkey is actually the only candidate to have a trade surplus with the EU in agricultural trade. 58 For instance, in the first stage of liberalization from 1995 to 2000, recourse was often made to safeguard measures.
The use of this practise has declined and since 2000 has been practically zero. More recently, however, recourse to such measures has intensified again. To keep control over textile and clothing imports from China, Turkey introduced such measures in January 2005. However, for Turkey there is no way to avoid tougher competition on exports markets.
71
together with the establishment of the WTO, was intended to permit the sector’s smooth transition from an import quota system to full integration in the multilateral trading system. The quota system dated back to the Long Term Agreement Regarding International Trade in Cotton Textiles (LTA) of 1962 which was then replaced in 1974 by the Multi Fibre Agreement (MFA), However, the ten-year transition period has not brought much progress in terms of liberalizing trade in textiles and clothing in the most restrictive countries (Canada, the EU, Norway, and the US). On the contrary, the burden of protectionism has yet to be done away with. Thus far, liberalization has been kept to a minimum, more often than not being restricted to lifting restrictions that were not binding anyway. Owing to its pronounced focus on textiles, Turkey may experience a loss in EU market shares in the near future, once the ATC is phased out. Since the start of the customs union, Turkey’s share in EU textile imports has increased from 10% to 16%. A recent study (Nordas, 2004) shows that the elimination of existing quotas may relegate Turkey to second place as a major supplier of textiles to the EU, the first place going to China. Furthermore, the import elasticity of textiles with respect to the current quotas is estimated to be rather small. Thus, an absolute decline in textile exports to the EU is in the realm of probability as well. While textile imports demanded by the EU are not expected to increase substantially, China’s market share is expected to rise to the detriment of Turkey. The situation is different for articles of clothing. Here, time to market is the important factor; in short, distance matters, especially so in the fashion clothing sector. Therefore, countries closer to the EU are expected to lose less of their market share to China and India, both of which are expected to benefit most from the elimination of existing quotas. Turkey’s share in EU imports in this industry has remained constant at 10% since 1995; it has moved up from third place behind China and Hong Kong to become second most important exporter to the EU. Its position is being challenged again under the post-ATC regime. Very much like China, Turkey has not developed competitive advantages in the design and fashion segments of the market. Thus, while it faces a real threat of losing market shares in the more footloose textile industry, Turkey only stands relatively little chance of benefiting from its proximity to the EU-market and zero tariffs in the customs union in the often highly fragmented clothing sector with its much higher value added. To sum up, it is difficult to assess the outlook for the Turkish textile sector. On the one hand, prospects are not too bright unless it shifts its focus from the more footloose textile segment of the market to the more fashion-oriented and vertically integrated clothing sector, where time-to-market considerations rank high. On the other hand, the immediate effects of the end of the ATC may not be very large quantitatively, since it is feasible that the EU, after having abolished the quota system by the end of 2004, at some point of time will adopt some compensatory measures. The recent increases in export shares in the machinery and transport equipment sector are quite promising for Turkey. A large proportion of these exports are the outcome of vertical integration in major European production networks, especially in the manufacture of rolling stock and motor vehicles. The white goods appliance sector has also taken on increasing importance for Turkey’s foreign trade; Turkey has rapidly built up a competitive position in the European market in this sector. These developments are likely to be accompanied by stronger trade integration in business services, the signs of which, even if modest at the moment, are already apparent in the Turkish balance of payments. The machinery industry also features a higher share of intra-industry trade than, for instance, the textile and clothing sector. In the case of Turkey, it is the only sector with a notable degree of intra-industry trade. Thus, Turkey’s trade potential in this sector is of great
72
importance to its trading partners, not least to Austria, which exhibits a clear comparative advantage in machinery (industrial plants) and accompanying services. Finally, with further liberalization steps looming large in the area of services, substantial increases in trade volume in this sector can be expected. The importance of the travel sector is undisputed; it will remain pre-eminent in the long run. Thanks to its extended and still largely undiscovered Mediterranean coastline, Turkey still possesses a large potential for further expansion in the tourism sector. Over the period 2001-2003, the number of international visitors to Turkey increased from 2.4 million to 14 million, while the average length of stay remained relatively constant at four nights. As a result, revenues have also increased substantially (from about USD 5 billion to more than USD 13 billion). Growth in this sector is expected to continue. However, business related services are also likely to gain in importance in the wake of further liberalization and privatization steps, not forgetting the ongoing changes in the global institutional framework after the Doha Round. Especially those services associated with the import and export of machinery and transport equipment, as well as financial services will record the greatest growth in the near future. The Turkish Straits – a chokehold on energy in transit
Given its relatively small economy, Turkey is not a major consumer of energy. Nor is it a major producer of energy as the country is not particularly rich in hydrocarbon deposits. However, its location between the Black Sea and the Mediterranean makes it an important route for both Russian and Caspian oil in transit to the rich and energy-hungry markets of Western Europe. The bulk of oil currently transported via Turkey is shipped in tankers via the Turkish Straits; the latter comprise the Bosporus, the Marmara Sea and the Dardanelles.59 Each day an estimated 3 million barrels – equivalent to around one fifth of the oil consumed in a day in the EU – pass through the Straits which are less than a kilometre wide at their narrowest point. More than half of this amount – some 1.7 million barrels per day (bpd) – is oil from the Russian terminal in Novorossiysk. It is linked via pipelines to several important oil-producing areas, including Western Siberia, the Volga basin and the Caspian area deposits of Kazakhstan and Azerbaidzhan (the latter constitutes the ‘northern route’ for Caspian oil). Apart from Novorossiysk, other important oil terminals on the Black Sea include the Russian port of Tuapse (100,000 bpd), the Georgian ports of Supsa (220,000 bpd) and Batumi (140,000 bpd), both of which part of the ‘western route’ for Caspian oil, as well as the Ukrainian port of Odessa (190,000 bpd) which is also linked to the Russian oil pipeline grid. Shipments from Odessa are expected to increase over the short term owing to more Russian oil being pumped down the Odessa-Brody pipeline. Completed in 2001, the pipeline was originally designed to pump Caspian oil from Odessa to Poland and on further to Western Europe; however, it has not been in operation for want of adequate oil supplies. Thus, in summer 2004 the Ukrainian government at the time accepted the Russian offer to use the pipeline in the reverse mode over a three-year period. Shipping oil from the Odessa-Brody pipeline across the Black Sea started in September 2004. The initial throughput was 97,000 bpd, but this will increase to some 180,000 bpd, provided the new (western-inclined) Ukrainian government does not decide to withdraw from the contract already signed with Russia.
59 Turkey also used to serve as a transit country for Iraqi oil, which was pumped via a 1.5 million bpd-capacity pipeline
from Kirkuk to the Turkish Mediterranean port of Ceyhan. However, as a result of the US-led invasion in Iraq, the Kirkuk-Ceyhan pipeline has virtually ceased to operate.
73
The importance of Russia to the energy transiting Turkey derives from the fact that Russia is one of the world’s two largest oil producers (on a par with Saudi Arabia) and is the second largest oil exporter (after Saudi Arabia). At the same time, the importance to Russia of the Black Sea and the Turkish Straits derives from the fact that they represent one of the three major routes for oil exports (the other two being the on-shore Druzhba export pipeline across Belarus, Ukraine and Central Europe and the Baltic Pipeline System in the north). Apart from Russia, Kazakhstan and Azerbaijan are the two other former Soviet states whose oil production has risen rapidly over the past few years. Both countries are landlocked and have been seeking openings for delivering their oil (and gas) to the European and Asian markets. Transit via pipelines through either Russia or Georgia followed by shipment in tankers across the Black Sea represents a natural (and for the time being the sole) export route for those countries, although it also poses an even greater challenge to the throughput capacity of the narrow Turkish Straits. In particular, oil shipments from Novorossiysk surged in late 2001, following its linkage via the Caspian Pipeline Consortium (CPC) pipeline to the vast Tengiz oil deposit in Kazakhstan close to the Caspian Sea. Currently, the capacity of CPC stands at 560,000 bpd; however, it is due to be upgraded to 1.34 million bpd by 2015. Pursuant to the Montreux Convention of 1936, the Turkish Straits enjoy the status of an international waterway, through which commercial shipping has the right of free passage. However in recent years, given the intense tanker traffic in the Straits, the Turkish authorities have been growing increasingly concerned over the related safety and environmental hazards. Those concerns will in all likelihood gain even greater importance as Turkey’s EU membership negotiations proceed. With some 50,000 vessels (5,000 are tankers loaded with oil and/or liquefied natural gas) passing through the Straits each year, the waterway is reported to be operating on the verge of its physical capacity. Following a collision between the Greek-Cypriot tanker ‘Nassia’ and another ship in March 1994, some 20,000 tons of oil were reported to have been spilled into the Bosporus – just a few kilometres away from Istanbul, Turkey’s biggest city. In response, the Turkish authorities imposed a new regulation requiring that ships carrying hazardous materials report to the Turkish ministry for environmental protection. However, implementation to date has been poor, not least on account of the pressure being brought to bear by the neighbouring Black Sea countries. Another major accident occurred in December 1999, when the Russian tanker ‘Volgoneft-248’ ran aground, spilling some 800 tons of fuel oil into the Marmara Sea. In order to cope with the growing tanker traffic in the Straits, Turkey has built a radar-controlled Vessel Traffic and Management System akin to an air-traffic control system. Furthermore, in October 2002, Turkey imposed new restrictions on oil tankers in transit through the Bosporus, including a ban on nighttime traffic for ships longer than 200 metres. In effect, the latter restriction applies to all tankers carrying crude oil and the larger petroleum product tankers; it incurs delays of up to 20-30 days, reportedly costing the supertankers’ owners some USD 30,000 per day. Finally, the Straits are not suited to large tankers, which offer the only profitable means of shipping oil over long distances.60 In particular, the bottleneck caused by the Turkish Straits was perceived as an obstacle to the shipment of Russian oil to the United States via the Black Sea – an option that was extensively discussed in the wake of 11 September 2001 when the US sought to reduce its dependence for oil on Saudi Arabia and other countries in the Middle East.
60 The largest tankers that can pass through the Turkish Straits are the Suezmax class tankers (120,000-200,000
deadweight tons).
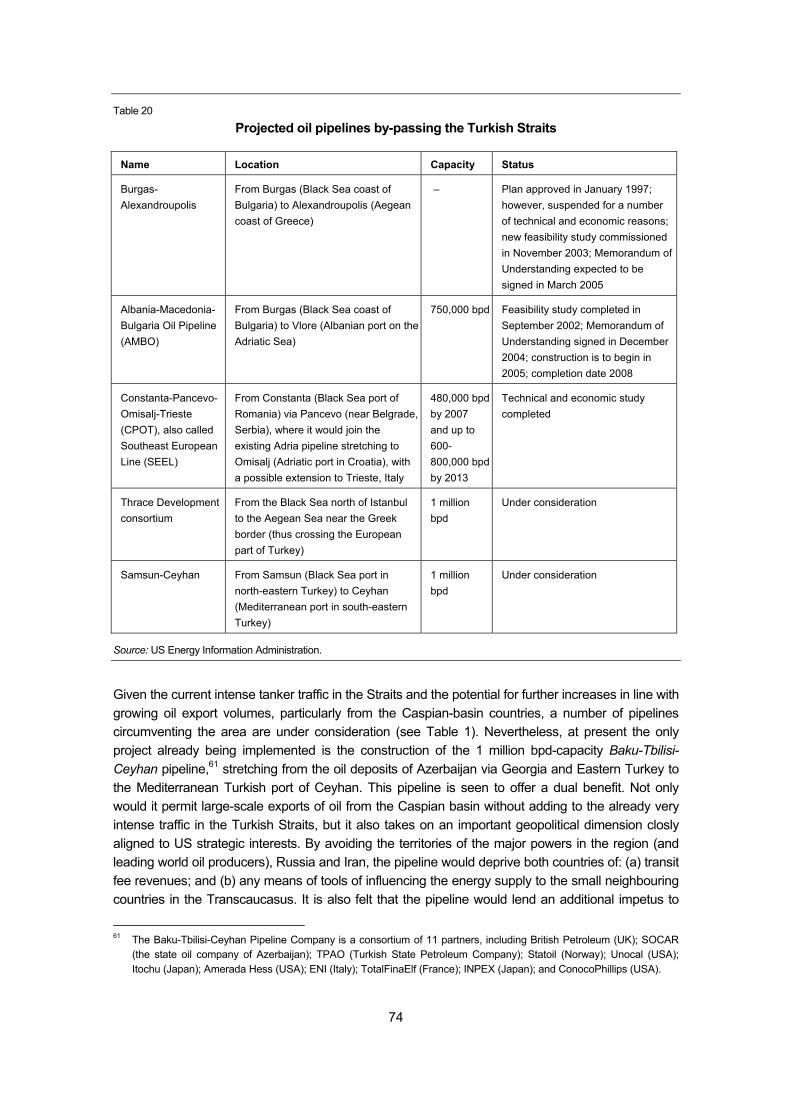
74
Table 20
Projected oil pipelines by-passing the Turkish Straits
Name Location Capacity Status
Burgas-Alexandroupolis
From Burgas (Black Sea coast of Bulgaria) to Alexandroupolis (Aegean coast of Greece)
– Plan approved in January 1997; however, suspended for a number of technical and economic reasons; new feasibility study commissioned in November 2003; Memorandum of Understanding expected to be signed in March 2005
Albania-Macedonia-Bulgaria Oil Pipeline (AMBO)
From Burgas (Black Sea coast of Bulgaria) to Vlore (Albanian port on the Adriatic Sea)
750,000 bpd Feasibility study completed in September 2002; Memorandum of Understanding signed in December 2004; construction is to begin in 2005; completion date 2008
Constanta-Pancevo-Omisalj-Trieste (CPOT), also called Southeast European Line (SEEL)
From Constanta (Black Sea port of Romania) via Pancevo (near Belgrade, Serbia), where it would join the existing Adria pipeline stretching to Omisalj (Adriatic port in Croatia), with a possible extension to Trieste, Italy
480,000 bpd by 2007 and up to 600-800,000 bpd by 2013
Technical and economic study completed
Thrace Development consortium
From the Black Sea north of Istanbul to the Aegean Sea near the Greek border (thus crossing the European part of Turkey)
1 million bpd
Under consideration
Samsun-Ceyhan From Samsun (Black Sea port in north-eastern Turkey) to Ceyhan (Mediterranean port in south-eastern Turkey)
1 million bpd
Under consideration
Source: US Energy Information Administration.
Given the current intense tanker traffic in the Straits and the potential for further increases in line with growing oil export volumes, particularly from the Caspian-basin countries, a number of pipelines circumventing the area are under consideration (see Table 1). Nevertheless, at present the only project already being implemented is the construction of the 1 million bpd-capacity Baku-Tbilisi-Ceyhan pipeline,61 stretching from the oil deposits of Azerbaijan via Georgia and Eastern Turkey to the Mediterranean Turkish port of Ceyhan. This pipeline is seen to offer a dual benefit. Not only would it permit large-scale exports of oil from the Caspian basin without adding to the already very intense traffic in the Turkish Straits, but it also takes on an important geopolitical dimension closly aligned to US strategic interests. By avoiding the territories of the major powers in the region (and leading world oil producers), Russia and Iran, the pipeline would deprive both countries of: (a) transit fee revenues; and (b) any means of tools of influencing the energy supply to the small neighbouring countries in the Transcaucasus. It is also felt that the pipeline would lend an additional impetus to
61 The Baku-Tbilisi-Ceyhan Pipeline Company is a consortium of 11 partners, including British Petroleum (UK); SOCAR
(the state oil company of Azerbaijan); TPAO (Turkish State Petroleum Company); Statoil (Norway); Unocal (USA); Itochu (Japan); Amerada Hess (USA); ENI (Italy); TotalFinaElf (France); INPEX (Japan); and ConocoPhillips (USA).
75
growth in the generally underdeveloped eastern areas of Turkey. Initially, serious doubts were voiced as to the commercial viability of the project. It was not until the upward re-assessment of the Azeri, Chirag and Gunashli oil fields in the Azeri sector of the Caspian Sea that pipeline construction actually started (construction of the Turkish section began in June 2002). However, certain doubts about the future profitability of the pipeline still remain, recently compounded by growing environmental and safety concerns. In particular, the 1,700 km long pipeline is believed to be an ideal target for international terrorism. Nevertheless, pipeline construction is reportedly nearing completion and the first oil is scheduled to arrive in Ceyhan by the second half of the current year. Parallel to Baku-Tbilisi-Ceyhan, the natural gas pipeline Baku-Tbilisi-Erzurum (or South Caucasus Gas Pipeline) is also under construction; as of 2006 it will deliver up to 7 billion cubic metres of natural gas per year from the Azeri Shah Deniz gas field in the Caspian Sea. To date, the implications that the circumventing pipelines discussed above might bear for the intensity of tanker traffic in the Turkish Straits are still unclear. In the short term, the Baku-Tbilisi-Ceyhan pipeline might well reduce the load on the Straits by diverting some Azerbaijani oil from the Black Sea ports Novorossiysk and Supsa. Needless to say, this projection is based on the assumption that no major wars or terrorist attacks upset the region that is already highly unstable in political terms (in all three countries involved, ethnic conflicts or territorial disputes have abounded in the recent past). However, in the longer term, the impact is likely to be more ambiguous; the Baku-Tbilisi-Ceyhan pipeline will be increasingly filled with oil from the new Caspian deposits, while additional Kazakhi oil pumped via the Caspian Pipeline Consortium to Novorossiysk will come onstream at the same time. Proven oil reserves in the entire Caspian Sea region are estimated at some 17-33 billion barrels – comparable to those of the North Sea. Long-term projections put total oil production in this area at around 4 million bpd. It remains to be seen whether the combined capacity of the Turkish Straits and the Baku-Tbilisi-Ceyhan pipeline will suffice to accommodate oil flows of this magnitude.
76
E Labour market
Over the past decade, the characteristic features of the Turkish labour market have been continuous rural-urban migration (Saracoğlu and Roe, 2004), changing sectoral employment patterns and declining employment and activity rates, particularly those of women. Turkey still has a strong agricultural sector, indicating that the country is still in transition as it moves towards an industry and service economy. Unemployment has been on the increase over the past few years; it is high by European standards, especially in urban regions and for educated young people. The present analysis of the Turkish labour market is based on labour force survey data published by the Turkish State Institute of Statistics (SIS). These data include results obtained from the labour force surveys conducted biannually over the period 1989-1999 and those conducted each quarter from 2000 onwards. As the two surveys also differ in terms of methodology and sample frame, the breaks in the two data sets become evident (e.g. the share of agricultural employment is shown to fall from 41.5% in 1999 to 36% in 2000). Bearing this in mind, the results obtained should be treated with some caution. Comparisons with the EU are based on Eurostat data. Population and internal migration
In contrast to the EU, which is characterized by an ageing population, the Turkish population has been growing continuously. According to the 2000 census, the population of Turkey reached 67.8 million, about two thirds of which lived in urban areas with 20,000 inhabitants or more. Over the period 1990-2000, the population grew at an annual rate of 1.8%; the growth rate was higher in urban areas (2.7%) than in rural areas (0.4%). Overall, both population growth and the birth rate (number of births per 1000 population) in Turkey have been slowing down over more than a decade (Figure 23). The growth gap between the urban and rural areas is mainly due to the steady migration from rural to urban regions, a process which is still underway (in 1950, the urban population accounted for only 18% of the total). Most people migrate from the eastern to the western parts of Turkey and have virtually no schooling. Their job opportunities are limited to manual work on account of their previous work experience as farmhands or some other low-skill activity. The massive regional income disparities are the prime cause of the large-scale migration from the poor to the rich regions of the country. In the 1990s the Marmara region – industrial heartland and one of the wealthiest areas – together with the Mediterranean region (tourist area) were the main target regions for internal migration from the agricultural regions in Anatolia. Both areas (Marmara and Mediterranean regions) registered a population growth of 20-25% over the period 1990-2000. A large part of the east-west migration is related to the Kurdish minority, who traditionally live in Southeast and East Anatolia. As a consequence of the Kurdish conflict that started in the 1980s and went on until the late 1990s, many Kurds have fled to urban areas in the western part of Turkey or left the country for good.62 Only a small fraction have returned to their villages in the south-east
62 For more on that see Schweızer Flüchtlingshilfe (2003),; Human Rights Watch (2005) dealing with internally displaced
Kurds; and Gunduz and Sezgin (2004) analysing the economic consequences of the armed conflict in southeastern Turkey - the number of violent incidents peaked in the mid-nineties.
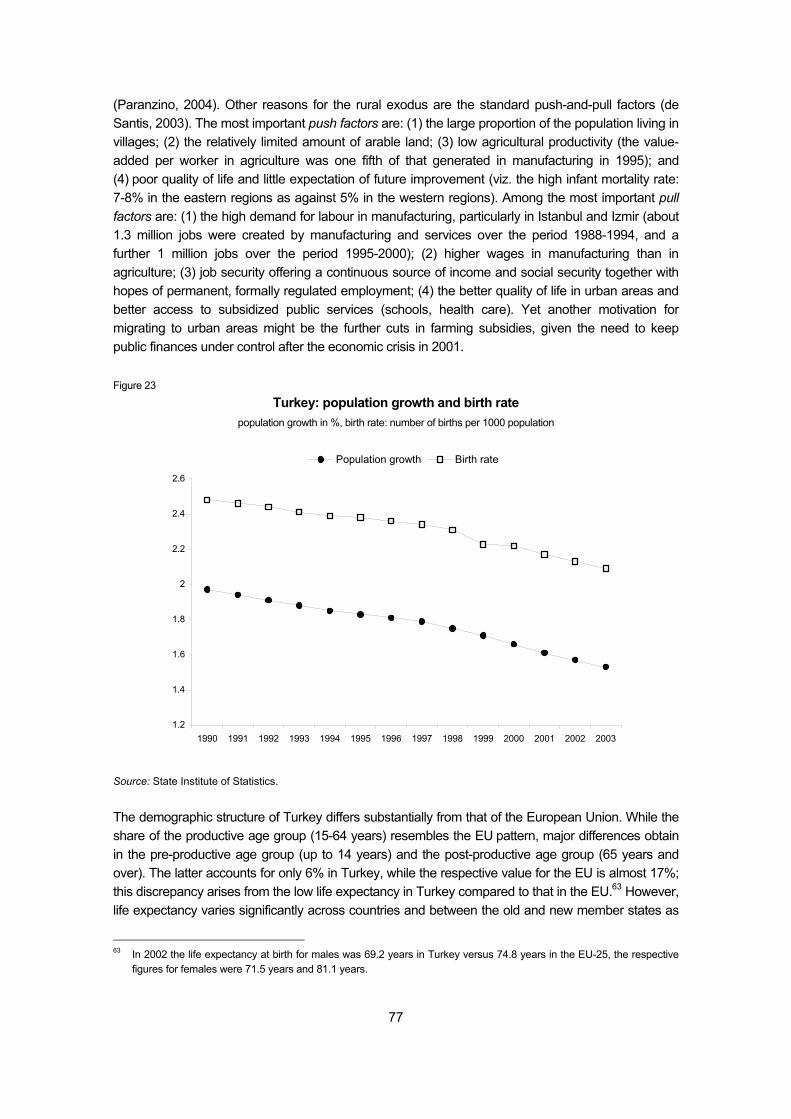
77
(Paranzino, 2004). Other reasons for the rural exodus are the standard push-and-pull factors (de Santis, 2003). The most important push factors are: (1) the large proportion of the population living in villages; (2) the relatively limited amount of arable land; (3) low agricultural productivity (the value-added per worker in agriculture was one fifth of that generated in manufacturing in 1995); and (4) poor quality of life and little expectation of future improvement (viz. the high infant mortality rate: 7-8% in the eastern regions as against 5% in the western regions). Among the most important pull factors are: (1) the high demand for labour in manufacturing, particularly in Istanbul and Izmir (about 1.3 million jobs were created by manufacturing and services over the period 1988-1994, and a further 1 million jobs over the period 1995-2000); (2) higher wages in manufacturing than in agriculture; (3) job security offering a continuous source of income and social security together with hopes of permanent, formally regulated employment; (4) the better quality of life in urban areas and better access to subsidized public services (schools, health care). Yet another motivation for migrating to urban areas might be the further cuts in farming subsidies, given the need to keep public finances under control after the economic crisis in 2001. Figure 23
Turkey: population growth and birth rate population growth in %, birth rate: number of births per 1000 population
1.2
1.4
1.6
1.8
2
2.2
2.4
2.6
1990 1991 1992 1993 1994 1995 1996 1997 1998 1999 2000 2001 2002 2003
Population growth Birth rate
Source: State Institute of Statistics.
The demographic structure of Turkey differs substantially from that of the European Union. While the share of the productive age group (15-64 years) resembles the EU pattern, major differences obtain in the pre-productive age group (up to 14 years) and the post-productive age group (65 years and over). The latter accounts for only 6% in Turkey, while the respective value for the EU is almost 17%; this discrepancy arises from the low life expectancy in Turkey compared to that in the EU.63 However, life expectancy varies significantly across countries and between the old and new member states as
63 In 2002 the life expectancy at birth for males was 69.2 years in Turkey versus 74.8 years in the EU-25, the respective
figures for females were 71.5 years and 81.1 years.
78
well. By way of contrast, the share of the pre-productive age group is almost 28% in Turkey as against some 16% in the EU as a whole. Employment
Employment fell only slightly in the crisis year 2001; however, it has not yet recovered despite the remarkable GDP growth from 2002 onwards. High economic growth was accompanied by high productivity growth rather than employment growth and an increase in working hours to more than 50 hours a week in urban areas (European Commission, 2004). Similar patterns were also to be observed in most of the new EU member states. Thus, creating additional employment calls for constant economic growth much higher, for example, than the rate in the EU which stands at about 2%. wiiw estimates the figure for Poland to be 6%; this might serve as a rough indicator for Turkey. On closer scrutiny, for example, it transpires that the job losses in 2003 were due to employment being cut back in rural areas, while it had increased in urban areas. With the exception of 2001 (when economic hardship led to reverse migration to rural areas) agricultural employment started to dip uninterruptedly from the late 1990s onwards, while employment in industry fluctuated wildly. The number of jobs in construction dropped quite substantially in 2001 and 2002, remaining stagnant in 2003. The decrease in construction is the more worrying as it is an important source of employment for urban workers, primarily young unskilled males. Employment in the services sector picked up again after a substantial decline in 2001 (Table 21). In 2003 only slightly more than half of all those employed were wage and salary earners; self-employed and employers accounted for 30% and unpaid family workers for 20% of total employment. From a gender perspective, 56% of the males earned a salary or wages, 36% were self-employed and 8% were unpaid family workers. Even more alarming are the corresponding figures for women, 38% of whom are wage-earners, 13% self-employed and almost half of them unpaid family workers. In terms of self-employment Turkey is quite different from the EU-15 where about 15% of those in employment are self-employed and 85% of the workforce has a standard dependable job. From a European perspective, the situation in Turkey is similar to that in Poland. Informal sector employment
Turkey employs a large share of workers in the informal sector. However, data on size vary considerably. From 2000 onwards the SIS has been including an independent informal sector survey in its labour force survey. Thus, the informal sector is defined as ‘all non-agricultural economic units which are unincorporated (establishments whose legal status is individual ownership or simple partnership), paying lump-sum tax or no tax at all, and working with 1-9 persons engaged.’ The most recent data obtained from the labour force survey indicate that in the second quarter of 2004 in the non-agricultural sector, the share of those employed in the informal sector accounted for 14% of the total workforce or 2.2 million persons. If informal employment in agriculture were to be included, the figure would stand at some 24% of total employment. The OECD (2004c) reports that overall the informal sector is estimated to account for some 52% of total employment (including agriculture) and 37% in private sector employment (excluding agriculture). This calculation apparently takes into account all those workers who are not registered in any social security institution: one third of whom work in urban and two thirds in rural areas. Sector-based observations
79
may raise doubts whether official estimates grasp the full extent of informal activities. For example, unofficial approximations come to the conclusion that the textiles and clothing industries alone may employ as much as 2 to 2.5 million undeclared domestic workers, apart from an additional 1 to 1.5 million undeclared foreign workers. Decline in employment and activity rates
In contrast to the EU, where employment rates have been on the increase over recent years, the Turkish labour market has displayed by a sharp decline in both employment and activity rates64 over the past decade and a half. Over the period 1988-2003, the employment rate fell by almost 10 percentage points to 45.5% in 2003; it is well below that of comparative countries. Compared to the EU-25 (63% in 2003), Turkey would find itself at the lower end of the scale, even behind Poland with its 51% (Figure 24). This outcome also stands in stark contrast to the Lisbon target of an overall employment rate of 70% (more than 60% for women) that the European Council agreed the EU member states would achieve by 2010 – a target that the enlarged EU itself will in all likelihood fail to meet.
64 Employment rate: employed in % of working-age population. Activity rate: labour force (employed and unemployed) in
% of working-age population. Working-age population: in Turkish national statistics the population aged 15 years and over, in EU (OECD) comparisons the age group between 15 and 64 years.
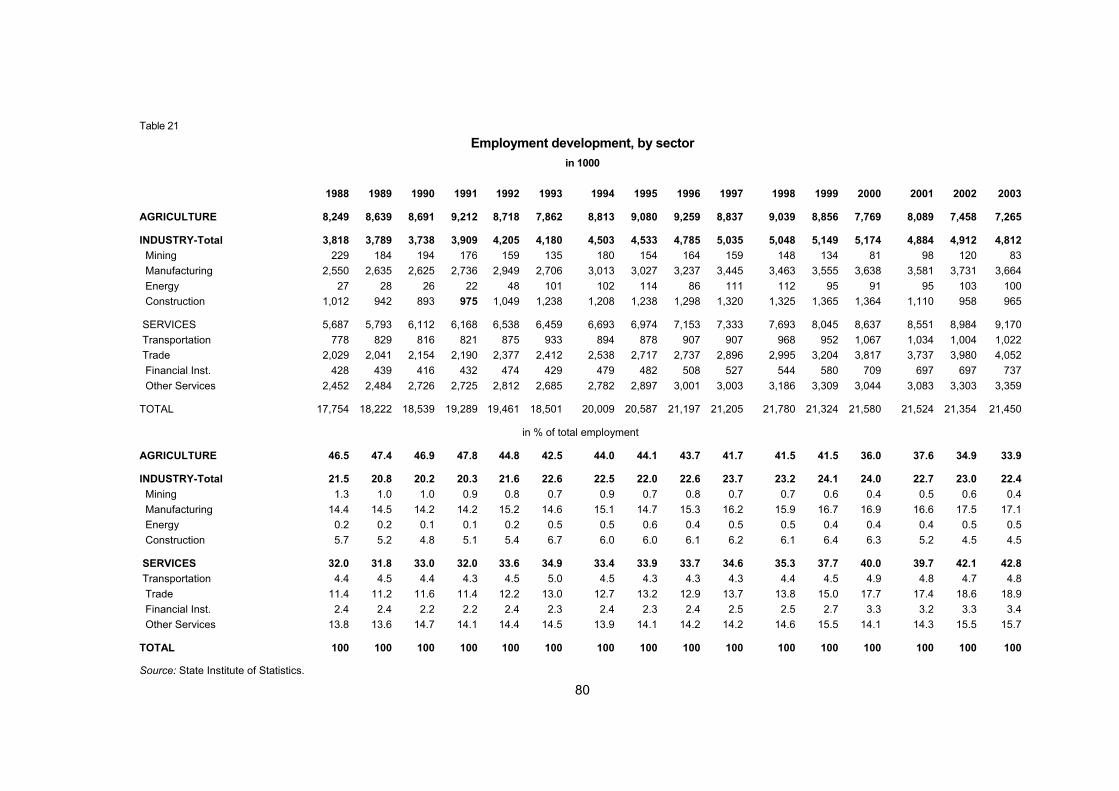
80
Table 21
Employment development, by sector in 1000
1988 1989 1990 1991 1992 1993 1994 1995 1996 1997 1998 1999 2000 2001 2002 2003
AGRICULTURE 8,249 8,639 8,691 9,212 8,718 7,862 8,813 9,080 9,259 8,837 9,039 8,856 7,769 8,089 7,458 7,265
INDUSTRY-Total 3,818 3,789 3,738 3,909 4,205 4,180 4,503 4,533 4,785 5,035 5,048 5,149 5,174 4,884 4,912 4,812 Mining 229 184 194 176 159 135 180 154 164 159 148 134 81 98 120 83 Manufacturing 2,550 2,635 2,625 2,736 2,949 2,706 3,013 3,027 3,237 3,445 3,463 3,555 3,638 3,581 3,731 3,664 Energy 27 28 26 22 48 101 102 114 86 111 112 95 91 95 103 100 Construction 1,012 942 893 975 1,049 1,238 1,208 1,238 1,298 1,320 1,325 1,365 1,364 1,110 958 965
SERVICES 5,687 5,793 6,112 6,168 6,538 6,459 6,693 6,974 7,153 7,333 7,693 8,045 8,637 8,551 8,984 9,170 Transportation 778 829 816 821 875 933 894 878 907 907 968 952 1,067 1,034 1,004 1,022 Trade 2,029 2,041 2,154 2,190 2,377 2,412 2,538 2,717 2,737 2,896 2,995 3,204 3,817 3,737 3,980 4,052 Financial Inst. 428 439 416 432 474 429 479 482 508 527 544 580 709 697 697 737 Other Services 2,452 2,484 2,726 2,725 2,812 2,685 2,782 2,897 3,001 3,003 3,186 3,309 3,044 3,083 3,303 3,359
TOTAL 17,754 18,222 18,539 19,289 19,461 18,501 20,009 20,587 21,197 21,205 21,780 21,324 21,580 21,524 21,354 21,450
in % of total employment
AGRICULTURE 46.5 47.4 46.9 47.8 44.8 42.5 44.0 44.1 43.7 41.7 41.5 41.5 36.0 37.6 34.9 33.9
INDUSTRY-Total 21.5 20.8 20.2 20.3 21.6 22.6 22.5 22.0 22.6 23.7 23.2 24.1 24.0 22.7 23.0 22.4 Mining 1.3 1.0 1.0 0.9 0.8 0.7 0.9 0.7 0.8 0.7 0.7 0.6 0.4 0.5 0.6 0.4 Manufacturing 14.4 14.5 14.2 14.2 15.2 14.6 15.1 14.7 15.3 16.2 15.9 16.7 16.9 16.6 17.5 17.1 Energy 0.2 0.2 0.1 0.1 0.2 0.5 0.5 0.6 0.4 0.5 0.5 0.4 0.4 0.4 0.5 0.5 Construction 5.7 5.2 4.8 5.1 5.4 6.7 6.0 6.0 6.1 6.2 6.1 6.4 6.3 5.2 4.5 4.5
SERVICES 32.0 31.8 33.0 32.0 33.6 34.9 33.4 33.9 33.7 34.6 35.3 37.7 40.0 39.7 42.1 42.8 Transportation 4.4 4.5 4.4 4.3 4.5 5.0 4.5 4.3 4.3 4.3 4.4 4.5 4.9 4.8 4.7 4.8 Trade 11.4 11.2 11.6 11.4 12.2 13.0 12.7 13.2 12.9 13.7 13.8 15.0 17.7 17.4 18.6 18.9 Financial Inst. 2.4 2.4 2.2 2.2 2.4 2.3 2.4 2.3 2.4 2.5 2.5 2.7 3.3 3.2 3.3 3.4 Other Services 13.8 13.6 14.7 14.1 14.4 14.5 13.9 14.1 14.2 14.2 14.6 15.5 14.1 14.3 15.5 15.7
TOTAL 100 100 100 100 100 100 100 100 100 100 100 100 100 100 100 100
Source: State Institute of Statistics.
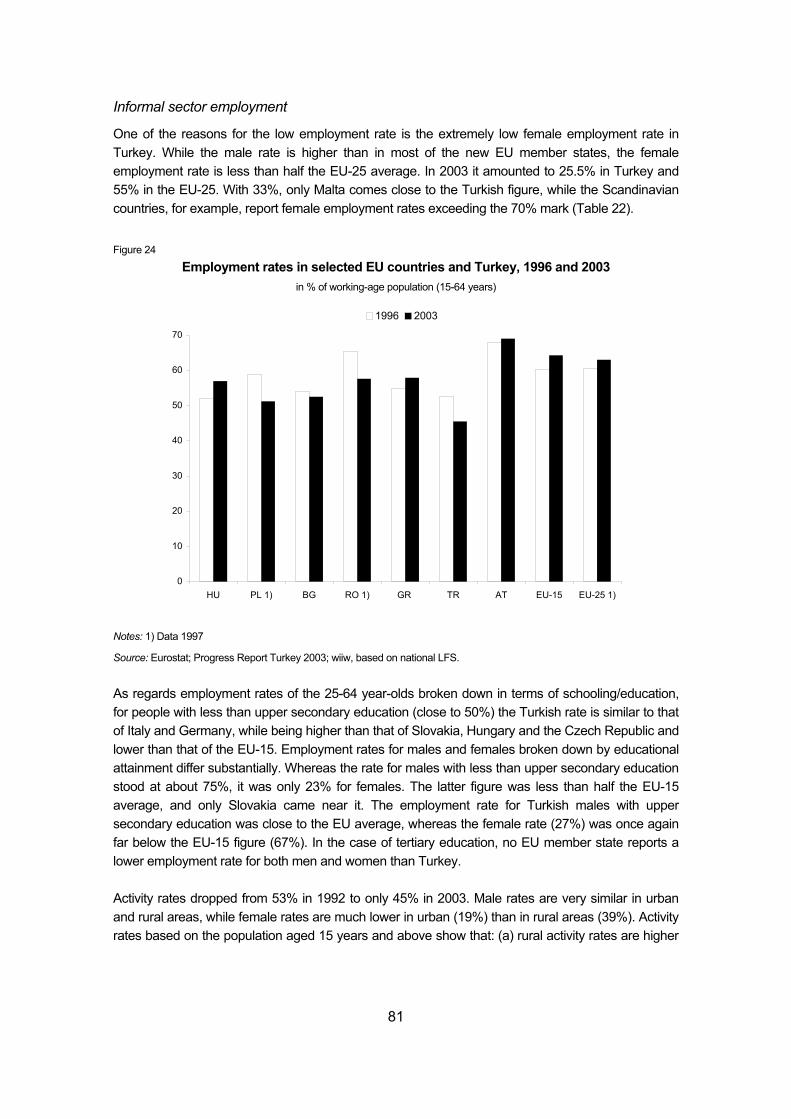
81
Informal sector employment
One of the reasons for the low employment rate is the extremely low female employment rate in Turkey. While the male rate is higher than in most of the new EU member states, the female employment rate is less than half the EU-25 average. In 2003 it amounted to 25.5% in Turkey and 55% in the EU-25. With 33%, only Malta comes close to the Turkish figure, while the Scandinavian countries, for example, report female employment rates exceeding the 70% mark (Table 22). Figure 24
Employment rates in selected EU countries and Turkey, 1996 and 2003 in % of working-age population (15-64 years)
0
10
20
30
40
50
60
70
HU PL 1) BG RO 1) GR TR AT EU-15 EU-25 1)
1996 2003
Notes: 1) Data 1997
Source: Eurostat; Progress Report Turkey 2003; wiiw, based on national LFS.
As regards employment rates of the 25-64 year-olds broken down in terms of schooling/education, for people with less than upper secondary education (close to 50%) the Turkish rate is similar to that of Italy and Germany, while being higher than that of Slovakia, Hungary and the Czech Republic and lower than that of the EU-15. Employment rates for males and females broken down by educational attainment differ substantially. Whereas the rate for males with less than upper secondary education stood at about 75%, it was only 23% for females. The latter figure was less than half the EU-15 average, and only Slovakia came near it. The employment rate for Turkish males with upper secondary education was close to the EU average, whereas the female rate (27%) was once again far below the EU-15 figure (67%). In the case of tertiary education, no EU member state reports a lower employment rate for both men and women than Turkey. Activity rates dropped from 53% in 1992 to only 45% in 2003. Male rates are very similar in urban and rural areas, while female rates are much lower in urban (19%) than in rural areas (39%). Activity rates based on the population aged 15 years and above show that: (a) rural activity rates are higher
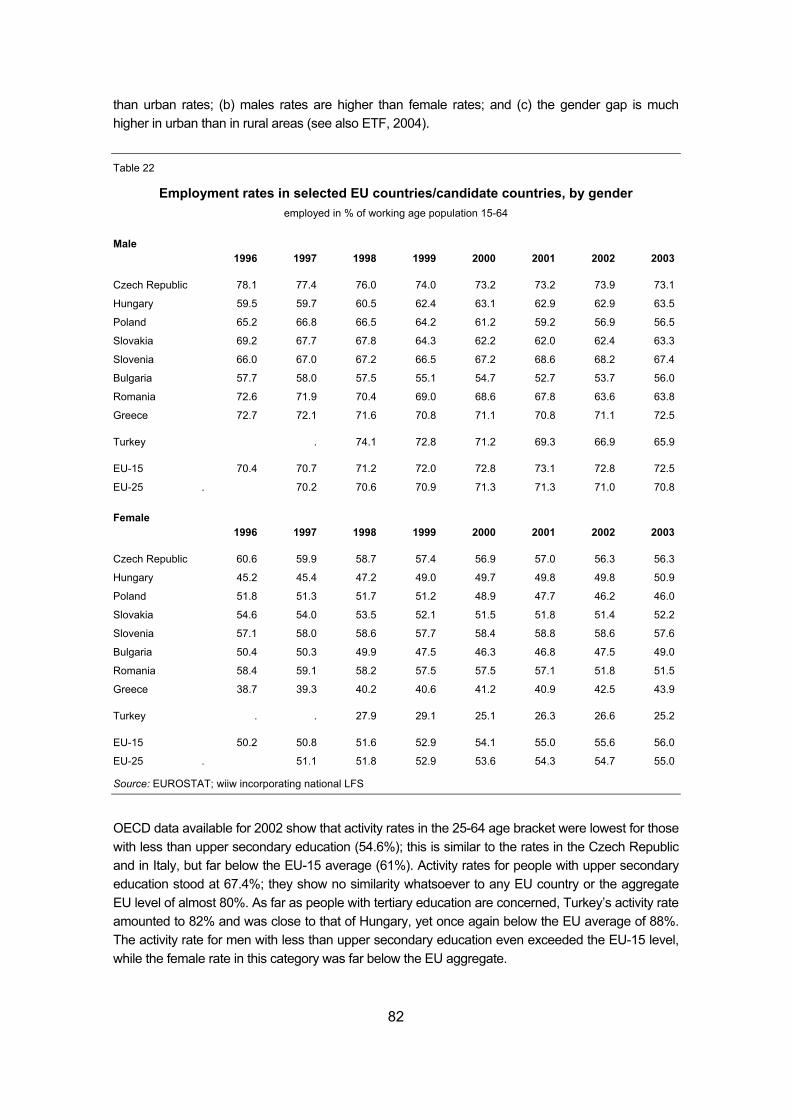
82
than urban rates; (b) males rates are higher than female rates; and (c) the gender gap is much higher in urban than in rural areas (see also ETF, 2004).
Table 22
Employment rates in selected EU countries/candidate countries, by gender employed in % of working age population 15-64
Male 1996 1997 1998 1999 2000 2001 2002 2003
Czech Republic 78.1 77.4 76.0 74.0 73.2 73.2 73.9 73.1
Hungary 59.5 59.7 60.5 62.4 63.1 62.9 62.9 63.5
Poland 65.2 66.8 66.5 64.2 61.2 59.2 56.9 56.5
Slovakia 69.2 67.7 67.8 64.3 62.2 62.0 62.4 63.3
Slovenia 66.0 67.0 67.2 66.5 67.2 68.6 68.2 67.4
Bulgaria 57.7 58.0 57.5 55.1 54.7 52.7 53.7 56.0
Romania 72.6 71.9 70.4 69.0 68.6 67.8 63.6 63.8
Greece 72.7 72.1 71.6 70.8 71.1 70.8 71.1 72.5
Turkey . 74.1 72.8 71.2 69.3 66.9 65.9
EU-15 70.4 70.7 71.2 72.0 72.8 73.1 72.8 72.5
EU-25 . 70.2 70.6 70.9 71.3 71.3 71.0 70.8
Female 1996 1997 1998 1999 2000 2001 2002 2003
Czech Republic 60.6 59.9 58.7 57.4 56.9 57.0 56.3 56.3
Hungary 45.2 45.4 47.2 49.0 49.7 49.8 49.8 50.9
Poland 51.8 51.3 51.7 51.2 48.9 47.7 46.2 46.0
Slovakia 54.6 54.0 53.5 52.1 51.5 51.8 51.4 52.2
Slovenia 57.1 58.0 58.6 57.7 58.4 58.8 58.6 57.6
Bulgaria 50.4 50.3 49.9 47.5 46.3 46.8 47.5 49.0
Romania 58.4 59.1 58.2 57.5 57.5 57.1 51.8 51.5
Greece 38.7 39.3 40.2 40.6 41.2 40.9 42.5 43.9
Turkey . . 27.9 29.1 25.1 26.3 26.6 25.2
EU-15 50.2 50.8 51.6 52.9 54.1 55.0 55.6 56.0
EU-25 . 51.1 51.8 52.9 53.6 54.3 54.7 55.0
Source: EUROSTAT; wiiw incorporating national LFS
OECD data available for 2002 show that activity rates in the 25-64 age bracket were lowest for those with less than upper secondary education (54.6%); this is similar to the rates in the Czech Republic and in Italy, but far below the EU-15 average (61%). Activity rates for people with upper secondary education stood at 67.4%; they show no similarity whatsoever to any EU country or the aggregate EU level of almost 80%. As far as people with tertiary education are concerned, Turkey’s activity rate amounted to 82% and was close to that of Hungary, yet once again below the EU average of 88%. The activity rate for men with less than upper secondary education even exceeded the EU-15 level, while the female rate in this category was far below the EU aggregate.
83
The falling activity rates in Turkey can be explained in several different ways (see Auer and Popova, 2003; Tansel, 2001): First, young people are staying at school longer (increasing the school enrolment rate) pursuant to law introduced in 1997 extending compulsory schooling from five to eight years. (In the long run, this measure may well have positive effects on the increase in overall activity rates, in particular for women). Secondly, the composition of the labour force is changing, shifting from agriculture to non-agricultural activities (in general both female and male activity rates are higher in rural than in urban areas). When women from rural areas – previously economically active as unpaid family worker in agriculture – migrate to industrial centres, they often leave the labour market and stay at home, as most of them lack the skills needed to find a new job. Thirdly, up until 2001 an early retirement scheme dating from the early 1980s was still in effect, whereby women were eligible for retirement after 20 years of service or at the age of 50, whereas men could retire after 25 years of service or at the age of 55. Low share of part-time work
Similar to the situation in the new EU member states, part-time work is less common in Turkey than in the EU-15. In 2003 part-time work accounted for 6% of total employment as against roughly 19% in the EU-15. Turkey has a higher proportion of part-time employed than the Czech Republic, Greece, Hungary, Slovakia and Bulgaria, but only half of that in Romania. Overall, Turkey resembles the EU-South more closely, where part-time employment also plays a subordinate role. The reasons for this trend are: (a) the low proportion of women in the labour force; and (b) the underdeveloped services sector in Turkey. For instance, in the EU-15 part-time employment is found primarily in health care, education and other services sectors (tourism and retailing). Within the EU-15 those countries with the largest services sector have the highest proportion of part-time work. Employment structure well below European standards
According to data in the labour force surveys, in 1990 agriculture accounted for 46% of all those employed, industry for 15%, construction for 5% and services for 35%.65 Despite shifts over time, employment patterns in Turkey are still far from those of a developed economy. Agriculture still plays an important function as an employer, absorbing about 34% of total employment or 7.2 million persons in 2003 (Figure 25). The EU-15 employs an agricultural workforce of a similar magnitude, whereas in the new EU member states about 6.7 million people are active in agriculture. From a gender perspective, agriculture accounted for 58.5% of total female employment, while only for 24.4% of male employment. Men were primarily engaged in services sector activities, whereas only a smaller proportion (28%) of women worked in the services sector. Industry absorbed about 20% of male and 13% of female employment. Given that agriculture accounts for 34% of all those employed and contributes about 14% to the country’s GDP, productivity in agriculture can be seen to be very low. About half of those employed in agriculture are unpaid family workers, of whom three quarters are women. As in other countries with a high proportion of their population employed in the primary sector, agriculture functions as a buffer against unemployment, absorbing laid-off workers from industry and construction. Similar to Poland and Romania, agriculture still masks unemployment.
65 The Census data for 1990 reveal a quite different picture; this might be attributable to the different definitions used in
the labour force survey and the Census: agriculture is thus reported as employing about 54% of the total labour force, industry 19% and services 28% (ETF, 2004).
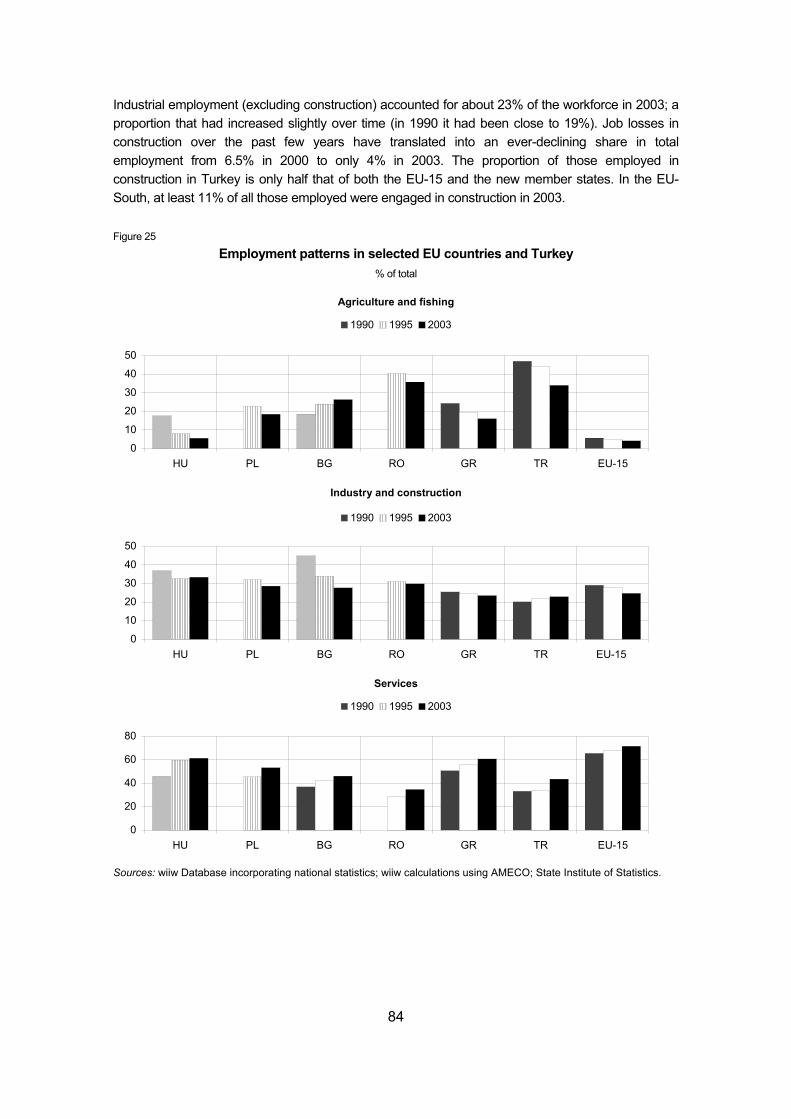
84
Industrial employment (excluding construction) accounted for about 23% of the workforce in 2003; a proportion that had increased slightly over time (in 1990 it had been close to 19%). Job losses in construction over the past few years have translated into an ever-declining share in total employment from 6.5% in 2000 to only 4% in 2003. The proportion of those employed in construction in Turkey is only half that of both the EU-15 and the new member states. In the EU-South, at least 11% of all those employed were engaged in construction in 2003. Figure 25
Employment patterns in selected EU countries and Turkey % of total
Agriculture and fishing
0
10
20
30
40
50
HU PL BG RO GR TR EU-15
1990 1995 2003
Industry and construction
0
10
20
30
40
50
HU PL BG RO GR TR EU-15
1990 1995 2003
Services
0
20
40
60
80
HU PL BG RO GR TR EU-15
1990 1995 2003
Sources: wiiw Database incorporating national statistics; wiiw calculations using AMECO; State Institute of Statistics.
85
With its 43% share in total employment, Turkey’s services sector employment comes close to that of Bulgaria and is well above Romania’s; however, it is still far below EU levels.66 In 2003 trade and tourism accounted for over 19% of total employment; this is higher than in the EU-15, yet somewhat below the EU-South.67 Employment in financial institutions [banking, insurance, real estate and business activities] is relatively underdeveloped, accounting for a meagre 3.5% of total employment; the corresponding value for the EU-South is some 9%. Turkey ranges somewhere between Bulgaria (4.8%) and Romania (2.6%). Employment in transport absorbs 4.5% of total jobs: once again below the level of the EU-South and similar to Romania. As for community services, Turkey reports an employment share similar in size to Romania, yet far below the EU average. A more detailed breakdown by individual sub-segments such as public administration, health and education is not available. Overall employment in the services sector is – as in other less developed countries – mainly concentrated in the low-skill/low value-added segments such as trade, tourism and transport, while employment in the high-skill segments is underdeveloped. Unemployment
Overall unemployment stood at an average rate of 8% in the 1990s, falling to 6.6% in 2000 and increasing steadily thereafter, reaching 10,5% in 2004. There is no significant difference in the incidence of unemployment between men and women at the national level. Over the past few years, female unemployment has been slightly lower than the male rate. However, when analysing unemployment account also has to be taken of the high proportion employed in the agricultural sector, thus masking a huge number of workers who would ‘normally’ be counted as unemployed. Urban unemployment is therefore considered to provide a better measure of the actual scale of unemployment. In 2003, the urban unemployment rate was 14.8%, much higher than the national average, while the rural rate was 6.5%. In 2003 unemployment in Turkey was higher than both in the EU-15 and EU-25, yet Turkey reported a significantly lower unemployment rate than did Poland and Bulgaria (Figure 26). In contrast to most of the new EU member states where long-term unemployment is persistently high and/or even increasing, the share of long-term unemployment in Turkey has been on the decline from 1996 onwards. It increased somewhat in 2002 only to drop again a year later to 24% of total unemployed. Women are affected more by long-term unemployment than are men. In 2003, the share of long-term unemployment was 31% for women as against only 22% for men. Overall, the incidence of long-term unemployment for males and females alike has dropped over time.
66 In 2003 services sector employment in the EU-15 accounted for 67%, in the EU-South for 59%, and in the new
member states in Central and Eastern Europe (excluding Poland) 57%. Romania’s share was 33%. 67 EU-South: Greece, Portugal and Spain.
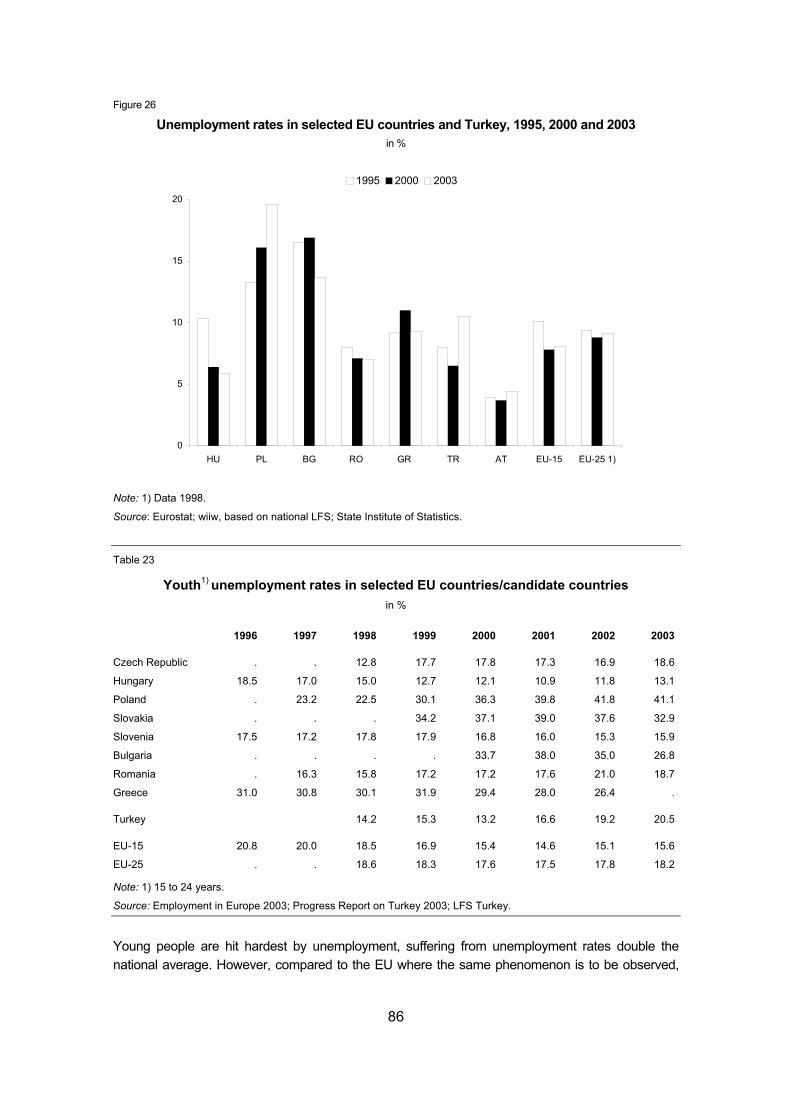
86
Figure 26
Unemployment rates in selected EU countries and Turkey, 1995, 2000 and 2003 in %
0
5
10
15
20
HU PL BG RO GR TR AT EU-15 EU-25 1)
1995 2000 2003
Note: 1) Data 1998.
Source: Eurostat; wiiw, based on national LFS; State Institute of Statistics.
Table 23
Youth1) unemployment rates in selected EU countries/candidate countries in %
1996 1997 1998 1999 2000 2001 2002 2003
Czech Republic . . 12.8 17.7 17.8 17.3 16.9 18.6
Hungary 18.5 17.0 15.0 12.7 12.1 10.9 11.8 13.1
Poland . 23.2 22.5 30.1 36.3 39.8 41.8 41.1
Slovakia . . . 34.2 37.1 39.0 37.6 32.9
Slovenia 17.5 17.2 17.8 17.9 16.8 16.0 15.3 15.9
Bulgaria . . . . 33.7 38.0 35.0 26.8
Romania . 16.3 15.8 17.2 17.2 17.6 21.0 18.7
Greece 31.0 30.8 30.1 31.9 29.4 28.0 26.4 .
Turkey 14.2 15.3 13.2 16.6 19.2 20.5
EU-15 20.8 20.0 18.5 16.9 15.4 14.6 15.1 15.6
EU-25 . . 18.6 18.3 17.6 17.5 17.8 18.2
Note: 1) 15 to 24 years.
Source: Employment in Europe 2003; Progress Report on Turkey 2003; LFS Turkey.
Young people are hit hardest by unemployment, suffering from unemployment rates double the national average. However, compared to the EU where the same phenomenon is to be observed,
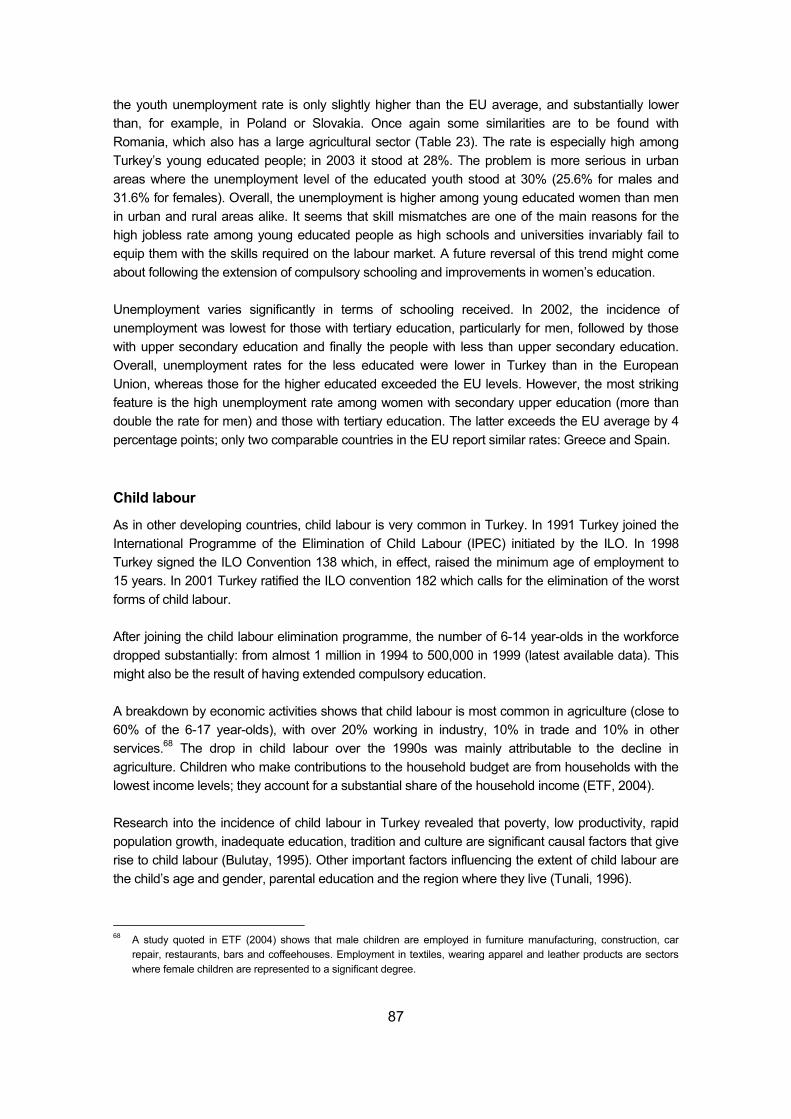
87
the youth unemployment rate is only slightly higher than the EU average, and substantially lower than, for example, in Poland or Slovakia. Once again some similarities are to be found with Romania, which also has a large agricultural sector (Table 23). The rate is especially high among Turkey’s young educated people; in 2003 it stood at 28%. The problem is more serious in urban areas where the unemployment level of the educated youth stood at 30% (25.6% for males and 31.6% for females). Overall, the unemployment is higher among young educated women than men in urban and rural areas alike. It seems that skill mismatches are one of the main reasons for the high jobless rate among young educated people as high schools and universities invariably fail to equip them with the skills required on the labour market. A future reversal of this trend might come about following the extension of compulsory schooling and improvements in women’s education. Unemployment varies significantly in terms of schooling received. In 2002, the incidence of unemployment was lowest for those with tertiary education, particularly for men, followed by those with upper secondary education and finally the people with less than upper secondary education. Overall, unemployment rates for the less educated were lower in Turkey than in the European Union, whereas those for the higher educated exceeded the EU levels. However, the most striking feature is the high unemployment rate among women with secondary upper education (more than double the rate for men) and those with tertiary education. The latter exceeds the EU average by 4 percentage points; only two comparable countries in the EU report similar rates: Greece and Spain. Child labour
As in other developing countries, child labour is very common in Turkey. In 1991 Turkey joined the International Programme of the Elimination of Child Labour (IPEC) initiated by the ILO. In 1998 Turkey signed the ILO Convention 138 which, in effect, raised the minimum age of employment to 15 years. In 2001 Turkey ratified the ILO convention 182 which calls for the elimination of the worst forms of child labour. After joining the child labour elimination programme, the number of 6-14 year-olds in the workforce dropped substantially: from almost 1 million in 1994 to 500,000 in 1999 (latest available data). This might also be the result of having extended compulsory education. A breakdown by economic activities shows that child labour is most common in agriculture (close to 60% of the 6-17 year-olds), with over 20% working in industry, 10% in trade and 10% in other services.68 The drop in child labour over the 1990s was mainly attributable to the decline in agriculture. Children who make contributions to the household budget are from households with the lowest income levels; they account for a substantial share of the household income (ETF, 2004). Research into the incidence of child labour in Turkey revealed that poverty, low productivity, rapid population growth, inadequate education, tradition and culture are significant causal factors that give rise to child labour (Bulutay, 1995). Other important factors influencing the extent of child labour are the child’s age and gender, parental education and the region where they live (Tunali, 1996).
68 A study quoted in ETF (2004) shows that male children are employed in furniture manufacturing, construction, car
repair, restaurants, bars and coffeehouses. Employment in textiles, wearing apparel and leather products are sectors where female children are represented to a significant degree.
88
Migration
Large-scale labour migration from Turkey to Western Europe started in 1961, following an agreement concluded between Turkey and Western Germany. In the subsequent years, Turkey signed similar agreements with other West European countries such as Austria, Belgium, Netherlands, France and Sweden. Labour recruitment from Turkey ended with the oil crisis in 1973, but Turkish emigration to Europe continued throughout the 1980s and 1990s via family reunifications and people, particularly the Kurdish minority, seeking political asylum. According to Turkish estimates, the flow of emigrants due to family reunification has steadily decreased from 90,000 in 1996 to about 60,000 in 2001. Other emigrants from Turkey include those asylum seekers (mostly from Afghanistan, Iran and Iraq) who pass through Turkey en route to the European Union (OECD, 2004c). Today emigration from Turkey is almost negligible. According to ISKUR (Turkish Labour Organization) less than 10,000 workers went abroad in 2001 and about 15,000 halfway through 2002. In 2002 Turkish migrants went mostly to Saudi Arabia, the Russian Federation and Germany (ETF, 2004). In general, information on external migration is extremely limited for want of systematic data collection. Today about 3.2 million Turkish nationals live in the European Union, the bulk of whom (two thirds) are concentrated in Germany. Other important host-countries are the Benelux countries, France and Austria. Most of the immigrants are of rural origin. However, over the past few years migration has taken on a new aspect – an increase in the number of Turkish emigrants with professional qualifications and university degrees to Europe and the CIS countries (Kirişçi, 2003 and 2004). The OECD estimates that some 1,000 highly skilled and skilled workers as well as university graduates (mostly in the fields of information technology, finance and management) emigrate from Turkey each year. Since the early 1990s Turkey has witnessed a wave of irregular immigration comprising nationals from neighbouring countries and transitory migrants. People from Azerbaijan, Georgia, Iran, Moldova, the Ukraine, Russia and the Central Asian republics are permitted to enter the country quite freely. A large number of them are engaged in small-small-scale trade; others work illegally (having overstayed their visa or failed to get their visa renewed) as household helps or workers in the construction and tourism sectors. The number of illegal workers is estimated at 150,000 up to 1 million persons (Kirişçi, 2003). The OECD established that illegal migrants from Moldova, Romania, Ukraine and the Russian Federation are mainly employed in agriculture, construction or ‘domestic services’ (mostly Moldavian women). From the early 1960s remittances sent by Turkish migrants from abroad have represented an important source of foreign exchange earnings for the Turkish economy. Remittances to Turkey stood at USD 3.2 billion in 1990, peaking at USD 5.4 billion in 1998, only to drop again to USD 1.9 billion in 2002.
89
References
Akgöngür, Sedef (2003), ‘Exploring Regional Specialisations in Turkey's Manufacturing Industries’, paper prepared for the Regional Studies Association International Conference, Pisa, Italy, 12-15 April 2003 (http://www.regional-studies-assoc.ac.uk/events/pisa03/akgungor.pdf).
Akkoyunlu-Wigley, Arzu and Sevinc Mihci (2004), ‘Effects of the Customs Union with the European Union on the Market Structure and Pricing Behaviour in Turkish Manufacturing Industry’, paper prepared for the 6th European Trade Study Group Meeting in Nottingham, 9 September 2004 (http://www.etsg.org/ETSG2004/Papers/wigley.pdf).
Alper, Emre C. (2001), ‘The Turkish Liquidity Crisis in 2000 – What went wrong’, Russian and East European Finance and Trade, Vol. 37, No. 6, November–December, pp. 58-80.
Amin, Samir (1990), ‘Maldevelopment: Anatomy of a Global Failure’, United Nations University (http://www.unu.edu/unupress/unupbooks/uu32me/uu32me03.htm)
Apap, Joanna, Sergio Carrera and Kemal Kirişci (2004), ‘Turkey in the EU Area of Freedom, Security and Justice’, Centre for European Policy Studies (CEPS), EU-Turkey Working Papers No. 3, August.
Auer, P. and N. Popova (2003), ‘Labour market policy for restructuring in Turkey: the need for more active policies’, Employment Paper 2003/51, ILO, Geneva.
Aydın, Senem and Keyman E. Fuat (2004), ‘European Integration and the Transformation of Turkish Democracy’, Centre for European Policy Studies (CEPS), EU-Turkey Working Papers No. 2, August.
Bakan, Ismail, Ismail Eraslan and Mehmet Sarac (2002), ‘Turkish vs Mexican Experience With Privatisation’, ERC/METU International Conference in Economics VI, 11-14 September 2002, Ankara, Turkey.
Baskın, Oran (2004), ‘Türkiye'de Azınlıklar: Kavramlar, Lozan, Iç Mevzuat, Içtihat, Uygulama’, TESEV Yayınları, June.
Bekmez, Selahattin and İsmail H. Genç (2002), ‘The Political Economy of Turkish-European Union Relations and the Macroeconomic Impact of Full Membership’, American Review of Political Economy, Vol. 1, No. 1, pp. 28-51.
Boratav, Korkut and Erinç Yeldan (2002), ‘Turkey 1980-2000: Financial Liberalization, Macroeconomic (In)Stability, and Patterns of Distribution’, manuscript.
Böttcher, Barbara (2004), ‘Türkei: EU-Beitritt der Türkei – der Weg ist das Ziel’, Deutsche Bank Research, EU-Monitor No. 18, 24 August.
Bougheas, Spiros, Paul Mizen and Cihan Yalçın (2004), ‘Access to external finance: Theory and evidence on the impact of firm-specific characteristics’, Central Bank of the Republic of Turkey, Research Department Working Paper No. 04/06.
Bulutay, T. (1995), Child labour in Turkey, ILO and SIS, Ankara.
Çağla, Okten and Ann Peren (2003), ‘How Does Privatization Affect Efficiency, Productivity and Technology Choice? Evidence from Turkey’, International Conference on Policy Modelling, 3-5 July 2003, İstanbul.
Cevik, Serhan (2004), ‘Turkey: Productivity-Led Growth’, Stanley Morgan, 5 May.
Cevik, Serhan (2005), ‘Turkey: Noah Built the Boat Before the Rain’, Stanley Morgan, 3 February.
Cihan News (2004), ‘Foreign Banks Lending 500 Million Dollars To Turkish Akbank’, 4 August, http://www.turkishpress
DEİK – Dış Ekonomik ilişkiler kurulu (2004a), Iran Ülke Bülteni, July.
DEİK – Dış Ekonomik ilişkiler kurulu (2004b), Güneydoğu Avrupa Ülkelerinde Yabancı Yatırım Eğilimleri, July.
90
Der Standard (2004), ‘Wie groß ist klein und mittel?’, 3 October.
De Santis, R. A. (2003), ‘The impact of a Customs Union with the European Union on Internal Migration in Turkey’, Journal of Regional Science, Vol. 43, No. 2 , pp. 349-372.
Derviş, Kemal, Daniel Gros, Faik Öztrak and Yusuf Işık in cooperation with Fırat Bayarand (2004), ‘Turkey and the EU Budget: Prospects and Issues’, Centre for European Policy Studies (CEPS), EU-Turkey Working Papers No. 6, August.
Derviş, Kemal, Daniel Gros, Faik Öztrak, Fırat Bayarand and Yusuf Işık (2004a), ‘Relative Income Growth and Convergence’, Centre for European Policy Studies (CEPS), EU-Turkey Working Papers No. 8, September.
Derviş, Kemal, Daniel Gros, Faik Öztrak, Fırat Bayarand and Yusuf Işık (2004/b), ‘Stabilising Stabilisation’, Centre for European Policy Studies (CEPS), EU-Turkey Working Papers No. 7, September.
Dibooglu, Sel and Aykut Kibritçioğlu (2004), ‘Inflation, output growth, and stabilization in Turkey, 1980-2002’, Journal of Economics & Business 56, pp. 43-61.
Die Zeit (2004), ‘Made in Turkey’, 22 January.
Duman, Anil, Hakki C. Erein and Fatma G. Ünal (2005), ‘The Determinants of Capital Flight in Turkey, 1971-2000’, in: Gerald Epstein (ed.), Capital Flight and Capital Controls in Developing Countries, Edward Elgar Publ., forthcoming.
Ecoi.net (2004), ‘Internal Flight Alternative’, European Country of Origin Information Network (Ecoi.net), download 17 October.
Economic Policy Committee (2004), ‘The structural challenges facing the candidate countries (Bulgaria, Romania, Turkey). A comparative perspective’, Brussels, 26 August.
Effenberger, Dirk (2003), ‘Frühwarnindikatoren für Währungskrisen’, Berliner Beiträge zur Internationalen Wirtschaftspolitik, Band 1, Weißensee Verlag Berlin.
Ekinci, Nazim K. and Korkut Ertürk (2004), ‘Turkish Currency Crisis of 2000-1, Revisited’, CEPA Working Paper 2004-1.
Emerson, Michael and Nathalie Tocci (2004), ‘Turkey as a Bridgehead and Spearhead: Integrating EU and Turkish Foreign Policy’, Centre for European Policy Studies (CEPS), EU-Turkey Working Papers No. 1, August.
Energy Information Administration EIA (2004), Turkey, May, http://www.eia.doe.gov/
Ercan, H. (2004), ‘Quarterly labour market report’, prepared for the European Employment Observatory, October.
Erkilek, Asim (2003), ‘A comparative analysis of inward and outward FDI in Turkey’, UNCTAD, Transnational Corporations, Vol. 12, No. 3, December.
European Commission (2003), ‘Employment in Europe 2003’, Directorate-General for Employment and Social Affairs, Brussels.
EU Commission (2004), ‘2004 Regular Report on Turkey's Progress towards Accession’, Brussels, 6 October, http://europa.eu.int/comm/enlargement/report_2004/pdf/rr_tr_2004_en.pdf
European Commission (2005), ‘Draft Joint Employment Report 2004/2005’, Brussels, 16 January.
European Round Table of Industrialists (2004), ‘Turkey – A new corporate world for Europe’, published on behalf of the Turkish-EU Enlargement Council, written and researched by IBS Research & Consultancy.
European Training Foundation ETF (2003), ‘Background Study on Labour Market and Employment in Turkey’, Torino.
FitchRatings (2005), January, www.fitchratings.com/corporate/reports/report_frame.cfm?rpt_id=233322
91
Flam, Harry (2004), ‘Turkey and the EU: Politics and Economics of Accession’, CES ifo Economic Studies, Vol. 50, No. 1, pp. 171-210.
Francois, Joseph (2003), ‘Accession of Turkey to the EU: Implications for the Transport Sector’, paper prepared for the World Bank conference on Turkish Accession to the WTO in Ankara, May 2003.
Gaygısız, Esma and Miyase Yeşim Köksal (2003), ‘Regional Variation In New Firm Formation In Turkey: Cross Section and Panel Data Evidence’, Economic Research Centre ERC, Working Papers in Economics 03/08, September.
Gligorov, Vladimir, Josef Pöschl, Sándor Richter et al. (2004), ‘As East You Go, the More They Grow: Transition Economies in a New Setting’, wiiw Research Reports, No. 308, The Vienna Institute for International Economic Studies (wiiw), July.
Gunduz, Necmi and Selami Sezgin (2004), ‘Economic Consequences of Armed Conflict in South Eastern Turkey’, Department of Economics, Pamukkale University, Denizli, Turkey, 4 March (http://www.wider.unu.edu/conference/conference-2004-1/conference%202004-1-papers/Gunduz-Sezgin-0403.pdf).
Gür, Mehmet, Volkan Cagdas and Hülya Demir (2003), ‘Urban-Rural Interrelationship and Issues in Turkey’, paper prepared for the 2nd FIG Conference, Marrakech, Morocco, 2-5 December 2003.
Hughes, Kirsty (2004), ‘Turkey and the European Union: Just Another Enlargement? Exploring the Implications of Turkish Accession’, A Friends of Europe Working Paper, June.
Human Rights Watch (2005), ‘”Still Critical” Prospects in 2005 for Internally Displaced Kurds in Turkey’, Vol. 17, March, downloadable from European Country of Origin Network (http://www.ecoi.net/).
Hutchison, Michael M. and Ilan Neuberger (2002), ‘How bad are twins? Output costs of currency and banking crises’, Federal Reserve Bank of San Francisco, Pacific Basin working paper series PB02-02, January.
IFC (2002), ‘IFC Boots Turkey's Banking Sector With $44 Million Loan Facility to Leading Bank’, IFC Press Release, 31 October.
IMF (2004), Turkey – Seventh Review under the Stand-By Arrangement, International Monetary Fund, 2 April.
Independent Commission on Turkey (2004), ‘Turkey in Europe: More than a Promise?’, 6 September (http://www.independentcommissiononturkey.org/pdfs/english.pdf).
Iyigün, Murat and Dani Rodrik (2004), ‘On the Efficacy of Reforms: Policy Tinkering, Institutional Change and Entrepreneurship’, CEPR Discussion Paper No. 4399, June.
Jaeger, Markus (2004), ‘Reif für Beitrittsverhandlungen?’, Deutsche Bank Research, EU-Monitor No. 18, 24 August.
Jaeger, Markus (2005), ‘Turkey 2020: On course for convergence’, Deutsche Bank Research, Current Issues, 12 January.
Karagöl, Erdal and Selami Sezgin (2003), ‘Do Defence Expenditures Increase Debt Rescheduling in Turkey? Probit Model’, paper prepared for the METU Conference in Economics VII, 6-9 September 2003, Ankara, Turkey.
Keyder, Nur (2003a), A Note on the Debt Sustainability Issue In Turkey, Economic Research Centre ERC, March.
Keyder, Nur (2003b), Debt Sustainability and the Exchange Rate: The Case of Turkey, Economic Research Centre ERC, June.
Kibritçioğlu, Aykut (2000), ‘EMU, EURO and EU-Membership: An Evaluation from the Turkish Macroeconomic Perspective (November 1998)’, first published in SBFTM-14/98, revised version May 2000.
92
Kibritçioğlu, Aykut (2003), ‘Monitoring Banking Sector Fragility’, Arab Bank Review, 5/2, pp. 51-66.
Kibritçioğlu, Aykut (2004), ‘A Short Review of the Long History of Turkish High Inflation’, manuscript, April, http://politics.ankara.edu.tr/
Kibritçioğlu, Aykut and Bengi Kirbritcioglu (2004), ‘Türkiye'de uzun-dönem reel döviz kuru dengesizligi 1987-2003’, T.C. Basbakanlik Hazine Müstesarligi, Research Paper No. 38, April.
Kibritçioğlu, Aykut, Libby Rittenberg and Faruk Selcuk (eds.) (2002), Inflation and Disinflation in Turkey, Ashgate Publishing.
Kirişçi, Kemal (2004), ‘Reconciling refugee protection with efforts to combat irregular migration: the case of Turkey and the EU’, Global migration perspectives, No. 11, Global Commission on International Migration, Geneva, Switzerland, October.
Kirişçi, Kemal (2003), ‘Turkey: A Transformation from Emigration to Immigration’, Centre for European Studies, Bogazici University, November.
Kotios, Angelos and George Petrakos (2003), ‘The industrial and trade structure of the Greek and Turkish Economies: Possibilities for cooperation’, University of Thessaly, Department of Planning and Regional Development, Discussion Paper No. 9, March.
Krieger, Eugen (2004), ‘Fragile EU-Perspektiven der Türkei seit den 1960er Jahren’, Europainstitut Basel, paper presented at the SGTMOIK/SSMOCI conference in Basel, 14-16 October 2004.
Kubicek, Paul (2004), ‘Turkish Accession to the EU in Comparative Perspective’, St Antony's College Oxford, Occasional Paper No. 1.
Lall, Sanjaya (2002), ‘Turkish Performance in Exporting Manufactures: A Comparative Structural Analysis’, QEH Working Paper Series, No. 47, August.
Lejour, A. M., R. A. de Mooij and C. H. Capel (2004), ‘Assessing the economic implications of Turkish accession to the EU’, CPB Document No. 56, CPB Netherlands Bureau for Economic Policy Analysis, The Hague, March.
Liberale Türkisch-Deutsche Vereinigung (2004), Türkei – Europäische Union, ein Positionspapier, 5 September, http://ltd-ev.de.
Lohrmann, Astrid-Marina (2000a), ‘On Turkey's Export Performance – A Decomposed Market Share Analysis’, Russian and East European Finance and Trade, Vol. 36, No. 4, pp. 80-90.
Lohrmann, Astrid-Marina (2000b), ‘Developments Effects of the Customs Union Between Turkey and the European Union – Catching-Up or the Heckscher-Ohlin Trap?’, Russian and East European Finance and Trade, Vol. 36, No. 4, pp. 26-44.
Lohrmann, Astrid-Marina (2002), ‘A Dynamic Analysis of Turkey's Trade with the European Union in the 1990s’, Russian and East European Finance and Trade, Vol. 38, No. 2, pp. 44-58.
Mahcupyan, Etyen (2004), Türkiye'de Gayrimüslim Cemaatlerin SorunlarI ve Vatandas Olamama Durumu Üzerine, TESEV, June.
Mardas, Dimitri and Thomas Moutos (2002), ‘The EU-Turkey Customs Union and Greece: Who is the loser?’, IAER, Vol. 8, No. 4, pp. 275-288.
Neyer, Gerda (2003), Family policies and low fertility in Western Europe, Max-Planck-Institute for Demographic Research, Working Paper 2003 – 021, July 2003
Nordas, Hildegunn Kyvik (2004), ‘The Global Textile and Clothing Industry post the Agreement on Textiles and Clothing’, WTO Discussion Paper No. 5.
OECD (2004a), Turkey, OECD Economic Survey, Organisation for Economic Development, Paris, 21 October.
93
OECD (2004b), Small and Medium-Sized Enterprises in Turkey, Organisation for Economic Development, Paris.
OECD (2004c), Trends in International Migration, SOPEMI, Annual Report, 2003 Edition, Organisation for Economic Development, Paris.
Ögüt, Menevis U. and R. Funda Barbaros (2003), ‘Regional Development Inequalities in Turkey: An Assessment on the Distribution of Investment Incentives’, METU Conference in Economics, Ankara, 6-9 September 2003.
Öniş, Z. and E. Alper (2002), ‘Soft Budget Constraints, Government Ownership of Banks and Regulatory Failure: The Political Economy of the Turkish Banking System in the Post-Capital Account Liberalization Era’, Boğaziçi University, ISS Working Paper, No. 02-02.
Oral, Necdet (2004), ‘Tekellerin Tarimda Özellestirme Vurgunlari’, www.sendika.org, 10 September 2004.
Özdemir, K. Azim (2004), ‘Public Debt in Turkey’, The Central Bank of the Republic of Turkey, Research Department Working Paper No. 04/11.
Özler, Sule (2004), ‘Does foreign ownership matter for survival and growth? Dynamics of competition and foreign direct investment’, ERC Working Paper 04/06, March.
Pınar, Abuzer and Güven Sak (2003), ‘The problem with publicly owned banks in Turkey: the story of duty losses and thereafter’, Ankara University and Central Bank of the Republic of Turkey, August.
Porter, Michael E. (2004), Global Competitiveness Report 2004-2005: Findings from the Business Competitiveness Index, Harvard Business School, October.
Profil (2004), ‘Start zum Halbmond’, No. 39, 20 September.
Quaisser, Wolfgang and Alexandra Reppegather (2004), ‘EU-Beitrittsreife der Türkei und Konsequenzen einer EU-Mitgliedschaft’, Working Paper No. 252, Osteuropa-Institut München, January.
Quaisser, Wolfgang and Steve Wood (2004), ‘EU Member Turkey? Preconditions, Consequences and Integration Alternatives’, Forost Arbeitspapier No. 25, October.
Quijano-Evans, Simon (2004), ‘Turkey – a major leap forward’, Turkey Country Analysis, EEMEA Markets Research, Bank Austria Creditanstalt, 21 October.
Rubin, Michael (2005), ‘Green Money. Islamist Politics in Turkey’, Middle East Quarterly, Winter.
Saraçoğlu, Dirdane S. (2003), ‘On the Size and the Evaluation of the Informal Sector in Developing Countries: The Case of Turkey’, paper prepared for the International Conference on Policy Modelling, İstanbul, 3-5 July 2003.
Saracoğlu, Şirin and Terry L. Roe (2004), ‘Rural-urban migration and economic growth in developing countries’, Department of Economics METU ([email protected]), Ankara and University of Minnesota, April.
Schäfer, Louisa (2004), ‘First Civilian as Head of National Security Council’, Deutsche Welle, 18 August.
Schweizerische Flüchtlingshilfe (2003), ‘Asylsuchende aus der Türkei’, 6 November.
Selçuk, Faruk and Oya P. Ardıç (2004), ‘Learning to Live with the Float: Turkey's Experience 2001-2003’, in: F. Columbus (ed.), Contemporary Issues in International Finance, Nova Science Pub., NY, forthcoming.
Sözen, Ahmet and Veysel Ulusoy (2003), ‘The Opportunity Cost of Customs Union: The Case of Turkey Establishing Customs Union with the European Union’, paper prepared for the 2003 Annual Conference of the International Studies Association in Portland, Oregon.
Spoor, Max (ed.) (2004), Globalisation, Poverty and Conflict – A Critical ‘Development’ Reader, Dordrecht, Boston and London.
94
Standard and Poor's (2004), Ratings Direct, 19 August 2004, http://www.securitization.net/pdf/sp/Turkey_Various_Ratings_19Aug04.pdf
Stankovsky Jan and Yvonne Wolfmayr (2004), ‘Potential Markets for Austrian Exports’, Austrian Economic Quarterly 3/2004, Austrian Institute of Economic Research (WIFO), Vienna, pp. 115-126.
Steinherr, Alfred, Ali Tukel and Murat Ucer (2004), ‘The Turkish Banking Sector: Challenges and Outlook in Transition to EU Membership’, EU-Turkey Working Papers, No. 4, Centre for European Policy Studies (CEPS), August.
Swiss Export Risk Guarantee (2004), ‘Turkey: List of banks as of 13 July 2004’, http://www.swiss-erg.com.
T. R. Prime Ministry State Planning Organization (2003), Industrial Policy for Turkey (Towards EU Membership), August.
Tamer, Meral (2004), ‘Soldaki kadin secmen, aktif siyasete ilgisiz’, Milliyet daily, 3 July.
Tansel, A. (2001), ‘Economic Development and Female Labour Force Participation in Turkey: Time-Series Evidence and Cross-Province Estimates’, Department of Economics, Middle East Technical University, Ankara, December.
The Banker – The International Islamic Finance Forum (2004), ‘Top 1000 World Banks’, 2 July, http://www.thebanker.com
The Economist (2004), ‘The impossibility of saying no’, Special Report on Turkey and the EU, 18 September.
Thompson, Edward, Berker Totan and Gordon Scott (2002), ‘Turkish Bank Capital Adequacy – Too Little, Too Late’, FitchRatings Special Report, 1 May.
Togan, Sübidey (2000), ‘Effects of a Turkey-European Union Customs Union and Prospects for the Future’, Russian and East European Finance and Trade, Vol. 36, No. 4, pp. 5-25.
Tunali, I. (1996), ‘Education and Work, Experiences of 6-14 Year Old Children in Turkey’, in: T. Bulutay, Education and Labour Market in Turkey, Ankara, pp. 106-143.
Turkish Banks.com, ‘Foreign Banks in Turkey’, http://www.turkishbanks.com
Turkish Foreign Trade Ministry (2004), ‘Turkey-EU Customs Union’, http://www.dtm.gov.tr/ab/ingilizce/gbnot.htm
TurkishPress, Babacan (2004), ‘Three-year Economic Program To Be Presented To E.U.’, 5 September, http://www.turkishpress.com/turkishpress/news.asp?ID=26273
Türkiye Bankalar Birligi, 6/9/2004 Tarihi İtibariyle Banka Bilgileri, List of Banks, http://www.tbb.org
Türkiye Vakıflar Bankası (2003), ‘Otomotiv Sektörü’, Sectör Arastirmalari Serisi, No 28.
Türkiye Vakıflar Bankası (2004), ‘Turism Sektörü’, Sectör Araştırmaları Serisi, No 30.
Ülgen, Sinan and Yiannis Zahariadis (2004), ‘The Future of Turkey-EU Trade Relations: Deepening vs Widening’, EU-Turkey Working Papers, No. 5, Centre for European Policy Studies (CEPS), August.
UN Population Division (2004), World Population Prospects: The 2002 Revision Population Database, http://es.un.org/unpp/p2k0data.asp, 1 September.
UNDP (2002), Human Development Report Turkey 2001.
UNHCR/ACCORD (2000), ‘Turkey Country Report’, 6th European Country of Origin Information Seminar, Vienna, 13-14 November 2000.
UNHCR (2005), ‘Niedrigste Zahl von Asylsuchenden seit 16 Jahren’, 2 March.
95
Vietor, Richard H. K. and Emily J. Thompson (2004), ‘Turkey: Securing Stability in a Rough Neighbourhood’, Harvard Business Online, 24 May.
World Bank (2003a), Turkey Country Economic Memorandum, Three Volumes, 28 July.
World Bank (2003b), ‘Country Assistance Strategy for Turkey’, Document of The World Bank, Report No. 26756 TU, 2 October.
Wyplosz, Charles (2001), ‘How Risky is Financial Liberalization in the Developing Countries?’, Contribution to a Group 24 Conference, Geneva, 14-15 September 2000; revised version January 2001.
Yabancı Sermaye Derneği YASED (2004), ‘The New Turkish Investment Environment’, http://www.yased.org.tr/
Yapı ve Kredi Bankası (2005), Monthy Bulletin, February.
Yeldan, Erinc (2004), ‘Macroeconomic Developments in Turkey 2003’, March 2004, http://www.bagimsizsosyalbilimciler.org
Yıldırım, Julide and Selami Sezgin (2002), ‘Defence, Education and Health Expenditures in Turkey 1924-96’, Journal of Peace Research, Vol. 39, No. 5.
Yilmaz, Bahri (2002), ‘Turkey's Competitiveness in the European Union – A Comparison with Greece, Portugal, Spain, and the EU/12/15’, Russian and East European Finance and Trade, Vol. 38, No. 3, pp. 54-72.
Yılmaz, Bahri (2003), ‘Turkey's Competitiveness in the European Union: A Comparison with Five Candidate Countries – Bulgaria, The Czech Republic, Hungary, Poland, Romania – and the EU15’, Ezoneplus Working Paper No. 12, February.
Yükseler, Zafer (2004), ‘Özel imalat sanayiinde verimlilik ve rekabet gücu göstergeleri’ (1997-2003), manuscript, 20 May.
Zeidan David (1995), The Alevi of Anatolia, December (http://www.angelfire.com/az/rescon/ALEVI.html).


97
A P P E N D I X
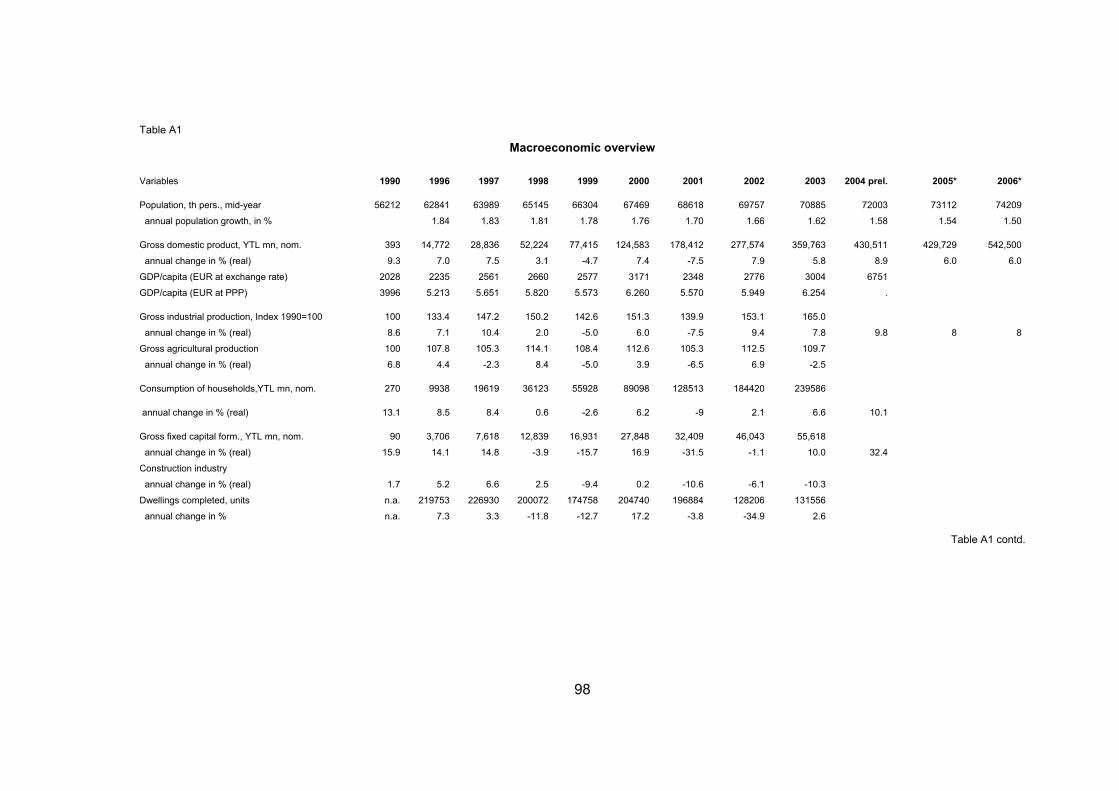
98
Table A1
Macroeconomic overview
Variables 1990 1996 1997 1998 1999 2000 2001 2002 2003 2004 prel. 2005* 2006*
Population, th pers., mid-year 56212 62841 63989 65145 66304 67469 68618 69757 70885 72003 73112 74209
annual population growth, in % 1.84 1.83 1.81 1.78 1.76 1.70 1.66 1.62 1.58 1.54 1.50
Gross domestic product, YTL mn, nom. 393 14,772 28,836 52,224 77,415 124,583 178,412 277,574 359,763 430,511 429,729 542,500
annual change in % (real) 9.3 7.0 7.5 3.1 -4.7 7.4 -7.5 7.9 5.8 8.9 6.0 6.0
GDP/capita (EUR at exchange rate) 2028 2235 2561 2660 2577 3171 2348 2776 3004 6751
GDP/capita (EUR at PPP) 3996 5.213 5.651 5.820 5.573 6.260 5.570 5.949 6.254 .
Gross industrial production, Index 1990=100 100 133.4 147.2 150.2 142.6 151.3 139.9 153.1 165.0
annual change in % (real) 8.6 7.1 10.4 2.0 -5.0 6.0 -7.5 9.4 7.8 9.8 8 8
Gross agricultural production 100 107.8 105.3 114.1 108.4 112.6 105.3 112.5 109.7
annual change in % (real) 6.8 4.4 -2.3 8.4 -5.0 3.9 -6.5 6.9 -2.5
Consumption of households,YTL mn, nom. 270 9938 19619 36123 55928 89098 128513 184420 239586
annual change in % (real) 13.1 8.5 8.4 0.6 -2.6 6.2 -9 2.1 6.6 10.1
Gross fixed capital form., YTL mn, nom. 90 3,706 7,618 12,839 16,931 27,848 32,409 46,043 55,618
annual change in % (real) 15.9 14.1 14.8 -3.9 -15.7 16.9 -31.5 -1.1 10.0 32.4
Construction industry
annual change in % (real) 1.7 5.2 6.6 2.5 -9.4 0.2 -10.6 -6.1 -10.3
Dwellings completed, units n.a. 219753 226930 200072 174758 204740 196884 128206 131556
annual change in % n.a. 7.3 3.3 -11.8 -12.7 17.2 -3.8 -34.9 2.6
Table A1 contd.
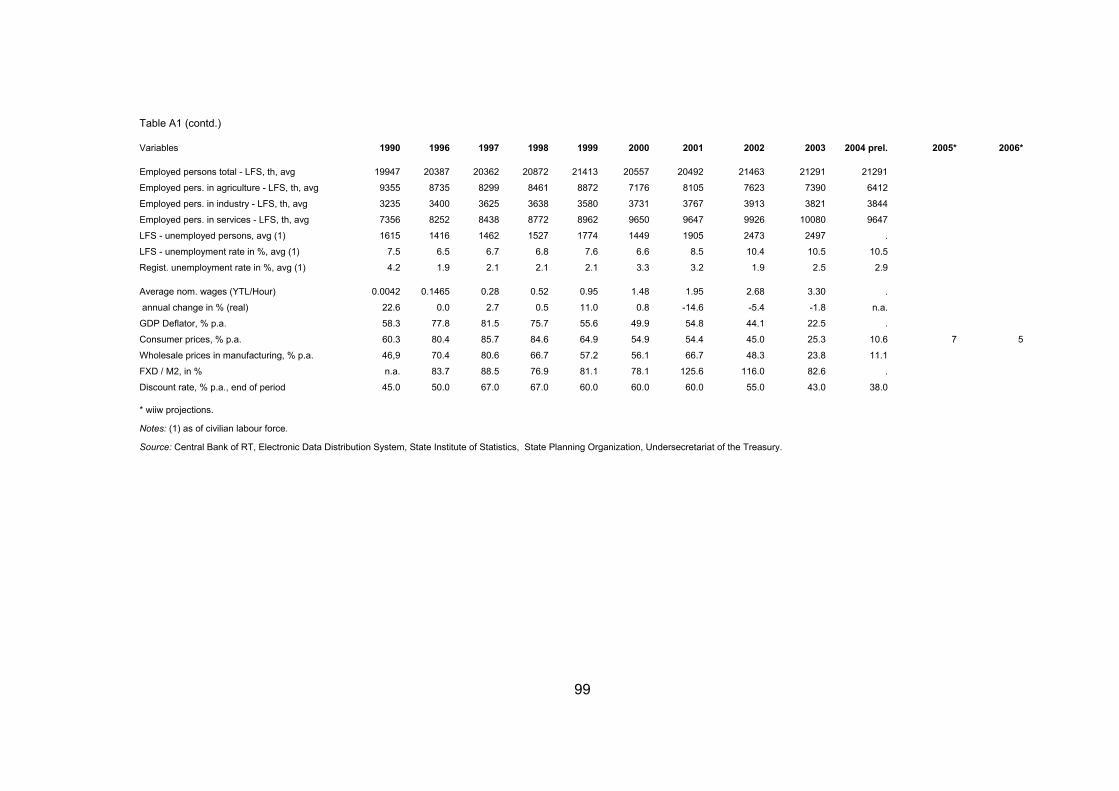
99
Table A1 (contd.)
Variables 1990 1996 1997 1998 1999 2000 2001 2002 2003 2004 prel. 2005* 2006*
Employed persons total - LFS, th, avg 19947 20387 20362 20872 21413 20557 20492 21463 21291 21291
Employed pers. in agriculture - LFS, th, avg 9355 8735 8299 8461 8872 7176 8105 7623 7390 6412
Employed pers. in industry - LFS, th, avg 3235 3400 3625 3638 3580 3731 3767 3913 3821 3844
Employed pers. in services - LFS, th, avg 7356 8252 8438 8772 8962 9650 9647 9926 10080 9647
LFS - unemployed persons, avg (1) 1615 1416 1462 1527 1774 1449 1905 2473 2497 .
LFS - unemployment rate in %, avg (1) 7.5 6.5 6.7 6.8 7.6 6.6 8.5 10.4 10.5 10.5
Regist. unemployment rate in %, avg (1) 4.2 1.9 2.1 2.1 2.1 3.3 3.2 1.9 2.5 2.9
Average nom. wages (YTL/Hour) 0.0042 0.1465 0.28 0.52 0.95 1.48 1.95 2.68 3.30 .
annual change in % (real) 22.6 0.0 2.7 0.5 11.0 0.8 -14.6 -5.4 -1.8 n.a.
GDP Deflator, % p.a. 58.3 77.8 81.5 75.7 55.6 49.9 54.8 44.1 22.5 .
Consumer prices, % p.a. 60.3 80.4 85.7 84.6 64.9 54.9 54.4 45.0 25.3 10.6 7 5
Wholesale prices in manufacturing, % p.a. 46,9 70.4 80.6 66.7 57.2 56.1 66.7 48.3 23.8 11.1
FXD / M2, in % n.a. 83.7 88.5 76.9 81.1 78.1 125.6 116.0 82.6 .
Discount rate, % p.a., end of period 45.0 50.0 67.0 67.0 60.0 60.0 60.0 55.0 43.0 38.0
* wiiw projections.
Notes: (1) as of civilian labour force.
Source: Central Bank of RT, Electronic Data Distribution System, State Institute of Statistics, State Planning Organization, Undersecretariat of the Treasury.
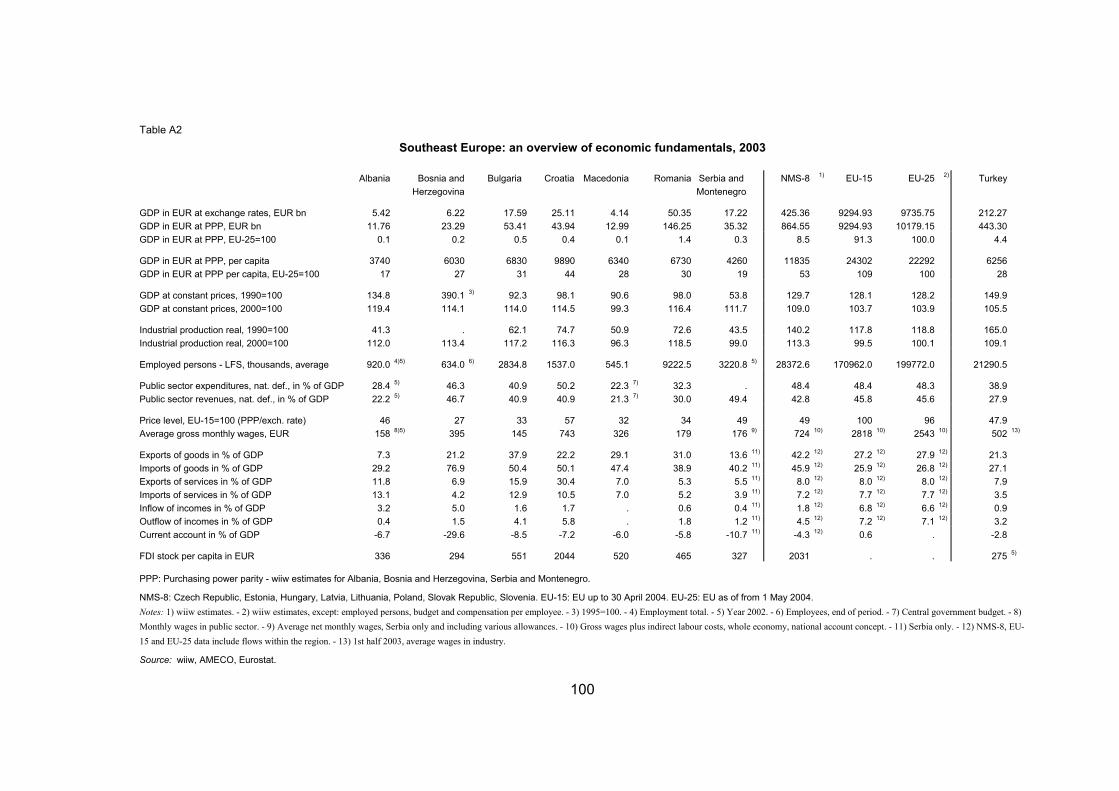
100
Table A2
Southeast Europe: an overview of economic fundamentals, 2003
Albania Bosnia and Herzegovina
Bulgaria Croatia Macedonia Romania Serbia and Montenegro
NMS-8 1) EU-15 EU-25 2) Turkey
GDP in EUR at exchange rates, EUR bn 5.42 6.22 17.59 25.11 4.14 50.35 17.22 425.36 9294.93 9735.75 212.27 GDP in EUR at PPP, EUR bn 11.76 23.29 53.41 43.94 12.99 146.25 35.32 864.55 9294.93 10179.15 443.30 GDP in EUR at PPP, EU-25=100 0.1 0.2 0.5 0.4 0.1 1.4 0.3 8.5 91.3 100.0 4.4
GDP in EUR at PPP, per capita 3740 6030 6830 9890 6340 6730 4260 11835 24302 22292 6256 GDP in EUR at PPP per capita, EU-25=100 17 27 31 44 28 30 19 53 109 100 28
GDP at constant prices, 1990=100 134.8 390.1 3) 92.3 98.1 90.6 98.0 53.8 129.7 128.1 128.2 149.9 GDP at constant prices, 2000=100 119.4 114.1 114.0 114.5 99.3 116.4 111.7 109.0 103.7 103.9 105.5
Industrial production real, 1990=100 41.3 . 62.1 74.7 50.9 72.6 43.5 140.2 117.8 118.8 165.0 Industrial production real, 2000=100 112.0 113.4 117.2 116.3 96.3 118.5 99.0 113.3 99.5 100.1 109.1
Employed persons - LFS, thousands, average 920.0 4)5) 634.0 6) 2834.8 1537.0 545.1 9222.5 3220.8 5) 28372.6 170962.0 199772.0 21290.5
Public sector expenditures, nat. def., in % of GDP 28.4 5) 46.3 40.9 50.2 22.3 7) 32.3 . 48.4 48.4 48.3 38.9 Public sector revenues, nat. def., in % of GDP 22.2 5) 46.7 40.9 40.9 21.3 7) 30.0 49.4 42.8 45.8 45.6 27.9
Price level, EU-15=100 (PPP/exch. rate) 46 27 33 57 32 34 49 49 100 96 47.9 Average gross monthly wages, EUR 158 8)5) 395 145 743 326 179 176 9) 724 10) 2818 10) 2543 10) 502 13)
Exports of goods in % of GDP 7.3 21.2 37.9 22.2 29.1 31.0 13.6 11) 42.2 12) 27.2 12) 27.9 12) 21.3 Imports of goods in % of GDP 29.2 76.9 50.4 50.1 47.4 38.9 40.2 11) 45.9 12) 25.9 12) 26.8 12) 27.1 Exports of services in % of GDP 11.8 6.9 15.9 30.4 7.0 5.3 5.5 11) 8.0 12) 8.0 12) 8.0 12) 7.9 Imports of services in % of GDP 13.1 4.2 12.9 10.5 7.0 5.2 3.9 11) 7.2 12) 7.7 12) 7.7 12) 3.5 Inflow of incomes in % of GDP 3.2 5.0 1.6 1.7 . 0.6 0.4 11) 1.8 12) 6.8 12) 6.6 12) 0.9 Outflow of incomes in % of GDP 0.4 1.5 4.1 5.8 . 1.8 1.2 11) 4.5 12) 7.2 12) 7.1 12) 3.2 Current account in % of GDP -6.7 -29.6 -8.5 -7.2 -6.0 -5.8 -10.7 11) -4.3 12) 0.6 . -2.8
FDI stock per capita in EUR 336 294 551 2044 520 465 327 2031 . . 275 5)
PPP: Purchasing power parity - wiiw estimates for Albania, Bosnia and Herzegovina, Serbia and Montenegro.
NMS-8: Czech Republic, Estonia, Hungary, Latvia, Lithuania, Poland, Slovak Republic, Slovenia. EU-15: EU up to 30 April 2004. EU-25: EU as of from 1 May 2004. Notes: 1) wiiw estimates. - 2) wiiw estimates, except: employed persons, budget and compensation per employee. - 3) 1995=100. - 4) Employment total. - 5) Year 2002. - 6) Employees, end of period. - 7) Central government budget. - 8) Monthly wages in public sector. - 9) Average net monthly wages, Serbia only and including various allowances. - 10) Gross wages plus indirect labour costs, whole economy, national account concept. - 11) Serbia only. - 12) NMS-8, EU-15 and EU-25 data include flows within the region. - 13) 1st half 2003, average wages in industry.
Source: wiiw, AMECO, Eurostat.
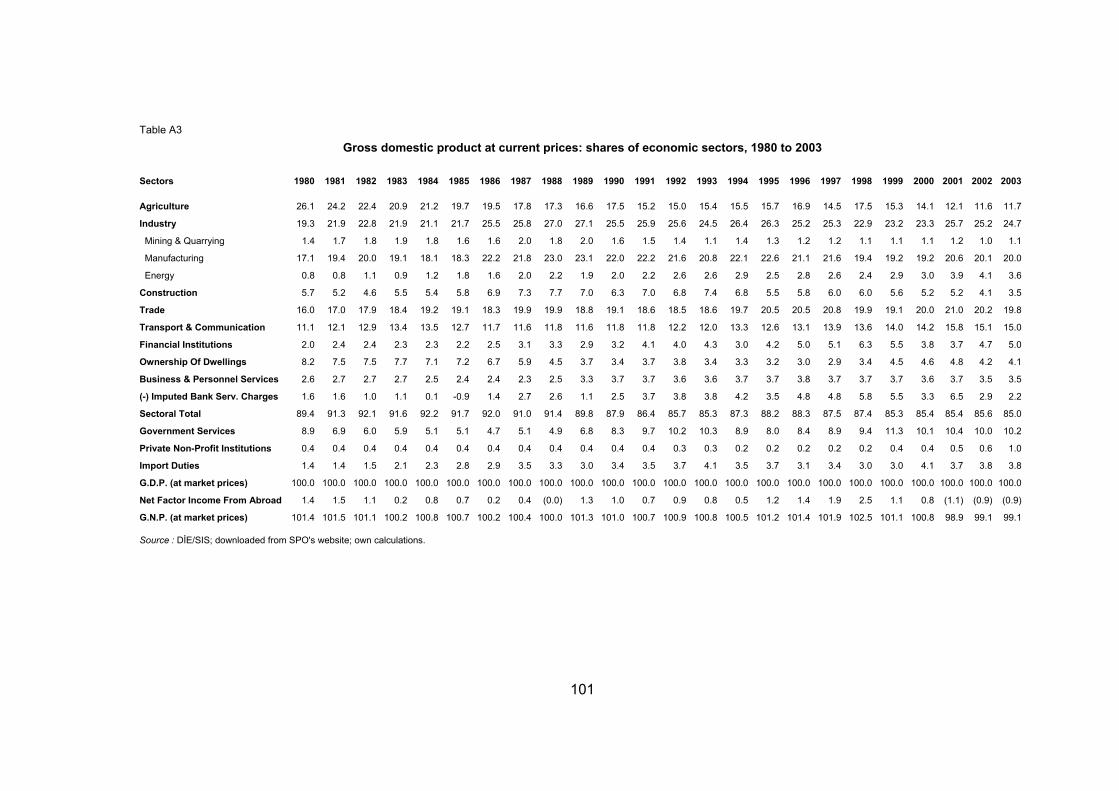
101
Table A3
Gross domestic product at current prices: shares of economic sectors, 1980 to 2003
Sectors 1980 1981 1982 1983 1984 1985 1986 1987 1988 1989 1990 1991 1992 1993 1994 1995 1996 1997 1998 1999 2000 2001 2002 2003
Agriculture 26.1 24.2 22.4 20.9 21.2 19.7 19.5 17.8 17.3 16.6 17.5 15.2 15.0 15.4 15.5 15.7 16.9 14.5 17.5 15.3 14.1 12.1 11.6 11.7
Industry 19.3 21.9 22.8 21.9 21.1 21.7 25.5 25.8 27.0 27.1 25.5 25.9 25.6 24.5 26.4 26.3 25.2 25.3 22.9 23.2 23.3 25.7 25.2 24.7
Mining & Quarrying 1.4 1.7 1.8 1.9 1.8 1.6 1.6 2.0 1.8 2.0 1.6 1.5 1.4 1.1 1.4 1.3 1.2 1.2 1.1 1.1 1.1 1.2 1.0 1.1
Manufacturing 17.1 19.4 20.0 19.1 18.1 18.3 22.2 21.8 23.0 23.1 22.0 22.2 21.6 20.8 22.1 22.6 21.1 21.6 19.4 19.2 19.2 20.6 20.1 20.0
Energy 0.8 0.8 1.1 0.9 1.2 1.8 1.6 2.0 2.2 1.9 2.0 2.2 2.6 2.6 2.9 2.5 2.8 2.6 2.4 2.9 3.0 3.9 4.1 3.6
Construction 5.7 5.2 4.6 5.5 5.4 5.8 6.9 7.3 7.7 7.0 6.3 7.0 6.8 7.4 6.8 5.5 5.8 6.0 6.0 5.6 5.2 5.2 4.1 3.5
Trade 16.0 17.0 17.9 18.4 19.2 19.1 18.3 19.9 19.9 18.8 19.1 18.6 18.5 18.6 19.7 20.5 20.5 20.8 19.9 19.1 20.0 21.0 20.2 19.8
Transport & Communication 11.1 12.1 12.9 13.4 13.5 12.7 11.7 11.6 11.8 11.6 11.8 11.8 12.2 12.0 13.3 12.6 13.1 13.9 13.6 14.0 14.2 15.8 15.1 15.0
Financial Institutions 2.0 2.4 2.4 2.3 2.3 2.2 2.5 3.1 3.3 2.9 3.2 4.1 4.0 4.3 3.0 4.2 5.0 5.1 6.3 5.5 3.8 3.7 4.7 5.0
Ownership Of Dwellings 8.2 7.5 7.5 7.7 7.1 7.2 6.7 5.9 4.5 3.7 3.4 3.7 3.8 3.4 3.3 3.2 3.0 2.9 3.4 4.5 4.6 4.8 4.2 4.1
Business & Personnel Services 2.6 2.7 2.7 2.7 2.5 2.4 2.4 2.3 2.5 3.3 3.7 3.7 3.6 3.6 3.7 3.7 3.8 3.7 3.7 3.7 3.6 3.7 3.5 3.5
(-) Imputed Bank Serv. Charges 1.6 1.6 1.0 1.1 0.1 -0.9 1.4 2.7 2.6 1.1 2.5 3.7 3.8 3.8 4.2 3.5 4.8 4.8 5.8 5.5 3.3 6.5 2.9 2.2
Sectoral Total 89.4 91.3 92.1 91.6 92.2 91.7 92.0 91.0 91.4 89.8 87.9 86.4 85.7 85.3 87.3 88.2 88.3 87.5 87.4 85.3 85.4 85.4 85.6 85.0
Government Services 8.9 6.9 6.0 5.9 5.1 5.1 4.7 5.1 4.9 6.8 8.3 9.7 10.2 10.3 8.9 8.0 8.4 8.9 9.4 11.3 10.1 10.4 10.0 10.2
Private Non-Profit Institutions 0.4 0.4 0.4 0.4 0.4 0.4 0.4 0.4 0.4 0.4 0.4 0.4 0.3 0.3 0.2 0.2 0.2 0.2 0.2 0.4 0.4 0.5 0.6 1.0
Import Duties 1.4 1.4 1.5 2.1 2.3 2.8 2.9 3.5 3.3 3.0 3.4 3.5 3.7 4.1 3.5 3.7 3.1 3.4 3.0 3.0 4.1 3.7 3.8 3.8
G.D.P. (at market prices) 100.0 100.0 100.0 100.0 100.0 100.0 100.0 100.0 100.0 100.0 100.0 100.0 100.0 100.0 100.0 100.0 100.0 100.0 100.0 100.0 100.0 100.0 100.0 100.0
Net Factor Income From Abroad 1.4 1.5 1.1 0.2 0.8 0.7 0.2 0.4 (0.0) 1.3 1.0 0.7 0.9 0.8 0.5 1.2 1.4 1.9 2.5 1.1 0.8 (1.1) (0.9) (0.9)
G.N.P. (at market prices) 101.4 101.5 101.1 100.2 100.8 100.7 100.2 100.4 100.0 101.3 101.0 100.7 100.9 100.8 100.5 101.2 101.4 101.9 102.5 101.1 100.8 98.9 99.1 99.1
Source : DİE/SIS; downloaded from SPO's website; own calculations.
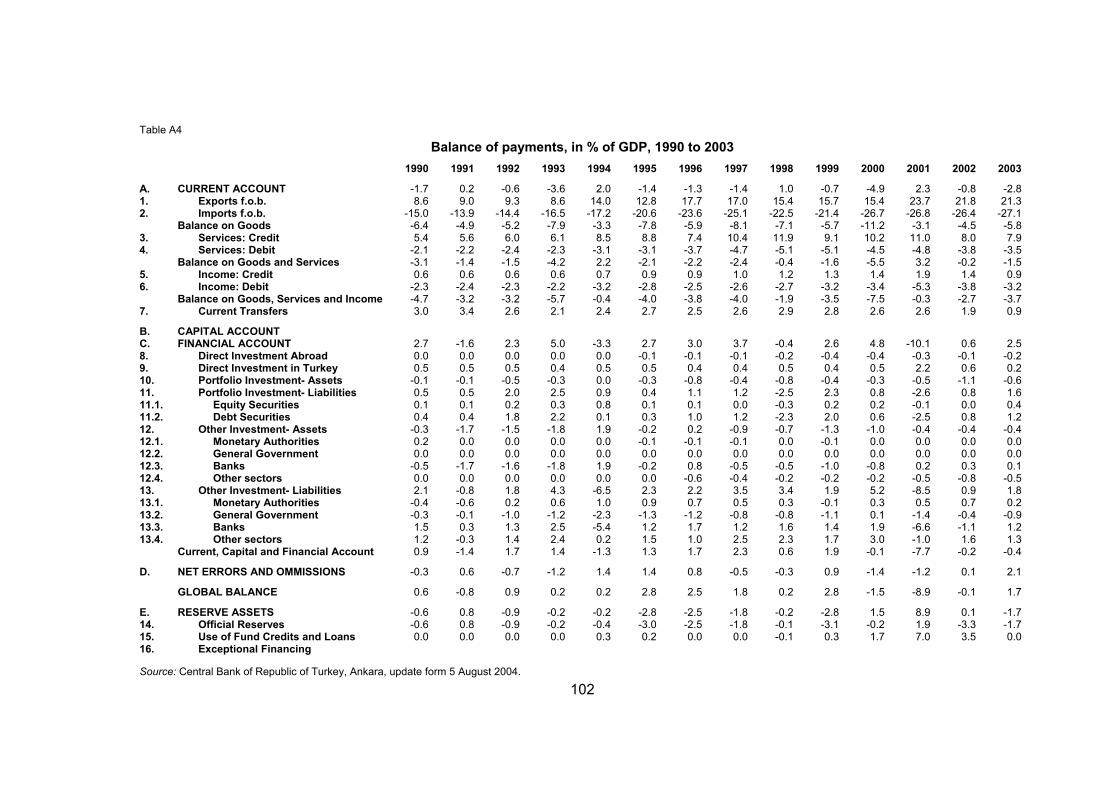
102
Table A4
Balance of payments, in % of GDP, 1990 to 2003 1990 1991 1992 1993 1994 1995 1996 1997 1998 1999 2000 2001 2002 2003
A. CURRENT ACCOUNT -1.7 0.2 -0.6 -3.6 2.0 -1.4 -1.3 -1.4 1.0 -0.7 -4.9 2.3 -0.8 -2.8 1. Exports f.o.b. 8.6 9.0 9.3 8.6 14.0 12.8 17.7 17.0 15.4 15.7 15.4 23.7 21.8 21.3 2. Imports f.o.b. -15.0 -13.9 -14.4 -16.5 -17.2 -20.6 -23.6 -25.1 -22.5 -21.4 -26.7 -26.8 -26.4 -27.1
Balance on Goods -6.4 -4.9 -5.2 -7.9 -3.3 -7.8 -5.9 -8.1 -7.1 -5.7 -11.2 -3.1 -4.5 -5.8 3. Services: Credit 5.4 5.6 6.0 6.1 8.5 8.8 7.4 10.4 11.9 9.1 10.2 11.0 8.0 7.9 4. Services: Debit -2.1 -2.2 -2.4 -2.3 -3.1 -3.1 -3.7 -4.7 -5.1 -5.1 -4.5 -4.8 -3.8 -3.5
Balance on Goods and Services -3.1 -1.4 -1.5 -4.2 2.2 -2.1 -2.2 -2.4 -0.4 -1.6 -5.5 3.2 -0.2 -1.5 5. Income: Credit 0.6 0.6 0.6 0.6 0.7 0.9 0.9 1.0 1.2 1.3 1.4 1.9 1.4 0.9 6. Income: Debit -2.3 -2.4 -2.3 -2.2 -3.2 -2.8 -2.5 -2.6 -2.7 -3.2 -3.4 -5.3 -3.8 -3.2
Balance on Goods, Services and Income -4.7 -3.2 -3.2 -5.7 -0.4 -4.0 -3.8 -4.0 -1.9 -3.5 -7.5 -0.3 -2.7 -3.7 7. Current Transfers 3.0 3.4 2.6 2.1 2.4 2.7 2.5 2.6 2.9 2.8 2.6 2.6 1.9 0.9
B. CAPITAL ACCOUNT C. FINANCIAL ACCOUNT 2.7 -1.6 2.3 5.0 -3.3 2.7 3.0 3.7 -0.4 2.6 4.8 -10.1 0.6 2.5 8. Direct Investment Abroad 0.0 0.0 0.0 0.0 0.0 -0.1 -0.1 -0.1 -0.2 -0.4 -0.4 -0.3 -0.1 -0.2 9. Direct Investment in Turkey 0.5 0.5 0.5 0.4 0.5 0.5 0.4 0.4 0.5 0.4 0.5 2.2 0.6 0.2 10. Portfolio Investment- Assets -0.1 -0.1 -0.5 -0.3 0.0 -0.3 -0.8 -0.4 -0.8 -0.4 -0.3 -0.5 -1.1 -0.6 11. Portfolio Investment- Liabilities 0.5 0.5 2.0 2.5 0.9 0.4 1.1 1.2 -2.5 2.3 0.8 -2.6 0.8 1.6 11.1. Equity Securities 0.1 0.1 0.2 0.3 0.8 0.1 0.1 0.0 -0.3 0.2 0.2 -0.1 0.0 0.4 11.2. Debt Securities 0.4 0.4 1.8 2.2 0.1 0.3 1.0 1.2 -2.3 2.0 0.6 -2.5 0.8 1.2 12. Other Investment- Assets -0.3 -1.7 -1.5 -1.8 1.9 -0.2 0.2 -0.9 -0.7 -1.3 -1.0 -0.4 -0.4 -0.4 12.1. Monetary Authorities 0.2 0.0 0.0 0.0 0.0 -0.1 -0.1 -0.1 0.0 -0.1 0.0 0.0 0.0 0.0 12.2. General Government 0.0 0.0 0.0 0.0 0.0 0.0 0.0 0.0 0.0 0.0 0.0 0.0 0.0 0.0 12.3. Banks -0.5 -1.7 -1.6 -1.8 1.9 -0.2 0.8 -0.5 -0.5 -1.0 -0.8 0.2 0.3 0.1 12.4. Other sectors 0.0 0.0 0.0 0.0 0.0 0.0 -0.6 -0.4 -0.2 -0.2 -0.2 -0.5 -0.8 -0.5 13. Other Investment- Liabilities 2.1 -0.8 1.8 4.3 -6.5 2.3 2.2 3.5 3.4 1.9 5.2 -8.5 0.9 1.8 13.1. Monetary Authorities -0.4 -0.6 0.2 0.6 1.0 0.9 0.7 0.5 0.3 -0.1 0.3 0.5 0.7 0.2 13.2. General Government -0.3 -0.1 -1.0 -1.2 -2.3 -1.3 -1.2 -0.8 -0.8 -1.1 0.1 -1.4 -0.4 -0.9 13.3. Banks 1.5 0.3 1.3 2.5 -5.4 1.2 1.7 1.2 1.6 1.4 1.9 -6.6 -1.1 1.2 13.4. Other sectors 1.2 -0.3 1.4 2.4 0.2 1.5 1.0 2.5 2.3 1.7 3.0 -1.0 1.6 1.3
Current, Capital and Financial Account 0.9 -1.4 1.7 1.4 -1.3 1.3 1.7 2.3 0.6 1.9 -0.1 -7.7 -0.2 -0.4
D. NET ERRORS AND OMMISSIONS -0.3 0.6 -0.7 -1.2 1.4 1.4 0.8 -0.5 -0.3 0.9 -1.4 -1.2 0.1 2.1
GLOBAL BALANCE 0.6 -0.8 0.9 0.2 0.2 2.8 2.5 1.8 0.2 2.8 -1.5 -8.9 -0.1 1.7
E. RESERVE ASSETS -0.6 0.8 -0.9 -0.2 -0.2 -2.8 -2.5 -1.8 -0.2 -2.8 1.5 8.9 0.1 -1.7 14. Official Reserves -0.6 0.8 -0.9 -0.2 -0.4 -3.0 -2.5 -1.8 -0.1 -3.1 -0.2 1.9 -3.3 -1.7 15. Use of Fund Credits and Loans 0.0 0.0 0.0 0.0 0.3 0.2 0.0 0.0 -0.1 0.3 1.7 7.0 3.5 0.0 16. Exceptional Financing
Source: Central Bank of Republic of Turkey, Ankara, update form 5 August 2004.
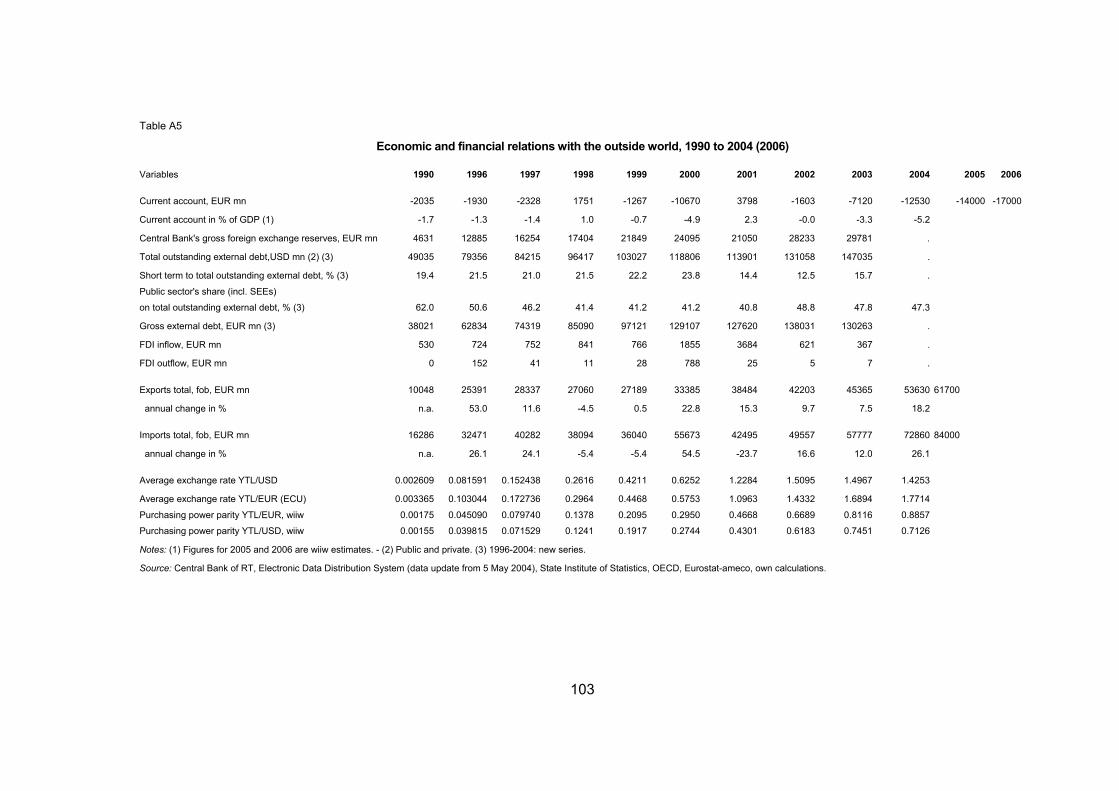
103
Table A5
Economic and financial relations with the outside world, 1990 to 2004 (2006)
Variables 1990 1996 1997 1998 1999 2000 2001 2002 2003 2004 2005 2006
Current account, EUR mn -2035 -1930 -2328 1751 -1267 -10670 3798 -1603 -7120 -12530 -14000 -17000
Current account in % of GDP (1) -1.7 -1.3 -1.4 1.0 -0.7 -4.9 2.3 -0.0 -3.3 -5.2
Central Bank's gross foreign exchange reserves, EUR mn 4631 12885 16254 17404 21849 24095 21050 28233 29781 .
Total outstanding external debt,USD mn (2) (3) 49035 79356 84215 96417 103027 118806 113901 131058 147035 .
Short term to total outstanding external debt, % (3) 19.4 21.5 21.0 21.5 22.2 23.8 14.4 12.5 15.7 .
Public sector's share (incl. SEEs)
on total outstanding external debt, % (3) 62.0 50.6 46.2 41.4 41.2 41.2 40.8 48.8 47.8 47.3
Gross external debt, EUR mn (3) 38021 62834 74319 85090 97121 129107 127620 138031 130263 .
FDI inflow, EUR mn 530 724 752 841 766 1855 3684 621 367 .
FDI outflow, EUR mn 0 152 41 11 28 788 25 5 7 .
Exports total, fob, EUR mn 10048 25391 28337 27060 27189 33385 38484 42203 45365 53630 61700
annual change in % n.a. 53.0 11.6 -4.5 0.5 22.8 15.3 9.7 7.5 18.2
Imports total, fob, EUR mn 16286 32471 40282 38094 36040 55673 42495 49557 57777 72860 84000
annual change in % n.a. 26.1 24.1 -5.4 -5.4 54.5 -23.7 16.6 12.0 26.1
Average exchange rate YTL/USD 0.002609 0.081591 0.152438 0.2616 0.4211 0.6252 1.2284 1.5095 1.4967 1.4253
Average exchange rate YTL/EUR (ECU) 0.003365 0.103044 0.172736 0.2964 0.4468 0.5753 1.0963 1.4332 1.6894 1.7714
Purchasing power parity YTL/EUR, wiiw 0.00175 0.045090 0.079740 0.1378 0.2095 0.2950 0.4668 0.6689 0.8116 0.8857
Purchasing power parity YTL/USD, wiiw 0.00155 0.039815 0.071529 0.1241 0.1917 0.2744 0.4301 0.6183 0.7451 0.7126
Notes: (1) Figures for 2005 and 2006 are wiiw estimates. - (2) Public and private. (3) 1996-2004: new series.
Source: Central Bank of RT, Electronic Data Distribution System (data update from 5 May 2004), State Institute of Statistics, OECD, Eurostat-ameco, own calculations.
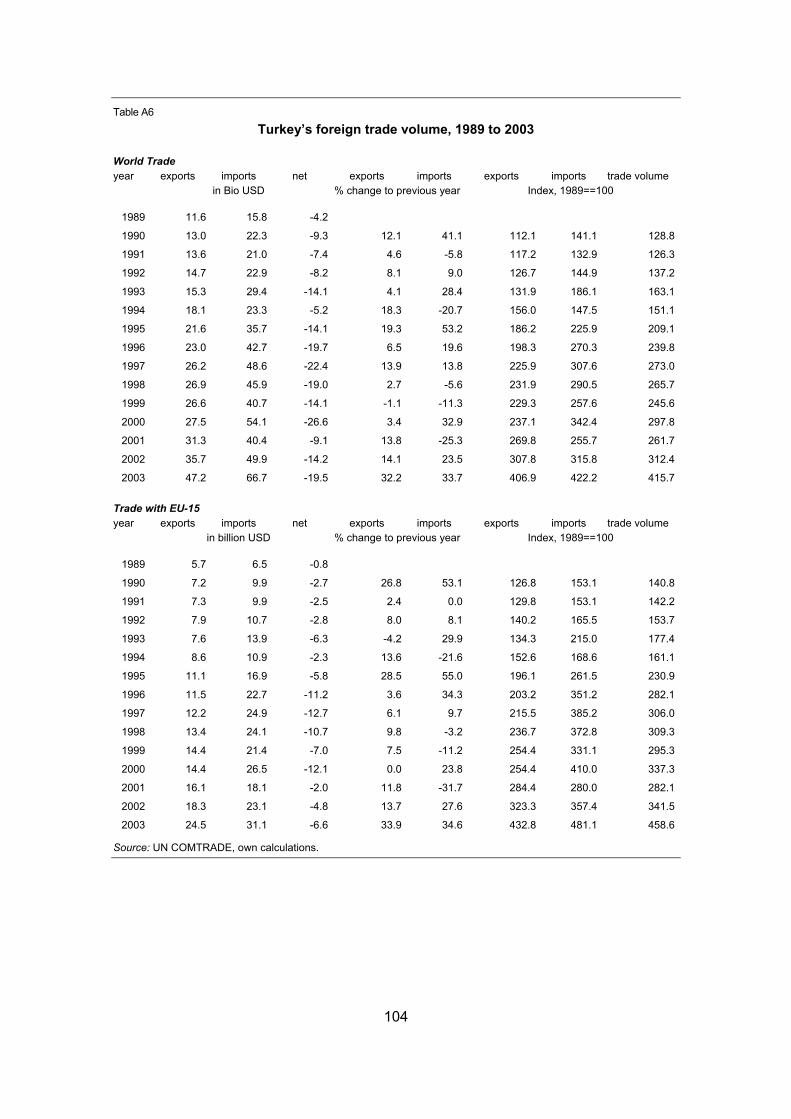
104
Table A6
Turkey’s foreign trade volume, 1989 to 2003
World Trade year exports imports net exports imports exports imports trade volume
in Bio USD % change to previous year Index, 1989==100
1989 11.6 15.8 -4.2
1990 13.0 22.3 -9.3 12.1 41.1 112.1 141.1 128.8
1991 13.6 21.0 -7.4 4.6 -5.8 117.2 132.9 126.3
1992 14.7 22.9 -8.2 8.1 9.0 126.7 144.9 137.2
1993 15.3 29.4 -14.1 4.1 28.4 131.9 186.1 163.1
1994 18.1 23.3 -5.2 18.3 -20.7 156.0 147.5 151.1
1995 21.6 35.7 -14.1 19.3 53.2 186.2 225.9 209.1
1996 23.0 42.7 -19.7 6.5 19.6 198.3 270.3 239.8
1997 26.2 48.6 -22.4 13.9 13.8 225.9 307.6 273.0
1998 26.9 45.9 -19.0 2.7 -5.6 231.9 290.5 265.7
1999 26.6 40.7 -14.1 -1.1 -11.3 229.3 257.6 245.6
2000 27.5 54.1 -26.6 3.4 32.9 237.1 342.4 297.8
2001 31.3 40.4 -9.1 13.8 -25.3 269.8 255.7 261.7
2002 35.7 49.9 -14.2 14.1 23.5 307.8 315.8 312.4
2003 47.2 66.7 -19.5 32.2 33.7 406.9 422.2 415.7
Trade with EU-15 year exports imports net exports imports exports imports trade volume
in billion USD % change to previous year Index, 1989==100
1989 5.7 6.5 -0.8
1990 7.2 9.9 -2.7 26.8 53.1 126.8 153.1 140.8
1991 7.3 9.9 -2.5 2.4 0.0 129.8 153.1 142.2
1992 7.9 10.7 -2.8 8.0 8.1 140.2 165.5 153.7
1993 7.6 13.9 -6.3 -4.2 29.9 134.3 215.0 177.4
1994 8.6 10.9 -2.3 13.6 -21.6 152.6 168.6 161.1
1995 11.1 16.9 -5.8 28.5 55.0 196.1 261.5 230.9
1996 11.5 22.7 -11.2 3.6 34.3 203.2 351.2 282.1
1997 12.2 24.9 -12.7 6.1 9.7 215.5 385.2 306.0
1998 13.4 24.1 -10.7 9.8 -3.2 236.7 372.8 309.3
1999 14.4 21.4 -7.0 7.5 -11.2 254.4 331.1 295.3
2000 14.4 26.5 -12.1 0.0 23.8 254.4 410.0 337.3
2001 16.1 18.1 -2.0 11.8 -31.7 284.4 280.0 282.1
2002 18.3 23.1 -4.8 13.7 27.6 323.3 357.4 341.5
2003 24.5 31.1 -6.6 33.9 34.6 432.8 481.1 458.6
Source: UN COMTRADE, own calculations.
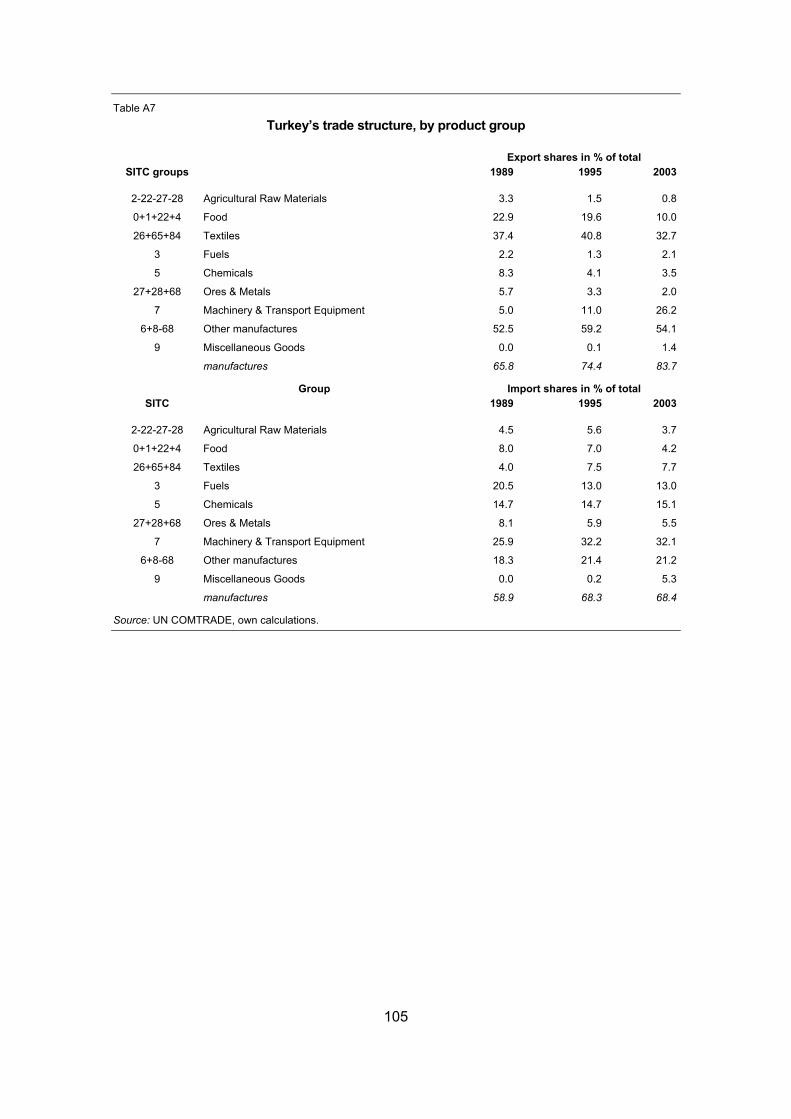
105
Table A7
Turkey’s trade structure, by product group
Export shares in % of total SITC groups 1989 1995 2003
2-22-27-28 Agricultural Raw Materials 3.3 1.5 0.8
0+1+22+4 Food 22.9 19.6 10.0
26+65+84 Textiles 37.4 40.8 32.7
3 Fuels 2.2 1.3 2.1
5 Chemicals 8.3 4.1 3.5
27+28+68 Ores & Metals 5.7 3.3 2.0
7 Machinery & Transport Equipment 5.0 11.0 26.2
6+8-68 Other manufactures 52.5 59.2 54.1
9 Miscellaneous Goods 0.0 0.1 1.4
manufactures 65.8 74.4 83.7
Group Import shares in % of total SITC 1989 1995 2003
2-22-27-28 Agricultural Raw Materials 4.5 5.6 3.7
0+1+22+4 Food 8.0 7.0 4.2
26+65+84 Textiles 4.0 7.5 7.7
3 Fuels 20.5 13.0 13.0
5 Chemicals 14.7 14.7 15.1
27+28+68 Ores & Metals 8.1 5.9 5.5
7 Machinery & Transport Equipment 25.9 32.2 32.1
6+8-68 Other manufactures 18.3 21.4 21.2
9 Miscellaneous Goods 0.0 0.2 5.3
manufactures 58.9 68.3 68.4
Source: UN COMTRADE, own calculations.
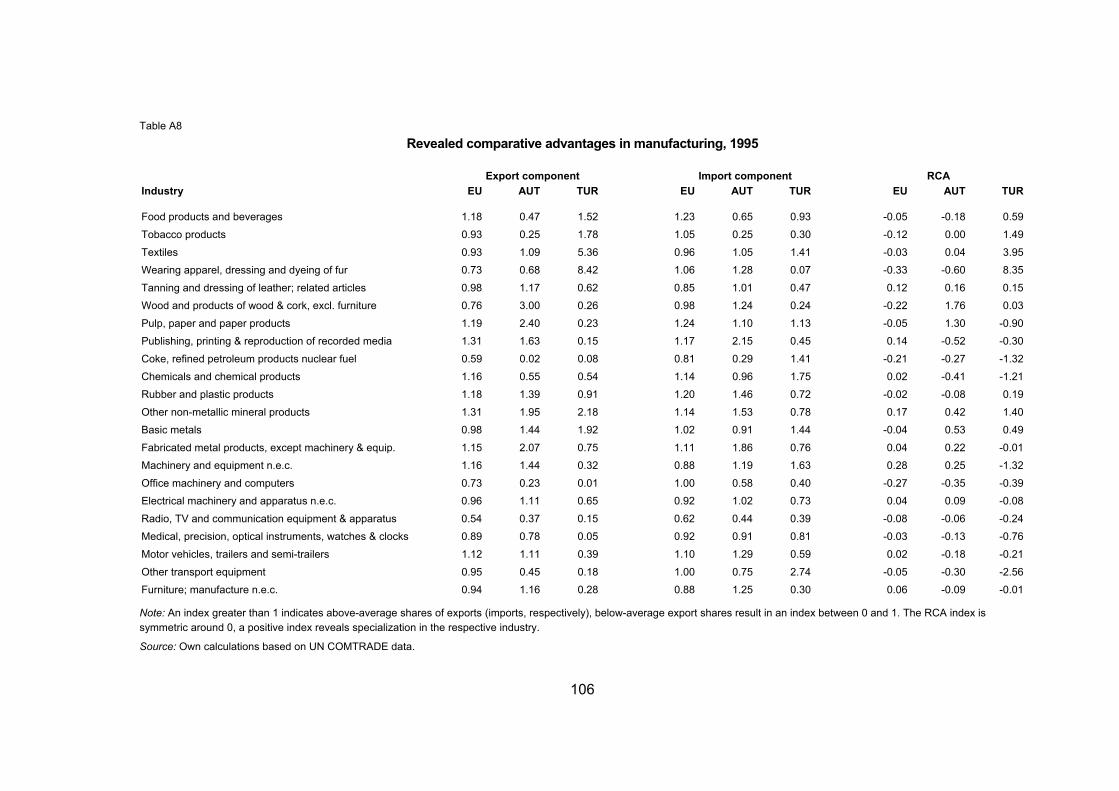
106
Table A8
Revealed comparative advantages in manufacturing, 1995
Export component Import component RCA Industry EU AUT TUR EU AUT TUR EU AUT TUR
Food products and beverages 1.18 0.47 1.52 1.23 0.65 0.93 -0.05 -0.18 0.59
Tobacco products 0.93 0.25 1.78 1.05 0.25 0.30 -0.12 0.00 1.49
Textiles 0.93 1.09 5.36 0.96 1.05 1.41 -0.03 0.04 3.95
Wearing apparel, dressing and dyeing of fur 0.73 0.68 8.42 1.06 1.28 0.07 -0.33 -0.60 8.35
Tanning and dressing of leather; related articles 0.98 1.17 0.62 0.85 1.01 0.47 0.12 0.16 0.15
Wood and products of wood & cork, excl. furniture 0.76 3.00 0.26 0.98 1.24 0.24 -0.22 1.76 0.03
Pulp, paper and paper products 1.19 2.40 0.23 1.24 1.10 1.13 -0.05 1.30 -0.90
Publishing, printing & reproduction of recorded media 1.31 1.63 0.15 1.17 2.15 0.45 0.14 -0.52 -0.30
Coke, refined petroleum products nuclear fuel 0.59 0.02 0.08 0.81 0.29 1.41 -0.21 -0.27 -1.32
Chemicals and chemical products 1.16 0.55 0.54 1.14 0.96 1.75 0.02 -0.41 -1.21
Rubber and plastic products 1.18 1.39 0.91 1.20 1.46 0.72 -0.02 -0.08 0.19
Other non-metallic mineral products 1.31 1.95 2.18 1.14 1.53 0.78 0.17 0.42 1.40
Basic metals 0.98 1.44 1.92 1.02 0.91 1.44 -0.04 0.53 0.49
Fabricated metal products, except machinery & equip. 1.15 2.07 0.75 1.11 1.86 0.76 0.04 0.22 -0.01
Machinery and equipment n.e.c. 1.16 1.44 0.32 0.88 1.19 1.63 0.28 0.25 -1.32
Office machinery and computers 0.73 0.23 0.01 1.00 0.58 0.40 -0.27 -0.35 -0.39
Electrical machinery and apparatus n.e.c. 0.96 1.11 0.65 0.92 1.02 0.73 0.04 0.09 -0.08
Radio, TV and communication equipment & apparatus 0.54 0.37 0.15 0.62 0.44 0.39 -0.08 -0.06 -0.24
Medical, precision, optical instruments, watches & clocks 0.89 0.78 0.05 0.92 0.91 0.81 -0.03 -0.13 -0.76
Motor vehicles, trailers and semi-trailers 1.12 1.11 0.39 1.10 1.29 0.59 0.02 -0.18 -0.21
Other transport equipment 0.95 0.45 0.18 1.00 0.75 2.74 -0.05 -0.30 -2.56
Furniture; manufacture n.e.c. 0.94 1.16 0.28 0.88 1.25 0.30 0.06 -0.09 -0.01
Note: An index greater than 1 indicates above-average shares of exports (imports, respectively), below-average export shares result in an index between 0 and 1. The RCA index is symmetric around 0, a positive index reveals specialization in the respective industry.
Source: Own calculations based on UN COMTRADE data.
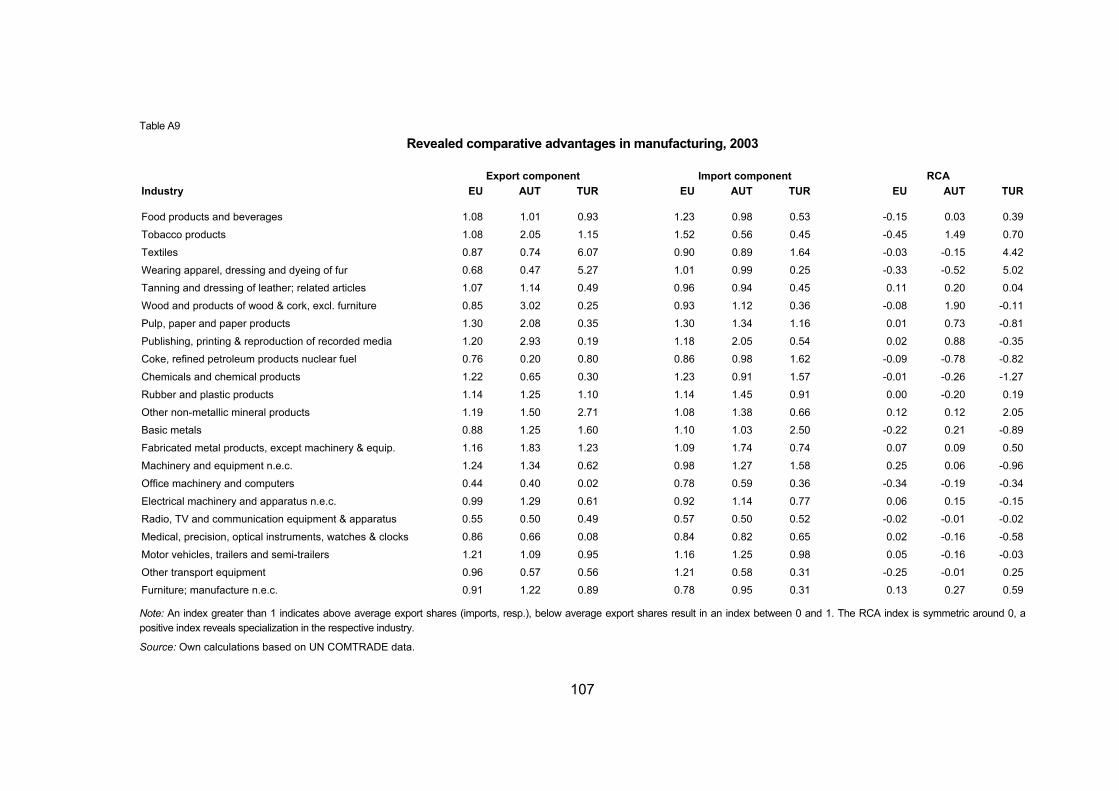
107
Table A9
Revealed comparative advantages in manufacturing, 2003
Export component Import component RCA Industry EU AUT TUR EU AUT TUR EU AUT TUR
Food products and beverages 1.08 1.01 0.93 1.23 0.98 0.53 -0.15 0.03 0.39
Tobacco products 1.08 2.05 1.15 1.52 0.56 0.45 -0.45 1.49 0.70
Textiles 0.87 0.74 6.07 0.90 0.89 1.64 -0.03 -0.15 4.42
Wearing apparel, dressing and dyeing of fur 0.68 0.47 5.27 1.01 0.99 0.25 -0.33 -0.52 5.02
Tanning and dressing of leather; related articles 1.07 1.14 0.49 0.96 0.94 0.45 0.11 0.20 0.04
Wood and products of wood & cork, excl. furniture 0.85 3.02 0.25 0.93 1.12 0.36 -0.08 1.90 -0.11
Pulp, paper and paper products 1.30 2.08 0.35 1.30 1.34 1.16 0.01 0.73 -0.81
Publishing, printing & reproduction of recorded media 1.20 2.93 0.19 1.18 2.05 0.54 0.02 0.88 -0.35
Coke, refined petroleum products nuclear fuel 0.76 0.20 0.80 0.86 0.98 1.62 -0.09 -0.78 -0.82
Chemicals and chemical products 1.22 0.65 0.30 1.23 0.91 1.57 -0.01 -0.26 -1.27
Rubber and plastic products 1.14 1.25 1.10 1.14 1.45 0.91 0.00 -0.20 0.19
Other non-metallic mineral products 1.19 1.50 2.71 1.08 1.38 0.66 0.12 0.12 2.05
Basic metals 0.88 1.25 1.60 1.10 1.03 2.50 -0.22 0.21 -0.89
Fabricated metal products, except machinery & equip. 1.16 1.83 1.23 1.09 1.74 0.74 0.07 0.09 0.50
Machinery and equipment n.e.c. 1.24 1.34 0.62 0.98 1.27 1.58 0.25 0.06 -0.96
Office machinery and computers 0.44 0.40 0.02 0.78 0.59 0.36 -0.34 -0.19 -0.34
Electrical machinery and apparatus n.e.c. 0.99 1.29 0.61 0.92 1.14 0.77 0.06 0.15 -0.15
Radio, TV and communication equipment & apparatus 0.55 0.50 0.49 0.57 0.50 0.52 -0.02 -0.01 -0.02
Medical, precision, optical instruments, watches & clocks 0.86 0.66 0.08 0.84 0.82 0.65 0.02 -0.16 -0.58
Motor vehicles, trailers and semi-trailers 1.21 1.09 0.95 1.16 1.25 0.98 0.05 -0.16 -0.03
Other transport equipment 0.96 0.57 0.56 1.21 0.58 0.31 -0.25 -0.01 0.25
Furniture; manufacture n.e.c. 0.91 1.22 0.89 0.78 0.95 0.31 0.13 0.27 0.59
Note: An index greater than 1 indicates above average export shares (imports, resp.), below average export shares result in an index between 0 and 1. The RCA index is symmetric around 0, a positive index reveals specialization in the respective industry.
Source: Own calculations based on UN COMTRADE data.
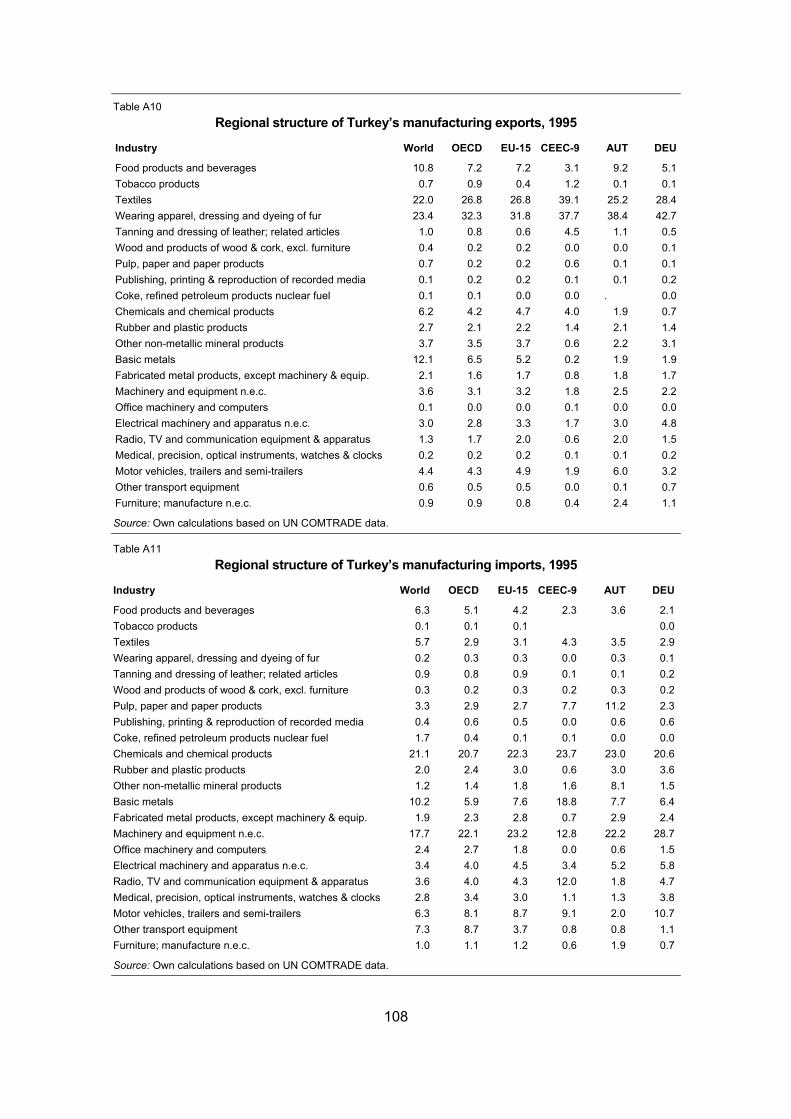
108
Table A10 Regional structure of Turkey’s manufacturing exports, 1995
Industry World OECD EU-15 CEEC-9 AUT DEU
Food products and beverages 10.8 7.2 7.2 3.1 9.2 5.1Tobacco products 0.7 0.9 0.4 1.2 0.1 0.1Textiles 22.0 26.8 26.8 39.1 25.2 28.4Wearing apparel, dressing and dyeing of fur 23.4 32.3 31.8 37.7 38.4 42.7Tanning and dressing of leather; related articles 1.0 0.8 0.6 4.5 1.1 0.5Wood and products of wood & cork, excl. furniture 0.4 0.2 0.2 0.0 0.0 0.1Pulp, paper and paper products 0.7 0.2 0.2 0.6 0.1 0.1Publishing, printing & reproduction of recorded media 0.1 0.2 0.2 0.1 0.1 0.2Coke, refined petroleum products nuclear fuel 0.1 0.1 0.0 0.0 . 0.0Chemicals and chemical products 6.2 4.2 4.7 4.0 1.9 0.7Rubber and plastic products 2.7 2.1 2.2 1.4 2.1 1.4Other non-metallic mineral products 3.7 3.5 3.7 0.6 2.2 3.1Basic metals 12.1 6.5 5.2 0.2 1.9 1.9Fabricated metal products, except machinery & equip. 2.1 1.6 1.7 0.8 1.8 1.7Machinery and equipment n.e.c. 3.6 3.1 3.2 1.8 2.5 2.2Office machinery and computers 0.1 0.0 0.0 0.1 0.0 0.0Electrical machinery and apparatus n.e.c. 3.0 2.8 3.3 1.7 3.0 4.8Radio, TV and communication equipment & apparatus 1.3 1.7 2.0 0.6 2.0 1.5Medical, precision, optical instruments, watches & clocks 0.2 0.2 0.2 0.1 0.1 0.2Motor vehicles, trailers and semi-trailers 4.4 4.3 4.9 1.9 6.0 3.2Other transport equipment 0.6 0.5 0.5 0.0 0.1 0.7Furniture; manufacture n.e.c. 0.9 0.9 0.8 0.4 2.4 1.1
Source: Own calculations based on UN COMTRADE data.
Table A11 Regional structure of Turkey’s manufacturing imports, 1995
Industry World OECD EU-15 CEEC-9 AUT DEU
Food products and beverages 6.3 5.1 4.2 2.3 3.6 2.1Tobacco products 0.1 0.1 0.1 0.0Textiles 5.7 2.9 3.1 4.3 3.5 2.9Wearing apparel, dressing and dyeing of fur 0.2 0.3 0.3 0.0 0.3 0.1Tanning and dressing of leather; related articles 0.9 0.8 0.9 0.1 0.1 0.2Wood and products of wood & cork, excl. furniture 0.3 0.2 0.3 0.2 0.3 0.2Pulp, paper and paper products 3.3 2.9 2.7 7.7 11.2 2.3Publishing, printing & reproduction of recorded media 0.4 0.6 0.5 0.0 0.6 0.6Coke, refined petroleum products nuclear fuel 1.7 0.4 0.1 0.1 0.0 0.0Chemicals and chemical products 21.1 20.7 22.3 23.7 23.0 20.6Rubber and plastic products 2.0 2.4 3.0 0.6 3.0 3.6Other non-metallic mineral products 1.2 1.4 1.8 1.6 8.1 1.5Basic metals 10.2 5.9 7.6 18.8 7.7 6.4Fabricated metal products, except machinery & equip. 1.9 2.3 2.8 0.7 2.9 2.4Machinery and equipment n.e.c. 17.7 22.1 23.2 12.8 22.2 28.7Office machinery and computers 2.4 2.7 1.8 0.0 0.6 1.5Electrical machinery and apparatus n.e.c. 3.4 4.0 4.5 3.4 5.2 5.8Radio, TV and communication equipment & apparatus 3.6 4.0 4.3 12.0 1.8 4.7Medical, precision, optical instruments, watches & clocks 2.8 3.4 3.0 1.1 1.3 3.8Motor vehicles, trailers and semi-trailers 6.3 8.1 8.7 9.1 2.0 10.7Other transport equipment 7.3 8.7 3.7 0.8 0.8 1.1Furniture; manufacture n.e.c. 1.0 1.1 1.2 0.6 1.9 0.7
Source: Own calculations based on UN COMTRADE data.
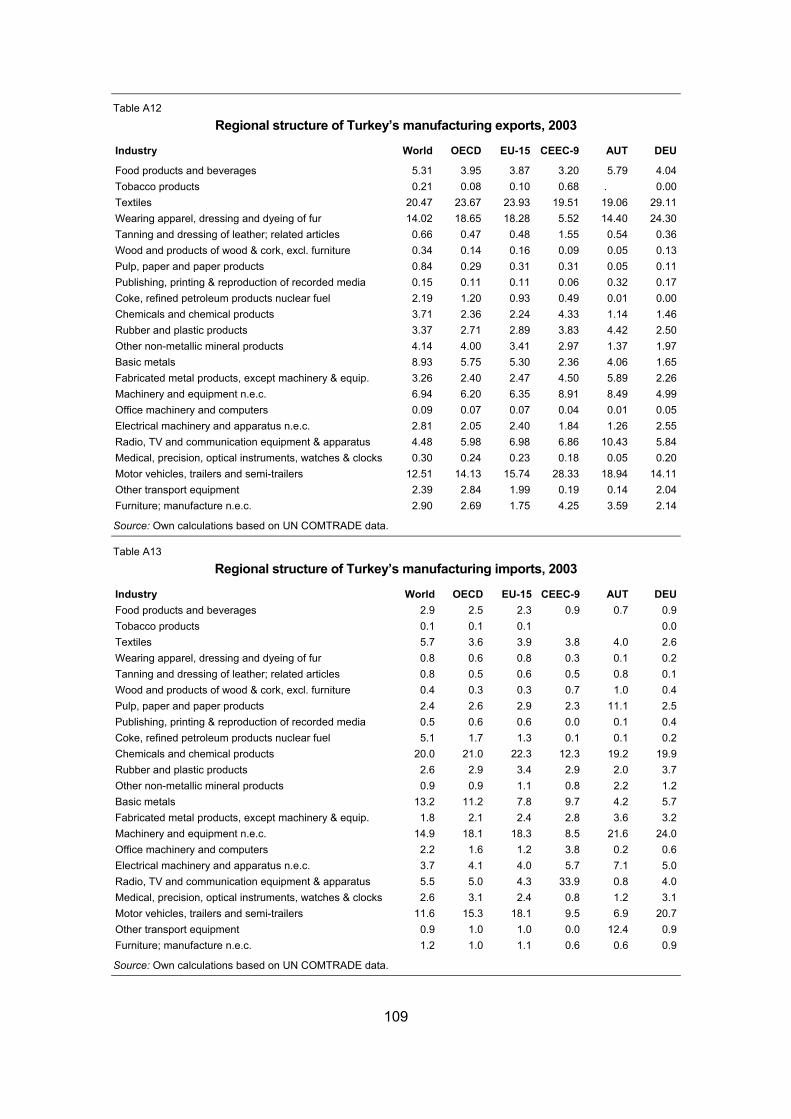
109
Table A12
Regional structure of Turkey’s manufacturing exports, 2003
Industry World OECD EU-15 CEEC-9 AUT DEU
Food products and beverages 5.31 3.95 3.87 3.20 5.79 4.04Tobacco products 0.21 0.08 0.10 0.68 . 0.00Textiles 20.47 23.67 23.93 19.51 19.06 29.11Wearing apparel, dressing and dyeing of fur 14.02 18.65 18.28 5.52 14.40 24.30Tanning and dressing of leather; related articles 0.66 0.47 0.48 1.55 0.54 0.36Wood and products of wood & cork, excl. furniture 0.34 0.14 0.16 0.09 0.05 0.13Pulp, paper and paper products 0.84 0.29 0.31 0.31 0.05 0.11Publishing, printing & reproduction of recorded media 0.15 0.11 0.11 0.06 0.32 0.17Coke, refined petroleum products nuclear fuel 2.19 1.20 0.93 0.49 0.01 0.00Chemicals and chemical products 3.71 2.36 2.24 4.33 1.14 1.46Rubber and plastic products 3.37 2.71 2.89 3.83 4.42 2.50Other non-metallic mineral products 4.14 4.00 3.41 2.97 1.37 1.97Basic metals 8.93 5.75 5.30 2.36 4.06 1.65Fabricated metal products, except machinery & equip. 3.26 2.40 2.47 4.50 5.89 2.26Machinery and equipment n.e.c. 6.94 6.20 6.35 8.91 8.49 4.99Office machinery and computers 0.09 0.07 0.07 0.04 0.01 0.05Electrical machinery and apparatus n.e.c. 2.81 2.05 2.40 1.84 1.26 2.55Radio, TV and communication equipment & apparatus 4.48 5.98 6.98 6.86 10.43 5.84Medical, precision, optical instruments, watches & clocks 0.30 0.24 0.23 0.18 0.05 0.20Motor vehicles, trailers and semi-trailers 12.51 14.13 15.74 28.33 18.94 14.11Other transport equipment 2.39 2.84 1.99 0.19 0.14 2.04Furniture; manufacture n.e.c. 2.90 2.69 1.75 4.25 3.59 2.14
Source: Own calculations based on UN COMTRADE data.
Table A13
Regional structure of Turkey’s manufacturing imports, 2003
Industry World OECD EU-15 CEEC-9 AUT DEUFood products and beverages 2.9 2.5 2.3 0.9 0.7 0.9Tobacco products 0.1 0.1 0.1 0.0Textiles 5.7 3.6 3.9 3.8 4.0 2.6Wearing apparel, dressing and dyeing of fur 0.8 0.6 0.8 0.3 0.1 0.2Tanning and dressing of leather; related articles 0.8 0.5 0.6 0.5 0.8 0.1Wood and products of wood & cork, excl. furniture 0.4 0.3 0.3 0.7 1.0 0.4Pulp, paper and paper products 2.4 2.6 2.9 2.3 11.1 2.5Publishing, printing & reproduction of recorded media 0.5 0.6 0.6 0.0 0.1 0.4Coke, refined petroleum products nuclear fuel 5.1 1.7 1.3 0.1 0.1 0.2Chemicals and chemical products 20.0 21.0 22.3 12.3 19.2 19.9Rubber and plastic products 2.6 2.9 3.4 2.9 2.0 3.7Other non-metallic mineral products 0.9 0.9 1.1 0.8 2.2 1.2Basic metals 13.2 11.2 7.8 9.7 4.2 5.7Fabricated metal products, except machinery & equip. 1.8 2.1 2.4 2.8 3.6 3.2Machinery and equipment n.e.c. 14.9 18.1 18.3 8.5 21.6 24.0Office machinery and computers 2.2 1.6 1.2 3.8 0.2 0.6Electrical machinery and apparatus n.e.c. 3.7 4.1 4.0 5.7 7.1 5.0Radio, TV and communication equipment & apparatus 5.5 5.0 4.3 33.9 0.8 4.0Medical, precision, optical instruments, watches & clocks 2.6 3.1 2.4 0.8 1.2 3.1Motor vehicles, trailers and semi-trailers 11.6 15.3 18.1 9.5 6.9 20.7Other transport equipment 0.9 1.0 1.0 0.0 12.4 0.9Furniture; manufacture n.e.c. 1.2 1.0 1.1 0.6 0.6 0.9
Source: Own calculations based on UN COMTRADE data.
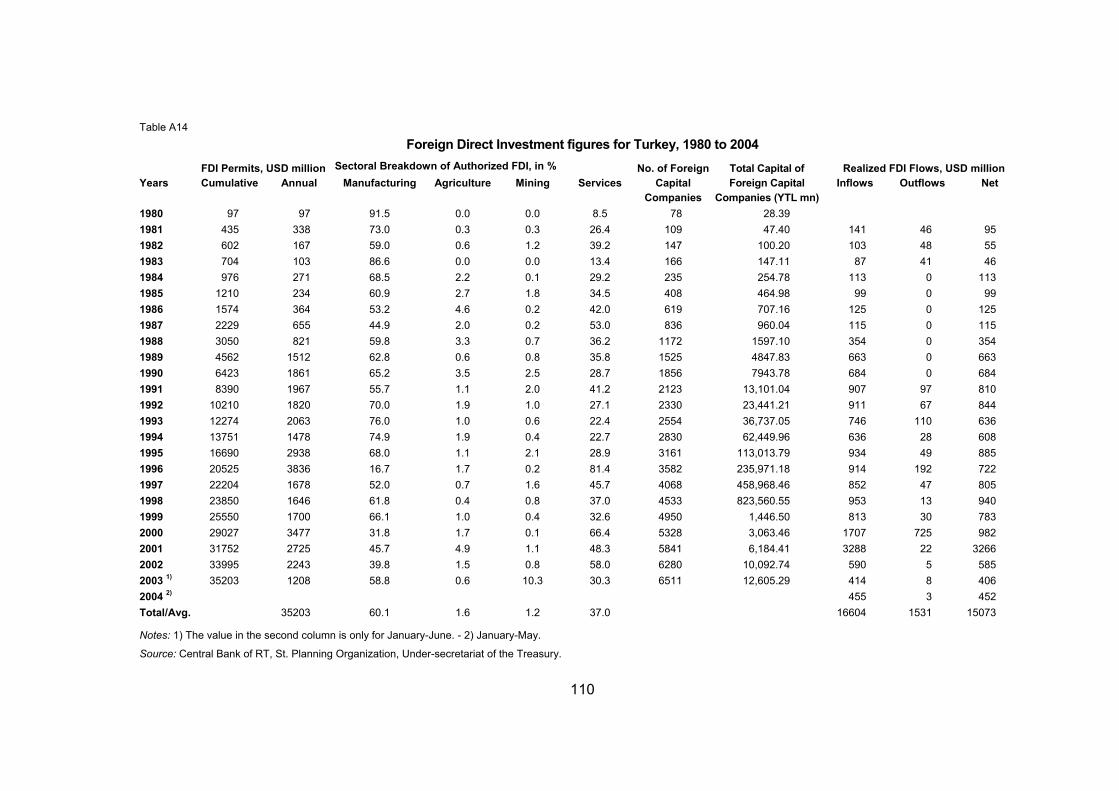
110
Table A14
Foreign Direct Investment figures for Turkey, 1980 to 2004 FDI Permits, USD million Sectoral Breakdown of Authorized FDI, in % Realized FDI Flows, USD million Years Cumulative Annual Manufacturing Agriculture Mining Services
No. of Foreign Capital
Companies
Total Capital of Foreign Capital
Companies (YTL mn)Inflows Outflows Net
1980 97 97 91.5 0.0 0.0 8.5 78 28.39 1981 435 338 73.0 0.3 0.3 26.4 109 47.40 141 46 95 1982 602 167 59.0 0.6 1.2 39.2 147 100.20 103 48 55 1983 704 103 86.6 0.0 0.0 13.4 166 147.11 87 41 46 1984 976 271 68.5 2.2 0.1 29.2 235 254.78 113 0 113 1985 1210 234 60.9 2.7 1.8 34.5 408 464.98 99 0 99 1986 1574 364 53.2 4.6 0.2 42.0 619 707.16 125 0 125 1987 2229 655 44.9 2.0 0.2 53.0 836 960.04 115 0 115 1988 3050 821 59.8 3.3 0.7 36.2 1172 1597.10 354 0 354 1989 4562 1512 62.8 0.6 0.8 35.8 1525 4847.83 663 0 663 1990 6423 1861 65.2 3.5 2.5 28.7 1856 7943.78 684 0 684 1991 8390 1967 55.7 1.1 2.0 41.2 2123 13,101.04 907 97 810 1992 10210 1820 70.0 1.9 1.0 27.1 2330 23,441.21 911 67 844 1993 12274 2063 76.0 1.0 0.6 22.4 2554 36,737.05 746 110 636 1994 13751 1478 74.9 1.9 0.4 22.7 2830 62,449.96 636 28 608 1995 16690 2938 68.0 1.1 2.1 28.9 3161 113,013.79 934 49 885 1996 20525 3836 16.7 1.7 0.2 81.4 3582 235,971.18 914 192 722 1997 22204 1678 52.0 0.7 1.6 45.7 4068 458,968.46 852 47 805 1998 23850 1646 61.8 0.4 0.8 37.0 4533 823,560.55 953 13 940 1999 25550 1700 66.1 1.0 0.4 32.6 4950 1,446.50 813 30 783 2000 29027 3477 31.8 1.7 0.1 66.4 5328 3,063.46 1707 725 982 2001 31752 2725 45.7 4.9 1.1 48.3 5841 6,184.41 3288 22 3266 2002 33995 2243 39.8 1.5 0.8 58.0 6280 10,092.74 590 5 585 2003 1) 35203 1208 58.8 0.6 10.3 30.3 6511 12,605.29 414 8 406 2004 2) 455 3 452 Total/Avg. 35203 60.1 1.6 1.2 37.0 16604 1531 15073
Notes: 1) The value in the second column is only for January-June. - 2) January-May.
Source: Central Bank of RT, St. Planning Organization, Under-secretariat of the Treasury.
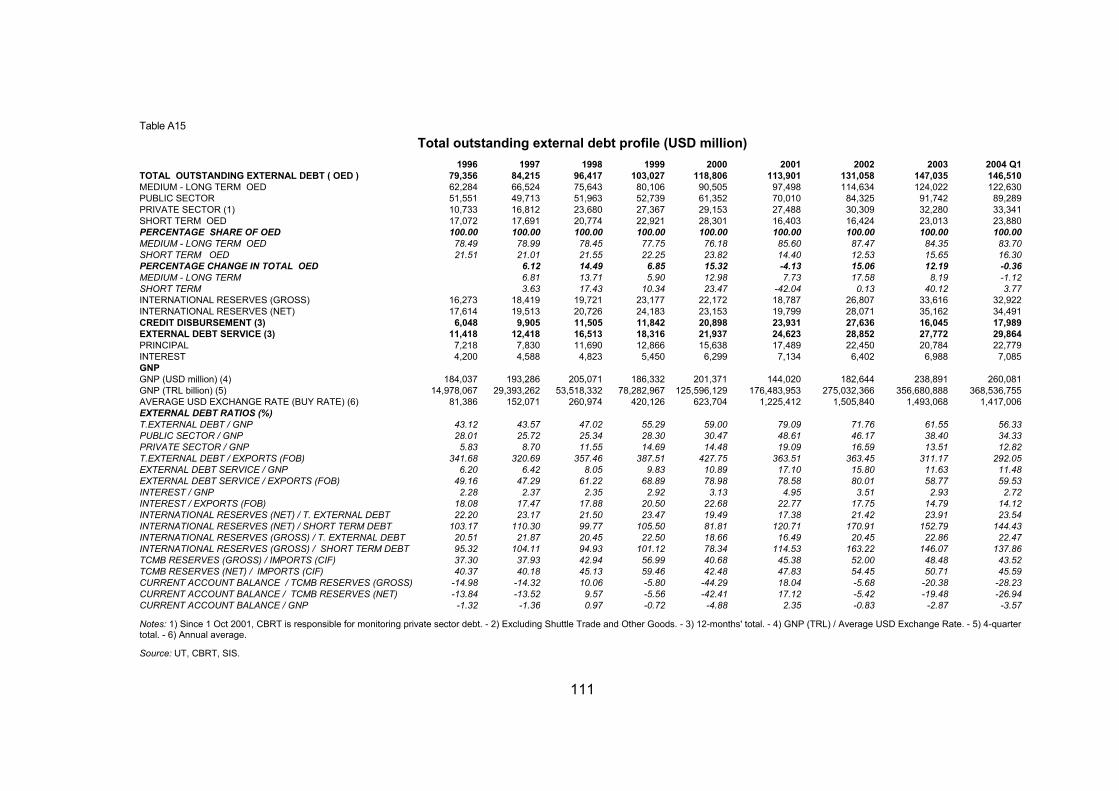
111
Table A15
Total outstanding external debt profile (USD million) 1996 1997 1998 1999 2000 2001 2002 2003 2004 Q1
TOTAL OUTSTANDING EXTERNAL DEBT ( OED ) 79,356 84,215 96,417 103,027 118,806 113,901 131,058 147,035 146,510 MEDIUM - LONG TERM OED 62,284 66,524 75,643 80,106 90,505 97,498 114,634 124,022 122,630 PUBLIC SECTOR 51,551 49,713 51,963 52,739 61,352 70,010 84,325 91,742 89,289 PRIVATE SECTOR (1) 10,733 16,812 23,680 27,367 29,153 27,488 30,309 32,280 33,341 SHORT TERM OED 17,072 17,691 20,774 22,921 28,301 16,403 16,424 23,013 23,880 PERCENTAGE SHARE OF OED 100.00 100.00 100.00 100.00 100.00 100.00 100.00 100.00 100.00 MEDIUM - LONG TERM OED 78.49 78.99 78.45 77.75 76.18 85.60 87.47 84.35 83.70 SHORT TERM OED 21.51 21.01 21.55 22.25 23.82 14.40 12.53 15.65 16.30 PERCENTAGE CHANGE IN TOTAL OED 6.12 14.49 6.85 15.32 -4.13 15.06 12.19 -0.36 MEDIUM - LONG TERM 6.81 13.71 5.90 12.98 7.73 17.58 8.19 -1.12 SHORT TERM 3.63 17.43 10.34 23.47 -42.04 0.13 40.12 3.77 INTERNATIONAL RESERVES (GROSS) 16,273 18,419 19,721 23,177 22,172 18,787 26,807 33,616 32,922 INTERNATIONAL RESERVES (NET) 17,614 19,513 20,726 24,183 23,153 19,799 28,071 35,162 34,491 CREDIT DISBURSEMENT (3) 6,048 9,905 11,505 11,842 20,898 23,931 27,636 16,045 17,989 EXTERNAL DEBT SERVICE (3) 11,418 12,418 16,513 18,316 21,937 24,623 28,852 27,772 29,864 PRINCIPAL 7,218 7,830 11,690 12,866 15,638 17,489 22,450 20,784 22,779 INTEREST 4,200 4,588 4,823 5,450 6,299 7,134 6,402 6,988 7,085 GNP GNP (USD million) (4) 184,037 193,286 205,071 186,332 201,371 144,020 182,644 238,891 260,081 GNP (TRL billion) (5) 14,978,067 29,393,262 53,518,332 78,282,967 125,596,129 176,483,953 275,032,366 356,680,888 368,536,755 AVERAGE USD EXCHANGE RATE (BUY RATE) (6) 81,386 152,071 260,974 420,126 623,704 1,225,412 1,505,840 1,493,068 1,417,006 EXTERNAL DEBT RATIOS (%) T.EXTERNAL DEBT / GNP 43.12 43.57 47.02 55.29 59.00 79.09 71.76 61.55 56.33 PUBLIC SECTOR / GNP 28.01 25.72 25.34 28.30 30.47 48.61 46.17 38.40 34.33 PRIVATE SECTOR / GNP 5.83 8.70 11.55 14.69 14.48 19.09 16.59 13.51 12.82 T.EXTERNAL DEBT / EXPORTS (FOB) 341.68 320.69 357.46 387.51 427.75 363.51 363.45 311.17 292.05 EXTERNAL DEBT SERVICE / GNP 6.20 6.42 8.05 9.83 10.89 17.10 15.80 11.63 11.48 EXTERNAL DEBT SERVICE / EXPORTS (FOB) 49.16 47.29 61.22 68.89 78.98 78.58 80.01 58.77 59.53 INTEREST / GNP 2.28 2.37 2.35 2.92 3.13 4.95 3.51 2.93 2.72 INTEREST / EXPORTS (FOB) 18.08 17.47 17.88 20.50 22.68 22.77 17.75 14.79 14.12 INTERNATIONAL RESERVES (NET) / T. EXTERNAL DEBT 22.20 23.17 21.50 23.47 19.49 17.38 21.42 23.91 23.54 INTERNATIONAL RESERVES (NET) / SHORT TERM DEBT 103.17 110.30 99.77 105.50 81.81 120.71 170.91 152.79 144.43 INTERNATIONAL RESERVES (GROSS) / T. EXTERNAL DEBT 20.51 21.87 20.45 22.50 18.66 16.49 20.45 22.86 22.47 INTERNATIONAL RESERVES (GROSS) / SHORT TERM DEBT 95.32 104.11 94.93 101.12 78.34 114.53 163.22 146.07 137.86 TCMB RESERVES (GROSS) / IMPORTS (CIF) 37.30 37.93 42.94 56.99 40.68 45.38 52.00 48.48 43.52 TCMB RESERVES (NET) / IMPORTS (CIF) 40.37 40.18 45.13 59.46 42.48 47.83 54.45 50.71 45.59 CURRENT ACCOUNT BALANCE / TCMB RESERVES (GROSS) -14.98 -14.32 10.06 -5.80 -44.29 18.04 -5.68 -20.38 -28.23 CURRENT ACCOUNT BALANCE / TCMB RESERVES (NET) -13.84 -13.52 9.57 -5.56 -42.41 17.12 -5.42 -19.48 -26.94 CURRENT ACCOUNT BALANCE / GNP -1.32 -1.36 0.97 -0.72 -4.88 2.35 -0.83 -2.87 -3.57
Notes: 1) Since 1 Oct 2001, CBRT is responsible for monitoring private sector debt. - 2) Excluding Shuttle Trade and Other Goods. - 3) 12-months' total. - 4) GNP (TRL) / Average USD Exchange Rate. - 5) 4-quarter total. - 6) Annual average.
Source: UT, CBRT, SIS.
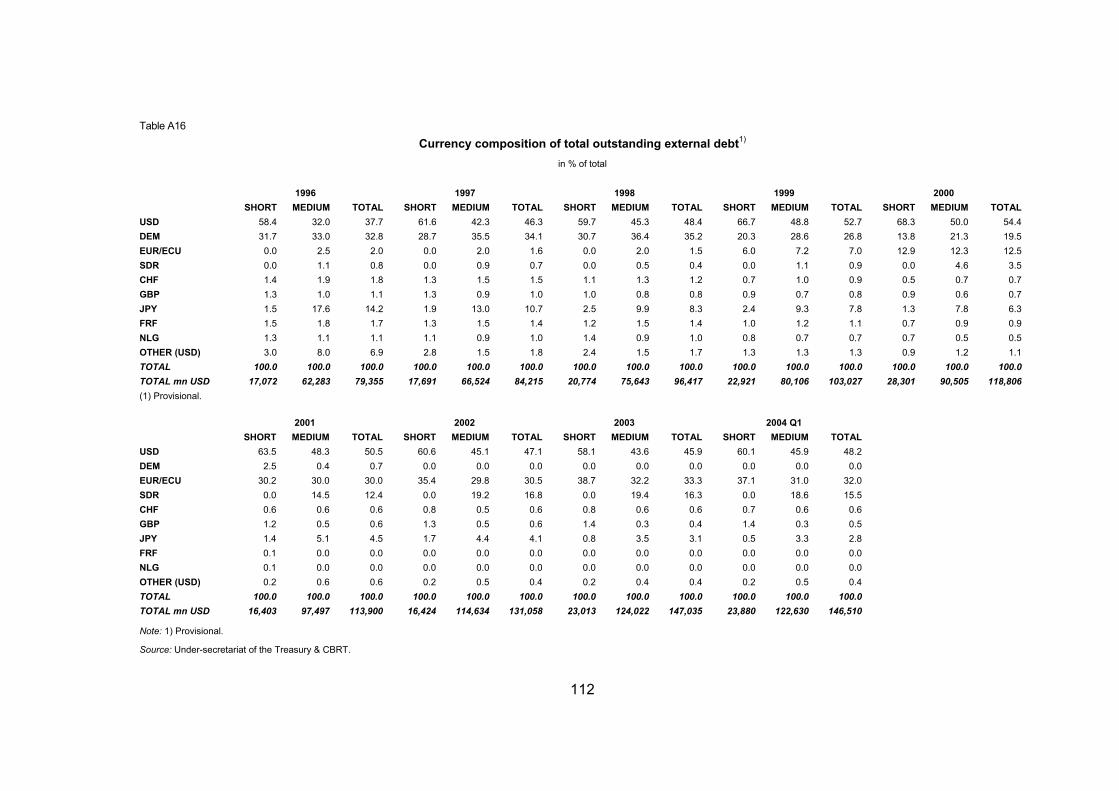
112
Table A16
Currency composition of total outstanding external debt1)
in % of total
1996 1997 1998 1999 2000 SHORT MEDIUM TOTAL SHORT MEDIUM TOTAL SHORT MEDIUM TOTAL SHORT MEDIUM TOTAL SHORT MEDIUM TOTAL
USD 58.4 32.0 37.7 61.6 42.3 46.3 59.7 45.3 48.4 66.7 48.8 52.7 68.3 50.0 54.4 DEM 31.7 33.0 32.8 28.7 35.5 34.1 30.7 36.4 35.2 20.3 28.6 26.8 13.8 21.3 19.5 EUR/ECU 0.0 2.5 2.0 0.0 2.0 1.6 0.0 2.0 1.5 6.0 7.2 7.0 12.9 12.3 12.5 SDR 0.0 1.1 0.8 0.0 0.9 0.7 0.0 0.5 0.4 0.0 1.1 0.9 0.0 4.6 3.5 CHF 1.4 1.9 1.8 1.3 1.5 1.5 1.1 1.3 1.2 0.7 1.0 0.9 0.5 0.7 0.7 GBP 1.3 1.0 1.1 1.3 0.9 1.0 1.0 0.8 0.8 0.9 0.7 0.8 0.9 0.6 0.7 JPY 1.5 17.6 14.2 1.9 13.0 10.7 2.5 9.9 8.3 2.4 9.3 7.8 1.3 7.8 6.3 FRF 1.5 1.8 1.7 1.3 1.5 1.4 1.2 1.5 1.4 1.0 1.2 1.1 0.7 0.9 0.9 NLG 1.3 1.1 1.1 1.1 0.9 1.0 1.4 0.9 1.0 0.8 0.7 0.7 0.7 0.5 0.5 OTHER (USD) 3.0 8.0 6.9 2.8 1.5 1.8 2.4 1.5 1.7 1.3 1.3 1.3 0.9 1.2 1.1 TOTAL 100.0 100.0 100.0 100.0 100.0 100.0 100.0 100.0 100.0 100.0 100.0 100.0 100.0 100.0 100.0 TOTAL mn USD 17,072 62,283 79,355 17,691 66,524 84,215 20,774 75,643 96,417 22,921 80,106 103,027 28,301 90,505 118,806 (1) Provisional.
2001 2002 2003 2004 Q1 SHORT MEDIUM TOTAL SHORT MEDIUM TOTAL SHORT MEDIUM TOTAL SHORT MEDIUM TOTAL
USD 63.5 48.3 50.5 60.6 45.1 47.1 58.1 43.6 45.9 60.1 45.9 48.2 DEM 2.5 0.4 0.7 0.0 0.0 0.0 0.0 0.0 0.0 0.0 0.0 0.0 EUR/ECU 30.2 30.0 30.0 35.4 29.8 30.5 38.7 32.2 33.3 37.1 31.0 32.0 SDR 0.0 14.5 12.4 0.0 19.2 16.8 0.0 19.4 16.3 0.0 18.6 15.5 CHF 0.6 0.6 0.6 0.8 0.5 0.6 0.8 0.6 0.6 0.7 0.6 0.6 GBP 1.2 0.5 0.6 1.3 0.5 0.6 1.4 0.3 0.4 1.4 0.3 0.5 JPY 1.4 5.1 4.5 1.7 4.4 4.1 0.8 3.5 3.1 0.5 3.3 2.8 FRF 0.1 0.0 0.0 0.0 0.0 0.0 0.0 0.0 0.0 0.0 0.0 0.0 NLG 0.1 0.0 0.0 0.0 0.0 0.0 0.0 0.0 0.0 0.0 0.0 0.0 OTHER (USD) 0.2 0.6 0.6 0.2 0.5 0.4 0.2 0.4 0.4 0.2 0.5 0.4 TOTAL 100.0 100.0 100.0 100.0 100.0 100.0 100.0 100.0 100.0 100.0 100.0 100.0 TOTAL mn USD 16,403 97,497 113,900 16,424 114,634 131,058 23,013 124,022 147,035 23,880 122,630 146,510
Note: 1) Provisional.
Source: Under-secretariat of the Treasury & CBRT.

113
Table A17
Total outstanding external debt by borrower, USD million, 1996 to 20041)
1996 1997 1998 1999 2000 2001 2002 2003 2004 Q1
TOTAL OUTSTANDING DEBT 79,356 84,215 96,417 103,027 118,806 113,901 131,058 147,035 146,510 SHORT TERM (2) 17,072 17,691 20,774 22,921 28,301 16,403 16,424 23,013 23,880 MEDIUM-LONG TERM 62,284 66,524 75,643 80,106 90,505 97,498 114,634 124,022 122,630 SHORT TERM (2) 17,072 17,691 20,774 22,921 28,301 16,403 16,424 23,013 23,880 GENERAL GOVERNMENT 0 54 0 0 1,000 0 0 0 0 CBRT 984 889 905 686 653 752 1,655 2,860 2,883 CBRT LOANS 42 30 7 6 26 20 15 11 11 DRESDNER BANK SCHEME 942 859 898 680 627 732 1,640 2,849 2,872 DEPOSIT MONEY BANKS 8,419 8,503 11,159 13,172 16,900 7,997 6,344 9,692 10,017 OTHER SECTORS 7,669 8,245 8,710 9,063 9,748 7,654 8,425 10,461 10,980 MEDIUM-LONG TERM 62,284 66,524 75,643 80,106 90,505 97,498 114,634 124,022 122,630 PUBLIC SECTOR 40,162 38,845 39,890 42,427 47,924 46,419 63,985 70,238 69,283 GENERAL GOVERNMENT 36,282 34,738 35,687 37,686 42,503 41,277 59,179 65,562 64,595 CENTRAL GOVERNMENT 32,305 31,406 32,333 34,582 39,524 38,763 56,833 63,457 62,566 LOCAL ADMINISTRATIONS 2,749 2,399 2,567 2,451 2,378 1,934 1,673 1,528 1,471 EXTRA BUDGETARY FUNDS 1,211 921 774 646 594 557 646 549 530 UNIVERSITIES 16 11 14 8 6 23 26 28 28 STATE OWNED ENTERPRISES 2,803 3,171 3,517 3,865 4,216 4,013 3,762 3,475 3,513 Financial SOEs 157 445 651 743 706 575 196 209 204 Non-financial SOEs 2,646 2,726 2,865 3,123 3,510 3,438 3,566 3,266 3,308 OTHER PUBLIC SECTOR (3) 1,077 936 686 875 1,205 1,129 1,045 1,200 1,176 CBRT 11,389 10,868 12,073 10,312 13,429 23,591 20,340 21,504 20,006 CBRT Loans 669 601 392 396 3,705 13,643 8,068 7,272 6,145 Dresdner Bank Scheme 10,720 10,267 11,681 9,916 9,724 9,948 12,272 14,232 13,861 PRIVATE SECTOR (4) 10,733 16,812 23,680 27,367 29,153 27,488 30,309 32,280 33,341 FINANCIAL 3,354 5,535 6,879 7,482 7,581 4,789 4,671 5,070 5,253 Banks 2,270 3,757 4,274 4,768 4,550 3,211 3,032 3,090 3,165 Non-Bank Financial Enterprises 1,084 1,778 2,605 2,713 3,032 1,578 1,639 1,980 2,088 NON-FINANCIAL 7,379 11,277 16,801 19,885 21,571 22,699 25,638 27,210 28,088
Notes: 1) Provisional. - 2) Source: CBRT. - 3) T. Development Bank, T. Eximbank. - 4) Since 1 Oct 2001, CBRT is responsible for monitoring private sector debt.
Source: Under-secretariat of the Treasury & CBRT.
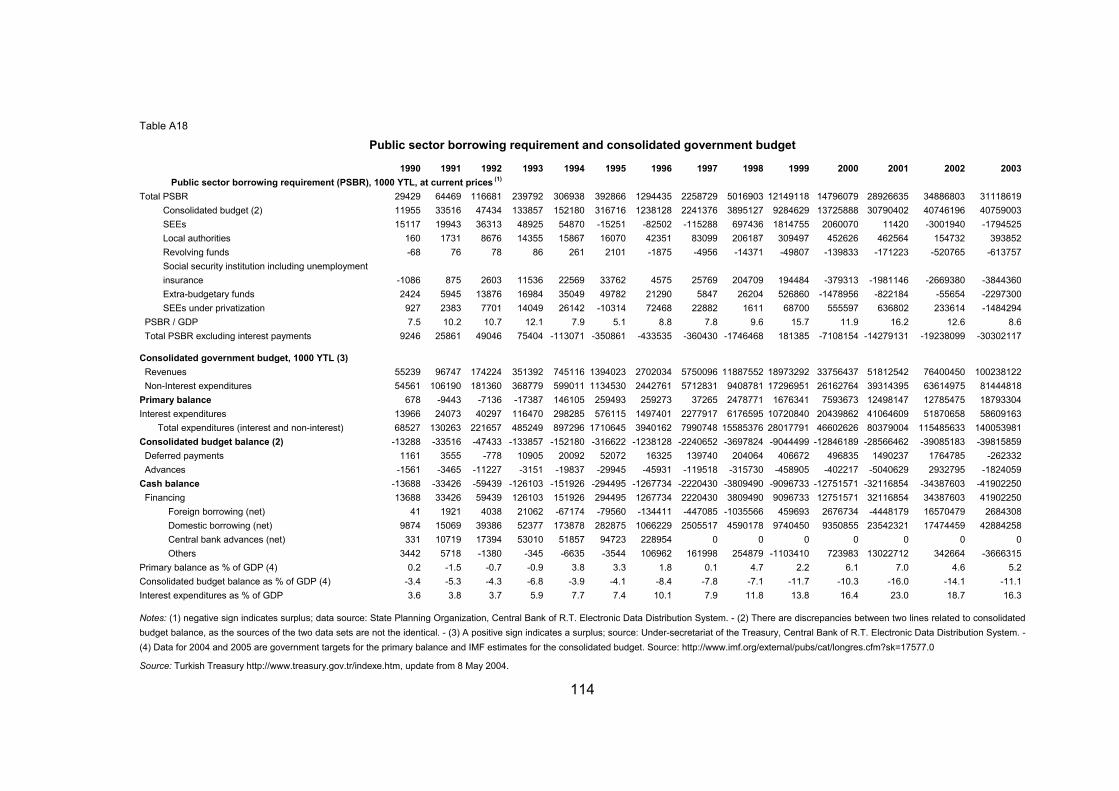
114
Table A18
Public sector borrowing requirement and consolidated government budget
1990 1991 1992 1993 1994 1995 1996 1997 1998 1999 2000 2001 2002 2003 Public sector borrowing requirement (PSBR), 1000 YTL, at current prices (1)
Total PSBR 29429 64469 116681 239792 306938 392866 1294435 2258729 5016903 12149118 14796079 28926635 34886803 31118619 Consolidated budget (2) 11955 33516 47434 133857 152180 316716 1238128 2241376 3895127 9284629 13725888 30790402 40746196 40759003 SEEs 15117 19943 36313 48925 54870 -15251 -82502 -115288 697436 1814755 2060070 11420 -3001940 -1794525 Local authorities 160 1731 8676 14355 15867 16070 42351 83099 206187 309497 452626 462564 154732 393852 Revolving funds -68 76 78 86 261 2101 -1875 -4956 -14371 -49807 -139833 -171223 -520765 -613757 Social security institution including unemployment insurance -1086 875 2603 11536 22569 33762 4575 25769 204709 194484 -379313 -1981146 -2669380 -3844360
Extra-budgetary funds 2424 5945 13876 16984 35049 49782 21290 5847 26204 526860 -1478956 -822184 -55654 -2297300 SEEs under privatization 927 2383 7701 14049 26142 -10314 72468 22882 1611 68700 555597 636802 233614 -1484294
PSBR / GDP 7.5 10.2 10.7 12.1 7.9 5.1 8.8 7.8 9.6 15.7 11.9 16.2 12.6 8.6 Total PSBR excluding interest payments 9246 25861 49046 75404 -113071 -350861 -433535 -360430 -1746468 181385 -7108154 -14279131 -19238099 -30302117
Consolidated government budget, 1000 YTL (3) Revenues 55239 96747 174224 351392 745116 1394023 2702034 5750096 11887552 18973292 33756437 51812542 76400450 100238122 Non-Interest expenditures 54561 106190 181360 368779 599011 1134530 2442761 5712831 9408781 17296951 26162764 39314395 63614975 81444818 Primary balance 678 -9443 -7136 -17387 146105 259493 259273 37265 2478771 1676341 7593673 12498147 12785475 18793304 Interest expenditures 13966 24073 40297 116470 298285 576115 1497401 2277917 6176595 10720840 20439862 41064609 51870658 58609163
Total expenditures (interest and non-interest) 68527 130263 221657 485249 897296 1710645 3940162 7990748 15585376 28017791 46602626 80379004 115485633 140053981 Consolidated budget balance (2) -13288 -33516 -47433 -133857 -152180 -316622 -1238128 -2240652 -3697824 -9044499 -12846189 -28566462 -39085183 -39815859 Deferred payments 1161 3555 -778 10905 20092 52072 16325 139740 204064 406672 496835 1490237 1764785 -262332 Advances -1561 -3465 -11227 -3151 -19837 -29945 -45931 -119518 -315730 -458905 -402217 -5040629 2932795 -1824059 Cash balance -13688 -33426 -59439 -126103 -151926 -294495 -1267734 -2220430 -3809490 -9096733 -12751571 -32116854 -34387603 -41902250 Financing 13688 33426 59439 126103 151926 294495 1267734 2220430 3809490 9096733 12751571 32116854 34387603 41902250
Foreign borrowing (net) 41 1921 4038 21062 -67174 -79560 -134411 -447085 -1035566 459693 2676734 -4448179 16570479 2684308 Domestic borrowing (net) 9874 15069 39386 52377 173878 282875 1066229 2505517 4590178 9740450 9350855 23542321 17474459 42884258 Central bank advances (net) 331 10719 17394 53010 51857 94723 228954 0 0 0 0 0 0 0 Others 3442 5718 -1380 -345 -6635 -3544 106962 161998 254879 -1103410 723983 13022712 342664 -3666315
Primary balance as % of GDP (4) 0.2 -1.5 -0.7 -0.9 3.8 3.3 1.8 0.1 4.7 2.2 6.1 7.0 4.6 5.2 Consolidated budget balance as % of GDP (4) -3.4 -5.3 -4.3 -6.8 -3.9 -4.1 -8.4 -7.8 -7.1 -11.7 -10.3 -16.0 -14.1 -11.1 Interest expenditures as % of GDP 3.6 3.8 3.7 5.9 7.7 7.4 10.1 7.9 11.8 13.8 16.4 23.0 18.7 16.3
Notes: (1) negative sign indicates surplus; data source: State Planning Organization, Central Bank of R.T. Electronic Data Distribution System. - (2) There are discrepancies between two lines related to consolidated budget balance, as the sources of the two data sets are not the identical. - (3) A positive sign indicates a surplus; source: Under-secretariat of the Treasury, Central Bank of R.T. Electronic Data Distribution System. - (4) Data for 2004 and 2005 are government targets for the primary balance and IMF estimates for the consolidated budget. Source: http://www.imf.org/external/pubs/cat/longres.cfm?sk=17577.0
Source: Turkish Treasury http://www.treasury.gov.tr/indexe.htm, update from 8 May 2004.
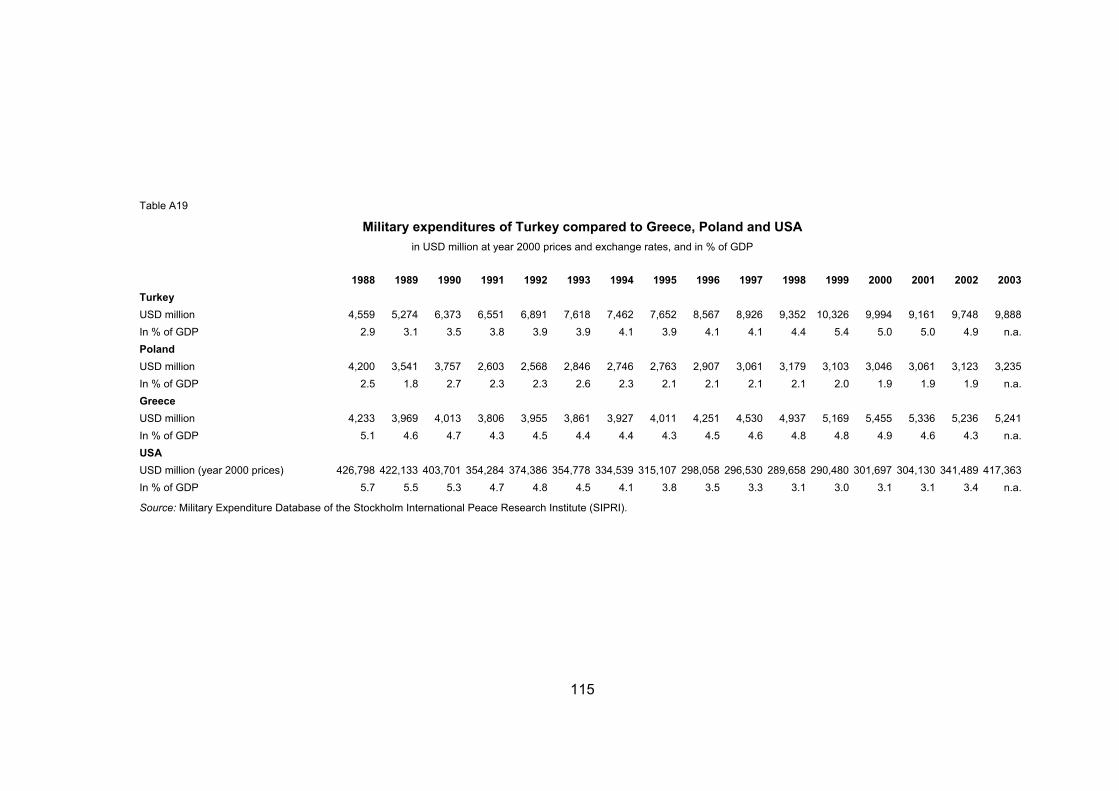
115
Table A19
Military expenditures of Turkey compared to Greece, Poland and USA in USD million at year 2000 prices and exchange rates, and in % of GDP
1988 1989 1990 1991 1992 1993 1994 1995 1996 1997 1998 1999 2000 2001 2002 2003 Turkey USD million 4,559 5,274 6,373 6,551 6,891 7,618 7,462 7,652 8,567 8,926 9,352 10,326 9,994 9,161 9,748 9,888 In % of GDP 2.9 3.1 3.5 3.8 3.9 3.9 4.1 3.9 4.1 4.1 4.4 5.4 5.0 5.0 4.9 n.a. Poland USD million 4,200 3,541 3,757 2,603 2,568 2,846 2,746 2,763 2,907 3,061 3,179 3,103 3,046 3,061 3,123 3,235 In % of GDP 2.5 1.8 2.7 2.3 2.3 2.6 2.3 2.1 2.1 2.1 2.1 2.0 1.9 1.9 1.9 n.a. Greece USD million 4,233 3,969 4,013 3,806 3,955 3,861 3,927 4,011 4,251 4,530 4,937 5,169 5,455 5,336 5,236 5,241 In % of GDP 5.1 4.6 4.7 4.3 4.5 4.4 4.4 4.3 4.5 4.6 4.8 4.8 4.9 4.6 4.3 n.a. USA USD million (year 2000 prices) 426,798 422,133 403,701 354,284 374,386 354,778 334,539 315,107 298,058 296,530 289,658 290,480 301,697 304,130 341,489 417,363 In % of GDP 5.7 5.5 5.3 4.7 4.8 4.5 4.1 3.8 3.5 3.3 3.1 3.0 3.1 3.1 3.4 n.a.
Source: Military Expenditure Database of the Stockholm International Peace Research Institute (SIPRI).

Short list of the most recent wiiw publications (as of March 2005)
For current updates and summaries see also wiiw's website at www.wiiw.ac.at
Turkey: Macroeconomic Vulnerability, Competitiveness and the Labour Market by Josef Pöschl, Hermine Vidovic, Julia Wörz and Vasily Astrov wiiw Current Analyses and Country Profiles, No. 21, April 2005 116 pages including 42 Tables and 26 Figures hardcopy: EUR 70.00 (PDF: EUR 65.00)
The Vienna Institute Monthly Report 3/05 edited by Leon Podkaminer • Turkey’s economy: situation report and outlook • Turkish Straits as a chokepoint for energy transit • Turkish-Russian relations: implications for Eurasia’s geopolitics • Selected monthly data on the economic situation in ten transition countries, 2003-2005 • Guide to wiiw statistical services on Central and Eastern Europe, Russia and Ukraine wiiw, March 2005 29 pages including 12 Tables and 4 Figures (exclusively for subscribers to the wiiw Service Package)
Accelerating GDP Growth, Improved Prospects for European Integration by Peter Havlik, Leon Podkaminer, Vladimir Gligorov et al. wiiw Research Reports, No. 314, March 2005 (special issue on economic prospects for Central, East and Southeast Europe; covering Albania, Belarus, Bosnia and Herzegovina, Bulgaria, Croatia, the Czech Republic, Estonia, Hungary, Latvia, Lithuania, Macedonia, Poland, Romania, Russia, Serbia and Montenegro, Slovakia, Slovenia, Ukraine, Turkey, and China) 122 pages including 55 Tables and 18 Figures hardcopy: EUR 70.00 (PDF: EUR 65.00)
The Vienna Institute Monthly Report 2/05 edited by Leon Podkaminer • New EU Member States: booming agro-food trade, Poland ahead • Unit labour costs as a measure of countries’ competitiveness • Distributional effects of evolving spending and tax policies in post-socialist Poland • Selected monthly data on the economic situation in ten transition countries, 2003-2004 • Guide to wiiw statistical services on Central and Eastern Europe, Russia and Ukraine wiiw, February 2005 32 pages including 18 Tables and 4 Figures (exclusively for subscribers to the wiiw Service Package)
Unit Labour Costs in the New EU Member States by Peter Havlik wiiw Statistical Reports, No. 1, January 2005 28 pages including 7 Tables and 7 Figures, hardcopy: EUR 22.00 (PDF: EUR 20.00)
Structural Change, Productivity and Employment in the New EU Member States by Peter Havlik wiiw Research Reports, No. 313, January 2005 33 pages including 7 Tables and 11 Figures hardcopy available at printing costs: EUR 8.00 (PDF: free download from wiiw’s website)
The Vienna Institute Monthly Report 1/05 edited by Leon Podkaminer • Grain surplus throughout the CEE region • Macroeconomic developments in Turkey: a long-term view • Debt, equity and financial vulnerability of countries • Selected monthly data on the economic situation in ten transition countries, 2003-2004 • Guide to wiiw statistical services on Central and Eastern Europe, Russia and Ukraine wiiw, January 2005 23 pages including 13 Tables and 1 Figure (exclusively for subscribers to the wiiw Service Package)
Economic Restructuring and Labour Market Developments in the New EU Member States by Michael Landesmann, Hermine Vidovic and Terry Ward wiiw Research Reports, No. 312, December 2004 59 pages including 10 Tables and 15 Figures hardcopy available at printing costs: EUR 8.00 (PDF: free download from wiiw’s website)
Macroeconomics versus ‘Common Sense’ by Kazimierz Laski wiiw Working Papers, No. 33, December 2004 11 pages hardcopy: EUR 8.00 (PDF: free download from wiiw’s website)
The Vienna Institute Monthly Report 12/04 edited by Leon Podkaminer • Russian Federation: GDP growth slows down • Albania: integrating into the Balkans • Bosnia and Herzegovina: shrinking donations, more foreign investment • Selected monthly data on the economic situation in ten transition countries, 2003-2004 • Guide to wiiw statistical services on Central and Eastern Europe, Russia and Ukraine wiiw, December 2004 21 pages including 13 Tables (exclusively for subscribers to the wiiw Service Package)
Determinants of Industrial Location Patterns in CEECs by Antje Hildebrandt and Julia Wörz wiiw Working Papers, No. 32, November 2004 21 pages including 6 Tables and 2 Figures hardcopy: EUR 8.00 (PDF: free download from wiiw’s website)
The Vienna Institute Monthly Report 11/04 edited by Leon Podkaminer • Updated wiiw forecasts for 2004 and 2005 • Bulgaria: economy keeps growing fuelled by credit expansion • Romania: booming, but cumbersome years ahead until EU accession • Croatia: growth losing momentum • Serbia and Montenegro: growth recovers • Macedonia: stagnation returns • Ukraine: a good grain harvest and booming exports • Selected monthly data on the economic situation in ten transition countries, 2003-2004 • Guide to wiiw statistical services on Central and Eastern Europe, Russia and Ukraine wiiw, November 2004 31 pages including 17 Tables (exclusively for subscribers to the wiiw Service Package)
Manufacturing FDI in New EU Member States – Foreign Penetration and Location Shifts between 1998 and 2002 by Gábor Hunya wiiw Research Reports, No. 311, November 2004 44 pages including 13 Tables hardcopy: EUR 22.00 (PDF: EUR 20.00)
Countries in Transition 2004: wiiw Handbook of Statistics covers twelve transition countries (Bulgaria, Croatia, Czech Republic, Hungary, Poland, Macedonia, Romania, Russia, Serbia and Montenegro, Slovakia, Slovenia, Ukraine), 1990 to August 2004 wiiw, Vienna, November 2004 (ISBN 3-85209-009-1) 555 pages including 415 Tables and Figures EUR 90.00
Foreign Direct Investment and the Catching-up Process in New EU Member States: Is There a Flying Geese Pattern? by Jože P. Damijan and Matija Rojec wiiw Research Reports, No. 310, October 2004 48 pages including 17 Tables and 10 Figures hardcopy: EUR 22.00 (PDF: EUR 20.00)
The Vienna Institute Monthly Report 10/04 edited by Leon Podkaminer • Czech Republic: economy in full swing at last • Hungary: new government facing old problems • Poland: strong profits and weak investment • Slovakia: robust economic growth amidst increasing regional disparities • Slovenia: running smoothly • Estonia: fast growth, on track to the euro • Latvia: highest EU-wide growth, deteriorating current account balance • Lithuania: loans fuel boom without inflation • Selected monthly data on the economic situation in ten transition countries, 2003 to 2004 • Guide to wiiw statistical services on Central and Eastern Europe, Russia and Ukraine wiiw, October 2004 41 pages including 18 Tables and 2 Figures (exclusively for subscribers to the wiiw Service Package)
Income Distribution, Technical Change and the Dynamics of International Economic Integration by Michael Landesmann and Robert Stehrer wiiw Working Papers, No. 31, September 2004 23 pages including 2 Tables and 2 Figures hardcopy: EUR 8.00 (PDF: free download from wiiw’s website)
Tax Rates and Corruption: Labour-market and Fiscal Effects. Empirical cross-country comparisons on OECD and transition countries by Mária Lackó wiiw Research Reports, No. 309, September 2004 80 pages including 27 Tables and 16 Figures hardcopy: EUR 22.00 (PDF: EUR 20.00)
wiiw Service Package The Vienna Institute offers to firms and institutions interested in unbiased and up-to-date information on Central, East and Southeast European markets a package of exclusive services and preferential access to its publications and research findings, on the basis of a subscription at an annual fee of EUR 2,000.
This subscription fee entitles to the following package of Special Services:
– A free invitation to the Vienna Institute's Spring Seminar, a whole-day event at the end of March, devoted to compelling topics in the economic transformation of the Central and East European region (for subscribers to the wiiw Service Package only).
– Copies of, or online access to, The Vienna Institute Monthly Report, a periodical consisting of timely articles summarizing and interpreting the latest economic developments in Central and Eastern Europe and the former Soviet Union. The statistical annex to each Monthly Report contains tables of the latest monthly country data. This periodical is not for sale, it can only be obtained in the framework of the wiiw Service Package.
– Free copies of the Institute's Research Reports (including Reprints), Current Analyses and Country Profiles and Statistical Reports.
– A free copy of the wiiw Handbook of Statistics, Countries in Transition (published in October/November each year and containing more than 400 tables and figures on the economies of Bulgaria, Croatia, the Czech Republic, Hungary, Macedonia, Poland, Romania, Russia, Serbia and Montenegro, Slovakia, Slovenia and Ukraine)
– Free online access to the wiiw Monthly Database, containing more than 1200 leading indicators monitoring the latest key economic developments in ten Central and East European countries.
– Consulting. The Vienna Institute is pleased to advise subscribers on questions concerning the East European economies or East-West economic relations if the required background research has already been undertaken by the Institute. We regret we have to charge extra for ad hoc research.
– Free access to the Institute's specialized economics library and documentation facilities.
Subscribers who wish to purchase wiiw data sets on CD-ROM or special publications not included in the wiiw Service Package are granted considerable price reductions.
For detailed information about the wiiw Service Package please visit wiiw's website at www.wiiw.ac.at
To The Vienna Institute for International Economic Studies Oppolzergasse 6 A-1010 Vienna
Please forward more detailed information about the Vienna Institute's Service Package Please forward a complete list of the Vienna Institute's publications to the following address
Please enter me for
1 yearly subscription of Research Reports (including Reprints) at a price of EUR 225.00 (within Austria), EUR 250.00 (Europe) and EUR 265.00 (overseas) respectively
Please forward
the following issue of Research Reports ..............................................................................................
the following issue of Current Analyses and Country Profiles .............................................................
the following issue of Working Papers .................................................................................................
the following issue of Statistical Reports ..............................................................................................
the following issue of Research Papers in German language ............................................................
the following issue of China Reports ....................................................................................................
the following issue of Industry Studies .................................................................................................
the following issue of Structural Reports ..............................................................................................
the following issue of wiiw-wifo Data on Foreign Direct Investment ...................................................
the following issue of COUNTRIES IN TRANSITION: wiiw Handbook of Statistics ..........................
.........................................................................................................................................................................................................
Name
.........................................................................................................................................................................................................
Address
.........................................................................................................................................................................................................
Telephone Fax E-mail
............................................................ ..........................................................
Date Signature
Herausgeber, Verleger, Eigentümer und Hersteller:
Verein „Wiener Institut für Internationale Wirtschaftsvergleiche“ (wiiw), Wien 1, Oppolzergasse 6
Postanschrift: A-1010 Wien, Oppolzergasse 6, Tel: [+431] 533 66 10, Telefax: [+431] 533 66 10 50
Internet Homepage: www.wiiw.ac.at
Nachdruck nur auszugsweise und mit genauer Quellenangabe gestattet.
P.b.b. Verlagspostamt 1010 Wien