Turbulent exchange of heat, water vapor, and momentum over a Tibetan prairie by eddy covariance and...
12
Turbulent exchange of heat, water vapor, and momentum over a Tibetan prairie by eddy covariance and flux variance measurements Taejin Choi, 1 Jinkyu Hong, 1 Joon Kim, 1 Heechoon Lee, 1 Jun Asanuma, 2 Hirohiko Ishikawa, 3 Osamu Tsukamoto, 4 Gao Zhiqiu, 5 Yaoming Ma, 6 Kenichi Ueno, 6 Jiemin Wang, 7 Toshio Koike, 8 and Tetsuo Yasunari 9 Received 12 March 2004; revised 28 July 2004; accepted 1 September 2004; published 6 November 2004. [1] Land-atmosphere interactions on the Tibetan Plateau are important because of their influence on energy and water cycles on both regional and global scales. Flux variance and eddy covariance methods were used to measure turbulent fluxes of heat, water vapor, and momentum over a Tibetan shortgrass prairie during the Global Energy and Water Cycle Experiment (GEWEX) Asian Monsoon Experiment (GAME) in 1998. Under unstable conditions during the monsoon period (July–September), the observed standard deviations of temperature and specific humidity (normalized by appropriate scaling parameters) followed the Monin-Obukhov theory. The similarity constants for heat C T and water vapor C q in their dimensionless functions of stability under a free convection limit were both 1.1, unlike the differences (i.e., C T C q ) reported in other studies. While the transfer efficiency of heat and water vapor exchange generally agreed with the prediction from the Monin-Obukhov theory, momentum exchange was less efficient than predicted. In comparison with the eddy covariance data, the flux variance method (with C T = C q = 1.1) underestimated both heat and water vapor fluxes by <5%. When the eddy covariance data were absent, the flux variance method was used for gap filling the seasonal flux database. To estimate latent heat flux during the premonsoon period in June, C T /C q was approximated as r Tq (where r Tq is a correlation coefficient for the fluctuations of temperature and water vapor) because of the sensitivity of C q to changes in soil moisture conditions. The dramatic changes in the Bowen ratio from 9.0 to 0.4 indicate the shift of energy sources for atmospheric heating over the plateau, which, in turn, resulted in the shift of turbulent exchange mechanisms for heat and water vapor. INDEX TERMS: 1878 Hydrology: Water/energy interactions; 0315 Atmospheric Composition and Structure: Biosphere/ atmosphere interactions; 3307 Meteorology and Atmospheric Dynamics: Boundary layer processes; 3379 Meteorology and Atmospheric Dynamics: Turbulence; KEYWORDS: Tibetan Plateau, eddy covariance, flux variance, Monin-Obukhov theory Citation: Choi, T., et al. (2004), Turbulent exchange of heat, water vapor, and momentum over a Tibetan prairie by eddy covariance and flux variance measurements, J. Geophys. Res., 109, D21106, doi:10.1029/2004JD004767. 1. Introduction [2] The Tibetan Plateau is characterized by high elevation (>4000 m) and vast area (10° in latitude and 25° in longitude). The plateau has been the subject of climate research for several decades because of its topographic characteristics and its influence on energy and water cycles on both regional (e.g., Asian monsoon) and global (e.g., El Nin ˜o) scales [e.g., Flohn, 1957; Yeh et al., 1957; Liu et al., 2003]. The onset of the Asian summer monsoon coincides with the reversal of the meridional temperature gradient in the upper troposphere south of the Tibetan Plateau, resulting from the large temperature increases in May to June over Eurasia and centered on the plateau [Li and Yanai, 1996]. [3] Much effort has been made to evaluate the strength and distribution of atmospheric heat and moisture sources over the plateau and its vicinity. Researchers have found that: (1) the plateau is the major energy source by providing sensible heat flux to the atmosphere before the onset of monsoon [e.g., Li and Yanai, 1996]; (2) during the rainy season, the latent heat released to the atmosphere is the dominant heat source over the eastern plateau, whereas JOURNAL OF GEOPHYSICAL RESEARCH, VOL. 109, D21106, doi:10.1029/2004JD004767, 2004 1 Department of Atmospheric Sciences, Yonsei University, Seoul, Republic of Korea. 2 Department of Geosciences, Tsukuba University, Tsukuba, Japan. 3 Disaster Prevention Research Institute, Kyoto University, Kyoto, Japan. 4 Faculty of Science, Okayama University, Okayama, Japan. 5 Chinese Administration for Meteorological Sciences, Beijing, China. 6 School of Environment, University of Shiga Prefecture, Shiga, Japan. 7 Cold and Arid Regions Environmental and Engineering Research Institute, Chinese Academy of Sciences, Lanzhou, China. 8 Department of Civil Engineering, University of Tokyo, Tokyo, Japan. 9 Hydrospheric Atmospheric Research Center, Nagoya University, Nagoya, Japan. Copyright 2004 by the American Geophysical Union. 0148-0227/04/2004JD004767$09.00 D21106 1 of 12
Transcript of Turbulent exchange of heat, water vapor, and momentum over a Tibetan prairie by eddy covariance and...

Turbulent exchange of heat, water vapor, and momentum over a
Tibetan prairie by eddy covariance and flux variance measurements
Taejin Choi,1 Jinkyu Hong,1 Joon Kim,1 Heechoon Lee,1 Jun Asanuma,2
Hirohiko Ishikawa,3 Osamu Tsukamoto,4 Gao Zhiqiu,5 Yaoming Ma,6 Kenichi Ueno,6
Jiemin Wang,7 Toshio Koike,8 and Tetsuo Yasunari9
Received 12 March 2004; revised 28 July 2004; accepted 1 September 2004; published 6 November 2004.
[1] Land-atmosphere interactions on the Tibetan Plateau are important because of theirinfluence on energy and water cycles on both regional and global scales. Flux variance andeddy covariance methods were used to measure turbulent fluxes of heat, water vapor,and momentum over a Tibetan shortgrass prairie during the Global Energy and WaterCycle Experiment (GEWEX) Asian Monsoon Experiment (GAME) in 1998. Underunstable conditions during the monsoon period (July–September), the observed standarddeviations of temperature and specific humidity (normalized by appropriate scalingparameters) followed the Monin-Obukhov theory. The similarity constants for heat CT andwater vapor Cq in their dimensionless functions of stability under a free convectionlimit were both 1.1, unlike the differences (i.e., CT � Cq) reported in other studies. Whilethe transfer efficiency of heat and water vapor exchange generally agreed with theprediction from the Monin-Obukhov theory, momentum exchange was less efficient thanpredicted. In comparison with the eddy covariance data, the flux variance method (withCT = Cq = 1.1) underestimated both heat and water vapor fluxes by <5%. When the eddycovariance data were absent, the flux variance method was used for gap filling theseasonal flux database. To estimate latent heat flux during the premonsoon period in June,CT/Cq was approximated as rTq (where rTq is a correlation coefficient for the fluctuationsof temperature and water vapor) because of the sensitivity of Cq to changes in soilmoisture conditions. The dramatic changes in the Bowen ratio from 9.0 to 0.4 indicate theshift of energy sources for atmospheric heating over the plateau, which, in turn, resultedin the shift of turbulent exchange mechanisms for heat and water vapor. INDEX TERMS:
1878 Hydrology: Water/energy interactions; 0315 Atmospheric Composition and Structure: Biosphere/
atmosphere interactions; 3307 Meteorology and Atmospheric Dynamics: Boundary layer processes; 3379
Meteorology and Atmospheric Dynamics: Turbulence; KEYWORDS: Tibetan Plateau, eddy covariance, flux
variance, Monin-Obukhov theory
Citation: Choi, T., et al. (2004), Turbulent exchange of heat, water vapor, and momentum over a Tibetan prairie by eddy covariance
and flux variance measurements, J. Geophys. Res., 109, D21106, doi:10.1029/2004JD004767.
1. Introduction
[2] The Tibetan Plateau is characterized by high elevation(>4000 m) and vast area (�10� in latitude and �25� in
longitude). The plateau has been the subject of climateresearch for several decades because of its topographiccharacteristics and its influence on energy and water cycleson both regional (e.g., Asian monsoon) and global (e.g., ElNino) scales [e.g., Flohn, 1957; Yeh et al., 1957; Liu et al.,2003]. The onset of the Asian summer monsoon coincideswith the reversal of the meridional temperature gradient inthe upper troposphere south of the Tibetan Plateau, resultingfrom the large temperature increases in May to June overEurasia and centered on the plateau [Li and Yanai, 1996].[3] Much effort has been made to evaluate the strength
and distribution of atmospheric heat and moisture sourcesover the plateau and its vicinity. Researchers have foundthat: (1) the plateau is the major energy source by providingsensible heat flux to the atmosphere before the onset ofmonsoon [e.g., Li and Yanai, 1996]; (2) during the rainyseason, the latent heat released to the atmosphere is thedominant heat source over the eastern plateau, whereas
JOURNAL OF GEOPHYSICAL RESEARCH, VOL. 109, D21106, doi:10.1029/2004JD004767, 2004
1Department of Atmospheric Sciences, Yonsei University, Seoul,Republic of Korea.
2Department of Geosciences, Tsukuba University, Tsukuba, Japan.3Disaster Prevention Research Institute, Kyoto University, Kyoto,
Japan.4Faculty of Science, Okayama University, Okayama, Japan.5Chinese Administration for Meteorological Sciences, Beijing, China.6School of Environment, University of Shiga Prefecture, Shiga, Japan.7Cold and Arid Regions Environmental and Engineering Research
Institute, Chinese Academy of Sciences, Lanzhou, China.8Department of Civil Engineering, University of Tokyo, Tokyo, Japan.9Hydrospheric Atmospheric Research Center, Nagoya University,
Nagoya, Japan.
Copyright 2004 by the American Geophysical Union.0148-0227/04/2004JD004767$09.00
D21106 1 of 12
sensible heat flux is comparable to latent heat flux over thewestern plateau [e.g., Chen et al., 1985]; (3) local recyclingthrough evaporation is important in the water budget overthe western plateau, whereas water vapor transport fromoutside is significant over the eastern plateau [e.g., Luo andYanai, 1983]; and (4) there is a consensus on the distributionof heat/moisture sources and the heating mechanism overthe plateau, but the magnitudes are conflicting. For instance,Yeh and Gao [1979] obtained a vertically integrated meanheat source of 138 Wm�2 over the western plateau in June,whereas Chen et al. [1985] estimated it as 37 Wm�2. Thislarge discrepancy was caused by the different drag coef-ficients used in the bulk method, resulting in differentsensible heat fluxes by a factor of 2–3. Li et al. [2001]reported a wide range of drag coefficients (i.e., 2.5 � 10�3
to 12 � 10�3) over the plateau despite the use of the samedata. Latent heat flux can be estimated as a residual of thesurface energy budget. However, this approach is prone toerror because significant lacks (10–40%) in the energybudget closure on the plateau have been reported [e.g.,Kim et al., 2001; Bian et al., 2002].[4] The paucity of direct flux measurements has hindered
us from better understanding the role of the Tibetan Plateau inthe cyclic processes of energy and water and their potentialalteration associated with global change. Consequently, theGlobal Energy and Water Cycle Experiment (GEWEX)Asian Monsoon Experiment (GAME) was organized andintensive field measurement campaigns were executed on theplateau in 1998 [e.g., Koike et al., 1999]. Since 2002, furtherlong-term flux measurements have been attempted throughthe Coordinated Enhanced Observing Period (CEOP, http://monsoon.t.u-tokyo.ac.jp/ceop/). In these efforts, the eddycovariance method has been used to quantify the seasonalchanges in surface energy partitioning.[5] The objective of this paper is to investigate turbulent
exchange characteristics over a Tibetan prairie in terms offlux variance relations, and to document the seasonalchanges in surface energy partitioning. Both eddy covari-ance and flux variance methods were employed to measurethe turbulent fluxes from late May to September in 1998.We have used flux variance when the eddy covariancemethod was not possible because of breakage of the sonicanemometer under the extreme environmental conditions onthe plateau. The validity of the use of flux variance is thustested against direct measurement by eddy covariance.Basic characteristics of turbulence statistics are analyzedto understand the mechanisms controlling the surfaceexchange of energy and water. The flux data obtained fromthe two methods are combined to examine the seasonalvariation of energy partitioning associated with the mon-soon. The gap-filled flux data have been documented in apublic domain database for further use in validating andcalibrating of various land surface models.
2. Materials and Method
2.1. Theoretical Considerations
2.1.1. Eddy Covariance Method[6] Vertical flux F of any scalar is based on the conser-
vation equation. If the site is homogeneous and flat, andassuming stationarity and no sink/source for the scalar,then F can be obtained from the covariance between the
fluctuations of vertical wind velocity w and a mixing ratioof scalar c as below [e.g., Swinbank, 1951].
F ¼ raw0c0; ð1Þ
where ra is the air density (�0.71 kg m�3 at the study site),and the overbar and primes denote time averaging andfluctuations from the mean, respectively.2.1.2. Flux Variance Method[7] On the basis of the Monin-Obukhov similarity theory,
standard deviations of any quantity, x such as w, longitudi-nal wind speed u, temperature T and specific humidity qnormalized by scaling parameters become universal func-tions of z/L as [e.g., Tillman, 1972]:
sx=x* ¼ fx z=Lð Þ ¼ Cx1 1� Cx2z=Lð Þ1=3; ð2Þ
where sx is the standard deviation of x, x* is the scalingparameter (w0x00/u*, where w0x00 is the flux at the surfaceand u* is the friction velocity), fx is the normalizedfunction, z is the measurement height, L is the Obukhovlength, and Cx1 and Cx2 are empirical constants. Positive(negative) sign corresponds to wind components (scalars).As �z/L approaches infinity (i.e., local free convection),equation (2) can be simplified as [e.g., Wyngaard et al.,1971]:
sx=x* ¼ fx z=Lð Þ ¼ Cx �z=Lð Þ1=3; ð3Þ
where Cx(=Cx1Cx2±1/3) is a similarity constant. Taking T as x
and rearranging equation (3), sensible heat flux H isexpressed as [e.g., Katul et al., 1995].
H ¼ cprasTCT
� �3=2kgz
T
� �1=2
; ð4Þ
where cp is the specific heat capacity of dry air at constantpressure (=1005 Jkg�1 K�1), CT is a similarity constant forheat, k is the von Karman constant (=0.4), and g is theacceleration due to gravity.[8] Water vapor flux is better estimated using a site-
specific similarity constant for water vapor Cq determinedunder free convection limit than using values in the litera-ture [Asanuma and Brutsaert, 1999];
lE ¼ lraCT
Cq
sqsT
w0T 0 ¼ lrarwq
rwT
sqsT
w0T 0; ð5Þ
where rwT and rwq are the correlation coefficients for w0 andT0, and w0 and q0, respectively.[9] The value of CT seems universal and independent on
surface conditions, unlike that of Cq [e.g., Weaver, 1990; DeBruin et al., 1993; Andreas et al., 1998]. The latter increasespronouncedly as rTq decreases [Asanuma and Brutsaert,1999]. The surface moisture condition at our study sitechanged dramatically as the summer monsoon progressed.We therefore assume that CT does not change through theseason, whereas Cq changes with soil water availability.[10] The term, rwT/rwq in equation (5) could be approx-
imated by rTq when rwT/rwq < 1 (or 1/rTq when rwT/rwq > 1)
D21106 CHOI ET AL.: TURBULENT EXCHANGE ON A TIBETAN PLATEAU
2 of 12
D21106

[Bink and Meesters, 1997; Katul and Hsieh, 1997]. Then,we can rewrite equation (5) as
lE ¼ lra1
rTq
sqsT
w0T 0 if rwT < rwq and ð6aÞ
lE ¼ lrarTqsqsT
w0T 0 if rwT > rwq: ð6bÞ
Figure 1a shows the relationship between rTq (or 1/rTq) andrwT/rwq at the study site (BJ site), indicating that equations(6a) and (6b) hold. When quadrant analysis is applied toremove the likely effect of entrainment from the ABL topon rTq, better relationship is obtained (Figure 1b).2.1.3. Correlation Coefficients[11] The vertical transfer efficiencies for heat and water
vapor can be evaluated by their correlation coefficients, rwTand rwq, respectively. The ratio of rwT to rwq represents therelative transfer efficiency. On the basis of the Monin-Obukhov similarity theory, rwx can be predicted using thecorresponding integral turbulence characteristics (ITC)[e.g., De Bruin et al., 1993]:
rwx ¼w0c0
swsx¼ 1� Cx2
z
L
� �1=3=Cw1Cx1 1� Cw2
z
L
� �1=3: ð7Þ
If x is scalar, the numerator is [1 � Cx2(z/L)]1/3. Otherwise,
[1 � Cx2(z/L)]�1/3 is used.
2.1.4. Drag Coefficients[12] Drag coefficients CD at the reference height (i.e., 10
m) and under neutral stability (CDN10), can be evaluatedthrough the relation [e.g., Andreas et al., 1998],
CDN10 ¼k2
ln 10=z0ð Þ½ �2; ð8Þ
where z0 is the roughness length for momentum.
2.2. Site and Measurements
2.2.1. Study Site[13] The field experiment was conducted at a shortgrass
prairie (BJ site) near Naqu (92.04�E, 31.29�N, 4580 mabove m.s.l.), Tibet in China. Soil was predominantly sandysilt loam at the site, which was homogeneous and flat with afetch of >1 km for the prevailing wind directions. The fluxmeasurement was made from late May to mid-September in1998. The rainy season started in late June. During thepremonsoon period the surface was dry and sparsely cov-ered with short grasses. With the onset of the monsoon, thevolumetric soil water content remained >15% and theaverage grass height was about 0.05 m with grazing.2.2.2. Flux Measurement[14] The eddy covariance measurement system consisted
of a three-dimensional sonic anemometer (CSAT3, CampbellScientific, Inc.), a krypton hygrometer (KH20, CampbellScientific, Inc.), and a fine-wire thermocouple. Measure-ments were taken 2.85 m above the ground, and the separa-tion between the sonic anemometer and the hygrometer was0.15m. The prevailing wind direction was from 135� to 225�.The sampling rate was 20 Hz and the raw data were saved on
a laptop computer connected to a data logger (CR9000,Campbell Scientific, Inc.) for postprocessing. Half-hourlyaveraged turbulence statistics were calculated and recordedon the data logger.[15] Because of long and rough transportation to the
experimental site, the sonic anemometer was broken andwas not replaced until 14 July. During this period standarddeviations of temperature and humidity were measuredwith fine wire thermocouples and a krypton hygrometer,respectively. Because of a wide range of humidity, thepath length of krypton hygrometer was adjusted, and theinstrument was calibrated again in a low-pressure chamberafter the experiment.
Figure 1. Relationship between rTq (or 1/rTq) and rwT/rwqat the study site from July to September in 1998: (a) withthe whole data set and (b) with reduced data set of thequadrant analysis.
D21106 CHOI ET AL.: TURBULENT EXCHANGE ON A TIBETAN PLATEAU
3 of 12
D21106

[16] Other supporting micrometeorological measurementsmade at the site included radiation components, soil heatflux, soil temperature, soil water content, air temperatureand humidity, wind speed, and direction. All these slow-response signals were sampled every 30 s. Average valuesfor 30-min periods were stored on the same data logger.Electrical power was not available, and thus all the instru-ments and the data-logging system were operated through12 VDC batteries that were recharged by solar panels [Kimet al., 2001].2.2.3. Flux Corrections[17] The effect of coordinate rotation on fluxes was less
than 1%. To further evaluate the contribution of low-frequency eddies [e.g., Finnigan et al., 2003], half-hourlyaveraged fluxes were compared against 2-hour averages andthe agreement was within 1%. Following Moore [1986],fluxes were adjusted for the effects of path length averagingand sensor separation, resulting in 5% increase in latent heatflux. Further correction for the density variation was appliedto latent heat flux [Webb et al., 1980].2.2.4. Stationarity Test[18] To satisfy the stationarity assumption, the statistical
properties of the measured time series should not changewith time. To evaluate the degree to which turbulentstatistics may violate this assumption, the nonstationarityratio (NR) is defined as [Mahrt, 1998]
NR sbtw=RE; ð9Þ
where sbtw is the between-record standard deviation ofstatistics (for this analysis, half-hourly raw data were dividedinto four records), and RE (=swi/
ffiffiffiJ
p) is the random error
estimate, where swi is the averaged within-record standarddeviation over all of the records, and J is the number ofsubrecord segments (six segments per record were used forthis study). While RE has the effect of random variability onturbulence statistics only, sbtw may be affected by bothnonstationarity and random variability. Ideally, NR = 1 if theturbulence statistics are stationary. In practice, data are
considered nonstationary when NR� 2 [Mahrt, 1998]. TheNR values for daytime averaged w0T 0 and sT
2 in Figure 2show that the stationarity requirement is generally met.
3. Results and Discussion
3.1. Turbulence Characteristics
[19] The measured sw/u* is plotted with �z/L inFigure 3a. A normalized function of sw/u*(=Cw1(1 +Cw2jz/Lj)1/3) was determined, resulting in Cw1 = 1.12 andCw2 = 2.8. Also presented is the formulation of Kaimal andFinnigan [1994] (i.e., sw/u* = 1.25 (1 + 3jz/Lj)1/3), whichpredicts consistently greater sw/u*. Similar results wereobtained from data collected 20 m above ground usingtaller towers: one at the BJ site in 2002 and the other at Annisite in 2003 [Hong et al., 2004]. The sw/u* value of �1.12under near-neutral conditions is within the range reported inthe literature [i.e., Kaimal and Finnigan, 1994; Pahlow etal., 2001]. Pattey et al. [2002] show that sw/u* can varydepending on the types of sonic anemometers, particularlywith one with longer path length due to loss of covariancebetween u and w.[20] The measured su/u* is plotted with�z/L in Figure 3b.
Its normalized function is 3.13 (1 + 8jz/Lj)1/3. In comparisonwith sw/u*, more scatters are evident with su/u*. The lattermay not totally follow the Monin-Obukhov theory and bebetter scaled with boundary layer depth hi [Panofsky andDutton, 1984; Van Den Hurk and De Bruin, 1995]. How-ever, su/u* in Figure 3b did not scale with hi/L, where hi wasgiven as constant. The normalized function (su/u* = 2.2 (1 +3jz/Lj)1/3) of De Bruin et al. [1993] underestimates theobserved su/u*.[21] The measured ruw is presented in Figure 4 with the
correlation function (equation (7) with Cu1 = 3.13, Cu2 = 8,Cw1 = 1.12, and Cw2 = 2.8). The ruw decreases in magnitudewith increasing stability because of the dominant role ofbuoyancy production over shear production. The measuredruw appears to follow the expected pattern as a function of�z/L but with magnitudes smaller than those predicted. Thenormalized function of De Bruin et al. [1993] underesti-mates the ruw, indicating a lower efficiency of momentumexchange over the Tibetan Plateau than over terrains at lowaltitudes.[22] To investigate whether the cause of such smaller ruw
observed with the Campbell sonic anemometer could beinstrumental, the data obtained during the intercomparisonstudy with a different sonic anemometer (DAT-600, KaijoDenki) were also examined. The result, however, wassimilar, indicating no instrumental bias [see also Hong etal., 2004]. Hogstrom [2002] and McNaughton and Brunet[2002] point out a role of inactive eddies that decreases ruwthrough the enhanced su. Indeed, on the basis of spectrumanalyses of u and v under near-neutral conditions, Hong etal. [2004] show the evidence of such inactive eddies (i.e.,large spectral density at low-frequency range) at the BJ site.[23] Figure 5 shows sT/T* and sq/q* under unstable to
near-neutral conditions. Except for the scatters under near-neutral conditions, the measured sT/T* follows well theMonin-Obukhov theory under unstable conditions. The datain Figure 5a fitted to a normalized function (i.e., sT/T* =CT1(1 + CT2jz/Lj)�1/3) resulted in CT1 = 3.7 and CT2 = 34.5.(To minimize the effect of scattered data, the data were
Figure 2. Variations of daytime-averaged nonstationarityratio NR for w0T 0 and variance of temperature sT
2 duringthe monsoon period. Error bars indicate standard error ofmean.
D21106 CHOI ET AL.: TURBULENT EXCHANGE ON A TIBETAN PLATEAU
4 of 12
D21106

selected when rTq > 0.9.) For comparison, the normalizedfunctions for heat of Kaimal and Finnigan [1994] andAndreas et al. [1998] are also presented in Figure 5. Thenormalized function for sT/T* in our study is almostidentical to that of Andreas et al. [1998] over a terrain withpatchy vegetation with height of <0.6 m. However, themagnitudes of sT/T* in our study are greater than thosefrom the Kansas data [Kaimal and Finnigan, 1994].[24] Surprisingly, the behavior of sq/q* is markedly
similar to that of heat (Figure 5b). Unlike sT/T*, thenormalized function for sq/q* of Andreas et al. [1998]overestimates sq/q*. A normalized function for sq/q* isnot given by Kaimal and Finnigan [1994] but is suggestedto have a functional form similar to that for sT/T* (alsoshown in Figure 5b for comparison).[25] Figure 6 shows the behavior of sT/T* and sq/q*
within the free convection limit (�z/L > 0.2). The similarityconstant in a simplified function (i.e., Cx in equation (3)) is1.1 for both CT and Cq. In the literature, CT ranges from 0.91
Figure 3. Integral turbulence characteristics of (a) vertical and (b) streamwise wind component with�z/L during the monsoon period. Solid lines are the normalized functions from this study, the dash-dottedline is that by Kaimal and Finnigan [1994], and the dotted line is that by De Bruin et al. [1993].
Figure 4. Variation of correlation coefficients for w and uduring the monsoon period. The solid line is predicted bythe corresponding ITCs in this study, and the dashed line isprovided by De Bruin et al. [1993].
D21106 CHOI ET AL.: TURBULENT EXCHANGE ON A TIBETAN PLATEAU
5 of 12
D21106

to 1.12 whereas Cq is greater, with a range of 1.1–1.5 [e.g.,Asanuma and Brutsaert, 1999; Katul and Hsieh, 1999]. Onthe basis of the analysis of covariance budget equations forw0T 0 and w0q0, Katul and Hsieh [1999] showed that CT < Cq,suggesting a dissimilarity between heat and water vapor.[26] In Figure 7, the transfer efficiency of heat to water
vapor (i.e., rwT/rwq) is plotted against �z/L. Except thescatters toward near-neutral conditions, the data convergeto unity under unstable conditions, suggesting a similarityof source/sink between heat and water vapor near theground surface.[27] The measured rwT and rwq are shown in Figure 8 with
equation (7) (with the predetermined constants: Cx1 = 3.7,Cx2 = 34.5, Cw1 = 1.12, and Cw2 = 2.8). Both rwT and rwqincrease as the stability becomes more unstable. For com-parison, the formulation of De Bruin et al. [1993] is alsoincluded. Both rwT and rwq show that each scalar follows theMonin-Obukhov theory with similar transfer efficiency.
[28] Figure 9 shows the transfer efficiencies of heat andwater vapor as compared to momentum. Heat and watervapor are transferred more efficiently than momentum overa range of different stabilities. While the momentumexchange is systematically less efficient, heat and watervapor exchange shows a similar efficiency in magnitude,following the Monin-Obukhov theory.
3.2. Drag Coefficients
[29] First, z0 is estimated on the basis of logarithmic windprofiles under neutral conditions (�0.05 < z/L < 0.05).By substituting the estimated z0(=0.009 ± 0.009 m) inequation (8), CDN is estimated to be 3.1 (±0.7) � 10�3.On the basis of wind profile measurements at the same site,Gao et al. [2000] reported z0 of 0.0113 m and CDN of 3.5 �10�3. Li et al. [2001] estimated the drag coefficients at fourstations on the plateau using wind profile measurementsover 6 years and obtained 4.4–4.7 � 10�3. Bian et al.
Figure 5. Integral turbulence characteristics of (a) heat and (b) water vapor near neutral and underunstable stability during the monsoon period. Solid lines are the fitted normalized functions for sT/T* andsq/q* from this study, dashed lines are those by Kaimal and Finnigan [1994], and dash-dotted lines arethose by Andreas et al. [1998].
D21106 CHOI ET AL.: TURBULENT EXCHANGE ON A TIBETAN PLATEAU
6 of 12
D21106

[2002] obtained CDN of 5.5 � 10�3 through turbulencemeasurements at Qamdo site with sparse weeds of 0.35 mheight in the southeastern Tibetan Plateau. Overall, theserecent estimates of drag coefficients are only half of those(6 � 8 � 10�3) reported by earlier studies [e.g., Yeh andGao, 1979].
3.3. Flux Comparison Between Eddy Covariance andFlux Variance Methods
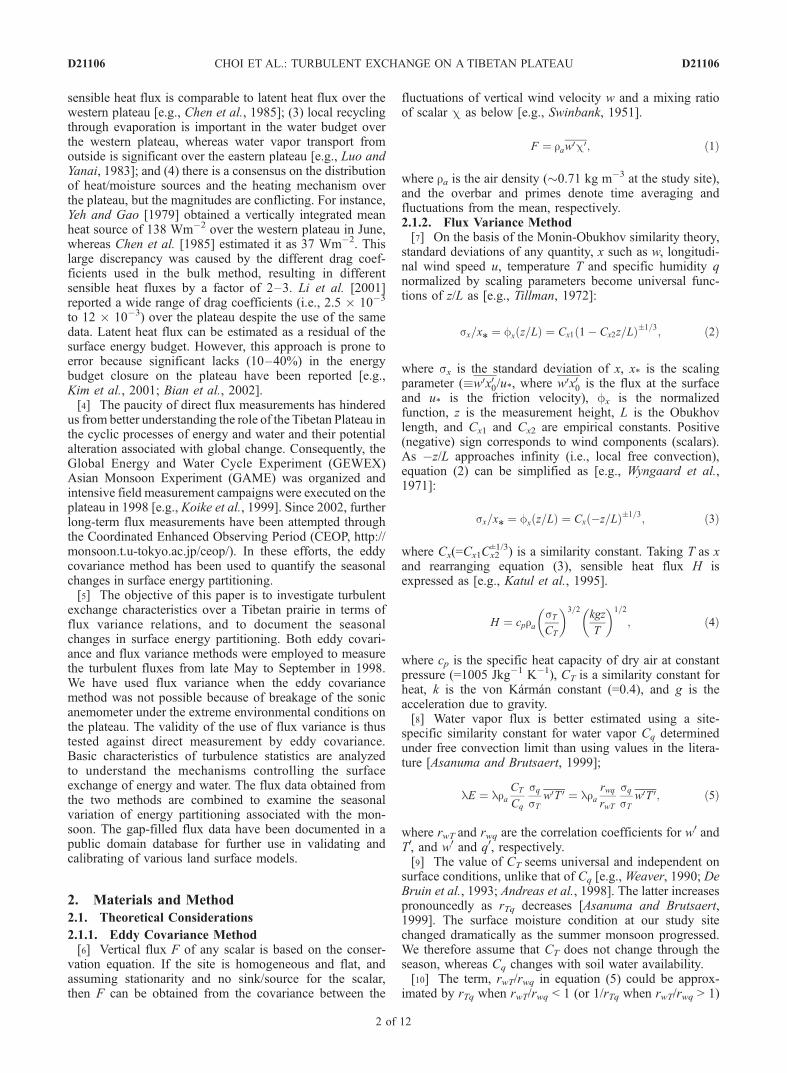
[30] Sensible heat HVAR and latent heat fluxes lEVAR fromthe flux variance method were calculated using equations(4) and (5), respectively (with CT = Cq = 1.1) and comparedagainst the available eddy covariance fluxes (HEC andlEEC) for the same period. The fluxes from the twomethods agree within 5% (SEE = 12 Wm�2 and r2 = 0.88for H; SEE = 37 Wm�2 and r2 = 0.78 for lE).[31] Because of changes in Cq with varying soil water
conditions, lEVAR was also computed with equations (6a)and (6b) using rTq and 1/rTq. Again, the flux comparisonbetween the two methods is similar to that with a constant
Figure 6. Integral turbulence characteristics of (a) T and (b) q under free convection (�z/L > 0.2) duringthe monsoon period. Solid lines are the regression lines fitted to the measurements from this study.
Figure 7. Variation of rwT/rwq with �z/L under near-neutral and unstable conditions during the monsoon period.The dotted line shows rwT/rwq = 1.
D21106 CHOI ET AL.: TURBULENT EXCHANGE ON A TIBETAN PLATEAU
7 of 12
D21106

Cq, except for larger values of SEE(=74 Wm�2) and lowerr2(=0.34) (Figure 10b). This is mainly due to small rTq,resulting in 1/rTq of much larger than 1.1. It is encouraging,however, that lEVAR using rTq is comparable to themeasured lEEC. This result provides good grounds forapplying the flux variance method when eddy covariancemeasurement is not available.
3.4. Seasonal Variations of Energy Partitioning andTurbulent Exchange Mechanism
[32] As the summer monsoon advanced, there weresignificant changes in meteorological conditions, surfaceenergy partitioning and turbulent exchange characteristics.3.4.1. Precipitation and Land Cover[33] Figure 11 shows the seasonal variations of precipi-
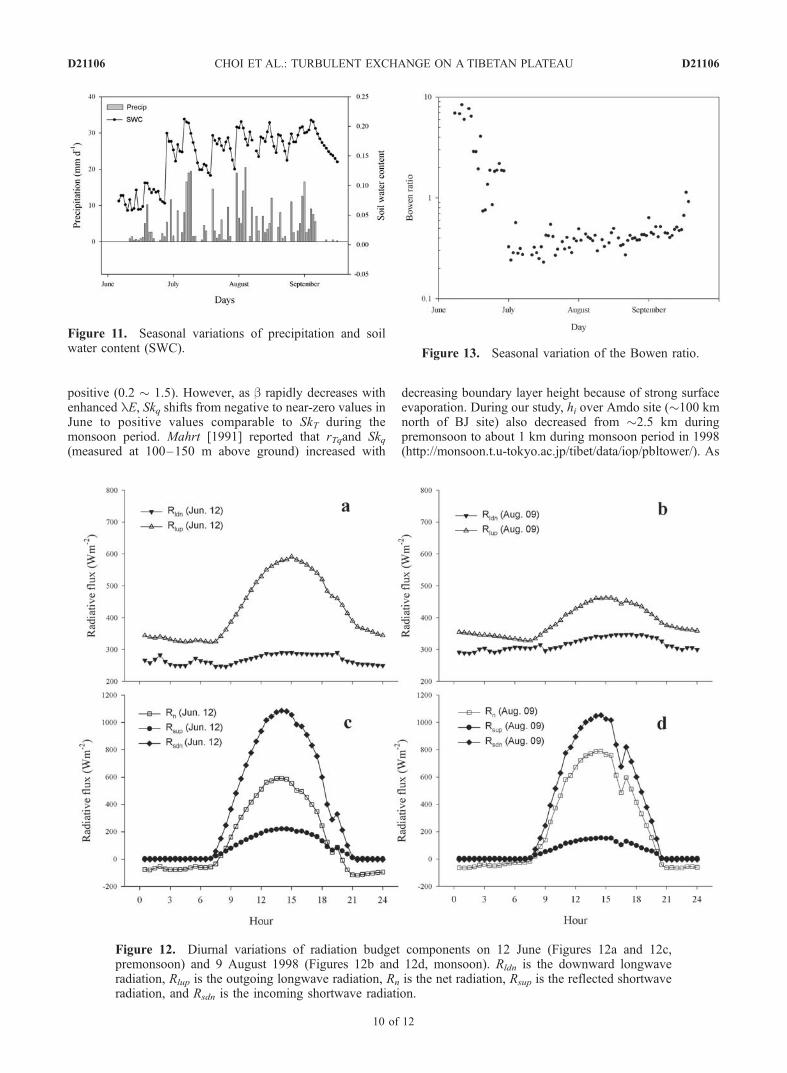
tation and soil water content (0.1 m layer). Frequency andmagnitude of precipitation increased particularly in lateJune, resulting in a rapid increase in soil water content.From the green-up stage in late June to peak growth inJuly–August, the approximate leaf area index (LAI) in-creased up to 0.45, with a mean canopy height of 0.05 m[Gao et al., 2004]. Following the change in vegetationcover, color and soil water conditions at the site, theradiation balance changed dramatically.3.4.2. Radiation Balance[34] Figure 12 shows the diurnal variation of radiation
components on two fairly clear days (12 June and 9 August
1998). Prior to monsoon (12 June), the daytime outgoinglongwave radiation Rlup and incoming longwave radiationRldn reached up to 600 Wm�2 and 300 Wm�2, respectively.The Rlup is significantly larger than those at low altitudes in
Figure 8. Variation of correlation coefficients for (a) w and T and (b) w and q during the monsoonperiod. Solid lines are predicted by the corresponding ITCs in this study, and dashed lines for eachcorrelation are provided by De Bruin et al. [1993].
Figure 9. Transfer efficiencies of heat and water vapor tomomentum under near-neutral and unstable conditionsduring the monsoon period. The solid line is the formulationfrom De Bruin et al. [1993].
D21106 CHOI ET AL.: TURBULENT EXCHANGE ON A TIBETAN PLATEAU
8 of 12
D21106
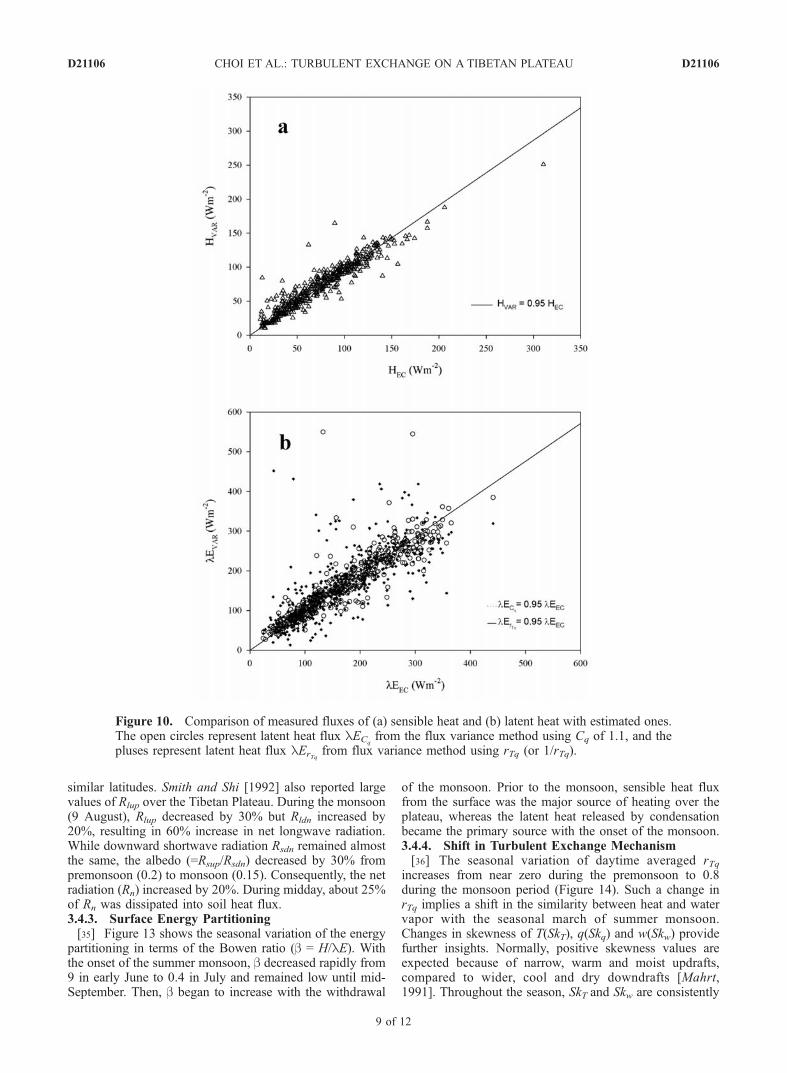
similar latitudes. Smith and Shi [1992] also reported largevalues of Rlup over the Tibetan Plateau. During the monsoon(9 August), Rlup decreased by 30% but Rldn increased by20%, resulting in 60% increase in net longwave radiation.While downward shortwave radiation Rsdn remained almostthe same, the albedo (=Rsup/Rsdn) decreased by 30% frompremonsoon (0.2) to monsoon (0.15). Consequently, the netradiation (Rn) increased by 20%. During midday, about 25%of Rn was dissipated into soil heat flux.3.4.3. Surface Energy Partitioning[35] Figure 13 shows the seasonal variation of the energy
partitioning in terms of the Bowen ratio (b = H/lE). Withthe onset of the summer monsoon, b decreased rapidly from9 in early June to 0.4 in July and remained low until mid-September. Then, b began to increase with the withdrawal
of the monsoon. Prior to the monsoon, sensible heat fluxfrom the surface was the major source of heating over theplateau, whereas the latent heat released by condensationbecame the primary source with the onset of the monsoon.3.4.4. Shift in Turbulent Exchange Mechanism[36] The seasonal variation of daytime averaged rTq
increases from near zero during the premonsoon to 0.8during the monsoon period (Figure 14). Such a change inrTq implies a shift in the similarity between heat and watervapor with the seasonal march of summer monsoon.Changes in skewness of T(SkT), q(Skq) and w(Skw) providefurther insights. Normally, positive skewness values areexpected because of narrow, warm and moist updrafts,compared to wider, cool and dry downdrafts [Mahrt,1991]. Throughout the season, SkT and Skw are consistently
Figure 10. Comparison of measured fluxes of (a) sensible heat and (b) latent heat with estimated ones.The open circles represent latent heat flux lECq
from the flux variance method using Cq of 1.1, and thepluses represent latent heat flux lErTq
from flux variance method using rTq (or 1/rTq).
D21106 CHOI ET AL.: TURBULENT EXCHANGE ON A TIBETAN PLATEAU
9 of 12
D21106
positive (0.2 � 1.5). However, as b rapidly decreases withenhanced lE, Skq shifts from negative to near-zero values inJune to positive values comparable to SkT during themonsoon period. Mahrt [1991] reported that rTqand Skq(measured at 100–150 m above ground) increased with
decreasing boundary layer height because of strong surfaceevaporation. During our study, hi over Amdo site (�100 kmnorth of BJ site) also decreased from �2.5 km duringpremonsoon to about 1 km during monsoon period in 1998(http://monsoon.t.u-tokyo.ac.jp/tibet/data/iop/pbltower/). As
Figure 11. Seasonal variations of precipitation and soilwater content (SWC).
Figure 12. Diurnal variations of radiation budget components on 12 June (Figures 12a and 12c,premonsoon) and 9 August 1998 (Figures 12b and 12d, monsoon). Rldn is the downward longwaveradiation, Rlup is the outgoing longwave radiation, Rn is the net radiation, Rsup is the reflected shortwaveradiation, and Rsdn is the incoming shortwave radiation.
Figure 13. Seasonal variation of the Bowen ratio.
D21106 CHOI ET AL.: TURBULENT EXCHANGE ON A TIBETAN PLATEAU
10 of 12
D21106

pointed out by De Bruin et al. [1999], the relative contribu-tions of entrainment of warm and dry air from the boundarylayer top probably have influenced the similarity near thesurface. Local advection or the heterogeneity of sink/sourcedistributions of heat and water vapor also could result indissimilarity between the two scalars [e.g., Katul et al., 1995;De Bruin et al., 1999]. Analysis of skewness under suchinfluences would be helpful to better understand the turbulentexchange mechanisms over the Tibetan Plateau.
4. Concluding Remarks
[37] Turbulent exchange characteristics in a Tibetanshortgrass prairie were investigated in terms of flux variancerelation, and the changes in environmental conditions,surface energy partitioning, and the similarity between heatand water vapor were presented with the seasonal march ofthe summer monsoon. Main results are summarized asfollows.[38] 1. Normalized standard deviations of heat and water
vapor follow the Monin-Obukhov similarity theory. Heatand water vapor are similar in terms of the similarityconstant, and the flux variance method produces compara-ble H and lE to those of eddy covariance method.[39] 2. Unlike the similar magnitudes of transfer efficiency
of heat and water vapor, momentum exchange is under-estimated compared to the Monin-Obukhov similarityprediction.[40] 3. As the summer monsoon progresses, significant
changes in surface energy partitioning occur toward theenhancement of lE. The entrainment from boundary layertop or inversion layer aloft probably affects the dissimilaritybetween heat and water vapor during the premonsoon,whereas its effect during the monsoon seems relativelyweak as evidenced by low b. More information is neededon the likely role of inactive eddies associated with turbu-lent exchange mechanisms over the plateau [Hong et al.,2004].[41] 4. Further direct measurements on turbulence statis-
tics, evaluation of local advection and heterogeneity ofsource/sink distribution through remote sensing analysis,
and profile measurements of heat and water vapor in theboundary layer are needed, particularly for premonsoonperiods. Such measurements are currently in progress onthe plateau through ongoing CEOP field campaigns.
[42] Acknowledgments. We are grateful to Bert Tanner and EdwardSwiatek at Campbell Scientific, Inc., for their prompt and generous lendingof the sonic anemometer used in this study. Our thanks also go out toY. Yupin for helping with field measurements. Financial support was giventhrough the ‘‘Eco-Technopia 21 project’’ by the Ministry of Environment,Korea, and the National Space Development Agency of Japan. The CEOPdata were provided within the framework of GAME/CAMP Tibet Scientificand Technological Research Project, funded by the Ministry of Education,Culture, Sports, Science and Technology; the Japan Science and Technol-ogy Agency; the Frontier Research System for Global Change; the JapanAerospace Exploration Agency; the Chinese Academy of Sciences; and theChinese Academy of Meteorological Sciences.
ReferencesAndreas, E. L., R. J. Hill, J. R. Gosz, D. I. Moore, W. D. Otto, and A. D.Sarma (1998), Statistics of surface-layer turbulence over terrain withmetre-scale heterogeneity, Boundary Layer Meteorol., 86, 379–408.
Asanuma, J., and W. Brutsaert (1999), Turbulence variance characteristicsof temperature and humidity in the unstable atmospheric surface layerabove a variable pine forest, Water Resour. Res., 35(2), 515–521.
Bian, L., Z. Gao, Q. Xu, L. Lu, and Y. Cheng (2002), Measurements ofturbulence transfer in the near-surface layer over the southeastern TibetanPlateau, Boundary Layer Meteorol., 102, 281–300.
Bink, N. J., and A. G. C. A. Meesters (1997), Comment on ‘‘Estimation ofsurface heat and momentum fluxes using the flux-variance method aboveuniform and non-uniform terrain’’ by Katul et al. (1995), Boundary LayerMeteorol., 84, 497–502.
Chen, L., E. R. Reiter, and Z. Feng (1985), The atmosphere heat sourceover the Tibetan Plateau: May–August 1979, Mon. Weather Rev., 113,1771–1790.
De Bruin, H. A. R., W. Kohsiek, and B. J. J. M. Van Den Hurk (1993), Averification of some methods to determine the fluxes of momentum,sensible heat, and water vapor using standard deviation and structureparameter of scalar meteorological quantities, Boundary Layer Meteorol.,63, 231–257.
De Bruin, H. A. R., B. J. J. M. Van Den Hurk, and L. J. M. Kroon (1999),On the temperature-humidity correlation and similarity, Boundary LayerMeteorol., 93, 453–468.
Finnigan, J. J., R. Clements, Y. Malhi, R. Leuning, and H. A. Cleugh(2003), A re-evaluation of long-term flux measurement techniques. Part1: Averaging and coordinate rotation, Boundary Layer Meteorol., 107,1–48.
Flohn, H. (1957), Large-scale aspects of the ‘‘summer monsoon’’ in southand east Asia, J. Meteorol. Soc. Jpn., 75th anniv. vol., 180–186.
Gao, Z., J. Wang, Y. Ma, J. Kim, T. Choi, H. Lee, J. Asanuma, and Z. Su(2000), Calculation of near-surface layer turbulent transport and analysisof surface thermal equilibrium features in Nagqu of Tibet, Phys. Chem.Earth, Part B: Hydrol. Oceans Atmos., 25, 135–139.
Gao, Z., N. Chae, J. Kim, J. Hong, T. Choi, and H. Lee (2004), Modeling ofsurface energy partitioning, surface temperature and soil wetness in theTibetan prairie using the Simple Biosphere Model 2 (SiB2), J. Geophys.Res., 109, D06102, doi:10.1029/2003JD004089.
Hogstrom, U. (2002), Theory and measurements for turbulence spectra andvariances in the atmospheric neutral surface layer, Boundary Layer Me-teorol., 103, 101–124.
Hong, J., T. Choi, H. Ishikawa, and J. Kim (2004), Turbulence structures inthe near-neutral surface layer on the Tibetan Plateau, Geophys. Res. Lett.,31, L15106, doi:10.1029/2004GL019935.
Kaimal, J. C., and J. Finnigan (1994), Atmospheric Boundary Layer Flows:Their Structure and Measurement, Oxford Univ. Press, New York.
Katul, G. G., and C.-I. Hsieh (1997), Reply to the comment by Bink andMeesters, Boundary Layer Meteorol., 84, 503–509.
Katul, G. G., and C.-I. Hsieh (1999), A note on the flux-variance similarityrelationships for heat and water vapor in the unstable atmospheric surfacelayer, Boundary Layer Meteorol., 90, 327–338.
Katul, G. G., S. M. Goltz, C.-I. Hsieh, Y. Cheng, F. Mowry, and J. Sigmon(1995), Estimation of surface heat and momentum fluxes using the flux-variance method above uniform and non-uniform terrain, BoundaryLayer Meteorol., 74, 237–260.
Kim, J., et al. (2001), On measuring and modeling surface energy partition-ing in a Tibetan prairie during GAME-IOP 1998, paper presented at theFifth International Study Conference on GEWEX in Asia and GAME,World Clim. Res. Program, Nagoya, Japan, 3–5 Oct.
Figure 14. Seasonal variations of daytime-averaged rTqand skewness of T, q, and w. Error bars indicate standarderror of mean.
D21106 CHOI ET AL.: TURBULENT EXCHANGE ON A TIBETAN PLATEAU
11 of 12
D21106
Koike, T., T. Yasunari, J. Wang, and T. Yao (1999), GAME-Tibet IOPsummary report, paper presented at the 1st International Workshop onGAME-Tibet, Chin. Acad. of Sci., Xian, China, 11–13 Jan.
Li, C., and M. Yanai (1996), The onset and interannual variability ofthe Asian summer monsoon in relation to land-sea thermal constrast,J. Clim., 9, 358–375.
Li, C., T. Duan, S. Haginoya, and L. Chen (2001), Estimates of the bulktransfer coefficients and surface fluxes over the Tibetan Plateau usingAWS data, J. Meteorol. Soc. Jpn., 79(2), 625–635.
Liu, X. D., J. E. Kutzbach, Z. Liu, Z. S. An, and L. Li (2003), The TibetanPlateau as amplifier of orbital-scale variability of the east Asian monsoon,Geophys. Res. Lett., 30(16), 1839, doi:10.1029/2003GL017510.
Luo, H., and M. Yanai (1983), The large-scale circulation and heat sourcesover the Tibetan Plateau and surrounding areas during the early summerof 1979: Part I. Precipitation and kinematic analyses, Mon. Weather Rev.,111, 922–944.
Mahrt, L. (1991), Boundary-layer moisture regimes, Q. J. R. Meteorol.Soc., 117, 151–171.
Mahrt, L. (1998), Flux sampling errors for aircraft and towers, J. Atmos.Oceanic Technol., 15, 416–429.
McNaughton, K. G., and Y. Brunet (2002), Townsend’s hypothesis, coher-ent structure and Monin-Obukhov similarity, Boundary Layer Meteorol.,102, 161–175.
Moore, C. J. (1986), Frequency response corrections for eddy correlationsystems, Boundary Layer Meteorol., 37, 17–35.
Pahlow, M., M. B. Parlange, and F. Porte-Agel (2001), On Monin-Obukhovsimilarity in the stable atmospheric boundary layer, Boundary LayerMeteorol., 99, 225–248.
Panofsky, H., and J. Dutton (1984), Atmospheric Turbulence: Models andMethods for Engineering Application, 397 pp., John Wiley, Hoboken,N. J.
Pattey, E., I. B. Strachan, R. L. Desjardins, and J. Massheder (2002),Measuring nighttime CO2 flux over terrestrial ecosystems using eddycovariance and nocturnal boundary layer methods, Agric. For. Meteorol.,113, 145–158.
Smith, E. A., and L. Shi (1992), Surface forcing of the infrared coolingprofile over the Tibetan Plateau. Part I: Influence of relative longwaveradiative heating at high altitude, J. Atmos. Sci., 49, 805–822.
Swinbank, W. C. (1951), The measurement of vertical transfer of heat,water vapor and momentum in the lower atmosphere with some results,J. Meteorol., 8, 135–145.
Tillman, J. E. (1972), The indirect determination of stability, heat andmomentum fluxes in the atmospheric boundary layer from simple scalarvariables during dry unstable conditions, J. Appl. Meteorol., 11, 783–792.
Van Den Hurk, B. J. J. M., and H. A. R. De Bruin (1995), Fluctuationsof the horizontal wind under unstable conditions, Boundary LayerMeteorol., 74, 341–352.
Weaver, H. (1990), Temperature and humidity flux-variance relationsdetermined by one-dimensional eddy correlation, Boundary LayerMeteorol., 53, 77–91.
Webb, E. K., G. I. Perman, and R. Leuning (1980), Correction of fluxmeasurements for density effects due to heat and water transfer, Q. J.R. Meteorol. Soc., 106, 85–100.
Wyngaard, J. C., O. R. Cote, and Y. Izumi (1971), Local free convection,similarity, and the budgets of shear stress and heat flux, J. Atmos. Sci., 28,1171–1182.
Yeh, D., and Y. X. Gao (1979), The Meteorology of the Qinghai-Xizang(Tibet) Plateau, 278 pp., Sci. Press, Beijing.
Yeh, T.-C., S.-Y. Dao, and M.-T. Li (1957), The abrupt change of circula-tion over the North Hemisphere during June and October, in The Atmo-sphere and the Sea in Motion, Rossy Memorial Volume, pp. 249–267,Rockefeller Inst. Press, Albany, N. Y.
�����������������������J. Asanuma, Department of Geosciences, Tsukuba University, Tsukuba
305-8571, Japan. ([email protected])T. Choi, J. Hong, J. Kim, and H. Lee, Department of Atmospheric
Sciences, Yonsei University, Seoul 120-749, Republic of Korea. ([email protected]; [email protected]; [email protected]; [email protected])Gao Zhiqiu, Chinese Administration for Meteorological Sciences, Beijing
100081, China. ([email protected])H. Ishikawa, Disaster Prevention Research Institute, Kyoto University,
Kyoto 611-0011, Japan. ([email protected])T. Koike, Department of Civil Engineering, University of Tokyo, Tokyo
113-8656, Japan. ([email protected])Y. Ma and K. Ueno, School of Environment, University of Shiga
Prefecture, Hassaka-cho 2500, Hikone, Shiga 522-8533, Japan. ([email protected]; [email protected])O. Tsukamoto, Faculty of Science, Okayama University, 3-1-1 Tsushima-
naka, Okayama 700-8530, Japan. ([email protected])J. Wang, Cold and Arid Regions Environmental and Engineering
Research Institute, Chinese Academy of Sciences, Lanzhou 730000, China.([email protected])T. Yasunari, Hydrospheric Atmospheric Research Center, Nagoya
University, Nagoya 464-8601, Japan. ([email protected])
D21106 CHOI ET AL.: TURBULENT EXCHANGE ON A TIBETAN PLATEAU
12 of 12
D21106