Trust as a Proxy for the Ability to Produce Local Public Goods : Testing Different Measures
32
Trust as a Proxy for the Ability to Produce Local Public Goods: Testing Different Measures Omar Sene To cite this version: Omar Sene. Trust as a Proxy for the Ability to Produce Local Public Goods: Testing Different Measures. Documents de travail du Centre d’Economie de la Sorbonne 2012.41 - ISSN : 1955- 611X. 2012. <halshs-00717141> HAL Id: halshs-00717141 https://halshs.archives-ouvertes.fr/halshs-00717141 Submitted on 12 Jul 2012 HAL is a multi-disciplinary open access archive for the deposit and dissemination of sci- entific research documents, whether they are pub- lished or not. The documents may come from teaching and research institutions in France or abroad, or from public or private research centers. L’archive ouverte pluridisciplinaire HAL, est destin´ ee au d´ epˆ ot et ` a la diffusion de documents scientifiques de niveau recherche, publi´ es ou non, ´ emanant des ´ etablissements d’enseignement et de recherche fran¸cais ou ´ etrangers, des laboratoires publics ou priv´ es.
-
Upload
independent -
Category
Documents
-
view
0 -
download
0
Transcript of Trust as a Proxy for the Ability to Produce Local Public Goods : Testing Different Measures
Trust as a Proxy for the Ability to Produce Local Public
Goods: Testing Different Measures
Omar Sene
To cite this version:
Omar Sene. Trust as a Proxy for the Ability to Produce Local Public Goods: Testing DifferentMeasures. Documents de travail du Centre d’Economie de la Sorbonne 2012.41 - ISSN : 1955-611X. 2012. <halshs-00717141>
HAL Id: halshs-00717141
https://halshs.archives-ouvertes.fr/halshs-00717141
Submitted on 12 Jul 2012
HAL is a multi-disciplinary open accessarchive for the deposit and dissemination of sci-entific research documents, whether they are pub-lished or not. The documents may come fromteaching and research institutions in France orabroad, or from public or private research centers.
L’archive ouverte pluridisciplinaire HAL, estdestinee au depot et a la diffusion de documentsscientifiques de niveau recherche, publies ou non,emanant des etablissements d’enseignement et derecherche francais ou etrangers, des laboratoirespublics ou prives.
Documents de Travail du
Centre d’Economie de la Sorbonne
Trust as a Proxy for the Ability to Produce Local Public
Goods : Testing Different Measures
Omar SENE
2012.41
Maison des Sciences Économiques, 106-112 boulevard de L'Hôpital, 75647 Paris Cedex 13 http://centredeconomiesorbonne.univ-paris1.fr/bandeau-haut/documents-de-travail/
ISSN : 1955-611X

Trust as a Proxy for the Ability to Produce Local
Public Goods: Testing Different Measures∗
Omar SENE†
June 20, 2012
∗I thank Juan Camillo Cardenas (Bogota Universitad), Guillaume Hollard (CNRS, Paris 1),Emmanuel Flachaire (GREQAM, Marseille), Fabian Gouret, and Leonard Wantchkon (New YorkUniversity) and Hela Maafi for their comments and suggestions. I think also participants at theAnnual Meeting of Association Francaise d’Economie Experimentale (2011), Workshop EconomicBehaviour and Interaction Models in ERASMUS Paris ((2011), Bi-annual meeting of the UP1Doctoral School of Paris School of Economy (2011) and seminar GERSEG in Saint-Louis (Senegal)
†Centre d’Economie de la Sorbonne, Universite Paris 1, 106-112 boulevard de l’Hopital, 75013Paris. E-mail: [email protected].
Documents de Travail du Centre d'Economie de la Sorbonne - 2012.41
Abstract
The ability to produce local public goods and services such as sharing
savings, risk, insurance, sanitation and educational services, is a key factor
for development. This ability, however, varies greatly across communities
(Ostrom 1990; Khwaja 2009). Considering that this ability depends critically
on members’ willingness to act collectively, this paper investigate whether
the level of trust among people measured in different ways can predict the
amount of public good produced. I find that (i) trust, as measured by survey
questions, has poor predictive power, while (ii) the results from our version
of Trust Game are much better predictors of local public-good production.
Keywors: Trust, Collective Action, Provision of Local Public Goods,
Trust Game.
JEL Classification Numbers: C93 H41 D71
Resume:
La capacite a produire des biens et des services publics locaux (les systemes
d’epargnes mutuelles, de credit ou d’assurance informels, ou les services
sanitaires) est un facteur cle de developpement. Cependant, une large
litterature s’accorde sur le fait que cette capacite varie considerablement
d’une communaute a une autre. Dans ce papier, je considere que cette
capacite, pour une communaute donnee, depend de la volonte de ses membres
d’agir collectivement. Je teste si le niveau de confiance entre les gens, mesuree
de differentes facons, permet de predire la quantite de biens publics produite.
Je trouve que (i) la confiance, telle que mesuree par les questions d’enquetes,
a un mauvais pouvoir predictif, tandis que (ii) les resultats de la version du
”jeu la confiance” a un bien meilleur pouvoir predictif.
Mots-cles: Confiance, Action Collective, Provision de Biens et Ser-
vices Locaux, Trust Game.
2
Documents de Travail du Centre d'Economie de la Sorbonne - 2012.41
1. Introduction
Inefficiencies in the provision of public goods are considered to be one of the
important causes of underdevelopment. States usually provide basic public goods
using tax revenue, but are not always able to mobilize the resources necessary to
finance them. In these cases, local communities are often called upon to organize the
production of the local public goods and services that they need themselves. The
problem with the voluntary provision of public goods is, however, the temptation
to free-ride, which affects the capacity of groups to carry out collective actions and,
thus, the ability of communities to produce local public goods.
Evidence from field research has shown that the capacity to cooperate varies
greatly across communities: while some communities are unable to perform joint
activities, there are many examples of communities that do engage successfully in
collective action to manage local resources (Ostrom, 1990; Khwaja, 2009). For ex-
ample, the 2009 Nobel Prize winner Elinor Ostrom has documented a number of
cases in which communities cooperate successfully in the management of common
interests. One of the factors Ostrom highlights as being behind this success is the
importance of communities’ shared norms and rules in improving cooperative behav-
ior. These findings have inspired new interest in the role of shared norms in group
performance.
Amongst these different norms, trust has attracted particular attention in Social
Science. First analyzed in Sociology and Psychology, Economists have paid greater
attention to trust since Arrow (1972) affirmed that ”much of economic backward-
ness in the world can be explain by a lack of mutual confidence”. In particular, it is
considered that trust can reduce transaction costs, encourage respect for contracts
(Akerlof, 1970; Holmstrom, 1979) and facilitates cooperation (Hardin (2002); Hardin
(2006); Fehr and G’achter (2002)) and conflict resolution (Ostrom, 1990).
The rapid growth of work on social capital over the past two decades has also
gone hand-in-hand with renewed interest in trust. Social-capital researchers consider
trust as a fundamental norm facilitating collective action and thus economic perfor-
mance. Putnam (1993), for example, considering the differences in the development
3
Documents de Travail du Centre d'Economie de la Sorbonne - 2012.41
of Northern and Southern Italy, concludes that the stronger trust relationships in
the North explain its economic success. Similar conclusions are reached by Knack
and Keefer (1997) and Bornschier (2000). This has encouraged the emergence of a
large literature appealing to trust to explain the pattern of economic development.
However, trust is anything but a simple concept, both in terms of definition and,
thus, its measurement. There is no unified and widely-accepted definition of trust
in empirical work: varying and sometimes conflicting measurement methods are ap-
plied (Narayan and Pritchett, 1999; Karlan, 2002;Knack and Keefer, 1997; La Porta
et al., 1997; Knack and Zak, 2003).
Trust measurement methods are of two kinds: survey and experimental. Survey
measures, the most common, include asking individuals directly about their trust
attitudes towards others such as ”most people”, ”neighbors”or ”strangers”. A widely-
used trust survey question is that in the World Values Survey (WVS): ”Generally
speaking, would you say that most people can be trusted or that you need to be
very careful in dealing with people?”. This question also appears in the American
General Social Survey, amongst others. However, survey questions regarding trust
are open to criticism. A number of researchers have argued that trust questions are
too abstract (Glaeser et al. (2000), Nannestad, 2008, and Sturgis and Smith, 2010)
and are not good measures of the underlying construct.
An alternative is to carry out experiments. The most widely-used experiment is
the trust game, initially developed by Berg et al. (1995). In this game, two players,
a sender and a receiver, are both given an endowment of X dollars. The sender has
then to decide whether to send part of his endowment (of X dollars) to an anony-
mous receiver. The sender is informed that the amount sent is tripled (3X) by the
experimenter on the way to the receiver. The receiver then decides how much of the
money to keep (Y) and, how much to return to the sender (3X - Y). The amount
sent by the first mover (the sender) is interpreted as a manifestation of trust and
the second mover’s transfer a manifestation of trustworthiness. The trust game has
been used by Glaeser et al. (2000), Fehr et al. (2003), Danielson and Holm (2005)
and Cardenas et al. (2008) to test the validity of attitudinal trust questions, with
mixed results. Using a sample of Harvard students, Glaeser et al. (2000) compare
4
Documents de Travail du Centre d'Economie de la Sorbonne - 2012.41

attitudinal questions to behavior in the Trust game. They find that the trust mea-
sured by the attitudinal questions is not correlated with the level of trust in the
trust game. Unlike Glaeser et al. (2000), Fehr et al. (2003) use a sample of German
households, and find that attitudinal trust is correlated with behavior in the trust
game. Danielson and Holm (2005) observe similar differences in the relationship
between the two trust-measurement methods in Sweden and Tanzania.
The purpose in this paper is, thus, to address the problem of trust measurement
by investigating the extent to which different measures of trust are connected to a
community’s ability to produce local public goods. If this ability depends critically
on members’ willingness to act collectively, the predictive power of different measures
of trust regarding the local levels of public goods can be tested. This paper is not
able here to explain the fundamental causes of trust. It is instead interested in deter-
mining which trust measurement method is better in explaining how heterogeneous
individuals manage to engage in joint activities, despite the associated problem of
free-riding. This paper is also a contribution to the literature testing whether the
trust measured in experiments is linked to real decisions in non-laboratory settings
(including Karlan (2002) in Peru, Cardenas et al. (2008) in six South American
countries and Etang et al. (2010) in Cameroon).
Trust measurement is addressed by comparing a version of Trust Game in which
subjects are matched with a random anonymous member of the community (the
”Community Condition” of the Trust Game (CCT ))1 to a number of survey trust
questions. The analysis is carried out in three parts.
The first question is to know how individuals understand the different trust
questions and whether these various trust measures are correlated with replies in
the WVS trust question and experimental behavior. This permits me to provide an
overview of the different trust measures. The results indicate that the WVS trust
question was understood to mean trust in strangers, while the experimental design
captured a particular form of trust regarding people who live in the respondent’s
local area, the CCT. The results further show, unlike Fehr et al. (2003), that the
1This procedure is similar to that in Buchan et al. (2000), which is called the society condition
(of the Trust Game)
5
Documents de Travail du Centre d'Economie de la Sorbonne - 2012.41
CCT as a measure of trust is not correlated with the replies on the WVS trust
question or any other survey-based trust measures.
In the second step, I test whether measurement can be used in a social-interaction
context. Measuring trust in social contexts is difficult, especially via survey questions
which have been shown to produce responses that vary according the interpretation
given to the question (Naef and Schupp, 2009, Sturgis and Smith, 2010). The prob-
lem is to know whether the data obtained are comparable when it does not clear if
individuals define trust in the same way, and more importantly, have the same thing
in mind when they refer to groups such as ”most people”, ”neighbors” or ”strangers”.
This may reflect that individuals identify themselves with a specific group to which
they belong as a function of their social status (such as by gender, race, or profes-
sion) or regard others according to their social position. The results show that social
category membership is indeed correlated with replies to the survey-based measures
and the WVS trust questions, while the amount sent in the trust game is indepen-
dent of social categorization. Results thus suggest that unlike, survey questions,
experimental results can be more easily compared across communities, despite any
differences in their social structure.
Third, the different trust measures are correlated with the individual’s voluntary
decision to participate in the provision of the local public goods tontine (it provides
collective insurance for many African villages communities) credit association (an
alternative to the formal financial system, which latter is inaccessible to the poor)
and animation (social-cohesion activities, such as the organization of sporting ac-
tivities, cleaning the village, and environmental-protection activities). Results show
that survey trust measures have only poor predictive power, while the results from
the trust game (using the CCT trust-measurement method) are better able to pre-
dict individual participation in local public good provision.
The remainder of the paper is organized as follows. The details of the method-
ology including the survey procedure and experimental design appear in Section 2.
Section 3 describes the data from the survey and experiment, and Section 4 tests
which trust measure best explains participation in the provision of local public goods.
Last, Section 5 concludes.
6
Documents de Travail du Centre d'Economie de la Sorbonne - 2012.41
2. Methodology
This section describes the context of this study and the sample, and then dis-
cusses survey implementation and the experimental design.
2.1. Context
The data here come from a survey and experiment conducted in May 2010 in three
villages in Mbour department in West Senegal. Since the early 1980s these villages,
like most Senegalese villages, have faced drought and falling prices for groundnuts,
their main crop. After several failed policies aimed at reviving the agricultural sec-
tor, the government decided, with the support of international institutions, to adopt
a strategy of giving greater responsibility to the local population. This led to a
reduced government presence and the promotion of local organizations that were
supposed to be more flexible and responsive. These local organizations contributed
greatly to poverty alleviation by enabling people to access a certain number of basic
public goods and services at lower cost. Several types of local public goods and
services such as training, banking, the management of irrigation, input supply (such
as fertilizer), sanitation services and agricultural advice and training are provided
by the local population.
The goal is to use this framework to compare different measures of trust in terms
of their explanatory power of individuals’ voluntary decisions to participate in col-
lective action. Three types of activities used to finance or produce local public goods
and services are considered: monitoring savings (tontine), monitoring credit (credit
association) and social-cohesion activities (animation).
Tontine refers to an association of individuals who meet at more or less regular
intervals in order to pool their savings. Participants make a fixed contribution at
each meeting to a common fund. The total sum contributed at each meeting is allo-
cated to one of the participants, generally by lot. These winners then pay back the
loan over a period of time. Over the cycle each participant is guaranteed to win this
7
Documents de Travail du Centre d'Economie de la Sorbonne - 2012.41
loan exactly once. Tontine2 allows collective insurance systems to be implemented
in the community. As this system functions via the mechanisms of mutual guaran-
tee and monitoring, tontine is not, however, at risk from abusive and opportunistic
behavior.
Credit Association is an alternative to the formal financial system, which latter
is inaccessible to the poor. This funds local projects ranging from small businesses
to village agricultural projects. The fund is managed by a committee which is com-
posed of individuals who are considered to be trustworthy. As with the tontine,
Credit Association funds are reserved for members only. However, participation is
open to the entire village.
Animation covers social-cohesion activities, such as the organization of sporting
activities, cleaning the village, environmental-protection activities and work on col-
lective fields. Collective-field activities refer to private land that members of the
group cultivate collectively, in turn for the families of each group member.
2.2. The survey
The villages in the survey are involved in public-good provision activities that
are typical of African villages. While the villages were chosen for this reason, the
households surveyed in the village are randomly selected to provide a representative
sample. In each selected household, the household head is asked to either partic-
ipate or send a representative. The survey and experiment covered a sample of
164 individuals in the communities. The survey was conducted via face-to-face
interviews with participants. The questionnaire had two parts. The first covered
household characteristics and the relationship with other people living in the neigh-
borhood. Table 1 provides a brief description of these characteristics.
The second part of the questionnaire concerned the trust questions. Respon-
dents are asked to state their trust levels with respect to particular types of people:
neighbors, individuals participating in experiments, and strangers. The questions
concerning trust in strangers were split up into four types: strangers met for the first
2In a recent paper, Etang et al. (2010) provide evidence that trust is very high among membersof ROSCAs, a more complex form of tontine, in Cameroon.
8
Documents de Travail du Centre d'Economie de la Sorbonne - 2012.41

Table 1: The characteristics of sample participants
Mean Std Dev Min MaxNumber of observations 164Household expenditure in dollars (per day) 2.5 16.46 0.55 7.78Age 36.17 14.40 18 75Household Size 10.51 5.47 2 21Education (years) 2.78 3.76 0 14Female 44.1% 0 1Married 81.71% 0 1Christian 20.73% 0 1
Note: Household expenditure per day is in dollars (1 dollar = 450 CFA).Source: Field survey data.
time, foreigners who regularly trade with villagers, strangers from the same ethnic
group as the respondent, and strangers from a different ethnic group. Respondents
answer the trust questions on a one to four scale (1 = Not at all; 2 = A little; 3 =
Somewhat and 4 = A lot). The trust data is summarized in Table 2
The question which is the most frequently used to measure trust: ”Generally
speaking, would you say that most people can be trusted or that you need to be
very careful in dealing with people?” is added. Respondents reply either ”Most peo-
ple can be trusted” or ”Can’t be too careful when dealing with people”. Another
group of questions concerns trust in the village authorities. Table 2 summarizes the
various measures of trust as described above.
Table 2: Description of trust variables
Variables Description Mean Std. Dev.Villagehea Trust in traditional leaders 3.39 1.00Neighbors Trust in neighbors 3.38 0.90Group members Trust in group members 3.23 1.07Co-ethnics Trust in people of your ethnic group 3.06 0.95Traders Trust in foreign traders 2.75 0.98Otherethnic Trust in other ethnic groups 2.53 1.09Strangers Trust in strangers 2.27 1.01WVS WVS trust question 0.44 0.49
Note: Replies are on a one-to-four scale (1 = Not at all; 2 = A little; 3 = Somewhat; and 4 = A lot.);For the WVS, the roportion of respondents who say that ”Most people can be trusted” is reportedin the table. Source: Field survey data.
9
Documents de Travail du Centre d'Economie de la Sorbonne - 2012.41

2.3. The Trust Game
The behavioral measure of trust is a version of the investment game in Berg et al.
(1995), where two players, a sender and a receiver, are both allocated an endowment
of 1000 CFA (2.23 dollars). The sender then has to decide how much of the 1000
CFA endowment to send to an anonymous receiver. The sender is informed that the
amount sent is tripled by the experimenter on the way to the receiver. The receiver
then decides how much of this tripled amount to keep (Y) and how much to return
to the sender (3X1000 CFA - Y). The amount sent by the first mover (the sender)
is interpreted as a measure of trust and the second mover’s transfer a measure of
trustworthiness.
The experiment was implemented by first explaining it clearly (repeated as often
as necessary) to the subjects. After providing some examples and asking questions
about the game to be sure that it was understood, all participants received their
endowment of one thousand CFA.3 Participants were not allowed to communicate
with each other during the game.
All participants belonged to the same village and knew each other (at least each
participant knew the others by name). A key element of the design is that each
participant knew that he was randomly matched to a member of his own commu-
nity, but did not know his opponent’s identity. This procedure is similar to that
in Buchan et al. (2000), which they call the society condition (of the Trust Game).
The Senders, when they play with their own community members as responders, are
faced with the dilemma of whether to send any amount or not. With this design of
the trust game, we expect to capture the level of trust (as measured by the amount
sent by the first player, which I call CCT trust) that explains whether subjects par-
ticipate (or not) in the provision of public goods.
The subjects were given an identification code before privately making their
decisions that they put into an envelope. Following the senders’ decisions the ex-
perimenter multiplied the amount and the envelopes were randomly assigned to
receivers. The receivers then decided how much to send back, and the game ended.
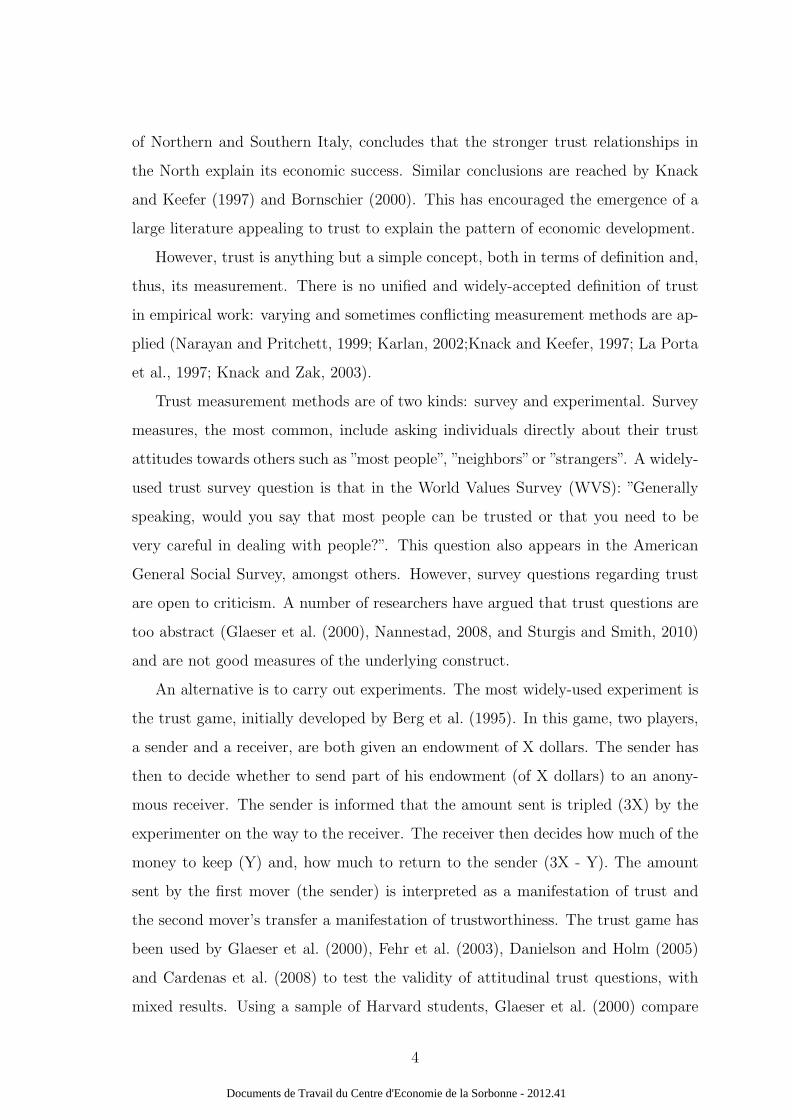
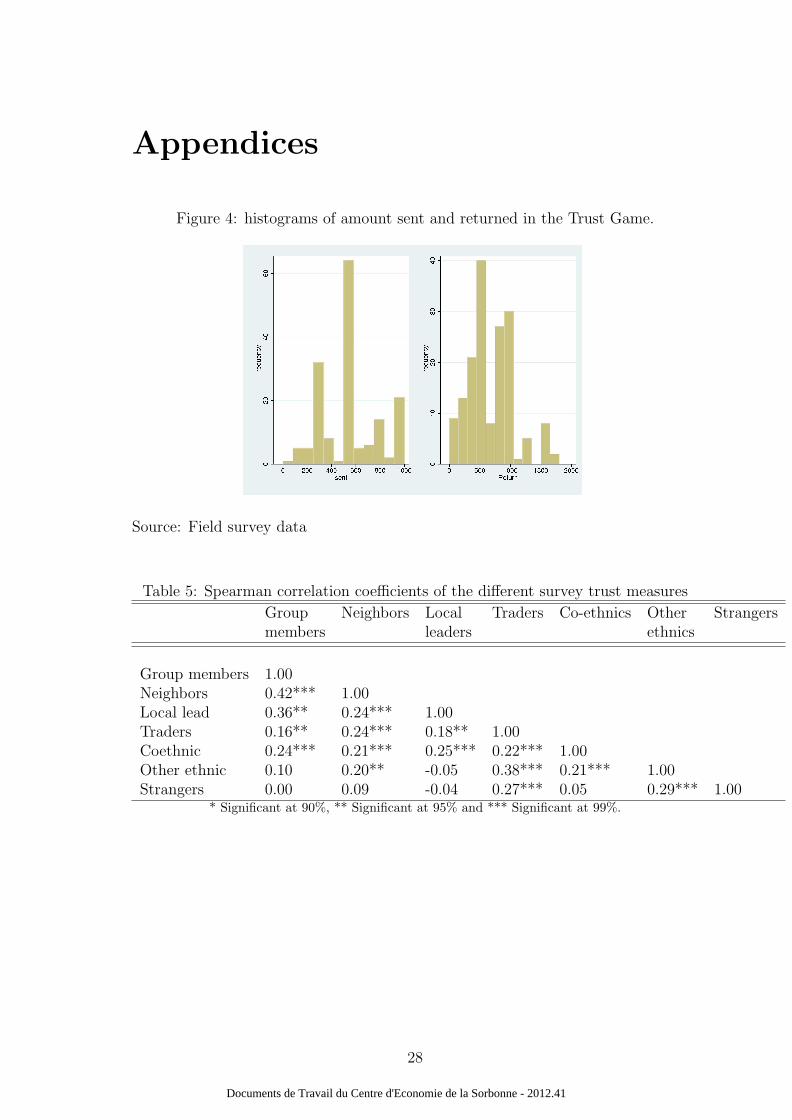
Figure 1 presents the distributions of the amounts sent and returned by the play-
3This is greater than the local daily wage
10
Documents de Travail du Centre d'Economie de la Sorbonne - 2012.41
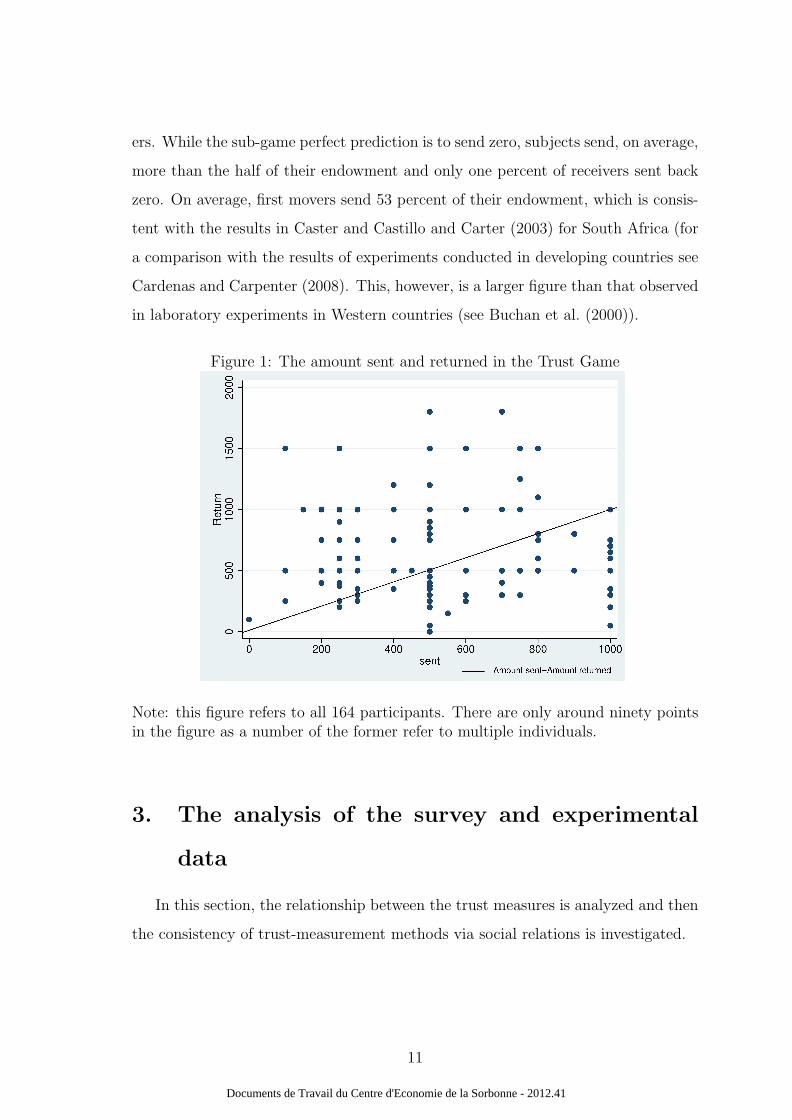
ers. While the sub-game perfect prediction is to send zero, subjects send, on average,
more than the half of their endowment and only one percent of receivers sent back
zero. On average, first movers send 53 percent of their endowment, which is consis-
tent with the results in Caster and Castillo and Carter (2003) for South Africa (for
a comparison with the results of experiments conducted in developing countries see
Cardenas and Carpenter (2008). This, however, is a larger figure than that observed
in laboratory experiments in Western countries (see Buchan et al. (2000)).
Figure 1: The amount sent and returned in the Trust Game
Note: this figure refers to all 164 participants. There are only around ninety pointsin the figure as a number of the former refer to multiple individuals.
3. The analysis of the survey and experimental
data
In this section, the relationship between the trust measures is analyzed and then
the consistency of trust-measurement methods via social relations is investigated.
11
Documents de Travail du Centre d'Economie de la Sorbonne - 2012.41

3.1. The relationship between the different trust measures
This section aims to examine how individuals in the sample interpreted the dif-
ferent trust questions and see how these are related to the WVS trust question and
trust behavior in the Trust Game. To do so, a classification of the particular trust
questions according to the respondents’ answers is established. The specific trust
questions concern trust in people ranging from neighbors to strangers met for the
first time.
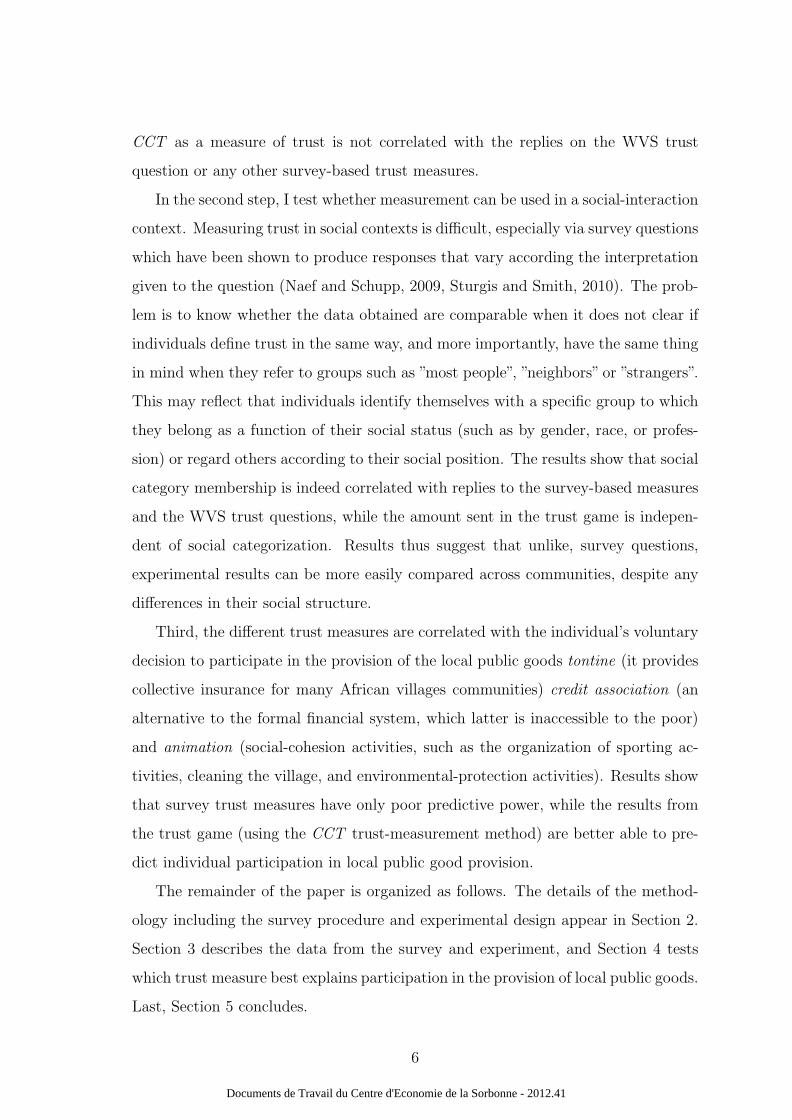
In Figure 5 the mean level of trust in others falls with social distance. In other
words, individuals report higher levels of trust for individuals or groups who are
closer to them. This result, similar to that in Cardenas (2003) and Etang et al.
(2011), is used to classify the questions as referring to trust in relatives and trust in
strangers. The Spearman rank correlation between the different survey trust mea-
sures is presented in Table 5: this confirms the dichotomous classification. Those
who exhibited greater levels of trust in group members also trusted their neighbors
more (Spearman rank correlation coefficient = 0.42, p < 0.000), as well as village
authorities (p < 0.000). On the other hand, individuals ranked trust in strangers, co-
ethnics and other ethnic groups in the same way. However, trust in foreign traders
was somewhat ambiguously ranked, being classified by respondents as similar to
both trust in strangers (p <0.05), trust in group members (p < 0.05) and trust in
neighbors (p < 0.05).
Now, the relationship between these two trust categories and other measures such
as the WVS trust question and the CCT is considered. Table 6 shows the results of
a logistic regression of WVS measure on the specific trust questions. One common
criticism of the WVS question is that it is too abstract (Glaeser et al., 2000). The
question is therefore to know how it was understood by responders: Is this a trust
question regarding relatives, strangers or simply the whole society? Here it seems
that the WVS trust question was interpreted as referring to trust in strangers. The
regression results show that while there is no correlation between trust in neighbors
and WVS measure, the latter is positively and significatively correlated with trust
in strangers met for the first time (p < 0.001). WVS measure is also correlated with
12
Documents de Travail du Centre d'Economie de la Sorbonne - 2012.41
trust in foreign traders, and trust in people from other ethnic groups. The WVS
measure of trust is therefore correlated with all of the scales of trust in strangers.
This is consistent with the suggestion in Glaeser et al. (2000) that questions referring
to trust in strangers are more precise than non-specific trust questions such as that
in the WVS measure.
I turn now to the relationship between the CCT measure and the survey. An
OLS regression of the amount sent by the first player in the Trust Game on each
of the replies to the direct question on trust shows that the CCT is negatively cor-
related with trust in strangers. This suggests that, as opposed to the WVS trust
question, the amount sent measures specific trust in members of the community in
the experiment. These regressions also show that there is no significant relationship
between the CCT and the other survey trust measures, including trust in group
members and neighbors. The correlation between the CCT and the response to the
WVS measure of trust is not significant, as in Glaeser et al. (2000).
In sum, only one of the seven survey trust measures is related to trusting be-
havior in the Trust Game, the CCT. The question is then to know whether these
measures are largely uncorrelated because they measure different types of trust, or
simply because they are not all valid trust measures. The following section therefore
focuses on the ability of these various measures to provide effective evaluations of
trust.
3.2. Evaluating the consistency of trust-measurement meth-
ods via social relations
This section questions the validity of the survey questions and experiments in
measuring trust in the sample. While the quality of trust measured by questions and
experiments has been widely discussed in the literature (Berg et al. (1995), Glaeser
et al. (2000), and Sapienza et al. (2007)) it is only rarely presented in a real-world
social-interaction context.
13
Documents de Travail du Centre d'Economie de la Sorbonne - 2012.41
3.2.1. Addressing survey trust questions via social interactions
Measuring trust in social contexts is difficult, especially via survey questions
which have been shown to produce different responses according to the interpreta-
tion given to the question (Sturgis and Smith (2010)). In surveys, it is difficult to
know if individuals define trust in the same way, and more importantly, have the
same thing in mind when they refer to groups such as ”most people”, ”neighbors”
or ”strangers”. This may reflect that individuals identify themselves with a specific
group to which they belong as a function of their social status (such as by gender,
race, or profession) or regard others according to their social position. Furthermore,
Gachter et al. (2004) find that the socio-economic background affects trust attitudes.
I thus conjecture that responses to trust questions are correlated with social posi-
tion.
To test this idea, the variance in reported trust across social classes is compared.
This reveals that social groups are statistically significantly correlated with survey
trust. For example, there are significant differences across income classes with re-
spect to trust in group members (Kruskal-Wallis test coefficient = 9.793, p-value
< 0.007), neighbors (Kruskal-Wallis test Coefficient = 3.330, p-value < 0.100) and
traders (Kruskal-Wallis test coefficient = 6.095, p-value < 0.05).
The response to the WVS measure is the only one which is sensitive to the size
of household. This may show that this question captures, in addition to trust, the
degree of open-mindedness of responders. Tables 7 and 8 show the results from
Wilcoxon-Mann-Whitney tests for different social classes. There are significant dif-
ferences between individuals according to the strength of their ties with village tra-
ditional leaders with respect to trust in group members and village authorities (re-
spectively p=0.07 and p=0.009). These results suggest that the responses to trust
questions can be considered as a proxy for community social structure. This finding
has important implications in terms of inter-community and international compar-
isons. As stressed by Naef and Schupp (2009) and Sturgis and Smith (2010), the
comparison the level of trust across communities or countries may be problematic,
and can be viewed instead as a comparison of these communities or countries’ social
14
Documents de Travail du Centre d'Economie de la Sorbonne - 2012.41
structures.
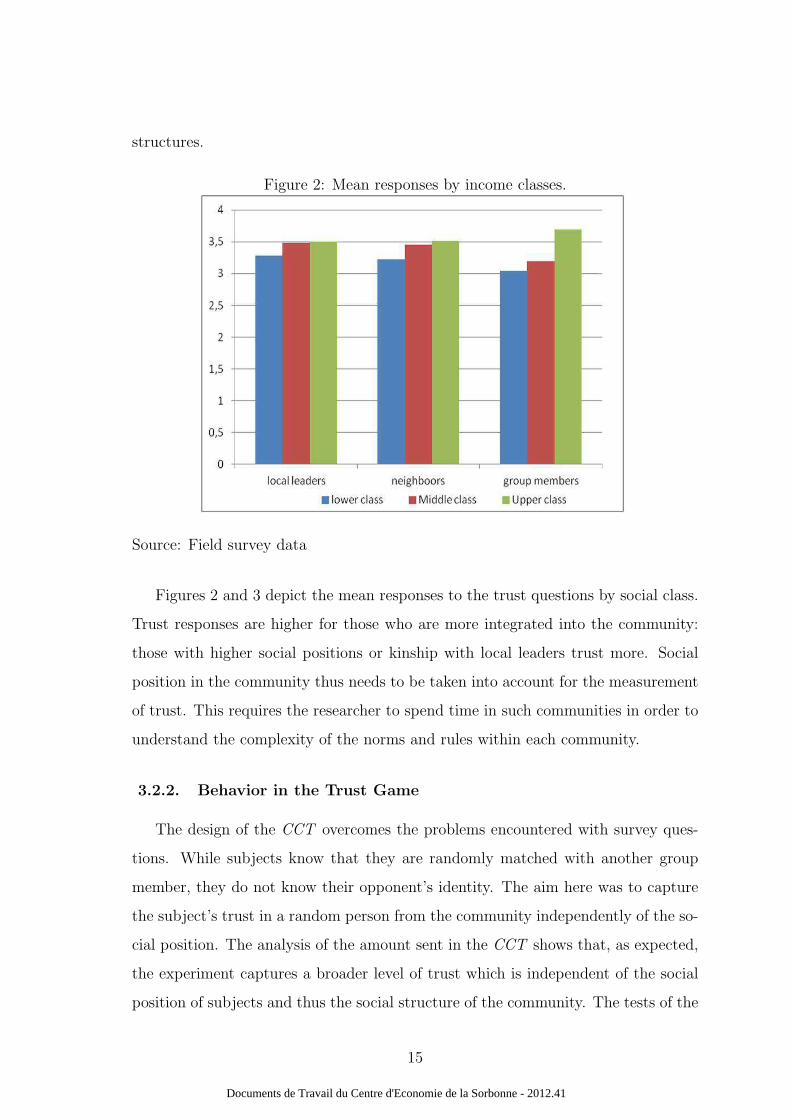
Figure 2: Mean responses by income classes.
Source: Field survey data
Figures 2 and 3 depict the mean responses to the trust questions by social class.
Trust responses are higher for those who are more integrated into the community:
those with higher social positions or kinship with local leaders trust more. Social
position in the community thus needs to be taken into account for the measurement
of trust. This requires the researcher to spend time in such communities in order to
understand the complexity of the norms and rules within each community.
3.2.2. Behavior in the Trust Game
The design of the CCT overcomes the problems encountered with survey ques-
tions. While subjects know that they are randomly matched with another group
member, they do not know their opponent’s identity. The aim here was to capture
the subject’s trust in a random person from the community independently of the so-
cial position. The analysis of the amount sent in the CCT shows that, as expected,
the experiment captures a broader level of trust which is independent of the social
position of subjects and thus the social structure of the community. The tests of the
15
Documents de Travail du Centre d'Economie de la Sorbonne - 2012.41

Figure 3: Means of responses by kinship with local leaders
Source: Field survey data
variances were insignificant, with the p-values from the Wilcoxon-Mann-Whitney
tests being well over the five percent level, showing that experimental trust was not
affected by social position.
However, the principal problem of the Trust Game as a measure of trust is, as
shown by Cox (2004), Karlan (2002) and Schechter (2007), that the first player’s
action may reflect preferences other than trust, such as risk or altruism. To deter-
mine the first player’s motivation in the experiment, subjects was asked to state
how much they expected in return when sending money to their opponent. Results
show a highly positive relationship between the amount sent and the amount ex-
pected. This result can be interpreted in the light of Sapienza et al. (2007), who
suggest that trust has a belief and a social-preference component. As expectations
regarding the amount to be returned by the second player explain 88 percent of the
amount sent by the first player, first-player behavior reflects, at least for the largest
part, a belief-based component of trust. While first-player behavior may be affected
by other-regarding preferences such as risk or altruism, these latter would therefore
seem to be only secondary.
16
Documents de Travail du Centre d'Economie de la Sorbonne - 2012.41

4. Using Trust To Predict Participation In Local
Public-Good Production
The next step in comparing the various measures of trust is to see how they
are correlated with a real-world problem of the production of local public goods.
In particular, analysis will focus on the public goods and services produced in the
villages: monitoring of savings (tontine), monitoring credit (Credit Association) and
social-cohesion activities (animation).
4.1. Model specification
Using information collected by interviews with staff members, I can establish
which individuals participate in tontine and the Credit Association. Information on
participation in animation activities is collected directly from household interviews
about their implication in a list of social-cohesion activities, such as the organization
of sporting activities, cleaning the village, and environmental-protection activities.
Over 57 percent of households in the experiment are members of the tontine, 45
percent have already contracted a loan from the Credit Association, and 56 percent
have already carried out animation activities.
De Janvry and Sadoulet (2004) identified a number of individual characteristics
which determine participation in collective activities in Senegal, such as income,
household size and age. Analysis here will focus on the role of trust in the provision
of public goods. This can be modeled using a discrete-choice equation such as:
Prob(Zij) = F (Trustij, Xij, Yij) (1)
where Prob(participate) is the probability that household i participates in the pro-
vision of public goods j, Trustij is a measure of trust, Xij is a vector of individual
characteristics and Yij a vector of community dummies. The binary latent variable
Zj equals 1 if household i participates in the provision of the public good and 0
otherwise, where j = 1, 2, 3 denotes the three local public goods. The reduced
17
Documents de Travail du Centre d'Economie de la Sorbonne - 2012.41
formed to be estimated can be represented as:
Tontine = γ11Trusti + γ12Xi + γ13Yi + ε1i (2)
Credit = γ21Trusti + γ22X(i) + γ23Yi + ε2i (3)
Animation = γ31Trusti + γ32Xi + γ33Yi + ε3i (4)
The following logistic model is estimated:
Pi = P (Zij = 1|X = xij, Y = yi) =e(γj1Trustij+γj2xijγj3Yi+εji)
1 + e(γj1Trustij+γj2xijγj3Yi+εji)(5)
where γji are the model parameters.
4.2. Empirical strategy
The analysis begins by introducing each trust measure into each of the three
equations defined above. For each public-good equation, for example, there are
four models corresponding to the CCT trust in the Trust Game (CCT Model), the
WVS measure (WVS Model), trust in neighbors (NEIGHBOR Model), and trust in
strangers (STRANGERS Model). The aim is to investigate which of these models
is the best at predicting public-good participation.
The strategy is based on the comparison of the log-likelihood LL of models, given
by:
LL(γji) = log
{
i=1∏
n
((Pi)zi + (1 − Pi)
(1−zi))
}
=i=1∑
n
(zilog(Pi) + (1 − zi)log(1 − Pi))
(6)
Parametric and non-parametric criteria are used. The parametric approach consists
in comparing the Akaike Information Criterion (AIC) obtained from the logistic
regression of the different models. The AIC selects models according to how close the
fitted values are to a certain expected value, by minimizing the value of −2LL + 2ρ,
where ρ is the number of parameters in the estimated model.
The non-parametric test relies the area under the receiver operating characteristic
(ROC) curve (AUC). The AUC tests the model’s ability to discriminate between
18
Documents de Travail du Centre d'Economie de la Sorbonne - 2012.41
those who participate in public-good provision and those who do not. The ROC
curves are constructed by calculating the sensitivity and specificity for consecutive
cut-off points according to the predicted probabilities. The greater is the area under
the curve, the better is the model. I test whether the AUC’s of the two models
are significantly different from each other. After comparing models, the effect of
each of the estimated trust coefficients is assessed. The Likelihood Ratio Test (L-R
Test) is used here. The L-R statistic tests whether certain model parameters are
zero by comparing the log likelihood of the fitted model (LL(γ)) to the likelihood
of a simpler model without the trust variable in question (LL0). The ratio of the
likelihoods is given by: L-RT = −2(LL0 − LL(γ)). In practice, the trust variable is
excluded from each full model to obtain a simpler model. The difference in the log
likelihoods of the full and simpler models is distributed χ2, and reveals the effect of
the trust variable to the model likelihood.
4.3. Results
Before analyzing the results, I test whether the explanatory variables used in
the participation equation are satisfactory in terms of the estimation. The Hosmer-
Lemeshow goodness-of-fit statistic, which is based on the distance between the pre-
dicted and observed values is used. The resulting χ2 statistic is at least 1.5, indicating
that they are properly calibrated. There are four candidate models for each of the
three public-good equations.
The models for each equation are first compared using the AIC criterion. The en-
suing test results are shown in Table 3. The AIC statistics for Tontine (equation 2)
suggest that the CCT model, using the behavioral measure of trust, best predicts
participation in Tontine. The AIC of the CCT model is 216.39, while the other AIC
figures are 225.14 (NEIGHBORS), 223.17 (STRANGERS) and 223.25 (WVS).
The results for Credit (equation 3) lead to the same conclusions. The CCT model
explains Credit the best, according to the AIC criterion. The results from the esti-
mation of Animation (equation 4) are different, as here it is the WVS model which
performs the best: the AIC value for the WVS model is lower than those from the
other models.
19
Documents de Travail du Centre d'Economie de la Sorbonne - 2012.41
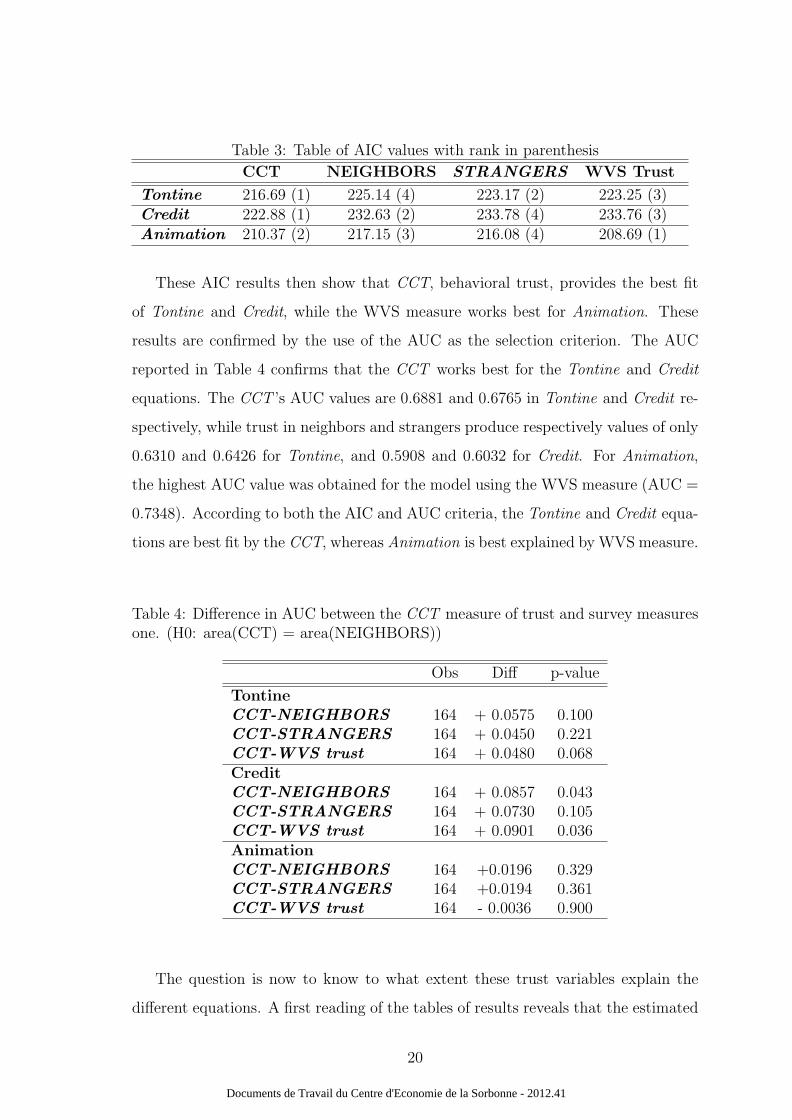
Table 3: Table of AIC values with rank in parenthesis
CCT NEIGHBORS STRANGERS WVS Trust
Tontine 216.69 (1) 225.14 (4) 223.17 (2) 223.25 (3)Credit 222.88 (1) 232.63 (2) 233.78 (4) 233.76 (3)Animation 210.37 (2) 217.15 (3) 216.08 (4) 208.69 (1)
These AIC results then show that CCT, behavioral trust, provides the best fit
of Tontine and Credit, while the WVS measure works best for Animation. These
results are confirmed by the use of the AUC as the selection criterion. The AUC
reported in Table 4 confirms that the CCT works best for the Tontine and Credit
equations. The CCT ’s AUC values are 0.6881 and 0.6765 in Tontine and Credit re-
spectively, while trust in neighbors and strangers produce respectively values of only
0.6310 and 0.6426 for Tontine, and 0.5908 and 0.6032 for Credit. For Animation,
the highest AUC value was obtained for the model using the WVS measure (AUC =
0.7348). According to both the AIC and AUC criteria, the Tontine and Credit equa-
tions are best fit by the CCT, whereas Animation is best explained by WVS measure.
Table 4: Difference in AUC between the CCT measure of trust and survey measuresone. (H0: area(CCT) = area(NEIGHBORS))
Obs Diff p-value
Tontine
CCT-NEIGHBORS 164 + 0.0575 0.100CCT-STRANGERS 164 + 0.0450 0.221CCT-WVS trust 164 + 0.0480 0.068Credit
CCT-NEIGHBORS 164 + 0.0857 0.043CCT-STRANGERS 164 + 0.0730 0.105CCT-WVS trust 164 + 0.0901 0.036Animation
CCT-NEIGHBORS 164 +0.0196 0.329CCT-STRANGERS 164 +0.0194 0.361CCT-WVS trust 164 - 0.0036 0.900
The question is now to know to what extent these trust variables explain the
different equations. A first reading of the tables of results reveals that the estimated
20
Documents de Travail du Centre d'Economie de la Sorbonne - 2012.41
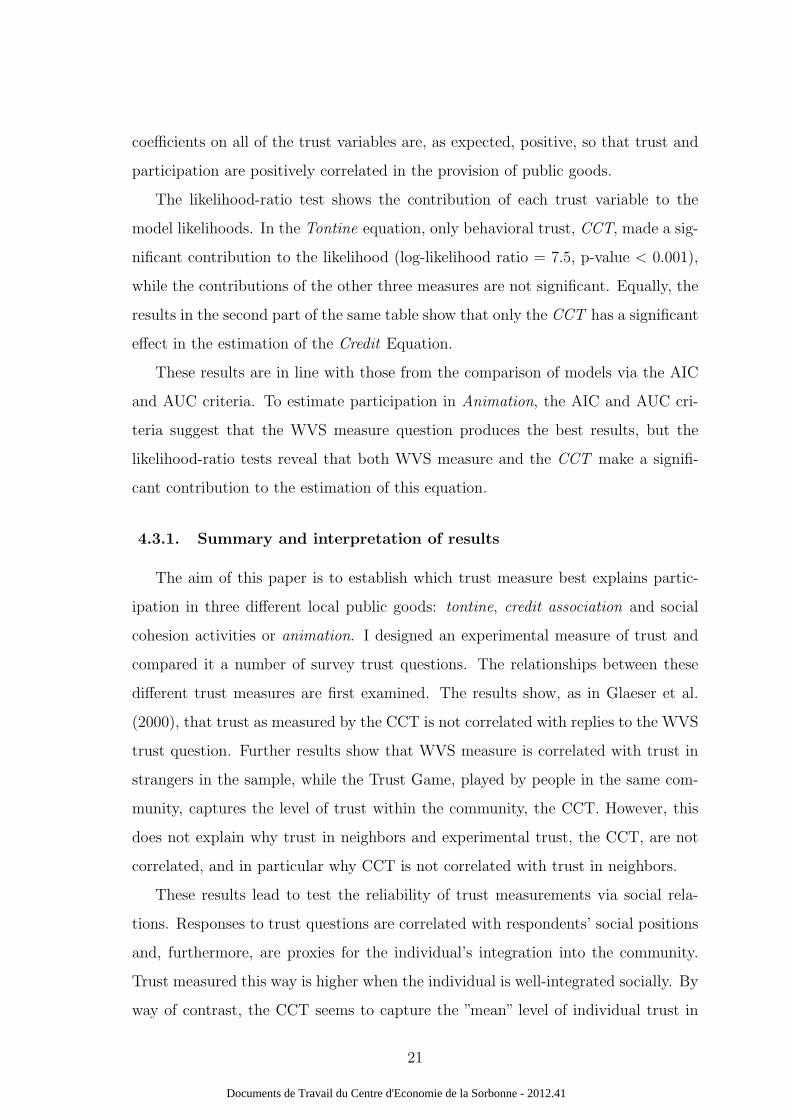
coefficients on all of the trust variables are, as expected, positive, so that trust and
participation are positively correlated in the provision of public goods.
The likelihood-ratio test shows the contribution of each trust variable to the
model likelihoods. In the Tontine equation, only behavioral trust, CCT, made a sig-
nificant contribution to the likelihood (log-likelihood ratio = 7.5, p-value < 0.001),
while the contributions of the other three measures are not significant. Equally, the
results in the second part of the same table show that only the CCT has a significant
effect in the estimation of the Credit Equation.
These results are in line with those from the comparison of models via the AIC
and AUC criteria. To estimate participation in Animation, the AIC and AUC cri-
teria suggest that the WVS measure question produces the best results, but the
likelihood-ratio tests reveal that both WVS measure and the CCT make a signifi-
cant contribution to the estimation of this equation.
4.3.1. Summary and interpretation of results
The aim of this paper is to establish which trust measure best explains partic-
ipation in three different local public goods: tontine, credit association and social
cohesion activities or animation. I designed an experimental measure of trust and
compared it a number of survey trust questions. The relationships between these
different trust measures are first examined. The results show, as in Glaeser et al.
(2000), that trust as measured by the CCT is not correlated with replies to the WVS
trust question. Further results show that WVS measure is correlated with trust in
strangers in the sample, while the Trust Game, played by people in the same com-
munity, captures the level of trust within the community, the CCT. However, this
does not explain why trust in neighbors and experimental trust, the CCT, are not
correlated, and in particular why CCT is not correlated with trust in neighbors.
These results lead to test the reliability of trust measurements via social rela-
tions. Responses to trust questions are correlated with respondents’ social positions
and, furthermore, are proxies for the individual’s integration into the community.
Trust measured this way is higher when the individual is well-integrated socially. By
way of contrast, the CCT seems to capture the ”mean” level of individual trust in
21
Documents de Travail du Centre d'Economie de la Sorbonne - 2012.41
community members, regardless of social structure. Results show that the amount
sent by the first player in the Trust Game, the CCT, is correlated at the 88 percent
level with the expectations of the amount that will be sent back by the anonymous
second player, who is randomly chosen from members of the community.
Results from the different trust measures thus answer the main question of this
paper: which of these trust measurements explains the best participation in the
three collective actions in the communities of tontine, the credit association and
animation. Trust measured by the CCT has good explanatory power while survey
questions only poorly explain participation in these public-good activities. The weak
explanatory power of survey trust questions may reflect that these are determined
by the social structure of respondents’ communities, as shown in Section 3.2.1., and
therefore capture heterogeneity in the nature of social relations of respondents which
have negative effects on the provision of public goods (Banerjee et al., 2005; Alesina
et al., 1999; Alesina and La Ferrara, 2000). The replies on WVS trust question
has no significant predictive power for participation in the Tontine and the Credit
Association but works better than the other measures in predicting involvement in
animation activities. This can be explained by the fact that the WVS question
seems, at some level, to capture the open-mindedness of the respondents in addi-
tion to capturing trust in strangers. This may explain why it captures, unlike the
other survey questions, individual participation in Animation activities, the bene-
fits of which go to the entire group, in contrast to tontine and credit activities, the
benefits of which are private. Apart from the immediate financial implications, the
amount sent in the CCT measure, in addition to measuring the respondent’s trust in
a randomly-chosen person from the community (Section 3.2.1.), mirrors the real-life
provision of public goods. These results differ from those obtained in Karlan (2002),
in which only the second-player’s behavior is correlated with real-world activities.
This difference can be explained by the fact that in Karlan (2002)’s Trust Game
there is no anonymity among opponents and, more importantly, the repayment loan
is not effectively explained by trust but only by trustworthiness.
22
Documents de Travail du Centre d'Economie de la Sorbonne - 2012.41
5. Conclusion
This paper discusses the strengths and weaknesses of different forms of trust
measures. The main objective is to see which of these measures explain why some
individuals carry out joint activities. To do so, a version of the Trust Game, the
CCT, was implemented in a small village community in Western Senegal. The
results are compared to survey trust questions: the WVS trust question and specific
questions regarding trust in neighbors and trust in strangers. I find that trust, as
measured by survey questions, has poor predictive power, while the results from a
simple CCT are much better predictors of public-goods production.
These results have important policy implications, in particular for the promotion
of community organizations based on social capital. Survey trust questions yield
greater trust scores for individuals in higher social positions or with kinship with
local leaders. If this correlation with respondents’ social status is not taken into
account, the results may be biased in favor of groups with higher social status and
thus exclude certain individuals from full participation in the social and economic
life of the community. This may in particular increase inequality in access to op-
portunities. Survey trust questions thus fail to capture trust in the face of diversity,
and furthermore fail to explain sufficiently trust levels that allow individuals with
different social statuses to carry out collective activities despite their heterogeneity.
To determine this latter level of trust, it is necessary to understand the social
structure of the community group and identify respondents’ social positions. This
requires that the researcher spend time in such communities in order to understand
the complexity of community norms and rules. However, given the diversity and
complexity of these latter, this will be difficult, especially when diversity is not
easily observable. This paper suggests a straightforward way of overcoming this
problem by showing that an adequately-designed Trust Game constitutes an effec-
tive tool to measure the trust behind individual decisions to carry out joint activities.
23
Documents de Travail du Centre d'Economie de la Sorbonne - 2012.41

References
Akerlof, G. (1970). The market for“lemons”: Qualitative uncertainty and the market
mechanism. Quarterly Journal of Economics 84, 488–500.
Alesina, A., R. Baqir, and W. Easterly (1999). Public goods and ethnic divisions.
Quarterly Journal of Economics 114 (4), 1243–1284.
Alesina, A. and E. La Ferrara (2000). Participation in heterogeneous communities.
The Quarterly Journal of Economics 115 (3), 847–903.
Arrow, K. (1972). Gifts and exchanges. Philosophy and Public Affairs I, 343–362.
Banerjee, A., L. Iyer, and R. Somanathan (2005). History, social divisions, and
public goods in rural india. Journal of the European Economic Association 3 (2-
3), 639–647.
Berg, J., J. Dickhaut, and K. McCabe (1995). Trust, reciprocity, and social history.
Games and Economic Behavior 10, 122–142.
Buchan, N., R., R. Croson, and N. Dawes, R. (2000). Who’s with me? direct
and indirect trust and reciprocity in china, japan, korea, and the united states.
University of Wisconsin Working Paper .
Cardenas, J. (2003). Real wealth and experimental cooperation: Evidence from field
experiments. Journal of Development Economics 70, 263–289.
Cardenas, J. and J. Carpenter (2008). Behavioural development economics: Lessons
from field labs in the developing world. The Journal of Development Studies 44 (3),
311–338.
Cardenas, J., A. Chong, and H. Nop (2008). Stated social behavior and revealed ac-
tion: evidence from six latin american countries. Working Paper 634. Washington,
DC.: Inter-American Development Bank, Research.
Castillo, M. and M. Carter (2003). An experimental approach to social capital
in south africa. University of Wisconsin Department of Agricultural Economics
Working Paper .
24
Documents de Travail du Centre d'Economie de la Sorbonne - 2012.41
Cox, J. (2004). How to identify trust and reciprocity. Games and Economic Behav-
ior. 46, 260–281.
Danielson, A. and H. Holm (2005). Tropic versus nordic trust: experiemental evi-
dence from tanzania and sweden. The Economic Journal. 115, 505–532.
De Janvry, A. and J.-C. Sadoulet (2004). Organisations paysannes et developpement
rural au senegal. Banque Mondiale .(Universite de Berkeley,).
Etang, A., D. Fielding, and S. Knowles (2010). Trust and rosca membership in rural
cameroon. Journal of International Development Forcoming.
Etang, A., D. Fielding, and S. Knowles (2011). Does trust extend beyond the
village? experimental trust and social distance in cameroon. Experimental Eco-
nomics 14 (1), 15–35.
Fehr, E., U. Fischbacher, V. Rosenbladt, J. Schupp, and G. Wagner (2003). A nation-
wide laboratory. examining trust and trustworthiness by integrating behavioral
experiments into representative surveys. CESifo working paper 866 .
Fehr, E. and S. G’achter (2002). Cooperation and punishment in public goods
experiments. American Economic Review 90, 980–994.
Gachter, S., B. Herrmann, and C. Thoni (2004). Trust, voluntary cooperation,
and socio-economic background: survey and experimental evidence. Journal of
Economic Behavior and Organization 55 (4), 505–534.
Glaeser, E., D. Laibson, J. Scheinkman, and C. Soutter (2000). Measuring trust.
Quarterly Journal of Economics 115 (3), 811–846.
Hardin, R. (2002). Trust. Russell Sage Foundation, New York.
Hardin, R. (2006). Trust. Cambridge, Polity Press.
Holmstrom, B. (1979). Moral hazard and observability. Bell Journal of Eco-
nomics 10 (1), 74–91.
25
Documents de Travail du Centre d'Economie de la Sorbonne - 2012.41
Karlan, D. (2002). Using experimental economics to measure social capital and
predict financial decisions. American Economic Review 95 (5), 1688–1699.
Khwaja, A. I. (2009). Can good projects succeed in bad communities? Journal of
Public Economics. 93 (7-8), 899–916.
Knack, S. and P. Keefer (1997). Does social capital have an economic payoff? a
cross- country investigation. Quarterly Journal of Economics 112(4), 1251–88.
Knack, S. and P. Zak (2003). Building trust; public policy, interpersonal trust and
economic development. Supreme Court Economic Review 10 (Fall), 91–107.
La Porta, R., F. Lopez-de Silanes, A. Shleifer, and R. Vishny (1997). Trust in large
organisations. American Economic Review 87[2], 333–338.
Naef, M. and J. Schupp (2009). Measuring trust: Experiments and surveys in
contrast and combination. mimeo, Royal Holloway College.
Nannestad, P. (2008). What have we learned about generalized trust, if anything?
Annual Review of Political Science 11, 413–436.
Narayan, D. and L. Pritchett (1999). Cents and sociability: Household in-
come and social capital in rural tanzania. Economic Development and Cultural
Change 47(4), pages 871–97.
Ostrom, E. (1990). Governing the Commons: The Evolution of Institutions for
Collective Action. Cambridge University Press (November 30, 1990).
Putnam, R. (1993). The prosperous community: social capital and public life. The
American Prospect 4 (13).
Sapienza, P., A. Toldra, and L. Zingales (2007). Understanding trust. National
Bureau of Economic Research Working Paper 13387.
Schechter, L. (2007). Traditional trust measurement and the risk confound: An
experiment in rural paraguay. Journal of Economic Behavior and Organization 62,
272–292.
26
Documents de Travail du Centre d'Economie de la Sorbonne - 2012.41

Sturgis, P. and P. Smith (2010). Assessing the validity of generalized trust questions:
what kind of trust are we measuring? International Journal of Public Opinion
Research 22, 74–92.
27
Documents de Travail du Centre d'Economie de la Sorbonne - 2012.41
Appendices
Figure 4: histograms of amount sent and returned in the Trust Game.
Source: Field survey data
Table 5: Spearman correlation coefficients of the different survey trust measures
Group Neighbors Local Traders Co-ethnics Other Strangersmembers leaders ethnics
Group members 1.00Neighbors 0.42*** 1.00Local lead 0.36** 0.24*** 1.00Traders 0.16** 0.24*** 0.18** 1.00Coethnic 0.24*** 0.21*** 0.25*** 0.22*** 1.00Other ethnic 0.10 0.20** -0.05 0.38*** 0.21*** 1.00Strangers 0.00 0.09 -0.04 0.27*** 0.05 0.29*** 1.00
* Significant at 90%, ** Significant at 95% and *** Significant at 99%.
28
Documents de Travail du Centre d'Economie de la Sorbonne - 2012.41

Table 6: Estimation results of WVS trust question as a function of trust questions
Variable 1 2 3 4 5 6 7
Gmembers 0.161(0.166)
Neighbors 0.236(0.192)
Local.lea 0.030(0.157)
Traders 0.298†
(0.175)Coethnic 0.481∗
(0.192)Otherethnic 0.430∗∗
(0.160)strangers 0.459∗∗
(0.171)Intercept -0.557 -0.781 -0.603 -0.813 -1.136 -1.730 -1.650
1.789 (1.809) 0.207 (1.816) (1.886) (1.877) (1.860)
N 164 164 164 164 164 164 164Log-likeli. -108.413 -108.115 -108.87 -107.408 -105.115 -105.115 -105.097
χ2(6) 6.92 7.516 6.006 8.929 12.636 13.516 13.553
Prob > χ2 0.3283 0.2757 0.4225 0.101 0.0815 0.0355 0.0351Significance levels : † : 10% ∗ : 5% ∗∗ : 1%
Note:Estimations with individual controls such age, age-squared, income, education and village
dummies.
Table 7: Wilcoxon-Mann-Whitney Test (with significant values in bold)
G. members Neighb. Local leaders WVS trust CCT
Female Coef 0.007 2.050 1.798 0.8990 0.2440pvalue 0.9940 0.040 0.8386 0.072 0.8075
Married Coef -1.713 -2.496 -3.146 0.7910 0.1120pvalue 0.0868 0.0126 0.0017 0.429 0.9111
Christian Coef 1.681 1.693 1.008 1.3810 -0.2370pvalue 0.0927 0.0905 0.3137 0.1672 0.8125
No school Coef -0.683 -1.5310 -2.039 1.0860 0.1710pvalue 0.4944 0.1257 0.0414 0.2773 0.8643
Respons. Coef -0.556 -0.9900 -0.390 -0.738 0.9000pvalue 0.5782 0.3221 0.6966 0.460 0.3682
Large family Coef 1.333 0.516 0.592 1.800 -1.000pvalue 0.1025 0.6060 0.5536 0.0719 0.3172
29
Documents de Travail du Centre d'Economie de la Sorbonne - 2012.41
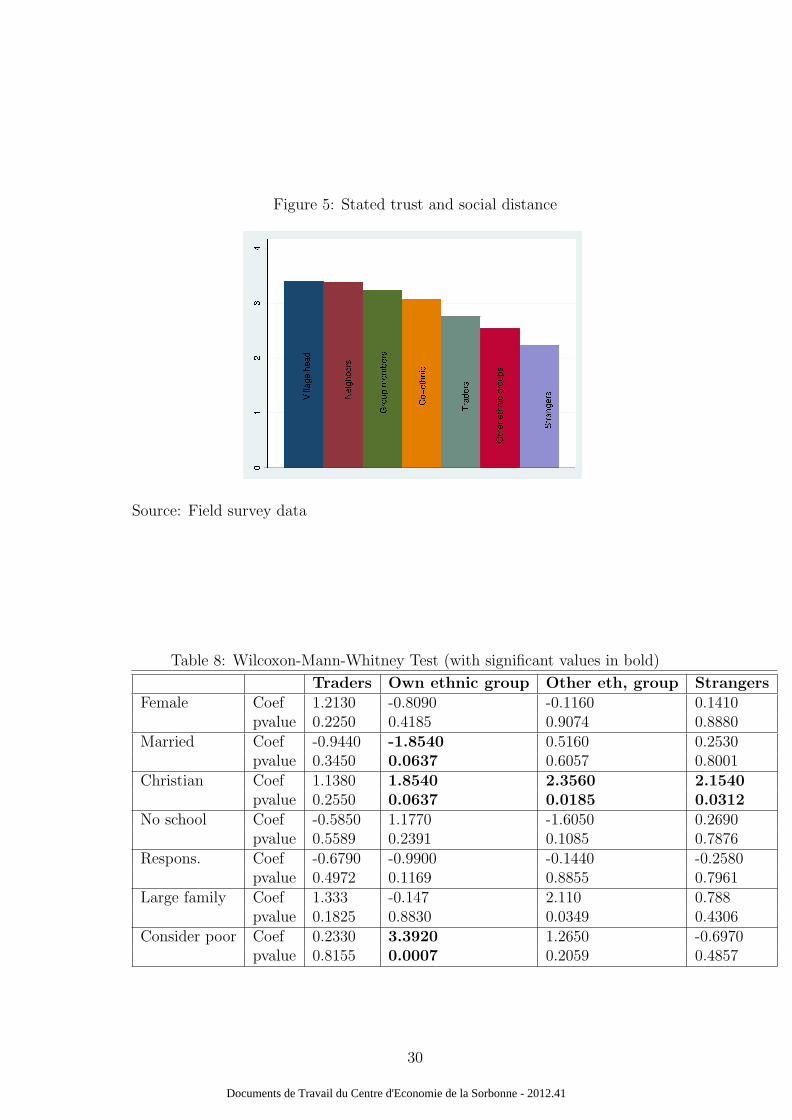
Figure 5: Stated trust and social distance
Source: Field survey data
Table 8: Wilcoxon-Mann-Whitney Test (with significant values in bold)
Traders Own ethnic group Other eth, group Strangers
Female Coef 1.2130 -0.8090 -0.1160 0.1410pvalue 0.2250 0.4185 0.9074 0.8880
Married Coef -0.9440 -1.8540 0.5160 0.2530pvalue 0.3450 0.0637 0.6057 0.8001
Christian Coef 1.1380 1.8540 2.3560 2.1540
pvalue 0.2550 0.0637 0.0185 0.0312
No school Coef -0.5850 1.1770 -1.6050 0.2690pvalue 0.5589 0.2391 0.1085 0.7876
Respons. Coef -0.6790 -0.9900 -0.1440 -0.2580pvalue 0.4972 0.1169 0.8855 0.7961
Large family Coef 1.333 -0.147 2.110 0.788pvalue 0.1825 0.8830 0.0349 0.4306
Consider poor Coef 0.2330 3.3920 1.2650 -0.6970pvalue 0.8155 0.0007 0.2059 0.4857
30
Documents de Travail du Centre d'Economie de la Sorbonne - 2012.41