
Global IP Proxy Networks Market
74
1 IPPN IP Proxy Networks Market Global IP Proxy Networks Market July 2019
-
Upload
khangminh22 -
Category
Documents
-
view
0 -
download
0
Transcript of Global IP Proxy Networks Market

1 IPPN
IP Proxy Networks Market Global IP Proxy Networks Market
July 2019

2 IPPN
Contents
Section Slide Number
Executive Summary 3
Market Overview 9
Drivers and Restraints – Total IPPN Market 17
Forecasts and Trends – Total IPPN Market 26
Forecasts and Trends – NALA 35
Forecasts and Trends – EMEA 38
Forecasts and Trends – APAC 41
Market Share and Competitive Analysis – Verticals 44
Market Share and Competitive Analysis – Total IPPN Market 47
Growth Opportunities and Companies to Action 62
The Last Word 68
Appendix 71

3 IPPN
Executive Summary

4 IPPN
• Websites increasingly change their displayed information based on user IP address, location, and
demographic attributes. This creates a need for companies to do competitor analysis, price
comparisons, and data extraction as a simulated user to capture this customized information.
Companies not familiar with these website practices or Internet Protocol proxy network (IPPN)
solutions are at risk of gathering incorrect data and left behind technology-wise.
• Frost & Sullivan estimates the Total Addressable Market (TAM) for IPPNs in 2018 to be $951.0
million, the Service Available Market (SAM) to be $358.9 million, and the Service Obtainable Market
(SOM) to be $76.3 million. $76.3 million is the combined revenue from market participants in 2018.
This IPPN market is forecasted to grow at a CAGR of 16.8% and reach $259.7 million by 2025.
• This global IPPN market study includes revenues from residential IP proxy networks, data center IP
proxy networks, and mobile IP proxy networks. Use cases include: price comparison, ad verification,
data collection, fraud protection, application performance, brand protection, talent sourcing, cyber
security, and account management.
• EMEA makes up 39.5% of revenues for the IPPN market in 2018, followed by NALA at 35.4%, and
APAC at 27.7%. By 2025, NALA‟s 37.9% market share overtakes EMEA‟s 34.4% of IPPN market.
Thanks to demographic trends and an increasing number of its residents developing online
presences, APAC has fastest overall CAGR at 18.7% growing to a 27.7% market share by 2025.
• Market leader Luminati, which practically invented the category, and competitors Oxylabs and
GeoSurf, make up 77.0% of the global IPPN market in 2018 with significant potential to grow as
IPPN solutions become more well-known.
Key Findings
Source: Frost & Sullivan
5 IPPN
IPPN TAM, SAM, and SOM
Source: Frost & Sullivan
IPPN TAM
$951.0 M
IPPN SAM
$358.9 M
IPPN
SOM
$76.3 M
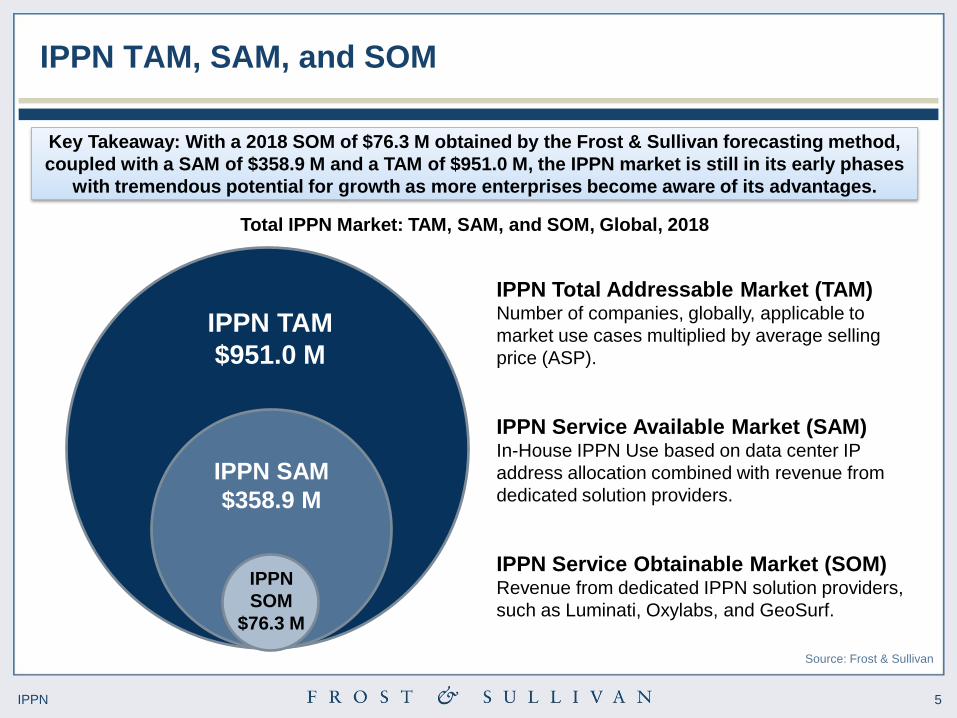
Key Takeaway: With a 2018 SOM of $76.3 M obtained by the Frost & Sullivan forecasting method,
coupled with a SAM of $358.9 M and a TAM of $951.0 M, the IPPN market is still in its early phases
with tremendous potential for growth as more enterprises become aware of its advantages.
Total IPPN Market: TAM, SAM, and SOM, Global, 2018
IPPN Total Addressable Market (TAM) Number of companies, globally, applicable to
market use cases multiplied by average selling
price (ASP).
IPPN Service Available Market (SAM) In-House IPPN Use based on data center IP
address allocation combined with revenue from
dedicated solution providers.
IPPN Service Obtainable Market (SOM) Revenue from dedicated IPPN solution providers,
such as Luminati, Oxylabs, and GeoSurf.

6 IPPN
Compound
Annual Growth
Rate
16.8%
(CAGR, 2019–2025)
Market
Concentration
77.0%
(Base Year Market Share
Held by Top 3 Companies)2
Market Engineering Measurements
Market Stage
Growth
Market Size for
Last Year of
Study Period
$259.7 M
(2025)
Customer Price
Sensitivity
8
(scale:1 [low] to 10 [high])
Degree of
Technical
Change
7
(scale:1 [low] to 10 [high])
Market Revenue, Service Obtainable
Market (SOM)
$76.3 M
(2018)
Total IPPN Market: Market Engineering Measurements, Global, 2018
Market Overview
Base Year
Market Growth
Rate
34.3%
For a tabular version, click here. Stable Increasing Decreasing Note: All figures are rounded. The base year is 2018. Source: Frost & Sullivan
Service
Addressable
Market (SAM)
$358.9 M
(2018)3
Total
Addressable
Market (TAM)
$951.0 M
(2018)
(2019)1
1. Early stage market slowing from explosive growth. 2. Concentration decreasing because of new entrants. 3. Assumes education and marketing by major vendors.

7 IPPN
IPPN Market Opportunity
Key Takeaway: Though Frost & Sullivan forecasts a market size of $259.7 M by 2025, there is an opportunity to
convert existing home grown IPPN solutions. Assuming IPPN vendors convert 80% of home grown IPPN solutions
by 2025 via accelerated marketing and consumer education, that increases the expected market to $341.7 M.
This achieves a third of the Total Addressable Market in the first 10 years of IPPN existence.
Note: All figures are rounded. The base year is 2018. Source: Frost & Sullivan
2018 2019 2020 2021 2022 2023 2024 2025
Revenue Forecast (SOM) 76.3 102.5 128.7 154.9 181.1 207.3 233.5 259.7
Revenue Forecast (SAM) 76.3 113.8 143.0 173.3 205.8 241.2 284.7 341.7
Total Addressable Market (TAM) 951.0 960.5 970.1 979.8 989.6 999.5 1009.5 1019.6
Growth Rate (SOM) 34.3 25.6 20.4 16.9 14.5 12.6 11.2
Growth Rate (SAM) 49.2 25.7 21.2 18.8 17.2 18.0 20.0
0.0
10.0
20.0
30.0
40.0
50.0
60.0
0.0
200.0
400.0
600.0
800.0
1000.0
1200.0
Gro
wth
Ra
te (
%)
Re
ve
nu
e (
$ M
illi
on
)
Year
Total IPPN Market: Revenue Opportunity, Global, 2018–2025 CAGR, 2019–2025 = 16.8% (SOM) / 20.1% (SAM)
8 IPPN
CEO’s Perspective
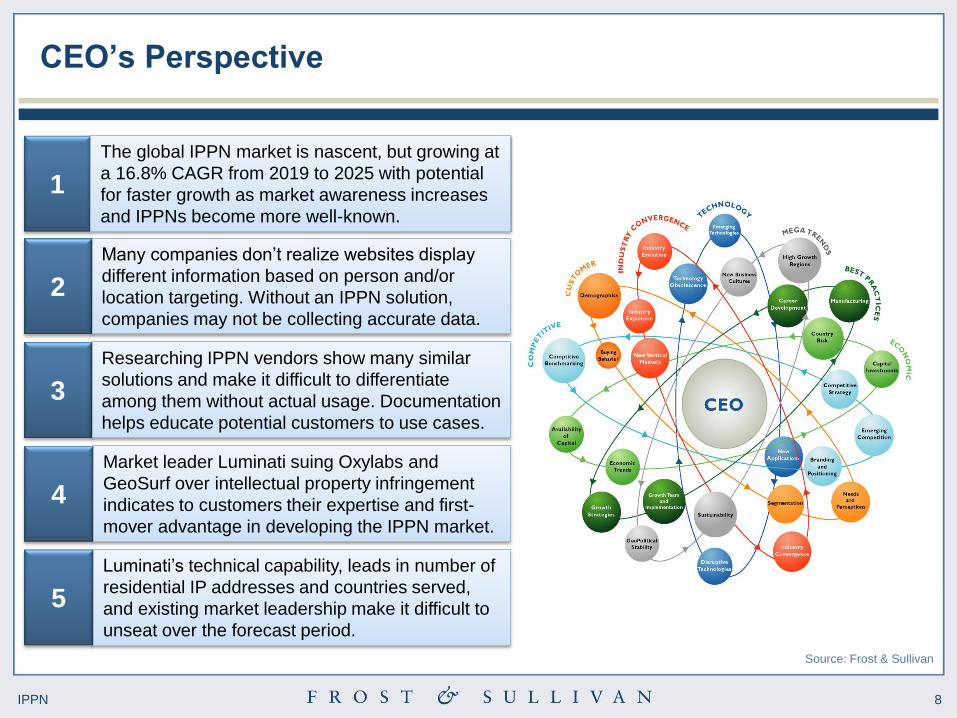
2
Many companies don‟t realize websites display
different information based on person and/or
location targeting. Without an IPPN solution,
companies may not be collecting accurate data.
Source: Frost & Sullivan
1
The global IPPN market is nascent, but growing at
a 16.8% CAGR from 2019 to 2025 with potential
for faster growth as market awareness increases
and IPPNs become more well-known.
3
Researching IPPN vendors show many similar
solutions and make it difficult to differentiate
among them without actual usage. Documentation
helps educate potential customers to use cases.
4
Market leader Luminati suing Oxylabs and
GeoSurf over intellectual property infringement
indicates to customers their expertise and first-
mover advantage in developing the IPPN market.
5
Luminati‟s technical capability, leads in number of
residential IP addresses and countries served,
and existing market leadership make it difficult to
unseat over the forecast period.

9 IPPN
Market Overview

10 IPPN
• Frost & Sullivan defines Internet Protocol (IP) proxy network (IPPN) providers as companies that
offer products that place an extra IP address from a rotating pool of addresses between a customer
and any website they visit on the public internet. Instead of getting data directly from a website, an
IPPN customer‟s request first passes through a separate device, a proxy server, before going to and
receiving a response from the target website.
• From the target website‟s perspective, no information about the original machine is sent. Only the
proxy device‟s IP address gets transmitted. As many websites place limits on the amount of
information sent to any one IP address, gathering additional, openly available data from any one
website often involves using proxy servers to make it appear as if the requests come from different
users, thus requiring the need to a rotating pool of IP addresses to be used by proxy servers.
• The rotating pool of IP addresses derive from proxy software installed on residential users computers
and mobile devices, while data centers use dedicated proxy servers. Based on the IP address it
receives, a target website can distinguish whether a request comes from a residence, mobile device,
or data center and display different information accordingly based on location and demographic
attributes. Companies tailoring information based on such attributes led to competitors needing
IPPNs to simulate being actual customers.
Market Definitions
Source: Frost & Sullivan

11 IPPN
• Proxy servers are intermediaries between devices requesting information from other servers. While
proxy servers have many purposes, such as anonymizing identities, filtering information, getting
around filters, and improving information retrieval performance. Rotating IP proxy servers tend to be
used by companies to simulate actual customers in different locations and to collect data, also known
as web scraping. Ever since the commercialization of the web, companies developed increasingly
better ways to target consumers via advertising and marketing to the point of adjusting pricing on a
location or even per customer basis.
• As companies put more of their product information online, this customer targeting made it very
difficult for competitors and customers to monitor and/or compare pricing and product availability that
can vary so much because of targeting. Websites today recognize customers to show different
advertising, content, and pricing based on location and other identifiable information. Companies
further evolved to prevent competitors from accessing their data via blocking their company‟s entire
range of IP addresses. This prevents companies from comparing pricing, security companies from
conducing audits for or detecting malware on malicious sites, and even website owners themselves
from verifying their advertising is safe and being delivered properly from their ad vendors.
Market Definitions (continued)
Source: Frost & Sullivan

12 IPPN
• Practically all IP proxy network solution providers highlight their network size by publishing the node
counts for residential/mobile/data center networks and the number of geographic regions served.
• IP proxy networks depend on users to install software on their devices, computers or handsets, to
become the nodes used in IP proxy networks. This software, often games, uses idle bandwidth and
computation resources in exchange for a better use experience, such as removing advertising.
• It is highly improbable that for any given market participant that all possible devices with IP proxy
network software are on, idle, and online at any given time to provide bandwidth or computation time,
so published network sizes are maximum possible values, not generally available values, i.e. devices
on, idle, and online over a 24 hour period. At any one given time, 5% to 10% of devices are available
on any given peer-to-peer based IP proxy network. The more static IPs on idle devices, such as PCs
not being used, the higher the available devices versus mobile devices, which are generally less idle.
• To determine a metric more applicable to potential customers, i,e, generally available IP proxy
network sizes, Frost & Sullivan ran scripts to count available IP addresses for different market
participants over different 24 hour periods. For each participant we noted: 1) published maximum IP
proxy network size; and 2) generally available IP proxy network size. The actual network size will
vary constantly based on devices being on, idle, and online on each network.
Market Definitions (continued)
Source: Frost & Sullivan
13 IPPN
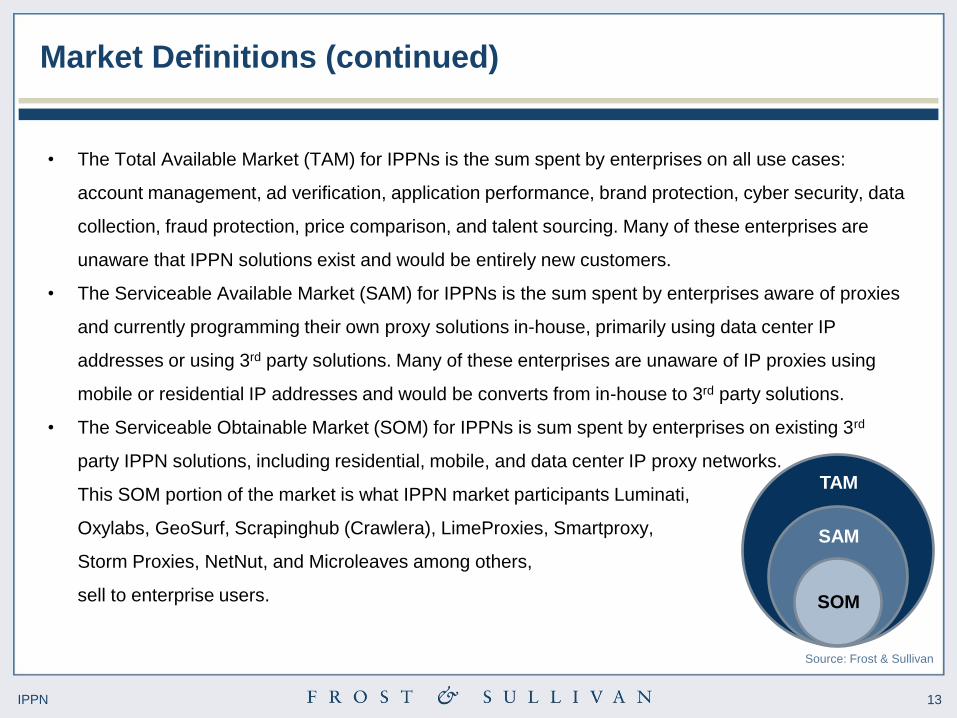
• The Total Available Market (TAM) for IPPNs is the sum spent by enterprises on all use cases:
account management, ad verification, application performance, brand protection, cyber security, data
collection, fraud protection, price comparison, and talent sourcing. Many of these enterprises are
unaware that IPPN solutions exist and would be entirely new customers.
• The Serviceable Available Market (SAM) for IPPNs is the sum spent by enterprises aware of proxies
and currently programming their own proxy solutions in-house, primarily using data center IP
addresses or using 3rd party solutions. Many of these enterprises are unaware of IP proxies using
mobile or residential IP addresses and would be converts from in-house to 3rd party solutions.
• The Serviceable Obtainable Market (SOM) for IPPNs is sum spent by enterprises on existing 3rd
party IPPN solutions, including residential, mobile, and data center IP proxy networks.
This SOM portion of the market is what IPPN market participants Luminati,
Oxylabs, GeoSurf, Scrapinghub (Crawlera), LimeProxies, Smartproxy,
Storm Proxies, NetNut, and Microleaves among others,
sell to enterprise users.
Market Definitions (continued)
Source: Frost & Sullivan
TAM
SAM
SOM
14 IPPN
Market Overview – Scope and Regions
Source: Frost & Sullivan
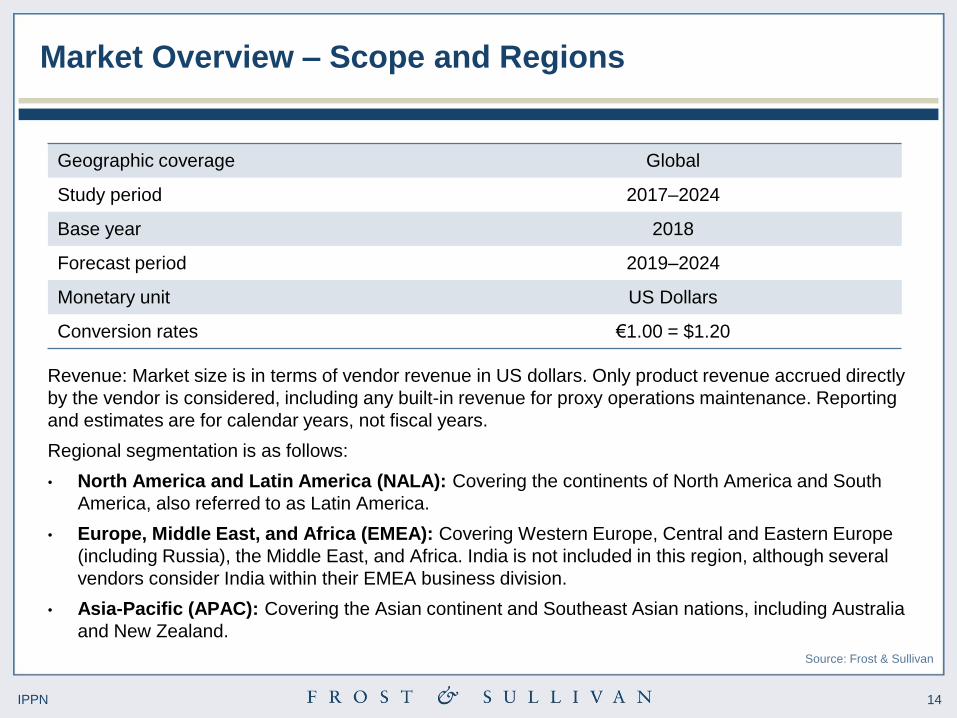
Revenue: Market size is in terms of vendor revenue in US dollars. Only product revenue accrued directly
by the vendor is considered, including any built-in revenue for proxy operations maintenance. Reporting
and estimates are for calendar years, not fiscal years.
Regional segmentation is as follows:
• North America and Latin America (NALA): Covering the continents of North America and South
America, also referred to as Latin America.
• Europe, Middle East, and Africa (EMEA): Covering Western Europe, Central and Eastern Europe
(including Russia), the Middle East, and Africa. India is not included in this region, although several
vendors consider India within their EMEA business division.
• Asia-Pacific (APAC): Covering the Asian continent and Southeast Asian nations, including Australia
and New Zealand.
Geographic coverage Global
Study period 2017–2024
Base year 2018
Forecast period 2019–2024
Monetary unit US Dollars
Conversion rates €1.00 = $1.20

15 IPPN
• Unlike static pages served in the early days of the web, modern websites are able to recognize
viewers and display content, advertising, and pricing according to demographic and geographic
information. Websites are also able to block ranges of IP addresses to prevent competitors from
comparing prices or conducting security audits and advertising checks. For these reasons, IP proxy
networks are used for the following use cases, information publicly available to average consumers:
• Price comparison – comparing prices from different user perspectives, often for travel and niche products.
• Ad verification – ensuring website ads are properly targeted to their intended audience, that ad links function
properly, and that the ad environment is security and/or regulatory compliant.
• Data collection – gathering data from websites to generate new data sets for internal use or sale.
• Fraud protection – identifying and/or detecting known proxies to prevent nefarious proxy use against companies.
• Application performance – testing web application loading and responsiveness across regions.
• Brand protection – preventing IP theft by disguising corporate networks when doing competitive analysis.
• Talent sourcing – researching job market needs and staffing requirements.
• Cyber security – adding an extra layer of protection between the Internet and corporate networks.
• Account management – creating and modifying accounts across social media and account-based websites.
• These use cases can distributed among residential, mobile, and data center proxy networks,
depending on the techniques used by the target website to block visitors.
IPPN Use Cases
Source: Frost & Sullivan

16 IPPN
Key Questions This Study Will Answer
Is the market growing? How long will it continue to grow, and at what rate? IPPN
What factors will drive market growth? What challenges will deter growth? IPPN
How do adoption patterns differ by region?
How will the landscape evolve? IPPN
Are existing competitors correctly structured to meet customer needs?
How will this market evolve? IPPN
What segments are most rapidly adopting these solutions?
How will this landscape evolve? IPPN
What technology trends are shaping the marketplace today?
What disruptions are on the horizon? IPPN
Source: Frost & Sullivan

17 IPPN
Drivers and Restraints – Total IPPN Market

18 IPPN
Drivers 1–2 Years 3–4 Years 5–6 Years
Companies doing competitive analysis need to view
websites as customers from different regions due to
increased profiling and blocking from target websites.
H H H
Gathering data programmatically from websites, such
as email addresses, real estate listings, and sports
information, for analysis or for sale.
M M M
Growing concern over nefarious advertising practices
and fraud detection lead to greater need for ad
verification.
M M M
Increasing awareness of IPPN use cases will grow the
total market as potential customers look for solutions
for brand protection, cyber security, etc. at potentially
lower cost than in-house solutions.
M M M
Social media account creation and maintenance need
more automated tools as they provide increasingly
desired direct communication between public figures,
products, and events and their followers.
M M L
News of and competition from region-specific products,
such as smartphones, and increasing globalization
increase the need for location-based customer
simulated competitive analysis.
M M L
Impact ratings: H = High, M = Medium, L = Low
Total IPPN Market: Key Market Drivers, Global, 2018–2024
Market Drivers
Source: Frost & Sullivan

19 IPPN
Companies doing competitive analysis need to view websites as customers from
different regions due to increased profiling and blocking from target websites.
• The primary motivation for IP proxy networks is companies needing to see competitor
websites as a typical customer sees them. Companies target consumers via advertising
and marketing to the point of adjusting pricing on a location or even per customer basis.
This customer targeting makes it difficult for competitors to monitor and/or compare
pricing and product availability without using IPPNs. Companies also increasingly block
access to their websites from known ranges of their competitor IP addresses, making it
difficult to do online competitive analysis without some form of proxy server.
Gathering data programmatically from websites, such as email addresses, real
estate listings, and sports information, for analysis or for sale.
• The proliferation of available data on the Internet has led to automated gathering of
information from websites, often called web scraping, indexing, crawling, or spidering.
These automated scripts, or “bots,” generate just over 40% of Internet traffic in 2018
according to Distil Networks and this percentage is growing. Such scripts can be used to
build new databases for analysis or to create new information services for sale. This
type of automated data collection is how much of the Internet functions, from indexing
websites for search engines to generating lists of available movie times to gathering
weather forecast data.
Drivers Explained
Source: Frost & Sullivan

20 IPPN
Growing concern over nefarious advertising practices and fraud detection lead to
greater need for ad verification.
• The billions of dollars generated by Internet marketing coupled with the automated
nature of digital advertising leads to significant potential for advertising fraud. Malware
infected browsers can give the false impression of web traffic and divert advertisements
from ad servers. Plus, such mis-targeted advertising can cause brand harm if ads are
not consistent with a company‟s message or values. By simulating residential or mobile
IP addresses, IPPNs enable companies to see how advertisements appear to actual
customers in different regions, verifying the appropriate, brand-confirmed ads, ads are
being displayed.
Social media account creation and maintenance need more automated tools as they
provide increasingly desired direct communication between public figures,
products, and events and their followers.
• The increasing use of social media for person, product, and/or event promotion
demands more tools to automate account management (creation and maintenance) in
all the regions they are needed. This allows companies to maintain a global presence
from centralized locations. Note: there is potential to use IPPNs to create artificial social
media accounts, but IPPN vendors with strong know-your-customer guidelines and strict
logging procedures limit this tactic.
Drivers Explained (continued)
Source: Frost & Sullivan

21 IPPN
News of and competition from region-specific products, such as smartphones, and
growing globalization, increase the need for location-based customer simulated
competitive analysis.
• Companies previously only had to deal with products in their home markets, however
increasing global product news and awareness require companies perform competitive
analysis across multiple regions. Better customer profiling and more customized
manufacturing has lead to more targeted products being marketed to consumers.
Discussion of such products across social media and online forums creates greater
demand for companies to track all these niche products.
Increasing awareness of IPPN use cases will grow the total market as potential
customers look for solutions for brand protection, cyber security, etc. at potentially
lower cost than in-house solutions.
• Nascent markets grow as public awareness grows via advertising, news, social media,
word of mouth, etc. As the IPPN market is only a few years old, smaller use cases will
gradually expand the market as more customers share their stories, publish case
studies, and demonstrate the usefulness to other customers. Though many customers
choose to remain anonymous, sharing the process of how each use case improved their
business helps grow the market. IPPN vendor marketing, technical support, and
potentially lower costs also encourages companies to migrate in-house IPPN tools to
dedicated IPPN solutions or start with dedicated tools in the first place.
Drivers Explained (continued)
Source: Frost & Sullivan

22 IPPN
Restraints 1–2 Years 3–4 Years 5-6 Years
User concerns over installing any software that uses idle
bandwidth and computing resources limit residential IP
network growth, despite user experience improvements.
H M M
Price comparison sites and product shopping tools limit
smaller IPPN use cases, while enterprises who want to
control their technology develop home grown IPPNs.
H H L
Companies use artificial intelligence and/or machine
learning to detect and block IP proxy network software. M M M
Spurred by data breaches, privacy concerns, and social
media regulations, countries enacted laws to limit
companies posing as customers via IPPNs.
M M L
Difficulty in differentiating IPPN vendors and separating
fact from fiction in reviews and online discussions, plus
pending legal battles concern potential customers.
M M L
Limited awareness of IPPN use cases hinders overall
market growth. M L L
Impact ratings: H = High, M = Medium, L = Low
Total IPPN Market: Key Market Restraints, Global, 2018–2024
Market Restraints
Source: Frost & Sullivan

23 IPPN
User concerns over installing any software from less well-known sources or that
uses idle bandwidth and computing resources, despite improving user experience.
• Consumers increasingly receive news of data breaches and privacy mishandlings
leading to caution over installing any software from less well-known sources. By using
software development kits (SDKs), IPPNs allow potentially any application to supply
bandwidth and computation time in exchange for a better user experience, such as
removing advertising. While consumers generally opt-in to using applications with IPPN
SDKs and use the software more, installing less software overall diminishes the
available pool of IP addresses gained by these installations, potentially making IPPNs
less effective over time.
Price comparison sites and product shopping tools limit smaller IPPN use cases,
while enterprises who want to control their technology develop home grown IPPNs.
• Dedicated price comparison tools can be sufficient for smaller businesses and product
shopping tools like specialized shoe shopping apps limit the need for some niche price
comparisons. While these tools also use IPPNs, they limit sales to potential customers
who might otherwise purchase dedicated IPPNs services. Though most companies
prefer IPPN vendor expertise, some business wanting to control their information flow
can deploy their own proxy networks to avoid using 3rd parties. Not all companies
require millions of rotating IP addresses, just enough IP addresses to accomplish their
competitive analysis tasks.
Restraints Explained
Source: Frost & Sullivan

24 IPPN
Companies use artificial intelligence and/or machine learning to detect and block IP
proxy network software.
• Much like the “cat and mouse” process of better user targeting that generated the need
for IPPNs, companies have a vested interest in preventing competitive analysis to
maintain their perceived advantages. Between artificial intelligence techniques and/or
machine learning, companies are researching ways to detect and prevent IPPN usage,
with or without regulations being put in place to identify web traffic routed through them.
Even without known proxy IP lists, similar to known virtual private network IP lists,
companies are investigating ways of blocking IPPNs, which diminishes their usefulness.
Spurred by data breaches, privacy concerns, and social media regulations, countries
enacted laws to limit companies posing as customers via IPPNs.
• While it is nearly impossible to ban or block the exit nodes of IP proxy networks,
governments could ban the practice of using IPPNs for intended use cases, similar to
how Russia ordered virtual private networks (VPNs) to block access to sites in its
centralized database, the European Union enacted privacy laws, or how Facebook is
requesting social media regulation. As legitimate IPPNs keep log files, there is less
incentive to use them for nefarious purposes, and those IPPNs using strict know your
customer (KYC) practices can minimize unintended use and help prevent the need for
such regulations.
Restraints Explained (continued)
Source: Frost & Sullivan

25 IPPN
Difficulty in differentiating IPPN vendors and separating fact from fiction in reviews
and online discussions, plus pending legal battles concern potential customers.
• Researching the IPPN market for a preferred vendor yields an assortment of reviews,
comparisons, blog posts, online discussions, and news, not all of which are from well-
known sources or verifiable journalists. Each vendor claims thousands to millions of
rotating IP addresses, assorted price points, and available locations. Until the market
matures with greater coverage by computer industry publications, potential customers
find it difficult to choose between vendors. Larger vendors with extensive education
materials and documentation help offset this situation. Pending legal battles protecting
intellectual property are important to IPPN market development and may influence some
customers toward particular vendors.
Limited awareness of IPPN use cases hinders overall market growth.
• While many companies understand the problem of doing competitive analysis, data
collection, and other IPPN use cases, widespread awareness of IPPNs is still lacking.
Proxy networks are well understood and virtual private networks are gaining in
popularity, but IPPNs are still in the early adopter phase among companies who stand
to benefit from them. This restraint accounts for not all IPPN vendors having the
marketing budgets to promote themselves, through the total market should be helped by
larger vendor advertising. This restraint counterbalances the increasing awareness
driver.
Restraints Explained (continued)
Source: Frost & Sullivan

26 IPPN
Forecasts and Trends – Total IPPN Market

27 IPPN
This study derives the size of the global IPPN market bottom-up from vendor revenues, including any
built-in revenue for proxy operations maintenance. Projections consider weighted averages of the
impacts of drivers and restraints detailed in the previous section and assume that they will remain as
forecast. The following factors impact forecast numbers:
o Currency: This research service reports market size in US dollars. Actual market revenue will vary
with the relative value of the US dollar.
o Economy: Forecasts assume a stable, slowly expanding global economy.
o Consumer confidence: Forecasts assume consumer confidence will remain relatively stable.
o Disruptive innovation: Forecasts assume gradual, incremental improvements across vendors.
Any IPPN vendor introducing a disruptive innovation could trigger unforeseen changes in sales,
revenues, and market shares.
o Exclusions: These numbers do not include revenue from home-grown IP proxy network solutions.
Forecast Assumptions
Source: Frost & Sullivan

28 IPPN
Global IPPN Revenue Forecast
Key Takeaway: Global revenue growth rate increases as companies target consumers more
accurately and attempt to prevent competitors from accessing their information as consumers.
Growing awareness of the IPPN market encourages companies to migrate from in-house solutions.
Note: All figures are rounded. The base year is 2018. Source: Frost & Sullivan
2018 2019 2020 2021 2022 2023 2024 2025
Revenue 76.3 102.5 128.7 154.9 181.1 207.3 233.5 259.7
Growth Rate 34.3 25.6 20.4 16.9 14.5 12.6 11.2
0.0
5.0
10.0
15.0
20.0
25.0
30.0
35.0
40.0
0.0
50.0
100.0
150.0
200.0
250.0
300.0
Gro
wth
Rate
(%
)
Reve
nu
e (
$ M
illi
on
)
Year
Total RPN Market: Revenue Forecast, Global, 2018–2025 CAGR, 2019–2025 = 16.8%

29 IPPN
• The global IPPN market grossed $76.3 million in 2018. Frost & Sullivan expects it to grow at a CAGR
of 16.8% to $259.7 million by 2025.
• The market is led by NALA in the base year, followed closely by EMEA, which will be surpassed by
APAC by the end of the forecast. The expected large-scale infrastructure spending will make APAC
the fastest-growing region. Regional growth rates and nuances are discussed in the following
sections.
• Market growth can also be attributed to the rising uptake of ad verification, brand protection, price
comparison, fraud protection, data collection, cyber security, and application performance needs
globally.
• About 70% of the market revenue is expected to come from recurring business and 30% from new
customers.
• The flexibility offered by residential and mobile IPPNs versus data center IPPNs is an important
growth driver. Companies needing both use cases are increasing, and cloud-based solutions enable
easy stakeholder collaboration and faster project turnaround.
Global Revenue Forecast Discussion
Source: Frost & Sullivan

30 IPPN
Regional Technology Adoption Cycle
Western Europe
North America
Central &
Eastern Europe
Middle East
Maturity Development Growth
Africa
Asia
Latin America
Decline
Time
Ma
rket
Va
lue
Total IPPN Market: Regional Technology Adoption Cycle, Global, 2018
Japan, South Korea
Australia
China and India
Source: Frost & Sullivan

31 IPPN
Percent Revenue Forecast by Region
Key Takeaway: In 2018, the EMEA region had the largest revenue share, followed closely by NALA.
By 2025, NALA and APAC will increase their market shares at the expense of EMEA.
Note: All figures are rounded. The base year is 2018. Source: Frost & Sullivan
0.0%
10.0%
20.0%
30.0%
40.0%
50.0%
60.0%
70.0%
80.0%
90.0%
100.0%
2018 2025
APAC (%) 25.1% 27.7%
EMEA (%) 39.5% 34.4%
NALA (%) 35.4% 37.9%
Reve
nu
e (
%)
Year
Total RPN Market: Percent Revenue Forecast by Region, Global, 2018 and 2025

32 IPPN
IPPN Revenue Forecast by Region
Year NALA ($ Million) EMEA ($ Million) APAC ($ Million)
2018 27.0 30.1 19.1
2019 36.8 39.9 25.7
2020 46.9 49.4 32.5
2021 57.2 58.4 39.3
2022 67.5 67.0 46.5
2023 77.9 75.1 54.3
2024 88.1 82.6 62.7
2025 98.3 89.4 72.0
CAGR 17.8% 14.4% 18.7%
Total IPPN Market: Revenue Forecast by Region, Global, 2018–2025
Note: All figures are rounded. The base year is 2018. Source: Frost & Sullivan
Key Takeaway: In 2018, the EMEA region had the largest revenue share, followed closely by NALA.
By 2025, NALA and APAC will increase their market shares at the expense of EMEA.

33 IPPN
• The market for IPPN solutions grossed revenues of $27.0 million in NALA, $30.1 million in EMEA,
and $19.1 million in APAC in 2018.
• The IPPN market in NALA is expected to grow at a CAGR of 17.8% to $98.3 million by 2025, going
from a 35.4% revenue market share to 37.9%. Frost & Sullivan expects North America, particularly
the United States, to undertake more IPPN projects over the forecast period.
• The IPPN market in EMEA is expected to grow at a CAGR of 14.4% to $89.4 million by 2025; while
the region is still growing, its revenue share over 2018-2025 will decrease from 39.5% to 34.4% as
NALA and APAC grow faster. Regional uncertainty over the consequences of Brexit hamper growth
of major expenditures which spur the sales of IPPN solutions.
• The IPPN market in APAC is expected to grow at a CAGR of 18.7% to $72.0 million by 2025,
increasing its revenue share from 25.1% to 27.7%. Expected IPPN spending will make APAC the
fastest-growing region as demographic trends and higher economic growth rates along with more
repressive Internet policies encourage additional spending.
Regional Revenue Forecast Discussion
Source: Frost & Sullivan

34 IPPN
Percent Revenue Forecast by Use Case
Key Takeaway: Price comparison and ad verification are the primary use cases for IPPNs along with
data collection showing growth over the forecast, while other use cases remain flat or shrink.
0%10%20%30%40%50%60%70%80%90%
100%
2018 2025
Account Management 12% 8%
Ad Verification 17% 20%
Application Performance 8% 8%
Brand Protection 8% 5%
Cyber Security 3% 3%
Data Collection 12% 15%
Fraud Protection 12% 8%
Price Comparison 24% 28%
Talent Sourcing 4% 4%
Others 0% 1%
Rev
en
ue (
%)
Year
Total RPN Market: Percent Revenue Forecast by Use Case, Global, 2018 and 2025
Others includes currently unanticipated use cases as IPPN awareness grows. Note: All figures are rounded. The base year is 2018. Source: Frost & Sullivan
Actual Revenues (M) 2018 2025
Ad Verification 13.0 39.9
Brand Protection 6.1 10.0
Data Collection 9.2 29.9
Fraud Protection 9.2 16.0
Application Performance 6.1 16.0
Price Comparison 18.3 55.9
Cyber Security 2.3 6.0
Account Management 9.2 16.0
Talent Sourcing 3.1 8.0
Others 0.0 2.0

35 IPPN
Forecasts and Trends – NALA

36 IPPN
NALA Revenue Forecast
Key Takeaway: The NALA market will grow at a CAGR of 17.8% over the forecast period.
Revenue will double over the forecast as customer realize the benefits of and adopt IPPNs.
Note: All figures are rounded. The base year is 2018. Source: Frost & Sullivan
2018 2019 2020 2021 2022 2023 2024 2025
Revenues 27.0 36.8 46.9 57.2 67.5 77.9 88.1 98.3
Growth 36.1 27.4 21.9 18.1 15.4 13.0 11.6
0.0
5.0
10.0
15.0
20.0
25.0
30.0
35.0
40.0
0.0
20.0
40.0
60.0
80.0
100.0
120.0
Gro
wth
Rae
(%
)
Reve
nu
e (
$ M
illi
on
)
Year
RPN Market: Revenue Forecast, NALA, 2018–2025 Revenue CAGR, 2019–2025 = 17.8%

37 IPPN
• At $27.0 million in 2018, revenue for the NALA market for IPPN solutions was just behind EMEA and
well ahead of APAC. Frost & Sullivan expects NALA revenue to reach $98.3 million by 2025, at a
CAGR of 17.8%.
• North America witnessed healthy growth over the past year thanks to increasing competitive analysis
in the United States causing companies to further lock down their information from competitors. This
growth is mostly due to the region‟s first mover advantage in IPPN adoption and the acceleration of
use case trends leading to a proliferation of services.
• Brazil has traditionally led Latin America in terms of IPPN spending; however, poor economic
conditions affected the region in 2018 and several vendors saw a decline in their revenue from Brazil.
• Additional IPPN services coming to market a far-reaching positive effect on the IPPN vendors in
NALA. Competition has helped constrain the costs of some services, but the growing need from
enterprise customers is leading to more attention being placed on IPPN services.
• Consolidation is inevitable in the IPPN market. These mergers and acquisitions have the potential to
create a larger competitor to market leader Luminati, primarily by combining support organizations.
Source: Frost & Sullivan
NALA Revenue Forecast Discussion

38 IPPN
Forecasts and Trends – EMEA

39 IPPN
EMEA Revenue Forecast
Key Takeaway: EMEA makes up over one third of the global IPPN market in 2018. Growth from
Western Europe is countered by countries in the Middle East and Central and Eastern Europe.
Note: All figures are rounded. The base year is 2018. Source: Frost & Sullivan
2018 2019 2020 2021 2022 2023 2024 2025
Revenues 30.1 39.9 49.4 58.4 67.0 75.1 82.6 89.4
Growth 32.5 23.7 18.2 14.7 12.2 10.0 8.2
0.0
5.0
10.0
15.0
20.0
25.0
30.0
35.0
0.0
10.0
20.0
30.0
40.0
50.0
60.0
70.0
80.0
90.0
100.0
Gro
wth
Rae
(%
)
Reve
nu
e (
$ M
illi
on
)
Year
RPN Market: Revenue Forecast, EMEA, 2018–2025 Revenue CAGR, 2019–2025 = 14.4%

40 IPPN
• EMEA contributed $30.1 million in sales, or 39.5% of the global market revenue in 2018, just ahead
of NALA and well ahead of APAC.
• Many IPPN vendors grew out of Europe, and so have their strongest footprint in the EMEA region.
• Strong demand for IPPN solutions continues from the Middle East, driven by investment in Internet
infrastructure. Since internet costs in the Middle East are among the highest in the world, the region‟s
overall growth has been limited by these costs.
• EMEA is expected to show modest growth with a CAGR of 14.4%. Economic uncertainty in Europe;
geopolitical instability in the Middle East, Russia, and parts of Africa; and the fact that spending on
internet infrastructure projects is not expected to reach pre-recession levels until the end of the
decade will only mean slow growth through 2025.
EMEA Revenue Forecast Discussion
Source: Frost & Sullivan

41 IPPN
Forecasts and Trends – APAC

42 IPPN
APAC Revenue Forecast
Key Takeaway: At a CAGR of 18.7%, APAC follows NALA as the
fastest growing region for IPPN revenues over the forecast period.
Note: All figures are rounded. The base year is 2018. Source: Frost & Sullivan
2018 2019 2020 2021 2022 2023 2024 2025
Revenues 19.1 25.7 32.5 39.3 46.5 54.3 62.7 72.0
Growth 34.5 26.3 21.1 18.3 16.6 15.6 14.7
0.0
5.0
10.0
15.0
20.0
25.0
30.0
35.0
40.0
0.0
10.0
20.0
30.0
40.0
50.0
60.0
70.0
80.0
Gro
wth
Rate
(%
)
Reve
nu
e (
$ M
illi
on
)
Year
RPN Market: Revenue Forecast, APAC, 2018–2025 Revenue CAGR, 2019–2025 = 18.7%

43 IPPN
• At $19.1 million in 2018, APAC was the smallest regional market for IPPN solutions by revenue.
Market revenue is expected to increase to $72.0 million by 2025 at a CAGR of 18.7%.
• Among all regions, APAC is the most price-sensitive market for technology solutions in general. The
tendency for firms to build home grown solutions or employ system integrators to make customized
solutions is the highest here, though regulations in most countries in the region drive demand more
than other regions.
• As emerging economies continue to urbanize, build out infrastructure, and grow their industries, it
will become imperative for companies in this region to follow global standards and best practices
and to implement checks and balances, in order to gain confidence in the global market. Because
IPPN solutions will be looked upon as a cost of doing business, price sensitivity is expected to
wane.
• Some vendors consider Australia a growing market, although some have been affected by the
downturn in the region‟s economy.
APAC Revenue Forecast Discussion
Source: Frost & Sullivan

44 IPPN
Market Share and Competitive Analysis –
Verticals

45 IPPN
IPPN Competitive Landscape – Vertical Market Share
Note: All figures are rounded. The base year is 2018. Source: Frost & Sullivan
Key Takeaway: The split between residential, mobile, and data center IPPN verticals is dominated
by residential at over 73%, followed by data centers at almost 20%, with mobile at 7% in 2018.
Choice of vertical depends on the techniques used by target websites to block visitors
Residential 73.6%
Mobile 7.0%
Data Center 19.4%
Total IPPN Market: Vertical Analysis, Global, 2018

46 IPPN
• IP proxy networks enable companies to simulate being actual customers by having users around the
world install software and agree to contribute a portion of their devices resources when idle to route
web traffic through their IP address. This is known as a residential proxy network, one of the three
verticals used in the market along with mobile and data center IPPNs.
• By getting thousands to millions of users to participate in their network, IP proxy network companies
create a pool of IP addresses to accomplish the aforementioned use cases. Since each node on the
network is in a different location using a different device, in the case of residential IPPNs websites
only see traffic as coming from individuals and residential internet service providers (ISPs).
• IP proxy network companies can also provide IP addresses coming from data centers instead of
ISPs. These data center proxies also hide IP addresses and location, and allow for data collection,
but they are known not to be residential or mobile. While they are generally less expensive than
residential or mobile proxies, they do not offer the benefits of appearing as actual customers.
• As more Internet use goes to mobile devices, IPPNs can also used to simulate traffic coming from
handsets, however it is more difficult to regulate broadband usage via cellular and WiFi, plus idle
computing time must be accounted for while on batteries versus charging.
Verticals Discussion
Source: Frost & Sullivan

47 IPPN
Market Share and Competitive Analysis –
Total IPPN Market

48 IPPN
IPPN Competitive Landscape – Market Share
Others includes companies listed here. Note: All figures are rounded. The base year is 2018. Source: Frost & Sullivan
Key Takeaway: Luminati, Oxylabs, and GeoSurf dominated the global IPPN market in 2018,
combining to represent 77.0% of the total market.
Luminati 53.1%
Oxylabs 13.3%
Geosurf 10.6%
Scrapinghub 5.3%
LimeProxies 1.3%
Smartproxy 4.0%
StormProxies 2.7%
Microleaves 1.7%
Netnut 1.3%
Others 6.6%
Total IPPN Market: Market Share Analysis, Global, 2018
49 IPPN
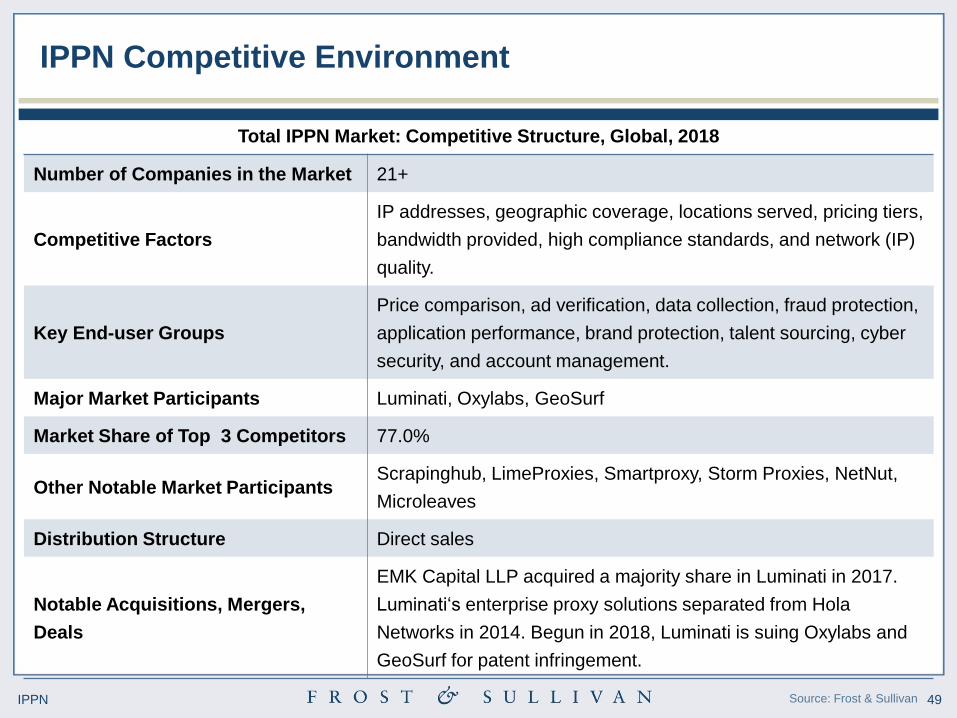
IPPN Competitive Environment
Number of Companies in the Market 21+
Competitive Factors
IP addresses, geographic coverage, locations served, pricing tiers,
bandwidth provided, high compliance standards, and network (IP)
quality.
Key End-user Groups
Price comparison, ad verification, data collection, fraud protection,
application performance, brand protection, talent sourcing, cyber
security, and account management.
Major Market Participants Luminati, Oxylabs, GeoSurf
Market Share of Top 3 Competitors 77.0%
Other Notable Market Participants Scrapinghub, LimeProxies, Smartproxy, Storm Proxies, NetNut,
Microleaves
Distribution Structure Direct sales
Notable Acquisitions, Mergers,
Deals
EMK Capital LLP acquired a majority share in Luminati in 2017.
Luminati„s enterprise proxy solutions separated from Hola
Networks in 2014. Begun in 2018, Luminati is suing Oxylabs and
GeoSurf for patent infringement.
Total IPPN Market: Competitive Structure, Global, 2018
Source: Frost & Sullivan

50 IPPN
Luminati At A Glance
Company Name Luminati
Location Netanya, Israel
Owner Private (120+ employees), EMK Capital LLP, United Kingdom
Platform Luminati Proxy Service (Residential IPs, Mobile IPs, and Data Center IPs)
Product Revenue $40 Million
Industries Served Retail price comparison, ad verification, sales intelligence, brand protection,
self-testing
Notable Customers Fortune 500 companies across all verticals
Primary Competitors Oxylabs, GeoSurf, Scrapinghub, LimeProxies, Smartproxy, Storm Proxies,
NetNut, Microleaves
Platform Highlights
35.0M+ published residential IPs / 32.0M+ generally available residential IPs
Serves 195 countries, 26,846 cities, 11,748 ASNs, 592 Mobile ASNs.
The only IP proxy network that requires consent from its residential peers and
has strict KYC rules. Proxy Manager, Chrome Extension, APIs available in
Shell, Node.js, Python, C#, Java, VB, PHP, Ruby, and Perl. Source: Frost & Sullivan

51 IPPN
Oxylabs At A Glance
Company Name Oxylabs
Location Vilnius, Lithuania
Owner Private (11-50 employees), Part of Tesonet
Platform Residential IPs, Data Center IPs, Real-Time Crawler
Product Revenue $10 Million
Industries Served Market research, brand protection, travel fare aggregation, ad verification,
pricing intelligence
Notable Customers 700+ customers, Case studies change customer names to provide anonymity.
Primary Competitors Luminati, GeoSurf, Scrapinghub, LimeProxies, Smartproxy, Storm Proxies,
Microleaves, NetNut (Luminati sued Oxylabs in 2018 for patent infringement.)
Platform Highlights
30.0M+ published residential IPs / 24.3M+ generally available residential IPs
Serves 195 countries. Two apps using the embedded Oxylabs SDK, Material
Notification Shade and Power Shade, were taken down from Google Play
Store when the SDK was marked as malicious by Google. The apps were
reinstated a day later without the Oxylabs SDK. Source: Frost & Sullivan

52 IPPN
GeoSurf At A Glance
Company Name GeoSurf
Location Tel Aviv, Israel, Development in Romania and Ukraine.
Owner Private (11-50 employees), part of BIScience
Platform Residential IPs, Data Center IPs
Product Revenue $8 Million
Industries Served Ad verification, social listening, search engine optimization, sales intelligence,
sneaker proxy
Notable Customers 7,000+ Professional Marketers, Ubisoft
Primary Competitors Luminati, Oxylabs, Scrapinghub, LimeProxies, Smartproxy, Storm Proxies,
Microleaves, NetNut (Luminati sued GeoSurf in 2018 for patent infringement.)
Platform Highlights
2.0M+ published residential IPs / 1.4M+ generally available residential IPs
Serves 130+ global locations. Good blog and resources explanation for
prospective customers.
Source: Frost & Sullivan

53 IPPN
Scrapinghub At A Glance
Company Name Scrapinghub
Location Ballincollig, Cork, Ireland
Owner Private (51-200 employees)
Platform Crawlera, “The World‟s Smartest Proxy Network”
Product Revenue $4 Million
Industries Served Focuses on data scraping, not individual use cases, like price comparison.
Notable Customers 2000+ Companies as customers, Used by over 1M+ developers
Data scraping customers: Amazon, Deloitte, HubSpot, Logitech, Walmart
Primary Competitors Luminati, Oxylabs, GeoSurf, LimeProxies, Smartproxy, Storm Proxies,
Microleaves, NetNut
Platform Highlights
No published residential IP network size
Almost hides proxy network to focus on data scraping. Open Sources much of
their code, giving clients peace of mind. APIs available in Python, Node.js,
Scrapy, C#, Java, PHP, Ruby
Source: Frost & Sullivan

54 IPPN
Smartproxy At A Glance
Company Name Smartproxy
Location Unknown
Owner Unknown
Platform Oxylabs Reseller
Product Revenue $3 Million
Industries Served
Account management, product releases, market research…also markets
specific proxies for Instagram, Sneakers, Twitter, Craigslist, Facebook, Reddit,
and for backconnects
Notable Customers Only lists anonymized residential customers, i.e. last name redacted. Any
corporate customers kept anonymous.
Primary Competitors Luminati, Oxylabs, GeoSurf, Scrapinghub, LimeProxies, Storm Proxies,
Microleaves, NetNut
Platform Highlights
10.0M+ published residential IPs / 7.4M+ generally available residential IPs
90%+ of available IP addresses appear to be resold Oxylabs nodes. Serves
190+ geographic locations. Very sneaker-focused and very use case-focus
versus vertical-focus, e.g. Get Instagram proxies versus Get Social Media
proxies. Blog has good use case explanations of how their Smartproxy solves
improves that specific use case. Source: Frost & Sullivan

55 IPPN
LimeProxies At A Glance
Company Name LimeProxies
Location Hong Kong
Owner Private (11-50 employees)
Platform High speed, premium proxies
Product Revenue $1 million
Industries Served Gaming proxies, ticketing proxies, Socks5 proxies, classified ads, custom
solutions.
Notable Customers Anonymous. No real case studies from current customers.
Primary Competitors Luminati, Oxylabs, GeoSurf, Scrapinghub, Smartproxy, Storm Proxies,
Microleaves, NetNut
Platform Highlights
No published residential IP network size
Serves 40+ geographic locations, makes a point of not being a subsidiary or
reseller of larger, parent company. Lot of bad chatter on forums about
customer service and affiliate programs recommending against LimeProxies.
Source: Frost & Sullivan

56 IPPN
Storm Proxies At A Glance
Company Name Storm Proxies
Location Unknown
Owner Unknown
Platform Backconnect Rotating Proxies
Product Revenue $2 Million
Industries Served Web scraping, traffic bots, bulk account registrations, search engine
optimization tools, ticket sites, sneaker sites
Notable Customers Anonymous. No real case studies from current customers.
Primary Competitors Luminati, Oxylabs, GeoSurf, Scrapinghub, LimeProxies, Smartproxy,
Microleaves, NetNut
Platform Highlights
40,000 published residential IPs / Proxies rotated every 5 minutes.
Dedicated proxy verticals, much like Smartproxy, i.e. Ticketmaster, Instagram,
Facebook, Twitter, Tumblr, Pinterest, Linkedin, Snapchat, Pokemon Go
proxies
Source: Frost & Sullivan

57 IPPN
NetNut At A Glance
Company Name NetNut
Location Tel Aviv, Israel
Owner Private, part of Safe-T Group Ltd. as of mid-2019
Platform NetNut SuperProxy
Product Revenue $2 Million
Industries Served Price comparisons, web scraping
Notable Customers Anonymous. No real case studies from current customers.
Primary Competitors Luminati, Oxylabs, GeoSurf, Scrapinghub, LimeProxies, Smartproxy, Storm
Proxies, Microleaves
Platform Highlights
10.0M+ published residential IPs / 7.4M+ generally available residential IPs
Serves approximately 50 countries. NetNut uses ISP IPs directly. Traffic does
not go through end-user devices. Instead of using a peer to peer (P2P)
network, NetNut depends on DiViNetworks‟ existing data delivery and network
management solutions. DiViNetworks provides services to over 100 ISPs from
tens of point of presence (PoPs) around the world. Safe-T Group Ltd. acquired
NetNut in mid-2019 to augment their software-defined access technology. Source: Frost & Sullivan

58 IPPN
Microleaves At A Glance
Company Name Microleaves
Location London, UK
Owner Unknown (19 employees)
Platform Adware
Product Revenue $1.3 Million
Industries Served Web scraping, ticket sites, sneaker sites
Notable Customers 19k Active Customers, 60+ New Customers Daily, Fortune 500 Companies
Primary Competitors Luminati, Oxylabs, GeoSurf, Scrapinghub, LimeProxies, Smartproxy, Storm
Proxies, NetNut
Platform Highlights
Microleaves proxy client software has been identified as an adware program
by various malware and virus tools. While its stated use is as an IP proxy
network, it appears to be serving unwanted advertisements across visited
webpages. Though Microleaves claims to have the lowest fail rate, instant
scaling, user-friendly integration, no limit on concurrent connections, 26M+
residential IPs, 5M+ mobile IPs, and 500K+ data center IPs, testing was not
performed to determine generally available IPs because of security concerns
over its proxy client software used to generate their network.
Source: Frost & Sullivan

59 IPPN
IPPN Competitive Landscape
Key Takeaway: Luminati, Oxylabs, and GeoSurf dominated the global IPPN market in 2018.
Source: Frost & Sullivan
Luminati
Oxylabs
Geosurf
Scrapinghub
LimeProxies
Smartproxy
StormProxies
Others
Microleaves
Netnut
Pro
du
ct L
ine a
nd
Com
petitive
Str
ate
gy
Market Penetration
Total IPPN Market: Competitive Landscape, Global, 2018
Niche Contender Participant Challenger Leader

60 IPPN
The IPPN competitive landscape represents the relative positioning of vendors in terms of their current
market share and their strategic positioning for growth according to the following factors:
• Current market share by percentage of revenue: The X axis represents a vendor‟s market
position; the size of the company‟s circle represents its base year revenues.
• Relative strategic excellence: The Y axis depicts a vendor‟s strategy score, particularly how likely it
is to outperform the market and win market share from its nearest competitors. Factors include:
o Current functionality and ongoing R&D investment: Feature-rich IPPN solutions with a strong,
consistent commitment to R&D score the highest on this vector.
o Scalability: The ability to manage large volumes of engineering assets and to work cross-
regionally and cross-functionally, on both mobile and cloud, determine the scalability score.
o Flexibility: Integrating or working alongside legacy solutions and other enterprise software.
o Vertical and geographic footprint: Working across industries and various countries.
o Merger and acquisition, partnership, and standardization strategy: Buying and/or partnering
with other vendors, coupled with organic growth. Source: Frost & Sullivan
IPPN Competitive Landscape – Factors and Assessment

61 IPPN
• Luminati is the only proxy network that requires consent from its peer network, has tight compliance
procedures for its customers, and serves Fortune 500 enterprises. With over 35 million residential IP
addresses, Luminati provides rotating IP proxy access in 195 countries across 26,846 cities, 11,748
Autonomous System Numbers (ASNs), and 592 mobile ASNs.
• Luminati enables enterprise customers to access the internet and view websites as they look to
actual consumers. As companies block and slow the web to competitors, Luminati‟s proprietary
network allows companies to access the web as if they were in any city covered by their residential
IP network.
• Luminati serves enterprise clients across many vertical industries to verify ad performance, collect
data, such as pricing information, conduct cyber security checks, protect their brand, monitor
application performance, and prevent fraud. Using a residential IP proxy service is the only way
businesses can check the accuracy of data and pricing matching what customers see in various
regions around the world.
IPPN Competitive Landscape – Market Leader Luminati
Source: Frost & Sullivan

62 IPPN
Growth Opportunities and Companies to Action

63 IPPN
Growth Opportunity 1: Expand Consumer Education
Applicable
Segments
• There are numerous reports of
suspicious proxy and virtual
private network services. While
many consumers are unaware of
nefarious uses of these services,
the customers knowingly
shopping for them are typically
aware enough to question them.
• Current marketing efforts do not
sufficiently assuage consumers
that any particular IPPN service
provider is not “shady.”
Context and Opportunity Call to Action
• Counter media reports of
potential nefarious use cases.
• Expand awareness of various
use cases to gain prosumer use,
not just enterprise customers.
Many customers don‟t know
something like the functionality
behind IP proxy networks exist,
much less know enough to
research it and shop for one.
• While knowledgeable enough
companies will compete on
metrics, there is room to grow
the market to newcomers.
Applicable
Regions
Content Services Infrastructure Business Other
NALA EMEA APAC
Vision Transformation
Megatrends Impact
Disruptive Applications
Business Models
Current Offerings
New Capabilities
Value-add Services
Vertical Markets
Geographic Expansion
Partnerships
Investment / M&A
Source: Frost & Sullivan

64 IPPN
Growth Opportunity 2: Multi-Privacy Solutions
Applicable
Segments
• Many companies want all-in-one
solutions rather than multi-
vendor, best-in-class solutions
for their privacy, security, and
competitive analysis needs,
leaving dedicated IP proxy
network vendors at a
disadvantage over more
integrated solution providers.
Context and Opportunity Call to Action
• Partner with VPN vendors to
provide a wider array of privacy
and security solutions to
customers looking to source
from single vendors.
• Develop complementary VPN
solutions to address the needs of
customers looking for all-in-one
competitive analysis and privacy
vendors.
Applicable
Regions
Content Services Infrastructure Business Other
NALA EMEA APAC
Vision Transformation
Megatrends Impact
Disruptive Applications
Business Models
Current Offerings
New Capabilities
Value-add Services
Vertical Markets
Geographic Expansion
Partnerships
Investment / M&A
Source: Frost & Sullivan
65 IPPN
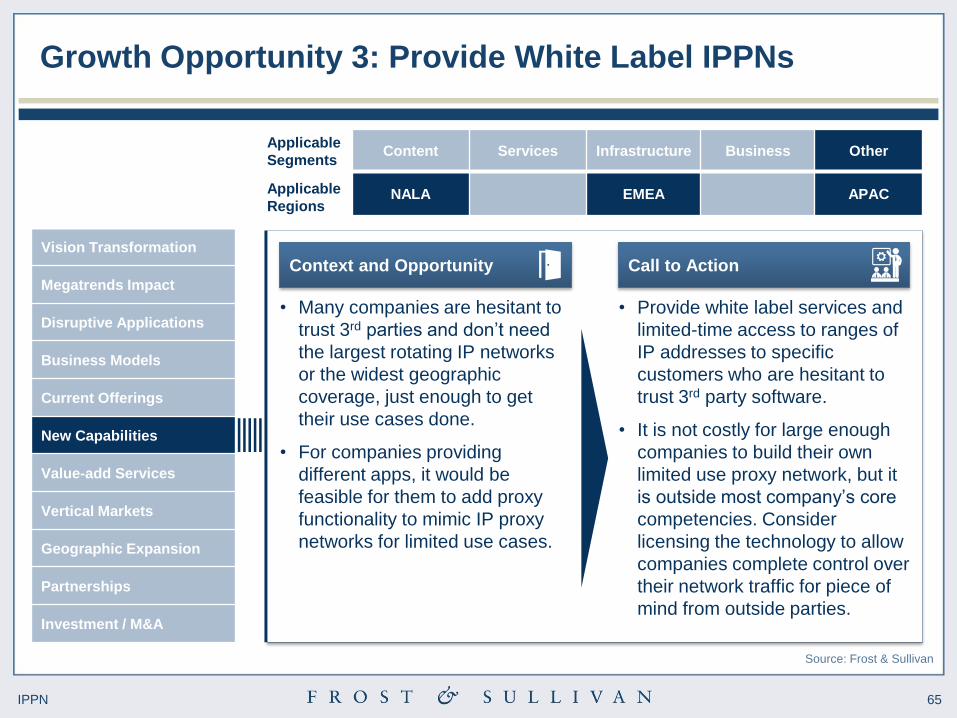
Growth Opportunity 3: Provide White Label IPPNs
Applicable
Segments
• Many companies are hesitant to
trust 3rd parties and don‟t need
the largest rotating IP networks
or the widest geographic
coverage, just enough to get
their use cases done.
• For companies providing
different apps, it would be
feasible for them to add proxy
functionality to mimic IP proxy
networks for limited use cases.
Context and Opportunity Call to Action
• Provide white label services and
limited-time access to ranges of
IP addresses to specific
customers who are hesitant to
trust 3rd party software.
• It is not costly for large enough
companies to build their own
limited use proxy network, but it
is outside most company‟s core
competencies. Consider
licensing the technology to allow
companies complete control over
their network traffic for piece of
mind from outside parties.
Applicable
Regions
Content Services Infrastructure Business Other
NALA EMEA APAC
Vision Transformation
Megatrends Impact
Disruptive Applications
Business Models
Current Offerings
New Capabilities
Value-add Services
Vertical Markets
Geographic Expansion
Partnerships
Investment / M&A
Source: Frost & Sullivan

66 IPPN
Growth Opportunity 4: Mergers and Acquisitions
Applicable
Segments
• Despite providing global
services, many IPPN vendors
have limited regional footprints
for sales, service, and support.
With a concentration of market
leadership, smaller companies
could decide to merge and/or
acquire one another to compete
more effectively.
• Besides immediately bolstering
the size of their proxy IP network
addresses, this provides
additional sales and support
capabilities in each company‟s
primary region.
Context and Opportunity Call to Action
• Explore opportunities to acquire
other vendors with
complementary product lines,
different software expertise,
beneficial vertical industry
presence, or geographically
desirable sales force and/or
support staff.
• Consolidate with vendors of
ancillary products, such as VPN
vendors to provide one-stop-
shop solutions for the wider
industry needs and/or to expand
vertical scope and regional
coverage.
Applicable
Regions
Content Services Infrastructure Business Other
NALA EMEA APAC
Vision Transformation
Megatrends Impact
Disruptive Applications
Business Models
Current Offerings
New Capabilities
Value-add Services
Vertical Markets
Geographic Expansion
Partnerships
Investment / M&A
Source: Frost & Sullivan

67 IPPN
Strategic Imperatives for Success and Growth
IPPN providers will grow as companies continue to silo information away from
competitors. The need for companies to view information as actual customers
and collect data for further analysis drives growth over the forecast period.
Growing investment in web-based businesses, tempered somewhat by
concern over possible Internet regulations, provides an opportunity for
widespread IPPN sales as globalization increased the need for comparisons.
Differentiating between IPPN solutions becomes increasingly necessary to
reach customers who could develop a home grown IPPN solution, but be better
served by expert IPPN vendors for cost savings, technology, increased network
size, and better geographic coverage.
Critical
Success
Factors
Due to growing awareness of advertising tracking practices, concern over
installing software on personal computers and mobile devices limits the
potential growth of residential IP networks. Transparency, logging, and strong
know your customer policies are key to reassuring customers and users.
With the APAC region expected to post the highest growth rate over the
forecast period, followed by NALA, IPPN solution providers should target
mergers and acquisitions and/or customer support in these regions.
Source: Frost & Sullivan

68 IPPN
The Last Word

69 IPPN
The Last Word – Recommendations
Source: Frost & Sullivan
To grow their business over the next few years, IPPNs need to focus their efforts on
marketing use cases to potential customers. Rather than tout technical criteria,
highlight customer journeys more to demonstrate effectiveness. Instead of battling it
out for a finite number of existing customers, IPPN vendors will be better served by
growing their market organically through educating customers about use cases.
1
Increased user demographic and location targeting for advertising and pricing
encourages companies to do competitive analysis via IPPNs to view websites as
actual customers see them. Gathering data programmatically from websites is as
much a part of the Internet as search engines are. IPPN vendors are encouraged to
support any companies or technologies that increase the need for IPPN use cases.
2
As the IPPN market grows and eventually consolidates, vendor positioning and
reputation is critical. Luminati already has sizable leads in technical criteria, though
pricing is considered premium, albeit with better customer support. Transparency,
strict logging rules, and strong know-your-customer policies help reassure potential
customers of Luminati‟s well-deserved market leadership position and reputation.
3

70 IPPN
Legal Disclaimer
Frost & Sullivan is not responsible for any incorrect information supplied to us by
manufacturers or users. Quantitative market information is based primarily on interviews
and therefore is subject to fluctuation. Frost & Sullivan research services are limited
publications containing valuable market information provided to a select group of
customers. Our customers acknowledge, when ordering or downloading, that Frost &
Sullivan research services are for customers‟ internal use and not for general publication
or disclosure to third parties. No part of this research service may be given, lent, resold or
disclosed to noncustomers without written permission. Furthermore, no part may be
reproduced, stored in a retrieval system, or transmitted in any form or by any means,
electronic, mechanical, photocopying, recording or otherwise, without the permission of
the publisher.
For information regarding permission, write to:
Frost & Sullivan
3211 Scott Blvd, Suite 203
Santa Clara, CA 95054
© 2019 Frost & Sullivan. All rights reserved. This document contains highly confidential information and is the sole property of Frost & Sullivan.
No part of it may be circulated, quoted, copied or otherwise reproduced without the written approval of Frost & Sullivan.

71 IPPN
Appendix

72 IPPN
Market Engineering Methodology
One of Frost & Sullivan‟s core
deliverables is its Market Engineering
studies. They are based on our
proprietary Market Engineering
Methodology. This approach, developed
across the 50 years of experience
assessing global markets, applies
engineering rigor to the often nebulous
art of market forecasting and
interpretation.
A detailed description of the
methodology can be found here.
Source: Frost & Sullivan

73 IPPN
Measurement Name Measurement Trend
Market Stage Growth -
Market Revenue (2018) $76.3 M ▲
Market Size for Last Year of Study Period (2025) $259.7 M ▲
Base Year Market Growth Rate (2018) 34.3% ▼
Compound Annual Growth Rate (CAGR, 2019 – 2025) 16.8% -
Customer Price Sensitivity (Scale:1 [low] to 10 [high]) 8 ●
Degree of Technical Change (Scale:1 [low] to 10 [high]) 7 ▲
Market Concentration (Base Year Market Share Held by Top 3 Companies) 77.0% ▼
Decreasing Stable Increasing
▼ ● ▲
Total IPPN Market: Market Engineering Measurements, Global, 2018
Market Overview
Market Engineering Measurements
Note: All figures are rounded. The base year is 2018. Source: Frost & Sullivan

74 IPPN
Primary
• Luminati
• Oxylabs
• GeoSurf
• Scrapinghub (Crawlera)
• LimeProxies
• Smartproxy
• Storm Proxies
• NetNut
• Microleaves
List of IPPN Market Participants
Source: Frost & Sullivan
Others
• RotatingProxies
• Local Proxies
• Smart DNS Proxy
• Residential IPs
• ProxyRain
• ProxyMesh
• ProxyRack
• ProxyKey
• Intoli
• BlazingProxies
• ProxyRotator
• GhostProxies
• Xverum