Tribal Sub-Plan (TSP) 2015-16 Meenangadi Village Panchayat
86
Twelfth Five Year Plan 2012-2017 Tribal Sub-Plan (TSP) 2015-16 Meenangadi Village Panchayat 2016 Meenangadi Village Panchayat Wayanad District Formulation Kerala Institute of Local Administration (KILA) Academic Support & Publishing
-
Upload
khangminh22 -
Category
Documents
-
view
1 -
download
0
Transcript of Tribal Sub-Plan (TSP) 2015-16 Meenangadi Village Panchayat
Twelfth Five Year Plan 2012-2017
Tribal Sub-Plan (TSP)2015-16
Meenangadi Village Panchayat
2016
Meenangadi Village PanchayatWayanad District
Formulation
Kerala Institute of Local Administration (KILA)
Academic Support & Publishing
Twelfth Five Year Plan 2012-2017
Meenangadi Village PanchayatTribal Sub Plan 2015-2016
Project TeamMeenangadi Village Panchayat
C AssainarPresident, Meenangadi Grama Panchayat
Latha SasiVice President, Meenangadi Grama Panchayat
V A AbbasChairman, Standing Committee for Development
Sheeba KrishnanChairperson, Standing Committee for Welfare
K K RamankuttyChairman, Standing Committee for Health and
Education
Sindhu RajanChairperson, Working Group for Scheduled Tribes
P VasudevanMember, Sulthan Bathery Block Panchayat
M R HemalathaAsst. Secretary, Meenangadi Grama Panchayat
V SureshFaculty, HRDC
Girijan GopiScientist, MSSRF
KILA
Project DirectorDr. J.B.RajanAssistant Professor, KILA
Project AssociateAS Prathap SinghTraining Associate, KILA
OP RanjithBRGF Associate, KILA
Experts-Extension Faculty, KILAT. UshakumariE.G. JosephN.P. VenugopalanT.M. Shihab
Translated byProf. Laxmanan.PExtension Faculty, KILA
ISBN: 978-93-84557-68-3
DTPJitto P George
Layout & CoverRajesh Thanikudam
PrintingCo-operative Press, Mulamgunnathukavu Thrissur, Phone: 0487 2200391
May 2016
Towards development horizon through Tribal IdentityThe Tribal community of Meenangadi Village Panchayat is seeking new avenue of development, roving onthe wings of sustainable development through “Towards Excellence with Unity” a development programmeimplemented by the Panchayat. The Panchayat is proud of its effective interventions in implementing theschemes under Tribal Sub-Plan aiming at the gradual raising of the standard of life of the tribal communityscattered in several Tribal Colonies by providing basic infrastructure and services relating to education, arts,sports and culture. Projects like TIDES aiming at comprehensive development of Tribes, Santhvana and SouhridamProject aiming at Happy Home and Happy Life and Awas for the development of Children and women arebeing implemented in the Panchayat.
The Panchayat has succeeded in its attempt to achieve total participation of Scheduled Tirbes in MGNREGSthereby ensuring their livelihood and promoting thrift. Tho Agro Veg-Agro Root schemes intended to bring infood and livelihood security have turned out to be a haven of relief to them. It is against this backdrop, thePanchayat undertook the task of preparing a model Tribal Sub Plan with the academic support of KILA.
We are grateful to Dr. P P Balan, Director, KILA, Dr. J B Rajan, Assistant Professor, the Faculty of KILA, thePanchayat Council, Members of Working Groups, Implementing Officers, Staff of the Panchayat, ScheduledTribe Promoters, Directors of HRDC, Workers of Tribal Desk and other volunteers for their sincere servicein the preparation of the document. The Panchayat proudly presents this Tribal Sub Plan to the peoplebearing in mind the valuable advice and suggestions of the generous persons that have gone into the makingof the Tribal Sub Plan 2015-16
C Assainar
Introduction
C AssainarPresident
Meenangadi Village PanchayatWayanad District
Meenangadi Village PanchayatWayanad District
Phone: 04935247236. e-mail: [email protected]: 9496048316
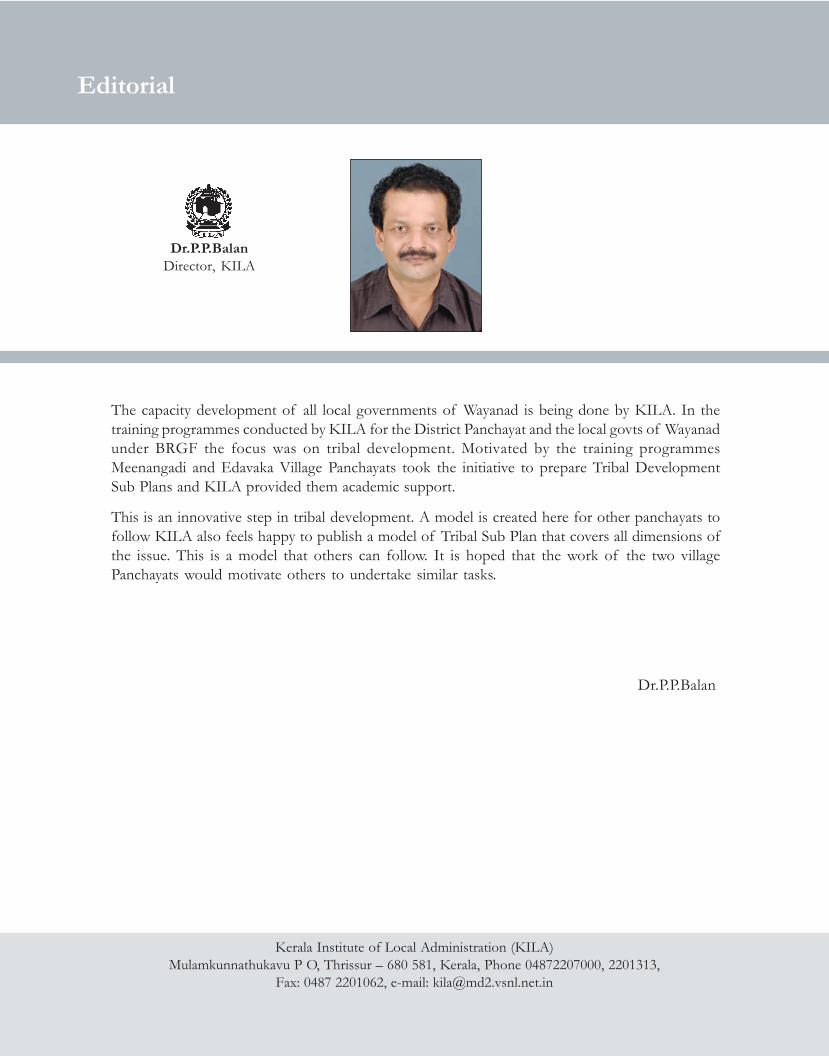
Editorial
Dr.P.P.BalanDirector, KILA
Kerala Institute of Local Administration (KILA)Mulamkunnathukavu P O, Thrissur – 680 581, Kerala, Phone 04872207000, 2201313,
Fax: 0487 2201062, e-mail: [email protected]
The capacity development of all local governments of Wayanad is being done by KILA. In thetraining programmes conducted by KILA for the District Panchayat and the local govts of Wayanadunder BRGF the focus was on tribal development. Motivated by the training programmesMeenangadi and Edavaka Village Panchayats took the initiative to prepare Tribal DevelopmentSub Plans and KILA provided them academic support.
This is an innovative step in tribal development. A model is created here for other panchayats tofollow KILA also feels happy to publish a model of Tribal Sub Plan that covers all dimensions ofthe issue. This is a model that others can follow. It is hoped that the work of the two villagePanchayats would motivate others to undertake similar tasks.
Dr.P.P.Balan

Kerala started implementing the local governments system based on democratic decentralisationeffectively since the beginning of the Ninth Five Year Plan. But we have not yet achieved thesocial and economic development of Scheduled Castes and Scheduled Tribes their status has notimproved much. They still belong to the marginalised sections of the society. So it has become anecessity to prepare a separate Sub Plan for the tribals. KILA organised a special training withfocus on preparation of plan for tribal development, but only Meenagadi and Edavaka VillagePanchayats of Wayanad district took the initiative to prepare Tribal Sub Plan during the TwelfthFYP. The academic support for the preparation of plan was provided by KILA. The Tribal SubPlan would enable the Panchayats to formulate effective projects for tribal development. At thesame time it would be a model for other Panchayats having scheduled caste and scheduled tribepopulation. It is hoped that this Tribal Sub Plan would be useful for the development of scheduledcastes and tribes and provide a model for other Panchayats.
Dr.J.B.Rajan
Relevance of Sub- Plan
Kerala Institute of Local Administration (KILA)Mulamkunnathukavu P O, Thrissur – 680 581, Kerala, Phone 04872207000, 2201313,
Fax: 0487 2201062, e-mail: [email protected]: [email protected]
Dr.J.B.RajanProject Director
KILA
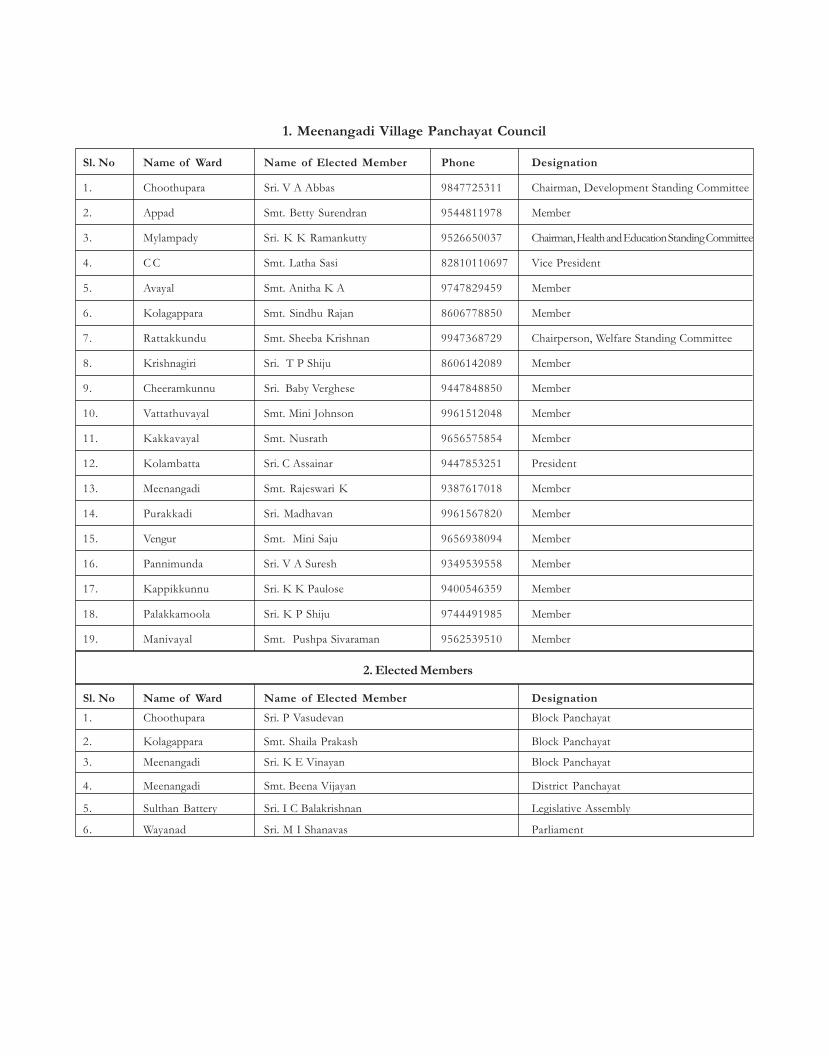
1. Meenangadi Village Panchayat Council
Sl. No Name of Ward Name of Elected Member Phone Designation
1. Choothupara Sri. V A Abbas 9847725311 Chairman, Development Standing Committee
2. Appad Smt. Betty Surendran 9544811978 Member
3. Mylampady Sri. K K Ramankutty 9526650037 Chairman, Health and Education Standing Committee
4. C C Smt. Latha Sasi 82810110697 Vice President
5. Avayal Smt. Anitha K A 9747829459 Member
6. Kolagappara Smt. Sindhu Rajan 8606778850 Member
7. Rattakkundu Smt. Sheeba Krishnan 9947368729 Chairperson, Welfare Standing Committee
8. Krishnagiri Sri. T P Shiju 8606142089 Member
9. Cheeramkunnu Sri. Baby Verghese 9447848850 Member
10. Vattathuvayal Smt. Mini Johnson 9961512048 Member
11. Kakkavayal Smt. Nusrath 9656575854 Member
12. Kolambatta Sri. C Assainar 9447853251 President
13. Meenangadi Smt. Rajeswari K 9387617018 Member
14. Purakkadi Sri. Madhavan 9961567820 Member
15. Vengur Smt. Mini Saju 9656938094 Member
16. Pannimunda Sri. V A Suresh 9349539558 Member
17. Kappikkunnu Sri. K K Paulose 9400546359 Member
18. Palakkamoola Sri. K P Shiju 9744491985 Member
19. Manivayal Smt. Pushpa Sivaraman 9562539510 Member
2. Elected Members
Sl. No Name of Ward Name of Elected Member Designation1. Choothupara Sri. P Vasudevan Block Panchayat
2. Kolagappara Smt. Shaila Prakash Block Panchayat
3. Meenangadi Sri. K E Vinayan Block Panchayat
4. Meenangadi Smt. Beena Vijayan District Panchayat
5. Sulthan Battery Sri. I C Balakrishnan Legislative Assembly
6. Wayanad Sri. M I Shanavas Parliament

Implementing Officers
Sl. No Name of Elected Member Designation Phone
1. Sri. P Shamsudin Secretary, Village Panchayat 9496048317
2. Smt. K Sobhana Kumari Agriculture Officer 9447433624
3. Dr. G Shirly Veterinary Surgeon 9946601973
4. Dr. Soumya Chandran Medical Officer, Indian System of Medicine 9495720211
5. Dr. S N Biji Medial Officer, Homeo 9447442866
6. Smt. K Kavitha Assistant Engineer 9947320578
7. Sri. R Sabu Head Master, GUP School 9744928319
8. Smt. A N Viswalatha V E O 9400176819
9. Smt. K K Usha ICDS Supervisor 9446926293
10. Smt. M R Hemalatha Assistant Secretary, Village Panchayat 9446257304
Scheduled Tribes Promoters
Sl. No Name Ward Number Phone
1. Smt. Sudha K 1 9605799139
2. Kumari Sumathi 2 9544961825
3. Smt. Ambili 3 9744580993
4. Smt. Ambadi K 4 9947698360
5. Kumari Yeshoda 5&6 9746552439
6. Smt. Prina O G 7 9847561401
7. Kumari Bindhu 9 9388714049
8. Smt. Ambika 8 7025513940
9. Sri. Sasi K G 10 & 11 9744698809
10. Smt. Rugmini 12 9947950593
11. Sri. Pratheesh K 13 9947934978
12. Sri. Sajan 14 9961569882
13. Sri. Ramesh O G 15 9947954704
14. Sri. Jagadish Kumar 16 9656582187
15. Kumari Anitha 17 9544961825
16. Smt. Savithri 18 9961424290
17. Smt. Santhi Sunil 19 9745991027
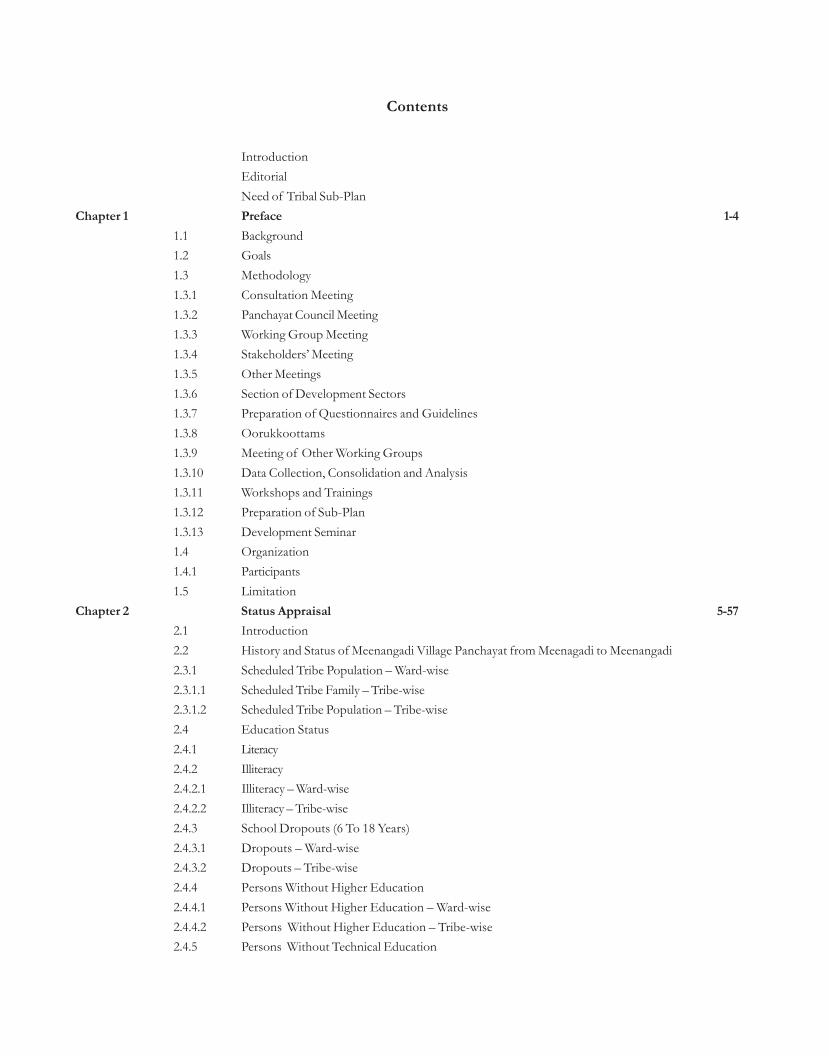
IntroductionEditorialNeed of Tribal Sub-Plan
Chapter 1 Preface 1-41.1 Background1.2 Goals1.3 Methodology1.3.1 Consultation Meeting1.3.2 Panchayat Council Meeting1.3.3 Working Group Meeting1.3.4 Stakeholders’ Meeting1.3.5 Other Meetings1.3.6 Section of Development Sectors1.3.7 Preparation of Questionnaires and Guidelines1.3.8 Oorukkoottams1.3.9 Meeting of Other Working Groups1.3.10 Data Collection, Consolidation and Analysis1.3.11 Workshops and Trainings1.3.12 Preparation of Sub-Plan1.3.13 Development Seminar1.4 Organization1.4.1 Participants1.5 Limitation
Chapter 2 Status Appraisal 5-572.1 Introduction2.2 History and Status of Meenangadi Village Panchayat from Meenagadi to Meenangadi2.3.1 Scheduled Tribe Population – Ward-wise2.3.1.1 Scheduled Tribe Family – Tribe-wise2.3.1.2 Scheduled Tribe Population – Tribe-wise2.4 Education Status2.4.1 Literacy2.4.2 Illiteracy2.4.2.1 Illiteracy – Ward-wise2.4.2.2 Illiteracy – Tribe-wise2.4.3 School Dropouts (6 To 18 Years)2.4.3.1 Dropouts – Ward-wise2.4.3.2 Dropouts – Tribe-wise2.4.4 Persons Without Higher Education2.4.4.1 Persons Without Higher Education – Ward-wise2.4.4.2 Persons Without Higher Education – Tribe-wise2.4.5 Persons Without Technical Education
Contents
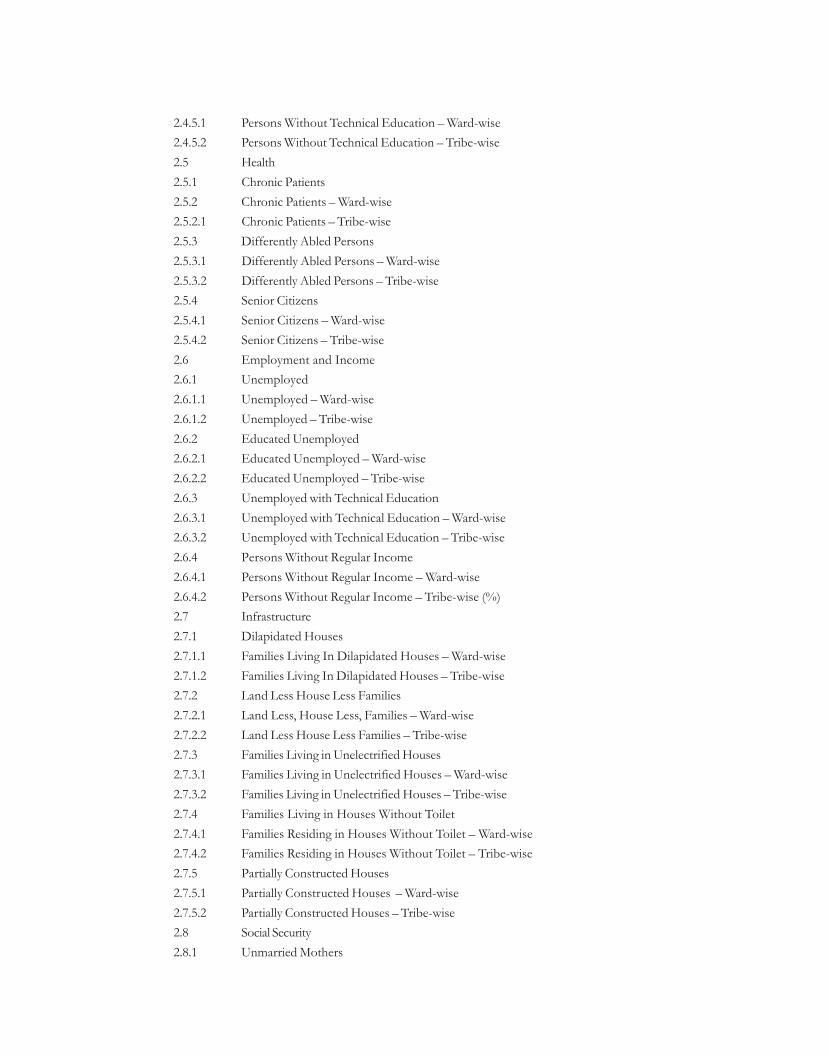
2.4.5.1 Persons Without Technical Education – Ward-wise2.4.5.2 Persons Without Technical Education – Tribe-wise2.5 Health2.5.1 Chronic Patients2.5.2 Chronic Patients – Ward-wise2.5.2.1 Chronic Patients – Tribe-wise2.5.3 Differently Abled Persons2.5.3.1 Differently Abled Persons – Ward-wise2.5.3.2 Differently Abled Persons – Tribe-wise2.5.4 Senior Citizens2.5.4.1 Senior Citizens – Ward-wise2.5.4.2 Senior Citizens – Tribe-wise2.6 Employment and Income2.6.1 Unemployed2.6.1.1 Unemployed – Ward-wise2.6.1.2 Unemployed – Tribe-wise2.6.2 Educated Unemployed2.6.2.1 Educated Unemployed – Ward-wise2.6.2.2 Educated Unemployed – Tribe-wise2.6.3 Unemployed with Technical Education2.6.3.1 Unemployed with Technical Education – Ward-wise2.6.3.2 Unemployed with Technical Education – Tribe-wise2.6.4 Persons Without Regular Income2.6.4.1 Persons Without Regular Income – Ward-wise2.6.4.2 Persons Without Regular Income – Tribe-wise (%)2.7 Infrastructure2.7.1 Dilapidated Houses2.7.1.1 Families Living In Dilapidated Houses – Ward-wise2.7.1.2 Families Living In Dilapidated Houses – Tribe-wise2.7.2 Land Less House Less Families2.7.2.1 Land Less, House Less, Families – Ward-wise2.7.2.2 Land Less House Less Families – Tribe-wise2.7.3 Families Living in Unelectrified Houses2.7.3.1 Families Living in Unelectrified Houses – Ward-wise2.7.3.2 Families Living in Unelectrified Houses – Tribe-wise2.7.4 Families Living in Houses Without Toilet2.7.4.1 Families Residing in Houses Without Toilet – Ward-wise2.7.4.2 Families Residing in Houses Without Toilet – Tribe-wise2.7.5 Partially Constructed Houses2.7.5.1 Partially Constructed Houses – Ward-wise2.7.5.2 Partially Constructed Houses – Tribe-wise2.8 Social Security2.8.1 Unmarried Mothers
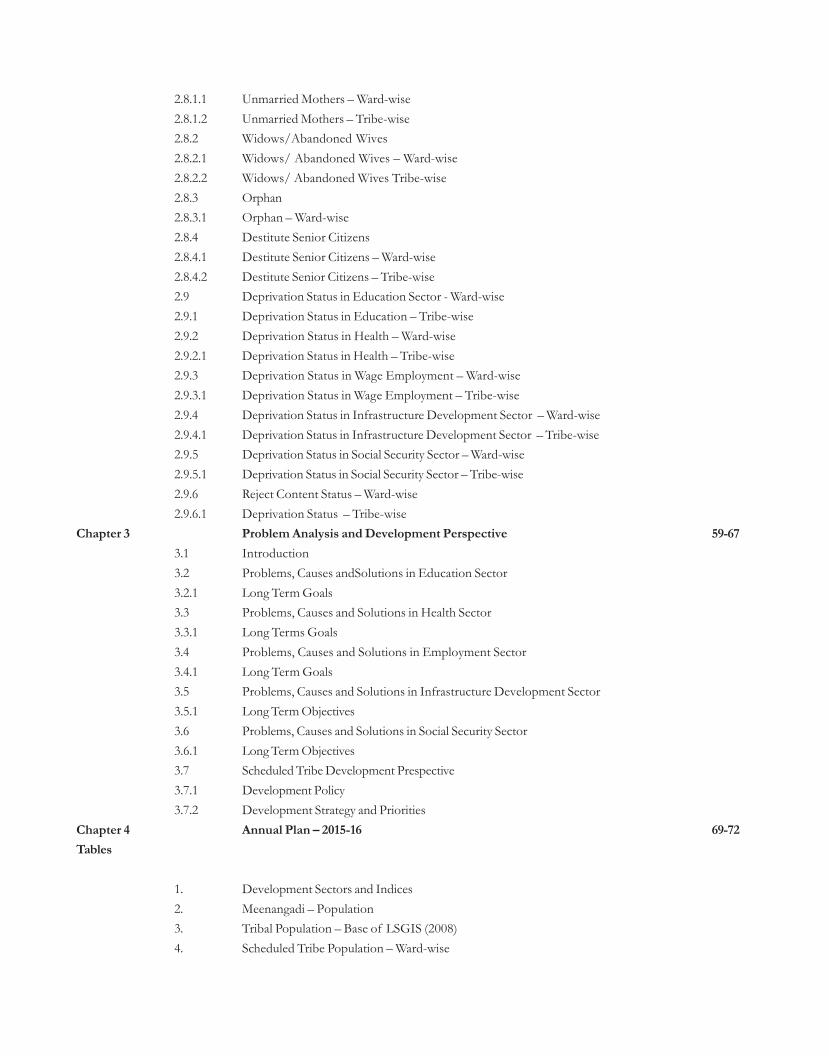
2.8.1.1 Unmarried Mothers – Ward-wise2.8.1.2 Unmarried Mothers – Tribe-wise2.8.2 Widows/Abandoned Wives2.8.2.1 Widows/ Abandoned Wives – Ward-wise2.8.2.2 Widows/ Abandoned Wives Tribe-wise2.8.3 Orphan2.8.3.1 Orphan – Ward-wise2.8.4 Destitute Senior Citizens2.8.4.1 Destitute Senior Citizens – Ward-wise2.8.4.2 Destitute Senior Citizens – Tribe-wise2.9 Deprivation Status in Education Sector - Ward-wise2.9.1 Deprivation Status in Education – Tribe-wise2.9.2 Deprivation Status in Health – Ward-wise2.9.2.1 Deprivation Status in Health – Tribe-wise2.9.3 Deprivation Status in Wage Employment – Ward-wise2.9.3.1 Deprivation Status in Wage Employment – Tribe-wise2.9.4 Deprivation Status in Infrastructure Development Sector – Ward-wise2.9.4.1 Deprivation Status in Infrastructure Development Sector – Tribe-wise2.9.5 Deprivation Status in Social Security Sector – Ward-wise2.9.5.1 Deprivation Status in Social Security Sector – Tribe-wise2.9.6 Reject Content Status – Ward-wise2.9.6.1 Deprivation Status – Tribe-wise
Chapter 3 Problem Analysis and Development Perspective 59-673.1 Introduction3.2 Problems, Causes andSolutions in Education Sector3.2.1 Long Term Goals3.3 Problems, Causes and Solutions in Health Sector3.3.1 Long Terms Goals3.4 Problems, Causes and Solutions in Employment Sector3.4.1 Long Term Goals3.5 Problems, Causes and Solutions in Infrastructure Development Sector3.5.1 Long Term Objectives3.6 Problems, Causes and Solutions in Social Security Sector3.6.1 Long Term Objectives3.7 Scheduled Tribe Development Prespective3.7.1 Development Policy3.7.2 Development Strategy and Priorities
Chapter 4 Annual Plan – 2015-16 69-72Tables
1. Development Sectors and Indices2. Meenangadi – Population3. Tribal Population – Base of LSGIS (2008)4. Scheduled Tribe Population – Ward-wise
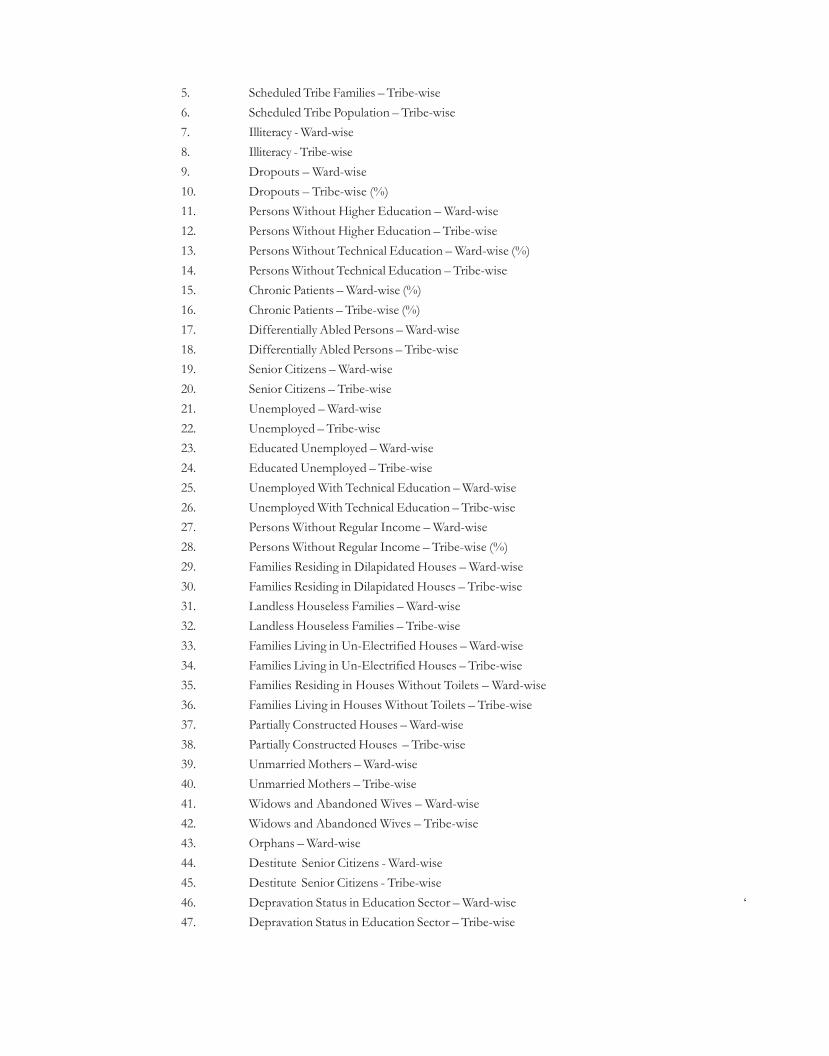
5. Scheduled Tribe Families – Tribe-wise6. Scheduled Tribe Population – Tribe-wise7. Illiteracy - Ward-wise8. Illiteracy - Tribe-wise9. Dropouts – Ward-wise10. Dropouts – Tribe-wise (%)11. Persons Without Higher Education – Ward-wise12. Persons Without Higher Education – Tribe-wise13. Persons Without Technical Education – Ward-wise (%)14. Persons Without Technical Education – Tribe-wise15. Chronic Patients – Ward-wise (%)16. Chronic Patients – Tribe-wise (%)17. Differentially Abled Persons – Ward-wise18. Differentially Abled Persons – Tribe-wise19. Senior Citizens – Ward-wise20. Senior Citizens – Tribe-wise21. Unemployed – Ward-wise22. Unemployed – Tribe-wise23. Educated Unemployed – Ward-wise24. Educated Unemployed – Tribe-wise25. Unemployed With Technical Education – Ward-wise26. Unemployed With Technical Education – Tribe-wise27. Persons Without Regular Income – Ward-wise28. Persons Without Regular Income – Tribe-wise (%)29. Families Residing in Dilapidated Houses – Ward-wise30. Families Residing in Dilapidated Houses – Tribe-wise31. Landless Houseless Families – Ward-wise32. Landless Houseless Families – Tribe-wise33. Families Living in Un-Electrified Houses – Ward-wise34. Families Living in Un-Electrified Houses – Tribe-wise35. Families Residing in Houses Without Toilets – Ward-wise36. Families Living in Houses Without Toilets – Tribe-wise37. Partially Constructed Houses – Ward-wise38. Partially Constructed Houses – Tribe-wise39. Unmarried Mothers – Ward-wise40. Unmarried Mothers – Tribe-wise41. Widows and Abandoned Wives – Ward-wise42. Widows and Abandoned Wives – Tribe-wise43. Orphans – Ward-wise44. Destitute Senior Citizens - Ward-wise45. Destitute Senior Citizens - Tribe-wise46. Depravation Status in Education Sector – Ward-wise ‘47. Depravation Status in Education Sector – Tribe-wise
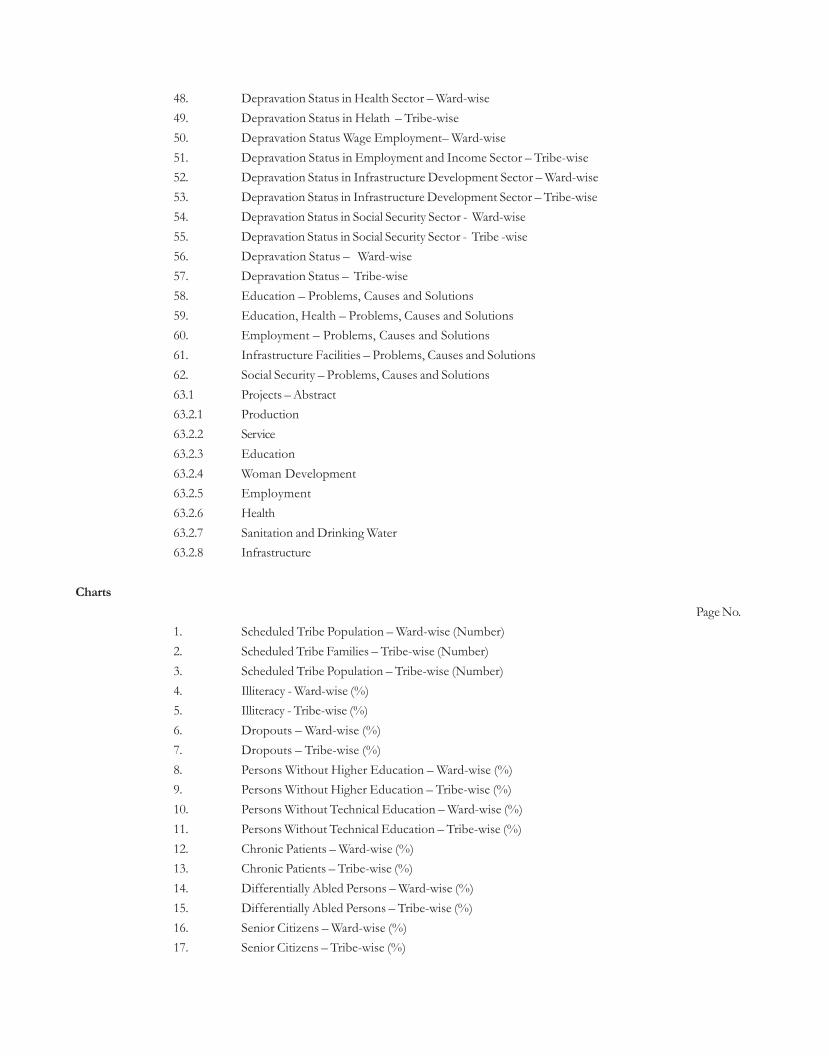
48. Depravation Status in Health Sector – Ward-wise49. Depravation Status in Helath – Tribe-wise50. Depravation Status Wage Employment– Ward-wise51. Depravation Status in Employment and Income Sector – Tribe-wise52. Depravation Status in Infrastructure Development Sector – Ward-wise53. Depravation Status in Infrastructure Development Sector – Tribe-wise54. Depravation Status in Social Security Sector - Ward-wise55. Depravation Status in Social Security Sector - Tribe -wise56. Depravation Status – Ward-wise57. Depravation Status – Tribe-wise58. Education – Problems, Causes and Solutions59. Education, Health – Problems, Causes and Solutions60. Employment – Problems, Causes and Solutions61. Infrastructure Facilities – Problems, Causes and Solutions62. Social Security – Problems, Causes and Solutions63.1 Projects – Abstract63.2.1 Production63.2.2 Service63.2.3 Education63.2.4 Woman Development63.2.5 Employment63.2.6 Health63.2.7 Sanitation and Drinking Water63.2.8 Infrastructure
ChartsPage No.
1. Scheduled Tribe Population – Ward-wise (Number)2. Scheduled Tribe Families – Tribe-wise (Number)3. Scheduled Tribe Population – Tribe-wise (Number)4. Illiteracy - Ward-wise (%)5. Illiteracy - Tribe-wise (%)6. Dropouts – Ward-wise (%)7. Dropouts – Tribe-wise (%)8. Persons Without Higher Education – Ward-wise (%)9. Persons Without Higher Education – Tribe-wise (%)10. Persons Without Technical Education – Ward-wise (%)11. Persons Without Technical Education – Tribe-wise (%)12. Chronic Patients – Ward-wise (%)13. Chronic Patients – Tribe-wise (%)14. Differentially Abled Persons – Ward-wise (%)15. Differentially Abled Persons – Tribe-wise (%)16. Senior Citizens – Ward-wise (%)17. Senior Citizens – Tribe-wise (%)
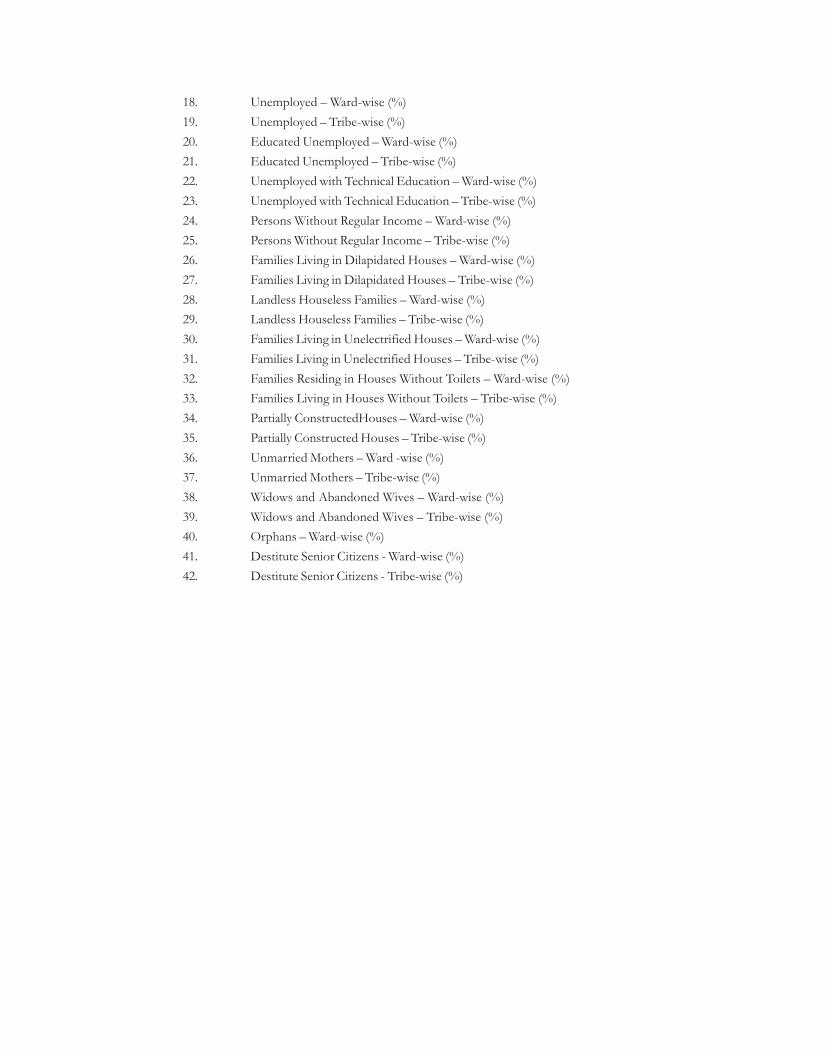
18. Unemployed – Ward-wise (%)19. Unemployed – Tribe-wise (%)20. Educated Unemployed – Ward-wise (%)21. Educated Unemployed – Tribe-wise (%)22. Unemployed with Technical Education – Ward-wise (%)23. Unemployed with Technical Education – Tribe-wise (%)24. Persons Without Regular Income – Ward-wise (%)25. Persons Without Regular Income – Tribe-wise (%)26. Families Living in Dilapidated Houses – Ward-wise (%)27. Families Living in Dilapidated Houses – Tribe-wise (%)28. Landless Houseless Families – Ward-wise (%)29. Landless Houseless Families – Tribe-wise (%)30. Families Living in Unelectrified Houses – Ward-wise (%)31. Families Living in Unelectrified Houses – Tribe-wise (%)32. Families Residing in Houses Without Toilets – Ward-wise (%)33. Families Living in Houses Without Toilets – Tribe-wise (%)34. Partially ConstructedHouses – Ward-wise (%)35. Partially Constructed Houses – Tribe-wise (%)36. Unmarried Mothers – Ward -wise (%)37. Unmarried Mothers – Tribe-wise (%)38. Widows and Abandoned Wives – Ward-wise (%)39. Widows and Abandoned Wives – Tribe-wise (%)40. Orphans – Ward-wise (%)41. Destitute Senior Citizens - Ward-wise (%)42. Destitute Senior Citizens - Tribe-wise (%)


Chapter – 1Preface
1.1 BackgroundThe Local Governments formulate and implement development plans based on the principles of transparency
participation and social justice; the foundation stones of decentralization of power and decentralized planning.Therefore the development of tribes who were pushed back to the margins needs special attention. It is a factthat the benefits of various development schemes specially designed for them do not reach them and theycontinues to remain outside the mainstream of society.
During the XII Five Year Plan the Local Governments tried to attain local economic development andsocial justice. This could be made possible only if development plan is formulated with long term perspectiveutilizing possibilities of integration. We have come to realize that the development interventions so far haveresulted in a strange situation with the ST habitats offering a high degree of development without correspondingdevelopment in the life of the tribes. Innovative development projects like TIDES (Tribal IntegratedDevelopment and Emerging Scheme), care and Friendship, Awas and TIME are devised to fill the developmentgaps, integrating the activities of MGNREGS various development departments and agencies. It is againstthis background that the TSP has been prepared to ensure the integrated development of each family and thetribe as a whole. The Panchayat is making an earnest attempt to put an end to the backwardness of theScheduled Tribes by providing them the prerogatives provided by the Constitution of India.
The history of the marginalization of Scheduled Tribes is a long one. A determined effort is necessary toenhance the social and economic status of the tribes who were suppressed and exploited for many years. Thiscannot be attained by giving them doles and benefits. They can be brought to the main stream by making themself-reliant in all aspects of life.
The TSP of Meenangadi Village Panchayat has been prepared using information from the integrated SurveyReport of KILA, Perspective Plan for Tribal Development prepared by Wayanad District Panchayat with theacademic support of KILA and the Survey conducted by Meenangadi Village Panchayat only data basedplanning can find solutions to problems. Hence such an approach is adopted in the preparation of the SubPlan. It is also ensured that all projects include in the plan are based on the suggestions from Oorukkoottam.
1.2. Goals• To make data based micro level planning possible.
• To formulate development plans suitable to the living environment, thereby enhancing local developmentand standard of life.
• To formulate and implement plans for economic empowerment ensuring social justice.
• To formulate development schemes to address the issues faced by each Scheduled Tribe.
• To formulate programmes to enhance the democratic views of the general public so as to ensure socialjustice in the sector.
• To utilize the existing possibilities for comprehensive development of Scheduled Tribes.
• To formulate and implement schemes to attain development in all important aspects of life such asAgriculture, Education, Health, Employment and Infrastructure Development.
• Integrate the activities of development departments and agencies.
1
• Ensure that the funds spent for Scheduled Tribe development are properly utilized to address the issues ofthe tribal population.
• To formulate schemes for the development of each family and for the whole colony.
• To formulate and implement schemes that would enhance the income of tribal families and create assetsthrough local economic development.
• To devise special projects for senior citizens, women differently abled persons and lonely mothers belongingto scheduled Tribes.
• To analyse problems based on data and devise projects to address the problems with the help of variousWorking Groups.
1.3 MethodologyThe TSP of Meenangadi Village Panchayat was prepared through a process having several stages. The importantstages are given below.
1.3.1 Consultation MeetingA meeting of seven Village Panchayats that expressed willingness to prepare TSP following the PerspectiveTSP prepared by Wayanad District Panchayat in collaboration with KILA was held in KILA on 08.10.2014and the President, Vice President, Secretary, Assistant Secretary and the Chairman of the Standing Committeefor Development participated in the meeting. KILA promised to extend academic support to the Panchayatsthat volunteer to prepare TSP. After detailed discussion facilitated by Dr. J.B. Rajan, an Action Plan wasfinalized.
1.3.2 Panchayat Council MeetingAs per the decision taken in the meeting held in KILA, the meeting of the Panchayat council was held on27.10.2014 and it was decided to prepare the TSP of the Panchayat with the support of the Human ResourceDevelopment Centre of the Panchayat.
1.3.3 Working Group MeetingThe meeting of the Working Group that should be the driving force of the TSP preparation was held in theMeeting Panchayat Hall on 30.10.14. Besides the members of the Working Group, Elected Members and themembers of HRDC participated in the meeting. Decisions regarding convening of Oorukkoottams and theagenda of discussions were taken in the meeting.
1.3.4 Stakeholders’ MeetingThe meeting of stakeholders and experts who can contribute to the preparation of plan was convened on27.11.2014
1.3.5 Other MeetingsFour meetings of Scheduled Tribe Promoters, Anganwadi Workers, ASHA Workers, Junior Health Inspectors,Junior Public Health Nurses, Literacy workers and experts were held on 20,25 and 28 November and 20December 2014. In the meetings, the activities to be done and responsibility of each activity were fixed.
1.3.6 Section of Development SectorsIt was decided to select the four development sectors that were considered for the preparation of the perspectiveTSP Document by the District Panchayat and KILA with necessary changes. Another sector, Social Securitywas added to them.
2
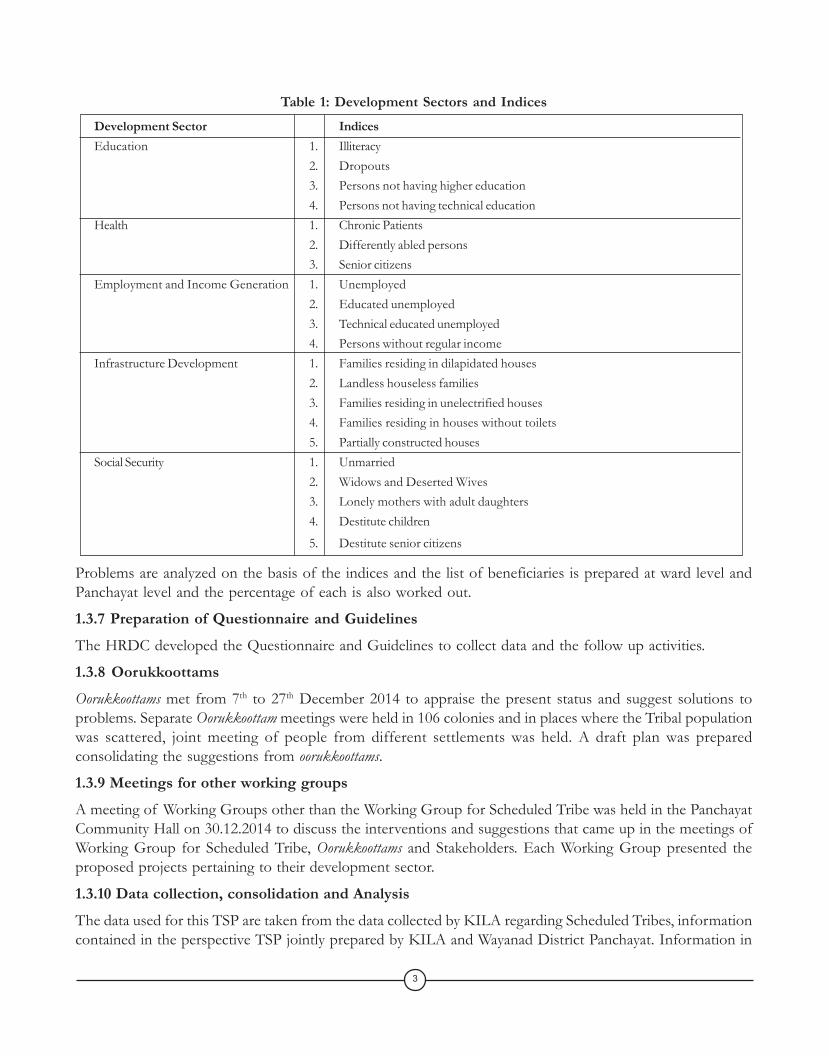
Table 1: Development Sectors and IndicesDevelopment Sector IndicesEducation 1. Illiteracy
2. Dropouts3. Persons not having higher education4. Persons not having technical education
Health 1. Chronic Patients2. Differently abled persons3. Senior citizens
Employment and Income Generation 1. Unemployed2. Educated unemployed3. Technical educated unemployed4. Persons without regular income
Infrastructure Development 1. Families residing in dilapidated houses2. Landless houseless families3. Families residing in unelectrified houses4. Families residing in houses without toilets5. Partially constructed houses
Social Security 1. Unmarried2. Widows and Deserted Wives3. Lonely mothers with adult daughters4. Destitute children
5. Destitute senior citizens
Problems are analyzed on the basis of the indices and the list of beneficiaries is prepared at ward level andPanchayat level and the percentage of each is also worked out.
1.3.7 Preparation of Questionnaire and GuidelinesThe HRDC developed the Questionnaire and Guidelines to collect data and the follow up activities.
1.3.8 OorukkoottamsOorukkoottams met from 7th to 27th December 2014 to appraise the present status and suggest solutions toproblems. Separate Oorukkoottam meetings were held in 106 colonies and in places where the Tribal populationwas scattered, joint meeting of people from different settlements was held. A draft plan was preparedconsolidating the suggestions from oorukkoottams.
1.3.9 Meetings for other working groupsA meeting of Working Groups other than the Working Group for Scheduled Tribe was held in the PanchayatCommunity Hall on 30.12.2014 to discuss the interventions and suggestions that came up in the meetings ofWorking Group for Scheduled Tribe, Oorukkoottams and Stakeholders. Each Working Group presented theproposed projects pertaining to their development sector.
1.3.10 Data collection, consolidation and AnalysisThe data used for this TSP are taken from the data collected by KILA regarding Scheduled Tribes, informationcontained in the perspective TSP jointly prepared by KILA and Wayanad District Panchayat. Information in
3
the Twelfth Five Year Plan document prepared by Meenangadi Village Panchayat and information collectedby Scheduled Tribe Promoters of the Panchayat.
1.3.11 Workshops and TrainingsTraining was given to Scheduled Tribe Promoters, Office bearers of Kudumbasree, Aasha Worker, Chairpersonsof Working Groups other than working for Scheduled Tribe, Elected Members, Chairpersons of Ward Level‘Awas’ and conveners regarding TSP preparation by HRDC with the cooperation of Extension Faculty ofKILA. A Workshop was organized participating the Scheduled Tribe Promoters, Chairman, Vice Chairmanand Convener of ward level ‘Awas’ to prepare Questionnaire, Guideline and Consolidation and Analysis formats.
1.3.12 Preparation of Tribal sub PlanThe Draft TSP containing project proposals suggested from various consultation meetings was discussed indetail by Elected Members, Office Bearers of Working Groups Scheduled Caste Promoters, Extension Facultyof KILA and representatives of HRDC approved.
1.3.13 Development SeminarThe development Seminar to discuss the TSP and the projects was conducted in the Panchayat CommunityHall on 16.03.2015. Elected Members, Chief of Oorukkoottams, Scheduled Tribe Promoters, Representativesof Aawas and selected members of Oorukkoottams participated in the seminar.
1.4 OrganizationThe TSP was prepared by the Village Panchayat with the academic support of KILA. The creative leadershipof the HRDC a unit run by the village Panchayat contributed a great deal for the preparation of the document.
1.4.1 Participants• Panchayat Council
• Human Resource Development Centre
• Extension Faculty of KILA
• Implementing Officers
• Members of HRDC Tribal Desk
• Scheduled Tribe Promoters
• Anganawadi Workers
• Working Group Members
• Aasha Workers
• Aadivasi Women and Colony empowerment corps (Aawas) representatives
• Officials of Various Departments
• Volunteers
1.5 Limitations• Basic Data of Scheduled Tribes – the data collected by the Village Panchayats the Surveys of 2008 and
2014 were used for preparation of the documents, but the main source is the 2008 survey
• The TSP does not cover all development issues faced by Scheduled Tribes4
Chapter 2Status Appraisal
2.1 IntroductionWayanad has the highest tribal population in Kerala. The percentage of tribal population in the District is18.52. The tribes of Wayanad that comes to 38.16 percent of the total tribal population of the State, consistsof Kuruman, Kurichyan, Paniyan, Adiyan, Kattunaykan, Vettakuruman, Thachanad Mooppan, Karimpalan, WayanadanKadar etc. that are divided into 36 tribes (Perspective plan for Tribal Development- Wayanad District 2013).
The status of tribes is appraised according to the concept that ensuring social justice to Tribes does not meangranting or dividing benefits, but giving equal opportunity to the eligible among them to solve their problems.In this chapter an attempt is made to analyse the present social and economic status of the people with a viewto identify the gap in education, health, employment and income, infrastructure and social security sectorsand find solutions to them.
2.2 History and status of Meenangadi Village Panchayat from ‘Mean Angidi’ to Meenangadi.Historical documents and studies ascertain that the Scheduled Tribes are successors of the uncivilized peoplewho lived in the forests of South India during Old Stone Age. During the middle stone age they started to livein communities and later the communities became different tribes. The study of the household utensils obtainedfrom the monolithic monuments of Wayanad throws light into the ancient history of the Scheduled Tribes.The stone wall pictures of Edakkal caves in the Ambukuthi mountains of Ambalavayal and the ‘Muniyaras’of Krishnagiri near Meenangadi Afford ample proof of the great stone Age culture that prevailed in Wayanad.Based on historical documents, Historians have recorded that the people who were part of the Mohenjadaroand Harappa culture migrated to Karnataka and from there to the Wayanad region through dense forests andmaking use of the availability of water developed a new agrarian culture there.
The first phase of the history of Wayanad starting with the gradual evolution of the tribes to the evolution ofHaunter Kings belongs to the prehistoric age. It is contained in the myths, lores and traditions passed fromone generation to another by word of mouth. Wayanad was known as Karkkanad during Saugha age. Theengravings or the walls of Edakkal caves are considered to be writings about Vishnuvarman of the Kadambadynasty. The temple at Meenangadi in which the Kudumby Kings worshipped the image of Fish, the first of theten incarnations of Lord Vishnu, has survived into our own times. The Thamilians that came to Wayanadduring the reign of Chera dynasty that succeeded the Kudumby dynasty used to call the local people “Meenavar”meaning people who worship fish. Similarly the people who migrated from Karnataka used to call the place“Meen Angidi” meaning Temple of Fish. Gradually ‘Meen Angidi’ became Meenangadi in Malayalam.
After the decline of Chera dynasty the Vedas became the rulers of Wayanad. The successors of the dynastythat came to be called ‘Bettukurumbar’ and ‘Mullaikurumbar’ are now known as ‘Vettukkurumar’ and‘Mullakkurumar’. At the same time ‘Kattunaykkar’ who spoke primitive Kannada language and ‘Paniyar’ whoworshipped Banasura Mountain known as Ippimala lived in Wayanad. During the region of Kottayam dynastythat conquered the Veda Kings there occurred considerable changes in the life style and culture of tribes. Theright of the Adivasis over their land was appropriated by the powerful ‘Nair’ community. They were estrangedfrom their own agricultural land, forest and places of worship. In consequence ‘Kurumar’ became tenants,‘Paniyar’ were turned labourers, oorazhis became craftsmen and ‘Kattunayakkar’ became hunters.
5

The temple festivals of Purakkady, Manikavu, Malakkad and Meenangadi provide the Adivasis occasion to meetand interact. The ‘Kurichyar’and ‘Kurumar’, two Scheduled Tribes of Wayanad played important role in therevolt against British colonial rule. The revolt against the order preventing clearing of forest land for cultivationin 1812, has become part of History as Kruichya revolt. It took the British Army six months to suppress therevolt. It was during the rule of Hyderali and Tippu Sulthan, the construction of the present National Highwaythat divides Meenangadi Panchayat into two was started. Later Arthur Wellesley developed the ghat road andmade it suitable for transportation.
Large scale migration to Wayanad after independence resulted in economic growth, but in the process theAdivasis of Wayanad lost their freedom and identity and their farm land and employment were taken awayfrom them. The social interaction with the settlers considerably changed the Adivasi way of life.
The Scheduled Tribe population of Meenangadi Village Panchayats consists of 7751 persons belonging to1854 families living in 106 colonies and scattered houses outside colonies. They come to 22.3% of the totalpopulation of the Panchayat and the dominant tribe is ‘Kurumar’/’Mullakkurumar’ that constitutes 52% of thetribe population with 4010 persons. The number of ‘Paniyans’ is 2529 and ‘Kattunaikkan’ that is the thirdhighest in Nilamboor consists of 845 persons. 295 belong to ‘Vettakkuruman’ community and 51 are ‘Krichya’.Among the Scheduled Tribes, the ‘Kurumar’ that constitute the majority are more developed economically,educationally and culturally (Table 2)
Table 2. Meenangadi – Population
1 Kurumar/ Mullakurumar 953 2015 1995 4010
2 Paniyan 587 1314 1215 2529
3 Kattunaykkan 221 431 414 845
4 Vettakuruman (urali) 81 145 150 295
5 Kurichyan 12 28 23 51
6 Scheduled Caste 0 2 3 5
7 Others 0 4 12 16
Total 1854 3939 3812 7751Source: Data collection of Scheduled Tribes - 2008
6
Sl.No
Category No. ofFamilies
PopulationMale Female Total
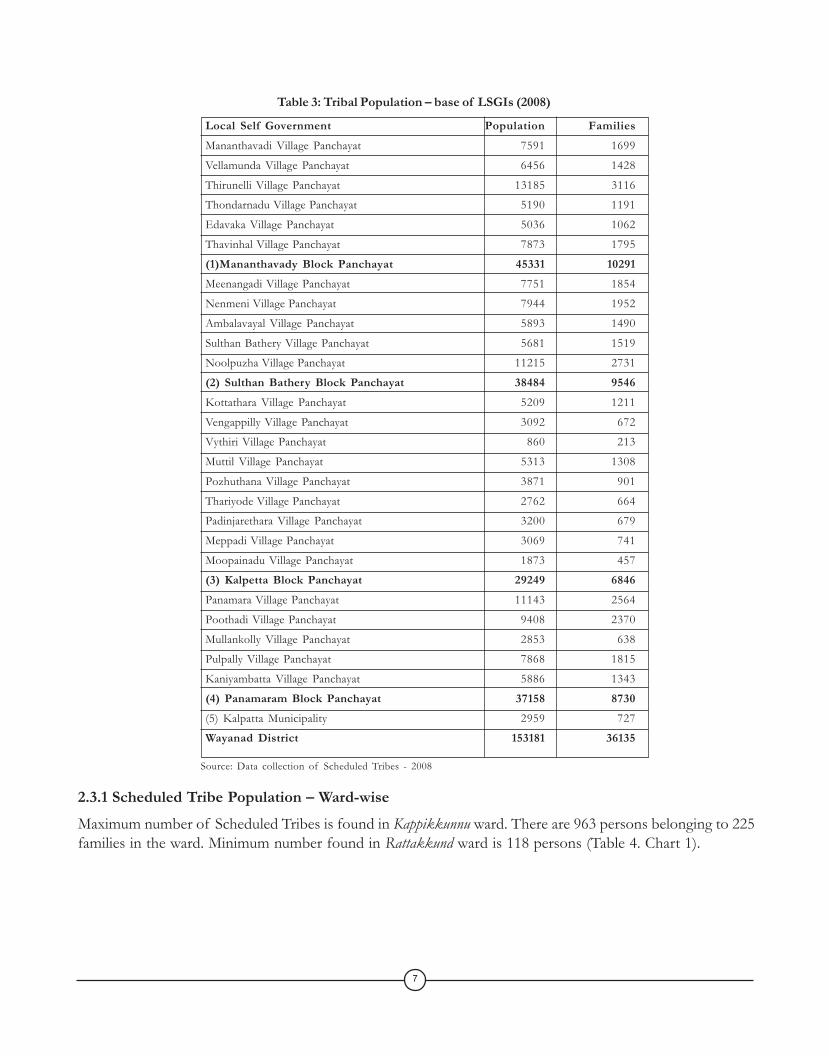
Table 3: Tribal Population – base of LSGIs (2008)
Local Self Government Population FamiliesMananthavadi Village Panchayat 7591 1699
Vellamunda Village Panchayat 6456 1428
Thirunelli Village Panchayat 13185 3116
Thondarnadu Village Panchayat 5190 1191
Edavaka Village Panchayat 5036 1062
Thavinhal Village Panchayat 7873 1795
(1)Mananthavady Block Panchayat 45331 10291Meenangadi Village Panchayat 7751 1854
Nenmeni Village Panchayat 7944 1952
Ambalavayal Village Panchayat 5893 1490
Sulthan Bathery Village Panchayat 5681 1519
Noolpuzha Village Panchayat 11215 2731
(2) Sulthan Bathery Block Panchayat 38484 9546Kottathara Village Panchayat 5209 1211
Vengappilly Village Panchayat 3092 672
Vythiri Village Panchayat 860 213
Muttil Village Panchayat 5313 1308
Pozhuthana Village Panchayat 3871 901
Thariyode Village Panchayat 2762 664
Padinjarethara Village Panchayat 3200 679
Meppadi Village Panchayat 3069 741
Moopainadu Village Panchayat 1873 457
(3) Kalpetta Block Panchayat 29249 6846Panamara Village Panchayat 11143 2564
Poothadi Village Panchayat 9408 2370
Mullankolly Village Panchayat 2853 638
Pulpally Village Panchayat 7868 1815
Kaniyambatta Village Panchayat 5886 1343
(4) Panamaram Block Panchayat 37158 8730(5) Kalpatta Municipality 2959 727
Wayanad District 153181 36135
2.3.1 Scheduled Tribe Population – Ward-wiseMaximum number of Scheduled Tribes is found in Kappikkunnu ward. There are 963 persons belonging to 225families in the ward. Minimum number found in Rattakkund ward is 118 persons (Table 4. Chart 1).
Source: Data collection of Scheduled Tribes - 2008
7
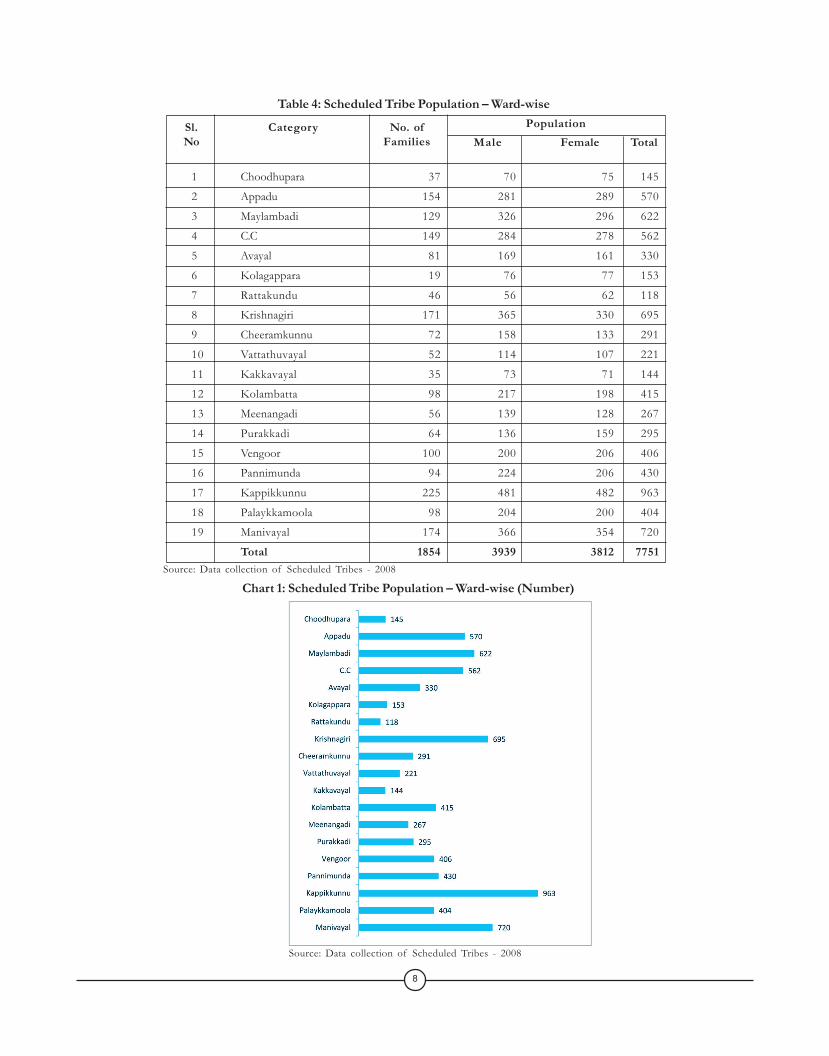
Table 4: Scheduled Tribe Population – Ward-wise
Chart 1: Scheduled Tribe Population – Ward-wise (Number)Source: Data collection of Scheduled Tribes - 2008
Source: Data collection of Scheduled Tribes - 2008
8
1 Choodhupara 37 70 75 145
2 Appadu 154 281 289 570
3 Maylambadi 129 326 296 622
4 C.C 149 284 278 562
5 Avayal 81 169 161 330
6 Kolagappara 19 76 77 153
7 Rattakundu 46 56 62 118
8 Krishnagiri 171 365 330 695
9 Cheeramkunnu 72 158 133 291
10 Vattathuvayal 52 114 107 221
11 Kakkavayal 35 73 71 144
12 Kolambatta 98 217 198 415
13 Meenangadi 56 139 128 267
14 Purakkadi 64 136 159 295
15 Vengoor 100 200 206 406
16 Pannimunda 94 224 206 430
17 Kappikkunnu 225 481 482 963
18 Palaykkamoola 98 204 200 404
19 Manivayal 174 366 354 720
Total 1854 3939 3812 7751
Sl.No
Category No. ofFamilies
PopulationMale Female Total
Source: Data collection of Scheduled Tribes - 2008
Ward Kurumar Paniyan Vettakuruman Kattunaykkan Kurichyan TotalChoodhupara 27 0 0 10 0 37Appadu 43 25 29 57 0 154Maylambadi 18 55 10 46 0 129C.C 88 37 2 22 0 149Avayal 71 0 0 10 0 81Kolagappara 5 10 1 3 0 19Rattakundu 9 36 0 1 0 46Krishnagiri 110 45 10 4 2 171Cheeramkunnu 21 48 1 0 2 72Vattathuvayal 42 10 0 0 0 52Kakkavayal 23 12 0 0 0 35Kolambatta 52 33 0 13 0 98Meenangadi 10 43 0 3 0 56Purakkadi 34 30 0 0 0 64Vengoor 83 9 2 6 0 100Pannimunda 39 44 6 5 0 94Kappikkunnu 104 73 11 37 0 225Palaykkamoola 73 12 4 1 8 98Manivayal 101 65 5 3 0 174Total 953 857 81 221 12 1854
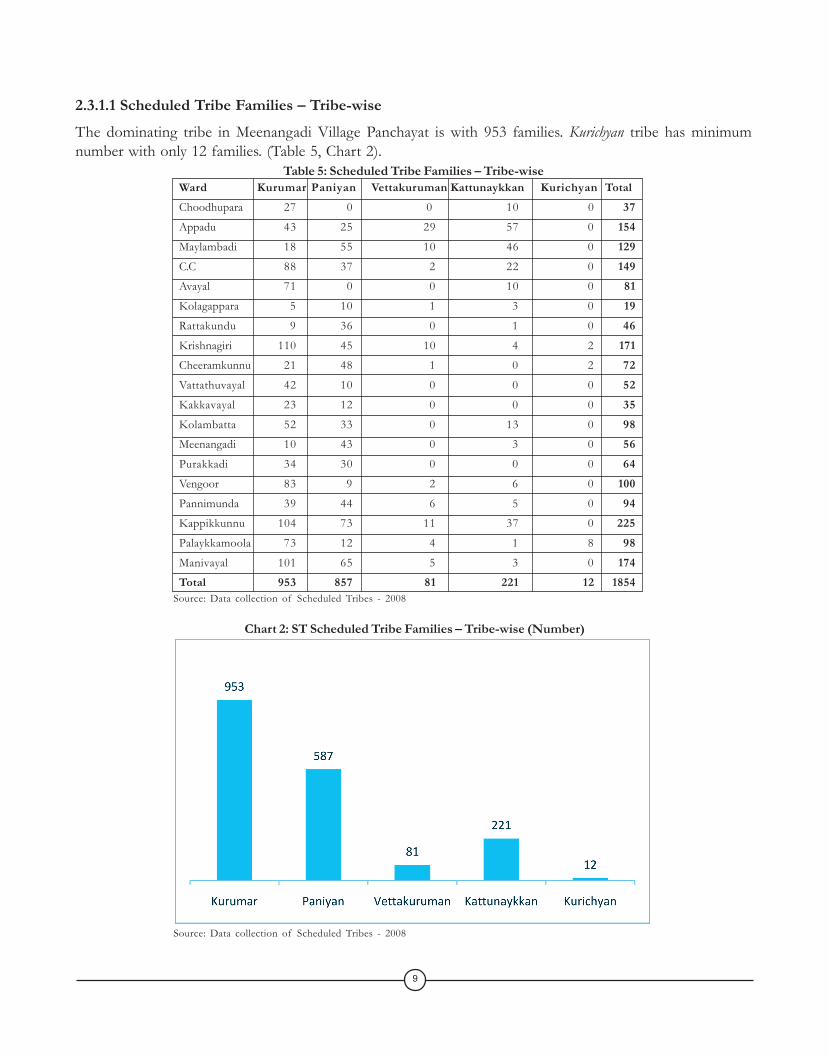
2.3.1.1 Scheduled Tribe Families – Tribe-wiseThe dominating tribe in Meenangadi Village Panchayat is with 953 families. Kurichyan tribe has minimumnumber with only 12 families. (Table 5, Chart 2).
Table 5: Scheduled Tribe Families – Tribe-wise
Chart 2: ST Scheduled Tribe Families – Tribe-wise (Number)
Source: Data collection of Scheduled Tribes - 2008
9
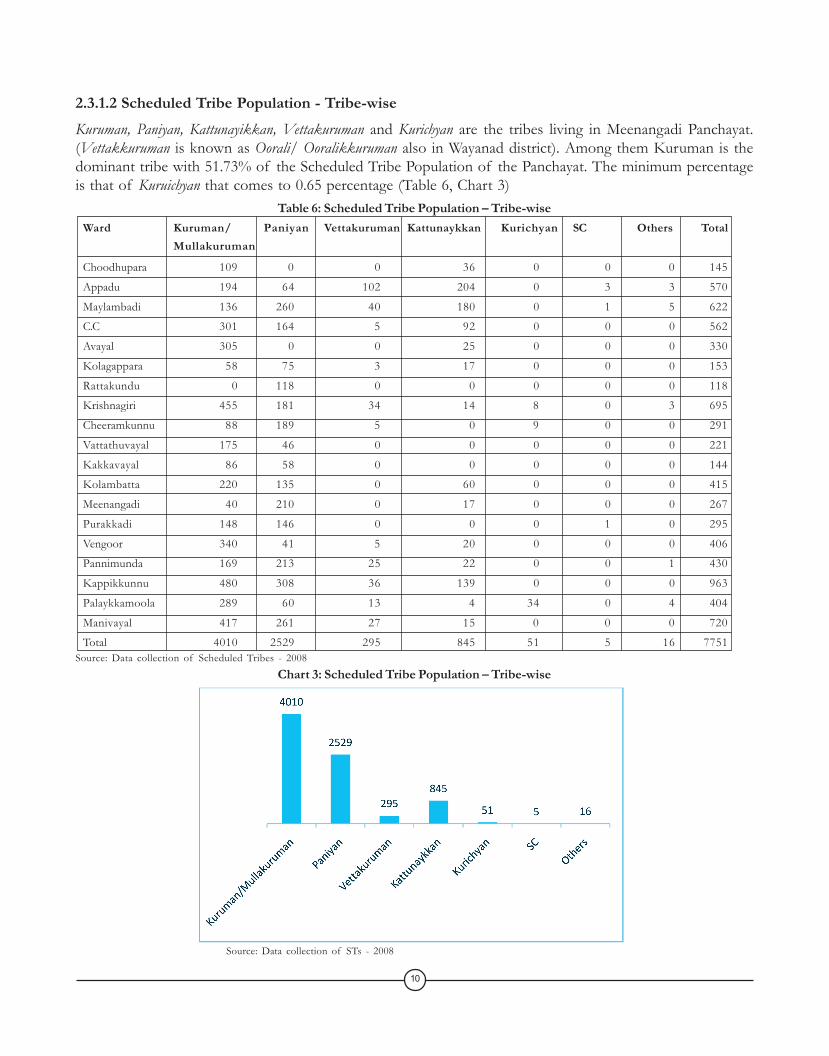
2.3.1.2 Scheduled Tribe Population - Tribe-wiseKuruman, Paniyan, Kattunayikkan, Vettakuruman and Kurichyan are the tribes living in Meenangadi Panchayat.(Vettakkuruman is known as Oorali/ Ooralikkuruman also in Wayanad district). Among them Kuruman is thedominant tribe with 51.73% of the Scheduled Tribe Population of the Panchayat. The minimum percentageis that of Kuruichyan that comes to 0.65 percentage (Table 6, Chart 3)
Table 6: Scheduled Tribe Population – Tribe-wiseWard Kuruman/ Paniyan Vettakuruman Kattunaykkan Kurichyan SC Others Total
Mullakuruman
Choodhupara 109 0 0 36 0 0 0 145
Appadu 194 64 102 204 0 3 3 570
Maylambadi 136 260 40 180 0 1 5 622
C.C 301 164 5 92 0 0 0 562
Avayal 305 0 0 25 0 0 0 330
Kolagappara 58 75 3 17 0 0 0 153
Rattakundu 0 118 0 0 0 0 0 118
Krishnagiri 455 181 34 14 8 0 3 695
Cheeramkunnu 88 189 5 0 9 0 0 291
Vattathuvayal 175 46 0 0 0 0 0 221
Kakkavayal 86 58 0 0 0 0 0 144
Kolambatta 220 135 0 60 0 0 0 415
Meenangadi 40 210 0 17 0 0 0 267
Purakkadi 148 146 0 0 0 1 0 295
Vengoor 340 41 5 20 0 0 0 406
Pannimunda 169 213 25 22 0 0 1 430
Kappikkunnu 480 308 36 139 0 0 0 963
Palaykkamoola 289 60 13 4 34 0 4 404
Manivayal 417 261 27 15 0 0 0 720
Total 4010 2529 295 845 51 5 16 7751
Chart 3: Scheduled Tribe Population – Tribe-wiseSource: Data collection of Scheduled Tribes - 2008
Source: Data collection of STs - 2008
10
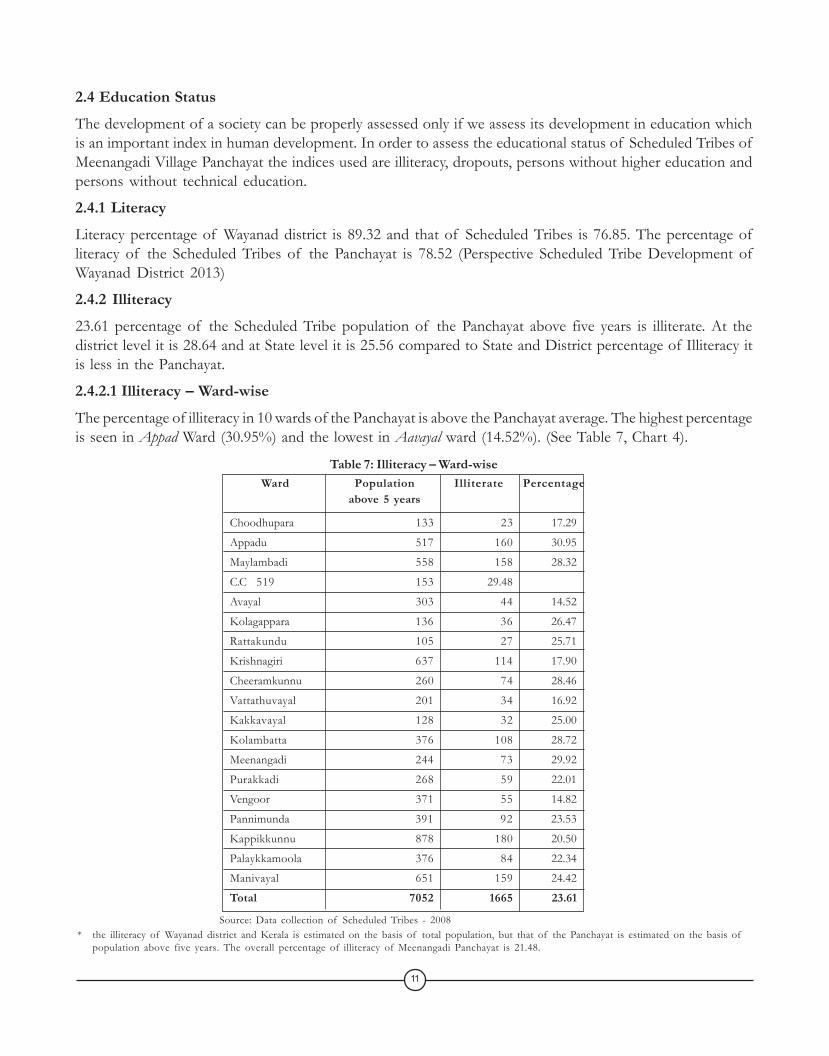
2.4 Education StatusThe development of a society can be properly assessed only if we assess its development in education whichis an important index in human development. In order to assess the educational status of Scheduled Tribes ofMeenangadi Village Panchayat the indices used are illiteracy, dropouts, persons without higher education andpersons without technical education.
2.4.1 LiteracyLiteracy percentage of Wayanad district is 89.32 and that of Scheduled Tribes is 76.85. The percentage ofliteracy of the Scheduled Tribes of the Panchayat is 78.52 (Perspective Scheduled Tribe Development ofWayanad District 2013)
2.4.2 Illiteracy23.61 percentage of the Scheduled Tribe population of the Panchayat above five years is illiterate. At thedistrict level it is 28.64 and at State level it is 25.56 compared to State and District percentage of Illiteracy itis less in the Panchayat.
2.4.2.1 Illiteracy – Ward-wiseThe percentage of illiteracy in 10 wards of the Panchayat is above the Panchayat average. The highest percentageis seen in Appad Ward (30.95%) and the lowest in Aavayal ward (14.52%). (See Table 7, Chart 4).
Table 7: Illiteracy – Ward-wiseWard Population Illiterate Percentage
above 5 years
Choodhupara 133 23 17.29
Appadu 517 160 30.95
Maylambadi 558 158 28.32
C.C 519 153 29.48
Avayal 303 44 14.52
Kolagappara 136 36 26.47
Rattakundu 105 27 25.71
Krishnagiri 637 114 17.90
Cheeramkunnu 260 74 28.46
Vattathuvayal 201 34 16.92
Kakkavayal 128 32 25.00
Kolambatta 376 108 28.72
Meenangadi 244 73 29.92
Purakkadi 268 59 22.01
Vengoor 371 55 14.82
Pannimunda 391 92 23.53
Kappikkunnu 878 180 20.50
Palaykkamoola 376 84 22.34
Manivayal 651 159 24.42
Total 7052 1665 23.61
* the illiteracy of Wayanad district and Kerala is estimated on the basis of total population, but that of the Panchayat is estimated on the basis ofpopulation above five years. The overall percentage of illiteracy of Meenangadi Panchayat is 21.48.
Source: Data collection of Scheduled Tribes - 2008
11
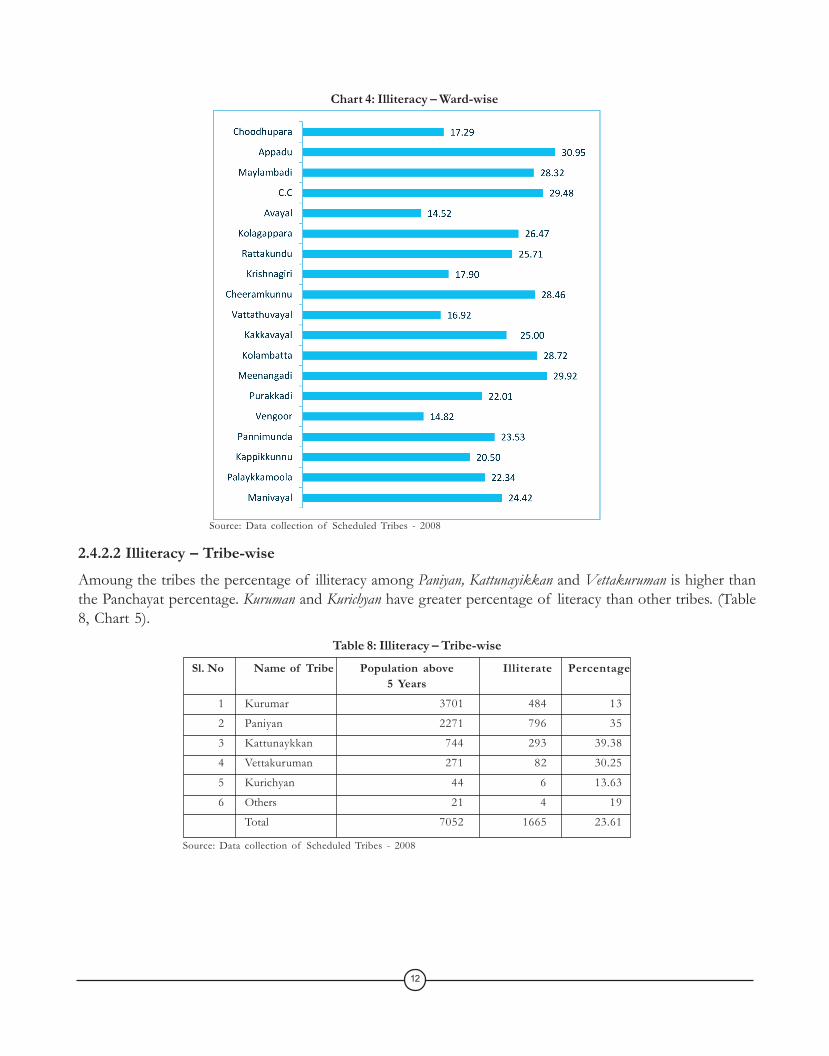
2.4.2.2 Illiteracy – Tribe-wiseAmoung the tribes the percentage of illiteracy among Paniyan, Kattunayikkan and Vettakuruman is higher thanthe Panchayat percentage. Kuruman and Kurichyan have greater percentage of literacy than other tribes. (Table8, Chart 5).
Table 8: Illiteracy – Tribe-wise
Chart 4: Illiteracy – Ward-wise
Source: Data collection of Scheduled Tribes - 2008
Source: Data collection of Scheduled Tribes - 2008
Sl. No Name of Tribe Population above Illiterate Percentage5 Years
1 Kurumar 3701 484 13
2 Paniyan 2271 796 35
3 Kattunaykkan 744 293 39.38
4 Vettakuruman 271 82 30.25
5 Kurichyan 44 6 13.63
6 Others 21 4 19
Total 7052 1665 23.61
12
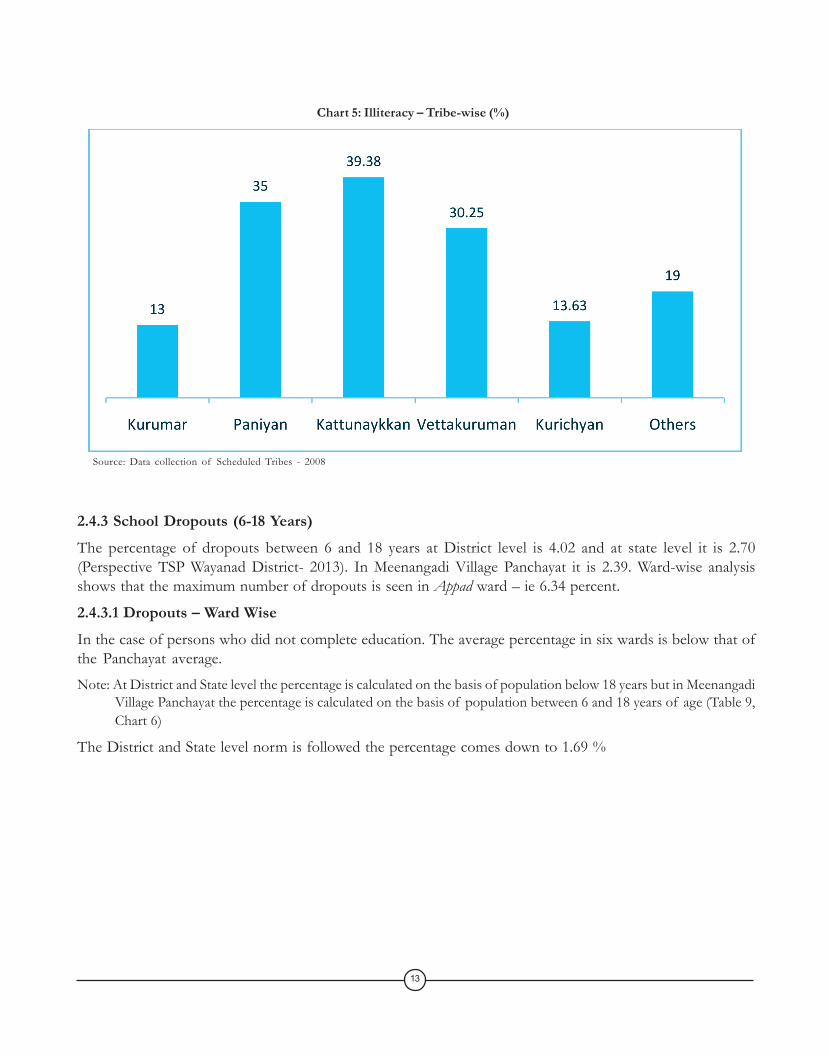
2.4.3 School Dropouts (6-18 Years)The percentage of dropouts between 6 and 18 years at District level is 4.02 and at state level it is 2.70(Perspective TSP Wayanad District- 2013). In Meenangadi Village Panchayat it is 2.39. Ward-wise analysisshows that the maximum number of dropouts is seen in Appad ward – ie 6.34 percent.
2.4.3.1 Dropouts – Ward WiseIn the case of persons who did not complete education. The average percentage in six wards is below that ofthe Panchayat average.Note: At District and State level the percentage is calculated on the basis of population below 18 years but in Meenangadi
Village Panchayat the percentage is calculated on the basis of population between 6 and 18 years of age (Table 9,Chart 6)
The District and State level norm is followed the percentage comes down to 1.69 %
Chart 5: Illiteracy – Tribe-wise (%)
Source: Data collection of Scheduled Tribes - 2008
13
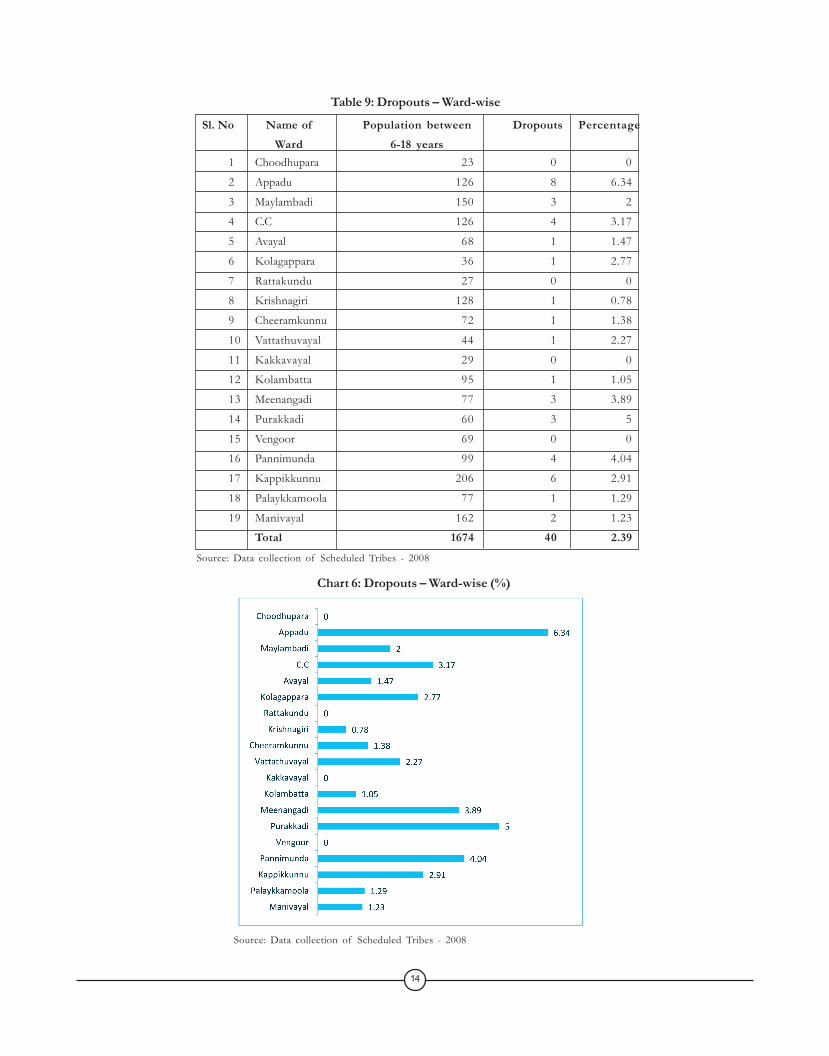
Sl. No Name of Population between Dropouts PercentageWard 6-18 years
1 Choodhupara 23 0 0
2 Appadu 126 8 6.34
3 Maylambadi 150 3 2
4 C.C 126 4 3.17
5 Avayal 68 1 1.47
6 Kolagappara 36 1 2.77
7 Rattakundu 27 0 0
8 Krishnagiri 128 1 0.78
9 Cheeramkunnu 72 1 1.38
10 Vattathuvayal 44 1 2.27
11 Kakkavayal 29 0 0
12 Kolambatta 95 1 1.05
13 Meenangadi 77 3 3.89
14 Purakkadi 60 3 5
15 Vengoor 69 0 0
16 Pannimunda 99 4 4.04
17 Kappikkunnu 206 6 2.91
18 Palaykkamoola 77 1 1.29
19 Manivayal 162 2 1.23
Total 1674 40 2.39Source: Data collection of Scheduled Tribes - 2008
Table 9: Dropouts – Ward-wise
Chart 6: Dropouts – Ward-wise (%)
Source: Data collection of Scheduled Tribes - 2008
14

2.4.3.2 Dropouts – Tribe-wiseTribe-wise analysis of the problem shows that it is the Paniyan tribe that maximum number of students leaveeducation without completing it. The percentage of such students in Kattunayikkan and Vettakuruman tribes ishigher than the Panchayat average (Table 10, Chart 7)
Table 10: Dropouts –Tribe-wise
2.4.4 Persons without Higher EducationThe tribes are generally backward in higher education because of poverty and lack of awareness of parents.The percentage of persons without higher education at district level is 99.13 and at state level 97.11 (PerspectiveTSP Wayanad District – 2013). In Meenangadi Panchayat the percentage is 97.99.
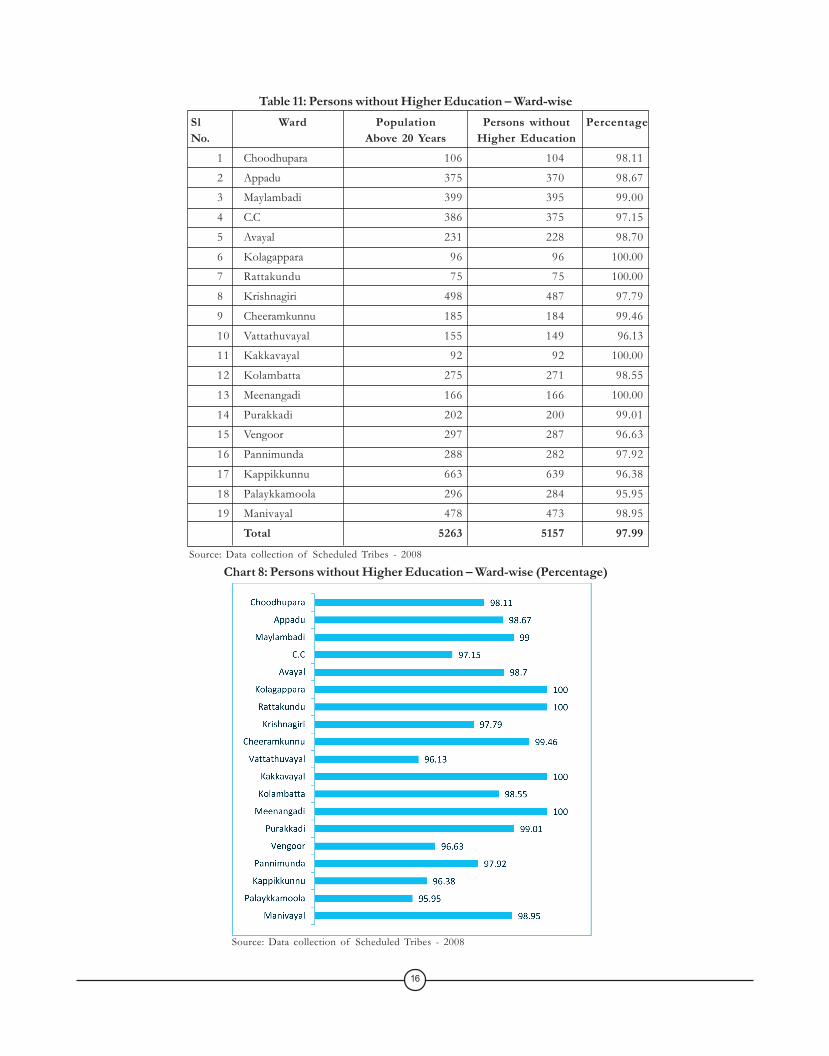
2.4.4.1 Persons without Higher Education – Ward-wiseThe percentage of persons without higher education is higher in 12 wards than the Panchayat percentage.There are four wards in the Panchayat where no one has got higher education (Table 11, Chart 8).
Sl. No Tribe Population between Dropouts Percentage6-18 years
1 Kurumar 748 3 0.4
2 Paniyan 642 27 4.20
3 Kattunaykkan 210 8 3.80
4 Vettakuruman 63 2 3.17
5 Kuricyan 11 0 0
Total 1674 40 2.39
Source: Data collection of Scheduled Tribes - 2008
Chart 7: Dropouts – Tribe-wise (%)
Source: Data collection of Scheduled Tribes - 2008
15
0
Sl Ward Population Persons without PercentageNo. Above 20 Years Higher Education
1 Choodhupara 106 104 98.11
2 Appadu 375 370 98.67
3 Maylambadi 399 395 99.00
4 C.C 386 375 97.15
5 Avayal 231 228 98.70
6 Kolagappara 96 96 100.00
7 Rattakundu 75 75 100.00
8 Krishnagiri 498 487 97.79
9 Cheeramkunnu 185 184 99.46
10 Vattathuvayal 155 149 96.13
11 Kakkavayal 92 92 100.00
12 Kolambatta 275 271 98.55
13 Meenangadi 166 166 100.00
14 Purakkadi 202 200 99.01
15 Vengoor 297 287 96.63
16 Pannimunda 288 282 97.92
17 Kappikkunnu 663 639 96.38
18 Palaykkamoola 296 284 95.95
19 Manivayal 478 473 98.95
Total 5263 5157 97.99
Source: Data collection of Scheduled Tribes - 2008
Table 11: Persons without Higher Education – Ward-wise
Chart 8: Persons without Higher Education – Ward-wise (Percentage)
Source: Data collection of Scheduled Tribes - 2008
16
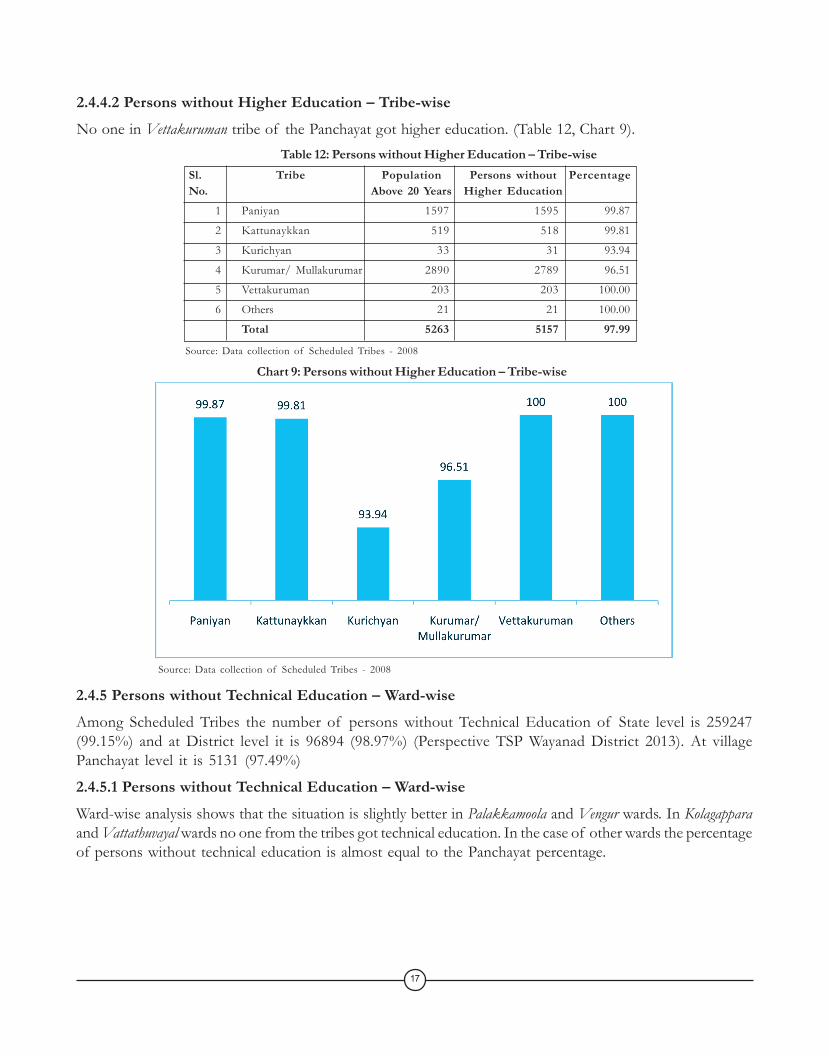
2.4.4.2 Persons without Higher Education – Tribe-wiseNo one in Vettakuruman tribe of the Panchayat got higher education. (Table 12, Chart 9).
Table 12: Persons without Higher Education – Tribe-wiseSl. Tribe Population Persons without PercentageNo. Above 20 Years Higher Education
1 Paniyan 1597 1595 99.87
2 Kattunaykkan 519 518 99.81
3 Kurichyan 33 31 93.94
4 Kurumar/ Mullakurumar 2890 2789 96.51
5 Vettakuruman 203 203 100.00
6 Others 21 21 100.00
Total 5263 5157 97.99
Chart 9: Persons without Higher Education – Tribe-wise
2.4.5 Persons without Technical Education – Ward-wiseAmong Scheduled Tribes the number of persons without Technical Education of State level is 259247(99.15%) and at District level it is 96894 (98.97%) (Perspective TSP Wayanad District 2013). At villagePanchayat level it is 5131 (97.49%)
2.4.5.1 Persons without Technical Education – Ward-wiseWard-wise analysis shows that the situation is slightly better in Palakkamoola and Vengur wards. In Kolagapparaand Vattathuvayal wards no one from the tribes got technical education. In the case of other wards the percentageof persons without technical education is almost equal to the Panchayat percentage.
Source: Data collection of Scheduled Tribes - 2008
Source: Data collection of Scheduled Tribes - 2008
17
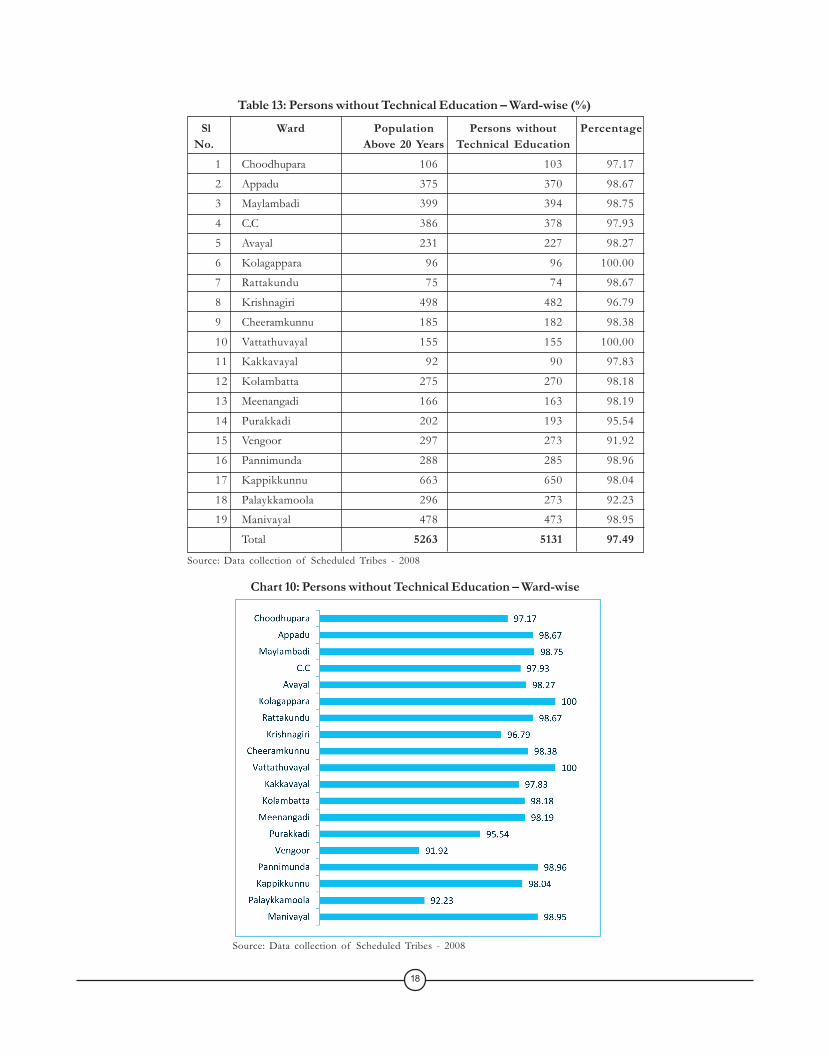
Table 13: Persons without Technical Education – Ward-wise (%)
Sl Ward Population Persons without Percentage No. Above 20 Years Technical Education
1 Choodhupara 106 103 97.17
2 Appadu 375 370 98.67
3 Maylambadi 399 394 98.75
4 C.C 386 378 97.93
5 Avayal 231 227 98.27
6 Kolagappara 96 96 100.00
7 Rattakundu 75 74 98.67
8 Krishnagiri 498 482 96.79
9 Cheeramkunnu 185 182 98.38
10 Vattathuvayal 155 155 100.00
11 Kakkavayal 92 90 97.83
12 Kolambatta 275 270 98.18
13 Meenangadi 166 163 98.19
14 Purakkadi 202 193 95.54
15 Vengoor 297 273 91.92
16 Pannimunda 288 285 98.96
17 Kappikkunnu 663 650 98.04
18 Palaykkamoola 296 273 92.23
19 Manivayal 478 473 98.95
Total 5263 5131 97.49
Source: Data collection of Scheduled Tribes - 2008
Chart 10: Persons without Technical Education – Ward-wise
Source: Data collection of Scheduled Tribes - 2008
18
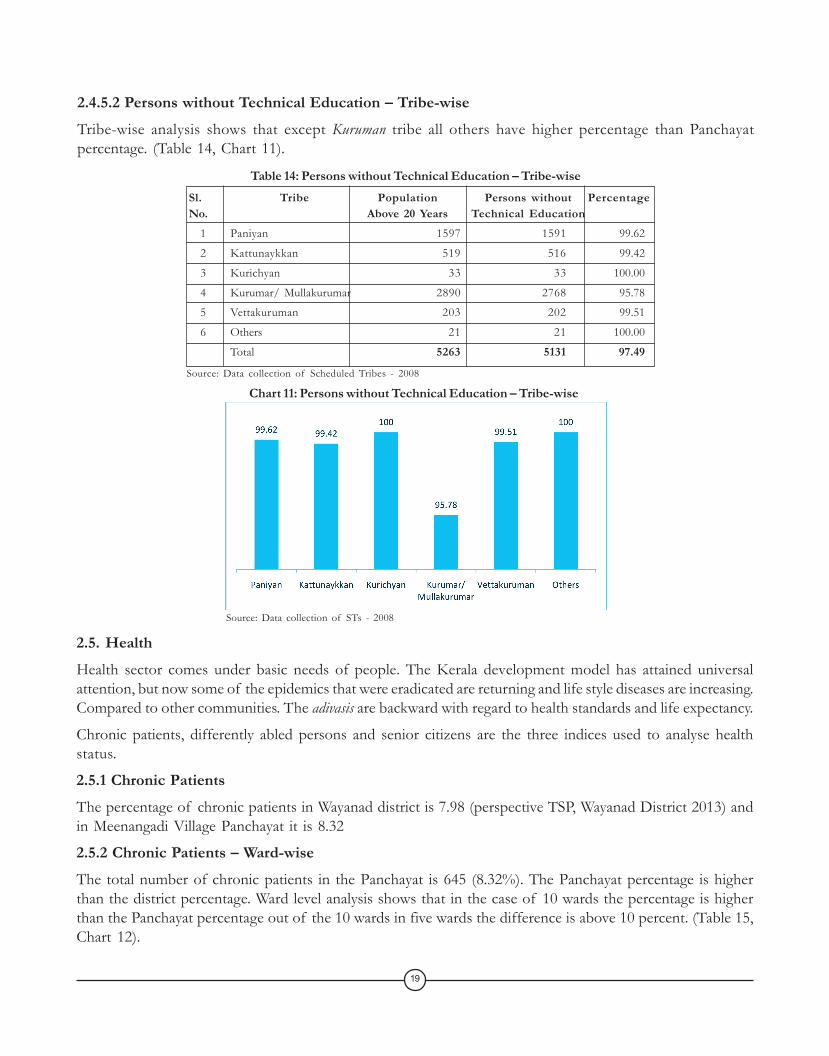
2.4.5.2 Persons without Technical Education – Tribe-wiseTribe-wise analysis shows that except Kuruman tribe all others have higher percentage than Panchayatpercentage. (Table 14, Chart 11).
Table 14: Persons without Technical Education – Tribe-wiseSl. Tribe Population Persons without PercentageNo. Above 20 Years Technical Education
1 Paniyan 1597 1591 99.62
2 Kattunaykkan 519 516 99.42
3 Kurichyan 33 33 100.00
4 Kurumar/ Mullakurumar 2890 2768 95.78
5 Vettakuruman 203 202 99.51
6 Others 21 21 100.00
Total 5263 5131 97.49
Chart 11: Persons without Technical Education – Tribe-wise
2.5. HealthHealth sector comes under basic needs of people. The Kerala development model has attained universalattention, but now some of the epidemics that were eradicated are returning and life style diseases are increasing.Compared to other communities. The adivasis are backward with regard to health standards and life expectancy.
Chronic patients, differently abled persons and senior citizens are the three indices used to analyse healthstatus.
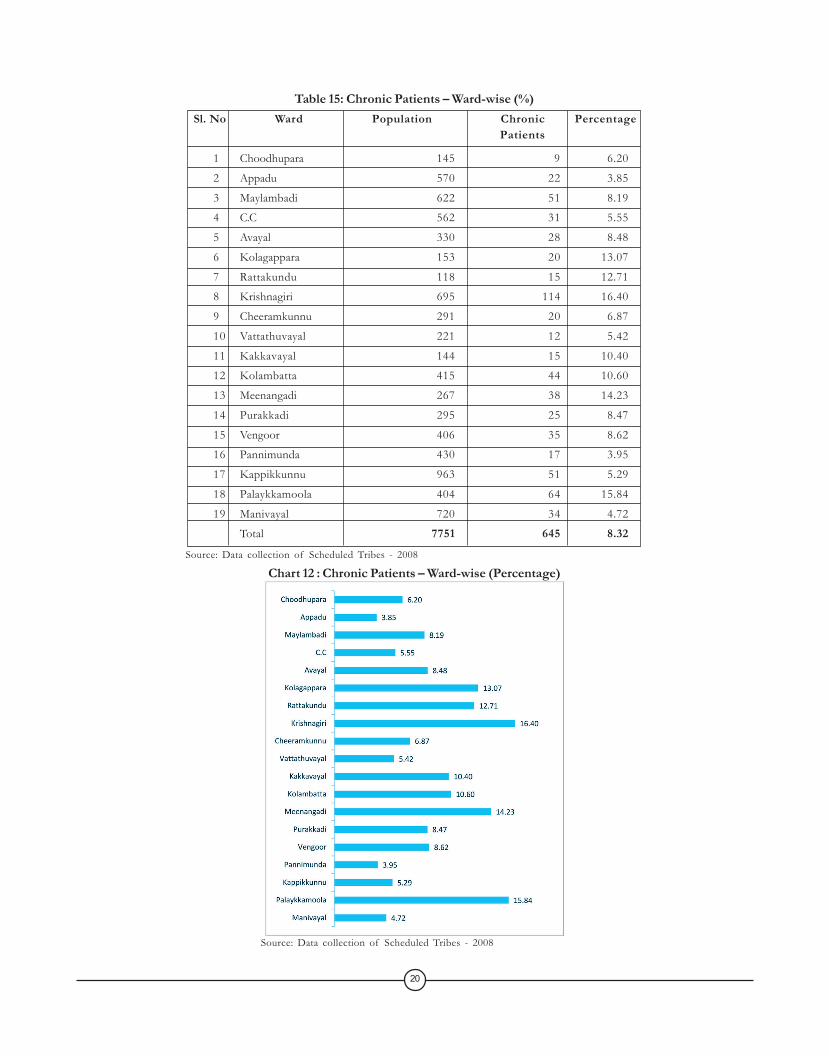
2.5.1 Chronic PatientsThe percentage of chronic patients in Wayanad district is 7.98 (perspective TSP, Wayanad District 2013) andin Meenangadi Village Panchayat it is 8.32
2.5.2 Chronic Patients – Ward-wiseThe total number of chronic patients in the Panchayat is 645 (8.32%). The Panchayat percentage is higherthan the district percentage. Ward level analysis shows that in the case of 10 wards the percentage is higherthan the Panchayat percentage out of the 10 wards in five wards the difference is above 10 percent. (Table 15,Chart 12).
Source: Data collection of Scheduled Tribes - 2008
Source: Data collection of STs - 2008
19
Sl. No Ward Population Chronic PercentagePatients
1 Choodhupara 145 9 6.20
2 Appadu 570 22 3.85
3 Maylambadi 622 51 8.19
4 C.C 562 31 5.55
5 Avayal 330 28 8.48
6 Kolagappara 153 20 13.07
7 Rattakundu 118 15 12.71
8 Krishnagiri 695 114 16.40
9 Cheeramkunnu 291 20 6.87
10 Vattathuvayal 221 12 5.42
11 Kakkavayal 144 15 10.40
12 Kolambatta 415 44 10.60
13 Meenangadi 267 38 14.23
14 Purakkadi 295 25 8.47
15 Vengoor 406 35 8.62
16 Pannimunda 430 17 3.95
17 Kappikkunnu 963 51 5.29
18 Palaykkamoola 404 64 15.84
19 Manivayal 720 34 4.72
Total 7751 645 8.32
Source: Data collection of Scheduled Tribes - 2008
Table 15: Chronic Patients – Ward-wise (%)
Chart 12 : Chronic Patients – Ward-wise (Percentage)
Source: Data collection of Scheduled Tribes - 2008
20

2.5.2.1 Chronic Patients – Tribe-wiseTribe-wise analysis shows that the percentage of chronic patients in Kuruman community is higher than thatof all other communities. (Table 16, Chart 13).
Table 16: Chronic Patients – Tribe-wise (%)Sl.No Community Population chronic Percentage
Patients
1. Kurumar 4010 356 8.87
2. Paniyan 2529 211 8.34
3. Kattunaykkan 845 46 5.44
4. Vettakuruman 295 23 7.79
5. Kurichyan 51 3 5.88
6. Others 21 6 28
Total 7751 645 8.32
2.5.3 Differently Abled PersonsThe percentage of physically and mentally challenged persons at district level is 3.07 and at state level it is4.71 (Perspective TSP, Wayanad District 2013) But Meenangadi Village Panchayat has 559 such persons andthe percentage is 7.21
2.5.3.1 Differently Abled Persons – Ward-wiseWard-wise analysis shows that in eight wards the percentage of differently abled persons is higher than that ofthe Panchayat. The highest number of such persons is in Krishnagiri ward (12.81 %) but the highest percentageis in Palakkamoola ward.(16.09) (Table 17, Chart 14).
Source: Data collection of Scheduled Tribes - 2008
Chart 13: Chronic Patients – Tribe-wise
Source: Data collection of Scheduled Tribes - 2008
21
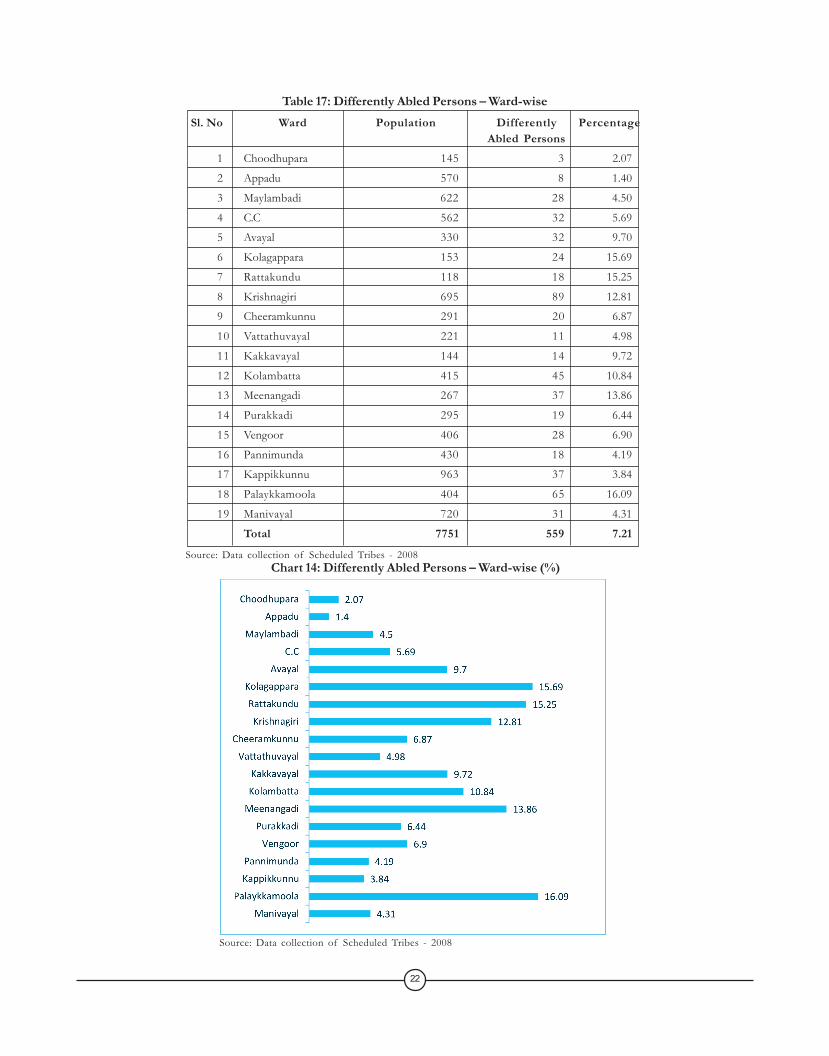
Table 17: Differently Abled Persons – Ward-wiseSl. No Ward Population Differently Percentage
Abled Persons1 Choodhupara 145 3 2.07
2 Appadu 570 8 1.40
3 Maylambadi 622 28 4.50
4 C.C 562 32 5.69
5 Avayal 330 32 9.70
6 Kolagappara 153 24 15.69
7 Rattakundu 118 18 15.25
8 Krishnagiri 695 89 12.81
9 Cheeramkunnu 291 20 6.87
10 Vattathuvayal 221 11 4.98
11 Kakkavayal 144 14 9.72
12 Kolambatta 415 45 10.84
13 Meenangadi 267 37 13.86
14 Purakkadi 295 19 6.44
15 Vengoor 406 28 6.90
16 Pannimunda 430 18 4.19
17 Kappikkunnu 963 37 3.84
18 Palaykkamoola 404 65 16.09
19 Manivayal 720 31 4.31
Total 7751 559 7.21
Source: Data collection of Scheduled Tribes - 2008Chart 14: Differently Abled Persons – Ward-wise (%)
Source: Data collection of Scheduled Tribes - 2008
22
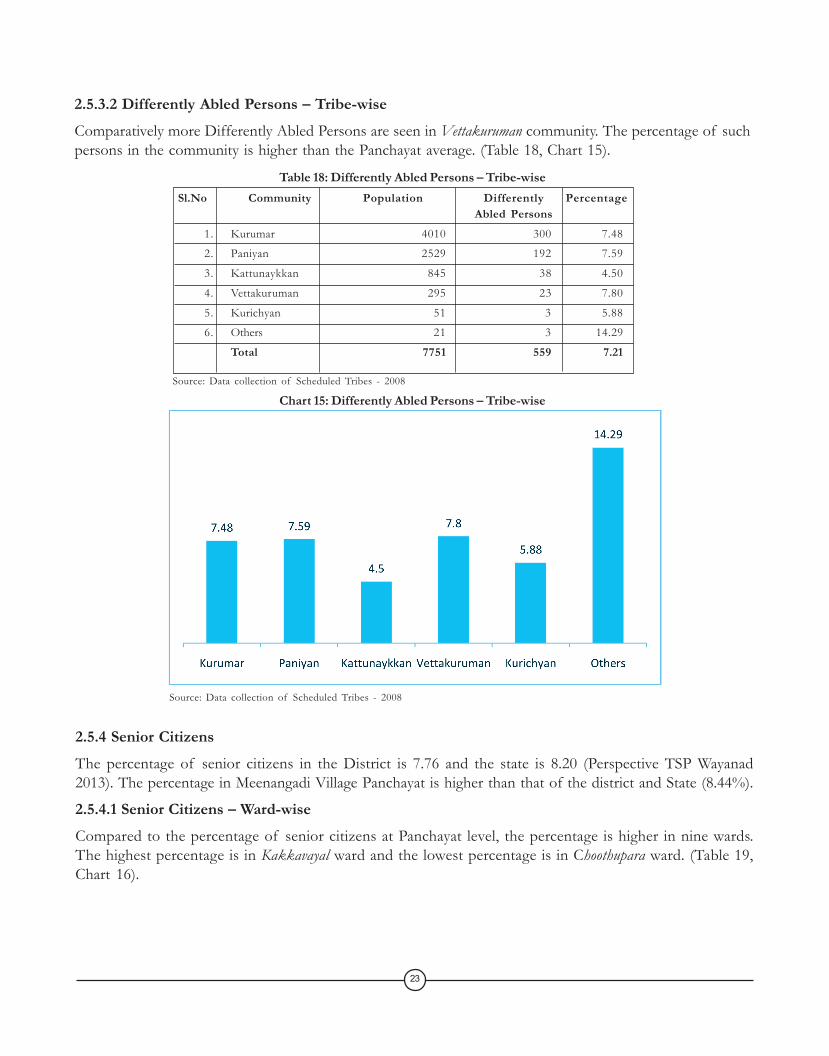
2.5.3.2 Differently Abled Persons – Tribe-wiseComparatively more Differently Abled Persons are seen in Vettakuruman community. The percentage of suchpersons in the community is higher than the Panchayat average. (Table 18, Chart 15).
Table 18: Differently Abled Persons – Tribe-wiseSl.No Community Population Differently Percentage
Abled Persons1. Kurumar 4010 300 7.48
2. Paniyan 2529 192 7.59
3. Kattunaykkan 845 38 4.50
4. Vettakuruman 295 23 7.80
5. Kurichyan 51 3 5.88
6. Others 21 3 14.29
Total 7751 559 7.21
2.5.4 Senior CitizensThe percentage of senior citizens in the District is 7.76 and the state is 8.20 (Perspective TSP Wayanad2013). The percentage in Meenangadi Village Panchayat is higher than that of the district and State (8.44%).
2.5.4.1 Senior Citizens – Ward-wiseCompared to the percentage of senior citizens at Panchayat level, the percentage is higher in nine wards.The highest percentage is in Kakkavayal ward and the lowest percentage is in Choothupara ward. (Table 19,Chart 16).
Chart 15: Differently Abled Persons – Tribe-wise
Source: Data collection of Scheduled Tribes - 2008
Source: Data collection of Scheduled Tribes - 2008
23
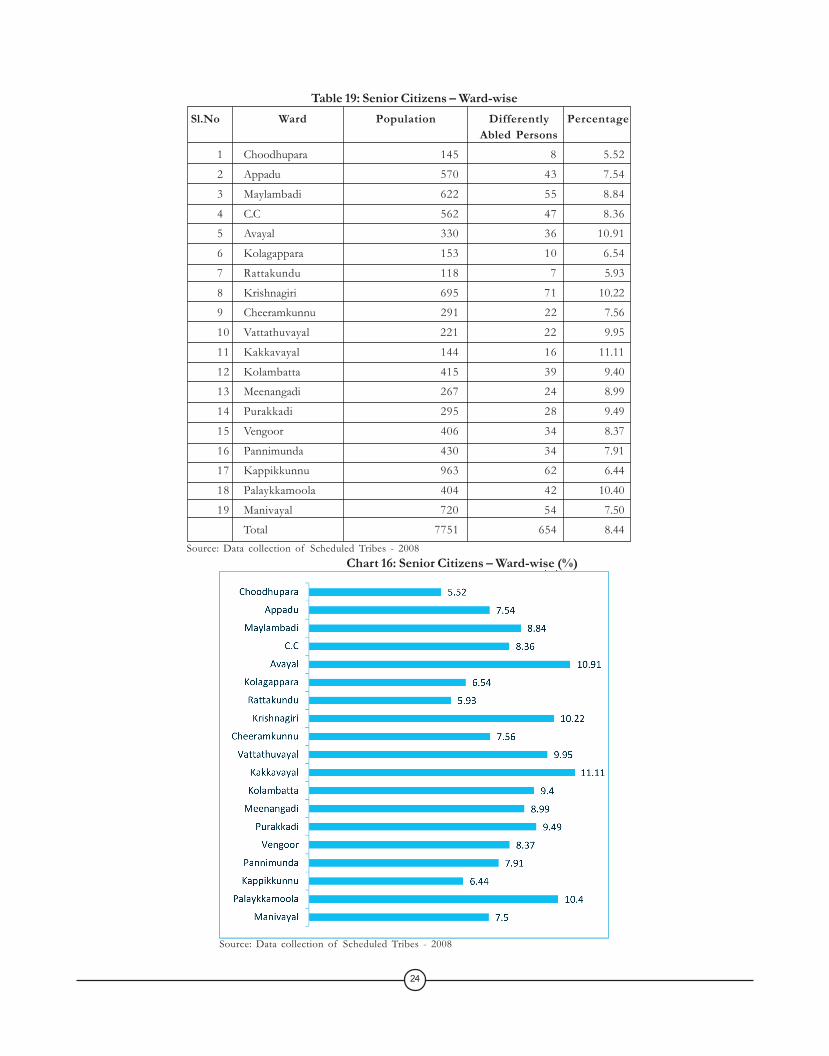
Table 19: Senior Citizens – Ward-wiseSl.No Ward Population Differently Percentage
Abled Persons1 Choodhupara 145 8 5.52
2 Appadu 570 43 7.54
3 Maylambadi 622 55 8.84
4 C.C 562 47 8.36
5 Avayal 330 36 10.91
6 Kolagappara 153 10 6.54
7 Rattakundu 118 7 5.93
8 Krishnagiri 695 71 10.22
9 Cheeramkunnu 291 22 7.56
10 Vattathuvayal 221 22 9.95
11 Kakkavayal 144 16 11.11
12 Kolambatta 415 39 9.40
13 Meenangadi 267 24 8.99
14 Purakkadi 295 28 9.49
15 Vengoor 406 34 8.37
16 Pannimunda 430 34 7.91
17 Kappikkunnu 963 62 6.44
18 Palaykkamoola 404 42 10.40
19 Manivayal 720 54 7.50
Total 7751 654 8.44
Chart 16: Senior Citizens – Ward-wise (%)
Source: Data collection of Scheduled Tribes - 2008
24
Source: Data collection of Scheduled Tribes - 2008
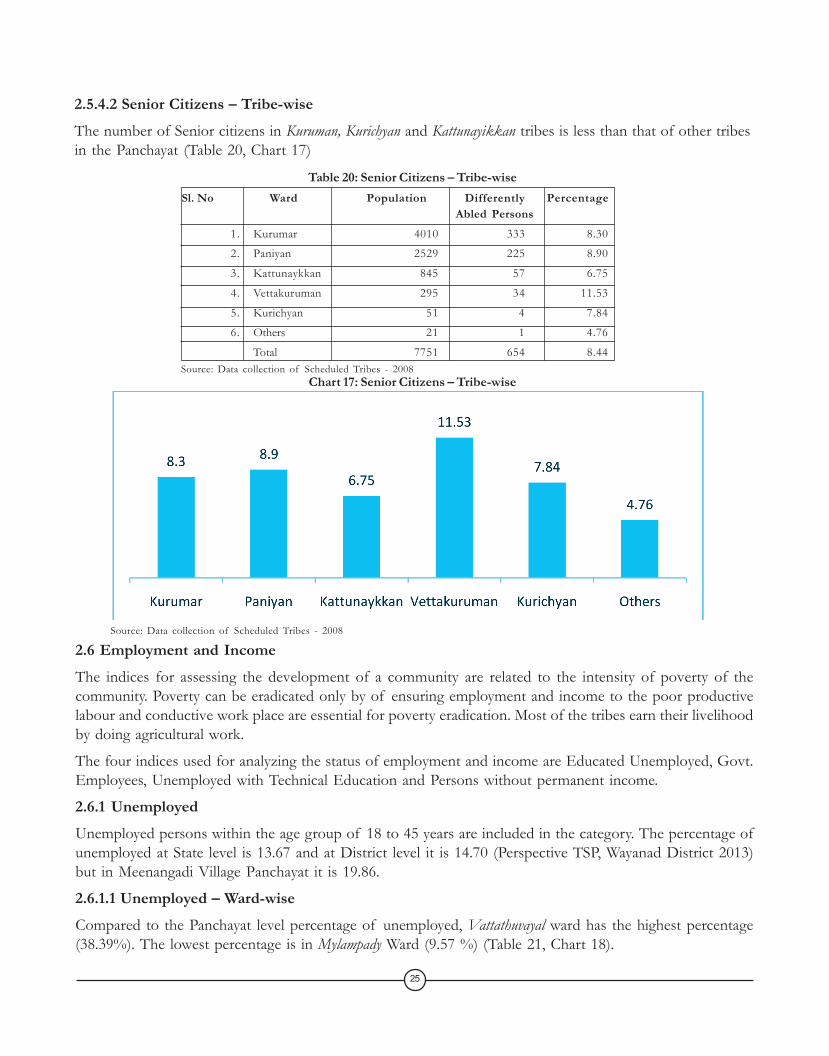
2.5.4.2 Senior Citizens – Tribe-wiseThe number of Senior citizens in Kuruman, Kurichyan and Kattunayikkan tribes is less than that of other tribesin the Panchayat (Table 20, Chart 17)
Table 20: Senior Citizens – Tribe-wiseSl. No Ward Population Differently Percentage
Abled Persons1. Kurumar 4010 333 8.30
2. Paniyan 2529 225 8.90
3. Kattunaykkan 845 57 6.75
4. Vettakuruman 295 34 11.53
5. Kurichyan 51 4 7.84
6. Others 21 1 4.76
Total 7751 654 8.44
2.6 Employment and IncomeThe indices for assessing the development of a community are related to the intensity of poverty of thecommunity. Poverty can be eradicated only by of ensuring employment and income to the poor productivelabour and conductive work place are essential for poverty eradication. Most of the tribes earn their livelihoodby doing agricultural work.
The four indices used for analyzing the status of employment and income are Educated Unemployed, Govt.Employees, Unemployed with Technical Education and Persons without permanent income.
2.6.1 UnemployedUnemployed persons within the age group of 18 to 45 years are included in the category. The percentage ofunemployed at State level is 13.67 and at District level it is 14.70 (Perspective TSP, Wayanad District 2013)but in Meenangadi Village Panchayat it is 19.86.
2.6.1.1 Unemployed – Ward-wiseCompared to the Panchayat level percentage of unemployed, Vattathuvayal ward has the highest percentage(38.39%). The lowest percentage is in Mylampady Ward (9.57 %) (Table 21, Chart 18).
Chart 17: Senior Citizens – Tribe-wiseSource: Data collection of Scheduled Tribes - 2008
Source: Data collection of Scheduled Tribes - 2008
25

Table 21: Unemployed - Ward-wiseSl. No Ward Population Unemployed Percentage
(18-45 Years)
1 Choodhupara 77 8 10.39
2 Appadu 278 36 12.95
3 Maylambadi 303 29 9.57
4 C.C 291 59 20.27
5 Avayal 185 22 11.89
6 Kolagappara 79 18 22.78
7 Rattakundu 61 18 29.51
8 Krishnagiri 353 78 22.10
9 Cheeramkunnu 139 52 37.41
10 Vattathuvayal 112 43 38.39
11 Kakkavayal 77 19 24.68
12 Kolambatta 210 33 15.71
13 Meenangadi 130 19 14.62
14 Purakkadi 155 49 31.61
15 Vengoor 213 57 26.76
16 Pannimunda 224 43 19.20
17 Kappikkunnu 511 77 15.07
18 Palaykkamoola 204 25 12.25
19 Manivayal 385 107 27.79
Total 3987 792 19.86
Chart 18: Unemployed - Ward-wise (%)
Source: Data collection of Scheduled Tribes - 2008
26
Source: Data collection of Scheduled Tribes - 2008

2.6.1.2 Unemployed – Tribe-wiseComparative analysis of unemployment among tribes shows that the percentage of unemployment in Kurichyancommunity is higher than the average unemployment in other communities and Panchayat level. (Table 22,Chart 19).
Table 22: Unemployed – Tribe-wiseSl. No Community Population Unemployed Percentage
(18-45 Years)1. Kurumar 2161 456 21.10
2. Paniyan 1244 255 20.50
3. Kattunaykkan 400 56 14.00
4. Vettakuruman 144 17 11.81
5. Kurichyan 24 6 25.00
6. Others 14 2 14.29
Total 3987 792 19.86
2.6.2 Educated UnemployedPersons with S.S.L.C. and higher education are included in this category. The percentage of persons inMeenangadi Village Panchayat is 35.86.
2.6.2.1 Educated Unemployed – Ward-wiseIn 9 wards of the Panchayat the percentage of educated unemployed is higher than the Panchayat percentage.(Table 23, Chart 20).
Chart 19: Unemployed - Tribe-wise (%)
Source: Data collection of Scheduled Tribes - 2008
Source: Data collection of Scheduled Tribes - 2008
27
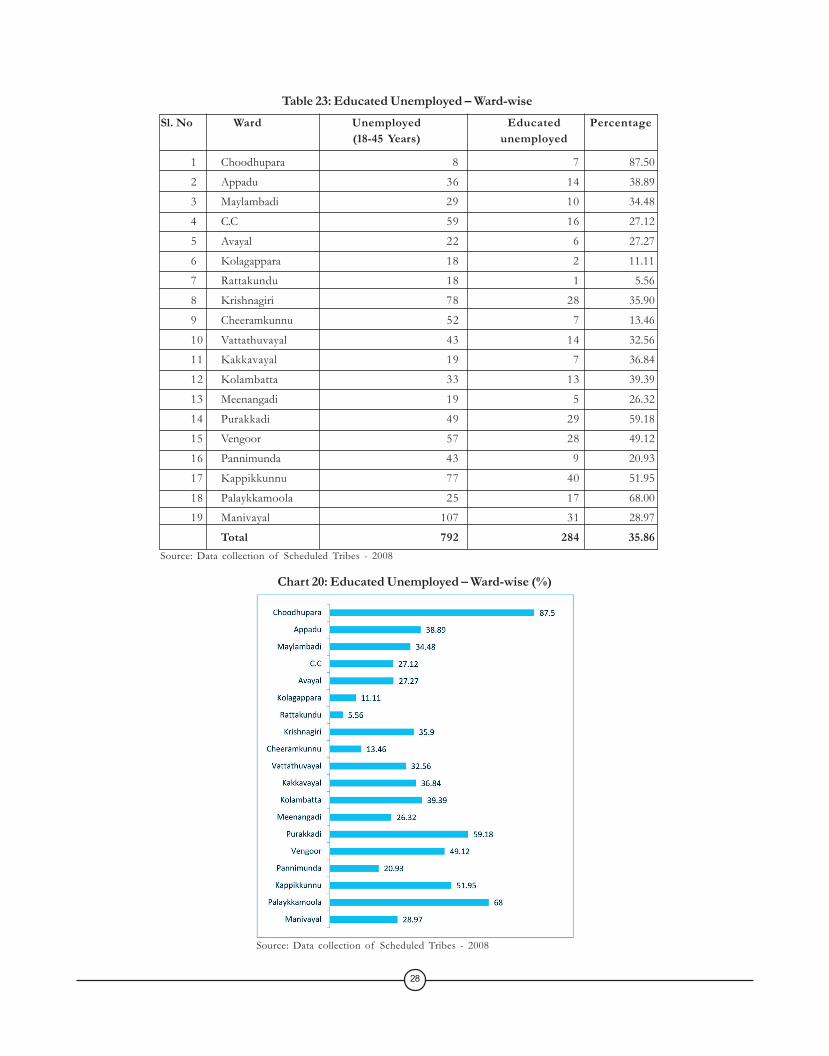
Sl. No Ward Unemployed Educated Percentage(18-45 Years) unemployed
1 Choodhupara 8 7 87.50
2 Appadu 36 14 38.89
3 Maylambadi 29 10 34.48
4 C.C 59 16 27.12
5 Avayal 22 6 27.27
6 Kolagappara 18 2 11.11
7 Rattakundu 18 1 5.56
8 Krishnagiri 78 28 35.90
9 Cheeramkunnu 52 7 13.46
10 Vattathuvayal 43 14 32.56
11 Kakkavayal 19 7 36.84
12 Kolambatta 33 13 39.39
13 Meenangadi 19 5 26.32
14 Purakkadi 49 29 59.18
15 Vengoor 57 28 49.12
16 Pannimunda 43 9 20.93
17 Kappikkunnu 77 40 51.95
18 Palaykkamoola 25 17 68.00
19 Manivayal 107 31 28.97
Total 792 284 35.86
Chart 20: Educated Unemployed – Ward-wise (%)
Source: Data collection of Scheduled Tribes - 2008
28
Source: Data collection of Scheduled Tribes - 2008
Table 23: Educated Unemployed – Ward-wise
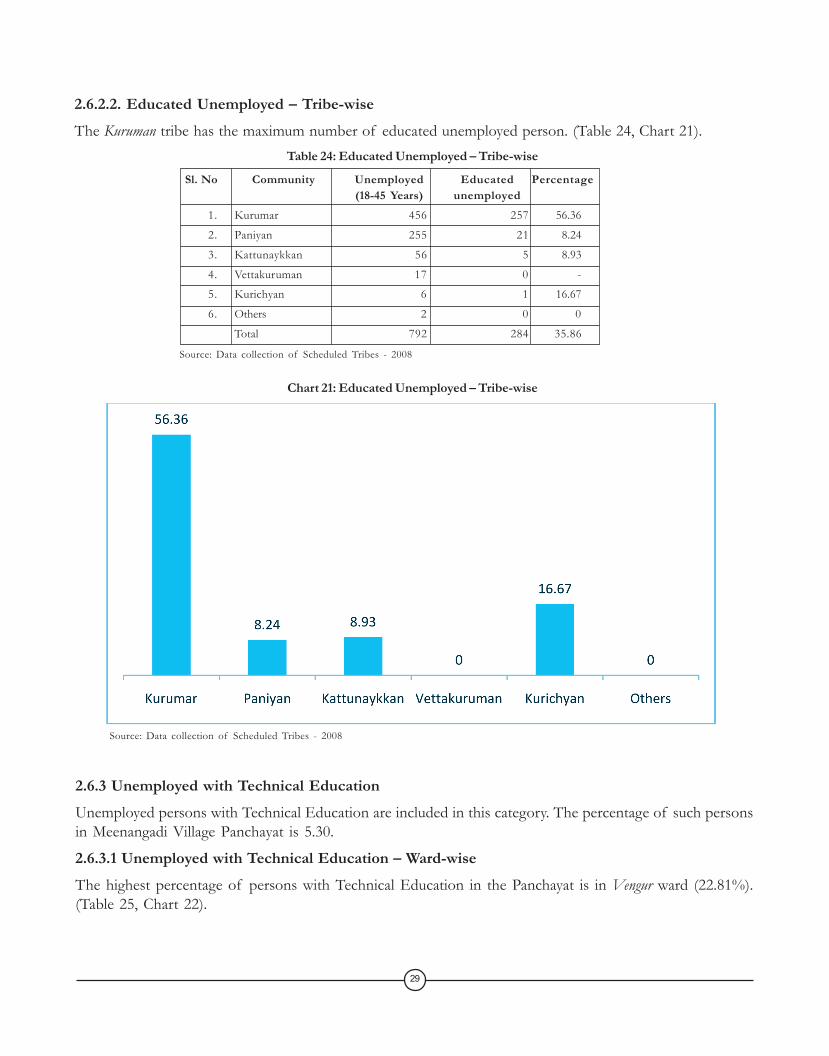
2.6.2.2. Educated Unemployed – Tribe-wiseThe Kuruman tribe has the maximum number of educated unemployed person. (Table 24, Chart 21).
Table 24: Educated Unemployed – Tribe-wise
2.6.3 Unemployed with Technical EducationUnemployed persons with Technical Education are included in this category. The percentage of such personsin Meenangadi Village Panchayat is 5.30.
2.6.3.1 Unemployed with Technical Education – Ward-wiseThe highest percentage of persons with Technical Education in the Panchayat is in Vengur ward (22.81%).(Table 25, Chart 22).
Sl. No Community Unemployed Educated Percentage(18-45 Years) unemployed
1. Kurumar 456 257 56.36
2. Paniyan 255 21 8.24
3. Kattunaykkan 56 5 8.93
4. Vettakuruman 17 0 -
5. Kurichyan 6 1 16.67
6. Others 2 0 0
Total 792 284 35.86
Chart 21: Educated Unemployed – Tribe-wise
Source: Data collection of Scheduled Tribes - 2008
Source: Data collection of Scheduled Tribes - 2008
29
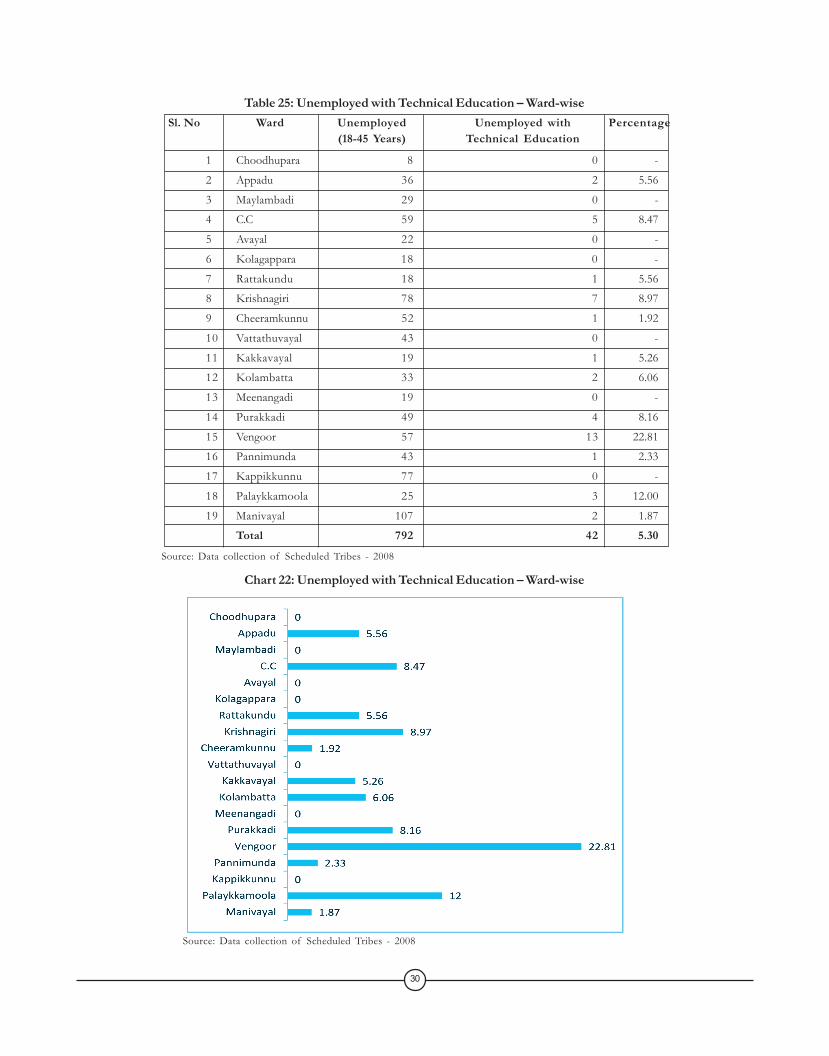
Table 25: Unemployed with Technical Education – Ward-wiseSl. No Ward Unemployed Unemployed with Percentage
(18-45 Years) Technical Education
1 Choodhupara 8 0 -
2 Appadu 36 2 5.56
3 Maylambadi 29 0 -
4 C.C 59 5 8.47
5 Avayal 22 0 -
6 Kolagappara 18 0 -
7 Rattakundu 18 1 5.56
8 Krishnagiri 78 7 8.97
9 Cheeramkunnu 52 1 1.92
10 Vattathuvayal 43 0 -
11 Kakkavayal 19 1 5.26
12 Kolambatta 33 2 6.06
13 Meenangadi 19 0 -
14 Purakkadi 49 4 8.16
15 Vengoor 57 13 22.81
16 Pannimunda 43 1 2.33
17 Kappikkunnu 77 0 -
18 Palaykkamoola 25 3 12.00
19 Manivayal 107 2 1.87
Total 792 42 5.30Source: Data collection of Scheduled Tribes - 2008
Chart 22: Unemployed with Technical Education – Ward-wise
Source: Data collection of Scheduled Tribes - 2008
30
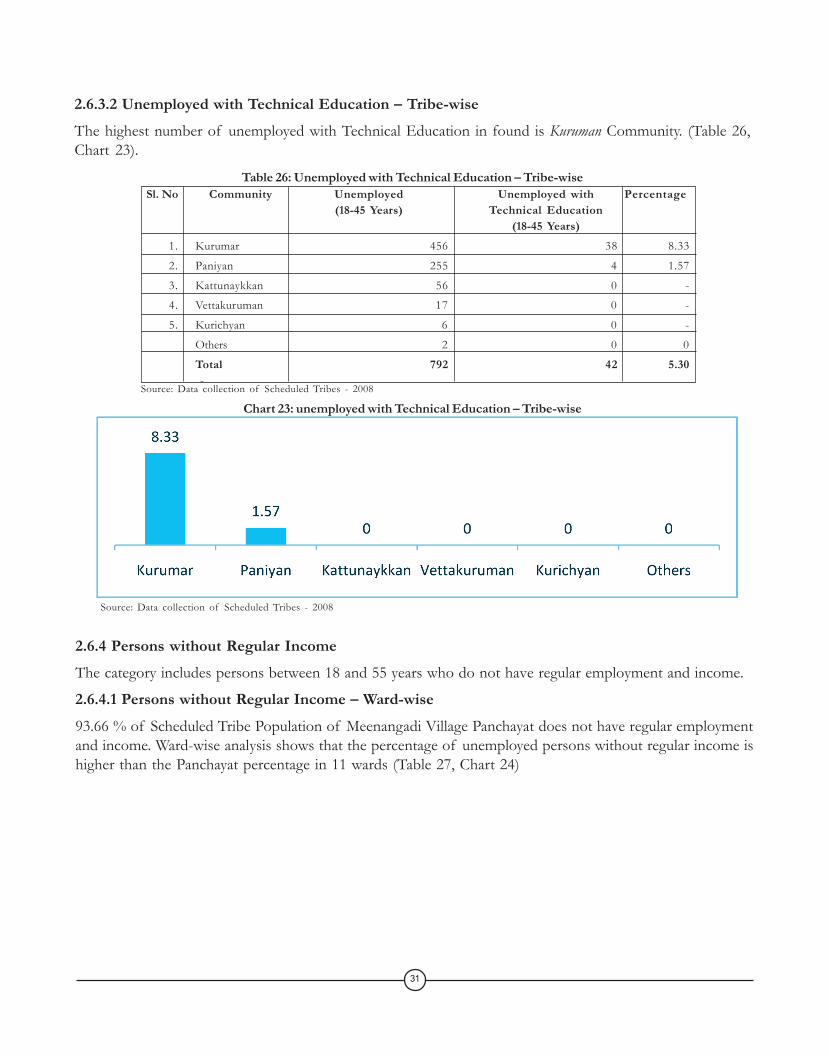
2.6.3.2 Unemployed with Technical Education – Tribe-wiseThe highest number of unemployed with Technical Education in found is Kuruman Community. (Table 26,Chart 23).
Table 26: Unemployed with Technical Education – Tribe-wise
2.6.4 Persons without Regular IncomeThe category includes persons between 18 and 55 years who do not have regular employment and income.
2.6.4.1 Persons without Regular Income – Ward-wise93.66 % of Scheduled Tribe Population of Meenangadi Village Panchayat does not have regular employmentand income. Ward-wise analysis shows that the percentage of unemployed persons without regular income ishigher than the Panchayat percentage in 11 wards (Table 27, Chart 24)
Sl. No Community Unemployed Unemployed with Percentage(18-45 Years) Technical Education
(18-45 Years)1. Kurumar 456 38 8.33
2. Paniyan 255 4 1.57
3. Kattunaykkan 56 0 -
4. Vettakuruman 17 0 -
5. Kurichyan 6 0 -
Others 2 0 0
Total 792 42 5.30 -
Source: Data collection of Scheduled Tribes - 2008
Chart 23: unemployed with Technical Education – Tribe-wise
Source: Data collection of Scheduled Tribes - 2008
31
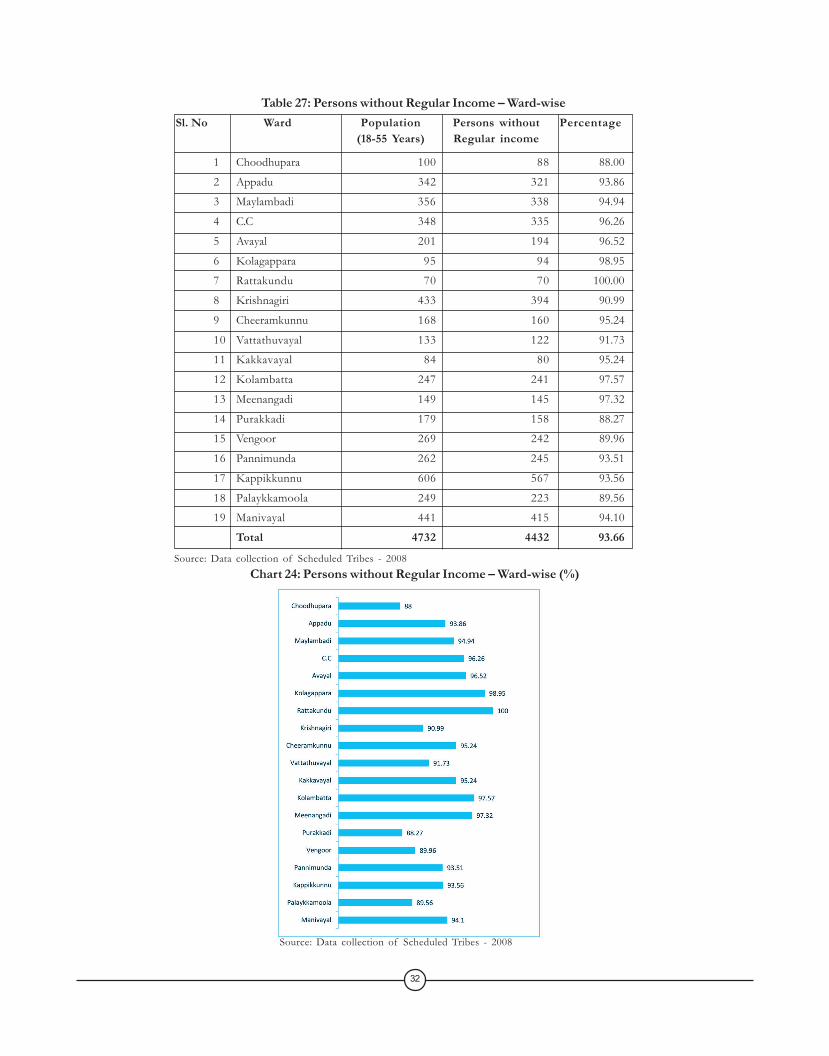
Table 27: Persons without Regular Income – Ward-wiseSl. No Ward Population Persons without Percentage
(18-55 Years) Regular income
1 Choodhupara 100 88 88.00
2 Appadu 342 321 93.86
3 Maylambadi 356 338 94.94
4 C.C 348 335 96.26
5 Avayal 201 194 96.52
6 Kolagappara 95 94 98.95
7 Rattakundu 70 70 100.00
8 Krishnagiri 433 394 90.99
9 Cheeramkunnu 168 160 95.24
10 Vattathuvayal 133 122 91.73
11 Kakkavayal 84 80 95.24
12 Kolambatta 247 241 97.57
13 Meenangadi 149 145 97.32
14 Purakkadi 179 158 88.27
15 Vengoor 269 242 89.96
16 Pannimunda 262 245 93.51
17 Kappikkunnu 606 567 93.56
18 Palaykkamoola 249 223 89.56
19 Manivayal 441 415 94.10
Total 4732 4432 93.66
Source: Data collection of Scheduled Tribes - 2008Chart 24: Persons without Regular Income – Ward-wise (%)
Source: Data collection of Scheduled Tribes - 2008
32
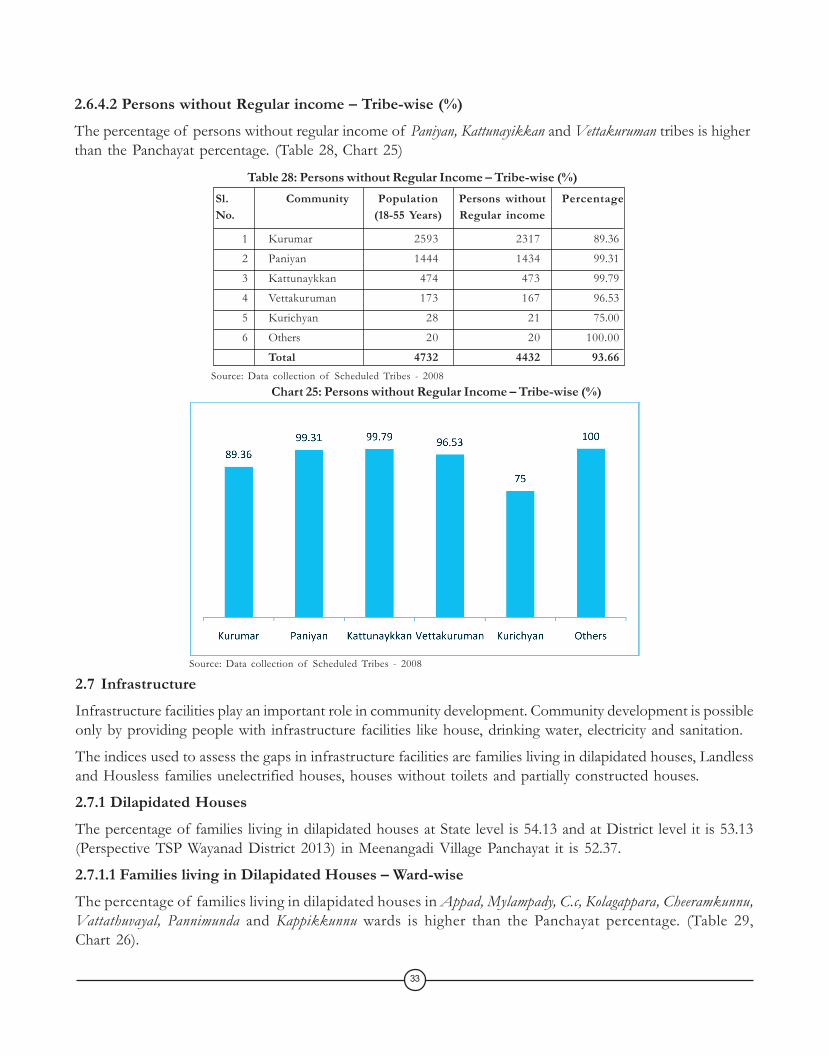
2.6.4.2 Persons without Regular income – Tribe-wise (%)The percentage of persons without regular income of Paniyan, Kattunayikkan and Vettakuruman tribes is higherthan the Panchayat percentage. (Table 28, Chart 25)
Table 28: Persons without Regular Income – Tribe-wise (%)
2.7 InfrastructureInfrastructure facilities play an important role in community development. Community development is possibleonly by providing people with infrastructure facilities like house, drinking water, electricity and sanitation.
The indices used to assess the gaps in infrastructure facilities are families living in dilapidated houses, Landlessand Housless families unelectrified houses, houses without toilets and partially constructed houses.
2.7.1 Dilapidated HousesThe percentage of families living in dilapidated houses at State level is 54.13 and at District level it is 53.13(Perspective TSP Wayanad District 2013) in Meenangadi Village Panchayat it is 52.37.
2.7.1.1 Families living in Dilapidated Houses – Ward-wiseThe percentage of families living in dilapidated houses in Appad, Mylampady, C.c, Kolagappara, Cheeramkunnu,Vattathuvayal, Pannimunda and Kappikkunnu wards is higher than the Panchayat percentage. (Table 29,Chart 26).
Sl. Community Population Persons without PercentageNo. (18-55 Years) Regular income
1 Kurumar 2593 2317 89.36
2 Paniyan 1444 1434 99.31
3 Kattunaykkan 474 473 99.79
4 Vettakuruman 173 167 96.53
5 Kurichyan 28 21 75.00
6 Others 20 20 100.00
Total 4732 4432 93.66
Chart 25: Persons without Regular Income – Tribe-wise (%)Source: Data collection of Scheduled Tribes - 2008
Source: Data collection of Scheduled Tribes - 2008
33
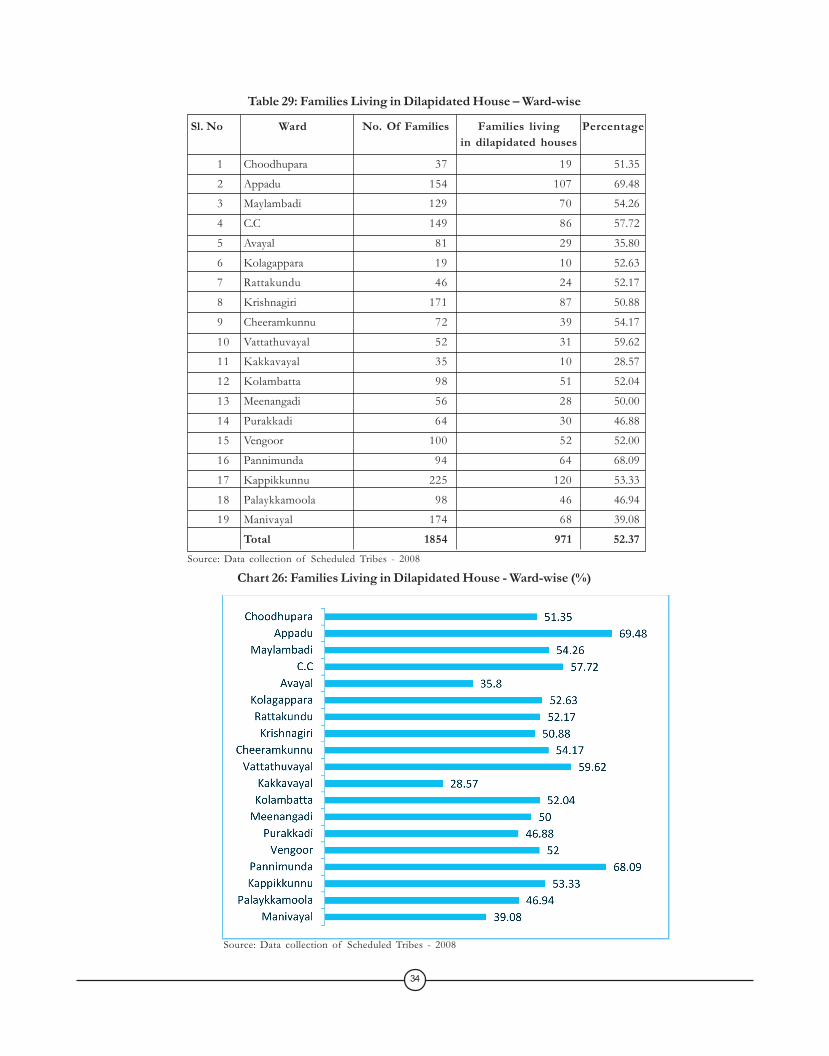
Table 29: Families Living in Dilapidated House – Ward-wise
Sl. No Ward No. Of Families Families living Percentagein dilapidated houses
1 Choodhupara 37 19 51.35
2 Appadu 154 107 69.48
3 Maylambadi 129 70 54.26
4 C.C 149 86 57.72
5 Avayal 81 29 35.80
6 Kolagappara 19 10 52.63
7 Rattakundu 46 24 52.17
8 Krishnagiri 171 87 50.88
9 Cheeramkunnu 72 39 54.17
10 Vattathuvayal 52 31 59.62
11 Kakkavayal 35 10 28.57
12 Kolambatta 98 51 52.04
13 Meenangadi 56 28 50.00
14 Purakkadi 64 30 46.88
15 Vengoor 100 52 52.00
16 Pannimunda 94 64 68.09
17 Kappikkunnu 225 120 53.33
18 Palaykkamoola 98 46 46.94
19 Manivayal 174 68 39.08
Total 1854 971 52.37Source: Data collection of Scheduled Tribes - 2008
Chart 26: Families Living in Dilapidated House - Ward-wise (%)
Source: Data collection of Scheduled Tribes - 2008
34
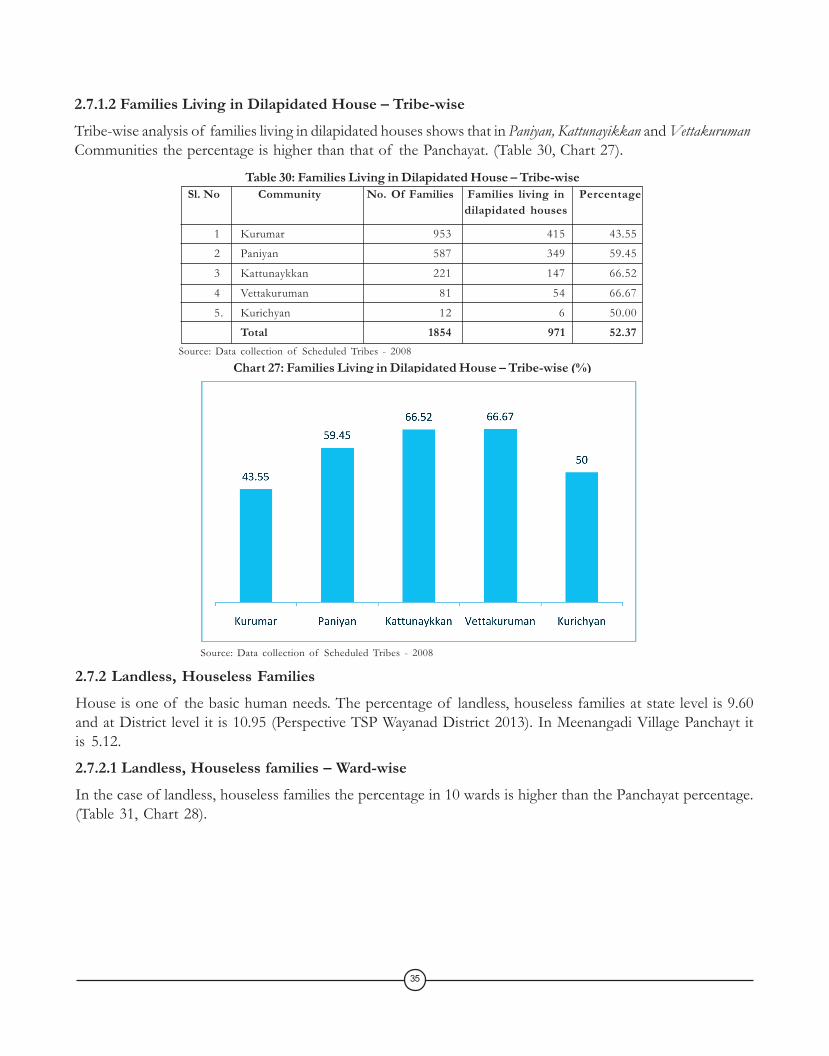
2.7.1.2 Families Living in Dilapidated House – Tribe-wiseTribe-wise analysis of families living in dilapidated houses shows that in Paniyan, Kattunayikkan and VettakurumanCommunities the percentage is higher than that of the Panchayat. (Table 30, Chart 27).
Table 30: Families Living in Dilapidated House – Tribe-wise
2.7.2 Landless, Houseless FamiliesHouse is one of the basic human needs. The percentage of landless, houseless families at state level is 9.60and at District level it is 10.95 (Perspective TSP Wayanad District 2013). In Meenangadi Village Panchayt itis 5.12.
2.7.2.1 Landless, Houseless families – Ward-wiseIn the case of landless, houseless families the percentage in 10 wards is higher than the Panchayat percentage.(Table 31, Chart 28).
Sl. No Community No. Of Families Families living in Percentagedilapidated houses
1 Kurumar 953 415 43.55
2 Paniyan 587 349 59.45
3 Kattunaykkan 221 147 66.52
4 Vettakuruman 81 54 66.67
5. Kurichyan 12 6 50.00
Total 1854 971 52.37Source: Data collection of Scheduled Tribes - 2008
Chart 27: Families Living in Dilapidated House – Tribe-wise (%)
Source: Data collection of Scheduled Tribes - 2008
35
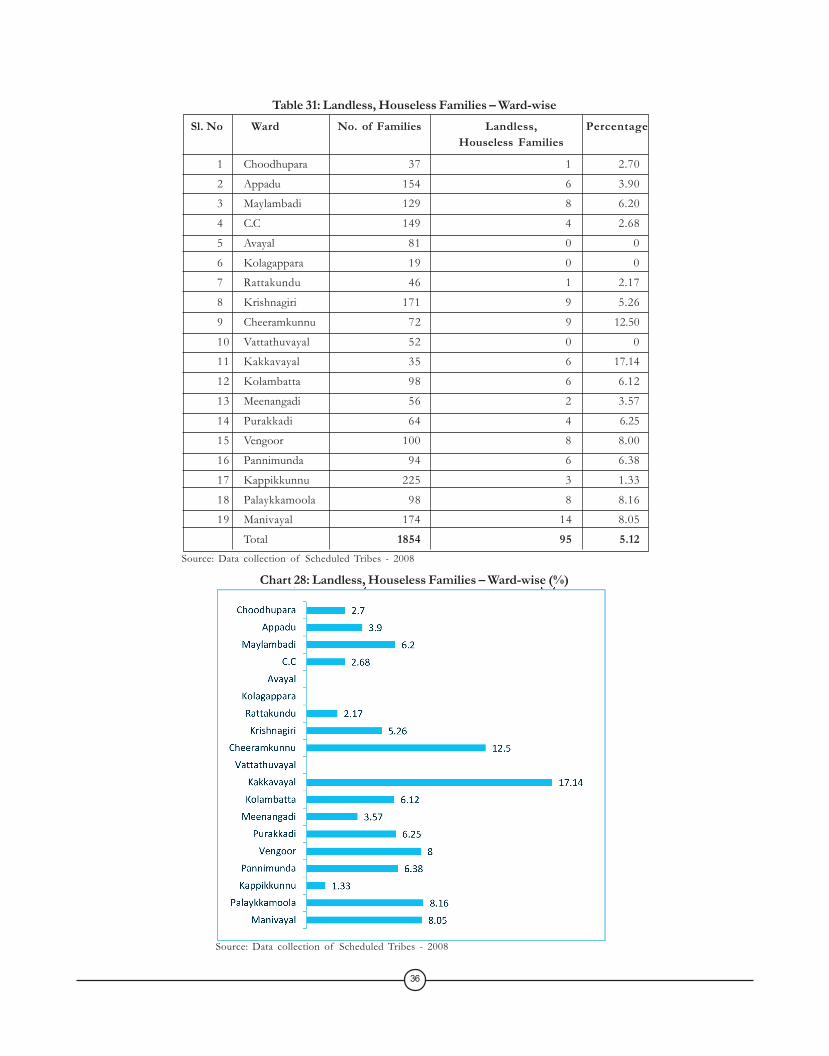
Table 31: Landless, Houseless Families – Ward-wiseSl. No Ward No. of Families Landless, Percentage
Houseless Families
1 Choodhupara 37 1 2.70
2 Appadu 154 6 3.90
3 Maylambadi 129 8 6.20
4 C.C 149 4 2.68
5 Avayal 81 0 0
6 Kolagappara 19 0 0
7 Rattakundu 46 1 2.17
8 Krishnagiri 171 9 5.26
9 Cheeramkunnu 72 9 12.50
10 Vattathuvayal 52 0 0
11 Kakkavayal 35 6 17.14
12 Kolambatta 98 6 6.12
13 Meenangadi 56 2 3.57
14 Purakkadi 64 4 6.25
15 Vengoor 100 8 8.00
16 Pannimunda 94 6 6.38
17 Kappikkunnu 225 3 1.33
18 Palaykkamoola 98 8 8.16
19 Manivayal 174 14 8.05
Total 1854 95 5.12Source: Data collection of Scheduled Tribes - 2008
Chart 28: Landless, Houseless Families – Ward-wise (%)
Source: Data collection of Scheduled Tribes - 2008
36
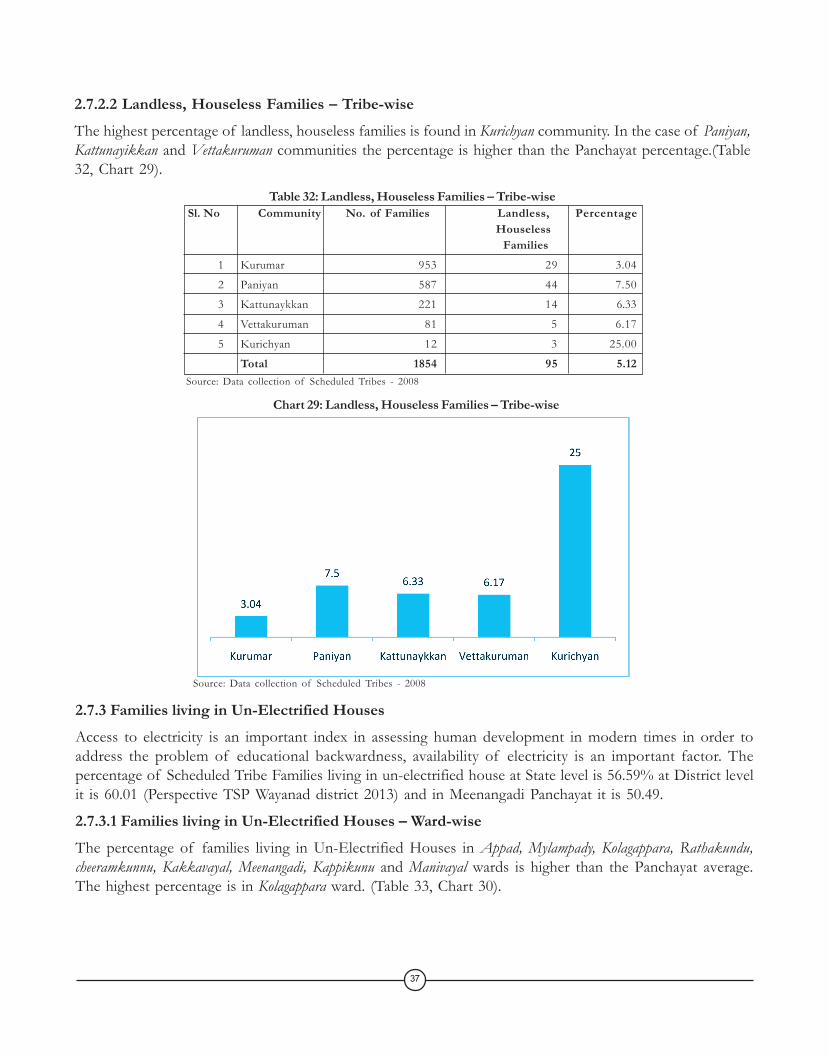
2.7.2.2 Landless, Houseless Families – Tribe-wiseThe highest percentage of landless, houseless families is found in Kurichyan community. In the case of Paniyan,Kattunayikkan and Vettakuruman communities the percentage is higher than the Panchayat percentage.(Table32, Chart 29).
Table 32: Landless, Houseless Families – Tribe-wise
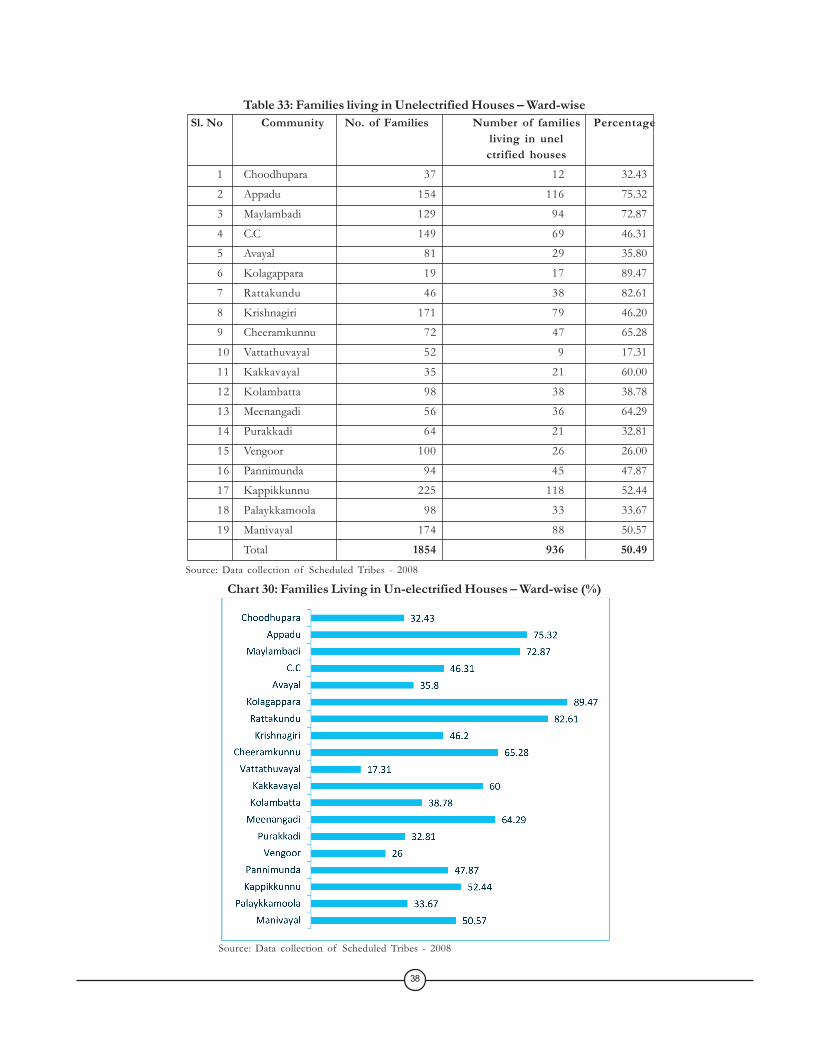
2.7.3 Families living in Un-Electrified HousesAccess to electricity is an important index in assessing human development in modern times in order toaddress the problem of educational backwardness, availability of electricity is an important factor. Thepercentage of Scheduled Tribe Families living in un-electrified house at State level is 56.59% at District levelit is 60.01 (Perspective TSP Wayanad district 2013) and in Meenangadi Panchayat it is 50.49.
2.7.3.1 Families living in Un-Electrified Houses – Ward-wiseThe percentage of families living in Un-Electrified Houses in Appad, Mylampady, Kolagappara, Rathakundu,cheeramkunnu, Kakkavayal, Meenangadi, Kappikunu and Manivayal wards is higher than the Panchayat average.The highest percentage is in Kolagappara ward. (Table 33, Chart 30).
Sl. No Community No. of Families Landless, PercentageHouseless Families
1 Kurumar 953 29 3.04
2 Paniyan 587 44 7.50
3 Kattunaykkan 221 14 6.33
4 Vettakuruman 81 5 6.17
5 Kurichyan 12 3 25.00
Total 1854 95 5.12Source: Data collection of Scheduled Tribes - 2008
Chart 29: Landless, Houseless Families – Tribe-wise
Source: Data collection of Scheduled Tribes - 2008
37
Sl. No Community No. of Families Number of families Percentageliving in unel
ctrified houses1 Choodhupara 37 12 32.43
2 Appadu 154 116 75.32
3 Maylambadi 129 94 72.87
4 C.C 149 69 46.31
5 Avayal 81 29 35.80
6 Kolagappara 19 17 89.47
7 Rattakundu 46 38 82.61
8 Krishnagiri 171 79 46.20
9 Cheeramkunnu 72 47 65.28
10 Vattathuvayal 52 9 17.31
11 Kakkavayal 35 21 60.00
12 Kolambatta 98 38 38.78
13 Meenangadi 56 36 64.29
14 Purakkadi 64 21 32.81
15 Vengoor 100 26 26.00
16 Pannimunda 94 45 47.87
17 Kappikkunnu 225 118 52.44
18 Palaykkamoola 98 33 33.67
19 Manivayal 174 88 50.57
Total 1854 936 50.49
Table 33: Families living in Unelectrified Houses – Ward-wise
Source: Data collection of Scheduled Tribes - 2008
Chart 30: Families Living in Un-electrified Houses – Ward-wise (%)
Source: Data collection of Scheduled Tribes - 2008
38
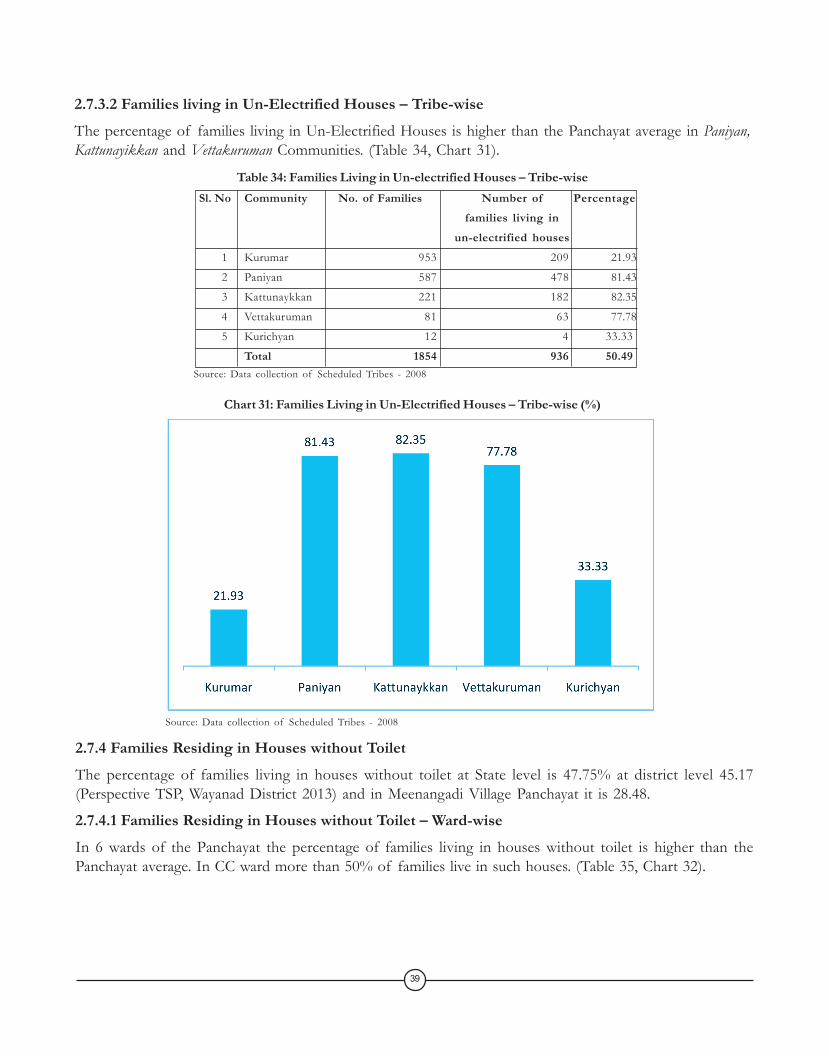
2.7.3.2 Families living in Un-Electrified Houses – Tribe-wiseThe percentage of families living in Un-Electrified Houses is higher than the Panchayat average in Paniyan,Kattunayikkan and Vettakuruman Communities. (Table 34, Chart 31).
Table 34: Families Living in Un-electrified Houses – Tribe-wise
2.7.4 Families Residing in Houses without ToiletThe percentage of families living in houses without toilet at State level is 47.75% at district level 45.17(Perspective TSP, Wayanad District 2013) and in Meenangadi Village Panchayat it is 28.48.
2.7.4.1 Families Residing in Houses without Toilet – Ward-wiseIn 6 wards of the Panchayat the percentage of families living in houses without toilet is higher than thePanchayat average. In CC ward more than 50% of families live in such houses. (Table 35, Chart 32).
Sl. No Community No. of Families Number of Percentagefamilies living in
un-electrified houses1 Kurumar 953 209 21.93
2 Paniyan 587 478 81.43
3 Kattunaykkan 221 182 82.35
4 Vettakuruman 81 63 77.78
5 Kurichyan 12 4 33.33
Total 1854 936 50.49Source: Data collection of Scheduled Tribes - 2008
Chart 31: Families Living in Un-Electrified Houses – Tribe-wise (%)
Source: Data collection of Scheduled Tribes - 2008
39
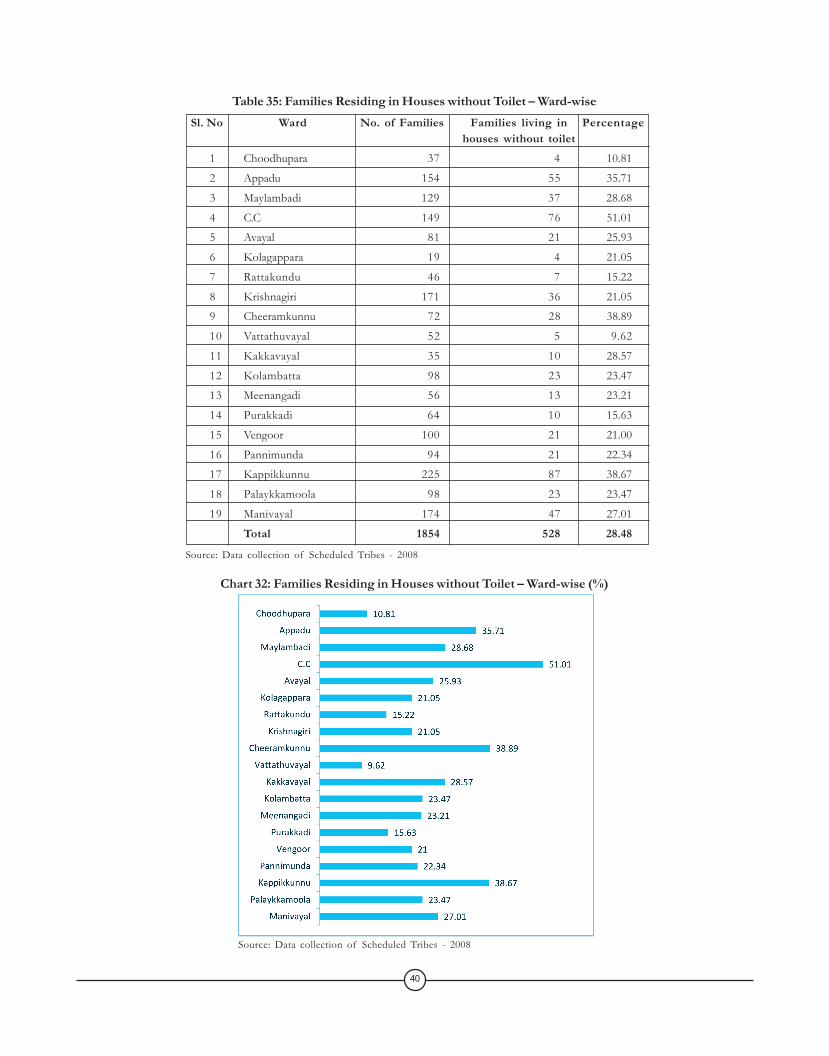
Table 35: Families Residing in Houses without Toilet – Ward-wiseSl. No Ward No. of Families Families living in Percentage
houses without toilet1 Choodhupara 37 4 10.81
2 Appadu 154 55 35.71
3 Maylambadi 129 37 28.68
4 C.C 149 76 51.01
5 Avayal 81 21 25.93
6 Kolagappara 19 4 21.05
7 Rattakundu 46 7 15.22
8 Krishnagiri 171 36 21.05
9 Cheeramkunnu 72 28 38.89
10 Vattathuvayal 52 5 9.62
11 Kakkavayal 35 10 28.57
12 Kolambatta 98 23 23.47
13 Meenangadi 56 13 23.21
14 Purakkadi 64 10 15.63
15 Vengoor 100 21 21.00
16 Pannimunda 94 21 22.34
17 Kappikkunnu 225 87 38.67
18 Palaykkamoola 98 23 23.47
19 Manivayal 174 47 27.01
Total 1854 528 28.48
Source: Data collection of Scheduled Tribes - 2008
Chart 32: Families Residing in Houses without Toilet – Ward-wise (%)
Source: Data collection of Scheduled Tribes - 2008
40
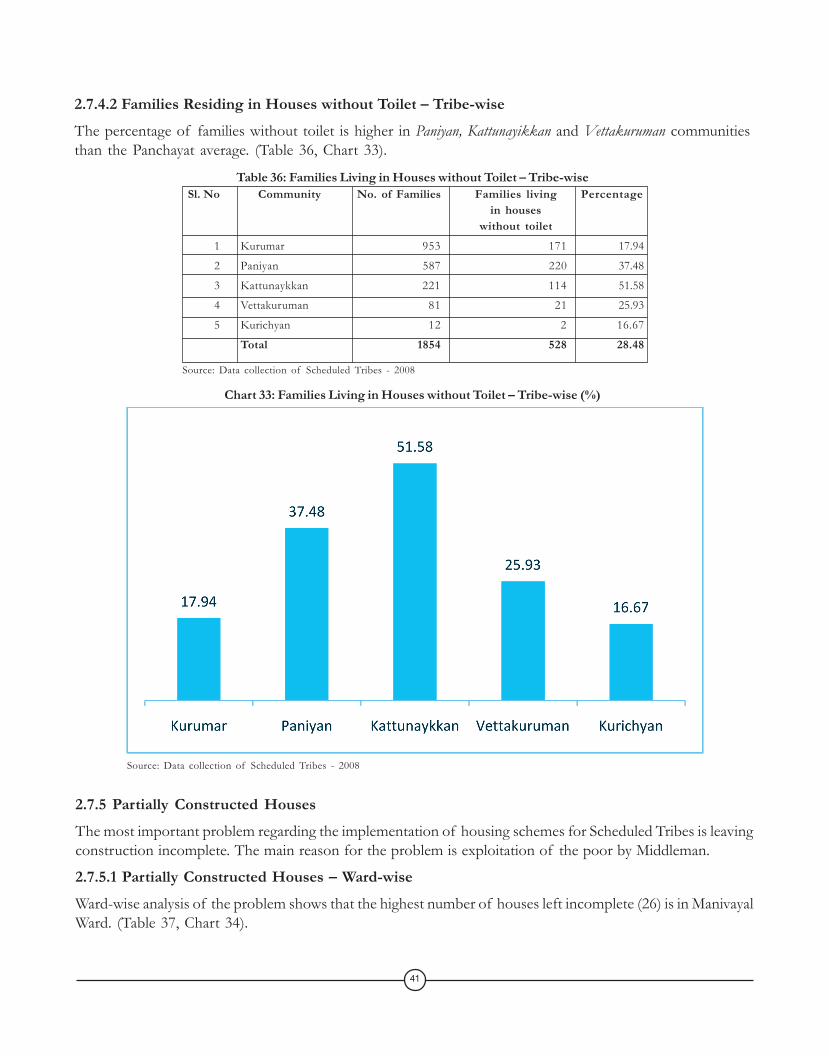
2.7.4.2 Families Residing in Houses without Toilet – Tribe-wiseThe percentage of families without toilet is higher in Paniyan, Kattunayikkan and Vettakuruman communitiesthan the Panchayat average. (Table 36, Chart 33).
Table 36: Families Living in Houses without Toilet – Tribe-wise
2.7.5 Partially Constructed HousesThe most important problem regarding the implementation of housing schemes for Scheduled Tribes is leavingconstruction incomplete. The main reason for the problem is exploitation of the poor by Middleman.
2.7.5.1 Partially Constructed Houses – Ward-wiseWard-wise analysis of the problem shows that the highest number of houses left incomplete (26) is in ManivayalWard. (Table 37, Chart 34).
Sl. No Community No. of Families Families living Percentagein houses
without toilet1 Kurumar 953 171 17.94
2 Paniyan 587 220 37.48
3 Kattunaykkan 221 114 51.58
4 Vettakuruman 81 21 25.93
5 Kurichyan 12 2 16.67
Total 1854 528 28.48
Source: Data collection of Scheduled Tribes - 2008
Chart 33: Families Living in Houses without Toilet – Tribe-wise (%)
Source: Data collection of Scheduled Tribes - 2008
41
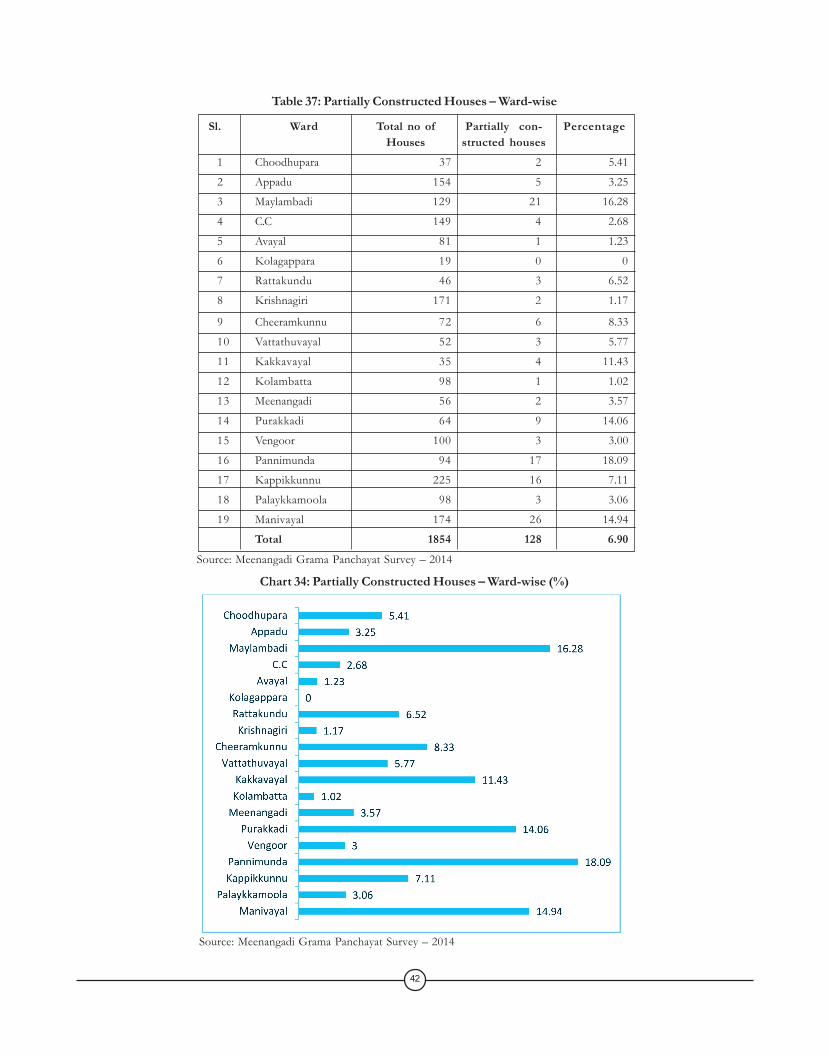
Table 37: Partially Constructed Houses – Ward-wise
Sl. Ward Total no of Partially con- PercentageHouses structed houses
1 Choodhupara 37 2 5.41
2 Appadu 154 5 3.25
3 Maylambadi 129 21 16.28
4 C.C 149 4 2.68
5 Avayal 81 1 1.23
6 Kolagappara 19 0 0
7 Rattakundu 46 3 6.52
8 Krishnagiri 171 2 1.17
9 Cheeramkunnu 72 6 8.33
10 Vattathuvayal 52 3 5.77
11 Kakkavayal 35 4 11.43
12 Kolambatta 98 1 1.02
13 Meenangadi 56 2 3.57
14 Purakkadi 64 9 14.06
15 Vengoor 100 3 3.00
16 Pannimunda 94 17 18.09
17 Kappikkunnu 225 16 7.11
18 Palaykkamoola 98 3 3.06
19 Manivayal 174 26 14.94
Total 1854 128 6.90Source: Meenangadi Grama Panchayat Survey – 2014
Chart 34: Partially Constructed Houses – Ward-wise (%)
Source: Meenangadi Grama Panchayat Survey – 2014
42
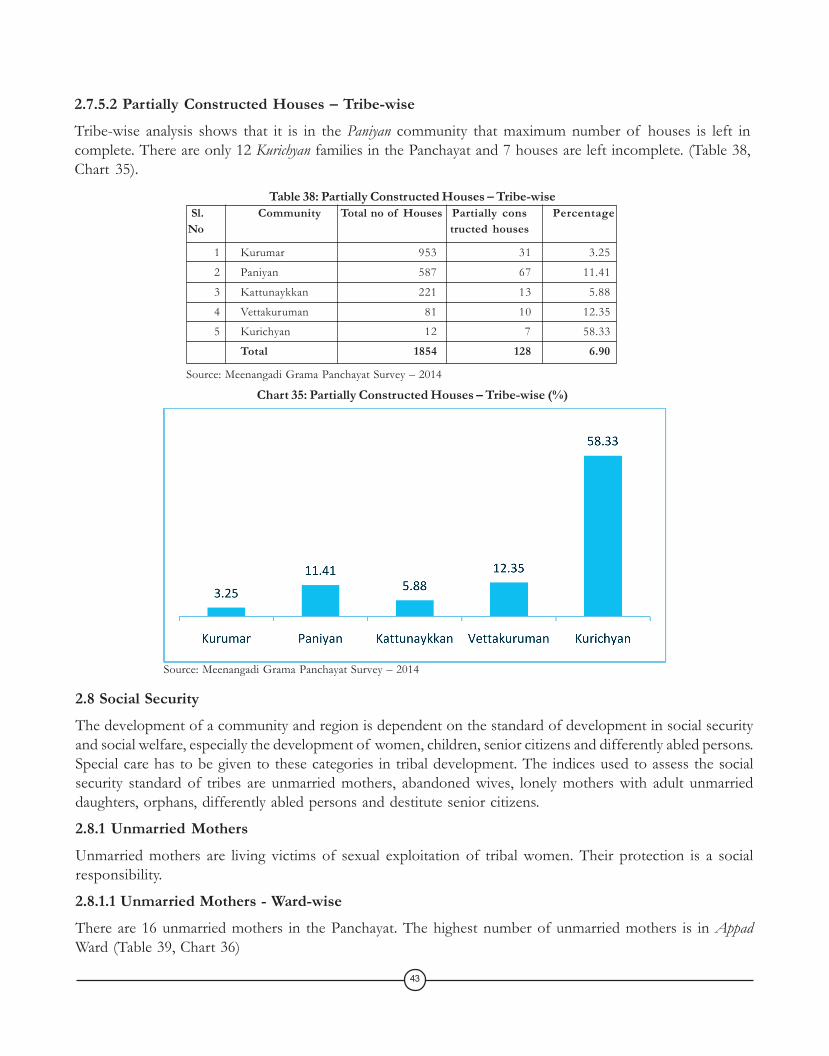
2.7.5.2 Partially Constructed Houses – Tribe-wiseTribe-wise analysis shows that it is in the Paniyan community that maximum number of houses is left incomplete. There are only 12 Kurichyan families in the Panchayat and 7 houses are left incomplete. (Table 38,Chart 35).
Table 38: Partially Constructed Houses – Tribe-wise
2.8 Social SecurityThe development of a community and region is dependent on the standard of development in social securityand social welfare, especially the development of women, children, senior citizens and differently abled persons.Special care has to be given to these categories in tribal development. The indices used to assess the socialsecurity standard of tribes are unmarried mothers, abandoned wives, lonely mothers with adult unmarrieddaughters, orphans, differently abled persons and destitute senior citizens.
2.8.1 Unmarried MothersUnmarried mothers are living victims of sexual exploitation of tribal women. Their protection is a socialresponsibility.
2.8.1.1 Unmarried Mothers - Ward-wiseThere are 16 unmarried mothers in the Panchayat. The highest number of unmarried mothers is in AppadWard (Table 39, Chart 36)
Sl. Community Total no of Houses Partially cons PercentageNo tructed houses
1 Kurumar 953 31 3.25
2 Paniyan 587 67 11.41
3 Kattunaykkan 221 13 5.88
4 Vettakuruman 81 10 12.35
5 Kurichyan 12 7 58.33
Total 1854 128 6.90
Source: Meenangadi Grama Panchayat Survey – 2014
Chart 35: Partially Constructed Houses – Tribe-wise (%)
Source: Meenangadi Grama Panchayat Survey – 2014
43
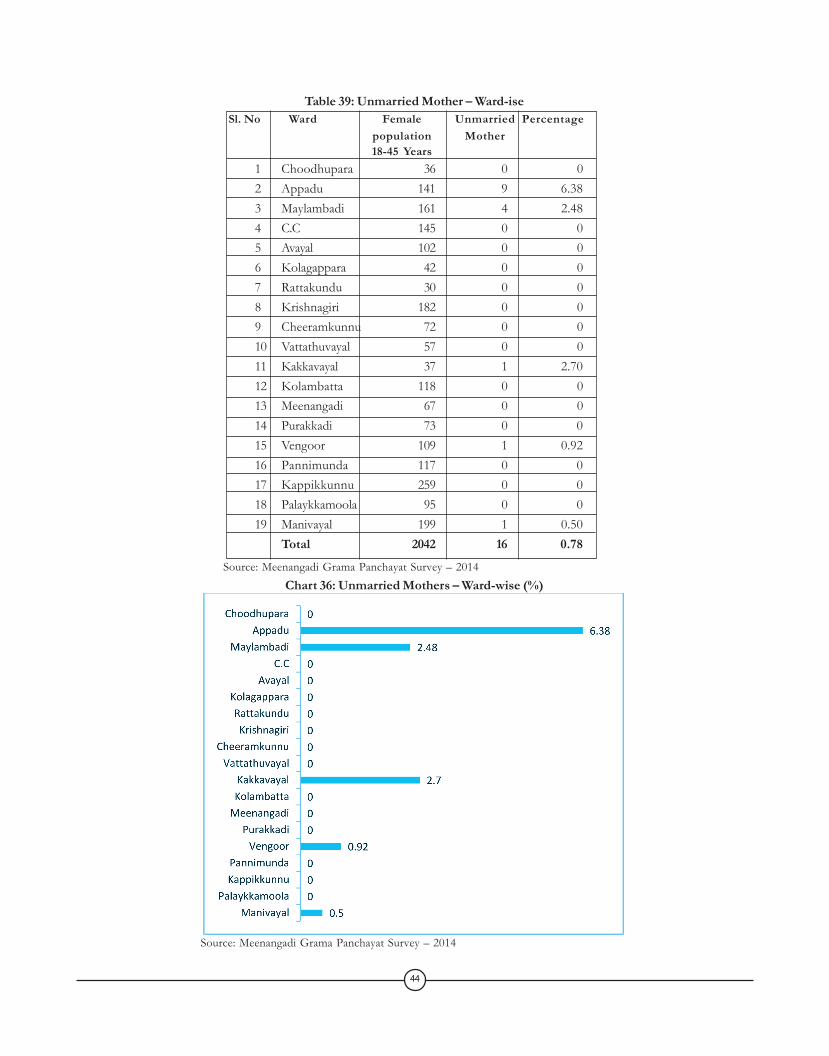
Table 39: Unmarried Mother – Ward-iseSl. No Ward Female Unmarried Percentage
population Mother18-45 Years
1 Choodhupara 36 0 02 Appadu 141 9 6.383 Maylambadi 161 4 2.484 C.C 145 0 05 Avayal 102 0 06 Kolagappara 42 0 07 Rattakundu 30 0 08 Krishnagiri 182 0 09 Cheeramkunnu 72 0 010 Vattathuvayal 57 0 011 Kakkavayal 37 1 2.7012 Kolambatta 118 0 013 Meenangadi 67 0 014 Purakkadi 73 0 015 Vengoor 109 1 0.9216 Pannimunda 117 0 017 Kappikkunnu 259 0 018 Palaykkamoola 95 0 019 Manivayal 199 1 0.50
Total 2042 16 0.78Source: Meenangadi Grama Panchayat Survey – 2014
Chart 36: Unmarried Mothers – Ward-wise (%)
Source: Meenangadi Grama Panchayat Survey – 2014
44
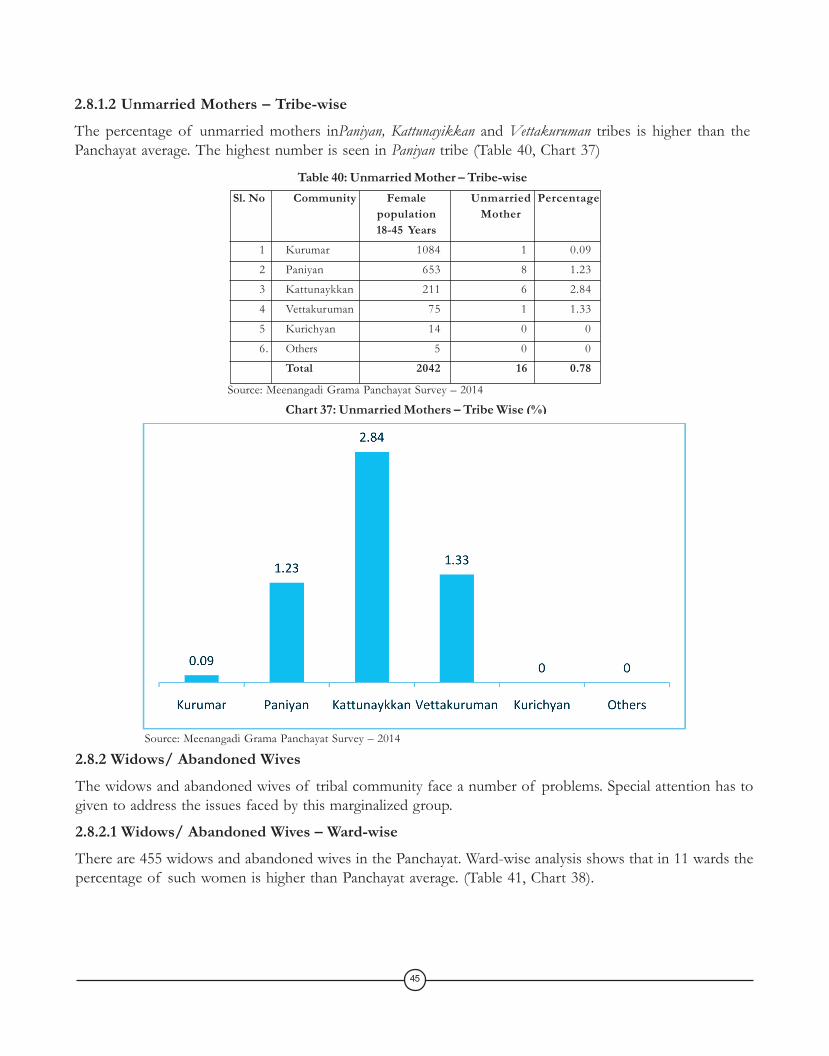
2.8.1.2 Unmarried Mothers – Tribe-wiseThe percentage of unmarried mothers inPaniyan, Kattunayikkan and Vettakuruman tribes is higher than thePanchayat average. The highest number is seen in Paniyan tribe (Table 40, Chart 37)
Table 40: Unmarried Mother – Tribe-wise
2.8.2 Widows/ Abandoned WivesThe widows and abandoned wives of tribal community face a number of problems. Special attention has togiven to address the issues faced by this marginalized group.
2.8.2.1 Widows/ Abandoned Wives – Ward-wiseThere are 455 widows and abandoned wives in the Panchayat. Ward-wise analysis shows that in 11 wards thepercentage of such women is higher than Panchayat average. (Table 41, Chart 38).
Sl. No Community Female Unmarried Percentagepopulation Mother18-45 Years
1 Kurumar 1084 1 0.09
2 Paniyan 653 8 1.23
3 Kattunaykkan 211 6 2.84
4 Vettakuruman 75 1 1.33
5 Kurichyan 14 0 0
6. Others 5 0 0
Total 2042 16 0.78
Source: Meenangadi Grama Panchayat Survey – 2014
Chart 37: Unmarried Mothers – Tribe Wise (%)
Source: Meenangadi Grama Panchayat Survey – 2014
45
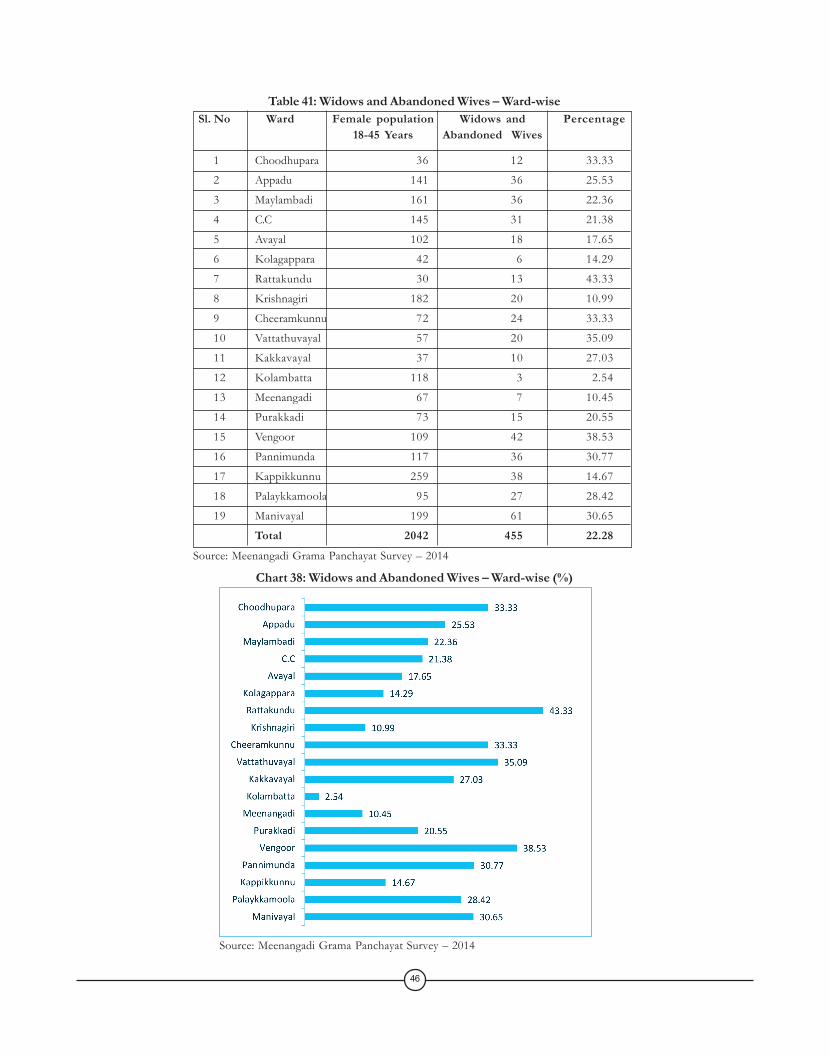
Table 41: Widows and Abandoned Wives – Ward-wiseSl. No Ward Female population Widows and Percentage
18-45 Years Abandoned Wives
1 Choodhupara 36 12 33.33
2 Appadu 141 36 25.53
3 Maylambadi 161 36 22.36
4 C.C 145 31 21.38
5 Avayal 102 18 17.65
6 Kolagappara 42 6 14.29
7 Rattakundu 30 13 43.33
8 Krishnagiri 182 20 10.99
9 Cheeramkunnu 72 24 33.33
10 Vattathuvayal 57 20 35.09
11 Kakkavayal 37 10 27.03
12 Kolambatta 118 3 2.54
13 Meenangadi 67 7 10.45
14 Purakkadi 73 15 20.55
15 Vengoor 109 42 38.53
16 Pannimunda 117 36 30.77
17 Kappikkunnu 259 38 14.67
18 Palaykkamoola 95 27 28.42
19 Manivayal 199 61 30.65
Total 2042 455 22.28Source: Meenangadi Grama Panchayat Survey – 2014
Chart 38: Widows and Abandoned Wives – Ward-wise (%)
Source: Meenangadi Grama Panchayat Survey – 2014
46
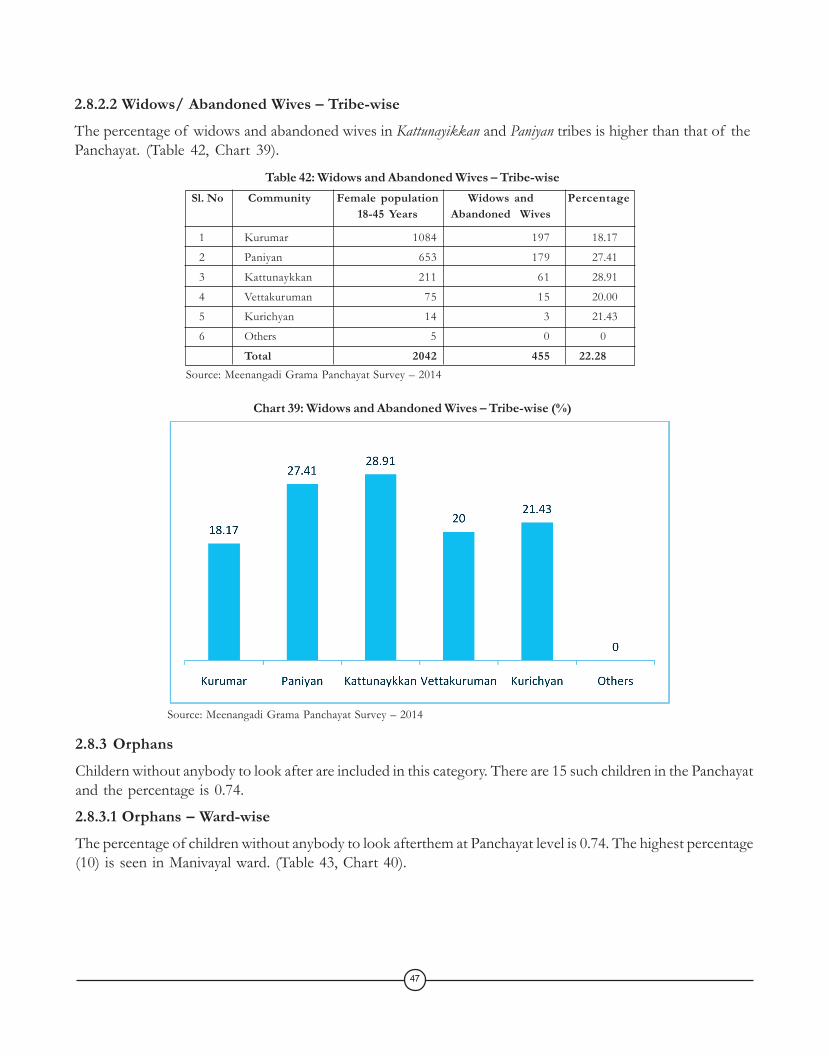
2.8.2.2 Widows/ Abandoned Wives – Tribe-wiseThe percentage of widows and abandoned wives in Kattunayikkan and Paniyan tribes is higher than that of thePanchayat. (Table 42, Chart 39).
Table 42: Widows and Abandoned Wives – Tribe-wise
2.8.3 OrphansChildern without anybody to look after are included in this category. There are 15 such children in the Panchayatand the percentage is 0.74.
2.8.3.1 Orphans – Ward-wiseThe percentage of children without anybody to look afterthem at Panchayat level is 0.74. The highest percentage(10) is seen in Manivayal ward. (Table 43, Chart 40).
Sl. No Community Female population Widows and Percentage18-45 Years Abandoned Wives
1 Kurumar 1084 197 18.17
2 Paniyan 653 179 27.41
3 Kattunaykkan 211 61 28.91
4 Vettakuruman 75 15 20.00
5 Kurichyan 14 3 21.43
6 Others 5 0 0
Total 2042 455 22.28Source: Meenangadi Grama Panchayat Survey – 2014
Chart 39: Widows and Abandoned Wives – Tribe-wise (%)
Source: Meenangadi Grama Panchayat Survey – 2014
47
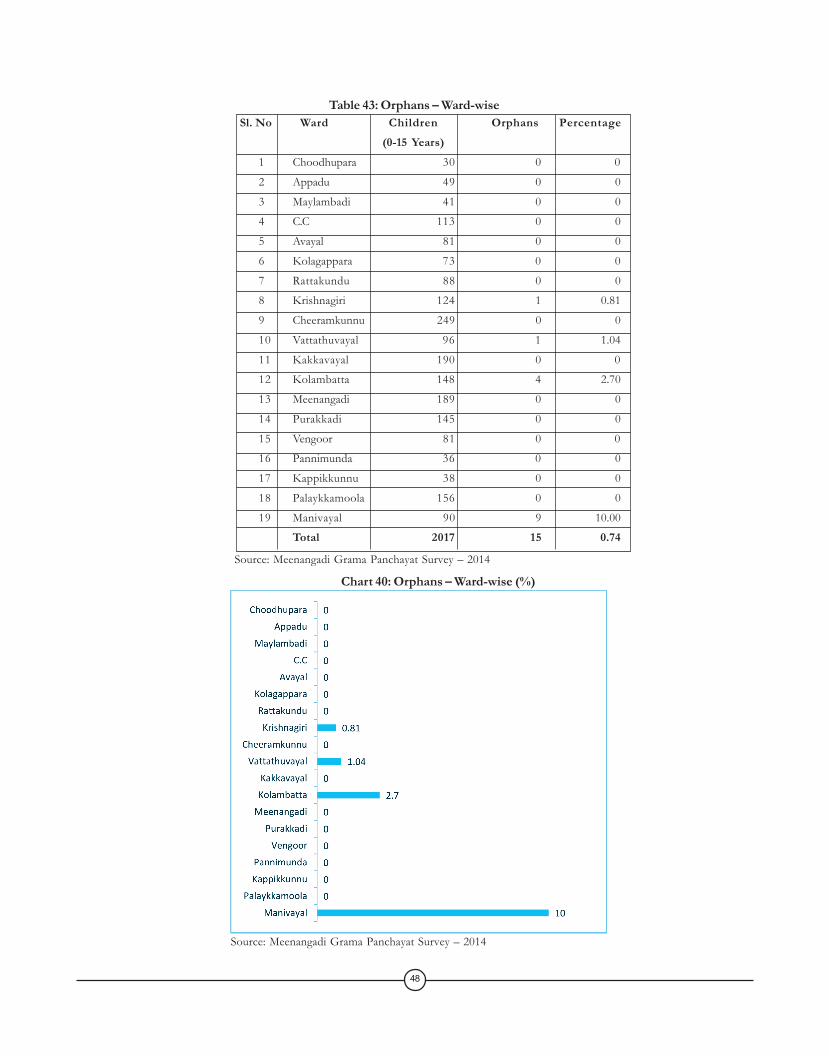
Table 43: Orphans – Ward-wiseSl. No Ward Children Orphans Percentage
(0-15 Years)1 Choodhupara 30 0 0
2 Appadu 49 0 0
3 Maylambadi 41 0 0
4 C.C 113 0 0
5 Avayal 81 0 0
6 Kolagappara 73 0 0
7 Rattakundu 88 0 0
8 Krishnagiri 124 1 0.81
9 Cheeramkunnu 249 0 0
10 Vattathuvayal 96 1 1.04
11 Kakkavayal 190 0 0
12 Kolambatta 148 4 2.70
13 Meenangadi 189 0 0
14 Purakkadi 145 0 0
15 Vengoor 81 0 0
16 Pannimunda 36 0 0
17 Kappikkunnu 38 0 0
18 Palaykkamoola 156 0 0
19 Manivayal 90 9 10.00
Total 2017 15 0.74
Source: Meenangadi Grama Panchayat Survey – 2014
Chart 40: Orphans – Ward-wise (%)
Source: Meenangadi Grama Panchayat Survey – 2014
48
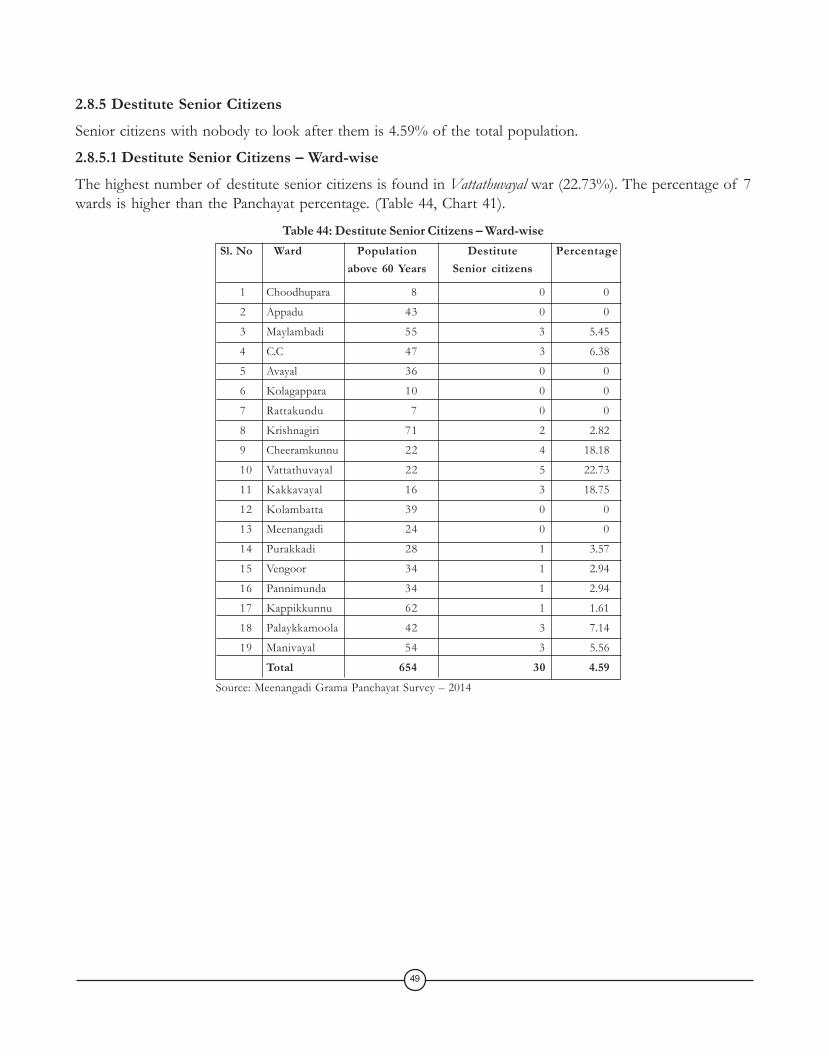
2.8.5 Destitute Senior CitizensSenior citizens with nobody to look after them is 4.59% of the total population.
2.8.5.1 Destitute Senior Citizens – Ward-wiseThe highest number of destitute senior citizens is found in Vattathuvayal war (22.73%). The percentage of 7wards is higher than the Panchayat percentage. (Table 44, Chart 41).
Table 44: Destitute Senior Citizens – Ward-wise Sl. No Ward Population Destitute Percentage
above 60 Years Senior citizens
1 Choodhupara 8 0 0
2 Appadu 43 0 0
3 Maylambadi 55 3 5.45
4 C.C 47 3 6.38
5 Avayal 36 0 0
6 Kolagappara 10 0 0
7 Rattakundu 7 0 0
8 Krishnagiri 71 2 2.82
9 Cheeramkunnu 22 4 18.18
10 Vattathuvayal 22 5 22.73
11 Kakkavayal 16 3 18.75
12 Kolambatta 39 0 0
13 Meenangadi 24 0 0
14 Purakkadi 28 1 3.57
15 Vengoor 34 1 2.94
16 Pannimunda 34 1 2.94
17 Kappikkunnu 62 1 1.61
18 Palaykkamoola 42 3 7.14
19 Manivayal 54 3 5.56
Total 654 30 4.59Source: Meenangadi Grama Panchayat Survey – 2014
49
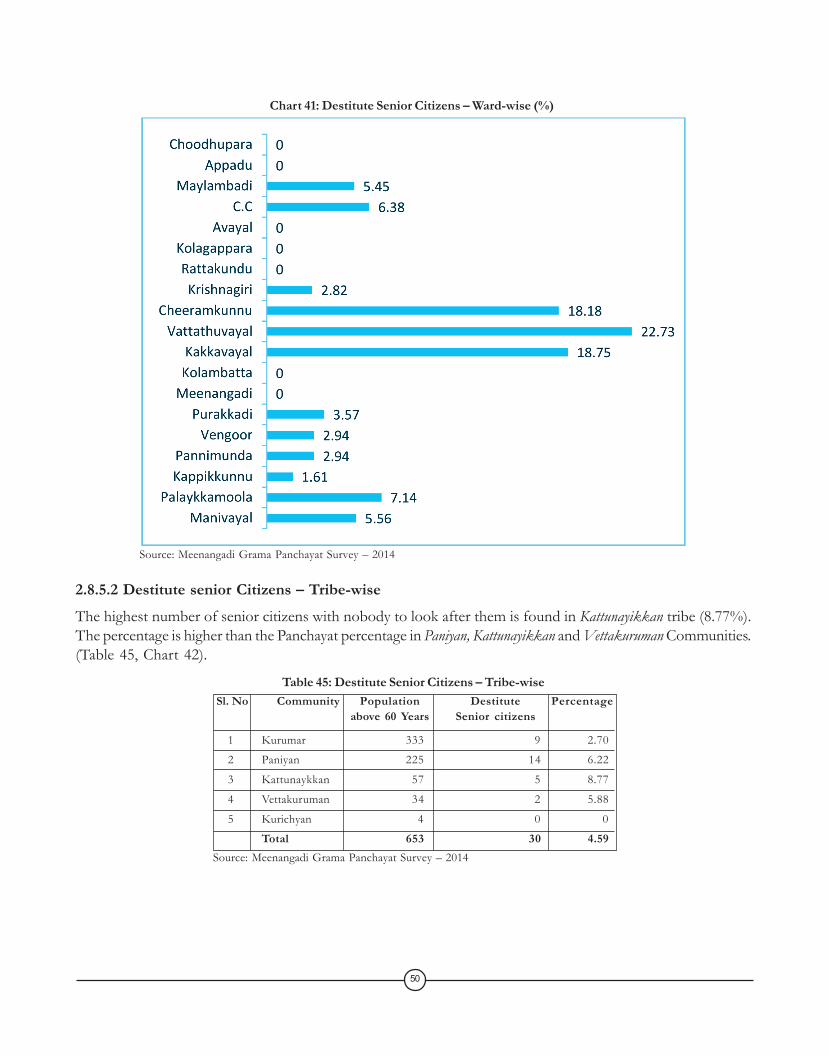
Chart 41: Destitute Senior Citizens – Ward-wise (%)
Source: Meenangadi Grama Panchayat Survey – 2014
2.8.5.2 Destitute senior Citizens – Tribe-wiseThe highest number of senior citizens with nobody to look after them is found in Kattunayikkan tribe (8.77%).The percentage is higher than the Panchayat percentage in Paniyan, Kattunayikkan and Vettakuruman Communities.(Table 45, Chart 42).
Table 45: Destitute Senior Citizens – Tribe-wiseSl. No Community Population Destitute Percentage
above 60 Years Senior citizens
1 Kurumar 333 9 2.70
2 Paniyan 225 14 6.22
3 Kattunaykkan 57 5 8.77
4 Vettakuruman 34 2 5.88
5 Kurichyan 4 0 0
Total 653 30 4.59Source: Meenangadi Grama Panchayat Survey – 2014
50
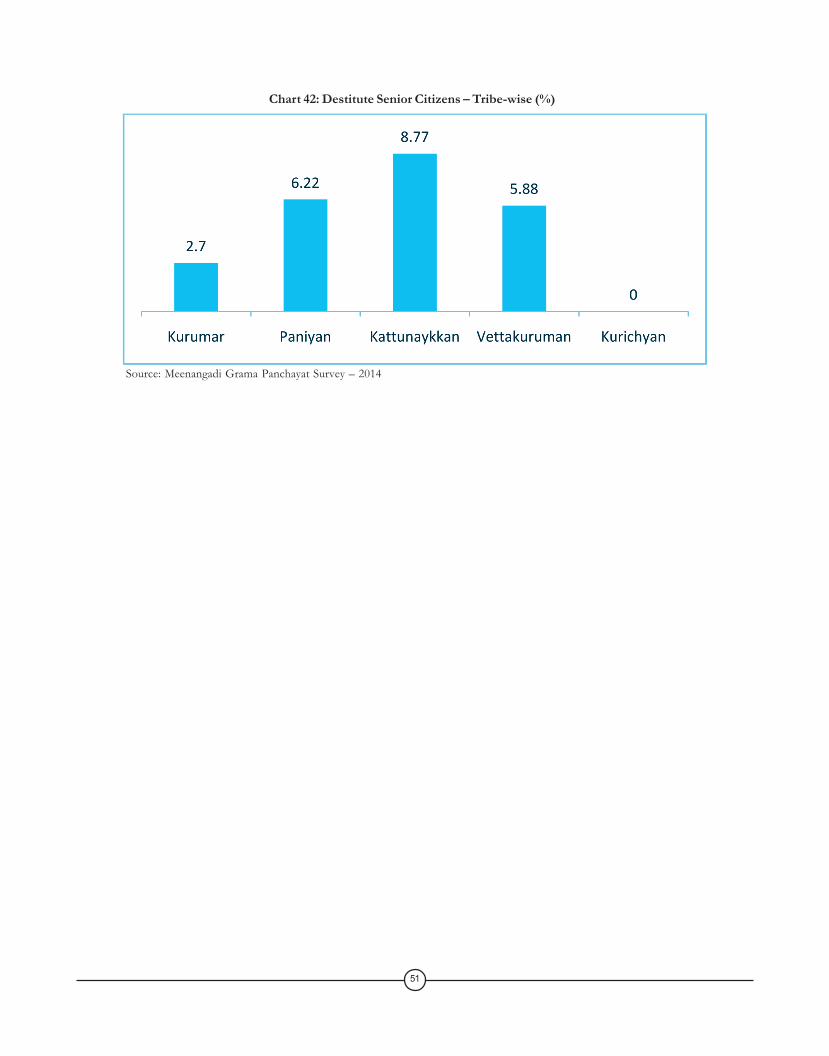
Source: Meenangadi Grama Panchayat Survey – 2014
Chart 42: Destitute Senior Citizens – Tribe-wise (%)
51
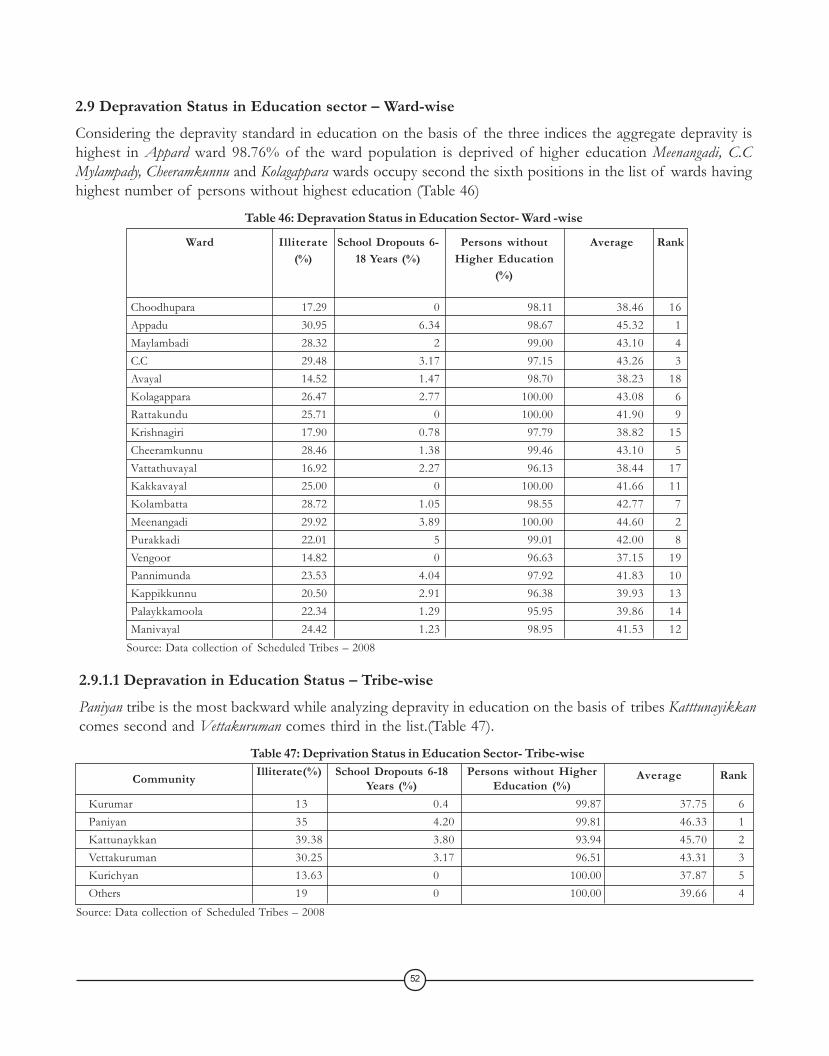
2.9 Depravation Status in Education sector – Ward-wiseConsidering the depravity standard in education on the basis of the three indices the aggregate depravity ishighest in Appard ward 98.76% of the ward population is deprived of higher education Meenangadi, C.CMylampady, Cheeramkunnu and Kolagappara wards occupy second the sixth positions in the list of wards havinghighest number of persons without highest education (Table 46)
Table 46: Depravation Status in Education Sector- Ward -wise
Source: Data collection of Scheduled Tribes – 2008
2.9.1.1 Depravation in Education Status – Tribe-wisePaniyan tribe is the most backward while analyzing depravity in education on the basis of tribes Katttunayikkancomes second and Vettakuruman comes third in the list.(Table 47).
Table 47: Deprivation Status in Education Sector- Tribe-wise
Source: Data collection of Scheduled Tribes – 2008
Kurumar 13 0.4 99.87 37.75 6Paniyan 35 4.20 99.81 46.33 1Kattunaykkan 39.38 3.80 93.94 45.70 2Vettakuruman 30.25 3.17 96.51 43.31 3Kurichyan 13.63 0 100.00 37.87 5Others 19 0 100.00 39.66 4
Community Illiterate(%) School Dropouts 6-18Years (%)
Persons without HigherEducation (%)
Average Rank
52
Choodhupara 17.29 0 98.11 38.46 16Appadu 30.95 6.34 98.67 45.32 1Maylambadi 28.32 2 99.00 43.10 4C.C 29.48 3.17 97.15 43.26 3Avayal 14.52 1.47 98.70 38.23 18Kolagappara 26.47 2.77 100.00 43.08 6Rattakundu 25.71 0 100.00 41.90 9Krishnagiri 17.90 0.78 97.79 38.82 15Cheeramkunnu 28.46 1.38 99.46 43.10 5Vattathuvayal 16.92 2.27 96.13 38.44 17Kakkavayal 25.00 0 100.00 41.66 11Kolambatta 28.72 1.05 98.55 42.77 7Meenangadi 29.92 3.89 100.00 44.60 2Purakkadi 22.01 5 99.01 42.00 8Vengoor 14.82 0 96.63 37.15 19Pannimunda 23.53 4.04 97.92 41.83 10Kappikkunnu 20.50 2.91 96.38 39.93 13Palaykkamoola 22.34 1.29 95.95 39.86 14Manivayal 24.42 1.23 98.95 41.53 12
Ward Illiterate(%)
School Dropouts 6-18 Years (%)
Persons withoutHigher Education
(%)
Average Rank
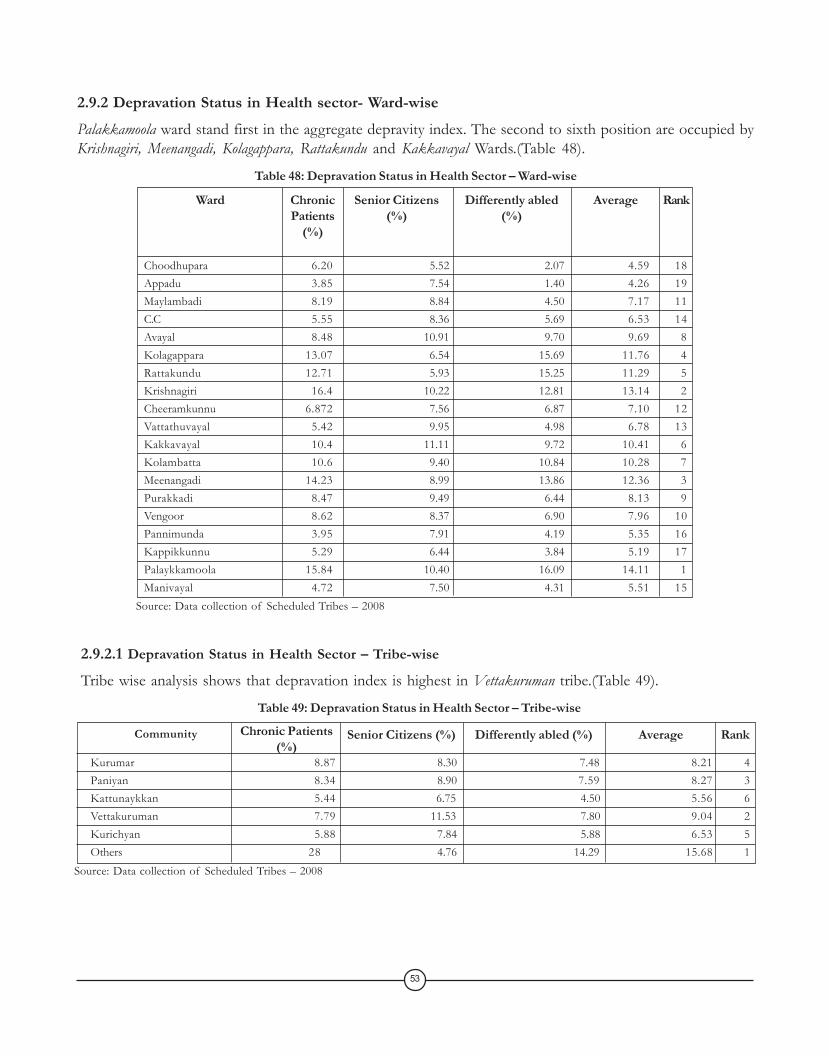
2.9.2 Depravation Status in Health sector- Ward-wisePalakkamoola ward stand first in the aggregate depravity index. The second to sixth position are occupied byKrishnagiri, Meenangadi, Kolagappara, Rattakundu and Kakkavayal Wards.(Table 48).
Table 48: Depravation Status in Health Sector – Ward-wise
Source: Data collection of Scheduled Tribes – 2008
Choodhupara 6.20 5.52 2.07 4.59 18Appadu 3.85 7.54 1.40 4.26 19Maylambadi 8.19 8.84 4.50 7.17 11C.C 5.55 8.36 5.69 6.53 14Avayal 8.48 10.91 9.70 9.69 8Kolagappara 13.07 6.54 15.69 11.76 4Rattakundu 12.71 5.93 15.25 11.29 5Krishnagiri 16.4 10.22 12.81 13.14 2Cheeramkunnu 6.872 7.56 6.87 7.10 12Vattathuvayal 5.42 9.95 4.98 6.78 13Kakkavayal 10.4 11.11 9.72 10.41 6Kolambatta 10.6 9.40 10.84 10.28 7Meenangadi 14.23 8.99 13.86 12.36 3Purakkadi 8.47 9.49 6.44 8.13 9Vengoor 8.62 8.37 6.90 7.96 10Pannimunda 3.95 7.91 4.19 5.35 16Kappikkunnu 5.29 6.44 3.84 5.19 17Palaykkamoola 15.84 10.40 16.09 14.11 1Manivayal 4.72 7.50 4.31 5.51 15
2.9.2.1 Depravation Status in Health Sector – Tribe-wise
Tribe wise analysis shows that depravation index is highest in Vettakuruman tribe.(Table 49).
Table 49: Depravation Status in Health Sector – Tribe-wise
Source: Data collection of Scheduled Tribes – 2008
Kurumar 8.87 8.30 7.48 8.21 4Paniyan 8.34 8.90 7.59 8.27 3Kattunaykkan 5.44 6.75 4.50 5.56 6Vettakuruman 7.79 11.53 7.80 9.04 2Kurichyan 5.88 7.84 5.88 6.53 5Others 28 4.76 14.29 15.68 1
Community Chronic Patients(%)
Senior Citizens (%) Differently abled (%) Average Rank
53
Ward ChronicPatients
(%)
Senior Citizens(%)
Differently abled(%)
Average Rank
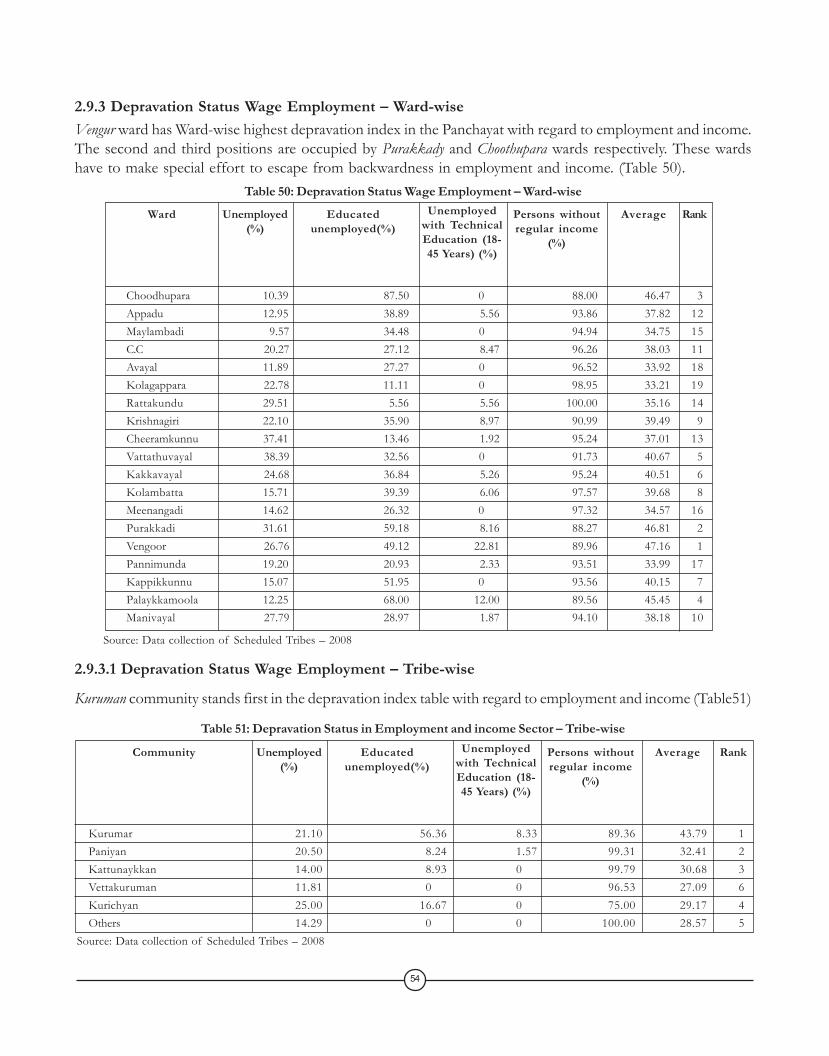
2.9.3 Depravation Status Wage Employment – Ward-wiseVengur ward has Ward-wise highest depravation index in the Panchayat with regard to employment and income.The second and third positions are occupied by Purakkady and Choothupara wards respectively. These wardshave to make special effort to escape from backwardness in employment and income. (Table 50).
Table 50: Depravation Status Wage Employment – Ward-wise
Source: Data collection of Scheduled Tribes – 2008
Choodhupara 10.39 87.50 0 88.00 46.47 3Appadu 12.95 38.89 5.56 93.86 37.82 12Maylambadi 9.57 34.48 0 94.94 34.75 15C.C 20.27 27.12 8.47 96.26 38.03 11Avayal 11.89 27.27 0 96.52 33.92 18Kolagappara 22.78 11.11 0 98.95 33.21 19Rattakundu 29.51 5.56 5.56 100.00 35.16 14Krishnagiri 22.10 35.90 8.97 90.99 39.49 9Cheeramkunnu 37.41 13.46 1.92 95.24 37.01 13Vattathuvayal 38.39 32.56 0 91.73 40.67 5Kakkavayal 24.68 36.84 5.26 95.24 40.51 6Kolambatta 15.71 39.39 6.06 97.57 39.68 8Meenangadi 14.62 26.32 0 97.32 34.57 16Purakkadi 31.61 59.18 8.16 88.27 46.81 2Vengoor 26.76 49.12 22.81 89.96 47.16 1Pannimunda 19.20 20.93 2.33 93.51 33.99 17Kappikkunnu 15.07 51.95 0 93.56 40.15 7Palaykkamoola 12.25 68.00 12.00 89.56 45.45 4Manivayal 27.79 28.97 1.87 94.10 38.18 10
Ward Unemployed(%)
Educatedunemployed(%)
Persons withoutregular income
(%)
Average RankUnemployedwith TechnicalEducation (18-45 Years) (%)
2.9.3.1 Depravation Status Wage Employment – Tribe-wise
Kuruman community stands first in the depravation index table with regard to employment and income (Table51)
Table 51: Depravation Status in Employment and income Sector – Tribe-wise
Kurumar 21.10 56.36 8.33 89.36 43.79 1Paniyan 20.50 8.24 1.57 99.31 32.41 2Kattunaykkan 14.00 8.93 0 99.79 30.68 3Vettakuruman 11.81 0 0 96.53 27.09 6Kurichyan 25.00 16.67 0 75.00 29.17 4Others 14.29 0 0 100.00 28.57 5
Community Unemployed(%)
Educatedunemployed(%)
Persons withoutregular income
(%)
Average RankUnemployedwith TechnicalEducation (18-45 Years) (%)
Source: Data collection of Scheduled Tribes – 2008
54
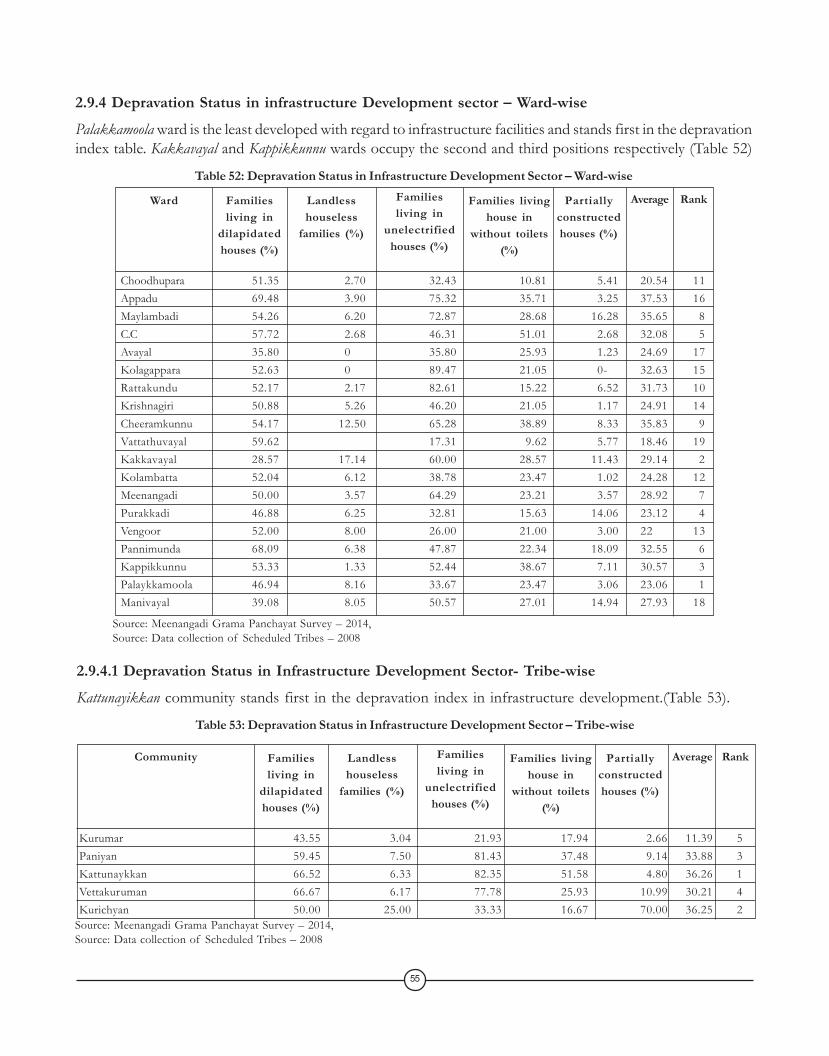
2.9.4 Depravation Status in infrastructure Development sector – Ward-wisePalakkamoola ward is the least developed with regard to infrastructure facilities and stands first in the depravationindex table. Kakkavayal and Kappikkunnu wards occupy the second and third positions respectively (Table 52)
Table 52: Depravation Status in Infrastructure Development Sector – Ward-wise
Source: Meenangadi Grama Panchayat Survey – 2014,Source: Data collection of Scheduled Tribes – 2008
Choodhupara 51.35 2.70 32.43 10.81 5.41 20.54 11Appadu 69.48 3.90 75.32 35.71 3.25 37.53 16Maylambadi 54.26 6.20 72.87 28.68 16.28 35.65 8C.C 57.72 2.68 46.31 51.01 2.68 32.08 5Avayal 35.80 0 35.80 25.93 1.23 24.69 17Kolagappara 52.63 0 89.47 21.05 0- 32.63 15Rattakundu 52.17 2.17 82.61 15.22 6.52 31.73 10Krishnagiri 50.88 5.26 46.20 21.05 1.17 24.91 14Cheeramkunnu 54.17 12.50 65.28 38.89 8.33 35.83 9Vattathuvayal 59.62 17.31 9.62 5.77 18.46 19Kakkavayal 28.57 17.14 60.00 28.57 11.43 29.14 2Kolambatta 52.04 6.12 38.78 23.47 1.02 24.28 12Meenangadi 50.00 3.57 64.29 23.21 3.57 28.92 7Purakkadi 46.88 6.25 32.81 15.63 14.06 23.12 4Vengoor 52.00 8.00 26.00 21.00 3.00 22 13Pannimunda 68.09 6.38 47.87 22.34 18.09 32.55 6Kappikkunnu 53.33 1.33 52.44 38.67 7.11 30.57 3Palaykkamoola 46.94 8.16 33.67 23.47 3.06 23.06 1Manivayal 39.08 8.05 50.57 27.01 14.94 27.93 18
Ward Familiesliving in
dilapidatedhouses (%)
Landlesshouseless
families (%)
Families livinghouse in
without toilets(%)
Average RankFamiliesliving in
unelectrifiedhouses (%)
2.9.4.1 Depravation Status in Infrastructure Development Sector- Tribe-wiseKattunayikkan community stands first in the depravation index in infrastructure development.(Table 53).
Table 53: Depravation Status in Infrastructure Development Sector – Tribe-wise
Partiallyconstructedhouses (%)
Kurumar 43.55 3.04 21.93 17.94 2.66 11.39 5Paniyan 59.45 7.50 81.43 37.48 9.14 33.88 3Kattunaykkan 66.52 6.33 82.35 51.58 4.80 36.26 1Vettakuruman 66.67 6.17 77.78 25.93 10.99 30.21 4Kurichyan 50.00 25.00 33.33 16.67 70.00 36.25 2
Community Familiesliving in
dilapidatedhouses (%)
Landlesshouseless
families (%)
Families livinghouse in
without toilets(%)
Average RankFamiliesliving in
unelectrifiedhouses (%)
Partiallyconstructedhouses (%)
Source: Meenangadi Grama Panchayat Survey – 2014,Source: Data collection of Scheduled Tribes – 2008
55

2.9.5 Depravation status in Social Security Sector – Ward-wiseIn social security sector Vattathuvayal and Cheeramkunnu are the most backward wards (Table 54)
Table 54: Depravation Status in Social Security Sector – Ward-wise
Source: Meenangadi Grama Panchayat Survey – 2014,Source: Data collection of Scheduled Tribes – 2008
Choodhupara 0 33.33 0 0 8.33 9Appadu 6.38 25.53 0 0 7.97 10Maylambadi 2.48 22.36 0 5.45 7.57 11C.C 0 21.38 0 6.38 6.94 12Avayal 0 17.65 0 0 4.41 14Kolagappara 0 14.29 0 0 3.57 17Rattakundu 0 43.33 0 0 10.83 5Krishnagiri 0 10.99 0.81 2.82 3.65 16Cheeramkunnu 0 33.33 0 18.18 12.87 2Vattathuvayal 0 35.09 1.04 22.73 14.71 1Kakkavayal 2.70 27.03 0 18.75 12.12 3Kolambatta 0 2.54 2.70 0 1.31 19Meenangadi 0 10.45 0 0 2.61 18Purakkadi 0 20.55 0 3.57 6.03 13Vengoor 0.92 38.53 0 2.94 10.59 6Pannimunda 0 30.77 0 2.94 8.42 8Kappikkunnu 0 14.67 0 1.61 4.07 15Palaykkamoola 0 28.42 0 7.14 8.89 7Manivayal 0.50 30.65 10.00 5.56 11.67 4
Ward UnmarriedMother SC
(%)
Widows/ AbandonedWives (%)
Destitute SeniorCitizens (%)
Average RankOrphans (%)
2.9.5.1 Depravation Status in Social Security Sector – Tribe-wiseIn social security Kurichyan Community is the least developed. Kattunayikkan Community comes second (Table55)
Table 55: Depravation Status in Social Security Sector – Tribe-wise
Kurumar 0.09 18.17 0 2.70 5.24 5Paniyan 1.23 27.41 0 6.22 8.71 3Kattunaykkan 2.84 28.91 0 8.77 10.13 2Vettakuruman 1.33 20.00 0 5.88 6.80 4Kurichyan 0.00 21.43 0 0 10.71 1
Community UnmarriedMother SC
(%)
Widows/ AbandonedWives (%)
Destitute SeniorCitizens (%)
Average RankOrphans (%)
Source: Meenangadi Grama Panchayat Survey – 2014,Source: Data collection of Scheduled Tribes – 2008
56
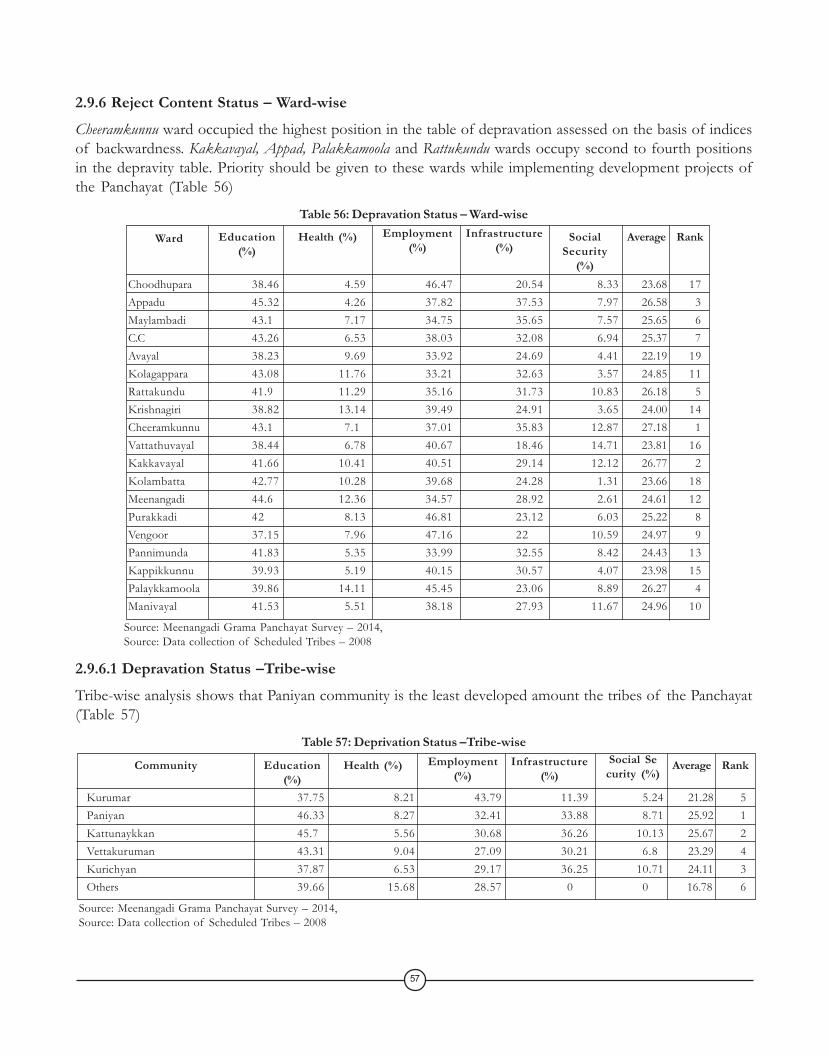
2.9.6 Reject Content Status – Ward-wiseCheeramkunnu ward occupied the highest position in the table of depravation assessed on the basis of indicesof backwardness. Kakkavayal, Appad, Palakkamoola and Rattukundu wards occupy second to fourth positionsin the depravity table. Priority should be given to these wards while implementing development projects ofthe Panchayat (Table 56)
Table 56: Depravation Status – Ward-wise
Source: Meenangadi Grama Panchayat Survey – 2014,Source: Data collection of Scheduled Tribes – 2008
Choodhupara 38.46 4.59 46.47 20.54 8.33 23.68 17Appadu 45.32 4.26 37.82 37.53 7.97 26.58 3Maylambadi 43.1 7.17 34.75 35.65 7.57 25.65 6C.C 43.26 6.53 38.03 32.08 6.94 25.37 7Avayal 38.23 9.69 33.92 24.69 4.41 22.19 19Kolagappara 43.08 11.76 33.21 32.63 3.57 24.85 11Rattakundu 41.9 11.29 35.16 31.73 10.83 26.18 5Krishnagiri 38.82 13.14 39.49 24.91 3.65 24.00 14Cheeramkunnu 43.1 7.1 37.01 35.83 12.87 27.18 1Vattathuvayal 38.44 6.78 40.67 18.46 14.71 23.81 16Kakkavayal 41.66 10.41 40.51 29.14 12.12 26.77 2Kolambatta 42.77 10.28 39.68 24.28 1.31 23.66 18Meenangadi 44.6 12.36 34.57 28.92 2.61 24.61 12Purakkadi 42 8.13 46.81 23.12 6.03 25.22 8Vengoor 37.15 7.96 47.16 22 10.59 24.97 9Pannimunda 41.83 5.35 33.99 32.55 8.42 24.43 13Kappikkunnu 39.93 5.19 40.15 30.57 4.07 23.98 15Palaykkamoola 39.86 14.11 45.45 23.06 8.89 26.27 4Manivayal 41.53 5.51 38.18 27.93 11.67 24.96 10
Ward Education(%)
Health (%) Infrastructure(%)
Average RankEmployment(%)
SocialSecurity
(%)
2.9.6.1 Depravation Status –Tribe-wiseTribe-wise analysis shows that Paniyan community is the least developed amount the tribes of the Panchayat(Table 57)
Table 57: Deprivation Status –Tribe-wise
Kurumar 37.75 8.21 43.79 11.39 5.24 21.28 5Paniyan 46.33 8.27 32.41 33.88 8.71 25.92 1Kattunaykkan 45.7 5.56 30.68 36.26 10.13 25.67 2Vettakuruman 43.31 9.04 27.09 30.21 6.8 23.29 4Kurichyan 37.87 6.53 29.17 36.25 10.71 24.11 3Others 39.66 15.68 28.57 0 0 16.78 6
Community Education(%)
Health (%) Infrastructure(%)
Average RankEmployment(%)
Social Security (%)
Source: Meenangadi Grama Panchayat Survey – 2014,Source: Data collection of Scheduled Tribes – 2008
57

Table 58: Education – Problems, Causes and SolutionsProblem – Dropouts (Leaving education incompletes)
Problems SolutionsIgnorance of parents Promote adult literacy programmeEconomic problems of parents Provide self-employment to parents and financial assistance to studentsApathy of students Provide hostel facilitiesLanguage problems Give importance to mother tongue of students at primary levelLack of reading Construction of cultural centers in colonies and provide reading materialsLack of nutrition Provide breakfast in schoolLack of facilities at home Make hostel child friendly. Avoid entrance testDistance to school Provide transportation to students
Problem: IlliteracyLack of primary education Extend literacy campaign to all coloniesProblem – Lack of opportunity for technical educationInsufficiency of technical institutions Open more technical institutionsProblem: backwardness in competitive examinationsLack of training Provide training, Coaching in PSC and entrance examination
Chapter 3Problem Analysis and Development Perspective
3.1 Introduction“Towards excellence with unity “ is an innovative development scheme aiming at the comprehensivedevelopment of the tribes being implemented by Meenangadi Village Panchayat Taking lessons from thesuccesses and short comings of the scheme we are launching the formulation of Tribal Sub Plan of thePanchayat.
The problems identified in the meetings of Oorukkoottam. Working Groups and other bodies and the solutionssuggested for the problems are consolidated and given below. The meeting of all Oorukkoottams and where thetribal population is small ward level meeting of Oorus were held. In the meetings held in connection with theformulation of TSP all Tribal Promotors working Group members and Elected Members of the Panchayathave participated. The problem analysis is carried out by dividing the development sectors into five; namelyEducation, Health, Employment and Income, infrastructure facilities and social security.
3.2 Problems, Causes and solutions in education sectorOnly educated society can be considered developed society. The education provided under the curriculumframework must be related to real life situations and hence modifications must be made to the curriculumaccordingly. The Scheduled Tribes as a whole and Paniyan and Kattunayikkan tribes in particular are apatheticto education. Kuruman and Kurichyan communities are comparatively forward in development. Backwardnessin education arises from ignorance of parents, social and economic backwardness and language problems.Because of their backwardness tribal children are not able to express or improve their talents in arts andsports. Given below are the analysis of problems and solutions suggested by the Oorukkoottams, WorkingGroups and experts in development sectors. (Table 58)
59
Reduce Illiteracy
• Reduce illiteracy by 5% a year• In the case of wards having percentage of illiteracy higher than the Panchayat average reduce the percentage of illiteracy to the
Panchayat percentage of 23.61• Bring down the percentage of dropouts from 2.39 to o in one year• Bring down the percentage of youth without technical education from 97.49 to 75 in five years• By the end of XIII Five Year Plan eradicate illiteracy in the tribal population of the Panchayat• Focus on poverty alleviation Programmes• Conduct literacy campaign in colonies• Panchayat should take initiative to implement compulsory primary education• Open tuition centers in colonies utilizing the service of educated tribal youth• Give total coverage to continuing education scheme by including all illiterate tribal with the cooperation of literacy mission.
3.2.1 Long Term Goals
60
Higher education• Reduce the percentage of youth without higher education from the present 97.99 to 87.99 in five year• In the case of communities having percentage of higher education less than the Panchayat percentage, bring down the percentage
to Panchayat level• Provide opportunity to students who complete secondary education for higher education in science and technology• Provide tuition fees and examination fees to Scheduled Tribes students• Create a support system for the timely solution of problems arising in education sector
Stop School dropouts
• Distribute study materials and other assistance on time• Identify students having problems in learning and take remedial measures• Ensure social interventions to stop the problems of school dropouts
3.3 Problems, Causes and Solutions in Health SectorAlthough the ‘Kerala Model’ of development in Health sector attained worldwide attention, the ScheduledTribes have not been benefited by the model in life expectancy and health standard the tribalag far behind therest of the society and some tribes are now on the verge of extinction. Alcoholism abuse of substances, lackof nutrition and poverty ruin there health. Another challenge is the problems arising from child marriage andadolescent delivery that result in health problems of mother and child. The apathy to medical treatment oftenleads them to ill health and even death. Therefore the health schemes for Scheduled Tribes must ensuremedical treatment of diseases. Such schemes must aim at increased production and corruption of traditionalfood like tubers’ leaf and other vegetables to maintain the health of the tribes. (Table 59)
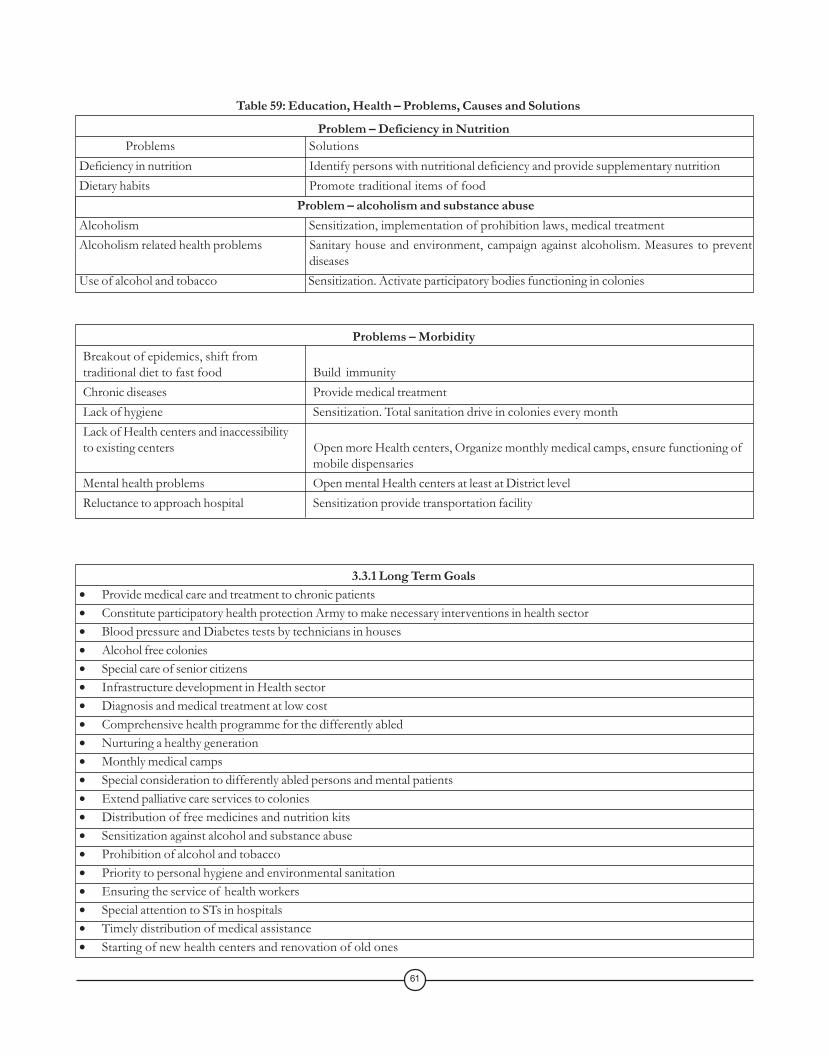
Table 59: Education, Health – Problems, Causes and Solutions
Problem – Deficiency in Nutrition Problems SolutionsDeficiency in nutrition Identify persons with nutritional deficiency and provide supplementary nutritionDietary habits Promote traditional items of food
Problem – alcoholism and substance abuseAlcoholism Sensitization, implementation of prohibition laws, medical treatmentAlcoholism related health problems Sanitary house and environment, campaign against alcoholism. Measures to prevent
diseasesUse of alcohol and tobacco Sensitization. Activate participatory bodies functioning in colonies
Problems – MorbidityBreakout of epidemics, shift fromtraditional diet to fast food Build immunityChronic diseases Provide medical treatmentLack of hygiene Sensitization. Total sanitation drive in colonies every monthLack of Health centers and inaccessibilityto existing centers Open more Health centers, Organize monthly medical camps, ensure functioning of
mobile dispensariesMental health problems Open mental Health centers at least at District levelReluctance to approach hospital Sensitization provide transportation facility
3.3.1 Long Term Goals• Provide medical care and treatment to chronic patients• Constitute participatory health protection Army to make necessary interventions in health sector• Blood pressure and Diabetes tests by technicians in houses• Alcohol free colonies• Special care of senior citizens• Infrastructure development in Health sector• Diagnosis and medical treatment at low cost• Comprehensive health programme for the differently abled• Nurturing a healthy generation• Monthly medical camps• Special consideration to differently abled persons and mental patients• Extend palliative care services to colonies• Distribution of free medicines and nutrition kits• Sensitization against alcohol and substance abuse• Prohibition of alcohol and tobacco• Priority to personal hygiene and environmental sanitation• Ensuring the service of health workers• Special attention to STs in hospitals• Timely distribution of medical assistance• Starting of new health centers and renovation of old ones
61
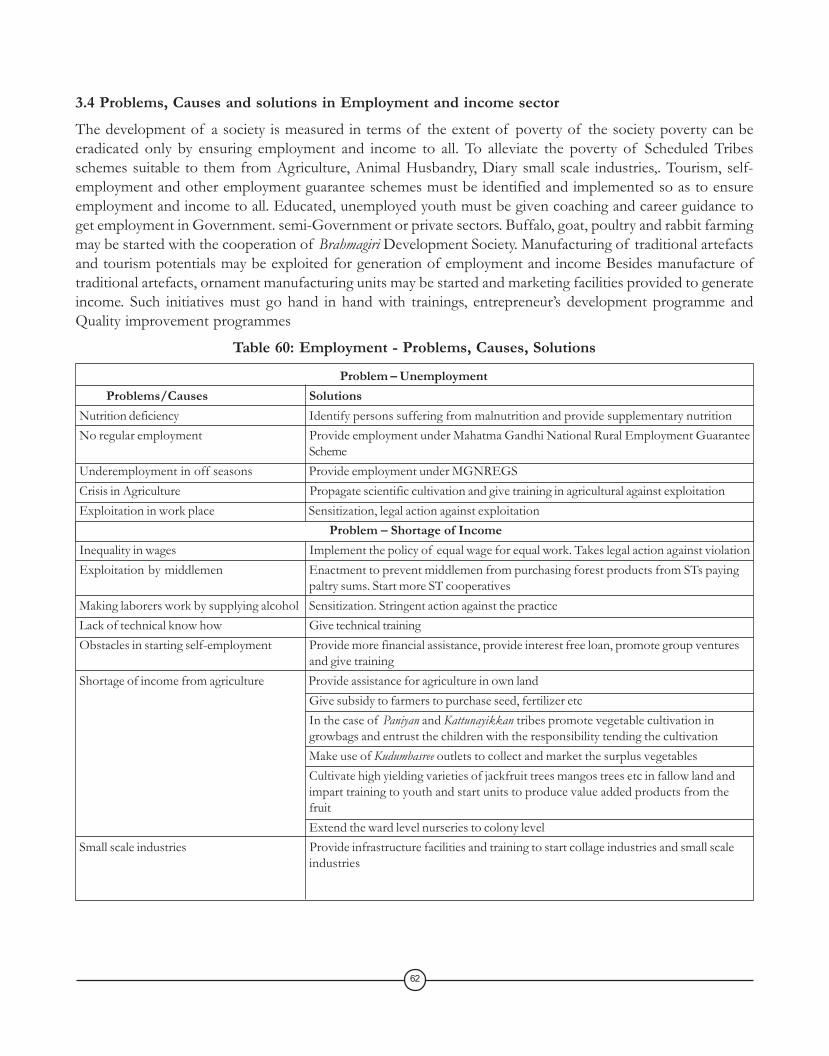
3.4 Problems, Causes and solutions in Employment and income sectorThe development of a society is measured in terms of the extent of poverty of the society poverty can beeradicated only by ensuring employment and income to all. To alleviate the poverty of Scheduled Tribesschemes suitable to them from Agriculture, Animal Husbandry, Diary small scale industries,. Tourism, self-employment and other employment guarantee schemes must be identified and implemented so as to ensureemployment and income to all. Educated, unemployed youth must be given coaching and career guidance toget employment in Government. semi-Government or private sectors. Buffalo, goat, poultry and rabbit farmingmay be started with the cooperation of Brahmagiri Development Society. Manufacturing of traditional artefactsand tourism potentials may be exploited for generation of employment and income Besides manufacture oftraditional artefacts, ornament manufacturing units may be started and marketing facilities provided to generateincome. Such initiatives must go hand in hand with trainings, entrepreneur’s development programme andQuality improvement programmes
Table 60: Employment - Problems, Causes, Solutions
Problem – Unemployment Problems/Causes SolutionsNutrition deficiency Identify persons suffering from malnutrition and provide supplementary nutritionNo regular employment Provide employment under Mahatma Gandhi National Rural Employment Guarantee
SchemeUnderemployment in off seasons Provide employment under MGNREGSCrisis in Agriculture Propagate scientific cultivation and give training in agricultural against exploitationExploitation in work place Sensitization, legal action against exploitation
Problem – Shortage of IncomeInequality in wages Implement the policy of equal wage for equal work. Takes legal action against violationExploitation by middlemen Enactment to prevent middlemen from purchasing forest products from STs paying
paltry sums. Start more ST cooperativesMaking laborers work by supplying alcohol Sensitization. Stringent action against the practiceLack of technical know how Give technical trainingObstacles in starting self-employment Provide more financial assistance, provide interest free loan, promote group ventures
and give trainingShortage of income from agriculture Provide assistance for agriculture in own land
Give subsidy to farmers to purchase seed, fertilizer etcIn the case of Paniyan and Kattunayikkan tribes promote vegetable cultivation ingrowbags and entrust the children with the responsibility tending the cultivationMake use of Kudumbasree outlets to collect and market the surplus vegetablesCultivate high yielding varieties of jackfruit trees mangos trees etc in fallow land andimpart training to youth and start units to produce value added products from thefruitExtend the ward level nurseries to colony level
Small scale industries Provide infrastructure facilities and training to start collage industries and small scaleindustries
62

3.5 Problems, Causes and Solutions in Infrastructure Development SectorInfrastructure development plays an important role in community development. Although Government atdifferent levels have formulated many schemes to provide infrastructure facilities to Scheduled Tribes, fordifferent reasons the Scheduled Tribe communities still lag behind in this respect. Comprehensive planningand interventions are necessary to achieve the targets in the case of housing, drinking water, electricity andsanitation (table 61)
3.4.1 Long Term Goals
Development of Agriculture sectorTo utilizing agriculture sector to ensure employment, income and food security of Scheduled Tribes implementing a comprehensiveagriculture development programme to realize the objectives. Watershed based development programme implementation focusingon food security and ensuring employment. Promotion of paddy, vegetable and tuber cultivation. Constitute Agriculture task force.Provide the members training in the use of machinery and make agriculture profitable to farmers enhance the income of the personsoperating machines and increase agricultural productivity. Identify Scheduled Tribe youth willing to be members of the AgriculturalTask force and train them. To encourage vegetable and tuber cultivation to provide free seeds and prepare the land for cultivationunder MGNREGS.
Formation of Scheduled Tribe cooperative societiesScheduled Tribe cooperative societies will be formed to generate employment. Skilled Laborers society will be constituted to enhancethe income of the labours and upgrade their skills. Tribal integrated Development and emerging Scheme (TIDES) will be extendedto all Sheduled Tribe colonies.
Animal Husbandry
The major part of the Scheduled Tribe population depends on Animal Husbandry for their livelihood. It provides them withemployment and income. Beahmagiri Meat processing factory and Meenangadi Milk Co-operative Society are engaged in activitiesrelating to Animal Husbandry and their expertise will be utilized development planning. Project will be formulated to enable personsinterested in cattle farming to start the venture either on individual basis or through Joint Liability Groups. Fodder cultivation infallow land will be taken up as an auxiliary project.
Lower the Number of the unemployed
• Bring down the percentage of the educated unemployed from 35.86 to 0.• In the case of wards and communities whose percentage of the unemployed is above the Panchayat average of 19.86 attempts will
be made to bring it down to the Panchayat level in two years. Total employment and regular income to all STs is the ultimate goal.• Enhance the income of workers by providing 100 days of work to each family under MGNREGS• Implement projects under MGNREGS according to Agriculture Calendar.• Mechanize agriculture and impart training to operate agricultural machines• Widen the functioning of Agricultural Task force by enlisting 50 new members each year and ensuring employment to all members• Encourage cultivation of traditional crops• Focus on diary development• Provide financial assistance to self-employment enterprises• Start coaching centers for vocational training and career guidance• Assist youth having higher education and technical education to get employment abroad
63
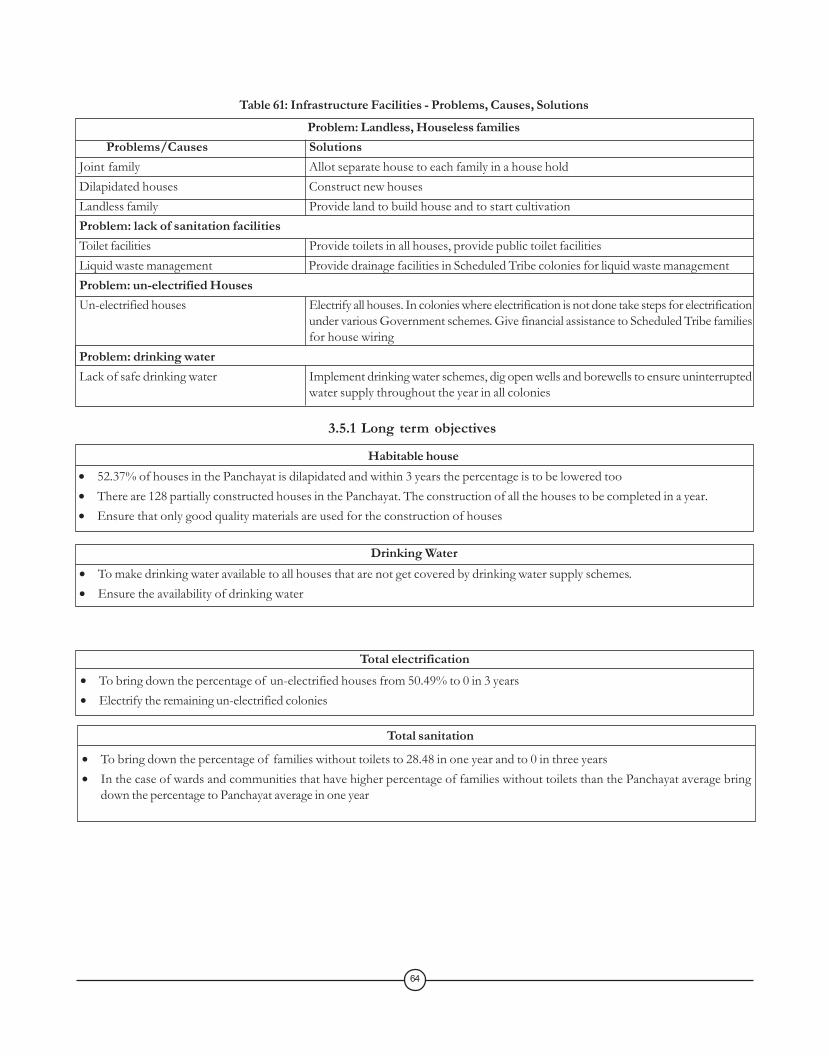
3.5.1 Long term objectives
Habitable house• 52.37% of houses in the Panchayat is dilapidated and within 3 years the percentage is to be lowered too• There are 128 partially constructed houses in the Panchayat. The construction of all the houses to be completed in a year.• Ensure that only good quality materials are used for the construction of houses
Drinking Water• To make drinking water available to all houses that are not get covered by drinking water supply schemes.• Ensure the availability of drinking water
Problem: Landless, Houseless families Problems/Causes SolutionsJoint family Allot separate house to each family in a house holdDilapidated houses Construct new housesLandless family Provide land to build house and to start cultivationProblem: lack of sanitation facilitiesToilet facilities Provide toilets in all houses, provide public toilet facilitiesLiquid waste management Provide drainage facilities in Scheduled Tribe colonies for liquid waste managementProblem: un-electrified HousesUn-electrified houses Electrify all houses. In colonies where electrification is not done take steps for electrification
under various Government schemes. Give financial assistance to Scheduled Tribe familiesfor house wiring
Problem: drinking waterLack of safe drinking water Implement drinking water schemes, dig open wells and borewells to ensure uninterrupted
water supply throughout the year in all colonies
Total electrification• To bring down the percentage of un-electrified houses from 50.49% to 0 in 3 years• Electrify the remaining un-electrified colonies
Total sanitation
• To bring down the percentage of families without toilets to 28.48 in one year and to 0 in three years• In the case of wards and communities that have higher percentage of families without toilets than the Panchayat average bring
down the percentage to Panchayat average in one year
64
Table 61: Infrastructure Facilities - Problems, Causes, Solutions
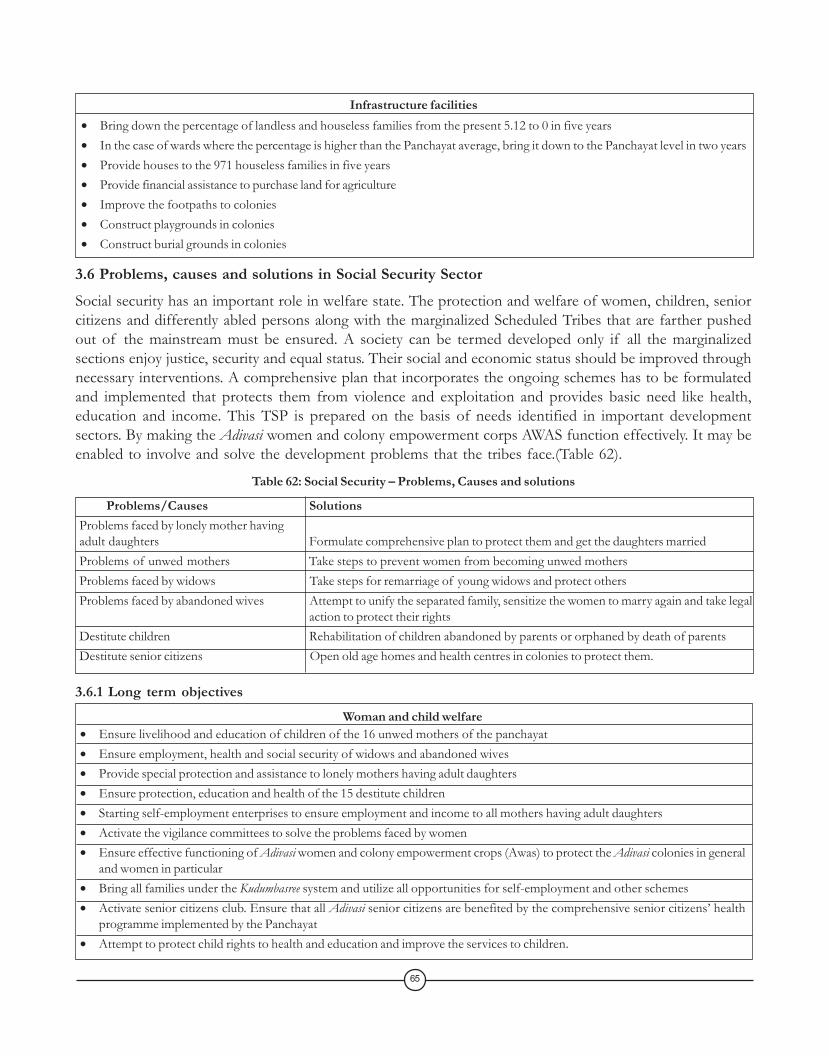
3.6 Problems, causes and solutions in Social Security SectorSocial security has an important role in welfare state. The protection and welfare of women, children, seniorcitizens and differently abled persons along with the marginalized Scheduled Tribes that are farther pushedout of the mainstream must be ensured. A society can be termed developed only if all the marginalizedsections enjoy justice, security and equal status. Their social and economic status should be improved throughnecessary interventions. A comprehensive plan that incorporates the ongoing schemes has to be formulatedand implemented that protects them from violence and exploitation and provides basic need like health,education and income. This TSP is prepared on the basis of needs identified in important developmentsectors. By making the Adivasi women and colony empowerment corps AWAS function effectively. It may beenabled to involve and solve the development problems that the tribes face.(Table 62).
Table 62: Social Security – Problems, Causes and solutions
Problems/Causes SolutionsProblems faced by lonely mother havingadult daughters Formulate comprehensive plan to protect them and get the daughters marriedProblems of unwed mothers Take steps to prevent women from becoming unwed mothersProblems faced by widows Take steps for remarriage of young widows and protect othersProblems faced by abandoned wives Attempt to unify the separated family, sensitize the women to marry again and take legal
action to protect their rightsDestitute children Rehabilitation of children abandoned by parents or orphaned by death of parentsDestitute senior citizens Open old age homes and health centres in colonies to protect them.
65
Infrastructure facilities• Bring down the percentage of landless and houseless families from the present 5.12 to 0 in five years• In the case of wards where the percentage is higher than the Panchayat average, bring it down to the Panchayat level in two years• Provide houses to the 971 houseless families in five years• Provide financial assistance to purchase land for agriculture• Improve the footpaths to colonies• Construct playgrounds in colonies• Construct burial grounds in colonies
3.6.1 Long term objectivesWoman and child welfare
• Ensure livelihood and education of children of the 16 unwed mothers of the panchayat• Ensure employment, health and social security of widows and abandoned wives• Provide special protection and assistance to lonely mothers having adult daughters• Ensure protection, education and health of the 15 destitute children• Starting self-employment enterprises to ensure employment and income to all mothers having adult daughters• Activate the vigilance committees to solve the problems faced by women• Ensure effective functioning of Adivasi women and colony empowerment crops (Awas) to protect the Adivasi colonies in general
and women in particular• Bring all families under the Kudumbasree system and utilize all opportunities for self-employment and other schemes• Activate senior citizens club. Ensure that all Adivasi senior citizens are benefited by the comprehensive senior citizens’ health
programme implemented by the Panchayat• Attempt to protect child rights to health and education and improve the services to children.
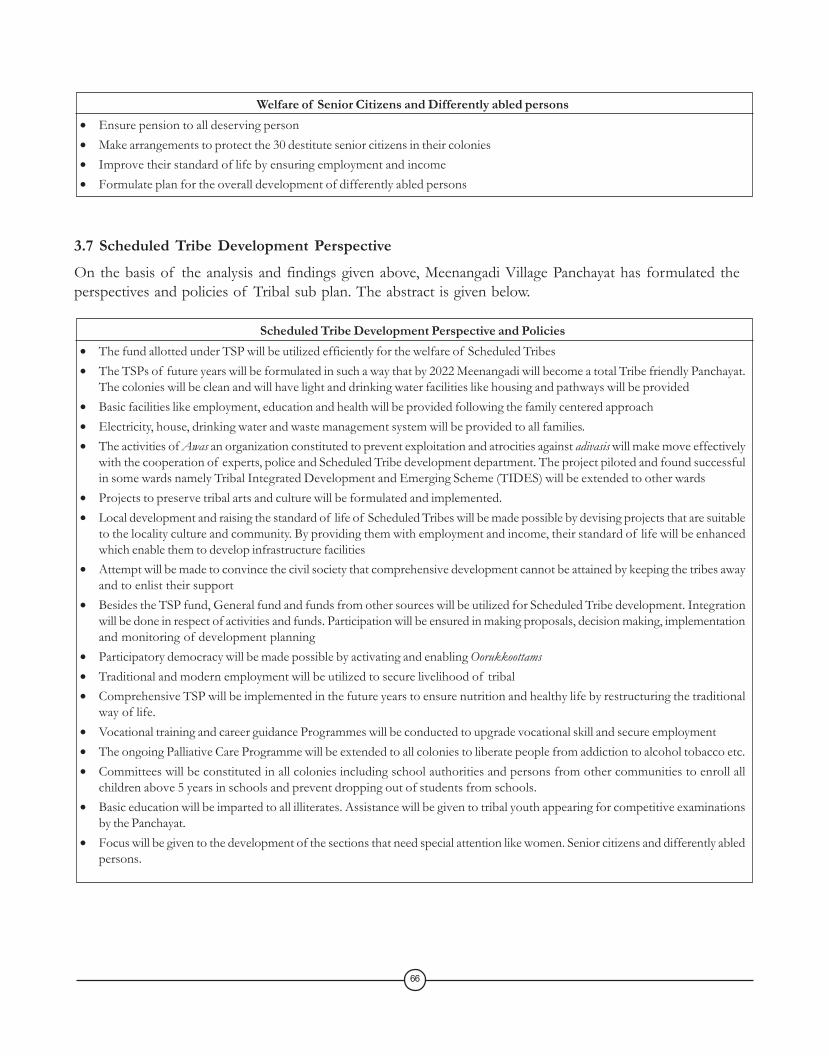
Welfare of Senior Citizens and Differently abled persons• Ensure pension to all deserving person• Make arrangements to protect the 30 destitute senior citizens in their colonies• Improve their standard of life by ensuring employment and income• Formulate plan for the overall development of differently abled persons
Scheduled Tribe Development Perspective and Policies• The fund allotted under TSP will be utilized efficiently for the welfare of Scheduled Tribes• The TSPs of future years will be formulated in such a way that by 2022 Meenangadi will become a total Tribe friendly Panchayat.
The colonies will be clean and will have light and drinking water facilities like housing and pathways will be provided• Basic facilities like employment, education and health will be provided following the family centered approach• Electricity, house, drinking water and waste management system will be provided to all families.• The activities of Awas an organization constituted to prevent exploitation and atrocities against adivasis will make move effectively
with the cooperation of experts, police and Scheduled Tribe development department. The project piloted and found successfulin some wards namely Tribal Integrated Development and Emerging Scheme (TIDES) will be extended to other wards
• Projects to preserve tribal arts and culture will be formulated and implemented.• Local development and raising the standard of life of Scheduled Tribes will be made possible by devising projects that are suitable
to the locality culture and community. By providing them with employment and income, their standard of life will be enhancedwhich enable them to develop infrastructure facilities
• Attempt will be made to convince the civil society that comprehensive development cannot be attained by keeping the tribes awayand to enlist their support
• Besides the TSP fund, General fund and funds from other sources will be utilized for Scheduled Tribe development. Integrationwill be done in respect of activities and funds. Participation will be ensured in making proposals, decision making, implementationand monitoring of development planning
• Participatory democracy will be made possible by activating and enabling Oorukkoottams• Traditional and modern employment will be utilized to secure livelihood of tribal• Comprehensive TSP will be implemented in the future years to ensure nutrition and healthy life by restructuring the traditional
way of life.• Vocational training and career guidance Programmes will be conducted to upgrade vocational skill and secure employment• The ongoing Palliative Care Programme will be extended to all colonies to liberate people from addiction to alcohol tobacco etc.• Committees will be constituted in all colonies including school authorities and persons from other communities to enroll all
children above 5 years in schools and prevent dropping out of students from schools.• Basic education will be imparted to all illiterates. Assistance will be given to tribal youth appearing for competitive examinations
by the Panchayat.• Focus will be given to the development of the sections that need special attention like women. Senior citizens and differently abled
persons.
3.7 Scheduled Tribe Development PerspectiveOn the basis of the analysis and findings given above, Meenangadi Village Panchayat has formulated theperspectives and policies of Tribal sub plan. The abstract is given below.
66
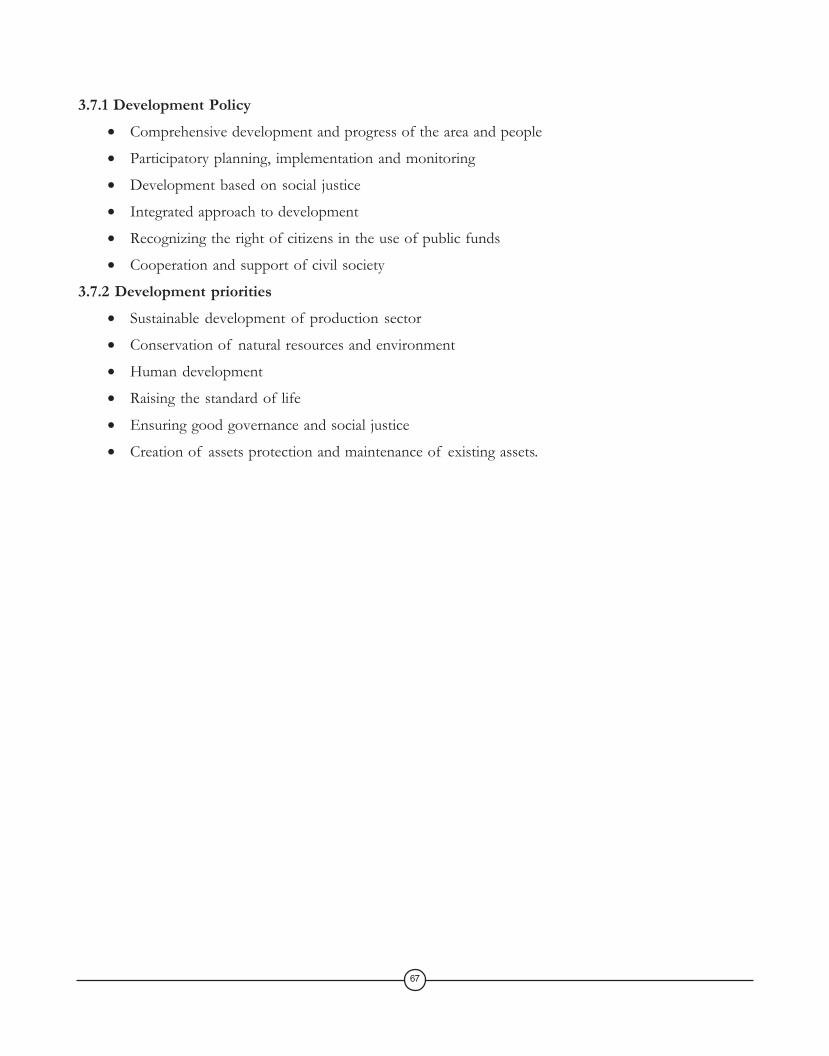
3.7.1 Development Policy• Comprehensive development and progress of the area and people
• Participatory planning, implementation and monitoring
• Development based on social justice
• Integrated approach to development
• Recognizing the right of citizens in the use of public funds
• Cooperation and support of civil society
3.7.2 Development priorities• Sustainable development of production sector
• Conservation of natural resources and environment
• Human development
• Raising the standard of life
• Ensuring good governance and social justice
• Creation of assets protection and maintenance of existing assets.
67

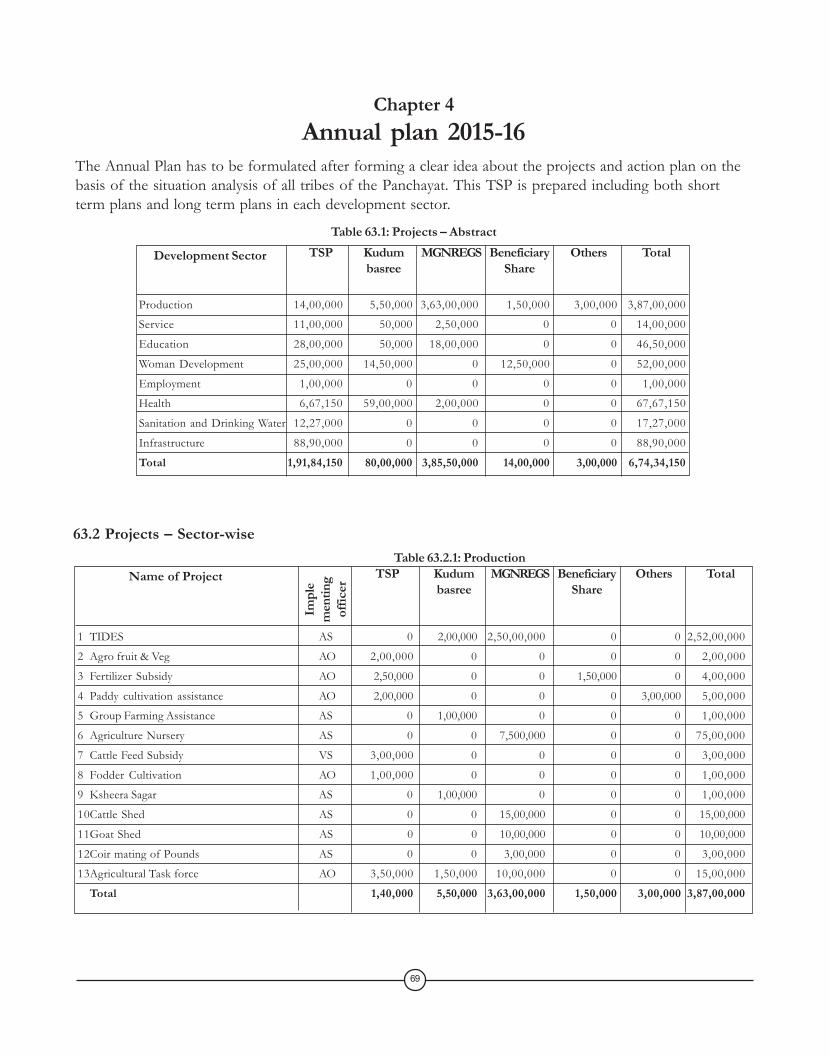
Chapter 4Annual plan 2015-16
The Annual Plan has to be formulated after forming a clear idea about the projects and action plan on thebasis of the situation analysis of all tribes of the Panchayat. This TSP is prepared including both shortterm plans and long term plans in each development sector.
Table 63.1: Projects – Abstract
Production 14,00,000 5,50,000 3,63,00,000 1,50,000 3,00,000 3,87,00,000
Service 11,00,000 50,000 2,50,000 0 0 14,00,000
Education 28,00,000 50,000 18,00,000 0 0 46,50,000
Woman Development 25,00,000 14,50,000 0 12,50,000 0 52,00,000
Employment 1,00,000 0 0 0 0 1,00,000
Health 6,67,150 59,00,000 2,00,000 0 0 67,67,150
Sanitation and Drinking Water 12,27,000 0 0 0 0 17,27,000
Infrastructure 88,90,000 0 0 0 0 88,90,000
Total 1,91,84,150 80,00,000 3,85,50,000 14,00,000 3,00,000 6,74,34,150
Development Sector
69
TotalOthersBeneficiaryShare
MGNREGSKudumbasree
TSP
1 TIDES AS 0 2,00,000 2,50,00,000 0 0 2,52,00,000
2 Agro fruit & Veg AO 2,00,000 0 0 0 0 2,00,000
3 Fertilizer Subsidy AO 2,50,000 0 0 1,50,000 0 4,00,000
4 Paddy cultivation assistance AO 2,00,000 0 0 0 3,00,000 5,00,000
5 Group Farming Assistance AS 0 1,00,000 0 0 0 1,00,000
6 Agriculture Nursery AS 0 0 7,500,000 0 0 75,00,000
7 Cattle Feed Subsidy VS 3,00,000 0 0 0 0 3,00,000
8 Fodder Cultivation AO 1,00,000 0 0 0 0 1,00,000
9 Ksheera Sagar AS 0 1,00,000 0 0 0 1,00,000
10Cattle Shed AS 0 0 15,00,000 0 0 15,00,000
11Goat Shed AS 0 0 10,00,000 0 0 10,00,000
12Coir mating of Pounds AS 0 0 3,00,000 0 0 3,00,000
13Agricultural Task force AO 3,50,000 1,50,000 10,00,000 0 0 15,00,000
Total 1,40,000 5,50,000 3,63,00,000 1,50,000 3,00,000 3,87,00,000
Name of Project
63.2 Projects – Sector-wiseTable 63.2.1: Production
Impl
em
entin
gof
ficer
TotalOthersBeneficiaryShare
MGNREGSKudumbasree
TSP

1 Nutrition Programme ICDS 11,00,000 0 0 0 0 11,00,0002 Mother – Child Health Care MO
(AYUR) 2,00,000 0 0 0 0 2,00,0003 Integrated Woman Development ICDS 5,00,000 2,00,000 0 0 0 7,00,0004 Protection of daughters of lonely
mothers ICDS 2,00,000 0 0 0 0 2,00,0005 Self-Employment Units AS 0 12,50,000 0 12,50,000 0 25,00,0005 Centralized Development plan
of Kudumbasree AS 0 12,50,000 0 12,50,000 0 25,00,000Total 25,00,000 14,50,000 - 12,50,000 - 52,00,000
Name of ProjectTable 63.2.4: Employment Women Development
Imple mentingofficer
TotalOthersBeneficiaryShare
MGNREGSKudumbasree
TSP
1 Santhvana souhridam MO(AYUR) 1,50,000 50,000 1,50,000 0 0 3,50,000
2 Tribal Cultural Study Centre HM 5,00,000 0 0 0 0 5,00,0003 Comprehensive senior citizen
Development ICDS 2,00,000 0 0 0 0 2,00,000 4 Comprehensive Senior Citizen MO
Development (AYUR) 2,50,000 2,00,000 1,00,000 0 0 3,50,000Total 11,00,000 50,000 2,50,000 0 0 14,00,000
Name of Project TotalTable 63.2.2: Service
a
1 Integrated Education Programme HM 853 6,00,000 0 0 0 0 6,00,0002 Learning Corner HM 100 2,00,000 0 0 0 0 2,00,0003 Break Fast HM 853 4,00,000 0 0 0 0 4,00,0004 Bal Panchayat HM 1,118 1,00,000 50,000 0 0 0 1,50,0005 Play Ground AS 1,118 0 0 18,00,000 0 0 18,00,0006 Child Health Development Mission MO
(AYUR) 1,118 3,00,000 0 0 0 0 3,00,0007 TIME HM 853 9,00,000 0 0 0 0 9,00,0008 Education of Differently Abled HM 0 3,00,000 0 0 0 0 3,00,000
ChildrenTotal 6,013 2,800,000 50,000 18,00,000 0 0 46,50,000
Name of Project
Table 63.2.3: Education
Impl
em
entin
gof
ficer
TotalOthersBeneficiaryShare
MGNREGS
Kudumbasree
TSPNo. ofBeneficiaries
70
Impl
em
entin
gof
ficer
OthersBeneficiaryShare
Department
KudumbasreeTSP
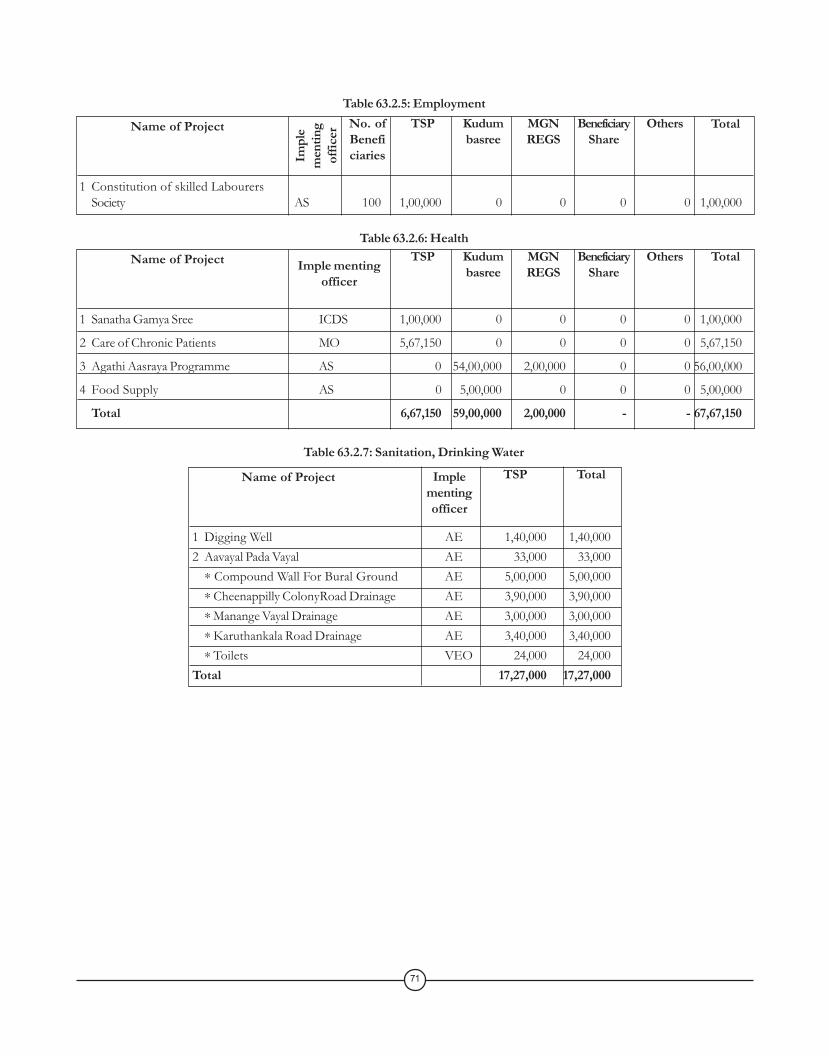
Table 63.2.5: Employment
1 Constitution of skilled LabourersSociety AS 100 1,00,000 0 0 0 0 1,00,000
Name of Project Total
Impl
em
entin
gof
ficer
OthersBeneficiaryShare
MGNREGS
Kudumbasree
TSPNo. ofBeneficiaries
1 Sanatha Gamya Sree ICDS 1,00,000 0 0 0 0 1,00,000
2 Care of Chronic Patients MO 5,67,150 0 0 0 0 5,67,150
3 Agathi Aasraya Programme AS 0 54,00,000 2,00,000 0 0 56,00,000
4 Food Supply AS 0 5,00,000 0 0 0 5,00,000
Total 6,67,150 59,00,000 2,00,000 - - 67,67,150
Name of ProjectTable 63.2.6: Health
Imple mentingofficer
TotalOthersBeneficiaryShare
MGNREGS
Kudumbasree
TSP
71
1 Digging Well AE 1,40,000 1,40,0002 Aavayal Pada Vayal AE 33,000 33,000
∗ Compound Wall For Bural Ground AE 5,00,000 5,00,000∗ Cheenappilly ColonyRoad Drainage AE 3,90,000 3,90,000∗ Manange Vayal Drainage AE 3,00,000 3,00,000∗ Karuthankala Road Drainage AE 3,40,000 3,40,000∗ Toilets VEO 24,000 24,000
Total 17,27,000 17,27,000
Table 63.2.7: Sanitation, Drinking Water
Name of Project Implementingofficer
TSP Total
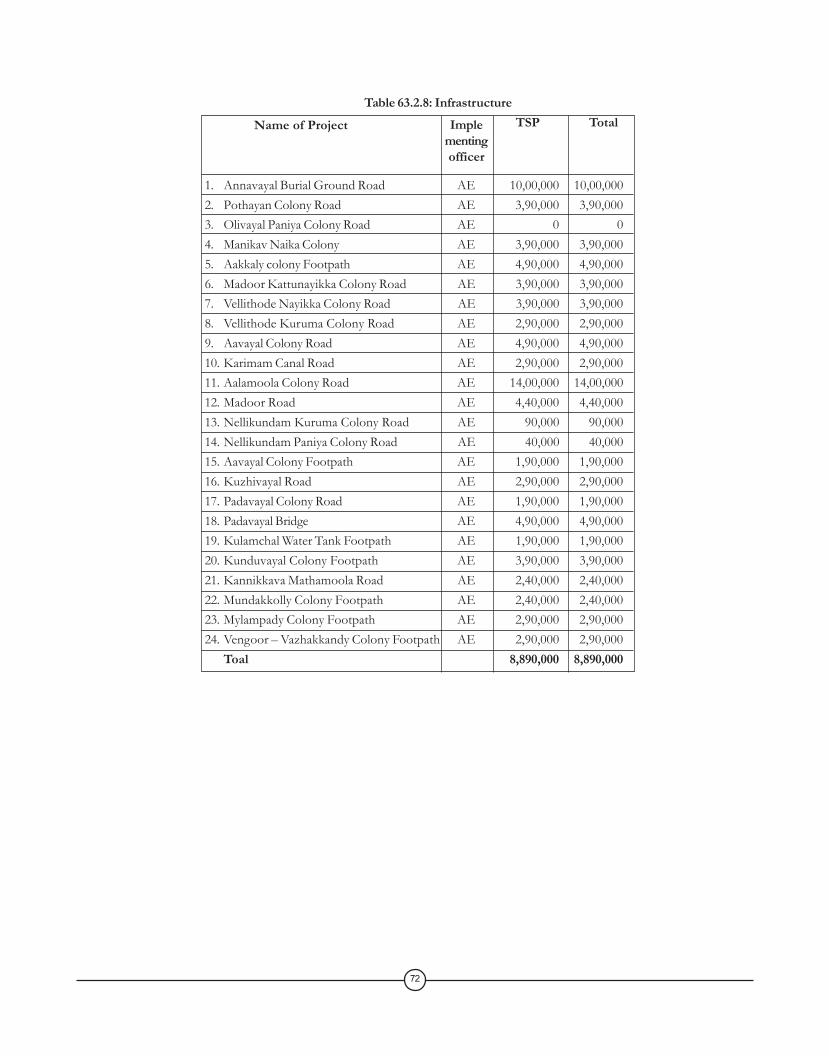
Table 63.2.8: Infrastructure
72
1. Annavayal Burial Ground Road AE 10,00,000 10,00,0002. Pothayan Colony Road AE 3,90,000 3,90,0003. Olivayal Paniya Colony Road AE 0 04. Manikav Naika Colony AE 3,90,000 3,90,0005. Aakkaly colony Footpath AE 4,90,000 4,90,0006. Madoor Kattunayikka Colony Road AE 3,90,000 3,90,0007. Vellithode Nayikka Colony Road AE 3,90,000 3,90,0008. Vellithode Kuruma Colony Road AE 2,90,000 2,90,0009. Aavayal Colony Road AE 4,90,000 4,90,00010. Karimam Canal Road AE 2,90,000 2,90,00011. Aalamoola Colony Road AE 14,00,000 14,00,00012. Madoor Road AE 4,40,000 4,40,00013. Nellikundam Kuruma Colony Road AE 90,000 90,00014. Nellikundam Paniya Colony Road AE 40,000 40,00015. Aavayal Colony Footpath AE 1,90,000 1,90,00016. Kuzhivayal Road AE 2,90,000 2,90,00017. Padavayal Colony Road AE 1,90,000 1,90,00018. Padavayal Bridge AE 4,90,000 4,90,00019. Kulamchal Water Tank Footpath AE 1,90,000 1,90,00020. Kunduvayal Colony Footpath AE 3,90,000 3,90,00021. Kannikkava Mathamoola Road AE 2,40,000 2,40,00022. Mundakkolly Colony Footpath AE 2,40,000 2,40,00023. Mylampady Colony Footpath AE 2,90,000 2,90,00024. Vengoor – Vazhakkandy Colony Footpath AE 2,90,000 2,90,000
Toal 8,890,000 8,890,000
Name of Project Implementingofficer
TSP Total