Trends, Inequalities, and Contextual Determinants of Child ...
80
DHS ANALYTICAL STUDIES 69 TRENDS, INEQUALITIES, AND CONTEXTUAL DETERMINANTS OF CHILD MARRIAGE IN ASIA July 2019 This publication was produced for review by the United States Agency for International Development. It was prepared by Kerry L. D. MacQuarrie, Christina Juan, and Thomas D. Fish.
-
Upload
khangminh22 -
Category
Documents
-
view
1 -
download
0
Transcript of Trends, Inequalities, and Contextual Determinants of Child ...

DHS ANALYTICAL STUDIES 69
Trends, InequalITIes, and ConTexTual deTermInanTs of ChIld marrIage In asIa
July 2019
This publication was produced for review by the United States Agency for International Development. It was prepared by Kerry L. D. MacQuarrie, Christina Juan, and Thomas D. Fish.


DHS Analytical Studies No. 69
Trends, Inequalities, and Contextual Determinants of Child Marriage in Asia
Kerry L. D. MacQuarrie1 Christina Juan2
Thomas D. Fish2
ICF Rockville, Maryland, USA
July 2019
1 The DHS Program, Avenir Health 2 The DHS Program, ICF
Corresponding author: Kerry L.D. MacQuarrie, The DHS Program, 530 Gaither Road, Suite 500, Rockville, MD 20850, USA; phone: 301-572-0282; fax: 301-407-6501; email: [email protected]

Acknowledgments: The authors extend their appreciation to numerous individuals who contributed to this study. First, we thank the Asia Bureau of the United States Agency for International Development (USAID) for commissioning the study and continuing to bring attention to the issue of child marriage. Next, we thank Trinadh Dontamsetti and Ben Mayala, ICF, for guidance on extractions of spatial covariates. Finally, we are grateful to the many people who reviewed drafts of this report or related papers for their thoughtful feedback: Micaela Arthur, USAID; Alka Barua; Netra Bhatta, USAID; Catherine Bollinger, USAID; Jamaica Corker, Bill and Melinda Gates Foundation; Amrita Goswami, USAID; Maureen Laisang, USAID; Lindsay Mallick, Avenir Health; Ben Mayala, ICF; Lucy Mize, USAID; Maryam Qonita, Satu Hati NGO; Chaitra Shenoy, USAID; Natacha Stevanovic Fenn, Georgetown University; and Jessica Williamson, Avenir Health.
Editor: Bryant Robey Document Production: Joan Wardell
This study was carried out with support provided by USAID through The DHS Program (#AID-OAA-C-13-00095). The views expressed are those of the authors and do not necessarily reflect the views of USAID or the United States Government.
The DHS Program assists countries worldwide in the collection and use of data to monitor and evaluate population, health, and nutrition programs. Additional information about The DHS Program can be obtained from ICF, 530 Gaither Road, Suite 500, Rockville, MD 20850 USA; telephone: +1 301-407-6500, fax: +1 301-407-6501, email: [email protected], internet: www.DHSprogram.com.
Recommended citation:
MacQuarrie, Kerry L. D., Christina Juan, and Thomas D. Fish. 2019. Trends, Inequalities, and Contextual Determinants of Child Marriage in Asia. DHS Analytical Studies No. 69. Rockville, Maryland, USA: ICF.

iii
CONTENTS
TABLES .................................................................................................................................................. v FIGURES .............................................................................................................................................. vii PREFACE .............................................................................................................................................. ix ABSTRACT ........................................................................................................................................... xi ACRONYMS AND ABBREVIATIONS ................................................................................................ xiii
1 BACKGROUND ......................................................................................................................... 1 1.1. The Burden of Child Marriage ....................................................................................... 1 1.2 Marriage in the Study Settings ...................................................................................... 2
1.2.1 Bangladesh ...................................................................................................... 2 1.2.2 India ................................................................................................................. 2 1.2.3 Indonesia .......................................................................................................... 3 1.2.4 Nepal ................................................................................................................ 3
1.3 Theories of Marriage ..................................................................................................... 4 1.3.1 Industrialization and urbanization .................................................................... 4 1.3.2 Diffusion ........................................................................................................... 4 1.3.3 Marriage markets and assortative mating ........................................................ 5 1.3.4 Economic and environmental instability and uncertainty ................................. 5
1.4 Study Aims and Hypotheses ......................................................................................... 6
2 Methods .................................................................................................................................... 7 2.1 Data ............................................................................................................................... 7 2.2 Analytical Strategy ........................................................................................................ 8
2.2.1 Trends analysis ................................................................................................ 8 2.2.2 Inequalities and socioeconomic factors associated with child marriage .......... 8 2.2.3 Spatial distribution of child marriage ................................................................ 9 2.2.4 Spatial and contextual determinants of child marriage .................................... 9
2.3 Measures .................................................................................................................... 10 2.3.1 Outcome measures ........................................................................................ 10 2.3.2 Socioeconomic variables ............................................................................... 10 2.3.3 Spatial covariates ........................................................................................... 11 2.3.4 Contextual variables ...................................................................................... 12
2.4 Ethical Considerations ................................................................................................ 13 2.4.1 Data availability .............................................................................................. 13 2.4.2 Ethical review ................................................................................................. 13
3 Trends in the Age Structure of Marriage ............................................................................. 15 3.1 Trends in the Age Structure of Marriage in Bangladesh ............................................. 15 3.2 Trends in the Age Structure of Marriage in India ........................................................ 16 3.3 Trends in the Age Structure of Marriage in Indonesia ................................................ 17 3.4 Trends in the Age Structure of Marriage in Nepal ...................................................... 18
4 Patterns and Trends in Inequality of Child Marriage .......................................................... 21 4.1 Associations of Child Marriage with Socioeconomic Characteristics ......................... 21 4.2 Trends in Educational Inequalities in Child Marriage .................................................. 21

iv
4.3 Trends in Wealth Inequalities in Child Marriage ......................................................... 22 4.4 Trends in Residential Inequalities in Child Marriage ................................................... 24
5 Spatial Distribution of Child Marriage .................................................................................. 25 5.1 Spatial Distribution of Marriage by Age 18 ................................................................. 25 5.2 Spatial Distribution of Marriage by Age 15 ................................................................. 26
6 Contextual Determinants of Child Marriage ........................................................................ 29 6.1 Gender and Fertility Context ....................................................................................... 29 6.2 Spatial Covariates ....................................................................................................... 32
6.2.1 Urbanization and industrialization covariates ................................................ 32 6.2.2 Marriage market covariates ........................................................................... 32 6.2.3 Environment and economic insecurity ........................................................... 32
6.3 Education and Wealth ................................................................................................. 32 6.4 Religion and Caste ...................................................................................................... 33
7 Discussion and Conclusion .................................................................................................. 37 7.1 Summary ..................................................................................................................... 37 7.2 Discussion ................................................................................................................... 37 7.3 Limitations and Future Directions ............................................................................... 40 7.4 Conclusion .................................................................................................................. 41
REFERENCES ...................................................................................................................................... 43

v
TABLES
Table 1 Survey sample sizes ............................................................................................ 7
Appendix Table A1 Descriptive statistics (percent distribution and means) for study sample of primary sampling units ....................................................................................... 55
Appendix Table A2 Contextual determinants of prevalence of marriage by age 18 in Bangladesh. Results from linear regression models (n=564 clusters) .......... 56
Appendix Table A3 Contextual determinants of prevalence of marriage by age 15 in Bangladesh. Results from linear regression models (n=564 clusters) .......... 57
Appendix Table A4 Contextual determinants of prevalence of marriage by age 18 in India. Results from linear regression models (n=9,472 clusters) ................... 58
Appendix Table A5 Contextual determinants of prevalence of marriage by age 15 in India. Results from linear regression models (n=9,472 clusters) ................... 59
Appendix Table A6 Contextual determinants of prevalence of marriage by age 18 in Nepal. Results from linear regression models (n=385 clusters) ................................... 60
Appendix Table A7 Contextual determinants of prevalence of marriage by age 15 in Nepal. Results from linear regression models (n=385 clusters) ................................... 61


vii
FIGURES
Figure 1 Cumulative incidence functions of age at marriage among women age 15-24, Bangladesh ...................................................................................... 16
Figure 2 Cumulative incidence functions of age at marriage among women age 15-24, India ................................................................................................. 17
Figure 3 Cumulative incidence functions of age at marriage among women age 15-24, Indonesia ......................................................................................... 18
Figure 4 Cumulative incidence functions of age at marriage among women age 15-24, Nepal ............................................................................................... 19
Figure 5 Prevalence of child marriage among women age 20-29 by education .............. 22
Figure 6 Prevalence of child marriage among women age 20-29 by wealth ................... 23
Figure 7 Prevalence of child marriage among women age 20-29 by residence .............. 24
Figure 8 Map of the prevalence of marriage by age 18 ................................................... 25
Figure 9 Map of the prevalence of marriage by age 15 ................................................... 27
Figure 10 Contextual determinants of the prevalence of marriage by age 18 among women age 20-29, Bangladesh (n=564 clusters) .............................................. 29
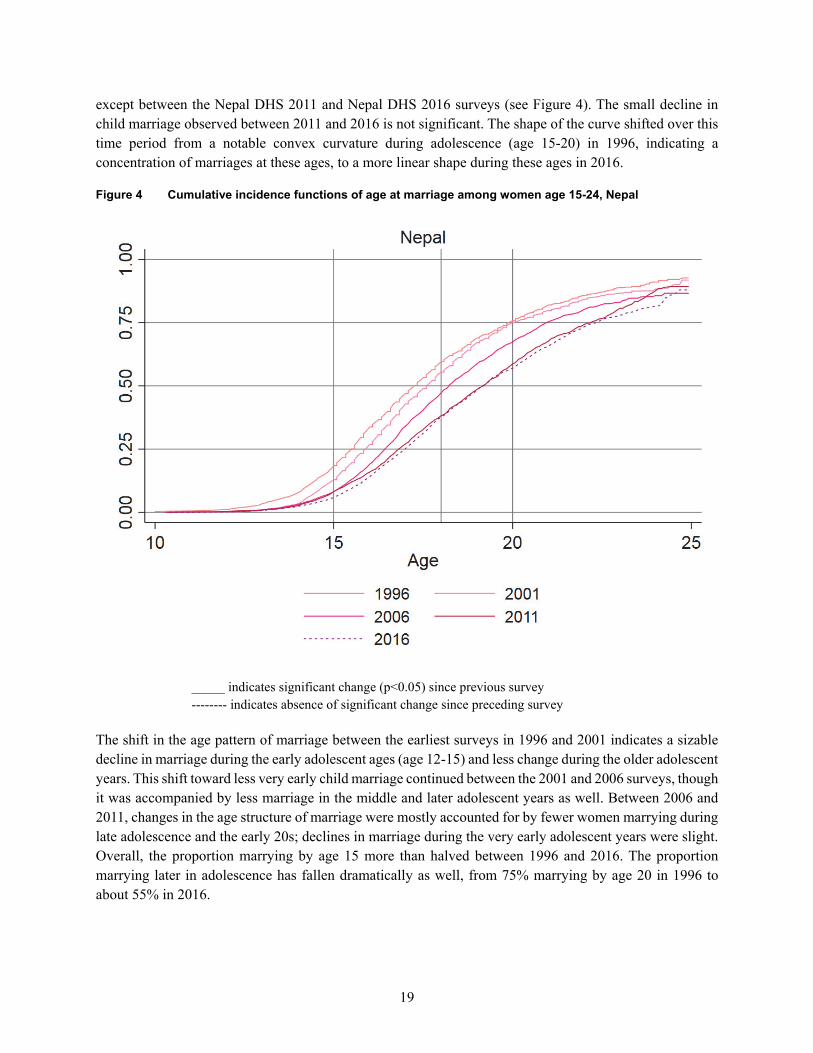
Figure 11 Contextual determinants of the prevalence of marriage by age 18 among women age 20-29, India (n=9,472 clusters) ...................................................... 30
Figure 12 Contextual determinants of the prevalence of marriage by age 18 among women age 20-29, Nepal (n=385 clusters) ........................................................ 31
Figure 13 Contextual determinants of the prevalence of marriage by age 15 among women age 20-29, Bangladesh (n=564 clusters) .............................................. 33
Figure 14 Contextual determinants of the prevalence of marriage by age 15 among women age 20-29, India (n=9,472 clusters) ...................................................... 34
Figure 15 Contextual determinants of the prevalence of marriage by age 15 among women age 20-29, Nepal (n=385 clusters) ........................................................ 35
Appendix Figure A1 Uncertainty around prevalence estimates of marriage by age 18 ..................... 55
Appendix Figure A2 Uncertainty around prevalence estimates of marriage by age 15 ..................... 63
Appendix Figure A3 International and internal boundaries and selected topographical features of Bangladesh, India, and Nepal ........................................................................ 64


ix
PREFACE
The Demographic and Health Surveys (DHS) Program is one of the principal sources of international data on fertility, family planning, maternal and child health, nutrition, mortality, environmental health, HIV/AIDS, malaria, and provision of health services.
One of the objectives of The DHS Program is to analyze DHS data and provide findings that will be useful to policymakers and program managers in low- and middle-income countries. DHS Analytical Studies serve this objective by providing in-depth research on a wide range of topics, typically including several countries and applying multivariate statistical tools and models. These reports are also intended to illustrate research methods and applications of DHS data that may build the capacity of other researchers.
The topics in this series are selected by The DHS Program in consultation with the U.S. Agency for International Development.
It is hoped that the DHS Analytical Studies will be useful to researchers, policymakers, and survey specialists, particularly those engaged in work in low- and middle-income countries.
Sunita Kishor Director, The DHS Program


xi
ABSTRACT
Child marriage—defined as marriage before age 18—is considered to be a violation of human rights and is associated with numerous adverse health, social, and economic outcomes. As such, it is the object of substantial programmatic and policy action. However, a better understanding of specifically how child marriage is or is not changing is needed to inform policies and programs to promote delayed marriage.
This study analyzes trends in the age structure of child marriage in four Asian countries—Bangladesh, India, Indonesia, and Nepal. It identifies specific patterns of and trends in inequalities of child marriage across three socioeconomic factors—education, wealth, and residence. We find significant decreases in child marriage in all four countries since the 1990s. The rate of change has been unevenly paced, with rapid increases in age at marriage followed by periods of little change. The prevalence of child marriage generally falls first at the youngest ages, followed by decreases in marriage rates later in adolescence. India has experienced the largest declines in child marriage, while marriage remains an adolescent experience for the majority of women in Bangladesh and Nepal. Child marriage is most common in Bangladesh and least common in Indonesia. There is no discernible trend toward non-marriage, but rather a trend toward delayed marriage only.
Inequalities in child marriage have mostly narrowed over the previous decade, except in Nepal. Still, we find widespread inequalities by women’s education, household wealth, and urban-rural residence, with child marriage concentrated among more disadvantaged groups. Inequalities based on education are wider than those based on either wealth or residence. A pattern of mass deprivation is observed with regard to education—child marriage is prevalent at all levels of education but the highest—while wealth-based inequalities follow a queuing pattern—child marriage increases with each category of disadvantage. These patterns of inequality suggest that policies should broadly promote delayed marriage, alongside targeted interventions directed to the most disadvantaged groups.
In addition, we assess the spatial distribution of child marriage. We find evidence of inequalities of child marriage based on geographic area residence in all study countries through use of interpolated surfaces rather than administrative units; we observe that areas across states, divisions, or provinces, such as hills and mountain ranges, are marked by high prevalence.
Finally, we identify contextual determinants of child marriage. This study provides some evidence supporting marriage market, economic and environmental insecurity, and diffusion theories of child marriage. Other determinants, such as education and wealth, suggest the value of greater investments in social infrastructure, including a more gender-equitable normative environment.
Key words: child marriage, early marriage, trends, inequalities, spatial determinants, contextual determinants, Asia, Bangladesh, India, Indonesia, Nepal


xiii
ACRONYMS AND ABBREVIATIONS
BMRC Bangladesh Medical Research Council
CEDAW Convention on the Elimination of All Forms of Discrimination Against Women CMC century month code
DHS Demographic and Health Survey
HDI Human Development Index
NHRC Nepal Health Research Council NOAA National Oceanic and Atmospheric Agency
OBC other backward caste
PSR population sex ratio PSU primary sampling unit
SC scheduled caste SDG Sustainable Development Goal ST scheduled tribe
USAID United States Agency for International Development

1
1 BACKGROUND
1.1. The Burden of Child Marriage
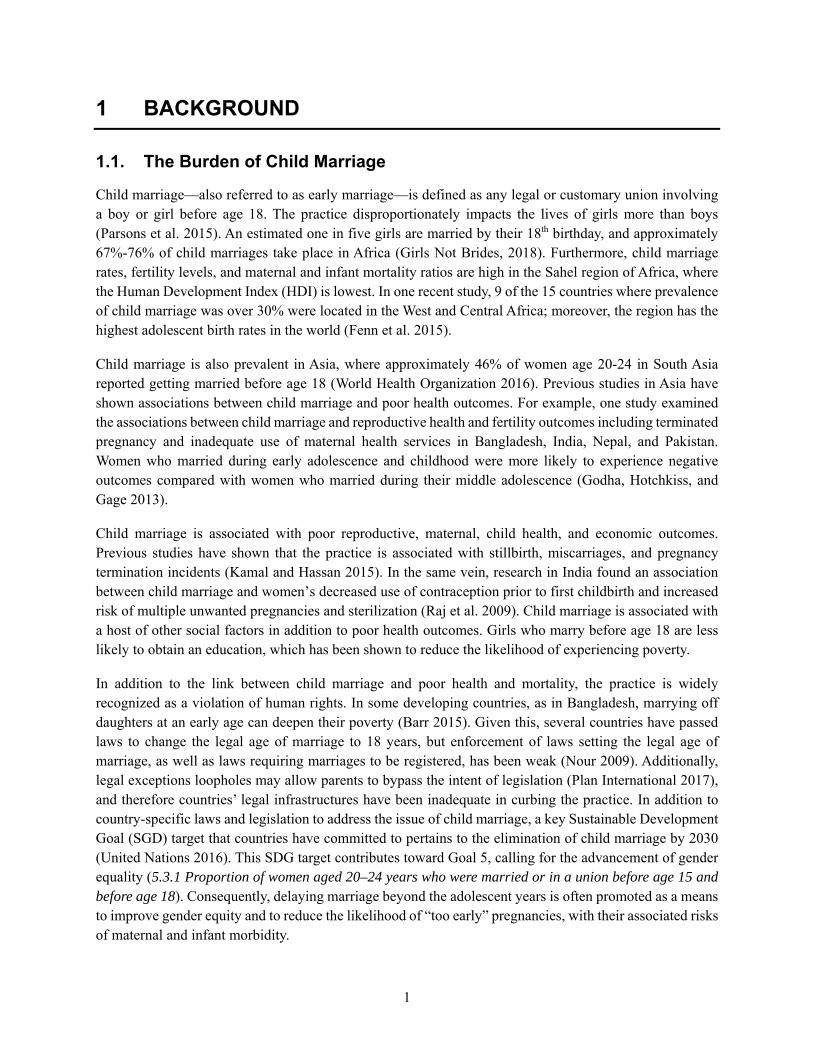
Child marriage—also referred to as early marriage—is defined as any legal or customary union involving a boy or girl before age 18. The practice disproportionately impacts the lives of girls more than boys (Parsons et al. 2015). An estimated one in five girls are married by their 18th birthday, and approximately 67%-76% of child marriages take place in Africa (Girls Not Brides, 2018). Furthermore, child marriage rates, fertility levels, and maternal and infant mortality ratios are high in the Sahel region of Africa, where the Human Development Index (HDI) is lowest. In one recent study, 9 of the 15 countries where prevalence of child marriage was over 30% were located in the West and Central Africa; moreover, the region has the highest adolescent birth rates in the world (Fenn et al. 2015).
Child marriage is also prevalent in Asia, where approximately 46% of women age 20-24 in South Asia reported getting married before age 18 (World Health Organization 2016). Previous studies in Asia have shown associations between child marriage and poor health outcomes. For example, one study examined the associations between child marriage and reproductive health and fertility outcomes including terminated pregnancy and inadequate use of maternal health services in Bangladesh, India, Nepal, and Pakistan. Women who married during early adolescence and childhood were more likely to experience negative outcomes compared with women who married during their middle adolescence (Godha, Hotchkiss, and Gage 2013).
Child marriage is associated with poor reproductive, maternal, child health, and economic outcomes. Previous studies have shown that the practice is associated with stillbirth, miscarriages, and pregnancy termination incidents (Kamal and Hassan 2015). In the same vein, research in India found an association between child marriage and women’s decreased use of contraception prior to first childbirth and increased risk of multiple unwanted pregnancies and sterilization (Raj et al. 2009). Child marriage is associated with a host of other social factors in addition to poor health outcomes. Girls who marry before age 18 are less likely to obtain an education, which has been shown to reduce the likelihood of experiencing poverty.
In addition to the link between child marriage and poor health and mortality, the practice is widely recognized as a violation of human rights. In some developing countries, as in Bangladesh, marrying off daughters at an early age can deepen their poverty (Barr 2015). Given this, several countries have passed laws to change the legal age of marriage to 18 years, but enforcement of laws setting the legal age of marriage, as well as laws requiring marriages to be registered, has been weak (Nour 2009). Additionally, legal exceptions loopholes may allow parents to bypass the intent of legislation (Plan International 2017), and therefore countries’ legal infrastructures have been inadequate in curbing the practice. In addition to country-specific laws and legislation to address the issue of child marriage, a key Sustainable Development Goal (SGD) target that countries have committed to pertains to the elimination of child marriage by 2030 (United Nations 2016). This SDG target contributes toward Goal 5, calling for the advancement of gender equality (5.3.1 Proportion of women aged 20–24 years who were married or in a union before age 15 and before age 18). Consequently, delaying marriage beyond the adolescent years is often promoted as a means to improve gender equity and to reduce the likelihood of “too early” pregnancies, with their associated risks of maternal and infant morbidity.

2
1.2 Marriage in the Study Settings
Bangladesh, India, Indonesia, and Nepal share some similarities in terms of international agreements and legal frameworks concerning the context of marriage. For instance, all four countries in our study committed to SDG target 5.3 to eliminate child, early, and forced marriage by 2030. Each of them nonetheless has unique pathways to the establishment of its marriage laws and the programmatic and policy implications that correspond with them.
1.2.1 Bangladesh
In 1990, Bangladesh set the minimum age at marriage to 18 for girls (and 21 for boys) through its ratification of the Convention on the Rights of the Child. Additionally, as part of the 2014 Kathmandu Call to Action to End Child Marriage, Bangladesh made a commitment to ensure that child brides have access to legal remedies as well as establishing age 18 as the legal age of marriage for girls (Girls Not Brides 2019a). Also in 2014, the Government of Bangladesh signed a charter to end child marriage by 2020. It is worth noting, however, the existence of a clause in the Child Marriage Restraint Act 2017 that allows for child marriage to take place “in special cases.”
Given the high rates of child marriage in Bangladesh, research and programs have been implemented in the country to help improve a girl’s chances of living a healthy and productive life through strategies that may delay marriage. The BALIKA project, for example, carried out a four-armed randomized controlled trial that was designed and implemented by the Population Council from February 2014 to August 2015 (Population Council 2019). The project evaluated three different skills-building approaches related to education, life skills, and livelihoods: one group of girls received tutoring in mathematics and English, as well as computing or financial skill training; a second group of girls received training on gender rights and negotiation, critical thinking, and decisionmaking; and a third group of girls received training in entrepreneurship, mobile phone servicing, photography, and basic first aid (Amin, Saha, and Ahmed 2018). Based on promising results from all approaches, the Population Council partnered with the Bangladesh Ministry of Women and Children Affairs, UNFPA, and UNICEF to expand the BALIKA program to new districts with the highest child marriage rates, through holistic approaches. Most recently, the Ministry of Women and Children Affairs and UNICEF Bangladesh in 2018 jointly launched the National Plan of Action to End Child Marriage (2018-2030) (UNICEF 2018b). Alongside these evidence-based interventions, practitioners have been working to ensure that marriage registrars do not perform marriages of girls under age 18 by helping them identify falsified information (Freccero and Whiting 2018).
1.2.2 India
In India, the legal age at marriage was set at 18 through the 1992 Convention on the Rights of Children. The following year, in 1993, India ratified the Convention on the Elimination of All Forms of Discrimination Against Women (CEDAW) to ensure free and full consent to marriage. More than a decade later, in 2006, India set the minimum legal age of marriage at 18 for girls (and 21 for boys) without exceptions, according to the Prohibition of Child Marriage Act (International Center for Research on Women and Plan Asia Regional Office 2013). Some, however, have petitioned against this minimum age at marriage, arguing that this law does not apply to Muslims because their marriages are governed by other laws. Nonetheless, cases to appeal the legal age at marriage have been rejected. Similar to Bangladesh, India had representatives at the 2014 Kathmandu Call to Action to End Child Marriage and committed

3
access to legal reparations for those who married as children, and the operationalization of its legal age of marriage. During India’s 2017 Universal Periodic Review, the country discussed recommendations to better enforce legal provisions against child marriage.
At the national and state levels in India, there is movement to address child marriage, albeit varied and uneven. A National Strategy on the Prevention of Child Marriage as well as a National Action Plan have been drafted but have not yet been finalized. The National Action Plan, for instance discusses proposals to shift social and behavioral norms, empower adolescents, and provide quality education. In terms of state-level action, in 2017, Rajasthan launched a Strategy and Action Plan for the Prevention of Child Marriage. Also, the Government of India has carried out programs using cash incentives, adolescent empowerment, and behavior change in order to address child marriage (Girls Not Brides 2019b). One program, the Rajiv Gandhi Scheme for Empowerment of Adolescent Girls, or Sabla, takes a holistic approach to working with girls in more than 250 districts in India. Through this initiative, which started in 2010, Sabla has several components that include nutrition, health care service access, vocational training, and life skills for adolescent girls (HAQ: Centre for Child Rights 2014). Another initiative that the Government of India established is the National Bravery Award, which recognizes children who demonstrate bravery and serve as positive role models; for example, the award was given to children who stood up to their community leaders and opposed child marriages, and successfully prevented these practices from happening.
1.2.3 Indonesia
The 1974 Marriage Law in Indonesia set the minimum age at marriage for women at 16 and 19 for men. In 1984, to help set the stage for legal frameworks regarding marriage, Indonesia ratified CEDAW to ensure free and full consent to marriage. In 1990, in contrast to the 1974 Marriage Law, the country ratified the Convention on the Rights of the Child, which set the minimum age for marriage at 18. Indonesia built momentum through a 2013 commitment to strengthen efforts protecting children from all forms of violence, including child marriage, through the Association of Southeast Asian Nations Declaration on the Elimination of Violence against Women and Children. Nationally, the Indonesian government drafted the National Strategy for the Elimination of Violence Against Children (2016-2020), which includes priorities such as analyzing risks and impacts of child marriage; increasing access to sexual and reproductive health services in areas with high child marriage rates; developing strategies to change behaviors and shift social norms; and strengthening linkages between efforts to end gender-based violence and violence against children. Indonesia also announced its development of a draft National Action Plan on Eliminating Child Marriage (Girls Not Brides 2019c). At the end of 2018, given the marriage laws with contradictory minimum age requirements, Indonesia’s Constitutional Court decided to revise the 1974 Marriage Law No. 4, setting the minimum age at marriage for girls from 16 to 18 in alignment with the Constitution and Child Protection Law. The Constitutional Court gave Indonesia’s parliament, Dewan Perwakilan Rakya, DPR, three years to change the law.
1.2.4 Nepal
In Nepal, through the 1971 Marriage Registration Act, the minimum legal age of marriage is age 20 for both girls and boys; marriage at age 18 is allowed with parental consent (Danish National ID Centre 2018). Under this law, anyone who is part of, performs, or arranges marriages of children is subject to prosecution, imprisonment, and fines (Human Rights Watch 2016). In 2014, the Government of Nepal signed a charter
4
committing to end child marriage by 2020. During the country’s 2015 Universal Periodic Review, several recommendations were flagged related to addressing child marriage and are being implemented.
In 2016, after many delays the government launched its National Strategy to End Child Marriage (Human Rights Watch 2016), with six specific components to end child marriage. Aims include the empowerment of girls, quality education for girls, and the provision of services. In addition to the launch of this strategy, the Government of Nepal developed a corresponding costing plan (Girls Not Brides 2019d). While these strategies and laws have been put in place, there is limited evidence on whether government officials, law enforcement, and other stakeholders are enforcing the aims to end early, child, and forced marriage.
1.3 Theories of Marriage
1.3.1 Industrialization and urbanization
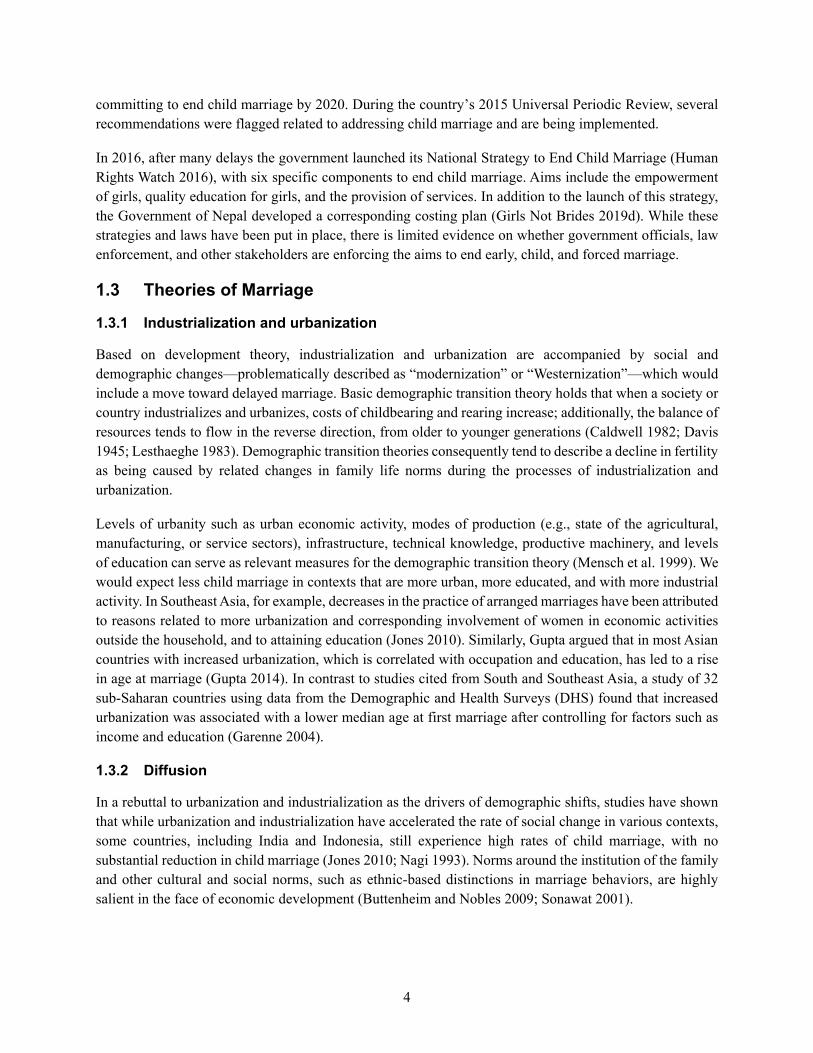
Based on development theory, industrialization and urbanization are accompanied by social and demographic changes—problematically described as “modernization” or “Westernization”—which would include a move toward delayed marriage. Basic demographic transition theory holds that when a society or country industrializes and urbanizes, costs of childbearing and rearing increase; additionally, the balance of resources tends to flow in the reverse direction, from older to younger generations (Caldwell 1982; Davis 1945; Lesthaeghe 1983). Demographic transition theories consequently tend to describe a decline in fertility as being caused by related changes in family life norms during the processes of industrialization and urbanization.
Levels of urbanity such as urban economic activity, modes of production (e.g., state of the agricultural, manufacturing, or service sectors), infrastructure, technical knowledge, productive machinery, and levels of education can serve as relevant measures for the demographic transition theory (Mensch et al. 1999). We would expect less child marriage in contexts that are more urban, more educated, and with more industrial activity. In Southeast Asia, for example, decreases in the practice of arranged marriages have been attributed to reasons related to more urbanization and corresponding involvement of women in economic activities outside the household, and to attaining education (Jones 2010). Similarly, Gupta argued that in most Asian countries with increased urbanization, which is correlated with occupation and education, has led to a rise in age at marriage (Gupta 2014). In contrast to studies cited from South and Southeast Asia, a study of 32 sub-Saharan countries using data from the Demographic and Health Surveys (DHS) found that increased urbanization was associated with a lower median age at first marriage after controlling for factors such as income and education (Garenne 2004).
1.3.2 Diffusion
In a rebuttal to urbanization and industrialization as the drivers of demographic shifts, studies have shown that while urbanization and industrialization have accelerated the rate of social change in various contexts, some countries, including India and Indonesia, still experience high rates of child marriage, with no substantial reduction in child marriage (Jones 2010; Nagi 1993). Norms around the institution of the family and other cultural and social norms, such as ethnic-based distinctions in marriage behaviors, are highly salient in the face of economic development (Buttenheim and Nobles 2009; Sonawat 2001).
5
Diffusion theory describes that normative behavior change—such as the elimination of child marriage or the adoption of modern contraceptive methods—is delineated by cultural-linguistic patterns, as new information and ideas permeate within and between affiliated groups (Casterline 2001; Cleland 1985; Cleland and Wilson 1987; Montgomery and Casterline 1993; Retherford and Palmore 1983). In an influential study in this area, Dyson and Moore documented that marriage and a range of other demographic behaviors appeared in a gradient between northwestern and southeastern parts of India, with the Satpura hill and Chota Nagpur hill ranges acting as a line of demarcation (Dyson and Moore 1983). They posited that the northwest-southeast contrast could be attributed to the different marriage systems and their respective gender-relations dynamics, with more exogenous marriage practiced in the north and more endogenous marriage in the south. In addition to geographic proximity, diffusion theory is often characterized by measures of linguistic group, ethnicity, or religious affiliation.
1.3.3 Marriage markets and assortative mating
The concept of marriage markets has been used to describe both the rate of marriage and the patterns of partnering observed in marriages. Borrowing the economic language of supply and demand, the marriage market “clears” when there is a sufficient pool of appropriate partners, given norms about age, education, and socioeconomic dimensions (among others) of hypergamy or homogamy (Becker 1974). It is believed, therefore, that the marriage market is most constrained for highly educated women, for whom it may be difficult to find men who are just as educated or more educated (Blau, Kahn, and Waldfogel 2000). Similarly, men with less wealth may find it difficult to find a marriage partner in an equivalent or more disadvantaged socioeconomic position (Gupta 2014). In a study in Bangladesh, parents reported that their daughter’s education was desirable to the extent that it helped them compete in the marriage market (Arends-Kuenning and Amin 2001). When the overall marriage market is greatly constrained, for example by highly skewed sex ratios (Mensch et al. 1999), the marriage market squeeze (Banerjee 1999) may be alleviated by expanding the pool of eligible brides to increasingly younger women or to women geographically farther afield. Indeed, the issue of importing brides and cross-border marriage has received media attention (e.g., Denyer and Gowen 2018). We would expect more child marriage under circumstances of a tight marriage market.
1.3.4 Economic and environmental instability and uncertainty
Natural and man-made disasters, with their resulting economic shocks, are drivers of child marriage around the world. Girls and women—and adolescent girls in particular—are disproportionately affected by natural disasters such as tsunamis, as well as conflicts and crises. It is especially important in emergency settings to consider the links between climate change and adolescent girl health and human rights (Atkinson and Bruce 2015; Potts and Henderson 2012). Vulnerabilities related to climate change are also common (Potts and Henderson 2012). A study in Bangladesh that examined the links between child and forced marriage, dowry, and climate change suggested that the effects of climate change on the livelihoods and resources of families caused adaptive responses such as dowry demands to increase by approximately 50% (Alston et al. 2014). The economic situation of families in Bangladesh is made more vulnerable as the country’s sea levels rise and climate change brings related sustained challenges; these issues impact both rural and urban areas and affect social relations.
In addition to climate change and other natural economic shocks, Human Rights Watch finds that armed conflict increases the likelihood of forced marriage of girls, as tactics used by the Islamic State, Boko

6
Haram, and other extremist groups. As in Bangladesh, insecurities such as armed conflict have led to more families marrying off their daughters early in order to avoid deepening poverty (Varia 2016). In contrast to research that finds that armed conflicts can increase child marriage rates, other research has pointed to how civil strife, wars, and economic crises may lead to a delay in marriage (Garenne 2004). For example, unemployment or lack of arable land has caused young, eligible men to migrate to other communities, which delays age at first marriage among young women. Garenne (2004) asserts that this may have been the situation in urban Senegal, where age at marriage has increased.
1.4 Study Aims and Hypotheses
This study examines trends in child marriage and socioeconomic factors associated with marriage over the past three decades in four Asian countries: Bangladesh, India, Indonesia, and Nepal. The prevalence of child marriage is: Bangladesh (59% according to the 2014 DHS); India (27% according to the NFHS 2015-2016); Indonesia (14% according to the SUSENAS 2013); and Nepal (40% according to the DHS 2016) (UNICEF 2018a).
Our research questions are:
To what extent has child marriage decreased since the early 1990s? As child marriage has declined over time, has the age distribution of marriage changed?
Is child marriage a generalized phenomenon across all socioeconomic groups, or is it inequitably concentrated? If so, among which groups? As child marriage has declined over time, has it become more or less equitably distributed across socioeconomic groups?
What is the spatial distribution of child marriage? Is the prevalence of child marriage concentrated or evenly distributed across geographic areas?
Which contextual factors are associated with child marriage, including factors related to the gender, fertility, industrialization, sociocultural, and socioeconomic contexts?

7
2 METHODS
2.1 Data
We use data from a total of 21 DHS surveys in four countries: Bangladesh 1993-94, 1996-97, 1999-2000, 2004, 2007, 2011, 2014; India 1998-99, 2005-06, 2015-16; Indonesia 1991, 1994, 1997, 2002-03, 2007, 2012; and Nepal 1996, 2001, 2006, 2011, and 2016. DHS surveys are nationally representative, household surveys with data on a wide range of population, reproductive health, nutrition, and maternal and child health indicators, including age of marriage and possible correlates. Data are representative at the national level, urban-rural residence level, and typically at least one subnational regional level in each survey.
The DHS surveys in this study range in total sample size from about 8,400 to 700,000 women. The largest sample sizes are found among the India surveys. Response rates of eligible women range from 92%-98%. This study focuses its analyses on young women age 15-29 or specific age groups within this range. The average analytic sample size approaches 32,000 women age 15-29. Sample details are shown in Table 1.
Table 1 Survey sample sizes
Survey/Year Eligible respondents Eligible woman response rate
Sample size
Age 15-19 Age 20-24 Age 25-29 Age 15-29 Age 15-49 Bangladesh Bangladesh 2014 Ever married women 96.4 2,023 3,161 3,343 8,527 17,863 Bangladesh 2011 [1] Ever married women 95.8 1,911 3,456 3,387 8,754 17,749 Bangladesh 2007 [2] Ever married women 97.8 1,348 2,174 1,935 5,457 10,996 Bangladesh 2004 [2] Ever married women 98.4 3,293 2,595 2,100 7,988 11,300 Bangladesh 1999-00 [2] Ever married women 96.2 3,006 2,345 2,101 7,452 10,373 Bangladesh 1996-97 [2] Ever married women 96.8 2,533 2,075 1,989 6,597 8,981 Bangladesh 1993-94 [2] Ever married women 96.5 2,562 2,329 2,038 6,929 9,493
India India 2015-16 All women 94.3 124,878 122,955 115,076 362,909 699,686 India 2005-06 All women 92.4 23,955 22,807 20,653 67,415 124,385 India 1998-99 Ever married women 93.0 20,130 20,401 19,420 59,951 90,303
Indonesia Indonesia 2012 All women 95.0 7,207 6,589 7,160 20,956 45,607 Indonesia 2007 Ever married women 95.1 914 4,156 6,170 11,240 32,895 Indonesia 2002-03 Ever married women 97.3 924 3,892 5,528 10,344 29,483 Indonesia 1997 Ever married women 97.1 5,896 6,286 6,555 18,737 28,810 Indonesia 1994 Ever married women 96.9 6,082 6,235 6,443 18,760 28,168 Indonesia 1991 Ever married women 96.7 4,777 5,200 5,503 15,480 22,909
Nepal Nepal 2016 All women 96.8 2,622 2,306 2,094 7,022 12,862 Nepal 2011 All women 97.6 2,790 2,281 2,129 7,200 12,674 Nepal 2006 All women 98.0 2,437 2,042 1,770 6,249 10,793 Nepal 2001 Ever married women 97.8 916 1,651 1,646 4,213 8,726 Nepal 1996 Ever married women 97.9 2,179 1,913 1,668 5,760 8,429 [1] Data collected for women age 12-49. [2] Data collected for women age 10-49.
Typically, DHS surveys interview all de facto women age 15-49 in sampled households. However, only ever-married women are eligible for interview in certain surveys. DHS surveys employ multistage, clustered sampling. Details of the sampling strategy can be found in final reports for each survey (Badan Pusat Statistik-Statistics Indonesia – BPS and ORC Macro 2003; CBS et al. 1991, 1995, 1998; Family Health Division of the Department of Health Services of the Ministry of Health/Nepal, New ERA/Nepal,

8
and ORC Macro 2002; Health et al. 2012; Health et al. 2007; IIPS and ICF 2017; IIPS and Macro International 2007; IIPS and ORC Macro 2000; Ministry of Health – MOH/Nepal, New ERA/Nepal, and ICF 2017; Mitra et al. 1997; Mitra et al. 1994; NIPORT, Mitra and Associates, and ICF International 2016; NIPORT, Mitra Associates, and ICF International 2013; NIPORT, Mitra Associates, and Macro International 2009; NIPORT, Mitra Associates, and ORC Macro 2001, 2005; Pradhan et al. 1997; Statistics Indonesia – Badan Pusat Statistik – BPS and Macro International 2008; Statistics Indonesia – Badan Pusat Statistik – BPS et al. 2013).
All analyses are conducted in Stata 15 (StataCorp 2017), and are weighted to account for sampling probability and non-response and use the svy suite of commands to account for the complex sampling design. Samples of ever-married women are adjusted using the all woman factors (awfactt, awfactu, awfacte, and awfactw) to account for this sampling restriction and to produce unbiased estimates of marriage age.
2.2 Analytical Strategy
This study consists of four related analyses. The first is a trends analysis and the second examines inequities in marriage age over time, in all four study countries. The third analysis examines the spatial distribution of child marriage within three countries: Bangladesh, India, and Nepal. The fourth analysis is a multivariable regression analysis of the contextual determinants predicting child marriage at the cluster level, also in these three countries.
2.2.1 Trends analysis
In the trends analysis, we use data from all 21 surveys to examine trends from the early 1990s through the most recent survey between 2012 (Indonesia) and 2016 (India and Nepal).
We use survival analysis methods to estimate the cumulative incidence function of age of marriage among women age 15-24. Unlike medians, survival analysis facilitates the use of data from all women throughout the age spectrum, regardless of right censoring due to young age or whether marriage is a rare event at young ages. These survival curves illustrate shifts in the age structure of child and early marriage. Tarone-Ware tests of equality are used to detect statistically significant changes between surveys (Cleves et al. 2010; Tarone and Ware 1977).
2.2.2 Inequalities and socioeconomic factors associated with child marriage
The second analysis examines socioeconomic factors associated with marriage by age 15 and by age 18 among women age 20-29 at the time of the survey. For this analysis, we use the most recent DHS survey in each country and the DHS survey that is approximately 10 years earlier to identify whether the factors associated with child marriage have shifted over the preceding decade. Chi-square tests of independence are used to assess any association between marriage age and socioeconomic factors at both time points. We analyze child marriage in relation to wealth, education, and rural-urban residence.
We further analyze whether the phenomenon of child marriage is equitably distributed across these factors. We examine whether child marriage has become more concentrated in certain population subgroups over time or whether it has converged at a common level among all subgroups. That is, we analyze whether child marriage has become more or less inequitable over the preceding decade. We employ equiplots in Stata to

9
present the results of this analysis (International Center for Equity in Health 2014). We identify the pattern of inequality, if any exists, as (1) a mass deprivation pattern if child marriage is prevalent in all population subgroups except the most advantaged; (2) a queuing pattern if child marriage increases with each category of disadvantage; or (3) a marginalization pattern if child marriage is concentrated only among the most disadvantaged subpopulations and rarer in all other, more advantaged subgroups (WHO 2013a). A pattern of universal coverage would indicate low levels of child marriage among all population subgroups, with no observed inequalities among them.
2.2.3 Spatial distribution of child marriage
Health geographers argue that spatial distribution of health outcomes is one, often overlooked, dimension of health inequalities (Burgert-Brucker et al. 2015; Burgert-Brucker et al. 2016; Tugwell, Robinson, and Morris 2007; Wirth et al. 2006). In Timothy Evans and Hilary Brown’s PROGRESS conceptual framework1 of health inequity, place of residence occupies the first ‘P’ position (Gwatkin 2007). Indeed, rural-urban residence and region are the most common stratifiers used to account for geographic inequalities. More systematic spatial analyses can provide more nuance. In this study, we are interested in examining the spatial distribution of child marriage and identifying whether child marriage is concentrated in specific areas or is geographically generalized throughout study countries.
We produce interpolated surface maps of the prevalence of child marriage, first of marriage by age 18 and second of marriage by age 15, in Bangladesh, India, and Nepal, using kriging at a 10 km by 10 km resolution. Geospatial researchers at The DHS Program have identified age at marriage as one indicator that is important and appropriate to map using spatial interpolation (Burgert 2014). The method that we use takes point data of prevalence from primary sampling units (PSUs) from the most recent DHS surveys in these countries and creates a modeled surface layer. Prevalence was estimated using the ordinary kriging implementation found in ESRI ArcGIS 10.6 (ESRI 2017). The semivariogram model was set to spherical and the search radius was set to variable with the maximum distance set to 100 km and the number of points set to 0. We also produce maps of the variance or uncertainty of these methods. The estimated prevalence for Bangladesh, India, and Nepal is mapped as a common surface because the countries are contiguous and because data collection in the three separate surveys in 2014, 2015-16, and 2016, respectively, covered roughly a common period. Geocoordinates of sampled PSUs (also known as sample clusters) were not collected in Indonesia, so Indonesia is omitted from this analysis.
2.2.4 Spatial and contextual determinants of child marriage
In the final analysis of child marriage, we analyze the contextual determinants of child marriage using the cluster as the unit of analysis. As potential contextual determinants, we include cluster-level measures of various factors, including spatial covariates that represent various theoretical explanations of marriage, the gender, fertility, sociocultural, and socioeconomic context of those clusters.
One limitation of cross-sectional data in the study of marriage timing is that many of the individual-level measures available, such as the wealth, education, and residence variables used in the analysis of
1 PROGRESS stands for Place of residence, Race, Occupation, Gender, Religion, Education, Socioeconomic status, and Social capital.

10
inequalities, are collected at the time of the survey. Thus, temporally, they follow rather than precede the marriage and may be inappropriate to interpret as possible determinants of individual women’s age of marriage. Using these measures at the cluster level, however, avoids this limitation. It has the further advantage of describing the normative context in the geographic setting in which women and their families make decisions about when to marry. We estimate first bivariate and then multivariate regression models. All models are weighted using a cluster weight, calculated as the mean individual sample weight in each cluster, which accounts for sampling probability and household non-response in the cluster. As with the spatial distribution of child marriage, the analysis of spatial and contextual determinants of child marriage is possible only for Bangladesh, India, and Nepal, because geocoordinates are not available for Indonesia.
2.3 Measures
2.3.1 Outcome measures
Our outcome of interest is age at first marriage. For the remainder of this study, the term “marriage” is used to refer to first marriage and refers equally to formal unions and the more informal condition of “living with someone as if married”. The DHS invests significant effort to ensure that dates of key events, including marriage, are accurately reported through multiple data checks and procedures for reconciling discrepant reports and imputing missing information (Croft, Marshall, and Allen 2018; ICF International 2012; Pullum 2006). Like most dates, date of marriage is recorded in DHS recode datasets in century month codes (CMC), which is the number of months since January 1900. Age at first marriage is calculated as the difference between the CMC of marriage and CMC of date of birth. For the trends analysis using survival curves, age at first marriage is expressed as a continuous variable in months. For the regression analysis, the outcome variable is the cluster-level prevalence of marriage by age 18 and by age 15, respectively, expressed as a proportion between 0 and 1.
2.3.2 Socioeconomic variables
For the analysis of socioeconomic factors associated with age at first marriage, our outcome is operationalized as two dichotomous variables: marriage by age 15 and marriage by age 18. We present the proportion married by each of these ages because we are interested in all child marriage (< age 18), and especially in the youngest child marriage (< age 15), which carries with it even more biological risks and social vulnerabilities.
The socioeconomic factors in this study are: women’s education, household wealth, and residence.
Women’s education at the time of the survey is categorized into no education, primary, secondary, and higher education.
Household wealth is a measure of relative wealth. A household wealth index is calculated based on ownership of a range of assets and housing materials. Wealth quintiles are then calculated based on the distribution of the index across the de jure population. The construction of both the household wealth index and quintiles, now standard in DHS surveys, is described in detail elsewhere (Rutstein and Johnson 2004).
Residence captures whether the respondent resides in a rural area or an urban area at the time of the survey, based on a priori classification of primary sampling units selected for the survey. In Nepal, a change in classification criteria between 2011 and 2016 resulted in the designation of areas as urban municipalities

11
that had previously been defined as rural areas, resulting in an overall increase from 58 municipalities in 2011 to 263 municipalities by 2016. As a result of the changed definition, rural-urban residence cannot be directly compared between the Nepal DHS 2016 and 2011 or earlier surveys.
In the analysis of inequalities, rural women, women in the poorer wealth quintiles, and women with no education or with only a primary education are considered to be relatively disadvantaged. These are denoted by yellow/orange shades, with more advantaged groups indicated by dark teal shades in the equiplots.
2.3.3 Spatial covariates
To examine contextual determinants of child marriage in Bangladesh, India, and Nepal, we examine the following spatial covariates: aridity, nightlights, and the adult population sex ratio. The first of these spatial covariates comes from standard DHS geospatial covariate datasets (designated as GC files). Since 2018, The DHS Program has made available through its Spatial Data Repository (https://spatialdata. dhsprogram.com/home/) a curated set of 22 population, climate, and environmental covariates from external sources that are linked with survey cluster locations in DHS surveys to facilitate geospatial statistical analyses. Details on how these external geospatial data are extracted and linked with cluster locations are found elsewhere (Dontamsetti et al. 2018; Perez-Haydrich et al. 2013). The second and third spatial covariates used in this study were not included in the standard geospatial covariate data files. While they come from a separate external source, they were extracted and linked to the cluster locations in the DHS surveys for Bangladesh, India, and Nepal using the same approach as described above.
This study measures aridity at the cluster level using the 2010 Aridity Index. The Aridity Index (AI) is defined as the ratio of annual precipitation to annual potential evapotranspiration and is a key parameter for characterizing drought (Mayala et al. 2018). The original data source for AI2010 is high-resolution grids from the Climate Research Unit (Climate Research Unit 2017; Harris et al. 2014). The resulting index ranges from 0 (most arid) to 300 (most wet). To assist in interpretation, we have reverse coded this index so that higher values indicate that a cluster was more arid in 2010.
This aridity measure serves as a proxy for economic and environmental instability in this study. Per the theory outlined earlier, we hypothesize that, if aridity is associated with child marriage, the prevalence of child marriage would be higher in clusters experiencing greater aridity in 2010.
Nightlights composite is a measure of the average nighttime luminosity of the area in a buffer (2 km for urban PSUs or 10 km for rural PSUs) surrounding the DHS cluster (Mayala et al. 2018). A nightlights composite variable is available in the DHS Spatial Data Repository. This study uses the 2010 nightlights composite variable, which is different from the (2015) nightlights variable available in the standard DHS geospatial covariate datasets. The original nightlights raster (stable_lights.avg_vis version) was downloaded from the National Geophysical Data Center at NOAA (National Geophysical Data Center 2013). This raster contains values from persistent nighttime lights from 2010, while excluding wildfires and background statistical noise. The nightlights covariate measures the degree of electrification of dwellings, commercial and industrial premises, and infrastructure, controlling for density of population (Mayala et al. 2018; Min et al. 2013), as such, it can be interpreted as a measure of industrial economic activity and urbanization. As described above, theories of industrialization and urbanization would lead us to hypothesize that, if there is any relationship detected, prevalence of child marriage would be lower in clusters with higher nightlights values.

12
Adult population sex ratio (PSR) is not a variable in the standard geospatial covariates datafiles. This measure is a customized extraction for this study. The adult PSR was calculated using a composite of the population breakdown from WorldPop (WorldPop 2016). The individual breakdowns by sex and age were downloaded for 2010 and the total number of men and women age 15-49 was calculated at the cell level. The two resulting rasters showing the population of reproductive age were used to calculate the sex ratio by dividing the total number of men (age 15-49) by the total number of women (age 15-49) for each cell.
A higher value of the resulting adult PSR (>1) indicates a more masculine sex ratio in the cluster, and a lower value (<1) indicates a more feminine sex ratio. The adult PSR is used to characterize the availability of potential mates in the marriage market. Theories of assortative mating marriage market squeeze would lead us to hypothesize that clusters with a PSR skewed toward men would have a higher prevalence of child marriage as age hypergamy is extended downward toward younger women for marriageable men.
All three spatial covariates are lagged to use data from 2010, because the mean duration of marriages observed in the data is 4.5 years for Bangladesh, 3.7 years for India, and 3.8 years for Nepal. This lag ensures that the spatial covariates characterize local conditions shortly preceding the majority of marriages.
2.3.4 Contextual variables
We also include cluster-mean levels of the several variables from the DHS datasets for the three study countries in the analysis of contextual determinants. These variables are as follows:
Attitudes toward violence are captured with a measure of the acceptance of wife-beating—as the proportion of women in a cluster who report that a husband is justified in hitting or beating beat his wife in any of five scenarios: if she goes out without telling him; if she neglects the children; if she argues with him; if she refuses to have sex with him; or if she burns the food. This is one of two variables that describe the gender context, which may influence child marriage.
Women’s health decisionmaking is measured as the proportion of married women in a cluster who report that they make decisions, either on their own or jointly, regarding their own health. This is the second of two variables describing the gender context.
Ideal number of children reflects fertility preferences and is calculated as the mean number of children women in a cluster report that they want in response to the question, “If you could go back to the time you did not have any children and could choose exactly the number of children to have in your whole life, how many would that be?” This measure is used to characterize the fertility context of study clusters, which may be associated with child marriage.
We include two cluster-level measures of the distribution of socioeconomic characteristics in this study.
Education is a categorical variable describing the percent distribution of women’s educational attainment in each cluster. It is calculated as the proportion of women who have completed primary schooling and the proportion who have completed secondary education or higher. The proportion of women with no education serves as the reference category.
Household wealth is calculated from an index of assets, housing materials, and sanitation resources present in a household, which is then divided into quintiles. This is a precalculated variable available in standard

13
DHS recode data files. In this study, we include a categorical variable describing the percent distribution across the five household wealth quintiles in each cluster. The poorest wealth quintile is used as the reference category.
Residence is a dichotomous measure at the cluster level with each PSU classified as either urban or rural. This variable is included in bivariate regressions, but excluded from multivariable regressions on child marriage due to high correlation (pearson’s r= -0.63 - -0.72) with nightlights, the other variable used in reference to urbanization and industrialization explanations for child marriage.
In models for all three countries, we include a measure of the religious composition of each cluster. In models for India and Nepal, we also include a measure of the caste composition of each cluster. There is no variable for caste available in the Bangladesh DHS. These two variables speak to diffusion theory, which suggests that social and demographic change spreads through geographic proximity but also through sociocultural groups.
Religion is a country-specific, categorical variable. In Bangladesh, religion captures the proportion of women in the cluster who are (in declining order of national prevalence): Muslim, Hindu, Buddhist, Christian, or “other”. In India, the categories are Hindu, Muslim, Christian, Sikh, Buddhist, or “other” (e.g., Jain, Jewish, Parsi/Zoroastrian, none, etc.). In Nepal, the categories are Hindu, Buddhist, Muslim, Christian, and “other” (usually Kirat). In each country, the most prevalent religion is designated the reference category.
Caste is similarly a country-specific, categorical variable. In India, caste is categorized as general caste, scheduled caste, scheduled tribe, and “other backward caste” (OBC). In Bangladesh, the caste categories are Brahmin/Chhetri; Terai/Madhesi other castes; Dalit; Janajati/Newar; and “other”. General caste and Brahmin/Chhetri, respectively, are the reference categories.
2.4 Ethical Considerations
2.4.1 Data availability
The DHS Program prepares and makes available DHS survey data in the form of standard recode files in a range of file formats for use with several statistical software packages. All data used in this study are publicly available and free of charge upon registration at https://www.dhsprogram.com/Data/. Spatial covariates are also available at the same site and at the DHS Spatial Data Repository (https://spatialdata.dhsprogram.com/home/).
2.4.2 Ethical review
DHS survey protocols undergo ethical review in the United States with ICF’s institutional review board.2 The Bangladesh and Nepal surveys underwent a second human subjects review with the Bangladesh Medical Research Council (BMRC) and the Nepal Health Research Council (NHRC), respectively. The Indonesia Ministry of Health has determined that the Indonesia surveys did not require a second ethical review. Prior to release, all survey data are anonymized and, where geographic coordinates of primary
2 Or that of its predecessor organizations, ORC Macro and Macro International.

14
sampling units are collected, these coordinates are offset by up to 2 km in urban areas and 5-10 km in rural areas to prevent identification (Burgert et al. 2013; Mayala et al. 2018).
15
3 TRENDS IN THE AGE STRUCTURE OF MARRIAGE
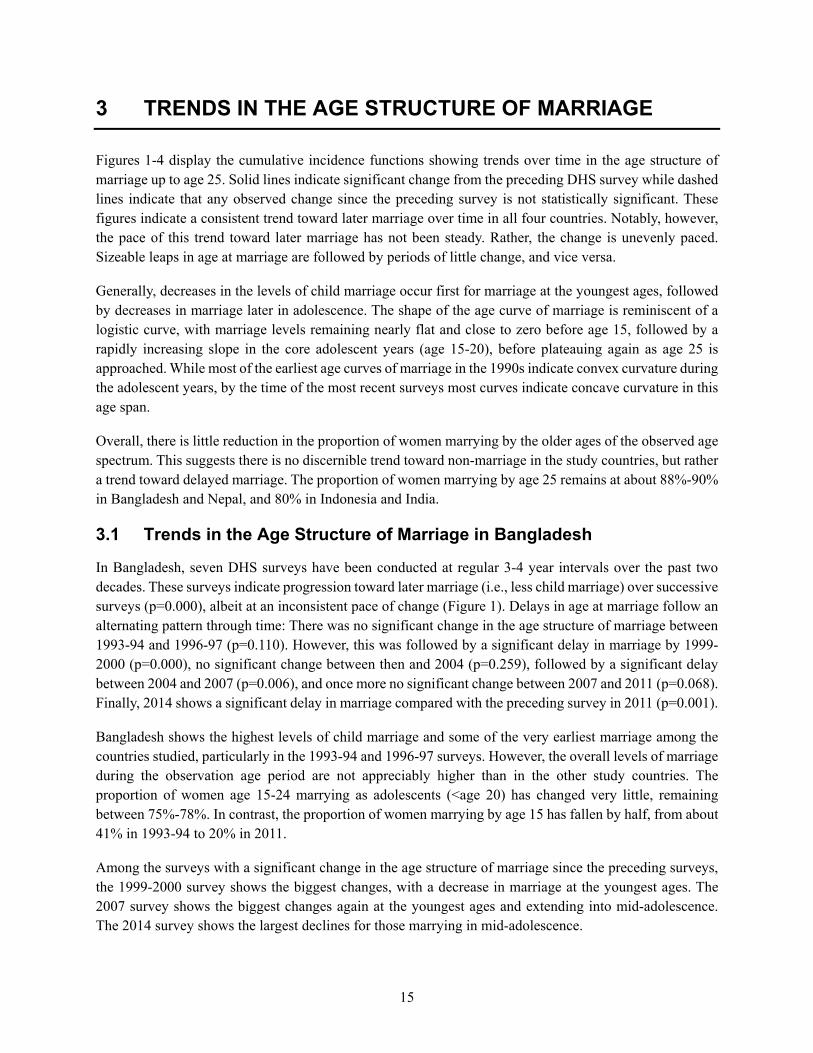
Figures 1-4 display the cumulative incidence functions showing trends over time in the age structure of marriage up to age 25. Solid lines indicate significant change from the preceding DHS survey while dashed lines indicate that any observed change since the preceding survey is not statistically significant. These figures indicate a consistent trend toward later marriage over time in all four countries. Notably, however, the pace of this trend toward later marriage has not been steady. Rather, the change is unevenly paced. Sizeable leaps in age at marriage are followed by periods of little change, and vice versa.
Generally, decreases in the levels of child marriage occur first for marriage at the youngest ages, followed by decreases in marriage later in adolescence. The shape of the age curve of marriage is reminiscent of a logistic curve, with marriage levels remaining nearly flat and close to zero before age 15, followed by a rapidly increasing slope in the core adolescent years (age 15-20), before plateauing again as age 25 is approached. While most of the earliest age curves of marriage in the 1990s indicate convex curvature during the adolescent years, by the time of the most recent surveys most curves indicate concave curvature in this age span.
Overall, there is little reduction in the proportion of women marrying by the older ages of the observed age spectrum. This suggests there is no discernible trend toward non-marriage in the study countries, but rather a trend toward delayed marriage. The proportion of women marrying by age 25 remains at about 88%-90% in Bangladesh and Nepal, and 80% in Indonesia and India.
3.1 Trends in the Age Structure of Marriage in Bangladesh
In Bangladesh, seven DHS surveys have been conducted at regular 3-4 year intervals over the past two decades. These surveys indicate progression toward later marriage (i.e., less child marriage) over successive surveys (p=0.000), albeit at an inconsistent pace of change (Figure 1). Delays in age at marriage follow an alternating pattern through time: There was no significant change in the age structure of marriage between 1993-94 and 1996-97 (p=0.110). However, this was followed by a significant delay in marriage by 1999-2000 (p=0.000), no significant change between then and 2004 (p=0.259), followed by a significant delay between 2004 and 2007 (p=0.006), and once more no significant change between 2007 and 2011 (p=0.068). Finally, 2014 shows a significant delay in marriage compared with the preceding survey in 2011 (p=0.001).
Bangladesh shows the highest levels of child marriage and some of the very earliest marriage among the countries studied, particularly in the 1993-94 and 1996-97 surveys. However, the overall levels of marriage during the observation age period are not appreciably higher than in the other study countries. The proportion of women age 15-24 marrying as adolescents (<age 20) has changed very little, remaining between 75%-78%. In contrast, the proportion of women marrying by age 15 has fallen by half, from about 41% in 1993-94 to 20% in 2011.
Among the surveys with a significant change in the age structure of marriage since the preceding surveys, the 1999-2000 survey shows the biggest changes, with a decrease in marriage at the youngest ages. The 2007 survey shows the biggest changes again at the youngest ages and extending into mid-adolescence. The 2014 survey shows the largest declines for those marrying in mid-adolescence.

16
Figure 1 Cumulative incidence functions of age at marriage among women age 15-24, Bangladesh
_____ indicates significant change (p<0.05) since previous survey -------- indicates absence of significant change since preceding survey
3.2 Trends in the Age Structure of Marriage in India
India has had three surveys3 over the past 17 years, conducted at irregular and longer intervals than is typical for DHS surveys. There was significant change between all surveys in the age structure of marriage (p=0.000), as shown in Figure 2. Between the NFHS-2 in 1998-99 and NFHS-3 2005-06, the decline in marriage occurred at all ages and the two curves are nearly parallel. Between 2005-06 and 2015-16, there were large declines in marriage at all adolescent ages, but relative declines were largest at younger ages. The proportion of women age 15-24 marrying by age 15 fell by two-thirds and the curve has become concave below age 18. Meanwhile, the largest absolute differences between surveys occurred among older adolescents, with the proportion of women who married by age 18 falling over 20 percentage points between 1998-99 and 2015-16.
3 An earlier NFHS-1 survey is not used in this analysis because it collected data on age at marriage in completed years only and not in century month codes.

17
Figure 2 Cumulative incidence functions of age at marriage among women age 15-24, India
_____ indicates significant change (p<0.05) since previous survey -------- indicates absence of significant change since preceding survey
India shows the sharpest declines in child marriage of the study countries. By 2015-16, marriage is no longer an adolescent experience for the majority of women. The proportion of women age 15-24 who married by age 20 fell from 64% in 1998-99 to 45% in 2015-16. Compared with Bangladesh and Nepal, India also indicates less marriage at older ages. In 2015-16, nearly two in every 10 women remained unmarried at age 25.
3.3 Trends in the Age Structure of Marriage in Indonesia
Of the six Indonesia surveys in this study, the first three were conducted at three-year intervals and the next three at five-year intervals. Overall, the cumulative declines in early marriage over the successive surveys between 1991 and 2012 are highly significant (p=0.000). However, changes between some pairs of surveys are not significant (Figure 3).
In contrast to the other study countries, Indonesia shows substantially less child marriage overall and, especially, much less very early marriage. In 2012, just 2% of women age 15-24 married by age 15, down from 8% in 1991. There are also slightly higher rates of non-marriage, with 2 in 10 women having not married by age 25.

18
Figure 3 Cumulative incidence functions of age at marriage among women age 15-24, Indonesia
_____ indicates significant change (p<0.05) since previous survey -------- indicates absence of significant change since preceding survey
There was modest but statistically significant change in the age structure of marriage between 1991 and 1994 (p=0.0046). The two age curves have a similar shape but differences emerge in the mid- and late-adolescent years. There was no significant change between the 1994 and 1997 surveys (p=0.5787), but this was followed by significant change in the 5 years between the 1997 and 2002-03 surveys (p=0.000). The shift is that the earliest marriages occurred at slightly older ages in 2002-03, along with declines in the proportion of women marrying throughout the adolescent years and early 20s.
The shifts toward delayed marriage between 2002-03 and 2007 were significant, while those between 2007 and 2012 were not significant, though these results are borderline (at p=0.0448 and p=0.0577 respectively). Overall the proportion of women age 15-24 marrying as adolescents (<age 20) declined from just over 50% in 1991 to 37% in 2012. The proportion marrying by age 18 halved over this time period, with the biggest declines (5 percentage points) occurring between 1997 and 2003-03.
3.4 Trends in the Age Structure of Marriage in Nepal
Five surveys have been conducted in Nepal at regular 5-year intervals over the past 20 years. Each successive survey indicates a shift in the age structure toward later marriage that is statistically significant,
19
except between the Nepal DHS 2011 and Nepal DHS 2016 surveys (see Figure 4). The small decline in child marriage observed between 2011 and 2016 is not significant. The shape of the curve shifted over this time period from a notable convex curvature during adolescence (age 15-20) in 1996, indicating a concentration of marriages at these ages, to a more linear shape during these ages in 2016.
Figure 4 Cumulative incidence functions of age at marriage among women age 15-24, Nepal
_____ indicates significant change (p<0.05) since previous survey -------- indicates absence of significant change since preceding survey
The shift in the age pattern of marriage between the earliest surveys in 1996 and 2001 indicates a sizable decline in marriage during the early adolescent ages (age 12-15) and less change during the older adolescent years. This shift toward less very early child marriage continued between the 2001 and 2006 surveys, though it was accompanied by less marriage in the middle and later adolescent years as well. Between 2006 and 2011, changes in the age structure of marriage were mostly accounted for by fewer women marrying during late adolescence and the early 20s; declines in marriage during the very early adolescent years were slight. Overall, the proportion marrying by age 15 more than halved between 1996 and 2016. The proportion marrying later in adolescence has fallen dramatically as well, from 75% marrying by age 20 in 1996 to about 55% in 2016.


21
4 PATTERNS AND TRENDS IN INEQUALITY OF CHILD MARRIAGE
To examine socioeconomic factors associated with child marriage and trends in the inequality of child marriage across population subgroups, we move from the entire age curve and examine levels of marriage at two age points—the percentage of women age 20-29 who have married by age 15; and the percentage married by age 18—and present these figures in equiplots. Figure 5 shows these indicators by women’s education. Figure 6 shows the same indicators by household wealth quintile, and Figure 7 by urban-rural residence.
4.1 Associations of Child Marriage with Socioeconomic Characteristics
Both indicators of child marriage are universally associated with education, with household wealth, and with residence in three of four study countries at both time points (p≤0.001). In Nepal, marriage by age 15 is associated with residence and wealth in 2016 (p≤0.001) but not in 2006. Stated otherwise, the prevalence of child marriage is inequitably distributed among educational, residential, and wealth population subgroups. In each study country, child marriage is more prevalent among more disadvantaged groups. In Bangladesh 2014, for example, the percentage of women age 20-29 who were married by age 15 is 41% among women with no education compared with just 2% among women with higher education (Figure 5). In Nepal 2016, the percentage of women in the poorest quintile who were married by age 18 is more than double that among the richest wealth quintile, at 51% versus 23% (Figure 6).
4.2 Trends in Educational Inequalities in Child Marriage
Overall, the percentage of women age 20-29 who married by age 15 declined over the previous decade: in Bangladesh, from 43% to 26%—a decrease of 17 percentage points; in India, from 16% to 8%; in Nepal, from 12% to 9%; and in Indonesia, from 6% to 4%. The overall percentage of women age 20-29 who married by age 18 declined the most in India over the decade, from 48% to 30%—a decline of 18 percentage points. In Nepal, the decrease was from 56% to 42%; in Bangladesh, from 74% to 64%; and in Indonesia, from 27% to 19%. However, these declines were not experienced equally by all population subgroups.
As Figure 5 shows, marriage by age 15 was already rare among women with higher education in the first survey examined and has not risen since. In all other educational categories, the percentage of women age 20-29 who married by age 15 decreased in Bangladesh, India, and Indonesia, narrowing inequalities in child marriage by education. In Nepal, however, there is no evidence of decreasing inequalities by education. In all study countries but Bangladesh, marriage by age 15 has fallen to less than 20% among the least educated women. While the prevalence of marriage by age 15 among women with no education is higher in Bangladesh than elsewhere, at 41% in 2014, this represents a decrease of more than 20 percentage points over the preceding decade. Bangladesh nonetheless exhibits a mass deprivation pattern and the greatest inequality by education, in which child marriage is prevalent in all educational subgroups but the most advantaged. The other countries exhibit a bifurcated pattern in the most recent survey, in which child marriage is high among women with no education or with primary education, and low among women with secondary education or with higher education. Indonesia shows the smallest inequalities by education in marriage before age 15.

22
Figure 5 Prevalence of child marriage among women age 20-29 by education
*** p≤ 0.001; ** p<0.01; * p< 0.05 Figure 5 similarly shows that while the prevalence of marriage by age 18 changed little over the past decade among women with secondary or higher education, the declines were more substantial among women with the least education—causing inequalities by education to decrease. India shows some of the most substantial decreases over the decade, with prevalence of marriage by age 18 falling 21 percentage points among women with no education, and 13 points among women with primary education. Bangladesh also saw sizable decreases among poorly educated women, as with marriage by age 15. Nonetheless, Bangladesh shows a mass deprivation pattern of inequality in this indicator too. In the other three countries, the inequality is a blend of a queuing pattern and a mass deprivation pattern: child marriage is more prevalent as educational disadvantage increases, while women with no education and women with primary education have similar levels of marriage by age 18. Overall, education-based inequalities in marriage by age 18 are greatest in Bangladesh and Nepal, and smallest in Indonesia.
4.3 Trends in Wealth Inequalities in Child Marriage
Figure 6 shows that prevalence of marriage by age 15 has declined over the decade among most wealth quintiles. In Bangladesh, India, and Indonesia, declines among more disadvantaged women (poorest and poorer wealth quintiles) have outpaced those among more advantaged women; as a result, wealth-based inequalities in marriage by age 15 have narrowed. In these countries, the pattern of inequality in the earliest child marriages has begun to change from a queuing pattern, in which prevalence increases steadily across levels of disadvantage, toward a universal pattern of lower prevalence, though statistically significant inequalities remain.

23
Figure 6 Prevalence of child marriage among women age 20-29 by wealth
*** p≤ 0.001; ** p<0.01; * p< 0.05 In Bangladesh, women in all wealth quintiles have experienced a decrease in marriage by age 18, at similar rates. As such, there is no observable decline in the degree of wealth-based inequalities in marriage by 18. Bangladesh demonstrates a queuing pattern in inequity by wealth, with a difference of 37 percentage points in the prevalence of marriage by age 18 among women in the poorest and the richest quintiles. In India and Indonesia, which also have queuing patterns, the overall degree of wealth-based inequality has decreased, as declines in child marriage among disadvantaged groups have outpaced those among advantaged groups.
Although wealth-based inequalities were smaller in Nepal than elsewhere a decade ago, these inequalities have not narrowed over time. This is because in Nepal, in contrast to the other study countries, declines in marriage by age 15 and by age 18 were driven by further declines among richer women, for whom child marriage was already less common. Thus, inequalities by wealth in Nepal increased between 2006 and 2016. Nepal has shifted from exhibiting a queuing pattern of inequality to a mass deprivation pattern, in which prevalence of child marriage is similarly high in all disadvantaged groups and relatively low only in the richest quintile. In both child marriage indicators, wealth-based inequalities are greatest in Bangladesh and smallest in Indonesia.

24
4.4 Trends in Residential Inequalities in Child Marriage
Marriage by age 15 and by age 18 has declined among both urban and rural women in all three countries for which we can assess trends4: Bangladesh, India, and Indonesia. Because declines in marriage by age 15 were larger among rural populations, the degree of inequality narrowed over the preceding decade in these countries. In India and Indonesia, but not in Bangladesh, the degree of residential inequality in marriage by age 18 also has declined.
Nonetheless, residence-based inequalities in both child marriage indicators are observed in all four study countries for the most recent survey. Nepal shows slightly greater residence-based inequality, with 17 percentage points separating the prevalence of marriage by age 18 among rural and urban populations. This difference ranges from 14-16 points elsewhere.
Figure 7 Prevalence of child marriage among women age 20-29 by residence
*** p≤ 0.001; ** p<0.01; * p< 0.05
4 Due to a change in the classification system of “rural” and “urban” designations between surveys, no conclusions can be drawn about the trends of child marriage by residence in Nepal. Rural-urban comparisons within the Nepal 2006 and the Nepal 2016 surveys remain valid.

25
5 SPATIAL DISTRIBUTION OF CHILD MARRIAGE
Figures 8 and 9 shows the spatial distribution of the prevalence of marriage by age 18 and by age 15, respectively, in a map indicating the national boundaries of Bangladesh, India, and Nepal.
Appendix Figures A1 and A2 show the level of uncertainty around these estimates. Overall uncertainty was low, though higher for marriage by age 15 than by age 18, in areas where selected PSUs were sparser, and in border regions where there were fewer neighboring estimates in the 100 km averaging zone. Importantly, there was no strong statistical evidence of correlation (r < |0.02|) between the estimated prevalence and uncertainty around those estimates.
Appendix Figure A3 indicates the international and internal boundaries, whether states (India), divisions (Bangladesh), or provinces (Nepal) for the three study countries and can be used as a reference to situate the location of the estimates shown in Figures 8 and 9.
5.1 Spatial Distribution of Marriage by Age 18 Figure 8 Map of the prevalence of marriage by age 18

26
As Figure 8 shows, there is geographic variation in the prevalence of marriage by age 18 both across and within the three study countries. The highest prevalence appears in Bangladesh, where the majority of the country indicates levels of marriage by age 18 at between 61% and 81% among women age 20-29. However, the map also shows spatial variation within each of the countries. High-prevalence Bangladesh shows notably lower prevalence in Sylhet Division to the east and also in eastern portions of Chittagong Division. Nepal exhibits a clear gradient across its northern provinces, with low prevalence (11%-40%) in the eastern part of Province 1 and gradual increases moving northwestward through Province 3 and Province 4 (Gandaki Pradesh), to Province 6 (Karnali Pradesh), where prevalence mostly ranges from 51% to 60%. In India, a clear crescent of moderate-to-high prevalence is visible, extending east to west from parts of the states of West Bengal and Jharkhand to Madhya Pradesh and Rajasthan, and from northwest to southeast from Rajasthan to Andhra Pradesh. This crescent follows the contours of the Chata Nagpur Hill and the Satpura and Vindhya Hill ranges and the Deccan plateau, as seen in Appendix Figure A3.
Additionally, there are hotspots of high prevalence and cold spots of low prevalence that contrast with the prevalence of surrounding areas. Typically, such cold spots and hotspots differ from their surroundings by a couple of prevalence bands rather than isolated concentrations of child marriage. Many of the cold spots represent major urban centers, such as the cities of Dhaka in Bangladesh, and Gwalior and Bhopal in Madhya Pradesh, India. Hotspots are noticeable throughout the three countries, such as western Assam and Arunchal Pradesh, India, most of Province 2 in Nepal, and specific points in Indian states on the aforementioned crescent.
Another feature of the spatial distribution of marriage by age 18 is similar levels on both sides of a shared border, whether international or internal. Examples include the high prevalence across Province 2, Nepal’s southern border with Bihar, India; the hotspot on the border between Province 6 and 5, extending into Uttar Pradesh, India; and the low prevalence across Province 1, Nepal’s eastern border with Sikkim and West Bengal, India. Similarly, Bangladesh’s western border shares high levels of marriage by age 18 with West Bengal, India, while an area along Dhaka division and Maghalaya, India, and another southeastern Chitagong and Mizoram, India, share low prevalence.
Within India, the areas of high prevalence in the crescent extend along both sides of the border of Bihar and Jharkhand, the portion of Uttar Pradesh that intrudes into Madhya Pradesh, and the shared borders between Rajasthan or Gujarat and Madhya Pradesh.
5.2 Spatial Distribution of Marriage by Age 15
Figure 9 shows findings regarding the spatial distribution of marriage by age 15 that are similar to those for marriage by age 18, albeit at lower prevalence levels. Whereas the prevalence of marriage by age 18 reached up to 81%, the range for marriage by age 15 is 0% to 50%. Hotspots of high prevalence of marriage by age 15 appear in light green and yellow shades.

27
Figure 9 Map of the prevalence of marriage by age 15
Large expanses of regions, in dark green, indicate prevalence in the lowest end of the scale, between 0% and 10%. These correspond to regions with very little to no marriage by age 18, but also areas with moderate levels of marriage by age 18 (41%-50%). For example, areas in Jammu & Kashmir and Punjab in the north of India, Kerala in the south, Manipur and Mizoram in the east, and around the border of Maharashtra, Madhya Pradesh, and Chhatisgarhh in central India show very low prevalence of child marriage by either measure. However, other areas of Rasjasthan, Uttar Pradhesh, West Bengal, and Assam have moderate to moderately high prevalence of marriage by age 18, and little or no marriage by age 15.
As with marriage by age 18, hotspots of marriage by age 15 appear throughout much of Bangladesh, predominately in western Bangladesh and along the border between Uttar Pradesh, India, and Province 5, Nepal. The hotspot in Arunchal Pradesh, India, is even more apparent for marriage by age 18 than by age 15. Areas of moderately high prevalence of marriage by age 15 appear in the same crescent from the Bihar-Jhakhand border west through northern Madhya Pradesh along its borders with Uttar Pradesh and Rajasthan and south-eastward to Telegana and Andhra Pradesh, which have clustered hotspots of marriage by age 18.


29
6 CONTEXTUAL DETERMINANTS OF CHILD MARRIAGE
Results from bivariate regressions indicate significant associations between most contextual covariates and the PSU prevalence of marriage by age 18 and by age 15. This includes both variables describing the gender context (violence and health decisionmaking), nightlights, PSR, aridity, residence, education, and at least some categories of education, wealth, religion, and caste. In Bangladesh, there is no significant association detected between ideal number of children and marriage by either age 18 or age 15, unlike in India and Nepal where these associations are significant. Being a rural cluster is significantly associated with higher levels of both measures of child marriage in all three study countries. However, rural-urban residence is excluded from multivariable models because it is correlated with nightlights. These details of bivariate models can be found in Appendix Tables A1-A6.
Figures 10-12 show the results of multivariable regression models for marriage by age 18 in the three study countries. Figures 13-15 show these same model results for marriage by age 15.
Figure 10 Contextual determinants of the prevalence of marriage by age 18 among women age 20-29, Bangladesh (n=564 clusters)
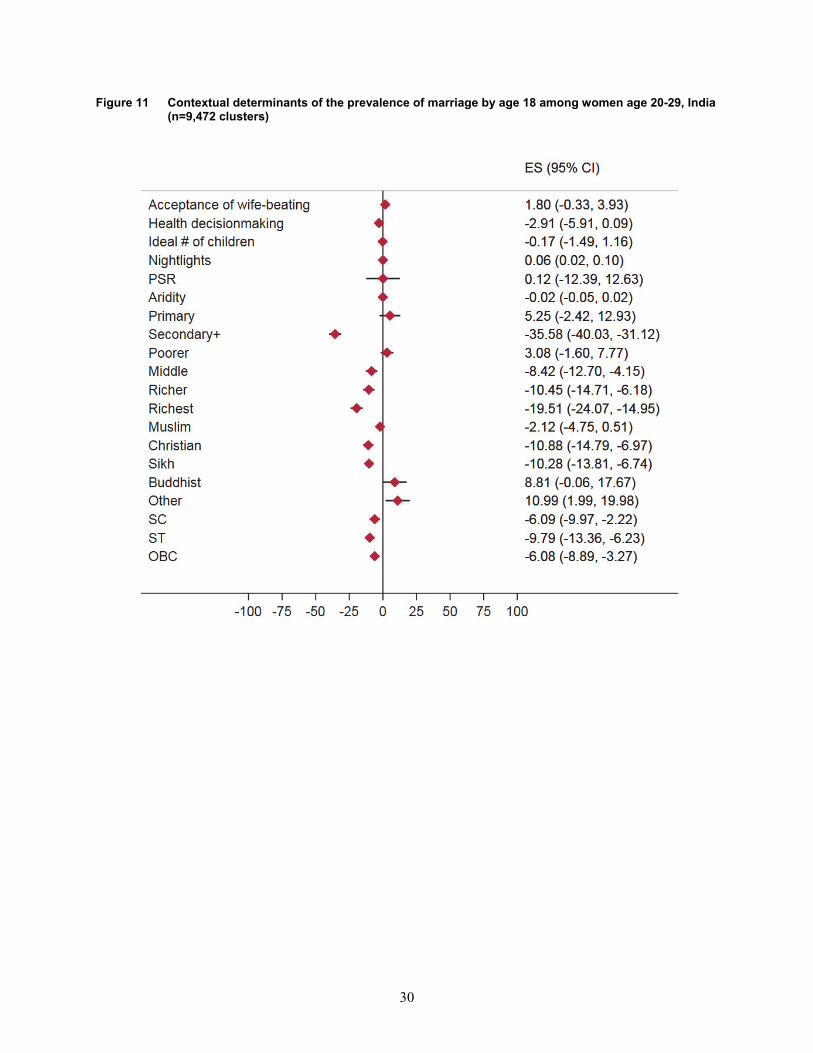
30
Figure 11 Contextual determinants of the prevalence of marriage by age 18 among women age 20-29, India (n=9,472 clusters)
31
Figure 12 Contextual determinants of the prevalence of marriage by age 18 among women age 20-29, Nepal (n=385 clusters)
6.1 Gender and Fertility Context
Once we control for other factors, both variables describing the gender context—attitudes accepting of wife-beating and women’s participation in decisions regarding their own health—do not appear to be significantly associated with the prevalence of marriage by age 18. Both variables had suggested such an association in bivariate analysis. We also fail to detect any association with ideal number of children, which had been significant in bivariate regressions in two of the three study countries.
In contrast, one or the other gender contextual variable is significantly associated with marriage by age 15 in each country. In Bangladesh and Nepal, marriage by age 15 is more common in clusters where attitudes accepting of wife-beating are more prevalent. The coefficient is especially large (β=15.6) in Nepal. In India, clusters in which more women participate in decisions about their own health have lower levels of marriage by age 15.

32
Ideal number of children is marginally associated (p=0.045) with marriage by age 15 in Bangladesh and India. The direction is negative, indicating that the prevalence of marriage by age 15 is slightly lower in clusters with a high mean ideal number of children, controlling for other factors.
6.2 Spatial Covariates
6.2.1 Urbanization and industrialization covariates
The nightlights composite variable, a measure of urbanization and industrialization, shows no evidence of an association with marriage by age 18 in Bangladesh and Nepal. In contrast, a significant association is detected in India. Here, the prevalence of marriage by age 18 increases slightly with increased nightlight activity. In no study country do we detect a relationship between marriage by age 15 and nightlights.
6.2.2 Marriage market covariates
Our measure of squeeze in the marriage market—adult PSR—indicates that it is a significant covariate of marriage by age 18 and by age 15 in Bangladesh. However, there is no such apparent relationship in India or Nepal. In Bangladesh, the prevalence of child marriage, by either measure, is substantially higher in clusters with a PSR skewed toward more men, controlling for the other factors in the models.
6.2.3 Environment and economic insecurity
Greater aridity is associated with higher levels of marriage by age 18 in both Bangladesh and Nepal, but not in India. In Bangladesh alone, it is also associated with higher levels of marriage by age 15.
6.3 Education and Wealth
Reflecting results from separate multivariate models, levels of marriage by age 18 are lower in clusters in which a greater proportion of women have completed secondary education or higher. The findings are most striking in Bangladesh, where the prevalence of child marriage is 25% lower for each percentage point increase in women’s secondary education. There appear to be no statistical differences in marriage by age 18 for primary education. A similar association is found for marriage by age 15.
In Bangladesh and India, the wealthier a cluster’s population, the lower the prevalence of marriage by age 18. This is particularly noticeable for the proportion of population in the richer and richest household wealth quintiles. We do not detect an association between household wealth and marriage by age 18 in Nepal, controlling for other factors. The negative association between household wealth and marriage by age 15 is more muted in India compared with marriage by age 18, and it is absent in Bangladesh and Nepal.

33
Figure 13 Contextual determinants of the prevalence of marriage by age 15 among women age 20-29, Bangladesh (n=564 clusters)
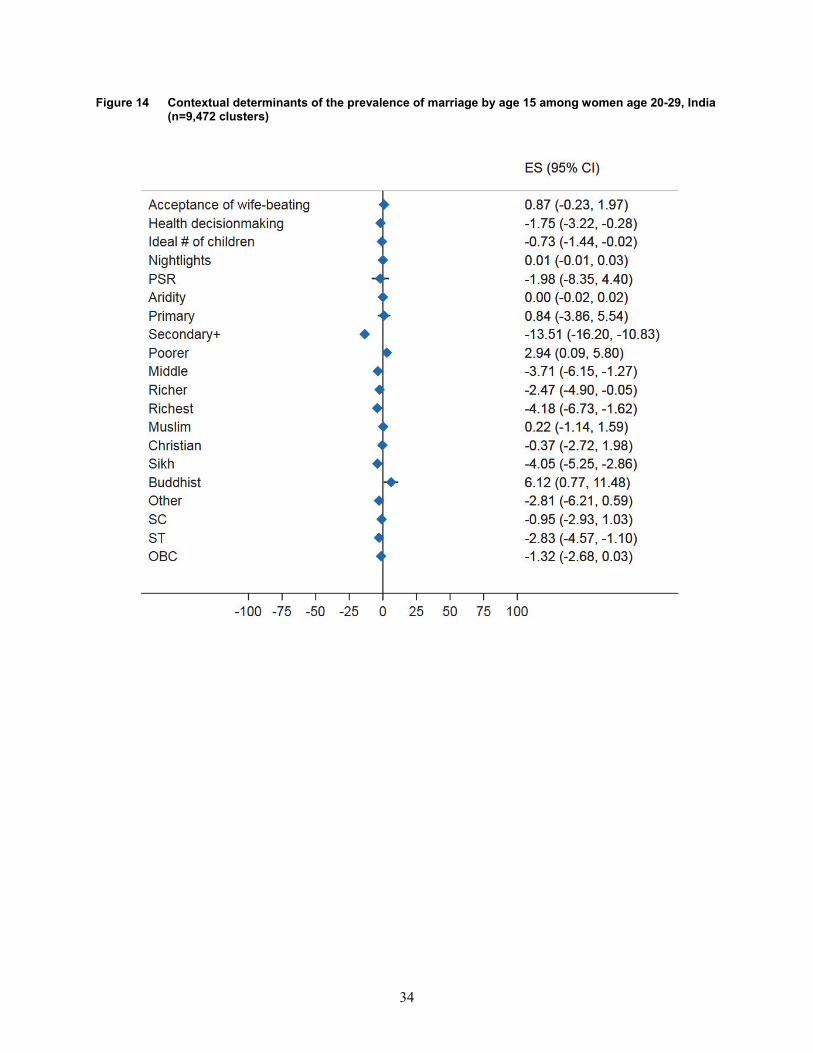
34
Figure 14 Contextual determinants of the prevalence of marriage by age 15 among women age 20-29, India (n=9,472 clusters)
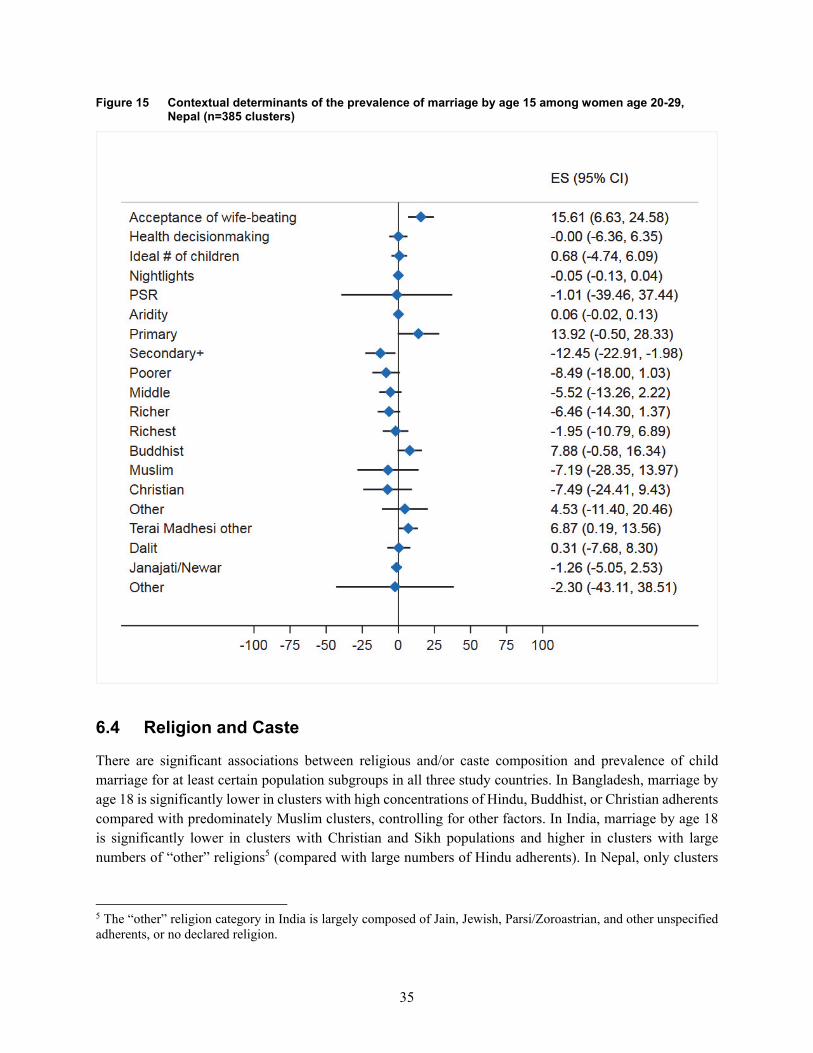
35
Figure 15 Contextual determinants of the prevalence of marriage by age 15 among women age 20-29, Nepal (n=385 clusters)
6.4 Religion and Caste
There are significant associations between religious and/or caste composition and prevalence of child marriage for at least certain population subgroups in all three study countries. In Bangladesh, marriage by age 18 is significantly lower in clusters with high concentrations of Hindu, Buddhist, or Christian adherents compared with predominately Muslim clusters, controlling for other factors. In India, marriage by age 18 is significantly lower in clusters with Christian and Sikh populations and higher in clusters with large numbers of “other” religions5 (compared with large numbers of Hindu adherents). In Nepal, only clusters
5 The “other” religion category in India is largely composed of Jain, Jewish, Parsi/Zoroastrian, and other unspecified adherents, or no declared religion.

36
with “other” religions6 have a lower prevalence of marriage by age 18 than clusters with large numbers of Hindus. Clusters with large Buddhist, Muslim, or Christian populations do not seem to differ in their prevalence of marriage by age 18.
Marriage by age 15 shows only a slightly different pattern. In Bangladesh, marriage by age 15 is significantly lower for clusters with large populations of all religions compared with Muslim clusters. In India, marriage by age 15 is less prevalent in clusters with large Sikh populations and more prevalent in clusters with large Buddhist populations (compared with clusters with large Hindu populations). And in Nepal, there is no detectable association between religious affiliation and marriage by age 15.
After controlling for other factors, marriage by age 18 is significantly higher in clusters in India with large numbers of people from SC, ST, or OBC castes (compared with general caste). This represents a change in direction of the association detected in bivariate models, suggesting an interaction between caste and religion or a socioeconomic factor included in the model. Only the negative association between ST and child marriage is significant for marriage by age 15, and not for SC and OBC. In Nepal, marriage by age 18 is significantly higher among clusters with large Terai Madhesi/other and Dalit populations (compared with Brahmin/Chhetri castes), whereas there are no noticeable differences between clusters with large Janajati/Newar or “other” caste populations. No such associations appear to be significant when examining marriage by age 15 after controlling for other factors.
6 The “other” religion category in Nepal is predominantly Kirati adherents, followed by other unspecified adherents.
37
7 DISCUSSION AND CONCLUSION
7.1 Summary
This study analyzed trends in the age structure of child marriage in four Asian countries. It further analyzed specific patterns of and trends in the inequality of child marriage according to three socioeconomic factors: education, wealth, and residence. Finally, the study assessed the geographic distribution of child marriage and examined contextual determinants of child marriage.
7.2 Discussion
We find significant and substantial decreases in prevalence of child marriage in all four countries between the earliest and most recent surveys. The rate of change has been uneven between intervening surveys. The first decreases in prevalence of child marriage to occur are at the youngest ages. Over time, they are followed by decreases in marriage later in adolescence.
We find widespread inequalities in child marriage based on education, wealth, and residence. In each study country, child marriage is more prevalent among more disadvantaged groups. Inequalities have mostly lessened over the decade, except in Nepal, where education-based and wealth-based inequalities in child marriage have increased or remained the same.
The results of this study suggest directions to build on recent achievements to promote child wellbeing and gender equality through accelerated reductions in child marriage. They suggest strategies targeting the middle to late adolescent years, when the majority of child marriages occur. Such efforts need to be accompanied by initiatives to eliminate marriage in the early adolescent ages in Bangladesh and among the least educated subgroups elsewhere. Marriage by age 15 still approaches 20% among women age 20-29 with only primary education or no education. Similarly, progress toward SDG 5.3 to eliminate the harmful practice of child, early, and forced marriages could be stymied without a continued focus on the needs of rural, poor, and undereducated subgroups. A focus on these groups could both hasten declines in child marriage and enhance equity in health and social outcomes, which are particularly needed in Bangladesh and Nepal.
This study finds that India has experienced the most rapid declines in child marriage among the four study countries. Child marriage is most common in Bangladesh and least common in Indonesia. Despite marked reductions in prevalence of child marriage, marriage is still an adolescent experience for the majority of women in Bangladesh and Nepal, and for substantial proportions (37%-45%) of women in Indonesia and India. These findings echo other research on the burden of child marriage and reinforce child marriage as an adolescent sexual and reproductive health priority (MacQuarrie, Mallick, and Allen 2017; Mathur, Greene, and Malhotra 2003; WHO 2011, 2017; Wodon et al. 2017).
With the cumulative incidence of marriage by age 25 remaining relatively static, the study finds no discernible trend toward non-marriage, but rather a trend toward delayed marriage only. This finding differs from studies in other parts of Asia that have noted paired trends of delayed marriage and non-marriage (Jones 2010; Jones 2007).

38
Although we find that inequalities in child marriage have largely declined over time, these inequalities persist in all the study countries. Inequalities based on education are wider than those based either on wealth or residence. These findings suggest paying continued attention to the needs of people with few educational opportunities. Gwatkin has argued that health inequalities could increase, even as progress is made toward achieving major international goals for improving health, if there is a failure to center health equity in health programming (Gwatkin 2002). Indeed, the SDG to eliminate child marriage may be stymied without a focus on addressing the needs of more disadvantaged groups.
Bangladesh, with the greatest amount of child marriage, experiences the most inequalities, and Indonesia the fewest. This finding suggests a positive relationship between the degree of inequality and the magnitude of child marriage. A pattern of mass deprivation, in which child marriage is prevalent in all but the most highly educated group, is observed with regard to education, while wealth-based inequalities follow a queuing pattern, in which child marriage increases with each category of wealth disadvantage. Results suggest a possible trajectory toward a universal pattern in which the earliest child marriages (<age 15) are nearly eliminated in all wealth groups in Bangladesh, India, and Indonesia. The combination of the mass deprivation and the queuing patterns observed in the study suggest that a combination of universal approaches among the whole population along with targeted interventions is warranted to eliminate inequalities while reducing child marriage (WHO 2013b, 2015).
Health geographers argue that spatial distribution of health outcomes is one, often overlooked, dimension of health inequalities (Burgert-Brucker et al. 2015; Burgert-Brucker et al. 2016; Tugwell, Robinson, and Morris 2007; Wirth et al. 2006). In all three study countries, we find evidence of inequalities in the spatial distribution of child marriage based on geographic area of residence. By using an interpolated surface, rather than a subnational administrative region as a singular unit, we observe that it is not simply selected states, divisions, or provinces that are marked by especially high (or low) prevalence of child marriage, but certain areas within states, divisions, or provinces. Further, even in many states, divisions, or provinces with lower overall prevalence, there are isolated areas with marked higher prevalence that still demand attention. The added precision of using an interpolated surface over a crude measure of residence or region provides more instructive direction as to where resources could be allocated to tackle the challenge of child marriage (Tugwell, Robinson, and Morris 2007; Wirth et al. 2006).
Our findings illustrate that the higher prevalence of child marriage in India follows the contours of certain geographic features, namely the Chata Nagpur, Satpura, and Vindhya Hill ranges and the Deccan plateau. These findings roughly correspond to the hill ranges that Dyson and Moore discovered acted as a line of demarcation between two demographic Indias (1983). Our study, again, finds more nuance in the spatial distribution of child marriage than a dichotomous division would suggest. Nonetheless, additional inquiry is warranted to uncover how this spatial concentration of high prevalence—here and elsewhere in the study regions—aligns (or not) with particular sociocultural groups and the normative behaviors and motivations that drive the practice of child marriage.
Dyson and Moore offered the gender context of marriage and kinship ties as the underlying explanation for the geographic variation in marriage timing and other demographic behaviors they observed in India (1983). Our study used two direct measures of the gender context at the cluster level: attitudes accepting of wife-beating and women’s participation in decisions regarding own health. However, we find limited evidence that the gender context influences child marriage. The measures of attitudes toward violence and women’s
39
decisionmaking are associated with levels of earliest child marriage—before age 15—but not necessarily with child marriage before age 18.
The fertility context, as measured by ideal number of children, lacks explanatory power. There is weak evidence for urbanization and industrialization as an explanation for child marriage, with neither nightlights nor rural-urban residence showing a detectable association with either child marriage outcome.
We find some evidence supporting explanations of child marriage related to marriage market, economic insecurity, and diffusion. In Bangladesh alone, where child marriage is most prevalent, child marriage is more common in areas where the adult population is skewed toward men. This indicates that younger and younger women are being drawn into the pool of eligible marriage partners to alleviate a squeeze in the marriage market. It is unclear why this association is seen only in Bangladesh and not in the other study countries.
Aridity, reflecting environmental and economic uncertainly, is associated with child marriage in two of the three study countries.
Diffusion theory suggests that changing norms, such as delayed marriage, are transmitted first within and then between closely aligned sociocultural groups. Consistent with such theory, our study finds differences in levels of child marriage by concentration of religious and caste groups in all three countries, with lower levels of child marriage in areas with non-Muslims in Bangladesh and Sikhs in India. Similarly, levels of child marriage are higher in areas with large SC, ST, and OBC populations in India and with large Terai/Madhesi other and Dalit populations in Nepal. Although we find these religious and caste group differences, we also find other similarities in child marriage between other religious and caste groups. Also, predominately Muslim areas have more child marriage than non-Muslim areas in Bangladesh, but not significantly so in India or Nepal. Others similarly have found that religious differences in demographic behaviors were not common across countries. This suggests that religion may not be the only or most important dimension marking one’s sociocultural group or, at least, that there are some geographic bounds on sociocultural group’s relationship with child marriage.
Perhaps most consistent are our findings that prevalence of child marriage is lower where there are higher levels of household wealth and women’s secondary education. This relationship is found in all three study countries. It is particularly strong at the secondary and higher education levels, suggesting that attention to expanded primary education is insufficient. Though these findings do not help us arbitrate among competing theories, they are broadly consistent with other literature on child marriage. Women’s education and its relationship with child marriage is a much-researched topic (e.g., Amin 2004; Bhatti and Jeffery 2012; Blossfeld and De Rose 1992; Delprato et al. 2015; Field and Ambrus 2008; Glick, Handy, and Sahn 2015; Ikamari 2005; Jejeebhoy 1995; Lloyd and Mensch 2008; MacQuarrie 2016; Mensch, Bruce, and Greene 1998). Regardless of the causal direction between child marriage and school drop out, there is widespread consensus that getting married competes with getting an education; therefore, promoting education and promoting delayed marriage are twin goals (Girls Not Brides 2018; MacQuarrie et al. 2016; McCleary-Sills et al. 2015; Warner, Malhotra, and McGonagle 2012). This study’s findings on inequalities and contextual determinants joins others in suggesting the need to reach poorly educated communities with interventions to avoid child marriage and to increase educational opportunities.
40
Although education is fundamental and has a synergistic association with delayed marriage, education is not a sufficient solution to the problem of child marriage. In systematic reviews the evidence is mixed on intervention approaches that seek to expand livelihood skills and economic opportunities, or that adopt a conditional cash transfer as a strategy to delay marriage (Chae and Ngo 2017; Chandra-Mouli, Lane, and Wong 2015). More promising are strategies that pursue empowerment, engage communities, and foster normative change (Chae and Ngo 2017; Denno, Hoopes, and Chandra-Mouli 2015; Lee-Rife et al. 2012).
7.3 Limitations and Future Directions
This study has several measurement limitations to note. Because DHS data are cross-sectional, we are unable to use socioeconomic and sociodemographic characteristics as individual determinants of child marriage. These variables are measured at the time of the survey and thus violate the temporal sequence required of determinants. Therefore, we examine cluster-level associations between these factors and the prevalence of child marriage.
The mean duration of marriages observed among the samples of women age 20-29 was 3.7-4.5 years. We lagged spatial covariates of aridity, nightlights, and adult PSR to 2010 levels to approximate conditions prevailing at the time these marriages were occurring. However, we are unable to lag cluster-level values of the other contextual variables that come from DHS surveys. This includes our measures of attitudes toward violence, women’s health decisionmaking, ideal number of children, education, wealth, religion, and caste composition.
Our analysis used a single measure of women’s decisionmaking in study clusters: participation in decisions regarding women’s own health care. We selected this measure over a composite index of household decisionmaking because our analysis of the individual candidate items indicated that different dimensions of decisionmaking manifest differing relationships with child marriage. A simple, additive index would have obscured these varying associations and increased the risk of making a Type II error. While we ideally would have preferred to have several measures to capture multiple facets of decisionmaking, we selected the single item that had the clearest conceptual connection to child marriage as an outcome, because of high correlations among decisionmaking items. Several efforts are underway to improve the measurement of women’s decisionmaking, specifically, and women’s empowerment more broadly (Edmeades et al. 2018; Emmart 2016; Hinson et al. 2019; Prata et al. 2017; Steinhaus et al. 2019). These are efforts that will only enhance the future study of gender equality and related outcomes, such as child marriage.
The criteria for classifying clusters in Nepal as either rural or urban changed before the 2016 Nepal DHS, making analysis of trends in urban-rural residence between the 2016 and prior surveys invalid. Although we can validly detect an association between residence and child marriage in both 2006 and 2016, we are compromised in our ability to draw any conclusions about growing or lessening residential inequalities in child marriage in Nepal.
According to the urbanization and industrialization theories of demographic change, urbanity and an industrial economy are separate but related factors. Measures of urbanity are typically more straightforward and accessible. We had available to us two measures for this theory: urban-rural residence and nightlights. We were unable to include both measures together in the regression analysis because they provided to be highly correlated. We opted to use the nightlights measure for several reasons: It is a more nuanced, continuous measure than the dichotomous urban rural residence measure. It is also a measure that captures

41
industrial economic activity, albeit one that assumes an underlying base level of electrification (Min et al. 2013). As such it is somewhat more rare in empirical analyses.
Finally, our analysis of the spatial distribution and contextual determinants of child marriage was possible for only three of the four study countries because geocoordinates of survey clusters were not collected in Indonesia.
Our study was also limited in its scope. We used a simple kriging method to develop surface maps of the prevalence of child marriage. It would be preferable to use additional spatial covariates in a more extensive mathematical model to develop an interpolated surface map because such surfaces are more statistically rigorous (Burgert-Brucker et al. 2016; Gething and Burgert-Brucker 2017). We opted to create surface maps that were naïve to the spatial distribution of such possible covariates because the empirical base for the association of these covariates and child marriage was insufficient. The results of the cluster-level regression analysis that we undertook of spatial and contextual determinants of child marriage contributes to this empirical base and provides some clues about covariates that could be used reliably in subsequent interpolated surfaces for child marriage.
Additionally, the maps showing the spatial distribution of child marriage suggest some interesting patterns with the concentration of child marriage highly prevalent in some areas and relative paucity of child marriage in other areas that deserve greater exploration, specifically through the use of spatial statistics. We did not examine, for example, how the spatial distribution of child marriage might relate to the spatial distribution of other characteristics of interest, such as income inequality or poverty, which could also be mapped. Such analysis was beyond the scope of this study, but this may be a fruitful area for future exploration.
This study examined child marriage among women only. However, child marriage is also a phenomenon affecting young men (Taylor 2019). There has been remarkably less advocacy attention and research focused on child marriage among men, and we know little about it. What we do know is that the countries with the greatest prevalence of child grooms are not necessarily the ones with the highest prevalence of child brides (MacQuarrie and Edmeades 2015). One multi-country study found that men’s marriage before age 18 was associated with men’s limits on their educational attainment and more children (MacQuarrie and Edmeades 2015). Additional research is warranted to explore to what extent men married as boys experience the same negative consequences as do women married as girls, or whether the precipitating factors are the same.
7.4 Conclusion
This study found a predictable pattern to changes in the age structure of child marriage: reductions in prevalence of the earliest child marriages occur before reductions in prevalence of marriages in the core adolescent years (age 15-20). An increase in delayed marriage is not accompanied by an increase in non-marriage. Amidst declining child marriage, we found persistent inequalities between richer and poorer, educated and less educated, and urban and rural women. Inequalities in child marriage narrowed in three of the four countries, but increased in Nepal. The patterns of inequality detected in this study indicate the need for widespread, broad initiatives to reduce child marriage for all, accompanied by special interventions targeted to the most disadvantaged subgroups. The patterns of spatial variation in child marriage provide a more nuanced indication of where such interventions should be directed. The consistent strength of

42
education and wealth as contextual determinants of less child marriage suggests the value of intensified investment in social infrastructure for all, alongside initiatives for a more gender-equitable normative environment.

43
REFERENCES
Alston, M., K. Whittenbury, A. Haynes, and N. Godden. 2014. “Are Climate Challenges Reinforcing Child and Forced Marriage and Dowry as Adaptation Strategies in the Context of Bangladesh?” Women’s Studies International Forum 47, Part A: 137-144. Elsevier. https://doi.org/10.1016/j.wsif.2014.08.005.
Amin, S., J. Saha, and J. Ahmed. 2018. “Skills-Building Programs to Reduce Child Marriage in Bangladesh: A Randomized Controlled Trial.” Journal of Adolescent Health 63 (3): 293-300. https://doi.org/10.1016/j.jadohealth.2018.05.013.
Amin, S., N. H. Al-Bassusi. 2004. “Education, Wage Work, and Marriage: Perspectives of Egyptian Working Women.” Journal of Marriage and Family 66 (5): 1287–1299. https://doi.org/10.1111/j.0022-2445.2004.00093.x.
Arends-Kuenning, M., and S. Amin. 2001. “Women’s Capabilities and the Right to Education in Bangladesh.” International Journal of Politics, Culture, and Society 15 (1): 125-142. https://doi.org/10.1023/A:1011124018138.
Atkinson, H. G., and J. Bruce. 2015. “Adolescent Girls, Human Rights and the Expanding Climate Emergency.” Annals of Global Health 81 (3): 323-330. https://doi.org/10.1016/j.aogh.2015.08.003.
Badan Pusat Statistik-Statistics Indonesia – BPS, and ORC Macro. 2003. Indonesia Demographic and Health Survey 2002-2003. Calverton, Maryland, USA: BPS and ORC Macro. http://dhsprogram.com/pubs/pdf/FR147/FR147.pdf.
Banerjee, K. 1999. “Gender Stratification and the Contemporary Marriage Market in India.” Journal of Family Issues 20 (5): 648-676.
Barr, H. 2015. Marry before Your House Is Swept Away: Child Marriage in Bangladesh. United States of America: Human Rights Watch. https://www.hrw.org/sites/default/files/report_pdf/bangladesh0615_web.pdf.
Becker, G. S. 1974. “A Theory of Marriage.” In Economics of the Family: Marriage, Children, and Human Capital, 299-351. University of Chicago Press.
Bhatti, F., and R. Jeffery. 2012. “Girls’ Schooling and Transition to Marriage and Motherhood: Exploring the Pathways to Young Women’s Reproductive Agency in Pakistan.” Comparative Education 48 (2): 149-166.
Blau, F. D., L. M. Kahn, and J. Waldfogel. 2000. “Understanding Young Women’s Marriage Decisions: The Role of Labor and Marriage Market Conditions.” ILR Review 53 (4): 624-647. https://doi.org/10.1177%2F001979390005300404.

44
Blossfeld, H., and A. De Rose. 1992. “Educational Expansion and Changes in Entry into Marriage and Motherhood. The Experience of Italian Women.” Genus 48 (3-4): 73-91. http://www.ncbi.nlm.nih.gov/entrez/query.fcgi?cmd=Retrieve&db=PubMed&dopt=Citation&list_uids=12286608.
Burgert-Brucker, C. R., T. Dontamsetti, A. Marshall, and P. Gething. 2016. Guidance for Use of the DHS Program Modeled Map Surfaces. DHS Spatial Analysis Reports No. 14. Rockville, Maryland, USA: ICF International. http://dhsprogram.com/pubs/pdf/SAR14/SAR14.pdf.
Burgert-Brucker, C. R., J. Yourkavitch, S. Assaf, and S. Delgado. 2015. Geographic Variation in Key Indicators of Maternal and Child Health across 27 Countries in Sub-Saharan Africa. DHS Spatial Analysis Reports No. 12. Rockville, Maryland, USA: ICF International. http://dhsprogram.com/pubs/pdf/SAR12/SAR12.pdf.
Burgert, C. R. 2014. Spatial Interpolation with Demographic and Health Survey Data: Key Considerations. DHS Spatial Analysis Reports No. 9. Rockville, Maryland, USA: ICF International. http://dhsprogram.com/pubs/pdf/SAR9/SAR9.pdf.
Burgert, C. R., J. Colston, T. Roy, and B. Zachary. 2013. Geographic Displacement Procedure and Georeferenced Data Release Policy for the Demographic and Health Surveys. DHS Spatial Analysis Reports No. 7. Calverton, Maryland, USA: ICF International. http://dhsprogram.com/pubs/pdf/SAR7/SAR7.pdf.
Buttenheim, A. M., and J. Nobles. 2009. “Ethnic Diversity, Traditional Norms, and Marriage Behaviour in Indonesia.” Population Studies 63 (3): 277-294. https://doi.org/10.1080/00324720903137224.
Caldwell, J. C. 1982. Theory of Fertility Decline. London, UK: Academic Press.
Casterline, J. B. 2001. “Introduction.” Diffusion Processes and Fertility Transition: Selected Perspectives, edited by National Research Council and Committee on Population. Washington, DC: National Academies Press (US).
CBS, National Family Planning Coordinating Board, Ministry of Health, and Macro International. 1991. Indonesia Demographic and Health Survey 1991. Calverton, Maryland, USA: Central Bureau of Statistics – CBS and Macro International. http://dhsprogram.com/pubs/pdf/FR18/FR18.pdf.
CBS, National Family Planning Coordinating Board, Ministry of Health, and Macro International. 1995. Indonesia Demographic and Health Survey 1994. Calverton, Maryland, USA: Central Bureau of Statistics – CBS and Macro International. http://dhsprogram.com/pubs/pdf/FR63/FR63.pdf.
CBS, National Family Planning Coordinating Board, Ministry of Health, and Macro International. 1998. Indonesia Demographic and Health Survey 1997. Calverton, Maryland, USA: Central Bureau of Statistics – CBS and Macro International. http://dhsprogram.com/pubs/pdf/FR95/FR95.pdf.
Chae, S., and T. D. Ngo. 2017. The Global State of Evidence on Interventions to Prevent Child Marriage, Girl Center Research Brief No. 1. New York, NY: Population Council.
45
Chandra-Mouli, V., C. Lane, and S. Wong. 2015. “What Does Not Work in Adolescent Sexual and Reproductive Health: A Review of Evidence on Interventions Commonly Accepted as Best Practices.” Global Health: Science and Practice 3 (3): 333-340. https://dx.doi.org/10.9745%2FGHSP-D-15-00126.
Child Marriage Database. New York, NY: UNICEF. Accessed March 2018. https://data.unicef.org/topic/child-protection/child-marriage/.
Cleland, J. 1985. “Marital Fertility Decline in Developing Countries: Theories and the Evidence.” https://acawiki.org/Marital_Fertility_Decline_in_Developing_Countries:_Theories_and_Evidence.
Cleland, J., and C. Wilson. 1987. “Demand Theories of the Fertility Transition: An Iconoclastic View.” Population Studies 41 (1): 5-30.
Cleves, M., R. G. Gutierrez, W. Gould, and Y. V. Marchenko. 2010. An Introduction to Survival Analysis Using Stata. Third ed. College Station, TX: Stata Press.
Climate Research Unit. 2017. “CRU TS v. 4.01.” Accessed August 21, 2018. http://doi.org/10/gcmcz3.
Croft, T. N., A. M. J. Marshall, and C. K. Allen. 2018. Guide to DHS Statistics. Rockville, Maryland, USA: ICF.
Danish National ID Centre. 2018. Nepal: Registration of Marriage and Divorce and Issuance of Related Certificates. Copenhagen, Denmark. https://nidc.dk/-/media/nidc/Dokumenter/Notatbibliotek/18122018-Nepal---Registration-of-marriage-and-divorce-and-issuance-of-related-certificates.pdf?la=da&hash=59C9E86EEFAE011D777867D22A1F349933B9E1C4.
Davis, K. 1945. “The World Demographic Transition.” The Annals of the American Academy of Political and Social Science 237 (1): 1-11.
Delprato, M., K. Akyeampong, R. Sabates, and J. Hernandez-Fernandez. 2015. “On the Impact of Early Marriage on Schooling Outcomes in Sub-Saharan Africa and South West Asia.” International Journal of Educational Development 44: 42-55. https://www.doi.org/10.1016/j.ijedudev.2015.06.001.
Denno, D. M., A. J. Hoopes, and V. Chandra-Mouli. 2015. “Effective Strategies to Provide Adolescent Sexual and Reproductive Health Services and to Increase Demand and Community Support.” Journal of Adolescent Health 56 (1): S22-S41. https://doi.org/10.1016/j.jadohealth.2014.09.012.
Denyer, S., and A. Gowen. 2018. “Too Many Men.” The Washington Post, April 18, 2018.
Dontamsetti, T., S. Assaf, J. Yourkavitch, and B. Mayala. 2018. A Primer on the Demographic and Health Surveys Program Spatial Covariate Data and Their Applications. DHS Spatial Analysis Reports No. 16. Rockville, Maryland, USA: ICF. http://dhsprogram.com/pubs/pdf/SAR16/SAR16.pdf.
Dyson, T., and M. Moore. 1983. “On Kinship Structure, Female Autonomy, and Demographic Behavior in India.” Population and Development Review 9 (1): 35-60. https://www.doi.org/10.2307/1972894.
Edmeades, J., L. Hinson, M. Sebany, and L. Murithi. 2018. A Conceptual Framework for Reproductive Empowerment: Empowering Individuals and Couples to Improve Their Health. Washington, DC: ICRW.

46
Emmart, P. 2016. “Measure for Measure: Measurement Issues in Empowerment and its Links to Family Planning.” Paper presented at the Population Association of America, Washington, DC, March 31, 2016.
ESRI. 2017. ArcGIS Desktop (10.6.1). Environmental Systems Research Institute. Redlands, CA, USA.
Family Health Division of the Department of Health Services of the Ministry of Health/Nepal, New ERA/Nepal, and ORC Macro. 2002. Nepal Demographic and Health Survey 2001. Calverton, Maryland, USA: Family Health Division Department of Health Services Ministry of Health/Nepal, New ERA, and ORC Macro. http://dhsprogram.com/pubs/pdf/FR132/FR132.pdf.
Fenn, N. S., J. Edmeades, H. Lantos, O. Onovo, K. Stoebenau, A. Warner, J. D. Edmeades, et al. 2015. “Child Marriage, Adolescent Pregnancy and Family Formation in West and Central Africa.” Senegal: UNICEF West and Central Africa Regional Office.
Field, E., and A. Ambrus. 2008. “Early Marriage, Age of Menarche, and Female Schooling Attainment in Bangladesh.” Journal of Political Economy 116 (5): 881-930. https://doi.org/10.1086/593333.
Freccero, J., and A. Whiting. 2018. Toward an End to Child Marriage: Lessons from Research and Practice in Development and Humanitarian Sectors. Berkeley: Human Rights Center, University of California Berkeley School of Law and Save the Children. https://www.law.berkeley.edu/wp-content/uploads/2018/08/Toward-an-End-to-Child_Marriage_Report_FINAL.pdf.
Garenne, M. 2004. “Age at Marriage and Modernisation in Sub-Saharan Africa.” Southern African Journal of Demography: 59-79. https://www.jstor.org/stable/20853271.
Gething, P. W., and C. R. Burgert-Brucker. 2017. The DHS Program Modeled Map Surfaces: Understanding the Utility of Spatial Interpolation for Generating Indicators at Subnational Administrative Levels. DHS Spatial Analysis Reports No. 15. Rockville, Maryland, USA: ICF. http://dhsprogram.com/pubs/pdf/SAR15/SAR15.pdf.
Girls Not Brides. 2018. Addressing Child Marriage through Education: What the Evidence Shows. Girls Not Brides. https://www.girlsnotbrides.org/where-does-it-happen/.
Girls Not Brides. 2019a. Bangladesh. https://www.girlsnotbrides.org/child-marriage/bangladesh/.
Girls Not Brides. 2019b. India. https://www.girlsnotbrides.org/child-marriage/india/.
Girls Not Brides. 2019c. Indonesia. https://www.girlsnotbrides.org/child-marriage/indonesia/.
Girls Not Brides. 2019d. Nepal. https://www.girlsnotbrides.org/child-marriage/nepal/.
Glick, P., C. Handy, and D. E. Sahn. 2015. “Schooling, Marriage, and Age at First Birth in Madagascar.” Population Studies 69 (2): 219-236. https://doi.org/10.1080/00324728.2015.1053513.
Godha, D., D. R. Hotchkiss, and A. J. Gage. 2013. “Association between Child Marriage and Reproductive Health Outcomes and Service Utilization: A Multi-Country Study from South Asia.” Journal of Adolescent Health 52 (5): 552-558. https://doi.org/10.1016/j.jadohealth.2013.01.021.

47
Gupta, B. 2014. “Where Have All the Brides Gone? Son Preference and Marriage in India over the Twentieth Century.” The Economic History Review 67 (1): 1-24. https://doi.org/10.1111/1468-0289.12011.
Gwatkin, D. R. 2002. “Who Would Gain Most from Efforts to Reach the Millennium Development Goals for Health.” Washington, DC: World Bank.
Gwatkin, D. R. 2007. “10 Best Resources on… Health Equity.” Health Policy and Planning 22 (5): 348-351. https://doi.org/10.1093/heapol/czm028.
HAQ: Centre for Child Rights. 2014. Child Marriage in India: Achievements, Gaps and Challenges. https://www.ohchr.org/Documents/Issues/Women/WRGS/ForcedMarriage/NGO/HAQCentreForChildRights1.pdf.
Harris, I., P. D. Jones, T. J. Osborn, and D. H. Lister. 2014. “Updated High‐Resolution Grids of Monthly Climatic Observations–the CRU TS3. 10 Dataset.” International Journal of Climatology 34 (3): 623-642. https://doi.org/10.1002/joc.3711.
Hinson, L., J. Edmeades, L. Murithi, and M. Puri. 2019. “Developing and Testing Measures of Reproductive Decision-Making Agency in Nepal.” Social Science & Medicine – Population Health Special Issue on Gender Empowerment and Health.
Human Rights Watch. 2016. “Our Time to Sing and Play”: Child Marriage in Nepal. https://www.hrw.org/report/2016/09/08/our-time-sing-and-play/child-marriage-nepal.
ICF International. 2012. Demographic and Health Survey Interviewer’s Manual, Measure DHS Basic Documentation No. 2. Calverton, MD: ICF International.
IIPS and ICF. 2017. India National Family Health Survey NFHS-4 2015-16. Mumbai, India: International Institute for Population Sciences – IIPS and ICF. http://dhsprogram.com/pubs/pdf/FR339/FR339.pdf.
IIPS and Macro International. 2007. India National Family Health Survey (NFHS-3) 2005-06. Volume 1. Mumbai, India: International Institute for Population Sciences – IIPS and Macro International. http://dhsprogram.com/pubs/pdf/FRIND3/FRIND3.pdf.
IIPS and ORC Macro. 2000. India National Family Health Survey (NFHS-2) 1998–99. Mumbai, India: International Institute for Population Sciences – IIPS and ORC Macro. http://dhsprogram.com/pubs/pdf/FRIND2/FRIND2.pdf.
Ikamari, L. 2005. “The Effect of Education on the Timing of Marriage in Kenya.” Demographic Research 12: 1-28. https://dx.doi.org/10.4054/DemRes.2005.12.1.
International Center for Equity in Health. 2014. Equiplot. Ado. International Center for Equity in Health, Universidade Federal de Pelotas, Pelotas, Brazil.

48
International Center for Research on Women, and Plan Asia Regional Office. 2013. Asia Child Marriage Initiative: Summary of Research in Bangladesh, India and Nepal. New Delhi, India. https://www.icrw.org/wp-content/uploads/2016/10/PLAN-ASIA-Child-Marriage-3-Country-Study.pdf.
Jejeebhoy, S. J. 1995. “Education and Women’s Age at Marriage.” In Women’s Education, Autonomy and Reproductive Behaviour: Experience from Developing Countries, edited by S. J. Jejeebhoy, 60-77. Oxford, England: Clarendon Press.
Jones, G. 2010. “Changing Marriage Patterns in Asia.” Asia Research Institute Working Paper No. 131. Singapore: National University of Singapore.
Jones, G. W. 2007. “Delayed Marriage and Very Low Fertility in Pacific Asia.” Population and Development Review 33 (3): 453-478.
Kamal, S. M., and C. H. Hassan. 2015. “Child Marriage and Its Association with Adverse Reproductive Outcomes for Women in Bangladesh.” Asia Pacific Journal of Public Health 27 (2): NP1492-NP1506.
Lee‐Rife, S., A. Malhotra, A. Warner, and A. M. Glinski. 2012. “What Works to Prevent Child Marriage: A Review of the Evidence.” Studies in Family Planning 43 (4): 287-303. https://doi.org/10.1111/j.1728-4465.2012.00327.x.
Lesthaeghe, R. 1983. “A Century of Demographic and Cultural Change in Western Europe: An Exploration of Underlying Dimensions.” Population and Development Review 9 (3): 411-435. https://www.doi.org/10.2307/1973316.
Lloyd, C. B., and B. S. Mensch. 2008. “Marriage and Childbirth as Factors in Dropping out from School: An Analysis of DHS Data from Sub-Saharan Africa.” Population Studies 62 (1): 1-13. https://doi.org/10.1080/00324720701810840.
MacQuarrie, K. L. D. 2016. Marriage and Fertility Dynamics: The Influence of Marriage Age on the Timing of First Birth and Birth Spacing. DHS Analytical Studies No. 56. Rockville, Maryland, USA: ICF International. http://dhsprogram.com/pubs/pdf/AS56/AS56.pdf.
MacQuarrie, K. L. D., and J. Edmeades. 2015. “Child Grooms: Prevalence, Correlates, and Consequences of Early Marriage among Men.” Paper presented at the Population Association of America, San Diego, CA, April 30-May 2, 2015.
MacQuarrie, K. L. D., L. Mallick, and C. Allen. 2017. Sexual and Reproductive Health in Early and Later Adolescence: DHS Data on Youth Age 10-19. DHS Comparative Reports No. 45. Rockville, Maryland, USA: ICF. http://dhsprogram.com/pubs/pdf/CR45/CR45.pdf.
MacQuarrie, K. L. D., Q. Nahar, R. Khan, and M. Sultana. 2016. Why So Young? The Social Context of Early Childbearing and Contraception among Young Women in Khulna, Bangladesh. DHS Further Analysis Reports No. 99. Rockville, Maryland, USA: ICF International. http://dhsprogram.com/pubs/pdf/FA99/FA99.pdf.
49
Mathur, S., M. Greene, and A. Malhotra. 2003. Too Young to Wed: The Lives, Rights, and Health of Young Married Girls. Washington DC: The International Center for Research on Women.
Mayala, B., T. D. Fish, D. Eitelberg, and T. Dontamsetti. 2018. The DHS Program Geospatial Covariate Datasets Manual (Second Edition). Rockville, Maryland, USA: ICF.
McCleary-Sills, J., L. Hanmer, J. Parsons, and J. Klugman. 2015. “Child Marriage: A Critical Barrier to Girls’ Schooling and Gender Equality in Education.” The Review of Faith & International Affairs 13 (3): 69-80. https://doi.org/10.1080/15570274.2015.1075755.
Mensch, B. S., D. Bagah, W. H. Clark, and F. Binka. 1999. “The Changing Nature of Adolescence in the Kassena-Nankana District of Northern Ghana.” Studies in Family Planning 30 (2): 95-111. https://doi.org/10.1111/j.1728-4465.1999.00095.x.
Mensch, B. S., J. Bruce, and M. E. Greene. 1998. The Uncharted Passage: Girls Adolescence in the Developing World. New York, NY: Population Council.
Min, B., K. M. Gaba, O. F. Sarr, and A. Agalassou. 2013. “Detection of Rural Electrification in Africa Using DMSP-OLS Night Lights Imagery.” International Journal of Remote Sensing 34 (22): 8118-8141. https://doi.org/10.1080/01431161.2013.833358.
Ministry of Health – MOH/Nepal, New ERA/Nepal, and ICF. 2017. Nepal Demographic and Health Survey 2016. Kathmandu, Nepal: MOH/Nepal, New ERA, and ICF. http://dhsprogram.com/pubs/pdf/FR336/FR336.pdf.
Ministry of Health and Population – MOHP/Nepal, New ERA/Nepal, and ICF International. 2012. Nepal Demographic and Health Survey 2011. Kathmandu, Nepal: MOHP/Nepal, New ERA, and ICF International. http://dhsprogram.com/pubs/pdf/FR257/FR257.pdf.
Ministry of Health and Population - MOHP/Nepal, New ERA/Nepal, and Macro International. 2007. Nepal Demographic and Health Survey 2006. Kathmandu, Nepal: MOHP/Nepal, New ERA/Nepal, and Macro International Inc. http://dhsprogram.com/pubs/pdf/FR191/FR191.pdf.
Mitra, S. N., A. Al-Sabir, A. R. Cross, and K. Jamil. 1997. Bangladesh Demographic and Health Survey 1996-1997. Dhaka, Bangladesh: National Institute of Population Research and Training – NIPORT/Bangladesh, Mitra and Associates/Bangladesh, and Macro International. http://dhsprogram.com/pubs/pdf/FR88/FR88.pdf.
Mitra, S. N., M. N. Ali, S. Islam, A. R. Cross, and T. Saha. 1994. Bangladesh Demographic and Health Survey 1993-1994. Calverton, Maryland, USA: National Institute of Population Research and Training – NIPORT/Bangladesh, Mitra and Associates/Bangladesh, and Macro International. http://dhsprogram.com/pubs/pdf/FR60/FR60.pdf.
Montgomery, M. R., and J. B. Casterline. 1993. “The Diffusion of Fertility Control in Taiwan: Evidence from Pooled Cross-Section Time-Series Models.” Population Studies 47 (3): 457-479. https://doi.org/10.1080/0032472031000147246.

50
Nagi, B. 1993. Child Marriage in India: A Study of Its Differential Patterns in Rajasthan. New Delhi, India: Mittal Publications.
National Geophysical Data Center. 2013. “Version 4 DMSP-OLS Nighttime Lights Time Series.” Accessed April 5, 2019. Https://Ngdc.Noaa.Gov/Eog/Dmsp/Downloadv4composites.Html.
NIPORT, Mitra and Associates, and ICF International. 2016. Bangladesh Demographic and Health Survey 2014. Dhaka, Bangladesh: NIPORT, Mitra and Associates, and ICF International. http://dhsprogram.com/pubs/pdf/FR311/FR311.pdf.
NIPORT, Mitra Associates, and ICF International. 2013. Bangladesh Demographic and Health Survey 2011. Dhaka, Bangladesh: National Institute of Population Research Training, Mitra and Associates, and ICF International. http://dhsprogram.com/pubs/pdf/FR265/FR265.pdf.
NIPORT, Mitra Associates, and Macro International. 2009. Bangladesh Demographic and Health Survey 2007. Dhaka, Bangladesh: National Institute of Population Research Training – NIPORT, Mitra and Associates, and Macro International. http://dhsprogram.com/pubs/pdf/FR207/FR207.pdf.
NIPORT, Mitra Associates, and ORC Macro. 2001. Bangladesh Demographic and Health Survey 1999-2000. Dhaka, Bangladesh: National Institute of Population Research Training – NIPORT, Mitra and Associates, and ORC Macro. http://dhsprogram.com/pubs/pdf/FR119/FR119.pdf.
NIPORT, Mitra Associates, and ORC Macro. 2005. Bangladesh Demographic and Health Survey 2004. Dhaka, Bangladesh: National Institute of Population Research Training – NIPORT, Mitra and Associates, and ORC Macro. http://dhsprogram.com/pubs/pdf/FR165/FR165.pdf.
Nour, N. M. 2009. “Child Marriage: A Silent Health and Human Rights Issue.” Reviews in Obstetrics and Gynecology 2 (1): 51.
Parsons, J., J. Edmeades, A. Kes, S. Petroni, M. Sexton, and Q. Wodon. 2015. “Economic Impacts of Child Marriage: A Review of the Literature.” The Review of Faith & International Affairs 13 (3): 12-22. https://doi.org/10.1080/15570274.2015.1075757.
Perez-Haydrich, C., J. L. Warren, C. R. Burgert, and M. E. Emch. 2013. Guidelines on the Use of DHS GPS Data. DHS Spatial Analysis Reports No. 8. Calverton, Maryland, USA: ICF International. http://dhsprogram.com/pubs/pdf/SAR8/SAR8.pdf.
Plan International. 2017. Marriage Loophole Threatens Girls’ Futures. https://plan-international.org/blog/2017/03/loophole-child-marriage-law-bangladesh.
Population Council. 2019. Balika (Bangladeshi Association for Life Skills, Income, and Knowledge for Adolescents). https://www.popcouncil.org/research/balika-bangladeshi-association-for-life-skills-income-and-knowledge-for-ado.
Potts, M., and C. E. Henderson. 2012. “Global Warming and Reproductive Health.” International Journal of Gynecology & Obstetrics 119 (S1). https://doi.org/10.1016/j.ijgo.2012.03.020.

51
Pradhan, A., R. H. Aryal, G. Regmi, B. Ban, and P. Govindasamy. 1997. Nepal Family Health Survey 1996. Kathmandu, Nepal: Ministry of Health/Nepal, New ERA/Nepal, and Macro International. http://dhsprogram.com/pubs/pdf/FR78/FR78.pdf.
Prata, N., A. Fraser, M. J. Huchko, J. D. Gipson, M. Withers, S. Lewis, E. J. Ciaraldi, and U. D. Upadhyay. 2017. “Women’s Empowerment and Family Planning: A Review of the Literature.” Journal of Biosocial Science 49 (6): 713-743. https://doi.org/10.1017/S0021932016000663.
Pullum, T. W. 2006. An Assessment of Age and Date Reporting in the DHS Surveys, 1985-2003. DHS Methodological Reports No. 5. Calverton, Maryland, USA: Macro International. http://dhsprogram.com/pubs/pdf/MR5/MR5.pdf.
Raj, A., N. Saggurti, D. Balaiah, and J. G. Silverman. 2009. “Prevalence of Child Marriage and Its Effect on Fertility and Fertility-Control Outcomes of Young Women in India: A Cross-Sectional, Observational Study.” The Lancet 373 (9678): 1883-1889. https://doi.org/10.1016/S0140-6736(09)60246-4.
Retherford, R. D., and J. A. Palmore. 1983. “Diffusion Processes Affecting Fertility Regulation.” In Determinants of Fertility in Developing Countries, Volume 2, Fertility Regulation and Institutional Influences, edited by RA Bulatao and Ron D Lee, 295-339. New York, NY: Academic Press.
Rutstein, S. O., and K. Johnson. 2004. The DHS Wealth Index, DHS Comparative Reports No. 6. Calverton, MD: ORC Macro.
Sonawat, R. 2001. “Understanding Families in India: A Reflection of Societal Changes.” Psicologia: Teoria e Pesquisa 17 (2): 177-186. http://dx.doi.org/10.1590/S0102-37722001000200010.
Stata Statistical Software: Release 15. College Station, TX: StataCorp LLC.
Statistics Indonesia – Badan Pusat Statistik – BPS, and Macro International. 2008. Indonesia Demographic and Health Survey 2007. Calverton, Maryland, USA: BPS and Macro International. http://dhsprogram.com/pubs/pdf/FR218/FR218.pdf.
Statistics Indonesia – Badan Pusat Statistik – BPS, N. Population, Family Planning Board – BKKBN/Indonesia, Kementerian Kesehatan – Kemenkes – Ministry of Health/Indonesia, and ICF International. 2013. Indonesia Demographic and Health Survey 2012. Jakarta, Indonesia: BPS, BKKBN, Kemenkes, and ICF International. http://dhsprogram.com/pubs/pdf/FR275/FR275.pdf.
Steinhaus, M., L. Hinson, A. T. Rizzo, and A. Gregowski. 2019. “Measuring Social Norms Related to Child Marriage among Adult Decision-Makers of Young Girls in Phalombe and Thyolo, Malawi.” Journal of Adolescent Health 64 (4, Supplement): S37-S44. https://dx.doi.org/10.1016/j.jadohealth.2018.12.019.
Tarone, R. E., and J. Ware. 1977. “On Distribution-Free Tests for Equality of Survival Distributions.” Biometrika 64 (1): 156-160. https://doi.org/10.1093/biomet/64.1.156.
Taylor, L. 2019. “U.N. Finds 115 Million “Child Grooms” with Central African Republic Topping List.” Thomson Reuters Foundation News, June 7 2019.
52
Tugwell, P., V. Robinson, and E. Morris. 2007. “Mapping Global Health Inequalities: Challenges and Opportunities.” The Minority Health & Health Equity Archive: 1-36. https://escholarship.org/uc/item/2f11d67c.
UNICEF. 2018. “Plan of Action Launched to Eliminate Child Marriage in Bangladesh.” Dhaka, Bangladesh: UNICEF. https://www.unicef.org/bangladesh/en/press-releases/plan-action-launched-eliminate-child-marriage-bangladesh.
United Nations. 2016. Sustainable Development Goal 5: Achieve Gender Equality and Empower All Women and Girls. https://sustainabledevelopment.un.org/sdg5.
Varia, N. 2016. “Ending Child Marriage Meeting the Global Development Goals’ Promise to Girls.” Human Right Watch 3.
Warner, A., A. Malhotra, and A. McGonagle. 2012. Girls’ Education, Empowerment, and Transitions to Adulthood: The Case for a Shared Agenda. Washington, DC: International Center for Research on Women (ICRW).
WHO. 2011. Who Guidelines: Preventing Early Pregnancy and Poor Reproductive Outcomes among Adolescents in Developing Countries. Geneva, Switzerland: World Health Organization. https://www.who.int/maternal_child_adolescent/documents/preventing_early_pregnancy/en/.
WHO. 2013a. Handbook on Health Inequality Monitoring with a Special Focus on Low- and Middle-Income Countries. Geneva, Switzerland: World Health Organization.
WHO. 2013b. Handbook on Health Inequality Monitoring: With a Special Focus on Low-and Middle-Income Countries. Geneva, Switzerland: World Health Organization.
WHO. 2015. State of Inequality: Reproductive Maternal Newborn and Child Health: Interactive Visualization of Health Data. Geneva, Switzerland: World Health Organization.
WHO. 2017. Global Accelerated Action for the Health of Adolescents (Aa-Ha!) Guidance to Support Country Implementation. Geneva, Switzerland: World Health Organization. https://apps.who.int/iris/bitstream/handle/10665/255418/WHO-FWC-MCA-17.05-eng.pdf?sequence=1.
Wirth, M. E., D. Balk, E. Delamonica, A. Storeygard, E. Sacks, and A. Minujin. 2006. “Setting the Stage for Equity-Sensitive Monitoring of the Maternal and Child Health Millennium Development Goals.” Bulletin of the World Health Organization 84: 519-527. https://apps.who.int/iris/handle/10665/269687.
Wodon, Q., C. Male, A. Nayihouba, A. Onagoruwa, A. Savadogo, A. Yedan, J. Edmeades, et al. 2017. Economic Impacts of Child Marriage: Global Synthesis Report. Washington, DC: The International Bank for Reconstruction and Development /The World Bank and The International Center for Research on Women (ICRW).
World Health Organization. 2016. Child, Early and Forced Marriage Legislation in 37 Asia-Pacific Countries. Geneva, Switzerland: Inter-Parliamentary Union (IPU) and World Health Organization (WHO).

53
WorldPop. 2016. “Asia Continental Population Datasets (2000-2020).” Accessed August 21, 2017. http://Doi.Org/10.5258/Soton/Wp00013.


55
APPENDIX
Appendix Table A1 Descriptive statistics (percent distribution and means) for study sample of primary sampling units
Bangladesh (n=600 PSUs) India (n=28,521 PSUs) Nepal (n=385 PSUs)
Mean (Range) Mean (Range) Mean (Range)
Gender and fertility context Acceptance of wife-beating [1] 30.0% (0%-79.2%) 42.9% (0%-100%) 28.5% (0%-80.6%) Women’s decisionmaking
about own health [1] 63.6% (18.5%-100%) 76.4% (0%-100%) 57.5% (9.4%-100%) Ideal number of children 2.21 (1.67-3.71) 2.27 (0-7.36) 2.10 (1.41-3.62)
Spatial covariates Nightlights composite 12.18 (0.00-63) 14.99 (0-63.00) 4.81 (0.00-61.82) Adult population sex ratio [2] 0.94 (0.88-1.06) 1.08 (0-1.43) 0.86 (0.82-1.00) Aridity index 242.27 (133.27-268.84) 269.51 (133-2,942) 259.74 (208.88-286.39)
Education None 23.6% (0%-93%) 27.6% (0%-100%) 33% (0%-100%) Primary 29.2% (0%-73%) 12.6% (0%-100%) 16% (0%-48.4%) Secondary or higher 47.2% (0%-100%) 59.8% (0%-100%) 51% (0%-100%)
Household wealth Poorest 18.6% (0%-93%) 19.0% (0%-100%) 22% (0%-100%) Poorer 19.0% (0%-69%) 21.2% (0%-100%) 21% (0%-80%) Middle 20.1% (0%-68%) 21.0% (0%-100%) 19% (0%-70.8%) Richer 20.6% (0%-84%) 19.8% (0%-100%) 19% (0%-69%) Richest 21.7% (0%-100%) 19.1% (0%-100%) 19% (0%-100%)
Religion and caste [4] Muslim 90.0% (0%-100%) Hindu 74.4% (0%-100%) Hindu 87% (0%-100%) Hindu 9.1% (0%-100%) Muslim 12.3% (0%-100%) Buddhist 5% (0%-100%) Buddhist 0.7% (0%-100%) Christian 8.2% (0%-100%) Muslim 4% (0%-97.7%) Christian 0.2% (0%-89%) Sikh 2.1% (0%-100%) Christian 1% (0%-39.5%) Other 0.0% (0%-12%) Buddhist 1.5% (0%-100%) Kirat/other 3% (0%-63.2%)
Other 1.5% (0%-100%) Brahmin/Chhetri 37% (0%-100%)
General caste 21.6% (0%-100%) Terai/Madhesi other 11% (0%-100%)
SC 18.7% (0%-100%) Dalit 13% (0%-97.7%) ST 19.9% (0%-100%) Janajati/Newar 35% (0%-100%) OBC 39.8% (0%-100%) Other 4% (0%-100%) [1] Data on attitudes toward wife-beating and decisionmaking is available for a sub-sample of 9,888 PSUs in India. [2] Data on adult population sex ratio are missing for 1 PSU in Bangladesh and 129 PSUs (<1%) in India. [3] Data on aridity are missing for 42 PSUs (7%) in Bangladesh and 458 PSUs (1.6%) in India. [4] Data on caste are missing for 90 PSUs (<1%) in India.
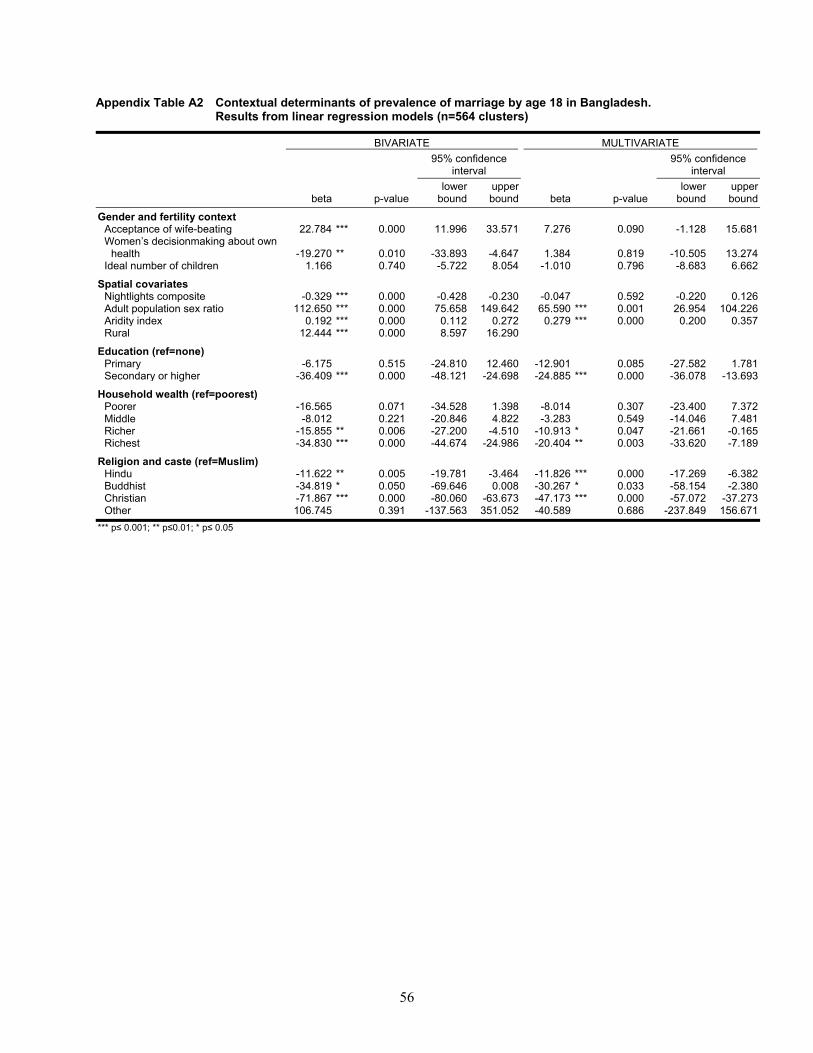
56
Appendix Table A2 Contextual determinants of prevalence of marriage by age 18 in Bangladesh. Results from linear regression models (n=564 clusters)
BIVARIATE MULTIVARIATE
beta p-value
95% confidence interval
beta
p-value
95% confidence interval
lower
bound upper bound
lower bound
upper bound
Gender and fertility context Acceptance of wife-beating 22.784 *** 0.000 11.996 33.571 7.276 0.090 -1.128 15.681 Women’s decisionmaking about own
health -19.270 ** 0.010 -33.893 -4.647 1.384
0.819 -10.505 13.274 Ideal number of children 1.166 0.740 -5.722 8.054 -1.010 0.796 -8.683 6.662
Spatial covariates Nightlights composite -0.329 *** 0.000 -0.428 -0.230 -0.047 0.592 -0.220 0.126 Adult population sex ratio 112.650 *** 0.000 75.658 149.642 65.590 *** 0.001 26.954 104.226 Aridity index 0.192 *** 0.000 0.112 0.272 0.279 *** 0.000 0.200 0.357 Rural 12.444 *** 0.000 8.597 16.290
Education (ref=none) Primary -6.175 0.515 -24.810 12.460 -12.901 0.085 -27.582 1.781 Secondary or higher -36.409 *** 0.000 -48.121 -24.698 -24.885 *** 0.000 -36.078 -13.693
Household wealth (ref=poorest) Poorer -16.565 0.071 -34.528 1.398 -8.014 0.307 -23.400 7.372 Middle -8.012 0.221 -20.846 4.822 -3.283 0.549 -14.046 7.481 Richer -15.855 ** 0.006 -27.200 -4.510 -10.913 * 0.047 -21.661 -0.165 Richest -34.830 *** 0.000 -44.674 -24.986 -20.404 ** 0.003 -33.620 -7.189
Religion and caste (ref=Muslim) Hindu -11.622 ** 0.005 -19.781 -3.464 -11.826 *** 0.000 -17.269 -6.382 Buddhist -34.819 * 0.050 -69.646 0.008 -30.267 * 0.033 -58.154 -2.380 Christian -71.867 *** 0.000 -80.060 -63.673 -47.173 *** 0.000 -57.072 -37.273 Other 106.745 0.391 -137.563 351.052 -40.589 0.686 -237.849 156.671
*** p≤ 0.001; ** p≤0.01; * p≤ 0.05

57
Appendix Table A3 Contextual determinants of prevalence of marriage by age 15 in Bangladesh. Results from linear regression models (n=564 clusters)
BIVARIATE MULTIVARIATE
beta p-value
95% confidence interval
beta
p-value
95% confidence interval
lower bound
upper bound
lower bound
upper bound
Gender and fertility context Acceptance of wife-beating 22.784 *** 0.000 11.996 33.571 7.276 0.090 -1.128 15.681 Women’s decisionmaking about own
health -19.270 ** 0.010 -33.893 -4.647 1.384
0.819 -10.505 13.274 Ideal number of children 1.166 0.740 -5.722 8.054 -1.010 0.796 -8.683 6.662
Spatial covariates Nightlights composite -0.329 *** 0.000 -0.428 -0.230 -0.047 0.592 -0.220 0.126 Adult population sex ratio 112.650 *** 0.000 75.658 149.642 65.590 *** 0.001 26.954 104.226 Aridity index 0.192 *** 0.000 0.112 0.272 0.279 *** 0.000 0.200 0.357 Rural 12.444 *** 0.000 8.597 16.290
Education (ref=none) Primary -6.175 0.515 -24.810 12.460 -12.901 0.085 -27.582 1.781 Secondary or higher -36.409 *** 0.000 -48.121 -24.698 -24.885 *** 0.000 -36.078 -13.693
Household wealth (ref=poorest) Poorer -16.565 0.071 -34.528 1.398 -8.014 0.307 -23.400 7.372 Middle -8.012 0.221 -20.846 4.822 -3.283 0.549 -14.046 7.481 Richer -15.855 ** 0.006 -27.200 -4.510 -10.913 * 0.047 -21.661 -0.165 Richest -34.830 *** 0.000 -44.674 -24.986 -20.404 ** 0.003 -33.620 -7.189
Religion and caste (ref=Muslim) Hindu -11.622 ** 0.005 -19.781 -3.464 -11.826 *** 0.000 -17.269 -6.382 Buddhist -34.819 * 0.050 -69.646 0.008 -30.267 * 0.033 -58.154 -2.380 Christian -71.867 *** 0.000 -80.060 -63.673 -47.173 *** 0.000 -57.072 -37.273 Other 106.745 0.391 -137.563 351.052 -40.589 0.686 -237.849 156.671
*** p≤ 0.001; ** p≤0.01; * p≤ 0.05

58
Appendix Table A4 Contextual determinants of prevalence of marriage by age 18 in India. Results from linear regression models (n=9,472 clusters)
BIVARIATE MULTIVARIATE
beta p-value
95% confidence interval
beta p-value
95% confidence interval
lower
bound upper bound
lower bound
upper bound
Gender and fertility context Acceptance of wife-beating 7.676 *** 0.000 5.261 10.091 1.799 0.098 -0.329 3.926 Women’s decisionmaking about
own health -12.877 *** 0.000 -15.946 -9.807 -2.910 0.058 -5.913 0.093 Ideal number of children 10.722 *** 0.000 10.029 11.415 -0.165 0.807 -1.486 1.156
Spatial covariates Nightlights composite -0.325 *** 0.000 -0.345 -0.306 0.063 ** 0.002 0.022 0.103 Adult population sex ratio 26.317 *** 0.000 19.653 32.981 0.120 0.985 -12.392 12.633 Aridity index 0.061 *** 0.000 0.045 0.078 -0.018 0.334 -0.055 0.019 Rural 14.661 *** 0.000 13.881 15.441
Education (ref=none) Primary 7.209 *** 0.001 2.811 11.607 5.255 0.180 -2.422 12.932 Secondary or higher -49.349 *** 0.000 -50.895 -47.802 -35.577 *** 0.000 -40.030 -31.124
Household wealth (ref=poorest) Poorer -5.457 *** 0.000 -8.194 -2.719 3.084 0.197 -1.599 7.768 Middle -15.694 *** 0.000 -18.164 -13.223 -8.424 *** 0.000 -12.700 -4.148 Richer -24.239 *** 0.000 -26.417 -22.061 -10.447 *** 0.000 -14.713 -6.182 Richest -39.345 *** 0.000 -41.009 -37.681 -19.514 *** 0.000 -24.074 -14.954
Religion (ref=Hindu) Muslim 1.400 0.063 -0.077 2.876 -2.121 0.114 -4.751 0.509 Christian -22.977 *** 0.000 -25.794 -20.161 -10.877 *** 0.000 -14.789 -6.965 Sikh -26.199 *** 0.000 -27.723 -24.674 -10.276 *** 0.000 -13.813 -6.739 Buddhist -16.118 *** 0.000 -22.541 -9.696 8.806 0.052 -0.058 17.669 Other 10.389 * 0.018 1.810 18.968 10.988 * 0.017 1.994 19.981
Caste (ref=general caste) SC 15.191 *** 0.000 12.927 17.455 -6.091 ** 0.002 -9.966 -2.216 ST 18.854 *** 0.000 17.019 20.690 -9.792 *** 0.000 -13.356 -6.229 OBC 9.089 *** 0.000 7.415 10.763 -6.083 *** 0.000 -8.893 -3.272
*** p≤ 0.001; ** p≤0.01; * p≤ 0.05

59
Appendix Table A5 Contextual determinants of prevalence of marriage by age 15 in India. Results from linear regression models (n=9,472 clusters)
BIVARIATE MULTIVARIATE
beta p-value
95% confidence interval
beta p-value
95% confidence interval
lower bound
upper bound
lower bound
upper bound
Gender and fertility context Acceptance of wife-beating 2.917 *** 0.000 1.815 4.018 0.870 0.122 -0.233 1.973 Women’s decisionmaking
about own health -5.282 *** 0.000 -6.856 -3.707 -1.747 * 0.020 -3.216 -0.278 Ideal number of children 3.350 *** 0.000 2.976 3.725 -0.731 * 0.045 -1.445 -0.017
Spatial covariates Nightlights composite -0.097 *** 0.000 -0.107 -0.086 0.014 0.167 -0.006 0.035 Adult population sex ratio 4.092 * 0.024 0.527 7.656 -1.977 0.543 -8.355 4.400 Aridity index 0.014 *** 0.002 0.005 0.023 0.000 0.974 -0.016 0.017 Rural 4.451 *** 0.000 4.032 4.870
Education (ref=none) Primary 0.948 0.519 -1.932 3.828 0.840 0.726 -3.855 5.535 Secondary or higher -17.509 *** 0.000 -18.432 -16.586 -13.515 *** 0.000 -16.202 -10.828
Household wealth (ref=poorest) Poorer -3.059 *** 0.000 -4.713 -1.404 2.945 * 0.043 0.091 5.799 Middle -6.340 *** 0.000 -7.765 -4.916 -3.710 ** 0.003 -6.149 -1.270 Richer -8.277 *** 0.000 -9.778 -6.777 -2.474 * 0.046 -4.901 -0.048 Richest -13.437 *** 0.000 -14.367 -12.507 -4.179 *** 0.001 -6.734 -1.624
Religion (ref=Hindu) Muslim 0.792 * 0.045 0.019 1.566 0.225 0.747 -1.139 1.588 Christian -5.546 *** 0.000 -6.796 -4.297 -0.369 0.758 -2.720 1.983 Sikh -9.083 *** 0.000 -9.632 -8.535 -4.052 *** 0.000 -5.247 -2.857 Buddhist -3.952 * 0.024 -7.381 -0.524 6.123 * 0.025 0.769 11.477 Other 0.269 0.908 -4.321 4.860 -2.812 0.105 -6.213 0.588
Caste (ref=general caste) SC 6.229 *** 0.000 5.002 7.457 -0.951 0.346 -2.928 1.026 ST 7.154 *** 0.000 6.221 8.088 -2.833 *** 0.001 -4.566 -1.100 OBC 3.830 *** 0.000 3.066 4.595 -1.325 0.055 -2.676 0.026
*** p≤ 0.001; ** p≤0.01; * p≤ 0.05
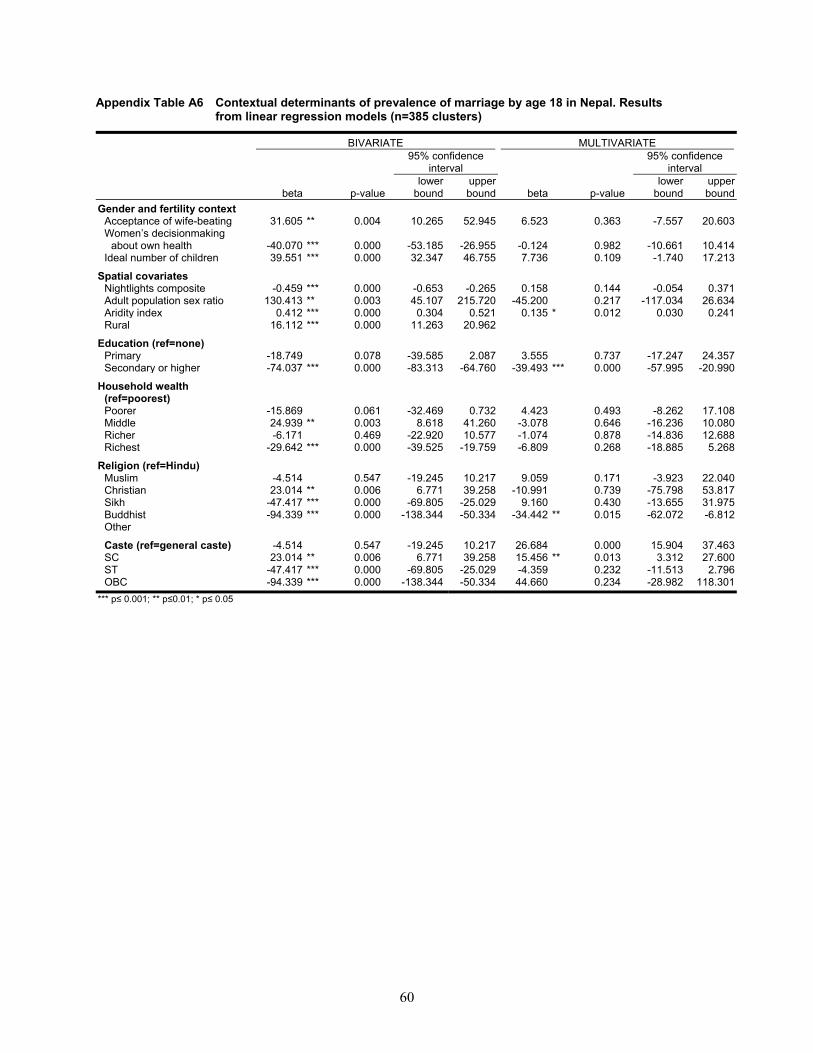
60
Appendix Table A6 Contextual determinants of prevalence of marriage by age 18 in Nepal. Results from linear regression models (n=385 clusters)
BIVARIATE MULTIVARIATE
beta p-value
95% confidence interval
beta p-value
95% confidence interval
lower
bound upper bound
lower bound
upper bound
Gender and fertility context Acceptance of wife-beating 31.605 ** 0.004 10.265 52.945 6.523 0.363 -7.557 20.603 Women’s decisionmaking
about own health -40.070 *** 0.000 -53.185 -26.955 -0.124 0.982 -10.661 10.414 Ideal number of children 39.551 *** 0.000 32.347 46.755 7.736 0.109 -1.740 17.213
Spatial covariates Nightlights composite -0.459 *** 0.000 -0.653 -0.265 0.158 0.144 -0.054 0.371 Adult population sex ratio 130.413 ** 0.003 45.107 215.720 -45.200 0.217 -117.034 26.634 Aridity index 0.412 *** 0.000 0.304 0.521 0.135 * 0.012 0.030 0.241 Rural 16.112 *** 0.000 11.263 20.962
Education (ref=none) Primary -18.749 0.078 -39.585 2.087 3.555 0.737 -17.247 24.357 Secondary or higher -74.037 *** 0.000 -83.313 -64.760 -39.493 *** 0.000 -57.995 -20.990
Household wealth (ref=poorest) Poorer -15.869 0.061 -32.469 0.732 4.423 0.493 -8.262 17.108 Middle 24.939 ** 0.003 8.618 41.260 -3.078 0.646 -16.236 10.080 Richer -6.171 0.469 -22.920 10.577 -1.074 0.878 -14.836 12.688 Richest -29.642 *** 0.000 -39.525 -19.759 -6.809 0.268 -18.885 5.268
Religion (ref=Hindu) Muslim -4.514 0.547 -19.245 10.217 9.059 0.171 -3.923 22.040 Christian 23.014 ** 0.006 6.771 39.258 -10.991 0.739 -75.798 53.817 Sikh -47.417 *** 0.000 -69.805 -25.029 9.160 0.430 -13.655 31.975 Buddhist -94.339 *** 0.000 -138.344 -50.334 -34.442 ** 0.015 -62.072 -6.812 Other
Caste (ref=general caste) -4.514 0.547 -19.245 10.217 26.684 0.000 15.904 37.463 SC 23.014 ** 0.006 6.771 39.258 15.456 ** 0.013 3.312 27.600 ST -47.417 *** 0.000 -69.805 -25.029 -4.359 0.232 -11.513 2.796 OBC -94.339 *** 0.000 -138.344 -50.334 44.660 0.234 -28.982 118.301
*** p≤ 0.001; ** p≤0.01; * p≤ 0.05

61
Appendix Table A7 Contextual determinants of prevalence of marriage by age 15 in Nepal. Results from linear regression models (n=385 clusters)
BIVARIATE MULTIVARIATE
beta p-value
95% confidence interval
beta p-value
95% confidence interval
lower
bound upper bound
lower bound
upper bound
Gender and fertility context Acceptance of wife-beating 22.634 *** 0.000 12.078 33.191 15.605 *** 0.001 6.628 24.582 Women’s decisionmaking about own
health -12.943 *** 0.000 -19.224 -6.663 -0.003 0.999 -6.356 6.350 Ideal number of children 10.113 *** 0.000 6.371 13.854 0.677 0.806 -4.735 6.089
Spatial covariates Nightlights composite -0.142 *** 0.000 -0.216 -0.067 -0.047 0.278 -0.132 0.038 Adult population sex ratio 55.710 * 0.022 8.236 103.183 -1.008 0.959 -39.458 37.442 Aridity index 0.137 *** 0.000 0.081 0.194 0.056 0.132 -0.017 0.128 Rural 4.933 *** 0.000 2.355 7.511
Education (ref=none) Primary 6.503 0.348 -7.115 20.121 13.918 0.058 -0.496 28.332 Secondary or higher -21.103 *** 0.000 -26.998 -15.209 -12.450 * 0.020 -22.914 -1.985
Household wealth (ref=poorest) Poorer -14.895 *** 0.001 -23.842 -5.948 -8.488 0.080 -18.004 1.027 Middle 3.669 0.383 -4.587 11.926 -5.524 0.161 -13.263 2.215 Richer -8.608 * 0.029 -16.331 -0.884 -6.465 0.106 -14.299 1.370 Richest -12.005 *** 0.000 -17.696 -6.314 -1.946 0.665 -10.786 6.894
Religion (ref=Hindu) Muslim 6.769 0.152 -2.515 16.054 7.880 0.068 -0.578 16.338 Christian 7.142 0.173 -3.149 17.432 -7.189 0.504 -28.345 13.968 Sikh -24.615 *** 0.000 -35.154 -14.076 -7.490 0.384 -24.406 9.426 Buddhist -8.588 0.402 -28.730 11.554 4.531 0.576 -11.397 20.458 Other
Caste (ref=general caste) 6.769 0.152 -2.515 16.054 6.871 * 0.044 0.186 13.556 SC 7.142 0.173 -3.149 17.432 0.307 0.940 -7.684 8.298 ST -24.615 *** 0.000 -35.154 -14.076 -1.257 0.515 -5.047 2.532 OBC -8.588 0.402 -28.730 11.554 -2.299 0.912 -43.105 38.506
*** p≤ 0.001; ** p≤0.01; * p≤ 0.05

62
Appendix Figure A1 Uncertainty around prevalence estimates of marriage by age 18
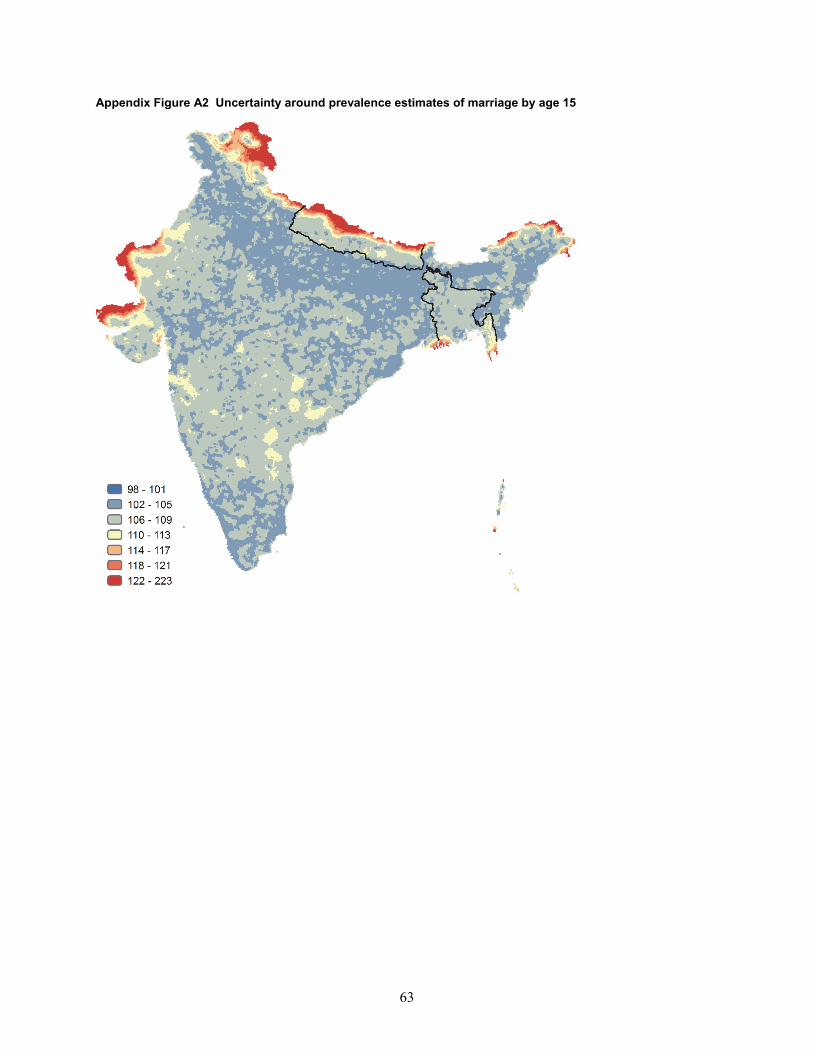
63
Appendix Figure A2 Uncertainty around prevalence estimates of marriage by age 15
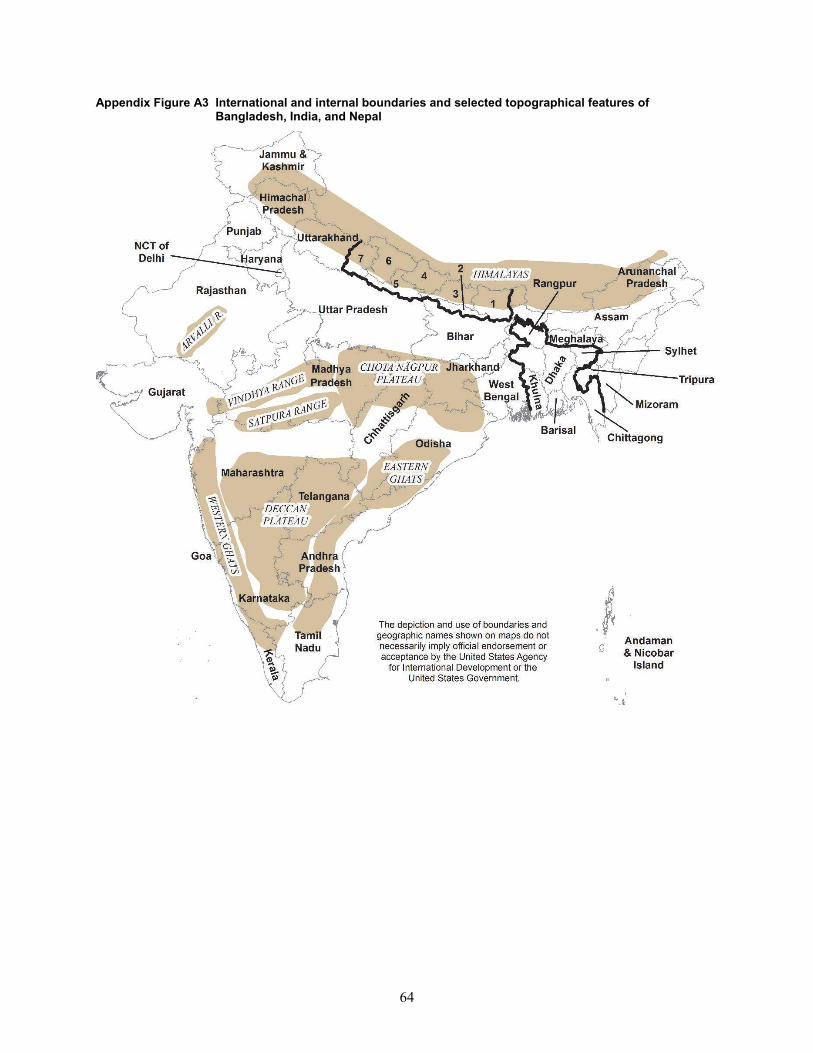
64
Appendix Figure A3 International and internal boundaries and selected topographical features of Bangladesh, India, and Nepal