Trends in thinness prevalence among adolescents in ten European countries and the USA (1998–2006):...
9
Public Health Nutrition: page 1 of 9 doi:10.1017/S1368980013002541 Trends in thinness prevalence among adolescents in ten European countries and the USA (1998–2006): a cross-sectional survey Giacomo Lazzeri 1, *, Stefania Rossi 1 , Colette Kelly 2 , Carine Vereecken 3 , Namanjeet Ahluwalia 4 and Mariano V Giacchi 1 1 Department of Molecular and Developmental Medicine, Research Centre for Health Promotion and Education, University of Siena, Via A. Moro, 53100 Siena, Italy: 2 Health Promotion Research Centre, National University of Ireland Galway, Galway, Republic of Ireland: 3 Department of Public Health, Ghent University, Ghent, Belgium: 4 Center for Research in Human Nutrition, INSERM 557, University of Paris13, Paris, France Submitted 26 November 2012: Final revision received 11 June 2013: Accepted 18 August 2013 Abstract Objective: To describe the prevalence of ‘graded thinness’ in children aged 11, 13 and 15 years in eleven developed countries and to identify trends in the prevalence of ‘thinness’ (BMI , 17 kg/m 2 at age 18 years) by age and gender. Design: Cross-sectional study using data collected through self-reported ques- tionnaires. Setting: Data were taken from the 1997/1998, 2001/2002 and 2005/2006 surveys of the Health Behaviours in School-aged Children (HBSC) Study. Subjects: Children and adolescents from ten European countries and the USA (n 158 000). Results: Prevalence of grades 1, 2 and 3 of thinness was higher among 11-year-old students compared with the 13- and 15-year-olds in all countries. A higher pre- valence of thinness was observed in girls than in boys. Since 1998 the prevalence of thinness decreased steadily in Czech boys and girls, while it increased for French girls. In the total European sample of females, thinness decreased from 1998 to 2006 (x 2 for trend, P , 0?01). Age-adjusted logistic regression analysis showed that Czech boys and girls, and Flemish and American girls were less likely to be thin in 2006 than in 1998; while a noteworthy increment, even if borderline significant, was observed for French girls with a 41 % increase in the likelihood to be thin. Conclusions: Our findings suggest that thinness is an important overlooked phenomenon with wide variation in prevalence and trends across developed countries. It deserves further longitudinal studies in a multinational context that could increase the understanding of the factors associated with thinness and contribute to developing preventive and nutritional programmes targeted at controlling obesity and chronic diseases, while monitoring thinness. Keywords Adolescents BMI Graded thinness Underweight Trend Thinness in infants, children and adolescents poses a considerable public health problem internationally and may produce unfavourable outcomes, particularly in young women, because their desire for thinness is greater than that of other age groups (1–3) . In most European countries, teenagers are under social pressure to pursue an unreal beauty ideal of thinness (4) , which may lead to risky weight-management practices and eating disorders. In the developed world, anorexia nervosa is in fact the third most common chronic condition of adolescence (5) . Moreover, thinness is frequently associated with nutri- tional deficiencies, menstrual irregularity, decreased cognitive and work capacity, and increased infections (6) . Nevertheless, while in developed countries the childhood obesity epidemic (7) and related consequences have broadly been investigated, thinness has received less consideration, although overweight and thinness frequently coexist even within a single family. This phenomenon, referred to as ‘dual burden households’ (8,9) , occurs in all countries and presents growing public health concerns for underweight individuals who may inadvertently become the focus of obesity prevention initiatives. Until 2007, when Cole et al. (10) proposed international age- and sex-specific thinness cut-offs from 2 to 18 years to provide comparable prevalence rates of thinness, trends in thinness among children and adolescents had Public Health Nutrition *Corresponding author: Email [email protected] r The Authors 2013
-
Upload
independent -
Category
Documents
-
view
0 -
download
0
Transcript of Trends in thinness prevalence among adolescents in ten European countries and the USA (1998–2006):...

Public Health Nutrition: page 1 of 9 doi:10.1017/S1368980013002541
Trends in thinness prevalence among adolescentsin ten European countries and the USA (1998–2006):a cross-sectional survey
Giacomo Lazzeri1,*, Stefania Rossi1, Colette Kelly2, Carine Vereecken3,Namanjeet Ahluwalia4 and Mariano V Giacchi11Department of Molecular and Developmental Medicine, Research Centre for Health Promotion and Education,University of Siena, Via A. Moro, 53100 Siena, Italy: 2Health Promotion Research Centre, National Universityof Ireland Galway, Galway, Republic of Ireland: 3Department of Public Health, Ghent University, Ghent,Belgium: 4Center for Research in Human Nutrition, INSERM 557, University of Paris13, Paris, France
Submitted 26 November 2012: Final revision received 11 June 2013: Accepted 18 August 2013
Abstract
Objective: To describe the prevalence of ‘graded thinness’ in children aged 11, 13and 15 years in eleven developed countries and to identify trends in theprevalence of ‘thinness’ (BMI , 17 kg/m2 at age 18 years) by age and gender.Design: Cross-sectional study using data collected through self-reported ques-tionnaires.Setting: Data were taken from the 1997/1998, 2001/2002 and 2005/2006 surveysof the Health Behaviours in School-aged Children (HBSC) Study.Subjects: Children and adolescents from ten European countries and the USA(n 158 000).Results: Prevalence of grades 1, 2 and 3 of thinness was higher among 11-year-oldstudents compared with the 13- and 15-year-olds in all countries. A higher pre-valence of thinness was observed in girls than in boys. Since 1998 the prevalenceof thinness decreased steadily in Czech boys and girls, while it increased forFrench girls. In the total European sample of females, thinness decreased from1998 to 2006 (x2 for trend, P , 0?01). Age-adjusted logistic regression analysisshowed that Czech boys and girls, and Flemish and American girls were lesslikely to be thin in 2006 than in 1998; while a noteworthy increment, even ifborderline significant, was observed for French girls with a 41 % increase in thelikelihood to be thin.Conclusions: Our findings suggest that thinness is an important overlookedphenomenon with wide variation in prevalence and trends across developedcountries. It deserves further longitudinal studies in a multinational contextthat could increase the understanding of the factors associated with thinness andcontribute to developing preventive and nutritional programmes targeted atcontrolling obesity and chronic diseases, while monitoring thinness.
KeywordsAdolescents
BMIGraded thinness
UnderweightTrend
Thinness in infants, children and adolescents poses a
considerable public health problem internationally and
may produce unfavourable outcomes, particularly in
young women, because their desire for thinness is greater
than that of other age groups(1–3). In most European
countries, teenagers are under social pressure to pursue
an unreal beauty ideal of thinness(4), which may lead to
risky weight-management practices and eating disorders.
In the developed world, anorexia nervosa is in fact the
third most common chronic condition of adolescence(5).
Moreover, thinness is frequently associated with nutri-
tional deficiencies, menstrual irregularity, decreased
cognitive and work capacity, and increased infections(6).
Nevertheless, while in developed countries the childhood
obesity epidemic(7) and related consequences have broadly
been investigated, thinness has received less consideration,
although overweight and thinness frequently coexist even
within a single family. This phenomenon, referred to as
‘dual burden households’(8,9), occurs in all countries and
presents growing public health concerns for underweight
individuals who may inadvertently become the focus of
obesity prevention initiatives.
Until 2007, when Cole et al.(10) proposed international
age- and sex-specific thinness cut-offs from 2 to 18 years
to provide comparable prevalence rates of thinness,
trends in thinness among children and adolescents had
Public
Hea
lth
Nutr
itio
n
*Corresponding author: Email [email protected] r The Authors 2013
been seldom described(11) and the comparisons between
countries had been difficult due to the use of several
cut-off points (Centers for Disease Control and Preven-
tion, WHO and International Obesity Task Force growth
references) and different terms (underweight, wasting,
thinness, undernutrition), which have a different meaning
in adults, adolescents and children(10–20). In their paper,
Cole et al. ‘tried to avoid potential confusion between the
terms wasting and underweight in children by adopting
the term thinness, which WHO uses to mean low BMI in
adults and adolescents’ and ‘extended the definition to
include low BMI for age in children, linked to the adult
definition through the fulcrum of BMI 17 at age 18’. Then
in addition to the primary cut-off of BMI 5 17 kg/m2 they
proposed ‘two secondary cut offs: 18?5, long used by
WHO in adult studies and for grade 1 thinness, and 16,
used for grade 3 thinness’. Thus the ‘three cut offs
correspond to the WHO graded definition of thinness’(20).
The objectives of the present study were to: (i) describe
the prevalence of graded thinness in ten European
countries and the USA, using the three cut-off points
proposed by Cole et al.(10); and (ii) identify trends in the
prevalence of grade 2 thinness and below (BMI , 17kg/m2
at age 18 years) in nationally representative samples of
11-, 13- and 15-year-old children from eleven countries.
To our knowledge, the present study is the first analysis
of thinness prevalence and trends over the last 10 years
among 11–15-year-olds in several European countries
and the USA using a standardized scientific methodology(21)
and the international cut-offs(10) recommended by the Inter-
national Obesity Task Force that are suitable for use with
a sample of children and adolescents in comparative
studies. Recently some studies have used the international
reference cut-offs(10) to describe the trends in thinness at
the national level(19,22–24).
From this point onwards, unless otherwise specified,
the term ‘thinness’ as used in the present article refers to
the cut-off identified by Cole et al. (‘BMI 17 at age 18’).
Methods
The present analysis uses data from the Health Behaviour in
School-aged Children (HBSC) Study, which is an interna-
tional WHO collaborative study conducted in schools every
four years. A detailed description of the study, its historical
development and methods are available elsewhere(25–27).
According to the HBSC international research protocol,
appropriate ethical approval was gained from qualified
authorities or committees for the study in all countries(26,27).
The survey instrument is an internationally standardized
self-report questionnaire which is administered in the
classroom and whose completion takes approximately
50min. Participants gave their assent and were assured of
the confidentiality of their answers. Parental permission to
participate was obtained before administration.
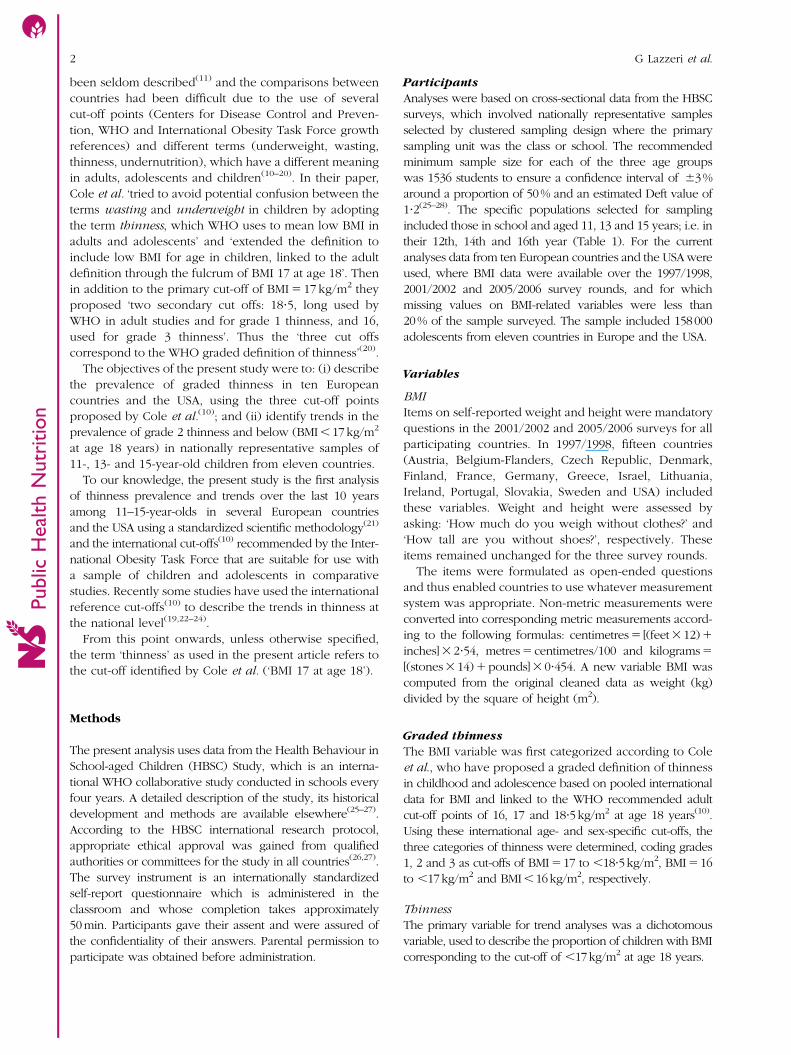
Participants
Analyses were based on cross-sectional data from the HBSC
surveys, which involved nationally representative samples
selected by clustered sampling design where the primary
sampling unit was the class or school. The recommended
minimum sample size for each of the three age groups
was 1536 students to ensure a confidence interval of 63%
around a proportion of 50% and an estimated Deft value of
1?2(25–28). The specific populations selected for sampling
included those in school and aged 11, 13 and 15 years; i.e. in
their 12th, 14th and 16th year (Table 1). For the current
analyses data from ten European countries and the USA were
used, where BMI data were available over the 1997/1998,
2001/2002 and 2005/2006 survey rounds, and for which
missing values on BMI-related variables were less than
20% of the sample surveyed. The sample included 158000
adolescents from eleven countries in Europe and the USA.
Variables
BMI
Items on self-reported weight and height were mandatory
questions in the 2001/2002 and 2005/2006 surveys for all
participating countries. In 1997/1998, fifteen countries
(Austria, Belgium-Flanders, Czech Republic, Denmark,
Finland, France, Germany, Greece, Israel, Lithuania,
Ireland, Portugal, Slovakia, Sweden and USA) included
these variables. Weight and height were assessed by
asking: ‘How much do you weigh without clothes?’ and
‘How tall are you without shoes?’, respectively. These
items remained unchanged for the three survey rounds.
The items were formulated as open-ended questions
and thus enabled countries to use whatever measurement
system was appropriate. Non-metric measurements were
converted into corresponding metric measurements accord-
ing to the following formulas: centimetres 5 [(feet3 12) 1
inches] 3 2?54, metres 5 centimetres/100 and kilograms 5
[(stones 3 14) 1 pounds] 3 0?454. A new variable BMI was
computed from the original cleaned data as weight (kg)
divided by the square of height (m2).
Graded thinness
The BMI variable was first categorized according to Cole
et al., who have proposed a graded definition of thinness
in childhood and adolescence based on pooled international
data for BMI and linked to the WHO recommended adult
cut-off points of 16, 17 and 18?5kg/m2 at age 18 years(10).
Using these international age- and sex-specific cut-offs, the
three categories of thinness were determined, coding grades
1, 2 and 3 as cut-offs of BMI 517 to ,18?5kg/m2, BMI516
to ,17kg/m2 and BMI,16kg/m2, respectively.
Thinness
The primary variable for trend analyses was a dichotomous
variable, used to describe the proportion of children with BMI
corresponding to the cut-off of ,17kg/m2 at age 18 years.
Public
Hea
lth
Nutr
itio
n2 G Lazzeri et al.

Year trend
The key independent variable was an ordered variable
representing the survey time. It was coded 0 for the 1997/
1998 survey, 1 for the 2001/2002 survey and 2 for the
2005/2006 survey.
Sociodemographic characteristics
Sociodemographic characteristics analysed were age and
country or region of residence of the children.
Missing values
A large number of height and/or weight values were
missing in the three HBSC surveys (about 10 % on aver-
age, Table 1), with the percentage of missing values being
higher than 20 % in some countries resulting in their
exclusion from the analysis (43 % in Ireland, 31 % in
Lithuania and 20 % in Israel). The extreme values of
height, weight and BMI (recoded as ‘out-of-range’) in the
three HBSC surveys have been cleaned according to the
same criteria using the range estimates of the US Centers
for Disease Control and Prevention’s website under the
Growth Chart Site.
Statistical analysis
The data were analysed using the statistical software
package SPSS for Windows version 16?0 and a more
conservative two-sided level of significance of P 5 0?01
was applied in the present study to account for the
Public
Hea
lth
Nutr
itio
n
Table 1 Sample description: number of participants in 1997/1998, 2001/2002 and 2005/2006 surveys, by year of data collection, gender,country- and age; Health Behaviour in School-aged Children (HBSC) Study
Missing-
-
11 years 13 years 15 years
n % Boys (n) Girls (n) Boys (n) Girls (n) Boys (n) Girls (n)
Austria1998 222 5 723 690 744 759 604 7592002 371 9 750 777 771 791 643 6342006 276 6 853 841 794 793 693 801
Belgium-Flemish1998 359 8 828 902 781 754 797 7622002 413 7 1003 1150 966 1140 1027 10032006 347 8 670 621 697 707 831 785
Czech Republic1998 77 2 579 588 637 637 596 6092002 22 1 826 865 780 881 806 8542006 56 1 765 744 804 797 842 823
Denmark1998 540 11 793 842 855 892 737 7832002 578 13 783 867 772 796 656 7132006 951 17 985 1108 980 1057 762 790
Finland1998 216 4 796 858 803 824 764 7722002 143 3 952 937 873 845 867 8742006 249 5 850 933 834 891 790 895
France1998 327 8 736 731 642 779 592 6532002 561 7 1332 1339 1421 1479 1301 13132006 533 8 1265 1228 1147 1279 1139 1083
Germany1998 275 6 813 756 821 792 795 7962002 757 13 1056 1038 879 921 842 8992006 626 9 1127 1104 1234 1207 1271 1281
Greece1998 110 6 788 800 643 653 605 7172002 223 4 627 625 600 631 643 6812006 133 4 543 544 553 634 650 766
Portugal1998 386 11 446 557 564 632 534 7752002 266 11 579 586 456 507 378 4222006 352 9 623 578 648 687 613 770
Sweden1998 393 10 656 621 699 647 607 5372002 389 10 743 744 606 585 609 6092006 422 10 772 741 655 698 752 774
USA1998 602 12 709 849 873 930 813 9952002 578 12 674 805 894 1027 754 8712006 375 11 500 594 708 806 649 635
-Only countries or regions included in the trend analysis.-
-
Percentage of 11–15-year-olds who did not respond to one or more self-reported weight and height items, by country/region and year of data collection.
Trends in thinness among adolescents 3

cluster sampling. Trends were assessed using unweighted
prevalence of thinness from countries that had data at
every time point. Temporal trends in graded-thinness
prevalence were plotted by age category, gender and
country (Figs 1 and 2).
The x2 test for trend (Mantel–Haenszel extension) was
calculated to assess a significant steady decrease or
increase in the prevalence of thinness (BMI , 17 kg/m2 at
age 18 years) across age groups within national surveys
and across survey years by age.
Logistic regression analyses by gender and country
(Table 3) were used to quantify the changes from 1998 to
2006 in the likelihood to be thin. Thinness was used as a
dependent variable and the survey period as an indepen-
dent variable (dummy), while controlling for age. The odds
ratios and relative 99% confidence intervals were calculated
with the 1997/1998 survey as the reference category.
Results
Data collected from European and American adolescents
during 1997/1998, 2001/2002 and 2005/2006 showed
(Figs 1 and 2) that prevalence of thinness grade 1, 2 and 3
was higher among 11-year-old students compared with
the 13- and 15-year-olds, with no effect by gender. For all
countries similar patterns were observed for prevalence
of thinness, with prevalence ranging (Table 2) in boys
between 0?2 % in Swedish 15-year-olds (1998) and 6?9 %
in Belgian-Flemish 11-year-olds (2002) and in girls
between 0?8 % in American 15-year-olds (2002) and 8?8 %
in Belgian-Flemish 11-year-olds (2002).
Table 2 presents a decreasing trend of thinness
(BMI , 17 kg/m2 at age 18 years) by age group but it was
not a characteristic of all national surveys. In 1997/1998,
2001/2002 and 2005/2006, thinness decreased steadily
with age for both genders only in the Czech Republic,
Germany and the USA and for girls in Belgium (x2 for
linear trend, P , 0?01). If we combine data of the ten
European countries, thinness decreased with age in both
genders by all years examined. Considering the total
samples of 11–15-year-olds by gender, there was a sig-
nificant decrease from 1998 to 2006 only in females
(P , 0?01; data not presented in table).
Although the prevalence of thinness declined in almost
all countries, larger age-adjusted reductions were
observed in the likelihood to be thin in 2006 compared
with 1998 (Table 3) for Czech boys and girls (OR 5 0?37,
99 % CI 0?16, 0?87 for boys; OR 5 0?47, 99 % CI 0?28, 0?79
for girls) and for American girls (OR 5 0?49, 99 % CI 0?30,
0?79 for girls) and Flemish girls (OR 5 0?68, 99 % CI 0?48,
0?97 for girls) and for Danish girls, but only from 1998 to
2002 (OR 5 0?59, 99 % CI 0?39, 0?89 for girls).
Increments, even if not statistically significant, were
observed for both boys and girls in Sweden (OR 5 1?33,
99 % CI 0?63, 2?82 for boys; OR 5 1?03, 99 % CI 0?62, 1?72
for girls) and for Greek boys (OR 5 1?53, 99% CI 0?76, 3?01)
Public
Hea
lth
Nutr
itio
n
25
20
15
10
5
0
2520151050
2520151050
Austria Belgium-Flemish
CzechRepublic
Denmark Finland France Germany Greece Portugal Sweden USA
1998
2002
2006
1998
2002
2006
1998
2002
2006
1998
2002
2006
1998
2002
2006
1998
2002
2006
1998
2002
2006
1998
2002
2006
1998
2002
2006
1998
2002
2006
1998
2002
2006
%%
%
Fig. 1 Prevalences of thinness grade 1 ( ), thinness grade 2 ( ) and thinness grade 3 ( ) in (a) 11-year-old, (b) 13-year-old and(c) 15-year-old boys, by country and year of data collection; Health Behaviour in School-aged Children (HBSC) Study
4 G Lazzeri et al.

and Finnish girls (OR 5 1?13, 99 % CI 0?67, 1?89 for girls).
Finally a noteworthy increment, even if borderline sig-
nificant, was observed for French girls, with a 41 %
increase in odds to be thin in 2006 with respect to 1998
(OR 5 1?41, 99 % CI 0?97, 2?06).
Discussion
Thinness in children and adolescents poses a considerable
public health problem globally and in the developed
world, where anorexia nervosa is the third most common
chronic condition of adolescence(5). Thinness can also
result in problems such as osteoporosis, menstrual irregu-
larity, increased susceptibility to infections, hypothermia,
thinning hair and premature mortality(1).
In the present study, ‘the fulcrum of BMI 17 at age 18’,
proposed by Cole and colleagues(10) to unify the two
WHO definitions of thinness for adults and adolescents,
while extending its use to include low BMI for age in
children too, was used to explore the direction in pre-
valence of thinness across developed countries. To our
knowledge the current report is the first one on thinness
trends among adolescents of ten European countries and
the USA, using internationally agreed standards and uti-
lizing international data collected using a standardized
protocol. The study found that the frequency of thinness
has decreased in almost all countries from 1998 to 2006 and
across age groups; however, declines were significant only
for Czech boys and girls, and Flemish and American girls.
A decline in the frequency of thinness has been forecast
for developed countries as a whole, over the period
1990–2015(29), and the present data seem to follow this
prediction. The forecast, and indeed the data that follow,
are probably due to a shift to the right of the entire dis-
tribution of BMI associated with the obesity epidemic(22,29).
As hand in hand with this overall phenomenon are an
increase in obesity and overweight and a decrease in
underweight, the reason for this evolution might be linked
to a progressive increase in the number of households
with a lower standard of living and, consequently, to the
change in eating habits. In fact, individuals of lower social
status spend a lower percentage of their disposable
income on food and tend to cover energy requirements
more easily by purchasing high-energy products, which
are often cheaper than low-energy products(30,31). While
the obesity epidemic is receiving considerable attention
in terms of both policy and practice, it is important not to
forget the public health challenge posed by thinness.
Data such as those presented herein are important in
order to track prevalence and identify where resources
and follow-up may be particularly needed. Up a until few
years ago, it appears that only some studies(23,24,32–34)
published results using the agreed cut-offs to define
Public
Hea
lth
Nutr
itio
n
25
20%
%%
15
10
5
0
25
20
15
10
5
0
2520151050
Austria Belgium-Flemish
1998
2002
2006
1998
2002
2006
CzechRepublic
1998
2002
2006
Denmark
1998
2002
2006
Finland
1998
2002
2006
France
1998
2002
2006
Germany1998
2002
2006
Greece
1998
2002
2006
Portugal
1998
2002
2006
Sweden
1998
2002
2006
USA
1998
2002
2006
Fig. 2 Prevalences of thinness grade 1 ( ), thinness grade 2 ( ) and thinness grade 3 ( ) in (a) 11-year-old, (b) 13-year-old and(c) 15-year-old girls, by country and year of data collection; Health Behaviour in School-aged Children (HBSC) Study
Trends in thinness among adolescents 5

thinness in European children and adolescents. Up until
then different cut-offs were used, which led to differences
in the prevalence of thinness and by gender. It was timely
that international data using the same classification sys-
tem were available on thinness.
In contrast to most countries, the frequency of thinness,
although not statistically significant, increased in France,
Sweden and Greece. Nevertheless, these data warrant
attention and consideration. We cannot explain why the
prevalence of thinness seems to have increased among in
these countries, but possible reasons include: (i) socio-
cultural factors associated with standards of beauty,
mainly in France where the first signs of thinness
increasing had been found in 2002 by Rolland-Cachera
et al.(29) and where thinness is more highly valued by
women than by those from other West European coun-
tries and being slender seems very desirable to them and
there is a strong pressure to remain thin(30); (ii) mor-
phological changes during puberty; (iii) low levels of
physical activity during leisure time, that a recent Swedish
study(34) has confirmed to be a predictor of thinness(35,36);
(iv) adolescent body dissatisfaction and unhealthy
weight-control behaviours and dieting(3,4) associated with
media exposure to images of ideally thin models,
repeatedly demonstrated experimentally in English-
speaking Western countries and now confirmed by the
first study investigating body image in Southern Europe
among French and Italian women(37,38). Finally if we were
to speculate, the answer also could be the ‘household
paradox’, because national policies targeted at controlling
obesity and chronic diseases may have had undesirable
effects on the thinnest individuals. Paradoxically, the
presence of an underweight person together with an
overweight individual in the same household underscores
the continuing importance of undernutrition(8,22). In this
respect, nutrition interventions targeting ‘at-risk’ individuals
should be cautioned against making recommendations that
would alter household diets.
Our results show an overall decline in all grades of
thinness, although we cannot conclude that thinness has
Public
Hea
lth
Nutr
itio
n
Table 2 Prevalence of thinness (BMI , 17 kg/m2 at age 18 years) by year of data collection, gender, country- and age; Health Behaviour inSchool-aged Children (HBSC) Study
Boys Girls
Country or region 11 years 13 years 15 years 11 years 13 years 15 years
Austria 1998-
-
4?3 1?6 1?4 1998 3?9 4?1 2?72002 4?8 2?2 3?0 2002 4?6 3?7 2?92006-
-
3?6 2?0 1?4 2006 4?7 2?9 2?5Belgium-Flemish 1998 4?4 5?5 3?8 1998-
-
8?3 7?2 4?52002-
-
6?9 4?4 3?7 2002-
-
8?8 5?4 2?92006 4?4 4?6 2?3 2006 6?0 4?5 3?4
Czech Republic 1998 1?6 2?4y 0?7 1998-
-
5?0 4?0y 2?32002-
-
3?3 1?2 1?4 2002-
-
5?0 3?0 1?62006 1?1 0?4 0?4 2006 2?4 1?8 1?2
Denmark 1998 2?9 2?7 2?2 1998-
-
6?2 6?0 2?52002-
-
2?5 1?6 0?5 2002 3?5 3?3 2?22006 2?7 2?4 1?6 2006 4?3 4?6 2?6
Finland 1998 1?0 0?5 0?8 1998 2?5 2?4 0?92002 0?9 1?0 0?6 2002 3?2 1?8 2?22006 0?7 0?5 0?5 2006-
-
3?0 2?2 1?3France 1998 2?1 2?6 2?1 1998 5?0 2?3y 3?4
2002 3?1 3?1 3?0 2002 4?4 4?9 2?92006-
-
3?6 2?5 1?0 2006 5?7 5?3 3?6Germany 1998-
-
5?0 3?1 1?6 1998-
-
8?5 6?3 2?62002 2?7 3?0 1?3 2002-
-
7?1 4?7 2?52006-
-
4?8 3?2 1?4 2006-
-
7?3 4?2 1?8Greece 1998 2?0 1?3 0?5 1998 3?8 1?6 2?8
2002 2?3 2?5 0?6 2002 4?0 3?7 2?62006-
-
2?9 1?9 0?8 2006 2?9 2?8 2?0Portugal 1998 1?6 3?0 1?6 1998 3?4 3?5 1?7
2002 3?7 3?1 0?8 2002 3?3 1?3 1?32006 2?3 1?9 1?6 2006 2?9 1?8 1?4
Sweden 1998-
-
2?5 0?8 0?2 1998 2?8 2?7 3?22002 1?6 1?7 1?2 2002 4?0 2?5 2?52006 1?3 2?0 1?3 2006-
-
3?0 3?3 2?6USA 1998-
-
4?1 1?9 0?9 1998-
-
7?0 4?0 2?62002-
-3?5 2?2 0?6 2002 6?6 3?0 2?4
2006 1?6 1?1 1?2 2006-
-
4?9 2?0 0?8Ten European countries combined 1998-
-
2?8 2?3 1?5 1998-
-
5?1 4?1 2?62002-
-
3?2 2?4 1?8 2002-
-
5?0 3?7 2?42006-
-
2?8 2?3 1?2 2006-
-
4?4 3?5 2?2
-Only countries or regions included in the trend analysis.-
-
Significant linear trend in prevalence across age groups by survey (test for trend, P , 001; underlined data).ySignificant linear trend in prevalence across survey years by age (test for trend, P , 0?01; data in bold).
6 G Lazzeri et al.

steadily been reduced, year-on-year, but only that we
observed a fluctuating pattern in prevalence like that
found by other studies(23,24). There is no geographical
pattern in this trend and no obvious reason for it, but only
some hypotheses to interpret the different direction of the
prevalence of thinness in these countries v. the remaining
countries in the present study. The mechanism behind the
development of thinness is in fact relatively unknown in
adolescents and is extremely complex(24). Thus further
work that monitors and explores this trend and these
particular countries is warranted.
Some limitations of the study must be considered. The
current results are based on self-reported data that could
be subject to socially desirable reporting bias. However,
students’ responses were anonymous and therefore
participants had no reason to misreport their height or
weight. A study has shown that the BMI based on self-
reported data can produce lower prevalence estimates of
overweight (preobesity and obesity) than those based on
actual height and weight measurements(39), while another
has reported high accuracy for classification of youth
as obese or non-obese based on self-reported data(40).
Furthermore, BMI based on self-reports has been found
to be fairly reliable(40) and suitable for identifying valid
relationships in epidemiological studies(40,41).
There was a large number of missing values for height
and/or weight in these three HBSC surveys (about 10 %
on average), with the percentage of missing values being
high in some countries (43 % in Ireland, 31 % in Lithuania
and 20 % in Israel); thus such countries were not included
in the current analysis involving eleven countries where
the data were available on .80 % of the sample surveyed.
Health problems associated with thinness have rarely
been investigated in industrialized countries. There is a
need for systematic longitudinal data to provide precise
estimates of prevalence and trends for thinness and the
presence of health-risk behaviours. Thus the results from
the current study add important information on this issue
and suggest wide variation in prevalence and trends
in thinness across nations. These findings suggest that
thinness is also an important overlooked phenomenon in
developed countries and deserves further study in a
multinational context utilizing longitudinal data as much
as possible. Such work would increase understanding of the
factors associated with thinness and could contribute to
developing optimal preventive programmes and nutritional
interventions for both overweight and thin persons.
Acknowledgements
Sources of funding: HBSC is an international study carried
out in collaboration with WHO/EURO. Funding from
national agencies and from an international subscription
system provide financial support: national data collection is
funded at national level; international data file production
Public
Hea
lth
Nutr
itio
n
Table 3 Odds ratios and 99 % confidence intervals for thinness (BMI , 17 kg/m2 at age 18 years) by country andgender from age-adjusted logistic regression models; Health Behaviour in School-aged Children (HBSC) Study
2001/2002 2005/2006
Country 1997/1998- OR 99 % CI OR 99 % CI
Boys-
-
Austria 1?00 1?27 0?77, 2?09 0?97 0?58, 1?63Belgium-Flemish 1?00 1?12 0?79, 1?58 0?81 0?54, 1?21Czech Republic 1?00 1?25 0?67, 2?33 0?37y 0?16, 0?87*Denmark 1?00 0?59 0?33, 1?01 0?98 0?61, 1?60Finland 1?00 1?07 0?46, 2?48 0?78 0?31, 1?99France 1?00 1?30 0?81, 2?11 1?07 0?65, 1?77Germany 1?00 0?75 0?48, 1?20 0?98 0?66, 1?47Greece 1?00 1?37 0?68, 2?73 1?53 0?76, 3?01Portugal 1?00 1?27 0?66, 1?26 0?87 0?45, 1?70Sweden 1?00 1?28 0?59, 2?76 1?33 0?63, 2?82USA 1?00 0?81 0?46, 1?42 0?55 0?27, 1?06
Girls-
-
Austria 1?00 0?99 0?64, 1?53 0?94 0?61, 1?44Belgium-Flemish 1?00 0?86 0?64, 1?15 0?68y 0?48, 0?97*Czech Republic 1?00 0?85 0?55, 1?30 0?47y 0?28, 0?79**Denmark 1?00 0?59y 0?39, 0?89** 0?75 0?67, 1?09Finland 1?00 1?25 0?76, 2?08 1?13 0?67, 1?89France 1?00 1?12 0?77, 1?64 1?41 0?97, 2?06Germany 1?00 0?88 0?62, 1?24 0?76 0?54, 1?05Greece 1?00 1?22 0?76, 1?96 0?93 0?55, 1?55Portugal 1?00 0?70 0?37, 1?32 0?65 0?36, 1?16Sweden 1?00 1?05 0?62, 1?77 1?03 0?62, 1?72USA 1?00 0?78 0?54, 1?15 0?49y 0?30, 0?79**
*P , 0?01, **P , 0?001 (Wald test).-Reference category.-
-
Total samples of 11–15-year-olds.yUnderlined bold characters are used to highlight significant changes in the likelihood to be thin in 2005/2006 compared with 1997/1998(age-adjusted OR, 99% CI)
Trends in thinness among adolescents 7

and management are supported by national funding; WHO
(as study partner) supports research dissemination, publi-
cation of international reports and the HBSC–WHO Forum
for policy and practice. Conflicts of interest: The authors
have no conflict of interest. Authors’ contributions: G.L.
wrote the manuscript; M.V.G. designed the analysis with
input from N.A.; S.R. carried out the statistical analysis;
G.L., M.V.G., N.A., C.K. and C.V. contributed to drafting of
the manuscript and its critical revision; all authors read
and approved the final manuscript. Acknowledgements:
HBSC is an international study carried out in collaboration
with the WHO Regional Office for Europe. The inter-
national coordinator of the 1997/1998, 2001/2002 and
2005/2006 surveys was Candace Currie, University of
Edinburgh, Scotland; and the databank manager was
Oddrun Samdal, University of Bergen, Norway. A complete
list of the participating researchers can be found on the
HBSC website (www.HBSC.org).
References
1. Takimoto H, Yoshiike N, Kaneda F et al. (2004) Thinnessamong young Japanese women. Am J Public Health 94, 9–16.
2. Kaneko K, Kiriike N, Ikenaga K et al. (1999) Weightand shape concerns and dieting behaviors among pre-adolescents and adolescents in Japan. Psychiatry ClinNeurosci 53, Suppl. 3, 365–371.
3. Rozin P & Fallon A (1988) Body image, attitudes to weight,and misperceptions of figure preferences of the oppositesex: a comparison of men and women in two generations.J Abnorm Psychol 97, Suppl. 3, 342–345.
4. Lawrie Z, Sullivan EA, Davies PS et al. (2006) Mediainfluence on the body image of children and adolescents.Eat Disord 14, 355–364.
5. Russell JD, Mira M, Allen BJ et al. (1994) Protein repletionand treatment in anorexia nervosa. Am J Clin Nutr 59,98–102.
6. Misra M, Aggarwal A, Miller KK et al. (2004) Effects ofanorexia nervosa on clinical, hematologic, biochemical,and bone density parameters in community-dwellingadolescent girls. Pediatrics 114, 1574–1583.
7. Lobstein T, Baur L & Uauy R (2004) Obesity in childrenand young people: a crisis in public health. Obes Rev 5,Suppl. 1, 4–104.
8. Doak CM, Adair LS, Bentley M et al. (2005) The dualburden household and the nutrition transition paradox. IntJ Obes (Lond) 29, 129–136.
9. Florencio TM, Ferreira HS, de Franca AP et al. (2001)Obesity and undernutrition in a very low-income popula-tion in the city of Maceio, northeastern Brazil. Br J Nutr 86,277–284.
10. Cole TJ, Flegal KM, Nicholls D et al. (2007) Body massindex cut offs to define thinness in children andadolescents: international survey. BMJ 335, 194–197.
11. Wang Y, Monteiro C & Popkin BM (2002) Trends of obesityand underweight in older children and adolescents in theUnited States, Brazil, China, and Russia. Am J Clin Nutr 75,971–977.
12. Kim E, Hwang JY, Woo EK et al. (2005) Body mass indexcutoffs for underweight, overweight, and obesity in SouthKorean schoolgirls. Obes Res 13, 1510–1514.
13. Oner N, Vatansever U, Sari A et al. (2004) Prevalence ofunderweight, overweight and obesity in Turkish adoles-cents. Swiss Med Wkly 134, 529–533.
14. Baya Botti A, Perez-Cueto FJ, Vasquez Monllor PA et al.(2010) International BMI-for-age references underestimatethinness and overestimate overweight and obesity inBolivian adolescents. Nutr Hosp 25, 428–436.
15. Khasnutdinova SL & Grjibovski AM (2010) Prevalence ofstunting, underweight, overweight and obesity in adoles-cents in Velsk district, north-west Russia: a cross-sectionalstudy using both international and Russian growthreferences. Public Health 124, 392–397.
16. Rosario AS, Kurth BM, Stolzenberg H et al. (2010) Bodymass index percentiles for children and adolescents inGermany based on a nationally representative sample(KiGGS 2003–2006). J Clin Nutr 64, 341–349.
17. Bovet P, Kizirian N, Madeleine G et al. (2011) Prevalence ofthinness in children and adolescents in the Seychelles:comparison of two international growth references. Nutr J9, 10–65.
18. World Health Organization (1995) Physical Status: The Useand Interpretation of Anthropometry. Report of a WHOExport Committee. WHO Technical Report Series no. 854.Geneva: WHO.
19. Kelishadi R, Ardalan G, Gheiratmand R et al. (2008)Thinness, overweight and obesity in a national sample ofIranian children and adolescents: CASPIAN Study. ChildCare Health Dev 34, 44–54.
20. World Health Organization (1995) Thin adults. In PhysicalStatus: The Use and Interpretation of Anthropometry. Reportof a WHO Export Committee. WHO Technical Report Seriesno. 854, pp. 354–374. Geneva: WHO; available at http://whqlibdoc.who.int/trs/WHO_TRS_854.pdf
21. Health Behaviour in School-aged Children World HealthOrganization Collaborative Cross-National Study (2010)HBSC International Protocol 2009/10. http://www.hbsc.org/methods/index.html
22. Martınez-Vizcaıno V, Sanchez Lopez M, Moya Martınez P etal. (2009) Trends in excess weight and thinness amongSpanish schoolchildren in the period 1992–2004: theCuenca study. Public Health Nutr 12, 1015–1018.
23. Tambalis KD, Panagiotakos DB, Kavouras SA et al. (2010)Eleven-year prevalence trends of obesity in Greek children:first evidence that prevalence of obesity is leveling off.Obesity (Silver Spring) 18, 161–166.
24. Boddy LM, Hackett AF & Stratton G (2009) The prevalenceof underweight in 9–10-year-old schoolchildren in Liver-pool: 1998–2006. Public Health Nutr 12, 953–956.
25. Currie C, Nic Gabhainn S & Godeau E, International HBSCNetwork Coordinating Committee (2009) The HealthBehaviour in School-aged Children: WHO CollaborativeCross-National (HBSC) study: origins, concept, history anddevelopment 1982–2008. Int J Public Health 54, Suppl. 2,131–139.
26. Roberts C, Francois Y, Batista-Foguet J et al. (2000)Methods. In Health and Health Behaviour amongYoung People. WHO Policy Series: Health for Childrenand Adolescents, pp. 9–21 [C Currie, K Hurrelmann,W Settertobulte et al., editors]. Geneva: WHO.
27. Roberts C, Freeman J, Samdal O et al.; International HBSCNetwork Coordinating Committee (2009) The HealthBehaviour in School-aged Children (HBSC) study: metho-dological developments and current tensions. Int J PublicHealth 54, Suppl. 2, 140–150.
28. King A, Wold B, Smith CT et al. (1996) The Health of Youth.A Cross-National Survey. WHO Regional PublicationsEuropean Series no. 69. Geneva: WHO.
29. Rolland-Cachera MF, Castetbon K, Arnault N et al. (2002)Body mass index in 7–9-year-old French children:frequency of obesity, overweight and thinness. Int J ObesRelat Metab Disord 26, Suppl. 12, 1610–1616.
30. de Saint Pol T (2009) Evolution of obesity by social status inFrance, 1981–2003. Econ Hum Biol 7, 398–404.
Public
Hea
lth
Nutr
itio
n8 G Lazzeri et al.

31. Drewnowski A & Specter S (2004) Poverty and obesity:the role of energy density and costs. Am J Clin Nutr 79,6–16.
32. Marques-Vidal P, Ferreira R, Oliveira JM et al. (2008) Isthinness more prevalent than obesity in Portugueseadolescents? Clin Nutr 27, 531–536.
33. Villa I, Yngve A, Poortvliet E et al. (2007) Dietary intakeamong under-, normal- and overweight 9-and 15-year-oldEstonian and Swedish schoolchildren. Public Health Nutr10, 311–322.
34. Elinder Schafer L & Sundblom E & Rosendahl KI (2011)Low physical activity is a predictor of thinness and low self-rated health: gender differences in a Swedish cohort.J Adolesc Health 48, 481–486.
35. Levin S, Lowry R, Brown DR et al. (2003) Physical activityand body mass index among US adolescents: youth riskbehavior survey, 1999. Arch Pediatr Adolesc Med 157,816–820.
36. Kumar BN, Holmboe-Ottesen G, Lien N et al. (2004) Ethnicdifferences in body mass index and associated factors of
adolescents from minorities in Oslo, Norway: a cross-sectional study. Public Health Nutr 7, 999–1008.
37. Rodgers R & Chabrol H (2009) The impact of exposure toimages of ideally thin models on body dissatisfaction inyoung French and Italian women. Encephale 35, 262–268.
38. Perkins JM, Perkins HW & Craig DW (2010) Peer weightnorm misperception as a risk factor for being over andunderweight among UK secondary school students. Eur JClin Nutr 64, 965–971.
39. Himes HJ, Hannan P, Wall M et al. (2005) Factors associatedwith errors in self-reports of stature, weight, and body massindex in Minnesota adolescents. Ann Epidemiol 15,272–278.
40. Strauss RS (1999) Comparison of measured and self-reported weight and height in a cross-sectional sample ofyoung adolescents. Int J Obes Relat Metab Disord 23,904–908.
41. Goodman E, Hinden BR & Khandelwal S (2000) Accuracyof teen and parental reports of obesity and body massindex. Pediatrics 106, 52–58.
Public
Hea
lth
Nutr
itio
nTrends in thinness among adolescents 9