Trends in socioeconomic disparities in stroke mortality in six european countries between 1981-1985...
10
52 Am J Epidemiol 2005;161:52–61 American Journal of Epidemiology Copyright © 2005 by the Johns Hopkins Bloomberg School of Public Health All rights reserved Vol. 161, No. 1 Printed in U.S.A. DOI: 10.1093/aje/kwi011 Trends in Socioeconomic Disparities in Stroke Mortality in Six European Countries between 1981–1985 and 1991–1995 M. Avendaño 1,2 , A. E. Kunst 1 , F. van Lenthe 1 , V. Bos 1 , G. Costa 3 , T. Valkonen 4 , M. Cardano 5 , S. Harding 6 , J-K. Borgan 7 , M. Glickman 6 , A. Reid 6 , and J. P. Mackenbach 1 1 Department of Public Health, Erasmus University Medical Center, Rotterdam, the Netherlands. 2 National Institute of Public Health and the Environment, Bilthoven, the Netherlands. 3 Department of Public Health and Microbiology, Turin University, Turin, Italy. 4 Department of Sociology, University of Helsinki, Helsinki, Finland. 5 Department of Social Sciences, Turin University, Turin, Italy. 6 Medical Statistics, Office for National Statistics, London, United Kingdom. 7 Division for Health Statistics, Statistics Norway, Oslo, Norway. Received for publication March 12, 2004; accepted for publication July 7, 2004. This study assesses whether stroke mortality trends have been less favorable among lower than among higher socioeconomic groups. Longitudinal data on mortality by socioeconomic status were obtained for Finland, Norway, Denmark, Sweden, England/Wales, and Turin, Italy. Data covered the entire population or a representative sample. Stroke mortality rates were calculated for the period 1981–1995. Changes in stroke mortality rate ratios were analyzed using Poisson regression and compared with rate ratios in ischemic heat disease mortality. Trends in stroke mortality were generally as favorable among lower as among higher socioeconomic groups, such that socioeconomic disparities in stroke mortality persisted and remained of a similar magnitude in the 1990s as in the 1980s. In Norway, however, occupational disparities in stroke mortality significantly widened, and a nonsignificant increase was observed in some countries. In contrast, disparities in ischemic heart disease mortality widened throughout this period in most populations. Improvements in hypertension prevalence and treatment may have contributed to similar stroke mortality declines in all socioeconomic groups in most countries. Socioeconomic disparities in stroke mortality generally persisted and may have widened in some populations, which fact underlines the need to improve preventive and secondary care for stroke among the lower socioeconomic groups. cerebrovascular accident; Europe; mortality; social class Abbreviations: ICD-9, International Classification of Diseases, Ninth Revision (ICD-8 and ICD-10 defined analogously). Higher stroke mortality rates have been observed among lower as compared with higher socioeconomic groups across Europe (1, 2). However, no study has explored how these disparities developed or examined trends in socioeconomic differences in stroke mortality. A less favorable relative decline in cardiovascular disease mortality has been observed among lower than among higher socioeconomic groups (3–10). However, trends in the two main cardiovas- cular diseases, stroke and ischemic heart disease, differ substantially within and between populations (9, 11, 12), as does their association with socioeconomic status (1, 3, 13, 14). During recent decades, European countries have experi- enced changes in the prevalence of classical cardiovascular risk factors such as smoking and hypertension (15, 16). Vari- ations between countries exist in these trends (17, 18), and socioeconomic differences in some of these factors have recently widened (19, 20). Similarly, changes in health-care policies for stroke have occurred across Europe (21, 22). International studies on trends may point at specific policies and risk factors that may have had an impact on socioeco- Correspondence to Mauricio Avendaño, Department of Public Health, Erasmus University Medical Center, P.O. Box 1738, Rotterdam 3000 DR, the Netherlands (e-mail: [email protected]).
Transcript of Trends in socioeconomic disparities in stroke mortality in six european countries between 1981-1985...
American Journal of EpidemiologyCopyright © 2005 by the Johns Hopkins Bloomberg School of Public HealthAll rights reserved
Vol. 161, No. 1Printed in U.S.A.
DOI: 10.1093/aje/kwi011
Trends in Socioeconomic Disparities in Stroke Mortality in Six European Countries between 1981–1985 and 1991–1995
M. Avendaño1,2, A. E. Kunst1, F. van Lenthe1, V. Bos1, G. Costa3, T. Valkonen4, M. Cardano5, S. Harding6, J-K. Borgan7, M. Glickman6, A. Reid6, and J. P. Mackenbach1
1 Department of Public Health, Erasmus University Medical Center, Rotterdam, the Netherlands. 2 National Institute of Public Health and the Environment, Bilthoven, the Netherlands. 3 Department of Public Health and Microbiology, Turin University, Turin, Italy. 4 Department of Sociology, University of Helsinki, Helsinki, Finland. 5 Department of Social Sciences, Turin University, Turin, Italy. 6 Medical Statistics, Office for National Statistics, London, United Kingdom. 7 Division for Health Statistics, Statistics Norway, Oslo, Norway.
Received for publication March 12, 2004; accepted for publication July 7, 2004.
This study assesses whether stroke mortality trends have been less favorable among lower than among highersocioeconomic groups. Longitudinal data on mortality by socioeconomic status were obtained for Finland,Norway, Denmark, Sweden, England/Wales, and Turin, Italy. Data covered the entire population or arepresentative sample. Stroke mortality rates were calculated for the period 1981–1995. Changes in strokemortality rate ratios were analyzed using Poisson regression and compared with rate ratios in ischemic heatdisease mortality. Trends in stroke mortality were generally as favorable among lower as among highersocioeconomic groups, such that socioeconomic disparities in stroke mortality persisted and remained of asimilar magnitude in the 1990s as in the 1980s. In Norway, however, occupational disparities in stroke mortalitysignificantly widened, and a nonsignificant increase was observed in some countries. In contrast, disparities inischemic heart disease mortality widened throughout this period in most populations. Improvements inhypertension prevalence and treatment may have contributed to similar stroke mortality declines in allsocioeconomic groups in most countries. Socioeconomic disparities in stroke mortality generally persisted andmay have widened in some populations, which fact underlines the need to improve preventive and secondarycare for stroke among the lower socioeconomic groups.
cerebrovascular accident; Europe; mortality; social class
Abbreviations: ICD-9, International Classification of Diseases, Ninth Revision (ICD-8 and ICD-10 defined analogously).
Higher stroke mortality rates have been observed amonglower as compared with higher socioeconomic groups acrossEurope (1, 2). However, no study has explored how thesedisparities developed or examined trends in socioeconomicdifferences in stroke mortality. A less favorable relativedecline in cardiovascular disease mortality has beenobserved among lower than among higher socioeconomicgroups (3–10). However, trends in the two main cardiovas-cular diseases, stroke and ischemic heart disease, differsubstantially within and between populations (9, 11, 12), as
does their association with socioeconomic status (1, 3, 13,14).
During recent decades, European countries have experi-enced changes in the prevalence of classical cardiovascularrisk factors such as smoking and hypertension (15, 16). Vari-ations between countries exist in these trends (17, 18), andsocioeconomic differences in some of these factors haverecently widened (19, 20). Similarly, changes in health-carepolicies for stroke have occurred across Europe (21, 22).International studies on trends may point at specific policiesand risk factors that may have had an impact on socioeco-
Correspondence to Mauricio Avendaño, Department of Public Health, Erasmus University Medical Center, P.O. Box 1738, Rotterdam 3000 DR, the Netherlands (e-mail: [email protected]).
52 Am J Epidemiol 2005;161:52–61
Stroke Mortality Trends among Socioeconomic Groups 53
nomic differences in stroke mortality. This may elucidateways through which socioeconomic disparities can bereduced in order to sustain the stroke mortality decline inEuropean countries.
The aim of this paper is to assess whether there is acommon tendency among lower socioeconomic groups toexperience less favorable trends in stroke mortality than dohigher socioeconomic groups in European countries. This isthe first longitudinal study of trends in stroke mortalityaccording to socioeconomic status across Europe. Previousresearch has focused mainly on specific countries andmiddle-aged men and been based on cross-sectional studydesigns (4, 5, 23, 24). We analyzed trends among men andwomen in six populations, using two complementary indica-tors of socioeconomic status: educational level and occupa-tional class. It has been argued that stroke and ischemic heartdisease mortality share a number of risk factors. Therefore,we assessed whether trends in socioeconomic differences inthese two cardiovascular diseases showed a similar pattern,which would suggest that changes over time might be relatedto common determinants.
MATERIALS AND METHODS
Data and subjects
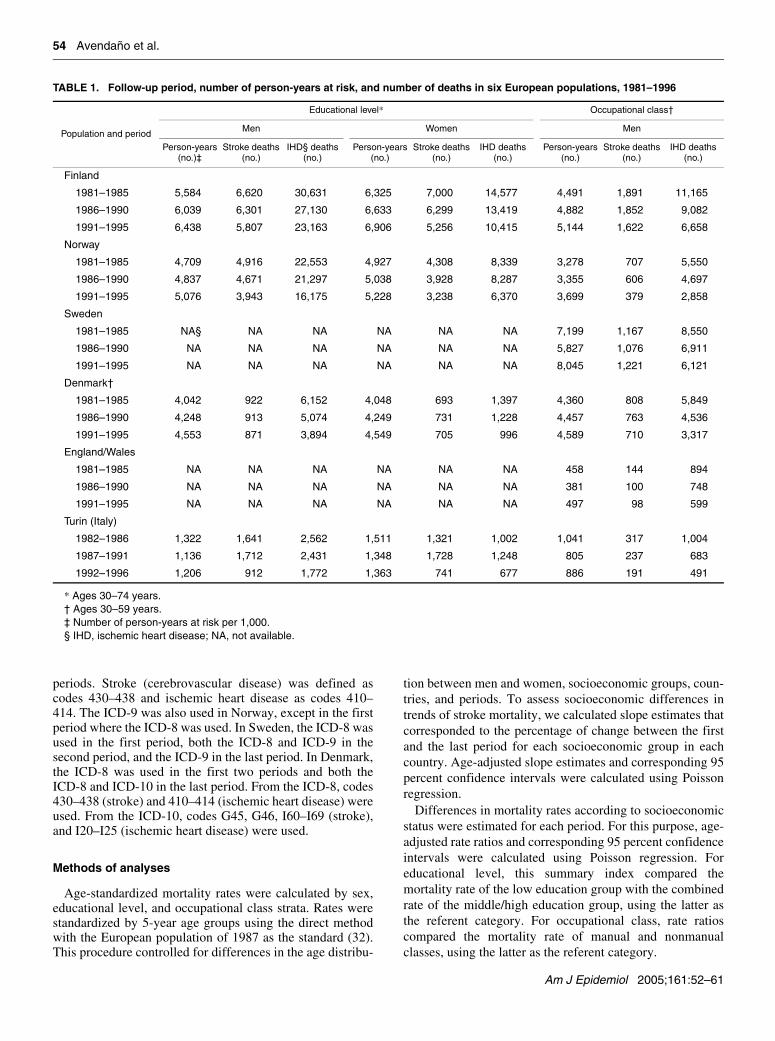
Within the framework of the European Union HealthMonitoring Project, longitudinal data on mortality by 5-yearage group, socioeconomic status, and sex were obtained forsix European populations in three separate periods: 1981–1985, 1986–1990, and 1991–1995. Data were obtained frommortality registries and linked to data on socioeconomicstatus from population censuses carried out in 1981, 1986(Finland only), or 1991 for each period. Participants wereenumerated during each census and followed up for differentperiods (table 1). Data from Finland, Norway, Denmark, andSweden covered the entire national population. Data fromEngland/Wales corresponded to a 1 percent representativesample of the population, whereas data from Italy wererestricted to the city of Turin. Details of these data have beendescribed elsewhere (25, 26). Table 1 shows the number ofperson-years and deaths observed in each population.
Socioeconomic status was defined on the basis of educa-tional level and occupational class, as these are the mostcommonly used indicators of socioeconomic status (27, 28).Educational level can be applied equally to both men andwomen and is considered the most reliable indicator ofsocioeconomic status among the elderly, as it includes botheconomically active and economically inactive populations(28). On the other hand, occupational class also has an inde-pendent association with mortality and is sensitive tochanges over the life course (27, 28). Thus, educational leveland occupational class may represent different aspects ofsocial standing and were both used as complementarymeasures of socioeconomic status (27, 28).
Data on educational level were available for both men andwomen in Finland, Denmark, Norway, and Turin. Datacovered the ages of 30–74 years (age specified at the start offollow-up), except in Denmark where data on educationwere not available for those aged 60 years or more. Educa-
tion was first coded according to national classificationschemes, based on the educational level completed by partic-ipants. Following this, education was reclassified into threecomparable categories based on the International StandardClassification of Education (29): levels 0–2 (preprimary,primary, and lower secondary education); level 3 (uppersecondary education); and levels 4–6 (postsecondary educa-tion). The two upper levels were combined in order to obtainmore precise estimates, given the small size of these educa-tion groups. In each country, the proportion of the populationin the high education group was higher among men thanwomen and increased over time. No detailed census data oneducational level were available for Sweden, while data oneducation for England/Wales were not comparable withthose collected in other countries. Therefore, no analyses oneducational level were conducted for these two countries.
Data on occupational class were available for men inFinland, Sweden, Norway, Denmark, England/Wales, andTurin. Data covered the ages of 30–59 years (age specified atthe start of follow-up). Men aged 60 years or more wereexcluded from the analysis because of lack of detailed occu-pational information among economically inactive men.Women were also excluded from the analysis, since it wasnot possible to apply an occupational classification that wasboth valid and comparable over time. Participants were clas-sified into four broad occupational classes using the schemedescribed by Erikson and Goldthorpe (30) as a reference:nonmanual workers, manual workers, farmers, and self-employed men. For summary purposes, we report only onmortality differences between “nonmanual” and “manual”classes, excluding workers in the agricultural sector and self-employed men. The nonmanual and manual classescomprised approximately 80–90 percent of the population inall countries. The share of the manual classes decreasedslightly over time, whereas the share of the nonmanualclasses slightly increased.
Occupational class was determined on the basis of theoccupation reported at the time of census. For some men,however, no information on occupation was available. Thismostly corresponded to economically inactive men such asthe disabled and retired. When possible, occupational classwas assigned to these individuals on the basis of a previouslyheld occupation, by linkage to a previous census. This waspossible for part of the population in Finland and England/Wales only. Men for whom no occupation could be assignedwere excluded from the analysis. Their exclusion is likely tolead to an underestimation of mortality differences betweenoccupational classes, because economically inactive menhave high mortality rates and predominantly originate fromlower occupational classes (1, 28, 31). Therefore, in allcountries, we applied a procedure that corrects for thisunderestimation and that has been shown to perform well ina large number of tests (31). This procedure calculatescorrection factors as a function of the population share andthe mortality of men excluded from the analysis (1, 31).Correction factors were calculated separately for stroke andischemic heart disease, for each country and age group.
In Finland, England/Wales, and Turin, Italy, the Interna-tional Classification of Diseases, Ninth Revision (ICD-9)(ICD-8 and ICD-10 defined analogously), was used in all
Am J Epidemiol 2005;161:52–61
54 Avendaño et al.
periods. Stroke (cerebrovascular disease) was defined ascodes 430–438 and ischemic heart disease as codes 410–414. The ICD-9 was also used in Norway, except in the firstperiod where the ICD-8 was used. In Sweden, the ICD-8 wasused in the first period, both the ICD-8 and ICD-9 in thesecond period, and the ICD-9 in the last period. In Denmark,the ICD-8 was used in the first two periods and both theICD-8 and ICD-10 in the last period. From the ICD-8, codes430–438 (stroke) and 410–414 (ischemic heart disease) wereused. From the ICD-10, codes G45, G46, I60–I69 (stroke),and I20–I25 (ischemic heart disease) were used.
Methods of analyses
Age-standardized mortality rates were calculated by sex,educational level, and occupational class strata. Rates werestandardized by 5-year age groups using the direct methodwith the European population of 1987 as the standard (32).This procedure controlled for differences in the age distribu-
tion between men and women, socioeconomic groups, coun-tries, and periods. To assess socioeconomic differences intrends of stroke mortality, we calculated slope estimates thatcorresponded to the percentage of change between the firstand the last period for each socioeconomic group in eachcountry. Age-adjusted slope estimates and corresponding 95percent confidence intervals were calculated using Poissonregression.
Differences in mortality rates according to socioeconomicstatus were estimated for each period. For this purpose, age-adjusted rate ratios and corresponding 95 percent confidenceintervals were calculated using Poisson regression. Foreducational level, this summary index compared themortality rate of the low education group with the combinedrate of the middle/high education group, using the latter asthe referent category. For occupational class, rate ratioscompared the mortality rate of manual and nonmanualclasses, using the latter as the referent category.
TABLE 1. Follow-up period, number of person-years at risk, and number of deaths in six European populations, 1981–1996
* Ages 30–74 years.† Ages 30–59 years.‡ Number of person-years at risk per 1,000.§ IHD, ischemic heart disease; NA, not available.
Population and period
Educational level* Occupational class†
Men Women Men
Person-years (no.)‡
Stroke deaths (no.)
IHD§ deaths (no.)
Person-years (no.)
Stroke deaths (no.)
IHD deaths (no.)
Person-years (no.)
Stroke deaths (no.)
IHD deaths (no.)
Finland
1981–1985 5,584 6,620 30,631 6,325 7,000 14,577 4,491 1,891 11,165
1986–1990 6,039 6,301 27,130 6,633 6,299 13,419 4,882 1,852 9,082
1991–1995 6,438 5,807 23,163 6,906 5,256 10,415 5,144 1,622 6,658
Norway
1981–1985 4,709 4,916 22,553 4,927 4,308 8,339 3,278 707 5,550
1986–1990 4,837 4,671 21,297 5,038 3,928 8,287 3,355 606 4,697
1991–1995 5,076 3,943 16,175 5,228 3,238 6,370 3,699 379 2,858
Sweden
1981–1985 NA§ NA NA NA NA NA 7,199 1,167 8,550
1986–1990 NA NA NA NA NA NA 5,827 1,076 6,911
1991–1995 NA NA NA NA NA NA 8,045 1,221 6,121
Denmark†
1981–1985 4,042 922 6,152 4,048 693 1,397 4,360 808 5,849
1986–1990 4,248 913 5,074 4,249 731 1,228 4,457 763 4,536
1991–1995 4,553 871 3,894 4,549 705 996 4,589 710 3,317
England/Wales
1981–1985 NA NA NA NA NA NA 458 144 894
1986–1990 NA NA NA NA NA NA 381 100 748
1991–1995 NA NA NA NA NA NA 497 98 599
Turin (Italy)
1982–1986 1,322 1,641 2,562 1,511 1,321 1,002 1,041 317 1,004
1987–1991 1,136 1,712 2,431 1,348 1,728 1,248 805 237 683
1992–1996 1,206 912 1,772 1,363 741 677 886 191 491
Am J Epidemiol 2005;161:52–61
Stroke Mortality Trends among Socioeconomic Groups 55
Finally, estimates of change in rate ratios between the firstand the last periods were calculated to assess differencesbetween stroke and ischemic heart disease mortality trendsin each country; 95 percent confidence intervals for theseestimates were calculated by pooling standard errors fromperiod-specific rate ratios for each country. Analyses wereperformed using SAS, version 6.12, software (SAS Institute,Inc., Cary, North Carolina).
RESULTS
The age-standardized stroke mortality rate declinedsteadily among both men and women in most countriesthroughout the periods 1981–1985, 1986–1990, and 1991–1995. A similar stroke mortality decline occurred amonglower and higher socioeconomic groups in most countries, in
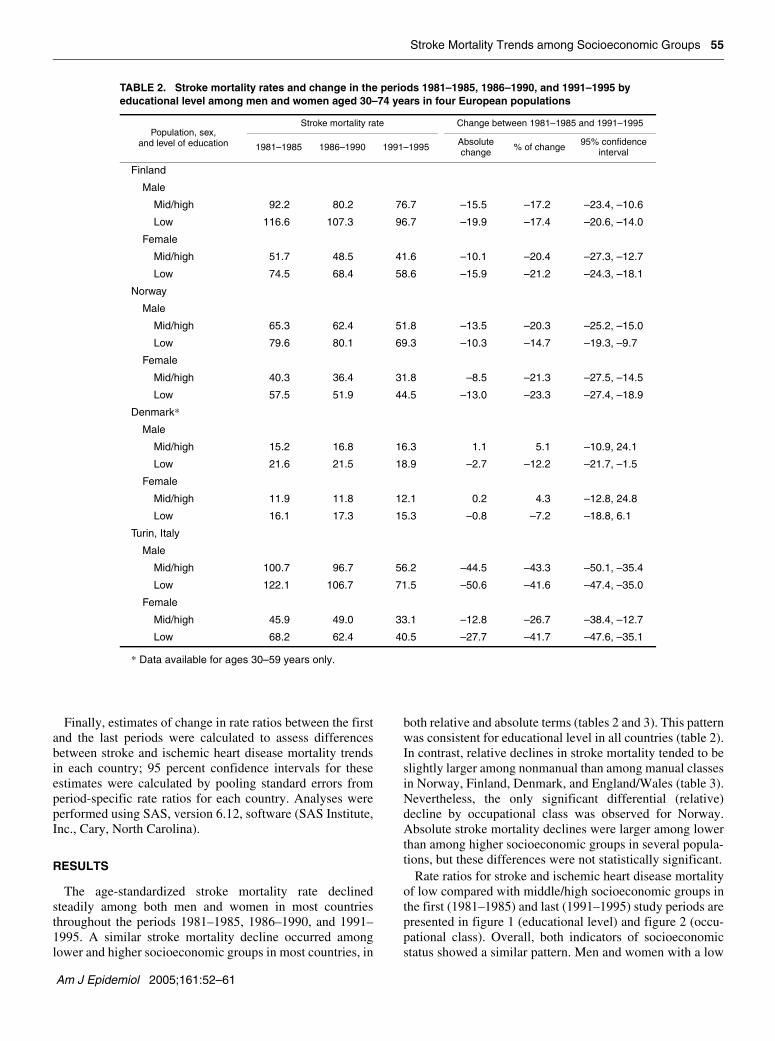
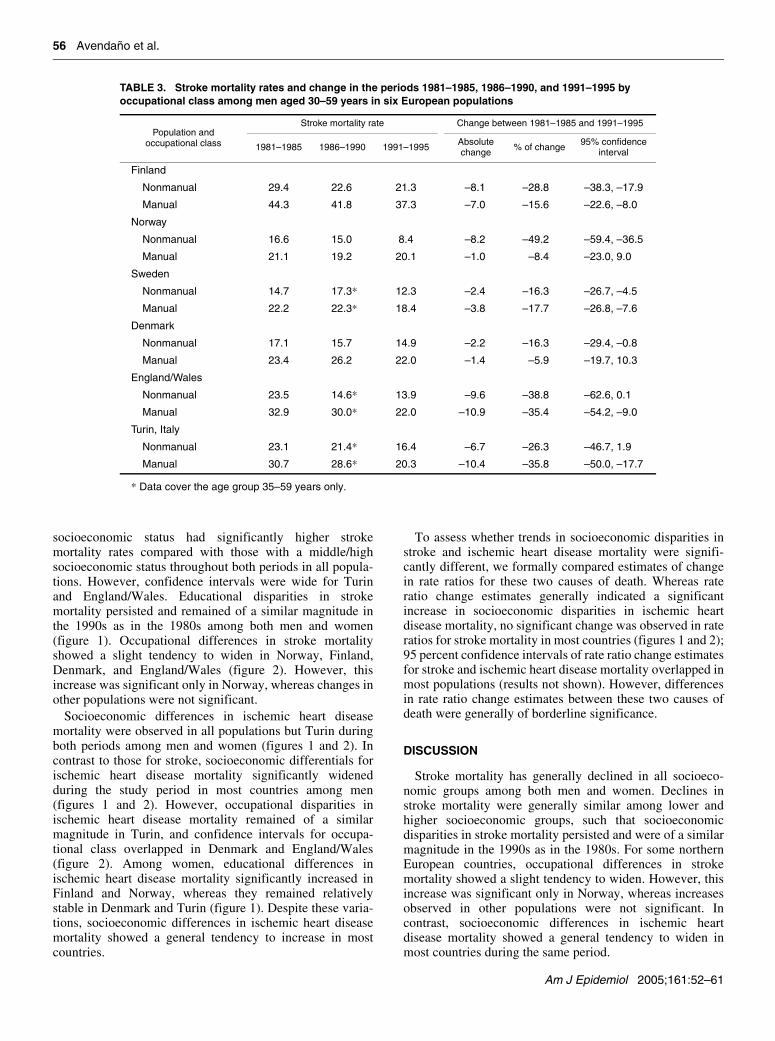
both relative and absolute terms (tables 2 and 3). This patternwas consistent for educational level in all countries (table 2).In contrast, relative declines in stroke mortality tended to beslightly larger among nonmanual than among manual classesin Norway, Finland, Denmark, and England/Wales (table 3).Nevertheless, the only significant differential (relative)decline by occupational class was observed for Norway.Absolute stroke mortality declines were larger among lowerthan among higher socioeconomic groups in several popula-tions, but these differences were not statistically significant.
Rate ratios for stroke and ischemic heart disease mortalityof low compared with middle/high socioeconomic groups inthe first (1981–1985) and last (1991–1995) study periods arepresented in figure 1 (educational level) and figure 2 (occu-pational class). Overall, both indicators of socioeconomicstatus showed a similar pattern. Men and women with a low
TABLE 2. Stroke mortality rates and change in the periods 1981–1985, 1986–1990, and 1991–1995 by educational level among men and women aged 30–74 years in four European populations
* Data available for ages 30–59 years only.
Population, sex, and level of education
Stroke mortality rate Change between 1981–1985 and 1991–1995
1981–1985 1986–1990 1991–1995 Absolute change % of change 95% confidence
interval
Finland
Male
Mid/high 92.2 80.2 76.7 –15.5 –17.2 –23.4, –10.6
Low 116.6 107.3 96.7 –19.9 –17.4 –20.6, –14.0
Female
Mid/high 51.7 48.5 41.6 –10.1 –20.4 –27.3, –12.7
Low 74.5 68.4 58.6 –15.9 –21.2 –24.3, –18.1
Norway
Male
Mid/high 65.3 62.4 51.8 –13.5 –20.3 –25.2, –15.0
Low 79.6 80.1 69.3 –10.3 –14.7 –19.3, –9.7
Female
Mid/high 40.3 36.4 31.8 –8.5 –21.3 –27.5, –14.5
Low 57.5 51.9 44.5 –13.0 –23.3 –27.4, –18.9
Denmark*
Male
Mid/high 15.2 16.8 16.3 1.1 5.1 –10.9, 24.1
Low 21.6 21.5 18.9 –2.7 –12.2 –21.7, –1.5
Female
Mid/high 11.9 11.8 12.1 0.2 4.3 –12.8, 24.8
Low 16.1 17.3 15.3 –0.8 –7.2 –18.8, 6.1
Turin, Italy
Male
Mid/high 100.7 96.7 56.2 –44.5 –43.3 –50.1, –35.4
Low 122.1 106.7 71.5 –50.6 –41.6 –47.4, –35.0
Female
Mid/high 45.9 49.0 33.1 –12.8 –26.7 –38.4, –12.7
Low 68.2 62.4 40.5 –27.7 –41.7 –47.6, –35.1
Am J Epidemiol 2005;161:52–61
56 Avendaño et al.
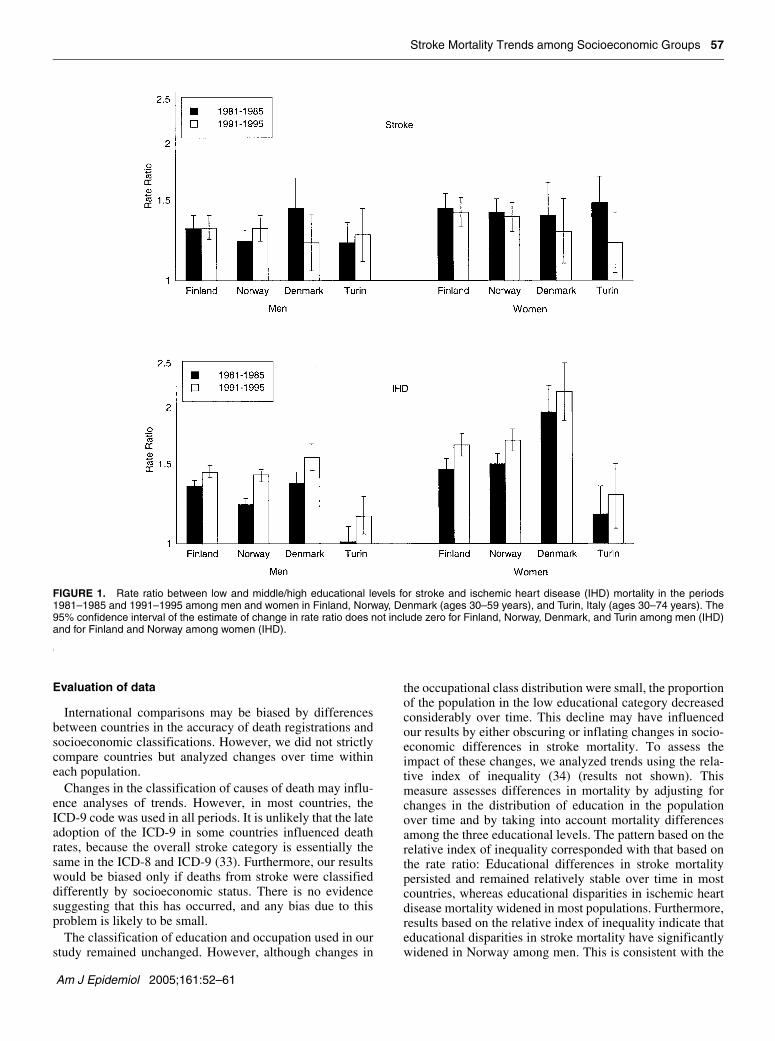
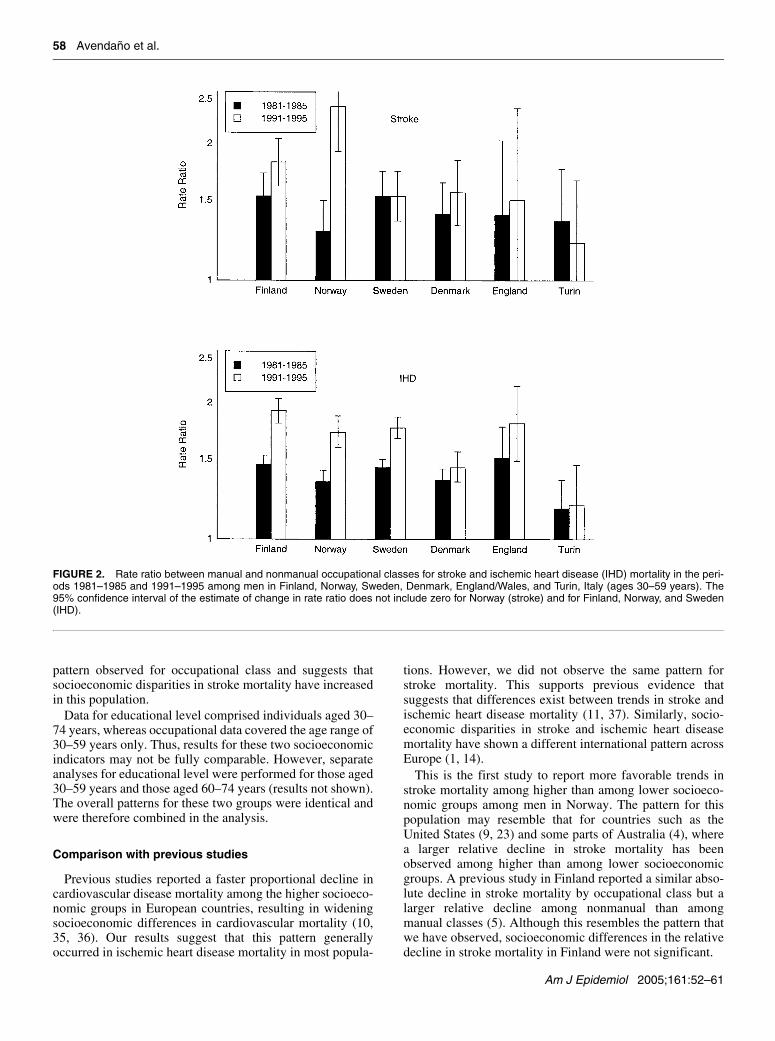
socioeconomic status had significantly higher strokemortality rates compared with those with a middle/highsocioeconomic status throughout both periods in all popula-tions. However, confidence intervals were wide for Turinand England/Wales. Educational disparities in strokemortality persisted and remained of a similar magnitude inthe 1990s as in the 1980s among both men and women(figure 1). Occupational differences in stroke mortalityshowed a slight tendency to widen in Norway, Finland,Denmark, and England/Wales (figure 2). However, thisincrease was significant only in Norway, whereas changes inother populations were not significant.
Socioeconomic differences in ischemic heart diseasemortality were observed in all populations but Turin duringboth periods among men and women (figures 1 and 2). Incontrast to those for stroke, socioeconomic differentials forischemic heart disease mortality significantly widenedduring the study period in most countries among men(figures 1 and 2). However, occupational disparities inischemic heart disease mortality remained of a similarmagnitude in Turin, and confidence intervals for occupa-tional class overlapped in Denmark and England/Wales(figure 2). Among women, educational differences inischemic heart disease mortality significantly increased inFinland and Norway, whereas they remained relativelystable in Denmark and Turin (figure 1). Despite these varia-tions, socioeconomic differences in ischemic heart diseasemortality showed a general tendency to increase in mostcountries.
To assess whether trends in socioeconomic disparities instroke and ischemic heart disease mortality were signifi-cantly different, we formally compared estimates of changein rate ratios for these two causes of death. Whereas rateratio change estimates generally indicated a significantincrease in socioeconomic disparities in ischemic heartdisease mortality, no significant change was observed in rateratios for stroke mortality in most countries (figures 1 and 2);95 percent confidence intervals of rate ratio change estimatesfor stroke and ischemic heart disease mortality overlapped inmost populations (results not shown). However, differencesin rate ratio change estimates between these two causes ofdeath were generally of borderline significance.
DISCUSSION
Stroke mortality has generally declined in all socioeco-nomic groups among both men and women. Declines instroke mortality were generally similar among lower andhigher socioeconomic groups, such that socioeconomicdisparities in stroke mortality persisted and were of a similarmagnitude in the 1990s as in the 1980s. For some northernEuropean countries, occupational differences in strokemortality showed a slight tendency to widen. However, thisincrease was significant only in Norway, whereas increasesobserved in other populations were not significant. Incontrast, socioeconomic differences in ischemic heartdisease mortality showed a general tendency to widen inmost countries during the same period.
TABLE 3. Stroke mortality rates and change in the periods 1981–1985, 1986–1990, and 1991–1995 by occupational class among men aged 30–59 years in six European populations
* Data cover the age group 35–59 years only.
Population and occupational class
Stroke mortality rate Change between 1981–1985 and 1991–1995
1981–1985 1986–1990 1991–1995 Absolute change % of change 95% confidence
interval
Finland
Nonmanual 29.4 22.6 21.3 –8.1 –28.8 –38.3, –17.9
Manual 44.3 41.8 37.3 –7.0 –15.6 –22.6, –8.0
Norway
Nonmanual 16.6 15.0 8.4 –8.2 –49.2 –59.4, –36.5
Manual 21.1 19.2 20.1 –1.0 –8.4 –23.0, 9.0
Sweden
Nonmanual 14.7 17.3* 12.3 –2.4 –16.3 –26.7, –4.5
Manual 22.2 22.3* 18.4 –3.8 –17.7 –26.8, –7.6
Denmark
Nonmanual 17.1 15.7 14.9 –2.2 –16.3 –29.4, –0.8
Manual 23.4 26.2 22.0 –1.4 –5.9 –19.7, 10.3
England/Wales
Nonmanual 23.5 14.6* 13.9 –9.6 –38.8 –62.6, 0.1
Manual 32.9 30.0* 22.0 –10.9 –35.4 –54.2, –9.0
Turin, Italy
Nonmanual 23.1 21.4* 16.4 –6.7 –26.3 –46.7, 1.9
Manual 30.7 28.6* 20.3 –10.4 –35.8 –50.0, –17.7
Am J Epidemiol 2005;161:52–61
Stroke Mortality Trends among Socioeconomic Groups 57
Evaluation of data
International comparisons may be biased by differencesbetween countries in the accuracy of death registrations andsocioeconomic classifications. However, we did not strictlycompare countries but analyzed changes over time withineach population.
Changes in the classification of causes of death may influ-ence analyses of trends. However, in most countries, theICD-9 code was used in all periods. It is unlikely that the lateadoption of the ICD-9 in some countries influenced deathrates, because the overall stroke category is essentially thesame in the ICD-8 and ICD-9 (33). Furthermore, our resultswould be biased only if deaths from stroke were classifieddifferently by socioeconomic status. There is no evidencesuggesting that this has occurred, and any bias due to thisproblem is likely to be small.
The classification of education and occupation used in ourstudy remained unchanged. However, although changes in
the occupational class distribution were small, the proportionof the population in the low educational category decreasedconsiderably over time. This decline may have influencedour results by either obscuring or inflating changes in socio-economic differences in stroke mortality. To assess theimpact of these changes, we analyzed trends using the rela-tive index of inequality (34) (results not shown). Thismeasure assesses differences in mortality by adjusting forchanges in the distribution of education in the populationover time and by taking into account mortality differencesamong the three educational levels. The pattern based on therelative index of inequality corresponded with that based onthe rate ratio: Educational differences in stroke mortalitypersisted and remained relatively stable over time in mostcountries, whereas educational disparities in ischemic heartdisease mortality widened in most populations. Furthermore,results based on the relative index of inequality indicate thateducational disparities in stroke mortality have significantlywidened in Norway among men. This is consistent with the
FIGURE 1. Rate ratio between low and middle/high educational levels for stroke and ischemic heart disease (IHD) mortality in the periods1981–1985 and 1991–1995 among men and women in Finland, Norway, Denmark (ages 30–59 years), and Turin, Italy (ages 30–74 years). The95% confidence interval of the estimate of change in rate ratio does not include zero for Finland, Norway, Denmark, and Turin among men (IHD)and for Finland and Norway among women (IHD).
Am J Epidemiol 2005;161:52–61
58 Avendaño et al.
pattern observed for occupational class and suggests thatsocioeconomic disparities in stroke mortality have increasedin this population.
Data for educational level comprised individuals aged 30–74 years, whereas occupational data covered the age range of30–59 years only. Thus, results for these two socioeconomicindicators may not be fully comparable. However, separateanalyses for educational level were performed for those aged30–59 years and those aged 60–74 years (results not shown).The overall patterns for these two groups were identical andwere therefore combined in the analysis.
Comparison with previous studies
Previous studies reported a faster proportional decline incardiovascular disease mortality among the higher socioeco-nomic groups in European countries, resulting in wideningsocioeconomic differences in cardiovascular mortality (10,35, 36). Our results suggest that this pattern generallyoccurred in ischemic heart disease mortality in most popula-
tions. However, we did not observe the same pattern forstroke mortality. This supports previous evidence thatsuggests that differences exist between trends in stroke andischemic heart disease mortality (11, 37). Similarly, socio-economic disparities in stroke and ischemic heart diseasemortality have shown a different international pattern acrossEurope (1, 14).
This is the first study to report more favorable trends instroke mortality among higher than among lower socioeco-nomic groups among men in Norway. The pattern for thispopulation may resemble that for countries such as theUnited States (9, 23) and some parts of Australia (4), wherea larger relative decline in stroke mortality has beenobserved among higher than among lower socioeconomicgroups. A previous study in Finland reported a similar abso-lute decline in stroke mortality by occupational class but alarger relative decline among nonmanual than amongmanual classes (5). Although this resembles the pattern thatwe have observed, socioeconomic differences in the relativedecline in stroke mortality in Finland were not significant.
FIGURE 2. Rate ratio between manual and nonmanual occupational classes for stroke and ischemic heart disease (IHD) mortality in the peri-ods 1981–1985 and 1991–1995 among men in Finland, Norway, Sweden, Denmark, England/Wales, and Turin, Italy (ages 30–59 years). The95% confidence interval of the estimate of change in rate ratio does not include zero for Norway (stroke) and for Finland, Norway, and Sweden(IHD).
Am J Epidemiol 2005;161:52–61
Stroke Mortality Trends among Socioeconomic Groups 59
Noteworthy is the pattern for Turin, Italy, where educa-tional disparities in stroke mortality remained of a similarmagnitude and where educational disparities in ischemicheart disease mortality showed an increase. This is consis-tent with the pattern that has been observed in other Mediter-ranean countries such as Spain (3). Similarly, a previousstudy in France reported similar stroke mortality declinesacross socioeconomic groups, accompanied by divergingtrends in mortality from ischemic heart disease (37).
Overall, similar results were observed for occupationalclass and educational level. However, a sharper widening ofdisparities in stroke mortality generally occurred for occupa-tional class than for educational level in some populations.This discrepancy suggests that differences may exist in theeffect of these two indicators of socioeconomic status onmortality (27, 28). Educational level might reflect gradualchanges in factors such as health behavior and access tohealth information, which may influence mortality differen-tials over a long period. Instead, trends in occupationaldisparities may reflect changes in factors such as the phys-ical and psychosocial dimensions of work (27). Despitethese discrepancies, results from this study indicate that,overall, similar trends have occurred for educational leveland occupational class in most populations.
Explanation of results
Hypertension is involved in nearly 70 percent of strokes(38). Recent evidence shows that hypertension prevalenceand blood pressure levels have generally declined in allsocioeconomic groups in Finland (19), Denmark (20),Sweden (39), and Italy (40). However, it still remainsunclear to what extent these changes are due to improve-ments in hypertension treatment or diet. Significantimprovements in the awareness, treatment, and control ofhypertension have occurred in countries such as Finland (41)and Spain (16). Within the United Kingdom, significantimprovements in hypertension management across all socio-economic groups have been observed in Scotland (42).Hypertension management among diabetic patients has alsoimproved significantly in many European populations (43).Thus, improvements in access to hypertension treatment—detection and management—have probably contributed tosimilar stroke mortality declines in all socioeconomicgroups. Furthermore, improvements in dietary salt and fatintake have been observed in all socioeconomic groups inseveral European countries (44–46). Population-based strat-egies, such as policies and legislation on salt concentrationsin processed food, introduced in countries such as Finlandmay have contributed to this pattern (47, 48). Additionally,similar declines in cholesterol level across social classeshave been observed in Finland (19, 49), Denmark (20),Sweden (39), and Italy (40). These factors may have contrib-uted to stroke mortality declines of a similar magnitudeacross socioeconomic groups in Europe.
Stroke and ischemic heart disease share several riskfactors. However, socioeconomic differences in strokemortality remained relatively stable, whereas disparities inischemic heart disease mortality widened over time in mostcountries. Recent trends in risk factors such as smoking and
overweight may have substantially contributed to the patternobserved for ischemic heart disease. Most Nordic countriesand the United Kingdom have generally experienceddeclining trends in smoking prevalence among the higherclasses, accompanied by increasing trends in the lowersocioeconomic groups (15, 19, 20, 39, 49, 50). Similarly, theprevalence of overweight and obesity has shown more favor-able trends among higher than among lower socioeconomicgroups (19, 51). These trends may partly explain thewidening of socioeconomic differences in ischemic heartdisease mortality across Europe. On the other hand, trends insocioeconomic differences in stroke mortality may havebeen more influenced by factors such as hypertension.
As shown in previous studies (14), we observed smallersocioeconomic disparities in ischemic heart diseasemortality in Turin than in northern European countries.Nevertheless, trends in inequalities in stroke and ischemicheart disease mortality in Turin were similar to trends inother populations: Educational disparities in stroke mortalityremained of a similar magnitude, whereas educationaldisparities in ischemic heart disease mortality tended toincrease. Widening smoking inequalities in Italy may havecontributed to the pattern for ischemic heart diseasemortality, whereas factors such as diet and hypertension mayhave contributed to the pattern for stroke mortality (40, 52).
Finally, research indicates that declines in case-fatalityrates have also contributed to declines in stroke mortality(53), which fact underlines the role of improvements inmedical care. Socioeconomic disparities in stroke mortalitypersisted from the 1980s to the 1990s in all populations,which may indicate that socioeconomic disparities in health-care utilization remain. This is supported by recent evidenceof socioeconomic differences in specialist care and diag-nostic procedures even in countries with universal health-care systems such as Finland (13, 54) and Sweden (55).Furthermore, the higher socioeconomic groups may havehad access to some surgical procedures earlier than the lowersocioeconomic groups (54, 56). This may have contributedto widening socioeconomic differences in ischemic heartdisease and stroke mortality in some countries. Similarly,despite favorable hypertension trends overall, socioeco-nomic disparities in blood pressure levels and hypertensioncare still remain (57, 58). These factors may have contrib-uted to persisting or widening socioeconomic inequalities instroke mortality in Europe.
Implications
Results from this study suggest that stroke mortality trendsin all socioeconomic groups have generally been responsiveto favorable changes in important risk factors such as hyper-tension. However, the persistence of socioeconomic inequal-ities in stroke mortality in most populations and thewidening of these disparities in Norway indicate that recentchanges in policies and risk factors have not been sufficient.Improvements in the quality of preventive care for factorssuch as hypertension and in the quality of hospital care forstroke can substantially improve survival among individualswith a low socioeconomic status (13, 58). Furthermore,population-based prevention strategies, such as policies and
Am J Epidemiol 2005;161:52–61
60 Avendaño et al.
legislation to stimulate a reduction in salt intake, raise aware-ness of hypertension, and decrease smoking prevalence, canpotentially benefit individuals in all socioeconomic groups(59). Our results indicate that focusing interventions on thelower socioeconomic groups may help sustain the strokemortality decline in European countries.
ACKNOWLEDGMENTS
This study was financed by the European Commission(Health Monitoring Program, contract SOC 98 201376Ø5FØ3). Dr. Frank van Lenthe is supported by a grant fromthe Netherlands Organization for Scientific Research (NWOgrant 904-66-104).
The authors thank Dr. Otto Andersen for his help with theDanish data and Dr. Orjan Hemström for his help with theSwedish data and valuable comments on the paper.
REFERENCES
1. Kunst AE, del Rios M, Groenhof F, et al. Socioeconomic ine-qualities in stroke mortality among middle-aged men: an inter-national overview. European Union Working Group on Socioeconomic Inequalities in Health. Stroke 1998;29:2285–91.
2. Avendano M, Kunst AE, Huisman M, et al. Educational level and stroke mortality: a comparison of 10 European populations during the 1990s. Stroke 2004;35:432–7.
3. Lostao L, Regidor E, Aiach P, et al. Social inequalities in ischaemic heart and cerebrovascular disease mortality in men: Spain and France, 1980–1982 and 1988–1990. Soc Sci Med 2001;52:1879–87.
4. Burnley IH, Rintoul D. Inequalities in the transition of cere-brovascular disease mortality in New South Wales, Australia, 1969–1996. Soc Sci Med 2002;54:545–59.
5. Valkonen T, Martikainen P, Jalovaara M, et al. Changes in socioeconomic inequalities in mortality during an economic boom and recession among middle-aged men and women in Finland. Eur J Public Health 2000;10:274–80.
6. Forssas E, Keskimaki I, Reunanen A, et al. Widening socioeco-nomic mortality disparity among diabetic people in Finland. Eur J Public Health 2003;13:38–43.
7. Singh GK, Siahpush M. Increasing inequalities in all-cause and cardiovascular mortality among US adults aged 25–64 years by area socioeconomic status, 1969–1998. Int J Epidemiol 2002;31:600–13.
8. Turrell G, Mathers C. Socioeconomic inequalities in all-cause and specific-cause mortality in Australia: 1985–1987 and 1995–1997. Int J Epidemiol 2001;30:231–9.
9. Cooper R, Cutler J, Desvigne-Nickens P, et al. Trends and dis-parities in coronary heart disease, stroke, and other cardiovas-cular diseases in the United States: findings of the national conference on cardiovascular disease prevention. Circulation 2000;102:3137–47.
10. Mackenbach JP, Bos V, Andersen O, et al. Widening socioeco-nomic inequalities in mortality in six Western European coun-tries. Int J Epidemiol 2003;32:830–7.
11. Truelsen T, Mahonen M, Tolonen H, et al. Trends in stroke and coronary heart disease in the WHO MONICA Project. Stroke 2003;34:1346–52.
12. Reed D. The paradox of high risk of stroke in populations with
low risk of coronary heart disease. Am J Epidemiol 1990;131:579–88.
13. Jakovljevic D, Sarti C, Sivenius J, et al. Socioeconomic status and ischemic stroke: the FINMONICA Stroke Register. Stroke 2001;32:1492–8.
14. Kunst AE, Groenhof F, Andersen O, et al. Occupational class and ischemic heart disease mortality in the United States and 11 European countries. Am J Public Health 1999;89:47–53.
15. Pierce JP. International comparisons of trends in cigarette smoking prevalence. Am J Public Health 1989;79:152–7.
16. Sans S, Paluzie G, Balana L, et al. Tendencias de la prevalencia, conocimiento, tratamiento y control de la hipertension arterial entre 1986 y 1996: estudio MONICA-Cataluna. (In Spanish). Med Clin (Barc) 2001;117:246–53.
17. Cavelaars AE, Kunst AE, Geurts JJ, et al. Educational differ-ences in smoking: international comparison. BMJ 2000;320:1102–7.
18. Cavelaars A, Kunst A, Mackenbach JP. Socio-economic differ-ences in risk factors for morbidity and mortality in the Euro-pean Community: an international comparison. J Health Psychol 1997;2:353–72.
19. Pekkanen J, Uutela A, Valkonen T, et al. Coronary risk factor levels: differences between educational groups in 1972–87 in eastern Finland. J Epidemiol Community Health 1995;49:144–9.
20. Osler M, Gerdes LU, Davidsen M, et al. Socioeconomic status and trends in risk factors for cardiovascular diseases in the Dan-ish MONICA population, 1982–1992. J Epidemiol Community Health 2000;54:108–13.
21. van Doorslaer E, Wagstaff A, van der Burg H, et al. Equity in the delivery of health care in Europe and the US. J Health Econ 2000;19:553–83.
22. Moon L. Stroke treatment and care: a comparison of approaches in OECD countries. In: Organization for Economic Cooperation and Development (OECD), ed. A disease-based comparison of health systems. Paris, France: Organization for Economic Cooperation and Development, 2003:53–75.
23. Steenland K, Henley J, Thun M. All-cause and cause-specific death rates by educational status for two million people in two American Cancer Society cohorts, 1959–1996. Am J Epidemiol 2002;156:11–21.
24. Borrell C, Plasencia A, Pasarin I, et al. Widening social ine-qualities in mortality: the case of Barcelona, a southern Euro-pean city. J Epidemiol Community Health 1997;51:659–67.
25. Harding S. Social class differences in mortality of men: recent evidence from the OPCS Longitudinal Study. Office of Popula-tion Censuses and Surveys. Popul Trends 1995;summer:31–7.
26. Cardano M, Costa G, Demaria M. Social mobility and health in the Turin longitudinal study. Soc Sci Med 2004;58:1563–74.
27. Daly MC, Duncan GJ, McDonough P, et al. Optimal indicators of socioeconomic status for health research. Am J Public Health 2002;92:1151–7.
28. Valkonen T. Problems in the measurement and international comparisons of socioeconomic differences in mortality. Soc Sci Med 1993;36:409–18.
29. United Nations Educational Scientific and Cultural Organiza-tion (UNESCO). International Standard Classification of Edu-cation—ISCED 1997. Paris, France: UNESCO, 1997. (http://www.uis.unesco.org/TEMPLATE/pdf/isced/ISCED_A.pdf).
30. Erikson E, Goldthorpe JH. The constant flux. Oxford, United Kingdom: Clarendon Press, 1992.
31. Kunst AE, Groenhof F, Mackenbach JP. Mortality by occupa-tional class among men 30–64 years in 11 European countries. EU Working Group on Socioeconomic Inequalities in Health. Soc Sci Med 1998;46:1459–76.
32. Eurostat. Demographic statistics 1987. Luxembourg: Eurostat
Am J Epidemiol 2005;161:52–61
Stroke Mortality Trends among Socioeconomic Groups 61
Office for Official Publications of the European Communities, 1987.
33. Sarti C, Rastenyte D, Cepaitis Z, et al. International trends in mortality from stroke, 1968 to 1994. Stroke 2000;31:1588–601.
34. Mackenbach JP, Kunst AE. Measuring the magnitude of socio-economic inequalities in health: an overview of available mea-sures illustrated with two examples from Europe. Soc Sci Med 1997;44:757–71.
35. Diderichsen F, Hallqvist J. Trends in occupational mortality among middle-aged men in Sweden 1961–1990. Int J Epide-miol 1997;26:782–7.
36. White C, Van Galen F, Chow YH. Trends in social class differ-ences in mortality by cause, 1986 to 2000. Health Stat Q 2003;20:25–37.
37. Lang T, Ducimetiere P. Premature cardiovascular mortality in France: divergent evolution between social categories from 1970 to 1990. Int J Epidemiol 1995;24:331–9.
38. Bronner LL, Kanter DS, Manson JE. Primary prevention of stroke. N Engl J Med 1995;333:1392–400.
39. Peltonen M, Huhtasaari F, Stegmayr B, et al. Secular trends in social patterning of cardiovascular risk factor levels in Sweden. The Northern Sweden MONICA Study 1986–1994. Multina-tional Monitoring of Trends and Determinants in Cardiovascu-lar Disease. J Intern Med 1998;244:1–9.
40. Ferrario M, Sega R, Chatenoud L, et al. Time trends of major coronary risk factors in a northern Italian population (1986–1994). How remarkable are socioeconomic differences in an industrialized low CHD incidence country? Int J Epidemiol 2001;30:285–97.
41. Kastarinen MJ, Salomaa VV, Vartiainen EA, et al. Trends in blood pressure levels and control of hypertension in Finland from 1982 to 1997. J Hypertens 1998;16:1379–87.
42. Chen R, Tunstall-Pedoe H, Morrison C, et al. Trends and social factors in blood pressure control in Scottish MONICA surveys 1986–1995: the rule of halves revisited. J Hum Hypertens 2003;17:751–9.
43. Soedamah-Muthu SS, Colhoun HM, Abrahamian H, et al. Trends in hypertension management in type I diabetes across Europe, 1989/1990–1997/1999. Diabetologia 2002;45:1362–71.
44. Osler M, Heitmann BL, Schroll M. Ten year trends in the dietary habits of Danish men and women. Cohort and cross-sec-tional data. Eur J Clin Nutr 1997;51:535–41.
45. Groth MV, Fagt S. Udviklingen i kostvaner i Danmark og Sver-ige siden 1960’erne. (In Danish). Ugeskr Laeger 2001;163:425–9.
46. Perrin AE, Simon C, Hedelin G, et al. Ten-year trends of
dietary intake in a middle-aged French population: relationship with educational level. Eur J Clin Nutr 2002;56:393–401.
47. Karppanen H, Mervaala E. Adherence to and population impact of non-pharmacological and pharmacological antihypertensive therapy. J Hum Hypertens 1996;10(suppl 1):S57–61.
48. Narhinen M, Cernerud L. Salt and public health—policies for dietary salt in the Nordic countries. Scand J Prim Health Care 1995;13:300–6.
49. Vartiainen E, Pekkanen J, Koskinen S, et al. Do changes in car-diovascular risk factors explain the increasing socioeconomic difference in mortality from ischaemic heart disease in Finland? J Epidemiol Community Health 1998;52:416–19.
50. Pride NB, Soriano JB. Chronic obstructive pulmonary disease in the United Kingdom: trends in mortality, morbidity, and smoking. Curr Opin Pulm Med 2002;8:95–101.
51. Molarius A, Seidell JC, Sans S, et al. Educational level, relative body weight, and changes in their association over 10 years: an international perspective from the WHO MONICA Project. Am J Public Health 2000;90:1260–8.
52. Faggiano F, Versino E, Lemma P. Decennial trends of social differentials in smoking habits in Italy. Cancer Causes Control 2001;12:665–71.
53. Sarti C, Stegmayr B, Tolonen H, et al. Are changes in mortality from stroke caused by changes in stroke event rates or case fatality? Results from the WHO MONICA Project. Stroke 2003;34:1833–40.
54. Hetemaa T, Keskimaki I, Manderbacka K, et al. How did the recent increase in the supply of coronary operations in Finland affect socioeconomic and gender equity in their use? J Epide-miol Community Health 2003;57:178–85.
55. Peltonen M, Rosen M, Lundberg V, et al. Social patterning of myocardial infarction and stroke in Sweden: incidence and sur-vival. Am J Epidemiol 2000;151:283–92.
56. Keskimäki I, Koskinen S, Salinto M, et al. Socioeconomic and gender inequalities in access to coronary artery bypass grafting in Finland. Eur J Public Health 1997;7:392–7.
57. de Gaudemaris R, Lang T, Chatellier G, et al. Socioeconomic inequalities in hypertension prevalence and care: the IHPAF Study. Hypertension 2002;39:1119–25.
58. de Koning JS, Klazinga NS, Koudstaal PJ, et al. Deprivation and systematic stroke prevention in general practice: an audit among general practitioners in the Rotterdam region, the Neth-erlands. Eur J Public Health 2003;13:340–6.
59. Murray CJ, Lauer JA, Hutubessy RC, et al. Effectiveness and costs of interventions to lower systolic blood pressure and cho-lesterol: a global and regional analysis on reduction of cardio-vascular-disease risk. Lancet 2003;361:717–25.
Am J Epidemiol 2005;161:52–61