Trends and behaviour of meteorological drought (1901-2008) over Indian region using standardized...
8
INTERNATIONAL JOURNAL OF CLIMATOLOGY Int. J. Climatol. (2015) Published online in Wiley Online Library (wileyonlinelibrary.com) DOI: 10.1002/joc.4392 Trends and behaviour of meteorological drought (1901–2008) over Indian region using standardized precipitation–evapotranspiration index Prabir Kumar Das, a * Dibyendu Dutta, a J. R. Sharma b and V. K. Dadhwal b a Regional Remote Sensing Centre-East, National Remote Sensing Centre, Kolkata, India b National Remote Sensing Centre, Hyderabad, India ABSTRACT: Monthly gridded (0.5 ∘ × 0.5 ∘ ) standardized precipitation –evapotranspiration index (SPEI) data of 1901 – 2008 were used to detect spatial pattern of temporal trend in meteorological drought during the Indian summer monsoon period. The SPEI data were converted into drought duration, magnitude and types of occurrence to capture overall drought scenario. A non-parametric (Mann–Kendall test) method was used to test for monotonic trend at each grid level, whereas the magnitude was estimated using Sen’s method. Further, a field significance test was performed at major meteorological regions level to assess whether the individual trends identified could occur by chance in an analysis of large number of time series analysed. Significant ( = 0.05) increasing trend of both drought duration and magnitude during the monsoon was found over parts of eastern, central and north-eastern region of India, whereas the parts of west coast, arid western region and north India showed significantly decreasing trend. The trends in mid- as well as late-season drought were contributing towards significant increase in drought condition, whereas trends in early-season drought were responsible for decrease in drought events. The time series analysis of rainfall and potential evapotranspiration (PET) illustrated that over eastern part of India the increase in drought was attributed due to decrease in rainfall, whereas the decrease in drought occurrence over western arid region was mainly because of decrease in PET. KEY WORDS Indian summer monsoon; meteorological drought; drought duration; drought magnitude; rainfall; potential evapotranspiration Received 13 August 2014; Revised 28 April 2015; Accepted 1 May 2015 1. Introduction Drought is considered as one of the main natural causes for considerable damage in rain-fed agriculture, resulting in economic loss and environmental degradation (Burton et al., 1978; Wilhite and Glantz, 1985; Wilhite, 1993). In the last few decades, several drought indices have been developed based on several parameters, the details of which can be found in Heim (2002), Mishra and Singh (2010) and Sivakumar et al. (2011). However, no single index has been able to adequately represent the intensity as well as severity of drought and its potential impacts on diverse group (Wilhite and Glantz, 1985). The Palmer Drought Severity Index (PDSI, Palmer, 1965) is one of the most widely used among various drought indices. PDSI is a climatic water balance index considering both precipitation and evapotranspiration anomalies as well as water-holding capacity of soil (Dai et al., 2004). The main shortcoming of PDSI lies in its lagged response of emerging droughts by several months, and its application is also limited in areas with frequent climatic extremes like in the Indian subcontinent (Niranjan et al., 2013). The multi-scalar drought index, e.g. the Standardized *Correspondence to: P. K. Das, Regional Remote Sensing Centre-East, National Remote Sensing Centre, Kolkata-700156, India. E-mail: pra- [email protected] Precipitation Index (SPI) (McKee et al., 1993), was used by many of the climate researchers in drought studies. The main limitation of SPI is that it uses precipitation data alone and does not consider other critical variables, especially temperature. Although precipitation is the main causative factor for drought, recent studies have illustrated the importance of temperature in explaining recent trends in water resources (Nicholls, 2004; Cai and Cowan, 2008; Gerten et al., 2008; Lorenzo-Lacruz et al., 2010). The proximal drought index must account for changes in atmospheric or moisture demand caused by increased surface warming (Dai, 2011). Recently, a new drought index, the standardized precipitation–evapotranspiration index (SPEI) has been proposed (Begueria et al., 2010; Vicente-Serrano et al., 2010a, 2010b) to quantify the drought condition. The SPEI takes into account both temperature and precipitation; hence, considered to be a better approach for studying the effects of climate change on drought occurrence. The knowledge of temporal and spatial variability of drought is becoming essential for better mitigation planning and its preparedness. Several studies have been carried out to characterize the drought over Indian region (Bhalme and Mooley, 1980; Rao, 1981; Parthasarathy et al., 1987; Sikka, 1999) in general and also on specific drought years during last few decades (Krishnamurti et al., © 2015 Royal Meteorological Society
-
Upload
independent -
Category
Documents
-
view
4 -
download
0
Transcript of Trends and behaviour of meteorological drought (1901-2008) over Indian region using standardized...
INTERNATIONAL JOURNAL OF CLIMATOLOGYInt. J. Climatol. (2015)Published online in Wiley Online Library(wileyonlinelibrary.com) DOI: 10.1002/joc.4392
Trends and behaviour of meteorological drought (1901–2008)over Indian region using standardized
precipitation–evapotranspiration indexPrabir Kumar Das,a* Dibyendu Dutta,a J. R. Sharmab and V. K. Dadhwalb
a Regional Remote Sensing Centre-East, National Remote Sensing Centre, Kolkata, Indiab National Remote Sensing Centre, Hyderabad, India
ABSTRACT: Monthly gridded (0.5∘ × 0.5∘) standardized precipitation–evapotranspiration index (SPEI) data of 1901–2008were used to detect spatial pattern of temporal trend in meteorological drought during the Indian summer monsoon period.The SPEI data were converted into drought duration, magnitude and types of occurrence to capture overall drought scenario.A non-parametric (Mann–Kendall test) method was used to test for monotonic trend at each grid level, whereas the magnitudewas estimated using Sen’s method. Further, a field significance test was performed at major meteorological regions level toassess whether the individual trends identified could occur by chance in an analysis of large number of time series analysed.Significant (𝛼 = 0.05) increasing trend of both drought duration and magnitude during the monsoon was found over parts ofeastern, central and north-eastern region of India, whereas the parts of west coast, arid western region and north India showedsignificantly decreasing trend. The trends in mid- as well as late-season drought were contributing towards significant increasein drought condition, whereas trends in early-season drought were responsible for decrease in drought events. The time seriesanalysis of rainfall and potential evapotranspiration (PET) illustrated that over eastern part of India the increase in droughtwas attributed due to decrease in rainfall, whereas the decrease in drought occurrence over western arid region was mainlybecause of decrease in PET.
KEY WORDS Indian summer monsoon; meteorological drought; drought duration; drought magnitude; rainfall; potentialevapotranspiration
Received 13 August 2014; Revised 28 April 2015; Accepted 1 May 2015
1. Introduction
Drought is considered as one of the main natural causesfor considerable damage in rain-fed agriculture, resultingin economic loss and environmental degradation (Burtonet al., 1978; Wilhite and Glantz, 1985; Wilhite, 1993). Inthe last few decades, several drought indices have beendeveloped based on several parameters, the details ofwhich can be found in Heim (2002), Mishra and Singh(2010) and Sivakumar et al. (2011). However, no singleindex has been able to adequately represent the intensityas well as severity of drought and its potential impactson diverse group (Wilhite and Glantz, 1985). The PalmerDrought Severity Index (PDSI, Palmer, 1965) is one ofthe most widely used among various drought indices.PDSI is a climatic water balance index considering bothprecipitation and evapotranspiration anomalies as wellas water-holding capacity of soil (Dai et al., 2004). Themain shortcoming of PDSI lies in its lagged response ofemerging droughts by several months, and its applicationis also limited in areas with frequent climatic extremeslike in the Indian subcontinent (Niranjan et al., 2013).The multi-scalar drought index, e.g. the Standardized
* Correspondence to: P. K. Das, Regional Remote Sensing Centre-East,National Remote Sensing Centre, Kolkata-700156, India. E-mail: [email protected]
Precipitation Index (SPI) (McKee et al., 1993), was usedby many of the climate researchers in drought studies.The main limitation of SPI is that it uses precipitationdata alone and does not consider other critical variables,especially temperature. Although precipitation is the maincausative factor for drought, recent studies have illustratedthe importance of temperature in explaining recent trendsin water resources (Nicholls, 2004; Cai and Cowan, 2008;Gerten et al., 2008; Lorenzo-Lacruz et al., 2010). Theproximal drought index must account for changes inatmospheric or moisture demand caused by increasedsurface warming (Dai, 2011). Recently, a new droughtindex, the standardized precipitation–evapotranspirationindex (SPEI) has been proposed (Begueria et al., 2010;Vicente-Serrano et al., 2010a, 2010b) to quantify thedrought condition. The SPEI takes into account bothtemperature and precipitation; hence, considered to be abetter approach for studying the effects of climate changeon drought occurrence.
The knowledge of temporal and spatial variabilityof drought is becoming essential for better mitigationplanning and its preparedness. Several studies have beencarried out to characterize the drought over Indian region(Bhalme and Mooley, 1980; Rao, 1981; Parthasarathyet al., 1987; Sikka, 1999) in general and also on specificdrought years during last few decades (Krishnamurti et al.,
© 2015 Royal Meteorological Society
P. K. DAS et al.
1989; Gadgil et al., 2003; Sikka, 2003; Francis and Gadgil,2010; Krishnamurti et al., 2010; Neena et al., 2011). Ingeneral, the previous studies of Indian droughts were basedon only rainfall data (Chowdhury et al., 1989; Sinha Rayand Shewale, 2001; Guhathakurta, 2003; Das et al, 2014).Of late, the district-wise drought climatology over Indianregion during monsoon season, i.e. June–September,was studied by Pai et al. (2011) using multiple droughtindices. The links between Indo-Pacific climate variabil-ity and drought were examined by Ummenhofer et al.(2012) using the Monsoon Asia Drought Atlas. TheSPEI has been successfully utilized for drought moni-toring in many countries and provinces, e.g. NW IberianPeninsula (Vicente-Serrano et al., 2011), West Afrrica(Vicente-Serrano et al., 2012), Portugal (Paulo et al.,2012), Crez Republic (Potop et al., 2012, 2014), NorthernChile (Meza, 2013), Republic of Moldova (Potop, 2013)and Carpathian region (Spinoni et al., 2013). The vari-ability of monsoon droughts over India using long-termSPEI data set and the co-variability of monsoon droughtswith tropical sea surface temperatures were analysed byNiranjan et al. (2013).
In spite of many drought studies over the Indian region,the long-term behaviour of meteorological drought andits characterization in terms of its duration, intensity andabove all the types of occurrence were hardly available.This study aimed at characterizing the Indian meteo-rological drought condition during monsoon season interms of its duration, magnitude and types of occurrenceusing long-term (1901–2008) SPEI data and studying thelong-term drought behaviour by analysing their temporaltrends. The temporal trends in long-term (1901–2008)rainfall and potential evapotranspiration (PET) anomalieswere also studied to find out the probable factors respon-sible for significant trends in meteorological droughtcondition.
2. Study area
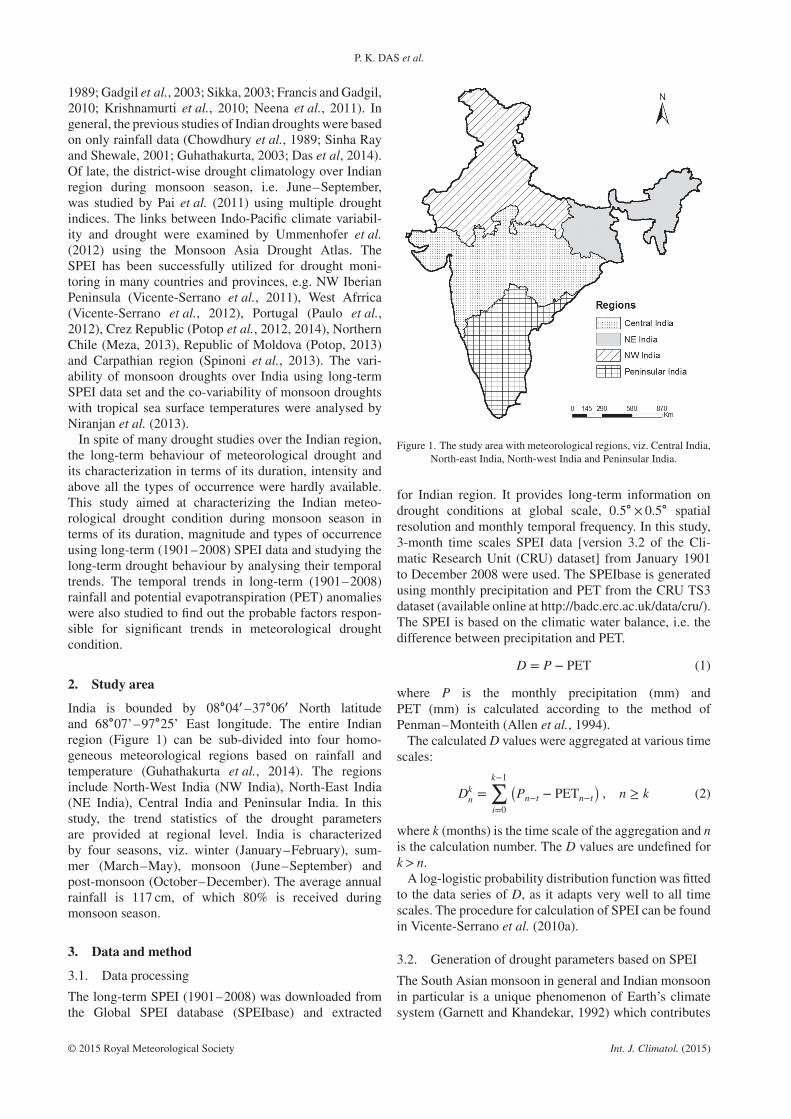
India is bounded by 08∘04′–37∘06′ North latitudeand 68∘07’–97∘25’ East longitude. The entire Indianregion (Figure 1) can be sub-divided into four homo-geneous meteorological regions based on rainfall andtemperature (Guhathakurta et al., 2014). The regionsinclude North-West India (NW India), North-East India(NE India), Central India and Peninsular India. In thisstudy, the trend statistics of the drought parametersare provided at regional level. India is characterizedby four seasons, viz. winter (January–February), sum-mer (March–May), monsoon (June–September) andpost-monsoon (October–December). The average annualrainfall is 117 cm, of which 80% is received duringmonsoon season.
3. Data and method
3.1. Data processing
The long-term SPEI (1901–2008) was downloaded fromthe Global SPEI database (SPEIbase) and extracted
Figure 1. The study area with meteorological regions, viz. Central India,North-east India, North-west India and Peninsular India.
for Indian region. It provides long-term information ondrought conditions at global scale, 0.5∘ × 0.5∘ spatialresolution and monthly temporal frequency. In this study,3-month time scales SPEI data [version 3.2 of the Cli-matic Research Unit (CRU) dataset] from January 1901to December 2008 were used. The SPEIbase is generatedusing monthly precipitation and PET from the CRU TS3dataset (available online at http://badc.erc.ac.uk/data/cru/).The SPEI is based on the climatic water balance, i.e. thedifference between precipitation and PET.
D = P − PET (1)
where P is the monthly precipitation (mm) andPET (mm) is calculated according to the method ofPenman–Monteith (Allen et al., 1994).
The calculated D values were aggregated at various timescales:
Dkn =
k−1∑
i=0
(Pn−t − PETn−t
), n ≥ k (2)
where k (months) is the time scale of the aggregation and nis the calculation number. The D values are undefined fork> n.
A log-logistic probability distribution function was fittedto the data series of D, as it adapts very well to all timescales. The procedure for calculation of SPEI can be foundin Vicente-Serrano et al. (2010a).
3.2. Generation of drought parameters based on SPEI
The South Asian monsoon in general and Indian monsoonin particular is a unique phenomenon of Earth’s climatesystem (Garnett and Khandekar, 1992) which contributes
© 2015 Royal Meteorological Society Int. J. Climatol. (2015)

TRENDS AND BEHAVIOUR OF METEOROLOGICAL DROUGHT
Table 1. Meteorological region wise account of temporal trend of time series anomalies of meteorological drought duration, SPEImagnitude, types of drought occurrence, rainfall and PET.
Meteorological regions N Duration Magnitude Early Mid Late Rainfall PET
+ − + − + − + − + − + − + −
NW India 391 0.012* 0.11* 0.008* 0.007* – * – * * – 1.1 1.8* – 0.18*
NE India 244 0.014* – – 0.01* * – * – * – 1.5 1.9* 0.14* –Central India 430 0.012* 0.012 0.008 0.009* – – * – * – 2.8 1.7* 0.15* 0.10Peninsular India 271 0.012* 0.010 0.008 0.009* – – – – – – 1.1* 1.7 0.17* 0.1*
N, number of total grid with the meteorological regions. Average magnitude of trends (positive or negative) estimated by Sen’s method are presentedas values, and meteorological regions passed ‘field significant test’ at 𝛼 = 0.05 are marked as asterisk. The meteorological regions with significantpositive or negative trends of early-, mid- and late-season drought using Mann–Kendall test are marked as asterisk.
about 80% of the total rainfall over the Indian regionduring the summer monsoon, i.e. June–September (Sahaiet al., 2003). Hence, in this study, the SPEI data for mon-soon season have been analysed to detect the trend in themeteorological drought over Indian region. The SPEI datawere converted to drought duration, magnitude and typeof drought using pre-defined criteria. The occurrence ofdrought episodes was defined following a threshold of theSPEI= 0 at monthly scale (Vicente-Serrano et al., 2011,2012; Meza, 2013). The number of drought months dur-ing the monsoon season, based on the above criterion,was considered as duration of drought for each of theyear. Whereas, the accumulative values of SPEI during thedrought months for each year was considered as its magni-tude (Vicente-Serrano et al., 2011). As the time of occur-rence and duration of drought varies over the years, wecategorized the drought events into three types based uponthe time of occurrence, i.e. early-, mid- and late-seasondrought. The occurrence of drought during June or July, orboth of them, was considered as early-season drought. Ona similar line, the mid-season drought was represented bythe drought occurred during both July and August, whereasoccurrence of drought during both August and Septem-ber was considered as late-season drought. As the rainfallanomaly during September is a major cause of late-seasondrought, the drought occurrence during September monthalone was also considered as late-season drought (Anony-mous, 2009). Mid-season drought occurs in associationwith the breaks in the southwest monsoon, which is moreprevalent during August, hence the drought occurrenceduring August alone was also considered as ‘mid-season’drought.
3.3. Trend analysis
The anomalies of seasonal drought parameters, in termsof duration, magnitude and occurrence, were calculatedusing the absolute deviation of these parameters from theirlong-term average. The rainfall and PET dataset for thesame duration was also downloaded and processed for theIndian region. The trends in long-term rainfall and PETwere estimated to find out the probable factor responsiblefor significant temporal trends in meteorological drought.Trend analyses were performed on the time series anoma-lies at each grid level, and the computed trend was furtherassessed over the four major meteorological regions of theIndian mainland (Figure 1).
The direction of trend in time series anomalies of SPEIderivatives at each grid during the monsoon was estimatedusing non-parametric Mann–Kendall test, whereas themagnitude of the trend was estimated using the Sen’smethod (Sen, 1968). For the details of the techniques andadvantages, Das et al. (2014) may be referred.
The field significance test was carried out at 𝛼 = 0.05over each meteorological region to check the hypothesiswhether one region has a trend or not. For performingthe field significance test, the number of grids havingsignificant positive or negative trends was used as inputs.For the details of the field significance test, Das et al.(2014) may be referred.
4. Results and discussion
The spatial variability of the temporal trends in Indianmeteorological drought during monsoon was representedat 0.5∘ × 0.5∘ grids and summary is provided in Table 1.The number of grids under each meteorological regionalong with the temporal trends of all parameters arepresented in Table 1.
The magnitude of positive and negative trends (slope)was estimated at grid level using Sen’s method and aver-aged over each meteorological region (SPEI year−1 in thecase of drought magnitude, mm year−1 in case of rainfalland PET). The values which qualified the field signifi-cance test were marked with asterisk in Table 1. The gridswith significant trends in terms of drought duration, magni-tude and occurrence are shown in Figures 2(a), 2(b) and 3,respectively. In a similar way, the spatial pattern of mediantrends in rainfall and PET during the monsoon season waspresented in Figure 4(a) and (b), respectively.
4.1. Trends in meteorological drought duration
The results of Mann–Kendall test showed that majority ofthe grids were falling under no significant trend at 95%level of significance, whereas among significant grids pos-itive trends were found to be spread over more areas incomparison with negative trends. The positive trend rep-resents the increase in meteorological drought duration,whereas negative trend signifies decrease in drought dura-tion. The positive trend was found over major parts of NEIndia, north-eastern parts of Central India, southern partsof Peninsular India and some isolated patches distributed
© 2015 Royal Meteorological Society Int. J. Climatol. (2015)

P. K. DAS et al.
Figure 2. Trends in meteorological drought (a) duration and (b) magnitude over Indian region during monsoon season (1901–2008).
across the Indian mainland (Figure 2(a)). Negative trendswere mainly confined in parts of NW India and west coast.The results of the field significant test at homogeneousmeteorological regions revealed that in all the regions,i.e. NW India, NE India, Central India and PeninsularIndia, the duration of drought has increased significantlyin the last 109 years, whereas the duration was found to bedecreasing significantly only in NW India. In NW India,the grids with positive trends are confined in the northernand eastern parts of the region, whereas the negative trendswere found in western parts (Figure 2(a)). The details ofthe long-term trends in drought duration over differentmeteorological regions are given in Table 1.
4.2. Trends in meteorological drought magnitude
The duration of the meteorological drought represents theextent and persistence of the drought, whereas the mag-nitude shows the intensity of the drought. The positivevalue of drought magnitude denotes a decrease in droughtintensity, whereas negative trends represent increasingdrought intensity, as in this study SPEI< 0 had been con-sidered as drought event. The analysis of Mann–Kendalltest revealed that the significant negative trend in droughtmagnitude (at 95% level of significance) was observed inmajor parts of NE India, north-eastern parts of CentralIndia, southern parts of Peninsular India and some isolatedpatches in NW India. On the contrary, significant positivetrend was observed in parts of NW India, west coast andsome isolated patches in Peninsular India (Figure 2(b)).The values of the significant positive and negative trendsin drought magnitude, derived from Sen’s method, werealso varying spatially across Indian region as depicted byFigure 2(b). The field significance test at meteorologicalregion level showed that all the regions have significant
negative trends, denoting an increase in drought magni-tude, whereas only NW India has a significant positivetrend with decreasing drought magnitude. The results ofSen’s method also showed that among all the regions,NE India has maximum increase in drought magnitudeover last 109 years, whereas it was lowest in NW India(Table 1).
4.3. Trends in meteorological drought types
The period of occurrence of drought has significant impacton overall agricultural productivity. Early-season droughthas a direct impact on delay in crop sowing activitieswhich leads to reduction in crop area as well as production.The mid-season drought affects the growth of crop and itsproductivity, whereas the late-season drought may lead tosignificant decrease in economic harvest. Hence, in thisstudy along with meteorological drought duration and itsmagnitude, the types of drought events were also studiedand their temporal trends were analysed.
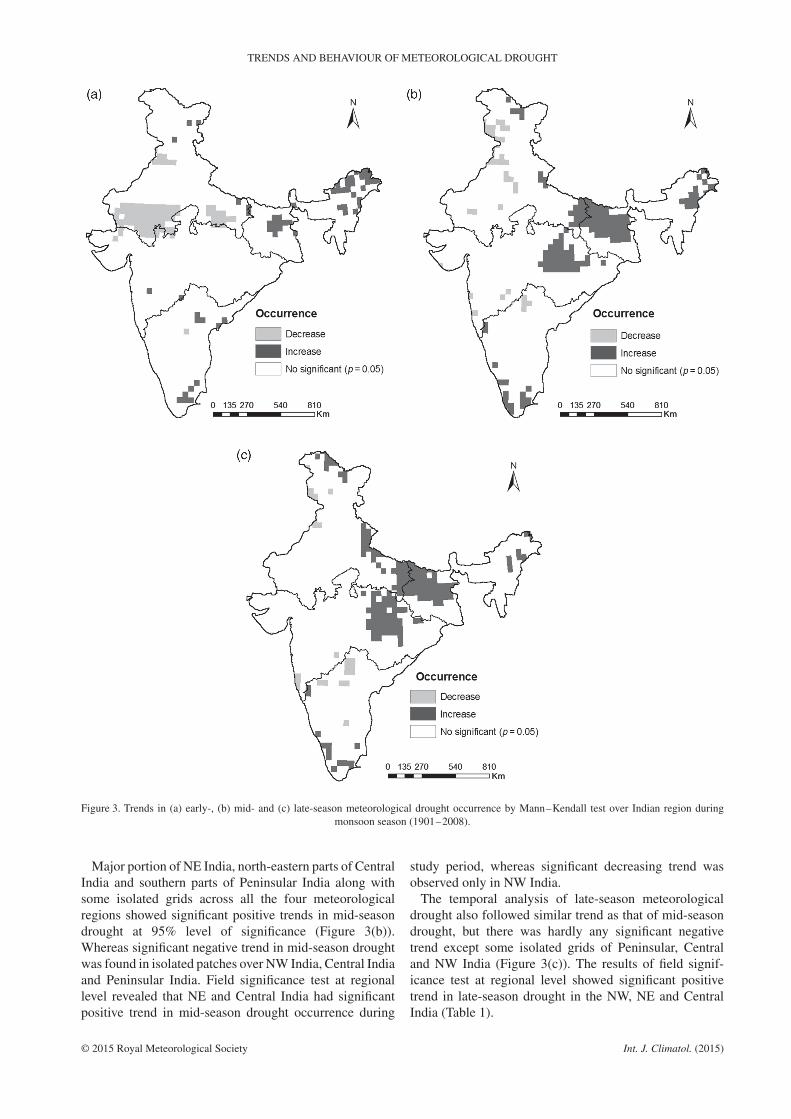
The significant trends in occurrence of early-,mid- and late-season meteorological drought areshown in Figure 3(a)–(c), respectively. The resultsof Mann–Kendall test showed that increased trend inearly-season drought was found in eastern and cen-tral parts of NE India, whereas decreasing trend wasfound over parts of NW India (Figure 3(a)). Few iso-lated patches of both increasing and decreasing trend inearly-season drought were found to be distributed acrossIndian mainland. The outcome of field significance testat meteorological region level showed that only NE Indiahas a significant increasing trend, whereas NW India hasa significant decreasing trend in early-season droughtoccurrence at 95% level of significance (Table 1).
© 2015 Royal Meteorological Society Int. J. Climatol. (2015)
TRENDS AND BEHAVIOUR OF METEOROLOGICAL DROUGHT
Figure 3. Trends in (a) early-, (b) mid- and (c) late-season meteorological drought occurrence by Mann–Kendall test over Indian region duringmonsoon season (1901–2008).
Major portion of NE India, north-eastern parts of CentralIndia and southern parts of Peninsular India along withsome isolated grids across all the four meteorologicalregions showed significant positive trends in mid-seasondrought at 95% level of significance (Figure 3(b)).Whereas significant negative trend in mid-season droughtwas found in isolated patches over NW India, Central Indiaand Peninsular India. Field significance test at regionallevel revealed that NE and Central India had significantpositive trend in mid-season drought occurrence during
study period, whereas significant decreasing trend wasobserved only in NW India.
The temporal analysis of late-season meteorologicaldrought also followed similar trend as that of mid-seasondrought, but there was hardly any significant negativetrend except some isolated grids of Peninsular, Centraland NW India (Figure 3(c)). The results of field signif-icance test at regional level showed significant positivetrend in late-season drought in the NW, NE and CentralIndia (Table 1).
© 2015 Royal Meteorological Society Int. J. Climatol. (2015)
P. K. DAS et al.
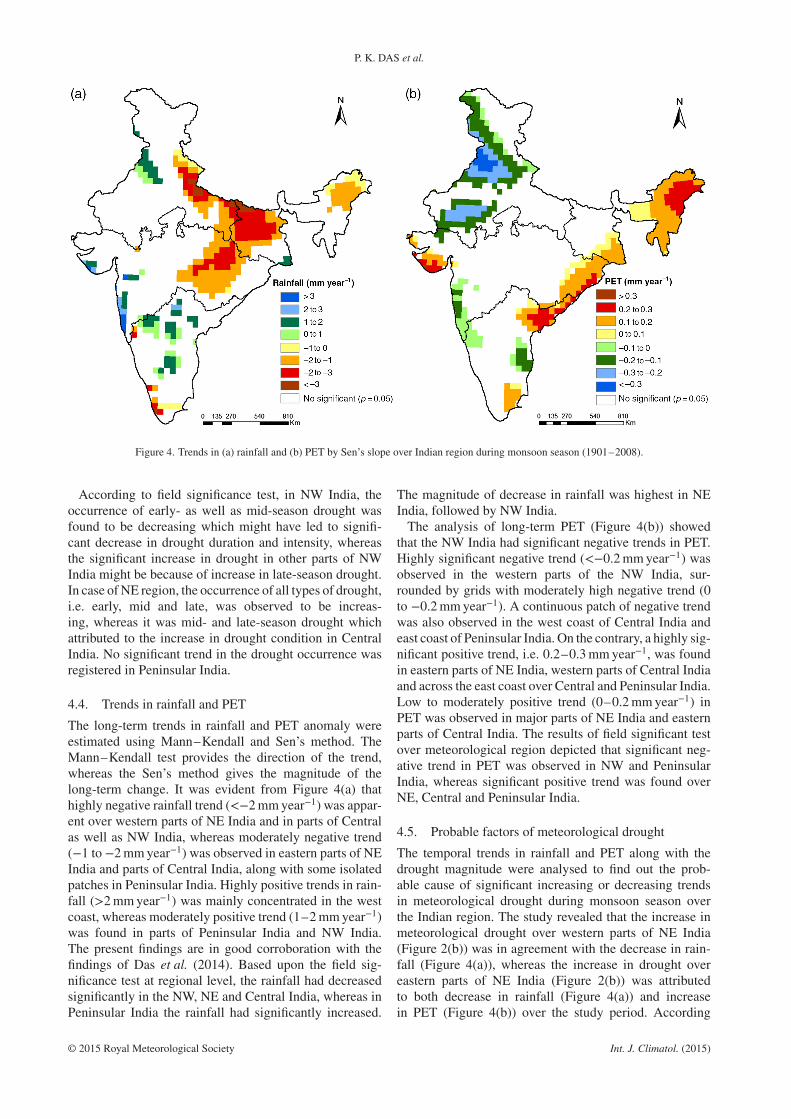
Figure 4. Trends in (a) rainfall and (b) PET by Sen’s slope over Indian region during monsoon season (1901–2008).
According to field significance test, in NW India, theoccurrence of early- as well as mid-season drought wasfound to be decreasing which might have led to signifi-cant decrease in drought duration and intensity, whereasthe significant increase in drought in other parts of NWIndia might be because of increase in late-season drought.In case of NE region, the occurrence of all types of drought,i.e. early, mid and late, was observed to be increas-ing, whereas it was mid- and late-season drought whichattributed to the increase in drought condition in CentralIndia. No significant trend in the drought occurrence wasregistered in Peninsular India.
4.4. Trends in rainfall and PET
The long-term trends in rainfall and PET anomaly wereestimated using Mann–Kendall and Sen’s method. TheMann–Kendall test provides the direction of the trend,whereas the Sen’s method gives the magnitude of thelong-term change. It was evident from Figure 4(a) thathighly negative rainfall trend (<−2 mm year−1) was appar-ent over western parts of NE India and in parts of Centralas well as NW India, whereas moderately negative trend(−1 to −2 mm year−1) was observed in eastern parts of NEIndia and parts of Central India, along with some isolatedpatches in Peninsular India. Highly positive trends in rain-fall (>2 mm year−1) was mainly concentrated in the westcoast, whereas moderately positive trend (1–2 mm year−1)was found in parts of Peninsular India and NW India.The present findings are in good corroboration with thefindings of Das et al. (2014). Based upon the field sig-nificance test at regional level, the rainfall had decreasedsignificantly in the NW, NE and Central India, whereas inPeninsular India the rainfall had significantly increased.
The magnitude of decrease in rainfall was highest in NEIndia, followed by NW India.
The analysis of long-term PET (Figure 4(b)) showedthat the NW India had significant negative trends in PET.Highly significant negative trend (<−0.2 mm year−1) wasobserved in the western parts of the NW India, sur-rounded by grids with moderately high negative trend (0to −0.2 mm year−1). A continuous patch of negative trendwas also observed in the west coast of Central India andeast coast of Peninsular India. On the contrary, a highly sig-nificant positive trend, i.e. 0.2–0.3 mm year−1, was foundin eastern parts of NE India, western parts of Central Indiaand across the east coast over Central and Peninsular India.Low to moderately positive trend (0–0.2 mm year−1) inPET was observed in major parts of NE India and easternparts of Central India. The results of field significant testover meteorological region depicted that significant neg-ative trend in PET was observed in NW and PeninsularIndia, whereas significant positive trend was found overNE, Central and Peninsular India.
4.5. Probable factors of meteorological drought
The temporal trends in rainfall and PET along with thedrought magnitude were analysed to find out the prob-able cause of significant increasing or decreasing trendsin meteorological drought during monsoon season overthe Indian region. The study revealed that the increase inmeteorological drought over western parts of NE India(Figure 2(b)) was in agreement with the decrease in rain-fall (Figure 4(a)), whereas the increase in drought overeastern parts of NE India (Figure 2(b)) was attributedto both decrease in rainfall (Figure 4(a)) and increasein PET (Figure 4(b)) over the study period. According
© 2015 Royal Meteorological Society Int. J. Climatol. (2015)

TRENDS AND BEHAVIOUR OF METEOROLOGICAL DROUGHT
to the results of field significance test, the significantincrease in meteorological drought in both NE and Cen-tral India was a combined effect of significant decreasein rainfall and increase in PET (Table 1). On the otherhand, the significant decrease in meteorological droughtin the north-western part of NW India and west coast(Figure 2(b)) might be due to both increase in rain-fall (Figure 4(a)) and decrease in PET (Figure 4(b)),whereas the significant reduction of drought magnitude insouth-western parts of NW India (Figure 2(b)) was mainlybecause of significant decrease in PET during the studyperiod. The introduction of major irrigation projects overnorthern as well as western parts of India during the 70scould be the reason for decreasing trend in PET. The greenrevolution over parts of NW India during the 60s mayalso be the reason for decreasing atmospheric demand.In the eastern part of NW India, the reduction in rainfall(Figure 4(a)) might be reason for increased meteorolog-ical drought (Figure 2(b)). The analysis of the field sig-nificant test also supports the fact that in parts of NWIndia the significant increase in drought condition was dueto negative trend of rainfall, whereas in other parts thedecreasing trend of meteorological drought was becauseof reduced PET (Table 1). In the western parts of Peninsu-lar India, the decrease in drought condition (Figure 2(b))was due to significant increase in rainfall (Figure 4(a)),whereas in the southern part the increase in drought wasmainly because of both decrease in rainfall (Figure 4(a))and increase in PET (Figure 4(b)). No impact of increasingPET was observed on magnitude of drought over east coastacross Central and Peninsular India and isolated pockets inwestern parts of Central India.
5. Summary and conclusions
In this study, long-term (1901–2008) monthly griddedSPEI data, over Indian region, during monsoon seasonwere used to estimate the trends of meteorological droughtparameters, i.e. duration, magnitude and time of occur-rence in relation to crop growing period. According tothe trend analysis and field significance test, the droughtcondition was found to be increasing with extended dura-tion and higher intensity in all the four meteorologicalregions, whereas decreasing trends were recorded only inNW India with both reduced drought duration and lowerintensity. It was interesting to note that the trends in mid-and late-season drought over eastern parts of India had agood corroboration with the increasing trend in meteoro-logical drought duration and magnitude, whereas the sig-nificant decrease in drought over western parts of India wasin good agreement with the negative trend of early-seasondrought events. The significant decreasing trends of rain-fall were registered in all the regions except PeninsularIndia, where the rainfall trend was positive. The analy-sis of long-term PET revealed that the trends were sig-nificantly positive in NE, Central and Peninsular India,whereas it was significantly negative in NW and Penin-sular India. In the south-western parts of NW India, thedecreased drought condition was mainly due to reduced
PET, whereas in the eastern part the increased drought con-dition might be because of reduced rainfall. In case of NEand Central India, the significant increase in drought con-dition was attributed to both significant decrease in rainfalland increase in PET. In the western parts of PeninsularIndia, the decrease in drought condition was due to signif-icant increase in rainfall, whereas in the southern part theincrease in drought was mainly because of both decreasein rainfall and increase in PET.
Acknowledgements
Guidance received from Dr Abhishek Chakraborty, NRSCis duly acknowledged. The authors acknowledge the sup-port received from Mrs. Bhavana Sahay, NRSC duringmanuscript preparation. Thanks to the anonymous review-ers and editor for their valuable suggestions. We dulyacknowledged CRU dataset for providing gridded SPEI,rainfall and PET data.
References
Allen RG, Smith M, Pereira LS, Perrier A. 1994. An update for thecalculation of reference evapotranspiration. ICID Bull. 43(2): 35–92.
Anonymous. 2009. Manual for Drought Management. Department ofAgriculture and Cooperation, Ministry of Agriculture, Govt. of India:New Delhi.
Begueria S, Vicente Serrano SM, Martínez MA. 2010. A multi-scalarglobal drought dataset: the SPEIbase: a new gridded product for theanalysis of drought variability and impacts. Bull. Am. Meteorol. Soc.10: 1351–1356.
Bhalme HN, Mooley DA. 1980. Large-scale droughts/floods and mon-soon circulation. Mon. Weather Rev. 108: 1197–1211.
Burton I, Kates RW, White GF. 1978. The Environment as Hazard.Oxford University Press, New York, NY, 240 pp.
Cai W, Cowan T. 2008. Evidence of impacts from rising temperature oninflows to the Murray-Darling basin. Geophys. Res. Lett. 35: L07701,doi: 10.1029/2008GL033390.
Chowdhury A, Dandekar MM, Raut PS. 1989. Variability in droughtincidence over India – a statistical approach. Mausam 40: 207–214.
Dai A. 2011. Drought under global warming: a review. Clim. Change 2:45–65.
Dai A, Trenberth KE, Qian T. 2004. A global dataset of Palmer DroughtSeverity Index for 1870–2002: relationship with soil moisture andeffects of surface warming. J. Hydrometeorol. 5: 1117–1130.
Das PK, Chakraborty A, Seshasai MVR. 2014. Spatial analysis of tem-poral trend of rainfall and rainy days during India summer monsoonseason using daily gridded (0.5∘ × 0.5∘) rainfall data for the period of1971–2005. Meteorol. Appl. 21: 481–493.
Francis PA, Gadgil S. 2010. Towards understanding the unusual Indianmonsoon in 2009. J. Earth Syst. Sci. 119: 397–415.
Gadgil S, Vinayachandran PN, Francis PA. 2003. Droughts of the Indiansummer monsoon: role of clouds over the Indian Ocean. Curr. Sci. 85:1713–1719.
Garnett ER, Khandekar ML. 1992. The impact of large scale atmosphericcirculations and anomalies on Indian monsoon and floods and onworld grain yields – a statistical analysis. Agric. For. Meteorol. 61:113–128.
Gerten D, Rost S, von BW, Lucht W. 2008. Causes of change in 20thcentury global river discharge. Geophys. Res. Lett. 35: L20405.
Guhathakurta P. 2003. Drought in districts of India during the recentall India normal monsoon years and its probability of occurrence.Mausam 54: 542–545.
Guhathakurta P, Rajeevan M, Sikka DR, Tyagi A. 2014. Observedchanges in southwest monsoon rainfall over India during 1901–2011.Int. J. Climatol., doi: 10.1002/joc.4095.
Heim RR. 2002. A review of twentieth century drought indices used inthe United States. Bull. Am. Meteorol. Soc. 83: 1149–1165.
Krishnamurti TN, Bedi HS, Subramaniam M. 1989. The summer mon-soon of 1987. J. Clim. 2: 321–340.
© 2015 Royal Meteorological Society Int. J. Climatol. (2015)

P. K. DAS et al.
Krishnamurti TN, Chakraborty A, Mishra AK. 2010. Desert air incur-sions, an overlooked aspect, for the dry spells of the Indian summermonsoon. J. Atmos. Sci. 67: 3423–3441.
Lorenzo-Lacruz J, Vicente-Serrano SM, López-Moreno JI, Beguería S,García-Ruiz JM, Cuadrat JM. 2010. The impact of droughts and watermanagement on various hydrological systems in the headwaters of theTagus River (central Spain). J. Hydrol. 386: 13–26.
McKee TB, Doesken NJ, Kliest J. 1993. The relationship of droughtfrequency and duration to timescales. In Proceedings of the 8th Con-ference on Applied Climatology, Anaheim, CA, American Meteoro-logical Society, Boston, MA, 17–22 January, 179–184.
Meza FJ. 2013. Recent trends and ENSO influence on droughts in North-ern Chile: an application of the standardized precipitation evapotran-spiration index. Weather Clim. Extremes 1: 51–58.
Mishra AK, Singh VP. 2010. A review of drought concepts. J. Hydrol.391: 202–216.
Neena JM, Suhas E, Goswami BN. 2011. Leading role of internaldynamics in the 2009 Indian summer monsoon drought. J. Geophys.Res. 116(D13): D13103.
Nicholls N. 2004. The changing nature of Australian droughts. Clim.Change 63: 323–326.
Niranjan KK, Rajeevan M, Pai DS, Srivasrava AK, Preethi B. 2013.On the observed variability of monsoon droughts over India. WeatherClim. Extremes 1: 42–50.
Pai DS, LathaSridhar P, Guhathakurta HHR. 2011. District-widedrought climatology of the south west monsoon season over Indiabased on standardized precipitation index (SPI). Nat. Hazards 59:1797–1813.
Palmer WC. 1965. Meteorological Drought. US Department of Com-merce, Weather Bureau: Washington, DC.
Parthasarathy B, Sontakke NA, Monot AA, Kothawale DR. 1987.Droughts/floods in the summer monsoon season over different meteo-rological subdivisions of India for the period 1871–1984. J. Climatol.7(1): 57–70.
Paulo AA, Rosa RD, Pereira LS. 2012. Climate trends and behaviourof drought indices based on precipitation and evapotranspirationin Portugal. Nat. Hazards Earth Syst. Sci. 12: 1481–1491, doi:10.5194/nhess-12-1481-2012.
Potop V. 2013. A multi-scalar character of droughts based on theSPEI in the Republic of Moldova, International Scientific Conference:Environmental Changes and Adaptive Strategies, Skalica, Slovakia,9–11 September 2013.
Potop V, Boroneant C, Možny M, Štepánek P, Skalák P. 2012. Observedevolution of drought episodes assessed with the Standardized Pre-cipitation Evapotranspiration Index (SPEI) over the Czech Repub-lic. European Geosciences Union, General Assembly 2012, Vienna,23–27 April 2012.
Potop V, Boroneant C, Možny M, Štepánek P, Skalák P. 2014. Observedspatiotemporal characteristics of drought on various time scales overthe Czech Republic. Theor. Appl. Climatol. 115: 563–581, doi:10.1007/s00704-013-0908-y.
Rao YP. 1981. Blocking highs over Asia and monsoon droughts overIndia. Nature 289: 271.
Sahai AK, Grimm AM, Satyan V, Pant GB. 2003. Long-lead predictionof Indian summer monsoon rainfall from global SST evolution. Clim.Dyn. 20: 855–863.
Sen PK. 1968. Estimation of regression co-efficients based on Kendall’stau. J. Am. Stat. Assoc. 63: 1379–1389.
Sikka DR. 1999. Monsoon drought in India. Joint COLA/CARE Techni-cal Report No. 2, Center for Ocean–Land–Atmosphere Studies, Cen-tre for the Application of Research on the Environment: Calverton,MD.
Sikka DR. 2003. Evaluation of monitoring and forecasting of summermonsoon over India and a review of monsoon drought of 2002. Proc.Ind. Natl. Acad. Sci. 69A: 479–504.
Sinha Ray KC, Shewale MP. 2001. Probability of occurrence of droughtin various subdivisions of India. Mausam 52: 541–546.
Sivakumar MVK, Wilhite DA, Motha RP, Wood DA. 2011. Agricul-tural drought indices. In Proceedings of WMO/UNISDR Expert GroupMeeting on Agricultural Drought Indices, Murcia, Spain, 2–4 June2010. AGM-11, WMO/TD No. 1572, WAOB-2011. World Meteoro-logical Organization: Geneva, Switzerland, 182 pp.
Spinoni J, Antofie T, Barbosa P, Bihari Z, Lakatos M, Szalai S, Szentim-rey T, Vogt J. 2013. An overview of drought events in the CarpathianRegion in 1961–2010. Adv. Sci. Res. 10: 21–32, doi: 10.5194/asr-10-21-2013.
Ummenhofer CC, D’Arrigo RD, Anchukaitis KJ, Buckley BM, CookER. 2012. Links between Indo-Pacific climate variability and droughtin the Monsoon Asia Drought Atlas. Clim. Dyn. 40: 1–16.
Vicente-Serrano SM, Beguería S, López-Moreno JI, Angulo M, KenawyAE. 2010a. A new global 0.5 gridded dataset (1901–2006) of a multi-scalar drought index: comparison with current drought index datasetsbased on the Palmer Drought Severity Index. J. Hydrometeorol. 11:1033–1043.
Vicente-Serrano SM, Beguería S, López-Moreno JI. 2010b. Amultiscalar drought index sensitive to global warming: the stan-dardized precipitation evapotranspiration index. J. Clim. 23:1696–1718.
Vicente-Serrano SM, López-Moreno JI, Drumond A, Gimeno L, NietoR, Moran-Tejada E, Lorenzo-Lacruz J, Beguería S, Zabalza J. 2011.Effects of warming processes on droughts and water resources in theNW Iberian peninsula (1931–200). Clim. Res. 48: 203–212.
Vicente-Serrano SM, Beguería S, Gimeno L, Eklundh L, Giuliani G,Weston D, Kenawy AE, López-Moreno JI, Nieto R, Ayenew T, KonteD, Ardo J, Pegram GS. 2012. Challenges for drought mitigation inAfrica: the potential use of geospatial data and drought informationsystems. Appl. Geogr. 34: 471–486.
Wilhite DA. 1993. Drought Assessment, Management, and Planning:Theory and Case Studies. Natural Resource Management and PolicySeries, Vol. 2. Kluwer, New York, NY, 293 pp.
Wilhite DA, Glantz MH. 1985. Understanding the drought phenomenon:the role of definitions. Water Int. 10: 111–120.
© 2015 Royal Meteorological Society Int. J. Climatol. (2015)