Trees grow on money: urban tree canopy cover and environmental justice
17
RESEARCH ARTICLE Trees Grow on Money: Urban Tree Canopy Cover and Environmental Justice Kirsten Schwarz 1 *, Michail Fragkias 2 , Christopher G. Boone 3 , Weiqi Zhou 4 , Melissa McHale 5 , J. Morgan Grove 6 , Jarlath O’Neil-Dunne 7 , Joseph P. McFadden 8 , Geoffrey L. Buckley 9 , Dan Childers 3 , Laura Ogden 10 , Stephanie Pincetl 11 , Diane Pataki 12 , Ali Whitmer 13 , Mary L. Cadenasso 14 1 Department of Biology, Northern Kentucky University, Highland Heights, Kentucky, United States of America, 2 Department of Economics, College of Business and Economics (COBE), Boise State University, Boise, Idaho, United States of America, 3 School of Sustainability, Arizona State University, Tempe, Arizona, United States of America, 4 Center for Eco-Environmental Sciences, Chinese Academy of Sciences, Haidian District, Beijing, China, 5 Department of Forestry and Environmental Resources, North Carolina State University, Raleigh, North Carolina, United States of America, 6 USDA Forest Service, Northern Research Station, Baltimore, Maryland, United States of America, 7 University of Vermont, Rubenstein School of Environment and Natural Resources and Spatial Analysis Lab, Burlington, Vermont, United States of America, 8 Department of Geography, University of California Santa Barbara, Santa Barbara, California, United States of America, 9 Department of Geography, Ohio University, Clippinger Laboratories 109, Athens, Ohio, United States of America, 10 Department of Global and Sociocultural Studies, Florida International University, FIU Modesto A. Maidique Campus, Miami, Florida, United States of America, 11 Institute of the Environment and Sustainability, University of California Los Angeles, Los Angeles, California, United States of America, 12 Department of Biology, University of Utah, Salt Lake City, Utah, United States of America, 13 Georgetown University, Washington D.C., United States of America, 14 Department of Plant Sciences, University of California Davis, Davis, California, United States of America * [email protected] Abstract This study examines the distributional equity of urban tree canopy (UTC) cover for Balti- more, MD, Los Angeles, CA, New York, NY, Philadelphia, PA, Raleigh, NC, Sacramento, CA, and Washington, D.C. using high spatial resolution land cover data and census data. Data are analyzed at the Census Block Group levels using Spearman’s correlation, ordinary least squares regression (OLS), and a spatial autoregressive model (SAR). Across all cities there is a strong positive correlation between UTC cover and median household income. Negative correlations between race and UTC cover exist in bivariate models for some cities, but they are generally not observed using multivariate regressions that include additional variables on income, education, and housing age. SAR models result in higher r-square val- ues compared to the OLS models across all cities, suggesting that spatial autocorrelation is an important feature of our data. Similarities among cities can be found based on shared characteristics of climate, race/ethnicity, and size. Our findings suggest that a suite of vari- ables, including income, contribute to the distribution of UTC cover. These findings can help target simultaneous strategies for UTC goals and environmental justice concerns. PLOS ONE | DOI:10.1371/journal.pone.0122051 April 1, 2015 1 / 17 a11111 OPEN ACCESS Citation: Schwarz K, Fragkias M, Boone CG, Zhou W, McHale M, Grove JM, et al. (2015) Trees Grow on Money: Urban Tree Canopy Cover and Environmental Justice. PLoS ONE 10(4): e0122051. doi:10.1371/journal.pone.0122051 Academic Editor: Steven Arthur Loiselle, University of Siena, ITALY Received: July 30, 2014 Accepted: February 7, 2015 Published: April 1, 2015 Copyright: This is an open access article, free of all copyright, and may be freely reproduced, distributed, transmitted, modified, built upon, or otherwise used by anyone for any lawful purpose. The work is made available under the Creative Commons CC0 public domain dedication. Data Availability Statement: Our data are publicly available through figshare: http://dx.doi.org/10.6084/ m9.figshare.1213775. Funding: Funding was provided by the National Center for Ecological Analysis and Synthesis, Project 12575 (http://www.nceas.ucsb.edu/). The funders had no role in study design, data collection and analysis, decision to publish, or preparation of the manuscript. Competing Interests: The authors have declared that no competing interests exist.
Transcript of Trees grow on money: urban tree canopy cover and environmental justice

RESEARCH ARTICLE
Trees Grow on Money Urban Tree CanopyCover and Environmental JusticeKirsten Schwarz1 Michail Fragkias2 Christopher G Boone3 Weiqi Zhou4Melissa McHale5 J Morgan Grove6 Jarlath OrsquoNeil-Dunne7 Joseph P McFadden8Geoffrey L Buckley9 Dan Childers3 Laura Ogden10 Stephanie Pincetl11 Diane Pataki12Ali Whitmer13 Mary L Cadenasso14
1 Department of Biology Northern Kentucky University Highland Heights Kentucky United States ofAmerica 2 Department of Economics College of Business and Economics (COBE) Boise State UniversityBoise Idaho United States of America 3 School of Sustainability Arizona State University Tempe ArizonaUnited States of America 4 Center for Eco-Environmental Sciences Chinese Academy of Sciences HaidianDistrict Beijing China 5 Department of Forestry and Environmental Resources North Carolina StateUniversity Raleigh North Carolina United States of America 6 USDA Forest Service Northern ResearchStation Baltimore Maryland United States of America 7 University of Vermont Rubenstein School ofEnvironment and Natural Resources and Spatial Analysis Lab Burlington Vermont United States ofAmerica 8 Department of Geography University of California Santa Barbara Santa Barbara CaliforniaUnited States of America 9 Department of Geography Ohio University Clippinger Laboratories 109Athens Ohio United States of America 10 Department of Global and Sociocultural Studies FloridaInternational University FIU Modesto A Maidique Campus Miami Florida United States of America11 Institute of the Environment and Sustainability University of California Los Angeles Los AngelesCalifornia United States of America 12 Department of Biology University of Utah Salt Lake City UtahUnited States of America 13 Georgetown University Washington DC United States of America14 Department of Plant Sciences University of California Davis Davis California United States of America
schwarzk1nkuedu
AbstractThis study examines the distributional equity of urban tree canopy (UTC) cover for Balti-
more MD Los Angeles CA New York NY Philadelphia PA Raleigh NC Sacramento
CA andWashington DC using high spatial resolution land cover data and census data
Data are analyzed at the Census Block Group levels using Spearmanrsquos correlation ordinary
least squares regression (OLS) and a spatial autoregressive model (SAR) Across all cities
there is a strong positive correlation between UTC cover and median household income
Negative correlations between race and UTC cover exist in bivariate models for some cities
but they are generally not observed using multivariate regressions that include additional
variables on income education and housing age SAR models result in higher r-square val-
ues compared to the OLS models across all cities suggesting that spatial autocorrelation is
an important feature of our data Similarities among cities can be found based on shared
characteristics of climate raceethnicity and size Our findings suggest that a suite of vari-
ables including income contribute to the distribution of UTC cover These findings can help
target simultaneous strategies for UTC goals and environmental justice concerns
PLOS ONE | DOI101371journalpone0122051 April 1 2015 1 17
a11111
OPEN ACCESS
Citation Schwarz K Fragkias M Boone CG ZhouW McHale M Grove JM et al (2015) Trees Grow onMoney Urban Tree Canopy Cover andEnvironmental Justice PLoS ONE 10(4) e0122051doi101371journalpone0122051
Academic Editor Steven Arthur Loiselle Universityof Siena ITALY
Received July 30 2014
Accepted February 7 2015
Published April 1 2015
Copyright This is an open access article free of allcopyright and may be freely reproduced distributedtransmitted modified built upon or otherwise usedby anyone for any lawful purpose The work is madeavailable under the Creative Commons CC0 publicdomain dedication
Data Availability Statement Our data are publiclyavailable through figshare httpdxdoiorg106084m9figshare1213775
Funding Funding was provided by the NationalCenter for Ecological Analysis and Synthesis Project12575 (httpwwwnceasucsbedu) The funders hadno role in study design data collection and analysisdecision to publish or preparation of the manuscript
Competing Interests The authors have declaredthat no competing interests exist
IntroductionThe environmental justice (EJ) community including activists academics and policy makershas long been concerned with recognized patterns of low-income and minority communitiesdisproportionately burdened by environmental hazards [12] Recently the scope of environ-mental equity has been broadened from a sole focus on burdens to include the distribution ofenvironmental goods or amenities [3] To date studies on the allocation of amenities across ur-banizing landscapes have focused mostly on the placement of parks and open spaces [4ndash7] aswell as vegetation cover [8ndash10] Generally these studies report uneven distribution of environ-mental amenities that disfavor racial and ethnic minority and low income neighborhoods
Environmental justice studies typically focus on single case studies This reflects the grass-roots and local nature of environmental justice struggles that have informed analytical ap-proaches [11] However comparative analyses of multiple cities using the same methodologycan reveal whether there are consistent and significant patterns across cities of different sizesmorphologies biophysical contexts ages of development and histories Although comparativeecological methodologies have been promoted in the field of urban ecology comparative urbanenvironmental justice studies are relatively few [12ndash15] and tend to focus on measuring envi-ronmental burdens rather than benefits [1617] Such analyses on generalizable patterns of envi-ronmental inequity should ideally lead to investigations of processes responsible for commonand differing patterns observed including the role of historic place-specific drivers of urbaniza-tion and environmental change [1118] Before such process-based studies can be undertakenhowever investigators should carefully examine the distributive equity of benefits or burdens
Urban Tree Canopy (UTC) cover is widely regarded as an environmental good or amenityUTC cover as an environmental amenity stems from the direct flow of perceived benefits orecosystem services to people and neighborhoods where UTC cover is found UTC cover hasbeen linked to the provisioning of multiple ecosystem services including regulation of regionalclimate and water cycles [19ndash26] In addition to UTC ldquogreennessrdquo as an indicator of vegeta-tion cover has been associated with reductions in childhood obesity rates [27] Presence of veg-etation can also decrease cognitive fatigue improve worker attitudes on the job and reducestress as well as feelings of anger depression or anxiety [2829] UTC cover has been associatedwith improved aesthetics noise reduction and stronger social cohesion and communityempowerment [1930ndash32] It is important to note however that UTC can also create disame-nities such as increased water demand maintenance costs allergies and perceived safety con-cerns [3334] Some street tree campaigns have been met with resistance from residents whosimply do not want trees in front of their houses The potential costs or burdens of UTC coverdepend on a number of factors including climate vulnerability and price of water supply in achanging climate socio-demographic preferences built environment characteristics and fiscalcapacity to maintain UTC cover [35] While benefits from and support for UTC are not univer-sally positive for the purposes of this analysis we treat UTC as an environmental amenity
Fairness of public investment in the distribution delivery and maintenance of services de-rived from urban tree canopies is a basic environmental justice concern [192730313336]Equity assessments must take into account existing distributions of benefits as they relate to so-cial groups especially ethnicracial minorities and lower-income groups who have been tradi-tionally disadvantaged and marginalized or lack the resources or capacity to overcome ascarcity of environmental benefits [37] These considerations point to the need for UTC assess-ments at a scale smaller than municipal jurisdictions because distributional patterns likely varydepending on the scale of analysis [38] Research must match the scale of analysis to the socialprocesses that drives the distribution of amenities in order to examine patterns at scales mean-ingful to environmental justice inquiries Important social processes may occur at the scale of a
Trees Grow on Money Urban Tree Canopy Cover and Environmental Justice
PLOS ONE | DOI101371journalpone0122051 April 1 2015 2 17
neighborhood a defined territory that reflects and reinforces group belonging In general stud-ies relating UTC cover to demographics and race use census tracts as a proxy for neighbor-hood For this paper we use the census block group (CBG) a subset of the census tract as theunit of analysis We tested for scale differences using the census tract and census block groupas analytical units but did not find meaningful differences between the two
The spatial resolution of biogeophysical datasets similar to census data is predicted to affectUTC assessments a phenomenon that is referred in spatial sciences as the Modifiable ArealUnit Problem [39] Individual trees or lines of street treesmdashboth common in urban areasmdasharenot captured by moderate-resolution imagery [40] Historically moderate-resolution data de-rived from 30 meter resolution Landsat Thematic Mapper imagery has been used to classifytree canopy cover These moderate resolution datasets such as the National Land Cover Data-set (NLCD) [41] have allowed for nation-wide comparisons but their usefulness is limited inurban systems that exhibit fine spatial heterogeneity [42] The advancement of high resolutionimagery and adoption of geographic information systems (GIS) by government entities has re-sulted in an abundance of high resolution geospatial data that can be used to derive very high(lt 1m) spatial resolution vegetation data [43] including individual tree canopies Accurateland cover data from high resolution imagery may help uncover patterns in UTC cover maskedby the NLCD Still even with higher spatial resolution important issues such as tree species ap-propriateness for different climate zones remains difficult to ascertain [44]
High spatial resolution of social and biogeophysical datasets matter little if the appropriatestatistical analyses are not used Some statistical methodologies used in ecology do not accountfor the spatial structure of data For example ordinary least squares (OLS) regression is a com-mon technique to assess relationships between dependent and predictor variables yet it fails toaccount for spatial autocorrelation which may violate the assumption of independence of theerrors in the regression Failure to account for spatial autocorrelation can result in biased re-gression estimates due to a lack of accounting of spatial dependence in variables or it can leadto higher standard errors in the regression estimators affecting statistical inference [45] Alter-natively spatial autoregression (SAR) models account for spatial autocorrelation and thereforecorrect for violations of the assumptions in the classic linear regression models The impor-tance of SAR models has been widely demonstrated in various social and natural science fieldsand at their intersection [4647]
In this study we examine potential inequities associated with the distribution of urban treecover in relationship to raceethnicity and income in seven cities across the US BaltimoreMD Los Angeles CA New York NY Philadelphia PA Raleigh NC Sacramento CA andWashington DC This work is the product of a NCEAS (National Center for Ecological Analy-sis and Synthesis) working group on the urban ecology of environmental justice NCEAS work-ing groups focus on discovering novel patterns in existing datasets rather than creation of newdatasets The NCEAS participants chose these cities based on their expert knowledge and avail-ability of high spatial resolution UTC cover We hypothesized that urban tree cover would bepositively correlated with increasing income and negatively correlated with minority popula-tions in all cities In particular we anticipated that bivariate analyses would indicate a statisti-cally significant and strong negative relationship between tree cover and minority populationsbut the use of multivariate regressions incorporating control variables such as population den-sity housing age education and income would change that relationship As all of our resultscan also be influenced by moderate and fine resolution biogeophysical and social data we ana-lyzed these relationships using high resolution land cover classifications (1 m) as well as censustracts and census block groups We hypothesized higher spatial resolution data would indicatestronger relationships among tree cover income and raceethnicity due to increased accuracyin describing the heterogeneity of urban systems Many studies have examined the
Trees Grow on Money Urban Tree Canopy Cover and Environmental Justice
PLOS ONE | DOI101371journalpone0122051 April 1 2015 3 17
relationships associated with UTC and demographics using ordinary least squares regression(OLS) but because these variables are not randomly distributed across the landscape we hy-pothesized that spatial autoregression (SAR) would provide more robust results
Materials and Methods
City Site DescriptionsThe seven case study cities vary in social (Table 1) and biogeophysical (Table 2) characteristicsAlthough high spatial resolution remotely sensed imagery is now freely available nationwidethrough the National Agriculture Imagery Program (NAIP) land cover classifications for citiesusing this imagery are still rare because they are expensive and time consuming to completeThe seven cities in our study were not randomly selected but based on the pooling of data fromthe NCEAS working group Even though the cities are not stratified by social or biogeophysicalcharacteristics there are important differences among cities Average annual temperatures fallwithin a band of 126 to 19degC (Table 2) and Los Angeles and Sacramento experience highermean temperatures and receive less rainfall compared to the other cities The arid cities of LosAngeles and Sacramento also have longer growing seasons and were not forested historicallyIn these regions trees grew in and around riparian corridors along with oak forests in the sur-rounding foothills For these California cities water is a more important limiting factor toplant growth than the length of the growing season In addition with a predicted drying cli-mate Sacramento and Los Angeles are expected to experience declines in water supply Al-though the East Coast cities (Baltimore Raleigh Philadelphia New York City andWashington DC) have longer winters and more freeze days annually growing season in-creases slightly at the more southern locations permitting higher growth rates and faster re-growth after removal of UTC Existing UTC cover varies considerably across the case studycities with the highest mean tree canopy percentage by CBG in Raleigh NC (55) and thelowest in Philadelphia PA (13) (Table 2)
The cities represent a range of sizes from New York City and Los Angeles (population8008278 and 3694820 in 2000) to much smaller cities such as Raleigh North Carolina (popu-lation of 276093 in 2000) (Table 1) The racial and ethnic makeup of the cities varies (Table 1)Over 88 of the population in Baltimore Philadelphia Raleigh and Washington DC self-identify as either Black or White and not Hispanic In contrast Los Angeles Sacramento andNew York City are more racially and ethnically diverse Differences in median household in-come range from $30078 in Baltimore to $46612 in Raleigh Populations vary in educational
Table 1 Site DescriptionsmdashSocial variables for the seven study cities
Population(2000)
PercentAsian (2000)
PercentBlack (2000)
PercentWhite (2000)
PercentHispanic (2000)
MedianIncome (1999)
No HSDiploma ()
BA Degree orHigher ()
Baltimore MD 651154 15 643 316 17 30078 316 191
Los Angeles CA 3694820 100 112 469 465 36687 334 255
New York NY 8008278 98 266 447 270 38293 277 274
Philadelphia PA 1517550 45 432 450 85 30746 288 178
Raleigh NC 276093 34 278 633 70 46612 115 448
Sacramento CA 407018 166 155 483 216 37049 227 239
Washington DC 572059 27 600 308 79 40127 222 391
Please note that not all race categories are included and that respondents can select more than one race for the 2000 Census Race and Hispanic origin
are considered separate Median income refers to household income
doi101371journalpone0122051t001
Trees Grow on Money Urban Tree Canopy Cover and Environmental Justice
PLOS ONE | DOI101371journalpone0122051 April 1 2015 4 17
attainment (Table 1) For example 334 of residents in the city of Los Angeles do not have ahigh school diploma while only 115 do not in Raleigh Raleigh has the highest percentage(448) of residents with a Bachelorrsquos degree or higher compared to Philadelphia which hasthe lowest percentage of residents with a Bachelorrsquos degree or higher (178)
Social DataGIS data layers of census block groups (CBG) for the seven cities were derived from the 2000US Census TIGER (Topographically Integrated Geographic Encoding and Referencing System)dataset Only census block groups that were completely within the boundary of the cities wereused in this study (census boundaries do not always align with municipal boundaries) Thesame boundary data layers were used as the common boundary for all geospatial operationsThe number of block groups included in the analyses for each city are listed in Table 3 The so-cial variables used in this study were calculated at the CBG level using data from the 2000 USCensus Social variables include indicators of race ethnicity income and educational attain-ment For race variables we used percent White Black and Asian and for ethnicity percentHispanic For income we used median household income For educational attainment (age 25+) we used percent with no high school diploma and percent with a bachelorrsquos degree or higherPercent of houses occupied by renters median housing age the percent of the CBG classified asresidential and population density were also included in the analyses Because our study focuseson environmental justice we highlight results for race ethnicity and income the remaining var-iables act as controls in our regression analysis and are typical in empirical environmental jus-tice research In addition the variables may further explain UTC cover density and distribution
Biogeophysical DatamdashHigh Resolution Tree CanopyThe percent of tree canopy cover for each CBG was calculated based on tree canopy data de-rived from high spatial resolution imagery The imagery used included 06 m resolution pan-sharpened QuickBird satellite imagery 1 m resolution NAIP (National Agriculture ImageryProgram) near-infrared aerial imagery and 015 m resolution natural color aerial imageryLiDAR (light detection and ranging) data with 05 m or 1 m resolution were also used to aid inclassification Object-based classification approaches were used for tree canopy classificationfor all cities except Los Angeles where a pixel-based approach was used Overall accuracy for
Table 2 Site DescriptionsmdashBiogeophysical variables for the seven study cities
Mean TreeCanopy byCBG
MeanAnnualPrecip
Mean AnnualTemp (degC)
CoolingDegree Days
HeatingDegreeDays
Median SpringFreeze Day(-22degC)
Median FallFreeze Day(-22degC)
GrowingSeasonDays
Baltimore MD 2234 4194 126 4720 1147 330 1110 226
Los Angeles CA 1761 1514 19 1506 928 000 000 365
New York NY 1635 4969 126 4754 1151 325 1128 249
Philadelphia PA 1265 4205 129 4759 1235 326 1119 239
Raleigh NC 5464 4649 153 3431 1456 315 1122 253
Sacramento CA 2366 1793 162 2666 1248 17 1224 352
Washington DC 2752 4194 126 4720 1147 330 1110 226
Population and demographics from American FactFinder (factfindercensusgov) Climate data from NOAA 1980ndash2010 Climate Normals httpcdoncdc
noaagovcgi-binclimatenormalsclimatenormalspl httpwwwncdcnoaagovoaclimatenormalsusnormalshtml
Calculated as the number of days in between the median freeze days in fall and spring for each location
doi101371journalpone0122051t002
Trees Grow on Money Urban Tree Canopy Cover and Environmental Justice
PLOS ONE | DOI101371journalpone0122051 April 1 2015 5 17
the New York City classification was 96 Sacramento was 92 Philadelphia was 95 andBaltimore was 94 The accuracy of the Los Angeles tree cover classification was assessedusing a stratified random sample of 100 parcels across the city with an overall classification ac-curacy of 886 based on pixel-by-pixel comparison [48] Although overall accuracy was notcalculated for the remaining cities similar data and procedures were used and we assume highaccuracy for those classifications as well
Statistical AnalysesBivariate and multivariate techniques were used in the analyses Spearmanrsquos correlation ordi-nary least squares (OLS) regressions and spatial autoregressive (SAR) techniques were used toinvestigate the relationship between key environmental justice variables (race ethnicity andincome) and UTC cover The CBG served as the unit of analysis The percent of UTC coverwas used as the response variable in subsequent statistical analyses
Bivariate analysis and correlations between major variables has been a primary analyticaltool in EJ studies It is used to establish a baseline incidence of disparities in the distribution ofenvironmental bads (or goods) and particular race income and demographic characteristicsIn our analysis we use the Spearman correlation measure as a simple indicator of associationbetween two variables (eg high values in one matching high values in another) We employthis type of analysis in our paper in order to formulate a baseline ldquopicturerdquo that is comparableacross all cities in our analysis
We next employ OLS in order to correct some of the obvious disadvantages that emergefrom bivariate analysis Regression allows us to examine the effect of a change in one variableon the value of another variable controlling for other factors in the system under study Empir-ically the correlation coefficient between two variables can be different from a multiple regres-sion coefficient when one of the variables is the dependent variable and the other theindependent variable There is a theoretical possibility that a correlation coefficient betweentwo variables is the same with the one you would get in regression analysis but that happensonly in the case of simple regression (one dependent and one independent variable) and only ifthe standard deviations of the two variables coincide In multiple regression the researchercaptures the effects of other covariates (beyond the two that are included in the bivariate analy-sis) with the result of different correlation and regression coefficients Thus results from bivari-ate and multivariate (regression) analysis are expected to be different and not directlycomparable Moving away from simple co-variation the latter is a methodology that tries toget closer to causation (but still is not causation)
Table 3 Spearmanrsquos Correlation Results
Baltimore Los Angeles New York Philadelphia Raleigh Sacramento Washington DC
CBG Tract CBG Tract CBG Tract CBG Tract CBG Tract CBG Tract CBG Tract
Percent Asian -001 -009 021 017 003 -002 003 005 006 009 -021 -035 011 006
Percent Black -04 004 -032 -033 002 004 009 008 -018 -035 -039 -057 -019 -002
Percent Hispanic -000 -009 -042 -048 -026 -025 -012 -016 -014 -017 -023 -027 -006 -008
Income 036 038 065 067 028 023 031 045 035 038 036 031 046 032
n 710 200 2449 839 5732 2216 1816 381 123 60 289 85 433 188
Note
p lt 01
p lt 05
doi101371journalpone0122051t003
Trees Grow on Money Urban Tree Canopy Cover and Environmental Justice
PLOS ONE | DOI101371journalpone0122051 April 1 2015 6 17
The OLS method assumes that the error terms are independent From a spatially-explicitperspective this is an unrealistic assumption since according to Toblerrsquos Law [49] ldquoeverythingis related to everything else but near things are more related than distant thingsrdquoMany studiesemploying spatial data are typically hindered by the problem of spatial autocorrelation whichbiases coefficient estimates of the variables employed in OLS regressionsmdashtypically describedas providing best linear unbiased estimators [45]
Identification of spatial autocorrelation patterns requires the use of spatial autoregressionmodeling and the comparison of the results from the two regression approaches Anselin [45]classifies spatial econometric models in two broad categories models of spatial dependence(capturing auto-correlative effects of distance in spatial processes) and spatial heterogeneity(capturing the lack of stability or relationships across space) Spatial autoregression methodsbring the spatial interrelationship structure of the units of analysis into the standard multipleregression in order to correct for problems of spatial autocorrelation They quantify the spatialrelationship of a (dependent) variable by a ntimesn matrix of spatial weights with each element ofthe matrix representing the strength of the interaction of two locations based on a proximitymeasure such as contiguity or distance Spatial regression models have become increasinglypopular in a variety of fields such as geography economics and political science [50] demog-raphy [51] ecology [52] and other fields that rely on spatially explicit data
There are two spatial autoregressive techniques that have foundations in theoretical andpractical considerations the spatial lag (SLAG) model and spatial error (SEM) model [45] TheSLAG assumes that the imposed spatial structure affects the dependent variable introducing aspatially lagged dependent variable Typical theoretical explanations of the importance of theSLAG include issues of externalities and spill-over effects In our study socioeconomic condi-tions local climatology and ecological processes could account for such effects A first ordermixed regressive-spatial autoregressive SLAG model takes the matrix algebra model form of
y frac14 rWy thorn Xbthorn eth1THORN
whereWy is a ntimes1 vector of the spatially lagged response variable ρ is the spatial autoregressivecoefficient X is a ntimesk vector of explanatory variables β is the ktimes1 vector of regression coeffi-cients and is a ntimes1 vector of independently and identically distributed (iid) errors
The SEMmodel incorporates the spatial effects into the error terms capturing the spatialstructure of unobserved variation eg from missing variables that are spatially autocorrelatedThis model is essentially capturing a spatial form of the problem of heteroscedasticity TheSEMmodel takes the mixed regressivemdashautoregressive form of
y frac14 Xbthorn ethI lWTHORN1 eth2THORN
where λ is the spatial autoregressive coefficient W is the ntimesn spatial weight matrix I is the ntimesnidentity matrix and ε is a ntimes1 vector of iid errors This paper reports the first type of spatialmodelling (spatial dependence) using spatial autoregression methods
We use a queen contiguity-based spatial weight matrixW (in the order of one) for all citiesin our study This approach in creating spatial weight matrices imposes a spatial structure inthe units of observation that takes into account the topology of shared borders or vertices ofthe irregular polygon data All regression models and spatial statistics used for measuring spa-tial autocorrelation are estimated using maximum likelihood estimation and are run on GeoDa095-i software platform [53]
The spatial models are compared through the Akaike Information Criterion (AIC) and log-likelihood statistic [45] A higher value of log-likelihood and a lower value of AIC point to a
Trees Grow on Money Urban Tree Canopy Cover and Environmental Justice
PLOS ONE | DOI101371journalpone0122051 April 1 2015 7 17
model with a better fit Only the model with the best fit (using spatial lag or spatial error) is re-ported in the results The model with the best fit is indicated in table 4
Results
Bivariate AnalysisIn some cities the bivariate analyses reveal negative and significant relationships among raceethnicity and UTC cover However the signs of the estimated coefficients are not consistentacross all cities Specifically the relationship between UTC cover and percent Asian is positiveand significant for Los Angeles and negative and significant for Sacramento (Table 3) The rela-tionship between UTC cover and percent Black is negative and significant for Los Angeles Ra-leigh Sacramento and Washington DC (Table 3 Figs 1 and 2) The relationship betweenUTC cover and percent Hispanic is negative and significant for Los Angeles New York CityPhiladelphia and Sacramento (Table 3) Consistent across all cities is a positive and significantrelationship between UTC cover and median household income (Table 3)
Multivariate AnalysesIn general the multivariate regressions reveal that with the addition of other control variablesthe relationships between race or ethnicity and UTC are not as strong likely due to collineari-ty among the variables included in the regression Negative and statistically significant associ-ations between percent Asian and UTC cover are observed in Los Angeles and New York Cityalthough the regression coefficients are very small (Table 4) In Baltimore Philadelphia andNew York City there is a significant and positive association between percent Black and UTCcover but regression coefficients are very small (Table 4) Relationships between percentBlack and UTC are significant and weakly positive in Raleigh and negative in Los Angeles butonly using OLS models they are not significant using SAR models Finally there is a signifi-cant and positive association between percent Hispanic and UTC cover in Los Angeles (OLS)Philadelphia (OLS amp SAR) and Washington DC (OLS) although the regression coefficientsare very small (Table 4)
Income which was positively correlated with UTC and highly significant across all cities inthe bivariate analyses shows positive and statistically significant in most cities for the multi-variate regressions but the magnitude of the coefficients is not large (Table 4) We estimatethat an increase of median household income by $1000 (in 2000 dollars) brings about a rangeof 005ndash020 point increase in the percent of UTC for the majority of our cities Philadelphiaand Washington DC present the highest positive income coefficients New York and Raleighare the only two cities with a negative effect of income the magnitude of that effect is veryclose to zero for New Yorkmdasheven if statistically significantmdashwhile it is more substantial in thecase of Raleigh
We also examine the effects of income through the use of SAR models The SAR modelsthat account for the spatial structure of the data consistently provide more robust results com-pared to the OLS models as evidenced by higher r-square values across all cities (Table 4)Overall while the SAR models do not substantially alter our findings about the signs of incomecoefficients differences occur in terms of magnitude and statistical significance In the case ofLos Angeles the statistical significance of the estimated positive income coefficient is reducedThe SAR models also reduce the size of the positive income coefficient for Philadelphia andWashington DC In the case of Raleigh the difference between the estimated income coeffi-cients for OLS models and the SAR models are minimal Our findings suggest collectively thatin addition to our variables exhibiting collinearity they are also spatially clustered
Trees Grow on Money Urban Tree Canopy Cover and Environmental Justice
PLOS ONE | DOI101371journalpone0122051 April 1 2015 8 17
Tab
le4
OrdinaryLea
stSquare(O
LS)an
dSpatialA
utoregress
ive(SAR)Res
ults
Baltim
ore
LosAngeles
New
York
Phila
delphia
Raleigh
Sac
ramen
toWas
hingtonDC
OLS
SAR(SLAG)OLS
SAR(SEM)OLS
SAR(SEM)OLS
SAR(SLAG)OLS
SAR(SEM)OLS
SAR(SEM)OLS
SAR(SLAG)
Perce
ntAsian
-010
-017
-003
-003
-005
-008
-000
-001
-003
-004
-012
001
010
008
Perce
ntBlack
007
002
-010
-001
001
002
005
003
013
011
-011
-002
004
005
Perce
ntHispa
nic
-010
003
003
-000
-000
-004
004
003
012
011
003
003
024
009
Inco
me(in
thou
sand
s)009
005
007
007
-005
-004
017
009
-018
-017
003
010
020
010
Rsq
uared
056
075
054
082
018
042
040
060
055
056
056
079
046
070
n71
071
024
4924
4957
3257
3218
1618
1612
312
328
928
943
343
3
Note
Res
ults
aresh
ownforCen
susBlock
Group
plt0
1
plt0
5
doi101371journalpone0122051t004
Trees Grow on Money Urban Tree Canopy Cover and Environmental Justice
PLOS ONE | DOI101371journalpone0122051 April 1 2015 9 17
DiscussionCorrelations between the distribution of benefits and socio-economic variables can vary acrosscities Baltimore is not the same as Philadelphia but the cities may share policies and regula-tions that have the potential to create environmental injustice However factors such as cli-mate demographics and city size may filter the outcome that shared processes have on thedistribution of environmental amenities and burdens Demographics or more specifically ra-cial and ethnic diversity differs among the represented cities and may represent an alternativeexplanation to climate Along with an arid climate Sacramento and Los Angeles have greaterracial and ethnic diversity compared to the other cities with a larger portion of the populationself-identifying as Asian or Hispanic The only city in the Northeast with comparable racialand ethnic diversity is New York City which demonstrates negative correlations between UTCcover and ethnicity but not race We have approached our analyses using various statistical
Fig 1 A spatially-explicit map depicting the percent of the population that self-identifies as black (leftpanel) and the percent of UTC cover for Sacramento City CA (right panel)
doi101371journalpone0122051g001
Fig 2 A spatially-explicit map depicting the percent of the population that self-identifies as black (leftpanel) and the percent of UTC cover for Baltimore MD (right panel)
doi101371journalpone0122051g002
Trees Grow on Money Urban Tree Canopy Cover and Environmental Justice
PLOS ONE | DOI101371journalpone0122051 April 1 2015 10 17
methods each one revealing something new about our data The most significant finding fromeach method is listed in Table 5
Cities are patchy landscapes and this unevenness can lead to inequitable distribution of en-vironmental benefits and burdens [5455] We expected all of the seven cities to show thatneighborhoods with lower-income less education and high percentages of people of colorwould have low UTC cover Overall our results confirm that UTC cover is related to socialcharacteristics of neighborhoods but not consistently across cities that vary in climate size andracial and ethnic composition We also found that the ability to detect patterns in the data is af-fected by statistical method (OLS vs SAR) Accounting for spatial autocorrelation producesmore robust models and in certain cases corrects the aspatial specification bias of regular OLSestimation (Table 4)
The most striking pattern in the data comes from the bivariate analyses which reveal astrong positive relationship between UTC cover and income across all cities Our multivariateregression analysis controlling for other factors reveals a positive relationship between UTCcover and income for most cities in our study (with the exception of New York and Raleigh)As our methodology section explains it is theoretically possible to have two variables with pos-itive correlations through bivariate analysis that become negatively related in a multiple regres-sion context controlling for other variables adjusts for the potential bias in the coefficient ofthe income variable with the resulting sign reversal in the case of two cities in our study Therelationship between UTC cover and income may be the result of a feedback loop where highamounts of UTC cover increase property values and further attract households with high in-comes This positive feedback loop may support the continued maintenance of UTC cover inneighborhoods with high-income households and high levels of homeownership Similarlyareas with low UTC cover have low property values and residents may have less access to re-sources or incentive to increase property values because they are renters or on fixed incomesResidents in low income neighborhoods might reasonably resist increases in UTC cover toavoid gentrification and rising rents [56] The cost of tree maintenance such as leaf clean-upwatering and pruning is another disincentive that can be particularly acute in low-incomeneighborhoods [33]
Table 5 Statistical Methods Used
Question Statistical Method Finding Implication
Is UTC coverdistributed equallyin the citiesexamined
SpearmanrsquosCorrelation
Positive correlation withincome across all citiesStrongest correlations amongUTC and race occur in aridcities
Regardless of what drives thepattern the pattern existsmdashUTC cover is not equallydistributed in regards toincome and in some casesrace
What othervariables drive thedistribution of UTCcover
Ordinary LeastSquaresRegression
There are no strongconsistent drivers across allcities
This is likely due tocollinearity among thevariables included in theregression providing lessexplanatory power
Do the data havesignificant spatialstructure
SpatialAutoregressiveModel
SAR models result in a betterfit evidenced by higher r-square values
This suggests that in additionto our variables exhibitingcollinearity they are alsospatially clusteredAccounting for the spatialstructure improves fit
doi101371journalpone0122051t005
Trees Grow on Money Urban Tree Canopy Cover and Environmental Justice
PLOS ONE | DOI101371journalpone0122051 April 1 2015 11 17
Income is so strongly associated with UTC cover that it must be controlled for in the analy-ses in order to detect additional drivers Raceethnicity was not consistently a significant factorin the bivariate analyses (Table 3) and few factors in addition to income were significant in themultivariate analyses (Table 4) However in the bivariate analyses of our California cities wedid see evidence of a link between raceethnicity and UTC (Table 3) For Sacramento and LosAngeles percent black and percent Hispanic are strongly and negatively correlated with UTCcover but the relationships are weak or insignificant for the other cities A distinguishing char-acteristic of the California cities is their arid climate Trees planted in more arid climates re-quire irrigation in order to survive while in temperate regions of the United States trees cangrow without water subsidies on unmanaged lands Given the high water resource require-ments in arid cities the dominant role of income in driving UTC cover likely creates a greaterpotential for environmental injustice in cities receiving little precipitation Natural growth andregeneration of trees in cities with greater precipitation could dampen any effects of differentlevels of resources allocated towards growing and maintaining UTC cover
In arid climates trees place a direct demand on limited resources such as water and an in-direct demand on additional resources such as energy used to transport that water makingtrees more costly from an environmental social and economic perspective In arid climatestreeless areas may represent less investment in UTC cover andor management while in tem-perate areas treeless areas may not be a reliable indicator of low investment In contrast tree-less areas may represent areas of greater economic andor community investment such as thecosts of maintaining grassy areas Nevertheless the results of this study cannot be interpretedwithout consideration of some important caveats which we outline below
Other variables may be better predictors of tree canopy coverThis study was framed by environmental justice which focuses on race and ethnicity as well asother social status characteristics (eg income education homeownership) as the variables ofconcern While the models included population density and housing density as proxies forbuilding density other variables such as urban morphology [57] impervious surface landrents past tree canopy cover water budgets tree planting policies and dominant tree speciesmight generate more robust models
Examining patterns between race and amenities does not capture intentIdentifying patterns of inequity are important and bring attention to the inequitable distribu-tion of environmental goods or bads but it is equally important to understand the processesdriving the inequitable distribution Consideration of both distributional and procedural equitycan help explain why the expected patterns predicted by environmental justice theory are notalways present [155859] For instance the high amount of green vegetation in predominantlyAfrican American neighborhoods in Baltimore may be reflective of the increased number ofvacant lots in those neighborhoods which resulted in part from decades of deliberate disinvest-ment and discrimination [660]
Vegetation structure and social structure may be mismatchedOur study is a comparison of current vegetation structure and how it relates to current socialstructure However trees are long-lived organisms that can take a very long time to establishand grow In contrast the social structure of cities can change more rapidly Recent studieshave highlighted this phenomenon describing the current landscapes we observe as legacies ofpast consumption patterns [11] Specifically Boone et al [11] found that vegetation operatingat short time scales (ie lawns) reflect current lifestyle characteristics while vegetation that
Trees Grow on Money Urban Tree Canopy Cover and Environmental Justice
PLOS ONE | DOI101371journalpone0122051 April 1 2015 12 17
takes longer to establish (ie trees) are reflections of the characteristics of past residents Re-search that does not include a historical analysis is still valuable as it represents current patternsand potential inequities associated with environmental amenities but it is also important tokeep in mind that present day patterns could be the result of inherited landscapes This may beespecially true for systems where trees are not part of the native landscape and are typicallyplanted at the time of development A more complete picture of the correlations between treecanopy cover and social characteristics could be obtained from analyzing multiple time periodsthat correspond to the life expectancy of dominant species of trees in the study area Howeverincorporating the importance of legacies and inherited landscapes into studies such as these re-quires multiple and compatible datasets
Tree cover canopy is treated as homogeneous across the unit ofanalysisIn reality tree canopy cover may be clustered with some residents in census block groupsexperiencing greater coverage and others experiencing less In addition our analysis does notdistinguish between tree canopy cover on public versus private lands or residential versus non-residential lands This may be important as management regimes likely differ on public versusprivate and residential versus non-residential lands [43] This distinction may also speak to thetotal plantable surfaces that are available for increasing UTC cover In addition by not distin-guishing between residential and non-residential we may be inflating or decreasing tree canopycover For a CBG that contains a small residential area and a large park the sum of all the treeswithin the tract will be correlated with the social characteristics that correspond to only the res-idential area of the CBG
Trees are not always an environmental amenityWhile trees are generally accepted as an environmental amenity evidenced by the many publicand private investments supporting increased tree canopy cover trees are sometimes consid-ered a disamenity especially in places of disinvestment [9] Trees may place a direct demandon limited resources such as water and an indirect demand on additional resources such asenergy used to transport water In addition there is the perception that increased vegetation fa-cilitates crime [3661] although recent research in Baltimore has shown a decrease in crimewith increasing UTC cover [62] Residents may also incur maintenance costs [36] Trees canalso be a source of allergens and pollution precursors (VOCs) While some of the benefits at-tributed to increased tree canopy cover are well supported in the scientific literature otherssuch as the removal of atmospheric pollutants are more tenuous [34] For many of the pur-ported ecosystem services attributed to increased tree cover the data simply do not exist inorder to adequately evaluate and quantify the service provided [34] More research is needed inorder to accurately evaluate the ecosystem services provided by increased tree canopy coverand evaluate the tradeoffs
ConclusionMoney may not grow on trees but this study suggests that in a way trees grow on money Ourfindings show that high-income neighborhoods in our selected cities are more likely than low-income neighborhoods to have high tree canopy cover We did not find however the expectedpattern of low tree canopy cover in neighborhoods with a high percentage of racial and ethnicminorities for all cities only in the California cities of Sacramento and Los Angeles did we seesuch a result Since these cities depend on irrigation to maintain tree canopy cover this distin-guishing factor of aridity may amplify socioeconomic differences in neighborhood tree cover
Trees Grow on Money Urban Tree Canopy Cover and Environmental Justice
PLOS ONE | DOI101371journalpone0122051 April 1 2015 13 17
more than in the humid temperate cities we analyzed In-depth analyses of the costs and bene-fits of maintaining tree cover in arid and humid environments along with qualitative analysesof residential land management practices could provide some explanation for these differences
Increasing UTC has become a widespread goal often incorporated into municipal sustain-ability plans It has been proposed as a way to mitigate impacts from human-dominated sys-tems on the immediate (eg shade and cooling) and global (eg carbon capture) environmentSacramento Tree Foundation has pledged to plant five million trees by the year 2025 an effortthat would double the regionrsquos tree canopy cover Philadelphia has established a goal of increas-ing tree canopy cover to 30 by the year 2025 (wwwphilagovgreentrees) New York CityBaltimore and Los Angeles have also announced extensive tree planting initiatives (wwwmilliontreesnycorg wwwbaltimorecitygov wwwmilliontreeslaorg) In addition to regionalefforts there are national and global efforts to bring more awareness to the benefits of UTCcover (Urban Environmental Accord 2005 wwwsfenvironmentorgdownloadslibraryaccordspdf httpwwwplant-for-the-planet-billiontreecampaignorgPartnersVariousPartnersTreePlantingaspx) One of the implications of embedding tree canopy goalsin sustainability plans is that environmental justice is frequently included as an objective of theplans and sometimes explicitly linked to UTC For example Philadelphiarsquos 2009 GreenWorksPlan includes goals of increasing tree canopy cover in all neighborhoods highlighting the desirefor the equitable distribution of UTC cover (wwwphilagovgreengreenworks2009-greenworks-reporthtml)
If the equity dimensions of sustainability are put into practice UTC goals can help to re-dress environmental injustices However it is important to note that tree planting schemes arenot a panacea for environmental justice Often overlooked is that the presence of trees can gen-erate disservices and in some cases costs may exceed local benefits or local desire and capacityto care for trees and other green infrastructure [333463] Benefits from tree canopy covermust therefore be assessed in spatially explicit ways since in some circumstances tree coverwill provide strong positive services while in others tree cover may provide negligible benefitsor disservices
The association between income and tree canopy cover has important implications forurban sustainability plans many of which include increased UTC cover as a goal If UTC andincome are positively reinforced (through property values investments or other mechanisms)any public or private interventions to increase tree canopies might first consider the needs oflow income communities provided that the economic and ecological benefits do not outweighthe costs and that the initiatives are supported by local residents In addition to consideringdistributional equity urban sustainability goals need to be supported by stronger science onperceived ecosystem services provided by UTC cover so that justice can be considered in termsof the distribution of ecosystem services not just the equitable distribution of trees
Supporting InformationS1 Table Full Model Results The full model results of the OLS and spatial regressions at theCBG level omitting the intercept Median household income is reported in dollars(DOCX)
Author ContributionsConceived and designed the experiments KS MF CGBWZMRM JMG JOD JPM GLB DC LOSP DP AWMLC Analyzed the data KS MF CGBWZ JOD Wrote the paper KS MF CGBWZMRM JMG JPMMLC
Trees Grow on Money Urban Tree Canopy Cover and Environmental Justice
PLOS ONE | DOI101371journalpone0122051 April 1 2015 14 17
References1 Bullard RD Dumping in Dixie Race Class and Environmental Quality Boulder CO Westview
Press 2000
2 Adamson J Evans MM Stein R The Environmental Justice Reader Politics Poetics and PedagogyTucson AZ University of Arizona Press 2002
3 Boone CG Environmental justice as process and new avenues for research Environ Justice 2008 1149ndash154
4 Low S Taplin D Scheld S Rethinking Urban Parks Public Spaces and Cultural Diversity Austin TXUniversity of Texas Press 2005
5 Wolch JR Wilson JP Fehrenbach J Parks and park funding in Los Angeles an equity-mapping analy-sis Urban Geogr 2005 26 4ndash35
6 Boone CG Buckley GL Grove JM Sister C Parks and people an environmental justice inquiry in Balti-more Maryland Ann Assoc AmGeogr 2009 99 767ndash787
7 Cutts BB Darby KJ Boone CG Brewis A City structure obesity and environmental justice an inte-grated analysis of physical and social barriers to walkable streets and park access Soc Sci Med 200969 1314ndash1322 101016jsocscimed200908020 PMID 19751959
8 Pedlowski MA Da Silva VAC Adell JJC Heynen NC Urban forest and environmental inequality inCampos dos Goytacazes Rio de Janeiro Brazil Urban Ecosyst 2002 6 9ndash20
9 Heynen NC Perkins HA Roy P The political ecology of uneven urban green space Urban Aff Rev2006 42 3ndash25
10 Landry SM Chakraborty J Street trees and equity evaluating the spatial distribution of an urban ame-nity Environ Plan A 2009 41 2651ndash2670 doi101068a41236
11 Boone CG Cadenasso ML Grove JM Schwarz K Buckley GL Landscape vegetation characteristicsand group identity in an urban and suburban watershed why the 60s matter Urban Ecosyst 2010 13255ndash271
12 Downey L Environmental racial inequality in Detroit Soc Forces 2006 85 771ndash796 PMID 21874071
13 Mohai P Saha R Racial inequality in the distribution of hazardous waste a national level assessmentSoc Probl 2007 54 343ndash370
14 Su JG Larson T Gould T Cohen M Buzzelli M Transboundary air pollution and environmental justiceVancouver and Seattle compared GeoJournal 2010 75 595ndash608
15 Downey L USmetropolitan-area variation in environmental inequality outcomes Urban Stud 200744 953ndash977 PMID 21909171
16 Tooke TR Klinkenber B Coops NC A geographical approach to identifying vegetation-related environ-mental equity in Canadian cities Environ Plan B Plan Des 2010 37 1040ndash1056
17 Clark LP Millet DB Marshall JD National patterns in environmental injustice and inequality outdoorNO2 air pollution in the United States PLoS One 2014 9 e94431 101371journalpone0094431PMID 24736569
18 Saha R Mohai P Historical context and hazardous waste facility siting understanding temporal pat-terns in Michigan Soc Probl 2005 52 618ndash648
19 Dwyer JF McPherson GE Schroeder HW Rowntree RA Assessing the benefits and costs of theurban forest J Arboric 1992 18 227ndash234
20 McPherson GE Rowntree RA Energy conservation potential of urban tree planting J Arboric 199319 321ndash331
21 McPherson GE Net benefits of healthy and productive urban forests In Bradley GA editor Urban For-est Landscapes Integrating Multidisciplinary Perspectives Seattle WA University of WashingtonPress 1995 pp 180ndash194
22 McPherson GE Urban forest landscapes how greenery saves greenbacks In Wagner C editor Pro-ceedings of the Annual Meeting of the American Society of Landscape Architects Washington DC1996 pp 27ndash29
23 Xiao Q McPherson GE Rainfall interception by Santa Monicarsquos municipal urban forest Urban Ecosyst2002 6 291ndash302
24 Xiao Q McPherson GE Simpson JR Ustin SL Rainfall interception by Sacramentorsquos urban forestJ Arboric 1998 24 235ndash244 PMID 10410677
25 Nowak DJ Crane DE Carbon storage and sequestration by urban trees in the USA Environ Pollut2002 116 381ndash389 PMID 11822716
Trees Grow on Money Urban Tree Canopy Cover and Environmental Justice
PLOS ONE | DOI101371journalpone0122051 April 1 2015 15 17
26 Nowak DJ Crane DE Stevens JC Air pollution removal by urban trees and shrubs in the United StatesUrban For Urban Green 2006 4 115ndash123
27 Bell JF Wilson JS Liu GC Neighborhood greenness and 2-year changes in body mass index of chil-dren and youth Am J Prev Med 2008 35 547ndash553 101016jamepre200807006 PMID 19000844
28 Kaplan R Kaplan S The Experience of Nature A Psychological Perspective New York CambridgeUniversity Press 1989
29 Wolf KL Urban ecosystem services metro nature and human well-being In Laband DN editorEmerging Issues along UrbanRural Interfaces III Linking Science and Society Atlanta GA 2010 p45
30 Kuo FE The role of arboriculture in a healthy social ecology J Arboric 2003 29 148ndash155
31 Westphal LM Urban greening and social benefits a study of empowerment outcomes J Arboric 200329 137ndash147
32 Holtan MT Dieterlen SL SullivanWC Social life under cover tree canopy and social capital in Balti-more Maryland Environ Behav 2014 0013916513518064
33 Pincetl S Bunje P Holmes T An expanded urban metabolism method Toward a systems approach forassessing urban energy processes and causes Landsc Urban Plan Elsevier BV 2012 107 193ndash202 doi101016jlandurbplan201206006
34 Pataki DE Carreiro MM Cherrier J Grulke NE Jennings V Pincetl S et al Coupling biogeochemicalcycles in urban environments ecosystem services green solutions and misconceptions Front EcolEnviron 2011 9 27ndash36 doi101890090220
35 Pincetl S Gillespie T Pataki DE Saatchi S Saphores JD Urban tree planting programs function orfashion Los Angeles and urban tree planting campaigns GeoJournal 2013 78 475ndash493
36 Pincetl S Implementing municipal tree planting Los Angeles Million-Tree Initiative Environ Manage2010 45 227ndash238 101007s00267-009-9412-7 PMID 20016982
37 Harlan SL Brazel AJ Prashad L StefanovWL Larsen L Neighborhood microclimates and vulnerabili-ty to heat stress Soc Sci Med 2006 63 2847ndash2863 PMID 16996668
38 Cutter SL Holm D Clark L The role of geographic scale in monitoring environmental justice Risk Anal1996 16 517ndash526
39 Openshaw S Taylor PJ A million or so correlation coefficients three experiments on the modifiableareal unit problem In Wrigley N editor Statistical Applications in the Spatial Sciences London Pion1979 pp 127ndash144
40 Moskal LM Styers DM Richardson J Halabisky M Seattle hyperspectral land useland cover (LULC)from LiDAR and near infrared aerial imagery using object-based image analysis (OBIA) Seattle WA2011
41 Homer C Huang C Yang L Wylie B Coan M Development of a 2001 national land-cover database forthe United States Photogramm Eng Remote Sens 2004 70 829ndash840
42 Cadenasso ML Pickett STA Schwarz K Spatial heterogeneity in urban ecosystems reconceptualizingland cover and a framework for classification Front Ecol Environ 2007 5 80ndash88 doi1018901540ndash9295(2007)5[80SHIUER]20CO2
43 Grove JM Troy AR OrsquoNeil-Dunne JPM BurchWR Jr Cadenasso ML Pickett STA Characterizationof households and its implications for the vegetation of urban ecosystems Ecosystems 2006 9 578ndash597 doi101007s10021ndash006ndash0116-z PMID 17354937
44 Gillespie TW Pincetl S Brossard S Smith J Saatchi S Pataki DE et al A time series of urban forestryin Los Angeles Urban Ecosyst 2012 15 233ndash246
45 Anselin L Spatial Econometrics Methods and Models Dudrecht The Netherlands Kluwer AcademicPublishers 1988
46 Anselin L Spatial effects in econometric practice in environmental and resource economics Am JAgric Econ 2001 83 705ndash710
47 Wagner HH Fortin M- J Spatial analysis of landscapes concepts and statistics Ecology 2005 861975ndash1987
48 McPherson GE Simpson JR Xiao Q Wu C Million Trees Los Angeles canopy cover and benefit as-sessment Landsc Urban Plan 2011 99 40ndash50
49 Tobler WR A computer movie simulating urban growth in the Detroit region Econ Geogr 1970 46234ndash240
50 Anselin L The future of spatial analysis in the social sciences Geogr Inf Sci 1999 5 67ndash76
51 Chi G Zhu J Spatial regression models for demographic analysis Popul Res Policy Rev 2008 2717ndash42
Trees Grow on Money Urban Tree Canopy Cover and Environmental Justice
PLOS ONE | DOI101371journalpone0122051 April 1 2015 16 17
52 Lichstein JW Simons TR Shriner SA Franzreb KE Spatial autocorrelation and autoregressive modelsin ecology Ecol Monogr 2002 72 445ndash463
53 Anselin L Exploring spatial data with GeoDa a workbook Urbana IL 2005 p 61801
54 Pickett STA Cadenasso ML Grove JM Resilient cities meaning models and metaphor for integratingthe ecological socio-economic and planning realms Landsc Urban Plan 2004 69 369ndash384 101016jlandurbplan200310035
55 Pickett STA White PS The Ecology of Natural Disturbance and Patch Dynamics New York Acade-my Press 1985 PMID 17816073
56 Battaglia MJ A multi-methods approach to determining appropriate locations for tree plantings in two ofBaltimorersquos tree-poor neighborhoods Ohio University 2010
57 Bigsby KM McHale MR Hess GR Urban morphology drives the homogenization of tree cover in Balti-more MD and Raleigh NC Ecosystems 2014 17 212ndash227
58 Boone CG An assessment and explanation of environmental inequity in Baltimore Urban Geogr2002 23 581ndash595
59 Mennis JL Jordan L The distribution of environmental equity exploring spatial nonstationarity in multi-variate models of air toxic releases Ann Assoc AmGeogr 2005 95 249ndash268
60 Troy AR Grove JM OrsquoNeill-Dunne JP Pickett STA Cadenasso ML Predicting opportunities for green-ing and patterns of vegetation on private urban lands Environ Manage 2007 40 394ndash412 PMID17602257
61 Kuo FE SullivanWC Environment and crime in the inner city does vegetation reduce crime EnvironBehav 2001 33 343ndash367
62 Troy AR Grove JM OrsquoNeill-Dunne JP The relationship between tree canopy and crime rates acrossan urban-rural gradient in the greater Baltimore region Landsc Urban Plan 2012 106 262ndash270
63 Lyytimaumlki J Petersen LK Normander B Bezaacutek P Nature as a nuisance Ecosystem services and dis-services to urban lifestyle Environ Sci 2008 5 161ndash172
Trees Grow on Money Urban Tree Canopy Cover and Environmental Justice
PLOS ONE | DOI101371journalpone0122051 April 1 2015 17 17
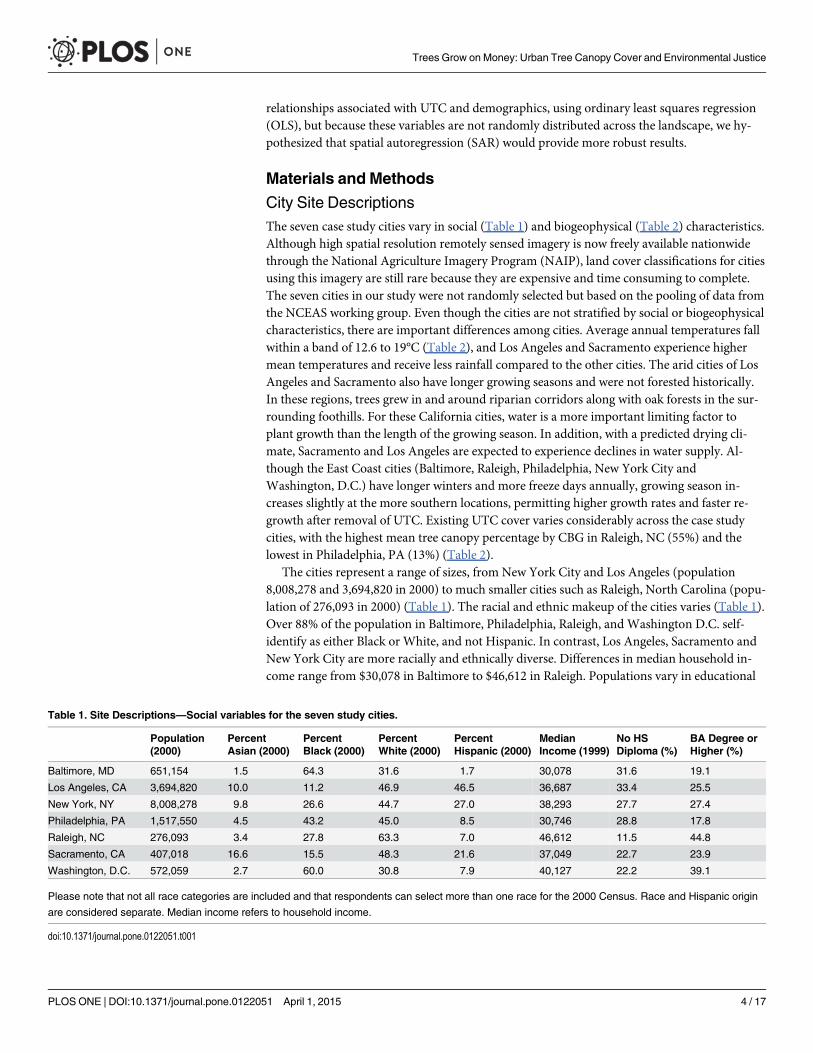