Treatment of municipal wastewater using laterite-based constructed soil filter
11
Treatment of municipal wastewater using laterite-based constructed soil filter Avinash M. Kadam, Pravin D. Nemade , G.H. Oza, H.S. Shankar Department of Chemical Engineering, Indian Institute of Technology, Bombay, Powai, Mumbai 400076, Maharashtra, India Keywords: Constructed soil filter (CSF) Wastewater Laterite Filtration Oxidation Pathogen removal abstract The present study reports the performance of municipal wastewater treatment plant located at Mum- bai, India using laterite soil-based constructed soil filter (CSF) system monitored over 17 months. The results indicated increase in dissolved oxygen levels and reduction of chemical oxygen demand (COD) from 135.4 ± 79.4 to 28.8 ± 19.5 mg/L with first order rate constant (K d ) of 0.23 h −1 . The bio-chemical oxy- gen demand (BOD) reduced from 92 to less than 10 mg/L with K d of 0.35 h −1 ; suspended solids reduction from mean 188 to 12–18mg/L and turbidity reduction from mean 140 to 5.0 ± 3.4 NTU. The seasonal data showed 3.2 ± 0.9, 2.8 ± 0.4 and 2.85 ± 1.0 log order removal for total coliform, fecal coliform and het- erotrophic plate count, respectively. The unique features of the system include a single unit, low HRT, high hydraulic loading, no chemicals, pretreatment and mechanical aeration, odor free, low energy requirement (0.04 kWh/m 3 ), and green ambience. 1. Introduction Several monitoring studies of water bodies reveal that the main source of pollution is the discharge of raw sewage (Belmont et al., 2004; Belmont and Metcalfe, 2002). Due to rapid economic growth and exponential population increase, Mumbai, the commercial cap- ital of India is expected to have a population of around 26.5 million by 2025. It is expected to lead to a water demand of 18,000 mil- lion litres per day (MLD) generating almost 14,400 MLD wastewater (Perks et al., 2004). Wastewater treatment and recycling are the potential sources for addressing problems in such rapidly grow- ing urban centres. There are various technological options available in the conventional approach for wastewater treatment. But most of the available technologies are often found to be unsuitable for applications in developing countries. One of the hurdles is the cost associated with its operation as regular supply of energy may not be available and the operating requirements are often ill matched to local skills. As a result such plants can be beyond the reach of the community (Fallowfield and Garrett, 1985; Bahgat et al., 1999). Natural systems overcome these disadvantages, viz., land treatment and wetland systems. Land treatment has emerged as one of the promising tech- nologies for wastewater renovation. In land treatment, wastewater is first treated by conventional physicochemical and/or biological treatment and then allowed to infiltrate through aerated unsatu- rated zone wherein it gets purified through unit operations and processes such as filtration, adsorption, chemical processes and biodegradation. Land treatment system comprises of mainly Slow- Rate Irrigation System (Ou et al., 1997), Overland Flow System (Smith and Schroeder, 1985), Compact Filter System (Heistad et al., 2006), Multi Soil Layering System (Luanmanee et al. (2001), Rapid Infiltration System (Bouwer, 1985) and On Site Disposal Sys- tem. Operation cost, mismatch of operating requirements with local skills and space constraint particularly in the urban sector of the developing world have limited their application to a great extent (Bahgat et al., 1999). 2. CSF system CSF is a process developed at the Indian Institute of Technology- Bombay, India. It works with formulated soil environment wherein fundamental processes of nature, viz., respiration, mineral weather- ing and photosynthesis are responsible for bioconversion. Suitable mineral constitution, culture containing native microflora, geoph- agus worm Pheretima elongata, and bio-indicator plants are the key components of the media (Shankar et al., 2005). Bioconver- sion takes place by bacterial processing of organics and oxidizable inorganics via natural oxygen supply wherein mineral-weathering reaction serves to regulate pH while green plants serve as bio- indicators of the health of process at work. The highly oxic potential and near neutral pH together with ecology of environment leads to significant reduction in the pathogens (Kadam et al., 2008). As in soils, inorganic transformations such as Fe 2+ to Fe 3+ and Mn 2+ to Mn 4+ serve as oxygen carrier (Langmuir, 1997).
-
Upload
independent -
Category
Documents
-
view
0 -
download
0
Transcript of Treatment of municipal wastewater using laterite-based constructed soil filter
T
AD
KCWLFOP
1
s2aibl(piioaabttNa
nit
reatment of municipal wastewater using laterite-based constructed soil filter
vinash M. Kadam, Pravin D. Nemade, G.H. Oza, H.S. Shankarepartment of Chemical Engineering, Indian Institute of Technology, Bombay, Powai, Mumbai 400076, Maharashtra, India
a b s t r a c t
The present study reports the performance of municipal wastewater treatment plant located at Mum-bai, India using laterite soil-based constructed soil filter (CSF) system monitored over 17 months. Theresults indicated increase in dissolved oxygen levels and reduction of chemical oxygen demand (COD)from 135.4 ± 79.4 to 28.8 ± 19.5 mg/L with first order rate constant (Kd) of 0.23 h−1. The bio-chemical oxy-
eywords:onstructed soil filter (CSF)astewater
ateriteiltration
gen demand (BOD) reduced from 92 to less than 10 mg/L with Kd of 0.35 h−1; suspended solids reductionfrom mean 188 to 12–18 mg/L and turbidity reduction from mean 140 to 5.0 ± 3.4 NTU. The seasonal datashowed 3.2 ± 0.9, 2.8 ± 0.4 and 2.85 ± 1.0 log order removal for total coliform, fecal coliform and het-erotrophic plate count, respectively. The unique features of the system include a single unit, low HRT, highhydraulic loading, no chemicals, pretreatment and mechanical aeration, odor free, low energy requirement
3 amb
rpbR(aRtsd(
2
Bfima
xidationathogen removal
(0.04 kWh/m ), and green
. Introduction
Several monitoring studies of water bodies reveal that the mainource of pollution is the discharge of raw sewage (Belmont et al.,004; Belmont and Metcalfe, 2002). Due to rapid economic growthnd exponential population increase, Mumbai, the commercial cap-tal of India is expected to have a population of around 26.5 milliony 2025. It is expected to lead to a water demand of 18,000 mil-ion litres per day (MLD) generating almost 14,400 MLD wastewaterPerks et al., 2004). Wastewater treatment and recycling are theotential sources for addressing problems in such rapidly grow-
ng urban centres. There are various technological options availablen the conventional approach for wastewater treatment. But mostf the available technologies are often found to be unsuitable forpplications in developing countries. One of the hurdles is the costssociated with its operation as regular supply of energy may note available and the operating requirements are often ill matchedo local skills. As a result such plants can be beyond the reach ofhe community (Fallowfield and Garrett, 1985; Bahgat et al., 1999).atural systems overcome these disadvantages, viz., land treatmentnd wetland systems.
Land treatment has emerged as one of the promising tech-ologies for wastewater renovation. In land treatment, wastewater
s first treated by conventional physicochemical and/or biologicalreatment and then allowed to infiltrate through aerated unsatu-
ksirias
a
ience.
ated zone wherein it gets purified through unit operations androcesses such as filtration, adsorption, chemical processes andiodegradation. Land treatment system comprises of mainly Slow-ate Irrigation System (Ou et al., 1997), Overland Flow SystemSmith and Schroeder, 1985), Compact Filter System (Heistad etl., 2006), Multi Soil Layering System (Luanmanee et al. (2001),apid Infiltration System (Bouwer, 1985) and On Site Disposal Sys-em. Operation cost, mismatch of operating requirements with localkills and space constraint particularly in the urban sector of theeveloping world have limited their application to a great extentBahgat et al., 1999).
. CSF system
CSF is a process developed at the Indian Institute of Technology-ombay, India. It works with formulated soil environment wherein
undamental processes of nature, viz., respiration, mineral weather-ng and photosynthesis are responsible for bioconversion. Suitable
ineral constitution, culture containing native microflora, geoph-gus worm Pheretima elongata, and bio-indicator plants are theey components of the media (Shankar et al., 2005). Bioconver-ion takes place by bacterial processing of organics and oxidizablenorganics via natural oxygen supply wherein mineral-weatheringeaction serves to regulate pH while green plants serve as bio-
ndicators of the health of process at work. The highly oxic potentialnd near neutral pH together with ecology of environment leads toignificant reduction in the pathogens (Kadam et al., 2008).As in soils, inorganic transformations such as Fe2+ to Fe3+
nd Mn2+ to Mn4+ serve as oxygen carrier (Langmuir, 1997).
Admin
Highlight

1052
Table 1Details of laterite based constructed soil filter plant.
Site description Values
Wastewater Domestic + septic tank
Batch volume (VL; m3) 50Pretreatment No
BedBed dimensions (m) 25 × 20 × 0.7Bed surface area (m2) 500Upper media (vb; m3) 150Lower media (m3) 200
HydraulicsFlow VerticalMean hydraulic load (m3/m2/h) 0.042Raw flow (vf; m3/h) 21.6Recycle flow (vr; m3/h) 21.6Batch time t (t + tr) (h) 6.30 (2.30 + 4.0)
P
S
PoePp>gadCpA1
Cms
3
3
Dufu
tDmO
wgrasoaaggmps
3
ws0rtowltcawap
TnitDuring drying cycle, this clogging layer develops cracks due to res-
b f
lant age 2002 onwards
ite located at naval housing colony, Kanjurmarg, eastern suburb of Mumbai.
redator–prey activities of geophagus worm and other macro-rganisms serve to regulate bacterial work force so that the systemxhibits chokage free operation. Results of Pattanaik (2001) andattanaik et al. (2004) indicate that for organic loading <0.15 kg/m2
er day and hydraulic loading <0.05 m3/m2/h, reduction potentials600 mV are typical. The available experimental studies on oxy-en transfer show transfer coefficient in the range of 10−2–10−3 s−1
lmost similar to agitated vessels. Hence aerobic oxidation is theominant reaction at work. Because of high oxygen levels, the saidSF system finds promising in variety of applications such as waterurification and sanitation. Also CSF shows oxidation of As (III) tos (V) and then co-precipitation by iron salt removes arsenic below0 �g/L WHO standard (Nemade et al., 2007, 2008).
The results for wastewater renovation with laterite soil basedSF also titled as Soil Biotechnology monitored over a period of 17onth, are presented in this paper. It is the only kind of such large-
cale plant based on red soil to the knowledge of authors.
. Materials and methods
.1. Plant description
The facility under investigations is located in Mumbai, India.etails of the site are presented in Table 1. The plants receivenclassified, untreated raw sewage and the treated water is usedor irrigation in nearby gardens and lawns and in proximity a largerban population lives. Mumbai being a port city shows very lit-
pptl
Fig. 1. Cross-sectional view and layout of CSF showin
le variation in temperature; the warmest May is 32 ◦C and coldestecember is 24 ◦C. It receives very heavy rainfall of about 2500 mmostly in three to four spells over 30 days spread over June toctober.
The system is constructed from RCC, stone-masonry or soilalls and consists of an impervious containment typically below
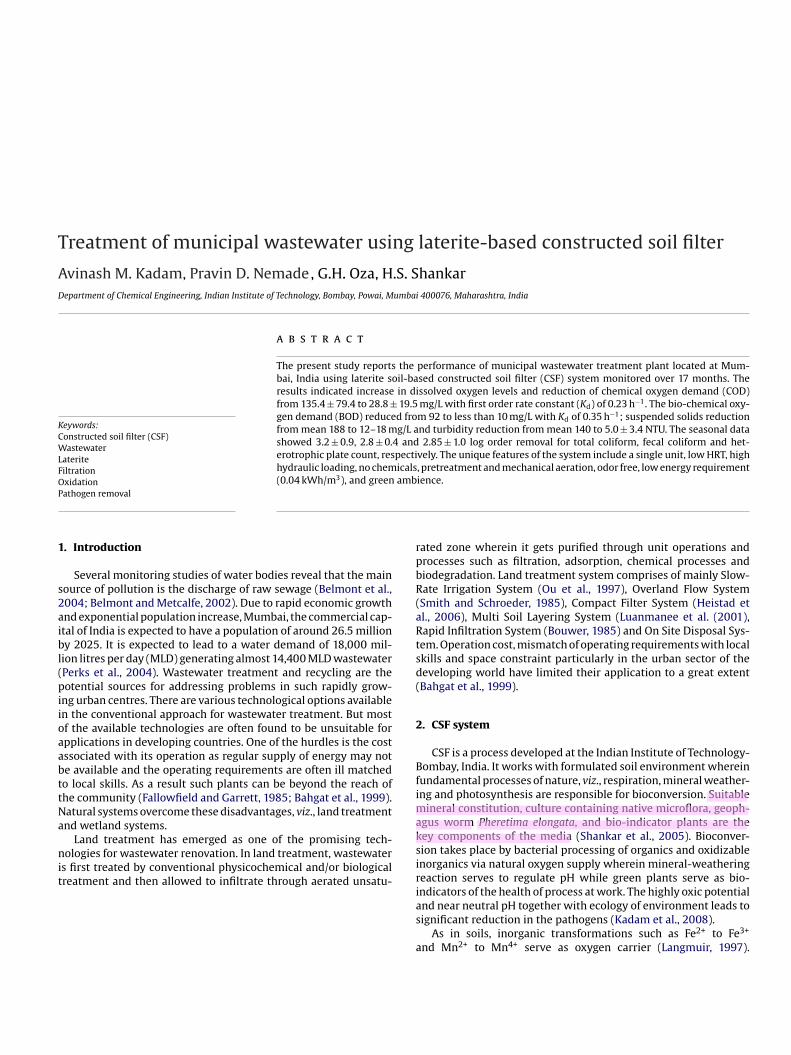
round, 0.7 m deep, with a 0.4 m of under drain layer of stone,ubble, above this a 0.3 m layer of red soil media housing culturend bio-indicator plants. Fig. 1 shows cross-sectional layout of CSFhowing upper and lower media. The distribution of wastewaterver the media is achieved via pumping, piping and distributionrrangements. The media consists of red soil along with suit-ble mineral constitution, culture containing native microflora,eophagus worm P. elongata, bio-indicator plants. In CSF system,eophagus worm P. elongata (k-selected organism) is engaged toaintain required soil microbial ecology. The design has suitable
rovision for manual removal of suspended solids from the biofilterurface.
.2. Process description and operation
The process can be run on batch as well continuous mode. Theastewater is pumped and applied on to the top surface of the CSF
ystem as shown in Fig. 1. Typical hydraulic loading is in the range of.04–0.05 m3/m2/h. A batch volume VL of wastewater is pumped atate vf into the system trenches. Water first percolates through therenches and gets collected in the collection tank. It is then pumpedn to the media with the help of distribution system. The filteredater then gets collected into the collection tank and then recircu-
ated (vr) on to the media again. The recirculation (vr) is continuedill desired quality of water is achieved and then the water is dis-harged. Suspended solids are retained in trenches due to stainingctivity of additive material. Additives also combine with organicaste and act as primary removal of organic waste. These materials
re scraped and removed periodically. The schematic details of therocess operation are shown in Fig. 2.
The overall time of operation (wetting cycle) is typically 6–7 h.he bed is then rested for rest of the period (drying cycle) prior toext cycle of use. In Soil Biotechnology system, problem of clogging
s overcome by propagating soil ecology in place, alternate wet-ing and drying cycles and appropriate substrate loading designs.
iration; so alternate wetting and drying is required for efficienterformance. Substrate loading rate of 0.25 g/m2/day is typicallyhe design guideline for CSF with scale up factor of 1.5 for shockoading.
g upper and lower media for processing water.
Admin
Highlight
Admin
Highlight
Admin
Highlight
4
4
aitImioNaoN(8
h2(fiSsPfar1
4
papsa2iioi
owwwett(ataab
K
wa
cce(ams
Ta(sceiaMo
rceLsNpfeafct(
4
pmt
Fig. 2. Schematic of the CSF process operation.
. Analysis
.1. Physicochemical and microbial analysis
Samples of raw water and processed water were collected andnalyzed during March 2003 to July 2004. Samples were collectedn sterile 2 L plastic cans. Water temperature, conductivity andotal dissolved solids (TDS) were measured using WTW (Germany)nolab1 conductivity meter; pH and dissolved oxygen (DO) were
easured using WTW (Germany) Inolab1 pH/Oxi meter. Turbid-ty was measured on WTW (Germany) Turb 550. Bio-chemicalxygen demand (BOD), chemical oxygen demand (COD), nitrite-, orthophosphate, total kjeldahl nitrogen, sulphate concentration,nd suspended solids were measured as per standard proceduresf the American Public Health Association (APHA, 2003). Nitrate-and NH4
+-N were measured with WTW combination electrodeModel no. NO3
− 106674) and ELIT double junction electrode (ELIT051 NH4
+ 60278), respectively.Indicator organism’s, viz., fecal coliform, total coliform and
eterotrophic plate counts were enumerated as per (APHA,003) using membrane filtration technique. Appropriately diluted10−3–10−7) sample (100 mL in volume) volumes, in triplicate, wereltered through 0.45 �m membrane filters supplied by PALL Lifeciences, Mumbai, and subsequently these filters were mounted onpecific media supplied from Hi Media Laboratory Pvt. Ltd., India.lates were then incubated for 24 h at 44.5 ◦C on M-FC mediumor fecal coliform, 24 h at 37 ◦C on M-Endo agar for total coliform,nd 24 h at 37 ◦C on M-HPC agar for heterotrophic plate counts. Theesults are reported as number of Colony Forming Unit (CFU) per00 mL.
.2. Media analysis
Composite soil samples were taken randomly in May 2004. Sam-les were augured from two levels: one at 30–50 cm and othert 120–150 cm. Samples were air dried and mixed in equal pro-ortion to obtain homogenous sample. Soil samples were thenub-sampled and analyzed within 5–7 days, or stored at 4 ◦C andnalyzed within 1 month. Air-dried soil was then passed through
mm sieve and subjected to most of the physicochemical stud-es except for particle size analysis. Physicochemical parametersnclude moisture content, specific gravity, particle size analysis,rganic carbon, hydraulic conductivity, pH, cation exchange capac-ty, anion exchange capacity, and contact angle.
ctptd
1053
Soil pH was measured on a suspension of 10 g soil and 25 mLf 1 M KCl as well with soil paste and 1:5 soil:water suspensionith glass electrode. Electrical conductivity (EC25) was measuredith 1:5 soil:water suspension. Soil moisture content (% MC)as measured by drying 5 g soil at 105–110 ◦C for 8 h and differ-
nce in weight is reported as % MC. A particle size analysis ofhe <2 mm fraction was carried out for each sample according tohe procedure of Gee and Bauder (1986). The proportion of sand2.0–0.05 mm) was determined by sieving, silt (0.05–0.002 mm)nd clay (<0.002 mm) proportions were determined by sedimen-ation using hygrometer method. Soil permeability was carried outs per falling-head permeability test method, adapted from Akbulutnd Saglamer (2004). The hydraulic conductivity KL was calculatedy Eq. (1).
L = 2.303aL
Atlog
(h1
h2
)(1)
here h is the head difference at any time t; A the area of specimen;the area of stand pipe and L is the length of specimen.
Percentage oxidizable organic matter was determined by thehromic acid method of Walkley and Black (Black, 1965). Organicarbon content was obtained by multiplying it by 1.33. Cationxchange capacity (CEC) was measured by Na saturation methodChapman, 1965). Anion exchange capacity (AEC) was measuredccording to the method of Mehlich (1948). This method involveseasurement of adsorbed P and extractable P separately and the
umming up of these two gives AEC.The percentage C, H, and N was determined using CHN analyzer,
hermo Finnegan-FLASHEA 1112 series, respectively. The contactngle (�) was determined using Contact Angle Measurement MeterGBX Instrumental Scientific). Exchangeable cations were mea-ured as per method given by Dubbin et al. (2006). The effectiveation exchange capacity (ECEC) was calculated as the sum ofxchangeable cations. Each of the above analyses was performedn duplicates and mean values are reported here. Population ofmmonia oxidizers and nitrite oxidizers was enumerated by theost Probable Number (MPN) method and represented as cells/g
f soil (Schmidt and Belser, 1994).Denitrifier population was enumerated by MPN method and
epresented as cells/g of soil (Tiedje, 1994). Heterotrophic plateount was measured as CFU/g after incubation for 48 h with het-rotrophic plate count media supplied by Hi Media Laboratory Pvt.td., India. Similarly actinomycetes were measured as CFU/g ofoil grown on starch casein medium (Wellington and Toth, 1994).umber of proteolytic bacteria was estimated by incubating appro-riately diluted soil suspension with casein/mil powder mediumor 48 h and reported as CFU/g of soil (Kern and Idler, 1999). Pres-nce or absence of protozoan population such as flagellates, amoeband ciliates in a mixture of soil and appropriate media incubatedor 3–6 weeks were noted using 20–45× magnification with phaseontrast microscopy, Leica DM LS2 series and density of the pro-ozoan was calculated in the original soil samples from MPN tableIngham, 1994).
.3. Enzymatic analysis of media
Enzymatic activities of dehydrogenase, acid and alkaline phos-hatase, urease and �-glucosidase were determined on freshoist sieved (<2 mm) soils within 15–20 days from the collec-
ion of the samples. Control tests with autoclaved soils were
arried out to evaluate the spontaneous or abiotic transforma-ion of substrates. Dehydrogenase activity was determined aser the protocol by Tabatabai (1994) and is expressed as �moleriphenylformazan h−1 g−1 soil. Urease activity was determined byetermination of urea remaining. This method is based on the ureaAdmin
Highlight
Admin
Highlight
1
reabspi�Tst(mdl
4
bPSmt(prMs
4
1fsi30N
ω
winsprf
4
gcaoo2�a
Table 2Physicochemical performance of laterite based CSF plant.
Parameters Influent Effluent % removal Kd (h−1)
pH (range) 6.7–7.3 7.1–7.7 – –Dissolved oxygen (mg/L) 0.72 ± 1.1 4.8 ± 1.6 – –Total dissolved solids (mg/L) 248.5 ± 22.1 239.1 ± 25.4 3.8 –Conductivity (�S/cm) 370.0 ± 34.2 357.1 ± 38.0 – –Total suspended solids (mg/L) 187.8 ± 145.3 9.1 ± 7.8 95.2 0.45Volatile suspended solids 90.9 ± 78.5 0.2 ± 1.0 99.7 0.89Turbidity (NTU) 96.3 ± 47.2 5.0 ± 3.4 94.8 0.44COD (mg/L) 135.4 ± 79.4 28.8 ± 19.5 78.7 0.23BOD (mg/L) 91.7 ± 54.7 8.6 ± 7.3 90.6 0.35Chlorides (mg/L) 33.8 ± 8.4 32.1 ± 14.8 5.1 0.06Sulphate (mg/L) 24.4 ± 14.4 20.2 ± 13.8 17.0 0.03Alkalinity (mg/L) 87.9 ± 31.0 78.9 ± 30.1 10.3 0.12
NitrogenNitrate-N (mg/L) 4.3 ± 4.7 5.1 ± 6.2 – –Nitrite-N (mg/L) 0.4 ± 1.1 0.3 ± 0.7 – 0.06Ammoniacal-N (mg/L) 4.3 ± 3.2 0.7 ± 0.8 82.7 0.26
O
f
q
wclv
5
avswc
K
wctvsp
5
wid4pa
9
054
emaining after incubating with soil and KCl–PMA buffer and isxpressed as �mole urea h−1 g−1 soil (Tabatabai, 1994). Acid andlkaline phosphatase was measured as per the protocol outlinedy Tabatabai (1994) and expresses as �mole p-nitrophenol h−1 g−1
oil. It is based on the estimation of p-nitrophenol formed with-nitro phenyl phosphate as substrate in presence of MUB (Mod-
fied Universal Buffer; pH 6.5 and 11.0) buffer (Tabatabai, 1994).-Glucosidase activity was determined according to Eivazi andabatabai (1977) and expressed as �mole p-nitrophenol h−1 1 g−1
oil. �-Glucosidase activity measurement is based on the estima-ion of p-nitrophenol formed with p-nitrophenyl-�-d-glucosidePNG) as substrate in presence of Tris hydroxymethyl amino
ethane (THAM, pH 12) buffer (Tabatabai, 1994). All chemicaleterminations and enzymatic activities were determined in trip-
icate and data were expressed on an oven-dry sample basis.
.4. Mineral investigation
Trace element concentrations in the medium were determinedy XRF spectroscopy on pressed powder pellets using a PhilipsW 2404 instrument. Data obtained were processed using PhilipsuperQ software. All the analyses were carried out in triplicates andean with standard deviation is presented here. Mineral constitu-
ion of the medium was investigated by powder X-ray diffractionXRD) using X’Pert Pro XRD Systems diffractometer with a curvedosition-sensitive detector in vertical geometry with a 2� detectionange of 3–60◦. Tube operating conditions were 40 kV and 30 mA.easurements were made in reflection geometry with the sample
urface at an angle of 1◦ to the incident beam.
.5. Nitrification rate
It is an indicator of activity of nitrifying bacteria in soil (Hart,994). Method of nitrification potential of soil medium is adaptedrom Zhang et al. (2005) with slight modification. Twenty gram ofoil sample was incubated with 100 mL NH4
+-N substrate solutionn a 250 mL flask and flasks were shaken at 180 rpm for 24 h at7 ◦C. After the incubation, soil suspension was filtered through a.45 �m-membrane filter for further analysis of NO3
−-N and NO2−-
. The nitrification potential was calculated as:
= (N0 − Nt)t
(V1 + V2)m(1 − w)
(2)
here ω is the rate of nitrate-N production (mg N kg−1 h−1), N0 thenitial nitrate-N concentration (mg/L) in the soil suspension, Nt theitrate-N concentration (mg/L) after incubation for time t, V1 theubstrate solution volume (L), V2 the water volume in the soil sam-le (L), m the mass of the soil sample (kg) and w is the water contentatio in the soil sample (fraction). The averages of three replicatesor each sample are presented herewith.
.6. Adsorption test for media
Batch tests for adsorption were carried out as per the methodiven by Zhang et al. (2005). Soil samples were dried at 105 ◦C foronstant weight and then were put in a conical flask of 250 mLnd sterilized at 121 ◦C and 1.1 MPa for 30 min. Then given volume
f solutions (generally 100 mL) containing different concentrationsf NH4+-N, NO3−-N, NO2
−-N, PO43−-P and soil samples shaken for
4 h at 180 rpm and 37 ◦C. Solution was then filtered through a 0.45-m membrane filter and N, P measurement was carried out withnalyte. Adsorption capacity for N or P was calculated using the
swvo0
TKN (mg/L) 5.9 ± 3.1 1.7 ± 0.9 71.6 0.19Total N (mg/L) 10.8 ± 6.4 7.0 ± 6.3 34.8 0.06
-Phosphate-P (mg/L) 1.4 ± 0.7 0.4 ± 0.2 67.3 0.17
ormula given in Eq. (3).
= (C0 − C)VM
(3)
here q is the adsorption capacity of soil (mg g−1); C0 the initialoncentration of solute in mixed soil solution (mg/L); C the equi-ibrium concentration of solute in mixed soil solution (mg/L); V theolume of the solution (L) and M is the dry weight of soil (g).
. Results
All the results are expressed as arithmetic means of triplicatenalysis over the period. Standard deviations and means for allariables were performed by Statistica package for Windows (Ver-ion 5.1 Edition 98). In case of microbial population densities, dataere log 10 transformed to obtain mean. First order removal rate
onstants were calculated as
d = Vf(C0 − Ce)Vb(Ce)
(4)
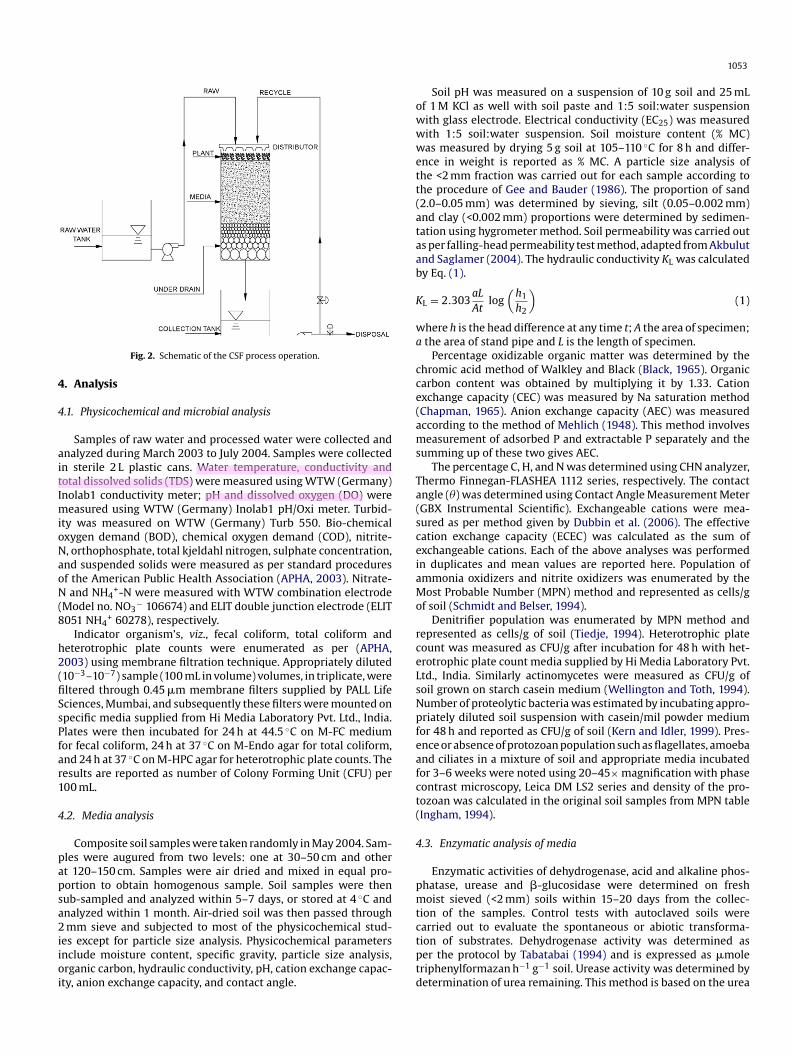
here Kd is the first order rate constant (h−1), C0 the initial con-entration of the contaminant (mg/L); Ce the final concentration ofhe contaminant (mg/L); Vf the flow rate (m3/min) and Vb the bedolume (m3/min). Physicochemical contaminant removal with redoil filter is presented in Table 2. Figs. 3–7 describe the monthlyattern for physicochemical contaminant removal.
.1. Physicochemical removal performance
In Fig. 3(a), the influent pH was found to be 7.0 ± 0.3 and effluentas found to be close to neutral (7.4 ± 0.3) showing buffering capac-
ty of CSF environment. All effluents shows significant increase inissolved oxygen levels and the high dissolved oxygen levels up to.8 ± 1.6 mg/L as shown in Fig. 3(b). This indicates water could sup-ort the oxygen requirement of the aquatic organisms (Belmont etl., 2004).
The influent BOD was found to be in the range of1.7 ± 54.7 mg/L. Effluent levels were reduced to 8.6 ± 7.3 mg/L as
hown in Fig. 4(a). First order rate constants (Kd) for BOD removalas found to be 0.36 h−1. In Fig. 4(b), influent COD shows wideariation as reflected in standard deviation. Mean effluent levelsf COD were 28.8 mg/L registering 78.7% removal with Kd value of.23 h−1. Considering batch volume (VL) taken for the monitoring
Admin
Highlight

1055
FI
elia
slwfpt
5
wtrf0
4c(
Fig. 4. Monthly monitoring of physicochemical contaminant removal of sites I andI
twoardts
iv((nlocnilt
ig. 3. Monthly monitoring of physicochemical contaminant removal of sites I andI. Profile of (a) pH and (b) dissolved oxygen.
xperiment, specific mass loading for BOD5 and COD was calcu-ated as 9.16 and 13.5 g/m2/day. Here single batch volume per days preferred keeping in mind the significance of alternate dryingnd wetting cycle.
TSS concentration in the untreated sewage was 187.8 ± 145.3,howing lot of variations as shown in Fig. 5(b). There were veryarge reductions of TSS to 9.1 ± 7.8 mg/L registering 95.2% removal
ith Kd values of 0.45 h−1. It is interesting that system accountedor large fraction of TSS removal, since this is a very simple and inex-ensive system. This trend was equally represented with apparenturbidity reduction to 5.0 ± 3.4.
.2. Nutrient removal
Removal of nutrients from sewage is the challenge for protectingater bodies from eutrophication. Ortho-phosphate-P concentra-
ion in the raw sewage was 1.4 ± 0.7 mg/L. Phosphate-P levels wereeduced to 0.4 ± 0.2 mg/L as shown in Fig. 7(b). Percent removalsor all the time were in the range of 55–67% with Kd value of.17 h−1.
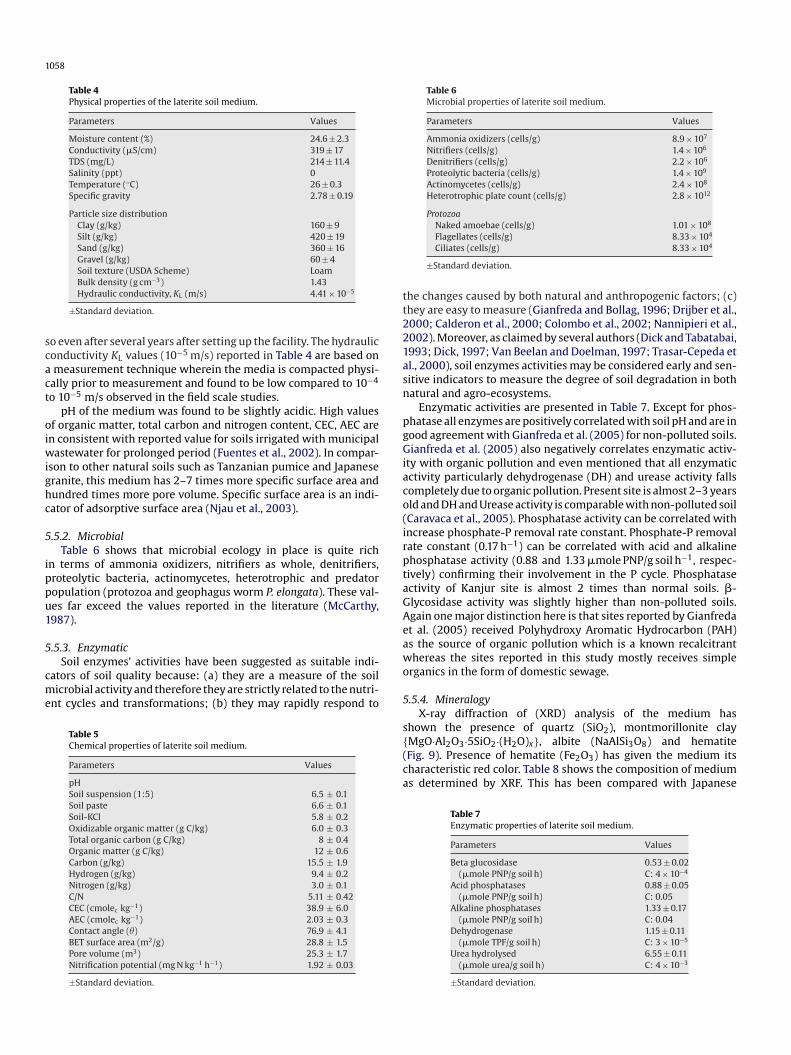
Ammonium-N concentration in the raw sewage was.3 ± 3.2 mg/L as shown in Fig. 6(a). This concentration is quite lowompared with values in domestic wastewater which is 12 mg/LMetcalf & Eddy Inc., 1995). Removal was almost 80–85% for all
ocr0
I. Profile of (a) BOD and (b) COD.
he time with 0.7 ± 0.8 mg/L in the outlet. The estimated Kd valueas 0.26 h−1. This was probably due to the elevated dissolved
xygen concentrations, since high oxygen promotes oxidation ofmmonium to nitrate. The mean nitrate-N concentration in theaw sewage was 4.3 mg/L even though nitrate is typically absent inomestic sewage (Metcalf & Eddy Inc., 1995). Monthly variation inhe influent and removal pattern for different forms of nitrogen ishown in Fig. 3.
Nitrate-N levels in the outlet were increased to 5.1 mg/L imply-ng nitrification at work. These values are similar to the literaturealue for septic tank effluent with soil and sand filter systemCochet et al., 1990). Very low levels of nitrite-N in the inlet0.03–0.4 mg/L) as well outlet (0.3 mg/L) was observed. Presence ofitrite-N in the outlet, loss of ammonia-N and absence of equiva-
ent amount of nitrate-N in the outlet implies incomplete oxidationf ammonia. Organic nitrogen was estimated by subtracting theoncentration of ammonium from Total kjeldahl nitrogen. Organicitrogen level is lower than ammonium level and is the character-
stic of sewage; also implies no other source of nitrogen. Organic Nevels in the raw were 1.62 ± 1.0 mg/L, and outlet shows reductiono 0.94 ± 0.5 mg/L giving percentage removal of 41.9% with Kd valuef 0.08 h−1 was observed as shown in Fig. 6(b). Total nitrogen (TN)oncentrations in the raw sewage were 10.8 ± 6.4 mg/L. Effluent TN
educed to 7.0 ± 6.3 mg/L showing 34.8% removal with Kd value of.06 h−1 as shown in Fig. 7(a).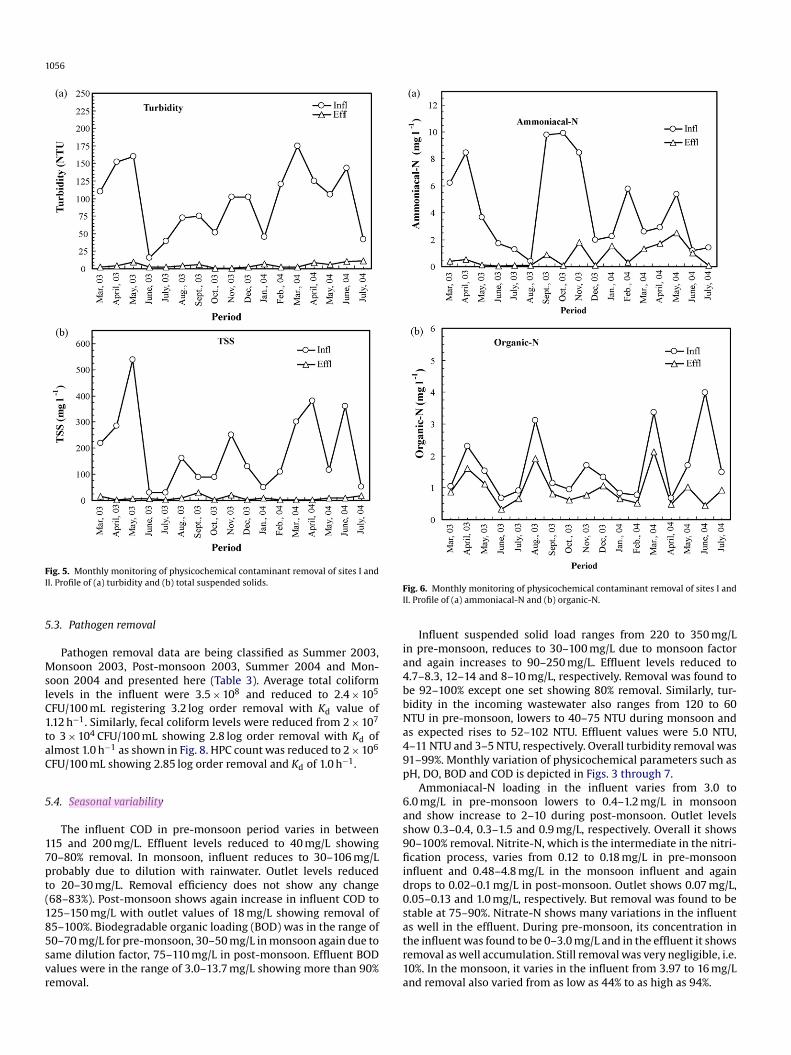
1056
FI
5
MslC1taC
5
17pt(185svr
FI
ia4bbNa49p
6as9fiid0sas well in the effluent. During pre-monsoon, its concentration in
ig. 5. Monthly monitoring of physicochemical contaminant removal of sites I andI. Profile of (a) turbidity and (b) total suspended solids.
.3. Pathogen removal
Pathogen removal data are being classified as Summer 2003,onsoon 2003, Post-monsoon 2003, Summer 2004 and Mon-
oon 2004 and presented here (Table 3). Average total coliformevels in the influent were 3.5 × 10⁸ and reduced to 2.4 × 10⁵
FU/100 mL registering 3.2 log order removal with Kd value of.12 h−1. Similarly, fecal coliform levels were reduced from 2 × 10⁷
o 3 × 10⁴ CFU/100 mL showing 2.8 log order removal with Kd oflmost 1.0 h−1 as shown in Fig. 8. HPC count was reduced to 2 × 10⁶
FU/100 mL showing 2.85 log order removal and Kd of 1.0 h−1.
.4. Seasonal variability
The influent COD in pre-monsoon period varies in between15 and 200 mg/L. Effluent levels reduced to 40 mg/L showing0–80% removal. In monsoon, influent reduces to 30–106 mg/Lrobably due to dilution with rainwater. Outlet levels reducedo 20–30 mg/L. Removal efficiency does not show any change68–83%). Post-monsoon shows again increase in influent COD to25–150 mg/L with outlet values of 18 mg/L showing removal of5–100%. Biodegradable organic loading (BOD) was in the range of
0–70 mg/L for pre-monsoon, 30–50 mg/L in monsoon again due toame dilution factor, 75–110 mg/L in post-monsoon. Effluent BODalues were in the range of 3.0–13.7 mg/L showing more than 90%emoval.tr1a
ig. 6. Monthly monitoring of physicochemical contaminant removal of sites I andI. Profile of (a) ammoniacal-N and (b) organic-N.
Influent suspended solid load ranges from 220 to 350 mg/Ln pre-monsoon, reduces to 30–100 mg/L due to monsoon factornd again increases to 90–250 mg/L. Effluent levels reduced to.7–8.3, 12–14 and 8–10 mg/L, respectively. Removal was found toe 92–100% except one set showing 80% removal. Similarly, tur-idity in the incoming wastewater also ranges from 120 to 60TU in pre-monsoon, lowers to 40–75 NTU during monsoon ands expected rises to 52–102 NTU. Effluent values were 5.0 NTU,–11 NTU and 3–5 NTU, respectively. Overall turbidity removal was1–99%. Monthly variation of physicochemical parameters such asH, DO, BOD and COD is depicted in Figs. 3 through 7.
Ammoniacal-N loading in the influent varies from 3.0 to.0 mg/L in pre-monsoon lowers to 0.4–1.2 mg/L in monsoonnd show increase to 2–10 during post-monsoon. Outlet levelshow 0.3–0.4, 0.3–1.5 and 0.9 mg/L, respectively. Overall it shows0–100% removal. Nitrite-N, which is the intermediate in the nitri-cation process, varies from 0.12 to 0.18 mg/L in pre-monsoon
nfluent and 0.48–4.8 mg/L in the monsoon influent and againrops to 0.02–0.1 mg/L in post-monsoon. Outlet shows 0.07 mg/L,.05–0.13 and 1.0 mg/L, respectively. But removal was found to betable at 75–90%. Nitrate-N shows many variations in the influent
he influent was found to be 0–3.0 mg/L and in the effluent it showsemoval as well accumulation. Still removal was very negligible, i.e.0%. In the monsoon, it varies in the influent from 3.97 to 16 mg/Lnd removal also varied from as low as 44% to as high as 94%.
Admin
Highlight

1057
Table 3Microbial performance of the laterite based constructed soil filter plant.
Organism Symbol Summer 2003 Monsoon 2003 Post-monsoon 2003 Summer 2004 Monsoon 2004 Average
Infl Effl Infl Effl Infl Effl Infl Effl Infl Effl Infl Effl
TCa avg 1.15 × 10⁸ 1.0 × 10³ 4.6 × 10⁸ 9.8 × 10⁴ 8.4 × 10⁷ 8.5 × 10⁴ 8.5 × 10⁸ 8.1 × 10⁵ 3.5 × 10⁸ 1.9 × 10⁵ 3.5 × 10⁸ 2.4 × 10⁵
K 5.06 3.67 2.99 3.02 3.13 3.17Kd
b 1.79 1.30 1.06 1.07 1.16 1.12
FCa avg 1.5 × 10⁵ 1.0 × 10³ 2.0 × 10⁷ 2.7 × 10⁴ 5.1 × 10⁶ 2.4 × 10⁴ 5.3 × 10⁷ 3.8 × 10⁴ 2.0 × 10⁷ 6.6 × 10⁴ 2 × 10⁷ 3.1 × 10⁴
K 2.18 2.86 2.32 3.15 2.49 2.79Kd
b 0.77 1.01 0.82 1.11 1.87 0.99
HPCa avg 5.1 × 10⁸ 1.2 × 10⁴ 1.5 × 10⁹ 5.1 × 10⁵ 6.3 × 10⁸ 2.3 × 10⁶ 3.0 × 10⁹ 6.5 × 10⁶ 1.4 × 10⁹ 8.7 × 10⁵ 1.4 × 10⁹ 2.0 × 10⁶
K 4.63 3.47 2.43 2.66 3.25 2.85Kd
b 1.64 1.23 0.86 0.94 1.13 1.01
T ; Kd (h(
iatP00
2f(S
FI
2ea2
whp
C: total coliform; FC: fecal coliform; HPC: heterotrophic plate count; K = log (N0/N)h−1), stdev = standard deviation.
a Colony Forming Unit (CFU)/100 mL.b h−1.
Sulphate concentration in the influent varies from 17 to 24 mg/Ln all three season and outlet shows 17–20 mg/L showing removals low as 12% during monsoon. Effluent levels were reducedo 14–21 mg/L showing 43–47% removal in rest of the season.hosphate-P concentration in the influent shows variation from.3 to 2.0 mg/L. Outlet levels of phosphate-P were reduced to.3–0.6 mg/L, showing removal of 11–80%.
Summer 2003 has shown better K and K compared to Summer
d004 for all three indicator organisms. In fact, highest log removalor total coliform and HPC were reported during Summer 20035.06 and 4.63, respectively). But FC log removal was better duringummer 2004 (3.15 log removal with Kd of 1.11 h−1) than Summerig. 7. Monthly monitoring of physicochemical contaminant removal of sites I andI. Profile of (a) total-N and (b) orthophosphate-P.
5
5
mwi
−1) = {ln (N0/N)}/tb, where K is log removal; Kd is pathogen removal rate constants
003. Dilution effects on the influent levels as well as wash outffect on effluent levels were not seen during two monsoon seasonss apprehended; except for fecal coliform levels during Monsoon004 decreased marginally.
This is important as hydraulic loading is generally overburdenedith monsoon precipitation during monsoon season and appre-ension was that it will affect the performance. Fig. 8 shows theattern of seasonal variation for pathogen removal.
.5. Media characteristics
.5.1. Physicochemical
Tables 4 and 5 summarize physicochemical characteristics of theedia which houses the ecology of selected bacteria, geophagusorms P. elongata and bio-indicator green plants. Moisture content
n the range of 24.6 ± 2.3% shows that, media drains rapidly this is
Fig. 8. Seasonal performance for total coliform and fecal coliform.
1058
Table 4Physical properties of the laterite soil medium.
Parameters Values
Moisture content (%) 24.6 ± 2.3Conductivity (�S/cm) 319 ± 17TDS (mg/L) 214 ± 11.4Salinity (ppt) 0Temperature (◦C) 26 ± 0.3Specific gravity 2.78 ± 0.19
Particle size distributionClay (g/kg) 160 ± 9Silt (g/kg) 420 ± 19Sand (g/kg) 360 ± 16Gravel (g/kg) 60 ± 4Soil texture (USDA Scheme) Loam
scact
oiwighc
5
ippu1
5
cme
Table 6Microbial properties of laterite soil medium.
Parameters Values
Ammonia oxidizers (cells/g) 8.9 × 10⁷
Nitrifiers (cells/g) 1.4 × 10⁶
Denitrifiers (cells/g) 2.2 × 10⁶
Proteolytic bacteria (cells/g) 1.4 × 10⁹
Actinomycetes (cells/g) 2.4 × 10⁸
Heterotrophic plate count (cells/g) 2.8 × 10¹²
ProtozoaNaked amoebae (cells/g) 1.01 × 10⁸
tt221asn
pgGiaco(irptaGAea
Bulk density (g cm−3) 1.43Hydraulic conductivity, KL (m/s) 4.41 × 10⁻⁵
±Standard deviation.
o even after several years after setting up the facility. The hydrauliconductivity KL values (10−5 m/s) reported in Table 4 are based onmeasurement technique wherein the media is compacted physi-
ally prior to measurement and found to be low compared to 10−4
o 10−5 m/s observed in the field scale studies.pH of the medium was found to be slightly acidic. High values
f organic matter, total carbon and nitrogen content, CEC, AEC aren consistent with reported value for soils irrigated with municipalastewater for prolonged period (Fuentes et al., 2002). In compar-
son to other natural soils such as Tanzanian pumice and Japaneseranite, this medium has 2–7 times more specific surface area andundred times more pore volume. Specific surface area is an indi-ator of adsorptive surface area (Njau et al., 2003).
.5.2. MicrobialTable 6 shows that microbial ecology in place is quite rich
n terms of ammonia oxidizers, nitrifiers as whole, denitrifiers,roteolytic bacteria, actinomycetes, heterotrophic and predatoropulation (protozoa and geophagus worm P. elongata). These val-es far exceed the values reported in the literature (McCarthy,987).
.5.3. EnzymaticSoil enzymes’ activities have been suggested as suitable indi-
ators of soil quality because: (a) they are a measure of the soilicrobial activity and therefore they are strictly related to the nutri-
nt cycles and transformations; (b) they may rapidly respond to
Table 5Chemical properties of laterite soil medium.
Parameters Values
pHSoil suspension (1:5) 6.5 ± 0.1Soil paste 6.6 ± 0.1Soil-KCl 5.8 ± 0.2Oxidizable organic matter (g C/kg) 6.0 ± 0.3Total organic carbon (g C/kg) 8 ± 0.4Organic matter (g C/kg) 12 ± 0.6Carbon (g/kg) 15.5 ± 1.9Hydrogen (g/kg) 9.4 ± 0.2Nitrogen (g/kg) 3.0 ± 0.1C/N 5.11 ± 0.42CEC (cmolec kg−1) 38.9 ± 6.0AEC (cmolec kg−1) 2.03 ± 0.3Contact angle (�) 76.9 ± 4.1BET surface area (m2/g) 28.8 ± 1.5Pore volume (m3) 25.3 ± 1.7Nitrification potential (mg N kg−1 h−1) 1.92 ± 0.03
±Standard deviation.
wo
5
s{(ca
Flagellates (cells/g) 8.33 × 10⁴
Ciliates (cells/g) 8.33 × 10⁴
±Standard deviation.
he changes caused by both natural and anthropogenic factors; (c)hey are easy to measure (Gianfreda and Bollag, 1996; Drijber et al.,000; Calderon et al., 2000; Colombo et al., 2002; Nannipieri et al.,002). Moreover, as claimed by several authors (Dick and Tabatabai,993; Dick, 1997; Van Beelan and Doelman, 1997; Trasar-Cepeda etl., 2000), soil enzymes activities may be considered early and sen-itive indicators to measure the degree of soil degradation in bothatural and agro-ecosystems.
Enzymatic activities are presented in Table 7. Except for phos-hatase all enzymes are positively correlated with soil pH and are inood agreement with Gianfreda et al. (2005) for non-polluted soils.ianfreda et al. (2005) also negatively correlates enzymatic activ-
ty with organic pollution and even mentioned that all enzymaticctivity particularly dehydrogenase (DH) and urease activity fallsompletely due to organic pollution. Present site is almost 2–3 yearsld and DH and Urease activity is comparable with non-polluted soilCaravaca et al., 2005). Phosphatase activity can be correlated withncrease phosphate-P removal rate constant. Phosphate-P removalate constant (0.17 h−1) can be correlated with acid and alkalinehosphatase activity (0.88 and 1.33 �mole PNP/g soil h−1, respec-ively) confirming their involvement in the P cycle. Phosphatasectivity of Kanjur site is almost 2 times than normal soils. �-lycosidase activity was slightly higher than non-polluted soils.gain one major distinction here is that sites reported by Gianfredat al. (2005) received Polyhydroxy Aromatic Hydrocarbon (PAH)s the source of organic pollution which is a known recalcitranthereas the sites reported in this study mostly receives simple
rganics in the form of domestic sewage.
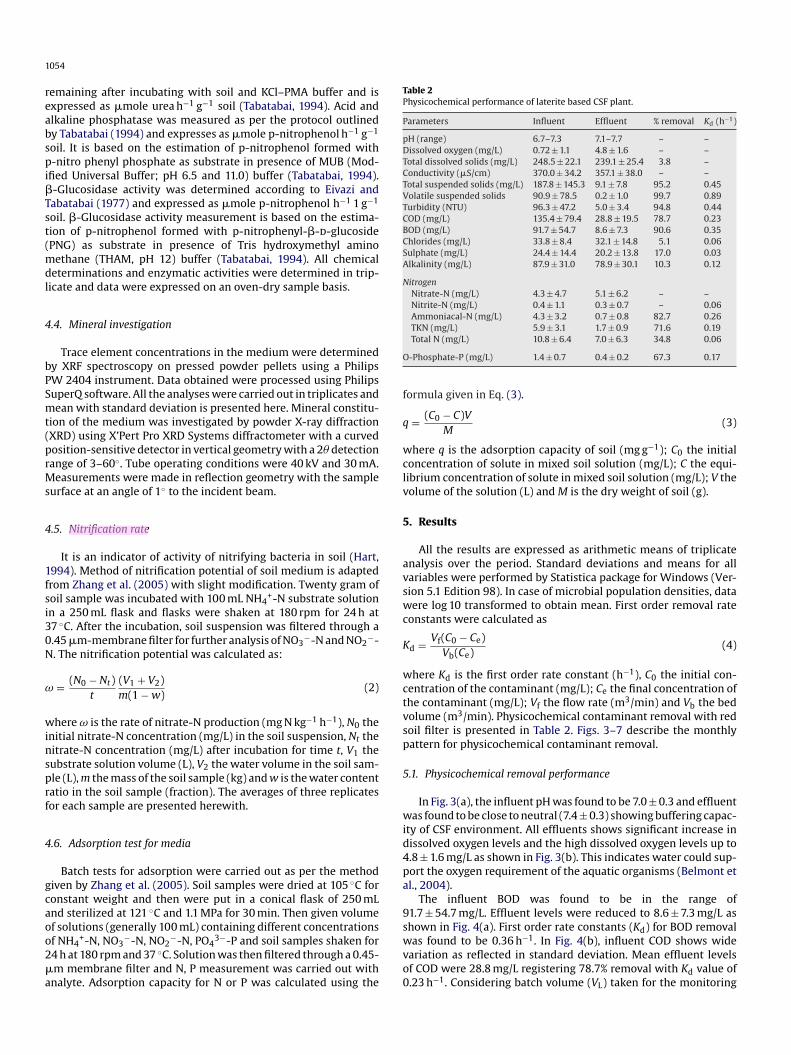
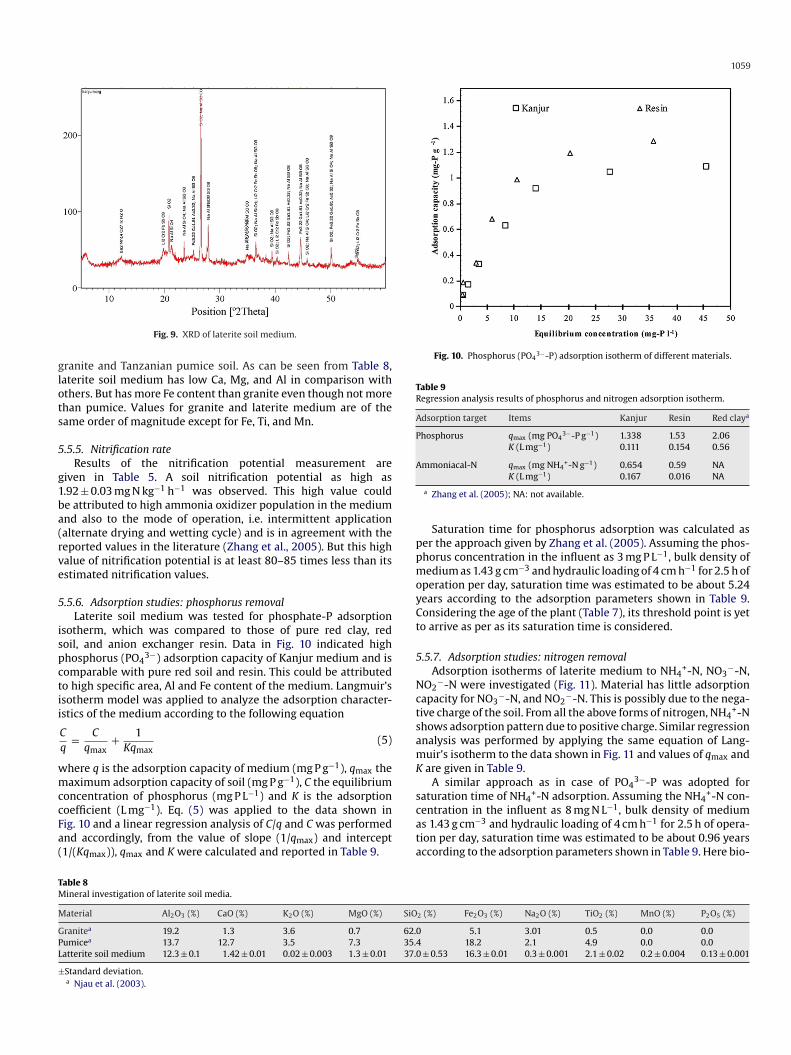
.5.4. MineralogyX-ray diffraction of (XRD) analysis of the medium has
hown the presence of quartz (SiO2), montmorillonite clayMgO·Al2O3·5SiO2·(H2O)x}, albite (NaAlSi3O8) and hematiteFig. 9). Presence of hematite (Fe2O3) has given the medium itsharacteristic red color. Table 8 shows the composition of mediums determined by XRF. This has been compared with Japanese
Table 7Enzymatic properties of laterite soil medium.
Parameters Values
Beta glucosidase 0.53 ± 0.02(�mole PNP/g soil h) C: 4 × 10⁻⁴
Acid phosphatases 0.88 ± 0.05(�mole PNP/g soil h) C: 0.05
Alkaline phosphatases 1.33 ± 0.17(�mole PNP/g soil h) C: 0.04
Dehydrogenase 1.15 ± 0.11(�mole TPF/g soil h) C: 3 × 10⁻⁵
Urea hydrolysed 6.55 ± 0.11(�mole urea/g soil h) C: 4 × 10⁻³
±Standard deviation.
1059
glots
5
g1ba(rve
5
ispctii
wmccFa(
Fig. 10. Phosphorus (PO43−-P) adsorption isotherm of different materials.
Table 9Regression analysis results of phosphorus and nitrogen adsorption isotherm.
Adsorption target Items Kanjur Resin Red claya
Phosphorus qmax (mg PO43−-P g−1) 1.338 1.53 2.06
K (L mg−1) 0.111 0.154 0.56
A
ppmoyCt
5
NctsamK
TM
M
GPL
±
Fig. 9. XRD of laterite soil medium.
ranite and Tanzanian pumice soil. As can be seen from Table 8,aterite soil medium has low Ca, Mg, and Al in comparison withthers. But has more Fe content than granite even though not morehan pumice. Values for granite and laterite medium are of theame order of magnitude except for Fe, Ti, and Mn.
.5.5. Nitrification rateResults of the nitrification potential measurement are
iven in Table 5. A soil nitrification potential as high as.92 ± 0.03 mg N kg−1 h−1 was observed. This high value coulde attributed to high ammonia oxidizer population in the mediumnd also to the mode of operation, i.e. intermittent applicationalternate drying and wetting cycle) and is in agreement with theeported values in the literature (Zhang et al., 2005). But this highalue of nitrification potential is at least 80–85 times less than itsstimated nitrification values.
.5.6. Adsorption studies: phosphorus removalLaterite soil medium was tested for phosphate-P adsorption
sotherm, which was compared to those of pure red clay, redoil, and anion exchanger resin. Data in Fig. 10 indicated highhosphorus (PO4
3−) adsorption capacity of Kanjur medium and isomparable with pure red soil and resin. This could be attributedo high specific area, Al and Fe content of the medium. Langmuir’ssotherm model was applied to analyze the adsorption character-stics of the medium according to the following equation
C
q= C
qmax+ 1
Kqmax(5)
here q is the adsorption capacity of medium (mg P g−1), qmax theaximum adsorption capacity of soil (mg P g−1), C the equilibrium
oncentration of phosphorus (mg P L−1) and K is the adsorptionoefficient (L mg−1). Eq. (5) was applied to the data shown inig. 10 and a linear regression analysis of C/q and C was performednd accordingly, from the value of slope (1/qmax) and intercept1/(Kqmax)), qmax and K were calculated and reported in Table 9.
scata
able 8ineral investigation of laterite soil media.
aterial Al2O3 (%) CaO (%) K2O (%) MgO (%) SiO
ranitea 19.2 1.3 3.6 0.7 62.0umicea 13.7 12.7 3.5 7.3 35.4atterite soil medium 12.3 ± 0.1 1.42 ± 0.01 0.02 ± 0.003 1.3 ± 0.01 37.0
Standard deviation.a Njau et al. (2003).
mmoniacal-N qmax (mg NH4+-N g−1) 0.654 0.59 NA
K (L mg−1) 0.167 0.016 NA
a Zhang et al. (2005); NA: not available.
Saturation time for phosphorus adsorption was calculated aser the approach given by Zhang et al. (2005). Assuming the phos-horus concentration in the influent as 3 mg P L−1, bulk density ofedium as 1.43 g cm−3 and hydraulic loading of 4 cm h−1 for 2.5 h of
peration per day, saturation time was estimated to be about 5.24ears according to the adsorption parameters shown in Table 9.onsidering the age of the plant (Table 7), its threshold point is yeto arrive as per as its saturation time is considered.
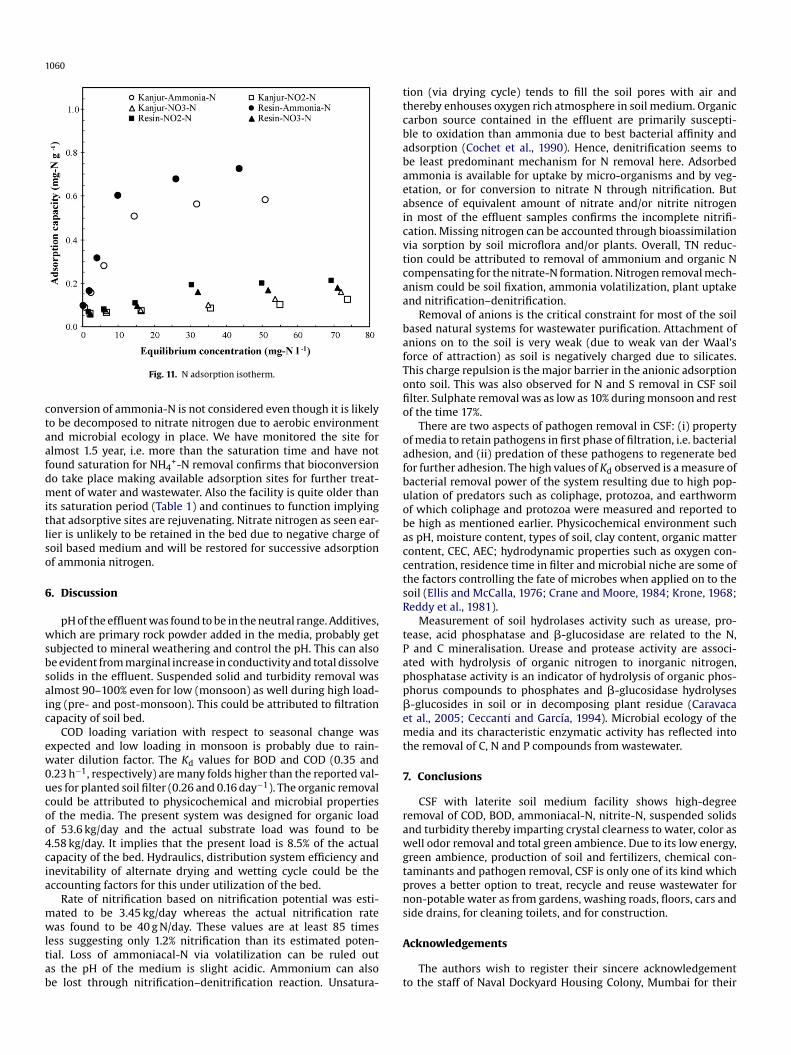
.5.7. Adsorption studies: nitrogen removalAdsorption isotherms of laterite medium to NH4
+-N, NO3−-N,
O2−-N were investigated (Fig. 11). Material has little adsorption
apacity for NO3−-N, and NO2
−-N. This is possibly due to the nega-ive charge of the soil. From all the above forms of nitrogen, NH4
+-Nhows adsorption pattern due to positive charge. Similar regressionnalysis was performed by applying the same equation of Lang-uir’s isotherm to the data shown in Fig. 11 and values of qmax andare given in Table 9.
A similar approach as in case of PO43−-P was adopted for
+ +
aturation time of NH4 -N adsorption. Assuming the NH4 -N con-entration in the influent as 8 mg N L−1, bulk density of mediums 1.43 g cm−3 and hydraulic loading of 4 cm h−1 for 2.5 h of opera-ion per day, saturation time was estimated to be about 0.96 yearsccording to the adsorption parameters shown in Table 9. Here bio-2 (%) Fe2O3 (%) Na2O (%) TiO2 (%) MnO (%) P2O5 (%)
5.1 3.01 0.5 0.0 0.018.2 2.1 4.9 0.0 0.0
± 0.53 16.3 ± 0.01 0.3 ± 0.001 2.1 ± 0.02 0.2 ± 0.004 0.13 ± 0.001
1060
ctaafdmitlso
6
wsbsaic
ew0ucoo4cia
mwltab
ttcbabaeaicvtcaa
bafTofio
oafbuobacctsR
tPapp�emt
7
rawgtpns
Fig. 11. N adsorption isotherm.
onversion of ammonia-N is not considered even though it is likelyo be decomposed to nitrate nitrogen due to aerobic environmentnd microbial ecology in place. We have monitored the site forlmost 1.5 year, i.e. more than the saturation time and have notound saturation for NH4
+-N removal confirms that bioconversiono take place making available adsorption sites for further treat-ent of water and wastewater. Also the facility is quite older than
ts saturation period (Table 1) and continues to function implyinghat adsorptive sites are rejuvenating. Nitrate nitrogen as seen ear-ier is unlikely to be retained in the bed due to negative charge ofoil based medium and will be restored for successive adsorptionf ammonia nitrogen.
. Discussion
pH of the effluent was found to be in the neutral range. Additives,hich are primary rock powder added in the media, probably get
ubjected to mineral weathering and control the pH. This can alsoe evident from marginal increase in conductivity and total dissolveolids in the effluent. Suspended solid and turbidity removal waslmost 90–100% even for low (monsoon) as well during high load-ng (pre- and post-monsoon). This could be attributed to filtrationapacity of soil bed.
COD loading variation with respect to seasonal change wasxpected and low loading in monsoon is probably due to rain-ater dilution factor. The Kd values for BOD and COD (0.35 and.23 h−1, respectively) are many folds higher than the reported val-es for planted soil filter (0.26 and 0.16 day−1). The organic removalould be attributed to physicochemical and microbial propertiesf the media. The present system was designed for organic loadf 53.6 kg/day and the actual substrate load was found to be.58 kg/day. It implies that the present load is 8.5% of the actualapacity of the bed. Hydraulics, distribution system efficiency andnevitability of alternate drying and wetting cycle could be theccounting factors for this under utilization of the bed.
Rate of nitrification based on nitrification potential was esti-ated to be 3.45 kg/day whereas the actual nitrification rate
as found to be 40 g N/day. These values are at least 85 timesess suggesting only 1.2% nitrification than its estimated poten-ial. Loss of ammoniacal-N via volatilization can be ruled outs the pH of the medium is slight acidic. Ammonium can alsoe lost through nitrification–denitrification reaction. Unsatura-
A
t
ion (via drying cycle) tends to fill the soil pores with air andhereby enhouses oxygen rich atmosphere in soil medium. Organicarbon source contained in the effluent are primarily suscepti-le to oxidation than ammonia due to best bacterial affinity anddsorption (Cochet et al., 1990). Hence, denitrification seems toe least predominant mechanism for N removal here. Adsorbedmmonia is available for uptake by micro-organisms and by veg-tation, or for conversion to nitrate N through nitrification. Butbsence of equivalent amount of nitrate and/or nitrite nitrogenn most of the effluent samples confirms the incomplete nitrifi-ation. Missing nitrogen can be accounted through bioassimilationia sorption by soil microflora and/or plants. Overall, TN reduc-ion could be attributed to removal of ammonium and organic Nompensating for the nitrate-N formation. Nitrogen removal mech-nism could be soil fixation, ammonia volatilization, plant uptakend nitrification–denitrification.
Removal of anions is the critical constraint for most of the soilased natural systems for wastewater purification. Attachment ofnions on to the soil is very weak (due to weak van der Waal’sorce of attraction) as soil is negatively charged due to silicates.his charge repulsion is the major barrier in the anionic adsorptionnto soil. This was also observed for N and S removal in CSF soillter. Sulphate removal was as low as 10% during monsoon and restf the time 17%.
There are two aspects of pathogen removal in CSF: (i) propertyf media to retain pathogens in first phase of filtration, i.e. bacterialdhesion, and (ii) predation of these pathogens to regenerate bedor further adhesion. The high values of Kd observed is a measure ofacterial removal power of the system resulting due to high pop-lation of predators such as coliphage, protozoa, and earthwormf which coliphage and protozoa were measured and reported toe high as mentioned earlier. Physicochemical environment suchs pH, moisture content, types of soil, clay content, organic matterontent, CEC, AEC; hydrodynamic properties such as oxygen con-entration, residence time in filter and microbial niche are some ofhe factors controlling the fate of microbes when applied on to theoil (Ellis and McCalla, 1976; Crane and Moore, 1984; Krone, 1968;eddy et al., 1981).
Measurement of soil hydrolases activity such as urease, pro-ease, acid phosphatase and �-glucosidase are related to the N,
and C mineralisation. Urease and protease activity are associ-ted with hydrolysis of organic nitrogen to inorganic nitrogen,hosphatase activity is an indicator of hydrolysis of organic phos-horus compounds to phosphates and �-glucosidase hydrolyses-glucosides in soil or in decomposing plant residue (Caravacat al., 2005; Ceccanti and García, 1994). Microbial ecology of theedia and its characteristic enzymatic activity has reflected into
he removal of C, N and P compounds from wastewater.
. Conclusions
CSF with laterite soil medium facility shows high-degreeemoval of COD, BOD, ammoniacal-N, nitrite-N, suspended solidsnd turbidity thereby imparting crystal clearness to water, color asell odor removal and total green ambience. Due to its low energy,
reen ambience, production of soil and fertilizers, chemical con-aminants and pathogen removal, CSF is only one of its kind whichroves a better option to treat, recycle and reuse wastewater foron-potable water as from gardens, washing roads, floors, cars andide drains, for cleaning toilets, and for construction.
cknowledgements
The authors wish to register their sincere acknowledgemento the staff of Naval Dockyard Housing Colony, Mumbai for their

htcTy
R
A
A
B
B
B
B
B
C
C
C
C
C
C
C
D
D
D
D
EE
F
F
G
G
G
H
H
I
K
K
K
L
L
M
M
M
N
N
N
N
O
P
P
P
R
S
S
S
T
T
T
V
elp in construction, operation, maintenance and monitoring ofhe plant. We would like to extent our sincere thanks to Sophisti-ated Analytical Instrumentation Facility (SAIF), Indian Institute ofechnology-Bombay, Mumbai for their assistance during the anal-sis of samples.
eferences
kbulut, S., Saglamer, A., 2004. Modification of hydraulic conductivity in granularsoils using waste materials. Waste Manage. 24 (5), 494–499.
merican Public Health Association (APHA), 2003. Standard Methods for the Exami-nation of Water and Wastewater. American Public Health Association, AmericanWater Works Association and Water Pollution Control Federation, Washington,DC.
ahgat, M., Dewedar, M.A., Zayed, A., 1999. Sand-filters used for wastewatertreatment: buildup and distribution of microorganisms. Water Res. 33 (8),1949–1955.
elmont, M.A., Metcalfe, C.D., 2002. Contaminacion del agua enla cuencal del rioTexcoco. In: Proceedings of the International Conference: AMBAKUCHA 2002.The first Intercultural Conference on the Integrated Management of HumanSettlements within Watersheds, Otavalo, Ecuador, May 28–31, 2002.
elmont, M.A., Cantellano, E., Thompson, S., Williamson, M., Sanchez, Abel, Chris, D.,Metcalfe, C.D., 2004. Treatment of domestic wastewater in a pilot scale naturaltreatment system in central Mexico. Ecol. Eng. 23, 299–311.
lack, C.A. (Ed.), 1965. Methods of Soil Analysis, Part 2. Chemical and MicrobiologicalProperties. American Society of Agronomy, Madison.
ouwer, H., 1985. Renovation of wastewater with rapid infiltration land treatmentsystems. In: Asano, T. (Ed.), Artificial Recharge of Groundwater. Butterworth,Boston, MA, pp. 249–282.
alderon, J.F., Jackson, L.E., Scow, K.M., Rolston, D.E., 2000. Microbial responses tosimulated tillage in cultivated and uncultivated soils. Soil Biol. Biochem. 32,1547–1549.
aravaca, F., Alguacil, M.M., Torres, P., Roldan, A., 2005. Plant type mediates rhizo-spheric microbial activities and soil aggregation in a semiarid Mediterraneansalt marsh. Geoderma 124 (3/4), 375–382.
eccanti, B., García, C., 1994. Coupled chemical and biochemical methodologies tocharacterize a composting process and the humic substances. In: Senesi, N.,Miano, T. (Eds.), Humic Substances in the Global Environment and Its Implicationon Human Health. Elsevier, New York, pp. 1279–1285.
hapman, H.D., 1965. Cation exchange capacity. In: Black, C.A., et al. (Eds.), Meth-ods of Soil Analysis. Agronomy 9. American Society of Agronomy, Madison, pp.891–901.
ochet, C., Derangere, D., Rousselle, T., 1990. Soil absorption systems and nitrogenremoval. Water Sci. Technol. 22 (3/4), 109–116.
olombo, C., Palumbo, G., Sannino, F., Gianfreda, L., 2002. Chemical and biochemicalindicators of managed agricultural soils. In: 17th World Congress of Soil Science,Bangkok, Thailand, 1740####, pp. 1–9.
rane, S.R., Moore, J.A., 1984. Bacterial pollution of groundwater: a review. WaterAir Soil Pollut. 22, 67–83.
ick, R.P., 1997. Soil enzyme activities as integrative indicators of soil health. In:Pankhurst, C.E., Doube, B.M., Gupta, V.V.S.R. (Eds.), Biological Indicators of SoilHealth. CAB International, Wallingford, USA, pp. 121–156.
ick, W.A., Tabatabai, M.A., 1993. Significance and potential uses of soil enzymes.In: Metting, F.B. (Ed.), Soil Microbial Ecology: Application in Agricultural andEnvironmental Management. Marcel Dekker, New York, pp. 95–125.
rijber, R.A., Doran, J.W., Parkhurst, A.M., Lyon, D.J., 2000. Changes in soil microbialcommunity structure with tillage under long-term wheat-fallow management.Soil Biol. Biochem. 32, 1419–1430.
ubbin, W.E., Penn, M.G., Hodson, M.E., 2006. Edaphic influences on plant commu-nity adaptation in the Chiquibul forest of Belize. Geoderma 131, 76–88.
ivazi, F., Tabatabai, M.A., 1977. Phosphatases in soils. Soil Biol. Biochem. 9, 167–172.llis, J.R., McCalla, T.M., 1976. Fate of pathogens in soils receiving animal wastes—a
review. ASAE Paper No. 762560. ASAE, St. Joseph, MI.allowfield, H.J., Garrett, M.K., 1985. The treatment of wastes by algal culture. J. Appl.
Bact. Symp. Suppl., 187S–205S.uentes, E.R., Constantino, C.L., Silva, E.E., Dendooven, L., 2002. Characteristics and
carbon and nitrogen dynamics in soil irrigated with wastewater for differentlengths of time. Bioresour. Technol. 85, 179–187.
ee, G.W., Bauder, J.W., 1986. Particle size analysis. In: Klute, A. (Ed.), Methods ofSoil Analysis, Part I. Agron. Monogr. 9, 2nd ed. ASA and SSSA, Madison, WI, pp.383–411.
ianfreda, L., Bollag, J.M., 1996. Influence of natural and anthropogenic factors onenzyme activity in soil. In: Stotzky, G., Bollag, J.M. (Eds.), Soil Biochemistry, vol.9. Marcel Dekker, New York, pp. 123–194.
ianfreda, L., Rao, M.A., Piotrowska, A., Palumbo, G., Colombo, C., 2005. Soil enzymeactivities as affected by anthropogenic alterations: intensive agricultural prac-tices and organic pollution. Sci. Total Environ. 341, 265–279.
W
Z
1061
art, S.C., Stark, J.M., Davidson, E.A., Firestone, M.K., 1994. Nitrogen mineralizationimmobilization and nitrification. In: Weaver, R.W., et al. (Eds.), Methods of SoilAnalysis. Part 2: Storage for Short Periods at Room Temperature. SSSA Book Ser.5. SSSA, Madison, WI, pp. 985–1018.
eistad, A., Paruch, A.M., Vråle, L., Ádám, K., Jenssen, P.D., 2006. A high-performancecompact filter system treating domestic wastewater. Ecol. Eng. 28 (4), 374–379.
ngham, E.R., 1994. Protozoa. In: Mickelson, S.H., Bigham, J.E. (Eds.), Methods of SoilAnalysis. Part 2: Microbial and Biochemical Properties. Soil Science Society ofAmerica, Madison, WI, pp. 491–515.
adam, A.M., Oza, G.H., Nemade, P.D., Shankar, H.S., 2008. Pathogen removal frommunicipal wastewater in constructed soil filter. Ecol. Eng. 33, 37–44.
ern, J., Idler, C., 1999. Treatment of domestic and agricultural wastewater by reedsystems. Ecol. Eng. 12, 13–25.
rone, R.B., 1968. In: Wilson, C.W., Beckett, F.E. (Eds.), Municipal Sewage Effluent forIrrigation. Louisiana Tech. Alumni Fndtn., Ruston, LA, pp. 75.
angmuir, D., 1997. Aqueous Environmental Geochemistry. Published by Prentice-Hall, Inc., New Jersey, USA, pp. 403–430.
uanmanee, S., Attanandana, T., Masunaga, T., Wakatsuki, T., 2001. The efficiency of amulti-soil-layering system on domestic wastewater treatment during the ninthand tenth years of operation. Ecol. Eng. 18, 185–199.
cCarthy, A.J.M., 1987. Lignocellulose-degrading actinomycetes. FEMS Microbiol.Rev. 46, 145–163.
ehlich, A., 1948. Determination of cation and anion exchange properties of cells.Soil Sci. 66, 429–445.
etcalf & Eddy Inc., 1995. Wastewater Engineering: Treatment, Disposal and Reuse.Revised by Tchobanglous G., Burton, F., 3rd edn., Tata McGraw-Hill PublishingCo., New Delhi.
annipieri, P., Kandeler, E., Ruggiero, P., 2002. Enzyme activities and microbiologicaland biochemical processes in soil. In: Burns, R.P., Dick, R.P. (Eds.), Enzymes in theEnvironmental Activity, Ecology and Applications. Marcel Dekker, New York, pp.1–33.
emade, P.D., Kadam, A.M., Oza, G.H., Dutta, S.M., Shankar, H.S., 2007. Adsorption ofarsenite As (III) by soil biotechnology and hydrous ferric oxide. In: InternationalConference on Water Management and Technology Applications in DevelopingCountries, Kuala Lumpur, Malaysia, 14–16 May 2007.
emade, P.D., Kadam, A.M., Shankar, H.S., 2008. Arsenic and iron removal fromwater using constructed soil filter—a novel approach. Asia-Pac. J. Chem. Eng.3, 497–502.
jau, K.N., Minja, R.J.A., Katima, J.H.Y., 2003. Pumice soil: a potential wetland sub-strate for treatment of domestic wastewater. Water Sci. Tech. 48 (5), 85–92.
u, Z., Sun, T., Li, P., Yediler, A., Yang, G., Kettrup, A., 1997. A production-scale ecolog-ical engineering forest system for the treatment and reutilization of municipalwastewater in the Inner Mongolia, China. Ecol. Eng. 9 (1/2), 71–88.
attanaik, B.R., 2001. Studies in waste water processing in biofilters. Ph.D. The-sis. Chemical Engineering Department, Indian Institute of Technology-Bombay,India.
attanaik, B.R., Gupta, A., Shankar, H.S., 2004. Residence time distribution model forsoil filters. Water Environ. Res. 76, 168–174.
erks, A.R., Bauer, G.A., Devnani, S., Bhmbane, E., 2004. Wastewater flow monitoringfor Mumbai, India. Internal Report for R.V. Anderson Associates Ltd., Ottawa,Canada, pp. 1–6.
eddy, K.R., Khallel, R., Overcash, M.R., 1981. Behavior and transport of microbialpathogens and indicator organisms in soils treated with organic wastes. J. Envi-ron. Qual. 10, 255–266.
chmidt, E.L., Belser, L.W., 1994. Autotrophic nitrifying bacteria. In: Mickelson, S.H.,Bigham, J.E. (Eds.), Methods of Soil Analysis. Part 2: Microbial and BiochemicalProperties. Soil Science Society of America, Madison, WI, pp. 159–177.
mith, R.G., Schroeder, E.D., 1985. Field studies of the overland flow process for thetreatment of raw and primary treated municipal wastewater. J. Water Pollut.Control Federation 57 (7), 785–794.
hankar, H.S., Bhawalkar, U.S., Pattanaik, B.R., 2005. US Patent: Process for Treatmentof Organic Wastes. US Patent No.: 6890438, www.uspto.gov (issue date: 10 May2005).
abatabai, M.A., 1994. Soil enzymes. In: Mickelson, S.H., Bigham, J.E. (Eds.), Meth-ods of Soil Analysis. Part 2: Microbial and Biochemical Properties. Soil ScienceSociety of America, Madison, WI, pp. 775–826.
iedje, J.M., 1994. Denitrifier. In: Mickelson, S.H., Bigham, J.E. (Eds.), Methods of SoilAnalysis. Part 2: Microbial and Biochemical Properties. Soil Science Society ofAmerica, Madison, WI, pp. 245–267.
rasar-Cepeda, C., Leiros, M.C., Seoane, S., Gil-Sotres, F., 2000. Limitation of soilenzymes as indicators of soil pollution. Soil Biol. Biochem. 32, 1867–1875.
an Beelan, P.V., Doelman, P., 1997. Significance and application of microbial toxicitytests in assessing ecotoxicological risks of contaminants in soil and sediments.
Chemosphere 43, 455–499.ellington, E.M.H., Toth, I.K., 1994. Actinomycetes. In: Mickelson, S.H., Bigham, J.E.(Eds.), Methods of Soil Analysis. Part 2: Microbial and Biochemical Properties.Soil Science Society of America, Madison, WI, pp. 269–290.
hang, J., Huang, C., Shi, H., Hu, H., 2005. Nitrogen removal enhanced by intermittentoperation in a subsurface wastewater infiltration system. Ecol. Eng. 25, 419–428.