Treasury Management Strategy - Orkney Islands Council
59
Treasury Management Strategy Statement and Annual Investment Strategy Orkney Islands Council 2021/2022
-
Upload
khangminh22 -
Category
Documents
-
view
1 -
download
0
Transcript of Treasury Management Strategy - Orkney Islands Council

Treasury Management Strategy Statement and Annual Investment Strategy Orkney Islands Council 2021/2022

Contents 1 Introduction .................................................................................................................... 3
1.1 Background ............................................................................................................. 3
1.2 Reporting requirements ........................................................................................... 4
1.3 Treasury Management Strategy for 2021/22 ........................................................... 5
1.4 Training ................................................................................................................... 5
1.5 Treasury management consultants .......................................................................... 5
2 The Capital Prudential Indicators 2021/22 – 2023/24 ..................................................... 6
2.1 Capital expenditure ................................................................................................. 6
2.2 The Council’s borrowing need (the Capital Financing Requirement) ........................ 6
2.3 Core funds and expected investment balances ....................................................... 7
2.4 Statutory repayment of loans fund advances ........................................................... 8
3 Borrowing ................................................................................................................... 9
3.1 Current portfolio position ......................................................................................... 9
3.2 Treasury Indicators: limits to borrowing activity ...................................................... 11
3.3 Prospects for interest rates .................................................................................... 12
3.4 Borrowing strategy ................................................................................................ 15
3.5 Policy on borrowing in advance of need ................................................................ 16
3.6 Debt Rescheduling ................................................................................................ 16
3.7 Municipal Bond Agency ......................................................................................... 16
4 Annual Investment Strategy ...................................................................................... 17
4.1 Investment policy ................................................................................................... 17
4.2 Creditworthiness policy .......................................................................................... 18
4.3 Other limits ............................................................................................................ 20
4.4 Investment strategy ............................................................................................... 20
4.5 Investment performance / risk benchmarking ........................................................ 23
4.6 End of year investment report ................................................................................ 24
4.7 External fund managers ........................................................................................ 24
5 Appendices .............................................................................................................. 25
5.1 The Capital Prudential And Treasury Indicators 2021/22 – 2023/24 ...................... 25
5.2 Interest Rate Forecasts 2020-2024 ...................................................................... 28
5.3 Economic Background ........................................................................................... 28
5.4 Treasury Management Practice (TMP1): Permitted Investments ........................... 36
5.5 Treasury Management Practice (TMP1): Credit and Counterparty Risk Management .................................................................................................................................... 51
5.6 Approved Countries for Investments ...................................................................... 57
5.7 Treasury Management Scheme of Delegation ....................................................... 58
5.8 The Treasury Management Role of The Section 95 Officer ................................... 59

1 Introduction
1.1 Background
The Council is required to operate a balanced budget, which broadly means that cash raised during the year will meet cash expenditure. Part of the treasury management operation is to ensure that this cash flow is adequately planned, with cash being available when it is needed. Surplus monies are invested in low risk counterparties or instruments commensurate with the Council’s low risk appetite, providing adequate liquidity initially before considering investment return.
The second main function of the treasury management service is the funding of the Council’s capital plans. These capital plans provide a guide to the borrowing need of the Council, essentially the longer-term cash flow planning, to ensure that the Council can meet its capital spending obligations. This management of longer-term cash may involve arranging long or short-term loans or using longer-term cash flow surpluses. On occasion, when it is prudent and economic, any debt previously drawn may be restructured to meet Council risk or cost objectives.
The contribution the treasury management function makes to the authority is critical, as the balance of debt and investment operations ensure liquidity or the ability to meet spending commitments as they fall due, either on day-to-day revenue or for larger capital projects. The treasury operations will see a balance of the interest costs of debt and the investment income arising from cash deposits affecting the available budget. Since cash balances generally result from reserves and balances, it is paramount to ensure adequate security of the sums invested, as a loss of principal will in effect result in a loss to the General Fund Balance.
Whilst any loans to third parties, commercial investment initiatives or other non-financial investments will impact on the treasury function, these activities are generally classed as non-treasury, arising mainly from investing activities of the Strategic Reserve Fund, and are separate from the day to day treasury management activities.
CIPFA defines treasury management as:
“The management of the local authority’s borrowing, investments and cash flows, its banking, money market and capital market transactions; the effective control of the risks associated with those activities; and the pursuit of optimum performance consistent with those risks.”
Revised reporting is required for the 2021/22 reporting cycle due to revisions of the CIPFA Prudential Code and the CIPFA Treasury Management Code. The primary reporting changes include the introduction of a capital strategy, to provide a longer-term focus to the capital plans, and greater reporting requirements surrounding any commercial activity if that is going to be undertaken. The capital strategy is being reported separately.

4
1.2 Reporting requirements
1.2.1 Capital Strategy
The CIPFA 2017 Prudential and Treasury Management Codes require all local authorities to prepare a capital strategy report which will provide the following:
• a high-level long-term overview of how capital expenditure, capital financing and treasury management activity contribute to the provision of services
• an overview of how the associated risk is managed
• the implications for future financial sustainability
The aim of this capital strategy is to ensure that all elected members on the full council fully understand the overall long-term policy objectives and resulting capital strategy requirements, governance procedures and risk appetite.
1.2.2 Treasury Management reporting
The Council is currently required to receive and approve, as a minimum, three main treasury reports each year, which incorporate a variety of policies, estimates and actuals.
a. Prudential and treasury indicators and treasury strategy (this report) - The first, and most important report is forward looking and covers:
• the capital plans, (including prudential indicators).
• a policy for the statutory repayment of debt, (how residual capital expenditure is charged to revenue over time).
• the treasury management strategy, (how the investments and borrowings are to be organised), including treasury indicators; and
• a permitted investment strategy, (the parameters on how investments are to be managed).
b. A mid-year treasury management report – This is primarily a progress report and will update members on the capital position, amending prudential indicators as necessary, and whether any policies require revision. In addition, this Council will receive quarterly update reports.
c. An annual treasury report – This is a backward-looking review document and provides details of a selection of actual prudential and treasury indicators and actual treasury operations compared to the estimates within the strategy.
Scrutiny
The above reports are required to be adequately scrutinised before being recommended to the Council. This role is undertaken by the Policy and Resources Committee.

5
1.3 Treasury Management Strategy for 2021/22
The strategy for 2021/22 covers two main areas:
Capital issues
• the capital expenditure plans and the associated prudential indicators.
• the loans fund repayment policy.
Treasury management issues
• the current treasury positions.
• treasury indicators which limit the treasury risk and activities of the Council.
• prospects for interest rates.
• the borrowing strategy.
• policy on borrowing in advance of need.
• debt rescheduling.
• the investment strategy.
• creditworthiness policy, and
• the policy on use of external service providers.
These elements cover the requirements of the Local Government in Scotland Act 2003, the CIPFA Prudential Code, the CIPFA Treasury Management Code and Scottish Government loans fund repayment regulations and investment regulations.
1.4 Training
The CIPFA Code requires the responsible officer to ensure that members with responsibility for treasury management receive adequate training in treasury management. This especially applies to members responsible for scrutiny. The members have undertaken taken training during 2020/2021 and further training will be arranged as required.
The training needs of treasury management officers are periodically reviewed.
1.5 Treasury management consultants
The Council uses Link Group, Treasury solutions as its external treasury management advisors.
The Council recognises that responsibility for treasury management decisions remains with the organisation at all times and will ensure that undue reliance is not placed upon the services of our external service providers. All decisions will be undertaken with regards to all available information, including, but not solely, our treasury advisers.
It also recognises that there is value in employing external providers of treasury management services in order to acquire access to specialist skills and resources. The Council will ensure that the terms of their appointment and the methods by which their value will be assessed are properly agreed, documented and subjected to regular review.

6
2 The Capital Prudential Indicators 2021/22 – 2023/24 The Council’s capital expenditure plans are the key driver of treasury management activity. The output of the capital expenditure plans is reflected in the prudential indicators, which are designed to assist members’ overview and confirm capital expenditure plans.
2.1 Capital expenditure
This prudential indicator is a summary of the Council’s capital expenditure plans, both those agreed previously, and those forming part of this budget cycle. Members are asked to approve the capital expenditure forecasts effective as at 1 April 2021:
Capital expenditure £m
2019/2 Actual
2020/21 Estimate
2021/22 Estimate
2022/23Estimate
2023/24Estimate
Non-HRA 18.373 20.712 15.339 11.345 6.463
HRA 1.547 5.992 2.537 0.000 0.000
Total 19.920 26.704 17.876 11.345 6.463
Other long-term liabilities - the above financing need excludes other long-term liabilities, such as PFI and leasing arrangements that already include borrowing instruments.
The table below summarises the above capital expenditure plans and how these plans are being financed by capital or revenue resources. Any shortfall of resources results in a funding borrowing need.
Financing of capital expenditure £m
2019/20 Actual
2020/21Estimate
2021/22Estimate
2022/23Estimate
2023/24Estimate
Capital receipts 0.175 0.225 0.150 0.150 0.150
Capital grants 11.362 11.284 5.720 5.777 5.000
Capital reserves 0.000 1.191 4.340 2.972 0.000
Revenue 1.100 1.392 0.569 0.569 0.569
Net financing need for the year
7.283 12.612 7.097 1.877 0.744
2.2 The Council’s borrowing need (the Capital Financing Requirement)
The second prudential indicator is the Council’s Capital Financing Requirement (CFR). The CFR is simply the total historic outstanding capital expenditure which has not yet been paid for from either revenue or capital resources. It is essentially a measure of the Council’s indebtedness and so its underlying borrowing need. Any capital

7
expenditure above, which has not immediately been paid for through a revenue or capital resource, will increase the CFR.
The CFR does not increase indefinitely, as prudent annual repayments from revenue need to be made which reflect the useful life of capital assets financed by borrowing. From 1.4.16, authorities may choose whether to use scheduled debt amortisation, (loans pool charges), or another suitable method of calculation in order to repay borrowing.
The CFR includes any other long-term liabilities (e.g. PFI schemes, finance leases). Whilst these increase the CFR, and therefore the Council’s borrowing requirement, these types of scheme include a borrowing facility by the PFI, PPP lease provider and so the Council is not required to separately borrow for these schemes. The Council currently has no such schemes within the CFR.
The Council is asked to approve the CFR projections below:
£m 2019/20 Actual
2020/21 Estimate
2021/22 Estimate
2022/23 Estimate
2023/24 Estimate
Capital Financing Requirement
CFR – non housing
39.609 48.896 51.708 51.700 50.511
CFR – housing 11.016 12.650 14.707 14.142 13.577
Total CFR 50.625 61.546 66.415 65.842 64.088
Movement in CFR 4.733 10.921 4.869 (0.573) (1.754)
Movement in CFR represented by
Net financing need for the year (above)
7.283 12.612 7.097 1.877 0.744
Less loan fund repayments and other financing movements
(2.550) (1.691) (2.228) (2.450) (2.498)
Movement in CFR 4.733 10.921 4.869 (0.573) (1.754)
2.3 Core funds and expected investment balances
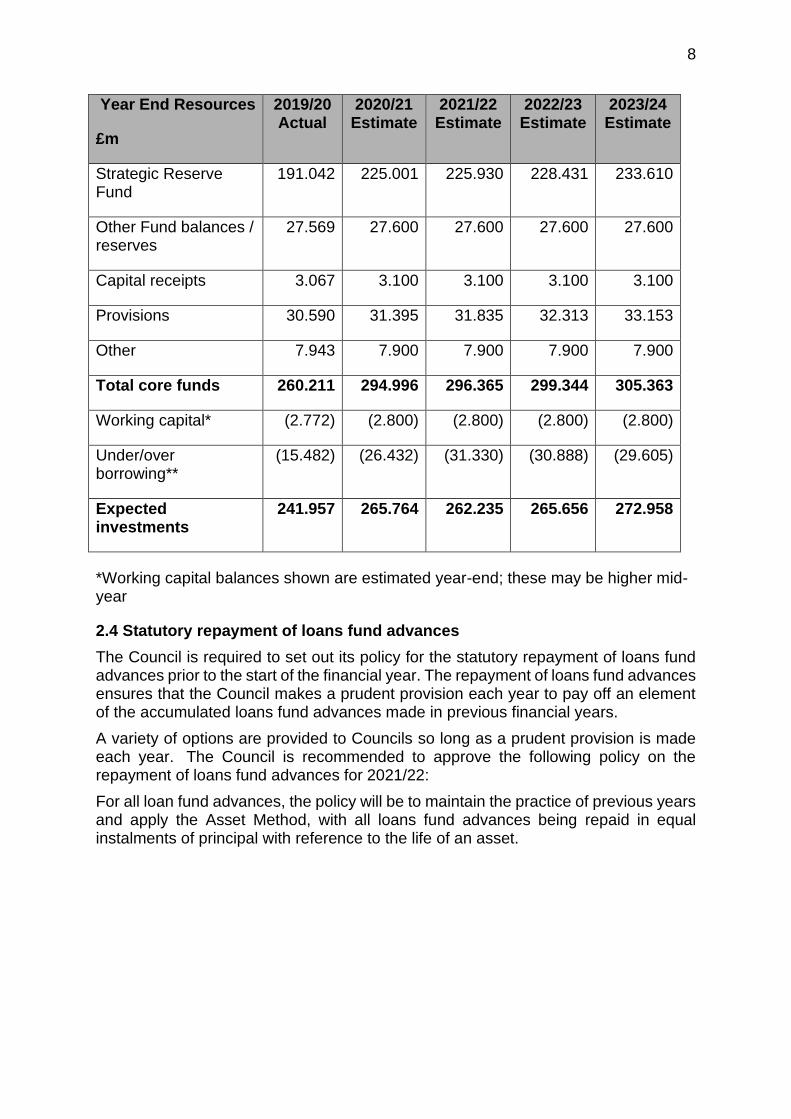
The application of resources (capital receipts, reserves etc.) to either finance capital expenditure or other budget decisions to support the revenue budget will have an ongoing impact on investments unless resources are supplemented each year from new sources (asset sales etc.). Detailed below are estimates of the year-end balances for each resource and anticipated day-to-day cash flow balances.
8
Year End Resources
£m
2019/20Actual
2020/21 Estimate
2021/22 Estimate
2022/23 Estimate
2023/24 Estimate
Strategic Reserve Fund
191.042 225.001 225.930 228.431 233.610
Other Fund balances / reserves
27.569 27.600 27.600 27.600 27.600
Capital receipts 3.067 3.100 3.100 3.100 3.100
Provisions 30.590 31.395 31.835 32.313 33.153
Other 7.943 7.900 7.900 7.900 7.900
Total core funds 260.211 294.996 296.365 299.344 305.363
Working capital* (2.772) (2.800) (2.800) (2.800) (2.800)
Under/over borrowing**
(15.482) (26.432) (31.330) (30.888) (29.605)
Expected investments
241.957 265.764 262.235 265.656 272.958
*Working capital balances shown are estimated year-end; these may be higher mid-year
2.4 Statutory repayment of loans fund advances
The Council is required to set out its policy for the statutory repayment of loans fund advances prior to the start of the financial year. The repayment of loans fund advances ensures that the Council makes a prudent provision each year to pay off an element of the accumulated loans fund advances made in previous financial years.
A variety of options are provided to Councils so long as a prudent provision is made each year. The Council is recommended to approve the following policy on the repayment of loans fund advances for 2021/22:
For all loan fund advances, the policy will be to maintain the practice of previous years and apply the Asset Method, with all loans fund advances being repaid in equal instalments of principal with reference to the life of an asset.

9
3 Borrowing The capital expenditure plans set out in Section 2 provide details of the service activity of the Council. The treasury management function ensures that the Council’s cash is organised in accordance with the relevant professional codes, so that sufficient cash is available to meet this service activity and the Council’s capital strategy. This will involve both the organisation of the cash flow and, where capital plans require, the organisation of appropriate borrowing facilities. The strategy covers the relevant treasury / prudential indicators, the current and projected debt positions and the annual investment strategy.
3.1 Current portfolio position
The overall treasury management portfolio as at 31 March 2020 and for the position as at 31 December 2020 are shown below for both borrowing and investments, including the Strategic Reserve Fund investments managed in-house and externally.
actual actual current current
31.3.20 31.3.20 31.12.20 31.12.20
Treasury investments £000 % £000 %
banks 8,425 3% 17,380 6%
building societies - unrated 0 0% 0 0%
building societies - rated 0 0% 0 0%
local authorities 14,000 5% 12,000 4%
DMADF (H.M.Treasury) 0 0% 0 0%
money market funds 7,200 3% 0 0%
certificates of deposit 0 0% 3,000 1%
Total managed in house 29,625 11% 32,380 10%
property investments 19,725 7% 19,753 6%
local investments 7,217 3% 7,382 2%
Strategic Reserve Fund managed in house 26,942 10% 27,135 9%
bond funds 51,823 19% 56,829 18%
diversified growth fund 37,499 14% 43,978 14%
equity fund 78,600 29% 102,319 33%
credit strategies fund 17,147 6% 21,489 7%
property funds 22,000 8% 22,409 7%
global private debt fund 3,463 1% 5,508 2%
Strategic Reserve Fund managed externally 210,532 79% 252,532 81%
Total treasury investments 267,099 100% 312,047 100%
TREASURY PORTFOLIO

10
The Council’s forward projections for borrowing are summarised below. The table shows the actual external debt, against the underlying capital borrowing need, (the Capital Financing Requirement - CFR), highlighting any over or under borrowing.
£m 2019/20
Actual
2020/21
Estimate
2021/22
Estimate
2022/23
Estimate
2023/24
Estimate
External Debt
Debt at 1 April 30.171 35.143 35.114 35.085 30.056
Expected change in Debt
4.972 (0.029) (0.029) (5.029) (0.029)
Other long-term liabilities (OLTL)
0.000 0.000 0.000 0.000 0.00
Expected change in OLTL
0.000
0.000 0.000 0.000 0.000
Actual gross debt at 31 March
35.143 35.114 35.085 30.056 30.027
The Capital Financing Requirement
50.625 61.546 66.415 60.973 64.661
Under / (over) borrowing
15.482 26.432 31.330 30.917 34.634
Within the range of prudential indicators there are a number of key indicators to ensure that the Council operates its activities within well-defined limits. One of these is that the Council needs to ensure that its gross debt does not, except in the short term, exceed the total of the CFR in the preceding year plus the estimates of any additional CFR for 2021/22 and the following two financial years. This allows some flexibility for limited early borrowing for future years but ensures that borrowing is not undertaken for revenue or speculative purposes.
The Head of Finance reports that the Council complied with this prudential indicator in the current year and does not envisage difficulties for the future. This view takes into account current commitments, existing plans, and the proposals in this budget report.

11
3.2 Treasury Indicators: limits to borrowing activity
The operational boundary. This is the limit beyond which external debt is not normally expected to exceed. In most cases, this would be a similar figure to the CFR, but may be lower or higher depending on the levels of actual debt and the ability to fund under-borrowing by other cash resources.
Operational boundary £m
2020/21 Estimate
2021/22 Estimate
2022/23 Estimate
2023/24 Estimate
Debt 65.000 65.000 65.000 65.000
Other long-term liabilities
0.000 0.000 0.000 0.000
Total 65.000 65.000 65.000 65.000
The authorised limit for external debt. This is a key prudential indicator and represents a control on the maximum level of borrowing. This represents a legal limit beyond which external debt is prohibited, and this limit needs to be set or revised by the full Council. It reflects the level of external debt which, while not desired, could be afforded in the short term, but is not sustainable in the longer term.
a) The authorised limits for external debt for the current year and two subsequent years are the legislative limits determined under Regulation 6(1) of the Local Authority (Capital Finance and Accounting) (Scotland) Regulations 2016.
b) The Council is asked to approve the following authorised limit:
Authorised limit £m
2020/21 Estimate
2021/22 Estimate
2022/23 Estimate
2023/24 Estimate
Debt 75.000 75.000 75.000 75.000
Other long-term liabilities
0.000 0.000 0.000 0.000
Total 75.000 75.000 75.000 75.000

12
3.3 Prospects for interest rates
The Council has appointed Link Group as its treasury advisor and part of their service is to assist the Council to formulate a view on interest rates. Link provided the following forecasts on 11.8.20. However, following the conclusion of the review of PWLB margins over gilt yields on 25.11.20, all forecasts below have been reduced by 1%. These are forecasts for certainty rates, gilt yields plus 80bps:
Additional notes by Link on this forecast table: -
• Please note that we have made a slight change to our interest rate forecasts table above for forecasts for 3, 6 and 12 months. Traditionally, we have used LIBID forecasts, with the rate calculated using market convention of 1/8th (0.125%) taken off the LIBOR figure. Given that all LIBOR rates up to 6m are currently running below 10bps, using that convention would give negative figures as forecasts for those periods. However, the liquidity premium that is still in evidence at the short end of the curve means that the rates actually being achieved by local authority investors are still modestly in positive territory. While there are differences between counterparty offer rates, our analysis would suggest that an average rate of around 10 bps is achievable for 3 months, 10bps for 6 months and 20 bps for 12 months.
• During 2021, Link will be continuing to look at market developments in this area and will monitor these with a view to communicating with clients when full financial market agreement is reached on how to replace LIBOR. This is likely to be an iteration of the overnight SONIA rate and the use of compounded rates and Overnight Index Swap (OIS) rates for forecasting purposes.
• We will maintain continuity by providing clients with LIBID investment benchmark rates on the current basis.
The coronavirus outbreak has done huge economic damage to the UK and economies around the world. After the Bank of England took emergency action in March to cut Bank Rate to first 0.25%, and then to 0.10%, it left Bank Rate unchanged at its subsequent meetings to 16th December, although some forecasters had suggested that a cut into negative territory could happen. However, the Governor of the Bank of England has made it clear that he currently thinks that such a move would do more damage than good and that more quantitative easing is the favoured tool if further action becomes necessary. As shown in the forecast table above, no increase in Bank Rate is expected in the near-term as economic recovery is expected to be only gradual and, therefore, prolonged. These forecasts were based on an assumption that a Brexit
Link Group Interest Rate View 9.11.20
These Link forecasts have been amended for the reduction in PWLB margins by 1.0% from 26.11.20
Mar-21 Jun-21 Sep-21 Dec-21 Mar-22 Jun-22 Sep-22 Dec-22 Mar-23 Jun-23 Sep-23 Dec-23 Mar-24
BANK RATE 0.10 0.10 0.10 0.10 0.10 0.10 0.10 0.10 0.10 0.10 0.10 0.10 0.10
3 month ave earnings 0.10 0.10 0.10 0.10 0.10 0.10 0.10 0.10 0.10 0.10 0.10 0.10 0.10
6 month ave earnings 0.10 0.10 0.10 0.10 0.10 0.10 0.10 0.10 0.10 0.10 0.10 0.10 0.10
12 month ave earnings 0.20 0.20 0.20 0.20 0.20 0.20 0.20 0.20 0.20 0.20 0.20 0.20 0.20
5 yr PWLB 0.80 0.80 0.80 0.80 0.90 0.90 0.90 0.90 0.90 1.00 1.00 1.00 1.00
10 yr PWLB 1.10 1.10 1.10 1.10 1.20 1.20 1.20 1.20 1.20 1.30 1.30 1.30 1.30
25 yr PWLB 1.50 1.60 1.60 1.60 1.60 1.70 1.70 1.70 1.70 1.80 1.80 1.80 1.80
50 yr PWLB 1.30 1.40 1.40 1.40 1.40 1.50 1.50 1.50 1.50 1.60 1.60 1.60 1.60

13
trade deal would be agreed by 31.12.20: as this has now occurred, these forecasts do not need to be revised.
Gilt yields / PWLB rates
There was much speculation during the second half of 2019 that bond markets were in a bubble which was driving bond prices up and yields down to historically very low levels. The context for that was a heightened expectation that the US could have been heading for a recession in 2020. In addition, there were growing expectations of a downturn in world economic growth, especially due to fears around the impact of the trade war between the US and China, together with inflation generally at low levels in most countries and expected to remain subdued. Combined, these conditions were conducive to very low bond yields. While inflation targeting by the major central banks has been successful over the last thirty years in lowering inflation expectations, the real equilibrium rate for central rates has fallen considerably due to the high level of borrowing by consumers. This means that central banks do not need to raise rates as much now to have a major impact on consumer spending, inflation, etc. The consequence of this has been the gradual lowering of the overall level of interest rates and bond yields in financial markets over the last 30 years. Over the year prior to the coronavirus crisis, this has seen many bonds yields up to 10 years turn negative in the Eurozone. In addition, there has, at times, been an inversion of bond yields in the US whereby 10-year yields have fallen below shorter-term yields. In the past, this has been a precursor of a recession. The other side of this coin is that bond prices are elevated as investors would be expected to be moving out of riskier assets i.e. shares, in anticipation of a downturn in corporate earnings and so selling out of equities.
Gilt yields had therefore already been on a generally falling trend up until the coronavirus crisis hit western economies during March 2020. After gilt yields spiked up during the financial crisis in March, we have seen these yields fall sharply to unprecedented lows as investors panicked during March in selling shares in anticipation of impending recessions in western economies, and moved cash into safe haven assets i.e. government bonds. However, major western central banks took rapid action to deal with excessive stress in financial markets during March, and started massive quantitative easing purchases of government bonds: this also acted to put downward pressure on government bond yields at a time when there has been a huge and quick expansion of government expenditure financed by issuing government bonds. Such unprecedented levels of issuance in “normal” times would have caused bond yields to rise sharply. Gilt yields and PWLB rates have been at remarkably low rates so far during 2020/21.
As the interest forecast table for PWLB certainty rates above shows, there is expected to be little upward movement in PWLB rates over the next two years as it will take economies, including the UK, a prolonged period to recover all the momentum they have lost in the sharp recession caused during the coronavirus shut down period. From time to time, gilt yields, and therefore PWLB rates, can be subject to exceptional levels of volatility due to geo-political, sovereign debt crisis, emerging market developments and sharp changes in investor sentiment, (as shown on 9 November when the first results of a successful COVID-19 vaccine trial were announced). Such volatility could occur at any time during the forecast period.

14
Investment and borrowing rates
• Investment returns are likely to remain exceptionally low during 2021/22 with little increase in the following two years.
• Borrowing interest rates fell to historically very low rates as a result of the COVID crisis and the quantitative easing operations of the Bank of England: indeed, gilt yields up to 6 years were negative during most of the first half of 20/21. The policy of avoiding new borrowing by running down spare cash balances has served local authorities well over the last few years. The unexpected increase of 100 bps in PWLB rates on top of the then current margin over gilt yields of 80 bps in October 2019, required an initial major rethink of local authority treasury management strategy and risk management. However, in March 2020, the Government started a consultation process for reviewing the margins over gilt rates for PWLB borrowing for different types of local authority capital expenditure. (Please note that Link has concerns over this approach, as the fundamental principle of local authority borrowing is that borrowing is a treasury management activity and individual sums that are borrowed are not linked to specific capital projects.) It also introduced the following rates for borrowing for different types of capital expenditure: -
• PWLB Standard Rate is gilt plus 200 basis points (G+200bps)
• PWLB Certainty Rate is gilt plus 180 basis points (G+180bps)
• PWLB HRA Standard Rate is gilt plus 100 basis points (G+100bps)
• PWLB HRA Certainty Rate is gilt plus 80bps (G+80bps)
• Local Infrastructure Rate is gilt plus 60bps (G+60bps)
• As a consequence of these increases in margins, many local authorities decided to refrain from PWLB borrowing unless it was for HRA or local infrastructure financing, until such time as the review of margins was concluded.
• On 25.11.20, the Chancellor announced the conclusion to the review of margins over gilt yields for PWLB rates; the standard and certainty margins were reduced by 1% but a prohibition was introduced to deny access to borrowing from the PWLB for any local authority which had purchase of assets for yield in its three year capital programme. The new margins over gilt yields are as follows: -.
▪ PWLB Standard Rate is gilt plus 100 basis points (G+100bps) ▪ PWLB Certainty Rate is gilt plus 80 basis points (G+80bps) ▪ PWLB HRA Standard Rate is gilt plus 100 basis points (G+100bps) ▪ PWLB HRA Certainty Rate is gilt plus 80bps (G+80bps) ▪ Local Infrastructure Rate is gilt plus 60bps (G+60bps)
• Borrowing for capital expenditure. As Link’s long-term forecast for Bank Rate is 2.00%, and all PWLB rates are under 2.00%, there is now value in borrowing from the PWLB for all types of capital expenditure for all maturity periods, especially as current rates are at historic lows. However, greater value can be obtained in borrowing for shorter maturity periods so the Council will assess its risk appetite in conjunction with budgetary pressures to reduce total interest costs. Longer-term borrowing could also be undertaken for the purpose of certainty, where that is desirable, or for flattening the profile of a heavily unbalanced maturity profile.

15
• While this authority will not be able to avoid borrowing to finance new capital expenditure, to replace maturing debt and the rundown of reserves, ), there will be a cost of carry, (the difference between higher borrowing costs and lower investment returns), to any new short or medium term borrowing that causes a temporary increase in cash balances as this position will, most likely, incur a revenue cost.
3.4 Borrowing strategy
The Council is currently maintaining an under-borrowed position. This means that the capital borrowing need (the Capital Financing Requirement), has not been fully funded with loan debt as cash supporting the Council’s reserves, balances and cash flow has been used as a temporary measure. This strategy is prudent as investment returns are low and counterparty risk is still an issue that needs to be considered.
Against this background and the risks within the economic forecast, caution will be adopted with the 2021/22 treasury operations. The Head of Finance will monitor interest rates in financial markets and adopt a pragmatic approach to changing circumstances:
• if it was felt that there was a significant risk of a sharp FALL in borrowing rates, (e.g. due to a marked increase of risks around relapse into recession or of risks of deflation), then borrowing will be postponed.
• if it was felt that there was a significant risk of a much sharper RISE in long and short term rates than that currently forecast, perhaps arising from an acceleration in the rate of increase in central rates in the USA and UK, an increase in world economic activity, or a sudden increase in inflation risks, then the portfolio position will be re-appraised. Most likely, fixed rate funding will be drawn whilst interest rates are lower than they are projected to be in the next few years.
Any decisions will be reported to the appropriate decision-making body at the next available opportunity.
The Council traditionally relied on its ability to finance its capital spending programmes through the use of internal borrowings. However, in approving the development of a major Schools Investment Programme in 2008 at an estimated capital cost of £58 million, and thereafter a significant Social Housing build programme, it was acknowledged that this approach would need to change. In particular, as interest rates were originally predicted to start to increase in 2010, the Council increased external borrowings to £40M to fund at least part of this sizable programme of capital works. At that time, this was regarded as an effective way for the Council to manage the risk of interest rate movements over the life of the programme, which could otherwise have the potential to adversely impact on the affordability of this programme going forward including future Council budgets. This also applied in the case of the house build programme where any increase in interest rates would impact on the affordability of the overall development, which relies on the ability of housing tenants to support the loan charges in the form of tenant rent increases.

16
Whilst the subsequent decision of Scottish Government to change the funding structure for the Schools Investment Programme mid 2010 effectively reduced the Council’s borrowing requirements for future years, the terms of the borrowings were still regarded as favourable at that time such that the Council was well placed to benefit from savings on loan charges in the longer term.
3.5 Policy on borrowing in advance of need
The Council will not borrow more than or in advance of its needs purely in order to profit from the investment of the extra sums borrowed. Any decision to borrow in advance will be within forward approved Capital Financing Requirement estimates and will be considered carefully to ensure that value for money can be demonstrated and that the Council can ensure the security of such funds.
Borrowing in advance will be made within the constraints that:
• It will be limited to no more than 50% of the expected increase in borrowing need (CFR) over the three-year planning period; and
• The authority would not look to borrow more than 24 months in advance of need.
Risks associated with any borrowing in advance activity will be subject to prior appraisal and subsequent reporting through the mid-year or annual reporting mechanism.
3.6 Debt Rescheduling
Rescheduling of current borrowing in our debt portfolio is unlikely to occur as there is still a very large difference between premature redemption rates and new borrowing rates, even though the general margin of PWLB rates over gilt yields was reduced by 100 bps in November 2020.
If rescheduling was done, it will be reported to the Council, at the earliest meeting following its action.
3.7 Municipal Bond Agency
It is possible that the Municipal Bond Agency will be offering loans to local authorities in the future. The Agency hopes that the borrowing rates will be lower than those offered by the Public Works Loan Board (PWLB). This Authority may make use of this new source of borrowing as and when appropriate.

17
4 Annual Investment Strategy
4.1 Investment policy
The Council’s investment policy implements the requirements of the following:-
• Local Government Investments (Scotland) Regulations 2010, (and accompanying Finance Circular 5/2010),
• CIPFA Treasury Management in Public Services Code of Practice and Cross Sectoral Guidance Notes 2017 (“the Code”)
• CIPFA Treasury Management Guidance Notes 2018
The Council’s investment priorities will be security first, portfolio liquidity second and then yield, (return). The Council will aim to achieve the optimum return (yield) on its investments commensurate with proper levels of security and liquidity and with the Council’s risk appetite. In the current economic climate it is considered appropriate to keep investments short term to cover cash flow needs, but also to seek out value available in periods up to 12 months with high credit rated financial institutions.
The above regulations and guidance place a high priority on the management of risk. This authority has adopted a prudent approach to managing risk and defines its risk appetite by the following means: -
• Minimum acceptable credit criteria are applied in order to generate a list of highly creditworthy counterparties. This also enables diversification and thus avoidance of concentration risk. The key ratings used to monitor counterparties are the short term and long-term ratings.
• Other information: ratings will not be the sole determinant of the quality of an institution; it is important to continually assess and monitor the financial sector on both a micro and macro basis and in relation to the economic and political environments in which institutions operate. The assessment will also take account of information that reflects the opinion of the markets. To achieve this consideration the Council will engage with its advisors to maintain a monitor on market pricing such as “credit default swaps” and overlay that information on top of the credit ratings.
• Other information sources used will include the financial press, share price and other such information pertaining to the banking sector in order to establish the most robust scrutiny process on the suitability of potential investment counterparties.
• This authority has defined the list of types of investment instruments that are permitted investments authorised for use in appendix 5.4. Appendix 5.5 expands on the risks involved in each type of investment and the mitigating controls.
• Lending limits, (amounts and maturity), for each counterparty will be set through applying the matrix table in paragraph 4.2.
• Transaction limits are set for each type of investment in appendix 5.4.
• This authority will set a limit for the amount of its investments which are invested for longer than 365 days, (see paragraph 4.4).
• Investments will only be placed with counterparties from countries with a specified minimum sovereign rating, (see paragraph 4.3).

18
• This authority has engaged external consultants, (see paragraph 1.5), to provide expert advice on how to optimise an appropriate balance of security, liquidity and yield, given the risk appetite of this authority in the context of the expected level of cash balances and need for liquidity throughout the year.
• All investments will be denominated in sterling.
• As a result of the change in accounting standards for 2021/22 under IFRS 9, this authority will consider the implications of investment instruments which could result in an adverse movement in the value of the amount invested and resultant charges at the end of the year to the General Fund. With much of the Council’s investment instruments held in the Strategic Reserve Fund, as part of the Harbour Fund, it is not anticipated that the impact of IFRS 9 on the General Fund will be significant.
• Externally managed fund investments are managed by externally appointed fund managers operating within individual mandates as part of an agreed investment strategy which sets both the permitted asset class limit and range. The appointed fund managers are authorised to manage risk within these mandates.
However, this authority will also pursue value for money in treasury management and will monitor the yield from investment income against appropriate benchmarks for investment performance, (see paragraph 4.5). Regular monitoring of investment performance will be carried out during the year.
Changes in risk management policy from last year.
Following a review of the investment strategy work is ongoing to achieve further diversification away from equity investments, into more illiquid longer-term alternative asset classes including illiquid debt and secured income/finance.
4.2 Creditworthiness policy
This Council applies the creditworthiness service provided by the Link Group. This service employs a sophisticated modelling approach utilising credit ratings from the three main credit rating agencies - Fitch, Moody’s and Standard and Poor’s. The credit ratings of counterparties are supplemented with the following overlays:
• credit watches and credit outlooks from credit rating agencies;
• CDS spreads to give early warning of likely changes in credit ratings;
• sovereign ratings to select counterparties from only the most creditworthy countries.
This modelling approach combines credit ratings, credit watches and credit outlooks in a weighted scoring system which is then combined with an overlay of CDS spreads for which the end product is a series of colour coded bands which indicate the relative creditworthiness of counterparties. These colour codes are used by the Council to determine the suggested duration for investments. The Council will therefore use counterparties within the following durational bands ):
• Yellow 5 years *
• Dark pink 5 years for Ultra short dated bond funds with a credit score of 1.25
• Light pink 5 years for Ultra short dated bond funds with a credit score of 1.5
• Purple 2 years

19
• Blue 1 year (only applies to nationalised or semi nationalised UK Banks)
• Orange 1 year
• Red 6 months
• Green 100 days
• No colour not to be used
The Link creditworthiness service uses a wider array of information than just primary ratings. Furthermore, by using a risk weighted scoring system, it does not give undue preponderance to just one agency’s ratings.
Typically the minimum credit ratings criteria the Council use will be a Short Term rating (Fitch or equivalents) of F1 and a Long Term rating of A-. There may be occasions when the counterparty ratings from one rating agency are marginally lower than these ratings but may still be used. In these instances consideration will be given to the whole range of ratings available, or other topical market information, to support their use.
All credit ratings will be monitored on a weekly basis. The Council is alerted to changes to ratings of all three agencies through its use of our creditworthiness service.
• if a downgrade results in the counterparty / investment scheme no longer meeting the Council’s minimum criteria, its further use as a new investment will be withdrawn immediately.
• in addition to the use of credit ratings the Council will be advised of information in movements in credit default swap spreads against the iTraxx benchmark and other market data on a daily basis via its Passport website, provided exclusively to it by Link. Extreme market movements may result in downgrade of an institution or removal from the Council’s lending list.
• Sole reliance will not be placed on the use of this external service. In addition this Council will also use market data and market information, information on sovereign support for banks and the credit ratings of that supporting government.
* Please note: the yellow colour category is for UK Government debt, or its equivalent, money market funds and collateralised deposits where the collateral is UK Government debt –see appendix 5.5.
Creditworthiness.
Although the credit rating agencies changed their outlook on many UK banks from stable to negative outlook during the quarter ended 30th June 2020 due to upcoming risks to banks’ earnings and asset quality during the economic downturn caused by the pandemic, the majority of ratings were affirmed due to the continuing strong credit profiles of UK banks. However, during Q1 and Q2 2020, banks made provisions for expected credit losses and the rating changes reflected these provisions. As we move into the next quarters ahead, more information will emerge on actual levels of credit losses. (Quarterly performance is normally announced in the second half of the month
Y Pi1 Pi2 P B O R G N/C
1 1.25 1.5 2 3 4 5 6 7
Up to 5yrs Up to 5yrs Up to 5yrs Up to 2yrs Up to 1yr Up to 1yr Up to 6mths Up to 100days No Colour

20
following the end of the quarter.) This has the potential to cause rating agencies to revisit their initial rating adjustments earlier in the current year. These adjustments could be negative or positive, although it should also be borne in mind that UK banks went into this pandemic with strong balance sheets. Indeed, the Financial Policy Committee (FPC) report on 6th August revised down their expected credit losses for the banking sector to “somewhat less than £80bn”. They stated that in their assessment, “banks have buffers of capital more than sufficient to absorb the losses that are likely to arise under the MPC’s central projection”. The FPC stated that for real stress in the sector, the economic output would need to be twice as bad as the MPC’s projection, with unemployment rising to above 15%.
All three rating agencies have reviewed banks around the world with similar results in many countries of most banks being placed on negative watch, but with a small number of actual downgrades.
CDS prices
Although bank CDS prices, (these are market indicators of credit risk), spiked upwards at the end of March / early April 2020 due to the heightened market uncertainty and ensuing liquidity crisis that affected financial markets, they have returned to more average levels since then. Nevertheless, prices are still elevated compared to end-February 2020. Pricing is likely to remain volatile as uncertainty continues. However, sentiment can easily shift, so it will remain important to undertake continual monitoring of all aspects of risk and return in the current circumstances. Link monitor CDS prices as part of their creditworthiness service to local authorities and the Council has access to this information via its Link-provided Passport portal
4.3 Other limits
The council has determined that it will only use approved counterparties from countries with a minimum sovereign credit rating of AA- from Fitch (or equivalent). The list of countries that qualify using this credit criteria as at the date of this report are shown in Appendix 5.6. The list will be added to, or deducted from, by officers should ratings change in accordance with this policy.
4.4 Investment strategy
In-house funds. Investments will be made with reference to the core balance and cash flow requirements and the outlook for short-term interest rates (i.e. rates for investments up to 12 months). Greater returns are usually obtainable by investing for longer periods. While most cash balances are required in order to manage the ups and downs of cash flow, where cash sums can be identified that could be invested for longer periods, the value to be obtained from longer term investments will be carefully assessed.
• If it is thought that Bank Rate is likely to rise significantly within the time horizon being considered, then consideration will be given to keeping most investments as being short term or variable.
• Conversely, if it is thought that Bank Rate is likely to fall within that time period, consideration will be given to locking in higher rates currently obtainable, for longer periods.

21
Investment returns expectations.
Bank Rate is unlikely to rise from 0.10% for a considerable period. It is very difficult to say when it may start rising so it may be best to assume that investment earnings from money market-related instruments will be sub 0.50% for the foreseeable future.
The suggested budgeted investment earnings rates for returns on investments placed for periods up to about three months during each financial year are as follows (the long-term forecast is for periods over 10 years in the future):
Average earnings in each year
2020/21 0.10%
2021/22 0.10%
2022/23 0.10%
2023/24 0.10%
2024/25 0.25%
Long term later years 2.00%
• The overall balance of risks to economic growth in the UK is probably now skewed to the upside but is subject to major uncertainty due to the virus and how quickly successful vaccines may become available and widely administered to the population. It may also be affected by what, if any, deal the UK agrees as part of Brexit.
• There is relatively little UK domestic risk of increases or decreases in Bank Rate and significant changes in shorter term PWLB rates. The Bank of England has effectively ruled out the use of negative interest rates in the near term and increases in Bank Rate are likely to be some years away given the underlying economic expectations. However, it is always possible that safe haven flows, due to unexpected domestic developments and those in other major economies, or a return of investor confidence in equities, could impact gilt yields, (and so PWLB rates), in the UK.
Negative investment rates
While the Bank of England said in August / September 2020 that it is unlikely to introduce a negative Bank Rate, at least in the next 6 -12 months, and in November omitted any mention of negative rates in the minutes of the meeting of the Monetary Policy Committee, some deposit accounts are already offering negative rates for shorter periods. As part of the response to the pandemic and lockdown, the Bank and the Government have provided financial markets and businesses with plentiful access to credit, either directly or through commercial banks. In addition, the Government has provided large sums of grants to local authorities to help deal with the COVID crisis; this has caused some local authorities to have sudden large increases in cash

22
balances searching for an investment home, some of which was only very short term until those sums were able to be passed on.
As for money market funds (MMFs), yields have continued to drift lower. Some managers have already resorted to trimming fee levels to ensure that net yields for investors remain in positive territory where possible and practical. Investor cash flow uncertainty, and the need to maintain liquidity in these unprecedented times, has meant there is a surfeit of money swilling around at the very short end of the market. This has seen a number of market operators, now including the DMADF, offer nil or negative rates for very short-term maturities. This is not universal, and MMFs are still offering a marginally positive return, as are a number of financial institutions for investments at the very short end of the yield curve.
Inter-local authority lending and borrowing rates have also declined due to the surge in the levels of cash seeking a short-term home at a time when many local authorities are probably having difficulties over accurately forecasting when disbursements of funds received will occur or when further large receipts will be received from the Government.
Property fund issues
The BlackRock UK Property Fund, in which the Council has £22.5m invested as at 31 December 2020, was suspended from trading by the fund manager on the 20
March 2020. Fund valuers considered that less weight could be attached to previous market evidence for comparison purposes to inform opinions of value. This recognised that the response to Covid-19 meant that Fund valuers were faced with an unprecedented set of circumstances upon which to base a judgement. Their valuations at that time were reported on the basis of “material valuation uncertainty” per the RICS Valuation - Global Standards. Consequently, less certainty and a higher degree of caution was attached to the valuation of commercial property assets than would normally be the case.
As time has progressed and more transactional evidence post the lockdown has become available it has become possible for valuers to feel more certain about the valuation of UK real estate. The Material Valuation Uncertainty clause has been lifted incrementally as valuers became comfortable with each sector having sufficient comparable evidence to have the clause lifted. This process of lifting the clause started on 14 May and the Manager approved full dealing in the Fund to resume on 30 October 2020.
Investment treasury indicator and limit - total principal funds invested for greater than 365 days. These limits are set with regard to the Council’s liquidity requirements, to reduce the need for early sale of an investment and are based on the availability of funds after each year-end.
The Council is asked to approve the following treasury indicator and limit:
Upper limit for principal sums invested for longer than 365 days
£m 2021/22 2022/23 2023/24
Principal sums invested for longer than 365 days
£m 50
£m 50
£m 50
Current investments as at 31 December 20 in excess of 1 year maturing in each year
Nil Nil Nil
23
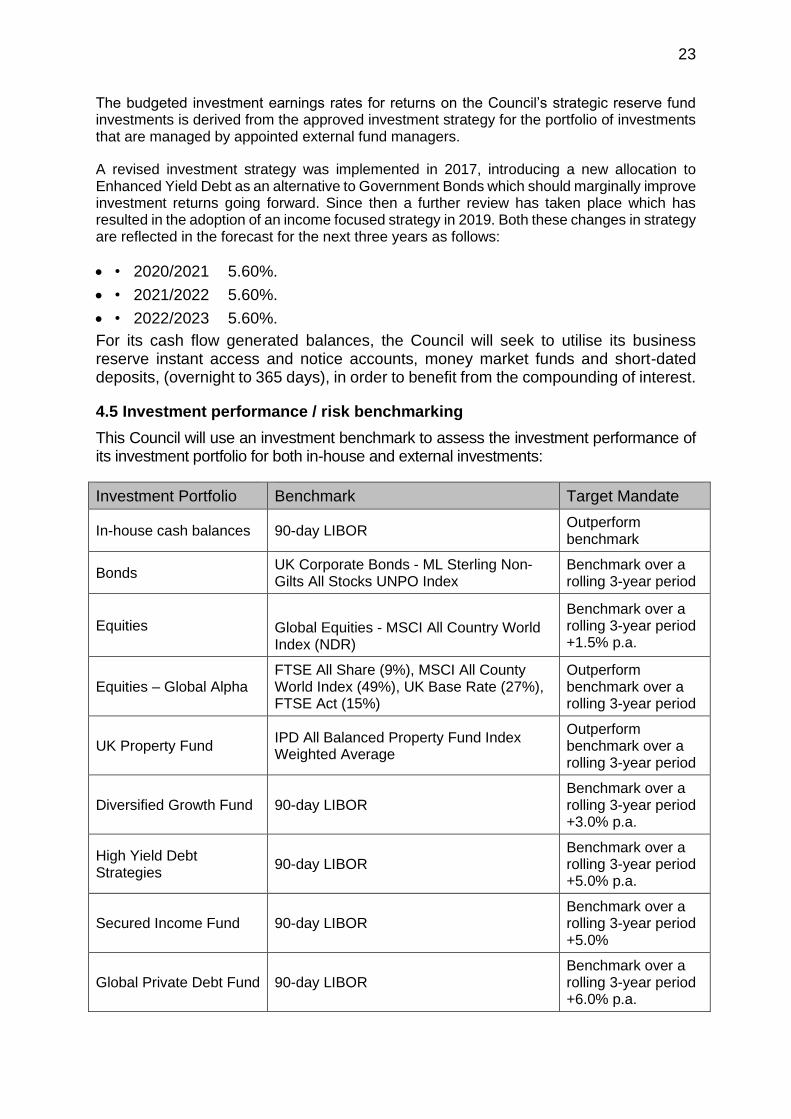
The budgeted investment earnings rates for returns on the Council’s strategic reserve fund investments is derived from the approved investment strategy for the portfolio of investments that are managed by appointed external fund managers.
A revised investment strategy was implemented in 2017, introducing a new allocation to Enhanced Yield Debt as an alternative to Government Bonds which should marginally improve investment returns going forward. Since then a further review has taken place which has resulted in the adoption of an income focused strategy in 2019. Both these changes in strategy are reflected in the forecast for the next three years as follows:
• • 2020/2021 5.60%.
• • 2021/2022 5.60%.
• • 2022/2023 5.60%.
For its cash flow generated balances, the Council will seek to utilise its business reserve instant access and notice accounts, money market funds and short-dated deposits, (overnight to 365 days), in order to benefit from the compounding of interest.
4.5 Investment performance / risk benchmarking
This Council will use an investment benchmark to assess the investment performance of its investment portfolio for both in-house and external investments:
Investment Portfolio Benchmark Target Mandate
In-house cash balances 90-day LIBOR Outperform benchmark
Bonds UK Corporate Bonds - ML Sterling Non-Gilts All Stocks UNPO Index
Benchmark over a rolling 3-year period
Equities
Global Equities - MSCI All Country World Index (NDR)
Benchmark over a rolling 3-year period +1.5% p.a.
Equities – Global Alpha FTSE All Share (9%), MSCI All County World Index (49%), UK Base Rate (27%), FTSE Act (15%)
Outperform benchmark over a rolling 3-year period
UK Property Fund IPD All Balanced Property Fund Index Weighted Average
Outperform benchmark over a rolling 3-year period
Diversified Growth Fund 90-day LIBOR Benchmark over a rolling 3-year period +3.0% p.a.
High Yield Debt Strategies
90-day LIBOR Benchmark over a rolling 3-year period +5.0% p.a.
Secured Income Fund 90-day LIBOR Benchmark over a rolling 3-year period +5.0%
Global Private Debt Fund 90-day LIBOR Benchmark over a rolling 3-year period +6.0% p.a.

24
The Council is appreciative that the provision of LIBOR and associated LIBID rates is expected to cease at the end of 2021. It will work with its advisors in determining suitable replacement investment benchmark(s) ahead of this cessation and will report back to members accordingly.
4.6 End of year investment report
At the end of the financial year, the Council will report on its investment activity as part of its Annual Treasury Report.
4.7 External fund managers
As at 31 March 2021, it is estimated that £244.6m of the Council’s funds will be externally managed on a discretionary by externally appointed fund managers.
A review of the investment strategy for the Councils strategic reserve fund was undertaken by the Investments Sub-committee in 2016. While the review concluded that the existing strategy had been effective in adding value, and at the same time preserving the value of the Fund in real terms, it did identify scope to improve the risk and return profile of the fund through the use of specialist pooled funds to diversify away from Equities as an asset class.
In 2018 the Investment Sub-Committee reviewed the investment strategy again and on 28 February 2019 resolved to further diversify into Illiquid Debt and Secured Income by way of direct investment to a pooled fund. It was further resolved that the equity allocation be split on a 50/50 basis between funds held on a growth basis, with a newly appointed Fund Manager, whilst retaining Schroders on a simplified single global equity strategy with the existing value style basis. The Corporate Bonds allocation will be transferred to a specialist passive manager. These diversifications will be matched by a proportionate reduction in growth assets.
The Head of Finance developed an Action Plan, in consultation with Hymans Robertson, to commence the process of implementation of the changes to the investment strategy. Interviews with potential fund managers took place in August and October 2019 after which fund managers were appointed to three new mandates, as follows:
• Baillie Gifford – Global Alpha. • Barings – Global Private Loan Fund III. • Blackrock – UK Strategic Alternative Income Fund.
In addition to the above appointments, Legal and General Investment Managers were appointed through a national framework to manage the bond allocation for the Strategic Reserve Fund on a passive basis.
The process to put the new mandates in place commenced in 2019 but has not concluded yet due to Covid-19 related volatility being experienced in the markets.
The Council’s external fund manager(s) will comply with the Annual Investment Strategy. The investment management agreement(s) between the Council and the fund manager(s) additionally stipulate guidelines on duration and other limits in order to contain and control risk. The minimum credit criteria to be used by the cash and managed fund manager(s) are set out in Table 2 of Appendix 5.3 on Permitted Investments.

25
5 Appendices
5.1. Prudential and treasury indicators.
5.2. Interest rate forecasts.
5.3. Economic background.
5.4. Treasury management practice TMP1 –permitted investments.
5.5. Treasury management practice TMP1 – credit and counterparty risk management.
5.6. Approved countries for investments.
5.7. Treasury management scheme of delegation.
5.8. The treasury management role of the section 95 officer.
5.1 The Capital Prudential and Treasury Indicators 2021/22 – 2023/24
The Council’s capital expenditure plans are the key driver of treasury management activity. The output of the capital expenditure plans is reflected in the prudential indicators, which are designed to assist members’ overview and confirm capital expenditure plans.
5.1.1 Capital expenditure
Capital expenditure £m
2019/20Actual
2020/21Estimate
2021/22Estimate
2022/23Estimate
2023/24Estimate
Social Care 3.013 0.974 4.340 5.905 1.400
Roads and Transportation
3.283 1.704 0.950 0.950 0.950
Education and Leisure
1.030 1.070 5.676 0.996 0.073
Marine Services 7.390 10.059 0.450 0.450 0.450
Other Services 3.657 6.905 3.804 3.044 3.590
Non-HRA 18.373 20.712 15.220 11.345 6.463
HRA 1.547 5.992 2.537 0.000 0.000
Total 19.920 26.704 17.757 11.345 6.463

26
5.1.2 Affordability prudential indicators
The previous sections cover the overall capital and control of borrowing prudential indicators, but within this framework prudential indicators are required to assess the affordability of the capital investment plans. These provide an indication of the impact of the capital investment plans on the Council’s overall finances. The Council is asked to approve the following indicators:
a. Ratio of financing costs to net revenue stream
This indicator identifies the trend in the cost of capital (borrowing and other long-term obligation costs net of investment income) against the net revenue stream.
% 2019/20
Actual
2020/21
Estimate
2021/22
Estimate
2022/23
Estimate
2023/24
Estimate
General Fund 3.5% 4.2% 4.0% 3.9% 4.0%
Scapa Flow Oil Port
3.9% 15.1% 20.0% 18.7% 18.4%
Miscellaneous Piers
14.9% 18.2% 15.5% 14.7% 14.5%
Housing Revenue Account
26.1% 22.1% 23.6% 24.4% 24.1%
The estimates of financing costs include current commitments and the proposals in this budget report.
The above ratio for the Housing Revenue Account shows the amount of rent income being committed to servicing the long term debt associated with the Council’s house building strategy and as such, 35% should be regarded as the upper limit for the cost of capital relative to net revenue on the Housing Revenue Account, for the term of the current 5 year capital programme.

27
HRA ratios
£ 2019/20
Actual
2020/21
Estimate
2021/22
Estimate
2022/23
Estimate
2023/24
Estimate
HRA debt £m 11.016 12.650 14.707 14.142 13.577
HRA revenues £m
3.786 3.850 3.935 3.935 3.935
Ratio of debt to revenues %
34.37 30.43 26.76 27.82 28.98
£ 2019/20
Actual
2020/21
Estimate
2021/22
Estimate
2022/23
Estimate
2023/24
Estimate
HRA debt £m 11.016 12.650 14.707 14.142 13.577
Number of HRA dwellings £m
944 946 1014 1014 1014
Debt per dwelling £
11,669 13,372 14,504 13,947 13,390
5.1.3 Maturity structure of borrowing
Maturity structure of borrowing. These gross limits are set to reduce the Council’s exposure to large fixed rate sums falling due for refinancing and are required for upper and lower limits.
The Council is asked to approve the following treasury indicators and limits:
Maturity structure of fixed interest rate borrowing 2021/22
Lower Upper
Under 12 months 0% 0%
12 months to 2 years 15% 20%
2 years to 5 years 0% 0%
5 years to 10 years 0% 0%
10 years to 20 years 0% 0%
20 years and above 80% 85%
5.1.4. Control of interest rate exposure
Please see paragraphs 3.3, 3.4 and 4.4.

28
5.2 Interest Rate Forecasts 2020-2024
PWLB forecasts are based on PWLB certainty rates. The PWLB rates below are based on the new margins over gilts announced on 26 November 2020. PWLB forecasts shown below have taken into account the 20 basis point certainty rate reduction effective as of the 1 November 2012. There are no changes to these forecasts as at 5.1.21.
5.3 Economic Background
UK. The key quarterly meeting of the Bank of England Monetary Policy Committee kept Bank Rate unchanged on 5.11.20. However, it revised its economic forecasts to take account of a second national lockdown from 5.11.20 to 2.12.20 which is obviously going to put back economic recovery and do further damage to the economy. It therefore decided to do a further tranche of quantitative easing (QE) of £150bn, to start in January when the current programme of £300bn of QE, announced in March to June, runs out. It did this so that “announcing further asset purchases now should support the economy and help to ensure the unavoidable near-term slowdown in activity was not amplified by a tightening in monetary conditions that could slow the return of inflation to the target”.
Its forecasts appeared, at that time, to be rather optimistic in terms of three areas:
• The economy would recover to reach its pre-pandemic level in Q1 2022
• The Bank also expected there to be excess demand in the economy by Q4 2022.
• CPI inflation was therefore projected to be a bit above its 2% target by the start of 2023 and the “inflation risks were judged to be balanced”.

29
Significantly, there was no mention of negative interest rates in the minutes or Monetary Policy Report, suggesting that the MPC remains some way from being persuaded of the case for such a policy, at least for the next 6 -12 months. However, rather than saying that it “stands ready to adjust monetary policy”, the MPC this time said that it will take “whatever additional action was necessary to achieve its remit”. The latter seems stronger and wider and may indicate the Bank’s willingness to embrace new tools.
One key addition to the Bank’s forward guidance in August was a new phrase in the policy statement, namely that “it does not intend to tighten monetary policy until there is clear evidence that significant progress is being made in eliminating spare capacity and achieving the 2% target sustainably”. That seems designed to say, in effect, that even if inflation rises to 2% in a couple of years’ time, do not expect any action from the MPC to raise Bank Rate – until they can clearly see that level of inflation is going to be persistently above target if it takes no action to raise Bank Rate. Our Bank Rate forecast currently shows no increase, (or decrease), through to quarter 1 2024 but there could well be no increase during the next five years as it will take some years to eliminate spare capacity in the economy, and therefore for inflationary pressures to rise to cause the MPC concern. Inflation is expected to briefly peak at just over 2% towards the end of 2021, but this is a temporary short-lived factor due to base effects from twelve months ago falling out of the calculation, and so is not a concern. Looking further ahead, it is also unlikely to be a problem for some years as it will take a prolonged time for spare capacity in the economy, created by this downturn, to be used up.
Public borrowing was forecast in November by the Office for Budget Responsibility (the OBR) to reach £394bn in the current financial year, the highest ever peace time deficit and equivalent to 19% of GDP. In normal times, such an increase in total gilt issuance would lead to a rise in gilt yields, and so PWLB rates. However, the QE done by the Bank of England has depressed gilt yields to historic low levels, (as has similarly occurred with QE and debt issued in the US, the EU and Japan). This means that new UK debt being issued, and this is being done across the whole yield curve in all maturities, is locking in those historic low levels through until maturity. In addition, the UK has one of the longest average maturities for its entire debt portfolio, of any country in the world. Overall, this means that the total interest bill paid by the Government is manageable despite the huge increase in the total amount of debt. The OBR was also forecasting that the government will still be running a budget deficit of £102bn (3.9% of GDP) by 2025/26. However, initial impressions are that they have taken a pessimistic view of the impact that vaccines could make in the speed of economic recovery.
Overall, the pace of recovery was not expected to be in the form of a rapid V shape, but a more elongated and prolonged one. The initial recovery was sharp after quarter 1 saw growth at -3.0% followed by -18.8% in quarter 2 and then an upswing of +16.0% in quarter 3; this still left the economy 8.6% smaller than in Q4 2019. While the one month second national lockdown that started on 5th November caused a further contraction of 5.7% m/m in November, this was much better than had been feared and showed that the economy is adapting to new ways of working. This left the economy ‘only’ 8.6% below the pre-crisis level.

30
Vaccines – the game changer. The Pfizer announcement on 9th November of a successful vaccine has been followed by approval of the Oxford University/AstraZeneca and Moderna vaccines. The Government has a set a target to vaccinate 14 million people in the most at risk sectors of the population by 15th February; as of mid-January, it has made good, and accelerating progress in hitting that target. The aim is to vaccinate all adults by September. This means that the national lockdown starting in early January, could be replaced by regional tiers of lighter restrictions, beginning possibly in Q2. At that point, there would be less reason to fear that hospitals could become overwhelmed any more. Effective vaccines have radically improved the economic outlook so that it may now be possible for GDP to recover to its pre-virus level as early as Q1 2022. These vaccines have enormously boosted confidence that life could largely return to normal during the second half of 2021. With the household saving rate having been exceptionally high since the first lockdown in March, there is plenty of pent-up demand and purchasing power stored up for when life returns to normal.
Provided that both monetary and fiscal policy are kept loose for a few years yet, then it is still possible that in the second half of this decade, the economy may be no smaller than it would have been if COVID-19 never happened. The significant risk is if another mutation of COVID-19 appears that defeats the current batch of vaccines. However, now that science and technology have caught up with understanding this virus, new vaccines ought to be able to be developed more quickly to counter such a development, and vaccine production facilities are being ramped up around the world.
Chart: Level of real GDP (Q4 2019 = 100)
This recovery of growth which eliminates the effects of the pandemic by about the middle of the decade, would have major repercussions for public finances as it would be consistent with the government deficit falling to around 2.5% of GDP without any tax increases. This would be in line with the OBR’s most optimistic forecast in the graph below, rather than their current central scenario which predicts a 4% deficit due to assuming much slower growth. However, Capital Economics forecasts assumed that politicians do not raise taxes or embark on major austerity measures and so, (perversely!), depress economic growth and recovery.

31
Chart: Public Sector Net Borrowing (as a % of GDP)
There will still be some painful longer term adjustments as e.g. office space and travel by planes, trains and buses may not recover to their previous level of use for several years, or possibly ever, even if vaccines are fully successful in overcoming the current virus. There is also likely to be a reversal of globalisation as this crisis has exposed how vulnerable long-distance supply chains are. On the other hand, digital services are one area that has already seen huge growth.
Brexit. The final agreement of a trade deal on 24.12.20 has eliminated a significant downside risk for the UK economy. The initial agreement only covers trade so there is further work to be done on the services sector where temporary equivalence has been granted in both directions between the UK and EU; that now needs to be formalised on a permanent basis. As the forecasts in this report were based on an assumption of a Brexit agreement being reached, there is no need to amend these forecasts.
Monetary Policy Committee meeting of 17 December. All nine Committee members voted to keep interest rates on hold at +0.10% and the Quantitative Easing (QE) target at £895bn. The MPC commented that the successful rollout of vaccines had reduced the downsides risks to the economy that it had highlighted in November. But this was caveated by it saying, “Although all members agreed that this would reduce downside risks, they placed different weights on the degree to which this was also expected to lead to stronger GDP growth in the central case.” So, while vaccines are a positive development, in the eyes of the MPC at least, the economy is far from out of the woods in the shorter term. The MPC, therefore, voted to extend the availability of the Term Funding Scheme, (cheap borrowing), with additional incentives for small and medium size enterprises for six months from 30.4.21 until 31.10.21. (The MPC had assumed that a Brexit deal would be agreed.)
Fiscal policy. In the same week as the MPC meeting, the Chancellor made a series of announcements to provide further support to the economy: -
• An extension of the COVID-19 loan schemes from the end of January 2021 to the end of March.
• The furlough scheme was lengthened from the end of March to the end of April.

32
• The Budget on 3.3.21 will lay out the “next phase of the plan to tackle the virus and protect jobs”. This does not sound like tax rises are imminent, (which could hold back the speed of economic recovery).
The Financial Policy Committee (FPC) report on 6.8.20 revised down their expected credit losses for the banking sector to “somewhat less than £80bn”. It stated that in its assessment, “banks have buffers of capital more than sufficient to absorb the losses that are likely to arise under the MPC’s central projection”. The FPC stated that for real stress in the sector, the economic output would need to be twice as bad as the MPC’s projection, with unemployment rising to above 15%.
US. The Democrats gained the presidency and a majority in the House of Representatives in the November elections: after winning two key Senate seats in Georgia in elections in early January, they now also have a very slim majority in the Senate due to the vice president’s casting vote. President Biden will consequently have a much easier path to implement his election manifesto. However, he will not have a completely free hand as more radical Democrat plans may not be supported by all Democrat senators. His initial radical plan for a fiscal stimulus of $1.9trn, (9% of GDP), is therefore likely to be toned down in order to get through both houses.
The economy had been recovering quite strongly from its contraction in 2020 of 10.2% due to the pandemic with GDP only 3.5% below its pre-pandemic level and the unemployment rate dropping below 7%. However, the rise in new cases during quarter 4, to the highest level since mid-August, suggests that the US could be in the early stages of a fourth wave. The latest upturn poses a threat that the recovery in the economy could stall. This is the single biggest downside risk to the shorter term outlook – a more widespread and severe wave of infections over the winter months, which is compounded by the impact of the regular flu season and, as a consequence, threatens to overwhelm health care facilities. Under those circumstances, individual states might feel it necessary to return to more draconian lockdowns.
The restrictions imposed to control the spread of the virus are once again weighing on the economy with employment growth slowing sharply in November and declining in December, and retail sales dropping back. The economy is set for further weakness into the spring. GDP growth is expected to rebound markedly from the second quarter of 2021 onwards as vaccines are rolled out on a widespread basis and restrictions are loosened.
After Chair Jerome Powell unveiled the Fed's adoption of a flexible average inflation target in his Jackson Hole speech in late August 2020, the mid-September meeting of the Fed agreed by a majority to a toned down version of the new inflation target in his speech - that "it would likely be appropriate to maintain the current target range until labour market conditions were judged to be consistent with the Committee's assessments of maximum employment and inflation had risen to 2% and was on track to moderately exceed 2% for some time." This change was aimed to provide more stimulus for economic growth and higher levels of employment and to avoid the danger of getting caught in a deflationary “trap” like Japan. It is to be noted that inflation has actually been under-shooting the 2% target significantly for most of the last decade, (and this year), so financial markets took note that higher levels of inflation are likely to be in the pipeline; long-term bond yields duly rose after

33
the meeting. The FOMC’s updated economic and rate projections in mid-September showed that officials expect to leave the fed funds rate at near-zero until at least end-2023 and probably for another year or two beyond that. There is now some expectation that where the Fed has led in changing its inflation target, other major central banks will follow. The increase in tension over the last year between the US and China is likely to lead to a lack of momentum in progressing the initial positive moves to agree a phase one trade deal.
The Fed’s meeting on 5 November was unremarkable - but at a politically sensitive time around the elections. At its 16 December meeting the Fed tweaked the guidance for its monthly asset quantitative easing purchases with the new language implying those purchases could continue for longer than previously believed. Nevertheless, with officials still projecting that inflation will only get back to 2.0% in 2023, the vast majority expect the Fed funds rate to be still at near-zero until 2024 or later. Furthermore, officials think the balance of risks surrounding that median inflation forecast are firmly skewed to the downside. The key message is still that policy will remain unusually accommodative – with near-zero rates and asset purchases – continuing for several more years. This is likely to result in keeping Treasury yields low – which will also have an influence on gilt yields in this country.
EU. In early December, the figures for Q3 GDP confirmed that the economy staged a rapid rebound from the first lockdowns. This provides grounds for optimism about growth prospects for next year. In Q2, GDP was 15% below its pre-pandemic level. But in Q3 the economy grew by 12.5% q/q leaving GDP down by “only” 4.4%. That was much better than had been expected earlier in the year. However, growth is likely to stagnate during Q4 and in Q1 of 2021, as a second wave of the virus has seriously affected many countries. The €750bn fiscal support package eventually agreed by the EU after prolonged disagreement between various countries, is unlikely to provide significant support, and quickly enough, to make an appreciable difference in the countries most affected by the first wave.
With inflation expected to be unlikely to get much above 1% over the next two years, the ECB has been struggling to get inflation up to its 2% target. It is currently unlikely that it will cut its central rate even further into negative territory from -0.5%, although the ECB has stated that it retains this as a possible tool to use. The ECB’s December meeting added a further €500bn to the PEPP scheme, (purchase of government and other bonds), and extended the duration of the programme to March 2022 and re-investing maturities for an additional year until December 2023. Three additional tranches of TLTRO, (cheap loans to banks), were approved, indicating that support will last beyond the impact of the pandemic, implying indirect yield curve control for government bonds for some time ahead. The Bank’s forecast for a return to pre-virus activity levels was pushed back to the end of 2021, but stronger growth is projected in 2022. The total PEPP scheme of €1,850bn of QE which started in March 2020 is providing protection to the sovereign bond yields of weaker countries like Italy. There is therefore unlikely to be a euro crisis while the ECB is able to maintain this level of support. However, as in the UK and the US, the advent of highly effective vaccines will be a game changer, although growth will struggle before later in quarter 2 of 2021.
China. After a concerted effort to get on top of the virus outbreak in Q1, economic recovery was strong in Q2 and then into Q3 and Q4; this has enabled China to

34
recover all of the contraction in Q1. Policy makers have both quashed the virus and implemented a programme of monetary and fiscal support that has been particularly effective at stimulating short-term growth. At the same time, China’s economy has benefited from the shift towards online spending by consumers in developed markets. These factors help to explain its comparative outperformance compared to western economies. However, this was achieved by major central government funding of yet more infrastructure spending. After years of growth having been focused on this same area, any further spending in this area is likely to lead to increasingly weaker economic returns in the longer term. This could, therefore, lead to a further misallocation of resources which will weigh on growth in future years.
Japan. A third round of fiscal stimulus in early December took total fresh fiscal spending this year in response to the virus close to 12% of pre-virus GDP. That’s huge by past standards, and one of the largest national fiscal responses. The budget deficit is now likely to reach 16% of GDP this year. Coupled with Japan’s relative success in containing the virus without draconian measures so far, and the likelihood of effective vaccines being available in the coming months, the government’s latest fiscal effort should help ensure a strong recovery and to get back to pre-virus levels by Q3 2021 – around the same time as the US and much sooner than the Eurozone.
World growth. World growth will has been in recession in 2020 and this is likely to continue into the first half of 2021 before recovery in the second half. Inflation is unlikely to be a problem for some years due to the creation of excess production capacity and depressed demand caused by the coronavirus crisis.
Until recent years, world growth has been boosted by increasing globalisation i.e. countries specialising in producing goods and commodities in which they have an economic advantage and which they then trade with the rest of the world. This has boosted worldwide productivity and growth, and, by lowering costs, has also depressed inflation. However, the rise of China as an economic superpower over the last thirty years, which now accounts for nearly 20% of total world GDP, has unbalanced the world economy. The Chinese government has targeted achieving major world positions in specific key sectors and products, especially high-tech areas and production of rare earth minerals used in high tech products. It is achieving this by massive financial support, (i.e. subsidies), to state owned firms, government directions to other firms, technology theft, restrictions on market access by foreign firms and informal targets for the domestic market share of Chinese producers in the selected sectors. This is regarded as being unfair competition that is putting western firms at an unfair disadvantage or even putting some out of business. It is also regarded with suspicion on the political front as China is an authoritarian country that is not averse to using economic and military power for political advantage. The current trade war between the US and China therefore needs to be seen against that backdrop. It is, therefore, likely that we are heading into a period where there will be a reversal of world globalisation and a decoupling of western countries from dependence on China to supply products. This is likely to produce a backdrop in the coming years of weak global growth and so weak inflation.
Summary
Central banks are, therefore, likely to support growth by maintaining loose monetary policy through keeping rates very low for longer. Governments could also help a
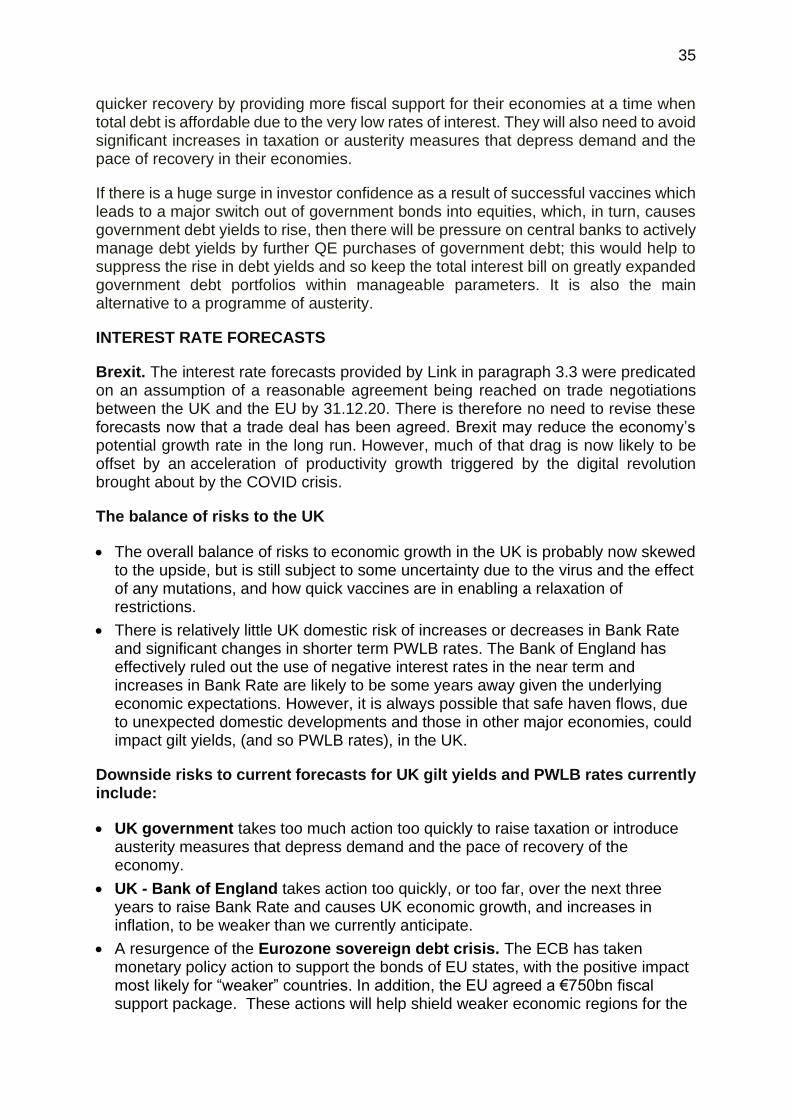
35
quicker recovery by providing more fiscal support for their economies at a time when total debt is affordable due to the very low rates of interest. They will also need to avoid significant increases in taxation or austerity measures that depress demand and the pace of recovery in their economies.
If there is a huge surge in investor confidence as a result of successful vaccines which leads to a major switch out of government bonds into equities, which, in turn, causes government debt yields to rise, then there will be pressure on central banks to actively manage debt yields by further QE purchases of government debt; this would help to suppress the rise in debt yields and so keep the total interest bill on greatly expanded government debt portfolios within manageable parameters. It is also the main alternative to a programme of austerity.
INTEREST RATE FORECASTS
Brexit. The interest rate forecasts provided by Link in paragraph 3.3 were predicated on an assumption of a reasonable agreement being reached on trade negotiations between the UK and the EU by 31.12.20. There is therefore no need to revise these forecasts now that a trade deal has been agreed. Brexit may reduce the economy’s potential growth rate in the long run. However, much of that drag is now likely to be offset by an acceleration of productivity growth triggered by the digital revolution brought about by the COVID crisis.
The balance of risks to the UK
• The overall balance of risks to economic growth in the UK is probably now skewed to the upside, but is still subject to some uncertainty due to the virus and the effect of any mutations, and how quick vaccines are in enabling a relaxation of restrictions.
• There is relatively little UK domestic risk of increases or decreases in Bank Rate and significant changes in shorter term PWLB rates. The Bank of England has effectively ruled out the use of negative interest rates in the near term and increases in Bank Rate are likely to be some years away given the underlying economic expectations. However, it is always possible that safe haven flows, due to unexpected domestic developments and those in other major economies, could impact gilt yields, (and so PWLB rates), in the UK.
Downside risks to current forecasts for UK gilt yields and PWLB rates currently include:
• UK government takes too much action too quickly to raise taxation or introduce austerity measures that depress demand and the pace of recovery of the economy.
• UK - Bank of England takes action too quickly, or too far, over the next three years to raise Bank Rate and causes UK economic growth, and increases in inflation, to be weaker than we currently anticipate.
• A resurgence of the Eurozone sovereign debt crisis. The ECB has taken monetary policy action to support the bonds of EU states, with the positive impact most likely for “weaker” countries. In addition, the EU agreed a €750bn fiscal support package. These actions will help shield weaker economic regions for the
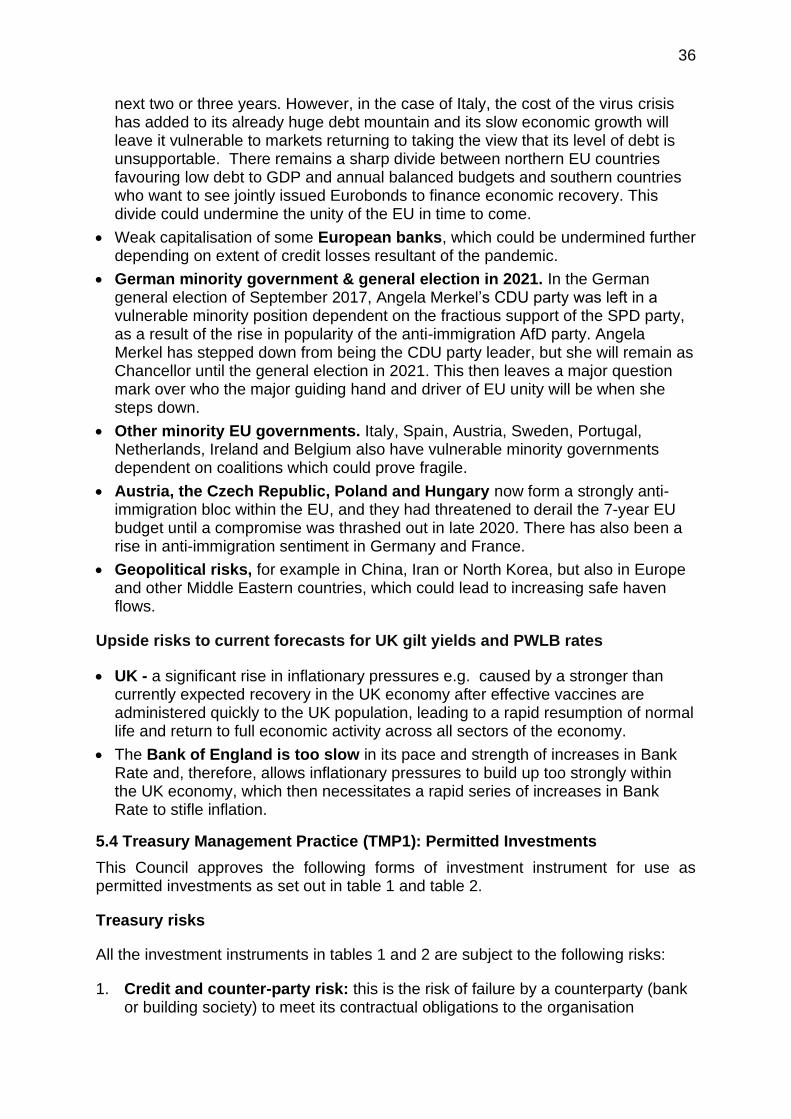
36
next two or three years. However, in the case of Italy, the cost of the virus crisis has added to its already huge debt mountain and its slow economic growth will leave it vulnerable to markets returning to taking the view that its level of debt is unsupportable. There remains a sharp divide between northern EU countries favouring low debt to GDP and annual balanced budgets and southern countries who want to see jointly issued Eurobonds to finance economic recovery. This divide could undermine the unity of the EU in time to come.
• Weak capitalisation of some European banks, which could be undermined further depending on extent of credit losses resultant of the pandemic.
• German minority government & general election in 2021. In the German general election of September 2017, Angela Merkel’s CDU party was left in a vulnerable minority position dependent on the fractious support of the SPD party, as a result of the rise in popularity of the anti-immigration AfD party. Angela Merkel has stepped down from being the CDU party leader, but she will remain as Chancellor until the general election in 2021. This then leaves a major question mark over who the major guiding hand and driver of EU unity will be when she steps down.
• Other minority EU governments. Italy, Spain, Austria, Sweden, Portugal, Netherlands, Ireland and Belgium also have vulnerable minority governments dependent on coalitions which could prove fragile.
• Austria, the Czech Republic, Poland and Hungary now form a strongly anti-immigration bloc within the EU, and they had threatened to derail the 7-year EU budget until a compromise was thrashed out in late 2020. There has also been a rise in anti-immigration sentiment in Germany and France.
• Geopolitical risks, for example in China, Iran or North Korea, but also in Europe and other Middle Eastern countries, which could lead to increasing safe haven flows.
Upside risks to current forecasts for UK gilt yields and PWLB rates
• UK - a significant rise in inflationary pressures e.g. caused by a stronger than currently expected recovery in the UK economy after effective vaccines are administered quickly to the UK population, leading to a rapid resumption of normal life and return to full economic activity across all sectors of the economy.
• The Bank of England is too slow in its pace and strength of increases in Bank Rate and, therefore, allows inflationary pressures to build up too strongly within the UK economy, which then necessitates a rapid series of increases in Bank Rate to stifle inflation.
5.4 Treasury Management Practice (TMP1): Permitted Investments
This Council approves the following forms of investment instrument for use as permitted investments as set out in table 1 and table 2.
Treasury risks
All the investment instruments in tables 1 and 2 are subject to the following risks:
1. Credit and counter-party risk: this is the risk of failure by a counterparty (bank or building society) to meet its contractual obligations to the organisation

37
particularly as a result of the counterparty’s diminished creditworthiness, and the resulting detrimental effect on the organisation’s capital or current (revenue) resources. There are no counterparties where this risk is zero although AAA rated organisations have the highest, relative, level of creditworthiness.
2. Liquidity risk: this is the risk that cash will not be available when it is needed. While it could be said that all counterparties are subject to at least a very small level of liquidity risk as credit risk can never be zero, in this document, liquidity risk has been treated as whether or not instant access to cash can be obtained from each form of investment instrument. However, it has to be pointed out that while some forms of investment e.g. gilts, CDs, corporate bonds can usually be sold immediately if the need arises, there are two caveats: - a. cash may not be available until a settlement date up to three days after the sale and b. there is an implied assumption that markets will not freeze up and so the instrument in question will find a ready buyer. The column in tables 1 / 2 headed as ‘market risk’ will show each investment instrument as being instant access, sale T+3 = transaction date plus 3 business days before you get cash, or term i.e. money is locked in until an agreed maturity date.
3. Market risk: this is the risk that, through adverse market fluctuations in the value of the principal sums an organisation borrows and invests, its stated treasury management policies and objectives are compromised, against which effects it has failed to protect itself adequately. However, some cash rich local authorities may positively want exposure to market risk e.g. those investing in investment instruments with a view to obtaining a long-term increase in value.
4. Interest rate risk: this is the risk that fluctuations in the levels of interest rates create an unexpected or unbudgeted burden on the organisation’s finances, against which the organisation has failed to protect itself adequately. This authority has set limits for its fixed and variable rate exposure in its Treasury Indicators in this report. It also manages interest rate risk by maintaining a number of discrete investment portfolios which are managed by external fund managers. The separation of equites, multi-asset and bond investments in this way effectively minimises the Council’s exposure to interest rate movements.
5. Legal and regulatory risk: this is the risk that the organisation itself, or an organisation with which it is dealing in its treasury management activities, fails to act in accordance with its legal powers or regulatory requirements, and that the organisation suffers losses accordingly.
Controls on treasury risks
1. Credit and counter-party risk: this authority has set minimum credit criteria to determine which counterparties and countries are of sufficiently high creditworthiness to be considered for investment purposes. See paragraphs 4.2 and 4.3.
2. Liquidity risk: this authority has a Treasury Management cash flow forecasting model to enable it to determine how long investments can be made for and how much can be invested.
3. Market risk: this is a risk that, through adverse market fluctuations in the value of the principle sums an organisation borrows and invests, its stated treasury management policies and objectives are compromised, against which effects it has failed to protect itself adequately. However, as a cash rich local authority the

38
Council carries an active exposure to market risk, e.g. those investing in investment instruments through the Strategic Reserve Fund with a view to obtaining a long-term increase in value.
4. Interest rate risk: this authority manages this risk by having a view of the future course of interest rates and then formulating a treasury management strategy accordingly which aims to maximise investment earnings consistent with control of risk or alternatively, seeks to minimise expenditure on interest costs on borrowing. See paragraph 4.4.
5. Legal and regulatory risk: this authority will not undertake any form of investing until it has ensured that it has all necessary powers and also complied with all regulations. All types of investment instruments.
Unlimited investments
Regulation 24 states that an investment can be shown in tables 1 / 2 as being ‘unlimited’ in terms of the maximum amount or percentage of the total portfolio that can be put into that type of investment. However, it also requires that an explanation must be given for using that category.
The authority has given the following types of investment an unlimited category: -
1. Debt Management Agency Deposit Facility. This is considered to be the lowest risk form of investment available to local authorities as it is operated by the Debt Management Office which is part of H.M. Treasury i.e. the UK Government’s sovereign rating stands behind the DMADF. It is also a deposit account and avoids the complications of buying and holding Government issued treasury bills or gilts.
2. High credit worthiness banks and building societies. See paragraph 4.2 for an explanation of this authority’s definition of high credit worthiness. While an unlimited amount of the investment portfolio may be put into banks and building societies with high credit worthiness, the authority will ensure diversification of its Treasury Management portfolio ensuring that no more than 25% of the total portfolio can be placed with any one institution or group at any one time.
3. The Council’s Current Provider of Banking Services. In normal circumstances the authority will ensure diversification of its portfolio ensuring that no more than 25% of the total portfolio can be placed with any one institution or group at any one time. In restricted circumstances, however, to be determined on a case by case basis by the Head of Finance as Section 95 Officer to the Council, the Council’s banker is further authorised to hold an unlimited amount, or up to 100%, of Council funds either in the form of cash or bonds as part of the transition process or portfolio restructuring exercise, in respect of the Strategic Reserve Fund managed fund investments, for a maximum period of up to 7 working days.

39
Objectives of each type of investment instrument
Regulation 25 requires an explanation of the objectives of every type of investment instrument which an authority approves as being ‘permitted’.
1. Deposits
The following forms of ‘investments’ are actually more accurately called deposits as cash is deposited in an account until an agreed maturity date or is held at call.
a) Debt Management Agency Deposit Facility. This offers the lowest risk form of investment available to local authorities as it is effectively an investment placed with the Government. It is also easy to use as it is a deposit account and avoids the complications of buying and holding Government issued treasury bills or gilts. As it is low risk it also earns low rates of interest. However, it is very useful for authorities whose overriding priority is the avoidance of risk. The longest period for a term deposit with the DMADF is 6 months.
b) Term deposits with high credit worthiness banks and building societies. See paragraph 4.2 for an explanation of this authority’s definition of high credit worthiness. This is the most widely used form of investing used by local authorities. It offers a much higher rate of return than the DMADF (dependent on term). The authority will ensure diversification of its portfolio of Treasury Management deposits ensuring that no more than 25% of the total portfolio can be placed with any one institution or group. In addition, longer term deposits offer an opportunity to increase investment returns by locking in high rates ahead of an expected fall in the level of interest rates. At other times, longer term rates can offer good value when the markets incorrectly assess the speed and timing of interest rate increases. This form of investing therefore, offers a lot of flexibility and higher earnings than the DMADF. Where it is restricted is that once a longer-term investment is made, that cash is locked in until the maturity date.
c) Call accounts with high credit worthiness banks and building societies. The objectives are as for 1b. but there is instant access to recalling cash deposited. This generally means accepting a lower rate of interest than that which could be earned from the same institution by making a term deposit. Some use of call accounts is highly desirable to ensure that the authority has ready access to cash when needed to pay bills.
d) Fixed term deposits with variable rate and variable maturities (structured deposits). This line encompasses ALL types of structured deposits. There has been considerable change in the types of structured deposits brought to the market over the last few years, some of which are already no longer available. In view of the fluidity of this area, this is a generic title for all structured deposits so as to provide councils with greater flexibility to adopt new instruments as and when they are brought to the market. However, this does mean that members ought to be informed as to what instruments are presently under this generic title so that they are aware of the current situation, and that they are informed and approve of intended changes in an appropriate manner.
e) Collateralised deposits. These are deposits placed with a bank which offers collateral backing based on specific assets. Examples seen in the past have

40
included local authority LOBOs, where such deposits are effectively lending to a local authority as that is the ultimate security.
2. Deposits with Counterparties Currently in Receipt of Government Support / Ownership
These banks offer another dimension of creditworthiness in terms of Government backing through either partial or full direct ownership. The view of this authority is that such backing makes these banks attractive institutions with whom to place deposits, and that will remain our view if the UK sovereign rating were to be downgraded in the coming year.
a. Term deposits with high credit worthiness banks which are fully or semi nationalised. As for 1b. but Government full, (or substantial partial), ownership, implies that the Government stands behind this bank and will be deeply committed to providing whatever support that may be required to ensure the continuity of that bank. This authority considers that this indicates a low and acceptable level of residual risk.
b. Fixed term deposits with variable rate and variable maturities (structured deposits). This line encompasses ALL types of structured deposits. There has been considerable change in the types of structured deposits brought to the market over the last few years, some of which are already no longer available. In view of the fluidity of this area, this is a generic title for all structured deposits so as to provide councils with greater flexibility to adopt new instruments as and when they are brought to the market. However, this does mean that members ought to be informed as to what instruments are presently covered under this generic title so that they are aware of the current situation, and that they are informed and approve of intended changes in an appropriate manner.
3. Collective Investment Schemes Structured as Open-Ended Investment Companies (OEICS)
a. Government liquidity funds. These are the same as money market funds (see below) but only invest in government debt issuance with highly rated governments. Due to the higher quality of underlying investments, they offer a lower rate of return than MMFs. However, their net return is typically on a par with the DMADF, but with instant access.
b. Money Market Funds (MMFs). By definition, MMFs are AAA rated and are widely diversified, using many forms of money market securities including types which this authority does not currently have the expertise or capabilities to hold directly. However, due to the high level of expertise of the fund managers and the huge amounts of money invested in MMFs, and the fact that the weighted average maturity (WAM) cannot exceed 60 days, MMFs offer a combination of high security, instant access to funds, high diversification and good rates of return compared to equivalent instant access facilities. They are particularly advantageous in falling interest rate environments as their 60-day WAM means they have locked in investments earning higher rates of interest than are currently available in the market. MMFs also help an authority to diversify its own portfolio as e.g. a £2m investment placed directly with HSBC is a 100% risk exposure to HSBC whereas

41
£2m invested in a MMF may end up with say £10,000 being invested with HSBC through the MMF. For authorities particularly concerned with risk exposure to banks, MMFs offer an effective way of minimising risk exposure while still getting much better rates of return than available through the DMADF.
c. Ultra-short dated bond funds. These funds are similar to MMFs, can still be AAA rated but have variable net asset values (VNAV) as opposed to a traditional MMF which has a Constant Net Asset Value (CNAV). They aim to achieve a higher yield and to do this either take more credit risk or invest out for longer periods of time, which means they are more volatile. These funds can have WAM’s and Weighted Average Life (WAL’s) of 90 – 365 days or even longer. Their primary objective is yield and capital preservation is second. They therefore are a higher risk than MMFs and correspondingly have the potential to earn higher returns than MMFs.
d. Gilt funds. These are funds which invest only in U.K. Government gilts. They offer a lower rate of return than bond funds but are highly rated both as a fund and through investing only in highly rated government securities. They offer a higher rate of return than investing in the DMADF, but they do have an exposure to movements in market prices of assets held.
e. Bond funds. These can invest in both government and corporate bonds. This therefore entails a higher level of risk exposure than gilt funds and the aim is to achieve a higher rate of return than normally available from gilt funds by trading in non-government bonds.
4. Securities Issued or Guaranteed by Governments
The following types of investments are where an authority directly purchases a particular investment instrument, a security, i.e. it has a market price when purchased and that value can change during the period the instrument is held until it matures or is sold. The annual earnings on a security is called a yield i.e. it is normally the interest paid by the issuer divided by the price you paid to purchase the security unless a security is initially issued at a discount e.g. treasury bills.
a. Treasury bills. These are short term bills, (up to 18 months but usually 9 months or less), issued by the Government and so are backed by the sovereign rating of the UK. The yield is higher than the rate of interest paid by the DMADF and another advantage compared to a time deposit in the DMADF is that they can be sold if there is a need for access to cash at any point in time. However, there is a spread between purchase and sale prices so early sales could incur a net cost during the period of ownership.
b. Gilts. These are longer term debt issuance by the UK Government and are backed by the sovereign rating of the UK. The yield is higher than the rate of interest paid by the DMADF and another advantage compared to a time deposit in the DMADF is that they can be sold if there is a need for access to cash at any point in time. However, there is a spread between purchase and sale prices so early sales may incur a net cost. Market movements that occur between purchase and sale may also have an adverse impact on proceeds. The advantage over Treasury bills is that they generally offer higher yields the longer it is to maturity (for most periods) if the yield curve is positive.

42
c. Bond issuance issued by a financial institution which is explicitly guaranteed by the UK Government e.g. National Rail. This is similar to a gilt due to the explicit Government guarantee.
d. Sovereign bond issues (other than the UK govt) denominated in Sterling. As for gilts but issued by other nations. Use limited to issues of nations with at least the same sovereign rating as for the UK.
e. Bonds issued by Multi-Lateral Development Banks (MLDBs). These are similar to c. and e. above but are issued by MLDBs which are typically guaranteed by a group of sovereign states e.g. European Bank for Reconstruction and Development.
5. Securities Issued by Corporate Organisations
The following types of investments are where an authority directly purchases a particular investment instrument, a security, i.e. it has a market price when purchased and that value can change during the period the instrument is held until it is sold. The annual earnings on a security is called a yield i.e. is the interest paid by the issuer divided by the price you paid to purchase the security. These are similar to the previous category, but corporate organisations can have a wide variety of credit worthiness, so it is essential for local authorities to only select the organisations with the highest levels of credit worthiness. Corporate securities are generally a higher risk than government debt issuance and so earn higher yields.
a. Certificates of deposit (CDs). These are shorter term securities issued by deposit taking institutions (mainly financial institutions). They are negotiable instruments, so can be sold ahead of maturity and also purchased after they have been issued. However, that liquidity can come at a price, where the yield could be marginally less than placing a deposit with the same bank as the issuing bank.
b. Commercial paper. This is similar to CDs but is issued by commercial organisations or other entities. Maturity periods are up to 365 days but commonly 90 days.
c. Corporate bonds. These are (long term) bonds (usually bearing a fixed rate of interest) issued by a financial institution, company or other non-government issuer in order to raise capital for the institution as an alternative to issuing shares or borrowing from banks. They are generally seen to be of a lower creditworthiness than government issued debt and so usually offer higher rates of yield.
d. Floating rate notes. These are bonds on which the rate of interest is established periodically with reference to short-term interest rates.
6. Other
Property fund. This is a collective investment fund specialising in property. Rather than owning a single property with all the risk exposure that means to one property in one location rising or falling in value, maintenance costs, tenants actually paying their rent / lease etc., a collective fund offers the advantage of diversified investment over a wide portfolio of different properties. This can be attractive for authorities who want exposure to the potential for the property sector to rise in value. However, timing is

43
critical to entering or leaving this sector at the optimum times of the property cycle of rising and falling values. Typically, the minimum investment time horizon for considering such funds is at least 3-5 years.
Diversified Growth Fund. This is a collective investment fund specialising in a diversified investment approach. Rather than holding individual stocks and shares a collective fund offers the advantage of more diversified investment over a wider portfolio of investments and range of asset classes. This can be attractive for authorities who want exposure to the potential for asset classes including listed equities, private equity, high yield and investment grade bonds, structured finance, emerging market bonds, absolute return, insurance linked, commodities, infrastructure and currency assets to rise in value. By their very nature, some of these asset classes are regarded as being higher risk and as such it is not considered prudent to hold individual stocks as a direct investment. The risk profile of the collective investment fund is managed as a whole to smooth out the volatility in terms of the performance of individual investments and across asset classes.
Enhanced Yield Debt or Multi Asset Credit Fund. This is a collective investment fund specialising in enhanced yield debt focused strategies or multi asset credit investment approach. Rather than holding individual stocks and shares a collective fund offers the advantage of targeting a select group of investments and range of asset classes. This can be attractive for authorities who want exposure to the specialist area of enhanced yield debt strategies or multi asset credit asset classes including for example senior secured corporate debt, high yield, mezzanine corporate debt, property debt, infrastructure debt, asset-backed securities and distressed debt. Some of these asset classes are regarded as being both higher risk and by their nature can be more illiquid, as such it is not considered prudent to hold individual stocks as a direct investment. The risk profile of the collective investment fund is managed as a whole to smooth out the volatility in terms of the performance of individual investments and across asset classes.
Private Debt Fund. This is an investment fund specialising in directly originated senior secured loans to private equity-owned businesses. Private debt provides a spread pick-up versus the syndicated loan markets. The privately negotiated debt deals tend to be structured with strong financial covenants which protect lenders. Lenders in the private credit market can also benefit from origination fees, which benefit banks in the syndicated market.

44
Table 1: permitted investments in house – Treasury Management and Common Good
This table is for use by the in-house treasury management team.
1.1 Deposits
* Minimum Credit Criteria / colour banding
Liquidity risk
Market risk
Max %
of total investments
Max. maturity period
Debt Management Agency Deposit Facility (DMADF)
--
term no 100% 6 months
Term deposits – local authorities --
term
no 100% 2 years
Call accounts – banks and building societies **
Green
instant
no 100% 2 years
Term deposits – banks and building societies **
Green
term
no 100% 2 years
Fixed term deposits with variable rate and variable maturities: -Structured deposits.
Green
term
no 20% 2 years
Collateralised deposit (see note 2) UK sovereign rating or note 1
term
no 20% 2 years
1.2 Deposits with counterparties currently in receipt of government support / ownership
* Minimum Credit Criteria / colour banding
Liquidity risk
Market risk
Max % of total investments
Max. maturity period
UK part nationalised banks See note 1
term
no 100% 2 years
Banks part nationalised by high credit rated (sovereign rating) countries – non-UK
Sovereign rating or note 1
term
no 20% 2 years
Fixed term deposits with variable rate and variable maturities: -Structured deposits
See note 1
term
yes 20% 2 years
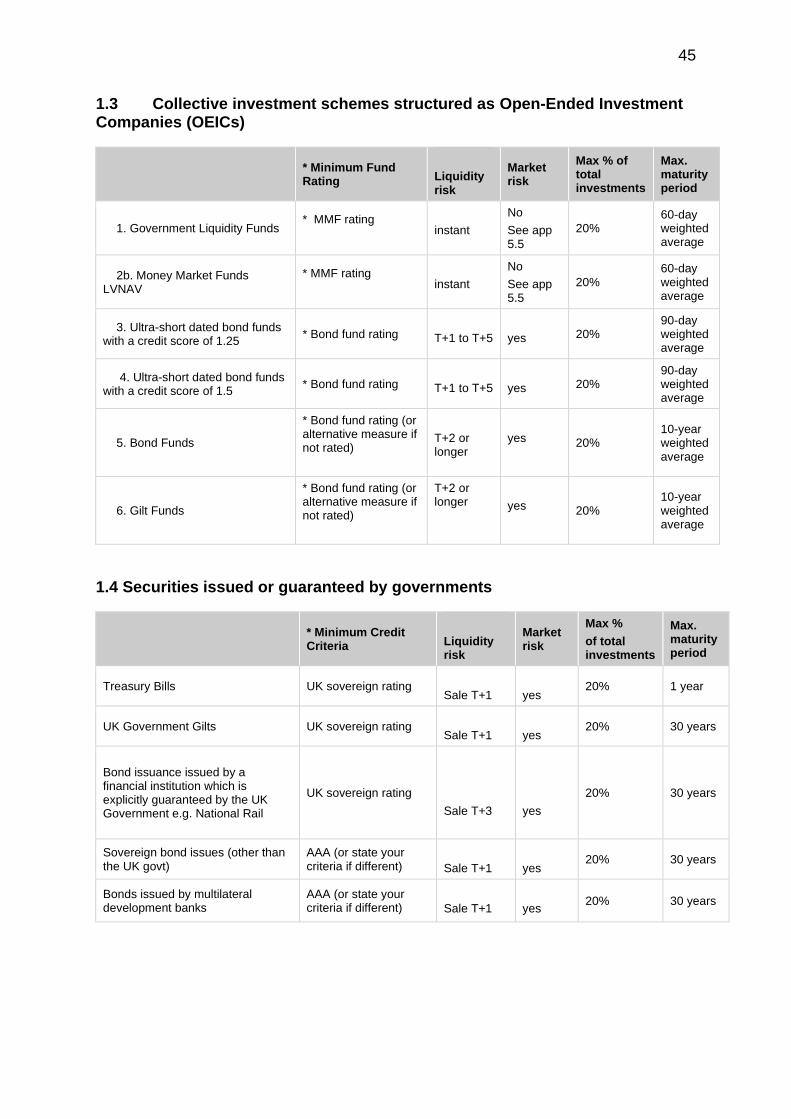
45
1.3 Collective investment schemes structured as Open-Ended Investment Companies (OEICs)
* Minimum Fund Rating
Liquidity risk
Market risk
Max % of total investments
Max. maturity period
1. Government Liquidity Funds * MMF rating
instant
No
See app 5.5
20% 60-day weighted average
2b. Money Market Funds LVNAV
* MMF rating
instant
No
See app 5.5
20% 60-day weighted average
3. Ultra-short dated bond funds with a credit score of 1.25
* Bond fund rating
T+1 to T+5
yes 20% 90-day weighted average
4. Ultra-short dated bond funds with a credit score of 1.5
* Bond fund rating
T+1 to T+5
yes 20% 90-day weighted average
5. Bond Funds
* Bond fund rating (or alternative measure if not rated)
T+2 or longer
yes 20% 10-year weighted average
6. Gilt Funds
* Bond fund rating (or alternative measure if not rated)
T+2 or longer
yes 20% 10-year weighted average
1.4 Securities issued or guaranteed by governments
* Minimum Credit Criteria
Liquidity risk
Market risk
Max %
of total investments
Max. maturity period
Treasury Bills UK sovereign rating
Sale T+1
yes 20% 1 year
UK Government Gilts UK sovereign rating
Sale T+1
yes 20% 30 years
Bond issuance issued by a financial institution which is explicitly guaranteed by the UK Government e.g. National Rail
UK sovereign rating
Sale T+3
yes
20% 30 years
Sovereign bond issues (other than the UK govt)
AAA (or state your criteria if different)
Sale T+1
yes 20% 30 years
Bonds issued by multilateral development banks
AAA (or state your criteria if different)
Sale T+1
yes 20% 30 years

46
1.5 Securities issued by corporate organisations
* Minimum Credit Criteria
Liquidity risk
Market risk
Max %
of total investments
Max. maturity period
Certificates of deposit issued by banks and building societies
Green
Sale T+0
yes
20% 2 year
Commercial paper other * Short-term F1, A1, P1, Long-term A, Viability C, Support 2
Sale T+0
yes 20% 90 days
Floating rate notes * Short-term F1, A1, P1, Long-term A, Viability C, Support 2
Sale T+0
yes 20% 30 years
Corporate Bonds other * Short-term F1, A1, P1, Long-term A, Viability C, Support 2
Sale T+3
yes
20% 30 years
Accounting treatment of investments. The accounting treatment may differ from the underlying cash transactions arising from investment decisions made by this Council. To ensure that the Council is protected from any adverse revenue impact, which may arise from these differences, we will review the accounting implications of new transactions before they are undertaken.
1.6 Other
* Minimum Credit Criteria / fund rating
Liquidity risk
Market risk
Max %
of total investments
Max. maturity period
Property Funds --
T+4
yes 20% 30 years
Diversified Growth Funds - T+4 Yes
20% 30 years
Enhanced Yield Debt Strategies or Multi Asset Fund
- T+4 Yes
20% 30 years
Local authority mortgage scheme Short-term F1, A1, P1, Long-term AA-, Viability B, Support 3
£5M 5 years
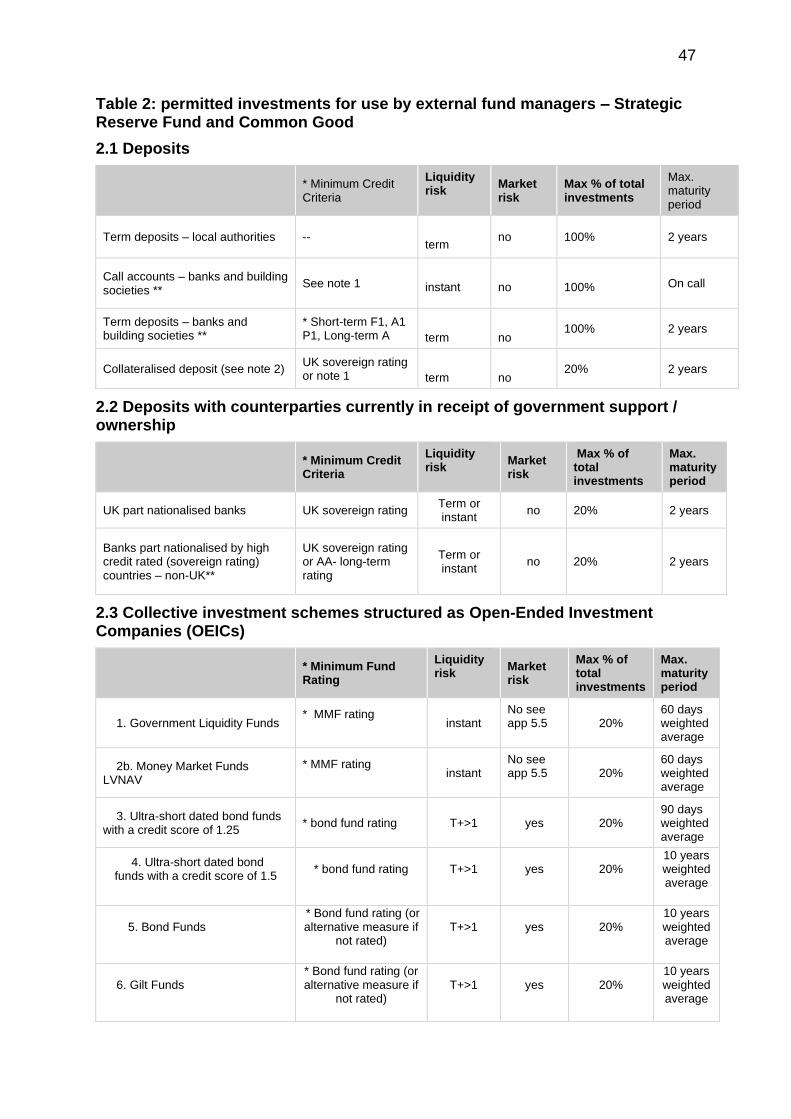
47
Table 2: permitted investments for use by external fund managers – Strategic Reserve Fund and Common Good
2.1 Deposits
* Minimum Credit Criteria
Liquidity risk
Market risk
Max % of total investments
Max. maturity period
Term deposits – local authorities --
term no 100% 2 years
Call accounts – banks and building societies **
See note 1
instant
no
100% On call
Term deposits – banks and building societies **
* Short-term F1, A1 P1, Long-term A
term
no 100% 2 years
Collateralised deposit (see note 2) UK sovereign rating or note 1
term
no 20% 2 years
2.2 Deposits with counterparties currently in receipt of government support / ownership
* Minimum Credit Criteria
Liquidity risk
Market risk
Max % of total investments
Max. maturity period
UK part nationalised banks UK sovereign rating Term or instant
no 20% 2 years
Banks part nationalised by high credit rated (sovereign rating) countries – non-UK**
UK sovereign rating or AA- long-term rating
Term or instant
no 20% 2 years
2.3 Collective investment schemes structured as Open-Ended Investment Companies (OEICs)
* Minimum Fund Rating
Liquidity risk
Market risk
Max % of total investments
Max. maturity period
1. Government Liquidity Funds * MMF rating
instant
No see app 5.5 20%
60 days weighted average
2b. Money Market Funds LVNAV
* MMF rating
instant
No see app 5.5 20%
60 days weighted average
3. Ultra-short dated bond funds with a credit score of 1.25
* bond fund rating T+>1 yes 20% 90 days weighted average
4. Ultra-short dated bond funds with a credit score of 1.5
* bond fund rating T+>1 yes 20% 10 years weighted average
5. Bond Funds * Bond fund rating (or alternative measure if
not rated) T+>1 yes 20%
10 years weighted average
6. Gilt Funds * Bond fund rating (or alternative measure if
not rated) T+>1 yes 20%
10 years weighted average

48
2.4 Securities issued or guaranteed by governments
* Minimum Credit Criteria
Liquidity risk
Market risk
Max %
of total investments
Max. maturity period
Treasury Bills UK sovereign rating Sale T+1 yes 20% 1 year
UK Government Gilts UK sovereign rating Sale T+1 yes 20% 100
years
Bond issuance issued by a financial institution which is explicitly guaranteed by the UK Government e.g. National Rail
UK sovereign rating Sale T+3 yes 20% 100
years
Sovereign bond issues (other than the UK govt)
AAA (or state your criteria if different)
Sale T+1 yes 20% 100
years
Bonds issued by multilateral development banks
AAA (or state your criteria if different)
Sale T+1 yes 20% 100
years
2.5 Securities issued by corporate organisations
* Minimum Credit Criteria
Liquidity risk
Market risk
Max %
of total investments
Max. maturity period
Certificates of deposit issued by banks and building
*Short-term F1, A1, P1, Long-term A
Sale T+1 yes 20% 1 year
Commercial paper other * Short-term F1, A1, P1, Long-term A
Sale T+1 yes 20% 90 days
Corporate Bonds other * Short-term F1, A1, P1, Long-term A
Sale T+3 yes 20% 75 years
Floating Rate Notes * Long-term A Sale T+1 yes 20% 75 years
Accounting treatment of investments. The accounting treatment may differ from the underlying cash transactions arising from investment decisions made by this Council. To ensure that the Council is protected from any adverse revenue impact, which may arise from these differences, we will review the accounting implications of new transactions before they are undertaken.

49
2.6 Other
* Minimum Credit Criteria
Liquidity risk
Market risk
Max %
of total investments
Max. maturity period
Property Funds - T+4 Yes 20% 30 years
Diversified Growth Funds - T+4 Yes 20% 30 years
Enhanced Yield Debt Strategies or Multi Asset Funds
- T+4 Yes 20% 30 years
Infrastructure Equity - T+4 Yes 20% 50 years
Illiquid or Private Debt Funds - T+4 Yes 20% 30 years
Secured Income/Secured Finance T+4 Yes 20% 30 years
It should be noted that the external fund managers appointed to manage the Council’s managed fund portfolios are authorised through agreed investment guidelines to hold permitted investments in the form of non-treasury investments as described in Appendix 6 to this strategy document i.e. equity shares, unit trusts and bond holdings.
7. Permitted Investments – Non Treasury Investments.
Definition of non-treasury investments
Regulation 9 adds to the normal definition of investments the following categories:-
• a. All shareholding, unit holding and bond holding, including those in a local authority owned company, is an investment.
• b. Loans to a local authority company or other entity formed by a local authority to deliver services, is an investment.
• c. Loans made to third parties are investments.
• d. Investment property is an investment.
However, the following loans are excluded from the definition of investments:
Loans made by a local authority to another authority or harbour authority using powers contained in Schedule 3, paragraph 10 or 11 of the Local Government (Scotland) Act 1975.
Regulation 24. A local authority shall state the limits for the amounts which, at any time during the financial year, may be invested in each type of permitted investment, such limit being applied when the investment is made. The limits may be defined by reference to a sum of money or a percentage of the local authority's overall investments, or both. A local authority may state that a permitted investment is unlimited. Where a limit is not placed on any type of permitted investment the risk assessment must support that categorisation and an explanation provided as to why an unlimited categorisation is recommended.

50
Regulation 25. The local authority should identify for each type of permitted investment the objectives of that type of investment. Further, the local authority should identify the treasury risks associated with each type of investment, together with the controls put into place to limit those risks. Treasury risks include credit or security risk of default, liquidity risk – the risks associated with committing funds to longer term investments and market risk – the effect of market prices on investment value.
Regulation 32. The Strategy shall include details of the maximum value and maximum periods for which funds may prudently be invested. The Strategy shall set out the local authority objectives for holding longer term investments. The Strategy shall also refer to the procedures for reviewing the holding of longer term investments particularly those investments held in properties, shareholdings in companies or joint ventures.
External fund managers appointed to manage the Council’s managed fund portfolios are authorised through agreed investment guidelines to hold permitted investments in the form of non-treasury investments as defined above i.e. equity shares, unit trusts and bond holdings.
Under current investment guidelines fund managers are authorised to hold up to 100% of the managed funds either in the form of bonds, equities, property or unit trusts including collective investment vehicles such as diversified growth and multi asset fund investments.
Each type of permitted investment has been detailed in Table 2 above, as part of the permitted investments for use by external cash and managed fund managers.
The Consent includes as an investment any loan issued to a local authority company or other entity formed by as local authority to deliver services, or a third party, subject to a maximum amount of £25M and a maximum duration of up to 30 years.
The Consent includes as an investment any investment property up to a maximum value of £10M per investment and a maximum duration of up to 30 years.
In such cases, individual requests will be considered by the Investment Sub-Committee as a potential investment opportunity on commercial terms in the first instance, and thereafter be the subject of due diligence exercise, if supported in principle.
Such loans and property investments are often made for service reasons and for which specific statutory provision exists. Where this is the case, the relevant Services Committee will give consideration to such requests, which may include for example loans at an interest rate below the market rate subject to the state aid implications being addressed.
All loans to third parties are classified as investments for the purposes of the Consent. Where the loan is advanced at less than a market interest rate there is an associated loss of investment return which would otherwise have been earned on these monies. Annual strategies and reports will recognise all loans to third parties as investments. In such cases, these loans will be categorised, identifying the service reason together with details of those loans carrying a below market interest rate and the impact these advances have on investment returns in future reports.

51
5.5 Treasury Management Practice (TMP1): Credit and Counterparty Risk Management
Orkney Islands Council, including Strategic Reserve Fund, Charitable and Common Good Funds Permitted Investments, Associated Controls and Limits
Type of Investment Treasury Risks Mitigating Controls Council Limits
Common Good Limits
Cash type instruments
a. Deposits with the Debt Management Account Facility (UK Government) (Very low risk)
This is a deposit with the UK Government and as such counterparty and liquidity risk is very low, and there is no risk to value. Deposits can be between overnight and 6 months.
Little mitigating controls required. As this is a UK Government investment the monetary limit is unlimited to allow for a safe haven for investments.
100%, maximum 6 months.
100%, maximum 6 months.
b. Deposits with other local authorities or public bodies (Very low risk)
These are considered quasi UK Government debt and as such counterparty risk is very low, and there is no risk to value. Liquidity may present a problem as deposits can only be broken with the agreement of the counterparty, and penalties can apply.
Deposits with other non-local authority bodies will be restricted to the overall credit rating criteria.
Little mitigating controls required for local authority deposits, as this is a quasi UK Government investment.
Non- local authority deposits will follow the approved credit rating criteria.
100% and maximum 2 years.
100% and maximum 2 years.
c. Money Market Funds (MMFs) (LVNAV) (Low to very low risk)
Pooled cash investment vehicle which provides very low counterparty, liquidity and market risk. These will primarily be used as liquidity instruments.
Funds will only be used where the MMFs has a “AAA” rated status from either Fitch, Moody’s or Standard and Poor’s.
20% 20%

52
Type of Investment Treasury Risks Mitigating Controls Council Limits
Common Good Limits
d. Ultra-short dated bond funds (low risk)
Pooled cash investment vehicle which provides very low counterparty, liquidity and market risk. These will primarily be used as liquidity instruments.
Funds will only be used where they have a “AAA” rated status from either Fitch, Moody’s or Standard and Poor’s.
20% 20%
e. Call account deposit accounts with financial institutions (banks and building societies) (Low risk depending on credit rating)
These tend to be low risk investments but will exhibit higher risks than categories (a), (b) and (c) above. Whilst there is no risk to value with these types of investments, liquidity is high, and investments can be returned at short notice.
The counterparty selection criteria approved above restricts lending only to high quality counterparties, measured primarily by credit ratings from Fitch, Moody’s and Standard and Poor’s. Day to day investment dealing with these criteria will be further strengthened by use of additional market intelligence.
As shown in the counterparty section criteria above.
As shown in the counterparty section criteria above.
f. Term deposits with financial institutions (banks and building societies) (Low to medium risk depending on period & credit rating)
These tend to be low risk investments but will exhibit higher risks than categories (a), (b) and (c) above. Whilst there is no risk to value with these types of investments, liquidity is low and term deposits can only be broken with the agreement of the counterparty, and penalties may apply.
The counterparty selection criteria approved above restricts lending only to high quality counterparties, measured primarily by credit ratings from Fitch, Moody’s and Standard and Poor’s. Day to day investment dealing with these criteria will be further strengthened by use of additional market intelligence.
As shown in the counterparty section criteria above.
As shown in the counterparty section criteria above.

53
Type of Investment Treasury Risks Mitigating Controls Council Limits
Common Good Limits
g. Government Gilts and Treasury Bills (Very low risk)
These are marketable securities issued by the UK Government and as such counterparty and liquidity risk is very low, although there is potential risk to value arising from an adverse movement in interest rates (no loss if these are held to maturity.
Little counterparty mitigating controls are required, as this is a UK Government investment. The potential for capital loss will be reduced by limiting the maximum monetary and time exposures.
20%, maximum 100 years.
20%, maximum 100 years.
h. Certificates of deposits with financial institutions (Low risk)
These are short dated marketable securities issued by financial institutions and as such counterparty risk is low but will exhibit higher risks than categories (a), (b) and (c) above. There is risk to value of capital loss arising from selling ahead of maturity if combined with an adverse movement in interest rates (no loss if these are held to maturity). Liquidity risk will normally be low.
The counterparty selection criteria approved above restricts lending only to high quality counterparties, measured primarily by credit ratings from Fitch, Moody’s and Standard and Poor’s. Day to day investment dealing with these criteria will be further strengthened by the use of additional market intelligence.
20% and maximum 75 years.
20% and maximum 75 years.
i. Structured deposit facilities with banks and building societies (escalating rates, de-escalating rates etc.) (Low to medium risk depending on period & credit rating)
These tend to be medium to low risk investments but will exhibit higher risks than categories (a), (b) and (c) above. Whilst there is no risk to value with these types of investments, liquidity is very low, and investments can only be broken with the agreement of the counterparty (penalties may apply).
The counterparty selection criteria approved above restricts lending only to high quality counterparties, measured primarily by credit ratings from Fitch, Moody’s and Standard and Poor’s. Day to day investment dealing with these criteria will be further strengthened by the use of additional market intelligence.
As shown in the counterparty section criteria above.
As shown in the counterparty section criteria above.

54
Type of Investment Treasury Risks Mitigating Controls Council Limits
Common Good Limits
j. Corporate bonds (Medium to high risk depending on period & credit rating)
These are marketable securities issued by financial and corporate institutions. Counterparty risk will vary and there is risk to value of capital loss arising from selling ahead of maturity if combined with an adverse movement in interest rates. Liquidity risk will be low.
The counterparty selection criteria approved above restricts lending only to high quality counterparties, measured primarily by credit ratings from Fitch, Moody’s and Standard and Poor’s. Corporate bonds will be restricted to those meeting the base criteria.
Day to day investment dealing with these criteria will be further strengthened by the use of additional market intelligence.
20% and maximum 75 years.
20% and maximum 75 years.

55
Type of Investment Treasury Risks Mitigating Controls Council Limits
Common Good Limits
Other types of investments
a. Investment properties
These are non-service properties which are being held pending disposal or for a longer-term rental income stream. These are highly illiquid assets with high risk to value (the potential for property prices to fall or for rental voids).
In larger investment portfolios some small allocation of property-based investment may counterbalance/compliment the wider cash portfolio.
Property holding will be re-valued regularly and reported annually with gross and net rental streams.
£10M and maximum of 30 years
n/a
b. Loans to third parties, including soft loans
These are service investments either at market rates of interest or below market rates (soft loans). These types of investments may exhibit credit risk and are likely to be highly illiquid.
Each third-party loan requires Member approval and each application is supported by the service rational behind the loan and the likelihood of partial or full default.
£5M and maximum 30 years.
n/a
c. Loans to a local authority company
These are service investments either at market rates of interest or below market rates (soft loans). These types of investments may exhibit credit risk and are likely to be highly illiquid.
Each loan to a local authority company requires Member approval and each application is supported by the service rational behind the loan and the likelihood of partial or full default.
£25M and maximum 30 years.
n/a
d. Shareholdings in a local authority company
These are service investments which may exhibit market risk and are likely to be highly illiquid.
Each equity investment in a local authority company requires Member approval and each application will be supported by the service rational behind the investment and the likelihood of loss.
100% n/a

56
The monitoring of investment counterparties - The status of counterparties will be monitored regularly. The Council receives credit rating and market information from Link, including when ratings change, and counterparties are checked promptly. On occasion ratings may be downgraded when an investment has already been made. The criteria used are such that a minor downgrading should not affect the full receipt of the principal and interest. Any counterparty failing to meet the criteria will be removed from the list immediately by the Director of Finance, and if required new counterparties which meet the criteria will be added to the list.
Use of External Fund Managers – It is the Council’s policy to use external fund managers for part of its investment portfolio. The fund managers are contractually committed to keep to the Council’s investment strategy. The limits for permitted investments have been established in consultation with external fund managers and are consistent with the terms of their appointment. The performance of each manager is reviewed at least quarterly by the Head of Finance and the managers are contractually required to comply with the annual investment strategy.
Type of Investment Treasury Risks Mitigating Controls Council Limits Common Good Limits
e. Non-local authority shareholdings
These are non-service investments which may exhibit market risk, be only considered for longer term investments and will be likely to be liquid.
Any non-service equity investment will require separate Member approval and each application will be supported by the service rational behind the investment and the likelihood of loss.
Specific managed fund investment guidelines
n/a
f. Local Authority Mortgage Scheme (LAMS)
These are service investments at market rates of interest. Under this scheme the Council would be required to place up to £5M on deposit with a participating bank for a period of between 3 to 5 years.
The counterparty selection criteria approved above restricts lending only to high quality counterparties, measured primarily by credit ratings from Fitch, Moody’s and Standard and Poor’s.
£5M and maximum 5 years.
n/a

5.6 Approved Countries for Investments
This list is based on those countries which have sovereign ratings of AA- or higher, (we show the lowest rating from Fitch, Moody’s and S&P) and also, (except - at the time of writing - for Hong Kong, Norway and Luxembourg), have banks operating in sterling markets which have credit ratings of green or above in the Link credit worthiness service.
Based on lowest available rating
AAA
• Australia
• Denmark
• Germany
• Luxembourg
• Netherlands
• Norway
• Singapore
• Sweden
• Switzerland
AA+
• Canada
• Finland
• U.S.A.
AA
• Abu Dhabi (UAE)
• France
AA-
• Belgium
• Hong Kong
• Qatar
• U.K.

58
5.7 Treasury Management Scheme of Delegation
1. Full Council
• receiving and reviewing reports on treasury management policies, practices and activities;
• approval of annual strategy.
2. Policy and Resources Committee
• approval of/amendments to the organisation’s adopted clauses, treasury management policy statement and treasury management practices;
• budget consideration and approval;
• approval of the division of responsibilities;
3. Investments Sub-committee
• reviewing the treasury management policy and procedures and making recommendations to the responsible body.
• receiving and reviewing regular monitoring reports and acting on recommendations;
• approving the selection of external service providers and agreeing terms of appointment.

59
5.8 The Treasury Management Role of The Section 95 Officer
The S95 (responsible) Officer:
• recommending clauses, treasury management policy/practices for approval, reviewing the same regularly, and monitoring compliance;
• submitting regular treasury management policy reports;
• submitting budgets and budget variations;
• receiving and reviewing management information reports;
• reviewing the performance of the treasury management function;
• ensuring the adequacy of treasury management resources and skills, and the effective division of responsibilities within the treasury management function;
• ensuring the adequacy of internal audit, and liaising with external audit;
• recommending the appointment of external service providers.