Ph.D. Admission List - Neville Wadia Institute of Management ...
Part 3: Final Feasibility Development Plan | Transit Oriented Development at Neville & Centre| Real Estate Design and Development 48-452|1
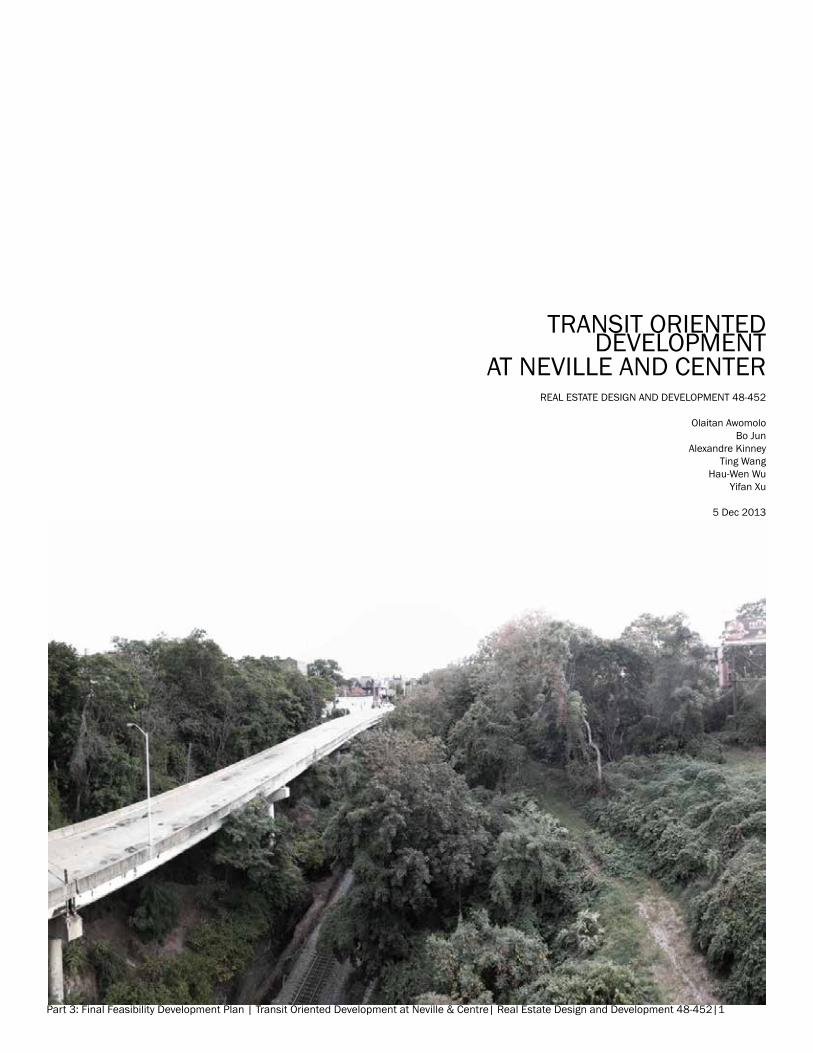
TRaNsiT ORiENTED DEvElOPmENT
aT NEvillE aND CENTERREal EsTaTE DEsiGN aND DEvElOPmENT 48-452
Olaitan awomoloBo Jun
alexandre KinneyTing Wang
Hau-Wen WuYifan Xu
5 Dec 2013
Part 3: Final Feasibility Development Plan | Transit Oriented Development at Neville & Centre| Real Estate Design and Development 48-452|2
1 | PROJECT DEsCRiPTiON
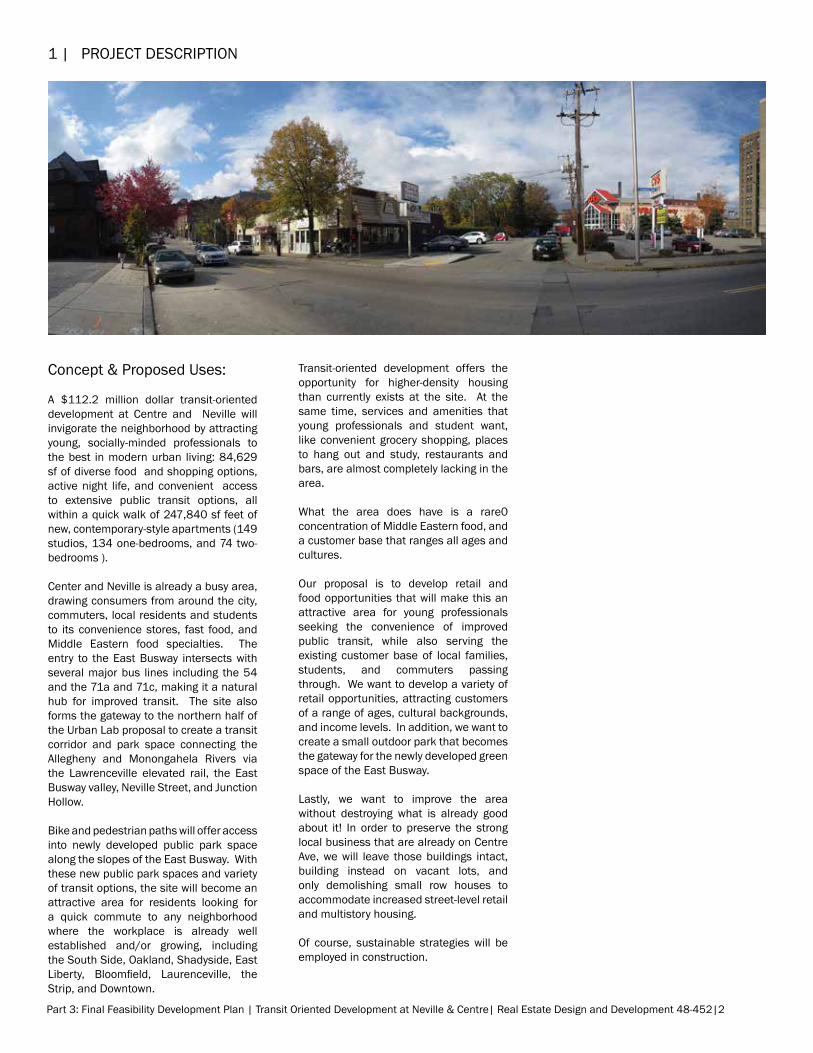
Concept & Proposed Uses:
a $112.2 million dollar transit-oriented development at Centre and Neville will invigorate the neighborhood by attracting young, socially-minded professionals to the best in modern urban living: 84,629 sf of diverse food and shopping options, active night life, and convenient access to extensive public transit options, all within a quick walk of 247,840 sf feet of new, contemporary-style apartments (149 studios, 134 one-bedrooms, and 74 two-bedrooms ).
Center and Neville is already a busy area, drawing consumers from around the city, commuters, local residents and students to its convenience stores, fast food, and middle Eastern food specialties. The entry to the East Busway intersects with several major bus lines including the 54 and the 71a and 71c, making it a natural hub for improved transit. The site also forms the gateway to the northern half of the Urban lab proposal to create a transit corridor and park space connecting the allegheny and monongahela Rivers via the lawrenceville elevated rail, the East Busway valley, Neville street, and Junction Hollow.
Bike and pedestrian paths will offer access into newly developed public park space along the slopes of the East Busway. With these new public park spaces and variety of transit options, the site will become an attractive area for residents looking for a quick commute to any neighborhood where the workplace is already well established and/or growing, including the south side, Oakland, shadyside, East Liberty, Bloomfield, Laurenceville, the strip, and Downtown.
Transit-oriented development offers the opportunity for higher-density housing than currently exists at the site. at the same time, services and amenities that young professionals and student want, like convenient grocery shopping, places to hang out and study, restaurants and bars, are almost completely lacking in the area.
What the area does have is a rare0 concentration of middle Eastern food, and a customer base that ranges all ages and cultures.
Our proposal is to develop retail and food opportunities that will make this an attractive area for young professionals seeking the convenience of improved public transit, while also serving the existing customer base of local families, students, and commuters passing through. We want to develop a variety of retail opportunities, attracting customers of a range of ages, cultural backgrounds, and income levels. in addition, we want to create a small outdoor park that becomes the gateway for the newly developed green space of the East Busway.
lastly, we want to improve the area without destroying what is already good about it! in order to preserve the strong local business that are already on Centre ave, we will leave those buildings intact, building instead on vacant lots, and only demolishing small row houses to accommodate increased street-level retail and multistory housing.
Of course, sustainable strategies will be employed in construction.

Part 3: Final Feasibility Development Plan | Transit Oriented Development at Neville & Centre| Real Estate Design and Development 48-452|3
2 | siTE lOCaTiON maP
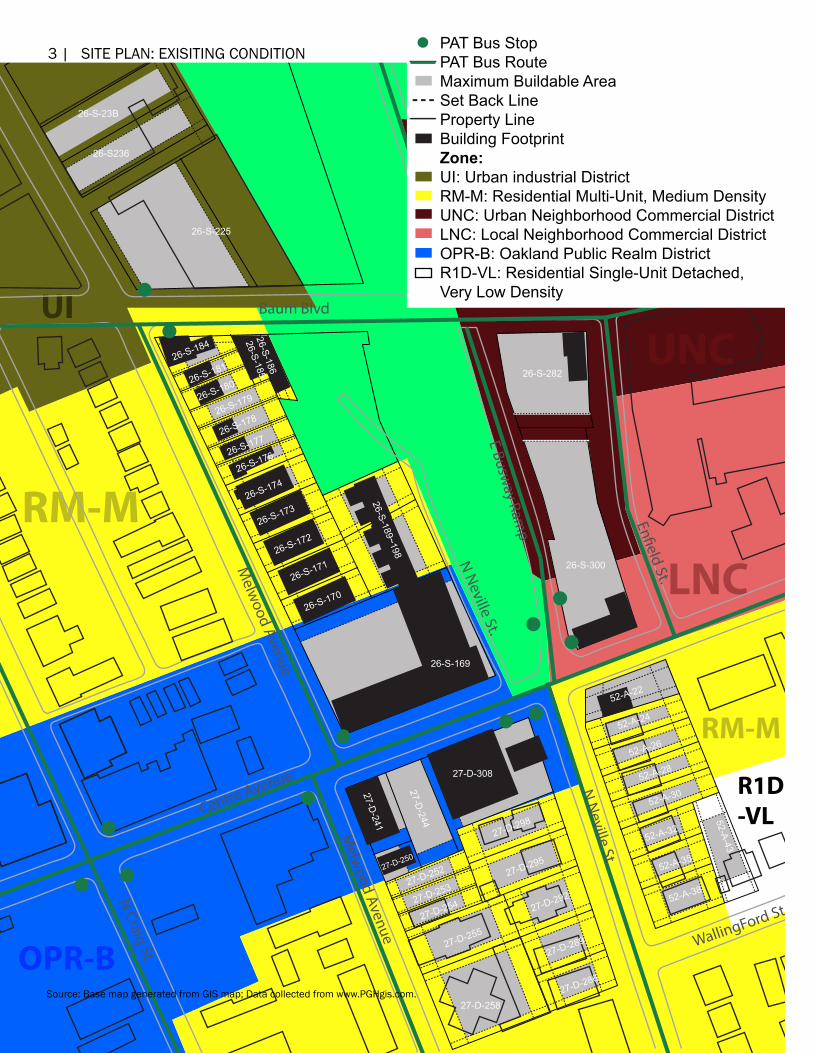
Bounded by Centre ave, Baum Blvd, Melwood Ave and Enfield St, our site is largely unoccupied green space encompassing the entry to the East Busway and the outlet of a train tunnel, making it an ideal location for transit oriented development. We can improve upon the existing commercial and residential stock, improve transit options, and create a public green space at the same time!
OaklandNeighborhood
Downtown Pittsburgh
Allegheny River
Monongahela River
Figure 1: Context of Oakland neighborhood in relation to
Figure 2: Context of site in relation to Oakland Neighborhood
source: Base map generated from Gis map.
aREa OF sElECTiON
CENTRE avE.
BaUm BlvD.
NEvillE sT. POTENTial EXPaNsiON
NEiGHBORHOOD aREa
WalliNGFORD sT.
BaYaRD sT.
CRaiG sT.
DEvONsHiRE sT.
ENFiElD
sT.
GlENN WaY
maRiPOE sT.
maRCH WaY
mOEWOOD avE.
millvalE avE.
BROUGHTON
sT.
maRTiN lUTHER KiNG JR. BUsWaY
mElW
OOD avE.
GOlD WaYBiGElOW
BlvD.
DiTHRiDGE sT.
DOllaR sT.
CHEsNEY WaYBEllEFiElD avE.
lEONaRD sT.
EllsWORTH avE.
Part 3: Final Feasibility Development Plan | Transit Oriented Development at Neville & Centre| Real Estate Design and Development 48-452|4
OPR-B
RM-M
UNC
LNC
RM-M
R1D-VL
UI
26-S-169
52-A-43
52-A-38
52-A-35
52-A-32
52-A-30
52-A-28
52-A-26
52-A-24
52-A-22
27-D-258
27-D-255
27-D-286
27-D-289
27-D-292
27-D-295
27-D-298
27-D-308
27-D-241
27-D-244
27-D-250
27-D-252
27-D-253
27-D-254
26-S-300
26-S-282
26-S-280
26-S-225
26-S236
26-S-23B
26-S-170
26-S-17126-S-172
26-S-17326-S-174
26-S-17626-S-17726-S-178
26-S-17926-S-18026-S-18126-S-184
26-S-186
26-S-185
26-S-189~198
Centre Avenue
Melw
ood Avenue
Melw
ood Avenue
N Craig St.
N N
eville St.
E Busway Ram
p
N N
eville St.Baum Blvd
En�eld St.
WallingFord St.
PAT Bus StopPAT Bus RouteMaximum Buildable AreaSet Back LineProperty LineBuilding Footprint Zone:UI: Urban industrial DistrictRM-M: Residential Multi-Unit, Medium DensityUNC: Urban Neighborhood Commercial DistrictLNC: Local Neighborhood Commercial DistrictOPR-B: Oakland Public Realm DistrictR1D-VL: Residential Single-Unit Detached, Very Low Density
source: Base map generated from Gis map; Data collected from www.PGHgis.com.
3 | siTE PlaN: EXisiTiNG CONDiTiON

Part 3: Final Feasibility Development Plan | Transit Oriented Development at Neville & Centre| Real Estate Design and Development 48-452|5
3 | siTE PlaN: PROPOsED_GROUND FlOOR
OPR-B
RM-M
UNC
LNC
RM-M
R1D-VL
UI
Centre Avenue
Melw
ood Avenue
Melw
ood Avenue
N Craig St.
N N
eville St.
E Busway Ram
p
N N
eville St.
Baum Blvd
En�eld St.
WallingFord St.
restaurant
park
new OPR-B zoning boundary
restaurants/stores
demolished buildings
pedestrian bridge
existing restau-rants
boutiques
bakery
co�eeshop
tram/bus station
Asian market
existing commercial
underground parking perimeter
parking entry
reading room
source: Base map generated from Gis map.
EXisTiNG BUilDiNG
vEHiClE PaRKiNG: 603 BiKE PaRKiNG: 178
PROPOsED BUilDiNG
PROPsED UNDERGROUND PaRKiNG
DEmOlisED BUilDiNG
Part 3: Final Feasibility Development Plan | Transit Oriented Development at Neville & Centre| Real Estate Design and Development 48-452|6
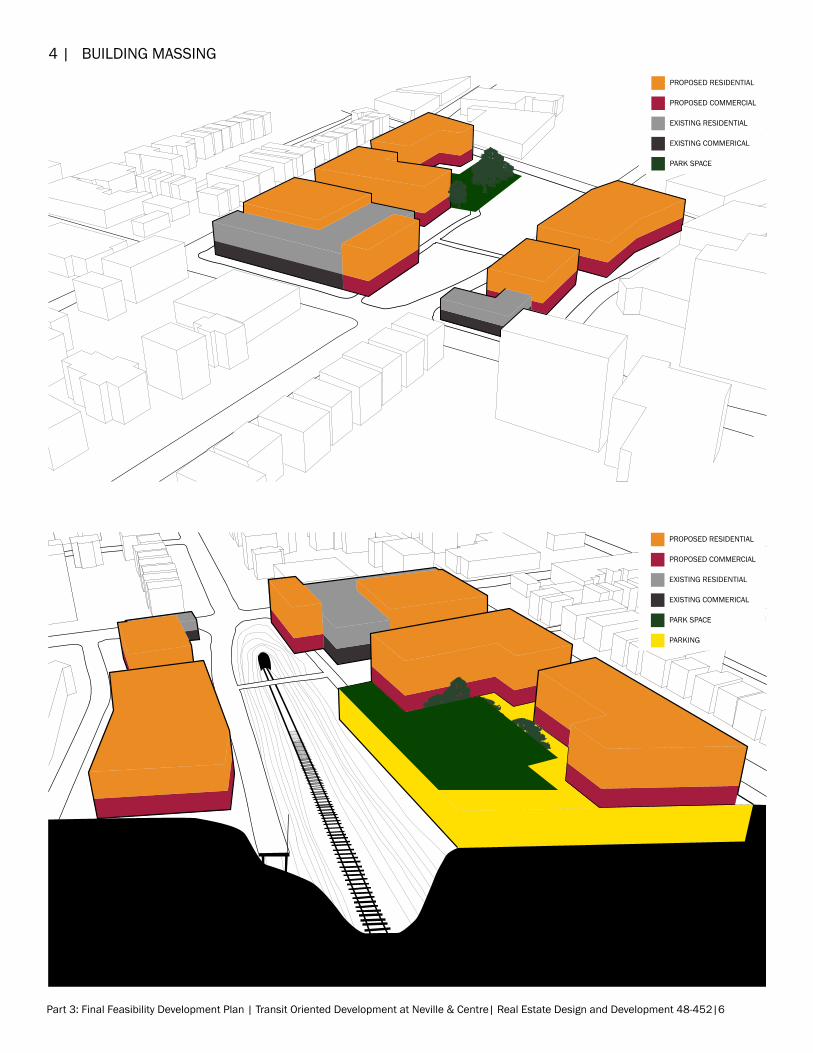
PROPOsED REsiDENTial
PROPOsED COmmERCial
EXisTiNG REsiDENTial
EXisTiNG COmmERiCal
PaRK sPaCE
PaRKiNG
PROPOsED REsiDENTial
PROPOsED COmmERCial
EXisTiNG REsiDENTial
EXisTiNG COmmERiCal
PaRK sPaCE
4 | BUilDiNG massiNG
Part 3: Final Feasibility Development Plan | Transit Oriented Development at Neville & Centre| Real Estate Design and Development 48-452|7
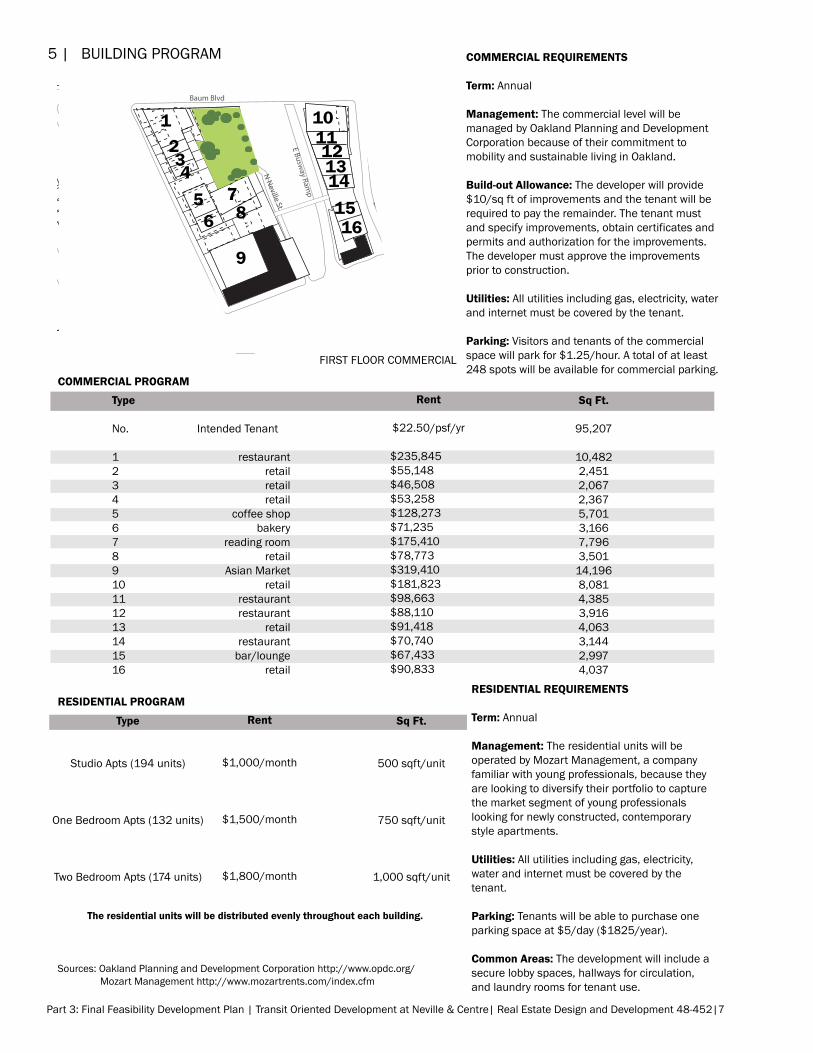
5 | BUilDiNG PROGRam
Centre Avenue
Melw
ood Avenue
N N
eville St.
E Busway Ram
p
N N
eville St.
Baum Blvd
En�eld St.
Type
No. Intended Tenant
12345678910111213141516
Rent
$22.50/psf/yr
$235,845 $55,148 $46,508 $53,258 $128,273 $71,235 $175,410 $78,773 $319,410 $181,823 $98,663 $88,110 $91,418 $70,740 $67,433 $90,833
restaurantretailretailretail
coffee shopbakery
reading roomretail
Asian Marketretail
restaurantrestaurant
retailrestaurant
bar/loungeretail
FIRST FLOOR COMMERCIAL
COMMERCIAL PROGRAM
RESIDENTIAL PROGRAM
Sq Ft.
95,207
10,4822,4512,0672,3675,7013,1667,7963,501
14,1968,0814,3853,9164,0633,1442,9974,037
COMMERCIAL REQUIREMENTS
Term: Annual
Management: The commercial level will be managed by Oakland Planning and Development Corporation because of their commitment to mobility and sustainable living in Oakland.
Build-out Allowance: The developer will provide $10/sq ft of improvements and the tenant will be required to pay the remainder. The tenant must and specify improvements, obtain certificates and permits and authorization for the improvements. The developer must approve the improvements prior to construction.
Utilities: All utilities including gas, electricity, water and internet must be covered by the tenant.
Parking: Visitors and tenants of the commercial space will park for $1.25/hour. A total of at least 248 spots will be available for commercial parking.
RESIDENTIAL REQUIREMENTS
Term: Annual
Management: The residential units will be operated by Mozart Management, a company familiar with young professionals, because they are looking to diversify their portfolio to capture the market segment of young professionals looking for newly constructed, contemporary style apartments.
Utilities: All utilities including gas, electricity, water and internet must be covered by the tenant.
Parking: Tenants will be able to purchase one parking space at $5/day ($1825/year).
Common Areas: The development will include a secure lobby spaces, hallways for circulation, and laundry rooms for tenant use.
Sources: Oakland Planning and Development Corporation http://www.opdc.org/ Mozart Management http://www.mozartrents.com/index.cfm
The residential units will be distributed evenly throughout each building.
1234
5 78
9
101112131415166
Type
Studio Apts (194 units)
One Bedroom Apts (132 units)
Two Bedroom Apts (174 units)
Rent
$1,000/month
$1,500/month
$1,800/month
Sq Ft.
500 sqft/unit
750 sqft/unit
1,000 sqft/unit
Part 3: Final Feasibility Development Plan | Transit Oriented Development at Neville & Centre| Real Estate Design and Development 48-452|8
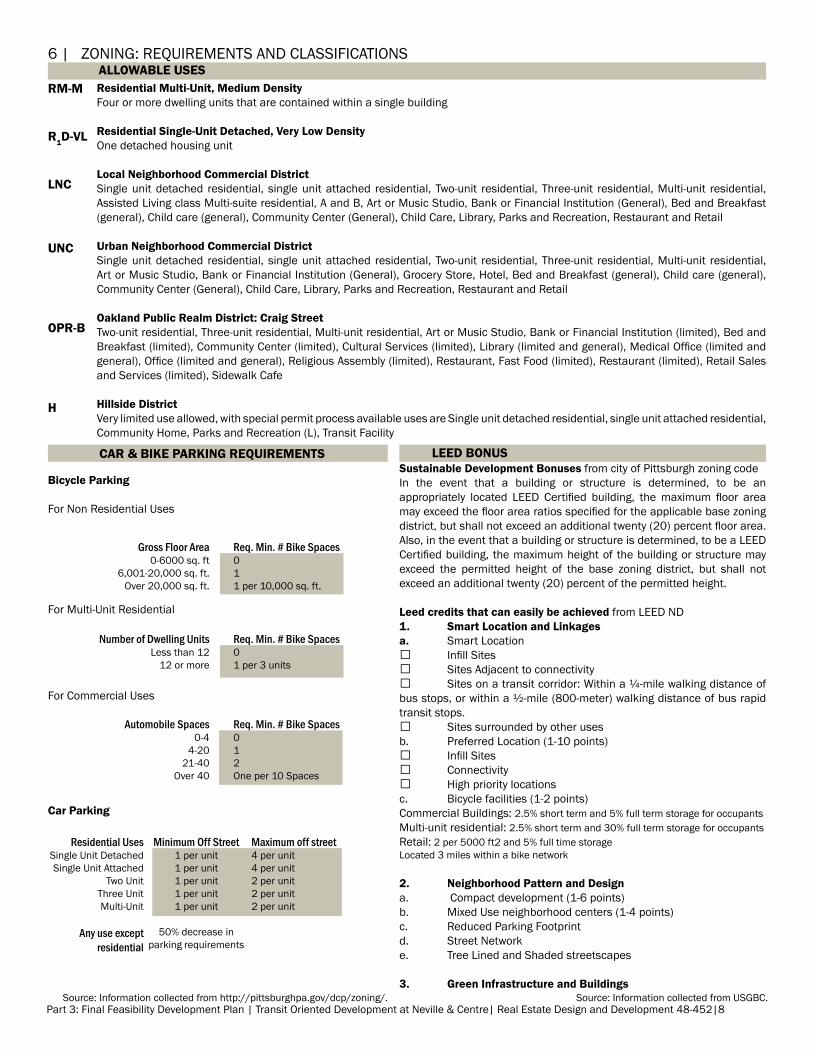
6 | ZONiNG: REQUiREmENTs aND ClassiFiCaTiONsALLOWABLE USES
CAR & BIKE PARKING REQUIREMENTS LEED BONUS
RM-M
R1D-VL
LNC
UNC
OPR-B
H
Residential Multi-Unit, Medium DensityFour or more dwelling units that are contained within a single building
Residential Single-Unit Detached, Very Low DensityOne detached housing unit
Local Neighborhood Commercial Districtsingle unit detached residential, single unit attached residential, Two-unit residential, Three-unit residential, multi-unit residential, assisted living class multi-suite residential, a and B, art or music studio, Bank or Financial institution (General), Bed and Breakfast (general), Child care (general), Community Center (General), Child Care, library, Parks and Recreation, Restaurant and Retail
Urban Neighborhood Commercial Districtsingle unit detached residential, single unit attached residential, Two-unit residential, Three-unit residential, multi-unit residential, art or music studio, Bank or Financial institution (General), Grocery store, Hotel, Bed and Breakfast (general), Child care (general), Community Center (General), Child Care, library, Parks and Recreation, Restaurant and Retail
Oakland Public Realm District: Craig StreetTwo-unit residential, Three-unit residential, multi-unit residential, art or music studio, Bank or Financial institution (limited), Bed and Breakfast (limited), Community Center (limited), Cultural Services (limited), Library (limited and general), Medical Office (limited and general), Office (limited and general), Religious Assembly (limited), Restaurant, Fast Food (limited), Restaurant (limited), Retail Sales and services (limited), sidewalk Cafe
Hillside Districtvery limited use allowed, with special permit process available uses are single unit detached residential, single unit attached residential, Community Home, Parks and Recreation (l), Transit Facility
Bicycle Parking
For Non Residential Uses
For multi-Unit Residential
For Commercial Uses
Car Parking
Gross Floor Area 0-6000 sq. ft
6,001-20,000 sq. ft.Over 20,000 sq. ft.
Number of Dwelling Units less than 12
12 or more
Automobile Spaces0-4
4-2021-40
Over 40
Residential Uses single Unit Detachedsingle Unit attached
Two UnitThree Unitmulti-Unit
Any use except residential
Minimum Off Street1 per unit1 per unit1 per unit1 per unit1 per unit
50% decrease in parking requirements
Req. Min. # Bike Spaces 011 per 10,000 sq. ft.
Req. Min. # Bike Spaces 01 per 3 units
Req. Min. # Bike Spaces 012One per 10 spaces
Maximum off street 4 per unit4 per unit2 per unit2 per unit2 per unit
Sustainable Development Bonuses from city of Pittsburgh zoning codein the event that a building or structure is determined, to be an appropriately located LEED Certified building, the maximum floor area may exceed the floor area ratios specified for the applicable base zoning district, but shall not exceed an additional twenty (20) percent floor area. also, in the event that a building or structure is determined, to be a lEED Certified building, the maximum height of the building or structure may exceed the permitted height of the base zoning district, but shall not exceed an additional twenty (20) percent of the permitted height.
Leed credits that can easily be achieved from lEED ND1. Smart Location and Linkagesa. smart location Infill Sites Sites Adjacent to connectivity Sites on a transit corridor: Within a ¼-mile walking distance of bus stops, or within a ½-mile (800-meter) walking distance of bus rapid transit stops. Sites surrounded by other usesb. Preferred location (1-10 points) Infill Sites Connectivity High priority locations c. Bicycle facilities (1-2 points)Commercial Buildings: 2.5% short term and 5% full term storage for occupantsmulti-unit residential: 2.5% short term and 30% full term storage for occupantsRetail: 2 per 5000 ft2 and 5% full time storagelocated 3 miles within a bike network
2. Neighborhood Pattern and Designa. Compact development (1-6 points)b. mixed Use neighborhood centers (1-4 points)c. Reduced Parking Footprintd. street Networke. Tree lined and shaded streetscapes
3. Green Infrastructure and Buildings source: information collected from UsGBC.source: information collected from http://pittsburghpa.gov/dcp/zoning/.
Part 3: Final Feasibility Development Plan | Transit Oriented Development at Neville & Centre| Real Estate Design and Development 48-452|9
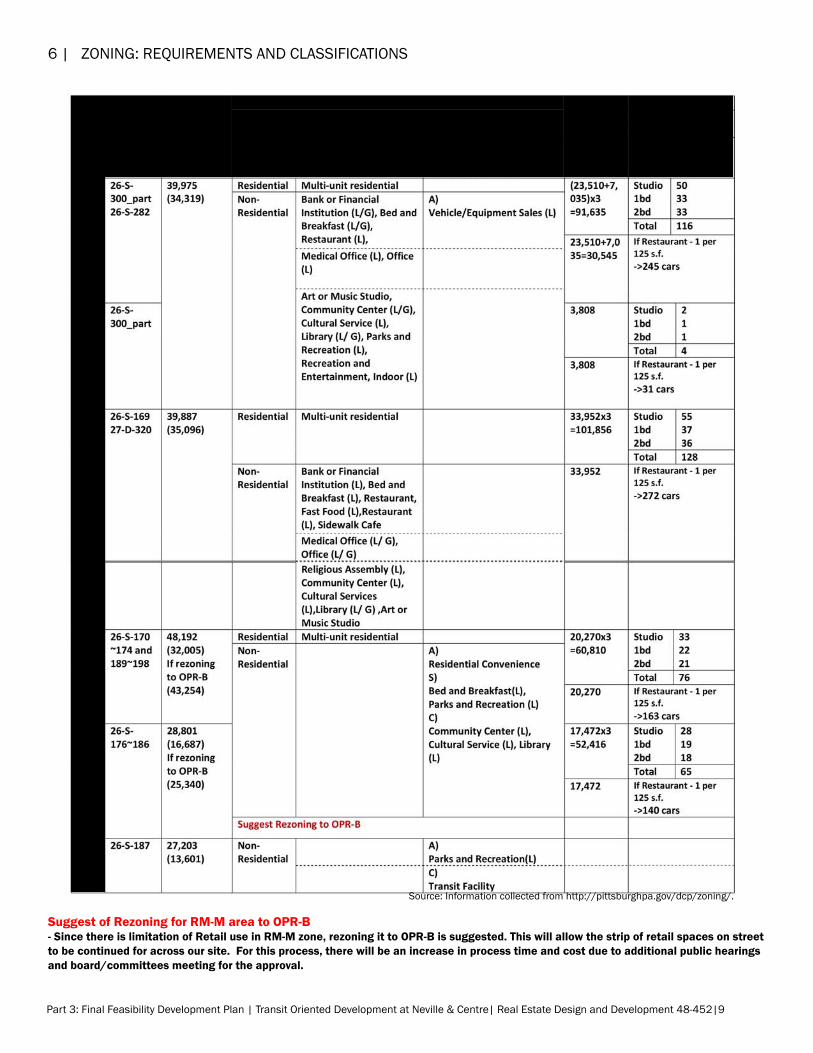
6 | ZONiNG: REQUiREmENTs aND ClassiFiCaTiONs
Suggest of Rezoning for RM-M area to OPR-B- Since there is limitation of Retail use in RM-M zone, rezoning it to OPR-B is suggested. This will allow the strip of retail spaces on street to be continued for across our site. For this process, there will be an increase in process time and cost due to additional public hearings and board/committees meeting for the approval.
source: information collected from http://pittsburghpa.gov/dcp/zoning/.
Part 3: Final Feasibility Development Plan | Transit Oriented Development at Neville & Centre| Real Estate Design and Development 48-452|10
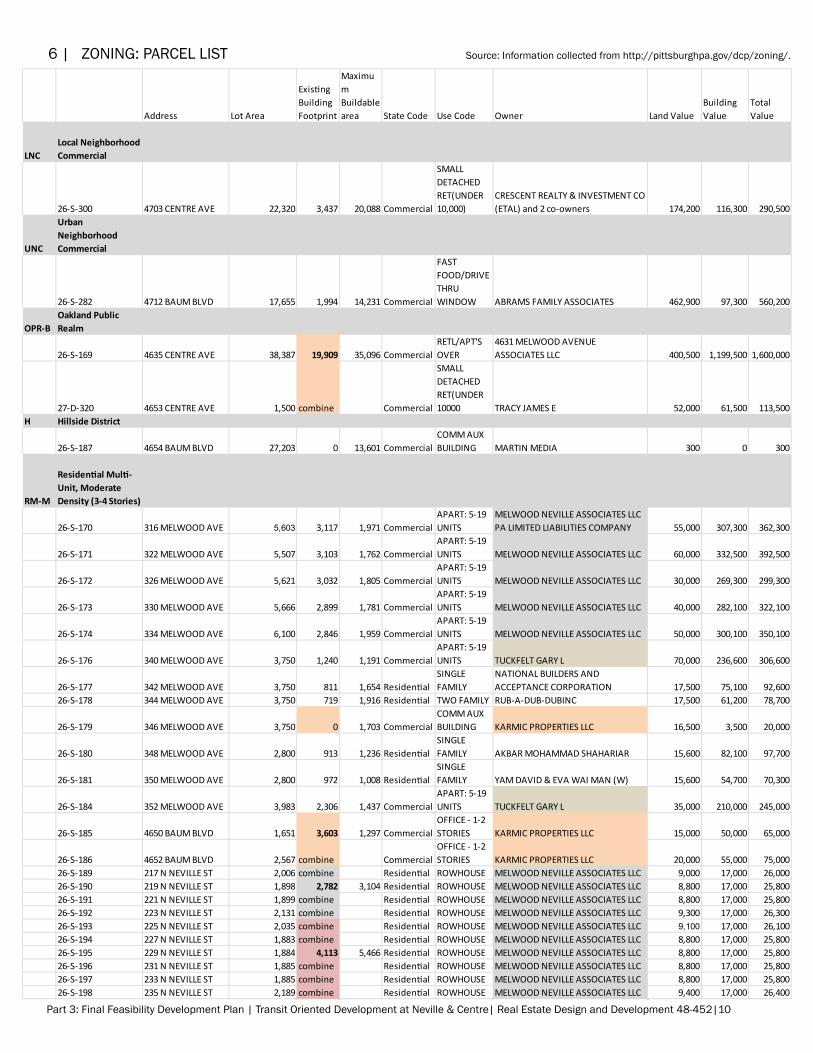
Address Lot Area
Existing Building Footprint
Maximum Buildable area State Code Use Code Owner Land Value
Building Value
Total Value
LNCLocal Neighborhood Commercial
26-S-300 4703 CENTRE AVE 22,320 3,437 20,088 Commercial
SMALL DETACHED RET(UNDER 10,000)
CRESCENT REALTY & INVESTMENT CO (ETAL) and 2 co-owners 174,200 116,300 290,500
UNC
Urban Neighborhood Commercial
26-S-282 4712 BAUM BLVD 17,655 1,994 14,231 Commercial
FAST FOOD/DRIVE THRU WINDOW ABRAMS FAMILY ASSOCIATES 462,900 97,300 560,200
OPR-BOakland Public Realm
26-S-169 4635 CENTRE AVE 38,387 19,909 35,096 CommercialRETL/APT'S OVER
4631 MELWOOD AVENUE ASSOCIATES LLC 400,500 1,199,500 1,600,000
27-D-320 4653 CENTRE AVE 1,500 combine Commercial
SMALL DETACHED RET(UNDER 10000 TRACY JAMES E 52,000 61,500 113,500
H Hillside District
26-S-187 4654 BAUM BLVD 27,203 0 13,601 CommercialCOMM AUX BUILDING MARTIN MEDIA 300 0 300
RM-M
Residential Multi-Unit, Moderate Density (3-4 Stories)
26-S-170 316 MELWOOD AVE 5,603 3,117 1,971 CommercialAPART: 5-19 UNITS
MELWOOD NEVILLE ASSOCIATES LLC PA LIMITED LIABILITIES COMPANY 55,000 307,300 362,300
26-S-171 322 MELWOOD AVE 5,507 3,103 1,762 CommercialAPART: 5-19 UNITS MELWOOD NEVILLE ASSOCIATES LLC 60,000 332,500 392,500
26-S-172 326 MELWOOD AVE 5,621 3,032 1,805 CommercialAPART: 5-19 UNITS MELWOOD NEVILLE ASSOCIATES LLC 30,000 269,300 299,300
26-S-173 330 MELWOOD AVE 5,666 2,899 1,781 CommercialAPART: 5-19 UNITS MELWOOD NEVILLE ASSOCIATES LLC 40,000 282,100 322,100
26-S-174 334 MELWOOD AVE 6,100 2,846 1,959 CommercialAPART: 5-19 UNITS MELWOOD NEVILLE ASSOCIATES LLC 50,000 300,100 350,100
26-S-176 340 MELWOOD AVE 3,750 1,240 1,191 CommercialAPART: 5-19 UNITS TUCKFELT GARY L 70,000 236,600 306,600
26-S-177 342 MELWOOD AVE 3,750 811 1,654 ResidentialSINGLE FAMILY
NATIONAL BUILDERS AND ACCEPTANCE CORPORATION 17,500 75,100 92,600
26-S-178 344 MELWOOD AVE 3,750 719 1,916 Residential TWO FAMILY RUB-A-DUB-DUBINC 17,500 61,200 78,700
26-S-179 346 MELWOOD AVE 3,750 0 1,703 CommercialCOMM AUX BUILDING KARMIC PROPERTIES LLC 16,500 3,500 20,000
26-S-180 348 MELWOOD AVE 2,800 913 1,236 ResidentialSINGLE FAMILY AKBAR MOHAMMAD SHAHARIAR 15,600 82,100 97,700
26-S-181 350 MELWOOD AVE 2,800 972 1,008 ResidentialSINGLE FAMILY YAM DAVID & EVA WAI MAN (W) 15,600 54,700 70,300
26-S-184 352 MELWOOD AVE 3,983 2,306 1,437 CommercialAPART: 5-19 UNITS TUCKFELT GARY L 35,000 210,000 245,000
26-S-185 4650 BAUM BLVD 1,651 3,603 1,297 CommercialOFFICE - 1-2 STORIES KARMIC PROPERTIES LLC 15,000 50,000 65,000
26-S-186 4652 BAUM BLVD 2,567 combine CommercialOFFICE - 1-2 STORIES KARMIC PROPERTIES LLC 20,000 55,000 75,000
26-S-189 217 N NEVILLE ST 2,006 combine Residential ROWHOUSE MELWOOD NEVILLE ASSOCIATES LLC 9,000 17,000 26,00026-S-190 219 N NEVILLE ST 1,898 2,782 3,104 Residential ROWHOUSE MELWOOD NEVILLE ASSOCIATES LLC 8,800 17,000 25,80026-S-191 221 N NEVILLE ST 1,899 combine Residential ROWHOUSE MELWOOD NEVILLE ASSOCIATES LLC 8,800 17,000 25,80026-S-192 223 N NEVILLE ST 2,131 combine Residential ROWHOUSE MELWOOD NEVILLE ASSOCIATES LLC 9,300 17,000 26,30026-S-193 225 N NEVILLE ST 2,035 combine Residential ROWHOUSE MELWOOD NEVILLE ASSOCIATES LLC 9,100 17,000 26,10026-S-194 227 N NEVILLE ST 1,883 combine Residential ROWHOUSE MELWOOD NEVILLE ASSOCIATES LLC 8,800 17,000 25,80026-S-195 229 N NEVILLE ST 1,884 4,113 5,466 Residential ROWHOUSE MELWOOD NEVILLE ASSOCIATES LLC 8,800 17,000 25,80026-S-196 231 N NEVILLE ST 1,885 combine Residential ROWHOUSE MELWOOD NEVILLE ASSOCIATES LLC 8,800 17,000 25,80026-S-197 233 N NEVILLE ST 1,885 combine Residential ROWHOUSE MELWOOD NEVILLE ASSOCIATES LLC 8,800 17,000 25,80026-S-198 235 N NEVILLE ST 2,189 combine Residential ROWHOUSE MELWOOD NEVILLE ASSOCIATES LLC 9,400 17,000 26,400
6 | ZONiNG: PaRCEl lisT source: information collected from http://pittsburghpa.gov/dcp/zoning/.
Part 3: Final Feasibility Development Plan | Transit Oriented Development at Neville & Centre| Real Estate Design and Development 48-452|11
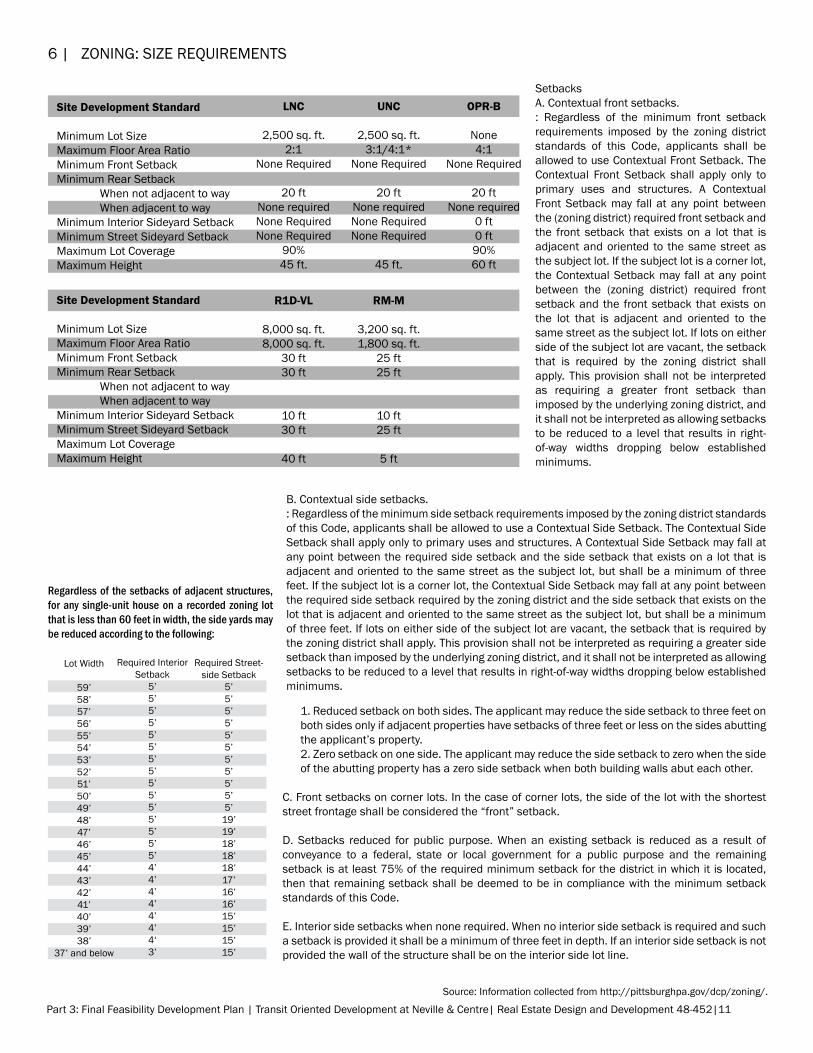
6 | ZONiNG: siZE REQUiREmENTs
1. Reduced setback on both sides. The applicant may reduce the side setback to three feet on both sides only if adjacent properties have setbacks of three feet or less on the sides abutting the applicant’s property.2. Zero setback on one side. The applicant may reduce the side setback to zero when the side of the abutting property has a zero side setback when both building walls abut each other.
C. Front setbacks on corner lots. in the case of corner lots, the side of the lot with the shortest street frontage shall be considered the “front” setback.
D. setbacks reduced for public purpose. When an existing setback is reduced as a result of conveyance to a federal, state or local government for a public purpose and the remaining setback is at least 75% of the required minimum setback for the district in which it is located, then that remaining setback shall be deemed to be in compliance with the minimum setback standards of this Code.
E. interior side setbacks when none required. When no interior side setback is required and such a setback is provided it shall be a minimum of three feet in depth. if an interior side setback is not provided the wall of the structure shall be on the interior side lot line.
Regardless of the setbacks of adjacent structures, for any single-unit house on a recorded zoning lot that is less than 60 feet in width, the side yards may be reduced according to the following:
setbacksa. Contextual front setbacks. : Regardless of the minimum front setback requirements imposed by the zoning district standards of this Code, applicants shall be allowed to use Contextual Front setback. The Contextual Front setback shall apply only to primary uses and structures. a Contextual Front setback may fall at any point between the (zoning district) required front setback and the front setback that exists on a lot that is adjacent and oriented to the same street as the subject lot. if the subject lot is a corner lot, the Contextual setback may fall at any point between the (zoning district) required front setback and the front setback that exists on the lot that is adjacent and oriented to the same street as the subject lot. if lots on either side of the subject lot are vacant, the setback that is required by the zoning district shall apply. This provision shall not be interpreted as requiring a greater front setback than imposed by the underlying zoning district, and it shall not be interpreted as allowing setbacks to be reduced to a level that results in right-of-way widths dropping below established minimums.
Lot Width
59’58’57’56’55’54’53’52’51’50’49’48’47’46’45’44’43’42’41’40’39’38’
37’ and below
Required Interior Setback
5’5’5’5’5’5’5’5’5’5’5’5’5’5’5’4’4’4’4’4’4’4‘3’
Required Street-side Setback
5’5’5’5’5’5’5’5’5’5’5’
19’19’18’18’18’17’16’16’15’15’15’15’
Site Development Standard
Minimum Lot Size Maximum Floor Area RatioMinimum Front SetbackMinimum Rear Setback When not adjacent to way When adjacent to wayMinimum Interior Sideyard SetbackMinimum Street Sideyard SetbackMaximum Lot CoverageMaximum Height
Site Development Standard
Minimum Lot Size Maximum Floor Area RatioMinimum Front SetbackMinimum Rear Setback When not adjacent to way When adjacent to wayMinimum Interior Sideyard SetbackMinimum Street Sideyard SetbackMaximum Lot CoverageMaximum Height
LNC
2,500 sq. ft.2:1
None Required
20 ftNone requiredNone RequiredNone Required
90%45 ft.
UNC
2,500 sq. ft.3:1/4:1*
None Required
20 ftNone requiredNone RequiredNone Required
45 ft.
OPR-B
None4:1
None Required
20 ftNone required
0 ft0 ft90%60 ft
R1D-VL
8,000 sq. ft.8,000 sq. ft.
30 ft30 ft
10 ft30 ft
40 ft
RM-M
3,200 sq. ft.1,800 sq. ft.
25 ft25 ft
10 ft25 ft
5 ft
B. Contextual side setbacks. : Regardless of the minimum side setback requirements imposed by the zoning district standards of this Code, applicants shall be allowed to use a Contextual side setback. The Contextual side setback shall apply only to primary uses and structures. a Contextual side setback may fall at any point between the required side setback and the side setback that exists on a lot that is adjacent and oriented to the same street as the subject lot, but shall be a minimum of three feet. if the subject lot is a corner lot, the Contextual side setback may fall at any point between the required side setback required by the zoning district and the side setback that exists on the lot that is adjacent and oriented to the same street as the subject lot, but shall be a minimum of three feet. if lots on either side of the subject lot are vacant, the setback that is required by the zoning district shall apply. This provision shall not be interpreted as requiring a greater side setback than imposed by the underlying zoning district, and it shall not be interpreted as allowing setbacks to be reduced to a level that results in right-of-way widths dropping below established minimums.
source: information collected from http://pittsburghpa.gov/dcp/zoning/.
Part 3: Final Feasibility Development Plan | Transit Oriented Development at Neville & Centre| Real Estate Design and Development 48-452|12
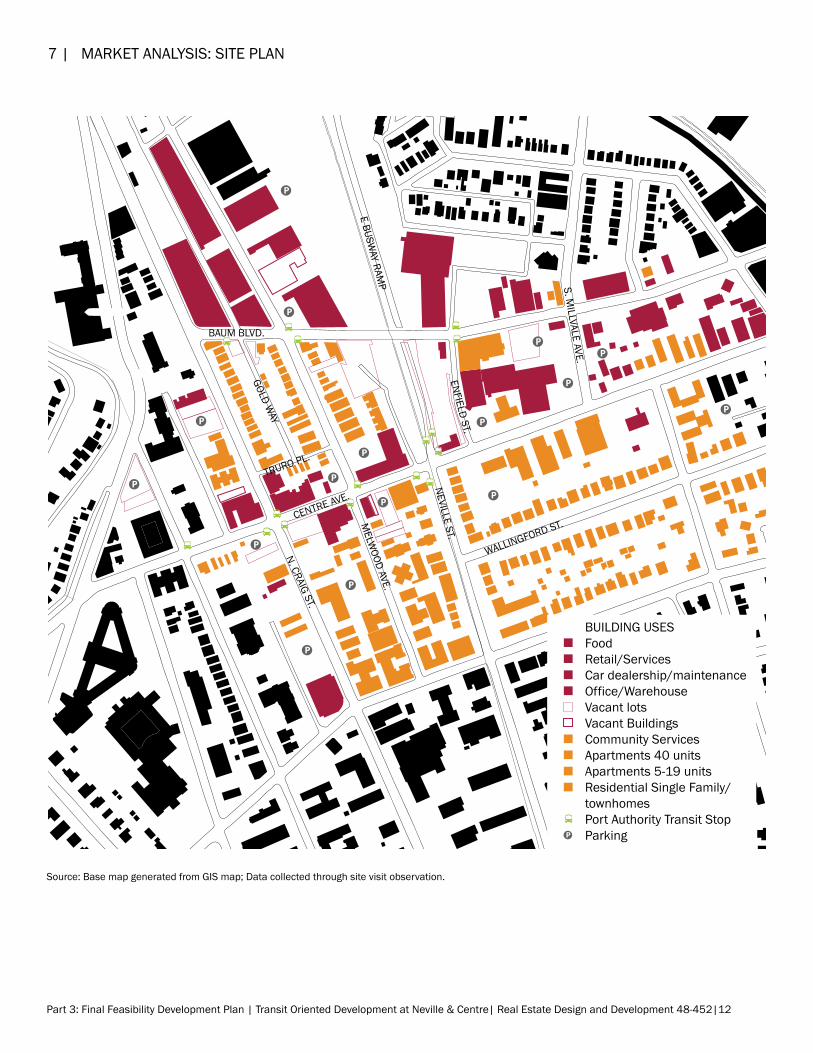
7 | maRKET aNalYsis: siTE PlaN
CENTRE AVE.
TRURO PL.
WALLINGFORD ST.
NEVILLE ST.ENFIELD ST.
S. MILLVALE AVE.
E BUSWAY RAM
P
MELW
OOD AVE.
GOLD WAY
N. CRAIG ST.
BAUM BLVD.
BUILDING USESFoodRetail/ServicesCar dealership/maintenanceOffice/WarehouseVacant lotsVacant BuildingsCommunity ServicesApartments 40 unitsApartments 5-19 unitsResidential Single Family/townhomesPort Authority Transit StopParkingP
P
P
P
P
P
P
P
P
P
P
P
P
P
P
P
P
source: Base map generated from Gis map; Data collected through site visit observation.
Part 3: Final Feasibility Development Plan | Transit Oriented Development at Neville & Centre| Real Estate Design and Development 48-452|13
CENTRE AVE.
TRURO PL.
WALLINGFORD ST.
NEVILLE ST.ENFIELD ST.
S. MILLVALE AVE.
E BUSWAY RAM
P
MELW
OOD AVE.
GOLD WAY
N. CRAIG ST.
BAUM BLVD.
Community servicesApartments 40 unitsApartments 5-19 unitsResidential Single Family/townhomes
Percent Number
Total housing units
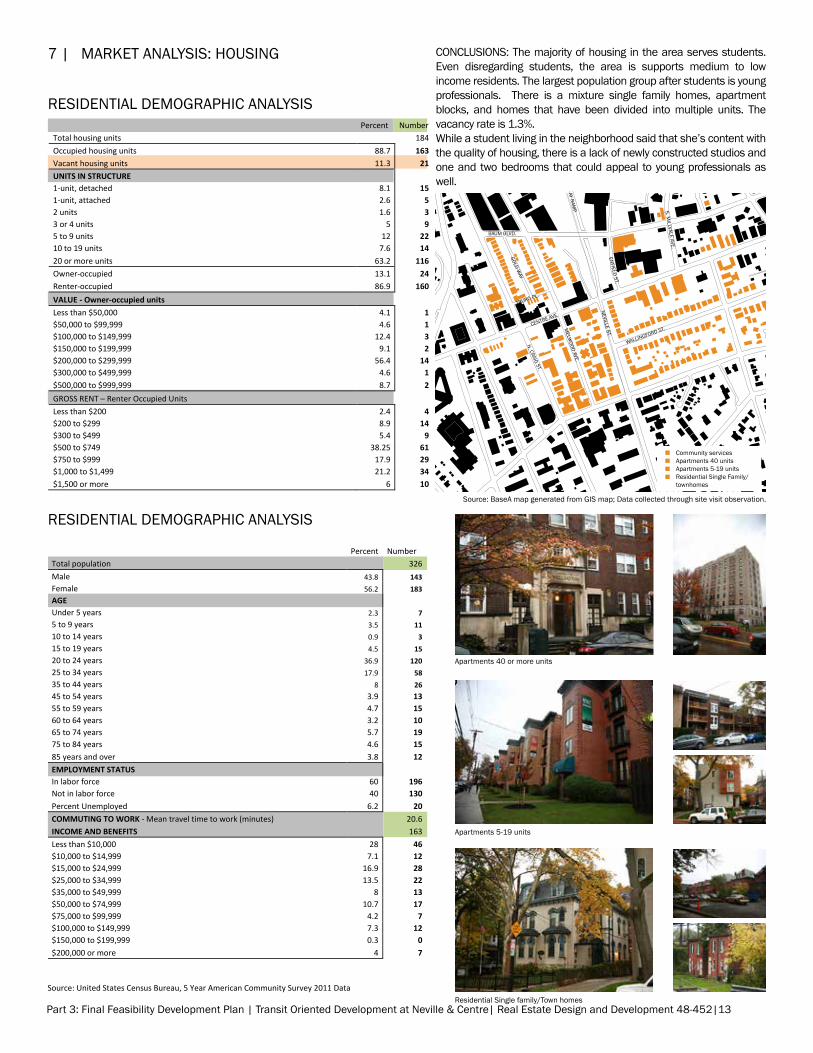
184 Occupied housing units 88.7 163 Vacant housing units 11.3 21 UNITS IN STRUCTURE 1-unit, detached 8.1 15 1-unit, attached 2.6 5 2 units 1.6 3 3 or 4 units 5 9 5 to 9 units 12 22 10 to 19 units 7.6 14 20 or more units 63.2 116 Owner-occupied 13.1 24 Renter-occupied 86.9 160 VALUE - Owner-occupied units
Less than $50,000 4.1 1 $50,000 to $99,999 4.6 1 $100,000 to $149,999 12.4 3 $150,000 to $199,999 9.1 2 $200,000 to $299,999 56.4 14 $300,000 to $499,999 4.6 1 $500,000 to $999,999 8.7 2 GROSS RENT – Renter Occupied Units
Less than $200 2.4 4 $200 to $299 8.9 14 $300 to $499 5.4 9 $500 to $749 38.25 61 $750 to $999 17.9 29 $1,000 to $1,499 21.2 34 $1,500 or more 6 10
CONClUsiONs: The majority of housing in the area serves students. Even disregarding students, the area is supports medium to low income residents. The largest population group after students is young professionals. There is a mixture single family homes, apartment blocks, and homes that have been divided into multiple units. The vacancy rate is 1.3%.While a student living in the neighborhood said that she’s content with the quality of housing, there is a lack of newly constructed studios and one and two bedrooms that could appeal to young professionals as well.
7 | maRKET aNalYsis: HOUsiNG
Source: United States Census Bureau, 5 Year American Community Survey 2011 Data
REsiDENTial DEmOGRaPHiC aNalYsis
REsiDENTial DEmOGRaPHiC aNalYsis
apartments 40 or more units
apartments 5-19 units
Residential single family/Town homes
source: Basea map generated from Gis map; Data collected through site visit observation.
Percent Number
Total population
326 Male 43.8 143 Female 56.2 183 AGE Under 5 years 2.3 7 5 to 9 years 3.5 11 10 to 14 years 0.9 3 15 to 19 years 4.5 15 20 to 24 years 36.9 120 25 to 34 years 17.9 58 35 to 44 years 8 26 45 to 54 years 3.9 13 55 to 59 years 4.7 15 60 to 64 years 3.2 10 65 to 74 years 5.7 19 75 to 84 years 4.6 15 85 years and over 3.8 12 EMPLOYMENT STATUS In labor force 60 196 Not in labor force 40 130 Percent Unemployed 6.2 20 COMMUTING TO WORK - Mean travel time to work (minutes)
20.6
INCOME AND BENEFITS 163 Less than $10,000 28 46 $10,000 to $14,999 7.1 12 $15,000 to $24,999 16.9 28 $25,000 to $34,999 13.5 22 $35,000 to $49,999 8 13 $50,000 to $74,999 10.7 17 $75,000 to $99,999 4.2 7 $100,000 to $149,999 7.3 12 $150,000 to $199,999 0.3 0 $200,000 or more 4 7
Source: United States Census Bureau, 5 Year American Community Survey 2011 Data (the other table as well)
Percent Number
Total housing units
184 Occupied housing units 88.7 163 Vacant housing units 11.3 21 UNITS IN STRUCTURE 1-unit, detached 8.1 15 1-unit, attached 2.6 5 2 units 1.6 3 3 or 4 units 5 9 5 to 9 units 12 22 10 to 19 units 7.6 14 20 or more units 63.2 116 Owner-occupied 13.1 24 Renter-occupied 86.9 160 VALUE - Owner-occupied units
Less than $50,000 4.1 1 $50,000 to $99,999 4.6 1 $100,000 to $149,999 12.4 3 $150,000 to $199,999 9.1 2 $200,000 to $299,999 56.4 14 $300,000 to $499,999 4.6 1 $500,000 to $999,999 8.7 2 GROSS RENT – Renter Occupied Units
Less than $200 2.4 4 $200 to $299 8.9 14 $300 to $499 5.4 9 $500 to $749 38.25 61 $750 to $999 17.9 29 $1,000 to $1,499 21.2 34 $1,500 or more 6 10
Part 3: Final Feasibility Development Plan | Transit Oriented Development at Neville & Centre| Real Estate Design and Development 48-452|14
CENTRE AVE.
TRURO PL.
WALLINGFORD ST.
NEVILLE ST.ENFIELD ST.
S. MILLVALE AVE.
E BUSWAY RAM
P
MELW
OOD AVE.
GOLD WAY
N. CRAIG ST.
BAUM BLVD.
Food
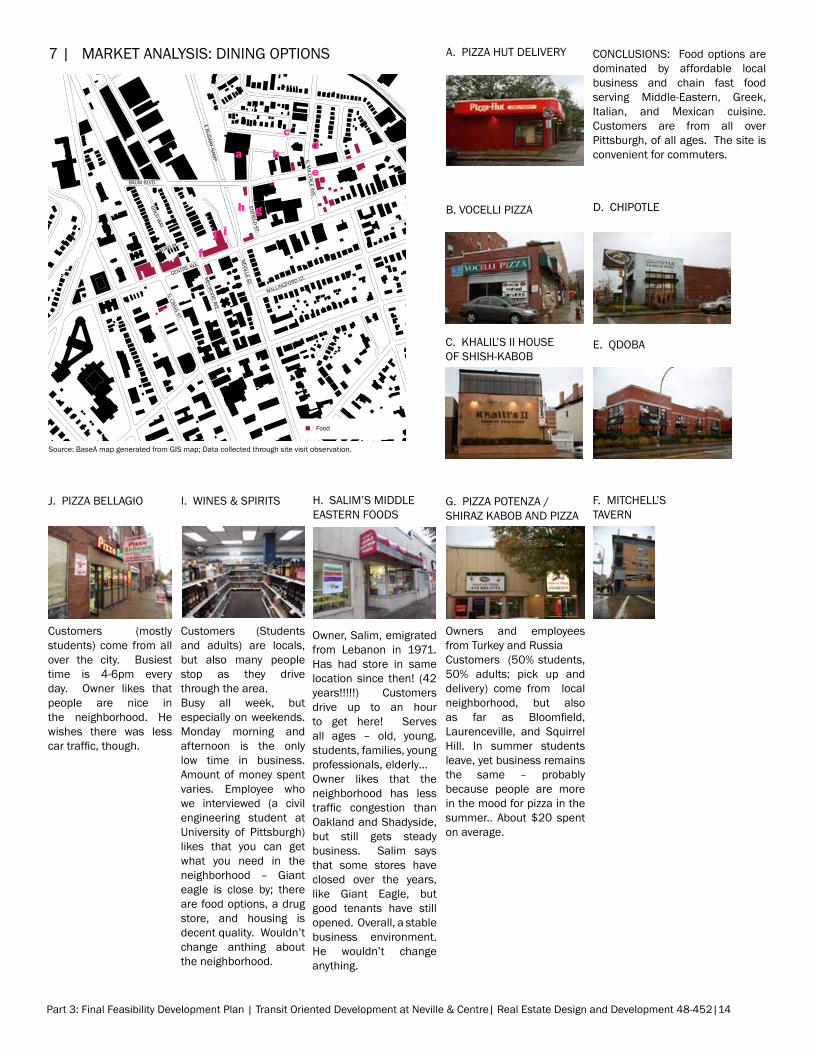
Customers (mostly students) come from all over the city. Busiest time is 4-6pm every day. Owner likes that people are nice in the neighborhood. He wishes there was less car traffic, though.
Customers (students and adults) are locals, but also many people stop as they drive through the area.Busy all week, but especially on weekends. monday morning and afternoon is the only low time in business. amount of money spent varies. Employee who we interviewed (a civil engineering student at University of Pittsburgh) likes that you can get what you need in the neighborhood – Giant eagle is close by; there are food options, a drug store, and housing is decent quality. Wouldn’t change anthing about the neighborhood.
Owner, salim, emigrated from lebanon in 1971. Has had store in same location since then! (42 years!!!!!) Customers drive up to an hour to get here! serves all ages – old, young, students, families, young professionals, elderly…Owner likes that the neighborhood has less traffic congestion than Oakland and shadyside, but still gets steady business. salim says that some stores have closed over the years, like Giant Eagle, but good tenants have still opened. Overall, a stable business environment. He wouldn’t change anything.
G. PiZZa POTENZa / sHiRaZ KaBOB aND PiZZa
H. salim’s miDDlE EasTERN FOODs
i. WiNEs & sPiRiTsJ. PiZZa BEllaGiO
E. QDOBa
F. miTCHEll’sTavERN
Owners and employees from Turkey and RussiaCustomers (50% students, 50% adults; pick up and delivery) come from local neighborhood, but also as far as Bloomfield, laurenceville, and squirrel Hill. in summer students leave, yet business remains the same – probably because people are more in the mood for pizza in the summer.. about $20 spent on average.
CONClUsiONs: Food options are dominated by affordable local business and chain fast food serving middle-Eastern, Greek, italian, and mexican cuisine. Customers are from all over Pittsburgh, of all ages. The site is convenient for commuters.
a. PiZZa HUT DElivERY
B. vOCElli PiZZa D. CHiPOTlE
C. KHalil’s ii HOUsE OF sHisH-KaBOB
a
c
be
d
f
gh
ij
7 | maRKET aNalYsis: DiNiNG OPTiONs
source: Basea map generated from Gis map; Data collected through site visit observation.
Part 3: Final Feasibility Development Plan | Transit Oriented Development at Neville & Centre| Real Estate Design and Development 48-452|15
CENTRE AVE.
TRURO PL.
WALLINGFORD ST.
NEVILLE ST.ENFIELD ST.
S. MILLVALE AVE.
E BUSWAY RAM
P
MELW
OOD AVE.
GOLD WAY
N. CRAIG ST.
BAUM BLVD.
Retail/ServicesCar dealership/maintenanceOffice/WarehouseVacant lotsVacant Buildings
Car63%
Walking37%
Bus0%
CVS Customer Statistics (Weekdays)
Car Walking Bus
Car67%
Walking33%
Bus0%
CVS Customer Statistics (Weekends)
Car Walking Bus
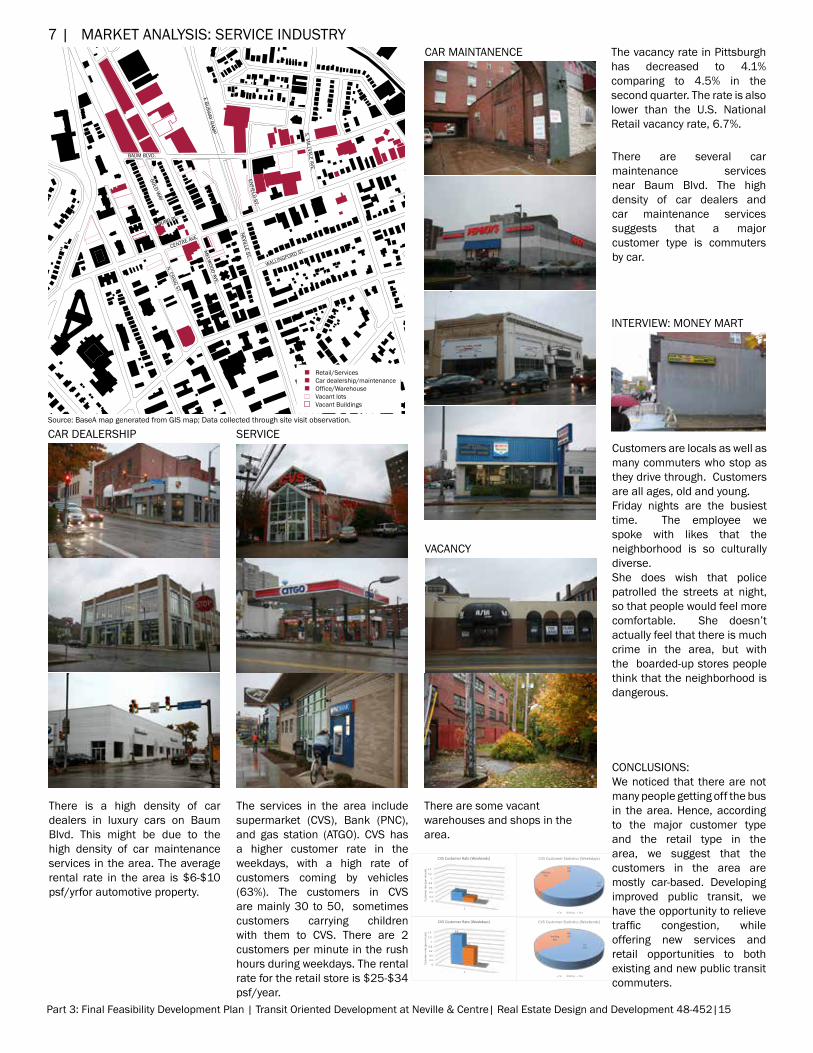
There is a high density of car dealers in luxury cars on Baum Blvd. This might be due to the high density of car maintenance services in the area. The average rental rate in the area is $6-$10 psf/yrfor automotive property.
There are some vacant warehouses and shops in the area.
The services in the area include supermarket (Cvs), Bank (PNC), and gas station (aTGO). Cvs has a higher customer rate in the weekdays, with a high rate of customers coming by vehicles (63%). The customers in Cvs are mainly 30 to 50, sometimes customers carrying children with them to Cvs. There are 2 customers per minute in the rush hours during weekdays. The rental rate for the retail store is $25-$34 psf/year.
0
0.2
0.4
0.6
0.8
1
1.2
1.4
1
0.4
0.2
0Cust
omer
rate
(per
min
ute)
CVS Customer Rate (Weekends)
0
0.2
0.4
0.6
0.8
1
1.2
1.4
1
1.3
0.775
0Cust
omer
rate
(per
min
ute)
CVS Customer Rate (Weekdays)
Customers are locals as well as many commuters who stop as they drive through. Customers are all ages, old and young.Friday nights are the busiest time. The employee we spoke with likes that the neighborhood is so culturally diverse.she does wish that police patrolled the streets at night, so that people would feel more comfortable. she doesn’t actually feel that there is much crime in the area, but with the boarded-up stores people think that the neighborhood is dangerous.
iNTERviEW: mONEY maRT
There are several car maintenance services near Baum Blvd. The high density of car dealers and car maintenance services suggests that a major customer type is commuters by car.
The vacancy rate in Pittsburgh has decreased to 4.1% comparing to 4.5% in the second quarter. The rate is also lower than the U.s. National Retail vacancy rate, 6.7%.
CONClUsiONs:We noticed that there are not many people getting off the bus in the area. Hence, according to the major customer type and the retail type in the area, we suggest that the customers in the area are mostly car-based. Developing improved public transit, we have the opportunity to relieve traffic congestion, while offering new services and retail opportunities to both existing and new public transit commuters.
7 | maRKET aNalYsis: sERviCE iNDUsTRY
CaR DEalERsHiP sERviCE
vaCaNCY
CaR maiNTaNENCE
source: Basea map generated from Gis map; Data collected through site visit observation.
Part 3: Final Feasibility Development Plan | Transit Oriented Development at Neville & Centre| Real Estate Design and Development 48-452|16
7 | maRKET aNalYsis: OPPORTUNiTiEs FOR DEvElOPmENT
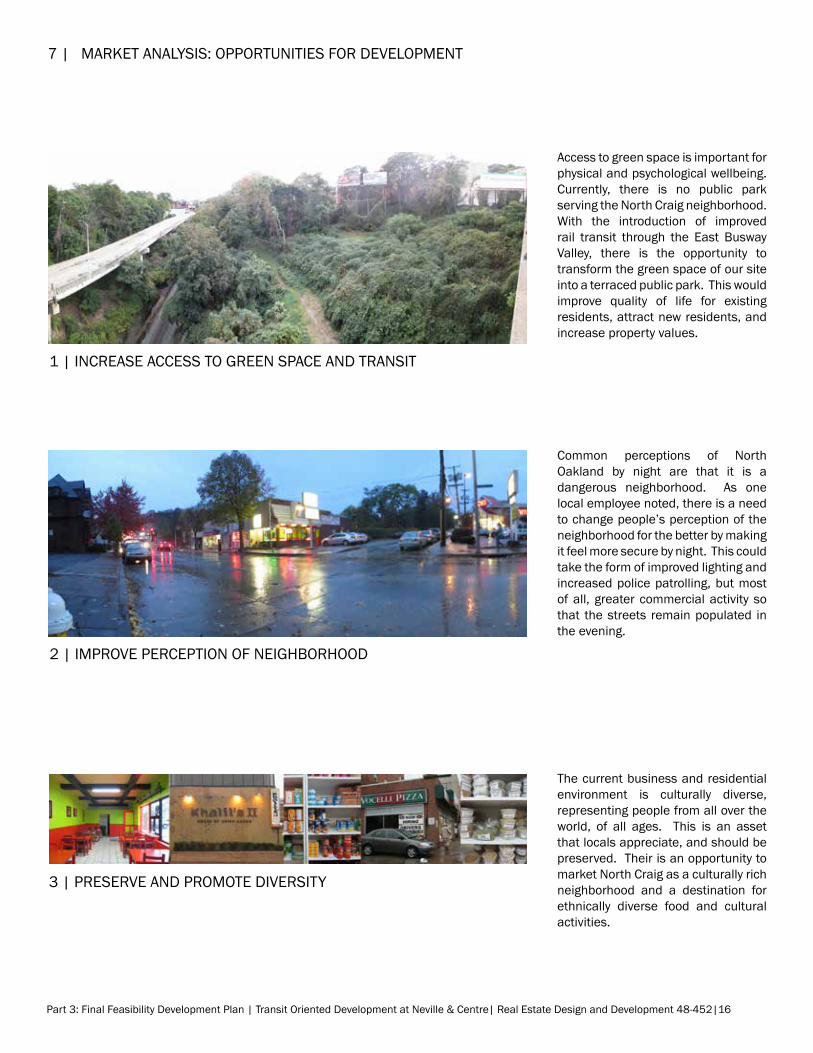
access to green space is important for physical and psychological wellbeing. Currently, there is no public park serving the North Craig neighborhood. With the introduction of improved rail transit through the East Busway valley, there is the opportunity to transform the green space of our site into a terraced public park. This would improve quality of life for existing residents, attract new residents, and increase property values.
1 | iNCREasE aCCEss TO GREEN sPaCE aND TRaNsiT
2 | imPROvE PERCEPTiON OF NEiGHBORHOOD
3 | PREsERvE aND PROmOTE DivERsiTY
Common perceptions of North Oakland by night are that it is a dangerous neighborhood. as one local employee noted, there is a need to change people’s perception of the neighborhood for the better by making it feel more secure by night. This could take the form of improved lighting and increased police patrolling, but most of all, greater commercial activity so that the streets remain populated in the evening.
The current business and residential environment is culturally diverse, representing people from all over the world, of all ages. This is an asset that locals appreciate, and should be preserved. Their is an opportunity to market North Craig as a culturally rich neighborhood and a destination for ethnically diverse food and cultural activities.
Part 3: Final Feasibility Development Plan | Transit Oriented Development at Neville & Centre| Real Estate Design and Development 48-452|17
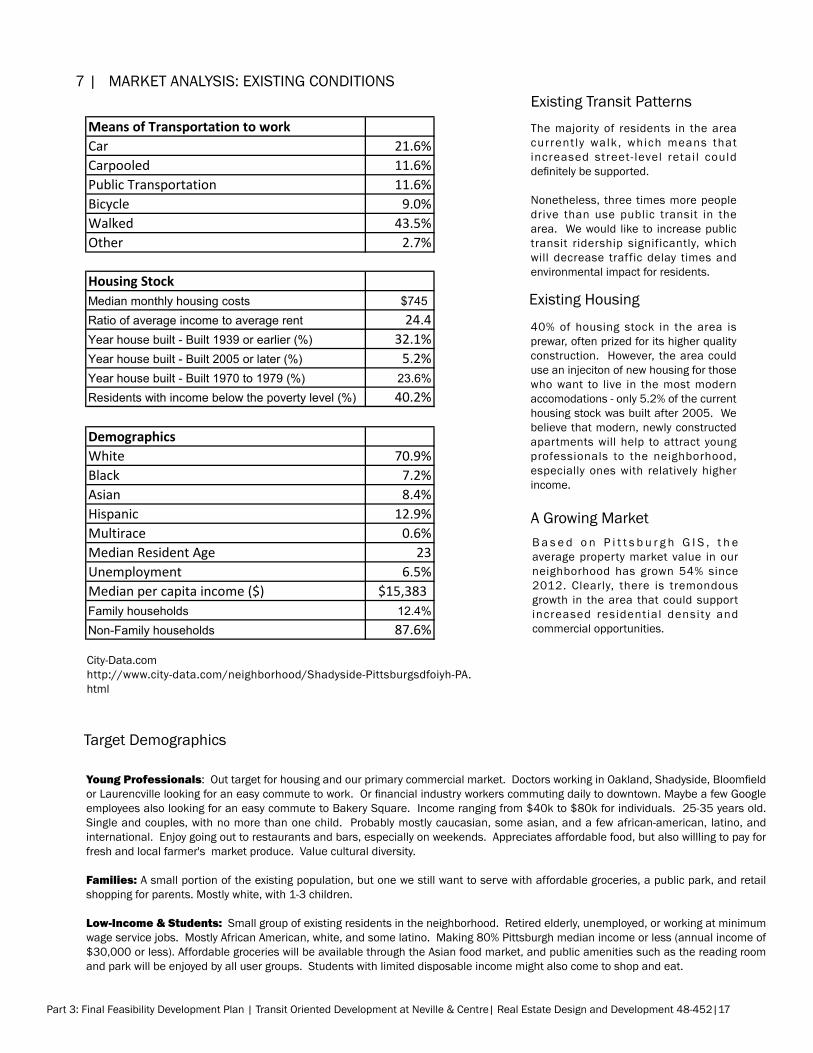
Means of Transportation to workCar 21.6%Carpooled 11.6%Public Transportation 11.6%Bicycle 9.0%Walked 43.5%Other 2.7%
Housing StockMedian monthly housing costs $745Ratio of average income to average rent 24.4Year house built - Built 1939 or earlier (%) 32.1%Year house built - Built 2005 or later (%) 5.2%Year house built - Built 1970 to 1979 (%) 23.6%Residents with income below the poverty level (%) 40.2%
DemographicsWhite 70.9%Black 7.2%Asian 8.4%Hispanic 12.9%Multirace 0.6%Median Resident Age 23Unemployment 6.5%Median per capita income ($) $15,383Family households 12.4%Non-Family households 87.6%
Existing Transit PatternsThe majority of residents in the area current ly walk, which means that increased street- level retai l could definitely be supported.
Nonetheless, three times more people drive than use public transit in the area. We would like to increase public transit ridership significantly, which will decrease traffic delay times and environmental impact for residents.
Existing Housing
Target Demographics
40% of housing stock in the area is prewar, often prized for its higher quality construction. However, the area could use an injeciton of new housing for those who want to live in the most modern accomodations - only 5.2% of the current housing stock was built after 2005. We believe that modern, newly constructed apartments will help to attract young professionals to the neighborhood, especially ones with relatively higher income.
Young Professionals: Out target for housing and our primary commercial market. Doctors working in Oakland, Shadyside, Bloomfield or Laurencville looking for an easy commute to work. Or financial industry workers commuting daily to downtown. Maybe a few Google employees also looking for an easy commute to Bakery square. income ranging from $40k to $80k for individuals. 25-35 years old. single and couples, with no more than one child. Probably mostly caucasian, some asian, and a few african-american, latino, and international. Enjoy going out to restaurants and bars, especially on weekends. appreciates affordable food, but also willling to pay for fresh and local farmer's market produce. value cultural diversity.
Families: a small portion of the existing population, but one we still want to serve with affordable groceries, a public park, and retail shopping for parents. mostly white, with 1-3 children.
Low-Income & Students: small group of existing residents in the neighborhood. Retired elderly, unemployed, or working at minimum wage service jobs. mostly african american, white, and some latino. making 80% Pittsburgh median income or less (annual income of $30,000 or less). affordable groceries will be available through the asian food market, and public amenities such as the reading room and park will be enjoyed by all user groups. students with limited disposable income might also come to shop and eat.
a Growing marketB a s e d o n P i t t s b u r g h G i s , t h e average property market value in our neighborhood has grown 54% since 2012. Clearly, there is tremondous growth in the area that could support increased residential density and commercial opportunities.
City-Data.comhttp://www.city-data.com/neighborhood/shadyside-Pittsburgsdfoiyh-Pa.html
7 | maRKET aNalYsis: EXisTiNG CONDiTiONs
Part 3: Final Feasibility Development Plan | Transit Oriented Development at Neville & Centre| Real Estate Design and Development 48-452|18
7 | maRKET aNalYsis: PROPOsED NEW UsEs
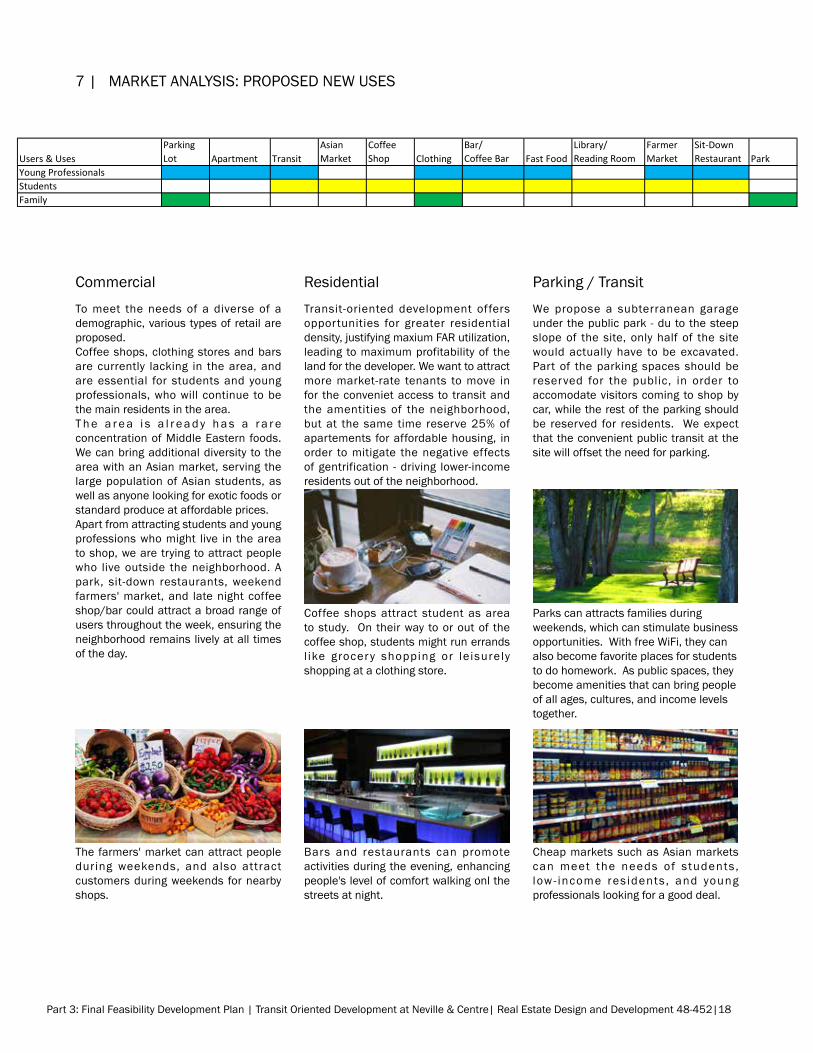
Users & UsesParking Lot Apartment Transit
Asian Market
Coffee Shop Clothing
Bar/Coffee Bar Fast Food
Library/Reading Room
Farmer Market
Sit-DownRestaurant Park
Young ProfessionalsStudentsFamily
CommercialTo meet the needs of a diverse of a demographic, various types of retail are proposed. Coffee shops, clothing stores and bars are currently lacking in the area, and are essential for students and young professionals, who will continue to be the main residents in the area.T h e a r e a i s a l r e a d y h a s a r a r e concentration of middle Eastern foods. We can bring additional diversity to the area with an asian market, serving the large population of asian students, as well as anyone looking for exotic foods or standard produce at affordable prices.apart from attracting students and young professions who might live in the area to shop, we are trying to attract people who live outside the neighborhood. a park, sit-down restaurants, weekend farmers' market, and late night coffee shop/bar could attract a broad range of users throughout the week, ensuring the neighborhood remains lively at all times of the day.
ResidentialTransit-oriented development offers opportunities for greater residential density, justifying maxium FaR utilization, leading to maximum profitability of the land for the developer. We want to attract more market-rate tenants to move in for the conveniet access to transit and the amentities of the neighborhood, but at the same time reserve 25% of apartements for affordable housing, in order to mitigate the negative effects of gentrification - driving lower-income residents out of the neighborhood.
Parking / TransitWe propose a subterranean garage under the public park - du to the steep slope of the site, only half of the site would actually have to be excavated. Part of the parking spaces should be reserved for the public, in order to accomodate visitors coming to shop by car, while the rest of the parking should be reserved for residents. We expect that the convenient public transit at the site will offset the need for parking.
The farmers' market can attract people during weekends, and also attract customers during weekends for nearby shops.
Coffee shops attract student as area to study. On their way to or out of the coffee shop, students might run errands l ike grocer y shopping or le isurely shopping at a clothing store.
Bars and restaurants can promote activities during the evening, enhancing people's level of comfort walking onl the streets at night.
Parks can attracts families during weekends, which can stimulate business opportunities. With free WiFi, they can also become favorite places for students to do homework. as public spaces, they become amenities that can bring people of all ages, cultures, and income levels together.
Cheap markets such as asian markets can meet the needs of students , low - income res idents , and young professionals looking for a good deal.
Part 3: Final Feasibility Development Plan | Transit Oriented Development at Neville & Centre| Real Estate Design and Development 48-452|19
after development, the apartment rent on our site will increase to over $1,000 per month, so our target customers for housing is relative high income young professionals ($60,000 in average), specially UPmC employees. Our site is only two blocks away from their workplace, and they will be more willing to spend more money on housing for better place and on leisure activities such as bars and sit-down restaurants.
most of the parking lots are for the tenants in the apartments, and others are preserved for customers coming with cars (families).
The target customers for the asian market are international (asian) students, since they are the group who tend to save money by cooking theirselves during their time in school. an asian market provides relatively cheap food ingredients, and exclusive ingredients for making asian dishes. it will also serve any other students or young professionals looking for a deal.
The main group of customers we expect in coffee shop is students or single young professionals in leisure. a lot of students in Pittsburgh live in Oakland and shadyside, so a coffee shop or reading room provides a quality alternatives work environment. also, the coffee shop is targeting american students, who are more willing than international students to spend money on espresso drinks.
We expect to have two types of target customers in fast food restaurant, in two time periods. The means of transportation to work in the area are mainly by walking, so we suggest that it is possible for professionals working near the site to come to the fast food restaurants during lunch time. On the other hand, students who lives in Oakland or shadyside will be the target customers during dinner time, since the restaurants are located on their way back home.
The library or reading room is public access and provides free Wi-Fi. The target customers will be students living in the neighborhood, and probably low-income coming for the free Wi-Fi. The library, asian market and fast food tend to have the same target customers, so the interaction between the three area will lead to more customers than we expected.
The public transit is mainly for young professionals, students and existing residents who do not have a car.
american students coming from high income families and single young professionals with medium or high income are the main potential customers in bars and coffee bars, and the convenient public transit makes this a perfect late-night hang out.
Bars / Coffee Bars
apartments
Parking lots
asian market
Coffee shop
Fast Food
Transit
library / Reading Room
7 | maRKET aNalYsis: UsER GROUPs
Farmers' market
a farmers' market in the park will to local families and young professionals on the weekend.
sit-Down Restaurants
sit-down restaurants will be visited occasionally by families, but the main market will be young professionals and students from higher-income families.
ParkGreen space wi l l be valued by ever yone in the neihgborhood - currently their is no park serving the North Oakland area. We expect in particular that families will like coming here on weekends with their kids, and that students and young professionals might also enjoy reading or studying outside, perhaps with a picnic. in the summer, we image Pittsburgh Film makers showing films on an outdoor screen.
Clothing storeslocally-owned boutiques and perhaps one or two national chains will serve neighborhood locals, including mothers, young professional women living in the development, and occasionally students. There may be one speciality men's clothing store, although the market demand is probably not be great enough for this. a mixture of stores focusing on accesories, everyday clothes, and maybe one higher-end boutiqu with modern style dresses and semi-formal clothing.
Part 3: Final Feasibility Development Plan | Transit Oriented Development at Neville & Centre| Real Estate Design and Development 48-452|20
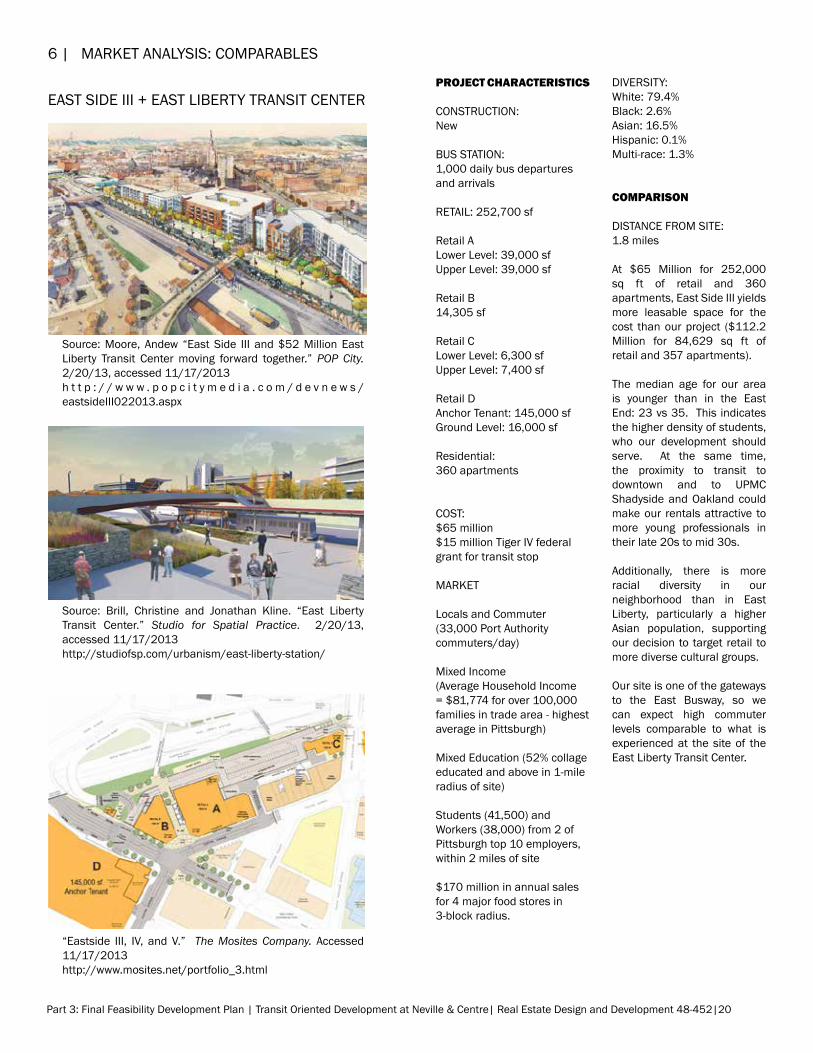
6 | maRKET aNalYsis: COmPaRaBlEs
DivERsiTY:White: 79.4%Black: 2.6%asian: 16.5%Hispanic: 0.1%multi-race: 1.3%
COMPARISON
DisTaNCE FROm siTE:1.8 miles
at $65 million for 252,000 sq ft of retail and 360 apartments, East side iii yields more leasable space for the cost than our project ($112.2 million for 84,629 sq ft of retail and 357 apartments).
The median age for our area is younger than in the East End: 23 vs 35. This indicates the higher density of students, who our development should serve. at the same time, the proximity to transit to downtown and to UPmC shadyside and Oakland could make our rentals attractive to more young professionals in their late 20s to mid 30s.
additionally, there is more racial diversity in our neighborhood than in East liberty, particularly a higher asian population, supporting our decision to target retail to more diverse cultural groups.
Our site is one of the gateways to the East Busway, so we can expect high commuter levels comparable to what is experienced at the site of the East liberty Transit Center.
EasT siDE iii + EasT liBERTY TRaNsiT CENTERPROJECT CHARACTERISTICS
CONsTRUCTiON:New
BUs sTaTiON:1,000 daily bus departures and arrivals
RETail: 252,700 sf
Retail alower level: 39,000 sfUpper level: 39,000 sf
Retail B14,305 sf
Retail Clower level: 6,300 sfUpper level: 7,400 sf
Retail Danchor Tenant: 145,000 sfGround level: 16,000 sf
Residential:360 apartments
COsT:$65 million$15 million Tiger iv federal grant for transit stop
maRKET
locals and Commuter(33,000 Port authority commuters/day)
mixed income(average Household income = $81,774 for over 100,000 families in trade area - highest average in Pittsburgh)
mixed Education (52% collage educated and above in 1-mile radius of site)
students (41,500) and Workers (38,000) from 2 of Pittsburgh top 10 employers, within 2 miles of site
$170 million in annual sales for 4 major food stores in 3-block radius.
source: moore, andew “East side iii and $52 million East liberty Transit Center moving forward together.” POP City. 2/20/13, accessed 11/17/2013 h t t p : / / w w w . p o p c i t y m e d i a . c o m / d e v n e w s /eastsideiii022013.aspx
source: Brill, Christine and Jonathan Kline. “East liberty Transit Center.” Studio for Spatial Practice. 2/20/13, accessed 11/17/2013 http://studiofsp.com/urbanism/east-liberty-station/
“Eastside iii, iv, and v.” The Mosites Company. accessed 11/17/2013 http://www.mosites.net/portfolio_3.html
Retail A Lower Level: 39,000 sf Upper Level: 39,000 sf Retail B 14,305 sf Retail C Lower Level: 6,300 sf Upper Level: 7,400 sf

Part 3: Final Feasibility Development Plan | Transit Oriented Development at Neville & Centre| Real Estate Design and Development 48-452|21
6 | maRKET aNalYsis: COmPaRaBlEsTotal Employees:1 mile: 12,4043 miles: 94,6535 miles: 270,714
Over $131,700,000.00 spent on dining out & over $138,059,381.00 spent on apparel service purchases in the neighboring communities in 2010
DivERsiTY:similar to East End iii
sUsTaiNaBiliTYLEED-Platimum certifiedsolar Pvlow-Flow FixturesGreen RoofNatural DaylightingRecycled & local materials
COMPARISONDisTaNCE FROm siTE:2.1 miles
Our project costs $112 million for 332, 469 sf ($336psf), compared to Bakery square at $135 million for 250,000 sf ($540psf), so our project might yield more leasable area for less money. However, as we are unable to determine the square footage of spring Hill suites and the parking at Bakery square, this comparison is likely flawed. The fact that Bakery square was adaptive reuse probably indicates a higher cost of construction than our project, however.The median household income in our neighborhood is about half of what it is surrounding Bakery square: about $40,000 for areas immediately adjacent to our site, supporting our decision to have retail offerings for middle to upper-middle-class young professionals, students, and low-income residents.We are adopting some of the same sustainable strategies including green roof and natural daylighting. in addition, we are striving for passive house energy efficiency standards with high insulation and energy recovery ventilators.
BaKERY sQUaREPROJECT CHARACTERISTICS
CONsTRUCTiON:adaptive Reuse & New
COmmERCial: 250,000 sf21 Tenants, including:Retail ClothingFast Food & CoffeeHi TechmedicalFitness/HealthBankHotel
Ground Floor Retail121,060 sq. ft.
Fitness Center41,550 sq. ft.
Office216,080 sq. ft.
Hotel – marriott springHill suites110 rooms
Parking932 garage | 99 surface
COsT:$135 million(including $1 million environmental remediation)$10 million TiF
maRKET
Residential Population:1 mile: 27,6903 miles: 181,7195 miles: 337,765
median age: 35.5 yrs
mixed incomeaverage Household income for neighboring communities: $81,663.0014.2% of Households have net worth of over $500,000.00
mixed Education (51% collage educated and above in surrounding area)
students (41,500) and Workers (38,000) from 2 of Pittsburgh top 10 employers, within 2 miles of site (University of Pittsburgh and Carnegie mellon University)
source: “Bakery square Development (Former Nabisco Factory.” Western Pennsylvania Brownfields Center. accessed 11/17/2013http://www.cmu.edu/steinbrenner/brownfields/
Retail A Lower Level: 39,000 sf Upper Level: 39,000 sf Retail B 14,305 sf Retail C Lower Level: 6,300 sf Upper Level: 7,400 sf
source: “leasing information.” Bakery Square. accessed 11/17/2013 http://bakery-square.com/lease/
“Google’s decision to lease more space at Bakery square expected to attract new businesses.” POP City. 1/12/13, accessed 11/17/2013 http://www.popcitymedia.com/devnews/googleexpansion011211.aspx
Part 3: Final Feasibility Development Plan | Transit Oriented Development at Neville & Centre| Real Estate Design and Development 48-452|22
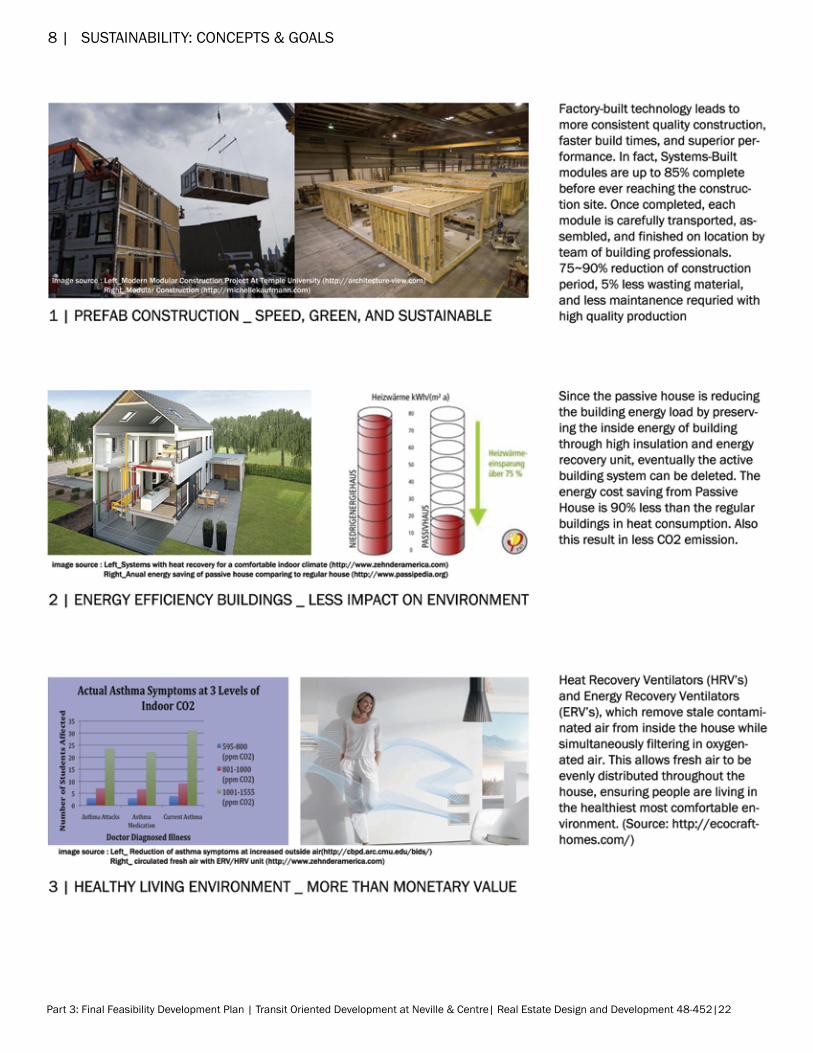
8 | sUsTaiNaBiliTY: CONCEPTs & GOals
Part 3: Final Feasibility Development Plan | Transit Oriented Development at Neville & Centre| Real Estate Design and Development 48-452|23
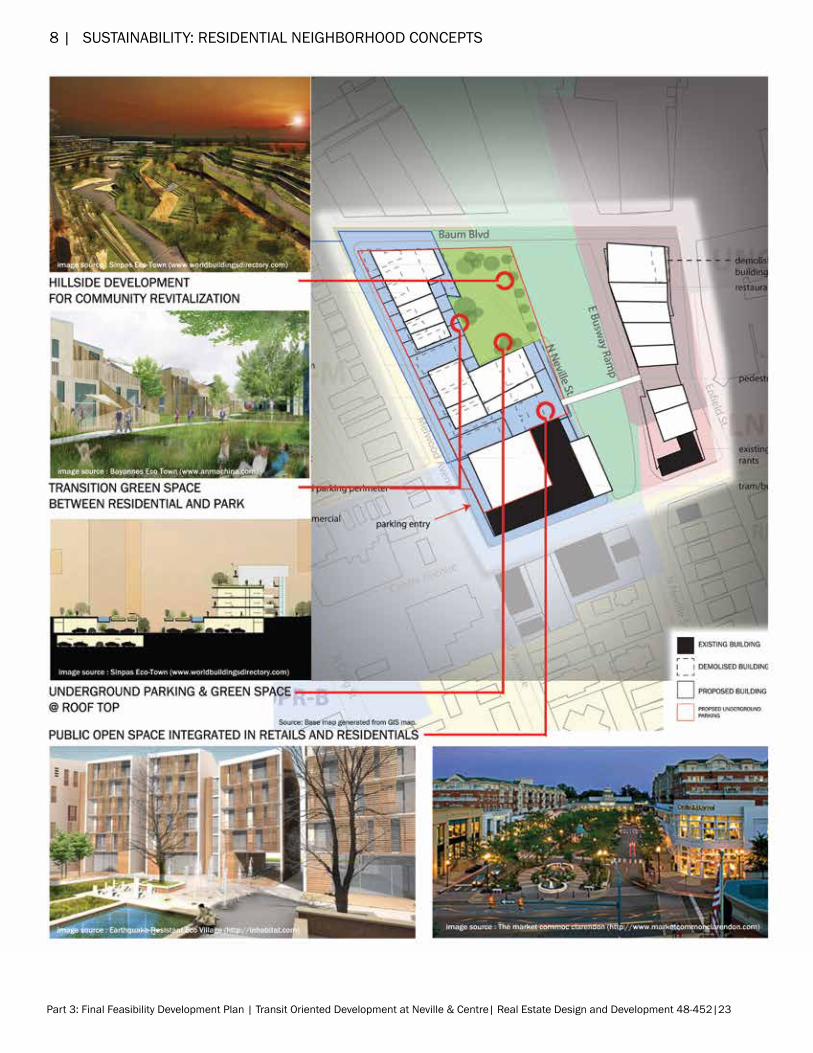
8 | sUsTaiNaBiliTY: REsiDENTial NEiGHBORHOOD CONCEPTs
Part 3: Final Feasibility Development Plan | Transit Oriented Development at Neville & Centre| Real Estate Design and Development 48-452|24
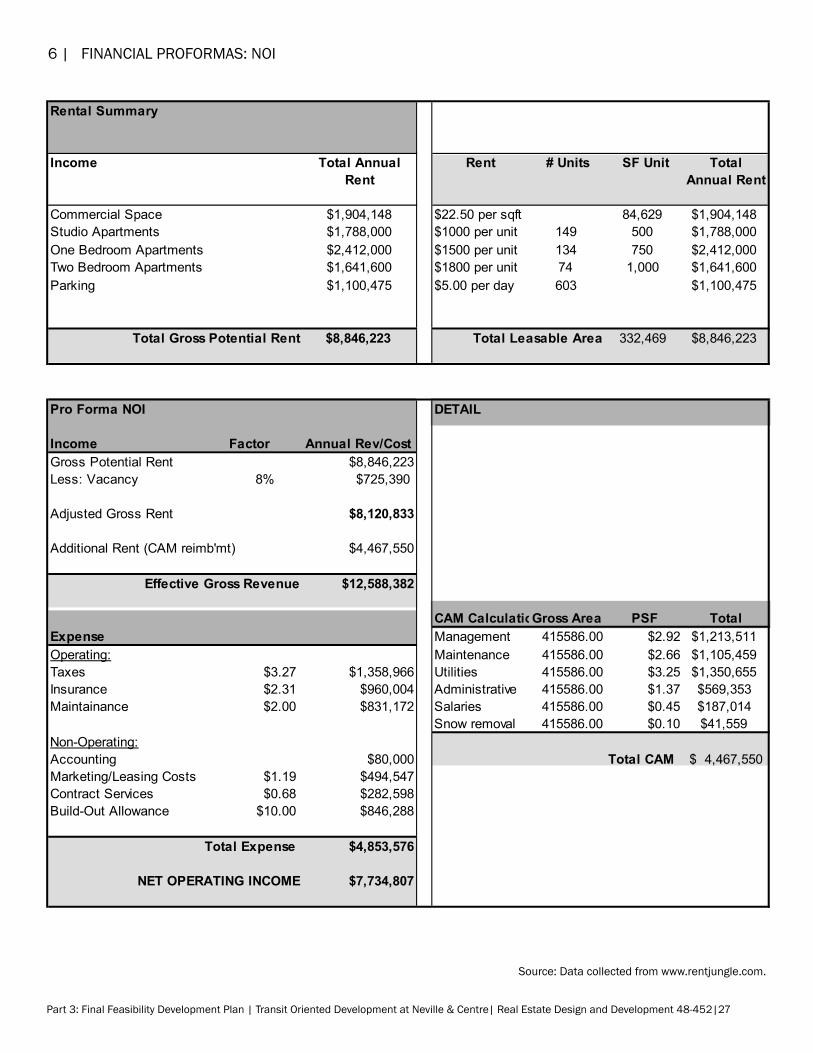
Landslide Prone Area
Our site is a landslide-prone area, along the East Busway. This area currently includes the town homes along the west side of the busway and the vacant lots on the east side.
Construction Contamination
The potential environmental issues in new construction are:1. Polluted particulate matter and dust (Pm10), such as diesel engine’s exhaust, which can damage human health when inhale, and can accumulate in top soil after precipitation.2. Construction waste such as mercury from thermostats and switches, and lead from paints.3. Carbon monoxide and carbon dioxide from buring activites.4. Others matters such as asbestos, nitrogen oxides.
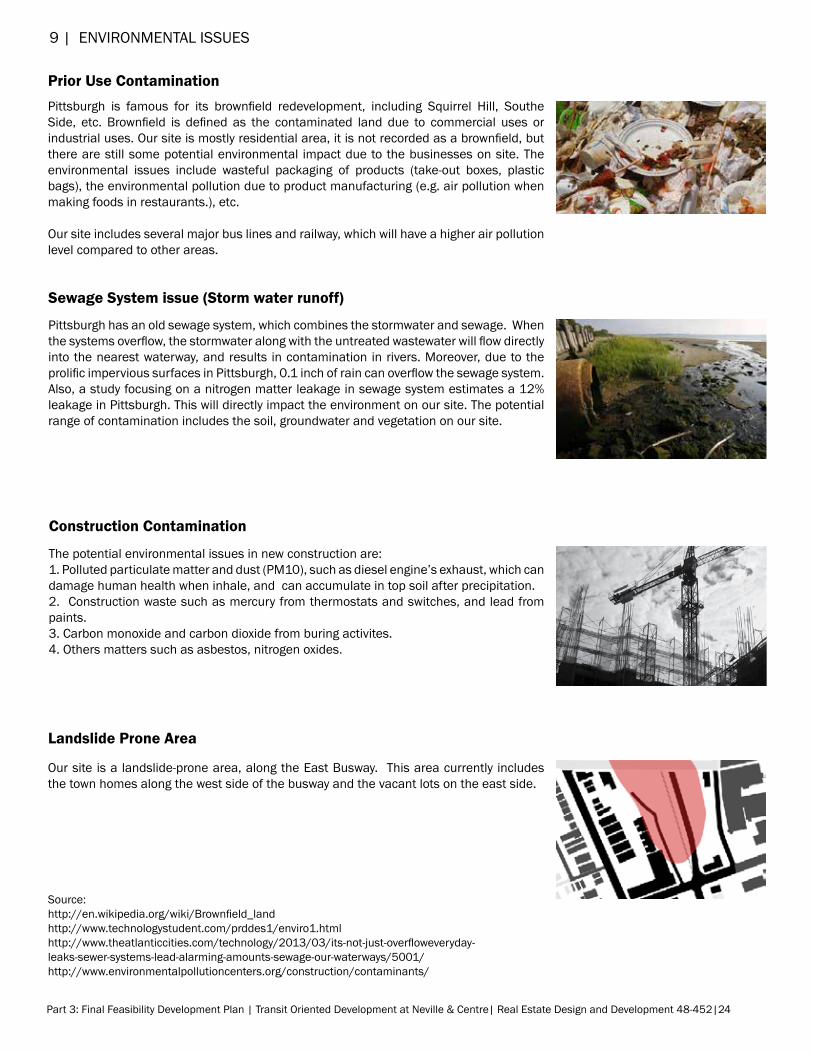
Prior Use ContaminationPittsburgh is famous for its brownfield redevelopment, including Squirrel Hill, Southe Side, etc. Brownfield is defined as the contaminated land due to commercial uses or industrial uses. Our site is mostly residential area, it is not recorded as a brownfield, but there are still some potential environmental impact due to the businesses on site. The environmental issues include wasteful packaging of products (take-out boxes, plastic bags), the environmental pollution due to product manufacturing (e.g. air pollution when making foods in restaurants.), etc.
Our site includes several major bus lines and railway, which will have a higher air pollution level compared to other areas.
Sewage System issue (Storm water runoff)
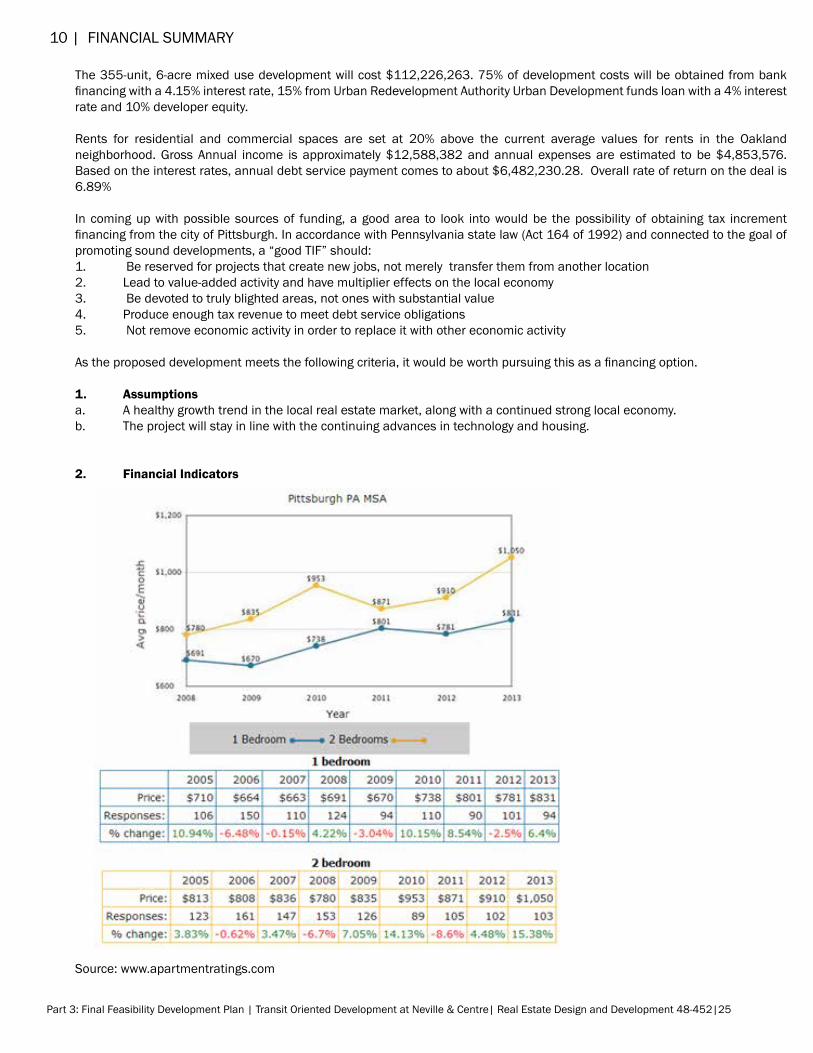
Pittsburgh has an old sewage system, which combines the stormwater and sewage. When the systems overflow, the stormwater along with the untreated wastewater will flow directly into the nearest waterway, and results in contamination in rivers. moreover, due to the prolific impervious surfaces in Pittsburgh, 0.1 inch of rain can overflow the sewage system. also, a study focusing on a nitrogen matter leakage in sewage system estimates a 12% leakage in Pittsburgh. This will directly impact the environment on our site. The potential range of contamination includes the soil, groundwater and vegetation on our site.
source: http://en.wikipedia.org/wiki/Brownfield_landhttp://www.technologystudent.com/prddes1/enviro1.htmlhttp://www.theatlanticcities.com/technology/2013/03/its-not-just-overfloweveryday-leaks-sewer-systems-lead-alarming-amounts-sewage-our-waterways/5001/http://www.environmentalpollutioncenters.org/construction/contaminants/
9 | ENviRONmENTal issUEs
Part 3: Final Feasibility Development Plan | Transit Oriented Development at Neville & Centre| Real Estate Design and Development 48-452|25
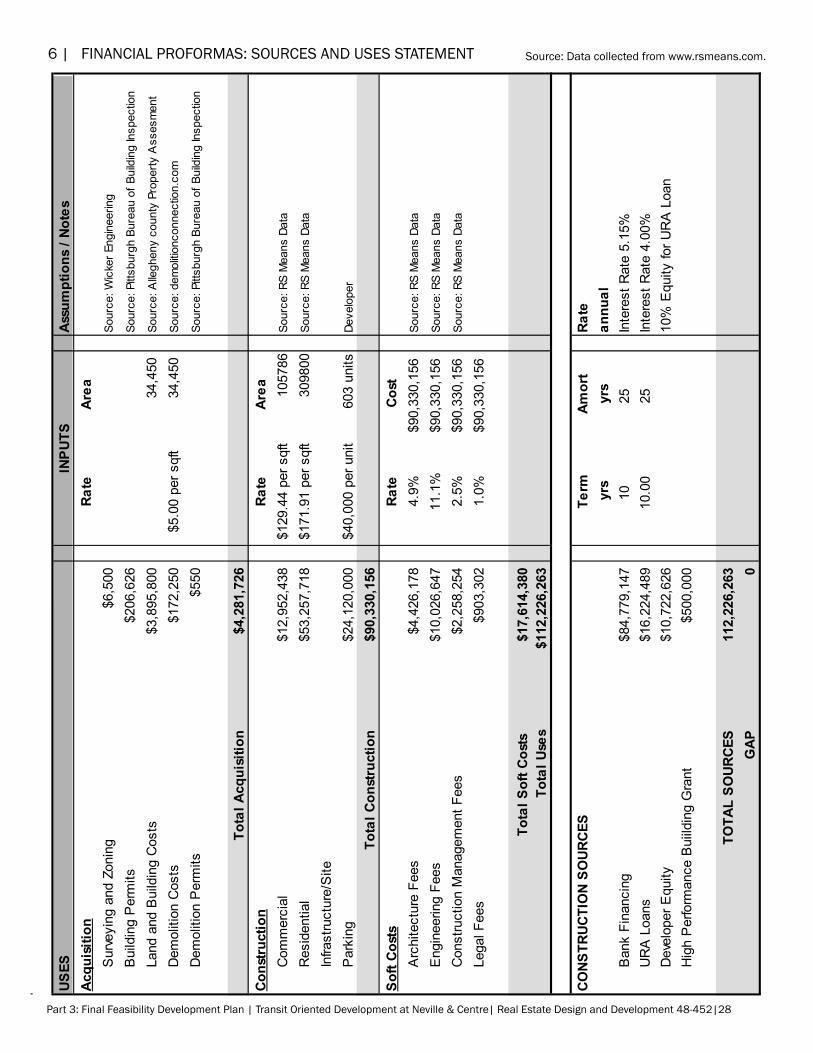
The 355-unit, 6-acre mixed use development will cost $112,226,263. 75% of development costs will be obtained from bank financing with a 4.15% interest rate, 15% from Urban Redevelopment Authority Urban Development funds loan with a 4% interest rate and 10% developer equity.
Rents for residential and commercial spaces are set at 20% above the current average values for rents in the Oakland neighborhood. Gross annual income is approximately $12,588,382 and annual expenses are estimated to be $4,853,576. Based on the interest rates, annual debt service payment comes to about $6,482,230.28. Overall rate of return on the deal is 6.89%
in coming up with possible sources of funding, a good area to look into would be the possibility of obtaining tax increment financing from the city of Pittsburgh. In accordance with Pennsylvania state law (Act 164 of 1992) and connected to the goal of promoting sound developments, a “good TiF” should:1. Be reserved for projects that create new jobs, not merely transfer them from another location2. lead to value-added activity and have multiplier effects on the local economy3. Be devoted to truly blighted areas, not ones with substantial value4. Produce enough tax revenue to meet debt service obligations5. Not remove economic activity in order to replace it with other economic activity
As the proposed development meets the following criteria, it would be worth pursuing this as a financing option.
1. Assumptionsa. a healthy growth trend in the local real estate market, along with a continued strong local economy. b. The project will stay in line with the continuing advances in technology and housing.
2. Financial Indicators
source: www.apartmentratings.com
10 | FiNaNCial sUmmaRY
Part 3: Final Feasibility Development Plan | Transit Oriented Development at Neville & Centre| Real Estate Design and Development 48-452|26
3. Projected Cash Flow Summary
Cost of land $3,895,800 Building Worth $128,913,442 Gross income $8,846,223 Operating costs $4,853,576 Tax Rate 40% value of land after 5 years, with 15% appreciation $4,480,170
Depreciation schedule land Year Rate amount Book value 1 0.024573 $3,167,790 $125,745,652 2 0.025641 $3,305,470 $122,440,182 3 0.025641 $3,305,470 $119,134,713 4 0.025641 $3,305,470 $115,829,243 5 0.025641 $3,305,470 $112,523,774
Cash�ow Statement (before debt service) Income Statement
End Of Year 0 1 2 3 4 5
Revenue
$8,846,223 $8,846,223 $8,846,223 $8,846,223 $8,846,223
Operating costs
$4,853,576 $4,853,576 $4,853,576 $4,853,576 $4,853,576
Depreciation Rate %
2.4573 2.5641 2.5641 2.5641 2.5641
Value
$3,167,790 $3,305,470 $3,305,470 $3,305,470 $3,305,470
Taxable Income
$824,857 $687,178 $687,178 $687,178 $687,178
Income tax (40%)
$329,943 $274,871 $274,871 $274,871 $274,871
Net Income
$494,914 $412,307 $412,307 $412,307 $412,307
Cash�ow Statement Operating Activities Net Income
$494,914 $412,307 $412,307 $412,307 $412,307
Depreciation
$3,167,790 $3,305,470 $3,305,470 $3,305,470 $3,305,470
Investement activities Land $3,895,800
$4,480,170
Building $128,913,442
$148,250,458
Gains Tax Land
$233,748
Net Cash Flow $132,809,242 $3,662,704 $3,717,776 $3,717,776 $3,717,776 $156,682,152
Depreciation Schedule Land Year Rate Amount Book Value
1 0.024573 $3,167,790 $125,745,652
2 0.025641 $3,305,470 $122,440,182
3 0.025641 $3,305,470 $119,134,713
4 0.025641 $3,305,470 $115,829,243
5 0.025641 $3,305,470 $112,523,774
10 | FiNaNCial sUmmaRY (cont.)
Part 3: Final Feasibility Development Plan | Transit Oriented Development at Neville & Centre| Real Estate Design and Development 48-452|27
6 | FiNaNCial PROFORmas: NOi
source: Data collected from www.rentjungle.com.
Rental Summary
Income Total Annual Rent
Rent # Units SF Unit Total Annual Rent
Commercial Space $1,904,148 $22.50 per sqft 84,629 $1,904,148Studio Apartments $1,788,000 $1000 per unit 149 500 $1,788,000One Bedroom Apartments $2,412,000 $1500 per unit 134 750 $2,412,000Two Bedroom Apartments $1,641,600 $1800 per unit 74 1,000 $1,641,600Parking $1,100,475 $5.00 per day 603 $1,100,475
Total Gross Potential Rent $8,846,223 Total Leasable Area 332,469 $8,846,223
Pro Forma NOI DETAIL
Income Factor Annual Rev/CostGross Potential Rent $8,846,223Less: Vacancy 8% $725,390
Adjusted Gross Rent $8,120,833
Additional Rent (CAM reimb'mt) $4,467,550
Effective Gross Revenue $12,588,382
CAM CalculationGross Area PSF TotalExpense Management 415586.00 $2.92 $1,213,511Operating: Maintenance 415586.00 $2.66 $1,105,459Taxes $3.27 $1,358,966 Utilities 415586.00 $3.25 $1,350,655Insurance $2.31 $960,004 Administrative 415586.00 $1.37 $569,353Maintainance $2.00 $831,172 Salaries 415586.00 $0.45 $187,014
Snow removal 415586.00 $0.10 $41,559Non-Operating:Accounting $80,000 Total CAM 4,467,550$ Marketing/Leasing Costs $1.19 $494,547Contract Services $0.68 $282,598Build-Out Allowance $10.00 $846,288
Total Expense $4,853,576
NET OPERATING INCOME $7,734,807
Part 3: Final Feasibility Development Plan | Transit Oriented Development at Neville & Centre| Real Estate Design and Development 48-452|28
6 | FiNaNCial PROFORmas: sOURCEs aND UsEs sTaTEmENT source: Data collected from www.rsmeans.com.US
ESIN
PUTS
Assu
mpt
ions
/ No
tes
Acqu
isiti
onRa
teAr
eaS
urve
ying
and
Zon
ing
$6,5
00So
urce
: Wic
ker E
ngin
eerin
g
Bui
ldin
g P
erm
its$2
06,6
26So
urce
: Pitt
sbur
gh B
urea
u of
Bui
ldin
g In
spec
tion
Land
and
Bui
ldin
g C
osts
$3,8
95,8
0034
,450
Sour
ce: A
llegh
eny
coun
ty P
rope
rty A
sses
men
t
Dem
oliti
on C
osts
$172
,250
$5.0
0 pe
r sqf
t34
,450
Sour
ce: d
emol
itionc
onne
ctio
n.co
m
Dem
oliti
on P
erm
its$5
50So
urce
: Pitt
sbur
gh B
urea
u of
Bui
ldin
g In
spec
tion
Tota
l Acq
uisi
tion
$4,2
81,7
26Co
nstru
ctio
nRa
teAr
eaC
omm
erci
al$1
2,95
2,43
8$1
29.4
4 pe
r sqf
t10
5786
Sour
ce: R
S M
eans
Dat
a
Res
iden
tial
$53,
257,
718
$171
.91
per s
qft
3098
00So
urce
: RS
Mea
ns D
ata
Infra
stru
ctur
e/S
iteP
arki
ng$2
4,12
0,00
0$4
0,00
0 pe
r uni
t60
3 un
itsDe
velo
per
Tota
l Con
stru
ctio
n$9
0,33
0,15
6So
ft Co
sts
Rate
Cost
Arc
hite
ctur
e Fe
es$4
,426
,178
4.9%
$90,
330,
156
Sour
ce: R
S M
eans
Dat
a
Eng
inee
ring
Fees
$10,
026,
647
11.1
%$9
0,33
0,15
6So
urce
: RS
Mea
ns D
ata
Con
stru
ctio
n M
anag
emen
t Fee
s$2
,258
,254
2.5%
$90,
330,
156
Sour
ce: R
S M
eans
Dat
a
Lega
l Fee
s$9
03,3
021.
0%$9
0,33
0,15
6
Tota
l Sof
t Cos
ts$1
7,61
4,38
0To
tal U
ses
$112
,226
,263
CONS
TRUC
TIO
N SO
URCE
STe
rmAm
ort
Rate
yrs
yrs
annu
alB
ank
Fina
ncin
g$8
4,77
9,14
710
25In
tere
st R
ate
5.15
%U
RA
Loa
ns$1
6,22
4,48
910
.00
25In
tere
st R
ate
4.00
%D
evel
oper
Equ
ity$1
0,72
2,62
610
% E
quity
for U
RA
Loa
nH
igh
Per
form
ance
Bui
ildin
g G
rant
$500
,000
TOTA
L SO
URCE
S11
2,22
6,26
3G
AP0
Part 3: Final Feasibility Development Plan | Transit Oriented Development at Neville & Centre| Real Estate Design and Development 48-452|29
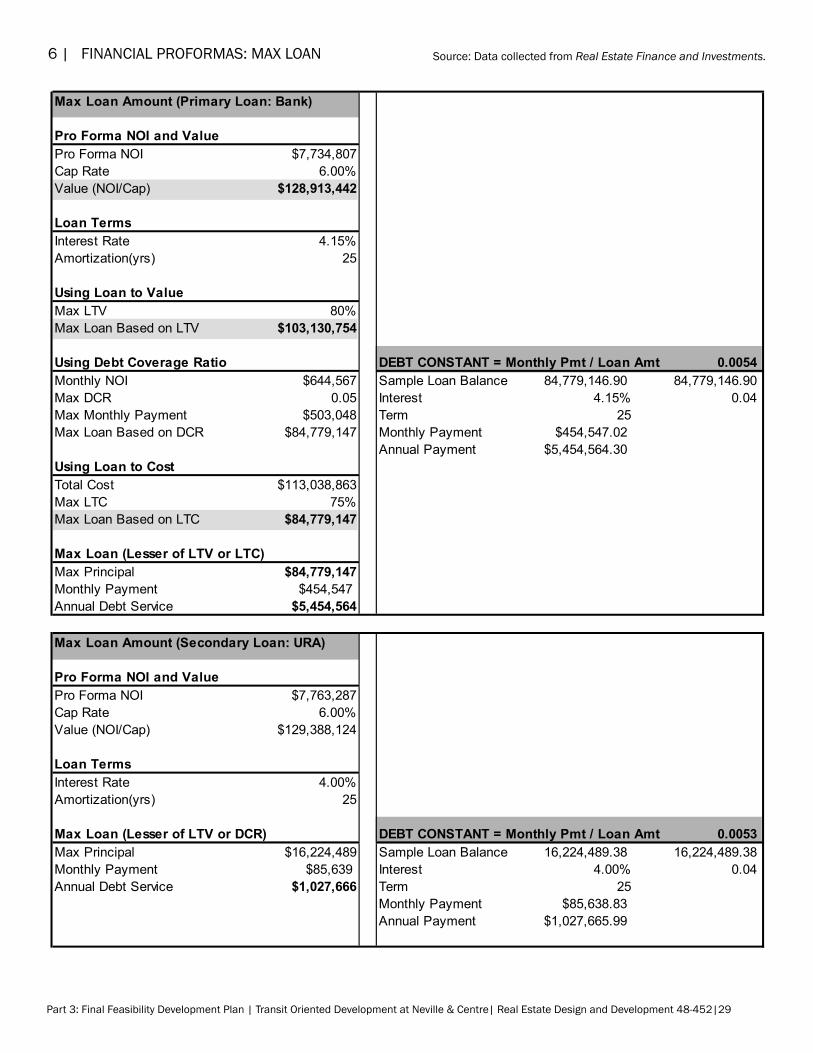
6 | FiNaNCial PROFORmas: maX lOaN source: Data collected from Real Estate Finance and Investments.
Max Loan Amount (Primary Loan: Bank)
Pro Forma NOI and ValuePro Forma NOI $7,734,807Cap Rate 6.00%Value (NOI/Cap) $128,913,442
Loan TermsInterest Rate 4.15%Amortization(yrs) 25
Using Loan to ValueMax LTV 80%Max Loan Based on LTV $103,130,754
Using Debt Coverage Ratio DEBT CONSTANT = Monthly Pmt / Loan Amt 0.0054Monthly NOI $644,567 Sample Loan Balance 84,779,146.90 84,779,146.90Max DCR 0.05 Interest 4.15% 0.04Max Monthly Payment $503,048 Term 25Max Loan Based on DCR $84,779,147 Monthly Payment $454,547.02
Annual Payment $5,454,564.30Using Loan to CostTotal Cost $113,038,863Max LTC 75%Max Loan Based on LTC $84,779,147
Max Loan (Lesser of LTV or LTC)Max Principal $84,779,147Monthly Payment $454,547Annual Debt Service $5,454,564
Max Loan Amount (Secondary Loan: URA)
Pro Forma NOI and ValuePro Forma NOI $7,763,287Cap Rate 6.00%Value (NOI/Cap) $129,388,124
Loan TermsInterest Rate 4.00%Amortization(yrs) 25
Max Loan (Lesser of LTV or DCR) DEBT CONSTANT = Monthly Pmt / Loan Amt 0.0053Max Principal $16,224,489 Sample Loan Balance 16,224,489.38 16,224,489.38Monthly Payment $85,639 Interest 4.00% 0.04Annual Debt Service $1,027,666 Term 25
Monthly Payment $85,638.83Annual Payment $1,027,665.99
Part 3: Final Feasibility Development Plan | Transit Oriented Development at Neville & Centre| Real Estate Design and Development 48-452|30
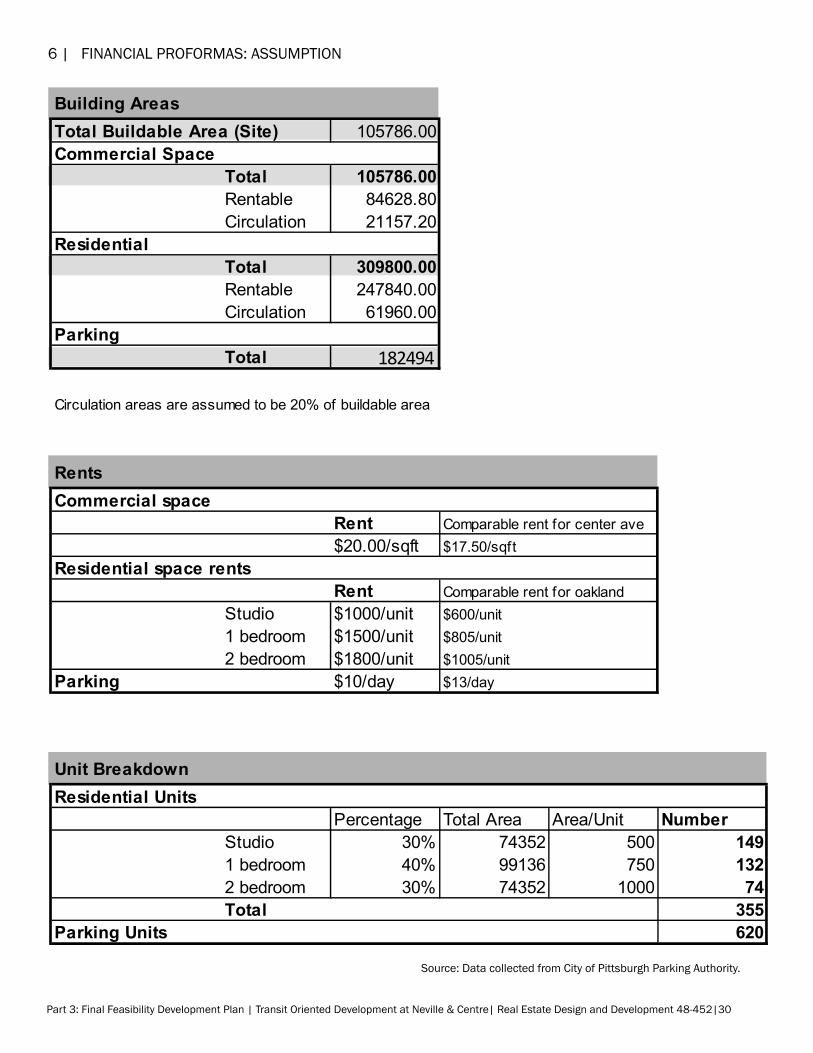
6 | FiNaNCial PROFORmas: assUmPTiON
source: Data collected from City of Pittsburgh Parking authority.
Building AreasTotal Buildable Area (Site) 105786.00Commercial Space
Total 105786.00Rentable 84628.80Circulation 21157.20
ResidentialTotal 309800.00Rentable 247840.00Circulation 61960.00
ParkingTotal
Circulation areas are assumed to be 20% of buildable area
RentsCommercial space
Rent Comparable rent for center ave$20.00/sqft $17.50/sqft
Residential space rentsRent Comparable rent for oakland
Studio $1000/unit $600/unit1 bedroom $1500/unit $805/unit2 bedroom $1800/unit $1005/unit
Parking $10/day $13/day
Unit BreakdownResidential Units
Percentage Total Area Area/Unit NumberStudio 30% 74352 500 1491 bedroom 40% 99136 750 1322 bedroom 30% 74352 1000 74Total 355
Parking Units 620
182494
Copyright © 2022 FDOKUMEN