Transcriptomic Analyses Reveal Novel Genes with Sexually Dimorphic Expression in the Zebrafish Gonad...
16
Transcriptomic Analyses Reveal Novel Genes with Sexually Dimorphic Expression in the Zebrafish Gonad and Brain Rajini Sreenivasan 1. , Minnie Cai 1. , Richard Bartfai 1¤a , Xingang Wang 1,2¤b , Alan Christoffels 3,4¤c , Laszlo Orban 1,2 * 1 Reproductive Genomics Group, Temasek Life Sciences Laboratory, Singapore, Singapore, 2 Department of Biological Sciences, National University of Singapore, Singapore, Singapore, 3 Computational Biology, Temasek Life Sciences Laboratory, Singapore, Singapore, 4 School of Biological Sciences, Nanyang Technological University, Singapore, Singapore Abstract Background: Our knowledge on zebrafish reproduction is very limited. We generated a gonad-derived cDNA microarray from zebrafish and used it to analyze large-scale gene expression profiles in adult gonads and other organs. Methodology/Principal Findings: We have identified 116638 gonad-derived zebrafish expressed sequence tags (ESTs), 21% of which were isolated in our lab. Following in silico normalization, we constructed a gonad-derived microarray comprising 6370 unique, full-length cDNAs from differentiating and adult gonads. Labeled targets from adult gonad, brain, kidney and ‘rest-of-body’ from both sexes were hybridized onto the microarray. Our analyses revealed 1366, 881 and 656 differentially expressed transcripts (34.7% novel) that showed highest expression in ovary, testis and both gonads respectively. Hierarchical clustering showed correlation of the two gonadal transcriptomes and their similarities to those of the brains. In addition, we have identified 276 genes showing sexually dimorphic expression both between the brains and between the gonads. By in situ hybridization, we showed that the gonadal transcripts with the strongest array signal intensities were germline-expressed. We found that five members of the GTP-binding septin gene family, from which only one member (septin 4) has previously been implicated in reproduction in mice, were all strongly expressed in the gonads. Conclusions/Significance: We have generated a gonad-derived zebrafish cDNA microarray and demonstrated its usefulness in identifying genes with sexually dimorphic co-expression in both the gonads and the brains. We have also provided the first evidence of large-scale differential gene expression between female and male brains of a teleost. Our microarray would be useful for studying gonad development, differentiation and function not only in zebrafish but also in related teleosts via cross-species hybridizations. Since several genes have been shown to play similar roles in gonadogenesis in zebrafish and other vertebrates, our array may even provide information on genetic disorders affecting gonadal phenotypes and fertility in mammals. Citation: Sreenivasan R, Cai M, Bartfai R, Wang X, Christoffels A, et al. (2008) Transcriptomic Analyses Reveal Novel Genes with Sexually Dimorphic Expression in the Zebrafish Gonad and Brain. PLoS ONE 3(3): e1791. doi:10.1371/journal.pone.0001791 Editor: Geraldine Butler, University College Dublin, Ireland Received October 26, 2007; Accepted February 7, 2008; Published March 12, 2008 Copyright: ß 2008 Sreenivasan et al. This is an open-access article distributed under the terms of the Creative Commons Attribution License, which permits unrestricted use, distribution, and reproduction in any medium, provided the original author and source are credited. Funding: This work was supported by fellowships from Temasek Life Sciences Laboratory and the Department of Biological Sciences of the National University of Singapore as well as by internal research grants from Temasek Life Sciences Laboratory. Competing Interests: The authors have declared that no competing interests exist. * E-mail: [email protected] ¤a Current address: Department of Molecular Biology, Nijmegen Center for Molecular Life Sciences, Nijmegen, The Netherlands ¤b Current address: Developmental and Biomedical Genetics, Institute of Molecular and Cell Biology, Singapore, Singapore ¤c Current address: South African National Bioinformatics Institute, University of Western Cape, Bellville, South Africa . These authors contributed equally to this work. Introduction Zebrafish (Danio rerio) has become a major vertebrate model for developmental biology and genetics [1], genomics [2,3] and human diseases [4–6] during the last three decades. Despite these advances, little is known about the molecular aspects of its reproduction. The molecular mechanisms underlying gonad development and function in zebrafish have yet to be elucidated. Gonad differentiation in zebrafish is a highly complex process involving a ‘juvenile ovary-to-testis’ transformation [7–9]. At 15– 20 days post fertilization (dpf), every zebrafish individual develops an ovary-like gonad (‘juvenile ovary’). The juvenile ovary continues to develop until maturation in the females while in the rest of the individuals it undergoes a transitional intersexual phase eventually leading to the formation of a differentiated testis [7,10]. This process is further complicated by the high variability of the starting point and extent of the transformation process in different individuals [9]. Although the molecular mechanism of gonad differentiation is largely unknown, the products of several genes, including aromatase (cyp19a1; [11], Fushi tarazu factor-1d (ff1d; [12,13]), anti-Mu ¨llerian hormone (amh; [14,15]), and 11b- hydroxylase (cyp11b; [15]) have been implicated in this process. PLoS ONE | www.plosone.org 1 March 2008 | Volume 3 | Issue 3 | e1791
-
Upload
independent -
Category
Documents
-
view
0 -
download
0
Transcript of Transcriptomic Analyses Reveal Novel Genes with Sexually Dimorphic Expression in the Zebrafish Gonad...
Transcriptomic Analyses Reveal Novel Genes withSexually Dimorphic Expression in the Zebrafish Gonadand BrainRajini Sreenivasan1., Minnie Cai1., Richard Bartfai1¤a, Xingang Wang1,2¤b, Alan Christoffels3,4¤c, Laszlo
Orban1,2*
1 Reproductive Genomics Group, Temasek Life Sciences Laboratory, Singapore, Singapore, 2 Department of Biological Sciences, National University of Singapore,
Singapore, Singapore, 3 Computational Biology, Temasek Life Sciences Laboratory, Singapore, Singapore, 4 School of Biological Sciences, Nanyang Technological
University, Singapore, Singapore
Abstract
Background: Our knowledge on zebrafish reproduction is very limited. We generated a gonad-derived cDNA microarrayfrom zebrafish and used it to analyze large-scale gene expression profiles in adult gonads and other organs.
Methodology/Principal Findings: We have identified 116638 gonad-derived zebrafish expressed sequence tags (ESTs), 21%of which were isolated in our lab. Following in silico normalization, we constructed a gonad-derived microarray comprising6370 unique, full-length cDNAs from differentiating and adult gonads. Labeled targets from adult gonad, brain, kidney and‘rest-of-body’ from both sexes were hybridized onto the microarray. Our analyses revealed 1366, 881 and 656 differentiallyexpressed transcripts (34.7% novel) that showed highest expression in ovary, testis and both gonads respectively.Hierarchical clustering showed correlation of the two gonadal transcriptomes and their similarities to those of the brains. Inaddition, we have identified 276 genes showing sexually dimorphic expression both between the brains and between thegonads. By in situ hybridization, we showed that the gonadal transcripts with the strongest array signal intensities weregermline-expressed. We found that five members of the GTP-binding septin gene family, from which only one member(septin 4) has previously been implicated in reproduction in mice, were all strongly expressed in the gonads.
Conclusions/Significance: We have generated a gonad-derived zebrafish cDNA microarray and demonstrated its usefulnessin identifying genes with sexually dimorphic co-expression in both the gonads and the brains. We have also provided thefirst evidence of large-scale differential gene expression between female and male brains of a teleost. Our microarray wouldbe useful for studying gonad development, differentiation and function not only in zebrafish but also in related teleosts viacross-species hybridizations. Since several genes have been shown to play similar roles in gonadogenesis in zebrafish andother vertebrates, our array may even provide information on genetic disorders affecting gonadal phenotypes and fertilityin mammals.
Citation: Sreenivasan R, Cai M, Bartfai R, Wang X, Christoffels A, et al. (2008) Transcriptomic Analyses Reveal Novel Genes with Sexually Dimorphic Expression inthe Zebrafish Gonad and Brain. PLoS ONE 3(3): e1791. doi:10.1371/journal.pone.0001791
Editor: Geraldine Butler, University College Dublin, Ireland
Received October 26, 2007; Accepted February 7, 2008; Published March 12, 2008
Copyright: � 2008 Sreenivasan et al. This is an open-access article distributed under the terms of the Creative Commons Attribution License, which permitsunrestricted use, distribution, and reproduction in any medium, provided the original author and source are credited.
Funding: This work was supported by fellowships from Temasek Life Sciences Laboratory and the Department of Biological Sciences of the National University ofSingapore as well as by internal research grants from Temasek Life Sciences Laboratory.
Competing Interests: The authors have declared that no competing interests exist.
* E-mail: [email protected]
¤a Current address: Department of Molecular Biology, Nijmegen Center for Molecular Life Sciences, Nijmegen, The Netherlands¤b Current address: Developmental and Biomedical Genetics, Institute of Molecular and Cell Biology, Singapore, Singapore¤c Current address: South African National Bioinformatics Institute, University of Western Cape, Bellville, South Africa
. These authors contributed equally to this work.
Introduction
Zebrafish (Danio rerio) has become a major vertebrate model for
developmental biology and genetics [1], genomics [2,3] and
human diseases [4–6] during the last three decades. Despite these
advances, little is known about the molecular aspects of its
reproduction. The molecular mechanisms underlying gonad
development and function in zebrafish have yet to be elucidated.
Gonad differentiation in zebrafish is a highly complex process
involving a ‘juvenile ovary-to-testis’ transformation [7–9]. At 15–
20 days post fertilization (dpf), every zebrafish individual develops
an ovary-like gonad (‘juvenile ovary’). The juvenile ovarycontinues to develop until maturation in the females while in the
rest of the individuals it undergoes a transitional intersexual phase
eventually leading to the formation of a differentiated testis [7,10].This process is further complicated by the high variability of the
starting point and extent of the transformation process in different
individuals [9]. Although the molecular mechanism of gonaddifferentiation is largely unknown, the products of several genes,
including aromatase (cyp19a1; [11], Fushi tarazu factor-1d (ff1d;
[12,13]), anti-Mullerian hormone (amh; [14,15]), and 11b-
hydroxylase (cyp11b; [15]) have been implicated in this process.
PLoS ONE | www.plosone.org 1 March 2008 | Volume 3 | Issue 3 | e1791
Besides the gonads, the brain is also involved in vertebrate
reproduction. The involvement of the brain in gonad development
has been established by studies on quail which showed that males
transplanted with female forebrains had abnormally developed testes,
indicating that a genetically male brain is necessary for normal testis
development [16]. Since sex change in some teleosts can be influenced
by social control [17,18], it is likely that events in the brain may
determine the fate of the gonads, as suggested earlier by Francis [19].
Vertebrate reproduction and in part, sexual development, is largely
controlled by feedback interactions in the brain-pituitary-gonadal
(BPG) axis [19,20]. Contrary to the dogma in mammals and birds that
brain sexual dimorphism is entirely a result of hormonal action from
the gonads, it has now been proven that the brain also develops
differently in the two sexes as a result of differential brain gene
expression, remarkably even before the gonads are formed [21–23].
Microarray-based approaches have been used to identify genes
involved in gonad development and function in several organisms. In
Caenorhabditis elegans, sex-regulated genes have been identified by
characterizing gene expression differences between males and
hermaphrodites using DNA microarrays [24], while in Drosophila
melanogaster, microarray analysis has been performed to obtain the gene
expression profile of the testis [25]. In rainbow trout, precocious ovaries
were compared against normal ones using ovary-specific microarrays
to reveal genes which are potentially involved in ovary maturation and
development [26]. Extensive array-based studies have also been
performed to elucidate gonad development and function in mice.
These include gene expression profiling in differentiating male and
female embryonic gonads [27], microarray analyses to identify genes
involved in ovary development [28] and time course profiling of
testicular gene expression during spermatogenesis [29].
In contrast to the extensive studies performed on other
organisms, there has been little information available regarding
the gonad transcriptomes of zebrafish. Currently available zebrafish
microarrays include at least seven commercial whole genome oligo
arrays, a heart and skeletal muscle-derived cDNA array [30], a
microarray derived from mixed tissues of 4-month-old to adult
zebrafish [31], an array containing brain-specific cDNAs [32] and a
microarray spanning promoter regions of over 11,000 genes [33].
In order to identify and characterize genes potentially involved
in gonad development and function, we constructed a microarray
comprising nearly 6,400 unique cDNAs from zebrafish gonads. In
our previous work, we analyzed a smaller subset of this collection
by hybridizing adult ovary-, testis- and kidney-derived labeled
targets to a membrane-based cDNA macroarray containing 2760
adult gonad cDNAs [34]. In the current experiment, we extended
the throughput of the study by adding 3634 clones (derived mostly
from the differentiating gonad) to the array and switching to a
slide-based platform. In order to analyze the transcriptomes of the
adult gonads and to compare them with those of other organs,
RNA from adult ovary and testis were used as targets for
hybridization onto the microarray, while RNA from the brain,
kidney and rest of the body from both male and female adult
zebrafish were used as controls. Our analysis revealed that a large
number of genes showed sexually dimorphic expression in the
gonads and other organs of adult zebrafish. These included novel
transcripts which have not been characterized in any other
vertebrate species according to our knowledge.
Results and Discussion
Extension of the gonadal EST set and generation of theGonad Uniclone Microarray
We generated 4613 new ESTs from the adult zebrafish testis
and ovary and 11010 sequences from the differentiating gonad [3,
4 and 5 weeks post-fertilization (wpf)], which has never been
sampled before by others (refer to Table S1 for details). In total,
15623 new zebrafish ESTs have been submitted to GenBank from
the effort described in this study.
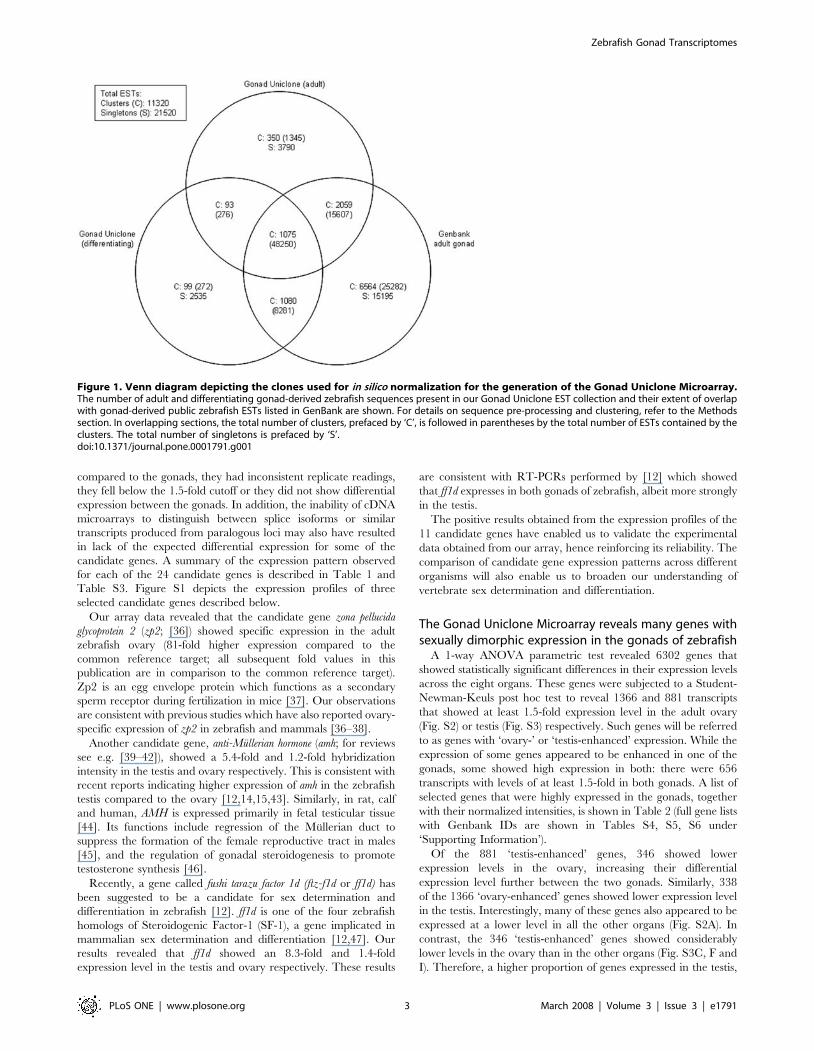
In order to minimize redundancy, we performed in silico
normalization of the above clone set by clustering their sequences
together with our clone set published earlier [34], gonad-derived
zebrafish ESTs from GenBank and gonadal zebrafish sequences
from RefSeq (see Methods for details). Clustering of these
sequences resulted in 11320 clusters and 21520 singletons
(Fig. 1). Out of these, 542 clusters (representing 1893 ESTs) and
6325 singletons that were isolated by us have not been previously
described from the zebrafish gonad by others. When we BLAST-
searched our transcripts against GenBank at the nucleotide level
(July 2007), 2018 transcripts did not hit any coding regions of the
zebrafish genome. Out of these, 90 of them could be translated
into peptides, 24 of which contained domains categorized by Gene
Ontologies [35] (Table S2). Of the 2018 transcripts, 365 did not
find any significant sequence identity to zebrafish ESTs, indicating
that they are likely to be absent from commercial zebrafish
microarrays. Of the 365 transcripts, 185 did not have hits to any
characterized genes in GenBank. Therefore, these sequences
represent entirely new zebrafish or vertebrate ESTs, justifying our
extension of gene discovery efforts to developmental stages that
have not been sampled previously.
From the clustered dataset, we selected full-length cDNA clones
representing 6370 unique clusters/singletons to form an extended,
in silico-normalized cDNA collection, PCR-amplified inserts of
which were used to generate our Gonad Uniclone Microarray. All
inserts were sequenced from the 59 end (refer to Table S1 for
GenBank IDs) and over 90% of them (5750 clones) from the 39
end, providing full-length sequences for 3582 clones (GenBank
IDs: EX153972-EX159719, EX159734-EX159735).
The expression profiles of several candidate genes on theGonad Uniclone Microarray were consistent withprevious reports
We performed a total of 32 hybridizations, using eight target
organs with four biological replicates each, with the aim of
identifying differentially expressed genes in the gonads and other
organs, and to set up a biological reference for future
hybridizations involving differentiating gonads. The target organs
consisted of adult ovary and testis; the brain, kidney and ‘rest-of-
body’ (ie. whole body except the three organs listed earlier) from
both male and female zebrafish, were used as controls. For
simplicity, ‘rest of body’ was regarded as an organ in this
publication. All targets were hybridized against a pooled common
reference consisting of equal amounts of targets from all dissected
organs from a single adult male and a single adult female.
In order to validate our data, duplicate clones of 24 candidate
genes, most of which were known to be involved in gonad
development and/or function in zebrafish and/or other organ-
isms, were also included in the microarray. We observed a good
similarity between expression profiles of the duplicate clones of
each candidate gene. Following a 1-way ANOVA test and a
Student-Newman-Keuls post hoc test, 18 of the 24 genes showed
statistically significant differences between the eight organs. Of the
18 genes, 11 showed at least 1.5-fold higher expression in
comparison to the common reference target in either of the
gonads. These 11 included four and seven genes most highly
expressed in the ovary and testis respectively. Although some of
the remaining candidate genes showed enhanced expression in the
gonads, they were excluded from analysis for the following
reasons: they were expressed more strongly in other organs
Zebrafish Gonad Transcriptomes
PLoS ONE | www.plosone.org 2 March 2008 | Volume 3 | Issue 3 | e1791
compared to the gonads, they had inconsistent replicate readings,
they fell below the 1.5-fold cutoff or they did not show differential
expression between the gonads. In addition, the inability of cDNA
microarrays to distinguish between splice isoforms or similar
transcripts produced from paralogous loci may also have resulted
in lack of the expected differential expression for some of the
candidate genes. A summary of the expression pattern observed
for each of the 24 candidate genes is described in Table 1 and
Table S3. Figure S1 depicts the expression profiles of three
selected candidate genes described below.
Our array data revealed that the candidate gene zona pellucida
glycoprotein 2 (zp2; [36]) showed specific expression in the adult
zebrafish ovary (81-fold higher expression compared to the
common reference target; all subsequent fold values in this
publication are in comparison to the common reference target).
Zp2 is an egg envelope protein which functions as a secondary
sperm receptor during fertilization in mice [37]. Our observations
are consistent with previous studies which have also reported ovary-
specific expression of zp2 in zebrafish and mammals [36–38].
Another candidate gene, anti-Mullerian hormone (amh; for reviews
see e.g. [39–42]), showed a 5.4-fold and 1.2-fold hybridization
intensity in the testis and ovary respectively. This is consistent with
recent reports indicating higher expression of amh in the zebrafish
testis compared to the ovary [12,14,15,43]. Similarly, in rat, calf
and human, AMH is expressed primarily in fetal testicular tissue
[44]. Its functions include regression of the Mullerian duct to
suppress the formation of the female reproductive tract in males
[45], and the regulation of gonadal steroidogenesis to promote
testosterone synthesis [46].
Recently, a gene called fushi tarazu factor 1d (ftz-f1d or ff1d) has
been suggested to be a candidate for sex determination and
differentiation in zebrafish [12]. ff1d is one of the four zebrafish
homologs of Steroidogenic Factor-1 (SF-1), a gene implicated in
mammalian sex determination and differentiation [12,47]. Our
results revealed that ff1d showed an 8.3-fold and 1.4-fold
expression level in the testis and ovary respectively. These results
are consistent with RT-PCRs performed by [12] which showed
that ff1d expresses in both gonads of zebrafish, albeit more strongly
in the testis.
The positive results obtained from the expression profiles of the
11 candidate genes have enabled us to validate the experimental
data obtained from our array, hence reinforcing its reliability. The
comparison of candidate gene expression patterns across different
organisms will also enable us to broaden our understanding of
vertebrate sex determination and differentiation.
The Gonad Uniclone Microarray reveals many genes withsexually dimorphic expression in the gonads of zebrafish
A 1-way ANOVA parametric test revealed 6302 genes that
showed statistically significant differences in their expression levels
across the eight organs. These genes were subjected to a Student-
Newman-Keuls post hoc test to reveal 1366 and 881 transcripts
that showed at least 1.5-fold expression level in the adult ovary
(Fig. S2) or testis (Fig. S3) respectively. Such genes will be referred
to as genes with ‘ovary-’ or ‘testis-enhanced’ expression. While the
expression of some genes appeared to be enhanced in one of the
gonads, some showed high expression in both: there were 656
transcripts with levels of at least 1.5-fold in both gonads. A list of
selected genes that were highly expressed in the gonads, together
with their normalized intensities, is shown in Table 2 (full gene lists
with Genbank IDs are shown in Tables S4, S5, S6 under
‘Supporting Information’).
Of the 881 ‘testis-enhanced’ genes, 346 showed lower
expression levels in the ovary, increasing their differential
expression level further between the two gonads. Similarly, 338
of the 1366 ‘ovary-enhanced’ genes showed lower expression level
in the testis. Interestingly, many of these genes also appeared to be
expressed at a lower level in all the other organs (Fig. S2A). In
contrast, the 346 ‘testis-enhanced’ genes showed considerably
lower levels in the ovary than in the other organs (Fig. S3C, F and
I). Therefore, a higher proportion of genes expressed in the testis,
Figure 1. Venn diagram depicting the clones used for in silico normalization for the generation of the Gonad Uniclone Microarray.The number of adult and differentiating gonad-derived zebrafish sequences present in our Gonad Uniclone EST collection and their extent of overlapwith gonad-derived public zebrafish ESTs listed in GenBank are shown. For details on sequence pre-processing and clustering, refer to the Methodssection. In overlapping sections, the total number of clusters, prefaced by ‘C’, is followed in parentheses by the total number of ESTs contained by theclusters. The total number of singletons is prefaced by ‘S’.doi:10.1371/journal.pone.0001791.g001
Zebrafish Gonad Transcriptomes
PLoS ONE | www.plosone.org 3 March 2008 | Volume 3 | Issue 3 | e1791
as opposed to those expressed in the ovary, are co-expressed in
other organs.
Genes with the most abundant transcripts in the gonadare expressed in the germline
In order to validate the expression patterns of genes obtained
from the microarray, we performed in situ hybridizations (ISH) of
16 different transcripts on adult ovary or testis sections. We
selected six ovary- and ten testis-enhanced genes on the basis of
our microarray data (Table S7).
ISH results showed the expected expression in the gonad for five
of the six ovary-expressed genes and eight of the ten testis-
expressed genes analyzed (see Table S7), indicating an 81.3%
concurrence with our array data. Images of ISH signals in gonad
sections for five ovary- and five testis-expressed genes, together
with their expression profiles from the microarray, are shown in
Fig. 2. Nine of the ten genes shown had a positive correlation of
ISH signal intensities with their corresponding gene expression
levels as reflected from our array data (Fig. 2; Table S7), hence
reinforcing the validity of our hybridization results. Four genes
with unknown functions that showed ovary- or testis-enhanced
expression were defined in our study as gez1-gez4 (‘gez’: gonad-
expressed in zebrafish; see Fig. 2D, Fig. 2F and Table S7).
All five ovary-enhanced genes with positive signal detected by
ISH showed oocyte-specific expression pattern (Fig. 2A–E).
Expression was strongest in Stage I and II oocytes, while only
some Stage III oocytes showed strong staining. It is likely that
expression of these genes is stage-specific and that they are
involved in early oogenesis, as shown by their strong expression in
earlier stages. Our observation is substantiated by previous studies
which showed that zp2 expression in zebrafish (shown in Fig. 2A) is
restricted to developing and not mature oocytes [38,48]. Similarly,
all eight testis-enhanced genes with positive signal detected by ISH
showed spermatocyte-specific expression (Fig. 2F–J). Staining was
observed in clearly defined clusters of primary and secondary
spermatocytes for all genes analyzed. Their expression pattern
indicates that these genes may play a role in spermatogenesis.
Most gonadal RNA would be derived from the germline cells
since they comprise the most abundant cell types in the gonads. This
may explain why all the genes analyzed in our study were found to
be expressing in the germline. Analysis of some of the weakly
expressed ‘gonad-enhanced’ genes by ISH may in turn reveal genes
which are specific to gonadal somatic cells. In addition to validating
our array data, our ISH results have also enabled us to identify new
gonadal germ cell-markers from zebrafish.
Microarray data analysis reveals gonad-enhancedexpression for several characterized and novel genes
A number of gonad-enhanced genes identified from our array
were previously reported to be involved in gonad development and
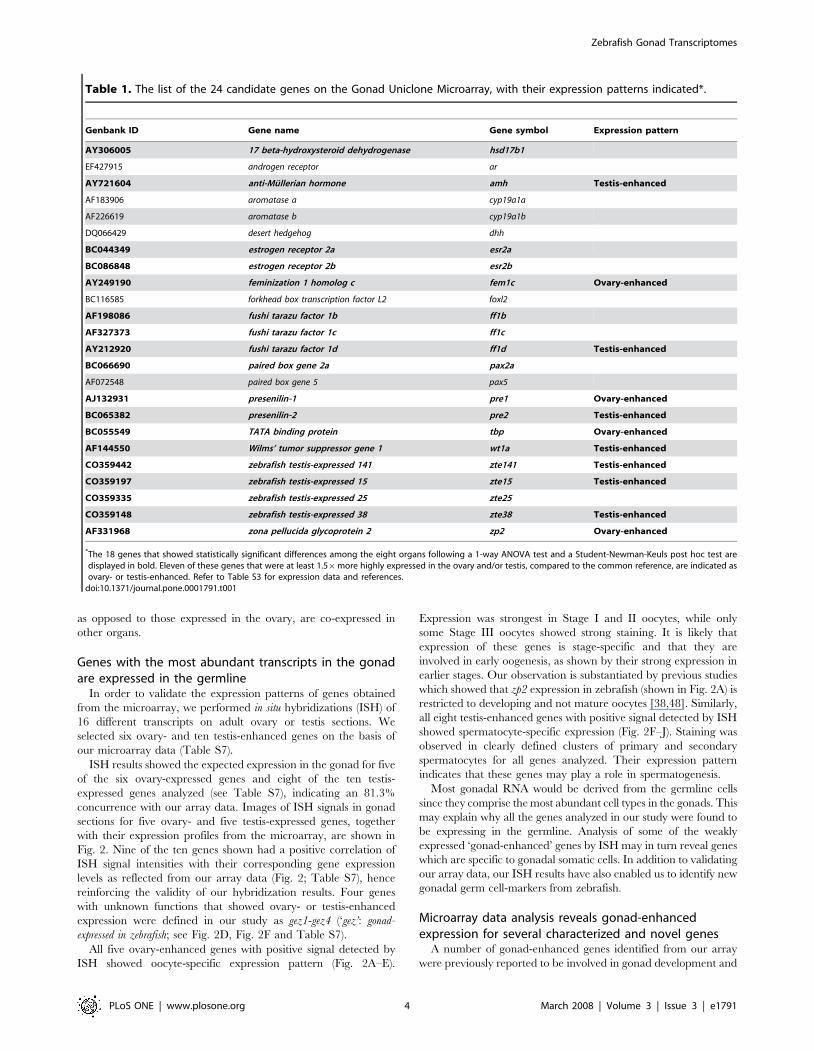
Table 1. The list of the 24 candidate genes on the Gonad Uniclone Microarray, with their expression patterns indicated*.
Genbank ID Gene name Gene symbol Expression pattern
AY306005 17 beta-hydroxysteroid dehydrogenase hsd17b1
EF427915 androgen receptor ar
AY721604 anti-Mullerian hormone amh Testis-enhanced
AF183906 aromatase a cyp19a1a
AF226619 aromatase b cyp19a1b
DQ066429 desert hedgehog dhh
BC044349 estrogen receptor 2a esr2a
BC086848 estrogen receptor 2b esr2b
AY249190 feminization 1 homolog c fem1c Ovary-enhanced
BC116585 forkhead box transcription factor L2 foxl2
AF198086 fushi tarazu factor 1b ff1b
AF327373 fushi tarazu factor 1c ff1c
AY212920 fushi tarazu factor 1d ff1d Testis-enhanced
BC066690 paired box gene 2a pax2a
AF072548 paired box gene 5 pax5
AJ132931 presenilin-1 pre1 Ovary-enhanced
BC065382 presenilin-2 pre2 Testis-enhanced
BC055549 TATA binding protein tbp Ovary-enhanced
AF144550 Wilms’ tumor suppressor gene 1 wt1a Testis-enhanced
CO359442 zebrafish testis-expressed 141 zte141 Testis-enhanced
CO359197 zebrafish testis-expressed 15 zte15 Testis-enhanced
CO359335 zebrafish testis-expressed 25 zte25
CO359148 zebrafish testis-expressed 38 zte38 Testis-enhanced
AF331968 zona pellucida glycoprotein 2 zp2 Ovary-enhanced
*The 18 genes that showed statistically significant differences among the eight organs following a 1-way ANOVA test and a Student-Newman-Keuls post hoc test aredisplayed in bold. Eleven of these genes that were at least 1.56more highly expressed in the ovary and/or testis, compared to the common reference, are indicated asovary- or testis-enhanced. Refer to Table S3 for expression data and references.
doi:10.1371/journal.pone.0001791.t001
Zebrafish Gonad Transcriptomes
PLoS ONE | www.plosone.org 4 March 2008 | Volume 3 | Issue 3 | e1791

function. For example, the tektin-1 gene (tekt1) and the 11b-
hydroxylase gene (cyp11b), which have been implicated in spermato-
genesis in mice and humans [49] and testicular differentiation in
teleosts [15,50], showed higher expression levels in the testis
(127.8-fold and 13.6-fold respectively).
Some of the gonad-enhanced genes have important molecular
functions and could possibly be implicated in gonad development
and function. For example, the cdc20 gene showed 69.3-fold and
18-fold expression levels in the ovary and testis respectively. This
WD40-repeat protein, which is a homolog of fizzy in Drosophila and
Xenopus, is required to activate the anaphase-promoting complex
(APC) to enable anaphase initiation and exit from mitosis [51,52].
Its strong expression in zebrafish gonads may indicate an
involvement in cell division during oogenesis and spermatogenesis.
Of the 2903 gonad-enhanced transcripts, 1008 were found to be
novel (without any functional information from zebrafish or other
organisms). Studies of these genes with unknown functions can
lead to further elucidation of various aspects of zebrafish gonad
development and function including gonadal differentiation.
Several members of the septin gene family arepredominantly expressed in the zebrafish gonad
One member of the septin gene family (septin 4) is required for
normal sperm development in mice [53,54]. We found that several
other members of the septin gene family are highly expressed in the
gonads of zebrafish (Fig. 3), suggesting a common role of septins in
gonad development and/or function. The septins are a family of
cytoskeletal GTP-binding proteins found in fungi and animals.
They are involved in diverse processes such as cytokinesis,
exocytosis, tumorigenesis, maintenance of cell polarity and
apoptosis (for reviews, see [55,56]). Most septin transcripts undergo
alternative splicing and their splice variants are expressed
differentially in various tissues [56,57].
We identified five members of the septin gene family from our
array (sept4, 6, 7, 8 and 9; Fig. 3). The expression profiles for sept6,
sept9 and sept8 were highly correlated to each other, while those of
sept4 and sept7 formed a separate cluster. All, except for sept7,
showed the highest expression levels in either one or both gonads.
Our array data revealed that sept4, which has been implicated in
various functions from cytokinesis to apoptosis to tumor
suppression [58–60], was most highly expressed in the testis
(137.4-fold), consistently with data from zebrafish [43] and mice
[53]. In mice, homozygous Sept4 mutants have immotile and
structurally defective sperm due to a disorganized annulus (a ring-
like structure in the sperm tail), indicating a role in spermiogenesis
[53,54]. We performed in situ hybridization on adult zebrafish
testis sections and found that sept4 was expressed in the primary
and secondary spermatocytes (and possibly round spermatids)
(Fig. 2G). This is in contrast to the more restricted expression
pattern observed in mouse, where specific testicular localization to
post-meiotic round spermatids and spermatozoa was found [53].
Our results, therefore, indicate that sept4 may be involved in earlier
stages of spermatogenesis in zebrafish, possibly in cytokinesis
during meiosis.
Table 2. Selected genes showing .1.5-fold higher expression than the common reference in adult zebrafish gonads (normalizedintensities for the gonads, and the range of the normalized intensities for the remaining organs are indicated).
Ovary-expressing genes:
Gene name Accession no. Ovary Testis Range for other organs
similar to egg envelope glycoprotein isoform 1 CO350790 195.88 0.31 0.35–0.89
similar to flap structure-specific endonuclease 1 EV603088 192.56 0.52 0.52–1.35
similar to mKIAA1026 protein EV561259 154.32 0.38 0.25–4.73
hypothetical protein LOC556628 CO350423 114.75 0.45 0.47–0.99
similar to low-density lipoprotein receptor dan isoform 5 EV606521 110.51 3.24 0.51–1.12
B-cell translocation gene 4 CO349959 102.79 0.72 0.58–1.07
zona pellucida glycoprotein 3 EV560504 99.40 0.21 0.30–1.05
transcription factor IIIA CO349799 86.27 0.97 0.32–0.66
zona pellucida glycoprotein 2 AF331968 80.93 0.02 0.03–0.11
cell division cycle 20 homolog CO350129 69.31 18.03 0.54–1.23
Testis-expressing genes:
Gene name Accession no. Ovary Testis Range for other organs
Unknown CO353055 0.18 243.77 0.43–1.74
similar to septin-4 isoform 1 CO353547 0.22 137.44 0.74–1.42
tektin 1 CO352798 0.17 127.88 0.40–1.76
similar to mKIAA1148 protein CO353006 0.09 119.76 0.26–1.64
dynein, axonemal, intermediate polypeptide 1 CO355627 0.96 96.42 0.65–1.75
similar to human AKAP-associated sperm protein CO353327 0.68 80.52 0.68–2.11
piwi-like 1 CO354057 7.57 60.42 0.57–1.09
testis-specific A-kinase-anchoring-protein CO354405 1.02 59.27 0.54–1.51
spermatogenesis associated 4 CO353245 1.94 57.08 0.48–2.25
11b–hydroxylase EV564930 0.82 13.62 0.76–1.40
doi:10.1371/journal.pone.0001791.t002
Zebrafish Gonad Transcriptomes
PLoS ONE | www.plosone.org 5 March 2008 | Volume 3 | Issue 3 | e1791

Figure 2. In situ hybridization revealed expression in the germline for ovary- and testis-enhanced genes. Adult ovary (A–E) and adulttestis (F–J) sections were hybridized with DIG-labeled riboprobes of ten genes which expressed strongly in either one of the gonads. Images arearranged from top to bottom in order of decreasing in situ hybridization signal intensity. Microarray expression levels for each gene across the eightorgans analyzed are indicated by the coloured expression profiles. (A: zp2, B: btg4, C: CO350808, D: gez1, E: CO350303, F: gez2, G: sept4, H: CO353006,I: tekt1, J: MGC75611; I, II, III: stage I, II and III oocytes; psc: primary spermatocytes, ssc: secondary spermatocytes; FB, FO, FK and FRB represent thebrain, ovary, kidney and ‘rest-of-body’ from female zebrafish, while MB, MT, MK and MRB represent the brain, testis, kidney and ‘rest-of-body’ frommale zebrafish.)doi:10.1371/journal.pone.0001791.g002
Zebrafish Gonad Transcriptomes
PLoS ONE | www.plosone.org 6 March 2008 | Volume 3 | Issue 3 | e1791
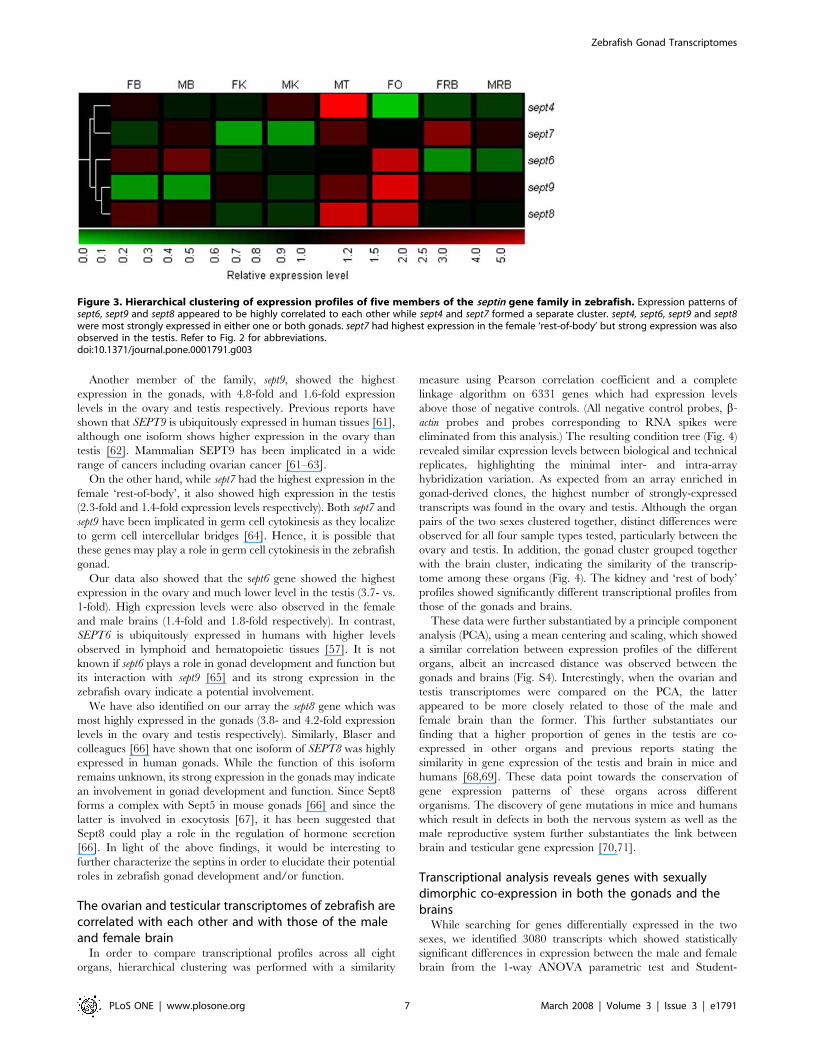
Another member of the family, sept9, showed the highest
expression in the gonads, with 4.8-fold and 1.6-fold expression
levels in the ovary and testis respectively. Previous reports have
shown that SEPT9 is ubiquitously expressed in human tissues [61],
although one isoform shows higher expression in the ovary than
testis [62]. Mammalian SEPT9 has been implicated in a wide
range of cancers including ovarian cancer [61–63].
On the other hand, while sept7 had the highest expression in the
female ‘rest-of-body’, it also showed high expression in the testis
(2.3-fold and 1.4-fold expression levels respectively). Both sept7 and
sept9 have been implicated in germ cell cytokinesis as they localize
to germ cell intercellular bridges [64]. Hence, it is possible that
these genes may play a role in germ cell cytokinesis in the zebrafish
gonad.
Our data also showed that the sept6 gene showed the highest
expression in the ovary and much lower level in the testis (3.7- vs.
1-fold). High expression levels were also observed in the female
and male brains (1.4-fold and 1.8-fold respectively). In contrast,
SEPT6 is ubiquitously expressed in humans with higher levels
observed in lymphoid and hematopoietic tissues [57]. It is not
known if sept6 plays a role in gonad development and function but
its interaction with sept9 [65] and its strong expression in the
zebrafish ovary indicate a potential involvement.
We have also identified on our array the sept8 gene which was
most highly expressed in the gonads (3.8- and 4.2-fold expression
levels in the ovary and testis respectively). Similarly, Blaser and
colleagues [66] have shown that one isoform of SEPT8 was highly
expressed in human gonads. While the function of this isoform
remains unknown, its strong expression in the gonads may indicate
an involvement in gonad development and function. Since Sept8
forms a complex with Sept5 in mouse gonads [66] and since the
latter is involved in exocytosis [67], it has been suggested that
Sept8 could play a role in the regulation of hormone secretion
[66]. In light of the above findings, it would be interesting to
further characterize the septins in order to elucidate their potential
roles in zebrafish gonad development and/or function.
The ovarian and testicular transcriptomes of zebrafish arecorrelated with each other and with those of the maleand female brain
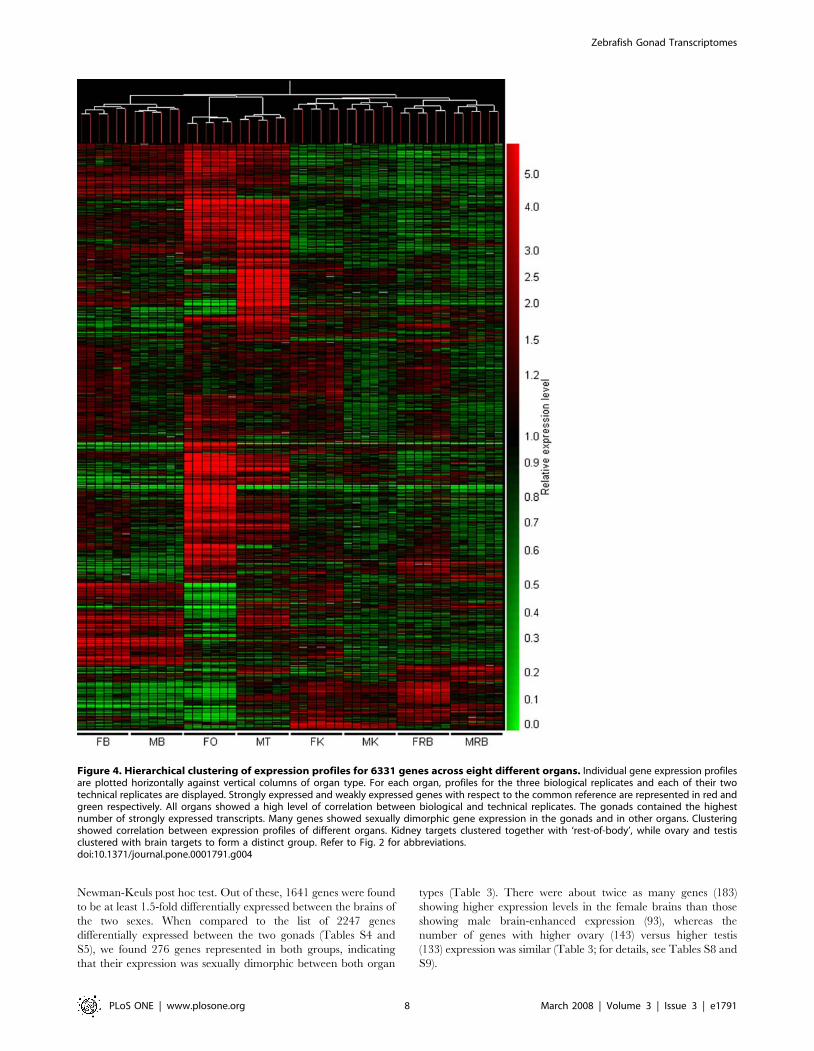
In order to compare transcriptional profiles across all eight
organs, hierarchical clustering was performed with a similarity
measure using Pearson correlation coefficient and a complete
linkage algorithm on 6331 genes which had expression levels
above those of negative controls. (All negative control probes, b-
actin probes and probes corresponding to RNA spikes were
eliminated from this analysis.) The resulting condition tree (Fig. 4)
revealed similar expression levels between biological and technical
replicates, highlighting the minimal inter- and intra-array
hybridization variation. As expected from an array enriched in
gonad-derived clones, the highest number of strongly-expressed
transcripts was found in the ovary and testis. Although the organ
pairs of the two sexes clustered together, distinct differences were
observed for all four sample types tested, particularly between the
ovary and testis. In addition, the gonad cluster grouped together
with the brain cluster, indicating the similarity of the transcrip-
tome among these organs (Fig. 4). The kidney and ‘rest of body’
profiles showed significantly different transcriptional profiles from
those of the gonads and brains.
These data were further substantiated by a principle component
analysis (PCA), using a mean centering and scaling, which showed
a similar correlation between expression profiles of the different
organs, albeit an increased distance was observed between the
gonads and brains (Fig. S4). Interestingly, when the ovarian and
testis transcriptomes were compared on the PCA, the latter
appeared to be more closely related to those of the male and
female brain than the former. This further substantiates our
finding that a higher proportion of genes in the testis are co-
expressed in other organs and previous reports stating the
similarity in gene expression of the testis and brain in mice and
humans [68,69]. These data point towards the conservation of
gene expression patterns of these organs across different
organisms. The discovery of gene mutations in mice and humans
which result in defects in both the nervous system as well as the
male reproductive system further substantiates the link between
brain and testicular gene expression [70,71].
Transcriptional analysis reveals genes with sexuallydimorphic co-expression in both the gonads and thebrains
While searching for genes differentially expressed in the two
sexes, we identified 3080 transcripts which showed statistically
significant differences in expression between the male and female
brain from the 1-way ANOVA parametric test and Student-
Figure 3. Hierarchical clustering of expression profiles of five members of the septin gene family in zebrafish. Expression patterns ofsept6, sept9 and sept8 appeared to be highly correlated to each other while sept4 and sept7 formed a separate cluster. sept4, sept6, sept9 and sept8were most strongly expressed in either one or both gonads. sept7 had highest expression in the female ‘rest-of-body’ but strong expression was alsoobserved in the testis. Refer to Fig. 2 for abbreviations.doi:10.1371/journal.pone.0001791.g003
Zebrafish Gonad Transcriptomes
PLoS ONE | www.plosone.org 7 March 2008 | Volume 3 | Issue 3 | e1791
Newman-Keuls post hoc test. Out of these, 1641 genes were found
to be at least 1.5-fold differentially expressed between the brains of
the two sexes. When compared to the list of 2247 genes
differentially expressed between the two gonads (Tables S4 and
S5), we found 276 genes represented in both groups, indicating
that their expression was sexually dimorphic between both organ
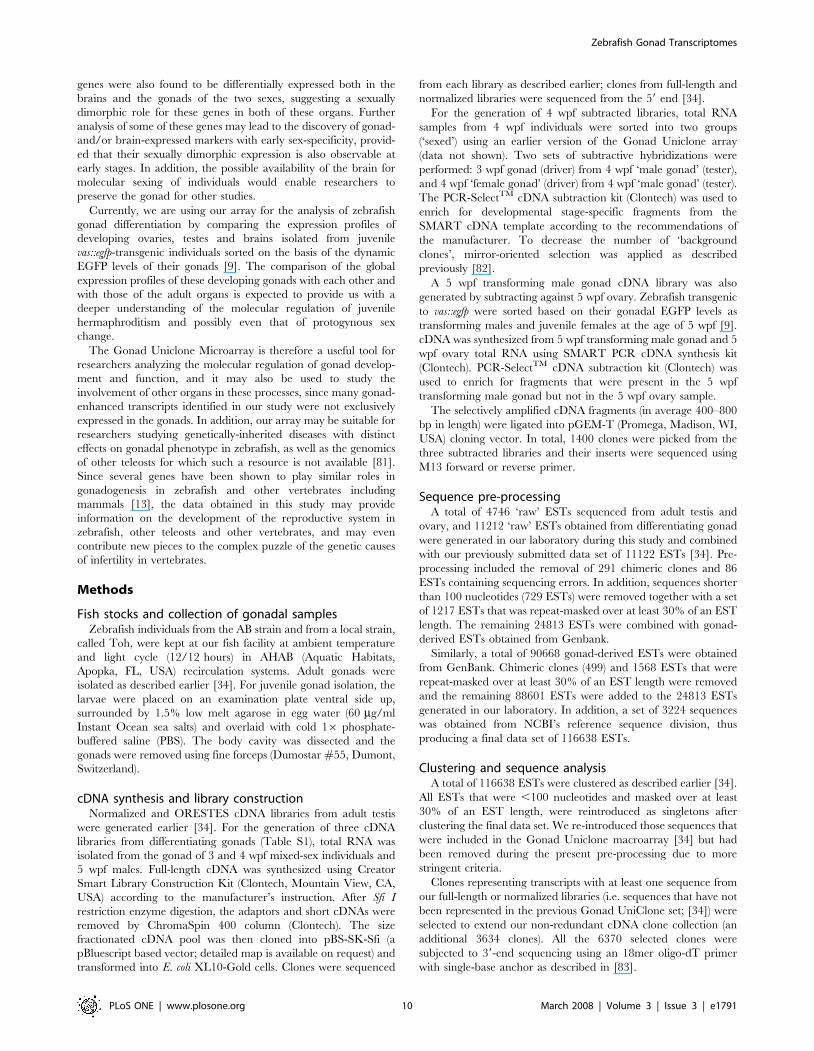
types (Table 3). There were about twice as many genes (183)
showing higher expression levels in the female brains than those
showing male brain-enhanced expression (93), whereas the
number of genes with higher ovary (143) versus higher testis
(133) expression was similar (Table 3; for details, see Tables S8 and
S9).
Figure 4. Hierarchical clustering of expression profiles for 6331 genes across eight different organs. Individual gene expression profilesare plotted horizontally against vertical columns of organ type. For each organ, profiles for the three biological replicates and each of their twotechnical replicates are displayed. Strongly expressed and weakly expressed genes with respect to the common reference are represented in red andgreen respectively. All organs showed a high level of correlation between biological and technical replicates. The gonads contained the highestnumber of strongly expressed transcripts. Many genes showed sexually dimorphic gene expression in the gonads and in other organs. Clusteringshowed correlation between expression profiles of different organs. Kidney targets clustered together with ‘rest-of-body’, while ovary and testisclustered with brain targets to form a distinct group. Refer to Fig. 2 for abbreviations.doi:10.1371/journal.pone.0001791.g004
Zebrafish Gonad Transcriptomes
PLoS ONE | www.plosone.org 8 March 2008 | Volume 3 | Issue 3 | e1791
Sexually dimorphic gene expression has recently been reported
in the mouse brain by two research groups [23,72]. In the first
report [23], 54 genes were found to show sexually dimorphic
expression in the developing mouse brain (10.5 dpc), with twice as
many genes showing enhanced expression in the female brain than
in the male brain (36 vs. 18). The second study [72] reported that
about 650 genes (14% of those detected from the brain) showed
sexually dimorphic expression between the two adult mouse brain
types, with about half of them showing higher expression in female
brain and the other half in male brain.
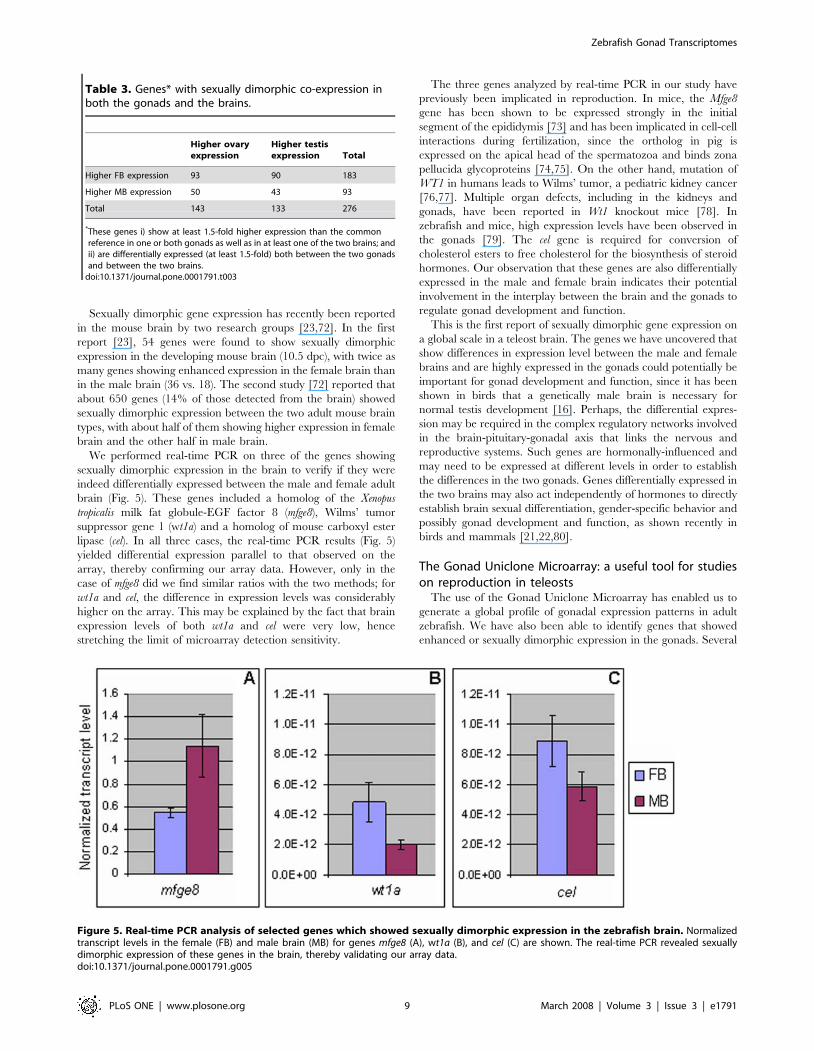
We performed real-time PCR on three of the genes showing
sexually dimorphic expression in the brain to verify if they were
indeed differentially expressed between the male and female adult
brain (Fig. 5). These genes included a homolog of the Xenopus
tropicalis milk fat globule-EGF factor 8 (mfge8), Wilms’ tumor
suppressor gene 1 (wt1a) and a homolog of mouse carboxyl ester
lipase (cel). In all three cases, the real-time PCR results (Fig. 5)
yielded differential expression parallel to that observed on the
array, thereby confirming our array data. However, only in the
case of mfge8 did we find similar ratios with the two methods; for
wt1a and cel, the difference in expression levels was considerably
higher on the array. This may be explained by the fact that brain
expression levels of both wt1a and cel were very low, hence
stretching the limit of microarray detection sensitivity.
The three genes analyzed by real-time PCR in our study have
previously been implicated in reproduction. In mice, the Mfge8
gene has been shown to be expressed strongly in the initial
segment of the epididymis [73] and has been implicated in cell-cell
interactions during fertilization, since the ortholog in pig is
expressed on the apical head of the spermatozoa and binds zona
pellucida glycoproteins [74,75]. On the other hand, mutation of
WT1 in humans leads to Wilms’ tumor, a pediatric kidney cancer
[76,77]. Multiple organ defects, including in the kidneys and
gonads, have been reported in Wt1 knockout mice [78]. In
zebrafish and mice, high expression levels have been observed in
the gonads [79]. The cel gene is required for conversion of
cholesterol esters to free cholesterol for the biosynthesis of steroid
hormones. Our observation that these genes are also differentially
expressed in the male and female brain indicates their potential
involvement in the interplay between the brain and the gonads to
regulate gonad development and function.
This is the first report of sexually dimorphic gene expression on
a global scale in a teleost brain. The genes we have uncovered that
show differences in expression level between the male and female
brains and are highly expressed in the gonads could potentially be
important for gonad development and function, since it has been
shown in birds that a genetically male brain is necessary for
normal testis development [16]. Perhaps, the differential expres-
sion may be required in the complex regulatory networks involved
in the brain-pituitary-gonadal axis that links the nervous and
reproductive systems. Such genes are hormonally-influenced and
may need to be expressed at different levels in order to establish
the differences in the two gonads. Genes differentially expressed in
the two brains may also act independently of hormones to directly
establish brain sexual differentiation, gender-specific behavior and
possibly gonad development and function, as shown recently in
birds and mammals [21,22,80].
The Gonad Uniclone Microarray: a useful tool for studieson reproduction in teleosts
The use of the Gonad Uniclone Microarray has enabled us to
generate a global profile of gonadal expression patterns in adult
zebrafish. We have also been able to identify genes that showed
enhanced or sexually dimorphic expression in the gonads. Several
Table 3. Genes* with sexually dimorphic co-expression inboth the gonads and the brains.
Higher ovaryexpression
Higher testisexpression Total
Higher FB expression 93 90 183
Higher MB expression 50 43 93
Total 143 133 276
*These genes i) show at least 1.5-fold higher expression than the commonreference in one or both gonads as well as in at least one of the two brains; andii) are differentially expressed (at least 1.5-fold) both between the two gonadsand between the two brains.
doi:10.1371/journal.pone.0001791.t003
Figure 5. Real-time PCR analysis of selected genes which showed sexually dimorphic expression in the zebrafish brain. Normalizedtranscript levels in the female (FB) and male brain (MB) for genes mfge8 (A), wt1a (B), and cel (C) are shown. The real-time PCR revealed sexuallydimorphic expression of these genes in the brain, thereby validating our array data.doi:10.1371/journal.pone.0001791.g005
Zebrafish Gonad Transcriptomes
PLoS ONE | www.plosone.org 9 March 2008 | Volume 3 | Issue 3 | e1791
genes were also found to be differentially expressed both in the
brains and the gonads of the two sexes, suggesting a sexually
dimorphic role for these genes in both of these organs. Further
analysis of some of these genes may lead to the discovery of gonad-
and/or brain-expressed markers with early sex-specificity, provid-
ed that their sexually dimorphic expression is also observable at
early stages. In addition, the possible availability of the brain for
molecular sexing of individuals would enable researchers to
preserve the gonad for other studies.
Currently, we are using our array for the analysis of zebrafish
gonad differentiation by comparing the expression profiles of
developing ovaries, testes and brains isolated from juvenile
vas::egfp-transgenic individuals sorted on the basis of the dynamic
EGFP levels of their gonads [9]. The comparison of the global
expression profiles of these developing gonads with each other and
with those of the adult organs is expected to provide us with a
deeper understanding of the molecular regulation of juvenile
hermaphroditism and possibly even that of protogynous sex
change.
The Gonad Uniclone Microarray is therefore a useful tool for
researchers analyzing the molecular regulation of gonad develop-
ment and function, and it may also be used to study the
involvement of other organs in these processes, since many gonad-
enhanced transcripts identified in our study were not exclusively
expressed in the gonads. In addition, our array may be suitable for
researchers studying genetically-inherited diseases with distinct
effects on gonadal phenotype in zebrafish, as well as the genomics
of other teleosts for which such a resource is not available [81].
Since several genes have been shown to play similar roles in
gonadogenesis in zebrafish and other vertebrates including
mammals [13], the data obtained in this study may provide
information on the development of the reproductive system in
zebrafish, other teleosts and other vertebrates, and may even
contribute new pieces to the complex puzzle of the genetic causes
of infertility in vertebrates.
Methods
Fish stocks and collection of gonadal samplesZebrafish individuals from the AB strain and from a local strain,
called Toh, were kept at our fish facility at ambient temperature
and light cycle (12/12 hours) in AHAB (Aquatic Habitats,
Apopka, FL, USA) recirculation systems. Adult gonads were
isolated as described earlier [34]. For juvenile gonad isolation, the
larvae were placed on an examination plate ventral side up,
surrounded by 1.5% low melt agarose in egg water (60 mg/ml
Instant Ocean sea salts) and overlaid with cold 16 phosphate-
buffered saline (PBS). The body cavity was dissected and the
gonads were removed using fine forceps (Dumostar #55, Dumont,
Switzerland).
cDNA synthesis and library constructionNormalized and ORESTES cDNA libraries from adult testis
were generated earlier [34]. For the generation of three cDNA
libraries from differentiating gonads (Table S1), total RNA was
isolated from the gonad of 3 and 4 wpf mixed-sex individuals and
5 wpf males. Full-length cDNA was synthesized using Creator
Smart Library Construction Kit (Clontech, Mountain View, CA,
USA) according to the manufacturer’s instruction. After Sfi I
restriction enzyme digestion, the adaptors and short cDNAs were
removed by ChromaSpin 400 column (Clontech). The size
fractionated cDNA pool was then cloned into pBS-SK-Sfi (a
pBluescript based vector; detailed map is available on request) and
transformed into E. coli XL10-Gold cells. Clones were sequenced
from each library as described earlier; clones from full-length and
normalized libraries were sequenced from the 59 end [34].
For the generation of 4 wpf subtracted libraries, total RNA
samples from 4 wpf individuals were sorted into two groups
(‘sexed’) using an earlier version of the Gonad Uniclone array
(data not shown). Two sets of subtractive hybridizations were
performed: 3 wpf gonad (driver) from 4 wpf ‘male gonad’ (tester),
and 4 wpf ‘female gonad’ (driver) from 4 wpf ‘male gonad’ (tester).
The PCR-SelectTM cDNA subtraction kit (Clontech) was used to
enrich for developmental stage-specific fragments from the
SMART cDNA template according to the recommendations of
the manufacturer. To decrease the number of ‘background
clones’, mirror-oriented selection was applied as described
previously [82].
A 5 wpf transforming male gonad cDNA library was also
generated by subtracting against 5 wpf ovary. Zebrafish transgenic
to vas::egfp were sorted based on their gonadal EGFP levels as
transforming males and juvenile females at the age of 5 wpf [9].
cDNA was synthesized from 5 wpf transforming male gonad and 5
wpf ovary total RNA using SMART PCR cDNA synthesis kit
(Clontech). PCR-SelectTM cDNA subtraction kit (Clontech) was
used to enrich for fragments that were present in the 5 wpf
transforming male gonad but not in the 5 wpf ovary sample.
The selectively amplified cDNA fragments (in average 400–800
bp in length) were ligated into pGEM-T (Promega, Madison, WI,
USA) cloning vector. In total, 1400 clones were picked from the
three subtracted libraries and their inserts were sequenced using
M13 forward or reverse primer.
Sequence pre-processingA total of 4746 ‘raw’ ESTs sequenced from adult testis and
ovary, and 11212 ‘raw’ ESTs obtained from differentiating gonad
were generated in our laboratory during this study and combined
with our previously submitted data set of 11122 ESTs [34]. Pre-
processing included the removal of 291 chimeric clones and 86
ESTs containing sequencing errors. In addition, sequences shorter
than 100 nucleotides (729 ESTs) were removed together with a set
of 1217 ESTs that was repeat-masked over at least 30% of an EST
length. The remaining 24813 ESTs were combined with gonad-
derived ESTs obtained from Genbank.
Similarly, a total of 90668 gonad-derived ESTs were obtained
from GenBank. Chimeric clones (499) and 1568 ESTs that were
repeat-masked over at least 30% of an EST length were removed
and the remaining 88601 ESTs were added to the 24813 ESTs
generated in our laboratory. In addition, a set of 3224 sequences
was obtained from NCBI’s reference sequence division, thus
producing a final data set of 116638 ESTs.
Clustering and sequence analysisA total of 116638 ESTs were clustered as described earlier [34].
All ESTs that were ,100 nucleotides and masked over at least
30% of an EST length, were reintroduced as singletons after
clustering the final data set. We re-introduced those sequences that
were included in the Gonad Uniclone macroarray [34] but had
been removed during the present pre-processing due to more
stringent criteria.
Clones representing transcripts with at least one sequence from
our full-length or normalized libraries (i.e. sequences that have not
been represented in the previous Gonad UniClone set; [34]) were
selected to extend our non-redundant cDNA clone collection (an
additional 3634 clones). All the 6370 selected clones were
subjected to 39-end sequencing using an 18mer oligo-dT primer
with single-base anchor as described in [83].
Zebrafish Gonad Transcriptomes
PLoS ONE | www.plosone.org 10 March 2008 | Volume 3 | Issue 3 | e1791
Singletons derived from our libraries and clusters without any
public ESTs were assessed in silico to retain every query EST that
does not match data in Genbank since these ESTs represent data
that have not been sampled by others. Transcripts were BLAST
searched locally against the zebrafish division of Genbank dbEST
using default parameters with the exception of e-value ,1e-02.
BLAST results were filtered by using a sequence similarity
threshold defined as 70% sequence identity across 30% of the
transcript length. (By using less stringent criteria, we found hits to
‘‘weak homologs’’ and ensured that our new ESTs indeed
represent data that had not been sampled in the current public
databases.) Sequences that did not show any sequence similarity to
zebrafish transcripts were screened against Genbank non-redun-
dant database. The absence of any identifiable homologs in
Genbank resulted in the ESTs being classified as either
‘noncoding’ as in the case of sequence identity to intergenic
regions or ‘unknown’ in the event that no significant sequence
identity was observed (e-value threshold of 1e-02).
Amplification and purification of cDNA insertsAdult gonad cDNAs in pBluescript II SK (+) (Stratagene, La
Jolla, CA, USA) were amplified in 90 ml colony PCR reactions
using the following forward and reverse primers respectively: 59-
GGGCTGCAGGAATTCGGC-39 and 59-GGGTTAAGCGG-
GATATCACTCAG-39. cDNAs from differentiating gonads in
pBS-SK-Sfi were amplified with the following forward and reverse
primers respectively: 59-TCCCAGTCACGACGTTG-39 and 59-
CCATGATTACGCCAAGC-39. Control and candidate cDNAs
were cloned into pBluescript II SK (+) and pBS-SK-Sfi
respectively and were PCR amplified with M13 primers. PCR
product quantity and quality were assessed by gel electrophoresis.
A Biomek 2000 workstation (Beckman Coulter, Inc., Fullerton,
CA, USA) was used to purify the PCR products by a vacuum-
based, size exclusion separation through Montage PCRm96 Plates
(Millipore Corporation, Billerica, MA, USA), following the
manufacturer’s instructions. The DNA was eluted in 50 ml sterile
water and separated equally into two 384-well polypropylene
plates. The cDNAs were dried completely in a speedvac and then
resuspended in 10 ml ArrayIt Micro Spotting Solution Plus
(TeleChem International Inc., Sunnyvale, CA, USA). The average
concentration of purified PCR products was 180 ng/ml.
Printing of Gonad Uniclone MicroarrayThe array was designed according to MIAME guidelines [84].
Purified cDNA inserts were spotted onto amine-coated microarray
slides (Genetix, Boston, MA, USA) with 24 Stealth SMP3 Micro
Spotting Pins (TeleChem International, Inc., Sunnyvale, CA,
USA) using the GeneMachines OmniGrid 100 Microarrayer
(Genomic Solutions, Ann Arbor, MI, USA). Spots were printed at
an average spot diameter of 145 mm with a vertical and horizontal
spot spacing of 180 mm to form a 4612 subarray layout. A total of
6912 probes were printed in duplicate arrays on each slide. In
order to assess spot morphology, red reflect scanning with a
633 nm laser at 10 mm resolution was performed using the
Scanarray Express Microarray Scanner (Perkin Elmer, Boston,
MA, USA).
The probes comprised 6,370 unique Gonad Uniclones, plus 24
candidate genes in duplicate and several control probes. Positive
controls included 132 b-actin clones and 111 clones representing
12 other ubiquitously-expressed genes. Negative controls com-
prised empty cloning vectors (111 pBluescript II SK (+) clones and
18 pBS-SK-Sfi clones), 78 clones representing nine Arabidopsis,
viral or fungal genes which showed no sequence similarity to those
of zebrafish, triplicates of two clones containing a poly-A tail and
flanking vector arms from both cloning vectors which are present
in all clones and six samples of spotting solution. Controls were
interspersed throughout the array. To validate and monitor target
labeling and hybridization, eight Array ControlTM PCR Spots
(Ambion, Austin, Texas, USA), a set of E. coli DNAs designed to
hybridize to eight Array ControlTM RNA Spikes (Ambion), were
included in four concentrations spanning the probe concentration
range (25, 60, 120, 250 ng/ul). Information regarding the probes
and genes on the Gonad Uniclone Microarray is shown in Table
S10 (ArrayExpress accession number: A-MEXP-838). A full list of
probes present on the array is listed in Table S11.
Target amplification and labelingFor generation of labeled targets, five female and five male 10-
month-old zebrafish from Toh strain were dissected and total
RNA was isolated from the gonad, brain, kidney and ‘rest of body’
using Trizol reagent (Invitrogen, Carlsbad, CA, USA). Following
DNase treatment, RNA quantification was performed using the
NanoDrop ND-1000 spectrophotometer (NanoDrop Technolo-
gies, Inc., Wilmington, DE, USA). RNA quality was assessed by
agarose gel electrophoresis and by analyzing RNA samples on the
Agilent 2100 Bioanalyzer (Palo Alto, CA, USA) using the RNA
6000 Nano LabChip Kit (Agilent, Santa Clara, CA, USA). The
RNA integrity number (RIN) ranged from 6–9 for all samples (a
RIN of 1 represents a completely degraded sample whereas a RIN
of 10 represents an intact sample). Four of the five individuals with
the best RNA quality were selected for subsequent reactions.
Target amplification and labeling were performed using the
Amino Allyl MessageAmpTM II aRNA Amplification Kit
(Ambion, Austin, TX, USA), following manufacturer’s instruc-
tions. Total RNA (800 ng) from each target organ was subjected to
reverse transcription, second strand synthesis and 1-round
amplification by in vitro transcription, from which 20 mg amino
allyl aRNA was labeled with Alexa Fluor 647 reactive dyes
(Invitrogen). For the common reference, 200 ng total RNA from
each of the four target organs (gonad, brain, kidney and ‘rest-of-
body’) were pooled from one male and one female individual
separately and amplified as described above. Ten mg of amino allyl
aRNA from each individual was then pooled and labeled with
Alexa Fluor 555 reactive dyes. Both aRNA and labeled aRNA
were quantified on the NanoDrop ND-1000 spectrophotometer
(NanoDrop Technologies, Inc.). Frequency of incorporation (FOI)
of the targets ranged from 31–58 dye molecules/1000 nucleotides.
Target quality was assessed by agarose gel electrophoresis. Gels of
labeled targets were imaged using the Typhoon 9200 Variable
Mode Imager and visualized using ImageQuant TL software (GE
Healthcare).
A set of eight E. coli RNA spikes (10–250 pg) from ArrayCon-
trolTM (Ambion) which are complementary to the Array Control
PCR Spots on the array were included in each labeling reaction in
different ratios as a labeling and hybridization control.
Hybridization and washing of the microarrayPrinted slides were heated on a 100uC heat block for 5 sec after
which DNA was UV crosslinked to the slide at 120 mJ using a UV
Stratalinker 2400 (Stratagene, La Jolla, CA, USA). The slides were
then heated to 100uC for 20 sec after which they were blocked
using a protocol adapted from [85]. Slides were immersed and
shaken for 1 hr at 40 rpm in a solution of 1.2 g succinic anhydride
(Fluka, Buchs, Switzerland) freshly dissolved in 240 ml anhydrous
1,2-dichloroethane (DCE; Fisher Scientific, New Jersey, USA) and
3 ml 1-methylimidazole (Fluka). After blocking, the slides were
rinsed once in DCE and three times in sterile water. DNA was
denatured by immersing the slides in boiling water for 2 min, after
Zebrafish Gonad Transcriptomes
PLoS ONE | www.plosone.org 11 March 2008 | Volume 3 | Issue 3 | e1791
which the slides were dipped twice in 100% ethanol and
immediately spin-dried in an Eppendorf 5804 centrifuge.
A total of 32 hybridizations were performed, which included the
four pairs of target organs (male and female) from four biological
replicates, all hybridized against the common reference. Fifty pmol
each of Alexa Fluor 555 and 647 labeled targets were dried
completely in a speedvac and dissolved in 50 ml of Micromax
hybridization buffer (Perkin Elmer). The targets were denatured at
90uC for 2 min and then incubated at 65uC. A MAUI Mixer FL
Hybridization Chamber Lid (BioMicro Systems, Salt Lake City,
UT, USA) was adhered onto the slide to form a sealed chamber,
allowing 46 ml of target to be loaded onto the array. Hybridization
was performed at 65uC for 16 hours on a MAUI 4-Bay
Hybridization System (BioMicro Systems) according to the
manufacturer’s instructions.
The post-hybridization wash protocol was adapted from Diehl
et al. [85]. After hybridization, the MAUI Mixer was removed
from the slide in a 65uC solution of 26SSC, 0.1% SDS. The slide
was then washed in fresh 26SSC, 0.1% SDS for 2 min, 16SSC
for 3 min and 0.26 SSC for 3 min. All three washes were
performed at room temperature with shaking at 50 rpm. The
slides were then dipped into fresh 0.26 SSC and immediately
blow-dried using a nitrogen gun at a pressure of 7 bar.
Microarray scanning and statistical analysisThe arrays were scanned at 5 mm resolution using the
ScanArray Express Microarray Scanner. A 543 nm and 633 nm
laser with 90% laser power were used to excite Alexa Fluor 555
and 647 fluorophores respectively. Scanned TIFF images of the
three biological replicates which gave the best hybridization signal
and lowest background were used for statistical analysis (24 images
in total). The median of signal and background intensities from the
Alexa Fluor 555 and 647 channels were quantified using GenePix
Pro 6.0 image acquisition and analysis software (Axon Instru-
ments, Union City, CA, USA).
Statistical analysis was performed using GeneSpring GX 7.3
(Agilent). Local background-subtracted median intensities of 6739
genes were subjected to Locally Weighed Scatterplot Smoothing
(Lowess) normalization, global normalization to 33 positive control
probes (comprising b-actin and nine of the 12 ubiquitously-
expressing genes mentioned above) and gene normalization to its
median. To eliminate signals that were close to background levels,
probes which showed intensities lower than the median raw
intensity of 111 negative control probes on each slide were
excluded from analysis. (These 111 probes included 99 pBluescript
II SK (+) clones, 6 pBS-SK-Sfi clones and 6 clones containing
flanking vector arms and poly-A tail.) The resulting probes were
subjected to a 1-way ANOVA parametric test (variances assumed
equal; p-value cutoff 0.05) and a multiple testing correction using
Benjamini and Hochberg False Discovery Rate to reveal probes
that showed statistically significant differences in expression across
the eight organs. A Student-Newman-Keuls post hoc test was
performed on these genes to identify genes that were differentially
expressed in a selected organ(s) compared to the others. All target
preparation and hybridization protocols as well as raw expression
data are available on ArrayExpress (accession no: E-MEXP-1272).
Quality control of array hybridizationsWe adopted the use of a common reference-based design for
our experiments. The common reference was generated by
pooling equal amounts of targets from the adult gonad, brain,
kidney and rest-of-body of both sexes. Such a common reference
should hybridize to all spots relevant to the individual target organ
hybridizations, thereby enabling a ‘non-zero value’ to be obtained
for each spot upon normalization. This strategy has the weakness
of being affected by extreme high or low expression level for any
given gene in one or more of the organs used.
For each probe, two technical replicates were printed on each
microarray. Duplicate spots were located distally from each other
to account for any intra-hybridization variation. Scatter plots of
background-subtracted raw intensities of Duplicate B against
Duplicate A of a single biological replicate of female brain (FB1),
male brain (MB2) and ovary (FO3) are shown in Fig. S5. For all
three organs, most spots were centered along the 45u line,
indicating the similarity in intensities between technical replicates.
There were a few spots scattered above or below the line, mostly at
the lower signal range. We used the square of the Pearson
correlation coefficient (R2) as a measure of the relatedness between
technical replicates. A high level of correlation was obtained
between technical replicates as the median R2 value for
normalized intensities across all 24 hybridizations was 0.977.
These results confirm that the hybridization conditions used for
our arrays generated highly reproducible technical replicates,
hence reflecting the reliability of our data.
For every organ type, the three best biological replicates (judged
on the basis of the linearity of scatter plot) were included in the
analysis. Scatter plots of the normalized intensities of various
biological replicates of the testis and female brain plotted against
each other showed that most genes were centered along the
gradient of 1, indicating that the data from the replicates were
reproducible (Fig. S6). As with the technical replicates, genes
which were scattered above or below the line were mostly at the
lower signal range. The biological replicates were confirmed to
show highly reproducible signals as a high level of correlation was
obtained across all 24 hybridizations (median R2 value for
normalized intensities = 0.909).
The eight spiked-in controls added in varying ratios during
target labeling produced raw/control ratios that were similar to
expected ratios (data not shown). This highlights the efficiency and
sensitivity of the target labeling, and the reproducibility of target
hybridization.
In situ hybridizationWe performed in situ hybridization (ISH) for six ovary-expressed
and ten testis-expressed genes on adult ovary or testis sections. Eco
RI or Spe I-linearized Gonad Uniclone plasmids containing the
cDNAs of interest were in vitro transcribed using DIG RNA
Labeling Mix (Roche Diagnostics GmbH, Mannheim, Germany)
and T7 RNA polymerase (Promega), following manufacturer’s
instructions. Probes larger than 800 bp were hydrolysed at 60uCusing 16 carbonate buffer (40 mM NaHCO3, 60 mM Na2CO3)
to generate approximately 300 bp fragments.
For ISH, we used a modified protocol based on Strahle et al.
[86]. Dissected gonads from two female and two male adult
zebrafish (AB strain) were fixed overnight at 4uC in 4%
paraformaldehyde in 16 PBS. Ovary and testis sections (20 mm
and 18 mm respectively) were made using a cryostat (Leica
Microsystems GmbH, Nussloch, Germany), transferred to micro-
scope slides and hybridized overnight at 70uC with DIG-labeled
riboprobes at a final concentration of 1 ng/ml. Slides were blocked
in a solution containing MABT (56 maleic acid buffer, 20%
Tween 20, pH 7.5), 20% fetal bovine serum and 2% blocking
reagent (Roche) for 2 hours at room temperature, followed by
overnight incubation in a 1:3000 dilution of anti-digoxigenin-AP
antibody (Roche) in blocking solution. Slides were stained
overnight at room temperature in a solution of NBT (337.5 mg/
ml) and BCIP (175 mg/ml) (Roche) in AP staining buffer (100 mM
NaCl, 50 mM MgCl2, 100 mM Tris pH 9.5, 0.1% Tween-20).
Zebrafish Gonad Transcriptomes
PLoS ONE | www.plosone.org 12 March 2008 | Volume 3 | Issue 3 | e1791
Slides were viewed under a Zeiss Axioplan 2 upright microscope
and imaged using a Nikon DXM1200F digital camera and ACT-1
software.
Real-time PCRReal-time PCRs were performed on three genes that showed
differential expression between the male and female brain in the
microarray data. Total brain RNA (300 ng) from three male and
three female adult individuals was reverse transcribed using the
iScript cDNA Synthesis Kit (Bio-Rad Laboratories, Inc., Hercules,
CA, USA) following manufacturer’s instructions. The RNA used
was identical to that used as targets for array hybridization. cDNA
(0.5–1 ml) was amplified in 25 ml triplicate reactions containing
0.2 mM primers and 12.5 ml iQ SYBR Green Supermix (Bio-Rad)
using a MyiQ Single Colour Real-time PCR Detection System
(Bio-Rad), according to manufacturer’s instructions. Primers used
for amplification were as follows: mfge8: F-59 TTATCAAGGCTTT
CAAGGTGGC 39, R-59 GGCTTTACGGCAGACAACAGG 39,
wt1a: F-59 GAGCCATCCCGGAGGTTATGA 39, R-59 TTGGT
CTCGGTTGAACGCACA 39; cel: F-59 ACATTCCCTCAATC
AACAACGC 39, R-59 CAAAGGCTTTCCAAACACATACTG
39;. Either a plasmid DNA or cDNA dilution series was used to
generate a standard curve for quantification of transcript levels and
for measuring amplification efficiency. For each sample, b–actin was
amplified in parallel using the following primers: F-59 CCAT
CCTTCTTGGGTATGGAATC 39, R-59 GGTGGGGCAATGA
TCTTGATC 39, to normalize transcript levels. Negative control
PCRs containing RNA templates and b–actin primers were included
for each individual to rule out the possibility of genomic DNA
contamination.
Supporting Information
Figure S1 Expression profiles of selected candidate genes across
eight organs in adult zebrafish. The normalized intensity (in log
scale) is indicated on the y-axis and organ types are stated on the x-
axis. FB, FO, FK and FRB represent the brain, ovary, kidney and
‘rest-of-body’ from female zebrafish, while MB, MT, MK and
MRB represent the brain, testis, kidney and ‘rest-of-body’ from
male zebrafish.
Found at: doi:10.1371/journal.pone.0001791.s001 (1.28 MB TIF)
Figure S2 Self-organizing map showing the 1366 genes which
had at least 1.5-fold higher expression in the ovary compared to
the common reference target. The genes were clustered using
1000000 iterations and a neighbourhood radius of 3.0. The
number of genes in each cluster is indicated in parentheses. FB,
FO, FK and FRB represent the brain, ovary, kidney and ‘rest-of-
body’ from female zebrafish, while MB, MT, MK and MRB
represent the brain, testis, kidney and ‘rest-of-body’ from male
zebrafish.
Found at: doi:10.1371/journal.pone.0001791.s002 (4.58 MB TIF)
Figure S3 Self-organizing map showing the 881 genes which
had at least 1.5-fold higher expression in the testis compared to the
common reference target. The genes were clustered using
1000000 iterations and a neighbourhood radius of 3.0. The
number of genes in each cluster is indicated in parentheses. FB,
FO, FK and FRB represent the brain, ovary, kidney and ‘rest-of-
body’ from female zebrafish, while MB, MT, MK and MRB
represent the brain, testis, kidney and ‘rest-of-body’ from male
zebrafish.
Found at: doi:10.1371/journal.pone.0001791.s003 (4.69 MB TIF)
Figure S4 Principle component analysis showing correlation
between expression profiles of eight different organs in the three
biological replicates analyzed. Kidney targets clustered together
with ‘rest of body’ to form a distinct group from the ovary, testis
and brain targets. The brain targets also showed a higher
correlation to the testis than the ovary. FB, FO, FK and FRB
represent the brain, ovary, kidney and ‘rest-of-body’ from female
zebrafish, while MB, MT, MK and MRB represent the brain,
testis, kidney and ‘rest-of-body’ from male zebrafish.
Found at: doi:10.1371/journal.pone.0001791.s004 (1.75 MB TIF)
Figure S5 Typical scatter plots showing reproducibility of
technical replicates in the following hybridizations: A) female
brain (FB), B) male brain (MB) and C) ovary (FO). Background-
subtracted raw intensities of Replicate B against Replicate A of a
single biological replicate are shown. All hybridizations were
performed against a common reference sample containing an
equal mixture of labeled targets from adult gonads, brains, kidney
and ‘rest-of-body’ from the two sexes.
Found at: doi:10.1371/journal.pone.0001791.s005 (2.47 MB TIF)
Figure S6 Scatter plots showing reproducibility of the three
biological replicates for testis (MT) and female brain (FB)
hybridizations. The normalized intensities of various biological
replicates are plotted against each other. A: MT2 vs MT1, B: MT3
vs MT1, C: MT3 vs MT2, D: FB2 vs FB1, E: FB3 vs FB1, F: FB3
vs FB2.
Found at: doi:10.1371/journal.pone.0001791.s006 (2.30 MB TIF)
Table S1 Description of the gonad-derived libraries and ESTs
used for the extension of the dataset featured on the Gonad
Uniclone Microarray. (Abbreviations: FL-full-length, NRM-nor-
malized, ORE-ORESTES, R-random, S/SU-subtracted, wpf-
week post fertilization)
Found at: doi:10.1371/journal.pone.0001791.s007 (0.02 MB
XLS)
Table S2 Domains and corresponding functional classes of 24
clones which did not find hits to characterized genes in Genbank
when BLAST-searched at the nucleotide level. *Source: ‘non-
coding’: transcripts align to non-coding regions of the zebrafish
genome; ‘no hits’: transcripts do not find any significant matches to
the zebrafish genome.
Found at: doi:10.1371/journal.pone.0001791.s008 (0.02 MB
XLS)
Table S3 Normalized intensities (‘Norm’) and corresponding
standard error (‘StdErr Norm’) of the 24 candidate genes on the
Gonad Uniclone Microarray. Genes which were at least 1.56more highly expressed in the ovary or testis, compared to the
common reference, are underlined or indicated in bold respec-
tively. References which describe the characterization of these
genes are also indicated. (FB, FO, FK, FRB: brain, ovary, kidney,
‘rest-of-body’ from female zebrafish; MB, MT, MK, MRB: brain,
testis, kidney, ‘rest-of-body’ from male zebrafish. Data from 3
biological replicates is shown.)
Found at: doi:10.1371/journal.pone.0001791.s009 (0.09 MB
XLS)
Table S4 List of 1366 genes with at least 1.5-fold higher
expression in the adult ovary compared to the common reference.
Normalized intensities (‘Norm’) and corresponding standard errors
(‘StdErr Norm’) are shown. (FB, FO, FK, FRB: brain, ovary,
kidney, ‘rest-of-body’ from female zebrafish; MB, MT, MK,
MRB: brain, testis, kidney, ‘rest-of-body’ from male zebrafish.)
Found at: doi:10.1371/journal.pone.0001791.s010 (0.63 MB
XLS)
Table S5 List of 881 genes with at least 1.5-fold higher
expression in the adult testis compared to the common reference.
Zebrafish Gonad Transcriptomes
PLoS ONE | www.plosone.org 13 March 2008 | Volume 3 | Issue 3 | e1791
Normalized intensities (‘Norm’) and corresponding standard errors
(‘StdErr Norm’) are shown. (FB, FO, FK, FRB: brain, ovary,
kidney, ‘rest-of-body’ from female zebrafish; MB, MT, MK,
MRB: brain, testis, kidney, ‘rest-of-body’ from male zebrafish.)
Found at: doi:10.1371/journal.pone.0001791.s011 (0.41 MB
XLS)
Table S6 List of 656 genes with at least 1.5-fold higher
expression in both the adult ovary and testis compared to the
common reference. Normalized intensities (‘Norm’) and corre-
sponding standard errors (‘StdErr Norm’) are shown. (FB, FO,
FK, FRB: brain, ovary, kidney, ‘rest-of-body’ from female
zebrafish; MB, MT, MK, MRB: brain, testis, kidney, ‘rest-of-
body’ from male zebrafish.)
Found at: doi:10.1371/journal.pone.0001791.s012 (0.32 MB
XLS)
Table S7 List of highly-expressed ovary and testis genes
analyzed by in situ hybridization (ISH). Normalized intensities
for ovary (FO) and testis (MT) targets and ratios of normalized
intensities of FO/MT (or vice versa) are shown.
Found at: doi:10.1371/journal.pone.0001791.s013 (0.02 MB
XLS)
Table S8 List of 183 gonad-expressed genes that show female
brain-enhanced expression. These genes i)show at least 1.5-fold
higher expression than the common reference in the female brain
and one or both gonads; and ii) are differentially expressed (at least
1.5-fold) both between the gonads and between the brains of the
two sexes. Normalized intensities (‘Norm’) and corresponding
standard errors (‘StdErr Norm’) are shown, along with the ratios of
normalized intensities of female brain:male brain (‘Ratio FB/MB’)
and ovary:testis (‘Ratio FO/MT’). (FB, FO, FK, FRB: brain,
ovary, kidney, ‘rest-of-body’ from female zebrafish; MB, MT, MK,
MRB: brain, testis, kidney, ‘rest-of-body’ from male zebrafish.)
Found at: doi:10.1371/journal.pone.0001791.s014 (0.11 MB
XLS)
Table S9 List of 93 gonad-expressed genes that show male
brain-enhanced expression. These genes i)show at least 1.5-fold
higher expression than the common reference in the male brain
and one or both gonads; and ii) are differentially expressed (at least
1.5-fold) both between the gonads and between the brains of the
two sexes. Normalized intensities (‘Norm’) and corresponding
standard errors (‘StdErr Norm’) are shown, along with the ratios of
normalized intensities of male brain:female brain (‘Ratio MB/FB’)
and ovary:testis (‘Ratio FO/MT’). (FB, FO, FK, FRB: brain,
ovary, kidney, ‘rest-of-body’ from female zebrafish; MB, MT, MK,
MRB: brain, testis, kidney, ‘rest-of-body’ from male zebrafish.)
Found at: doi:10.1371/journal.pone.0001791.s015 (0.07 MB
XLS)
Table S10 Composition of probes and genes on Gonad
Uniclone Microarray.
Found at: doi:10.1371/journal.pone.0001791.s016 (0.01 MB
XLS)
Table S11 Complete list of probes on Gonad Uniclone
Microarray
Found at: doi:10.1371/journal.pone.0001791.s017 (1.10 MB
XLS)
Acknowledgments
We thank Woei Chang Liew, Mohammad Sorowar Hossain, Hamsa
Srinivasan, Aaron Chuah, Isvary Sivalingam, Deepa Govindasamy,
Pusparani Venugopal, Yi Zhen Wee, Melanie Chua Eelyn, Rashmi
Sukumaran, Natascha May and William Birch for technical contribution;
Linsheng Wong for help with data analysis, Naweed Naqvi, Terje Dokland
and Wei-Cai Yang for control probes used on the array. We would also like
to thank John Postlethwait and Kellee Siegfrid for their suggestions on the
manuscript. The help of TLL Sequencing Facility is also acknowledged.
Author Contributions
Conceived and designed the experiments: LO RS RB. Performed the
experiments: RS MC RB XW. Analyzed the data: RS AC. Wrote the
paper: LO RS. Other: Initiated the project: LO RB. Performed in silico
normalization : AC. Corrected the drafts: AC RB XW LO RS. Supervised
the project: LO.
References
1. Grunwald DJ, Eisen JS (2002) Headwaters of the zebrafish-emergence of a new
model vertebrate. Nat Rev Genet 3: 717–724.
2. Wixon J (2000) Featured organism: Danio rerio, the zebrafish. Yeast 17: 225–231.
3. Beier DR (1998) Zebrafish: Genomics on the fast track. Genome Res 8: 9–17.
4. Amatruda JF, Shepard JL, Stern HM, Zon LI (2002) Zebrafish as a cancer
model system. Cancer Cell 1: 229–231.
5. Dodd A, Curtis PM, Williams LC, Love DA (2000) Zebrafish: bridging the gap
between development and disease. Hum Mol Genet 9: 2443–2449.
6. Dooley K, Zon LI (2000) Zebrafish: a model system for the study of human
disease. Curr Opin Genet Dev 10: 252–256.
7. Takahashi H (1977) Juvenile hermaphroditism in the zebrafish, Brachydanio rerio.
Bull Fac Fish Hokkaido Univ 28: 57–65.
8. Maack G, Segner H (2003) Morphological development of the gonads in
zebrafish. J Fish Biol 62: 895–906.
9. Wang XG, Bartfai R, Sleptsova-Freidrich I, Orban L (2007) The timing and
extent of ‘juvenile ovary’ phase are highly variable during zebrafish testis
differentiation. J Fish Biol 70: 1–12.
10. Uchida D, Yamashita M, Kitano T, Iguchi T (2002) Oocyte apoptosis during
the transition from ovary-like tissue to testes during sex differentiation of juvenile
zebrafish. J Exp Biol 205: 711–718.
11. Chiang EFL, Yan YL, Yann GG, Postlethwait J, Chung BC (2001) Two Cyp19
(P450 aromatase) genes on duplicated zebrafish chromosomes are expressed in
ovary or brain. Mol Biol Evol 18: 542–550.
12. von Hofsten J, Larsson A, Olsson PE (2005) Novel steroidogenic factor-1
homolog (ff1d) is coexpressed with anti-Mullerian hormone (AMH) in zebrafish.
Dev Dyn 233: 595–604.
13. von Hofsten J, Olsson PE (2005) Zebrafish sex determination and differentiation:
Involvement of FTZ-F1 genes. Reprod Biol Endocrinol 3: 63.
14. Rodriguez-Mari A, Yan YL, BreMiller RA, Wilson C, Canestro C, et al. (2005)
Characterization and expression pattern of zebrafish anti-Mullerian hormone
(amh) relative to sox9a, sox9b, and cyp19a1a, during gonad development. Gene
Expr Pattern 5: 655–667.
15. Wang XG, Orban L (2007) Anti-Mullerian hormone and 11ß-hydroxylase show
reciprocal expression to that of aromatase in the transforming gonad of zebrafish
males. Dev Dyn 236: 1329–1338.
16. Gahr M (2003) Male Japanese quails with female brains do not show male sexual
behaviors. Proc Natl Acad Sci USA 100: 7959–7964.
17. Munday PL, Buston PM, Warner RR (2006) Diversity and flexibility of sex-
change strategies in animals. Trends Ecol Evol 21: 89–95.
18. Francis RC, Barlow GW (1993) Social control of primary sex differentiation in
the Midas cichlid. Proc Natl Acad Sci USA 90: 10673–10675.
19. Francis RC (1992) Sexual lability in teleosts: Developmental factors. Quart Rev
Biol 67: 1–18.
20. Weltzien FA, Andersson E, Andersen O, Shalchian-Tabrizi K, Norberg B (2004)
The brain-pituitary-gonad axis in male teleosts, with special emphasis on
flatfish (Pleuronectiformes). Comp Biochem Physiol A Mol Integr Physiol 137:
447–477.
21. Dennis C (2004) Brain development: the most important sexual organ. Nature
427: 390–392.
22. Davies W, Wilkinson LS (2006) It is not all hormones: alternative explanations
for sexual differentiation of the brain. Brain Res 1126: 36–45.
23. Dewing P, Shi T, Horvath S, Vilain E (2003) Sexually dimorphic gene
expression in mouse brain precedes gonadal differentiation. Mol Brain Res 118:
82–90.
24. Jiang M, Ryu J, Kiraly M, Duke K, Reinke V, et al. (2001) Genome-wide
analysis of developmental and sex-regulated gene expression profiles in
Caenorhabditis elegans. Proc Natl Acad Sci USA 98: 218–223.
25. Andrews J, Bouffard GG, Cheadle C, Lu J, Becker KG, et al. (2000) Gene
discovery using computational and microarray analysis of transcription in the
Drosophila melanogaster testis. Genome Res 10: 2030–2043.
Zebrafish Gonad Transcriptomes
PLoS ONE | www.plosone.org 14 March 2008 | Volume 3 | Issue 3 | e1791

26. von Schalburg KR, Rise ML, Brown GD, Davidson WS, Koop BF (2005) A
comprehensive survey of the genes involved in maturation and development of
the rainbow trout ovary. Biol Reprod 72: 687–699.
27. Small CL, Shima JE, Uzumcu M, Skinner MK, Griswold MD (2005) Profiling
gene expression during the differentiation and development of the murine
embryonic gonad. Biol Reprod 72: 492–501.
28. Herrera L, Ottolenghi C, Garcia-Ortiz JE, Pellegrini M, Manini F, et al. (2005)
Mouse ovary developmental RNA and protein markers from gene expression
profiling. Dev Biol 279: 271–290.
29. Shima JE, McLean DJ, McCarrey JR, Griswold MD (2004) The murine
testicular transcriptome: Characterizing gene expression in the testis during the
progression of spermatogenesis. Biol Reprod 71: 319–330.
30. Ton C, Stamatiou D, Dzau VJ, Liew CC (2002) Construction of a zebrafish
cDNA microarray: gene expression profiling of the zebrafish during develop-
ment. Biochem Biophys Res Commun 296: 1134–1142.
31. Lo J, Lee S, Xu M, Liu F, Ruan H, et al. (2003) 15000 unique zebrafish EST
clusters and their future use in microarray for profiling gene expression patterns
during embryogenesis. Genome Res 13: 455–466.
32. van der Ven K, De Wit M, Keil D, Moens L, Van Leemput K, et al. (2005)
Development and application of a brain-specific cDNA microarray for effect
evaluation of neuro-active pharmaceuticals in zebrafish (Danio rerio). Comp
Biochem Physiol B Biochem Mol Biol 141: 408–417.
33. Wardle FC, Odom DT, Bell GW, Yuan B, Danford TW, et al. (2006) Zebrafish
promoter microarrays identify actively transcribed embryonic genes. Genome
Biol 7: R71.
34. Li Y, Chia JM, Bartfai R, Christoffels A, Yue GH, et al. (2004) Comparative
analysis of the testis and ovary transcriptomes in zebrafish by combining
experimental and computational tools. Comp Funct Genomics 5: 403–418.
35. Ashburner M, Ball CA, Blake JA, Botstein D, Butler H, et al. (2000) Gene
Ontology: tool for the unification of biology. Nat Genet 25: 25–29.
36. Wang H, Gong Z (1999) Characterization of two zebrafish cDNA clones
encoding egg envelope proteins ZP2 and ZP3. Biochim Biophys Acta 1446:
156–160.
37. Wassarman PM, Jovine L, Litscher ES (2004) Mouse zona pellucida genes and
glycoproteins. Cytogenet Genome Res 105: 228–234.
38. Mold DE, Kim IF, Tsai CM, Lee D, Chang CY, et al. (2001) Cluster of genes
encoding the major egg envelope protein of zebrafish. Mol Reprod Dev 58:
4–14.
39. Rey R, Lukas-Croisier C, Lasala C, Bedecarras P (2003) AMH/MIS: what we
know already about the gene, the protein and its regulation. Mol Cell
Endocrinol 211: 21–31.
40. Josso N, di Clemente N, Gouedard L (2001) Anti-Mullerian hormone and its
receptors. Mol Cell Endocrinol 179: 25–32.
41. Josso N, Racine C, di Clemente N, Rey R, Xavier F (1998) The role of anti-
Mullerian hormone in gonadal development. Mol Cell Endocrinol 145: 3–7.
42. di Clemente N, Josso N, Gouedard L, Belville C (2003) Components of the anti-
Mullerian hormone signaling pathway in gonads. Mol Cell Endocrinol 211:
9–14.
43. Santos EM, Workman VL, Paull GC, Filby AL, Van Look KJ, et al. (2007)
Molecular basis of gender and reproductive status in breeding zebrafish. Physiol
Genomics 30: 111–122.
44. Picard JY, Benarous R, Guerrier D, Josso N, Kahn A (1986) Cloning and
expression of cDNA for anti-mullerian hormone. Proc Natl Acad Sci USA 83:
5464–5468.
45. Munsterberg A, Lovell-Badge R (1991) Expression of the mouse anti-mullerian
hormone gene suggests a role in both male and female sexual differentiation.
Development 113: 613–624.
46. di Clemente N, Ghaffari S, Pepinsky RB, Pieau C, Josso N, et al. (1992) A
quantitative and interspecific test for biological activity of anti-mullerian
hormone - the fetal ovary aromatase assay. Development 114: 721–727.
47. Giuili G, Shen WH, Ingraham HA (1997) The nuclear receptor SF-1 mediates
sexually dimorphic expression of Mullerian Inhibiting Substance, in vivo.
Development 124: 1799–1807.
48. Liu X, Wang H, Gong Z (2006) Tandem-repeated zebrafish zp3 genes possess
oocyte-specific promoters and are insensitive to estrogen induction. Biol Reprod
74: 1016–1025.
49. Xu M, Zhou Z, Cheng C, Zhao W, Tang R, et al. (2001) Cloning and
characterization of a novel human TEKTIN1 gene. Int J Biochem Cell Biol 33:
1172–1182.
50. Liu S, Govoroun M, D’Cotta H, Ricordel MJ, Lareyre JJ, et al. (2000)
Expression of cytochrome P450(11beta) (11beta-hydroxylase) gene during
gonadal sex differentiation and spermatogenesis in rainbow trout, Oncorhynchus
mykiss. J Steroid Biochem Mol Biol 75: 291–298.
51. Kramer ER, Gieffers C, Holzl G, Hengstschlager M, Peters JM (1998)
Activation of the human anaphase-promoting complex by proteins of the
CDC20/Fizzy family. Curr Biol 8: 1207–1210.
52. Lorca T, Castro A, Martinez AM, Vigneron S, Morin N, et al. (1998) Fizzy is
required for activation of the APC/cyclosome in Xenopus egg extracts. EMBO J
17: 3565–3575.
53. Kissel H, Georgescu MM, Larisch S, Manova K, Hunnicutt GR, et al. (2005)
The Sept4 septin locus is required for sperm terminal differentiation in mice. Dev
Cell 8: 353–364.
54. Ihara M, Kinoshita A, Yamada S, Tanaka H, Tanigaki A, et al. (2005) Cortical
organization by the septin cytoskeleton is essential for structural and mechanical
integrity of mammalian spermatozoa. Dev Cell 8: 343–352.
55. Kinoshita M (2003) The septins. Genome Biol 4: 236.
56. Hall PA, Russell SE (2004) The pathobiology of the septin gene family. J Pathol
204: 489–505.
57. Hall PA, Jung K, Hillan KJ, Russell SE (2005) Expression profiling the human
septin gene family. J Pathol 206: 269–278.
58. Elhasid R, Sahar D, Merling A, Zivony Y, Rotem A, et al. (2004) Mitochondrial
pro-apoptotic ARTS protein is lost in the majority of acute lymphoblastic
leukemia patients. Oncogene 23: 5468–5475.
59. Larisch S, Yi Y, Lotan R, Kerner H, Eimerl S, et al. (2000) A novel
mitochondrial septin-like protein, ARTS, mediates apoptosis dependent on its P-
loop motif. Nat Cell Biol 2: 915–921.
60. Zhang J, Kong C, Xie H, McPherson PS, Grinstein S, et al. (1999)
Phosphatidylinositol polyphosphate binding to the mammalian septin H5 is
modulated by GTP. Curr Biol 9: 1458–1467.
61. Osaka M, Rowley JD, Zeleznik-Le NJ (1999) MSF (MLL septin-like fusion), a
fusion partner gene of MLL, in a therapy-related acute myeloid leukemia with a
t(11;17)(q23;q25). Proc Natl Acad Sci USA 96: 6428–6433.
62. Scott M, Hyland PL, McGregor G, Hillan KJ, Russell SE, et al. (2005)
Multimodality expression profiling shows SEPT9 to be overexpressed in a wide
range of human tumours. Oncogene 24: 4688–4700.
63. Montagna C, Lyu MS, Hunter K, Lukes L, Lowther W, et al. (2003) The Septin 9
(MSF) gene is amplified and overexpressed in mouse mammary gland
adenocarcinomas and human breast cancer cell lines. Cancer Res 63:
2179–2187.
64. Greenbaum MP, Ma L, Matzuk MM (2007) Conversion of midbodies into germ
cell intercellular bridges. Dev Biol 305: 389–396.
65. Hanai N, Nagata K, Kawajiri A, Shiromizu T, Saitoh N, et al. (2004)
Biochemical and cell biological characterization of a mammalian septin, Sept11.
FEBS Lett 568: 83–88.
66. Blaser S, Jersch K, Hainmann I, Zieger W, Wunderle D, et al. (2003) Isolation of
new splice isoforms, characterization and expression analysis of the human
septin SEPT8 (KIAA0202). Gene 312: 313–320.
67. Dent J, Kato K, Peng XR, Martinez C, Cattaneo M, et al. (2002) A prototypic
platelet septin and its participation in secretion. Proc Natl Acad Sci USA 99:
3064–3069.
68. Guo J, Zhu P, Wu C, Yu L, Zhao S, et al. (2003) In silico analysis indicates a
similar gene expression pattern between human brain and testis. Cytogenet
Genome Res 103: 58–62.
69. Guo JH, Huang Q, Studholme DJ, Wu CQ, Zhao SY (2005) Transcriptomic
analyses support the similarity of gene expression between brain and testis in
human as well as mouse. Cytogenet Genome Res 111: 107–109.
70. Dragatsis I, Levine MS, Zeitlin S (2000) Inactivation of Hdh in the brain and
testis results in progressive neurodegeneration and sterility in mice. Nat Genet
26: 300–306.
71. Kitamura K, Yanazawa M, Sugiyama N, Miura H, Iizuka-Kogo A, et al. (2002)
Mutation of ARX causes abnormal development of forebrain and testes in mice
and X-linked lissencephaly with abnormal genitalia in humans. Nat Genet 32:
359–369.
72. Yang X, Schadt EE, Wang S, Wang H, Arnold AP, et al. (2006) Tissue-specific
expression and regulation of sexually dimorphic genes in mice. Genome Res 16:
995–1004.
73. Hsia N, Cornwall GA (2004) DNA microarray analysis of region-specific gene
expression in the mouse epididymis. Biol Reprod 70: 448–457.
74. Ensslin M, Vogel T, Calvete JJ, Thole HH, Schmidtke J, et al. (1998) Molecular
cloning and characterization of P47, a novel boar sperm-associated zona
pellucida-binding protein homologous to a family of mammalian secretory
proteins. Biol Reprod 58: 1057–1064.
75. Petrunkina AM, Lakamp A, Gentzel M, Ekhlasi-Hundrieser M, Topfer-
Petersen E (2003) Fate of lactadherin P47 during post-testicular maturation
and capacitation of boar spermatozoa. Reproduction 125: 377–387.
76. Call KM, Glaser T, Ito CY, Buckler AJ, Pelletier J, et al. (1990) Isolation and
characterization of a zinc finger polypeptide gene at the human chromosome 11
Wilms’ tumor locus. Cell 60: 509–520.
77. Gessler M, Poustka A, Cavenee W, Neve RL, Orkin SH, et al. (1990)
Homozygous deletion in Wilms tumours of a zinc-finger gene identified by
chromosome jumping. Nature 343: 774–778.
78. Kreidberg JA, Sariola H, Loring JM, Maeda M, Pelletier J, et al. (1993) WT-1 is
required for early kidney development. Cell 74: 679–691.
79. Bollig F, Mehringer R, Perner B, Hartung C, Schafer M, et al. (2006)
Identification and comparative expression analysis of a second wt1 gene in
zebrafish. Dev Dyn 235: 554–561.
80. Arnold AP (2004) Sex chromosomes and brain gender. Nat Rev Neurosci 5:
701–708.
81. Orban L, Wu QJ (2008) Cyprinids. In: Kole C, Kocher TD, eds. Genome
Mapping and Genomics in Animals: Fishes and Aquatic Animals. Berlin,
Germany: Springer Verlag, (in press).
82. Rebrikov DV, Britanova OV, Gurskaya NV, Lukyanov KA, Tarabykin VS, et
al. (2000) Mirror orientation selection (MOS): a method for eliminating false
positive clones from libraries generated by suppression subtractive hybridization.
Nucleic Acids Res 20: e90.
Zebrafish Gonad Transcriptomes
PLoS ONE | www.plosone.org 15 March 2008 | Volume 3 | Issue 3 | e1791

83. Liao J, Gong Z (1997) Sequencing of 39 cDNA clones using anchored oligo(dT)
primers. Biotechniques 23: 368–370.
84. Brazma A, Hingamp P, Quackenbush J, Sherlock G, Spellman P, et al. (2001)
Minimum information about a microarray experiment (MIAME) - toward
standards for microarray data. Nat Genet 29: 365–371.
85. Diehl F, Grahlmann S, Beier M, Hoheisel JD (2001) Manufacturing DNA
microarrays of high spot homogeneity and reduced background signal. NucleicAcids Res 29: E38.
86. Strahle U, Blader P, Adam J, Ingham PW (1994) A simple and efficient
procedure for non-isotopic in situ hybridization to sectioned material. TrendsGenet 10: 75–76.
Zebrafish Gonad Transcriptomes
PLoS ONE | www.plosone.org 16 March 2008 | Volume 3 | Issue 3 | e1791