Transcriptional profiles reveal a stepwise developmental program of memory CD8+ T cell...
10
Please cite this article in press as: Roychoudhuri R, et al. The transcriptional program of vaccine-induced CD8 + T cell memory. Vaccine (2014), http://dx.doi.org/10.1016/j.vaccine.2014.10.007 ARTICLE IN PRESS G Model JVAC 15827 1–10 Vaccine xxx (2014) xxx–xxx Contents lists available at ScienceDirect Vaccine j our na l ho me page: www.elsevier.com/locate/vaccine The transcriptional program of vaccine-induced CD8 + T cell memory Rahul Roychoudhuri a,1 , Francois Lefebvre b , Mitsuo Honda a,1 , Li Pan b , Yun Ji c , Q1 Christopher A. Klebanoff c , Carmen Nichols b , Slim Fourati b , Ahmed N. Hegazy d , Jean-Philippe Goulet b , Luca Gattinoni c , Gary J. Nabel a,1 , Michel Gilliet e , Mark Cameron b , Nicholas P. Restifo c , Rafick P. Sékaly b,∗,2 , Lukas Flatz e,f,∗,2 Q2 a Vaccine Research Center, National Institute for Allergy and Infectious Diseases, National Institutes of Health, Bethesda, MD 20892, USA Q3 b Vaccine and Gene Therapy Institute, Port St. Lucie, FL 34987, USA c National Cancer Institute (NCI), National Institutes of Bethesda, Bethesda, MD 20892, USA d Translational Gastroenterology Unit, Nuffield Department of Clinical Medicine, University of Oxford, Oxford, United Kingdom e Department of Dermatology, University Hospital CHUV, 1011 Lausanne, Switzerland f Institute of Immunobiology, Kantonsspital St. Gallen, St. Gallen, Switzerland a r t i c l e i n f o Article history: Received 4 June 2014 Received in revised form 11 September 2014 Accepted 6 October 2014 Available online xxx Keywords: CD8 Memory T cells T cell memory Prime-boost vaccination LCMV vector Adenovirus vector a b s t r a c t The generation of CD8 + T-cell memory is a major aim of vaccination. While distinct subsets of CD8 + T-cells are generated following immunization that differ in their ability to confer long-term immunity against infection, the transcriptional profiles of these subsets within endogenous vaccine-induced CD8 + T cell responses have not been resolved. Here, we measure global transcriptional profiles of endogenous effector (T EFF ), effector memory (T EM ) and central memory (T CM ) CD8 + T-cells arising from immuniza- tion with three distinct prime-boost vaccine regimens. While a proportion of transcripts were uniquely regulated within distinct CD8 + T cell populations, we observed progressive up- or down-regulation in the expression of a majority of differentially expressed transcripts when subsets were compared in the order T N > T CM > T EM > T EFF. Strikingly, when we compared global differences in gene expression between T N , T CM , T EM and T EFF cells with known transcriptional changes that result when CD8 + T cells repetitively encounter antigen, our analysis overwhelmingly favored a model whereby cumulative antigen stimu- lation drives differentiation specifically from T N > T CM > T EM > T EFF and this was common to all vaccines tested. These findings provide insight into the molecular basis of immunological memory and identify potential biomarkers for characterization of vaccine-induced responses and prediction of vaccine efficacy. © 2014 Elsevier Ltd. All rights reserved. 1. Introduction Following immunization or infection, a small number of naïve (T N ) CD8 + T-cells bearing specificity for pathogen-associated anti- gens proliferate and differentiate to generate an acute response. Following clearance of antigen there is a contraction in the size of the acute response and only a fraction of cells remain to form long- lived memory cells. Upon infection with a pathogen bearing similar antigens, these memory cells expand to control the infection, often ∗ Corresponding authors at: Institute of Immunobiology, Rorschacher Strasse 95, Q4 9007 St. Gallen, Switzerland. Tel.: +0041 79 425 4113. E-mail addresses: [email protected] (R. Roychoudhuri), rpsekaly@vgtifl.org (R.P. Sékaly), lukas.fl[email protected] (L. Flatz). 1 These authors contributed equally to this work. 2 These authors contributed equally to this work. to a better extent than the primary response. Consequently, the generation of CD8 + T-cell memory is an important aim of vaccina- tion. Phenotypically distinct subsets of CD8 + T cells have been defined with differential capacity for proliferation, lymphoid homing and effector function [1–3]. In particular, naïve (T N ), central memory (T CM ), effector memory (T EM ) and effector (T EFF ) CD8 + T cells can be distinguished based upon the expression of surface proteins relating to lymphoid homing and activation status [2,4]. Distinct subsets of memory CD8 + T cells confer differential levels of pro- tective immunity in a manner that is pathogen-dependent. For example, adoptive transfer of T CM specific for a recombinant virally encoded model antigen resulted in better protection against vac- cinia virus when compared with T EM while a similar number T EM cells provided better protection against lymphocytic choriomenin- gitis virus infection, respectively, when compared with T CM [5]. Moreover, a persistent recombinant viral vector based on rhesus http://dx.doi.org/10.1016/j.vaccine.2014.10.007 0264-410X/© 2014 Elsevier Ltd. All rights reserved. 1 2 3 4 5 6 7 8 9 10 11 12 13 14 15 16 17 18 19 20 21 22 23 24 25 26 27 28 29 30 31 32 33 34 35 36 37 38 39 40 41 42 43 44 45 46 47 48 49 50 51 52 53 54
-
Upload
independent -
Category
Documents
-
view
0 -
download
0
Transcript of Transcriptional profiles reveal a stepwise developmental program of memory CD8+ T cell...

J
T
RQ1
CJNQ2
aQ3b
c
d
e
f
a
ARR1AA
KCMTPLA
1
(gFtla
Q49
r
h0
1
2
3
4
5
6
7
8
9
10
11
12
13
14
15
16
17
18
19
20
21
22
23
24
25
26
27
28
29
30
31
32
33
34
35
36
37
ARTICLE IN PRESSG ModelVAC 15827 1–10
Vaccine xxx (2014) xxx–xxx
Contents lists available at ScienceDirect
Vaccine
j our na l ho me page: www.elsev ier .com/ locate /vacc ine
he transcriptional program of vaccine-induced CD8+ T cell memory
ahul Roychoudhuria,1, Francois Lefebvreb, Mitsuo Hondaa,1, Li Panb, Yun Ji c,hristopher A. Klebanoff c, Carmen Nicholsb, Slim Fouratib, Ahmed N. Hegazyd,
ean-Philippe Gouletb, Luca Gattinonic, Gary J. Nabela,1, Michel Gilliete, Mark Cameronb,icholas P. Restifoc, Rafick P. Sékalyb,∗,2, Lukas Flatze,f,∗,2
Vaccine Research Center, National Institute for Allergy and Infectious Diseases, National Institutes of Health, Bethesda, MD 20892, USAVaccine and Gene Therapy Institute, Port St. Lucie, FL 34987, USANational Cancer Institute (NCI), National Institutes of Bethesda, Bethesda, MD 20892, USATranslational Gastroenterology Unit, Nuffield Department of Clinical Medicine, University of Oxford, Oxford, United KingdomDepartment of Dermatology, University Hospital CHUV, 1011 Lausanne, SwitzerlandInstitute of Immunobiology, Kantonsspital St. Gallen, St. Gallen, Switzerland
r t i c l e i n f o
rticle history:eceived 4 June 2014eceived in revised form1 September 2014ccepted 6 October 2014vailable online xxx
eywords:D8emory T cells
cell memory
a b s t r a c t
The generation of CD8+ T-cell memory is a major aim of vaccination. While distinct subsets of CD8+
T-cells are generated following immunization that differ in their ability to confer long-term immunityagainst infection, the transcriptional profiles of these subsets within endogenous vaccine-induced CD8+
T cell responses have not been resolved. Here, we measure global transcriptional profiles of endogenouseffector (TEFF), effector memory (TEM) and central memory (TCM) CD8+ T-cells arising from immuniza-tion with three distinct prime-boost vaccine regimens. While a proportion of transcripts were uniquelyregulated within distinct CD8+ T cell populations, we observed progressive up- or down-regulation inthe expression of a majority of differentially expressed transcripts when subsets were compared in theorder TN > TCM > TEM > TEFF. Strikingly, when we compared global differences in gene expression betweenTN, TCM, TEM and TEFF cells with known transcriptional changes that result when CD8+ T cells repetitively
rime-boost vaccinationCMV vectordenovirus vector
encounter antigen, our analysis overwhelmingly favored a model whereby cumulative antigen stimu-lation drives differentiation specifically from TN > TCM > TEM > TEFF and this was common to all vaccinestested. These findings provide insight into the molecular basis of immunological memory and identifypotential biomarkers for characterization of vaccine-induced responses and prediction of vaccine efficacy.
© 2014 Elsevier Ltd. All rights reserved.
38
39
40
41
42
43
. Introduction
Following immunization or infection, a small number of naïveTN) CD8+ T-cells bearing specificity for pathogen-associated anti-ens proliferate and differentiate to generate an acute response.ollowing clearance of antigen there is a contraction in the size of
Please cite this article in press as: Roychoudhuri R, et al. The transcrip(2014), http://dx.doi.org/10.1016/j.vaccine.2014.10.007
he acute response and only a fraction of cells remain to form long-ived memory cells. Upon infection with a pathogen bearing similarntigens, these memory cells expand to control the infection, often
∗ Corresponding authors at: Institute of Immunobiology, Rorschacher Strasse 95,007 St. Gallen, Switzerland. Tel.: +0041 79 425 4113.
E-mail addresses: [email protected] (R. Roychoudhuri),[email protected] (R.P. Sékaly), [email protected] (L. Flatz).
1 These authors contributed equally to this work.2 These authors contributed equally to this work.
ttp://dx.doi.org/10.1016/j.vaccine.2014.10.007264-410X/© 2014 Elsevier Ltd. All rights reserved.
44
45
46
47
48
49
50
to a better extent than the primary response. Consequently, thegeneration of CD8+ T-cell memory is an important aim of vaccina-tion.
Phenotypically distinct subsets of CD8+ T cells have been definedwith differential capacity for proliferation, lymphoid homing andeffector function [1–3]. In particular, naïve (TN), central memory(TCM), effector memory (TEM) and effector (TEFF) CD8+ T cells canbe distinguished based upon the expression of surface proteinsrelating to lymphoid homing and activation status [2,4]. Distinctsubsets of memory CD8+ T cells confer differential levels of pro-tective immunity in a manner that is pathogen-dependent. Forexample, adoptive transfer of TCM specific for a recombinant virallyencoded model antigen resulted in better protection against vac-
tional program of vaccine-induced CD8+ T cell memory. Vaccine
cinia virus when compared with TEM while a similar number TEMcells provided better protection against lymphocytic choriomenin-gitis virus infection, respectively, when compared with TCM [5].Moreover, a persistent recombinant viral vector based on rhesus
51
52
53
54

ING ModelJ
2 Vacci
cdhalTv
C[itAfUpAcTcmctrp
scesmmstTpKciT
fivrcpruabeiwoostpcolWvmte
scanner and Illumina BeadStudio v3 software. Illumina probe datawere exported from BeadStudio as raw data and screened for qual-
55
56
57
58
59
60
61
62
63
64
65
66
67
68
69
70
71
72
73
74
75
76
77
78
79
80
81
82
83
84
85
86
87
88
89
90
91
92
93
94
95
96
97
98
99
100
101
102
103
104
105
106
107
108
109
110
111
112
113
114
115
116
117
118
119
120
121
122
123
124
125
126
127
128
129
130
131
132
133
134
135
136
137
138
139
140
141
142
143
144
145
146
147
148
149
150
151
152
153
154
155
156
157
158
159
160
161
162
163
164
165
166
167
168
169
170
171
172
173
174
175
ARTICLEVAC 15827 1–10
R. Roychoudhuri et al. /
ytomegalovirus encoding antigens derived from simian immuno-eficiency virus (SIV) predominantly generating TEM responses thatomed to peripheral tissues exhibited superior protective capacitygainst subsequent infection with SIV [6]. Resolving the molecu-ar basis for differences in the protective capacity of distinct CD8+
cell subsets is therefore a priority for the development of betteraccines.
Much has been learnt about the kinetics and composition ofD8+ T-cell responses from the study of antiviral responses in mice7–10]. Two major models exist to explain the observed predom-nance of cells with an effector phenotype during acute phases ofhe response and cells with a memory phenotype at later phases:ccording to the linear differentiation hypothesis, naive cells uni-
ormly differentiate into effector cells upon encounter with antigen.pon pathogen clearance, effector cells then either undergo apo-tosis or differentiate into central/effector memory T cells [11].ccording to the progressive differentiation hypothesis, CD8+ Tells differentiate along a single continuum from TN to TCM to TEM toEFF. Moreover, the model proposes that T cells acquire irreversiblehanges while differentiating that result from antigenic or inflam-atory signals [12,13]. While there is a predominance of effector
ells during the acute phase, central memory cells generated at thisime survive while effector cells die upon withdrawal of antigenesulting in a predominance of central memory cells at late timeoints.
While fate-mapping experiments using artificial Gzmb promoterequences to induce expression of a heritable marker in effectorells and their progeny indicated that cells that had once beenffector cells could contribute to the memory pool [14,15], thesetudies did not rely on the activity of the endogenous GzmB pro-oter that may have been subject to further epigenetic or otherodulation. Data from adoptive transfer models, on the other hand,
upport the progressive differentiation model. By performing adop-ive transfers of central memory, effector memory and effector-cell receptor (TCR) transgenic CD8+ T cells arising at an acutehase of an antiviral response into infection-matched recipients,aech et al. were able to demonstrate a reduced capacity of effectorells to form memory cells [2]. Thus, there is contradictory evidencen the literature regarding lineage relationship between the CD8+
cell subsets.In this study, we have measured global transcriptional pro-
les of distinct CD8+ T cell subsets arising endogenously fromaccination of mice with three distinct prime-boost vaccineegimens. By using tetrameric peptide/major histocompatibilityomplex (MHC)-based sorting and highly sensitive microarraylatforms, we were able to analyze endogenous vaccine-inducedesponses, avoiding the need for adoptive T cell transfer and these of T cell receptor-transgenic model systems. Once fraction-ted into subsets, transcriptional profiles were remarkably similaretween distinct vaccines. This enabled calculation of core genexpression profiles associated with distinct CD8+ T cell subsetsndependent of vaccine used. While a proportion of transcripts
ere uniquely regulated within distinct CD8+ T cell subsets, webserved progressive up- or down-regulation in the expressionf a majority of differentially expressed transcripts when sub-ets were compared in the order TN > TCM > TEM > TEFF. When theranscriptional relationships of the CD8+ T-cell subsets were com-ared in an unbiased fashion with known global transcriptionalhanges that result when T-cells repeatedly encounter antigen,ur results favored a model whereby cumulative antigenic stimu-ation drives differentiation specifically from TN > TCM > TEM > TEFF.
e have established transcriptional profiles of endogenousaccine-induced CD8+ T-cell responses that provide insight intoolecular basis of immunological memory following vaccina-
Please cite this article in press as: Roychoudhuri R, et al. The transcrip(2014), http://dx.doi.org/10.1016/j.vaccine.2014.10.007
ion and identify potential biomarkers for prediction of vaccinefficacy.
PRESSne xxx (2014) xxx–xxx
2. Materials and methods
2.1. Animals and immunization protocols
Female BALB/c mice between the ages of 6 and 10 wk (NCI/DCT,Jackson Laboratories or Charles River) were used for our exper-iments. They were housed in the animal facility of the VaccineResearch Center, National Institute of Allergy and Infectious Dis-eases, National Institutes of Health (NIH), Bethesda, MD. All animalexperiments were reviewed and approved by the Animal Careand Use Committee, Vaccine Research Center, National Institute ofAllergy and Infectious Diseases, NIH and were performed in accor-dance with all relevant federal NIH guidelines and regulations. Allimmunizations were administered intramuscularly. Recombinantreplication-defective adenovirus (rAd5) vectors are replication-defective E1-, E3-, and E4-deleted human adenovirus serotype5-derived vaccines generated as described previously [16]. Threeintramuscular priming immunizations using plasmid DNA vaccineswere used as previously described [17]. Recombinant lympho-cytic choriomeningitis virus (rLCMV) vectors were generated asdescribed previously [18].
2.2. Flow cytometry and cell sorting
Splenocytes were stained with H2-Dd/PA9-PE tetramers for15 min at 4 ◦C in PBS prior to staining with fluorescently conjugatedantibodies. Tetramers were produced by the NIH tetramer corefacility. All other fluorochrome-coupled antibodies were obtainedfrom Becton–Dickinson and used as directed by the manufacturer:CD3 Alexa Fluor 700, CD8a PerCP-Cy5.5, CD127-PECy7, CD62L-APC-Cy7, CD16-PacBlue and CD32-PacBlue. Sorting for microarrayanalysis was performed using a FACS Aria directly into coldRNALater (Ambion, Inc.) before freezing at −80 ◦C.
2.3. Intracellular cytokine staining
Briefly, spleens were harvested from mice 3 wk after the finalimmunization, and dissociated over nylon gauze. Single-cell sus-pensions were washed twice in PBS and 2 million cells per well weredistributed into 96-well conical-bottomed plates, in RPMI mediumsupplemented with 10% FCS containing Brefeldin A (10 �g/mL) andPA9 or an irrelevant peptide (0.1 �g/100 �L). Cells were incubatedat 37 ◦C for 5 h before being washed and stained with VIVID dye(Invitrogen) and fluorescently conjugated antibodies against CD3,CD8, and CD4. Cells were then fixed and permeabilized using BDCytofix/Cytoperm (BD Pharmingen) and stained with antibodiesagainst IFN-�, TNF-�, and IL-2. Cells were analyzed using an LSRIIflow cytometer (Becton–Dickinson) and resultant data were ana-lyzed using FlowJo software (Treestar, Inc.).
2.4. Microarray cDNA hybridization analysis
Quantification was performed using a spectrophotometer(NanoDrop Technologies) and RNA quality was assessed usingthe Experion automated electrophoresis system (Bio-Rad Labora-tories). Total RNA was amplified and labeled using the IlluminaTotalPrep RNA Amplification kit, which is based on the Eberwineamplification protocol. This protocol involves a first cDNA synthe-sis step followed by in vitro transcription for cRNA synthesis. Thebiotinylated cRNA was hybridized onto Illumina Mouse Chips at58 ◦C for 20 h and quantified using an Illumina BeadStation 500G×
tional program of vaccine-induced CD8+ T cell memory. Vaccine
ity. Samples failing chip visual inspection and control examinationwere removed.
176
177

ING ModelJ
Vacci
RdtC(utmo(aaswncsfsl1olgcpp
3
3f
ecD(pbarTtpte3tapwtap
3v
scai
178
179
180
181
182
183
184
185
186
187
188
189
190
191
192
193
194
195
196
197
198
199
200
201
202
203
204
205
206
207
208
209
210
211
212
213
214
215
216
217
218
219
220
221
222
223
224
225
226
227
228
229
230
231
232
233
234
235
236
237
238
239
240
241
242
243
244
245
246
247
248
249
250
251
252
253
254
255
256
257
258
259
260
261
262
263
264
265
266
267
268
269
270
271
272
273
274
275
276
277
278
279
280
281
282
283
284
285
286
287
288
289
290
291
292
293
294
295
296
297
ARTICLEVAC 15827 1–10
R. Roychoudhuri et al. /
Analysis of the GenomeStudio output data was conducted using (R Development Core Team) and software packages from Biocon-uctor [19]. Quantile normalization was applied followed by a logransformation. Microarray data are available through the Nationalenter for Biotechnology Information Gene Expression OmnibusGEO), accession number GSE42459. The LIMMA package [20] wassed to fit a linear model to each probe and to perform (moderated)-tests on various differences of interest. Specifically, contrast for-
ulas were defined as differences between the vaccine averagesf CD8+ T cells subsets. The expected proportions of false positivesFDR) were estimated using the Benjamini and Hochberg method,nd statistical significance for differential expression was reachedt 5% FDR coupled with a minimal difference of one on the log 2cale (|FC| > 2). A CD8+ T cell subset discriminating gene signatureas defined as the union of all genes that reached statistical sig-ificance for at least one pairwise subset comparison. Probes wereollapsed to genes by retaining only the probe with the highest F-tatistic over all pairwise comparisons. CD8+ T cell subset fractionsor each of the samples from the repetitive antigen stimulation dataet [21] were deconvoluted by solving a linear latent model for theeast square solution constrained by inequalities (bounded by 0 and) [22]. Quadratic programming implemented by the pcls functionf the mgcv R package was used for this purpose. The deconvo-ution algorithm was applied to a subset of the full discriminatingene signature limited to the top 100 genes within each pairwiseomparison. Confirmation of microarray gene expression data waserformed using Fluidigm Biomark gene expression analysis (Sup-lemental Fig. 2).
. Results
.1. CD8+ T cell responses in diverse states of differentiation areound at a single time point following immunization
To generate endogenous CD8+ T-cell responses to a singlepitope, we immunized mice with three distinct prime-boost vac-ine regimens encoding the model antigen HIV-1 Env [16,23]:NA prime/recombinant adenovirus serotype 5 (rAd5) boost
DNA-rAd5), rAd5 prime/rAd5 boost (rAd5-rAd5) and rAd5rime/recombinant lymphocytic choriomeningitis virus (rLCMV)oost (rAd5-rLCMV). The prime and boost immunizations weredministered 8 weeks apart. HIV-1 Env contains a H-2Dd-estricted immunodominant epitope (PA9) capable of eliciting-cell responses that can be identified by binding of PA9/H-2Dd
etramers [24]. Thus, we were able to analyze the magnitude andhenotype of vaccine-elicited CD8+ T cell responses. We notedhat the three vaccines (DNA-rAd5, rAd5-rAd5 and rAd5-rLCMV)licited PA9-specific immune responses of similar magnitude at
weeks following boost immunization that remained stable overime (Fig. 1A). No significant differences in the ratios of TCM, TEMnd TEFF cells were observed between immunization groups (at
< 0.05; Fig. 1B). Importantly, however, at this single time point,e were able to observe PA9-specific CD8+ T cells within the
hree major antigen-experienced differentiation states (TCM, TEMnd TEFF) allowing their analysis at a single contemporaneous timeoint following immunization.
.2. Global transcriptional analysis of endogenousaccine-elicited CD8+ T cells
For analysis of gene transcription in the four major CD8+ T cell
Please cite this article in press as: Roychoudhuri R, et al. The transcrip(2014), http://dx.doi.org/10.1016/j.vaccine.2014.10.007
ubsets, we isolated PA9/H-2Dd tetramer-binding TCM, TEM and TEFFells elicited by each of the three vaccine regimens by fluorescence-ctivated cell sorting (Supplemental Fig. 1A). Additionally, wesolated naïve CD44–CD62L+ CD8+ T cells from pre-immune mice
PRESSne xxx (2014) xxx–xxx 3
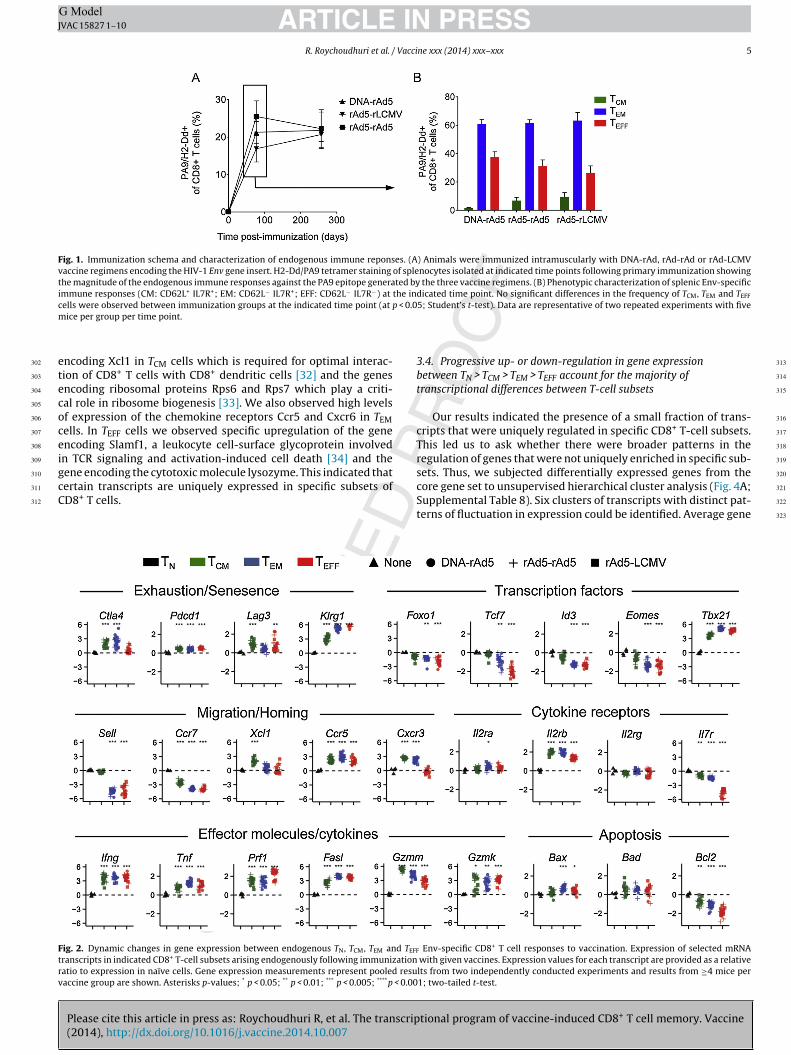
(Supplemental Fig. 1B). Isolated RNA was subjected to global geneexpression analysis using the Illumina BeadChip platform withgreater than four biological replicate measurements per cellularsubset and per vaccine regimen used. Consistent with our sortingstrategy, we observed downregulation of Sell (encoding CD62L)specifically in TEM and TEFF and downregulation of Il7r expressionin TEFF cells alone (Fig. 2). Further, there were dynamic changesin the expression of individual genes between distinct CD8+ T-cellsubsets that were remarkably similar between all three vaccinationprotocols (Fig. 2). In particular, we observed changes in the expres-sion of genes known to regulate T-cell migration (Sell, Ccr7, Xcl1,Ccr5 and Cxcr3), cytokine responsiveness (Il2ra, Il2rb and Il7r) andeffector function (Ifng, Tnf, Prf1, Fasl, Gzmm and Gzmk) consistentwith previous reports [3,13]. Additionally, we observed the induc-tion of the canonical transcription factor of effector differentiationin CD8+ T cells, Tbet (Tbx21) [25] and downregulation of tran-scription factors associated with naïve or memory T cells (Foxo1,Tcf7, Id3 and Eomes) [26–29]. Additionally, there was acquisitionof genes encoding inhibitory receptors and markers of exhaus-tion/senescence (Ctla4, Pdcd1, Lag3, Klrg1 and Tim3) as has beenpreviously described upon differentiation of naïve CD8+ T cells intoeffector cells [30].
Given the similarity in transcriptional profiles of fractionatedpopulations of TN, TCM, TEM and TEFF cells elicited by the three vac-cines, as has been previously described [23], we used the threedatasets to derive core gene expression signatures of TCM, TEM andTEFF cells that were independent of the vaccine protocol used. Fromthis dataset, we were able to identify numerous gene expressionchanges consistent with previous reports from microarray anal-ysis of adoptively transferred TCR-transgenic CD8+ T cells [2,3].However, we also observed numerous changes in the expression ofgenes with known or unknown function in CD8+ T cells that werenot previously reported (Table 1).
3.3. TCM cells exhibit a higher degree of transcriptionalrelatedness to TN cells than TEM or TEFF cells
Using derived core signatures, we were able to compare thetranscriptional proximity of each antigen-experienced subset toTN cells by analysing the number of differentially expressed genes(Fig. 3A). The number of genes significantly differentially expressedas compared to TN cells was greatest in TEFF cells, less in TEMcells and the lowest in TCM cells. This indicates that at a trans-criptional level, TCM cells share greater transcriptional relatednesswith TN cells than either TEM or TEFF cells. This transcriptionalproximity relationship was also reflected in a multidimensionalscaling analysis (Fig. 3B). This analysis reduces the dimensionalityof gene expression datasets to allow the transcriptional distancebetween distinct whole transcriptome measurements to be pre-sented in a lower-dimensional representation while preservingrelative between-object distances as well as possible [31]. Our anal-ysis placed TN cells closer to TCM than TEM or TEFF cells. It wasalso apparent that TCM is closer to TEM than to TEFF. Moreover,the vaccine protocol does not appear to affect substantially affectpositioning within clusters, indicating that once fractionated intosubsets, the immunogen appeared to play a minor role in deter-mining population-level gene expression.
Uniquely regulated transcripts specific to particular cellularsubsets are of interest since such genes could be required forlineage-specific maintenance or function. We therefore examineduniquely up- or downregulated genes in TCM, TEM and TEFF cellcompared to TN cells (Fig. 3C–F and Supplemental Tables 1–7). Con-
tional program of vaccine-induced CD8+ T cell memory. Vaccine
sistent with previous reports, we observed enrichment of the geneencoding Cxcr5 in TCM cells, which guides CD8+ T cells to lymphnodes by binding the ligand Cxcl13, expressed in secondary lym-phoid organs. We also observed unique upregulation of the gene
298
299
300
301

Please cite this article in press as: Roychoudhuri R, et al. The transcriptional program of vaccine-induced CD8+ T cell memory. Vaccine(2014), http://dx.doi.org/10.1016/j.vaccine.2014.10.007
ARTICLE IN PRESSG ModelJVAC 15827 1–10
4 R. Roychoudhuri et al. / Vaccine xxx (2014) xxx–xxx
Table 1Identity and expression of known and novel genes dynamically expressed within endogenously generated CD8+ T cell subsets. Following the calculation of a coregeneset enriched for differences in gene expression independent of vaccine used, differentially expressed genes (p < 0.000001) were ranked in order of greatest differentialgene expression compared with naïve cells. Fold change gene expression relative to naïve is presented in the table.
CM EM EFF CM EM EFF CM EM EFF CM EM EFF
Apoptosis Killer-cell Lectin-like receptors Transcription (cont’d) Other/Unknown function (cont’d)Dapl1 −2.40 −14.62 −15.21 Klrk1 9.07 19.19 13.87 Zfp238 −2.91 −3.72 −5.63 C030011O14Rik −2.99 −5.62 −4.98Pdcd4 −4.28 −7.19 −2.10 Klre1 3.09 16.31 39.44 Tcf7 −2.39 −5.38 Ttc14 −3.53 −6.46 −4.88Gadd45b 2.29 3.81 6.12 Klrg1 7.43 42.99 64.41 Srebf2 −3.62 −3.59 −5.29 Whrn −2.16 −5.13 −4.81Dapk2 19.08 38.17 49.61 Tbl1x −4.98 −7.35 −5.03 Psmd7 −4.73 −5.66 −4.32Casp1 41.64 44.85 51.91 Metabolism L3mbtl3 −4.32 −6.25 −4.99 Heatr5a −4.25 −5.98 −4.25
Igfbp4 −2.84 −23.09 −17.14 Rexo1 −8.94 −4.86 −3.71 Zc3h13 −2.97 −10.31 −4.05Cell cycle Ampd1 −7.61 −16.02 −14.63 Bach1 −3.11 −9.34 −3.04 Vapa −6.27 −4.21 −4.03Actn1 −3.53 −15.79 −35.35 Slc2a9 −8.70 −10.47 −9.46 Zmynd11 −2.95 −13.84 −2.79 Rab5c −5.92 −5.08 −3.941190002H23Rik −4.96 −11.76 −11.59 Bdh1 −3.63 −4.97 −8.33 Gabpb2 −3.41 −9.48 −2.61 Lmnb1 −6.64 −5.09 −3.81Pard6g −6.18 −10.27 −8.70 Slc16a6 −8.65 −8.12 −8.02 Cep110 −3.64 −6.49 −2.17 Timp2 −3.86 −5.07 −3.71Zc3h12d −4.07 −5.39 −8.17 Osbpl6 −4.59 −7.25 −7.63 Zbtb7a −5.32 1.69 LOC100048583 −4.70 −5.68 −3.70Trp53 −3.17 −5.14 −6.95 Art2b −4.38 −4.65 −6.21 Smad3 3.69 5.63 4.62 Snx1 −5.12 −3.80 −3.26Ptp4a2 −4.48 −4.51 −5.33 Adk −4.06 −5.48 Polr1d 6.38 4.03 4.88 Tmem23 −2.23 −7.97 −2.99Rbm38 −2.82 −4.12 −5.20 Ctps −2.24 −3.50 −5.34 Tceb2 4.74 4.18 5.16 Nol5a −3.23 −8.58 −2.93Cdkn1b −5.31 −19.16 −3.88 Faah −2.09 −2.83 −5.16 Rora 1.66 3.03 5.33 Rsrc2 −4.30 −8.63 −2.65
Hsd3b2 −7.12 −5.60 −4.06 E2f2 2.94 4.50 5.42 C330021F23Rik −6.79 −5.39 −2.23Cellular homing and adhesion Ndufa6 6.36 4.88 4.65 Scand1 2.79 3.08 6.59 Rad23a −1.96 −5.44 −1.97Sell −21.73 −18.66 Dcxr 2.57 3.03 5.03 Bhlhb2 6.02 17.09 20.79 D1Bwg0212e −3.23 −6.11 −1.96Itgb1 3.22 6.12 4.15 Cox6b1 4.27 3.60 5.51 Tbx21 11.64 35.19 26.24 Oas1 g 6.40 5.91 2.88Pcdh21 2.87 6.91 Dpm3 4.33 3.35 5.66 Zeb2 11.48 52.67 68.32 Rps13 5.86 2.52 2.91
Ndufb10 4.19 5.44 6.89 5830482F20Rik 4.51 5.63 4.12Chemokines Tktl1 5.70 7.82 Other/Unknown function Sytl2 2.52 5.66 4.32Ccl3 2.88 8.53 10.82 Alad 6.24 5.64 8.30 St6gal1 −3.97 −36.84 −37.06 Gabarapl1 2.04 5.53 4.93Ccl5 52.52 67.71 68.50 Alas2 8.01 11.69 14.34 Ppic −6.37 −30.36 −30.87 Lhfpl2 2.99 5.10Ccl4 37.06 87.57 95.56 Soat2 8.36 18.71 26.95 Atp1b1 −6.82 −27.99 −25.59 1700020L24Rik 2.36 2.95 5.18
Tmie −6.90 −20.98 −20.93 Clic1 3.54 4.34 5.41Chemokine receptors Signal transduction LOC100041103 −2.79 −12.81 −20.31 Insl6 3.71 4.22 5.54Ccr7 −5.35 −14.59 −16.05 Socs3 −4.03 −24.35 Anp32a −19.04 −17.73 −17.23 Ahnak 1.98 4.47 5.55Cxcr3 6.46 4.77 Ramp1 −4.67 −20.74 −20.58 Rasl11b −6.85 −6.90 −17.02 Sdcbp2 4.82 6.29 5.65Ccr5 5.32 7.59 4.07 Gpr114 −3.19 −10.48 −18.77 Tpm3 −12.46 −17.60 −13.93 Dnajc15 5.80 5.93 5.73Ccl9 2.04 5.84 8.25 Lrp12 −8.29 −14.94 −17.17 Fam134b −3.41 −7.28 −10.57 1700025G04Rik 5.17 3.97 5.83Cx3cr1 4.00 18.49 29.36 Rgs10 −3.67 −17.22 −14.62 Lypd6b −3.89 −6.28 −10.49 6330503C03Rik 2.37 4.75 5.88
Trib2 −2.93 −15.50 −14.57 Raly −15.11 −11.52 −10.46 Plxdc1 5.30 6.67Chromatin structure and modification Pacsin1 −3.55 −12.74 −13.02 Pscd3 −4.04 −10.91 −10.12 Snx8 4.48 3.65 6.67Chmp4b −11.19 −10.34 −10.20 Usp10 −2.46 −6.23 −11.78 Pitpnm2 −5.34 −8.23 −9.48 Crip2 2.64 5.65 6.95Jmjd3 −5.50 −3.28 −1.99 Ppm1l −4.13 −10.76 −11.52 Clec2i −3.40 −8.01 −9.14 Nrp1 3.51 7.70 7.39Hist1h2bf 2.47 3.15 5.59 Csnk1g1 −6.83 −9.11 −8.90 Arl6ip5 −11.51 −12.34 −9.09 Plek 3.58 5.81 7.72Hist2h2ab 3.62 3.86 5.88 Mycbp2 −1.64 −4.30 −7.89 Cnr2 −8.51 −8.88 LOC641240 7.90 3.45 7.74Hist1h2bj 3.10 3.76 5.88 Rras2 −7.71 −6.36 −7.33 Fntb −2.51 −6.66 −8.70 6330403K07Rik 2.77 5.67 7.97Hist1h4m 4.31 7.67 6.29 Amigo2 −1.95 −5.99 −7.30 Trub1 −2.16 −3.50 −8.69 Fcgr2b 4.10 9.06 8.19Hist1h2bk 3.74 4.90 6.56 Trat1 −2.98 −6.39 −7.16 Kif23 −4.39 −5.88 −8.52 Bloc1s1 8.23 5.06 8.31Hist2h2ac 5.30 4.86 6.65 Ppp3r1 −7.59 −3.32 −6.71 Slc11a2 −2.41 −3.57 −8.43 Trex1 3.10 4.66 8.63Hist1h4k 4.66 8.07 6.76 Limk1 −6.98 −5.46 −6.52 2410066E13Rik −5.94 −7.08 −7.94 H2-Ea 9.38 4.36 8.65Hist1h3a 4.70 5.04 7.93 Rnf167 −6.74 −5.50 −5.69 Smc6 −4.57 −5.37 −7.78 H2-Eb1 7.42 3.75 9.51Hist1h2ag 4.79 4.52 8.41 4631426J05Rik −5.39 −5.18 −5.66 Xkrx −4.32 −7.61 −7.56 Nt5e 5.97 6.81 9.53Hist1h4i 5.10 7.63 8.42 Dusp10 −4.68 −5.13 −5.11 Cep68 −6.39 −7.39 −7.33 Myadm 5.23 14.61 9.72Hist1h2ao 7.07 6.22 9.80 Cd69 −2.33 −3.64 −5.07 Spnb2 −4.07 −3.09 −7.16 Kcnk6 8.20 8.56 9.85Hist1h3d 6.53 6.84 9.97 Usp1 −4.25 −7.02 −5.03 Psme3 −6.88 −8.50 −7.16 Hbb-b2 3.76 6.85 9.87Hist1h4j 7.57 10.17 11.41 Rgs1 8.42 8.52 5.32 Tatdn2 −6.49 −5.14 −6.80 Arsb 4.22 9.66 10.13Hist1h3e 8.46 7.83 12.04 Gng2 6.02 6.37 5.88 Ephx1 −4.96 −9.08 −6.57 Plekhg3 4.58 10.05 10.21Hist1h2af 7.76 7.46 12.91 Slamf7 3.56 7.86 6.64 LOC100047606 −2.41 −5.15 −6.12 Lmna 3.90 7.97 10.36Hist1h2an 7.88 7.93 13.44 Cish 5.06 10.69 7.48 Crlf3 −3.84 −3.89 −5.84 Clip4 3.34 10.60Hist1h2ad 11.04 10.89 20.17 Prdx4 3.10 6.33 8.47 Tmem9 −2.87 −3.78 −5.66 Stard10 2.69 7.16 14.85Hist1h2ak 12.21 11.37 21.35 Ier3 4.56 8.10 9.64 Rcl1 −2.79 −4.07 −5.53 Fam129b 3.11 15.99 15.61Hist1h2ah 12.89 12.44 21.99 S100a13 3.94 5.94 10.10 Tspan14 −3.17 −3.35 −5.52 Anxa2 7.74 12.32 15.75
Socs2 5.29 7.56 10.49 Spsb1 −2.81 −4.85 −5.48 Endod1 7.98 11.87 16.27Cytokines Ncald 4.09 9.56 10.57 Armcx2 −2.47 −5.36 Mt1 5.59 9.14 16.53Tnfsf14 4.85 7.60 5.76 Lrrk1 6.19 11.45 20.39 Nsg2 2.26 −2.10 −5.30 Kcnj8 2.86 13.71 23.98Ifng 51.34 75.28 60.60 Edg8 3.34 30.46 52.53 Cd55 −1.60 −3.28 −5.30 Emp1 9.77 28.48 24.41
5830457O10Rik −5.45 −4.49 −5.30 Garnl4 6.70 29.08 28.81Cytokine receptors Transcription Emb −2.56 −3.29 −5.22 Sytl3 15.71 31.72 29.32Il7r −1.93 −2.67 −25.83 Bach2 −7.42 −21.29 −29.62 Ivns1abp −3.15 −2.80 −5.21 Esm1 8.17 24.22 33.91Il18rap 2.15 3.87 6.34 Smad1 −3.22 −4.90 −10.34 5530601I19Rik −3.32 −2.76 −5.20 S100a6 29.85 30.96 36.16
Egr2 −4.22 −8.41 −10.14 Luc7l2 −4.01 −4.15 −5.19 Lgals1 14.29 34.21 40.32Cellular cytotoxicity Egr1 −4.28 −6.53 −7.51 Golim4 −7.78 −6.48 −5.19 Kcnk5 26.54 40.75 45.29Prf1 2.52 2.71 5.07 Taf15 −6.88 −4.58 −7.06 Agfg1 −1.84 −3.12 −5.13 Hba-a1 31.57 36.16 48.95Gzmm 43.06 16.76 6.99 Epc1 −5.93 −6.39 −6.73 Gbp5 −4.32 −6.76 −5.11 Smpdl3b 19.68 42.79 50.58Fasl 6.01 15.35 12.55 Eif4a1 −5.21 −2.94 −6.06 Ddx6 −4.74 −12.18 −5.08 Osbpl3 25.32 59.82 65.74
Lgals3 23.93 97.00 123.44
ARTICLE IN PRESSG ModelJVAC 15827 1–10
R. Roychoudhuri et al. / Vaccine xxx (2014) xxx–xxx 5
Fig. 1. Immunization schema and characterization of endogenous immune reponses. (A) Animals were immunized intramuscularly with DNA-rAd, rAd-rAd or rAd-LCMVvaccine regimens encoding the HIV-1 Env gene insert. H2-Dd/PA9 tetramer staining of splenocytes isolated at indicated time points following primary immunization showingthe magnitude of the endogenous immune responses against the PA9 epitope generated by the three vaccine regimens. (B) Phenotypic characterization of splenic Env-specificimmune responses (CM: CD62L+ IL7R+; EM: CD62L− IL7R+; EFF: CD62L− IL7R−) at the indicated time point. No significant differences in the frequency of TCM, TEM and TEFF
c p < 0.0m
etecoceigcC
Ftrv
302
303
304
305
306
307
308
309
310
311
312
313
314
315
316
317
318
319
ells were observed between immunization groups at the indicated time point (at
ice per group per time point.
ncoding Xcl1 in TCM cells which is required for optimal interac-ion of CD8+ T cells with CD8+ dendritic cells [32] and the genesncoding ribosomal proteins Rps6 and Rps7 which play a criti-al role in ribosome biogenesis [33]. We also observed high levelsf expression of the chemokine receptors Ccr5 and Cxcr6 in TEMells. In TEFF cells we observed specific upregulation of the genencoding Slamf1, a leukocyte cell-surface glycoprotein involvedn TCR signaling and activation-induced cell death [34] and the
Please cite this article in press as: Roychoudhuri R, et al. The transcrip(2014), http://dx.doi.org/10.1016/j.vaccine.2014.10.007
ene encoding the cytotoxic molecule lysozyme. This indicated thatertain transcripts are uniquely expressed in specific subsets ofD8+ T cells.
ig. 2. Dynamic changes in gene expression between endogenous TN, TCM, TEM and TEFF
ranscripts in indicated CD8+ T-cell subsets arising endogenously following immunizationatio to expression in naïve cells. Gene expression measurements represent pooled resuaccine group are shown. Asterisks p-values; * p < 0.05; ** p < 0.01; *** p < 0.005; ****p < 0.00
5; Student’s t-test). Data are representative of two repeated experiments with five
3.4. Progressive up- or down-regulation in gene expressionbetween TN > TCM > TEM > TEFF account for the majority oftranscriptional differences between T-cell subsets
Our results indicated the presence of a small fraction of trans-cripts that were uniquely regulated in specific CD8+ T-cell subsets.This led us to ask whether there were broader patterns in theregulation of genes that were not uniquely enriched in specific sub-
tional program of vaccine-induced CD8+ T cell memory. Vaccine
sets. Thus, we subjected differentially expressed genes from thecore gene set to unsupervised hierarchical cluster analysis (Fig. 4A;Supplemental Table 8). Six clusters of transcripts with distinct pat-terns of fluctuation in expression could be identified. Average gene
Env-specific CD8+ T cell responses to vaccination. Expression of selected mRNA with given vaccines. Expression values for each transcript are provided as a relativelts from two independently conducted experiments and results from ≥4 mice per1; two-tailed t-test.
320
321
322
323

Please cite this article in press as: Roychoudhuri R, et al. The transcriptional program of vaccine-induced CD8+ T cell memory. Vaccine(2014), http://dx.doi.org/10.1016/j.vaccine.2014.10.007
ARTICLE IN PRESSG ModelJVAC 15827 1–10
6 R. Roychoudhuri et al. / Vaccine xxx (2014) xxx–xxx
Fig. 3. TCM cells exhibit greater transcriptional relatedness to TN cells than either TEM or TEFF cells. (A) Number of differentially expressed genes between the antigen-experienced CD8+ T-cell subsets (TCM, TEM and TEFF) and TN cells from the core signature. (B) Multidimensional scaling analysis of global gene expression data from the CD8+
T-cell subsets separated by vaccine protocol indicating transcriptional proximity of endogenously derived CD8+ T-cell subsets. (C) Venn diagram indicating uniquely up- ordown-regulated transcripts within distinct CD8+ T cell subsets as compared with TN. Members of the Venn diagram are provided in Supplemental Tables 1–7. (D–F) Uniquelyregulated transcripts in TCM (D), TEM (E) and TEFF (F) cells; selected transcripts and the direction in which they are either up- or down-regulated are identified.
Fig. 4. Progressive up- or down-regulation of gene expression accounts for the majority of transcriptional changes occurring in the order TN > TCM > TEM > TEFF. (A) Hierarchicalclustering analysis of differentially expressed genes between subsets. Clusters [A-F] of genes exhibiting distinct patterns of regulation between subsets are highlighted alongthe right hand side corresponding to the dendrogram on the left side of the heatmap. Clustering of CD8+ T-cell subsets based on global transcriptional proximity is highlightedabove the heatmap and corresponds to the dendrogram. (B) Average and individual patterns of gene expression within the six identified clusters. Samples are distributedalong the x-axis of plots based upon their position in the hierarchical clustering analysis in A and y-axes represent standardized gene expression levels. The top four rankedmembers of each cluster are displayed to the right of the average gene expression plot for each cluster.

ING ModelJ
Vacci
eecsi(flaCcTsrctcCTigaaCmt
sc
orbtaral
cs[ntedTwp(conCTwcT
Tdcfssf
324
325
326
327
328
329
330
331
332
333
334
335
336
337
338
339
340
341
342
343
344
345
346
347
348
349
350
351
352
353
354
355
356
357
358
359
360
361
362
363
364
365
366
367
368
369
370
371
372
373
374
375
376
377
378
379
380
381
382
383
384
385
386
387
388
389
390
391
392
393
394
395
396
397
398
399
400
401
402
403
404
405
406
407
408
409
410
411
412
413
414
415
416
417
418
419
420
421
422
423
424
425
426
427
428
429
430
431
432
433
434
435
436
437
438
439
440
441
442
443
444
445
446
447
448
ARTICLEVAC 15827 1–10
R. Roychoudhuri et al. /
xpression and profiles of the four most representative genes inach cluster are shown (Fig. 4B). Interestingly, the two largestlusters (A and B), showed a pattern of fluctuation in gene expres-ion that was sequential, with progressive up- or down-regulationn gene expression from TN > TCM > TEM > TEFF. Within cluster Athe largest cluster, containing genes progressively upregulatedrom TN > TCM > TEM > TEFF) we observed genes encoding the surfaceectin associated with T cell senescence KLRG1 [35], the effector-ssociated transcription factors Tbet and Id2, and the chemokinecl4 (Supplemental Table 9). Within cluster B (the second largestluster, containing transcripts progressively downregulated fromN to TCM to TEM to TEFF), we observed genes encoding the tran-cription factor Tcf7, the lymphoid homing molecule CD62L, theeceptor for homeostatic cytokine IL-7 (IL-7R) and a marker of Tell longevity, CD27 (Supplemental Table 10)[36–38]. Smaller clus-ers of genes with distinct patterns of fluctuation in gene expressionould also be identified (Clusters C–E; Supplemental Tables 11–14).luster C contained genes whose expression was shared by TN andEFF cells while cluster E contained genes predominantly expressedn TEM cells. Other clusters could be identified mainly comprisingenes specifically up- or down-regulated in naïve cells (clusters Fnd D, respectively). A majority of genes were assigned to Clusters And B, indicating that most differentially expressed genes betweenD8+ T cell subsets undergo progressive up- or down-regulation inRNA expression in a pattern that is sequential and in the order TN
o TCM to TEM to TEFF.Progressive transcriptional differences between CD8+ T cell sub-
ets are similar to global changes in gene expression when CD8+ Tells progressively encounter antigen
Our data indicated that CD8+ T cells exist along a continuumf transcriptional relatedness with progressive up- or down-egulation of a majority of differentially expressed transcriptsetween subsets in the order TN, TCM, TEM and TEFF. According tohe progressive differentiation model, CD8+ T cells differentiatelong a unidirectional continuum from TN to TCM to TEM to TEFF as aesult of antigenic or inflammatory signals and exhibit progressivecquisition of effector function and concomitant loss of capacity forong-term survival [39].
A recent study by Wirth et al. established global transcriptionalhanges that occur when CD8+ T-cells undergo either primary (1◦),econdary (2◦), tertiary (3◦) or quaternary(4◦) stimulation in vivo21]. We therefore set about comparing the global transcriptio-al differences we observed between CD8+ T-cell subsets withranscriptional changes that occur when CD8+ T cells repeatedlyncounter antigen as defined by Wirth et al. Global transcriptionalifferences between pairwise combinatorial comparisons of CD8+
cell subsets from our analysis (e.g. TN vs. TCM or TEFF vs. TCM)ere correlated with transcriptional changes accompanying eachrogressive round of stimulation from the dataset of Wirth et al.e.g. Naïve � 1◦, 1◦ � 2◦, 2◦ � 3◦ or 3◦ � 4◦). We observed that trans-riptional changes accompanying either Naïve � 1◦, 1◦ � 2◦, 2◦ � 3◦
r 3◦ � 4◦ stimulation were often positively correlated, but neveregatively correlated, with transcriptional differences betweenD8+ T-cell subsets in the direction TN > TCM > TEM > TEFF (Fig. 5A).he directionality of these correlations add support for a modelhereby cumulative exposure to antigen promotes progressive
hanges in gene expression resulting in differentiation from TN toCM to TEM to TEFF.
Given the directionality of these changes, we hypothesised thatCM, TEM and TEFF cells bear greatest transcriptional similarity toistinct populations of repetitively stimulated cells. We thereforeompared the transcriptional similarity of TCM, TEM and TEFF cells
Please cite this article in press as: Roychoudhuri R, et al. The transcrip(2014), http://dx.doi.org/10.1016/j.vaccine.2014.10.007
rom our analysis to cells that had undergone either 1◦, 2◦, 3◦ or 4◦
timulation in the study of Wirth et al. To compare transcriptionalimilarity of each subset to 1◦, 2◦, 3◦ or 4◦ stimulated cells we per-ormed a deconvolution analysis between the two datasets (Fig. 5B)
PRESSne xxx (2014) xxx–xxx 7
[22]. From this analysis, we found that cells that had undergone 1◦
stimulation had the greatest relative transcriptional signal of TCMcells. Likewise, we found that the relative transcriptional signal ofTEM cells was most represented in 2◦ cells while the relative trans-criptional signal of TEFF cells was most represented in 4◦ cells. Whatis remarkable from this observation is that at a single contempora-neous time point following vaccination, cells are isolated bearing atranscriptional imprint of differential exposure to antigen, and thatthis imprint coincides with their cellular phenotype.
4. Discussion
In this study we have established global transcriptional profilesof endogenous vaccine-induced effector (TEFF), effector memory(TEM) and central memory (TCM) CD8+ T cells. Previous stud-ies have derived transcriptional profiles of CD8+ T cell subsetsarising following adoptive transfer of T-cell receptor (TCR) trans-genic cells specific for model antigens expressed by infectiouspathogens. While these studies have provided a substantial mech-anistic insights into the molecular basis of immunological memory,lymphocyte migration and effector function, the high affinityof transgenic TCRs for cognate model antigens, and imbalancesbetween endogenous immune cells and antigen-specific cellscaused by adoptive transfer may leave artifactual imprints inderived transcriptional profiles. By using tetramer-based identi-fication of cellular subsets with defined antigen-specificity andhighly sensitive microarray platforms, we were able to circumventthese problems and use prime-boost vaccine vectors to generateendogenous populations of CD8+ T cells specific for a single epi-tope within a vaccine antigen. Using this approach, we have beenable to derive transcriptional profiles from endogenous vaccine-elicited CD8+ T cell responses, leading to identification of noveldifferentially expressed transcripts between subsets and a numberof genes that are uniquely expressed in distinct cell populations.
A new direction in the field of vaccine development is theapplication of systems biology to define molecular predictors ofindividual responses to vaccination, potentially enabling rapidscreening of promising vaccine candidates [40]. While selectedor global gene expression profiles from peripheral blood samplesfollowing vaccination may enable resolution of distinct cellu-lar subsets comprising vaccine-induced immune responses usingdecomposition analysis, such attempts will require gene expressionprofiles of defined cellular subsets that are reflective of endogenousvaccine-induced responses. By providing such data, we anticipatethat this study will substantially enable these attempts.
What was remarkable to us was the observation that the major-ity of genes that were differentially expressed between CD8+ Tcell subsets underwent either progressive up- or down-regulationwhen comparing subsets in the order TN, TCM, TEM and TEFF. As aresult, TCM cells appeared to share greater transcriptional related-ness with TN cells than did either TEM or TEFF cells. An importantaspect of the linear differentiation model, whereby effector cells areformed uniformly following antigen stimulation regardless of anti-genic signal strength, is that we might expect effector cells to mostresemble cells that had undergone few encounters with antigen,and that subsequent differentiation into central or effector mem-ory cells would not result in any decrease in the imprint of antigensignaling. By comparing cells in distinct subsets arising contempo-raneously following immunization with known changes that occurwhen CD8+ T cells undergo cumulative encounters with antigenhowever, we observed that effector cells exhibited the transcrip-
tional program of vaccine-induced CD8+ T cell memory. Vaccine
tional imprint of high antigen exposure, while the analysis placedcentral and then effector memory cells as intermediates in thisspectrum. These results are more consistent with the progressivedifferentiation hypothesis whereby cumulative encounters with
449
450
451
452

ARTICLE IN PRESSG ModelJVAC 15827 1–10
8 R. Roychoudhuri et al. / Vaccine xxx (2014) xxx–xxx
Fig. 5. Differences in gene expression between CD8+ T-cell subsets isolated at a single time point following immunization resemble known transcriptional changes thatoccur when T cells repetitively encounter antigen. (A) Differences in gene expression between subject and comparator CD8+ T cell subsets were evaluated in the contextof known transcriptional changes that occur when CD8+ T cells repetitively encounter antigen [21]. Pearson’s correlation coefficient between the fold-changes (log 2) of agiven pairwise CD8+ T cell subset comparison (subject and comparator subsets are indicated as column and row titles) and the fold-changes of a given repetitive antigenstimulation (red boxes) comparison are shown. Statistically significant values (p < 0.05) are indicated in bold text. Naïve to primary (top left), primary to secondary (bottomleft), secondary to tertiary (top right) and tertiary to quaternary (bottom right) gene expression changes from the dataset of Wirth et al. were evaluated independently. Onlygenes that reached statistical significance in the subset comparisons were considered for the correlation calculations. (B) Deconvolution analysis showing relative similarityo etitiva sum
s ated r
atWewe
453
454
455
456
457
458
459
460
f TN, TCM, TEM and TEFF cell fractions within cell populations generated following repnd quaternary (IV)). Colored asterisks represent p-values (* p < 0.05; Wilcoxon rankubset (as indicated by the color of the asterisk) in populations resulting from indic
ntigen signals results in irreversible differentiation along a con-inuum defined by a transition from TN to TCM to TEM to TEFF states.
Please cite this article in press as: Roychoudhuri R, et al. The transcrip(2014), http://dx.doi.org/10.1016/j.vaccine.2014.10.007
hile these results are merely correlative and do not definitivelystablish lineage relationships, our conclusions are in agreementith a recent study which utilized a single-cell fate-mapping strat-
gy to define lineage relationships between antigen-experienced
e antigen stimulations of Wirth et al. (naïve, primary (I), secondary (II), tertiary (III)test) and indicate statistical significance of enrichment of the indicated CD8+ T-cellepetitive antigen stimulation in vivo.
cell populations arising following infection [41]. Importantly, ourresults do not preclude that a subset of cells with a central memory
tional program of vaccine-induced CD8+ T cell memory. Vaccine
phenotype revert their transcriptional profiles to a state resemblingcells with low antigen exposure history despite arising from effec-tor cells with transcriptional profiles resembling high exposure toantigen.
461
462
463
464

ING ModelJ
Vacci
grgrpsuit
tFulC
A
mRMR
A
A
GatbQ7tQ8aPt
A
fj
R
[
[
[
[
[
[
[
[
[
[
[Q9
[
[
[
[
[
[
[
[
[
[[
[
[
[
[
[
465
466
467
468
469
470
471
472
473
474
475
476
477
478
479
480
481
482
483
484
485
486
487
488
489
490
491
492
493
494
495
496
497
498
499
500
501
502
503
504
505
506
507
508
509
510
511
512
513
514
515
516
517
518
519
520
521
522
523
524
525
526
527
528
529
530
531
532
533
534
535
536
537
538
539
540
541
542
543
544
545
546
547
548
549
550
551
552
553
554
555
556
557
558
559
560
561
562
563
564
565
566
567
568
569
570
571
572
573
574
575
576
577
578
579
580
581
582
583
584
585
586
587
588
589
590
591
592
593
594
595
596
597
598
599
600
601
602
603
604
ARTICLEVAC 15827 1–10
R. Roychoudhuri et al. /
The relationship between repetitive antigenic signaling and pro-ressive differentiation to TEM and TEFF states is of importance, sincehesus CMV-based vaccine vectors capable of chronic persistenceenerated effector memory CD8+ T cell responses that affordedobust protection against SIV challenge [6]. Given advantageouseripheral and mucosal homing properties effector memory cells toites where the majority of HIV infections are acquired in humans,nderstanding factors that lead to generation of these cells follow-
ng vaccination, and their transcriptional program is a priority tohe field.
Finally, our analysis of endogenous responses identifies novelranscriptional differences between distinct CD8+ T cell subsets.unctional characterization of these transcripts will enable betternderstanding of the biology of CD8+ T cells and provide molecu-
ar targets and signaling pathways relevant to the manipulation ofD8+ T cell responses during vaccination.
uthor contributions
R.R., L.F. and M.H., L.P., Y.J., C.A.K., and S.R. carried out experi-ents; R.R., L.F., F.L., G.J.N., R.P.S. and M.H. designed experiments;
.R., L.F., F.L., J.G., A.N.H., L.G., M.C. and M.H. analyzed experiments;.S., C.A.K and N.P.R. edited the manuscript and R.R., F.L., L.F. and
.P.S. wrote the manuscript.
ccession codes
GEO: microarray data, GSE42459.
cknowledgements
We thank S. Perfetto, E. Lugli, M. Vernez, A. Bergthaler and. Fabozzi, D.C. Macallan and G.E. Griffin for helpful insightsnd discussion. We also thank R. Nguyen and D. Ambrozak forheir expertise with FACS sorting. This research was supportedy the Intramural Research Programs of the US National Insti-utes of Health, National Institute of Allergy and Infectious Diseasesnd National Cancer Institute. L.F. is supported by the Stiftungropter Homines, Vaduz, Principality of Liechtenstein, the Fonda-ion Leenaards and the Medic Foundation.
Conflict of interest statementThe authors declare no competing financial interests.
ppendix A. Supplementary data
Supplementary data associated with this article can beound, in the online version, at http://dx.doi.org/10.1016/.vaccine.2014.10.007.
eferences
[1] Sallusto F, Lenig D, Forster R, Lipp M, Lanzavecchia A. Two subsets of memoryT lymphocytes with distinct homing potentials and effector functions. Nature1999;401:708–12.
[2] Kaech SM, Tan JT, Wherry EJ, Konieczny BT, Surh CD, Ahmed R. Selective expres-sion of the interleukin 7 receptor identifies effector CD8 T cells that give rise tolong-lived memory cells. Nat Immunol 2003;4:1191–8.
[3] Sarkar S, Kalia V, Haining WN, Konieczny BT, Subramaniam S, Ahmed R. Func-tional and genomic profiling of effector CD8 T cell subsets with distinct memoryfates. J Exp Med 2008;205:625–40.
[4] Sallusto F, Geginat J, Lanzavecchia A. Central memory and effector memoryT cell subsets: function, generation, and maintenance. Annu Rev Immunol2004;22:745–63.
[5] Bachmann MF, Wolint P, Schwarz K, Jager P, Oxenius A. Functional properties
Please cite this article in press as: Roychoudhuri R, et al. The transcrip(2014), http://dx.doi.org/10.1016/j.vaccine.2014.10.007
and lineage relationship of CD8+ T cell subsets identified by expression of IL-7receptor alpha and CD62L. J Immunol 2005;175:4686–96.
[6] Hansen SG, Ford JC, Lewis MS, Ventura AB, Hughes CM, Coyne-Johnson L, et al.Profound early control of highly pathogenic SIV by an effector memory T-cellvaccine. Nature 2011;473:523–7.
[
PRESSne xxx (2014) xxx–xxx 9
[7] Cui W, Kaech SM. Generation of effector CD8+ T cells and their conversion tomemory T cells. Immunol Rev 2010;236:151–66.
[8] Kaech SM, Ahmed R. Memory CD8+ T cell differentiation: initial antigenencounter triggers a developmental program in naive cells. Nat Immunol2001;2:415–22.
[9] Badovinac VP, Porter BB, Harty JT. Programmed contraction of CD8(+) T cellsafter infection. Nat Immunol 2002;3:619–26.
10] Zehn D, Lee SY, Bevan MJ. Complete but curtailed T-cell response to very low-affinity antigen. Nature 2009;458:211–4.
11] Opferman JT, Ober BT, Ashton-Rickardt PG. Linear differentiation of cytotoxiceffectors into memory T lymphocytes. Science 1999;283:1745–8.
12] Kaech SM, Hemby S, Kersh E, Ahmed R. Molecular and functional profiling ofmemory CD8 T cell differentiation. Cell 2002;111:837–51.
13] Kaech SM, Wherry EJ, Ahmed R. Effector and memory T-cell differenti-ation: implications for vaccine development. Nat Rev Immunol 2002;2:251–62.
14] Bannard O, Kraman M, Fearon DT. Secondary replicative function of CD8+ T cellsthat had developed an effector phenotype. Science 2009;323:505–9.
15] Jacob J, Baltimore D. Modelling T-cell memory by genetic marking of memoryT cells in vivo. Nature 1999;399:593–7.
16] Flatz L, Cheng C, Wang L, Foulds KE, Ko SY, Kong WP, et al. Gene-based vaccina-tion with a mismatched envelope protects against simian immunodeficiencyvirus infection in nonhuman primates. J Virol 2012;86:7760–70.
17] Catanzaro AT, Roederer M, Koup RA, Bailer RT, Enama ME, Nason MC, et al.Phase I clinical evaluation of a six-plasmid multiclade HIV-1 DNA candidatevaccine. Vaccine 2007;25:4085–92.
18] Flatz L, Hegazy AN, Bergthaler A, Verschoor A, Claus C, Fernandez M, et al. Devel-opment of replication-defective lymphocytic choriomeningitis virus vectors forthe induction of potent CD8+ T cell immunity. Nat Med 2010;16:339–45.
19] Gentleman RC, Carey VJ, Bates DM, Bolstad B, Dettling M, Dudoit S, et al.Bioconductor: open software development for computational biology andbioinformatics. Genome Biol 2004;5:R80.
20] Smyth GK. Linear models and empirical Bayes methods for assessing differ-ential expression in microarray experiments. Stat Appl Genet Mol Biol 2004;3
(Article3).21] Wirth TC, Xue HH, Rai D, Sabel JT, Bair T, Harty JT, et al. Repetitive antigen stim-
ulation induces stepwise transcriptome diversification but preserves a coresignature of memory CD8(+) T cell differentiation. Immunity 2010;33:128–40.
22] Gong T, Hartmann N, Kohane IS, Brinkmann V, Staedtler F, Letzkus M, et al.Optimal deconvolution of transcriptional profiling data using quadratic pro-gramming with application to complex clinical blood samples. PLoS One2011;6:e27156.
23] Flatz L, Roychoudhuri R, Honda M, Filali-Mouhim A, Goulet JP, Kettaf N,et al. Single-cell gene-expression profiling reveals qualitatively distinct CD8T cells elicited by different gene-based vaccines. Proc Natl Acad Sci USA2011;108:5724–9.
24] Honda M, Wang R, Kong WP, Kanekiyo M, Akahata W, Xu L, et al. Differentvaccine vectors delivering the same antigen elicit CD8+ T cell responses withdistinct clonotype and epitope specificity. J Immunol 2009;183:2425–34.
25] Szabo SJ, Sullivan BM, Stemmann C, Satoskar AR, Sleckman BP, Glimcher LH.Distinct effects of T-bet in TH1 lineage commitment and IFN-gamma produc-tion in CD4 and CD8 T cells. Science 2002;295:338–42.
26] Ji Y, Pos Z, Rao M, Klebanoff CA, Yu Z, Sukumar M, et al. Repression of the DNA-binding inhibitor Id3 by Blimp-1 limits the formation of memory CD8+ T cells.Nat Immunol 2011;12:1230–7.
27] Kerdiles YM, Beisner DR, Tinoco R, Dejean AS, Castrillon DH, DePinho RA, et al.Foxo1 links homing and survival of naive T cells by regulating L-selectin, CCR7and interleukin 7 receptor. Nat Immunol 2009;10:176–84.
28] Zhou X, Xue HH. Cutting edge: generation of memory precursors and functionalmemory CD8+ T cells depends on T cell factor-1 and lymphoid enhancer-binding factor-1. J Immunol 2012;189:2722–6.
29] Intlekofer AM, Takemoto N, Wherry EJ, Longworth SA, Northrup JT, PalanivelVR, et al. Effector and memory CD8+ T cell fate coupled by T-bet and eomeso-dermin. Nat Immunol 2005;6:1236–44.
30] Wherry EJ. T cell exhaustion. Nat Immunol 2011;12:492–9.31] Borg I, Groenen PJF. Modern multidimensional scaling: theory and applications.
New York, NY: Springer; 1997.32] Dorner BG, Dorner MB, Zhou X, Opitz C, Mora A, Guttler S, et al. Selective
expression of the chemokine receptor XCR1 on cross-presenting dendritic cellsdetermines cooperation with CD8+ T cells. Immunity 2009;31:823–33.
33] Robledo S, Idol RA, Crimmins DL, Ladenson JH, Mason PJ, Bessler M. The role ofhuman ribosomal proteins in the maturation of rRNA and ribosome production.RNA 2008;14:1918–29.
34] Detre C, Keszei M, Romero X, Tsokos GC, Terhorst C. SLAM family recep-tors and the SLAM-associated protein (SAP) modulate T cell functions. SeminImmunopathol 2010;32:157–71.
35] Joshi NS, Cui W, Chandele A, Lee HK, Urso DR, Hagman J, et al. Inflammationdirects memory precursor and short-lived effector CD8(+) T cell fates via thegraded expression of T-bet transcription factor. Immunity 2007;27:281–95.
36] Hendriks J, Gravestein LA, Tesselaar K, van Lier RA, Schumacher TN, Borst J. CD27is required for generation and long-term maintenance of T cell immunity. Nat
tional program of vaccine-induced CD8+ T cell memory. Vaccine
Immunol 2000;1:433–40.37] Ochsenbein AF, Riddell SR, Brown M, Corey L, Baerlocher GM, Lansdorp PM,
et al. CD27 expression promotes long-term survival of functional effector-memory CD8+ cytotoxic T lymphocytes in HIV-infected patients. J Exp Med2004;200:1407–17.
605
606
607
608
609

ING ModelJ
1 Vacci
[
[
610
611
612
613
ARTICLEVAC 15827 1–10
0 R. Roychoudhuri et al. /
Please cite this article in press as: Roychoudhuri R, et al. The transcrip(2014), http://dx.doi.org/10.1016/j.vaccine.2014.10.007
38] Peperzak V, Xiao Y, Veraar EA, Borst J. CD27 sustains survival of CTLs in virus-infected nonlymphoid tissue in mice by inducing autocrine IL-2 production. JClin Invest 2010;120:168–78.
39] Klebanoff CA, Gattinoni L, Restifo NP. CD8+ T-cell memory in tumor immunol-ogy and immunotherapy. Immunol Rev 2006;211:214–24.
[
[
PRESSne xxx (2014) xxx–xxx
tional program of vaccine-induced CD8+ T cell memory. Vaccine
40] Haining WN, Pulendran B. Identifying gnostic predictors of the vaccineresponse. Curr Opin Immunol 2012;24:332–6.
41] Buchholz VR, Flossdorf M, Hensel I, Kretschmer L, Weissbrich B, Graf P, et al.Disparate individual fates compose robust CD8+ T cell immunity. Science2013;340:630–5.
614
615
616
617
618