Object detection by stepwise analysis of spectral, spatial, and topographic features
21
COMPUTER VISION, GRAPHICS, AND IMAGE PROCESSING 51, 235-2% (1990) Object Detection by Step-Wise Analysis of Spectral, Spatial, and Topographic Features* MOHANM. TRIVEDI AND CHUXINCHEN Department of Electrical and Computer Engineering The University of Tennessee-Knoxville, Tennessee 37996-2100 AND DANIEL H. CRESS Waterways Experiment Station, U.S. Army Corps of Engineers, ticksburg Mississippi 39180 Received October 8, 1987; revised July 5, 1989 In many computer vision systems accurate identification of various objects appearing in a scene is required. In this paper we address the problem of object detection in analyzing high resolution multispectral aerial images. Development of a practical object detection approach should consider issues of speed, accuracy, robustness, and amount of supervision allowed. The approach is based upon extraction of information from images and their systematic analysis utilizing available prior knowledge of various physical attributes of the objects. The step-wise approach examines spectral, spatial, and topographic features in making the object vs background decision. Techniques for the analysis of the spectral, spatial, and topographic features tend to be of increasing levels of computational complexity. The computationally simpler spectral feature analysis is performed for the entire image to detect candidate object regions. Only these regions are considered in the spatial feature analysis step to further reduce the number of candidate regions which need to be analyzed in the topographic feature analysis step. Such step-wise analysis makes the entire object detection process efficient by incorporating the process of “focus of attention” to identify regions of interest thus eliminating a relatively large portion of image from further detailed examination at every stage. Results of the experiments performed using several high resolution multispectral images have demonstrated the basic feasibility of the approach. The images utilized in the experiments are acquired from geographically different locations, at different times, with different types of background, and are of different resolution. Successful object detection with high accuracy and low false alarm rates indicate the robustness of this approach. 1. INTRODUCTION In many computer vision systems a main requirement is to identify the presence of a unique object appearing in the scene. The term unique object is used in a generic manner specifying an entity with well-defined physical characteristics. Many examples of specific object detection tasks can be cited. In developing robot vision systems unique objects such as industrial parts, or components need to be recognized [2,3,4,5]; in analyzing aerial images of urban scenes objects such as individual houses or roads may have to be detected [6,7]; and in interpreting reconnaissance images objects such as airplanes, tanks or bridges may have to be detected [8,9,10]. Development of techniques for performing such object detection tasks depends on the ability to extract object features in different information domains and then attempting to match the image derived features with the models *This research was supported in part by the U.S. Army Grant DACA 39-84-C-0017 an the Army Research Office Grant DAAG23-82-K-0189. 235 0734-189X/90 $3.00 Copyright 8 1990 by Academic Press, Inc. All rights of reproduction in any form resewed.
Transcript of Object detection by stepwise analysis of spectral, spatial, and topographic features
COMPUTER VISION, GRAPHICS, AND IMAGE PROCESSING 51, 235-2% (1990)
Object Detection by Step-Wise Analysis of Spectral, Spatial, and Topographic Features*
MOHANM. TRIVEDI AND CHUXINCHEN
Department of Electrical and Computer Engineering The University of Tennessee-Knoxville, Tennessee 37996-2100
AND
DANIEL H. CRESS
Waterways Experiment Station, U.S. Army Corps of Engineers, ticksburg Mississippi 39180
Received October 8, 1987; revised July 5, 1989
In many computer vision systems accurate identification of various objects appearing in a scene is required. In this paper we address the problem of object detection in analyzing high resolution multispectral aerial images. Development of a practical object detection approach should consider issues of speed, accuracy, robustness, and amount of supervision allowed. The approach is based upon extraction of information from images and their systematic analysis utilizing available prior knowledge of various physical attributes of the objects. The step-wise approach examines spectral, spatial, and topographic features in making the object vs background decision. Techniques for the analysis of the spectral, spatial, and topographic features tend to be of increasing levels of computational complexity. The computationally simpler spectral feature analysis is performed for the entire image to detect candidate object regions. Only these regions are considered in the spatial feature analysis step to further reduce the number of candidate regions which need to be analyzed in the topographic feature analysis step. Such step-wise analysis makes the entire object detection process efficient by incorporating the process of “focus of attention” to identify regions of interest thus eliminating a relatively large portion of image from further detailed examination at every stage. Results of the experiments performed using several high resolution multispectral images have demonstrated the basic feasibility of the approach. The images utilized in the experiments are acquired from geographically different locations, at different times, with different types of background, and are of different resolution. Successful object detection with high accuracy and low false alarm rates indicate the robustness of this approach.
1. INTRODUCTION
In many computer vision systems a main requirement is to identify the presence of a unique object appearing in the scene. The term unique object is used in a generic manner specifying an entity with well-defined physical characteristics. Many examples of specific object detection tasks can be cited. In developing robot vision systems unique objects such as industrial parts, or components need to be recognized [2,3,4,5]; in analyzing aerial images of urban scenes objects such as individual houses or roads may have to be detected [6,7]; and in interpreting reconnaissance images objects such as airplanes, tanks or bridges may have to be detected [8,9,10]. Development of techniques for performing such object detection tasks depends on the ability to extract object features in different information domains and then attempting to match the image derived features with the models
*This research was supported in part by the U.S. Army Grant DACA 39-84-C-0017 an the Army Research Office Grant DAAG23-82-K-0189.
235 0734-189X/90 $3.00
Copyright 8 1990 by Academic Press, Inc. All rights of reproduction in any form resewed.
236 TRIVEDI, CHEN, AND CRESS
defined from our knowledge of various physical characteristics of objects and their manifestation in imagery. In the analysis of passive images, information is typically extracted from the spectral, spatial and temporal domains [ll]. Spectral and spatial domain features are derived from a single image of a scene whereas derivation of temporal domain features require multiple images of the scene [12]. In the analysis of active or stereo imagery object features associated with range or depth informa- tion can be derived [13].
1.1. Object Detection in Aerial Images
In this paper we focus on the problem of object detection in aerial images acquired by passive sensors having high spectral and spatial resolutions. Recent advances in sensor technology allow acquisition of very high spectral and spatial resolution images [ 141. Analysis techniques primarily developed for analyzing multispectral imagery acquired from satellite based sensors [15] with significantly lower resolutions, encounter limitations in analyzing higher resolution images. High resolution multispectral images offer a potential to extract robust features associated with the spectral, spatial, and topographic properties of the objects. Multispectral images can be considered as a generalization of color images where, instead of acquiring images in only three bands (R, B, G) situated in the visible part of the electromagnetic spectrum, several bands from ultraviolet, visible, near infrared, and even thermal infrared portion of the spectrum are utilized. Design and development of practical object detection approaches should address the issues of accuracy, speed, and robustness. Accuracy relates to high detection rates as well as low false alarm rates. Also, in many applications such systems are required to operate with minimal supervision. In this paper we develop an object detection approach for analyzing high resolution multispectral images. It involves extraction and analysis of spectral, spatial, and topographic features from images and their analysis based upon a limited knowledge of object attributes. Techniques for the interpretation of the spectral, spatial, and topographic features tend to be of increasing levels of computational complexity. The computationally simpler spectral feature analysis is performed for the entire image to detect candidate object regions. Only these regions are considered in the spatial feature analysis step to further reduce the number of candidate regions which need to be analyzed in the topographic feature analysis step. Such step-wise analysis makes the entire object detection process efficient by incorporating the process of “focus of atten- tion” to identify regions of interest thus eliminating a relatively large portion of image from further detailed examination at every stage.
1.2. Issues Underlying Zmage Acquisition
The high resolution multispectral imagery was acquired using a specially fabri- cated scanning system mounted on an aerial platform. Special care was taken in acquiring real world images from a multitude of actual operational environments instead of using some synthetic or simulated data set. The data set used in our experiments reflect the real variations in signal-to-noise characteristics, sensor response (inherent in any complex electro-optical device), platform stability and scanning rates, background types and composition, clutter, spatial resolutions, illumination, and environmental conditions. The aerial data acquisition task was supported by a team collecting, in carefully planned fashion, the ground truth
OBJECT DETECTION BY STEP-WISE ANALYSIS 237
information. This activity provided a detailed recording of the exact physical sizes of objects, types of objects, surface characteristics of objects, and geographical locations of objects, environmental and illumination conditions. The data acquisi- tion mission itself represents over four man-years of effort which includes design and fabrication of the scanner, selection of test sites, development of logistical support for data acquisition, planning of aerial missions, site preparation, actual aerial flights, data preprocessing, formating, and ground truth association. In Ref. [l], Cress and Smith describe the details associated with the data acquisition mission. We believe that this data set provides a very unique and valuable resource to evaluate the performance of the object detection approach.
The central focus of our research is to develop a methodology which is tested using real-world images to evaluate its strength and limitation. The objective is not to devise a theoretical approach but to engineer an approach tested in real situations. Real-world environments involve complex matter-energy interactions governing the total image formation process making use of simulated images inappropriate. The step-wise approach was successful in detecting objects appear- ing in a diverse set of real images with high accuracy and very low false alarm rates, indicating the basic feasibility and robustness of the approach.
2. STEP-WISE ANALYSIS OF IMAGES FOR OBJECT DETECTION
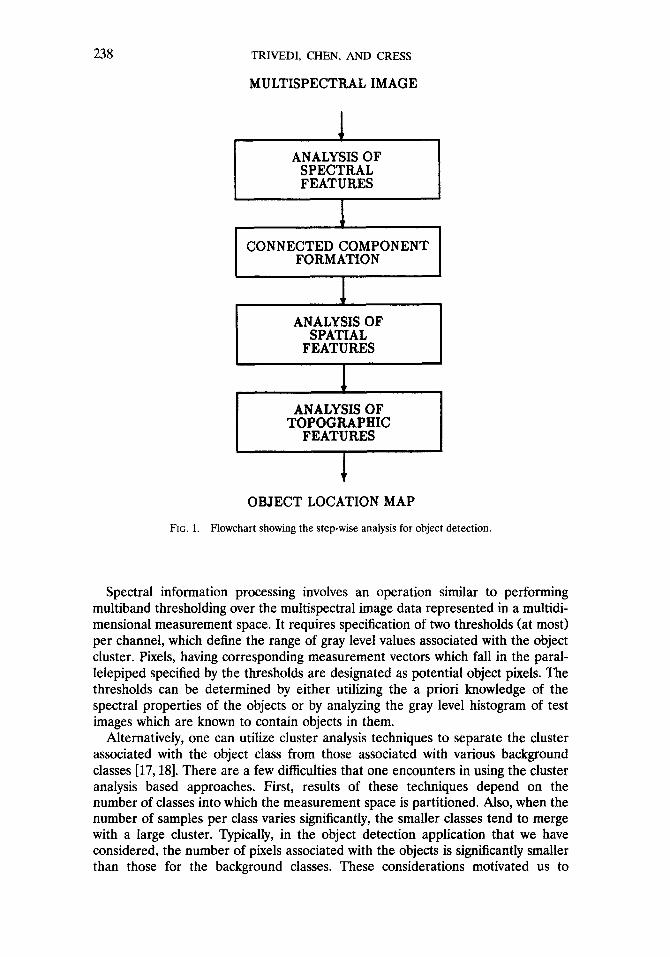
Development of a robust object detection methodology requires effective utiliza- tion of the information derived from an image along with any available prior knowledge of various object attributes. Our formulation is based upon the general framework of model-based vision, where features extracted from the image are matched against the attributes derived from the assumed object models [16]. The approach we present is hierarchical in nature where object detection is accom- plished by progressively eliminating competing background regions by examining various spectral and spatial properties in a step-wise fashion. This can be seen as the process of “focus of attention” where, at every stage, regions of interest are detected and a relatively large portion of the image is eliminated from further examination. Step-wise examination of features extracted from an image begins by examination of the most easily computable spectral features to identify candidate object regions. These regions are then subjected to the spatial feature analysis to further reduce the number of regions which need to be examined by the topo- graphic feature analysis step. Image analysis begins with the multispectral imagery of a scene and proceeds to derive a map showing the locations of the objects detected (Fig. 1). Detailed discussion of these processing steps is presented in this section.
2.1. Analysis of the Spectral Features
The objective of spectral feature analysis is not to find the final bit-mask associated with all of the objects in an image but only to identify those regions which appear like objects based solely upon their spectral characteristics. The assumption is made that the measurement vectors associated with the objects tend to form a cluster in the measurement space whose axes represent sensor response in different spectral channels. Typically, the object cluster is not compact and well separated from the background vectors, and therefore one cannot separate object regions without encountering false alarms.
238 TRIVEDI, CHEN, AND CRESS
MULTISPECTRAL IMAGE
1
CONNECTED COMPONENT FORMATION
1
AN;p\$;fLOF
FEATURES c
I
ANALYSIS OF TOPOGRAPHIC
FEATURES
OBJECT LOCATION MAP
FIG. 1. Flowchart showing the step-wise analysis for object detection.
Spectral information processing involves an operation similar to performing multiband thresholding over the multispectral image data represented in a multidi- mensional measurement space. It requires specification of two thresholds (at most) per channel, which define the range of gray level values associated with the object cluster. Pixels, having corresponding measurement vectors which fall in the paral- lelepiped specified by the thresholds are designated as potential object pixels. The thresholds can be determined by either utilizing the a priori knowledge of the spectral properties of the objects or by analyzing the gray level histogram of test images which are known to contain objects in them.
Alternatively, one can utilize cluster analysis techniques to separate the cluster associated with the object class from those associated with various background classes [17,18]. There are a few difficulties that one encounters in using the cluster analysis based approaches. First, results of these techniques depend on the number of classes into which the measurement space is partitioned. Also, when the number of samples per class varies significantly, the smaller classes tend to merge with a large cluster. Typically, in the object detection application that we have considered, the number of pixels associated with the objects is significantly smaller than those for the background classes. These considerations motivated us to
OBJECT DETECTION BY STEP-WISE ANALYSIS 239
1 40.
- %--
- I I I 1
00 60.00 80.00 100.00 120.00 140.00 GRAY LEVEL
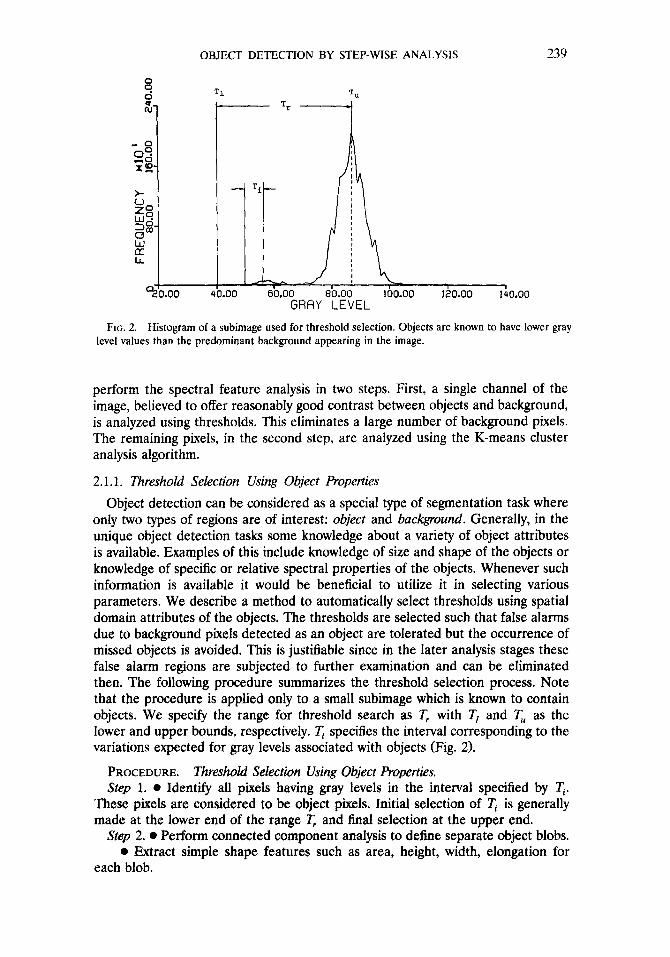
FIG. 2. Histogram of a subimage used for threshold selection. Objects are known to have lower gray level values than the predominant background appearing in the image.
perform the spectral feature analysis in two steps. First, a single channel of the image, believed to offer reasonably good contrast between objects and background, is analyzed using thresholds. This eliminates a large number of background pixels. The remaining pixels, in the second step, are analyzed using the K-means cluster analysis algorithm.
2.1.1. Threshold Selection Using Object Properties
Object detection can be considered as a special type of segmentation task where only two types of regions are of interest: object and background. Generally, in the unique object detection tasks some knowledge about a variety of object attributes is available. Examples of this include knowledge of size and shape of the objects or knowledge of specific or relative spectral properties of the objects. Whenever such information is available it would be beneficial to utilize it in selecting various parameters. We describe a method to automatically select thresholds using spatial domain attributes of the objects. The thresholds are selected such that false alarms due to background pixels detected as an object are tolerated but the occurrence of missed objects is avoided. This is justifiable since in the later analysis stages these false alarm regions are subjected to further examination and can be eliminated then. The following procedure summarizes the threshold selection process. Note that the procedure is applied only to a small subimage which is known to contain objects. We specify the range for threshold search as T, with TI and T, as the lower and upper bounds, respectively. q specifies the interval corresponding to the variations expected for gray levels associated with objects (Fig. 2).
PROCEDURE. Threshold Selection Using Object Properties. Sfep 1. l Identify all pixels having gray levels in the interval specified by ?;..
These pixels are considered to be object pixels. Initial selection of I; is generally made at the lower end of the range T, and final selection at the upper end.
Step 2. 0 Perform connected component analysis to define separate object blobs. l Extract simple shape features such as area, height, width, elongation for
each blob.
240 TRIVEDI, CHEN, AND CRESS
T
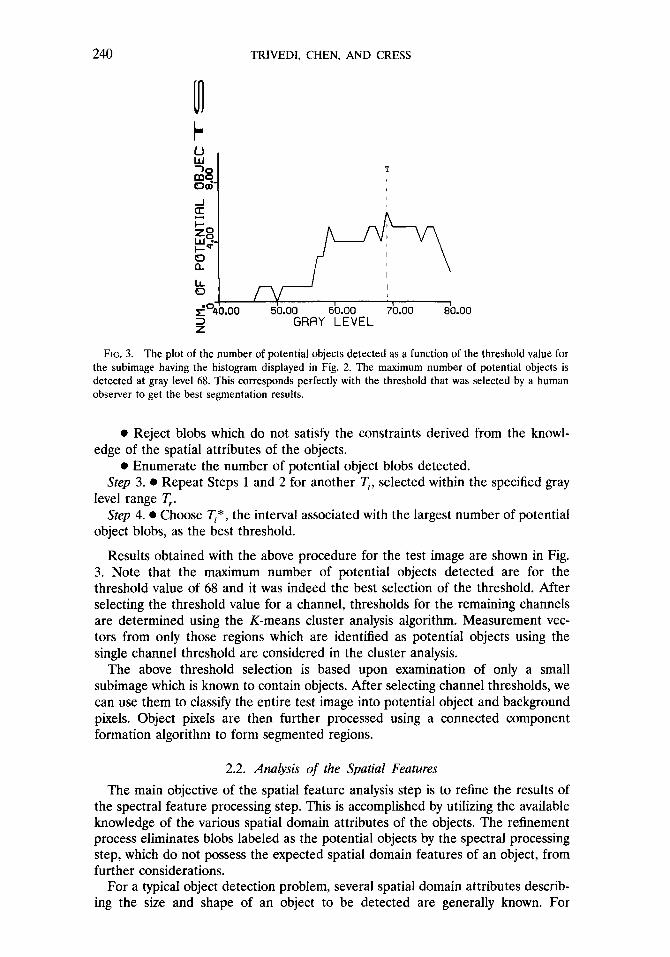
FIG. 3. The plot of the number of potential objects detected as a function of the threshold value for the subimage having the histogram displayed in Fig. 2. The maximum number of potential objects is detected at gray level 68. This corresponds perfectly with the threshold that was selected by a human observer to get the best segmentation results.
l Reject blobs which do not satisfy the constraints derived from the knowl- edge of the spatial attributes of the objects.
l Enumerate the number of potential object blobs detected. Step 3. l Repeat Steps 1 and 2 for another q, selected within the specified gray
level range T,. Step 4. l Choose Ti*, the interval associated with the largest number of potential
object blobs, as the best threshold.
Results obtained with the above procedure for the test image are shown in Fig. 3. Note that the maximum number of potential objects detected are for the threshold value of 68 and it was indeed the best selection of the threshold. After selecting the threshold value for a channel, thresholds for the remaining channels are determined using the K-means cluster analysis algorithm. Measurement vec- tors from only those regions which are identified as potential objects using the single channel threshold are considered in the cluster analysis,
The above threshold selection is based upon examination of only a small subimage which is known to contain objects. After selecting channel thresholds, we can use them to classify the entire test image into potential object and background pixels. Object pixels are then further processed using a connected component formation algorithm to form segmented regions.
2.2. Analysis of the Spatial Features
The main objective of the spatial feature analysis step is to refine the results of the spectral feature processing step. This is accomplished by utilizing the available knowledge of the various spatial domain attributes of the objects. The refinement process eliminates blobs labeled as the potential objects by the spectral processing step, which do not possess the expected spatial domain features of an object, from further considerations.
For a typical object detection problem, several spatial domain attributes describ- ing the size and shape of an object to be detected are generally known. For
OBJECT DETECTION BY STEP-WISE ANALYSIS 241
example, in an aerial image analysis problem the sensor characteristics and resolutions as well as the altitude of the sensor platform are known. Using this information one can quite accurately predict the typical sizes and shapes of various objects such as cars, roads, or houses appearing in an image. The available prior knowledge of the various spatial attributes of an object is encoded in the form of rules. Details of spatial feature analysis are discussed below.
The first step of feature extraction consists of computing the centroid and the area for each individual region. Next, using the moments of a region the principal axis of the region is calculated. Then, the length, width, and the width to height ratio of each region are computed. Features are also extracted from the contours of the regions. Marr edge detector [19] is applied to generate one-pixel wide, closed contours around the regions. Finally, Fourier shape descriptors, normalized for scale change, translation, and orientation of an object are extracted [20].
The second step in the spatial feature analysis includes matching of each object’s extracted features against the rules developed from prior knowledge of the object shape and size. A region which does not satisfy these constraints is rejected as a false alarm.
2.3. Analysis of the Topographic Features
As discussed earlier in this section, topographic feature analysis is the final step in the proposed step-wise object detection approach. Ideally, the objective of this step is to generate the final object location map where all occurrences of the objects are accurately detected and all false alarms are rejected. In this step we examine only those potential object regions which satisfied the spectral and spatial domain constraints. Although the topographic feature analysis is relatively com- plex, it is applied to only a limited area in the image. We begin a detailed description of this analysis step by justifying the use of such features.
Topographic features relate to the local intensity variations appearing on the surface of an object. In many applications, these variations can be utilized as useful characteristic features of an object. Indeed, studies such as those reported in Refs. [7,21] successfully utilized features related to the cooccurrences of gray levels in a localized area to identify objects such as airplanes in high resolution images. These features were derived from the gray level cooccurrence (GLC) matrices, elements of which are the estimates of the second-order probability of a transition from a pixel with gray level i to a pixel with gray level j, given that the pixels are a specified distance apart. This experience motivated us to consider topographic features for the present study. Observation indicates that in high resolution images intensity levels over object surface are not constant, but can be characterized as having convex or concave shape. Their profile can be approximated with a polynomial that is easy to compute. Coefficients of the polynomial can later be analyzed to make inferences about the surface profile of an object. The procedure developed below is similar to that presented in Ref. [22]. The main difference in the two is that while Haralick and his colleagues have analyzed a complete topographic map of an image, our topographic feature analysis is restricted to only a small selected portion of an image, i.e., blobs which were identified as potential objects as the result of the spectral and spatial feature analysis. Also, our development is based upon the fourth-order polynomial fit, whereas the technique described in Ref. [22] utilizes a third-order polynomial.
242 TRIVEDI, CHEN, AND CRESS
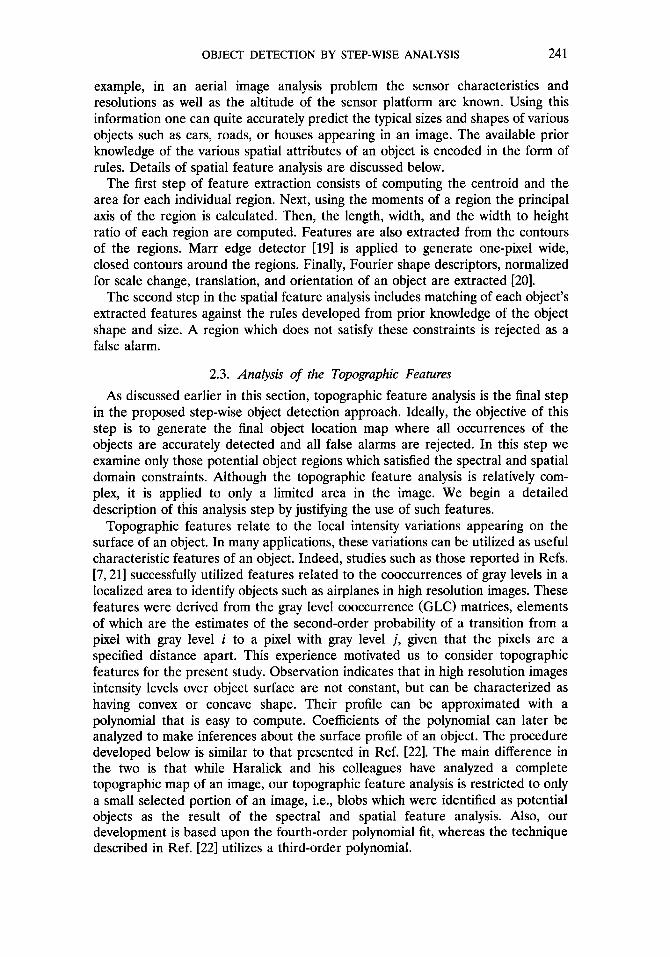
As a first step in the analysis we approximate the object intensity profile by a fourth-order polynomial f(x, y):
f(x, y) = b,n4 + b,x3 + b3x3y + b,x2 + b,x’y + b,x*y* + b,x + b,xy
+ b,xy* + bloxy3 + b,,y + b,,y2 + b13y3 + b,,y4 + b15. (2.3.1)
Analysis of the topographic features of objects involves the assumption that local intensity variations over object surface as manifested in an image are quite unique to objects. Justification for this is graphically provided with the aid of Fig. 4. In part (a), gray level intensity variations on an object surface are plotted. Note that the intensities are not constant over the region. In part (b), the object profile is reconstructed using a fourth-order polynomial. Utility of such topographic charac- terization in object detection task is illustrated using Fig. 5, which shows intensity
FIG. 4. Topographic features of an object surface. (a) is a plot of gray level intensity variations over an object surface. (b) shows the object surface reconstructed using a fourth-order polynomial fit.
OBJECT DETECTION BY STEP-WISE ANALYSIS 243
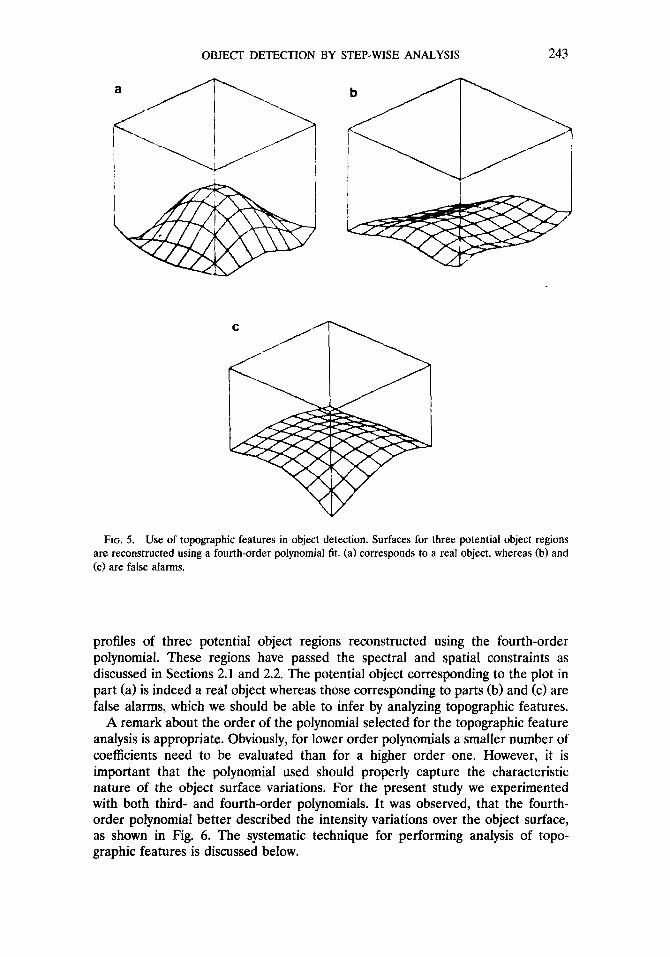
FIG. 5. Use of topographic features in object detection. Surfaces for three potential object regions are reconstructed using a fourth-order polynomial fit. (a) corresponds to a real object, whereas (b) and Cc) are false alarms.
profiles of three potential object regions reconstructed using the fourth-order polynomial. These regions have passed the spectral and spatial constraints as discussed in Sections 2.1 and 2.2. The potential object corresponding to the plot in part (a) is indeed a real object whereas those corresponding to parts (b) and Cc) are false alarms, which we should be able to infer by analyzing topographic features.
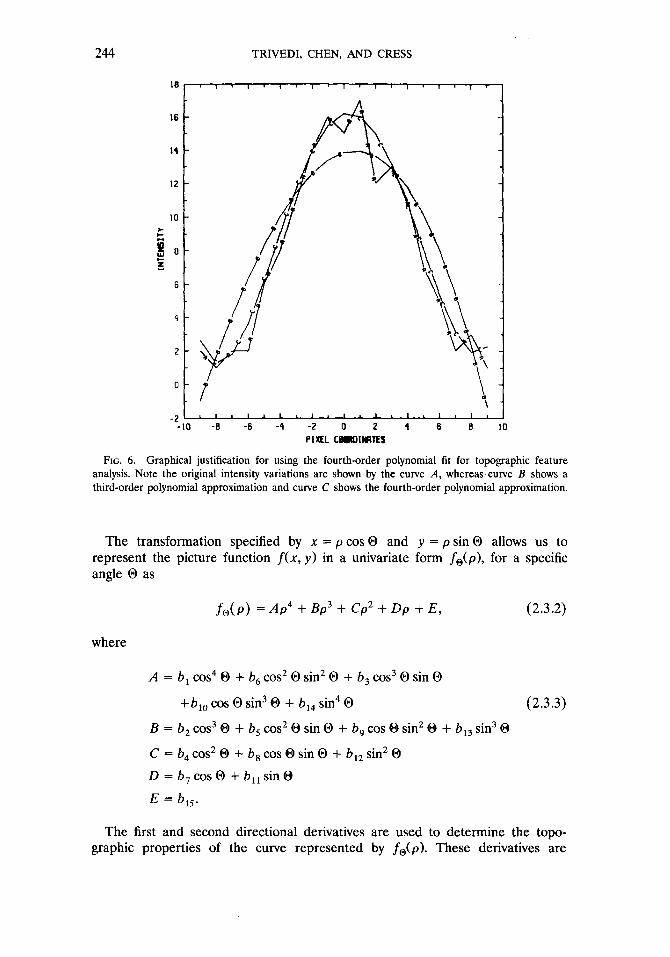
A remark about the order of the polynomial selected for the topographic feature analysis is appropriate. Obviously, for lower order polynomials a smaller number of coefficients need to be evaluated than for a higher order one. However, it is important that the polynomial used should properly capture the characteristic nature of the object surface variations. For the present study we experimented with both third- and fourth-order polynomials. It was observed, that the fourth- order polynomial better described the intensity variations over the object surface, as shown in Fig. 6. The systematic technique for performing analysis of topo- graphic features is discussed below.
244 TRIVEDI, CHEN, AND CRESS
2
0
-10 -8 -6 -4 -2 0 2 PIXEL CORDllAKS
FIG. 6. Graphical justification for using the fourth-order polynomial fit for topographic feature analysis. Note the original intensity variations are shown by the curve A, whereas curve B shows a third-order polynomial approximation and curve C shows the fourth-order polynomial approximation.
The transformation specified by x = p cos 0 and y = p sin 0 allows us to represent the picture function f(x, y) in a univariate form f@(p), for a specific angle 0 as
fo( p) = Ap4 + Bp3 + Cp2 + Dp -t E, (2.3.2)
where
A = b, cos4 0 + b, cos2 0 sin2 0 + b, cos3 0 sin 0
+b,,cosOsin30 + b,,sin40 (2.3.3)
B = b, cos3 0 + b, cos2 0 sin 0 + b, cos 0 sin2 0 + b,, sin3 0
C = b4 cos2 0 + b, cos 0 sin 0 + b,, sin2 0
D = 6, cos 0 + b,, sin 0
E = b,,.
The first and second directional derivatives are used to determine the topo- graphic properties of the curve represented by f@(p). These derivatives are
OBJECT DETECTION BY STEP-WISE ANALYSIS 245
specified as
f&(p) = 4Ap3 + 3Bp2 + 2Cp + D, (2.3.4)
f&(p) = 12Ap2 + 6Bp + 2c. (2.3.5)
The value of 0 is chosen so that the second directional derivative of fo(x, y) has an extremum. It can be shown that the value of 0 for which f&x, y) possesses an extremum is
(2.3.6)
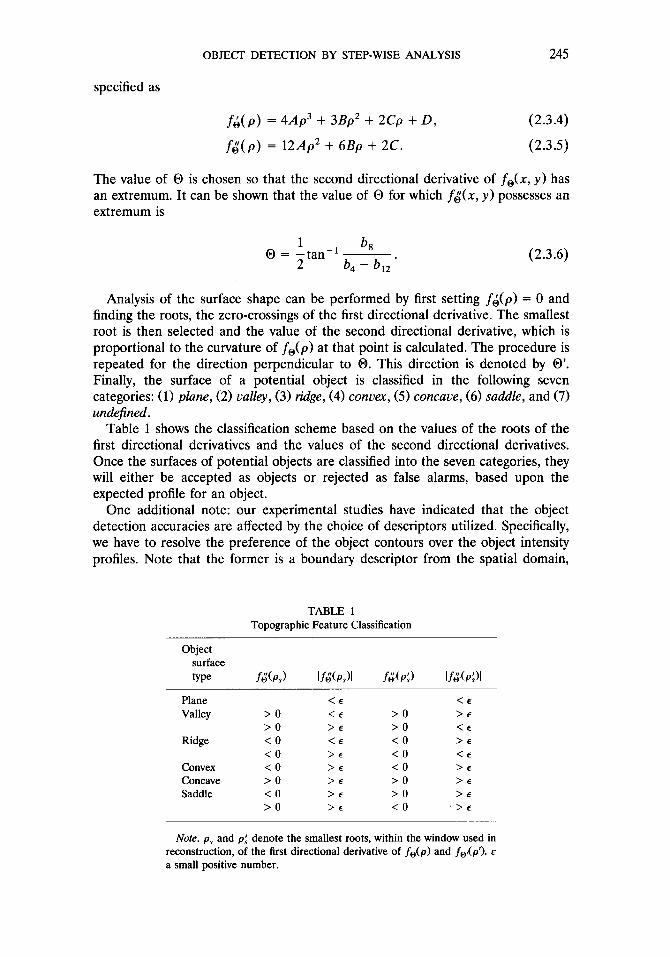
Analysis of the surface shape can be performed by first setting f&(p) = 0 and finding the roots, the zero-crossings of the first directional derivative. The smallest root is then selected and the value of the second directional derivative, which is proportional to the curvature of f@(p) at that point is calculated. The procedure is repeated for the direction perpendicular to 0. This direction is denoted by 0’. Finally, the surface of a potential object is classified in the following seven categories: (1) plane, (2) u&y, (3) ridge, (4) co~z~e.~, (5) coIzcoEue, (6) saddle, and (7) undefined.
Table 1 shows the classification scheme based on the values of the roots of the first directional derivatives and the values of the second directional derivatives. Once the surfaces of potential objects are classified into the seven categories, they will either be accepted as objects or rejected as false alarms, based upon the expected profile for an object.
One additional note: our experimental studies have indicated that the object detection accuracies are affected by the choice of descriptors utilized. Specifically, we have to resolve the preference of the object contours over the object intensity profiles. Note that the former is a boundary descriptor from the spatial domain,
TABLE 1 Topographic Feature Classification
Object surface me ff$(P,) If&P,)l f&p;) If&(P:l
Plane Valley >o
>o Ridge <o
<o Convex <o Concave >o Saddle <o
>o
<e
<E >E <E >E
>E >E >E
>E
>o >o <o <o <o >o >o <o
<E >E
<E >e <E
>e >E >E >E
Note. ps and pj denote the smallest roots, within the window used in reconstruction, of the first directional derivative of f,Jp) and f&p’). c a small positive number.
246 TRIVEDI, CHEN, AND CRESS
whereas the latter is a region descriptor from the topographic domain. We have observed that for low resolution images, topographic features provide better characterization than the object contours. In relatively higher resolution images, object contours provide a better description due to objects appearing larger. Also, in such situations one typically uses larger window size, and therefore the polyno- mial approximations do not accurately characterize the actual intensity variations.
3. EXPERIMENTAL VERIFICATION OF THE OBJECI- DETECTION METHODOLOGY
In the previous sections we have presented a step-wise object detection ap- proach that systematically analyzes information from the spectral, spatial, and topographic domains. In order to establish the practical validity of the approach several experiments utilizing high resolution multispectral imagery were con- ducted. In this section, these experiments and their results are described.
The test data set consists of several high resolution multispectral images ac- quired from a broad range of geographical and environmental conditions. The multispectral images record the radiated energy from the scene in several chan- nels, each allowing radiation in a specific wavelength band to pass [14]. Multispec- tral images can be considered as generalization of the color images, where instead of recording incident energy from only three channels (R, G, B) in the visible spectrum, several channels from the visible as well as the infrared portion of the electromagnetic spectrum are utilized. The recorded images are in perfect spatial registration with one another enabling examination of the same “footprint” on the ground through several distinct spectral bands. Multispectral images recorded by satellite-based platforms have proven their utility in a number of applications such as agricultural crop classification, land use classification, and even oceanographic feature analysis [15,23]. These images are typically of fairly low spatial resolutions, having footprints of the order of about 100 m. More recently, high resolution multispectral images have shown promise in a number of complex urban scene analysis tasks [6,24]. The spatial resolution of these images is orders of magnitude higher than of the satellite images, requiring different methods of analysis than those utilized for the satellite images. In the following experiments, we analyze high resolution multispectral imagery using the step-wise analysis approach. It provides a proper scheme for utilizing all of the meaningful characteristics of the objects in a systematic manner.
The step-wise object detection approach was applied to several high resolution multispectral images. Our presentation includes images from two entirely different tests areas, acquired at different times, of different resolutions, and having differ- ent background classes and clutter characteristics. The objects to be detected are, however, of the same class and if their detection is successfully accomplished in such diverse dataset then we can justify the practical utility and robust nature of the approach.
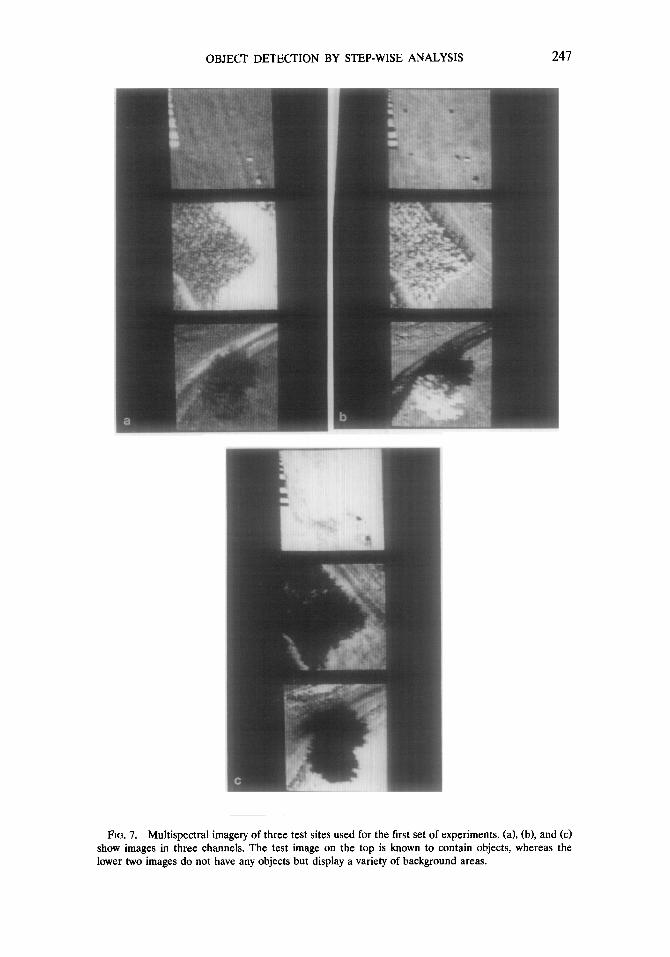
The first set of experiments included three separate test sites. The multispectral images of these test sites are shown in Fig. 7. Note, that the scene appears quite different in the three spectral channels, supporting the non-redundant nature of the spectral characterization. These high resolution images were acquired during the same data acquisition mission and their spatial resolutions are the same. Test site 1 was known to contain objects of interest whereas the other two sites did not
OBJECT DETECTION BY STEP-WISE ANALYSIS 247
FIG. 7. Multispectral imagery of three test sites used for the first set of experiments. (a), (b), and (( show images in three channels. The test image on the top is known to contain objects, whereas th lower two images do not have any objects but display a variety of background areas.
:) e
248 TRIVEDI, CHEN, AND CRESS
have any objects, and are comprised of only background classes. These test sites were selected after a very careful scrutiny. The two test sites known to have background classes were identified by a photointerpreter to be those having the following two features:
1. These background classes represent the most common environments in which the objects are expected to appear, and
2. The sites include backgrounds which are most difficult to discriminate from objects.
Thus, success of an object detection approach will have to be judged by its ability to detect objects in site 1 and reject all competing background classes appearing in sites 2 and 3.
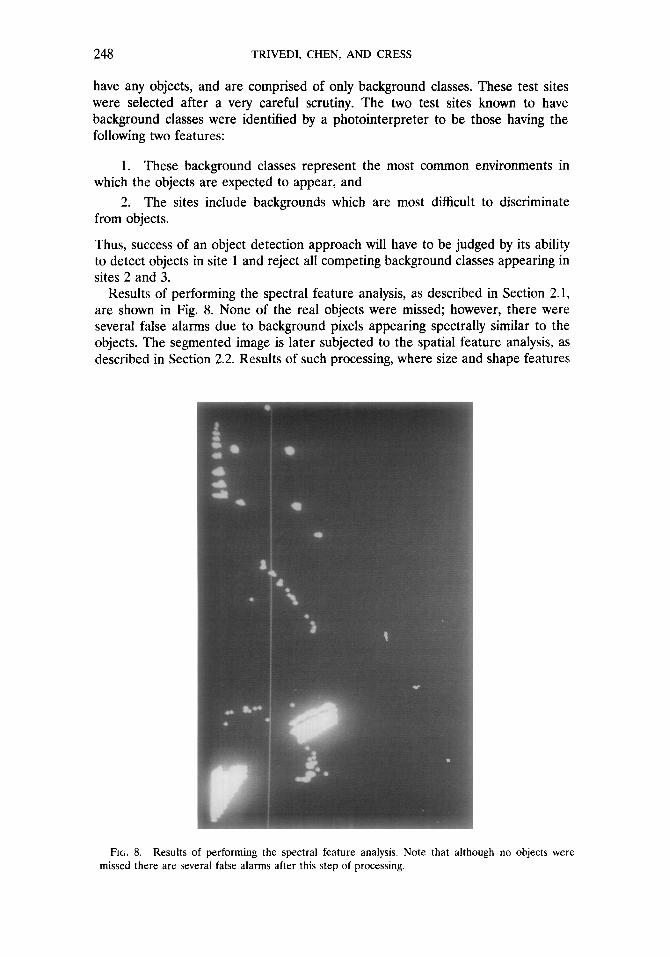
Results of performing the spectral feature analysis, as described in Section 2.1, are shown in Fig. 8. None of the real objects were missed; however, there were several false alarms due to background pixels appearing spectrally similar to the objects. The segmented image is later subjected to the spatial feature analysis, as described in Section 2.2. Results of such processing, where size and shape features
FIG. 8. Results of performing the spectral feature analysis. Note that although no objects were missed there are several false alarms after this step of processing.
OBJECT DETECTION BY STEP-WISE ANALYSIS 249
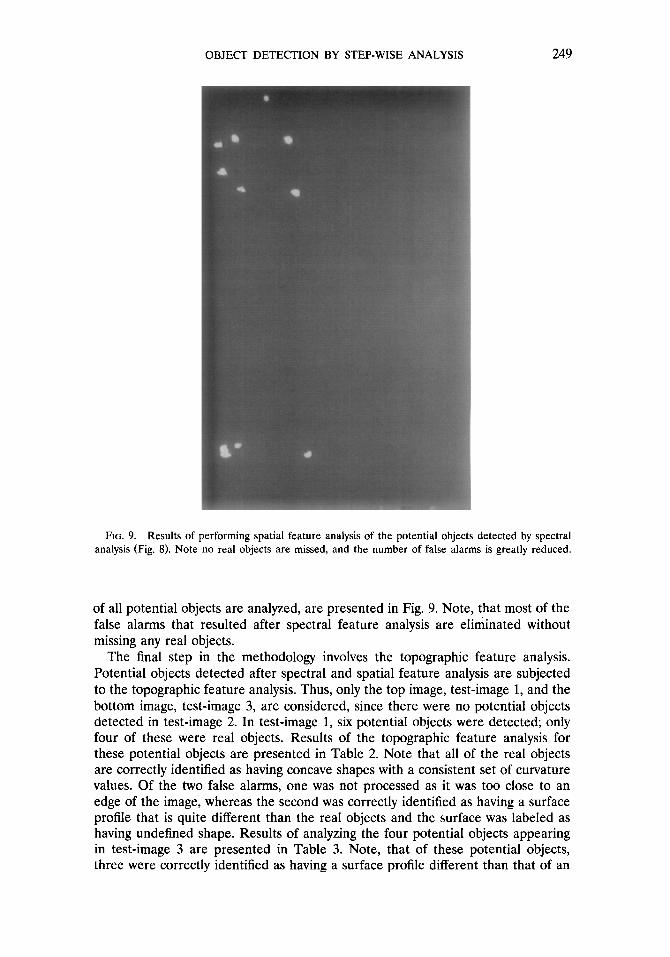
FIG. 9. Results of performing spatial feature analysis of the potential objects detected by spectral analysis (Fig. 8). Note no real objects are missed, and the number of false alarms is greatly reduced.
of all potential objects are analyzed, are presented in Fig. 9. Note, that most of the false alarms that resulted after spectral feature analysis are eliminated without missing any real objects.
The final step in the methodology involves the topographic feature analysis. Potential objects detected after spectral and spatial feature analysis are subjected to the topographic feature analysis. Thus, only the top image, test-image 1, and the bottom image, test-image 3, are considered, since there were no potential objects detected in test-image 2. In test-image 1, six potential objects were detected; only four of these were real objects. Results of the topographic feature analysis for these potential objects are presented in Table 2. Note that all of the real objects are correctly identified as having concave shapes with a consistent set of curvature values. Of the two false alarms, one was not processed as it was too close to an edge of the image, whereas the second was correctly identified as having a surface profile that is quite different than the real objects and the surface was labeled as having undefined shape. Results of analyzing the four potential objects appearing in test-image 3 are presented in Table 3. Note, that of these potential objects, three were correctly identified as having a surface profile different than that of an
250 TRIVEDI, CHEN, AND CRESS
TABLE 2 Results of the Topographic Feature Analysis of the Potential Objects Resulting
after the Spectral and Spatial Analysis for Test-image 1
Potential object number
1
2
3
4
5
6
Principal axes
0, = 5.4” 0, = -84.6” 0, = 21.8 0, = -68.2” 0, = 89.4” 0, = -0.6” 0, = 88.1” 0, = - 1.9” 0, = 62.1” 0, = -27.9
Object too close to the edge
Curvature
5.74 4.12 5.01 4.42
11.89 0.87 5.18 3.12 5.74 3.38
-
Intensity profile shape
Concave
Concave
Undefined
Concave
Concave
-
object and were labeled as having undefined surface shape. The fourth potential object was, however, labeled as having a concave surface shape. A closer scrutiny of the curvature values corresponding to this region reveals that, in comparison with the curvature values associated with the real objects (as shown in Table 2), the region has quite dissimilar curvature. This observation suggests that in performing topographic feature analysis, in addition to the surface shape classification one may have to use a threshold curvature value in making the final objects vs background decision.
In order to verify the robustness of this approach additional experiments were conducted involving high resolution test images acquired from other test sites. These test sites were at entirely different geographical locations. The images were acquired at different times and during different environmental conditions than
TABLE 3 Results of the Topographic Feature Analysis of the Potential Objects Resulting
after the Spectral and Spatial Analysis for Test-image 3
Potential object number Principal axes Curvature
1 0, = -70.4” 1.65 0, = 19.6” 0.62
2 0, = -39.7” 2.05 0, = 50.3 0.23
3 0, = 78.1” 0.87 0, = -11.9” 0.75
4 0, = 63.4” 4.32 0, = -26.8” - 0.02
Intensity profile shape
Concave
Undefined
Undefined
Undefined
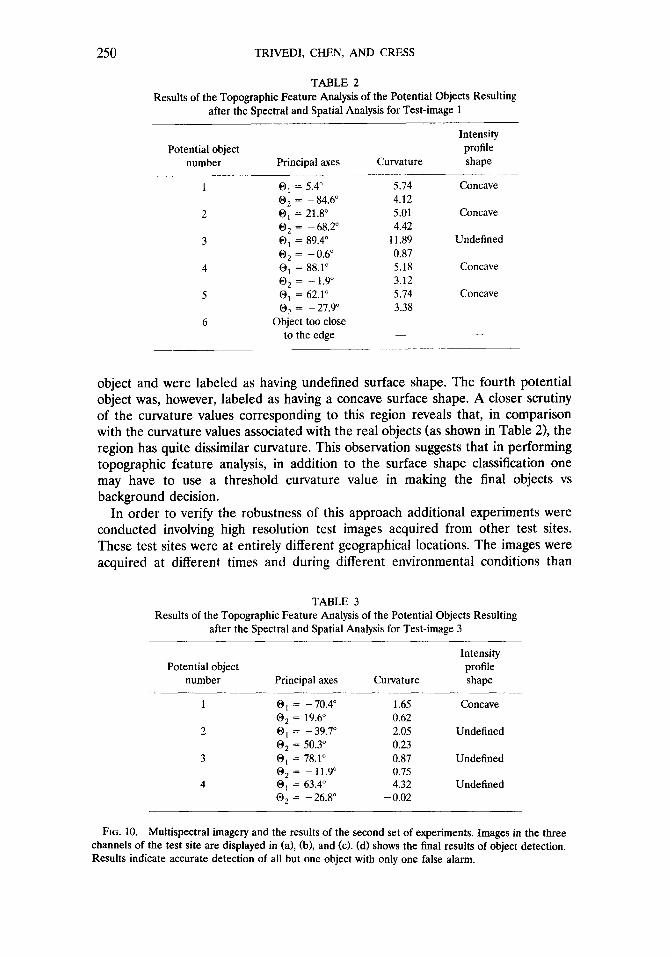
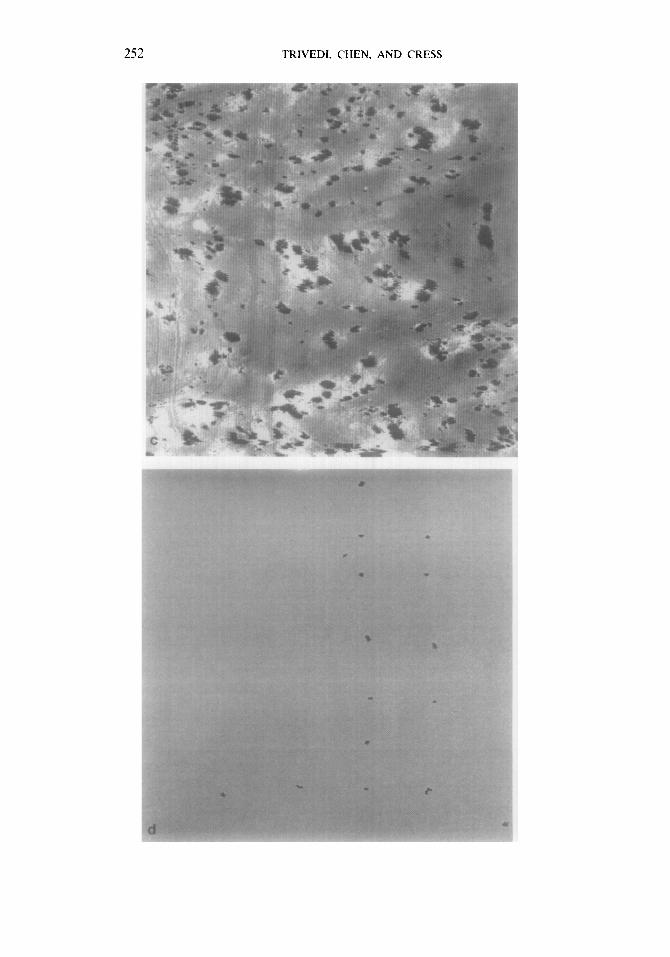
FIG. 10. Multispectral imagery and the results of the second set of experiments. Images in the three channels of the test site are displayed in (a), (b), and (cl. (d) shows the final results of object detection. Results indicate accurate detection of all but one object with only one false alarm.

OBJECT DETECTION BY STEP-WISE ANALYSIS 251
252 TRIVEDI. CHEN. AND CRESS
OBJECT DETECTION BY STEP-WISE ANALYSIS 253
those existing when the previous set of images were acquired. Another important distinguishing aspect of the second test area was the totally dissimilar nature of the background classes appearing at the test sites. The three channel test images from this area are displayed in Fig. 10. The objects placed at these sites for the experimentation were of the same class as those which appeared in the test sites shown in Fig. 7. However, the spatial resolution of these images is different than that of the previous test. The point should be made that the objects of interest are indiscernible to human observers in the imagery. Many background objects both natural and manmade appear quite similar to the objects. The step-wise object detection approach was utilized to analyze this test imagery. The sequence of operation was identical to the one described above: starting with spectral, then spatial, and finally topographic feature analysis. The final results of the object detection process are displayed in Fig. 10d. The observation was made that all but one of the 16 objects present in the test images were correctly detected (detection accuracy of 93.8%) and only one false alarm was encountered. This reflects an extremely small false alarm rate, since the portion of the image associated with the background is much greater than the object class (the ratio of object pixels to background pixels was less than 10e4).
The above experiments show the utility of the step-wise object approach based upon the systematic analysis of various spectral, spatial, and topographic features. By successful application of the approach to test images from different locations and with different backgrounds we have demonstrated the robustness of the approach.
4. SUMMARY AND CONCLUSIONS
Accurate and robust detection of objects is a main requirement encountered in a variety of image interpretation studies. In this paper we have presented the development of an object detection approach applicable to high resolution multi- spectral imagery. Multispectral images, acquired from satellite platforms, have shown utility in a variety of application domains. These images are generally of lower resolutions and new generation of sensors offer the capability of acquiring higher resolution images. Due to the increased spectral and spatial resolutions of these images, newer tools and approaches are required for their analysis.
The step-wise object detection approach developed in this paper provides a systematic framework for analyzing information related to the spectral, spatial, and topographic characteristics of the objects and their backgrounds. The approach effectively utilizes the information extracted from an image and the available prior knowledge of various object attributes. It basically involves matching of image domain features to the attributes derived from the assumed object models. The approach involves a step-wise analysis of images, where the initial object/back- ground discrimination is based upon low-level features and further processing requires limited knowledge of object attributes. Techniques for the analysis of the spectral, spatial, and topographic features tend to be of increasing levels of computational complexity. The computationally simpler spectral feature analysis is performed for the entire image to detect candidate object regions. Only these regions are considered in the spatial feature analysis step to further reduce the number of candidate regions which need to be analyzed in the topographic feature

254 TRIVEDI, CHEN, AND CRESS
analysis step. Such step-wise analysis makes the entire object detection process efficient.
For the spectral analysis a procedure based upon cluster analysis concepts was utilized. Values for thresholds required in this analysis were determined using knowledge of few spatial domain object attributes. Connected component analysis was employed to locate potential objects satisfying the spectral domain constraints. Various size and shape measures of these potential objects were calculated and were compared with the known object attributes to eliminate false alarms. Finally, detailed topographic feature analysis of the surface shape of the potential objects was performed to further eliminate false alarm regions which satisfied both the spectral and spatial domain constraints. It is assumed that the local intensity variations associated with objects can be utilized as their topographic characteris- tics. The topographic feature analysis involves fitting of the local intensity varia- tions over small regions by a fourth-order polynomial and classifying these varia- tions into seven different types of profiles. The object detection methodology was tested by performing experiments on a variety of multispectral imagery. The test images utilized in the experiments are acquired from a number of test sites. The sites are quite different and include very dissimilar background classes. The step-wise object detection approach successfully detected objects in these experi- ments with high detection rates and small false alarm rates. Results obtained in imagery acquired from different test sites, at different times, of different resolu- tions, and with different background classes validate the robustness of the ap- proach.
The main objective of this research is to evaluate the feasibility of the integrated system for performing object detection. Our primary emphasis was not on the development of the most computationally efficient implementation. However, a brief remark about the computational aspects of the approach is in order. Spectral processing by multiband thresholding and application of spatial domain constraints to the selected regions can be done at an extremely fast rate. Spatial feature analysis which is applied to a smaller section of the original image, involves extraction of various simple size and shape features and a computationally simple thresholding step for the matching. Even the topographic feature analysis is not an unreasonable computationally expensive task, although time required is dependent upon the number of regions to be tested. Because of these reasons, as well as the basic nature of the step-wise approach, where progressively smaller sections of the images are subjected to more involved examination, it is believed that it should be feasible to develop an efficient implementation of the integrated object detection approach which will perform within the timing constraints of an operational system.
ACKNOWLEDGMENTS This research was supported in part by the U.S. Army Research Grant DACA 39-84-C-0017 and the
Army Research Office Grant DAAG23-82-K-0189. Mr. Perry Smith and Mr. Ernest Cespedes, of the Army Corps of Engineers, provided valuable assistance in the data acquisition and experimental verification phase of the research. We also thank the reviewers for their valuable comments. Mrs. Janet Smith provided assistance in the preparation of the manuscript.
REFERENCES 1. D. H. Cress and P. A. Smith, Database for Remote Detection of Objects: High Resolution Passive
OBJECT DETECTION BY STEP-WISE ANALYSIS 255
Imagery, Technical Report EL-82, U.S. Army Engineer Waterways Experiment Station, Vicks- burg, MS, November 1983.
2. W. A. Perkins, A model-based vision system for industrial parts, IEEE Trans. Comput. C-27, No. 2, 1978, 126-143.
3. S. W. Holland, L. Rossol, and M. R. Ward, Consight-1: A vision-controlled robot system for transferring parts from belt conveyors, in Computer Vision and Sensor-Based Robotics, pp. 81-100, Plenum, New York, 1979.
4. N. Ayache, and 0. D. Faugeras, HYPER: A new approach for the recognition and positioning of two-dimensional objects, IEEE Trans. Pattern Anal. Mach. Intell. P&II-I, No. 1, 1986, 44-54.
5. M. M. Trivedi, C. Chen, and S. Marapane, A vision system for robotic inspection and manipula- tion, IEEE Computer 22, No. 6, 1989, 91-97.
6. C. A. Harlow, M. M. Trivedi, R. W. Conners, and D. Phillips, Scene analysis of high resolution aerial scenes, Opt. Eng. 25, No. 3, 1986, 347-355.
7. D. Harwood, S. Chang, and L. S. Davis, Interpreting aerial photographs by segmentation and search, Opt. Digital Pattern Recognit. SPIE 754, 1987, 241-254.
8. M. M. Trivedi and C. A. Harlow, identification of unique objects in high resolution aerial images, Opt. Eng. 24, No. 3, 1985, 502-506.
9. L. G. Sevigny, H. Jensen, M. Bohner, E. Ostevold, S. Grinaker, and J. Dehne, Discrimination and classification of vehicles in natural scenes from thermal imagery, Comput. Ksion Graphics Image Process. 24, 1983, 229-243.
10. S. M. Lutton and 0. R. Mitchell, Adaptive segmentation of unique objects, in Proceedings, the 5th Int. Conf. Pattern Recognition, Miami, FL, December 1980, pp. 548-550.
11. C. L. Wyatt, Radiometric Calibration: Theory and Methods, Academic Press, New York, 1978. 12. D. H. Ballard, and C. M. Brown, Computer k’ision, Prentice-Hall, Englewood Cliffs, NJ, 1982. 13. P. J. Besl and R. C. Jain, Three-dimensional object recognition, Comput. Surveys 17, No. 1, 1985,
75-14s. 14. A. F. M. Goetz, G. Vane, J. E. Soloman, and B. N. Rock, Imaging spectrometry for earth remote
sensing, Science 228, No. 4704, 1985, 1147-1153. 15. D. A. Landgrebe, Analysis technology for land remote sensing, Proc. IEEE, 69, No. 5, 1981,
628-642. 16. H. G. Barrow and J. M. Tenenbaum, Computational vision, Proc. IEEE 69, No. 5, 1981,572-595. 17. G. B. Coleman, and H. C. Andrews, Image segmentation by clustering, Proc. IEEE 67, No. 5,
1979, 773-785. 18. M. M. Trivedi and J. C. Bezdek, Low-level segmentation of aerial images with fuzzy clustering,
IEEE Trans. Systems Man Cybemet. SMC-16, No. 4, 1986, 589-598. 19. D. Marr, vision, Freeman, San Francisco, 1982. 20. 0. R. Mitchell, and T. A. Grogan, Global and partial shape discrimination for computer vision,
Opt. Eng. 23, No. 5, 1984, 484-491. 21. M. M. Trivedi, C. A. Harlow, R. W. Conners, and S. Goh, Object detection based on gray level
cooccurrence, Comput. Vision Graphics Image Process. 28, No. 2, 1984, 199-219. 22. R. M. Haralick, L. T. Watson, and T. J. Laffey, The topographic primal sketch, Int. I. Rob. Res. 2,
No. 1, 1983, SO-72. 23. R. N. Colwell (Ed.), Manual of Remote Sensing, 2nd ed., American Society of Photogrammetry,
1983. 24. M. M. Trivedi, Object detection in multispectral high resolution images, Proc. Multispectral Image
Processing and Enhancement, SPIE 933, 1988, 8-14.