Transatlantic time and frequency transfer by GPS carrier phase
11
FIRST RESULTS ON A TRANSATLANTIC TIME AND FREQUENCY TRANSFER BY GPS CARRIER PHASE G. Dudle, F. Overney, 1;. Prost Swiss Federal Office of Metrology Lindenweg 50, CH-3003 Bern-Wabern, Switzerland Th. Schildknecht, T. Springer Astronomical Institute of the University of Berne Switzerland P. Hetzel P hysikalisch Techllische Bundesantalt Braunschweig, Germany E. Powers U.S. Naval Observatory, Washington, DC, USA A hstract Time and frequency transfer hy GPS carrier phase, also referred to as Geodetic Time Transfer (GeTT), has been studied intensively in the frame of a cullahoration between the Swiss Federal Office of Metrology (OFMET) and the Astronomical Institute of the University of Berne (AIUB). Two terminah equipped with geodetic GPS receivers have been built and were successfully deployed over European baselines. The study has demonstrated the low instrumental noke of GeTT (q(4 = 1@13 at z = 100 s) which makes this method an ideal tool for frequency comparisons between high performance clocks since much shorter averaging times are required than with GPS common viens This new time and frequency transfer method is now to be tested over longer baselines. In this paper we report on a transdluntic campaign between the Physikabch-Technkche Bundesanstalt in Germany (PrB) and the US Naval Observatory, Washington (USNO). Besides the longer baseline the choice of these two sites offers aho the possibility to compare frequently GeTT and TWSTFT. The paper outlines the main parts of u GeTT campaign and summarizes the first resuLts of time and frequency transfer b+y GPS carrier phase between RB and USNO.
Transcript of Transatlantic time and frequency transfer by GPS carrier phase

FIRST RESULTS ON A TRANSATLANTIC TIME AND
FREQUENCY TRANSFER BY GPS CARRIER PHASE
G . Dudle, F. Overney, 1;. Prost Swiss Federal Office of Metrology
Lindenweg 50, CH-3003 Bern-Wabern, Switzerland
Th. Schildknecht, T. Springer Astronomical Institute of the University of Berne
Switzerland
P. Hetzel P hysikalisch Techllische Bundesantalt
Braunschweig, Germany
E. Powers U.S. Naval Observatory, Washington, DC, USA
A hstract
Time and frequency transfer hy GPS carrier phase, also referred to as Geodetic Time Transfer (GeTT), has been studied intensively in the frame of a cullahoration between the Swiss Federal Office of Metrology (OFMET) and the Astronomical Institute of the University of Berne (AIUB). Two terminah equipped with geodetic GPS receivers have been built and were successfully deployed over European baselines. The study has demonstrated the low instrumental noke of GeTT (q(4 = 1@13 at z = 100 s) which makes this method an ideal tool for frequency comparisons between high performance clocks since much shorter averaging times are required than with GPS common viens This new time and frequency transfer method is now to be tested over longer baselines. In this paper we report on a transdluntic campaign between the Physikabch-Technkche Bundesanstalt in Germany (PrB) and the US Naval Observatory, Washington (USNO). Besides the longer baseline the choice of these two sites offers aho the possibility to compare frequently GeTT and TWSTFT. The paper outlines the main parts of u GeTT campaign and summarizes the first resuLts of time and frequency transfer b+y GPS carrier phase between R B and USNO.

Report Documentation Page Form ApprovedOMB No. 0704-0188
Public reporting burden for the collection of information is estimated to average 1 hour per response, including the time for reviewing instructions, searching existing data sources, gathering andmaintaining the data needed, and completing and reviewing the collection of information. Send comments regarding this burden estimate or any other aspect of this collection of information,including suggestions for reducing this burden, to Washington Headquarters Services, Directorate for Information Operations and Reports, 1215 Jefferson Davis Highway, Suite 1204, ArlingtonVA 22202-4302. Respondents should be aware that notwithstanding any other provision of law, no person shall be subject to a penalty for failing to comply with a collection of information if itdoes not display a currently valid OMB control number.
1. REPORT DATE DEC 1998 2. REPORT TYPE
3. DATES COVERED 00-00-1998 to 00-00-1998
4. TITLE AND SUBTITLE First Results on a Transatlantic Time and Frequency Transfer by GPSCarrier Phase
5a. CONTRACT NUMBER
5b. GRANT NUMBER
5c. PROGRAM ELEMENT NUMBER
6. AUTHOR(S) 5d. PROJECT NUMBER
5e. TASK NUMBER
5f. WORK UNIT NUMBER
7. PERFORMING ORGANIZATION NAME(S) AND ADDRESS(ES) U.S. Naval Observatory,3450 Massachusetts Ave NW,Washington,DC,20392
8. PERFORMING ORGANIZATIONREPORT NUMBER
9. SPONSORING/MONITORING AGENCY NAME(S) AND ADDRESS(ES) 10. SPONSOR/MONITOR’S ACRONYM(S)
11. SPONSOR/MONITOR’S REPORT NUMBER(S)
12. DISTRIBUTION/AVAILABILITY STATEMENT Approved for public release; distribution unlimited
13. SUPPLEMENTARY NOTES See also ADA415578. 30th Annual Precise Time and Time Interval (PTTI) Systems and ApplicationsMeeting, Reston, VA, 1-3 Dec 1998
14. ABSTRACT see report
15. SUBJECT TERMS
16. SECURITY CLASSIFICATION OF: 17. LIMITATION OF ABSTRACT Same as
Report (SAR)
18. NUMBEROF PAGES
10
19a. NAME OFRESPONSIBLE PERSON
a. REPORT unclassified
b. ABSTRACT unclassified
c. THIS PAGE unclassified
Standard Form 298 (Rev. 8-98) Prescribed by ANSI Std Z39-18

INTRODUCTION
The GPS Common View (CV) and thc Two Way Satellite Time and Frequency Transfer (TWSTFT) are up to now the most used methods for precise tirnc and frequency transfer. In parallel with the dcvelopmcnt of new types of frequency standards acheving outstanding performances, there IS a demand for new tools 1.0 compare these devices. Requiring only receiver capabilities on either side of the comparison, the CV method is relativcly simple to use. However, an averagmg time of at least a few days is needed to compare thc new frequency standards at their best levels. On the other hand, the TWSTFT technique allows comparisons with a shorter trme but at the prize of heavy sending and receiving equipment on each site
An interesting alternative to associate simplicity and precision is to use geodetic GPS receivers [I]. Since only code dormation is processed in the CV t e c h q u e while carrier phase mformation is dscarded, the CiPS is not used to its full potential in time and frequency transfer. The approach to record all GPS observables (Code CA, P 1, P2, phase Ll , L2) is well established in the gcodcsy community where these observations are carried out routinely in the hamework of the International GPS Service for Geodynamics (IGS) [2]. Powerful tools have been developed to deal with the problem of phase arnbiguty, ionospheric and tropospheric delays and satellite orbits. It is thus natural to seek for improvement of the time and frequency transfer by GPS in a collaboration between the geodesy and the time and frequency communities. The recent IGS - BIPM pilot project [3] is a perfect example of a joint effort in this hrection.
As a precursor to the IGS-BIPM project, a collaboration between the Astronomical institute of the Universip of Bernc (AIUB) and the Swiss Federal Office of Metrology (OFMET) has led to the development and construction of two terminals and the processing software for geodetic time transfer (GeTT).
CAMPAIGN SETUP
A typical configuration of a GeTT campaign is shown in Figure 1. A GeTT terminal is placed on each site participating in the campaign. For simplicity, only two sites arc drawn in Figure 1 but more stations could be included and treated simultaneously. The local clocks to be compared provide a 5 MHz signal and a 1 PPS. Each station acquires all 5 GPS observables every 30 s and sends the results daily to the processing center via FTP. A detailed description of a GeTT terminal can be found e.g. in [4]. Taking into account the precise orbits of the satellites and information on ionospheric and tropospheric delays, the processing center computes for each observation the delay between an arbitrarily chosen reference station and all other participants. The final GeTT results are computed 5 days after the observations when the IGS products become available.
For the study of h s paper, a first GeTT station has been placed at the PTB in Braunschweig, I). It will be labeled PTBA throughout the paper. A second is installed at the USNO, Washngton, USA, and is referred to as USNB. The baseline between the two receivers measures 6'275 krn. At the PTB, the local clock connected to the station is a hydrogen maser (Kvarz CHI-75, labeled H2), the same clock that is used for the TWSTFT measurement. This maser is free running and not steered to follow the local timescale. However, a local comparison every 30 minutes betwccn the maser H2 and UTC(PTB) allows to perform time transfer cxperiments. The local clock at the USNO is also a hydrogen maser (MC2), but in contrast LO the PTB

configuration h s maser is corrected once a day to follow UTC(Mean),whch is a steered timc=scale 171. Local comparisons at the USNO to connect UTC(USN0) to other stations are, therefore, not necessary. Both stations were installed around MJD 5 10 14 and t11c campaign will probably last bcyond the end of 1998.
FREQUENCY TRANSFER
Let us first assess the frequency transfer capabilities of GeTT over the transatlantic baseline. Since only relative frequency is of interest here, the local comparisons at the PTB between the maser H2 and UTC(PTB) are not taken into account. Figure 2 summarizes the main results of this part of the study in the form of an Allan variance diagram. The black triangles give the comparison of H7 at PTB and MC2 at USNO by GeTT. Typical individual performances of the participating clocks are represented by diamonds (H2 at PTB) [GI and triangles (MC2 at USNO) 177. The circles. finally, indicate a comparison between PTB and USNO by means of GPS CV. For t h s purpose. out of the set of unequally spaccd CV obsen.ations. one value was computed every 6 hours.
Several important features have to be emphasized on t h s graph. First, for ave rapg times of 10's up to 10' s, both local clocks, the masers at the PTB and at thc USNO, have a relative frequency stability in the 10- 15 range and, thus, do not represent a limiting factor for the experiment. Secondly, it has to be noted that GeTT performs, as expected, better than classical GPS CV for all avc rapg times displayed. For short T (< lo5 s), the improvement gained by GeTT is at lcast one order of magnitude. This result is of great practical importance. If 2 clocks at the level are to be compared, averaging times of up to lo6 s (> 10 d) are requircd with GPS CV, whle 3 . 1 0 ~ s (< 1 d) are sufficient with GcTT. Thls makes b s tool suitable for the comparison of clocks of the upcoming generation of primary frequency standards. Another important and surprising point is the observed slope on the G,(T) plot for GeTT. The instrumental noise of CV averages with T;' indicating phase noise. For GeTT, however, the ny(=) decreases with 2-Ii2, a sipature for whte FM. Since both clocks are significantly below the noise level computed with GeTT, the slope -112 must be ascribed to the method. While the mechanism leadmg to h s behavior is not fully understood yet, some elements of explanation can nevertheless be pointed out. In order to verify if the excessive noise is due to the long baseline between PTB and USNO, a comparison with another station was undertaken. This third station, also located at the USNO, is not a dedicated GeTT terminal but part of the IGS network [2] in which it is labelled USNO. It is stecrcd by a different maser than USNB. Figure 3 shows the delay between the stations USNO and USNB as measured with GPS carrier phase. In fact, since all delavs in the present setup are given against PTBA, the difference USNB -USNO is obtained by evaluating (PTBA - USNO) - (PTBA - USNB). Discontinuities in the delay are clearly visible in thc graph at the transition between consecutive days. These jumps are the consequence of a discrete offset correction whch is calculated every day to bring the average phase solution in agreement with the average of the codc. Odd behavior of the code on a gven day induces large differences bctween the offset of two consecutive days and causes the observcd discontinuities. A good example of such a behavior is Day of Year (DoY) 280. If the Allan variance is calculated for a set of delays between USNO and USNB as &splayed in Figure 3. the level of noise for short z is identical for h s short baseline to the s,(=) observed for PTBA - USNB. To make the influence of these jumps on the Allan variance even clearer, especially for T < 10's. data of a single day were used. thus avoiding entirely the discontinuitics.
The resulting Allm variance is displayed in Figure 4. Since no jumps are present in t h s subset of data, it is not surprising that the noise level of the Allan variance is lower. But in addition to the lower noise, the slope for z < 5 . 1 0 ~ s is also steeper than previously. It is also interesting to notc that even though thc comparison USNB - USNO is obtained over the detour of PTBA the noise is similar to the one measured in a common clock experiment over a zero-baseline campaign (long dashes in Figure 4).
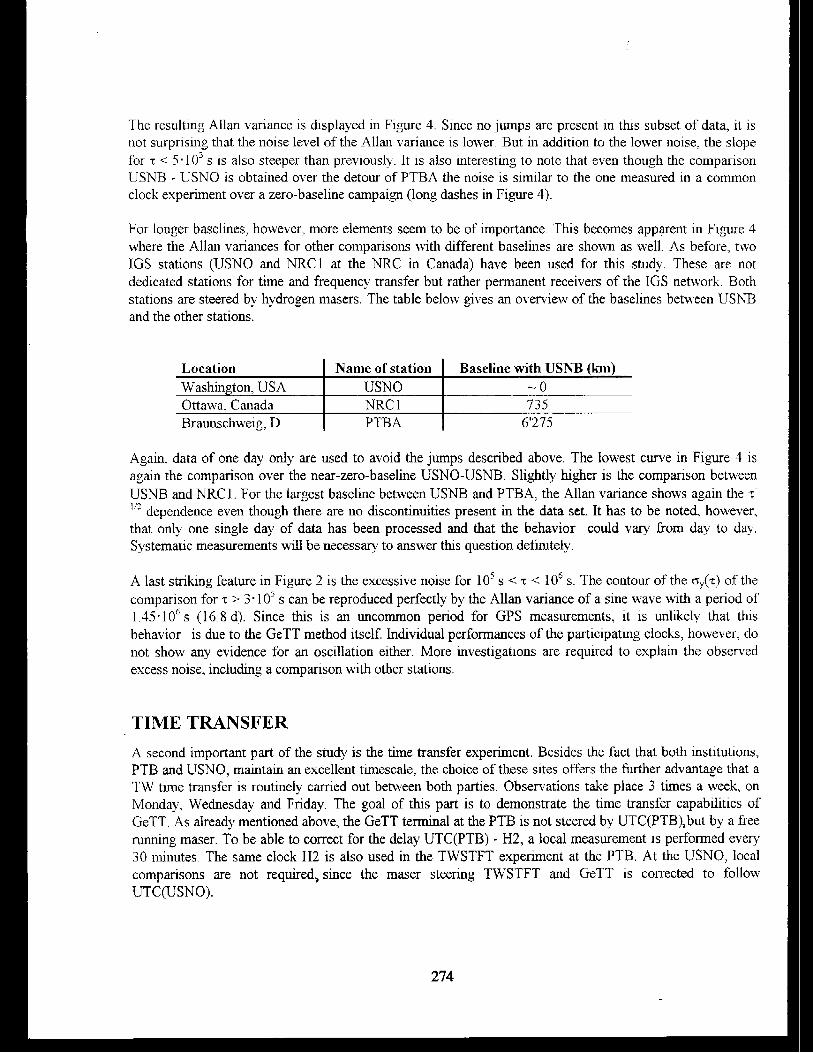
For longer baselines, howevcr, more elements scem to be of importance This becomes apparent in Figure 4 where the Allan variances for other comparisons with different baselines are shown as well. As before, two 1GS stations (USNO and NRCl at the NRC in Canada) havc been used for t h s study These are not ded~cated statlons for time and frequency transfer but rather permanent receivers of the IGS network Both stations are steered by hydrogen masers. The tablc below gves an overview of the baselincs betwccn USNB and the other stations
Again, data of one day only are used to avoid the jumps described above. The lowest curve in Figure 4 is again the comparison over the near-zero-baseline USNO-USNB. Slightly higher is the comparison between USNB and NRC 1. For the largest baseline between USNB and PTBA, the Allan variance shows again the T- 112 dependence even though there are no dscontinuities present in the data set. It has to be noted, however, that only one single day of data has been processed and that the behavior could vary from day to day. Systematic measurements will be necessary to answer h s question definitely.
Location Washington, USA Ottawa, Canada Braunschweig, D
A last striking feature in Figure 2 is the excessive noise for lo5 s < z < lo6 s. The contour of the o,(t) of the con~parison for T > 3-10' s can be reproduced perfectly by thc Allan variance of a sine wave with a period of 1.45.10~ s (16.8 d). Since this is an uncommon period for GPS measurements, it is unlikely that this behavior is due to the GeTT method itself. Individual performances of the participating clocks, however, do not show any evidence for an oscillation either. More investigations are required to explain the observed excess noise, including a comparison with other stations.
TIME TRANSFER
Name of station USNO NRC 1 PTBA
A second important part of the study is the time transfer experiment. Besides the fact that both institutions, PTB and USNO, maintain an excellent timcscale, the choice of these sites offers the further advantage that a TW time transfer is routinely carried out between both parties. Observations take place 3 times a week, on Monday, Wednesday and Friday. The goal of t h s part is to demonstrate the timc transfer capabilities of GeTT. As already mentioned above, the GeTT terminal at the PTB is not steered by UTC(PTB),but by a free running maser. To be able to correct for the delay UTC(PTB) - H2, a local measurement is performed every 30 minutes. The same clock H2 is also used in the TWSTFT experiment at the PTB. At the USNO, local comparisons are not required, since the maser steering TWSTFT and GeTT is corrected to follow UTC(USN0).
Baseline with USNB (,km) - 0 735
6'275

The results of the comparison of the two timescales are represented in Figure 5. The whte circles stand for the data obtained by TWSTFT 191. Over the displayed period of 80 d, 24 successful TWSTFT sessions were carried out between PTB and USNO (out of a scheduled maximum of 34). Each data point represents the avcragc 01 thc data collected over onc TWSTFT session lasting 120 s. The black curve gives thc GcTT results of which 2880 are taken per day. To speed up the processins time. the delays are calculated every 300 s only, reducing the amount of data by a factor of 10. Uncalibrated internal delays of the GeTT terminal have made it necessary to shift the raw data by a fixed amount of -1 12.9 ns to fit the GeTT results to the TWSTFT. The thrd curve in gray is added to the graph to visualize the difference of transfer by GeTT and by GPS CV. On average, 15 CV observations per day are possible between PTB and USNO. Thesc data have again been shfted to match the TWSTFT results (shifted data = raw data - 24.4 ns). It is easiest to analyze the time transfer capabilities if the difference between the transfer by TWSTFT and the transfer by the alternative method is built. The two curves of Fibwe 6 correspond to transferGeTT - transferm (black triangles, connected by a solid curve to gmde the eye) and to transfercv - transferrw (white squares. connected by a dotted line). For t h s graph. no avcragng has been performed on the GeTT data. Displavcd are simplv the differences belween thc GcTT result correspondmg to the epoch for uhich a TWSTFT result exists and the TWSTFT result itself. For the differencc CV against TWSTFT, a linear interpolation was used to compute the delay measured by CV at the epoch for whch a TWSTFT result is available.
Having shftcd CV and GeTT data, the absolute value in Figure 6 can not bc of interest. What is more important is the constancy of the difference and, thus, the internal delays. The delays in the GeTT terminals seem to be insensitive to an interruption of the acquisition. On two occasions (DoY 238 and DoY 258) over the period of interest, the method failed to acquire data continuously. The delays seem not to have changed after the restait since no discontinuity can be observed on these days. Let us point out that the spread of the result GeTT - TWSTFT is significantly smaller than that of the difference CV - TWSTFT. As expected, GeTT outperforms GPS CV as a time transfer tool.
However. the difference between the time transfers by GeTT and TWSTFT respectively is drifting with an average slope of +43 psld. The origm of this slope is not know. Since Fibwe 6 &splays differences of comparisons by two distinct methods whch are steered by the same clocks, the only possible explanation for the slope is a drift of a delay in one or the other time transfer system. Delays in the antenna and the cables are known to change with temperature,but the coefficients for GeTT [XI are not large enough to explain the observed slope. It is also difficult to draw conclusions from the differencc CV - TWSTFT, mainly due to the large spread of the data. Morc work is needed to explain the origin of the dnft between GeTT and TWSTFT.
CONCLUSION
The possibility of time and frequency transfer by GPS carrier phase betw-een the PTB, Braunschwelg, D and the USNO. Washmgton, USA has now been studied over a period of 4 months. The study has proven the feasibility of this techmquc over transatlantic distanccs and s h o w a good reliability throughout the campaign. The hardware of GeTT is only slightly more complicated than classical GPS CV, but for short

averagng times GeTT outperforms GPS CV by at least one order of magnitude. The price to pay is a more sophisticated processing of the data. However, the required tools exist and have already proven their adequacy to handle the large amount of data in a network of over 10 stations. A frequency bansfer at the level of 10-'"or r = 300 s was possible over the 6'275 km long baseline of t h ~ s study. At present, h s limit secms to be imposed by the data processing. As for the time transfer the results look very promising as wcll. The main goal of this part of the study was to check the constancy of the different local delays. The differencc of the time transfer by GeTT and the time transfer by TWSTFT has dnfted with a slope of 43 ps/d ovcr the period of 80 observed days. It remains unclear whether this slope must be ascribed entirely to GeTT or if the involved TWSTFT contributes also to t h ~ s hfference. More work needs to be done on this topic. It is also imporlant to note that in the present setup not all local delays are known and that, therefore, it is impossible to carry out absolute time transfer. Ln spite of this, GeTT is certainly an interesting additional tool for time and frequency transfer, especially due to its quasi-continuous acquisition of data whch makes an uninterrupted comparison between remote timescales possible.
ACKNOWLEDGMENTS
We wish to thank both the PTB and the USNO for letting us build up the experiment in their institution. In particular we would like to acknowledge A. Bauch, D. Matsakis and J. Ray for many helpful dtscussionsand advice.
REFERENCES
[ l ] Th. Schildknecht, G. Beutler, W. G m e r , M, Rothacher, "Towards sub-nanosecond GPS time Transfer using Geodetic Processing Technique", Proc. 4Lh EFTF, pp. 335-346, 1990.
[2] G. Beutler, I. I. Mueller, R. E. Neilan, "The International GPS Service for Geodynamics (IGS): the Story", IAGS Syposium No 1 15, pp. 3-13, 1995.
[3] 5. R. Ray, "The IGSBIPM Time Transfer Project", IGS Analysis Center Workshop Proceedings. in press 1998
[4] F. Overney, et. al, "GPS Time Transfer Using Geodetic~eceivers(GcTT): Results on a European Baseline", Proc 12" EFTF, pp. 94-99, 1998.
[ 5 ] Th. Schildknecht et al., these proceedings
[6] A. Bauch, private communication
[7] J. Deyoung, private communication, for the data cf also ht~p:/ltycho.usno.navy.mil/gp~~pPdd.htd and links there
[XI F. Overney, Th. Schildknecht, G. Beutler, L. Prost, U. Feller, "GPS Time Transfer using Geodetic Receivers: Middle-Term Stability and Temperature Dependence of the Signal Delays", Proc 11' EFTF, pp, 504 - 508, 1997.
[9] The TWSTFT data used for this graph are available in standard format from FTP sites at the PTB and the USNO.
276
L

1 PPSI I 1 PPS local clock local clock I-# te"? AJ
1 I B 71 5 MHz 5 MHz
li Internet :.:. :::. ....................... / .................... .,,,. .,.,.,.,.,..,.,.,., ......... ..... ......... :. ...... ........ ...... . ..............., ., .,,,,,,,,,,,,,,,, ,, ,, ,..
Processing Centre
Figure 1: A typical configuration of a GeTT campaign. On each site, a GeTT t e m a l is installed and corlnected tc:) the local clock to he compared, Acquired data are sent daily via FTP to the processing center whch dzlivcrs the delay between the arbitrarily chosen reference station and all other participants 5 days after the observations.
A r 4
w X
I o4 I 0 j 1 o6 s (s)
Figure 2: Allan vmance for the cornpanson 1-12 - MC2 bq GeTT (black tnmgles) the local clocks 142 at PTB (dtarnonds) and MC2 at the IJSNO (whte triangles) The whtz circles represent the Allan vanance for a cornpanson between PTB and USNO b! GPS C V (not with the same cinch sources) The plain l ~ n e without symbols shows the a,(%) for a slnc wave with mplitudc 2 2 ns aid a penod of 1 45.10"

MJD-50813 (LbY 1998) (d)
Figure 3: Delay between USNH and IJSNO as measured by GeTT. 1)iscontinuities discussed in thc text are clearly visible
10-13 , - - v.-- 8 - 6- -
4 -
-
A
r, 2 - b'> -. ..
.L
1 0 - l ~
I "4
\
\
1 I I L L 1 1 1 1 1
\ 21
2 3 4 5 6 7 8 9 2 3 4 5 b 7 $ 9
1 1 o2 1 o3 1 o0
7 ( 5 )
Figure 4: Allan vmance computed with only onc day of data for d f i ren t cornpansons IJSNR-USNO white tnangles, USNB -NRCl whte squares, PTBA - USNB black diamonds For purpose of comparison the Allan vanance for the complete set of data PTBA - USNH 1s also mdicated (short dashes, Inverted black tnangles) The lnstrvmental noise of GeTT, as measured over a Lcro baselme in a common clock expmen t , is mdicated by the long dashed llne

MJZ)-508 13 (DoY 1998) (d) Figure 5: DiIYerence of the timescales at PTB and USNO by a) TWSTFT in whtte circles, b) GeT?', black curve, c)
GPS CV in gray. The result of GeTT has bccn shifted by -1 12 9 ns, those of CV by -24.4 ns, both to match the result of TWSTFT.
MJE-508 13 (DoY 1998) (d) Figure 6: Black triangles: Difference bctwecil the tlme transfer by GeTT and the t h e transfcr by TWSTF?'
White squares: 1)iRerence between the time transfer by CV and the time transfer by TWSTFI'.

Questions and Answers
JlM DeYOUNG (USNO): Perhaps I missed it, but at PTB the distance between the two-way antenna and the clock hall is quite a long &stance, 100 meters to 150 meters, or perhaps more. Can you tell me the location of where the Ashtech - or whatever antenna you use, what is the location of it? Is it on the clock hall?
GREGOR DUDLE (Swiss Federal Office of Metrology): It is almost in the clock hall. We use approximately 40 meters of cable, so it is not very far away.
DIETER KIRCHNER (TUG): When you say you have carrier phase measurements every 30 seconds, is this an average over 30 seconds?
GREGOR DUDLE: No, no. This is just the 30-second observations. We have an observation every 30 seconds.
DIETER KIRCI3NER: So, there is no averaging.
GREGOR DUDLE: No.
ROBERT DOUGLAS (NRC): When you say that it is an independent measure; what is the initial point for the integration? Because, you are integrating the carrier phase ---
GREGOR DUDLE: I am not the expert on the data processing. Maybe we can discuss the data processing problem after this session.
280