Trading Stocks - A Mathematician Plays The Stock Market - J A Paulos (Basic Books) - 2003
225
-
Upload
independent -
Category
Documents
-
view
4 -
download
0
Transcript of Trading Stocks - A Mathematician Plays The Stock Market - J A Paulos (Basic Books) - 2003


AMathematician
Plays theStock Market

Also by John Allen Paulos
Mathematics and Humor (1980)
I Think Therefore I Laugh (1985)
Innumeracy: Mathematical Illiteracyand its Consequences (1988)
Beyond Numeracy: Ruminationsof a Numbers Man (1991)
A Mathematician Readsthe Newspaper (1995)
Once Upon a Number: The HiddenMathematical Logic of Stories (1998)

AMathematician
Plays the Stock Market
John Allen Paulos
BASIC
BBOOKS
A Member of the Perseus Books Group
Plays the

Copyright © 2003 by John Allen Paulos
Published by Basic Books,A Member of the Perseus Books GroupAll rights reserved. Printed in the United States of America. No partof this book may be reproduced in any manner whatsoever withoutwritten permission except in the case of brief quotations embodied incritical articles and reviews. For information, address Basic Books,387 Park Avenue South, New York, NY 10016-8810.
Designed by Trish WilkinsonSet in 11-point Sabon by the Perseus Books Group
Library of Congress Cataloging-in-Publication DataPaulos, John Allen.
A mathematician plays the stock market / John Allen Paulos.p. cm.
Includes bibliographical references and index.ISBN 0-465-05480-3 (alk. paper)1. Investments—Psychological aspects. 2. Stock
exchanges—Psychological aspects. 3. Stock exchanges—Mathematicalmodels. 4. Investment analysis. 5. Stocks. I. Title.
HG4515.15.P38 2003332.63'2042—dc21 2002156215
03 04 05 /10 9 8 7 6 5 4 3 2 1

To my father, who never playedthe market and knew little about probability,
yet understood one of the prime lessons of both."Uncertainty," he would say, "is the only
certainty there is, and knowing how to livewith insecurity is the only security."

This page intentionally left blank

Contents
1 Anticipating Others' Anticipations 1Falling in Love with WorldCom • Being Right VersusBeing Right About the Market • My PedagogicalCruelty • Common Knowledge, Jealousy, and Mar-ket Sell-Offs
2 Fear, Greed, and Cognitive Illusions 13Averaging Down or Catching a Falling Knife? • Emo-tional Overreactions and Homo Economicus • Be-havioral Finance • Psychological Foibles, A List• Self-Fulfilling Beliefs and Data Mining • Rumorsand Online Chatrooms • Pump and Dump, Short andDistort
3 Trends, Crowds, and Waves 37Technical Analysis: Following the Followers • TheEuro and the Golden Ratio • Moving Averages, BigPicture • Resistance and Support and All That • Pre-dictability and Trends • Technical Strategies andBlackjack • Winning Through Losing?
4 Chance and Efficient Markets 57Geniuses, Idiots, or Neither • Efficiency and RandomWalks • Pennies and the Perception of Pattern •A Stock-Newsletter Scam • Decimals and OtherChanges • Benford's Law and Looking Out for Num-ber One • The Numbers Man—A Screen Treatment
vii
viii Contents
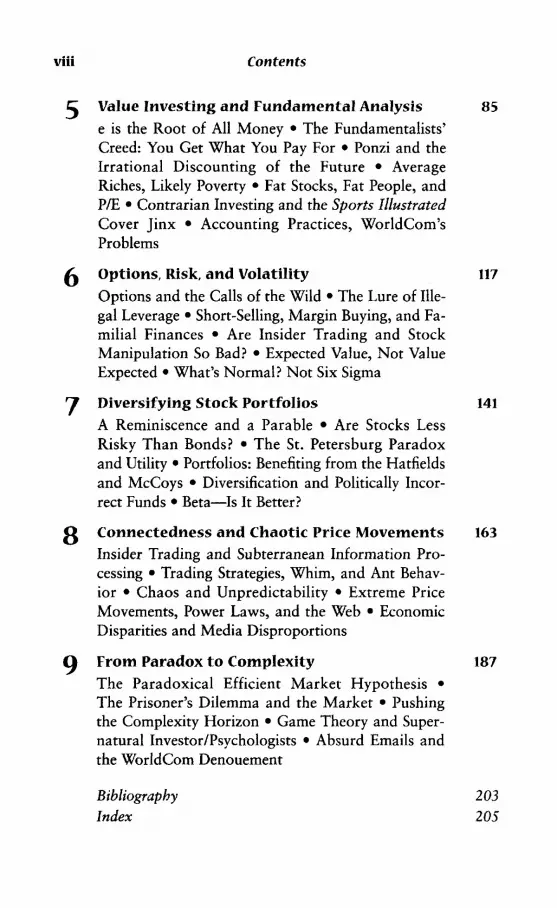
5 Value Investing and Fundamental Analysis 85e is the Root of All Money • The Fundamentalists'Creed: You Get What You Pay For • Ponzi and theIrrational Discounting of the Future • AverageRiches, Likely Poverty • Fat Stocks, Fat People, andP/E • Contrarian Investing and the Sports IllustratedCover Jinx • Accounting Practices, WorldCom'sProblems
6 Options, Risk, and Volatility 117Options and the Calls of the Wild • The Lure of Ille-gal Leverage • Short-Selling, Margin Buying, and Fa-milial Finances • Are Insider Trading and StockManipulation So Bad? • Expected Value, Not ValueExpected • What's Normal? Not Six Sigma
7 Diversifying Stock Portfolios 141A Reminiscence and a Parable • Are Stocks LessRisky Than Bonds? • The St. Petersburg Paradoxand Utility • Portfolios: Benefiting from the Hatfieldsand McCoys • Diversification and Politically Incor-rect Funds • Beta—Is It Better?
8 Connectedness and Chaotic Price Movements 163Insider Trading and Subterranean Information Pro-cessing • Trading Strategies, Whim, and Ant Behav-ior • Chaos and Unpredictability • Extreme PriceMovements, Power Laws, and the Web • EconomicDisparities and Media Disproportions
9 From Paradox to Complexity 187The Paradoxical Efficient Market Hypothesis •The Prisoner's Dilemma and the Market • Pushingthe Complexity Horizon • Game Theory and Super-natural Investor/Psychologists • Absurd Emails andthe WorldCom Denouement
Bibliography 203Index 205

AnticipatingOthers' Anticipations
It was early 2000, the market was booming, and my invest-ments in various index funds were doing well but not gener-
ating much excitement. Why investments should generateexcitement is another issue, but it seemed that many peoplewere genuinely enjoying the active management of their port-folios. So when I received a small and totally unexpectedchunk of money, I placed it into what Richard Thaler, a be-havioral economist I'll return to later, calls a separate mentalaccount. I considered it, in effect, "mad money."
Nothing distinguished the money from other assets of mineexcept this private designation, but being so classified mademy modest windfall more vulnerable to whim. In this case itentrained a series of ill-fated investment decisions that, evennow, are excruciating to recall. The psychological ease withwhich such funds tend to be spent was no doubt a factor in myusing the unexpected money to buy some shares of WorldCom(abbreviated WCOM), "the pre-eminent global communica-tions company for the digital generation," as its ads boasted,at $47 per share. (Hereafter I'll generally use WCOM to referto the stock and WorldCom to refer to the company.)
Today, of course, WorldCom is synonymous with businessfraud, but in the halcyon late 1990s it seemed an irrepressibly

2 John Allen Paulos
successful devourer of high-tech telecommunications compa-nies. Bernie Ebbers, the founder and former CEO, is nowviewed by many as a pirate, but then he was seen as a swash-buckler. I had read about the company, knew that high-techguru George Gilder had been long and fervently singing itspraises, and was aware that among its holdings were MCI,the huge long-distance telephone company, and UUNet, the"backbone" of the Internet. I spend a lot of time on the net(home is where you hang your @) so I found Gilder's lyricalwritings on the "telecosm" and the glories of unlimited band-width particularly seductive.
I also knew that, unlike most dot-corn companies with nomoney coming in and few customers, WorldCom had morethan $25 billion in revenues and almost 25 million customers,and so when several people I knew told me that WorldComwas a "strong buy," I was receptive to their suggestion. Al-though the stock had recently fallen a little in price, it was, Iwas assured, likely to soon surpass its previous high of $64.
If this was all there was to it, there would have been no im-portant financial consequences for me, and I wouldn't be writ-ing about the investment now. Alas, there was something else,or rather a whole series of "something elses." After buying theshares, I found myself idly wondering, why not buy more? Idon't think of myself as a gambler, but I willed myself not tothink, willed myself simply to act, willed myself to buy moreshares of WCOM, shares that cost considerably more than thefew I'd already bought. Nor were these the last shares I wouldbuy. Usually a hardheaded fellow, I was nevertheless fallingdisastrously in love.
Although my particular heartthrob was WCOM, almost allof what I will say about my experience is unfortunately appli-cable to many other stocks and many other investors. Wher-ever WCOM appears, you may wish to substitute the symbols

A Mathematician Plays the Stock Market 3
for Lucent, Tyco, Intel, Yahoo, AOL-Time Warner, GlobalCrossing, Enron, Adelphia, or, perhaps, the generic symbolsWOE or BANE. The time frame of the book—in the midst ofa market collapse after a heady, nearly decade-long surge—may also appear rather more specific and constraining than itis. Almost all the points made herein are rather general or canbe generalized with a little common sense.
Falling in Love with WorldCom
John Maynard Keynes, arguably the greatest economist of thetwentieth century, likened the position of short-term investorsin a stock market to that of readers in a newspaper beautycontest (popular in his day). The ostensible task of the readersis to pick the five prettiest out of, say, one hundred contest-ants, but their real job is more complicated. The reason is thatthe newspaper rewards them with small prizes only if theypick the five contestants who receive the most votes from read-ers. That is, they must pick the contestants that they think aremost likely to be picked by the other readers, and the otherreaders must try to do the same. They're not to become enam-ored of any of the contestants or otherwise give undue weightto their own taste. Rather they must, in Keynes' words, antici-pate "what average opinion expects the average opinion tobe" (or, worse, anticipate what the average opinion expectsthe average opinion expects the average opinion to be).
Thus it may be that, as in politics, the golden touch derivesoddly from being in tune with the brass masses. People mightdismiss rumors, for example, about "Enronitis" or "World-Comism" affecting the companies in which they've invested,but if they believe others will believe the rumors, they can'tafford to ignore them.

4 John Allen Paulos
BWC (before WorldCom) such social calculations never in-terested me much. I didn't find the market particularly inspir-ing or exalted and viewed it simply as a way to trade shares inbusinesses. Studying the market wasn't nearly as engaging asdoing mathematics or philosophy or watching the ComedyNetwork. Thus, taking Keynes literally and not having muchconfidence in my judgment of popular taste, I refrained frominvesting in individual stocks. In addition, I believed thatstock movements were entirely random and that trying tooutsmart dice was a fool's errand. The bulk of my moneytherefore went into broad-gauge stock index funds.
AWC, however, I deviated from this generally wise course.Fathoming the market, to the extent possible, and predictingit, if at all possible, suddenly became live issues. Instead ofsnidely dismissing the business talk shows' vapid talk, sports-caster-ish attitudes, and empty prognostication, I began tosearch for what of substance might underlie all the commen-tary about the market and slowly changed my mind aboutsome matters. I also sought to account for my own sometimesfoolish behavior, instances of which will appear throughoutthe book, and tried to reconcile it with my understanding ofthe mathematics underlying the market.
Lest you dread a cloyingly personal account of how I lostmy shirt (or at least had my sleeves shortened), I shouldstress that my primary purpose here is to lay out, elucidate,and explore the basic conceptual mathematics of the market.I'll examine—largely via vignettes and stories rather thanformulas and equations—various approaches to investing aswell as a number of problems, paradoxes, and puzzles, someold, some new, that encapsulate issues associated with themarket. Is it efficient? Random? Is there anything to techni-cal analysis, fundamental analysis? How can one quantifyrisk? What is the role of cognitive illusion? Of commonknowledge? What are the most common scams? What are

A Mathematician Plays the Stock Market 5
options, portfolio theory, short-selling, the efficient markethypothesis? Does the normal bell-shaped curve explain themarket's occasional extreme volatility? What about fractals,chaos, and other non-standard tools? There will be no ex-plicit investment advice and certainly no segments devoted tothe ten best stocks for the new millennium, the five smartestways to jump-start your 401 (k), or the three savviest stepsyou can take right now. In short, there'll be no financialpornography.
Often inseparable from these mathematical issues, how-ever, is psychology, and so I'll begin with a discussion of theno-man's land between this discipline and mathematics.
Being Right VersusBeing Right About the Market
There's something very reductive about the stock market. Youcan be right for the wrong reasons or wrong for the right rea-sons, but to the market you're just plain right or wrong.Compare this to the story of the teacher who asks if anyonein the class can name two pronouns. When no one volunteers,the teacher calls on Tommy who responds, "Who, me?" Tothe market, Tommy is right and therefore, despite being un-likely to get an A in English, he's rich.
Guessing right about the market usually leads to chortling.While waiting to give a radio interview at a studio in Philadel-phia in June 2002, I mentioned to the security guard that Iwas writing this book. This set him off on a long disquisitionon the market and how a couple of years before he had re-ceived two consecutive statements from his 401(k) adminis-trator indicating that his retirement funds had declined. (Hetook this to be what in chapter 3 is called a technical sell sig-nal.) "The first one I might think was an accident, but two in

6 John Allen Paulos
a row, no. Do you know I had to argue with that pension per-son there about getting out of stocks and into those treasurybills? She told me not to worry because I wasn't going to re-tire for years, but I insisted 'No, I want out now.' And I'msure glad I did get out." He went on to tell me about "all thebig shots at the station who cry like babies every day abouthow much money they lost. I warned them that two downstatements and you get out, but they didn't listen to me."
I didn't tell the guard about my ill-starred WorldCom expe-rience, but later I did say to the producer and sound man thatthe guard had told me about his financial foresight in re-sponse to my mentioning my book on the stock market. Theyboth assured me that he would have told me no matter what."He tells everyone," they said, with the glum humor of bigshots who didn't take his advice and now cry like babies.
Such anecdotes bring up the question: "If you're so smart,why ain't you rich?" Anyone with a modicum of intelligenceand an unpaid bill or two is asked this question repeatedly.But just as there is a distinction between being smart and be-ing rich, there is a parallel distinction between being right andbeing right about the market.
Consider a situation in which the individuals in a groupmust simultaneously choose a number between 0 and 100.They are further directed to pick the number that they thinkwill be closest to 80 percent of the average number chosen bythe group. The one who comes closest will receive $100 for hisefforts. Stop for a bit and think what number you would pick.
Some in the group might reason that the average numberchosen is likely to be 50 and so these people would guess 40,which is 80 percent of this. Others might anticipate thatpeople will guess 40 for this reason and so they would guess32, which is 80 percent of 40. Still others might anticipatethat people will guess 32 for this reason and so they wouldguess 25.6, which is 80 percent of 32.

A Mathematician Plays the Stock Market 7
If the group continues to play this game, they will gradu-ally learn to engage in ever more iterations of this meta-reasoning about others' reasoning until they all reach theoptimal response, which is 0. Since they all want to choose anumber equal to 80 percent of the average, the only way theycan all do this is by choosing 0, the only number equal to 80percent of itself. (Choosing 0 leads to what is called the Nashequilibrium of this game. It results when individuals modifytheir actions until they can no longer benefit from changingthem given what the others' actions are.)
The problem of guessing 80 percent of the average guess is abit like Keynes's description of the investors' task. What makesit tricky is that anyone bright enough to cut to the heart of theproblem and guess 0 right away is almost certain to be wrong,since different individuals will engage in different degrees ofmeta-reasoning about others' reasoning. Some, to increase theirchances, will choose numbers a little above or a little below thenatural guesses of 40 or 32 or 25.6 or 20.48. There will be somerandom guesses as well and some guesses of 50 or more. Unlessthe group is very unusual, few will guess 0 initially.
If a group plays this game only once or twice, guessing theaverage of all the guesses is as much a matter of readingthe others' intelligence and psychology as it is of following anidea to its logical conclusion. By the same token, gauging in-vestors is often as important as gauging investments. And it'slikely to be more difficult.
My Pedagogical Cruelty
Other situations, as well, require anticipating others' actionsand adapting yours to theirs. Recall, for example, the televi-sion show on which contestants had to guess how theirspouses would guess they would answer a particular question.
8 John Allen Paulos
There was also a show on which opposing teams had to guessthe most common associations the studio audience had madewith a collection of words. Or consider the game in which youhave to pick the location in New York City (or simply the lo-cal shopping mall) that others would most likely look for youfirst. You win if the location you pick is chosen by most of theothers. Instances of Keynes's beauty contest metaphor arewidespread.
As I've related elsewhere, a number of years ago I taught asummer probability course at Temple University. It met everyday and the pace was rapid, so to induce my students to keepup with the material I gave a short quiz every day. Applying aperverse idea I'd experimented with in other classes, I placeda little box at the bottom of each exam sheet and a notationnext to it stating that students who crossed the box (placed anX in it) would have ten extra points added to their examscores. A further notation stated that the points would beadded only if less than half the class crossed the box. If morethan half crossed the box, those crossing it would lose tenpoints on their exam scores. This practice, I admit, borderedon pedagogical cruelty.
A few brave souls crossed the box on the first quiz and re-ceived ten extra points. As the summer wore on, more andmore students did so. One day I announced that more thanhalf the students had crossed the box and that those who didhad therefore been penalized ten points. Very few studentscrossed the box on the next exam. Gradually, however, thenumber crossing it edged up to around 40 percent of the classand stayed there. But it was always a different 40 percent, andit struck me that the calculation a student had to perform todecide whether to cross the box was quite difficult. It was es-pecially so since the class was composed largely of foreign stu-dents who, despite my best efforts (which included this littlegame), seemed to have developed little camaraderie. Without

A Mathematician Plays the Stock Market 9
any collusion that I could discern, the students had to antici-pate other students' anticipations of their anticipations in aconvoluted and very skittish self-referential tangle. Dizzying.
I've since learned that W. Brian Arthur, an economist at theSanta Fe Institute and Stanford University, has long used an es-sentially identical scenario to describe the predicament of barpatrons deciding whether or not to go to a popular bar, the ex-perience being pleasant only if the bar is not thronged. Anequilibrium naturally develops whereby the bar rarely becomestoo full. (This almost seems like a belated scientific justificationfor Yogi Berra's quip about Toots Shor's restaurant in NewYork: "Nobody goes there any more. It's too crowded.")Arthur proposed the model to clarify the behavior of marketinvestors who, like my students and the bar patrons, must an-ticipate others' anticipations of them (and so on). Whether onebuys or sells, crosses the box or doesn't cross, goes to the baror doesn't go, depends upon one's beliefs about others' possibleactions and beliefs.
The Consumer Confidence Index, which measures con-sumers' propensity to consume and their confidence in theirown economic future, is likewise subject to a flighty, reflexivesort of consensus. Since people's evaluation of their own eco-nomic prospects is so dependent on what they perceive others'prospects to be, the CCI indirectly surveys people's beliefsabout other people's beliefs. ("Consume" and "consumer" are,in this context, common but unfortunate terms. "Buy," "pur-chase," "citizen," and "household" are, I think, preferable.)
Common Knowledge,Jealousy, and Market Sell-Offs
Sizing up other investors is more than a matter of psychol-ogy. New logical notions are needed as well. One of them,

10 John Allen Paulos
"common knowledge," due originally to the economistRobert Aumann, is crucial to understanding the complexityof the stock market and the importance of transparency. Abit of information is common knowledge among a group ofpeople if all parties know it, know that the others know it,know that the others know they know it, and so on. It ismuch more than "mutual knowledge," which requires onlythat the parties know the particular bit of information, notthat they be aware of the others' knowledge.
As I'll discuss later, this notion of common knowledge is es-sential to seeing how "subterranean information processing"often underlies sudden bubbles or crashes in the markets,changes that seem to be precipitated by nothing at all andtherefore are almost impossible to foresee. It is also relevantto the recent market sell-offs and accounting scandals, but be-fore we get to more realistic accounts of the market, considerthe following parable from my book Once Upon a Number,which illustrates the power of common knowledge. The storytakes place in a benightedly sexist village of uncertain loca-tion. In this village there are many married couples and eachwoman immediately knows when another woman's husbandhas been unfaithful but not when her own has. The very strictfeminist statutes of the village require that if a woman canprove her husband has been unfaithful, she must kill him thatvery day. Assume that the women are statute-abiding, intelli-gent, aware of the intelligence of the other women, and, mer-cifully, that they never inform other women of theirphilandering husbands. As it happens, twenty of the menhave been unfaithful, but since no woman can prove her hus-band has been so, village life proceeds merrily and warilyalong. Then one morning the tribal matriarch comes to visitfrom the far side of the forest. Her honesty is acknowledgedby all and her word is taken as truth. She warns the assem-bled villagers that there is at least one philandering husband
A Mathematician Plays the Stock Market 11
among them. Once this fact, already known to everyone, be-comes common knowledge, what happens?
The answer is that the matriarch's warning will be followedby nineteen peaceful days and then, on the twentieth day, by amassive slaughter in which twenty women kill their husbands.To see this, assume there is only one unfaithful husband, Mr.A. Everyone except Mrs. A already knows about him, so whenthe matriarch makes her announcement, only she learns some-thing new from it. Being intelligent, she realizes that she wouldknow if any other husband were unfaithful. She thus infersthat Mr. A is the philanderer and kills him that very day.
Now assume there are two unfaithful men, Mr. A and Mr.B. Every woman except Mrs. A and Mrs. B knows about boththese cases of infidelity. Mrs. A knows only of Mr. B's, andMrs. B knows only of Mr. A's. Mrs. A thus learns nothingfrom the matriarch's announcement, but when Mrs. B fails tokill Mr. B the first day, she infers that there must be a secondphilandering husband, who can only be Mr. A. The sameholds for Mrs. B who infers from the fact that Mrs. A has notkilled her husband on the first day that Mr. B is also guilty.The next day Mrs. A and Mrs. B both kill their husbands.
If there are exactly three guilty husbands, Mr. A, Mr. B,and Mr. C, then the matriarch's announcement would haveno visible effect the first day or the second, but by a reasoningprocess similar to the one above, Mrs. A, Mrs. B, and Mrs. Cwould each infer from the inaction of the other two of themon the first two days that their husbands were also guilty andkill them on the third day. By a process of mathematical in-duction we can conclude that if twenty husbands are unfaith-ful, their intelligent wives would finally be able to prove it onthe twentieth day, the day of the righteous bloodbath.
Now if you replace the warning of the matriarch with thatprovided by, say, an announcement by the Securities and Ex-change Commission, the nervousness of the wives with the

12 John Allen Paulos
nervousness of investors, the wives' contentment as long astheir own husbands weren't straying with the investors' con-tentment as long their own companies weren't cooking thebooks, killing husbands with selling stocks, and the gap be-tween the warning and the killings with the delay between an-nouncement of an investigation and big sell-offs, you canunderstand how this parable of common knowledge appliesto the market.
Note that in order to change the logical status of a bit ofinformation from mutually known to commonly known,there must be an independent arbiter. In the parable it was thematriarch; in the market analogue it was the SEC. If there isno one who is universally respected and believed, the motivat-ing and cleansing effect of warnings is lost.
Happily, unlike the poor husbands, the market is capableof rebirth.

2 Fear, Greed, andCognitive Illusions
Kou don't need to have been a temporarily besotted investor:o realize that psychology plays an important and some-
times crucial role in the market, but it helps. By late summer2000, WCOM had declined to $30 per share, inciting me tobuy more. As "inciting" may suggest, my purchases were notcompletely rational. By this I don't mean that there wasn't arational basis for investing in WCOM stock. If you didn'tlook too closely at the problems of overcapacity and the long-distance phone companies' declining revenue streams, youcould find reasons to keep buying. It's just that my reasonsowed less to an assessment of trends in telecommunicationsor an analysis of company fundamentals than to an unsus-pected gambling instinct and a need to be right. I sufferedfrom "confirmation bias" and searched for the good news,angles, and analyses about the stock while avoiding the lesssanguine indications.
Averaging Down or Catching a Falling Knife?
After an increasingly intense, albeit one-sided courtship of thestock (the girl never even sent me a dividend), I married it. As
13

14 John Allen Paulos
its share price fell, I continued to see only opportunities forgains. Surely, I told myself, the stock had reached its bottomand it was now time to average down by buying the consider-ably cheaper shares. Of course, for every facile invitation I ex-tended myself to "average down," I ignored an equally facilewarning about not attempting to "catch a falling knife." Thestale, but prudent adage about not putting too many of one'seggs in the same basket never seemed to push itself very force-fully into my consciousness.
I was also swayed by Salomon Smith Barney's Jack Grub-man (possessor, incidentally, of a master's degree in mathemat-ics from Columbia) and other analysts, who ritualisticallysprinkled their "strong buys" over the object of my affections.In fact, most brokerage houses in early 2000 rated WCOM a"strong buy," and those that didn't had it as a "buy." It re-quired no great perspicacity to notice that at the time, almostno stock ever received a "sell," much less a "strong sell," andthat even "holds" were sparingly bestowed. Maybe, I thought,only environmental companies that manufactured solar-powered flashlights qualified for these latter ratings. Accus-tomed to grade inflation and to movie, book, and restaurantreview inflation, I wasn't taken in by the uniformly positiveratings. Still, just as you can be moved by a television commer-cial whose saccharine dialogue you are simultaneously ridicul-ing, part of me gave credence to all those "strong buys."
I kept telling myself that I'd incurred only paper losses andhad lost nothing real unless I sold. The stock would comeback, and if I didn't sell, I couldn't lose. Did I really believethis? Of course not, but I acted as if I did, and "averagingdown" continued to seem like an irresistible opportunity. Ibelieved in the company, but greed and fear were already do-ing their usual two-step in my head and, in the process, step-ping all over my critical faculties.

A Mathematician Plays the Stock Market 15
Emotional Overreactionsand Homo Economicus
Investors can become (to borrow a phrase Alan Greenspanand Robert Shiller made famous) irrationally exuberant, or,changing the arithmetical sign, irrationally despairing. Someof the biggest daily point gains and declines in Nasdaq's his-tory occurred in a single month in early 2000, and the patternhas continued unabated in 2001 and 2002, the biggest pointgain since 1987 occurring on July 24, 2002. (The increase involatility, although substantial, is a little exaggerated since ourperception of gains and losses have been distorted by the risein the indices. A 2 percent drop in the Dow when the market isat 9,000 is 180 points, whereas not too long ago when it wasat 3,000, the same percentage drop was only 60 points.) Thevolatility has come about as the economy has hovered near arecession, as accounting abuses have come to light, as CEOmalfeasance has mounted, as the bubble has fizzled, and aspeople have continued to trade on their own, influenced nodoubt by capricious lists of the fifty most beautiful (er . . . , un-dervalued) stocks.
As with beautiful people and, for that matter, distinguisheduniversities, emotions and psychology are imponderable fac-tors in the market's jumpy variability. Just as beauty and aca-demic quality don't change as rapidly as ad hoc lists andmagazine rankings do, so, it seems, the fundamentals of com-panies don't change as quickly as our mercurial reactions tonews about them do.
It may be useful to imagine the market as a fine race carwhose exquisitely sensitive steering wheel makes it impossibleto drive in a straight line. Tiny bumps in our path cause us toswerve wildly, and we zigzag from fear to greed and back again,from unreasonable gloom to irrational exuberance and back.

16 John Allen Paulos
Our overreactions are abetted by the all-crisis-all-the-timebusiness media, which brings to mind a different analogy:the reigning theory in cosmology. The inflationary universehypothesis holds—very, very roughly—that shortly after theBig Bang the primordial universe inflated so fast that all ofour visible universe derives from a tiny part of it; we can't seethe rest. The metaphor is strained (in fact I just developedcarpal tunnel syndrome typing it), but it seems reminiscent ofwhat happens when the business media (as well as the mediain general) focus unrelentingly on some titillating but rela-tively inconsequential bit of news. Coverage of the item ex-pands so fast as to distort the rest of the global village andrender it invisible.
Our responses to business news are only one of the ways inwhich we fail to be completely rational. More generally, wesimply don't always behave in ways that maximize our eco-nomic well-being. "Homo economicus" is not an ideal to-ward which many people strive. My late father, for example,was distinctly uneconimicus. I remember him sitting andchuckling on the steps outside our house one autumn nightlong ago. I asked what was funny and he told me that he hadbeen watching the news and had heard Bob Buhl, a pitcherfor the then Milwaukee Braves, answer a TV reporter's ques-tion about his off-season plans. "Buhl said he was going tohelp his father up in Saginaw, Michigan, during the winter."My father laughed again and continued. "And when the re-porter asked Buhl what his father did up in Saginaw, Buhlsaid, 'Nothing at all. He does nothing at all.'"
My father liked this kind of story and his crooked grin lin-gered on his face. This memory was jogged recently when Iwas straightening out my office and found a cartoon he hadsent me years later. It showed a bum sitting happily on a parkbench as a line of serious businessmen traipsed by him. Thebum calls out "Who's winning?" Although my father was a
A Mathematician Plays the Stock Market 17
salesman, he always seemed less intent on making a sale thanon schmoozing with his customers, telling jokes, writing po-etry (not all of it doggerel), and taking innumerable coffeebreaks.
Everyone can tell such stories, and you would be hard-pressed to find a novel, even one with a business setting,where the characters are all actively pursuing their economicself-interest. Less anecdotal evidence of the explanatory limitsof the homo economicus ideal is provided by so-called "ulti-matum games." These generally involve two players, one ofwhom is given a certain amount of money, say $100, by anexperimenter, and the other of whom is given a kind of veto.The first player may offer any non-zero fraction of the $100to the second player, who can either accept or reject it. If heaccepts it, he is given whatever amount the first player has of-fered, and the first player keeps the balance. If he rejects it,the experimenter takes the money back.
Viewing this in rational game-theoretic terms, one wouldargue that it's in the interest of the second player to acceptwhatever is offered since any amount, no matter how small, isbetter than nothing. One would also suspect that the firstplayer, knowing this, would make only tiny offers to the sec-ond player. Both suppositions are false. The offers range up to50 percent of the money involved, and, if deemed too smalland therefore humiliating, they are sometimes rejected. No-tions of fairness and equality, as well as anger and revenge,seem to play a role.
Behavioral Finance
People's reactions to ultimatum games may be counterpro-ductive, but they are at least clear-eyed. A number of psychol-ogists in recent years have pointed out the countless ways in

18 John Allen Paulos
which we're all subject to other sorts of counterproductivebehavior that spring from cognitive blind spots that are ana-logues, perhaps, of optical illusions. These psychological illu-sions and foibles often make us act irrationally in a variety ofdisparate endeavors, not the least of which is investing.
Amos Tversky and Daniel Kahneman are the founders ofthis relatively new field of study, many of whose early resultsare reported upon in the classic book Judgment Under Uncer-tainty^ edited by them and Paul Slovic. (Kahneman wasawarded the 2002 Nobel Prize in economics, and Tversky al-most certainly would have shared it had he not died.) Otherswho have contributed to the field include Thomas Gilovich,Robin Dawes, J. L. Knetschin, and Baruch Fischhoff. Econo-mist Richard Thaler (mentioned in the first chapter) is one ofthe leaders in applying these emerging insights to economicsand finance, and his book The Winner's Curse, as well asGilovich's How We Know What Isn't So, are very useful com-pendiums of recent results.
What makes these results particularly intriguing is the waythey illuminate the tactics used, whether consciously or not,by people in everyday life. For example, a favorite ploy of ac-tivists of all ideological stripes is to set the terms of a debateby throwing out numbers, which need have little relation toreality to be influential. If you are appalled at some condition,you might want to announce that more than 50,000 deathseach year are attributable to it. By the time people catch upand realize that the number is a couple of orders of magni-tude smaller, your cause will be established.
Unfounded financial hype and unrealistic "price targets"have the same effect. Often, it seems, an analyst cites a "pricetarget" for a stock in order to influence investors by putting anumber into their heads. (Since the targets are so often indis-tinguishable from wishes, shouldn't they always be infinite?)

A Mathematician Plays the Stock Market 19
The reason for the success of this hyperbole is that most ofus suffer from a common psychological failing. We credit andeasily become attached to any number we hear. This tendencyis called the "anchoring effect" and it's been demonstrated tohold in a wide variety of situations.
If an experimenter asks people to estimate the populationof Ukraine, the size of Avogadro's number, the date of an his-torical event, the distance to Saturn, or the earnings of XYZCorporation two years from now, their guesses are likely to befairly close to whatever figure the experimenter first suggestsas a possibility. For example, if he prefaces his request for anestimate of the population of Ukraine with the question—"Isit more or less than 200 million people?"—the subjects' esti-mates will vary and generally be a bit less than this figure, butstill average, say, 175 million people. If he prefaces his requestfor an estimate with the question—"Is the population ofUkraine more or less than 5 million people?"—the subjects'estimates will vary and this time be a bit more than this figure,but still average, say, 10 million people. The subjects usuallymove in the right direction from whatever number is pre-sented to them, but nevertheless remain anchored to it.
You might think this is a reasonable strategy for people tofollow. They might realize they don't know much aboutUkraine, chemistry, history, or astronomy, and they probablybelieve the experimenter is knowledgeable, so they stick closeto the number presented. The astonishing strength of the ten-dency comes through, however, when the experimenter ob-tains his preliminary number by some chance means, say byspinning a dial that has numbers around its periphery—300million, 200 million, 50 million, 5 million, and so on. Say hespins the dial in front of the subjects, points out where it hasstopped, and then asks them if the population of Ukraine ismore or less than the number at which the dial has stopped.

20 John Allen Paulos
The subjects' guesses are still anchored to this number eventhough, one presumes, they don't think the dial knows any-thing about Ukraine!
Financial numbers are also vulnerable to this sort of manip-ulation, including price targets and other uncertain future fig-ures like anticipated earnings. The more distant the future thenumbers describe, the more it's possible to postulate a hugefigure that is justified, say, by a rosy scenario about the expo-nentially growing need for bandwidth or online airline ticketsor pet products. People will discount these estimates, but usu-ally not nearly enough. Some of the excesses of the dot-cornsare probably attributable to this effect. On the sell side too,people can paint a dire picture of ballooning debt or shrinkingmarkets or competing technology. Once again, the numberspresented, this time horrific, need not have much to do withreality to have an effect.
Earnings and targets are not the only anchors. People oftenremember and are anchored to the fifty-two-week high (orlow) at which the stock had been selling and continue to basetheir deliberations on this anchor. I unfortunately did thiswith WCOM. Having first bought the stock when it was inthe forties, I implicitly assumed it would eventually right itselfand return there. Later, when I bought more of it in the thir-ties, twenties, and teens, I made the same assumption.
Another, more extreme form of anchoring (although thereare other factors involved) is revealed by investors' focus onwhether the earnings that companies announce quarterlymeet the estimates analysts have established for them. Whencompanies' earnings fall short by a penny or two per share,investors sometimes react as if this were tantamount to near-bankruptcy. They seem to be not merely anchored to earningsestimates but fetishistically obsessed with them.
Not surprisingly, studies have shown that companies' earn-ings are much more likely to come in a penny or two above

A Mathematician Plays the Stock Market 21
the analysts' average estimate than a penny or two below it. Ifearnings were figured without regard to analysts' expecta-tions, they'd come in below the average estimate as often asabove it. The reason for the asymmetry is probably that com-panies sometimes "back in" to their earnings. Instead of de-termining revenues and expenses and subtracting the latterfrom the former to obtain earnings (or more complicatedvariants of this), companies begin with the earnings they needand adjust revenues and expenses to achieve them.
Psychological Foibles, A List
The anchoring effect is not the only way in which our facul-ties are clouded. The "availability error" is the inclination toview any story, whether political, personal, or financial,through the lens of a superficially similar story that is psycho-logically available. Thus every recent American military in-volvement is inevitably described somewhere as "anotherVietnam." Political scandals are immediately compared to theLewinsky saga or Watergate, misunderstandings betweenspouses reactivate old wounds, normal accounting questionsbring the Enron-Andersen-WorldCom fiasco to mind, andany new high-tech firm has to contend with memories of thedot-corn bubble. As with anchoring, the availability error canbe intentionally exploited.
The anchoring effect and availability error are exacerbatedby other tendencies. "Confirmation bias" refers to the waywe check a hypothesis by observing instances that confirm itand ignoring those that don't. We notice more readily andeven diligently search for whatever might confirm our beliefs,and we don't notice as readily and certainly don't look hardfor what disconfirms them. Such selective thinking reinforcesthe anchoring effect: We naturally begin to look for reasons

22 John Allen Paulos
that the arbitrary number presented to us is accurate. If wesuccumb completely to the confirmation bias, we step overthe sometimes fine line separating flawed rationality andhopeless closed-mindedness.
Confirmation bias is not irrelevant to stock-picking. Wetend to gravitate toward those people whose take on a stockis similar to our own and to search more vigorously for posi-tive information on the stock. When I visited WorldComchatrooms, I more often clicked on postings written by peoplecharacterizing themselves as "strong buys" than I did onthose written by "strong sells." I also paid more attention toWorldCom's relatively small deals with web-hosting compa-nies than to the larger structural problems in the telecommu-nications industry.
The "status quo bias" (these various biases are generallynot independent of each other) also applies to investing. Ifsubjects are told, for example, that they've inherited a gooddeal of money and then asked which of four investment op-tions (an aggressive stock portfolio, a more balanced collec-tion of equities, a municipal bond fund, or U.S. Treasuries)they would prefer to invest it in, the percentages choosingeach are fairly evenly distributed.
Surprisingly, however, if the subjects are told that they'veinherited the money but it is already in the form of municipalbonds, almost half choose to keep it in bonds. It's the samewith the other three investment options: Almost half elect tokeep the money where it is. This inertia is part of the reasonso many people sat by while not only their inheritances buttheir other investments dwindled away. The "endowment ef-fect," another kindred bias, is an inclination to endow one'sholdings with more value than they have simply because oneholds them. "It's my stock and I love it."
Related studies suggest that passively endured losses induceless regret than losses that follow active involvement. Some-

A Mathematician Plays the Stock Market 23
one who sticks with an old investment that then declines by25 percent is less upset than someone who switches into thesame investment before it declines by 25 percent. The samefear of regret underlies people's reluctance to trade lotterytickets with friends. They imagine how they'll feel if theiroriginal ticket wins.
Minimizing possible regret often plays too large a role ininvestors' decisionmaking. A variety of studies by Tversky,Kahneman, and others have shown that most people tend toassume less risk to obtain gains than they do to avoid losses.This isn't implausible: Other research suggests that peoplefeel considerably more pain after incurring a financial lossthan they do pleasure after achieving an equivalent gain. Inthe extreme case, desperate fears about losing a lot of moneyinduce people to take enormous risks with their money.
Consider a rather schematic outline of many of the situa-tions studied. Imagine that a benefactor gives $10,000 toeveryone in a group and then offers each of them the follow-ing choice. He promises to a) give them an additional $5,000or else b) give them an additional $10,000 or $0, dependingon the outcome of a coin flip. Most people choose to receivethe additional $5,000. Contrast this with the choice people ina different group make when confronted with a benefactorwho gives them each $20,000 and then offers the followingchoice to each of them. He will a) take from them $5,000 orelse b) will take from them $10,000 or $0, depending on theflip of a coin. In this case, in an attempt to avoid any loss,most people choose to flip the coin. The punchline, as it oftenis, is that the choices offered to the two groups are the same: asure $15,000 or a coin flip to determine whether they'll re-ceive $10,000 or $20,000.
Alas, I too took more risks to avoid losses than I did to ob-tain gains. In early October 2000, WCOM had fallen below$20, forcing the CEO, Bernie Ebbers, to sell 3 million shares

24 John Allen Paulos
to pay off some of his investment debts. The WorldCom chat-rooms went into one of their typical frenzies and the pricedropped further. My reaction, painful to recall, was, "Atthese prices I can finally get out of the hole." I bought moreshares even though I knew better. There was apparently aloose connection between my brain and my fingers, whichkept clicking the buy button on my Schwab online account inan effort to avoid the losses that loomed.
Outside of business, loss aversion plays a role as well. It'ssomething of a truism that the attempt to cover up a scandaloften leads to a much worse scandal. Although most peopleknow this, attempts to cover up are still common, presumablybecause, here too, people are much more willing to take risksto avoid losses than they are to obtain gains.
Another chink in our cognitive apparatus is Richard Thaler'snotion of "mental accounts," mentioned in the last chapter."The Legend of the Man in the Green Bathrobe" illustrates thisnotion compellingly. It is a rather long shaggy dog story, butthe gist is that a newlywed on his honeymoon in Las Vegaswakes up in bed and sees a $5 chip left on the dresser. Unableto sleep, he goes down to the casino (in his green bathrobe, ofcourse), bets on a particular number on the roulette wheel, andwins. The 35 to 1 odds result in a payout of $175, which thenewlywed promptly bets on the next spin. He wins again andnow has more than $6,000. He bets everything on his numbera couple more times, continuing until his winnings are in themillions and the casino refuses to accept such a large bet. Theman goes to a bigger casino, wins yet again, and now com-mands hundreds of millions of dollars. He hesitates and thendecides to bets it all one more time. This time he loses. In adaze, he stumbles back up to his hotel room where his wifeyawns and asks how he did. "Not too bad. I lost $5."
It's not only in casinos and the stock market that we cate-gorize money in odd ways and treat it differently depending
A Mathematician Plays the Stock Market 25
on what mental account we place it in. People who lose a$100 ticket on the way to a concert, for example, are lesslikely to buy a new one than are people who lose $100 in cashon their way to buy the ticket. Even though the amounts arethe same in the two scenarios, people in the former one tendto think $200 is too large an expenditure from their enter-tainment account and so don't buy a new ticket, while peoplein the latter tend to assign $100 to their entertainment ac-count and $100 to their "unfortunate loss" account and buythe ticket.
In my less critical moments (although not only then) I men-tally amalgamate the royalties from this book, whose writingwas prompted in part by my investing misadventure, with myWCOM losses. Like corporate accounting, personal account-ing can be plastic and convoluted, perhaps even more sosince, unlike corporations, we are privately held.
These and other cognitive illusions persist for several rea-sons. One is that they lead to heuristic rules of thumb thatcan save time and energy. It's often easier to go on automaticpilot and respond to events in a way that requires little newthinking, not just in scenarios involving eccentric philanthro-pists and sadistic experimenters. Another reason for the illu-sions' persistence is that they have, to an extent, becomehardwired over the eons. Noticing a rustle in the bush, ourprimitive ancestors were better off racing away than theywere plugging into Bayes' theorem on conditional probabilityto determine if a threat was really likely.
Sometimes these heuristic rules lead us astray, again not justin business and investing but in everyday life. Early in the fall2002 Washington, D.C., sniper case, for example, the policearrested a man who owned a white van, a number of rifles,and a manual for snipers. It was thought at the time that therewas one sniper and that he owned all these items, so for thepurpose of this illustration let's assume that this turned out to

26 John Allen Paulos
be true. Given this and other reasonable assumptions, which ishigher—a) the probability that an innocent man would ownall these items, or b) the probability that a man who owned allthese items would be innocent? You may wish to pause beforereading on.
Most people find questions like this difficult, but the sec-ond probability would be vastly higher. To see this, let memake up some plausible numbers. There are about 4 millioninnocent people in the suburban Washington area and, we'reassuming, one guilty one. Let's further estimate that tenpeople (including the guilty one) own all three of the itemsmentioned above. The first probability—that an innocentman owns all these items—would be 9/4,000,000 or 1 in400,000. The second probability—that a man owning allthree of these items is innocent—would be 9/10. Whatever theactual numbers, these probabilities usually differ substan-tially. Confusing them is dangerous (to defendants).
Self-Fulfilling Beliefs and Data Mining
Taken to extremes, these cognitive illusions may give rise toclosed systems of thought that are immune, at least for awhile, to revision and refutation. (Austrian writer and satiristKarl Kraus once remarked, "Psychoanalysis is that mental ill-ness for which it regards itself as therapy.") This is especiallytrue for the market, since investors' beliefs about stocks or amethod of picking them can become a self-fulfilling prophecy.The market sometimes acts like a strange beast with a will, ifnot a mind, of its own. Studying it is not like studying scienceand mathematics, whose postulates and laws are (in quite dif-ferent senses) independent of us. If enough people suddenlywake up believing in a stock, it will, for that reason alone, goup in price and justify their beliefs.

A Mathematician Plays the Stock Market 27
A contrived but interesting illustration of a self-fulfillingbelief involves a tiny investment club with only two investorsand ten possible stocks to choose from each week. Let's as-sume that each week chance smiles at random on one of theten stocks the investment club is considering and it rises pre-cipitously, while the week's other nine stocks oscillate withina fairly narrow band.
George, who believes (correctly in this case) that the move-ments of stock prices are largely random, selects one of the tenstocks by rolling a die (say an icosehedron—a twenty-sidedsolid—with two sides for each number). Martha, let's assume,fervently believes in some wacky theory, Q analysis. Herchoices are therefore dictated by a weekly Q analysis newslet-ter that selects one stock of the ten as most likely to break out.Although George and Martha are equally likely to pick thelucky stock each week, the newsletter-selected stock will resultin big investor gains more frequently than will any other stock.
The reason is simple but easy to miss. Two conditions mustbe met for a stock to result in big gains for an investor: Itmust be smiled upon by chance that week and it must be cho-sen by one of the two investors. Since Martha always picksthe newsletter-selected stock, the second condition in her caseis always met, so whenever chance happens to favor it, it re-sults in big gains for her. This is not the case with the otherstocks. Nine-tenths of the time, chance will smile on one ofthe stocks that is not newsletter-selected, but chances areGeorge will not have picked that particular one, and so it willseldom result in big gains for him. One must be careful in in-terpreting this, however. George and Martha have equalchances of pulling down big gains (10 percent), and eachstock of the ten has an equal chance of being smiled upon bychance (10 percent), but the newsletter-selected stock willachieve big gains much more often than the randomly se-lected ones.

28 John Allen Paulos
Reiterated more numerically, the claim is that 10 percent ofthe time the newsletter-selected stock will achieve big gains forMartha, whereas each of the ten stocks has only a 1 percentchance of both achieving big gains and being chosen byGeorge. Note again that two things must occur for thenewsletter-selected stock to achieve big gains: Martha mustchoose it, which happens with probability 1, and it must bethe stock that chance selects, which happens with probability1/10th. Since one multiplies probabilities to determine thelikelihood that several independent events occur, the probabil-ity of both these events occurring is 1 x 1/10, or 10 percent.Likewise, two things must occur for any particular stock toachieve big gains via George: George must choose it, whichoccurs with probability 1/10th, and it must be the stock thatchance selects, which happens with probability 1/10th. Theproduct of these two probabilities is 1/100th or 1 percent.
Nothing in this thought experiment depends on there beingonly two investors. If there were one hundred investors, fiftyof whom slavishly followed the advice of the newsletter andfifty of whom chose stocks at random, then the newsletter-selected stocks would achieve big gains for their investorseleven times as frequently as any particular stock did for itsinvestors. When the newsletter-selected stock is chosen bychance and happens to achieve big gains, there are fifty-fivewinners, the fifty believers in the newsletter and five whopicked the same stock at random. When any of the other ninestocks happens to achieve big gains, there are, on average,only five winners.
In this way a trading strategy, if looked at in a small popu-lation of investors and stocks, can give the strong illusion thatit is effective when only chance is at work.
"Data mining," the scouring of databases of investments,stock prices, and economic data for evidence of the effective-ness of this or that strategy, is another example of how an

A Mathematician Plays the Stock Market 29
inquiry of limited scope can generate deceptive results. Theproblem is that if you look hard enough, you will always findsome seemingly effective rule that resulted in large gains overa certain time span or within a certain sector. (In fact, in-spired by the British economist Frank Ramsey, mathemati-cians over the last half century have proved a variety oftheorems on the inevitability of some kind of order in largesets.) The promulgators of such rules are not unlike the be-lievers in bible codes. There, too, people searched for codedmessages that seemed to be meaningful, not realizing that it'snearly impossible for there not to be some such "messages."(This is trivially so if you search in a book that has a chapter11, conveniently foretelling many companies' bankruptcies.)
People commonly pore over price and trade data attempt-ing to discover investment schemes that have worked in thepast. In a reductio ad absurdum of such unfocused fishing forassociations, David Leinweber in the mid-90s exhaustivelysearched the economic data on a United Nations CD-ROMand found that the best predictor of the value of the S&P 500stock index was—a drum roll here—butter production inBangladesh. Needless to say, butter production in Bangladeshhas probably not remained the best predictor of the S&P 500.Whatever rules and regularities are discovered within asample must be applied to new data if they're to be accordedany limited credibility. You can always arbitrarily define aclass of stocks that in retrospect does extraordinarily well,but will it continue to do so?
I'm reminded of a well-known paradox devised (for a dif-ferent purpose) by the philosopher Nelson Goodman. He se-lected an arbitrary future date, say January 1, 2020, anddefined an object to be "grue" if it is green and the time is be-fore January 1, 2020, or if it is blue and the time is after Janu-ary 1, 2020. Something is "bleen," on the other hand, if it isblue and the time is before that date or if it is green and the

30 John Allen Paulos
time is after that date. Now consider the color of emeralds.All emeralds examined up to now (2002) have been green. Wetherefore feel confident that all emeralds are green. But allemeralds so far examined are also grue. It seems that weshould be just as confident that all emeralds are grue (andhence blue beginning in 2020). Are we?
A natural objection is that these color words grue andbleen are very odd, being defined in terms of the year 2020.But were there aliens who speak the grue-bleen language, theycould make the same charge against us. "Green," they mightargue, is an arbitrary color word, being defined as grue before2020 and bleen afterward. "Blue" is just as odd, being bleenbefore 2020 and grue from then on. Philosophers have notconvincingly shown what exactly is wrong with the termsgrue and bleen, but they demonstrate that even the abruptfailure of a regularity to hold can be accommodated by the in-troduction of new weasel words and ad hoc qualifications.
In their headlong efforts to discover associations, data min-ers are sometimes fooled by "survivorship bias." In marketusage this is the tendency for mutual funds that go out ofbusiness to be dropped from the average of all mutual funds.The average return of the surviving funds is higher than itwould be if all funds were included. Some badly performingfunds become defunct, while others are merged with better-performing cousins. In either case, this practice skews past re-turns upward and induces greater investor optimism aboutfuture returns. (Survivorship bias also applies to stocks,which come and go over time, only the surviving ones makingthe statistics on performance. WCOM, for example, was un-ceremoniously replaced on the S&P 500 after its steep declinein early 2002.)
The situation is rather like that of schools that allow stu-dents to drop courses they're failing. The grade point aver-ages of schools with such a policy are, on average, higher

A Mathematician Plays the Stock Market 31
than those of schools that do not allow such withdrawals. Butthese inflated GPAs are no longer a reliable guide to students'performance.
Finally, taking the meaning of the term literally, survivorshipbias makes us all a bit more optimistic about facing crises. Wetend to see only those people who survived similar crises.Those who haven't are gone and therefore much less visible.
Rumors and Online Chatrooms
Online chatrooms are natural laboratories for the observationof illusions and distortions, although their psychology is moreoften brutally basic than subtly specious. While spellboundby WorldCom, I would spend many demoralizing, annoying,and engaging hours compulsively scouring the various World-Com discussions at Yahoo! and RagingBull. Only a brief visitto these sites is needed to see that a more accurate descriptionof them would be rantrooms.
Once someone dons a screen name, he (the masculine pro-noun, I suspect, is almost always appropriate) usually dis-penses with grammar, spelling, and most conventionalstandards of polite discourse. Other people become morons,idiots, and worse. A poster's references to the stock, if he'sshorting it (selling shares he doesn't have in the hope that hecan buy them back when the price goes down), put a burdenon one's ability to decode scatological allusions and acro-nyms. Any expression of pain at one's losses is met with unre-lenting scorn and sarcasm; ostensibly genuine musings aboutsuicide are no exception. A suicide threat in April 2002,lamenting the loss of house, family, and job because ofWCOM, drew this response: "You sad sack loser. Die. Youmight want to write a note too in case the authorities andyour wife don't read the Yahoo! chatrooms."

32 John Allen Paulos
People who characterize themselves as sellers are generally(but not always) more vituperative than those claiming to bebuyers. Some of the regulars appear genuinely interested indiscussing the stock rationally, imparting information, andexchanging speculation. A few seem to know a lot, many aredevotees of various outlandish conspiracy theories, includingthe usual anti-Semitic sewage, and even more are just plainclueless, asking, for example, why they "always put thatslash between the P and the E in P/E, and is P price or profit."There were also many discussions that had nothing directlyto do with the stock. One that I remember fondly was aboutsomeone who called a computer help desk because his com-puter didn't work. It turned out that he had plugged thecomputer and all his peripheral devices into his surge protec-tor, which he then plugged into itself. The connection withwhatever company was being discussed I've forgotten.
Taking advice from such an absurdly skewed sample ofposters is silly, of course, but the real-time appeal of the sitesis akin to overhearing gossip about a person you're interestedin. It's likely to be false, spun, or overstated, but it still holds acertain fascination. Another analogy is to listening to policeradio and getting a feel for the raw life and death on thestreets.
Chatroom denizens form little groups that spend a lot oftime excoriating, but not otherwise responding to, opposinggroups. They endorse each other's truisms and denouncethose of the others. When WorldCom purchased a small com-pany or had a reversal in its Brazilian operations, this wasconsidered big news. It was not nearly as significant, however,as an analyst changing his recommendation from a strongbuy to a buy or vice versa. If you filter out the postingsdrenched in anger and billingsgate, you find most of the bi-ases mentioned above demonstrated on a regular basis. Theposters are averse to risk, anchored to some artificial number,

A Mathematician Plays the Stock Market 33
addicted to circular thought, impressed by data mining, or allof the above.
Most boards I visited had a higher percentage of rationalposters than did WorldCom's. I remember visiting the Enronboard and reading rumors of the bogus deals and misleadingaccounting practices that eventually came to light. Unfortu-nately, since there are always rumors of every conceivable andcontradictory sort (sometimes posted by the same individual),one cannot conclude anything from their existence exceptthat they're likely to contribute to feelings of hope, fear,anger, and anxiety.
Pump and Dump, Short and Distort
The rumors are often associated with market scams that ex-ploit people's normal psychological reactions. Many of thesereactions are chronicled in Edwin Lefevre's 1923 classicnovel, Reminiscences of a Stock Operator, but the standard"pump and dump" is an illegal practice that has gained newlife on the Internet. Small groups of individuals buy a stockand tout it in a misleading hyperbolic way (that is, pump it).Then when its price rises in response to this concerted cam-paign, they sell it at a profit (dump it). The practice worksbest in bull markets when people are most susceptible togreed. It is also most effective when used on thinly tradedstocks where a few buyers can have a pronounced effect.
Even a single individual with a fast Internet connection anda lot of different screen names can mount a pump and dumpoperation. Just buy a small stock from an online broker, thenvisit the chatroom where it's discussed. Post some artful innu-endoes or make some outright phony claims and then backyourself up with one of your pseudonyms. You can evenmaintain a "conversation" among your various screen names,
34 John Allen Paulos
each salivating over the prospects of the stock. Then just waitfor it to move up and sell it quickly when it does.
A fifteen-year-old high school student in New Jersey wasarrested for successfully pumping and dumping after school.It's hard to gauge how widespread the practice is since theperpetrators generally make themselves invisible. I don't thinkit's rare, especially since there are gradations in the practice,ranging from organized crime telephone banks to conven-tional brokers inveigling gullible investors.
In fact, the latter probably constitute a vastly bigger threat.Being a stock analyst used to be a thoroughly respectable pro-fession, and for most practitioners no doubt it still is. Unfor-tunately, however, there seem to be more than a few whosefervent desire to obtain the investment banking fees associ-ated with underwriting, mergers, and the other quite lucrativepractices induces them to shade their analyses—and "shade"may be a kind verb—so as not to offend the companiesthey're both analyzing and courting. In early 2002, there werewell-publicized stories of analysts at Merrill Lynch exchang-ing private emails deriding a stock that they were publiclytouting. Six other brokerage houses were accused of similarwrongdoing.
Even more telling were records from Salomon Smith Bar-ney subpoenaed by Congress indicating that executives atcompanies generating large investment fees often personallyreceived huge dollops of companies' initial public offerings.Not open to ordinary investors, these hot, well-promoted of-ferings quickly rose in value and their quick sale generatedimmediate profits. Bernie Ebbers was reported to have re-ceived, between 1996 and 2000, almost a million shares ofIPOs worth more than $11 million. The $1.4 billion settle-ment between several big brokerage houses and the govern-ment announced in December 2002 left little doubt that thepractice was not confined to Ebbers and Salomon.
A Mathematician Plays the Stock Market 35
In retrospect it now seems that some analysts' ratingsweren't much more credible than the ubiquitous email invita-tions from people purporting to be Nigerian government offi-cials in need of a little seed money. The usual claim is that themoney will enable them and their gullible respondents toshare in enormous, but frozen foreign accounts.
The bear market analogue to pumping and dumping isshorting and distorting. Instead of buying, touting, and sell-ing on the jump in price, snorters and distorters sell, lambast,and buy on the decline in price.
They first short-sell the stock in question. As mentioned,that is the practice of selling shares one doesn't own in thehope that the price of the shares will decline when it comestime to pay the broker for the borrowed shares. (Short-sellingis perfectly legal and also serves a useful purpose in maintain-ing markets and limiting risk.) After short-selling the stock,the scamsters lambast it in a misleading hyperbolical way(that is, distort its prospects). They spread false rumors ofwritedowns, unsecured debts, technology problems, employeemorale, legal proceedings. When the stock's price declines inresponse to this concerted campaign, they buy the shares atthe lower price and keep the difference.
Like its bull-market counterpart, shorting and distortingworks best on thinly traded stocks. It is most effective in abear market when people are most susceptible to fear andanxiety. Online practitioners, like pumpers and dumpers, usea variety of screen names, this time to create the illusion thatsomething catastrophic is about to befall the company inquestion. They also tend to be nastier toward investors whodisagree with them than are pumpers and dumpers, who mustmaintain a sunny, confident air. Again there are gradations inthe practice and it sometimes seems indistinguishable fromsome fairly conventional practices of brokerage houses andhedge funds.

36 John Allen Paulos
Even large stocks like WCOM (with 3 billion outstandingshares) can be affected by such shorters and distorters al-though they must be better placed than the dermatologicallychallenged isolates who usually carry on the practice. I don'tdoubt that there was much shorting of WCOM during itslong descent, although given what's come to light about thecompany's accounting, "short and report" is a more faithfuldescription of what occurred.
Unfortunately, after Enron, WorldCom, Tyco, and the oth-ers, even an easily generated whiff of malfeasance can causeinvestors to sell first and ask questions later. As a result, manyworthy companies are unfairly tarred and their investors un-necessarily burned.

3 Trends, Crowds,and Waves
s a predictor of stock prices, psychology goes only so far.Many investors subscribe to "technical analysis," an ap-
proach generally intent on discerning the short-term di-rection of the market via charts and patterns and thendevising rules for pursuing it. Adherents of technical analy-sis, which is not all that technical and would more accu-rately be termed "trend analysis," believe that "the trend istheir friend," that "momentum investing" makes sense, thatcrowds should be followed. Whatever the validity of thesebeliefs and of technical analysis in general (and I'll get to thisshortly), I must admit to an a priori distaste for the herdishbehavior it often seems to counsel: Figure out where thepack is going and follow it. It was this distaste, perhaps, thatprevented me from selling WCOM and that caused me tosputter continually to myself that the company was the vic-tim of bad public relations, investor misunderstanding, me-dia bashing, anger at the CEO, a poisonous business climate,unfortunate timing, or panic selling. In short, I thought thecrowd was wrong and hated the idea that it must be obeyed.As I slowly learned, however, disdaining the crowd is some-times simply hubris.
37
38 John Allen Paulos
Technical Analysis:Following the Followers
My own prejudices aside, the justification for technical analysisis murky at best. To the extent there is one, it most likely de-rives from psychology, perhaps in part from the Keynesian ideaof conventionally anticipating the conventional response, orperhaps from some as yet unarticulated systemic interactions."Unarticulated" is the key word here: The quasi-mathematicaljargon of technical analysis seldom hangs together as a coher-ent theory. I'll begin my discussion of it with one of its lessplausible manifestations, the so-called Elliott wave theory.
Ralph Nelson Elliott famously believed that the marketmoved in waves that enabled investors to predict the behaviorof stocks. Outlining his theory in 1939, Elliott wrote thatstock prices move in cycles based upon the Fibonacci numbers(1, 2, 3, 5, 8,13, 21, 34, 59, 93, . . . , each successive number inthe sequence being the sum of the two previous ones). Mostcommonly the market rises in five distinct waves and declinesin three distinct waves for obscure psychological or systemicreasons. Elliott believed as well that these patterns exist atmany levels and that any given wave or cycle is part of a largerone and contains within it smaller waves and cycles. (To giveElliott his due, this idea of small waves within larger ones hav-ing the same structure does seem to presage mathematicianBenoit Mandelbrot's more sophisticated notion of a fractal, towhich I'll return later.) Using Fibonacci-inspired rules, the in-vestor buys on rising waves and sells on falling ones.
The problem arises when these investors try to identifywhere on a wave they find themselves. They must also decidewhether the larger or smaller cycle of which the wave is in-evitably a part may temporarily be overriding the signal tobuy or sell. To save the day, complications are introduced intothe theory, so many, in fact, that the theory soon becomes

A Mathematician Plays the Stock Market 39
incapable of being falsified. Such complications and unfalsifi-ability are reminiscent of the theory of biorhythmns andmany other pseudosciences. (Biorhythm theory is the ideathat various aspects of one's life follow rigid periodic cyclesthat begin at birth and are often connected to the numbers 23and 28, the periods of some alleged male and female princi-ples, respectively.) It also brings to mind the ancient Ptolemaicsystem of describing the planets' movements, in which moreand more corrections and ad hoc exceptions had to be createdto make the system jibe with observation. Like most othersuch schemes, Elliott wave theory founders on the simplequestion: Why should anyone expect it to work?
For some, of course, what the theory has going for it is themathematical mysticism associated with the Fibonacci num-bers, any two adjacent ones of which are alleged to stand inan aesthetically appealing relation. Natural examples of Fi-bonacci series include whorls on pine cones and pineapples;the number of leaves, petals, and stems on plants; the num-bers of left and right spirals in a sunflower; the number ofrabbits in succeeding generations; and, insist Elliott enthusi-asts, the waves and cycles in stock prices.
It's always pleasant to align the nitty-gritty activities of themarket with the ethereal purity of mathematics.
The Euro and the Golden Ratio
Before moving on to less barren financial theories, I invite youto consider a brand new instance of financial numerology. Anemail from a British correspondent apprised me of an inter-esting connection between the euro-pound and pound-euroexchange rates on March 19, 2002.
To appreciate it, one needs to know the definition of thegolden ratio from classical Greek mathematics. (Those for

40 John Allen Paulos
whom the confluence of Greek, mathematics, and finance is abit much may want to skip to the next section.) If a point ona straight line divides the line so that the ratio of the longerpart to the shorter is equal to the ratio of the whole to thelonger part, the point is said to divide the line in a golden ra-tio. Rectangles whose length and width stand in a golden ratioare also said to be golden, and many claim that rectangles ofthis shape, for example, the facade of the Parthenon, are par-ticularly pleasing to the eye. Note that a 3-by-5 card is almosta golden rectangle since 5/3 (or 1.666 . . . ) is approximatelyequal to (5 + 3)/5 (or 1.6).
The value of the golden ratio, symbolized by the Greek let-ter phi, is 1.618 ... (the number is irrational and so its deci-mal representation never repeats). It is not difficult to provethat phi has the striking property that it is exactly equal to 1plus its reciprocal (the reciprocal of a number is simply 1 di-vided by the number). Thus 1.618 ... is equal to 1 + 1/1.618
This odd fact returns us to the euro and the pound. An an-nouncer on the BBC on the day in question, March 19, 2002,observed that the exchange rate for 1 pound sterling was 1euro and 61.8 cents (1.618 euros) and that, lo and behold,this meant that the reciprocal exchange rate for 1 euro was61.8 pence (.618 pounds). This constituted, the announcerwent on, "a kind of symmetry." The announcer probablydidn't realize how profound this symmetry was.
In addition to the aptness of "golden" in this financial con-text, there is the following well-known relation between thegolden ratio and the Fibonacci numbers. The ratio of any Fi-bonacci number to its predecessor is close to the golden ratioof 1.618 ..., and the bigger the numbers involved, the closerthe two ratios become. Consider again, the Fibonacci num-bers, 1, 2, 3, 5, 8, 13, 21, 34, 59, The ratios, 5/3, 8/5,

A Mathematician Plays the Stock Market 41
13/8, 21/13, . . . , of successive Fibonacci numbers approachthe golden ratio of 1.618 ... !
There's no telling how an Elliott wave theorist dabbling incurrencies at the time of the above exchange rate coincidencewould have reacted to this beautiful harmony between moneyand mathematics. An unscrupulous, but numerate hoaxermight have even cooked up some flapdoodle sufficiently plau-sible to make money from such a "cosmic" connection.
The story could conceivably form the basis of a movie likePi, since there are countless odd facts about phi that could beused to give various investing schemes a superficial plausibil-ity. (The protagonist of Pi was a numerologically obsessedmathematician who thought he'd found the secret to justabout everything in the decimal expansion of pi. He was pur-sued by religious zealots, greedy financiers, and others. Theonly sane character, his mentor, had a stroke, and the synco-pated black-and-white cinematography was anxiety-inducing.Appealing as it was, the movie was mathematically nonsensi-cal.) Unfortunately for investors and mathematicians alike,the lesson again is that more than beautiful harmonies areneeded to make money on Wall Street. And Phi can't matchthe cachet of Pi as a movie title either.
Moving Averages, Big Picture
People, myself included, sometimes ridicule technical analysisand the charts associated with it in one breath and then in thenext reveal how much in (perhaps unconscious) thrall to theseideas they really are. They bring to mind the old joke aboutthe man who complains to his doctor that his wife has for sev-eral years believed she's a chicken. He would have sought helpsooner, he says, "but we needed the eggs." Without reading

42 John Allen Paulos
too much into this story except that we do sometimes seem toneed the notions of technical analysis, let me finally proceedto examine some of these notions.
Investors naturally want to get a broad picture of themovement of the market and of particular stocks, and for thisthe simple technical notion of a moving average is helpful.When a quantity varies over time (such as the stock price of acompany, the noontime temperature in Milwaukee, or thecost of cabbage in Kiev), one can, each day, average its valuesover, say, the previous 200 days. The averages in this se-quence vary and hence the sequence is called a moving aver-age, but the value of such a moving average is that it doesn'tmove nearly as much as the stock price itself; it might betermed the phlegmatic average.
For illustration, consider the three-day moving average of acompany whose stock is very volatile, its closing prices onsuccessive days being: 8, 9, 10, 5, 6, 9. On the day the stockclosed at 10, its three-day moving average was (8 + 9 + 10)/3or 9. On the next day, when the stock closed at 5, its three-day moving average was (9 + 10 + 5)/3 or 8. When the stockclosed at 6, its three-day moving average was (10 + 5 + 6)/3or 7. And the next day, when it closed at 9, its three-day mov-ing average was (5 + 6 + 9)/3 or 6.67.
If the stock oscillates in a very regular way and you arecareful about the length of time you pick, the moving averagemay barely move at all. Consider an extreme case, the twenty-day moving average of a company whose closing stock pricesoscillate with metronomic regularity. On successive days theyare: 51, 52, 53, 54, 55, 54, 53, 52, 51, 50, 49, 48, 47, 46, 45,46, 47, 48, 49, 50, 51, 52, 53, and so on, moving up anddown around a price of 50. The twenty-day moving averageon the day marked in bold is 50 (obtained by averaging the20 numbers up to and including it). Likewise, the twenty-daymoving average on the next day, when the stock is at 51, is

A Mathematician Plays the Stock Market 43
also 50. It's the same for the next day. In fact, if the stockprice oscillates in this regular way and repeats itself everytwenty days, the twenty-day moving average is always 50.
There are variations in the definition of moving averages(some weight recent days more heavily, others take account ofthe varying volatility of the stock), but they are all designed tosmooth out the day-to-day fluctuations in a stock's price inorder to give the investor a look at broader trends. Softwareand online sites allow easy comparison of the stock's dailymovements with the slower-moving averages.
Technical analysts use the moving average to generatebuy-sell rules. The most common such rule directs you tobuy a stock when it exceeds its X-day moving average. Con-text determines the value of X, which is usually 10, 50, or200 days. Conversely, the rule directs you to sell when thestock falls below its X-day moving average. With the regu-larly oscillating stock above, the rule would not lead to anygains or losses. It would call for you to buy the stock when itmoves from 50, its moving average, to 51, and for you to sellit when it moves from 50 to 49. In the previous example ofthe three-day moving average, the rule would require thatyou buy the stock at the end of the third day and sell it at theend of the fourth, leading in this particular case to a loss.
The rule can work well when a stock fluctuates about along-term upward- or downward-sloping course. The rationalefor it is that trends should be followed, and that when a stockmoves above its X-day moving average, this movement signalsthat a bullish trend has begun. Conversely, when a stock movesbelow its X-day moving average, the movement signals a bear-ish trend. I reiterate that mere upward (downward) movementof the stock is not enough to signal a buy (sell) order; a stockmust move above (below) its moving average.
Alas, had I followed any sort of moving average rule, Iwould have been out of WCOM, which moved more or less
44 John Allen Paulos
steadily downhill for almost three years, long before I lostmost of my investment in it. In fact, I never would havebought it in the first place. The security guard mentioned inchapter 1 did, in effect, use such a rule to justify the sale ofthe stocks in his pension plan.
There are a few studies, which I'll get to later, suggestingthat a moving average rule is sometimes moderately effective.Even so, however, there are several problems. One is that it cancost you a lot in commissions if the stock price hovers aroundthe moving average and moves through it many times in bothdirections. Thus you have to modify the rule so that the pricemust move above or below its moving average by a non-trivialamount. You must also decide whether to buy at the end of theday the price exceeds the moving average or at the beginningof the next day or later still.
You can mine the voluminous time-series data on stockprices to find the X that has given the best returns for adher-ing to the X-day moving average buy-sell rule. Or you cancomplicate the rule by comparing moving averages over dif-ferent intervals and buying or selling when these averagescross each other. You can even adapt the idea to day tradingby using X-minute moving averages defined in terms of themathematical notion of an integral. Optimal strategies can al-ways be found after the fact. The trick is getting somethingthat will work in the future; everyone's very good at predict-ing the past. This brings us to the most trenchant criticism ofthe moving-average strategy. If the stock market is efficient,that is, if information about a stock is almost instantaneouslyincorporated into its price, then any stock's future moves willbe determined by random external events. Its past behavior,in particular its moving average, is irrelevant, and its futuremovement is unpredictable.
Of course, the market may not be all that efficient. There'llbe much more on this question in later chapters.

A Mathematician Plays the Stock Market 45
Resistance and Support and All That
Two other important ideas from technical analysis are resist-ance and support levels. The argument for them assumes thatpeople usually remember when they've been burned, insulted,or left out; in particular, they remember what they paid, orwish they had paid, for a stock. Assume a stock has been sell-ing for $40 for a while and then drops to $32 before slowlyrising again. The large number of people who bought itaround $40 are upset and anxious to recoup their losses, so ifthe stock moves back up to $40, they're likely to sell it,thereby driving the price down again. The $40 price is termeda resistance level and is considered an obstacle to further up-ward movement of the stock price.
Likewise, investors who considered buying at $32 but didnot are envious of those who did buy at that price and reapedthe 25 percent returns. They are eager to get these gains, so ifthe stock falls back to $32, they're likely to buy it, driving theprice up again. The $32 price is termed a support level and isconsidered an obstacle to further downward movement.
Since stocks often seem to meander between their supportand resistance levels, one rule followed by technical analystsis to buy the stock when it "bounces" off its support level andsell it when it "bumps" up against its resistance level. Therule can, of course, be applied to the market as a whole, in-ducing investors to wait for the Dow or the S&P to defini-tively turn up (or down) before buying (or selling).
Since chartists tend to view support levels as shaky, oftentemporary, floors and resistance levels as slightly stronger, butstill temporary, ceilings, there is a more compelling rule in-volving these notions. It instructs you to buy the stock if therising price breaks through the resistance level and to sell it ifthe falling price breaks through the support level. In boththese cases breaking through indicates that the stock has

46 John Allen Paulos
moved out of its customary channel and the rule counsels in-vestors to follow the new trend.
As with the moving-average rules, there are a few studiesthat indicate that resistance-support rules sometimes lead tomoderate increases in returns. Against this there remains theperhaps dispiriting efficient-market hypothesis, which main-tains that past prices, trends, and resistance and support lev-els provide no evidence about future movements.
Innumerable variants of these rules exist and they can becombined in ever more complicated ways. The resistance andsupport levels can change and trend up or down in a channelor with the moving average, for example, rather than remainfixed. The rules can also be made to take account of varia-tions in a stock's volatility as well.
These variants depend on price patterns that often comeequipped with amusing names. The "head and shoulders"pattern, for example, develops after an extended upwardtrend. It is comprised of three peaks, the middle and highestone being the head, and the smaller left and right ones (earlierand later ones, that is) being the shoulders. After falling be-low the right shoulder and breaking through the support lineconnecting the lows on either side of the head, the stock pricehas, technical chartists aver, reversed direction and a down-ward trend has begun, so sell.
Similar metaphors describe the double-bottom trend rever-sal. It develops after an extended downward trend and iscomprised of two successive troughs or bottoms with a smallpeak between them. After bouncing off the second bottom,the stock has, technical chartists again aver, reversed directionand an upward trend has begun, so buy.
These are nice stories, and technical analysts tell them withgreat earnestness and conviction. Even if everyone told thesame stories (and they don't), why should they be true? Pre-sumably the rationale is ultimately psychological or perhaps
A Mathematician Plays the Stock Market 47
sociological or systemic, but exactly what principles justifythese beliefs? Why not triple or quadruple bottoms? Or twoheads and shoulders? Or any of innumerable other equallyplausible, equally risible patterns? What combination of psy-chological, financial, or other principles has sufficient speci-ficity to generate effective investment rules?
As with Elliott waves, scale is an issue. If we go to the levelof ticks, we can find small double bottoms and little headsand tiny shoulders all over. We find them also in the move-ment of broad market indices. And do these patterns meanfor the market as whole what they are purported to mean forindividual stocks? Is the "double-dip" recession discussed inearly 2002 simply a double bottom?
Predictability and Trends
I often hear people swear that they make money using therules of technical analysis. Do they really? The answer, ofcourse, is that they do. People make money using all sortsof strategies, including some involving tea leaves and sun-spots. The real question is: Do they make more money thanthey would investing in a blind index fund that mimics theperformance of the market as a whole? Do they achieve ex-cess returns? Most financial theorists doubt this, but there issome tantalizing evidence for the effectiveness of momentumstrategies or short-term trend-following. Economists Nara-simhan Jegadeesh and Sheridan Titman, for example, havewritten several papers arguing that momentum strategies re-sult in moderate excess returns and that, having done so overthe years, their success is not the result of data mining.Whether this alleged profitability—many dispute it—is due tooverreactions among investors or to the short-term persist-ence of the impact of companies' earnings reports, they don't

48 John Allen Paulos
say. They do seem to point to behavioral models and psycho-logical factors as relevant.
William Brock, Josef Lakonishok, and Blake LeBaron havealso found some evidence that rules based on moving aver-ages and the notions of resistance and support are moderatelyeffective. They focus on the simplest rules, but many arguethat their results have not been replicated on new stock data.
More support for the existence of technical exploitabilitycomes from Andrew Lo, who teaches at M.I.T., and CraigMacKinlay, from the Wharton School. They argue in theirbook, A Non-Random Walk Down Wall Street, that in theshort run overall market returns are, indeed, slightly positivelycorrelated, much like the local weather. A hot, sunny day is abit more likely to be followed by another one, just as a goodweek in the market is a bit more likely to be followed by an-other one. Likewise for rainy days and bad markets. Employ-ing state-of-the-art tools, Lo and MacKinlay also claim that inthe long term the prognosis changes: Individual stock pricesdisplay a slight negative correlation. Winners are a bit morelikely to be losers three to five years hence and vice versa.
They also bring up an interesting theoretical possibility.Weeding out some of the details, let's assume for the sake ofthe argument (although Lo and MacKinlay don't) that thethesis of Burton Malkiel's classic book, A Random WalkDown Wall Street, is true and that the movement of the mar-ket as a whole is entirely random. Let's also assume that eachstock, when its fluctuations are examined in isolation, movesrandomly. Given these assumptions it would nevertheless stillbe possible that the price movements of, say, 5 percent ofstocks accurately predict the price movements of a different 5percent of stocks one week later.
The predictability comes from cross-correlations over timebetween stocks. (These associations needn't be causal, butmight merely be brute facts.) More concretely, let's say stock

A Mathematician Plays the Stock Market 49
X, when looked at in isolation, fluctuates randomly fromweek to week, as does stock Y. Yet if X's price this week oftenpredicts Y's next week, this would be an exploitable opportu-nity and the strict random-walk hypothesis would be wrong.Unless we delved deeply into such possible cross-correlationsamong stocks, all we would see would be a randomly fluctu-ating market populated by randomly fluctuating stocks. Ofcourse, I've employed the typical mathematical gambitof considering an extreme case, but the example does suggestthat there may be relatively simple elements of order in a mar-ket that appears to fluctuate randomly.
There are other sorts of stock price anomalies that can leadto exploitable opportunities. Among the most well-known areso-called calendar effects whereby the prices of stocks, prima-rily small-firm stocks, rise disproportionately in January, espe-cially during the first week of January. (The price of WCOMrose significantly in January 2001, and I was hoping this risewould repeat itself in January 2002. It didn't.) There has beensome effort to explain this by citing tax law concerns that endwith the close of the year, but the effect also seems to hold incountries with different tax laws. Moreover, unusual returns(good or bad) occur not only at the turn of the year, but, asRichard Thaler and others have observed, at the turn of themonth, week, and day as well as before holidays. Again,poorly understood behavioral factors seem to be involved.
Technical Strategies and Blackjack
Most academic financial experts believe in some form of therandom-walk theory and consider technical analysis almostindistinguishable from a pseudoscience whose predictions areeither worthless or, at best, so barely discernibly better thanchance as to be unexploitable because of transaction costs.

50 John Allen Paulos
I've always leaned toward this view, but I'll reserve my morenuanced judgment for later in the book. In the meantime, I'dlike to point out a parallel between market strategies such astechnical analysis in one of its many forms and blackjackstrategies. (There are, of course, great differences too.)
Blackjack is the only casino game of chance whose out-comes depend on past outcomes. In roulette, the previousspins of the wheel have no effect on future spins. The proba-bility of red on the next spin is 18/38, even if red has come upon the five previous spins. The same is true with dice, whichare totally lacking in memory. The probability of rolling a 7with a pair of dice is 1/6, even if the four previous rolls havenot resulted in a single 7. The probability of six reds in a rowis (18/38)6; the probability of five 7s in a row is (1/6)5. Eachspin and each roll are independent of the past.
A game of blackjack, on the other hand, is sensitive to itspast. The probability of drawing two aces in a row from adeck of cards is not (4/52 x 4/52) but rather (4/52 x 3/51).The second factor, 3/51, is the probability of choosing an-other ace given that the first card chosen was an ace. In thesame way the probability that a card drawn from a deck willbe a face card (jack, queen, or king) given that only three ofthe thirty cards drawn so far have been face cards is not12/52, but a much higher 9/22.
This fact—that (conditional) probabilities change accordingto the composition of the remaining portion of the deck—is thebasis for various counting strategies in blackjack that involvekeeping track of how many cards of each type have alreadybeen drawn and increasing one's bet size when the odds are (oc-casionally and slightly) in one's favor. Some of these strategies,followed carefully, do work. This is evidenced by the fact thatsome casinos supply burly guards free of charge to abruptly es-cort successful counting practitioners from the premises.
A Mathematician Plays the Stock Market 51
The vast majority of people who try these strategies (or,worse, others of their own devising) lose money. It wouldmake no sense, however, to point to the unrelenting averagelosses of blackjack players and maintain that this proves thatthere is no effective betting strategy for playing the game.
Blackjack is much simpler than the stock market, ofcourse, which depends on vastly more factors as well as onthe actions and beliefs of other investors. But the absence ofconclusive evidence for the effectiveness of various investingrules, technical or otherwise, does not imply that no effectiverules exist. If the market's movements are not completely ran-dom, then it has a kind of memory within it, and investingrules depending on this memory might be effective. Whetherthey would remain so if widely known is very dubious, butthat is another matter.
Interestingly, if there were an effective technical tradingstrategy, it wouldn't need any convincing rationale. Most in-vestors would be quite pleased to use it, as most blackjackplayers use the standard counting strategy, without under-standing why it works. With blackjack, however, there is acompelling mathematical explanation for those who care tostudy it. By contrast an effective technical trading strategymight be found that was beyond the comprehension not onlyof the people using it but of everyone. It might simply work,at least temporarily. In Plato's allegory of the cave the be-nighted see only the shadows on the wall of the cave and notthe real objects behind them that are causing the shadows. Ifthey were really predictive, investors would be quite contentwith the shadows alone and would simply take the cave to bea bargain basement.
The next segment is a bit of a lark. It offers a suggestivehint for developing a novel and counterintuitive investmentstrategy that has a bit of the feel of technical analysis.

52 John Allen Paulos
Winning Through Losing?
The old joke about the store owner losing money on everysale but making it up in volume may have a kernel of truth toit. An interesting new paradox by Juan Parrondo, a Spanishphysicist, brings the joke to mind. It deals with two games,each of which results in steady losses over time. When thesegames are played in succession in random order, however, theresult is a steady gain. Bad bets strung together to produce bigwinnings—very strange indeed!
To understand Parrondo's paradox, let's switch from a fi-nancial to a spatial metaphor. Imagine you are standing onstair 0, in the middle of a very long staircase with 1,001 stairsnumbered from -500 to 500 (-500, –499, –498, . . . , –4, –3,-2, -1, 0, 1, 2, 3, 4, . .., 498, 499, 500). You want to go uprather than down the staircase and which direction you movedepends on the outcome of coin flips. The first game—let'scall it game S—is very Simple. You flip a coin and move up astair whenever it comes up heads and down a stair wheneverit comes up tails. The coin is slightly biased, however, andcomes up heads 49.5 percent of the time and tails 50.5 per-cent. It's clear that this is not only a boring game but a losingone. If you played it long enough, you would move up anddown for a while, but almost certainly you would eventuallyreach the bottom of the staircase.
The second game—let's continue to wax poetic and call itgame C—is more Complicated, so bear with me. It involvestwo coins, one of which, the bad one, comes up heads only9.5 percent of the time, tails 90.5 percent. The other coin, thegood one, comes up heads 74.5 percent of the time, tails 25.5percent. As in game S, you move up a stair if the coin you flipcomes up heads and you move down one if it comes up tails.
But which coin do you flip? If the number of the stairyou're on is a multiple of 3 (that is, .. ., -9, -6, -3, 0, 3, 6, 9,

A Mathematician Plays the Stock Market 53
12, . . . ), you flip the bad coin. If the number of the stairyou're on is not a multiple of 3, you flip the good coin. (Note:Changing these odd percentages and constraints may affectthe game's outcome.)
Let's go through game C's dance steps. If you were on stairnumber 5, you would flip the good coin to determine your di-rection, whereas if you were on stair number 6, you wouldflip the bad coin. The same holds for the negatively numberedstairs. If you were on stair number -2 and playing game C,you would flip the good coin, whereas if you were on stairnumber -9, you would flip the bad coin.
Though less obviously so than in game S, game C is also alosing game. If you played it long enough, you would almostcertainly reach the bottom of the staircase eventually. Game Cis a losing game because the number of the stair you're on is amultiple of 3 more often than a third of the time and thus youmust flip the bad coin more often than a third of the time.Take my word for this or read the next paragraph to get abetter feel for why it is.
(Assume that you've just started playing game C. Sinceyou're on stair number 0, and 0 is a multiple of 3, you wouldflip the bad coin, which lands heads with probability less than10 percent, and you would very likely move down to stairnumber -1. Then, since -1 is not a multiple of 3, you wouldflip the good coin, which lands heads with probability almost75 percent, and would probably move back up to stair 0. Youmay move up and down like this for a while. Occasionally,however, after the bad coin lands tails, the good coin, whichlands tails almost 25 percent of the time, will land tails twicein succession, and you would move down to stair number -3,where the pattern will likely begin again. This latter down-ward pattern happens slightly more frequently (with proba-bility .905 x .255 x .255) than does a rare head on the badcoin being followed by two heads on the good one (with

54 John Allen Paulos
probability .095 x .745 x .745) and your moving up threestairs as a consequence. So-called Markov chains are neededfor a fuller analysis.)
So far, so what? Game S is simple and results in steadymovement down the staircase to the bottom, and game C iscomplicated and also results in steady movement down thestaircase to the bottom. Parrondo's fascinating discovery isthat if you play these two games in succession in random or-der (keeping your place on the staircase as you switch be-tween games), you will steadily ascend to the top of thestaircase. Alternatively, if you play two games of S followedby two games of C followed by two games of S and so on, allthe while keeping your place on the staircase as you switchbetween games, you will also steadily rise to the top of thestaircase. (You might want to look up M. C. Escher's para-doxical drawing, "Ascending and Descending" for a nice vi-sual analog to Parrondo's paradox.)
Standard stock-market investments cannot be modeled bygames of this type, but variations of these games might con-ceivably give rise to counterintuitive investment strategies.The probabilities might be achieved, for example, by compli-cated combinations of various financial instruments (options,derivatives, and so on), but the decision which coin (which in-vestment, that is) to flip (to make) in game C above would, itseems, have to depend upon something other than whetherone's holdings were worth a multiple of $3.00 (or a multipleof $3,000.00). Perhaps the decision could depend in someway on the cross-correlation between a pair of stocks or turnon the value of some index being a multiple of 3.
If strategies like this could be made to work, they wouldyield what one day might be referred to as Parrondo profits.
Finally, let's consider a companion paradox of sorts thatmight be called "losing through winning" and that may helpexplain why companies often overpaid for small companies

A Mathematician Plays the Stock Market 55
they were purchasing during the bubble in the late '90s. Pro-fessor Martin Shubik has regularly auctioned off $1 to stu-dents in his classes at Yale. The bidding takes place atfifty-four intervals, and the highest bidder gets the dollar, ofcourse, but the second highest bidder is required to pay his bidas well. Thus, if the highest bid is 504 and you are secondhighest at 454, the leader stands to make 504 on the deal andyou stand to lose 454 on it if bidding stops. You have an in-centive to up your bid to at least 554, but after you've done sothe other bidder has an even bigger incentive to raise his bid aswell. In this way a one dollar bill can be successfully auctionedoff for two, three, four, or more dollars.
If several companies are bidding on a small company andthe cost of the preliminary legal, financial, and psychologicalefforts required to purchase the company are a reasonablefraction of the cost of the company, the situation is formallysimilar to Shubik's auction. One or more of the bidding com-panies might feel compelled to make an exorbitant preemp-tive offer to avoid the fate of the losing bidder on the $1.WorldCom's purchase of the web-hostjng company Digex in2000 for $6 billion was, I suspect, such an offer. John Sidg-more, the CEO who succeeded Bernie Ebbers, says that Digexwas worth no more than $50 million, but that Ebbers was ob-sessed with beating out Global Crossing for the company.
The purchase is much more bizarre than Parrondo's paradox.

This page intentionally left blank

Chance andEfficient Markets
If the movement of stock prices is random or near-random,then the tools of technical analysis are nothing more than
comforting blather giving one the illusion of control and thepleasure of a specialized jargon. They can prove especially at-tractive to those who tend to infuse random events with per-sonal significance.
Even some social scientists don't seem to realize that if yousearch for a correlation between any two randomly selectedattributes in a very large population, you will likely find somesmall but statistically significant association. It doesn't matterif the attributes are ethnicity and hip circumference, or (somemeasure of) anxiety and hair color, or perhaps the amount ofsweet corn consumed annually and the number of mathemat-ics courses taken. Despite the correlation's statistical signifi-cance (its unlikelihood of occurring by chance), it is probablynot practically significant because of the presence of so manyconfounding variables. Furthermore, it will not necessarilysupport the (often ad hoc) story that accompanies it, the onepurporting to explain why people who eat a lot of corn takemore math. Superficially plausible tales are always available:Corn-eaters are more likely to be from the upper Midwest,where dropout rates are low.
57

58 John Allen Paulos
Geniuses, Idiots, or Neither
Around stock market rises and declines, people are prone todevise just-so stories to satisfy various needs and concerns.During the bull markets of the '90s investors tended to seethemselves as "perspicacious geniuses." During the more re-cent bear markets they've tended toward self-descriptionssuch as "benighted idiots."
My own family is not immune to the temptation to makeup pat after-the-fact stories explaining past financial gains andlosses. When I was a child, my grandfather would regale mewith anecdotes about topics as disparate as his childhood inGreece, odd people he'd known, and the exploits of theChicago White Sox and their feisty second baseman "Fox Nel-son" (whose real name was Nelson Fox). My grandfather wasvoluble, funny, and opinionated. Only rarely and succinctly,however, did he refer to the financial reversal that shaped hislater life. As a young and uneducated immigrant, he worked inrestaurants and candy stores. Over the years he managed tobuy up eight of the latter and two of the former. His candystores required sugar, which led him eventually to speculate insugar markets and—he was always a bit vague about the de-tails—to place a big bet on several train cars full of sugar. Heapparently put everything he had into the deal a few weeks be-fore the sugar market crashed. Another version attributed hisloss to underinsurance of the sugar shipment. In any case, helost it all and never really recovered financially. I rememberhim saying ruefully, "Johnny, I would have been a very, veryrich man. I should have known." The bare facts of the storyregistered with me then, but my recent less calamitous experi-ence with WorldCom has made his pain more palpable.
This powerful natural proclivity to invest random eventswith meaning on many different levels makes us vulnerable topeople who tell engaging stories about these events. In the

A Mathematician Plays the Stock Market 59
Rorschach blot that chance provides us, we often see what wewant to see or what is pointed out to us by business prognos-ticators, distinguishable from carnival psychics only by thesize of their fees. Confidence, whether justified or not, is con-vincing, especially when there aren't many "facts of the mat-ter." This may be why market pundits seem so much morecertain than, say, sports commentators, who are compara-tively frank in acknowledging the huge role of chance.
Efficiency and Random Walks
The Efficient Market Hypothesis formally dates from the1964 dissertation of Eugene Fama, the work of Nobel prize-winning economist Paul Samuelson, and others in the 1960s.Its pedigree, however, goes back much earlier, to a disserta-tion in 1900 by Louis Bachelier, a student of the great Frenchmathematician Henri Poincare. The hypothesis maintains thatat any given time, stock prices reflect all relevant informationabout the stock. In Fama's words: "In an efficient market,competition among the many intelligent participants leads toa situation where, at any point in time, actual prices of indi-vidual securities already reflect the effects of informationbased both on events that have already occurred and onevents which, as of now, the market expects to take place inthe future."
There are various versions of the hypothesis, depending onwhat information is assumed to be reflected in the stock price.The weakest form maintains that all information about pastmarket prices is already reflected in the stock price. A conse-quence of this is that all of the rules and patterns of technicalanalysis discussed in chapter 3 are useless. A stronger versionmaintains that all publicly available information about acompany is already reflected in its stock price. A consequence

60 John Allen Paulos
of this version is that the earnings, interest, and other ele-ments of fundamental analysis discussed in chapter 5 are use-less. The strongest version maintains that all information ofall sorts is already reflected in the stock price. A consequenceof this is that even inside information is useless.
It was probably this last, rather ludicrous version of the hy-pothesis that prompted the joke about the two efficient markettheorists walking down the street: They spot a hundred dollarbill on the sidewalk and pass by it, reasoning that if it werereal, it would have been picked up already. And of coursethere is the obligatory light-bulb joke. Question: How manyefficient market theorists does it take to change a light bulb?Answer: None. If the light bulb needed changing the marketwould have already done it. Efficient market theorists tend tobelieve in passive investments such as broad-gauged indexfunds, which attempt to track a given market index such asthe S&P 500. John Bogle, the crusading founder of Vanguardand presumably a believer in efficient markets, was the first tooffer such a fund to the general investing public. His Vanguard500 fund is unmanaged, offers broad diversification and verylow fees, and generally beats the more expensive, managedfunds. Investing in it does have a cost, however: One must giveup the fantasy of a perspicacious gunslinger/investor outwit-ting the market.
And why do such theorists believe the market to be effi-cient? They point to a legion of investors of all sorts all seek-ing to make money by employing all sorts of strategies. Theseinvestors sniff out and pounce upon any tidbit of informationeven remotely relevant to a company's stock price, quicklydriving it up or down. Through the actions of this investinghorde the market rapidly responds to the new information,efficiently adjusting prices to reflect it. Opportunities to makean excess profit by utilizing technical rules or fundamentalanalyses, so the story continues, disappear before they can be

A Mathematician Plays the Stock Market 61
fully exploited, and investors who pursue them will see theirexcess profits shrink to zero, especially after taking into ac-count brokers' fees and other transaction costs. Once again,it's not that subscribers to technical or fundamental analysiswon't make money; they generally will. They just won't makemore than, say, the S&P 500.
(That exploitable opportunities tend to gradually disappearis a general phenomenon that occurs throughout economicsand in a variety of fields. Consider an argument about base-ball put forward by Steven Jay Gould in his book Full House:The Spread of Excellence from Plato to Darwin. The absenceof .400 hitters in the years since Ted Williams hit .406 in1941, he maintained, was not due to any decline in baseballability but the reverse: a gradual increase in the athleticism ofall players and a consequent decrease in the disparity betweenthe worst and best players. When players are as physicallygifted and well trained as they are now, the distribution ofbatting averages and earned run averages shows less variabil-ity. There are few "easy" pitchers for hitters and few "easy"hitters for pitchers. One result is that .400 averages are nowvery scarce. The athletic prowess of hitters and pitchersmakes the "market" between them more efficient.)
There is, moreover, a close connection between the Effi-cient Market Hypothesis and the proposition that the move-ment of stock prices is random. If present stock prices alreadyreflect all available information (that is, if the information iscommon knowledge in the sense of chapter 1), then futurestock prices must be unpredictable. Any news that might berelevant in predicting a stock's future price has already beenweighed and responded to by investors whose buying andselling have adjusted the present price to reflect the news.Oddly enough, as markets become more efficient, they tend tobecome less predictable. What will move stock prices in thefuture are truly new developments (or new shadings of old

62 John Allen Paulos
developments), news that is, by definition, impossible to an-ticipate. The conclusion is that in an efficient market, stockprices move up and down randomly. Evincing no memory oftheir past, they take what is commonly called a random walk,each step of which is independent of past steps. There is overtime, however, an upward trend, as if the coin being flippedwere slightly biased.
There is a story I've always liked that is relevant to the im-possibility of anticipating new developments. It concerns acollege student who completed a speed-reading course. Henoted this fact in a letter to his mother. His mother respondedwith a long, chatty letter of her own in the middle of whichshe wrote, "Now that you've taken that speed-reading course,you've probably finished reading this letter by now."
Likewise, true scientific breakthroughs or applications, bydefinition, cannot be foreseen. It would be preposterous tohave expected a newspaper headline in 1890 proclaiming"Only 15 Years Until Relativity." It is similarly foolhardy, theefficient market theorist reiterates, to predict changes in acompany's business environment. To the extent these predic-tions reflect a consensus of opinion, they're already accountedfor. To the extent that they don't, they're tantamount to fore-casting coin flips.
Whatever your views on the subject, the arguments for anefficient market spelled out in Burton MalkiePs A RandomWalk Down Wall Street and elsewhere can't be grossly wrong.After all, most mutual fund managers continue to generate av-erage gains less than those of, say, the Vanguard Index 500fund. (This has always seemed to me a rather scandalous fact.)There is other evidence for a fairly efficient market as well.There are few opportunities for risk-free money-making or ar-bitrage, prices seem to adjust rapidly in response to news, andthe autocorrelation of the stock prices from day to day, weekto week, month to month, and year to year is small (albeit not

A Mathematician Plays the Stock Market 63
zero). That is, if the market has done well (or poorly) over agiven time period in the past, there is no strong tendency for itto do well (or poorly) during the next time period.
Nevertheless, in the last few years I have qualified my viewof the Efficient Market Hypothesis and random-walk theory.One reason is the accounting scandals involving Enron, Adel-phia, Global Crossing, Qwest, Tyco, WorldCom, Andersen,and many others from corporate America's Hall of Infamy,which make it hard to believe that available informationabout a stock always quickly becomes common knowledge.
Pennies and the Perception of Pattern
The Wall Street Journal has famously conducted a regular ser-ies of stock-picking contests between a rotating collection ofstock analysts, whose selections are a result of their own stud-ies, and dart-throwers, whose selections are determined ran-domly. Over many six-month trials, the pros' selections haveperformed marginally better than the darts' selections, butnot overwhelmingly so, and there is some feeling that thepros' picks may influence others to buy the same stocks andhence drive up their price. Mutual funds, although lessvolatile than individual stocks, also display a disregard foranalysts' pronouncements, often showing up in the top quar-ter of funds one year and in the bottom quarter the next.
Whether or not you believe in efficient markets and therandom movement of stock prices, the huge element ofchance present in the market cannot be denied. For this rea-son an examination of random behavior sheds light on manymarket phenomena. (So does study of a standard tome onprobability such as that by Sheldon Ross.) Sources for suchrandom behavior are penny stocks or, more accessible andmore random, stocks of pennies, so let's imagine flipping a
64 John Allen Paulos
penny repeatedly and keeping track of the sequence of headsand tails. We'll assume the coin and the flip are fair (although,if we wish, the penny can be altered slightly to reflect thesmall upward bias of the market over time).
One odd and little-known fact about such a series of coinflips concerns the proportion of time that the number of headsexceeds the number of tails. It's seldom close to 50 percent!
To illustrate, imagine two contestants, Henry and Tommy,who bet that heads and tails respectively will be the outcomeof a daily coin flip, a ritual that goes on for years. (Let's notask why.) Henry is ahead on any given day if up to that daythere have been more heads than tails, and Tommy is ahead ifup to that day there have been more tails. The coin is fair, sothey're equally likely to be in the lead, but one of them willprobably be in the lead during most of their rather stultifyingcontest.
Stated numerically, the claim is that if there have been1,000 coin flips, then it's considerably more probable thatHenry (or Tommy) has been ahead more than, say, 96 percentof the time than that either one has been ahead between 48percent and 52 percent of the time.
People find this result hard to believe. Many subscribe tothe "gambler's fallacy" and believe that the coin's deviationsfrom a 50-50 split between heads and tails are governed by aprobabilistic rubber band: the greater the deviation, thegreater the equalizing push toward an even split. But even ifHenry were way ahead, with 525 heads to Tommy's 475 tails,his lead would be as likely to grow as to shrink. Likewise, astock that's fallen on a truly random trajectory is as likely tofall further as it is to rise.
The rarity with which the lead switches sides in no waycontradicts the fact that the proportion of heads approaches1/2 as the number of flips increases. Nor does it contradict thephenomenon of regression to the mean. If Henry and Tommy

A Mathematician Plays the Stock Market 65
were to start over and flip their penny another 1,000 times,it's quite likely that the number of heads would be smallerthan 525.
Given the relative rarity with which Henry and Tommyovertake one another in their penny-flipping contest, itwouldn't be surprising if one of them came to be known as a"winner" and the other a "loser" despite their complete lackof control over the penny. If one professional stock pickeroutperformed another by a margin of 525 to 475, he mighteven be interviewed on Moneyline or profiled in Fortunemagazine. Yet he might, like Henry or Tommy, owe his suc-cess to nothing more than getting "stuck" by chance on theup side of a 50-50 split.
But what about such stellar "value investors" as WarrenBuffet? His phenomenal success, like that of Peter Lynch, JohnNeff, and others, is often cited as an argument against themarket's randomness. This assumes, however, that Buffett'schoices have no effect on the market. Originally no doubt theydidn't, but now his selections themselves and his ability to cre-ate synergies among them can influence others. His perform-ance is therefore a bit less remarkable than it first appears.
A different argument points to the near certainty of somestocks, funds, or analysts doing well over an extended periodmerely by chance. Of 1,000 stocks (or funds or analysts), forexample, roughly 500 might be expected to outperform themarket next year simply by chance, say by the flipping of acoin. Of these 500, roughly 250 might be expected to do wellfor a second year. And of these 250, roughly 125 might be ex-pected to continue the pattern, doing well three years in a rowsimply by chance. Iterating in this way, we might reasonablyexpect there to be a stock (or fund or analyst) among thethousand that does well for ten consecutive years by chancealone. Once again, some in the business media are likely to gogaga over the performance.

66 John Allen Paulos
The surprising length and frequency of consecutive runs ofheads or tails is yet another lesson of penny flipping. IfHenry and Tommy were to continue flipping pennies once aday, then there's a better-than-even chance that within abouttwo months Henry will have won at least five flips in a row,as will Tommy. If they continue flipping for six years, there'sa better-than-even chance that each will have won at least tenflips in a row.
When people are asked to write down a series of heads andtails that simulates a series of coin flips, they almost alwaysfail to include enough runs of consecutive heads or consecu-tive tails. In particular, they fail to include any very long runsof heads or tails, and their series are thus easily distinguish-able from a real series of coin flips.
But try telling people that long streaks are due to chancealone, whether the streak is a basketball player's shots, astock analyst's picks, or a series of coin flips. The fact is thatrandom events can frequently seem quite ordered.
To literally see this, take out a large piece of paper and par-tition it into little squares in a checkerboard pattern. Flip acoin repeatedly and color the squares white or black depend-ing upon whether the coin lands heads or tails. After thecheckerboard has been completely filled in, look it over andsee if you can discern any patterns or clusters of similarly col-ored squares. Chances are you will, and if you felt the need toexplain these patterns, you would invent a story that mightsound superficially plausible or intriguing, but, given how thecolors were determined, would necessarily be false.
The same illusion of pattern would result if you were tograph (with time on the horizontal axis) the results of the coinflips, up one unit for a head, down one for a tail. Somechartists and technicians would no doubt see "head and shoul-ders," "triple tops," or "ascending channels" patterns in thesezigzag, up-and-down movements, and they would expatiate

A Mathematician Plays the Stock Market 67
on their significance. (One difference between coin flips andmodels of random stock movements is that in the latter it isgenerally assumed that stocks move up or down not by a fixedamount per unit time, but by a fixed percentage.)
Leaving aside, once again, the question whether the marketis perfectly efficient or whether stock movements follow atruly random walk, we can nevertheless say that phenomenathat are truly random often appear almost indistinguishablefrom real-market behavior. This should, but probably won't,give pause to commentators who provide a neat post hoc ex-planation for every rally, every sell-off, and everything in be-tween. Such commentators generally don't make remarksanalogous to the observation that the penny happened bychance to land heads a few more times than it did tails. Insteadthey will refer to Tommy's profit-taking, Henry's increasedconfidence, labor problems in the copper mines, or countlessother factors.
Because so much information is available—business pages,companies' annual reports, earnings expectations, allegedscandals, on-line sites, and commentary—something insightful-sounding can always be said. All we need do is filter the sea ofnumbers until we catch a plausible nugget of speculation. Likeflipping a penny, doing so is a snap.
A Stock-Newsletter Scam
The accounting scandals involving WorldCom, Enron, andothers derived from the data being selected, spun, and filtered.A scam I first discussed in my book Innumeracy derives in-stead from the recipients of the data being selected, spun, andfiltered. It goes like this. Someone claiming to be the publisherof a stock newsletter rents a mailbox in a fancy neighborhood,has expensive stationery made up, and sends out letters to

68 John Allen Paulos
potential subscribers boasting of his sophisticated stock-picking software, financial acumen, and Wall Street connec-tions. He writes also of his amazing track record, but notesthat the recipients of his letters needn't take his word for it.
Assume you are one of these recipients and for the next sixweeks you receive correct predictions about a certain com-mon stock index. Would you subscribe to the newsletter?What if you received ten consecutive correct predictions?
Here's the scam. The newsletter publisher sends out 64,000letters to potential subscribers. (Using email would save post-age, but might appear to be a "spam scam" and hence be lesscredible.) To 32,000 of the recipients, he predicts the index inquestion will rise the following week and to the other 32,000,he predicts it will decline. No matter what happens to the in-dex the next week, he will have made a correct prediction to32,000 people. To 16,000 of them he sends another letter pre-dicting a rise in the index for the following week, and to theother 16,000 he predicts a decline. Again, no matter whathappens to the index the next week, he will have made correctpredictions for two consecutive weeks to 16,000 people. To8,000 of them he sends a third letter predicting a rise for thethird week and to the other 8,000 he predicts a decline.
Focusing at each stage on the people to whom he's madeonly correct predictions and winnowing out the rest, he iter-ates this procedure a few more times until there are 1,000people left to whom he's made six straight correct "predic-tions." To these he sends a different sort of follow-up letter,pointing out his successes and saying that they can continue toreceive these oracular pronouncements if they pay the $1,000subscription price to the newsletter. If they all pay, that's a mil-lion dollars for someone who need know nothing about stock,indices, trends, or dividends. If this is done knowingly, it is il-legal. But what if it's done unknowingly by earnest, confident,and ignorant newsletter publishers? (Compare the faithhealerwho takes credit for any accidental improvements.)

A Mathematician Plays the Stock Market 69
There is so much complexity in the market, there are somany different measures of success and ways to spin a story,that most people can manage to convince themselves thatthey've been, or are about to be, inordinately successful. Ifpeople are desperate enough, they'll manage to find someseeming order in random happenings.
Similar to the newsletter scam, but with a slightly differenttwist, is a story related to me by an acquaintance who de-scribed his father's business and its sad demise. He claimed thathis father, years before, had run a large college-preparation ser-vice in a South American country whose identity I've forgotten.My friend's father advertised that he knew how to drasticallyimprove applicants' chances of getting into the elite nationaluniversity. Hinting at inside contacts and claiming knowledgeof the various forms, deadlines, and procedures, he charged anexorbitant fee for his service, which he justified by offering amoney-back guarantee to students who were not accepted.
One day, the secret of his business model came to light. Allthe material that prospective students had sent him over theyears was found unopened in a trash dump. Upon investigationit turned out that he had simply been collecting the students'money (or rather their parents' money) and doing nothing forit. The trick was that his fees were so high and his marketing sofocused that only the children of affluent parents subscribed tohis service, and almost all of them were admitted to the univer-sity anyway. He refunded the fees of those few who were notadmitted. He was also sent to prison for his efforts.
Are stock brokers in the same business as my acquain-tance's father? Are stock analysts in the same business as thenewsletter publisher? Not exactly, but there is scant evidencethat they possess any unusual predictive powers. That's why Ithought news stories in November 2002 recounting NewYork Attorney General Eliot Spitzer's criticism of Institu-tional Investor magazine's analyst awards were a tad super-fluous. Spitzer noted that the stock-picking performances of

70 John Allen Paulos
most of the winning analysts were, in fact, quite mediocre.Maybe Donald Trump will hold a press conference pointingout that the country's top gamblers don't do particularly wellat roulette.
Decimals and Other Changes
Like analysts and brokers, market makers (who make theirmoney on the spread between the bid and the ask price for astock) have received more than their share of criticism in re-cent years. One result has been a quiet reform that makes themarket a bit more efficient. Wall Street's surrender to radical"decacrats" occurred a couple of years ago, courtesy of aCongressional mandate and a direct order from the Securitiesand Exchange Commission. Since then stock prices have beenexpressed in dollars and cents, and we no longer hear "profit-taking drove XYZ down 2 and 1/8" or "news of the deal sentPQR up 4 and 5/16."
Although there may be less romance associated with de-clines of 2.13 and rises of 4.31, decimalization makes sensefor a number of reasons. The first is that price rises and de-clines are immediately comparable since we no longer mustperform the tiresome arithmetic of, say, dividing 11 by 16.Mentally calculating the difference between two decimals gen-erally requires less time than subtracting 3 5/8 from 5 3/16.Another benefit is global uniformity of pricing, as Americansecurities are now denominated in the same decimal units asthose in the rest of the world. Foreign securities no longerneed to be rounded to the nearest multiple of 1/16, a perversearithmetical act if there ever was one.
More importantly, the common spread between the bidand ask prices has shrunk. Once generally 1/16 (.0625, thatis), the spread in many cases has become .01 and, by so shriv-
A Mathematician Plays the Stock Market 71
eling, will save investors billions of dollars over the years.Market makers aside, most investors applaud this conse-quence of decimalization.
The last reason for cheering the change is more mathemati-cal. There is a sense in which the old system of halves, quar-ters, eighths, and sixteenths is more natural than decimals. Itis, after all, only a slightly disguised binary system, based onpowers of 2 (2, 4, 8, 16) rather than powers of 10. It doesn'tinherit any of the prestige of the binary system, however, be-cause it awkwardly combines the base 2 fractional part of astock price with the base 10 whole-number part.
Thus it is that Ten extends its imperial reach to Wall Street.From the biblical Commandments to David Letterman's lists,the number 10 is ubiquitous. Not unrelated to the perennialyearning for the simplicity of the metric system, 10 envy hasalso come to be associated with rationality and efficiency. It isthus fitting that all stocks are now expressed in decimals. Still,I suspect that many market veterans miss those pesky frac-tions and their role in stories of past killings and baths. Ex-cept for generation X-ers (Roman numeral ten-ers), manyothers will too. Anyway, that's my two cents (.02, 1/5Oth)worth on the subject.
The replacement of marks, francs, drachmas, and other Eu-ropean currencies by euros on stock exchanges and in storesis another progressive step that nevertheless rouses a touch ofnostalgia. The coins and bills from my past travels that arescattered about in drawers are suddenly out of work and willnever see the inside of a wallet again.
Yet another vast change in trading practices is the greaterself-reliance among investors. Despite the faulty accountingthat initially disguised their sickly returns, the ladies ofBeardstown, Illinois, helped popularize investment clubs.Even more significant in this regard is the advent of effortlessonline trading, which has further hastened the decline of the

72 John Allen Paulos
traditional broker. The ease with which I clicked on simpleicons to buy and sell (specifically sell reasonably performingfunds and buy more WCOM shares) was always a littlefrightening, and I sometimes felt as if there were a loadedgun on my desk. Some studies have linked online trading andday trading to increased volatility in the late '90s, althoughit's not clear that they remain factors in the '00s.
What's undeniable is that buying and selling online remainseasy, so easy that I think it might not be a bad idea were smallpictures of real-world items to pop up before every stock pur-chase or sale as a reminder of the approximate value ofwhat's being traded. If your transaction were for $35,000, aluxury car might appear; if it were for $100,000, a small cot-tage; and if it were for a penny stock, a candy bar. Investorscan now check stock quotations, the size and the number ofthe bids and the asks, and megabytes of other figures on so-called level-two screens available in (almost) real-time ontheir personal computers. Millions of little desktop broker-ages! Unfortunately, librarian Jesse Sherra's paraphrase ofColeridge often seems apt: Data, data everywhere, but not athought to think.
Benford's Law and Looking Out for Number One
I mentioned that people find it very difficult to simulate a ser-ies of coin flips. Are there other human disabilities that mightallow someone to look at a company's books, say Enron's orWorldCom's, and determine whether or not they had beencooked? There may have been, and the mathematical princi-ple involved is easily stated, but counterintuitive.
Benford's Law states that in a wide variety of circum-stances, numbers—as diverse as the drainage areas of rivers,physical properties of chemicals, populations of small towns,
A Mathematician Plays the Stock Market 73
figures in a newspaper or magazine, and the half-lives of ra-dioactive atoms—have "1" as their first non-zero digit dispro-portionately often. Specifically, they begin with "1" about 30percent of the time, with "2" about 18 percent of the time,with "3" about 12.5 percent, and with larger digits progres-sively less often. Less than 5 percent of the numbers in thesecircumstances begin with the digit "9." Note that this is instark contrast to many other situations where each of the dig-its has an equal chance of appearing.
Benford's Law goes back one hundred years to the astron-omer Simon Newcomb (note the letters WCOM in his name),who noticed that books of logarithm tables were much dirtiernear the front, indicating that people more frequently lookedup numbers with a low first digit. This odd phenomenon re-mained a little-known curiosity until it was rediscovered in1938 by the physicist Frank Benford. It wasn't until 1996,however, that Ted Hill, a mathematician at Georgia Tech, es-tablished what sort of situations generate numbers in accordwith Benford's Law. Then a mathematically inclined account-ant named Mark Nigrini generated considerable buzz whenhe noted that Benford's Law could be used to catch fraud inincome tax returns and other accounting documents.
The following example suggests why collections of num-bers governed by Benford's Law arise so frequently:
Imagine that you deposit $1,000 in a bank at 10 percentcompound interest per year. Next year you'll have $1,100, theyear after that $1,210, then $1,331, and so on. (Compoundingis discussed further in chapter 5.) The first digit of youraccount balance remains a "1" for a long time. When your ac-count grows to over $2,000, the first digit will remain a "2"for a shorter period. And when your deposit finally grows toover $9,000, the 10 percent growth will result in more than$10,000 in your account the following year and a long returnto "1" as the first digit. If you record your account balance

74 John Allen Paulos
each year for many years, these numbers will thus obey Ben-ford's Law.
The law is also "scale-invariant" in that the dimensions ofthe numbers don't matter. If you expressed your $1,000 ineuros or pounds (or the now defunct francs or marks) andwatched it grow at 10 percent per year, about 30 percent ofthe yearly values would begin with a "1," about 18 percentwith a "2," and so on.
More generally, Hill showed that such collections of num-bers arise whenever we have what he calls a "distribution ofdistributions," a random collection of random samples of data.Big, motley collections of numbers will follow Benford's Law.
This brings us back to Enron, WorldCom, accounting, andMark Nigrini, who reasoned that the numbers on accountingforms, which often come from a variety of company operationsand a variety of sources, should be governed by Benford's Law.That is, these numbers should begin disproportionately withthe digit "1," and progressively less often with bigger digits,and if they don't, that is a sign that the books have beencooked. When people fake plausible-seeming numbers, theygenerally use more "5s" and "6s" as initial digits, for example,than Benford's Law would predict.
Nigrini's work has been well publicized and has surelybeen noted by accountants and by prosecutors. Whether theEnron, WorldCom, and Anderson people have heard of it isunknown, but investigators might want to check if the distri-bution of leading digits in the Enron documents accords withBenford's Law. Such checks are not foolproof and sometimeslead to false-positive results, but they provide an extra toolthat might be useful in certain situations.
It would be amusing if, in looking out for number one, theculprits forgot to look out for their "Is." Imagine the An-derson accountants muttering anxiously that there weren'tenough leading "1s" on the documents they were feedinginto the shredders. A 1-derful fantasy!

A Mathematician Plays the Stock Market 75
The Numbers Man—A Screen Treatment
An astonishing amount of attention has been paid recently tofictional and narrative treatments of mathematical topics.The movies Good Will Hunting, Pi, and The Croupier cometo mind; so do plays such as Copenhagen, Arcadia, and TheProof, the two biographies of Paul Erdos, A Beautiful Mind,the biography of John Nash (with its accompanying Acad-emy Award-winning movie), TV specials on Fermat's LastTheorem, and other mathematical topics, as well as countlessbooks on popular mathematics and mathematicians. Theplays and movies, in particular, prompted me to expandthe idea in the stock-newsletter scam discussed above (Ichanged the focus, however, from stocks to sports) into asort of abbreviated screen treatment that highlights the rele-vant mathematics a bit more than has been the case in theproductions just cited. Yet another instance of what colum-nist Charles Krauthammer has dubbed "Disturbed NerdChic," the treatment might even be developed into an in-triguing and amusing film. In fact, I rate it a "strong buy" forany studio executive or independent filmmaker.
Rough Idea: Math nerd runs a clever sports-betting scam andaccidentally nets an innumerate mobster.
Act OneLouis is a short, lecherous, somewhat nerdy man who droppedout of math graduate school about ten years ago (in the late'80s) and now works at home as a technical consultant. Helooks and acts a bit like the young Woody Allen. He's playingcards with his pre-teenage kids and has just finished tellingthem a funny story. His kids are smart and they ask him how itis that he always knows the right story to tell. His wife, Marie,is uninterested. True to form, he begins telling them the LeoRosten story about the famous rabbi who was asked by an

76 John Allen Paulos
admiring student how it was that the rabbi always had a per-fect parable for any subject. Louis pauses to make sure theysee the relevance.
When they smile and his wife rolls her eyes again, he con-tinues. He tells them that the rabbi replied to his studentswith a parable. It was about a recruiter in the Tsar's armywho was riding through a small town and noticed dozens ofchalked circular targets on the side of a barn, each with a bul-let hole through the bull's-eye. The recruiter was impressedand asked a neighbor who this perfect shooter might be. Theneighbor responded, "Oh that's Shepsel, the shoemaker's son.He's a little peculiar." The enthusiastic recruiter was unde-terred until the neighbor added, "You see, first Shepsel shootsand then he draws the chalk circles around the bullet hole."The rabbi grinned. "That's the way it is with me. I don't lookfor a parable to fit the subject. I introduce only subjects forwhich I have parables."
Louis and his kids laugh until a distracted, stricken lookcrosses his face. Closing the book, Louis hurries his kids offto bed, interrupts Marie's prattling about her new pearl neck-lace and her Main Line parents' nasty neighbors, distractedlybids her good night, and retreats to his study where he startsscribbling, making calls, and performing calculations. Thenext day he stops by the bank and the post office and a sta-tionery store, does some research online, and then has a longdiscussion with his friend, a sportswriter on the local subur-ban New Jersey newspaper. The conversation revolves aroundthe names, addresses, and intelligence of big sports bettorsaround the country.
The idea for a lucrative con game has taken shape in hismind. For the next several days he sends letters and emails tomany thousands of known sports bettors "predicting" theoutcome of a certain sporting event. His wife is uncompre-hending when Louis mumbles that, Shepsel-like, he can't lose

A Mathematician Plays the Stock Market 77
since whatever happens in the sporting event, his prediction isbound to be right for half the bettors. The reason, it will turnout, is that to half of these people he predicts a certain teamwill win, and to the other half he predicts that it will lose.
Tall, blond, plain, and dim-witted, Marie is left wonderingwhat exactly her sneaky husband is up to now. She finds thenew postage meter behind the computer, notes the increas-ingly frequent secret telephone calls, and nags him about theirworsening financial and marital situation. He replies that shedoesn't really need three closets full of clothes and a small for-tune of jewelry when she spends all her time watching soapsand puts her off with some mathematical mumbo-jumboabout demographic research and new statistical techniques.She still doesn't follow, but she is mollified by his promisethat his mysterious endeavor will end up being lucrative.
They go out to eat to celebrate and Louis, intense and cad-like as always, talks up genetically modified food and tellsthe cute waitress that he wants to order whatever item on themenu has the most artificial ingredients. Much to Marie'schagrin, he then involves the waitress in a classic mathemati-cal trick by asking her to examine his three cards, one blackon both sides, one red on both sides, and one black on oneside and red on the other. He asks her for her cap, drops thecards into it, and tells her to pick a card, but only to look atone side of it. The side is red, and Louis notes that the cardshe picked couldn't possibly be the card that was black onboth sides, and therefore it must be one of the other twocards—the red-red card or the red-black card. He guessesthat it's the red-red card and offers to double her 15 percenttip if it's the red-black card and stiff her if it's the red-redcard. He looks at Marie for approbation that is not forth-coming. The waitress accepts and loses.
Tone-deaf to Marie's discomfort, Louis thinks he's mak-ing amends with her by explaining the trick. She is less than

78 John Allen Paulos
enthralled. He tells her that it's not an even bet even though atfirst glance it appears to be one. There are, after all, two cardsit could be, and he bet on one, and the waitress bet on theother. The rub is, he gleefully runs on with his mouth full,there are two ways he can win and only one way the waitresscan win. The visible side of the card the waitress picked couldbe the red side of the red-black card, in which case she wins, orit could be one side of the red-red card, in which case he wins,or it could be the other side of the red-red card, in which casehe also wins. His chances of winning are thus 2/3, he concludesexultantly, and the average tip he gives is reduced by a third.Marie yawns and checks her Rolex. He breaks to go to themen's room where he calls his girlfriend May Lee to apologizefor some vague indiscretion.
The next week he explains the sports-betting con to MayLee, who looks a bit like Lucy Liu and is considerably smarterthan Marie and even more materialistic. They're in her apart-ment. She is interested in the con and asks clarifying questions.He enthuses to her that he needs her secretarial help. He'ssending out more letters and making a second prediction inthem, but this time just to the half of the people to whom hesent a correct first prediction; the other half he plans to ignore.To half of this smaller group, he will predict a win in a secondsporting event, to the other half a loss. Again for half of thisgroup his prediction is going to be right, and so for one-fourthof the original group he's going to be right two times in a row."And to this one-fourth of the bettors?" she asks knowinglyand excitedly. A mathematico-sexual tension develops.
He smiles rakishly and continues. To half of this one-fourthhe will predict a win the following week, to the other half aloss; he again will ignore those to whom he's made an incorrectprediction. Once again he will be right—this time for the thirdstraight time—although for only one-eighth of the originalpopulation. May Lee helps with the mailings as he continues

A Mathematician Plays the Stock Market 79
this process, focusing only on those to whom he's made correctpredictions and winnowing out those to whom he's made in-correct ones. There is a sex scene amid all the letters, and theyjoke about winning whether the teams in question do or not,whether the predictions are right or wrong. Whether up ordown, they'll be happy.
As the mailings go on, so does his other life as a bored con-sultant, cyber-surfer, and ardent sports fan. He continues toextend his string of successful predictions to a smaller andsmaller group of people until finally with great anticipationhe sends a letter to the small group of people who are left. Init he points to his impressive string of successes and requests asubstantial payment to keep these valuable and seeminglyoracular "predictions" coming.
Act TwoHe receives many payments and makes a further prediction.Again he's right for half of the remaining people and dropsthe half for which he's wrong. He asks the former group foreven more money for another prediction, receives it, and con-tinues. Things improve with Marie and with May Lee as themoney rolls in and Louis realizes his plan is working even bet-ter than he expected. He takes his kids and, in turn, eachwoman to sports events or to Atlantic City, where he com-ments smugly on the losers who, unlike him, bet on iffypropositions. When Marie worries aloud about shark attacksoff the beach, Louis tells her that more Americans die fromfalling airplane parts each year than from shark attacks. Hemakes similar pronouncements throughout the trip.
He plays a little blackjack and counts cards while doing so.He complains that it requires too much low-level concentra-tion and that, unless one has a lot of money already, the rateat which one makes money is so slow and uneven that onemight as well get a job. Still, he goes on, it's the only game
80 John Allen Paulos
where a strategy exists for winning. All the other games arefor mentally flabby losers. He goes to one of the casinorestaurants where he shows his kids the waitress tip-cheatinggame. They think it's great.
Back home in suburban New Jersey again, the sports-betting con resumes. Now there are only a few people leftamong the original thousands of sports-bettors. One ofthem, a rough underworld type named Otto, tracks himdown, follows him to the parking lot of the basketball arena,and, politely at first and then more and more insistently, de-mands a prediction on an upcoming game on which he plansto bet a lot of money. Louis dismisses him and Otto, wholooks a little like Stephen Segal, promptly orders him into hiscar at gunpoint and threatens to harm his family. He knowswhere they live.
Not understanding how he could be the recipient of somany consecutive correct predictions, Otto doesn't believeLouis's protestations that this is a con game. Louis makessome mathematical points in an effort to convince Otto of thepossible falsity of any particular prediction. But no matterhow he tries, he can't quite convince Otto of the fact thatthere will always be some people who receive many consecu-tive correct predictions by chance alone.
Marooned in Otto's basement, the math-nerd scam artistand the bald muscled extortionist are a study in contrasts.They speak different languages and have different frames ofreference. Otto claims, for example, that every bet is more orless a 50-50 proposition because you either win or lose. Louistalks of his basketball buddies Lewis Carroll and BertrandRussell and the names go over Otto's head, of course. Oddly,they have similar attitudes toward women and money andalso share an interest in cards, which they play to while awaythe time. Otto proudly shows off his riffle shuffle that heclaims completely mixes the cards, while Louis prefers soli-

A Mathematician Plays the Stock Market 81
taire and silently scoffs at Otto's lottery expenditures andgambling misconceptions. When they forget why they're therethey get along well enough, although now and then Otto re-news his threats and Louis renews his disavowal of any spe-cial sports knowledge and his plea to go home.
Finally granting that he might receive an incorrect predic-tion occasionally, Otto still insists that Louis give him his takeon who's going to win an upcoming football game. In addi-tion to not being too bright, Otto, it appears, is in seriousdebt. Under extreme duress (with a gun to his head), Louismakes a prediction that happens to be right, and Otto, des-perate and still convinced that he is in control of a moneytree, now wants to bet funds borrowed from his gambling as-sociates on Louis's next prediction.
Act ThreeLouis at last convinces Otto to let him go home and do re-search for his next big sports prediction. He and May Lee,whose need for money, baubles, and clothes has all along pro-vided the impetus for the scam, discuss his predicament andrealize they must exploit Otto's only weaknesses, his stupidityand gullibility, and his only intellectual interests, money andplaying cards.
Both go over to Otto's apartment. Otto is charmed by MayLee, who flirts with him and offers him a deal. She wordlesslytakes two decks of cards from her purse and asks Otto toshuffle each of them. Otto is pleased to show off to a moreappreciative audience. She then gives him one of the decksand asks him to turn over one card at a time as she, keepingpace with him, does the same thing with the other deck. MayLee asks, what does he think is the likelihood that the cardsthey turn over will ever match, denomination and suit exactlythe same? He scoffs but is entranced by May Lee and isamazed when after a tense minute or so that is exactly what

82 John Allen Paulos
happens. She explains that it will happen more often than notand perhaps he can use this fact to make some money. Afterall, Louis is a mathematical genius and he's proved that itwill. Louis smiles proudly.
Otto is puzzled. May Lee tells Otto again that the sports-betting was a scam and that he's more likely to make moneywith the card tricks that Louis can teach him. Louis steps for-ward with the same two decks, which he's now arranged sothat the cards in each deck alternate colors. In one, it's red-black, red-black, red-black . . . . In the other it's black-red,black-red, black-red . . . . He gives the two decks to Otto andchallenges him to do one of his great riffle shuffles of one deckinto the other so that the cards will be mixed. Otto does andarrogantly announces that the cards are completely mixednow, whereupon Louis takes the combined two decks, putsthem behind his back, pretends to be manipulating them, andbrings forward two cards, one black and one red. So, Ottoasks? Louis brings forth two more cards, one of each color,and then he does this again and again. I really shuffled them,Otto observes. How'd you do that? Louis explains that it in-volves no skill; the cards no longer alternate color in the com-bined deck, but any two from the top on down are always ofdifferent color.
There is a collage scene in which Louis explains variouscard tricks to Otto and the ways in which they can be ex-ploited to make money. There's always some order, some de-viation from randomness, that a card man like you can use toget rich, Louis says to Otto. He even explains to him how heavoids paying waitresses tips. The deal, of course, is that Ottoreleases them, understanding, vaguely at least, how the bet-ting scheme works and, more precisely, how the new cardtricks do. Louis promises a one-day crash course on how toexploit the tricks for money.

A Mathematician Plays the Stock Market 83
In the last scene Louis is seen working the same scam butthis time with predictions about the movements of a stockmarket index. Since he doesn't want any more Ottos, but ahigher class clientele, he's redefined himself as the publisher ofa stock newsletter. The house he's in is more sumptuous andMay Lee, to whom he's now married, bustles about in an ex-pensive suit as Louis plays cards with his slightly older chil-dren, occasionally doodling little bull's-eyes and targets on anenvelope. He excuses himself and goes to his study to make asecret telephone call to an apartment on Central Park Westthat he's just purchased for his new mistress.

This page intentionally left blank

5 Value Investing andFundamental Analysis
/was especially smitten with WorldCom's critical Internet di-vision, UUNet. The Internet wasn't going away, and so, I
thought, neither was UUNet or WorldCom. During this timeof enchantment my sensible wife would say "UUNet, UUNet"and roll her pretty eyes to mock my rhapsodizing aboutWorldCom's global IP network and related capabilities. Therepetition of the word gradually acquired a more general anti-Pollyannish meaning as well. "Maybe the bill is so exorbitantbecause the plumber ran into something he didn't expect.""Yeah, sure. UUNet, UUNet."
"Smitten," "rhapsodizing," and "Pollyanna" are not wordsthat come naturally to mind when discussing value investing, amajor approach to the market that uses the tools of so-calledfundamental analysis. Often associated with Warren Buffett'sgimlet-eyed no-nonsense approach to trading, fundamentalanalysis is described by some as the best, most sober strategy forinvestors to follow. Had I paid more attention to WorldComfundamentals, particularly its $30 billion in debt, and less atten-tion to WorldCom fairy tales, particularly its bright future roleas a "dumb" network (better not to ask), I would no doubthave fared better. In the stock market's enduring tug-of-war be-tween statistics and stories, fundamental analysis is generally onthe side of the numbers.
85

86 John Allen Paulos
Still, fundamental analysis has always seemed to meslightly at odds with the general ethic of the market, which isbased on hope, dreams, vision, and a certain monetarilytinted yet genuine romanticism. I cite no studies or statisticsto back up this contention, only my understanding of the in-vestors I've known or read about and perhaps my own infatu-ation, quite atypical for this numbers man, with WorldCom.
Fundamentals are to investing what (stereotypically) mar-riage is to romance or what vegetables are to eating—health-ful, but not always exciting. Some understanding of them,however, is essential for any investor and, to an extent, forany intelligent citizen. Everybody's heard of people who re-frain from buying a house, for example, because of theamount they would have paid in interest over the years. ("Ohmy, don't get a mortgage. You'll end up paying four times asmuch.") Also common are lottery players who insist that theworth of their possible winnings is really the advertised onemillion dollars. ("In only 20 years, I'll have that million.")And there are many investors who doubt that the opaquepronouncements of Alan Greenspan have anything to do withthe stock or bond markets.
These and similar beliefs stem from misconceptions aboutcompound interest, the bedrock of mathematical finance,which is in turn the foundation of fundamental analysis.
e is the Root of All Money
Speaking of bedrocks and foundations, I claim that e is theroot of all money. That's e as in ex as in exponential growth asin compound interest. An old adage (probably due to an oldbanker) has it that those who understand compound interestare more likely to collect it, those who don't more likely topay it. Indeed the formula for such growth is the basis for

A Mathematician Plays the Stock Market 87
most financial calculations. Happily, the derivation of a re-lated but simpler formula depends only on understandingpercentages, powers, and multiplication—on knowing, forexample, that 15 percent of 300 is .15 x 300 (or 300 x .15)and that 15 percent of 15 percent of 300 is 300 x (.15)2.
With these mathematical prerequisites stated, let's beginthe tutorial and assume that you deposit $1,429.73 into abank account paying 6.9 percent interest compounded annu-ally. No, let's bow to the great Rotundia, god of round num-bers, and assume instead that you deposit $1,000 at 10percent. After one year, you'll have 110 percent of your origi-nal deposit—$1,100. That is, you'll have 1,000 x 1.10 dollarsin your account. (The analysis is the same if you buy $1,000worth of some stock and it returns 10 percent annually.)
Looking ahead, observe that after two years you'll have110 percent of your first-year balance—$1,211. That is, you'llhave ($1,000 x 1.10) x 1.10. Equivalently, that is $1,000 x1.102. Note that the exponent is 2.
After three years you'll have 110 percent of your second-year balance—$1,331. That is, you'll have ($1,000 x 1.102) x1.10. Equivalently, that is $1,000 x 1.103. Note the exponent is3 this time.
The drill should be clear now. After four years you'll have110 percent of your third-year balance—$1,464.10. Thatis, you'll have ($1,000 x 1.103) x 1.10. Equivalently, that is$1,000 x 1.104. Once again, note the exponent is 4.
Let me interrupt this relentless exposition with the story ofa professor of mine long ago who, beginning at the left sideof a very long blackboard in a large lecture hall, started writ-ing 1 + 1/1! + 1/2! + 1/3! + 1/4! + 1/5! (Incidentally theexpression 5! is read 5 factorial, not 5 with an exclamatoryflair, and it is equal to 5 x 4 x 3 x 2 x 1 . For any whole numberN, N! is defined similarly.) My fellow students initiallylaughed as this professor, slowly and seemingly in a trance,

88 John Allen Paulos
kept on adding terms to this series. The laughter died out,however, by the time he reached the middle of the board andwas writing 1/44! + 1/45! + . . . . I liked him and remember afeeling of alarm as I saw him continue his senseless repetitions.When he came to the end of the board at 1/83!, he turned andfaced the class. His hand shook, the chalk dropped to thefloor, and he left the room and never returned.
Mindful thereafter of the risks of too many illustrative rep-etitions, especially when I'm standing at a blackboard in aclassroom, I'll end my example with the fourth year and sim-ply note that the amount of money in your account after tyears will be $1,000 x 1.10t. More generally, if you deposit Pdollars into an account earning r percent interest annually, itwill be worth A dollars after t years, where A = P(l + r)r, thepromised formula describing exponential growth of money.
You can adjust the formula for interest compounded semi-annually or monthly or daily. If money is compounded fourtimes per year, for example, then the amount you'll have aftert years is given by A = P(l + r/4)4t. (The quarterly interest rateis r/4, one-fourth the annual rate of r, and the number of com-poundings in t years is 4t, four per year for t years.)
If you compound very frequently (say n times per year for alarge number n), the formula A = P(l + r/n)nt can be mathe-matically massaged and rewritten as A = Pert, where e, ap-proximately 2.718, is the base of the natural logarithm. Thisvariant of the formula is used for continuous compounding(and is, of course, the source of my comment that e is the rootof all money).
The number e plays a critical role in higher mathematics,best exemplified perhaps by the formula e + 1 = 0, whichpacks the five arguably most important constants in mathe-matics into a single equation. The number e also arises ifwe're simply choosing numbers between 0 and 1 at random.If we (or, more likely, our computer) pick these numbers until

A Mathematician Plays the Stock Market 89
their sum exceeds 1, the average number of picks we'd needwould be e, about 2.718. The ubiquitous e also happens toequal 1 + 1/1! + 1/2! + 1/3! + 1/4! + . .., the same expressionmy professor was writing on the board many years ago. (In-spired by a remark by stock speculator Ivan Boesky, GordonGecko in the 1987 movie Wall Street stated, "Greed isgood." He misspoke. He intended to say, "e is good.")
Many of the formulas useful in finance are consequences ofthese two formulas: A = P(l + r)1 for annual compoundingand, for continuous compounding, A = Pert. To illustrate howthey're used, note that if you deposit $5,000 and it's com-pounded annually for 12 years at 8 percent, it will be worth$5,000(1.08)12 or $12,590.85. If this same $4,000 is com-pounded continuously, it will be worth $4,000e(-08 x 12) or$13,058.48.
Using this interest rate and time interval, we can say thatthe future value of the present $5,000 is $12,590.85 andthat the present value of the future $12,590.85 is $5,000. (Ifthe compounding is continuous, substitute $13,058.48 in theprevious sentence.) The "present value" of a certain amountof future money is the amount we would have to depositnow so that the deposit would grow to the requisite amountin the allotted time. Alternatively stated (repetition may bean occupational hazard of professors; so may self-reference),the idea is that given an interest rate of 8 percent, you shouldbe indifferent between receiving $5,000 now (the presentvalue) and receiving something near $13,000 (the futurevalue) in twelve years.
And just as "George is taller than Martha" and "Martha isshorter than George" are different ways to state the same rela-tion, the interest formulas may be written to emphasize eitherpresent value, P, or future value, A. Instead of A = P(l + r)1, wecan write P = A/(l + r)t, and instead of A = Pert, we can writeP = A/ert. Thus, if the interest rate is 12 percent, the present value

90 John Allen Paulos
of $50,000 five years hence is given by P = $50,000/(1.12)5 or$28,371.34. This amount, $28,371.34, if deposited at 12 per-cent compounded annually for five years, has a future value of$50,000.
One consequence of these formulas is that the "doublingtime," the time it takes for a sum of money to double in value,is given by the so-called rule of 72: divide 72 by 100 times theinterest rate. Thus, if you can get an 8 percent (.08) rate, it willtake you 72/8 or nine years for a sum of money to double,eighteen years for it to quadruple, and twenty-seven years forit to grow to eight times its original size. If you're luckyenough to have an investment that earns 14 percent, yourmoney will double in a little more than five years (since 72/14is a bit more than 5) and quadruple in a bit over ten years. Forcontinuous compounding, you use 70 rather than 72.
These formulas can also be used to determine the so-calledinternal rate of return and to define other financial concepts.They provide as well the muscle behind common pleas toyoung people to begin saving and investing early in life if theywish to become the "millionaire next door." (They don't,however, tell the millionaire next door what he should dowith his wealth.)
The Fundamentalists'Creed: You Get What You Pay For
The notion of present value is crucial to understanding the fun-damentalists' approach to stock valuation. It should also beimportant to lottery players, mortgagors, and advertisers. Thatthe present value of money in the future is less than its nominalvalue explains why a nominal $1,000,000 award for winning alottery—say $50,000 per year at the end of each of the next

A Mathematician Plays the Stock Market 91
twenty years—is worth considerably less than $1,000,000. Ifthe interest rate is 10 percent annually, for example, the$1,000,000 has a present value of only about $426,000. Youcan obtain this value from tables, from financial calculators, ordirectly from the formulas above (supplemented by a formulafor the sum of a so-called geometric series).
The process of determining the present value of futuremoney is often referred to as "discounting." Discounting isimportant because, once you assume an interest rate, it allowsyou to compare amounts of money received at different times.You can also use it to evaluate the present or future value ofan income stream—different amounts of money coming intoor going out of a bank or investment account on differentdates. You simply "slide" the amounts forward or backwardin time by multiplying or dividing by the appropriate powerof (1 + r). This is done, for example, when you need to figureout a payment sufficient to pay off a mortgage in a specifiedamount of time or want to know how much to save eachmonth to have sufficient funds for a child's college educationwhen he or she turns eighteen.
Discounting is also essential to defining what is often calleda stock's fundamental value. The stock's price, say investingfundamentalists (fortunately not the sort who wish to imposetheir moral certitudes on others), should be roughly equal tothe discounted stream of dividends you can expect to receivefrom holding onto it indefinitely. If the stock does not paydividends or if you plan on selling it and thereby realizingcapital gains, its price should be roughly equal to the dis-counted value of the price you can reasonably expect to re-ceive when you sell the stock plus the discounted value of anydividends. It's probably safe to say that most stock prices arehigher than this. During the 1990 boom years, investors weremuch more concerned with capital gains than they were with

92 John Allen Paulos
dividends. To reverse this trend, finance professor JeremySiegel, author of Stocks for the Long Run, and two of his col-leagues recently proposed eliminating the corporate dividendtax and making dividends deductible.
The bottom line of bottom-line investing is that you shouldpay for a stock an amount equal to (or no more than) the pres-ent value of all future gains from it. Although this sounds veryhard-headed and far removed from psychological considera-tions, it is not. The discounting of future dividends and the fu-ture stock price is dependent on your estimate of future interestrates, dividend policies, and a host of other uncertain quanti-ties, and calling them fundamentals does not make them im-mune to emotional and cognitive distortion. The tango ofexuberance and despair can and does affect estimates of stock'sfundamental value. As the economist Robert Shiller has longargued quite persuasively, however, the fundamentals of astock don't change nearly as much or as rapidly as its price.
Ponzi and the IrrationalDiscounting of the Future
Before returning to other applications of these financial no-tions, it may be helpful to take a respite and examine an ex-treme case of undervaluing the future: pyramids, Ponzischemes, and chain letters. These differ in their details andcolorful storylines. A recent example in California took theform of all-women dinner parties whose new members con-tributed cash appetizers. Whatever their outward appearance,however, almost all these scams involve collecting moneyfrom an initial group of "investors" by promising them quickand extraordinary returns. The returns come from moneycontributed by a larger group of people. A still larger groupof people contributes to both of the smaller earlier groups.
A Mathematician Plays the Stock Market 93
This burgeoning process continues for a while. But thenumber of people needed to keep the pyramid growing andthe money coming in increases exponentially and soon be-comes difficult to maintain. People drop out, and the easymarks become scarcer. Participants usually lack a feel for howmany people are required to keep the scheme going. If each ofthe initial group of ten recruits ten more people, for example,the secondary group numbers 100. If each of these 100 recruitten people, the tertiary group numbers 1,000. Later groupsnumber 10,000, then 100,000, then 1,000,000. The systemcollapses under its own weight when enough new people canno longer be found. If you enter the scheme early, however,you can make extraordinarily quick returns (or could if suchschemes were not illegal).
The logic of pyramid schemes is clear, but people generallyworry only about what happens one or two steps ahead andanticipate being able to get out before a collapse. It's not irra-tional to get involved if you are confident of recruiting a "big-ger sucker" to replace you. Some would say that the dot-corns'meteoric stock price rises in the late '90s and their subsequentprecipitous declines in 2000 and 2001 were attenuated ver-sions of the same general sort of scam. Get in on the initialpublic offering, hold on as the stock rockets upward, andjump off before it plummets.
Although not a dot-corn, WorldCom achieved its all-too-fleeting dominance by buying up, often for absurdly inflatedprices, many companies that were (and a good number thatweren't). MCI, MFS, ANS Communication, CAI Wireless,Rhythms, Wireless One, Prime One Cable, Digex, and dozensmore companies were acquired by Bernie Ebbers, a pied piperwhose song seemed to consist of only one entrancing andrepetitive note: acquire, acquire, acquire. The regular drum-beat of WorldCom acquisitions had the hypnotic quality ofthe tinkling bells that accompany the tiniest wins at casino

94 John Allen Paulos
slot machines. As the stock began its slow descent, I'd checkthe business news every morning and was tranquilized bynews of yet another purchase, web hosting agreement, or ex-tension of services.
While corporate venality and fraud played a role in (someof) their falls, the collapses of the dot-corns and WorldComwere not the brainchilds of con artists. Even when entrepre-neurs and investors recognized the bubble for what it was,most figured incorrectly that they'd be able to find a chairwhen the mania-inducing IPO/acquisition music stopped.Alas, the journey from "have-lots" to "have-nots" was all toofrequently by way of "have-dots."
Maybe our genes are to blame. (They always seem to getthe rap.) Natural selection probably favors organisms that re-spond to local or near-term events and ignore distant or fu-ture ones, which are discounted in somewhat the same waythat future money is. Even the ravaging of the environmentmay be seen as a kind of global Ponzi scheme, the early "in-vestors" doing well, later ones less well, until a catastrophewipes out all gains.
A quite different illustration of our short-sightednesscomes courtesy of Robert Louis Stevenson's "The Imp in theBottle." The story tells of a genie in a bottle able and willingto satisfy your every romantic whim and financial desire.You're offered the opportunity to buy this bottle and itsamazing denizen at a price of your choice. There is a seriouslimitation, however. When you've finished with the bottle,you have to sell it to someone else at a price strictly less thanwhat you paid for it. If you don't sell it to someone for alower price, you will lose everything and will suffer excruciat-ing and unrelenting torment. What would you pay for such abottle?
Certainly you wouldn't pay 1 cent because then youwouldn't be able to sell it for a lower price. You wouldn't pay

A Mathematician Plays the Stock Market 95
2 cents for it either since no one would buy it from you for 1cent since everyone knows that it must be sold for a price lessthan the price at which it is bought. The same reasoningshows that you wouldn't pay 3 cents for it since the person towhom you would have to sell it for 2 cents would object tobuying it at that price since he wouldn't be able to sell it for 1cent. Likewise for prices of 4 cents, 5 cents, 6 cents, and soon. We can use mathematical induction to formalize this ar-gument, which proves conclusively that you wouldn't buy thegenie in the bottle for any amount of money. Yet you wouldalmost certainly buy it for $1,000. I know I would. At whatpoint does the argument against buying the bottle cease to becompelling? (I'm ignoring the possibility of foreign currenciesthat have coins worth less than a penny. This is an Americangenie.)
The question is more than academic since in countless situ-ations people prepare exclusively for near-term outcomes anddon't look very far ahead. They myopically discount the fu-ture at an absurdly steep rate.
Average Riches, Likely Poverty
Combining time and money can yield unexpected results in arather different way. Think back again to the incandescentstock market of the late 1990s and the envious feeling manyhad that everyone else was making money. You might easilyhave developed that impression from reading about investingin those halcyon days. In every magazine or newspaper youpicked up, you were apt to read about IPOs, the initial publicofferings of new companies, and the investment gurus whoclaimed that they could make your $10,000 grow to morethan a million in a year's time. (All right, I'm exaggeratingtheir exaggerations.) But in those same periodicals, even then,

96 John Allen Paulos
you also would have read stories about new companies thatwere stillborn and naysayers' claims that most investorswould lose their $10,000 as well as their shirts by investing insuch volatile offerings.
Here's a scenario that helps to illuminate and reconcile suchseemingly contradictory claims. Hang on for the math thatfollows. It may be a bit counterintuitive, but it's not difficult tofollow and it illustrates the crucial difference between thearithmetic mean and the geometric mean of a set of returns.(For the record: The arithmetic mean of N different rates of re-turn is what we normally think of as their average; that is,their sum divided by N. The geometric mean of N differentrates of return is equal to that rate of return that, if received Ntimes in succession, would be equivalent to receiving the Ndifferent rates of return in succession. We can use the formulafor compound interest to derive the technical definition. Doingso, we would find that the geometric mean is equal to the Nthroot of the product [(1 + first return) x (1 + second return) x (1+ third return) x ... (1 + Nth return)] - 1.)
Hundreds of IPOs used to come out each year. (Pity thatthis is only an illustrative flashback.) Let's assume that thefirst week after the stock comes out, its price is usually ex-tremely volatile. It's impossible to predict which way the pricewill move, but we'll assume that for half of the companies' of-ferings the price will rise 80 percent during the first week andfor half of the offerings the price will fall 60 percent duringthis period.
The investing scheme is simple: Buy an IPO each Mondaymorning and sell it the following Friday afternoon. Abouthalf the time you'll earn 80 percent in a week and half thetime you'll lose 60 percent in a week for an average gain of 10percent per week: [(80%) + (-60%)]/2, the arithmetic mean.
Ten percent a week is an amazing average gain, and it's notdifficult to determine that after a year of following this strategy,

A Mathematician Plays the Stock Market 97
the average worth of an initial $10,000 investment is morethan $1.4 million! (Calculation below.) Imagine the newspaperprofiles of happy day traders, or week traders in this case, whosold their old cars and turned the proceeds into almost a mil-lion and a half dollars in a year.
But what is the most likely outcome if you were to adoptthis scheme and the assumptions above held? The answer isthat your $10,000 would likely be worth all of $1.95 at theend of a year! Half of all investors adopting such a schemewould have less than $1.95 remaining of their $10,000 nestegg. This same $1.95 is the result of your money growing at arate equal to the geometric mean of 80 percent and -60 per-cent over the 52 weeks. (In this case that's equal to the squareroot (the Nth root for N = 2) of the product [(1 + 80%) x(1 + (-60%))] minus 1, which is the square root of [1.8 x .4]minus 1, which is .85 minus 1, or -.15, a loss of approxi-mately 15 percent each week.)
Before walking through this calculation, let's ask for the in-tuitive reason for the huge disparity between $1.4 million and$1.95. The answer is that the typical investor will see his in-vestment rise by 80 percent for approximately 26 weeks anddecline by 60 percent for 26 weeks. As shown below, it's notdifficult to calculate that this results in $1.95 of your moneyremaining after one year.
The lucky investor, by contrast, will see his investment riseby 80 percent for considerably more than 26 weeks. This willresult in astronomical returns that pull the average up. Theinvestments of the unlucky investors will decline by 60 per-cent for considerably more than 26 weeks, but their lossescannot exceed the original $10,000.
In other words, the enormous returns associated with dis-proportionately many weeks of 80 percent growth skew theaverage way up, while even many weeks of 60 percent shrink-age can't drive an investment's value below $0.

98 John Allen Paulos
In this scenario the stock gurus and the naysayers are bothright. The average worth of your $10,000 investment afterone year is $1.4 million, but its most likely worth is $1.95.
Which results are the media likely to focus on?The following example may help clarify matters. Let's exam-
ine what happens to the $10,000 in the first two weeks. Thereare four equally likely possibilities. The investment can increaseboth weeks, increase the first week and decrease the second, de-crease the first week and increase the second, or decrease bothweeks. (As we saw in the section on interest theory, an increaseof 80 percent is equivalent to multiplying by 1.8. A 60 percentfall is equivalent to multiplying by 0.4.) One-quarter of in-vestors will see their investment increase by a factor of 1.8 x1.8, or 3.24. Having increased by 80 percent two weeks in arow, their $10,000 will be worth $10,000 x 1.8 x 1.8, or$32,400 in two weeks. One-quarter of investors will see theirinvestment rise by 80 percent the first week and decline by 60percent the second week. Their investment changes by a factorof 1.8 x 0.4, or 0.72, and will be worth $7,200 after two weeks.Similarly, $7,200 will be the outcome for one-quarter of in-vestors who will see their investment decline the first week andrise the second week, since 0.4 x 1.8 is the same as 1.8 x 0.4.Finally, the unlucky one-quarter of investors whose investmentloses 60 percent of its worth for two weeks in a row will have0.4 x 0.4 x $10,000, or $1,600 after two weeks.
Adding $32,400, $7,200, $7,200, and $1,600 and dividingby 4, we get $12,100 as the average worth of the investmentsafter the first two weeks. That's an average return of 10 per-cent weekly, since $10,000 x 1.1 x 1.1 = $12,100. More gener-ally, the stock rises an average of 10 percent every week (theaverage of an 80 percent gain and a 60 percent loss, remem-ber). Thus after 52 weeks, the average value of the investmentis $10,000 x (1.10)52, which is $1,420,000.
The most likely result is that the companies' stock offeringswill rise during 26 weeks and fall during 26 weeks. This means

A Mathematician Plays the Stock Market 99
that the most likely worth of the investment is $10,000 x (1.8)26
x (.4)26, which is only $1,95. And the geometric mean of 80percent and -60 percent? Once again, it is the square rootof the product of [(1 + .8) x (1 - .6)] minus 1, which equalsapproximately -.15. Every week, on average, your portfolioloses 15 percent of its value, and $10,000 x (1 - .15)52 equalsapproximately $1.95.
Of course, by varying these percentages and time frames,we can get different results, but the principle holds true: Thearithmetic mean of the returns far outstrips the geometricmean of the returns, which is also the median (middle) returnas well as the most common return. Another example: If halfof the time your investment doubles in a week, and half of thetime it loses half its value in a week, the most likely outcomeis that you'll break even. But the arithmetic mean of your re-turns is 25 percent per week—[100% + (-50%)]/2, whichmeans that your initial stake will be worth $10,000 x 1.2552,or more than a billion dollars! The geometric mean of yourreturns is the square root of (1 + 1) x (1 - .5) minus 1, whichis a 0 percent rate of return, indicating that you'll probablyend up with the $10,000 with which you began.
Although these are extreme and unrealistic rates of return,these example have much more general importance than itmight appear. They explain why a majority of investors receiveworse-than-average returns and why some mutual fund com-panies misleadingly stress their average returns. Once again,the reason is that the average or arithmetic mean of differentrates of return is always greater than the geometric mean ofthese rates of return, which is also the median rate of return.
Fat Stocks, Fat People, and P/E
You get what you pay for. As noted, fundamentalists believethat this maxim extends to stock valuation. They argue that a

100 John Allen Paulos
company's stock is worth only what it returns to its holder individends and price increases. To determine what that valueis, they try to make reasonable estimates of the amount ofcash the stock will generate over its lifetime, and then theydiscount this stream of payments to the present. And how dothey estimate these dividends and stock price increases? Valueinvestors tend to use the company's stream of earnings as areasonable substitute for the stream of dividends paid to themsince, the reasoning goes, the earnings are, or eventually willbe, paid out in dividends. In the meantime, earnings may beused to grow the company or retire debt, which also increasesthe company's value. If the earnings of the company are goodand promise to get better, and if the economy is growing andinterest rates stay low, then high earnings justify paying a lotfor a stock. And if not, not.
Thus we have a shortcut for determining a reasonable pricefor a stock that avoids complicated estimations and calcula-tions: the stock's so-called P/E ratio. You can't look at thebusiness section of a newspaper or watch a business show onTV without hearing constant references to it. The ratio is justthat—a ratio or fraction. It's determined by dividing the priceP of a share of the company's stock by the company's earn-ings per share E (usually over the past year). Stock analystsdiscuss countless ratios, but the P/E ratio, sometimes calledsimply the multiple, is the most common.
The share price, P, is discovered simply by looking in anewspaper or online, and the earnings per share, E, is ob-tained by taking the company's total earnings over the pastyear and dividing it by the number of shares outstanding.(Unfortunately, earnings are not nearly as cut-and-dried asmany once thought. All sorts of dodges, equivocations, andoutright lies make it a rather plastic notion.)
So how does one use this information? One very commonway to interpret the P/E ratio is as a measure of investors'

A Mathematician Plays the Stock Market 101
expectations of future earnings. A high P/E indicates high ex-pectations about the company's future earnings, and a lowone low expectations. A second way to think of the ratio issimply as the price you must pay to receive (indirectly via div-idends and price appreciation) the company's earnings. TheP/E ratio is thus both a sort of prediction and an appraisal ofthe company.
A company with a high P/E must perform to maintain itshigh ratio. If its earnings don't continue to grow, its price willdecline. Consider Microsoft, whose P/E was somewhere northof 100 a few years ago. Today its P/E is under 50, althoughit's one of the larger companies in Redmond, Washington.Still a goliath, it's nevertheless growing more slowly than itdid in its early days. This shrinking of the P/E ratio occursnaturally as start-ups become blue-chip pillars of the businesscommunity.
(The pattern of change in a company's growth rate bringsto mind a mathematical curve—the S-shaped or logisticcurve. This curve seems to characterize a wide variety of phe-nomena, including the demand for new items of all sorts. Itsshape can most easily be explained by imagining a few bac-teria in a petri dish. At first the number of bacteria will in-crease slowly, then at a more rapid exponential rate becauseof the rich nutrient broth and the ample space in which to ex-pand. Gradually, however, as the bacteria crowd each other,their rate of increase slows and their number stabilizes, atleast until the dish is enlarged.
The curve appears to describe the growth of entities as dis-parate as a composer's symphony production, the rise of air-line traffic, highway construction, mainframe computerinstallations, television ownership, even the building ofGothic cathedrals. Some have speculated that there is a kindof universal principle governing many natural and humanphenomena, including the growth of successful businesses.)

102 John Allen Paulos
Of course, the P/E ratio by itself does not prove anything.A high P/E does not necessarily indicate that a stock is over-valued (too expensive for the cash flow it's likely to generate)and a candidate for selling, nor does a low one indicate that astock is undervalued and a candidate for buying. A low P/Emight mean that a company is in financial hot water despiteits earnings.
As WorldCom approached bankruptcy, for example, it hadan extremely low P/E ratio. A constant stream of postings inthe chatrooms compared it to the P/Es of SBC, AT&T,Deutsche Telekom, Bell South, Verizon, and other compara-ble companies, which were considerably higher. The stridencyof the postings increased when they failed to have their de-sired effect: Investors hitting their foreheads with the suddenrealization that WCOM was a great buy. The posters didhave a point, however. One should compare a company's P/Eto its value in the past, to that of similar companies, and tothe ratios for the sector and the market as a whole. The aver-age P/E for the entire market ranges somewhere between 15and 25, although there are difficulties with computing such anaverage. Companies that are losing money, for example, havenegative P/Es although they're generally not reported as such;they probably should be. Despite the recent market sell-offs in2001-2002, some analysts believe that stocks are still too ex-pensive for the cash flow they're likely to generate.
Like other tools that fundamental analysts employ, the P/Eratio seems to be precise, objective, and quasi-mathematical.But, as noted, it too is subject to events in the economy as awhole, strong economies generally supporting higher P/Es. Asbears reiteration (verb appropriate), the P in the numerator isnot invulnerable to psychological factors nor is the E in thedenominator invulnerable to accountants' creativity.
The P/E ratio does provide a better measure of a com-pany's financial health than does stock price alone, just as,
A Mathematician Plays the Stock Market 103
for example, the BMI or body mass index (equal to yourweight divided by the square of your height in appropriateunits) gives a better measure of somatic health than doesweight alone. The BMI also suggests other ratios, such as theP/E2 or, in general, the P/EX, whose study might exercise ana-lysts to such a degree that their BMIs would fall.
(The parallel between diet and investment regimens is notthat far-fetched. There are a bewildering variety of diets andmarket strategies, and with discipline you can lose weight ormake money on most of them. You can diet or invest on yourown or pay a counselor who charges a fee and offers no guar-antee. Whether the diet or strategy is optimal or not is an-other matter, as is whether the theory behind the diet orstrategy makes sense. Does the diet result in faster, more eas-ily sustained weight loss than the conventional counsel ofmore exercise and a smaller but balanced intake? Does themarket strategy make any excess returns, over and abovewhat you would earn with a blind index fund? Unfortunately,most Americans' waistlines in recent years have been expand-ing, while their portfolios have been getting slimmer.
Numerical comparisons of the American economy to theworld economy are common, but comparisons of our collec-tive weight to that of others are usually just anecdotal. Al-though we constitute a bit under 5 percent of the world'spopulation, we make up, I suspect, a significantly greater per-centage of the world's human biomass.)
There is one refinement of the P/E ratio that some find veryhelpful. It's called the PEG ratio and it is the P/E ratio dividedby (100 times) the expected annual growth rate of earnings. Alow PEG is usually taken to mean that the stock is underval-ued, since the growth rate of earnings is high relative to theP/E. High P/E ratios are fine if the rate of growth of the com-pany is sufficiently rapid. A high-tech company with a P/E ra-tio of 80 and annual growth of 40 percent will have a PEG of

104 John Allen Paulos
2 and may sound promising, but a stodgier manufacturingcompany with a P/E of 7 and an earnings growth rate of 14percent will have a more attractive PEG of .5. (Once again,negative values are excluded.)
Some investors, including the Motley Fool and PeterLynch, recommend buying stocks with a PEG of .5 or lowerand selling stocks with PEG of 1.50 or higher, although with anumber of exceptions. Of course, finding stocks having sucha low PEG is no easy task.
Contrarian Investing andthe Sports Illustrated Cover Jinx
As with technical analysis, the question arises: Does it work?Does using the ideas of fundamental analysis enable you to dobetter than you would by investing in a broad-gauged indexfund? Do stocks deemed undervalued by value investors con-stitute an exception to the efficiency of the markets? (Notethat the term "undervalued" itself contests the efficient mar-ket hypothesis, which maintains that all stocks are alwaysvalued just right.)
The evidence in favor of fundamental analysis is a bit morecompelling than that supporting technical analysis. Value in-vesting does seem to yield moderately better rates of return. Anumber of studies have suggested, for example, that stockswith low P/E ratios (undervalued, that is) yield better returnsthan do those with high P/E ratios, the effect's strength vary-ing with the type and size of the company. The notion of risk,discussed in chapter 6, complicates the issue.
Value investing is frequently contrasted with growth invest-ing, the chasing of fast-growing companies with high P/Es. Itbrings better returns, according to some of its supporters, be-cause it benefits from investors' overreactions. Investors sign

A Mathematician Plays the Stock Market 105
on too quickly to the hype surrounding fast-growing compa-nies and underestimate the prospects of solid, if humdrumcompanies of the type that Warren Buffett likes—Coca-Cola,for instance. (I write this in a study littered with empty cansof Diet Coke.)
The appeal of value investing tends to be contrarian, andmany of the strategies derived from fundamental analysis re-flect this. The "dogs of the Dow" strategy counsels investorsto buy the ten Dow stocks (among the thirty stocks that gointo the Dow-Jones Industrial Average) whose price-to-dividend, P/D, ratios are the lowest. Dividends are not earn-ings, but the strategy corresponds very loosely to buying theten stocks with the lowest P/E ratios. Since the companies areestablished organizations, the thinking goes, they're unlikelyto go bankrupt and thus their relatively poor performanceprobably indicates that they're temporarily undervalued. Thisstrategy, again similar to one promoted by the Motley Fool,became popular in the late '80s and early '90s and did resultin greater gains than those achieved by, say, the broad-gaugedS&P 500 average. As with all such strategies, however, the in-creased returns tended to shrink as more people adopted it.
A ratio that seems to be more strongly related to increasedreturns than price-to-dividends or price-to-earnings is theprice-to-book ratio, P/B. The denominator B is the company'sbook value per share—its total assets minus the sum of totalliabilities and intangible assets. The P/B ratio changes lessover time than does the P/E ratio and has the further virtue ofalmost always being positive. Book value is meant to capturesomething basic about a company, but like earnings it can bea rather malleable number.
Nevertheless, a well-known and influential study by theeconomists Eugene Fama and Ken French has shown P/B to bea useful diagnostic device. The authors focused on the periodfrom 1963 to 1990 and divided almost all the stocks on the

106 John Allen Paulos
New York Stock Exchange and the Nasdaq into ten groups:the 10 percent of the companies with the highest P/B ratios,the 10 percent with the next highest, on down to the 10 per-cent with the lowest P/B ratios. (These divisions are calleddeciles.) Once again a contrarian strategy achieved better thanaverage rates of return. Without exception, every decile withlower P/B ratios outperformed the deciles with higher P/B ra-tios. The decile with lowest P/B ratios had an average return of21.4 percent versus 8 percent for the decile with the highestP/B ratios. Other studies' findings have been similar, althoughless pronounced. Some economists, notably James O'Shaugh-nessy, claim that a low price to sales ratio, P/S, is an evenstronger predictor of better-than-average returns.
Concern with the fundamental ratios of a company is notnew. Finance icons Benjamin Graham and David Dodd, intheir canonical 1934 text Security Analysis, stressed the im-portance of low P/E and P/B ratios in selecting stocks to buy.Some even stipulate that low ratios constitute the definition of"value stocks" and that high ratios define "growth stocks."There are more nuanced definitions, but there is a consensusthat value stocks typically include most of those in oil, finance,utilities, and manufacturing, while growth stocks typically in-clude most of those in computers, telecommunications, phar-maceuticals, and high technology.
Foreign markets seem to deliver value investors the sameexcessive returns. Studies that divide a country's stocks intofifths according to the value of their P/E and P/B ratios, forexample, have generally found that companies with low ra-tios had higher returns than those with high ratios. Onceagain, over the next few years, the undervalued, unpopularstocks performed better.
There are other sorts of contrarian anomalies. RichardThaler and Werner DeBondt examined the thirty-five stockson the New York Stock Exchange with the highest rates of
A Mathematician Plays the Stock Market 107
returns and the thirty-five with the lowest rates for each yearfrom the 1930s until the 1970s. Three to five years later, thebest performers had average returns lower than those ofthe NYSE, while the worst performers had averages consider-ably higher than the index. Andrew Lo and Craig MacKinlay,as mentioned earlier, came to similar contrarian conclusionsmore recently, but theirs were significantly weaker, reflectingperhaps the increasing popularity and hence decreasing effec-tiveness of contrarian strategies.
Another result with a contrarian feel derives from manage-ment guru Tom Peters's book In Search of Excellence, inwhich he deemed a number of companies "excellent" basedon various fundamental measures and ratios. Using thesesame measures a few years after Peters's book, Michelle day-man compiled a list of "execrable" companies (my word, nothers) and compared the fates of the two groups of companies.Once again there was a regression to the mean, with the exe-crable companies doing considerably better than the excellentones five years after being so designated.
All these contrarian findings underline the psychologicalimportance of a phenomenon I've only briefly mentioned: re-gression to the mean. Is the decline of Peters's excellent com-panies, or of other companies with good P/E and P/B ratiosthe business analogue of the Sports Illustrated cover jinx?
For those who don't follow sports (a field of endeavor wherethe numbers are usually more trustworthy than in business), ablack cat stared out from the cover of the January 2002 issueof Sports Illustrated signaling that the lead article was aboutthe magazine's infamous cover jinx. Many fans swear that get-ting on the cover of the magazine is a prelude to a fall fromgrace, and much of the article detailed instances of an athlete'sor a team's sudden decline after appearing on the cover.
There were reports that St. Louis Rams quarterback KurtWarner turned down an offer to pose with the black cat on

108 John Allen Paulos
the issue's cover. He wears No. 13 on his back, so maybethere's a limit to how much bad luck he can withstand. Be-sides, a couple of weeks after gracing the cover in October2000, Warner broke his little finger and was sidelined for fivegames.
The sheer number of cases of less than stellar performanceor worse following a cover appearance is impressive at first.The author of the jinx story, Alexander Wolff, directed a teamof researchers who examined almost all of the magazine'snearly 2,500 covers dating back to the first one, featuringMilwaukee Braves third baseman Eddie Mathews in August1954. Mathews was injured shortly after that. In October1982, Penn State was unbeaten and the cover featured itsquarterback, Todd Blackledge. The next week Blackledgethrew four interceptions against Alabama and Penn State lostbig. The jinx struck Barry Bonds in late May 1993, seemingto knock him into a dry spell that reduced his batting averageforty points in just two weeks.
I'll stop. The article cited case after case. More generally,the researchers found that within two weeks of a cover ap-pearance, over a third of the honorees suffered injuries,slumps, or other misfortunes. Theories abound on the causeof the cover jinx, many having to do with players or teamschoking under the added performance pressure.
A much better explanation is that no explanation is needed.It's what you would expect. People often attribute meaning tophenomena governed only by a regression to the mean, themathematical tendency for an extreme value of an at least par-tially chance-dependent quantity to be followed by a valuecloser to the average. Sports and business are certainly chancyenterprises and thus subject to regression. So is genetics to anextent, and so very tall parents can be expected to have off-spring who are tall, but probably not as tall as they are. A sim-ilar tendency holds for the children of very short parents.

A Mathematician Plays the Stock Market 109
If I were a professional darts player and threw one hundreddarts at a target (or a list of companies in a newspaper's busi-ness section) during a tournament and managed to hit thebull's-eye (or a rising stock) a record-breaking eighty-threetimes, the next time I threw one hundred darts, I probablywouldn't do nearly as well. If featured on a magazine cover(Sports Illustrated or Barren's) for the eighty-three hits, I'dprobably be adjudged a casualty of the jinx too.
Regression to the mean is widespread. The sequel to a greatCD is usually not as good as the original. The same can besaid of the novel after the best-seller, the proverbial sopho-more slump, Tom Peters's excellent companies faring relativelybadly after a few good years, and, perhaps, the fates of BernieEbbers of WorldCom, John Rigas of Adelphia, Ken Lay of En-ron, Gary Winnick of Global Crossing, Jean-Marie Messier ofVivendi (to throw in a European), Joseph Nacchio of Qwest,and Dennis Kozlowski of Tyco—all CEOs of large companieswho received adulatory coverage before their recent plungesfrom grace. (Satirewire.com refers to these publicity-fleeing,company-draining executives as the CEOnistas.)
There is a more optimistic side to regression. I suggest thatSports Illustrated consider featuring an established playerwho has had a particularly bad couple of months on its backcover. Then they could run feature stories on the boost associ-ated with such appearances. Barron's could do the same thingwith its back cover.
An expectation of a regression to the mean is not the wholestory, of course, but there are dozens of studies suggestingthat value investing, generally over a three-to-five year period,does result in better rates of return than, say, growth invest-ing. It's important to remember, however, that the size of theeffect varies with the study (not surprisingly, some studies findzero or a negative effect), transaction costs can eat up some orall of it, and competing investors tend to shrink it over time.

110 John Allen Paulos
In chapter 6 I'll consider the notion of risk in general, butthere is a particular sort of risk that may be relevant to valuestocks. Invoking the truism that higher risks bring greater re-turns even in an efficient market, some have argued that valuecompanies are risky because they're so colorless and easily ig-nored that their stock prices must be lower to compensate!Using "risky" in this way is risky, however, since it seems toexplain too much and hence nothing at all.
Accounting Practices, WorldCom's Problems
Even if value investing made better sense than investing inbroad-gauged index funds (and that is certainly not proved) abig problem remains. Many investors lack a clear understand-ing of the narrow meanings of the denominators in the P/E,P/B, and P/D ratios, and an uncritical use of these ratios canbe costly.
People are easily bamboozled about numbers and moneyeven in everyday circumstances. Consider the well-knownstory of the three men attending a convention at a hotel. Theyrent a booth for $30, and after they go to their booth, themanager realizes that it costs only $25 and that he's over-charged them. He gives $5 to the bellhop and directs him togive it back to the three men. Not knowing how to divide the$5 evenly, the bellhop decides to give $1 to each of the threemen and pockets the remaining $2 for himself. Later thatnight the bellhop realizes that the men each paid $9 ($10 mi-nus the $1 they received from him). Thus, since the $27 themen paid (3 x $9 = $27) plus the $2 that he took for himselfsums to $29, the bellhop wonders what happened to the miss-ing dollar. What did happen to it?
The answer, of course, is that there is no missing dollar.You can see this more easily if we assume that the manager
A Mathematician Plays the Stock Market 111
originally made a bigger mistake, realizing after charging themen $30 that the booth costs only $20 and that he's over-charged them $10. He gives $10 to the bellhop and directshim to give it back to the three men. Not knowing how to di-vide the $10 evenly, the bellhop decides to give $3 to each ofthe three men and pockets the remaining $1 for himself. Laterthat night the bellhop realizes that the men each paid $7 ($10minus the $3 they received from him). Thus, since the $21 themen paid (3 x $7 = $21) plus the $1 he took for himself sumsto $22, the bellhop wonders what happened to the missing$8. In this case there's less temptation to think that there's anyreason the sum should be $30.
If people are baffled by these "disappearances," and manyare, what makes us so confident that they understand the ac-counting intricacies on the basis of which they may be plan-ning to invest their hard-earned (or even easily earned)dollars? As the recent accounting scandals make clear, even agood understanding of these notions is sometimes of littlehelp in deciphering the condition of a company's finances.Making sense of accounting documents and seeing how bal-ance sheets, cash flow statements, and income statements feedinto each other is not something investors often do. They relyinstead on analysts and auditors, and this is why conflatingthe latter roles with those of investment bankers and consult-ants causes such concern.
If an accounting firm auditing a company also serves as aconsultant to the company, there is a troubling conflict of in-terest. (A similar crossing of professional lines that is moreupsetting to me has been curtailed by Eliot Spitzer, New Yorkattorney general. One typical instance involved Jack Grub-man, arguably the most influential analyst of telecommunica-tions companies such as WorldCom, who was incestuallyentangled in the investments and underwriting of the verycompanies he was supposed to be dispassionately analyzing.)

112 John Allen Paulos
A student's personal tutor who is paid to improve his or herperformance should not also be responsible for grading thestudent's exams. Nor should an athlete's personal coach bethe referee in a game in which the athlete competes. The situ-ation may not be exactly the same since, as accounting firmshave argued, different departments are involved in auditingand consulting. Nevertheless, there is at least the appearanceof impropriety, and often enough the reality too.
Such improprieties come in many flavors. Enron's account-ing feints and misdirections involving off-shore entities andcomplicated derivatives trading were at least subtle and al-most elegant. WorldCom's moves, by contrast, were so simpleand blunt that Arthur Andersen's seeming blindness is jaw-dropping. Somehow Andersen's auditors failed to note thatWorldCom had classified $3.8 billion in corporate expensesas capital investments. Since expenses are charged againstprofits as they are incurred, while capital investments arespread out over many years, this accounting "mistake" al-lowed WorldCom to report profits instead of losses for atleast two years and probably longer. After this revelation, in-vestigators learned that earnings were increased another $3.3billion by some combination of the same ruse and the shiftingof funds from exaggerated one-time charges against earnings(bad debts and the like) back into earnings as the need arose,creating, in effect, a huge slush fund. Finally (almost finally?)in November 2002 the SEC charged WorldCom with inflatingearnings by an additional $2 billion, bringing the total finan-cial misstatements to over $9 billion! (Many comparisonswith this sum are possible; one is that $9 billion is more thantwice the gross domestic product of Somalia.)
WorldCom's accounting fraud first came to light in June2002, long after I had invested a lot of money in the companyand passively watched as its value shriveled to almost nothing.Bernie Ebbers and company had not merely made $1 disap-
A Mathematician Plays the Stock Market 113
pear as in the puzzle above, but had presided over the vanish-ing of approximately $190 billion, the value of WorldCom'smarket capitalization in 1999—$64 a share times 3 billionshares. For this and many other reasons it might be arguedthat both the multi-trillion-dollar boom of the '90s and thecomparably sized bust of the early '00s were largely driven bytelecommunications. (With such gargantuan numbers it's im-portant to remember the fundamental laws of financial estima-tion: A trillion dollars plus or minus a few dozen billion is stilla trillion, just as a billion dollars plus or minus a few dozenmillion is still a billion.)
I was a victim, but the primary victimizer, I'm sorry to say,was not WorldCom management but myself. Putting so muchmoney into one stock, failing to place stop-loss orders or tobuy insurance puts, and investing on margin (puts and marginwill be discussed in chapter 6) were foolhardy and certainlynot based by the company's fundamentals. Besides, these fun-damentals and other warning signs should have been visibleeven through the accounting smoke screen.
The primary indication of trouble was the developing glutin the telecommunications industry. Several commentatorshave observed that the industry's trajectory over the lastdecade resembled that of the railroad industry after the CivilWar. The opening of the West, governmental inducements,and new technology led the railroads to build thousands ofmiles of unneeded track. They borrowed heavily, each com-pany attempting to be the dominant player; their revenuecouldn't keep pace with the rising debt; and the resulting col-lapse brought on an economic depression in 1873.
Substitute fiber-optic cable for railroad tracks, the openingof global markets for the opening of the West, the Internet forthe intercontinental railroad network, and governmental in-ducements for governmental inducements, and there you haveit. Millions of miles of unused fiber-optic cable costing billions

114 John Allen Paulos
of dollars were laid to capture the insufficiently burgeoningdemand for online music and pet stores. In a nutshell: Debtsincreased, competition grew keener, revenue declined, andbankruptcies loomed. Happily, however, no depression, atleast as of this writing.
In retrospect, it's clear that the situation was untenable andthat WorldCom's accounting tricks and deceptions (as well asGlobal Crossing's and others') merely papered over whatwould soon have come to light anyway: These companieswere losing a lot of money. Still, anyone can be forgiven fornot recognizing the problem of overcapacity or for not seeingthrough the hype and fraudulent accounting. (Far less blame-less, if I may self-flagellate again, were my dumb investingpractices, for which WorldCom management and accountantscertainly weren't responsible.) The real source of mostpeople's dismay and apprehension, I suspect, derives less fromaccountants' malfeasance than from the market's continuingto flounder. If it were rising, interest in the various accountingreforms that have been proposed and enacted would rival thepublic's keen fascination with partial differential equations orCantor's continuum hypothesis.
Reforms can only accomplish so much. There are countlessways for accountants to dissemble, many of which shade intolegitimate moves, and this highlights a different tension run-ning through the accounting profession. The precision andobjectivity of its bookkeeping fit uncomfortably alongside thevagueness and subjectivity of many of its practices. Every dayaccountants must make judgments and determinations thatare debatable—about the way to value inventory, the burdensof pensions and health care, the quantification of goodwill,the cost of warranties, or the classification of expenses—butonce made, these judgments result in numbers, exact to thenearest penny, that seem indubitable.

A Mathematician Plays the Stock Market 115
The situation is analogous to that in applied mathematicswhere the appropriateness of a mathematical model is al-ways vulnerable to criticism. Is this model the right one forthis situation? Are these assumptions warranted? Once theassumptions are made and the model is adopted, however,the numbers and organizational clarity that result have an ir-resistible appeal. Responding to this appeal two hundredyears ago, the German poet Goethe rapturously described ac-counting this way: "Double entry bookkeeping is one of themost beautiful discoveries of the human spirit."
Focusing only on the bookkeeping and the numerical out-put, however, and refusing to examine the legitimacy of theassumptions made, can be disastrous, both in mathematicsand accounting. Recall the tribe of bear hunters who becameextinct once they became expert in the complex calculationsof vector analysis. Before they encountered mathematics, thetribesmen killed, with their bows and arrows, all the bearsthey could eat. After mastering vector analysis, they starved.Whenever they spotted a bear to the northeast, for example,they would fire, as vector analysis suggested, one arrow to thenorth and one to the east.
Even more important than the appropriateness of account-ing rules and models is the transparency of these practices. Itmakes compelling sense, for example, for companies to countthe stock options given to executives and employees as ex-penses. Very few do so, but as long as everyone knows this,the damage is not as great as it could be. Everyone knowswhat's going on and can adapt to it.
If an accounting practice is transparent, then an outside au-ditor who is independent and trusted can, when necessary, is-sue a statement analogous to the warning made by theindependent and trusted matriarch from chapter 1. By mak-ing a bit of information common knowledge, an auditor (or

116 John Allen Paulos
the SEC) can alert everyone involved to a violation and stimu-late remedial action. If the auditor is not independent or nottrusted (as Harvey Pitt, the recently departed chairman of theSEC, was not), then he is simply another player and viola-tions, although perhaps widely and mutually known, will notbecome commonly known (everyone knowing that everyoneelse knows it and knowing that everyone else knows theyknow it and so on), and no action will result. In a similar way,family secrets take on a different character and have somehope of being resolved when they become common knowl-edge rather than merely mutual knowledge. Family and cor-porate "secrets" (such as WorldCom's misclassification ofexpenses) are often widely known, just not talked about.
Transparency, trust, independence, and authority are allneeded to make the accounting system work. They are all ingreat demand, but sometimes in short supply.

6 Options, Risk,and Volatility
/Consider a rather ugly mathematical physicist who goes toc the same bar every evening, always takes the second to thelast seat, and seems to speak toward the empty seat next tohis as if someone were there. The bartender notes this, and onValentine's Day when the physicist seems to be especially fer-vent in his conversation, he asks why he is talking into the air.The physicist scoffs that the bartender doesn't know anythingabout quantum mechanics. "There is no such thing as a vac-uum. Virtual particles flit in and out of existence, and there isa non-zero probability that a beautiful woman will material-ize and, when she does, I want to be here to ask her out." Thebartender is baffled and asks why the physicist doesn't justask one of the real women who are in the bar. "You neverknow. One of them might say yes." The physicist sneers, "Doyou know how unlikely that is?"
Being able to estimate probabilities, especially minusculeones, is essential when dealing with stock options. I'll soondescribe the language of puts and calls, and we'll see why theJanuary 2003 calls on WCOM at 15 have as much chance ofending up in the money as Britney Spears has of suddenly ma-terializing before the ugly physicist.
117

118 John Allen Paulos
Options and the Calls of the Wild
Here's a thought experiment: Two people (or the same personin parallel universes) have roughly similar lives until each un-dertakes some significant endeavor. The endeavors are equallyworthy and equally likely to result in success, but one en-deavor ultimately leads to good things for X and his familyand friends, and the other leads to bad things for Y and hisfamily and friends. It seems that X and Y should receiveroughly comparable evaluations for their decision, but gener-ally they won't. Unwarranted though it may be, X will bejudged kindly and Y harshly. I tell this in part because I'd liketo exonerate myself for my investing behavior by claimingstatus as a faultless Mr. Y, but I don't qualify.
By late January 2002, WCOM had sunk to about $10 pershare, and I was feeling not only dispirited but guilty aboutlosing so much money on it. Losing money in the stock marketoften induces guilt in those who have lost it, whether they'vedone anything culpable or not. Whatever your views on therandomness of the market, it's indisputable that chance plays ahuge role, so it makes no sense to feel guilty about havingcalled heads when a tails comes up. If this was what I'd done, Icould claim to be a Mr. Y: It wouldn't have been my fault.Alas, as I mentioned, it does make sense to blame yourself forbetting recklessly on a particular stock (or on options for it).
There is a term used on Wall Street to describe traders andothers who "blow up" (that is, lose a fortune) and as a resultbecome hollow, sepulchral figures. The term is "ghost" and Ihave developed more empathy for ghosts than I wanted tohave. Often they achieve their funereal status by taking un-necessary risks, risks that they could and should have "diver-sified away." One perhaps counterintuitive way in which toreduce risk is to buy and sell stock options.

A Mathematician Plays the Stock Market 119
Many people think of stock options as slot machines,roulette wheels, or dark horse long shots; that is, as puregambles. Others think of them as absurdly large inducementsfor people to stay with a company or as rewards for taking acompany public. I have no argument with these characteriza-tions, but much of the time an option is more akin to a boringold insurance policy. Just as one buys an insurance policy incase one's washing machine breaks down, one often buys op-tions in case one's stock breaks down. They lessen risk, whichis the bete noire, bugbear, and bane of investors' lives and thetopic of this chapter.
How options work is best explained with a few numericalexamples. (How they're misused is reserved for the next sec-tion.) Assume that you have 1,000 shares of AOL (just to giveWCOM a rest), and it is selling at $20 per share. Althoughyou think it's likely to rise in the long term, you realize there'sa chance that it may fall significantly in the next six months.You could insure against this by buying 1,000 "put" optionsat an appropriate price. These would give you the right to sell1,000 shares of AOL for, say, $17.50 for the next six months.If the stock rises or falls less than $2.50, the puts becomeworthless in six months (just as your washing machine war-ranty becomes worthless on its expiration if your machine hasnot broken down by then). Your right to sell shares at $17.50is not attractive if the price of the stock is more than that.However, if the stock plunges to, say, $10 per share within thesix-month period, your right to sell shares at $17.50 is worthat least $7.50 per share. Buying put options is a hedge againsta precipitous decline in the price of the underlying stock.
As I was first writing this, only a few paragraphs and a fewdays after WCOM had fallen to $10, it fell to under $8 pershare, and I wished I had bought a boatload of puts on itmonths before when they were dirt cheap.
120 John Allen Paulos
In addition to put options, there are "call" options. Buyingthem gives you the right to buy a stock at a certain pricewithin a specified period of time. You might be tempted to buycalls when you strongly believe that a stock, say Intel this time(abbreviated INTC), selling at $25 per share, will rise substan-tially during the next year. Maybe you can't afford to buymany shares of INTC, but you can afford to buy calls givingyou the right to buy shares at, say, $30 during the next year. Ifthe stock falls or rises less than $5 during the next year, thecalls become worthless. Your right to buy shares at $30 is notattractive if the price of the stock is less than that. But if thestock rises to, say, $40 per share within the year, each call isworth at least $10. Buying call options is a bet on a substantialrise in the price of the stock. It is also a way to insure that youare not left out when a stock, too expensive to buy outright,begins to take off. (The figures $17.50 and $30 in the AOLand INTC examples above are the "strike" prices of the re-spective options; this is the price of the stock that determinesthe point at which the option has intrinsic value or is "in themoney.")
One of the most alluring aspects of buying puts and calls isthat your losses are limited to what you have paid for them,but the potential gains are unlimited in the case of calls andvery substantial in the case of puts. Because of these huge po-tential gains, options probably induce a comparably hugeamount of fantasy—countless investors thinking somethinglike "the option for INTC with a $30 strike price costsaround a dollar, so if the stock goes to $45 in the next year,I'll make 15 times my investment. And if it goes to $65, I'llmake 35 times my investment." The attraction for some spec-ulators is not much different from that of a lottery.
Although I've often quoted approvingly Voltaire's quip thatlotteries are a tax on stupidity (or at least on innumeracy),yes, I did buy a boatload of now valueless WCOM calls. In

A Mathematician Plays the Stock Market 121
fact, over the two years of my involvement with the stock, Ibought many thousands of January 2003 calls on WCOM at$15.1 thought that whatever problems the company had weretemporary and that by 2003 it would right itself and, in theprocess, me as well. Call me an ugly physicist.
There is, of course, a market in puts and calls, whichmeans that people sell them as well as buy them. Not surpris-ingly, the payoffs are reversed for sellers of options. If you sellcalls for INTC with a strike price of $30 that expires in ayear, then you keep your proceeds from the sale of the callsand pay nothing unless the stock moves above $30. If, how-ever, the stock moves to, say, $35, you must supply the buyerof the calls with shares of INTC at $30. Selling calls is thus abet that the stock will either decline or rise only slightly in agiven time period. Likewise, selling puts is a bet that the stockwill either rise or decline only slightly.
One common investment strategy is to buy shares of astock and simultaneously sell calls on them. Say, for example,you buy some shares of INTC stock at $25 per share and sellsix-month calls on them with a strike price of $30. If thestock price doesn't rise to $30, you keep the proceeds fromthe sale of the calls, but if the stock price does exceed $30,you can sell your own shares to the buyer of the calls, thuslimiting the considerable risk in selling calls. This selling of"covered" calls (covered because you own the stock and don'thave to buy it at a high price to satisfy the buyer of the call) isone of many hedges investors can employ to maximize theirreturns and minimize their risks.
More generally, you can buy and sell the underlying stockand mix and match calls and puts with different expirationdates and strike prices to create a large variety of potentialprofit and loss outcomes. These combinations go by nameslike "straddles," "strangles," "condors," and "butterflies,"but whatever strange and contorted animal they're named for,
122 John Allen Paulos
like all insurance policies, they cost money. A surprisingly dif-ficult question in finance has been "How does one place avalue on a put or a call?" If you're insuring your house, someof the determinants of the policy premium are the replace-ment cost of the house, the length of time the policy is in ef-fect, and the amount of the deductible. The considerations fora stock include these plus others having to do with the riseand fall of stock prices.
Although the practice and theory of insurance have a longhistory (Lloyd's of London dates from the late seventeenthcentury), it wasn't until 1973 that a way was found to ration-ally assign costs to options. In that year Fischer Black andMyron Scholes published a formula that, although much re-fined since, is still the basic valuation tool for options of allsorts. Their work and that of Robert Merton won the Nobelprize for economics in 1997.
Louis Bachelier, whom I mentioned in chapter 4, also de-vised a formula for options more than one hundred years ago.Bachelier's formula was developed in connection with his fa-mous 1900 doctoral dissertation in which he was the first toconceive of the stock market as a chance process in whichprice movements up and down were normally distributed.His work, which utilized the mathematical theory of Brown-ian motion, was way ahead of its time and hence was largelyignored. His options formula was also prescient, but ulti-mately misleading. (One reason for its failure is that Bachelierdidn't take account of the effect of compounding on stock re-turns. Over time this leads to what is called a "lognormal"distribution rather than a normal one.)
The Black-Scholes options formula depends on five parame-ters: the present price of the stock, the length of time until theoption expires, the interest rate, the strike price of the option,and the volatility of the underlying stock. Without getting intothe mechanics of the formula, we can see that certain general

A Mathematician Plays the Stock Market 123
relations among these parameters are commonsensical. Forexample, a call that expires two years from now has to costmore than one that expires in three months since the later ex-piration date gives the stock more time to exceed the strikeprice. Likewise, a call with a strike price a point or two abovethe present stock price will cost more than one five pointsabove the stock price. And options on a stock whose volatilityis high will cost more than options on stocks that barely movefrom quarter to quarter (just as a short man on a pogo stick ismore likely to be able to peek over a nine-foot fence than a tallman who can't jump). Less intuitive is the fact that the cost ofan option also rises with the interest rate, assuming all otherparameters remain unchanged.
Although there are any number of books and websites onthe Black-Scholes formula, it and its variants are more likelyto be used by professional traders than by gamblers, who relyon commonsense considerations and gut feel. Viewing op-tions as pure bets, gamblers are generally as interested incarefully pricing them as casino-goers are in the payoff ratiosof slot machines.
The Lure of Illegal Leverage
Because of the leverage possible with the purchase, sale, ormere possession of options, they sometimes attract peoplewho aren't content to merely play the slots but wish to sticktheir thumbs onto the spinning disks and directly affect theoutcomes. One such group of people are CEOs and othermanagement personnel who stand to reap huge amounts ofmoney if they can somehow contrive (by hook, crook, or, toooften, by cooking the books) to raise their companies' stockprice. Even if the rise is only temporary, the suddenly valuablecall options can "earn" them tens of millions of dollars. This

124 John Allen Paulos
is the luxury version of "pump and dump" that has animatedmuch of the recent corporate malfeasance.
(Such malfeasance might make for an interesting novel. Onpublic television one sometimes sees a fantasia in which di-verse historical figures are assembled for an imaginary con-versation. Think, for example, of Leonardo da Vinci, ThomasEdison, and Benjamin Franklin discussing innovation. Some-times a contemporary is added to the mix or simply pairedwith an illustrious precursor—maybe Karl Popper and DavidHume, Stephen Hawking and Isaac Newton, or Henry Kis-singer and Machiavelli. Recently I tried to think with whom Imight pair a present-day ace CEO, investor, or analyst. Thereare a number of books about the supposed relevance to con-temporary business practices of Plato, Aristotle, and other an-cient wise men, but the conversation I'd be most interested inwould be one between a current wheeler-dealer and some ac-complished hoaxer of the past, maybe Dennis Koslowski andP. T. Barnum, or Kenneth Lay and Harry Houdini, or possiblyBernie Ebbers and Elmer Gantry.)
Option leverage works in the opposite direction as well, theoptions-fueled version of "short and distort." One particularlyabhorrent example may have occurred in connection with thebombing of the World Trade Center. Just after September 11,2001, there were reports that Al Qaeda operatives in Europehad bought millions of dollars worth of puts on various stockindices earlier in the month, reasoning that the imminent at-tacks would lead to a precipitous drop in the value of these in-dices and a consequent enormous rise in the value of theirputs. They may have succeeded, although banking secrecylaws in Switzerland and elsewhere make that unclear.
Much more commonly, people buy puts on a stock and thentry to depress its price in less indiscriminately murderousways. A stockbroker friend of mine tells me, for example, ofhis fantasy of writing a mystery novel in which speculators

A Mathematician Plays the Stock Market 125
buy puts on a company whose senior management is ab-solutely critical to the success of the company. The imaginaryspeculators then proceed to embarrass, undermine, and ulti-mately kill the senior management in order to reap the benefitof the soon-to-be valuable puts. The WorldCom chatroom,home to all sorts of utterly baseless rumors, once entertained abrief discussion about the possibility of WorldCom manage-ment having been blackmailed into doing all the ill-consideredthings they did on pain of having some awful secrets revealed.The presumption was that the blackmailers had boughtWCOM puts.
Intricacies abound, but the same basic logic governing stockoptions is at work in the pricing of derivatives. Sharing onlythe same name as the notion studied in calculus, derivativesare financial instruments whose value is derived from someunderlying asset—the stock of a company, commodities likecotton, pork bellies, and natural gas, or almost anythingwhose value varies significantly over time. They present thesame temptation to directly change, affect, or manipulate con-ditions, and the opportunities for doing so are more variedand would also make for an intriguing business mystery novel.
The leverage involved in trading options and derivativesbrings to mind a classic quote from Archimedes, who main-tained that given a fulcrum, a long enough lever, and a place tostand, he could move the earth. The world-changing dreamsthat created the suggestively named WorldCom, Global Cross-ing, Quantum Group (George Soros' companies, no strangerto speculation), and others may have been similar in scope.The metaphorical baggage of levers and options is telling.
One can also look at seemingly non-financial situationsand discern something like the buying, selling, and manipu-lating of options. For example, the practice of defraying themedical bills of AIDS patients in exchange for being madethe beneficiary of their insurance policies has disappeared
126 John Allen Paulos
with the increased longevity of those with AIDS. However, ifthe deal were modified so that the parties put a time limit ontheir agreement, it could be considered a standard optionsale. The "option buyer" would pay a sum of money, and thepatient/option seller would make the buyer the beneficiaryfor an agreed-upon period of time. If the patient happens notto expire within that time, the "option" does. Maybe an-other mystery novel here?
Less ghoulish variants of option buying, selling, and ma-nipulating play an important role in everyday life from educa-tion and family planning to politics. Political options, betterknown as campaign contributions to relatively unknown can-didates, usually expire worthless after the candidate loses therace. If he or she is elected, however, the "call option" be-comes very valuable, enabling the contributor to literally callon the new officeholder. There is no problem with that, butdirect manipulation of conditions that might increase thevalue of the political option is generally called "dirty tricks."
For all the excesses options sometimes inspire, they aregenerally a good thing, a valuable lubricant that enables pru-dent hedgers and adventurous gamblers to form a mutuallyadvantageous market. It's only when the option holders dosomething to directly affect the value of the options that thelure of leverage turns lurid.
Short-Selling, MarginBuying, and Familial Finances
An old Wall Street couplet says, "He who sells what isn'this'n must buy it back or go to prison." The lines allude to"short-selling," the selling of stocks one doesn't own in thehope that the price will decline and one can buy the sharesback at a lower price in the future. The practice is very risky
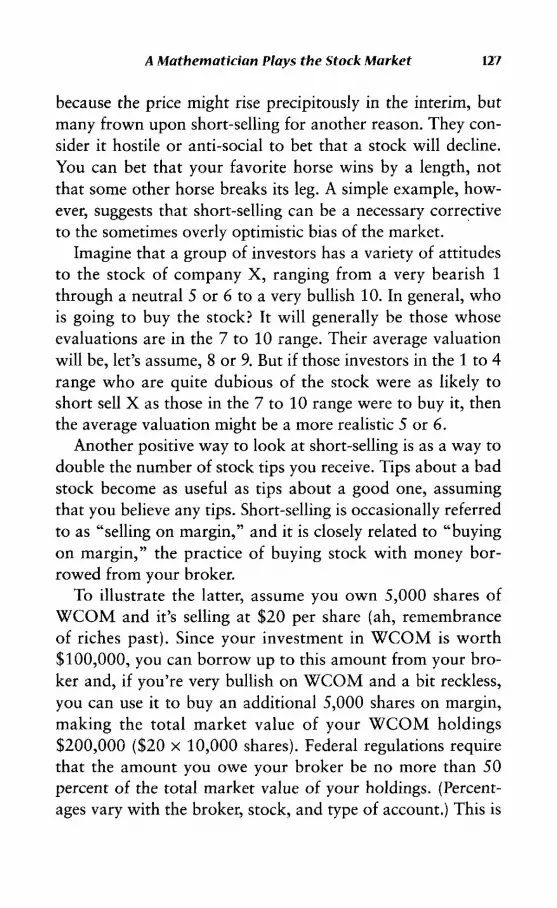
A Mathematician Plays the Stock Market 127
because the price might rise precipitously in the interim, butmany frown upon short-selling for another reason. They con-sider it hostile or anti-social to bet that a stock will decline.You can bet that your favorite horse wins by a length, notthat some other horse breaks its leg. A simple example, how-ever, suggests that short-selling can be a necessary correctiveto the sometimes overly optimistic bias of the market.
Imagine that a group of investors has a variety of attitudesto the stock of company X, ranging from a very bearish 1through a neutral 5 or 6 to a very bullish 10. In general, whois going to buy the stock? It will generally be those whoseevaluations are in the 7 to 10 range. Their average valuationwill be, let's assume, 8 or 9. But if those investors in the 1 to 4range who are quite dubious of the stock were as likely toshort sell X as those in the 7 to 10 range were to buy it, thenthe average valuation might be a more realistic 5 or 6.
Another positive way to look at short-selling is as a way todouble the number of stock tips you receive. Tips about a badstock become as useful as tips about a good one, assumingthat you believe any tips. Short-selling is occasionally referredto as "selling on margin," and it is closely related to "buyingon margin," the practice of buying stock with money bor-rowed from your broker.
To illustrate the latter, assume you own 5,000 shares ofWCOM and it's selling at $20 per share (ah, remembranceof riches past). Since your investment in WCOM is worth$100,000, you can borrow up to this amount from your bro-ker and, if you're very bullish on WCOM and a bit reckless,you can use it to buy an additional 5,000 shares on margin,making the total market value of your WCOM holdings$200,000 ($20 x 10,000 shares). Federal regulations requirethat the amount you owe your broker be no more than 50percent of the total market value of your holdings. (Percent-ages vary with the broker, stock, and type of account.) This is

128 John Allen Paulos
no problem if the price of WCOM rises to $25 per share,since the $100,000 you owe your broker will then constituteonly 40 percent of the $250,000 ($25 x 10,000) market valueof your WCOM shares. But consider what happens if thestock fails to $15 per share. The $100,000 you owe now con-stitutes 67 percent of the $150,000 ($15 x 10,000) marketvalue of your WCOM shares, and you will receive a "margincall" to deposit immediately enough money ($25,000) intoyour account to bring you back into compliance with the 50percent requirement. Further declines in the stock price willresult in more margin calls.
I'm embarrassed to reiterate that my devotion to WCOM(others may characterize my relationship to the stock in lesskindly terms) led me to buy it on margin and to make themargin calls on it as it continued its long, relentless decline.Receiving a margin call (which often takes the literal form ofa telephone call) is, I can attest, unnerving and confronts youwith a stark choice. Sell your holdings and get out of thegame now or quickly scare up some money to stay in it.
My first margin call on WCOM is illustrative. Althoughthe call was rather small, I was leaning toward selling some ofmy shares rather than depositing yet more money in my ac-count. Unfortunately (in retrospect), I needed a book quicklyand decided to go to the Borders store in Center City, Phila-delphia, to look for it. While doing so, I came across thephrase "staying in the game" while browsing and realizedthat staying in the game was what I still wanted to do. I real-ized too that Schwab was very close to Borders and that I hada check in my pocket.
My wife was with me, and though she knew of my invest-ment in WCOM, at the time she was not aware of its extentnor of the fact that I'd bought on margin. (Readily grantingthat this doesn't say much for the transparency of my finan-cial practices, which would not likely be approved by even

A Mathematician Plays the Stock Market 129
the most lax Familial Securities Commission, I plead guilty tospousal deception.) When she went upstairs, I ducked out ofthe store and made the margin call. My illicit affair withWCOM continued. Occasionally exciting, it was for the mostpart anxiety-inducing and pleasureless, not to mention costly.
I took some comfort from the fact that my margin buyingdistantly mirrored that of WorldCom's Bernie Ebbers, whoborrowed approximately $400 million to buy WCOM shares.(More recent allegations have put his borrowings at closer to$1 billion, some of it for personal reasons unrelated to World-Com. Enron's Ken Lay, by contrast, borrowed only $10 to $20million.) When he couldn't make the ballooning margin calls,the board of directors extended him a very low interest loanthat was one factor leading to further investor unrest, massivesell-offs, and more trips to Borders for me.
Relatively few individuals short-sell or buy on margin, butthe practice is very common among hedge funds—private,lightly regulated investment portfolios managed by peoplewho employ virtually every financial tool known to man. Theycan short-sell, buy on margin, use various other sorts of lever-age, or engage in complicated arbitrage (the near simultaneousbuying and selling of the same stock, bond, commodity, oranything else, in order to profit from tiny price discrepancies).They're called "hedge funds" because many of them try tominimize the risks of wealthy investors. Others fail to hedgetheir bets at all.
A prime example of the latter is the collapse in 1998 ofLong-Term Capital Management, a hedge fund, two of whosefounding partners, Robert Merton and Myron Scholes, werethe aforementioned Nobel prize winners who, together withFischer Black, derived the celebrated formula for pricing op-tions. Despite the presence of such seminal thinkers on theboard of LTCM, the debacle roiled the world's financial mar-kets and, had not emergency measures been enacted, might

130 John Allen Paulos
have seriously damaged them. (Then again, there is a laissez-faire argument for letting the fund fail.)
I admit I take a certain self-serving pleasure from this storysince my own escapades pale by comparison. It's not clear,however, that the LTCM collapse was the fault of the Nobellaureates and their models. Many believe it was a consequenceof a "perfect storm" in the markets, a vanishingly unlikely con-fluence of chance events. (The claim that Merton and Scholeswere not implicated is nevertheless a bit disingenuous, sincemany invested in LTCM precisely because the fund was toutingthem and their models.)
The specific problems encountered by LTCM concerned alack of liquidity in world markets, and this was exacerbatedby the disguised dependence of a number of factors that wereassumed to be independent. Consider, for illustration's sake,the likelihood that 3,000 specific people will die in New Yorkon any given day. Provided that there is no connection amongthem, this is an impossibly minuscule number—a small prob-ability raised to the 3,000th power. If most of the peoplework in a pair of buildings, however, the independence as-sumption that allows us to multiply probabilities fails. The3,000 deaths are still extraordinarily unlikely, but not impos-sibly minuscule. Of course, the probabilities associated withpossible LTCM scenarios were nowhere near as small and, ac-cording to some, could and should have been anticipated.
Are Insider Trading andStock Manipulation So Bad?
It's natural to take a moralistic stance toward the corporatefraud and excess that have dominated business news the lastcouple of years. Certainly that attitude has not been com-pletely absent from this book. An elementary probability puz-

A Mathematician Plays the Stock Market 131
zle and its extensions suggest, however, that some argumentsagainst insider trading and stock manipulation are ratherweak. Moral outrage, rather than actual harm to investors,seems to be the primary source of many people's revulsion to-ward these practices.
Let me start with the original puzzle. Which of the follow-ing two situations would you prefer to be in? In the first oneyou're given a fair coin to flip and are told that you will re-ceive $1,000 if it lands heads and lose $1,000 if it lands tails.In the second you're given a very biased coin to flip and mustdecide whether to bet on heads or tails. If it lands the way youpredict you win $1,000 and, if not, you lose $1,000. Althoughmost people prefer to flip the fair coin, your chances of win-ning are 1/2 in both situations, since you're as likely to pickthe biased coin's good side as its bad side.
Consider now a similar pair of situations. In the first oneyou are told you must pick a ball at random from an urn con-taining 10 green balls and 10 red balls. If you pick a greenone, you win $1,000, whereas if you pick a red one, you lose$1,000. In the second, someone you thoroughly distrustplaces an indeterminate number of green and red balls in theurn. You must decide whether to bet on green or red and thenchoose a ball at random. If you choose the color you bet on,you win $1,000 and, if not, you lose $1,000. Again, yourchances of winning are 1/2 in both situations.
Finally, consider a third pair of similar situations. In thefirst one you buy a stock that is being sold in a perfectly effi-cient market and your earnings are $1,000 if it rises the nextday and -$1,000 if it falls. (Assume that in the short run itmoves up with probability 1/2 and down with the same prob-ability.) In the second there is insider trading and manipula-tion and the stock is very likely to rise or fall the next day as aresult of these illegal actions. You must decide whether to buyor sell the stock. If you guess correctly, your earnings are

132 John Allen Paulos
$1,000 and, if not, -$1,000. Once again your chances of win-ning are 1/2 in both situations. (They may even be slightlyhigher in the second situation since you might have knowl-edge of the insiders' motivations.)
In each of these pairs, the unfairness of the second situationis only apparent. You have the same chance of winning thatyou do in the first situation. I do not by any means defend in-sider trading and stock manipulation, which are wrong formany other reasons, but I do suggest that they are, in a sense,simply two among many unpredictable factors affecting theprice of a stock.
I suspect that more than a few cases of insider trading andstock manipulation result in the miscreant guessing wrongabout how the market will respond to his illegal actions. Thismust be depressing for the perpetrators (and funny for every-one else).
Expected Value, Not Value Expected
What can we anticipate? What should we expect? What's thelikely high, low, and average value? Whether the quantity inquestion is height, weather, or personal income, extremes aremore likely to make it into the headlines than are more in-formative averages. "Who makes the most money," for ex-ample, is generally more attention-grabbing than "what is theaverage income" (although both terms are always suspect be-cause—surprise—like companies, people lie about how muchmoney they make).
Even more informative than averages, however, are distri-butions. What, for example, is the distribution of all incomesand how spread out are they about the average? If the averageincome in a community is $100,000, this might reflect thefact that almost everyone makes somewhere between $80,000

A Mathematician Plays the Stock Market 133
and $120,000, or it might mean that a big majority earns lessthan $30,000 and shops at Kmart, whose spokesperson, the(too) maligned Martha Stewart, also lives in town and bringsthe average up to $100,000. "Expected value" and "standarddeviation" are two mathematical notions that help clarifythese issues.
An expected value is a special sort of average. Specifically,the expected value of a quantity is the average of its values,but weighted according to their probabilities. If, for example,based on analysts' recommendations, our own assessment, amathematical model, or some other source of information, weassume that 1/2 of the time a stock will have a 6 percent rateof return, that 1/3 of the time it will have a -2 percent rate ofreturn, and that the remaining 1/6 of the time it will have a 28percent rate of return, then, on average, the stock's rate of re-turn over any given six periods will be 6 percent three times,-2 percent twice, and 28 percent once. The expected value ofits return is simply this probabilistically weighted average—(6% + 6% + 6% + (-2%) + (-2%) + 28%)/6, or 7%.
Rather than averaging directly, one generally obtains theexpected value of a quantity by multiplying its possible valuesby their probabilities and then adding up these products.Thus .06 x 1/2 + (-.02) x 1/3 + .28 x 1/6 = .07, or 7%, the ex-pected value of the above stock's return. Note that the term"mean" and the Greek letter u (mu) are used interchangeablywith "expected value," so 7% is also the mean return, u.
The notion of expected value clarifies a minor investingmystery. An analyst may simultaneously and without con-tradiction believe that a stock is very likely to do well butthat, on average, it's a loser. Perhaps she estimates that thestock will rise 1 percent in the next month with probability95 percent and that it will fall 60 percent in the same timeperiod with probability 5 percent. (The probabilities mightcome, for example, from an appraisal of the likely outcome of

134 John Allen Paulos
an impending court decision.) The expected value of its pricechange is thus (.01 x .95) + (-.60) x .05), which equals-.021 or an expected loss of 2.1%. The lesson is that the ex-pected value, -2.1%, is not the value expected, which is 1%.
The same probabilities and price changes can also be usedto illustrate two complementary trading strategies, one thatusually results in small gains but sometimes in big losses, andone that usually results in small losses but sometimes in biggains. An investor who's willing to take a risk to regularlymake some "easy money" might sell puts on the above stock,puts that expire in a month and whose strike price is a littleunder the present price. In effect, he's betting that the stockwon't decline in the next month. Ninety-five percent of thetime he'll be right, and he'll keep the put premiums and makea little money. Correspondingly, the buyer of the puts will losea little money (the put premiums) 95 percent of the time. As-suming the probabilities are accurate, however, when the stockdeclines, it declines by 60 percent, and so the puts (the right tosell the stock at a little under the original price) become veryvaluable 5 percent of the time. The buyer of the puts thenmakes a lot of money and the seller loses a lot.
Investors can play the same game on a larger scale by buy-ing and selling puts on the S&P 500, for example, rather thanon any particular stock. The key to playing is coming up withreasonable probabilities for the possible returns, numbersabout which people are as likely to differ as they are in theirpreferences for the above two strategies. Two exemplars ofthese two types of investor are Victor Niederhoffer, a well-known futures trader and author of The Education of a Spec-ulator, who lost a fortune by selling puts a few years ago, andNassim Taleb, another trader and the author of Fooled byRandomness, who makes his living by buying them.
For a more pedestrian illustration, consider an insurancecompany. From past experience, it has good reason to believe

A Mathematician Plays the Stock Market 135
that each year, on average, one out of every 10,000 of itshomeowners' policies will result in a claim of $400,000, oneout of 1,000 policies will result in a claim of $60,000, one outof 50 will result in a claim of $4,000, and the remainderwill result in a claim of $0. The insurance company wouldlike to know what its average payout will be per policy writ-ten. The answer is the expected value, which in this case is($400,000 x 1/10,000) + ($60,000 x 1/1,000) + ($4,000 x1/50) + ($0 x 9,979/10,000) = $40 + $60 + $80 + $0 = $180.The premium the insurance company charges the homeown-ers will no doubt be at least $181.
Combining the techniques of probability theory with thedefinition of expected value allows for the calculation of moreinteresting quantities. The rules for the World Series of base-ball, for example, stipulate that the series ends when oneteam wins four games. The rules further stipulate that team Aplays in its home stadium for games 1 and 2 and howevermany of games 6 and 7 are necessary, whereas team B plays inits home stadium for games 3, 4, and, if necessary, game 5. Ifthe teams are evenly matched, you might be interested in theexpected number of games that will be played in each team'sstadium. Skipping the calculation, I'll simply note that team Acan expect to play 2.9375 games and team B 2.875 games intheir respective home stadiums.
Almost any situation in which one can calculate (or reason-ably estimate) the probabilities of the values of a quantity al-lows us to determine the expected value of that quantity. Anexample more tractable than the baseball problem concernsthe decision whether to park in a lot or illegally on the street.If you park in a lot, the rate is $10 or $14, depending uponwhether you stay for less than an hour, the probability ofwhich you estimate to be 25 percent. You may, however, de-cide to park illegally on the street and have reason to believethat 20 percent of the time you will receive a simple parking

136 John Allen Paulos
ticket for $30, 5 percent of the time you will receive an ob-struction of traffic citation for $100, and 75 percent of thetime you will get off for free.
The expected value of parking in the lot is ($10 x .25) +($14 x .75), which equals $13. The expected value of parkingon the street is ($100 x .05) + ($30 x .20) + ($0 x .75), whichequals $11. For those to whom this is not already Greek, wemight say that UL, the mean costs of parking in the lot, and us,the mean cost of parking on the street, are $13 and $11,respectively.
Even though parking in the street is cheaper on average (as-suming money was your only consideration), the variabilityof what you'll have to pay there is much greater than it iswith the lot. This brings us to the notion of standard devia-tion and stock risk.
What's Normal? Not Six Sigma
Risk in general is frightening, and the fear it engenders ex-plains part of the appeal of quantifying it. Naming bogeymentends to tame them, and chance is one of the most terrifyingbogeyman around, at least for adults.
So how might one get at the notion of risk mathematically?Let's start with "variance," one of several mathematical termsfor variability. Any chance-dependent quantity varies and de-viates from its mean or average; it's sometimes more than theaverage, sometimes less. The actual temperature, for example,is sometimes warmer than the mean temperature, sometimescooler. These deviations from the mean constitute risk and arewhat we want to quantify. They can be positive or negative,just as the actual temperature minus the mean temperaturecan be positive or negative, and hence they tend to cancel out.If we square them, however, the deviations are all positive,
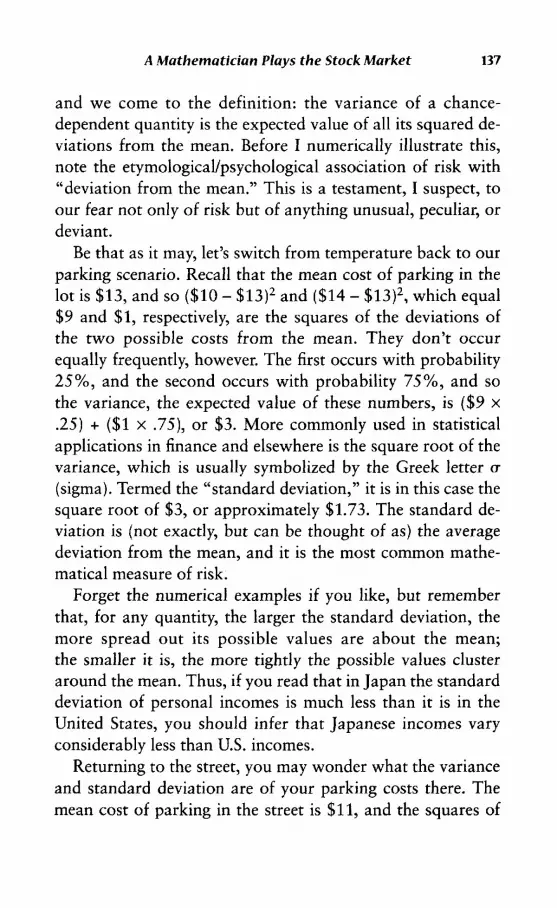
A Mathematician Plays the Stock Market 137
and we come to the definition: the variance of a chance-dependent quantity is the expected value of all its squared de-viations from the mean. Before I numerically illustrate this,note the etymological/psychological association of risk with"deviation from the mean." This is a testament, I suspect, toour fear not only of risk but of anything unusual, peculiar, ordeviant.
Be that as it may, let's switch from temperature back to ourparking scenario. Recall that the mean cost of parking in thelot is $13, and so ($10 - $13)2 and ($14 - $13)2, which equal$9 and $1, respectively, are the squares of the deviations ofthe two possible costs from the mean. They don't occurequally frequently, however. The first occurs with probability25%, and the second occurs with probability 75%, and sothe variance, the expected value of these numbers, is ($9 x.25) + ($1 x .75), or $3. More commonly used in statisticalapplications in finance and elsewhere is the square root of thevariance, which is usually symbolized by the Greek letter o(sigma). Termed the "standard deviation," it is in this case thesquare root of $3, or approximately $1.73. The standard de-viation is (not exactly, but can be thought of as) the averagedeviation from the mean, and it is the most common mathe-matical measure of risk.
Forget the numerical examples if you like, but rememberthat, for any quantity, the larger the standard deviation, themore spread out its possible values are about the mean;the smaller it is, the more tightly the possible values clusteraround the mean. Thus, if you read that in Japan the standarddeviation of personal incomes is much less than it is in theUnited States, you should infer that Japanese incomes varyconsiderably less than U.S. incomes.
Returning to the street, you may wonder what the varianceand standard deviation are of your parking costs there. Themean cost of parking in the street is $11, and the squares of

138 John Allen Paulos
the deviations of the three possible costs from the mean are($100 - $11)2, ($30 - $11)2, and ($0 - $11)2, or $7,921,$361, and $121, respectively. The first occurs with probability5%, the second with probability 20%, and the third withprobability 75%, and so the variance, the expected values ofthese numbers, is ($7,921 x .05) + ($361 x .20) + ($0 x .75),or $468.25. The square root of this gives us the standard de-viation of $21.64, more than twelve times the standard devia-tion of parking in the lot.
Despite this blizzard of numbers, I reiterate that all wehave done is quantify the obvious fact that the possible out-comes of parking on the street are much more varied and un-predictable than those of parking in the lot. Even though theaverage cost of parking in the street ($11) is less than that ofparking in the lot ($13), most would prefer to incur less riskand would therefore park in the lot for prudential reasons, ifnot moral ones.
This brings us to the market's use of standard deviation(sigma) to measure a stock's volatility. Let's use the same ap-proach to calculate the variance of the returns for our stockthat yields a rate of 6% about 1/2 the time, -2% about 1/3 ofthe time, and 28% the remaining 1/6 of the time. The meanor expected value of its returns is 7%, and so the squares ofthe deviations from the mean are (.06 - .07)2, (-.02 - .07)2,and (.28 - .07)2 or .0001, .0081, and .0441, respectively.These occur with probabilities 1/2, 1/3, and 1/6, and so thevariance, the expected value of the squares of these deviationsfrom the mean, is (.0001 x 1/2) + (.0081 x 1/3) + (.0441 x1/6), which is .01. The square root of .01 is .10 or 10%, andthis is the standard deviation of the returns for this stock.
The Greek lesson again: The expected value of a quantity isits (probabilistically weighted) average and is symbolized bythe letter p (mu), and the standard deviation of a quantity is ameasure of its variability and is symbolized by the letter

A Mathematician Plays the Stock Market 139
a (sigma). If the quantity in question is the rate of return on astock price, its volatility is generally taken to be the standarddeviation.
If there are only two or three possible values a quantitymight assume, the standard deviation is not that helpful a no-tion. It becomes very useful, however, when a quantity can as-sume many different values and these values, as they often do,have an approximately normal bell-shaped distribution—highin the middle and tapering off on the sides. In this case, theexpected value is the high point of the distribution. Moreover,approximately 2/3 of the values (68 percent) lie within onestandard deviation of the expected value, and 95 percent ofthe values lie within two standard deviations of the expectedvalue.
Before we go on, let's list a few of the quantities that have anormal distribution: age-specific heights and weights, naturalgas consumption in a city for any given winter day, water usebetween 2 A.M. and 3 A.M. in a given city, thicknesses of a par-ticular machined part coming off an assembly line, I.Q.s(whatever it is that they measure), the number of admissionsto a large hospital on any given day, distances of darts from abull's-eye, leaf sizes, nose sizes, the number of raisins in boxesof breakfast cereal, and possible rates of return for a stock. Ifwe were to graph any of these quantities, we would obtainbell-shaped curves whose values are clustered about the mean.
Take as an example the number of raisins in a large box ofcereal. If the expected number of raisins is 142 and the stan-dard deviation is 8, then the high point of the bell-shapedgraph would be at 142. About two-thirds of the boxes wouldcontain between 134 and 150 raisins, and 95 percent of theboxes would contain between 126 and 158 raisins.
Or consider the rate of return of a conservative stock. If thepossible rates are normally distributed with an expected valueof 5.4 percent and a volatility (standard deviation, that is) of

140 John Allen Paulos
only 3.2 percent, then about two-thirds of the time, the rateof return will be between 2.2 percent and 8.6 percent, and 95percent of the time the rate will be between -1 percent and11.8 percent. You might prefer this stock to a more risky onewith the same expected value but a volatility of, say, 20.2 per-cent. About two-thirds of the time, the rate of return of thismore volatile stock will be between -14.8 percent and 25.6percent, and 95 percent of the time it will be between -35percent and 45.8 percent.
In all cases, the more standard deviations from the ex-pected value, the more unusual the result. This fact helps ac-count for the many popular books on management andquality control having the words "six sigma" in their titles.The covers of many of these books suggest that by followingtheir precepts, you can attain results that are six standard de-viations above the norm, leading, for example, to a minusculenumber of product defects. A six-sigma performance is, infact, so unlikely that the tables in most statistics texts don'teven include values for it. If you look into the books on man-agement, however, you learn that Sigma is usually capitalizedand means something other than sigma, the standard devia-tion of a chance-dependent quantity. A new oxymoron: minorcapital offense.
Whether they are defects, nose sizes, raisins, or water use ina city, almost all normally distributed quantities can bethought of as the average or sum of many factors (genetic,physical, social, or financial). This is not an accident: The so-called Central Limit Theorem states that averages and sumsof a sufficient number of chance-dependent quantities are al-ways normally distributed.
As we'll see in chapter 8, however, not everyone believesthat stocks' rates of return are normally distributed.

DiversifyingStock Portfolios
r ong before my children's fascination with Super MariojL/Brothers, Tetris, and more recent addictive games, I spentinterminable hours as a kid playing antediluvian, low-techMonopoly with my two brothers. The game requires the play-ers to roll dice and move around the board buying, selling,and trading real estate properties. Although I paid attentionto the probabilities and expected values associated with vari-ous moves (but not to what have come to be called the game'sMarkov chain properties), my strategy was simple: Play ag-gressively, buy every property whether it made sense or not,and then bargain to get a monopoly. I always traded awayrailroads and utilities if I could, much preferring to build ho-tels on the real estate I owned instead.
A Reminiscence and a Parable
Although the game's get-out-of-jail-free card was one of thefew ties to the present-day stock market, I've recently had atiny epiphany. On some atavistic level I've likened hotel build-ing to stock buying and the railroads and utilities to bonds.Railroads and utilities seemed safe in the short run, but theostensibly risky course of putting most of one's money into
141

142 John Allen Paulos
building hotels was ultimately more likely to make one a win-ner (especially since we occasionally altered the rules to allowunlimited hotel building on a property).
Was my excessive investment in WorldCom a result of a badgeneralization from playing Monopoly? I strongly doubt it,but such just-so stories come naturally to mind. Aside fromthe jail card, a board game called WorldCom would have fewfeatures in common with Monopoly (but might more closelyresemble Grand Theft Auto). Different squares along players'paths would call for SEC investigations, Eliot Spitzer prosecu-tions, IPO giveaways, or favorable analyst ratings. If you at-tained CEO status, you would be allowed to borrow up to$400 million ($1 billion in later versions of the game), whereasif you were reduced to the rank of employee, you would haveto pay a coffee fee after each move and invest a certain portionof your savings in company stock. If you were unfortunateenough to become a stockholder, you would be required to re-move your shirt while playing, while if you became CEO, youwould receive stock options and get to keep the stockholders'shirts. The object of the game would be to make as muchmoney and collect as many of your fellow players' shirts aspossible before the company went bankrupt.
The game might be fun with play money; it wasn't with thereal thing.
Here's a better analogue for the market. People are millingaround a huge labyrinthine bazaar. Occasionally some of thebooths in the bazaar attract a swarm of people jostling to buytheir wares. Likewise, some booths are occasionally devoid ofany prospective customers. At any given time most boothshave a few customers. At the intersections of the bazaar's al-leys are sales people from some of the bigger booths as well aswell-traveled seers. They know the various sections of thebazaar intimately and claim to be able to foretell the fortunesof various booths and collections of booths. Some of these

A Mathematician Plays the Stock Market 143
sales people and some of the prognosticates have very largebullhorns and can be heard throughout the bazaar, while oth-ers make do by shouting.
In this rather primitive setting, many aspects of the stockmarket can already be discerned. The forebears of technicaltraders might be those who buy from booths where crowdsare developing, while the forebears of fundamental tradersmight be those who coolly weigh the worth of the goods ondisplay. The seers are the progenitors of analysts, the salespeople progenitors of brokers. The bullhorns are a rudimen-tary form of business media, and, of course, the goods on saleare companies' stocks. Crooks and swindlers have their an-cestors as well with some of the booths hiding their shoddymerchandise under the better goods.
If everyone, not just the booth owners, could sell as well asbuy, this would be a better elemental model of an equitiesmarket. (I don't intend this as an historical account, butmerely as an idealized narrative.) Nevertheless, I think it'sclear that stock exchanges are natural economic phenomena.It's not hard to imagine early analogues of options trading,corporate bonds, or diversified holdings developing out ofsuch a bazaar.
Maybe there'd even be some arithmeticians around too,analyzing booths' sales and devising purchasing strategies. Inacting on their theories, some might even lose their togas andprotractors.
Are Stocks Less Risky Than Bonds?
Perhaps because of Monopoly, certainly because of WorldCom,and for many other reasons, the focus of this book has been thestock market, not the bond market (or real estate, commodi-ties, and other worthy investments). Stocks are, of course,

144 John Allen Paulos
shares of ownership in a company, whereas bonds are loans toa company or government, and "everybody knows" thatbonds are generally safer and less volatile than stocks, althoughthe latter have a higher rate of return. In fact, as Jeremy Siegelreports in Stocks for the Long Run, the average annual rate ofreturn for stocks between 1802 and 1997 was 8.4 percent; therate on treasury bills over the same period was between 4 per-cent and 5 percent. (The rates that follow are before inflation.What's needless to say, I hope, is that an 8 percent rate of re-turn in a year of 15 percent inflation is much worse than a 4percent return in a year of 3 percent inflation.)
Despite what "everybody knows," Siegel argues in hisbook that, as with Monopoly's hotels and railroads, stocksare actually less risky than bonds because, over the long run,they have performed so much better than bonds or treasurybills. In fact, the longer the run, the more likely this has beenthe case. (Comments like "everybody knows" or "they're alldoing this" or "everyone's buying that" usually make me itch.My background in mathematical logic has made it difficultfor me to interpret "all" as signifying something other thanall.) "Everybody" does have a point, however. How can webelieve Siegel's claims, given that the standard deviation forstocks' annual rate of return has been 17.5 percent?
If we assume a normal distribution and allow ourselves toget numerical for a couple of paragraphs, we can see howstomach-churning this volatility is. It means that about two-thirds of the time, the rate of return will be between -9.1 per-cent and 25.9 percent (that is, 8.4 percent plus or minus 17.5percent), and about 95 percent of the time the rate will be be-tween -26.6 percent and 43.4 percent (that is, 8.4 percentplus or minus two times 17.5 percent). Although the precisionof these figures is absurd, one consequence of the last asser-tion is that the returns will be worse than -26.6 percent about2.5 percent of the time (and better than 43.4 percent with the

A Mathematician Plays the Stock Market 145
same frequency). So about once every forty years (1/40 is 2.5percent), you will lose more than a quarter of the value ofyour stock investments and much more frequently than thatdo considerably worse than treasury bills.
These numbers certainly don't seem to indicate that stocksare less risky than bonds over the long term. The statisticalwarrant for Siegel's contention, however, is that over time, thereturns even out and the deviations shrink. Specifically, the an-nualized standard deviation for rates of return over a numberN of years is the standard deviation divided by the square rootof N. The larger N is, the smaller is the standard deviation.(The cumulative standard deviation is, however, greater.) Thusover any given four-year period the annualized standard devia-tion for stock returns is 17.5%/2, or 8.75%. Likewise, sincethe square root of 30 is about 5.5, the annualized standard de-viation of stock returns over any given thirty-year period isonly 17.5%/5.5, or 3.2%. (Note that this annualized thirty-year standard deviation is the same as the annual standard de-viation for the conservative stock mentioned in the example atthe end of chapter 6.)
Despite the impressive historical evidence, there is no guar-antee that stocks will continue to outperform bonds. If youlook at the period from 1982 to 1997, the average annual rateof return for stocks was 16.7 percent with a standard devia-tion of 13.1 percent, while the returns for bonds were be-tween 8 percent and 9 percent. But from 1966 to 1981, theaverage annual rate of return for stocks was 6.6 percent witha standard deviation of 19.5 percent, while the returns forbonds were about 7 percent.
So is it really the case that, despite the debacles, deadbeats,and doomsday equities like WCOM and Enron, the less riskylong-term investment is in stocks? Not surprisingly, there is acounterargument. Despite their volatility, stocks as a wholehave proven less risky than bonds over the long run because

146 John Allen Paulos
their average rates of return have been considerably higher.Their rates of return have been higher because their priceshave been relatively low. And their prices have been relativelylow because they've been viewed as risky and people needsome inducement to make risky investments.
But what happens if investors believe Siegel and others,and no longer view stocks as risky? Then their prices will risebecause risk-averse investors will need less inducement to buythem; the "equity-risk premium," the amount by which stockreturns must exceed bond returns to attract investors, will de-cline. And the rates of return will fall because prices will behigher. And stocks will therefore be riskier because of theirlower returns.
Viewed as less risky, stocks become risky; viewed as risky,they become less risky. This is yet another instance of the skit-tish, self-reflective, self-corrective dynamic of the market. In-terestingly, Robert Shiller, a personal friend of Siegel, looks atthe data and sees considerably lower stock returns for thenext ten years.
Market practitioners as well as academics disagree. In earlyOctober 2002, I attended a debate between Larry Kudlow, aCNBC commentator and Wall Street fixture, and Bob Prech-ter, a technical analyst and Elliot wave proponent. The audi-ence at the CUNY graduate center in New York seemedaffluent and well-educated, and the speakers both seemed verysure of themselves and their predictions. Neither seemed at allaffected by the other's diametrically opposed expectations.Prechter anticipated very steep declines in the market, whileKudlow was quite bullish. Unlike Siegel and Shiller, they didn'tengage on any particulars and generally talked past each other.
What I find odd about such encounters is how typical theyare of market discussions. People with impressive credentialsregularly expatiate upon stocks and bonds and come to con-clusions contrary to those of other people with equally im-

A Mathematician Plays the Stock Market 147
pressive credentials. An article in the New York Times in No-vember 2002 is another case in point. It described three plau-sible prognoses for the market—bad, so-so, and good—putforth by economic analysts Steven H. East, Charles Pradilla,and Abby Joseph Cohen, respectively. Such stark disagree-ment happens very rarely in physics or mathematics. (I'm notcounting crackpots who sometimes receive a lot of publicitybut aren't taken seriously by anybody knowledgeable.)
The market's future course may lie beyond what, in chapter9, I term the "complexity horizon." Nevertheless, aside fromsome real estate, I remain fully vested in stocks, which may ormay not result in my remaining fully shirted.
The St. Petersburg Paradox and Utility
Reality, like the perfectly ordinary woman in Virginia Woolf'sfamous essay "Mr. Bennett and Mrs. Brown," is endlesslycomplex and impossible to capture completely in any model.Expected value and standard deviation seem to reflect the or-dinary meanings of average and variability most of the time,but it's not hard to find important situations where they don't.
One such case is illustrated by the so-called St. Petersburgparadox. It takes the form of a game that requires that youflip a coin repeatedly until a tail first appears. If a tail appearson the first flip, you win $2. If the first tail appears on the sec-ond flip, you win $4. If the first tail appears on the third flip,you win $8, and, in general, if the first tail appears on the Nthflip, you win 2N dollars. How much would you be willing topay to play this game? One could argue that you should bewilling to pay any amount to play this game.
To see why this is so, recall that the probability of a se-quence of independent events such as coin flips is obtained bymultiplying the probabilities of each of the events. Thus the

148 John Allen Paulos
probability of getting the first tail, T, on the first flip is 1/2; ofgetting a head and then the first tail on the second flip, HT, is(1/2)2 or 1/4; of getting the first tail on the third flip, HHT,is (1/2)3 or 1/8; and so on. Putting these probabilities and thepossible winnings associated with them into the formula forexpected value, we see that the expected value of the game is($2 x 1/2) + ($4 x 1/4) + ($8 x 1/8) + ($16 x 1/16) + . . . (2N x(1/2))N + ... . All of these products are 1, there are infinitelymany of them, and so their sum is infinite. The failure of ex-pected value to capture our intuitions becomes clear whenyou ask yourself why you'd be reluctant to pay even a measly$1,000 for the privilege of playing this game.
The most common resolution is roughly that provided bythe eighteenth century mathematician Daniel Bernoulli, whowrote that people's enjoyment of any increase in wealth (orregret at any decrease) is "inversely proportionate to thequantity of goods previously possessed." The fewer dollarsyou have, the more you appreciate gaining one and the moreyou fear losing one, and so, for almost everyone, the likelyprospect of losing $1,000 more than cancels the remote possi-bility that you'll win, say, a billion dollars.
What's important is the "utility" to you of the dollars thatyou receive, and this utility drops off as you receive more ofthem. (Note that this is not irrelevant to the rationale for pro-gressive taxation.) For this reason people consider not the dol-lar amount involved in any investment (or game), but theutility of the dollar amount for the individual involved. The St.Petersburg paradox disappears, for example, if we consider aso-called logarithmic utility function, which attempts to reflectthe slowly diminishing satisfaction of having more money andwhich results in the expected value of the game above being fi-nite. Other versions of the game, in which the payoffs increaseeven faster, require even slower-growing utility functions sothat the expected value remains finite.

A Mathematician Plays the Stock Market 149
People do differ in their utility assignments. Some are soacquisitive that the 741,783,219th dollar is almost as dear tothem as the first; others are so laid back that their 25,000thdollar is almost worthless to them. There are probably rela-tively few of the latter, although my father in his later yearscame close. His attitude suggests that utility functions varynot only across people but also over time. Furthermore, util-ity may not be so easily described by simple functions since,for example, there may be variations in the utility of moneyas one approaches a certain age or reaches some financialmilestone such as X million dollars. And we're back to Vir-ginia Woolf's essay.
Portfolios: Benefitingfrom the Hatfields and McCoys
John Maynard Keynes wrote, "Practical men, who believethemselves to be quite exempt from any intellectual influ-ences, are usually the slaves of some defunct economist. Mad-men in authority, who hear voices in the air, are distilling theirfrenzy from some academic scribbler of a few years back." Acorollary of this is that fund managers and stock gurus, whoslickly dispense their investment ideas and advice, generallyderive them from a previous generation's Nobel prize-winningfinance professor.
To get a taste of what a couple more of these Nobelistshave written, assume you're a fund manager intent on mea-suring the expected return and volatility (risk) of a portfolio.In stock market contexts a portfolio is simply a collection ofdifferent stocks—a mutual fund, for example, or Uncle Jake'sragbag of mysterious picks, or a nightmare inheritance con-taining a bunch of different stocks, all in telecommunications.Portfolios like the latter that are so lacking in diversification

150 John Allen Paulos
often become portfolios lacking in dollars. How can youmore judiciously choose stocks to maximize a portfolio's re-turns and minimize its risks?
Let's first envision a simple portfolio consisting of onlythree stocks, Abbey Roads, Barkley Hoops, and ConsolidatedFragments. Let's further assume that 40 percent (or $40,000)of a $100,000 portfolio is in Abbey, 25 percent in Barkley,and the remaining 35 percent in Consolidated. Assume fur-ther that the expected rate of return from Abbey is 8 percent,from Barkley is 13 percent, and from Consolidated is 7 per-cent. Using these weights, we compute that the expected re-turn from the portfolio as a whole is (.40 x .08) + (.25 x .13)+ (.35 x .07), which is .089 or 8.9 percent.
Why not put all our money in Barkley Hoops since its ex-pected rate of return is the highest of the three stocks? The an-swer has to do with volatility and the risk of not diversifying,of putting all one's proverbial eggs in one basket. (The result,as was the case with my WorldCom misadventure, may wellbe egg on one's face and the transformation of one's nest egginto a scrambled egg if not a goose egg. Sorry, but thought ofthe stock even now sometimes momentarily unhinges me.) Ifyou were indifferent to risk, however, and simply wanted tomaximize your returns, you might well put all your money inBarkley Hoops.
So how does one determine the volatility—that is, sigma,the standard deviation—of a portfolio? Does one just weightthe volatilities of the companies' stocks as we weighted theirreturns to get the volatility of the portfolio? In general, wecan't do this because the stocks' performances are sometimesnot independent of each other. When one goes up in responseto some news, the others' chances of going up or down maybe affected and this in turn affects their joint volatility.
Let me illustrate with an even simpler portfolio consistingof only two stocks, Hatfield Enterprises and McCoy Produc-
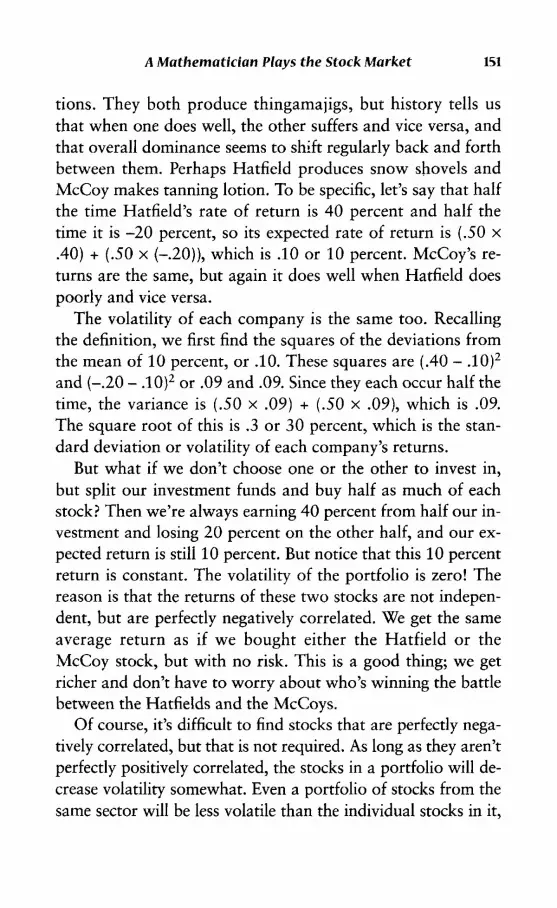
A Mathematician Plays the Stock Market 151
tions. They both produce thingamajigs, but history tells usthat when one does well, the other suffers and vice versa, andthat overall dominance seems to shift regularly back and forthbetween them. Perhaps Hatfield produces snow shovels andMcCoy makes tanning lotion. To be specific, let's say that halfthe time Hatfield's rate of return is 40 percent and half thetime it is -20 percent, so its expected rate of return is (.50 x.40) + (.50 x (-.20)), which is .10 or 10 percent. McCoy's re-turns are the same, but again it does well when Hatfield doespoorly and vice versa.
The volatility of each company is the same too. Recallingthe definition, we first find the squares of the deviations fromthe mean of 10 percent, or .10. These squares are (.40 - .10)2
and (-.20 - ,10)2 or .09 and .09. Since they each occur half thetime, the variance is (.50 x .09) + (.50 x .09), which is .09.The square root of this is .3 or 30 percent, which is the stan-dard deviation or volatility of each company's returns.
But what if we don't choose one or the other to invest in,but split our investment funds and buy half as much of eachstock? Then we're always earning 40 percent from half our in-vestment and losing 20 percent on the other half, and our ex-pected return is still 10 percent. But notice that this 10 percentreturn is constant. The volatility of the portfolio is zero! Thereason is that the returns of these two stocks are not indepen-dent, but are perfectly negatively correlated. We get the sameaverage return as if we bought either the Hatfield or theMcCoy stock, but with no risk. This is a good thing; we getricher and don't have to worry about who's winning the battlebetween the Hatfields and the McCoys.
Of course, it's difficult to find stocks that are perfectly nega-tively correlated, but that is not required. As long as they aren'tperfectly positively correlated, the stocks in a portfolio will de-crease volatility somewhat. Even a portfolio of stocks from thesame sector will be less volatile than the individual stocks in it,
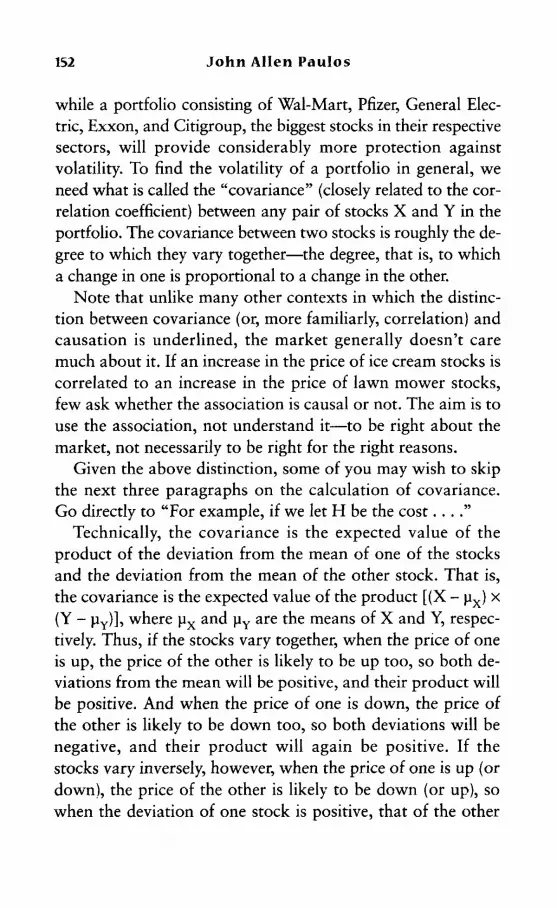
152 John Allen Paulos
while a portfolio consisting of Wal-Mart, Pfizer, General Elec-tric, Exxon, and Citigroup, the biggest stocks in their respectivesectors, will provide considerably more protection againstvolatility. To find the volatility of a portfolio in general, weneed what is called the "covariance" (closely related to the cor-relation coefficient) between any pair of stocks X and Y in theportfolio. The covariance between two stocks is roughly the de-gree to which they vary together—the degree, that is, to whicha change in one is proportional to a change in the other.
Note that unlike many other contexts in which the distinc-tion between covariance (or, more familiarly, correlation) andcausation is underlined, the market generally doesn't caremuch about it. If an increase in the price of ice cream stocks iscorrelated to an increase in the price of lawn mower stocks,few ask whether the association is causal or not. The aim is touse the association, not understand it—to be right about themarket, not necessarily to be right for the right reasons.
Given the above distinction, some of you may wish to skipthe next three paragraphs on the calculation of covariance.Go directly to "For example, if we let H be the cost. . . ."
Technically, the covariance is the expected value of theproduct of the deviation from the mean of one of the stocksand the deviation from the mean of the other stock. That is,the covariance is the expected value of the product [(X - ux) x(Y - uy)], where ux and uy are the means of X and Y, respec-tively. Thus, if the stocks vary together, when the price of oneis up, the price of the other is likely to be up too, so both de-viations from the mean will be positive, and their product willbe positive. And when the price of one is down, the price ofthe other is likely to be down too, so both deviations will benegative, and their product will again be positive. If thestocks vary inversely, however, when the price of one is up (ordown), the price of the other is likely to be down (or up), sowhen the deviation of one stock is positive, that of the other

A Mathematician Plays the Stock Market 153
is negative, and the product will be negative. In general and inshort, we want negative covariance.
We may now use this notion of covariance to find the vari-ance of a two-equity portfolio, p percent of which is in stockX and q percent in stock Y. The mathematics involves nothingmore than squaring the sum of two terms. (Remember, how-ever, that (A + B)2 = A2 + B2 + 2AB.) By definition, the varianceof the portfolio, (pX + qY), is the expected value of thesquares of its deviations from its mean, pux + quy. That is, thevariance of (pX + qY) is the expected value of [(pX + qY) -(pux + quY)]2, which, upon rewriting, is the expected value of[(pX - pux ) + (qY - quy)]
2, which, using the algebra rule citedabove, is the expected value of [(pX - pux)2 + (qY - quY)2 + 2 xthe expected value of [(pX - pux) x (qY - quy)].
Minding (that is, factoring out) our p's and q's, we find thatthe variance of the portfolio, (pX + qY), equals [(p2 x the vari-ance of X) + (q2 x the variance of Y) + (2pq x the covarianceof X and Y)]. If the stocks vary negatively (that is, have nega-tive covariance), the variance of the portfolio is reduced bythe last factor. (In the case of the Hatfield and McCoy stocks,the variance was reduced to zero.) And when they vary posi-tively (that is, have positive covariance), the variance of theportfolio is increased by the last factor, a situation we want toavoid, volatility and risk being bad for our peace of mind andstomach.
For example, if we let H be the cost of a randomly selectedhomeowner's house in a given community and I be his or herhousehold income, then the variance of (H + I) is greater thanthe variance of H plus the variance of I. People who live in ex-pensive houses generally have higher incomes than peoplewho don't, so the extremes of the sum, house cost plus per-sonal income, are going to be considerably greater than theywould be if house cost and personal income did not have apositive covariance.

154 John Allen Paulos
Likewise, if C is the number of classes skipped during theyear by a randomly selected student in a large lecture and S ishis score on the final exam, then the variance of (C + S)is smaller than the variance of C plus the variance of S. Stu-dents who miss a lot of classes generally (although certainlynot always) achieve a lower score, so the extremes of the sum,number of classes missed plus exam scores, are going to beconsiderably less that they would be if number of classesmissed and exam scores did not have a negative covariance.
When choosing stocks for a diversified portfolio, investors,as noted, generally look for negative covariances. They wantto own equities like the Hatfield and the McCoy stocks andnot like WCOM, say, and some other telecommunicationsstock. With three or more stocks in a portfolio, one uses thestocks' weights in the portfolio as well as the definitions justdiscussed to compute the portfolio's variance and standarddeviation. (The algebra is tedious, but easy.) Unfortunately,the covariances between all possible pairs of stocks in theportfolio are needed for the computation, but good software,troves of stock data, and fast computers allow investors todetermine a portfolio's risk (volatility, standard deviation)fairly quickly. With care, you can minimize the risk of a port-folio without hurting its expected rate of return.
Diversification andPolitically Incorrect Funds
There are countless mutual funds, and many commentatorshave noted that there are more funds than there are stocks, asif this were a surprising fact. It isn't. In mathematical terms afund is simply a set of stocks, so, theoretically at least, thereare vastly more possible funds than there are stocks. Any set

A Mathematician Plays the Stock Market 155
of n stocks (people, books, CDs) has 2N subsets. Thus, if therewere only 20 stocks in the world, there would be 220 or ap-proximately 1 million possible subsets of these stocks—1 mil-lion possible mutual funds. Of course, most of these subsetswould not have a compelling reason for existence. Somethingmore is needed, and that is the financial balancing act that en-sures diversification and low volatility.
We can increase the number of possibilities even further byextending the notion of diversification. Instead of searchingfor individual stocks or whole sectors that are negatively cor-related, we can search for concerns of ours that are negativelycorrelated. Say, for example, financial and social ones. Anumber of portfolios purport to be socially progressive andpolitically correct, but in general their performance is not stel-lar. Less appealing to many are funds that are socially regres-sive and politically incorrect but that do perform well. In thislatter category many people would place tobacco, alcohol,defense contractors, fast food, or any of several others.
The existence of these politically incorrect funds suggests,for those passionately committed to various causes, a non-standard strategy that exploits the negative correlation thatsometimes exists between financial and social interests. Investheavily in funds holding shares in companies that you find dis-tasteful. If these funds do well, you make money, money thatyou could, if you wished, contribute to the political causes youfavor. If these funds cool off, you can rejoice that the compa-nies are no longer thriving, and your psychic returns will soar.
Such "diversification" has many applications. People oftenwork for organizations, for example, whose goals or productsthey find unappealing and use part of their salary to counterthe organization's goals or products. Taken to its extreme, di-versification is something we do naturally in dealing with theinevitable trade-offs in our daily lives.

156 John Allen Paulos
Of course, extending the notion of diversification to theseother realms is difficult for several reasons. One is that quan-tifying contributions and payoffs is problematic. How do youplace a numerical value on your efforts and their various con-sequences? The number of possible "funds," subsets of allyour possible concerns, also grows exponentially.
Another problem derives from the logic of the notion of di-versification. It often makes sense in life, where some combi-nation of work, play, family, personal experiences, study,friends, money, and so forth, seems more likely to lead to sat-isfaction than, say, all toil or pure hedonism. Nevertheless, di-versification may not be appropriate when you are trying tohave a personal impact. Take charity, for example.
As the economist Steven Landsburg has argued, you diver-sify when investing to protect yourself, but when contributingto large charities in which your contributions are a small frac-tion of the total, your goal is presumably to help as much aspossible. Since you incur no personal risk, if you truly thinkthat Mothers Against Drunk Driving is more worthy than theAmerican Cancer Society or the American Heart Association,why would you split your charitable dollars among them?The point isn't to insure that your money will do some good,but to maximize the good it will do. There are other situa-tions too where bulleting one's efforts is preferable to a blanddiversification.
Metaphorical extensions of the notion of diversificationcan be useful, but uncritical use of them can lead you to, inthe words of W. H. Auden, "commit a social science."
Beta—Is It Better?
Returning to more quantitative matters, we choose stocks sothat when some are down, others are up (or at least not as

A Mathematician Plays the Stock Market 157
down), giving us a healthy rate of return with as little risk aspossible. More precisely, given any portfolio of stocks, wegrind the numbers describing their past performances andcome up with estimates for their expected returns, volatilities,and covariances, and then use these to determine the expectedreturns and volatilities of the portfolio as a whole. We could,if we had the time, the price data, and fast computers, do thisfor a variety of different portfolios. The Nobel prize-winningeconomist Harry Markowitz, one of the originators of thisapproach, developed mathematical techniques for carryingout these calculations in the early 1950s, graphed his resultsfor a few portfolios (computers weren't fast enough to domuch more then), and defined what he called the "efficientfrontier" of portfolios.
If we were to use these techniques and construct compara-ble graphs for a wide variety of contemporary portfolios,what would we find? Arraying the (degree of) volatility ofthese portfolios along the graph's horizontal axis and theirexpected rates of return along its vertical axis, we would see aswarm of points. Each point would represent a portfoliowhose coordinates would be its volatility and expected re-turn, respectively. We'd also notice that among all the portfo-lios having a given level of risk (that is, volatility, standarddeviation), there would be one with the highest expected rateof return. If we single out the portfolio with the highest ex-pected rate of return for each level of risk, we would obtain acurve, Markowitz's efficient frontier of optimal portfolios.
The more risky a portfolio on the efficient frontier curve is,the higher is its expected return. In part, this is because mostinvestors are risk-averse, making risky stocks cheaper. Theidea is that investors decide upon a risk level with whichthey're comfortable and then choose the portfolio with thisrisk level that has the highest possible return. Call this Varia-tion One of the theory of portfolio selection.

158 John Allen Paulos
Don't let this mathematical formulation blind you to thegenerality of the psychological phenomenon. Automobile en-gineers have noted, for example, that safety advances in auto-mobile design (say anti-lock brakes) often result in peopledriving faster and turning more sharply. Their driving per-formance is enhanced rather than their safety. Apparently,people choose a risk level with which they're comfortable andthen seek the highest possible return (performance) for it.
Inspired by this trade-off between risk and return, WilliamSharpe proposed in the 1960s what is now a common mea-sure of the performance of a portfolio. It is defined as the ra-tio of the excess return of a portfolio (the difference betweenits expected return and the return on a risk-free treasury bill)to the portfolio's volatility (standard deviation). A portfoliomight have a hefty rate of return, but if the volatility the in-vestor must endure to achieve this return is roller coasterish,the portfolio's Sharpe measure won't be very high. By con-trast, a portfolio with a moderate rate of return but a lessanxiety-inducing volatility will have a higher Sharpe measure.
There are many complications to portfolio selection theory.As the Sharpe measure suggests, an important one is the exis-tence of risk-free investments, such as U.S. treasury bills.These pay a fixed rate of return and have essentially zerovolatility. Investors can always invest in such risk-free assetsand can borrow at the risk-free rates as well. Moreover, theycan combine risk-free investment in treasury bills with a riskystock portfolio.
Variation Two of portfolio theory claims that there is oneand only one optimal stock portfolio on the efficient frontierwith the property that some combination of it and a risk-freeinvestment (ignoring inflation) constitute a set of investmentshaving the highest rates of return for any given level of risk. Ifyou wish to incur no risk, you put all your money into treas-ury bills. If you're comfortable with risk, you put all your

A Mathematician Plays the Stock Market 159
money into this optimal stock portfolio. Alternatively, if youwant to divide your money between the two, you put p% intothe risk-free treasury bills and (100 - p)% into the optimalrisky stock portfolio for an expected rate of return of [p x(risk-free return) + (1 - p) x (stock portfolio)]. An investorcan also invest more money than he has by borrowing at therisk-free rate and putting this borrowed money into the riskyportfolio.
In this refinement of portfolio selection, all investorschoose the same optimal stock portfolio and then adjust howmuch risk they're willing to take by increasing or decreasingthe percentage, p, of their holdings that they put into risk-freetreasury bills.
This is easier said than done. In both variations the re-quired mathematical procedures put enormous pressure onone's computing facilities, since countless calculations mustbe performed regularly on new data. The expected returns,variances, and covariances are, after all, derived from theirvalues in the recent past. If there are twenty stocks in a port-folio, we would need to compute the covariance of every pos-sible pair of stocks, and there are (20 x 19)/2, or 190, suchcovariances. If there were fifty stocks, we'd need to compute(50 x 49)/2, or 1,225 covariances. Doing this for each of awide class of portfolios is not possible without massive com-putational power.
As a way to avoid much of the computational burden ofupdating and computing all these covariances, efficient fron-tiers, and optimal risky portfolios, Sharpe, yet another NobelPrize winner in economics, developed (with others) what'scalled the "single index model." This Variation Three relatesa portfolio's rate of return not to that of all possible pairs ofstocks in the portfolio, but simply to the change in some in-dex representing the market as a whole. If your portfolio orstock is statistically determined to be relatively more volatile

160 John Allen Paulos
than the market as a whole, then changes in the market willbring about exaggerated changes in the stock or portfolio. Ifit is relatively less volatile than the market as a whole, thenchanges in the market will bring about attenuated changes inthe stock or portfolio.
This brings us to the so-called Capital Asset Pricing Model,which maintains that the expected excess return on one's stockor portfolio (the difference between the expected return on theportfolio, Rp , and the return on risk-free treasury bills, Rf) isequal to the notorious beta, symbolized by (3, multiplied bythe expected excess return of the general market (the differ-ence between the market's expected return, Rm, and the returnon risk-free treasury bills, Rf). In algebraic terms: (R - Rf) =P(Rm - Rf). Thus, if you can get a sure 4 percent on treasurybills and if the expected return on a broad market index fundis 10 percent and if the relative volatility, beta, of your portfo-lio is 1.5, then the portfolio's expected return is obtained bysolving (Rp - 4%) = 1.5(10% - 4%), which yields 13 percentfor R . A beta of 1.5 means that your stock or portfolio gains(or loses) an average of 1.5 percent for every 1 percent gain (orloss) in the market as a whole.
Betas for the stocks of high-tech companies like World-Com are often considerably more than 1, meaning thatchanges in the market, both up and down, are magnified.These stocks are more volatile and thus riskier. Betas for util-ity company stocks, by contrast, are often less than 1, whichmeans that changes in the market are muted. If a companyhas a beta of .5, then its expected return is obtained by solv-ing (Rp - 4%) = .5(10% - 4%), which yields 7% for Rp, theexpected return on the portfolio. Note that for short-termtreasury bills, whose returns don't vary at all, beta is 0. To re-iterate: Beta quantifies the degree to which a stock or a port-folio fluctuates in relation to market fluctuations. It is not thesame as volatility.

A Mathematician Plays the Stock Market 161
This all sounds neat and clean, but you beta watch yourstep with all of these portfolio selection models. Specificallywith regard to Variation Three, we might wonder where thenumber beta comes from. Who says your stock or portfoliowill be 40 percent more volatile or 25 percent less volatilethan the market as a whole? Here's the rough technique forfinding beta. You check the change in the broad marketfor the last three months—say it's 3 percent—and check thechange in the price of your stock or portfolio for the sameperiod—say it's 4.1 percent. You do the same thing for thethree months before that—say the numbers this time are 2percent and 2.5 percent, respectively—and for the threemonths before that—say -1.2 percent and -3 percent, respec-tively. You continue doing this for a number of such periodsand then on a graph you plot the points (3%, 4.1%), (2%,2.5%), (-1.2%, -3%), and so on. Most of the time if yousquint hard enough, you'll see a sort of linear relationship be-tween changes in the market and changes in your stock orportfolio, and you then use standard mathematical methodsfor determining the line of closest fit through these points.The slope or steepness of this line is beta.
One problem with beta is that companies change overtime, sometimes rather quickly. AT&T, for example, or IBMis not the same company it was twenty years ago or even twoyears ago. Why should we expect a company's relative volatil-ity, beta, to remain the same? In the opposite direction is a re-lated difficulty. Beta is often of very limited value in the shortterm and varies with the index chosen for comparison and thetime period used in its definition. Still another problem is thatbeta depends on market returns, and market returns dependon a narrow definition of the market, namely just the stockmarket rather than stocks, bonds, real estate, and so forth.For all its limitations, however, beta can be a useful notion ifit's not turned into a fetish.

162 John Allen Paulos
You might compare beta to different people's emotional re-activity and expressiveness. Some respond to the slightestgood news with outbursts of joy and to the tiniest hardshipwith wails of despair. At the other end of the emotional spec-trum are those who say "ouch" when they accidentally toucha scalding iron and allow themselves an "oh, good" whenthey win the lottery. The former have high emotional beta,the latter low emotional beta. A zero beta person would haveto be unconscious, perhaps from ingesting too many beta-blockers. Unfortunate for the prospect of predicting the be-havior of people, however, is the commonplace that people'semotional betas vary depending on the type of stimulus a per-son faces. I'll leave out the examples, but this may be beta'sbiggest limitation as a measure of the relative volatility of aportfolio or stock. Betas may vary with the type of stimulusa company faces.
Whatever refinements of portfolio theory are developed, onesalient point remains: Portfolios, although often less risky thanindividual stocks, are still risky (as millions of 401 (k) returnsattest). Some mathematical manipulation of the notions ofvariance and covariance and a few reasonable assumptions aresufficient to show that this risk can be partitioned into twoparts. There is a systematic part that is related to general move-ments in the market, and there is a non-systematic part that isidiosyncratic to the stocks in the portfolio. The latter, non-systematic risk, specific to the individual stocks in the portfolio,can be eliminated or "diversified away" by an appropriatechoice of thirty or so stocks. An irreducible core, however, re-mains inherent in the market and cannot be avoided. This sys-tematic risk depends on the beta of one's portfolio.
Or so the story goes. To the criticisms of beta above shouldbe added the problems associated with forcing a non-linearworld into a linear mold.

Connectedness andChaotic Price Movements
A Tear the end of my involvement with WorldCom, when IlYwas particularly concerned about what the new daywould bring, I would sometimes wake up very early, grab aDiet Coke, and check how the stock was faring on the Ger-man or English exchanges. As the computer was booting up, Igrew more and more apprehensive. The European response tobad overnight news sometimes prefigured Wall Street's re-sponse, and I dreaded seeing a steeply downward-slopinggraph pop up on my screen. More often the European ex-changes treaded water on WCOM until trading began in NewYork. Occasionally I'd be encouraged when the stock was upthere, but I soon learned that the small volume sold on over-seas exchanges didn't always mean much.
Whether haunted by a bad investment or not, we're all con-nected. No investor is an island (or even a peninsula). Statedmathematically, this means that statistical independence oftenfails; your actions affect mine. Most accounts of the stockmarket acknowledge in a general way that we learn from andrespond to one another, but a better understanding of the mar-ket requires that one's models reflect the complexity of in-vestors' interaction. In a sense, the market is the interaction.Stocks R Us. Before discussing some of the consequences of
163

164 John Allen Paulos
this complexity, let me consider three such sources for it: onemicro, one macro, and the third mucro (yup, it's a word).
The micro example involves insider trading, which has al-ways struck me as an odd sort of crime. Few people whoaren't psychopaths daydream about murder or burglary, butmany investors, I suspect, fantasize about coming upon insideinformation and making a bundle from it. The thought offinding myself on a plane next to Bernie Ebbers and JackGrubman (assuming they flew economy class on commercialairliners) and overhearing their conversation about an im-pending merger or IPO offering, for example, did cross mymind a few times. Insider trading seems the limit or culmina-tion of what investors and traders do naturally: getting all theinformation possible and acting on it before others see andunderstand what they see and understand.
Insider Trading andSubterranean Information Processing
The kind of insider trading I want to consider is relevant toseemingly unexplained price movements. It's also relatedto good poker playing, which may explain why the trainingprogram of at least one very successful hedge fund has a sub-stantial unit on the game. The strategies associated withpoker include learning not only the relevant probabilities butalso the bluffing that is a necessary part of the game. Optionstraders often deal with relatively few other traders, many ofwhom they recognize, and this gives rise to the opportunityfor feints, misdirection, and the exploitation of idiosyncrasies.
The example derives from the notion of common knowl-edge introduced in chapter 1. Recall that a bit of informationis common knowledge among a group of people if they allknow it, know that the others know it, know that the others

A Mathematician Plays the Stock Market 165
know that they know it, and so on. Robert Aumann, whofirst defined the notion, proved a theorem that can be roughlyparaphrased as follows: Two individuals cannot forever agreeto disagree. As their beliefs, formed in rational response todifferent bits of private information, gradually become com-mon knowledge, the beliefs change and eventually coincide.
When private information becomes common knowledge, itinduces decisions and actions. As anyone who has overheardteenagers' gossip with its web of suppositions can attest, thistransition to common knowledge sometimes relies on convo-luted inferences about others' beliefs. Sergiu Hart, an econo-mist at Hebrew University and one of a number of peoplewho have built on Aumann's result, demonstrates this with anexample relevant to the stock market. Superficially compli-cated, it nevertheless requires no particular background be-sides an ability to decode gossip, hearsay, and rumor anddecide what others really think.
Hart asks us to consider a company that must make a deci-sion. In keeping with the WorldCom leitmotif, let's suppose itto be a small telecommunications company that must decidewhether to develop a new handheld device or a cell phone witha novel feature. Assume that the company is equally likely todecide on one or the other of these products, and assume fur-ther that whatever decision it makes, the product chosen has a50 percent chance of being successful, say being bought inhuge numbers by another company. Thus there are fourequally likely outcomes: Handheld+, Handheld-, Phone+,Phone- (where Handheld+ means the handheld device waschosen for development and it was a success, Handheld-means the handheld was chosen but it turned out to be a fail-ure, and similarly for Phone+ and Phone-).
Let's say there are two influential investors, Alice and Bob.They both decide that at the current stock price, if thechances of success of this product development are better

166 John Allen Paulos
than 50 percent, they should (continue to) buy, and if they're50 percent or less they should (continue to) sell.
Furthermore, they are each privy to a different piece of in-formation about the company. Because of her inside contacts,Alice knows which product decision was made, Handheld orPhone, but not whether it was successful or not.
Bob, because of his position with another company, standsto get the "rejects" from a failed phone project, so he knowswhether or not the cell phone was chosen for developmentand failed. That is, Bob knows whether Phone- or not.
Let's assume that the handheld device was chosen for devel-opment. So the true situation is either Handheld* or Hand-held-. Alice therefore knows Handheld, while Bob knows thatthe decision is not Phone- (else he would have received therejects).
After the first period (week, day, or hour), Alice sells sinceHandheld+ and Handheld- are equally likely, and one sells ifthe probability of success is 50 percent or less. Bob buys sincehe estimates that the probability for success is 2/3. WithPhone- ruled out, the remaining possibilities are Handheld+,Handheld-, and Phone+, and two out of three of them aresuccesses.
After the second period, it is common knowledge that thetrue situation is not Phone- since otherwise Bob would havesold in the first period. This is not news to Alice, who contin-ues to sell. Bob continues to buy.
After the third period, it is common knowledge that it isnot Phone (neither Phone+ nor Phone-) since otherwise Alicewould have bought in the second period. Thus it's eitherHandheld+ or Handheld-. Both Bob and Alice take the prob-ability of success to be 50 percent, thus both sell, and there isa mini-crash of the stock price. (Selling by both influential in-vestors triggers a general sell-off.)
A Mathematician Plays the Stock Market 167
Note that at the beginning both Alice and Bob know that thetrue situation is not Phone-, but this knowledge is mutual, notcommon. Alice knows that Bob knows it is not Phone-, but Bobdoes not know that Alice knows this. From his position the truesituation might be Phone+, in which case Alice would knowPhone but not whether the situation is Phone+ or Phone-.
The example can be varied in a number of ways: thereneedn't be merely three periods before a crash, but an arbi-trary number; there may be a bubble (sellers suddenly switch-ing to become buyers) instead of a crash; there may be anarbitrarily large number of investors or investor groups; theremay be an issue other than buying or selling under delibera-tion, perhaps a decision whether to employ one stock-pickingapproach rather than another.
In all these cases the stock's price can move in response tono external news. Nevertheless, the subterranean informationprocessing leading to common knowledge among the in-vestors eventually leads to precipitous and unexpected move-ment in the stock's price. Analysts will express surprise at thecrash (or bubble) because "nothing happened."
The example is also relevant to what I suspect is a rela-tively common kind of insider trading, in which "partial in-siders" are privy to bits of insider information but not to thewhole story.
Trading Strategies, Whim, and Ant Behavior
A more macro-level interaction among investors occurs be-tween technical traders and value traders. Also contributingover time to booms and busts, this interaction comes throughclearly in computer models of the following commonsensedynamic.

168 John Allen Paulos
Let's suppose that value traders perceive individual stocksor the market as a whole to be strongly undervalued. Theystart buying and, by doing so, raise prices. As prices increase,a trend develops and technical traders, as is their wont, fol-low it, increasing prices even further. Soon enough, the mar-ket is seen as overvalued by value traders, who begin to selland thereby slow and then reverse the trend. The trend-following technical traders eventually follow suit, and the cy-cle begins over again. There are, of course, other sources ofvariation (one being the number of people who are technicaltraders and value traders at any given time), and the oscilla-tions are irregular.
The bottom line of much of this modeling is that contrarianvalue traders have a stabilizing effect on the market, whereastechnical traders increase volatility. So does computer-generated program trading, which tends to produce buying orselling in lockstep. There are other sorts of interaction amongdifferent classes of investors leading to cycles of varying dura-tion, all of which have differential impacts on the others onwhich they are superimposed.
In addition to these more or less rational interactionsamong investors I must also note influences inspired by noth-ing more than whim, where behavior turns on a mucro. I re-call many times, for example, reluctantly beginning work ona project when a niggling detail about some utterly irrelevantmatter came to mind. It may have concerned the etymology ofa word, or the colleague whose paper bag ripped open at adepartmental meeting revealing an embarrassing magazine in-side, or why caller ID misidentified a friend's telephone num-ber. These in turn brought to mind the next in a train ofassociations and musings, which ultimately led me to an en-tirely different project. My impulsively deciding, while brows-ing in Borders, to make my first margin call on WCOM isanother instance.

A Mathematician Plays the Stock Market 169
When this capriousness extends to influential analysts, theeffect is more pronounced. In November 2002 the New YorkTimes reported on such a case involving Jack Grubman,telecommunications analyst and anxious father. In an emailto a friend Grubman allegedly stated that his boss, SanfordWeill, the chairman of Citigroup, helped get Grubman's chil-dren into an exclusive nursery school after he raised his ratingof AT&T in 1999. Gretchen Morgenson, the article's author,further reported that Weill had his own personal reasons forwanting this upgrade. Whether these particular charges aretrue or not is immaterial. It's very hard to believe, however,that this sort of influence is rare.
Such episodes strongly suggest to me that there will neverbe a precise science of finance or economics. Buying and sell-ing must surely partake of a similar iffiness, at least some-times. Butterfly Economics, by the British economic theoristPaul Ormerod, faults these disciplines for not sufficiently tak-ing into account the commonsense fact that people, whetherknowledgeable or not, influence each other.
People do not, as chapter 2 demonstrated, have a set of fixedpreferences on which they coolly and rationally base their eco-nomic decisions. The assumption that investors are sensitiveonly to price and a few ratios simplifies the mathematical mod-els, but it is not always true to our experience of fads, fashions,and people's everyday monkey-see, monkey-do behavior.
Ormerod tells of an experiment involving not monkeys butants that provides a useful metaphor. Two identical piles offood are set up at equal distances from a large nest of ants.Each pile is automatically replenished and the ants have noreason to prefer one to the other. Entomologists tell us thatonce an ant has found food, it usually returns to the samesource. Upon returning to the nest, however, it physicallystimulates other ants, who might be frequenting the otherpile, to follow it to the first pile.

170 John Allen Paulos
So where do the ants go? It might be speculated that eitherthey would split into two roughly even groups or perhaps alarge majority would arbitrarily settle on one or the otherpile. Their actual behavior is counterintuitive. The number ofants going to each pile fluctuates wildly and doesn't ever settledown. A graph of these fluctuations looks suspiciously like agraph of the stock market.
And in a way, the ants are like stock traders (or people de-ciding whether or not to make a margin call). Upon leavingthe nest, each ant must make a decision: Go to the pile visitedlast time, be influenced by another to switch piles, or switchpiles of its own volition. This slight openness to the influenceof other ants is enough to insure the complicated and volatilefluctuations in the number of ants visiting the two sites.
An astonishingly simple formal model of such influence isprovided by Stephen Wolfram in his book A New Kind of Sci-ence. Imagine a colossally high brick wall wherein each brickrests on parts of two bricks below it and, except for the toprow, has parts of two bricks above it. Imagine further that thetop row has some red bricks and some green ones. The color-ing of the bricks in the top row determines the coloring of thebricks in the second row as follows. Pick a brick in the secondrow and check the colors of the two bricks above it in the firstrow. If exactly one of these bricks is green, then the brick inthe second row is colored green. If both or neither are green,then the brick is colored red. Do this for every brick in thesecond row.
The coloring of the bricks in the second row determines thecoloring of the bricks in the third row in the same way, and ingeneral, the coloring of the bricks in any row determines thecoloring of the bricks in the row below it in the same way.That's it.
Now if we interpret a row of bricks as a collection of in-vestors at any given instant, green ones for buyers and red ones

A Mathematician Plays the Stock Market 171
for sellers, then the change from moment to moment of in-vestor sentiment is reflected in the changing color compositionof the succeeding rows of bricks. If we let P be the differencebetween the number of green bricks and the number of redbricks, then P is a rough analogue of a stock's price. Graphingit, we see that it oscillates up and down in a way that looksrandom.
The model can be made more realistic, but it is significantthat even this bare-bones version, like the ant behavior,evinces a kind of internally generated random noise. This sug-gests that part of the oscillation of stock prices is also inter-nally generated and is not a response to anything besidesinvestors' reactions to each other. The theme of Wolfram'sbook, borne out here, is that complex behavior can resultfrom very simple rules of interaction.
Chaos and Unpredictability
What is the relative importance of private information, in-vestor trading strategies, and pure whim in predicting themarket? What is the relative importance of conventional eco-nomic news (interest rates, budget deficits, accounting scan-dals, and trade balances), popular culture fads (in sports,movies, fashions), and germane political and military events(terrorism, elections, war) too disparate even to categorize? Ifwe were to carefully define the problem, predicting the mar-ket with any precision is probably what mathematicians call auniversal problem, meaning that a complete solution to itwould lead immediately to solutions for a large class of otherproblems. It is, in other words, as hard a problem in socialprediction as there is.
Certainly, too little notice is taken of the complicated con-nections among these variables, even the more clearly defined

172 John Allen Paulos
economic ones. Interest rates, for example, have an impact onunemployment rates, which in turn influence revenues; budgetdeficits affect trade deficits, which sway interest rates and ex-change rates; corporate fraud influences consumer confidence,which may depress the stock market and alter other indices;natural business cycles of various periods are superimposed onone another; an increase in some quantity or index positively(or negatively) feeds back on another, reinforcing or weaken-ing it and being reinforced or weakened in turn.
Few of these associations are accurately described by astraight-line graph and so they bring to a mathematician'smind the subject of nonlinear dynamics, more popularlyknown as chaos theory. The subject doesn't deal with anar-chist treatises or surrealist manifestoes but with the behaviorof so-called nonlinear systems. For our purposes these may bethought of as any collection of parts whose interactions andconnections are described by nonlinear rules or equations.That is to say, the equations' variables may be multiplied to-gether, raised to powers, and so on. As a consequence the sys-tem's parts are not necessarily linked in a proportional manneras they are, for example, in a bathroom scale or a thermo-meter; doubling the magnitude of one part will not doublethat of another—nor will outputs be proportional to inputs.Not surprisingly, trying to predict the precise long-term behav-ior of such systems is often futile.
Let me, in place of a technical definition of such nonlinearsystems, describe instead a particular physical instance ofone. Picture before you a billiards table. Imagine that approx-imately twenty-five round obstacles are securely fastened toits surface in some haphazard arrangement. You hire the bestpool player you can find and ask him to place the ball at aparticular spot on the table and take a shot toward one of theround obstacles. After he's done so, his challenge is to makeexactly the same shot from the same spot with another ball.
A Mathematician Plays the Stock Market 173
Even if his angle on this second shot is off by the merest frac-tion of a degree, the trajectories of these two balls will verysoon diverge considerably. An infinitesimal difference in theangle of impact will be magnified by successive hits of the ob-stacles. Soon one of the balls will hit an obstacle that theother misses entirely, at which point all similarity betweenthe two trajectories ends.
The sensitivity of the billiard balls' paths to minuscule vari-ations in their initial angles is characteristic of nonlinear sys-tems. The divergence of the billiard balls is not unlike thedisproportionate effect of seemingly inconsequential events,the missed planes, serendipitous meetings, and odd mistakesand links that shape and reshape our lives.
This sensitive dependence of nonlinear systems on eventiny differences in initial conditions is, I repeat, relevant tovarious aspects of the stock market in general, in particularits sometimes wildly disproportionate responses to seeminglysmall stimuli such as companies' falling a penny short ofearnings estimates. Sometimes, of course, the differences aremore substantial. Witness the notoriously large discrepanciesbetween government economic figures on the size of budgetsurpluses and corporate accounting statements of earningsand the "real" numbers.
Aspects of investor behavior too can no doubt be bettermodeled by a nonlinear system than a linear one. This is so de-spite the fact that linear systems and models are much morerobust, with small differences in initial conditions leading onlyto small differences in final outcomes. They're also easier topredict mathematically, and this is why they're so often em-ployed whether their application is appropriate or not. Thechestnut about the economist looking for his lost car keys un-der the street lamp comes to mind. "You probably lost themnear the car," his companion remonstrates, to which the econ-omist responds, "I know, but the light is better over here."
174 John Allen Paulos
The "butterfly effect" is the term often used for the sensitivedependence of nonlinear systems, a characteristic that hasbeen noted in phenomena ranging from fluid flow and heartfibrillations to epilepsy and price fluctuations. The namecomes from the idea that a butterfly flapping its wings some-place in South America might be sufficient to change futureweather systems, helping to bring about, say, a tornado in Ok-lahoma that would otherwise not have occurred. It also ex-plains why long-range precise prediction of nonlinear systemsisn't generally possible. This non-predictability is the result notof randomness but of complexity too great to fathom.
Yet another reason to suspect that parts of the market maybe better modeled by nonlinear systems is that such systems'"trajectories" often follow a fractal course. The trajectories ofthese systems, of which the stock price movements may beconsidered a proxy, turn out to be aperiodic and unpredictableand, when examined closely, evince even more intricacy. Stillcloser inspection of the system's trajectories reveals yet smallervortices and complications of the same general kind.
In general, fractals are curves, surfaces, or higher dimensionalobjects that contain more, but similar, complexity the closer onelooks. A shoreline, to cite a classic example, has a characteristicjagged shape at whatever scale we draw it; that is, whether weuse satellite photos to sketch the whole coast, map it on a finescale by walking along some small section of it, or examine afew inches of it through a magnifying glass. The surface of themountain looks roughly the same whether seen from a height of200 feet by a giant or close up by an insect. The branching of atree appears the same to us as it does to birds, or even to wormsor fungi in the idealized limiting case of infinite branching.
As the mathematician Benoit Mandelbrot, the discoverer offractals, has famously written, "Clouds are not spheres,mountains are not cones, coastlines are not circles, and barkis not smooth, nor does lightning travel in a straight line."These and many other shapes in nature are near fractals, hav-

A Mathematician Plays the Stock Market 175
ing characteristic zigzags, push-pulls, bump-dents at almostevery size scale, greater magnification yielding similar butever more complicated convolutions.
And the bottom line, or, in this case, the bottom fractal, forstocks? By starting with the basic up-down-up and down-up-down patterns of a stock's possible movements, continuallyreplacing each of these patterns' three segments with smallerversions of one of the basic patterns chosen at random, andthen altering the spikiness of the patterns to reflect changes inthe stock's volatility, Mandelbrot has constructed what hecalls multifractal "forgeries." The forgeries are patterns ofprice movement whose general look is indistinguishable fromthat of real stock price movements. In contrast, more conven-tional assumptions about price movements, say those of astrict random-walk theorist, lead to patterns that are notice-ably different from real price movements.
These multifractal patterns are so far merely descriptive,not predictive of specific price changes. In their modesty, aswell as in their mathematical sophistication, they differ fromthe Elliott waves mentioned in chapter 3.
Even this does not prove that chaos (in the mathematicalsense) reigns in (part of) the market, but it is clearly a bitmore than suggestive. The occasional surges of extremevolatility that have always been a part of the market are notas nicely accounted for by traditional approaches to finance,approaches Mandelbrot compares to "theories of sea wavesthat forbid their swells to exceed six feet."
Extreme Price Movements,Power Laws, and the Web
Humans are a social species, which means we're all connectedto each other, some in more ways than others. This is espe-cially so in financial matters. Every investor responds not only

176 John Allen Paulos
to relatively objective economic considerations, but also invarying degrees to the pronouncements of national and worldleaders (not least of those Mr. Greenspan), consumer confi-dence, analysts' ratings (bah), general and business media re-ports and their associated spin, investment newsletters, thebehavior of funds and large institutions, the sentiments offriends, colleagues, and of course the much-derided brother-in-law.
The linkage of changes in stock prices to the varieties of in-vestor responses and interactions suggests to me that commu-nication networks, degrees of connectivity, and so-calledsmall world phenomena ("Oh, you must know my uncleWaldo's third wife's botox specialist") can shine a light on theworkings of Wall Street.
First the conventional story. Movements in a stock or indexover small units of time are usually slightly positive or slightlynegative, less frequently very positive or very negative. A largefraction of the time, the price will rise or fall between 0 per-cent and 1 percent; a smaller fraction of the time, it will rise orfall between 1 percent and 2 percent; a very small fraction ofthe time will the movement be more than, say, 10 percent upor down. In general, the movements are well described by anormal bell-shaped curve. The most likely change for a smallunit of time is probably a minuscule jot above zero, reflectingthe market's long-term (and recently invisible) upward bias,but the fact remains that extremely large price movements,whether positive or negative, are rare.
It's been clear for some time, however (that is, since Man-delbrot made it clear), that extreme movements are not asrare as the normal curve would predict. If you measure com-modity price changes, for example, in each of a large numberof small time units and make from these measurements a his-togram, you will notice that the graph is roughly normal nearits middle. The distribution of these price movements, how-

A Mathematician Plays the Stock Market 177
ever, seems to have "fatter tails" than the normal distribution,suggesting that crashes and bubbles in a stock, an index, orthe entire market are less unlikely than many would like toadmit. There is, in fact, some evidence that very large move-ments in stock prices are best described by a so-called powerlaw (whose definition I'll get to shortly) rather than the tailsof the normal curve.
An oblique approach to such evidence is via the notions ofconnectivity and networks. Everyone's heard people exclaimabout how amazed they were to run into someone they knewso far from home. (What I find amazing is how they can becontinually amazed at this sort of thing.) Most have heard tooof the alleged six degrees of separation between any twopeople in this country. (Actually, under reasonable assump-tions each of us is connected to everyone else by an average oftwo links, although we're not likely to know who the two in-termediate parties are.) Another popular variant of the notionconcerns the number of movie links between film actors, saybetween Marlon Brando and Christina Ricci or betweenKevin Bacon and anyone else. If A and B appeared together inX, and B and C appeared together in Y, then A is linked to Cvia these two movies.
Although they may not know of Kevin Bacon and hismovies, most mathematicians are familiar with Paul Erdosand his theorems. Erdos, a prolific and peripatetic Hungarianmathematician, wrote hundreds of papers in a variety ofmathematical areas during his long life. Many of these hadco-authors, who are therefore said to have Erdos number 1.Mathematicians who have written a joint paper with some-one with Erdos number 1 are said to have Erdos number 2,and so on.
Ideas about such informal networks lead naturally to thenetwork of all networks, the Internet, and to ways to analyzeits structure, shape, and "diameter." How, for example, are

178 John Allen Paulos
the Internet's nearly 1 billion web pages connected? Whatconstitutes a good search strategy? How many links does theaverage web page contain? What is the distribution of docu-ment sizes? Are there many with, say, more than 1,000 links?And, perhaps most intriguingly, how many clicks on averagedoes it take to get from one of two randomly selected docu-ments to another?
A couple of years ago, Albert-Laszlo Barabasi, a physicsprofessor at Notre Dame, and two associates, Reka Albertand Hawoong Jeong, published results that strongly suggestthat the web is growing and that its documents are linking ina rather collective way that accounts for, among other things,the unexpectedly large number of very popular documents.The increasing number of web pages and the "flocking effect"of many pages pointing to the same popular addresses, caus-ing proportionally more pages to do the same thing, is whatleads to a power law.
Barabasi, Albert, and Jeong showed that the probabilitythat a document has k links is roughly proportional to 1/k3—or inversely proportional to the third power of k. (I'verounded off; the model actually predicts an exponent of 2.9.)This means, for example, that there are approximately one-eighth as many documents with twenty links as there are doc-uments with ten links since 1/203 is one-eighth of 1/103. Thusthe number of documents with k links declines quickly as kincreases, but nowhere near as quickly as a normal bell-shaped distribution would predict. This is why the power lawdistribution has a fatter tail (more instances of very large val-ues of k) than does the normal distribution.
The power laws (sometimes called scaling laws, sometimesPareto laws) that characterize the web also seem to character-ize many other complex systems that organize themselves intoa state of skittish responsiveness. The physicist Per Bak, whohas made an extensive study of them, described in his book

A Mathematician Plays the Stock Market 179
How Nature Works., claims that such l/km laws (for variousexponents m) are typical of many biological, geological, musi-cal, and economic processes, and that they tend to arise in awide variety of complex systems. Traffic jams, to cite a differ-ent domain and seemingly unrelated dynamic, also seem toobey a power law, with jams involving k cars occurring with aprobability roughly proportional to l/km for an appropriate m.
There is even a power law in linguistics. In English, for ex-ample, the word "the" appears most frequently and is said tohave rank order 1; the words "of," "and," and "to" rank 2,3, and 4, respectively. "Chrysanthemum" has a much higherrank order. Zipf's Law relates the frequency of a word to itsrank order k and states that a word's frequency in a writtentext is proportional to 1/k1; that is, inversely proportional tothe first power of k. (Again, I've rounded off; the power of kis close to, but not exactly 1.) Thus a relatively unusual wordwhose rank order is 10,000 will still appear with a frequencyproportional to 1/10,000, rather than essentially not at all aswould be the case if word frequencies were described by thetail of a normal distribution. The size of cities also follows apower law with k close to 1, the kth largest city having a pop-ulation proportional to 1/k.
One of the most intriguing consequences of the Barabasi-Albert-Jeong model is that because of the power law distribu-tion of links to and from documents on web sites (the nodesof the network), the diameter of the web is only nineteenclicks. By this they mean that you can travel from one arbi-trarily selected web page to any other in approximately nine-teen clicks, far fewer than had been conjectured. On the otherhand, comparing nineteen with the much smaller number oflinks between arbitrarily selected people, we may wonderwhy the diameter is as big as it is. The answer is that the aver-age web page contains only seven links, whereas the averageperson knows hundreds of people.

180 John Allen Paulos
Even though the web is expected to grow by a power of 10over the next few years, its diameter will likely grow by onlya couple of clicks, from nineteen to twenty-one. The growthand preferential linking assumptions above indicate that theweb's diameter D is governed by a logarithmic law; D is a bitmore than 2 log(N), where N is the number of documents,presently about 1 billion.
If the Barabasi model is valid (and more work needs to bedone), the web is not as unmanageable and untraversable as itoften seems. Its documents are much more closely intercon-nected than they would be if the probability that a documenthas k links were described by a normal distribution.
What is the relevance of power laws, networks, and diame-ters to extreme price movements? Investors, companies, mu-tual funds, brokerages, analysts, and media outlets areconnected via a large, vaguely defined network, whose nodesexert influence on the nodes to which they're connected. Thisnetwork is likely to be more tightly connected and to containmore very popular (and hence very influential) nodes thanpeople realize. Most of the time this makes no difference andprice movements, resulting from the sum of a myriad of in-vestors' independent zigs and zags, are governed by the nor-mal distribution.
But when the volume of trades is very high, the trades arestrongly influenced by relatively few popular nodes—mutualfunds, for example, or analysts or media outlets—becomingaligned in their sentiments, and this alignment can create ex-treme price movements. (WCOM often led the Nasdaq in vol-ume during its slide.) That there exist a few very popular, veryconnected nodes is, I reiterate, a consequence of the fact thata power law and not the normal distribution governs theirfrequency. A contagious alignment of this handful of verypopular, very connected, very influential nodes will occur

A Mathematician Plays the Stock Market 181
more frequently than people expect, as will, therefore, ex-treme price movements.
Other examples suggest that the exponent m in marketpower laws, l/km, may be something other than 3, but thepoint stands. The trading network is sometimes more herd-like and volatile in its behavior than standard pictures of itacknowledge. The crash of 1929, the decline of 1987, and therecent dot-corn meltdown should perhaps not be seen as inex-plicable aberrations (or as "just deserts") but as natural con-sequences of network dynamics.
Clearly much work remains to be done to understand whypower laws are so pervasive. What is needed, I think, is some-thing like the central limit theorem in statistics, which ex-plains why the normal curve arises in so many differentcontexts. Power laws provide an explanation, albeit not anairtight one, for the frequency of bubbles and crashes and theso-called volatility clustering that seem to characterize realmarkets. They also reinforce the impression that the market isa different sort of beast than that usually studied by social sci-entists or, perhaps, that social scientists have been studyingthese beasts in the wrong way.
I should note that my interest in networks and connectivityis not unrelated to my initial interest in WorldCom, whichowned not only MCI, but, as I've mentioned twice already,UUNet, "the backbone of the Internet." Obsessions fadeslowly.
Economic Disparitiesand Media Disproportions
WorldCom may have been based in Mississippi, but BernieEbbers, who affected an unpretentious, down-home style,

182 John Allen Paulos
wielded political and economic influence foreign to the aver-age Mississippian and the average WorldCom employee. Forthis he may serve as a synecdoche for the following.
More than a mathematical pun suggests that power lawsmay have relevance to economic, media, and political poweras well as to the stock market. Along various social dimen-sions, the dynamics underlying power laws might allow forthe development of more centers of concentration than wemight otherwise expect. This might lead to larger, more pow-erful economic, media, and political elites and consequentgreat disparities. Whether or not this is the case, and whetheror not great disparities are necessary for complex societies tofunction, such disparities certainly reign in modern America.Relatively few people, for example, own a hugely dispropor-tionate share of the wealth, and relatively few people attract ahugely disproportionate share of media attention.
The United Nations issued a report a couple of years agosaying that the net worth of the three richest families in theworld—the Gates family, the sultan of Brunei, and the Waltonfamily—was greater than the combined gross domestic prod-uct of the forty-three poorest nations on Earth. The U.N.statement is misleading in an apples-and-oranges sort of way,but despite the periodic additions, subtractions, and reshuf-flings of the Forbes 400 and the fortunes of underdevelopedcountries, some appropriately modified conclusion no doubtstill holds.
(On the other hand, the distribution of wealth in some ofthe poorest nations—where almost everybody is poverty-stricken—is no doubt more uniform than it is here, indicatingthat relative equality is no solution to the problem of poverty.I suspect that significant, but not outrageous, disparities ofwealth are probably more conducive to wealth creation thanis relative uniformity, provided the society meets some mini-mal conditions: It's based on law, offers some educational and
A Mathematician Plays the Stock Market 183
other opportunities, and allows for a modicum of privateproperty.)
The dynamic whereby the rich get richer is nowhere moreapparent than in the pharmaceutical industry, in which com-panies understandably spend far, far more money researchinglifestyle drugs for the affluent than life-saving drugs for thehundreds of millions of the world's poor people. Instead oftrying to come up with treatments for malaria, diarrhea, tu-berculosis, and acute lower-respiratory diseases, resources gointo treatments for wrinkles, impotence, baldness, and obesity.
Surveys indicate that the ratio of the remuneration of a U.S.firm's CEO to that of the average employee of the firm is at anall-time high of around 500, whether the CEO has improvedthe fortunes of the company or not, and whether he or she isunder indictment or not. (If we assume 250 workdays peryear, arithmetic tells us the CEO needs only half a day tomake what the employee takes all year to earn.) Professor Ed-ward Wolff of New York University has estimated that therichest 1 percent of Americans own half of all stocks, bonds,and other assets. And Cornell University's Robert Frank hasdescribed the spread of the winner-take-all model of compen-sation from the sports and entertainment worlds to manyother domains of American life.
Nero-like arrogance often accompanies such exorbitantcompensation. High-tech WorldCom faced a host of prob-lems before its 2002 collapse. Did Bernie Ebbers utilize thecompany's horde of top-flight technical people (at leastthe ones who hadn't quit or been fired) to devise a cleverstrategy to extricate the company from its troubles? No, hecut out free coffee for employees to save money. As Tyco spi-raled downward, its CEO, Dennis Kozlowski, spent millionsof company dollars on personal items, including a $6,000shower curtain, a $15,000 umbrella stand, and a $7 millionManhattan apartment.
184 John Allen Paulos
(Even successful CEOs are not always gentlemen. Oracle'sLarry Ellison, a fierce foe of Bill Gates, a couple of years agoadmitted to spying on Microsoft. Amusingly, Oracle's sophis-ticated snoops didn't employ state-of-the-art electronics, buttried to buy the garbage of a pro-Microsoft group in order toexamine its contents for clues about Microsoft's public rela-tions plans. I'm talking real cookies here, not the type that In-ternet sites leave on your computer; scribbled memos andaddresses on torn envelopes, not emails and Internet routingnumbers; germs and bacteria, not computer viruses.)
What should we make of such stories? Communism, hap-pily, has been discredited, but unregulated and minimally reg-ulated free markets (as evidenced by the behavior of someaccountants, analysts, CEOs, and, yes, greedy, deluded, andshort-sighted investors) have some obvious drawbacks. Someof the reforms proposed by Congress in 2002 promise to behelpful in this regard, but I wish here only to express disquietat such enormous and growing economic disparities.
The same steep hierarchy and disproportion that character-ize our economic condition affect our media as well. The fa-mous get ever more famous, celebrities become ever morecelebrated. (Pick your favorite ten examples here.) Magazinesand television increasingly run features asking who's hot andwho's not. Even the search engine Google has a version inwhich surfers can check the topics and people attracting themost hits the previous week. The up-and-down movements ofcelebrity seem to constitute a kind of market in which almostall the "traders" are technical traders trying to guess whateveryone else thinks, rather than value traders looking forworth.
The pattern holds in the political realm as well. In general,on the front page and in the first section of a newspaper, thenumber one newsmaker is undoubtedly the president of

A Mathematician Plays the Stock Market 185
the United States. Other big newsmakers are presidentialcandidates, members of Congress, and other federal officials.
Twenty years ago, Herbert Cans wrote in Deciding What'sNews that 80 percent of the domestic news stories on televi-sion network news concerned these four classes of people;most of the remaining 20 percent covered the other 280 mil-lion of us. Fewer than 10 percent of all stories were about ab-stractions, objects, or systems. Things haven't changed muchsince then (except on the cable networks where disaster sto-ries, show trials, and terrorist obsessions dominate). Newspa-pers generally have broader coverage, although studies havefound that up to 50 percent of the sources for national storieson the front pages of the New York Times and the WashingtonPost were officials of the U.S. government. The Internet hasstill broader scope, although there, too, one notes strong andunmistakable signs of increasing hierarchy and concentration.
And what about foreign coverage? The frequency of report-ing on overseas newsmakers demonstrates the same biases. Wehear from heads of state, from leaders of opposition parties orforces, and occasionally from others. The masses of ordinarypeople are seldom a presence at all. The journalistic rule ofthumb that one American equals 10 Englishmen equals 1,000Chileans equals 10,000 Rwandans varies with time and cir-cumstance, but it does contain an undeniable truth. Ameri-cans, like everybody else, care much less about some parts ofthe world than others. Even the terrorist attack in Bali didn'trate much coverage here, and many regions have no corre-spondents at all, rendering them effectively invisible.
Such disparities may be a natural consequence of complexsocieties. This doesn't mean that they need be as extreme asthey are or that they're always to be welcomed. It may be thatthe stock market's recent volatility surges are a leading indica-tor for even greater social disparities to come.

This page intentionally left blank

9 From Paradoxto Complexity
/^roucho Marx vowed that he'd never join a club thatG would be willing to accept him as a member. Epimenidesthe Cretan exclaimed (almost) inconsistently, "All Cretans areliars." The prosecutor booms, "You must answer Yes or No.Will your next word be 'No'?" The talk show guest lamentsthat her brother is an only child. The author of an investmentbook suggests that we follow the tens of thousands of hisreaders who have gone against the crowd.
Warped perhaps by my study of mathematical logic and itsemphasis on paradoxes and self-reference, I'm naturally inter-ested in the paradoxical and self-referential aspects of themarket, particularly of the Efficient Market Hypothesis. Canit be proved? Can it be disproved? These questions beg adeeper question. The Efficient Market Hypothesis is, I think,neither necessarily true nor necessarily false.
The Paradoxical Efficient Market Hypothesis
If a large majority of investors believe in the hypothesis, theywould all assume that new information about a stock wouldquickly be reflected in its price. Specifically, they would affirmthat since news almost immediately moves the price up or
187

188 John Allen Paulos
down, and since news can't be predicted, neither can changesin stock prices. Thus investors who subscribe to the EfficientMarket Hypothesis would further believe that looking fortrends and analyzing companies' fundamentals is a waste oftime. Believing this, they won't pay much attention to new de-velopments. But if relatively few investors are looking for anedge, the market will not respond quickly to new informa-tion. In this way an overwhelming belief in the hypothesis en-sures its falsity.
To continue with this cerebral somersault, recall now a ruleof logic: Sentences of the form "H implies I" are equivalent tothose of the form "not I implies not H." For example, the sen-tence "heavy rain implies that the ground will be wet" is logi-cally equivalent to "dry ground implies the absence of heavyrain." Using this equivalence, we can restate the claim thatoverwhelming belief in the Efficient Market Hypothesis leadsto (or implies) its falsity. Alternatively phrased, the claim isthat if the Efficient Market Hypothesis is true, then it's notthe case that most investors believe it to be true. That is, if it'strue, most investors believe it to be false (assuming almost allinvestors have an opinion and each either believes it or disbe-lieves it).
Consider now the inelegantly named Sluggish Market Hy-pothesis, the belief that the market is quite slow in respond-ing to new information. If the vast majority of investorsbelieve the Sluggish Market Hypothesis, then they all wouldbelieve that looking for trends and analyzing companies iswell worth their time and, by so exercising themselves, theywould bring about an efficient market. Thus, if most in-vestors believe the Sluggish Market Hypothesis is true, theywill by their actions make the Efficient Market Hypothesistrue. We conclude that if the Efficient Market Hypothesis isfalse, then it's not the case that most investors believe the

A Mathematician Plays the Stock Market 189
Sluggish Market Hypothesis to be true. That is, if the Effi-cient Market Hypothesis is false, then most investors believeit (the EMH) to be true. (You may want to read over the lastfew sentences in a quiet corner.)
In summary, if the Efficient Market Hypothesis is true,most investors won't believe it, and if it's false, most investorswill believe it. Alternatively stated, the Efficient Market Hy-pothesis is true if and only if a majority believes it to be false.(Note that the same holds for the Sluggish Market Hypothe-sis.) These are strange hypotheses indeed!
Of course, I've made some big assumptions that may nothold. One is that if an investor believes in one of the two hy-potheses, then he disbelieves in the other, and almost all be-lieve in one or the other. I've also assumed that it's clear what"large majority" means, and I've ignored the fact that itsometimes requires very few investors to move the market.(The whole argument could be relativized to the set of knowl-edgeable traders only.)
Another gap in the argument is that any suspected devia-tions from the Efficient Market Hypothesis can always be at-tributed to mistakes in asset pricing models, and thus thehypothesis can't be conclusively rejected for this reason either.Maybe some stocks or kinds of stock are riskier than our pric-ing models allow for and that's why their returns are higher.Nevertheless, I think the point remains: The truth or falsity ofthe Efficient Market Hypothesis is not immutable but dependscritically on the beliefs of investors. Furthermore, as the per-centage of investors who believe in the hypothesis itself varies,the truth of the hypothesis varies inversely with it.
On the whole, most investors, professionals on WallStreet, and amateurs everywhere, disbelieve in it, so for thisreason I think it holds, but only approximately and onlymost of the time.

190 John Allen Paulos
The Prisoner's Dilemma and the Market
So you don't believe in the Efficient Market Hypothesis. Still,it's not enough that you discover simple and effective invest-ing rules. Others must not find out what you're doing, eitherby inference or by reading your boastful profile in a businessmagazine. The reason for secrecy, of course, is that without it,simple investing rules lead to more and more complicatedones, which eventually lead to zero excess returns and a re-liance on chance.
This inexorable march toward increased complexity arisesfrom the actions of your co-investors, who, if they notice (orinfer, or are told) that you are performing successfully on thebasis of some simple technical trading rule, will try to do thesame. To take account of their response, you must complicateyour rule and likely decrease your excess returns. Your morecomplicated rule will, of course, also inspire others to try tofollow it, leading to further complications and a furtherdecline in excess returns. Soon enough your rule assumes anear-random complexity, your excess returns are reduced es-sentially to zero, and you're back to relying on chance.
Of course, your behavior will be the same if you learn ofsomeone else's successful performance. In fact, a situation arisesthat is clarified by the classic "prisoner's dilemma," a usefulpuzzle originally framed in terms of two people in prison.
Suspected of committing a major crime, the two are appre-hended in the course of committing some minor offense.They're then interrogated separately, and each is given thechoice of confessing to the major crime and thereby implicat-ing his partner or remaining silent. If they both remain silent,they'll each get one year in prison. If one confesses and theother doesn't, the one who confesses will be rewarded by be-ing set free, while the other one will get a five-year term. Ifthey both confess, they can both expect to spend three years

A Mathematician Plays the Stock Market 191
in prison. The cooperative option (cooperative with the otherprisoner, that is) is to remain silent, while the non-cooperativeoption is to confess. Given the payoffs and human psychol-ogy, the most likely outcome is for both to confess; the bestoutcome for the pair as a pair is for both to remain silent; thebest outcome for each prisoner as an individual is to confessand have one's partner remain silent.
The charm of the dilemma has nothing to do with any inter-est one might have in prisoners' rights. (In fact, it has about asmuch relevance to criminal justice as the four-color-map theo-rem has to geography.) Rather, it provides the logical skeletonfor many situations we face in everyday life. Whether we'renegotiators in business, spouses in a marriage, or nations in adispute, our choices can often be phrased in terms of the pris-oner's dilemma. If both (all) parties pursue their own interestsexclusively and do not cooperate, the outcome is worse forboth (all) of them; yet in any given situation, any given party isbetter off not cooperating. Adam Smith's invisible hand ensur-ing that individual pursuits bring about group well-being is, atleast in these situations (and some others), quite arthritic.
The dilemma has the following multi-person market ver-sion: Investors who notice some exploitable stock marketanomaly may either act on it, thereby diminishing its effec-tiveness (the non-cooperative option) or ignore it, therebysaving themselves the trouble of keeping up with develop-ments (the cooperative option). If some ignore it and othersact on it, the latter will receive the biggest payoffs, the formerthe smallest. As in the standard prisoner's dilemma, the logi-cal response for any player is to take the non-cooperative op-tion and act on any anomaly likely to give one an edge. Thisresponse leads to the "arms race" of ever more complex tech-nical trading strategies. People search for special knowledge,the result eventually becomes common knowledge, and thedynamic between the two generates the market.

192 John Allen Paulos
This searching for an edge brings us to the social value ofstock analysts and investment professionals. Although the re-cipients of an abundance of bad publicity in recent years, theyprovide a most important service: By their actions, they helpturn special knowledge into common knowledge and in theprocess help make the market relatively efficient. Absent a dra-conian rewiring of human psychology and an accompanyingdraconian rewiring of our economic system, this accomplish-ment is an impressive and vital one. If it means being "non-cooperative" with other investors, then so be it. Cooperationis, of course, generally desirable, but cooperative decisionmak-ing among investors seems to smack of totalitarianism.
Pushing the Complexity Horizon
The complexity of trading rules admits of degrees. Most of therules to which people subscribe are simple, involving supportlevels, P/E ratios, or hemlines and Super Bowls, for example.Others, however, are quite convoluted and conditional. Be-cause of the variety of possible rules, I want to take an obliqueand abstract approach here. The hope is that this approachwill yield insights that a more pedestrian approach misses. Itskey ingredient is the formal definition of (a type of) complex-ity. An intuitive understanding of this notion tells us thatsomeone who remembers his eight-digit password by means ofan elaborate, long-winded saga of friends' addresses, chil-dren's ages, and special anniversaries is doing something silly.Mnemonic rules make sense only when they're shorter thanwhat is to be remembered.
Let's back up a bit and consider how we might describethe following sequences to an acquaintance who couldn't seethem. We may imagine the 1s to represent upticks in the

A Mathematician Plays the Stock Market 193
price of a stock and the 0s downticks or perhaps up-and-down days.
1. 0101010101010101010101010...
2. 0101101010101101010101011...
3. 1000101101101100010101100...
The first sequence is the simplest, an alternation of Os and1s. The second sequence has some regularity to it, a single 0alternating sometimes with a 1, sometimes with two Is, whilethe third sequence doesn't seem to manifest any pattern at all.Observe that the precise meaning of " . . . " in the first se-quence is clear; it is less so in the second sequence, and not atall clear in the third. Despite this, let's assume that these se-quences are each a trillion bits long (a bit is a 0 or a 1) andcontinue on "in the same way."
Motivated by examples like this, the American computerscientist Gregory Chaitin and the Russian mathematician A.N. Kolmogorov defined the complexity of a sequence of 0sand 1s to be the length of the shortest computer program thatwill generate (that is, print out) the sequence in question.
A program that prints out the first sequence above can con-sist simply of the following recipe: print a 0, then a 1, and re-peat a half trillion times. Such a program is quite short,especially compared to the long sequence it generates. Thecomplexity of this first trillion-bit sequence may be only a fewhundred bits, depending to some extent on the computer lan-guage used to write the program.
A program that generates the second sequence would be atranslation of the following: Print a 0 followed by either a sin-gle 1 or two 1s, the pattern of the intervening 1s being one,two, one, one, one, two, one, one, and so on. Any programthat prints out this trillion-bit sequence would have to be

194 John Allen Paulos
quite long so as to fully specify the "and so on" pattern of theintervening 1s. Nevertheless, because of the regular alterna-tion of 0s and either one or two 1s, the shortest such programwill be considerably shorter than the trillion-bit sequence itgenerates. Thus the complexity of this second sequence mightbe only, say, a quarter trillion bits.
With the third sequence (the commonest type) the situationis different. This sequence, let us assume, remains so disor-derly throughout its trillion-bit length that no program wemight use to generate it would be any shorter than the se-quence itself. It never repeats, never exhibits a pattern. Allany program can do in this case is dumbly list the bits in thesequence: print 1, then 0, then 0, then 0, then 1, then 0, then1, . . . . There is no way the . . . can be compressed or the pro-gram shortened. Such a program will be as long as the se-quence it's supposed to print out, and thus the third sequencehas a complexity of approximately a trillion.
A sequence like the third one, which requires a program aslong as itself to be generated, is said to be random. Randomsequences manifest no regularity or order, and the programsthat print them out can do nothing more than direct that theybe copied: print 1 0 0 0 1 0 1 1 0 1 1 . . . . These programscannot be abbreviated; the complexity of the sequences theygenerate is equal to the length of these sequences. By contrast,ordered, regular sequences like the first can be generated byvery short programs and have complexity much less thantheir length.
Returning to stocks, different market theorists will havedifferent ideas about the likely pattern of 0s and 1s (downsand upticks) that can be expected. Strict random walk theo-rists are likely to believe that sequences like the third charac-terize price movements and that the market's movements aretherefore beyond the "complexity horizon" of human fore-casters (more complex than we, or our brains, are, were we
A Mathematician Plays the Stock Market 195
expressed as sequences of 0s and 1s). Technical and funda-mental analysts might be more inclined to believe that se-quences like the second characterize the market and that thereare pockets of order amidst the noise. It's hard to imagineanyone believing that price movements follow sequences asregular as the first except, possibly, those who send away"only $99.95 for a complete set of tapes that explain this rev-olutionary system."
I reiterate that this approach to stock price movements israther stark, but it does nevertheless "locate" the debate.People who believe there is some pattern to the market,whether exploitable or not, will believe that its movementsare characterized by sequences of complexity somewhere be-tween those of type two and type three above.
A rough paraphrase of Kurt Godel's famous incomplete-ness theorem of mathematical logic, due to the aforemen-tioned Gregory Chaitin, provides an interesting sidelight onthis issue. It states that if the market were random, we mightnot be able to prove it. The reason: encoded as a sequence of0s and 1s, a random market would, it seems plausible to as-sume, have complexity greater than that of our own were wealso so encoded; it would be beyond our complexity horizon.From the definition of complexity it follows that a sequencecan't generate another sequence of greater complexity than it-self. Thus if a person were to predict the random market's ex-act gyrations, the market would have to be less complex thanthe person, contrary to assumption. Even if the market isn'trandom, there remains the possibility that its regularities areso complex as to be beyond our complexity horizons.
In any case, there is no reason why the complexity of pricemovements as well as the complexity of investor/computerblends cannot change over time. The more inefficient the mar-ket is, the smaller the complexity of its price movements, andthe more likely it is that tools from technical and fundamental

196 John Allen Paulos
analysis will prove useful. Conversely, the more efficient themarket is, the greater the complexity of price movements, andthe closer the approach to a completely random sequence ofprice changes.
Outperforming the market requires that one remain on thecusp of our collective complexity horizon. It requires fastermachines, better data, improved models, and the smarter useof mathematical tools, from conventional statistics to neuralnets (computerized learning networks, the connections be-tween the various nodes of which are strengthened or weak-ened over a period of training). If this is possible for anyoneor any group to achieve, it's not likely to remain so for long.
Game Theory andSupernatural Investor/Psychologists
But what if, contrary to fact, there were an entity possessingsufficient complexity and speed that it was able with reason-ably high probability to predict the market and the behaviorof individuals within it? The mere existence of such an entityleads to Newcombe's paradox, a puzzle that calls into ques-tion basic principles of game theory.
My particular variation of Newcombe's paradox involvesthe World Class Options Market Maker (WCOMM), which(who?) claims to have the power to predict with some accu-racy which of two alternatives a person will choose. Imaginefurther that WCOMM sets up a long booth on Wall Street todemonstrate its abilities.
WCOMM explains that it tests people by employing twoportfolios. Portfolio A contains a $1,000 treasury bill, whereasportfolio B (consisting of either calls or puts on WCOM stock)is either worth nothing or $1,000,000. For each person in lineat the demonstration, WCOMM has reserved a portfolio of

A Mathematician Plays the Stock Market 197
each type at the booth and offers each person the followingchoice: He or she can choose to take portfolio B alone orchoose to take both portfolios A and B. However, and this iscrucial, WCOMM also states that it has used its unfathomablepowers to analyze the psychology, investment history, andtrading style of everyone in line as well as general market con-ditions, and if it believes that a person will take both portfo-lios, it has ensured that portfolio B will be worthless. On theother hand, if WCOMM believes that a person will trust itswisdom and take only portfolio B, it has ensured that portfo-lio B will be worth $1,000,000. After making these announce-ments, WCOMM leaves in a swirl of digits and stock symbols,and the demonstration proceeds.
Investors on Wall Street see for themselves that when a per-son in the long line chooses to take both portfolios, most of thetime (say with probability 90 percent) portfolio B is worthlessand the person gets only the $1,000 treasury bill in portfolio A.They also note that when a person chooses to take the contentsof portfolio B alone, most of the time it's worth $1,000,000.
After watching the portfolios placed before the people inline ahead of me and seeing their choices and the conse-quences, I'm finally presented with the two portfolios pre-pared for me by WCOMM. Despite the evidence I've seen, Isee no reason not to take both portfolios. WCOMM is gone,perhaps to the financial district of London or Frankfurt orTokyo, to make similar offers to other investors, and portfo-lio B is either worth $1,000,000 or not, so why not take bothportfolios and possibly get $1,001,000. Alas, WCOMM readcorrectly the skeptical smirk on my face and after opening myportfolios, I walk away with only $1,000. My portfolio Bcontains call options on WCOM with a strike price of 20,when the stock itself is selling at $1.13.
The paradox, due to the physicist William Newcombe (notthe Newcomb of Benford's Law, but the same mocking four

198 John Allen Paulos
letters WCOM) and made well-known by the philosopherRobert Nozick, raises other issues. As mentioned, it makesproblematical which of two game-theoretic principles oneshould use in making decisions, principles that shouldn't con-flict.
The "dominance" principle tells us to take both portfoliossince, whether portfolio B contains options worth $1,000,000or not, the value of two portfolios is at least as great as thevalue of one. (If portfolio B is worthless, $1,000 is greaterthan $0, and if portfolio B is worth $1,000,000, $1,001,000is greater than $1,000,000.)
On the other hand, the "maximization of expected value"principle tells us to take only portfolio B since the expectedvalue of doing so is greater. (Since WCOMM is right about 90percent of the time, the expected value of taking only portfolioB is (.90 x $1,000,000) + (.10 x $0), or $900,000, whereas theexpected value of taking both is (.10 x $1,001,000) + (.90 x$1,000), or $101,000.) The paradox is that both principlesseem reasonable, yet they counsel different choices.
This raises other general philosophical matters as well, butit reminds me of my resistance to following the WCOM-fleeing crowd, most of whose B portfolios contained puts onthe stock worth $1,000,000.
One conclusion that seems to follow from the above is thatsuch supernatural investor/psychologists are an impossibility.For better or worse, we're on our own.
Absurd Emails and the WorldCom Denouement
A natural reaction to the vagaries of chance is an attempt atcontrol, which brings me to emails regarding WorldCom that,Herzog-like, I sent to various influential people. I had growntired of carrying on one-sided arguments with CNBC's always

A Mathematician Plays the Stock Market 199
perky Maria Bartiromo and always apoplectic James Crameras they delivered the relentlessly bad news about WorldCom.So in fall 2001, five or six months before its final swoon, Icontacted a number of online business commentators criticalof WorldCom's past performance and future prospects. Hav-ing spent too much time in the immoderate atmosphere ofWorldCom chatrooms, I excoriated them, though mildly, fortheir shortsightedness and exhorted them to look at the com-pany differently.
Finally, out of frustration with the continued decline ofWCOM stock, I emailed Bernie Ebbers, then the CEO, in earlyFebruary 2002 suggesting that the company was not effectivelystating its case and quixotically offering to help by writingcopy. I said I'd invested heavily in WorldCom, as did familyand friends at my suggestion, that I could be a persuasivewordsmith when I believed in something, and WorldCom, Ibelieved, was well positioned but dreadfully undervalued.UUNet, the "backbone" of much of the Internet, was, I fatu-ously informed the CEO of the company, a gem in and of itself.
I knew, even as I was writing them, that sending these elec-tronic epistles was absurd, but it gave me the temporary illu-sion of doing something about this recalcitrant stock otherthan dumping it. Investing in it had originally seemed like ano-brainer. The realization that doing so had indeed beena no-brainer was glacially slow in arriving. During the2001-2002 academic year, I took the train once a week fromPhiladelphia to New York to teach a course on "numbers inthe news" at the Columbia School of Journalism. Spendingthe two and a half hours of the commute out of contact withWCOM's volatile movements was torturous, and uponemerging from the subway, I'd run to my office computer tocheck what had happened. Not exactly the behavior of a sagelong-term investor; my conduct even then suggested to me arather dim-witted addict.

200 John Allen Paulos
Recalling the two or three times I almost got out of thestock is dispiriting as well. The last time was in April 2002.Amazingly, I was even then still somewhat in thrall to the ideaof averaging down, and when the price dipped below $5, Ibought more WCOM shares. Around the middle of themonth, however, I did firmly and definitively resolve to sell.By Friday, April 19, WCOM had risen to over $7, whichwould have allowed me to recoup at least a small portion ofmy losses, but I didn't have time to sell that morning. I had todrive to northern New Jersey to give a long-promised lectureat a college there. When it was over, I wondered whether toreturn home to sell my shares or simply use the college's com-puter to log onto my Schwab account to do so. I decided togo home, but there was so much traffic on the cursed NewJersey turnpike that afternoon that I didn't arrive until 4:05,after the market had closed. I had to wait until Monday.
Investors are often nervous about holding volatile stocksover the weekend, and I was no exception. My anxiety waswell-founded. Later that evening there was news about im-pending cuts in WorldCom's bond ratings and another an-nouncement from the SEC regarding its comprehensiveinvestigation of the company. The stock lost more than athird of its value by Monday, when I did finally sell the stockat a huge loss. A few months later the stock completely col-lapsed to $.09 upon revelations of massive accounting fraud.
Why had I violated the most basic of investing fundamen-tals: Don't succumb to hype and vaporous enthusiasm; even ifyou do, don't put too many eggs in one basket (especiallywith the uncritical sunny-side up); even if you do this, don'tforget to insure against sudden drops (say with puts, notcalls); and even if you do this too, don't buy on margin. Afterselling my shares, I felt as if I were gradually and groggilycoming out of a self-induced trance. I'd long known aboutone of the earliest "stock" hysterias on record, the seven-

A Mathematician Plays the Stock Market 201
teenth century tulip bulb craze in Holland. After its collapse,people also spoke of waking up and realizing that they werestuck with nearly worthless bulbs and truly worthless optionsto buy more of them. I smiled ruefully at my previous smugdismissal of people like the tulip bulb "investors." I was asvulnerable to transient delirium as the dimmest bulb-buyingbulbs.
I've followed the ongoing drama of the WorldCom story—the fraud investigations, various prosecutions, new managers,promised reforms, and court settlements—and, oddly perhaps,the publicity surrounding the scandals and their aftermath hasdistanced me from my experience and lessened its intensity.My losses have become less a small personal story and more (apart of) a big news story, less a result of my mistakes and morea consequence of the company's behavior. This shifting of re-sponsibility is neither welcome nor warranted. For reasons offact and of temperament, I continue to think of myself as hav-ing been temporarily infatuated rather than deeply victimized.Remnants of my fixation persist, and I still sometimes wonderwhat might have happened if WorldCom's deal with Sprinthadn't been foiled, if Ebbers hadn't borrowed $400 million (ormore), if Enron hadn't imploded, if this or that or the otherevent hadn't occurred before I sold my shares. My recklessnessmight then have been seen as daring. Post hoc stories alwaysseem right, whatever the pre-existing probabilities.
One fact remains incontrovertible: Narratives and numberscoexist uneasily on Wall Street. Markets, like people, arelargely rational beasts occasionally provoked and disturbedby their underlying animal spirits. The mathematics discussedin this book is often helpful in understanding (albeit not beat-ing) the market, but I'd like to end with a psychologicalcaveat. The basis for the application of the mathematicaltools discussed herein is the sometimes shifty and alwaysshifting attitudes of investors. Since these psychological states

202 John Alien Paulos
are to a large extent imponderable, anything that depends onthem is less exact than it appears.
The situation reminds me a bit of the apocryphal story ofthe way cows were weighed in the Old West. First the cow-boys would find a long, thick plank and place the middle of iton a large, high rock. Then they'd attach the cow to one endof the plank with ropes and tie a large boulder to the otherend. They'd carefully measure the distance from the cow tothe rock and from the boulder to the rock. If the plank didn'tbalance, they'd try another big boulder and measure again.They'd keep this up until a boulder exactly balanced the cattle.After solving the resulting equation that expresses the cow'sweight in terms of the distances and the weight of the boulder,there would be only one thing left for them to do: They wouldhave to guess the weight of the boulder. Once again the math-ematics may be exact, but the judgments, guesses, and esti-mates supporting its applications are anything but.
More apropos of the self-referential nature of the marketwould be a version in which the cowboys had to guess theweight of the cow whose weight varied depending on their col-lective guesses, hopes, and fears. Bringing us full circle toKeynes's beauty contest, albeit in a rather forced, more bovinemode, I conclude that despite rancid beasts like WorldCom,I'm still rather fond of the pageant that is the market. I justwish I had a better (and secret) method for weighing the cows.
Bibliography
The common ground and intersection of mathematics, psychology,and the market is a peculiar interdisciplinary niche (even withoutthe admixture of memoir). There are within it many mathematicaltomes and theories ostensibly relevant to the stock market. Mostare not. There are numerous stock-picking techniques and strategiesthat appear to be very mathematical. Not many are. There are agood number of psychological accounts of trading behavior, and amuch smaller number of mathematical approaches to psychology,but much remains to be discovered. A few pointers to this inchoate,nebulously defined, yet fascinating area follow:
Bak, Per, How Nature Works, New York, Springer-Verlag, 1996.Barabasi, Albert-Laszlo, Linked: The New Science of Networks,
New York, Basic Books, 2002.Dodd, David L., and Benjamin Graham, Security Analysis, New
York, McGraw-Hill, 1934.Fama, Eugene R, "Efficient Capital Markets, II," Journal of Fi-
nance, December 1991.Gilovich, Thomas, How We Know What Isn't So, New York, Simon
and Schuster, 1991.Hart, Sergiu, and Yair Tauman, "Market Crashes Without Exoge-
nous Shocks," The Hebrew University of Jerusalem, Centerfor Rationality DP-124, December 1996 (forthcoming inJournal of Business).
Kritzman, Mark P., Puzzles of Finance, New York, John Wiley,2000.
203
204 Bibliography
Lefevre, Edwin, Reminiscences of a Stock Operator, New York,John Wiley, 1994 (orig. 1923).
Lo, Andrew, and Craig MacKinlay, A Non-Random Walk DownWall Street, Princeton, Princeton University Press, 1999.
Malkiel, Burton, A Random Walk Down Wall Street, New York, W.W. Norton, 1999 (orig. 1973).
Mandelbrot, Benoit, "A Multifractal Walk Down Wall Street," Sci-entific American, February 1999.
Paulos, John Allen, Once Upon a Number, New York, Basic Books,1998.
Ross, Sheldon, Probability, New York, Macmillan, 1976.Ross, Sheldon, Mathematical Finance, Cambridge, Cambridge Uni-
versity Press, 1999.Siegel, Jeremy J., Stocks for the Long Run, New York, McGraw-
Hill, 1998.Shiller, Robert J., Irrational Exuberance, Princeton, Princeton Uni-
versity Press, 2000.Taleb, Nassim Nicholas, Fooled by Randomness, New York, Texere,
2001.Thaler, Richard, The Winner's Curse, Princeton, Princeton Univer-
sity Press, 1992.Tversky, Amos, Daniel Kahneman, and Paul Slovic, Judgment Under
Uncertainty: Heuristics and Biases, Cambridge, CambridgeUniversity Press, 1982.

Index
accounting practicesassumptions vs. practices, 115auditors and, 115-116comparing corporate and personal
accounting, 25conflict of interest and, 111-112deciphering company financial health,
111Enron, 112reforms, 114transparency, 115vagueness and subjectivity of, 114value investing and, 110WorldCom (WCOM), 112
accounting scandals, see also fraudBenford's Law and, 74deciphering company financial health,
111Efficient Market Hypothesis and, 63psychology of cover ups, 24volatility and, 15WCOM fraud, 200
Al Qaeda, 124Albert, Reka, 178-179anchoring effect
financial numbers and, 20number experiments, 19-20online chatroom example, 32
arithmetic mean, see also mean valueIPO purchases/sales, 96-98outstripping geometric mean rate of
return, 99Arthur Andersen, 112Arthur, W. Brian, 9auditors, 115-116Aumann, Robert, 10, 165availability error, 21
average valuescompared with distribution of incomes,
132-133risk as variance from, 136-137
averagesaverage return compared with median
return, 99average value compared with
distribution of incomes, 132-133buy-sell rules and, 43outguessing average guess, 6-7risk as variance from average value,
136-137averaging down, 13-14
Bachelier, Louis, 59, 122Bak, Per, 178-179Barabasi, Albert-Lazlo, 178-179Bartiromo, Maria, 199bear markets
investor self-descriptions and, 58shorting and distorting strategy in,
35-36Benford, Frank, 73Benford's Law, 72-74
applying to corporate fraud, 74background of, 73frequent occurrence of numbers
governed by, 73-74Bernoulli, Daniel, 148Beta (B) values
causes of variations in, 161comparing market against individual
stocks or funds, 160-161strengths and weaknesses of, 161-162technique for finding, 161volatility and, 160
205
206 Index
Big Bang, 16billiards, as example of nonlinear system,
172-173binary system, 71biorhythm theory, 39Black, Fischer, 121-122, 129Black-Scholes option formula, 122blackjack strategies, 50-51Blackledge, Todd, 108"blow up," investor, 118blue chip companies, P/E ratio of, 101Bogle, John, 60bonds
Greenspan's impact on bond market, 86history of stocks outperforming,
143-145will not necessarily continue to be
outperformed by stocks, 145-146Bonds, Barry, 108bookkeeping, see accounting practicesbottom-line investing, 92Brock, William, 48brokers, see stock brokersBuffet, Warren, 65, 85bull markets
investor self-descriptions and, 58pump and dump strategy in, 33
Butterfly Economics (Ormerod), 169"butterfly effect," of nonlinear systems,
174buy-sell rules, 43buying on the margin, 127, 129. see also
margin investments
calendar effects, 49call options, see also stock options
covering, 121how they work, 120selling, 120strategies, 121-122valuation tools, 122-123
campaign contributions, 126Capital Asset Pricing Model, 160capital gains vs. dividends, 91-92Central Limit Theorem, 140CEOs
arrogance of, 184-185benefits in manipulating stock prices,
123-124
remuneration compared with that ofaverage employee, 183
volatility due to malfeasance of, 15chain letters, 92-95Chaitin, Gregory, 193chance, see also whim
trading strategies and, 28as undeniable factor in market, 63
chaos theory, 172. see also nonlinearsystems
charity, 156Clayman, Michelle, 107cognitive illusions, 21-26
availability error, 21confirmation bias, 21-22heuristics rules of thumb for saving
time, 25-26mental accounts, 24-25status quo bias, 22-23
Cohen, Abby Joseph, 147coin flipping, 63-64common knowledge
accounting scandals and, 63definition and importance to investors,
9-10dynamic with private knowledge, 191insider trading and, 164-165parable illustrating, 10-12private information becoming, 165-167
companies/corporationsadjusting results to meet expectations,
21applying Benford's Law to corporate
fraud, 74comparing corporate and personal
accounting, 25financial health and, 102P/E ratio of blue chips, 101
competition vs. cooperation, prisoner'sdilemma, 191-192
complexitychanging over time, 195-196horizon, 195of sequences (mathematics), 193of trading strategies, 191, 192, 194-196
compound interestas basis of wealth, 86doubling time and, 90formulas for, 88-89

Index 207
future value and, 89-90present value and, 89
confirmation biasdefinition of, 21-22investments reflecting, 13stock-picking and, 22
connectedness, see also networksEuropean market causing reaction on
Wall Street, 163interactions based on whim, 168-169interactions between technical traders
and value traders, 167-168irrational interactions between traders,
169-170Wolfram model of interactions between
traders, 170-171Consumer Confidence Index (CCI), 9contrarian investing
dogs of the Dow, 105measures of excellence and, 107rate of return and, 106-107
cooperation vs. competition, prisoner'sdilemma, 191-192
correlation coefficient, 152. see alsostatistical correlations
counter-intuitive investment, 54counterproductive behavior, psychology of,
17-18covariance
calculation of, 152-153portfolio diversification based on, 154portfolio volatility and, 152stock selection and, 159
Cramer, James, 199crowd
following or not, 37herd-like nature of price movements,
181
dart throwing, stock-picking contest in theWall Street Journal, 63
data miningillustrated by online chatrooms, 32moving averages and, 44survivorship bias and, 30-31trading strategies and, 28-30
DeBondt, Werner, 106-107Deciding What's News (Cans), 185decimalization reforms, 70-71
decision makingminimizing regret, 23selling WCOM, 200
depression of 1873, 113derivatives trading, Enron, 112despair and guilt over market losses, 118deviation from the mean, see also mean
valuecovariance, 152standard deviation (d), 137-139variance, 136-137
dice, probability and, 50Digex, 55discounting process, present value of
future money, 91-92distribution of incomes, 132distribution of wealth
dynamic of concentration, 182-183UN report on, 182
diversified portfolios, see stock portfolios,diversifying
dividendsearnings and, 100proposals benefitting returns from, 92
Dodd, David, 106dogs of the Dow strategy, 105"dominance" principle, game theory,
198dot com IPOs, as a pyramid scheme, 93double-bottom trend reversal, 46"double-dip" recession, 46double entry bookkeeping, 115doubling time, compound interest
and, 90Dow
dogs of the Dow strategy, 105percentages of gains and losses, 15
e (exponential growth)compound interest and, 86-88higher mathematics and, 88-89
earningsanchoring effect and, 20complications with determination of,
100inflating (WCOM), 112P/E ratio and, 100stock valuation and, 100
East, Steven H., 147

208 Index
Ebbers, Bernieacquisition appetite of, 93arrogance of, 183author emails offer of help, 199Digex purchase, 55down-home style of, 181-182forced to sell WCOM stock, 23fraud by, 112-113pump and dump strategy and, 34purchase of WorldCom stock by, 129
economics, human behavior and, 16-17The Education of a Speculator
(Niederhoffer), 134"efficient frontier" of portfolios
(Markowitz), 157Efficient Market Hypothesis
background of, 59impact of accounting scandals on, 63increased efficiency results in decreased
predictability, 61-62investors beliefs impacting, 189moving averages and, 44paradoxes of, 187-189randomness and, 57rationale for, 60-61resistance and support levels and, 46versions of, 59-60
Elliott, Ralph Nelson, 38-39Ellison, Larry, 184employee remuneration vs. CEO
remuneration, 183endowment effect, 22Enron
accounting practices, 112margin calls on CEO Ken Lay, 129
environmental exploitation, as Ponzischeme, 93-94
equity-risk premium, 146Erdos, Paul, 75,177Escher, M. C., 54European stock market, 163euros
benefits of standardizing Europeancurrencies, 71
euro-pound/pound-euro exchange rate,39-40
expected excess return, 158, 160expected value, see also mean value
covariance and, 152formula for obtaining, 133-134
graphing against risk (Markowitzoptimal portfolios), 157
insurance company example, 135"maximization of expected value," 198mu (m), 133, 138probability theory and, 135-136
exploitable opportunities, tendency todisappear, 61
Fama, Eugene, 59, 105Fibonacci numbers
Elliott wave theory and, 38golden ratio and, 40-41
fibre-optic cable, 113-144fifty-two-week highs, 20"flocking effect," Internet, 178Fooled by Randomness (Taleb), 134formulas
Black-Scholes options, 122compound interest, 88-89expected value, 133-134
fractals, 38, 174-175Frank, Robert, 183fraud, see also accounting scandals
applying Benford's Law to corporatefraud, 74
applying Benford's law to income taxfraud, 73
Bernie Ebbers, 112-113Salomon Smith Barney benefitting
illegally from IPOs, 34WCOM fraud, 200wrongdoing of brokers at Merrill
Lynch, 34free market economy, 184French, Ken, 105Full House: The Spread of Excellence from
Plato to Darwin (Gould), 61fund managers, 149. see also stock
brokers/analystsfundamental analysis
determining fundamental value bydiscounting process, 91-92
evidence supporting, 104present value and, 90sequence complexity and trading rules
and,195as sober investment strategy, 85stock valuation with, 99-100unexciting nature of, 86

Index 209
future valueP/E ratio as measure of future earnings
expectations, 101present value and, 89-90
gambler's fallacy, 64games
gambling and probability, 50-51game theory, 198guessing games, 6-9Monopoly, 141-142Parrondo's paradox, 52-54St. Petersburg paradox, 147-149ultimatum games, 17WorldCom board game, 142
Gans, Herbert, 185Gates, Bill, 182, 184geometric mean
illustrated by IPO purchases/sales,96-98
rate of return, 99"ghosts," investors, 118Gilder, George, 2Gilovich, Thomas, 18Godel, Kurt, 195Goethe, 115golden ratio, 39-40Goodman, Nelson, 29gossip, 32Gould, Steven Jay, 61Graham, Benjamin, 106Greek mathematics, 39—40Greenspan, Alan
impact on stock and bond markets,86
on irrational exuberance of investors,13-14
growth investing vs. value investing, 104,109
growth stocks, 106Grubman, Jack, 14, 111, 169guessing games, 6-9guilt and despair over market losses, 118
Hart, Sergiu, 165"head and shoulders" pattern, 46hedge funds, 129herd-like nature, of stock market, 181Hill, Ted, 73-74How Nature Works (Bak), 179
How We Know What Isn't So (Gilovich),18
"The Imp in the Bottle" (Stevenson), 94In Search of Excellence (Peters), 107incompleteness theorem of mathematical
logic, 195index funds
Efficient market theorists investing in,60
as safe investment, 4inflationary universe hypothesis, 16Innumeracy (Paulos), 67insider trading
attraction of, 164stock manipulation by, 130-132unexplained price movements and,
164-167Institutional Investor, 69insurance company example, expected
value, 135insurance put options, 113interest rates, market predictability and,
172internal rate of return, 90Internet
diameter (or interconnectedness) of,179-180
"flocking effect," 178as network of associations, 177-178
investment clubs, 71investment strategies, see also
predictability, of stock marketbased on Parrondo's paradox, 54contrarian investing, 105-107dogs of the Dow, 105fundamental analysis, see fundamental
analysismomentum investing, 37, 47secrecy and, 202value investing, see value investing
investments, see also margin investmentsconfirmation bias and, 13considering utility of dollars invested vs.
dollars themselves, 148-149counter-intuitive, 54emotions dictating, 2guilt and despair over losses, 118ignoring uniformity of positive ratings,
14
210 Index
investments (continued)protective measures, 113randomness vs. predictability and, 4rumors and, 3safe, 4, 158windfall money and, 1
investors, see also tradersbehavior as nonlinear systems, 172-173beliefs of impact Efficient Market
Hypothesis, 189"blow up" and becoming "ghosts," 118buying/selling puts on S&P 500, 134common knowledge and, 9-10gauging investors as important as
gauging investments, 7irrational exuberance/irrational despair,
13-14,15online trading and, 71-72price oscillation created by investor
reactions to each other, 171self description in bear and bull
markets, 58short-term, 3-4
IPOsalternative rates of return from, 98as a pyramid scheme, 93Salomon Smith Barney benefitting
illegally from, 34stock market in 1990s and, 95strategy for buying and selling, 96-97
Jegadeesh, Narsimhan, 47Jeong, Hawoong, 178-179Judgment Under Uncertainty (Tversky,
Kahneman, and Slovic), 18
Kahneman, Daniel, 18, 23Keynes, John Maynard, 3-4, 149Kolmogorov, A. N., 193Kozlowski, Dennis, 183Kraus, Karl, 26Krauthammer, Charles, 75Kudlow, Larry, 146
Lakonishok, Josef, 48Landsburg, Steven, 156Lay, Ken, 129LeBaron, Blake, 48Lefevre, Edwin, 33
Leibweber, David, 29linguistics, power law and, 179Lo, Andrew, 48, 107logistic curve, 101lognormal distribution, 122Long-Term Capital Management (LTCM),
129-130losing through winning, 54-55loss aversion, 23-24lotteries
present value and, 90-91as tax on stupidity, 120
Lynch, Peter, 65, 104
MacKinlay, Craig, 48, 107mad money, 1Malkiel, Burton, 48, 62management, manipulating stock prices,
123-124Mandelbrot, Benoit, 38, 174-175margin calls, 128-129margin investments
buying on the margin, 127-128as investment type, 113margin calls, 128-129selling on the margin, 127
market makersdecimalization and, 70-71World Class Options Market Maker
(WCOMM), 196-198Markowitz, Harry, 157mathematics, generally
Greek, 39-40movies and plays about, 75outguessing the average guess,
6-7risk and, 136-137stock markets and, 4-5
Mathews, Eddie, 108"maximization of expected value"
principle, 198mean value, see also expected value
arithmetic mean, 96-99deviation from the mean, 136-139,
152-153geometric mean, 96-99regression to the mean, 107-109using interchangeably with expected
value, 133

Index 211
mediacelebrities and, 184crisis mentality and impact on market
volatility, 16median rate of return, 99Merrill Lynch, 34Merton, Robert, 122, 129mnemonic rules, 192momentum investing, 37, 47money, categorizing into mental accounts,
1, 24-25Morgenson, Gretchen, 169Motley Fool
contrarian investment strategy, 105PEG ratio and, 104
moving averages, 41-44complications with, 44evidence supporting, 48example of, 42-43generating buy-sell rules from, 43getting the big picture with, 42irrelevant in efficient market, 44phlegmatic nature of, 42
mu (m), 138multifractal forgeries, 175mutual funds
expert picks and, 63hedge funds, 129index funds, 4, 60, 62-63politically incorrect, 155rationale for, 154-155socially regressive funds, 154-155
mutual knowledge, contrasted withcommon knowledge, 9-10
Nash equilibrium, 7Nash, John, 75Neff, John, 65negatively correlated stocks
as basis of mutual fund selection, 155as basis of stock selection, 154stock portfolios and, 151
networksInternet as example of, 177-178price movements and, 180-181six degrees of separation and, 177
A New Kind of Science (Wolfram),170-171
Newcomb, Simon, 73
Newcombe, William, 197Newcombe's paradox, 196Niederhoffer, Victor, 134Nigrini, Mark, 73-74nominal value, 90-91A Non-Random "Walk Down Wall Street
(Lo and MacKinlay), 48nonlinear systems
billiards example, 173"butterfly effect" or sensitive
dependence of, 174chaos theory and, 172fractals and, 174-175investor behavior and, 172
normal distribution, 122, 139Nozick, Robert, 198numbers
anchoring effect, 19-20Benford's Law and, 73-74Fibonacci numbers and, 38, 40-41
off-shore entities, Enron, 112Once Upon a Number (Paulos), 10online chatrooms, 31-33online trading, 71-72optimal portfolio
balancing with risk-free portfolio,158-159
Markowitz efficient frontier of, 157options, see stock optionsOrmerod, Paul, 169O'Shaughnessy, James, 106
P/B (price-to-book) ratio, 105-106P/E ratio
interpreting, 102measuring future earnings expectations,
101PEG variation on, 103-104stock valuation and, 100
P/S (price to sales) ratio, 106paradoxes
Efficient Market Hypothesis and,187-189
examples of, 187Newcombe's paradox, 196Parrondo's paradox, 52-54St. Petersburg paradox, 147-149
Pareto laws, see power law
212 Index
Parrondo, Juan, 52-54patterns, random events and, 66-67PEG ratio, 103-104personal accounting, 25Peters, Tom, 107Pi, 41Pitt, Harvey, 116Poincare, Henri, 59politics
campaign contributions, 126politically incorrect funds, 155power law and, 182, 184
Ponzi schemes, 92-95portfolios, see stock portfoliospound-euro/euro-pound exchange rate,
39-40power law
complex systems, 178-179economic power, 182, 183-184"flocking effect" on Internet, 178linguistics, 179media influence, 182, 184political power, 182, 184-185price movements, 177, 180
Pradilla, Charles, 147Prechter, Bob, 146predictability, of stock market
complexity of, 171-172cross-correlations over time and, 48—49Efficient Market Hypothesis, 61-62multifractal forgeries, 175price anomalies leading to, 49private information, 171randomness vs., 4, 48, 62technical analysis, 37, 47-49trading strategies, 171unemployment, 172whim, 171World Class Options Market Maker
(WCOMM), 196-198present value
compound interest and, 89discounting process for, 91stock purchases based on, 92
price movementscomplexity changes over time, 195-196extreme movements, 176-177herd-like and volatile nature of, 181insider trading and, 164-167
network effect on, 180-181normal curve and, 176power law and, 177, 180subterranean information processing
and, 167price, P/E ratio, 100price targets
anchoring effect and, 20hype and unrealistic, 18-19
prices, of stocksmanipulating for own benefit
(management/CEO), 123-124oscillation created by investor reactions
to each other, 171reflecting publicly available
information, 59-60prisoner's dilemma, 190-191private information
becoming common knowledge, 165dynamic with common knowledge, 191market predictions and, 171
probabilitycoin flipping game and, 63-64dice and, 50gambling games, 50-51games of chance, 65-66outguessing the average guess, 7-9St. Petersburg paradox, 147-149stock-newsletter scam based on, 67-68stock options and, 116
probability theory, 135-136progressive taxation, 148psychology
anchoring effect, 19-20availability error, 21behind buying more stock as price
drops, 13-14confirmation bias, 21-22counterproductive behavior, 17-18endowment effect, 22scandal cover-ups, 24status quo bias, 22trying to outguess the masses, 5-7
publicly available information, see alsocommon knowledge
accounting scandals and, 63Efficient market hypothesis and, 59-60
pump and dump strategy, 33-34,123-124
Index 213
put options, see also stock optionsbuying/selling puts on S&P 500,
134as hedge against decline of stock, 119selling, 121strategies for using, 121-122valuation tools for, 122-123
pyramid schemes, 92-95
quarterly estimates, 20
RagingBull, 31-32railroads, depression of 1873, 113Ramsey, Frank, 29random events
appearance of order in, 66-67Efficient market hypothesis and, 62investing with meaning, 58-59vs. predictability, 48
random sequences, 194A Random Walk Down Wall Street
(Malkiel), 48, 62random walk theory, 63, 194–195rate of return
arithmetic mean outstripping geometricmean, 99
Beta (B) values and, 160determining, 139-140expected excess return, 160fixed, with treasury bills, 158IPO purchases/sales and, 96-98median vs. average, 99minimizing risk without reducing,
154"single index model" and, 159standard deviation and, 144-145stocks vs. bonds, 146
ratio of the excess return on a portfolio,158
reality, inability to model, 147reforms, accounting practices, 114regression to the mean
as contrarian measure, 107Sport Illustrated cover jinx as
illustration of, 108widespread examples of, 109
Reminiscences of a Stock Operator(Lefevre), 33
resistance levels, 45–-47, 48
risksaversion, illustrated by online
chatrooms, 32diversification and, 150graphing against expected value
(Markowitz optimal portfolios), 157market-related and stock-related, 162mathematics of, 136–137minimizing without hurting rate of
return, 154options and, 118rate of return and, 110selling short and, 126-127stocks vs. bonds, 144, 146taking unnecessary, 118
Roschach blots, 59Ross, Sheldon, 63roulette, 50-51rules, see trading strategiesrules of thumb, as time saving device, 25rumors
conclusions based on, 33not being able to ignore when
considering investments, 3
S-shaped curve, P/E ratio, 101S&P 500, buying/selling puts, 134Salomon Smith Barney, 14, 34Samuelson, Paul, 59scaling laws, see power lawscams
card tricks, 82Ponzi schemes, chain letters, and
pyramid schemes, 92-95sports betting scam, 76-82stock-newsletter scam, 67-68
scandals, see accounting scandals; fraudScholes, Myron, 121-122, 129script, sports scam, 75-83secrecy
complexity resulting from lack of, 190investment strategies and, 202
Securities and Exchange Commission(SEC)
charging WorldCom of inflatedearnings, 112
decimalization reforms, 70parable of common knowledge and,
11-12

214 Index
Security Analysis (Graham and Dodd), 106self-fulfilling beliefs, 27-28selling on the margin, see short sellingsensitive dependence, nonlinear systems,
173-174sequences
complexity of (mathematics of),193-194
random sequences, 194random walk theory and, 194-195
share price, P/E ratio, 100. see also prices,of stocks
Sharpe, William, 158-159Sherra, Jesse, 72Shiller, Robert, 15, 92, 146short selling, 126-127, 129short-term investors, 3-4shorting and distorting strategy, 35-36,
124Shubik, Martin, 55Sidgmore, John, 55Siegel, Jeremy, 92, 143-145"single index model" (Sharpe), 159six sigma performance, 140Slovic, Paul, 18Sluggish Market Hypothesis, 188-189Smith, Adam, 191socially regressive funds, 154, 155Spitzer, Eliot, 69-70, 111Sport Illustrated, 107-108spread, making money on, 70St. Petersburg paradox, 147-149standard deviation (d)
mean value and, 137-139of a portfolio, 150rate of return and, 144-145
start-ups, P/E ratio, 101statistical correlations
negatively correlated stocks, 151,154-155
random attributes resulting in, 57statistical independence, 163statistics, use by activists, 18status quo bias, 22-23Stevenson, Robert Louis, 94stock brokers/analysts
credibility of ratings, 35generating buy-sell rules from moving
averages, 43
online trading and, 71-72shady practices of, 34sources for investment ideas of, 149stock-picking contest in the Wall Street
Journal, 63stock markets
analogy for, 142-143applying parable of common knowledge
to, 11-12bear markets, 35-36, 58being right for the wrong reasons, 5-6Beta (B) values and, 160-161bull markets, 33, 58chance, 63common vs. private knowledge in,
191-192complexity changing over time, 190,
195-196conceptual mathematics and, 4-5despair and guilt over losses, 118efficiency of. see Efficient Market
HypothesisEuropean market causing reaction on
Wall Street, 163free market economy, 184Greenspan's impact on, 86herd-like nature of, 181IPOs in 1990s, 95lack of liquidity in world markets, 130market makers and, 70-71, 196-198media, 16predictability, see predictability, of stock
marketrandom phenomena and, 67randomness vs. predictability, 4, 48selling short as corrective to, 127Sluggish Market Hypothesis, 188-189volatility of, 15-16, 46, 71-72
stock-newsletter scam, 67-68stock options
Black-Scholes option formula, 122-123buying, 119-120counting as expenses, 115how they work, 119leverage in, 123-124reducing risk with, 118-119selling, 121strategies for using, 121valuation tools for, 122
Index 215
stock-pickingconfirmation bias and, 22contest in the Wall Street Journal, 63negative covariances and, 154PEG ratio, 104theory of portfolio selection, Variation
One, 157-158theory of portfolio selection, Variation
Three, 159theory of portfolio selection, Variation
Two, 158-159stock portfolios
balancing risk-free with optimal,158-159
Beta (B) values and, 160-161diversifying, 149-150Markowitz techniques for comparing,
157negatively correlated stocks, 151ratio of the excess return and, 158risks and, 162"single index model" (Sharpe), 159social and political basis of, 155-156stock selection based on negative
covariances, 154theory of portfolio selection, 157-159volatility of, 150-152
stock prices, see also P/E ratio; pricemovements
manipulating for own benefit(management/CEO), 123-124
oscillation created by investor reactionsto each other, 171
reflecting publicly availableinformation, 59-60
targets, 18-19, 20stock traders, see tradersstocks
Beta (B) values of, 160-161bonds vs., 143-145, 145-146getting what you pay for, 99-100insider trading and, 130-132overvaluation, 102price anomalies that lead to
predictability, 49price targets of, 18–19selecting, see stock-pickinguniformity of positive ratings, 14value stocks, 106
Stocks for the Long Run (Siegel), 92, 144stop-loss orders, 113strike prices, of stock options, 120subterranean information processing, 167support levels, 45–47, 48survivorship bias, 30–31
Taleb, Nassim, 134taxes, progressive, 148technical analysis
blackjack strategies as parallel to,50-51
Elliott wave theory, 38-39illusion of control created by, 57moving averages, 41–44as predictor of stock prices, 37vs. random-walk theory, 49resistance and support levels, 45—47sequence complexity and trading rules
and, 195trends and predictability, 47—49
telecommunications industry, 113-144Thaler, Richard
on calendar effects, 49contrarian anomalies in stock studies of,
106-107on counter-productive behavior, 18notion of mental accounts, 1, 24-25
thinly traded stockspump and dump strategy and, 33shorting and distorting strategy, 35
time saving, heuristic rules for, 25Titman, Sheridan, 47traders, see also investors
"blow up" and becoming "ghosts," 118irrational interactions between,
169-170technical traders and value traders,
167-168Wolfram model of interactions between,
170-171trading strategies, see also investment
strategies; predictability, of stockmarket
buy-sell rules, 43complexity of, 191, 192, 194-196data mining and, 28-30market predictions and, 171role of chance in, 28

216 Index
trading strategies (continued)technical traders vs. value traders,
167-168treasury bills, 158trend analysis, 37, 47. see also technical
analysisTversky, Amos, 18, 23
ultimatum games, 17undervalued stocks, lists of, 15unemployment, 172United Nations, 182UUNet division, WorldCom (WCOM),
85
value investing, see also fundamentalanalysis
accounting practices and, 110–116better returns than with growth
investing, 109contrarian basis of, 105contrasted with growth investing,
104-105risk and, 110
value stocks, 106Vanguard 500 fund,60,62-63variance from mean
as measure of risk, 136-137portfolio volatility and, 153
volatilityBeta (B) values and, 160diversification and, 150-152measuring with standard deviation, 138online trading and, 71-72options prices and, 123resistance and support levels and, 46stock market, 15stocks, 144treasury bills, 158
European market causing reaction on,163
variety of influences effecting,175-176
Wall Street Journal, 63Warner, Kurt, 107-108Web. see InternetWeill, Sanford, 169whim, 171. see also chancewindfall money, 1The Winner's Curse (Thaler), 18Wolff, Alexander, 108Wolff, Edward, 183Wolfram, Stephen, 170–171World Class Options Market Maker
(WCOMM), 196-198world markets, liquidity in, 130World Trade Center, 124WorldCom (WCOM)
acquisitions by, 93-94anchoring to fifty-two-week high, 20attempts to help out, 198-199board game, 142buying more as price drops, 13-14decision to sell, 200emotions dictating increased investment
in, 2guilt and despair over losses, 118impact of Ebbers sell-off, 23-24infatuation with, 201margin calls on, 128-129moving averages and, 43-44purchase of Digex as example of "losing
through winning," 55recommended as strong buy in 1990s,
1-2UUNet division, 85
Yahoo!, 31-32
Wall Street, see also stock markets Zipf's Law, 179