Trade Union Membership, UK 1995-2020: Statistical Bulletin
37
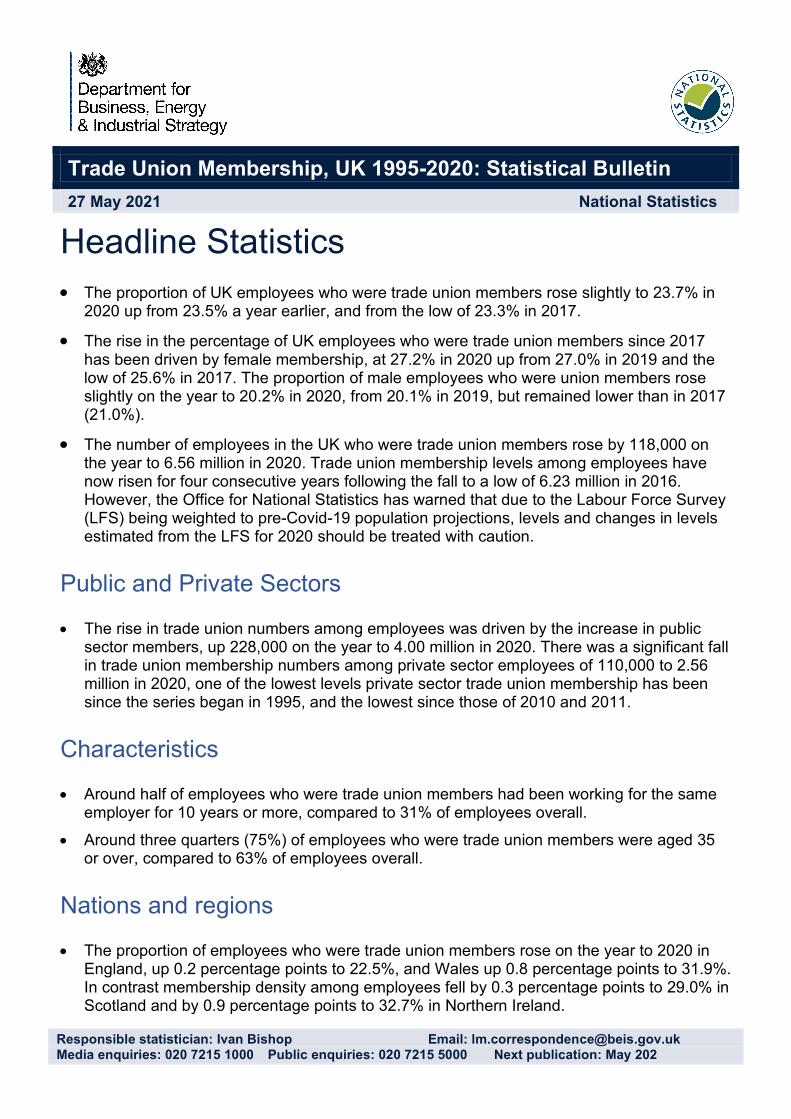
Responsible statistician: Ivan Bishop Email: [email protected] Media enquiries: 020 7215 1000 Public enquiries: 020 7215 5000 Next publication: May 202 Trade Union Membership, UK 1995-2020: Statistical Bulletin 27 May 2021 National Statistics Headline Statistics The proportion of UK employees who were trade union members rose slightly to 23.7% in 2020 up from 23.5% a year earlier, and from the low of 23.3% in 2017. The rise in the percentage of UK employees who were trade union members since 2017 has been driven by female membership, at 27.2% in 2020 up from 27.0% in 2019 and the low of 25.6% in 2017. The proportion of male employees who were union members rose slightly on the year to 20.2% in 2020, from 20.1% in 2019, but remained lower than in 2017 (21.0%). The number of employees in the UK who were trade union members rose by 118,000 on the year to 6.56 million in 2020. Trade union membership levels among employees have now risen for four consecutive years following the fall to a low of 6.23 million in 2016. However, the Office for National Statistics has warned that due to the Labour Force Survey (LFS) being weighted to pre-Covid-19 population projections, levels and changes in levels estimated from the LFS for 2020 should be treated with caution. Public and Private Sectors The rise in trade union numbers among employees was driven by the increase in public sector members, up 228,000 on the year to 4.00 million in 2020. There was a significant fall in trade union membership numbers among private sector employees of 110,000 to 2.56 million in 2020, one of the lowest levels private sector trade union membership has been since the series began in 1995, and the lowest since those of 2010 and 2011. Characteristics Around half of employees who were trade union members had been working for the same employer for 10 years or more, compared to 31% of employees overall. Around three quarters (75%) of employees who were trade union members were aged 35 or over, compared to 63% of employees overall. Nations and regions The proportion of employees who were trade union members rose on the year to 2020 in England, up 0.2 percentage points to 22.5%, and Wales up 0.8 percentage points to 31.9%. In contrast membership density among employees fell by 0.3 percentage points to 29.0% in Scotland and by 0.9 percentage points to 32.7% in Northern Ireland.
-
Upload
khangminh22 -
Category
Documents
-
view
5 -
download
0
Transcript of Trade Union Membership, UK 1995-2020: Statistical Bulletin
Responsible statistician: Ivan Bishop Email: [email protected] Media enquiries: 020 7215 1000 Public enquiries: 020 7215 5000 Next publication: May 202
Trade Union Membership, UK 1995-2020: Statistical Bulletin
27 May 2021 National Statistics
Headline Statistics
The proportion of UK employees who were trade union members rose slightly to 23.7% in 2020 up from 23.5% a year earlier, and from the low of 23.3% in 2017.
The rise in the percentage of UK employees who were trade union members since 2017 has been driven by female membership, at 27.2% in 2020 up from 27.0% in 2019 and the low of 25.6% in 2017. The proportion of male employees who were union members rose slightly on the year to 20.2% in 2020, from 20.1% in 2019, but remained lower than in 2017 (21.0%).
The number of employees in the UK who were trade union members rose by 118,000 on the year to 6.56 million in 2020. Trade union membership levels among employees have now risen for four consecutive years following the fall to a low of 6.23 million in 2016. However, the Office for National Statistics has warned that due to the Labour Force Survey (LFS) being weighted to pre-Covid-19 population projections, levels and changes in levels estimated from the LFS for 2020 should be treated with caution.
Public and Private Sectors
The rise in trade union numbers among employees was driven by the increase in public sector members, up 228,000 on the year to 4.00 million in 2020. There was a significant fall in trade union membership numbers among private sector employees of 110,000 to 2.56 million in 2020, one of the lowest levels private sector trade union membership has been since the series began in 1995, and the lowest since those of 2010 and 2011.
Characteristics
Around half of employees who were trade union members had been working for the same employer for 10 years or more, compared to 31% of employees overall.
Around three quarters (75%) of employees who were trade union members were aged 35 or over, compared to 63% of employees overall.
Nations and regions
The proportion of employees who were trade union members rose on the year to 2020 in England, up 0.2 percentage points to 22.5%, and Wales up 0.8 percentage points to 31.9%. In contrast membership density among employees fell by 0.3 percentage points to 29.0% in Scotland and by 0.9 percentage points to 32.7% in Northern Ireland.

Trade Union Membership Statistics, UK 1995-2020
2
Contents
Headline Statistics __________________________________________________________ 1
Public and Private Sectors __________________________________________________ 1
Characteristics ___________________________________________________________ 1
Nations and regions _______________________________________________________ 1
Introduction _______________________________________________________________ 3
Long term and recent trends __________________________________________________ 5
Public and Private Sectors ___________________________________________________ 14
Personal and job characteristics ______________________________________________ 17
Country and Regional Trends ________________________________________________ 19
Accompanying tables _______________________________________________________ 24
Technical information _______________________________________________________ 26
Concepts and definitions ____________________________________________________ 33
Further information _________________________________________________________ 34
Future updates to these statistics ____________________________________________ 34
Related statistics ________________________________________________________ 35
Revisions policy _________________________________________________________ 35
Uses of these statistics ____________________________________________________ 35
User engagement ________________________________________________________ 35
National Statistics designation ______________________________________________ 36
Pre-release access to statistics _____________________________________________ 36
Contact ________________________________________________________________ 36

Trade Union Membership Statistics, UK 1995-2020
3
Introduction
The Department for Business, Energy and Industrial Strategy is responsible for publishing the National Statistics on trade union membership. The statistics are published on an annual basis.
An annual question on trade union membership was introduced into the Labour Force Survey (LFS) in 1989 and it has been asked in the fourth quarter (Q4) every year since 1992. Questions on trade union presence were added in 1993, and the question on collective agreements between an employer and a trade union was introduced in 1996. The LFS trade union questions have United Kingdom coverage from 1995 onwards. The publication primarily produces UK statistics for the period 1995 to 2020, with some headline Great Britain statistics going back to 1989.
The bulletin primarily reports statistics on trade union membership among employees estimated from the Labour Force Survey (LFS). It also reports on:
Trade union membership among those in employment, from the LFS (tables 1.3a, 1.3b) Trade union presence in the workplace, from the LFS (tables 1.10, 2.4a and 4.3) Whether employee’s pay and terms and conditions are directly affected by agreements
between the employer and a trade union (tables 1.10, 1.11, 2.4b and 4.3) Administrative statistics on trade union membership collected by government (table
1.1a)
Official government statistics on trade union membership have been collected on a regular basis since 1892 from administrative records. Coverage of the data relates to unions scheduled or listed in Great Britain but will include union members from outside the UK as well as union members not in employment.
The statistics provide a record of collective representation of employees in the UK workforce and how it has changed over time. The information is mainly reported as the proportion of employees that were trade union members (trade union membership density), but some data on membership numbers is included. These estimates are also presented by age, gender, ethnicity, income, major occupation, industry, full and part-time employment, sector, nation, and region.
The data reported in this bulletin are published in the accompanying spreadsheets.
About Labour Market Analysis
Labour Market Analysis is a multi-disciplinary team of economists, social researchers and statisticians based in the Labour Market Directorate of the Department for Business, Energy and Industrial Strategy. Members of the team are responsible for producing this bulletin.
Conventions
The statistics presented in this bulletin are based on fourth quarter estimates (October to December) from the Labour Force Survey unless otherwise specified. Members of the armed

Trade Union Membership Statistics, UK 1995-2020
4
forces are excluded from analysis. All tables and charts relate to employees (population aged 16 or over in paid employment) or those in employment in the United Kingdom with the exception of those specified in Chapter 1 (Long Term Trends).
More detailed information on the concepts, methods, and quality of data used in this bulletin is available in the technical information and concepts and definitions sections.
Symbols
The following symbols are used in the accompanying tables:
* sample size too small for a reliable estimate
- data not available
Weighting
This publication uses the latest available Labour Force Survey weights for each year for its statistics. For the datasets for the years 2011 to 2020, the latest available weights are the 2018 weights.
The ONS published an article which describes the new LFS weighting methodology (more robust data on migration), which will be applied to results from July 2021. In the article the ONS estimated that with the new weighting the unemployment rate would have been 0.2 percentage points higher than the current weightings gave for October to December 2020. However, rates published from the LFS remain robust; but figures regarding levels and changes in levels should be used with caution.
Covid-19
The ONS has stated that due to the impact of Covid-19, the LFS has been affected due to the weighting of LFS responses to official 2018-based population projections on demographic trends that pre-date the pandemic. The ONS states in its latest (May 2021) Labour Market Statistics that the rates published from the LFS for 2020 onwards remain robust. However, levels and changes in levels should be treated with caution. ONS specifies that this issue will particularly affect estimates for ethnicity, disability, country of birth and nationality.
Trade Union Membership Statistics, UK 1995-2020
5
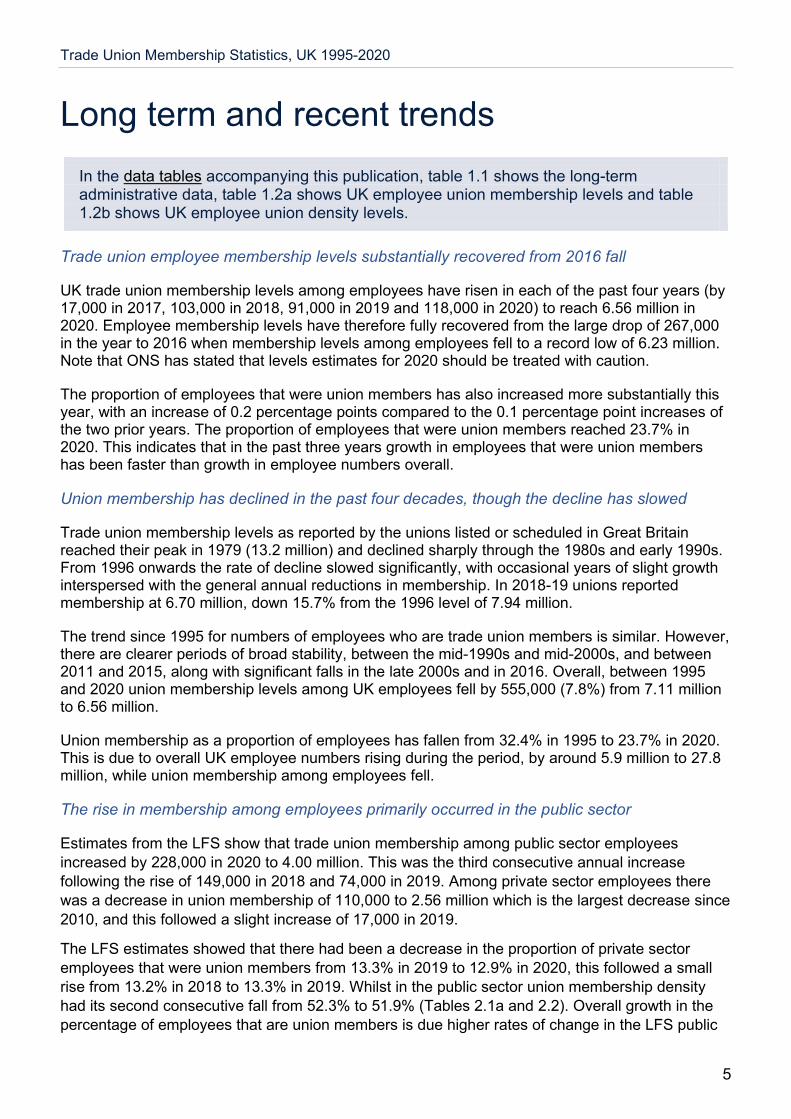
Long term and recent trends
In the data tables accompanying this publication, table 1.1 shows the long-term administrative data, table 1.2a shows UK employee union membership levels and table 1.2b shows UK employee union density levels.
Trade union employee membership levels substantially recovered from 2016 fall
UK trade union membership levels among employees have risen in each of the past four years (by 17,000 in 2017, 103,000 in 2018, 91,000 in 2019 and 118,000 in 2020) to reach 6.56 million in 2020. Employee membership levels have therefore fully recovered from the large drop of 267,000 in the year to 2016 when membership levels among employees fell to a record low of 6.23 million. Note that ONS has stated that levels estimates for 2020 should be treated with caution.
The proportion of employees that were union members has also increased more substantially this year, with an increase of 0.2 percentage points compared to the 0.1 percentage point increases of the two prior years. The proportion of employees that were union members reached 23.7% in 2020. This indicates that in the past three years growth in employees that were union members has been faster than growth in employee numbers overall.
Union membership has declined in the past four decades, though the decline has slowed
Trade union membership levels as reported by the unions listed or scheduled in Great Britain reached their peak in 1979 (13.2 million) and declined sharply through the 1980s and early 1990s. From 1996 onwards the rate of decline slowed significantly, with occasional years of slight growth interspersed with the general annual reductions in membership. In 2018-19 unions reported membership at 6.70 million, down 15.7% from the 1996 level of 7.94 million.
The trend since 1995 for numbers of employees who are trade union members is similar. However, there are clearer periods of broad stability, between the mid-1990s and mid-2000s, and between 2011 and 2015, along with significant falls in the late 2000s and in 2016. Overall, between 1995 and 2020 union membership levels among UK employees fell by 555,000 (7.8%) from 7.11 million to 6.56 million.
Union membership as a proportion of employees has fallen from 32.4% in 1995 to 23.7% in 2020. This is due to overall UK employee numbers rising during the period, by around 5.9 million to 27.8 million, while union membership among employees fell.
The rise in membership among employees primarily occurred in the public sector
Estimates from the LFS show that trade union membership among public sector employees increased by 228,000 in 2020 to 4.00 million. This was the third consecutive annual increase following the rise of 149,000 in 2018 and 74,000 in 2019. Among private sector employees there was a decrease in union membership of 110,000 to 2.56 million which is the largest decrease since
2010, and this followed a slight increase of 17,000 in 2019.
The LFS estimates showed that there had been a decrease in the proportion of private sector employees that were union members from 13.3% in 2019 to 12.9% in 2020, this followed a small rise from 13.2% in 2018 to 13.3% in 2019. Whilst in the public sector union membership density had its second consecutive fall from 52.3% to 51.9% (Tables 2.1a and 2.2). Overall growth in the percentage of employees that are union members is due higher rates of change in the LFS public

Trade Union Membership Statistics, UK 1995-2020
6
sector employee figures compared to the private sector, and the much higher rates of employee
union membership in the public sector relative to employees overall.
It should be pointed out that the LFS estimates for employees in the public and private sector differ from the Office for National Statistics Public Sector Employment statistical release. The LFS bases its definition of sector according to how individuals define whether the organisation they work for is a private company (private business or limited company) or some other organisation (and if so, what type of organisation, from central government to charity to public limited company to grant funded organisation etc). The ONS release is based on a survey of public sector employers in accordance with the UK National Accounts sector definitions. Overall, the LFS sector variable estimates public sector employment at around 7.7 million in 2020. This compares to a 5.6 million figure for December 2020 from the ONS March 2021 release. It is the main public sector industries (Public Administration and Defence, Education and Human Health and Social Work) that predominantly account for the difference between the LFS public sector estimate and the figures reported in the ONS release.
Figure 1: Trade union membership levels in the UK, 1892 to 2020
Source: Administrative data on union membership from Department for Employment (1892-1973); and the Certification Office (1974-2019). Data on UK employees that are trade union members is based on the Labour Force Survey, Office for National Statistics
0
2,000
4,000
6,000
8,000
10,000
12,000
14,000
1892 1900 1908 1916 1924 1932 1940 1948 1956 1964 1972 1980 1988 1996 2004 2012 2020
tho
usa
nd
s
Trade union members (administrative data) Employees that are union members, UK
Employees that are union members, GB

Trade Union Membership Statistics, UK 1995-2020
7
Figure 2: Trade union membership levels in the UK, 1995 to 2020
Source: Administrative data on union membership from Department for Employment (1892-1973); and the Certification Office (1974-2019). Data on UK employees that are trade union members is based on the Labour Force Survey, Office for National Statistics
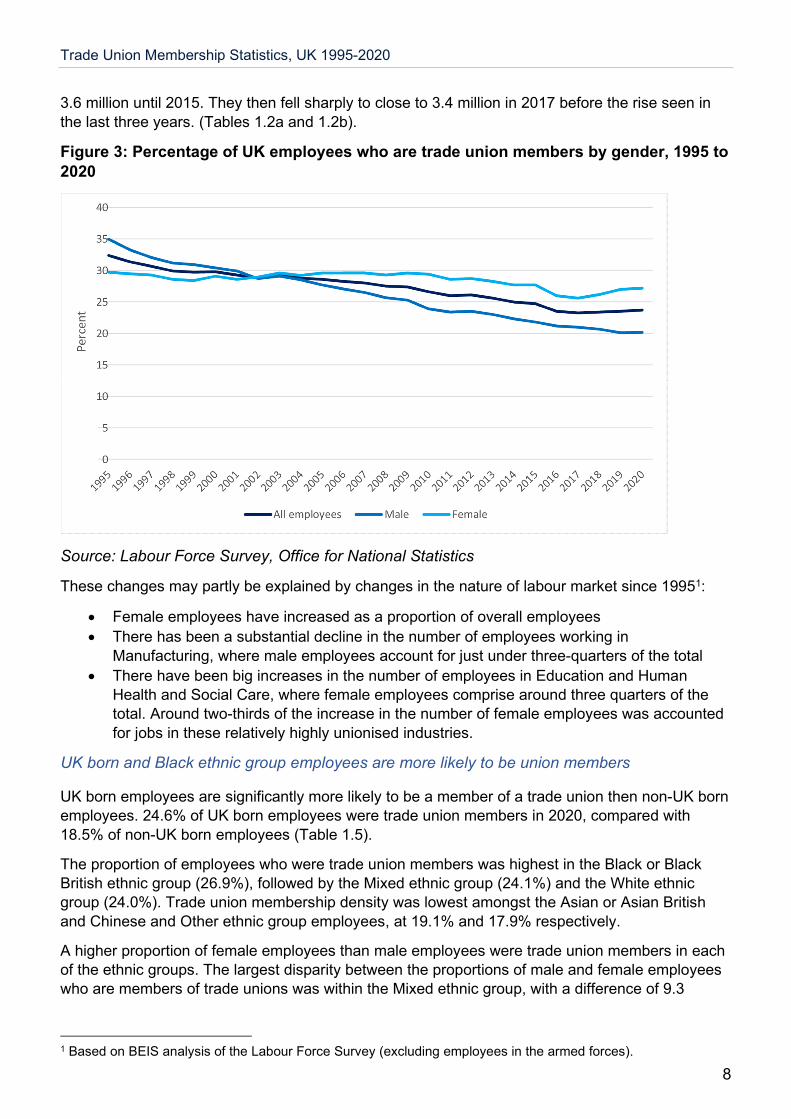
Female employee union membership rates rise again, with levels reaching a series high
The proportion of female employees who are members of trade unions increased by 0.2 percentage points to 27.2% in 2020, the third rise in succession flowing the fall to 25.6% in 2017.
However, female membership density remains below that of 27.7% in 2015.
The number of UK female employees who were union members rose by 72,000 to 3.76 million in 2020. This was the highest level recorded since the series began in 1995 and follows on from the
previous highest in 2019 of 3.69 million.
Meanwhile, the proportion of UK male employees who were in a trade union in 2020 increased marginally to 20.2%, after falling to a series low in 2019. Membership levels for male employees increased by 46,000 on the year to 2.80 million in 2020, following two years of membership levels decline.
These figures reflect the longer-term trend that the decline in the proportion of employees who are trade union members since 1995 has been significantly weaker for women than men. In 1995, the proportion of male employees who belonged to a trade union was around 35%, compared with just below 30% for female employees. High falls in union membership densities among male employees narrowed the gap between males and females. In 2002, the proportion of employees
who belonged to a trade union was around 29% for both genders.
These trends continued between 2002 and 2020, with union member densities among male employees falling by 8.5 percentage points from 28.7% in 2002 to 20.2% in 2020. Over the same period the proportion of female employees with union membership had remained comparatively
stable, decreasing by 1.7 percentage points.
Membership levels among UK male employees have fallen throughout the period from 1995, though the rate of decline has slowed since 2011. UK female employee membership levels increased between 2000 and 2007, then dipped slightly before stabilising at around (or just below)
4,000
4,500
5,000
5,500
6,000
6,500
7,000
7,500
8,000
8,500
tho
usa
nd
s
Trade union members (administrative data) Employees that are union members, UK
Trade Union Membership Statistics, UK 1995-2020
8
3.6 million until 2015. They then fell sharply to close to 3.4 million in 2017 before the rise seen in
the last three years. (Tables 1.2a and 1.2b).
Figure 3: Percentage of UK employees who are trade union members by gender, 1995 to 2020
Source: Labour Force Survey, Office for National Statistics
These changes may partly be explained by changes in the nature of labour market since 19951:
Female employees have increased as a proportion of overall employees
There has been a substantial decline in the number of employees working in
Manufacturing, where male employees account for just under three-quarters of the total
There have been big increases in the number of employees in Education and Human Health and Social Care, where female employees comprise around three quarters of the total. Around two-thirds of the increase in the number of female employees was accounted
for jobs in these relatively highly unionised industries.
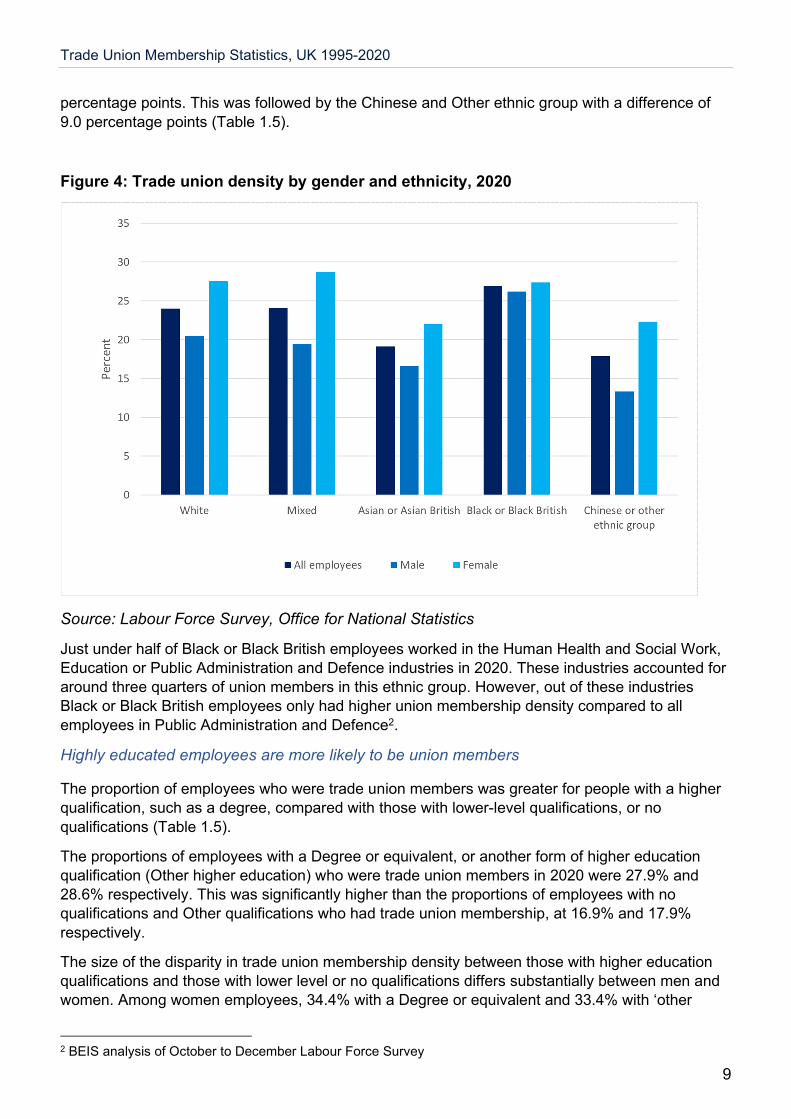
UK born and Black ethnic group employees are more likely to be union members
UK born employees are significantly more likely to be a member of a trade union then non-UK born employees. 24.6% of UK born employees were trade union members in 2020, compared with
18.5% of non-UK born employees (Table 1.5).
The proportion of employees who were trade union members was highest in the Black or Black British ethnic group (26.9%), followed by the Mixed ethnic group (24.1%) and the White ethnic group (24.0%). Trade union membership density was lowest amongst the Asian or Asian British
and Chinese and Other ethnic group employees, at 19.1% and 17.9% respectively.
A higher proportion of female employees than male employees were trade union members in each of the ethnic groups. The largest disparity between the proportions of male and female employees who are members of trade unions was within the Mixed ethnic group, with a difference of 9.3
1 Based on BEIS analysis of the Labour Force Survey (excluding employees in the armed forces).
Trade Union Membership Statistics, UK 1995-2020
9
percentage points. This was followed by the Chinese and Other ethnic group with a difference of
9.0 percentage points (Table 1.5).
Figure 4: Trade union density by gender and ethnicity, 2020
Source: Labour Force Survey, Office for National Statistics
Just under half of Black or Black British employees worked in the Human Health and Social Work, Education or Public Administration and Defence industries in 2020. These industries accounted for around three quarters of union members in this ethnic group. However, out of these industries Black or Black British employees only had higher union membership density compared to all
employees in Public Administration and Defence2.
Highly educated employees are more likely to be union members
The proportion of employees who were trade union members was greater for people with a higher qualification, such as a degree, compared with those with lower-level qualifications, or no
qualifications (Table 1.5).
The proportions of employees with a Degree or equivalent, or another form of higher education qualification (Other higher education) who were trade union members in 2020 were 27.9% and 28.6% respectively. This was significantly higher than the proportions of employees with no qualifications and Other qualifications who had trade union membership, at 16.9% and 17.9%
respectively.
The size of the disparity in trade union membership density between those with higher education qualifications and those with lower level or no qualifications differs substantially between men and women. Among women employees, 34.4% with a Degree or equivalent and 33.4% with ‘other
2 BEIS analysis of October to December Labour Force Survey
Trade Union Membership Statistics, UK 1995-2020
10
higher education’ qualifications were union members, compared to 19.8% or lower for those with lower levels of qualification or no qualifications. However, among male employees the difference was only around 8.7 percentage points between the 23.4% of those with an ‘other higher
education’ qualification and the 14.7% with no qualifications who are union members.
Employees in larger workplaces are more likely to have a union presence in their workplace
Employees who worked in larger workplaces (with 50 or more staff) were more likely to be members of a trade union and were more likely to have a trade union presence in the workplace. They were also more likely to have their pay directly affected by a collective agreement between their employer and a trade union (Table 1.10).
The proportion of employees who belonged to a trade union in larger workplaces was 30.5% in 2020, compared to 15.4% of employees who are employed in a smaller workplace (less than 50 employees). 65.7% of employees working in larger workplaces had a trade union presence in the workplace, compared to 31.5% of employees based in smaller workplaces. The proportion of employees whose pay was affected by a collective agreement between their employer and a union
was 35.1% in larger workplaces and 14.2% in smaller workplaces (Table 1.10).
The proportions of employees who belong to a trade union were significantly higher in the Education sector (51.4%) and in Public Administration and Defence (42.4%) than for the UK economy as a whole (23.7%). Consequently, a high proportion of employees in both industries had a union presence in their workplace (85.6% in Education, and 82.1% in Public Administration and Defence). Similarly, in both industries a high proportion of employees had their pay influenced by collective agreements between their employer and a trade union (56.4% in Public Administration
and Defence, and 48.9%% in Education) (Table 1.10).
Northern Ireland was the nation with the highest proportion of employees whose pay was affected by collective agreements between their employer and a trade union (43.5%), whilst among English
regions it was Yorkshire and the Humber (30.1%) (Table 1.10).
Alternative information on collective agreements suggest they are more widespread
The Annual Survey of Hours and Earnings (ASHE) also collects information on collective agreements. ASHE collects information from employers about around 180,000 workers each year in April (around 136,000 in 2020). It asks if the worker’s pay was set with reference to an agreement covering more than one employee (for instance pay may be agreed collectively by a trade union or workers’ committee). The question is slightly broader than the LFS question and covers jobs rather than individuals (as individuals can have more than one job, so the employer can only provide information on the job rather than comprehensive information on the worker). For 2020, the ASHE data shows that around 38.7% of jobs had pay set by an agreement covering multiple employees (primarily through National or industry agreements, followed by organisational agreements). In the Public Sector around 90% of jobs had pay set by such agreements according to ASHE, compared to around 20% of jobs in the Private Sector. As discussed in the technical information section below, one factor in the difference between the LFS and ASHE figures is likely to be a lack of awareness among some individuals about how their terms and conditions are set.
Employees in permanent jobs and full-time jobs are more likely to be trade union members
Overall, 24.1% of employees in permanent positions belonged to a trade union in 2020, compared
to 17.9% of employees in temporary positions (Table 1.4).
Trade Union Membership Statistics, UK 1995-2020
11
A higher proportion of full-time employees (24.4%) compared to part-time employees (21.5%) had trade union membership in 2020. This trend was reflected across the majority of industries and
occupations, the exceptions being:
Professional occupations (36.5% full-time, compared to 50.6% part-time),
Wholesale and Retail Trade (13.3% full-time, 14.3% part-time),
Financial and Insurance Activities (10.2% full-time, 19.5% part-time),
Professional, Scientific and Technical Activities (8.3%full-time, 8.6% part-time), Administrative and support service activities (11.1% full-time, 14.0% part-time) (Table 1.4).
Of those employees who were members of a trade union in 2020, 78.6% worked full-time, above the proportions working full-time among all UK employees (76.6%), and employees who are not
union members (75.7%) (Table 3.1).
Middle-income earners are more likely to be trade union members
Higher proportions of employees within the middle earnings bands (weekly earnings between £250 and £999) had trade union membership relative to employees whose earnings fell into the lower band (less than £250 per week) or the upper earnings band (£1,000 and above per week) (Table 1.5). The proportions of employees who were trade union members by weekly earnings in 2020
were:
12.6% of those earning less than £250
24.1% of those earning between £250 and £499
30.5% of those earning between £500 and £999
17.9% of those earning £1,000 or more
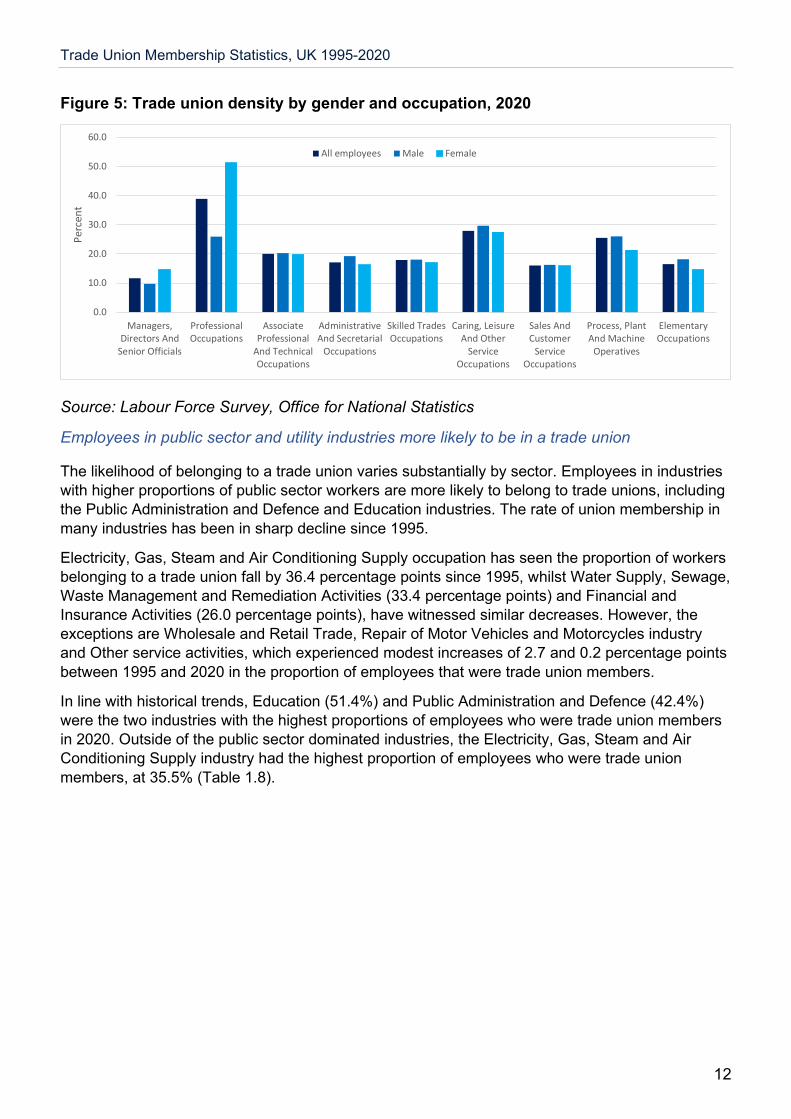
Employees in professional occupations are more likely to be trade union members
Those working in Professional occupations accounted for over four-in-ten (41.6%) of employees who were trade union members in 2020, but only 24.5% of UK employees overall, indicating that this occupational group is relatively highly unionised. The other occupations which accounted for a higher proportion of employees who were trade union members than employees overall were Caring, Leisure and Other Service occupations (10.0% compared to 8.7%) and Process, Plant and
Machine Operatives (5.3% compared to 5.1%) (Table 3.1).
This was reflected in the high proportion of employees in Professional occupations that were trade union members in 2020 (38.9%). However, this was 6.7 percentage points lower than in 2011 (45.5%). Union membership density fell in almost all the occupation groups between 2011 and 2020, the only exemption was in sales and Customer Service Occupations which increased by 0.6 percentage points between 2011 and 2020. Comparison with earlier years is affected by the change in Standard Occupational Classification (SOC) definitions introduced to the LFS in 2011. For instance, the decrease in the proportion of employees within Associate Professional and Technical occupations who were trade union members, from 40.2% in 2010 to 20.0% in 2020 is mainly explained by the moving of nurses and midwives, and therapy professionals, both relatively highly unionised occupations, into the Professional group in the 2010 SOC definitions, from
‘Associate Professional and Technical’ (Tables 1.7a and 1.7b).
Male employees had higher union membership proportions in seven of the nine occupation groups, with female employees only having higher proportions in Professional occupations and among
Managers, Directors and Senior Officials (Table 1.4).
Trade Union Membership Statistics, UK 1995-2020
12
Figure 5: Trade union density by gender and occupation, 2020
Source: Labour Force Survey, Office for National Statistics
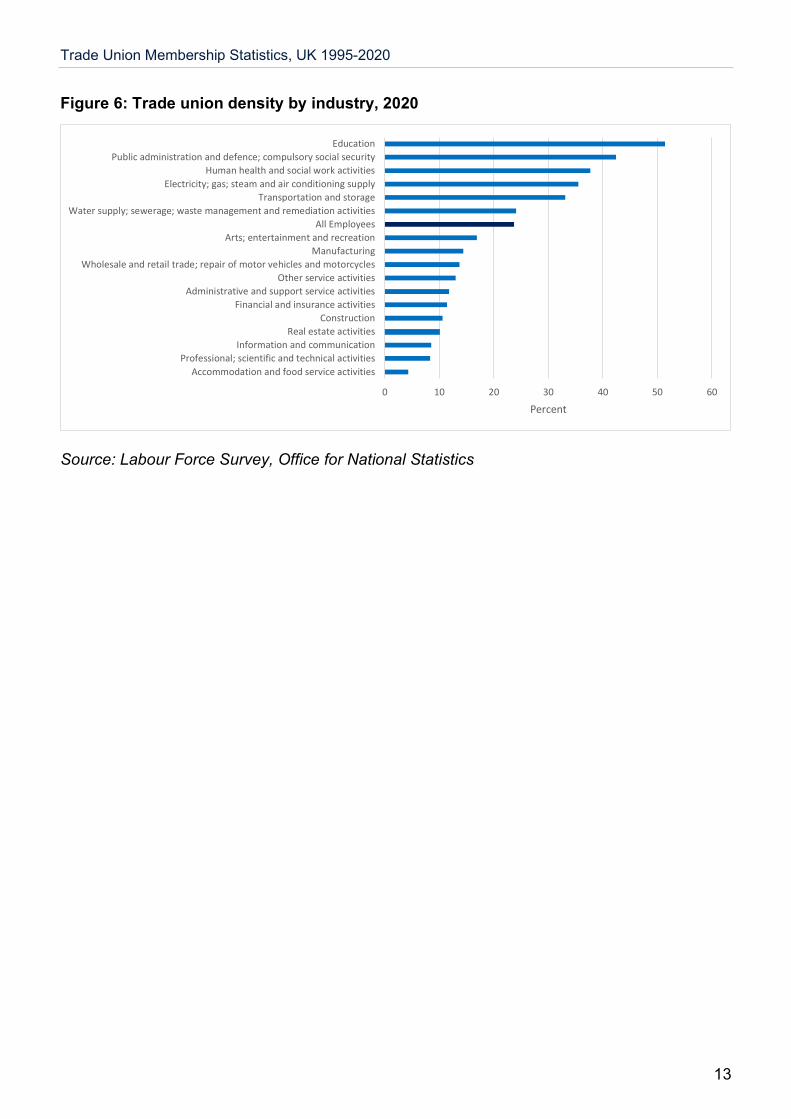
Employees in public sector and utility industries more likely to be in a trade union
The likelihood of belonging to a trade union varies substantially by sector. Employees in industries with higher proportions of public sector workers are more likely to belong to trade unions, including the Public Administration and Defence and Education industries. The rate of union membership in
many industries has been in sharp decline since 1995.
Electricity, Gas, Steam and Air Conditioning Supply occupation has seen the proportion of workers belonging to a trade union fall by 36.4 percentage points since 1995, whilst Water Supply, Sewage, Waste Management and Remediation Activities (33.4 percentage points) and Financial and Insurance Activities (26.0 percentage points), have witnessed similar decreases. However, the exceptions are Wholesale and Retail Trade, Repair of Motor Vehicles and Motorcycles industry and Other service activities, which experienced modest increases of 2.7 and 0.2 percentage points
between 1995 and 2020 in the proportion of employees that were trade union members.
In line with historical trends, Education (51.4%) and Public Administration and Defence (42.4%) were the two industries with the highest proportions of employees who were trade union members in 2020. Outside of the public sector dominated industries, the Electricity, Gas, Steam and Air Conditioning Supply industry had the highest proportion of employees who were trade union
members, at 35.5% (Table 1.8).
0.0
10.0
20.0
30.0
40.0
50.0
60.0
Managers,Directors And
Senior Officials
ProfessionalOccupations
AssociateProfessional
And TechnicalOccupations
AdministrativeAnd Secretarial
Occupations
Skilled TradesOccupations
Caring, LeisureAnd Other
ServiceOccupations
Sales AndCustomer
ServiceOccupations
Process, PlantAnd Machine
Operatives
ElementaryOccupations
Per
cen
t
All employees Male Female
Trade Union Membership Statistics, UK 1995-2020
13
Figure 6: Trade union density by industry, 2020
Source: Labour Force Survey, Office for National Statistics
0 10 20 30 40 50 60
Accommodation and food service activities
Professional; scientific and technical activities
Information and communication
Real estate activities
Construction
Financial and insurance activities
Administrative and support service activities
Other service activities
Wholesale and retail trade; repair of motor vehicles and motorcycles
Manufacturing
Arts; entertainment and recreation
All Employees
Water supply; sewerage; waste management and remediation activities
Transportation and storage
Electricity; gas; steam and air conditioning supply
Human health and social work activities
Public administration and defence; compulsory social security
Education
Percent

Trade Union Membership Statistics, UK 1995-2020
14
Public and Private Sectors
In the data tables accompanying this publication, tables 2.1a and b show employee numbers split by union membership and sector, table 2.2 shows union membership densities by sector, tables 2.4 a and b cover union presence and collective agreements
This section is based on analysis of the Labour Force Survey. Therefore, it differs from the statistics published by the ONS in its Public Sector Employment Release, as discussed on page 6. Trade union membership levels among public sector employees continue to recover
In 2020, the number of public sector employees belonging to a trade union increased by 228,000 on the year to 4.00 million in 2020, continuing the recovery from the series low of 3.55 million in 2017. In 2020, private sector trade union membership levels fell, down 110,000, to 2.56 million in 2020. Overall, since 2010, union membership levels have increased by 3.0% in the private sector, while falling by 2.6% in the public sector. These changes may be at least in part due to transfers of jobs from the public sector into the private sector (for instance with the Royal Mail in September
2013).
This contrasted with the previous decade, when public sector union membership accounted for an increasing proportion of overall union membership among employees in the period up to 2010. This was driven by a steady rise in the public sector membership levels in the 2000s up to 2005, followed by a period of stability until 2010. Public sector membership levels rose by 381,000 between 1995 and 2010. Over the same period, private sector union membership levels declined
by 905,000 (Table 2.1a).
Figure 7: Trade union membership levels among employees by sector, 1995 to 2020

Trade Union Membership Statistics, UK 1995-2020
15
Source: Labour Force Survey, Office for National Statistics. The overall proportion of employees who are members of trade unions is significantly higher in the public sector relative to the private sector. 12.9% of private sector employees belonged to a trade union, compared to 51.9% of public sector employees, in 2020. The proportion of private sector employees in a union fell slightly from 13.3% in 2019 to 12.9% in 2020. Across the same period
union membership density among public sector employees fell from 52.3% to 51.9%.
A higher proportion of female employees than male employees were trade union members in the public sector in 2020, at 53.6% and 48.5% respectively. However, within the private sector male employees are more likely to be trade union members, at 13.5% in 2020 compared to 12.0% for
female private sector employees (Table 2.1a, 2.1b and 2.2).
Figure 8: Employee composition by trade union membership and sector, 1995, 2010 and 2020
Source: Labour Force Survey, Office for National Statistics

Trade Union Membership Statistics, UK 1995-2020
16
Figure 9: Trade union density by sector, 1995 to 2020
Source: Labour Force Survey, Office for National Statistics
The trade union wage gap has fallen
The trade union wage gap, defined as the percentage difference in average gross hourly earnings of union members compared with non-members, has decreased for employees in the public sector from 17.7% in 2019 to 9.4% in 2020. The private sector trade union wage gap also decreased on the year, from 3.6% in 2019 to -3.6% in 2020 this is the first time that non-union members in the
private sector had higher average gross hourly earnings than union-members (Table 2.3).
Several factors influence this figure, and the size of the premium is likely to be strongly influenced by other differences in the characteristics of unionised and non-unionised employees. It should also be noted that where pay is determined by collective agreements, these are likely to apply to
both unionised and non-unionised employees in the bargaining unit (Table 2.4b).
Trade Union Membership Statistics, UK 1995-2020
17
Personal and job characteristics
In the data tables accompanying this publication, table 3.1 compares the personal and job characteristics of employees who are union members, not union members and employees overall.
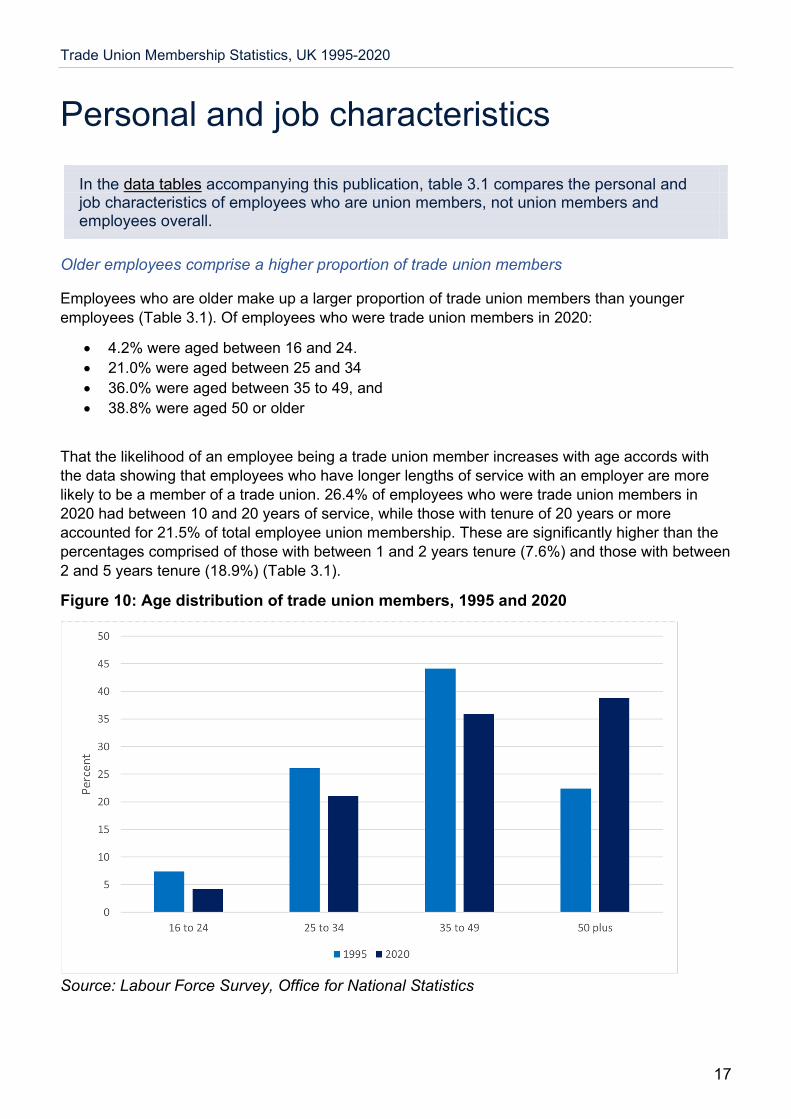
Older employees comprise a higher proportion of trade union members
Employees who are older make up a larger proportion of trade union members than younger
employees (Table 3.1). Of employees who were trade union members in 2020:
4.2% were aged between 16 and 24.
21.0% were aged between 25 and 34
36.0% were aged between 35 to 49, and
38.8% were aged 50 or older
That the likelihood of an employee being a trade union member increases with age accords with the data showing that employees who have longer lengths of service with an employer are more likely to be a member of a trade union. 26.4% of employees who were trade union members in 2020 had between 10 and 20 years of service, while those with tenure of 20 years or more accounted for 21.5% of total employee union membership. These are significantly higher than the percentages comprised of those with between 1 and 2 years tenure (7.6%) and those with between
2 and 5 years tenure (18.9%) (Table 3.1).
Figure 10: Age distribution of trade union members, 1995 and 2020
Source: Labour Force Survey, Office for National Statistics
Trade Union Membership Statistics, UK 1995-2020
18
Employees with disabilities are more likely to be a member of a trade union
29.6% of employees who have a disability under the Equality Act 2010 were members of a trade union in 2020, above the 22.7% membership rate for employees who do not have a disability
(Table 1.5).
Employees who are disabled under the Equality Act 2010 comprised 17.9% of employees who were trade union members in 2020, a higher proportion than they accounted for of UK employees
overall, at 14.2% (Table 3.1).
In previous years, this bulletin has reported on the LFS variable covering current and/or work limiting disabilities, rather than disability as defined under the Equality Act 2010. A time series
comparison of these two variables is provided in the tables in A19 a and b.
Foremen or supervisors are more likely to be trade union members
Employees who are foremen or supervisors are more likely to be members of a trade union relative to managers and those who are not managers or supervisors. 32.1% employees who were in foreman or supervisor roles were members of a trade union in 2020, significantly higher than the 22.2% of managers and the 23.0% without managerial or supervisory responsibility who were
affiliated with a union (Table 1.5).

Trade Union Membership Statistics, UK 1995-2020
19
Country and Regional Trends
In the data tables accompanying this publication, table 4.1 shows trade union membership density in the UK nations and English regions, while table 4.2 shows their membership levels, for 1995 to 2020. Table 4.3 shows data for 20 UK regions for 2020.
Employees in the English northern regions and other Nations more likely to be trade union members
In 2020, the northern regions of England had higher proportions of employees with trade union membership than Southern regions. The North East (29.7%), North West (28.2%) and Yorkshire and the Humber (26.6%), had higher densities of trade union membership than the other English regions. The East Midlands (23.8%) and West Midlands (22.8%) were also above the England average of 22.5%. Meanwhile London (18.7%), the South East (19.6%), the South West (21.5%)
and the East of England (19.1%) were all below the England average (Table 4.1).
Northern Ireland (32.7%) and Wales (31.9%) had higher proportions of employees in unions than all the England regions, with Scotland (29.0%) having higher union membership density than all
English regions apart from the North East.
Figure 11: Trade union density by nation and region, 2020
Source: Labour Force Survey, Office for National Statistics
England and Wales experienced increases in the proportion of employees who were trade union members between 2019 and 2020. In Wales, union membership density rose by 0.8 percentage points to 31.9%, while in England there was a 0.2 percentage point rise to 22.5%. However, in Northern Ireland and Scotland the proportion of employee trade union members fell by 0.9 and 0.3
0 5 10 15 20 25 30 35
London
East of England
South East
South West
England
West Midlands
United Kingdom
East Midlands
Yorkshire and the Humber
North West
Scotland
North East
Wales
Northern Ireland
Percent
Trade Union Membership Statistics, UK 1995-2020
20
percentage points respectively between 2019 and 2020, to 32.7% in Northern Ireland and 29.0 in
Scotland (Table 4.1).
Between 2019 and 2020, six English regions experienced an increase in the proportions of employees that were union members, with the biggest increase being in Yorkshire and the Humber, up 2.1 percentage points to 26.6%. There were also 1.0 percentage point increases in union membership density in London and the South East, up to 18.7% and 19.6% respectively. In contrast, the largest fall in the proportion of employees that were union members was in the East of
England from 20.9% to 19.1% (Table 4.1).
Since 1995, Northern Ireland has recorded a 9.5 percentage point fall in the proportion of employees who are trade union members, while Wales and Scotland, over the same period, has experienced a 12.5 and 9.9 percentage point fall respectively. These three decreases are higher than the 8.7 percentage point fall in the proportion of employees who are members of a trade union
recorded for the UK as a whole since 1995.
Trade union membership levels increase in England and Wales
There were increases in the level of employees who had trade union membership in England and Wales, between 2019 and 2020. England experienced the largest change in membership levels, increasing by 115,000 to 5,251,000. This was primarily driven by increases in membership levels in London, the South East and Yorkshire and the Humber. Membership levels rose by 18,000 in Wales, to 407,000. In Northern Ireland, union membership levels fell by 10,000 to 235,000 while there was a smaller 5,000 fall in membership levels in Scotland, to 665,000 (Table 4.2).

Trade Union Membership Statistics, UK 1995-2020
21
Figure 12 shows the proportion of employees who are members of a trade union broken down by 20 geographical regions and nations across the UK in 2020. Merseyside (34.5%) and Tyne and Wear (33.5%) had the highest proportions of workers who were members of trade unions, followed by Northern Ireland (32.7%) and Strathclyde (32.3%). Inner London (17.7%) had the lowest proportion of workers affiliated to a trade union, with the East of England (19.1%) and Outer London (19.5%) next lowest (Table 4.3).
Figure 12: Trade union membership as a proportion of employees, by region, UK employees, 2020

Trade Union Membership Statistics, UK 1995-2020
22
Figure 13 shows the percentage of employees with a trade union presence in the workplace in the 20 geographical regions. Tyne and Wear had the highest rates in the UK, with 62.1% of employees having a trade union presence in their workplace, followed by Wales at 60.2%. Outer London had the lowest rate of trade union presence, with 42.5% of employees having a trade union presence in their workplace.
Figure 13: Employees with a trade union presence in their workplace by region, per cent, 2020
Trade Union Membership Statistics, UK 1995-2020
23
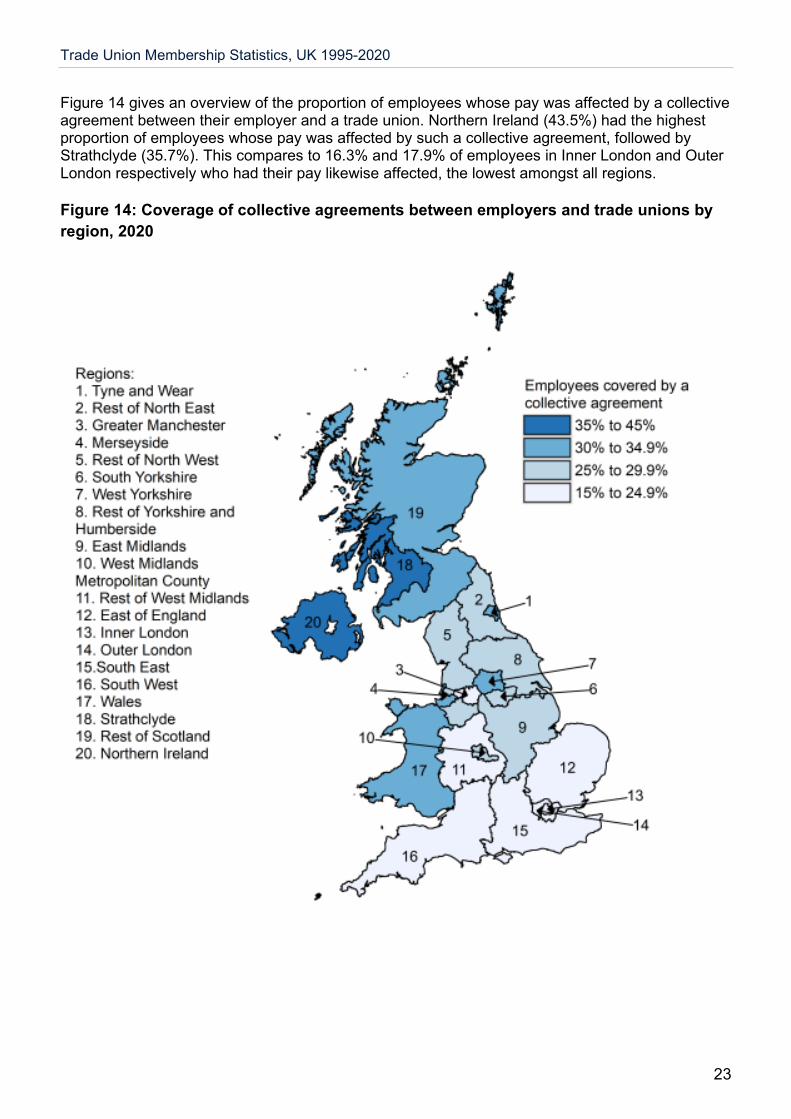
Figure 14 gives an overview of the proportion of employees whose pay was affected by a collective agreement between their employer and a trade union. Northern Ireland (43.5%) had the highest proportion of employees whose pay was affected by such a collective agreement, followed by Strathclyde (35.7%). This compares to 16.3% and 17.9% of employees in Inner London and Outer London respectively who had their pay likewise affected, the lowest amongst all regions.
Figure 14: Coverage of collective agreements between employers and trade unions by
region, 2020
Trade Union Membership Statistics, UK 1995-2020
24
Accompanying tables
The following tables are available in open source format on the department’s statistics website https://www.gov.uk/government/statistics/trade-union-statistics-2020 Table 1.1 Trade union membership, unions registered, listed or scheduled in Great Britain,
1892 to 2018-19 Table 1.2a Trade union membership levels, employees, UK and Great Britain, 1989 to 2020 Table 1.2b Trade union membership as a proportion of employees, UK and Great Britain,
1989 to 2020 Table 1.3a Trade union membership levels, in employment, UK and Great Britain,1989 to
2020 Table 1.3b Trade union membership as a proportion of those in employment, UK and Great
Britain, 1989 to 2020 Table 1.4 Trade union membership as a proportion of employees by gender, full/ part time
and permanent/ temporary status, UK 2020 Table 1.5 Trade union membership as a proportion of employees by personal
characteristics, and work and job characteristics, UK 2020
Table 1.6 Trade union membership as a proportion of employees by age group and gender, UK 1995 to 2020
Table 1.7a Trade union membership as a proportion of employees by major occupation group and gender, UK 2005 to 2010
Table 1.7b Trade union membership as a proportion of employees by major occupation group and gender, UK 2011 to 2020
Table 1.8 Trade union membership as a proportion of employees by industry and gender, UK 1995 to 2020
Table 1.9 Average hourly earnings by union status, UK 2020
Table 1.10 Trade union membership proportions, union presence and coverage of collective agreements between employers and trade unions, UK 2020
Table 1.11 Coverage of collective agreements between employers and trade unions by full/ part time and permanent/ temporary status, UK 2020
Table 2.1a Trade union membership levels by sector and gender, UK 1995 to 2020
Table 2.1b Trade union non-membership levels by sector and gender, UK 1995 to 2020
Table 2.2 Trade union membership as a proportion of employees by sector and gender, UK 1995 to 2020
Table 2.3 Average hourly earnings by union status and sector, UK 1995 to 2020
Table 2.4a Trade union presence by sector, UK 1999 to 2020
Table 2.4b Coverage of collective agreements between an employer and trade union by sector, UK 1996 to 2020
Table 2.5 Trade union membership levels by Industry, UK 1995 to 2020
Table 3.1 Characteristics of union members and non-members, UK 2020
Table 4.1 Trade union membership as a proportion of employees by nation and region, 1995 to 2020
Table 4.2 Trade union membership levels by nation and region, 1995 to 2020
Table 4.3 Trade union membership proportions, trade union presence and collective agreement coverage by regions, 2020
Trade Union Membership Statistics, UK 1995-2020
25
A1-A13 Individual tables for the nations and regions, covering trade union membership as a proportion of employees by various characteristics, 2020
A14 Trade union membership as a proportion of employees, by 2-digit Standard Industrial Classification and gender, 1995-2020
A15 Trade union membership as a proportion of employees, by 2-digit Standard Industrial Classification and gender, full/part time and permanent/temporary, 2020
A16 The proportion of Polish employees in the UK that are union members, by nationality and country of birth, gender and full/part-time work, 2020
A17 Age distribution of employees who are trade union members, UK 1995 and 2020 A18 The percentage of jobs where pay is set with reference to an agreement affecting
more than one employee (collective agreement), by sector – Annual Survey of Hours and Earnings, 2020
A19 a and b Comparison of disability variables 2013 to 2020 A20 Comparison of dependent child variables 2011 to 2020 Trade Union Membership Confidence Intervals Tables 2020
Trade Union Membership Statistics, UK 1995-2020
26
Technical information
Trade union questions in the Labour Force Survey
A question on the LFS on trade union membership has been asked annually since 1989 of all individuals in employment. Questions on trade union presence and recognition were introduced in 1993 and the question on collective agreements was introduced in 1996. The questions relating to trade union membership were reordered and reworded in 1999; these changes affect the time-series for trade union presence and collective agreements.
The union questions were altered substantially in the 1999 questionnaire. The exact wording and sequence of the questions as they are now and as they were previously are shown below. The following should be noted:
• The wording of the question that asks respondents whether they are a member of a trade union remains the same, only its place in the sequence has changed.
• The question that asks whether any of the people at the respondent’s place of work are members of a trade union or staff association is designed to measure trade union presence. The wording, routing and sequence of this question have changed. Previously, it was asked of all in employment; now it is only asked to those who say that they are not union members.
• Before 1999, the question on whether the respondent’s pay and conditions were directly affected by collective agreements between their employer and a union (TUCOV) was only asked where the respondent first identified unions as being present at the workplace (TUPRES), and then whether or not it was recognised (TUREC). This meant that the number of people whose pay and conditions were affected by collective agreement was an underestimate. For this reason, the routing of the question was changed in the 1999 LFS and is now asked of all in employment. Users must therefore be aware that data derived from the TUCOV variable in the 1999 dataset are not directly comparable with those of previous years due to the change in the question’s coverage.
• It is possible that some non-sampling error arises in the series of questions on trade unions because of measurement problems. Around a third of the sample are proxy respondents, and the data show that this group are less likely to be identified as union members than those responding on their own behalf. An estimate of the extent of bias is provided below.
On the question of coverage of collective agreements, it is known from surveys of employers that only a small proportion of public sector workplaces are not covered, and that these arrangements are generally made at head office level or across many organisations. It is therefore likely that some employees who are not union members and/or who work in small workplaces in the public sector may be unaware that collective bargaining arrangements apply to their organisation. There is potentially a similar affect among workers in the private sector. In addition, because sector is self-reported in the LFS, there may be a number of respondents wrongly classifying themselves as public sector workers. Consequently, there may be a downward bias to this measure. Also, it should be noted that the question in the Labour Force Survey specifically refers to negotiations between the employer and a trade union that affect an employee’s pay and conditions.
Trade Union Membership Statistics, UK 1995-2020
27
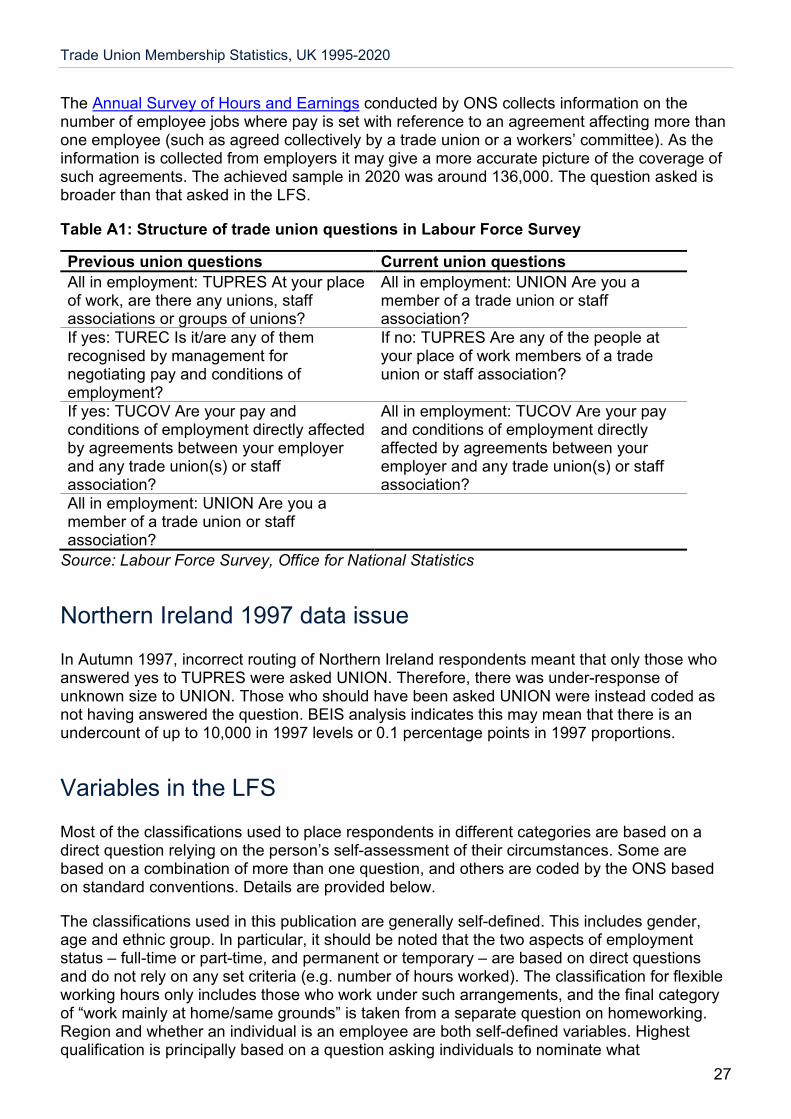
The Annual Survey of Hours and Earnings conducted by ONS collects information on the number of employee jobs where pay is set with reference to an agreement affecting more than one employee (such as agreed collectively by a trade union or a workers’ committee). As the information is collected from employers it may give a more accurate picture of the coverage of such agreements. The achieved sample in 2020 was around 136,000. The question asked is broader than that asked in the LFS.
Table A1: Structure of trade union questions in Labour Force Survey
Previous union questions Current union questions
All in employment: TUPRES At your place of work, are there any unions, staff associations or groups of unions?
All in employment: UNION Are you a member of a trade union or staff association?
If yes: TUREC Is it/are any of them recognised by management for negotiating pay and conditions of employment?
If no: TUPRES Are any of the people at your place of work members of a trade union or staff association?
If yes: TUCOV Are your pay and conditions of employment directly affected by agreements between your employer and any trade union(s) or staff association?
All in employment: TUCOV Are your pay and conditions of employment directly affected by agreements between your employer and any trade union(s) or staff association?
All in employment: UNION Are you a member of a trade union or staff association?
Source: Labour Force Survey, Office for National Statistics
Northern Ireland 1997 data issue
In Autumn 1997, incorrect routing of Northern Ireland respondents meant that only those who answered yes to TUPRES were asked UNION. Therefore, there was under-response of unknown size to UNION. Those who should have been asked UNION were instead coded as not having answered the question. BEIS analysis indicates this may mean that there is an undercount of up to 10,000 in 1997 levels or 0.1 percentage points in 1997 proportions.
Variables in the LFS
Most of the classifications used to place respondents in different categories are based on a direct question relying on the person’s self-assessment of their circumstances. Some are based on a combination of more than one question, and others are coded by the ONS based on standard conventions. Details are provided below.
The classifications used in this publication are generally self-defined. This includes gender, age and ethnic group. In particular, it should be noted that the two aspects of employment status – full-time or part-time, and permanent or temporary – are based on direct questions and do not rely on any set criteria (e.g. number of hours worked). The classification for flexible working hours only includes those who work under such arrangements, and the final category of “work mainly at home/same grounds” is taken from a separate question on homeworking. Region and whether an individual is an employee are both self-defined variables. Highest qualification is principally based on a question asking individuals to nominate what

Trade Union Membership Statistics, UK 1995-2020
28
qualifications they have from a list of around 50 categories. These have then been aggregated for the purposes of analysis. The categories for ethnic groups have been changed in the LFS in both 2001 and 2011 to be consistent with those used in the 2001 and 2011 Censuses respectively.
Industry and occupation variables in the LFS are produced by coding textual open-ended survey answers to standard classifications, the Standard Industrial Classification and Standard Occupation Classification.
Defining whether people work in the public or private sector is based on two questions first introduced in 1993. These ask, first, if they worked in a private firm or business, a limited company, or some other kind of organisation; and second, if other, what kind of non-private organisation. The LFS defines public sector as that owned, funded or run by central or local government and the private sector is everything else. Some respondents may not know whether their industry is in the public or private sector and, for certain types of activity, there may be no clear answer and the interviewers are given some guidelines to help sort out some common confusion. There is no indication that the temporary reclassification of some banks to the public sector by the ONS in its Public Sector Employment statistics had any impact on how people working in these organisations classified their sector in the LFS. The estimates produced in this bulletin from the LFS data show a higher level of employment in the public sector, and a lower level in the private sector, than the ONS Public Sector Employment statistics.
Revised method for estimating union presence
Prior to the 2017 Bulletin, prompted by correspondence with Rhys Davies of the Wales Institute for Social and Economic Research at Cardiff University, BEIS reconsidered the calculations used to estimate union presence in the workplace from the Labour Force Survey data. Previously, all those who answered ‘no’ to the ‘UNION’ question (about whether the respondent was a union member) were included in the population of employees used to estimate trade union presence, even if they did not provide a valid response to the ‘TUPRES’ question (on whether any people in the workplace were members of a trade union). This included people who said they used their home as their place of work or main base for work. This makes an underlying assumption that those who did not provide a valid response to ‘TUPRES’ would not have others in their workplace who were members of a trade union. After examining the data, on balance BEIS decided that it would be more appropriate to exclude those who did not provide a valid response to the TUPRES question from the population used to estimate union presence. The revised method introduced for the 2017 Bulletin excludes this group from the estimates of union presence.
Change of disability variable
ONS introduced a variable, DISEA, into the LFS in 2013 to reflect disability as defined in the Equality Act 2010. The figures for disability in Tables 1.5 and 3.1 are now estimated using this variable.
In previous years’ bulletins the disability data has been estimated using the DISCURR variables (also DISCURR13 and DISCURR20) which asked about current and/or work limiting disabilities.

Trade Union Membership Statistics, UK 1995-2020
29
Comparison data for the two variables for 2013 to 2020 is contained in tables A19 a and b. This shows that the proportion of employees (and union members) defined as disabled using the DISCURR variables is slightly higher than that using the DISEA variable. However, using the DISEA variable gives a higher proportion of those employees with a disability being union members.
Change in dependent child variable
Union membership density is reported by whether an employee has a dependent child in Table 1.5. In previous years, the split between those with a child or children under 6 and those with a child or children over 6 was based on the age of the oldest child. On consideration, it was felt more meaningful if it was based on the age of the youngest child (as this is likely to have more of a differential impact on child care responsibilities etc). A comparison between the two different approaches for the years 2011 to 2020 is contained in Table A20.
Sample size and standard errors
The cell sizes in some tables in this publication are too small to provide reliable estimates and have been marked with an asterisk. In this publication data fewer than 10,000 have not been published because standard errors are likely to be larger than the estimates themselves. Although the ONS has lifted its protocol of not releasing data under the 10,000 threshold, it is now the statistician’s discretion whether to release anything under this threshold. For wage related data, the threshold used is 30,000.
As an indication of the standard errors in the trade union estimates, the standard errors around the total employment and employee union membership proportions are likely to be around 0.3 percentage points. Standard errors for union membership proportions by gender are likely to be around 0.4 percentage points. Standard errors for union membership proportions by region average around 1.0 percentage points.
Switch from seasonal to calendar quarters
In 2006, the structure of the Labour Force Survey switched from a seasonal quarter basis to a calendar quarter basis. The last set of published LFS seasonal results covered December 2004 to February 2005. In accordance with European Union regulations, all subsequent quarters have been published on a calendar quarter basis. In 2008, the Office for National Statistics carried out an extensive reweighting programme and all quarterly Labour Force Survey data are now published on a calendar quarter basis back to 1992. This has eliminated the structural break into the trade union membership time series associated with the change from seasonal to calendar quarters.
Figure A1 shows the trade union density of UK employees from 1995 to 2007, as shown in Table 1.2b and trade union density from the previous LFS. The chart gives evidence that the reweighting of historic LFS datasets has not materially changed the trade union densities from those that were previously published.

Trade Union Membership Statistics, UK 1995-2020
30
Figure A1: Trade union density of UK employees, 1995-2007
Per cent Source: Labour Force Survey, Office for National Statistics.
Estimating union membership levels
Each household agreeing to take part in the LFS is interviewed on five consecutive quarters (or waves). However, there are cases on subsequent waves when households are not contactable or do not agree to continue taking part so further responses cannot be recorded. When this happens, current data may be imputed by carrying forward answers given by them in the previous interview. However, for questions that do not appear every quarter, as on trade union membership, there is no previous response to carry forward, and a ‘does not apply’ (DNA) response is therefore recorded.
There are two possible methods of estimating union membership levels. One method relies on calculating an adjusted weight, whereby cases with missing data are assumed to have the same distribution as valid responses. Consequently, missing data is included in the estimates by allocation of their weight along the same distribution as valid respondents. Unfortunately, due to the restructuring of the LFS to calendar quarters (described earlier) this produced too much missing data in the seasonal quarter series to produce reliable estimates. Information was lost for September in converting seasonal to calendar quarters and no information was available to be brought forward from December. Therefore, it was not possible to display a consistent time series including the data originally collected on a seasonal quarter basis using the adjusted weight method.
In order to mitigate these issues a second method was developed to closely approximate the results from an adjusted weights approach (see Table A2) but also allow a consistent time series with the calendar quarter information to be estimated. It consists of union density multiplied by the population (as estimated by the LFS). The method is improved by making the same calculation but by detailed age, gender and regional disaggregations and then aggregating them back up to national and regional levels. Age, gender and region were specifically chosen as they are the basis on which the LFS is weighted (see the Labour Survey User Guide Vol 1.). This approach is further supported by the fact that union density figures are produced on a valid response basis and do not consider any missing data. Furthermore, union densities show a great deal of robustness under change. These estimates of union
5%
10%
15%
20%
25%
30%
35%
1995 1996 1997 1998 1999 2000 2001 2002 2003 2004 2005 2006 2007
Reweighted LFS
Old LFS

Trade Union Membership Statistics, UK 1995-2020
31
membership levels are now provided as the headline figures in this publication (see Tables 1.2a, 1.3a, 2.1a, 4.2).
To produce trade union membership broken down by public/ private sector, a further step was applied. It consists of union density split by public and private sector multiplied by the union membership population (estimated as above). The calculations involved are similar-to that of the second method described above, apart from the fact that a further breakdown by sector was used. A comparable method was used to calculate membership levels by industry with a breakdown by industry used rather than a breakdown by public/ private sector. The table below (produced in 2011) gives a comparison of the estimates from the two methods between 2006 and 2010 by gender and employment status.
Table A2: Estimated trade union membership levels, United Kingdom, 2006 to 2010
Thousands, not seasonally adjusted
Employees In employment Density ×
Population Adjusted Weights
Difference Density × Population
Adjusted Weights
Difference
All employees 2006 7,021 6,992 29 7,359 7,315 44 2007 7,005 6,978 27 7,334 7,292 42 2008 6,878 6,857 21 7,219 7,188 31 2009 6,715 6,696 19 7,054 7,017 37 2010 6,536 6,530 6 6,854 6,818 36 Males 2006 3,430 3,400 30 3,649 3,611 38 2007 3,379 3,355 24 3,606 3,574 32 2008 3,278 3,254 24 3,522 3,487 35 2009 3,121 3,099 22 3,344 3,311 33 2010 2,976 2,967 9 3,188 3,162 26 Females 2006 3,591 3,591 - 3,710 3,702 8 2007 3,625 3,621 4 3,728 3,716 12 2008 3,599 3,601 -2 3,697 3,697 - 2009 3,593 3,596 -3 3,709 3,704 5 2010 3,560 3,562 -2 3,666 3,654 12
Table source: Labour Force Survey, Office for National Statistics
To provide the levels estimates in these statistics, BEIS uses the GOVTOR LFS variable for regions. If this variable is not available to analysts trying to replicate the results, then GOVTOF, or URESMC would provide a reasonable alternative. However, it would produce marginally different results.
The levels figures presented in the bulletin are rounded to the nearest thousand and the percentage figures to one decimal place. The year-on-year changes reported are calculated on the unrounded data (so may differ slightly from the difference between two years calculated from the published tables).
Differences between administrative data and LFS estimates
Another official source of trade union membership data is provided by the Certification Officer and can be seen in Table 1.1. Data collected annually from trade unions by the government, including the Certification Officer (CO) from 1974, provide a long and consistent back series of the number of trade unions and the number of union members. The LFS has a shorter back

Trade Union Membership Statistics, UK 1995-2020
32
series, from 1989 onwards, but can provide extensive information on the respondent’s individual and workplace characteristics, allowing more detailed analysis.
There are differences in how the two sources report union membership. For example, the CO membership count includes all members of unions having their head office in Great Britain (unions that are listed or scheduled by the CO), including those members in Northern Ireland, the Irish Republic and ‘elsewhere abroad’. These figures may also include union members who are unemployed, inactive or retired. The LFS asks questions on the union status of all those in employment, thus excluding the unemployed and retired. The LFS also only covers those who are resident in the UK (or in Great Britain for the years 1989 to 1994).
The LFS union questions have United Kingdom coverage from 1995 onwards. The LFS estimates the number of individuals who are union members, rather than the individual memberships. Hence those belonging to two unions would appear twice in the CO data, but only once in the LFS data.
Trade Union Membership Statistics, UK 1995-2020
33
Concepts and definitions
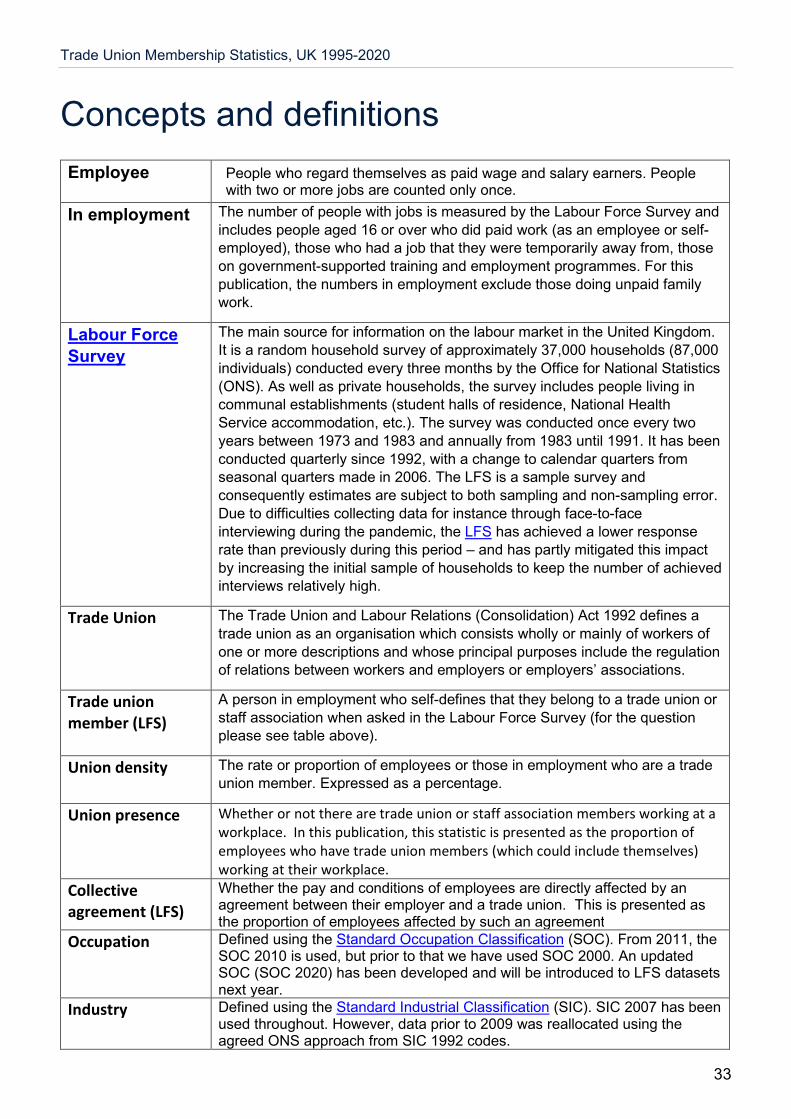
Employee People who regard themselves as paid wage and salary earners. People with two or more jobs are counted only once.
In employment The number of people with jobs is measured by the Labour Force Survey and includes people aged 16 or over who did paid work (as an employee or self-employed), those who had a job that they were temporarily away from, those on government-supported training and employment programmes. For this publication, the numbers in employment exclude those doing unpaid family work.
Labour Force
Survey
The main source for information on the labour market in the United Kingdom. It is a random household survey of approximately 37,000 households (87,000 individuals) conducted every three months by the Office for National Statistics (ONS). As well as private households, the survey includes people living in communal establishments (student halls of residence, National Health Service accommodation, etc.). The survey was conducted once every two years between 1973 and 1983 and annually from 1983 until 1991. It has been conducted quarterly since 1992, with a change to calendar quarters from seasonal quarters made in 2006. The LFS is a sample survey and consequently estimates are subject to both sampling and non-sampling error. Due to difficulties collecting data for instance through face-to-face interviewing during the pandemic, the LFS has achieved a lower response rate than previously during this period – and has partly mitigated this impact by increasing the initial sample of households to keep the number of achieved interviews relatively high.
Trade Union The Trade Union and Labour Relations (Consolidation) Act 1992 defines a trade union as an organisation which consists wholly or mainly of workers of one or more descriptions and whose principal purposes include the regulation of relations between workers and employers or employers’ associations.
Trade union member (LFS)
A person in employment who self-defines that they belong to a trade union or staff association when asked in the Labour Force Survey (for the question please see table above).
Union density The rate or proportion of employees or those in employment who are a trade union member. Expressed as a percentage.
Union presence Whether or not there are trade union or staff association members working at a workplace. In this publication, this statistic is presented as the proportion of employees who have trade union members (which could include themselves) working at their workplace.
Collective agreement (LFS)
Whether the pay and conditions of employees are directly affected by an agreement between their employer and a trade union. This is presented as the proportion of employees affected by such an agreement
Occupation Defined using the Standard Occupation Classification (SOC). From 2011, the SOC 2010 is used, but prior to that we have used SOC 2000. An updated SOC (SOC 2020) has been developed and will be introduced to LFS datasets next year.
Industry Defined using the Standard Industrial Classification (SIC). SIC 2007 has been used throughout. However, data prior to 2009 was reallocated using the agreed ONS approach from SIC 1992 codes.
Trade Union Membership Statistics, UK 1995-2020
34
Further information
Future updates to these statistics
The next update of these statistics will be in May 2022.
Past Trade Union Membership bulletins
Trade Union Membership 2019, Ivan Bishop Trade Union Membership 2018, George Williams Trade Union Membership 2017, Pierre Baustert Trade Union Membership 2016, Kirsty Chapman Trade Union Membership 2015, Cara Maguire Trade Union Membership 2014, Connor Russell Trade Union Membership 2013, Andrew Rowlinson Trade Union Membership 2012, Andrew Rowlinson Trade Union Membership 2011, Nikki Brownlie Trade Union Membership 2010, James Achur Trade Union Membership 2009, James Achur Trade Union Membership 2008, Craig Barratt Trade Union Membership 2007, Sally Mercer and Richard Notley Trade Union Membership 2006, Heidi Grainger and Martin Crowther Trade Union Membership 2005, Heidi Grainger Trade Union Membership 2004, Heidi Grainger, Heather Holt Trade Union Membership 2003, Tom Palmer, Heidi Grainger, Grant Fitzner
Trade union membership articles in Labour Market Trends
1. Analysis in brief: Trade union membership: estimates from the autumn 2003 Labour Force Survey, by Stephen Hicks and Tom Palmer. March 2004.
2. Labour Market Spotlight: Trade union membership. July 2003.
3. Article: Trade union membership: an analysis of data from the autumn 2001 LFS, by Keith Brook. July 2002.
4. Article: Trade union membership 1999-2000: an analysis of data from the Certification Officer and the Labour Force Survey, by Abby Sneade. September 2001.
5. Article: Trade union membership 1998-99: an analysis of data from the Certification Officer and Labour Force Survey, by Stephen Hicks. July 2000.
6. Article: Trade union membership and recognition 1997-8: an analysis of data from the Certification Officer and the Labour Force Survey, by Paul Bland. July 1999.
Trade Union Membership Statistics, UK 1995-2020
35
Trade union membership: additional analysis
7. Use and users of BIS statistics on trade union membership, April 2013.
8. Trade union membership statistics: Measuring bias in the Labour Force Survey, March 2013
9. Sampling variance in the trade union membership statistics, March 2013
10. Trade union membership statistics: 2012 to 2013 user survey report, March 2013
Related statistics
The Certification Officer’s Annual Reports includes statistics from the annual returns from scheduled and listed trade unions.
https://www.gov.uk/government/collections/certification-officer-annual-reports
Revisions policy
The BEIS statistical revisions policy sets out the revisions policy for these statistics, which has been developed in accordance with the UK Statistics Authority Code of Practice for Statistics.
Uses of these statistics
Trade union membership statistics are used within government to help inform on worker representation within industries and occupations, and to help develop policies on employment relations.
The statistics are also used by non-government organisations such as think tanks, trade unions and employer organisations to analyse union membership and the extent of collective worker representation.
User engagement
Users are encouraged to provide comments and feedback on how these statistics are used and how well they meet user needs. Comments on any issues relating to this statistical release are welcomed and should be sent to: [email protected]
The BEIS statement on statistical public engagement and data standards sets out the department’s commitments on public engagement and data standards as outlined by the Code of Practice for Statistics.

Trade Union Membership Statistics, UK 1995-2020
36
National Statistics designation
National Statistics status means that our statistics meet the highest standards of trustworthiness, quality and public value, and it is our responsibility to maintain compliance with these standards.
The continued designation of these statistics as National Statistics was confirmed in June 2013. This followed a full assessment against the Code of Practice for Statistics in 2012.
Since the latest review by the Office for Statistics Regulation, we have continued to comply with the Code of Practice for Statistics, and have made the following improvements:
Example A – Added more value by providing breakdowns previously requested as freedom of information requests as annexed tables.
Example B – Revised the method of estimating trade union presence in the workplace following advice from an academic
Example C – Published analysis investigating examining the potential for bias in the trade union membership statistics arising from LFS methodology.
Pre-release access to statistics
Some ministers and officials receive access to these statistics up to 24 hours before release. Details of the arrangements for doing this and a list of the ministers and officials that receive pre-release access to these statistics can be found in the BEIS statement of compliance with the Pre-Release Access to Official Statistics Order 2008.
Contact
Responsible statistician: Ivan Bishop
Email: [email protected]
Media enquiries: 020 7215 1000
Public enquiries: 020 7215 5000

© Crown copyright 2021
This publication is licensed under the terms of the Open Government Licence v3.0 except where otherwise stated. To view this licence, visit nationalarchives.gov.uk/doc/open-government-licence/version/3 or write to the Information Policy Team, The National Archives, Kew, London TW9 4DU, or email: [email protected].
Where we have identified any third-party copyright information you will need to obtain permission from the copyright holders concerned.
This publication is available from: www.gov.uk/beis
If you need a version of this document in a more accessible format, please email [email protected]. Please tell us what format you need. It will help us if you say what assistive technology you use.