Trade Liberalisation and Employment Effects in Ukraine
23
Trade Liberalisation and Employment Effects in Ukraine ATANAS CHRISTEV 1,2 , OLGA KUPETS 2,3 & HARTMUT LEHMANN 1,2,4 1 Department of Economics and CERT, Heriot-Watt University, Edinburgh, UK 2 IZA, Schaumburg-Lippe, Str 7-9, D-53113 Bonn, Germany 3 Department of Economics, National University-Kiev Mohyla Academy, Ukraine 4 DARRT, Department of Economics, University of Bologna, Strada Maggiore 45, Bologna 40125, Italy. E-mail: [email protected] This paper addresses the effects of trade liberalisation on job flows. It studies the case of Ukraine where the sudden opening up of the economy to trade can be viewed as a quasi-natural experiment. We use disaggregated data on manufacturing industries and customs data on trade flows to account for shifting trade patterns after the disintegration of the Soviet Union and the Council of Mutual Economic Assistance (CMEA) trade regime. We provide, for the first time, evidence on job flows at the three-digit sector level in Ukrainian manufacturing and show that these flows are predominantly driven by idiosyncratic factors within industries. However, we also establish that trade openness does affect job flows differently across different trading areas. We find that while trade with Commonwealth of Independent States decreases job destruction, trade with the European Union increases excess reallocation mainly through job creation. Comparative Economic Studies (2008) 50, 318–340. doi:10.1057/palgrave.ces.8100250 Keywords: job creation, job destruction, trade flows and trade liberalisation, Ukraine JEL Classifications: E24, F14, J63, P23 INTRODUCTION The flexibility of labour markets is an essential feature of well-functioning market economies. Baldwin et al. (1998) and Davis and Haltiwanger (1992, 1999) report that in North America roughly one in every 10 jobs is created and one in every 10 jobs is destroyed each year. Businesses react continuously to Comparative Economic Studies, 2008, 50, (318–340) r 2008 ACES. All rights reserved. 0888-7233/08 $30.00 www.palgrave-journals.com/ces
-
Upload
independent -
Category
Documents
-
view
0 -
download
0
Transcript of Trade Liberalisation and Employment Effects in Ukraine
Trade Liberalisation and EmploymentEffects in Ukraine
ATANAS CHRISTEV1,2, OLGA KUPETS2,3 & HARTMUT LEHMANN1,2,4
1Department of Economics and CERT, Heriot-Watt University, Edinburgh, UK2IZA, Schaumburg-Lippe, Str 7-9, D-53113 Bonn, Germany3Department of Economics, National University-Kiev Mohyla Academy, Ukraine4DARRT, Department of Economics, University of Bologna, Strada Maggiore 45,Bologna 40125, Italy. E-mail: [email protected]
This paper addresses the effects of trade liberalisation on job flows. It studies the
case of Ukraine where the sudden opening up of the economy to trade can be viewed
as a quasi-natural experiment. We use disaggregated data on manufacturing
industries and customs data on trade flows to account for shifting trade patterns
after the disintegration of the Soviet Union and the Council of Mutual Economic
Assistance (CMEA) trade regime. We provide, for the first time, evidence on job flows
at the three-digit sector level in Ukrainian manufacturing and show that these flows
are predominantly driven by idiosyncratic factors within industries. However, we
also establish that trade openness does affect job flows differently across different
trading areas. We find that while trade with Commonwealth of Independent States
decreases job destruction, trade with the European Union increases excess
reallocation mainly through job creation.
Comparative Economic Studies (2008) 50, 318–340. doi:10.1057/palgrave.ces.8100250
Keywords: job creation, job destruction, trade flows and trade liberalisation,
Ukraine
JEL Classifications: E24, F14, J63, P23
INTRODUCTION
The flexibility of labour markets is an essential feature of well-functioningmarket economies. Baldwin et al. (1998) and Davis and Haltiwanger (1992,1999) report that in North America roughly one in every 10 jobs is created andone in every 10 jobs is destroyed each year. Businesses react continuously to
Comparative Economic Studies, 2008, 50, (318–340)r 2008 ACES. All rights reserved. 0888-7233/08 $30.00
www.palgrave-journals.com/ces
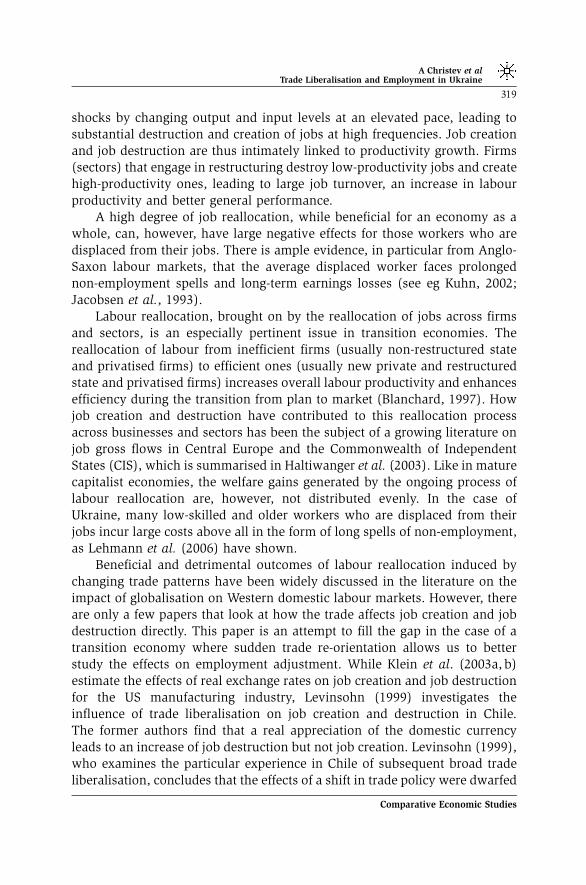
shocks by changing output and input levels at an elevated pace, leading tosubstantial destruction and creation of jobs at high frequencies. Job creationand job destruction are thus intimately linked to productivity growth. Firms(sectors) that engage in restructuring destroy low-productivity jobs and createhigh-productivity ones, leading to large job turnover, an increase in labourproductivity and better general performance.
A high degree of job reallocation, while beneficial for an economy as awhole, can, however, have large negative effects for those workers who aredisplaced from their jobs. There is ample evidence, in particular from Anglo-Saxon labour markets, that the average displaced worker faces prolongednon-employment spells and long-term earnings losses (see eg Kuhn, 2002;Jacobsen et al., 1993).
Labour reallocation, brought on by the reallocation of jobs across firmsand sectors, is an especially pertinent issue in transition economies. Thereallocation of labour from inefficient firms (usually non-restructured stateand privatised firms) to efficient ones (usually new private and restructuredstate and privatised firms) increases overall labour productivity and enhancesefficiency during the transition from plan to market (Blanchard, 1997). Howjob creation and destruction have contributed to this reallocation processacross businesses and sectors has been the subject of a growing literature onjob gross flows in Central Europe and the Commonwealth of IndependentStates (CIS), which is summarised in Haltiwanger et al. (2003). Like in maturecapitalist economies, the welfare gains generated by the ongoing process oflabour reallocation are, however, not distributed evenly. In the case ofUkraine, many low-skilled and older workers who are displaced from theirjobs incur large costs above all in the form of long spells of non-employment,as Lehmann et al. (2006) have shown.
Beneficial and detrimental outcomes of labour reallocation induced bychanging trade patterns have been widely discussed in the literature on theimpact of globalisation on Western domestic labour markets. However, thereare only a few papers that look at how the trade affects job creation and jobdestruction directly. This paper is an attempt to fill the gap in the case of atransition economy where sudden trade re-orientation allows us to betterstudy the effects on employment adjustment. While Klein et al. (2003a, b)estimate the effects of real exchange rates on job creation and job destructionfor the US manufacturing industry, Levinsohn (1999) investigates theinfluence of trade liberalisation on job creation and destruction in Chile.The former authors find that a real appreciation of the domestic currencyleads to an increase of job destruction but not job creation. Levinsohn (1999),who examines the particular experience in Chile of subsequent broad tradeliberalisation, concludes that the effects of a shift in trade policy were dwarfed
A Christev et alTrade Liberalisation and Employment in Ukraine
319
Comparative Economic Studies

by macroeconomic shocks even though there was substantial churning ofworkers and jobs in the period.
In this regard, with respect to the impact of shifting trade patterns ondomestic labour markets, transition economies provide something of aquasi-natural experiment. Under central planning the state had a foreigntrade monopoly. Firms were not in principle acting autonomously in exportmarkets. At the same time, enterprises were sheltered from importcompetition. Firms in most centrally planned economies were completelyisolated from world markets.1 With the start of transition, the foreign tradestate monopoly was abolished and trade was liberalised. As a consequence oftrade liberalisation, we observe a strong re-orientation of trade away from thedefunct CMEA trade area to Western markets, in particular to the EuropeanUnion (EU). In addition, trade liberalisation implies that many firms engageautonomously in fast-growing Western export markets. The same firms orother firms have to confront import competition. Firms’ engagement in exportmarkets and the abrupt exposure to import competition imply that somesectors of industry in transition countries open up to the world economy overa short time horizon at a very rapid pace. Industrial sectors in maturecapitalist economies have opened up much more gradually over the 1980sand 1990s, making it difficult to isolate the effect of changing trade patternson employment adjustment in domestic labour markets.
We try to take advantage of the rapid opening up of one transitioncountry, Ukraine. As we shall show in the next section, Ukrainian trade flowsto and from areas outside the CIS have increased dramatically over the lastdecade. We exploit this dramatic increase and investigate whether and howtrade liberalisation causally affects job creation and destruction in three-digitindustrial sectors. To our knowledge, the question of how trade liberalisationis related to gross jobs flows in the former CMEA area over time has not beensufficiently studied. In an earlier study, two of the authors used Ukrainianestablishment-level data from the Amadeus database to look at the impact oftrade liberalisation on job gross flows at the establishment level in the late1990s (Konings et al., 2003). The present paper is complementary insofar as itextends the analysis to the sectoral level and augments the time dimension tonearly the entire decade of the last century. The sectoral gross job flows are
1 In Poland and Hungary, economic reforms of the central planning system gave some
autonomy to state-owned enterprises in the 1980s. Some of the Hungarian and Polish enterprises did
have trade relationships with Western firms already in the 1980s as a consequence of these reforms
(see eg Repkine and Walsh (1999) who study Polish enterprises). In the Soviet Union, on the other
hand, where the Classical Planning System was less affected by economic reform throughout the
Communist regime, the foreign trade monopoly of the state was not touched until the implosion of
the centrally planned economy.
A Christev et alTrade Liberalisation and Employment in Ukraine
320
Comparative Economic Studies
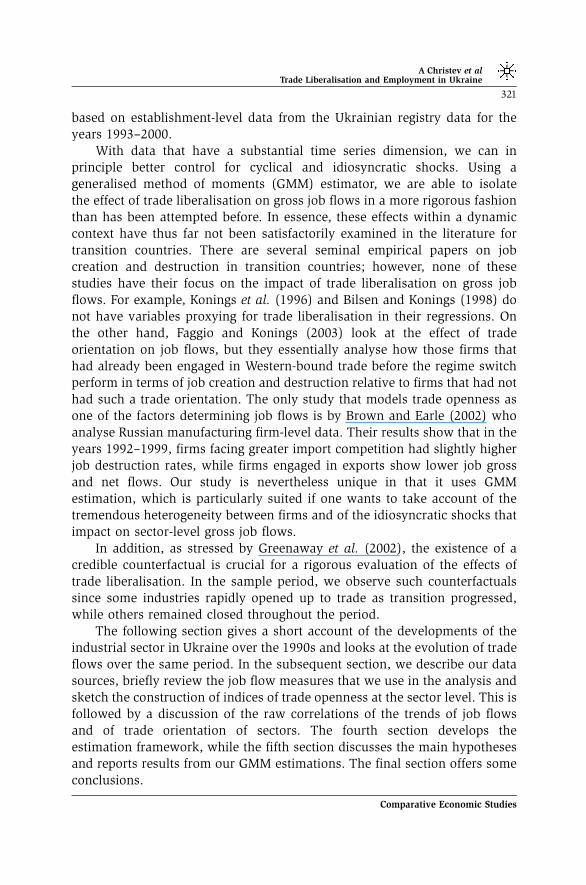
based on establishment-level data from the Ukrainian registry data for theyears 1993–2000.
With data that have a substantial time series dimension, we can inprinciple better control for cyclical and idiosyncratic shocks. Using ageneralised method of moments (GMM) estimator, we are able to isolatethe effect of trade liberalisation on gross job flows in a more rigorous fashionthan has been attempted before. In essence, these effects within a dynamiccontext have thus far not been satisfactorily examined in the literature fortransition countries. There are several seminal empirical papers on jobcreation and destruction in transition countries; however, none of thesestudies have their focus on the impact of trade liberalisation on gross jobflows. For example, Konings et al. (1996) and Bilsen and Konings (1998) donot have variables proxying for trade liberalisation in their regressions. Onthe other hand, Faggio and Konings (2003) look at the effect of tradeorientation on job flows, but they essentially analyse how those firms thathad already been engaged in Western-bound trade before the regime switchperform in terms of job creation and destruction relative to firms that had nothad such a trade orientation. The only study that models trade openness asone of the factors determining job flows is by Brown and Earle (2002) whoanalyse Russian manufacturing firm-level data. Their results show that in theyears 1992–1999, firms facing greater import competition had slightly higherjob destruction rates, while firms engaged in exports show lower job grossand net flows. Our study is nevertheless unique in that it uses GMMestimation, which is particularly suited if one wants to take account of thetremendous heterogeneity between firms and of the idiosyncratic shocks thatimpact on sector-level gross job flows.
In addition, as stressed by Greenaway et al. (2002), the existence of acredible counterfactual is crucial for a rigorous evaluation of the effects oftrade liberalisation. In the sample period, we observe such counterfactualssince some industries rapidly opened up to trade as transition progressed,while others remained closed throughout the period.
The following section gives a short account of the developments of theindustrial sector in Ukraine over the 1990s and looks at the evolution of tradeflows over the same period. In the subsequent section, we describe our datasources, briefly review the job flow measures that we use in the analysis andsketch the construction of indices of trade openness at the sector level. This isfollowed by a discussion of the raw correlations of the trends of job flowsand of trade orientation of sectors. The fourth section develops theestimation framework, while the fifth section discusses the main hypothesesand reports results from our GMM estimations. The final section offers someconclusions.
A Christev et alTrade Liberalisation and Employment in Ukraine
321
Comparative Economic Studies
UKRAINIAN INDUSTRY AND TRADE IN THE 1990S
Reform efforts to transform the Ukrainian economy were either non-existentor very inconsistent in the 1990s, the period analysed in this paper. Thecapture of the state by a few oligarchic groups, the exclusion of the majorityof the population from the decision-making process and weak property rightsresulted in stagnancy, corruption and a collapse in output for most of thedecade (Aslund, 2002). In the first half of the 1990s runaway inflation,bordering for a prolonged period on hyperinflation was one of themanifestations of the poor economic policies that brought Ukraine on thebrink of collapse. Only towards the end of the 1990s were serious reformsundertaken that loosened the grip of the oligarchs and spurred robust andunabated growth for the first time since the collapse of the Soviet Union.
The trends of real wages, production and employment in Ukraine overthe 1990s clearly show that these years were a lost decade for the country.After an extremely sharp contraction of industrial output in 1993 (the year ofthe hyperinflation), there was a 5-year trough until some recovery occurred in1999 and 2000. By the end of the decade, industrial output had ‘recovered’ toonly about 60% of the pre-transition level, which points to a dismalperformance in comparison with all central and east European transitioncountries apart from the Balkans and Belorussia.
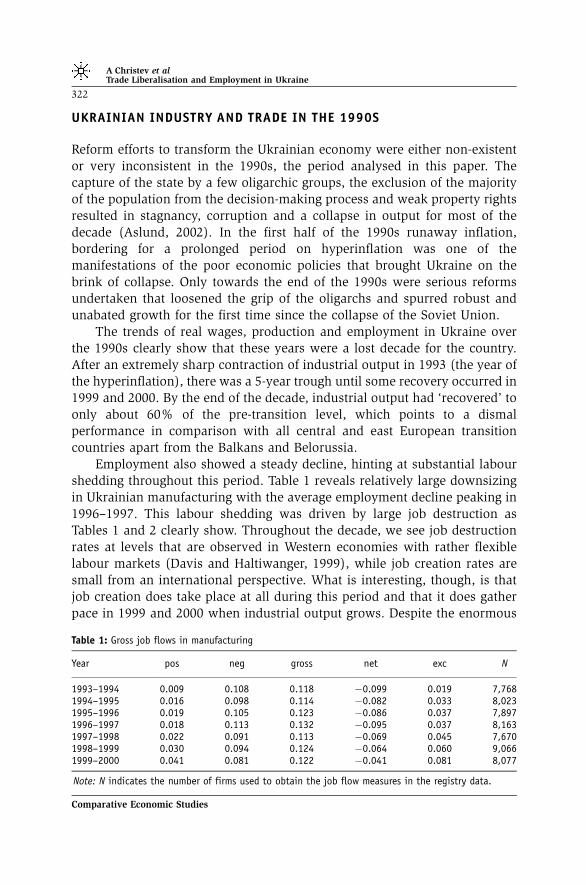
Employment also showed a steady decline, hinting at substantial labourshedding throughout this period. Table 1 reveals relatively large downsizingin Ukrainian manufacturing with the average employment decline peaking in1996–1997. This labour shedding was driven by large job destruction asTables 1 and 2 clearly show. Throughout the decade, we see job destructionrates at levels that are observed in Western economies with rather flexiblelabour markets (Davis and Haltiwanger, 1999), while job creation rates aresmall from an international perspective. What is interesting, though, is thatjob creation does take place at all during this period and that it does gatherpace in 1999 and 2000 when industrial output grows. Despite the enormous
Table 1: Gross job flows in manufacturing
Year pos neg gross net exc N
1993–1994 0.009 0.108 0.118 �0.099 0.019 7,7681994–1995 0.016 0.098 0.114 �0.082 0.033 8,0231995–1996 0.019 0.105 0.123 �0.086 0.037 7,8971996–1997 0.018 0.113 0.132 �0.095 0.037 8,1631997–1998 0.022 0.091 0.113 �0.069 0.045 7,6701998–1999 0.030 0.094 0.124 �0.064 0.060 9,0661999–2000 0.041 0.081 0.122 �0.041 0.081 8,077
Note: N indicates the number of firms used to obtain the job flow measures in the registry data.
A Christev et alTrade Liberalisation and Employment in Ukraine
322
Comparative Economic Studies
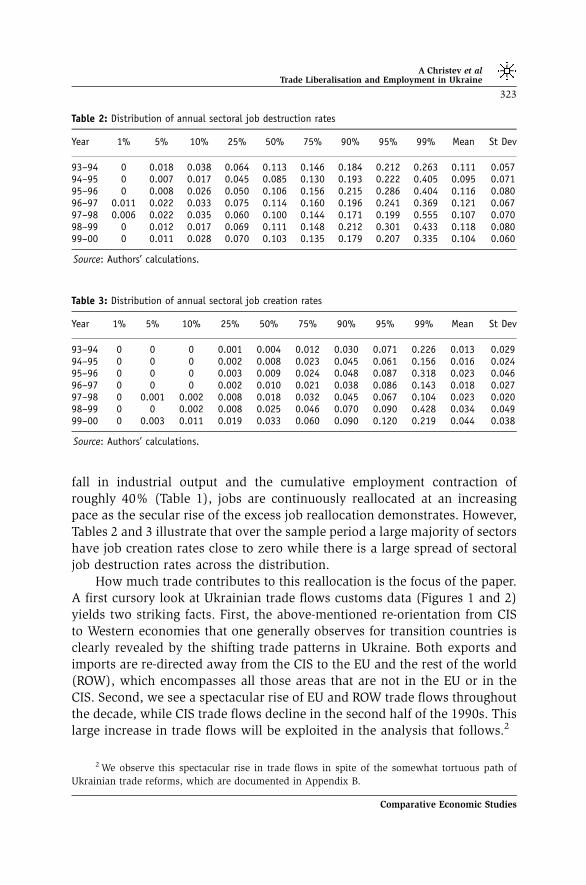
fall in industrial output and the cumulative employment contraction ofroughly 40% (Table 1), jobs are continuously reallocated at an increasingpace as the secular rise of the excess job reallocation demonstrates. However,Tables 2 and 3 illustrate that over the sample period a large majority of sectorshave job creation rates close to zero while there is a large spread of sectoraljob destruction rates across the distribution.
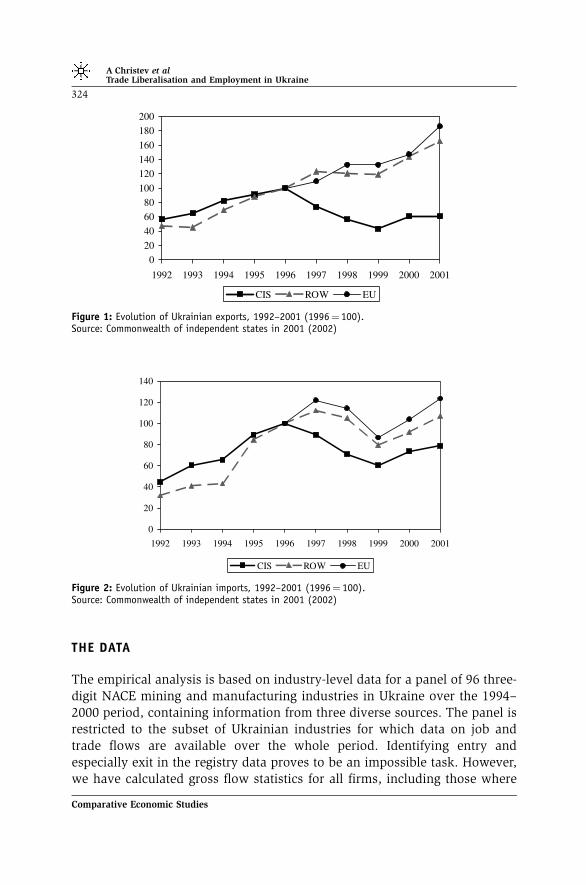
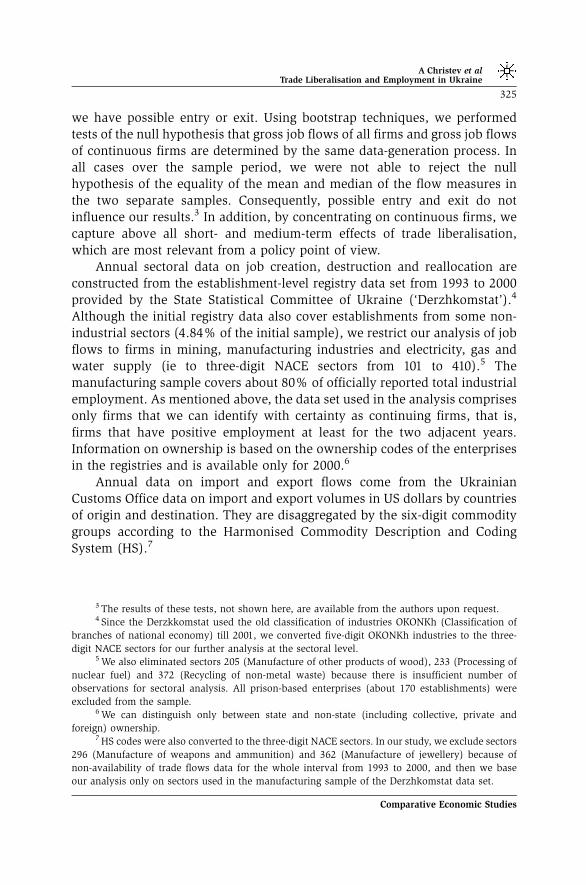
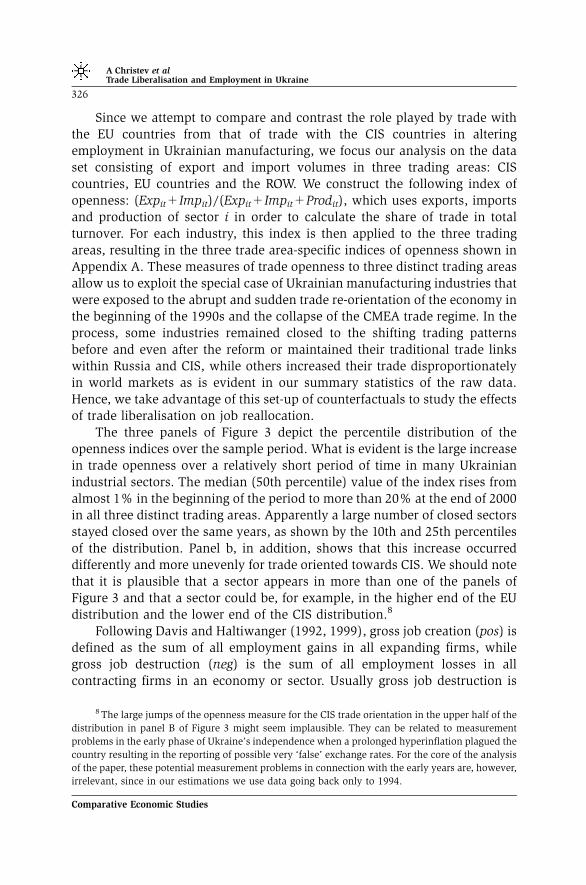
How much trade contributes to this reallocation is the focus of the paper.A first cursory look at Ukrainian trade flows customs data (Figures 1 and 2)yields two striking facts. First, the above-mentioned re-orientation from CISto Western economies that one generally observes for transition countries isclearly revealed by the shifting trade patterns in Ukraine. Both exports andimports are re-directed away from the CIS to the EU and the rest of the world(ROW), which encompasses all those areas that are not in the EU or in theCIS. Second, we see a spectacular rise of EU and ROW trade flows throughoutthe decade, while CIS trade flows decline in the second half of the 1990s. Thislarge increase in trade flows will be exploited in the analysis that follows.2
Table 3: Distribution of annual sectoral job creation rates
Year 1% 5% 10% 25% 50% 75% 90% 95% 99% Mean St Dev
93–94 0 0 0 0.001 0.004 0.012 0.030 0.071 0.226 0.013 0.02994–95 0 0 0 0.002 0.008 0.023 0.045 0.061 0.156 0.016 0.02495–96 0 0 0 0.003 0.009 0.024 0.048 0.087 0.318 0.023 0.04696–97 0 0 0 0.002 0.010 0.021 0.038 0.086 0.143 0.018 0.02797–98 0 0.001 0.002 0.008 0.018 0.032 0.045 0.067 0.104 0.023 0.02098–99 0 0 0.002 0.008 0.025 0.046 0.070 0.090 0.428 0.034 0.04999–00 0 0.003 0.011 0.019 0.033 0.060 0.090 0.120 0.219 0.044 0.038
Source: Authors’ calculations.
Table 2: Distribution of annual sectoral job destruction rates
Year 1% 5% 10% 25% 50% 75% 90% 95% 99% Mean St Dev
93–94 0 0.018 0.038 0.064 0.113 0.146 0.184 0.212 0.263 0.111 0.05794–95 0 0.007 0.017 0.045 0.085 0.130 0.193 0.222 0.405 0.095 0.07195–96 0 0.008 0.026 0.050 0.106 0.156 0.215 0.286 0.404 0.116 0.08096–97 0.011 0.022 0.033 0.075 0.114 0.160 0.196 0.241 0.369 0.121 0.06797–98 0.006 0.022 0.035 0.060 0.100 0.144 0.171 0.199 0.555 0.107 0.07098–99 0 0.012 0.017 0.069 0.111 0.148 0.212 0.301 0.433 0.118 0.08099–00 0 0.011 0.028 0.070 0.103 0.135 0.179 0.207 0.335 0.104 0.060
Source: Authors’ calculations.
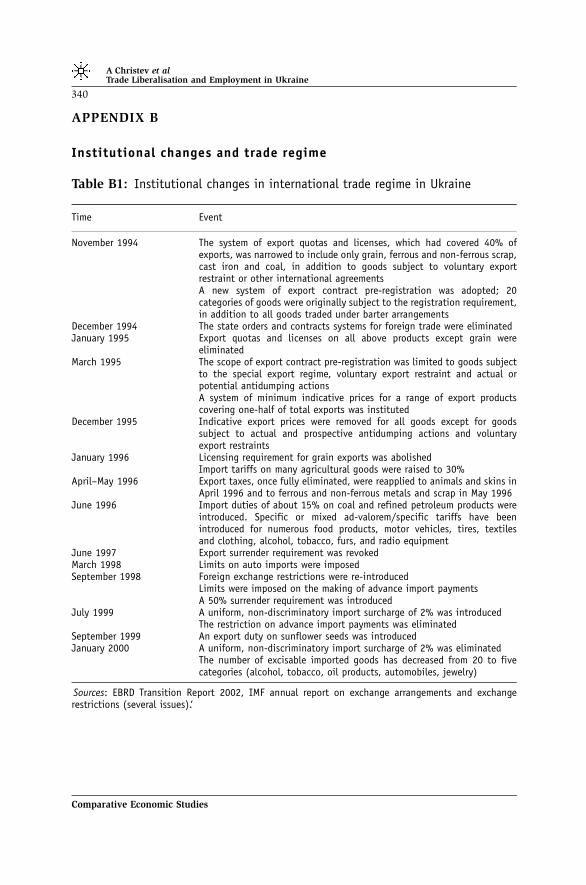
2 We observe this spectacular rise in trade flows in spite of the somewhat tortuous path of
Ukrainian trade reforms, which are documented in Appendix B.
A Christev et alTrade Liberalisation and Employment in Ukraine
323
Comparative Economic Studies
THE DATA
The empirical analysis is based on industry-level data for a panel of 96 three-digit NACE mining and manufacturing industries in Ukraine over the 1994–2000 period, containing information from three diverse sources. The panel isrestricted to the subset of Ukrainian industries for which data on job andtrade flows are available over the whole period. Identifying entry andespecially exit in the registry data proves to be an impossible task. However,we have calculated gross flow statistics for all firms, including those where
0
20
40
60
80
100
120
140
160
180
200
1992 1993 1994 1995 1996 1997 1998 1999 2000 2001
CIS ROW EU
Figure 1: Evolution of Ukrainian exports, 1992–2001 (1996¼ 100).Source: Commonwealth of independent states in 2001 (2002)
0
20
40
60
80
100
120
140
1992 1993 1994 1995 1996 1997 1998 1999 2000 2001
CIS ROW EU
Figure 2: Evolution of Ukrainian imports, 1992–2001 (1996¼ 100).Source: Commonwealth of independent states in 2001 (2002)
A Christev et alTrade Liberalisation and Employment in Ukraine
324
Comparative Economic Studies
we have possible entry or exit. Using bootstrap techniques, we performedtests of the null hypothesis that gross job flows of all firms and gross job flowsof continuous firms are determined by the same data-generation process. Inall cases over the sample period, we were not able to reject the nullhypothesis of the equality of the mean and median of the flow measures inthe two separate samples. Consequently, possible entry and exit do notinfluence our results.3 In addition, by concentrating on continuous firms, wecapture above all short- and medium-term effects of trade liberalisation,which are most relevant from a policy point of view.
Annual sectoral data on job creation, destruction and reallocation areconstructed from the establishment-level registry data set from 1993 to 2000provided by the State Statistical Committee of Ukraine (‘Derzhkomstat’).4
Although the initial registry data also cover establishments from some non-industrial sectors (4.84% of the initial sample), we restrict our analysis of jobflows to firms in mining, manufacturing industries and electricity, gas andwater supply (ie to three-digit NACE sectors from 101 to 410).5 Themanufacturing sample covers about 80% of officially reported total industrialemployment. As mentioned above, the data set used in the analysis comprisesonly firms that we can identify with certainty as continuing firms, that is,firms that have positive employment at least for the two adjacent years.Information on ownership is based on the ownership codes of the enterprisesin the registries and is available only for 2000.6
Annual data on import and export flows come from the UkrainianCustoms Office data on import and export volumes in US dollars by countriesof origin and destination. They are disaggregated by the six-digit commoditygroups according to the Harmonised Commodity Description and CodingSystem (HS).7
3 The results of these tests, not shown here, are available from the authors upon request.4 Since the Derzkkomstat used the old classification of industries OKONKh (Classification of
branches of national economy) till 2001, we converted five-digit OKONKh industries to the three-
digit NACE sectors for our further analysis at the sectoral level.5 We also eliminated sectors 205 (Manufacture of other products of wood), 233 (Processing of
nuclear fuel) and 372 (Recycling of non-metal waste) because there is insufficient number of
observations for sectoral analysis. All prison-based enterprises (about 170 establishments) were
excluded from the sample.6 We can distinguish only between state and non-state (including collective, private and
foreign) ownership.7 HS codes were also converted to the three-digit NACE sectors. In our study, we exclude sectors
296 (Manufacture of weapons and ammunition) and 362 (Manufacture of jewellery) because of
non-availability of trade flows data for the whole interval from 1993 to 2000, and then we base
our analysis only on sectors used in the manufacturing sample of the Derzhkomstat data set.
A Christev et alTrade Liberalisation and Employment in Ukraine
325
Comparative Economic Studies
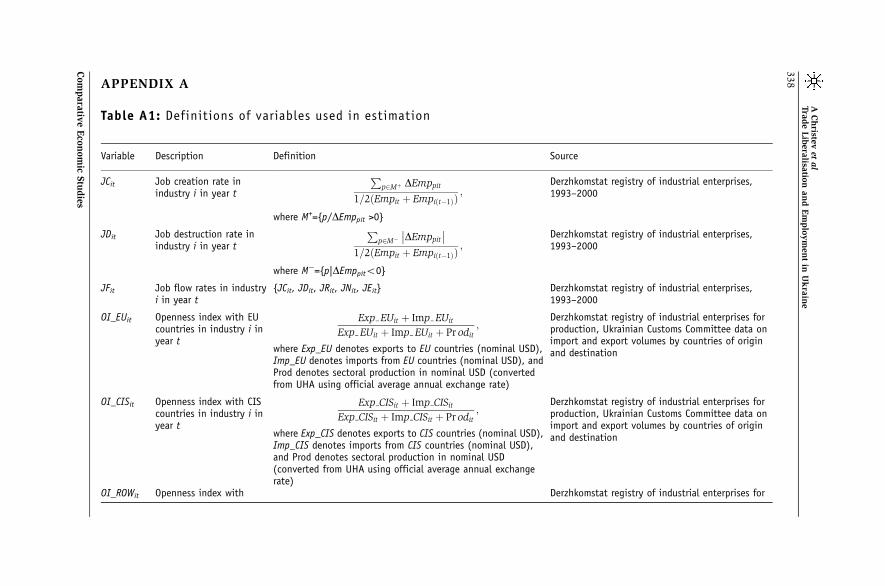
Since we attempt to compare and contrast the role played by trade withthe EU countries from that of trade with the CIS countries in alteringemployment in Ukrainian manufacturing, we focus our analysis on the dataset consisting of export and import volumes in three trading areas: CIScountries, EU countries and the ROW. We construct the following index ofopenness: (Expit+Impit)/(Expit+Impit+Prodit), which uses exports, importsand production of sector i in order to calculate the share of trade in totalturnover. For each industry, this index is then applied to the three tradingareas, resulting in the three trade area-specific indices of openness shown inAppendix A. These measures of trade openness to three distinct trading areasallow us to exploit the special case of Ukrainian manufacturing industries thatwere exposed to the abrupt and sudden trade re-orientation of the economy inthe beginning of the 1990s and the collapse of the CMEA trade regime. In theprocess, some industries remained closed to the shifting trading patternsbefore and even after the reform or maintained their traditional trade linkswithin Russia and CIS, while others increased their trade disproportionatelyin world markets as is evident in our summary statistics of the raw data.Hence, we take advantage of this set-up of counterfactuals to study the effectsof trade liberalisation on job reallocation.
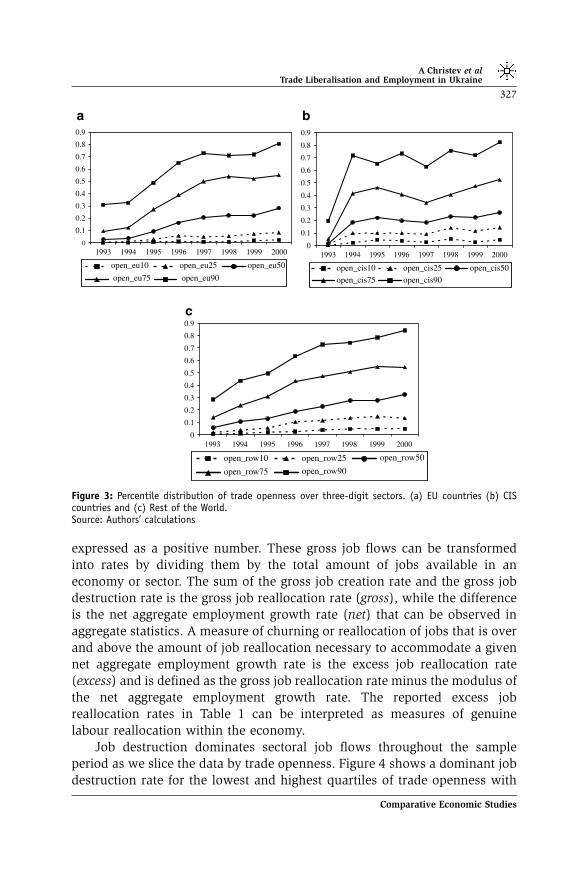
The three panels of Figure 3 depict the percentile distribution of theopenness indices over the sample period. What is evident is the large increasein trade openness over a relatively short period of time in many Ukrainianindustrial sectors. The median (50th percentile) value of the index rises fromalmost 1% in the beginning of the period to more than 20% at the end of 2000in all three distinct trading areas. Apparently a large number of closed sectorsstayed closed over the same years, as shown by the 10th and 25th percentilesof the distribution. Panel b, in addition, shows that this increase occurreddifferently and more unevenly for trade oriented towards CIS. We should notethat it is plausible that a sector appears in more than one of the panels ofFigure 3 and that a sector could be, for example, in the higher end of the EUdistribution and the lower end of the CIS distribution.8
Following Davis and Haltiwanger (1992, 1999), gross job creation (pos) isdefined as the sum of all employment gains in all expanding firms, whilegross job destruction (neg) is the sum of all employment losses in allcontracting firms in an economy or sector. Usually gross job destruction is
8 The large jumps of the openness measure for the CIS trade orientation in the upper half of the
distribution in panel B of Figure 3 might seem implausible. They can be related to measurement
problems in the early phase of Ukraine’s independence when a prolonged hyperinflation plagued the
country resulting in the reporting of possible very ‘false’ exchange rates. For the core of the analysis
of the paper, these potential measurement problems in connection with the early years are, however,
irrelevant, since in our estimations we use data going back only to 1994.
A Christev et alTrade Liberalisation and Employment in Ukraine
326
Comparative Economic Studies
expressed as a positive number. These gross job flows can be transformedinto rates by dividing them by the total amount of jobs available in aneconomy or sector. The sum of the gross job creation rate and the gross jobdestruction rate is the gross job reallocation rate (gross), while the differenceis the net aggregate employment growth rate (net) that can be observed inaggregate statistics. A measure of churning or reallocation of jobs that is overand above the amount of job reallocation necessary to accommodate a givennet aggregate employment growth rate is the excess job reallocation rate(excess) and is defined as the gross job reallocation rate minus the modulus ofthe net aggregate employment growth rate. The reported excess jobreallocation rates in Table 1 can be interpreted as measures of genuinelabour reallocation within the economy.
Job destruction dominates sectoral job flows throughout the sampleperiod as we slice the data by trade openness. Figure 4 shows a dominant jobdestruction rate for the lowest and highest quartiles of trade openness with
0
0.1
0.2
0.3
0.4
0.5
0.6
0.7
0.8
0.9
1993 1994 1995 1996 1997 1998 1999 2000
open_eu10 open_eu25 open_eu50
open_eu75 open_eu90
0
0.1
0.2
0.3
0.4
0.5
0.6
0.7
0.8
0.9
1993 1994 1995 1996 1997 1998 1999 2000
open_cis10 open_cis25 open_cis50
open_cis75 open_cis90
0
0.1
0.2
0.3
0.4
0.5
0.6
0.7
0.8
0.9
1993 1994 1995 1996 1997 1998 1999 2000
open_row10 open_row25 open_row50
open_row75 open_row90
Figure 3: Percentile distribution of trade openness over three-digit sectors. (a) EU countries (b) CIScountries and (c) Rest of the World.Source: Authors’ calculations
A Christev et alTrade Liberalisation and Employment in Ukraine
327
Comparative Economic Studies
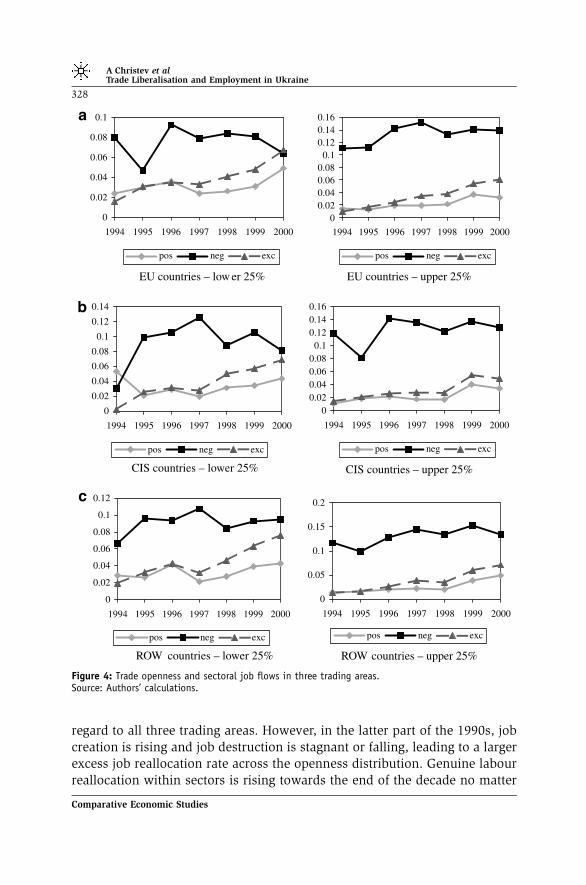
regard to all three trading areas. However, in the latter part of the 1990s, jobcreation is rising and job destruction is stagnant or falling, leading to a largerexcess job reallocation rate across the openness distribution. Genuine labourreallocation within sectors is rising towards the end of the decade no matter
0
0.02
0.04
0.06
0.08
0.1
1994 1995 1996 1997 1998 1999 2000
pos neg exc
EU countries – low er 25%
00.020.040.060.08
0.10.120.140.16
1994 1995 1996 1997 1998 1999 2000
pos neg exc
EU countries – upper 25%
0
0.02
0.04
0.06
0.08
0.1
0.12
0.14
1994 1995 1996 1997 1998 1999 2000
pos neg exc
CIS countries – lower 25%
00.020.040.060.08
0.10.120.140.16
1994 1995 1996 1997 1998 1999 2000
pos neg exc
CIS countries – upper 25%
0
0.02
0.04
0.06
0.08
0.1
0.12
1994 1995 1996 1997 1998 1999 2000
pos neg exc
ROW countries – lower 25%
0
0.05
0.1
0.15
0.2
1994 1995 1996 1997 1998 1999 2000
pos neg exc
ROW countries – upper 25%
Figure 4: Trade openness and sectoral job flows in three trading areas.Source: Authors’ calculations.
A Christev et alTrade Liberalisation and Employment in Ukraine
328
Comparative Economic Studies
how open a sector is towards the respective trading area or block. These rawdata thus indicate that labour reallocation might be predominantly driven byidiosyncratic factors and not necessarily by trade liberalisation alone.
Job destruction evolves, however, quite unevenly and differently acrosstrade regimes and the degree of openness. It is more volatile and has aconsistently lower level in the more closed sectors across all three panels.More trade openness seems to be correlated with more persistent and largerjob destruction, resulting in unabated large labour shedding throughout thesample period. On the other hand, we see a marked downward trend inthe job destruction rate and a rising job creation rate in those sectors thatare relatively closed. Thus, labour shedding declines disproportionately inthese sectors.
THEORETICAL FRAMEWORK AND EMPIRICAL SPECIFICATION
There is little theoretical and empirical work relating gross job flows andinternational trade (Klein et al., 2003a b). In addition, Davis et al. (1996)establish ‘no systematic relationship’ between job flows and openness totrade in US manufacturing for 1973 to 1986. To study the employment effectsof exposure to international trade in the Ukrainian industrial sectors, weclosely follow Klein et al. (2003a), who study the costly adjustment to tradeflows using detailed data on US manufacturing for the period 1973–1993.We specify job flows as a function of trade flows that vary systematicallyby industry and control for other industry-specific effects (including pri-vatisation) and explicitly model dynamic adjustment of labour reallocation insectors by including lagged dependent variables. Earlier work has shown thatadjustment costs in transition tend to differ in non-trivial ways according toindustry and ownership. We expect that opening up of essentially closed(former CMEA) markets to international trade will affect different industriesdisproportionately.
Thus, we study the effects of trade liberalisation on job creation,destruction and labour reallocation by analysing differences in internationalexposure of industrial sectors in Ukraine controlling for idiosyncratic shocksand ownership structure at the end of period. We construct three measures oftrade openness towards three different groups of countries (EU, CIS (formerSoviet Union countries apart from the Baltic States) and the ROW).Furthermore, we use a trade-weighted (multilateral) real exchange rate asan additional regressor or interact the trade openness indices with thisexchange rate to isolate the effects of relative prices and productivitydifferences according to industrial sectors at the three-digit level (see
A Christev et alTrade Liberalisation and Employment in Ukraine
329
Comparative Economic Studies
Appendix A for a definition of these and other variables used in ourestimation).
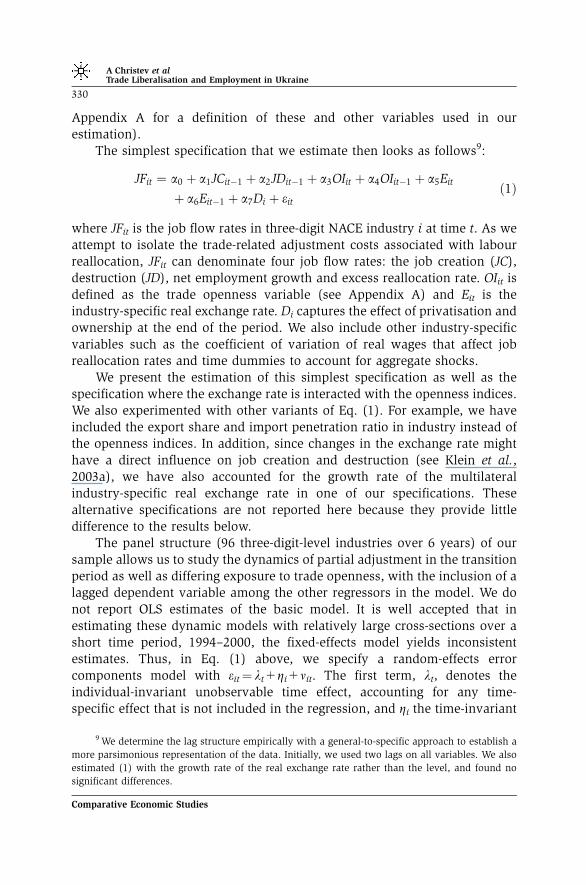
The simplest specification that we estimate then looks as follows9:
JFit ¼ a0 þ a1JCit�1 þ a2JDit�1 þ a3OIit þ a4OIit�1 þ a5Eit
þ a6Eit�1 þ a7Di þ eit
ð1Þ
where JFit is the job flow rates in three-digit NACE industry i at time t. As weattempt to isolate the trade-related adjustment costs associated with labourreallocation, JFit can denominate four job flow rates: the job creation (JC),destruction (JD), net employment growth and excess reallocation rate. OIit isdefined as the trade openness variable (see Appendix A) and Eit is theindustry-specific real exchange rate. Di captures the effect of privatisation andownership at the end of the period. We also include other industry-specificvariables such as the coefficient of variation of real wages that affect jobreallocation rates and time dummies to account for aggregate shocks.
We present the estimation of this simplest specification as well as thespecification where the exchange rate is interacted with the openness indices.We also experimented with other variants of Eq. (1). For example, we haveincluded the export share and import penetration ratio in industry instead ofthe openness indices. In addition, since changes in the exchange rate mighthave a direct influence on job creation and destruction (see Klein et al.,2003a), we have also accounted for the growth rate of the multilateralindustry-specific real exchange rate in one of our specifications. Thesealternative specifications are not reported here because they provide littledifference to the results below.
The panel structure (96 three-digit-level industries over 6 years) of oursample allows us to study the dynamics of partial adjustment in the transitionperiod as well as differing exposure to trade openness, with the inclusion of alagged dependent variable among the other regressors in the model. We donot report OLS estimates of the basic model. It is well accepted that inestimating these dynamic models with relatively large cross-sections over ashort time period, 1994–2000, the fixed-effects model yields inconsistentestimates. Thus, in Eq. (1) above, we specify a random-effects errorcomponents model with eit¼ lt+Zi+nit. The first term, lt, denotes theindividual-invariant unobservable time effect, accounting for any time-specific effect that is not included in the regression, and Zi the time-invariant
9 We determine the lag structure empirically with a general-to-specific approach to establish a
more parsimonious representation of the data. Initially, we used two lags on all variables. We also
estimated (1) with the growth rate of the real exchange rate rather than the level, and found no
significant differences.
A Christev et alTrade Liberalisation and Employment in Ukraine
330
Comparative Economic Studies
unobservable individual specific effect, which accounts for any individual-specific effect not included in the regression. The last term,nit, is a white noiseerror term. This type of error components model, however, raises well-knownadditional problems when lagged dependent variables are included. We,therefore, resort to the use of the GMM estimation that has dominated recentstudies of dynamic panel regressions.10
In estimation we apply the asymptotically efficient (one-step) GMMestimator advocated by Arellano and Bover (1995) and Blundell and Bond(1998).11 This estimator usually exploits a different number of instruments ineach time period. The only, rather weak, assumption we make is that theerror term and the instruments that become available with this estimationapproach remain orthogonal. We perform a Sargan (Hansen J) test of over-identifying restrictions, which is robust to heteroscedasticity, to verify thevalidity of this assumption. Further, we transform the data and allow suitablylagged endogenous or predetermined variables in levels to enter asinstruments in the transformed equations. Additional moment conditions,which increase efficiency, become available when the original equation inlevels is added to the system. Then, the endogenous and predeterminedvariables in levels are instrumented by their own, suitably lagged firstdifferences.
By construction, the transformed error term does not contain Zi andorthogonality among the errors is preserved, implying consistent estimates.The original errors may be heteroskedastic but may not be autocorrelated of ahigher order, for which we also test formally, and treat all variables in ourmodels as potentially endogenous. In addition, we check for serial correlationin the errors to establish consistency. When Deit are the first-differences ofserially uncorrelated errors, then it is easy to show that E[DeitDeit�1] is notzero; yet for consistency of the GMM estimator used here we require thatE[DeitDeit�2]¼ 0 holds. Diagnostics, reported in Tables 4 and 5, show thatboth AR(1) and AR(2) tests provide evidence to confirm the lack of second (orhigher order) serial correlation in the errors. The robust Sargan test statisticindicates that the choice of the instruments used in the paper is appropriate,that is, the instruments as a group are uncorrelated with the errors.12 Theseare reported in the Diagnostics section of Tables 4 and 5, to whose mainfindings we now proceed.
10 For background and a detailed discussion see Baltagi (1995, Ch.8). For an overview, see Bond
(2002) and Hall (2003).11 The results do not change substantially when we apply a finite sample correction to the two-
step covariance matrix as shown in Windmeijer (2005).12 Where possible, in addition to predetermined variables, we use the lagged differences and
levels of real industrial output as instruments in our regressions.
A Christev et alTrade Liberalisation and Employment in Ukraine
331
Comparative Economic Studies
MAIN HYPOTHESES AND RESULTS
Changes in trading patterns have a direct effect on the labour demand in differentindustries and are thus closely related to the pace of job creation and destruction.
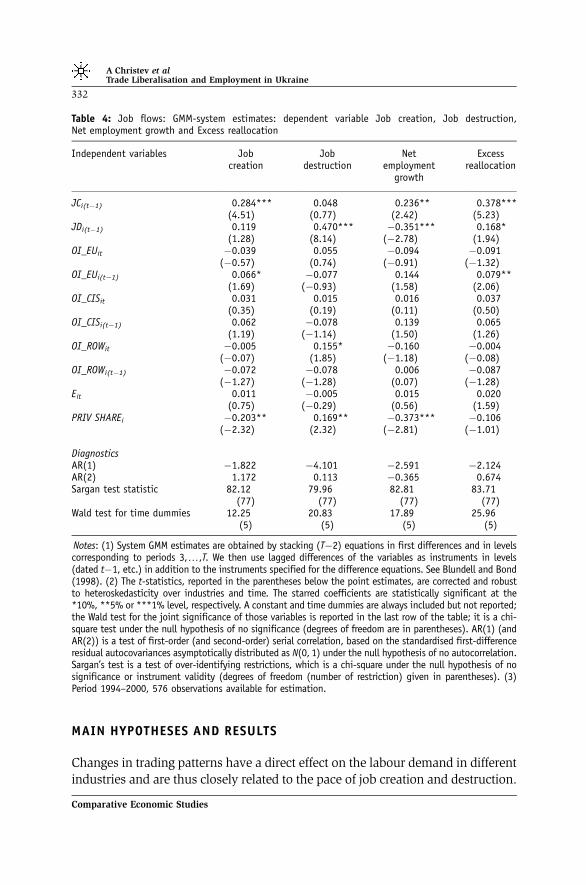
Table 4: Job flows: GMM-system estimates: dependent variable Job creation, Job destruction,Net employment growth and Excess reallocation
Independent variables Jobcreation
Jobdestruction
Netemployment
growth
Excessreallocation
JCi(t�1) 0.284*** 0.048 0.236** 0.378***(4.51) (0.77) (2.42) (5.23)
JDi(t�1) 0.119 0.470*** �0.351*** 0.168*(1.28) (8.14) (�2.78) (1.94)
OI_EUit �0.039 0.055 �0.094 �0.091(�0.57) (0.74) (�0.91) (�1.32)
OI_EUi(t�1) 0.066* �0.077 0.144 0.079**(1.69) (�0.93) (1.58) (2.06)
OI_CISit 0.031 0.015 0.016 0.037(0.35) (0.19) (0.11) (0.50)
OI_CISi(t�1) 0.062 �0.078 0.139 0.065(1.19) (�1.14) (1.50) (1.26)
OI_ROWit �0.005 0.155* �0.160 �0.004(�0.07) (1.85) (�1.18) (�0.08)
OI_ROWi(t�1) �0.072 �0.078 0.006 �0.087(�1.27) (�1.28) (0.07) (�1.28)
Eit 0.011 �0.005 0.015 0.020(0.75) (�0.29) (0.56) (1.59)
PRIV SHAREi �0.203** 0.169** �0.373*** �0.106(�2.32) (2.32) (�2.81) (�1.01)
DiagnosticsAR(1) �1.822 �4.101 �2.591 �2.124AR(2) 1.172 0.113 �0.365 0.674Sargan test statistic 82.12 79.96 82.81 83.71
(77) (77) (77) (77)Wald test for time dummies 12.25 20.83 17.89 25.96
(5) (5) (5) (5)
Notes: (1) System GMM estimates are obtained by stacking (T�2) equations in first differences and in levelscorresponding to periods 3,y,T. We then use lagged differences of the variables as instruments in levels(dated t�1, etc.) in addition to the instruments specified for the difference equations. See Blundell and Bond(1998). (2) The t-statistics, reported in the parentheses below the point estimates, are corrected and robustto heteroskedasticity over industries and time. The starred coefficients are statistically significant at the*10%, **5% or ***1% level, respectively. A constant and time dummies are always included but not reported;the Wald test for the joint significance of those variables is reported in the last row of the table; it is a chi-square test under the null hypothesis of no significance (degrees of freedom are in parentheses). AR(1) (andAR(2)) is a test of first-order (and second-order) serial correlation, based on the standardised first-differenceresidual autocovariances asymptotically distributed as N(0, 1) under the null hypothesis of no autocorrelation.Sargan’s test is a test of over-identifying restrictions, which is a chi-square under the null hypothesis of nosignificance or instrument validity (degrees of freedom (number of restriction) given in parentheses). (3)Period 1994–2000, 576 observations available for estimation.
A Christev et alTrade Liberalisation and Employment in Ukraine
332
Comparative Economic Studies
Trade theory provides little explanation as to the links, causes and effects ofadjustment costs associated with job and worker reallocation. As discussedearlier, previous work has generally focused on the effects of trade on netemployment change and neglected other aspects of this process, namely grossjob creation and destruction. Only Gourinchas (1999) and Klein et al. (2003a)studied explicitly the effects of trade on job gross flows as far as we know.
We expect that job destruction will be both more volatile and larger thanjob creation following trade liberalisation in Ukraine. Job destruction causedby increased trade flows may exacerbate unemployment if workers do notreallocate to new jobs or exit the labour force (Lehmann et al., 2006). Jobcreation, on the other hand, may be constrained by the lower competitivenessof Ukrainian industries, and especially those industries that are initially eitherclosed to trade with the EU or ROW or that have maintained strong trading
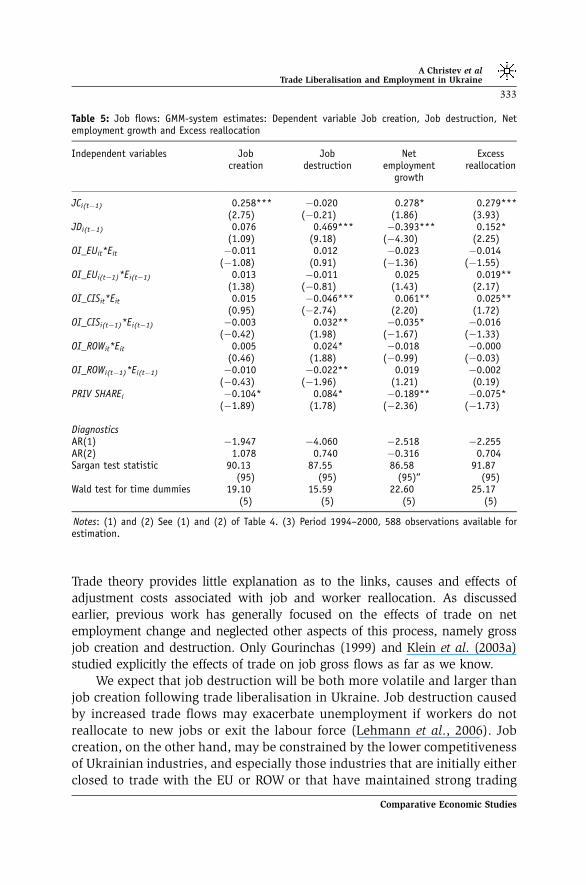
Table 5: Job flows: GMM-system estimates: Dependent variable Job creation, Job destruction, Netemployment growth and Excess reallocation
Independent variables Jobcreation
Jobdestruction
Netemployment
growth
Excessreallocation
JCi(t�1) 0.258*** �0.020 0.278* 0.279***(2.75) (�0.21) (1.86) (3.93)
JDi(t�1) 0.076 0.469*** �0.393*** 0.152*(1.09) (9.18) (�4.30) (2.25)
OI_EUit*Eit �0.011 0.012 �0.023 �0.014(�1.08) (0.91) (�1.36) (�1.55)
OI_EUi(t�1)*Ei(t�1) 0.013 �0.011 0.025 0.019**(1.38) (�0.81) (1.43) (2.17)
OI_CISit*Eit 0.015 �0.046*** 0.061** 0.025**(0.95) (�2.74) (2.20) (1.72)
OI_CISi(t�1)*Ei(t�1) �0.003 0.032** �0.035* �0.016(�0.42) (1.98) (�1.67) (�1.33)
OI_ROWit*Eit 0.005 0.024* �0.018 �0.000(0.46) (1.88) (�0.99) (�0.03)
OI_ROWi(t�1)*Ei(t�1) �0.010 �0.022** 0.019 �0.002(�0.43) (�1.96) (1.21) (0.19)
PRIV SHAREi �0.104* 0.084* �0.189** �0.075*(�1.89) (1.78) (�2.36) (�1.73)
DiagnosticsAR(1) �1.947 �4.060 �2.518 �2.255AR(2) 1.078 0.740 �0.316 0.704Sargan test statistic 90.13 87.55 86.58 91.87
(95) (95) (95)‘‘ (95)Wald test for time dummies 19.10 15.59 22.60 25.17
(5) (5) (5) (5)
Notes: (1) and (2) See (1) and (2) of Table 4. (3) Period 1994–2000, 588 observations available forestimation.
A Christev et alTrade Liberalisation and Employment in Ukraine
333
Comparative Economic Studies
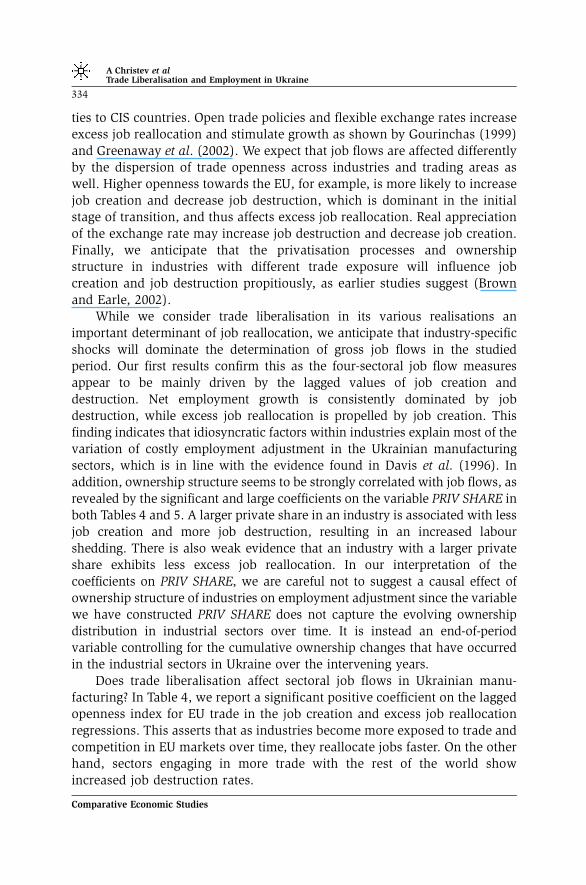
ties to CIS countries. Open trade policies and flexible exchange rates increaseexcess job reallocation and stimulate growth as shown by Gourinchas (1999)and Greenaway et al. (2002). We expect that job flows are affected differentlyby the dispersion of trade openness across industries and trading areas aswell. Higher openness towards the EU, for example, is more likely to increasejob creation and decrease job destruction, which is dominant in the initialstage of transition, and thus affects excess job reallocation. Real appreciationof the exchange rate may increase job destruction and decrease job creation.Finally, we anticipate that the privatisation processes and ownershipstructure in industries with different trade exposure will influence jobcreation and job destruction propitiously, as earlier studies suggest (Brownand Earle, 2002).
While we consider trade liberalisation in its various realisations animportant determinant of job reallocation, we anticipate that industry-specificshocks will dominate the determination of gross job flows in the studiedperiod. Our first results confirm this as the four-sectoral job flow measuresappear to be mainly driven by the lagged values of job creation anddestruction. Net employment growth is consistently dominated by jobdestruction, while excess job reallocation is propelled by job creation. Thisfinding indicates that idiosyncratic factors within industries explain most of thevariation of costly employment adjustment in the Ukrainian manufacturingsectors, which is in line with the evidence found in Davis et al. (1996). Inaddition, ownership structure seems to be strongly correlated with job flows, asrevealed by the significant and large coefficients on the variable PRIV SHARE inboth Tables 4 and 5. A larger private share in an industry is associated with lessjob creation and more job destruction, resulting in an increased labourshedding. There is also weak evidence that an industry with a larger privateshare exhibits less excess job reallocation. In our interpretation of thecoefficients on PRIV SHARE, we are careful not to suggest a causal effect ofownership structure of industries on employment adjustment since the variablewe have constructed PRIV SHARE does not capture the evolving ownershipdistribution in industrial sectors over time. It is instead an end-of-periodvariable controlling for the cumulative ownership changes that have occurredin the industrial sectors in Ukraine over the intervening years.
Does trade liberalisation affect sectoral job flows in Ukrainian manu-facturing? In Table 4, we report a significant positive coefficient on the laggedopenness index for EU trade in the job creation and excess job reallocationregressions. This asserts that as industries become more exposed to trade andcompetition in EU markets over time, they reallocate jobs faster. On the otherhand, sectors engaging in more trade with the rest of the world showincreased job destruction rates.
A Christev et alTrade Liberalisation and Employment in Ukraine
334
Comparative Economic Studies
To account for different productivity and relative price shocks over time,we interact proxies for the industry-specific real exchange rate with the tradeopenness indices and report the results in Table 5. While it is more difficult todisentangle the effects of trade on job flows using these new variables, theresults suggest that openness and an appreciation of the real exchange rateaffect job creation and job destruction disproportionately due to trade bycountry of origin and destination. The estimates of Table 5 show a smallpositive effect on increased job destruction rates for sectors trading with therest of the world. Our data indicate that for the average sector, a realdepreciation within the CIS trading area is reflected by a real appreciation ofrelative prices towards the EU and ROW and vice versa. This observation is inaccordance with Coricelli and Jazbec (2004), who find that the realappreciation of the exchange rate occurred with different pace over time andacross countries for different reasons in transition economies. We, therefore,establish that sectors with more trade to CIS countries have declining jobdestruction rates primarily because of a depreciation of the real exchange ratewithin the former ruble zone over the sample period. The positive effect ofincreased openness to the EU trading area does not disappear when the index isinteracted with the real exchange rate. We interpret this result as evidence thatincreased restructuring and job reallocation are brought about by stiffercompetition in EU markets. Finally, net employment growth occurs only insectors that maintain strong trade ties in the CIS area.
CONCLUSIONS
This paper addresses the effects of trade liberalisation on gross job flows, anarea that has been relatively neglected in the trade liberalisation as well as inthe job flows literature. It studies the labour market of Ukraine where we viewthe sudden opening up of the economy to world markets as a quasi-naturalexperiment. We provide some evidence that three-digit NACE sector job flowsin Ukrainian manufacturing are mainly driven by idiosyncratic factors withinindustries. Trade is a factor of some but of minor importance in thedetermination of gross job flows, a finding well established in Westernstudies. In particular, we find that while trade with CIS decreases jobdestruction, trade with the EU increases excess reallocation mainly throughjob creation.
AcknowledgementsWe thank John Haltiwanger and Peter Wright and the participants at the GEPConference, Nottingham, June 2003, and the IZA-Upjohn-WDI conference
A Christev et alTrade Liberalisation and Employment in Ukraine
335
Comparative Economic Studies
on ‘Microeconomic Aspects of Labor Reallocation’, Kalamazoo, Michigan,August 2003, for valuable comments and insightful discussions. Commentsby an anonymous referee and the editor of this journal have improved thepaper considerably. This study was partially financed by the CERT-RWIproject ‘Analysis of Labor Markets in Transition Countries Using Large MicroData Sets’. Kupets is grateful to the ‘INTAS’ program for facilitating her stay inEdinburgh, during which the first version of the paper took shape.
REFERENCES
Arellano, M and Bover, O. 1995: Another look at the instrumental variable estimation of error-
components models. Journal of Econometrics 68: 29–51.
Aslund, A. 2002: Why has Ukraine returned to economic growth? Institute of Economic Research
Working Paper No. 15, Kiev, Ukraine.
Baldwin, J, Dunne, T and Haltiwanger, J. 1998: A comparison of job creation and job destruction in
Canada and the United States. The Review of Economics and Statistics LXXX(3): 347–356.
Baltagi, B. 1995: Econometric Analysis of Panel Data. John Wiley & Sons: New York.
Bilsen, V and Konings, J. 1998: Job creation, job destruction and growth of newly established,
privatized, and state-owned enterprises in transition economics: Survey evidence from Bulgaria,
Hungary and Romania. Journal of Comparative Economics 26(3): 429–445.
Blanchard, O. 1997: The economics of post-communist transition. Claredon Lectures in Economics:
Oxford.
Blundell, R and Bond, SR. 1998: Initial conditions and moment restrictions in dynamic panel data
models. Journal of Econometrics 87: 115–143.
Bond, S. 2002: Dynamic panel data models: A guide to micro data methods and practice. Centre for
Microdata Methods and Practice Working Paper CWP09/02.
Brown, D and Earle, J. 2002: Gross job flows in Russian industry before and after reforms: Has
destruction become more creative? Journal of Comparative Economics 30(1): 96–133.
Coricelli, F and Jazbec, B. 2004: Real exchange rate dynamics in transition economies. Structural
Change and Economic Dynamics 15: 83–100.
Davis, S and Haltiwanger, J. 1992: Gross job creation, gross job destruction and employment
reallocation. Quarterly Journal of Economics 107(3): 819–863.
Davis, S and Haltiwanger, J. 1999: Gross job flows. In: Ashenfelter, O and Card, D. (eds). Handbook
of Labor Economics, Vol. 3 Elsevier: Amsterdam pp. 2711–2805.
Davis, S, Haltiwanger, J and Schuh, S. 1996: Job creation and job destruction. MIT Press: Cambridge.
Faggio, G and Konings, J. 2003: Job creation, job destruction and employment growth in transition
countries in the 90’s. Economic Systems 27: 129–154.
Gourinchas, P-O. 1999: Exchange rates do matter: French job reallocation and exchange rate
turbulence, 1984–1992. European Economic Review 43: 1279–1316.
Greenaway, D, Morgan, W and Wright, P. 2002: Trade liberalization and growth in developing
countries. Journal of Development Economics 67: 229–244.
Hall, AR. 2003: Generalized method of moments. In: Baltagi, BH (ed). A Companion to Theoretical
Econometrics. Blakwell Publishing: Oxford pp. 230–255.
Haltiwanger, J, Lehmann, H and Terrell, K. 2003: Job creation and job destruction in transition
countries: Introduction to a symposium. Economics of Transition 11(2): 1–15.
Jacobsen, L, LaLonde, R and Sullivan, D. 1993: The costs of worker displacement. WE Upjohn
Institute: Kalamazoo.
A Christev et alTrade Liberalisation and Employment in Ukraine
336
Comparative Economic Studies
Klein, MW, Schuh, S and Triest, RK. 2003a: Job creation, job destruction and the real exchange rate.
Journal of International Economics 59: 239–265.
Klein, MW, Schuh, S and Triest, RK. 2003b: Job creation, job destruction and international
competition. WE Upjohn Institute: Kalamazoo.
Konings, J, Lehmann, H and Schaffer, M. 1996: Employment growth, job creation and job
destruction in polish industry: 1988–91. Labor Economics 3: 299–317.
Konings, J, Kupets, O and Lehmann, H. 2003: Gross job flows in Ukraine: Size, ownership and trade
effects. Economics of Transition 11(2): 231–251.
Kuhn, P. 2002: Losing work, moving on: Worker displacement in international perspective. WE
Upjohn Institute for Employment Research: Kalamazoo.
Lehmann, H, Pignatti, N and Wadsworth, J. 2006: The incidence and cost of job loss in the Ukrainian
labor market. Journal of Comparative Economics 34(2): 248–271.
Levinsohn, J. 1999: Employment responses to international liberalization in Chile. Journal of
International Economics 47(2): 321–344.
Repkine, A and Walsh, P. 1999: Evidence of European trade and investment U-shaping industrial
output in Bulgaria, Hungary, Poland and Romania. Journal of Comparative Economics 27(4):
730–752.
Windmeijer, F. 2005: A finite sample correction for the variance of linear efficient two-step GMM
estimators. Journal of Econometrics 126: 25–51.
A Christev et alTrade Liberalisation and Employment in Ukraine
337
Comparative Economic Studies
APPENDIX A
Table A1: Definitions of variables used in estimation
Variable Description Definition Source
JCit Job creation rate inindustry i in year t
Pp2Mþ DEmppit
1=2ðEmpit þ Empiðt�1ÞÞ;
where M+={p/DEmppit >0}
Derzhkomstat registry of industrial enterprises,1993–2000
JDit Job destruction rate inindustry i in year t
Pp2M� DEmppit
�� ��1=2ðEmpit þ Empiðt�1ÞÞ
;
where M�={p|DEmppito0}
Derzhkomstat registry of industrial enterprises,1993–2000
JFit Job flow rates in industryi in year t
{JCit, JDit, JRit, JNit, JEit} Derzhkomstat registry of industrial enterprises,1993–2000
OI_EUit Openness index with EUcountries in industry i inyear t
Exp EUit þ Imp EUit
Exp EUit þ Imp EUit þ Pr odit;
where Exp_EU denotes exports to EU countries (nominal USD),Imp_EU denotes imports from EU countries (nominal USD), andProd denotes sectoral production in nominal USD (convertedfrom UHA using official average annual exchange rate)
Derzhkomstat registry of industrial enterprises forproduction, Ukrainian Customs Committee data onimport and export volumes by countries of originand destination
OI_CISit Openness index with CIScountries in industry i inyear t
Exp CISit þ Imp CISit
Exp CISit þ Imp CISit þ Pr odit;
where Exp_CIS denotes exports to CIS countries (nominal USD),Imp_CIS denotes imports from CIS countries (nominal USD),and Prod denotes sectoral production in nominal USD(converted from UHA using official average annual exchangerate)
Derzhkomstat registry of industrial enterprises forproduction, Ukrainian Customs Committee data onimport and export volumes by countries of originand destination
OI_ROWit Openness index with Derzhkomstat registry of industrial enterprises for
AC
hriste
vet
al
Tra
de
Lib
era
lisatio
nan
dE
mplo
ym
en
tin
Uk
rain
e
338
Com
para
tive
Eco
nom
icStu
dies
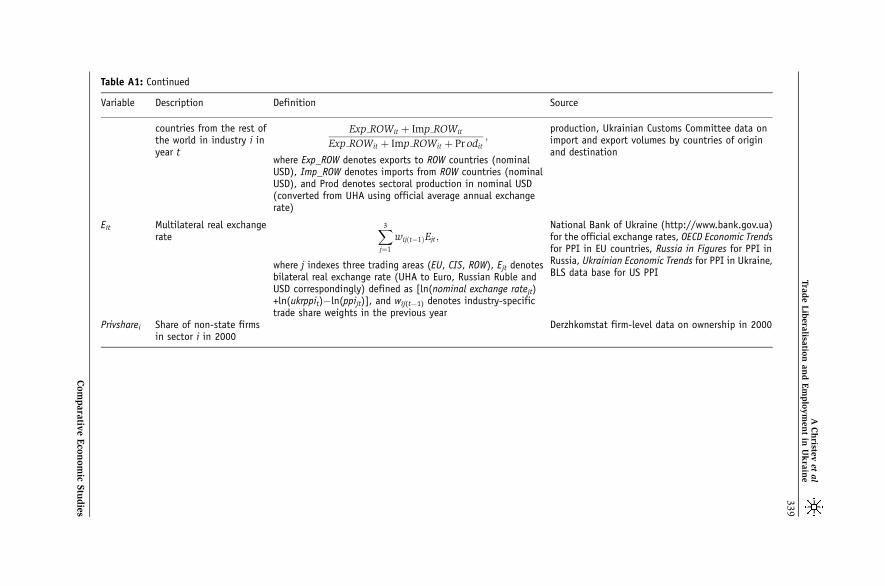
Table A1: Continued
Variable Description Definition Source
countries from the rest ofthe world in industry i inyear t
Exp ROWit þ Imp ROWit
Exp ROWit þ Imp ROWit þ Pr odit;
where Exp_ROW denotes exports to ROW countries (nominalUSD), Imp_ROW denotes imports from ROW countries (nominalUSD), and Prod denotes sectoral production in nominal USD(converted from UHA using official average annual exchangerate)
production, Ukrainian Customs Committee data onimport and export volumes by countries of originand destination
Eit Multilateral real exchangerate
X3
j¼1
wijðt�1ÞEjt;
where j indexes three trading areas (EU, CIS, ROW), Ejt denotesbilateral real exchange rate (UHA to Euro, Russian Ruble andUSD correspondingly) defined as [ln(nominal exchange ratejt)+ln(ukrppit)�ln(ppijt)], and wij(t�1) denotes industry-specifictrade share weights in the previous year
National Bank of Ukraine (http://www.bank.gov.ua)for the official exchange rates, OECD Economic Trendsfor PPI in EU countries, Russia in Figures for PPI inRussia, Ukrainian Economic Trends for PPI in Ukraine,BLS data base for US PPI
Privsharei Share of non-state firmsin sector i in 2000
Derzhkomstat firm-level data on ownership in 2000
AC
hriste
vet
al
Tra
de
Lib
era
lisatio
nan
dE
mplo
ym
en
tin
Uk
rain
e
339
Com
para
tive
Eco
nom
icStu
dies
APPENDIX B
Institutional changes and trade regime
Table B1: Institutional changes in international trade regime in Ukraine
Time Event
November 1994 The system of export quotas and licenses, which had covered 40% ofexports, was narrowed to include only grain, ferrous and non-ferrous scrap,cast iron and coal, in addition to goods subject to voluntary exportrestraint or other international agreementsA new system of export contract pre-registration was adopted; 20categories of goods were originally subject to the registration requirement,in addition to all goods traded under barter arrangements
December 1994 The state orders and contracts systems for foreign trade were eliminatedJanuary 1995 Export quotas and licenses on all above products except grain were
eliminatedMarch 1995 The scope of export contract pre-registration was limited to goods subject
to the special export regime, voluntary export restraint and actual orpotential antidumping actionsA system of minimum indicative prices for a range of export productscovering one-half of total exports was instituted
December 1995 Indicative export prices were removed for all goods except for goodssubject to actual and prospective antidumping actions and voluntaryexport restraints
January 1996 Licensing requirement for grain exports was abolishedImport tariffs on many agricultural goods were raised to 30%
April–May 1996 Export taxes, once fully eliminated, were reapplied to animals and skins inApril 1996 and to ferrous and non-ferrous metals and scrap in May 1996
June 1996 Import duties of about 15% on coal and refined petroleum products wereintroduced. Specific or mixed ad-valorem/specific tariffs have beenintroduced for numerous food products, motor vehicles, tires, textilesand clothing, alcohol, tobacco, furs, and radio equipment
June 1997 Export surrender requirement was revokedMarch 1998 Limits on auto imports were imposedSeptember 1998 Foreign exchange restrictions were re-introduced
Limits were imposed on the making of advance import paymentsA 50% surrender requirement was introduced
July 1999 A uniform, non-discriminatory import surcharge of 2% was introducedThe restriction on advance import payments was eliminated
September 1999 An export duty on sunflower seeds was introducedJanuary 2000 A uniform, non-discriminatory import surcharge of 2% was eliminated
The number of excisable imported goods has decreased from 20 to fivecategories (alcohol, tobacco, oil products, automobiles, jewelry)
Sources: EBRD Transition Report 2002, IMF annual report on exchange arrangements and exchangerestrictions (several issues).‘
A Christev et alTrade Liberalisation and Employment in Ukraine
340
Comparative Economic Studies