Trade Liberalisation and Wage Inequality: Lessons from the Mexican Experience
23
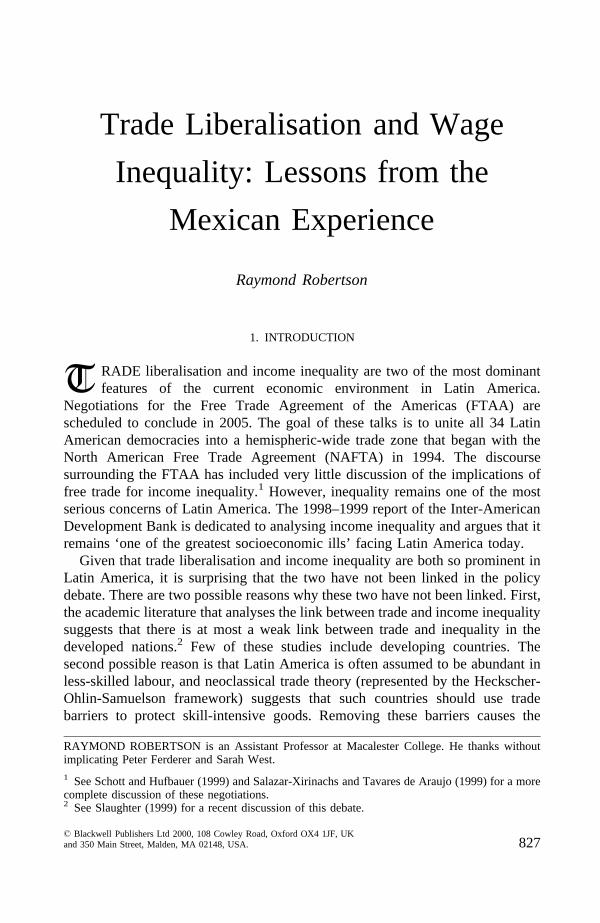
Trade Liberalisation and Wage Inequality: Lessons from the Mexican Experience Raymond Robertson 1. INTRODUCTION T RADE liberalisation and income inequality are two of the most dominant features of the current economic environment in Latin America. Negotiations for the Free Trade Agreement of the Americas (FTAA) are scheduled to conclude in 2005. The goal of these talks is to unite all 34 Latin American democracies into a hemispheric-wide trade zone that began with the North American Free Trade Agreement (NAFTA) in 1994. The discourse surrounding the FTAA has included very little discussion of the implications of free trade for income inequality. 1 However, inequality remains one of the most serious concerns of Latin America. The 1998–1999 report of the Inter-American Development Bank is dedicated to analysing income inequality and argues that it remains ‘one of the greatest socioeconomic ills’ facing Latin America today. Given that trade liberalisation and income inequality are both so prominent in Latin America, it is surprising that the two have not been linked in the policy debate. There are two possible reasons why these two have not been linked. First, the academic literature that analyses the link between trade and income inequality suggests that there is at most a weak link between trade and inequality in the developed nations. 2 Few of these studies include developing countries. The second possible reason is that Latin America is often assumed to be abundant in less-skilled labour, and neoclassical trade theory (represented by the Heckscher- Ohlin-Samuelson framework) suggests that such countries should use trade barriers to protect skill-intensive goods. Removing these barriers causes the ß Blackwell Publishers Ltd 2000, 108 Cowley Road, Oxford OX4 1JF, UK and 350 Main Street, Malden, MA 02148, USA. 827 RAYMOND ROBERTSON is an Assistant Professor at Macalester College. He thanks without implicating Peter Ferderer and Sarah West. 1 See Schott and Hufbauer (1999) and Salazar-Xirinachs and Tavares de Araujo (1999) for a more complete discussion of these negotiations. 2 See Slaughter (1999) for a recent discussion of this debate.
Transcript of Trade Liberalisation and Wage Inequality: Lessons from the Mexican Experience
Trade Liberalisation and Wage
Inequality: Lessons from the
Mexican Experience
Raymond Robertson
1. INTRODUCTION
T RADE liberalisation and income inequality are two of the most dominantfeatures of the current economic environment in Latin America.
Negotiations for the Free Trade Agreement of the Americas (FTAA) arescheduled to conclude in 2005. The goal of these talks is to unite all 34 LatinAmerican democracies into a hemispheric-wide trade zone that began with theNorth American Free Trade Agreement (NAFTA) in 1994. The discoursesurrounding the FTAA has included very little discussion of the implications offree trade for income inequality.1 However, inequality remains one of the mostserious concerns of Latin America. The 1998–1999 report of the Inter-AmericanDevelopment Bank is dedicated to analysing income inequality and argues that itremains ‘one of the greatest socioeconomic ills’ facing Latin America today.
Given that trade liberalisation and income inequality are both so prominent inLatin America, it is surprising that the two have not been linked in the policydebate. There are two possible reasons why these two have not been linked. First,the academic literature that analyses the link between trade and income inequalitysuggests that there is at most a weak link between trade and inequality in thedeveloped nations.2 Few of these studies include developing countries. Thesecond possible reason is that Latin America is often assumed to be abundant inless-skilled labour, and neoclassical trade theory (represented by the Heckscher-Ohlin-Samuelson framework) suggests that such countries should use tradebarriers to protect skill-intensive goods. Removing these barriers causes the
ß Blackwell Publishers Ltd 2000, 108 Cowley Road, Oxford OX4 1JF, UKand 350 Main Street, Malden, MA 02148, USA. 827
RAYMOND ROBERTSON is an Assistant Professor at Macalester College. He thanks withoutimplicating Peter Ferderer and Sarah West.1 See Schott and Hufbauer (1999) and Salazar-Xirinachs and Tavares de Araujo (1999) for a morecomplete discussion of these negotiations.2 See Slaughter (1999) for a recent discussion of this debate.

relative prices of skill-intensive goods to fall. In response to this change in prices,less-skill-intensive industries expand, raising the demand for less-skilled labour.The resulting relationship between trade and wages in the HOS framework iscaptured in the Stolper-Samuelson theorem. The Stolper-Samuelson theorempredicts that, given an increase in the relative price of less-skill-intensiveindustries, the wages of less-skilled workers should increase relative to the wagesof more skilled workers, thus reducing income inequality.
Wood (1997) compares the relationship between wage inequality and tradeliberalisation in East Asia with studies of the Latin American experience andconcludes that, while the East Asian case was consistent with the HOSframework, early evidence suggests that the Latin American experience was not.Several recent papers have focused on Mexico’s experience in particular toevaluate the implications of trade liberalisation on income inequality in LatinAmerica. These studies may offer more accurate predictions for what awaits therest of Latin America than studies of developed countries. This paper synthesisesrecent studies of the Mexican experience to illustrate the reasons why wageinequality increased following trade liberalisation and quantify the contributionof each. The studies cited by Wood (1997) produce an unusually strongconsensus that the sharp increase in inequality that followed trade liberalisationcan be attributed to a rising demand for skilled workers. However, the reasonswhy the demand for skill increased were less clear. Understanding why therelative demand for skilled workers increased is important if a discussion ofpolicies to address inequality is to be included in the FTAA negotiations.
This paper identifies the mechanisms driving the increase in demand for skilland illustrates what this may predict for the rest of Latin America. It should benoted at the outset, however, that one of the problems in describing thisrelationship is that most of these studies examine changes in wage inequality, andnot income inequality. However, to the extent that a large determinant of incomeinequality is rising wage inequality, these studies tell us a great deal about howtrade affects inequality in recently liberalised developing countries.
To describe the links between trade and income inequality, I discuss Mexico’sliberalisation and the increase in wage inequality in Mexico in Section 2. I thendescribe how changes in relative prices that were linked to the change in tariffscontributed to wage inequality in Section 3. In this section, I explain how theincrease in relative wages was consistent with the HOS framework. The rise ininequality seems to contradict the neoclassical framework because, if Mexicowere actually abundant in less-skilled workers, then the relative price of skill-intensive goods should have fallen when tariffs fell. However, Mexico used tradepolicy to protect less-skill-intensive industries and cut these tariffs more, causingthis change in relative prices. Consistent with the Stolper-Samuelson theorem, therelative price of skill-intensive goods rose when trade barriers fell. Beyond theStolper-Samuelson theorem, other papers find that an influx of capital and
828 RAYMOND ROBERTSON
ß Blackwell Publishers Ltd 2000
changes in production technology also contributed to the rising demand for skill. Iexamine the effects of foreign investment and changes in plant technology inSection 4. I draw from these lessons to discuss policy implications andconclusions in Section 5.
2. TRADE LIBERALISATION AND THE RISE IN WAGE INEQUALITY IN MEXICO
Mexico’s trade liberalisation began in the early 1980s. Like many LatinAmerican countries, Mexico had maintained high trade barriers in an attempt tofoster domestic industry. Disappointed with the results, Mexico’s governmentbegan its path to liberalisation by reducing barriers to capital flows in 1983.These changes were largely restricted to Mexico’s border regions. The mostdrastic change in trade policy was its 1985 announcement to join the GeneralAgreement on Tariffs and Trade (GATT). When Mexico joined the GATT in1986, trade barriers fell dramatically. The average tariff fell from 23.5 to 12.5 percent between 1985 and 1990. The maximum tariff fell from 100 to 20 per centand import licence coverage fell from 92.2 to less than 20 per cent of importsover the 1985–1990 period.3 Mexico further liberalised controls on foreigncapital in the Decree of May 1989 (‘Regulations of the law to promote Mexicaninvestment and regulate foreign investment’). This law opened formerlyrestricted sectors to foreign investment. In 1990, Mexico announced that itwould enter into NAFTA negotiations with the US and Canada. Mexico, Canadaand the US signed NAFTA on 17 December 1992, and it went into force 1January 1994. The first of NAFTA’s objectives, as listed in Article 102 of theagreement, is to complete the move to free trade.
Removing trade barriers had both expected and unexpected effects. Asexpected, the reduction in trade barriers increased trade volumes. Between 1987and 1995, the annual sum of imports and exports divided by GDP rose from 30 to50 per cent. Between 1980 and 1990, manufacturing replaced petroleum as thelargest export category. Seemingly contrary to the predictions of the Heckscher-Ohlin-Samuelson (HOS) framework, however, the relative wages of skilledworkers began to rise following trade liberalisation.
One commonly applied metric of relative wages is the ratio of non-production-worker wages to production-worker wages. As in the United States, productionworkers are those who are physically engaged in production. They have lesseducation than non-production workers, and industries with higher relativeemployment of non-production workers have higher average education levels.Between 1987 and 1995, the relative wage of non-production workers rose 55.9per cent. Other measures of inequality tell the same story. Figure 1 presents data
3 Hanson and Harrison (1999b). See also Lustig (1992).
WAGE INEQUALITY IN MEXICO 829
ß Blackwell Publishers Ltd 2000
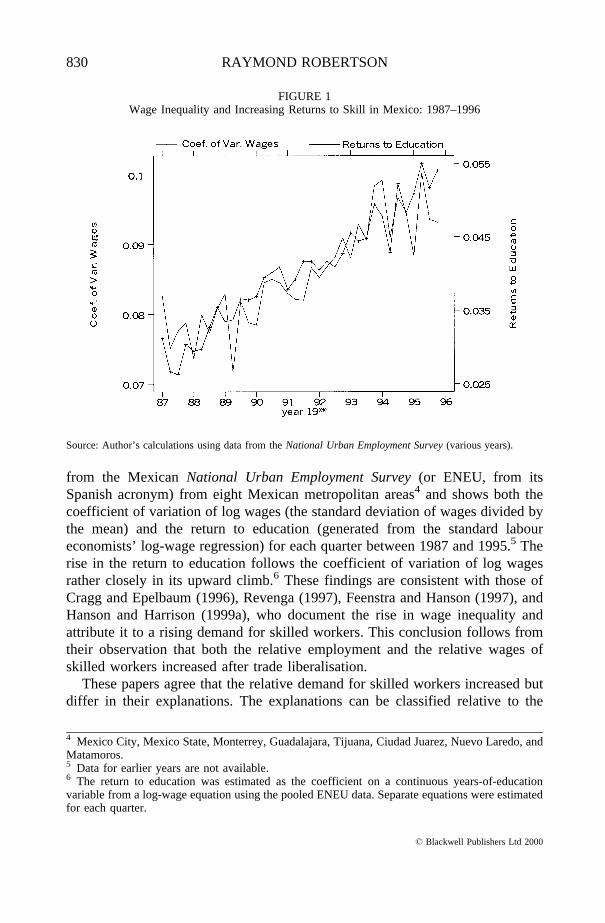
from the MexicanNational Urban Employment Survey(or ENEU, from itsSpanish acronym) from eight Mexican metropolitan areas4 and shows both thecoefficient of variation of log wages (the standard deviation of wages divided bythe mean) and the return to education (generated from the standard laboureconomists’ log-wage regression) for each quarter between 1987 and 1995.5 Therise in the return to education follows the coefficient of variation of log wagesrather closely in its upward climb.6 These findings are consistent with those ofCragg and Epelbaum (1996), Revenga (1997), Feenstra and Hanson (1997), andHanson and Harrison (1999a), who document the rise in wage inequality andattribute it to a rising demand for skilled workers. This conclusion follows fromtheir observation that both the relative employment and the relative wages ofskilled workers increased after trade liberalisation.
These papers agree that the relative demand for skilled workers increased butdiffer in their explanations. The explanations can be classified relative to the
FIGURE 1Wage Inequality and Increasing Returns to Skill in Mexico: 1987–1996
Source: Author’s calculations using data from theNational Urban Employment Survey(various years).
4 Mexico City, Mexico State, Monterrey, Guadalajara, Tijuana, Ciudad Juarez, Nuevo Laredo, andMatamoros.5 Data for earlier years are not available.6 The return to education was estimated as the coefficient on a continuous years-of-educationvariable from a log-wage equation using the pooled ENEU data. Separate equations were estimatedfor each quarter.
830 RAYMOND ROBERTSON
ß Blackwell Publishers Ltd 2000
HOS framework. The HOS framework suggests that, in response to changes inindustry prices, industries whose prices increase will expand and others willcontract. The factor intensively employed in the expanding industry (which is theabundant factor in the HOS framework) will be in greater demand, so its wagewill increase. This is the result of resources shiftingbetweenindustries. On theother hand, implementing advanced technology may require more skill, thusagain causing firms to increase their demand for skill. Increasing the demand forskill through implementing new technologies is considered to be a changewithinindustries and reflects changes outside the traditional HOS framework. Cragg andEpelbaum (1996) and Feenstra and Hanson (1997) suggest that the increase indemand was largely due to changes within industries while Hanson and Harrison(1999a) and Revenga (1997) suggest that these changes were linked to tariffs thatimplicitly caused movements between industries.
To quantify the contribution ofbetween-andwithin-industry changes, I turn tothe Mexican Monthly Industrial Survey (Encuesta Industrial Mensual, or EIM).7
The data capture most of the changes in the domestic labour market because theyare a representative sample of domestic manufacturing firms. The data excludefirms in the maquiladora industry,8 firms with less than six employees, andtemporary or unpaid workers. To decompose the rising demand for skilledworkers, I calculate each industry’s share of total employment and the ratio ofnon-production to production workers in each industry. The overall change in therelative employment of non-production workers is then the sum of twocomponents. The first, the product of the change in the non-production/production employment ratio within each industry and each industry’s averageshare of total employment, generates the fraction of the increase in demand that isdue to changes within industries (holding industry employment shares constant).The second, the product of the change in employment shares and the average non-production/production employment ratio in each industry, generates the fractionof the increase in demand that is due to changes between industries when therelative employment of the two types of worker is held constant.9 I calculate thesechanges between 1987 and both 1994 and 1995.
The HOS framework assumes that factor supplies are fixed and all economicsectors are included in the decomposition, which implies that the total change in
7 The survey covers 3,172 manufacturing firms in 129 4-digit classes of industrial activity and isconducted by the National Institute of Geography, Information, and Statistics (INEGI) to constructindicators of industrial activity.8 The maquiladoraindustry, orin-bond industry, is composed of the group of plants allowed toimport parts for assembly duty-free and then export the finished product. Tariffs are only paid onvalue added in Mexico. These firms are included in the firm-level surveys used later in this paper.9 The specific formula used in the decomposition is�E � �j�sj�ej � �j�ej�sj (total = within +between) in whichsj is the employment share of each industryj, and ej is the ratio of non-production to production workers in each industry. Variables with a bar represent the mean over thesample period.
WAGE INEQUALITY IN MEXICO 831
ß Blackwell Publishers Ltd 2000
relative employment of the two factors would be zero. If this change were zero(as the HOS framework assumes), then an increase in the relative price of skill-intensive goods would cause a between-industry shift towards skilled workers,which, given fixed factor supplies, would have to be offset by a decline in theemployment ratio within industries.
When looking at a particular sector, the assumption of fixed factor suppliesdoes not hold if workers can move between that and other sectors. Nonetheless,looking at the manufacturing sector is informative because, as the most prominenttradable industry, it was most affected by trade liberalisation. The values for thisdecomposition between 1987 and 1994 are 0.028 = 0.012 (between) + 0.016(within). Over the period 1987 to 1994, the relative employment of non-production workers increased 2.8 points, an increase of 6 per cent – a relativelylarge increase for such a short time period. Extending the period to 1995 produces0.041 = 0.021 (between) + 0.019 (within). Over the 1987–1995 period the relativeemployment of skilled workers in manufacturing increased by over 8 per cent.The decomposition reveals that the change in skill demand over the 1987–1995period was about equally divided betweenbetweenandwithin effects. As it turnsout, the explanations for rising inequality in Mexico can also be divided intothose that focus on between effects and within effects.
3. PREDICTIONS OF NEOCLASSICAL TRADE THEORY
The finding that the demand for skill increased between industries has fuelledthe opinion that the HOS framework cannot explain Mexico’s experience.However, there is a very subtle distinction within the HOS framework that needsto be made in order to make that assessment. First, the HOS framework has twoprincipal predictions that apply in this case. First, if Mexico is actually abundantin less-skilled workers, Mexico should have been protecting industries thatintensively use its scarce factor – skill. Second, if the Stolper-Samuelson theorem(which captures the mechanics of the link between trade and wages within theHOS framework) can explain the rise in wage inequality, several conditions mustbe met. First, the change in tariffs should have been consistent with the change inrelative prices. Second, the change in relative prices must be consistent with theincrease in the demand for skill. That is, for the Stolper-Samuelson theorem toexplain the increase in relative wages in Mexico, the relative prices of skill-intensive goods must have risen following trade liberalisation.
To evaluate the applicability of the HOS framework in general, and theStolper-Samuelson theorem in particular, to rising wage inequality in Mexico, Ipresent the evidence supporting each step.10 To follow these steps, I rely on
10 See Robertson (1999b) for a more detailed analysis.
832 RAYMOND ROBERTSON
ß Blackwell Publishers Ltd 2000
several sources of data. First, I combine industrial surveys with detailed tariffdata to document the pattern of protection before liberalisation according tofactor intensity. Tariffs increased between 1984 and 1985 (right before Mexicojoined the GATT) and then fell sharply until 1988. To measure factor intensity, Iuse the skill breakdown in the Industrial Survey (non-production/productionworkers). These data, generated from theMonthly Industrial Survey, are matchedto the average most-favoured-nation (MFN) tariff rates for Mexico in 1985.11
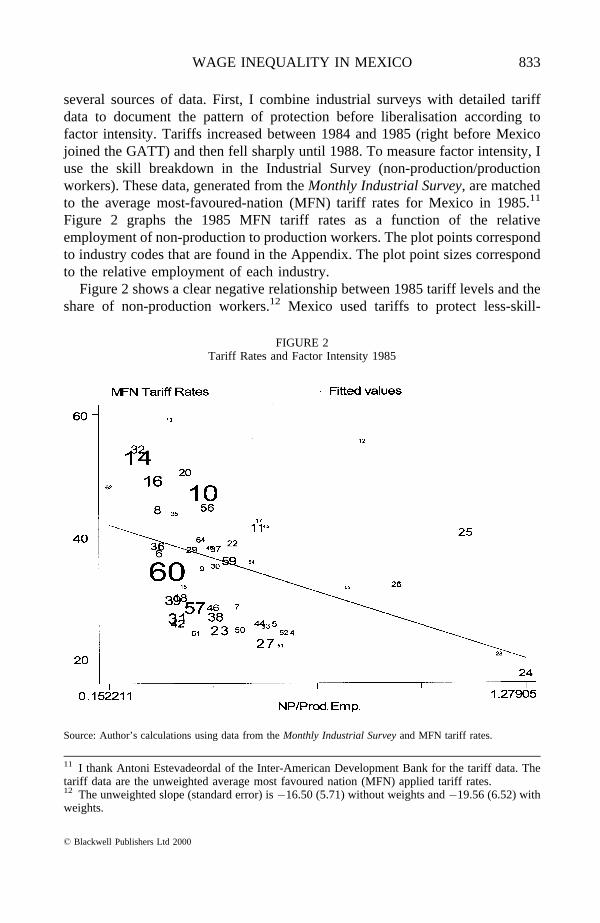
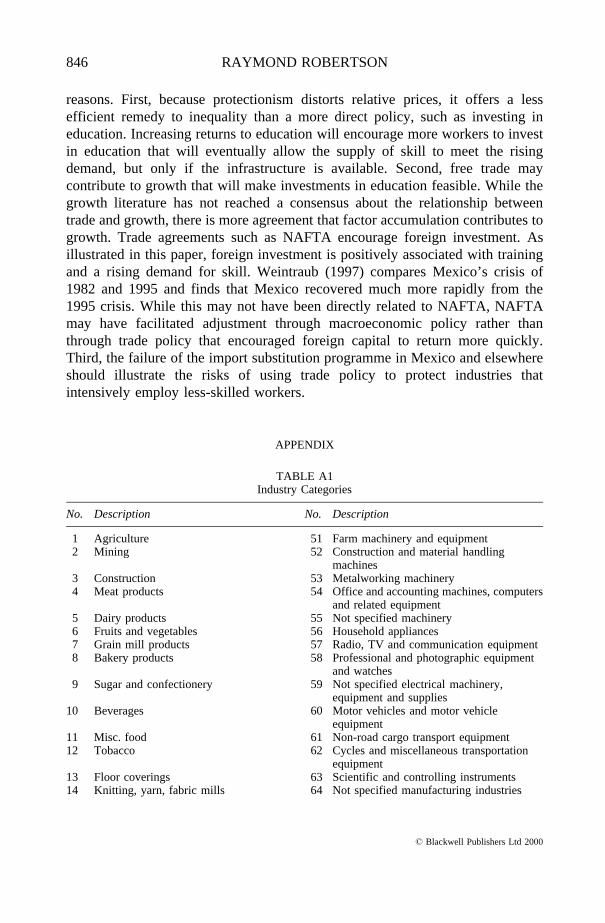
Figure 2 graphs the 1985 MFN tariff rates as a function of the relativeemployment of non-production to production workers. The plot points correspondto industry codes that are found in the Appendix. The plot point sizes correspondto the relative employment of each industry.
Figure 2 shows a clear negative relationship between 1985 tariff levels and theshare of non-production workers.12 Mexico used tariffs to protect less-skill-
11 I thank Antoni Estevadeordal of the Inter-American Development Bank for the tariff data. Thetariff data are the unweighted average most favoured nation (MFN) applied tariff rates.12 The unweighted slope (standard error) isÿ16.50 (5.71) without weights andÿ19.56 (6.52) withweights.
FIGURE 2Tariff Rates and Factor Intensity 1985
Source: Author’s calculations using data from theMonthly Industrial Surveyand MFN tariff rates.
WAGE INEQUALITY IN MEXICO 833
ß Blackwell Publishers Ltd 2000
intensive industries. This contrasts with the predictions of the HOS framework ifMexico is abundant in production workers because it suggests that Mexico wasprotecting its abundant factor. However, the introduction of China and other low-wage countries into the world trading system raises the possibility that Mexicoand other Latin American countries are not abundant in less-skilled workers ascommonly assumed.
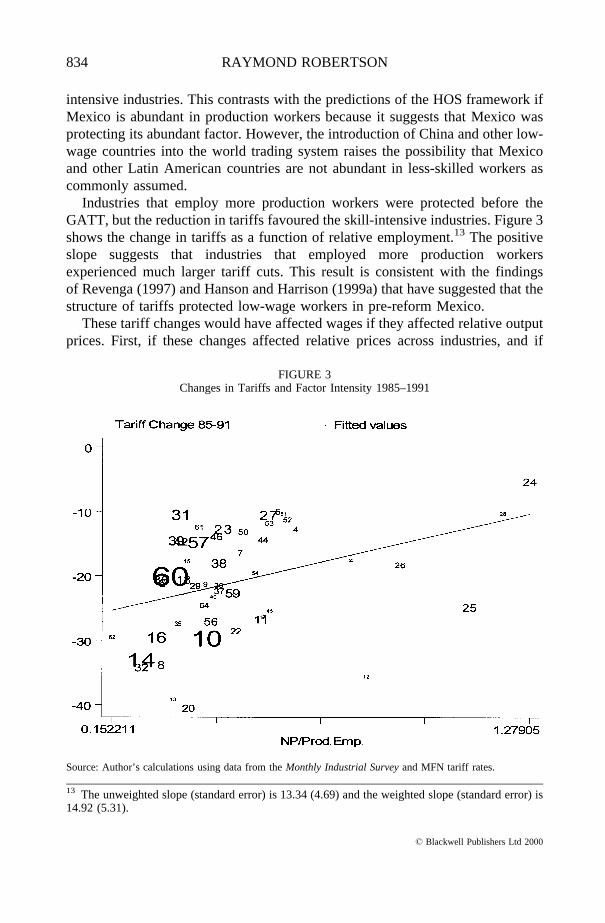
Industries that employ more production workers were protected before theGATT, but the reduction in tariffs favoured the skill-intensive industries. Figure 3shows the change in tariffs as a function of relative employment.13 The positiveslope suggests that industries that employed more production workersexperienced much larger tariff cuts. This result is consistent with the findingsof Revenga (1997) and Hanson and Harrison (1999a) that have suggested that thestructure of tariffs protected low-wage workers in pre-reform Mexico.
These tariff changes would have affected wages if they affected relative outputprices. First, if these changes affected relative prices across industries, and if
FIGURE 3Changes in Tariffs and Factor Intensity 1985–1991
Source: Author’s calculations using data from theMonthly Industrial Surveyand MFN tariff rates.
13 The unweighted slope (standard error) is 13.34 (4.69) and the weighted slope (standard error) is14.92 (5.31).
834 RAYMOND ROBERTSON
ß Blackwell Publishers Ltd 2000
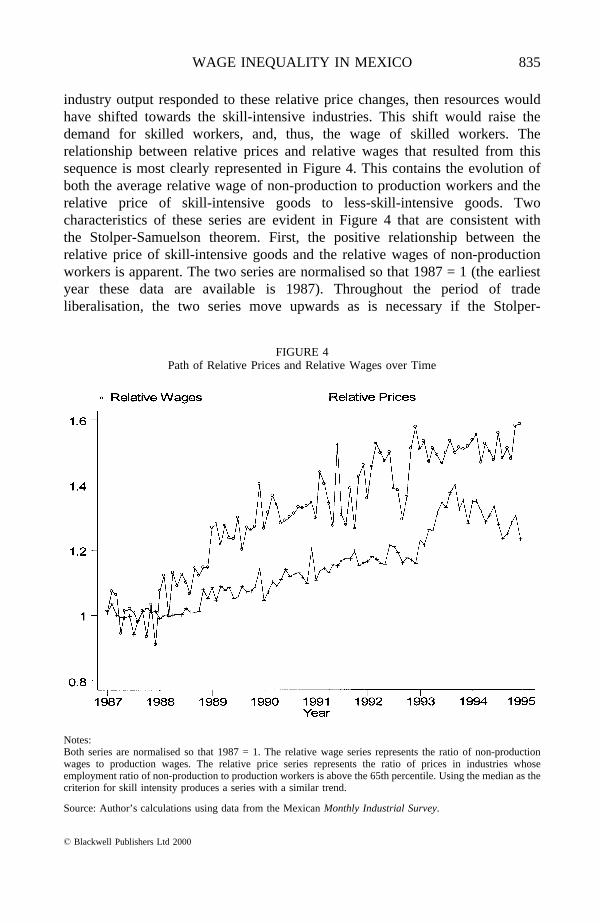
industry output responded to these relative price changes, then resources wouldhave shifted towards the skill-intensive industries. This shift would raise thedemand for skilled workers, and, thus, the wage of skilled workers. Therelationship between relative prices and relative wages that resulted from thissequence is most clearly represented in Figure 4. This contains the evolution ofboth the average relative wage of non-production to production workers and therelative price of skill-intensive goods to less-skill-intensive goods. Twocharacteristics of these series are evident in Figure 4 that are consistent withthe Stolper-Samuelson theorem. First, the positive relationship between therelative price of skill-intensive goods and the relative wages of non-productionworkers is apparent. The two series are normalised so that 1987 = 1 (the earliestyear these data are available is 1987). Throughout the period of tradeliberalisation, the two series move upwards as is necessary if the Stolper-
FIGURE 4Path of Relative Prices and Relative Wages over Time
Notes:Both series are normalised so that 1987 = 1. The relative wage series represents the ratio of non-productionwages to production wages. The relative price series represents the ratio of prices in industries whoseemployment ratio of non-production to production workers is above the 65th percentile. Using the median as thecriterion for skill intensity produces a series with a similar trend.
Source: Author’s calculations using data from the MexicanMonthly Industrial Survey.
WAGE INEQUALITY IN MEXICO 835
ß Blackwell Publishers Ltd 2000
Samuelson theorem can explain the rise in wage inequality. Second, relativewages rise more quickly than relative prices. This is consistent with themagnification effect: a result of the Stolper-Samuelson theorem that predicts thatthe change in relative wages is greater than the changes in relative prices. As aresult of these price changes, resources shifted towards skill-intensive industriesand increased the demand for and wages of skilled workers, as the Stolper-Samuelson theorem predicts.
Baldwin and Cain (1997), Krueger (1997), Leamer (1998), Feenstra andHanson (1999), and Haskel and Slaughter (1999) apply a method that may moredirectly determine whether price and wage changes are consistent with theStolper-Samuelson theorem. This approach, referred to as the ‘mandated wage’approach, uses factor intensities and price changes to ‘predict’ changes in wagesthat are consistent with the Stolper-Samuelson theorem. The assumption thatprices and technology are exogenous makes this approach problematic for USstudies, but these problems are at least partially obviated by examining Mexicobecause Mexico more closely approximates the small country case.
To test the long-run relationship between wages and prices, the mandatedwage approach compares predicted changes in wages with actual changes. If thepredicted changes match the actual changes, then Stolper-Samuelson effects areconsidered to have a large contributing role in determining wages. If the match ispoor, then the direction of the difference suggests other factors, such as changesin technology. I apply the mandated wage approach in Robertson (1999b) to theMexican case. The predicted change in wages for production workers is large andnegative while the predicted change in non-production wages is large andpositive. These results are also consistent with the Stolper-Samuelson predictions.
Breaking down the increase in the demand for skill suggests that about half ofthis increase is explained by between-industry forces. Other forces, not capturedby the basic HOS framework, triggered an increase in the demand for skill withinindustries. Forces that affected the wage structure that are outside the HOSframework are described in the next section.
4. BEYOND NEOCLASSICAL TRADE THEORY
a. Inter-industry Wage Differentials
Revenga (1997) finds that trade protection generated rents that were passedalong to workers in the form ofwage differentials: higher-than-average wagespaid to similar workers in protected industries. When the barriers were removed,these differentials were greatly reduced which affected the wage structure. SinceMexico was protecting industries that intensively employed less-skilled workers,loss of these premiums hit less-skilled workers especially hard.
836 RAYMOND ROBERTSON
ß Blackwell Publishers Ltd 2000
Analysis of these premiums is beyond the neoclassical trade theory becauseneoclassical trade theory assumes that identical workers are paid the same wagein all industries. The wage differentials analysed by Revenga (1997), Cragg andEpelbaum (1996), and Robertson (1999c) are common characteristics of wagestructures. However, few studies outside of these focus on how trade affectsthem.
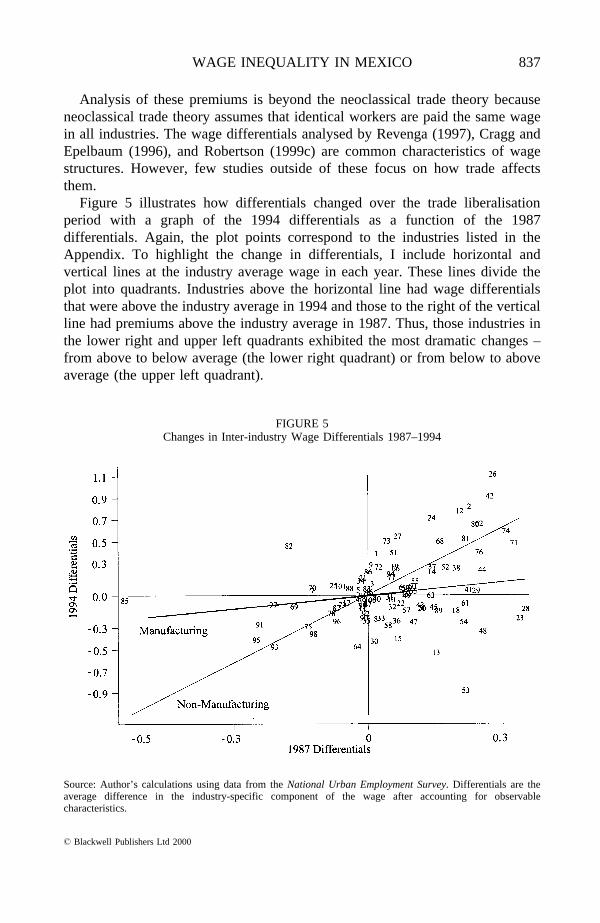
Figure 5 illustrates how differentials changed over the trade liberalisationperiod with a graph of the 1994 differentials as a function of the 1987differentials. Again, the plot points correspond to the industries listed in theAppendix. To highlight the change in differentials, I include horizontal andvertical lines at the industry average wage in each year. These lines divide theplot into quadrants. Industries above the horizontal line had wage differentialsthat were above the industry average in 1994 and those to the right of the verticalline had premiums above the industry average in 1987. Thus, those industries inthe lower right and upper left quadrants exhibited the most dramatic changes –from above to below average (the lower right quadrant) or from below to aboveaverage (the upper left quadrant).
FIGURE 5Changes in Inter-industry Wage Differentials 1987–1994
Source: Author’s calculations using data from theNational Urban Employment Survey. Differentials are theaverage difference in the industry-specific component of the wage after accounting for observablecharacteristics.
WAGE INEQUALITY IN MEXICO 837
ß Blackwell Publishers Ltd 2000
One feature that is immediately apparent is that manufacturing industries –numbered 4 through 64 – dominate the lower right quadrant. That is,manufacturing industries experienced large drops in differentials. This isconsistent with the findings of Revenga (1997) who finds that Mexican tariffchanges had a negative effect on wages in protected industries. Obversely, it isinteresting that the upper left quadrant is dominated by non-manufacturingindustries. Differentials in Real Estate, the Postal Service, and Governmentincreased relative to the other industries.
If differentials changed as a result of the change in trade policy, one potentialhypothesis is that the differentials of manufacturing (traded goods) should havechanged differently than the differentials of non-manufacturing (non-tradedgoods). To examine this hypothesis, I estimated two slope lines – one formanufacturing and another for the other industries. The estimated lines are alsoshown in Figure 5. There is a clear difference between manufacturing and otherindustries. The high (low) differentials of the non-manufacturing industriesincreased (decreased) and the high differentials of the manufacturing industriesfell.14 Combined with the price movements described earlier, this finding isconsistent with the hypothesis that trade liberalisation reduced the prices of somemanufacturing industries over others. It illustrates that the industries able to paywage premiums as a result of trade protection were less able to pay thosepremiums after trade liberalisation. Several Mexican ‘high-wage’ industriesbecome ‘low-wage’ industries and several ‘low-wage’ industries become ‘high-wage’ industries. Further analysis reveals strong and consistent evidence of apositive link between changes in industry prices and industry differentials.
The change in relative prices, which resulted from trade liberalisation, causedboth sector-specific wage premiums to fall and resources to shift betweenindustries that favoured skilled workers. By changing relative prices betweenindustries, trade liberalisation contributed to a reallocation of resources thatfavoured skilled workers and increased wage inequality.
b. Outsourcing and Different Definitions of Skill
The basic HOS framework assumes that there are two factors that differ inrelative amounts between trading partners. One obvious shortcoming of thisframework is that the division into two groups is not always clear. In particular,workers considered less skilled in the United States may qualify as skilled inMexico. American workers average about 13 years of education while theirMexican counterparts average just over six years. In the United States, there are
14 The slope (standard error) of the manufacturing line is 0.404 (0.265), which is significantlydifferent from 1.00 at the 5 per cent level. The slope (standard error) of the non-manufacturing line(excluding Private Households) is 2.060 (0.190).
838 RAYMOND ROBERTSON
ß Blackwell Publishers Ltd 2000
relatively few workers with less than 12 years, but the Mexican distribution ismore symmetrically distributed around the mean. As a result, the dichotomy of‘skilled’ and ‘less skilled’ has a different meaning in the two countries. In theUnited States, economists generally divide workers into those with high school orless education and those with some college or more education. In Mexico,however, high school graduates are often grouped with those with more educationinto the ‘skilled’ worker group. Thus, a large part of the skilled workers inMexico would be considered less-skilled workers in the United States.
This difference has important implications for the predictions of trade on thewage distribution. Consider an industry that intensively employs high-schooleducated workers. One possible result of trade liberalisation between Mexico andthe US is that production of goods that are produced intensively with high-schooleducated workers may move to Mexico. This results in an increase in the demandfor skilled workers in Mexico, while reducing the demand for less-skilled workersin the US. As demand for skill increases in Mexico, the relative wage of the moreskilled workers increases. However, in the US, the change in demand favoursskilled workers, also causing an increase in their relative wage.
One of the most often cited examples of this line of reasoning is the study byFeenstra and Hanson (1996). Their innovation is to capture what they calloutsourcingof production. In their framework, the assembly of the final goodrequires a continuum of stages that can be ordered according to the relativeamount of skill required for each stage. In an initial equilibrium, stages ofproduction are divided between a skill-abundant country and its partner. Forexample, consider the clothing industry. The stages of production that require themost skill – such as clothing design – take place in the skill-abundant country.The stages that require the least amount of skill – such as assembly of finalgarments – take place in the other country. What is interesting about the Feenstraand Hanson framework is that a reduction of trade barriers in the partner countrywill shift production stages from the skill-abundant country to the partner. Thestages that move are those that are the least-skill intensive in the skill-abundantcountry but are the most skill-intensive in the partner country. The result is thatthe demand for skill increases in both countries.
Feenstra and Hanson (1997) find that the sharp increase in foreign investmentin the maquiladorasector in Mexico’s northern border region favoured skilledworkers and contributed to the rising demand for skill and, thus, the increase inwage inequality in Mexico. They find that about 52 per cent of the increase inwage inequality in regions where foreign investment located during this periodcan be attributed to outsourcing. Investment in themaquiladoraindustry that isclassified as outsourcing is considered a within-industry change because thesefirms are assembly plants that perform stages of production of the final good. Theinflux of capital increases the skill intensity within each industry by expandingthe range of production processes.
WAGE INEQUALITY IN MEXICO 839
ß Blackwell Publishers Ltd 2000
c. Trade Increases the Demand for Technology that Complements Skill
Feenstra and Hanson’s framework suggests that foreign investment thatoutsources a stage of final production can have a direct effect on wage inequality.Foreign investment and technology transfer are two of the main sources of newtechnology for Mexican firms. The changes in Mexican policy towards foreigninvestment helped to significantly increase the flow of foreign capital intoMexico that affected domestic firms as well as themaquiladorasexamined byFeenstra and Hanson (1997). Foreign direct investment, already on an upwardtrend following the entrance into the GATT, dramatically increased between1990 and 1991 following the change in policy.15 Between the fourth quarter of1991 and the fourth quarter of 1998, the flow of foreign direct investmentincreased by a further 102 per cent.
The coincidence of rising foreign direct investment and rising wage inequalitycomplements a growing body of theoretical literature that postulates a linkbetween trade liberalisation and technology investment. Bernard (1995) andAcemoglu (1999) suggest that in order to compete in the international market,firms in previously closed economies must invest in technology in order toincrease productivity, quality, or flexibility in the production process. When thesenations open to competition, they are confronted with producers who are able toproduce higher quality at a lower cost. This idea has empirical support. Aw andHwang (1995), Aw, Chen and Roberts (1997), and Tan and Batra (1997) findsignificant differences in productivity as well as other systematic differencesbetween exporting and non-exporting firms within industries. Empirical work byHanson and Harrison (1999a) and Hanson and Harrison (1999b) suggests thatexposure to foreign markets may cause firms to increase productivity and reduceprofit margins.
The relationship between exposure to foreign markets and technology choicecan be illustrated with a simple model. Suppose firms within each industry have achoice between producing either for the export market or for the domesticmarket. In this model, the difference between the two markets is that, in order tocompete in the export market, the firm must make an investment in technology,such as more sophisticated machinery. These investments may be reflected by thepresence of fixed costs in the export decision, as Roberts and Tybout (1997) findfor Colombia.
If technology and skill are complements, as Autor, Katz and Krueger (1998),and Acemoglu (1998) suggest, then the returns to producing in the export marketwould be a decreasing function of the relative wage of skilled workers, such asthe declining curveeein Figure 6. The curveeerepresents expected net revenuesfrom exporting as a function of the relative wage of skilled workers. On the otherhand, domestic market production would be less-skill-intensive. The upward-
15 For an excellent discussion of foreign investment in Mexico during this period, see Ros (1994).
840 RAYMOND ROBERTSON
ß Blackwell Publishers Ltd 2000
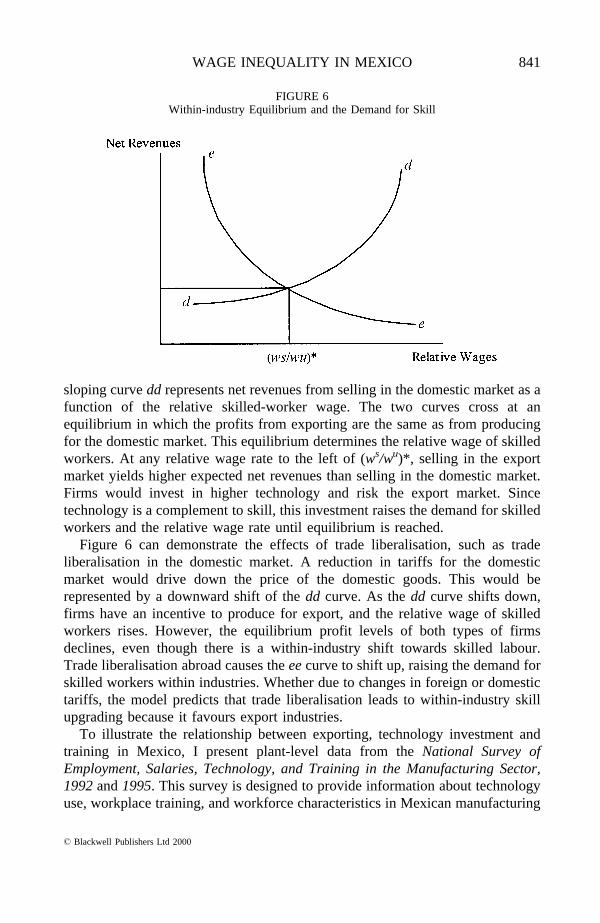
sloping curvedd represents net revenues from selling in the domestic market as afunction of the relative skilled-worker wage. The two curves cross at anequilibrium in which the profits from exporting are the same as from producingfor the domestic market. This equilibrium determines the relative wage of skilledworkers. At any relative wage rate to the left of (ws/wu)*, selling in the exportmarket yields higher expected net revenues than selling in the domestic market.Firms would invest in higher technology and risk the export market. Sincetechnology is a complement to skill, this investment raises the demand for skilledworkers and the relative wage rate until equilibrium is reached.
Figure 6 can demonstrate the effects of trade liberalisation, such as tradeliberalisation in the domestic market. A reduction in tariffs for the domesticmarket would drive down the price of the domestic goods. This would berepresented by a downward shift of thedd curve. As thedd curve shifts down,firms have an incentive to produce for export, and the relative wage of skilledworkers rises. However, the equilibrium profit levels of both types of firmsdeclines, even though there is a within-industry shift towards skilled labour.Trade liberalisation abroad causes theeecurve to shift up, raising the demand forskilled workers within industries. Whether due to changes in foreign or domestictariffs, the model predicts that trade liberalisation leads to within-industry skillupgrading because it favours export industries.
To illustrate the relationship between exporting, technology investment andtraining in Mexico, I present plant-level data from theNational Survey ofEmployment, Salaries, Technology, and Training in the Manufacturing Sector,1992and1995. This survey is designed to provide information about technologyuse, workplace training, and workforce characteristics in Mexican manufacturing
FIGURE 6Within-industry Equilibrium and the Demand for Skill
WAGE INEQUALITY IN MEXICO 841
ß Blackwell Publishers Ltd 2000
plants. The 1992 survey covers 5,071 plants and was conducted in April andOctober of 1992 using questions about the period 1989–1992. The 1995 surveycovers 5,242 plants and also covers the years just prior to the survey. The timingof these surveys is ideal for these questions because they come in the midst of thetrade liberalisation period. As in similar US surveys, both samples were stratifiedby number of employees per plant. Plants with more than 100 workers wereincluded with certainty while smaller plants were selected at random. Theresponse rate was 85.5 per cent.
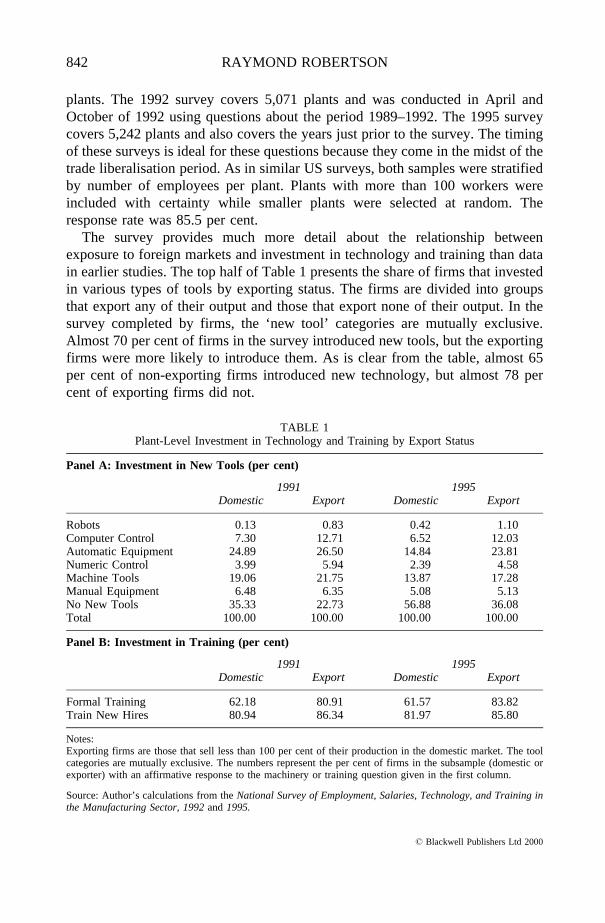
The survey provides much more detail about the relationship betweenexposure to foreign markets and investment in technology and training than datain earlier studies. The top half of Table 1 presents the share of firms that investedin various types of tools by exporting status. The firms are divided into groupsthat export any of their output and those that export none of their output. In thesurvey completed by firms, the ‘new tool’ categories are mutually exclusive.Almost 70 per cent of firms in the survey introduced new tools, but the exportingfirms were more likely to introduce them. As is clear from the table, almost 65per cent of non-exporting firms introduced new technology, but almost 78 percent of exporting firms did not.
TABLE 1Plant-Level Investment in Technology and Training by Export Status
Panel A: Investment in New Tools (per cent)
1991 1995Domestic Export Domestic Export
Robots 0.13 0.83 0.42 1.10Computer Control 7.30 12.71 6.52 12.03Automatic Equipment 24.89 26.50 14.84 23.81Numeric Control 3.99 5.94 2.39 4.58Machine Tools 19.06 21.75 13.87 17.28Manual Equipment 6.48 6.35 5.08 5.13No New Tools 35.33 22.73 56.88 36.08Total 100.00 100.00 100.00 100.00
Panel B: Investment in Training (per cent)
1991 1995Domestic Export Domestic Export
Formal Training 62.18 80.91 61.57 83.82Train New Hires 80.94 86.34 81.97 85.80
Notes:Exporting firms are those that sell less than 100 per cent of their production in the domestic market. The toolcategories are mutually exclusive. The numbers represent the per cent of firms in the subsample (domestic orexporter) with an affirmative response to the machinery or training question given in the first column.
Source: Author’s calculations from theNational Survey of Employment, Salaries, Technology, and Training inthe Manufacturing Sector, 1992and1995.
842 RAYMOND ROBERTSON
ß Blackwell Publishers Ltd 2000
Given that the investment in technology is more common among the exportingplants, one may expect that these plants demand more skill. One sign that thesefirms demand more skill is that they would invest more in training. The bottomhalf of Table 1 shows the per cent of firms in each category that provide formaltraining and the per cent of firms in each category that provide training to newhires. Exporters are slightly more likely to provide training to new hires, but thedifference between providing any training between the two types of firmssuggests that exporters are much more likely to invest in continuing training –skill upgrading – than non-exporters.
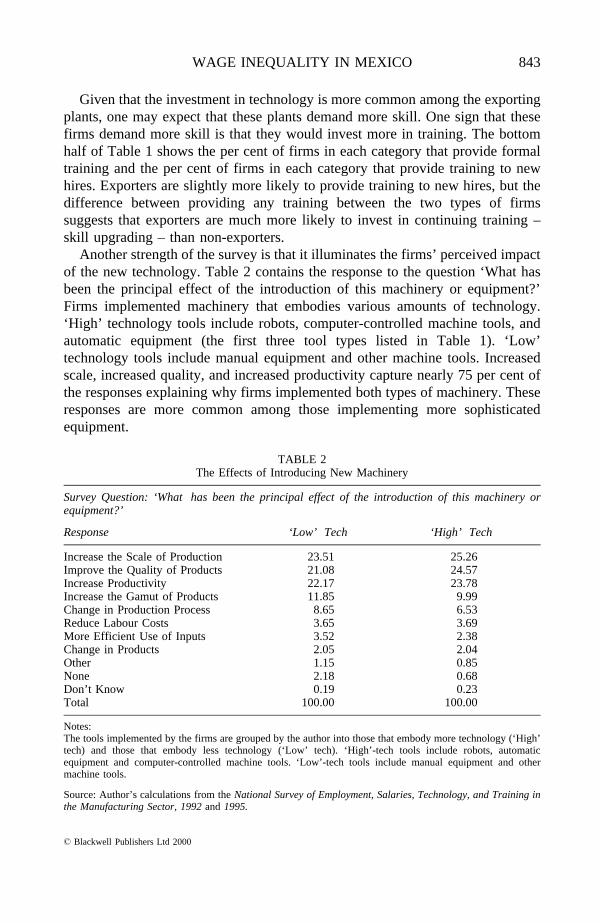
Another strength of the survey is that it illuminates the firms’ perceived impactof the new technology. Table 2 contains the response to the question ‘What hasbeen the principal effect of the introduction of this machinery or equipment?’Firms implemented machinery that embodies various amounts of technology.‘High’ technology tools include robots, computer-controlled machine tools, andautomatic equipment (the first three tool types listed in Table 1). ‘Low’technology tools include manual equipment and other machine tools. Increasedscale, increased quality, and increased productivity capture nearly 75 per cent ofthe responses explaining why firms implemented both types of machinery. Theseresponses are more common among those implementing more sophisticatedequipment.
TABLE 2The Effects of Introducing New Machinery
Survey Question: ‘What has been the principal effect of the introduction of this machinery orequipment?’
Response ‘Low’ Tech ‘High’ Tech
Increase the Scale of Production 23.51 25.26Improve the Quality of Products 21.08 24.57Increase Productivity 22.17 23.78Increase the Gamut of Products 11.85 9.99Change in Production Process 8.65 6.53Reduce Labour Costs 3.65 3.69More Efficient Use of Inputs 3.52 2.38Change in Products 2.05 2.04Other 1.15 0.85None 2.18 0.68Don’t Know 0.19 0.23Total 100.00 100.00
Notes:The tools implemented by the firms are grouped by the author into those that embody more technology (‘High’tech) and those that embody less technology (‘Low’ tech). ‘High’-tech tools include robots, automaticequipment and computer-controlled machine tools. ‘Low’-tech tools include manual equipment and othermachine tools.
Source: Author’s calculations from theNational Survey of Employment, Salaries, Technology, and Training inthe Manufacturing Sector, 1992and1995.
WAGE INEQUALITY IN MEXICO 843
ß Blackwell Publishers Ltd 2000
Foreign investment, or joint ventures with foreign producers, may enableplants to make these investments. Aitken, Harrison and Lipsey (1996) examinethe effects of foreign capital on wages in Mexico, Venezuela and the UnitedStates. They find that foreign capital is associated with higher wages in all threecountries, but the effects of foreign capital do not spill over into domestic plantsin Mexico and Venezuela. If the goods sold in the US market require moreadvanced production technology than the goods sold in Mexico, then domesticfirms producing for the domestic market may be different enough to precludespillover effects.
A more detailed analysis of these survey data16 suggests that there is also asignificant difference between firms with foreign capital that export and thosewith foreign capital that do not export. Firms with some foreign capital that donot export are much less likely to introduce new tools. The marginal effect islarger for firms that are 100 per cent foreign owned. This is consistent with thehypothesis that market choice affects technology choice.
The results also suggest that exposure to foreign markets affects the degree oftechnological sophistication of the tools implemented. Plants with some foreigncapital that do not export are much less likely to introduce more advanced tools.However, plants with some foreign capital that export some or all of their outputare much more likely to introduce more advanced tools than to not introduce anytools. While exporting plants with some foreign capital are about 3.7 times morelikely to introduce manual tools than no tools, the same plants are about 7.7 timesmore likely to introduce more advanced tools than no tools. Productivity andquality are both factors that help firms compete in foreign markets, so it is notsurprising that exporters are more likely to introduce new tools.
Note here that the causality between foreign exposure and technology choice isnot clear. More technologically advanced firms may be the ones that export, asBernard and Jensen (1999) find for the US. However, regardless of the directionof causality – from exports to firms or from firms to exports – policies thatfavoured exporting firms at the expense of firms producing for the domesticmarket lead to skill upgrading. If more technologically advanced firms export,then policies that promote exports will help these firms at the expense of theircompetition and thus raise the demand for skill. If exports lead to investment inskill, then policies that promote exports will promote investment in skill as moreand more firms export. The finding that is relevant for this paper is the positiverelationship within industries between exporting firms and the demand for skill.Trade liberalisation seems to have played a large role in increasing the demandfor skill within industries through investments in technology and training.
16 See Robertson (1999a).
844 RAYMOND ROBERTSON
ß Blackwell Publishers Ltd 2000
5. POLICY IMPLICATIONS AND CONCLUSIONS
Empirical research has generated a strong consensus that trade liberalisation inMexico increased the demand for skilled workers, and, as a result, increased wageinequality. These findings may be more accurate predictors for the rest of LatinAmerica than studies of developed countries that find a weak link between tradeand wages. The strength and consistency of these results suggest that wageinequality should be considered in the negotiations of the FTAA. This literatureidentifies several forces that worked in concert to increase the demand for skill.Some of these forces – such as the resulting change of output prices – areconsistent with the Stolper-Samuelson theorem. Mexico protected less-skill-intensive industries and trade liberalisation caused the relative price of skill-intensive goods to rise. The resulting shift in resources between industriesgenerated an increase in the demand for skilled workers that explains about halfof the rise in the demand for skilled workers.
The other half of the increase in demand for skilled workers can be explainedby changes within firms that are generally outside neoclassical theory. Protectedfirms were able to pass some of the benefits of protection along to workers in theform of inter-industry wage differentials. The fall in trade barriers contributed tothe loss of these premiums and affected the wage structure. Opening to foreigninvestment also encouraged outsourcing of tasks that are less-skill-intensive indeveloped countries but are skill-intensive in developing countries. The result isan increase in the relative demand for skill in both countries. Even domesticfirms, however, may choose to invest in technology in order to compete in thenewly opened foreign market. Foreign investment facilitates these investmentsand further increases the demand for skill. Since advanced technology is oftencomplementary with skill, these investments can also raise the demand for skillwithin industries.
The causes and mechanisms that contributed to the increase in the demand forskilled workers all suggest one clear policy response: increased investment ineducation. The change in relative prices and demand for skill has createdopportunities for more educated workers that should be met with strong and rapidinvestments in education. As a result of trade liberalisation, workers now have alarger incentive than ever to invest in education. Unless these workers have theinfrastructure to invest in these skills, wage inequality will continue to increase.The 1998–1999 report of the Inter-American Development Bank agrees. With alarge cohort entering the workforce and declining fertility throughout the region,Latin America now has a unique opportunity to make strong investments ineducation that will be necessary to reduce regional inequality as trade agreementsproliferate.
It is important to note that the strong link between wage inequality and tradefound in Mexico does not justify a return to protectionism for at least three
WAGE INEQUALITY IN MEXICO 845
ß Blackwell Publishers Ltd 2000
reasons. First, because protectionism distorts relative prices, it offers a lessefficient remedy to inequality than a more direct policy, such as investing ineducation. Increasing returns to education will encourage more workers to investin education that will eventually allow the supply of skill to meet the risingdemand, but only if the infrastructure is available. Second, free trade maycontribute to growth that will make investments in education feasible. While thegrowth literature has not reached a consensus about the relationship betweentrade and growth, there is more agreement that factor accumulation contributes togrowth. Trade agreements such as NAFTA encourage foreign investment. Asillustrated in this paper, foreign investment is positively associated with trainingand a rising demand for skill. Weintraub (1997) compares Mexico’s crisis of1982 and 1995 and finds that Mexico recovered much more rapidly from the1995 crisis. While this may not have been directly related to NAFTA, NAFTAmay have facilitated adjustment through macroeconomic policy rather thanthrough trade policy that encouraged foreign capital to return more quickly.Third, the failure of the import substitution programme in Mexico and elsewhereshould illustrate the risks of using trade policy to protect industries thatintensively employ less-skilled workers.
APPENDIX
TABLE A1Industry Categories
No. Description No. Description
1 Agriculture 51 Farm machinery and equipment2 Mining 52 Construction and material handling
machines3 Construction 53 Metalworking machinery4 Meat products 54 Office and accounting machines, computers
and related equipment5 Dairy products 55 Not specified machinery6 Fruits and vegetables 56 Household appliances7 Grain mill products 57 Radio, TV and communication equipment8 Bakery products 58 Professional and photographic equipment
and watches9 Sugar and confectionery 59 Not specified electrical machinery,
equipment and supplies10 Beverages 60 Motor vehicles and motor vehicle
equipment11 Misc. food 61 Non-road cargo transport equipment12 Tobacco 62 Cycles and miscellaneous transportation
equipment13 Floor coverings 63 Scientific and controlling instruments14 Knitting, yarn, fabric mills 64 Not specified manufacturing industries
846 RAYMOND ROBERTSON
ß Blackwell Publishers Ltd 2000
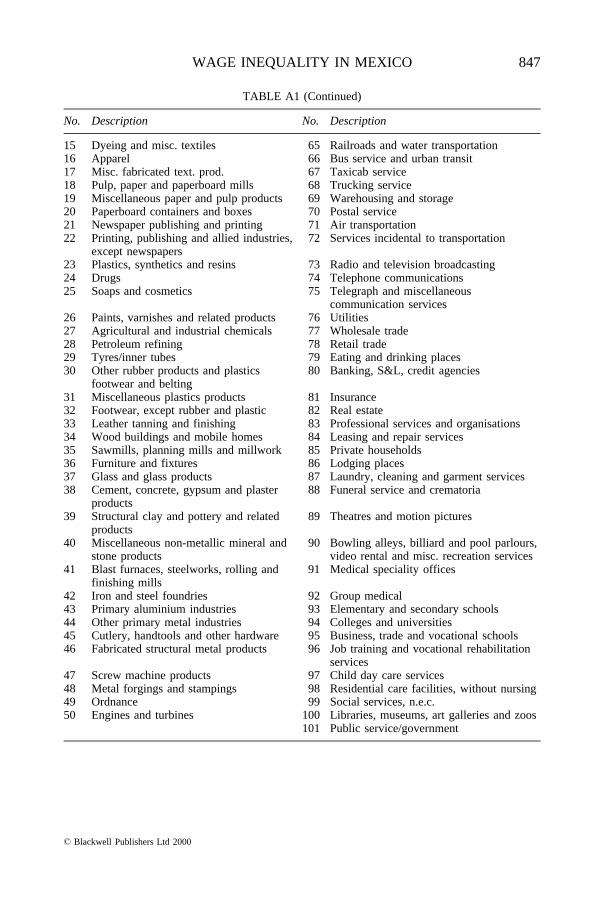
TABLE A1 (Continued)
No. Description No. Description
15 Dyeing and misc. textiles 65 Railroads and water transportation16 Apparel 66 Bus service and urban transit17 Misc. fabricated text. prod. 67 Taxicab service18 Pulp, paper and paperboard mills 68 Trucking service19 Miscellaneous paper and pulp products 69 Warehousing and storage20 Paperboard containers and boxes 70 Postal service21 Newspaper publishing and printing 71 Air transportation22 Printing, publishing and allied industries, 72 Services incidental to transportation
except newspapers23 Plastics, synthetics and resins 73 Radio and television broadcasting24 Drugs 74 Telephone communications25 Soaps and cosmetics 75 Telegraph and miscellaneous
communication services26 Paints, varnishes and related products 76 Utilities27 Agricultural and industrial chemicals 77 Wholesale trade28 Petroleum refining 78 Retail trade29 Tyres/inner tubes 79 Eating and drinking places30 Other rubber products and plastics 80 Banking, S&L, credit agencies
footwear and belting31 Miscellaneous plastics products 81 Insurance32 Footwear, except rubber and plastic 82 Real estate33 Leather tanning and finishing 83 Professional services and organisations34 Wood buildings and mobile homes 84 Leasing and repair services35 Sawmills, planning mills and millwork 85 Private households36 Furniture and fixtures 86 Lodging places37 Glass and glass products 87 Laundry, cleaning and garment services38 Cement, concrete, gypsum and plaster 88 Funeral service and crematoria
products39 Structural clay and pottery and related 89 Theatres and motion pictures
products40 Miscellaneous non-metallic mineral and 90 Bowling alleys, billiard and pool parlours,
stone products video rental and misc. recreation services41 Blast furnaces, steelworks, rolling and 91 Medical speciality offices
finishing mills42 Iron and steel foundries 92 Group medical43 Primary aluminium industries 93 Elementary and secondary schools44 Other primary metal industries 94 Colleges and universities45 Cutlery, handtools and other hardware 95 Business, trade and vocational schools46 Fabricated structural metal products 96 Job training and vocational rehabilitation
services47 Screw machine products 97 Child day care services48 Metal forgings and stampings 98 Residential care facilities, without nursing49 Ordnance 99 Social services, n.e.c.50 Engines and turbines 100 Libraries, museums, art galleries and zoos
101 Public service/government
WAGE INEQUALITY IN MEXICO 847
ß Blackwell Publishers Ltd 2000
REFERENCES
Acemoglu, D. (1998), ‘Why Do New Technologies Complement Skills? Directed TechnicalChange and Wage Inequality,’Quarterly Journal of Economics, 113, 1055–89.
Acemoglu, D. (1999), ‘Patterns of Skill Premia’ (National Bureau of Economic Research WorkingPaper 7018).
Aitken, B., A. Harrison and R. Lipsey (1996), ‘Wages and Foreign Ownership: A ComparativeStudy of Mexico, Venezuela, and the United States,’Journal of International Economics, 40,345–71.
Autor, D., L. Katz and A. Krueger (1998), ‘Computing Inequality: Have Computers Changed theLabor Market?’Quarterly Journal of Economics, 113, 1169–213.
Aw, B. and A. Hwang (1995), ‘Productivity and the Export Market: A Firm-level Analysis,’Journal of Development Economics, 47, 313–32.
Aw, B., X. Chen and M. Roberts (1997), ‘Firm-level Evidence on Productivity Differentials,Turnover, and Exports in Taiwanese Manufacturing’ (National Bureau of Economic ResearchWorking Paper 6235).
Baldwin, R.E. and G.G. Cain (1997), ‘Shifts in U.S. Relative Wages: The Role of Trade,Technology, and Factor Endowments’ (National Bureau of Economic Research Working Paper5934).
Bernard, A.B. (1995), ‘Exporters and Trade Liberalization in Mexico: Production Structure andPerformance’ (mimeo, Yale University).
Bernard, A.B. and J.B. Jensen (1999), ‘Exceptional Exporter Performance: Cause, Effect, or Both?’Journal of International Economics, 47, 1–25.
Cragg, M.I. and M. Epelbaum (1996), ‘Why Has Wage Dispersion Grown in Mexico? Is it theIncidence of Reforms or the Growing Demand for Skills?’Journal of Development Economics,51, 99–116.
Feenstra, R.C. and G.H. Hanson (1996), ‘Foreign Investment, Outsourcing, and Relative Wages’, inR.C. Feenstra, G.M. Grossman and D.A. Irwin (eds.),Political Economy of Trade Policy:Essays in Honor of Jagdish Bhagwati(Cambridge, MIT Press).
Feenstra, R.C. and G.H. Hanson (1997), ‘Foreign Direct Investment and Relative Wages: Evidencefrom Mexico’s Maquiladoras,’Journal of International Economics, 42, 371–93.
Feenstra, R.C. and G.H. Hanson (1999), ‘Productivity Measurement and the Impact of Trade andTechnology on Wages: Estimates for the US, 1972–1990,’Quarterly Journal of Economics(forthcoming).
Hanson, G.H. and A. Harrison (1999a), ‘Trade, Technology, and Wage Inequality,’Industrial andLabor Relations Review, 52, 271–88.
Hanson, G.H. and A. Harrison (1999b), ‘Who Gains from Trade Reform? Some RemainingPuzzles’ (National Bureau of Economic Research Working Paper 6915).
Haskel, J.E. and M.J. Slaughter (1999), ‘Does the Sector Bias of Skill-Biased Technical ChangeExplain Changing Skill Differentials?’ (National Bureau of Economic Research Working Paper6565).
Inter-American Development Bank (1999),Facing Up to Inequality in Latin America: Economicand Social Progress in Latin America: 1998–1999 Report(Washington DC, Johns HopkinsPress).
Krueger, A.B. (1997), ‘Labour Market Shifts and the Price Puzzle Revisited’ (National Bureau ofEconomic Research Working Paper 5924).
Leamer, E.E. (1998), ‘In Search of Stolper-Samuelson Effects on US Wages,’ in S. Collins (ed.),Exports, Imports, and the American Worker(Washington, DC, The Brookings Institution).
Lustig, N. (1992),Mexico: The Remaking of an Economy(Washington, DC, The BrookingsInstitution).
Revenga, A. (1997), ‘Employment and Wage Effects of Trade Liberalization: The Case of MexicanManufacturing,’Journal of Labor Economics, 15, S20–S43.
Roberts, M. and J. Tybout (1997), ‘The Decision to Export in Colombia: An Empirical Model ofEntry with Sunk Costs,’American Economic Review, 87, 545–64.
848 RAYMOND ROBERTSON
ß Blackwell Publishers Ltd 2000
Robertson, R. (1999a), ‘Trade or Technology? Why Not Both? Evidence on Technology Choice,Wage Inequality, and International Trade’ (mimeo, Macalester College).
Robertson, R. (1999b), ‘Relative Wages and Relative Prices: Can the Stolper-Samuelson TheoremExplain Relative Wage Movements in Mexico?’ (mimeo, Macalester College).
Robertson, R. (1999c), ‘Inter-industry Wage Differentials Across Time, Borders, and TradeRegimes: Evidence from the US and Mexico’ (mimeo, Macalester College).
Ros, J. (1994), ‘Financial Markets and Capital Flows in Mexico,’ in J. Ocampo and R. Steiner(eds.),Foreign Capital in Latin America(Washington, DC, Inter-American Development Bank;distributed by Johns Hopkins University Press, Baltimore).
Salazar-Xirinachs, J.M. and J. Tavares de Araujo (1999), ‘The Free Trade Area of the Americas: ALatin American Perspective,’The World Economy, 22, 783–98.
Schott, J.J. and G.C. Hufbauer (1999), ‘Whither the Free Trade Area of the Americas?’The WorldEconomy, 22, 765–82.
Slaughter, M.J. (1999), ‘Globalisation and Wages: A Tale of Two Perspectives,’The WorldEconomy, 22, 609–29.
Tan, H. and G. Batra (1997), ‘Technology and Firm-Size Wage Differentials in Colombia, Mexico,and Taiwan (China),’World Bank Economic Review, 11, 59–84.
Weintraub, S. (1997),NAFTA at Three: A Progress Report(Washington DC, Center for Strategicand International Studies).
Wood, A. (1997), ‘Openness and Wage Inequality in Developing Countries: The Latin AmericanChallenge to East Asian Conventional Wisdom,’World Bank Economic Review, 11, 33–57.
WAGE INEQUALITY IN MEXICO 849
ß Blackwell Publishers Ltd 2000