Trade, investment and employment in the Southern ... - ILO
204
Trade, investment and employment in the Southern Mediterranean Countries Thematic Report of the “Mainstreaming Employment into Trade and Investment in the Southern Neighbourhood” project
-
Upload
khangminh22 -
Category
Documents
-
view
3 -
download
0
Transcript of Trade, investment and employment in the Southern ... - ILO

Trade, investment and employment in the Southern Mediterranean CountriesThematic Report of the “Mainstreaming Employment into Trade and Investment in the Southern Neighbourhood” project

Trade, investment and employment in the Southern Mediterranean CountriesThematic Report of the “Mainstreaming Employment into Trade and Investment in the Southern Neighbourhood” project
International Labour Office • Geneva

Copyright © International Labour Organization 2022 First published 2022
Publications of the International Labour Office enjoy copyright under Protocol 2 of the Universal Copyright Convention. Nevertheless, short excerpts from them may be reproduced without authorization, on condition that the source is indicated. For rights of reproduction or translation, application should be made to ILO Publishing (Rights and Licensing), International Labour Office, CH-1211 Geneva 22, Switzerland, or by email: [email protected]. The International Labour Office welcomes such applications.
Libraries, institutions and other users registered with a reproduction rights organization may make copies in accordance with the licences issued to them for this purpose. Visit www.ifrro.org to find the reproduction rights organization in your country.
The designations employed in ILO publications, which are in conformity with United Nations practice, and the presentation of material therein do not imply the expression of any opinion whatsoever on the part of the International Labour Office concer-ning the legal status of any country, area or territory or of its authorities, or concerning the delimitation of its frontiers.
The responsibility for opinions expressed in signed articles, studies and other contributions rests solely with their authors, and publication does not constitute an endorsement by the International Labour Office of the opinions expressed in them.
Reference to names of firms and commercial products and processes does not imply their endorsement by the International Labour Office, and any failure to mention a particular firm, commercial product or process is not a sign of disapproval.
Information on ILO publications and digital products can be found at: www.ilo.org/publns.
Trade, investment and employment in the Southern Mediterranean Countries. Thematic Report of the “Mainstreaming Employment into Trade and Investment in the Southern Neighbourhood” project. International Labour Organization– Geneva: ILO, 2022.
ISBN: 978-92-2-036229-7 (print)ISBN: 978-92-2-036230-3 (web PDF)
Produced by the Publications Production Unit (PRODOC) of the ILO.Graphic and typographic design, layout and composition,
printing, electronic publishing and distribution.The ILO endeavours to use paper sourced from forests managed
in an environmentally sustainable and socially responsible manner.
Code: JMB-PMSERV

iii
X Table of Contents
X Acknowledgements xii
X About the METI programme xiii
X Executive summary xiii
X Chapter 1. Overview of the labour market, trade and investment in the Southern Mediterranean Countries 1
1.1. Overview of the Southern Mediterranean Countries 2
1.1.1 The labour market in the region at a glance 71.1.2 Trade and investment in the Southern Mediterranean Countries at a glance 101.1.3 Intra-regional trade and regional integration 151.1.4 The nexus between trade, investment and the labour market 24
X Chapter 2. Inclusive economic transformation through employment-oriented trade, industrial and investment policies Inclusive economic transformation through employment-oriented trade, industrial and investment policies 29
2.1. Industrial and trade policies: theory and applications globally and in the Southern Mediterranean Countries 30
2.1.1. Structural transformation and industrial and trade policies – schools of thought and evolution 30
2.1.2. Evolution of industrial, trade and investment policies in the region 34
2.2. Review of employment policies and underlying institutional mechanisms 49
2.2.1. Review of employment policies 492.2.2. Institutional mechanisms to shape employment-related policies in the Southern
Mediterranean Countries 52
2.3. Impact of industrial, investment and trade policies and structural transformation and the labour market 55
2.3.1. Structural change in the region 552.3.2. Impact of industrial, investment and trade policies on exports and FDIs 612.3.4 Why so idle? The role of physical and soft infrastructure 91
X Chapter 3. Trade, investment and youth and women in the labour market 103
3.1. Youth and the labour market in the Southern Mediterranean Countries 1043.2. Women and the labour market in the Southern Mediterranean Countries 1103.3. Employment in tradable and non-tradable sectors for women and youth in the region 1173.4. Policy orientations: What could be done to improve the impact of trade and investment
policies, including for women and youth? 150

Trade, investment and employment in the Southern Mediterranean Countriesiv
3.4.1. A focus on structural transformation through effective industrial policies can help to reverse early deindustrialization and foster long-term and inclusive growth 151
3.4.2. A close monitoring and mitigation of the impact of trade policies on the labour market, including for women and youth, and investment in infrastructure could help facilitate the reshuffling of productive factors 153
X Chapter 4. Future trends and impact on the labour market 157
4.1. Short-term: Impact of COVID-19 and pathways to recovery 158
4.1.1. Global impact of the COVID-19 crisis 1584.1.2. COVID-19 in the Southern Mediterranean Countries 1594.1.3. Responses in countries in the region 1644.1.4. Pathways to short-term recovery from COVID-19 166
4.2. Long-term trends: the technological revolution and the future of work in the region 168
4.2.1. Future of work: The state of the debate 1684.2.2. How does this apply to low- and middle-income countries, including in the Southern
Mediterranean Countries? 170
X References 176

v Table of Contents
List of figures
X Figure 1: Economic growth in the different in the Southern Mediterranean Countries, real GDP growth rate (percentage) 3
X Figure 2: Economic growth in Libya, real GDP growth rate in per cent (estimation for 2020, projection for 2021) 3
X Figure 3: Inflation rate in the region (percentage) 4
X Figure 4: Gross debt per cent of GDP 4
X Figure 5: Sectoral participation to GDP in value-added (%) in the Southern Mediterranean Countries in 2019 6
X Figure 6: Sectoral employment in the region in 2019 (% total employment) 6
X Figure 7: Share of the top 10 per cent and the bottom 50 per cent in national income, 2010 and 2019 7
X Figure 8: Share of female and male in employment per sector in the region in 2019 9
X Figure 9: Evolution of the status in employment in the region, 2010–19 9
X Figure 10: Informal employment in selected countries in the region by sector and gender in 2019 10
X Figure 11: Evolution of merchandise imports and exports in the Southern Mediterranean Countries, 2000–19 (total value in US$ million) 11
X Figure 12: Evolution of services imports and exports in the Southern Mediterranean Countries, 2005–19 (total value in US$ million) 11
X Figure 13: Evolution of trade in services by category in the Southern Mediterranean Countries and share of the region to the world (total value in US$ million) 12
X Figure 14: Evolution of trade balance as a percentage of GDP in the region 13
X Figure 15: Evolution of export destinations for the Southern Mediterranean Countries 13
X Figure 16: ShareofproductsintheSouthernMediterraneanCountriesʼexportsin2000 14
X Figure 17: ShareofproductsintheSouthernMediterraneanCountriesʼexportsin2019 14
X Figure 18: FDI inflows in the world and G20 countries, 2005–19 (US$ million) 15
X Figure 19: FDI inflows in the Southern Mediterranean Countries and sub-Saharan African countries, 2000–19 (US$ million) 15
X Figure 20: Evolution of total imports, exports, GDP (US$ million) and trade openness in the region, 2005–19 16
X Figure 21: Trade openness in different countries in the region in 2019, compared to OECD and middle-income countries 16
X Figure 22: Untapped export potential from Egypt to the world by sector (in US$) 20
X Figure 23: Untapped export potential from Egypt to North Africa by sector (in US$) 20
X Figure 24: Untapped export potential from Egypt to the Middle East by sector (in US$) 20

Trade, investment and employment in the Southern Mediterranean Countriesvi
X Figure 25: Untapped export potential from Jordan to the world by sector (in US$) 21
X Figure 26: Untapped export potential from Jordan to North Africa by sector (in US$) 21
X Figure 27: Untapped potential from Jordan to the Middle East by sector (in US$) 21
X Figure 28: Untapped potential from Morocco to the world by sector (in US$) 22
X Figure 29: Untapped export potential from Morocco to North Africa by sector (in US$) 22
X Figure 30: Untapped potential from Morocco to the Middle East by sector (in US$) 22
X Figure 31: Untapped export potential from Tunisia to the world by sector (in US$) 23
X Figure 32: Untapped export potential from Tunisia to North Africa by sector (in US$) 23
X Figure 33: Untapped potential from Tunisia to the Middle East by sector (in US$) 23
X Figure 34: Evolution of trade tariffs measured by Most Favoured Nation-trade-weighted average duty in comparison with other world regions and with countries in the region (percentage) 36
X Figure 35: EvolutionofsectorsʼparticipationtoGDPinvalue-added 57
X Figure 36: Share of manufacturing in GDP in value-added in the Southern Mediterranean Countries (percentage) 57
X Figure 37: Evolution of manufacturing value-added as per cent of GDP in METI partner countries, 1970–2019 58
X Figure 38: Evolution of the structure of employment in the eight countries in the region, 1991–2019 59
X Figure 39: Evolution of exports in non-oil-exporting countries of the Southern Mediterranean Countries (US$ thousands) 62
X Figure 40: Evolution of exports in oil-exporting countries of the Southern Mediterranean Countries (US$ thousands) 62
X Figure 41: Evolution of labour productivity in manufacturing in Tunisia and Morocco (in constant 2010 US$) 64
X Figure 42: Evolution of the share of manufactured goods in merchandise exports and their skill and technology intensity in the region, 2000–19 66
X Figure 43: Evolution of FDIs inflows in selected countries in the region – 1 (US$ million) 70
X Figure 44: Evolution of FDIs inflows in selected countries in the region – 2 (US$ million) 70
X Figure 45: Level of FDI restriction per country and sector, 2020 (0=open, 1=closed) 71
X Figure 46: TheSouthernMediterraneanCountriesʼshareofforeignvalue-addedinexports and comparison with middle-income countries 72
X Figure 47: The Southern Mediterranean Countries share of value-added in exports (US$) 72
X Figure 48: The Southern Mediterranean Countries share of value-added in exports, share of foreign and domestic value-added 72
X Figure 49: Evolution of employment share of tradable and non-tradable sectors in Egypt, 2009–19 77

vii Table of Contents
X Figure 50: Sectoral distribution of job creation in Egypt, 2009–2019 (in thousands) 78
X Figure 51: Job creation in the manufacturing sector in Egypt, 2009–2019 (in thousands) 78
X Figure 52: Evolution of exports of selected products in Egypt 79
X Figure 53: Distribution of level of skills in Egyptian economy and manufacturing in 2009 and 2018 80
X Figure 54: Evolution of employment share of tradable and non-tradable sectors in Jordan, 2017–19 80
X Figure 55: Sectoral distribution of job creation in Jordan, 2017–19 (in thousands) 81
X Figure 56: Job creation in the manufacturing sector in Jordan, 2017–19 (in thousands) 81
X Figure 57: Evolution of selected merchandise exports in Jordan, 2009–19 82
X Figure 58: Distribution of level of skills in all sectors and manufacturing in Jordan, 2017–19 83
X Figure 59: Evolution of employment share of tradable and non-tradable sectors in Morocco, 2000–19 84
X Figure 60: Sectoral distribution of job creation in Morocco, 2000–19 (thousands) 84
X Figure 61: Distribution of levels of skills for employed population in Morocco, 2011–19 (percentage) 85
X Figure 62: Evolution of employment share of tradable and non-tradable sectors in Tunisia, 2000–19 86
X Figure 63: Sectoral distribution of job creation in Tunisia, 2000–19 86
X Figure 64: Share of different industries in manufacturing employment in Tunisia, 2000–19 87
X Figure 65: Distribution of level of skills in all sectors and manufacturing in Tunisia, 2005–16 87
X Figure 66: Evolution of employment share of tradable and non-tradable sectors in the Occupied Palestinian Territory, 2000–19 88
X Figure 67: Job creation in the Occupied Palestinian Territory, 2000–19 88
X Figure 68: Evolution of employment share of tradable and non-tradable sectors in Algeria, 2000–19 89
X Figure 69: Sectoral distribution of job creation in Algeria, 2000–09 and 2009–19 (thousands) 89
X Figure 70: Evolution of employment share of tradable and non-tradable sectors in Libya, 2000–19 90
X Figure 71: Evolution of job creation in Libya, 2000–19 90
X Figure 72: Quality of port infrastructure in countries in the region (from 1 to 7, with 7 being the highest score) 92
X Figure 73: Evolution of Logistics Performance Index scores of countries in the region, 2007–18 93
X Figure 74: Share of enterprises that declare access to electricity as their biggest challenge (percentage) 93

Trade, investment and employment in the Southern Mediterranean Countriesviii
X Figure 75: Electricity production from renewable sources, excluding hydroelectric (percentage of total) 94
X Figure 76: Mobile Connectivity Index, 2019 (score out of 100) 94
X Figure 77: Domestic credit to private sector, total and provided by banks, as per cent GDP, 2017 96
X Figure 78: Sources of financing for enterprises in the region, 2019 96
X Figure 79: Share of enterprises declaring access to finance as their biggest challenge 97
X Figure 80: Share of enterprises declaring corruption as their biggest challenge 101
X Figure 81: Level of youth NEET in countries in the region between 2005 and 2019 (percentage) 105
X Figure 82: Evolution of youth unemployment rate (percentage) 106
X Figure 83: Unemployment by level of education in Egypt, Jordan, Tunisia and the Occupied Palestinian Territory 109
X Figure 84: Unemployment rate by level of education in Morocco between 2000 and 2014 110
X Figure 85: School enrolment in tertiary education by gender, 2017 (percentage of gross) 111
X Figure 86: Female labour force participation rate by age, 2019 (percentage) 112
X Figure 87: Labour force by levels of education and sex 113
X Figure 88: Unemployment rate per sex in the region 114
X Figure 89: Distribution of sectoral employment by sex in countries in the region, 2019 115
X Figure 90: Employment in tradable and non-tradable sectors by sex in Egypt, 2009–19 119
X Figure 91: Job creation in Egypt by sector and gender, 2009–19 (in thousands) 120
X Figure 92: Distribution of skills levels by gender in manufacturing and all sectors in Egypt, 2009–18 121
X Figure 93: Employment in tradable and non-tradable sectors by age in Egypt, 2009–19 122
X Figure 94: Job creation in Egypt by sector and age, 2017–19 (in thousands) 123
X Figure 95: Distribution of skills levels by age for manufacturing and all sectors in Egypt, 2009–18 124
X Figure 96: Employment in tradable and non-tradable sectors by sex and level of skills in Jordan, 2017–19 125
X Figure 97: Job creation in Jordan by sector and gender, 2017–19 (in thousands) 125
X Figure 98: Distribution of skills levels by sex in Jordan, 2017–19 126
X Figure 99: Employment in tradable and non-tradable sectors by age and level of skills in Jordan, 2017–19 128
X Figure 100: Job creation in Jordan by sector and age, 2017–19 (in thousands) 128
X Figure 101: Distribution of skills levels by age in Jordan, 2017–19 129

ix Table of Contents
X Figure 102: Employment in tradable and non-tradable sectors by sex in Morocco, 2000–19 131
X Figure 103: Evolution of enrolment in tertiary education (% gross) for females and males in Morocco, 2005–19 131
X Figure 104: Job creation in Morocco by sector and gender, 2000–19 (in thousands) 132
X Figure 105: Employment in tradable and non-tradable sectors by sex in Tunisia, 2005–17 134
X Figure 106: Job creation in Tunisia by sector and gender, 2005–17 (in thousands) 134
X Figure 107: Distribution of skill levels by sex in Tunisia, 2005–17 135
X Figure 108: Employment in tradable and non-tradable sectors by age in Tunisia, 2005–17 137
X Figure 109: Job creation in Tunisia by sector and age, 2005–17 (in thousands) 137
X Figure 110: Distribution of skill levels by age in Tunisia, 2005–17 138
X Figure 111: Employment in tradable and non-tradable sectors by sex in the Occupied Palestinian Territory, 2000–19 140
X Figure 112: Job creation by sector and gender in the Occupied Palestinian Territory, 2000–19 (in thousands) 140
X Figure 113: Evolution of level of skills in employed population by sex in the Occupied Palestinian Territory, 2000–19 141
X Figure 114: Employment in tradable and non-tradable sectors by age in the Occupied Palestinian Territory, 2000–19 142
X Figure 115: Job creation in Occupied Palestinian Territory by sector and age, 2000–19 (in thousands) 143
X Figure 116: Evolution of level of skills in employed population by age in the Occupied Palestinian Territory, 2000–19 144
X Figure 117: Employment in tradable and non-tradable sectors by sex in Algeria, 2000–19 145
X Figure 118: Job creation by sector and gender in Algeria, 2000–19 (in thousands) 146
X Figure 119: Evolution of enrolment in tertiary education for female and male in Algeria, 2009–18 (% gross) 147
X Figure 120: Evolution of occupations by gender in Algeria, 2010–19 147
X Figure 121: Employment in tradable and non-tradable sectors by sex in Libya, 2000–19 148
X Figure 122: Job creation in Libya by sector and gender, 2000–19 (in thousands) 149
X Figure 123: General government revenues (percentage of GDP) 161
X Figure 124: General government gross debt (percentage of GDP) 161

Trade, investment and employment in the Southern Mediterranean Countriesx
List of tables
X Table 1: Main macro-indicators in 2000, 2010, 2019 5
X Table 2: Unemployment rate in different countries in the region, 2005–19 (percentage) 8
X Table 3: Levels of exports and imports within the region in 2019 (percentage) 17
X Table 4: Comparison of the sophistication of products with untapped export potential from Egypt to the world, North Africa and the Middle East 18
X Table 5: Comparison of the sophistication of products with untapped export potential from Jordan to the world, North Africa and the Middle East 18
X Table 6: Comparison of sophistication of products with untapped export potential from Morocco to the world, North Africa and the Middle East 19
X Table 7: Comparison of the sophistication of products with untapped export potential from Tunisia to the world, North Africa and the Middle East 19
X Table 8: Overview of incentives provided in the Southern Mediterranean Countries in SEZs 38
X Table 9: Evaluation of the design and creation process of industrial policies in the region 48
X Table 10: Characteristics of national employment strategy (NEP) formulation 52
X Table 11: Modalities of stakeholder engagement in national employment strategy (NEP) formulation processes 53
X Table 12: Average annual growth of aggregate labour productivity, gross value-added (GVA) and employment, 2000–09 and 2009–19 (percentage) 56
X Table 13: Comparison of the evolution of exports between Tunisia and Morocco, 2009–19 (US$ million) 63
X Table 14: Evolution of exports of phosphate products in Morocco and Tunisia, 2009–19 (US$ million) 63
X Table 15: Classification of tradable and non-tradable sectors based on Mano and Castillo (2015) 74
X Table 16: Classification of tradable and non-tradable sectors in the region based on Mano and Castillo (2015) 75
X Table 17: Evolution of key indicators in the labour market 76
X Table 18: Evolution of the share of wage-employment per sector between 2009 and 2019 in Egypt (percentage) 79
X Table 19: Logistics Performance Index scoring in the Southern Mediterranean Countries (1 to 5, 5=best)
X Table 20: Rank of countries in the ICT Development Index (out of 175 countries) 95
X Table 21: Selected indicators on access to finance 97
X Table 22: Gross school enrolment in tertiary education in the region (percentage) 98
X Table 23: Scoring of countries in the Human Capital Index, 2020 99
X Table 24: Youth population in the region, 2019 104
X Table 25: Youth labour force participation rate in the region 105
X Table 26: Labour force participation rates by gender in the region, 2019 111

xi Table of Contents
X Table 27: Evolution of labour force and employment by sex in Egypt, 2009–19 (in thousands) 118
X Table 28: Evolution of labour force and employment by age in Egypt, 2009–19 (in thousands) 121
X Table 29: Evolution of labour force and employment by sex in Jordan, 2017–19 (in thousands) 124
X Table 30: Evolution of labour force and employment by age in Jordan, 2017–19 (in thousands) 127
X Table 31: Evolution of labour force and employment by sex in Morocco, 2000–19 (in thousands) 130
X Table 32: Evolution of labour force and employment by sex in Tunisia, 2005–17 (in thousands) 133
X Table 33: Evolution of labour force and employment by age in Tunisia, 2005–17 (in thousands) 136
X Table 34: Evolution of labour force and employment by sex in the Occupied Palestinian Territory, 2000–19 (in thousands) 139
X Table 35: Evolution of labour force and employment by age in the Occupied Palestinian Territory, 2000–19 (in thousands) 142
X Table 36: Evolution of labour force and employment by sex in Algeria, 2000–19 (in thousands) 145
X Table 37: Evolution of labour force and employment by sex in Libya, 2000–19 (in thousands) 148
X Table 38: GDP growth between 2019 and 2021, constant prices 160
X Table 39: Total investment (percentage of GDP) 160
X Table 40: Change of volume of exports of goods and services (percentage) 162
X Table 41: Change of volume of exports of goods (percentage) 162
X Table 42: FDI inflows to countries in the region between 2019 and 2020 162
X Table 43: Selection of indicators from the firm high-frequency survey 163
X Table 44: Share of firms that started or increased the use of digital platforms during COVID-19 crisis (no micro-firms) June–August 2020 173
List of boxes
X Box 1: Role of the European Union in the UfM and engagement in the Southern Mediterranean Countries 24
X Box 2: ITC interventions on the new NEAR regional trade and investment programme 68
X Box 3: EU–OECD programme on investment in the Southern Mediterranean Countries 70

xii
X About the METI programme
Mainstreaming Employment into Trade and Investment (METI) is a programme hosted in the DEVINVEST branch of the ILOʼsEmploymentPolicyDepartment, funded by the European Commission (EC) and implemented by the ILO. METI aims to bet-ter enable policymakers in Middle East and North Africa (MENA) to incorporate an employment per-spective into trade and investment policies. This will support the design and implementation of invest-ment strategies that optimize the quantity and quality of employment creation in the region. These objectives are all the more urgent in the context of post-COVID-19 pandemic recovery.
The programme is facilitating the operationaliza-tion of the EUʼsExternalInvestmentPlan(EIP) that aims to support inclusive and sustainable develop-ment of the Southern Neighbourhood region of the European Union. It aims to boost public and private investment to create more jobs and higher growth and work towards meeting other UN Sustainable Development Goals. METI was launched in the fall of 2020 and will continue to support policymakers for a four-year period.
For more information, please visit: http://www.ilo.org/meti
X Acknowledgements
This report was drafted by Chema Triki, consultant, with inputs from David Kucera, Martin Ostermeier and Héla Miniaoui from ILO. Chema Triki is cur-rently working as the Head of Industrialisation at the Institute for Global Change, focusing on eco-nomic transformation and private sector devel-opment in 16 African countries. Before this role, she was an embedded advisor with the Ethiopian Government working on job creation, industrial and SMEs development and employment policies. She worked before on private sector development in the Middle East and North Africa region at the OECD and contributed to several studies on employment and investment in the region. She has also worked for several years in management consulting in financialservices.SheisanEngineerwithappliedmathematics as a major and holds a Master of Public Administration from Sciences Po Paris and London School of Economics, with economic policy as a major.
The author would like to thank Luca Fedi (ILO CountryOfficeinCairo)forsharinghisvasttech-nical knowledge and regional expertise. The report alsobenefittedfromcommentsfromHilmaKupilaMote,ArielCastroandNezamQahoush(allILOʼsBureauforWorkersʼActivities-ACTRAV)andNacerBouyahia(ILOCountryOfficeinCairo).Theauthoralso wishes to acknowledge the comments and sug-gestions provided by Ilektra Tsakalidou and Michel Marciano (both European Commission).
The support provided by the ILO Department of Statistics – in particular, by David Bescond and Mabelin Villarreal-Fuentes – was invaluable.
The author is very grateful for the steady administra-tive support by Sonia Forero and Aysha Elsharabassy, and for the thorough editing by Elizabeth Coleman. Lastly, the author would like to express her thanks to the ILOʼs Publications Production Unit forassisting with the production process, and to the ILO Department of Communication and Public Information for their collaboration and support in disseminating this publication.

xiii
X Executive summary
1 Calculations based on UNCTAD data.
Trade, investment and industrial policies are at the heart of economic transformation and of job-rich strategies in developing countries. In the Southern Mediterranean Countries, despite the many reforms adopted over the past decades, structural trans-formation remains slow and the impact of these policies on job creation remains low, especially for women and youth. This thematic report examines the evolution of these policies and their impact on economictransformation,diversificationofexportsand the labour market, with a focus on youth and women, and on small and medium-sized enter-prises in the region. The report also provides an analysis of future trends that are expected impact to the labour market in the region.
Overview of the labour market, trade and investmentChapter 1 provides an overview of the current economic outlook in the region, with an overview of the labour market and the evolution of trade and investment in the region.
The Southern Mediterranean Countries has been throughsignificantpoliticalandeconomicturmoil,from the 2011 social movements to the global COVID-19crisis,withmanycountry-specificeventsthathadasignificantimpactontheregionʼseco-nomic trajectory. The 2011 social movements, which started in Tunisia and swept through to Egypt, Libya and other countries in the region, were driven mainly by youth striving for economic and social prosperity, for more participation in shaping their countriesʼdevelopmentpathsandforademocrati-zation of the political systems. Countries like Jordan andLebanonhavealsobeenseverelyaffectedbythe Syrian Civil War, which started in 2011.
Overall, economic growth in the region has been lower than its potential over the past decade. The disappointing economic growth in the Southern Mediterranean Countries is reflected in the regionʼslabourmarketoutcomes,characterizedbya low labour force participation rate, especially for women and youth, high levels of unemployment and informality, and low levels of quality job cre-ation. A decade after the 2011 social movements,
very little has changed for the economic reality of women and youth in the region. For instance, the female labour force participation rate is one of the lowest globally, lower on average than other coun-tries within the same or a lower income category. Similarly, for youth (15–29 years), the labour force participation rate is much lower than the rate for theirolderpeers.Thesignificantshareofwomenand youth not participating in economic activities and not even looking to be economically active hints atthedifficultiesthatwomenandyouthfacetopar-ticipatefullyintheircountriesʼeconomies.
The share of the Southern Mediterranean Countries in global trade did not improve over the past decades. In 2019, the region accounted for about only 0.08 per cent of world merchandise exports in 2019 and 1 per cent of world merchandise imports in the same year.1 The regionʼsmerchandisesimportsaresignificantlyhigherthanitsexports,with a shift in the dynamic in 2008 and a widened gap since then. The higher growth in imports than in exports, in general, resulted in persistent trade andcurrentaccountdeficitsamongoil-importingcountries in the region. Lebanon, Morocco, Jordan, Tunisia, the Occupied Palestinian Territory and Egypt have been running large and persistent trade deficitsformorethanadecade.Incontrast,theregionʼsoilexportershavehistoricallysignificantcurrent accounts and trade surpluses, although that has changed in recent years for Algeria. Moreover, the region has important vulnerabilities in trade. These include the high volatility of exports for oil-dependent countries, which was demonstrated in 2020 by the huge drop in oil prices and its impact on the economies of Algeria and Libya. Also, there is a high concentration of export markets, particularly in Europe, especially for North African countries. Finally, despite its relatively open regional economy, there is little intra-regional trade, and non-existent trade between some countries in the region.
The Southern Mediterranean Countries has adopted several reforms to attract foreign direct investment (FDI) over the past decades, including reforms of the regulatory frameworks and the establishment of special economic zones. Despite these reforms, FDIinflowshaveincreasedatarelativelylowpaceintheregionbetween2005and2019.FDIinflows

Trade, investment and employment in the Southern Mediterranean Countriesxiv
represented 2.1 per cent of total GDP in the region in 2019 and have constantly been growing in stocks. However,FDIinflowshavebeenunstable,especiallyafter the 2011 social movements and the impact of the COVID 19 pandemic on the global economy.
Inadditiontoreformsatthenationallevel,effortshave also been made to foster regional integration. The launch of the Union for the Mediterranean (UfM) in 2008 led to noticeable improvements in termsofcollaborationandtradeintensification.Althoughtraderelationshipsintensifiedbetweenseveral countries in the region, there remains con-siderable untapped trade potential between the Southern Mediterranean Countries and non-EU or UfM countries.
The nexus between the labour market and trade, investment and industrial policies is particu-larly important for the Southern Mediterranean Countries.Ifchannelledcorrectly,througheffec-tive institutions and industrial policies that promote structural change, trade and investment policies could help the countries in the region expand their productive sectors, including for SMEs, while creat-ing much-needed quality jobs, including for women and youth. In this context, promoting dialogue and technical cooperation within the region provides an important opportunity to further accelerate these effortsandfosterregionalintegration.
Trade, investment, industrial and employment policies and their impact on the labour marketChapter 2 provides an overview of industrial, trade, investment and employment policies in the region, and their impact on exports and job creation, including in productive and tradable sectors.
The Southern Mediterranean Countries followed the international trends in terms of industrial and trade policies. After independence, all countries in the region adopted policies to protect and develop their local industries and reduce dependency on the more developed countries in the 1970s and 80s. Many countries in the region started focusing on export promotion and trade liberalization. These policies,however,wereimplementedatadifferentpace and intensity across the region. During the
2 This is the carrot and stick feature as described by Dani Rodrik (2008).
1990s, most countries in the region adopted struc-tural adjustment reforms prescribed by the World Bank and the IMF. With the structural adjustment programmes (SAPs), countries in the region went through a significant wave of privatization. As aresult,tradebarriers,specificallytradetariffs,progressivelyandsignificantlydecreasedintheregion. Over the last two decades and particularly since the mid-1990s, countries in the region have relatively opened their economies and tried to inte-grate them into the global economy by adopting a set of trade and investment policies that aim to attract foreign direct investment (FDI) and improve their levels of exports. These policies also aimed to improve labour productivity, support SME develop-ment, foster the convergence process with devel-oped economies and create more jobs, including quality ones, to absorb the entrants to the labour market. In the 1990s and 2000s, parallel to these substantial trade liberalization reforms, countries in the region embarked on considerable investment reforms either through the revision of the regula-tory frameworks or the establishment of special economic zones (SEZs), also called free zones (FZs), free trade zones (FTZs) or export processing zones (EPZs)inordertocreatemainlyfiscalincentives.
Countries in the region have also implemented a number of industrial policies including both trans-versal and targeted objectives, with a set of policies and measures to improve the market functioning and the business environment and targeted sup-port to sectors that could yield productivity growth and development. Morocco and Egypt stand out in the region as the countries that have put the most effortintodesigningandimplementingindustrialpolicies that combine transversal and targeted interventions. Morocco is the only country to design and implement a repeated self-discovery process, with an updated list of targeted sectors and inter-ventionsbasedonidentifiedeconomicchanges.Thedesignofindustrialpoliciescanbesignificantlyimproved for all countries in the region. The main gaps remain on the conditionality of support pro-videdtofirms,2 the embeddedness and social dia-logue with the private sector and the transparency in the implementation. Most of the countries in the region have some level of public–private dialogue. However,aneffectivedialoguerequiresformalizedforums, frequency and transparency in the deci-sion-making and deliberations, which remains a weak spot for most countries in the region. Another

xv Executive summary
major gap is on the implementation and its trans-parency. There is limited information available on the implementation mechanisms, which suggests that transparency and monitoring and evaluation mechanisms remain to be improved in the region.
In terms of employment policies, not all countries have separate and explicit national employment policies (NEPs), some countries incorporate employ-ment measures in national development plans or other national policies. There are various dynam-ics that helped the adoption of NEPs. First was the job crisis, which helped put employment policies on the agenda from the early 2000s. Second, the 2020 labour market disruptions arising from the COVID-19 pandemic are confirming the crucial role of employment policies, not only to mitigate the short-term impacts of the crisis, but also to promote recovery and strengthen the resilience of economies and labour markets to adverse shocks in the long-run. Third, employment policy processes have also been stimulated by socio-political crises specifictocertaincountries.Anotableexamplewasthe2011socialmovements,inwhichpeopleʼsclaims and protests also centred around access to employment. From 2010 onwards, this led to the emergence of NEPs in Arab countries such as and Morocco and Tunisia.
Overall,thesepoliciesdidnotresultineffectivestructural transformation. Since 2000, the region has gone through a shift of labour from agricul-ture; however, this shift has been mainly towards services, with at best a relatively stable share of manufacturingandindustryindifferentcountries.In terms of outputs, the contribution of the broad sectorstoGDPinvalue-addeddidnotsignificantlychange in the countries in the region. In terms of both employment and outputs, most of the econo-mies in the region are service driven, particularly in Lebanon, in which the share of services in outputs increased to around 80 per cent in 2019. Countries in the region are witnessing an early deindustrial-ization. Manufacturing, which has been historically the driver of structural transformation for more advancedeconomies,hasadifferentweightacrossthe region but has been at best stagnant and at worst decreasing in countries in the region.
Trade, investment and industrial policies have gen-erally yielded some positive results in the region, with higher levels of exports pre-COVID-19-pan-demic in 2019 than in 2000. However, the results have been uneven across countries in the region. Egypt and Morocco in particular have been driving theexportgrowthintheregion,reflectingboth
countriesʼeffortsintrade,investmentandindus-trial policies undertaken in the past two decades. Exportsofbothcountriessignificantlyincreasedsince the early 2000s, except for a downward trend between 2011 and 2015. In 2019, both countries had very similar levels of merchandise exports, which is quite remarkable for Morocco, consider-ingthedifferencesinthesizeofbotheconomies(EgyptʼsGDPis2.5timeshigherthanMoroccoʼsGDP). The evolution of skill and technology inten-sity of exports in the region shows an increase in the share of medium-skill and technology-intensive and high-skill and technology-intensive manufac-tures in exports in Morocco, Egypt and Tunisia. This indicates a certain level of sophistication improve-ment and upgrade of technological capabilities in these economies. However, the region did not wit-nessasignificantdiversificationofexportedprod-ucts, except for some encouraging signs in Egypt, Morocco and Tunisia, including in the electronics and automotive sectors in Morocco and, to a lesser extent, in Tunisia, and electrical machinery in Egypt.
MostcountriesintheregionhavenotsignificantlyimprovedtheirlevelsofFDI.InwardFDIflowsinmost countries in the region increased signifi-cantly between 2000 and 2008 and have been on a declining trajectory since then, except for Egypt and Morocco. For other countries, pre-pandemic FDI levels have been stagnating at best. FDIs in the region are not yielding the expected results, with most investments concentrated in capital-intensive sectors. Hence, the impact of FDIs in job creation, labour productivity and structural change might not be to the level expected by policymakers in the region. A focus on the domestic linkages with local SMEs should be enhanced to maximise the impact of these FDIs and their contribution to domestic economic outcomes.
Overall, and despite the industrial, trade and invest-mentpoliciesimplemented,therehasnʼtbeenasignificantemploymentgrowthintheregionintrad-able sectors, such as manufacturing and tradable services. Workers in almost all countries are moving out of agriculture, mainly towards the non-tradable and low-productive sectors. However, exports and trade have increased demand for higher skills in the region, particularly in Egypt, Morocco and Tunisia, in line with an increased share of skill and tech-inten-sive exports. Tradable sectors and particularly man-ufacturing, were not able to create enough demand fortheregionʼslabourforce.Theshareofmanufac-turing in employment in almost all countries has decreased, except in Egypt. At the same time, the

Trade, investment and employment in the Southern Mediterranean Countriesxvi
share of wholesale and retail has almost systemat-ically increased. Other non-tradable sectors such as public administration and education have contrib-utedsignificantlytojobcreation.Therearesomeencouraging signs, however, in generally high-skilled tradable services, particularly in Morocco, which is in line with the increasing role that trade in services is playing in the region. Tradable ser-viceshavesignificantgrowthpotentialintheregion;however, they will mostly increase the demand for high-skilled workers. Focusing on high-skilled sec-tors and other sectors in manufacturing that would absorb the important share of low- and mid-skilled workers seems to be the right approach for coun-tries in the Southern Mediterranean Countries.
The impact of trade policies on the labour market is not only determined by the level of trade liberal-ization and trade policies but also depends heavily on the adoption of other sets of policies that are coherent with trade policies and that build the nec-essary environment for their success. As discussed earlier, the quality of industrial policies in the region is relatively low, despite some encouraging signs inEgyptandMorocco.Tradepoliciesneedeffec-tive industrial policies to yield the expected positive outcomes and provide quality jobs for workers in the region. The impact of both industrial and trade policies in the region depends heavily on the quality ofinfrastructure.Infrastructurecanbedefinedbyphysical and soft infrastructure and is an import-ant input to economic development and trade expansion. Physical infrastructure includes roads, connectivity, telecommunications and ports and softinfrastructureincludesfinance,humancapitaland the quality of institutions. Overall, the quality of hard and soft infrastructure in the region can besignificantlyimprovedtounlockthepotentialof trade and industrial policies and their impact on the labour market. For instance, the quality of insti-tutions in the region is particularly low. The 2011 social movements marked an attempt to reform the extractive economic institutions that led to endemic corruption, strong rent-seeking business-state ties and ultimately low levels of quality job creation and growth. The success of industrial policies depends on the capacity of the state to establish a transpar-ent and collaborative relationship with the private sector, with a clear set of rules and incentives, and a “carrot-and-stick” attribute that would decrease the rent-seeking approach. Countries in the region should focus on reforming the economic institu-tions, including the competition laws and agencies, and promoting the rule of law if they are to stand a chanceindevelopingtheireconomiesandbenefit-
ting from a positive impact of trade and investment on their economies.
Trade, investment and industrial policies and youth and women in the labour marketChapter 3 provides a detailed analysis of youth and women in the labour market in the region, and the evolution of their employment in productive sectors, including tradable ones over the last two decades.
Youth in the Southern Mediterranean Countries struggle to secure quality jobs and develop their economic potential. The labour force participation rate in the region is lower than 40 per cent for youth andtheregionalsosuffersfromrelativelyhighshares of youth not in employment, education or training (NEET). Youth unemployment rates in the region are one of the highest globally, ranging from a maximum of 42 per cent in Algeria and a mini-mum of 19 per cent in Tunisia in 2019. The unem-ployment rate has increased with the increase in levelsofeducationalattainment,suggestingsignifi-cant skill mismatches in the countries in the region. Unemployment has increased in particular for grad-uates and educated youth in the region, including for Tunisia and Jordan, two countries that have achieved relatively important levels of participation in tertiary education.
Thetertiarygraduatesʼunemploymentisparticularlyproblematic for the region. It indicates low returns of investmentineducationandmightinfluencefuturegenerationsʼchoicesandleadtoanoveralldecreasein human capital accumulation in these economies. Moreover, graduate unemployment is an economic and human capital loss for the middle-income coun-tries in the region, considering the high opportu-nity cost of completing education at higher levels. Graduateunemploymentreflectstheabsenceofstructural transformation and therefore the inca-pacity of the economies to create quality jobs for its educated youth. The high levels of youth unem-ployment and the lack of economic dynamism led to significantmigration,includinganundocumentedone, and brain drain levels in most countries in the region. The share of highly skilled individuals among the migrant population has increased in these coun-tries, reaching 20 per cent among migrant youth in 2017, suggesting a brain drain.

xvii Executive summary
Employed youth in Egypt, Jordan, Occupied Palestinian Territory and Tunisia seem to be doing better when compared to their peers in other coun-tries in the region in terms of participation in trad-able sectors. Overall, the share of youth working in manufacturing and in tradable sectors is higher than for older workers. Manufacturing has, in general, increased demand for high skilled youth workers and in most countries, the demand for high-skilled youth has increased faster than for high-skilled older workers. However, youth tend to be more concen-trated in low-skilled non-tradable sectors than their older peers, mainly in construction and wholesale and retail. Finally, there is no clear trend for the level of skills: Employed youth tend to be slightly better educated and with higher skills than their adult peers in Egypt and Tunisia and with lower levels of edu-cation in Jordan and Occupied Palestinian Territory.
As countries in the region have adopted new development models that are export-oriented, the demand dynamics for female labour should have significantlychanged.However,intheSouthernMediterranean Countries, women are still facing structural challenges to participating in the labour market. The female labour force participation rate in the region is among the lowest in the world, with only 22 per cent in 2019. In the region, countries with the highest levels of educational attainments, such as Jordan and Tunisia, do not have the highest levels of female labour force participation rates. The female labour force participation rate is the highest in Libya (32 per cent), where females are less likely to be highly educated than any other country in the region. The low labour force participation rates for women and the overall high levels of education in the region constitute a paradox. In general, wom-enʼspropensitytoparticipateinthelabourforceincreases with higher levels of education. However, there is no clear correlation between levels of edu-cation and levels of labour force participation for women in the region, which indicates that there are structuralchallengesforwomenʼslabourforcepar-ticipation outside of skills challenges.
The low levels of female labour force participation rates in the region are due to a lack of economic dynamism in the region as well as to social norms and stereotypes. Women in the region have gen-erally preferred public sector employment for its formal nature and its security. However, the public sector opportunities have declined since the struc-tural adjustment reforms in the 1990s, despite the important role they continue to play. In parallel, the private sector has been unable to provide the same
qualityofjobsofferedbythepublicsector,includ-ing for highly educated and married women. Other root causes reinforce and perpetuate the social norms and stereotypes, such as inadequate child-careprovision,lowaccesstoaffordableandpublictransportation, discriminatory family and labour laws and low wages and economic compensation.
Within the labour force, women in the region expe-rience higher levels of unemployment, despite being more educated than men. There are larger shares of women with higher education than men in the labour force in almost all countries in the region. Palestinian and Jordanian women in the labour force are the most educated, with respec-tively 63 per cent and 58 per cent with tertiary edu-cation in 2019. Yet, unemployment is much higher for women than men in the region, except for Morocco, where the unemployment rate is at sim-ilarlevels.Thehighwomenʼsunemploymentratescan be explained by the same constraints leading to their exclusion from the labour force. Also, it can beexplainedbythesignificantnumberofwomeninthe region, especially in Jordan and Tunisia, queuing for the perceived “female-friendly” jobs, including in thepublicsector,whichisreflectedbythelong-termunemployment for females.
As a result of meagre labour force participation rates and high levels of unemployment, the share of women in employment is very low across all countries in the region, ranging from 14 per cent in Jordan to 32 per cent in Libya. Women tend, in general, to work in a limited number of sectors, mostly in services. North African economies tend to be more inclusive for women, as women in Algeria, Morocco, Tunisia and Libya tend to work in more diverse sectors, including agriculture and manufacturing. For instance, in Libya, women rep-resent 45 per cent of employment in manufactur-ing and 31 per cent of employment in agriculture. InMorocco,womenrepresentasignificantshareof employment in agriculture (37 per cent) and manufacturing (29 per cent). Tunisian and Algerian women are more represented in manufacturing (43 per cent and 36 per cent) than in services (28 per cent and 22 per cent). In employment, women in EgyptandTunisiasufferfromarelativelylargegen-der wage gap, with the mean gap using monthly earnings being respectively at 14 and 9 per cent. However, in Jordan, the gender wage gap is less of a concern as it is estimated on average at only 2 per cent using the monthly earnings.
Overall, women are more shifting out of tradable sectors towards non-tradable ones in the region.

Trade, investment and employment in the Southern Mediterranean Countriesxviii
This is mainly driven by a shift of labour of agricul-ture that has not been replaced at similar levels in other more productive tradable sectors. This trend is however more pronounced for women than for men. The share of manufacturing female employ-ment has decreased in almost all countries, with the exception of Egypt, while it remained relatively stable for men. Male employment in tradable ser-vices has generally increased, while it remained either stable or decreased for women. Tradable services represent in general a very small share of female employment in the region, at lower levels than men and their share in employment has been mainly increasing for men. Women in the region tend to be concentrated in a handful number of sectors, mainly high-skilled services such as edu-cation, healthcare and public administration. The share of these sectors in female employment has significantlyincreasedinalmostallcountries,trans-lating to the increase of high-skilled female work-ersintheregionʼslabourforce.Also,theshareofwholesaleandretailhassignificantlyincreasedforfemale workers in most countries in the region.
Policy orientations based on analysis in Chapters 1, 2 and 3Overall, the slow structural change and the early deindustrialization that countries in the region are experiencing reduces the capacity of the econ-omy to create productive and quality jobs for its relatively young and increasingly educated popu-lation. The high adjustment costs that trade poli-ciesandincreasedcompetitionimposeonfirmsand workers, especially vulnerable ones, might lead to sub-optimal outcomes. In the case of the Southern Mediterranean Countries, this has led to a decreased participation of women in tradable sec-tors in the labour market. The structural issues that women and youth face in the labour market, beyond the impact of trade policies, negatively impact labour productivity growth and output growth in the region, with an economic potential that remains untapped. Increased youth and women labour participation would help to improve economic out-comes in the region through increased human cap-ital accumulation and increased household income, potentially leading to further consumption and an increaseinlocaldemand,and,finally,adecreaseinthe dependency ratio.
Addressing this requires integrated trade, indus-trial and domestic policies that reduce the pos-sible unequal impact of trade liberalization on
the labour market. Women in the region tend to be highly educated and engage mainly in formal employment; therefore, focusing on high-skilled tradable sectors that could absorb this labour forceiscrucialforwomenʼseconomicempower-ment and inclusive trade and investment policies. Industrial policies should be used as a transmis-sion channel for trade and investment policies to realize a productive structural change and yield the intended results, including creating opportunities forwomenandyouthtobenefitfromtradeliber-alization and sophistication of exports. Countries in the region should focus on structural transfor-mation to reverse the early deindustrialization and foster long-term and inclusive growth.
Policymakers in the Southern Mediterranean Countries need to incorporate employment issues into trade and investment policies and design and implement trade and investment interventions that ultimately optimize the quantity and quality of employment created in the region. This would requireadoptingeffectiveandmodernindustrialpolicies that would act as transmission channels to yield an inclusive and positive impact of trade poli-ciesontheregionʼslabourmarkets.Activeandpas-sive labour market policies and programmes can be used as a tool to facilitate labour mobility, facilitating thereshufflingofproductivefactorsandimprovingthe capacity of vulnerable workers to face the signif-icant adjustment costs imposed by trade liberaliza-tion. Moreover, investment in physical infrastructure can foster employment creation and trade expan-sion by facilitating labour mobility and reducing theadjustmentcostsofworkersandfirmstotradeliberalization. Investment in infrastructure can also foster trade expansion by lowering the trade-related transaction costs, including communication costs, domestic transport costs, time and money spent in ports on border procedures and international trans-port costs. Overall, a well-developed physical infra-structurecanreducethenon-tariffbarrierstotrade.
Future trends in the labour marketChapter 4 provides an analysis of the COVID-19 impact on the labour market and potential pathways for recovery, as well as future trends that might disrupt the labour market in the region, with a focus on the technological revolution.
The COVID-19 crisis has resulted in severe eco-nomic and social consequences for the Southern

xix Executive summary
Mediterranean Countries. All countries in the regionhavewitnessedasignificantGDPcontrac-tion, with a more pronounced decrease in Libya and Lebanon (in the case of Lebanon, this is mostly duetothesignificantongoingsocialandeconomiccrisis). The IMF estimates a recovery in almost all countries in the region, except for Lebanon, where the economic and social situation remains highly uncertain. However, considering the health crisis, these estimations for recovery might be too opti-mistic.Thelevelofinvestmenthasalsosignificantlydropped in most countries in the region, except for Jordan and Libya. The COVID-19 crisis is also impact-ing the macro-economic balances in the countries, with an increase of the gross debt (as a percentage of GDP) in most countries and a decrease in public revenues. In most countries in the region, public revenues dropped in 2020, driven by the shock on the real economy.
Trade and particularly exports in the region have significantlydroppedduetothepandemic.Mostcountries in the region have exported fewer goods and services in 2020, except for Egypt, which wit-nessed a 3 per cent growth in goods exports between 2019 and 2020. Exports of goods in 2020 have decreased in Libya in particular, driven by the oil crisis. While high-income countries are cur-rently slowly recovering, it remains unclear how the recovery will be for the Southern Mediterranean countries.
The COVID-19 pandemic has severely affected the labour market in the Southern Mediterranean Countries. As witnessed across the world and as expected, the COVID-19 crisis has led to relatively significantjoblayoffsintheregion,andmostbusi-nesses have reported severe drops in sales and outputs due to the COVID-19 crisis. Moreover, the crisis has impacted the level of wages of workers andincomesforhouseholdsinasignificantmannerin the region. However, wage-employed workers in the public sector have been the least concerned by wages decrease. Most countries in the region have adopted relatively quickly several measures to reduce the impact of COVID-19 on their econo-mies, despite relatively low incidence of the health crisis in the second quarter of 2020, during which most of these measures have been adopted. The measures have three main objectives: simulating the economy, protecting jobs and incomes, and pro-tecting workers in the workplace.
The recovery from the COVID-19 crisis in the Southern Mediterranean Countries will strongly dependontheeffectivenessandspeedintackling
the health crisis. Globally, there are signs of recov-ery in international trade, especially within high-in-come countries; however, the pathways for recovery in the region remain uncertain. International travel remains highly disrupted, directly impacting a stra-tegic sector in most countries: the tourism sector. Recovery in FDI is also highly uncertain, and partic-ularlyfornewgreenfieldprojectsinthemanufac-turing sector, outside of the extractive industries.
The investment and production dynamics within some sectors that are particularly important for countries in the region, such as the textiles and apparel, pharmaceuticals, and electronics and automobile equipment, might shift to favour more nearshoring and reshoring activities. Another path-way to recovery includes the level of public and pri-vate investment into productive sectors that could upgrade technological capabilities and strengthen the local manufacturing sector. The COVID-19 cri-sis highlights even further the importance of indus-trial policies and of developing the local production capabilities. Industrial and trade policies should therefore be geared towards not only integrating countries in the region in the global value chains (GVCs) but also towards building high-growth SMEs in high-productive sectors, which could strengthen thecountriesʼresilienceinthecaseofanewglobalpandemicandsignificantdisruptionsintheGVCs.Other pathways to recovery are the levels of invest-ment in human capital and the bandwidth within government to drive key and reforms that promote structural transformation.
Other trends might shape the future of work in the region and globally, driven by the technological rev-olution that might be accelerated with the COVID-19 crisis. The future of work and the impact of new technologies on the labour market are among the most debated questions today. The adjustment costs to these new technologies might be high, especially for low-skilled workers currently engaged in routine-based tasks that are more likely to be computerized and automated than other tasks. This might lead to an increase in inequality among low- and high-skilled workers, as high-skilled work-ers are generally not involved in routine-based tasks and as the new technologies are likely to increase the demand for this segment of workers. More broadly, technological innovation might slow down or disrupt the convergence process and widen the inequality gap between high-income and low- and middle-income countries.
Innovation in technologies is evolving at an expo-nential and unprecedented pace and affect all

Trade, investment and employment in the Southern Mediterranean Countriesxx
economic sectors. Technologies that are likely to bethemostdisruptiveareartificialintelligence,big data, the internet of things and connected devices, text, image and voice processing, robot-ics, 3D printing and modelling, cloud computing and biotechnology.
While globally the impact of these technologies on the labour market and the share of jobs that will be automated is highly debated, for countries in the Southern Mediterranean Countries, the impact of technologies is linked to another central and criti-cal question: will these technologies slow down or accelerate their convergence process, and will they provide an opportunity for these countries to “leap-frog” and bridge the productivity and knowledge gap with high-income countries? Technologies suchasartificialintelligence(AI)arelikelytobelabour-saving, which would devaluate the main competitive advantage that most low- and mid-dle-income countries have. The threat of automa-tion in low- and middle-income countries is more a concern within the manufacturing sector, consid-ering the historic role that this sector has played in structural transformation. Manufacturing, which has historically absorbed mostly low-skilled labour engaged in repetitive tasks, could be highly exposed to automation. In manufacturing, three main technologies are expected to disrupt the industry: robotics and AI, 3D printing and the internet of things. These technologies can be com-bined and are most likely to be adopted in parallel to respond to the increasing demand for custom-izedandpersonalizedproductsindifferentsec-tors.Withinmanufacturing,differentsectorsareexposedindifferentwaystotheautomationthreat,with automotive and transport equipment, phar-maceuticals and electronics and cars components beingthesectorsidentifiedbytheliteratureasthemost at risk for automation.
The impact of these technologies on the labour market and the extent to which countries will ben-efitfromthisongoingrevolutionwilllikelybedeter-minedbyatleastfourmainvariablesthatinfluencethepotentialadjustmentcostsindifferentecono-mies. These are: the pace of innovation and techno-logical change globally, which is currently growing exponentially; the level of digital infrastructure in each country; the level of skills and its readiness for technology in each country; and the absorption rate
oftechnologybyfirmsgloballyandineachcountry.Theabsorptionrateoftechnologybyfirmsgloballyand in the Southern Mediterranean Countries will beinfluencedbythecostoftechnologiescomparedto labour costs, as well as by the adoption of the currentlevelsofhumancapitalwithinfirms,andtheir capacity understand, to invest and adopt these technologies.Theabsorptionrateoffirmsheavilyaffectsthepotentialforautomation.
Overall,itisverydifficulttoassesstheimpactofthese technologies on the labour market in the Southern Mediterranean Countries. It is easier to assess how technology will shape the demand for skillsthanitistoestimateitseffectonjoblosses.There seems to be a consensus on the role of human capital in the future of work and that the highest disruption caused by technological change will most probably be on the demand for skills. As discussed above, routine tasks are the most likely to be highly automated, which would decrease the demand for low-skilled workers. Moreover, soft skills or cognitive skills are expected to gain momentum and importance as these are skills that are unlikely to be automated, which would increase the demand and the premium for these skills. Therefore, the quality and composition of human capital in the Southern Mediterranean Countries and the level of investment to prepare workers in these countries for the technological rev-olutionwillplayasignificantroleintheadjustmentof their economies to the future of work and rep-resent important variables that would determine if countries in the region would witness more job dis-placement or more job replacement and creation.
Policy orientations based on analysis in Chapter 4
Policymakers in the region need to proactively align industrial trade and employment policies with the technological revolution. This includes designing and implementing proactive and anticipative edu-cation and training policies to prepare the labour force and workers for the disruptions in the labour market. There is a need to invest in developing dig-ital and soft skills for all workers, including for low -skilledworkerswhowillbethemostaffectedbythe technological revolution.

1 Table of Contents
Overview of the labour market, trade and investment in the Southern Mediterranean Countries
Chapter 1

2
X Chapter 1. Overview of the labour market, trade and investment in the Southern Mediterranean Countries
3 Algeria, Egypt, Jordan, Lebanon, Libya, Morocco, the Occupied Palestinian Territory and Tunisia.
4 ClassificationaccordingtheWorldBankcountryclassification.
5 The level of GDP growth in each country was calculated based on the GDP in current US$ between 2018 and 2019, with data provided by the World Bank World Development Indicators (WDI).
6 Data calculated based on WDI data.
7 DefinitionoftheMENAregion:Algeria,Bahrain,Djibouti,Egypt,Iran,Iraq,Jordan,Kuwait,Lebanon,Libya,Morocco,Oman,OccupiedPalestinianTerritory,Qatar, Saudi Arabia, Syria, Tunisia, United Arab Emirates and Yemen.
1.1. Overview of the Southern Mediterranean CountriesThe Southern Mediterranean Countries3 is an eco-nomically diverse region that includes countries with different natural endowments, economic structures and economic development stages. The economies in the region can be assigned to three main categories: a) oil-exporters such as Algeria; b)thosethataremorediversifiedandtryingtoemerge as knowledge-based economies, such as Egypt, Jordan, Tunisia, Lebanon and Morocco, and c) economies impacted by war and occupation, such as the Occupied Palestinian Territory. Libya could fall under categories a) and c), as the country has beengoingthroughaseriesofconflictsandcivilunrest since 2011. Most countries in the region are lower-middle-income countries, except for Lebanon and Jordan, classified as upper-middle-income countries (table 1).4
The Southern Mediterranean Countries has been throughsignificantpoliticalandeconomicturmoil,from the 2011 social movements to the global COVID-19crisis,withmanycountry-specificeventsthatsignificantlyimpactedtheireconomictrajec-tories. The 2011 social movements, which started in Tunisia and swept through to Egypt, Libya and other countries in the region, were mainly driven by youth striving for economic and social prosperity, formoreparticipationinshapingtheircountriesʼdevelopment paths and for a democratization of the political systems. Countries like Jordan and Lebanon have also been severely impacted by the Syrian civil war which started in 2011.
Overall, economic growth in the region has been lower than its potential, with average real gross domesticproduct(GDP)growthindifferentcoun-tries below levels in emerging and developing Asia.
Jordan witnessed the highest levels of growth in the 2000s, with an average real GDP growth of 7 per cent between 2000 and 2009. However, even for Jordan, GDP growth was lower than the average in emerging and developing Asia (around 8 per cent). Economic growth in most countries has been slowly recovering since 2011; however, it remains in gen-eral at pre-2011 levels. In 2019, the region recorded around 4 per cent of GDP growth,5 mainly driven by growth in Egypt (real GDP growth at around 6 per cent in 2019). Other countries in the region have wit-nessed lower levels of growth, except for Lebanon, which experienced a pre-pandemic recession with –7 per cent GDP growth in 2019 ( figure 1). The regionrepresentsabout3percentoftheworldʼspopulation, with an average population growth of around 2 per cent in 2019, with the highest level being in the Occupied Palestinian Territory (around 3 per cent) and the lowest in Lebanon (0.1 per cent).6
The 2011 social movements unevenly impacted the countries in the region. Egypt, Tunisia and Libya are the countries that witnessed the most profound political and economic changes. Tunisia organised three free elections between 2011 and 2019 and had peaceful power successions during the same period. However, despite this relative success, the country has been challenged economically in the last decade. The Tunisian economy produced lower outputs, with lower GDP growth since 2011 than between 2000 and 2010. Real GDP growth recorded an average of 1 per cent between 2011 and 2019 as opposed to 4 per cent between 2000 and 2010. The country also witnessed a sharp increase in the debt-to-GDP ratio (from 39 per cent in 2010 to 72 per cent in 2019). Overall,theeconomiccostoftheSyrianconflictinthe Middle East and North Africa (MENA) region,7 cap-tured by the foregone economic growth or the loss in GDP relative to the “no-war” counterfactual in Syria, is estimated at US$200–300 billion (World Bank, 2017).

3 Chapter 1. Overview of the labour market, trade and investment in the Southern Mediterranean Countries
The COVID-19 global pandemic has severely impacted all countries in the region, with most coun-tries witnessing a recession in 2020, except for Egypt. According to an IMF projection, the real GDP growth in Egypt in 2020 reached a bit less than 4 per cent. In Egypt, the COVID-19 measures were lighter than other countries in the region, and the revenues from
8 Reuters, “EgyptʼsSuezCanalannualrevenuesdecline3%in2020to$5.61bln”, 3 January 2021.
the Suez Canal, a huge contributor to the Egyptian economy, have remained relatively stable in 2020, with a slight decrease of 3 per cent from 2019 to 2020.8 Libya has had the most unstable economic growth in the region over the last decade, with sharp variationsthroughouttheyears(figure2).Afterwhatseemed a promising recovery during 2017–18, the
X Figure 1: Economic growth in the different in the Southern Mediterranean Countries, real GDP growth rate (percentage)
Note: 2020 data is estimated; 2021 data is a projection.Source: IMF, World Economic Outlook, October 2020.
–30
–25
–20
–15
–10
–5
0
5
10
15
Perc
enta
ge
Algeria Egypt Jordan Lebanon Morocco Tunisia Occupied Palestinian Territory (O.P.T)
Average
2000-09
2010 2011 2012 2013 2014 2015 2016 2017 2018 2019 2020 2021
X Figure 2: Economic growth in Libya, real GDP growth rate in per cent (estimation for 2020, projection for 2021)
Source: IMF – World Economic Outlook, October 2020.
–100
–50
0
50
100
150
Perc
enta
ge
Libya
Average
2000–2019
2010 2011 2012 2013 2014 2015 2016 2017 2018 2019 2020 2021

Trade, investment and employment in the Southern Mediterranean Countries4
massivedropinglobaloilpricesin2020hassignifi-cantly impacted the Libyan economy, which regis-tered a record recession of 67 per cent in 2020 (real GDP). In Algeria, the other major oil and gas exporter in the region, the recession in 2020 was less severe, with a real GDP growth of –6 per cent. This could be explained in part by the fact that Algeria is relatively less dependent on natural resources than Libya.
The huge drop in economic output in Lebanon is not only linked to the COVID-19 crisis. Since 2019 Lebanon has been witnessing severe economic, politicalandsocialturmoil,culminatinginthefirstsovereign default of the Government in March 2020. The recent crisis started in October 2019 after
9 Source: IMF, World Economic Outlook, October 2020.
asuddenstopincapitalinflows,whichincreasedthe already-peaking public debt and plunged the local currency. Lebanon has historically had the third-highest public debt globally (an average of 147 per cent of GDP between 2000 and 2019)9 andthehighestpublicdebtintheregion(figure4),without carrying out the necessary reforms to boost the economy. The lockdown measures imposed to reduce the spread of the COVID-19 crisis exacer-batedtheeconomiccrisis.Inflationreachedmorethan85percentin2020,onlyfiveyearsafterdefla-tionin2015(figure3).Thehugespikeinconsumerprices is mainly linked to the massive plunge of the currency value, after a severe decrease of capital inflowsthatrevealedwhathasbeendescribedby
Source: IMF, World Economic Outlook, October 2020. Gross debt per cent GDP is missing for Libya.
Source: IMF, World Economic Outlook, October 2020.
X Figure 3: Inflation rate in the region (percentage)
–20
0
20
40
60
80
100
Perc
enta
ge
Algeria Egypt Jordan Lebanon Morocco Libya Tunisia Occupied Palestinian Territory
2010 2015 2016 2017 2018 2019 2020
0
50
100
150
200
Perc
enta
ge
Algeria Egypt Jordan Lebanon Morocco Tunisia Occupied Palestinian Territory
2000 2005 2010 2011 2012 2013 2014 2015 2016 2017 2018 2019 2020
E
X Figure 4: Gross debt per cent of GDP
–20
0
20
40
60
80
100
Perc
enta
ge
Algeria Egypt Jordan Lebanon Morocco Libya Tunisia Occupied Palestinian Territory
2010 2015 2016 2017 2018 2019 2020
0
50
100
150
200
Perc
enta
ge
Algeria Egypt Jordan Lebanon Morocco Tunisia Occupied Palestinian Territory
2000 2005 2010 2011 2012 2013 2014 2015 2016 2017 2018 2019 2020
E

5 Chapter 1. Overview of the labour market, trade and investment in the Southern Mediterranean Countries
many sources as a Ponzi scheme organized by the Central Bank of Lebanon, to keep the value of the Lebanese pound pegged to the US dollar.10
In terms of economic structure, economies in the region are predominantly service based, with high levels of services contribution to GDP in value-addedandemployment(figures5and6).Lebanon has the highest share of services in eco-nomic output and employment in the region, with
10 TheEconomist,“DeconstructingtheLebanesecentralbankʼsPonzischeme”,7November2020.
services contributing up to 79 per cent to GDP in value-added and with 65 per cent of employment. Jordan also has relatively high levels of employment in services with 73 per cent of the employed pop-ulation being in services. Algeria and Egypt have the highest levels of industry participation to GDP in value-added in the region, with respectively 37 per cent and 36 per cent in 2019. In terms of employ-ment in industry, Tunisia is the leading country in the region with 34 per cent, followed by Algeria
X Table 1: Main macro-indicators in 2000, 2010, 2019
Countries Indicators 2000 2010 2019
Algeria Population 31,041,235 35,977,455 43,053,054
GDP per capita (current US$) 1,765 4,479 3,974
Life expectancy at birth (in years) 70.6 74.9 76.7 (2018)
Egypt Population 68,831,561 82,761,235 100,388,073
GDP per capita (current US$) 1,450 2,646 3,019
Life expectancy at birth (in years) 68.6 70.3 71.8 (2018)
Jordan Population 5,122,493 7,261,539 10,101,694
GDP per capita (current US$) 1,652 3,737 4,406
Life expectancy at birth (in years) 71.7 73.4 74.4 (2018)
Lebanon Population 3,842,778 4,953,061 6,855,713
GDP per capita (current US$) 4,492 7,762 7,584
Life expectancy at birth (in years) 74.5 78.4 78.8 (2018)
Libya Population 5,357,891 6,197,663 6,777,452
GDP per capita (current US$) 7,143 12,065 7,686
Life expectancy at birth (in years) 70.9 72.0 72.7 (2018)
Morocco Population 28,793,679 32,343,389 36,471,769
GDP per capita (current US$) 1,335 2,840 3,204
Life expectancy at birth (in years) 68.7 74.4 76.5 (2018)
Occupied Palestinian territory Population 2,922,153 3,786,161 4,685,306
GDP per capita (current US$) 1,476 2,557 3,562 (2018)
Life expectancy at birth (in years) 71.0 72.8 73.9 (2018)
Tunisia Population 9,708,350 10,635,244 11,694,719
GDP per capita (current US$) 2,212 4,142 3,318
Life expectancy at birth 73.2 75.0 76.5 (2018)
Source: WDI.

Trade, investment and employment in the Southern Mediterranean Countries6
and Occupied Palestinian Territory (30 per cent) and Egypt (27 per cent). Agriculture plays a small role in terms of value-added and employment, with its lowest contribution to GDP value-added being in Lebanon (3 per cent) and lowest contribution to employment being in Jordan (2 per cent).
The wave of social movements that the region wit-nessed is rooted in the lack of economic dynamism in the region and inequality. Alvaredo et al. (2018) study inequality in the Middle East, including in Egypt, Jordan, Lebanon and the Occupied Palestinian Territoryandfindthattheregionappearstobethe
X Figure 5: Sectoral participation to GDP in value-added (%) in the Southern Mediterranean Countries in 2019
X Figure 6: Sectoral employment in the region in 2019 (% total employment)
Note: The value-added shares presented in the World Development Indicators for agriculture, industry and services do not always add up to a 100 per cent due to FISIM (Financial Intermediation Services Indirectly Measured) and net indirect taxes. GDP is measured at purchaser prices in this indicator. Source: WDI.
Source: ILOStat.
0
10
20
30
40
50
60
70
80
90
100
Perc
enta
ge
Agriculture, forestry, and fishing, value added (% of GDP) Industry (including construction), value added (% of GDP) Services, value added (% of GDP)
Algeria Egypt Jordan Lebanon Morocco Tunisia
46.2
37.4
12.4
50.5
35.6
11.0
60.9
24.5
4.9
78.8
12.83.1
50.9
25.3
12.2
61.7
22.7
10.4
0
10
20
30
40
50
60
70
80
90
100
Perc
enta
ge
Employment in Agriculture Employment in Industry Employment in Services
Algeria Egypt Jordan Lebanon Libya Morocco Occupied
Palsestinian
Territory
Tunisia
60.0
30.4
9.6
52.4
26.9
20.6
73.1
24.5
2.5
65.1
23.6
11.3
59.2
24.4
16.4
43.7
23.1
33.3
52.8
33.5
13.8
63.6
30.4
6.1
0
10
20
30
40
50
60
70
80
90
100
Perc
enta
ge
Agriculture, forestry, and fishing, value added (% of GDP) Industry (including construction), value added (% of GDP) Services, value added (% of GDP)
Algeria Egypt Jordan Lebanon Morocco Tunisia
46.2
37.4
12.4
50.5
35.6
11.0
60.9
24.5
4.9
78.8
12.83.1
50.9
25.3
12.2
61.7
22.7
10.4
0
10
20
30
40
50
60
70
80
90
100
Perc
enta
ge
Employment in Agriculture Employment in Industry Employment in Services
Algeria Egypt Jordan Lebanon Libya Morocco Occupied
Palsestinian
Territory
Tunisia
60.0
30.4
9.6
52.4
26.9
20.6
73.1
24.5
2.5
65.1
23.6
11.3
59.2
24.4
16.4
43.7
23.1
33.3
52.8
33.5
13.8
63.6
30.4
6.1

7 Chapter 1. Overview of the labour market, trade and investment in the Southern Mediterranean Countries
most unequal region in the world, with a top decile income share of 64 per cent, compared to 37 per cent in Western Europe, 47 per cent in the US and 55 per cent in Brazil. According to the World Inequality Database, in 2019, the share of the top 10 per cent in national income varies from 37 per cent in Algeria to 57 per cent in Lebanon, the most unequal coun-try in the region. Respectively, the share of the bot-tom 50 per cent in national income is the highest in Algeria at 21 per cent and the lowest in Lebanon at 11 per cent in 2019. These levels have remained relatively stable since 2010, despite the 2011 social movements, which aspired to more equality in the region. These stable inequality levels are a conse-quence of the lack of economic dynamism in the region and are linked to what can be described as rent-seeking economies in many countries as well asasignificantparticipationofthemilitaryineco-nomic activities, mainly in Algeria, Egypt and Jordan. High-income inequality weakens the social contract and can be considered as a constraint to sustainable growth as illustrated by Ostry et al. (2014), who pro-vide evidence that inequality is a robust determinant of faster and more durable growth.
1.1.1. The labour market in the region at a glanceThe disappointing economic growth in the Southern MediterraneanCountriesisreflectedintheregionʼs
labour market outcomes. The last decade, marked by the 2011 social movements, has put the labour market failures under the spotlight and put pres-sure on policymakers in the region to adopt policies that foster job creation and labour market inclusion for all in their economies.
The working-age population (15–64) in the Southern Mediterranean Countries is estimated at more than 145 million people, with approximately half of it being in Egypt. The labour force participation rate in the region varies from 39 per cent in Jordan to 50 per cent in Libya in 2019 with an average of 47.3 per cent in 2019, at much lower levels than the global rate (around 67 per cent), Southeast Asian countries (around 75 per cent) and sub-Saharan African countries (around 68 per cent). Women andyouthareparticularlyvulnerableintheregionʼslabourmarket,withsignificantlylowerlabourforceparticipation rates and higher unemployment in general (details in chapter 3). For instance, the female labour force participation rate is one of the lowest globally, lower than other countries within the same or a lower income category. The female labour force participation rate varies in the region from 13 per cent in Jordan to 27 per cent in Libya (2019), compared to 49 per cent for middle-income countries in the same year. In sub-Saharan African countries, mostly low-income countries, the female labour force participation rate is around 63 per cent, reflectingthenecessityofsub-Saharanwomento
X Figure 7: Share of the top 10 per cent and the bottom 50 per cent in national income, 2010 and 2019
Source: World Inequality Database.
0
10
20
30
40
50
60
Perc
enta
ge
2019 share top 10% in national income 2019 share bottom 50% in national income
2010 share top 10% in national income 2010 share top 50% in national income
Algeria Egypt Jordan Lebanon Libya Morocco Tunisia AsiaO.P.T.
21
37
20
47
18
47
11
57
18
43
15
49
14
50
18
41
11
49

Trade, investment and employment in the Southern Mediterranean Countries8
engage in any economic activity to participate in the householdʼsincome.Foryouth(15–29),thelabourforce participation rate is relatively higher than women, at 35 per cent in 2019, but at much lower levels than the total labour force participation rate. Thesignificantshareofwomenandyouthnotpar-ticipating in economic activities and not even look-ingtobeeconomicallyactivehintsatthedifficultiesthat women and youth face to participate fully in theircountriesʼeconomies.Highyouthunemploy-ment and inactivity rates were at the heart of the 2011 social movements, led mainly by youth in the region. A decade after these important events, very little has changed for the economic reality of women and youth in the region.
In general, the region has had negative job outlooks (more details in the next chapter). The unemploy-ment rate is relatively high in the region and has notsignificantlydecreasedsince2011(table2).The highest unemployment rate is in the Occupied Palestinian Territory, where unemployment has increased substantially between 2014 and 2019. In most countries, the unemployment rate is expected tosignificantlyincreasein2020,reflectingthemas-siveeffectsoftheglobalCOVID-19pandemiconeconomies in the region and globally.
The countries of the region are facing challenges both on the demand and the supply side of the labour market. Job creation or labour market demand is severely constrained by what could be described as a rent-seeking economy which may have led to the concentration of wealth and job creation in the hands of a few industrialists. This
ultimately does not promote competition, innova-tion, or sustainable job creation. Combined with challenges such as the weak development of the financialsectoranditsconcentrationonthebank-ingoffer,itlimitstheexpansionanddevelopmentofsmall and medium enterprises (SMEs). SMEs could be a critical source of value-addition and innova-tion in the region and an engine of decent jobs to absorb the new entrants to the labour market. SMEs already play an important role in job creation in most emerging economies as highlighted by Ayyagarietal.(2011).Theauthorsfindthatmorethan 50 percent of formal jobs in developing coun-triesareinsmallfirms,andSMEsprovideapprox-imately two thirds of jobs in all countries, both developed and developing countries. However, SME development is more constrained in emerging economies, including in countries in the region. For instance, according to Bruhn (2016), in high-income countries,over70percentoflargefirmsstartedout as SMEs, compared to about 60 per cent in low-er-middle income countries.
Onthesupplyside,theregionsuffersfromasig-nificantskillsmismatchamongyouthenteringthelabour market, which leads to high youth unem-ployment, particularly among the educated. During the last decades, countries in the region have experienced a sharp increase in education levels and in particular a strong increase in the number of graduates joining the labour market. However, in parallel, the unemployment rate of educated youth has substantially increased (more details in chapter 3).
X Table 2: Unemployment rate in different countries in the region, 2005–19 (percentage)
Total 2005 2011 2014 2015 2016 2017 2018 2019
Algeria 15.3 10.0 10.2 11.2 10.2 12.0 11.9 11.8
Egypt - 11.8 13.1 13.1 12.4 11.7 9.8 7.8
Jordan - - - - - 18.1 18.3 16.8
Lebanon - - - - - - - 11.4
Libya 19.2 19.0 18.9 18.9 18.8 18.6 18.5 18.3
Morocco 11.0 8.9 9.7 9.5 9.3 9.2 9.1 9.0
Occupied Palestinian Territory 20.0 17.6 20.5 23.0 23.9 25.7 26.3 25.3
Tunisia 12.9 18.3 - 15.2 15.6 15.3 - -
Sources: ILO statistics department, based on micro-data for Egypt, Jordan, Lebanon, Occupied Palestinian Territory and Tunisia; ILO modelled estimates for Algeria, Libya and Morocco.

9 Chapter 1. Overview of the labour market, trade and investment in the Southern Mediterranean Countries
The exclusion of women and youth from the labour market represent structural challenges in the region. Women comprise merely 18 per cent of total employment in the region and their participation in thelabourforceismeagre(figure8).Aswomentendto be highly educated in the region, this constitutes a substantial human capital and economic loss for the region. For their part, youth represent the future of the economy and their exclusion or low levels of participation might lead to substantial productivity and human capital losses in the long run.
The share of wage employment has increased in most countries in the region since 2010, including in Algeria, Egypt, Morocco, Occupied Palestinian TerritoryandTunisia(figure9).InJordan,theshareof wage employment remained constant at 86 per cent, the highest level in the region, whereas in Lebanon and Libya it decreased slightly between 2010 and 2019. Since the 2011 social movements, some countries in the region have used employ-ment in the public sector as a last resort. For instance, in Tunisia, the 38-2020 law was passed
X Figure 8: Share of female and male in employment per sector in the region in 2019
X Figure 9: Evolution of the status in employment in the region, 2010–19
Source:AuthorʼscomputationbasedonILOdata.
Source: ILO data.
0
20
40
60
80
100
Perc
enta
ge
Share female in employment Share male in employment
Agriculture Manufacturing Construction Mining
and utilities
Services Total
77.9
22.1
79.1
20.9
98.9
1.1
92.3
7.7
77.8
22.2
81.1
18.9
0 20 40 60 80 100
Algeria
Egypt
Jordan
Lebanon
Libya
Morocco
O. P. T.
Tunisia
Percentage
Wage-employed Employers Self-employed Contributing family workers
69
68
46
67
66
86
62
67
7
6
3
3
9
5
15
4
19
19
28
29
22
9
12
27
6
7
23
2
3
0
11
2
0 20 40 60 80 100
Algeria
Egypt
Jordan
Lebanon
Libya
Morocco
O. P. T.
Tunisia
Percentage
2010 2019
75
71
51
62
63
86
70
68
6
7
2
3
7
3
12
5
17
18
31
34
30
11
12
26
2
4
15
1
1
0
6
2

Trade, investment and employment in the Southern Mediterranean Countries10
guaranteeing public sector employment for the long-term unemployed with higher education.
Another important characteristic of the labour market in the region is the high levels of informal employment. In Egypt, Jordan, Lebanon and the Occupied Palestinian Territory, the share of infor-mality represents more than 50 per cent of total employment, with the highest levels being in Egypt with64percent(figure10).Unsurprisingly,informalemployment is the norm for employment in agricul-ture, with more than 90 per cent of workers work-ing informally. Women tend to be less represented in informal employment than men. However, this does not indicate that women have a higher quality of jobs. While women in the region have one of the lowest labour force participation rates globally, a significantshareoftheiremploymentisgenerallyinthepublicsector,whichgenerallyoffersformalandwage-employment jobs. In other words, women in the region tend to either engage in formal and rel-atively good-quality jobs or not engage at all in the labour market.
1.1.2. Trade and investment in the Southern Mediterranean Countries at a glanceOver the past few decades, and particularly since the mid-1990s, countries in the region have taken steps to open their economies and integrate them into the global economy by adopting trade and investment policies aimed at attracting Foreign Direct Investments (FDIs) and improving their levels of exports. These policies also aimed to improved labour productivity, foster the convergence process with developed economies and create more jobs, including quality ones, to absorb the entrants to the labour market. These efforts translated into significant trade reforms and liberalization since the 1990s. These reforms included the adoption and implementation of several Free Trade Agreements (FTA), trade liber-alizationmeasuresthroughsignificanttariffsreduc-tion and investment measures aiming to attract FDIs in their economies (more details about the
X Figure 10: Informal employment in selected countries in the region by sector and gender in 2019
Source: ILOSTAT (online website); data missing for Algeria, Libya, Morocco and Tunisia.
0
20
40
60
80
100
Perc
enta
ge
Total Agriculture Non-Agriculture
Egypt Jordan Lebanon Occupied Palestinian
Territory
0
20
40
60
80
100
Perc
enta
ge
Total Female Male
Egypt Jordan Lebanon Occupied Palestinian
Territory

11 Chapter 1. Overview of the labour market, trade and investment in the Southern Mediterranean Countries
evolution of trade policies in the region in the next chapter). Among the FTAs, the Euro-Mediterranean Free Trade Area, which includes all the countries in the Southern Mediterranean Countries, is highly strategic to the region, considering the importance of Europe as a trading partner.
Despitetheserelativelysignificanttradereforms,the share of the Southern Mediterranean Countries in the global trade remains very low. The region accounted for about only 0.08 per cent of world mer-chandise exports in 2019 and 1 per cent of world merchandise imports in the same year.11 From 2000 to 2009, the level of merchandise exports increased significantlyintheregion,withanaverageannualgrowth of 7 per cent. However, merchandise exports witnessedtwoepisodesofasignificantdropinthe
11 Calculations based on UNCTAD data.
last20years(figure11):thefirstfrom2008to2009duringtheglobalfinancialcrisis,andthesecondfrom 2012 to 2016, in the years following the 2011 social movements. Another sharp drop is expected in 2020 due to the COVID-19 crisis. Notably, the oil-exporting countries in the region (such as Algeria and Libya) are expected to witness a significant decline in their total exports in 2020 due to the drop inoilprices.Theleveloftheregionʼsmerchandiseimportsissignificantlyhigherthanitsexports,witha shift in the dynamic in 2008 and a widened gap sincethen,asdemonstratedbyfigure11.
Contrary to the merchandise trade, the region is overall a net exporter of services since 2017 (figure12),reflectingthehighgrowthoftradeinservices globally and the growing importance of
X Figure 11: Evolution of merchandise imports and exports in the Southern Mediterranean Countries, 2000–19 (total value in US$ million)
X Figure 12: Evolution of services imports and exports in the Southern Mediterranean Countries, 2005–19 (total value in US$ million)
Source: UNCTAD.
Source: UNCTAD.
0
50,000
100,000
150,000
200,000
250,000
300,000
US$
mill
ion
Merchandise exports Merchandise imports
2000 2001 2002 2003 2004 2005 2006 2007 2008 2009 2010 2011 2012 2013 2014 2015 2016 2017 2018 2019
0
10,000
20,000
30,000
40,000
50,000
60,000
70,000
80,000
US$
mill
ion
Service exports Service imports
2005 2006 2007 2008 2009 2010 2011 2012 2013 2014 2015 2016 2017 2018 2019
0
50,000
100,000
150,000
200,000
250,000
300,000
US$
mill
ion
Merchandise exports Merchandise imports
2000 2001 2002 2003 2004 2005 2006 2007 2008 2009 2010 2011 2012 2013 2014 2015 2016 2017 2018 2019
0
10,000
20,000
30,000
40,000
50,000
60,000
70,000
80,000
US$
mill
ion
Service exports Service imports
2005 2006 2007 2008 2009 2010 2011 2012 2013 2014 2015 2016 2017 2018 2019

Trade, investment and employment in the Southern Mediterranean Countries12
the services sector in the region. Travel represents the biggest share of the exports in services and hasbeensignificantlygrowingoverthepastyears.The exports in services represent half the value of exports in the region; however, the sector is prom-ised steady growth driven by the global dynamic. The region has enormous potential for e-commerce and the digital economy overall, especially consid-ering the relatively high levels of education of the labour force and considering the global dynamic. For instance, global e-commerce increased by 44 percentoverthepastfiveyearsandisnowworthUS$28 trillion, with business-to-business e-com-merce making up more than 86 per cent of its value (UNCTAD,2017).Theregioncouldwidelybenefitfrom this, as it generally has a relatively good digi-tal infrastructure and a relatively well-educated and younglabourforcethatcouldperformthedifferenttypes of digital activities.
The higher growth in imports than in exports, in general, resulted in persistent trade and current account deficits among the oil-importing coun-triesintheregion(figure14).Lebanon,Morocco,Jordan, Tunisia, the Occupied Palestinian Territory and Egypt have been running large and persistent
12 Source: Observatory of Economic Complexity.
tradedeficitsformorethanadecade.Incontrast,theregionʼsoilexportershavehistoricallysignifi-cant current accounts and trade surpluses, but that has changed in recent years for Algeria.
The region has important vulnerabilities in trade. First, oil-exporting countries are exposed to the high volatility of their exports, which was demon-strated in 2020 by the huge drop in oil prices and its impact on the economies of Algeria and Libya. Second, there is a high concentration of export mar-kets in Europe, especially for North African coun-tries(figure15).Forinstance,in2019,around54percentoftheregionʼsmerchandiseexportsweretoEurope, 48 per cent to countries of the European Union, mainly to France, Italy, Spain and Germany (the four countries represent 37 per cent of regional exports).However,therearesomesignsofdiversifi-cation with increasing trade with Asia, with a higher level of trade with some Asian countries, with Asia representing27percentoftheregionʼsmerchan-dise exports in 2019. For instance, exports from the region to China increased by 24-fold from US$290 million in 2000 to about US$7.06 billion in 2019.12 ImportsfromChinahavealsorisensignificantlyinthe last decades, reaching US$32.5 billion in 2019
X Figure 13: Evolution of trade in services by category in the Southern Mediterranean Countries and share of the region to the world (total value in US$ million)
Source: UNCTAD.
0
10,000
20,000
30,000
40,000
50,000
60,000
70,000
80,000
US$
mill
ion
Perc
enta
ge
Goods-related services Transport Travel Other services % commercial services in the region to the world
2.0
1.5
1.0
0.5
02005 2006 2007 2008 2009 2010 2011 2012 2013 2014 2015 2016 2017 2018 2019

13 Chapter 1. Overview of the labour market, trade and investment in the Southern Mediterranean Countries
from US$1.8 billion in 2000 and US$18.8 billion in 2010. Trade with sub-Saharan African countries has significantlyincreasedbetween2000and2010buthas been constant since then. Sub-Saharan African countriescanofferimportantopportunitiesfortheSouthern Mediterranean Countries, especially for North African countries, as most African countries remain at very early stages of industrialization.
Thereissomeevidenceofproductdiversificationintheregionʼsexports;however,thisremainsrel-ativelylow,especiallyconsideringthesignificanttrade and investment reforms adopted in countries in the region. The share of oil and gas products in total merchandise exports decreased from 65.6 per centin2000to43.2percentin2019(figures16and 17). The share of chemical products increased
from 2.8 per cent to 6.4 per cent from 2000 to 2019. Anotherproductthatincreasedsignificantlyisroadvehicles, becoming one of the top ten products exported in the region in 2019 and representing 2.9 per cent of total merchandise exports. However, the share of apparel and clothing, a historic product since the 1970s in the region, decreased from 9.1 per cent to 6.5 per cent between 2000 and 2019. Overall,thereissomelevelofdiversification;how-ever, not at a speed required for an economic trans-formation in the region.
The Southern Mediterranean Countries have adopted several reforms to attract FDIs over the past decades, including regulatory frameworks and the establishment of special economic zones. Several countries have put in place several Special
X Figure 14: Evolution of trade balance as a percentage of GDP in the region
X Figure 15: Evolution of export destinations for the Southern Mediterranean Countries
Source: UNCTAD. Data for Algeria and O.P.T. for 2019 are missing and were replaced by data from 2018.
Source: Observatory of Economic Complexity.
–60
–40
–20
0
20
40
Perc
enta
ge
2005 2010 2019
2005 2010 2019
Algeria Egypt Jordan Libya Lebanon Morocco O. P. T. Tunisia
0
20
40
60
80
Perc
enta
ge
Africa Asia Europe North America Oceania South America
–60
–40
–20
0
20
40
Perc
enta
ge
2005 2010 2019
2005 2010 2019
Algeria Egypt Jordan Libya Lebanon Morocco O. P. T. Tunisia
0
20
40
60
80
Perc
enta
ge
Africa Asia Europe North America Oceania South America

Trade, investment and employment in the Southern Mediterranean Countries14
Economic Zones (SEZs) and Free Trade Zones (FTZs), following a model of “plug-and-play”, which has facilitatedFDIsinflowsintheregion.Thesezonesgenerallyofferawiderangeofservices,includingfinancialservicesandlogisticsandfacilitateaccessto land and production facilities. However, political instability, weak governance and law enforcement and weak regulatory environment remain the main challenges and binding constraints to trade and investment in the region.
FDI inflows have increased at a relatively low paceintheregionbetween2005and2019(fig-ure 19). FDIs are mostly driven by multinational enterprises aiming to diversify their markets or reduce their production costs. The FDI inflows and total inward FDI stock in the region increased by 80 per cent between 2008 and 2019. In the Southern Mediterranean Countries, FDI inflows represented 2.1 per cent of total GDP (US$, cur-rent prices) in 2019 along with consistent growth instocks.However,FDIinflowshavebeenunsta-ble, especially after the 2011 social movements. In2019,FDIsinflowstoNorthAfricadecreasedby11percenttoUS$14billion,withreducedinflowsin all countries except Egypt. In 2019, the Southern Mediterranean Countries received about 1.04 per centoftheWorldʼsFDIinflows.Comparatively,sub-Saharan Africa received about 3 per cent of theworldʼsFDIinflowsin201913 and Latin American and Caribbean countries about 11 per cent of global inflowsin2018(OECD,2020a).Itisworthnotingthat both the Southern Mediterranean Countries and sub-Saharan Africa received the same levels of FDIinflowsasashareoftheirGDP(around2percentin2019).Giventhedifferentlevelsofdevelop-ment across the two regions, the level of FDIs in the Southern Mediterranean Countries could be higher, contributing more to decent job creation and technology transfer in the region. The Southern Mediterranean Countries is generally more devel-oped than sub-Saharan Africa, as most countries in sub-Saharan Africa are low-income countries, and the region is closer to high-income countries that play an important role in the global value chains and in FDIs.
13 Source: UNCTAD.
X Figure 16: Share of products in the Southern Mediterranean Countriesʼ exports in 2000
X Figure 17: Share of products in the Southern Mediterranean Countriesʼ exports in 2019
Source:AuthorʼscalculationbasedonUNCTADdata.
33- Petroleum 34 - Gas
84 - Apparel & clothing 77 - Electrical machinery
56 - Fertilizers 05 - Vegetables and fruits
52 - Inorganic chemicals 03 - Fish and preparations
27 - Crude fertilizers and minerals 65 - Textile yarn and related products
Others
33- Petroleum 34 - Gas
84 - Apparel & clothing 77 - Electrical machinery
05 - Vegetables and fruits 56 - Fertilizers
52 - Inorganic chemicals 78 - Road vehicles
97- Gold 03 - Fish and preparations
Others
49.0%
16.5%
9.1%
2.8%2.1%2.0%
1.9%1.8%
1.5%1.3%
11.9%
31.4%
11.8%
6.5%6.4%5.2%
4.1%3.2%
2.9%
2.6%1.6%
24.4%
33- Petroleum 34 - Gas
84 - Apparel & clothing 77 - Electrical machinery
56 - Fertilizers 05 - Vegetables and fruits
52 - Inorganic chemicals 03 - Fish and preparations
27 - Crude fertilizers and minerals 65 - Textile yarn and related products
Others
33- Petroleum 34 - Gas
84 - Apparel & clothing 77 - Electrical machinery
05 - Vegetables and fruits 56 - Fertilizers
52 - Inorganic chemicals 78 - Road vehicles
97- Gold 03 - Fish and preparations
Others
49.0%
16.5%
9.1%
2.8%2.1%2.0%
1.9%1.8%
1.5%1.3%
11.9%
31.4%
11.8%
6.5%6.4%5.2%
4.1%3.2%
2.9%
2.6%1.6%
24.4%

15 Chapter 1. Overview of the labour market, trade and investment in the Southern Mediterranean Countries
1.1.3. Intra-regional trade and regional integrationAnother vulnerability in trade in the region is the extremely low intra-regional trade. The region is relatively an open regional economy; however, intra-region trade remains very low and, in some cases, inexistent.Theregionʼs tradeopenness,definedasthevalueofexportsplusimportsoverGDP, is at around 68 per cent GDP in 2019, declin-ing from 80 per cent in 2005, but remains at higher levels than the OECD countries (around 61 per cent) and middle-income countries (around 49 per cent) (figure21).Thetradeopennessintheregionwasimpactedbyboththeglobalfinancialcrisisandthe2011 social movements. The level of trade openness hasbeensteadilyincreasingbeforetheglobalfinan-cial crisis in 2008 and fell by 14 per centage points
between2008and2009,reflectingtheso-called“great trade collapse” (Baldwin, 2009) and decreased between 2011 and 2016, before picking up between 2016 and 2018, driven by an increase in Egyptian exports. Libya and Tunisia are the most open coun-tries in the region, with respectively trade openness at 117 per cent and 109 per cent of GDP in 2019. However, and despite these important levels of openness, intra-regional trade represents less than 10 per cent of imports and exports (table 3). Some countries within the region do not even trade with each other. North African countries tend to trade less within the region than other countries, as most of their exports are destined to European countries, mainly France, Germany, Italy and Spain. The most-traded products within the region are mineral prod-ucts. For instance, Tunisia imports more than 87 per cent of its petroleum gas from Algeria.
X Figure 18: FDI inflows in the world and G20 countries, 2005–19 (US$ million)
X Figure 19: FDI inflows in the Southern Mediterranean Countries and sub-Saharan African countries, 2000–19 (US$ million)
Source:AuthorʼscomputationbasedonUNCTADdata.
Source:AuthorʼscomputationbasedonUNCTADdata.
0
500,000
1,000,000
1,500,000
2,000,000
2,500,000
US$
mill
ion
20102005 2006 2007 2008 2009 2011 2012 2013 2014 2015 2016 2017 2018 2019
World G20
0
10,000
20,000
30,000
40,000
50,000
US$
mill
ion
20102000 2004200320022001 2005 2006 2007 2008 2009 2011 2012 2013 2014 2015 2016 2017 2018 2019
Southern Neighbourhood Region Sub-Saharan Africa
0
500,000
1,000,000
1,500,000
2,000,000
2,500,000
US$
mill
ion
20102005 2006 2007 2008 2009 2011 2012 2013 2014 2015 2016 2017 2018 2019
World G20
0
10,000
20,000
30,000
40,000
50,000
US$
mill
ion
20102000 2004200320022001 2005 2006 2007 2008 2009 2011 2012 2013 2014 2015 2016 2017 2018 2019
Southern Neighbourhood Region Sub-Saharan Africa

Trade, investment and employment in the Southern Mediterranean Countries16
X Figure 20: Evolution of total imports, exports, GDP (US$ million) and trade openness in the region, 2005–19
X Figure 21: Trade openness in different countries in the region in 2019, compared to OECD and middle-income countries
Source:WDIforGDPandUNCTADfortradefigures.
Source: WDI.
0
100,000
200,000
300,000
400,000
500,000
600,000
700,000
800,000
900,000
US$
mill
ion
Perc
enta
ge
Total exports Total imports Total GDP (current US$) Trade openess in %
100
80
60
40
20
02005 2006 2007 2008 2009 2010 2011 2012 2013 2014 2015 2016 2017 2018 2019
0 20 40 60 80 100 120 140
Algeria
Egypt
Jordan
Lebanon
Libya
Morocco
Occupied Palestinian Territory
Tunisia
Middle income
OECD members
Percentage
61
49
109
69
87
117
96
86
43
52

17 Chapter 1. Overview of the labour market, trade and investment in the Southern Mediterranean Countries
Intra-regional trade remains very low with a sig-nificantuntappedexportpotentialbetweencoun-tries in the region, as is illustrated by the untapped export potential calculated by the International Trade Centre (ITC). The ITC estimates the untapped export potential for countries both at the intensive and the extensive margin. The untapped export potentialiscalculatedforacountryʼsexportswithdifferentregions,providingvaluableinsightsonthepotential of a regional integration in the Southern Mediterranean Countries and the complexity of products that could be traded within the region. For instance, in Egypt, the products with the most untapped export potential to North Africa include chemical products, fertilizers and machinery, which are products with a certain level of sophistication (table 4). High- and medium-skill and technolo-gy-intensive manufactures represent 61 per cent of the top ten products with untapped export poten-tial from Egypt to North Africa and 58 per cent in exports from Egypt to the world. The structure of skills and technology of the top ten products with untapped export potential is more sophisticated for exports from Egypt to North Africa compared to Egypt to the world. The untapped export poten-tial from Egypt to the Middle East is slightly less sophisticated than to the world; however, chemi-cals are among the top three sectors with the most untappedexportpotential(figure24)totheregion.For Jordan, the untapped export potential of the top ten products to North Africa is more sophisticated than to the Middle East, which highlights the cur-rent weak trade with North Africa (table 5). The sec-tors with the most untapped export potential from Jordan to North Africa and the Middle East region include chemical industries (chemical products and
fertilizers)andmachineries(figures26and27).ForMorocco, the share of high-skill and technology-in-tensive manufactures among the top ten products with untapped export potential with North Africa is higher than with the world as a market (table 6). The untapped export potential of Morocco with the Middle East is also concentrated in technology and high-valueadditionsectors(figure30)andthetopten products are highly sophisticated with 70 per cent of them being high-skill and technology inten-sive manufactures. For Tunisia, intra-regional trade could increase exports in high-value addition sec-tors (table 7). For instance, machineries and fer-tilizers are among the sectors and products with the highest untapped export potential with North AfricaandtheMiddleEast(figures32and33),andhigh-skill and technology intensive manufactures represent respectively 34 and 58 per cent of the top ten products.
These elements suggest that increased intra-re-gional trade could positively impact the develop-ment trajectory of these countries and support the structural transformation in the region by stimulat-ing exports of sophisticated products that require more technological know-how. Intra-regional trade couldalsoofferanopportunityforMENAtoboosteconomic growth and job creation through poten-tiallylowernon-tariffbarriersandtradecoststhanother regions. However, this requires investing in the necessary infrastructure between different countries in the region, which remains under-devel-oped. In a recent report, Regional Integration in the Union for the Mediterranean, the OECD (2021) indi-cates that cross-border infrastructure represents a significantgapfortradewithintheNorthAfricaandMiddle East region.
X Table 3: Levels of exports and imports within the region in 2019 (percentage)
Country % of exports to the region to total exports % of imports from the region to total imports
Algeria 7.2 4.7
Egypt 10.5 1.3
Jordan 6.7 6.3
Lebanon 5.4 3.1
Libya 0.9 9.9
Morocco 1.2 3.0
Occupied Palestinian Territory 32.3 34.8
Tunisia 5.5 20.2
Source: The Observatory of Economic Complexity.

Trade, investment and employment in the Southern Mediterranean Countries18
X Table 5: Comparison of the sophistication of products with untapped export potential from Jordan to the world, North Africa and the Middle East
Untapped export potential – Jordan to the world (category of products)
Total category (US$ million)
Total top 10 products (US$ million)
% in top 10 products
High-skill and technology-intensive manufactures 2,047.3
3,245.8
63%
Medium-skill and technology-intensive manufactures 76 2%
Low-skill and technology-intensive manufactures 76.5 2%
Labour-intensive and resource-intensive manufactures 1,046 32%
Untapped export potential – Jordan to North Africa (category of products)
Total category
(US$ million)
Total top 10 products
(US$ million)
% in top 10 products
Untapped export potential – Jordan to the Middle East (category of products)
Total category
(US$ million)
Total top 10 products
(US$ million)
% in top 10 products
High-skill and technology-intensive manufactures 121.2
243
50% High-skill and technology-intensive manufactures 313.7
1,049.9
30%
Medium-skill and technology- intensive manufactures 7.4 3% Medium-skill and technology-
intensive manufactures 24.8 2%
Low-skill and technology-intensive manufactures 17.6 7% Low-skill and technology-intensive
manufactures 55.7 5%
Labour-intensive and resource- intensive manufactures 96.8 40% Labour-intensive and resource-
intensive manufactures 655.7 62%
Source:AuthorsʼcomputationbasedondatafromInternational Trade Center.
X Table 4: Comparison of the sophistication of products with untapped export potential from Egypt to the world, North Africa and the Middle East
Untapped export potential – Egypt to the world (category of products)
Total category (US$ million)
Total top 10 products (US$ million)
% in top 10 products
High-skill and technology-intensive manufactures 4,191.1
12,084.5
35%
Medium-skill and technology-intensive manufactures 2,771.7 23%
Low-skill and technology-intensive manufactures 1,200 10%
Labour-intensive and resource-intensive manufactures 3,921.7 32%
Untapped export potential – Egypt to North Africa (category of products)
Total category
(US$ million)
Total top 10 products
(US$ million)
% in top 10 products
Untapped export potential – Egypt to the Middle East (category of products)
Total category
(US$ million)
Total top 10 products
(US$ million)
% in top 10 products
High-skill and technology-intensive manufactures 245.4
754.7
33% High-skill and technology-intensive manufactures 914.6
3,188.9
29%
Medium-skill and technology- intensive manufactures 217.1 29% Medium-skill and technology-
intensive manufactures 832.5 26%
Low-skill and technology-intensive manufactures 120.1 16% Low-skill and technology-intensive
manufactures 643.4 20%
Labour-intensive and resource- intensive manufactures 172.1 23% Labour-intensive and resource-
intensive manufactures 798.4 25%
Note: We use the UNCTADclassification for the top products. For food products: fruits and vegetables are considered labour-intensive and resource-intensive products, and processed foods products are considered as low-skill and technology-intensive products. Source:AuthorsʼcomputationbasedondatafromInternational Trade Center.

19 Chapter 1. Overview of the labour market, trade and investment in the Southern Mediterranean Countries
X Table 7: Comparison of the sophistication of products with untapped export potential from Tunisia to the world, North Africa and the Middle East
Untapped export potential – Tunisia to the world (category of products)
Total category (US$ million)
Total top 10 products (US$ million)
% in top 10 products
High-skill and technology-intensive manufactures 648.4
921.1
70%
Medium-skill and technology-intensive manufactures 0 0%
Low-skill and technology-intensive manufactures 58.5 6%
Labour-intensive and resource-intensive manufactures 214.2 23%
Untapped export potential – Tunisia to North Africa (category of products)
Total category
(US$ million)
Total top 10 products
(US$ million)
% in top 10 products
Untapped export potential – Tunisia to the Middle East (category of products)
Total category
(US$ million)
Total top 10 products
(US$ million)
% in top 10 products
High-skill and technology-intensive manufactures 28.2
82.1
34% High-skill and technology-intensive manufactures 158
273.5
58%
Medium-skill and technology- intensive manufactures 0 0% Medium-skill and technology-
intensive manufactures 20.3 7%
Low-skill and technology-intensive manufactures 5.5 7% Low-skill and technology-intensive
manufactures 43.9 16%
Labour-intensive and resource- intensive manufactures 42.4 52% Labour-intensive and resource-
intensive manufactures 51.3 19%
Source:AuthorsʼcomputationbasedondatafromInternational Trade Center.
X Table 6: Comparison of sophistication of products with untapped export potential from Morocco to the world, North Africa and the Middle East
Untapped export potential – Morocco to the World (category of products)
Total category (US$ million)
Total top 10 products (US$ million)
% in top 10 products
High-skill and technology-intensive manufactures 4,380.6
11,071
40
Medium-skill and technology-intensive manufactures 1,600 14
Low-skill and technology-intensive manufactures 0 0
Labour-intensive and resource-intensive manufactures 5,090.4 46%
Untapped export potential – Morocco to North Africa (category of products)
Total category
(US$ million)
Total top 10 products
(US$ million)
% in top 10 products
Untapped export potential – Morocco to the Middle East (category of products)
Total category
(US$ million)
Total top 10 products
(US$ million)
% in top 10 products
High-skill and technology-intensive manufactures 138.8
333.4
42% High-skill and technology-intensive manufactures 475.5
681.3
70%
Medium-skill and technology- intensive manufactures 0 0% Medium-skill and technology-
intensive manufactures 0 0%
Low-skill and technology-intensive manufactures 18 5% Low-skill and technology-intensive
manufactures 0 0%
Labour-intensive and resource- intensive manufactures 176.6 53% Labour-intensive and resource-
intensive manufactures 205.8 30%
Source:AuthorsʼcomputationbasedondatafromInternational Trade Center.

Trade, investment and employment in the Southern Mediterranean Countries20
X Figure 22: Untapped export potential from Egypt to the world by sector (in US$)
X Figure 23: Untapped export potential from Egypt to North Africa by sector (in US$)
X Figure 24: Untapped export potential from Egypt to the Middle East by sector (in US$)
US$0 500 mn 1 bn 2 bn 3 bn 4 bn 5 bn 6 bn
Plastics & rubberFruits
ApparelChemicals
FertilizersFood products n.e.s. (processed or preserved)
VegetablesMachinery, electricity
Beauty products & perfumesPaper products
Electronic equipmentMineral productsFerrous metals
Metals (except ferrous & precious)Ceramic articlesSugar
Dairy productsMetal products
Glass articlesPharmaceutical components
0 50 mn 100 mn 150 mn 200 mn 250 mn 300 mn 350 mn
Fruits
Plastics & rubberChemicals
Food products n.e.s. (processed or preserved)Machinery, electricity
Paper productsMineral products
Beauty products & perfumesVegetable oils & fats
FertilizersSynthetic textile fabric
ApparelVegetal residues & animal feed
Metals (except ferrous & precious)Pulses
Electronic equipmentMetal products
Cotton (fabric)
Dairy productsSugar
US$
US$ 0 200 mn 400 mn 600 mn 800 mn 1 bn 1,2 bn
Sugar
Plastics & rubberFruits
ChemicalsFood products n.e.s. (processed or preserved)
VegetablesPaper products
Beauty products & perfumesMachinery, electricity
FertilizersApparel
Mineral productsDairy products
Metals (except ferrous & precious)Ferrous metals
Ceramic articlesCereals (processed)
Electronic equipment
Cocoa beans & productsMetal products
Actual exports Export potential Potential to actual exports gap

21 Chapter 1. Overview of the labour market, trade and investment in the Southern Mediterranean Countries
X Figure 25: Untapped export potential from Jordan to the world by sector (in US$)
X Figure 26: Untapped export potential from Jordan to North Africa by sector (in US$)
X Figure 27: Untapped potential from Jordan to the Middle East by sector (in US$)
US$0 500 mn 1 bn 2 bn 3bn
ApparelChemicals
FertilizersPharmaceutical components
Live animals (except poultry)Vegetables
Jewellery & precious metal articlesMineral productsFood products n.e.s. (processed or preserved)Machinery, electricityPaper products
Plastics & rubberMetal productsFruitsMetals (except ferrous & precious)
Beauty products & perfumesFerrous metalsCarpetsAircrafts, spacecrafts & partsOptical products, watches & medical instruments
0 20 mn 40 mn 60 mn 80 mn 100 mn 120 mn 140 mn
Metals (except ferrous & precious)
FertilizersPharmaceutical components
ChemicalsLive animals (except poultry)Apparel
Machinery, electricityMetal products
Plastics & rubberFood products n.e.s. (processed or preserved)
FruitsPaper products
Ferrous metalsTea & mate
Carpets
Miscellanous manufactured productsBeauty products & perfumes
Vegetal residues & animal feed
Synthetic textile fabricSeeds for sowing
US$
US$ 0 100 mn 200 mn 300 mn 400 mn 500 mn 600 mn
Dairy products
Live animals (except poultry)Chemicals
ApparelPharmaceutical components
VegetablesJewellery & precious metal articlesMineral products
Food products n.e.s. (processed or preserved)Fertilizers
Paper productsMetal products
Machinery, electricityFruits
Plastics & rubber
Beauty products & perfumesFerrous metals
Processed meat
CarpetsTea & mate
Actual exports Export potential Potential to actual exports gap

Trade, investment and employment in the Southern Mediterranean Countries22
X Figure 28: Untapped potential from Morocco to the world by sector (in US$)
X Figure 29: Untapped export potential from Morocco to North Africa by sector (in US$)
X Figure 30: Untapped potential from Morocco to the Middle East by sector (in US$)
US$0 1 bn 2 bn 3 bn 5 bn4 bn
ApparelMachinery, electricity
Motor vehicles & partsFertilizers
Fish & shellfishChemicals
FruitsAircrafts, spacecrafts & parts
Fish products (processed)Vegetables
Food products n.e.s. (processed or preserved)Footwear
Miscellanous manufactured productsPulses
Plastic & rubberElectronic equipment
Metals (except ferrous and precious)Vegetal residues & animal feedMetal products
Vegetable oils & fats
0 20 mn 40 mn 60 mn 80 mn 100 mn 120 mn 140 mn
Pulses
Motor vehicles & partsMachinery, electricity
ApparelFish products (processed)
Fish & shellfishFertilizers
SugarFood products n.e.s. (processed or preserved)
ChemicalsMetal products
FootwearMiscellanous manufactured products
Vegetable oils & fatsMineral products
Paper productsPlastic & rubber
Vegetables
Aircrafts, spacecrafts & partsCotton (fabric)
US$
US$ 0 50 mn 100 mn 150 mn 200 mn 250 mn 350 mn300 mn
Beauty products & perfumes
Motor vehicles & partsFertilizers
ApparelMachinery, electricity
ChemicalsAircrafts, spacecrafts & parts
Fish products (processed)Vegetal residues & animal feed
FruitsVegetablesFood products n.e.s. (processed or preserved)
Miscellanous manufactured productsFish & shellfish
Sugar
FootwearPlastic & rubber
Metal products
Vegetable oils & fatsFerrous metals
Actual exports Export potential Potential to actual exports gap

23 Chapter 1. Overview of the labour market, trade and investment in the Southern Mediterranean Countries
X Figure 31: Untapped export potential from Tunisia to the world by sector (in US$)
X Figure 32: Untapped export potential from Tunisia to North Africa by sector (in US$)
X Figure 33: Untapped potential from Tunisia to the Middle East by sector (in US$)
US$0 500 mn 1 bn 2 bn 7 bn3 bn 4 bn 5 bn 6 bn
Machinery, electricityApparel
Vegetable oils & fatsFootwearOptical products, watches & medical instrumentsAircrafts, spacecrafts & parts
Motor vehicles & partsPlastic & rubber
Electronic equipmentFruits
ChemicalsMetal products
Miscellanous manufactured productsFertilizers
Paper productsFood products n.e.s. (processed or preserved)
Skins, leather & products thereofFish & shellfish
Textiles products n.e.s.Mineral products
0 1 mn 2 mn 3 mn 4 mn 5 mn 6 mn 7 mn 8 mn 9 mn
Mineral products
Machinery, electricityApparel
ChemicalsVegetable oils & fats
Optical products, watches & medical instrumentsMotor vehicles & partsFood products n.e.s. (processed or preserved)
FootwearPlastic & rubber
Electronic equipmentMetal products
Paper productsMiscellanous manufactured products
Fruits
SugarAircrafts, spacecrafts & parts
Fish products (processed)
FertilizersFish & shellfish
US$
US$ 0 20 mn 40 mn 60 mn 80 mn 100 mn 120 mn
Sugar
Machinery, electricityApparel
Vegetable oils & fatsChemicals
Motor vehicles & partsElectronic equipment
Plastic & rubberFruitsOptical products, watches & medical instruments
Metal productsFertilizers
FootwearAircrafts, spacecrafts & parts
Food products n.e.s. (processed or preserved)
Paper productsMiscellanous manufactured products
Ferrous metals
Skins, leather & products thereofBeauty products & perfumes
Actual exports Export potential Potential to actual exports gap
Source: ITC export potential map.

Trade, investment and employment in the Southern Mediterranean Countries24
Despite noticeable improvements over the last two decades, the countries in the Southern Mediterranean are not very well integrated with the Union for the Mediterranean countries outside of the European Union. Since the mid-1990s, import-ant initiatives took place for regional integration with the Northern Mediterranean Region, notably through the Barcelona Process in 1995 and the launch of the Union for the Mediterranean (UfM) in 2008. The UfM was launched as an inter-gov-ernmental organization to strengthen regional integration and increase trade between countries in the UfM region.14 Countries in the Southern Mediterranean trade mainly with EU countries, with a relatively low integration with other UfM countries such as the Western Balkan countries. In 2018, the EU represented more than 95 per cent of the exports within the UfM region and 93 per cent of its export to the world (OECD, 2021). However, there has been some progress. In 2018, for exam-ple, North African UfM countries and Levant UfM countries exported respectively 10.5 per cent and 16.8 per cent of their total exports to non-EU UfM countries, compared to 5.5 per cent and 15.2 per cent in 2005 (OECD, 2021). Despite this improve-ment, especially for North African countries, there remains a considerable untapped trade potential between the Southern Mediterranean Countries and non-EU UfM countries.
14 UfM countries include countries in the Southern Mediterranean Countries, countries in the European Union, Israel and Western Balkans countries such as Albania, Bosnia and Herzegovina and Montenegro.
1.1.4. The nexus between trade, investment and the labour marketTrade and globalization offer significant oppor-tunities for economic development through the expansion of productive sectors and the catch-up and learning of technology. Trade and globaliza-tionalsooffer,atleastintheory,thegrowthpoten-tial for productive and decent jobs that could help the Southern Mediterranean CountriesSouthern Mediterranean Countriesto provide suitable eco-nomic opportunities for their increasingly educated labour forces.
Historically, there was a focus on the impact of trade policies on growth and income per capita, typically using computable general equilibrium models. The impact of trade on employment has been fre-quently regarded as a by-product of growth and trade expansion, rather than as something that requiredthemonitoringanddesignofspecificpol-icies. More recently, the impact of trade policies on the labour market and employment has been increasingly studied, especially in low- and mid-dle-incomecountries,characterizedbysignificantinstitutional and market failures and high transac-tion costs.
In theory, trade liberalization reforms are expected to lead to aggregate productivity gains in open-ing-up economies. Trade liberalization leads to increasedcompetitionwithforeignfirmsandtheproduction of products with higher technology, quality and potentially lower prices. This imposes
X Box 1: Role of the European Union in the UfM and engagement in the Southern Mediterranean Countries
The European Union has historically been at the centre of the Barcelona Process and the establishment of the UnionfortheMediterranean(UfM)andcontinuestoplayasignificantroleininitiativesundertheUfM.Recentlyand as a response to support a recovery from COVID-19 in the region, the EU launched the New Agenda for the Mediterranean, aiming to relaunch the Euro-Mediterranean partnership and unleash the Southern Mediterranean Countriesʼuntappedpotentialbyfacilitatingagreen,digital,resilientandjustrecovery,guidedbythe2030Agen-da for Sustainable Development. This New Agenda focuses on key themes for the region including human deve-lopment, good governance and the rule of law, resilience, prosperity and the digital transition, peace and security, migration and mobility and the green transition. For the period 2021–27, the European Commission proposes to mobilize up to €7 billion under the Neighbourhood Development and International Cooperation Instrument. This support includes provisioning for the European Fund for Sustainable Development as well as for guarantees and blending under the Neighbourhood Investment Platform, which would help mobilize private and public invest-ments of up to €30 billion in the Southern Neighbourhood.
Source: EC (2021). Fact Sheet: Towards a renewed partnership with the Southern Neighbourhood.

25 Chapter 1. Overview of the labour market, trade and investment in the Southern Mediterranean Countries
significantadjustmentstoindustriesandfirmspre-viouslyprotectedbyhightariffs.Ultimately,atleastin theory and in a well-functioning market, uncom-petitiveactivitiesandfirmsareforcedtoexitandactivitieswhilefirmsthatcanbeartheadjustmentcosts and adapt to the new competitive landscape continue operating and become more productive. Productive factors, including capital and labour, that are liberated from uncompetitive activities andfirmsareabsorbedbycompetitiveones,lead-ingtoanefficienttransferofproductivefactorsand eventually resulting in aggregate productivity gains. In the traditional trade theory, the reshuf-flingofproductivefactorsisdoneacrosssectors,or,asinthe“new”newtradetheory,acrossfirmsinthesamesectororindifferentsectors.Melitz(2003)demonstratesthefirmheterogeneityeffectsof trade policies and provides important evidence forthe“new”newtradetheory.Theauthorfindsthatexposuretotradeleadstoproductivefirmsentering the export market, forcing the least pro-ductiveonestoexit.Theauthoralsofindsthattheseinter-firmreallocationeffectsleadtogrowthin the aggregate industry productivity, ultimately resulting in welfare gains.
In the case of middle-income countries, like in the Southern Mediterranean Countries, this reshuf-flingmightbecostlyforfirmsandworkers,duetoimportant existing market failures. These include the under-development of infrastructure and the financialoffer,theineffectivecompetitionpoliciesand the relatively low human capital. Haltiwanger (2011) indicates that the reallocation and reshuf-flingofproductivefactorsacrosssectorsorfirms,is an inherent feature of developed and well-func-tioning markets and economies. In developed countries,firmsmustconstantlyandrapidlyadjustto new technologies and to a high level of compe-tition,leadingtotheexitofuncompetitivefirmsand the development of more competitive ones. Haltiwanger (2011) indicates that in low- and mid-dle-incomecountries,achievingthisallocativeeffi-ciencyiscostlyanddifficultduetothefailuresinthe business climate and economic institutions. This might lead to a sub-optimal impact of trade liberal-ization on the labour market, with more job destruc-tion than job creation, with high adjustment costs for low-skilled and vulnerable workers. Vulnerable workers, such as youth and women in the Southern Mediterranean countries, would be unable to bear these adjustment costs and secure jobs in the pro-ductivefirmsandtradablesectorsandmightulti-mately move to the non-tradable sectors and even to informality.
The impact of trade and investment policies on the labour market can be summarized in four categories:
1. The impact of trade policies on the quantity of jobs, captured by the number of jobs created in the tradable sectors and the aggregate level of unemployment.
2. The impact of trade policies on the quality ofjobs,measuredbytheimpactonworkersʼwages and the demand for skills.
3. The impact on the informal economy: tradable sectors are generally with higher levels of skills; hence, trade liberalization might increase the demand for higher skills, displacing low-skill workers to the informal economy and untrad-able sectors.
4. The impact of trade policies on inequality: even if trade facilitates growth in average per capita incomesandwages,theeffectsarenotuni-form, with possible negative impacts on vul-nerable groups, including women and youth in developing countries, as these groups tend to be over-represented in low-skilled jobs.
There is some evidence suggesting that trade pol-icies might lead to more job destruction than job creation in low- and middle-income countries, depending on how trade policies are implemented and the complementarity between trade, invest-ment and industrial policies. In these countries, trade expansion often relies on trade liberaliza-tion that may hurt previously protected sectors in the short term, leading to the displacement of low-skilled workers and not securing a job in more competitive industries. For instance, McMillan and Rodrik (2011a) study the impact of trade lib-eralization and structural change on economies inAsia,LatinAmericaandAfricaandfindthattherelativesizeoftheeconomyʼsproductivesegmenthas shrunk in Latin America and Africa rather than expanded following trade liberalization. In Africa and Latin America, the structural change has led to labour moving from more productive and trad-able activities (agriculture and manufacturing) to less productive ones, mainly wholesale and retail trade, where productivity growth has been nega-tive. Other studies in Latin America (Casacuberta et al. 2004; Menezes Filho and Muendler, 2007) also indicate that trade opening in Uruguay and Brazil resulted in more job destruction than job creation, with some evidence of displacement of workers outside of tradable sectors. Rodrik (2006) studies therootcausesofthesignificantlyhighunemploy-

Trade, investment and employment in the Southern Mediterranean Countries26
ment rate in South Africa (one of the highest in the world)andfindsthatthemaincauseistheshrink-age of the non-mineral tradable sector, namely manufacturing, following a trade liberalization epi-sode. This is due to two main dynamics: an increase indemandforskilledworkersindifferentsectoralactivities and production techniques becoming pro-gressively more capital-intensive.
Trade liberalization could lead to positive impacts in low- and middle-income countries by increas-ing quality job creation in export-led sectors and increase the demand for high-skilled workers, as suggested by some studies. For instance, Robertson et al. (2009) study the impact of trade and investment policies on jobs in Cambodia, El Salvador, Honduras, Indonesia and Madagascar. They find that in all these countries, the exposure to international trade and investment in the textile and garment sectors is correlated with an increase in the number of jobs in the industrial sector and a decrease of employment in the agricultural sector, improving the overall qual-ity of jobs. Moreover, Brambilla et al. (2015) study the relationship between exports, employment and wages in developing countries and show that, on average, exporters pay 31 per cent higher salaries than non-exporters.
However, this positive impact can be unevenly distributed and might not hold for women, youth and vulnerable populations in low- and middle-in-come countries. For instance, Kucera and Roncolato (2011) use social accounting matrices in a Leontief multipliermodeltoestimatetheeffectsoftradeon employment, incomes and poverty following a period of rapid trade liberalization in India and SouthAfricaintheearly1990s.Theauthorsfindmixedeffectsofliberalizationonjobsandincomesandconsistentnegativeeffectsonwomenandvul-nerablepopulations.InIndia,theauthorsfindthattrade liberalization between 1993 and 2004 led to 2.3 million fewer jobs, with this loss mainly driven by trade with developing countries. In South Africa, theauthorsfindthattradereformsbetween1993to 2006 led to a net gain of 135,000 jobs; however, theyestimatethatwomenʼsshareofemploymentwould have been higher without trade liberalization reforms. In both countries, women tend to be con-centrated in labour-intensive industries; therefore, trade liberalization reforms did not yield positive employment outcomes for them.
The impact of trade policies on wages, including in export-oriented sectors, might be disappoint-ing in low- and middle-income countries. For instance, McMillan et al. (2003) study the impact of
theexportliberalizationofMozambiqueʼscashewtrade in the early 1990s on incomes. In 1991–92, the authorities replaced an export ban on cashews with export taxes, which were gradually lowered, and privatized state-owned enterprises that were engagedinthesector.Theauthorsfindthatfollow-ing the reform, farmers earned more and output grew. However, wages increased by a much lower magnitude than expected. Overall, the average annual wage increase per household for farmers amounted to less than four days of the average wageinMozambique,despiteasignificantsurplusgenerated by the reform.
Anothereffectthattradeandinvestmentpoliciescan have is the displacement of workers from the tradable sectors to non-tradable sectors, including informal ones. This would increase inequality due to high adjustment costs on the most vulnerable groups, including women and youth. Vulnerable groups tend to have low skills and resources, which might increase the adjustment costs for them and, therefore, constrain them in taking advantage of economic opportunities provided by trade liberaliza-tion. For instance, Al-Wadi (2017) studies the impact oftradeliberalizationonwomenʼsemployment(self-employment and wage-employment) in the MiddleEast.Theauthorfindsthattradeliberaliza-tion has increased the share of females in self-em-ployment but decreased the share of females in wage employment. As generally, self-employment tends to be correlated with informality in low and middle-income countries, this might suggest that women have been displaced from the tradable sec-tor to informal sectors in the Middle East.
The impact of trade policies on the labour market, including on the non-tradable sectors, depends heavily on the institutional settings in different countries and on the capacity of these settings tosupportfirmsandworkersindealingwiththepotentially high adjustment costs. This should be closely monitored and addressed by policymakers in the Southern Mediterranean Countries. Also, trade and investment policies should be aligned witheffectiveindustrialpoliciestoensurethatcoun-tries are building on their comparative advantages and maximizing the impact of trade and investment policies. Focusing on policies that could improve the export potential of tradable sectors would increase the productivity and job creation potential of these sectors, contributing even further to the absorption oftherelativeincreaseofhighlyqualifiedworkersenteringtheregionʼslabourmarket.Thefocusonhigh-strategic sectors that could yield export expan-

27 Chapter 1. Overview of the labour market, trade and investment in the Southern Mediterranean Countries
sionthrougheffectiveindustrialpoliciesisthere-fore of high importance. Other policies that focus, for instance, on developing public infrastructure and trade logistics would facilitate the composi-tional shifts of production factors in these econo-mies,decreasetheadjustmentcostsforfirmsandworkers and facilitate the emergence of high-added valueandproductivefirms.Thiscouldhelpenhancethe impact of trade and investment policies on the labour market and the economy as a whole.
The nexus between trade and industrial policies and the labour market is particularly important for the Southern Mediterranean Countries, considering the stagnant labour market, high levels of unem-ployment and substantial disconnect between the populationʼsaspirationsandtherealityofeconomic
opportunities. If channelled correctly, through effectiveinstitutionsandindustrialpoliciesthatpromote structural change, trade and investment policies could help the countries in the Southern Mediterranean Countries to expand their productive sectors while creating much-needed quality jobs, including for women and youth. The next chapter will focus on the evolution of industrial, trade and investment policies in the region and their overall impact on structural transformation and the paral-lel evolution of job creation and employment in the tradable and non-tradable sectors. The objective of the next chapter is to provide evidence on the evo-lution of employment in countries in the Southern Mediterranean Countries and to relate these trends to trends in trade and industrial policies.

Trade, investment and employment in the Southern Mediterranean Countries28

29 Chapter 2. Inclusive economic transformation through employment-oriented trade, industrial and investment policies Table of Contents
Inclusive economic transformation through employment-oriented trade, industrial and investment policies
Chapter 2

30
X Chapter 2. Inclusive economic transformation through employment-oriented trade, industrial and investment policies
2.1. Industrial and trade policies: theory and applications globally and in the Southern Mediterranean CountriesIndustrial policies and trade and investment policies are interlinked, as export promotion or import sub-stitution are critical strategies employed by coun-tries to develop their economies. Some industrial policies are even called export strategies, as they tend to focus on developing export-oriented light manufacturing. Trade policies can be seen as an instrument for industrial policies. Industrial poli-cies have the objective of improving the local pro-duction capacity and technological capacity within industries and sectors. Whether designed towards protection or liberalization, trade policies provide a set of rules and frameworks that enable the devel-opment of industries and sectors while regulating their interaction with the rest of the world. Trade policies in an inward-oriented and protectionist strategytendedtoincludetariffmeasurestopro-tectaspecificindustry.Whetherinanoutward-ori-ented and export-promotion strategy, trade policies focusedonreducingtariffsoninputsandinterme-diary goods and attract Foreign Direct Investment to promote exports and technological transfer. In theory,tariffreduction,themaintooloftradelib-eralization,canhelpfirmshavecheaperaccesstoinputs and intermediary goods. For instance, some developingcountrieschosetoapplylowertariffsoninputs, intermediary goods and capital goods than onfinishedandconsumptiongoodstoencouragethe development of the local economy while inte-grating it in the global economy, with potentially increased know-how and technological capacities. Achieving coherence between trade, investment and industrial policies is critical to the development agenda,aseffectiveindustrialpoliciesrepresentanimportant transmission channel for the impact of trade policies on the labour market and equality. Therefore, these policies should be designed and
implemented in a complementary way, building on countriesʼnaturalendowmentsanddynamiccom-parative advantages.
2.1.1. Structural transformation and industrial and trade policies – schools of thought and evolution Industrial policies until the 1990s
During the latter half of the twentieth century, the development and growth policies around the worldwitnessedseveralepisodes,influencedbydif-ferent economic models and schools of thought. The 1950s and 1960s witnessed the popularity of industrial policies associated with import substi-tution strategies to develop local economies after World War II and colonialism. Industrial policies were mainly implemented through infant-industry protection (with import-substitution and trade pro-tectionism policies) and picking winners to provide support. This translated mostly in planning econo-mies with heavy involvement of the state to admin-isterdifferenteconomicactivities,includingimportauthorizations for private actors. This led in many countries to the development of uncompetitive industries, the proliferation of rent-seeking domes-ticfirms,misallocationofresourcesandtheineffi-cientconsumptionofgoodsindifferenteconomies(Krueger, 1974; Lin, 2010). Following these results, the 1970s were generally marked by the beginning of liberal in most developing countries, mainly through export promotion and sets of incentives to attract FDI. In the 1980s and 1990s, the liberaliza-tion accelerated further with structural adjustment reforms. Private sector development strategies mainly followed the Washington consensus view promoted by international institutions that focused on the enabling environment and market-oriented policies. The view promoted a minor role for the state, typically focusing on improving market func-tioning and the business environment.
In a successful development experience, structural transformation is associated with improvement

31 Chapter 2. Inclusive economic transformation through employment-oriented trade, industrial and investment policies
of aggregate labour productivity and a structural change in employment from labour-intensive sectors towards more productive and skill-inten-sive sectors (Lin 2010; Lin and Monga, 2014; and Ocampo et al., 2009). The improvement in aggre-gate labour productivity is generally the outcome of two processes: a) the reallocation of labour from lower to higher productivity sectors (generally manufacturing) and b) increases in within-sector productivity, due to static and dynamic econo-miesofscale,improvementsinfirmsʼcapabilitiesthrough improvements of means of production, managerial capabilities, technological capabilities, and so on. (McMillan and Rodrik 2011b; Kucera andRoncolato2016).Theimprovementsoffirmsʼcapabilities might also be due to the process of cre-ativedestruction,inwhichlow-productivefirmsareforced to exit the sector and are replaced by newly establishedandhigh-productivefirms.McMillanetal. (2017) indicate that the accumulation, innova-tion and productivity improvements take place in the modern sector (typically industry and manufac-turing), while the traditional sector (such as agricul-ture) remains stagnant.
Growth and development policies are aimed at finding pathways to realize a successful devel-opment experience and have been a constant search for a balance between the role of the state and the role of the market in developing the pri-vate sector and spurring growth. This is demon-strated in the emergence of two main schools of thought on growth and economic development: the Washington Consensus school and the struc-turalist development school, both aiming to identify anddefinepoliciesandstrategiesthatwillsupporteconomic growth.
As indicated above, the Washington Consensus school, based on the neo-classical model, stipulates thatthegovernmentʼsintrinsicfailuresareacon-straint to “getting it right”, understanding the mar-ketandpicking-winners,whichisoneofthefirstapplications of industrial policies in emerging econ-omies. It indicates that government interventions in the economy lead to important distortions in the market, including misallocation of resources and distortions of prices (Lin, 2010). The Washington consensusindicatesthatthestateʼsroleshouldbeonly focusing on improving the business environ-ment and adopting “horizontal” policies.
15 Hardinfrastructureisdefinedbytheauthorashighways,portfacilities,airports,telecommunicationsystems,electricitygridsandotherpublicutilitiesandsoft infrastructure as institutions, regulations, social capital, value systems and other social economic arrangements.
The structuralist development school recognizes that countries can experience episodes of growth, but not necessarily growth that is sustainable, which requires a structural transformation (Ocampo et al., 2009).Structuraltransformationcanbedefinedbya shift of employment and output towards higher productivity sectors of the economy. These sec-tors are generally characterized by economies of scale and macro spillovers. For instance, McMillan andRodrik(2011a)findthatstructuralchangehasbeen growth-reducing in both Africa and Latin America, with labour reallocating towards low-pro-ductive sectors instead of high-productive ones. In sub-Saharan Africa, these low-productive sectors, generallyservicesinurbanareas,offeropportuni-ties that are generally at near-subsistence levels in low-skilled employment. For instance, wholesale and retail is typically the main sector in services thatbenefitfromthelabourreallocation,withoutsignificantimprovementsinaggregatelabourpro-ductivity. These urban jobs are generally associated with informality and with low technological capa-bilities and as such they constrain the sustainable and long-term perspective of physical and human capital accumulation. The structuralist school of thought indicates that development needs struc-tural transformation and that structural transfor-mationrequiresthestateʼsinterventiontoaddressthe market failures that might become a binding constraint to industrial development and capital accumulation (Lin 2010; Lin and Monga, 2014; and Ocampo et al., 2009). Lin (2010) indicates that as the industrial structure develops, new needs of the industry develop that require improvement and alignment of “soft” and “hard” infrastructure15 in an economy, which can be done through collective action and therefore through the intervention of the state. Ultimately, structural transformation leads toimprovementsinworkersʼoutputs,includingthat of low-skilled workers, higher GDP per capita and lower levels of unemployment and inequality in developing countries (Stiglitz and Greenwald, 2015). Within the structuralist development school, industrial policies play a major role in ensuring sus-tainable growth through state interventionism.
The experience of the import substitution pol-icies in the 1960s and 1970s made these policies unpopular in the 1980s and 1990s. However, the successful structural transformation of East Asian

Trade, investment and employment in the Southern Mediterranean Countries32
countries, including China, Vietnam, South Korea and Singapore, has shed new light on the role that the state can play in economic development through well-designed, orchestrated and imple-mented industrial policies (Lin, 2010). The success-ful transformation of East Asia is attributable to the stateʼsactiveroleinimplementingeconomicpol-icies that promoted capital accumulation, innova-tion and productivity growth. East Asian countries promoted investment in research and development (R&D),providedpreferentialaccesstofinanceandencouraged technological capability to targeted sectors in the economy (Rodrik, 2008). The success of East Asian countries is also attributed to the qual-ity of institutions, including the quality of collabo-ration between the public and the private sector. Chang (1997) indicates that the industrial policies in East Asian countries were more successful than in other countries due to better networks and a well-implemented collaboration with the private sectorthatfacilitatedinformationflows.
A new wave of industrial policies – features
A rebirth of industrial policies followed the Asian experience, and these were accelerated by the 2008globalfinancialcrisis.Thisnewwave,gener-ally called “modern industrial policies” in the liter-ature, includes critical learnings from the policies of the 1960s. Rodrik (2004) indicates that govern-ment failures exist, but market failures as well. He mentions that both the private sector and the gov-ernment lack information. Therefore, industrial pol-icies should not focus on the outcome but rather on the process, and particularly the process of what he refers to as “self-discovery,” in which pub-lic and private actors learn from each other and findsolutionstogether.Hewritesthat“therightway of thinking of industrial policy is as a discov-eryprocess–onewherefirmsandthegovernmentlearn about underlying costs and opportunities and engage in strategic coordination” (page 3). Rodrik(2008)definesthefeaturesofnewindus-trial policies in three main points: a) embedded-ness, b) carrots and sticks, and c) accountability. All three aspects aim to address the challenges facedbythefirstversionofindustrialpoliciesandthe critics faced by these policies. First, embedded-ness seeks to address the asymmetry of informa-tion and to support the self-discovery process. To designeffectiveindustrialpolicies,thegovernmentneeds information from the private sector about the market constraints, which requires extensive public-private collaboration. Rodrik indicates that
this collaboration should be systemic and institu-tionalized. Second, the carrots and sticks feature aims to address the failures in picking winners by providing conditional incentives to market suc-cess and performance, avoiding the rent-seeking approachandavoidingsupportingfirmsthatfail.This feature has been included, for instance, in industrial policies in Taiwan and Korea. The third feature,accountability,includesdefiningcleargov-ernance mechanisms, including mandating a com-petent agency to implement the industrial policies and periodically publishing its results and achieve-ments. Moreover, modern industrial policies are designed in a way that reconciles the horizontal or transversalapproach,whichfocusesonlyonfixingthe business environment and the vertical or tar-getedapproachinthefirstwaveofindustrialpol-icies which mainly focus on a set of strategic and priority sectors. Modern industrial policies include both transversal and targeted objectives, with a set of policies and measures to improve the market functioning and the business environment and tar-geted support to sectors that could yield productiv-ity growth and development.
Inredefiningindustrialpolicies,thesectorfocusbrings to light a critical question: should countries, especially low- and middle-income countries, con-tinue focusing on manufacturing or expanding to technology and knowledge-intensive activities in services? Industrial policies aim to support the structural transformation of an economy and the development of high-productive sectors. Historically, structural change took place through manufacturing growth and therefore, industrial policies tended to focus on developing the man-ufacturing sector. The expansion of manufactur-ing creates demand for agricultural inputs, thus supporting an increase of agriculture productivity and creating a need for certain supportive activ-itiesintheservicessector,suchasfinancialser-vices, logistics, business development and real estate. Recently, Stiglitz and Rodrik, among other economists, have favoured industrial policies that focus on a broader range of sectors, including agriculture, manufacturing and services. Stiglitz andGreenwald(2015)definemodernindustrialpoliciesas“anypolicyredirectinganeconomyʼssectoral allocation (or other production decisions, such as the choice of technique or the nature of innovation) where market incentives, as shaped by rules and regulations, are misaligned with pub-lic objectives.” (p. 207). Also, Aiginger and Rodrik (2020) indicate that the global economy is increas-ingly turning towards services; therefore, indus-

33 Chapter 2. Inclusive economic transformation through employment-oriented trade, industrial and investment policies
trial policies would need to focus on developing modern economic activities more broadly and not focus only on manufacturing. The authors even suggest changing the naming of industrial policies to “structural transformation policies.” It remains critical for countries to select a few high-potential sectors in industrial policies, whether in manufac-turing, agriculture or services, for at least three reasons: a) higher efficiency gains by focusing on high-potential sectors and activities in which countries do have a competitive advantage and are ready to enter, b) better ability to address sec-tor-specificbindingconstraintswhenfocusingontargeted sectors and c) higher capacity to address the limited bandwidth within the government, which might impact the capacity to channel scarce publicresourceseffectively.
Moreover, targeting sectors in low- or middle-in-come countries would need to keep a balance between three main development objectives: a) absorbing low-skilled or mid-skilled workers who stillrepresentthemostsignificantshareofwork-ers in low-income and middle-income countries, which could help in decreasing levels of inequal-ity, b) accelerating the convergence process with developed countries by increasing labour produc-tivity and facilitating technological catch-up and c) helping to integrate countries in the global econ-omy and therefore promoting tradable sectors. Manufacturingfulfilledtheseconditionshistoricallyand did help to reduce inequality; however, this is less clear for services or agriculture. For instance, Baymul and Sen (2020) study the correlation between structural transformation, driven either by manufacturing or services and income inequal-ity.Theauthorsfindthateconomicgrowthresultsin higher income inequality when the structural transformation is services-driven rather than man-ufacturing-driven. Moreover, tradable services tend to be skill-intensive and would mainly create jobs for the high-skilled, which might be a constraint for low-income and middle-income countries. Services that are labour intensive, such as wholesale and retail, are generally not tradable and will not sup-port the convergence process or integration into the global economy.
A subsequent question is how to select the tar-geted sectors. As discussed earlier, Rodrik (2008) indicates that industrial policies should be a self-discovery process, including in the selection of sectors. In a more recent paper, Aiginger and Rodrik (2020) indicate that modern industrial pol-icies are unlikely to be top-down, including in the
pre-selection of sectors. Rather, they are much more about a systemic and sustained collabo-ration with the private sector, including in the selection of sectors. However, the self-discovery processneedstobuildonthecountriesʼcompara-tive advantages. For instance, Lin (2010) indicates that industrial policies should be consistent with thechangeinthecountryʼscomparativeadvan-tagethatreflectstheaccumulationofhumanandphysicalcapital.Similarly,Stiglitz(2016)specifiesthat countries will need to identify and focus on their dynamic comparative advantage, not a static one. Therefore, in modern industrial policies, iden-tifying targeted sectors should be made in a collab-orative approach, through a self-discovery process, based on a rigorous analysis and understanding of the economy, its complexity and readiness and itsnewfactorsendowments.ILO(2020a)identifiesthree main analytical methodologies that could be used to select the prioritized sectors: a) The GrowthIdentificationandFacilitationFramework(GIFF) (Lin and Xu, 2016); b) the economic com-plexity and product space method (Hidalgo and Hausmann 2009; Hausmann et al. 2013); and c) the International Trade Center (ITC) export potential and product diversification indicators method (Decreux and Spies, 2016). The three methodolo-giesproposedifferenttechnicaltoolsandanalyti-cal steps for countries to identify their comparative advantages, including latent ones. The GIFF pro-poses a six-step practical framework for countries to identify their comparative advantage and their sector focus by studying the experience of other countries that have achieved structural transfor-mation and significant improvements in their GDP per capita and that had similar factor endow-ments before achieving their transformation and ultimately identifying the sub-sectors that helped these countries to achieve this transformation. The economic complexity and product space meth-odology uses international trade data to measure the complexity of products and countries, captur-ing their set of capabilities and mapping their pro-duction in a global network of products to identify new products that these countries might enter and develop and that could help in accumulat-ing productive knowledge. Finally, the ITC export potential methodology proposes a framework to informcountriesʼexportanddevelopmentstrate-gies. The methodology proposes two approaches: the Export Potential Indicator (EPI) approach to identify the future potential of existing products withinaframeworkandtheProductDiversificationIndicator (PDI) approach, based on the product

Trade, investment and employment in the Southern Mediterranean Countries34
space methodology, to identify new products that a country can enter. Countries can combine thesedifferentmethodologiesandtheirresultstoinform their focus sectors, but what is ultimately important is that low and middle-income countries use rigorous analysis to inform their development and industrial strategies.
2.1.2. Evolution of industrial, trade and investment policies in the regionThe Southern Mediterranean Countries followed the international trends in terms of industrial and trade policies. After the independence, all coun-tries in the region adopted protectionist policies to protect and develop their local industries and reduce dependency on ex-colonizers. This phase resulted in the emergence of a local manufactur-ing sector across the region. For instance, Tunisia implemented an import substitution policy in the 1960s within a broad planned economy strategy, including a collectivization strategy implemented in 1961 to increase agriculture productivity and reduce dependency on exports. Between 1965 and 1969, the authorities implemented a very tight and com-prehensive exchange control, and a highly admin-istered and bureaucratic import licensing system was put in place (Nabli, 1980). Similarly, Morocco adopted an import substitution strategy from the 1960s throughout the 1970s, which relatively ben-efittedthemanufacturingsector,especiallythetextile industry (Achy, 2013; Hahn and Vidican-Auktor, 2018). The Moroccan authorities admin-istered licenses on imports, overvalued the local currency (dirham) until the early 1980s, imposed tariffs from 50 per cent to 200 per cent on cer-tain consumer goods and implemented in 1973 a “Moroccanization” of company ownership in indus-try and services (Ferrali, 2012). In Egypt,theStateʼsindustrial policy in the 1960s was central planning and state-enterprise-led industrialization (Said et al., 1995). Equally, Jordan implemented, after its inde-pendence in 1946, import-substitution policies, with ahighlevelofindustrialprotectionandasignificantrole of the state in the economy. During this period, Jordanachievedsignificantgrowthlevels,withanaverage annual rate of 10 per cent between 1960 to 1985 and witnessed the emergence of a vital manu-facturing sector (Abugattas-Majluf, 2012). The cen-tral planning and protectionism episode ultimately resultedinsignificantmacro-imbalances,marketinefficienciesandalackofstate-ownedcompa-
niesʼcompetitiveness,despitesomepositiveresults,including the emergence of certain local manu-facturing activities such as the textile industry in Morocco, Tunisia and Jordan.
In the 1970s and 1980s, many countries in the region started focusing on export promotion and trade liberalization. These policies, however, were implemented at a different pace and intensity across the region. Tunisiawasthefirstcountryinthe region to adopt an intensive investment and export promotion policy in 1972 through the adop-tion of an investment code famously called “loi 1972”, which was a turning point for industrial pol-iciesinTunisia.Thelawcreatedanoffshoresectorandgaveextensivefiscalandfinancialincentivesto companies established in this sector to attract FDIandincreaseexports.Incentivesforoffshorecompanies included duty-free raw materials and capital goods, 10-year corporate tax holiday, free repatriationofprofitsandtradefacilitationservices,amongotherbenefits.The“loi1972”alsoestab-lished a dedicated agency in charge of implement-ing the investment and export policies. Tunisia also startedslowlydecreasingtradetariffsin1973,withtheintroductionoftariffscodethateasedsomeofthe trade barriers (Nabli, 1980). Other countries in the region started focusing on export promotion later on. Egypt took the same approach in 1974, with the adoption of the “the open-door policy” andestablishingitsfirstfreezones,whichaimedto attract foreign investment and promote exports (WTO, 2018). Jordan and Morocco started trade lib-eralization in the 1980s. For Jordan, the trade liber-alization process started following a series of crises, including a major oil crisis in the region in 1983, whichheavilyaffectedthecountryandcontributedto a debt crisis in 1988–89 (Abugattas-Majluf, 2012), as the country depended heavily on oil imports fromcountriesintheMENAregion,specificallyIraq.Moreover, many Jordanians worked in Gulf coun-tries, contributing to remittances that represented 20to25percentofthecountryʼsGDPbeforethe1983 crisis. The country started adopting an export promotion scheme in 1989 to increase manufactur-ing exports, diversify economic activity and attract-ing more foreign investment.
During the 1990s, most countries in the region adopted structural adjustment reforms prescribed by the World Bank and the IMF. With the structural adjustment programmes (SAPs), countries in the regionwentthroughasignificantwaveofprivatiza-tion. They mainly adopted the Washington consensus view on private sector development, focusing on

35 Chapter 2. Inclusive economic transformation through employment-oriented trade, industrial and investment policies
improving the business environment. This phase coincided globally with an increasing internalization of production and value chains, mainly driven by a cost-reduction rationale. During the 1990s, European manufactures increasingly relocated part of their value chains to countries with low costs, including relatively cheap labour. This dynamic favoured some manufacturing sectors, including the textile indus-try in Morocco, Tunisia and Jordan, mainly through sub-contracting mechanisms. However, this industry remained a low value-added sector throughout the 1990s and the 2000s.
As a result of the SAPs, trade barriers, specifi-callytradetariffs,progressivelyandsignificantlydecreased in the region. For instance, in Egypt, the maximumtradetariffratedecreasedfrom110percent in 1989 to 40 per cent by the end of 1990s (Selwaness and Zaki, 2013). In Morocco, the max-imumtradetariffreducedfrom45percentinthelate 1980s to 40 per cent in 1992 and 35 per cent in 1993.16 However, the country increased some agricultureproductstariffsoverthesameperiod,to protect the local farmers. Similarly, in Tunisia, the trade liberalization plan, accompanying the SAPs and implemented in the mid-1980s, aimed to remove all import restrictions by end of 1991 and achieveauniformtradetariffataround25percent(WTO, 1996). Between 1986 and 1988, the trade tariffrangenarrowedfromarangeof5–236percent in the early 1980s to a range of 17–43 per cent by 1988 (WTO, 1996). This process resulted in four countries in the region becoming WTO members: Morocco (1995), Tunisia (1995), Egypt (1995) and Jordan (2000).17 Algeria, Lebanon and Libya are cur-rently only WTO observers.
2.1.2.1 Evolution of trade and investment policies in the 2000s
Between 2000 and 2010, countries in the region acceleratedtheireffortstointegratetheirecono-mies into the global economy further. Notably, the accession to WTO membership for Egypt, Jordan, Morocco and Tunisia put the countries on an accelerated trade liberalization process by adopt-ing important bilateral and multilateral free trade agreements (FTAs). Most of the countries in the
16 WTO, “Morocco continues liberalizing its trade regime but the WTO raises concerns in some sectors”, 1 January 1996.
17 Countries are listed by order of accession date.
18 Deep and Comprehensive Free Trade Agreements (DCFTA) is used by the European Union (EU) as a template for substantial reforms leading to closer reg-ulatory integration between the EU and its partners. In theory, DCFTAs are supposed to be more comprehensive than Association Agreements.
19 Source: OEC. Available from: https://oec.world/en/visualize/tree_map/hs92/export/mar/usa/show/2004.2008.2010.2015.2019/.
20 WITSandWTO(2009)forthe2009figure.
region continued the trade liberalization process that started in the late 1980s. However, Egypt and Morocco have been more effective in adopting bilateral and multilateral trade agreements than in Tunisia and Jordan. Also, countries in the region havegonethroughasignificantdecreaseintheirtradetariffs(figure35).Thiswasparticularlythecase in Lebanon, Tunisia, Morocco and Egypt and ledtorelativelylowtradetariffsintheregion,com-paredtootherregions(figure35).AlgeriaandEgyptaretheonlycountriesslightlyabovetheworldʼsaverageforimporttariffsintheregion.
In early 2000 and upon ascension to the WTO, Moroccobenefittedfromimplementingseveralimportant Free Trade Agreements (FTAs) that significantly increased Moroccan exports. The EU-Morocco Association Agreement between MoroccoandtheEuropeanUnion(EU)tookeffectin 2000, and since 2013, negotiations are ongo-ing for a Deep and Comprehensive FTA (DCFTA).18 Furthermore, Morocco joined the Greater Arab Free Trade Area (GAFTA) and the European Free Trade Association (EFTA) agreement. In 2001, Morocco signedanFTAwiththeUAE,whichtookeffectin2003. In 2006, the Morocco-USA free trade agree-ment was implemented, making Morocco the only African country to have an FTA with the USA. Consequently,MoroccoʼsexportstotheUSAsig-nificantlyincreasedfromUS$565millionin2004to almost US$1.4 billion in 2019.19 Moreover, an FTAwithTurkeysignedin2004tookeffectin2006,mainly covering non-agricultural products. Finally, the Agadir Agreement, which includes four coun-tries in the Southern Mediterranean Countries (Egypt,Jordan,MoroccoandTunisia),tookeffectin2007. All these new trade agreements have had a significantimpactonthetradetariffsforMorocco.For instance, the MFN-trade-weighted average duty decreased from 25 per cent in 2002 to 20 per cent in 2005, 11 per cent in 2009 and to 10 per cent in 2015(figure34).20
Egypt has also signed several bilateral and multilat-eralFTAsandfurtherreduceditstradetariffsandbarriers. One of the most important FTAs is with the European Union (EU), a major trading partner. The FTA entered in force in 2004 creating a free-

Trade, investment and employment in the Southern Mediterranean Countries36
trade area between the EU and Egypt by removing tariffsonnon-agriculturalproductsandmakingagricultural products easier to trade. Moreover, the EU and Egypt are in negotiation on a Deep and Comprehensive Free Trade Agreement since 2013. Egypt also has an FTA with Turkey and an agree-ment with EFTA in place since 2007. Similarly, Egypt adheredtoCOMESAʼsCommonExternalTariff(CET), the Pan-Arab free trade area and the Agadir agreement between 2004 and 2007.21 In parallel, the Egyptian authorities launched in 2004 the sec-ond wave of trade liberalization aiming at reducing furtherboththetariffandnon-tarifftradebarriers(Selwaness and Zaki, 2013). As a result, the average
21 Consideringherethedateofentrytoeffect.
appliedMFNtarifffellfrom27percentin1998to20percentin2005(WTO,2005).Tariffshavesincecontinued to decline, falling to 11 per cent in 2015.
In Tunisia, the trade liberalization process started inthe1990s,withtwomainphases:afirstperioduntil 1995, in which trade liberalization remained relatively limited, and a more active period starting in 1996 when the free trade agreement with the EU entered into force (Marouani and Mouelhi, 2015). The FTA with the EU had the objective of establish-ing the Euro-Mediterranean free trade area by 2010. Trade in non-agricultural goods has been duty free since 2008 through this agreement (WTO, 2016). Negotiations were launched in 2015 to conclude a
X Figure 34: Evolution of trade tariffs measured by Most Favoured Nation-trade-weighted average duty in comparison with other world regions and with countries in the region (percentage)
Note:MostFavouredNation(MFN):Normalnon-discriminatorytariffchargedonimports(excludespreferentialtariffsunderfreetradeagreementsandotherschemesortariffschargedinsidequotas).TheMiddleEastandNorthAfricaregionincludesthefollowingcoun-tries: Algeria, Bahrain, Djibouti, Egypt, Jordan, Kuwait, Lebanon, Libya, Malta, Morocco, Omar, Occupied Palestinian Territory, Qatar, Saudi Arabia, Syria, Tunisia and United Arab Emirates.Source: WITS, data missing for Libya.
Percentage
7.9
10.86.7
14.1
3.1
3.5
Sub-Saharan Africa
Middle East & North Africa
Latin America & Caribbean
European Union
East Asia & Pacific
World
Tunisia
Occupied Palestinian Territory
Morocco
Lebanon
Jordan
Egypt
Algeria
0 5 10 15 20 25 30
7.1
12.6
3.9
5.27.7
11.4
9.3
4.9
10.5
6.7
9.4
12.711.9
19.912.7
13.0
27.3
24.5
26.4
2017 2016 2015 2005 2002

37 Chapter 2. Inclusive economic transformation through employment-oriented trade, industrial and investment policies
Deep and Comprehensive Free Trade Agreement (DCFTA) between Tunisia and the EU and are still ongoing. Tunisia has also an association agree-mentwiththeEFTAeffectivesince2008andcov-ering only non-agricultural goods. An FTA between Tunisia and Turkey was signed in 2004 and in force since 2005. Tunisia is also part of the Greater Arab Free Trade Area (GAFTA), covering 18 Arab coun-tries and which entered into force in 1998, and the AgadirAgreement.Intermsoftariffs,Tunisiahassignificantlydecreaseditstariffssinceearly2000,with the weighted average applied MFN tariff decreasing from 26 per cent in 2002 to 9 per cent in 2016.
In the 2000s, Jordan adopted eight FTAs with dif-ferent partners, including with the EU, a major trad-ing partner for the country. These FTAs include four multilateral agreements: the EU-Jordan agreement in place since 2002, the agreement between the EFTA States and Jordan, the Pan-Arab Free Trade Agreement (PAFTA) and the Agadir Agreement. Jordan has bilateral FTAs with the USA since 2001, Singapore since 2005, Turkey since 2011 and, since 2019, Canada. However, Jordan suspended the FTA with Turkey in 2018 until further assessment of its impactonJordanʼseconomy(WTO,2018).Jordansignificantlyreduceditstariffsinthe2000s,fromaweightedaverageappliedMFNtariffintheregionin 2002 dropping from 12.65 per cent to 9 per cent in2016,thesecond-lowesttariffintheregion,afterLebanon(figure34).
Lebanon has also embarked on a trade liberal-izationprocess,intensifiedinearly2000inparal-lel with negotiations for the accession agreement with the WTO in 1999. According to the WTO data-base, Lebanon has three main multilateral FTAs Similar to other countries in the region, Lebanon has signed an FTA with the EU and the EFTA, implemented respectively in 2006 and 2007. Most recently, Lebanon and the United Kingdom signed an FTA that entered into force on 1 January 2021 andisexpectedtoimprovethecountryʼsexportsto the United Kingdom. According to the Lebanese Ministry of Economy and Trade, Lebanon is also a signatory to FTAs with Egypt and Syria in force respectively since 1999 and 1993. Lebanon also has more than 30 economic agreements and trade cooperation frameworks.22
22 Republic of Lebanon, website of the Ministry of Economic Trade.
23 Source: Observatory of Economic Complexity.
The Occupied Palestinian Territoryhasadifferentdynamic than other countries in the region, as its economic and trade policies are heavily impacted bytheIsraelioccupation,whichinflictsheavydis-tortions and binding constraints for trade, invest-mentandemployment.Thefirsttradeagreementsadopted in the country were associated with peace agreements, including the Oslo Accords signed in 1993 and the associated Paris Protocol. In 1997, the Occupied Palestinian Territory signed a trade agree-ment with the EU as part of the EuroMed initiative. As in other countries in the region, this agreement focuses on gradually establishing a free trade area with the EU for non-agricultural goods and provides preferential arrangements for some agricultural products (UNCTAD, 2012). The Occupied Palestinian Territorysigneditsfirstbilateralfreetradeagree-ment with Jordan, followed by an FTA with Egypt in 1997 and Turkey in 2004. The Occupied Palestinian TerritoryisalsopartoftheGAFTA,effectivelyinplacesince 2006. The Occupied Palestinian Territory and the USA have an indirect trade agreement through the Israel-USA FTA, which provides for duty-free Palestinian exports to the USA, conditional on prod-ucts being wholly grown and produced in Occupied PalestinianTerritory(UNCTAD,2012).Tariffdataisnot available for the Occupied Palestinian Territory; however, import and export measures are heavily impacted by the Israeli occupation. Most of the imports to the Occupied Palestinian Territory are channelled through Israel, most often recorded as Israeli exports (UNCTAD, 2012).
Algeria and Libya, the oil-exporting countries in the region, have had less incentive to sign and implementFTAs,giventheirsignificantoilresourcesand the high demand for them, including from the region. For instance, Libya is the only country in the region with no FTA with the European Union, despite the fact that 63 per cent of its exports are destined for Europe (2019).23 However, Libya has a few FTAs with countries in the region and other developing countries, which dates to the south-to-south policy adopted by the Libyan authorities and theKhadafiregimepriortoitsoverturnin2011.Forinstance, the country is part of the Greater Arab Free Trade Area and the Arab Maghreb Union (AMU) and has bilateral trade agreements with Morocco and Jordan. Algeria has an FTA with the EU in place since 2005 and an FTA with its neighbouring Tunisia and is part of the GAFTA.

Trade, investment and employment in the Southern Mediterranean Countries38
In parallel to these substantial trade liberaliza-tion reforms, countries in the region embarked in the 1990s and 2000s in considerable investment reforms, either through the revision of the regu-latory frameworks or the establishment of spe-cial economic zones (SEZs), also called free zones (FZs), free trade zones (FTZs) or export processing zones (EPZs). The rationale for the establishment of SEZs is mainly rooted in cluster theory and pol-icies.ClusterswerefirstdescribedbyMarshallin1890 as a “concentration of specialized industries in particular localities,” and several theoretical models were developed later, such as the cluster growth theory of Michael Porter (1998). Clusters are gen-erallydefinedasageographicagglomerationofinterconnectedfirmsandsupportinginstitutions(Porter 1998) and theory indicates that clusters can create positive externalities, including a) knowledge spillover, b) better access to the markets and sup-pliers and c) creation of pools of specialized work-erswithcluster-specificskills.SEZsarespecializedclustersthataimtorealizetheclustersʼbenefitswhile attracting FDIs and promoting exports. SEZs are generally designed under a “plug-and-play” model to attract foreign investments. They became a central piece of investment and export promo-tion policies over the past few decades. They could even be considered a comparative advantage of an economy aiming to integrate further into the global economy. The plug-and-play model includes an extensive set of services, including upgraded and adequate infrastructure, streamlined administra-tiveandregulatoryframeworks,fiscalandfinancial
incentives and facilitated access to support services (logistics,finance,etc.).
As indicated previously, Egypt and Tunisia were the firsttwocountriesintheregiontoadoptinvest-ment and export promotion policies in the region in the early 1970s. These policies were accompanied in Egypt by the establishment of SEZs, including the areaofPortSaidin1974.ThefirsttwoeconomicFTZs in Tunisia were established in 1993 (Bizerte Free Zone in the North and Zarzis Free Zone in the South,closetoLibyaʼsborders).Bothcountrieshavewitnessed an increasing number of public and pri-vate SEZs since then, including the important Suez Canal Economic Zone established by the public authorities in Egypt. Both in Tunisia and Egypt, there are currently several types of SEZs, which include EPZs, Technological Park and Free Economic Zones in Tunisia and public or private free zones (FZs), investment zones, technological zones, spe-cial economic zones (SEZs), industrial zones and qualifiedindustrialzones(QIZs)inEgypt(OECD,2020a). QIZs were also established in Jordan and in both countries, these zones followed the peace treaties with Israel (in 1980 for Egypt and in 1994 for Jordan) and were mainly a US initiative to enhance regional economic cooperation between Israel and the Arab world. The QIZs include conditions on using inputs from Israel and other countries in the region, including Egypt and have been further strengthened after the adoption of the US-Jordan FTA. As of 2020, Jordan has 13 QIZs and Egypt has ten QIZs that have been established over the
X Table 8: Overview of incentives provided in the Southern Mediterranean Countries in SEZs
Country Incentives Zones for Regional Development Incentives in Special Economic Zones and Free Zones
Algeria Tax holiday, customs/sales tax exemption, land/property tax exemption, grants
Egypt Tax deduction, customs/sales tax exemption, grants Tax deduction, customs/sales tax reduction/exemption, grants
Jordan Corporate income Tax (CIT) reduction, tax holiday, customs/sales tax exemption
CIT reduction, customs/sales tax exemption, land/property tax exemption
Lebanon CIT reduction, tax holiday, customs/sales tax exemption Tax holiday, customs/sales tax exemption, land/property tax exemption
Libya Tax holiday, customs/sales tax exemption, land/property tax exemption
Tax holiday, customs/sales tax exemption
Morocco Grants Tax holiday, CIT reduction, customs/sales tax exemption
Occupied Palestinian Territory CIT reduction, customs/sales tax exemption CIT reduction, customs/sales tax exemption, grants
Tunisia Tax holiday, CIT reduction, tax deduction, grants CIT reduction, tax deduction, customs/sales tax exemption
Source:OECD(2020a),withminormodifications.

39 Chapter 2. Inclusive economic transformation through employment-oriented trade, industrial and investment policies
past two decades. Lebanon joined the trend later and established its main SEZ, the Tripoli Special Economic Zones, in 2008.
Countriesintheregionofferawiderangeofincen-tives and services to attract investment, either in export-oriented SEZs or FZs or in develop-ment zones aiming to foster economic growth in under-developed regions. For instance, in Tunisia, companies established in SEZs are generally under theoffshoreregimeestablishedbythe“loi1972”.For instance, the law provided an income tax holi-day for all companies exporting at least 80 per cent of their production initially in 1972 for 20 years and currently for eight years. The law also provides companies a full exoneration from customs duties for imported capital goods. Generally, the type of incentivesdiffersbetweenexport-orientedzones(for example, SEZs and FZs) and regional develop-ment-oriented zones, as indicated in table 8.
2.1.2.2 Evolution of industrial and sectoral policies
As discussed in previous sections, industrial pol-icies and investment and trade policies are inter-linked. We discussed in the previous section the trade liberalization process from a generic per-spective. This section will discuss the targeting of activities and sectors and the state interventions thatwereimplementedtodevelopspecificactivi-ties, including export-oriented ones. Following the Washington consensus episodes in the late 1980s and 1990s, many countries in the region adopted a mix of transversal industrial policies, focusing on improving the business environment and targeted sectoral reforms based on their competitive advan-tages. These policies aimed to create jobs, improve value-addition, improve technological capabilities and ultimately realize a structural transformation and sustainable growth.
The structural adjustment era was associated with a relatively high level of growth. The level of FDI inflowstotheregionincreasedsubstantiallyaswell,and the level of exports started rising in a sustained manner. However, trade and investment policies did not result in pro-poor and sustainable growth. Inequality rose substantially and corruption was widespread in the region, with the proliferation of a rent-seeking economy, in which only some industri-alistswithstrongtieswiththestatebenefitedfromthe economic reforms and growth. This ultimately
24 The evaluation provided below is based on a desk research and literature review, and therefore might be limited by the level of information available.
did not favour innovation and the accumulation of technological capacities, nor provided decent eco-nomicopportunitiesfortheregionʼspopulations.At the beginning of the 2000s, a new wave of eco-nomic policies, including industrial policies, was adopted in most countries in the region.
In the next section, we review the latest industrial policies adopted by the countries in the region since the 2000s, focusing on Egypt, Jordan, Morocco and Tunisia and try to provide an overall evaluation for these policies from a design and creation perspec-tive.24 The following section and chapter will focus on the results from a trade and employment per-spective. For the design evaluation, we use a frame-workthatcombinestheframeworksidentifiedbyRodrik (2008) and by ILO (2020a):
1. Selection of sectors: Is there a selection of sec-tors,accordingtoaspecificanddetailedmeth-odology that has been formalized, written and approved? Does the design of the industrial policy follow a “self-discovery” process?
2. Actionability: Is the industrial policy accom-panied by a clear implementation plan that identifiedeachstakeholderʼsresponsibilityanddefinedclearobjectives?
3. Carrots and sticks: Are the incentives and sup-port provided in the industrial policy bound in time and conditional to performance?
4. Embeddedness/social dialogue: Was the pol-icydevelopedincollaborationwithdifferentstakeholders, including private sector actors andworkersʼandemployersʼassociations?Isthere a systemic use of formalized platforms to engage with the private sector?
5. Political support: Does the industrial policy adopted have the approval and the support of the political leadership?
6. Financial commitment:Isthereafinancialcommitment from public authorities to imple-ment the policies and the support designed for the private sector?
7. Institutional settings and transparency: Do institutions involved in the implementation process have adequate governance, capacity and management to implement these policies? And are there monitoring and evaluation mech-anisms that enable data collection, policy evalu-ation and learning mechanisms? Are the results periodically published?

Trade, investment and employment in the Southern Mediterranean Countries40
Egypt
In Egypt, the trade liberalization reforms that intensifiedinthe2000swereaccompaniedbytheIndustrial Development Strategy (IDS), a central piece of economic policy that was adopted in 2005. TheIDSwasadoptedinparalleltothe2004tariff-re-duction reforms by the Government led by Prime Minister Ahmed Nazif, which featured many prom-inent private sector actors (Loewe, 2013). The IDS is an ambitious and comprehensive industrial policy with the following mission:
The IDS took a hybrid approach, with both trans-versal and targeted industrial policies. Transversal policies focused on innovation and technology transfer, human capital and entrepreneurship, accesstofinance,infrastructure(digitalandphys-ical), competitiveness and FDI and export promo-tion, following the East-Asian model. Each pillar was implemented through a dedicated institution. For instance, the innovation and technology trans-fer pillar was implemented through the “Egypt Technology Transfer and Innovation Centres” and the human capital and entrepreneurship was imple-mented by the new Industrial Training Council (ITC), established under the Social Fund for Development (SFD), which mainly provided on-the-job-training for workers, with a focus on technology (Ministry for Trade and Industry, 2006). The targeted industrial policies focused on a number of light-manufac-turing and export-oriented sectors: engineering, food processing, chemicals and pharmaceuticals, textiles and clothing, building materials, furniture, paper and paperboard and leather. The strat-egy excluded non-manufacturing companies and microandsmallenterprises(definedaslessthanten employees and less than 50 employees). The sectors were selected to maximize value addition in manufacturing and increase the share of medi-um-technology activities in total, considering their importance in mature economies and their growth potential in Egypt. However, the document does not indicate the analytical methodology used to select the industries and it is not clear if any data-driven or transparent methodology was used.
Loewe (2013) provides an assessment of industrial policies in Egypt from 2004 to 2011, considering the countryʼspoliticaleconomyandtheevolutionofthedifferentregimesandpoliticalforcessinceitsinde-pendence. He indicates that the IDS, despite being adopted by a private-sector-oriented government, wasnotdefinednorimplementedincollaborationwith the private sector. The evaluation indicates thatthepolicyʼsresultsandachievementswerenot monitored nor communicated. There was a significantproblemofcoordinationwithunclearmandatesandresponsibilitiesbetweendifferentagencies within the government. Moreover, the strategyʼsservicesandsupportwerenotnecessar-ily demand-driven. The focus was on medium and largeenterprises,excludingmicroandsmallfirmsdespite their importance in the Egyptian economy andtheirsignificanteconomicpotential.Loewe(2013) also indicates that the selection of sup-ported enterprises was not necessarily done on a rational basis but rather on networks and favourit-ism. Finally, the implementation of IDS did not apply the “carrots and stick” feature suggested by Rodrik (2008),withgenerousfinancialpackagesprovidedunconditionally on performance.
The IDS remained the main industrial policy in Egypt between 2004 and 2016. In 2016, the Egyptian authorities launched the Egypt Vision 2030, a broad national plan that includes eco-nomic, social and environmental axes. Among the economic axis, the national plan includes a) devel-oping a knowledge-based economy and encourag-ing innovation, and b) a better industrial upgrading and integration in global value chains. The objec-tive of developing a knowledge-based economy in the national plan has translated into adopting a National Strategy for Science, Technology and Innovation.Thestrategyaimstopromotescientificresearch and encourage links between industry and research and private participation in R&D. It includes a focus on a broad number of manufac-turing activities requiring R&D and technological capacity upgrade and on the Internet of Things (IoT) and other promising technologies.
Moreover,significanttransversalindustrialpoli-cies have been undertaken since adopting Egypt Vision 2030. These policies aim to realize the nationalplanʼssecondeconomicobjective:abet-ter industrial upgrading and integration in global value chains. In 2017, an export development agencywasestablishedtoimprovelocalfirmsʼaccess to international markets. The new agency mainly works on providing technical assistance
By the year 2025, Egypt will be a leading industrialising nation in the MENA region in terms of industrial performance as well as the main export hub for medium-tech-nology manufactured products.

41 Chapter 2. Inclusive economic transformation through employment-oriented trade, industrial and investment policies
to potential e xporters. Moreover, the establish-ment of the agency has been accompanied by effortstofacilitatetradeforlocalfirms.In2017,the number of documents required to export decreased from 9 to 5 and to import from 11 to 6 (OECD, 2018). Also, the authorities established a Micro, Small and Medium Enterprises Development Agency (MSMEDA) to coordinate and implement the support to MSMEs across all sectors in the economy. MSMEDA replaces the Social Fund for Development and includes the International Trade Centre (ITC) as well as the Industrial Modernisation Centre (IMC) and the Technology Innovation and Entrepreneurship Centre (TIEC) (OECD, 2018). Finally, in 2020, the authorities adopted an SME lawthatlegallydefinesSMEsaccordingtothesizeoftheircapitalandincludesasetoffinancialandnon-financialincentivesforinvestorsandentrepre-neursinspecificactivities:
X Digital transformation and industrial intelligence;
X Industrial upgrading projects;
X Agricultural or animal production;
X Information technology or related services;
X Innovations into industry and technology systems;
X Renewable energy.
The law, implemented by MSMEDA, includes identi-fyingnewactivitiesandfieldsandincludingtheminthe targeted support. The law also includes incen-tives that aim to encourage the formalization of informal enterprises.
In 2018, the authorities published an update of the Egypt Vision 2030 plan, with the publication of a mid-term economic plan (2018/19–2021/22), which includes a focus on the following sectors:
X Engineering, electrical and food industries;
X Chemical and pharmaceutical;
X Electronic industries and medical devices;
X Genetic engineering and biotechnology;
X Automobile industries, in particular petrochem-ical, equipment manufacturing, software and information technology industries.
This series of reforms can be considered the con-tinuity of the IDS, identifying new sectors and activities on which the authorities will focus. These reforms, including a combination of transversal and targeted policies, aim to align with the econo-myʼsnewneeds.AccordingtotheEgyptianMinistryof International Cooperation, significant finan-
cial resources have been committed to the Egypt Vision 2030 plan: in 2020, development partners committed more than US$3 billion to implement the plan. According to the same source, the plan wasdevelopedincollaborationwithdifferentstake-holders, including private sector actors and donors. However, it is not clear if there is a systemic and periodicconsultationduringtheplanʼsimplemen-tation. Also, the carrot and stick feature is not clearly identifiedintheplanandthemidtermeconomicplan and the selection of plans are not explained in publicly available documents.
Jordan
Like many countries in the region, the Jordanian industrial sector largely developed during the import-substitution phase in the 1960s and 1970s. The main industries that emerged are extractive industries (for the exploitation of phosphates), tex-tiles and agro-processing. Interestingly, the phar-maceutical sector also developed during this period, with a couple of local companies emerging in the 1960s and the 1970s (Alomari and Saqfalhait, 2015). Today the pharmaceutical sector in Jordan is consid-ered to be one of the most advanced in the region and represents 7.2 per cent of Jordanian exports.
Following the 1990s and the liberalization process, Jordan, unlike Egypt, did not renew its economy with targeted industrial policies. Instead, the coun-try continued to adopt transversal policies that aimed to attract FDI, promote exports, improve the businessenvironmentandincreasefirmsʹcompet-itiveness, including SMEs. In 2009, the authorities adopted a transversal industrial policy intended to cover three years (2009–2011), which focused on increasingJordanianindustriesʼcompetitivenessinthe local and export market. The strategy included mainlytheprovisionoftechnicalandfinancialsup-port to SMEs, focusing on SMEs in export industries such as pharmaceuticals, textiles and garments, food industries and high value-added industries such as the information technology industry (OECD, 2008).
Since adopting this policy, Jordan has created a vari-ety of programmes to support SMEs and industrial firmsalongsideinvestmentpolicies,butwithoutanoverarching industrial policy. However, the imple-mentation of these programmes and allocation of incentives to the private sector was fragmented betweendifferentinstitutionswithsometimesover-lapping mandates such as the Jordan Investment Board and the Free Zones Commission (World Bank,

Trade, investment and employment in the Southern Mediterranean Countries42
2015).Also,theselectionoffirmswasnottranspar-ent, with intervention from the Council of Ministers toselectbeneficiaries(WorldBank,2015).
It should be highlighted that the series of wars in theregionhasseverelyimpactedthecountryʼstra-jectory, including the Syrian civil war started in 2011 and the Islamic State formation in 2014. Authorities focusedmostoftheireffortssince2011onmiti-gating the social and economic impact of the over-whelming refugee crisis.
In 2014, the authorities passed a new investment law to facilitate investment and unify the legisla-tion and responsibilities. The law also improved the set of incentives provided to foreign investors, including new incentives to foster domestic linkages (Oxford Business Group, 2014). The law also created an Investment Commission, mandated to regulate and implement investment policies in Jordan. Also, majorsimplificationreformswereimplemented,including the introduction of a one-stop-shop for investors and a number of procedures were facili-tated and digitalized.
Other more recent policies, including the National Innovation Strategy (2014), Jordan National Vision and Strategy (2015–2025) and the Economic Growth Plan (2018–2022), have highlighted the importance of innovation, building a knowledge economy and of exports as a vehicle for job creation. The Jordan National Vision and Strategy includes a focus on economic sectors (or clusters): a construction and engineering cluster, a transport and logistics, tour-ism and events, a healthcare cluster, life sciences cluster (including pharmaceuticals), a digital and business services cluster, an educational services clusterandafinancialservicescluster.Thevisionwas followed by the Economic Growth Plan, which provided a focus on the same broad sectors, with a highlight on innovation and entrepreneurship in the economy. The strategies documents do not explain the methodology used for the selection of these sectors and do not include clear targets and implementation mechanisms, limiting the possibil-ity of monitoring and evaluating progress in imple-menting the strategy.
Interestingly, the Center for International Develop-ment (CID) at Harvard University developed a growth diagnostic for Jordan and following the economic complexity methodology, identifying the countryʼscomparativeadvantages.TheCIDiden-tifiedeightexport-orientedsectorsthathavethehighest potential to drive growth in Jordan while supporting increasing wage levels and delivering
positive spillover to the non-tradable economy: 1) business, IT and professional services, 2) edu-cation services, 3) healthcare services, 4) creative industries, 5) tourism, 6) transportation and logis-tics, 7) construction materials and services, and 8) agriculture and food processing (Hausmann et al.,2019).Sixsectorsidentifiedinthisexercisehavebeen included in the National Vision and Strategy and the Economic Growth Plan, which suggests that astronganalyticalmethodologywasusedtodefinethe target sectors in Jordan.
Morocco
From the early 1980s and until 2005, Morocco focused on promoting exports and on “fixing” the business environment, including through the structural adjustment reforms programme. In the 1990s, the Moroccan authorities continued the lib-eralization and export-promotion policies through the trade tariffs and quota coverage reduction, as well as the introduction of export taxes (Achy, 2013). The liberalization period was associated with a complicated relationship between the state and the private sector, characterized by a lack of trust in the state, which pushed domestic investors out-side of manufacturing, according to Achy (2013). As a result, in the early 2000s, there was little diver-sification and expansion of the manufacturing sector outside of the historic and low-productive industries, namely textiles and agro-processing, mainly developed following the 1960s and 1970s industrial policies era. Between 2000 and 2005, the authorities focused on transversal policies, particu-larlyonimprovingSMEsʼcompetitiveness.Thiswasthrough the establishment of the Hassan II Fund for Economic and Social Development in 2002. The fundintervenedtosupportthefinancingofcapitalgoodsandphysicalinfrastructureinspecificsec-tors, including automotive and aeronautics indus-tries (Hahn and Vidican-Auktor, 2018). Moreover, in 2002, the authorities established the back-then National Agency for the Promotion of Small and Medium Enterprises (Agence Nationale pour la Promotion des Petites et Moyennes Entreprises) and now Maroc PME. The agency focused on improvingSMEsʼproductivityandcompetitivenessthrough “upgrading” programmes.
2005 marked a turning point for industrial policies in Morocco, with the adoption of three industrial plans between 2005 and 2015, all including a mix of transversal and targeted industrial policies, with an update of the list of targeted sectors in each new plan. Between 2005 and 2015, Morocco applied a

43 Chapter 2. Inclusive economic transformation through employment-oriented trade, industrial and investment policies
self-discovery process, with updated interventions and list of targeted sectors and an increased focus on manufacturing development. The design and implementation of the plans also improved in time, with more collaboration with the private sector in the second and third industrial policies and better monitoring and evaluation frameworks, including through the introduction of “performance con-tracts” for each institution involved in the imple-mentation (Hahn and Vidican-Auktor, 2018).
Thefirstplanadoptedin2005wasthe“PlandʼEmer-genceMaroc”.ThePlandʼEmergenceincludedamixof transversal and targeted industrial policies, with afocusonsixidentifiedhigh-potentialsectors.Theplan was more a framework for a new industrial policy until 2015 (Hahn and Vidican-Auktor, 2018) andsetasaspecificobjectivetoincreasethecon-tribution of manufacturing and industry to GDP and to expand the tradable sector. Piveteau and Rougier (2011)proposeanevaluationofthispolicyʼsdesignand indicates that the targeted approach included inthePlandʼEmergencewasdrivenbythehigh-est authorities in the Kingdom. The design process included detailed analyses of the traditional indus-triesʼcompetitivenessandbindingconstraintsanda benchmarking and scoring exercise provided by theMcKinseymanagementconsultingfirmthatinformed the selection of high-potential and tar-geted sectors. The selection of sectors took into considerationthefollowingidentifiedcompetitiveadvantages of Morocco: proximity to Europe, the important progress made in signing and imple-menting FTAs, the life quality in Morocco, the qual-ity of infrastructure and the mid-skilled labour in the Moroccan economy (Piveteau and Rougier, 2011). This selection exercise resulted in the plan focusing on the following six economic sectors – knownasMoroccoʼsGlobalJobs(Métiers Mondiaux du Maroc–MMM):aeronautics,offshoring(subcon-tracted activities including in services), food indus-try, textile, electronics and automobiles. The plan also included the creation of “Med Zones”, indus-trial zones focusing on aeronautics, electronics and automobiles, sectors mainly driven by European FDIs and sub-contracting agreements. Ambitious targetsweresetinthePlandʼEmergenceincludingtargeted sectors would contribute up to 70 per cent of industrial growth by 2015 and create 440,000 jobs, including 240,000 direct ones.
TheframeworkofPlandʼEmergencewasrefinedand updated in 2009 with the adoption of the National Pact for Industrial Emergence (PNEI). PNEI provided a stronger focus on the competi-
tivenessandtransversalpolicies,withanidentifi-cation of new targeted sectors. Transversal policies included improvement of the business climate, the provision of demand-driven training and competi-tiveness support to SMEs. The SME agency was in charge of implementing two support programmes: “Imtiaz”, aiming at providing direct subsidies to sup-port high-growth SMEs and “Moussanada” which provided technical support on different areas suchasmarketing,finance,supplymanagement,R&D and quality enhancement (Hahn and Vidican-Auktor, 2018). The updated plan also included new targeted sectors that were added to the list iden-tifiedin2005,namely:pharmaceuticalandchem-ical and para-chemical sectors and detailed the incentives provided to investors and entrepreneurs engaginginthetargetedsectors,mainlyfinancedthrough the Hassan II Fund for Economic and Social Development and for large projects through an agreement regime (Vidican-Auktor and Hahn, 2017; Hahn and Vidican-Auktor, 2018). According to Hahn and Vidican-Auktor (2018), the PNEI was developed and implemented based on increased collaboration withdifferentactors,includingprivatesectoractors,comparedtothefirstPlandʼEmergence.
ThePlanforIndustrialAcceleration(PlandʼAccéléra-tion Industrielle, PAI) was the third industrial policy adopted in 2014 for the period 2014–2020 and the success of the PNEI and took the same approach asPlandʼEmergenceandPNEI:amixoftransversaland targeted industrial policies. PAI had the objec-tives of increasing the contribution of industry to GDP by 9 percentage points (from 14 per cent in 2014 to 23 per cent in 2020), and creating 500,000 jobs while reducing the share of informal sector and developing MSMEs. The implementation of the third industrial policy adopted in the 2000s was financedthroughthenewlyestablishedFundforIndustrial Development (Fonds de Développement Industriel).Thelistoftargetedsectorswasrefinedfurther, adding to the list included in the PNEI build-ing materials, renewable energy, electrical industry and metallurgy and metalworking, and withdraw-ing food-processing from the list of targeted sec-tors. In terms of transversal support, PAI focuses on the creation of clusters and eco-systems, with high participation of the private sector in their establishment (Hahn and Vidican-Auktor, 2018), including through the creation of public-private training institutions and an improved and increased collaboration with business associations. The plan also focuses on a better integration in global value chains (GVCs) by improving linkages between multi-nationalfirmsanddomesticfirms,especiallySMEs,
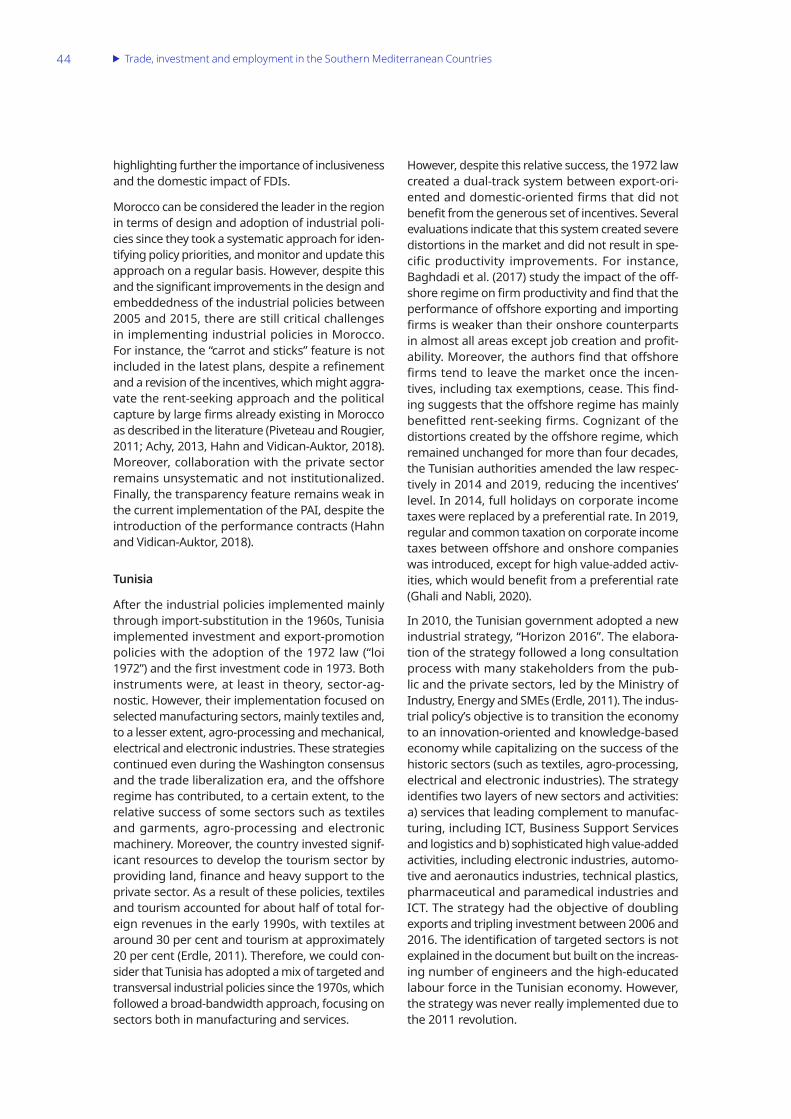
Trade, investment and employment in the Southern Mediterranean Countries44
highlighting further the importance of inclusiveness and the domestic impact of FDIs.
Morocco can be considered the leader in the region in terms of design and adoption of industrial poli-cies since they took a systematic approach for iden-tifying policy priorities, and monitor and update this approach on a regular basis. However, despite this andthesignificantimprovementsinthedesignandembeddedness of the industrial policies between 2005 and 2015, there are still critical challenges in implementing industrial policies in Morocco. For instance, the “carrot and sticks” feature is not includedinthelatestplans,despitearefinementand a revision of the incentives, which might aggra-vate the rent-seeking approach and the political capturebylargefirmsalreadyexistinginMoroccoas described in the literature (Piveteau and Rougier, 2011; Achy, 2013, Hahn and Vidican-Auktor, 2018). Moreover, collaboration with the private sector remains unsystematic and not institutionalized. Finally, the transparency feature remains weak in the current implementation of the PAI, despite the introduction of the performance contracts (Hahn and Vidican-Auktor, 2018).
Tunisia
After the industrial policies implemented mainly through import-substitution in the 1960s, Tunisia implemented investment and export-promotion policies with the adoption of the 1972 law (“loi 1972”)andthefirstinvestmentcodein1973.Bothinstruments were, at least in theory, sector-ag-nostic. However, their implementation focused on selected manufacturing sectors, mainly textiles and, to a lesser extent, agro-processing and mechanical, electrical and electronic industries. These strategies continued even during the Washington consensus andthetradeliberalizationera,andtheoffshoreregime has contributed, to a certain extent, to the relative success of some sectors such as textiles and garments, agro-processing and electronic machinery. Moreover, the country invested signif-icant resources to develop the tourism sector by providingland,financeandheavysupporttotheprivate sector. As a result of these policies, textiles and tourism accounted for about half of total for-eign revenues in the early 1990s, with textiles at around 30 per cent and tourism at approximately 20 per cent (Erdle, 2011). Therefore, we could con-sider that Tunisia has adopted a mix of targeted and transversal industrial policies since the 1970s, which followed a broad-bandwidth approach, focusing on sectors both in manufacturing and services.
However, despite this relative success, the 1972 law created a dual-track system between export-ori-entedanddomestic-orientedfirmsthatdidnotbenefitfromthegeneroussetofincentives.Severalevaluations indicate that this system created severe distortions in the market and did not result in spe-cific productivity improvements. For instance, Baghdadietal.(2017)studytheimpactoftheoff-shoreregimeonfirmproductivityandfindthattheperformanceofoffshoreexportingandimportingfirmsisweakerthantheironshorecounterpartsinalmostallareasexceptjobcreationandprofit-ability.Moreover,theauthorsfindthatoffshorefirms tend to leave the market once the incen-tives,includingtaxexemptions,cease.Thisfind-ingsuggeststhattheoffshoreregimehasmainlybenefitted rent-seeking firms. Cognizant of the distortionscreatedbytheoffshoreregime,whichremained unchanged for more than four decades, the Tunisian authorities amended the law respec-tivelyin2014and2019,reducingtheincentivesʼlevel. In 2014, full holidays on corporate income taxes were replaced by a preferential rate. In 2019, regular and common taxation on corporate income taxesbetweenoffshoreandonshorecompanieswas introduced, except for high value-added activ-ities,whichwouldbenefitfromapreferentialrate(Ghali and Nabli, 2020).
In 2010, the Tunisian government adopted a new industrial strategy, “Horizon 2016”. The elabora-tion of the strategy followed a long consultation process with many stakeholders from the pub-lic and the private sectors, led by the Ministry of Industry, Energy and SMEs (Erdle, 2011). The indus-trialpolicyʼsobjectiveistotransitiontheeconomyto an innovation-oriented and knowledge-based economy while capitalizing on the success of the historic sectors (such as textiles, agro-processing, electrical and electronic industries). The strategy identifiestwolayersofnewsectorsandactivities:a) services that leading complement to manufac-turing, including ICT, Business Support Services and logistics and b) sophisticated high value-added activities, including electronic industries, automo-tive and aeronautics industries, technical plastics, pharmaceutical and paramedical industries and ICT. The strategy had the objective of doubling exports and tripling investment between 2006 and 2016.Theidentificationoftargetedsectorsisnotexplained in the document but built on the increas-ing number of engineers and the high-educated labour force in the Tunisian economy. However, the strategy was never really implemented due to the 2011 revolution.

45 Chapter 2. Inclusive economic transformation through employment-oriented trade, industrial and investment policies
Following the revolution, Tunisia took a more hori-zontal and generic approach to industrial policies. In 2016, Tunisia adopted the National Plan for Development (2016–2020), which served as the countryʼsnationaldevelopmentframeworkpost-2011. The Plan was adopted following an intensive public-private dialogue, with series of consultations organized in almost all districts and with a clear on regional development, one of the main root causes of the 2011 revolution. The proposed reforms cover a wide range, from e-governance and anti-corrup-tionpoliciestoeconomicdiversificationandthereduction of regional inequalities. The National Plan for Development (2016–2020) indicates that there is a need to “focus on promising activities that have significantrenewalpotentialandsignificantinvest-ment opportunities.” These activities include com-munication devices, electronic payment systems, cars and airplane components, biotechnology, nan-otechnology, smart textiles, agricultural and food products, biological products and renewable ener-gies. The National Plan for Development is divided into a regional and sectoral plan, which included implementation plans with the identification of institutional responsibilities. However, the sectoral plandoesnotincludeaspecificfocusonmanufac-turing sectors but rather focuses on cross-cutting activities and on ICT and Tourism. Out of the seven questions included in the industrial policy evalua-tion framework, the National Plan for Development scores relatively well on the social dialogue and political support questions; however, it falls short on the other critical aspects, including a clear selection of targeted sectors and transparency and condition-ality of incentives.
The authorities did not formally adopt new verti-calindustrialpoliciesthatidentifiedstrategicfocussectors but rather implemented a couple of pro-grammes with financial and technical supports from donors. For instance, Tunisia implemented an upgrading programme, the Programme de mise à niveau, in 1995, aiming at improving competitive-ness in the manufacturing sector and funded by the Fonds de Développement de la Compétitivité (FODEC) with the contribution of multiple donors. The programme relies mainly on subsidies to industrialfirms.Theprogrammefocusesonpro-vidingsupporttobusinessesontwospecificpoints:a) dealing with the business environment con-straintsandb)improvethefirmsʼcompetitivenessby reducing costs, adopting innovative methods and upgrading technical capabilities. The programme mainlyprovidessubsidiesandfinancialsupporttofirmstoaccesstechnicalassistanceorupgradethe
means of production. Marouani and Marshalian (2020)studytheimpactofthisprogrammeonfirmsandfindthattheprogrammebenefittedonlysmallfirmsintermsofwageincreasesandjobcreation.Insmallfirms,wagesincreasedfrom10to17percent, with growth in employment and net job cre-ation.However,inlargerfirms,wagesdecreasedandtherewasnosignificantimpactonemploy-ment. Despite the importance of this programme, and as Ghali and Nabli (2020) indicated, it cannot be considered a vertical industrial policy despite focus-ingonmanufacturing.Itdoesnotfocusonspecifichigh-potential sectors in manufacturing but rather takes a broad approach. In terms of horizontal sup-port to manufacturing, Tunisian authorities also implemented an export-promotion programme, Fonds dʼaccès aux marchés dʼexportation (FAMEX) in 2005. The programme consists of providing match-inggrantsforTunisianfirmstoaccessexport-devel-opment assistance. Another interesting programme implemented in 2013 in Tunisia is the Competitive Industries and Innovation Programme (CIIP). The CIIP aims to strengthen existing sectoral clusters, including through enhancing public-private dia-logue mechanisms. In its pilot phase, the program focused on four sectors: pharmaceuticals, textiles and garments, IT services and medical tourism. The programme does focus on tackling sector-spe-cificbindingconstraintsandcanbeconsideredasa vertical instrument. However, this programme is a multi-country donor initiative and cannot be con-sidered as a national industrial policy. In general, and as indicated by Mouelhi and Ghazali (2020), the implementation of these programmes and indus-trialsupportsufferedfromlowcapacityandledtocoordination failures due to the fragmentation of multiple programmes without a clear overarching strategy and vision.
However, in 2018, Tunisia adopted a policy that focuses on services and that could be considered a modern industrial policy: The Start-up Act. The Start-up Act is a legal framework that aims to iden-tifyasetoffiscalandfinancialincentivesforinnova-tive and high-growth newly established enterprises (established for less than eight years). The Start-up Act was adopted by the Tunisian Assembly of PeopleʼsRepresentativesin2018andisbeingimple-mented since 2019. The Act is in theory sector-ag-nostic;however,theActʼsownership(MinistryofCommunication Technologies in charge of the ICT sector) and the eligibility criteria (innovation) indi-cate that the Act is meant mainly to focus on the ICT sector and other high-technology-based activities. The Start-up Act is the result of almost three years

Trade, investment and employment in the Southern Mediterranean Countries46
ofextensiveconsultationswithdifferentstakehold-ers. Unusually, the Start-up Act in Tunisia started as a private sector initiative and was later adopted by the Ministry of Communication Technologies. During its design, the Ministry of Communication Technologieswasledbytwodifferentministers.Both have put a strong leadership behind the Act and have considered it their main priority. The implementationoftheActhasdedicatedfinanc-ing from the Government as well as from donors, includingtheWorldBank.Morespecifically,theStart-upActfulfillsalmostallthefeaturesdefinedby Rodrik (2008):
X Embeddedness: the design of the Act included public and private actors. There is a systemic and periodic consultation with the private sector in the implementation, with the establishment of an advisory council composed of public and private actors that participate in selecting the enterprises benefiting from the support.
X “Carrot and stick”: the support provided is time-bound (start-ups need to have a maximum of eight years of establishment) and is condi-tional on performance. The advisory council an-nually monitors the performance of beneficiary enterprises.
X Transparency: The Start-up Act is well-docu-mented and well-publicized,25 including on a dedicated website that explains its journey, the incentives provided, the eligibility criteria and the results achieved. The implementation of the Start-up Act started in April 2019, with a clear implementation mechanism and governance. Also, the implementation of the Act is accompa-nied by clear evaluation and monitoring mech-anisms and data collection, which enables the evaluation of the policy and its impact.
Lebanon
Lebanonʼsindustrialandeconomicpoliciesfollowapath that is similar to other countries in the region in the 1990s; however, they were severely impacted by the civil war of 1975–1990. Lebanon is today largely a service-based economy with a very low role for the manufacturing sector, as demonstrated by the participation of services to GDP value-added. Particularly, construction, real estate and tourism playasignificantroleintheeconomy.
25 MoreinformationonTunisiaʼsStart-upActcanbefoundat:https://www.startupact.tn/rapport/Startup-Act-Annual-Report-2019-2020-en.pdf.
Targeted industrial policies have never been a pri-ority in the Lebanese economy (Atallah and Srour, 2014) and authorities have focused mainly on transversal investment policies to develop the pri-vate sector, complemented by trade liberalization measures discussed in the previous section. For instance, in 1995, the Investment Development Authority of Lebanon (IDAL) adopted an indus-trial zone strategy to develop manufacturing and industry across different regions and to attract investment through a set of incentives and services provision. Lebanon has today about 131 industrial zones, mainly in Beirut and in the north of the country (World Bank, 2016a). Lebanon also estab-lished the Logistics Free Zone in Beirut in 2007, operated by the Port of Beirut, to attract FDIs. The Government also established in 2008 the Tripoli Special Economic Zone (TSEZ), which aims to attract both local and foreign investment in manufactur-ing. Investors in these zones are provided one of the most generous incentives globally, with unlim-ited-in-time tax exemptions, including on corporate income, social security contribution and customs (World Bank, 2016a).
Occupied Palestinian Territory
The Palestinian economy and industry are highly restricted by the Israeli occupation. This translates in terms of control over imports of materials and inputs, as well the prevention of construction of industrial zones (Morrar and Gallouj, 2016). This severely constrains the development of a vibrant manufacturing sector in Occupied Palestinian Territoryandtheimplementationofeffectiveindus-trial policies. However, despite these structural chal-lenges, the Palestinian authorities have designed and implemented a set of policies since the 1990s to support the convergence process and develop their local economy.
In the 1990s, and following the liberalization wave in the region and across the globe, the Palestinian National Authority has worked to design and imple-ment mostly transversal industrial policies that focus on the improvement of the business environ-ment. For instance, the authorities adopted in 1998 the Industrial Free Zones Law and the Investment Promotion Act in an effort to attract FDIs and promote export-oriented industries (Morrar and Gallouj, 2016).

47 Chapter 2. Inclusive economic transformation through employment-oriented trade, industrial and investment policies
More recently, the Palestinian authorities have taken a more targeted approach to industrial pol-icies. For instance, the National Export Strategy (NES) adopted in 2014, with the support of the European Union and technical assistance from the ITC, includes a focus on eight targeted sub-sectors: stone and marble; olive oil and agro-processed meat; fresh fruits, vegetables and herbs; footwear and leather; textiles and garments; furniture; tour-ism; and information and communication tech-nology (ICT). These sectors have been selected according to their trade performance (export dynamics and world demand dynamics for a given product), their potential socioeconomic impact on employment and other qualitative considerations. The NES also includes a set of transversal and cross-cutting interventions, including the improve-ment of the public-private dialogue to bridge the gap between economic policies and the reality of themarketandimprovingthedeliveryefficiency.The NES has been developed following extensive consultation with private sector actors, as indicated by the strategy document, and is being imple-mented with a clear institutional framework and action plan. For instance, the NES recommends the creation of a Palestinian Export Council (PES) to not only monitor the implementation of the strategy but also to serve as a formal public–private dialogue platform. The NES indicates that the PES would be co-chaired by representatives from the public and private sectors to ensure a continuous and formal inclusionoftheprivatesectorʼsviews.Finally,thedocumentidentifiesaclearactionplanwithabud-get estimated for each intervention. From a design perspective,theNESdoesfulfilsomecriteriaiden-tifiedintheevaluationframework,includingtheuse of a clear methodology to select the sectors. However,itisuncleariftheselectionofbeneficiarycompanies does include the carrot and stick aspect and if there are implemented monitoring and eval-uation mechanisms that enable data collection and the evaluation of the NES with periodically pub-lished results.
Algeria
Industrialization and industrial policies in Algeria were historically heavily linked to the exploitation of its natural resources. Since its independence in 1962, the oil-exporting country focused on building heavy and state-led industries, using import substi-tutionpolicieswithhightariffsandquotabarriers.This policy focused on developing large state-owned enterprises and did not allow for strong par-
ticipation of the state. Begga and Merghit (2014) indicate that in 1970s, Algeria invested about half of its gross domestic product to develop a national state-owned industry. Like other countries in the regionanddrivenbysignificanteconomicchal-lenges, including a huge oil crisis in 1986, the country went through liberalization and structural adjustment reforms in the 1990s. This included the current account convertibility reform in 1997 and a privatization wave of state-owned enterprises (SOEs). Industry was dominated by low-productive andinefficientSOEsandbecameasignificantbur-denonastrugglingstate(Joffe,2002).Therefore,inthe early 90s, Algeria also witnessed a wave of pri-vatization of state-owned enterprises. However, this process did not yield the intended results, according to Begga and Merghit (2014).
Authorities have introduced more recent policies following the 2014 oil-prices crisis. Algeria adopted afive-yearinvestmentplan(2015–19),focusingondiversifying the economy, reducing the dependency on oil and hydrocarbons and increasing job creation in non-oil manufacturing sectors (Oxford Business Group, 2018). This plan takes a hybrid approach with transversal and targeted industrial policies. Transversal industrial policies focus on improving the competitiveness and business environment and developing SMEs, including by incentivizing horizontal and vertical linkages. Targeted indus-trial policies focused on developing the indus-trial landscape, identifying seven priority sectors: iron and steel; mechanical and metals; electrical and electronics; agri-business; chemicals; plastics and pharmaceuticals; and construction materials. Moreover, the authorities adopted an SME law (Law No. 17-02) in 2017, with the provision of tax incen-tivesforfirmsusingsub-contractingmechanisms(Oxford Business Group, 2018). Information about the details, design and implementation of this plan are scarce; therefore, its evaluation is highly con-strained. However, this plan and the inclusion of hybridinterventionsisafirststeptowardsadoptingindustrial policies that could support the economic diversificationinAlgeria.
Libya
LikeinAlgeria,Libyaʼseconomicdevelopmentwasheavily linked to the development of the oil indus-try. In the 1960s, the authorities implemented industrialpoliciesthatweremainlyfinancedfromtheoilrevenues,suchasthefirstfive-yeardevel-opmentplan(1963–68),whichincludedsignificantmeasurestoimproveagricultureʼsproductivityand

Trade, investment and employment in the Southern Mediterranean Countries48
develop manufacturing. The manufacturing and export sectors in Libya are virtually non-existent outside of the oil industry and industrial policies have never been a priority in the economic policy-making in Libya. Moreover, the economic infrastruc-turewasdegradedsignificantlyduringthecivilwarand economic uncertainty remains very high. An ini-tiative launched by the Libya Institute for Advanced Study called “Libya Vision 2020” aimed to provide a clear economic vision for the country, including for industrial development; however, this initiative remainedonpaperduetothecountryʼsongoingcivil war and uncertainty.
Summary
Overall, Morocco and Egypt stand out in the region asthecountriesthathaveputthemosteffortintodesigning and implementing industrial policies that combine transversal and targeted interventions. Morocco is the only country to design and imple-ment a repeated self-discovery process, with an updated list of targeted sectors and interventions basedonidentifiedeconomicchanges.Tunisiahasrecently adopted a well-designed and implemented industrial policy focusing on the ICT sector in ser-vices. However, the period of 2000–18 was marked by unstructured industrial policies that were shaped more by donor-funded programmes rather than an overarching and well-articulated policy. The 2011 revolution did not create momentum for effec-tive industrial policies in the country outside of the Start-up Act and jeopardized the implementation
of what looked like a promising industrial strategy (Horizon 2016) that aimed to focus on developing the manufacturing capabilities. Jordan and Lebanon have focused mainly on transversal policies, despite recent changes in Jordan, and their economic and industrial plans and programmes have been heavily affectedbytheseriesofwarsintheregion,includ-ing the Syrian civil war, which started in 2011, and the Islamic State formation in 2014. There are prom-ising signs in the Occupied Palestinian Territory, despite the severe impact of the Israeli occupation andtheseriesofconflictsintheregiononanyeco-nomic policy. The Occupied Palestinian Territory has taken important steps towards adopting and implementingeffectiveindustrialpolicieswiththeadoption of the National Export Strategy in 2014. Finally, for the oil-exporting countries in the region, thereareinterestingmeasurestowardsdiversifi-cation strategies, for example, in Algeria, with the adoption of the investment plan (2015–19) aiming to develop the industrial fabric in seven priority sectors in manufacturing. However, in Libya, the ongoingcivilconflictisseverelyconstraininganylong-term economic planning and visions, despite some interesting initiatives such as the “Libya Vision 2020” economic plan, mainly driven by the UN, civil society and private sector actors.
However, the design of industrial policies can be sig-nificantlyimprovedforallcountriesintheregion,including Egypt and Morocco (table 9). The main gaps remain on the conditionality of support pro-videdtofirms(thecarrotandstickfeature),theembeddedness and the social dialogue with the
X Table 9: Evaluation of the design and creation process of industrial policies in the region
CountriesAssessment criteria METI partner countries Other countries in the region
Egypt Jordan Morocco Tunisia Algeria Libya LebanonOccupied
Palestinian Territory
Selection of sectors/self-discovery process + o + o - - - o
Actionability o - o o - - - +
Carrots and sticks - - - o - - - -
Embeddedness - - - o - - - -
Political support + - + o - - - o
Financial commitment n/a n/a n/a n/a n/a n/a n/a n/a
Transparency/institutional settings - - - o - - - -
Legend: + = good; o = acceptable; - = needs improvement.

49 Chapter 2. Inclusive economic transformation through employment-oriented trade, industrial and investment policies
private sector and the transparency in the imple-mentation. Most of the countries in the region have some level of public-private dialogue. However, an effectivedialoguerequiresformalizedplatforms,frequency and transparency in the decision-making and deliberations, which remains a weak spot for most countries in the region. Another major gap is on the implementation and its transparency. There is limited information available on the implementa-tion mechanisms, which suggests that transparency and monitoring and evaluation mechanisms remain to be improved in the region. The example of the start-up act in Tunisia provides an interesting exam-pleforeffectiveandtransparentimplementationintheregion.Informationontheexactfinancialcom-mitment for the implementation of industrial poli-cies is unavailable for most countries. However, it is importanttohighlightthefactthateffectiveindus-trial policies take time and require commitment, politicalstabilityandimportantfinancialresourcestobeeffective.
2.2. Review of employment policies and underlying institutional mechanisms2.2.1. Review of employment policies Not all countries have separate and explicit national employment policies (NEPs); some countries incor-porate employment measures in national develop-ment plans or other national policies.
There are various incentives for adopting NEPs. First, the jobs crisis put employment policies on the agenda from the early 2000s. In Morocco, for example, the relatively sustained growth in recent yearswasnotsufficienttocreateenoughjobs,inquantity or quality. This situation requires proac-tive and explicit public action on employment in the form of an employment strategy. The NES acknowl-edges the cross-cutting nature of employment and that a wide array of measures cutting across both macro- and micro-economic dimensions and addressing both labour supply and demand are necessary to ensure a fair redistribution of growth benefitstoallcitizens.Second,thelabourmarketdisruptions, in 2020, arising from the COVID-19 pandemicareconfirmingthecrucialroleofemploy-ment policies, not only to mitigate the short-term impacts of the crisis, but also to promote recovery
26 ILO. 2020. National employment policies for an inclusive, job-rich recovery from the COVID-19 crisis, Geneva.
and strengthen the resilience of economies and labour markets to adverse shocks in the long-run.26 NEPs currently under formulation with the support of the ILO are already being adapted to focus on COVID responses. This is the case for Tunisia and Lebanon. Third, employment policy processes have also been stimulated by socio-political crises spe-cifictocertaincountries.AnotableexamplewastheArabSpring,inwhichpeopleʼsclaimsandprotestsalso centred around access to employment. From 2010 onwards, this led to the emergence of NEPs in Arab countries such as and Morocco and Tunisia.
A large number of countries have formulated stand-alone employment policies over the past two decades.Certaincountrieshaveofficiallyadoptedan NEP (Algeria, Jordan, Morocco and Occupied Palestinian Territory) while others are in the pro-cess of doing so (Lebanon and Tunisia). Other countries have adopted other types of NEP, such as the integration of employment objectives in their national development plans or other targeted strat-egies such as youth, rural or informal employment strategies. This is the case of Egypt, which has action plans for youth employment. Other coun-tries, such as Libya, have neither initiated a process nor adopted a policy.
The following sections provide a review of employ-ment policies in Tunisia, Egypt, Morocco and Jordan.
Tunisia
The National Plan for Development 2016–2020 aimed to make employment one of the most prom-inent objectives of sectoral policies, in parallel with the development of a number of measures and programmes that stimulate the pattern of creat-ing jobs and help job seekers to integrate into the labour market.
The formulation of the National Employment Strategy (NES) 2020–2030 is part of the continuity of the participatory and inclusive approach taken during the phase of diagnosing employment in Tunisia.ThefirststepintheNESprocessconsistedin the development of a diagnosis aimed at building a solid knowledge so that issues could be identi-fiedandaddressed,concreteobjectivescouldbedefinedalongsidenecessarypoliticalinterventions.
The Tunisian Employment Declaration of 29 March 2016 calls for the development of an “integrated national strategy that makes employment the

Trade, investment and employment in the Southern Mediterranean Countries50
central element of all sectoral policies and is based on a comprehensive approach to the issue, (...) by having (the) launch of a set of short-term measures that would complement the strategic approach to employment in the medium and long term."
This Declaration takes up the main guidelines set out in the social contract signed in January 2013 by the Government and the social partners. This contract marks the will of the Government and the social partners to move from a series of active labour market policies to a multidimensional and transversal employment strategy that incorporates themeasuresthatarelikelytocreatejobsinsuffi-cient quantity and quality, and a strategy that brings together a wide range of actors to engage in formu-lating employment policies and measures.
The Ministry of Vocational Training and Employment, the Tunisian General Union of Labour (UGTT) and the Tunisian Union of Industry, Trade and Handicrafts(UTICA)havedefinedtheinstitutionalmechanism to be put in place to ensure a formu-lation process based on a broad, participatory and inclusive dialogue. It is structured around a political committee, a steering committee and a technical committee. These tripartite and inter-ministerial committees bring together all the players con-cerned, and aim to promote the coherence of their actions, while guiding the formulation of the future employmentstrategy.Thefirstpoliticalcommit-tee,heldon22August2017,officiallylaunchedtheformulation process under the aegis of the Head of Government, in the presence of the Secretary General of the UGTT and the President of the UTICA, various ministers and representatives of ministerial departments, parliamentarians and technical and financialpartners.
The formulation of a NEP responds to the social projectofofferingdecentjobsforall,thatistosay,jobs where respect for fundamental principles and rights at work, the conditions for social dialogue, thebenefitofbasicsocialsecurityservicesandaminimum level of income deemed socially admis-sible are guaranteed.
Egypt
The January 2011 revolution placed the issue of unemployment in a position of major concern to Egyptian society, together with corruption and a lack of democracy. Prior to the revolution, Egypt did not have an approved policy or strategy for employment.
However, certain measures at developing employ-ment policies, action plans and labour market infor-mation systems are worth mentioning. During the 2006–2010 period, with support from the European Training Foundation (ETF), the Egyptian Observatory for Education, Training and Employment was cre-ated under the umbrella of the Information and Decision Support Centre (IDSC) within the cabinet of the Prime Minister. A steering committee was formed to include representatives from the relevant ministries, the private sector and civil society in the Observatory. A concept of labour market observa-tory was developed and a number of labour market analyses and capacity-building activities were car-ried out. This included seminars and workshops on labour market information systems and two study visitsforstafftoFranceandtotheNetherlands.
In May 2009, the Ministry of Manpower and Migration launched a comprehensive consultative process to develop a youth action plan, with the support of the ILO, GIZ and the United Nations. The Youth Employment National Action Plan 2010–2015 aimed to reduce youth unemployment and pro-vide decent and productive jobs. Its main objec-tives were to raise youth employability, to provide more job opportunities in key economic sectors and to resolve the mismatch between labour demand and supply by improving labour market policies and programmes.
More recently, the National Strategy for the Empowerment of Egyptian Women 2030, endorsed in March 2017, adopted a rights-based approach andisgroundedintheSDGsandEgyptʼsSustainableDevelopment Strategy 2030. The strategy promotes the leadership roles of women in both the public and private sector and sets a 30 per cent target for women in senior management posts by 2030.
Morocco
MoroccoʼsNationalEmploymentStrategy(NES)2015–2025 is a strategic vision of employment pre-pared by the Ministry of Employment and approved by the Government. It proposes a new approach to employment policy aiming at going beyond tradi-tional active labour market policies and the issue of unemployment. It aims to put employment at the core of public action and adopts a comprehen-siveapproachthatintegrateseconomic,financial,budgetary and institutional dimensions and takes intoaccountallthejobdeficitsandcategoriesofthepopulationaffectedbythesedeficits.

51 Chapter 2. Inclusive economic transformation through employment-oriented trade, industrial and investment policies
The NES proposes a set of strategic objectives to promote productive and decent employment in Morocco. It aims to:
X ensure a volume of employment compatible with potential demand;
X reduce gender and environmental inequalities (education and training);
X reduce disparities in productivity and income;
X extend social protection to all workers;
X ensure efficient representation of all categories of workers.
The NES aims to achieve two main objectives relatedtoyouthandwomen.Thefirstistoensurethatalltheconditionsforthecreationofsufficientjobs, in terms of number and quality, are met in order to respond to the expectations of youth. The second objective is to reduce gender inequalities and regional disparities in employment.
Moroccan policymakers and stakeholders have set a ten-year deadline to meet the aspirations of thecountryʼsyouthintermsofemployment.Thisnational employment strategy was intended to be innovative in that it broke with the old policies which werebasedsolelyonthefirst-timeintegrationofyoung graduates through active employment poli-cies. As such, the NES articulates three main levers: a) the promotion of productive employment, a) the development of human capital and a) good gover-nance of the labour market.
The NES is an ambitious project involving all of Moroccan counterparts and supported by the entire Government. Based on an innovative vision and approach and on strong values, including new methods and structures, it is a social project that promotes a new social model.
The NES is complemented by the National Integrated Youth Policy, 2015–2030, which was developed after more than a decade of measures tofacilitateyoungpeopleʼsintegrationintothelabourmarketdidnotyieldsignificantimprove-ments. The overall strategic objective of this strat-egy is to create equal opportunities for all Moroccan youth, including in the labour market. One of the fivepillarsofthisstrategyistoincreaseeconomicopportunities for young people and to promote their employability.
Jordan
In recent years, the Government of Jordan devel-oped multiple strategy documents with implica-
tionsforthelabourmarket.JordanʼsVision2025and Economic Growth Plan 2018–22 provide an overarching direction and prioritize the promotion of entrepreneurship, a reform of the educational system and reduced reliance on foreign workers. The Vision 2025 and the Economic Growth Plan are further elaborated in several national strategies.
Launched in 2012, the National Employment Strategy2011–20definesitsmaingoalas“improv-ing standards of living for Jordanians, through increasedemployment,wages,andbenefits,andproductivity improvements”. In order to achieve this goal, the NES suggests an integrated approach thatcombinesfiscal,monetaryandinvestmentpol-icies, as well as education and social welfare poli-cies. Its action points are divided into three phases. The short-term goal (until 2014) was to absorb the unemployed through targeted active labour market programmes and SME development programmes. In the mid-term (until 2017), the educational sector was supposed to be reformed in order to improve the school-to-work transition and reduce the skills mismatch in the labour market. The long-term goal (until 2020) focused on increasing productiv-ity through human capital development and eco-nomic restructuring. The Jordanian Government is currently preparing a new NES which is supposed to be launched in 2022.
To bridge the gap, the Ministry of Labour is imple-menting a National Empowerment and Employment Programme 2017–21 (NEEP) which seeks to foster the participation of Jordanians in the labour market and to create jobs for skilled Jordanians. Moreover, it strengthens labour inspection and compliance with occupational safety and health standards, fos-ters labour relationships with social partners and improves the quality of public employment services.
The NES as well as the NEEP place particular impor-tance on supporting women and the youth, two areas which are further elaborated in the National Youth Strategy (2019–25) and the National Strategy for Women (2020–25) respectively.
InlinewiththeNESʼsandNEEPʼsfocusonahighlyskilled and qualified workforce, the National Strategy for Human Resource Development (NSHRD)(2016–25)aimstoachieveJordanʼssocialand economic ambitions through an ambitious reform agenda for all sectors related to education.
Drafted in 2014, the National Entrepreneurship and SME Growth Strategy (2015–19) seeks to foster job creation and income generation by promoting business start-ups and improving the performance

Trade, investment and employment in the Southern Mediterranean Countries52
and growth of existing SMEs. However, the strategy andtheaccompanyingactionplanwereneveroffi-cially approved by the Government. In 2021, under the patronage of the Prime Minister, the Jordan Cooperative Corporation (JCC) launched a National Strategy for the Cooperative Movement in Jordan with the support of the ILO. This strategy seeks to strengthen the role of cooperatives in enhancing decentworkandproductivityindifferenteconomicsectors in the country.
2.2.2. Institutional mechanisms to shape employment-related policies in the Southern Mediterranean CountriesOver the last 20 years, NEP processes supported by the ILO have opened to a wider group of stake-holders, facilitating new frameworks and enhanc-ing social dialogue to generate a consensus around employment solutions. The common stakeholders are ministries in charge of labour and employ-ment,aswellasemployersʼorganizationsandtrade unions. Dialogue between the tripartite social partners has helped shape NEP processes, though the extent and outcomes have varied from one country to another. Over the last two decades, social dialogue around employment policymaking has also embraced new actors, such as the minis-triesinchargeofeconomyandfinanceandcivilsociety. However, important actors such as repre-sentatives of informal and rural workers are not always represented.
The following section reviews the main institutional mechanisms in place to derive employment policies
and elaborates on certain advantages and disad-vantages of the processes.
The Occupied Palestinian Territory and Tunisia have held employment policy discussions through existing tripartite social dialogue mechanisms, as per table 11. However, if the participatory process is held to short deadlines, or the Government does not recognize the value of social dialogue, the social partners will have little motivation to fully engage in the process. In Tunisia, for example, in 2012, the UGTT, the main trade union federa-tion, as well as line ministries, complained about a lack of involvement. The resulting draft National Employment Strategy was not recognized, which blocked its adoption. It was not until 2016–17 that a new employment strategy formulation process was launched by the Tunisian Government.
In some countries, negotiations on conflictive issues such as pension reform, the revision of the labour code, or wage negotiations, have been tense or blocked. In these circumstances, discussions on employment policy, which are less controversial, can be a point of entry for restoring social dialogue and strengthening tripartism. In Morocco, for example, when work began on the national employ-mentstrategy,theworkersʼorganizationshadjustwithdrawn from negotiations on the revision of the labour code.
Over the past two decades, there has also been greater involvement of other strategic actors beyond the traditional tripartite partners. This includes other economic and sectoral ministries that act as job creators, including agriculture, industry, trade and infrastructure. Most countries have ensured the participation of the economy
X Table 10: Characteristics of national employment strategy (NEP) formulation
Country Year of adoption Duration of formulation
Participants other than social partners and ministries responsible for employment Dialogue
Economy/Finance Ministry Civil society Other* Regional Local
Algeria 2008 n/a No No Yes No No
Jordan 2011 n/a Yes Yes Yes No No
Morocco 2015 2–3 years Yes No Yes No No
Occupied Palestinian Territory 2020 4–5 years Yes No Yes No No
Note: *This can include representatives of sectoral ministries, academia, think tanks, development partners, private sector, etc.Source:DʼAchon,Eléonore,Twodecadesofnationalemploymentpolicies:2000–2020,PartI:Employmentpolicydesign:Lessonsfromthe past, policies for the future. (ILO, 2021).

53 Chapter 2. Inclusive economic transformation through employment-oriented trade, industrial and investment policies
X Table 11: Modalities of stakeholder engagement in national employment strategy (NEP) formulation processes
Country Political committee Steering committee Technical committee Thematic groups Tripartite social dialogue committees
Occupied Palestinian Territory 2020
A tripartite interministeri-al committee, under the leadership of the Minis-try of Labour and host-edbytheCabinetOfficewas established to devel-op the NES. The mem-bers included represen-tatives of the ministries of Labour; General Sec-retariat of the Council of Ministers; Higher Edu-cationandScientificRe-search; Education; Indus-try; Social Development; WomenʼsAffairs;Entre-preneurship and Empow-erment; Economy; Pub-lic Works and Housing; Tourism and Antiquities; and Agriculture – as well as the Palestinian Gen-eral Federation of Trade Unions, the Federation of Palestinian Chambers of Commerce and the Pales-tinian Central Bureau of Statistics.
Various sectoral work-shops were conducted to identify policy priorities by sector.
Tunisia (to be adopted) Political committee: chaired by the Head of the Government and composed of the direc-tors of the UGTT (trade union) and the UTICA (employers) and all Min-isters.
Steering committee chaired by the Minister of Vocational Training and Employment and com-posed of the social part-ners and seven Ministers (SocialAffairs,Economy,Finance, Industry, Agri-culture, Higher Educa-tion, and Tourism).
Technical committee: chaired by the Employ-ment Department of Vocational Training and Employment Ministry and composed of the so-cial partners as well as the Ministries of Employ-ment, Finance, Social Af-fairs; Economy; Industry; Agriculture; Higher Edu-cation, and Tourism.
Four ad-hoc working groups were set up: Mac-roeconomic and sectoral policies; Human capital development; Labour market governance; and NEP implementation.
Source:DʼAchon,Eléonore,Two decades of national employment policies: 2000–2020, Part I: Employment policy design: Lessons from the past, policies for the future. (ILO, 2021).
andfinanceministriesaspertable10.Otheractorsthat are key to employment and are increasingly included are central banks (Jordan and Morocco), national statistics offices (Morocco), regional actors (Morocco), as well as other technical and financialpartners.
ILOsupportandefforthasalsohelpedextendpol-icy discussions to other actors key to employment but that were previously absent from the NEP dis-cussions. These have included central banks (Jordan andMorocco),nationalstatisticsoffices(Morocco),regional actors (Morocco), as well as other technical andfinancialpartners.
More recent processes have seen greater involve-ment from civil society organizations (CSOs) and
representativesfromspecificsegmentsofthepop-ulation, for example young people in Tunisia and people with disabilities in Jordan. Nevertheless, there is still a generally low participation from asso-ciations for young people, women, unemployed and others.
A critical component of participation is access to information. One problem is that employment diagnostic and policy documents tend to be long and daunting. With ILO support, some ministries have therefore tried also to provide simple and clear versions for other line ministries, social partners, civil society and the general public. In Morocco and Tunisia for example, the ILO supported the pro-duction of more accessible versions of the national employment strategies. Similarly, Morocco and

Trade, investment and employment in the Southern Mediterranean Countries54
Tunisia produced thematic policy briefs to make the main ideas in technical diagnostic analyses available to a wider audience. Such initiatives on simplifying policies and studies should be further supported to enable line ministries, social partners, CSOsandthepublictoengagemoreconfidentlyinpolicy debates.
Somecountrieshavealsomadeeffectiveuseofinformation and communication technologies to extend information on employment policy to a wider range of stakeholders and the public. In other countries, the ILO supported the creation of portals and dedicated websites with all the documents on the consultation process along with webcasts (for example, in Morocco and Tunisia). Unfortunately, these websites are rarely updated. That is why some countries, such as Tunisia, have looked beyond a traditional communication approach, using the usual mass media and websites, to fuller commu-nication strategies to promote visibility of the NEP and encourage everyone to take ownership of it.
The scope of employment policy diagnostic anal-yses has expanded over time. They are no longer the exclusive domain of the ministries responsible for employment. The latest diagnostic analysis aims at identifying the constraints on and opportunities for enhancing inclusive job-rich growth as well as the issues that need to be addressed in order to enhance productive and decent employment.27 Assuch,theycoverallthedifferentareasofinter-vention, which have an impact on supply and/or demand for labour, as well as on the functioning of the labour market. Such comprehensive diagnos-tics have been undertaken in Morocco and Tunisia.
In many cases, specific studies are also under-taken to examine certain topics in greater depth. Thenumberofstudiesandtheirscopevarysignifi-cantly from country to country, depending on the needs, the priorities and the gaps to be addressed. This includes studies combining employment with macroeconomic policies, gender or sectoral policies as in Tunisia.
Data collection, assessment methods and modelling approaches also evolved over the years. In the con-text of the COVID-19 crisis, for example, new data collection methods as well as analytical approaches
27 See for example, the ILO diagnostics carried out under the ILO-Sida partnership country reports on Delivering on SDG8 and the ILO Rapid Assessments of the COVID-19 impacts on employment.
28 ILO, Technical brief: Rapid Diagnostics for Assessing the Country Level Impact of COVID-19 on the Economy and Labour Market - Guidelines, 2020. For more on rapid assessments undertaken in various countries, see https://www.ilo.org/emppolicy/areas/covid/lang--en/index.htm.
29 ILO, Country Assessments, 2020.
30 ILO, Employment Diagnistoic Analysis, 2012.
have been developed to respond to the increased uncertainty and the need for more and more rapid information. For example, high-frequency data and phone-based rapid labour force surveys have been carried out (for instance, in Egypt, Morocco, Jordan and Tunisia). The ILO has also developed guidelines to undertake rapid assessments of the labour mar-ket.28 On this basis, a range of assessments have been carried out in a number of countries, including in Lebanon and Morocco).29
In more recent NEP processes, ILO support has been aimed at stimulating a debate over the entire lifecycle,frominitialdiagnosistofinalvalidation.This has typically been done in a series of work-shops lasting over several days, as in Tunisia.30 Similarly, Moroccosetupfivethematicworkshopson macroeconomic and sectoral policies, human capital development, labour market governance, NEP implementation, and regionalization of the NEP. These workshops established the strategic orientations and proposed operational responses to the main employment problems. Similar dia-logues were organized in other countries, includ-ing in Tunisia.
The methods and forums of participation will depend on the objectives and stages of the pro-cesses, the available time and resources, the stakeholders participating, and according to what level, for instance, political or technical, as in the Occupied Palestinian Territory and Tunisia (table 11). In addition to formal forums, there have also been iterative consultations carried out through a range of formal and informal methods – such as working groups, circulation for com-ments, bilateral discussions, interviews, question-naires and workshops – in order to gather a wide range of opinions. Morocco, for example, had NEP steering and technical committees (both tripartite and inter-ministerial), and also a series of thematic groups for stakeholders. In addition, each stake-holder received a questionnaire through which they could identify existing measures and policies within their responsibility that would support the strategic objectives of the NEP. They could also identify ben-efits,harmsandcostsofcurrentpoliciesandtheirimpact on employment. Consultations and political advocacy also included all forms of discretionary,

55 Chapter 2. Inclusive economic transformation through employment-oriented trade, industrial and investment policies
ad hoc, and informal contacts – from phone calls to letters, informal meetings and circulation for com-ments to the collection of information and views from interested parties.
The COVID-19 context is making it more import-ant than ever to develop new ways of engaging remotely with stakeholders and the public and developing new tools to facilitate online consulta-tions and e-participation. In this context, further effortsareneededtodevelopinnovativepublicpolicydesign,includingthroughsmartandeffi-cient use of information and communication technologies.
In some countries, forging alliances, including with those who have a successful track record influ-encing national policies, not only helped ensure that research efforts across governmental and academic structures are complementary, but also proved useful in securing the engagement of key actors for employment. In Morocco, the Ministry of Employment worked with the High Commission for Planning and the Ministry of Finance to draw up forecasts and costed objectives.
Toensurebuy-infromgovernmentofficials,theNEP requires political advocacy in the form of brief-ing notes, facts, media and messaging, as well as creating relationships. In other cases, the support of the head of the government was enlisted to start the formulation process or launch the NEP, for instance in Tunisia. Other ways of mobilizing political engagement included integrating employ-ment as a priority in national development plans or in key reference frameworks of the constitution, as in Tunisia. In Tunisia, the Social Contract (2013) and the Declaration on Employment (2016) were signed by the highest representatives of the tripartite part-ners. This Declaration outlines eleven principles to guide further action on employment, including the need to adopt a comprehensive employment strategy covering all aspects of job creation. It was signed by the Tunisian Prime Minister, the heads of workersʼandemployersʼorganizations(UGTTandUTICA) and in the presence of the UN Secretary General and the ILO Director General. This estab-lished a solid political basis for the NEP formula-tion process and a common point of reference for diverging views.
In a few cases, the NEP processes have also includedcitizensʼvoicesandfeedbacktoensurethat the NEP addresses the real needs of popula-tions. In Tunisia for example, “quick” youth and enterprise surveys have been carried out to bet-
ter understand the problems and aspirations of young people and enterprises. In addition, youth representatives were invited to join some NEP dis-cussions, including those identifying the vision and strategic objectives of the NEP.
Lower levels of government can respond to local employmentneedsinrapid,targeted,effectiveandappropriate ways. In Morocco, for example, this has been achieved by having regional representa-tives participate in national workshops. In addition, sub-national or provincial action plans were devel-oped after adoption of the NEP. In 2017 in Morocco, the ILO supported the development of territorial policies in three pilot regions: Rabat-Salé- Kénitra, Tangier-Tétouan, Al Hoceima and Souss-Massa. In workshops held over several months, the par-ticipantsidentifiedtheproblemsandthepolicymeasurestogether,thusofferingaplatformforregional negotiations and tripartite consultations between public authorities and social partners. These regional plans bring new solutions for spe-cificregionalemploymentissues,whilealsobeingin line with the wider national employment strat-egy. They also help address the issue of regional dis-parities which are particularly pressing in Morocco. This approach is now being replicated in the other regions of Morocco.
Assembling all NEP partners for continuous coordi-nation throughout the planning process is crucial but does not happen naturally. In practice, these coordination mechanisms vary. In the absence of appropriateoreffectivetripartiteandinter-min-isterial structures, many countries have set up ad hoc committees for NEP design, as seen in Tunisia. The NEP processes in this and other countries have demonstrated two important requirements: they should be tripartite and inter-ministerial and oper-ate at high levels of government.
2.3. Impact of industrial, investment and trade policies and structural transformation and the labour market2.3.1. Structural change in the region Countries in the region witnessed relatively high lev-els of growth from 2000 to 2009 before the 2011 social movements. However, this high-growth decade experienced relatively lower levels of labour productivity and employment growth (table 12).

Trade, investment and employment in the Southern Mediterranean Countries56
Outcomes between 2009 and 2019 were at lower levelsthanfrom2000to2009,reflectingthesignif-icant political and institutional challenges that the region witnessed during the last decade. From 2009 to 2019, employment growth was slow, particularly in Morocco and Tunisia.
Since 2000, the region has gone through a shift of labour from agriculture; however, this shift has been mainly towards services, with at best a rela-tively stable share of manufacturing and industry in differentcountries.Intermsofoutputs,thecontri-bution of the broad sectors to GDP in value-added didnotsignificantlychangeinthecountriesintheregion(figure35).Intermsofbothemploymentand outputs, most of the economies in the region are service driven, particularly in Lebanon, in which the share of services in outputs increased to around 80 per cent in 2019.
Manufacturing, which has been historically the driver of structural transformation for more advancedeconomies,hasadifferentweightacrossthe region but has been at best stagnant and at worst decreasing in countries in the region. The manufacturingshareinAlgeriaʼsoutputsisthehighest in the region; however, its structure is mainly driven by heavy industries linked to nat-uralresourcesprocessingandrefining,whichisreflectedinthestructureofAlgerianexports.The
share of manufacturing in Algeria decreased sub-stantially, from 45.4 per cent in 2000 to 23.8 per cent in 2019, which might be due to the poor results of the reform of state-owned enterprises since the 1990s. The share of manufacturing in out-put increased from 1990 to 2010 in Egypt, Jordan and Tunisia, with a peak around 2008 in Jordan andTunisia.Since2010,manufacturingʼsshareinoutput in Jordan and Tunisia has been slightly but steadily decreasing, while in Egypt and Morocco, manufacturingʼscontributiontooutputshasbeenrelativelystable(figure36).Overall,theshareofmanufacturing in value-added reached lower lev-els in 2019 than in 2000 in almost all the countries, except in Jordan and Occupied Palestinian Territory (figure37).
Generally, countries in the Southern Mediterranean Countries have made an early shift towards services, bypassing the manufacturing-driven structural change, as levels of GDP per capita remain relatively low in these middle-income countries. Looking at developedcountriesʼhistoricaldevelopmentpath,the shift to services happened with a deindustri-alization process at high levels of GDP per capita, which is not the case for countries in the region. ThisisconfirmedbyMouelhiandGhazali(2020)forEgypt, Morocco and Tunisia. The authors study the structural transformation in these three countries between 1960 and 2010, using the decomposition
X Table 12: Average annual growth of aggregate labour productivity, gross value-added (GVA) and employment, 2000–09 and 2009–19 (percentage)
Country Aggregate labour productivity growth GVA growth Employment growth
2000–09 2009–19 2000–09 2009–19 2000–09 2009–19
Algeria –1.5 1.1 3.5 2.6 5.1 1.5
Egypt - 2.3 5.0 3.4 - 1.2
Jordan - - 6.3 2.6 - -
Lebanon - - 5.8 1.2 - -
Libya - - - - 3.2 1.5
Morocco 2.5 2.6 5.0 3.2 2.4 0.7
Occupied Palestinian Territory 2.3 1.3 4.8 4.4 2.9 3.6
Tunisia 2.5 1.0 4.4 1.8 1.9 0.8
Note: Available data for employment is from 2000 to 2019. In order to be able to compare two similar time series, we divide this period into 2000–09and2009–19.LabourproductivityisdefinedhereasGVA(constant2010US$)/Totalemployment,consideringtheunavailabilityof the number of hours worked data. Source: WDI for GVA, ILO for employment data. Employment data available for Egypt only from 2009 to 2019, for Jordan only from 2017 to 2019, for Lebanon only for 2019 and GVA data unavailable for Libya.

57 Chapter 2. Inclusive economic transformation through employment-oriented trade, industrial and investment policies
X Figure 35: Evolution of sectorsʼ participation to GDP in value-added
Note: The value-added shares presented in the World Development Indicators for agriculture, industry and services may not always add up to a hundred per cent due to FISIM and net indirect taxes. Note that GDP in the database is measured at purchaser prices.Source: WDI.
Agriculture Industry Services
0
20
40
60
80
100
Perc
enta
ge
Algeria
2000 2010 20190
20
40
60
80
100
Perc
enta
ge
Egypt
1970 1980 1990 2000 2010 20190
20
40
60
80
100
Perc
enta
ge
Jordan
1970 1980 1990 2000 2010 2019
0
20
40
60
80
100
Perc
enta
ge
Lebanon
2000 2010 20190
20
40
60
80
100
Perc
enta
ge
Morocco
1980 1990 2000 2010 20190
20
40
60
80
100
Perc
enta
ge
Tunisia
1970 1980 1990 2000 2010 2019
X Figure 36: Share of manufacturing in GDP in value-added in the Southern Mediterranean Countries (percentage)
Source: WDI, data missing for Libya, data for 1980 and 1990 missing for Algeria, Lebanon and Occupied Palestinian Territory.
1980 1990 2000 2010 2015 2019
0
10
20
30
40
50
Perc
enta
ge
Algeria Egypt,
Arab Rep.
Jordan Lebanon Morocco Occupied
Palestinian
Territory
Tunisia
45.5
39.0
22.9
23.8
18.0
16.1
12.4 17
.0
16.7
15.9
13.5 18
.9
9.0 12
.8 18.4
17.7
11.4
7.7
8.1
5.6
18.5
15.618
.0 19.3
16.1
14.9
10.4 12
.29.
3 11.5 16
.216
.5
11.8 16
.9
15.3
14.8
60

Trade, investment and employment in the Southern Mediterranean Countries58
X Figure 37: Evolution of manufacturing value-added as per cent of GDP in METI partner countries, 1970–2019
Source: WDI
0
5
10
15
20
25
Perc
enta
ge
Egypt
19
80
19
90
20
00
20
01
20
02
20
03
20
04
20
05
20
06
20
07
20
08
20
09
20
10
20
11
20
12
20
13
20
14
20
15
20
16
20
17
20
18
20
19
0
5
10
15
20
25
Perc
enta
ge
Jordan
19
70
19
80
19
90
20
00
20
01
20
02
20
03
20
04
20
05
20
06
20
07
20
08
20
09
20
10
20
11
20
12
20
13
20
14
20
15
20
16
20
17
20
18
20
19
0
5
10
15
20
25
Perc
enta
ge
Tunisia
19
70
19
80
19
90
20
00
20
01
20
02
20
03
20
04
20
05
20
06
20
07
20
08
20
09
20
10
20
11
20
12
20
13
20
14
20
15
20
16
20
17
20
18
20
19
0
5
10
15
20
25
Perc
enta
ge
Morocco
19
70
19
80
19
90
20
00
20
01
20
02
20
03
20
04
20
05
20
06
20
07
20
08
20
09
20
10
20
11
20
12
20
13
20
14
20
15
20
16
20
17
20
18
20
19
of labour productivity growth used by McMillan and Rodrik (2011b), which aims to identify the source of labourproductivitygrowth,differentiatingbetweenwithin-sectoreffectsandlabourreallocationeffects.Within-sectoreffectsarelinkedtointrinsicimprove-ments within a sector and demonstrate an improve-ment in technological capabilities beyond labour. Labourreallocationeffectstranslatetheproductiv-ity gains linked to structural change contribution and to the movement of labour between sectors. Theauthorsfindthatthepaceofstructuraltrans-formation in Morocco, Tunisia and Egypt has been higher before 1990 than from 1990 to 2010, during which structural transformation slowed down while countries were still at a low level of development before catching up with the emerging countries.
In other words, the three countries witnessed an early deindustrialization contrary to the experience of developed countries.
Deindustrializationisdefinedindifferentwaysinthe literature, mainly either by focusing on the evo-lution of manufacturing share in employment or outputs. However, Rodrik (2016) indicates that dein-dustrialization is clearer in manufacturing employ-ment share than in terms of value-added share. In almost all countries in the region, employment growth in services has been higher than in industry since1991(figure38),exceptforJordan.Theshiftoflabour is in most countries from agriculture to ser-vices in the region. Meanwhile, the share of indus-try and manufacturing employment has remained

59 Chapter 2. Inclusive economic transformation through employment-oriented trade, industrial and investment policies
X Figure 38: Evolution of the structure of employment in the eight countries in the region, 1991–2019
0
20
40
60
80
100
Perc
enta
ge
Egypt1
99
1
19
92
19
93
19
94
19
95
19
96
19
97
19
98
19
99
20
00
20
01
20
02
20
03
20
04
20
05
20
06
20
07
20
08
20
09
20
10
20
11
20
12
20
13
20
14
20
15
20
16
20
17
20
18
20
19
0
20
40
60
80
100
Perc
enta
ge
Jordan
19
91
19
92
19
93
19
94
19
95
19
96
19
97
19
98
19
99
20
00
20
01
20
02
20
03
20
04
20
05
20
06
20
07
20
08
20
09
20
10
20
11
20
12
20
13
20
14
20
15
20
16
20
17
20
18
20
19
Employment in Agriculture Employment in Industry Employment in Services
0
20
40
60
80
100
Perc
enta
ge
Morocco
19
91
19
92
19
93
19
94
19
95
19
96
19
97
19
98
19
99
20
00
20
01
20
02
20
03
20
04
20
05
20
06
20
07
20
08
20
09
20
10
20
11
20
12
20
13
20
14
20
15
20
16
20
17
20
18
20
19
0
20
40
60
80
100
Perc
enta
ge
Tunisia
19
91
19
92
19
93
19
94
19
95
19
96
19
97
19
98
19
99
20
00
20
01
20
02
20
03
20
04
20
05
20
06
20
07
20
08
20
09
20
10
20
11
20
12
20
13
20
14
20
15
20
16
20
17
20
18
20
19

Trade, investment and employment in the Southern Mediterranean Countries60
X Figure 38 (continued)
0
20
40
60
80
100
Perc
enta
ge
Algeria
19
91
19
92
19
93
19
94
19
95
19
96
19
97
19
98
19
99
20
00
20
01
20
02
20
03
20
04
20
05
20
06
20
07
20
08
20
09
20
10
20
11
20
12
20
13
20
14
20
15
20
16
20
17
20
18
20
19
0
20
40
60
80
100
Perc
enta
ge
Libya
19
91
19
92
19
93
19
94
19
95
19
96
19
97
19
98
19
99
20
00
20
01
20
02
20
03
20
04
20
05
20
06
20
07
20
08
20
09
20
10
20
11
20
12
20
13
20
14
20
15
20
16
20
17
20
18
20
19
Employment in Agriculture Employment in Industry Employment in Services
0
20
40
60
80
100
Perc
enta
ge
Lebanon1
99
1
19
92
19
93
19
94
19
95
19
96
19
97
19
98
19
99
20
00
20
01
20
02
20
03
20
04
20
05
20
06
20
07
20
08
20
09
20
10
20
11
20
12
20
13
20
14
20
15
20
16
20
17
20
18
20
19
0
20
40
60
80
100
Perc
enta
ge
Occupied Palestinian Territory
19
91
19
92
19
93
19
94
19
95
19
96
19
97
19
98
19
99
20
00
20
01
20
02
20
03
20
04
20
05
20
06
20
07
20
08
20
09
20
10
20
11
20
12
20
13
20
14
20
15
20
16
20
17
20
18
20
19
Source: WDI

61 Chapter 2. Inclusive economic transformation through employment-oriented trade, industrial and investment policies
relatively stable, with a relatively slow increase for Egypt, Jordan, Morocco and Tunisia between 1990 and 2019, driven mainly by construction. For Jordan, the share of employment in services remained sta-ble at a very high level since the 1990s (at about 73 per cent of the employed population). There are signs of an increase in agricultural productivity in most countries in the region between 1990 and 2019,withthegrowthinthesectorʼscontributiontoGDP being higher than the growth in employment. However, for industry (including construction and utilities),thegrowthinthesectorʼscontributiontoGDP has been slower than the growth in employ-ment for almost all countries in the region.
The region is witnessing an early deindustrialization. First, historically, manufacturing is the main channel through which rapid growth and labour productiv-ity convergence have taken place. Therefore, early deindustrialization might take away a rapid growth perspective, leaving the countries in the region stuck in the “middle-income” trap. Second, as indi-cated earlier in this chapter, manufacturing growth is generally associated with a decrease in inequality, as it creates a demand for low-skilled workers, who are relatively abundant in countries in the region. For instance, in a recent study, Ravindran and Babu (2021)findthatincomeinequalityriseswithpre-mature deindustrialization if the displaced workers are absorbed into services, especially with employ-ment increases in low-productivity services such as wholesale and retail, transport, hotels and accom-modation. The shift towards high-productive ser-vices might yield the same manufacturing results in terms of rapid growth, labour productivity con-vergence and inequality reduction. However, they wouldrequireasubstantialup-skillingofasignifi-cant part of the labour force.
2.3.2. Impact of industrial, investment and trade policies on exports and FDIs2.3.2.1. Evolution of exports
Despite the relatively slow structural change in the region, trade and investment policies have gen-erally yielded some positive results, with higher levels of exports in 2019 before the COVID-19 pandemic than in 2000. However, the results have been uneven across countries in the region. Egypt and Morocco have been driving the export growth intheregion,reflectingbothcountriesʼeffortsintrade, investment and industrial policies in the
past decades. Since the early 2000s, exports of bothcountriesincreasedsignificantly(figure39).However, the instability following the 2011 social movements had negative effects on the export growth trajectory; for both countries, the upward trajectory resumed in 2015. Both countries now had 2019 very similar levels of merchandise exports, which is quite remarkable for Morocco, consider-ingthedifferencesinthesizeofbotheconomies(EgyptʼsGDPis2.5timeshigherthanMoroccoʼsGDP).InEgypt,the2004tariffreformresultedinsignificanttradeincreasesforthecountry,withexports increasing on average annually by 5 per cent before 2004 and 24 per cent after this date, while imports increased by 2 per cent and 24 per cent, respectively (Selwaness and Zaki, 2013).
However, trade and investment policies seem not to have yielded the same results for Jordan, Lebanon andTunisia(figure39).Thesethreecountriescanbe considered stagnant in terms of merchandise exports. After the 2011 social movements, these countries experienced a relative decrease in mer-chandise exports but since 2012 have remained at an almost constant level. In Jordan and Lebanon, this can be explained by the heavy impact of the Syriancivilwarandtheregionʼsconflictsingen-eral. It is worth noting that merchandise exports in the Occupied Palestinian Territory witnessed the regionsʼsteepestgrowthbetween2012and2019,with an increase of 60 per cent. However, the base-line level of exports was by far the lowest in the region, at US$775 million in 2012.
For the oil exporting countries in the region, exports havebeenfluctuatingfollowingasimilarpatternforAlgeriaandLibyabetween2000and2019(fig-ure40).Thisreflectsthehighdependencyonoilinboth countries, which exposes them to price vola-tility,whichhasbeenparticularlysignificantsince2020 with the COVID-19 crisis. This emphasizes the importance of investing in economic diversi-ficationinbothcountriesandanurgentneedtoadopt industrial policies to diversify their export baskets and build the competitiveness of their economies, while creating quality jobs for their young population.
There is some evidence that the Euro-Mediterranean Association Agreements have resulted in positive outcomes for Algeria, Egypt, Jordan, Lebanon, Morocco and Tunisia. For instance, Euro-Med FTAS have been positive on trade, GDP and welfare, and theyhavebenefittedthesecountriesproportionallymore than they did the EU. Exports from these six countries to the EU are estimated to have increased

Trade, investment and employment in the Southern Mediterranean Countries62
by 15 per cent and their imports rose by 32 per cent on average (European Commission, 2021). Moreover, these countries are estimated to have experiencedpositiveincomeandwelfareeffects,ranging from 0.4 per cent of GDP (0.4 per cent of welfare) in Egypt to, respectively, 0.4 per cent, 0.6 per cent and 1.5 per cent of GDP (0.1 per cent, 0.4 per cent and 1.5 per cent of welfare) in Jordan, Morocco and Tunisia.
Historically, Tunisia and Morocco are competitors in the region. Both countries have relatively same comparative advantages, including the same nat-ural resources (such as phosphate) and they both export to the same markets (mainly European coun-tries). Both countries have historically focused on
the same sectors, starting from textiles in the 1970s and 1980s and more recently on more complex and skill-intensive sectors such as pharmaceutical, automobile and aeronautics. Over the past decade, however, Tunisia and Morocco have been on a diverging trajectory, despite recording very similar export levels before 2010. Since 2009, this dynamic has shifted, with Moroccan exports increasing at a much higher pace than Tunisian ones. Three main reasons can explain this:
X First, Morocco has signed an FTA with the United States, effective since 2006, which significantly increasedMoroccoʼsexportstotheUSA(table13) and provided Moroccan exports a huge ad-ditional market compared to Tunisia.
Source: UNCTAD.
Source: UNCTAD.
X Figure 39: Evolution of exports in non-oil-exporting countries of the Southern Mediterranean Countries (US$ thousands)
X Figure 40: Evolution of exports in oil-exporting countries of the Southern Mediterranean Countries (US$ thousands)
US$
thou
sand
Egypt Jordan Lebanon Morocco Tunisia Occupied Palestine Territory
2000 2005 2010 20142012 20162015 20182017 2019
US$
thou
sand
Algeria Libya
2000 2001 2002 2003 2004 2005 2006 2007 2008 2009 2010 2011 2012 2013 2014 2015 2016 2017 2018 2019
35,000,000
30,000,000
25,000,000
20,000,000
15,000,000
10,000,000
5,000,000
0
80,000,000
60,000,000
40,000,000
20,000,000
0
US$
thou
sand
Egypt Jordan Lebanon Morocco Tunisia Occupied Palestine Territory
2000 2005 2010 20142012 20162015 20182017 2019
US$
thou
sand
Algeria Libya
2000 2001 2002 2003 2004 2005 2006 2007 2008 2009 2010 2011 2012 2013 2014 2015 2016 2017 2018 2019
35,000,000
30,000,000
25,000,000
20,000,000
15,000,000
10,000,000
5,000,000
0
80,000,000
60,000,000
40,000,000
20,000,000
0

63 Chapter 2. Inclusive economic transformation through employment-oriented trade, industrial and investment policies
X Second, the export of phosphate products31 in Tunisia decreased significantly after 2011 due to the continuous social crisis in the Gafsa mining area. On the other hand, Morocco, the other major phosphate producer and exporter in the region, undertook significant reforms starting in 2008 to improve the governance and functioning of the OCP (Office Chérifien des Phosphates), the state-owned enterprise inchargeofexploitingthecountryʼsphosphateresources. As a result, exports of Moroccan phosphate products were double in value to the Tunisian ones in 2019, after having been at the same level in 2009 (table 14). This widening gap in phosphate exports might explain why MoroccoʼsexportstoEuropeincreasedsignif-icantlymorethanTunisiaʼsbetween2009and2019 (table 13).
X Third, Morocco has relatively diversified its ex-port destinations compared to Tunisia, including increasing exports to Asia and Africa between 2009and2019.Forinstance,MoroccoʼsexportstoAsiadoubledwhileTunisiaʼsexportstothe
31 Definedasphosphoricacid,phosphinatesandphosphonates,phosphides,phosphoricestersandsalts,phosphaticfertilizersandcalciumphosphates.
continent remained at the same level between 2009 and 2019. Also, Morocco has been inten-sively investing in sub-Saharan African countries over thea past decade, with an increasing level of FDI outflows to the region, which significantly increased its exports to the African continent. Contrary to this dynamic, Tunisian exports to Africa decreased between 2009 and 2019.
Interestingly, the evolution of manufacturing labour productivityalsoreflectsthedivergentpathsthatTunisia and Morocco have taken since 2010–11 (figure 41). Between 2000 and 2011, manufac-turing labour productivity (expressed in constant 2010 US$) was at similar levels between Tunisia and Morocco. However, there is a clear turning point in 2011, with manufacturing labour produc-tivity in Morocco increasing faster than the stag-nant and even decreasing productivity in Tunisia. This suggests that the industrial and trade policies implementedinMoroccohaveyieldedsignificantresults, at least from an export and labour produc-tivity perspective.
X Table 13: Comparison of the evolution of exports between Tunisia and Morocco, 2009–19 (US$ million)
Exports to continent Country 2009 2019
Europe Tunisia 12,117.48 13,023.45
Morocco 10,730.94 22,146.31
North America Tunisia 399.19 584.91
Morocco 742.93 2,077.27
Asia Tunisia 1,185.76 1,174.79
Morocco 2,906.90 4,953.36
Africa Tunisia 2,052.87 1,714.76
Morocco 1,575.61 2,412.74
Source: Observatory of Economic Complexity.
X Table 14: Evolution of exports of phosphate products in Morocco and Tunisia, 2009–19 (US$ million)
Country 2009 2010 2011 2012 2013 2016 2018 2019
Morocco 16,103.26 20,380.84 24,488.97 24,965.84 26,152.15 26,579.72 34,219.01 32,935.94
Tunisia 15,907.37 17,965.64 19,196.74 18,563.13 19,248.61 15,094.54 17,646.78 16,630.81
Source: Observatory of Economic Complexity.

Trade, investment and employment in the Southern Mediterranean Countries64
The evolution of skill and technology intensity of exports in the region shows an increase in the share of medium-skill and technology-intensive and high-skill and technology-intensive manufactures inexportsinMorocco,EgyptandTunisia(figure42). This indicates a certain level of sophistication improvement and upgrade of technological capa-bilities in these economies. However, overall, coun-triesintheregionhavenotsignificantlydiversifiedtheir basket of exported products, except for some encouraging signs in Egypt, Morocco and Tunisia.
In Egypt, the share of high-skill and technology-in-tensivemanufacturesincreasedsignificantlyfrom7 per cent in 2000 to to 21 per cent in 2019, indicat-ing a technological production upgrade. However, and despite a relative increase since 2000 from 38 per cent to 45 per cent in 2019, the share of man-ufactured goods in exports remains much lower than in Tunisia (82 per cent), Jordan (76 per cent) and Morocco (71 per cent). There are, in general, somesignsofexportsdiversificationinEgypt,witha decrease in the share of petroleum products, from 42 per cent in 2000 to 21 per cent in 2019. There is asignificantincreaseofexportsofmanufacturedgoods such as fertilizers, plastics products, non-me-tallic mineral manufactures and electrical machin-ery. In 2019, these products were among the top ten exported products in Egypt. Comparatively, the top products exported in 2000 aside from petro-leum products were metals, vegetables and fruits, cereals, and textile and apparel. Exports of phar-maceuticals products have also increased between
2000 and 2019; however, their share represented merely 1 per cent of total exports in 2019, despite the sector being prioritized by industrial policies in Egypt. The increase in exports of electrical machin-eryreflectssomepositiveimpactfromindustrialpolicies adopted in Egypt, as electrical and chem-ical industries were among the prioritized sectors by industrial policies.
Jordan has by far the highest share of high-skill and technology intensive manufactures in the region, with this segment representing around 39 per cent of its total merchandise exports. For instance, Jordan has a well-developed pharmaceutical sector representing about 7 per cent of its merchandise exports in 2019, with a growth of 367 per cent in thesectorʼsexportvaluebetween2000and2019.However, the share of high-skill and tech-intensive manufactures has remained relatively stable in Jordan over the past 19 years (37 per cent in 2000 and 39 per cent in 2019), while the share of labour and resource-intensive manufactures has increased significantly,from16percentin2000to27percentin 2019. Also, the structure of products exported by Jordan did not change substantially. In 2000, the top 10 products exported by Jordan were chemical products (crude fertilizers and minerals, fertilizers, inorganic chemicals), pharmaceutical products, veg-etables and fruits, clothing and apparel, road vehi-cles, non-metallic mineral products, miscellaneous manufactured articles and paper products. The top ten products represented 67.6 per cent of total exports in 2000. In 2019, almost the same products
Note:LabourproductivityisdefinedhereasMVA(constant2010US$)/Totalemployment,consideringtheunavailabilityofthenumberof hours worked data. Source:Authorʼscalculation,basedonWDIdataforvalue-addedandILOSTATforemploymentdata.
X Figure 41: Evolution of labour productivity in manufacturing in Tunisia and Morocco (in constant 2010 US$)
US$
thou
sand
Tunisia Morocco
2000 2001 2002 2003 2004 2005 2006 2007 2008 2009 2010 2011 2012 2013 2014 2015 2016 2017 2018 2019
16,000
14,000
12,000
10,000
8,000
6,000
4,000
2,000
0

65 Chapter 2. Inclusive economic transformation through employment-oriented trade, industrial and investment policies
were on the top 10 exported products, with only three new products making it to the top ten, out of which only one is from another industry than in 2000 (gold from the mining industry). In 2019, the top ten products represented 69 per cent of total exports, at similar levels than in 2000.
Over the past 20 years, Morocco and Tunisia have witnessed the biggest change in terms of the skill and technology intensity of their manufactured goods exports. Both countries have recorded a sig-nificantincreaseintheshareofmedium-skilltech-nology-intensive goods (for Morocco, around 5 per cent in 2000 versus 30 per cent in 2019, and for Tunisia, 14 per cent in 2000 versus around 32 per cent in 2019). Also, both countries witnessed a significantincreaseintheshareofhigh-skillandtechnology-intensive manufactures. For instance, Morocco witnessed with an increase from 20 per cent in 2000 to 22 per cent in 2019. In Tunisia, the share of high-skill and technology-intensive man-ufactures increased by about 7 per cent over the same period. In parallel, the share of labour and resource-intensive manufactures dropped by more than 19 per cent for Morocco and almost 24 per cent for Tunisia.
The industrial policies implemented in Morocco and the sector focus on textiles, electronics and automotivegoodshaveyieldedsignificantpositiveresults in terms of exports. The automotive industry has witnessed the highest level of export growth, driven by investment from anchor enterprises such as Renault, Peugeot-Citroen and the Chinese BYD. This has resulted in a spectacular rise in exports of automotive products (road vehicles – SITC 78) from US$22.3 million in 2000 to almost US$3.6 billion in 2019. The focus on electronics has also resulted in a significantincreaseofexportsinelectricalmachin-ery from US$817.5 million in 2000 to more than US$5 billion in 2019, with the production and export of insulated wires used as input for automotive and aeronautics industries. Electrical machinery was the firstproductexportedin2019byMoroccoandrep-resented 17 per cent of total exports, up from 11 per cent in 2000. The share of textiles and apparel prod-uctssignificantlydecreasedinMoroccanʼsexportsfrom 31 per cent in 2000 to 13 per cent in 2019; its value, however, increased by 39 per cent over the sameperiod.Ingeneral,Moroccohasdiversifieditsexportmerchandise(withadifferentsetoftopten
32 Source for aircraft parts: OEC. Aircraft parts are part of “other transport equipment”.
products in 2019 as opposed to 2000) and has suc-ceeded in translating its industrial and trade policies into export outcomes.
Tunisiaalsowitnessedarelativediversificationofits exported products between 2000 and 2019, how-ever, at a much lower pace than Morocco. Although the 2016 industrial strategy was not properly imple-mented,somesectorsidentifiedinthestrategy,such as electronics, automotive and aeronautics expanded, mainly driven by an increase of FDIs in these sectors. For instance, the electronics sec-torhassignificantlydeveloped,withitsshareinTunisian exports doubling between 2000 and 2019 andincreasingfive-foldinvalue.Similarly,exportsofroadvehicleshavesignificantlyincreasedfromUS$54 million in 2000 to US$521.6 million in 2019 and its share increased from 0.9 per cent to 3.5 per cent between 2000 and 2019. The aeronautics industry also significantly increased its exports with aeronautics parts (in other transport equip-ment) representing more than US$330 million in 2019, up from US$28.8 million in 2000.32 The top ten products exported by Tunisia saw the emergence of new products such as telecommunication and sound recording apparatus, with export of these products increasing from almost US$30 million in 2000 to US$458.5 million in 2019. However, his-toric sectors in Tunisia, such as textile and apparel and phosphates products, either stagnated or decreased significantly in terms of exports. For instance, levels of exports for apparel and clothing remained almost constant between 2000 and 2019, andtheexportofphosphatesproducthavesignifi-cantly dropped since 2011.
The structure of manufactured good exports in Lebanon has witnessed minor changes, with an overall decrease in their share in merchandise exports and a decrease in the share of labour and resource intensive products. The structure of exportedproductsinLebanondidnotsignificantlychange between 2000 and 2019. The country relies more on gold and miscellaneous manufactured articles (mainly jewellery and diamonds and arms and ammunition, according to the Observatory of Economic Complexity), which represented 34 per cent of its merchandise exports in 2019. There are some exports in manufacturing sectors that have been slowly growing, such as paper manufacture, electrical machinery and apparel and clothing.

Trade, investment and employment in the Southern Mediterranean Countries66
In the Occupied Palestinian Territory, manufac-turedgoodsʼexportsareconcentratedinlabour-and resource-intensive goods, with minor changes in their structure since 2000. The main prod-ucts exported in Occupied Palestinian Territory are non-metallic mineral manufactures, mainly consisting in construction materials. Goods exports are generally concentrated on raw materials and low-transformed products. There are some sophis-ticated products being exported, such as pharma-ceutical products; however, they represent merely 3 per cent of exports in 2019 and their share has not increased since 2000.
For oil-exporting countries, unsurprisingly, man-ufactured goods represent a very low share of exports, representing less than 10 per cent of exports for both countries. Petroleum, petroleum products and related materials represented 84 per cent of Libyan exports and gas, natural and man-ufactured represented 8 per cent of total exports in 2019. For Algeria, oil represented 53 per cent of total exports and gas about 40 per cent in 2019. For both countries, most of the manufactured goods are categorized as high-skill and technol-ogy-intensive manufactures. For Algeria, manu-factured goods represented around 6 per cent of
X Figure 42: Evolution of the share of manufactured goods in merchandise exports and their skill and technology intensity in the region, 2000–19
0
20
40
60
80
100
Perc
enta
ge
Algeria
20
00
20
01
20
02
20
03
20
04
20
05
20
06
20
07
20
08
20
09
20
10
20
11
20
12
20
13
20
14
20
15
20
16
20
17
20
18
20
19
0
20
40
60
80
100
Perc
enta
ge
Lybia
20
00
20
01
20
02
20
03
20
04
20
05
20
06
20
07
20
08
20
09
20
10
20
11
20
12
20
13
20
14
20
15
20
16
20
17
20
18
20
19
0
20
40
60
80
100
Perc
enta
ge
Jordan
20
00
20
01
20
02
20
03
20
04
20
05
20
06
20
07
20
08
20
09
20
10
20
11
20
12
20
13
20
14
20
15
20
16
20
17
20
18
20
19
6.7
38.9
27.4
12.1
37.1
15.80
20
40
60
80
100
Perc
enta
ge
Egypt
20
00
20
01
20
02
20
03
20
04
20
05
20
06
20
07
20
08
20
09
20
10
20
11
20
12
20
13
20
14
20
15
20
16
20
17
20
18
20
19
20.812.67.0
Low-skill and technology-intensive manufactures Labour-intensive and resource-intensive manufactures
High-skill and technology-intensive manufactures Medium-skill and technology-intensive manufactures

67 Chapter 2. Inclusive economic transformation through employment-oriented trade, industrial and investment policies
total merchandise exports, with chemical (organic and inorganic) products and fertilizers as the main manufactured exported goods. Exports of inorganic chemicalsincreasedsignificantlybetween2000and2019, which translated into an increase in the share of high-skill and technology-intensive manufactures from about 1 per cent in 2000 to 6 per cent in 2019. In Libya, manufactured goods represented less than 5 per cent of merchandise exports in 2019, with organic chemicals and fertilizers being the only manufactured products in the top ten products exported by Libya. The share of exported manufac-turing goods decreased from 6 per cent in 2000 to 4 per cent in 2019, with the main decrease being in high-skill and technology-intensive manufactures.
The International Trade Centre (ITC) provides inter-esting insights into the potential of exports of dif-ferent countries. The ITC estimates the untapped exportpotentialcountrieswouldhaveindifferentalready exported products and analyses the diver-sificationpotentialofeachcountrybyidentifyingalist of potentially exported products. The ITC anal-ysis for the countries in the region indicates that the level of merchandise exports is lower than its potential. For Egypt, plastics and rubber, fruits, apparel, chemicals, fertilizers and food products remainlargelyuntappedwithinsignificantexportgrowth potential in these products. According to ITC, the untapped export potential for these prod-ucts is estimated at US$8.9 billion, representing
X Figure 42 (continued)
Source:AuthorʼscalculationbasedonUNCTAD.
0
20
40
60
80
100
Perc
enta
geOccupied Palestinian Territory
20
00
20
01
20
02
20
03
20
04
20
05
20
06
20
07
20
08
20
09
20
10
20
11
20
12
20
13
20
14
20
15
20
16
20
17
20
18
20
19
0
20
40
60
80
100
Perc
enta
ge
Lebanon
20
00
20
01
20
02
20
03
20
04
20
05
20
06
20
07
20
08
20
09
20
10
20
11
20
12
20
13
20
14
20
15
20
16
20
17
20
18
20
19
0
20
40
60
80
100
Perc
enta
ge
Tunisia
20
00
20
01
20
02
20
03
20
04
20
05
20
06
20
07
20
08
20
09
20
10
20
11
20
12
20
13
20
14
20
15
20
16
20
17
20
18
20
19
31.91
19.10
25.02
14.05
12.37
48.73
0
20
40
60
80
100
Perc
enta
ge
Morocco
20
00
20
01
20
02
20
03
20
04
20
05
20
06
20
07
20
08
20
09
20
10
20
11
20
12
20
13
20
14
20
15
20
16
20
17
20
18
20
19
21.98
30.18
18.26
19.3120.49
4.98
36.93
Low-skill and technology-intensive manufactures Labour-intensive and resource-intensive manufactures
High-skill and technology-intensive manufactures Medium-skill and technology-intensive manufactures

Trade, investment and employment in the Southern Mediterranean Countries68
about 30 per cent of Egyptian exports in 2019. In Jordan, for instance, fertilizers and chemical prod-ucts are the most untapped products, with a poten-tial of additional US$708.9 million for fertilizers and US$666.5 million for chemicals, representing respectively 89 per cent and 76 per cent of the levels of exports of these products in 2019. For Tunisia, the untapped export potential on the top ten prod-ucts represents about 6 per cent of total exports in 2019. For Morocco, apparel, machineries, motor vehiclesandpart,fertilizersandfisharetheprod-ucts that have the highest untapped export poten-tial, and their potential represents about 26.8 per cent of total exports in 2019.
In terms of destination markets, there are some signsofdiversification,withnotablyanincreaseintrade with Asian countries.33 However, a high con-centration of European markets remains, mainly for North African countries. For instance, the top destination markets in Algeria have remained rel-atively the same with a focus on European coun-tries such as Italy, Spain and France, despite a slight increase of exports to Asia countries such as India and South Korea. In the Southern Mediterranean Countries, Algeria exports mainly to Tunisia (4 per cent). Libya also has Italy as the top destination market with 18 per cent in 2019, but recently
33 Data on destination markets is from the Observatory of Economic Complexity.
increased its exports to China, which is now the second destination of Libyan exports (16 per cent in 2019). In terms of imports, China is the primary origin of goods for both countries. Tunisia and Morocco also export mainly to Europe. However, as mentioned before, Morocco has more actively diversifieditsexportstoAsiaandtheUnitedStatesover the past decade.
The dependency on European markets is less obvi-ous in other countries in the region. For instance, Jordan does not mainly export to European coun-tries, with its top export destinations in 2019 being the United States (21 per cent), Saudi Arabia (13 per cent), India (8 per cent), Iraq (7 per cent), United Arab Emirates (5 per cent) and China (5 per cent). Egypt also has relatively diverse export markets, with less dependency on the European market and less concentration on a couple of countries. For instance, in 2019, Egypt exported mainly to the United States (9 per cent), United Arab Emirates (6 per cent), Italy (6 per cent), Turkey (6 per cent), Saudi Arabia (6 per cent) and India (5 per cent). Lebanon exported mainly to Switzerland (27 per cent), the UAE (15 per cent), South Korea (11 per cent), Saudi Arabia (7 per cent) and Kuwait (6 per cent) in 2019, whereas the Occupied Palestinian Territory focuses on neighbouring countries, with Jordan being the
X Box 2: ITC interventions on the new NEAR regional trade and investment programme
The International Trade Centre (ITC) is currently implementing a programme funded by the EU and focusing on the region, in close collaboration with ILO and the OECD. The project is part of the Trade and Investment Facilitation Mechanism (TIFM). A major outcome of a preceding project was the EuroMed Trade Helpdesk, which, in collabora-tion with the EU Export Helpdesk, aims to facilitate trade and investment in the Euro-Mediterranean Region. Current-ly, it contains market information on Algeria, Egypt, Israel, Jordan, Lebanon, Morocco, Occupied Palestinian Territory and Turkey.The overall objective of the programme is to contribute to inclusive and sustainable economic growth focused on de-cent job creation and greater regional integration through enhanced and better-informed trade and investment po-licymaking processes in the Southern Mediterranean Countries. In particular, the programmes focus on a) facilitating closer economic ties between the EU and South Mediterranean countries and enhancing regional economic integra-tion and b) improving trade and investment transparency by providing free access to information for economic ope-rators and policymakers.
Expected Outputs: X enhancedEuromedTradeHelpdesk(investment,rulesoforigin,WTOnotifications,exportpotentialassessment
tool, trade procedures guides and trade in services); X enhancedunderstandingofregulatoryandproceduraltradeobstaclesfacedbySMEsintheregionandidentifica-
tion of options to reduce costs of trade in goods and services; X strengthened market analysis and research skills and raised awareness on the use of the Euromed Trade Helpdesk.

69 Chapter 2. Inclusive economic transformation through employment-oriented trade, industrial and investment policies
top export destination at 32 per cent, followed by the UAE (15 per cent) and Saudi Arabia (9 per cent).
2.3.2.2 Evolution of foreign direct investment (FDI)
MostcountriesintheregionhavenotsignificantlyimprovedtheirlevelsofFDI,despitethesignifi-cantinvestmentandtradereforms.FDIinflowsinmostcountriesintheregionincreasedsignifi-cantly between 2000 and 2008, but have been on a declining trajectory since then, except for Egypt and Morocco. Both countries have improved their FDI inflowsbetween2008and2019,withEgyptbeingthe top recipient of FDI in Africa. However, for other countries, pre-pandemic FDI levels have been stag-nating at best.
Egypt has witnessed the highest level of inward FDI growth since 2000 in the region, despite a huge drop following the social movements in 2011 and has reinforced its position as the largest FDI recip-ientintheregionsince2012.FDIinflowsinEgyptaccountedfor56percentoftotalFDIinflowsinthe region, compared to 35 per cent in 2008. In 2019, Egypt was the largest FDI recipient in Africa. Economic reforms, including the reforms of the exchange regime in 2016, seem to have improved foreigninvestorsʼconfidenceinthecountry,asFDIinflowssignificantlyincreasedbetween2016and2019. In 2019, FDI in Egypt was mainly driven by the oil and gas industry; however, an important share was invested in the non-oil economy, including tele-communication, consumer goods and real estate (UNCTAD, 2020).
In Jordan,thelevelsofFDIhavedecreasedsignifi-cantly since 2007, with the FDI levels in 2019 nearly three times lower than their value in 2007. In 2019, FDI was mostly directed to manufacturing, fol-lowed by real estate and services (UNCTAD, 2020). In 2019, the Government introduced a new initiative toencourageinvestment,includingofferinginves-tors a single-window application facility through the Jordanian Investment Commission, which might helpincreasetheconfidenceofforeigninvestors.
Morocco and Tunisia received the same levels of FDI from 2006 to 2009. This dynamic changed dras-tically after the 2011 social movements started in Tunisia.Moroccohasbenefittedfromarelativelystable economic and political environment, which playedtothecountryʼsadvantageintermsofFDI.The gap between Tunisia and Morocco continued towidenuntil2019,whenFDIflowstoMoroccodecreased by 55 per cent to US$1.6 billion. FDI
inflowstoTunisiahavedecreasedconstantlysince2011,likelyaffectedbythepoliticalinstabilitythatled to the formation of eight governments in only ten years. In 2019, most FDI inflows in Tunisia went to industry, followed by energy and services (US$95 million), with a sharp decline in investment in the services sector (UNCTAD, 2020).
Lebanon witnessed a drop in FDI by 20 per cent in 2019, mainly due to the huge political crisis ongo-ing in the country since October 2019. At the end of 2019,Lebanonwitnessedastopincapitalinflows,which led to a severe foreign currency crisis and a local currency plunge. Foreign investments are mainly directed to the services sector (UNCTAD, 2020). Algeriahaswitnessedasignificantdropin FDI inflows since 2009: FDI inflows were at US$2.7 billion in 2009 and reached US$1.4 billion in 2019.
FDI in the region is not yielding the expected results, with most investments concentrated in capital-in-tensive sectors. According to the OECD, between 2003and2019,mostofthegreenfieldFDIsintheeight countries in the region went to real estate and construction (35 per cent) and mining and extractive industries (26 per cent) (OECD, 2020a). According to the same source, manufacturing accounted for only about 25 per cent of FDI over the same period and created more than 55 per cent of employment generated by FDI. Hence, the impact of FDI on job creation, labour productivity and structural change might not be to the level expected by policymak-ers in the region. A focus on the domestic linkages with local SMEs should be enhanced to maximize the impact of these FDIs and their contribution to domestic economic outcomes.
The level of FDI restriction in the region varies across countries and across sectors (figure 45). Morocco and Egypt are the least restrictive coun-tries to FDI in the region, scoring at similar level in the OECD–FDI restriction index as the United States. On the other hand, Libya is the most restric-tive country in the region, scoring 0.7 in the index (1 being closed to FDI). Jordan, Tunisia and Lebanon are also relatively restrictive to FDI, however, at a much lower level than Libya. The FDI restrictions varyacrosssectorsasindicatedbyfigure45.Thereare almost no restrictions to FDI in the region in the manufacturing sector, except in Libya and a very low restriction in Jordan. FDI in transport is partic-ularly restricted in the region, as well as in high-in-come countries such as France and the United States. However, FDI in telecom, another strategic

Trade, investment and employment in the Southern Mediterranean Countries70
Source: UNCTAD.
Source: UNCTAD.
X Figure 43: Evolution of FDIs inflows in selected countries in the region – 1 (US$ million)
X Figure 44: Evolution of FDIs inflows in selected countries in the region – 2 (US$ million)
–2,000
0
2,000
4,000
6,000
8,000
10,000
12,000
14,000
US$
mill
ion
Algeria Egypt Jordan Lebanon
20192017 201820162015201420132012201120102009200820072006200520042003200220012000
20192017 2018201620152014201320122011201020092008200720062005200420032002200120000
2,000
4,000
6,000
8,000
10,000
12,000
14,000
US$
mill
ion
Morocco Tunisia Occupied Palestinian Territory
X Box 3: EU–OECD programme on investment in the Southern Mediterranean Countries
The OECD is implementing a programme funded by the European Union that focuses on supporting the investment climate for countries in the Southern Mediterranean Countries. The programme aims at supporting countries in the region improving the business and investment climate by attracting higher quality and more inclusive investment, reinforcingcountriesʼcapacitytoself-assess, implementandimproveinvestmentclimatereformsandsupportingsustainable growth and decent job creation. The programme has three main outputs:
X policy advice to support investment climate reforms implementation, including policy research and insights on measure the quality of FDIs and their impact on the labour market and on local SMEs;
X regional and national public-private dialogue on investment climate reforms; X supporttothemonitoringofselectedreformsʼimplementation.
Source: OECD. For further information, see: https://www.oecd.org/mena/eu-oecd-mediterranean-investment/.

71 Chapter 2. Inclusive economic transformation through employment-oriented trade, industrial and investment policies
sector, is relatively open in Jordan and completely open in Egypt and Morocco.
The level of integration of the region into global value chains (GVCs) is an important measure of theexportopportunitiesprovidedtolocalfirms,including SMEs and the potential for sophistication upgrade of production and exports. Integration into GVCs is generally driven by multinational enter-prises (MNE), driven by the cost reduction rationale, or optimization of supply chains. The Southern Mediterranean Countries can be considered rela-tively well-integrated into the GVC compared with countrieswiththesamelevelofincome(figure46). Particularly, Lebanon, Tunisia and Jordan had higher levels of foreign value-added in exports than upper-middle-income and lower-middle-income countriesin2018.However,anddespiteasignifi-cant increase in foreign and domestic value-added in exports (figure 47), the share of foreign val-ue-added remained almost constant between 2000 and2018(figure48),indicatingthattheregionisnotsignificantlyincreasingitsintegrationintoGVCs.
BetterintegrationintoGVCsprovidessignificantexport opportunities to local SMEs and enter-prises, ultimately leading to technological upgrade. EvidenceshowsthatexportingSMEsandlocalfirmscanincreasetheirprofitandrealizeproductivityand
profitgains,mainlythrough“learning-by-export-ing”. For instance, Atkin et al. (2017) study rug pro-ducersinEgyptandfindthatexportopportunitieshavesignificantlyincreasedprofit(between16percent and 26 per cent of increase), with improve-ments in the quality of products. The researchers provided evidence that the increase in productivity was due to the so-called “learning-by-exporting”, rather than due to a change in the product mix that the entrepreneurs could produce even before the intervention.Theauthorsfindthattheproductivitygains included a rise in quality and productivity after adjustingforproductspecification(whichwouldnʼtbe the case if entrepreneurs continued using the same techniques). Second, they found that in the controlled environment when control entrepre-neurs were asked to make a rug, the treatment group provided a higher-quality product without taking longer to produce it. Finally, by looking at the evolution of quality and productivity, research-ersfindevidenceofagradualimprovementconsis-tent with a learning curve rather than with a switch toadifferentproductmix.Theauthorsnotethereisevidenceofknowledgeflowincorrespondencebetween foreign buyers and producers and that therewasnoextrainvestmentmadeinthefirms.Currently in the region, the share of firms that export directly at least 10 per cent of their total
X Figure 45: Level of FDI restriction per country and sector, 2020 (0=open, 1=closed)
Note: Data missing for the Occupied Palestinian Territory.Source: Foreign direct investment (FDI) – FDI restrictiveness – OECD Data.
0.0
0.1
0.2
0.3
0.4
0.5
0.6
0.7
0.8
Total Telecom Transport Financial services Manufacturing
Libya Jordan Tunisia Lebanon Egypt U.S.A. Morocco France

Trade, investment and employment in the Southern Mediterranean Countries72
X Figure 46: The Southern Mediterranean Countriesʼ share of foreign value-added in exports and comparison with middle-income countries
Source:UNCTAD-EoraGlobalValueChain(GVC)andauthorʼscalculation.DatamissingforLibyaandOccupiedPalestinianTerritory.
Source:UNCTAD-EoraGlobalValueChain(GVC)andauthorʼscalculation.DatamissingforLibyaandOccupiedPalestinianTerritory.
0 5 10 15 20 25 30 35
Lebanon
Tunisia
Jordan
Morocco
Egypt
Algeria
Low-middle income
Upper-middle income
Percentage
X Figure 47: The Southern Mediterranean Countries share of value-added in exports (US$)
X Figure 48: The Southern Mediterranean Countries share of value-added in exports, share of foreign and domestic value-added
0
20,000,000
40,000,000
60,000,000
80,000,000
100,000,000
120,000,000
US$
2000 2010 2018
Region Domestic Value-Added Region Foreign Value-Added
0
20
40
60
80
100
Perc
enta
ge
2000 2010 2018
Region Domestic Value-Added Region Foreign Value-Added
0
20,000,000
40,000,000
60,000,000
80,000,000
100,000,000
120,000,000
US$
2000 2010 2018
Region Domestic Value-Added Region Foreign Value-Added
0
20
40
60
80
100
Perc
enta
ge
2000 2010 2018
Region Domestic Value-Added Region Foreign Value-Added

73 Chapter 2. Inclusive economic transformation through employment-oriented trade, industrial and investment policies
annual sales is above the average in the MENA region, which is 16 per cent. Morocco is at 20 per cent, Jordan at 23 per cent and Tunisia is at 24 per cent. In Egypt, the share remains relatively low, at 6 per cent.34
2.3.3. The evolution of job creation and destruction across sectors As discussed in the previous chapter, trade and investment policies can support productivity enhancement across the economy and job cre-ation in export-oriented sectors. However, their impact on other non-tradable sectors should be monitored and addressed, as they might lead to more job destruction and inequality than expected and might increase informality and inequality in low- and middle-income countries. There is grow-ing literature focusing on the impacts of trade and investment policies on the labour market in coun-tries in the region.
The existing evidence in the region generally con-cludes that trade liberalization reforms did not substantially improve employment growth. For instance, Dasgupta et al. (2002) study the impact of trade liberalization on employment in 59 countries from the 1960s to the late 1990s and compare the MENA countries to other developing countries. The authorsfindthattradeopennesshascontributedless to overall employment creation in manufactur-ing in MENA compared to trends seen elsewhere in developing countries. The authors explain this by concentration on low-value-added and slowly grow-ing products, as well as by labour market rigidities, largely associated with the important role public sector employment plays. Mouelhi (2007) studies the impact of trade liberalization on the labour mar-ket in Tunisia by comparing the pre-liberalization phase(1987–1995)tothefirstphaseofliberalization(1995–2003).Theauthorfindsthatthefirstphaseoftradeliberalizationhasnotsignificantlyaffectedmanufacturing growth and employment growth. However, the period included in the study covered only a couple of years after the liberalization reform and therefore might not capture the long-term impact of trade policies.
However, evidence suggests that trade liberaliza-tion has increased the demand for high-skilled workers in the region. This is particularly relevant for Morocco, Tunisia and Jordan, which have been
34 Source: EIB and WB enterprise survey.
increasingly focusing on high-value-added and technology-intensive industries such as pharma-ceuticals, aeronautics and automobile industries. For instance, Charfeddine and Mrabet (2015) study the impact of trade liberalization on employment and skills demand in Tunisia by analysing a data-base covering 12 Tunisian sectors between 1983 and2010.Theauthorsfindthattradeopennesspositivelyaffectstherelativedemandforskilledlabor. Moreover, in a study particularly relevant to the region, ILO (2017) analyses the trends in exports from 2000 to 2015, including in Jordan, Morocco andTunisia,andfindsthattheincreaseinexportsgenerated substantial demand for medium- and high-skilled labour in these countries.
The evidence on the impact of trade on informal-ity in the region suggests an increase of formality. For instance, Selwaness and Zaki (2013) study the impact of trade liberalization reforms on the struc-tureoffirmsinEgyptandfindthatitdecreasedfirminformality.Theauthorsexplainthisfindingby reducing trade costs that increased the attrac-tivenessandprofitabilityoftheformalsectorforsomeinformalfirms,aswellasbyhigherlabourmarketflexibilityassociatedwithalabourreformintroduced in 2003. In a more recent study, Ben Salem and Zaki (2019) examine the impact of trade openness on job quality through the evolution of the shares of informal and irregular employment intotalemploymentinEgypt.Thepaperfindsthattariffreductionledtoadecreaseofbothinformaland irregular employment in Egypt, with a signif-icanteffectoninformality.Thiscanbeexplainedby the higher demand for skilled workers that are generally more suitable for formal jobs.
In the next section, we explore the evolution of job creation and job destruction in the labour market, highlighting the evolution of employment in trad-able sectors and indicating trends in trade and the labour market and the demand for skills when data is available. A more precise analysis of the impact onfirms,workersandlevelofwagesrequiresmorean in-depth assessment using econometric tools and social accounting matrixes and is beyond the scope of this report.
To examine the evolution of employment in trad-ableandnon-tradablesectors,thefirststepistocategorize all the sectors in tradable and non-trad-ableones.Tradablesectorsaregenerallydefinedassectors that produce goods or services that can be

Trade, investment and employment in the Southern Mediterranean Countries74
tradedacrossborders.However,thissimpledefini-tion does not allow for a straightforward categori-zationastradabilityofasectoriscountry-specificand might evolve over time. For instance, coun-tryAmightnottradefinancialservicesinyearXand therefore the sector would be categorized as non-tradable in country A in year X. In the same year, the sector might be tradable in another coun-try. Also, country A might start trading services in thefinancialsectorsacoupleofyearslater.
To categorize tradable and non-tradable sectors and in the absence of data of export by each sub-sector for all countries, we use the results of Mano and Castillo (2015) as a basis. Mano and Castillo study the evolution of productivity within tradable and non-tradable sectors in 56 countries from 1989 to 2012 and develop methodologies to catego-rize the sectors in tradable and non-tradable. The authors use three methods to categorize sectors. Thefirstmethodusesexportdataattheindustry
levelfromtheWorldInputOutputDatabaseʼsInput-Output tables for 1995–2011; derives the export to the gross value-added ratio for each industry in all countries across all years; and calculates the ratio per industry across all time periods. Then, the authors categorize an industry as tradable or non-tradable if the average export to value-added ratio is great than 10 per cent. Using this approach, theauthorsarriveattheclassificationpresentedintable 15 (based on ISIC Rev.3). The second considers only goods-producing industries as tradable, which includesagriculture,hunting,forestryandfishing,manufacturing and mining and quarrying. Other services are assigned to non-tradable by default. The third approach considers only manufacturing as a tradable sector.
Theclassificationbasedonthefirstapproachseemsto be the most reasonable to use, considering the growing importance of trade in services globally andtheregion.Astheresultsofthisclassification
X Table 15: Classification of tradable and non-tradable sectors based on Mano and Castillo (2015)
ISIC Rev.3 Classification based on Mano and Castillo (2015)
Section Divisions Description
A; B 1; 2; 5 Agricultureandfishing Tradable
C 10-14 Mining and quarrying Tradable
D 15-37 Manufacturing Tradable
E 40;41 Electricity, gas and water supply Non-tradable
F 45 Construction Non-tradable
G 50-52 Wholesale and retail trade; repair of motor vehicles, motorcycles and personal and household goods
Non-tradable for division 50 and 52;Tradable for division 51.
H 55 Hotels and restaurants Non-tradable
I 60-64 Transport, storage and communications Tradable for divisions 60 to 63; Non-tradable for division 64.
J 65-67 Financial intermediation Tradable
K 70-74 Real estate, renting and business activities Non-tradable for division 70; Tradable for divisions 71 to 74 (renting and business activities).
L 75 Public administration and defence; compulsory social security Non-tradable
M 80 Education Non-tradable
N 85 Health and social work Non-tradable
O 90-93 Other community, social and personal service activities Non-tradable
P 95-97 Activities of private households Non-tradable
Q 99 Extraterritorial organizations and bodies Non-tradable
Source: Mano and Castillo (2015).

75 Chapter 2. Inclusive economic transformation through employment-oriented trade, industrial and investment policies
X Table 16: Classification of tradable and non-tradable sectors in the region based on Mano and Castillo (2015)
ISIC Rev. 4 Classification Comment
Section Division Description
A 01-03 Agriculture,forestryandfishing Tradable n/a
B 05-09 Mining and quarrying Tradable n/a
C 10-33 Manufacturing Tradable n/a
D 35 Electricity, gas, steam and air conditioning supply Non-tradable n/a
E 36-39Water supply; sewerage; waste management and remediation
activitiesNon-tradable n/a
F 41-43 Construction Non-tradable n/a
G 45-47 Wholesale and retail Non-tradableMano and Castillo (2015) identify 2 divisions out of three are non-tradable, as wedonʼthavethedisaggregationforallcountries,wecategorizewholesaleand retail as non-tradable.
H 49-53 Transportation and storage Tradable
Mano and Castillo (2015) identify divisions 60 to 63 in ISIC REV. 3 as tradable and division 64 as non-tradable. In ISIC REV. 4, division 64 is under informa-tion and communication. Therefore, we classify transportation and storage as tradable.
I 55-56 Accommodation and food service activities Tradable
IdentifiedbyManoandCastillo(2015)asnon-tradable;however,theseactiv-ities are linked to tourism, an important foreign reserve generating sector in many countries in the region. There, we classify it as tradable.
J 58-63 Information and communication Tradable
Information and communication (Section J) is not included in ISIC REV. 3 andthereforenotclassifiedbyManoandCastillo(2015).InISICREV.4,SectionJ includes: 58- Publishing activities, 59- Motion picture, video and television programme production, sound recording and music publishing activities; 60- Programming and broadcasting activities; 61- Telecommunications; 62- Computer programming, consultancy and related activities; 63- Information service activities. Outside of 62-telecommunications (corresponding to 64 under ISIC REV. 3), all other activities can be tradable and correspond to a growing traded activity in the region, linked to ICT and programming. Therefore, we classify this section as tradable.
K 64-66 Financial and insurance activities Tradable CorrespondstoSectionJinISICREV.3,classifiedastradablebyManoandCastillo (2015).
L 68 Real estate activities Non-tradable Corresponds to real estate activities Division 70 in ISIC REV. 3 and therefore classifiedasnon-tradable.
M 69-75 Professional,scientificandtechnical activities Tradable Professional,scientificandtechnicalactivitiescorrespondtodivision71-74
thathavebeenclassifiedbyManoandCastillo(2015)astradable.
N 77-82 Administrative and support service activities Non-tradable NotinISICREV.3;Classificationbytheauthor.
O 84 Public administration and defence; compulsory social security Non-tradable n/a
P 85 Education Non-tradable n/a
Q 86-88 Human health and social work activities Non-tradable n/a
R 90-93 Arts, entertainment and recreation Tradable Not in ISIC REV. 3. However, arts, entertainment and recreation are linked to tourism activities and therefore, we classify it as tradable.
S 94-96 Other service activities Non-tradable n/a
T 97-98 Activities of households as employers Non-tradable n/a
U 99 Activities of extraterritorial organizations and bodies Non-tradable n/a

Trade, investment and employment in the Southern Mediterranean Countries76
are across 58 countries, it seems robust enough for us to use it for this report. However, three points aretohighlightforthisclassificationasindicatedbyManoandCastillo(2015).First,theclassifica-tionisnotcountry-specific,astheindustryisclas-sifiedastradablebasedontheaverageexporttovalue-added ratio being greater than 10 per cent for all countries included in the study. Second, it is based on the levels of exports and not imports and exports. This is an important point as many indus-triesthatareclassifiedasnon-tradabledoimportgoodsfortheiractivities.Third,theclassificationtakesatime-fixedapproachtocomparetheevolu-tion of industries across time.
Inordertobeabletousethisclassification,weintroduceacoupleofadjustmentstotheclassifi-cation using correspondence between ISIC Rev. 3 andISICRev.4.First,theclassificationisbasedonISIC Rev. 3 disaggregated at level 2. For most of the countries in the region, the available sectoral data use ISIC Rev 4. and is at Broad Categories. Second, somesectorsidentifiedasnon-tradablebyManoand Castillo (2015), such as accommodation and foods, are linked to tourism, considered a tradable industry in most countries in the region. Table 16 details the adjustment provided when necessary andthefinalclassificationusedfortradableandnon-tradable sectors based on ISIC Rev.4.
2.3.3.1 The impact of industrial, trade and investment policies on job creation in the region
The region has had generally negative job outlooks, as indicated by table 17. The working-age popu-lation and labour force have grown faster than employment in most countries in the region. For countries like Egypt and Morocco, the working-age population grew faster than the labour force.
Overall, and despite the industrial, trade and invest-ment policies that have been implemented, there hasnʼtbeenasignificant increaseemploymentgrowth in the region in tradable sectors, such as manufacturing and tradable services. Workers in almost all countries are moving out of agriculture, mainly towards the non-tradable and low-pro-ductive sectors. However, exports and trade have increased demand for higher skills in the region, particularly in Egypt, Morocco and Tunisia, in line with an increased share of skill and tech-intensive exports. Tradable sectors, particularly manufactur-ing, were not able to create enough demand for theregionʼslabourforce.Theshareofmanufac-turing in employment in almost all countries has decreased, except in Egypt. At the same time, the share of wholesale and retail has almost systemat-ically increased. Other non-tradable sectors such as
X Table 17: Evolution of key indicators in the labour market
Country A Employment growth
B Working-age population
(15–64) growth
Difference (A-B) In percentage points (pp)
C Labour force growth
Difference (A-C) In percentage points (pp)
2000–2009 2009–2019 2000–2009 2009–2019 2000–2009 2009–2019 2000–2009 2009–2019 2000–2009 2009–2019
Algeria 56% 16% 25% 14% 31 pp 2 pp 22% 18% 34% –2 pp
Egypt - 14% - 27% - –14 pp - 12% - 2 pp
Jordan - 8% - 9% - –1 pp - 7% - 2 pp
Lebanon - - - - - - - - - -
Libya 33% 16% 23% 11% 10 pp 5 pp 33% 15% 0% 1 pp
Morocco 24% 7% 18% 15% 6 pp –9 pp 17% 7% 6% –0.1 pp
Occupied Palestinian Territory
24% 42% 42% 35% –18 pp 7 pp 39% 51% –15% –9 pp
Tunisia 9% 6% 7% 10% 1.8 pp –3.3 pp 10% 11% - –4 pp
Note: For Jordan, growth for 2009–2019 is calculated only between 2017–2019 due to data availability. For Tunisia: growth for 2000–2009 is calculated only between 2005–2009 due to data availability. Source:AuthorʼscomputationbasedondataprovidedbyILOSTATforEgypt,Jordan,Lebanon,OccupiedPalestinianTerritoryandTunisia,ILO modelled estimates for Algeria, Morocco and Libya. Data for Lebanon available only for 2019.

77 Chapter 2. Inclusive economic transformation through employment-oriented trade, industrial and investment policies
publicadministrationandeducationhavesignifi-cantly contributed to job creation. There are some encouraging signs, however, in generally high-skilled tradable services, particularly in Morocco, which is in line with the increasing role that trade in services is playing in the region. Tradable services havesignificantpotentialofgrowthintheregion;however, they will mostly increase the demand for high-skilled workers. Focusing on high-skilled sec-tors and other sectors in manufacturing that would absorb the important share of low- and mid-skilled workers seems to be the right approach for coun-tries in the Southern Mediterranean Countries.
In Egypt, employment grew by 14 per cent between 2009 and 2019, faster than the labour force (12 per cent). This led to a decrease of the aggregate unem-ployment rate from 9 per cent to 8 per cent over the same period. However, employment in non-trad-able sectors grew faster than in tradable sectors between 2009 and 2019, driven by a decrease in agricultural employment from 30 per cent to 21 per cent(figure50).Theshareofmanufacturingintotalemployment slightly increased from 12 per cent in 2009 to 13 per cent in 2019, down from close to20percentinthe1990s(figure49).Similarly,the share of tradable services has increased from 12 per cent to 15 per cent over the same period. However, employment growth in these sectors did not compensate for the decrease in agricultural employment. Overall, labour shifted to non-trad-able industries, mainly to low-productive sectors such as construction and wholesale and retail. These two sectors created the bulk of jobs, mainly for low-skilled and mid-skilled workers.
However, manufacturing has witnessed employ-mentgrowthinEgypt,reflectingthesignificant
growth in merchandise exports and some posi-tive impacts from the industrial and trade policies implemented in the country. The sector created about 726,500 jobs between 2009 and 2019 and recorded the highest employment growth in man-ufacturing in the region over the same period (an increase of 23 per cent). Food processing, wearing apparel, metal products and non-metallic mineral products are the sectors that created most of the jobswithinmanufacturing(figure51).Theshareof most of these sectors in manufacturing employ-menthasalsosignificantlyincreased,withfoodpro-cessing representing 19 per cent of manufacturing employment in 2019, compared to 16 per cent in 2009. The share of wearing apparel has also risen from 11 per cent to 13 per cent between 2009 and 2019. Most of these sectors were prioritized by the Industrial Development Strategy implemented in the country between 2004 and 2016. The exports levels for these sectors generally increased between 2009 and 2019, except for metal products, for which exports decreased by 45 per cent between 2009 and 2019(figure52).Exportsfornon-metallicmineralproducts, pharmaceuticals and wearing apparel increased by a minimum of 20 per cent between 2009 and 2019. Food processing, the leading sector in job creation between 2009 and 2019, witnessed a slight increase in exports of 9 per cent over the sameperiod(figure52).
In general, the levels of wage employment improved in Egypt, from 60.6 per cent in 2009 to 71 per cent in 2019, driven by agriculture (table 18). Wage employ-ment in agriculture more than doubled between 2009 and 2019 (from 19 per cent to 44 per cent). The share of wage employment also increased in man-ufacturing, construction and wholesale and retail,
X Figure 49: Evolution of employment share of tradable and non-tradable sectors in Egypt, 2009–19
Source:Authorʼscomputation,basedondataprovidedbyILOStatisticsDepartment.
0 10 20 30 40 50 60 70 80 90 100
Percentage
2019 21.2 13.0 14.6 51.2
30.1 11.6 12.0 46.42009
Agriculture and mining Manufacturing Tradable services Non-tradable sectors

Trade, investment and employment in the Southern Mediterranean Countries78
X Figure 50: Sectoral distribution of job creation in Egypt, 2009–2019 (in thousands)
X Figure 51: Job creation in the manufacturing sector in Egypt, 2009–2019 (in thousands)
Source:Authorʼscomputation,basedondataprovidedbyILOStatisticsDepartment.
–1,500 –1,000 –500 0 500 1,000 1,500
Other services
Human health and social work activities
Education
Financial and insurance activities
Real estate; business and administrative activities
Public administration and defence; compulsory social security
Accommodation and food service activities
Transport; storage and communication
Wholesale and retail trade; repair of motor vehicles and motorcycles
Utilities
Mining and quarrying
Manufacturing
Construction
Agriculture
Thousands
–50 0 50 100 150 200 250
Other manufacturing
31 - Furniture
27 - Electrical equipment
25 - Metal products, except machinery and equipment
24 - Basic metals
23 - Non-metallic mineral products
21 - Pharmaceuticals, medicinal chemical and botanical products
20 - chemical industry
19 - coke and refined petroleum products
16 - Woodwork, except furniture
14 - Wearing appareal
13 - Textiles
10 - Food processing
Thousands

79 Chapter 2. Inclusive economic transformation through employment-oriented trade, industrial and investment policies
the primary sectors that created jobs between 2009 and 2019. However, the share of wage employment remained stable in tradable services and decreased in non-tradable sectors, from 79 per cent in 2009 to 76 per cent in 2019.
35 Data is unavailable for employment by level of skills in 2019.
Looking at the distribution of jobs created by the level of skills, there is a clear trend towards creat-ing more skilled jobs between 2009 and 2018 in the Egyptian economy, including in manufacturing.35 The share of high-skilled and mid-skilled workers
X Figure 52: Evolution of exports of selected products in Egypt
Note: Wearing apparel includes articles of apparel and clothing (SITC 84). Pharmaceutical products include medicinal and pharmaceutical products (SITC 54). Metal products, except machinery and equipment includes manufactures of metal, n.e.s. (SITC 69). Food-processing includes SITC 01 to 09, excluding 05-fruits and vegetables.Source:AuthorʼscalculationbasedondatafromUNCTAD.
25 - Metal products, except machinery and equipment 23 - Non-metallic mineral products
21 - Pharmaceuticals, medicinal chemical and botanical products 14 - Wearing appareal 10 - Food processing
2009
1,397,276
764,393
669,309
226,118
2010 2011 2012 2013 2014 2015 2016 2017 2018 2019
2,000,000
1,600,000
1,200,000
800,000
400,000
0
1,519,805
1,661,789
948,489
369,694
274,832
1,724,184
X Table 18: Evolution of the share of wage-employment per sector between 2009 and 2019 in Egypt (percentage)
Share of wage-employment 2009 2010 2011 2012 2013 2015 2016 2017 2018 2019
Agriculture 19.0 21.3 21.7 22.3 20.9 23.7 43.9 39.3 39.1 43.5
Manufacturing 79.9 82.4 78.3 80.9 80.0 81.1 83.6 85.1 85.3 86.2
Tradable services 74.3 73.2 71.1 70.5 69.3 68.8 72.9 71.5 72.4 74.2
Non-tradable sectors 78.8 77.7 78.3 77.9 77.1 75.2 77.4 75.3 74.3 76.4
Construction 76.8 77.6 77.2 76.7 77.1 79.3 81.2 81.2 79.1 78.8
Wholesale and Retail 42.4 42.3 41.6 40.9 39.8 39.8 45.1 46.1 46.0 51.6
Total share of wage-employment in total employment 60.6 62.2 61.2 62.5 61.1 62.5 69.7 67.9 68.6 71.1
Note: Data is missing for 2014.Source:Authorʼscomputation,basedondataprovidedbyILOStatisticsDepartment.

Trade, investment and employment in the Southern Mediterranean Countries80
increased across all sectors between 2009 and 2018 (figure53).Theemploymentgrowthinmanufac-turing increased the demand for mid-skilled work-ers, with their share increasing from 14 per cent in 2009 to 21 per cent in 2018. Most of the jobs cre-ated during this period are either for workers with intermediate and advanced education or for those in mid-skill and high-skill jobs. In manufacturing, between 2010 and 2018, more than 144,000 low-skilled jobs were lost (workers with less than basic education), mainly in food processing, textiles and
36 Data is available only between 2017 and 2019.
apparel, woodwork, furniture and chemical prod-ucts.Inparallel,thesesectorsʼexportsincreasedsignificantlyoverthesameperiodasindicatedinfigure52.Thissuggeststhatastradeandexportsincrease in Egypt, the demand for mid and high-skilled workers increases in manufacturing and demand for low-skilled workers decreases.
In Jordan, employment grew by 8 per cent between 2017 and 2019, slightly higher than labour force growth (around 7 per cent)36, mainly in non-trad-ablesectors(figure54).Theshareoftradablesec-
X Figure 53: Distribution of level of skills in Egyptian economy and manufacturing in 2009 and 2018
X Figure 54: Evolution of employment share of tradable and non-tradable sectors in Jordan, 2017–19
Source:Authorʼscomputation,basedondataprovidedbyILOStatisticsDepartment.
Source:Authorʼscomputation,basedondataprovidedbyILOStatisticsDepartment.
0 10 20 30 40 50 60 70 80 90 100
Percentage
2018 42.7 39.2 18.0
49.3 34.5 16.3
67.4 20.5 11.8
74.9 14.3 10.8
2009
2018
Ma
nu
fact
uri
ng
All
sect
ors
2009
Low-skilled Mid-skilled High-skilled
0 10 20 30 40 50 60 70 80 90 100
Percentage
2019 3.9 8.8 15.5 71.8
3.8 10.9 18.3 67.02017
Agriculture and mining Manufacturing Tradable services Non-tradable sectors

81 Chapter 2. Inclusive economic transformation through employment-oriented trade, industrial and investment policies
X Figure 55: Sectoral distribution of job creation in Jordan, 2017–19 (in thousands)
X Figure 56: Job creation in the manufacturing sector in Jordan, 2017–19 (in thousands)
Source:Authorʼscomputation,basedondataprovidedbyILOStatisticsDepartment.
Source:Authorʼscomputation,basedondataprovidedbyILOStatisticsDepartment.
–100 –50 0 50 100 150 200 250
Other services
Human health and social work activities
Education
Financial and insurance activities
Real estate; business and administrative activities
Public administration and defence; compulsory social security
Accommodation and food service activities
Transport; storage and communication
Wholesale and retail trade; repair of motor vehicles and motorcycles
Utilities
Mining and quarrying
Manufacturing
Construction
Agriculture
Thousands
–10 –5 0 5 10 15 20
Other manufacturing
31 - Furniture
25 - Fabricated metal products, except machinery and equipment
24 - Basic metals
23 - Other non-metallic mineral products
21 - Pharmaceuticals, medicinal chemical and botanical products
20 -Chemicals and chemical products
14 - Wearing apparel
11 - Beverages
10 - Food products
Thousands
2017–19
2017–19

Trade, investment and employment in the Southern Mediterranean Countries82
tors decreased over the same period from 33 per cent to 28.2 per cent. Unlike Egypt, this decrease is not driven by agriculture, for which the employ-ment share remained relatively stable, but rather by asignificantdeclineinmanufacturingandtradableservices. Between 2017 and 2019, employment in manufacturingsignificantlydecreasedby11.7percent, destroying about 27,000 jobs. Most of the jobs lost were in chemical industries, fabricated metal products, textile, leather, printing and recorded media reproduction. Between 2017 and 2019, trad-able sectors did not create jobs and their share in employment shrank by almost 5 percentage points, reflectingthestagnationofexportsoverthesameperiod in Jordan.
Within manufacturing, the sectors that witnessed the highest level of job destruction observed an increase in their level of exports. Indeed, the chemicals and chemical products sector lost more than 6,750 jobs (27 per cent of the employment decrease)from2017to2019(figure56).Inparal-lel, exports of chemical products increased over the last ten years, including from 2017 to 2019, despite aslowdownfor2014–16(figure57).Forinstance,
employment decreased in the wearing apparel sector by 3 per cent from 2017 to 2019, despite a significantincreaseinexportslevelsoverthesameperiod. Other manufacturing sectors that witnessed a decrease in their employment levels observed either reduced or stagnant exports (figures 56 and 57).
Most employment growth within the services sec-tor took place within the real estate, business and administrativeactivitiessectors,specificallywithinsecurityandinvestigationactivities(figure55).Thesector created mostly jobs for mid-skilled workers. In contrast, almost all the other sectors in services lost jobs between 2017 and 2019.
In general, the level of skills increased among the employed population, with the share of high-skilled workers increasing from 23 per cent to 30 per cent from 2017 to 2019. However, in manufacturing, the percentage of low-skilled workers grew slightly over the same period, while the share of high-skilled workers remained stable. This indicates a slight decrease in the level of skills demanded by the manufacturing industries in Jordan. In other trad-able sectors, including agriculture, the demand for
X Figure 57: Evolution of selected merchandise exports in Jordan, 2009–19
Note: Chemicals and chemical products include: organic chemicals (SITC 51), inorganic chemicals (SITC 52), dyeing, tanning and colouring materials (SITC 53), essential oils for perfume materials and cleaning preparations (SITC 55), fertilizers other than group 272 (SITC 56), plastics in primary forms (SITC 57), plastics in non-primary forms (SITC 58) and chemical materials and products (SITC 59); wearing apparel includes: articles of apparel and clothing (SITC 84) and footwear (SITC 85); pharmaceutical products include: medicinal and pharmaceutical products (SITC 54); manufacture of metals includes: manufactures of metal, n.e.s. (SITC 69); Basic metal includes: iron and steel (SITC 67) and non-ferrous metals (SITC 68); beverages include: beverages (SITC 11); furniture includes: furniture (SITC 82). Source:AuthorʼscalculationbasedondatafromUNCTAD.
Pharmaceuticals products Basic metal Manufacture of metals
Chemicals and chemical products Wearing apparel Furniture Beverages
2009 2010 2011 2012 2013 2014 2015 2016 2017 2018 2019
2,500,000
2,000,000
1,500,000
1,000,000
500,000
0

83 Chapter 2. Inclusive economic transformation through employment-oriented trade, industrial and investment policies
X Figure 58: Distribution of level of skills in all sectors and manufacturing in Jordan, 2017–19
Source:Authorʼscomputation,basedondataprovidedbyILOStatisticsDepartment.
0 10 20 30 40 50 60 70 80 90 100
Percentage
75.0 13.0 12.0
73.3 14.9 11.8
32.4 17.5 50.1
31.7 18.8 49.5
68.3 19.6 12.1
66.2 21.5 12.3
54.5 15.3 30.2
55.8 21.2 22.9
2019
Ma
nu
fact
uri
ng
Tra
da
ble
se
rvic
es
Ag
ricu
ltu
reA
ll se
cto
rs
2017
2019
2017
2019
2017
2019
2017
Basic or less basic education Intermediate education High education
both low-skilled and high-skilled workers increased slightly(figure58).
Jordan has oriented its strategic focus towards high value-added and technology-intensive industries to absorb the increasing number of highly educated workers. The growth of these industries and the higher sophistication of Jordanian exports might inevitably decrease the demand for low and mid-skilled workers. The adjustments costs and capacity of workers to reallocate into other tradable or for-mal sectors are two major points that policymakers in Jordan need to be aware of to ensure inclusive trade and investment policies in the region.
Morocco, the champion of industrial policies in the region since 2005, has also witnessed a decrease in theshareoftradablesectorsinemployment(fig-ure 59). The highest drop is unsurprisingly in agri-culture, with the share of agriculture in employment decreasing from 46 per cent in 2000 to 34 per cent in 2019. Over the same period, the share of manu-facturing also decreased from 13 per cent to 11 per
cent, while tradable services increased from 6.7 per cent to 9.0 per cent. Between 2000 and 2009, only 5 per cent of jobs created were in manufacturing, in contrast to 49 per cent in services. As in Egypt, the shift of labour out of agriculture was not compen-sated by enough job creation in tradable sectors. Instead, labour moved to non-tradable sectors such asconstructionandwholesaleandretail(figure60).For instance, employment growth in construction grew by 84 per cent for 2000–09 and by 33 per cent for 2009–19.
However, in Morocco, job creation in services has beensignificantacrossallsectors,notonlylow-pro-ductive ones but also in high-productive and some tradable sectors. For instance, from 2009 to 2019, employment in education and health services grew respectively by 20 per cent and 24 per cent. Over thesameperiod,financialandinsuranceactivitieswitnessed an employment growth of 28 per cent, inparallelwithasignificantincreaseof55percentemployment growth in trade in other services (out-side of travel and transport). Data of the level of

Trade, investment and employment in the Southern Mediterranean Countries84
skills by sector are unavailable for Morocco; how-ever,financialservicestendtocreatehigh-levelskilled jobs in general. Similarly, other tradable sec-tors like transport have also witnessed considerable employment growth since 2000, including from 2009 to 2019, during which exports in transport
increased by 74 per cent. However, it is worth noting that, like most of the other countries in the region, public administration has played an important role in job creation since 2000 in Morocco. Employment in public administration grew by 28 per cent from 2000 to 2009 and by 12 per cent from 2009 to 2019.
X Figure 59: Evolution of employment share of tradable and non-tradable sectors in Morocco, 2000–19
Note: The ILO modelled estimates provide the employment for categories ISIC rev.4 L; M; N aggregated under real estate; business and administrative activities; and categories ISIC rev.4 R; S; T; U aggregated under other services. Therefore, categories M and R, categorized as tradable, are included in the non-tradable sectors. It is, however, very unlikely that this would change the results of employment distri-bution, as the share of these categories in employment are generally very low. Source:AuthorʼscomputationbasedonILOSTATdata(modelledestimates).
Source:AuthorʼscomputationbasedonILOSTATdata(modelledestimates).
0 10 20 30 40 50 60 70 80 90 100
Percentage
2019 34.0 10.5 9.0 46.6
41.8 11.2 7.6 39.5
45.9 12.6 6.7 34.8
2009
2000
Agriculture and mining Manufacturing Tradable services Non-tradable sectors
X Figure 60: Sectoral distribution of job creation in Morocco, 2000–19 (thousands)
–800 –600 –400 –200 0 200 400 600
Other services
Human health and social work activities
Financial and insurance activities
Education
Transport; storage and communication
Accommodation and food service activities
Real estate; business and administrative activities
Public administration and defence; compulsory social security
Wholesale and retail trade; repair of motor vehicles and motorcycles
Utilities
Mining and quarrying
Manufacturing
Construction
Agriculture
Thousands 2000–09 2009–19

85 Chapter 2. Inclusive economic transformation through employment-oriented trade, industrial and investment policies
X Figure 61: Distribution of levels of skills for employed population in Morocco, 2011–19 (percentage)
Source: HCP Morocco.
0
20
40
60
80
Perc
enta
ge
2011 2012 2013 2014 2015 2016 2017 2018 2019
Low-skilled Mid-skilled High-skilled
64.6
24.6
10.8
63.2
25.5
11.3
62.9
25.6
11.4
62.0
26.6
11.4
61.3
27.1
11.6
60.3
27.2
12.4
58.6
27.9
13.5
57.6
28.7
13.7
55.4
29.6
14.9
In general, there is a significant increase in the level of skills within the employed population in Morocco(figure61).Theshareofmid-skilledandhigh-skilled workers increased from 2011 to 2019, while the share of low-skilled workers dropped sig-nificantlyoverthesameperiod.Skill-leveldataisnotavailable by sector; however, there are some indi-cations that the increase in exports drove demand for high-skilled workers, especially considering the employment growth in high-skilled tradable ser-vices. As mentioned in the previous section, exports insectorsidentifiedbyindustrialpoliciesinMoroccohavesignificantlyincreased.Inaddition,theshareof medium-skill and technology-intensive and high-skill and technology-intensive manufactures has expanded since 2000. However, employment in manufacturing did not grow at the same level. This suggests that export and trade growth in manufac-turing was not labour-intensive but rather skill-in-tensive and resulted in higher demand for higher skills in the Moroccan economy.
In Tunisia, employment in tradable sectors fell from 2000 to 2019, mostly driven by a shift of labour out of agriculture. The share of employment in manu-facturing also decreased, from 20 per cent in 2000 to 18 per cent in 2009 and has remained relatively stable in the past decade. Employment in tradable services increased slightly from 11 per cent in 2000 to12percentin2019,drivenmostlybysignificantjob creation in transportation and storage. In par-allel, the level of skills of the employed population
37 Data are available only for this period.
38 Source is INS, National Statistics Institute, Tunisia.
increasedsignificantlyfrom2005to2016,37 with the share of high-skilled workers increasing from 13 per centto18percentacrossallsectors(figure62).Overall, the number of jobs created from 2000 to 2019 outside of agriculture was higher than the number of jobs destroyed in agriculture; however, most jobs were created in non-tradable sectors.
Despite the overall decrease in its share, employ-ment in manufacturing grew steadily after 2000 (from 8 per cent of growth for 2000–09 to 10 per cent for 2009–19), and Tunisia has the highest level of manufacturing employment in the region. In manufacturing, the mechanical and electrical indus-tries created most of the jobs from 2000 to 2019.38 The share of mechanical and electrical industries in manufacturing employment grew from 11 per cent in 2000 to 16 per cent in 2019, while the share of the textiles and garments industry declined from 50 per cent to 36 per cent. At the same time, the share of high-skilled workers in manufacturing increased(figure65),translatingthelabourshiftinmanufacturing from skill-intensive manufacturing to mid-skilled and high-skilled manufacturing in, for example, the mechanical and electrical industries. Thefactthattheelectricalindustriesʼshareintotalexports doubled from 2000 to 2019 indicates that the expansion of exports in manufacturing resulted in employment creation and in increased demand for higher skills in the Tunisian economy.
Overall, the Tunisian economy has created more jobs in low-productive sectors such as construction,

Trade, investment and employment in the Southern Mediterranean Countries86
wholesale and retail than in tradable sectors, despite the employment growth in manufactur-ing and tradable services (figures 63 and 64). Non-tradable services have created most of the jobs since 2000 and its share in employment has increased from 49 per cent in 2000 to 55 per cent
in2019.Constructionalsoplayedasignificantrolein job creation, with employment growth of 41 per cent from 2000 to 2009 and 15 per cent from 2009 to 2019. Accommodation and food services linked to the tourism sector, a historically targeted sec-tor by the Tunisian authorities, had a very slight
X Figure 62: Evolution of employment share of tradable and non-tradable sectors in Tunisia, 2000–19
Note: The ILO modelled estimates provide the employment for categories ISIC rev.4 L; M; N are aggregated under real estate; business and administrative activities; and categories ISIC rev.4 R; S; T; U are aggregated under other services. Therefore, categories M and R, catego-rized as tradable, are included in the non-tradable sectors. It is, however, very unlikely that this would change the results of employment distribution, as the share of these categories in employment is generally very low. Source:AuthorʼscomputationbasedonILOSTATdata(modelledestimates).
0 10 20 30 40 50 60 70 80 90 100
Percentage
2019 14.3 18.3 12.4 55.1
19.0 18.0 11.7 51.3
20.7 19.7 11.1 48.5
2009
2000
Agriculture and mining Manufacturing Tradable services Non-tradable sectors
Source:AuthorʼscomputationbasedonILOSTATdata(modelledestimates).
X Figure 63: Sectoral distribution of job creation in Tunisia, 2000–19
–150 –100 –50 0 50 100 150
Other services
Human health and social work activities
Financial and insurance activities
Education
Transport; storage and communication
Accommodation and food service activities
Real estate; business and administrative activities
Public administration and defence; compulsory social security
Wholesale and retail trade; repair of motor vehicles and motorcycles
Utilities
Mining and quarrying
Manufacturing
Construction
Agriculture
Thousands 2000–09 2009–19

87 Chapter 2. Inclusive economic transformation through employment-oriented trade, industrial and investment policies
X Figure 64: Share of different industries in manufacturing employment in Tunisia, 2000–19
Source: Institut National de la Statistique (INS), Tunisia.
0 10 20 30 40 50 60 70 80 90 100
Percentage
2019 15.8 5.6 24.3 4.4 35.6 14.2
11.9 18.36.4 4.4 43.1 15.9
11.0 7.2 12.5 49.9 15.24.2
2009
2000
Agro-processing Construction materials Mechanical and electrical industries Chemical industries
Textiles and garments Other manufacturing sectors
X Figure 65: Distribution of level of skills in all sectors and manufacturing in Tunisia, 2005–16
Note: the total is slightly less than 100% due to the existence of a category in which the level of education is not stated. Source:Authorʼscomputation,basedondataprovidedbyILOStatisticsDepartment.
0 10 20 30 40 50 60 70 80 90 100
Percentage
2016 44.9 37.0 17.9
51.0 35.9 13.0
43.8 44.6 11.4
51.1 43.1 5.7
2005
2016
Ma
nu
fact
uri
ng
All
sect
ors
2005
Basic or less basic education Intermediate education High education
job creation record from 2009 to 2019, impacted by the revolution in Tunisia and its instability. The public sector is one of the leading sectors in job cre-ation, with employment growth at 28 per cent for 2000–09 and at 11 per cent for 2009–19. Since 2011, the Tunisian authorities have used the public sector as a last resort for long-term unemployment and as a social-justice tool, providing some of those who sufferedduringBenAliʼsdictatorshipwitheconomicopportunities. In 2020, the authorities adopted the 38-2020 law, which includes preferential recruit-ment for long-term unemployed tertiary graduates. This law is in itself a strong indication of the low
dynamism of the labour market in Tunisia and the lack of economic opportunities, as long-term unem-ploymenthasbeendefinedformorethantenyears.
In the Occupied Palestinian Territory, the shift of labour out of agriculture was not compensated by enough job creation in tradable sectors such as manufacturing. The share of agriculture in employ-mentdecreasedsignificantlyandinparallel,theshare of employment in non-tradable sectors has increased(figure66).Theexpansionofnon-tradablesectors was mainly driven by wholesale and retail (figure67),astheshareofthesectorinemployment

Trade, investment and employment in the Southern Mediterranean Countries88
increased from 15 per cent in 2000 to 19 per cent in 2019. Construction also played a major role in job creation, mostly from 2009 to 2019; however, its share in employment decreased from 20 per cent to 17 per cent from 2000 to 2019. The share of manufacturing in employment decreased by almost 2 per cent from 2000 to 2019, despite a rel-ative increase of Palestinian exports over the same
period. However, the share of tradable services increased slightly, mainly driven by an expansion of transportation, storage and information and com-munication(figures66and67).Publicadministra-tionhasalsoplayedasignificantroleinjobcreationin the Occupied Palestinian Territory between 2000 and 2019, with its share in employment increasing from 12 per cent in 2000 to 13 per cent in 2019.
X Figure 66: Evolution of employment share of tradable and non-tradable sectors in the Occupied Palestinian Territory, 2000–19
Source:Authorʼscomputation,basedondataprovidedbyILOStatisticsDepartment.
0 10 20 30 40 50 60 70 80 90 100
Percentage
2019 6.4 11.9 11.6 70.2
12.1 11.7 10.9 65.2
14.3 13.8 9.1 62.7
2009
2000
Agriculture and mining Manufacturing Other-tradable Non-tradable
Source:Authorʼscomputation,basedondataprovidedbyILOStatisticsDepartment.
X Figure 67: Job creation in the Occupied Palestinian Territory, 2000–19
–40 –20 0 20 40 60 80 100
Other services
Human health and social work activities
Financial and insurance activities
Education
Transport; storage and communication
Accommodation and food service activities
Real estate; business and administrative activities
Public administration and defence; compulsory social security
Wholesale and retail trade; repair of motor vehicles and motorcycles
Utilities
Mining and quarrying
Manufacturing
Construction
Agriculture
Thousands 2000–09 2009–19

89 Chapter 2. Inclusive economic transformation through employment-oriented trade, industrial and investment policies
In Algeria, like other countries in the region, the share of tradable sectors in employment decreased from 2000 to 2019. From 2000 to 2009, the services sector accounted for 66 per cent of jobs created; thatfiguregrewto77percentfrom2009to2019.Agriculture lost a considerable number of jobs in Algeria from 2000 to 2019, with employment decreasing by 23 per cent in the sector, while most
jobs created over the last 19 years were in low-pro-ductive, labour-intensive and non-tradable sectors suchasconstructionandwholesaleandretail(fig-ures 68 and 69). Public administration has played a significantroleinjobcreationoverpastdecades,with the number of jobs in the public sector almost doubling between 2000 and 2019 (employ-ment grew from 972,800 to 1,791,500 workers).
Source:AuthorʼscomputationbasedonILOSTATdata(modelledestimates).
0 10 20 30 40 50 60 70 80 90 100
Percentage
2019 11.1 10.4 9.3 69.2
14.0 11.5 8.3 66.2
24.3 10.5 8.0 57.2
2009
2000
Agriculture and mining Manufacturing Other-tradable Non-tradable
Source:AuthorʼscomputationbasedonILOSTATdata(modelledestimates).
X Figure 69: Sectoral distribution of job creation in Algeria, 2000–09 and 2009–19 (thousands)
–400 –200 0 200 400 600 800 1,000
Other services
Human health and social work activities
Financial and insurance activities
Education
Transport; storage and communication
Accommodation and food service activities
Real estate; business and administrative activities
Public administration and defence; compulsory social security
Wholesale and retail trade; repair of motor vehicles and motorcycles
Utilities
Mining and quarrying
Manufacturing
Construction
Agriculture
Thousands 2000–09 2009–19
X Figure 68: Evolution of employment share of tradable and non-tradable sectors in Algeria, 2000–19

Trade, investment and employment in the Southern Mediterranean Countries90
Manufacturing contributed considerably to job creation, witnessing an employment growth of 70 per cent from 2000 to 2009. However, this trend decreasedsignificantlyafter2009,withemploy-ment growing by only 4 per cent from 2009 to 2019. Overall, the share of manufacturing remained sta-ble in total employment. Tradable sectors in Algeria are mostly extractive sectors, which do not contrib-
utetojobcreation.Economicdiversificationandmanufacturing development should be the focus of future industrial policies in Algeria.
In Libya, the share of employment in agriculture decreasedsignificantlybetween2000and2019,leading to a decrease in the employment share of tradablesectors(figure70).Theshareoftradable
X Figure 70: Evolution of employment share of tradable and non-tradable sectors in Libya, 2000–19
Source:AuthorʼscomputationbasedonILOSTATdata(modelledestimates).
0 10 20 30 40 50 60 70 80 90 100
Percentage
2019 18.9 10.6 13.8 56.7
23.6 11.9 11.4 53.1
28.7 13.1 10.6 47.6
2009
2000
Agriculture and mining Manufacturing Other-tradable Non-tradable
Source:AuthorʼscomputationbasedonILOSTATdata(modelledestimates).
X Figure 71: Evolution of job creation in Libya, 2000–19
–40 –20 0 20 40 60 80 100 120
Other services
Human health and social work activities
Financial and insurance activities
Education
Transport; storage and communication
Accommodation and food service activities
Real estate; business and administrative activities
Public administration and defence; compulsory social security
Wholesale and retail trade; repair of motor vehicles and motorcycles
Utilities
Mining and quarrying
Manufacturing
Construction
Agriculture
Thousands 2000–09 2009–19

91 Chapter 2. Inclusive economic transformation through employment-oriented trade, industrial and investment policies
sectors decreased from 52 per cent in 2000 to 43 per cent in 2019, despite an increase in the share of tradable services in employment. On the other hand, the share of non-tradable sectors increased from 48 per cent in 2000 to 57 per cent in 2019, with wholesale and retail being the leading sector in terms of job creation since 2000. Manufacturing cre-ated only 8 per cent of the jobs from 2000 to 2009 and 3 per cent from 2009 to 2019. Employment data for Libya is only available in broad categories; however, it is worth noting that exports in manufac-turing are concentrated in chemical products, spe-cificallyorganicchemicalsandnon-metallicmineralproducts, generally linked to the oil industry. From 2009 to 2019, agriculture and construction were the onlytwosectorsthatlostasignificantshareofjobs,and job creation in services has been in all sectors, includingfinancialandinsuranceactivities,realestateandbusinessactivities(figure71).Likeothercountries in the region, public administration plays asignificantroleinjobcreationinLibya,accountingfor 8 per cent of jobs created from 2000 to 2009 and 12 per cent of jobs created from 2009 to 2019 – overall, at higher levels than manufacturing.
2.3.4. Why so idle? The role of physical and soft infrastructure The impact of trade policies on the labour market is not only determined by the level of trade liberal-ization and trade policies but also depends heavily on the adoption of other sets of policies that are coherent with trade policies and that build the nec-essary environment for their success. As discussed earlier in this chapter, of the design of industrial policies in the region could be improved, despite some encouraging signs in Egypt and Morocco. Tradepoliciesneedeffectiveindustrialpoliciestoyield the expected positive outcomes and provide quality jobs for workers in the region. The impact of both industrial and trade policies in the region also depends heavily on the quality of infrastruc-ture. Infrastructure can be defined by physical and soft infrastructure and is an important input to economic development and trade expansion. Physical infrastructure includes roads, connectiv-ity, telecommunications and ports and soft infra-structurebyfinance,humancapitalandthequalityof institutions.
39 Oxford Business Group, “InvestmentinTunisiaʼsportinfrastructureboostingcompetitiveness”, The Report: Tunisia 2018.
2.3.4.1 Physical infrastructure
High-quality physical infrastructure is foundational for economic growth in general and for yielding the impact of trade policies on the labour mar-ket. Investment in physical infrastructure can fos-ter employment creation and trade expansion by creatingsignificanttemporaryjobopportunitiesduring the infrastructure projects and by facilitat-ing labour mobility and reducing the adjustment costsofworkersandfirmstotradeliberalization.Investment in infrastructure can also foster trade expansion by reducing the trade-related transaction costs, which include communication costs, domes-tic transport costs, time and money spent in ports on border procedures and international transport costs. Therefore, investing in public infrastructure andtradelogisticswouldfacilitatethereshufflingof production factors in these economies and facil-itate the emergence of high-added value and pro-ductivefirms,enhancingtheimpactoftradeandinvestment policies on the labour market and the economy as a whole. Physical infrastructure can be assessed by the quality of transport, including roads, railways, airports, ports, public transporta-tion, the development of the energy sector, access to electricity and connectivity and digital infrastruc-ture and ICT development.
Quality of transport
Improving the transport quality, including the road networks, and the logistics environment are key to improving the level of trade in the region and to better integration of local SMEs into global value chains. Particularly, the maritime transport and the logistics framework play a strategic role in trade and in the expansion of export-oriented industries. According to the World Bank Enterprise survey, countries in the Southern Mediterranean Countries requiresignificantlymoretimetoclearcustomsfor export. While upper-middle income countries require on average four days to clear customs for export, Egypt, Morocco and Tunisia needed about 6.7 days, while Jordan fares with 4.7 days.
Maritime transport and quality of ports represent an essential part of trade in the region, as coun-tries rely mainly on maritime transport for cargo transport. For instance, in Tunisia, 98 per cent of cargo enters the country through the maritime port network.39 Similarly, in Morocco, 95 per cent of cargos transit by sea route (Moroccan Ministry

Trade, investment and employment in the Southern Mediterranean Countries92
of Finance, 2016). However, and despite the strate-gic importance of maritime transport for trade, the quality of port infrastructure remains low in most countries in the region, except for Jordan, Morocco and Egypt. The three countries have the best qual-ity of port infrastructure, higher than the global median score. Morocco, particularly, has made substantial investments to improve the quality of Tangier port, which in 2019 became the largest port in the Mediterranean in terms of capacity after the opening of new terminals.40 The quality of the port infrastructure in Tunisia and Lebanon has been decreasing over the last years. In Tunisia, Radès port,themaindeepseaport,suffersfromsignifi-
40 AhmedEljechtimiandUlfLaessing,“MoroccoʼsTangierporttobecomeMediterraneanʼslargest”,Reuters,26June2019.
41 Oxford Business Group, “Tunisia exploring new development for maritime infrastructure”, The Report: Tunisia 2018.
cantchallenges,includingsignificantdelaysandlow workers productivity. For instance, dwell time at Radès averages over 15 days, which raises inven-tory costs.41 The container operations in the port are currently managed by STAM, a public company.
The quality of the logistics network is crucial to the development of trade and transport of goods. The region scores particularly low on the quality of logistics, according to the Logistics Performance Indicators. The indicators reported in table 19 show the weakness of the logistics environment in the region on all the indicators: customs, infrastruc-ture, international shipments, logistics quality and
X Table 19: Logistics Performance Index scoring in the Southern Mediterranean Countries (1 to 5, 5=best)
Countryoverall
LPI rank – over 160 countries
overall LPI score Customs Infrastructure International
Logistics quality and competence
Tracking Timeliness
Algeria 117 2.45 2.13 2.42 2.39 2.39 2.60 2.76
Egypt 67 2.82 2.60 2.82 2.79 2.82 2.72 3.19
Jordan 84 2.69 2.49 2.72 2.44 2.55 2.77 3.18
Lebanon 79 2.72 2.38 2.64 2.80 2.47 2.80 3.18
Libya 154 2.11 1.95 2.25 1.99 2.05 1.64 2.77
Morocco 109 2.54 2.33 2.43 2.58 2.49 2.51 2.88
Tunisia 105 2.57 2.38 2.10 2.50 2.30 2.86 3.24
Source: LPI 2018.
X Figure 72: Quality of port infrastructure in countries in the region (from 1 to 7, with 7 being the highest score)
Source:WorldEconomicForum,(1=extremelyunderdevelopedto7=welldevelopedandefficientbyinternationalstandards).
2007 2011 2017
0
1
2
3
4
5
6
7
Scor
e
Algeria Egypt Jordan Lebanon
Median World
Libya Morocco Tunisia

93 Chapter 2. Inclusive economic transformation through employment-oriented trade, industrial and investment policies
competence, tracking and tracing and timeliness. The North African countries (except for Egypt) rank lower than other in the region on this index, with the lowest performance on customs, infrastructure and international shipments. The performance of Tunisia, Morocco and Libya has worsened from 2007 to 2018, particularly for Tunisia from 2012 to2018.Moroccohasmadesubstantialeffortstoimprove maritime transport through substantial investment in the Tangier port; however, the quality of the logistics remains relatively low. Between 2012 and 2018, there was a particular decrease in the quality of logistics, tracking and tracing timeliness. Countries in the region have invested heavily in physical infrastructure over the last decades (from 3 per cent to 5 per cent of their GDP annually); how-ever, several gaps remain especially in cross-border road transport and energy (OECD, 2021).
Quality of Energy and electricity
Unreliable electricity supply remains a challenge in some countries in the region, despite univer-sal electricity access. Most countries in the region have achieved universal access to energy, except for Libya, where only 67 per cent of the population has access to electricity, according to 2019 WDI data.However,asignificantshareoffirmsinEgypt,Jordan, Lebanon and the Occupied Palestinian Territory reports unreliable electricity supply as a significantchallengetodoingbusiness(figure74).
Some countries in the region have started diversi-fyingintorenewableenergyinanefforttoexploittheir comparative advantage. Morocco increased its focus on renewable energy, particularly solar energy, to decrease its dependence on energy imports, which represented 93 per cent of its
X Figure 73: Evolution of Logistics Performance Index scores of countries in the region, 2007–18
X Figure 74: Share of enterprises that declare access to electricity as their biggest challenge (percentage)
Source: LPI 2018.
Source: World Bank Enterprise survey.
2007 2012 2018
0
1
2
3
4
Scor
e
Algeria Egypt Jordan Lebanon
2.06 2.
41 2.45
2.37
2.98
2.82 2.89
2.56 2.69
2.37 2.
58 2.72
2.28
2.11 2.
383.
032.
54 2.76 3.
172.
57
Libya Morocco Tunisia
0
5
10
15
20
Perc
enta
ge
Egypt
(2020)
Jordan
(2019)
Morocco
(2019)
Lebanon
(2019)
5.5
16.1
4.2
10.3
1.3
5.2
Tunisia
(2020)
Occupied
Palestinian
Territory
(2019)
2000 2010 2015
0
2
4
6
8
10
Perc
enta
ge
Egypt Jordan Morocco
0.21.2 0.9
0.0 0.10.7 0.5
2.8
8.2
0.20.9
2.5
Tunisia

Trade, investment and employment in the Southern Mediterranean Countries94
energy consumption in 2019. In 2009, the Moroccan authorities adopted a National Energy Strategy “Horizon 2030” focused on developing renewable energy production. This led to an increase in the share of renewable energy in energy production from less than 1 per cent in 2000 to 8 per cent in 2015. To a lesser extent, Tunisia has also slowly been increasing its production of renewable energy, atamuchslowerpacethanMorocco(figure75).Renewableenergypresentsasignificantopportu-nity in the region. Countries in the region could take advantage of their natural endowments and focus on developing renewable energy to decrease their energy dependence, reduce the costs of energy for consumers,includingforfirmsandimprovethereliability of electricity, particularly in Egypt, Jordan, Lebanon and the Occupied Palestinian Territory.
Digital infrastructure
Theregionbenefitsfromarelativelywell-developeddigital infrastructure. For instance, most countries in the region score relatively high on the Mobile Connectivity Index, which measures the perfor-mance of 170 countries against the key enablers of mobile internet adoption. Non-oil exporting coun-tries in the region score higher than the average of the 170 countries assessed in this index, while Algeria and Libya seem to have the weakest digital infrastructure in the region. Countries in the region score particularly high on the network coverage. For instance, Jordan, Lebanon, Morocco and Tunisia score among the leading countries in network cov-erage, with a score higher than 85 out of 100.
X Figure 75: Electricity production from renewable sources, excluding hydroelectric (percentage of total)
X Figure 76: Mobile Connectivity Index, 2019 (score out of 100)
Source: World Bank Enterprise survey.
Source: GSMA, Data unavailable for the Occupied Palestinian Territory.
0
5
10
15
20
Perc
enta
geEgypt
(2020)
Jordan
(2019)
Morocco
(2019)
Lebanon
(2019)
5.5
16.1
4.2
10.3
1.3
5.2
Tunisia
(2020)
Occupied
Palestinian
Territory
(2019)
2000 2010 2015
0
2
4
6
8
10
Perc
enta
ge
Egypt Jordan Morocco
0.21.2 0.9
0.0 0.10.7 0.5
2.8
8.2
0.20.9
2.5
Tunisia
Max: 90.5
Average: 54.4
Min: 12.2
0
20
40
60
80
100
Scor
e
Algeria Egypt Jordan Lebanon Libya Morocco Tunisia
53.2 55.760.4 59.5
50.859.9 60.0

95 Chapter 2. Inclusive economic transformation through employment-oriented trade, industrial and investment policies
However, accessibility to digital infrastructure for individualsandenterprisesremainsasignificantchallenge in the region. Despite an overall good dig-ital infrastructure, countries in the region rank rel-atively low in the International Telecommunication UnionʼsICTDevelopmentIndex(table20).Theindexcoversaccessibilityindicatorsincludingfixed-tele-phone networks, mobile-cellular telephone sub-scriptions, mobile-broadband subscriptions, fixed-broadbandsubscriptions(totalandbyspeedtiers), international bandwidth, ICT prices and sta-tistics on ICT access and use by households and individuals. Outside of Lebanon, countries in the region rank in the bottom 50 per cent of countries on accessibility. Usage of the internet for business purposes remains also limited in the region: only 8 per cent of businesses in MENA (including the Southern Mediterranean Countries), have a digital presenceandonly1.5percentoftheregionʼsretailsales are done online (McKenna, 2017).
2.3.4.2 Soft infrastructure
Finance
The level of development and functioning of the financial sector are essential determinants of the impact of trade policies on the labour mar-ket.Adevelopedandfunctioningfinancialsectorfacilitates the reshuffling of production factors in the economy and facilitates the entry of new and highly productive firms. More generally, thereisasignificantpositivecorrelationbetweenfinancial and economic development levels. For instance, in his famous book, The Theory of Economic Development, published in 1911, Joseph Schumpeter argued that the services provided byfinancialintermediariesthatmobilizesavings,assessrisksandfacilitatefinancialtransactionsare
essential for technological innovation and economic development. In their paper, “Finance and Growth: Schumpeter might be right”, published in 1993, King and Levine study the correlation between lev-elsoffinancialdevelopmentandeconomicdevel-opment across more than 80 countries from 1960 to1989.Theyusethesizeoftheformalfinancialintermediary sector relative to GDP, the percentage ofcreditallocatedtoprivatefirmsandthecreditissuedtoprivatefirmstoGDPasindicatorsoftheleveloffinancialdevelopmentacross.Theauthorsestablishthatahigherdevelopmentoffinancialservicesissignificantlyandrobustlycorrelatedwithfaster economic growth rates, physical capital accu-mulationandeconomicefficiencyimprovements.
In the Southern Mediterranean Countries, Lebanon, Jordan,TunisiaandMoroccohavefinancialandbanking sectors that seem large and relatively well-developed. In this group of countries, the domestic credit to private sector ratio is higher than in peer countries in Asia and Latin America; how-ever, it remains lower than the global average, esti-mated at 132 per cent in 2019. The second group of countries, composed of Algeria, Egypt, Libya and the Occupied Palestinian Territory, has a less devel-opedfinancialandbankingsectorwithadomesticcredit to private sector ratio at a much lower level thanothercountriesintheregion(figure77)andotherpeercountries.Inbothcountriesʼgroups,thefinancialsectorismainlyconcentratedonthebank-ingoffer.Theregionhasrelativelylow-developedequityfinance,whichplaysaminorrole,exceptforJordanandMorocco,whereequityfinanceisthesecondfinancingsourceforfirms(figure78).
However,evenincountrieswherethefinancialsectorseems to be well-developed, challenges for access to financeremainimportant.Mostofthecountriesinthe region are at the bottom of the Doing Business
X Table 20: Rank of countries in the ICT Development Index (out of 175 countries)
Country Name 2015
Algeria 112
Egypt 97
Jordan 89
Lebanon 61
Morocco 98
Tunisia 95
Source: ITU ICT Development Index.

Trade, investment and employment in the Southern Mediterranean Countries96
X Figure 77: Domestic credit to private sector, total and provided by banks, as per cent GDP, 2017
X Figure 78: Sources of financing for enterprises in the region, 2019
Source: WDI.
Source: World Bank Enterprise survey data, 2019.
0
20
40
60
80
100
120
Pere
ntag
e
Pro
vid
ed
by
ba
nks
Tota
l
Algeria Egypt Jordan Lebanon Libya
Occupied
Palestinian
TerritoryMorocco Tunisia
24.4 24.4 28.5 28.5
74.8 74.9
101.9 106.3
23.0 23.0
62.9
86.7
41.7 41.7
68.6
86.6
Pro
vid
ed
by
ba
nks
Tota
l
Pro
vid
ed
by
ba
nks
Tota
l
Pro
vid
ed
by
ba
nks
Tota
l
Pro
vid
ed
by
ba
nks
Tota
l
Pro
vid
ed
by
ba
nks
Tota
l
Pro
vid
ed
by
ba
nks
Tota
l
Pro
vid
ed
by
ba
nks
Tota
l
0
20
40
60
80
100
Perc
enta
ge
Financed internally Financed by banks Financed by equity Others
Egypt
2020
91
7
60
15
23
54
8
20
18
74
24
47
20
32
73
1359
68
20
571/1 1/12
1
Jordan
2019
Morocco
2019
Lebanon
2019
Tunisia
2020
Lower-
middle-
income
2020
Upper-
middle-
income
2019

97 Chapter 2. Inclusive economic transformation through employment-oriented trade, industrial and investment policies
rankinginaccesstofinance,exceptforJordanandthe Occupied Palestinian Territory (table 21). Also, inTunisiaandLebanon,accesstofinanceisbyfarthemainchallengefacedbyfirmstooperateanddevelop, as indicated by the results of the World Bankenterprisesurvey(figure79).InJordan,only2percentoffirmsstatedthataccesstofinanceistheir biggest challenge. However, IFC data indicate that in countries like Lebanon, Jordan, Tunisia and Morocco, banking lending is concentrated on a lim-itednumberoflargefirms.
A root cause of the low level of financial sector developmentistheunder-developedfinancialinfra-structure, which translates to a scarcity of reliable data and information about businesses. Countries
in the region either do not have credit registries and credit bureaus or have relatively low coverage for both (table 21). Weak credit information and data collection about firms and individuals lead to a high asymmetry of information and high transac-tion costs. This also encourages relationship-based lending instead of transaction-based lending, which tendstofavourlendingtoexistingfirms,generallylargeones,andprohibitstheprovisionoffinancingtonewlyestablishedfirms,hinderingcompetitionand innovation. Credit registries, generally pub-lic-owned, and bureaus both aim to collect credit dataaboutfirmsandimprovethefunctioningoffinancialservicesbyreducinginformationasymme-try and the risk of adverse selection.
X Figure 79: Share of enterprises declaring access to finance as their biggest challenge
Source: World Bank Doing Business and Enterprise survey data, 2019.
0
10
20
30
40
50
Egypt Jordan Lebanon Morocco
8.42.2
28.7
4.3
39.4
17.713.0
9.6 9.0
Tunisia Occupied
Palestinian
Territory
East Asia
& Pacific
Latin
America
& Caribbean
Europe
& Central
Asia
X Table 21: Selected indicators on access to finance
Location Getting Credit rank Getting Credit score Credit registry coverage (percentage of adults)
Credit bureau coverage (percentage of adults)
Algeria 181 10.0 3.6 0.0
Egypt 67 65.0 9.5 31.3
Jordan 4 95.0 5.0 22.9
Lebanon 132 40.0 21.3 0.0
Libya 186 0.0 0.6 0.0
Morocco 119 45.0 0.0 31.6
Occupied Palestinian Territory 25 80.0 22.9 0.0
Tunisia 104 50.0 36.4 0.0
Source: World Bank Doing Business and Enterprise survey data, 2019.

Trade, investment and employment in the Southern Mediterranean Countries98
Evidence suggests that advanced credit information systems are associated with lower transaction costs and credit constraints, especially for SMEs. Stiglitz is considered the pioneer of the information asymme-try theory and its impact on markets. In his paper published in 1981 with Weiss, the authors indicate that information asymmetries in credit markets arise when borrowers have substantially more information than lenders regarding their risk pro-fileandrepaymentprobability(StiglitzandWeiss,1981). Asymmetry of information means that lend-erscannotassessborrowersʼrepaymentcapacity.Thatmeansthatthelenderhastoofferaninterestratethatmakesitprofitabletolendonaverage–an interest rate that may be too high for low-risk borrowers. As a result, only high-risk borrowers borrow – in other words, adverse selection takes place. The higher this asymmetry of information, themoreconstrainedtheaccesstofinanceisforfirms.Establishingacreditinformationsystemcanthus help reduce the asymmetry of information and the risk of adverse selection. Chavez (2017) studiescredit-constrainedfirmsʼcharacteristicsusingfirm-levelmeasuresofcreditconstraintsfor111 countries and analyses the role of a credit infor-mationsystem.Thestudyfindsthatfirmsizeandfirmtransparencyarethemostimportantfactorsaffectingfirmsʼaccesstofinanceandthatamoredeveloped credit information system is associated with lower levels of credit constraints, particularly forsmallerfirms.Thestudyfindsthatthisispartic-ularly the case in the presence of advanced private credit bureaus.
Countries in the region should focus on diversify-ingthesourcesoffinancingforbusinessesout-side of the traditional banking sector, notably by developingbothpublicandprivateequityfinancesegments, including stock and corporate bond
markets.Thistypeoffinancinggenerallyrespondsmoretotheneedsofinnovativefirms,ratherthanthe traditional banking offer. Also, countries in theregionshouldfocusandimprovethefinan-cial infrastructure, which would improve the credit scoringtechniquesandultimatelyaccesstofinanceforfirms.Countriesintheregionshouldbuildtheemergingandrapidlygrowinginnovativefinancingtools and develop the FinTech segment that could transform finance access in the region. Several examples in low- and middle-income countries illustrateFinTechanddigitalfinancialservicesʼroleinimprovingfinancialservicesforcustomersandfirms.Forinstance,M-PESA,amobilepaymentsolu-tioninKenya,completelytransformedthefinancialsectorinKenyaandsignificantlyimprovedfinancialinclusion. With the emergence of FinTech, innova-tionsincreditscoring,riskassessmentandfinancialinclusion could be used in the region to enhance thefunctioningofthefinancialsectorandimproveaccesstofinanceforfirmsandSMEs.
Human capital
The region has, in general, a well-educated popu-lation, with relatively high educational attainment, especially among women. The school enrollment in tertiary education is relatively high among almost all countries in the region, with Algeria and the Occupied Palestinian Territory having higher rates than the global average (38 per cent) in 2018, and rates in Egypt, Jordan, Morocco and Tunisia being similar to the average in middle-income countries (35 per cent in 2017). However, Jordan and Tunisia, countries with the highest levels of education in the region historically, have witnessed a slight decrease in enrolment in tertiary education over the past decade (table 22).
X Table 22: Gross school enrolment in tertiary education in the region (percentage)
2010 2011 2012 2013 2014 2015 2016 2017 2018
Algeria 29.9 31.2 32.2 33.9 34.5 36.8 42.6 47.6 51.4
Egypt 31.4 26.8 27.7 30.1 31.1 35.0 33.9 35.2 -
Jordan 37.1 36.3 41.8 - - 36.6 31.1 31.1 34.4
Morocco 14.6 16.4 19.5 22.6 25.3 28.4 32.0 33.8 35.9
OPT 47.8 49.7 48.5 45.9 44.8 45.3 43.9 43.7 44.3
Tunisia 35.4 35.2 35.9 35.0 35.3 35.2 32.8 32.1 31.7
Note: No recent data available for Libya and Lebanon. OPT is Occupied Palestinian Territory.Source: WDI.

99 Chapter 2. Inclusive economic transformation through employment-oriented trade, industrial and investment policies
The Human Capital Index (HCI) shows, however, important gaps in the region (table 23). The HCI measures the amount of human capital that a child born today can expect to attain by age 18 and can be used as a proxy for the productivity of the next generation of workers compared to a benchmark of complete education and full health.42 Children born today in the region will be between 49 per cent and 58 per cent as productive when they grow up than they would be if they could enjoy complete educa-tion and full health. The index shows that HCI for males is lower than for females in most countries in the region, driven by higher educational outcomes of females. Overall, there are high levels of human capital that remain untapped in the region, and this is expected to remain the case for future gen-erationsifsignificantinvestmentineducationandhealth is not made.
On average, countries in the region invest less in R&D than other middle-income countries. Middle-income countries spent on average 1 per cent of their GDP on R&D in 2018. Countries in the region spend less than 0.7 per cent of their GDP on R&D. According to UNESCO data, Egypt and Jordan spent approximately 0.7 per cent of their GDP in R&D in 2016; Algeria spent 0.6 per cent of GDP in 2017; the Occupied Palestinian Territory spent 0.5 per cent of GDP in 2013; and Tunisia spent 0.6 per cent of GDP in 2016. Comparatively, Eastern and Southern Asian countries invest about 2 per cent of their
42 World Bank, The Human Capital Index, 2020 Update, 2020.
GDP in R&D. Data available on the breakdown of R&D investment is only available in Algeria, Egypt, Morocco and Tunisia and shows that most of the R&D investment goes to R&D performed by gov-ernment and higher education, with a minor share of investment in businesses. For instance, only 7 per cent of investment in R&D in Algeria goes to businesses and private sector innovation. The figure reaches 5 per cent for Egypt, 15 per cent for Morocco and 18.5 per cent for Tunisia. Comparatively, countries like Singapore and Turkey spend at least 50 per cent of the R&D in businesses, providing direct support to foster innovation in the private sector.
Investment in R&D, technology and innovation, including for the private sector, can be major driv-ers of productivity and development and can help countries in the region foster the convergence pro-cess and the structural transformation. Evidence indicates that innovation and the adoption of new technologies provide firms with a competitive marketadvantage,improvestheeffectivenessofthe use of production factors and resources and increases enterprise productivity and their potential for growth, including in middle-income countries. For instance, Crespi and Zuñiga (2010) evaluate the impactoftechnologicalinnovationonfirmlabourproductivity across six Latin American countries (Argentina, Chile, Colombia, Costa Rica, Panama and Uruguay). The paper indicates that in all these
X Table 23: Scoring of countries in the Human Capital Index, 2020
Index rank (range between 0 and 1)
Algeria 0.53
Egypt 0.49
Jordan 0.55
Lebanon 0.52
Morocco 0.50
Occupied Palestinian Territory 0.58
Tunisia 0.52
Highest value 0.88
Lowest value 0.29
Note: No data available for Libya.Source: World Bank Human Capital Index, 2020.

Trade, investment and employment in the Southern Mediterranean Countries100
countries,firmsthatinvestinknowledgearemorelikely to introduce new technological advances and those who innovate have higher labour productivity thanotherfirms.Theseresultsareconsistentwithabundant literature indicating a positive relation-ship between investment in R&D, which can be a proxyforaccesstotechnology,innovationandfirmproductivity(Griffithetal.,2004;Griffithetal.,2006;Hall et al., 2010).
Policymakers in the region can use a set of inter-ventions to promote access to technology and inno-vation for the private sector, including for SMEs. Interventions, in general, aim to reduce the cost of R&D and innovation or to increase the demand for R&D and innovative products. Interventions to reduce the cost of R&D can include R&D grants, subsidies, or tax incentives. Other interventions aim to stimulate the demand for innovative and technol-ogy-basedproductsmadebyfirms,includingSMEs,notably through public procurement of innovative products that can then be used to solve social issues and add value to society. Other interventions are transversal, notably through creating a pro-innova-tion environment, fostering collaboration between industriesandfirms,incentivizingknowledge-shar-ing, intellectual property laws and patents and com-mercialization of research.
Quality of institutions
Institutions have been defined by Douglass C. North (1991) as “the humanly devised constraints that structure human interaction. They are made up of formal constraints (rules, laws, constitutions), informal constraints (norms of behaviour, conven-tions and self-imposed codes of conduct) and their enforcementcharacteristics”.Usingthisdefinition,economic institutions can be characterized as for-malconstraintsorrulesthatdefineandstructuretheeconomicinteractionbetweendifferentagentsin an economy. Generally, economic institutions include property rights, competition laws, mar-kets and state support for markets, labour mar-ket institutions, contract enforcement and access to education.
There is ample and growing evidence about the significantrolethateconomicinstitutionsplayinthe level of development in different countries. Particularly, Acemoglu and Robinson, in their book, Why Nations Fail: The Origins of Power, Prosperity and Poverty(2012),definetwosetsofeconomicinstitu-tions: inclusive and extractive ones. Inclusive eco-nomic institutions provide the right set of rules
and incentives for investment and innovation and createalevelplayingfieldforfirmsandentrepre-neurs. They ultimately lead to economic growth and prosperity. On the other hand, extractive economic institutions are designed by powerful and well-con-nected economic and political elites with rent-seek-ing rationale. They ultimately extract resources from the rest of society, leading to under-development andinefficientdistributionofresourcesandineffec-tive allocation of productive factors. Acemoglu and Robinson use this distinction between the two sets of institutions to explain the divergent development pathsbetweendifferentcountriesintheworld.
In the case of the Southern Mediterranean Countries, the 2011 social movements marked an attempt to reform the extractive economic institu-tions that had led to endemic corruption, strong rent-seeking and business–state ties and the atten-dant low levels of quality job creation and growth. Several studies highlight the role that business–state relationships have played in focus countries and documented extractive economic institutions in the region. For instance, Rijkers et al. (2017) study theevolutionofconnectedfirmsduringBenAliʼsera in Tunisia. The authors establish a database on politicalconnections,firmperformanceandentryregulation between 1993 and 2010 to assess the economicsizeofwell-connectedfirmsandstudythe mechanisms through which they developed andcomparethemwithnon-connectedfirms.InTunisia,manyofthewell-connectedfirmsbelongedtoBenAliʼsextendedfamily,whichbenefittedfromthe privatization reforms to secure a way into many strategic economic sectors such as telecom-munications and cars. The authors establish that well-connectedfirmsrepresented21percentofnetprivate-sectorprofitsandaccountedforaround3 per cent of private-sector output. The authors alsofindthatthesefirmsweremorelikelytooper-ate in sectors subject to prior authorization by the state, indicating regulatory abuse. The authors alsofindthatthesefirmsgenerallyperformedbet-ter than their competitors, with a market share on average 6.3 per cent higher than non-connected firms,mainlyduetotheirpresenceinhighlyreg-ulated sectors. In Egypt, Chekir and Diwan (2015) studytheeffectsofthebusiness–staterelationshiponwell-connectedfirmsduringtheMubarakera(between 1996 and 2006) and their impact on the sectorstheyentered.Usingtheyearofthesefirmsʼentrance, they establish a quasi-experimental set-tingandestimateadifference-in-differenceeffect,comparing employment growth in sectors that thesefirmsenteredwithindustriesthattheydidnot

101 Chapter 2. Inclusive economic transformation through employment-oriented trade, industrial and investment policies
enter.Theauthorsfindtwoimportantresults.First,politicallywell-connectedfirmsbenefitednotonlyfrom higher access to credits but also were more likelytobenefitfromenergysubsidies,tradepro-tectionandaccesstoland,amongotherbenefits.Second and more importantly, they establish that theentranceofthesefirmstopreviouslyuncon-nected sectors led to slow employment growth and inefficientallocationsofresourcesinthesesectors,with a higher concentration of employment in less productivefirmswithlowerinnovationoutputs.Thesecondfindingisparticularlysignificant,asitdemonstratestheadverseeffectsthatrent-seekingandwell-connectedfirmscanhaveoneconomicgrowth and innovation, through extractive institu-tions, in this case, illustrated by strong rent-seeking business–state connections.
Evidence suggests that extractive institutions have at best remained in place since 2011, and at worst, solidifiedfurther,withchangesintheindividualsbutnot in the structure of the business–state ties. For instance, in Tunisia, Kchouk (2017) studies the evo-lution of economic actors that were well-connected toBenAliandcloselylinkedtoandbenefittedfromhisregime.Theauthorsfindthattheseeconomicactors, mostly part of UTICA, the main employer association in Tunisia, were the only domestic actorscapableofbuyingtheconfiscatedcompa-nies from Ben Ali and his family and resuming their activities. The author indicates that these power-ful industrialists were also able to take over the “monopolization channels” and advantages asso-ciated with these companies, including the strong ties with parts of the state. Also, in Tunisia, Arouri et
al. (2019) builds on Rijkers et al. (2017) and establish thatwell-connectedfirmsaccountedfor10percentof all jobs, 39 per cent of outputs and 53 per cent of netprofits,despiterepresentingonly0.1percentofallfirmsinthecountry.However,theirsignificantshare in the economy was not obtained legally but through regulatory capture and tax evasion, nota-bly through under-reporting import prices. The authorsfindthattaxevasionhasincreasedaftertherevolution; but while it decreased in product lines whereBenAliʼsfirmswereoperating,itincreasedinother product lines, suggesting that the revolution has democratized tax evasion. The paper also indi-cates that the complex regulation and institutional framework that enables state capture has remained the same after the revolution. This suggests that there was only a change in names and actors but that the structure of extractive institutions contin-ues to operate in Tunisia. This is perpetuated by multiple unpublished and untransparent autho-rizations and requirements designed to serve the interestofexistingbigfirmswithmonopolisticandrent-seeking tendencies. The strong business–state tiesenablethesebigfirmstonavigateandtakeadvantage of the designed-to-be-complex bureau-cracyandregulations,constrainingtheeconomyʼscapacity to innovate and create the much-needed jobsforitspopulation.ThesefindingsarefurtherconfirmedbythecountryʼsWorldBankenterprisesurvey, which indicates that little has changed from the corruption and the rule of law perspective, as asignificantshareofenterprisesreportsthatcor-ruption is their biggest challenge for doing business anddevelopingtheiractivities(figure80).
X Figure 80: Share of enterprises declaring corruption as their biggest challenge
Source: World Bank Enterprise surveys, 2019 and 2020.
Corruption
0
10
20
30
40
Perc
enta
ge
Egypt
(2020)
Jordan
(2019)
Morocco
(2019)
Lebanon
(2019)
Tunisia
(2020)
Occupied
Palestinian
Territory
(2019)
13.718.6
28.6
12.416.4
0.2

Trade, investment and employment in the Southern Mediterranean Countries102
The transition from extractive to inclusive institu-tions is crucial for trade and industrial policies to effectivelygeneratetheexpectedeconomicout-puts for job creation, technological upgrade and SME development. As indicated in the previous sections, the success of industrial policies depends on the capacity of the state to establish a transpar-ent and collaborative relationship with the private
sector, with a clear set of rules and incentives and a “carrot-and-stick” attribute that would decrease the rent-seeking approach. Countries in the region must focus on reforming the economic institutions, including competition laws and agencies and pro-moting the rule of law if they are to develop their economiesandbenefitfromthepositiveimpactoftrade and investment on their economies.

103 Chapter 2. Inclusive economic transformation through employment-oriented trade, industrial and investment policies Table of Contents
Trade, investment and youth and women in the labour market
Chapter 3

104
X Chapter 3. Trade, investment and youth and women in the labour market
43 Mostofcountriesintheregiondefineyouthas15–29orevenbeyond,therefore,weusedthedefinition15–29inthisreport.
3.1. Youth and the labour market in the Southern Mediterranean Countries The Southern Mediterranean Countries are rel-atively young, with a youth population (15–29)43 estimated at 59.3 million in 2019 and representing about 27 per cent of the population. Comparatively, in 2019, the share of youth (15–29) in the popula-tion was at 27 per cent in South Asia, at 28 per cent in sub-Saharan Africa and 23 per cent globally. The Occupied Palestinian Territory has the highest share of the youth population in the region, with 31 per cent in 2019, and Algeria has the lowest share with 22 per cent (table 24).
In general, youth in the Southern Mediterranean Countries struggle to secure quality jobs and develop their economic potential. The labour force participation rate in the region is lower than 40 per cent for youth, with the lowest levels being in Jordan and Libya (around 33 per cent) (table 25). The region alsosuffersfromrelativelyhighsharesofyouthnot
in employment, education or training (NEET). The youth NEET share is very high in all countries in the region and has decreased in Algeria, Egypt, Lebanon and Morocco, while increasing in Jordan and the Occupied Palestinian Territory and remaining sta-bleinTunisia(figure81).Despitehigheducationalattainments, the highest level of NEET is in Jordan and has been increasing since 2005: 38 per cent of youth in 2019 up from 33 per cent in 2005. The share of youth NEET is particularly problematic as it hassignificanteconomicandsocialconsequences.Youth NEETs are not investing in developing their human or economic capital, leading to long-term and structural inactivity (Elder, 2015). The high youth NEET share might also lead to an increase inthedependencyrateandasignificantadditionalcharge on household income, especially in low and middle-income countries. Without supporting these youth,theywillsufferfromalong-lastingexclusionfrom the labour market, the economy and society.
Youth unemployment rates in the region are one of the highest globally, ranging from a maximum of 49 per cent in Libya and a minimum of 17 per cent
X Table 24: Youth population in the region, 2019
Youth population 2019 Youth (15–29) population (in thousands) Population (percentage)
Algeria 9,606.1 22.3
Egypt 30,907.9 30.8
Jordan 2,756.0 27.3
Lebanon 1,222.5 17.8
Libya 1,657.0 24.4
Morocco 8,877.0 24.3
Occupied Palestinian Territory 1,440.8 30.8
Tunisia (2017) 2,814.0 24.6
Total in the region 59,281.3 26.9
Source: Data provided by ILO Statistics Department for Egypt, Jordan, Occupied Palestinian Territory and Tunisia. ILO modelled estimates for Algeria, Morocco and Libya.

105 Chapter 3. Trade, investment and youth and women in the labour market
inEgyptin2019(figure82).Youtharemuchmoreunlikelytosecureajobandafinancialincomethantheir older peers, with an average gap of 18 per-centagepointsbetweenyouthandolderworkersʼunemployment rates. For instance, in Algeria, the unemployment rate among youth is almost double the rate among older workers. In Lebanon, youth unemployment was around 20 in 2019 versus. 8 per cent for older workers. In nearly all countries in the region, youth unemployment has increased since 2010, except for Egypt, which recorded a sig-nificantdecreaseinyouthunemploymentin2019,reachingforthefirsttimeinadecadelowerlev-els of youth unemployment than before the 2011 social movements.
The unemployment rate has increased with the increase in levels of educational attainment, sug-gestingsignificantskillmismatchesinthecoun-tries in the region. Unemployment has particularly increased for graduates and educated youth in the region. For instance, Tunisia and Jordan, two coun-tries with high youth unemployment rates, have had relative success in increasing participation in tertiary education. Tunisia experienced a sharp increase in the gross enrolment rate in higher edu-cation, from 13 per cent in 1996 to 35 per cent in 2015. At the same time, the youth unemployment rate and in particular for higher education grad-uates, has steadily increased in Tunisia. In 2019, it is estimated that the number of unemployed
X Table 25: Youth labour force participation rate in the region
Country Youth (15–29) population (in thousands)
Youth labour force (in thousands)
Youth Labour Force participation rate (percentage)
Algeria 9,606.1 3,800.6 39.6
Egypt 30,907.9 9,952.0 32.2
Jordan 2,756.0 999.1 36.3
Lebanon 1,222.5 599.1 49.0
Libya 1,657.0 544.4 32.9
Morocco 8,877.0 3,356.1 37.8
Occupied Palestinian Territory 1,440.8 571.6 39.7
Tunisia (2017) 2,814.0 1,187.8 42.2
Total 59,281.4 21,010.7 35.4
Source: National data sources provided by ILO Statistics Department for Egypt, Jordan, Occupied Palestinian Territory and Tunisia. ILO modelled estimates for Algeria, Morocco and Libya.
X Figure 81: Level of youth NEET in countries in the region between 2005 and 2019 (percentage)
Source: ILOSTAT.
2005 2009 2014 2019
0
10
20
30
40
50
Perc
enta
ge
Algeria Egypt Jordan Lebanon Libya Morocco TunisiaOccupied
Palestinian
Territory
30.5
20.6
31.027.2
32.838.0
21.117.8
31.2 31.424.5
20.6
29.833.4
25.7 27.4

Trade, investment and employment in the Southern Mediterranean Countries106
X Figure 82: Evolution of youth unemployment rate (percentage)
0
10
20
30
40
Perc
enta
ge
Egypt
2008 2009 2010 2011 2012 2013 2014 2015 2016 2017 2018 2019
20.7 20.7 19.323.8
27.5 28.0 26.5 26.4 25.6 24.722.4
16.7
1.2 2.4 2.45.2 4.6 5.4 6.7
4.5 4.0 3.6 3.4 3.1
0
10
20
30
40
50
Perc
enta
ge
Tunisia
2005 2008 200920072006 2010 2011 2012 2013 2015 2016 2017
25.2 25.628.2
24.924.626.7
38.235.2 33.5 33.1 33.5 33.2
6.2 5.3 5.95.66.2 6.1 8.0 8.0 7.3 8.2 8.1 8.2
0
10
20
30
40
50
Perc
enta
ge
Occupied Palestinian Territory
2000 2002 2004 2006 2008 2010 2012 2014 2015 2017 20202001 2003 2005 2007 2009 2011 2013 2016 2018 2019
14.6
30.627.3 26.6
30.1 30.8 32.736.6
39.5 39.4
27.934.2
30.426.4
32.7 32.128.1
32.535.6
39.0 37.9
8.0
18.415.6
13.0 14.011.1 12.3
14.516.4 17.2
17.5
23.518.9
14.4 16.5 14.410.5 11.1
13.6 15.4 16.4
0
10
20
30
40
Perc
enta
ge
Jordan
2017 2018 2019
29.5 30.8
10.9
30.4
11.0 9.2
Youth (15–29) Older workers (30–64)
0
10
20
30
40
Perc
enta
ge
Egypt
2008 2009 2010 2011 2012 2013 2014 2015 2016 2017 2018 2019
20.7 20.7 19.323.8
27.5 28.0 26.5 26.4 25.6 24.722.4
16.7
1.2 2.4 2.45.2 4.6 5.4 6.7
4.5 4.0 3.6 3.4 3.1
0
10
20
30
40
50
Perc
enta
ge
Tunisia
2005 2008 200920072006 2010 2011 2012 2013 2015 2016 2017
25.2 25.628.2
24.924.626.7
38.235.2 33.5 33.1 33.5 33.2
6.2 5.3 5.95.66.2 6.1 8.0 8.0 7.3 8.2 8.1 8.2
0
10
20
30
40
50
Perc
enta
ge
Occupied Palestinian Territory
2000 2002 2004 2006 2008 2010 2012 2014 2015 2017 20202001 2003 2005 2007 2009 2011 2013 2016 2018 2019
14.6
30.627.3 26.6
30.1 30.8 32.736.6
39.5 39.4
27.934.2
30.426.4
32.7 32.128.1
32.535.6
39.0 37.9
8.0
18.415.6
13.0 14.011.1 12.3
14.516.4 17.2
17.5
23.518.9
14.4 16.5 14.410.5 11.1
13.6 15.4 16.4
0
10
20
30
40
Perc
enta
ge
Jordan
2017 2018 2019
29.5 30.8
10.9
30.4
11.0 9.2
Youth (15–29) Older workers (30–64)

107 Chapter 3. Trade, investment and youth and women in the labour market
X Figure 82 (continued)
Note:Thedefinitionofyouthintheregionisgenerally15to29yearsold.However,thedataforMorocco,AlgeriaandLibyaisavailableonly for 15–24. Source: Data provided by ILO Statistics Department for Egypt, Jordan, Occupied Palestinian Territory, Algeria, Morocco and Tunisia. ILOSTAT modelled estimates for Libya. Data for Lebanon available only for 2019.
0
5
10
15
20
25
30
Perc
enta
ge
Morocco
2010 2011 2012 2013 2014 2015 2016
17.6 17.9 18.6 19.1 19.9 20.822.2
6.9 6.8 6.8 7.2 7.6 7.3 7.0
0
10
20
30
40
Perc
enta
ge
2010 2011 2012 2013 2014 2015 2016
0
10
20
30
40
50
60
2010 2011 2012 2013 2014 2015 20192016 2017 2018
48.82 49.07 49.56 49.92 49.76 49.84 49.5449.89 49.94 49.92
15.66 15.77 15.88 16.00 16.02 16.04 15.7916.02 15.92 15.82
21.5 22.4
27.524.8 25.0
29.825.7
7.1 7.2 7.6 6.8 7.4 8.0 7.7
0
5
10
15
20
25
Perc
enta
ge
Lebanon – 2019
Youth (15–29) Older workers (30–64)
19.5
7.6��
Perc
enta
ge
Libya
Algeria
Youth (15–24) Older workers (25+)
0
5
10
15
20
25
30
Perc
enta
ge
Morocco
2010 2011 2012 2013 2014 2015 2016
17.6 17.9 18.6 19.1 19.9 20.822.2
6.9 6.8 6.8 7.2 7.6 7.3 7.0
0
10
20
30
40
Perc
enta
ge
2010 2011 2012 2013 2014 2015 2016
0
10
20
30
40
50
60
2010 2011 2012 2013 2014 2015 20192016 2017 2018
48.82 49.07 49.56 49.92 49.76 49.84 49.5449.89 49.94 49.92
15.66 15.77 15.88 16.00 16.02 16.04 15.7916.02 15.92 15.82
21.5 22.4
27.524.8 25.0
29.825.7
7.1 7.2 7.6 6.8 7.4 8.0 7.7
0
5
10
15
20
25
Perc
enta
ge
Lebanon – 2019
Youth (15–29) Older workers (30–64)
19.5
7.6��
Perc
enta
ge
Libya
Algeria
Youth (15–24) Older workers (25+)

Trade, investment and employment in the Southern Mediterranean Countries108
graduates is 250,000, representing almost 29 per cent of graduates in Tunisia.44 Jordan is also expe-riencing the same phenomenon. The gross enrol-ment ratio in tertiary education rose from 18 per cent in 1995 to 34 per cent in 2018, while tertiary graduates represented at least 40 per cent of the unemployedbetween2017and2019(figure83).Morocco has also witnessed substantial improve-ments in educational attainments, with the gross enrolment ratio in higher education increased from merely 10 per cent in 2000 to 38.5 per cent in 2019. However, the level of unemployment is substantially higher for educated workers than workers without diplomas(figure84).In2014inMorocco,tertiarygraduates witnessed the highest unemployment levels, followed by secondary educated workers, with the lowest levels of unemployment being among workers without diplomas since 2000. This indicatessignificantskills-mismatchchallengesindifferentcountriesintheregion.However,thisisalso a result of the slow structural transformation and lack of dynamism in the region, leading econ-omies in the region to create primarily low-produc-tive jobs suitable for low-skilled workers. The ILO school-to-work transition surveys available in coun-tries in the region indicate that the low levels of job creation are the main obstacle for youth, includ-ingtertiary-educatedyouth,tofindajob.Dimovaet al. (2016) indicate that on average, 53 per cent of unemployed youth in Egypt, Jordan, Lebanon, Occupied Palestinian Territory and Tunisia indicated that the lack of available jobs was the main reason for their unemployment.
Thetertiarygraduatesʼunemploymentispartic-ularly problematic for the region. It indicates low returns of investment in education and might influencefuturegenerationsʼchoicesandleadtoan overall decrease in human capital accumulation in these economies. Moreover, graduate unem-ployment is an economic and human capital loss for the middle-income countries in the region, considering the high opportunity cost of com-pleting education up to higher levels. This trend also indicates a tendency towards an educational inflationdrivenbyquantityratherthanbyqual-ity.Graduatesʼunemploymenthascontributedtosocial and political unrest in the region with the 2011 social movements and may continue to be a structural issue if not tackled.
44 Source: INS.
45 Webdo.tn, “80% of freshly graduated doctors leave Tunisia!”, 2 February 2021 (in French).
Unemployed youth in the region tend to rely on their informal network for their job search in the region, despite the existence of relatively well-devel-oped public employment services, such as in Jordan and Tunisia. Dimova et al. (2016) indicate that 76 per cent of youth in Egypt and even 88 per cent in the Occupied Palestinian Territory rely on their social andinformalnetworkstofindajob.Thisshareisalso relatively high in Lebanon (68 per cent), Jordan (33 per cent) and Tunisia (26.8 per cent).
The high levels of youth unemployment and the lack ofeconomicdynamismledtosignificantmigration,including an undocumented one, and brain-drain levels in most countries in the region, including Egypt, Tunisia, Morocco, Jordan and Lebanon. The share of highly skilled individuals among the migrant population has increased in these coun-tries, reaching 20 per cent among migrant youth in 2017, suggesting a brain drain (Akgüç et al., 2020). Musette (2016) analyses the brain drain phenomenon in Algeria, Morocco and Tunisia and indicates that the share of highly skilled migrants from Algeria, Morocco and Tunisia to OECD coun-tries doubled between 1990 and 2010 to reach 800,000 in 2010. The author looks at the job out-comes at the destinations of these migrants and findsa“brainwaste”atthedestination,astheyareoften unpaid or in skill-related underemployment. In Tunisia, the number of highly skilled Tunisians who moved abroad has increased by 64 per cent between 2000 and 2010 (Samet, 2014). Moreover, according to a study done by Forum Tunisien pour les Droits Economiques et Sociaux (FTDES) 40 per cent of Tunisians are willing to leave the country for better economic opportunities, even through undocumented immigration. This trend in Tunisia issignificantlyincreasing,especiallyamongdoc-tors, medical students and engineers. For instance, in 2020, 80 per cent of freshly graduated doctors have left the country, mainly for Europe (France or Germany).45Illegalimmigrationalsosignificantlyincreased in the region, particularly in Tunisia, fol-lowing the 2011 social movements. Illegal immi-gration concerns mainly low-skilled individuals; however, it is generally driven by the same eco-nomic reasons for highly educated migration (FTDES, 2020).

109 Chapter 3. Trade, investment and youth and women in the labour market
X Figure 83: Unemployment by level of education in Egypt, Jordan, Tunisia and the Occupied Palestinian Territory
Egypt
0
5
10
15
20
25
30
Perc
enta
ge
Unemployment with basic education (% of total labor force with basic education)
Unemployment with intermediate education (% of total labor force with intermediate education)
Unemployment with advanced education (% of total labor force with advanced education)
Unemployment with basic education (% of total labor force with basic education)
Unemployment with intermediate education (% of total labor force with intermediate education)
Unemployment with advanced education (% of total labor force with advanced education)
2008 2009 2010 2011 2012 2013 2014 2015 2016 2017 2018
Occupied Palestinian Territory
0
10
20
30
40
Perc
enta
ge
2008 2009 2010 2011 2012 2013 2014 2015 2016 2017 2018
Tunisia
0
10
20
30
40
Perc
enta
ge
2009 2010 2011 2012 2013 2014 2015 2016 2017
Jordan
0
5
10
15
20
25
30
Perc
enta
ge
20192017 2018
Source: WDI.

Trade, investment and employment in the Southern Mediterranean Countries110
Thereisadebateabouttheeffectsofbraindrainon developing countries and often the question of brain drain or brain gain is discussed. On the one hand, brain drain leads to human capital and pro-ductivity loss in origin countries, potentially lower-ing growth rates. On the other hand, in the case of the Southern Mediterranean Countries, this might lead to a decrease of pressure on the failing local labour market and might lead to an increase in human capital accumulation for those who migrated and might come back to their origin coun-tries and contribute to overall economic growth. The latter phenomenon is what can be described as a brain gain in the long run. Moreover, migra-tionmightleadtopositivespillovereffects,suchasan increase in the level of remittances, as demon-stratedbyBollardetal.(2009).Theexacteffectsofthis phenomenon on the region remain undeter-minedandwouldbenefitfrombeingexplored.
3.2. Women and the labour market in the Southern Mediterranean Countries The female labour force participation rate in the region is among the lowest in the world, with only 22 per cent in 2019, compared to 53 per cent glob-ally, 62.8 per cent in sub-Saharan Africa and 25 per cent in South Asia.46 In the region, countries with
46 Source: WDI.
47 Source: WDI.
the highest levels of educational attainments, such as Jordan and Tunisia, do not have the highest rates of female labour force participation. The female labour force participation rate is the highest in Libya (32 per cent), where females are less likely to be educated than any other country in the region. The lowest rate of female labour force participation is in Jordan, despite the high levels of educational attain-ment and even though women tend to do better at school than men. For instance, school enrolment in tertiary education in Jordan is higher for females than for men (37 per cent for females as opposed to 32 per cent for men in 2018).47 The low labour force participation rates for women and the over-all high levels of education in the region constitute aparadox.Ingeneral,womenʼspropensitytopar-ticipate in the labour force increases with higher levels of education. However, there is no clear cor-relation between levels of education and levels of labour force participation for women in the region, which indicates that there are structural challenges forwomenʼslabourforceparticipationoutsideofskills challenges.
The low levels of female labour force participation rates in the region are due to a lack of economic dynamism in the region as well as to social norms and stereotypes. Women in the region have gen-erally preferred public sector employment for its formal nature and its security. However, public sec-tor opportunities have declined since the structural
X Figure 84: Unemployment rate by level of education in Morocco between 2000 and 2014
Source: HCP Morocco.
0
10
20
30
40
Perc
enta
ge
Primary education diploma Secondary education diploma Tertiary education diploma Withouth diploma
2000 2001 2002 2003 2004 2005 2006 2007 2008 2009 2010 2011 2012 2013 2014

111 Chapter 3. Trade, investment and youth and women in the labour market
adjustment reforms in the 1990s, despite the important role they continue to play. In parallel, the private sector has been unable to provide the samequalityofjobsofferedbythepublicsector,including for highly educated and married women (Assaad et al., 2019). The conservative culture and the traditional view of gender roles in society have usually been used to explain the low labour force participation and high levels of unemployment for women in the region in countries in the region. However, this explanation alone is too simplistic
anddoesnotreflectthecomplexityofwomenʼseconomic outcomes. Social norms might con-tribute to these poor outcomes as women in the region are expected to be the primary caregivers. However, other root causes reinforce and perpet-uate these social norms and stereotypes. The root causes include inadequate childcare provision, low accesstoaffordableandpublictransportation,dis-criminatory family and labour laws and low wages and economic compensation (Moghadam, 2008; Ross, 2008)).
X Table 26: Labour force participation rates by gender in the region, 2019
Country Female labour force participation rate (LFPR) Male LFPR Gender gap in LFPR
(percentage points)Total labour force participation rate
Algeria 17% 68% 49 pp 43%
Egypt 16% 67% 49 pp 42%
Jordan 13% 61% 48 pp 39%
Lebanon 29% 70% 41 pp 49%
Libya 34% 65% 39 pp 50%
Morocco 22% 70% 48 pp 50%
Occupied Palestinian Territory 18% 70% 52 pp 44%
Tunisia (2017) 26% 68% 42 pp 47%
Source: ILOSTAT.
X Figure 85: School enrolment in tertiary education by gender, 2017 (percentage of gross)
Source: WDI.
0
10
20
30
40
50
60
70
Perc
enta
ge
Algeria
Male Female Male Female Male Female Male Female Male Female Male Female
Egypt Jordan Morocco Tunisia
Occupied
Palestinian
Territory
38.4
57.2
34.6 35.829.1
33.3 34.3 33.3 33.5
54.2
23.1
41.7

Trade, investment and employment in the Southern Mediterranean Countries112
The female labour force participation rate in the region increases for women aged 15–25, before significantlydroppingforthoseaged25–29inmostcountries(figure86).InAlgeria, Tunisia, Occupied Palestinian Territory and Lebanon, there is a clear decrease in labour force participation rates for women aged 25 to 29, which generally corresponds totheageofhavingthefirstchild.Thesametrendexists in a less pronounced manner in Morocco, Libya and Egypt. In Egypt and Morocco, the rates display a slight M-shaped pattern, which suggests that women leave the labour market driven by their family duties, as Lassassi and Tansel (2020) demonstrated for Egypt. One explanation for this phenomenon is the inadequacy of early childcare, whichrepresentsasignificantconstraintforwomento balance their family and work life. For instance, in Tunisia, the early childcare facilities host only 32 per cent of children48 and are often perceived as expen-sive and unsafe, with several child abuse scandals occurring in the last few years.49
48 Source: Ministry of Women and Family in Tunisia, available at: http://www.femmes.gov.tn/wp-content/uploads/2017/11/Fiches-finales_Sandouk_toufoulati -version-AR-1.pdf.
49 For example, the following news stories, in French: Tunisie Numerique, “Arrestoftheownerofachildʼsnurseryfollowingthedeathofababy”, 12 January 2021, and Realites Online, “Suspicious death of a baby in an illegal nursery in Menzeh 9: arrest of the owner”, 17 June 2021.
50 TEMA, “Urban Travel in the Middle East and North Africa”, Journal of Land Use, Mobility and Environment, January 2018.
51 PaulNoumbaandDicksonEffah,“If urban transport in MENA was safe for women, economies would prosper”, World Bank Blog, 29 October 2020.
Another primary constraint is access to public, affordableandsafetransportation,especiallyforwomen from disadvantaged social classes. Public transportation in the region is underdeveloped and inefficient.Urbanplanningandtransportstrategieshave prioritized the development of road infrastruc-tures focusing on private cars and informal means of transportation than the development of public transportation systems (Attari et al., 2018). Moreover, women tend to feel insecure in public transporta-tionduetoharassment,whichmightinfluencetheirjob and labour market choices. For instance, a study done by the Laboratory of Land Use Mobility and Environment at the University of Naples "Federico II" reports that in Egypt, Morocco, Tunisia, Lebanon, and Jordan, at least 65 per cent of women mentioned fear of violence or harassment as a reason not to use public transportation systems.50 Moreover, according to the World Bank, in Jordan, 40 per cent of women have refused job opportunities due to the lack of access to viable transport.51 The informal means
X Figure 86: Female labour force participation rate by age, 2019 (percentage)
Note: The ILO modelled estimates are used here across all countries for the availability of data by age and comparability between countries. Source: ILOSTAT - modelled estimates.
0
10
20
30
40
50
60
70
Perc
enta
ge
Algeria Egypt Jordan Lebanon Morocco Libya
Occupied Palestinian Territory (O.P.T) Tunisia
Age:
15–19
Age:
20–24
Age:
25–29
Age:
30–34
Age:
35–39
Age:
40–44
Age:
45–49
Age:
50–54
Age:
55–59
Age:
60–64

113 Chapter 3. Trade, investment and youth and women in the labour market
of transportation in countries like Egypt, Lebanon and Tunisia, are unsafe for women and limit their mobility. The rapid urbanization and lack of public resources have imposed these choices and indirectly led to the spatial exclusion of disadvantaged women from access to the labour market.
From personal status to labour laws, the legal framework in the region disadvantages women andaffectstheirabilitytoparticipateinthelabourmarket, despite recent improvements. Particularly, personal status laws in the region are disadvan-tageous towards women. Women tend to have fewer rights than men in family decision-making, marriage, divorce and inheritance. The inheritance law is particularly disadvantageous for women in the region and little progress is expected there in the region, considering its link with religious beliefs. Theselawsandtheirapplicationsinfluencethecol-lective perception of the role of women in societies and therefore economies. However, there is some
progress in labour laws in countries like Egypt, Jordan, Tunisia and Morocco to promote equal pay, promote women entrepreneurship and equality in employment, as indicated by OECD (2020b).
Within the labour force, women in the region expe-rience higher levels of unemployment, despite being more educated than men. Women in the labour force are more educated than men, with higher shares of women with higher education than meninalmostallcountriesintheregion(figure87).Particularly, Palestinian and Jordanian women in the labour force are the most educated in the region, with 63 per cent and 58 per cent respectively with higher education in 2019. However, despite this, unemployment is much higher for women than for men in the region, except for Morocco, where the unemployment rate is at similar levels for femalesandmales(figure88).Thehighestleveloffemale unemployment is recorded for the Occupied Palestinian Territory, where rate is 40 per cent,
X Figure 87: Labour force by levels of education and sex
Source:AuthorʼscomputationbasedonILOSTAT.
Basic education or less
Intermediate education
High education
0
20
40
60
80
100
Perc
enta
ge
Egypt – 2017
Labour
force
Male Female
19.3 16.029.7
39.540.1
37.5
41.2 43.932.9
0
20
40
60
80
100
Perc
enta
ge
Occupied Palestinian Territory – 2019
Labour
force
Male Female
27.218.1
63.723.2
24.1
19.849.657.8
16.6
0
20
40
60
80
100
Perc
enta
ge
Jordan – 2019
Labour
force
Male Female
23.5 17.0
57.625.0
26.4
17.851.5 56.6
24.6
0
20
40
60
80
100
Perc
enta
ge
Lebanon – 2019
Labour
force
Male Female
33.626.7
48.6
17.118.4
14.2
49.3 54.8
37.3
0
20
40
60
80
100
Perc
enta
ge
Tunisia – 2017
Labour
force
Male Female
22.1 14.8
40.1
37.540.6
30.1
40.4 44.629.8

Trade, investment and employment in the Southern Mediterranean Countries114
X Figure 88: Unemployment rate per sex in the region
0
10
20
30
Perc
enta
ge
Algeria
2012 2013 2014 2015 2016
17.0 16.3 15.6 16.6 18.2
9.6 8.3 9.0 9.9 8.2
0
10
20
30
Perc
enta
ge
Egypt
2010 2011 2012 2013 2014 2015 20192016 2017 2018
22.1 22.4 24.0 24.2 24.0 24.8 21.623.6 23.0 21.3
4.8 8.8 9.2 9.8 9.7 9.44.8
8.8 8.2 6.8
0
10
20
30
Perc
enta
ge
2010 2011 2012 2013 2014 2015 20192016 2017 2018
21.7 21.2 19.9 22.2 20.7 22.6 24.124.127.2
24.1
10.4 11.0 10.4 10.6 10.1 11.015.413.3
15.8 17.0
0
5
10
15
Perc
enta
ge
2010 2011 2012 2013 2014 2015 2016
9.5 10.2 9.9 9.6 10.3 10.4 10.7
8.9 8.4 8.7 9.1 9.5 9.1 8.8
Jordan
Morocco
0
10
20
30
40
50
Perc
enta
ge
Occupied Palestinian Territory
2010 2011 2012 2013 2014 2015 20202016 2017 2018 2019
0
10
20
30
40
Perc
enta
ge
Tunisia
2010 2011 2012 2013 2015 20172016
18.927.4 25.6 23.0 22.2 22.623.5
10.915.0 14.6 13.3 12.4 12.412.4
Total Female Male
Total Female Male
21.6 22.426.0 27.4 26.2
34.3 40.138.0 42.8 41.9 41.2
21.416.5 17.6 18.2 19.2 20.2 22.520.6 21.5 22.4 21.4
Source: ILOSTAT.

115 Chapter 3. Trade, investment and youth and women in the labour market
X Figure 89: Distribution of sectoral employment by sex in countries in the region, 2019
0
20
40
60
80
100
Perc
enta
ge
Algeria
Agriculture Manufacturing Construction Mining
and utilities
Services Total
93.7
64.3
98.3 92.878.1 82.1
6.3
35.71.7 7.2
21.9 17.9
Share female in employment Share malein employment
0
20
40
60
80
100
Perc
enta
ge
Egypt
Agriculture Manufacturing Construction Mining
and utilities
Services Total
84.7 91.1 99.1 92.078.9 84.7
15.3 8.9 0.9 8.021.1 15.3
0
20
40
60
80
100
Perc
enta
ge
Jordan
Agriculture Manufacturing Construction Mining
and utilities
Services Total
95.7 90.8 98.9 95.583.2 85.7
4.3 9.2 1.1 4.5 16.8 14.3
0
20
40
60
80
100
Perc
enta
ge
Lebanon
Agriculture Manufacturing Construction Mining
and utilities
Services Total
86.7 83.7 97.4 95.2
63.169.5
13.3 16.3 2.6 4.8
36.9 30.5

Trade, investment and employment in the Southern Mediterranean Countries116
X Figure 89 (continued)
0
20
40
60
80
100
Perc
enta
ge
Libya
Agriculture Manufacturing Construction Mining
and utilities
Services Total
69.354.8
97.8
2.2
87.764.0 68.3
30.745.2
12.336.0 31.7
Share female in employment Share malein employment
0
20
40
60
80
100
Perc
enta
ge
Morocco
Agriculture Manufacturing Construction Mining
and utilities
Services Total
62.6 71.199.3 94.3
81.1 76.1
37.4 28.90.7 5.7 18.9 23.9
0
20
40
60
80
100
Perc
enta
ge
Occupied Palestinian Territory
Agriculture Manufacturing Construction Mining
and utilities
Services Total
82.5 90.9 99.5 95.378.7 84.2
17.5 9.1 0.5 4.721.3 15.8
0
20
40
60
80
100
Perc
enta
ge
Tunisia
Agriculture Manufacturing Construction Mining
and utilities
Services Total
83.7
57.1
98.7 88.572.3 75.0
16.3
42.9
1.3 11.527.7 25.0
Source:AuthorʼscomputationbasedonILOSTAT.

117 Chapter 3. Trade, investment and youth and women in the labour market
almost double the rate for males (23 per cent) in 2020. The female unemployment rate in Occupied PalestinianTerritoryhasbeensignificantlyincreas-ing over the past decade, reaching in 2019 a level almost double that recorded in 2010. In Jordan and Tunisia, where women generally have better educational attainments than men, the unemploy-ment rate gap between females and males is 9 and 10percentagepoints.Thehighlevelsofwomenʼsunemployment rates can be explained by the same constraints leading to their exclusion from the labour force. Also, it can be explained by the sig-nificantnumberofwomenintheregion,especiallyin Jordan and Tunisia, queuing for the perceived “female-friendly” jobs, including in the public sec-tor,whichisreflectedbythelong-termunemploy-ment for females. For instance, in Jordan, long-term unemployment(morethanoneyear)affects72percent of unemployed females, compared to 58 per cent of men (Hausmann et al., 2019).
As a result of the meagre labour force participation rates and the high levels of unemployment, the share of women in employment is very low across all countries in the region, ranging from 14 per cent in Jordan to 32 per cent in Libya. In general, women tend to work in a limited number of sectors, mostly in services. For instance, in Egypt, Jordan, Lebanon and Occupied Palestinian Territory, the highest lev-els of female employment are in services, where women represent respectively 21 per cent, 17 per cent, 37 per cent and 21 per cent of sectoral employ-ment. North African economies tend to be more inclusive for women, as women in Algeria, Morocco, Tunisia and Libya tend to work in more diverse sec-tors, including agriculture and manufacturing. For instance, in Libya, women represent 45 per cent of employment in manufacturing and 31 per cent of employment in agriculture. In Morocco, women represent a significant share of employment in agriculture (37 per cent) and manufacturing (29 per cent). Tunisian and Algerian women are more rep-resented in manufacturing (43 per cent and 36 per cent) than in services (28 per cent and 22 per cent). In Egypt and despite manufacturing being one of the main job-creating sectors, women represented less than 9 per cent of its total employment in 2019. In employment, women in Egypt and Tunisia suf-fer from an important wage gap in comparison withtheirmalecounterparts;rootedinemployersʼdiscrimination, the mean gender wage gap using monthly earnings is respectively at 14 and 9 per
52 Source: ILO Global Wage Report 19/20; data unavailable for Algeria, Libya, Morocco, Occupied Palestinian Territory and Tunisia.
cent.52 However, in Jordan, the gender wage gap is estimated on average to be only 2 percent using monthly earnings.
3.3. Employment in tradable and non-tradable sectors for women and youth in the region Overall, women are shifting out of tradable sectors towards non-tradable ones in the region. As indi-cated in the previous chapter, this is mainly driven by a shift of labour from agriculture that has not been replaced at similar levels in other more pro-ductive tradable sectors. This trend is however more pronounced for women than for men. The share of manufacturing female employment has decreased in almost all countries, except for Egypt, while it remained relatively stable for men. Male employ-ment in tradable services has generally increased, while it remained either stable or decreased for women. Tradable services represent in general a very small share of female employment in the region, at lower levels than men and their share in employment has been mainly increasing for men. Women in the region tend to be concentrated in a handful of sectors, mainly high-skilled services such as education, healthcare and public administration. The share of these sectors in female employment hassignificantlyincreasedinalmostallcountries,translating to the increase of high-skilled female workersintheregionʼslabourforce.Also,theshareofwholesaleandretailhassignificantlyincreasedfor female workers in most countries in the region.
Employed youth in in Egypt, Jordan, Occupied Palestinian Territory and Tunisia seem to be doing better when compared to their peers in terms of participation in tradable sectors. Data for youth employment over time is only available for Egypt, Jordan, the Occupied Palestinian Territory and Tunisia. In these countries, the share of youth work-ing in manufacturing and in tradable sectors is, over-all, higher than for older workers. Manufacturing has, in general, increased demand for high-skilled youth workers and in most countries, the demand for high-skilled youth has increased faster than high-skilled older workers. However, youth tend to be more concentrated in low-skilled non-tradable sectors than their older peers, mainly in construc-tion and wholesale and retail. Finally, there is no clear trend for the level of skills: Employed youth

Trade, investment and employment in the Southern Mediterranean Countries118
tend to be slightly better educated and with higher skills than their adult peers in Egypt and Tunisia and with lower levels of education in Jordan and the Occupied Palestinian Territory.
Even though the female working-age population increased by 26 per cent in Egypt, the labour force for women decreased by 14 per cent between 2009 and 2019, while female employment decreased by 13 per cent over the same period. This indi-cates that the jobs created between 2009 and 2019 have absorbed some unemployed females, whichisreflectedinaslightdecreaseinthefemaleunemployment rate (from 22.4 per cent in 2009 to 21.6 per cent in 2019). For men, the labour force and employment grew at similar levels, with employ-ment growth being slightly higher to labour force growth (table 27). Employment growth did not only absorb the new male entrant to the labour force but also created jobs beyond, leading to a slight decrease in the unemployment rate over the same period (from 5.0 per cent to 4.8 per cent).
Between 2009 and 2019, female labour shifted from agriculture, a tradable sector, to mostly non-trad-able sectors such as human health and social services, wholesale and retail, and education. As a result, the share of women in tradable sectors decreased from 54.6 per cent in 2009 to 34.8 per cent in 2019, while the share of men in tradable sec-torsremainedstable(figure90).However,manufac-turingplayedasignificantroleinjobcreationforwomen between 2009 and 2019, with its share in female employment increasing from 4.2 per cent to 7.5 per cent. Growth in employment in manu-
53 Data was unavailable for skills in 2019.
facturing has been higher for females than males between2009and2019,asmaleworkersʼsharehasremained stable. Tradable services have created more jobs for men than women in Egypt. Between 2009 and 2019, the share of men in employment increased from 13.8 per cent to 16.2 per cent, while for women it only increased from 4.4 per cent to 5.7 per cent.
There are some noticeable improvements in female employmentinmanufacturing,reflectingacertainsuccess of industrial and trade policies implemented in Egypt. As mentioned in the previous chapter, manufacturing has witnessed considerable employ-ment growth in Egypt, the highest in the region. In reality, 85 per cent of jobs created between 2009 and 2019 in manufacturing were for male work-ers. However, manufacturing created a relatively sizable number of jobs for women, considering the decrease in the female labour force between 2009 and 2019. Manufacturing was the third source of job creation for women after wholesale and retail and human health and social activities, with 108,000 jobs created for females between 2009 and 2019, increasing the share of women employed in manufacturing (out of total female employment) from 4 per cent to 8 per cent in 2019. Most of the jobs created were in the sectors prioritized by indus-trial policies, such as apparel (+69,000 jobs), textiles (+11,000 jobs), electrical equipment (7,400 jobs) and pharmaceuticals (4,200 jobs). However, in terms of skills, manufacturing mostly created low-skilled jobs for women between 2009 and 2018,53 as the share of low-skilled women employed in manufac-turingincreasedby6percentagepoints(figure92).
X Table 27: Evolution of labour force and employment by sex in Egypt, 2009–19 (in thousands)
Labour force and employment in thousands 2009 2019 2009–2019 Growth 2009–2019 (%)
Labour force, female 5,898 5,101 –797.7 –13.5 %
Labour force, male 19,373 23,258 3884.2 20.0 %
Labour force, total 25,272 28,358 3086.5 12.2 %
Employment, female 4578.3 3998.2 –580.1 –12.7 %
Employment, male 18,397 22,135 3738.3 20.3 %
Employment, total 22,975 26,134 3158.2 13.7 %
Source:Authorʼscomputation,basedondataprovidedbyILOStatisticsDepartment.

119 Chapter 3. Trade, investment and youth and women in the labour market
These results, coupled with the evolution of exports in manufacturing, indicate that low-skilled women have not been displaced due to trade policies and that trade expansion seems to have relatively increased the demand for low-skilled female work-ers. On the other hand, manufacturing seems to have increased the demand for mid and high-skilled male workers.
Employment and job creation for Egyptian women are constrained in a handful of sectors, mostly in non-tradable sectors. In 2019, nearly 50 per cent of women were employed in education, health and human services, social services and wholesale and retail. The other main sector employing women in Egypt is agriculture (21 per cent); however, its sharehassignificantlydecreasedfrom46percentin 2009. On the other hand, all sectors across the economy have created jobs for men. Between 2009 and 2019, the Egyptian economy created nearly 3.7 million jobs for male workers, across all eco-nomic sectors, except for public administration. Meanwhile, female employment decreased, with 595,000 jobs destroyed for female workers driven by the decrease in labour supply.
Unsurprisingly, most of the jobs created for women were in services, both in low-productive sectors such as wholesale and retail and high-skilled ones suchashealthcare(figure91).Theshareofwhole-
sale and retail in female employment has more than doubled between 2009 and 2019, increasing from 6 per cent to 13 per cent. Human health and social activities, a high-skilled sector, also created arelativelysignificantnumberofjobsforwomenbetween 2009 and 2019 (210,000), doubling its share in female employment (7 per cent in 2009 versus 13 per cent in 2019). The share of both these sectors in male employment has remained rela-tively stable, with a slight increase from 12 per cent to 14 per cent for wholesale and retail. Employment in the public sector shrank between 2009 and 2019, both for female and male workers, with more than 361,000 jobs destroyed in this sector, primarily for men (259,000). Contrary to other countries in the region, such as Jordan and Tunisia, employment in public administration is mainly composed of men, with women representing only 21 per cent of total employment in this sector in 2019.
In general, there was a slight improvement in the level of skills for employed women between 2009 and2018(figure92).Theshareofhigh-skilledandmid-skilled employment increased over the same period and the share of low-skilled employment decreased by more than 11 percentage points. This ismainlydrivenbythesignificantdecreaseinagri-culture employment and the increase in high-skilled sectors such as education and human health and social work.
X Figure 90: Employment in tradable and non-tradable sectors by sex in Egypt, 2009–19
Source:Authorʼscomputation,basedondataprovidedbyILOStatisticsDepartment.
0 10 20 30 40 50 60 70 80 90 100
Percentage
2019 21.1 5.77.5 65.7
46.0 4.44.2 45.4
21.2 16.213.9 48.7
26.1 13.813.4 46.7
2009
2019
Ma
leFe
ma
le
2009
Agriculture and mining Manufacturing Tradable services Non-tradable sectors
0 10 20 30 40 50 60 70 80 90 100
Percentage
2019 21.5 16.715.3 46.5
32.4 12.813.7 41.1
20.3 14.512.0 53.3
27.8 12.410.7 49.1
2009
2019
Old
er
wo
rke
rsYo
uth
2009
Agriculture and mining Manufacturing Tradable services Non-tradable sectors

Trade, investment and employment in the Southern Mediterranean Countries120
X Figure 91: Job creation in Egypt by sector and gender, 2009–19 (in thousands)
Source:Authorʼscomputation,basedondataprovidedbyILOStatisticsDepartment.
–1,500 –1,000 –500 0 500
Other services
Human health and social work activities
Education
Financial and insurance activities
Real estate; business and administrative activities
Public administration and defence; compulsory social security
Accommodation and food service activities
Transport; storage and communication
Wholesale and retail trade; repair of motor vehicles and motorcycles
Utilities
Mining and quarrying
Manufacturing
Construction
Agriculture
–500 0 500 1,000 1,500
Other services
Human health and social work activities
Education
Financial and insurance activities
Real estate; business and administrative activities
Public administration and defence; compulsory social security
Accommodation and food service activities
Transport; storage and communication
Wholesale and retail trade; repair of motor vehicles and motorcycles
Utilities
Mining and quarrying
Manufacturing
Construction
Agriculture
–1,262.3
16.6
108.8
0.4
11.0
235.4
0.3
16.8
–111.3
25.0
–7.7
31.2
210.1
130.4
–104.3
1,113.3
617.7
4.5
127.5
892.2
630.5
347.3
–250.5
172.3
–15.8
–135.9
98.0
197.1
Female 2009–19
Male 2009–19
Thousands
Thousands

121 Chapter 3. Trade, investment and youth and women in the labour market
The youth labour force increased by only 7 per cent between 2009 and 2019, despite the youth work-ing-age population rising by 41 per cent over the same period (table 28). The youth labour force par-ticipation rate decreased by ten percentage points, from 42 per cent in 2009 to 32 per cent in 2019. However, youth in the Egyptian labour market have had a more positive dynamic than adult peers during this period. Youth employment grew faster than the youth labour force, leading to a decrease in the youth unemployment rate from 20.7 per cent in 2009 to 17 per cent in 2019. On the other hand, for older workers (30–64), the supply of labour was higher than the demand (16 per cent versus 15 per cent). This led to a slight increase in their unemployment rate from 2 per cent in 2009 to 3 per cent in 2019.
Youth employment in tradable sectors decreased between 2009 and 2019, albeit at a slower pace than for older workers. As was the case for women, the decrease was driven by a labour shift out of agriculture. In fact, the share of manufacturing and tradable services in youth employment increased atahigherpacethanforolderworkers(figure93).The share of manufacturing and tradable services in youth employment increased respectively by 2 and 4 percentage points. Comparatively, for employed older workers, the share of manufacturing and trad-able sectors grew by 1 and 2 percentage points. Employment growth in manufacturing increased the demand for mid- and high-skilled older work-ers and high-skilled youth workers (figure 95). Overall, trade expansion in Egypt yielded a more
X Figure 92: Distribution of skills levels by gender in manufacturing and all sectors in Egypt, 2009–18
Note: the total is slightly less than 100% due to the existence of a category in which the level of education is not stated. Source:Authorʼscomputation,basedondataprovidedbyILOStatisticsDepartment.
0
20
40
60
80
100
Perc
enta
ge
Female
2009
All sectors Manufacturing
2018 2009 2018
23.1 29.913.7 12.0
29.734.1
43.439.1
47.136.0
42.948.9
0
20
40
60
80
100
Perc
enta
ge
Male
2009
All sectors Manufacturing
2018 2009 2018
14.6 15.3 10.5 11.8
35.740.4
41.5 46.0
49.744.2 48.0 42.0
Basic or less than basic education Intermediate education High education
X Table 28: Evolution of labour force and employment by age in Egypt, 2009–19 (in thousands)
Egypt 2009 2019 2009–2019 Growth 2009–2019 (%)
Labour force, youth (15–29) 9,270 9,952 682.2 7.4 %
Labour force, older workers (30–64) 15,590 18,001 2411.2 15.5 %
Employment, youth (15–29) 7,347 8,293 946.4 12.9 %
Employment, older workers (30–64) 15,217 17,435 2218.7 14.6 %
Source:Authorʼscomputation,basedondataprovidedbyILOStatisticsDepartment.

Trade, investment and employment in the Southern Mediterranean Countries122
positive impact on youth employment than older workersʼemployment.
Unlike women, youth benefitted from jobs cre-ated in all sectors except for agriculture and public administration(figure94).Thisdynamicismainlydriven by male youth, as young women face the same constraints and restrictions as their adult peers. Most of the jobs for youth were created in construction, wholesale and retail, manufacturing, transportation and storage and accommodation and food. These sectors created mostly low and mid-skilled jobs. The share of construction and wholesale and retail in employment has increased more for youth than older workers, suggesting a concentration of job creation for youth in low-skilled non-tradable sectors. However, human health and socialworkactivitiesalsocreatedasignificantnum-ber of jobs, primarily high-skilled and mid-skilled ones, as 95 per cent of jobs are for youth workers with high and intermediate education. The dynamic in job creation between 2009 and 2018 slightly increased the demand for youth with high levels of education (from 15 per cent in 2009 to 18 per cent in 2018) and for older workers with intermediate education. Most of the youth in the Egyptian labour market have intermediate education (43 per cent in 2018) or basic or less than basic education (39 per
cent in 2018). The distribution of skills in 2018 indi-cates that youth are generally slightly better edu-cated and have higher skills than their adult peers. In 2018, youth and older workers had similar high-skilled employment levels, but youth had higher shares of mid-skilled employment and older work-ers had higher shares of lower-skilled employment.
In Jordan, the supply of female labour decreased significantlyby19percentinonlytwoyearsfrom2017 to 2019, even though the female working-age population grew by 2 per cent over the same period. Female labour force participation rate decreased from 17 per cent in 2017 to 13 per cent in 2019. However, female labour force demand exceeded the supply, as the female labour force decreased by 19.1 per cent while female employment decreased by only 16 per cent between 2017 and 2019. For males, employment and labour force grew at almost identical levels between 2017 and 2019, respectively, 14 per cent and 13 per cent (table 29).
Female employment in Jordan is largely restricted in a limited number of non-tradable sectors, mostly in highly skilled activities and women tend to be morepresentinnon-tradablesectorsthanmen(fig-ure 96). Employment data is only available between 2017 and 2019 and therefore, parallel trends with the evolution of trade are only possible between
X Figure 93: Employment in tradable and non-tradable sectors by age in Egypt, 2009–19
Source:Authorʼscomputation,basedondataprovidedbyILOStatisticsDepartment.
0 10 20 30 40 50 60 70 80 90 100
Percentage
2019 21.1 5.77.5 65.7
46.0 4.44.2 45.4
21.2 16.213.9 48.7
26.1 13.813.4 46.7
2009
2019
Ma
leFe
ma
le
2009
Agriculture and mining Manufacturing Tradable services Non-tradable sectors
0 10 20 30 40 50 60 70 80 90 100
Percentage
2019 21.5 16.715.3 46.5
32.4 12.813.7 41.1
20.3 14.512.0 53.3
27.8 12.410.7 49.1
2009
2019
Old
er
wo
rke
rsYo
uth
2009
Agriculture and mining Manufacturing Tradable services Non-tradable sectors

123 Chapter 3. Trade, investment and youth and women in the labour market
X Figure 94: Job creation in Egypt by sector and age, 2017–19 (in thousands)
Source:Authorʼscomputation,basedondataprovidedbyILOStatisticsDepartment
–1,000 –500 0 500 1,000
Other services
Administrative and support services activities
Human health and social work activities
Financial and insurance activities
Transport; storage and communication
Accommodation and food service activities
Real estate; business and administrative activities
Public administration and defence; compulsory social security
Wholesale and retail trade; repair of motor vehicles and motorcycles
Mining and quarrying, and utilities
Manufacturing
Construction
Agriculture
Youth (15–29) 2017–19
–1,000 –500 0 500 1,000
Other services
Administrative and support services activities
Human health and social work activities
Financial and insurance activities
Transport; storage and communication
Accommodation and food service activities
Real estate; business and administrative activities
Public administration and defence; compulsory social security
Wholesale and retail trade; repair of motor vehicles and motorcycles
Mining and quarrying, and utilities
Manufacturing
Construction
Agriculture
Older workers 2017–19
–592.20
423.31
260.49
11.53
329.31
–91.98
6.52
152.39
239.51
7.54
150.85
25.93
4.31
–712.46
706.17
460.51
131.97
772.82
–266.48
23.30
210.82
382.68
–30.63
155.38
43.24
302.80
Thousands
Thousands

Trade, investment and employment in the Southern Mediterranean Countries124
thesetwoyears.However,thereisacleardiffer-ence in the employment dynamic between men and women. Women in Jordan do not engage in agriculture (only 1 per cent of women are working in agriculture compared to about 5 per cent of men) and engage at very low levels in manufacturing, less than men.
Tradable sectors employ only a small share of women, at lower levels than men. For instance, manufacturing and tradable services (including financialservices,professional,scientificandtech-nical activities and information and communication)
employ merely 14 per cent of women. Between 2017 and 2019, these sectors did not create jobs for women(figure97).Theirshareinfemaleemploy-ment even decreased slightly over the same period, withjoblossesforwomeninmanufacturing(fig-ure 98). Manufacturing employs only 6 per cent of Jordanian women, mostly in textile and apparel. In terms of skills, 22 per cent of women working in manufacturing have advanced education and 59 per cent are low-skilled. However, even in man-ufacturing, the share of women with advanced edu-cationishigherthanmen(figure98).
X Figure 95: Distribution of skills levels by age for manufacturing and all sectors in Egypt, 2009–18
Source:Authorʼscomputation,basedondataprovidedbyILOStatisticsDepartment.
0
20
40
60
80
100
Perc
enta
ge
Youth
2009
All sectors Manufacturing
2018 2009 2018
15.4 17.910.8 12.0
43.9 43.149.0 48.4
40.7 38.9 40.3 39.5
0
20
40
60
80
100
Perc
enta
ge
Older workers
2009
All sectors Manufacturing
2018 2009 2018
17.1 18.310.9 11.8
30.938.4
37.5 44.0
52.043.2
51.6 44.0
Basic or less than basic education Intermediate education High education
0
20
40
60
80
100
Perc
enta
ge
Female
2017
All sectors Manufacturing
2019 2017 2019
44.4 46.4
20.8 21.6
18.4 18.7
20.6 19.9
37.2 34.9
58.6 58.5
0
20
40
60
80
100
Perc
enta
ge
Male
2017
All sectors Manufacturing
2019 2017 2019
18.1 24.711.2 11.1
21.9 14.1
21.6 19.6
60.0 61.2 67.2 69.3
Basic or less than basic education Intermediate education High education
X Table 29: Evolution of labour force and employment by sex in Jordan, 2017–19 (in thousands)
Jordan 2017 2018 2019 2017–2019 Growth 2017–2019 (%)
Labour force, female 534 464 432 –101.6 –19.1 %
Labour force, male 2,053 2,165 2,326 273.0 13.3 %
Labour force, total 2,587 2,629 2,758 171.4 6.6 %
Employment, female 388 352 328 –60.7 –15.6 %
Employment, male 1,729 1,797 1,967 238.2 13.8 %
Employment, total 2,117 2,148 2,294 177.5 8.4 %
Source:Authorʼscomputation,basedondataprovidedbyILOStatisticsDepartment.

125 Chapter 3. Trade, investment and youth and women in the labour market
X Figure 96: Employment in tradable and non-tradable sectors by sex in Jordan, 2017–19
Source: Author’s computation, based on data provided by ILO Statistics Department.
0 10 20 30 40 50 60 70 80 90 100
Percentage
2019
1.18.05.7 85.3
0.98.16.5 84.6
4.3 12.79.4 73.6
4.5 15.211.9 68.4
2017
2019
Ma
leFe
ma
le
2017
Agriculture and mining Manufacturing Tradable services Non-tradable sectors
0 10 20 30 40 50 60 70 80 90 100
Percentage
2019 3.2 13.39.6 73.9
3.0 14.911.4 70.7
4.1 11.88.5 75.6
4.2 14.010.6 71.2
2017
2019
Old
er
wo
rke
rsYo
uth
2017
Agriculture and mining Manufacturing Tradable services Non-tradable sectors
X Figure 97: Job creation in Jordan by sector and gender, 2017–19 (in thousands)
–50 –40 –30 –20 –10 0 10
Other services
Human health and social work activities
Education
Financial and insurance activities
Real estate; business and administrative activities
Public administration and defence; compulsory social security
Accommodation and food service activities
Transportation and storage
Wholesale and retail trade; repair of motor vehicles and motorcycles
Utilities
Mining and quarrying
Manufacturing
Construction
Agriculture
Female 2017–19
–100 –50 0 50 100 150 200 250
Other services
Human health and social work activities
Education
Financial and insurance activities
Real estate; business and administrative activities
Public administration and defence; compulsory social security
Accommodation and food service activities
Transportation and storage
Wholesale and retail trade; repair of motor vehicles and motorcycles
Utilities
Mining and quarrying
Manufacturing
Construction
Agriculture
Male 2017–19
Thousands
Thousands
0.18
0.78
–6.50
–0.23
–3.82
–8.30
–0.73
–0.75
–0.26
–5.94
–3.27
–42.56
0.65
0.91
85.57
1.27
–1.84
–1.49
2.83
–49.38
–15.12
–13.62
–1.49
–1.84
10.11
213,87
1.27
85.57

Trade, investment and employment in the Southern Mediterranean Countries126
X Figure 97 (continued)
–50 –40 –30 –20 –10 0 10
Other services
Human health and social work activities
Education
Financial and insurance activities
Real estate; business and administrative activities
Public administration and defence; compulsory social security
Accommodation and food service activities
Transportation and storage
Wholesale and retail trade; repair of motor vehicles and motorcycles
Utilities
Mining and quarrying
Manufacturing
Construction
Agriculture
Female 2017–19
–100 –50 0 50 100 150 200 250
Other services
Human health and social work activities
Education
Financial and insurance activities
Real estate; business and administrative activities
Public administration and defence; compulsory social security
Accommodation and food service activities
Transportation and storage
Wholesale and retail trade; repair of motor vehicles and motorcycles
Utilities
Mining and quarrying
Manufacturing
Construction
Agriculture
Male 2017–19
Thousands
Thousands
0.18
0.78
–6.50
–0.23
–3.82
–8.30
–0.73
–0.75
–0.26
–5.94
–3.27
–42.56
0.65
0.91
85.57
1.27
–1.84
–1.49
2.83
–49.38
–15.12
–13.62
–1.49
–1.84
10.11
213,87
1.27
85.57
Source:Authorʼscomputation,basedondataprovidedbyILOStatisticsDepartment.
X Figure 98: Distribution of skills levels by sex in Jordan, 2017–19
Source: Author’s computation, based on data provided by ILO Statistics Department.
0
20
40
60
80
100
Perc
enta
ge
Youth
2009
All sectors Manufacturing
2018 2009 2018
15.4 17.910.8 12.0
43.9 43.149.0 48.4
40.7 38.9 40.3 39.5
0
20
40
60
80
100Pe
rcen
tage
Older workers
2009
All sectors Manufacturing
2018 2009 2018
17.1 18.310.9 11.8
30.938.4
37.5 44.0
52.043.2
51.6 44.0
Basic or less than basic education Intermediate education High education
0
20
40
60
80
100
Perc
enta
ge
Female
2017
All sectors Manufacturing
2019 2017 2019
44.4 46.4
20.8 21.6
18.4 18.7
20.6 19.9
37.2 34.9
58.6 58.5
0
20
40
60
80
100
Perc
enta
ge
Male
2017
All sectors Manufacturing
2019 2017 2019
18.1 24.711.2 11.1
21.9 14.1
21.6 19.6
60.0 61.2 67.2 69.3
Basic or less than basic education Intermediate education High education

127 Chapter 3. Trade, investment and youth and women in the labour market
Non-tradable sectors such as education, health-care and public administration represented 56 per cent of total female employment in 2019, with 68 per cent of women working in these three sectors having an advanced education. This and the very low levels of labour force participation indicate that these sectors are considered as “suitable for women”, contrary to other sectors. However, these sectors did not grow to absorb the increasing num-ber of highly educated women in Jordan. Among these sectors, only public administration created less than 1,000 jobs in two years. As indicated in the previous section, Jordanian women are better educated than men within and outside the labour market. In 2019, 46 per cent of employed women had a higher education compared to only 25 per centofmen(figure98).
In addition to sectors that could absorb most of the low-skilled and mid-skilled in the labour force, Jordan would need to invest in high-skilled trad-ablesectors,tomeetthesupplyofhighlyqualifiedwomen. High-skilled tradable sectors could expand beyond the local market, create quality jobs for highlyqualifiedfemaleworkersandabsorbthesignificantshareofunemployedfemaleswithter-tiary education. In fact, in Jordan, the sectors that employ most of the highly educated women are not expanding and their capacity to expand would be limited if they supply only the local market. This leads to high unemployment among educated women. According to the national statistics depart-ment, 81 per cent of unemployed women have at leastabachelorʼsdegree.
Like women, youth in Jordan are discouraged from enteringthelabourmarket,whichisreflectedina decrease of the labour force by 2 per cent from 2017 to 2019, despite that fact that the youth pop-ulation grew by 2 per cent over the same period (table 30). The labour force participation rate slightly
decreased over the same period (from 38 per cent to 36 per cent) but at much higher levels than for women, driven by young male workers.
Unlikewomen,youthemploymentisdiversifiedacross all sectors in the economy, driven by male youth. Youth are concentrated, like their older peers, in non-tradable sectors. However, youth tend to be slightly over-represented in tradable sectors comparedtotheirolderpeers(figure99).Tradablesectors represented 26 per cent of youth employ-mentin2019versus24percentoftheirolderpeersʼemployment. For both groups of workers, employ-ment in tradable sectors slightly decreased from 2017 to 2019. The manufacturing sector employs more low- and high-skilled youth than older work-ers. However, the largest share comprises older workerswithanintermediateskilllevel(figure101).As discussed in the previous chapter, demand for low-skilled workers has increased in tradable sec-tors and manufacturing in Jordan, explaining the slight over-representation of youth in these sectors.
Manufacturing represents a small share of employ-ment for youth and older workers, despite mer-chandise exports representing around 19 per cent of national GDP. In 2019, 10 per cent of youth were working in manufacturing compared to 11 per cent in 2017. Manufacturing created jobs neither for youth nor for older workers between 2017 and 2019, despite merchandise exports (excluding petroleum products and gas) increasing by 10 per centoverthesameperiod(figure100).Theonlysectors that created jobs for youth in manufactur-ing were food-processing, apparel and leather, for which exports increased slightly between 2017 and 2019, and paper manufacturing, despite a decrease of exports by 11 per cent between 2017 and 2019.
More than half of the youth and older workers were employed in construction, public adminis-tration, wholesale and retail, security services and
X Table 30: Evolution of labour force and employment by age in Jordan, 2017–19 (in thousands)
Jordan 2017 2018 2019 2017–2019 Growth 2017–2019 (%)
Labour force, youth 1,009 985 999 –24.1 –2.4 %
Labour force, older workers 1,552 1,622 1,742 69.7 4.5 %
Employment, youth 712 682 696 –29.8 –2.2 %
Employment, older workers 1,381 1,445 1,582 63.9 4.6 %
Source:Authorʼscomputation,basedondataprovidedbyILOStatisticsDepartment.

Trade, investment and employment in the Southern Mediterranean Countries128
X Figure 99: Employment in tradable and non-tradable sectors by age in Jordan, 2017–19
Source: Author’s computation, based on data provided by ILO Statistics Department.
0 10 20 30 40 50 60 70 80 90 100
Percentage
2019
1.18.05.7 85.3
0.98.16.5 84.6
4.3 12.79.4 73.6
4.5 15.211.9 68.4
2017
2019
Ma
leFe
ma
le
2017
Agriculture and mining Manufacturing Tradable services Non-tradable sectors
0 10 20 30 40 50 60 70 80 90 100
Percentage
2019 3.2 13.39.6 73.9
3.0 14.911.4 70.7
4.1 11.88.5 75.6
4.2 14.010.6 71.2
2017
2019
Old
er
wo
rke
rsYo
uth
2017
Agriculture and mining Manufacturing Tradable services Non-tradable sectors
X Figure 100: Job creation in Jordan by sector and age, 2017–19 (in thousands)
–30 –20 –10 0 10 20 30 40 50 60
Total
Other service
Administrative and support service activities
Human health and social work activities
Education
Financial and insurance activities
Transportation and storage
Accommodation and food service activities
Real estate activities
Public administration and defence; compulsory social security
Wholesale and retail trade; repair of motor vehicles and motorcycles
Mining, quarrying and utilities
Manufacturing
Construction
Agriculture
Youth (15-29) 2017–19
–50 0 50 100 150 200 250
Total
Other service
Administrative and support service activities
Human health and social work activities
Education
Financial and insurance activities
Transportation and storage
Accommodation and food service activities
Real estate activities
Public administration and defence; compulsory social security
Wholesale and retail trade; repair of motor vehicles and motorcycles
Mining, quarrying, and utilities
Manufacturing
Construction
Agriculture
Older workers 2017–19
Thousands
Thousands
2.46
–16.01
1.86
49.53
3.41
–3.70
–7.97
–1.38
–3.29
–2.46
–0.99
–16.26
–22.29
–14.49
–0.43
16.40
201.62
2.23
174.52
33.17
2.46
2.37
–0.25
–11.78
12.36
–2.21
3.76
–27.43
–12.36
8.38

129 Chapter 3. Trade, investment and youth and women in the labour market
X Figure 100 (continued)
–30 –20 –10 0 10 20 30 40 50 60
Total
Other service
Administrative and support service activities
Human health and social work activities
Education
Financial and insurance activities
Transportation and storage
Accommodation and food service activities
Real estate activities
Public administration and defence; compulsory social security
Wholesale and retail trade; repair of motor vehicles and motorcycles
Mining, quarrying and utilities
Manufacturing
Construction
Agriculture
Youth (15-29) 2017–19
–50 0 50 100 150 200 250
Total
Other service
Administrative and support service activities
Human health and social work activities
Education
Financial and insurance activities
Transportation and storage
Accommodation and food service activities
Real estate activities
Public administration and defence; compulsory social security
Wholesale and retail trade; repair of motor vehicles and motorcycles
Mining, quarrying, and utilities
Manufacturing
Construction
Agriculture
Older workers 2017–19
Thousands
Thousands
2.46
–16.01
1.86
49.53
3.41
–3.70
–7.97
–1.38
–3.29
–2.46
–0.99
–16.26
–22.29
–14.49
–0.43
16.40
201.62
2.23
174.52
33.17
2.46
2.37
–0.25
–11.78
12.36
–2.21
3.76
–27.43
–12.36
8.38
Source: Author’s computation, based on data provided by ILO Statistics Department.
X Figure 101: Distribution of skills levels by age in Jordan, 2017–19
Source: Author’s computation, based on data provided by ILO Statistics Department.
0
20
40
60
80
100
Perc
enta
ge
Youth
2017
All sectors Manufacturing
2019 2017 2019
21.4 19.4 13.0 12.6
17.8 22.015.8 15.6
60.8 58.6
71.2 71.7
0
20
40
60
80
100
Perc
enta
ge
Older workers
2017
All sectors Manufacturing
2019 2017 2019
23.5 21.011.9 11.5
23.2 28.9
24.7 21.6
53.3 50.1 63.466.9
Basic or less than basic education Intermediate education High education

Trade, investment and employment in the Southern Mediterranean Countries130
education. Interestingly, youth are more repre-sented in public administration than their adult peers (20 per cent versus 15 per cent in 2019); how-ever, mainly in low-skilled jobs, as 64 per cent of them have basic education compared to 38 per cent of their adult peers. In general, in both tradable and non-tradable sectors, employed youth tend to have lower skills than their adult peers.
In Morocco,womenʼslabourforceparticipationhas not notably improved between 2000 and 2019, despite the important trade and industrial policies that the authorities have implemented, particularly since 2005. In terms of labour supply, women have been progressively more excluded from the labour market since 2000, with a decrease in the rate of labour force participation from 25 per cent in 2000 to 22 per cent in 2019 (table 31). The rate of labour force participation for men also decreased over the same period (from 77 per cent in 2000 to 71 per cent in 2019). However, in terms of employment and job creation, both females and males have had positive dynamics since 2009. Male employment grew faster than labour force growth from 2000 to 2019, particularly from 2000 to 2009. Female employment also grew faster than the labour force from 2000 to 2019, driven by a particularly positive dynamic from 2000 to 2009. This led to the unem-ployment rate decreasing between 2000 and 2019 (pre-covid-19 pandemic) from 13 per cent to 11 per cent for women and 14 per cent to 9 per cent for men. It is worth noting that Morocco has the lowest gender gap in unemployment in the region.
Like in Egypt and Tunisia, the share of women working in tradable sectors in Morocco decreased
54 Source:authorʼscomputation.
between 2000 and 2019, driven by a shift of labour out of agriculture. The percentage of women engagedintradablesectorsissignificantlyhigherin Morocco than in Egypt, Jordan and Tunisia. However,thisismainlyduetothesignificantshareof women involved in agriculture: more than half of the employed women work in agriculture, a low-productive sector. For instance, in Morocco, agriculturallabourproductivity,definedastheval-ue-added over employed population, is estimated at US$3,643 compared to US$14,167 in manufactur-ing and US$11,514 in services in 2019.54
Despite the relative quality of industrial policies implemented in Morocco, manufacturing did not generate new jobs for women, although it did gen-erate a limited number of jobs for males, particu-larly between 2009 and 2019. This is despite the significantlevelsofmerchandiseexportsgrowth.From 2000 to 2019, the share of manufacturing decreased by 6 percentage points for women and 1percentagepointformen(figure102).LikeinEgypt and Tunisia, the shift of women out of agri-culture has not been compensated with job creation in more productive tradable sectors, limiting the benefitsofindustrialandtradepoliciesforwomenin the Morocco economy. Women tend to work more in manufacturing than men in Morocco, with manufacturing representing 13 per cent of female employment in 2019 compared to 11 per cent for men. The shift of labour out of agriculture has been a male phenomenon in Morocco since 2000. The share of men working in agriculture decreased from 42 per cent in 2000 to 28 per cent in 2019, while for female the decrease was less than 6 percentage
X Table 31: Evolution of labour force and employment by sex in Morocco, 2000–19 (in thousands)
Morocco 2000 2009 2019 2000–2009 2009–2019 Growth 2000–2009
Growth 2009–2019
Labour force, female 2,434 2,996 2,934 561.9 –61.8 23.1% –2.1%
Labour force, male 7,199 8,320 9,150 1,120.7 830.7 15.6% 10.0%
Labour force, total 9,633 11,316 12,085 1,682.6 768.9 17.5% 6.8%
Employment, female 2,117 2,718 2,627 600.7 –90.8 28.4% –3.3%
Employment, male 6,208 7,584 8,369 1376.2 785.3 22.2% 10.4%
Employment, total 8,325 10,302 10,996 1976.9 694.5 23.7% 6.7%
Source:AuthorʼscomputationbasedonILOSTATdata(modelledestimates).
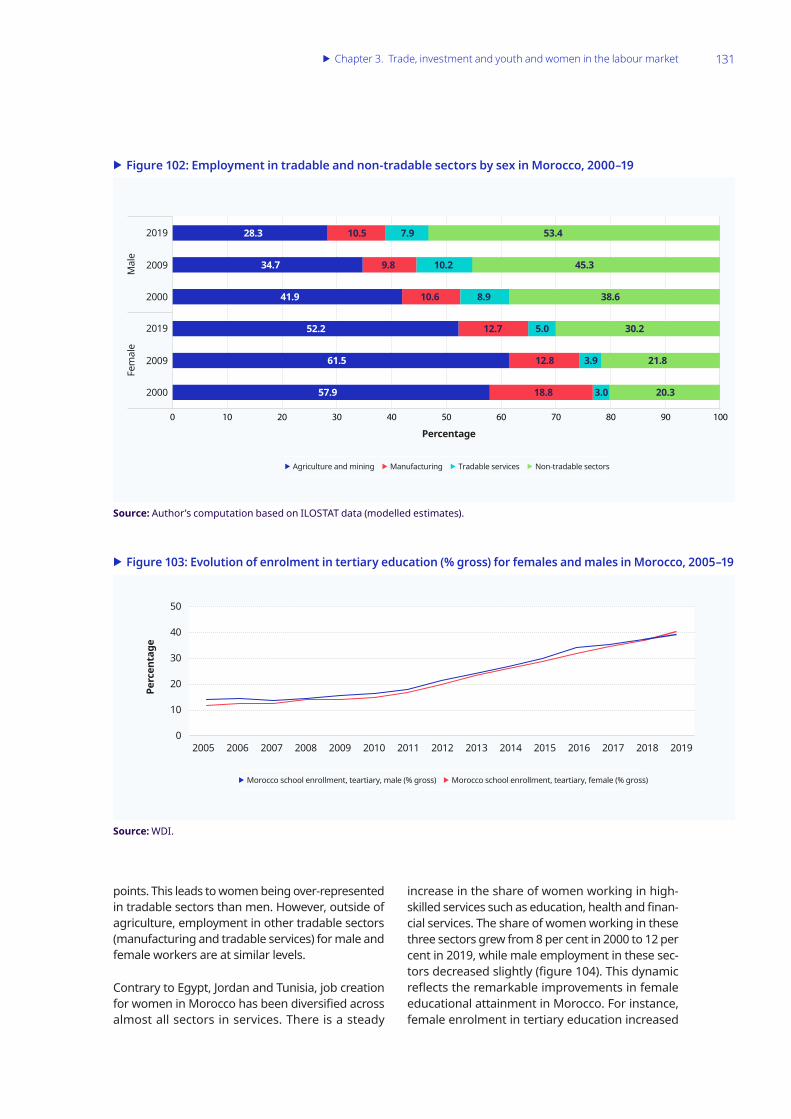
131 Chapter 3. Trade, investment and youth and women in the labour market
points. This leads to women being over-represented in tradable sectors than men. However, outside of agriculture, employment in other tradable sectors (manufacturing and tradable services) for male and female workers are at similar levels.
Contrary to Egypt, Jordan and Tunisia, job creation forwomeninMoroccohasbeendiversifiedacrossalmost all sectors in services. There is a steady
increase in the share of women working in high-skilledservicessuchaseducation,healthandfinan-cial services. The share of women working in these three sectors grew from 8 per cent in 2000 to 12 per cent in 2019, while male employment in these sec-torsdecreasedslightly(figure104).Thisdynamicreflectstheremarkableimprovementsinfemaleeducational attainment in Morocco. For instance, female enrolment in tertiary education increased
X Figure 102: Employment in tradable and non-tradable sectors by sex in Morocco, 2000–19
X Figure 103: Evolution of enrolment in tertiary education (% gross) for females and males in Morocco, 2005–19
Source:AuthorʼscomputationbasedonILOSTATdata(modelledestimates).
Source: WDI.
0 10 20 30 40 50 60 70 80 90 100
Percentage
28.3 10.5 7.9 53.4
34.7 9.8 10.2 45.3
41.9 10.6 8.9 38.6
52.2 12.7 5.0 30.2
61.5 12.8 3.9 21.8
57.9 18.8 3.0 20.3
2019
Ma
leFe
ma
le
2009
2000
2019
2009
2000
Agriculture and mining Manufacturing Tradable services Non-tradable sectors
0
10
20
30
40
50
Perc
enta
ge
Morocco school enrollment, teartiary, male (% gross) Morocco school enrollment, teartiary, female (% gross)
2005 2006 2007 2008 2009 2010 2011 2012 2013 201920182017201620152014

Trade, investment and employment in the Southern Mediterranean Countries132
X Figure 104: Job creation in Morocco by sector and gender, 2000–19 (in thousands)
Source: Author’s computation based on ILOSTAT data (modelled estimates).
–400 –200 0 200 400 600
Other services
Human health and social work activities
Financial and insurance activities
Education
Transport; storage and communication
Accommodation and food service activities
Real estate; business and administrative activities
Public administration and defence; compulsory social security
Wholesale and retail trade; repair of motor vehicles and motorcycles
Utilities
Mining and quarrying
Manufacturing
Construction
Agriculture
Thousands Female (2009–19) Female (2000–09)
–400 –200 0 200 400 600
Other services
Human health and social work activities
Financial and insurance activities
Education
Transport; storage and communication
Accommodation and food service activities
Real estate; business and administrative activities
Public administration and defence; compulsory social security
Wholesale and retail trade; repair of motor vehicles and motorcycles
Utilities
Mining and quarrying
Manufacturing
Construction
Agriculture
Thousands Male (2009–19) Male (2000–09)
–301.0445.1
1.32.0
–13.8–50.3
–0.90.4
2.40.9
41.542.4
23.525.4
14.220.7
2.111.3
50.630.8
8.411.4
19.08.4
35.734.4
26.117.6
–296.527.4
314.0426.8
16.4154.0
27.77.1
7.33.3
343.0351.5
35.183.3
80.254.2
87.0119.2
20.419.6
14.210.5
2.03.2
84.662.5
49.953.7

133 Chapter 3. Trade, investment and youth and women in the labour market
significantlyfrom11percentin2005to39percentin2019,recordingforthefirst-timehigherlevelsthanmales(figure103).ThisdynamicindicatestheMoroccan economy would need to create more high-skilled jobs for women in the future.
In Tunisia, employment prospects are more favourable for females than in Egypt and Jordan, as northern African countries tend to be slightly more inclusive for women than other countries in the region. Tunisia has higher female labour force participation rates and witnessed a larger female labour force from 2005 to 2017 than Egypt and Jordan. Between 2005 and 2017, the female labour force grew by 33 per cent, at a higher pace than female working-age population growth (19 per cent over the same period) and female labour force participation increased from 24 per cent to 27 per cent (table 32). However, the female unemploy-ment rate increased from 15 per cent in 2005 to 23 per cent in 2017, with its highest level in 2011 at 27 per cent. Employment grew overall slower than the labour force, despite a positive trend between 2011 and 2017.
Like in Jordan and Egypt, female employment in Tunisia tends to be concentrated in few sectors. In 2017, 71 per cent of Tunisian women were work-ing in manufacturing, public administration and agriculture. However, unlike Jordan and Egypt, Tunisian females are much more engaged in pro-ductive tradable sectors, such as manufacturing. Approximately one in three women in employment is engaged in manufacturing in Tunisia, which is a much higher level than in Egypt and Jordan (8 per cent in Egypt and 6 per cent in Jordan in 2019). However,theshareofwomenʼsemploymentin
tradable sectors decreased by more than ten per-centage points between 2005 and 2017, while the share of males engaged in both tradable and non-tradable sectors has remained relatively sta-ble(figure105).AsinEgypt,thisismainlydrivenby a shift of female labour out of agriculture that has not been replaced at similar levels in other more productive tradable sectors. The patterns of employment between men and women in tradable sectorsareverydifferent.First,maleemploymentin agriculture, manufacturing and tradable services has remained stable since 2005: male workers have not been transitioning out of agriculture and were not more likely to be working in other more pro-ductive tradable sectors. Second, employment in manufacturing is less important for men than for women. Third, tradable services represent a higher share for male workers than female work-ers. Overall, the employment structure for men did not change much between 2005 and 2017, while women witnessed a transition out of agriculture, mostly to non-tradable sectors.
Overall, job creation for female workers has been higher in non-tradable sectors than tradable ones, particularly in public administration and wholesale andretail,thanintradablesectors(figure106).Theshare of public administration and wholesale and retail in female employment respectively grew from 25 per cent and 7 per cent to 30 per cent and 12 per cent from 2005 to 2017. In Tunisia, like in Jordan, women, and particularly high-skilled women, are over-represented in public sector administration: 30 per cent of employed women are in public administration, of which 66 per cent have advanced education versus only 16 per cent of men, of which
X Table 32: Evolution of labour force and employment by sex in Tunisia, 2005–17 (in thousands)
Tunisia 2005 2011 2017 2005–11 2011–17 Growth 2005–11
Growth 2011–17
Labour force, female 881 1,027 1,174 145.7 146.9 16.5% 14.3%
Labour force, male 2,478 2,818 2,911 339.8 92.7 13.7% 3.3%
Labour force, total 3,359 3,845 4,084 485.6 239.6 14.5% 6.2%
Employment, female 751.1 743.0 865.6 - 8.1 122.6 -1.1% 16.5%
Employment, male 2,208.9 2,419.3 2,570.5 210.40 151.20 9.5% 6.2%
Employment, total 2,960.1 3,162.3 3,436.1 202.20 273.80 6.8% 8.7%
Source:Authorʼscomputation,basedondataprovidedbyILOStatisticsDepartment.

Trade, investment and employment in the Southern Mediterranean Countries134
X Figure 106: Job creation in Tunisia by sector and gender, 2005–17 (in thousands)
–60 –40 –20 0 20 40 60
Other services
Human health and social work activities
Financial and insurance activities
Education
Transport; storage and communication
Accommodation and food service activities
Real estate; business and administrative activities
Public administration and defence; compulsory social security
Wholesale and retail trade; repair of motor vehicles and motorcycles
Utilities
Mining and quarrying
Manufacturing
Construction
Agriculture
Thousands Female (2011–17) Female (2005–11)
–24.8–45.00
1.81.2
31.8–12.2
–0.10.5
1.6–0.8
26.017.5
47.226.1
6.73.8
9.51.5
1.30.2
8.7–1.5
3.60.6
6.7–1.6
2.71.4
-20 0 20 40 60 80 100
Other services
Human health and social work activities
Financial and insurance activities
Education
Transport; storage and communication
Accommodation and food service activities
Real estate; business and administrative activities
Public administration and defence; compulsory social security
Wholesale and retail trade; repair of motor vehicles and motorcycles
Utilities
Mining and quarrying
Manufacturing
Construction
Agriculture
Thousands Male (2011–17) Male (2005–11)
14.014.1
18.687.1
19.931.9
1.02.4
2.7–3.3
36.733.9
5.112.7
11.314.9
2.1–2.7
3.1–0.4
0.61.1
0.9–0.7
12.8–2.7
22.622.2
X Figure 105: Employment in tradable and non-tradable sectors by sex in Tunisia, 2005–17
Source:Authorʼscomputation,basedondataprovidedbyILOStatisticsDepartment.
0 10 20 30 40 50 60 70 80 90 100
Percentage
17.0 14.2 14.0 54.9
17.4 14.2 14.2 54.2
18.3 14.2 13.6 53.9
10.1 31.6 5.8 52.5
15.1 32.5 4.3 48.0
20.8 33.8 4.5 40.8
2017
Ma
leFe
ma
le
2011
2005
2017
2011
2005
Agriculture and mining Manufacturing Tradable services Non-tradable sectors

135 Chapter 3. Trade, investment and youth and women in the labour market
X Figure 106 (continued)
Source: Author’s computation, based on data provided by ILO Statistics Department.
–60 –40 –20 0 20 40 60
Other services
Human health and social work activities
Financial and insurance activities
Education
Transport; storage and communication
Accommodation and food service activities
Real estate; business and administrative activities
Public administration and defence; compulsory social security
Wholesale and retail trade; repair of motor vehicles and motorcycles
Utilities
Mining and quarrying
Manufacturing
Construction
Agriculture
Thousands Female (2011–17) Female (2005–11)
–24.8–45.00
1.81.2
31.8–12.2
–0.10.5
1.6–0.8
26.017.5
47.226.1
6.73.8
9.51.5
1.30.2
8.7–1.5
3.60.6
6.7–1.6
2.71.4
-20 0 20 40 60 80 100
Other services
Human health and social work activities
Financial and insurance activities
Education
Transport; storage and communication
Accommodation and food service activities
Real estate; business and administrative activities
Public administration and defence; compulsory social security
Wholesale and retail trade; repair of motor vehicles and motorcycles
Utilities
Mining and quarrying
Manufacturing
Construction
Agriculture
Thousands Male (2011–17) Male (2005–11)
14.014.1
18.687.1
19.931.9
1.02.4
2.7–3.3
36.733.9
5.112.7
11.314.9
2.1–2.7
3.1–0.4
0.61.1
0.9–0.7
12.8–2.7
22.622.2
X Figure 107: Distribution of skill levels by sex in Tunisia, 2005–17
Note: the total is slightly less than 100% due to the existence of a category in which the level of education is not stated. Source: Author’s computation, based on data provided by ILO Statistics Department.
0
20
40
60
80
100
Perc
enta
ge
Female
2005
All sectors Manufacturing
2017 2005 2017
17.531.6
3.3 9.1
33.7
32.6
42.346.6
48.635.8
54.244.2
0
20
40
60
80
100
Perc
enta
ge
Male
2005
All sectors Manufacturing
2017 2005 2017
11.5 13.8 7.6 12.3
36.639.0
43.845.5
51.847.1 48.5 42.2
Basic or less than basic education Intermediate education High education

Trade, investment and employment in the Southern Mediterranean Countries136
only 35 per cent have advanced education. Also, as in Jordan, women in the Tunisian labour market tendtobemoreeducatedthanmen(figure107).Job creation between 2005 and 2017 increased the demand for high-skilled female workers, includ-ing in tradable sectors such as manufacturing. For instance, the share of high-skilled women in man-ufacturing tripled, from 3 per cent in 2005 to 9 per cent in 2017. Comparatively, the demand for high-skilled male workers has also increased in manufac-turing, however, at a slower pace than for women.
In Tunisia, youth labour market outcomes slightly improved since the 2011 revolution. From 2011 to 2017, youth employment growth decreased at much lower levels than the labour force (–3 per cent versus –17 per cent) and the unemployment rate decreased from 38. per cent to 33 per cent. Comparatively, since 2005 and before the 2011 revolution, youth employment declined by 9 per cent, while the supply of youth labour increased by 8 per cent, leading to a sharp rise of youth unem-ployment from 25 per cent in 2005 to 38 per cent in 2011. However, there are indications that youth have been more discouraged from entering the labour market after the 2011 revolution. The youth labour force shrank by 17 per cent between 2011 and 2017, a much higher level than the decrease of the youth population (–6 per cent over the same period), leading to a decline in the youth labour force participation rate from 45 per cent in 2011 to 42 per cent in 2017 (table 33).
The industrial and trade policies implemented since the 2000s in Tunisia led to an increased demand for mid and high-skilled youth workers, despite not creating more jobs for youth in tradable sec-tors compared to older workers. Between 2005 and 2017, the share of youth in tradable sectors
declined, mainly driven by lower youth employ-ment in agriculture and manufacturing (fig-ures 108 and 109). In 2017, 25 per cent of youth were employed in manufacturing versus 30 per cent in 2005. Manufacturing represents a higher share in youth employment than for older work-ers. However, while there is a negative trend for youth employment in manufacturing, the share ofmanufacturinginolderworkersʼemploymentgrew from 2005 to 2017. Despite the decline of the manufacturing share in youth employment, thestructureofskillshassignificantlyimprovedfor youth in this sector, with higher shares of mid-skilled and high-skilled youth workers in manufac-turingin2017comparedto2005(figure110).Youthemployed in manufacturing have higher skills than their older peers, with particularly higher shares of mid-skilled youth workers and lower low-skilled ones. The share of mid-skilled youth workers has increased at higher levels in manufacturing than in the overall economy, suggesting that the demand for mid-skilled workers has particularly risen in manufacturing between 2005 and 2017.
In the Occupied Palestinian Territory, the labour forceincreasedsignificantlyoverthetwodecades,driven by considerable growth in the female work-ing-age population (+92 per cent from 2000 to 2019). The female labour force nearly tripled and the male labour force doubled in 19 years. Employment grewsignificantlyoverthesameperiod;however,at lower levels than the labour force, which wors-ened the labour market outcomes, particularly for women (table 34). The pre-pandemic unemploy-ment rate reached 41 per cent in 2019.
Employment in tradable sectors decreased for both female and male workers between 2000 and 2019, however at a much higher levels for women
X Table 33: Evolution of labour force and employment by age in Tunisia, 2005–17 (in thousands)
Tunisia 2005 2011 2017 2005–2011 2011–2017 Growth 2005–2011 (%)
Growth 2011–2017 (%)
Labour force, youth (15-29) 1,210 1,310 1,089 99.8 –220.4 8.2% –16.8%
Labour force, older workers (30–64) 2,100 2,489 2,909 388.9 420.6 18.5% 16.9%
Employment, youth (15–29) 902 821 793 –81.4 –27.8 –9.0% –3.4%
Employment, older workers (30–64) 1,941 2,250 2,603 308.8 352.5 15.9% 15.7%
Source:Authorʼscomputation,basedondataprovidedbyILOStatisticsDepartment.

137 Chapter 3. Trade, investment and youth and women in the labour market
X Figure 109: Job creation in Tunisia by sector and age, 2005–17 (in thousands)
–60 –40 –20 0 20
Human health and social work activities
Financial and insurance activities
Transport; storage and communication
Accommodation and food service activities
Real estate; business and administrative activities
Public administration and defence; compulsory social security
Wholesale and retail trade; repair of motor vehicles and motorcycles
Utilities
Mining and quarrying
Manufacturing
Construction
Agriculture
Thousands Youth (15–29) 2011–17 Youth (15–29) 2005–11
–7.61–47.57
–3.317.71
–19.40–46.25
–1.29 2.09
0.720.15
7.80
2.02
–0.243.943.53
5.90
–1.91–6.95
–3.62–1.26
3.35–0.81
–6.90–4.71
–20 0 20 40 60 80 100
Human health and social work activities
Financial and insurance activities
Transport; storage and communication
Accommodation and food service activities
Real estate; business and administrative activities
Public administration and defence; compulsory social security
Wholesale and retail trade; repair of motor vehicles and motorcycles
Utilities
Mining and quarrying
Manufacturing
Construction
Agriculture
Thousands Older workers 2011–17 Older workers 2005–11
22.6912.13
35.3781.24
72.8070.16
2.500.78
3.95–4.03
58.3153.19
70.7834.00
36.0023.93
22.963.19
14.7317.30
5.870.53
14.2312.55
X Figure 108: Employment in tradable and non-tradable sectors by age in Tunisia, 2005–17
Source: Author’s computation, based on data provided by ILO Statistics Department.
0 10 20 30 40 50 60 70 80 90 100
Percentage
14.9 16.5 10.9 57.7
16.1 15.8 10.7 57.4
18.0 14.7 11.3 56.0
13.5 25.3 8.0 53.2
14.1 26.8 8.0 51.1
17.9 29.5 8.3 44.3
2017
Old
er
wo
rke
rsYo
uth
2011
2005
2017
2011
2005
Agriculture and mining Manufacturing Other tradable Non-tradable

Trade, investment and employment in the Southern Mediterranean Countries138
X Figure 109 (continued)
Source: Author’s computation, based on data provided by ILO Statistics Department.
–60 –40 –20 0 20
Human health and social work activities
Financial and insurance activities
Transport; storage and communication
Accommodation and food service activities
Real estate; business and administrative activities
Public administration and defence; compulsory social security
Wholesale and retail trade; repair of motor vehicles and motorcycles
Utilities
Mining and quarrying
Manufacturing
Construction
Agriculture
Thousands Youth (15–29) 2011–17 Youth (15–29) 2005–11
–7.61–47.57
–3.317.71
–19.40–46.25
–1.29 2.09
0.720.15
7.80
2.02
–0.243.943.53
5.90
–1.91–6.95
–3.62–1.26
3.35–0.81
–6.90–4.71
–20 0 20 40 60 80 100
Human health and social work activities
Financial and insurance activities
Transport; storage and communication
Accommodation and food service activities
Real estate; business and administrative activities
Public administration and defence; compulsory social security
Wholesale and retail trade; repair of motor vehicles and motorcycles
Utilities
Mining and quarrying
Manufacturing
Construction
Agriculture
Thousands Older workers 2011–17 Older workers 2005–11
22.6912.13
35.3781.24
72.8070.16
2.500.78
3.95–4.03
58.3153.19
70.7834.00
36.0023.93
22.963.19
14.7317.30
5.870.53
14.2312.55
X Figure 110: Distribution of skill levels by age in Tunisia, 2005–17
Note: the total is slightly less than 100% due to the existence of a category in which the level of education is not stated. Source: Author’s computation, based on data provided by ILO Statistics Department.
0
20
40
60
80
100
Perc
enta
ge
Youth
2005 2011 2011
All sectors Manufacturing
2017 2005 2017
10.5
43.0
46.4
14.8
53.4
31.8
17.2
56.6
26.1
4.7
47.2
48.0
10.9
60.8
28.3
11.3
62.5
26.1
0
20
40
60
80
100
Perc
enta
ge
Older workers
2005 2011 2011
All sectors Manufacturing
2017 2005 2017
14.7
34.0
51.1
18.1
31.9
49.9
19.2
32.2
48.6
6.6
39.6
53.6
9.8
39.2
50.9
10.7
38.4
50.8
Basic or less than basic education Intermediate education High education

139 Chapter 3. Trade, investment and youth and women in the labour market
(–3 percentage points for males versus –27 per-centagepointsforfemales)(figure111).Thiswasdriven by a considerable decrease in the share of agriculture from around 35 per cent in 2000 to around 7 per cent in 2019 and to a lesser extent in a reduction in the share of manufacturing in female employment. The share of manufactur-ing in female employment decreased from 11 per cent in 2000 to 7 per cent in 2009, and is at 12 per cent in 2019, a much lower level than for male workers.
Employment for women has shifted out of agricul-ture and manufacturing towards mostly high-skilled and non-tradable sectors. In 2000, 71 per cent of employed women were working in agriculture (35 per cent), education (26 per cent) and manu-facturing (11 per cent). In 2019, employment in edu-cation, healthcare and public administration grew significantly(figure112),witheducationreachingalmost 40 per cent of female employment, health-care 11 per cent up from 7 per cent in 2000 and public administration 8 per cent from 5 per cent in 2000. Employment in wholesale and retail, a rela-tively low-skilled and non-tradable sector, also grew to 10 per cent, up from 7 per cent in 2000.
This shift towards more high-skilled sectors trans-lates the huge improvements in female educa-tional attainment and skills in the labour market. The share of the employed female with advanced education grew from 19 per cent to 57 per cent between 2000 and 2019 at a much higher pace than theirmalepeers(figure113).Theshareoffemaleswith advanced education has increased in almost all sectors, including manufacturing (from 2 per cent in 2000 to 19 per cent in 2019) and even in whole-
sale and retail (from 12 per cent in 2000 to 38 per cent in 2019).
The employment outcomes for Palestinian women significantlychangedfromaskillsandsectorsper-spective in recent years and are becoming relatively like the Jordanian scenario. Women are highly edu-cated and concentrated in high-skilled non-tradable sectors, such as public administration, education and health and social work activities. This indicates that the Occupied Palestinian Territory would need to focus on developing high-skilled tradable sectors that could expand to create jobs for the increasing number of women entering the labour market and create high-skilled jobs to build on the new com-parative advantage of the Palestinian economy: a highly skilled female labour force.
The youth labour force increased significantly between 2000 and 2019 (table 35) and the youth labour force participation rate increased from 34 per cent to 40 per cent. However, the labour force grew at a much higher pace than youth employment growth,leadingtoasignificantincreaseintheyouthunemployment rate, from 15 per cent to 38 per cent. Labour market outcomes for older workers have also worsened over the last two decades, albeit at a lower scale than for youth, with the unemployment rate for older workers rising from 8 per cent in 2000 to 16 per cent in 2019.
There are two trends for youth employment in trad-able sectors between 2000 and 2019: a decrease in the overall share due to the decline in employ-ment in agriculture and manufacturing, and an increased employment share in tradable services. Manufacturingʼs share in youth employment
X Table 34: Evolution of labour force and employment by sex in the Occupied Palestinian Territory, 2000–19 (in thousands)
Occupied Palestinian Territory 2000 2009 2019 Diff (2009–2000)
Diff (2019–2009)
Growth 2000–2009 (%)
Growth 2009–2019 (%)
Labour force, female 97 162 273 65 111 66.6% 68.8%
Labour force, male 548 737 1,084 189 348 34.4% 47.2%
Labour force, total 645 899 1,358 253 459 39.2% 51.1%
Employment, female 89 129 161 40 31 45% 24%
Employment, male 487 585 851 98 266 20% 45%
Employment, total 577 715 1,012 138 297 24% 42%
Source:Authorʼscomputation,basedondataprovidedbyILOStatisticsDepartment.

Trade, investment and employment in the Southern Mediterranean Countries140
X Figure 112: Job creation by sector and gender in the Occupied Palestinian Territory, 2000–19 (in thousands)
–40 –20 0 20 40 60 80 100
Other services
Human health and social work activities
Financial and insurance activities
Education
Transport; storage and communication
Accommodation and food service activities
Real estate; business and administrative activities
Public administration and defence; compulsory social security
Wholesale and retail trade; repair of motor vehicles and motorcycles
Utilities
Mining and quarrying
Manufacturing
Construction
Agriculture
Thousands Female (2009–19) Female (2000–09)
–7.3 8.4
92.3–30.6
37.12.4
1.30.6
4.21.5
66.631.1
11.441.3
10.52.4
9.26.8
–3.14.5
–6.811.6
–9.79.3
17.53.2
17.711.6
–40 –20 0 20 40 60 80 100
Other services
Human health and social work activities
Financial and insurance activities
Education
Transport; storage and communication
Accommodation and food service activities
Real estate; business and administrative activities
Public administration and defence; compulsory social security
Wholesale and retail trade; repair of motor vehicles and motorcycles
Utilities
Mining and quarrying
Manufacturing
Construction
Agriculture
Thousands Male (2009–19) Male (2000–09)
–7.37.7
92.3–30.6
37.12.4
1.30.6
4.21.5
66.631.1
11.441.3
–11.86.4
9.26.8
6.56.9
1.22.4
5.26.8
17.53.2
9.711.6
X Figure 111: Employment in tradable and non-tradable sectors by sex in the Occupied Palestinian Territory, 2000–19
Source:Authorʼscomputation,basedondataprovidedbyILOStatisticsDepartment.
0 10 20 30 40 50 60 70 80 90 100
Percentage
6.3 12.8 12.1 68.8
10.3 12.4 10.2 67.2
10.6 14.4 8.7 66.3
6.7 6.9 8.1 78.3
20.6 8.9 3.3 67.3
34.7 11.0 2.7 51.6
2019
Ma
leFe
ma
le
2009
2000
2019
2009
2000
Agriculture Manufacturing Otrher tradable services Non-tradable

141 Chapter 3. Trade, investment and youth and women in the labour market
X Figure 112 (continued)
Source:Authorʼscomputation,basedondataprovidedbyILOStatisticsDepartment.
–40 –20 0 20 40 60 80 100
Other services
Human health and social work activities
Financial and insurance activities
Education
Transport; storage and communication
Accommodation and food service activities
Real estate; business and administrative activities
Public administration and defence; compulsory social security
Wholesale and retail trade; repair of motor vehicles and motorcycles
Utilities
Mining and quarrying
Manufacturing
Construction
Agriculture
Thousands Female (2009–19) Female (2000–09)
–7.3 8.4
92.3–30.6
37.12.4
1.30.6
4.21.5
66.631.1
11.441.3
10.52.4
9.26.8
–3.14.5
–6.811.6
–9.79.3
17.53.2
17.711.6
–40 –20 0 20 40 60 80 100
Other services
Human health and social work activities
Financial and insurance activities
Education
Transport; storage and communication
Accommodation and food service activities
Real estate; business and administrative activities
Public administration and defence; compulsory social security
Wholesale and retail trade; repair of motor vehicles and motorcycles
Utilities
Mining and quarrying
Manufacturing
Construction
Agriculture
Thousands Male (2009–19) Male (2000–09)
–7.37.7
92.3–30.6
37.12.4
1.30.6
4.21.5
66.631.1
11.441.3
–11.86.4
9.26.8
6.56.9
1.22.4
5.26.8
17.53.2
9.711.6
X Figure 113: Evolution of level of skills in employed population by sex in the Occupied Palestinian Territory, 2000–19
Source:Authorʼscomputation,basedondataprovidedbyILOStatisticsDepartment.
0
20
40
60
80
100
Perc
enta
ge
Female
2000 2009 2009
All sectors Manufacturing
2019 2000 2019
19.3
29.3
51.4
38.4
23.6
38.0
57.2
19.0
23.8
1.918.1
80.0
7.211.2
81.7
19.3
17.2
63.6
0
20
40
60
80
100
Perc
enta
ge
Male
2000 2009 2009
All sectors Manufacturing
2019 2000 2019
11.4
23.7
64.9
16.3
24.5
59.2
19.4
23.9
56.7
4.1
18.6
77.4
4.4
21.1
74.5
7.5
24.3
68.3
Basic or less than basic education Intermediate education High education

Trade, investment and employment in the Southern Mediterranean Countries142
decreased overall from around 18 per cent in 2000 to15percentin2019,despiteasignificantlevelof job creation and employment growth between 2009and2019(figure114).Theshareofmanu-facturingʼsshareinolderworkersʼemploymentalso decreased at a slower pace than for youth. Despite this, the share of manufacturing in youth employment remains higher than for older work-ers.However,tradableservices,includingfinancialservices, accommodation and restaurants (tourism) andtransportation,createdasignificantnumberofjobs for youth, driving the total increase in tradable sectors outside of agriculture. Youth employment
in tradable services increased faster than for older workers between 2000 and 2019. This led to trad-able sectors having a higher share in youth employ-ment than for older workers in 2019 (36 per cent versus around 27 per cent in 2019).
Despite the increase in youth employment share in tradable sectors outside of agriculture, job cre-ation for youth was mainly in non-tradable sec-tors such as wholesale and retail, healthcare and construction, particularly between 2009 and 2019. Manufacturing was the third sector in job creation for youth during that period, behind wholesale and retail and construction, although, as mentioned
X Table 35: Evolution of labour force and employment by age in the Occupied Palestinian Territory, 2000–19 (in thousands)
Occupied Palestinian Territory 2000 2009 2019 Diff (2009–2000)
Diff (2019–2009)
Growth 2000–2019 (%)
Growth 2009–2019 (%)
Labour force, youth (15–29) 270 364 572 95 207 35% 57%
Labour force, older workers 362 523 772 161 249 44% 48%
Employment, youth (15–29) 230 255 355 24 100 11% 39%
Employment, older workers 333 449 645 116 196 35% 44%
Source:Authorʼscomputation,basedondataprovidedbyILOStatisticsDepartment.
X Figure 114: Employment in tradable and non-tradable sectors by age in the Occupied Palestinian Territory, 2000–19
Source: Author’s computation, based on data provided by ILO Statistics Department.
0 10 20 30 40 50 60 70 80 90 100
Percentage
5.8 9.9 11.1 73.2
11.5 10.8 9.1 68.6
14.3 11.7 8.4 65.5
7.0 15.6 13.9 63.6
12.1 13.4 9.0 65.6
12.5 17.4 7.1 63.0
2019
Old
er
wo
rke
rsYo
uth
2009
2000
2019
2009
2000
Agriculture and mining Manufacturing Other tradable sectors Non-tradable

143 Chapter 3. Trade, investment and youth and women in the labour market
X Figure 115: Job creation in Occupied Palestinian Territory by sector and age, 2000–19 (in thousands)
Source: Author’s computation, based on data provided by ILO Statistics Department.
–30 –20 –10 0 10 20 30 40 50
Other services
Human health and social work activities
Financial and insurance activities
Education
Transport; storage and communication
Accommodation and food service activities
Real estate; business and administrative activities
Public administration and defence; compulsory social security
Wholesale and retail trade; repair of motor vehicles and motorcycles
Mining, quarrying, and utilities
Manufacturing
Construction
Agriculture
Thousands Youth 2009–19 Youth 200–09
–6.891.78
37.60–23.74
21.20–5.94
3.170.47
40.9413.72
–18.9510.03
10.033.07
10.161.48
6.303.97
–5.1510.43
3.5814.01
1.730.94
3.01–5.78
–20 –10 0 10 20 30 40 50 60 70 80
Other services
Human health and social work activities
Financial and insurance activities
Education
Transport; storage and communication
Accommodation and food service activities
Real estate; business and administrative activities
Public administration and defence; compulsory social security
Wholesale and retail trade; repair of motor vehicles and motorcycles
Mining, quarrying, and utilities
Manufacturing
Construction
Agriculture
Thousands
–14.633.48
54.80–6.79
14.939.63
2.791.68
31.4720.81
34.0070.78
3.524.01
8.711.81
11.688.79
32.3618.49
7.409.23
0.932.00
7.659.45
Older workers 2009–19 Older workers 2000–09

Trade, investment and employment in the Southern Mediterranean Countries144
earlier, its share in youth employment decreased overall between 2000 and 2019. Public admin-istration created a considerable number of jobs between 2000 and 2019, however, mainly for older workers(figure115).Thiswasespeciallythecasebetween 2009 and 2019, with an increased share of high-skilled jobs for older workers in this sector reflectingthehigherpercentageofolderworkerswith advanced education as opposed to youth in thePalestinianeconomy(figure116).
In Algeria, the labour market outcomes have in overall improved for women between 2000 and 2009, even though less than 20 per cent of work-ing-age women are engaged in the labour market. Since2000,womenhavewitnessedasignificantpositive trend as the labour force participation rate increased from 12 per cent in 2000 to 17 per cent in 2019. Over the last two decades, the female labour force grew faster than the male labour force, lead-ing to a decrease in the male labour force partici-pation rate (from 75 per cent in 2000 to 68 per cent in 2019) and a lower gender gap in the labour force participation rate (LFPR). Between 2000 and 2009, employment grew at remarkably high levels both for men and women and at a much higher pace thanlabourforcegrowth.Womenʼsemploymentgrew by 76 per cent between 2000 and 2009, while
male employment grew by 52 per cent. (table 36) This dynamic led the unemployment rate to drop from 30 per cent to 18 per cent for women and from 30 per cent to 9 per cent for men between 2000 and 2009. This positive dynamic slowed down considerably after 2009, with the labour force for both males and females slightly exceeding employ-ment growth, which led to the unemployment rate rising marginally to 20 per cent for women and 10 per cent for men in 2019.
In Algeria, employment in tradable sectors is rela-tively small and has been decreasing over the last two decades for both men and women, particularly between 2000 and 2009. This decrease is primar-ily driven by the shift of labour out of agriculture, mainly towards low-productive services. The share of manufacturing in employment for women has significantlydecreasedoverthepast19years,par-ticularly between 2000 and 2009, while it increased overall for men between 2000 and 2019. Like Tunisia and unlike other countries in the region, manufac-turing represents an important sector for female employment, with around 21 per cent of women engaged in this sector in 2019, despite this share decreasingfrom27percentin2000(figure117).However, like Jordan, women are concentrated in a limited number of sectors: around 77 per cent
X Figure 116: Evolution of level of skills in employed population by age in the Occupied Palestinian Territory, 2000–19
Source: Author’s computation, based on data provided by ILO Statistics Department.
0
20
40
60
80
100
Perc
enta
ge
Youth
2000 2009 2009
All sectors Manufacturing
2019 2000 2019
9.3
21.9
68.8
18.5
24.6
56.9
19.8
23.2
57.0
2.015.4
82.6
5.1
19.8
75.0
8.4
22.8
68.8
0
20
40
60
80
100
Perc
enta
ge
Older workers
2000 2009 2009
All sectors Manufacturing
2019 2000 2019
15.3
27.2
57.5
21.6
24.6
53.8
28.5
23.2
48.2
5.6
22.1
72.4
4.6
20.0
75.4
8.6
24.5
66.9
Basic or less than basic education Intermediate education High education

145 Chapter 3. Trade, investment and youth and women in the labour market
of women employed in 2019 were in education, healthcare, public administration and manufac-turing. Over the last two decades, manufacturing createdasignificantnumberofjobsforfemaleworkers, despite the decrease of its share in female employment. The sector created 100,000 jobs for women between 2000 and 2009 and 83,000 jobs for women between 2009 and 2019. In that period, jobs created in that sector were mostly for women, as male employment shrank with the destruction of40,500jobs(figure118).
Outside of manufacturing, job creation for women has been mainly driven by services. Women entering the labour market between 2000 and 2019 in Algeria were most likely to get a job in education (+437,000 jobs), public administration (+202,000 jobs) and human health and social work activities (+137,000 jobs). These three sectors repre-sented about 66 per cent of jobs created for women between 2000 and 2019. Jobs in these three sec-torsaregenerallyhigh-skilled,whichreflectsthesignificant improvement in female educational
X Table 36: Evolution of labour force and employment by sex in Algeria, 2000–19 (in thousands)
Algeria 2000 2009 2019 2009–2000 2019–2009 Growth 2000–2009 (%)
Growth 2009–2019 (%)
Labour force, Female 1,200 1,811 2,528 610 717 50.8% 39.6%
Labour force, Male 7,680 8,990 10,188 1,310 1,198 17.1% 13.3%
Labour force, Total 8,880 10,801 12,716 1,920 1,915 21.6% 17.7%
Employment, Female 844 1,483 2,011 640 528 75.8% 35.6%
Employment, Male 5,393 8,220 9,204 2,827 983 52.4% 12.0%
Employment, Total 6,237 9,703 11,215 3,467 1,511 55.6% 15.6%
Source:AuthorʼscomputationbasedonILOSTATdata(modelledestimates).
X Figure 117: Employment in tradable and non-tradable sectors by sex in Algeria, 2000–19
Source: Author’s computation based on ILOSTAT data (modelled estimates).
0 10 20 30 40 50 60 70 80 90 100
Percentage
12.5 8.4 10.5 68.6
15.7 9.6 9.1 65.6
25.8 7.9 8.6 57.7
3.9 20.6 2.9 72.6
4.5 22.3 4.0 69.2
14.4 27.3 4.1 54.2
2019
Ma
leFe
ma
le
2009
2000
2019
2009
2000
Agriculture and mining Manufacturing Tradable services Non-tradable sectors

Trade, investment and employment in the Southern Mediterranean Countries146
X Figure 118: Job creation by sector and gender in Algeria, 2000–19 (in thousands)
Source: Author’s computation based on ILOSTAT data (modelled estimates).
–100 –50 0 50 100 150 200 250 300
Other services
Human health and social work activities
Financial and insurance activities
Education
Transport; storage and communication
Accommodation and food service activities
Real estate; business and administrative activities
Public administration and defence; compulsory social security
Wholesale and retail trade; repair of motor vehicles and motorcycles
Utilities
Mining and quarrying
Manufacturing
Construction
Agriculture
Thousands Female (2009–19) Female (2000–09)
5.9–52.1
9.115.9
83.4100.8
5.6–2.9
7.2–2.2
36.331.0
76.2125.9
30.024.2
196.9240.5
27.548.0
–5.76.3
51.685.5
0.83.3
2.815.6
–400 –200 0 200 400 600 800 1,000
Other services
Human health and social work activities
Financial and insurance activities
Education
Transport; storage and communication
Accommodation and food service activities
Real estate; business and administrative activities
Public administration and defence; compulsory social security
Wholesale and retail trade; repair of motor vehicles and motorcycles
Utilities
Mining and quarrying
Manufacturing
Construction
Agriculture
Thousands Male (2009–19) Male (2000–09)
–193.8–76.6
330.3868.1
–40.5360.3
72.0–22.2
74.7–1.6
432.9475.6
45.9570.7
43.735.6
–36.2183.4
36.372.5
1.66.0
–22.678.1
88.269.0
151.2207.8

147 Chapter 3. Trade, investment and youth and women in the labour market
attainment and level of skills and occupation in the labour market in Algeria. Enrolment in tertiary education for females has been steadily increasing since 2009 and has almost doubled between 2009 and2019(figure119),withAlgeriahavingthehigh-est female enrolment in tertiary education in the region (64.4 per cent in 2019). This has translated to a steadily increasing share of women in high-skilled occupations, compared to stagnating levels of occu-pationformen(figure120).AsinMorocco,thissig-nificantincreaseinfemaleeducationalattainment
will increase the demand for high-skilled jobs, which would require a focus on tradable sectors in indus-tryandservicesandadiversificationofexportsout-side of gas and oil.
In Libya, labour force participation rates increased over the last two decades, from around 29 per cent in 2000 to 34 per cent in 2019 for women and from 59 per cent to 65 per cent for men over the same period. Between 2000 and 2009, the labour force growth rate for both males and females was at
X Figure 119: Evolution of enrolment in tertiary education for female and male in Algeria, 2009–18 (% gross)
X Figure 120: Evolution of occupations by gender in Algeria, 2010–19
Source: WDI.
Note: High-skilled: Managers and professionals; mid-skilled: Technicians and associate professionals, Clerical support workers, Service and sales workers, Craft and related trades workers; low-skilled: Plant and machine operators and assemblers and Elementary occupations andskilledagricultural,forestryandfisheryworkers.Source: ILO modelled estimates.
0
20
40
60
80
Perc
enta
ge
Algeria School enrollment, tertiary, male (% gross) Algeria School enrollment, tertiary, female (% gross)
2009 2010 2011 2012 2013 20182017201620152014
24.7 24.5 25.5 26.0 27.138.838.4
32.028.827.3
35.3 35.4 37.1 38.6 40.9
64.457.253.6
45.041.9
0 20 40 60 80 100
Percentage
Female
2019
2015
2010
29.77
28.99
20.26
57.56
57.93
63.58
12.67
13.09
16.16
0 20 40 60 80 100
Percentage
Male
2019
2015
2010
High-skilled Mid-skilled Low-skilled
10.33
10.73
10.11
45.60
45.82
44.97
44.07
43.46
44.93

Trade, investment and employment in the Southern Mediterranean Countries148
around 46 per cent (table 37). Between 2000 and 2019,despitethesignificantturmoilthatthecoun-try has gone through, employment continued to grow at higher levels than labour force growth. This led to a slight decrease in the unemployment rate from 25 per cent in 2000 to 24 per cent in 2019 for women and from 16 per cent to 15 per cent for men over the same period.
Like other economies in the region, employment in tradable sectors decreased for both men and women from 2000 to 2019, mainly due to the
decrease of employment in agriculture. However, the shift out of tradable sectors for women has beensignificantlyhigherthanformenbetween2000and2019(figure121).Theshareofmanufac-turing in female employment decreased at higher levels than men, while tradable services have cre-ated more jobs for men than for women. Overall, the increase in trade reduced the share of women in tradable sectors, both in manufacturing and services. The share of manufacturing in female employment decreased from 19 per cent to 15 per
X Table 37: Evolution of labour force and employment by sex in Libya, 2000–19 (in thousands)
Libya 2000 2009 2019 2009–2000 2019–2009 Growth 2000–2009 (%)
Growth 2009–2019 (%)
Labour force, female 488 710 826 223 116 45.7% 16.3%
Labour force, male 1,098 1,391 1,597 293 206 26.7% 14.8%
Labour force, total 1,586 2,101 2,423 516 322 32.5% 15.3%
Employment, female 364 532 627 168 95 46.0% 17.8%
Employment, male 917 1,171 1,352 254 180 27.7% 15.4%
Employment, total 1,281 1,703 1,978 422 275 32.9% 16.2%
Source:AuthorʼscomputationbasedonILOSTATdata(modelledestimates).
X Figure 121: Employment in tradable and non-tradable sectors by sex in Libya, 2000–19
Source: Author’s computation based on ILOSTAT data (modelled estimates).
0 10 20 30 40 50 60 70 80 90 100
Percentage
19.9 8.4 12.4 59.3
22.9 9.3 10.6 57.2
28.4 10.6 9.4 51.6
16.9 15.1 5.1 62.9
25.0 17.4 4.2 53.4
29.2 19.4 3.3 48.1
2019
Ma
leFe
ma
le
2009
2000
2019
2009
2000
Agriculture and mining Manufacturing Tradable services Non-tradable sectors

149 Chapter 3. Trade, investment and youth and women in the labour market
X Figure 122: Job creation in Libya by sector and gender, 2000–19 (in thousands)
Source: Author’s computation based on ILOSTAT data (modelled estimates).
–40 –30 –20 –10 0 10 20 30 40 50
Other services
Human health and social work activities
Financial and insurance activities
Education
Transport; storage and communication
Accommodation and food service activities
Real estate; business and administrative activities
Public administration and defence; compulsory social security
Wholesale and retail trade; repair of motor vehicles and motorcycles
Utilities
Mining and quarrying
Manufacturing
Construction
Agriculture
Thousands Female (2009–19) Female (2000–09)
–28.324.0
–2.03.9
1.822.1
1.42.4
0.30.3
22.024.4
4.05.3
2.01.6
3.63.5
15.814.9
37.833.7
16.110.8
16.412.6
4.08.1
–60 –40 –20 0 20 40 60 80 100 120
Other services
Human health and social work activities
Financial and insurance activities
Education
Transport; storage and communication
Accommodation and food service activities
Real estate; business and administrative activities
Public administration and defence; compulsory social security
Wholesale and retail trade; repair of motor vehicles and motorcycles
Utilities
Mining and quarrying
Manufacturing
Construction
Agriculture
Thousands Male (2009–19) Male (2000–09)
–6.0–5.1
–35.2102.4
5.111.9
5.712.9
2.51.8
77.057.2
32.731.2
6.63.5
4.72.8
17.20.5
15.41.9
9.03.9
33.119.5
12.310.0

Trade, investment and employment in the Southern Mediterranean Countries150
cent between 2000 and 2019, even though the sectorcreatedasignificantnumberofjobs.Maleemployment predominated in other tradable sec-tors, in services such as transportation and stor-ageandfinancialservices,despitegainingsharesin female employment. These sectors represented 5.1 per cent of female employment in 2019, up from 3 per cent in 2000.
The Libyan economy is the only economy in the region that created more jobs for women than men in manufacturing between 2000 and 2019 in numbers(figure122).Manufacturingcreated23,900jobs for women versus 17,000 jobs for men between 2000 and 2019, with most of the jobs for both cre-ated between 2000 and 2009, before the 2011 events. Outside of manufacturing, most of the jobs for women and men have been created in non-trad-able sectors. There is a steady growth of employ-ment in high-skilled non-tradable sectors such as educationandhealthcareforwomen,reflectingtheimprovement in female educational outcomes. For instance, in 2019, the enrollment in tertiary educa-tion for females was at 39 per cent compared to 10 per cent for men. In education and healthcare, 80 per cent of the jobs created between 2000 and 2019 were for female workers, and the share of both sec-tors in female employment increased from 26 per cent in 2000 to 30 per cent in 2019.
Conclusion
As mentioned in the previous chapter, trade policies might lead to high adjustment costs for vulnera-ble workers, especially for women in the Southern Mediterranean Countries. Addressing this requires integrated trade, industrial and domestic policies that reduce the possible unequal impact of trade liberalization on the labour market. Women in the region tend to be highly educated and engage mainly in formal employment; therefore, focusing on high-skilled tradable sectors that could absorb thislabourforceiscrucialforwomenʼseconomicempowerment and inclusive trade and investment policies. Industrial policies should be used as a transmission channel for trade and investment pol-icies to realize a productive structural change and yield the intended results, including creating oppor-tunitiesforwomenandyouthtobenefitfromtradeliberalization and sophistication of exports. For women in the region, outside of the impact of trade policies, the lack of public transportation and social facilitiessuchaschildcarefacilitiesconfineswomento their traditional roles in society and prohibits them from being economically active. For youth,
two main root causes need to be addressed. The firstistheskillmismatchduetothegapbetweenthe education system and the needs of the labour market. The second is slow structural transforma-tion, which limits the economies in the region to mainly creating low-productive jobs. As a result, the most educated youth and women experience very high unemployment rates, which represents a huge loss of human capital for economies in the region.
3.4. Policy orientations: What could be done to improve the impact of trade and investment policies, including for women and youth? The possible negative impact of trade in the labour market should be addressed by policy measures that maintain open markets while providing the necessarysupporttoenablefirmsandworkerstoadjust and to increase their human and technologi-cal capabilities. Trade liberalization should be part of effectiveandwell-implementedindustrialpolicies,and these in turn require the intervention of well-ca-pacitated public institutions and a formalized, docu-mentedandeffectivepublic–privatedialogue.
Trade liberalization reforms alone are not enough to improve economic outcomes, including on the labour market. The potential gains from trade lib-eralization require a competitive business envi-ronment, functioning economic institutions and well-developed infrastructure to ensure a fast and efficientallocationofproductivefactors.Under-developedinfrastructurelimitsthereshufflingofproductive factors, including labour mobility and delays,anddecreasesthebenefitsoftradereforms.In particular, as discussed earlier, physical infrastruc-turedevelopmentwouldimprovethelogistics,flowof information and communication with clients.
The set of interventions required to improve the impact of trade on the labour market and mitigate the additional burden and exclusion imposed on women and youth require that coherent and com-plementary policies be designed and implemented through well-orchestrated coordination. These pol-icies should address three main challenges that we discussed in this report:
X The slow structural change and the early de-industrialization that countries in the region are experiencing reduces the capacity of the

151 Chapter 3. Trade, investment and youth and women in the labour market
economy to create productive and quality jobs for its relatively young and increasingly edu-cated population.
X The high adjustment costs that trade policies and increased competition impose on firms and workers, especially vulnerable ones, might lead to sub-optimal outcomes. In the case of the Southern Mediterranean Countries, this has led to a decreased participation of women in trada-ble sectors in the labour market.
X The structural issues that women and youth face in the labour market, beyond the impact of trade policies, negatively impact labour produc-tivity growth and output growth in the region, with an economic potential that remains un-tapped. Increased labour participation for youth and women would help to improve economic outcomes in the region through increased hu-man capital accumulation and increased house-hold income. This in turn would potentially lead to further consumption, increased local demand and finally, a decrease in the dependency ratio.
The set of proposed policies and interventions listed below aim to provide some recommenda-tions to address these challenges. An underlying conditionofallthesepoliciesʼsuccessliesinaneffectiveimplementation,whichrequireswell-ca-pacitated public institutions, dedicated resources and strong political leadership. These interventions would help countries in the region realize a number of Sustainable Development Goals (SDGs), includ-ing SDG 8 which promotes sustained, inclusive and sustainable economic growth, full and productive employment and decent work for all (including targets: 8.3. 8.5. 8.6. 8.b), SDG 9, which promotes resilient infrastructure, inclusive and sustainable industrialization and fosters innovation, as well as SDG 10, which focuses on reducing inequality throughfiscalandwagereformsandequalaccessto productive employment.
3.4.1. A focus on structural transformation through effective industrial policies can help to reverse early deindustrialization and foster long-term and inclusive growth The focus on structural transformation would require adopting effective and modern indus-trial policies that would act as transmission
channels to yield an inclusive and positive impact of trade policies on the regionʼs labour markets.
Structural change from low-productive activities to high-productive ones is necessary to ensure sustain-able growth and enable physical, human and tech-nological capital accumulation. As demonstrated by the experience of the Southern Mediterranean Countries, the shift of labour out of agriculture is not necessarily accompanied by substantial gains in per capita income, with labour moving primarily to low-productive sectors and activities. The man-ufacturing sector remains an important driver of this structural transformation, by enabling capital accumulation, increased labour productivity and higher value-addition. This ultimately would lead toincreaseddiversificationandhighersophistica-tion of exports and better overall competitiveness oftheregionʼseconomies.Highvalue-addedsec-tors in services can also contribute to the struc-tural transformation; however, policymakers in the region should be wary of the potential inequality that focusing only on these services would lead to. Tradable services require higher-skilled work-ers than manufacturing. An increased trade within these sectors might lead to an increased demand for these workers at a higher pace than in man-ufacturing and would lead to higher inequalities, especiallyintheabsenceofsignificantinvestmentin human capital and infrastructure. Evidence sug-gests that countries that have gone through a structural change driven by manufacturing have witnessed less inequality than those in which struc-tural change was driven by services (Ravindran and Babu, 2021; Baymul and Sen, 2020).
Overall, Northern African countries have been doing better than other countries in the region in terms of industrial policies; however, even in these countries, the design and implementation of these policiesrequiresignificantimprovement.Below,weprovide a summary of the necessary features for effectivemodernpolicies,basedonthediscussionprovided in the previous chapter and based on the framework developed by Rodrik (2008) and by ILO (2020a):
X A mix of targeted and transversal industrial policies is needed: As identified in the litera-ture, a mix between focusing the public support on a selected and well-identified sector and a more transversal approach to fix the business environment and improve the soft infrastruc-ture. Transversal industrial policies in the region should focus on investment in R&D and human

Trade, investment and employment in the Southern Mediterranean Countries152
capital to improve technological capabilities. For targeted policies, identifying the high-potential sectors should follow a continuous self-discov-ery process, which remains mostly unimple-mented in the region, except for encouraging signs in Morocco, and should be based on a deep understanding of the changing competi-tive advantages and reality in the economy. We recommended in this report (chapter 2) three methodologies that can help countries in the region identify these sectors and concentrate theireffortstomaximizeresourceallocationsʼimpact and efficiency. For countries with a significant supply of highly qualified labour, especially among women, as in Jordan, Tunisia and the Occupied Palestinian Territory, tar-geted sectors should absorb both high-skilled workers, including female workers, and low- and mid-skilled ones. This, in practice, might trans-late into a selection of a mix of targeted sectors between manufacturing and services.
X Modern and effective industrial policies require:
X Conditional support to minimize rent-seek-ing: The carrot-and-stick feature, or in other words, the conditionality of the support pro-vided to firms, is also almost completely absent in the region, except for the recent start-up act in Tunisia. This is a fundamental feature to the new wave of industrial policies and would require strong monitoring and evaluation mechanisms and transparency in the design of criteria and conditions of support.
X Actionable interventions with clear insti-tutional responsibilities: Industrial policies need to identify clear implementation mech-anisms, including clear institutional mandates and accountability, to avoid duplication of ef-forts and maximize synergies.
X A strong social dialogue and public–private partnerships: Such partnership would be im-portant in designing these policies and their implementation to ensure the continuous self-discovery process. The public–private di-alogue needs to be inclusive of different com-ponents of the private sectors not just big and already well-connected players, as is the case in the region. This might require programmes and interventions to build the capacity of the private sector in terms of organization and sustainability, to include SMEs and small firms generallynotrepresentedinbigemployersʼassociations. The public–private dialogue should be institutionalized, formalized and
with clear objectives and governance mech-anisms. These formal platforms should have periodic and publicly published deliberations.
X A strong political support and should ideally be implemented at the centre of Government: Industrial policies are at the centre of economic policies and translate a vision for the economy and society. Their implementation requires an integrated ap-proach and constant alignment with other economic policies and instruments such as trade policies. Ideally, their implementation should be led by the centre of Government to ensure policy coherence and synergies.
X A financial commitment: Financial resources should be dedicated to implementing both targeted and transversal industrial policies to fund the incentives and financial support. The financial resources can be secured from pri-vate investment as well as public investment.
X A strong and well-capacitated institutions and clear and transparent monitoring, evaluation and learning mechanisms: Institutions included in the implementation of industrial policies should be well-capaci-tated and clear monitoring and evaluation mechanisms should be in place. The results of industrial policies should be periodically published in a transparent way to ensure accountability and to ensure the application of a self-discovery process, in case of meagre results due to the selection of the wrong sec-tor or the design of the wrong incentives and interventions.
Overall, the success of industrial and trade pol-icies requires reforming the economic institu-tions to address rent-seeking and to unleash the economic potential of the region.
As indicated in the previous chapter, economic insti-tutions in the region tend to be extractive (using thedefinitionofAcemogluandRobinson,2012).Reforming these institutions is crucial to any eco-nomic reform in the area and to unleashing the potential of innovation and entrepreneurship. This is not a straightforward process and is typically at the intersection of political and economic individ-ual and collective power. However, countries in the region should reform their regulatory framework throughmoreeffectiveandtransparentcompeti-tion laws and institutions and adopt and respect intellectual property rights. Policymakers should also focus on reforming the set of rules and require-

153 Chapter 3. Trade, investment and youth and women in the labour market
ments that govern economic activities by setting clear and transparent rules that promote competi-tionandleveltheplayingfield.Policymakersshouldalso focus on removing the barriers to entry and exitofbusinesses.Asimplifiedandeasyfirmentryand exit in an economy would facilitate the entry ofmoreproductivefirmsandtheexitofunproduc-tive ones, which would lead to a better reallocation of resources and ultimately to an improvement of aggregate productivity. More generally, policymak-ers in the region should promote the rule of law if they are to stand a chance in developing their economiesandbenefittingfromapositiveimpactof trade and investment on their economies.
3.4.2. A close monitoring and mitigation of the impact of trade policies on the labour market, including for women and youth, and investment in infrastructure could help facilitate the reshuffling of productive factors Active and passive labour market policies and pro-grammes can be used as a tool to facilitate labour mobility,facilitatingthereshufflingofproductivefactors and improving the capacity of vulnerable workerstofacethesignificantadjustmentcostsimposed by trade liberalization. These policies and programmes should be designed and implemented in a coherent manner with trade, investment and industrial policies in the region. Vulnerable work-ersarerestrictedbylowhumancapital,adifficultschool-to-worktransitionandsignificantskillsmis-matches.Thisleadstoinefficientlabourmobilityand, therefore, the incapacity to adapt to the con-sequences of trade liberalization. The reallocation of factors is a huge process in all countries and trade liberalization and technological change will only increase its magnitude.
Adopt passive labour market programmes to reduce the adjustment costs for workers, focus-ing on women and youth.
Workers in the Southern Mediterranean Countries are for the most part not covered by unemployment insurance. Passive labour market policies can help protect workers and facilitate their reallocation acrossfirmsandsectors,facilitatingtheirre-em-ployment and reducing the risk of informality and structural exclusion from the labour market. This
is the case, for instance, in most of the developed economies,whichofferacertainlevelofsocialpro-tection, job retention mechanisms, wage insurance programmesandunemploymentbenefits.ThesemechanismsandbenefitshavebeenwidelyusedinEuropetooffsetthesignificantdemandandsup-ply shocks imposed by the COVID-19 pandemic. Some countries in the region, such as Morocco and Tunisia,usedtemporarydirectcashtransferstooff-set the COVID-19 pandemic (see Chapter 4).
Formalizing these policies and mechanisms would allow authorities to intervene and support a spe-cificgrouporactivityimpactedbyacrisisandaneconomic downturn. For example, these mech-anisms can be applied to support workers work-ing in previously protected industries when going through a trade liberalization reform. Policymakers in the region should design passive labour market policies in collaboration with social partners and definethemaccordingtothelevelofincomesintheir domestic labour market and the level of skills of the various age groups in the labour force that are mostly impacted by trade reforms.
Improve the quality of employment services and design active labour market policies and programmes to improve the capacity of women and youth to deal with the impact of trade on the labour market.
Active labour market policies and policies and pro-grammes (ALMPs) are mostly used in countries in North Africa to support the unemployed population, mostly focusing on youth graduates. ALMPs include intervention on both the supply and demand side of the labour market. They generally include voca-tional training and upskilling programmes, support in the job search process through employment services, entrepreneurship programmes and sub-sidized employment and public work schemes. For instance, in Tunisia, several ALMPs have been launched to improve youth employability, includ-ing Forsati and others promoting small businesses and transition to work. However, most of these pro-grammes were designed for university graduates and did not target other low-skilled and mid-skilled youth (World Bank, 2014).
Most of the countries in the region have employ-ment services and employment agencies and pro-vide labour intermediation services. For instance, in Morocco ANAPEC (Agence Nationale de Promotion delʼEmploietdesCompétences)isresponsibleforlabour intermediation between jobseekers and

Trade, investment and employment in the Southern Mediterranean Countries154
employers. Similarly, in Tunisia, ANETI (Agence NationalepourlʼEmploietleTravailIndépendant)provides employment services to self-employed and unemployed. However, the quality of the services they provide is not satisfactory and these services require modernization to be able to link the sup-plyeffectivelytothedemandinthelabourforce(European Training Foundation, 2006; ILO, 2015).
Policymakers in the region should ensure that ALMPs support workers displaced by trade policies and improve the inclusiveness of the labour markets in general. Particularly, policymakers should invest in reforms that aim to improve the education and professional training systems to improve human capital and help the upskilling of low- and mid-skilled workers, who would be impacted by trade reforms. Investment in these programmes would help enhance the capacity of these workers, especially youth, to adapt to the needs of new activities. The adaptability of the labour force to the new needs of the labour market is a challenge that will only inten-sify with the technological revolution. Therefore, a significantinvestmentintheseprogrammesisofkey importance for a functioning labour market and inclusive industrial and trade policies.
Invest in physical public infrastructure to reduce the non-tariff barriers to trade to enable the adjustment of firms and workers to trade pol-icies and invest in social facilities to support womenʼs economic empowerment.
As discussed previously, investment in physical infrastructure can foster employment creation and trade expansion by facilitating labour mobility and reducingtheadjustmentcostsofworkersandfirmsto trade liberalization. Investment in infrastructure can also foster trade expansion by lowering the trade-related transaction costs, including commu-nication costs, domestic transport costs, time and money spent in ports on border procedures and international transport costs. Overall, a well-devel-opedphysicalinfrastructurereducesthenon-tariffbarriers to trade.
Policymakers in the region should significantly invest in physical infrastructure to facilitate trade and logistics. Most countries in the region require asignificantupgradeoftheirmaritimetransport,their road networks and public transportation. Particularly, investment in public transportation
55 ILO, “Tunisia:Empoweringwomenthroughtheinducedeffectsofinvestmentsforeconomicdiversification”, Employment Intensive Investment Programme.
56 ILO, “Jordan: Advancing gender equality and supporting job creation among refugees and host communities through public works”, Employment Intensive Investment Programme.
canhelpworkersdealwithsignificantadjustmentcosts and improve their mobility. Also, investment to improve accessibility to digital infrastructure iscrucialtofacilitatetheflowofinformation,animportant input to well-functioning markets.
Inordertofosterwomenʼsintegrationinthelabourmarket, policymakers in the region should focus on investing in childcare facilities and other social infrastructure that would help liberate women in the region from their traditional roles and engage in productive employment. Considering the import-ant needs in the region in terms of infrastructure and the extreme low female labour force participa-tion rates in these countries, infrastructure projects couldprovideasignificantsourceofemploymentfor women in the region, particularly low-skilled ones, either directly or indirectly. However, the design of these programmes would need to con-sider the gender constraints and issues, particularly the cultural ones in the Southern Mediterranean Countries. The ILO has developed a framework to design and implement programmes that are employment intensive for women in infrastruc-ture (ILO, 2016) and couple of these programmes have been implemented in Tunisia and Jordan, for instance. In Tunisia, the ILO implemented the “Support Programme for the Development of Underprivileged Areas” in 2012, focusing on inte-grating women in employment generated by infra-structure projects. The programme has created a total of more than 152,000 work days in infrastruc-ture projects and the supply of materials for women in under-developed regions in the country, and cre-ated more than 200 indirect jobs for rural women in their communities.55 In Jordan, the ”Employment through Labour Intensive Infrastructure”, imple-mentedin2016,wasdesignedtointegratewomenʼsconstraintsintothedifferentstepsoftheprojectinorder to create a female-friendly environment for female labour in infrastructure or public works. As a result, female worker-days made up 16 per cent of worker-days over more than two years in the programme.56 In 2016, the project developed a genderstrategytolaythegroundsforefficientgen-der mainstreaming throughout the project cycle in order to ensure gender equality concerns are thor-oughly included in implementation, monitoring and evaluation. The strategy foresees, among others, measures related to setting targets (a minimum 10percentofalldirectbeneficiariesinEmployment

155 Chapter 3. Trade, investment and youth and women in the labour market
Intensive Investment Programme (EIIP) interven-tions to be women); a gender-friendly work environ-ment to enable women to balance their domestic and care responsibilities with EIIP employment; awareness-raising to address gender stereotypes and a zero tolerance for sexual harassment and sexual violence at work; and technical and soft skills-building for women in the areas of construc-tion, agriculture, and business management.
Invest in other soft infrastructure, including human capital and innovation, to foster the convergence processandimprovethefunctioningofthefinancialsector,forittoactasanefficientbackbonefortradeand industrial policies.
Educational outcomes in the region have generally increased; however, there are signs of a decreasing trend in enrolment in tertiary education in countries like Jordan and Tunisia. Also, the Human Capital Indexshowsthattheregionisnotbenefittingfromalmost half of its human capital. The region should not increase its focus on education and human cap-ital in general as past investments in education and health policies might not be enough to prepare the labour force for the impact of the technological rev-olution on the labour market beyond the impact of trade policies.
Public investment in education, health and R&D and innovation to foster human capital and technolog-
ical upgrade should be a focus on policymakers in the region. Education levels would determine coun-triesʼcapacitytoadapttonewtechnologies,fosterinnovation and compete globally. Investment in R&D and innovation, including in the private sec-tor, will foster technological upgrades in the econ-omies in the region. The digital growth economy provides a tremendous opportunity for countries intheregion.However,tobenefitfromthisoppor-tunity, individuals in the region should be prepared to deal with change and learn new skills quickly. Particularly, there is a need to focus on education, from an early age, on “learning to learn” and soft skills, which can help individuals face the challenges imposed by trade policies and prepare future gener-ations for the reality of future labour markets.
Finally,reformingthefinancialsectorandfacilitat-ingaccesstocreditiscrucialforaneffectiveadjust-ment to trade policies. Countries in the region shouldfocusonimprovingthequalityoffinancialinfrastructure to facilitate access to credit. This can be done notably by adopting innovative FinTech technologiestotransformthefinancialsectorʼscapacity. Also, the diversification of sources of financingforbusinessesoutsideofthetraditionalbanking sector should be a focus of policymak-ers, notably by developing both public and private equityfinancesegments,includingstockandcor-porate bond markets.

Trade, investment and employment in the Southern Mediterranean Countries156

157 Chapter 4. Future trends and impact on the labour market Table of Contents
Future trends and impact on the labour market
Chapter 4

158
X Chapter 4. Future trends and impact on the labour market
57 Source: WDI.
58 UNCTAD, Impact of the COVID-19 pandemic on trade and development: Recovering, but unevenly, March 2021.
59 WTO, World trade primed for strong but uneven recovery after COVID-19 pandemic shock,31 March 2021.
60 ICAO, 2020 passenger totals drop 60 percent as COVID-19 assault on international mobility continues, 15 January 2021.
61 World Travel and Tourism Council, Economic Impact Reports.
4.1. Short-term: Impact of COVID-19 and pathways to recovery 4.1.1. Global impact of the COVID-19 crisis The COVID-19 pandemic has brought about severe global, economic and employment crises. In fact, in 2020, the global GDP contracted by 4 per cent.57 The COVID-19 economic crisis has resulted in an unprecedented shock to the private sector and continues to negatively impact global demand and international supply chains. For example, there has been a huge drop in demand in most export-ori-ented sectors, both globally and in the Southern Mediterranean Countries. The COVID-19 crisis is unprecedented as it has impacted both supply and demand in all economies. The uncertainty that the COVID-19 crisis has created has led to wait-and-see behaviours among economic agents, including firmsandhouseholds.Moreover,socialdistancingand lockdown measures have had a huge impact on local demand and economic activities across the globe.
The COVID-19 crisis has most severely hit interna-tional trade, global supply chains and global value chains. In 2020, global trade decreased by approx-imately 8 per cent, both in value and volume.58 Specifically,tradeingoodswitnessedadropof5percent in 2020, although it steadily recovered by 8 per centinthefirstquarterof2021.59 Meanwhile, trade in services witnessed an even sharper drop, with a 20 per cent decrease in value in 2020. Furthermore, trade in services is recovering at a slower pace than trade in goods. For example, travel and transport were the most severely hit, and are not expected to fully recover in 2021. This contraction in trade is mainly due to a global slowdown of economic activ-ity and demand, as well as several trade restrictions
by governments, including inputs necessary for vaccine production. Due to lockdown measures in many industrialized countries, supply chains have been severely disrupted. For instance, maritime transport was relatively disrupted by the pandemic, whichissignificantbecausemaritimetransportisat the heart of global supply chains, carrying more than 80 per cent of global merchandise by volume and more than 70 per cent by value. According to UNCTAD, container vessel port calls fell by around 3 per cent in 2020 compared with 2019, and port calls for dry break-bulk carriers fell by around 8 per cent (UNCTAD, 2021a). The disruption in maritime transportaffectsalmostallsectorsdependingonimported inputs, particularly in manufacturing, in all countries. GVCs, driven by FDIs, have also been severely hit by the crisis. UNCTAD estimates that the global levels of FDI dropped by 35 per cent in 2020, reaching US$1 trillion, down from US$1.5 trillion in 2019,atalowerlevelthanthepost-globalfinancialcrisis (UNCTAD, 2021b). However, the drop in FDIs has been more severe in high-income countries than LMICs. FDIs in LMICs decreased by only 8 per cent, despite a severe 42 per cent decrease in the numberofnewlyannouncedgreenfieldprojects(UNCTAD, 2021b).
The COVID-19 crisis has also hit international travel and tourism in an unprecedented manner. Airports worldwide either closed or drastically decreased their activities, due to the massive drop in inter-national travel and tourism driven by social dis-tancing and lockdown measures. According to the International Civil Aviation Organization (ICAO), globalpassengertrafficfelldrasticallyby60percent in 2020 (year-over-year), sending global air traffic back to 2003 levels.60 Similarly, the tour-ism sector witnessed a sharp contraction, with a 74 per cent decrease in international tourist arriv-als (UNCTAD, 2021c). According to World Travel and Tourism Council, the tourism and travel sector is estimated to have lost US$4.5 trillion in 2020.61 The

159 Chapter 4. Future trends and impact on the labour market
recovery in both related sectors remains uncertain, and international travel is expected to remain lower than pre-pandemic levels for at least the next year, considering the uneven progression of vaccination around the world and the uncertainty about the duration of immunization provided by the currently existing vaccine. Moreover, tourists adjusted during the pandemic by visiting destinations that were closer to them, and these behavioural changes might persist even after the end of the pandemic.
Globally, manufacturing activity witnessed an important shock, but recovered relatively quickly, driven by a quick recovery in China. According to UNIDO, manufacturing output decreased by about 7 per cent in early 2020 due to the pandemic but showedasignificantrecoveryinthelastquarterof2020 with an increase of 2 per cent (UNIDO, 2021). The drop in output is, however, uneven across dif-ferent sectors. Some manufacturing products have witnessedarelativelysignificantgrowthin2020,driven by an increase in demand. This includes basic pharmaceutical products, electrical equip-ment, computer, electronic and optical products as well as motor vehicles. Other sectors recorded asignificantdropin2020,includingtextilesandapparel, and food and beverage. The crisis has also impacted countries unevenly. For example, the manufacturing sector in China quickly recovered to record a growth of 9 per cent between March and December 2020, while outputs in the sector remained stagnant in Europe and East Asia and decreased in North America by around 3 per cent in 2020 (UNIDO, 2021).
The COVID-19 crisis has led to a severe deterio-ration of labour markets across the world, with increasedunemployment,significantjoblossesand decreased labour income. According to the ILO, the crisis has led to a decrease of about 9 per cent in total global working hours in 2020, which is equivalent to 255 million full-time jobs. The num-ber of hours worked has increased since then, but remains lower than pre-pandemic levels, with a decreaseofaround5percentinthefirstquarterof 2021, and 4 per cent in the second quarter. The decrease in number of hours worked is either due to job losses or to reduced working hours among workers who remained employed without working. The global labour force participation rate decreased by 2 percentage points between 2019 and 2020, at muchhigherlevelsthanthe2008globalfinancial
62 ILO, ILO Monitor: COVID-19 and the world of work. Seventh edition Updated estimates and analysis, 25 January 2021.
63 ILO, ILO Monitor: COVID-19 and the world of work. Seventh edition Updated estimates and analysis, 25 January 2021.
crisis, with about 81 million people becoming inac-tive. ILO estimates that at least 114 million workers lost their jobs in 2020 as a direct consequence of the global pandemic, and that this increased the global unemployment rate by 1 percentage point between 2019 and 2020.62
TheeffectsoftheCOVID-19crisishavebeenmoresevere on vulnerable workers, including women and youth, in almost all countries around the world. In fact, women have been more likely than men to become economically inactive. Globally, employ-ment loss for women reached 5 per cent, compared to almost 4 per cent for men. Similarly, youth wit-nessed about 9 per cent of the employment loss in 2020, compared to 4 percent for older workers. There is a risk of disconnection between youth and the labour market, which might lead to long-lasting effects.63
4.1.2. COVID-19 in the Southern Mediterranean Countries
The Southern Mediterranean Countries have not been spared by the COVID-19 crisis, or by its eco-nomic and social consequences. All countries in the regionhavewitnessedasignificantGDPcontrac-tion, with more pronounced decreases in Lebanon and Libya. In Lebanon, the COVID-19 crisis is exac-erbated by a massive social and institutional crisis that is eroding the economic fabric of the country. In general, the depth and impact of the COVID-19 crisiscannotyetbecompletelyquantified,asthehealth crisis is still ongoing. The IMF estimates a recovery in the Southern Mediterranean Countries, except for Lebanon (table 38). However, these esti-mations might be too optimistic. Most of the coun-triesintheregiondonothavesufficientaccessto COVID-19 vaccines, so their vaccinated popula-tions remain relatively low. Moreover, as of June 2021, Tunisia is facing a severe third wave that is impacting all economic activities in the country, reducing the probability of an economic recovery in2021.AccordingtothelatestfiguresoftheIMFʼsWorld Economic Outlook, the level of investment hasalsosignificantlydroppedinmostcountriesinthe region, except for Jordan and Libya. Investment in Jordan slightly increased in 2020 compared to 2019.InLibya,theinvestmentratehassignificantlyincreased, driven by the public sector (table 39).

Trade, investment and employment in the Southern Mediterranean Countries160
The COVID-19 crisis is also impacting macro-eco-nomic balances in the Southern Mediterranean Countries, with an increase of gross debt (percent-age GDP) in most countries, and a decrease in pub-lic revenues. In most countries in the region, public revenues dropped in 2020, driven by the shock on the real economy. Only Morocco witnessed a slight increase of 3 percentage points in its public reve-nues in 2020. In parallel, the level of public debt also increased quickly in 2020 in most countries, except for Lebanon. For instance, gross debt as a percent-age of GDP increased by more than 10 percentage points in Jordan, Morocco, the Occupied Palestinian Territory and Tunisia. Tunisia recorded the highest increase, with 16 percentage points. These trends reflecttheimpactofCOVID-19ontherealecon-omyaswellasthecostofthecountriesʼCOVID-19
responses, which aimed to reduce the economic shockonhouseholdsandfirmsandsupportthereal economy (see next section).
Trade in the region, particularly exports, has dropped significantly due to the pandemic. Countries in the region exported fewer goods and services in 2020 (table 40). While high-income coun-tries are slowly recovering, it remains unclear how the recovery will be for the Southern Mediterranean countries. Exports of goods in 2020 have particu-larly decreased in Libya, driven by the oil crisis (table 41). Only Egypt has witnessed a growth in goods exports between 2019 and 2020, at 3 per cent.
FDIinflowsdecreasedinhalfofthecountriesinthe region and remained stable in the other half (table42).FDIinflowstoTunisiadeclinedby23per
X Table 38: GDP growth between 2019 and 2021, constant prices
Country 2019 2020 2021
Algeria 0.8 –5.9 2.9
Egypt 5.6 3.6 2.5
Jordan 1.9 –1.9 2.0
Lebanon –6.7 –25 n/a
Libya 13.2 –59.7 130.9
Morocco 2.5 –7.0 4.5
Tunisia 0.9 –8.8 3.8
Occupied Palestinian Territories 1.4 –10.9 5.7
Source: IMF World Economic Outlook April 2021, estimation for 2020 and 2021.
X Table 39: Total investment (percentage of GDP)
Country 2019 2020 2021
Algeria 45.9 45.7 49.3
Egypt 17.9 13.8 16.4
Jordan 16.7 18.8 18.7
Lebanon n/a n/a n/a
Libya 192.5 363.4 117.1
Morocco 32.2 29.1 29.7
Tunisia 17.2 7.8 10.6
West Bank and Gaza 26.8 20.9 25.4
Source: IMF World Economic Outlook 2021, estimation for 2020 and projection for 2021.

161 Chapter 4. Future trends and impact on the labour market
cent between 2019 and 2020, to reach US$652 mil-lion, with most directed to the manufacturing sector (UNCTAD,2021b).InAlgeria,FDIinflowsdroppedby16 per cent, and remained mainly directed to the extractive sector, despite some reforms adopted whichaimtodiversifythesectorsofFDI.Inflowsin Egypt dropped by 35 per cent, but the country remained the largest recipient in the region, and inAfricaasawhole.FDIinflowstoJordan,Lebanonand Morocco remained relatively stable, with a slight increase of 1 per cent in Jordan and Lebanon, and 3 per cent in Morocco.
64 World Bank, Jordan Economic Update – April 2021.
65 OECD, Economic Outlook: Tunisia, Volume 2020, Issue 2.
66 World Bank, Tunisia Economic Update – April 2021.
In particular, the COVID-19 crisis has impacted the tourism sector, a strategic sector in most of thecountriesintheregion.Forinstance,Jordanʼstourism sector, which represented about 18 per cent of GDP and total employment in 2019, wit-nessed a sharp decrease, and is expected to remain at around 40 per cent of 2019 levels in 2021.64 In Tunisia, tourism represented about 5 per cent of GDP in 201965, and witnessed an 80 per cent decline in passenger arrivals, which impacted the tourism sector and transport.66 According to the Tunisian Central Bank, the growth in value
X Figure 123: General government revenues (percentage of GDP)
X Figure 124: General government gross debt (percentage of GDP)
Source: World Economic Outlook 2021, estimation for 2021.
Source: World Economic Outlook 2021, estimation for 2021.
2019 2020 2021
0
10
20
30
40
50
60
70
80
Perc
enta
ge
Algeria Egypt Jordan Lebanon Libya Morocco Occupied
Palestinian
Territory
Tunisia
2019 2020 2021
0
20
40
60
80
100
120
140
160
180
200
Perc
enta
ge
Algeria Egypt Jordan Lebanon Morocco Occupied
Palestinian
Territory
Tunisia
2019 2020 2021
0
10
20
30
40
50
60
70
80
Perc
enta
ge
Algeria Egypt Jordan Lebanon Libya Morocco Occupied
Palestinian
Territory
Tunisia
2019 2020 2021
0
20
40
60
80
100
120
140
160
180
200
Perc
enta
ge
Algeria Egypt Jordan Lebanon Morocco Occupied
Palestinian
Territory
Tunisia

Trade, investment and employment in the Southern Mediterranean Countries162
X Table 40: Change of volume of exports of goods and services (percentage)
Country 2019 2020 2021
Algeria –2.9 –4.2 0.3
Egypt 9.8 –4.1 –18.1
Jordan 11.6 –17.4 4.6
Lebanon –3.0 –49.5 n/a
Libya –12.9 –80.9 285.1
Morocco 3.3 -20.5 16.2
Occupied Palestinian Territory 2.0 –10.9 2.6
Tunisia –5.1 –12.3 10.0
Source: IMF World Economic Outlook 2021, estimation for 2020 and projection for 2021.
X Table 41: Change of volume of exports of goods (percentage)
Country 2019 2020 2021
Algeria –4.5 –9.3 –1.5
Egypt 7.0 3.6 –0.2
Jordan 17.6 –6.0 6.2
Lebanon 24.3 –19.4 n/a
Libya –12.9 –81.1 287.9
Morocco 1.2 –8.6 7.4
Tunisia –5.1 –12.3 10
West Bank and Gaza –0.5 –10.9 2.6
Source: IMF World Economic Outlook 2021, estimation for 2020 and projection for 2021.
X Table 42: FDI inflows to countries in the region between 2019 and 2020
FDI inflows 2019 (US$ million)
2020 (US$ million)
Percentage change between 2019 and 2020
Algeria 47,143 39,785 –16%
Egypt 9,010 5,852 –35%
Jordan 730 726 -1%
Lebanon 2,055 2,067 1%
Morocco 1,720 1,763 3%
Occupied Palestinian Territory 132 52 –61%
Tunisia 845 652 –23%
Source: UNCTAD – World Investment Report 2021.

163 Chapter 4. Future trends and impact on the labour market
add in the tourism sector is estimated to contract by 30 per cent in 2020.67 In Morocco, authorities implemented a strict lockdown and closed the bor-ders in the second quarter of 2020, which severely impacted the travel and tourism industry. The rev-enuesofMoroccoʼstourismsectorhavedroppedby about 60 per cent in 2020 compared to 2019.68 Finally,inEgypt,thetourismsectorʼscontributionto GDP decreased from 10 per cent in 2019 to about 6 per cent in 2020.69
The COVID-19 pandemic has hit the labour mar-ket in the Southern Mediterranean Countries severely, as it has all around the world. To monitor the impact of the pandemic on the labour market, several organizations have put in place surveys of businesses and households in most countries in the region. For instance, the World Bank has con-ductedphone-basedsurveysoffirmsinJordan,Morocco, the Occupied Palestinian Territory, Tunisia and Lebanon, as well as phone-based household surveys in the Occupied Palestinian Territory and Tunisia. The goal is to assess and monitor the impact of the crisis on the real economy. The ILO and Economic Research Forum (ERF), a think tank focusing on the MENA region, have put in place sim-ilar surveys in Egypt, Morocco and Tunisia, and the ERFhasalsoputinplaceafirmsurveyinJordan.Below we report the main results from these sur-veys, focusing on two layers of impact: impact on businesses, outputs and activities and impact on jobs and incomes for workers.
As expected, and as witnessed across the world, a majority of businesses reported severe drops in sales and outputs due to the COVID-19 crisis. In
67 Tunisian Central Bank, Annual Report 2020 (in French), June 2020.
68 World Bank, Morocco Economic Update – April 2021.
69 WTTC, Economic Impact Reports.
70 INS and IFC, Business Pulse Survey, Tunisia: Impact of the COVID-19 Crisis on the Finance Sector in Tunisia, 2020.
Jordan, Morocco and Tunisia, more than 86 per cent offirmsreporteddecreasedmonthlysalescom-pared to a year before the interview, according to WorldBankfirmsurveys.Forinstance,inJordan,firmsreportedanaveragepercentagechangeinmonthly sales year-over-year of –52 per cent as of July 2020. Businesses in Morocco reported on average an output loss of 47 per cent as of August 2020. In Tunisia, the same indicator reached 68 per cent as of June 2020. In Morocco, according to the European Investment Bank (EIB) and the World Bank enterprise survey for COVID-19, the decline of the average change in monthly sales was about 12.4 per cent, compared to the previous year, and strongest for medium-sized companies (18 per cent). In Jordan, sales collapsed on average by 33.4 per cent with the strongest decline for small firms(39.8percent).
The COVID-19 crisis has severely impacted busi-nesses turnovers but has had a relatively low impact on the continuity of activities. According to the EIB and World Bank Enterprise survey for COVID-19,alargenumberoffirmshaveclosedpermanently since the COVID-19 pandemic, for instance in Morocco (11.8 per cent) and Jordan (14.6 per cent). Small-sized companies were dispro-portionallyaffectedinbothMorocco(12.9percent)and Jordan (18.8 per cent). A survey by the Institut National de la Statistique (INS) in Tunisia together with the International Finance Corporation (IFC), interviewed firms through December 2020 and foundthat10percentoffirmsclosedpermanentlyin 2020, and that 3 per cent of these enterprises reported closing due to COVID-19.70 The highest
X Table 43: Selection of indicators from the firm high-frequency survey
CountryShare of establishments
that fired workers in the last 30 days
Share of establishments that reduced hours in the last 30 days
Share of establishments that reduced wages in the last 30 days
Last month of interview
Jordan 18.2 n/a n/a July 2020
Morocco 7.9 n/a n/a August 2020
Tunisia 8.6 13.9 15.6 June 2020
Occupied Palestinian Territory 13. 8 3.7 9.2 August 2020
Source:WorldBankhigh-frequencyfirmsurvey;surveyunavailableinAlgeria,Egypt,LebanonandLibya.

Trade, investment and employment in the Southern Mediterranean Countries164
levelofclosurewasamongfirmsinservices,par-ticularly those operating in hotels and restaurants. Interestingly,non-exportingfirmsweremorecon-cerned about ceasing activities than were exporting firms(10percentfornon-exportingversus4percent for exporting companies).
The COVID-19 crisis has also led to a relatively important level of job layoffs in the region. AccordingtoWorldBankfirmsurveys,theshareoffirmsthatfiredworkersisrelativelyhigh,with18percentoffirmsinJordan(July2020),8percentin Morocco (August 2020), 9 per cent in Tunisia (June 2020) and 14 per cent in the Occupied Palestinian Territory (August 2020). In more recent surveys done by ETF, the results indicate that, of those who were private-sector wage workers in February 2020, 10 per cent in Morocco and 16 per cent in Tunisia becameunemployedbyOctober2020(Krafftetal., 2021).
TheCOVID-19crisishassignificantlyimpactedboththe levels of wages for workers and household incomes in the Southern Mediterranean Countries. In Morocco and Tunisia, respectively 37 and 40 per cent of private sector wage workers reported a decrease in income by more than 25 per cent, according to ETF surveys. There, farmers and infor-mal workers have been the most concerned about the decrease in incomes. Respectively 61 and 53 per cent of farmers in Morocco and Tunisia reported a decrease in their income of more than 25 per cent, while respectively 59 and 52 per cent of infor-mal workers there reported similar reality. Wage-employed workers in the public sector have been the least concerned by decreases in wages. The labour market outcomes improved in both coun-tries between November and February 2021, as labour force participation rates increased (from 61 per cent to 68 per cent in Morocco, and from 64 per cent to 68 per cent in Tunisia). At the same time, employment in Morocco and Tunisia increased by fourtofivepercentagepoints,whileinJordan,thelabour force participation rate remained lower than that of November 2020. The COVID-19 pandemic has also worsened labour market outcomes in the Occupied Palestinian Territory. The latest labour statistics produced by PCBS show that the unem-ployment rate has reached 28.5 per cent during the third quarter of 2020, up by three percentage points incomparisonwiththefirstquarterof2020.
71 The policy responses listed here are drawn from the ILO and IMF policy trackers.
4.1.3. Responses in countries in the region Most countries in the region have adopted sev-eral measures to reduce the impact of COVID-19 on their economies and have done so relatively quickly.71 Many of these measures were adopted in the second quarter of 2020, despite relatively low incidences of COVID-19 at the time. The measures had three main objectives: stimulating the econ-omy, protecting jobs and incomes and protecting workers in the workplace. These objectives are aligned with the ILO policy framework for tackling the economic and social impact of the COVID-19 cri-sis, which includes four pillars: (a) stimulating the economy and employment; (b) supporting enter-prises, jobs and incomes; (c) protecting workers in the workplace and (d) relying on social dialogue for solutions.
In Egypt, the economic and social response to COVID-19 has been relatively strong and included a wide range of policies. In terms of monetary andfinancialpolicies,theCentralBankofEgyptreduced the interest rate from 13.25 per cent to 10.25percent.Additionally,financialinstitutionsdelayed credit dues for both business loans and personal loans by 6 months, and implemented a debtreliefprogramme,financedbytheCentralBank,toaid225distressedfirms,andindividualsatriskoffinancialdistress.Theyalsoprovidedsoftloans with preferential interest rates to SMEs in industry and tourism, as well as to low- and mid-dle-income families. On top of this, the authorities announced a stimulus package for US$6.4 billion, which represents approximately 2 per cent of the countryʼsGDP.Thestimuluspackageaimedtosup-port health workers and health services, as well as affectedsectors,businessesandworkers.Notably,theauthoritiesusedthispackagetofinanceasetof measures that aim to support vulnerable work-ersandbusinessesinaffectedsectors,throughthe expansion of social protection mechanisms. In terms of support to businesses, the authorities (a) lowered the energy costs for the entire indus-trial sector, (b) provided a real estate tax relief to businesses in the industrial and tourism sectors and (c) implemented several other tax reduction measurestoreducethefinancialburdenonbusi-nesses. Moreover, the authorities provided targeted support to the tourism sector, one of the most affected sectors from the COVID-19 crisis. They

165 Chapter 4. Future trends and impact on the labour market
mobilizedUS$3.2billiontofinancetherenovationof tourism enterprises through the extension of a credit line of US$1.3 billion to the tourism sector. Themedicalandhealthsectoralsobenefitedfromtargeted support, with about US$64 million (one billion Egyptian pounds) provided to the Ministry of Health to acquire preventive supplies and help curb spread of the virus. The authorities also pro-vided a 75 per cent allowance over current wages to medical professionals and health workers. Furthermore, a number of measures were put in place to support vulnerable and informal workers. For instance, social protection programmes were expandedto100,000affectedhouseholds,andaone-offdirectcashtransferwasprovidedtoinfor-malworkers,with40percentofthebeneficiariesbeing women. Finally, a set of tax measures were introducedtoreducethefinancialburdenonlow-in-come families, with the introduction of a new tax bracket of 2.5 per cent for low-income citizens, and an increase tax exemption income bracket, from 8,000 EGP (US$508) to 15,000 EGP (US$952).
Similar to Egypt, Jordan also quickly implemented a number of policies aiming to support the real econ-omyandreducethefinancialburdenonbusinessesand distressed families. On the monetary front, the Central Bank of Jordan reduced the interest rate twice in March 2020, to reach a level of 2.5 per cent, down from 3.5 per cent. The Central Bank also reduced the cash reserve requirement for banks, from 7 to 5 per cent, to release an additional liquid-ity of US$775 million. Also, several measures were put in place to help businesses preserve their levels ofcashflowandreducetheirfinancialburdens.Forinstance, authorities gave tax relief on sales tax to companies in the food supply and health sectors so that rather than paying taxes upon signing con-tracts, they would do so upon selling their goods. Other measures included reducing customs fees to 30 per cent, and postponing payment for the 70 per cent remaining. Moreover, social contributions such as pensions were temporarily reduced and eased for businesses. To inject funds into businesses and support them in facing the drops in demand and revenue, the authorities established two funds: one managed directly by the Government, and one managed by the private sector. The fund managed by the private sector received direct contributions fromprivateactorsandprovideddirectfinancialsupporttoidentifieddistressedbusinesses.Thefund managed by the Government, named the NationalAidFund,financedsocialprotectionmea-sures to about 200,000 families who were not sup-ported by existing social protection programmes.
The authorities also put in place several measures to protect jobs and retain workers. For instance, authorities allowed for a wage reduction mecha-nism, with the consent of workers, to reduce the financialburdenonbusinessesandreducejob-lay-offs.Temporarywagesubsidieswereprovidedtofirmsunderspecificrequirementsandconditions.The authorities also put in place targeted support tothemostaffectedsectors,includingthetourism,transportation and the health sectors. For the tour-ism sector, guarantee schemes and credit facilities were put in place, including soft loans for hotels and tourism facilities, and businesses in the sector also benefittedfromtargetedtaxreliefmeasures.
In Morocco, authorities quickly took an extensive set of measures to protect businesses and the economy. The Central Bank of Morocco reduced the interest rate from 2.25 per cent to 2 per cent andsoftenedtherequirementsforcredittofinan-cialinstitutions.Onthefiscalside,theauthoritiesestablished a special fund equal to about 3 per centofGDP,tofinancemedicalandhealthneedsandtoprovidefinancialsupporttobusinessesandhouseholds. The fund was financed from both public contributions and contributions from inter-nationalfinancialinstitutionssuchastheIMF.Themeasuresfinancedbythefundincluded(a)busi-ness loans guaranteed by the state, (b) the deferral of social insurance contributions under certain con-ditions,(c)theexpeditionoftheStateʼspaymentsto small and medium enterprises and (d) an access to zero-interest loans for micro-enterprises. The authorities also put in place several social protec-tionmeasuresfinancedbythefund,includingdirectcashtransferstolaidoffworkersfromApril2020toMarch 2021, and ongoing direct cash transfers to informal workers since April 2020.
In Tunisia, authorities implemented a set of unprec-edentedsupporttobusinessesandaffectedhouse-holds. Like in Morocco, Jordan and Egypt, the Central Bank of Tunisia decreased the interest rate by 100 basis points to reach 6.75 per cent, and additional liquidities were availed to banks so that they could financerealeconomyneeds.Theauthoritiesalsoimplemented several measures to protect busi-nesses and jobs. This included the establishment of an investment fund (US$250 million) to support therestructuringofaffectedbusinesses,aswellasa guarantee fund (US$179 million) to facilitate busi-nessesʼaccesstofinance.Exceptionally,theauthor-ities allowed exporting businesses to sell 50 per cent of their products in the local market, up from only 30 per cent prior to the crisis. Businesses also

Trade, investment and employment in the Southern Mediterranean Countries166
benefittedfromtaxbreaks,taxdeferralsandsocialcontribution deferrals. In terms of social protection mechanisms,theauthoritiesusedforthefirst-timemobile cash transfers to provide social protection to an additional 260,000 households threatened by poverty, representing 7.9 per cent of the popu-lation(Krafftetal.,2021).Thissupportwasimple-mentedbetweenAprilandMay2020duringthefirstlockdown imposed by authorities. Authorities also provided a one-time additional pension payment, temporary unemployment payments and tempo-rary cash transfers to the self-employed, in mid-May.
In Algeria, measures have been relatively limited and mostly aimed at facilitating administrative pro-cedures and reducing the cost of credit in the econ-omy. The Central Bank of Algeria (Bank of Algeria) reduced the interest rate by 0.25 per cent in March 2020 and has maintained it at the same level since. Authorities have eased tax procedures for busi-nesses, provided cash transfers to frontline health workers, and eased procedures for social security contributions for businesses.
In Libya, the authorities announced dedicating an amount equivalent to 1 per cent of the GDP to financespecificmeasurestoaddresstheCOVID-19 crisis. In early January 2021, the Central Bank of Libya stated that the total amount of funds spent to combat the pandemic had reached about US$290 million (more than 2 per cent of the GDP), mostly directed to the health sector.72
In Lebanon, the COVID-19 response was less exten-sive, compared to Egypt and Jordan. However, authorities implemented several measures with the objectivesofreducingthefinancialburdenonbusi-nessesaffectedbythecrisis,andsupportingvulner-able populations at risk of falling under the poverty line. For instance, the Lebanese Central Bank pro-videdinstructionstofinancialinstitutionstofacili-tatebusinessesʼaccesstoloans,backedbyfive-yearzero per cent interest rate lines of credit in dollars, providedbytheCentralBanktofinancialinstitu-tions. Also, several measures were implemented topreservethebusinessescashflows,includingpostponement of payment of taxes and social contributions for all productive sectors. Moreover, the authorities put in place several social protec-tion measures, such as temporary emergency cashtransferschemes.InJune2021,Lebanonʼsparliamentary committees approved a ration card for populations under the poverty line, which is
72 IMF, Policy Responses to COVID-19, Policy Tracker.
increasingatanalarmingrate.However,financingmechanisms for this are not clear yet, as half of the population is at risk of falling below the poverty line.
Finally, in the Occupied Palestinian Territory, author-itiesprovidedacertainlevelofsupporttoaffectedbusinesses and workers. These measures included postponing credits and tax payments and estab-lishing a US$300 million SME fund to provide soft loans,whichwasnotablyfinancedfrombanksʼreserves. In 2020 and according to the IMF, total COVID-related spending in 2020 reached 1.1 per cent of GDP, out of which 0.8 per cent of GDP was dedicated to the health response, and 0.3 per cent of GDP was dedicated to social protection mecha-nisms.Thisincludesthesupportoflaid-offworkersinaffectedsectors,suchasconstruction,tourism,services and transport.
Despite these numerous policies, the number of firmsreceivingsupportonthegroundisrelativelylow. For instance, according to the many World Bank firmssurveys,only6percentoffirmsinJordandeclared accessing credits, and only 22 per cent declared receiving wage subsidies. Furthermore, the policies implemented in Jordan faced criticism from the private sector, as businesses reported that the implemented policies were more about protecting employees rather than protecting and supporting businesses (Building Markets, 2020). In Morocco,theshareoffirmsreceivingsupportisabit higher, with 12 per cent receiving cash trans-fer and 25 per cent receiving wage subsidies. In Tunisia, however, only 9 per cent received wage subsidies,andmerely2percentbenefittedfrompayment deferral.
4.1.4. Pathways to short-term recovery from COVID-19
The recovery from the COVID-19 crisis in the Southern Mediterranean Countries will strongly dependonhowquicklyandeffectivelyeachcoun-try responds. In July 2021, countries like Tunisia and Jordan witnessed a strong wave of contamination, and most countries in the region are still at very low levels of vaccination. Morocco and Jordan are the only two countries in the region to have higher vaccinerates.Specifically,respectively26percentofMoroccoʼspopulation,and18percentofJordanʼspopulation, have received at least one vaccine dose,

167 Chapter 4. Future trends and impact on the labour market
compared to 13 per cent of populations globally.73 Egypt has one of the lowest vaccine rates in the world, with merely 2.3 per cent of the population having received at least one dose of the vaccine.
Globally, there are signs of recovery in interna-tional trade, especially within high-income coun-tries, but the pathways for recovery in the Southern Mediterranean Countries Southern Mediterranean Countriesremain uncertain. International travel remains highly disrupted, which directly impacts the tourism sector, a strategic sector in most coun-tries. The recovery of the tourism sector remains highly uncertain around the world, especially for the Southern Mediterranean Countries that are still trying to address the health crisis, such as Tunisia and Jordan. Recovery in FDI is also highly uncertain, particularlyfornewgreenfieldprojectsinthemanu-facturing sector, outside of the extractive industries.
For countries in the region, investment and pro-duction dynamics are particularly important within certain sectors, such as textile and apparel, pharma-ceutical and electronics and automobile equipment. These sectors might shift to favour more near-shore and reshore activities. For instance, Bárcia de Mattos et al. (2020) indicate that in recent years, nearshoring and onshoring have grown in impor-tance for some buyers in the textile and apparel industry. The disruption in international supply chains has highlighted the relevance and necessity of these trends. Before COVID-19, the reshoring dynamic was very low, as highlighted by Dachs et al. (2019).Theauthorsfindthat105outof2,450firms(4 per cent) reported back-shoring or reshoring their activities, with more reshoring in high and medium-high technology sectors (7 and 6 per cent ofsurveyedhigh/medium-hightechnologyfirms).However, the COVID-19 crisis might favour the near-shoring dynamic, as the crisis has put into light the fragility of international supply chains and GVCs. For the textile and apparel sector, the most stra-tegic production location remains Asia, and par-ticularly Southeast Asia for now. The nearshoring trendcouldbenefittheSouthernMediterraneanCountriesifconfirmed,particularlycountriesthathave a strong physical infrastructure and a relatively stable political and social climate, such as Morocco. Other regions such as West Africa might become a competitor of the Southern Mediterranean Countries,despitebeingnowalmostagreenfieldfor the industry. West Africa might become attrac-
73 Our World in Data, Coronavirus Vaccinations.
tive since the region represents about 5 per cent of global production of cotton, relatively lower labour prices and recent improvements in the business environmentincountriessuchasCôtedʼIvoireand Senegal. These elements might constitute an attractive package for textile and garment manu-facturers and brands looking to reduce the risk of disruption in their supply chains. Lastly, the growing importance of reshoring or nearshoring might also be observed for the electronics industry, which has developed in Morocco in recent years. A reshoring or nearshoring trend for European manufacturers mightparticularlybenefitMorocco,andprobablyother countries in the region too, such as Tunisia, if the social and economic environment in the country would stabilize.
Another pathway to recovery in the region includes the level of public and private investment into pro-ductive sectors, which could upgrade technologi-cal capabilities and strengthen local manufacturing sectors. The COVID-19 crisis highlights the impor-tance of industrial policies, developing local pro-ductioncapabilitiesanddiversificationstrategies.Industrial and trade policies should be geared not only towards integrating countries in the region into global value chains, but also towards building high-growth SMEs in high-productive sectors. This could strengthenthecountriesʼresilienceinthecaseofanewglobalpandemicandsignificantdisruptionsin the GVCs. Other pathways to recovery include higher levels of investment in human capital, as well as governments having more bandwidth to drive reforms that promote structural transformation. Also,diversificationintonewsectorsandproductsmust be at the centre of structural transformation, as this could help countries in the region reduce the shock and impact of future crises (ILO, 2020b). However, there are other trends that might shape the future of work, both in the region and around the world, driven by the technological revolution that may have accelerated during the COVID-19 crisis. As highlighted by Korinek and Stiglitz (2021), the disruption imposed by COVID-19 in daily inter-actions between humans might provide incentives to accelerate the automation of jobs that require physical interaction. In conclusion, the important shift brought on by the COVID-19 crisis in the world of work and in the use of technology, might lead to long-lasting effects on the economies in the Southern Mediterranean Countries, accelerated by exponential technological advancement.

Trade, investment and employment in the Southern Mediterranean Countries168
4.2. Long-term trends: the technological revolution and the future of work in the region 4.2.1. Future of work: The state of the debate What the future of work might look like, and what impact new technologies will have on the labour market, are among the most debated questions today. The debate is generally associated with huge anxiety on the part of the public, policymakers and some economists. For instance, Pew Research Center carried out a survey on the impact of tech-nology on the labour market in ten countries, with the results indicating a widely shared view that the nature of work is likely to be transformed over the next half-century, with machines taking over much of human labour (Wike and Stokes, 2018). These concerns are rooted in the unprecedented pace of innovation, which is expected to severely disrupt the labour market, unevenly, between high-income countries and low- and middle-income countries. Overall, the adjustment costs to these new technol-ogies might be high, especially for low-skilled work-ers currently engaged in routine-based tasks that are more likely to be computerized and automated. This might lead to an increase in inequality among low- and high-skilled workers, as high-skilled work-ers are generally not involved in routine-based tasks. In fact, the new technologies are likely to increase the demand for high-skilled workers. More broadly, technological innovation might slow down or disrupt the convergence process and widen the inequality gap between high-income, and low- and middle-income countries. Often this anxious debate is based more on assumptions and mod-els that try to predict the potential impact of these technologies. Today, it is virtually impossible to pre-dict the exact impact of new technologies on the labour market and their exact impact on workers, aggregate employment and welfare. However, it is possible to highlight potential trends and poten-tial drivers of impact, building on a growing body of literature.
Technological innovation is evolving at an expo-nentialandunprecedentedpaceandwillaffectalleconomic sectors. Technologies that are likely to be themostdisruptiveincludeartificialintelligence,big data, the Internet of Things and connected devices, text, image and voice processing, robot-
ics, 3D printing and modelling, cloud computing and biotechnology (World Economic Forum, 2020). These technologies are expected to impact produc-tion and supply chains in all sectors. For instance, in agriculture, technology is being used to develop precision agriculture and vertical farming, among othertechniques,whichareexpectedtosignifi-cantly increase aggregate productivity in agricul-ture, especially in low-income countries. Similarly, inservices,artificialintelligence(AI)andbigdataarechanging the way services are being produced, with a tendency towards more personalized and opti-mized services. The main new technologies that are expected to disrupt the manufacturing sector are robotics, AI, the Internet of Things and 3D printing.
A growing body of research focuses on the impact of technologies on the labour market by observing and assessing the tasks that computers can do, and therefore jobs that could be automated and done by machines. Routine tasks are easy to codify, as they are composed by repetitive steps and rules. Therefore, they are easy to be programmed and performed by computers. On the contrary, tasks based on cognitive skills, which include problem solving, creativity, critical thinking and decision making, are harder to codify and are thus less likely to be operated by computers and machines (Autor et al. 2003; Acemoglu and Autor, 2011). Based on this, Frey and Osborne (2013) estimated that 47 per cent of jobs in the US and 35 per cent of jobs in the UK are automatable from a technological capabil-ities point of view. Their estimations are based on identifyingdifferentoccupationswithwell-definedprocedures, which algorithms can easily perform, and which could therefore be automated. Machine-learning experts assessed the characteristics of over 700 occupations and determined the probability of job automation in the United States. Using the same methodology, other studies have focused on estimating the potential impact for other coun-tries. For instance, Bowles (2014) estimates that for Europe, the share of jobs susceptible to auto-mation ranges between 45 per cent to more than 60 per cent, with Southern European workforces facing the highest exposure to potential automa-tion.Otherstudieshavetakenadifferentapproachin estimating the number of jobs at risk of being automated.Inapaperrevisitingthesefindings,Arntz et al. (2016) take another approach to esti-mate the number of jobs that can be automated. This approach considers the heterogeneity of tasks within occupations and jobs by utilizing the Survey of Adult Skills (PIAAC) within 21 OECD countries. The authors consider the considerable variation across

169 Chapter 4. Future trends and impact on the labour market
taskswithinonejob,aswellasthedifferentlevelsof routinization, and therefore predict the likelihood automation of these tasks. Following this approach, theauthorsfindthatwithinthe21OECDcountries,an average of 9 per cent of jobs are automatable. There are variations across countries, of course, due todifferinglevelsofeducationandpreviousinvest-ments into automation technologies. Nadelkoska and Quintini (2018) build on the methodology used by Arntz et al. (2016) and expand the focus to all 32 countries that participated in the PIAAC survey. Theauthorsfindthat,onaverage,14percentofjobs in these countries are at a high risk of auto-mation (that is, probability of automation of over 70 per cent). However, the authors go beyond just estimating the number of jobs to be automated, and study how the new technologies will impact the taskcompositionofdifferentjobs.Theyfindthat32 per cent of jobs could change their task com-position due to technology adoption. These jobs have an automation risk between 50 per cent and 70percent,meaningthatasignificantshareoftasks, but not all, might be automated, which would lead to a substantial change in the skills required for these jobs. In other words, technology in the labour market will not only impact the number of automatedjobs;itwillalsosignificantlychangetheskills required for currently existing jobs, which will use more intensive technologies (ILO, 2018a). To monitor the exact and real impact of technology on the labour market, the World Economic Forum (WEF) has put in place a monitor of automation in the labour market in 26 countries, mainly in high-in-come and some middle-income countries, such as India, China and Brazil. The 2020 WEF survey indi-cates that 43 per cent of the businesses surveyed indicate that they will reduce their workforce due to technology adoption.
The magnitude of the impact of these technologies on net job creation is, however, widely debated. Some economists argue that, like with the Industrial Revolution,thesetechnologieswillcreatedifferentjobs and probably better ones. The debate on the impact of technology on the labour market is, after all, an age-old one, and the fears that technology creates today are similar to the ones generated by the Industrial Revolution. For instance, the mecha-nization of spinning and weaving replaced manual routinejobs,andtheworldʼstechnologicalprogresssince 1980 has also contributed to a decrease in jobs with routine tasks, as demonstrated by Autor et al. (2003). Advancement in technology often contrib-utes to productivity growth, as well as the creation of better-quality jobs and higher living standards.
It can lead to more job replacement and creation, rather than just job destruction and displacement. For instance, Acemoglu and Restrepo (2018) argue that the jobs that these new technologies might displace could be counterbalanced by the jobs that they might create. The authors argue that the automation process (which is to replace labour with cheaper technology), would decrease the cost of automated task production, increase productivity, and therefore increase the demand for non-auto-mated tasks and labour. A 2018 study by WEF indi-cates that while 75 million jobs could be lost by 2022 due to automation, 133 million new jobs could be created over the same period, suggesting that by 2022, the technological revolution would contribute to the net creation of 58 million jobs.
However, using historic patterns to predict the future might be a limited approach, considering theimportantdifferencesbetweentheIndustrialRevolution and the current technological revolu-tion. These two revolutions diverge on at least two levels: the pace of innovation, and the impact on labour organization and the bargaining power of workers. As discussed above, the pace of innova-tion is exponential and unprecedented, enabled by a well-developed digital infrastructure, and tech-nologyʼsexponentiallygrowingabilitytostoreandprocess data and information. The increasing abil-ity of computers and robots fuels the speculation that one day, computers and machines will be able to completely replace human labour, in both cog-nitive and non-cognitive tasks and skills. In terms oftheorganizationoflabour,thefirstIndustrialRevolution enabled the formation of organized lines of production where workers depend on each otherʼsoutputsandengageincoordinated,orches-trated and chained tasks. This ultimately enabled workers to organize through the formation of trade unionsandworkersʼassociations.Thecurrenttech-nological revolution is expected to fragment labour and isolate workers, especially within the services sector and sectors that are highly digitalized. The COVID-19 crisis has already disrupted the orga-nizationoflabour,withasignificantshareofjobsbeing done remotely and online, even if they are mostly blue-collar jobs in high-income countries. This trend is expected to increase and be sustained by the technological revolution, with increased fragmented and remote labour, and lower worker tenure. For instance, the services sector is already marked by smaller establishment and lower worker tenure (Korinek and Stiglitz, 2021) and the techno-logical revolution is expected to give rise to more monopolypowertosuperstarfirms,whichwould

Trade, investment and employment in the Southern Mediterranean Countries170
ultimately decrease the bargaining power of work-ers, and would increase the monopsony power of employers in the labour market (Korinek and Xuan Ng, 2017; Korinek and Stiglitz, 2021).
4.2.2. How does this apply to low- and middle-income countries, including in the Southern Mediterranean Countries?
For low- and middle-income countries, the impact of technologies is linked to another central and critical question: will these technologies slow down or speed up their convergence process, and will this provide an opportunity for these countries to “leapfrog” and bridge the productivity and knowl-edge gaps between them and high-income coun-tries? Technologies such as AI are likely to save labour, which would devaluate the main compet-itive advantage that most low- and middle-income countries have (Korinek and Stiglitz, 2021). These technologies might lead to productivity gains in low- and middle-income countries adopting them; however, they might lead to fewer manufacturing jobs created, particularly for unskilled and mid-skilledworkers.Moreover,firmsinunindustrialized countries might struggle to leapfrog into using new technologies, given that there is less development inthesecountriesʼmanufacturingandserviceeco-systems (Hallward-Driemeier and Nayyar, 2017). Therefore, there is a worry that the technological revolution will only slow down the convergence pro-cess and further increase the gap with high-income countries, and that the manufacturing-led growth model might be less feasible.
A major driver of concern for low- and middle-in-come countries is the trend towards “nearshoring” and “reshoring” that automation might enable, which the COVID-19 crisis has brought to light. As opposedtooffshoring,productioninnearshoringis brought back to close-by destinations, and pro-duction in reshoring is brought back to high-income countries. This includes production in labour-inten-sive manufacturing. The cost of new technologies that are expected to disrupt the manufacturing sectorwilldecrease,sooffshoringlocationsmightbecomelessattractivefordifferentmanufacturinggoods. The decrease in cost might also increase the political arguments and pressure for reshoring to industrialized economies (Bárcia de Mattos, 2020; World Bank, 2016). The EU (2021) indicates that the trend towards reshoring is driven by several
factors, including an increase in costs in low- and middle-income countries, the underestimation of thefullcostofoffshoring,andtheneedforpro-duction to be closer to markets, highlighted further by the COVID-19 crisis and the disruption to supply chains. This trend would translate to a decrease in FDIinflowsinlow-andmiddle-incomecountries,including countries in the Southern Mediterranean Countries, and therefore to a decrease in the num-berofjobsthatFDIsandoffshoringactivitieswereexpected to create. Ultimately, this might slow down the convergence process and the technological catch-up.Whatʼsmore,itwouldnotonlyincreaseinequality across countries, but also within coun-tries, as manufacturing plays a huge role in struc-tural transformation and the reduction of inequality among workers.
The studies trying to assess the potential impact of technology on the labour market have mainly focused on high-income countries; however, some studies have tried to predict and assess the impact on low- and middle-income countries, using dif-ferent methodologies. For instance, Chang and Huynh (2016) use the same methodology as Frey and Osborne (2013) to estimate the number of jobs at high risk of automation in ASEAN countries. They findthatthreeinfivejobsface“ahighriskofauto-mation”,andhighlightthedifferencesinimpactbetween high-, middle- and low-income countries. The World Bank (2016) also uses the same meth-odology as Frey and Osborne (2013) to assess the automation risk in low- and middle- income coun-triesandfindsimilarresultstoChangandHuynh(2016). The report indicates that the share of jobs at risk of automation is higher in low- and middle-in-come countries than in high-income countries. Specifically,theshareofjobsatriskofautomationis 77 per cent of all jobs in China, 69 per cent in India, more than 80 per cent in Ethiopia and over 70 per cent in Bangladesh, China, El Salvador, Guatemala and Nepal. A study done by McKinsey focuses on assessing the risks of automation in six countries from the MENA region: Bahrain, Egypt, Kuwait, Oman, Saudi Arabia and the United Arab Emirates (McKinsey, 2018). The study uses a simi-lar methodology, but also incorporates the current level of technology adoption, to assess the risk of automation.Itfindsthatinthesesixcountries,45 per cent of the existing occupations could be automated, with the highest automation risk in Egypt, at 48 per cent. The study highlights that the risk of automation is higher in low- and mid-skilled activities. However, the study also highlights tech-nologyʼsjobcreationpossibilities,withthepotential

171 Chapter 4. Future trends and impact on the labour market
emergence of “middle jobs” to assist machines, which would be performed by humans. However, and as discussed earlier, the results using Frey and Osborneʼsmethodologyshouldbereadwithcau-tion, as they might be over-estimating the share of routine-based tasks within jobs and not account-ingfortechnologyʼsjob-replacementpotential.Forinstance, Ahmed and Chen (2017) apply the same methodology as Arntz et al. (2016) by breaking occupationsdownintotaskswithdifferentlevelsofroutinization,andfindthatinlow-andmiddle-in-come countries, only 2 to 8 per cent of jobs are at a high risk of automation. The World Bank (2016) looks at the historic impact of technology on the labourmarketandfindthatbetween1995and2012 the share of low- and high-skilled routine jobs fell by only 8 percentage points in low- and mid-dle-income countries, while the share of non-rou-tine jobs increased in most countries. This indicates that routine jobs are negatively impacted by tech-nological improvements, but at a much lower scale and magnitude than the one presented by stud-ies using the methodology of Frey and Osborne (2013). However, and as mentioned earlier, it is important to highlight that the pace of the current technological innovation and change is so unprec-edented that the historic trend might not hold in the future. Overall, there is a need to improve the understanding of the impact of technology in low- and middle-income countries, and this can be done throughconsideringdifferenttrendsanddynam-ics, such as the evolution of GVCs and trade, and the nearshoring and reshoring trends, among oth-ers. The potential of job replacement and creation should also be considered, rather than only focus-ing on job displacement.
As mentioned earlier, technological advancement will impact all sectors in the economy. The threat of automation in low- and middle-income countries is more of a concern within the manufacturing sec-tor, considering the historic role that this sector has played in structural transformation. Manufacturing has historically absorbed mostly low-skilled labour, and this is considered as one of the comparative advantages of low- and middle-income countries, engaged in repetitive tasks that could be highly exposed to automation. In manufacturing, three main technologies are expected to disrupt the industry: robotics and artificial intelligence, 3D printing and the Internet of Things. These technol-ogies can be combined and are most likely to be adopted in parallel, to respond to the increasing demand for customized and personalized products indifferentsectors.
Roboticsandartificialintelligence(AI)areexpectedto be the most disruptive technologies. AI, which includes machine learning, is providing comput-ers and robots with skills that they did not have a decade ago, like reading, writing, speaking and recognizing patterns. AI technologies are growing at a rapid scale, as demonstrated by the number of AI patents, which increased by at least fourfold between 2012 and 2016 (ILO, 2018b). The evolu-tion of these technologies might lead to computers and robots becoming agents of their own (Korinek, 2019), with a certain level of autonomy and deci-sion-making enabled by machine learning. These skills would allow computers and robots to engage in tasks that are traditionally performed by human labour. The current pace of innovation and the level of sophistication of AI indicate that the share of tasks that these technologies could perform could be relatively high. As highlighted by Korinek and Stiglitz (2021), if computers and machines can engage in all the tasks traditionally performed by labour, then human labour would become redun-dant and irrelevant. However, this is highly unlikely, as some skills and tasks are not easily automated and performed by machines, including non-cogni-tive, or “soft”, skills, such as problem-solving, team-work, creative thinking, and so on. This reduces the probability of the extreme scenario under which innovation is fully labour-saving. The main vari-ables that will determine how much labour these technologies will replace are (a) the cost of these technologies compared to that of human labour, and(b)thelevelofefficiencyandproductivitygainsthat these technologies provide.
3Dprintingisalsoexpectedtosignificantlyimpactthe manufacturing sector, by reducing the cost of pieces of machinery and disrupting the supply chains in the sector. 3D printing is currently used across many sectors, including in the automobile sector, and it has significant advantages which include a high speed of delivery and a high level of customization and personalization. As the cost and robustness of the technology decrease, the adop-tion of 3D printing, to access pieces of machinery and necessary components for production, will increase, and this will disrupt the current means of production. For instance, 3D printing can improve the production of car components, plastics and footwear among others (World Bank, 2016). For low- and middle-income countries, this could rep-resentasignificantadvantage.Bydecreasingthecost of access to machinery and means of produc-tion,andincreasingtheiravailability,firmsinlow-and middle-income countries might be more able

Trade, investment and employment in the Southern Mediterranean Countries172
to engage in manufacturing production. However, manipulating 3D printing technology requires a high level of skill that is currently unavailable in low- and middle-income countries. This could lead to an emergence of hubs of 3D printing activities in high-income countries.
The Internet of Things is also expected to sig-nificantly impact the manufacturing sector and its development in the Southern Mediterranean Countries. The Internet of Things refers to technol-ogies that enable the collection, interpretation and analysis of data without human intervention. The InternetofThingswillofferreal-timeanddetailedvisibility to all manufacturing processes, enabling their monitoring and improvement. This would enable a constant optimization of the production chain,leadingtoproductivity,qualityandefficiencygains, and could impact virtually all sectors. These technologies are also expected to generate a new set of services and jobs, which will aim to use the significantamountofdatagenerated.Ultimately,these technologies are expected to increase the demand for high-skilled labour, such as engineers, data scientists, programmers and so on, and decrease the demand for mass low-skilled labour.
Within manufacturing, different sectors are exposed to the automation threat in different ways. Hallward-Driemeier and Nayyar (2017) iden-tify automotive and transport equipment, pharma-ceuticals, electronics and car components as the sectors within manufacturing that are the most at risk for automation. According to the same report, these sectors are also the most exposed to disrup-tion by 3D printing techniques, which might lead to a high level of reshoring of activities within these sectors. There is some evidence that automation is already happening in the automotive and electron-ics industry. According to International Federation of Robotics (IFR), the automotive and electronics industries are among the industries that purchased the most robots over the last years. In 2019, the electronics industry replaced the automotive indus-try as the leading sector in industrial robot instal-lations, with the electronics industry accounting for about 34 per cent of all industrial robot instal-lations, and the automotive industry accounting for about 28 per cent.74 The importance of these two industries adopting industrial robots and tech-nology is expected to continue growing in the next years as high-income countries purchase and install robots. These sectors are relatively important in
74 International Federation of Robotics (IFR), Executive Summary, World Robotics 202 Industrial Robots.
the Southern Mediterranean Countries, as some countries in the region have prioritized them in their development plans, and as they represent an increasing share of investment and trade in coun-tries like Morocco, Tunisia and Jordan.
The textile and apparel sector, a particularly important sector for structural transformation in developing countries, including for countries in the Southern Mediterranean Countries, seems to be a bit more protected by the automation risk. Historically, the technological evolution has highly disrupted some parts of the value chain in this sec-tor, particularly the textile value chain. However, current evidence suggests that this sector is not expected to be highly automated, particularly the apparel value chain. For instance, the World Bank (2016) indicates that the signs of this sector being automated are weak, as there is currently a low usage of robots in the industry. The report also indi-cates that a large-scale reshoring within this sector is unlikely, despite the potential high adoption of 3D printing particularly in the footwear industry, driven by higher demand for product personal-ization. This prediction on the textile and apparel sectorisfurtherconfirmedbyacoupleofstudieswhich attempt to assess the current level of auto-mation within the sector. For instance, Parschau and Hauge (2020) adopt a qualitative approach to assess the impact of automation on the apparel industry in South Africa and to improve the under-standing of how automation will impact develop-ingcountries.Ininterviewswith26firmmanagersinindustryandgovernmentandunionofficials,theauthorsfindthatautomationhasthusfarhada very limited impact in South Africa and is in fact expected to have a rather positive impact on the labourmarketbyincreasingfirmsʼproductivity.Interviewedfirmsrespondedthatsometaskscan-not be automated, and that automation will be rel-atively slow and incremental considering that in the apparel industry, labour costs are much lower than the cost of technology. This is a considerable con-straint to automation. It indicates that the impact of automation and new technologies on the labour market in low- and middle-income countries is still unclear, and that the job replacement and creation potential of these technologies might be underes-timated. Similarly, Bárcia de Mattos et al. (2020) use a series of in-depth interviews with 11 representa-tives from four leading brands in the industry to assess the current and future use of automation

173 Chapter 4. Future trends and impact on the labour market
technologies in the sector. They focus on apparel manufacturing rather than the early stages of the valuechaininthesector.Theauthorsfindthatauto-mation in apparel manufacturing is currently lim-ited, as automation is mainly concentrated either in the textile value chain, or in logistics and distri-butionprocesses.Theauthorsalsofindthatoneof the main constraints of automation in apparel manufacturing is technical, as current technolo-giesdonotallowforaflexiblehandlingoffabricswhich require a high dexterity, including in the sew-ingprocess.Theauthorsalsofindthatthecurrentcost of technology is a constraint for automation in the sector, considering the low cost of labour and very thin margins in the sector. Finally, the study findsthattheimpactofautomationandtechnolo-gies on employment in the sector is unlikely to be significantlynegative,andthatratherthannetjobdisplacement, technologies might create new “mid-dle-jobs” to improve machine-worker collaboration. However, the skills of workers will need to evolve for them to be prepared for the middle-jobs and to be able to handle the expected growing collaboration between worker and machine.
The impact of these technologies on the labour market,andthewaythatcountrieswillbenefitfromthis ongoing revolution, will be determined by at
leastfourmainvariables,whichwillinfluencethepotentialadjustmentcostsindifferenteconomies:(a) the pace of global innovation and technological change, which is currently growing exponentially, (b) the level of digital infrastructure in each coun-try, (c) the level of skills and the readiness for tech-nology in each country and (d) the absorption rate oftechnologybyfirms,bothgloballyandineachcountry. In the Southern Mediterranean Countries and around the world, the absorption rate of tech-nologybyfirmswillbeinfluencedbythecostoftechnology compared to cost of labour. The rate willalsobeinfluencedbytheadoptionofthecur-rentlevelsofhumancapitalwithinfirms,andtheircapacity to understand, invest in and adopt these technologies.Theabsorptionrateoffirmsheavilyaffectsthepotentialforautomation.TheWorldBank (2019) highlights that the use of mobile tele-phony, for example, spread faster than earlier tech-nologies, and faster than the internet. However, in the Southern Mediterranean Countries, the COVID-19 crisis has accelerated the use of digi-talplatformsbyfirms,aswellastheirinclusionin the digital economy. For instance, the results ofthehigh-frequencyfirmsurveysconductedbytheWorldBankindicatethatmorefirmsareusingdigital platforms for their activities (table 44) in the manufacturing and services sectors.
X Table 44: Share of firms that started or increased the use of digital platforms during COVID-19 crisis (no micro-firms) June–August 2020
Country Sector percentage of firms
Jordan Manufacturing 38.4
Retail 36.8
Other services 38.4
Morocco Manufacturing 28.6
Retail 28.2
Other services 30.9
Occupied Palestinian Territory Manufacturing 8.4
Retail 21.8
Other services 41.5
Tunisia Manufacturing 34.4
Retail 27.5
Other services 32.9
Source:WorldBankhigh-frequencyfirmsurvey2020.

Trade, investment and employment in the Southern Mediterranean Countries174
Overall,itisverydifficulttoassesstheimpactofthese technologies on the labour market in the Southern Mediterranean Countries, as it depends on many variables and dynamics explained above. It is, however, easier to assess how technology will shape the demand for skills, than it is to estimate itseffectonjoblosses.Thereseemstobeacon-sensus on the role of human capital in the future of work, and that the highest disruption caused by technological change will probably be on the demand for skills. As discussed above, routine tasks are the most likely to be highly automated, which would decrease the demand for low-skilled work-ers. Moreover, soft, noncognitive skills are expected to gain importance and momentum, as they are unlikely to be automated, which would increase the demand and premium for these skills. Therefore, the quality and composition of human capital in
the Southern Mediterranean Countries, as well as the level of investment to prepare workers in these countries for the technological revolution, will play asignificantroleinadjustingtheireconomiestothefuture of work. These important variables will deter-mine whether countries in the region will witness more job displacement, or more job replacement and creation.
Policymakers in the region need to proactively align industrial and trade policies with the technologi-cal revolution. This includes designing and imple-menting proactive and anticipative education and training policies to prepare the labour force for the coming disruptions in the labour market. There is a need to invest in the development of both digi-tal and soft skills for all workers, including for low-skilledworkers,whowillbethemostaffectedbythetechnological revolution.

175 Chapter 4. Future trends and impact on the labour market Table of Contents
References

176
X References
Abugattas-Majluf, Luis. 2012. “Jordan: Model Reformer without Upgrading?”. St Comp Int Dev 47: 231–253.
Achy, Lahcen. 2013. “Structural Transformation and Industrial Policy in Morocco”. Economic Research Forum Working Paper 796.
Ahmed, Syud Amer, and Pinyi Chen. 2017. Emerging Technologies Manufacturing, and Development: Some Perspectives for Looking Forward. Unpublished manuscript, World Bank.
Acemoglu, Daron and David Autor. 2011. "Skills, Tasks and Technologies: Implications for Employment and Earnings." In Handbook of Labor Economics 4.
Acemoglu, Daron and James Robinson. 2012. Why Nations Fail: The Origins of Power, Prosperity and Poverty. New York: Crown.
Acemoglu, Daron and Pascual Restrepo. 2018. “ArtificialIntelligence,AutomationandWork”,NBER Working Paper 24196.
Aiginger, Karl and Dani Rodrik. 2020. “Rebirth of Industrial Policy and an Agenda for the Twenty-First Century”. Journal of Industry, Competition and Trade 20: 189–207.
Akgüç, Mehtap, Cinzia Alcidi and Mattia Di Salvo. 2020. Brain Drain in Southern Mediterranean coun-tries: Evidence, Challenges and Policies. EMNES Policy Paper 012.
Alomari, Mohammad and Nahil Saqfalhait. 2015. “Analyzing the Structure of Jordanian Pharmaceutical Industry”. European Journal of Social Sciences 49 (1): 91–104.
Alvaredo, Facundo, Lucas Chancel, Thomas Piketty, Emmanuel Saez and Gabriel Zucman. 2018. “The Elephant Curve of Global Inequality and Growth”. AEA Papers and Proceedings 108: 103–108.
Al-Wadi, Mahmoud Hussein. 2017. “The Impact of Trade Liberalisation on Women Employment in Middle East Countries”. European Journal of Economics, Finance and Administrative Sciences 94.
Arntz, Melanie, Terry Gregory, and Ulrich Zierahn. 2016. “The Risk of Automation for Jobs in OECD Countries: A Comparative Analysis”. OECD
Social, Employment and Migration Working Paper 189.
Arouri, Hassen, Leila Baghdadi and Bob Rijkers. 2019.“StateCaptureinBenAliʼsTunisia”.InCrony Capitalism in the Middle East: Business and Politics from Liberalization to the Arab Spring, edited by Ishac Diwan, Adeel Malik and Izak Atiyas, 173–204. Oxford, United Kingdom: Oxford University Press.
Assaad, Ragui and Ghada Barsoum. 2019. “Public Employment in the Middle East and North Africa”. IZA World of Labor 463.
Atallah, Sami and Ilina Srour. 2014. “The Emergence of Highly Sophisticated Lebanese Exports in the Absence of an Industrial Policy”. Economic Research Forum Working Paper 876.
Atkin, David, Amit K. Khandelwal and Adam Osman. 2017. “Exporting and firm performance: Evidence from a Randomized Experiment”. The Quarterly Journal of Economics 132 (2): 551–615.
Attari, Ali, Ronja Schiffer, Mohamed Hegazy, Hazem Zureiqat, Rami Semaan, and Sameer Abu-Eisheh. 2018. “The Mobility Transition in the MENA region”. Friedrich Ebert Stiftung Comparative Policy Perspectives.
Autor, David H., Frank Levy and Richard J. Murnane. 2003. “The Skill Content of Recent Technological Change: An Empirical Exploration”. The Quarterly Journal of Economics 118 (4): 1279–1333.
Ayyagari, Meghana, Asli Demirguc-Kunt, and Vojislav Maksimovic. 2011. “Small vs. Young Firms across the World Contribution to Employment, Job Creation, and Growth”. World Bank Policy Research Working Paper 5631.
Baghdadi, Leila, Sonia Ben Kheder and Hassen Arouri. 2017. “In Search of a New Development Model for Tunisia: Assessing the Performance oftheOffshoreRegime”.EconomicResearchForum Working Paper 1118.
Baldwin, Richard. 2009. “The Great Trade Collapse: What Caused It and What Does It Mean?” CEPR, VoxEUorg.
Bárcia de Mattos, Fernanda, Sukti Dasgupta, Xiao Jiang, David Kucera and Ansel Schiavone. 2020. Robotics and Reshoring: Employment Implications for Developing Countries, ILO.

177 References
Baymul, Cinar and Kunal Sen. 2020. “Was Kuznets Right? New Evidence on the Relationship between Structural Transformation and Inequality”. The Journal of Development Studies 56(9): 1643–1662.
Begga, Cherif and Abdelhamid Merghit. 2014. “Attempts to Industrial Reforms in Algeria: Do They Fit the Logic of Globalization?” Topics in Middle Eastern and African Economies 16(1): 96–113.
Ben Salem, Mélika Ben and Chahir Zaki. 2019. “Revisiting the Impact of Trade Openness on Informal and Irregular Employment in Egypt”. Economic Research Forum Working Paper 1107.
Bollard, Albert, David.McKenzie, Melanie Morten, Hillel Rapoport. 2009. “Remittances and the Brain Drain Revisited: The Microdata Show that More Educated Migrants Remit More”. IZA Discussion Paper 4534.
Bowles, Jeremy. 2014. “The Computerisation of European Jobs”. Bruegel (blog), July 17, www.bruegel.org/2014/07/the-computerisation-of -european-jobs/.
Brambilla, Irene , Nicolas Depetris Chauvin and Guido Porto. 2015. “Wage and Employment Gains from Exports: Evidence from Developing Countries”. CEPII Working Paper 28, December.
Bruhn, Miriam. 2016. “Policies for SME Growth: What Works,WhatDoesnʼt?”Presentation.http://pub docs.worldbank.org/en/269861478801095302/Policies-for-SME-Growth.pdf.
Building Markets. 2020. The Impact of COVID-19 on Small Businesses in Jordan.
Casacuberta, Carlos, Gabriela Fachola and Nestor Gandelman. 2004. “The Impact of Trade Liberalization on Employment, Capital and Productivity Dynamics: Evidence from the Uruguayan Manufacturing Sector”. Journal of Policy Reform 7(4): 225–248.
Chang, Ha-Joon. 1997. “Evaluating the Current Industrial Policy of South Africa”. Transformation: Critical Perspectives on Southern Africa 36:51–72.
Chang, Jae-Hee, and Phu Huynh. 2016. The Future of Jobs at Risk of Automation. ILO, Bureau for EmployersʼActivities,WorkingPaper9.
Charfeddine, Lanouar and Zouhair Mrabet. 2015. ”Trade Liberalization and Relative Employment: Further Evidence from Tunisia”. Eurasian Business Review 5(1): 173–202.
Chavez,Edgar.2017.“CreditInformationandFirmsʼAccess to Finance: Evidence from an Alternative Measure of Credit Constraints”. World Bank, Doing Business Research Notes 2.
Chekir, Hamouda and Ishac Diwan. 2015. “Crony Capitalism in Egypt”. Journal of Globalization and Development 5(2): 1–35.
Crespi, Gustavo. and Pluvia Zuñiga. 2010. “Innovation and Productivity: Evidence from Six Latin American Countries”. IDB Working Paper 218.
Dachs,Bernard,SteffenKinkel,andAngelaJäger.2019. “Bringing it all back home? Backshoring of Manufacturing Activities and the Adoption of Industry 4.0 Technologies”. Journal of World Business 54 (6).
Dasgupta, Dipak, Mustapha Kamel Nabli, Christopher Pissarides and Aristomene Varoudakis. 2002. “Making Trade Work for Jobs: International Evidence and Lessons for MENA”. World Bank and London School of Economics working paper.
Decreux Yvan and Julia Spies. 2016. “Export Potential Assessments - A methodology to identify export opportunities for developing countries.”
Dimova, Ralitza, Sara Elder, and Karim Stephan. 2016. “Labour Market Transitions of Young Women and Men in the Middle East and North Africa”. ILO, Work for Youth Publications Series 44.
European Commission. 2021. Ex-post Evaluation of the Impact of Trade Chapters of the Euro-Mediterranean Association Agreements with Six Partners.
European Training Foundation. 2006. Employment Policy Reforms in the Middle East and North Africa: Selected Issues on the Functioning of the Labour Market.
European Union. 2021. Post Covid-19 Value Chains: Options for Reshoring Production back to Europe in a Globalised Economy.
Elder, Sara. 2015. “What Does NEETs Mean and Why Is the Concept So Easily Misinterpreted?”. ILO, Work for Youth Technical Brief No. 1.
Erdle,Steffen.2011.“IndustrialPoliciesinTunisia”.German Development Institute Discussion Paper 1.
https://thedocs.worldbank.org/en/doc/269861478801095302-0050022016/original/PoliciesforSMEGrowth.pdf

Trade, investment and employment in the Southern Mediterranean Countries178
Ferrali, Romain. 2012. The Maghribi Industrialists: Contract Enforcement in the Moroccan Industry. SE Economic History working paper 169/12.
Forum Tunisien pour les Droits Economiques et Sociaux. 2020. Rapport annuel – 2020.
Frey, Carl Benedikt and Michael A. Osborne. 2013. “The Future of Employment: How Susceptible Are Jobs to Computerisation?”. Oxford Martin Programme on Technology and Employment Working Paper.
Ghali,SofianceandMustaphaKamelNabli.2020.“ExportDiversificationandSophisticationandIndustrial Policy in Tunisia”, Economic Research Forum Working Paper 1415.
Griffith,Rachel,ElenaHuergo,JacquesMairesse,and Bettina Peters. 2006. “Innovation and Productivity Across Four European Countries”. NBER Working Paper 12722.
Griffith, Rachel, Stephen Redding and John Van Reenen. 2004. “Mapping the Two Faces of R&D: Productivity Growth in a Panel of OECD Industries”. Review of Economics and Statistics 86 (4): 883–895.
Hahn, Tina and Georgeta Vidican-Auktor. 2018. “Industrial Policy in Morocco and its Potential Contribution to a New Social Contract”. German Development Institute Discussion Paper 31/2018.
Hall, Bronwyn, Jacques Mairesse and Pierre Monhen. 2010. “Measuring the Returns to R&D”. In Handbook of the Economics of Innovation, edited by Bronwyn Hall and Nathan Rosenberg, 1033–1082. Amsterdam: Elsevier.
Haltiwanger, John. 2011. “Firm Dynamics and Productivity Growth”. European Investment Bank Papers 16(1): 116–136.
Hallward-Driemeier, Mary and Gaurav Nayyar. 2017. Trouble in the Making? The Future of Manufacturing-Led Development. Washington, D.C.: World Bank.
Hausmann, Ricardo, César A. Hidalgo, Sebastián Bustos Michele Coscia, Alexander Simoes, andMuhammedA.Yıldırım.2013.The Atlas of Economic Complexity: Mapping Paths to Prosperity. Cambridge, MA: MIT Press.
Hausmann, Ricardo, Tim OʼBrien, MiguelAngel Santos, Ana Grisanti, Semiray Kasoolu, Nikita Taniparti, Jorge Tapia and Ricardo Villasmil. 2019. “Jordan: The Elements of a Growth
Strategy”. Harvard University CID Working Paper Series 2019.346.
Hidalgo, César A. and Ricardo Hausmann. 2009. “The Building Blocks of Economic Complexity”. PNAS 106(26): 10570–10575.
ILO (International Labour Organization). 2011. Trade and Employment: From Myths to Facts.
—. 2017. Impact of Trade on Jobs: Selection of Countries.
—. 2016. llustrated Guidelines for Gender-responsive Employment Intensive Investment Programmes.
—. 2018a. “Skills Policies and Systems for a Future Workforce”. Global Commission on the Future of Work, Issue Brief #8.
—.2018b.“TheEconomicsofArtificialIntelligence:Implications for the Future of Work”. ILO Future of Work Research Paper Series 5.
—. 2020a. Global Employment Policy Review: Employment Policies for Inclusive Structural Transformation.
—. 2020b. COVID-19: Impact on Trade and Employment in Developing Countries. Policy brief.
Joffe,George.2002.“TheRoleofViolencewithinthe Algerian economy”. Journal of North African Studies, 7(1): 29–52.
Kchouk,Bilel.2017.“TheʼFormerʼEconomicElitesand the Change of Regime in Tunisia: On the Uncertainty surrounding the Political and Economic Consolidation of Positions”, Politix 120 (4): 157–178.
King, Robert G. and Ross Levine. 1993. “Finance and Growth: Schumpeter Might Be Right”. The Quarterly Journal of Economics 108(3): 717–37.
Korinek, Anton. 2019. The Rise of Artificially Intelligent Agents, working paper, University of Virginia.
Korinek, Antoine and Xuan Ng. 2017. “The Macroeconomics of Superstars”.
Korinek,AntonandJosephE.Stiglitz.2021.“ArtificialIntelligence, Globalization, and Strategies for Economic Development”. Institute for New Economic Thinking Working Paper Series 146.
Krafft,Caroline,RaguiAssaadandMohamedAliMarouani. 2021. “Vulnerable Workers in MENA a Year into the Pandemic”. Economic Research Forum Policy Portal (blog).

179 References
Krueger, Anne O. 1974. The Political Economy of the Rent-seeking Society. American Economic Review, 64(3): 291–303.
Kucera, David and Leanne Roncolato. 2011. “Trade Liberalization, Employment and Inequality in India and South Africa”. International Labour Review 150(1-2): 1–41.
Kucera, David and Leanne Roncolato. 2016. “The Manufacturing–Services Dynamic in Economic Development”. International Labour Review 155(2): 171–199.
Lassassi, Moundir and Aysit Tansel. 2020. “Female Labor Force Participation in Five Selected MENA Countries: An Age- Period-Cohort Analysis (Algeria, Egypt, Jordan, Palestine and Tunisia)”. IZA Discussion Paper 13814.
Lin, Justin. 2010. “Growth Identification and Facilitation: The Role of the State in the Dynamics of Structural Change”. World Bank Policy Research working paper 5313.
Lin, Justin and Celestin Monga. 2014. “Comparative Advantage: The Silver Bullet of Industrial Policy”. In The Industrial Policy Revolution I, edited by Joseph Stiglitz and J.Y. Lin, 19–38. London: Palgrave Macmillan.
Lin, Justin and Jiajun Xu. 2016. “Applying the Growth Identification and Facilitation Framework to the Least Developed Countries: The Case of Uganda”. UNDESA CDP Background Paper 32.
Loewe, Markus. 2013. “Industrial Policy in Egypt 2004–2011”. German Development Institute Discussion Paper 13/2013.
Mano, Rui and Marola Castillo. 2015. ”The Level of Productivity in Traded and Non-Traded Sectors for a Large Panel of Countries”. IMF Working Paper 15/48.
Marouani, Mohamed Ali and Rim Mouelhi. 2015. “Contribution of Structural Change to Productivity Growth: Evidence from Tunisia”. Journal of African Economies 25(1): 110–132.
Marouani, Mohamed Ali and Michelle Marshalian. 2020. “Winners and Losers in Industrial Policy 2.0”. WIDER Working Paper 2020/21.
Marshall, Alfred. 1890. Principles of Economics. London: Macmillan and Co.
McKenna,John.2017.“TheMiddleEastʼsStart-upScene – Explained in Five Charts”. World Economic Forum blog. 17 May 2017. https://www.
weforum.org/agenda/2017/05/what-you-need -to-know-about-the-middle-easts-start-up -scene-in-five-charts/.
McKinsey. 2018. The Future of Jobs in the Middle East. Report for the World Government Summit.
McMillian, Margaret, Karen Horn Welch, Dani Rodrik. 2003. “When Economic Reform Goes Wrong: Cashew in Mozambique”. NBER Working Paper 9117.
McMillan, Margaret and Dani Rodrik. 2011a. “Globalization, Structural Change and Productivity Growth”. NBER Working Paper 17143.
McMillan, Margaret and Dani Rodrik. 2011b. “Trade, Employment Structure and Structural Transformation”. Letʼs Talk Development (World Bank blog). 11 November 2010. https://blogs.worldbank.org/developmenttalk/trade -employment-and-structural-transformation.
McMillan, Margaret, Dani Rodrik and Íñigo Verduzco-Gallo. 2014. Globalization, Structural Change and Productivity Growth, with an Update on Africa. World Development 63: 11–32.
McMillan, Margaret, Dani Rodrik, Claudia Sepúlveda. 2017. “Structural Change, Fundamentals and Growth: A Framework and Case Studies”. NBER Working Paper 23378.
Melitz, Marc J. 2003. “The Impact of Trade on Intra-Industry Reallocations and Aggregate Industry Productivity”. Econometrica 71(6): 1695–1725.
Mouelhi, Rim. 2007. “Impact of Trade Liberalization onFirmsʼLabourDemandbySkill:Thecaseof Tunisian Manufacturing”. Labour Economics 14(3): 539–563.
Mouelhi, Rim and Monia Ghazali. 2020. “Structural Transformation in Egypt, Morocco and Tunisia: Structure, Drivers and Constraints”. Economics of Transition and Institutional Change 29(1): 25–61.
Moghadam, Valentine M. 2008. “Feminism, Legal ReformandWomenʼsEmpowermentintheMiddle East and North Africa”. International Social Science Journal 59(191): 9–16.
Ministry for Trade and Industry (of the Government of Egypt). 2006. Egypt Industrial Development Strategy – the Engine of Growth.
Morrar, Rabeh and Faiz Gallouj. 2016. “The Growth of the Service Sector in Palestine: the Productivity Challenge”. Journal of Innovation Economics 19(1) 179–204.

Trade, investment and employment in the Southern Mediterranean Countries180
Moroccan Ministry of Finance. 2016. The Maritime Transportation of Goods in Morocco: Evolution and Prospects.
Musette, Mohammed Saïb.2016. “Brain Drain from the Southern Mediterranean”. European Institute of the Mediterranean website. www.iemed.org/publication/brain-drain-from-the -southern-mediterranean/.
Nabli, Mustapha Kamel. 1980. “Alternative Trade Policies and Employment in Tunisia”. In Trade and Employment in Developing Countries, Volume 1: Individual Studies, edited by Anne O. Krueger, Hal B. Lary, Terry Monson, and Narongchai Akrasanee, 435–498. Chicago: University of Chicago Press.
Nedelkoska, Ljubica and Glenda Quintini (2018). “Automation, Skills Use and Training”. OECD Social, Employment and Migration Working Paper 202.
North, Douglass Cecil. 1991. “Institutions”. Journal of Economic Perspectives 5(1): 97–112.
Ocampo, José Antonio, Codrina Rada, and Lance Taylor. 2009. Growth and Policy in Developing Countries: A Structuralist Approach. New York: Columbia University Press.
OECD (Organisation for Economic Cooperation and Development).2008.“JordanʼsIndustrialPolicy”.Presentation by Dr. Jamal Mahasneh at MENA–OECD Investment Program Manama, Bahrain 18–19 November 2008.
—. 2018. Deauville Partnership – Compact for Economic Governance, Stocktaking Report: Egypt.
—. 2020a. Middle East and North Africa Investment Policy Perspectives.
—. 2020b. Changing Laws and Breaking Barriers for Womenʼs Economic Empowerment in Egypt, Jordan, Morocco and Tunisia.
—. 2021. Regional Integration in the Union for the Mediterranean: Progress Report.
Ostry, Jonathan D., Andrew Berg and Charalambos G. Tsangarides. 2014. “Redistribution, Inequality andGrowth”.IMFStaffDiscussionNote14/02.
Oxford Business Group. 2014. “New Investment Law to Provide Economic Boost for Jordan”. https://oxfordbusinessgroup.com/overview/laws -attraction-enactment-new-laws-enhance -investment-and-economic-environment-0.
—. 2018. “Algeriaʼs Industrial Policy of SmallBusiness Creation and Local Integration”. https://oxfordbusinessgroup.com/overview/productivity-boost-industrial-policy-focuses -facilitating-small-business-creation-and-raising -local.
Parschau, Christian and Jostein Hauge. 2020. “Is Automation Stealing Manufacturing Jobs? EvidencefromSouthAfricaʼsApparelIndustry”.Geoforum 115: 120–131.
Piveteau, Alain and Éric Rougier. 2011. “The Trompe lʼœilReturntoIndustrialPolicy”.Revue Tiers Monde 4 208: 177–192.
Porter, Michael E. 1998. Clusters and the New Economy of Competition. Harvard Business Review 76 (6): 77–90.
Ravindran, Ravindran and Suresh Babu M. 2021. “Premature Deindustrialization and Income Inequality in Middle-income Countries.” WIDER Working Paper 2021/8.
Robertson, Raymond; Drusilla Brown, Gaëlle Pierre, and María Laura Sanchez-Puerta. 2009. Globalization, Wages, and the Quality of Jobs: Five Country Studies. Washington, D.C: World Bank.
Rodrik, Dani. 2004. “Industrial Policy for the Twenty-firstCentury”.https://ssrn.com/abstract =617544.
—.2006.“UnderstandingSouthAfricaʼsEconomicPuzzles”. CID (Center for International Development at Harvard University) Working Paper 130.
—.2008.“IndustrialPolicy:DonʼtAskWhy,AskHow”. Middle East Development Journal 1(1): 1–29.
—. 2013. “The Past, Present and Future of Economic Growth”. Challenge 57 (3): 5–39.
—. 2016. “Premature Deindustrialisation”. Journal of Economic Growth 21(1):1–33.
—. 2018. New Technologies, Global Value Chains and the Developing Economies. Pathways for Prosperity Commission Background Paper Series 1.
Ross, Michael L. 2008. “Oil, Islam and Women”. American Political Science Review 102(1): 107–123.
Rijkers, Bob, Hassen Arouri, Caroline Freund and Antonio Nucifora. 2014. “Which Firms Create the Most Jobs in Developing Countries? Evidence from Tunisia”. Labour Economics 31(C): 84–102.

181 References
Rijkers, Bob, Caroline Freund and Antonio Nucifora. 2017. “All in the Family: State Capture in Tunisia”. World Bank Policy Research Working Paper 6810.
Said, Monia, Ha Joon Chang and Khaled Sakr. 1995. “Industrial Policy and the Role of the State in Egypt: Relevance of the East Asian Experience”. IDRC Working Paper 9514.
Samet, Kaies. 2014. “La fuite des cerveaux en Tunisie –Evolutioneteffetssurlʼéconomietunisienne”.Fuites et migration 1307:123–138.
Selwaness, Irene and Chahir Zaki. 2013. “Assessing the Impact of Trade Reforms on Informality in Egypt”. Economic Research Forum Working Paper 759.
Schumpeter, Joseph A. 1911. The Theory of Economic Development: An Inquiry into Profits, Capital, Credit, Interest and the Business Cycle.
Stiglitz, Joseph E. and Andrew Weiss. 1981. “Credit Rationing in Markets with Imperfect Information”. American Economic Review, 71 (3)393–410.
Stiglitz, Joseph. E. and Bruce C. Greenwald. 2015. Creating a Learning Society: A New Approach to Growth, Development and Social Progress. New York: Columbia University Press.
Stiglitz. Joseph. E. 2016. “Industrial Policy, Learning and Development”. WIDER Working Paper 2016.
UNCTAD (United Nations Conference on Trade and Development). 2012. The Palestinian Economy: Macroeconomic and Trade Policymaking under Occupation.
—. 2014. “Trade and Industrial Policies in an Evolving Global Governance Regime”. Trade and Development Report. Chapter V.
—. 2017. Services and Structural Transformation for Development.
—. 2018. “Investment and New Industrial Policies”. World Investment Report 2020.
—. 2020. World Investment Report 2020.
—. 2021a. “Container Shipping in Times of COVID-19: Why Freight Rates Have Surged and Implications for Policymakers”. UNCTAD Policy Brief 84.
—. 2021b. World Investment Report 2021.
—. 2021c. COVID-19 and Tourism: an Update.
UNIDO (United Nations Industrial Development Organization). 2021. World Manufacturing Production: Statistics for Quarter I 2021.
Vidican-Auktor, Georgeta and Tina Hahn. 2017. The Effectiveness of Moroccoʼs Industrial Policy in Promoting a National Automotive Industry.
Wike, Richard and Bruce Stokes. 2018. “In Advanced and Emerging Economies Alike, Worries About Job Automation”. Pew Research Center Report, 13 September.
World Bank. 2015. Jobs or Privileges: Unleashing the Employment Potential of the Middle East and North Africa.
—. 2016a. Lebanon Economic Monitor: A Geo-economy of Risks and Rewards.
—. 2016b. The World Development Report 2016: Digital Dividends.
—. 2017. MENA Economic Monitor: The Economics of Post-Conflict Reconstruction in MENA. April.
—. 2018. MENA Economic Update: A New Economy for the Middle East and North Africa. October.
—. 2019. MENA Economic Update: Reforms and External Balances. April.
—. 2019. The World Development Report: The Changing Nature of Work.
World Trade Organization. 1996. Trade Policy Review – Tunisia.
—. 2005. Trade Policy Review – Egypt.
—. 2015a. Trade Policy Review – Morocco.
—. 2015b. Trade Policy Review – Jordan.
—. 2016. Trade Policy Review – Tunisia.
—. 2018. Trade Policy Review – Egypt.
World Economic Forum. 2018. The Future of Jobs Report 2018.
—. 2020. The Future of Jobs Report 2020.

Trade, investment and employment in the Southern Mediterranean Countries182
Disclaimer
This publication was produced with the financial support of the European Union. Its contents are the sole respon-sibility of the author(s) and do not necessarily reflect the views of the European Union.
The designations employed in ILO publications, which are in conformity with United Nations practice, and the pre-sentation of material therein do not imply the expression of any opinion whatsoever on the part of the International Labour Office concerning the legal status of any country, area or territory or of its authorities, or concerning the delimitation of its frontiers.
The responsibility for opinions expressed in signed articles, studies and other contributions rests solely with their authors, and publication does not constitute an endorsement by the International Labour Office of the opinions expressed in them.
Reference to names of firms and commercial products and processes does not imply their endorsement by the International Labour Office, and any failure to mention a particular firm, commercial product or process is not a sign of disapproval.

International Labour Office4, route des MorillonsCH-1211 Geneva 22, Switzerland
Trade, investment and employment in the Southern Mediterranean CountriesThematic Report of the “Mainstreaming Employment into Trade and Investment in the Southern Neighbourhood” projectTrade, investment and industrial policies are at the heart of economic transformation and of job-rich strategies in developing countries. In the Southern Mediterranean Countries, despite the many reforms adopted over the past decades, structural transformation remains slow and the impact of these policies on job creation remains low, especially for women and youth. This thematic report examines the evolution of these policies and their impact on economic transformation, diversification of exports and the labour market, with a focus on youth and women, and on small and medium-sized enterprises in the region. The report also provides an analysis of future trends that are expected impact to the labour market in the region.