Conditions of Work and Employment Series No - ILO
99
Conditions of Work and Employment Series No. 16 Conditions of Work and Employment Programme Wage fixing in the informal economy: Evidence from Brazil, India, Indonesia and South Africa Catherine Saget INTERNATIONAL LABOUR OFFICE – GENEVA
-
Upload
khangminh22 -
Category
Documents
-
view
3 -
download
0
Transcript of Conditions of Work and Employment Series No - ILO

Conditions of Work and Employment Series No. 16
Conditions of Work and Employment Programme
Wage fixing in the informal economy: Evidence from Brazil, India, Indonesia and South Africa
Catherine Saget
INTERNATIONAL LABOUR OFFICE – GENEVA

Copyright © International Labour Organization 2006 Publications of the International Labour Office enjoy copyright under Protocol 2 of the Universal Copyright Convention. Nevertheless, shortexcerpts from them may be reproduced without authorization, on condition that the source is indicated. For rights of reproduction or translation, application should be made to the Publications Bureau (Rights and Permissions), International Labour Office, CH-1211 Geneva 22, Switzerland. The International Labour Office welcomes such applications. Libraries, institutions and other users registered in the United Kingdom with the Copyright Licensing Agency, 90 Tottenham Court Road,London W1T 4LP [Fax: (+44) (0)20 7631 5500; email: [email protected]], in the United States with the Copyright Clearance Center, 222 Rosewood Drive, Danvers, MA 01923 [Fax: (+1) (978) 750 4470; email: [email protected]] or in other countries with associatedReproduction Rights Organizations, may make photocopies in accordance with the licences issued to them for this purpose.
ISBN 978-92-2-118830-8 (print version) ISBN 978-92-2-118831-5 (web version)
First published 2006
Cover: DTP/Design Unit, ILO
The designations employed in ILO publications, which are in conformity with United Nations practice, and the presentation of material therein do not imply the expression of any opinion whatsoever on the part of the International Labour Office concerning the legal status ofany country, area or territory or of its authorities, or concerning the delimitation of its frontiers. The responsibility for opinions expressed in signed articles, studies and other contributions rests solely with their authors, and publicationdoes not constitute an endorsement by the International Labour Office of the opinions expressed in them. Reference to names of firms and commercial products and processes does not imply their endorsement by the International Labour Office,and any failure to mention a particular firm, commercial product or process is not a sign of disapproval. ILO publications can be obtained through major booksellers or ILO local offices in many countries, or direct from ILO Publications,International Labour Office, CH-1211 Geneva 22, Switzerland. Catalogues or lists of new publications are available free of charge from the above address, or by email: [email protected] Visit our website: www.ilo.org/publns
Printed by the International Labour Office, Geneva, Switzerland
Preface
There is little information on working conditions in general and wage fixing in particular in the informal economy. It is often assumed that informal wages are fixed according to the law of the demand and supply of labour. It is also stated that income from participation in the informal economy is a major source of income for poor people. However, how wages are actually fixed at the concrete level of the informal employer remains a kind of black hole.
Based on data analysis and surveys of firms in Brazil, India, Indonesia and South Africa, this paper shows that wage fixing in the informal economy is a much more complex and elaborated process than often thought. In particular, the provision of a number of diversified allowances and benefits, as well as ― at least in some countries ― the reference to the minimum wage, are common.
The paper also provides information on working hours in informal firms, which are found to be very long in India and Indonesia, and much less in the other two countries. In a number of cases, no rest day is allowed.
Finally, the paper concludes that labour laws can, to a certain extent, reach the informal economy, providing that they are formulated in a simple and realistic way and adapted to the social and economic realities of countries.
William D. Salter, Officer-in-Charge,
Conditions of Work and Employment Programme,
Social Protection Sector.
Conditions of Work and Employment Series No. 16 iii
Acknowledgements
Section 5 of this paper is based on firm surveys undertaken by André Urani, Valéria Pero and André Brunelli (Brazil); Anup Karan (India); Diah Widarti (Indonesia); and Raji Matshdisho (South Africa). I want to thank them all for their great contribution.
iv Conditions of Work and Employment Series No. 16

Contents
Page
Preface..................................................................................................................................... iii Acknowledgements ................................................................................................................. iv
1. Introduction ................................................................................................................................... 1
2. Conceptual framework .................................................................................................................. 3 2.1 Informality ........................................................................................................................ 3 2.2 Structure of employment................................................................................................... 4
Structure of employment in the four countries ............................................................. 4 2.3 Literature review: Effect of the minimum wage on informal wages ................................ 5
3. Applicability of the minimum wage to informal workers ............................................................. 9 3.1 Applicability of the minimum wage to informal workers in India.................................... 9
Fixing mechanisms............................................................................................. 9 Coverage............................................................................................................. 9 Level .................................................................................................................. 9 Revision of rates ................................................................................................. 10 Frequency of adjustment .................................................................................... 11 Control mechanisms ........................................................................................... 11 Conclusions and recommendations .................................................................... 11
3.2 Applicability of the minimum wage to informal workers in Indonesia ............................ 11 Fixing/revising minimum wages ........................................................................ 12
3.3 Applicability of the minimum wage to the informal sector in South Africa..................... 13 3.4 Applicability of the minimum wage to informal workers in Brazil .................................. 14 3.5 Comparative analysis: Challenges of minimum wage systems and purchasing power of the minimum wage.................................................................................................................. 14
India ............................................................................................................................ 16 Brazil ............................................................................................................................ 16 Indonesia....................................................................................................................... 16 South Africa.................................................................................................................. 16
4. Wage fixing in the informal sector: Insights from labour force household surveys ..................... 17 4.1 India .................................................................................................................................. 17 4.2 Wage fixing in the informal sector: Insights from labour force surveys........................... 21
Indonesia....................................................................................................................... 21 Percentage of workers below the minimum wage ........................................................ 22
4.2 Wage fixing in the informal sector: Insights from labour force surveys........................... 23 South Africa.................................................................................................................. 23
4.4 Wage fixing in the informal sector: Insights from household surveys in Brazil............... 25
5. Results from the qualitative surveys ............................................................................................. 27
Conditions of Work and Employment Series No. 16 v

5.1 Results from the Indian qualitative survey........................................................................ 27 5.1.1 Pay practice and other working conditions.......................................................... 27
Basic pay package .............................................................................................. 28 Process of recruitment and entry-level wage...................................................... 29 Other allowances ................................................................................................ 29 Working hours .................................................................................................... 29 Leave and other benefits..................................................................................... 30
5.1.2 Knowledge of minimum wages ........................................................................... 30 5.1.3 Application of the Minimum Wage Act, 1948 .................................................... 31
5.2 Results from the Indonesian qualitative survey ................................................................ 34 5.2.1 Pay practice and other working conditions.......................................................... 35
Working time...................................................................................................... 37 Payment .............................................................................................................. 38 Other working conditions ................................................................................... 38
5.2.2 Knowledge of minimum wage............................................................................. 38 5.2.3 Application of the minimum wage legislation..................................................... 39
5.3 Results from the South African qualitative survey ........................................................... 39 Existence of work contracts................................................................................ 40 Working after hours, weekends and holidays..................................................... 41 Wage rates .......................................................................................................... 41 Bonuses and payments in kind ........................................................................... 43
5.3.2 Knowledge of minimum wage............................................................................. 43 5.3.3 Application of minimum wages........................................................................... 44
Demand for minimum wage............................................................................... 45 5.4 Results from the Brazil qualitative survey ........................................................................ 45
5.4.1 Pay practice and other working conditions.......................................................... 46 5.4.2 Knowledge of the minimum wage....................................................................... 47 5.4.3 Application of the minimum wage ...................................................................... 47
5.5 Conclusions from the qualitative surveys ......................................................................... 47
6. Results and policy implications..................................................................................................... 49
Bibliography...................................................................................................................................... 51
Annexes............................................................................................................................................. 53
vi Conditions of Work and Employment Series No. 16
List of tables
Page
Table 1: Definition of formal and informal wage employment in four countries ............................. 4 Table 2: Structure of employment in India in 1999-2000 ................................................................. 4 Table 3: Structure of employment in Brazil (percentage of total employment)................................ 5 Table 4: Structure of employment in Indonesia ................................................................................ 5 Table 5: Floor-level minimum wage in India.................................................................................... 10 Table 6: Main challenges of minimum wages systems with respect to the informal economy ........ 15Table 7: The level of the minimum wage in 2004 (monthly levels, except daily for India) ............. 15Table 8: Daily minimum wages in three occupations between 1 July 1999 and 30 June 2000
(National Sample Survey time; in rupees) ....................................................................... 17 Table 9: Daily wages between 1 July 1999 and 30 June 2000 for casual workers (in rupees) ......... 17Table 10: Percentage of casual workers at the minimum wage in 1999-2000 .................................. 18 Table 11: Percentage of male casual workers in agriculture, construction, and hotels and
restaurants at the minimum wage, 1999-2000 ................................................................. 18 Table 12: Percentage of female workers in agriculture, construction, and hotel and restaurants at
the minimum wage, 1999-2000 ....................................................................................... 19 Table 13: Median wages of male casual workers in agriculture and construction ........................... 20 Table 14: Median wages of female casual workers in agriculture and construction (rupees per
day) .................................................................................................................................. 20 Table 15: Percentage of daily casual workers earning below the minimum wage they are entitled
to ...................................................................................................................................... 20 Table 16: Relation between the level of the minimum wage and its impact..................................... 20 Table 17: Monthly rates of minimum wage and median wages in Indonesia at the survey time
(2004)............................................................................................................................... 21 Table 18: Average wage in the six provinces.................................................................................... 21 Table 19: Percentage of wage workers at the minimum wage in six Indonesian provinces ............. 22Table 20: Percentage of wage workers below the minimum wage in six Indonesian provinces ...... 22Table 21: Percentage of wage workers below the minimum wage in the province of Bangka
Belitung............................................................................................................................ 23 Table 22: Minimum wages for farm and domestic workers (March 2003)....................................... 23 Table 23: Percentage of workers earning the minimum wage .......................................................... 24 Table 24: Mean and median wages for domestic and farm workers (in Rand)................................. 24 Table 25: Percentage of workers earning less than the minimum wage they are entitled to............. 25Table 26: Summary statistics of monthly wages in Brazil in 2003 (in R$)....................................... 25 Table 27: Percentage of workers earning the minimum wage and below in 2003............................ 26 Table 28: Existing pay practices across different enterprises............................................................ 28 Table 29: Comparison of statutory minimum wages and actual wages (per day)............................. 32 Table 30: Pay practice in the surveyed firms .................................................................................... 36 Table 31: Working time in the surveyed firms.................................................................................. 38 Table 32: Type of enterprise and the number of regular and irregular workers................................ 39 Table 33: Enterprises and their wage rates........................................................................................ 42 Table 34: Wage-fixing factors........................................................................................................... 44 Table 35: Wage increase factors ....................................................................................................... 45 Table 36: Wage practice in the firms surveyed ................................................................................. 46 Table 37: Characteristics of the firms: Days of operation and working conditions .......................... 46
Conditions of Work and Employment Series No. 16 vii

1. Introduction
The growth of informal employment in most parts of the world has defeated many earlier predictions on its rapid eradication. In Africa, informal work accounts for over 90 per cent of new jobs. In Latin America, urban informal employment as a share of total urban employment grew from 52 to 58 per cent in the 1990s (ILO, 2002a). The causes of this phenomenon have attracted a lot of attention both on the informal labour demand and supply side. Several “pull factors” (entry barriers into formal economy, labour market institutions) and “push factors” (demography, poverty, lack of infrastructure and education, growth) have been suggested as key explanations.
Informal employment is very diverse: it encompasses daily agriculture workers, street vendors, undeclared work, non-registered self-employment and many other forms. One can therefore speak of different level of informality, spreading from workers without labour rights to workers with a contract but unpaid overtime work. On top of that, there is a difference within informal employment between wage workers and workers in self-employment. This paper focuses on the first group of informal wage employment. The main focus is on one particular aspect of informal wage employment: wage fixing and the (ir)relevance of a minimum wage for such type of work.
On the subject of informal wage fixing, many beliefs and theories are available. They commonly make the hypothesis that informal wages result from the interaction of informal labour supply and demand. They also assume that no labour market institution applies, be it minimum wage, limits on hours of work or benefits.
The reality of the working conditions of informal workers in general, and the determination of informal wages in particular, have received much less attention. This is all the more surprising as depending on the continents, wage employment makes up between 30 and 40 per cent of non-agricultural informal employment (ILO, 2002b). This paper aims at filling part of the gap.
The effort to understanding the factors behind informal employment have been accompanied by the recent development of statistics on the structure of employment and workers’ characteristics. As a result, it is now possible to analyse informal workers’ individual characteristics as well as job characteristics (sector of employment, firm size, location, etc.).
This paper draws on these new data. Using labour force survey data for two countries, Indonesia and South Africa, as well as household surveys in Brazil and India, the paper gives a picture of informal wages. It also relies on four informal employers’ surveys. The aim is to go beyond statistics on wages received from informal work and focus on the determination of wage levels in informal firms. This includes the role of the minimum wage in informal wage determination, as well as explanatory factors of wage fixing at the firm level. A related aim is to analyse the interaction of informal wages with other aspects of working conditions, including employment contracts, working time and the provision of benefits.
The structure of the paper is as follows. Following the introduction, the second section provides the conceptual framework of the paper. It defines informality in the four country studies, provides estimations of informal employment, and reviews the empirical evidence available on informal wage fixing. The third section summarizes the scope of application of minimum wage legislation in the informal sector. The fourth section analyses informal wage data coming from labour force surveys. In the next section, the results of the surveys of working conditions in a dozen informal firms from each country
Conditions of Work and Employment Series No. 16 1

are commented upon. Section 6 is concerned with the policy implications of our results on minimum wage-fixing policy.
2 Conditions of Work and Employment Series No. 16
2. Conceptual framework
2.1 Informality
There are sociological, economic and legal definitions of informality. For example, the International Labour Conference Resolution on decent work and the informal economy (2002) defines the informal economy as “activities that are, in law or in practise, not covered or insufficiently covered by formal arrangements”.
For purpose of statistics, there are also different measures/definitions of informal sector (=informal firms) and informal employment (=informal workers). For example, the International Conference of Labour Statisticians in its 1993 Resolution defines the informal sector as household enterprises, below a certain size, which are unregistered, and/or do not comply with social security laws and other regulations. New guidelines from the 2003 International Conference of Labour Statisticians define informal employment as own-account workers and employers employed in their own informal sector enterprises, family workers, members of informal producers’ co-operatives and employees holding informal jobs. Informal jobs are characterized by an employment relationship which is in law or in practice not subject to national labour legislation, income taxation, social protection or entitlement to certain employment benefits.
Hence, the definition of informal employment encompasses informal workers in formal enterprises, informal workers at different degrees of informality (earning the minimum wage but without social security, social security but no entitlement to paid overtime work, etc.). There are therefore different levels of employment informality (idem for informal firms) within the same country depending on the definition used.
For the purpose of this research, several criteria available in labour force surveys have been used to estimate informal employment according to several definitions. To complete the analysis, qualitative surveys were also undertaken in a small subset of informal firms.
Four countries from three continents have been chosen as case studies on the basis of data availability and minimum wage-fixing systems. Data availability here means easy access to labour force/household surveys files which provide information on the employment status, wage level and other characteristics, such as education and location of all surveyed individuals. Selected countries all share a common feature of their minimum wage systems: the national minimum wage or one of its gears legally applies to the informal economy for various reasons. In India and South Africa, one branch of the minimum wage system is specifically targeted to the informal economy (or the bulk of it), while wages determination in the formal economy is left to collective bargaining. The situation is very different in Brazil, where the national minimum wage legally covers all adult workers. The scope of application of minimum wage legislation in the informal economy is examined in more detail in Section 3.
Conditions of Work and Employment Series No. 16 3

2.2 Structure of employment
Table 1: Definition of formal and informal wage employment in four countries
Country Formal Informal Brazil Workers who have a labour card (carteira de trabalho).
Alternatively, workers who contribute to the social security fund.
Workers without a written contract or workers who do not contribute to the social security fund.
India Regular salaried/wage employees: These are persons who work in others’ farm or non-farm enterprises (both household and non-household) and, in return, receive salary or wages on a regular basis (i.e. not on the basis of daily or periodic renewal of work contract). This category includes not only persons getting time wage, but also persons receiving piece wage or salary and paid apprentices, both full time and part time.
Casual wage labour: A person who is casually engaged in others’ farm or non-farm enterprises (both household and non-household) and, in return, receives wages according to the terms of the daily or periodic work contract.
Indonesia A regular employee is a person who works for another person or an institution with a stable contract for pay in cash or in kind.
A casual employee (agricultural and non-agricultural) is defined as a person who works at his/her own risk, without assistance from his/her family members or from other employees.
South Africa The formal sector consists of those businesses that are registered.
The informal sector consists of those businesses that are not registered in any way. They are generally small in nature and are seldom run from business premises.
Source: Labour force surveys from Brazil, India, Indonesia and South Africa.
In Brazil, the 2000 Census divides the working population into nine employment categories, further sub-divided according to whether workers have a workbook (carteira assinada) and whether they contribute to social security. On the basis of this information, up to four levels of employment informality can be constructed (Saboia and Saboia, 2004).
A different definition is adopted in the 2004 Labour Overview (ILO, 2004), where employed persons in the informal sector include independent workers (except technical and professional), domestic workers and workers in establishments with less than six workers. According to this definition, social protection coverage in the informal sector is 26 per cent in 2003.
Structure of employment in the four countries
Table 2: Structure of employment in India in 1999-2000
Self-employment Regular wage employment Casual wage employment Total employment
207.38 58.38 131.48 397.25 (millions) 53 15 33 100 (percentage)
Source: National sample survey 1999/2000
Traditionally, informal employment is defined in India as unorganized labour. Using casual wage employment as an estimate for informal wage employment, the above table shows that informal wage employment represents 33 per cent of total employment. The share is higher in rural areas (not shown in the table).
The informal sector tends to be defined on a registration-basis in South Africa. According to this definition, firms which are not registered for value added tax are
4 Conditions of Work and Employment Series No. 16
informal in nature. Including subsistence agriculture and domestic work, informal employment represents around 30 per cent of all employment at the beginning of the 2000s (LFS, 2001, 2002). This figure is a rough estimate, as it is quite possible that some workers employed in non-registered firms might enjoy the same working conditions as formal workers, while casualization and outsourcing of work are becoming increasingly common within the formal sector.
Table 3: Structure of employment in Brazil (percentage of total employment)
Self-employment Wage employment Other Formal 7.2 42.1 Informal 19.2 24.1 Total 26.4 66.2 7.5 Source: Demographic Census, 2000, computed from Saboia and Saboia (2004).
Excluding unpaid household workers, unpaid apprentices and workers working for self-consumption purposes (7.5 per cent of total employment), the above table shows that informal wage employment represents 24.1 per cent of total employment in Brazil, or 36 per cent of total wage employment.
Table 4: Structure of employment in Indonesia
Self-employment Regular wage employment Casual wage employment Unpaid workers 44.3 30.3 7.1 18.3
Self-employment is the dominant form of employment in Indonesia, accounting for 44.3 per cent of the total. At the same time, regular wage employment represents 30.3 per cent of total employment, while casual wage employment is far less widespread (7.1 per cent of total employment). However, the share of unpaid workers is surprisingly high, as 18.3 per cent of workers are reported to be unpaid.
2.3 Literature review: Effect of the minimum wage on informal wages
In this section, we show that there is some evidence of a minimum wage impact on informal wages in Latin America, and on wages received by domestic and farm workers in South Africa.
Most evidence on the effect of the minimum wage in developing countries has focused on the employment effect in the formal economy (Bell, 1995, on manufacturing employment in Mexico) and, more recently, in the informal economy (Lemos, 2003a, for Brazil). A small subset of the literature has analysed the positive effects on household income induced by a rise in the minimum wage (Camargo and Garcia, 1992) and showed that the minimum wage is a powerful tool to reduce conventional estimates of wage inequalities (Angel-Urdinala and Wadon for Brazil and Colombia, 2004).
Only recently, attention has switched to the effect of the minimum wage on informal wages (Kristensen and Cunningham, 2006; Maloney and Nuñez, 2001; Lemos, 2003a). This follows South American observations from the mid-1990s onwards showing that a sizeable share of informal wage-earners receive exactly the minimum wage. The cluster of informal wage-earners at the minimum wage has been labelled the “spike” in the informal wage distribution. As shown in this paper ― and this is one of our key results ― the spike in the distribution of informal wages is found outside South American countries as well.
Conditions of Work and Employment Series No. 16 5

A recent study has looked at the impact of introducing the minimum wage in South Africa for domestic workers (Hertz, 2004). The analysis relies on panel data from the South African labour force survey, and shows that adjustment in the minimum wage over time is associated with increases in wages received by domestic workers.
For India, studies have drawn attention to the low level of minimum wages and lack of enforcement, especially for agriculture workers (Anant and Sundaram, 1998).
In Indonesia, the increase in the minimum wage after the 1997 crisis (+50 per cent between 2000 and 2002) did not benefit domestic workers, nor agriculture workers whose earnings remained more or less unchanged over the three-year period (Bird and Manning, 2004). The study shows that increases in the minimum wage go in-hand with real wages in large manufacturing firms and, to a lesser extent, with real wages in medium manufacturing firms. The study also shows that increases in the minimum wage were associated with a decrease in earnings for self-employed workers. In fact, a number of workers receive wages below the minimum wage that is applicable to them. For example, a qualitative survey undertaken by SMERU (2001) found that 28 per cent of wages in the formal sector were below the minimum wage in 2001.
The percentage of workers earning multiples of the minimum wages (such as half, one, one-and-a-half, two, two-and-a-half) reached as much as 20 per cent during the introduction of the price stabilization plans in the second half of the 1980s and the early 1990s (Lemos, 2003a).
Around 15 per cent of Brazilian informal workers in 1996 received exactly the minimum wage and 5 per cent received its multiples. In some cases, such as Costa Rica, more informal workers (defined as workers in small firms or in rural firms) than formal workers (urban workers in medium and large firms) receive minimum wages applicable to them.
The few studies which have centred on the spike of informal wages at the minimum wage have tended to focus on the employment effect, assuming that if the minimum wage “applies” in the informal economy, it must create unemployment. After showing that in Ghana there is a clustering of wages near the minimum in firms in 1992, Jones (1998, p.7) notes that:
As expected the majority of workers in the informal sector earn a wage that is less than the minimum. 1 But there is also a spike near the minimum which indicates that
some firms in the informal sector comply with the labour legislation.
Jones concluded that “this is consistent with the prediction that some production workers have lost their job as a result of the labour market intervention”.
Others have argued that the effects of the minimum wage on prevailing wages in the informal economy reduce the extent of poverty among informal workers and their family.
Although the “spike” in the informal wage distribution is documented for some countries of Latin and Central America, there is so far no convincing explanation for it. This is because the recent literature on minimum wages has tended to describe the spike and measure the consequences on informal employment and poverty, rather than searching for explanations.
1 The informal sector is defined as all firms that use only hand tools.
6 Conditions of Work and Employment Series No. 16

Some have argued that the low levels of the minimum wage in some of these countries would be used as a political opportunity to introduce a kind of “living wage” or “fair wage” at the low tails of the income distribution. Yet “fair wages” and “political pressure” are vague notions, which fail to explain the interest of employers to comply to some extent. This further motivates our interest in informal wage fixing.
Conditions of Work and Employment Series No. 16 7

3. Applicability of the minimum wage to informal workers
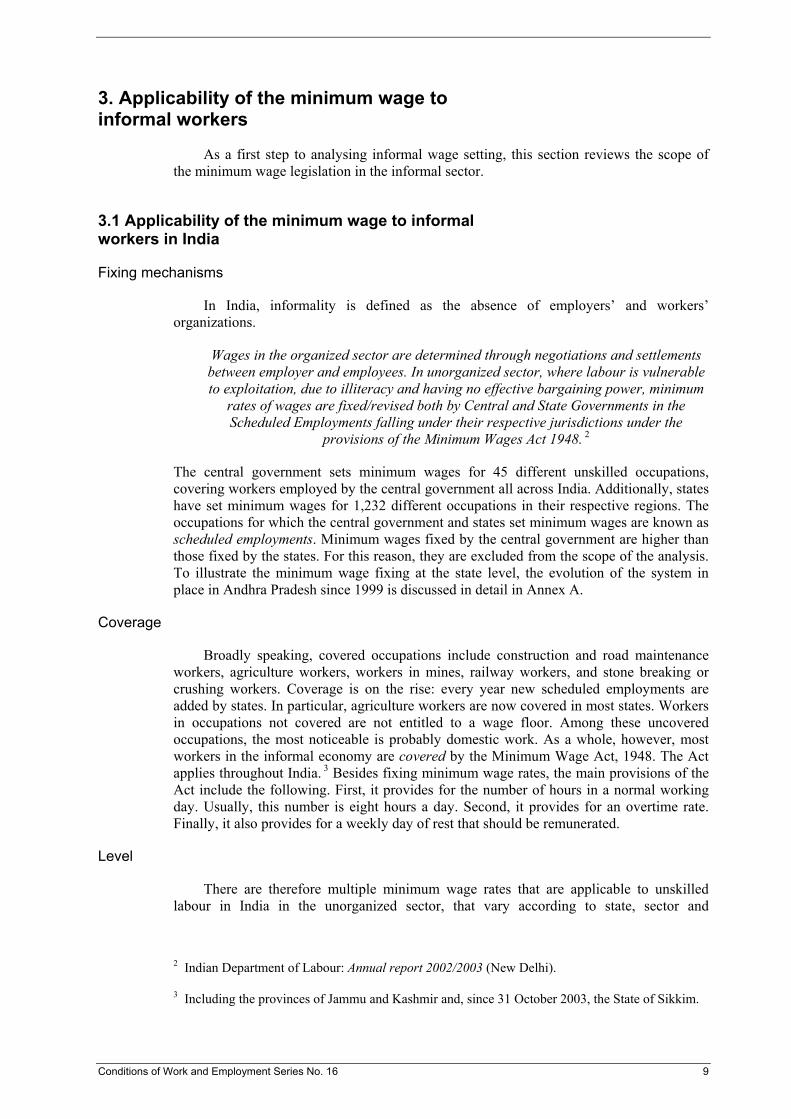
As a first step to analysing informal wage setting, this section reviews the scope of the minimum wage legislation in the informal sector.
3.1 Applicability of the minimum wage to informal workers in India
Fixing mechanisms
In India, informality is defined as the absence of employers’ and workers’ organizations.
Wages in the organized sector are determined through negotiations and settlements between employer and employees. In unorganized sector, where labour is vulnerable to exploitation, due to illiteracy and having no effective bargaining power, minimum
rates of wages are fixed/revised both by Central and State Governments in the Scheduled Employments falling under their respective jurisdictions under the
provisions of the Minimum Wages Act 1948. 2
The central government sets minimum wages for 45 different unskilled occupations, covering workers employed by the central government all across India. Additionally, states have set minimum wages for 1,232 different occupations in their respective regions. The occupations for which the central government and states set minimum wages are known as scheduled employments. Minimum wages fixed by the central government are higher than those fixed by the states. For this reason, they are excluded from the scope of the analysis. To illustrate the minimum wage fixing at the state level, the evolution of the system in place in Andhra Pradesh since 1999 is discussed in detail in Annex A.
Coverage
Broadly speaking, covered occupations include construction and road maintenance workers, agriculture workers, workers in mines, railway workers, and stone breaking or crushing workers. Coverage is on the rise: every year new scheduled employments are added by states. In particular, agriculture workers are now covered in most states. Workers in occupations not covered are not entitled to a wage floor. Among these uncovered occupations, the most noticeable is probably domestic work. As a whole, however, most workers in the informal economy are covered by the Minimum Wage Act, 1948. The Act applies throughout India. 3 Besides fixing minimum wage rates, the main provisions of the Act include the following. First, it provides for the number of hours in a normal working day. Usually, this number is eight hours a day. Second, it provides for an overtime rate. Finally, it also provides for a weekly day of rest that should be remunerated.
Level
There are therefore multiple minimum wage rates that are applicable to unskilled labour in India in the unorganized sector, that vary according to state, sector and
2 Indian Department of Labour: Annual report 2002/2003 (New Delhi).
3 Including the provinces of Jammu and Kashmir and, since 31 October 2003, the State of Sikkim.
Conditions of Work and Employment Series No. 16 9

occupation. In some instances, rates also vary according to the level of urbanity, the difficulty or the intensity of work, and the provision of food.
Revision of rates
Minimum wages are often composed of two elements: a basic rate and a variable dearness allowance (VDA). The most noticeable exception is often agriculture and a few other lowest paid occupations for which there is only a basic rate in many states. As the name indicates, the level of the VDA is linked to inflation. Increasing the VDA has become the major channel of revising minimum wage rates. In many instances, the VDA is increased by the same amount for all scheduled occupations. As a result, the span of wages tends to reduce over time. This increase might reflect one of the guidelines provided by the Committee on Fair Wages (1948), which states that the lowest paid categories of workers should be fully compensated for the rise in prices. For the other categories, a lower compensation might be justifiable.
There is also a floor-level minimum wage which was introduced in 1996. This floor is fixed by the government at currently Rs. 66 per day with effect from 1 February 2004. All minimum wage rates fixed by either the central or the state government must be higher than this rate. However in a few cases, states have not complied with this obligation and have set minimum wages at a lower level than the floor-level minimum wage. Table 5 below relates changes in the floor level and in the consumer price index. The table shows that the floor level more or less followed inflation until 2004, when it was increased by 28 per cent in real terms.
Table 5: Floor-level minimum wage in India
January 1998 December 1999 September 2002 February 2004 Floor (in rupees) 40 45 50 66 CPI 100 112.5 124.9 129.9 Floor (January 1998 = 1000) 100 112 126.6 167.1 Source: Consumer Price Index for industry workers, all of India.
Finally, it should be noted that some states have adopted one unique rate of minimum wages for all the range of covered occupations. This is the case of Delhi, Haryana, Chandigarh and a few others. Two states have reduced the ranges of minimum wages in recent years; for example, between 1996 and 2001, Himachal Pradesh has gone from three rates to one, and the Punjab from two to one.
Changes in the opposite direction were implemented in other regions. To illustrate the complexity of those changes, the example of Maharastra is given. In this state, the minimum wage was Rs. 30 a day for both laundry workers and workers in rice, flour and dal mills in Maharastra on 31 December 1996. Five years later, the rates for laundry workers vary from 92.64 to 94.57 rupees a day according to zones (three zones) and between 57.12 and 103.27 rupees a day for workers in rice, flour and dal mills (four zones). These rates include a variable dearness allowance. In the case of these two occupations, the allowance was equal across the zones. However, for other occupations, the allowance varies according to zones. In parallel, new occupations are added to those already covered, sometimes very narrowly defined occupations. As a result, the system in some states appears very scattered, with many different minimum wages across occupations and zones.
10 Conditions of Work and Employment Series No. 16
Frequency of adjustment
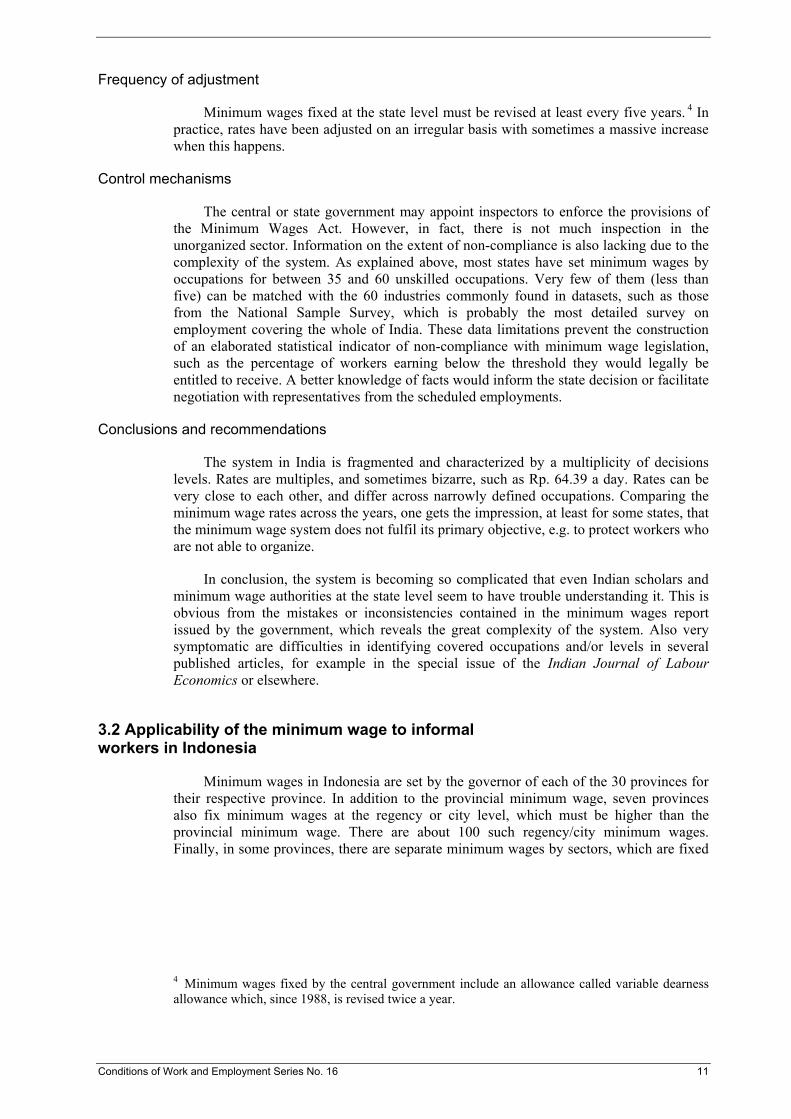
Minimum wages fixed at the state level must be revised at least every five years. 4 In practice, rates have been adjusted on an irregular basis with sometimes a massive increase when this happens.
Control mechanisms
The central or state government may appoint inspectors to enforce the provisions of the Minimum Wages Act. However, in fact, there is not much inspection in the unorganized sector. Information on the extent of non-compliance is also lacking due to the complexity of the system. As explained above, most states have set minimum wages by occupations for between 35 and 60 unskilled occupations. Very few of them (less than five) can be matched with the 60 industries commonly found in datasets, such as those from the National Sample Survey, which is probably the most detailed survey on employment covering the whole of India. These data limitations prevent the construction of an elaborated statistical indicator of non-compliance with minimum wage legislation, such as the percentage of workers earning below the threshold they would legally be entitled to receive. A better knowledge of facts would inform the state decision or facilitate negotiation with representatives from the scheduled employments.
Conclusions and recommendations
The system in India is fragmented and characterized by a multiplicity of decisions levels. Rates are multiples, and sometimes bizarre, such as Rp. 64.39 a day. Rates can be very close to each other, and differ across narrowly defined occupations. Comparing the minimum wage rates across the years, one gets the impression, at least for some states, that the minimum wage system does not fulfil its primary objective, e.g. to protect workers who are not able to organize.
In conclusion, the system is becoming so complicated that even Indian scholars and minimum wage authorities at the state level seem to have trouble understanding it. This is obvious from the mistakes or inconsistencies contained in the minimum wages report issued by the government, which reveals the great complexity of the system. Also very symptomatic are difficulties in identifying covered occupations and/or levels in several published articles, for example in the special issue of the Indian Journal of Labour Economics or elsewhere.
3.2 Applicability of the minimum wage to informal workers in Indonesia
Minimum wages in Indonesia are set by the governor of each of the 30 provinces for their respective province. In addition to the provincial minimum wage, seven provinces also fix minimum wages at the regency or city level, which must be higher than the provincial minimum wage. There are about 100 such regency/city minimum wages. Finally, in some provinces, there are separate minimum wages by sectors, which are fixed
4 Minimum wages fixed by the central government include an allowance called variable dearness allowance which, since 1988, is revised twice a year.
Conditions of Work and Employment Series No. 16 11

by collective agreement. Provincial and regency/city minimum wages are reviewed on a yearly basis. 5
All workers in an employment relationship with an employer are covered by minimum wage regulations. However, domestic workers are excluded from the minimum wage provisions as they are not employed by an employer as defined by the legislation. Minimum wage rates in Indonesia are in principle entry-level wages: they are only valid for workers in the first year of their employment. After this time, a review of wage rates must be conducted between the workers or the workers' associations and the company. 6 A few provinces also provide the rate of increase for workers with a period of employment greater than one year. 7 Some provinces add that “[t]he minimum wage shall only apply to workers of the lowest level”. 8 Furthermore, the minimum wage does not apply to the entire take-home pay, as workers are entitled to fixed allowances on top of the minimum wage.
The legislation provides for exceptions to be made for companies that are not in a position to pay the minimum wage to their workforce. An agreement must be reached between employers and employees. Approval for any postponement must be given by governors. 9 Regulations in some provinces stipulate that small and medium-scale businesses can be given a postponement by submitting a written agreement between workers and the employer.
Fixing/revising minimum wages
A table of minimum wage rates applicable in six provinces is given in Annex B. As can be seen from the table, there is a lot of variation between minimum wage rates by municipality/regency within the same province. For example, the minimum wage in the province of Jawa Barat is Rp. 367,500 a month for Kota Banjar, while it is 642,000 for Kota Depok. Rates can sometimes be fixed at “bizarre” rates, such as 562,428 in Kab. Bandung. In some cases, the variation between rates is very small and can be as small as a 0.2 percentage point within the same province.
One major feature of the minimum wage policy in Indonesia is that it corresponds to minimum living needs, which cover food, fuel, housing, clothing, transport and other needs. In total, 47 items have been defined making up for the needs of a single worker. Some of the bizarre rates provided in Annex B actually reflect the attempt to fix the minimum wage based on minimum living needs in the regency/municipality.
5 Minimum Wages: Regulation of the Minister of Manpower, No. Per-01-Men/1999 (Business News, No. 6278, 26 February 1999), Article 4/7).
6 ibid., as amended by Decree No. Kep 26/Men/2000 (Business News, Nos. 6536-6537, 1 November 2000), Article 13(2)-(3).
7 For example, Article 4 of the Decision of the Governor of South Sulawi, No. 812/XII/2003 (Business News, No. 7018, 6 February 2004), dated 1 December 2003, stipulates that wages for workers with a tenure between one and five years should be paid an additional wage of 2 per cent a month, and those with five to ten years of tenure should be paid an additional wage of 4 per cent per month in the case of companies not having a collective agreement regulating this matter.
8 For example, Central Java. See Decision of the Central Java Governor No. 561/44/2003 (Business News, No. 7018, 6 February 2004), dated 12 November 2003.
9 Article 24, Minimum Wages: Regulation of the Minister of Manpower, No. Per-01-Men/1999, op. cit.; Law on Manpower Affairs, Article 90(2).
12 Conditions of Work and Employment Series No. 16

This brief summary of the legislation highlights the complexity of the Indonesian system, caught up between the objective of setting an entry-level minimum wage that could be used as a basis for or even promoting collective bargaining at the company level, and the reality of high rates that actually reduce the space for collective bargaining and correspond to the wage paid to semi-skilled labour in big companies.
3.3 Applicability of the minimum wage to the informal sector in South Africa
A dual system of minimum wage fixing has been established in South Africa. Minimum wage rates are set by the government for certain sectors, usually for those sectors where workers and employers are weakly organized. In setting minimum wage rates for those sectors, the government is advised by the Employment Conditions Commission, which is a tripartite body. For other sectors which are better organized, minimum wages are set by collective agreement. Under specific circumstances, these collective agreements can be extended to workers who were not party to the collective agreement.
So far, minimum wages have been set by the government in the following weakly organized sectors: contract cleaning sector, private security sector, agriculture, wholesale and retail trade, domestic work sector, and civil engineering sector. Within each sectoral determination of minimum wage, rates often vary according to geographical zones, hours of work performed and occupations.
Those sectors gained coverage after the significant reform of the minimum wage system in 2000-2001. Occupations commonly found in those sectors represent the bulk of informal wage employment. This is obviously the case of domestic and agriculture work, but also of work performed in small firms in the service sector, such as wholesale and retail trade. Introducing a minimum wage for those occupations was part of a policy package aimed at formalizing the employment relationship. The newly covered occupations are almost exclusively performed by Blacks. The aim of the reform was therefore also to address the huge income inequality which was inherited from the apartheid period.
Today, the minimum wage in South Africa is still very much oriented towards the promotion of equality between ethnic groups; for example, wholesale and retail workers receiving the minimum wage in the former homelands were entitled to wage increases of 20 per cent as from February 2004. 10 Workers from other areas were entitled to an 8.8 per cent increase. 11
Examples of sectoral determinations and sectoral collective agreements can be found in Annexes C, D and E for the following sectors: tearoom, restaurant and catering trade, furniture, bedding and upholstery, farm worker sector, wholesale and retail sector, and meat trade.
10 Homelands were the territories that were set aside for Black South Africans under apartheid. They were abolished in 1993. However, populations living in the former homelands are still deprived and black.
11 South African Department of Labour, at www.labour.fov.za, accessed on 15 February 2005.
Conditions of Work and Employment Series No. 16 13

3.4 Applicability of the minimum wage to informal workers in Brazil
The minimum wage in Brazil is a very old institution officially created in 1936. The Federal Constitution currently defines the minimum wage as the lowest pay that any worker can receive. The minimum wage is the "wage floor proportionate to the extent and complexity of the work", whereby the lowest pay to which a worker in a particular occupational category is entitled is also established. Hence, all workers are covered by the minimum legislation irrespective of sectors and occupations. The current system dates from 1988, when a reform established a unified minimum wage level in the country. By law, the level of the minimum wage must be sufficient to fulfil the basic needs of the workers and their families with food, housing, education, health and personal care, leisure, transportation and social security.
In Brazil, the role of the minimum wage as a reference is very important. Statistics on wage and income distribution commonly use the minimum wage as a threshold and report the proportion of workers or the total population living with less than the minimum wage, or with between one and two minimum wages. For example, “42 million Brazilians live with less than two minimum wages” (Le Monde, 14 July 2005). The influence of the minimum wage on negotiations of wage collective agreements was important because, in periods of high inflation, the minimum wage acted as a kind of index to compare pay levels of different categories of workers. There has been a long decline in the level of the minimum wage since the 1980s. This decline is apparent: DIEESE (2004) indicated that only 12 per cent of wage floors in collective agreements are equivalent or greater than the minimum wage in 1980.
3.5 Comparative analysis: Challenges of minimum wage systems and purchasing power of the minimum wage
Specific challenges of minimum wage legislation in each of the four countries are outlined in Table 3. The issue of a weak labour inspectorate, which is universal, has not been mentioned.
14 Conditions of Work and Employment Series No. 16
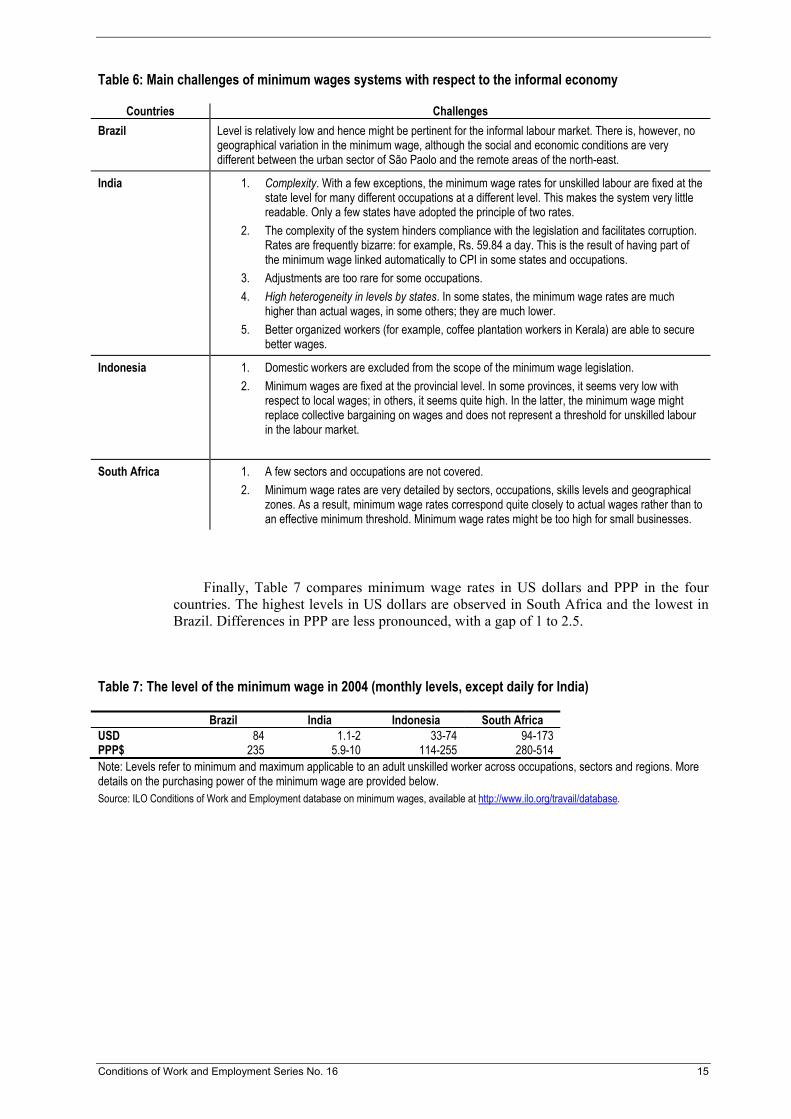
Table 6: Main challenges of minimum wages systems with respect to the informal economy
Countries Challenges Brazil Level is relatively low and hence might be pertinent for the informal labour market. There is, however, no
geographical variation in the minimum wage, although the social and economic conditions are very different between the urban sector of São Paolo and the remote areas of the north-east.
India 1. Complexity. With a few exceptions, the minimum wage rates for unskilled labour are fixed at the state level for many different occupations at a different level. This makes the system very little readable. Only a few states have adopted the principle of two rates.
2. The complexity of the system hinders compliance with the legislation and facilitates corruption. Rates are frequently bizarre: for example, Rs. 59.84 a day. This is the result of having part of the minimum wage linked automatically to CPI in some states and occupations.
3. Adjustments are too rare for some occupations. 4. High heterogeneity in levels by states. In some states, the minimum wage rates are much
higher than actual wages, in some others; they are much lower. 5. Better organized workers (for example, coffee plantation workers in Kerala) are able to secure
better wages.
Indonesia 1. Domestic workers are excluded from the scope of the minimum wage legislation. 2. Minimum wages are fixed at the provincial level. In some provinces, it seems very low with
respect to local wages; in others, it seems quite high. In the latter, the minimum wage might replace collective bargaining on wages and does not represent a threshold for unskilled labour in the labour market.
South Africa 1. A few sectors and occupations are not covered. 2. Minimum wage rates are very detailed by sectors, occupations, skills levels and geographical
zones. As a result, minimum wage rates correspond quite closely to actual wages rather than to an effective minimum threshold. Minimum wage rates might be too high for small businesses.
Finally, Table 7 compares minimum wage rates in US dollars and PPP in the four countries. The highest levels in US dollars are observed in South Africa and the lowest in Brazil. Differences in PPP are less pronounced, with a gap of 1 to 2.5.
Table 7: The level of the minimum wage in 2004 (monthly levels, except daily for India)
Brazil India Indonesia South Africa USD 84 1.1-2 33-74 94-173 PPP$ 235 5.9-10 114-255 280-514 Note: Levels refer to minimum and maximum applicable to an adult unskilled worker across occupations, sectors and regions. More details on the purchasing power of the minimum wage are provided below. Source: ILO Conditions of Work and Employment database on minimum wages, available at http://www.ilo.org/travail/database.
Conditions of Work and Employment Series No. 16 15
India
According to a study currently being carried out at the ILO and based on food prices and country-specific nutrition habits, the living wage rate 12 per hour in India is 9.65 rupees or 1.11 PPP$ per hour (Anker, 2004, p. 60). This amounts to about 77.20 rupees a day, while the floor-level minimum wage is 66 rupees a day.
Brazil
DIEESE estimates the income needed by a family of four for basic food, housing, education, health, clothing, transport and leisure at Rs. 1,538 in June 2005, which represents five times the minimum wage of Rs. 300. Another straightforward measure of the purchasing power of the minimum wage is given by the corresponding level of consumption. In 2003, one could buy 29 kg of meat (or 186 litres of milk) with the monthly minimum wage in Brazil.
The minimum wage represented 1.05 of the Brazilian per capital poverty line in 1997 and 1.25 in 2002. It represented respectively 25 and 31 per cent of average earnings of total wage and salaried workers (ILO, 2004).
Indonesia
In 2005, the minimum wage in the province of Jakarta covered 93.67 per cent of the minimum living needs (MLN). 13 As explained earlier, the MLN is defined according to 47 items including not only food and housing, but also education and leisure activities.
South Africa
In South Africa, minimum wages from the sectoral determinations can be assessed against the poverty line defined by the Institute for Planning Research of the University of Port Elisabeth. In 1993, the poverty line was estimated to be R 207.64 per month for an adult living in rural areas and R 267.21 for an adult living in urban areas.
12 The living wage rate measures the hourly pay rate full-time workers would need to earn enough to support a family of four at an acceptable minimum living standard for the country. In the case of India, it was assumed that the family consumption for food is 80 per cent.
13 Source: Jakarta Office of Manpower.
16 Conditions of Work and Employment Series No. 16
4. Wage fixing in the informal sector: Insights from labour force household surveys
4.1 India
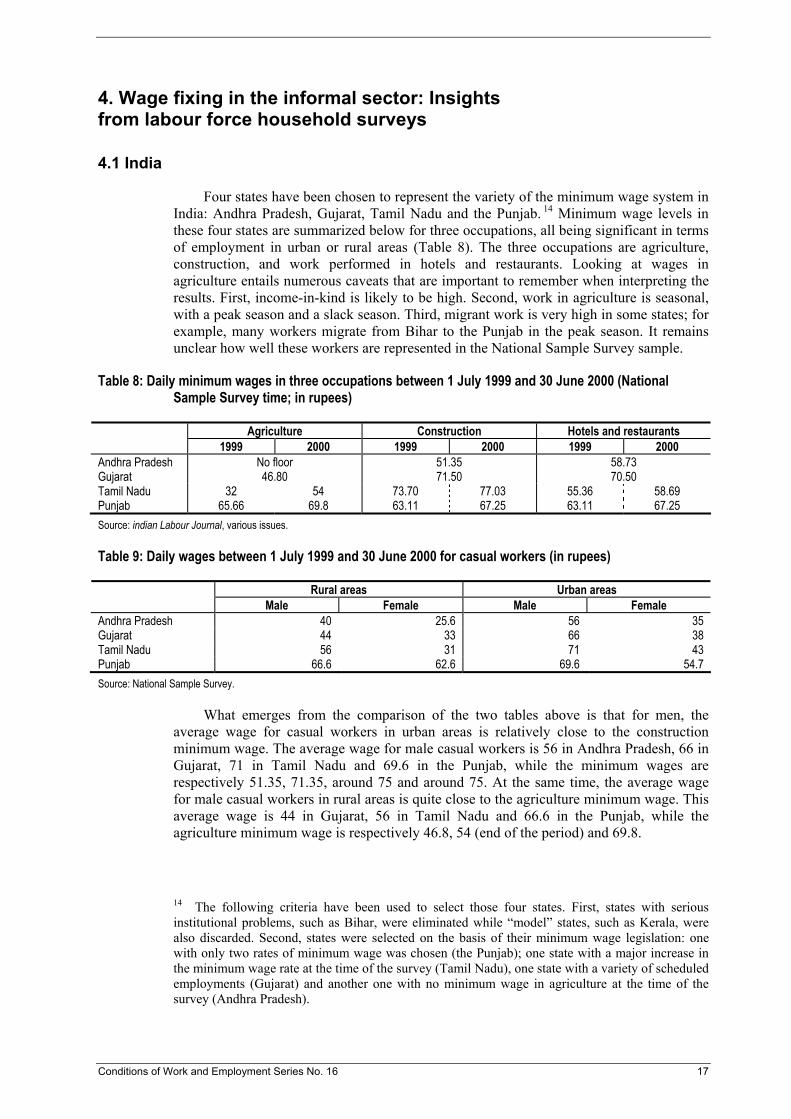
Four states have been chosen to represent the variety of the minimum wage system in India: Andhra Pradesh, Gujarat, Tamil Nadu and the Punjab. 14 Minimum wage levels in these four states are summarized below for three occupations, all being significant in terms of employment in urban or rural areas (Table 8). The three occupations are agriculture, construction, and work performed in hotels and restaurants. Looking at wages in agriculture entails numerous caveats that are important to remember when interpreting the results. First, income-in-kind is likely to be high. Second, work in agriculture is seasonal, with a peak season and a slack season. Third, migrant work is very high in some states; for example, many workers migrate from Bihar to the Punjab in the peak season. It remains unclear how well these workers are represented in the National Sample Survey sample.
Table 8: Daily minimum wages in three occupations between 1 July 1999 and 30 June 2000 (National Sample Survey time; in rupees)
Agriculture Construction Hotels and restaurants 1999 2000 1999 2000 1999 2000
Andhra Pradesh No floor 51.35 58.73 Gujarat 46.80 71.50 70.50 Tamil Nadu 32 54 73.70 77.03 55.36 58.69 Punjab 65.66 69.8 63.11 67.25 63.11 67.25 Source: indian Labour Journal, various issues.
Table 9: Daily wages between 1 July 1999 and 30 June 2000 for casual workers (in rupees)
Rural areas Urban areas Male Female Male Female
Andhra Pradesh 40 25.6 56 35 Gujarat 44 33 66 38 Tamil Nadu 56 31 71 43 Punjab 66.6 62.6 69.6 54.7 Source: National Sample Survey.
What emerges from the comparison of the two tables above is that for men, the average wage for casual workers in urban areas is relatively close to the construction minimum wage. The average wage for male casual workers is 56 in Andhra Pradesh, 66 in Gujarat, 71 in Tamil Nadu and 69.6 in the Punjab, while the minimum wages are respectively 51.35, 71.35, around 75 and around 75. At the same time, the average wage for male casual workers in rural areas is quite close to the agriculture minimum wage. This average wage is 44 in Gujarat, 56 in Tamil Nadu and 66.6 in the Punjab, while the agriculture minimum wage is respectively 46.8, 54 (end of the period) and 69.8.
14 The following criteria have been used to select those four states. First, states with serious institutional problems, such as Bihar, were eliminated while “model” states, such as Kerala, were also discarded. Second, states were selected on the basis of their minimum wage legislation: one with only two rates of minimum wage was chosen (the Punjab); one state with a major increase in the minimum wage rate at the time of the survey (Tamil Nadu), one state with a variety of scheduled employments (Gujarat) and another one with no minimum wage in agriculture at the time of the survey (Andhra Pradesh).
Conditions of Work and Employment Series No. 16 17
For female casual workers, however, the daily wage represents around 60 per cent of the male wage in all states, both in the rural and urban areas. The only exception is the Punjab, where the female wage seems much closer to the male wage. However, women represent less than 10 per cent of casual workers in this state against between 32 and 43 in the other states. Hence, the lower level of the gender wage gap in the Punjab is achieved with a very small participation of female workers in the labour market. The second fact that emerges is that the average wages for female casual workers are far below minimum wages in any of the three occupations (agriculture, construction, and hotels and restaurants). The gap between women’s wages and the minimum wage remains, even if we take into account the sub-minimum wages of women in some occupations in exchange for lower hours of work. In Tamil Nadu, for example, female workers in agriculture are entitled to receive at least 45 rupees a day for five hours of work, while men are entitled to 54 rupees for six hours.
On the basis of that comparison, there is a possibility, which will be explored in the next section, that the minimum wage might represent a norm or a reference wage for male casual workers. For women, this possibility is almost entirely ruled out.
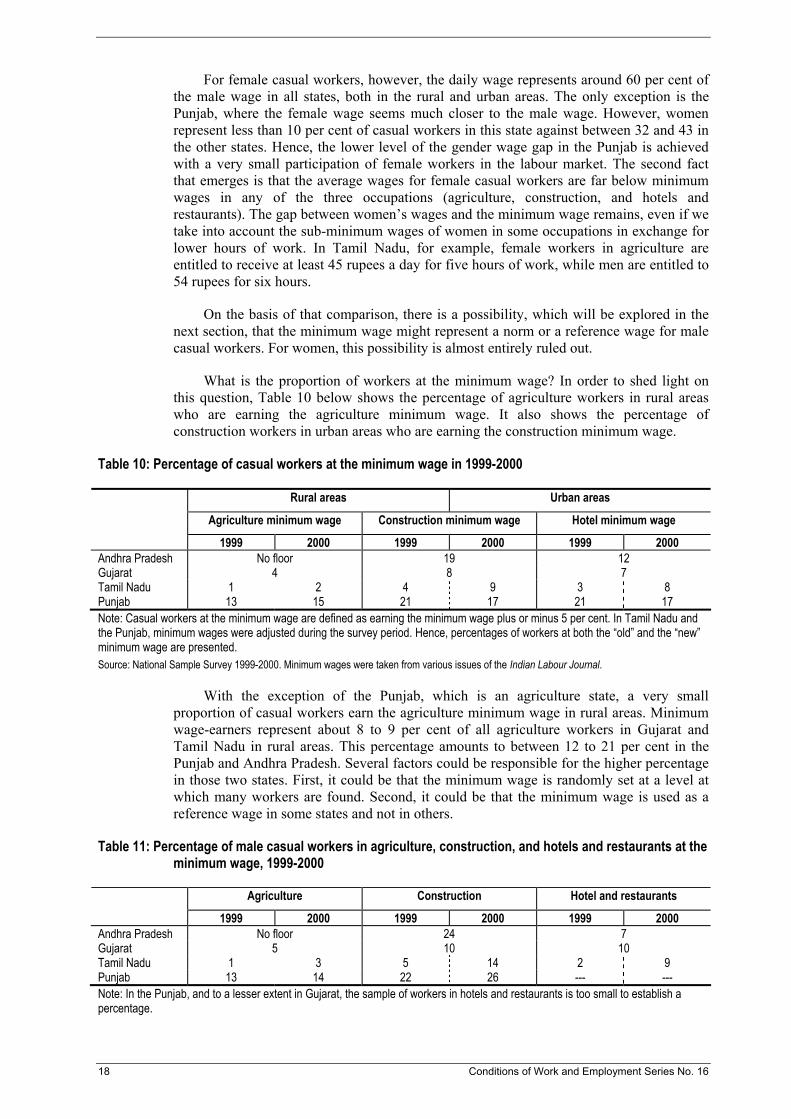
What is the proportion of workers at the minimum wage? In order to shed light on this question, Table 10 below shows the percentage of agriculture workers in rural areas who are earning the agriculture minimum wage. It also shows the percentage of construction workers in urban areas who are earning the construction minimum wage.
Table 10: Percentage of casual workers at the minimum wage in 1999-2000
Rural areas Urban areas
Agriculture minimum wage Construction minimum wage Hotel minimum wage
1999 2000 1999 2000 1999 2000 Andhra Pradesh No floor 19 12 Gujarat 4 8 7 Tamil Nadu 1 2 4 9 3 8 Punjab 13 15 21 17 21 17 Note: Casual workers at the minimum wage are defined as earning the minimum wage plus or minus 5 per cent. In Tamil Nadu and the Punjab, minimum wages were adjusted during the survey period. Hence, percentages of workers at both the “old” and the “new” minimum wage are presented. Source: National Sample Survey 1999-2000. Minimum wages were taken from various issues of the Indian Labour Journal.
With the exception of the Punjab, which is an agriculture state, a very small proportion of casual workers earn the agriculture minimum wage in rural areas. Minimum wage-earners represent about 8 to 9 per cent of all agriculture workers in Gujarat and Tamil Nadu in rural areas. This percentage amounts to between 12 to 21 per cent in the Punjab and Andhra Pradesh. Several factors could be responsible for the higher percentage in those two states. First, it could be that the minimum wage is randomly set at a level at which many workers are found. Second, it could be that the minimum wage is used as a reference wage in some states and not in others.
Table 11: Percentage of male casual workers in agriculture, construction, and hotels and restaurants at the minimum wage, 1999-2000
Agriculture Construction Hotel and restaurants
1999 2000 1999 2000 1999 2000 Andhra Pradesh No floor 24 7 Gujarat 5 10 10 Tamil Nadu 1 3 5 14 2 9 Punjab 13 14 22 26 --- --- Note: In the Punjab, and to a lesser extent in Gujarat, the sample of workers in hotels and restaurants is too small to establish a percentage.
18 Conditions of Work and Employment Series No. 16
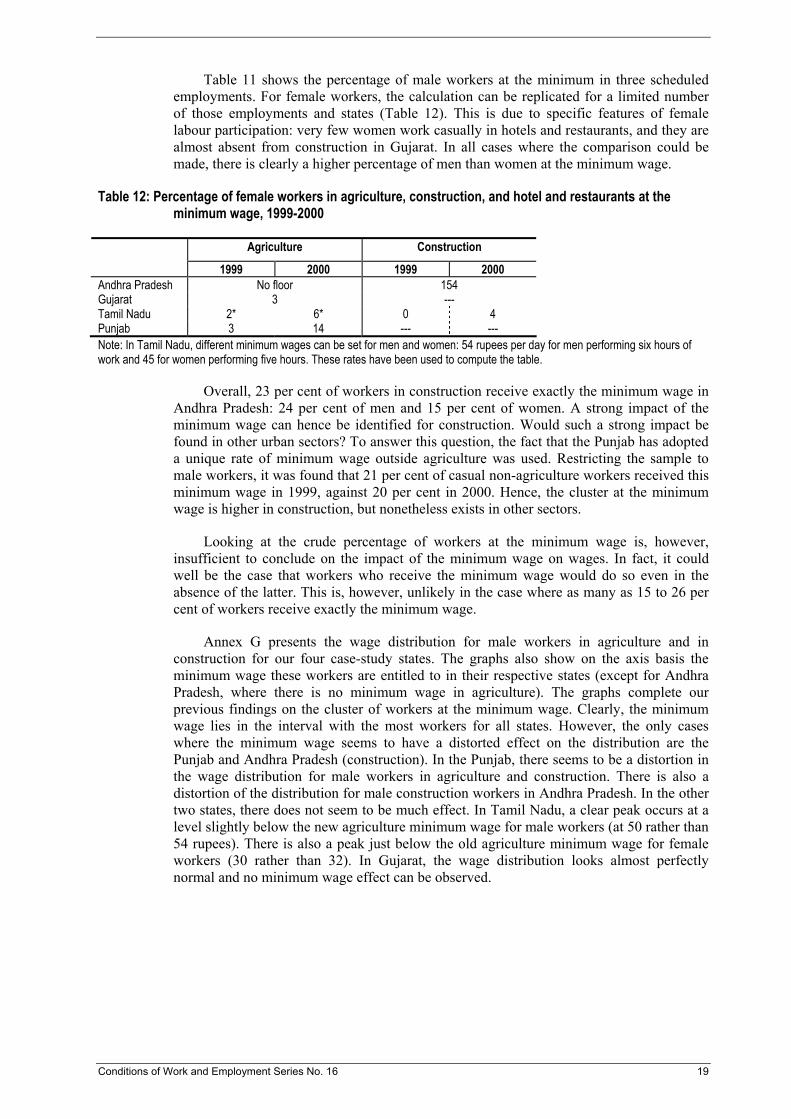
Table 11 shows the percentage of male workers at the minimum in three scheduled employments. For female workers, the calculation can be replicated for a limited number of those employments and states (Table 12). This is due to specific features of female labour participation: very few women work casually in hotels and restaurants, and they are almost absent from construction in Gujarat. In all cases where the comparison could be made, there is clearly a higher percentage of men than women at the minimum wage.
Table 12: Percentage of female workers in agriculture, construction, and hotel and restaurants at the minimum wage, 1999-2000
Agriculture Construction
1999 2000 1999 2000 Andhra Pradesh No floor 154 Gujarat 3 --- Tamil Nadu 2* 6* 0 4 Punjab 3 14 --- --- Note: In Tamil Nadu, different minimum wages can be set for men and women: 54 rupees per day for men performing six hours of work and 45 for women performing five hours. These rates have been used to compute the table.
Overall, 23 per cent of workers in construction receive exactly the minimum wage in Andhra Pradesh: 24 per cent of men and 15 per cent of women. A strong impact of the minimum wage can hence be identified for construction. Would such a strong impact be found in other urban sectors? To answer this question, the fact that the Punjab has adopted a unique rate of minimum wage outside agriculture was used. Restricting the sample to male workers, it was found that 21 per cent of casual non-agriculture workers received this minimum wage in 1999, against 20 per cent in 2000. Hence, the cluster at the minimum wage is higher in construction, but nonetheless exists in other sectors.
Looking at the crude percentage of workers at the minimum wage is, however, insufficient to conclude on the impact of the minimum wage on wages. In fact, it could well be the case that workers who receive the minimum wage would do so even in the absence of the latter. This is, however, unlikely in the case where as many as 15 to 26 per cent of workers receive exactly the minimum wage.
Annex G presents the wage distribution for male workers in agriculture and in construction for our four case-study states. The graphs also show on the axis basis the minimum wage these workers are entitled to in their respective states (except for Andhra Pradesh, where there is no minimum wage in agriculture). The graphs complete our previous findings on the cluster of workers at the minimum wage. Clearly, the minimum wage lies in the interval with the most workers for all states. However, the only cases where the minimum wage seems to have a distorted effect on the distribution are the Punjab and Andhra Pradesh (construction). In the Punjab, there seems to be a distortion in the wage distribution for male workers in agriculture and construction. There is also a distortion of the distribution for male construction workers in Andhra Pradesh. In the other two states, there does not seem to be much effect. In Tamil Nadu, a clear peak occurs at a level slightly below the new agriculture minimum wage for male workers (at 50 rather than 54 rupees). There is also a peak just below the old agriculture minimum wage for female workers (30 rather than 32). In Gujarat, the wage distribution looks almost perfectly normal and no minimum wage effect can be observed.
Conditions of Work and Employment Series No. 16 19
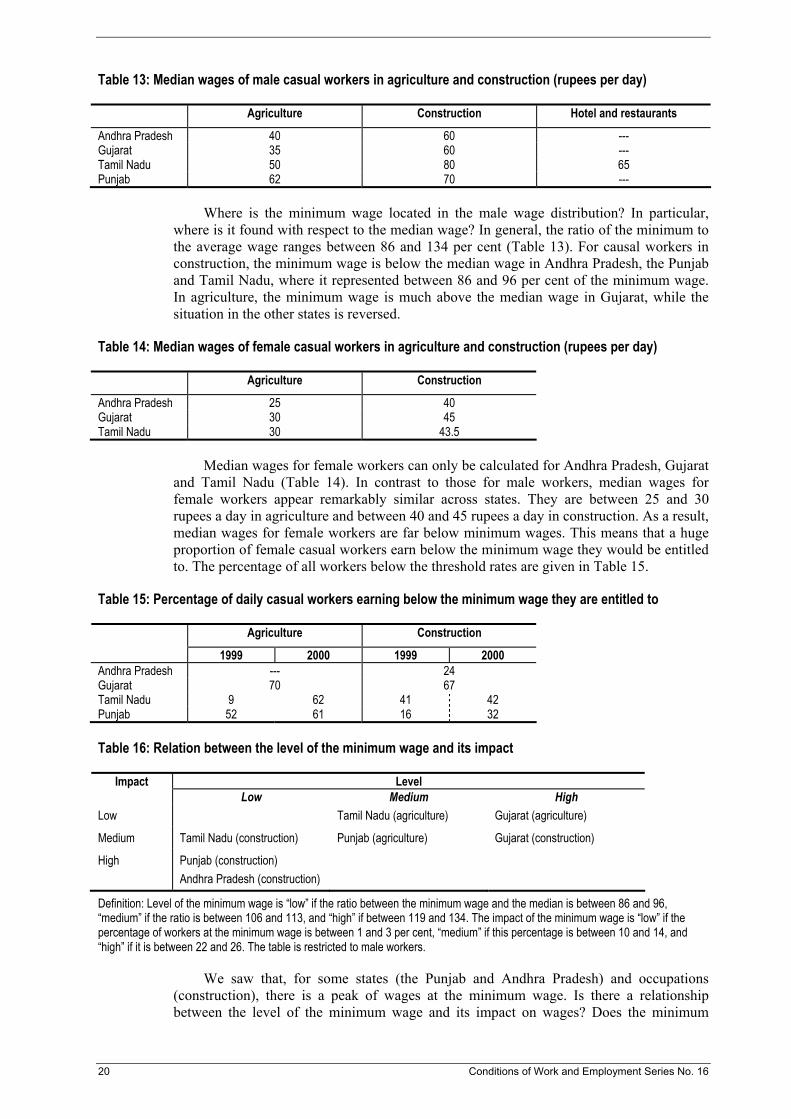
Table 13: Median wages of male casual workers in agriculture and construction (rupees per day)
Agriculture Construction Hotel and restaurants
Andhra Pradesh 40 60 --- Gujarat 35 60 --- Tamil Nadu 50 80 65 Punjab 62 70 ---
Where is the minimum wage located in the male wage distribution? In particular, where is it found with respect to the median wage? In general, the ratio of the minimum to the average wage ranges between 86 and 134 per cent (Table 13). For causal workers in construction, the minimum wage is below the median wage in Andhra Pradesh, the Punjab and Tamil Nadu, where it represented between 86 and 96 per cent of the minimum wage. In agriculture, the minimum wage is much above the median wage in Gujarat, while the situation in the other states is reversed.
Table 14: Median wages of female casual workers in agriculture and construction (rupees per day)
Agriculture Construction
Andhra Pradesh 25 40 Gujarat 30 45 Tamil Nadu 30 43.5
Median wages for female workers can only be calculated for Andhra Pradesh, Gujarat and Tamil Nadu (Table 14). In contrast to those for male workers, median wages for female workers appear remarkably similar across states. They are between 25 and 30 rupees a day in agriculture and between 40 and 45 rupees a day in construction. As a result, median wages for female workers are far below minimum wages. This means that a huge proportion of female casual workers earn below the minimum wage they would be entitled to. The percentage of all workers below the threshold rates are given in Table 15.
Table 15: Percentage of daily casual workers earning below the minimum wage they are entitled to
Agriculture Construction
1999 2000 1999 2000 Andhra Pradesh --- 24 Gujarat 70 67 Tamil Nadu 9 62 41 42 Punjab 52 61 16 32
Table 16: Relation between the level of the minimum wage and its impact
Level Impact Low Medium High
Low Tamil Nadu (agriculture) Gujarat (agriculture)
Medium Tamil Nadu (construction) Punjab (agriculture) Gujarat (construction)
High Punjab (construction) Andhra Pradesh (construction)
Definition: Level of the minimum wage is “low” if the ratio between the minimum wage and the median is between 86 and 96, “medium” if the ratio is between 106 and 113, and “high” if between 119 and 134. The impact of the minimum wage is “low” if the percentage of workers at the minimum wage is between 1 and 3 per cent, “medium” if this percentage is between 10 and 14, and “high” if it is between 22 and 26. The table is restricted to male workers.
We saw that, for some states (the Punjab and Andhra Pradesh) and occupations (construction), there is a peak of wages at the minimum wage. Is there a relationship between the level of the minimum wage and its impact on wages? Does the minimum
20 Conditions of Work and Employment Series No. 16

wage have a higher impact when it is set at relatively lower or higher levels? Table 16 gives a partial answer to these questions. It shows that the minimum wage, which is set at a level between 85 and 95 per cent of the median, has a high impact on wages earned by construction workers in Andhra Pradesh and the Punjab. The table seems to suggest that there is a stronger impact in states/sectors where the minimum wage is fixed below, but relatively close, to the median.
In conclusion, there is a small effect of minimum wages on informal wages in India. At least, there is one in the construction sector, and in agriculture in the Punjab. However, many workers remain below the legal threshold, most notably the bulk of female workers.
4.2 Wage fixing in the informal sector: Insights from labour force surveys
Indonesia
Six provinces have been chosen to represent Indonesia: Bangka Belitung, Jawa Barat, Banten, Jawa Tengah, Jawa Timur and Bali. As explained earlier, minimum wage rates may vary within each province according to municipalities or regencies. Minimum wages rates by regency/municipalities at the survey time (2004) can be found in Annex B for seven provinces. Annex B also provides the mean and median wages in each regency/municipality represented in the labour force survey sample. What is very striking is that some regencies/municipalities which have their own minimum wage only have a dozen workers represented in the labour force survey.
As said before, there is a huge variation within each province: for example, in Jawa Barat, 27 municipalities or regencies have fixed 24 different rates, ranging from 390,000 to 670,000 a month. The lowest and highest rates per province are given in Table 17.
Table 17: Monthly rates of minimum wage and median wages* in Indonesia at the survey time (2004)
Lowest rate Highest rate Median wages* Bangka Belitung 510,000 553,000 700,000 Jawa Barat 367,500 670,000 400,000 Jawa Tenga 365,000 435,000 375,000 Jawa Timur 310,000 550,700 325,000 Banten 550,000 660,000 587,500 Bali 432,650 469,000 480,000 * Median wages for casual workers
Median wages for casual workers are above the lowest minimum wage level in the province.
Table 18: Average wage in the six provinces
All wage-earners Employees Casual workers Bangka Belitung 840,040 863,618 740,350 Jawa Barat 715,893 804,464 433,937 Jawa Tenga 549,607 614,574 407,105 Jawa Timur 628,565 723,756 367,739 Banten 903,136 923,688 553,131 Bali 753,637 814,018 477,299
Tables 18 and 19 give statistics on wages by provinces. Annex B presents the same statistics in a more detailed way by regency/municipality. On the one hand, it shows that the ratio of the minimum to the average wage varies between .5 and 1.66. On average, this
Conditions of Work and Employment Series No. 16 21

ratio is equal to 60 per cent. On the other hand, the ratio of the minimum to the median wage shows considerable variation as well and ranges between .5 and 2.0. On average, the ratio of the minimum to the average wage is equal to .67 per cent. As a consequence, the percentage of workers below the minimum wage is very unequal across provinces and regencies/municipalities.
Table 19: Percentage of wage workers at the minimum wage in six Indonesian provinces
Employees Casual workers Bangka Belitung 1.9 3.5 Jawa Barat 3.5 5.0 Jawa Tenga 7.1 5.8 Jawa Timur 2.9 4.2 Banten 5.0 9.1 Bali 4.4 8.1 Source: Labour force survey (2004).
Table 19 shows the percentage of wage workers whose wage lies between .95 and 1.05 of the regency/municipality minimum wage. Percentages have been averaged over the provinces. Wage workers include employees,and all casual workers, including those in agriculture.
The distribution of wages in each of the six provinces is shown in Annex G. Because of the multiplicity of minimum wage rates in Indonesia, no minimum wage figure is indicated on the graph. To make comparison easier, the axis line locates the figure 500,000, which is in the range of minimum wage rates. The axis also indicates extreme values of wages: 100,000 and 8,500,500.
In conclusion, not much is observed on the minimum wage impact. Attempts to restrict the analysis to first-entrants who are targeted by the minimum wage policy also fail. First-entrants earn in fact far below the minimum wage and no peak is observed. The same can be said about young workers.
Percentage of workers below the minimum wage
The share of employees below the minimum wage varies between 18.8 per cent in Banten to 31.68 in Jawa Tenga. This is shown in Table 20. Percentages for casual workers are much higher: about twice as many casual workers earn below the minimum wage as regular employees in five of the provinces studied.
Table 20: Percentage of wage workers below the minimum wage in six Indonesian provinces
Employees Casual workers Bangka Belitung 26.8 (36.3) Jawa Barat 26.2 60.8 Jawa Tenga 31.6 49.0 Jawa Timur 29.6 62.9 Banten 18.8 (50) Bali 20.6 41.6 Note: Bangka Belitung and Banten: sample size of casual workers less than 100. Source: Labour force survey (2004).
It is also possible to calculate the percentage of workers below each regency/municipality represented in the labour force survey. We give below one example for the province of Bangka Belitung (Table 21).
22 Conditions of Work and Employment Series No. 16

Table 21: Percentage of wage workers below the minimum wage in the province of Bangka Belitung
Regency Minimum wage Percentage of workers Kota Pangkal Pinang 510,000 12 Kab. Bangka 557,000 18 Kab. Belitung 553,000 24
4.2 Wage fixing in the informal sector: Insights from labour force surveys
South Africa
As explained earlier, minimum wages in South Africa are fixed by the government in certain weakly organized sectors. The table below presents the rates for two occupations typical of the informal economy: farm workers and domestic workers. These two occupations represent respectively 15.5 and 14.5 of total wage employment. Almost 80 per cent of domestic workers are women. As can be seen from Table 22, rates also differ according to geographic zones. These zones more or less correspond to an urban/rural split.
To assess the impact of the minimum wage on informal wages, data from the March 2003 round of the labour force survey have been used. At survey time, the following rates of minimum wages were established for domestic and farm workers.
Table 22: Minimum wages for farm and domestic workers (March 2003)
Farm workers Hours of work > 27 hours a week Area A: R. 800 a month Area B. R. 650 a month Hours of work <= 27 hours a week Area A: 4.10 an hour Area B: 3.33 an hour
Domestic workers Hours of work > 27 hours a week Area A: 4.10 an hour Area B: 3.33 an hour Hours of work <= 27 hours a week Area A: 4.51 an hour Area B: 3.66 an hour
For farm wages and from March 2003, a deduction of 10 per cent for food is allowed and a further 10 per cent for accommodation when it meets certain requirements. 15
The percentage of farm and domestic workers earning exactly the minimum wage they are entitled to (plus or minus 5 per cent) is reported in Table 23. Wage distribution can be found in Annex G.
15 Government Gazette, 2 December 2002.
Conditions of Work and Employment Series No. 16 23

Table 23: Percentage of workers earning the minimum wage
Farm workers Hours of work greater than 27 hours a week Area A: 16 Area B. 10 Hours of work less than or equal to 27 hours a week Area A: ---* Area B: 4
Domestic workers Hours of work greater than 27 hours a week Area A: 5 Area B: 5 Hours of work less than or equal to 27 hours a week Area A: 8 Area B: 6 * Number of observations is too small. The table gives the percentage of workers earning the minimum wage plus or minus 5 per cent. Source: Labour force survey (March 2003).
From Table 23, it is possible to see that out of all workers occupied in agriculture, 16 per cent of those working close to urban centres and 10 per cent of those working in rural zones earn the minimum wage that they are entitled to. These figures have been calculated for farm workers working more than 27 hours a week, the overwhelming majority of all farm workers. For domestic workers, the percentage is smaller and ranges between 5 and 8 per cent, depending on the geographical zone and the number of hours worked.
These numbers should be taken with caution. The following method was used to compute them. As shown earlier, the minimum wage can be defined on a monthly or an hourly basis, depending on occupations and hours worked. To compute the percentage of workers at the minimum wage, hourly wages have been calculated using the LFS data on wages and hours of work. Hence, errors on reporting hours of work as well as wages could be responsible for wrong estimates of hourly wages. This means that figures in Table 23 are more reliable for farm workers working more than 27 hours a week than for other groups of workers.
Table 24: Mean and median wages for domestic and farm workers (in Rand)
Farm workers Area Mean Median Hours of work greater than 27 hours a week A 996 per month 758 B 784 per month 600
Domestic workers Area Mean Median Hours of work greater than 27 hours a week A 2.71 3.39 B 2.49 1.98 Hours of work less than or equal to 27 hours a week A 4.62 6.79 B 5.07 3.85
Comparing minimum wage rates to average wages shows two things (Table 24). First, wages for farm workers are on average higher than the minimum wage. This is true in both rural and urban areas. Second, for domestic workers, wages are lower than the minimum wage for those working more than 27 hours a month and higher for the others. The comparison with median wages shows a different light on compliance with minimum wage regulations. Minimum wage rates are close to median wage for farm workers, while for domestic workers, the situation very much depends on the number of hours worked. This suggests that the proportion of workers below the minimum wage varies according to occupation and hours. Table 25 demonstrates this.
24 Conditions of Work and Employment Series No. 16
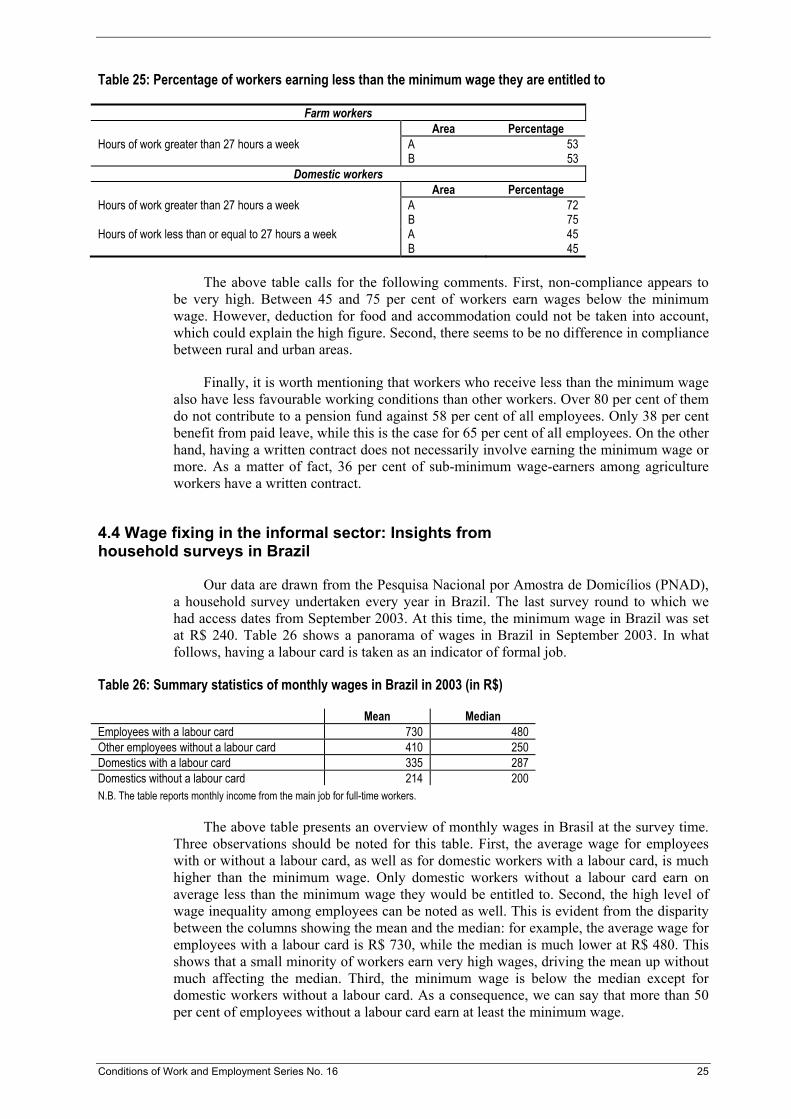
Table 25: Percentage of workers earning less than the minimum wage they are entitled to
Farm workers Area Percentage Hours of work greater than 27 hours a week A 53 B 53
Domestic workers Area Percentage Hours of work greater than 27 hours a week A 72 B 75 Hours of work less than or equal to 27 hours a week A 45 B 45
The above table calls for the following comments. First, non-compliance appears to be very high. Between 45 and 75 per cent of workers earn wages below the minimum wage. However, deduction for food and accommodation could not be taken into account, which could explain the high figure. Second, there seems to be no difference in compliance between rural and urban areas.
Finally, it is worth mentioning that workers who receive less than the minimum wage also have less favourable working conditions than other workers. Over 80 per cent of them do not contribute to a pension fund against 58 per cent of all employees. Only 38 per cent benefit from paid leave, while this is the case for 65 per cent of all employees. On the other hand, having a written contract does not necessarily involve earning the minimum wage or more. As a matter of fact, 36 per cent of sub-minimum wage-earners among agriculture workers have a written contract.
4.4 Wage fixing in the informal sector: Insights from household surveys in Brazil
Our data are drawn from the Pesquisa Nacional por Amostra de Domicílios (PNAD), a household survey undertaken every year in Brazil. The last survey round to which we had access dates from September 2003. At this time, the minimum wage in Brazil was set at R$ 240. Table 26 shows a panorama of wages in Brazil in September 2003. In what follows, having a labour card is taken as an indicator of formal job.
Table 26: Summary statistics of monthly wages in Brazil in 2003 (in R$)
Mean Median Employees with a labour card 730 480 Other employees without a labour card 410 250 Domestics with a labour card 335 287 Domestics without a labour card 214 200 N.B. The table reports monthly income from the main job for full-time workers.
The above table presents an overview of monthly wages in Brasil at the survey time. Three observations should be noted for this table. First, the average wage for employees with or without a labour card, as well as for domestic workers with a labour card, is much higher than the minimum wage. Only domestic workers without a labour card earn on average less than the minimum wage they would be entitled to. Second, the high level of wage inequality among employees can be noted as well. This is evident from the disparity between the columns showing the mean and the median: for example, the average wage for employees with a labour card is R$ 730, while the median is much lower at R$ 480. This shows that a small minority of workers earn very high wages, driving the mean up without much affecting the median. Third, the minimum wage is below the median except for domestic workers without a labour card. As a consequence, we can say that more than 50 per cent of employees without a labour card earn at least the minimum wage.
Conditions of Work and Employment Series No. 16 25
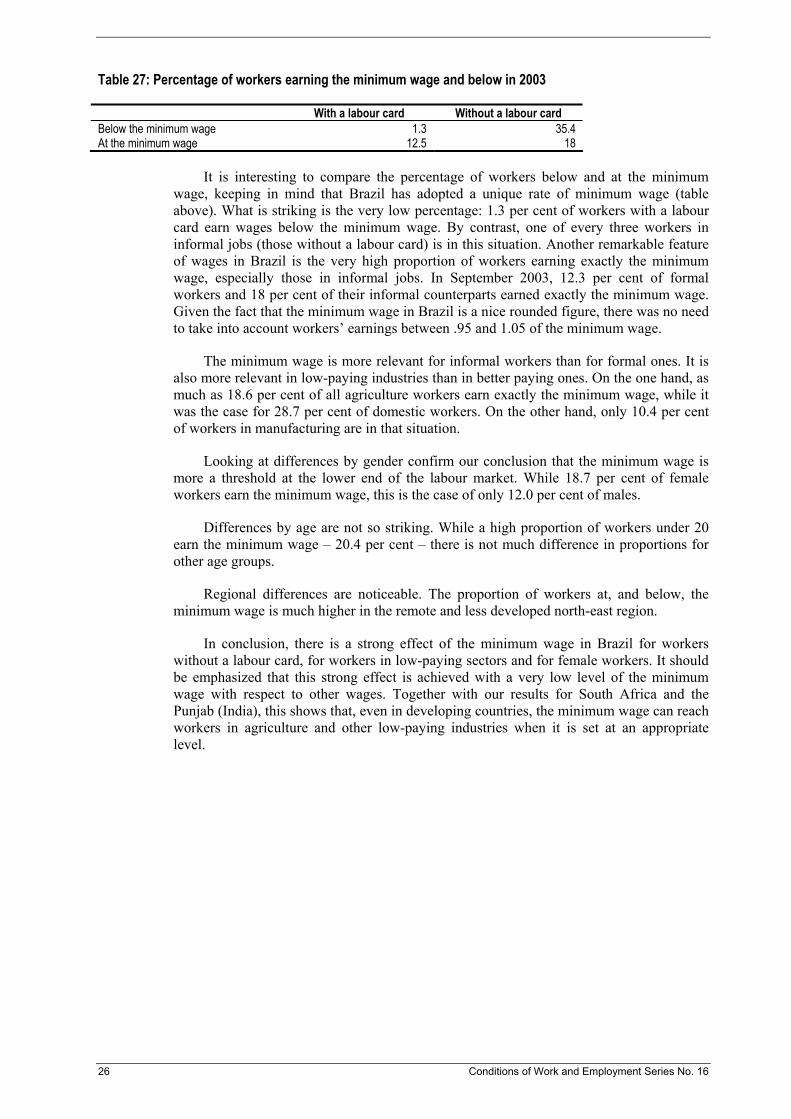
Table 27: Percentage of workers earning the minimum wage and below in 2003
With a labour card Without a labour card Below the minimum wage 1.3 35.4 At the minimum wage 12.5 18
It is interesting to compare the percentage of workers below and at the minimum wage, keeping in mind that Brazil has adopted a unique rate of minimum wage (table above). What is striking is the very low percentage: 1.3 per cent of workers with a labour card earn wages below the minimum wage. By contrast, one of every three workers in informal jobs (those without a labour card) is in this situation. Another remarkable feature of wages in Brazil is the very high proportion of workers earning exactly the minimum wage, especially those in informal jobs. In September 2003, 12.3 per cent of formal workers and 18 per cent of their informal counterparts earned exactly the minimum wage. Given the fact that the minimum wage in Brazil is a nice rounded figure, there was no need to take into account workers’ earnings between .95 and 1.05 of the minimum wage.
The minimum wage is more relevant for informal workers than for formal ones. It is also more relevant in low-paying industries than in better paying ones. On the one hand, as much as 18.6 per cent of all agriculture workers earn exactly the minimum wage, while it was the case for 28.7 per cent of domestic workers. On the other hand, only 10.4 per cent of workers in manufacturing are in that situation.
Looking at differences by gender confirm our conclusion that the minimum wage is more a threshold at the lower end of the labour market. While 18.7 per cent of female workers earn the minimum wage, this is the case of only 12.0 per cent of males.
Differences by age are not so striking. While a high proportion of workers under 20 earn the minimum wage – 20.4 per cent – there is not much difference in proportions for other age groups.
Regional differences are noticeable. The proportion of workers at, and below, the minimum wage is much higher in the remote and less developed north-east region.
In conclusion, there is a strong effect of the minimum wage in Brazil for workers without a labour card, for workers in low-paying sectors and for female workers. It should be emphasized that this strong effect is achieved with a very low level of the minimum wage with respect to other wages. Together with our results for South Africa and the Punjab (India), this shows that, even in developing countries, the minimum wage can reach workers in agriculture and other low-paying industries when it is set at an appropriate level.
26 Conditions of Work and Employment Series No. 16
5. Results from the qualitative surveys
The “compliance” of some informal employers is all the more surprising, since the monitoring by the labour inspectorate might be quite rare in small firms where the bulk of informal wage-earners is concentrated. To explain the “spike” in the wage distribution at the minimum wage, it seems necessary to understand the motivation of employers and hence their wage-fixing practice. Wage fixing in the informal economy is rarely analysed, being considered as simply determined by supply-and-demand considerations as in the competition model. However, the few available qualitative studies reveal that complex mechanisms entailing the necessity of retaining and motivating skilled workers and combining basic pay, bonuses and income in kind are also at stake (for example, SMERU, 2001, for Indonesia).
A survey of a dozen enterprises was undertaken in each of the four countries under analysis. In each firm, employers were interviewed with the help of the questionnaire shown in Annex H. The questionnaire was designed with the objective of gaining information on three topics: pay practices, knowledge of the minimum wage, and the use and application of the minimum wage.
The surveys show that, depending on the countries, different factors were selected to choose the informal firms, except for one factor that is common: the fact that firms are located in urban areas, labour-based and/or operating with unskilled labour. In Brazil, the selection was very much based on the firms’ size and their location. In South Africa, small firms operating mostly in the service sector were interviewed. In India and Indonesia, the lack or incompleteness of firms’ registration was a major factor.
5.1 Results from the Indian qualitative survey
5.1.1 Pay practice and other working conditions
The enterprises surveyed are all located in urban areas from different states. Services, manufacturing and the construction sector are represented among the enterprises surveyed. Among them, pay practices are fixed largely on the basis of oral contract. Employers do not enter into any type of written contract, mainly to avoid any kind of possible claim from employees in future. Though most of the workers are paid the minimum wages applicable to the sector of employment, they are seldom given other incentives, such as bonuses, leave, health security or any other types of social security. Since the contracts are made on an oral basis, employers also do not contribute to gratuity and provident fund schemes for workers. A summary of the pay practices across the 15 surveyed enterprises is presented in Table 28.
Conditions of Work and Employment Series No. 16 27
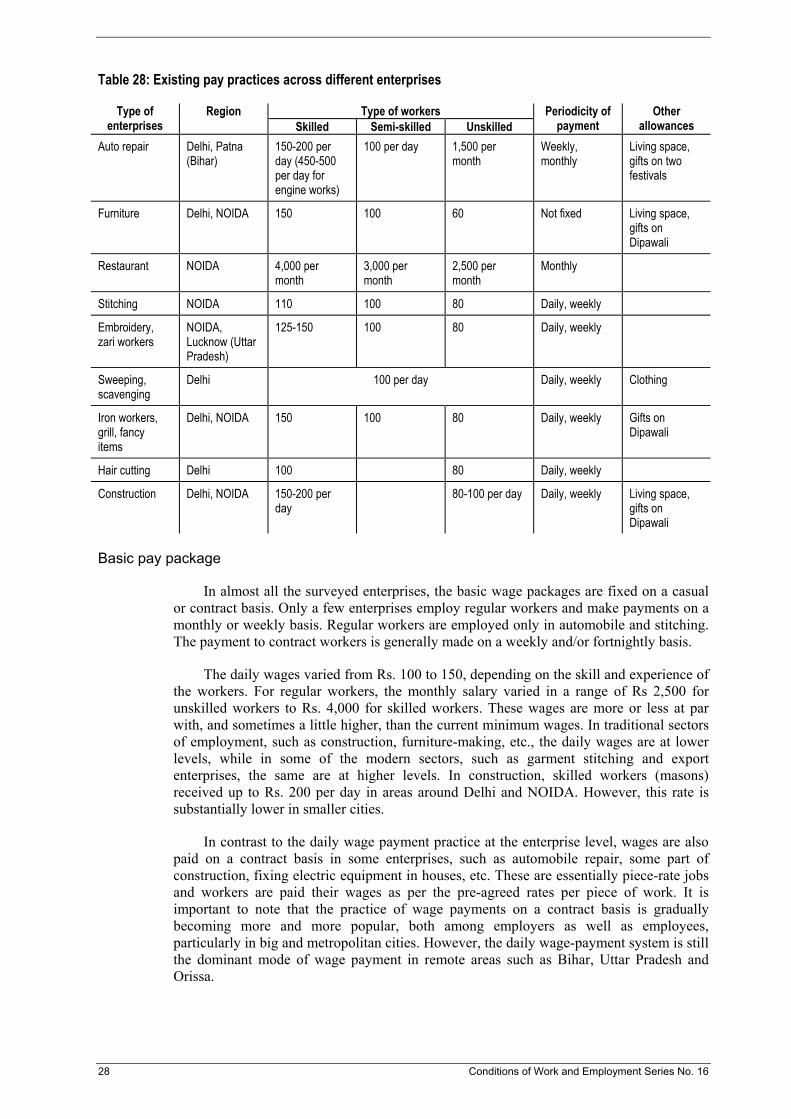
Table 28: Existing pay practices across different enterprises
Type of workers Type of enterprises
Region Skilled Semi-skilled Unskilled
Periodicity of payment
Other allowances
Auto repair Delhi, Patna (Bihar)
150-200 per day (450-500 per day for engine works)
100 per day 1,500 per month
Weekly, monthly
Living space, gifts on two festivals
Furniture Delhi, NOIDA 150 100 60 Not fixed Living space, gifts on Dipawali
Restaurant NOIDA 4,000 per month
3,000 per month
2,500 per month
Monthly
Stitching NOIDA 110 100 80 Daily, weekly
Embroidery, zari workers
NOIDA, Lucknow (Uttar Pradesh)
125-150 100 80 Daily, weekly
Sweeping, scavenging
Delhi 100 per day Daily, weekly Clothing
Iron workers, grill, fancy items
Delhi, NOIDA 150 100 80 Daily, weekly Gifts on Dipawali
Hair cutting Delhi 100 80 Daily, weekly
Construction Delhi, NOIDA 150-200 per day
80-100 per day Daily, weekly Living space, gifts on Dipawali
Basic pay package
In almost all the surveyed enterprises, the basic wage packages are fixed on a casual or contract basis. Only a few enterprises employ regular workers and make payments on a monthly or weekly basis. Regular workers are employed only in automobile and stitching. The payment to contract workers is generally made on a weekly and/or fortnightly basis.
The daily wages varied from Rs. 100 to 150, depending on the skill and experience of the workers. For regular workers, the monthly salary varied in a range of Rs 2,500 for unskilled workers to Rs. 4,000 for skilled workers. These wages are more or less at par with, and sometimes a little higher, than the current minimum wages. In traditional sectors of employment, such as construction, furniture-making, etc., the daily wages are at lower levels, while in some of the modern sectors, such as garment stitching and export enterprises, the same are at higher levels. In construction, skilled workers (masons) received up to Rs. 200 per day in areas around Delhi and NOIDA. However, this rate is substantially lower in smaller cities.
In contrast to the daily wage payment practice at the enterprise level, wages are also paid on a contract basis in some enterprises, such as automobile repair, some part of construction, fixing electric equipment in houses, etc. These are essentially piece-rate jobs and workers are paid their wages as per the pre-agreed rates per piece of work. It is important to note that the practice of wage payments on a contract basis is gradually becoming more and more popular, both among employers as well as employees, particularly in big and metropolitan cities. However, the daily wage-payment system is still the dominant mode of wage payment in remote areas such as Bihar, Uttar Pradesh and Orissa.
28 Conditions of Work and Employment Series No. 16

For migrant workers, the payment is generally on the lower side. However, almost all migrant workers are also provided with the facility of staying at workshops at night. The construction and automobile sectors are largely dominated by migrant workers. However, in other sectors also, some migrant workers from nearby villages are employed.
Process of recruitment and entry-level wage
Before confirming the employment, almost all the employers conduct a test of the worker’s skill. Workers are asked to work for a few days with senior members to show their skills to the employers. The period of training varies from a few days (two to three) in construction/restaurant work to two weeks in automobile and furniture works. In garment stitching and embroidery works, new workers are required to work with main skilled workers (popularly known as “master”) for about a week and then their wages are fixed and employment is confirmed. A garment stitcher from NOIDA says: “We want to test worker’s skill before he exactly starts working. We cannot just put him on work as if he does not work properly our name is stake. New workers have to work with master for a while and then it is the master who fixes his skill level and wages in turn”. For this period of training/probation, workers are not paid anything other than their daily food expenditure.
Though minimum wages are not a reference point at the time of negotiating wages, in general, the entry wages are equal or very close to minimum wages fixed for the sector. However, some employers said that, during the training or probation period of the workers, they sometimes received less than minimum wages fixed for the sector. At the time of the survey, some young workers in ‘automobile repair’ and a few female workers in ‘garment stitching’ were reported as getting less than minimum wage as they were treated as trainees or probationers by employers. The employers told them that as soon as they get confirmed for the job, they will start receiving higher wages. However, the period of training was never stipulated clearly in any case.
Other allowances
No payments of bonuses, provisions for gratuity and provident funds were made in any of the surveyed enterprises. Most of the employers feel that, since they run small enterprises, they cannot afford to pay these perks to their employees. One employer in construction says “We run enterprises based on small capital, we cannot provide such facilities to workers”. However, most of the employers say that in case “we get bulk orders, we also give additional payments to workers for their additional work”. These kinds of payment are made to workers in case of bulk orders from big enterprises during some specific seasons. Furthermore, allowances or gifts on festivals are provided in five out of ten firms. Free accommodation on the shopfloor is also quite common. In some cases, the employer supports minor medical expenses.
Working hours
Normal working hours in almost all the enterprises vary from nine to ten hours a day. Workers generally work from 9 a.m. to 7 p.m. or 10 a.m. to 8 p.m. In the same enterprises, some workers also work for more than ten hours, as they are supposed to open the shopfloor before other employees come and close the shop after all the other employees leave. No additional payments are made for these extra duties. In some enterprises, particularly in garment stitching, embroidery and sari works, and furniture, there are seasonal peaks of demand by bigger enterprises and retail markets. During these seasons, workers are asked to work for longer hours. Every worker is paid for the additional hours put in for the additional work. During peak seasons, most of the workers are asked to work for more than 12 hours a day; however, there is no overtime rate.
Conditions of Work and Employment Series No. 16 29

Leave and other benefits
Since most of the workers are employed on a daily casual or contact basis, they are not provided with any kind of leave. If workers do not turn up on the job on any particular day, their salary is deducted for that particular day. However, the workers are not free to join any other enterprise without proper notice, as employers always keep some part of their salary as the balance for security. Also, if any worker arrives late to the workshop, employers cut his/her salary for half a day.
Even if workers fall sick, leave is not allowed. In a few cases, however, employers reported that they have met some minor costs for the treatment of the workers. One employer of a furniture enterprise says “We take care of small illness of workers and we also spend on treatment of illness of workers”. In none of the surveyed enterprises, employers mentioned about any compensation and/or major cost reimbursement in case of serious illness or injury of workers. Generally workers suffering from prolonged illness are retrenched without any compensation or other benefits.
5.1.2 Knowledge of minimum wages
In contrast to the publicity rules laid out in Section 22 of the Minimum Wages (Central) Rules, 1950, information collected from informal employers indicates that a majority of the employers shows absolute unawareness about the existence of minimum wage regulations per se. However, interactions with employers reveal that they purposely did not acknowledge various provisions of the regulation and cited ignorance about such regulations.
However, a few contractors in the construction sector (who employ workers on behalf of the principal employer) reported that they are aware about the existence of the said regulations. These contractors say that, since they have to bargain for wages with the principal employers, they keep themselves updated with the rates announced by the government. However, it is not always possible for the contractors to successfully bargain for wages for workers. Moreover, even if contractors succeed, the entire benefit may not be passed onto workers by the contractors. Furthermore, it should be noted that even these contractors did not know exactly about various other aspects of the minimum wages regulations except some vague information on some of the well-known provisions, such as standard working hours, overtime rate, etc. The vagueness of their knowledge about other provisions could be inferred from the response of the employers that “we are asking the workers only to work for 12 hours, which is accepted work duration in all workplaces”. Further, most of the employers did not have any idea about the existing minimum wage rates for concerned occupation, across types of workers, periodical revision and fixation, revision authorities, etc.
In light of this low awareness, many employers could not ascertain if minimum wages were applied or not in their respective units. Here again, the contract employers reported their awareness that they have to comply with minimum wage regulation. Most of the employers, except contract employers, perceived that since their scale of operation is very small and numbers of workers are low, labour regulations in general are not applicable to their units, including minimum wages. The response that ‘Such kind of legislation can work only in big industries where there is market certainty and employ regular workers. We operate on a fluctuating business environment, have negligible market share and employ labour on the basis of day-to-day orders” points to such perceptions of these employers.
Overall, employers were found unanimously in favour of not knowing about the provisions of the Minimum Wage Act. The responses that “We don’t have any information
30 Conditions of Work and Employment Series No. 16

about the government wage nor do we have any interest in knowing it” reveal the intensity of their opposition towards any effort to publicize the Act.
5.1.3 Application of the Minimum Wage Act, 1948
Table 29 provides a comparison between wages paid in the visited firms and minimum wages to which workers would be entitled in selected occupational categories. From the table, it prima facie appears that almost all the categories of job under consideration are deriving actual wages that are fairly high compared to the statutory daily wages prescribed following the Act. However, a closer analysis disproves this inference as the additional hours of work are fairly high (four to six hours of overtime work in all cases) and there are hardly any paid holidays for the workers. It is only in the case of restaurants that the employer gives two paid holidays. 16
If the longer number of working hours and absence of paid holidays are taken into consideration in the actual wage calculation, it is evident that in most of the cases, either the actual wages are below the eligible level of minimum wages and, in some cases, much lower than the prescribed level. This implies that if there were a strict implementation of minimum wages, the employers would have to pay more and provide more facilities and better working conditions (in terms of working hours and weekly rest days).
16 Though barbers and sweepers are getting one weekly day of rest, due to the system followed by the trade association of barbers (Tuesday rest day) and the government (sweepers are employed by government scavengers), it was found that these rest days are without wage payment.
Conditions of Work and Employment Series No. 16 31
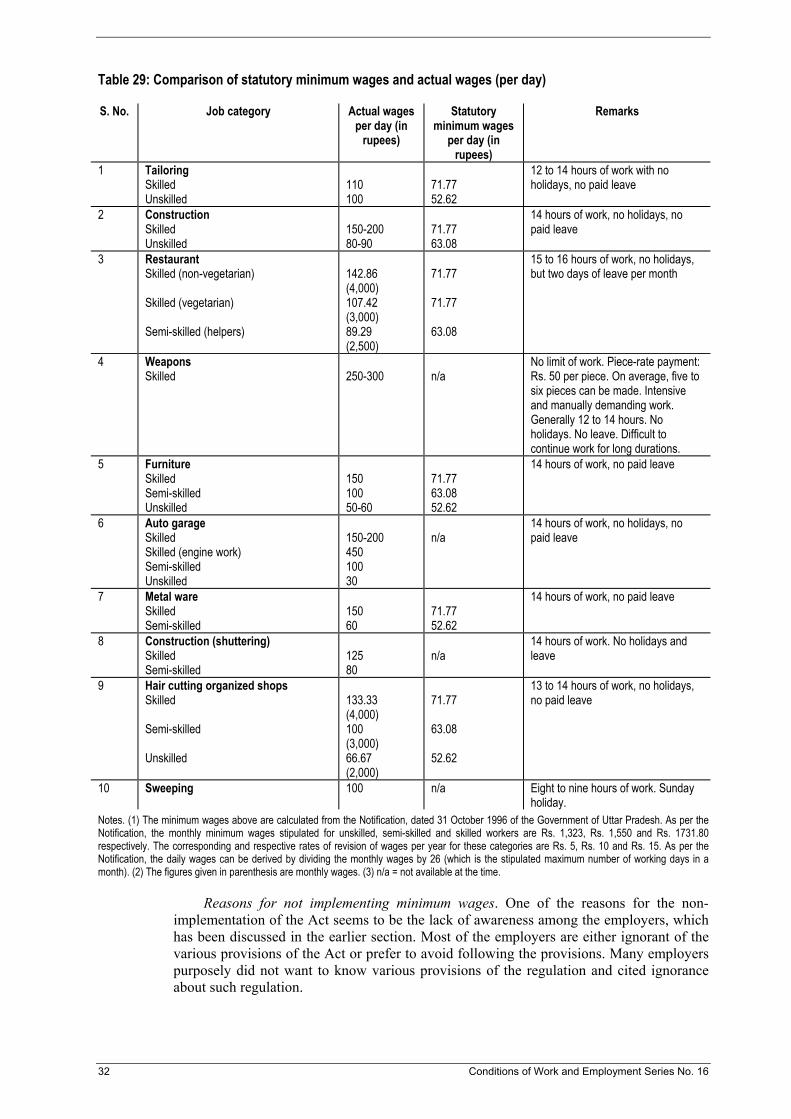
Table 29: Comparison of statutory minimum wages and actual wages (per day)
S. No. Job category Actual wages per day (in
rupees)
Statutory minimum wages
per day (in rupees)
Remarks
1 Tailoring Skilled Unskilled
110 100
71.77 52.62
12 to 14 hours of work with no holidays, no paid leave
2 Construction Skilled Unskilled
150-200 80-90
71.77 63.08
14 hours of work, no holidays, no paid leave
3 Restaurant Skilled (non-vegetarian) Skilled (vegetarian) Semi-skilled (helpers)
142.86 (4,000) 107.42 (3,000) 89.29 (2,500)
71.77 71.77 63.08
15 to 16 hours of work, no holidays, but two days of leave per month
4 Weapons Skilled
250-300
n/a
No limit of work. Piece-rate payment: Rs. 50 per piece. On average, five to six pieces can be made. Intensive and manually demanding work. Generally 12 to 14 hours. No holidays. No leave. Difficult to continue work for long durations.
5 Furniture Skilled Semi-skilled Unskilled
150 100 50-60
71.77 63.08 52.62
14 hours of work, no paid leave
6 Auto garage Skilled Skilled (engine work) Semi-skilled Unskilled
150-200 450 100 30
n/a
14 hours of work, no holidays, no paid leave
7 Metal ware Skilled Semi-skilled
150 60
71.77 52.62
14 hours of work, no paid leave
8 Construction (shuttering) Skilled Semi-skilled
125 80
n/a
14 hours of work. No holidays and leave
9 Hair cutting organized shops Skilled Semi-skilled Unskilled
133.33 (4,000) 100 (3,000) 66.67 (2,000)
71.77 63.08 52.62
13 to 14 hours of work, no holidays, no paid leave
10 Sweeping 100 n/a Eight to nine hours of work. Sunday holiday.
Notes. (1) The minimum wages above are calculated from the Notification, dated 31 October 1996 of the Government of Uttar Pradesh. As per the Notification, the monthly minimum wages stipulated for unskilled, semi-skilled and skilled workers are Rs. 1,323, Rs. 1,550 and Rs. 1731.80 respectively. The corresponding and respective rates of revision of wages per year for these categories are Rs. 5, Rs. 10 and Rs. 15. As per the Notification, the daily wages can be derived by dividing the monthly wages by 26 (which is the stipulated maximum number of working days in a month). (2) The figures given in parenthesis are monthly wages. (3) n/a = not available at the time.
Reasons for not implementing minimum wages. One of the reasons for the non-implementation of the Act seems to be the lack of awareness among the employers, which has been discussed in the earlier section. Most of the employers are either ignorant of the various provisions of the Act or prefer to avoid following the provisions. Many employers purposely did not want to know various provisions of the regulation and cited ignorance about such regulation.
32 Conditions of Work and Employment Series No. 16
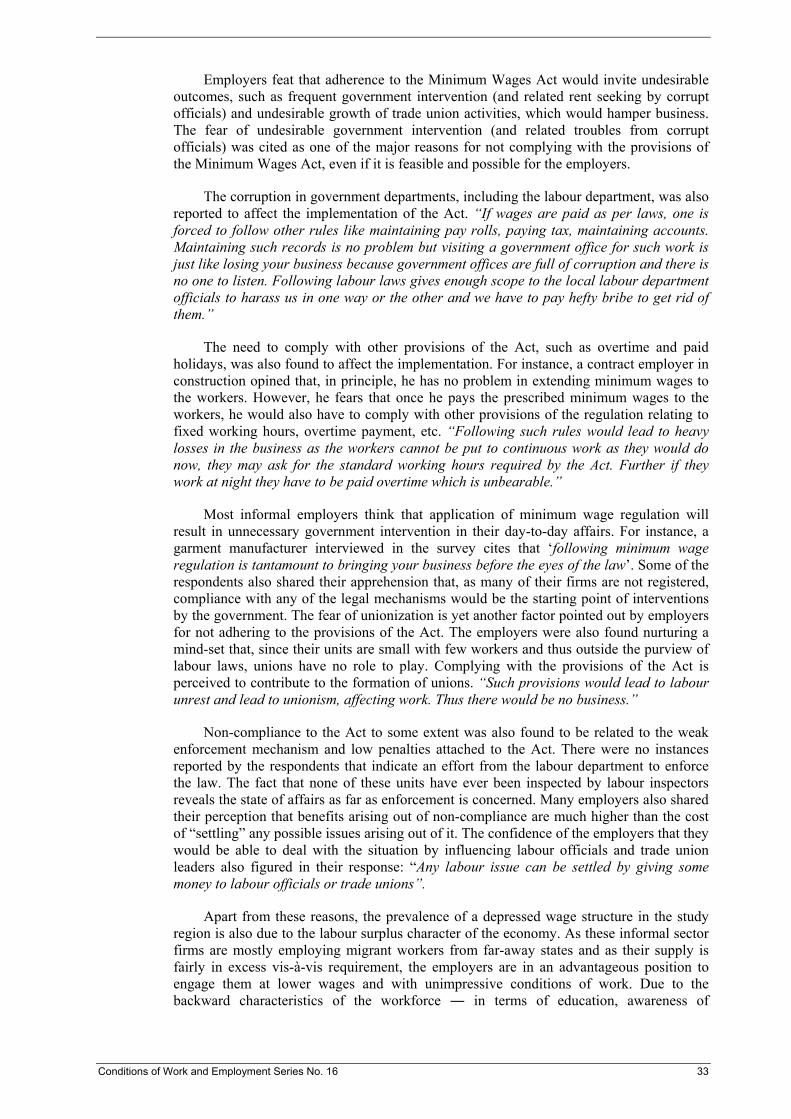
Employers feat that adherence to the Minimum Wages Act would invite undesirable outcomes, such as frequent government intervention (and related rent seeking by corrupt officials) and undesirable growth of trade union activities, which would hamper business. The fear of undesirable government intervention (and related troubles from corrupt officials) was cited as one of the major reasons for not complying with the provisions of the Minimum Wages Act, even if it is feasible and possible for the employers.
The corruption in government departments, including the labour department, was also reported to affect the implementation of the Act. “If wages are paid as per laws, one is forced to follow other rules like maintaining pay rolls, paying tax, maintaining accounts. Maintaining such records is no problem but visiting a government office for such work is just like losing your business because government offices are full of corruption and there is no one to listen. Following labour laws gives enough scope to the local labour department officials to harass us in one way or the other and we have to pay hefty bribe to get rid of them.”
The need to comply with other provisions of the Act, such as overtime and paid holidays, was also found to affect the implementation. For instance, a contract employer in construction opined that, in principle, he has no problem in extending minimum wages to the workers. However, he fears that once he pays the prescribed minimum wages to the workers, he would also have to comply with other provisions of the regulation relating to fixed working hours, overtime payment, etc. “Following such rules would lead to heavy losses in the business as the workers cannot be put to continuous work as they would do now, they may ask for the standard working hours required by the Act. Further if they work at night they have to be paid overtime which is unbearable.”
Most informal employers think that application of minimum wage regulation will result in unnecessary government intervention in their day-to-day affairs. For instance, a garment manufacturer interviewed in the survey cites that ‘following minimum wage regulation is tantamount to bringing your business before the eyes of the law’. Some of the respondents also shared their apprehension that, as many of their firms are not registered, compliance with any of the legal mechanisms would be the starting point of interventions by the government. The fear of unionization is yet another factor pointed out by employers for not adhering to the provisions of the Act. The employers were also found nurturing a mind-set that, since their units are small with few workers and thus outside the purview of labour laws, unions have no role to play. Complying with the provisions of the Act is perceived to contribute to the formation of unions. “Such provisions would lead to labour unrest and lead to unionism, affecting work. Thus there would be no business.”
Non-compliance to the Act to some extent was also found to be related to the weak enforcement mechanism and low penalties attached to the Act. There were no instances reported by the respondents that indicate an effort from the labour department to enforce the law. The fact that none of these units have ever been inspected by labour inspectors reveals the state of affairs as far as enforcement is concerned. Many employers also shared their perception that benefits arising out of non-compliance are much higher than the cost of “settling” any possible issues arising out of it. The confidence of the employers that they would be able to deal with the situation by influencing labour officials and trade union leaders also figured in their response: “Any labour issue can be settled by giving some money to labour officials or trade unions”.
Apart from these reasons, the prevalence of a depressed wage structure in the study region is also due to the labour surplus character of the economy. As these informal sector firms are mostly employing migrant workers from far-away states and as their supply is fairly in excess vis-à-vis requirement, the employers are in an advantageous position to engage them at lower wages and with unimpressive conditions of work. Due to the backward characteristics of the workforce ― in terms of education, awareness of
Conditions of Work and Employment Series No. 16 33

legal/protective provisions, low social capital and community support at the place of work, complete absence of mobilization and organization (under trade unions), etc. ― employers are in a favourable position to follow informal mechanism fixing/revising wages. The prevalence of poverty (in absolute terms) affects the implementation of minimum wages. The fact that most of the workers have no income-generating assets or landholdings of their own, which has been widely documented by other studies, that would inter alia enhance their reservation income or bargaining power in the labour market, forces them to accept whatever wages are given by the employer.
The migratory nature of the workers in general thus favours employers, where supply of labour is assured irrespective of wage levels. This upper hand of the employers is evident from responses of employers to the implication of workers demanding minimum wages: “No question of higher wages or bargaining. If they bargain they would be out. There are others who are ready to work’. The response of employers suggest that they are quite convinced about the fact that they would be able to get as many workers as they want with the required skill at any point in time.
Yet another aspect that has a strong bearing on the ineffective implementation of the provisions of the Act is that, in many cases, the employers were not truly “the principal employers”. Rather, they were essentially contractors who are part of a sub-contracting chain. For instance, piece-rate work and construction activities are normally obtained by these contractors or “employers at the workplace” by the principal employers, who do not have any direct interaction and knowledge regarding the workers and terms of work. In such situations, the validity of the implementation of the minimum wages by the employer needs to be reviewed. This is particularly important in the contemporary phase of economic liberalization and global production systems arrangements, where outsourcing of work and work processes are increasingly becoming the logic of business and where engaging informal sector workers through contractors is a central strategy.
The findings of the fieldwork also suggest the importance of institutions and worker organizations in the effective implementation of the provisions of the Act. The fact that only sweepers and barbers had an accepted weekly day off (though without any payment) strengthens this argument further. In the case of sweeping, as the workers are being hired for municipal work and since the local self-government has a statutory holiday, the workers get a weekly day off. In the case of barbers, it is due to the widely followed custom of the workers’ association that the workers are getting a regular weekly day off on Tuesday. Thus, if there are systems in place and institutions involved, it is easier to implement the provisions of the Act, especially in terms of working hours and weekly rest days.
To work for better administration of the provisions of the Act, it is necessary to look at the problems in a wider perspective and see how far it could be resolved through the involvement of various stakeholders. Involvement of community actors and local self-governments, as well as the strengthening of collective bargaining and collective bargaining institutions, would be among the potential options in this direction.
5.2 Results from the Indonesian qualitative survey
In Indonesia, 12 employers were interviewed in the Jakarta area. Enterprises surveyed are relatively small, except the newspaper agency which has 40 workers. However, none of them is tiny and most have at least five workers. They belong to the service and manufacturing sector and operate in urban areas. All the firms are run by men except two: the hairdresser salon and the cake-maker. Three owners run the business from their houses. All contracts are made orally.
34 Conditions of Work and Employment Series No. 16

5.2.1 Pay practice and other working conditions
Table 30 shows pay practice in those firms. Two remarkable facts emerge from the table: the fact that wages are on average well below the minimum wage, and the elaborative pay setting mechanisms. First, wages are below minimum wage rates for the Jakarta area at the survey time (November 2005). At that time, minimum wages were about 711,843 a month. In the sampled firms, only craftsmen, administrators and delivery workers received wages equal to or above the threshold. The second remarkable feature is the complexity and ingenuity of wage setting in these small firms. Except in such enterprises as those of the tailor, vehicle body repairs and hairdresser, most informal employers provide bonuses or extra pay to their workers. These bonuses can be in the form of an “attendance bonus”, an “achievement bonus”, an “overtime bonus”, a “job order bonus” and others. Five out of the 12 informal enterprises give an Id ul Fitri allowance (end of Ramadan) to their workers.
Conditions of Work and Employment Series No. 16 35
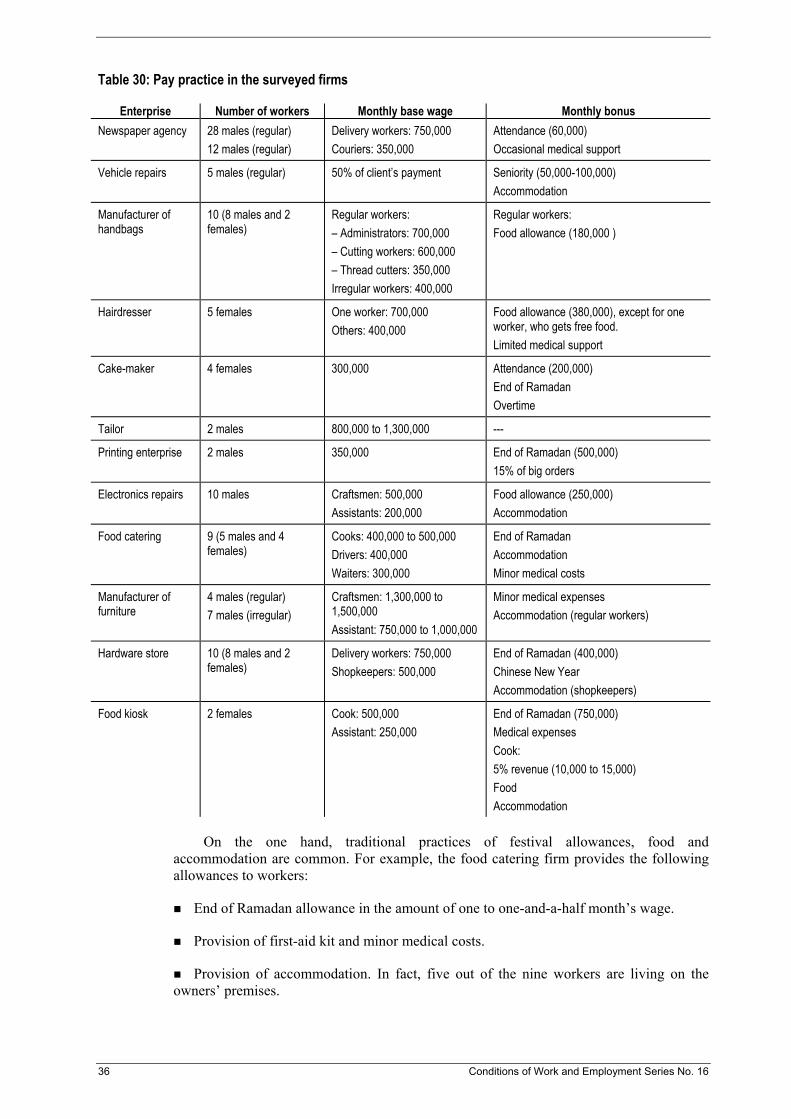
Table 30: Pay practice in the surveyed firms
Enterprise Number of workers Monthly base wage Monthly bonus Newspaper agency 28 males (regular)
12 males (regular) Delivery workers: 750,000 Couriers: 350,000
Attendance (60,000) Occasional medical support
Vehicle repairs 5 males (regular) 50% of client’s payment Seniority (50,000-100,000) Accommodation
Manufacturer of handbags
10 (8 males and 2 females)
Regular workers: – Administrators: 700,000 – Cutting workers: 600,000 – Thread cutters: 350,000 Irregular workers: 400,000
Regular workers: Food allowance (180,000 )
Hairdresser 5 females One worker: 700,000 Others: 400,000
Food allowance (380,000), except for one worker, who gets free food. Limited medical support
Cake-maker 4 females 300,000 Attendance (200,000) End of Ramadan Overtime
Tailor 2 males 800,000 to 1,300,000 ---
Printing enterprise 2 males 350,000 End of Ramadan (500,000) 15% of big orders
Electronics repairs 10 males Craftsmen: 500,000 Assistants: 200,000
Food allowance (250,000) Accommodation
Food catering 9 (5 males and 4 females)
Cooks: 400,000 to 500,000 Drivers: 400,000 Waiters: 300,000
End of Ramadan Accommodation Minor medical costs
Manufacturer of furniture
4 males (regular) 7 males (irregular)
Craftsmen: 1,300,000 to 1,500,000 Assistant: 750,000 to 1,000,000
Minor medical expenses Accommodation (regular workers)
Hardware store 10 (8 males and 2 females)
Delivery workers: 750,000 Shopkeepers: 500,000
End of Ramadan (400,000) Chinese New Year Accommodation (shopkeepers)
Food kiosk 2 females Cook: 500,000 Assistant: 250,000
End of Ramadan (750,000) Medical expenses Cook: 5% revenue (10,000 to 15,000) Food Accommodation
On the one hand, traditional practices of festival allowances, food and accommodation are common. For example, the food catering firm provides the following allowances to workers:
End of Ramadan allowance in the amount of one to one-and-a-half month’s wage.
Provision of first-aid kit and minor medical costs.
Provision of accommodation. In fact, five out of the nine workers are living on the owners’ premises.
36 Conditions of Work and Employment Series No. 16
Food allowance is reported in two firms, where it represents between 20 and 50 per cent of the basic wage. This is very similar to the practice in larger and more formal firms in Indonesia, which give numerous allowances.
Beside the festival allowance, food and accommodation, more modern pay-setting practices are also widespread. Some kind of profit-sharing scheme is found in three out of 12 firms. For instance, one employee from the hairdresser salon is paid based on net income sharing, with the ratio of 60 per cent for the owner and 40 per cent for the employee. With the 40 per cent of net income, this employee gets on average Rp 700,000 per month of base wage. In the vehicle repair shop, the net amount workers will receive is the amount of money paid by the customer after deducting the workers’ expenses for food/beverage/cigarettes. This amount is then divided into two parts: 50 per cent for the owner and 50 per cent for workers.
An incentive bonus is also common: for example, couriers from the newspaper agency are paid monthly based on the number of documents delivered. Apart from that, they receive a so-called “achievement bonus”. This bonus is given on two conditions: (a) the documents are delivered on time, and (b) there is no complaint received from customers. The bonus for fulfilling these conditions is Rp 10 per document. It should be noted that each courier in general can deliver 1,000 documents a month.
Three other firms have also adopted monetary incentives to encourage attendance at work or to punish absenteeism: for example, the cake-maker’s workers receive a 200,000 monthly attendance allowance. This allowance is provided under the condition that no working day is missed. In the hardware store, workers who come late for work are penalized Rp 2,500 per day.
Five firms provide limited medical support, at least to their regular workers.
Working time
The findings in Table 31 reveal that the number of working hours depends on the nature of the business activity. Hours are not regulated in enterprises where work is piece-based or contract-based. Some other business activities, such as the hairdresser, the manufacturer of handbags and the food kiosk, apply fixed working hours. The number of working days in the formal sector, depending on the nature of work, is normally five days a week. In these informal enterprises, however, it is usually six working days, and some also operate during the weekends. Lengthy working hours are sometimes applied in such business activities as food catering, printing, cake/cookie-maker. Extra pay is usually granted, but without an overtime rate.
Working time is very long in most surveyed firms. Three firms have no day of rest: the tailor, the hardware store and the printing agency, while the other firms have adopted a six-day working schedule.
Conditions of Work and Employment Series No. 16 37
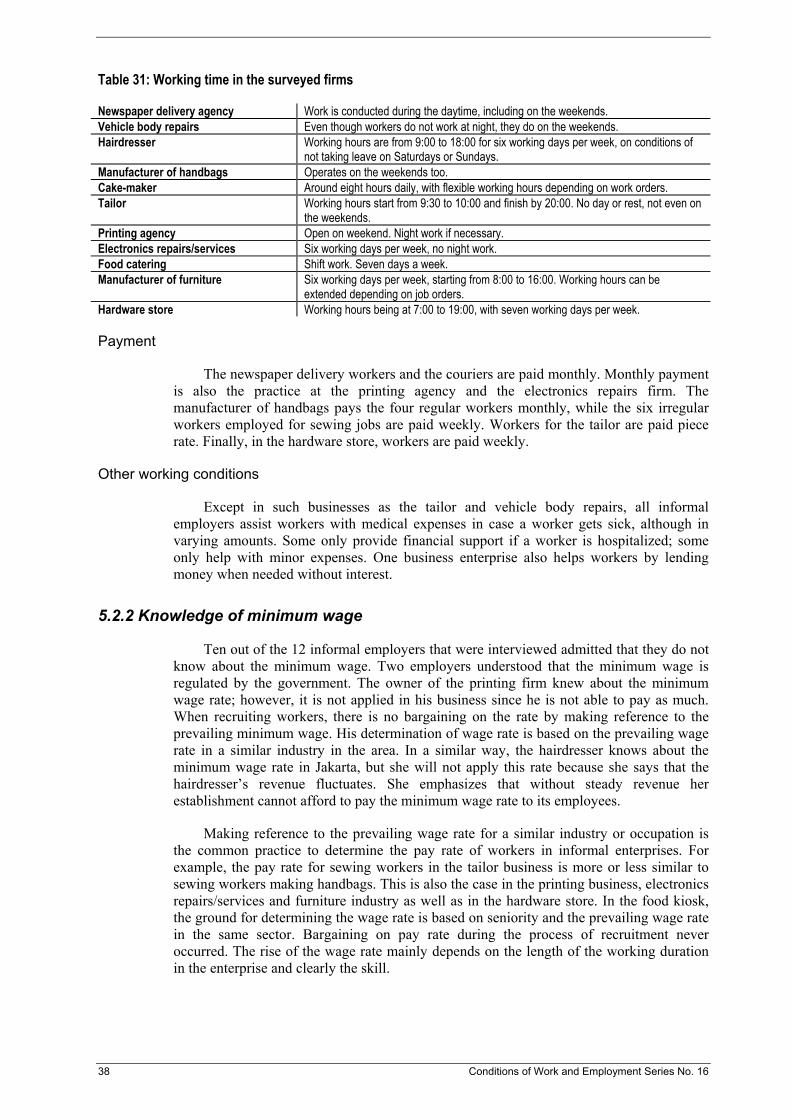
Table 31: Working time in the surveyed firms
Newspaper delivery agency Work is conducted during the daytime, including on the weekends. Vehicle body repairs Even though workers do not work at night, they do on the weekends. Hairdresser Working hours are from 9:00 to 18:00 for six working days per week, on conditions of
not taking leave on Saturdays or Sundays. Manufacturer of handbags Operates on the weekends too. Cake-maker Around eight hours daily, with flexible working hours depending on work orders. Tailor Working hours start from 9:30 to 10:00 and finish by 20:00. No day or rest, not even on
the weekends. Printing agency Open on weekend. Night work if necessary. Electronics repairs/services Six working days per week, no night work. Food catering Shift work. Seven days a week. Manufacturer of furniture Six working days per week, starting from 8:00 to 16:00. Working hours can be
extended depending on job orders. Hardware store Working hours being at 7:00 to 19:00, with seven working days per week.
Payment
The newspaper delivery workers and the couriers are paid monthly. Monthly payment is also the practice at the printing agency and the electronics repairs firm. The manufacturer of handbags pays the four regular workers monthly, while the six irregular workers employed for sewing jobs are paid weekly. Workers for the tailor are paid piece rate. Finally, in the hardware store, workers are paid weekly.
Other working conditions
Except in such businesses as the tailor and vehicle body repairs, all informal employers assist workers with medical expenses in case a worker gets sick, although in varying amounts. Some only provide financial support if a worker is hospitalized; some only help with minor expenses. One business enterprise also helps workers by lending money when needed without interest.
5.2.2 Knowledge of minimum wage
Ten out of the 12 informal employers that were interviewed admitted that they do not know about the minimum wage. Two employers understood that the minimum wage is regulated by the government. The owner of the printing firm knew about the minimum wage rate; however, it is not applied in his business since he is not able to pay as much. When recruiting workers, there is no bargaining on the rate by making reference to the prevailing minimum wage. His determination of wage rate is based on the prevailing wage rate in a similar industry in the area. In a similar way, the hairdresser knows about the minimum wage rate in Jakarta, but she will not apply this rate because she says that the hairdresser’s revenue fluctuates. She emphasizes that without steady revenue her establishment cannot afford to pay the minimum wage rate to its employees.
Making reference to the prevailing wage rate for a similar industry or occupation is the common practice to determine the pay rate of workers in informal enterprises. For example, the pay rate for sewing workers in the tailor business is more or less similar to sewing workers making handbags. This is also the case in the printing business, electronics repairs/services and furniture industry as well as in the hardware store. In the food kiosk, the ground for determining the wage rate is based on seniority and the prevailing wage rate in the same sector. Bargaining on pay rate during the process of recruitment never occurred. The rise of the wage rate mainly depends on the length of the working duration in the enterprise and clearly the skill.
38 Conditions of Work and Employment Series No. 16
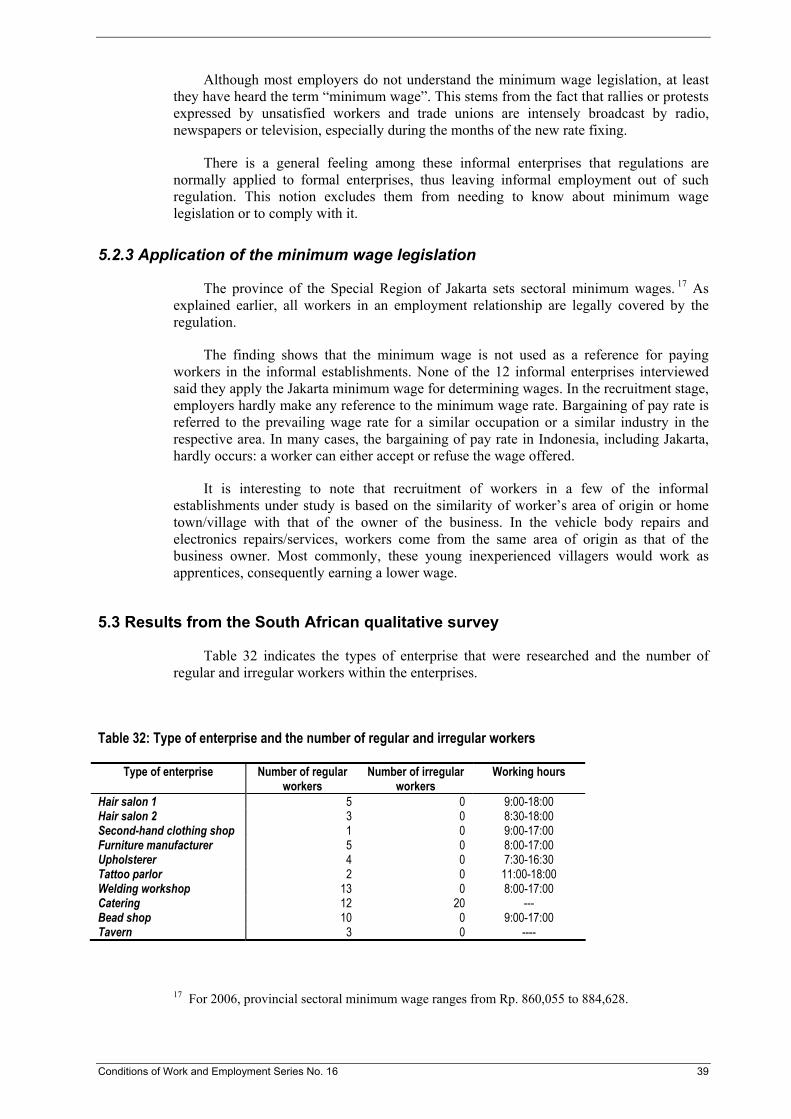
Although most employers do not understand the minimum wage legislation, at least they have heard the term “minimum wage”. This stems from the fact that rallies or protests expressed by unsatisfied workers and trade unions are intensely broadcast by radio, newspapers or television, especially during the months of the new rate fixing.
There is a general feeling among these informal enterprises that regulations are normally applied to formal enterprises, thus leaving informal employment out of such regulation. This notion excludes them from needing to know about minimum wage legislation or to comply with it.
5.2.3 Application of the minimum wage legislation
The province of the Special Region of Jakarta sets sectoral minimum wages. 17 As explained earlier, all workers in an employment relationship are legally covered by the regulation.
The finding shows that the minimum wage is not used as a reference for paying workers in the informal establishments. None of the 12 informal enterprises interviewed said they apply the Jakarta minimum wage for determining wages. In the recruitment stage, employers hardly make any reference to the minimum wage rate. Bargaining of pay rate is referred to the prevailing wage rate for a similar occupation or a similar industry in the respective area. In many cases, the bargaining of pay rate in Indonesia, including Jakarta, hardly occurs: a worker can either accept or refuse the wage offered.
It is interesting to note that recruitment of workers in a few of the informal establishments under study is based on the similarity of worker’s area of origin or home town/village with that of the owner of the business. In the vehicle body repairs and electronics repairs/services, workers come from the same area of origin as that of the business owner. Most commonly, these young inexperienced villagers would work as apprentices, consequently earning a lower wage.
5.3 Results from the South African qualitative survey
Table 32 indicates the types of enterprise that were researched and the number of regular and irregular workers within the enterprises.
Table 32: Type of enterprise and the number of regular and irregular workers
Type of enterprise Number of regular workers
Number of irregular workers
Working hours
Hair salon 1 5 0 9:00-18:00 Hair salon 2 3 0 8:30-18:00 Second-hand clothing shop 1 0 9:00-17:00 Furniture manufacturer 5 0 8:00-17:00 Upholsterer 4 0 7:30-16:30 Tattoo parlor 2 0 11:00-18:00 Welding workshop 13 0 8:00-17:00 Catering 12 20 --- Bead shop 10 0 9:00-17:00 Tavern 3 0 ----
17 For 2006, provincial sectoral minimum wage ranges from Rp. 860,055 to 884,628.
Conditions of Work and Employment Series No. 16 39
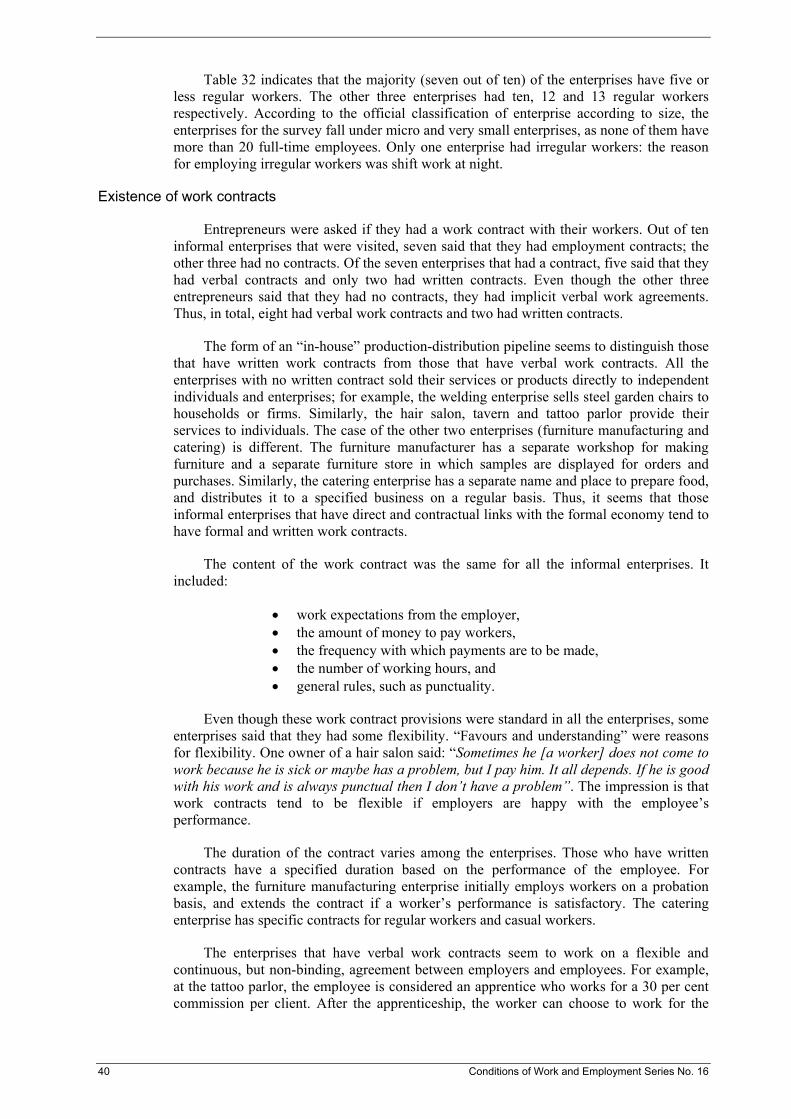
Table 32 indicates that the majority (seven out of ten) of the enterprises have five or less regular workers. The other three enterprises had ten, 12 and 13 regular workers respectively. According to the official classification of enterprise according to size, the enterprises for the survey fall under micro and very small enterprises, as none of them have more than 20 full-time employees. Only one enterprise had irregular workers: the reason for employing irregular workers was shift work at night.
Existence of work contracts
Entrepreneurs were asked if they had a work contract with their workers. Out of ten informal enterprises that were visited, seven said that they had employment contracts; the other three had no contracts. Of the seven enterprises that had a contract, five said that they had verbal contracts and only two had written contracts. Even though the other three entrepreneurs said that they had no contracts, they had implicit verbal work agreements. Thus, in total, eight had verbal work contracts and two had written contracts.
The form of an “in-house” production-distribution pipeline seems to distinguish those that have written work contracts from those that have verbal work contracts. All the enterprises with no written contract sold their services or products directly to independent individuals and enterprises; for example, the welding enterprise sells steel garden chairs to households or firms. Similarly, the hair salon, tavern and tattoo parlor provide their services to individuals. The case of the other two enterprises (furniture manufacturing and catering) is different. The furniture manufacturer has a separate workshop for making furniture and a separate furniture store in which samples are displayed for orders and purchases. Similarly, the catering enterprise has a separate name and place to prepare food, and distributes it to a specified business on a regular basis. Thus, it seems that those informal enterprises that have direct and contractual links with the formal economy tend to have formal and written work contracts.
The content of the work contract was the same for all the informal enterprises. It included:
• work expectations from the employer, • the amount of money to pay workers, • the frequency with which payments are to be made, • the number of working hours, and • general rules, such as punctuality.
Even though these work contract provisions were standard in all the enterprises, some enterprises said that they had some flexibility. “Favours and understanding” were reasons for flexibility. One owner of a hair salon said: “Sometimes he [a worker] does not come to work because he is sick or maybe has a problem, but I pay him. It all depends. If he is good with his work and is always punctual then I don’t have a problem”. The impression is that work contracts tend to be flexible if employers are happy with the employee’s performance.
The duration of the contract varies among the enterprises. Those who have written contracts have a specified duration based on the performance of the employee. For example, the furniture manufacturing enterprise initially employs workers on a probation basis, and extends the contract if a worker’s performance is satisfactory. The catering enterprise has specific contracts for regular workers and casual workers.
The enterprises that have verbal work contracts seem to work on a flexible and continuous, but non-binding, agreement between employers and employees. For example, at the tattoo parlor, the employee is considered an apprentice who works for a 30 per cent commission per client. After the apprenticeship, the worker can choose to work for the
40 Conditions of Work and Employment Series No. 16

owner or open his or her own tattoo parlor. The welding enterprise employs workers as long as they are willing to work for their employer. Similarly, there is no contract that binds tavern workers to remain in the enterprise. However, not all enterprises with verbal work contracts are unspecific about contract duration: the second-hand clothing shop’s verbal contract is valid for only two months and renewed on the basis of business performance. Similarly, the two hair salons provide training for people who want to work in the salons. The trainees are paid half the normal salary for a period of three months. After three months, the training contract ends and the employers decide if they want to hire the trainees. The main criterion for hiring is competence in hair styling.
Working after hours, weekends and holidays
Night work
Only the tavern and the catering enterprise said that they resorted to night work. The tavern owner said that he operated on weekends from the afternoon until midnight. The catering enterprise employs casual workers after hours. The other eight enterprises said that they did not use night work. They all seem to follow the 40-hour-per-week limit as set out in the Basic Conditions of Employment Act of 1997. Table 32 above indicates their working hours.
Weekend and holiday work
Six out of ten enterprises said that they required weekend work: the hair salon, the tavern, the furniture manufacturer, the tattoo parlor, the bead shop and the catering establishment. Also, six out of the ten enterprises said that they operated on public holidays: the tavern, the tattoo parlor, the catering shop, the bead shop, the upholsterer, and one of the hair salons.
Only the catering enterprise said that it paid for weekend work and holiday work according to labour legislation, even though the owner did not specify how that was done. All other enterprises that used weekend work and holiday work said that they paid the same wage rate for weekends and holidays as during the usual week’s working hours. Workers in the upholstery enterprise get extra payment for overtime work, which is work beyond the normal working hours on a particular day.
Wage rates
Table 33 indicates the wage rates of the ten enterprises.
Conditions of Work and Employment Series No. 16 41
Table 33: Enterprises and their wage rates
Type of enterprise Wage/salary Rate Official minimum wage Hair salon 1 ZAR 400 Per week Not applicable Hair salon 2 ZAR 700-1,000 Per month Not applicable Second-hand clothing shop ZAR 75 Per day ZAR 395.62 per week* Furniture manufacturer ZAR 100 Per day ZAR 340-660 per week** Upholsterer ZAR 350-600 Per week ZAR 340-660 per week Tattoo parlor Commission 30% Not applicable Welding workshop ZAR 250-1,000 Per week ZAR 19.82-30.94 per hour***
Regular workers: ZAR 2,000-5,000
Per month**** ZAR 1,200 per month Catering
Irregular workers: ZAR 35
Per day ZAR 1,200 per month
Bead shop --- --- Tavern ZAR 300-400 Per week Not applicable*****
* This rate is for a shop assistant. The sectoral determination of minimum wages in the wholesale and retail industry provides for different rates by occupations (See Annex C). ** The lowest rate is for an unskilled apprentice and the highest rate is for a tradesman. This also applies to the upholstery enterprise, as indicated in Annex C. *** This rate is according to a wage determination with the South African Metal Workers Union (SAMWU). **** Annex C shows the breakdown of workers in the catering sector. ***** Taverns and shebeens do not seem to be covered by a minimum wage determination, but they are legally obliged to have liqueur licenses. One of the reasons for lack of wage determination could be that, even though they are lucrative, they emerged as micro-enterprises out of the need to supplement income in black township areas where pubs were not allowed to operate under the apartheid government.
The above wages are estimates: with the exception of the furniture manufacturer, the owners were reluctant to provide exact figures. Moreover, the owners emphasized that wages varied according to skill and performance: the furniture manufacture increased wages according to entry level (ZAR 73 per day), performance and skill of a particular worker. The bead shop owner also said that he paid according to skill and performance, but declined to mention the ranges or actual amounts. The upholsterer explained that the least skilled worker was paid ZAR 350-400 per week and that the trader was paid ZAR 600 per week. One of the hair salon owners said that he decided on the payment according to the “quality of work first and then performance and punctuality”.
In conclusion, no minimum wage was applicable in four out of ten surveyed firms. In the remaining six, wages were below the minimum wage as in the second-hand clothing shop. In the others, wages paid seem to fall within the ranges of the minimum wage. It is, however, not possible to assess whether workers get the rates that are applicable to them according to their skills.
The furniture manufacturer and the catering enterprise seem to pay their workers above the minimum wage, as set out in their current bargaining councils agreements and as indicated in Annex C respectively. According to the furniture bargaining council, the minimum weekly wage ranges from ZAR 340 to ZAR 660. The furniture manufacturer said that he paid his workers a minimum of ZAR 100 per day, which adds up to ZAR 400 per week. However, the entry-level pay of ZAR 50 per day is below the minimum wage. Even though the upholsterer said that he did not know about minimum wage applicability, he paid within the furniture bargaining council’s range of ZAR 359 to ZAR 600 per week. The catering enterprise also seems to pay according to the range set out by the catering
42 Conditions of Work and Employment Series No. 16
bargaining council (Annex C). The catering enterprise’s range is ZAR 1,200 to ZAR 5,000. According to Annex C, the increased range is ZAR 1,255 to ZAR 2,607.
Bonuses and payments in kind
Bonuses
The general type of bonus in South Africa is the Christmas bonus, or 13th cheque. In general, however, there are also performance and production bonuses in some enterprises. Eight out of ten enterprises surveyed said that they paid bonuses; however, none of the bonuses was based on hours of work or short-term productivity. Bonuses were paid at the end of the year in a form of a 13th cheque (Christmas bonus at the end of each year) as in formal enterprises. However, unlike most formal enterprises, bonuses in informal enterprises are not paid in predetermined amounts. The amount of bonus depends on business performance and the employee’s commitment throughout the year; for example, one of the hair salon owners said that he paid bonuses between ZAR 500 to ZAR 1,000.
Exclusion of bonuses in the work contract is not an unfair labour practice in South Africa. South African labour law says nothing about payment or non-payment of bonuses. It is entirely up to the employer to decide whether to pay bonuses or not. However, a unilateral decision to stop paying bonuses could be regarded as an unfair labour practice. Instead, an employer has to justify in time (usually six months in advance) why he or she would stop or suspend bonuses. Hence, during the survey, the owner of the furniture workshop said that he was applying to the bargaining council to be exempted from paying bonuses because it was too costly for him (15 per cent of the wages).
Payment in kind
Six of the enterprises said that they made payments in kind: the tavern, the catering enterprise, the tattoo parlor, the second-hand clothing shop, and one of the hair salons. Two of the three workers at the tavern live on the tavern premises and their food and accommodation costs are incurred by the owner. At the tattoo parlor, the apprentices get free tattoos, piercing and jewellery. The catering shop provides free meals. The hair salon workers receive free hair care. The worker at the second-hand clothing shop can buy the clothes at cost price.
Five of the owners of these informal enterprises did not necessarily regard payment in kind as part of wages or cost of employment. They regarded them as free benefits for workers by virtue of working in the enterprise. Only the tavern owner regarded free accommodation and food as part of directly paying workers and convenient for the business.
5.3.2 Knowledge of minimum wage
Half of the enterprises said that they knew about minimum wages: the furniture manufacturer, the catering shop, the second-hand clothing shop, the tattoo parlor and the upholsterer. However, only the catering shop and the furniture manufacturer said that they knew that a minimum wage was applicable to their enterprises. The furniture manufacturer and the catering enterprise said that the applicable minimum wage was ZAR 35 per day and, for the catering shop, it was ZAR 1,200 per month for regular workers. Both entrepreneurs said that they paid more than the minimum wages, as reflected in Table 33 above. The other three enterprises said that they did not know if a minimum wage was applicable to their enterprises.
The furniture manufacturer and the catering enterprise said that they knew about minimum wages from their bargaining councils. The other enterprises said that they knew
Conditions of Work and Employment Series No. 16 43

about minimum wages from general sources, such as the television news or newspapers. All the enterprises seemed to be unsure if their workers knew about minimum wages. Some said that their workers knew about minimum wages, but they could not respond to the question of how the workers knew about it.
5.3.3 Application of minimum wages
The majority of enterprises that they base their wage rates on skill, performance, experience and mutual agreement. Table 34 indicates what all the enterprises used as a basis for determining wages.
Table 34: Wage-fixing factors
Enterprise Wage determination
Hair salon 1 Mutual agreement between the employer and job applicant before employment commences. Wages increase with quality of work.
Hair salon 2 Mutual agreement between the employer and job applicant before employment commences. Wages increase with quality of work and satisfactory performance, such as punctuality.
Second-hand clothing shop Mutual agreement between employer and employee.
Furniture manufacturer Skill and performance. But always pays above the minimum wage.
Catering shop Based on skill level and adjusted according to performance.
Upholsterer Skill and performance.
Tavern The employer determines the wage level and takes into account income in kind, such as accommodation and food.
Welding workshop Skill and performance.
Tattoo parlor Thirty per cent commission is determined by the employer. Minimum wage not necessary because the apprentice can recruit as many customers as he or she pleases. Moreover, the price of the service can be up to ZAR 1,000, which means a wage of ZAR 300 per day.
Bead shop Depends on the task to be performed and the experience of the worker.
On the subject of wages, the enterprises had different reason why wages increased. The following grid outlines the reasons (Table 35).
44 Conditions of Work and Employment Series No. 16
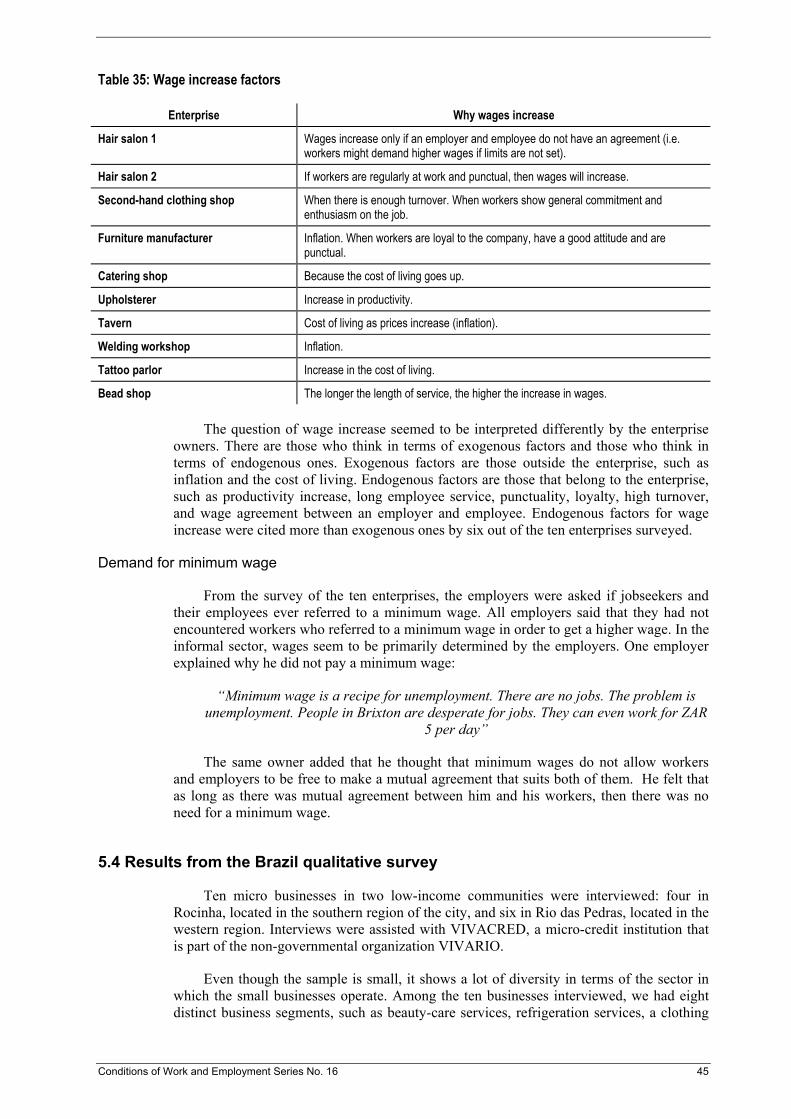
Table 35: Wage increase factors
Enterprise Why wages increase
Hair salon 1 Wages increase only if an employer and employee do not have an agreement (i.e. workers might demand higher wages if limits are not set).
Hair salon 2 If workers are regularly at work and punctual, then wages will increase.
Second-hand clothing shop When there is enough turnover. When workers show general commitment and enthusiasm on the job.
Furniture manufacturer Inflation. When workers are loyal to the company, have a good attitude and are punctual.
Catering shop Because the cost of living goes up.
Upholsterer Increase in productivity.
Tavern Cost of living as prices increase (inflation).
Welding workshop Inflation.
Tattoo parlor Increase in the cost of living.
Bead shop The longer the length of service, the higher the increase in wages.
The question of wage increase seemed to be interpreted differently by the enterprise owners. There are those who think in terms of exogenous factors and those who think in terms of endogenous ones. Exogenous factors are those outside the enterprise, such as inflation and the cost of living. Endogenous factors are those that belong to the enterprise, such as productivity increase, long employee service, punctuality, loyalty, high turnover, and wage agreement between an employer and employee. Endogenous factors for wage increase were cited more than exogenous ones by six out of the ten enterprises surveyed.
Demand for minimum wage
From the survey of the ten enterprises, the employers were asked if jobseekers and their employees ever referred to a minimum wage. All employers said that they had not encountered workers who referred to a minimum wage in order to get a higher wage. In the informal sector, wages seem to be primarily determined by the employers. One employer explained why he did not pay a minimum wage:
“Minimum wage is a recipe for unemployment. There are no jobs. The problem is unemployment. People in Brixton are desperate for jobs. They can even work for ZAR
5 per day”
The same owner added that he thought that minimum wages do not allow workers and employers to be free to make a mutual agreement that suits both of them. He felt that as long as there was mutual agreement between him and his workers, then there was no need for a minimum wage.
5.4 Results from the Brazil qualitative survey
Ten micro businesses in two low-income communities were interviewed: four in Rocinha, located in the southern region of the city, and six in Rio das Pedras, located in the western region. Interviews were assisted with VIVACRED, a micro-credit institution that is part of the non-governmental organization VIVARIO.
Even though the sample is small, it shows a lot of diversity in terms of the sector in which the small businesses operate. Among the ten businesses interviewed, we had eight distinct business segments, such as beauty-care services, refrigeration services, a clothing
Conditions of Work and Employment Series No. 16 45
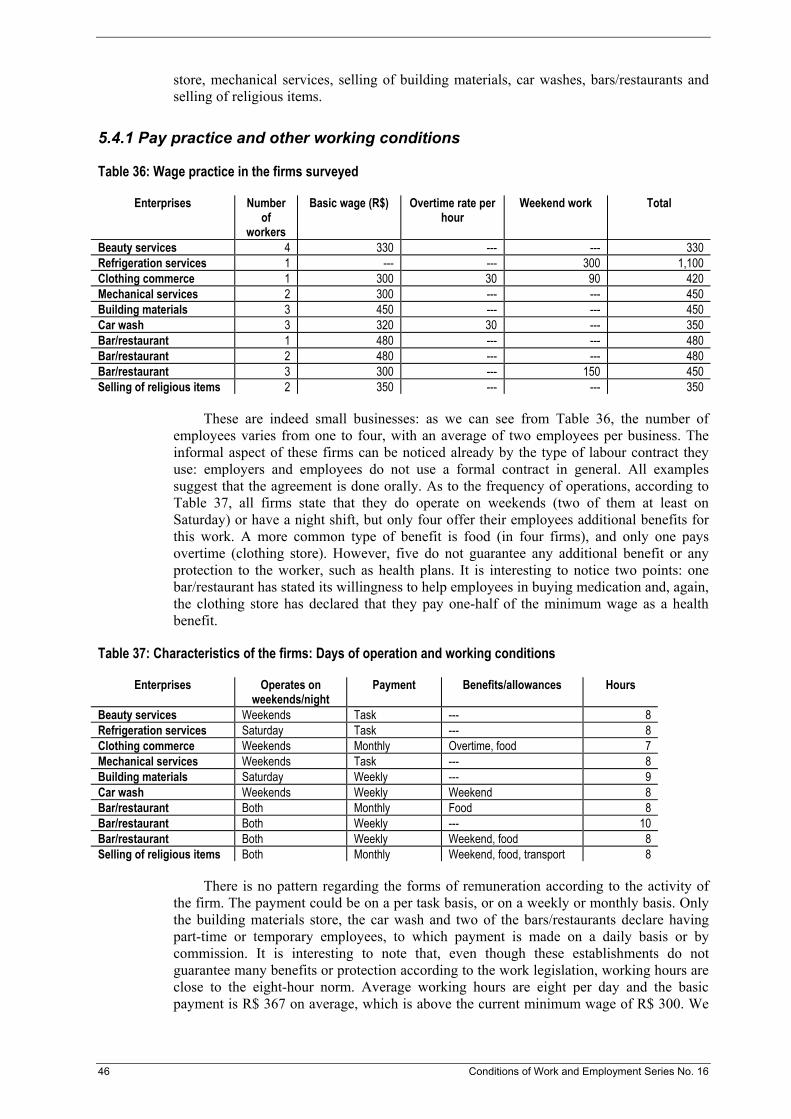
store, mechanical services, selling of building materials, car washes, bars/restaurants and selling of religious items.
5.4.1 Pay practice and other working conditions
Table 36: Wage practice in the firms surveyed
Enterprises Number of
workers
Basic wage (R$) Overtime rate per hour
Weekend work Total
Beauty services 4 330 --- --- 330 Refrigeration services 1 --- --- 300 1,100 Clothing commerce 1 300 30 90 420 Mechanical services 2 300 --- --- 450 Building materials 3 450 --- --- 450 Car wash 3 320 30 --- 350 Bar/restaurant 1 480 --- --- 480 Bar/restaurant 2 480 --- --- 480 Bar/restaurant 3 300 --- 150 450 Selling of religious items 2 350 --- --- 350
These are indeed small businesses: as we can see from Table 36, the number of employees varies from one to four, with an average of two employees per business. The informal aspect of these firms can be noticed already by the type of labour contract they use: employers and employees do not use a formal contract in general. All examples suggest that the agreement is done orally. As to the frequency of operations, according to Table 37, all firms state that they do operate on weekends (two of them at least on Saturday) or have a night shift, but only four offer their employees additional benefits for this work. A more common type of benefit is food (in four firms), and only one pays overtime (clothing store). However, five do not guarantee any additional benefit or any protection to the worker, such as health plans. It is interesting to notice two points: one bar/restaurant has stated its willingness to help employees in buying medication and, again, the clothing store has declared that they pay one-half of the minimum wage as a health benefit.
Table 37: Characteristics of the firms: Days of operation and working conditions
Enterprises Operates on weekends/night
Payment Benefits/allowances Hours
Beauty services Weekends Task --- 8 Refrigeration services Saturday Task --- 8 Clothing commerce Weekends Monthly Overtime, food 7 Mechanical services Weekends Task --- 8 Building materials Saturday Weekly --- 9 Car wash Weekends Weekly Weekend 8 Bar/restaurant Both Monthly Food 8 Bar/restaurant Both Weekly --- 10 Bar/restaurant Both Weekly Weekend, food 8 Selling of religious items Both Monthly Weekend, food, transport 8
There is no pattern regarding the forms of remuneration according to the activity of the firm. The payment could be on a per task basis, or on a weekly or monthly basis. Only the building materials store, the car wash and two of the bars/restaurants declare having part-time or temporary employees, to which payment is made on a daily basis or by commission. It is interesting to note that, even though these establishments do not guarantee many benefits or protection according to the work legislation, working hours are close to the eight-hour norm. Average working hours are eight per day and the basic payment is R$ 367 on average, which is above the current minimum wage of R$ 300. We
46 Conditions of Work and Employment Series No. 16

can notice from Table 36 that R$ 300 is the lowest value paid by employers (three pay exactly R$ 300). It is interesting to compare these results without statistical analysis in section 5. The analysis showed that about one-third of workers without a labour card received wages below the minimum wage in 2003. The contrast between the percentage of workers below the minimum wage and what employers state is striking. As an interpretation, we suggest that the survey reveals the awareness of employers of the minimum wage. It could also be the case that employers spoke about their pay for regular, rather than irregular, workers.
5.4.2 Knowledge of the minimum wage
As mentioned in section 3, there is one unique rate of minimum wage in Brazil, which is applicable to all workers. Seven out of ten employers interviewed confirm knowing that there is a minimum wage applicable to their firm, and they know it from local associations, newspapers, radio or television. The other three say that they have no information whatsoever on the use of the minimum wage.
5.4.3 Application of the minimum wage
Only three employers answered that during the salary negotiations with the workers the minimum wage was not a reference. Also, only one employer (refrigeration service) affirms that the employees mention the minimum wage during the negotiations, although this is not effective, since the firm does not use it as a reference. Besides, only four employers confirm that they do not offer any type of incentive to the employees apart from the minimum wage. Among those who offer other benefits, those benefits include commissions and extras for weekend work.
As to the perception of the factors that could explain the increases of salaries in the informal sector, five firms answered that the reason is “worker’s pressure”, and six stated also “increase in intensity/amount of work” as a reason. The increase in the minimum wage seems to be a more unanimous reason, with eight affirmative answers.
Even though only three employers effectively pay the minimum wage to employees, eight of the firms interviewed mentioned that they tend to pay the minimum wage either because “it’s in the law” (five), or “it’s in the law and is fair” (one) or “it’s in the law and is easier” (one) or “it’s easier and it is fair” (one). Among those respondents who do not remunerate based on the minimum wage, some remunerate their employees by commission, per task or according to the local market. However, even though some of them say that they do not use the minimum wage as a reference, the rules applied to the minimum wage act as a reference – although not always explicitly.
5.5 Conclusions from the qualitative surveys
Pay practice in small enterprises from developing countries is much more complex than usually thought. Pay practice and the provisions of bonuses and other allowances show the necessity of keeping a stable, motivated and healthy workforce. A kind of paternalistic behaviour seems widespread amongst employers.
Working hours are very long, especially in India and Indonesia. A rest day is not always provided. Overtime is very common. In most cases, it is paid, but there is rarely an overtime rate.
In India and Indonesia, the surveys put in evidence a lot of resistance from employers with respect to minimum wage legislation because of its high level or due to fear of
Conditions of Work and Employment Series No. 16 47
government regulation and corruption. In India, knowledge of the (highly complex) minimum wage system is low, even among employers paying above the minimum wage.
In Brazil and South Africa, informal employers show a lot more knowledge of the minimum wage applicable to their firm. However the complexity of the system in South Africa seems to be a barrier.
In Brazil and India, the level of the minimum wage does not seem to be a big problem in the surveyed firms. In South Africa and also in Indonesia, the minimum wage is in some cases much higher than wages paid in the surveyed firms.
48 Conditions of Work and Employment Series No. 16
6. Results and policy implications
The aim of this paper was twofold. First, it was to document the importance of the cluster of informal wages at the minimum wage using labour force/household surveys. Second, the aim of the report was to give a picture of working conditions in informal firms with particular attention to the payment of minimum wage.
In all four countries chosen for analysis, there is a heavy debate around the social and economic consequences of the minimum wage. In all of them, the right of the minimum wage has been perceived as one major tool in a policy kit targeted at sectors previously excluded from many labour rights. In India, the Minimum Wage Act (1948) was introduced soon after Independence to cover parts of unorganized labour and regenerated in the 1990s. In South Africa, sectoral determination of minimum wages in weakly organized sectors was introduced recently with the aim of reducing inequalities in the country. In Brazil, the minimum wage effect on effective wages in the informal economy is an unforeseen consequence of the general decline in minimum wages. In Indonesia, the revival of the minimum wage system in the 1990s went hand-in-hand with the democratization of the country in which trade unions actively participated.
The first conclusion is that the minimum wage can have an impact on informal wages. The paper shows that a concentration of informal workers at the minimum wage occurs in at least one Indian state (the Punjab) and one occupation (construction). It also shows a similar concentration in Brazil, and in South Africa for farm workers. This is a major conclusion, as it means that informal workers too can benefit from minimum wage protection. It shows that the spike is not limited to Latin American countries due to specific characteristics of the informal economy (definition of informal economy in terms of firm size rather than absence of regulation, urbanity, etc.).
How is this possible in the informal sector? The second conclusion of the paper deals with conditions associated with informal workers benefiting from the minimum wage. Simplicity of the minimum wage, like in Brazil or in the Punjab (India), is a prerequisite. Simplicity provides the best support for compliance in a part of the economy difficult to reach by labour inspectors. Simplicity means that the minimum wage can be widely known among the population. Workers can use it as a levy, and employers can use it in their bargaining as well. Economic conditions also matter. It is obvious that the minimum wage must be fixed in line with informal wages to target the poorest workers. Indeed the “best results” were found for a rich agriculture Indian state (the Punjab), a booming sector (construction in India) and an emerging country (Brazil). In Brazil, the high percentage of informal workers at, and above, the minimum wage is made possible because the minimum wage is set at a relatively low level.
The analysis reveals that in none of the four countries is the minimum wage fixed at the lower end of informal labour market. With the exception of Tamil Nadu (India) for the pre-2000 period, the minimum wage is fixed within 80 and 120 per cent of the median of informal wages. This structural fact means that numerous informal workers are paid below the legal threshold. This is also true in countries in which many informal workers are paid around the minimum wage. Hence workers at the minimum wage are not the poorest among informal workers.
The third point of the conclusion deals with the employment impact of the minimum wage. If the minimum wage is set at a level meaningful for informal wage-earners and it is enforced, what will be the effect on employment? For example, what will happen if wages increase on average by 10 per cent because of the minimum wage? Of course, there will almost certainly be a negative effect on employment. This effect will probably be smaller than 10 per cent because the elasticity of employment to wages is less than 1. What is
Conditions of Work and Employment Series No. 16 49

important to observe here is that the decrease in employment does not necessarily mean that families living on wages earned in the informal economy will be worse off. In short, some workers will lose and others will be better off. There might be a gender effect in who loses and wins from the increase of the minimum wage. The extent to which some workers will be better off depends on the minimum wage impact on prices. If wages increase, the demand for goods consumed by informal workers, mostly food will also increase. Depending on regulation on the market for food stuff, there might be an effect on prices as well.
The paper suggests therefore that under certain conditions, the minimum wage can be used as a reference wage in the bargaining between an individual worker and an employer. The hypothesis that the minimum wage is used by informal employers because it conveys information on workers’ productivity remains to be tested. In the case of Brazil especially, it would be worth looking at whether the minimum wage is used because it is close to the survival income that enables a worker to reproduce his/her workforce.
The “compliance” of some informal employers is all the more surprising, since the monitoring by the labour inspectorate might be quite rare in small firms where the bulk of informal wage-earners is concentrated. To explain the “spike” in the wage distribution at the minimum wage, it seems necessary to understand the motivation of employers and hence their wage-fixing practice. Wage fixing in the informal economy is rarely analysed, being considered as simply determined by supply and demand consideration as in the competition model. To help fill in the gap, four qualitative surveys were undertaken in a dozen informal firms of each country. The surveyed firms were small and operated in the construction and service sector of urban areas. Workers in those firms had no written labour contract. The surveys reveal that pay setting in these informal firms is a lot more complex than traditionally thought. In particular, mechanisms entailing the necessity of retaining and motivating skilled workers and combining basic pay, bonuses, in-kind income are also at stake.
50 Conditions of Work and Employment Series No. 16
Bibliography
D.F. Angel-Urdinala and Q. Wadon (2004): „The impact of raising the minimum wage: Gap-narrowing and reranking effects“, in Labour, Vol. 18, No. 2, pp. 317-327.
R. Anker, I. Chernyshev, P. Egger, F. Mehran and J. Ritter (2003): “Measuring decent work with statistical indicators”, in International Labour Review, Vol. 142, No. 2, pp. 147-177.
R. Anker (2004): Living wage rates around the world: Methodological development and measurement (Geneva, ILO).
T.C.A. Anant and K. Sundaram (1998): “Wage policy in India: A review”, in Indian Journal of Labour Economics (New Delhi), Vol. 41, No. 4, October-December, pp. 815-834.
L.A. Bell (1995): “The impact of minimum wages in Mexico and Colombia”, in Journal of Labor Economics (Chicago), Vol. 15, No. 3, pp. S102-S135.
K. Bird and C. Manning (2004): Impact of minimum wage policy on employment and earnings in the informal sector: The case of Indonesia, unpublished document.
W. Brade (2005): “South Africa: Bringing informal workers into the regulated sphere: Overcoming Apartheid’s legacy”, in T. Avirgan, L.J. Bivens and S. Gammage (eds.): Good jobs, bad jobs, no jobs (Washington, DC, Global Policy Network, Economic Policy Institute), pp. 369-490.
J.M. Camargo and N.E. Garcia (1992): Salario minimo como senal para el mercado de trabajo (Santiago, ILO).
Departemento Intersindical de Estatística e Estudos Sócio-Econõmicos (DIESSE) (2004): Boletim (São Paulo), May.
F. Eyraud and C. Saget (2005): The fundamentals of minimum wage fixing (Geneva, ILO).
A. Falk, E. Fehr and C. Zehnder (2005): The hevavioural effects of minimum wages, Institut zur Zufunft der Arbeit Discussion Paper No. 1625 (Bonn, June).
T.H. Gindling and K. Terrell (2005): “The effect of minimum wages on actual wages in formal and informal sectors in Costa Rica”, work in progress.
―― (2004a): The effects of multiple minimum wages throughout the labour market, William Davidson Institute Working Paper No. 701 (May).
―― (2004b): “Minimum wages, inequality and globalization”, in Michigan Journal of International Law, Vol. 26, pp. 245-269.
T.H. Gindling, M. Montenegro, D. Ordóñez and K. Terrell (2005): “Impacto de los reajustes al salario mínimo en Honduras”, paper written for the Honduras PRSP.
T. Hertz (2004): Have minimum wages benefited South Africa’s domestic service workers, mimeo.
ILO (2002a): Decent work and the informal economy, International Labour Conference, 90th Session, 2002, Report VI (Geneva).
Conditions of Work and Employment Series No. 16 51
―― (2002b): Women and men in the informal economy: A statistical picture (Geneva, Employment Sector).
―― (2004): 2004 Labour Overview: Latin America and the Caribbean (Lima).
P. Jones (1998): The impact of the minimum wage legislation in developing countries where coverage is incomplete, Working Paper No. WPS/98-2 (Oxford, Centre for Study of African Economics, Institute of Economics and Statistics).
N. Kristensen and W. Cunningham (2006): Do minimum wages in Latin America and the Caribbean matter? Evidence from 19 countries, Policy Research Working Paper No. 3870 (Washington, DC, World Bank, March).
A. Lally (2005): Wages in Turkey’s textiles and garment sector, Joint Initiative for Corporate Accountability and Workers’ Rights Briefing Paper No. 2.
S. Lemos (2003a): The effect of the minimum wage on wages and employment in Brazil: A menu of minimum wage variables, University College London Discussion Paper 03/02 (London).
―― (2003b): A menu of minimum wage variables for evaluating wages and employment effects: Evidence from Brazil, work in progress.
W.F. Maloney and J. Nuñez (2001): Measuring the impact of minimum wages: Evidence from Latin America, Policy Research Working Paper No. 2597 (Washington, DC, World Bank), at http://papers.ssrn.com.
N.G. Neri and J.M. Camargo (2001): “Salario mínimo, ‘efecto-farol’ e pobreza” [Minimum wage, ‘lighthouse-effect’ and poverty (English summary)], in Revista de Economía Política, Vol. 21, No. 2, pp. 68-90.
M. Rama (1996): The consequences of doubling the minimum wage: The case of Indonesia, Policy Research Working Paper No. 1643 (Washington, DC, World Bank).
J. Saboia and A.L. Saboia (2004): Caracterização do sector informal a partir dos dados do censo demográfico do Brazil de 2000, unpublished document (Rio de Janeiro, June).
C. Saget (2001): “Poverty reduction and employment in developing countries: Do minimum wages help?”, in International Labour Review, Vol. 140, No. 3, pp. 237-269.
SMERU Research Institute (2001): Wage and employment effects of minimum wage policy in the Indonesian labour market, Research report (October), at http://www.smeru.or.id/.
52 Conditions of Work and Employment Series No. 16

Annexes
Conditions of Work and Employment Series No. 16 53

Annex A: Overview of the minimum wage system for scheduled employments in Andhra Pradesh
1. Minimum wages revised/fixed for unskilled workers in scheduled employment as effective at 31 December 1999
56 scheduled employments, including one (paper and paper board) in which the minimum wages were fixed for the first time during 1999. All minimum wages for scheduled employments are fixed per day and range between Rs. 45 for paper and paper board and 78.77 a day for oil mills. All scheduled employments but two include a variable dearness allowance (VDA) on top of the basic minimum wage. VDA is the part of the minimum wage which is linked to consumer price increases.
Source: Half-yearly review on the minimum wages fixed/revised under the Minimum Wage Act, 1948, for the half-year ending on 31 December 1999, Indian Labour Journal, Vol. 42, No. 3, March 2001, pp 277-302.
2. Minimum wages revised/fixed for unskilled workers in scheduled employment as effective at 30 June 2000
The system was changed in a number of ways in early 2000. First, five scheduled employments were added to the 56 already existing. Very noticeably, agriculture is now one of the scheduled employments. Second, minimum wages at 30 June 2000 seem to be fixed per month for all except four scheduled employments and not on a daily basis. Third, variable dearness allowance was removed from a dozen employments as the basic rates of wages are linked to the consumer price index for industrial workers and fixed at 352 points (base year 1982=100). Finally, the newer rates are differentiated according to geographical zones in a number of cases, while this was not the case earlier.
On the basis of six days of work a week and 4.33 weeks a month, minimum wage rates range between Rs. 25.96 for sericulture and 63.19 a day for distilleries and breweries. Sericulture is a new scheduled employment.
The lower range of 27 indicated in the booklet does not correspond to the rates actually provided. There are also inconsistencies between the rates on 30 June 2000 and the previous one. For example, it is unclear how the rates for oil mills could go from 78.77 a day on 31 December 1999 down to 52.93 six months later.
Source: Ministry of Labour: Minimum wages in India, 2000 (2000).
3. Minimum wages revised/fixed for unskilled workers in scheduled employment as effective at 01 October 2001
What is remarkable among the changes made in the minimum wage system in 2001 is that the rate of increase is not uniform across occupations. Hence the pay gap between occupations actually changes.
Source: Ministry of Labour: Minimum wages in India, 2002 (2002).
Conditions of Work and Employment Series No. 16 55


Annex B: Minimum wage rates, average and median wages by regency/municipality in selected provinces in Indonesia in 2002 (per month)
No. Regency/municipality MW Mean Median MW/Mean MW/Median
1 RIAU 1 Kota Batam 602 175 2 Kab. Indragiri - 2 BANGKA BELITUNG 1 Kota Pangkal Pinang 510,000 970,685 900,000 0.53 0.57 2 Kab. Bangka 557,000 861,882 800,000 0.65 0.70 3 Kab. Belitung 553,000 753,184 650,000 0.73 0.85 3 JAWA BARAT 1 Kota Bandung --- 2 Kab. Bandung 562,428 640,140 560,000 0.88 1.00 3 Kota Bekasi 670,000 635,160 600,000 1.05 1.12 4 Kab. Bekasi 670,000 5 Kota Bogor 620,000 542,000 523,290 400,000 1.04 1.36 6 Kab. Bogar --- a. Manufaktur 639,325 b. Non Manufaktur 570,342 400,333 280,000 1.42 2.04 7 Kota Depok 642,000 543,740 480,000 1.18 1.34 8 Kab. Sumedang 567,000 390,000 9 Kab Karawang 632,000 477,422 416,000 1.32 1.52 10 Kab. Purwakarta 567,500 498,620 420,000 1.14 1.35 11 Kota Sukabumi 453,100 639,380 600,000 0.71 0.76 12 Kab. Sukabumi 367,000 13 Kab. Subang 450,000 538,290 500,000 0.84 0.90 14 Kab. Garut 380,000 849,870 600,000 0.45 0.63 15 Kab. Tasikmalaya 385,000 16 Kota Tasikmalaya 385,000 17 Kab. Ciamis 367,500 552,110 480,000 0.67 0.77 18 Kab. Cirebon 415,000 19 Kota Cirebon 435,000 20 Kab. Indramayu 482,000 21 Kab. Majalengka 395,000 22 Kab. Kuningan 370,000 23 Kab. Cianjur 370,000 24 Kab. Cimahi 562,500 35 Kota Banjar 367,500 4 BANTEN 1 Kota Tangerang 660,000 813,820 735,000 0.81 0.90 2 Kab. Tangerang 660,000 3 Kota Cilegon --- 4 Kab Pandeglang --- 5 Kab Lebak 550,000 6 Kab Serang --- 5 JAWA TENGAH 1 Kota Semarang 440,000 614,500 500,000 0.72 0.88 2 Kab Demak 410,000 546,700 420,000 0.75 0.98 3 Kab Kendal 410,000 546,700 420,000 0.75 0.98 4 Kab Semarang 430,000 402,450 310,000 1.07 1.39
Conditions of Work and Employment Series No. 16 57
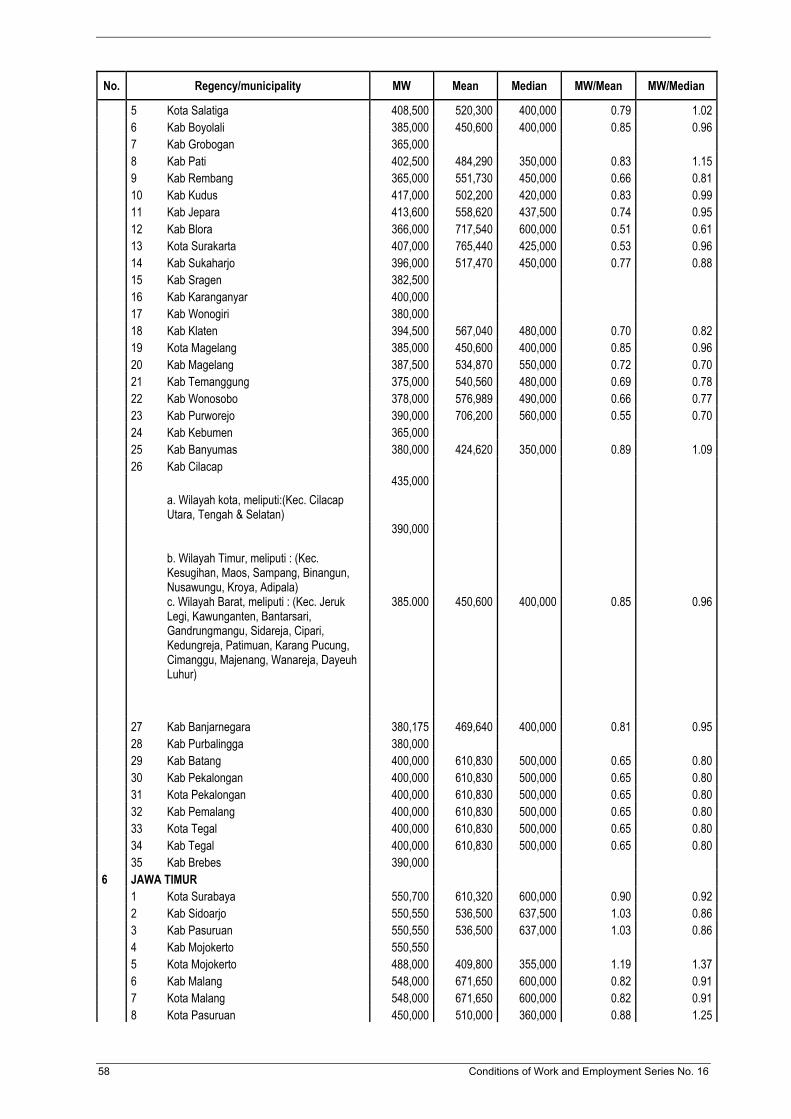
No. Regency/municipality MW Mean Median MW/Mean MW/Median
5 Kota Salatiga 408,500 520,300 400,000 0.79 1.02 6 Kab Boyolali 385,000 450,600 400,000 0.85 0.96 7 Kab Grobogan 365,000 8 Kab Pati 402,500 484,290 350,000 0.83 1.15 9 Kab Rembang 365,000 551,730 450,000 0.66 0.81 10 Kab Kudus 417,000 502,200 420,000 0.83 0.99 11 Kab Jepara 413,600 558,620 437,500 0.74 0.95 12 Kab Blora 366,000 717,540 600,000 0.51 0.61 13 Kota Surakarta 407,000 765,440 425,000 0.53 0.96 14 Kab Sukaharjo 396,000 517,470 450,000 0.77 0.88 15 Kab Sragen 382,500 16 Kab Karanganyar 400,000 17 Kab Wonogiri 380,000 18 Kab Klaten 394,500 567,040 480,000 0.70 0.82 19 Kota Magelang 385,000 450,600 400,000 0.85 0.96 20 Kab Magelang 387,500 534,870 550,000 0.72 0.70 21 Kab Temanggung 375,000 540,560 480,000 0.69 0.78 22 Kab Wonosobo 378,000 576,989 490,000 0.66 0.77 23 Kab Purworejo 390,000 706,200 560,000 0.55 0.70 24 Kab Kebumen 365,000 25 Kab Banyumas 380,000 424,620 350,000 0.89 1.09 26 Kab Cilacap
a. Wilayah kota, meliputi:(Kec. Cilacap Utara, Tengah & Selatan)
435,000
b. Wilayah Timur, meliputi : (Kec. Kesugihan, Maos, Sampang, Binangun, Nusawungu, Kroya, Adipala)
390,000
c. Wilayah Barat, meliputi : (Kec. Jeruk
Legi, Kawunganten, Bantarsari, Gandrungmangu, Sidareja, Cipari, Kedungreja, Patimuan, Karang Pucung, Cimanggu, Majenang, Wanareja, Dayeuh Luhur)
385.000 450,600 400,000 0.85 0.96
27 Kab Banjarnegara 380,175 469,640 400,000 0.81 0.95 28 Kab Purbalingga 380,000 29 Kab Batang 400,000 610,830 500,000 0.65 0.80 30 Kab Pekalongan 400,000 610,830 500,000 0.65 0.80 31 Kota Pekalongan 400,000 610,830 500,000 0.65 0.80 32 Kab Pemalang 400,000 610,830 500,000 0.65 0.80 33 Kota Tegal 400,000 610,830 500,000 0.65 0.80 34 Kab Tegal 400,000 610,830 500,000 0.65 0.80 35 Kab Brebes 390,000 6 JAWA TIMUR 1 Kota Surabaya 550,700 610,320 600,000 0.90 0.92 2 Kab Sidoarjo 550,550 536,500 637,500 1.03 0.86 3 Kab Pasuruan 550,550 536,500 637,000 1.03 0.86 4 Kab Mojokerto 550,550 5 Kota Mojokerto 488,000 409,800 355,000 1.19 1.37 6 Kab Malang 548,000 671,650 600,000 0.82 0.91 7 Kota Malang 548,000 671,650 600,000 0.82 0.91 8 Kota Pasuruan 450,000 510,000 360,000 0.88 1.25
58 Conditions of Work and Employment Series No. 16

No. Regency/municipality MW Mean Median MW/Mean MW/Median
9 Kab Jombang 426,500 451,610 352,000 0.94 1.21 10 Kota Probolinggo 416,000 526,670 450,000 0.79 0.92 11 Kab Probolinggo 456,000 305,400 275,000 1.49 1.66 12 Kab Banyuwangi 356,000 378,660 315,000 0.94 1.13 13 Kab Jember 397,606 420,510 300,000 0.95 1.33 14 Kab Situbundo 348,500 554,550 550,000 0.63 0.63 15 Kab Lumajang 321,000 16 Kab Bodowoso 310,000 626,270 556,000 0.49 0.56 17 Kota Madiun 325,000 534,450 450,000 0.61 0.72 18 Kab. Madiun 320,000 494,320 375,000 0.65 0.85 19 Kab. Ngawi 323,600 20 Kab. Magetan 321,530 664,240 600,000 0.48 0.54 21 Kab. Ponorogo 315,000 529,990 425,000 0.59 0.74 22 Kab. Pacitan 320,975 613,600 520,000 0.52 0.62 23 Kota Kediri 480,000 807,900 500,000 0.59 0.96 24 Kab. Kediri 480,000 807,900 500,000 0.59 0.96 25 Kab. Nganjuk 354,000 892,940 700,000 0.40 0.51 26 Kab. Tulungagung 349,000 695,920 650,000 0.50 0.54 27 Kab. Trenggalek 316,500 658,760 529,000 0.48 0.60 28 Kota Blitar 331,210 749,290 750,000 0.44 0.44 29 Kab. Blitar 317,200 617,050 450,000 0.51 0.70 30 Kab. Bojonegoro 331,000 688,090 600,000 0.48 0.55 31 Kab. Tuban 345,000 540,170 400,000 0.64 0.86 32 Kab. Lamongan 380,743 709,270 600,000 0.54 0.63 33 Kab. Bangkalan 440,000 565,150 500,000 0.78 0.88 34 Kab. Sampang 330,000 713,630 750,000 0.46 0.44 35 Kab. Pamekasan 430,000 672,250 600,000 0.64 0.72 36 Kab. Sumenep 400,000 773,280 585,000 0.52 0.68 37 Kota Batu 548,000 38 Kab Gresik 550,550 7 BALI 1 Kota Denpasar 465,000 734,700 600,000 0.63 0.78 2 Kab. Badung 469,000 807,970 650,000 0.58 0.72 3 Kab. Gianyar 446,265 805,860 735,000 0.55 0.61 4 Kab. Jembrana 432,650 644,570 565,000 0.67 0.77
Conditions of Work and Employment Series No. 16 59


Annex C: Examples of bargaining councils agreements and sectoral determination for farm workers, South Africa
BARGAINING COUNCIL FOR THE TEAROOM, RESTAURANT AND CATERING TRADE, PRETORIA
MAIN COLLECTIVE AGREEMENT (Consolidating Regulation Gazettes 6430 of 12/02/1999, 7025 of 16/03/2001,7197 of 9/11/2001, 7725 of
25/07/2003 & 8289 of 12/08/2005)
in accordance with the provisions of the Labour Relations Act (Act No. 66 of 1995), made and entered into by and between the:
Pretoria and Districts Caterers Association (hereinafter referred to as the "employers"
or the "employers organisation"), of the one part, and the South African Commercial, Catering and Allied Workers' Union (SACCAWU),
Club, Caterers, Retail and Allied Workers' Union (CCRAWUSA) (hereinafter referred to as the "employees" or the "trade union"),
of the other part, being the parties to the Bargaining Council for the Tearoom,
Restaurant and Catering Trade, Pretoria.
5. REMUNERATION: WAGES
(A) EXEMPTIONS: Where a small employer or his employee can satisfy the Council that any provisions of the Agreement are restricting entrepreneurial initiative and/or employment opportunities, such an employer or employee may apply to the Council for exemption from the specific provisions and the Council may grant such an exemption. Prescribed wages for an employee on probation may be reduced by not more than 10% for a period not exceeding three months. The wages prescribed pertain to the payment for ordinary hours of work as specified in clause 7. Should statutory legislation reduce these ordinary hours of work the wages will automatically be reduced proportionately.
(B) MINIMUM WAGES:
(1) Employees that are paid above the minimum wage as determined in this Agreement shall be entitled to a minimum increase of-
(a) small employer - 6% across the board with effect from the date of coming into operation of this agreement to 28 February 2006 and 7% across the board for the period 01 March 2006 to 28 February 2007 and thereafter.
(b) other establishments – 8% across the board with effect from the date of coming into operation of this agreement to 28 February 2006 and 8.8% across the board for the period 01 March 2006 to 28 February 2007 and thereafter.
(2) The minimum wage which shall be paid by an employer to each member of the under-mentioned classes of employees shall be as follows:
Conditions of Work and Employment Series No. 16 61

MINIMUM WAGE TABLE
With effect from the date of coming into operation of this agreement until 28 February 2006
1 March 2006 and thereafter Job description
Monthly Weekly Hourly Monthly Weekly Hourly
Assistant Manager Area A Area B
2 607.09 2 558.81
602.10 590.95
13.38 13.13
2 841.73 2 737.93
656.29 632.32
14.58 14.05
Barker/Confectionery/Cook Area A Area B
1 439.94 1 413.28
332.55 326.39
7.39 7.25
1 569.53 1 512.21
362.48 349.24
10.72 10.33
Catering Assistant Area A Area B
1 519.83 1 419.69
351 344.5
7.8 7.66
1 656.61 1 596.11
382.59 368.62
8.6 8.19
(2) Basis of contract: For the purposes of this clause, an employee shall be deemed to be a weekly employee unless he falls within the definition of "casual employee" or "special function employee," and save as provided in subclause (4) of this clause and in clause 6 (5) shall be paid in respect of any week not less than the full weekly wage prescribed in subclause (1) for an employee of his class, whether he works in that week for the maximum number of ordinary hours specified for a week in clause 7 (2) or less.
(3) Differential wages: An employer who requires or permits a member of one class of his employees to perform for longer than one hour, either in addition to his work or in substitution thereof, work of another class for which a higher wage is prescribed in subclause (1) shall pay such employee at the higher wage in respect of the whole day on which he performs such work: Provided that where the difference between classes is, in terms of subclause (1), based on experience or age, the provisions of this subclause shall not apply.
(4) Calculation of daily wage: For the purposes of subclause (3), the wage payable in respect of any day shall be not less than one twenty-sixth of the monthly wage as prescribed in subclause (1) for the higher work performed.
(5) Nothing in this Agreement shall operate to reduce the wage which is being paid to an employee at the date on which this Agreement comes into operation.
(6) The areas for the minimum wages are as follows: Area A: Magisterial districts of Pretoria, Cullinan, Wonderboom and Municipal area of Midrand. Area B: Magisterial districts of Brits, Bronkhorstspruit, Rustenburg, Warmbaths and Witbank.
(7) No employer shall reduce the ordinary hours of work in order to reduce salary/wage payment.
62 Conditions of Work and Employment Series No. 16
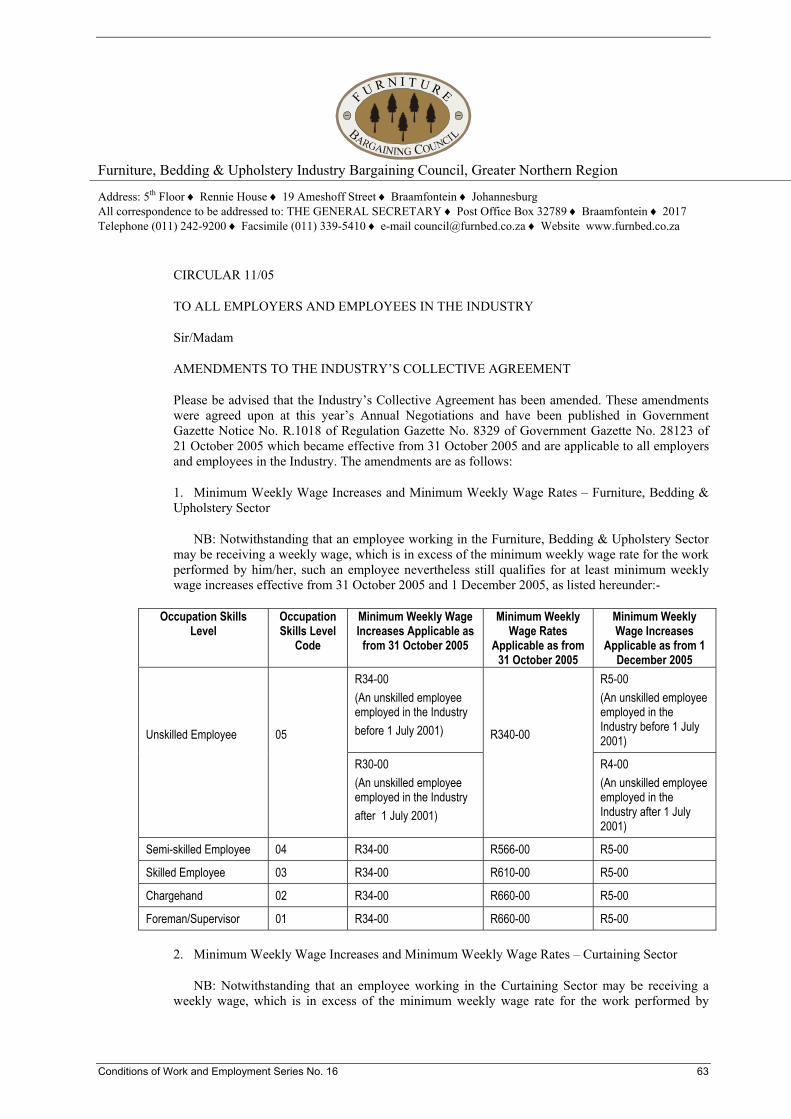
F U R N I T U R E
Furniture, Bedding & Upholstery Industry Bargaining Council, Greater Northern Region Address: 5th Floor ♦ Rennie House ♦ 19 Ameshoff Street ♦ Braamfontein ♦ Johannesburg All correspondence to be addressed to: THE GENERAL SECRETARY ♦ Post Office Box 32789 ♦ Braamfontein ♦ 2017 Telephone (011) 242-9200 ♦ Facsimile (011) 339-5410 ♦ e-mail [email protected] ♦ Website www.furnbed.co.za
CIRCULAR 11/05
TO ALL EMPLOYERS AND EMPLOYEES IN THE INDUSTRY
Sir/Madam
AMENDMENTS TO THE INDUSTRY’S COLLECTIVE AGREEMENT
Please be advised that the Industry’s Collective Agreement has been amended. These amendments were agreed upon at this year’s Annual Negotiations and have been published in Government Gazette Notice No. R.1018 of Regulation Gazette No. 8329 of Government Gazette No. 28123 of 21 October 2005 which became effective from 31 October 2005 and are applicable to all employers and employees in the Industry. The amendments are as follows:
1. Minimum Weekly Wage Increases and Minimum Weekly Wage Rates – Furniture, Bedding & Upholstery Sector
NB: Notwithstanding that an employee working in the Furniture, Bedding & Upholstery Sector may be receiving a weekly wage, which is in excess of the minimum weekly wage rate for the work performed by him/her, such an employee nevertheless still qualifies for at least minimum weekly wage increases effective from 31 October 2005 and 1 December 2005, as listed hereunder:-
Occupation Skills Level
Occupation Skills Level
Code
Minimum Weekly Wage Increases Applicable as
from 31 October 2005
Minimum Weekly Wage Rates
Applicable as from 31 October 2005
Minimum Weekly Wage Increases
Applicable as from 1 December 2005
R34-00 (An unskilled employee employed in the Industry before 1 July 2001)
R5-00 (An unskilled employee employed in the Industry before 1 July 2001)
Unskilled Employee
05
R30-00 (An unskilled employee employed in the Industry after 1 July 2001)
R340-00
R4-00 (An unskilled employee employed in the Industry after 1 July 2001)
Semi-skilled Employee 04 R34-00 R566-00 R5-00
Skilled Employee 03 R34-00 R610-00 R5-00
Chargehand 02 R34-00 R660-00 R5-00
Foreman/Supervisor 01 R34-00 R660-00 R5-00
2. Minimum Weekly Wage Increases and Minimum Weekly Wage Rates – Curtaining Sector
NB: Notwithstanding that an employee working in the Curtaining Sector may be receiving a weekly wage, which is in excess of the minimum weekly wage rate for the work performed by
Conditions of Work and Employment Series No. 16 63

him/her, such an employee nevertheless still qualifies for at least a minimum weekly wage increase effective from 31 October 2005, as listed hereunder:-
Occupation Skills Level Occupation Skills Level Code
Minimum Weekly Wage Increases Applicable as from 31 October 2005
Minimum Weekly Wage Rates Applicable as from 31 October 2005
Unskilled Employee 05 R18-50 R340-00
Semi-skilled Employee 04 R28-00 R516-79
Skilled Employee 03 R32-50 R587-30
Chargehand 02 R35-00 R645-25
Foreman/Supervisor 01 R35-00 R645-25
NOTE: Employees in the Curtaining Sector will not receive a further weekly wage increase on 1 December 2005, as is the case with the Furniture, Bedding and Upholstery Sector.
3. Council Levies
The Council Levies effective from 31 October 2005 amounts to R4-25 per week from the employer and R4-25 per week from the employee. This amounts to a total Council Levy of R8-50 per week, per employee.
All other provisions of the Industry’s current Collective Agreement remain applicable together with these amendments.
Kindly ensure that all provisions of this Circular are complied with. Do not hesitate to contact the Agents of this Council should you require any additional information. Please do not contact any junior staff members of the Council in this regard.
64 Conditions of Work and Employment Series No. 16
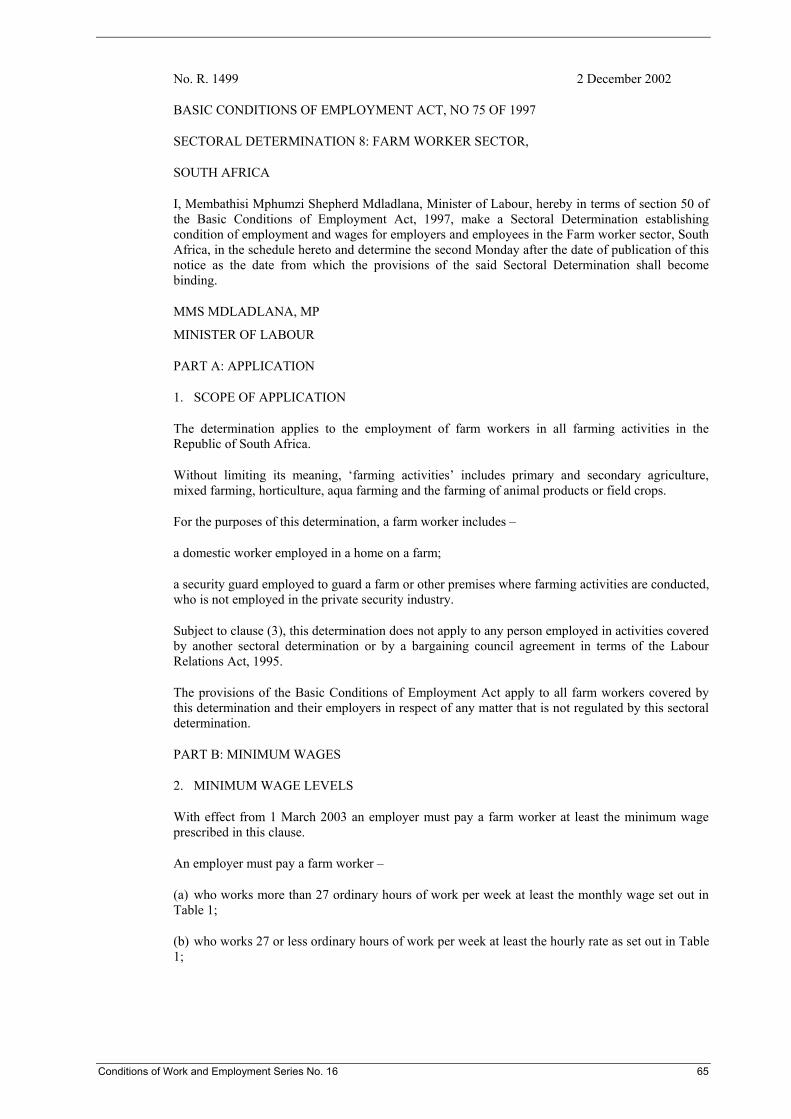
No. R. 1499 2 December 2002
BASIC CONDITIONS OF EMPLOYMENT ACT, NO 75 OF 1997
SECTORAL DETERMINATION 8: FARM WORKER SECTOR,
SOUTH AFRICA
I, Membathisi Mphumzi Shepherd Mdladlana, Minister of Labour, hereby in terms of section 50 of the Basic Conditions of Employment Act, 1997, make a Sectoral Determination establishing condition of employment and wages for employers and employees in the Farm worker sector, South Africa, in the schedule hereto and determine the second Monday after the date of publication of this notice as the date from which the provisions of the said Sectoral Determination shall become binding.
MMS MDLADLANA, MP
MINISTER OF LABOUR
PART A: APPLICATION
1. SCOPE OF APPLICATION
The determination applies to the employment of farm workers in all farming activities in the Republic of South Africa.
Without limiting its meaning, ‘farming activities’ includes primary and secondary agriculture, mixed farming, horticulture, aqua farming and the farming of animal products or field crops.
For the purposes of this determination, a farm worker includes –
a domestic worker employed in a home on a farm;
a security guard employed to guard a farm or other premises where farming activities are conducted, who is not employed in the private security industry.
Subject to clause (3), this determination does not apply to any person employed in activities covered by another sectoral determination or by a bargaining council agreement in terms of the Labour Relations Act, 1995.
The provisions of the Basic Conditions of Employment Act apply to all farm workers covered by this determination and their employers in respect of any matter that is not regulated by this sectoral determination.
PART B: MINIMUM WAGES
2. MINIMUM WAGE LEVELS
With effect from 1 March 2003 an employer must pay a farm worker at least the minimum wage prescribed in this clause.
An employer must pay a farm worker –
(a) who works more than 27 ordinary hours of work per week at least the monthly wage set out in Table 1;
(b) who works 27 or less ordinary hours of work per week at least the hourly rate as set out in Table 1;
Conditions of Work and Employment Series No. 16 65
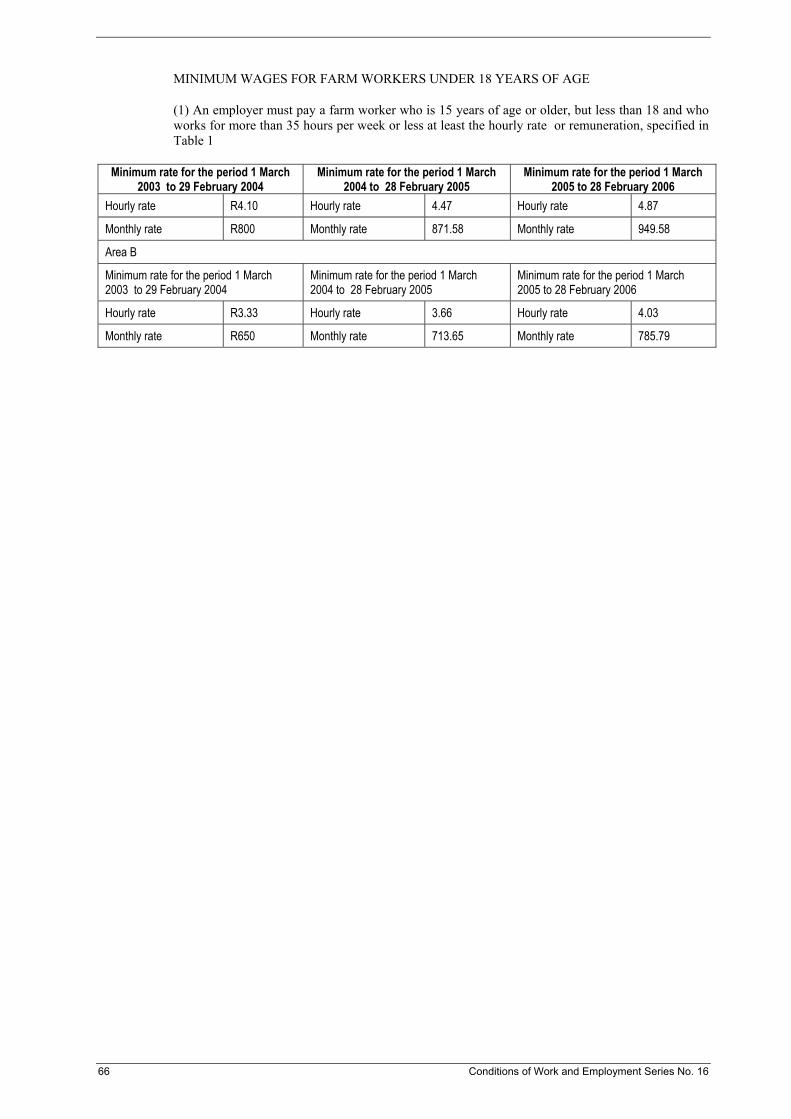
MINIMUM WAGES FOR FARM WORKERS UNDER 18 YEARS OF AGE
(1) An employer must pay a farm worker who is 15 years of age or older, but less than 18 and who works for more than 35 hours per week or less at least the hourly rate or remuneration, specified in Table 1
Minimum rate for the period 1 March 2003 to 29 February 2004
Minimum rate for the period 1 March 2004 to 28 February 2005
Minimum rate for the period 1 March 2005 to 28 February 2006
Hourly rate R4.10 Hourly rate 4.47 Hourly rate 4.87
Monthly rate R800 Monthly rate 871.58 Monthly rate 949.58
Area B
Minimum rate for the period 1 March 2003 to 29 February 2004
Minimum rate for the period 1 March 2004 to 28 February 2005
Minimum rate for the period 1 March 2005 to 28 February 2006
Hourly rate R3.33 Hourly rate 3.66 Hourly rate 4.03
Monthly rate R650 Monthly rate 713.65 Monthly rate 785.79
66 Conditions of Work and Employment Series No. 16
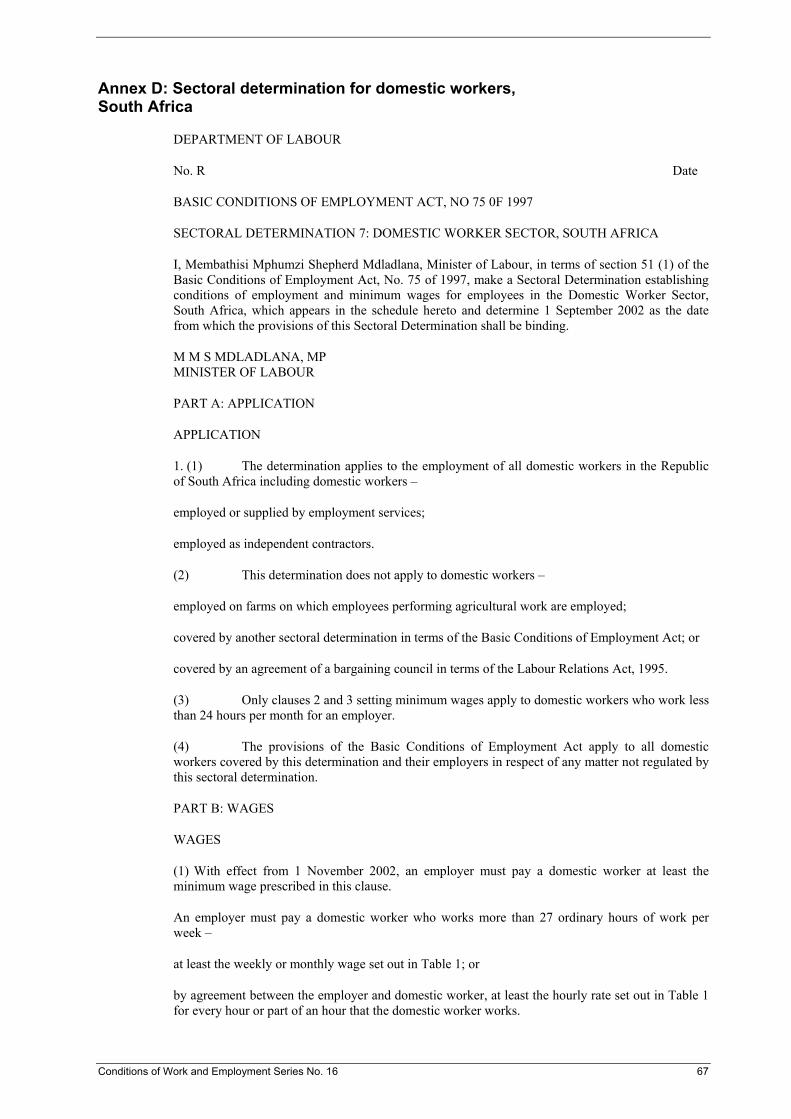
Annex D: Sectoral determination for domestic workers, South Africa
DEPARTMENT OF LABOUR
No. R Date
BASIC CONDITIONS OF EMPLOYMENT ACT, NO 75 0F 1997
SECTORAL DETERMINATION 7: DOMESTIC WORKER SECTOR, SOUTH AFRICA
I, Membathisi Mphumzi Shepherd Mdladlana, Minister of Labour, in terms of section 51 (1) of the Basic Conditions of Employment Act, No. 75 of 1997, make a Sectoral Determination establishing conditions of employment and minimum wages for employees in the Domestic Worker Sector, South Africa, which appears in the schedule hereto and determine 1 September 2002 as the date from which the provisions of this Sectoral Determination shall be binding.
M M S MDLADLANA, MP MINISTER OF LABOUR
PART A: APPLICATION
APPLICATION
1. (1) The determination applies to the employment of all domestic workers in the Republic of South Africa including domestic workers –
employed or supplied by employment services;
employed as independent contractors.
(2) This determination does not apply to domestic workers –
employed on farms on which employees performing agricultural work are employed;
covered by another sectoral determination in terms of the Basic Conditions of Employment Act; or
covered by an agreement of a bargaining council in terms of the Labour Relations Act, 1995.
(3) Only clauses 2 and 3 setting minimum wages apply to domestic workers who work less than 24 hours per month for an employer.
(4) The provisions of the Basic Conditions of Employment Act apply to all domestic workers covered by this determination and their employers in respect of any matter not regulated by this sectoral determination.
PART B: WAGES
WAGES
(1) With effect from 1 November 2002, an employer must pay a domestic worker at least the minimum wage prescribed in this clause.
An employer must pay a domestic worker who works more than 27 ordinary hours of work per week –
at least the weekly or monthly wage set out in Table 1; or
by agreement between the employer and domestic worker, at least the hourly rate set out in Table 1 for every hour or part of an hour that the domestic worker works.
Conditions of Work and Employment Series No. 16 67

An employer must pay a domestic worker who works 27 or less ordinary hours of work per week –
at least the weekly or monthly wage set out in Table 2;
by agreement between the employer and domestic worker, at least the hourly rate set out in Table 2 for every hour or part of an hour that the domestic worker works.
A domestic worker who works for less than four hours on any day must be paid for four hours’ work on that day.
ANNUAL WAGE INCREASES
3. (1) Every domestic worker must be granted wage increases of at least 8% on 1 November 2003 and on 1 November 2004.
The wage increases in terms of sub-clause (1) must be calculated on the domestic worker’s actual wage in the preceding month.
If the annual increase in the Consumer Price Index reported by Statistics South Africa six weeks before a wage increase in terms of this clause comes into effect is 10% or higher, domestic workers will be entitled to receive a wage increase equivalent to the increase in the Consumer Price Index.
Any wage increase in excess of 8% required in terms of sub-clause (3) must be published in the Government Gazette as an amendment to this sectoral determination.
Table 1: Minimum wages for domestic workers who work more than 27 ordinary hours per week
AREA A Minimum rates for the period
1 November 2002 to 31 October 2003 Minimum rates for the period
1 November 2003 to 31 October 2004 Minimum rates for the period
1 November 2004 to 31 October 2005 Hourly rate (R)
4,10
Hourly rate (R)
4,42
Hourly rate (R)
4,77
Weekly rate (R)
184,62
Weekly rate (R)
198,90
Weekly rate (R)
214,65
Monthly rate (R)
800,00
Monthly rate (R)
861,90
Monthly rate (R)
930,15
AREA B Minimum rates for the period
1 November 2002 to 31 October 2003 Minimum rates for the period
1 November 2003 to 31 October 2004 Minimum rates for the period
1 November 2004 to 31 October 2005 Hourly rate (R)
3,33
Hourly rate (R)
3,59
Hourly rate (R)
3,87
Weekly rate (R)
150,00
Weekly rate (R)
161,55
Weekly rate (R)
174,15
Monthly rate (R)
650,00
Monthly rate (R)
700,05
Monthly rate (R)
754,65
68 Conditions of Work and Employment Series No. 16

Table 2: Minimum wages for part-time domestic workers who work 27 ordinary hours per week or less
AREA A Minimum rates for the period
1 November 2002 to 31 October 2003 Minimum rates for the period
1 November 2003 to 31 October 2004 Minimum rates for the period
1 November 2004 to 31 October 2005 Hourly rate (R)
4,51
Hourly rate (R)
4,87
Hourly rate (R)
5,25
Weekly rate (R)
212,77
Weekly rate (R)
131,49
Weekly rate (R)
141,75
Monthly rate (R)
527,67
Monthly rate (R)
569,79
Monthly rate (R)
614,25
AREA B Minimum rates for the period
1 November 2002 to 31 October 2003 Minimum rates for the period
1 November 2003 to 31 October 2004 Minimum rates for the period
1 November 2004 to 31 October 2005 Hourly rate (R)
3,66
Hourly rate (R)
3,95
Hourly rate (R)
4,26
Weekly rate (R)
98,82
Weekly rate (R)
106,65
Weekly rate (R)
115,02
Monthly rate (R)
428,22
Monthly rate (R)
462,15
Monthly rate (R)
498,42
Conditions of Work and Employment Series No. 16 69

70 Conditions of Work and Employment Series No. 16
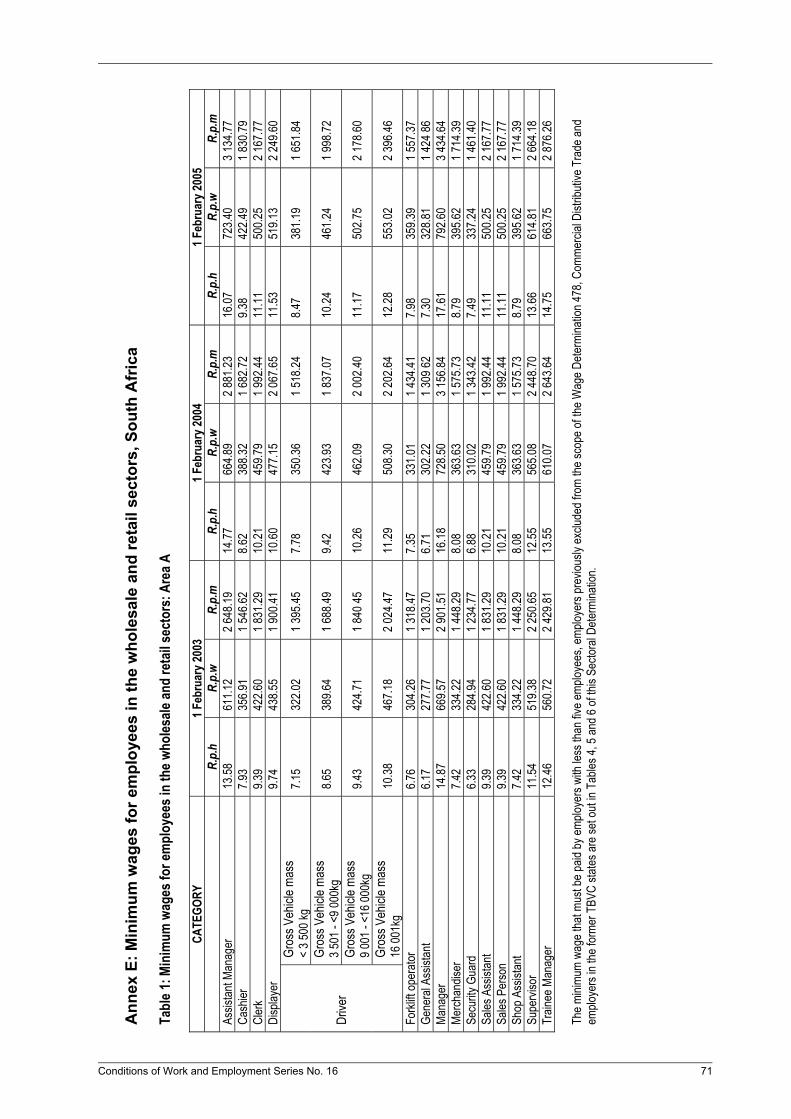
Conditions of Work and Em
ployment Series No. 16 71
Ann
ex E
: Min
imum
wag
es fo
r em
ploy
ees
in th
e w
hole
sale
and
reta
il se
ctor
s, S
outh
Afr
ica
Tabl
e 1: M
inim
um w
ages
for e
mpl
oyee
s in
the w
holes
ale an
d re
tail s
ecto
rs: A
rea A
CATE
GORY
1 F
ebru
ary 2
003
1 Feb
ruar
y 200
4 1 F
ebru
ary 2
005
R.
p.h
R.
p.w
R.p.
m
R.p.
h
R.p.
wR.
p.m
R.p.
h
R.p.
wR.
p.m
Assis
tant M
anag
er
13.58
61
1.12
2 648
.19
14.77
66
4.89
2 881
.23
16.07
72
3.40
3 134
.77
Cash
ier
7.93
356.9
1 1 5
46.62
8.6
2 38
8.32
1 682
.72
9.38
422.4
9 1 8
30.79
Cl
erk
9.39
422.6
0 1 8
31.29
10
.21
459.7
9 1 9
92.44
11
.11
500.2
5 2 1
67.77
Di
splay
er
9.74
438.5
5 1 9
00.41
10
.60
477.1
5 2 0
67.65
11
.53
519.1
3 2 2
49.60
Gr
oss V
ehicl
e mas
s <
3 500
kg
7.15
322.0
2 1 3
95.45
7.7
8 35
0.36
1 518
.24
8.47
381.1
9 1 6
51.84
Gros
s Veh
icle m
ass
3 501
- <9
000k
g 8.6
5 38
9.64
1 688
.49
9.42
423.9
3 1 8
37.07
10
.24
461.2
4 1 9
98.72
Gros
s Veh
icle m
ass
9 001
- <1
6 000
kg
9.43
424.7
1 1 8
40 45
10
.26
462.0
9 2 0
02.40
11
.17
502.7
5 2 1
78.60
Dr
iver
Gros
s Veh
icle m
ass
16 00
1kg
10.38
46
7.18
2 024
.47
11.29
50
8.30
2 202
.64
12.28
55
3.02
2 396
.46
Forkl
ift op
erato
r 6.7
6 30
4.26
1 318
.47
7.35
331.0
1 1 4
34.41
7.9
8 35
9.39
1 557
.37
Gene
ral A
ssist
ant
6.17
277.7
7 1 2
03.70
6.7
1 30
2.22
1 309
62
7.30
328.8
1 1 4
24 86
Ma
nage
r 14
.87
669.5
7 2 9
01.51
16
.18
728.5
0 3 1
56.84
17
.61
792.6
0 3 4
34.64
Me
rchan
diser
7.4
2 33
4.22
1 448
.29
8.08
363.6
3 1 5
75.73
8.7
9 39
5.62
1 714
.39
Secu
rity G
uard
6.3
3 28
4.94
1 234
.77
6.88
310.0
2 1 3
43.42
7.4
9 33
7.24
1 461
.40
Sales
Ass
istan
t 9.3
9 42
2.60
1 831
.29
10.21
45
9.79
1 992
.44
11.11
50
0.25
2 167
.77
Sales
Per
son
9.39
422.6
0 1 8
31.29
10
.21
459.7
9 1 9
92.44
11
.11
500.2
5 2 1
67.77
Sh
op A
ssist
ant
7.42
334.2
2 1 4
48.29
8.0
8 36
3.63
1 575
.73
8.79
395.6
2 1 7
14.39
Su
pervi
sor
11.54
51
9.38
2 250
.65
12.55
56
5.08
2 448
.70
13.66
61
4.81
2 664
.18
Train
ee M
anag
er
12.46
56
0.72
2 429
.81
13.55
61
0.07
2 643
.64
14.75
66
3.75
2 876
.26
The m
inimu
m wa
ge th
at mu
st be
paid
by em
ploye
rs wi
th les
s tha
n five
emplo
yees
, emp
loyer
s pre
vious
ly ex
clude
d fro
m the
scop
e of t
he W
age D
eterm
inatio
n 478
, Com
merci
al Di
stribu
tive T
rade
and
emplo
yers
in the
form
er T
BVC
states
are s
et ou
t in T
ables
4, 5
and 6
of th
is Se
ctora
l Dete
rmina
tion.

72
Conditions of Work and Employment Series No. 16
Tabl
e 2: M
inim
um w
ages
for e
mpl
oyee
s in
the w
holes
ale an
d re
tail s
ecto
rs: A
rea B
CATE
GORY
1 F
ebru
ary 2
003
1 Feb
ruar
y 200
4 1 F
ebru
ary 2
005
R.
p.h
R.
p.w
R.p.
m
R.p.
h
R.p.
wR.
p.m
R.p.
h
R.p.
wR.
p.m
Assis
tant M
anag
er
10.97
49
3.74
2 139
.58
11.93
53
7.19
2 327
.86
12.98
58
4.47
2 532
.71
Cash
ier
6.38
287.4
6 1 2
45.69
6.9
5 31
2.76
1 355
.31
7.55
340.3
3 1 4
74.77
Cl
erk
7.63
343.4
4 1 4
88.24
8.3
0 37
3.66
1 619
.20
9.03
406.5
4 1 7
61.68
Di
splay
er
7.35
330.7
6 1 4
33.33
7.9
9 35
9.87
1 559
.47
8.70
391.5
4 1 6
96.70
Gr
oss V
ehicl
e mas
s <
3 500
kg
5.67
255.4
8 1 1
07.11
6.1
7 27
7.96
1 204
.53
6.72
302.4
2 1 3
10.52
Gros
s Veh
icle m
ass
3 501
- <9
000k
g 6.8
6 30
9.13
1 339
.60
7.47
336.3
4 1 4
57.48
8.1
3 36
5.93
1 585
.72
Gros
s Veh
icle m
ass
9 000
1 - <
16 00
0kg
7.48
336.9
6 1 4
60.16
8.1
4 36
6.61
1 588
.65
9.83
442.7
8 1 9
18.72
Drive
r
Gros
s Veh
icle m
ass
16 00
1kg
8.23
370.6
5 1 6
06.17
8.9
6 40
3.27
1 747
.51
10.82
48
7.05
2 110
.59
Forkl
ift op
erato
r 5.3
4 24
0.50
1 042
.18
5.81
261.6
6 1 1
33.89
6.3
2 28
4.69
1 233
.67
Gene
ral A
ssist
ant
5.31
238.9
6 1 0
35.52
5.7
7 25
9.99
1 126
.64
6.28
282.8
7 1 2
25.78
Ma
nage
r 11
.90
535.5
3 2 3
20.64
6.2
8 28
2.65
2 524
.85
14.08
63
3.93
2 747
.03
Merch
andis
er
5.99
269.6
1 1 1
68.35
6.5
1 29
3.34
1 271
.16
7.09
319.1
5 1 3
83.02
Se
curity
Gua
rd
6.02
271.2
3 1 1
75.36
6.5
5 29
5.10
1 278
.79
7.13
321.0
7 1 3
91.32
Sa
les A
ssist
ant
7.63
343.4
4 1 4
88.24
8.3
0 37
3.66
1 619
.20
9.03
406.5
4 1 7
61.68
Sa
les P
erso
n 7.6
3 34
3.44
1 488
.24
8.30
373.6
6 1 6
19.20
9.0
3 40
6.54
1 761
.68
Shop
Ass
istan
t 5.9
9 26
9.61
1 168
.35
6.51
293.3
4 1 2
71.16
7.0
9 31
9.15
1 383
.02
Supe
rviso
r 9.3
0 41
8.60
1 813
95
10.12
45
5.43
1 973
.57
11.01
49
5.51
2 147
.24
Train
ee M
anag
er
11.03
49
6.45
2 151
.32
10.83
48
7.76
2 113
.64
11.78
53
0.31
2 298
.01
The m
inimu
m wa
ge th
at mu
st be
paid
by em
ploye
rs wi
th les
s tha
n five
emplo
yees
, emp
loyer
s pre
vious
ly ex
clude
d fro
m the
scop
e of t
he W
age D
eterm
inatio
n 478
, Com
merci
al Di
stribu
tive T
rade
and
emplo
yers
in the
form
er T
BVC
states
are s
et ou
t in T
ables
4, 5
and 6
of th
is Se
ctora
l Dete
rmina
tion.
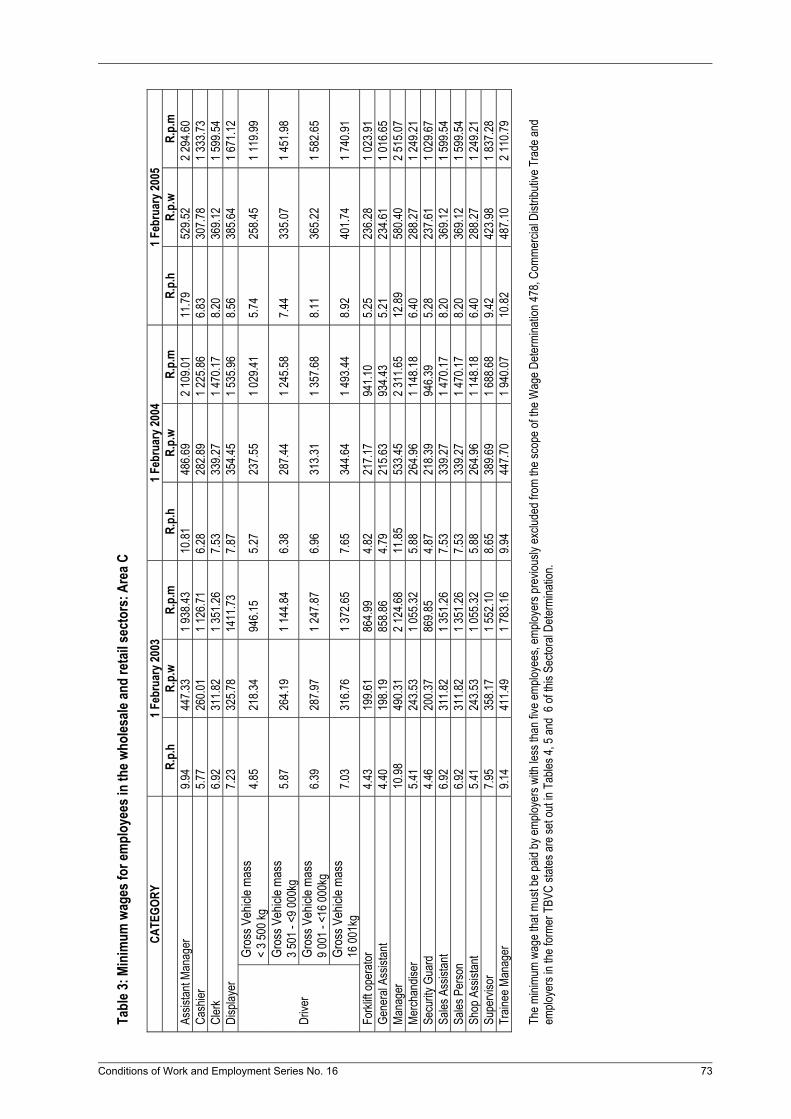
Conditions of Work and Em
ployment Series No. 16 73
Tabl
e 3: M
inim
um w
ages
for e
mpl
oyee
s in
the w
holes
ale an
d re
tail s
ecto
rs: A
rea C
CATE
GORY
1 F
ebru
ary 2
003
1 Feb
ruar
y 200
4 1 F
ebru
ary 2
005
R.
p.h
R.
p.w
R.p.
m
R.p.
h
R.p.
wR.
p.m
R.p.
h
R.p.
wR.
p.m
Assis
tant M
anag
er
9.94
447.3
3 1 9
38.43
10
.81
486.6
9 2 1
09.01
11
.79
529.5
2 2 2
94.60
Ca
shier
5.7
7 26
0.01
1 126
.71
6.28
282.8
9 1 2
25.86
6.8
3 30
7.78
1 333
.73
Cler
k 6.9
2 31
1.82
1 351
.26
7.53
339.2
7 1 4
70.17
8.2
0 36
9.12
1 599
.54
Disp
layer
7.23
325.7
814
11.73
7.87
354.4
51 5
35.96
8.56
385.6
41 6
71.12
Gros
s Veh
icle m
ass
< 3 5
00 kg
4.8
5
21
8.34
946.1
55.2
723
7.55
1 029
.415.7
425
8.45
1 119
.99
Gros
s Veh
icle m
ass
3 501
- <9
000k
g 5.8
7 26
4.19
1 144
.84
6.38
287.4
4 1 2
45.58
7.4
4 33
5.07
1 451
.98
Gros
s Veh
icle m
ass
9 001
- <1
6 000
kg
6.39
287.9
7 1 2
47.87
6.9
6 31
3.31
1 357
.68
8.11
365.2
2 1 5
82.65
Drive
r
Gros
s Veh
icle m
ass
16 00
1kg
7.03
316.7
6 1 3
72.65
7.6
5 34
4.64
1 493
.44
8.92
401.7
4 1 7
40.91
Forkl
ift op
erato
r 4.4
3
19
9.61
864.9
94.8
221
7.17
941.1
05.2
523
6.28
1 023
.91Ge
nera
l Ass
istan
t
4.40
198.1
985
8.86
4.79
215.6
393
4.43
5.21
234.6
11 0
16.65
Mana
ger
10.98
49
0.31
2 124
.68
11.85
53
3.45
2 311
.65
12.89
58
0.40
2 515
.07
Merch
andis
er
5.41
243.5
3 1 0
55.32
5.8
8 26
4.96
1 148
.18
6.40
288.2
7 1 2
49.21
Se
curity
Gua
rd
4.4
620
0.37
869.8
54.8
721
8.39
946.3
95.2
823
7.61
1 029
.67Sa
les A
ssist
ant
6.92
311.8
2 1 3
51.26
7.5
3 33
9.27
1 470
.17
8.20
369.1
2 1 5
99.54
Sa
les P
erso
n 6.9
2 31
1.82
1 351
.26
7.53
339.2
7 1 4
70.17
8.2
0 36
9.12
1 599
.54
Shop
Ass
istan
t 5.4
1 24
3.53
1 055
.32
5.88
264.9
6 1 1
48.18
6.4
0 28
8.27
1 249
.21
Supe
rviso
r 7.9
5 35
8.17
1 552
.10
8.65
389.6
9 1 6
88.68
9.4
2 42
3.98
1 837
.28
Train
ee M
anag
er
9.14
411.4
9 1 7
83.16
9.9
4 44
7.70
1 940
.07
10.82
48
7.10
2 110
.79
The m
inimu
m wa
ge th
at mu
st be
paid
by em
ploye
rs wi
th les
s tha
n five
emplo
yees
, emp
loyer
s pre
vious
ly ex
clude
d fro
m the
scop
e of t
he W
age D
eterm
inatio
n 478
, Com
merci
al Di
stribu
tive T
rade
and
emplo
yers
in the
form
er T
BVC
states
are s
et ou
t in T
ables
4, 5
and
6 of th
is Se
ctora
l Dete
rmina
tion.
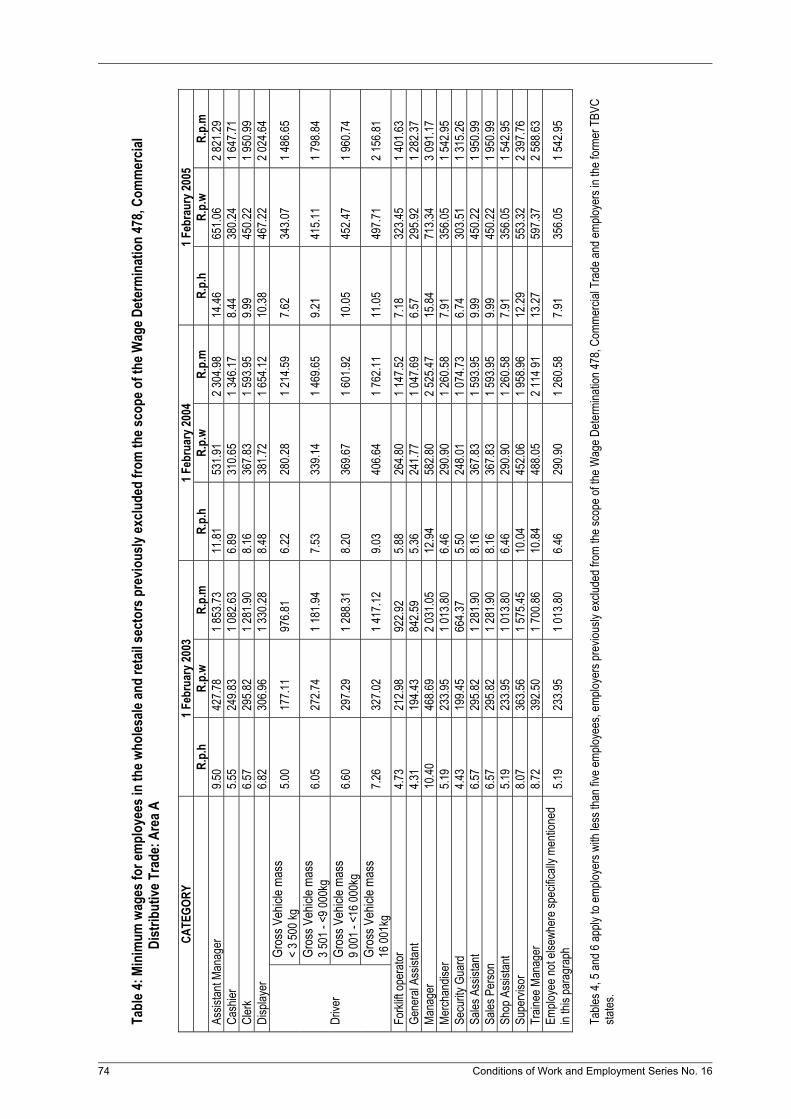
74
Conditions of Work and Employment Series No. 16
Tabl
e 4: M
inim
um w
ages
for e
mpl
oyee
s in
the w
holes
ale an
d re
tail s
ecto
rs p
revio
usly
exclu
ded
from
the s
cope
of t
he W
age D
eter
min
atio
n 47
8, Co
mm
ercia
l Di
strib
utive
Tra
de: A
rea A
CATE
GORY
1 F
ebru
ary 2
003
1 Feb
ruar
y 200
4 1 F
ebra
ury 2
005
R.
p.h
R.
p.w
R.p.
m
R.p.
h
R.p.
wR.
p.m
R.p.
h
R.p.
wR.
p.m
Assis
tant M
anag
er
9.50
427.7
8 1 8
53.73
11
.81
531.9
1 2 3
04.98
14
.46
651.0
6 2 8
21.29
Ca
shier
5.5
5 24
9.83
1 082
.63
6.89
310.6
5 1 3
46.17
8.4
4 38
0.24
1 647
.71
Cler
k 6.5
7 29
5.82
1 281
.90
8.16
367.8
3 1 5
93.95
9.9
9 45
0.22
1 950
.99
Disp
layer
6.8
2 30
6.96
1 330
.28
8.48
381.7
2 1 6
54.12
10
.38
467.2
2 2 0
24.64
Gr
oss V
ehicl
e mas
s <
3 500
kg
5.00
177.1
197
6.81
6.22
280.2
81 2
14.59
7.62
343.0
71 4
86.65
Gros
s Veh
icle m
ass
3 501
- <9
000k
g 6.0
5 27
2.74
1 181
.94
7.53
339.1
4 1 4
69.65
9.2
1 41
5.11
1 798
.84
Gros
s Veh
icle m
ass
9 001
- <1
6 000
kg
6.60
297.2
9 1 2
88.31
8.2
0 36
9.67
1 601
.92
10.05
45
2.47
1 960
.74
Drive
r
Gros
s Veh
icle m
ass
16 00
1kg
7.26
327.0
2 1 4
17.12
9.0
3 40
6.64
1 762
.11
11.05
49
7.71
2 156
.81
Forkl
ift op
erato
r 4.7
3
21
2.98
922.9
25.8
826
4.80
1 147
.527.1
832
3.45
1 401
.63Ge
nera
l Ass
istan
t
4.31
194.4
384
2.59
5.36
241.7
71 0
47.69
6.57
295.9
21 2
82.37
Mana
ger
10.40
46
8.69
2 031
.05
12.94
58
2.80
2 525
.47
15.84
71
3.34
3 091
.17
Merch
andis
er
5.19
233.9
5 1 0
13.80
6.4
6 29
0.90
1 260
.58
7.91
356.0
5 1 5
42.95
Se
curity
Gua
rd
4.4
319
9.45
664.3
75.5
024
8.01
1 074
.736.7
430
3.51
1 315
.26Sa
les A
ssist
ant
6.57
295.8
2 1 2
81.90
8.1
6 36
7.83
1 593
.95
9.99
450.2
2 1 9
50.99
Sa
les P
erso
n 6.5
7 29
5.82
1 281
.90
8.16
367.8
3 1 5
93.95
9.9
9 45
0.22
1 950
.99
Shop
Ass
istan
t 5.1
9 23
3.95
1 013
.80
6.46
290.9
0 1 2
60.58
7.9
1 35
6.05
1 542
.95
Supe
rviso
r 8.0
7 36
3.56
1 575
.45
10.04
45
2.06
1 958
.96
12.29
55
3.32
2 397
.76
Train
ee M
anag
er
8.72
392.5
0 1 7
00.86
10
.84
488.0
5 2 1
14 91
13
.27
597.3
7 2 5
88.63
Em
ploye
e not
elsew
here
spec
ificall
y men
tione
d in
this p
arag
raph
5.1
9 23
3.95
1 013
.80
6.46
290.9
0 1 2
60.58
7.9
1 35
6.05
1 542
.95
Table
s 4, 5
and 6
apply
to em
ploye
rs wi
th les
s tha
n five
emplo
yees
, emp
loyer
s pre
vious
ly ex
clude
d fro
m the
scop
e of th
e Wag
e Dete
rmina
tion 4
78, C
omme
rcial
Trad
e and
emplo
yers
in the
form
er T
BVC
states
.
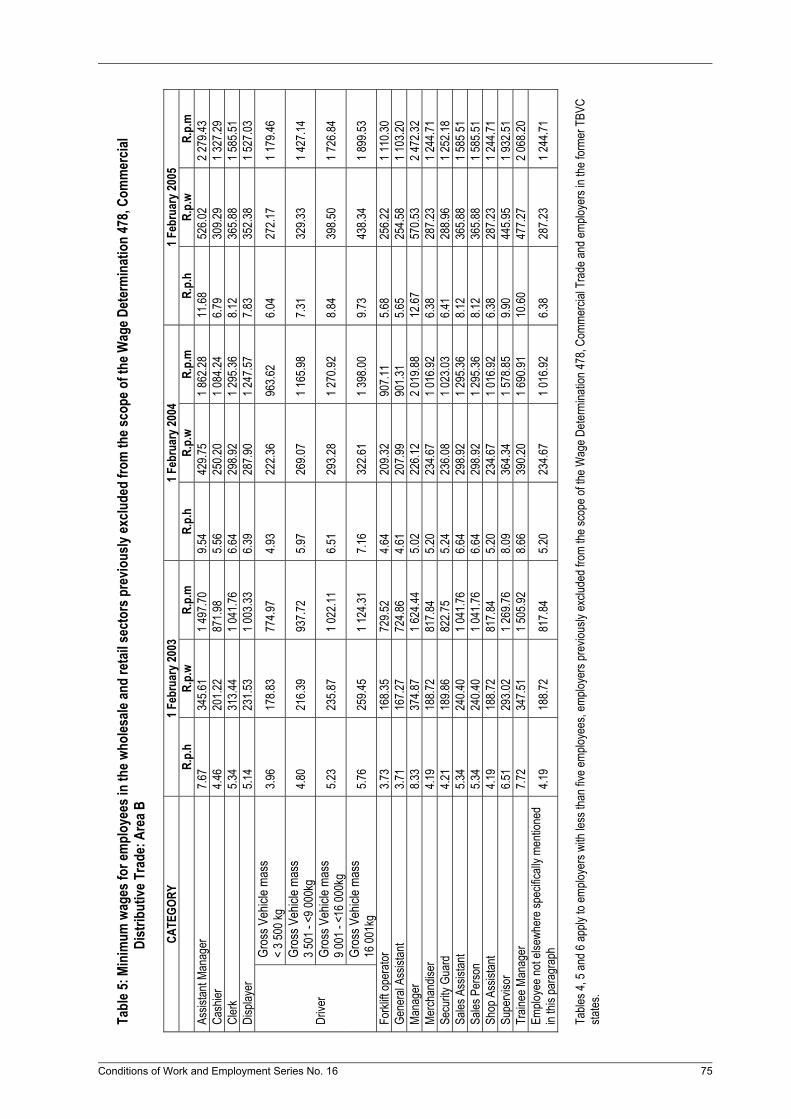
Conditions of Work and Em
ployment Series No. 16 75
Tabl
e 5: M
inim
um w
ages
for e
mpl
oyee
s in
the w
holes
ale an
d re
tail s
ecto
rs p
revio
usly
exclu
ded
from
the s
cope
of t
he W
age D
eter
min
atio
n 47
8, Co
mm
ercia
l Di
strib
utive
Tra
de: A
rea B
CATE
GORY
1 F
ebru
ary 2
003
1 Feb
ruar
y 200
4 1 F
ebru
ary 2
005
R.
p.h
R.
p.w
R.p.
m
R.p.
h
R.p.
wR.
p.m
R.p.
h
R.p.
wR.
p.m
Assis
tant M
anag
er
7.67
345.6
1 1 4
97.70
9.5
4 42
9.75
1 862
.28
11.68
52
6.02
2 279
.43
Cash
ier
4.46
201.2
287
1.98
5.56
250.2
01 0
84.24
6.79
309.2
91 3
27.29
Cler
k 5.3
4 31
3.44
1 041
.76
6.64
298.9
2 1 2
95.36
8.1
2 36
5.88
1 585
.51
Disp
layer
5.1
4 23
1.53
1 003
.33
6.39
287.9
0 1 2
47.57
7.8
3 35
2.38
1 527
.03
Gros
s Veh
icle m
ass
< 3 5
00 kg
3.9
6
17
8.83
774.9
74.9
322
2.36
963.6
26.0
427
2.17
1 179
.46
Gros
s Veh
icle m
ass
3 501
- <9
000k
g 4.8
0
21
6.39
937.7
25.9
726
9.07
1 165
.987.3
132
9.33
1 427
.14
Gros
s Veh
icle m
ass
9 001
- <1
6 000
kg
5.23
235.8
7 1 0
22.11
6.5
1 29
3.28
1 270
.92
8.84
398.5
0 1 7
26.84
Drive
r
Gros
s Veh
icle m
ass
16 00
1kg
5.76
259.4
5 1 1
24.31
7.1
6 32
2.61
1 398
.00
9.73
438.3
4 1 8
99.53
Forkl
ift op
erato
r 3.7
3
16
8.35
729.5
24.6
420
9.32
907.1
15.6
825
6.22
1 110
.30Ge
nera
l Ass
istan
t
3.71
167.2
772
4.86
4.61
207.9
990
1.31
5.65
254.5
81 1
03.20
Mana
ger
8.33
374.8
7 1 6
24.44
5.0
2 22
6.12
2 019
.88
12.67
57
0.53
2 472
.32
Merch
andis
er
4.1
918
8.72
817.8
45.2
023
4.67
1 016
.926.3
828
7.23
1 244
.71Se
curity
Gua
rd
4.2
118
9.86
822.7
55.2
423
6.08
1 023
.036.4
128
8.96
1 252
.18Sa
les A
ssist
ant
5.34
240.4
0 1 0
41.76
6.6
4 29
8.92
1 295
.36
8.12
365.8
8 1 5
85 51
Sa
les P
erso
n 5.3
4 24
0.40
1 041
.76
6.64
298.9
2 1 2
95.36
8.1
2 36
5.88
1 585
.51
Shop
Ass
istan
t
4.19
188.7
281
7.84
5.20
234.6
71 0
16.92
6.38
287.2
31 2
44.71
Supe
rviso
r 6.5
1 29
3.02
1 269
.76
8.09
364.3
4 1 5
78.85
9.9
0 44
5.95
1 932
.51
Train
ee M
anag
er
7.72
347.5
1 1 5
05.92
8.6
6 39
0.20
1 690
.91
10.60
47
7.27
2 068
.20
Emplo
yee n
ot els
ewhe
re sp
ecific
ally m
entio
ned
in thi
s par
agra
ph
4.19
188.7
281
7.84
5.20
234.6
71 0
16.92
6.38
287.2
31 2
44.71
Table
s 4, 5
and 6
apply
to em
ploye
rs wi
th les
s tha
n five
emplo
yees
, emp
loyer
s pre
vious
ly ex
clude
d fro
m the
scop
e of th
e Wag
e Dete
rmina
tion 4
78, C
omme
rcial
Trad
e and
emplo
yers
in the
form
er T
BVC
states
.
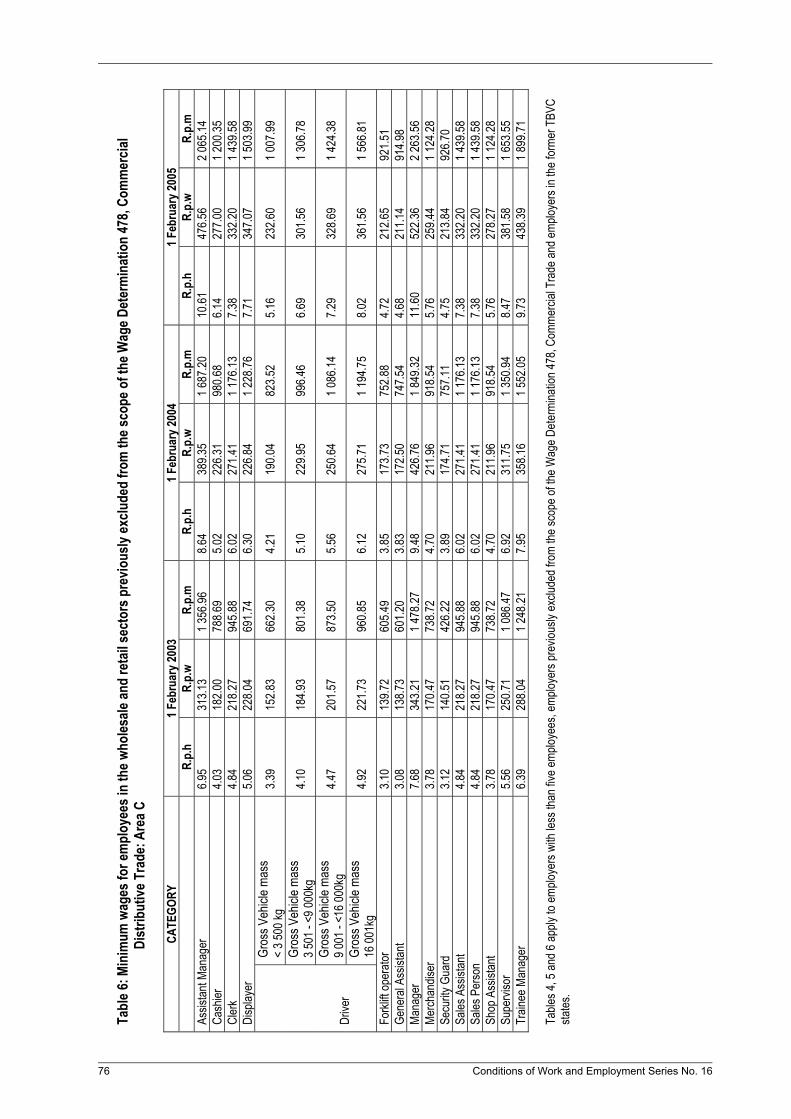
CATE
GORY
1 F
ebru
ary 2
003
1 Feb
ruar
y 200
4 1 F
ebru
ary 2
005
R.
p.h
R.
p.w
R.p.
m
R.p.
m
R.p.
h R.
p.m
R.
p.h
R.
p.w
R.p.
w As
sistan
t Man
ager
6.9
5 31
3.13
1 356
.96
8.64
389.3
5 1 6
87.20
10
.61
476.5
6 2 0
65.14
Ca
shier
4.0
3
226.3
1 98
0.68
6.14
277.0
0 1 2
00.35
18
2.00
788.6
95.0
2Cl
erk
4.84
271.4
1 17
6.13
7.38
332.2
0 1 4
39.58
21
8.27
945.8
8 6.0
2 1
Disp
layer
5.0
6 22
6.84
228.7
6 7.7
1 34
7.07
1 503
.99
228.0
4 69
1.74
6.30
1 Gr
oss V
ehicl
e mas
s <
3 500
kg
3.39
190.0
4 82
3.52
5.16
232.6
0 1 0
07.99
15
2.83
662.3
0 4.2
1
Gros
s Veh
icle m
ass
3 501
- <9
000k
g 4.1
0 22
9.95
996.4
6 6.6
9 30
1.56
1 306
.78
184.9
3 80
1.38
5.10
Gros
s Veh
icle m
ass
9 001
- <1
6 000
kg
4.47
250.6
4 08
6.14
7.29
328.6
9 1 4
24.38
20
1.57
873.5
0 5.5
6 1
Drive
r Gr
oss V
ehicl
e mas
s 16
001k
g 4.9
2 27
5.71
194.7
5 8.0
2 36
1.56
1 566
.81
221.7
3 96
0.85
6.12
1
Forkl
ift op
erato
r 3.1
0
173.7
3 75
2.88
4.72
139.7
260
5.49
3.85
212.6
592
1.51
Gene
ral A
ssist
ant
3.08
17
2.50
747.5
4 4.6
8
13
8.73
601.2
03.8
321
1.14
914.9
8Ma
nage
r 7.6
8 34
3.21
1 478
.27
9.48
426.7
6 1 8
49.32
11
.60
522.3
6 2 2
63.56
Me
rchan
diser
3.7
8
211.9
6 91
8.54
5.76
259.4
4 1 1
24.28
17
0.47
738.7
24.7
0Se
curity
Gua
rd
3.12
17
4.71
757.1
1 4.7
5
14
0.51
426.2
23.8
921
3.84
926.7
0Sa
les A
ssist
ant
4.84
27
1.41
176.1
3 7.3
8 33
2.20
1 439
.58
218.2
794
5.88
6.02
1 Sa
les P
erso
n 4.8
4
271.4
1 17
6.13
7.38
332.2
0 1 4
39.58
21
8.27
945.8
86.0
21
Shop
Ass
istan
t 3.7
8 21
1.96
918.5
4 5.7
6 27
8.27
1 124
.28
170.4
7 73
8.72
4.70
Supe
rviso
r 5.5
6 25
0.71
1 086
.47
6.92
311.7
5 1 3
50.94
8.4
7 38
1.58
1 653
.55
Train
ee M
anag
er
6.39
288.0
4 1 2
48.21
7.9
5 35
8.16
1 552
.05
9.73
438.3
9 1 8
99.71
Tabl
e 6: M
inim
um w
ages
for e
mpl
oyee
s in
the w
holes
ale an
d re
tail s
ecto
rs p
revio
usly
exclu
ded
from
the s
cope
of t
he W
age D
eter
min
atio
n 47
8, Co
mm
ercia
l Di
strib
utive
Tra
de: A
rea C
Table
s 4, 5
and 6
apply
to em
ploye
rs wi
th les
s tha
n five
emplo
yees
, emp
loyer
s pre
vious
ly ex
clude
d fro
m the
scop
e of th
e Wag
e Dete
rmina
tion 4
78, C
omme
rcial
Trad
e and
emplo
yers
in the
form
er T
BVC
states
.
76 Conditions of Work and Employment Series No. 16
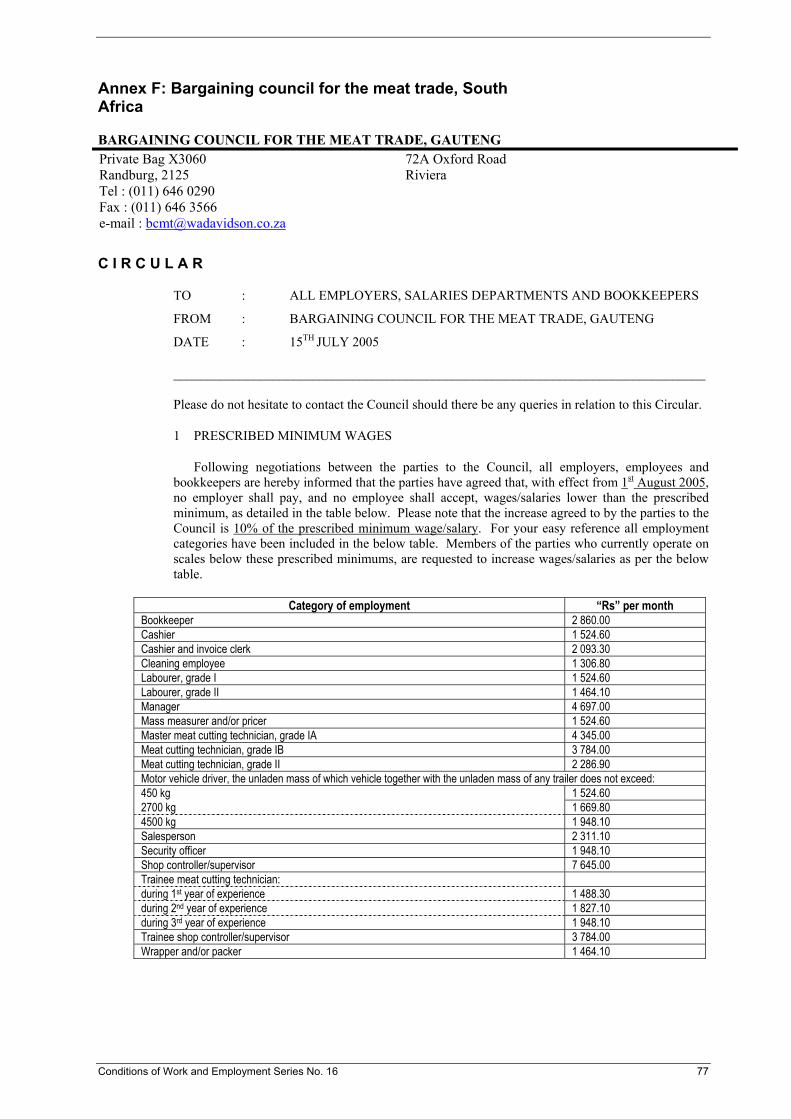
Annex F: Bargaining council for the meat trade, South Africa
BARGAINING COUNCIL FOR THE MEAT TRADE, GAUTENG Private Bag X3060 72A Oxford Road Randburg, 2125 Riviera Tel : (011) 646 0290 Fax : (011) 646 3566 e-mail : [email protected]
C I R C U L A R
TO : ALL EMPLOYERS, SALARIES DEPARTMENTS AND BOOKKEEPERS
FROM : BARGAINING COUNCIL FOR THE MEAT TRADE, GAUTENG
DATE : 15TH JULY 2005
________________________________________________________________________________
Please do not hesitate to contact the Council should there be any queries in relation to this Circular.
1 PRESCRIBED MINIMUM WAGES
Following negotiations between the parties to the Council, all employers, employees and bookkeepers are hereby informed that the parties have agreed that, with effect from 1st August 2005, no employer shall pay, and no employee shall accept, wages/salaries lower than the prescribed minimum, as detailed in the table below. Please note that the increase agreed to by the parties to the Council is 10% of the prescribed minimum wage/salary. For your easy reference all employment categories have been included in the below table. Members of the parties who currently operate on scales below these prescribed minimums, are requested to increase wages/salaries as per the below table.
Category of employment “Rs” per month Bookkeeper 2 860.00 Cashier 1 524.60 Cashier and invoice clerk 2 093.30 Cleaning employee 1 306.80 Labourer, grade I 1 524.60 Labourer, grade II 1 464.10 Manager 4 697.00 Mass measurer and/or pricer 1 524.60 Master meat cutting technician, grade IA 4 345.00 Meat cutting technician, grade IB 3 784.00 Meat cutting technician, grade II 2 286.90 Motor vehicle driver, the unladen mass of which vehicle together with the unladen mass of any trailer does not exceed: 450 kg 1 524.60 2700 kg 1 669.80 4500 kg 1 948.10 Salesperson 2 311.10 Security officer 1 948.10 Shop controller/supervisor 7 645.00 Trainee meat cutting technician: during 1st year of experience 1 488.30 during 2nd year of experience 1 827.10 during 3rd year of experience 1 948.10 Trainee shop controller/supervisor 3 784.00 Wrapper and/or packer 1 464.10
Conditions of Work and Employment Series No. 16 77


Annex G: Wage distribution in the informal economy
Wage distribution in A. Pradesh - Male agriculture workersF
ract
ion
dailyw20 200
0
.1
.2
.3
.4
Wage distribution in A. Pradesh - Male construction workers (urban)
Fra
ctio
n
dailyw20 51.35 200
0
.2
.4
Conditions of Work and Employment Series No. 16 79
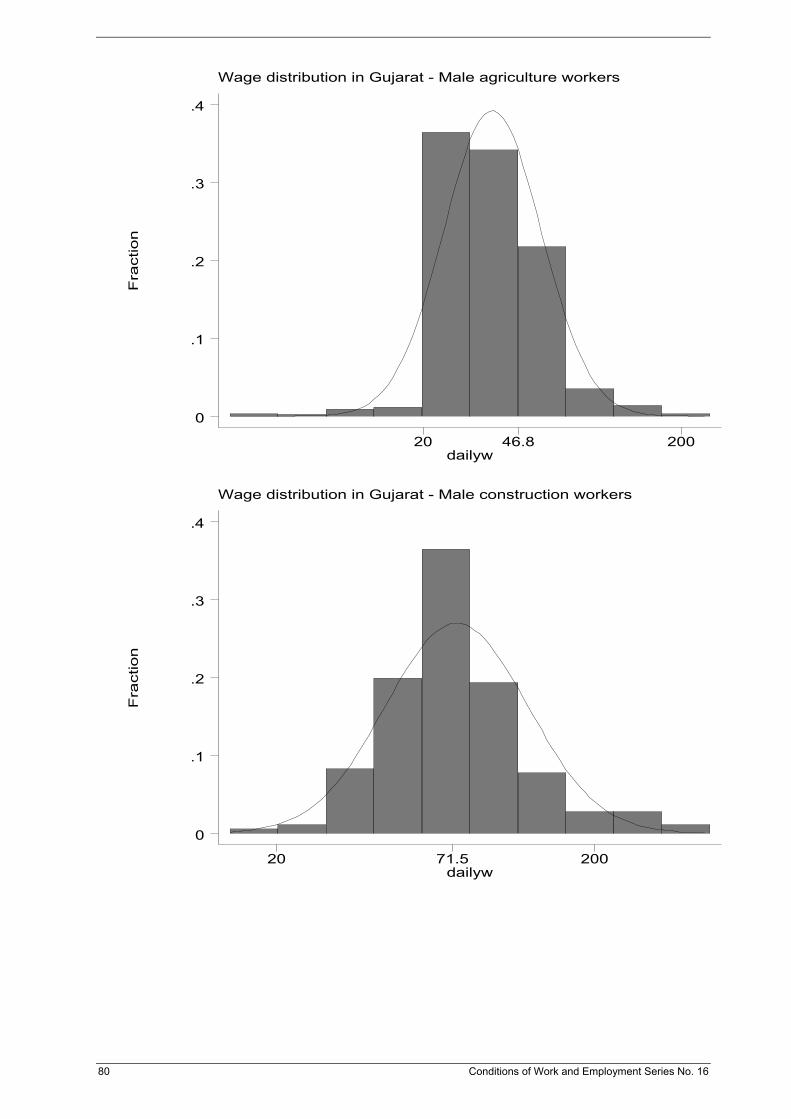
Wage distribution in Gujarat - Male agriculture workers
Fra
ctio
n
dailyw20 46.8 200
0
.1
.2
.3
.4
Wage distribution in Gujarat - Male construction workers
Fra
ctio
n
dailyw20 71.5 200
0
.1
.2
.3
.4
80 Conditions of Work and Employment Series No. 16
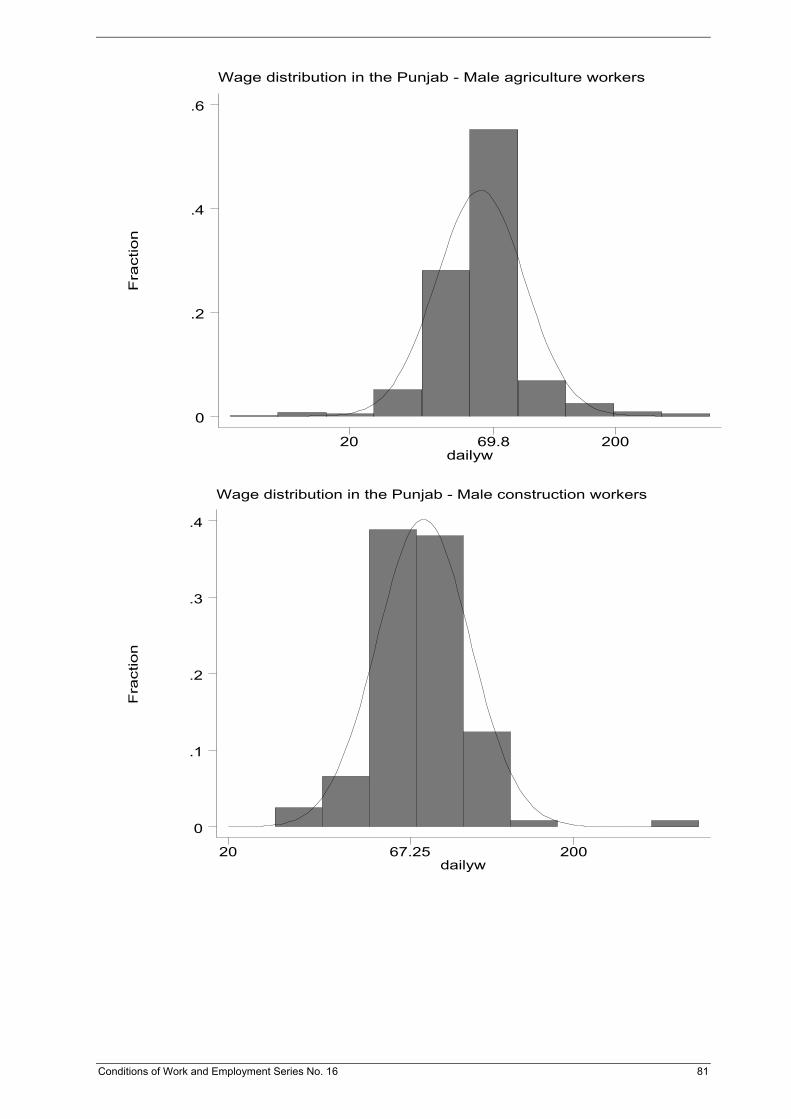
Wage distribution in the Punjab - Male agriculture workers
Fra
ctio
n
dailyw20 69.8 200
0
.2
.4
.6
Wage distribution in the Punjab - Male construction workers
Fra
ctio
n
dailyw20 67.25 200
0
.1
.2
.3
.4
Conditions of Work and Employment Series No. 16 81
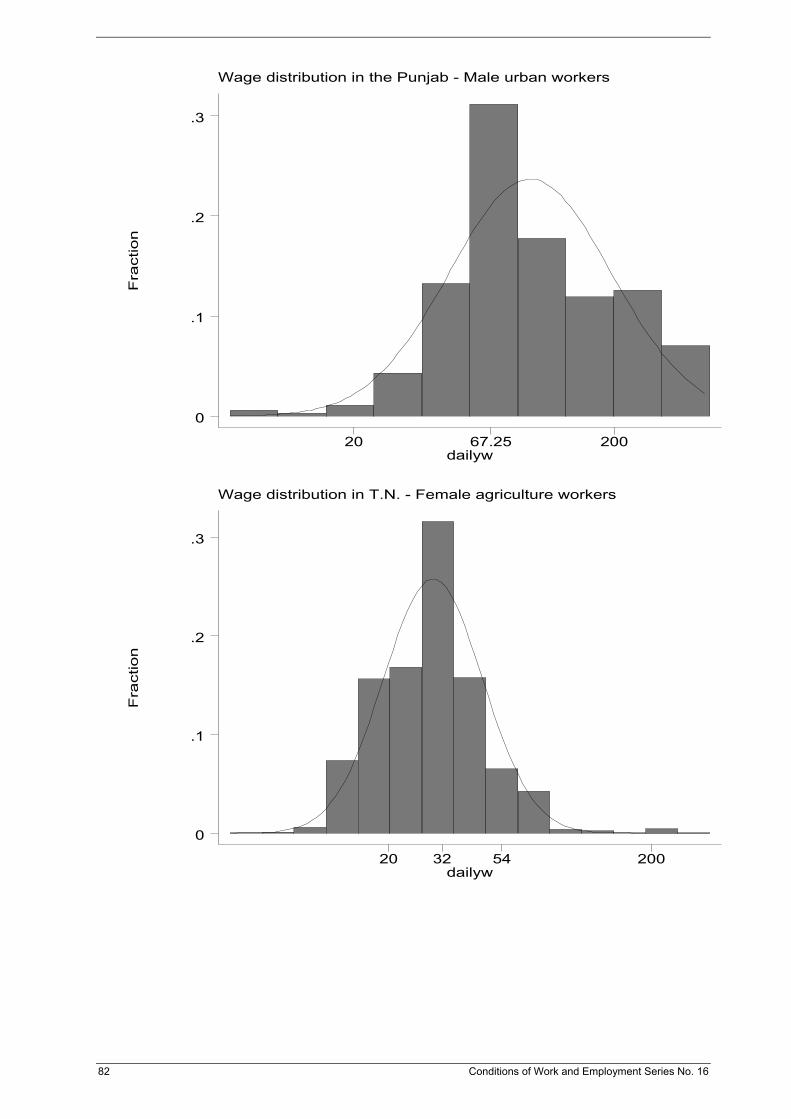
Wage distribution in the Punjab - Male urban workers
Fra
ctio
n
dailyw20 67.25 200
0
.1
.2
.3
Wage distribution in T.N. - Female agriculture workers
Fra
ctio
n
dailyw20 32 54 200
0
.1
.2
.3
82 Conditions of Work and Employment Series No. 16

Wage distribution in T.N. - Male agriculture workers
Fra
ctio
n
dailyw20 32 54 200
0
.2
.4
Wage distribution in T.N. - Male construction workers (urban)
Fra
ctio
n
dailyw20 73.7 200
0
.1
.2
.3
Conditions of Work and Employment Series No. 16 83
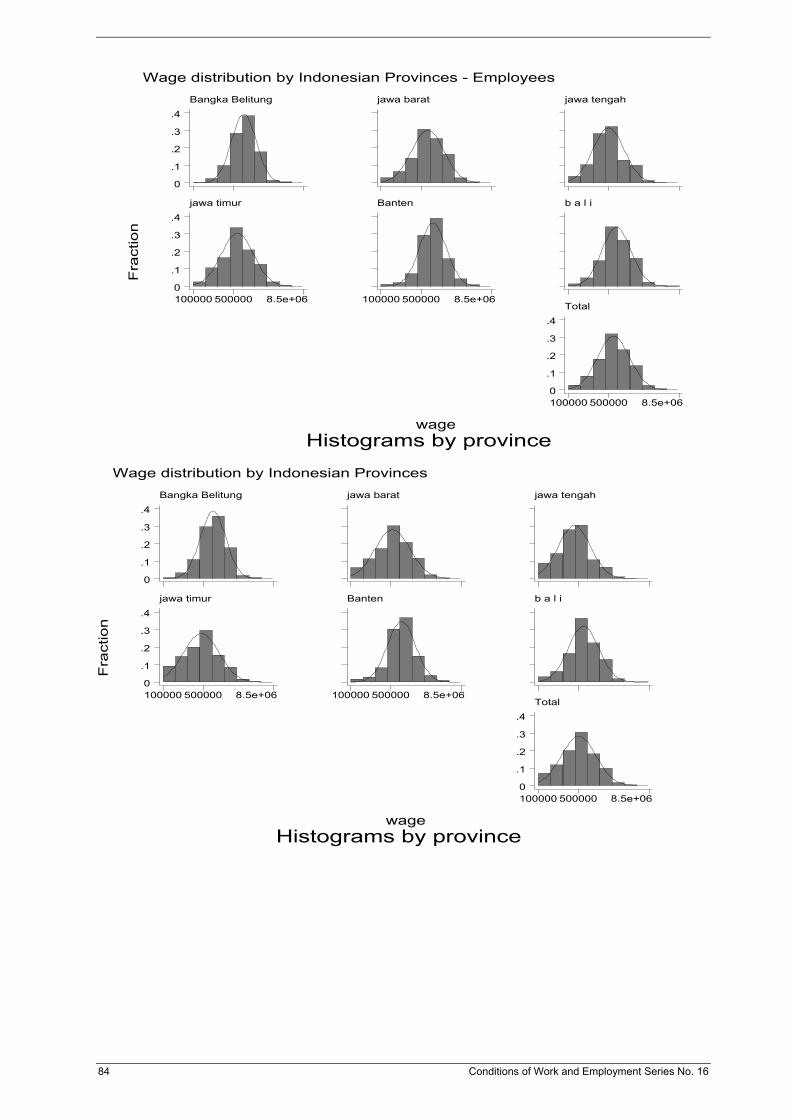
Wage distribution by Indonesian Provinces - Employees
Fra
ctio
n
Histograms by provincewage
Bangka Belitung
0
.1
.2
.3
.4jawa barat jawa tengah
jawa timur
100000 500000 8.5e+060
.1
.2
.3
.4Banten
100000 500000 8.5e+06
b a l i
Total
100000 500000 8.5e+060
.1
.2
.3
.4
Wage distribution by Indonesian Provinces
Fra
ctio
n
Histograms by provincewage
Bangka Belitung
0
.1
.2
.3
.4jawa barat jawa tengah
jawa timur
100000 500000 8.5e+060
.1
.2
.3
.4Banten
100000 500000 8.5e+06
b a l i
Total
100000 500000 8.5e+060
.1
.2
.3
.4
84 Conditions of Work and Employment Series No. 16
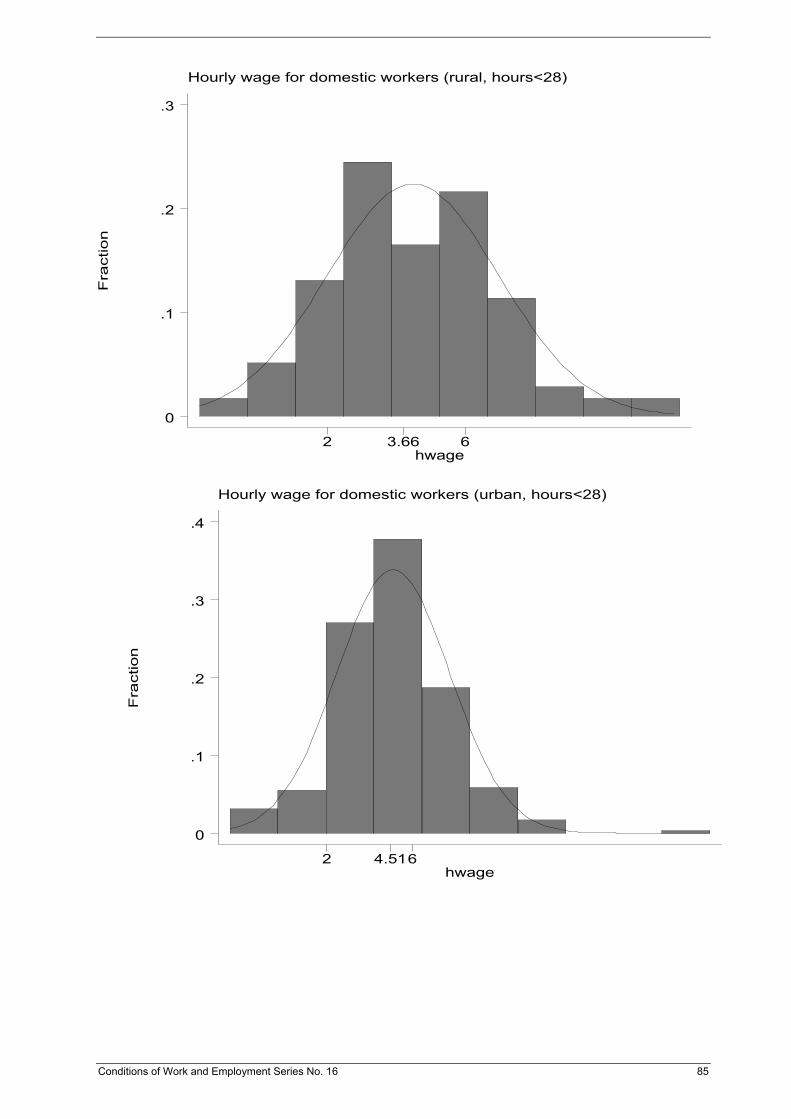
Hourly wage for domestic workers (rural, hours<28)
Fra
ctio
n
hwage2 3.66 6
0
.1
.2
.3
Hourly wage for domestic workers (urban, hours<28)
Fra
ctio
n
hwage2 4.516
0
.1
.2
.3
.4
Conditions of Work and Employment Series No. 16 85

Hourly wage for domestic workers (rural, hours>27)
Fra
ctio
n
hwage2 3.33 6
0
.1
.2
.3
Hourly wage for domestic workers (urban, hours>27)
Fra
ctio
n
hwage2 4.1 6
0
.1
.2
.3
.4
86 Conditions of Work and Employment Series No. 16
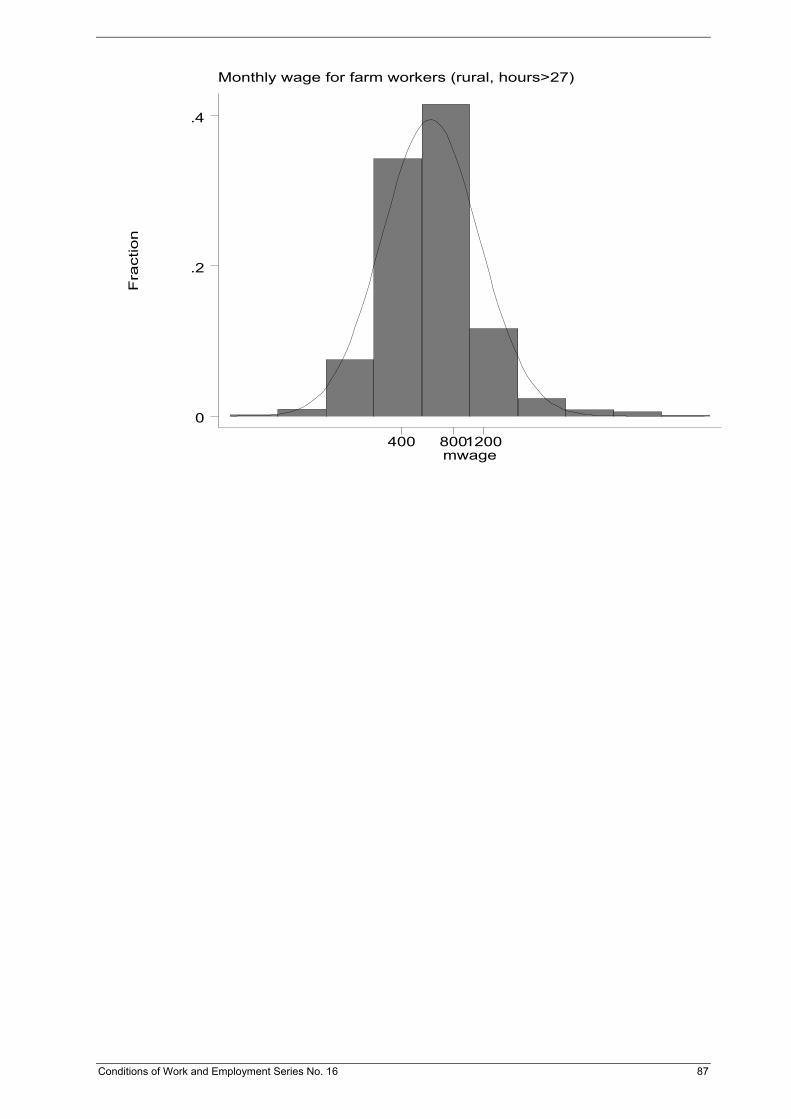
Monthly wage for farm workers (rural, hours>27)
Fra
ctio
n
mwage400 8001200
0
.2
.4
Conditions of Work and Employment Series No. 16 87


Annex H: Questionnaire to informal employers
CHAPTER 0: BASIC FIRM CHARACTERISTICS
1. Name of the firm
2. Location of the firm
3. Main production of the firm
4. Number of regular and irregular workers
CHAPTER 1: PAY PRACTICES
1. Do your workers have a work contract which defines the work task, remuneration, hours of work, etc.? Is it oral or written?
2. Do you have regular workers? Irregular workers? Do you use night work? Weekend work?
3. Do you pay per hour/day/month/week (please specify) Or do you pay by result?
4. Do you pay bonuses (overtime, premium for work on nights/weekends/Sundays) and income in kind (food, transport, etc.)?
5. How many hours do the workers have to work before they are paid an overtime rate?
6. If you have occasional workers, seasonal workers or part-time workers, how do you fix the hourly rate?
7. What happens in case of sickness? Do you pay for the cost of medicine?
8. How do you fix wages?
Amount (regular workers) Amount (irregular workers) Basic pay Overtime work Work on weekend/night/holidays Commission In-kind income (food, transport) Bonuses Total
Specify if the amount refers to hourly, daily, weekly, monthly payment.
CHAPTER 2: KNOWLEDGE OF MINIMUM WAGES
1. Do you know if there is a minimum wage that is applicable to your enterprise?
2. What is the level of that minimum wage applicable to your enterprise (approximately)?
Is it set on an hourly/monthly/daily basis?
3. How do you know about the minimum wage? How are you informed when the level changes? Are you informed through the radio, the newspaper? Workers? Friends? Associations? Other channels? Please specify.
Conditions of Work and Employment Series No. 16 89

CHAPTER 3: APPLICATION/USE OF THE MINIMUM WAGE
1. Do you use the minimum wage as a reference wage to agree on the wage level? For example, does it happen that you refer to it by saying to a worker or somebody looking for a job “I cannot pay you the minimum wage, it is too high”. Or “I pay you the minimum wage/more than the minimum wage, it’s enough”? If not, how does the bargain occur?
2. When someone is looking for a job and comes to see you, does it happen that this person tries to get a higher wage by referring to the minimum wage and say for example, “The wage you offer is less than the minimum wage. I would like to get the minimum wage”? If not, what other reference wages are used by workers to try and bargain their wages?
3. How do you motivate your workers? Is the minimum wage motivating enough for workers? Explain further
4. From time to time, wages increase also in the informal economy. In your opinion, which of the following factors play a role in this wage increase:
Pressure from workers because of price increases Yes/No
Peak in work load Yes/No
Increase in the minimum wage. Please explain
Other factors. Please specify
5. Do you pay some of your workers the minimum wage?
How many of them?
Who are the workers who receive the minimum wage in your firm?
Older workers/Adult/young/teenage workers?
Women/Men workers?
How many years/months have they been working for your firm?
Do you tend to pay the minimum wage to workers who are
Regular workers Yes/No
Occasional workers Yes/No
Newly hired/entrant workers Yes/No
Skilled workers Yes/No
Do you tend to pay the minimum wage to workers who have been in your firm
For a short time Yes/No
For a long time Yes/No
Do you tend to pay the minimum wage to workers who have a work contract (or carteira de trabalho in the case of Brazil) Yes/No
90 Conditions of Work and Employment Series No. 16
6. Do you tend to pay the minimum wage because
It is easier to pay the minimum wage?
Because it is fair?
Because it is the law?
7. If you don’t pay any of your workers the minimum wage, can you explain why?
Conditions of Work and Employment Series No. 16 91