Town Survey Report, Kallakkudi Town, Part X-B, Series-20
225
CENSUS OF INDIA 1981 PART X-B SERIES-20 TAMIL NADU TOWN SURVEY REPORT KALLAKKUDI TOWN Drafted by R. LAKSHMINARAYANAN Investigator A. G. BHASKARAN Assistant Director Edited by K.V. RAMASWAMI Deputy Director Directorate of Census Operations TAMILNADU
-
Upload
khangminh22 -
Category
Documents
-
view
1 -
download
0
Transcript of Town Survey Report, Kallakkudi Town, Part X-B, Series-20
CENSUS OF INDIA 1981 PART X-B
SERIES-20
TAMIL NADU
TOWN SURVEY REPORT
KALLAKKUDI TOWN
Drafted by
R. LAKSHMINARAYANAN Investigator
A. G. BHASKARAN Assistant Director
Edited by
K.V. RAMASWAMI Deputy Director
Directorate of Census Operations
TAMILNADU

FORE~rORD
Apart fJ ·)fn the decennial enurneration of population, the Indian Census is ste,~pcd in the tradition of undertaking a variety of studies of topical inter~sL In fact, the publicatio,lS br()ught out in connection with the e lrlier cei1suses contah;ed v~ritable mines of information on raCial, (!ultural, iinguistic and a number of other aspects of life of the,peopie of this country. With the advent of freedom, however the sCope and dimei1s i on of these special studies had to be restructured in a mariner . that would provide the basic feedbacks on the processes of development taking place in different· spheres of life of the people especially nnde: planned development. \
, I
Thus, in connection vlith the 196 i Census. a massIve programme was launched inlf:r-alia to c:mduct socio-economic survey of about 500 vi1lag~s selecteq from different parts of the country. The main objective of this stu~y, was to know the way of life of the people living in Indian vi1!~ges which accounted for 82 per cent of the total population as per the 1961 Census. There was, however. an imperative need tn extrnd the area (If the ~tudy to urban centres as welL to provide a coml"11ete covera;e or the people living in diverse socia-economic conditiQ11s. It was ~}.'ith this objective in view ancilhry stitdies on towns '-r.rcre launched as part of the social studies prognlmme in connecti0l{ with the 1971 Census,
\ .
fhe programme of !social . studies taken up in connection -\\;rrb the 1971 Census was continued without any· major -·qhaQ~ ~t: -.. lhe. 1981 Census as weII. A study on traditional rural hased h'andicrafts was, however, added as a new item under the ·socia.! study projects of the 19B1 Census. For the conduct of urban study;'7~~ small -'and' medium towns were selected from different parts of the country following the criteria such as (a) size, (b) demographic features, (c) functional characteristics, (d) specific industr)' or occupation domi-Jnating the economy, (e) location;, (f) concentration of different castes and communities, and (g) other social and cultural phenomenon like temple town, health resort etc.
The research design, tools for data collection and formats for data tabulation and report writing required for urban studies were originally formulated by Dr. B. K. Roy Burman, the then Deputy Registrar General, Social Studies Division. His successor. Dr. N. G. Nag took considerable pains to revise an the formats to make them mOTe comprehensive. Dr. K. P. Ittaman, the present Deputy Registrar General heading Social Studies Division, coordinated these stl:dies at different levels as well as rendered necessary guidance to the Directorates of Census Operations for their successful cOflsummation. Shri M. K. Jain, Senior Research Officer with the able assistance of Research Officer Shri 1. C. Aggarwal and Smt. V. R. Khanna, Investigator, did a commendable job in scrutinising the reports and communicating the comments thereon to the Directorates. J am grateful to all of them.
(iii)
(iv)
, The present report is the outcome of a study on Kallakkudi town undertaken by the Directorate of Census Operations, Tamil Nadu. ] am jndebted to Shri M. Thangaraju, Deputy Director and his colleagues in the Census Directorate for their painsfraking efforts in bringing out this report.
N~\N Delhi, the 1 st of June, 19S8
V. S. VERMA, Regi.<;frar General. India.
PREFACE
Under the programme of social studies taken up in connection with the 1981 Census, Kallakkudi is the first town studied among the three towns selected in Tamil N adu. This volurne covers a variety of items about the town like history of growth, economic life, ethnic and socio--:demographic characteristics, migration, family life etc.
As a preliminary, town schedule and household schedules designed for this purpose were canvassed in the field during 1986-87 by a team of 6 official under Shri K. Kuppuswamy, Tabulation Officer and Shri A. G. Bhaskaran, Asst. Director. The d~tails collected in the field were tabulated in the office by a team consisting of 10 official! and the required tables were prepared under the supervision of Shri R. Lakshminarayanan, Investigator and Shri. A. G. Bhaskaran, Asst. Director. Both the field survey and tabulation were ably guided by Shri M. Panchapakesan, the then Deputy Director. The contribution of the above teams for the supply of basic materials required for the report is worth reckoning and this has heen duly acknowledged separately.
The chapters of this report were drafted by S / Shri A. G. Bhaskaran, Asst. Director and R. Lakshmin:lrayanan, Investigator and the report was edited and finalised by Shri K. V. Ramaswami, Deputy Director witb the able assistance of Shri R. Lakshminarayanan, Investigator.
We are grateful to Dr. K. P. Ittaman, Deputy Registrar General (Social Studies), and Shri. M. K. Jain, Senior Research Officer for their guidance in bringing out the report in the present form and to Shri B. P. Jain, Deputy Director (Printing) for arranging the printing of this report.
We also record our deepest sense of gratitude to Shri V. S. Verma, former Registrar General, India and Shri A. R. Nanda, the present Registrar General, India for their inspiration and encouragement in bringing out this report.
Shri Amaldoss, President, Kallakkudi town pancbayat and the Management of Dalmia Cements extended full cooperation and assistance to the staff and officers of this Directorate who visited Kallakkudi in connection with the survey. They deserve our sincere thanks.
The typing of this report was done by Smt. M. S. Shantha, Junior Stenographer, Smt. M. Usha Rani, Lower Division Clerk and Smt. S. Uma, Lower Division Clerk. The maps and charts were prepared by S/Shri A. RaiamanL Senior Artist N. Cha!ldran, Artist
(v)
~1Iln E. S. J:=i:;amona.i~, Artist under the guidance of Shri R. Joseph, ~tm:::jgrapher The pllOtog;:aphs for the report were taken by Shri F. S. Jayanwnan CC3;l fT(lr;1 des.i.~,ning the cover. The services of all the above o~1;";la:" ..1re .l.cknowledged with immense pleasure. OUf thanks ale also due to an unnaUleo assistants in various grades who have cGntributed i!) fht.~ Ar:~~ Ii ~(ltjt)D and pdnting of this report.
v[adras. "'1. THANGARAJU, Joint Director of Census Operations.
Field Study:
Shri B. Shankar. Statistical A&Slstant
Shri G. Subramani, Statistical Assistant
Shri N. Gnanasekaran Statistical A&sistant
Smt. R· Sakunthala. Statistical \ssistam
Shri K. Sreehdhlp"an. Computor
Shri K. SurendraBa:bu, Computor
Tabulation and preparal,jon of inset fables:
Shri H. Shankar. statistical Assistant
Shri G. Subramani, Statistical Assista'1t I
Shri N. Gnanasekarart, Statistical Assistant
Smt. A. Parvathy Ku¢ari. Statistical Assistant
Smt. R. Vasantha. Statistcal Assistant
Smt. N. Muniammal. Stati&tical Assistant
Smt. K. M. Maheswari, Statistical Assistant
Smt. S. P. Kanchanamala. Computor
Smt. Malika Sultana, Computor
Shri K. Sreedharan, Computor


CONTENTS
Foreword
Preface
CHAPTER I Introduction
CHAPTER II History of growth of the town
CHAPTER III Amenities and services-History of growth and the present position
CHAPTER IV Economic life of the town
CHAPTER V Ethnic and selected socio-demographic characteristics of the population
CHAPTER VI Migration and settlement of families.
CHAPTER VII Neighbourhood pattern
CHAPTER VITI Family life in the town
CHAPTER IX Housing and material culture
CHAPTER X Slums; blighted and other areas with sub-statldard living conditions
CHAPTER XI Organisation of power and prestige
CHAPTER XU Leisure and recreation, social particii)ation, sOCial awareness, religion and crime
CHAPTER XIII Linkage and continua
CHAPTER XIV Conclusion
(ix)
2-2() RGI(NDI89
Page
iii-iv
v-vi
'-9 10--15
16-26
27-60
61~93
94-116
117-124
125 -145
14&-153
154
155-159
160-169
.170-182
183-184
(x)
ILLlJSTRA nONS
Maps and charts
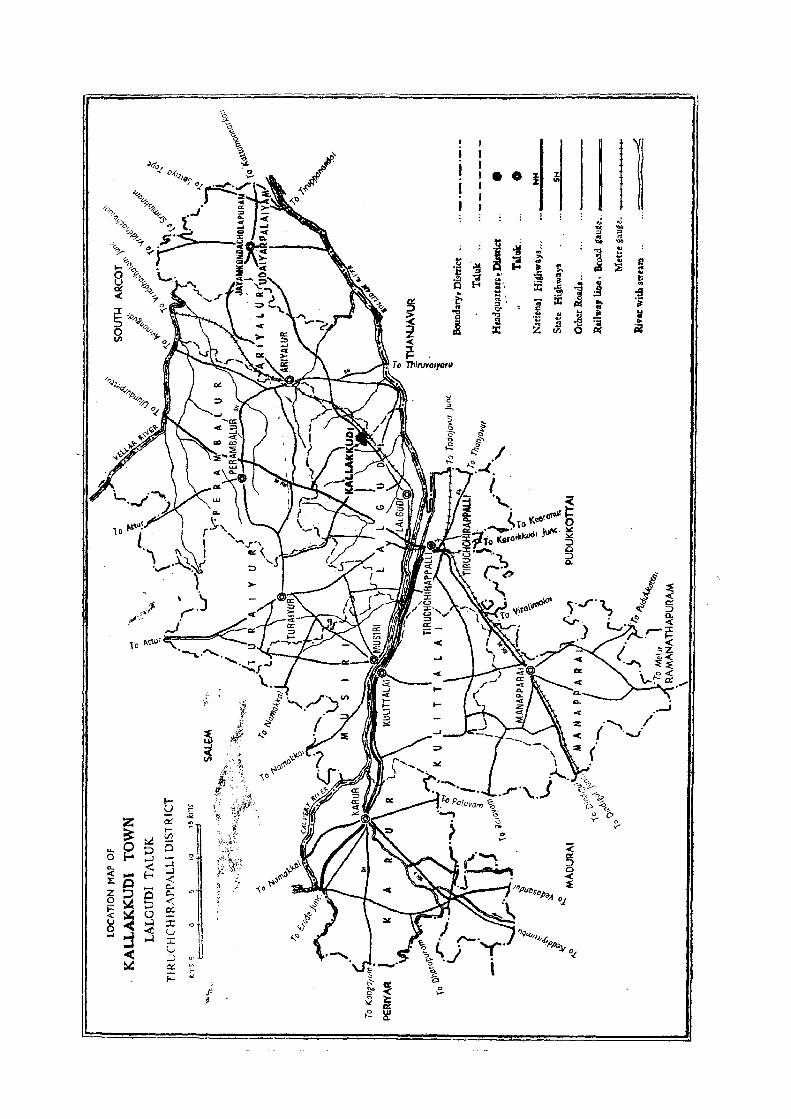
1. Location map of Kallakkudi
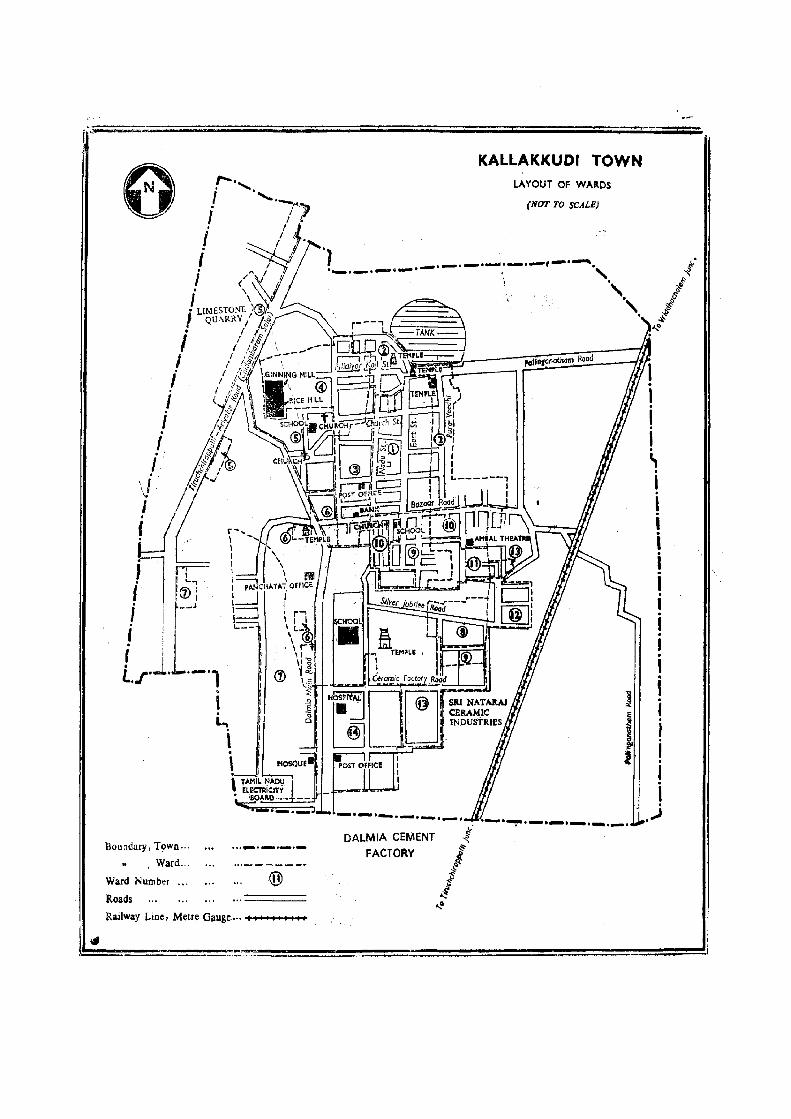
2. Layout of wards
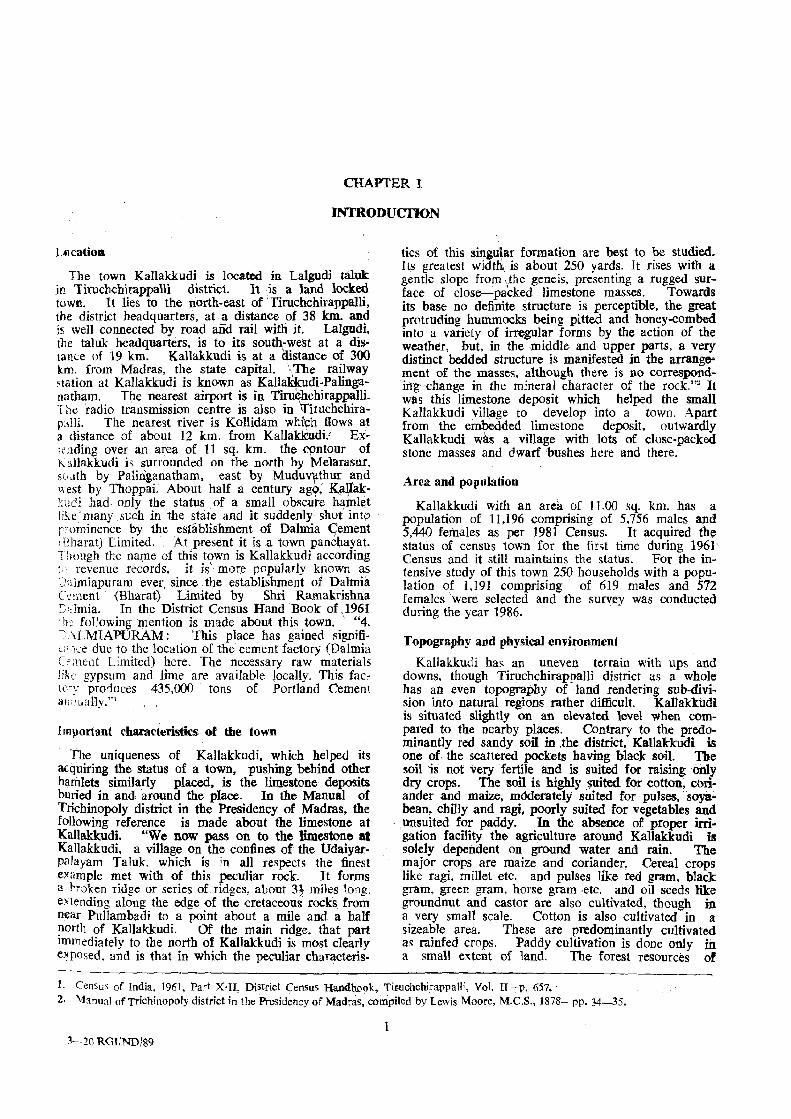
3. Decadal variation of population 1901-1981
4~ Kallakkudi-Pullambadi water supply sub-project_Schematic diagram
5. Percentage distribution of main workers, marginal worker~ and non-workers, 1981
6. Distribution of workers and non-workers
7. Non-workers by type of activity
8. Distribution of workers by occupational divisioflS
9. Distribution of population by religion
10. Distribution of population by sex and age-group
11. Marital status by sex
12. Distribution of population by educational levels
13. Hinderland villages selected
p]tOtograpbS
1. Aerial view of the town
2. Surroundings
3. The me')siah- Dalmia Cements (Bharat) Ltd.
4. Aerial view of Dalmia Cement (Bharat) Ltd. factory
5. The main bus stop
6. Railway station'
7. A narrow lane outside the Dalmia compound
8. Another road outside the Dalmia compound which is sufficiently broad
9. A road inside Dalmia compound
10. Low class thatched houses outside Dalmia compound
11. A middle class house outside D3lmia compound
12. A highcla~s double storey house outside Dalmia compound
13. A type of staff quarters provided by Dalmia Cements
14. Other type., of staff quarters provided by Da1mia Cements
15. One of the overhead tanks near the 'Urani' (tank)
16. One of the public latrines provided by the panchayat
17. Town Panchayat Office
18. Administrative Office - Dalmia Cements
19. Administrative Office- Shri Nataraj Ceramics and Chemical Industries Ltd.
20. Post and Telegraphs Office
21. Punjab National Bank
22. Holy Cross Convent
23. An inside view of the typewriting class conducted for girls by Holy Cross convent
24. Dalmia Higher Secondary School
25. Tailoring cla<;s in Labour Welfare Centre
26. Balwadi in Labour Welfare Centre
27. Entrance to Dalmia Cement (Bhara.t) Ltd. Employee~' Co-op. Milk Supply Society
28, Types of cattle in the dairy
(Xl)
Photographs
29. A cow in the dairy- Indigenous variety
30. A stud bull in the dairy
31. Utilization dispensary,
32. Dalmia main road-one of the main business centres in the town
:B. Bazaat area----anothcr main business centre in the town
34. Sivan koil
35. Dhroupathi Amman koil
36. Kaliamman koil inside Dalmia compound
37. Chandramouleeshwarar koil wi!hin Dalmia compound
38. Recently constructed Ramar koiJ within the Dal'mia compound
39. Reading room and recreation club of the work'ers,of Dalmia Cements
40. Silver jubilee ball and branch library in Dalmia main road
41. Dalmia Community Centre
42. Children's park within Dalmia compound
43. Ambal talkies

-._
t
I 1
I. 0 I I J
! r-.. • "'?_ ~J' 'f
\ . t <> f,
o ....
;:. .. .. l '" to .,!!!, i< ::z: ~ -;; :f ~ ~ .~
~ z
1 ., .,;
"'" ... " ::J
'" :. ... .. "'" 1:: l .. 2 ~ ..
~ .. ~ ~ ~
~ ... ~ .. ~ ... it .s :a I>-
0 p:: ii

.. -
Boundary, Town .. ·
, Ward ...
Ward Number ...
Roads
... _.,-.._--
@
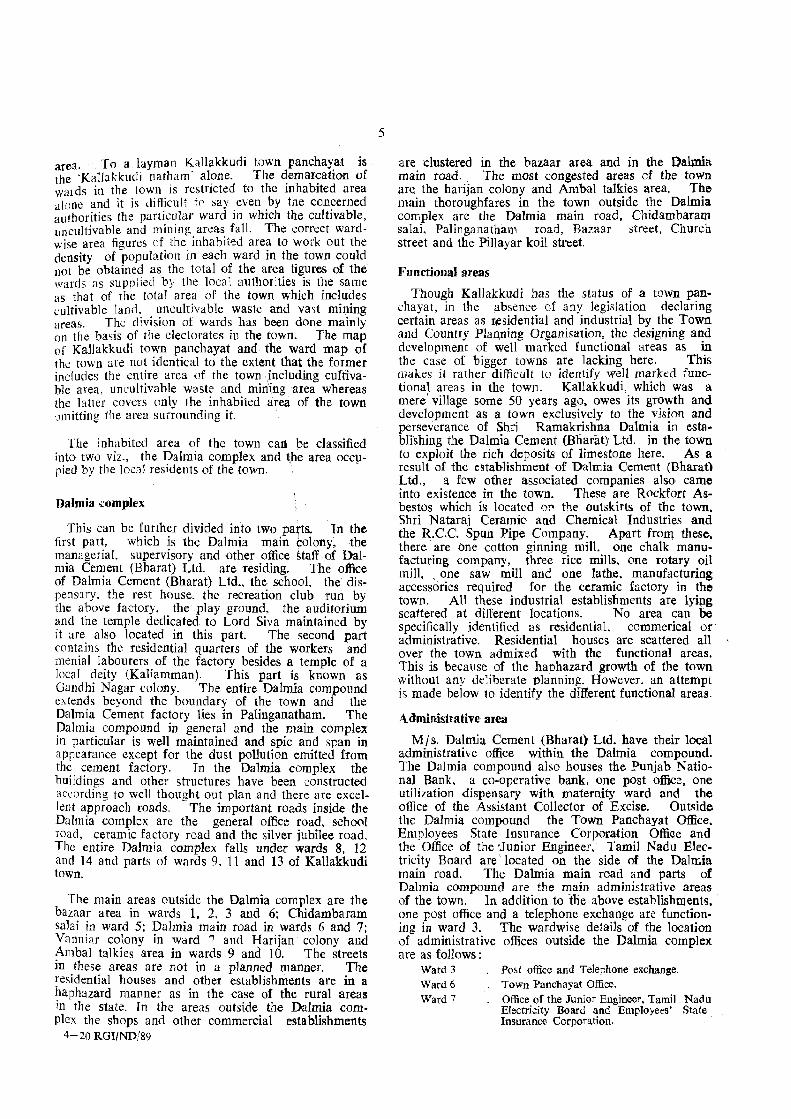
KALLAKKUDI TOWN LAYOUT OF WAII.OS
(NOT TO SCALE)
.~.-.-.-.-.~.-.-.~.~,~.~ \ "
DALMIA CEMENT FACTORY
. "
".
I . 1 I i . ~ . I . , I i i I · 1 · I I · , i ; J
i · , i
.J
Railway Line, Metre Gauge .... "+ I I I I , I I I ,
~==~--__ ., .. ,.~====---==~==:dJ

CHAPTER 1
INfRODUCI10N
LtlCatioD
The town Kallakkudi is located in Lalgudi taluk in Tiruchchirappalli district. It is a land locked town. It lies to the north-east of 'Tiruchchirappalli, the district headquarters, at a distance of 38 Ian. and is well connected by road aild rail with it. Lalgudi, the taluk headquarters, is to its south-west at a distance of 19 km. Ka11akkudi is at a distance of 300 km. from Madras, the state capital. ·_The railway station at Kallakkudi is known as KaIla~di-Palinganatham. The nearest airport is in Tiru~chirappalli. The radio transmission centre is also in Ifiruchchirap~lJli. The nearest river is Kollidam wtith .fi~ws. at a distance of about 12 km. from Kallakkudl! Extending over an area of 11 sq. km. the ('pntouT of K aHakkudi is ~urrounded on the north by Melarasur, Sllath by Palingapatham, east by Muduv"Ilthur and ",est by Thoppai. About half a century ag~. K~yakl:udi had only the status of a small obscure h~mlet lihe'many st:ch in the state and it suddenly shot intI' r"ominence by the establishment of Dalmia <:)~ment I Bharat) Limited. - At present it is a town pancbayat. Though the llaJ;lle of this town is Kallakkudi according i· revenue records, it is' mor:e popularly known as D"lmiapuram ever,_ since the establishment of Dalmia Cement {Bharat) Limited by Shri Ramakrishna C dmia. In the District Census Hand Book of ,}961 1h.: following mention is made about this town. "4. [ALMIAPURAM: This place has gained signific:"we due to the location of the cement factory (Dalmia C ~;ncnt Limited) here. The necessary raw materials like gypsum and lime are available Jocally. This facto"y produces 435,000 tons of Portland Cement 3n:maHy."1
Important charnc1eristic5 of the town
The uniqueness of Kallakkudi. which helped its acquiring the status of a town, pushing behind other hamlets similarly placed. is the limestone deposits buried in and around the place. In the Manual of Trichinopoly district in the Presidency of Madras, the following reference is made about the limestone at Kallakkudi. "We now pass on to the limestone at Kallakkudi. a village on the confines {)f the Udaiyarpalayam TaIuk which is in all respects the finest example met with of this peculiar rock. It forms a h·oken ridge or series of ridges, about 3! miles lOllg. e\tending along the edge of the cretaceous rocks from near Pullambadi to a point about a mile and a ha1f north of Kallakkudi. Of the main ridge, that part immediately to the north of Kal1akkudi is most clearly e~po~ed, and is that in which the peCUliar characteris-
tics of this singular formation are best to be studied. It.s greatest width, is about 250 yards. It rises with a gentle slope from ,the gene is, presenting a rugged surface of close-packed limestone masses. Towards its base no definite structure is perceptible, the great protruding hummocks being pitted and hon~y-combed into a variety of irregular forms by the action of the weather, but, in the middle and upper parts, a very distinct bedded structure is manifested in the arrangement of the masses. although there is no correspondirrg -change in the mineral character of the rock."~ It was this limestone deposit which helped the small Kallakkudi village to develop into a town. Apart from the embedded limestone deposit, outwardly Kallakkudi was a village with lots of close-packed stone masses and dwarf bushes here and there.
Area and population
Kallakkudi with an area of 11.00 sq. km, has a population of 11,l96 comprising of 5.756 males and 5,440 feinales as per 1981 Census. It acquired the status of census town for the first time during 1961' Census and it still maintains the status. For the intensive study of this town 250 households with a population of 1,191 comprising of 619 males and 572 females were selected and the survey was conducted during the year 1986.
T opogrnp-by and p,hYSlical environment
Kallakkudi has an uneven terrain with ups and downs, though TiruchchirappaUi district as a whole has an even topography of land rendering sub-division into natural regions rather difficult. Kal]akkudi is situated slightly on an elevated level when compared to the nearby places. Contrary to the predominantly red sandy soil in .the district. Kallakkudi is one of the scattered pockets having black soil. The soil is not very fertile and is suited for raising oDly dry crops. The roil is highly ~uited for cotton, coriander and maize. mOderately suited for pulses. soya" bean. chilly and ragi, poorly suited for vegetables and . unsuited for paddy. In the absence of proper irrigation facility the agriculture around Kallakkudi is solely dependent on ground water and rain. The major crops are maize and coriander. Cereal crops like ragi, millet etc. and pulses like red gram, black gram. green gram, horse gram ·etc. and oil seeds like groundnut and castor are also cultivated, though in a very small scale. Cotton is also cultivated in a sizeable area. These are predominantly cultivated as rainfed crops. Paddy cuHivation is done only in a small extent of land. The forest resources -of
1. Census of India, 1961, Part x-n, District Census Handb.ollk, Tir-Uchchirappalli, Vol. IT -:-P. 657.' 2. \1anua1 of Trichinopoly district in the Presidency of Madras, compi-Ied by Lewis Moore, M.e.S., 1878- pp. 34-35.
1 3-20 RGliND/S9
Tirnchchirappalli district are very meagre when compared to the state as a whole. In Kallakkudi there is no forest nearby.
Soil
The soil of Kallakkudi belongs to black series. The colour of the soil of Kallakkudi IS dark grey to very dark brown. The black colour is not due to humus content or organic matter, but due to the presence of high percentage of lime. This soil is deeper, fine grained and dark in colour. It contains a good proportion of carbonate of calcium, iron and magnesium. It is highly retentive of moisture and becomes sticky when wet. When dried, it forms long and deep cracks and crevices. It is free from salinity. The water holding capacity of the soil is high about 44.2 to 57.14 per cent
Regarding the fossils found in the Kallakkudi ridge the Manual of Trichinopoly District in the Presidency of Madras contains the following details.
"The fossils noticed are not very numerous, but are of interest as tending to confirm the view of the Uttattur age of lime stone; they consist of-
Corals
Rhyncholclla
Ostrea
Pecten
Belemnites
Flora and fauna
1 species
1
1
• 1
• 1
"
"
elongated and placated like 0 larva, much resemblinfo!. a species common in the Uttattur group.
the large-ribbed species noticed at Tiruppattur .
not determinable"l
There is nothing remarkable in the flora and fauna of the town. The areas surrounding the town present a barren look except for scattered tropical dry deciduous and tropical thorn-ever-green plants. Residential clusters have common species of plain-grown trees like D"m (Azadisachta indica), coconut (Cocos nucifera), vagai (Albizzia lebbeck), peepul (Ficus reli. giosa), banyan (Ficus '~ngalensis). tamarind (Tamarindus. indica), poovarasu (Tbespesla populnea), rnuringa. (Mua.inga oleifera) etc.
2
In the absence of forests in the vicinity of the town no wild animals are found anywhere near the town. The domestic animals consist of cows, bullocks, buffaloes, sheep, goats, dogs a~d . cats. The cattle one come across are mostly of mdlgenous breed and nondescriptive. type. . ~ven in the Dalmia Mil~ \=o-operative SOCIety ongmally there were only mdlgenous breed of cows though exotic breeds like New J ercy and Itoshein have been added to the strength, at present. Even now the indegenous breeds have not been completely eliminated and both the breeds are available here. Some households belonging to. the low income-group !ear pigs also. Bir~s like crow, sparrow, parrot, mma and such other bIrds normally found in plain villages and towns are found in this town also. In the absence of extensive cultivation of cereals and pulses in the surroundings flocks of sparrows and minas, which are a common sight in the nearby areas. are absent in Kallakkudi. The idea of poultry rearing has not gl}ined much ground among the town dwellers. However, poultry is reared in small numbers in many houS<!hold~ especially amon~ non-vegetarians. '
Climate The climate of Kallakkudi is the hme.. as prev~ilin~
in the region as a whole. . The ~ow~ has a high meat temperature with low degree of hu~dity due to i~ location far away from the se~sh0!f' T)1e town 11 not subjected' to extremes of clImates. The summeL months are quite hot and the variation between maximum and minimum temperature is only moderate.
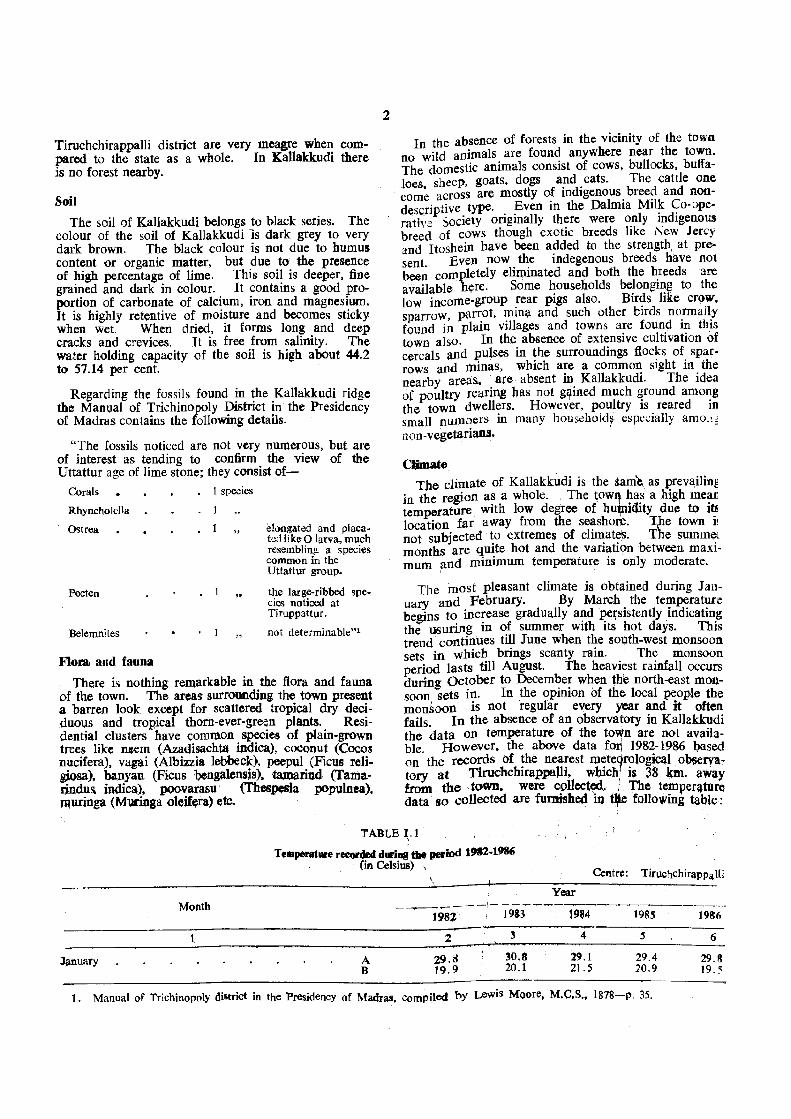
The most pleasant climate is obtained during January and February. By March the temperature begins to inc~ease gradually a~d .r.e~sistently indicating the usuring 11) of summer WIth Its ~ot days. This trend continues till June when the south-west monsoon sets in which brings scanty rain. . The monsoon period lasts till August. The heaviest rainfall occurs during ()ctober to December when the north-east monsoon sets in. In the opinion of the local people the mon~oon is not regular every year and it often fails. In the absence of an observatory in Kallakkudi the data on temperature of the to~n are not available. However, the above data fo~ 1982-1986 based on the records of the nearest mete7rological ob$ervatory at Tiruchchirappalli, which is 38 l\m. away from the·· town. were collected. " The temperature data [110 collected are furnjshed in ~ following table;
TABLE ~.l
Month
January
Temperllture reeorcled duri~ da. period 1"2-.1986 (in Celsius) ,
\, Centre: TiruchchirapPalli
Year ---~ - --/- ---~~-~--------------
1981 ,1983 1984 1985 1986
A B
2
29.S 19.9
3
30.8 20.1
4
29.1 21. 5
5
29.4 20.9
6
29.8 19.~
1. Manual of Trichinopoly diltrict in the Presidency of Madras, compiled hy Lewis Moore, M.e,S •• 1878-p. 35.
3,
TABLE -I'l-Cont;ld.
.' 1
Febrl.@Y
March
APril
May
June
July
August
Septemher
OctOber
November ".
December
A-Mean maximum. B--Mean minimum.
A B
A B
A B
A B
A B
'., A B
A B
A B
A B
A B
. '~. A B
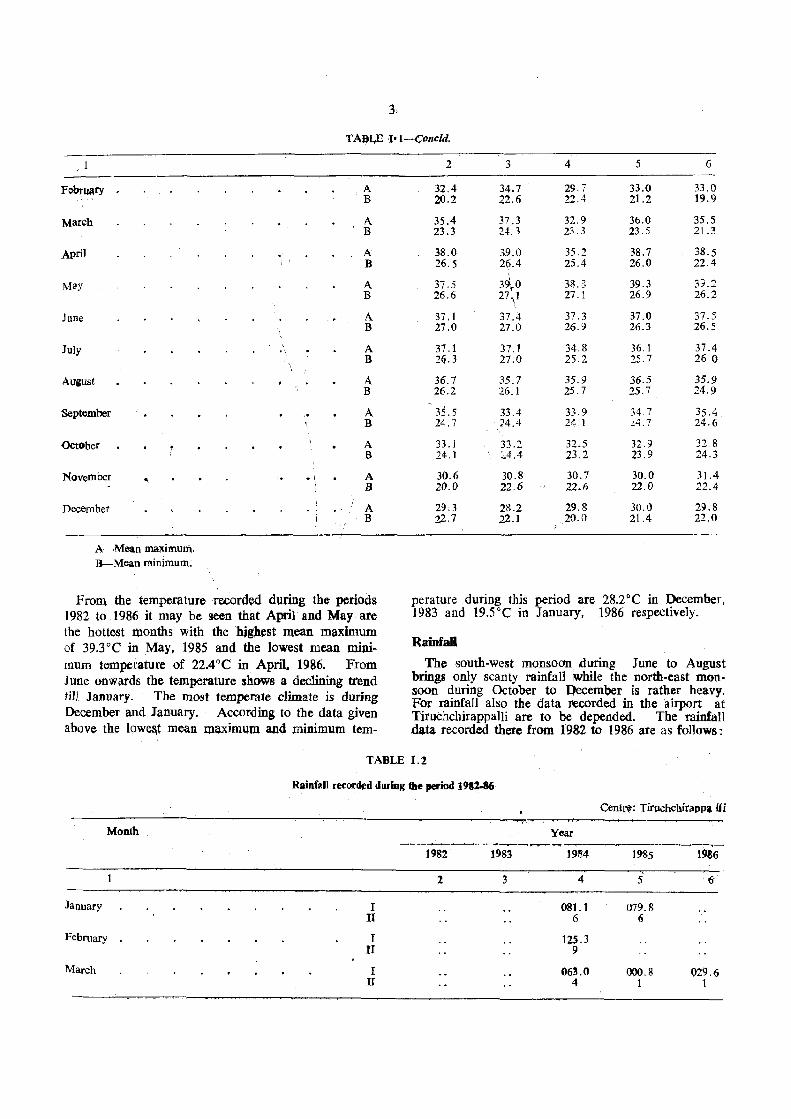
FroI1\ the temperature recorded during the periods 1982 to 1986 it may be seen that April and May are the hottest months with the higbest mean maximum of 39.3°C in May, 1985 and the lowest mean minimum temperature of 22.4°C in April. 1986. From June onwards the temperature shows a declining trend till January. The most temperate climate is during December and January. According to the data given above the lowe~t m~an maximum and minimum tem-
2 3 4 5 6
32.4 34.7 29.7 33.0 33.0 20.2 22.6 22.4 21.2 19.9
35.4 37.3 32.9 36.0 35.5 23.3 24.3 23 3 23.5 21.3
38.0 39.0 35.2 38.7 38.5 26.5 26.4 25.4 26.0 22.4
37.5 3~0 38.& 39.3 3~.2 26.6 27 1 27.1 26.9 26.2
"
37.1 37.4 37.3 37.0 37.5 27.0 27.0 26.9 26.3 26.5
37.1 37.1 34.8 36.1 37.4 26.3 27.0 25.2 25.7 260
36.7 35.7 35.9 36.5 35,9 26.2 26.1 25 7 25.7 24.9
35.5 33.4 33.9 34 7 35.4 24.7 74.4 24.1 -,4.7 24.6
33.1 33.2 32.5 32.9 32 8 24.1 \ ::4.4 23.2 23.9 24.3
30.6 30.8 30.7 30.0 31.4 2/).0 22.6 22.6 22.0 22.4
29.3 28.2 29.8 30.0 29.8 22.7 22.1 20.0 21.4 22.0
perature during this period. are 28.2°C in December, 1983 and 19.soC in January, 1986 respectively.
Rainfa1J
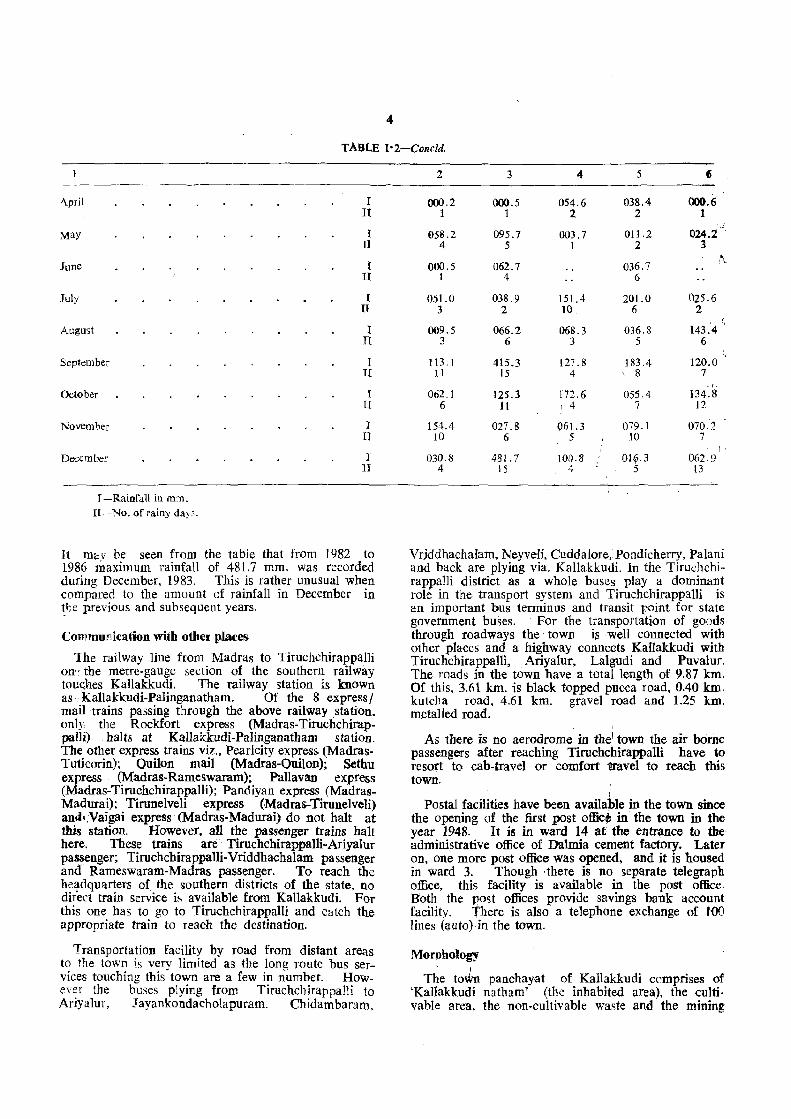
The south-west monsoon during June to August brings only scanty rainfall while the north-east monsoon during October to December is rather heavy. For rainfall also the data l1ecorded in the airport at Tiruchchirappalli are to be depended. The rainfall data recorded there from 1982 to 1986 are as follows:
TABLE I.:!
Rainfd) reco~de" during tile period 1981-86
Month
1982 1983
2 3
January I II
February I II
March I II
Year
1984
4
081.1 6
12S.3 9
063.0 4
Cent~: Tirllchc{1irappa lfi
~-
1985 1986
5 6'
079.8 6
000.8 1
029.6 1
4
TABLE 1'2-Concld.
April I II
May I II
June I II
July I IT
August r II
September J Il
October J II
November I II
December I II
r -RainPall in mm. II-No. of rainy days.
It ma v be seen from the table that from 1982 to 1986 maximum rainfall of 481.7 mm. was recorded durino- December, 1983. This is rather unusual when comp~red to the amount of rainfall in December III ~he ,previous and subsequent years.
Communication with other places
The railway line from Madras to Tiruchchirappalli on" the metre-gauge section of the southern railway tou<;hes Kallakkudi. The railway station is known as Kallakkudi-Palinganatham. Of the 8 express/ mail trains passing through the above railway ,station, only the Rockfort express (Madras-Tiruchchirappalli) halts at Kallakkudi-Palinganatham station. The other express trains viz., Pearlcity express (MadrasTuticorin); Quilon mail (Madras-Quilon); Sethu express (Madras-Rameswaram); Pallavan express (Madras-TiruchchirappaHi); Pandiyan express (MadrasMadurai); Tirunelveli express (Madras'-Tirunelveli) and.Vaigai express (Madras-Madurai) do not halt at this station. However. all the passenger trains halt here. These trains are Tiruchchirappa1li-Ariyalur passenger; Tiruchchirappalli-Vriddhachalam passenger arid Rameswaram-Madras passenger. To reach the headquarters of the southern districts of the state, no direct train service is available from KaI1akkudi. For this one has to go to Tiruchchirappalli and catch the appropriate train to reach the destination.
Transportation facility by road from distant areas to the town is very limited as the long route bus services touching this town are a few in number. How-ever the buses plying from Tiruchc11irappalli to Ariyalur, Jayankondacholapuram. Chidambaram.
2
000.2 1
058.2 4
000.5 1
051.0 3
009.5 3
113 .1 11
062.1 6
154.4 10
030.8 4
3
000.5 1
095.7 5
062.7 4
038.9 2
066.2 6
415.3 15
125.3 11
027.8 6
481.7 15
4
054.6 2
003.7 1
151.4 10
068.3 3
127.8 4
172.6 I 4
(l61.3 5
'100.8 4
5 fi
038.4 000.6 2 1
011.2 024.2' { 2 3
" 036.7 "
6
201.0 025.6 6 2
036.8 143:4 5 6
183.4 120.0 \ 8 7
055.4 134.8 7 12
079.1 070.2 10 7
0lf3 062.9 5 13
Vrjddhachalam, Neyveli, Cuddalore,.Pondicherry, Palani and back are plying via. Kallakkudi. In the Tiruchchirappa11i district as a whole buses play a dominant role in the transport system and Timchchirappalli is an important bus terminus and transit raint for state government buses. For the transportation of goods through roadways the town is well connected with other places and a highway connects Kallakkudi with Tiruchchirappalli. Ariyalur, Lalgudi and Puvalur. The road8 in the town have a total length of 9.87 krn. Of this, 3.61 km. is black topped pucca road, 0.40 krn, kutcha road, 4.61 km. gravel road and 1.25 km. m.etalled road. ~
As there is no aerodrome in the: town the air borne passengers after reaching Tiruchchirappalli have to resort to cab-travel or comfort travel to reach this town.
I Postal facilities have been available in the town since
the opening of the first post offic~ in the town in the year 1948. It is in ward 14 at the entrance to the administrative office of Dalmia cement factory. Later on, one more post office was opened. and it is housed in ward 3. Though ,there is no separate telegraph office. this facility is available in the post office, Both the post offices provide savings bank account facility. There is also a telephone exchange of 100 lines (auto) in the town.
Morphology ,
The toWn panchayat of Kallakkudi comprises of 'Kallakkudi natham' (the inhabited area), the cultivable area, the non-cultivable waste and the mining
area. To a layman Kallakkudi town panchayat is the 'Kal1akkudi l1atham' alone. The demarcation of wards in the town is restricted to the inhabited area done and it is difficult to say even by the concerned
;uthorities the particular ward in which the cultivable. un cultivable and mining areas fall. The correct wardwise area figures of the inhabited area to work out the density of population in each ward in the town could not be obtained as the total of the area figures of the wards as supnlied by the local authorities is the same as that of the total area of the town which includes cuJtivable lanel. ullcultivable waste and vast mining areas. The division of wards has been done mainly on the basis of the electorates in the town. The map of Kallakkudi town panchayat and the ward map of the town are not identical to the extent that the former includes the entire area of the town .including cuftlvable area, un cultivable waste and mining area whereas the latter covers cnly the inhabited area of the town 'Jmitting the area surrounding it.
The inhabited area of the town can be classified into two viz., the Dalmia complex and t.he area occllpied by the local residents of the town.
Dalmia .complex
This can be further divided into two pahs. Tn the first part. which is the Dalmia main colony~ the managerial. supervisory and other office ~taff. of 031-mia Cement (Bharat) Ltd. are residing. The office of Dalmia Cement (Bharat) Ltd., the school, the dispens,3ry, the rest house, the recreation club run by the above factory, the play ground, the auditorium and the temple dedicated to Lord Siva maintained by it are also located in this part. The second part contains the residential quarters of the workers and menial labourers of the factory besides a temple of a local deity (Kaliamman). This part is known as Gandhi Nagar colony. The entire Dalmia compound ex tends beyond the boundary of the town and the Dalmia Cement factory lies in PaHnganatham. The Dalmia compound in general and the main complex in particular is well maintained and spic and span in appearance except for the dust pollution emitted from the cement factory. In the Dalmia complex the buildings and other structures have been constructed according to well thought out p1an and there are excellent approach roads. The important roads inside the Dalmia complex are the general office road. school road. ceramic factory road and the silver jubilee road. The entire Dalmia complex falls under wards 8. 12 ancl 14 and parts of wards 9, 11 and 13 of Kallakkudi town.
The main areas outside the Dalmia complex are the bazaar area in wards 1, 2, 3 and 6; Chidambaram salai in ward 5; Dalmia main road in wards 6 and 7: V3nnbr colony in ward '7 and Harijan colony and Ambal talkies area in wards 9 and 10. The streets in these areas are not in a planned manner. The residential houses and other establishments are in a haphazard manner as in the case of the rural areas in the state. In the areas outside the Dalmia complex the shops and other commercial establishments
4-20 RGI/ND!89
5
are clustered in the bazaar area and in the Dahnia main road.. The most congested areas of the town are the harijan colony and Ambal talkies area. The main thoroughfares in the town outside the Da1mia complex are the Dalmia main road. Chidambaram salai, Palinganatham road, Bazaar street, Church street and the Pillayar koil street.
Functional areas
Though Kallakkudi has the status of a tawn panchayat, in the absence of any legislation declaring certain areas as r4'!sidential and industrial by the Town and Country PIa fining Organisation, the designing and development of well marked functional areas as in the case of bigger towns are lacking here. This makes it rather difficult to identify well marked functional areas in the town. Kallakkudi, which was a mere' village some 50 years ago, owes its growth and development as a town exclusively to the vision and perseverance of Shri Ramakrishna Dalmia in establishing the Dalmia Cement (Bbarat) Ltd. in the town to exploit the rich deposits of limestone here. As a result of the establishment of Dalmia Cement (Bharat) Ltd.. a few other associated companies alsOo came into existence in the town. These are Rockfort Asbestos which is located 01" the outskirts of the town. 5hri Nataraj Ceramic and Chemical Industries and the RC.C. Spun Pipe Company. Apart from these, there are bne cotton ginning mill. one chalk manufacturing company. three rice mills. one rotary oil mill, ,one saw mill and one lathe, manufacturing accessories required for the ceramic factory in the town. An these industrial establishments are ly~g scattered at different locations. No area can be specifically identified as residential, commerical or' administrative. Residential houses are scattered all over the town admixed with the functional areas. This is because of the haphazard growth of the town without any deliberate planning. However, an attempt is made below to identify the different functional areas.
Administrative area
MIs. Dalmia Cement (Bharat) Ltd. have their local administrative office within the Dalmia compound. The Dalmia compound also bouses the Punjab National Bank, a co-operative bank. one post office. one utilization dispensary with maternity ward and the office of the Assistant Collector of Excise. Outside the Dalmia compound the Town Panchayat Office. Employees State Insurance Corporation Office and the Office of the 'Junior Engineer, Tamil Nadu Electricity Board are located on the side of the Dalmia main road. The Dalmia main road and parts of Dalmia compound are the main administrative areas of the town. In addition to tne above establishments, one post office and a telephone exchange are functioning in ward 3. The wardwise details of the location of administrative offices outside the Dalmia complex are as follows:
Ward 3 Ward 6 Ward 7
Po,t office and Telephone eXchange. Town Panchayat Office. Office of the JUni(}r Engineer, Tamil Nadu Electricity Board and Employees' State Insurance Corporation.
Important market areas of the town are the Dalmia main road area and the bazaar area. Shops are located on one side of the Da\mi::l. main road, opposite to Dalmia compound wall whereas in the bazaar area shops are located on both the sides of the road. All kinds of shops, both big and small. dealing with grocery, statior.ery, textile, household utensils, hardwares, electric goods and vegetables are found intermingled. The dealers in meat have their shops in an isolated place in Dalmia main road away from all the shops. The det~iIs of the banks and co-operative societies avaitable in the town are the following:
Ward 2 K?,llakkudi CO-L!)erative stort.
Ward 3
Ward 7
Ward t4
Industria) area
Bank of Tlnnjavur aud Kallakkudi Primary Co-operative Bank.
Dalmir>, Milk Co-operative Society.
Punjab National Bank and Dalmiap'Jram Emp!oyoos' Co-operative Bank. (within Oalmia compound)
Kallakkudi, as already stated. is known for the manufacture of cement and its allied products. Nearly 16 per cent of the total cement produced in Tamil Nadu is produced in this town. Cement, R.C.C. spun Dipes, A.C. pipes and fittings for building purposes and lift '~',~ieI irrigation schemes are the most important things manufactured in the town. Chalk pieces are al so manufactured and sent to other places. Industrial establishments are found scattered. Mis. Dalmia Cemellt (Bharat}Ltd. and Mfs. Rockfort Asbestos are located on the outskirts cf Kallakkudi extending to the adjoining Palinganatham village. Shri Nataraj Ceramic and Chemical industries is located in Kallakkudi itself. Palani Andavar Rice mill is located by the side of the Palinganatham road. Hirudaya ginning mill, The National Chalk factory, Balu Spun pipes, Lakshmi pipes private limited etc. are located by the side of Chidambaram salai. The major industrial units such as Dalmia Cement (Bharat) Limited, Shri Nataraj Ceramics and Chemical Industries and Rockfort Asbestos are located at one end and all the other industrial units are located at the other end which is on the northern side of the town. These two localities can be classified as the industrial areas of the town. The wardwise details of the industrial establishments in the town outside the Dalmia complex are as follows:
Ward 2
Ward 4
Ward 5
Ward 6
Resi~ntial area
Esther rice mill, Pazhaniandavar rice mill, Gemini soda factory and Ayyappan Enginel"Ting works.
Hirudaya ginning mill, flour mill, rice mill and rotary oil mill.
Lakshmi pipes, Balu spun pipes, Akbar saw mill, Jegan Engineering works and National Chalk factory.
Vinayakar soda factory.
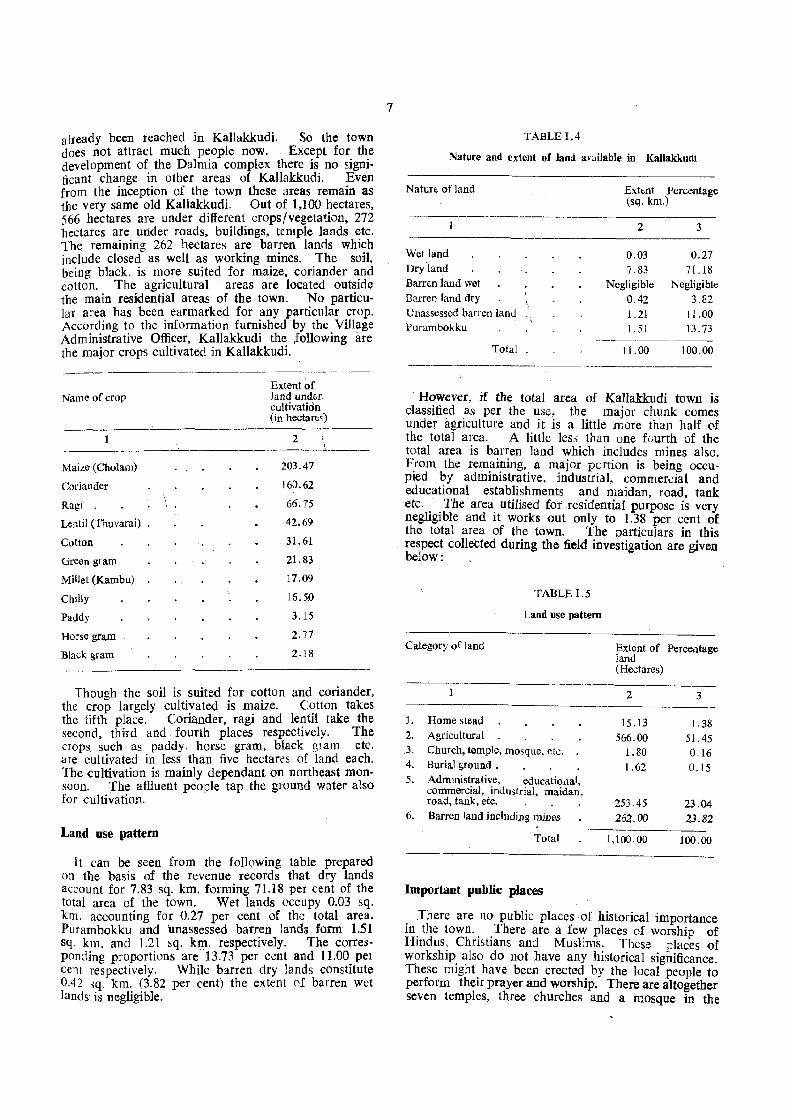
As per 1981 Census data there are 2.429 residential houses with 2,429 households in Kallakkudi. Resi-
6
dential houses are spread allover the town (limited to the area known as Kallakkudi natham). Density of population of KaUakkudi according to 1981 Census was 1,018 persons per sq. km. whereas that of TiruchchirappaUi district urban was 2,700 and that of Tamil Nadu state urban was 2,722. Thus, the density of population in Kallakkudi is less than that of both the district and state· urban. Some of the areas are found crowded and congested. In the absence of correct area of each ward it is not possible to workout the density of population in each ward. However, the impression obtained during the survey was that wards 9 and 10 (Ambal taTkies and harijan colony) are the most thickly populated areas and these are followed by ward 8 (the residential colony of the staff of Dalmia cements). The staff quarters in Dalmia cements are multi-storeyed fiats and naturally the area is crowded. But one will not feel the congestion here due to the planned construction of the tesidential quarters.
The table given below contains the details of the houses and population in each ward according to 1981 Census data.
TABLE 1.3
Wardwise details of the bouses and population as ~r 1981 Census ,
Ward number Total nulnber Population of houses
2 3
139 664
2 183 910 :3 173 791 4 171 749 5 233 985 6 150 655 7 227 1,042 8 221 1,078
9 186 912 10 325 1,374 11 133 632 12 120 666 13 138 623 14 30 115
"
Total 2,42~ 11,196
Agricultural area
The town has been developed on a~ already existing viIIage exclusively due to, industrialization. Generally tile process of urbanization exhibits a pattern in which tl1e rate of: change is slow at first, then rises steeply as the early stages of industrializatioh are reached and taper~ off gradually when the process of urbanization reaches the saturation point. Since the industrial'2Jation in Kanakkudi is solely df1pendant on the lime stone deposits available, there is only a limited scope for .'the industrial development as it can depend only on cement and cement products. The saturation point in the process of urbanization has
,
already been reached in Kallakkudi. So the town does not attract much people now. Except for the development of the Dalmia complex there is no significant change in other areas of Kallakkudi. Even from the inception of the town these areas remain as the very same old Kallakkudi. Out of two hectares, 566 hectares are under different crops/vegeta~ion, 272 hectares are urider roads, buildings, temple lands etc. The remaining 262 hectares are barren lands which include closed as well as working mines. The soil, being black, is more suited for maize, coriander and cotton. The agricultural areas are located outside the main residential areas of the town. No particular area has been earmarked for any particular crop. According to the information furnished by the. Village Administrative Officer. Kallakkudi the :followmg are the major crops cultivated in Kallakkudi.
Name of crop
Maize (Cholam)
Coriander
Ragi .
Lentil (Thuvarai) .
Cotton
Green gram
MiHet (Kambu)
Chilly
Paddy
Horse gram
Blac:k gram
Extent af land under cultivatidn (in hectar(;;s)
2
203.47
160.62
66.75
42.69
31.61
21.83
17.09
16.50
3.15
2.77
2.18
Though the soil is suited for cotton and coriander. the crop largely cultivated is maize. Cotton takes the fifth place. Coriander, ragi and lentil take the second. third and fourth places respectively. The crops such as paddy, horse gram, black glam etc. are cultivated in less than five hectares of land each. The cultivation is mainly dependant on northeast monSOon. The affluent people tap the ground water also for cultivation.
Land use pattern
It can be seen from the following table prepared on the basis of the revenue records that dry lands account for 7.83 sq. km. forming 71.18 per cent of the total area of the town. Wet lands (}ccupy 0.03 sq. km. accounting for 0.27 per cent of the total area. Purambokku and 'unassessed barren lands form 1.51 sq. km. and 1.21 sq. km. respectively. The corresponding proportions are 13.73 per cent and 11.00 pel cent respectively. While barren dry lands constitute 0.42 sq. km. (3.82 per cent) the extent ef barren wet lands is negligible.
7
TABLE 1.4
Nature and extent of land a\"ailable in Kallakkudi
Naturt- of land
Wet land Dry land Barren land wet Barren land dry Unassessed barren land Purambokku
Total
Ex(t-nt Percentage (sq. km.)
2 3
0.03 0.27 7.83 71.18
Negligible Negligible 0.42 3.82 1.21 j 1.00 j . 51 13.73
11.00 100.00
However, if the total area of Kallakkudi town is classHied as per the use, the major chunk comes under agriculture and it is a little more than half of the total area. A little less than one fuurth of the total area is barren land which includes mines also. From the remaining. a major portion is being occupied by administrative. industrial. commerdal and educational establishments and maidan. road. tank etc. The area utilised fof residential purpose is very negligible and it works out only to 1.38 per cent of the total area of the town. The oarticuiars in this respect collected during the field investigation are given below: ,
TABLE 1.5
Land use pattern
Category of land
1. Home stead 2. Agricultural 3. Church, temple, mosque, t'tc. 4. Burial &round • 5. Administrative, educational,
commercial, industrial, maidan, road, tank, etc.
6. Barren land including mines
Total
Important publie places
Extent of Perce.1tage land (Hectares)
2 3
15.13 1.38 566.00 51.45
1.80 0.16 1.62 0.15
253.45 23.04 262.00 23.82
1,100.00 100.00
. There are no public places of historical importance III the town. There are a few places of worship of Hindus, Christians and Muslims. These places of workship also do not have any historical significance. These might have been erected by the local people to perform their prayer and worship. There are altogether seven temples, three churches and a mosque in the
town. Among these. two temples are located inside the Dalmia compound. The details of the places of worship in Kallakkudi are as follows:
Ward Names of the places of worship number
Sivan koil 2 Pillayar koil and Mariamman koil 5 Iyanar (Karuppasamy) koil
10 Mariammaa koil 12 Kaliamman koil (imide Dalmia compound) 14 Chandra Mouieeshwarar koil (inside Dalmia compouud)
4 Saint Xavier's church 5 Saint Mark's church
10 Saint Antony's church
7 Mosque
The Pillayar koil thidal {Pillayar koi1 maidan) in ward 5. Kamaraj thidal in ward 6 and Ambal talkies in ward Hl are important among. the ether public places.
Pillayar koil thidal (Pil1ayar koil maidan) and Kamaraj thidal (Kamaraj maid an) are the place5 where political meetings are held. Small meetings which are likely to attract less crowd are generally held in Pillayar koil thidal. In Kamaraj thida I meetings which are likely to attract huge crowd are held.
There are no recreation club, community hall. auditorium, play ground, park etc. outside the Dalmia compound. However, all these facilities are available within the Dalmia compound. The community hall and the places of worship within the Dalmia compound are accessible to the local people in the town also. Annual sports and other cultural activities are held in the Dalmia school ground. In addition to the community hall within the Dalmia compound, the Dalmia Cement National Workers Union has constructed a silver jubilee hall in tEe Dalmia main road. This hall is made available on hire for marriages and other functions.
Ambal talkies area is another important public place of the town. The Ambal talkies, which is the only cinema theatre available in the town, is located in this area. The Ambal talkies and the local library-cum-reading room are the two important places for the local people to spend their leisure time.
Residential pattern with leferen.:c to ethnic groups
No separate area in the town can be identified as the residential area of any particular caste or ethnic group. People of all castes are found scattered and intermixed in all parts of the town. The harijan colony is the only exception and it is predominantly occupied by the members of Adi-dravida community which is a scheduled caste in the state.
The religion-wise distribution of the population of the town more or less follows the pattern of the state,
8
district and taluk. [n the state as per 1981 Census Hindus are in majority forming 88.86 per cent of the total population followed by Christians and Muslims with 5.78 and 5.21 per cent respectively. The corresponding figures for the district of Tiruchchirappalli are 89.26, 5.96 and 4.72 per cent respectively for Hindus. Christians and Muslims. The religious distribution for the taluk of Lalgudi is Hindus 84.15 per cent. ~hristians 12.87. per ,cent and Muslims 2.87 per cent. I he correspondll1g figures for Kallakkudi town are 73.63, 20.12 and 6.07 per cent respectively. The percentage distribution of population by religion at state, district, taluk and town level are as follows:
TABLE l.&
i:>erccntage distribution of population b~' religion
(l9l:51 Census)
Name of re>ligion Stalu District
2 3 4
Bindu 88.815 89.26 84.15
Christian 5.78 5.96 12.87
Muslim 5.21 4.72 2.87
Kalla, kkudi
5
73.63
20.12
6.07
A general idea of the relative strength of tBe major castes can, however, be had from the data collected for the study. The sample data collected also show that Hindus form the major religious group with 71.62 per cent followed by Christians and Muslims with 21.83 and 6.55 per cent respectively. Among the various castes found in the town Boyars, Udayars and Brahmins are in majority. Their percentages among Hindus in the town are 21.81, 13.60, and 7.85 respectively. Among the entire population their percentage representations are 15.62, 9.74 ::tnd 5.63 respectively. Though people of all castes are found scattered in the town, in some wards a smaller concentration of particular castes can be seen.
Location of slums and other named areas of the town
In the entire district, Tiruchchirappalli municipality alone has slum population. In Kallakkudi town no area has been identified as slum. The most congested area in the town is the harijan colony and Ambal talkies area predominantly occupied by poor class people. Malnutrition and poor sanitary conditions str~~k the residents of th~se areas, especially those in han]an colony, as the bIggest evils for their health. However, this area cannot be identified as slum as this is nut a disorganised housing settlement.
In' wa.rd 10, Udayars, Moopanars and Asaris are the domlllant castes apart from the Dhobies and Barbers who serve the people in the town. In wards 2 a!,d 4 both Hindu and Christian Udayars are in majonty. 'Nards 3 and 5 have concentration of Vanniars (locally known as Naickers); Udayars and people
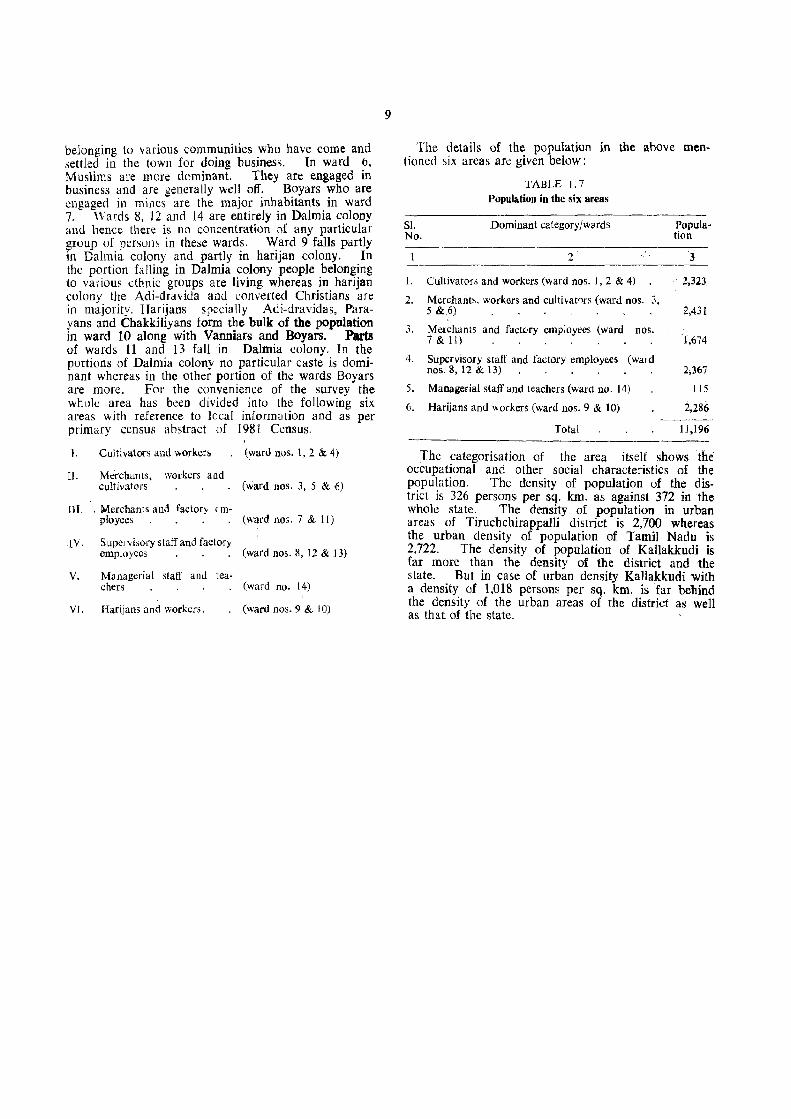
belonging to various communities who have come and settled in the town for doing business. In ward 6. Muslims are more dcminant. They are engaged in business and are generally well off. Boyars who are engaged in mines are the major inhabitants in ward 7. Wards 8, 12 and l4 are entirely in Dalmia colony and hence there is no concentration of any particular group of persons in these wards. Ward 9 falls partly in Dalmia colony and partly in harijan colony. In the portion falling in Dalmia colony people belonging to various dhnic groups are living whereas in harijan colony the Adi-dravida and converted Christians an:: in majority. Harijans specially Adi-dravidas, Parayans and Chakkiliyans form the bulk of the population in ward 10 along with Vanniars and Boyars. Parts of wards 11 and 13 fall in Dalmia colony. In the portions of Dalmia colony no particular caste is domi· nant whereas in the other portion of the wards Boyars are more. For the convenience of the survey the whole area has been divided into the following six areas with reference to local information and as per primary census abstract of 1981 Census.
T. Cultivators and worker"
ll. Merchants, workers and cultiva.tors
HI. . Merchants and factory f m· ployees
1 V. S upeJ ~ isory staff and factory employees
V. Managerial staff and tea· chers
vr. Harijans and workers.
(ward nos. 1,2 & 4)
(ward nos. 3, 5 & (j)
(ward nos. 7 & II)
(ward nos. 8, 12 & 13)
(ward no. 14)
(ward nos. 9 & 10)
9
The details of the population in the above mentioned six areas arc given below:
Sl. No.
1.
2.
3.
4.
5.
6.
TABLE L 7 Population in tbe six areas
Dominant category/w<Jrds
2
Cultivators and workers (ward nos. j, 2 & 4)
Merchants. workers and cultivat0rs (ward nos. 3. 5 & 6)
Merchants and factory employees (ward nos. 7 & II) . . . . . .
Supervisory stalf and factory employees nos. 8,12 & 13) . . . .
(ward
Managerial staff and teachers (ward no. 14)
Harijans and \\orkers (ward nos. 9 & 10)
Total
Popula-tion
3
2,323
2,431
" 1,674
2;367
115
2,286 ----
11,196
The categorisation of the area itself shows the -occupational and other social characteristics of the popUlation. The density of population of the dis· trict is 326 persons per sq. km. as against 372 in the whole state. The density of popUlation in urban areas of Tiruchchirappalli district is 2,700 whereas the urban density of population of Tamil Nadu is 2.722. The density of population of Kallakkudi is far more than the density of the district and the state. But in case of urban density Kallakkudi with a density of 1,018 persons per sq. km. is far behind the density of the urban areas of the district as well as that of the state.
CHAPTER II
HISTORY OF GROWTH OF THE TOWN
Myth legeud and history
In the past Kallakkudi was. like many other villages in the state and elsewhere, ah inconspicuous village with little history or any myth or legend. No records to decide as to how this place acquired the name Kallakkudi is readily available and it is not likely that there may be any such record. Kallakkudi was a dry and sparsely populated vjJlage with lots of limestone pieces found everywhere. The people of Kallakkudi have no definite idea about the origin of the name of that place. However, some elders in the town are of the opinion that the place might have acquired the name Kallakkudi because of the limestone found scattered here in abundance. The Tamil word 'kalIu' means 'stone' and 'kudi' can be taken to mean 'habitation'. It appears that this explanation is not totally unconvincing. There is yet another possibility as to how this place might have acquired its name and that is discussed below. In his Tamil book 'TamizhakamOorum Perum' (Tamil Nadu-viIlag;es and names). llate Prof. R. P. Sethu PilIai, Professor of Tamil. Madras University has attempted to give logical explanation all the origin of names of the villages in Tamil Nadu. Though he has covered a number of villages in his hook, KaUakkudi has escaped from being included there. This shows the obscurity of the village and the lack of any historical or mythical significance attached to this name. However, while discussing the word 'kudi' he gives the following explanation:
" ®Uj. "'~WJw Qa:rrriIJ .2!!1J rTuQUllJrTa;6Yf)riIJ ~mLDPJ.§jJ @jlJj.uJ1@ U ~ U i1LCOW rT jJ.§jJ,;v ;$ rr@j t.b . !!L j!J Iilf (!p m .m ILf (0) L IlJ
U6l) @[email protected]'§;forrrT 'fj!@ @jl.!J-~W!lrr<$8; .$@:'!iuu(£t<iillrT. ~.§;§jma;1lJ @jL'l-u51~rT GJ'rTft;.§jJ ,;[email protected] ®lJj.u51®uLj ~~.!l)Jw ®L!J- riT~!J)fw GldffGvGl)Uu(ElLb".l
The above passage means that the word 'kudi' Occurring in the names of places wil1 denote human settlement and the settlements where people belonging to a number of families who are related to each other live are called 'kudiyiruppu' ( @jUj.u51®uy ) or kudi (@i!l1-). His emphasis here to call a place 'kudi' is that the people there should be rel"ted to each other. On the basis of this. if it is presumed that in the very long past families of Kallar community who were related to each other were living there, the place might have acquired the name Kallakkudi denoting the human settlement where related families of Kallar community were living. Even now peopJe belonging to Kallar caste are living in Kallakkudi, though very few in number. Edgar Thurston in his book 'Castes :lnd Tribes of Southern India' refers only to the caste KalIan and not Kallar. So the present Ka11ar caste and
the Kallan caste referred to by Thurston may be one and the same. About KaHan, Thurston in his above book quotes Mr. H.A. Stuart as follows:
"the Kallans are said to be a middle sized dark skinned tribe found chiefly in the districts of Tanjore, Tr~cbinopoly and Madurai. and in Pudukota territory."~ Thurston again writes as under about this caste. "In Trichinopoly town households are obliged to keep a member of the KaHan caste in their service as a protection against the depredations of the thieves, and any refusal to be given into this custom invariably results in loss of property. On the other hand, if a theft should by any chance, be committed in a house where a Kallan is employed, the articles stolen will be recovered and returned to the owner."3 This evidently shows that in the long past !there were concentration of people belonging tei KaHan caste 111
Tiruchchirappalli district (formerly known as Trichinopoly) where Kallakkudi is situated. The present Kal1akkudi in the ancient days might have been the settlement of inter-related families of Ka1lan caste and thereby acquired the name Kallakkudi. But ~e elders living in the town say ascertively that the original inhabitants of this town were the people belonging to Udayar caste and not people belonging to Kallar caste. This strongly disputes the above contention. In order to say anything ascertively as to how this place acquired its present name much research is required.
Whatever may be the background for this place to acquire its name. in living memory the place became prominent with the establishment of Dalmia Cement (Bharat) Limited in the town during 1938. Consequent on the establishment of the cement factory. the place came to be known as Da,lmiapuram and the railway station was named as Dalmiapuram railway station. The post office and police station in Kallakkudi were also named as Dalmiapuram post office and Dalmiapuram police station. Till. the year 1952 there was no problem in the above newly acquired names. However, during 1953 the Dravida Munnetra Kazhakam launched an agitation to change the name of the raIlway station as Kal1akkudi railway station. By the middle of July 1953 the agitation was intensified resulting in police firing. At that time the Congress government was in power in Tamil Nadu. When the Dravida Munnetra Kazhakam came into power in 1967 political pressure was said to have been exerted on the presicjent of KaUakkudi Panchayat to pass a resolution to request the government of Tamil Nadu to change the names of the railway statIOn, post office and police station by using the prefix 'Kallakkudi' in
I. Thar'1izhakam -Oofum Perum by Prof. R.P. Sethu Pillai, Professor of Tamil, U,liversity of Madras, 1956, P. 58. 2. Castes and Tribes of Southern lndia (Vol. III·-K) by Edgar Thur,ton, 1909, P. 60. 3. Ibid, pp. 63-64.
10
lieu of 'Dalmiapurall1'. Consequently the panchayat president convened a meeting during March \969 to consider the above matter and it was resolved in the meeting that the panchayat would refrain from the demand for change of name as there was difference of opinion among the members. In spite of this, mounting pressure was continued to be applied and tn the year 1970 the name of the railway station was changed as Kallakkudi-Palinganatham. In the subsequent year the place name of the post office was a Iso changed as Ka]lakkudi. In spite of the agitation launched and the consequent change of names of the railway station and post office, the area adjacent to the Dalmia Cement (Bharat) Limited is still familiarly known as Dalmiapuram and most of the name boards of shops in the above area bear the name Dalmiapuram.
Pre-urballisation position of the town
TiU the year 1917 Kallakudi was in Perambalur taluk. The scheme for the redistribution of divisional and taluk changes in the Trichioopoly (present Tiruchchirappal1i) and Salem districts was sanctioned in 1918 (G.O. No. 641. Revenue dated 14th Februarv 1918). This resulted in the rendition of the Namakkal taluk. to the Salem clistr:ct and formation of a new taluk in the Trichinopoly district. . The taluk was first caIled Samayavaram and its headquarters was fixed at Kannanur (Trichinopoly) but soon afterwards the name and headquarters were changed to Lalgudi (Notification in Fort St. George Gazette-Part I dated 19th February 1915-pages 147-149). This new taluk Fas formed out of the portion of the old Trichinopoly taluk lying north of the Coleroon with the addition of a number of villages of Musiri and Perambalur taluks, and comprised of 115 ayan and 16 inam villages. I Thus, from 1918 Kallakkudi came under Lalgudi taluk and still it continues as such. Details, are not readily available as to whether Kallakkudi underwent jurisdictional changes during the abOve mentioned redistribution of divisions and taluks. It appears that the chances for any such change are very remote.
Local administration in the state began with the passing of the Towns Improvement Act X of 1865 and the Local Funds Act IV of 1871. The first act created the municipalities and the second the local fund boards. These were later changed into district boards and panchayats by subsequent legislation. The next important mile stone in local administration came with the passing of the Local Boards Act V of 1920 and the Village Panchayat Act XV of 1920. The Village Panchayat Act XV of 1920 authorised the constitution of panchayats in rural areas where there were no union boards for the administration of village affairs by the villagers themselves. The Inspector of Local Boards and Municipal Councils was appointed as the Registrar General of Panchayats and was placed in direct charge of the panchayats in the state. Prior to the passing of the Village Panchayats Act XV of 1920 and till the end of 1928 KaUakkudi had no union board for the administration of "iUage affairs by the villager~ themselves. In exercise of the
1]
power~ delegaled by the Local Government under section :'.7(3) of Madras ViHagc Panchayat Act, 1920 the Registrar General of Panchayats declared KaIIakkudi to be a village for the purpose of the above Act and ordered that a panchayat should b~ constituted ~or the village and named as Kallakkudl Panchayat wlth effect from 20-3-1929 (Notification R. Dis No. 160 dated 4th March, 1929 by the Registrar General of Panchayats).
Position' of the town after urbaDisation
In exercise of powers conferred by the provision~ of the Village Panchayat Act X of 1950, Kal1akkudl Panchayat was classified as class I Punchayat from 13-8-1958 (Proceedings of the Inspector of Local Boards Madras No. R.Dis 56722/58 dated 13-8-58) and th~ Health Eduoation and Local Administration Department of the Govt. issued orders. u!lder the Madras Village Panchayat Act, 1950 notlfYlllg Kallakkudi Panchayat as a Panchayat for which a whole time Executive Officer shall be appointed (G.O. Ms. No. 1681, LA dated 18th November, 1958). The above orders bestowed on KaUakkudi the status of a town panchayat.
It will be really of interest to find out how the insignificant Kallakkudi viIlage gained significance an~ attained the status of a town panchayat. Kallakkudl town owes its growth and development from village panchayat to grade I town panchayat and again to selection grade panchayat from 27-10-70 (as per pr~~ ceedings R.Dis. 16770/70, dated 27-10-70 of the DIrector of Rural Development Madras), to the vision and perseverance of Shri Ramakrishna Dalmia a~ his. worthy successors in establishing a cement fac~ory in Kallakkudi during 1938, attracted by. the fairly rich deposits of lime stone and gypsum In the precincts of this town.
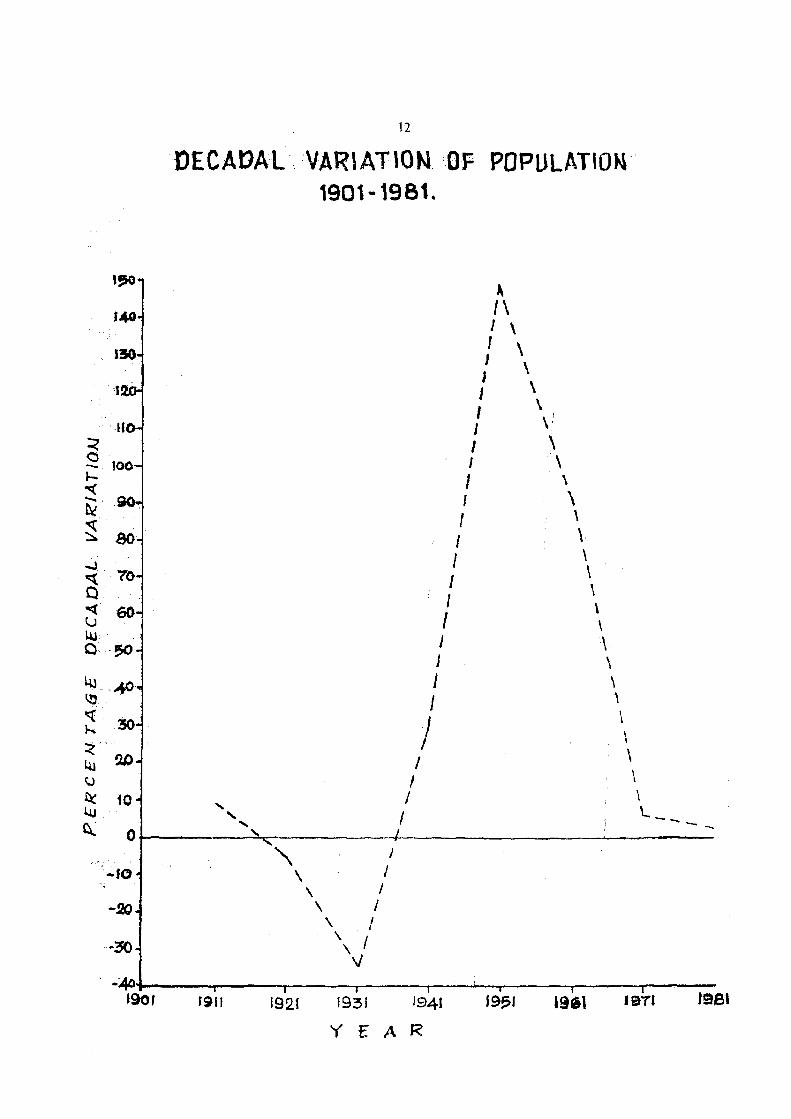
A perusal of the popula~ion of Kallakkudi. during different decades commencmg from 1901. WhICh are given below will give an idea about the trend of growth of the tow~. It has been ascertained t~at th.ere was no change of boundary in Kallakkudl dunng 1901 to 1981.
TABLE n.1
Population particulars of KaDakkudi town from 1001 to 1981
Year Number Population ofoccu- ---_._-_------- ~--------pied Males Females. Total Percenta~ houses docadal
variation
2 3 4 5 6
901 424 1,233 1,306 2,539 911 452 1,373 1,402 2,775 + 9.29
921 493 1,289 1,309 2,598 - 6.38 1931 294 814 882 1.696 -.34.72
1. Madras District Gazetteers, Trichio()poly District Vol. fT (Statistical Appendix), 1931.
4J I.,1J ~(
30 h
:t ~ Lu
\J t( 10 lJ.J. ~ 0
-.20
12
OECADA·L·. ·VAR\AT\ON 'OF POPULATION' 1901 .. 1981.
.....
" .....
" I \ / \ I
\ I \ / \ I \J
I
I I
/
~ /\ J I 1 I I I J I I I 1 I I I I I I J
J J I
!
\ \ \ \ \ \!
\ '\
\
\ \
\ , \ \ \ \ \ \ \ 1 \ \ \ \ \ '-_
rgll 1921 1931 1941 J9!)1 1961 IIlTI
Y fAR
-_
JSS1
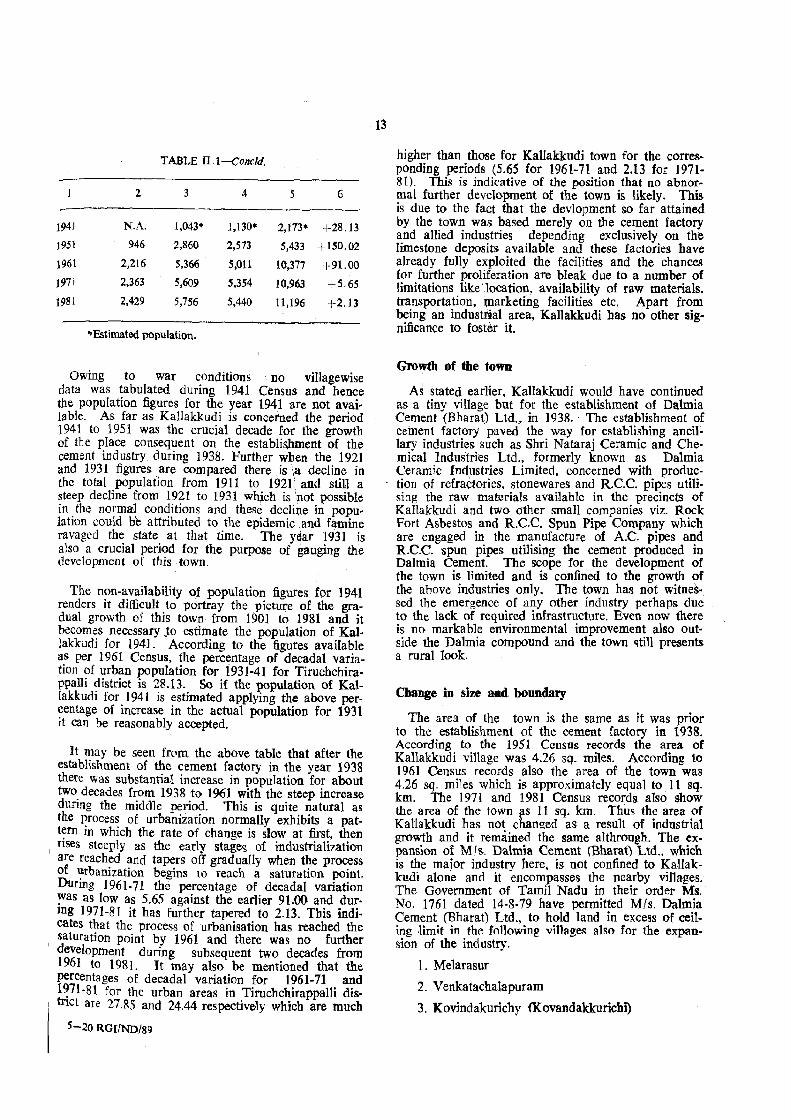
TABLE II, l-Concld.
2 3 4 5 6
1941 N.A. 1,043* 1,130* 2,113* +28.13
1951 946 2,860 2,573 5,433 +150.02
1961 2,216 5,366 5,011 10,377 +91.00
197i 2,363 5,609 5,354 10,963 +5.65
1981 2,429 5,756 5,440 11,196 +2.13
"Estimated population.
Owing to war conditions 'no viIIagewise data was tabulated. during 1941 Census and hence the popUlation figures for the year 1941 ate not available. As far as Kallakkudi is concerned the period 194] to 1951 was the crucial decade for the growth of the place consequent on the establi$hment of the cement industry during 1938. Further when the 1921 and 1931 figures are compared there is ',a decline in the total population from 1911 to 1921. and still a steep decline from 1921 to 1931 whjch is 'pot possible in the normal conditions and these decline in population could be attributed to the epidemic ,and famine ravaged the state at that time. The year 1931 is also a crucial period for the purpose of gauging the deveIopment of this town.
The non-availability of population figures for 1941 renders it difficult to portray the picture of the gradual growth of this town from 1901 to 1981 and it becomes necessary )0 estimate the population of Kallakkudi for 1941. According to the figures available as per 1961 Census, the percentage of decadal variation of urban population for 1931-41 for Tiruchchirappalli district is 28.13. So if the population of Kallakkudi for 1941 is estimated applying the above percentage of increase in the actual population for 1931 it caT( be reasonably accepted.
It may be seen from the above table that after the establishment of the cement factory in the year 1938 there was substantial increase in population for about two. decades from 1938 to 1961 with the steep increase dunng the middle period. This is quite natura1 as the process of urbanization normally exhibits a patt~m in which the rate of change is slow at first, then
I nses steeply as the early stages of industrialization are reached and tapers off gradually when the process of ~rbanization begins to reach a saturation point. DuTlng 1961-71 the percentage of decadal variation ~as as low as 5.65 against the earlier 91.00 and durmg 1971-81 it has further tapered to 2.13. This indicates that the process of urbanisation has reached the saturation paint by 1961 and there was no further development during subsequent two decades from 1961 to 1981. It may also be mentioned that the percentages of decadal variation for 1961-71 and 1~71-81 for the urban areas in Tirucbchirappalli district are 27,85 and 24.44 respectively which are much
5-20 RGr/ND/89
13
higher than those for Kallakkudi town for the corresponding periods (5.65 for 1961-71 and 2.13 for 1971-81). This is indicative of the position that no abnormal further development of the town is likely. This is due to the fact that the devlopment so far attained by the town was based merely on the cement factory and allied industries depending exclusively on the limestone deposits available and these factories have already fully exploited the facilities and the chances for further proliferation are bleak due to a number of limitations like 'location, availability of raw materials_ transportation, ~arketing facilities etc. Apart from being an industnal area, Kallakkudi has no other significance to foster it.
Growth of the town
As stated earlier, Kallakkudi would have continued as a tiny village but for the establishment of Dalmia Cement (Eharat) Ltd .• in 1938. ' The establishment of cement factory paved the way for estab1ishing ancillary industries such as Shri Nataraj Ceramic and Chemical Industries Ltd., formerly known as Dalmia Ceramic Industries Limited, concerned with production of refractories, stonewares and RC.C. pipes utilising the raw materials available in the precincts of Kallakkudi and two other small companies viz. Rock Fort Asbestos and R.C.C. Spun Pipe Company which are engaged in the manufacture of A.C. pipes and RC.C. 'Spun pipes utiliSing the cement produced in Dalmia Cement. The scope for the development of the town is limited and is confined to the growth of the above industries only. The town has not witnessed the emergence of any other industry perhaps due to the lack of required infrastmcture. Even now there is no markable environmental improvement also outside the Dalmia compound and the town still presents a rural look.
Change in size and boundary
The area of the town is the same as it was prior to the establishment of the cement factory in 1938. According to the 1951 Census records the area of Kallakkudi village was 4.26 sq. miles. According to 1961 Census records also the area of the town was 4.26 sq. miles which is approximately equal to, 11 sq. km. The 1971 and 1981 Census records also show the area of the town fis 11 sq. km. Thus the area of Kallakkudi has not changed as a result of industrial growth and it remained the same aIthrough. The expanslon or Mis. Da\mia Cement (Bharat) Ltd., which is the major industry here, is not confined to Kallakkudi alone and it encompasses the nearby villages. The Government of Tamil Nadu in their order Ms. No. 1761 dated 14-8-79 have permitted MIs. Dalmia Cement (Bharat) Ltd., to hold land in excess of ceiling .limit in the following villages also for the expansion of the industry.
1. Me1arasur
2. Venkatachalapuram
3. Kovindakurichy (Kovandakkuricbi)
· 4. Kallakudy (KallakkudH
S. Palanganathan (Palinganatham)
6. Odhiyam
However, the above villages have not been merged with Kalla kkudi to make it a larger administrative unit. In fact only the residenti:.'.! solony and office of Dalmia Cement (Bharat) Ltj., are lo::ated in Kallakkudi while the Dalm:a factory is located in Palinganatham. Shri Natraj Ceramics and Chemical Industries is located entirely in Kallakkudi.
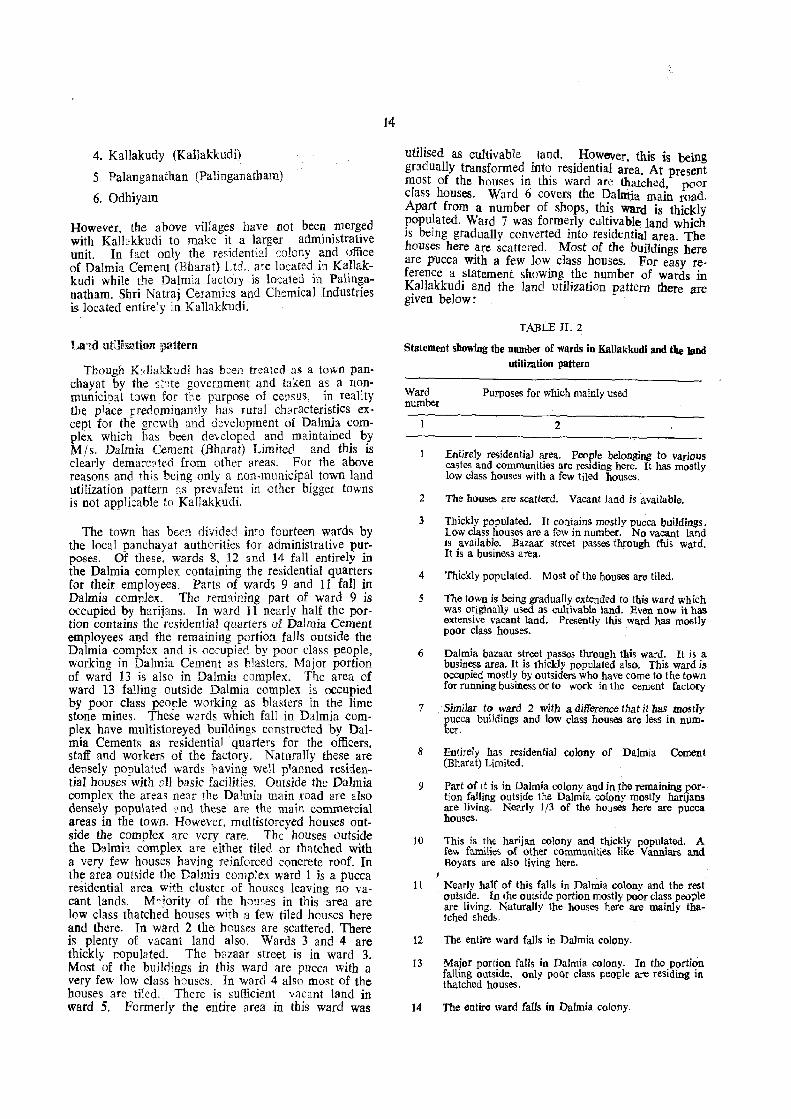
La'1d utmsation pattern
Though Klllakkudi has been treated as a town panchayat by the sc'tte government and taken as a llonmunicipal town for the purpose of censuS, in reality the place predominantly has rural characteristics except for the growth and development of Dalmia complex which has been developed and m:tintained by Mis. Dalmia Cement (Bharat) Limited and this is clearly demarc?ted from other areas. For the above reasons and th1s being only a non-municipal town land utilization pattern ;(s prevalent in other bigger towns is not applicable to Kallakkudi.
The town has bee;1 divided into fourteen wards by the local panchayat authorities for administrative purposes. Of these, wards 8, 12 and 14 fall entirely in the Dalmia complex containing the residential quarters for their employees. Parts of wards 9 and 11 fall in Dalmia complex. The rem:1ining part of ward 9 is occupied by harijans. In ward II nearly half the portion contains the residential quarters of Dalmia Cement employees and the remaining portion falls outside the Dalmia complex and is occupied by poor class people, working in Dalmia Cement as blasters. Major portion of ward 13 is also in Dalmia complex. The area of ward 13 falling outside Dalmia complex is occupied by poor class people working as blasters in the lime stone mines. These w2rds which fall in Dalmia complex have multi storeyed buildings constructed by Dalmia Cements as residential quarters for the officers, staff and workers of the factory. Naturally these are densely populated wards havin~ wen planned residential houses with oIl basic facilities. Outside the Dalmia complex the areas near the Da1mia main road are also densely populattOd pud these are the main commercial areas in the town. However, multistoreyed houses outside the complex llre very rare. The houses outside the Dalmia complex are either tiled or thatched with a very few houses having reinforced concrete roof. In the area outside the Dalmh complex ward 1 is a pucca residential area with cluster of houses leaving no vacant lands. M~jority of the houses in this area are low class thatched houses with a few tiled houses here and there. In ward 2 the houses are scattered. There is plenty of vacant land also. Wards 3 and 4 are thickly copulated. The b::lZaar street is in ward 3. Most of the buildings in this ward are pUCCI! with a very few low class houses. In ward 4 also most of the houses are tiled.. There is sufficient vacant land in ward 5. FormerIy the entire area in this ward was
14
utilised as cultivable land. However, this is being graduaUy transformed into residential area. At present most of the houses in this ward are tha.tched, poor class houses. Ward 6 covers the DalJIlja main rOlld. Apart from a number of shops, this ward is thickly populated. Ward 7 was formerly cultivable land which is being gradually converted into residtntial area. The houses here are scattered. Most of the buildings here are pucca with a few low class houses. For easy reference a statement showing the number ()f wards in Kallakkudi and the land utilization pattern there are given below: -
TABLE II. 2
Statement showing tbe number of wards in Kallakkudl and the )and utilization pattern
Ward number
Purposes for which mainly used
2
Entirely residential area. People belonging to various castes and communities are residing here. It has mostly low class houses with a few tiled houses.
2 The houses are scatterd. Vacant land is ·available.
3 Thickly populated. It contains mostly pucca buildings. Low class houses are a few in number. No vacant land IS available. Bazaar street passes through this ward. It is a business area.
4 Thickly populated. Most of the houses are tiled.
5 The town is being gradually extended to this ward which was originally used as cultivable land. Even now it has extensive vacant land. Presently this ward has mostly poor class houses.
6 Dalmia bazaar street pasSes through this ward. It is a business area. It is thickJy populated also. This ward is occupied mostly by outsiders who have come to the town for running business or to work in the cement factory
7 Similar to ward 2 witb II differ811ce that it has mostly pucca buildings and low class houses are less in number.
S Entirely has residential colony of Dalmia Cement (Bharat) Limited.
9 Part of It is in Dalmia colony and in ~he remaining por-· fion falling outside the Dalmia colony mostly harijans are living. Nearly 1/3 of the houses here are pucca houses.
10 This is the harijan colony and thickly populated. A few familie, of other communities like Vanniars and Boyats are also liVIng here.
11 Nearly half ()f this falls in Dalmia colony and the rest outSide. In the outside portion mostly poor class people are living. Naturally the houses here are mainly thatched shed~.
12 The entire ward falls in Dalmia colony.
13 Major portion falls in Dalrnia colony. In the portion falling outside, only poor class people are residing in thatched houses.
14 The entire ward (aUs in Dalmia colony.
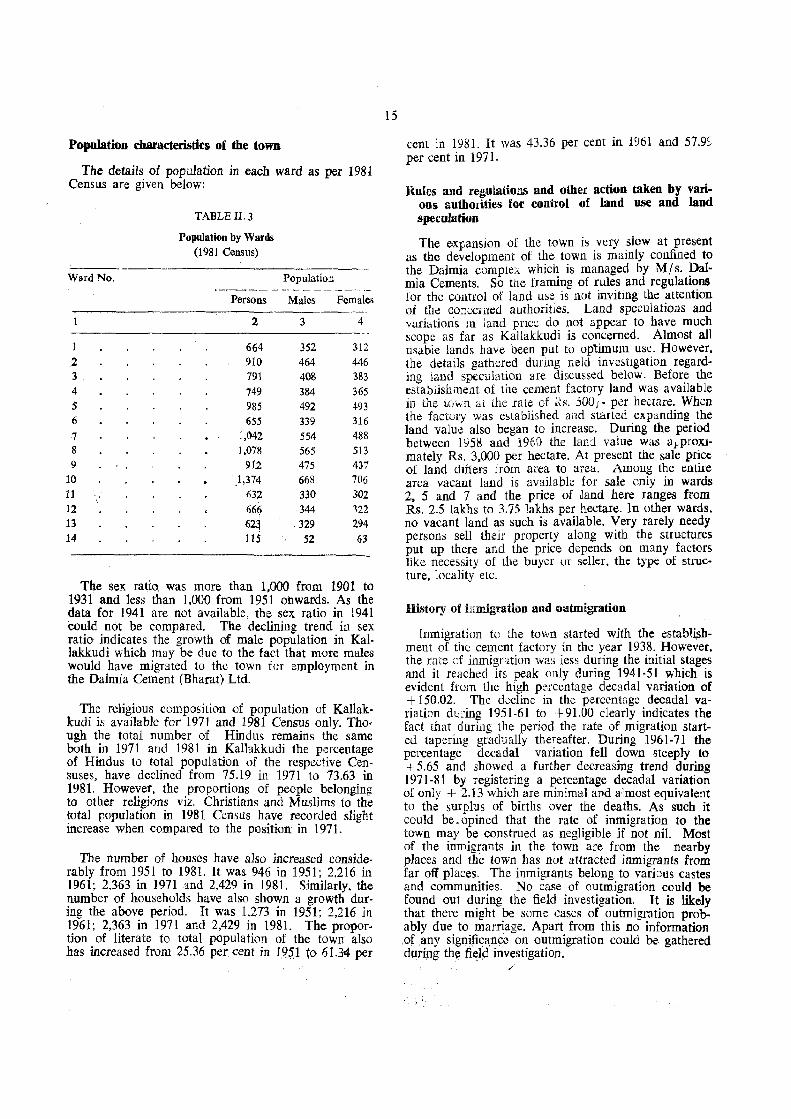
Population characteristics of the town
The details of population in each ward as per 1981 Census are given below:
TABLEII.3
Population by Wards (1981 Census)
---._._---------_-------Ward No. Population
Persons Males Females
2 3 4
1 664 352 312 2 910 464 446 3 791 408 31S3 4 749 384 365 5 985 492 493 6 655 339 316 7 1,042 554 488 8 1,078 565 513 9 91.2 475 437
10 },374 668 706 11 '. , 63'2 330 302 12 666 344 122 13 62~ 329 294 14 115 52 63
The sex ratio was more than 1.000 from 1901 to 1931 and less than 1,000 from 1951 onwards. As the data for 1941 are not available, the sex ratio in 1941 could not be compared. The declining trend in sex ratio indicates the growth of male population in Kallakkudi which may be due to the fact that more males would have migrated to the town for employment in the Dalmia Cement (Bharat) Ltd.
The religious composition of population of Kallakkudi is available for 1971 and 1981 Census only. Though the total number of Hindus remains the same both in 1971 and 1981 in Kal1akkudi the percentage of Hindus to total population of the respective Censuses, have declined from 75.19 in 1971 to 73.63 in 1981. However, the proportions of people belonging to other religions viz. Christians and Muslims to the total population in 1981 Census have recorded slight increase when compared to the position in 1971.
The number of houses have also increased considerably from 1951 to 1981. It was 946 in 1951; 2,216 in 1961; 2,363 in 1971 and 2,429 in 1981. Similarly, the number of households have also shown a growth during the above period. It was 1,273 in 195 I; 2,216 in 1961; 2,363 in 1971 and 2,429 in 1981. The proportion of literate to total population of the town also has increased from 25.36 percent in 19$1 to 61.34 per
15
cent in 1981. It was 43.36 per cent in 1961 and 57.9S per cent in 1971.
Rules and regulatio.ll6 and other action taken by various authorities for control of land use and land speculation
The expansion of the town is .very slow at present as the development of the town IS ma1ll1y confined to the Dalmia complex whic~ is managed by MJ s. palmia Cements. So the framIng of rules and regulatlOns for the ~ntrol of land u~e is not inviting t~e ~ttention of tile concerned authontles. Land speCulatlOlls and variations in land price do not appear to have much scope as far as Kallakkudi is co~cerned. Almost all usable lands have been put to opl:unum use. However, the details gathered dunng ueld investlgation regardinn land speculation are diE.Cussed below. Before the esfablishme,1t of the cement factory land was available in the town at the rate of ~{s. 5001- per hectare. When the factory was established aad started expanding the land value also began to increase. During the period between 1958 and 1960 the land value was ai-proximately Rs. 3,000 per hectare. At present the sale pr~ce of land dIffers from area to area. Among the enUre area vacant land is available for sale only in wards 2~ 5 and 7 and the price of Jand here ranges from Rs. 2.5 lakhs to 3.75 lakhs per hectare. In other wards, no vacant land as such is available. Very rarely needy persons sell thdr property along with the structures put up there and the price depends on many factors like necessity of the buyer ur seller, the type of structure, locality etc.
History of irumigration and oatmigration
lnmigration to the town started with the estab~~hment of the cement factory in the year 1938. However, the rate of inmigr:ltion was jess during the initial stages and it reached its peak only during 1941·51 which is evident from the high p:'.'rcentage decadal variation of + 150,02. The decline in thc percentage decadal variation during 1951-61 to +91.00 clearly indicates the fact that during the period the rate of migration started tapering gradually thereafter. During 1961-71 the percentage decadal variation fell down steeply to + 5.65 and showed a further decreasing trend during 1971-81 by registering a percentage decadal variation of only + 2.13 which are minimal aDd almost equivalent to the surplus of births over the deaths. As such it could be. opined that the rate of inmigra tion to the town may be construed as negligible if not nil. Most of the inmigrants in the town are from the nearby places and the town has not attracted inmigrants from far off places. The inmigrants belong to various castes and communities. No case of outmigration could be found out during the field investigation. It is likely that there might be some cases of outmigration probably due to marriage. Apart from this no information .of ,any signipqnce on outmigration could be gathered during th~ fi~19 investigation.
/'

CHAPTER III
AMENITIES AND, SERVICES-HISTORY OF GROWTH AND THE PRESENT POSITION
Kallakkudi. a tiny village with limestone deposits. caught the public eye and found a place in the industrial map of the country due to the establishment of Dalmia cement factory in the year 1938. Thanks to the efJ'orts of Shri Ramakrishna Dalmia, a daring and far-sighted pioneer in the field of industrialisation of India. Even though the establishment of the cement factory at Kallakkudi paved the way for ~tarting one or two ancillary projects, large number of aaministrative odices of the government or other agencies. connected either directly or indirectly with the labour or industry, were not started due to limited scope. However. in order to cater to the basic needs and to provide amenities to the people of the town, two post offices, a telephone exchange, an office oi the Junior Engineer, Tamil Nadu Electricity Board, one Emp~oyees' State Insurance Corporation office and two natIonalised banks' branches are functicning here, besides the Town Panchayat Board office which is a statutory body of local self government. Kallakkudi is neither the taluk nor the district headquarters and hence it has only a very limited number of gove~nment office~. The foLowing are the few offices located lD Kallakkudr.
fown Panchayat Board 0.1600
Kallakkudi village was constituted as a village panchayat on 4-3-1929. In the then existing panchayat syStem a far-reaching change was introduced by the Village Panchayats Act .X of 1950. Unde~ this act a . panchayat is compulsonly to be formed ill every VIllage witn a population of 5UO and above and w~ere the population is less than 500, more than one VIllage have to be clubbed to form a panchayat. Panchayats having a population of 5,000 and above and an annual income of Rs. 10,000 and above are to be classified as Class 1 Panchayats and others as Class II Panchayats. Apart from preside[lts and vice-presidents who are elected members executive officers are appointed in the panchayats by the government, where necessary, by notification. Aocording to the Village Panchayats Act X of 1950 it is obligatory upon ever)' panchayat to' provide within the limits of its funds, for the construction' and repair of roads, bridges, culverts, drain.s etc., for the lighting of public places, for the cleamng of streets for the removal of rubbish etc., for the construction of public latrines and the maintenance of burning ghats and burial grounds .for. the sinki.ng and repairing of wells or tanks for dr~illg, washmg and bathing purposes; and for the carrymg out of preventive and remedial measures connected with epidemics or malaria. A panchayat may also make provisions for the planting of avenues; for the opening of pub!ic markets and slaughter houses; for the control of faus and festivals, for the euension of village sites and regulation of buildings; for the improyement of agri~ulture and agriculture stock; for the promotion of
16
cottage industries; for the opening and maintenance of elementary schools, reading rooms and libraries; for the establishment of wireless receiving sets, playgrounds, sports clubs and centres of physical culture; for the running of dispensaries, maternity and childwelfare centres; for the rendering of veterinary aid and for the undertaking of any other measure of public utility. Every panchayat is required to levy house-tax, profession tax, vehicle tax and duty on certain transfers of property. It may also, with the permission of the Inspector of Municipal Councils and local boards, levy land cess at the rate of 3 pies in the rupee on the rent value of all occupied lands, a tax on agricultural land and fees on commercial crops brought and sold in the village. In addition to these sources of revenue, the panchayats receive pilgrim tax, toll and ferries and fishery rents, market fees and contribution from district boards for elell,lentary edu-cation. '
With the passing of the Tamil Nadu Panchayat Act, 1958 wher,ein all the class I panchaya'ts were deemed as town panchayats, Kallakkudi was made a town pancbayat and subsequently during the end of 1958, it was notified as per G.O. Ms. 1681, LA, dt. 18-11-58 as a panchayat for which a whole time Executive Officer should be appointed. At the end of 1970, the status of the town panchayat was upgraded as selection grade as per the proceedings of the Director of Rural Development, Madras on the basis of the annual income which was the criter.ion for upgradation of panchayats.
The panchayat office is located in the Dalmia main road. The jurisdiction of the panchayat covers the entire Kallakkudi town. The main functions of this office are the maintenance of public health and preventive measures, sanitary arrangements, w'ater supply, street lighting, collection of house tax, professional tax etc., issue of licences for shops and for construction of buildings, maintenance and construction of roads etc. The panchayat board now consists of the president elected by the local I)eople, 14 elected members, one representing each ward and 1 nominated member. The present administrative staff strength in the panchayat board office is as follows.
1. Executive Officer 1 2. . Sanitary Inppector 1 3. Clerks 3 4. Bill clerks 2 5. Pump mechanic 1 6. Electrician 1 1. Peon 1 8. Maistry 1 9. Sweepers 16
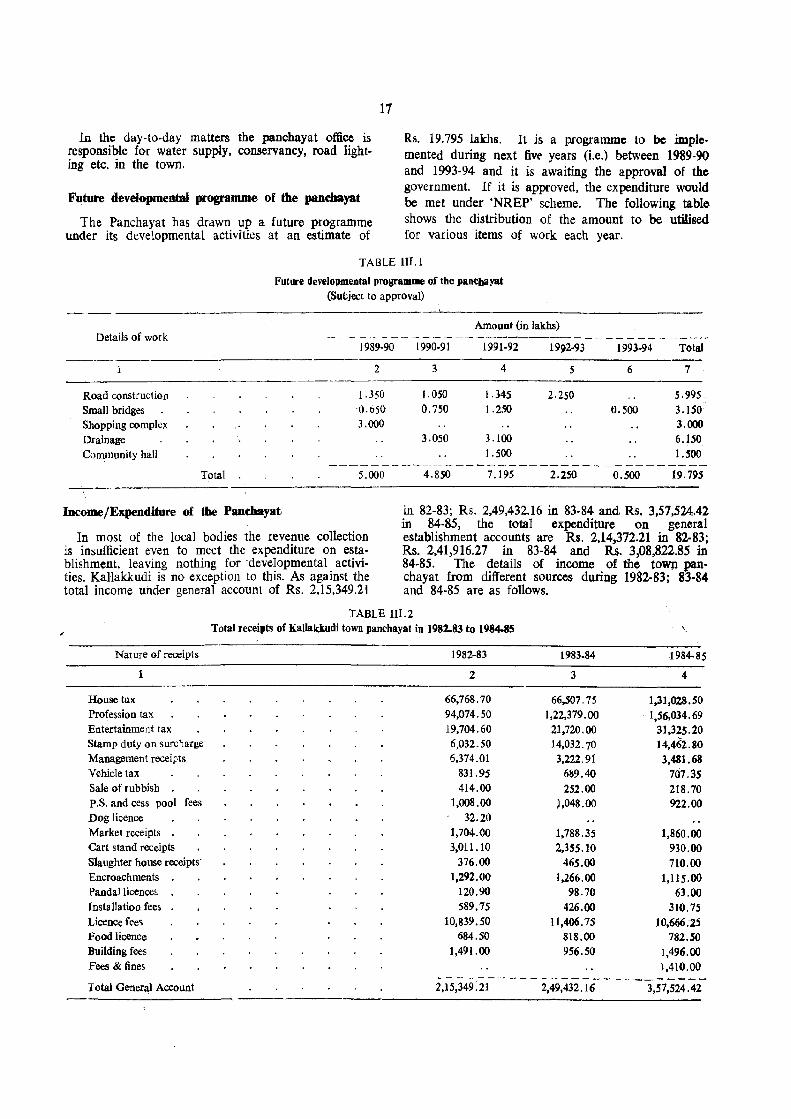
In the day-to-day matters the pancbayat office is responsible for water supply. conservancy, road lighting etc. in the town.
Future developmental programme of the panchayat
The Panchayat has drawn up a future programme under its developmental activities at an estimate of
17
Rs. 19.795 lakh!!. It is a programme to be implemented during next fiv~ years (i.e.) between 1989-90 and 1993-94 and it is awaiting the approval of the government. If it is approved. the expenditure would be met under 'NREP' scheme. The following table shows the distribution of the amount to be utilised for various items of work each year.
TABLE 1IJ.1
Future developmental programme of the pantbayat (Subject to approval)
-----------------------------------------------~----------------------------------
Details of work
--,_-, -----------~---------
Road construction Small bridges Shopping complex Drainage Community hall
Total
Amount (in lakhs) --~"- _.- - -_"----------_----- _- -_- -------
1989-90 1990-91 1991-92 1992-93 1993-94 Total
2 3 4 5 6 7
1.350 1.050 1.345 2.250 5.995 0.650 0.750 1.250 tJ.500 3.150 3.000 3.000
3.050 3.100 6.150 1.500 1.500
5.000 4.850 7.195 2.250 0.500 19.795 _____ .. ---------------------------------------------------------------------------Income /Expenditure of the PODthayat
In most of the local bodies the revenue collection is insufficient even to meet the expenditure on establishment, leaving nothing for 'developmental activi· ties_ Kallakkudi is no exception to this. As against the total income under general account of Rs. 2,15,349.21
in 82-83; Rs. 2,49,432.16 in 83·84 and Rs. 3,57,524,.42 in 84-85, the total expenditure on general establishment accounts are Rs. 2,14,372.21 in 82-83; Rs_ 2,41,916.27 in 83·84 and Rs. 3,08,822.85 in 84-85. The details of income of the town~· chayat from different sources during 1982·83; 83·84 and 84-85 are as follows.
TABLE III.2
Nature of receipts
1
House tax Profession tax Entertainment tax Stamp duty on surcharge Management receipts Vehicle tax Sale of rubbish . P.S. and cess pool fees Dog licence Market receipts . Cart stand receipts Slaughter house receipts' Encroachments Panda] licence~ Installatioa fees LiCi!nce ft."e<;
Food licence Building fees
Fees & fines
Total Gener~ Account
Total receipts of KaUakkudi town panchayat in 1982-83 to 1984-85
1982-83
2
66,768.70 94.074.50 19,704.60 6,032.50 6,374.01
831.95 414.00
1,008.00 32.20
1,704.00 3.011.10
376.00 ],292.00
120.90 589.75
10,839.50 684.50
1.491.00
1983-84
3
66,507.75 1,22.379.00
21,720.00 14,032.70 3,222.91
6ls9.40 252.00
),048.00
1.788.35 2,3S5.10
465.00 1.266.00
98.70
426.00 11.406.75
818_00 956.50
\
1984-85
4
1,31,028.50 1,56,034.69
31,325.20 14,462.80
3,481.68 707.35 218.70 922.00
1,860.00 930.00 710.00
1,115.00 63.00
310.75 10,666.25
782.50 1,496.00 J ,410.00
2.15.349:21- - - - - 2,i9;4j"2.16- - - --3 . .57;524A2
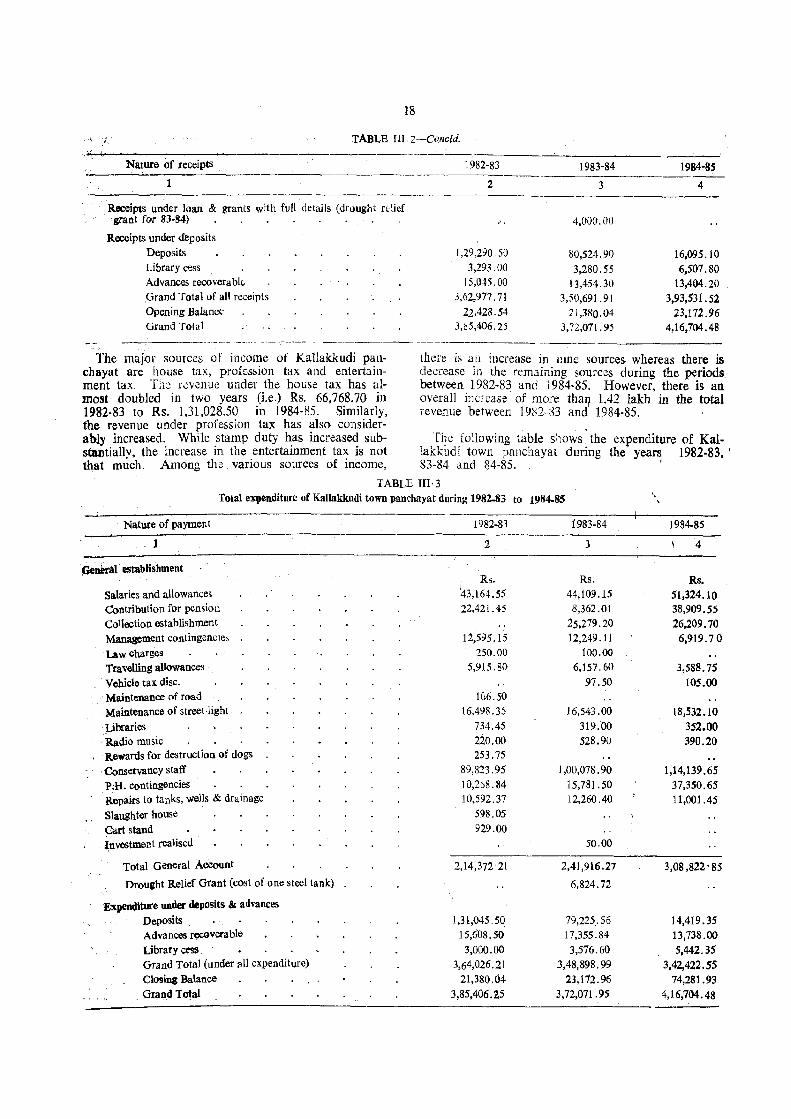
18
TABLE III. 2-Conc{d.
Nature of receipts
1
Receipts under loan & grants with full details (drought relief 'grant for 83-84)
Receipts under deposits Deposits Library cess Advances recoverablt. .Grand Total of all receipts Opening HamIll."· Grand Total
The major sources of income of Kallakkudi panchayat are house tax, profession tax and entertainment tax. The rcwnue under the house tax has almost doubled in two years (i.e.) Rs. 66,768.70 in 1982-83 to Rs. 1,31,028.50 in 1984-85. SimilarlY, the revenue under profession tax has also considerably increased. While stamp duty has increased substantially, the increase in the entertainment tax is not that much. Among the various sources of income,
1982-83
2
1,29,290.50 3,293.00
I S,OelS. 00 3;62,977.71
22,428.54 3,85,406.25
1983-84 1984-85 --------------------
3 4
4,000.00
80,524.90 3,280.55
13,454.30 3,50,691. 9 [
2i,380.04 3,72,071. 95
16,095.10 6,501.80
13,404.20 3,93,531. 52
23,172.96 4,16,704.48
----------there is an increase in lllne sources whereas there is decrease in the remaining sourcc.s during the periods between 1982-83 and ] 984-85: However, there is an overall increase of more thaI] 1.42 lakh in the total revenue between 1982-83 and 1984-85.
The following table shows the expenditure of Kallakkudi town panchayat during the years 1982-83, I
83-84 and 84-85. I
TABLE IIl-3 Total expenditure of Kallakkudi town pancltayat during 1982-83 to 1984-85
Nature of payment
1
~nen\l . establishment
Salaries and allowances Contribution for pension Collection establishment Management contingencies Law charges Travelling allowances Vehicle tax disc. Maintenance of road Maintenance of street light
Libraries .' Radio music . Rewards for destruction of dogs Conservancy staff P ;H. contingencies Repairs to tanks, wells & drainage
Slaughter house Cart stand investment realised
Total General Account
Drought Relief Grant (cost of one steel tank)
Expenditure under deposits & advances Deposits Advances recoverable Library ct"S1I Grand Total (under all expenditure) Closing Balance Grand Total
1982-83
2
Rs. 143,164.55 22,421.45
12,595.15 250.00
5,915.80
[(;6.50 16,498.35
734.45 220.00 253.75
89,823.95 10,2G8.84 10,592.37
598.05 929.00
2,14,372' 21
1,31,045.50 15,608.50
3,000.00 3,64,026.21
21,380.04 3,85,406.25
1983-84
3
Rs. 44,109.15 8,362.01
25,279.20 12,249.11
100.00 6,157.60
97.50
16,543.00 319.00 528.90
J ,00,078.90 15,781.50 12,260.40
50.00
2,41,916.27
6,824.72
79,225 .. 56 17,355.84
3,576.60 3,48,898.99
23,172.96 3,72,071.95
..
1984-85
4
Rs. 51,324.10 38,909.55 26,209.70
6,919.70
3,588.75 105.00
18,532.10 352.00 390.20
1,14,139.65 37,350.65 11,001.45
3,08,822' 85
14,419.35 13,738.00 5,442.35
3,42,422.55 74,281.93
4,16,704.48
More than half of the total expenditure goes towards the salary of the staff and conservancy staff in all the three years. It was Rs. 1,32,988.50 out of total expenditure of Rs. 2,14,372.2l in 1982-83. In 1983-84, the expenditure under. this head had gone up to Rs. 1,44,188.05 and a sum of Rs. 1,65,463.75 was paid under this head during 1984-85. Contribution for pension also consumes a sizable portion of the income. A sum of Rs. 22,421.45 was contributed in 1982-83 while the contribution for pension in 1983-84 was Rs. 8,362.01 only. In 1984-85, it has gone up steeply to Rs. 38,909.55. The steep increase is due to the payment of contribution for the period 1983-84 also in 1984-85. The maintenance of street lights also takes a considerable portion of income, besides 'the repairing of. tanks, wells and drains. lIt can be observed from the table that nothing has been spent for developmental activities such as laying df new roads etc. .
Provision of amenities
Water supply
The entire town outside the Dalmia compound is provided with protected water supply by the town panchayat board. The requirement of water supply inside the Da~mia c.ompound, both for the i factory and to the reslden'ts In the officers and staff guarters. is met by the Dalmia company itself. T~e man:; sources of water to the town are one grourld level reservoir, one bore well, one tank (Urani) and three wells. There are five pumping stations in the town one with 10 H.P_, two with 5 H.P., another one with 3 H.P. and another with 7.,5 H.P. capacity. Daily, nearly 35,000 gallons of water is supplied at the rate of around 14 1trs. per head. Water is chlorinated first and then pumped into three overhead tanks each having a storage capacity of 11,200 gallons. The water supply is regulated for two hours between 6 AM and 8 AM through 155 public taps, provided at different places. There are 12 hand pumps also at different places. There is no house connection. The total length of pipes laid in the town is 4.7 km. and no water tax is being collected at present. Within the Dalmia compound, the supply is managed by the coml?any itse~f .. Water is .being brought here from ~olhdam, a dlstnbutary of rIver Cauvery, through pipe hne. The company diverts the excess water over their requirement to quench the thirst of the inhabitants of the town. Sums of Rs. 12,260 and Rs. 11,000 were spent to repair the tanks, we]Js etc. durin&! 1983-84 and 1984-85 respectively. With the help of the World Bank, a project for supply of water to KalIakkudi and adiacent panchayats like Pullambadi at a cost of Rs. 123.43 lakhs has been drawn and the work has ~lready been commenced. The total cost of the "rolect for Kallakkudi alone is Rs. 62.85 lakhs of which 75 per cent (Rs. 47.14 lakhs) will be treated as government aid and 25 per cent (Rs. 15.71 lakhs) as loan to be repaid by the panchayat.
Under this scheme. 4 bore weJJs wiJ1 be sunk in the Kollidam river-bed and the water-collected will be stored in a sump with a capacity of one lakh litres. The water from the sump will be pumped through
19
pipes of diameter 125 mm to 500 mm using electrical motors of 70 H.P. to the overhead tank with a capacity of five 1akh litres in Kallakkudi. Then supply of water will be made to the public through public taps at 13 different places and the length of the pipes will be 8,735 metres. The entire project is expected to be completed by the end of 1989. A schematic diagram of Kallakkudi-Pullambadi water supply sub pro;cct as published by the Tamil Nadu water Supply a'1d Drainage Board is given.
Conservancy
The conservancy work of the town outside the Dalmia compound is the responsibility of the town panchayat. There are 16 sweepers (10 males and 6 females) in the panchayat's payroll besides a maistry to supervise the work. The sanitation of the town is looked after by the sanitary inspector. There are at present 22 private and 3 public dry latrines in the town against 12 private and 3 public dry latrines in 1985. Most of the houses in the town outside the Dalmia compound do not have any type of latrine. Onen spaces abound in the town and people use these open spaces to ease themselves. There is one handcart available with the town panchayat to transport the night-soil for disposal. But within the Dalmia compound all the quartets are provided with water borne latrines. Inside the Dalmia. factory. there are 18 (57 seats) water borne latrines and 35 water borne urinals for the use of the workers. In Shri Nataraj Ceramic and Chemical Industries, there are 11 (26 seats) water borne latrines and 8 water borne urinals for the workers. The sewage is flushed to a place 1 km. away from the main residential area of the town by gravitational method. There is open drainage in the town and its length is 7.5 kID. However, the open drainage is not capable of draining rain waters. Bl .• t the undulated terrain of the town facilitates the rain water to have natural drain. During 1983-84 and 1984-85 sums of Rs. 1,00.080 and Rs. 1,14,140 had been spent on conservancy. The amount bas gone up to Rs. 1.87.990 during 1981-88.
Electricity
The office of the Junior Engineer, Tamil Nadu Electricity Board is responsible for the supply of electricity to the town and the Dalmia Cement (Bharat) Limited. The town is electrified since the early thirties. In the early stages, supply of electricity was the responsibility of the then South Madras Electric Supply Corporation. The capacity of the transformers was 313KVA in 1984-85 and it is 613 KVA at present For supply of electricity to Dalmia Cements (Bharat) Ltd. and the allied industries three transformers with capacities of 20 MY A; 110 KV and 22 KV are maintained. All the trans.formers are owned by the company itself. Though the entire town area is served. the coverage in terms of people is 80 per cent, while in terms of buildings it is 70 per cent. There were 451 connections for domestic lightings in 1984-85 whereas it is 538 at present. The industrial services have also increased from 29 in 84-85 to 31 now. The number of connections for road lighting remains
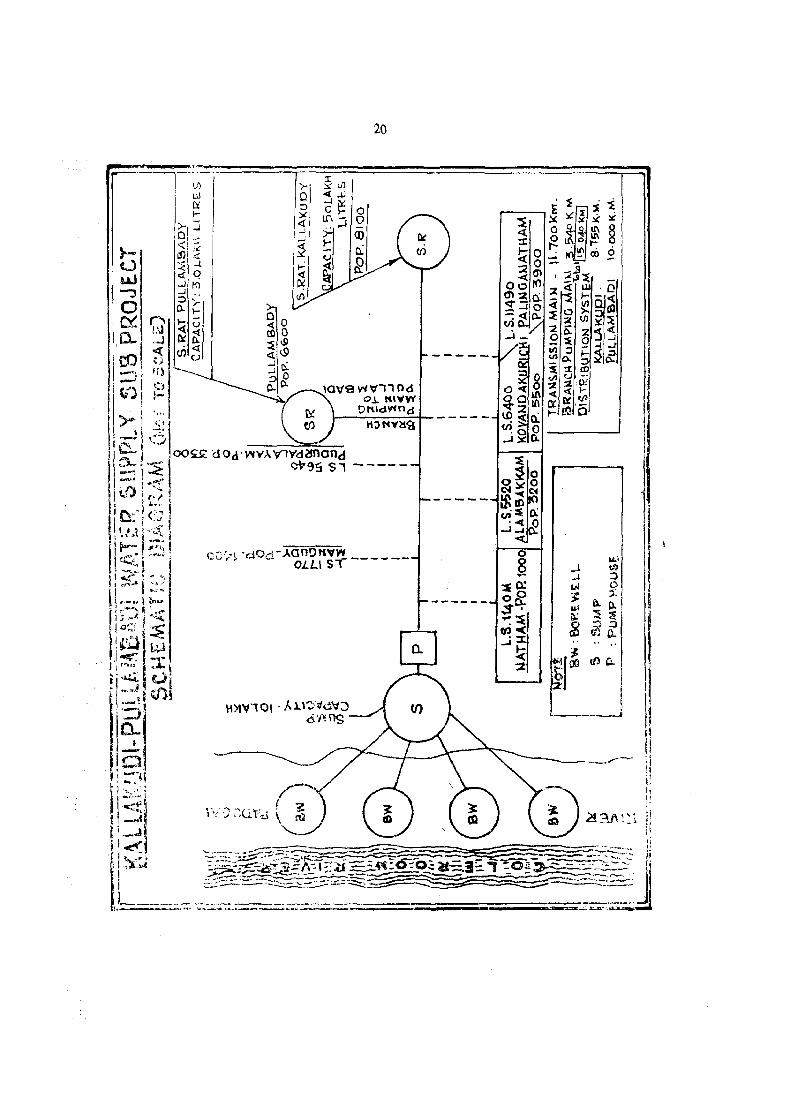
20
I II
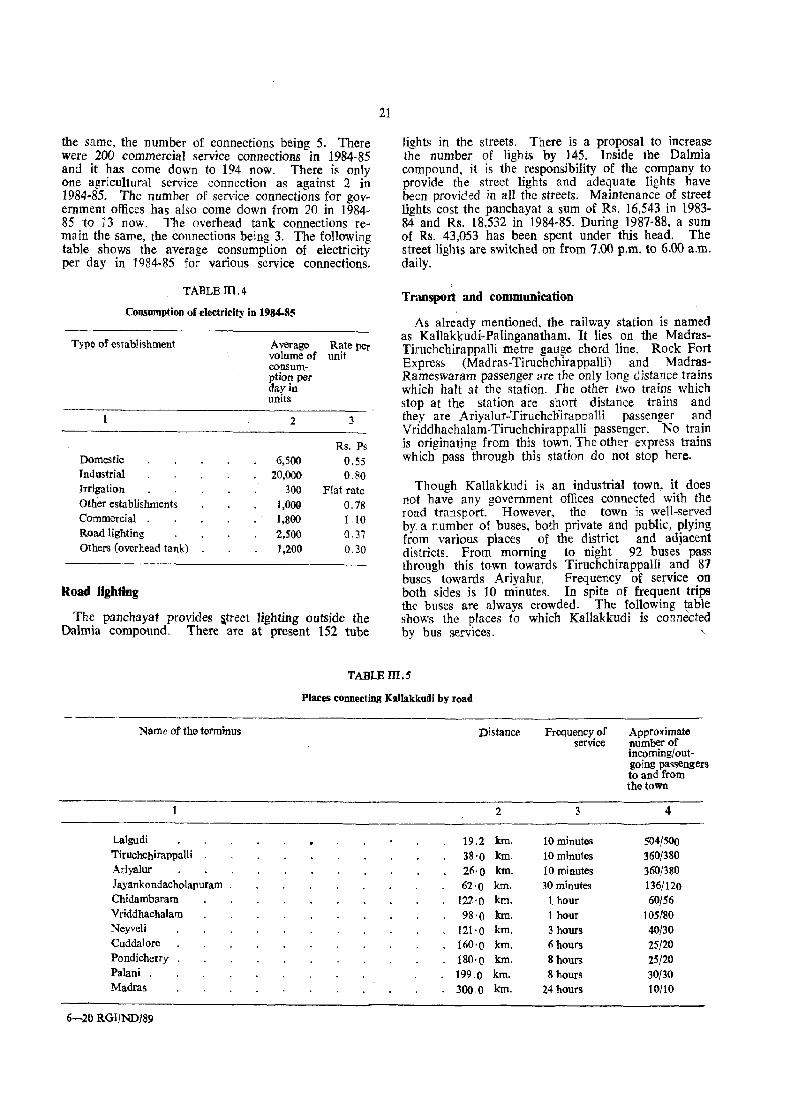
the same, the number of connections being 5. There were 200 commercial service connections in 1984-85 and it has come down to 194 now. There is only one agricultural service connection as against 2 in 1984-85. The number of service connections for government offices has also come down from 20 in 1984-85 to 13 now. The overhead tank connections remain the same. the connections being 3. The follOWing table shows the average consumption of electricity per day in ] 984-85 for various service connections.
TABLE 1II.4
Consumption of electricity in 1984-8~
Type of establishment
Domestic Industrial Irrigation
Oth~r establishments Commercial . Road lighting Others (overhead tank)
Road lighting
Average volume of consum-ption per day in units
2
6,500 20,000
300 1,000 1,800 2,5'00 1,200
Rate per unit
3
Rs. Ps
0.55 0.80
Flat rate 0.78 1.10 0.37 0.30
The panchayat provides ~treet lighting outside the Dalmia compound. There are at present 152 tube
21
lights in the streets. There is a proposal to increase the number of lights by 145. Inside the Dalmia compound, it is the responsibility of the company to provide the street lights and adequate lights have been provided in all the streets. Maintenance of street lights cost the panchayat a sum of Rs. 16,543 in 1983-84 and Rs. 18,532 in 1984·85. During 1987-88, a sum of Rs. 43,053 has been spent under this head. The street lights are switched on from 7.00 p.m. to 6.00 a.m. daily.
Transport and communication
As already mentioned, the railway station is named as Kallakkudi-Palinganatham. It lies on the MadrasTiruchchirappal1i metre gauge chord line. Rock Fort Express (Madras-Tiruchchirappalli) and MadrasRameswaram passenger Me the only long distance trains which halt at the station. The other tWO trains w'hich stop at the station are short distance trains and they are Ariyalur-Tiruchcnirappalli passenger and Vriddhachalam-Tiruchchirappalli passenger. No train is originating from this town. The other e"Xpress trains which pass through this station do not stop here.
Though Kallakkudi is an industrial town, it does not have any government offices connected with the road transport. However, the town is well-served by. a number of buses, both private and public, plying from various places of the district and aujacent districts. From morning to night 92 buses pass through this town towards Tiruchchirappalli and 81 buses towards Ariyalur. Frequency of service on both sides is 10 minutes. In spite of frequent trips the buses are always crowded. The following table shows the places to which Kallakkudi is connected by bus services.
TABLEm.5
Places connecting Kallakkudi by road
Name of the terminus Distanre
2
Lalgudi 19.2 kIn. Tiruchchirappalli 38'0 km. Ariyalur 26'0 kIn. J ayankondacholapuram 62'0 km. Chidambaram 122'0 km. Vriddhachalam 98 '0 km. Neyveli 121'0 km. Cuddalore 160'0 km. PGndicherry 180'0 km. Palani 199.0 km. Madras 300.0 km.
6-20 RGI1NDJ89
Frequency of Approximate service number of
incoming/outgoing passengers to and rrGm
3
10 minutes 10 minutes 10 minutes 30 minutes
1 hour 1 hour 3 hours 6 hours
8 hours 8 hours
24 hours
the tGWD
4
504/500 360/380 360/380 136/120 60/56
105/80 40/30 25/20 25/20 30/30 10/10
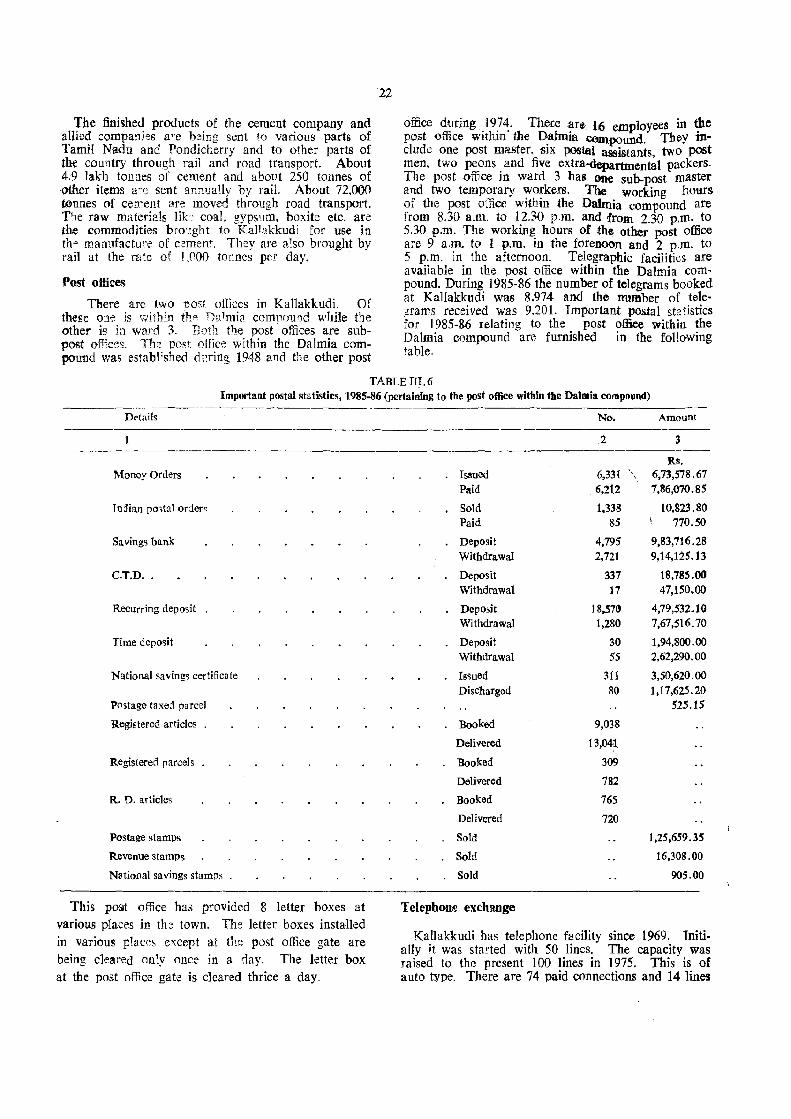
The finished products of the cement company and allied compani~s a"e b~bg sent to various parts of Tamil Nadu and Pondicherry and to other parts of the country through rail and road transport. About 4.9 lakh tOl1nes of cement and about 250 tonnes of other items are sent annually by raiL About 72,000 tonnes of cement are moved through road transport. The raw materials lik:- coal, gyps '1m, boxite etc. arc the commodities b"o',ght to KaHakkudi for use in tho manufacture of cement. They are a1so brought by rail at the rate o{ 1 JlOO tonnes per day.
Post offices
There are two post offices in Kallakkudi. Of these one is within th~ Da1mia comDou'1d while the other is in ward 3. Both the post offices are subpost offices. Th~ post office within the Dalmia compOlmd was estabhhed during 1948 and the other post
22
office during 1974.. There are 16 employees in the post office within' the D.almia compound. They include one post master. SIX postal assistants, two post men, two peons and five extra-departmental packers. The post office in ward 3 has one sub-post master and two temporary ,:,,?~kers. The working hours of the post office wttOtn the Datmia compound are from 8.30 a.m. to 12.30 p.m. and from 2.30 p.m. to 5.30 p.m. The working hours of the other post office are 9 a.m. to I p.m. in the forenoon and 2 p.m. to 5 p.m. in the afternoon. Telegraphic facilities are available in the post office within the Dalmia compound. During 1985-86 the number of telegrams booked at Kallakkudi was 8,974 and the number of telegrams received was 9,20l. Important postal statistics for 1985-&6 relating to the post office within the Dalmia compound are furnished in the following table.
TABLE TIl. 6 Important postal statistics, 1985-86 (pertaining to the post office within the Dalmia compound)
Dt"tails
Money Orders
rn1ian po-;tal orders
Saving<; bank
C.T.D ..
Recurring deposit
Time deposit
National saving, certificate
Postage taxej parcel
Registered articles
Registered parcels
R. 1). articles
Postage stamps
Revenue stamps
N8tioflal savings stamps .
This po~ office has provided 8 letter boxes at various places in the town. The letter boxes installed in various places ey.cept at the post office gate are being cleared only once in a nay. The letter box at the post office gate is cleared thrice a day.
No. Amount
2 3
Rs. Issued 6,331 6,73,578.67
Paid 6,2t2 7,86,670.85
Sold 1,338 [0,823.80
Paid 85 770.50
Deposit 4,795 9,83,716.28
Withdrawal 2,721 9,14,125.13
Deposit 337 18,785.00 Withdrawal 11 47,150.00
Depo,it 18,51(t 4,19,532.10
Withdrawal 1,280 1,67,516.70
Deposit 30 1,94,800 . 00
Withdrawal 55 2,62,290.00
Issued 311 3,50,620.00
Discharged 80 1,17,625.20 525.15
Booked 9,038
Delivered 13,041
Booked 309
Delivered 782
Booked 765
Delivered 720
Sold 1,25,659.3S
Sold 16,308.00
Sold 905.00
Telephone excha.nge
Kallakkudi has telephone facility since 1969. Initially it. was started with 50 lines. The capacity was raised to the present 100 lines in 1975. This is of auto type. There are 74 paid connections and 14 lines
are reserved for departmental purposes. The establisItmellt now consists of one telephone operator, one transmission assistant, one technician, two linemen and one mazdoor. The average annual re-¥enue is Rs. 3.6 lak:b3.
There is no fire fighting station in Kallakkudi. However, a fire fighting unit is located in Pullambadi which is at a distance of 3 km. from the town as well as in Ariyalur which is 25 km. away. Those two units serve the needs of the town in case of any call. Fortu:wtely no fire misllap in the recent past was reported in the town. All the factories in the town are wen equipped with their own fire fighting systems and equipments as per th~ specifkations.
Educational facilitieS! and: edutati&naI iMtitudoBs
There are five nursery schools. qne middle school, one welfare school, one higher secondary school. one labour welfare centre with If bahvadi'and two privately ron typewriting institutes to cater to the educational needs of the people of Kallak.k.udi·
Holy Cross Convent
It is in ward 5. It was started in 1976. It conducts mtrs-ery classes fur the children. There are 27 students in LKG class and 23 in UKG class at present. The medium of instruction is English. A technical school is also run by the convent to impart training in typewriting and tailot'ing for girls. There are five nuns to run the convent. It has 12 typewriters (3 Tamil and 9" English) and 7 sew:ng machines. At the time of the survey 23 students were undergoing training in typewriting and 15 in tailoring.
Dalmia Primary Sch(){)l
It was started in 1%9-70. It is located inside the Dalmia compound, by the gide of the Dalmia Higher SeCOfldary School. ClaS5e9 for standards 1 to 5 are condacted here. The medium of instruction is English. There are 228 students comprising of 142 boys and 86 girls at the time of the survey. Arrangements are under way to convert this iDto a matriculation school.
DMmi3' NtaScey Sdtool
The nursery sC'hool was started three years ago by the maRa'gement of the Dalmia cement company. 'There are 3 teachers with 90 children in this school. This school is al9{) accommodated inside the Oalmia compound. ., .: .
In addition to the above thr~ ~chools, there are two unrecognised 1It!rsery schools run. by private parfies. These are located outside the Dalmia CompOlnid in ward 1 and ward 2. The llllTSery school in ward 1 is named as Pyula Nursery School and the nur~y sehool in ward 2 is named as Sree Pliya Nursery S~hoo1.
23
St Xavier's Aided Middle SciIooI
This senool was started as an elementary school in 1919. fnis is run by St. Xavier's Church as an aided school H has been upgraded into middle school in 1906. It has now a strength of 840 pupils compriSing of 43') boys and 410 gins. There are 2' teacllers ot wijch 10 are males a.'1d the rest females. rhey inc.lude one B.T. grade assistant; one physical education teacher and one pre-vocational instructor. [he rest are seconduIY grade assistants. Mid-day meal is providc:d t6 41)0 children in the school. So far 9 students nave won the scholarsnip by passing the talented children examination, conducted by Govt. of I amil Nadu every year. The scho~arship amount per annum is Rs. 1,000/- for hostellers and Rs. 500/- for day-scholars upto hIgher secondary lewl. In sports also tile school has won credentials. They are the winners in foot ball and Khokho conducted at the educational district level. In atheletics they are the group champions at Pu;iambadi range leveL
Adi-dravida Welfse SdH)91
This school was started in June, 1937. The school is in ward iO. Initially, the school was known as labour school, probably because it was run by the labour department. Subsequently it was taken over by the Welfare department. There are 8 teachers comprising of 5 males and 3 females. There are 201 students studying in classes 1 to 5. Among them 96 are toys and 105 girls. Though the school is run by the welfare department for the welfare of students belonging to scheduled castes and scheduled tribes. admission is not restricted to them and children belonging to different religions and castes are studyiX,1g here. Note books, text books, slates etc. are given free of cost to all the students. Mid-day meal is" also provided to the students.
Dalmia Higher Secondary S~ooI
The school was started in 1950 with the avowed purpose of providing better educational facilities to the childl-.;;n of the emp:oyees in the Dalmia cement factory and to t~,e children in the nearby areas of the town w:tll 310 students and 13 teachers imparting education upto standard IX. The school has been making steady progress in the years that followed. It attained the status of high school in 1953-54. In 1978, the school was upgraded into a higher secondary school. The present strength of the school is 1,559 pupils consisting of 924 boys and 635 girls. The school has 59 te~chers on its roll as on date. The school provides edL1cat'on both through Tamil and English medium. It is reported that there is no higher secondary school in the nearby places imparting education in English medium and hence students from nearby viUag ~s and small towns like Ariyalur are availing the facilities offered by this school The school is governed by a team of managerial experts w,fro constitut~ the Dalmia Educational Society. It is a:ded by· the gowmment. It imparts education on general· ~tream and vocational stream in 10 + 2 classes. Instructions are imparted in the following group combimnTMs a"d subjects for XI and XII standards undtr
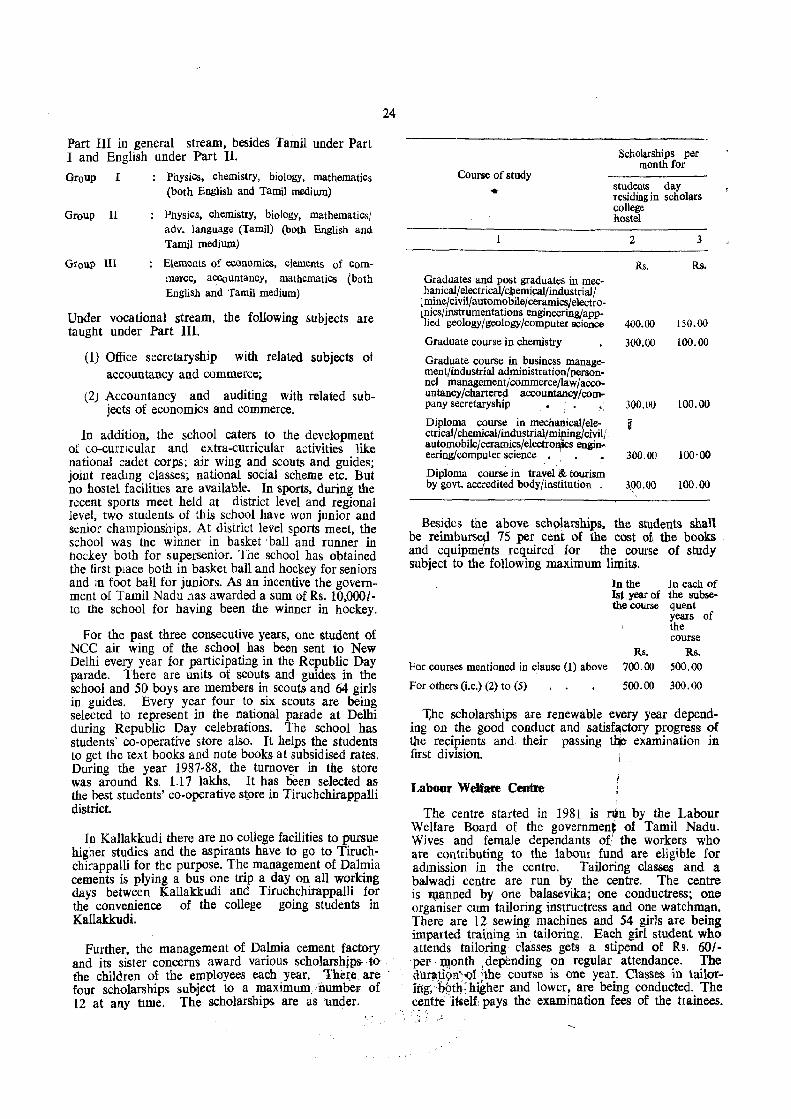
Part III in general stream, besides Tamil under Part I and English under Part II.
Group I
Group 11
Group III
Physics, chemistry, biology, mathematics (both English and Tamil medium)
Physics, chemistry, biology, mathematics/ adv. language (Tamil) (both English and Tamil medium)
Elements of economies, elements of comme:'rce, accountancy, mathematics (both English and Tamil medium)
Under vocational stream, the following subjects are taught under Part Ill.
(1) Office secretaryship with related subjects of accountancy and commerce;
(2) Accountancy and auditing with related subjects of economics and commerce.
In addition, the school caters to the development of co-cumeular and extra-curricular activities like national cadet corps; air wing and scouts and guides; joint readmg classes; national social scheme etc. But no hostel facilities are available" In sports, during the recent sports meet held at district level and regionai level, two students of this school have won junior and senior championships. At district level sports meet, the school was tne winner in basket· ball and runner in hockey both for 8upersenior. The school has obtained the first place both in basket ball and hockey for seniors and m foot ball for juniors. As an incentive the government of Tamil Nadu has awarded a sum of Rs. 10.000/to the school for having been the winner in hockey.
For the past three consecutive years, one student of NeC air wing of the school has been sent to New Delhi every year for participating in the Republic Day parade. There are units of scouts and guides in the school and 50 boys are members in scouts and 64 girls in guides. Every year four to six scouts are being selected to rep:tesent in the national parade at Delhi during Republic Day celebrations. The school has students' co-operative store also. It helps the students to get the text books and note books at subsidised rates. During the year 1987-88. the turnov~r in the store was around Rs. 1.17 lakhs. It has been selected as the best students' co-operative store in TiruchchirappaUi district.
In Kallakkudi there are no college facilities to pursue higher studies and the aspirants have to go to Tiruchchirappalli for the purpose. The management of Dalmia cements is plying a bus one trip a day on all working days between Kallakkudi and Tiruchchirappalli for the convenience of the college going students in Kallakkudi.
Further, the management of Dalmia cement factory and its sister concerns award various scholarshjps. ,to the children of the employees each year. TheJ:e. are four scholarships subject to a maximum number of 12 at any tIme. The scholarships are as under.
24
Course of study ..
Graduates and post graduates in meeh~icay~leetrjcaljcll:emical/industrial/ ~ mme/clVll/automoblle/ceramicsJelectro-lnics/instrumentations engineering/appljed geology/geology/computer science
Graduate course in chemistry
Graduate course in business ~nage-ment/industrial administration(person-nel management/commerce/law/acco-untancy/chartered accountancy/com-
Bcholarships per month for
students day residing in scholars college hostel
2
Rs.
400.00
300.00
3
Rs.
150.00
100.00
pany secretaryship '. 300.00 100. 00
Diploma course in mechatiical!ele- g ctrical/chemical/industrial/miping/civilj automobile/ceramics/electr0I¥cs engin. eering/computer science. . • 300.00 100'00
Diploma course in travel & tourism by govt. accredited body/institution 3.~.OO 100.00
Besides the above seh91arships. the students shall be reimbursed 75 per cent of the cost oi the books and equipme'nts required for the course of study subject to the following maximum limits.
In the 1st year of the course
Rs. For cour~es mentioned in clause (1) above 700.00
For others (Le.) (2) to (5) .500.00
In each of the subsequent years of the course
Rs. 500.00
300.00
1;he scholarships are renewable every year depending on the good conduct and satisf~ctory progress of the recipients and their passing tJie examination in first diVIsion.
LaboUl' Welfare Centre
The centre started in 1981 is run by the Labour Welfare Board of the governmen, of Tamil Nadu. Wives and female dependants of the workers who are contributing to the labour fund are eligible for admission in the centre. Tailoring classes and a balwadi eentre are run by the centre. The centre is lllanned by one balasevika; one conduetress~ one organiser cum tailoring instructress and one watchman. There are 12 sewing machines and 54 girls are being imparted trai,ning in tailoring. Each girl stu~ent who attends tailQring classes gets a stipend of Rs. 60/
'pel' . w,onth ,depending on regular attendance. The duraJiQn"'Of ,the course is one year. Classes in tailoring; ·b~Hh; h~her and lower, are being conducted. The c~nti'e itself pays the examination fees of the trainees.
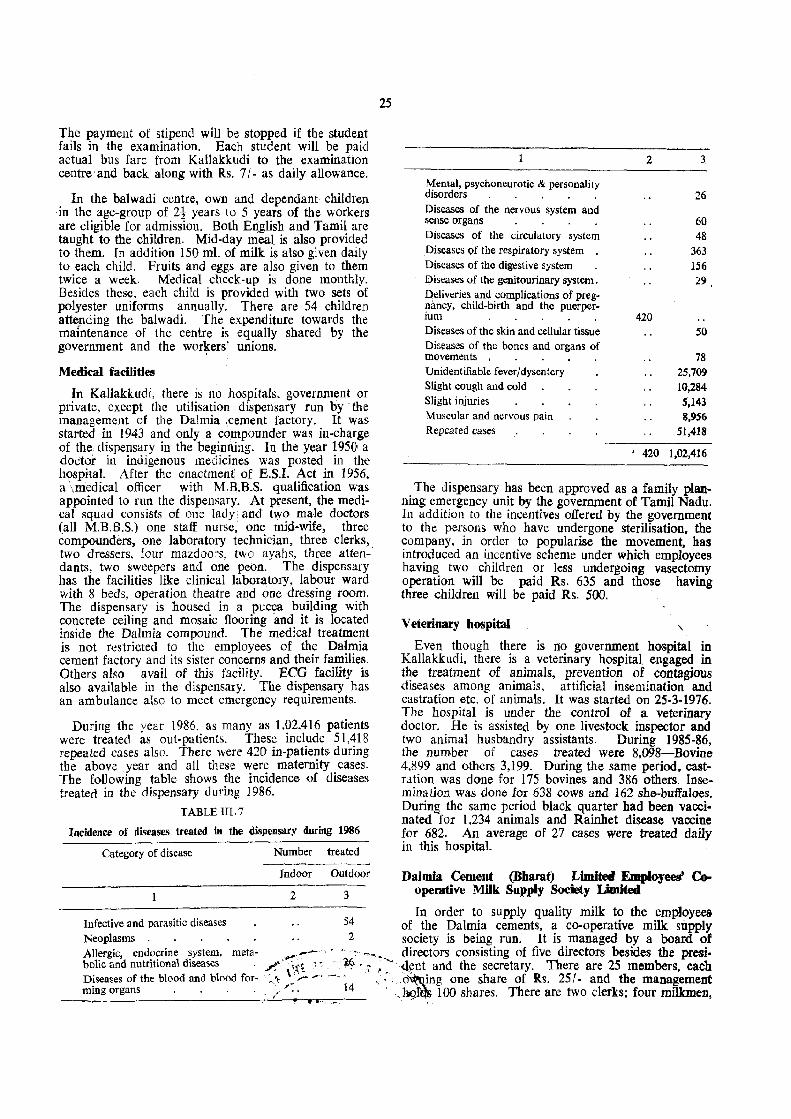
The payment of stipend will be stopped if the student fails in the examination. Each student will be paid actual bus fare from Kallakkudi to the examination centre and back along with Rs. 7/- as daily allowance.
In the balwadi centre, own and dependant children in the age-group of 21 years to 5 years of the workers are eligible for admission. Both En_glish and Tamil are taught to the children. Mid-day meal is also provided to them. In addition 150 ml. of milk is also given daily to each child. Fruits and eggs are also given to them twice a week. Medical check-up is done monthly. Besides these. each child is provided with two sets of polyester uniforms annually. There are 54 children attellding the balwadi. The expenrliture towards the maintenance of the centre is equally shared by the government and the wor~ers' unions.
MedkaJ. facllities
In Kallakkudi, there is no hospitals, government or private, except the utilisation dispensary run by· the management of the Dalmia ,.cement factory. It was started in 1943 and only a compounder was in-charge of the dispensary in the beginning. In the year 1950 a doctor in indigenous medicines was posted in the h<.>Spital. After the enactmen~ of E.S.I. Act in 1956, a \medical officer with M.B.B.S. qualification was appointed to run the dispensary, At present, the medical squad consists of on~ lady; and two male doctors (all M.B.B.S.) one staff nurse; one mid-wife, three compounders, one laboratory technician, three clerks, two dressers, four mazdoo:'s, two ayahs, three attendants, two sweepers and one peon. The dispensary has the facilities like clinical laboratory, labour ward with 8 beds, operation theatre and one dressing room. The dispensary is housed in a pucca building with concrete ceiling and mosaic flooring and it is located inside the Dalmia compound. The medical treatment is not restricted to the employees of the Dalmia cement factory and its sister concerns and their families. Others also avail of this facility. BeG facility is also available in the dispensary. The dispensary has an ambulance also to meet emergency requirements.
During the year 1986, as many as 1.02,416 patients were treated as out-patients. These include 51,418 repeated cases also. There were 420 in-patients during the above year and all these were maternity cases. The following table shows the incidence of diseases treated in the dispensary during 1986.
TABLE UI.7
Incidence of diseases treated in the dispensary during 1986
Category of disease
Infective and parasitic diseases Neoplasms .
Number treated
Indoor Outdoor
2 3
54 2
25
Allergic, endocrine system, meta- .. --: . - ~ •.• _ bolic and nutritional diseases . J' ''':".. .' - 1;6 " "
F,," \:"\t. ',. Diseases of the blood and blood fOT- _ 'I; '".- _. -" - • -ming organs . . . . , --: . 14
2 3
Mental, psychoneurotic & personality disorders . . . . . 26 Diseases of the nervous system and sense organs 60 Diseases of the circulatory system 48 Diseases of the r(',gpiratory system 363 Diseases of the digestive system 156 Ii)iseases of the genitourinary system. 29 Deliveries and complications of preg-!laney, child-birth and the puerper-Ium 420 Diseases of the skin and cellular tissue 50 Diseases of the bones and organs of movements 78 Unidentifiable fever/dysentery 25,709 Slight cough and cold 10,284 Slight injuries 5,143 Muscular and nervous pain 8,956 Repeated cases 51,418
• 420 1,02,416
The Jispensary has been approved as a family planning emergency unit by the government of Tamil Nadu. In addition to the incentives offered by the government to the persons who have undergone sterilisation, the company, in order to popularise the movement, has introduced an incentive scheme under which employees having two children or less undergoing vasectomy operation will be paid Rs. 635 and those having three children will be paid Rs. 500.
Veterinary hospital " Even though there is no government hospital in
Kallakkudi, there is a veterinary hospital engaged in the treatment of animals, prevention of contagious diseases among animals, artificial insemination and castration etc. of animals. It was started on 25-3-1976. The hospital is under the control of a veterinary doctor. He is assisted by one livestock inspector and two animal husbandry assistants. During 1985-86, the number of cases treated were 8,098-Bovine 4,899 and others 3,199. During the same period. castration was done for 175 bovines and 386 others. Iusemina tion was done for 638 cows and 162 she-bulfaloes. Durine: the same period black quarter had been vaccinated .... for 1,234 animals and Rainhet disease vaccine for 682. An average of 27 cases were treated daily in this hospital.
Dalmia Cement (Bharat) Limited Employees' C0-operative Milk Supply Society Limited
In order to supply quality milk to the employees of the Dalmia cements, a co-operative milk supply society is being run. It is managed by a board of directors consisting of five directors besides the presi-<lfnt and the secretary. There are 25 members, each o~ing one share of Rs. 251- and the management ,llQ~ 100 shares. There are two clerks; four milkmen,
two milk vendors, four grass cutters and 20 labourers employed f0r looking after the day-to-day work. At present the total yield is around 80 litres per day, But the dairy requirement for the supply to the regular customers is 250 ltrs. (F25 itFs. per session). Tr:e short· age is supplemented by purchasing milk from the nearby villages at a cost of Rs. 3.l(} per titre. The milk is sold at the rate of Rs. 3.20 per litre to card holders and at Rs. 4.30 per litre to others if there is surplus. The milk is delivered at the doors of the card holders and for th18 Re. 0.60 per litre is ckarged extra. A grass farm is also developed il.110
maintained within the Dadmia compound to get animal feed. There are 375 C0£Onut trees also in the farm. Two grass cnttJng machines are also instalJed in the farm.
26
Da:mia Cement (Bllarat) Limited Em,.,. ~ operative Store
To cater to the needs of the employees a ex>openttive sto~,~ is being run by the employees of Dalmia Cement (Bharat) Limited. It is located inside the Da]mia compound. It sells foodgrains, oils.~ provision, Ieeo. vegetables, fruits etc. to the employees at ;'easonable rales, There are 2,843 members and the sale pi'('2ceds per year in the store exceed Rs. 55 lakhs. [b.; store was converted into a mini-super market ill the year 1973 by the government of Tamil Nadu, as it was considered to be one of the bat managed stores.
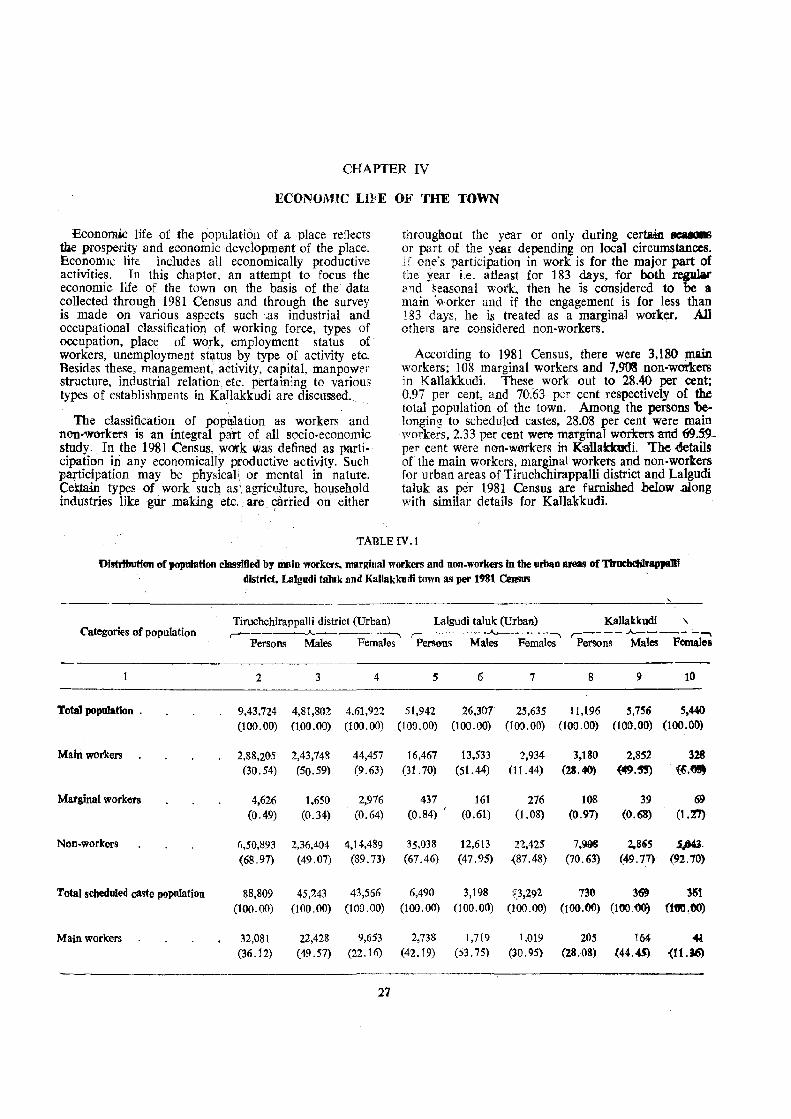
CHAPTER IV
ECONOMIC LIF'E OF THE TOWN
Economic life of the population of a place reflects the prosperity and economic development of the place. Econonu~ lite includes all economically productive activities. Tn this chapter, an attempt to focus the economic life of the town on the basis of the data collected through 1981 Census and through the survey is made on various aspects such '.as industrial and occupational classification of working force, types of occupation, place of work, employment status of workers, unemployment st~tus by type of activity etc. Besides these, management, activity, capital, manpower structure, industrial relation. etc. pertaining to various types of establishments in Kallakkudi are discussoo ..
The classification of pop;"lation as workers and non-workers is an integral patt of all socio-economic study., In the 1981 Census, work was defined as participation hi any economically productive activity. Such participation may be physical, or mental in nature. Ce~ types of work such as: agriculture, household industries like gur making etc.' are. carried on either
throughout the year or only during certain ~ or part of the year depending on local circumstances. I f one's participation in work is for the major part of the year i.e. atleast for 183 days, for both regular ct'1d seasonal work. then he is considered to be a main 'worker and if the engagement is for less than 183 days, he is treated as a marginal worker. All others are considered non-workers.
According to 1981 Census, there were 3.180 main workers; 108 marginal workers and 7,908 non-waders in Kallakkudi. These work out to 28.40 per cent; 0.97 per cent, and 70.63 per cent respectively of the total population of the town. Among the persons 'be. longing to scheduled castes, 28.08 per cent were main workers, 2.33 per cent were marginal workers '81ld 69.5:9-p~r cent were n()n-w.(!Jfkers in Kallatkudi. The -details of the main workers, marginal workers and non-workers for urban areas of Tiruchchirappalli district and Lalgudi taluk as per 1981 Census are flllllished below .along with similar details for Kallakkudi.
TABLEIV.1
Distribution of population classified by main workers, marginal workers and non_workers In the urbltn areas of TirochcliJrappaDi district, Lalgodi taluk and Kallakkuili town as per 1981 Census
Categories of population Tiruchchirappalli district (Urban) Lalgudi taIuk: (Urban) Kallakkudi" r-----~~-----, ~----~~--, ~----A_~-__ ~,
Persons Males Females Persons Males Females Persons Males Females
-----------------_._----------------------2 3 4 s 6 7 8 9 10
Total IJOpmaHon . 9,43,724 4,81,802 4,61,922 51,942 26,307 25,635 11,196 5,756 5,440
(100.00) (100.00) (100.00) (100.00) (100.00) (100.00) (100.00) (100.00) (100.00)
Mabi workers 2,88,205 2,43,748 44,457 16,467 13,533 2,934 3,180 2,852 328 (30.54) (50.59) (9.63) (31. 70) (51.44) (11.44) (28.40) (49.'5!) (fj;~
Marginal workers 4,626 1,650 2,916 437 161 276 108 39 69
(0.49) (0.34) (0.64) (0.84) (0.61) (1.08) (0.97) (0.6B) (1.T7)
Non-workers 0,50,893 2,36,404 4,14,489 35,038 12,613 22,425 7,998 2,.865 jJW. (68.97) (49.07) (89.73) (67.46) (47.95) (87.48) (70.63) (49.77) (92.70)
Total scbeduled caste population 88,809 45.~43 43,566 6,490 3,198 ~3,292 730 3~ 361 (100.00) (100.00) (l00.00) (100.00) (100.00) (100.00) (100.00) (tOO.~O) (1«1.00)
Main workers 32,081 22,428 9,653 2,738 1,719 1.019 205 164 4.1 (36.12) (<19.57) (22.16) (42.19) (53.75) (30.95) (28.{)8) (44.4SJ (11.36)
27
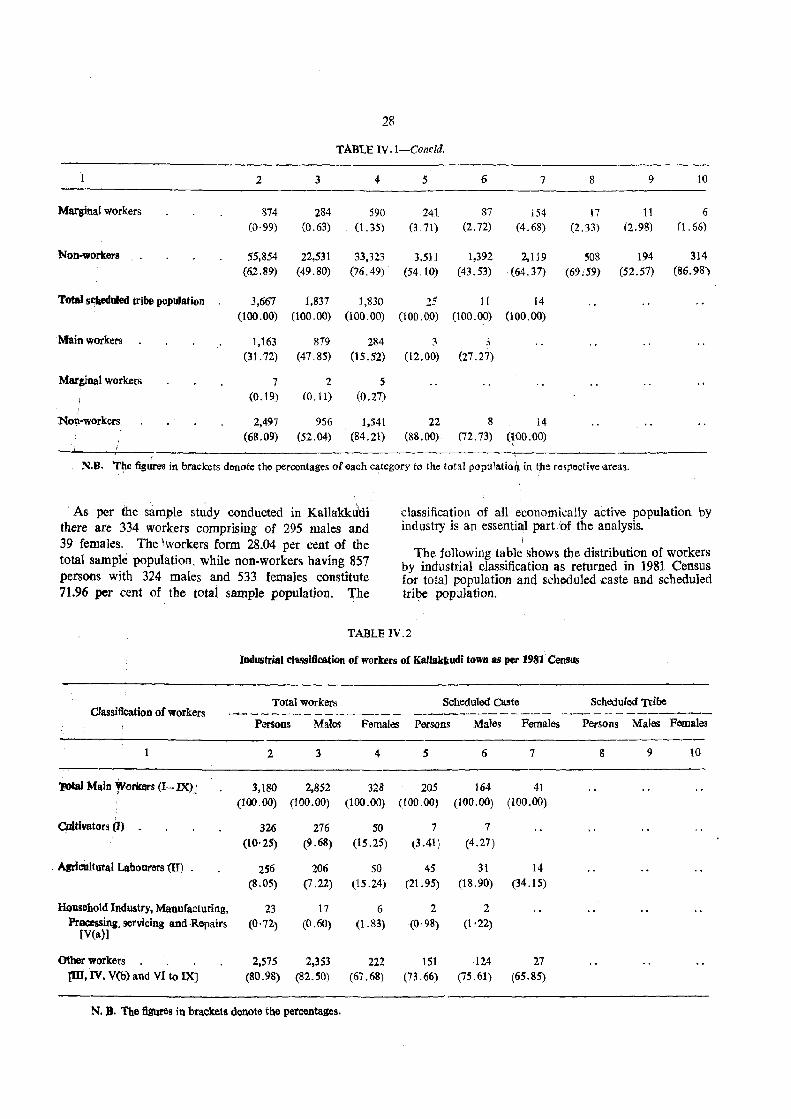
28
TABLE IV.I-Coneld.
2 3 4-
Marginal workers 874- 284 590 (0·99) (0.63) (1. 35)
Non-work.ers 55,854 22,531 33,323 (62.89) (49.80) (76.49)
Total sl'heduled tribe population 3,667 1,837 1,830 (100.00) (100.00) (100.00)
Main workers 1,163 879 284 (31. 72) (47.85) (IS . 52)
Marginal workers 7 2 5 (0.19) (0.11) (0.27)
No~-workers 2,497 956 1,541 (68.09) (52.04) (84.21)
. ,
S
241 (3.71)
3,511 (54. to)
25 (100.00)
3 (12.00)
22 (88.00).
6
87 (2.72)
1,392 (43.53)
II (100.00)
.)
(27,27)
7
i54 (4.68)
2,119 (64.31)
14
000.00)
8 14 (72.73) (100.00) ,
8 9 10
17 11 6 (2.33) (2.98) 0.66)
508 194 314
(69 :59) (52.57) (86.98)
, N.D. 'rhe figures in brackets denote the percentages of each c~tegory to the total pOllu1atioq. in (he relpective areas.
As per the s~mple study conducted in KaUafu'tij there are 334 workers comprising of 295 males and 39 females.' The 'workers form 28.04 per cent of the total sample population, while non-workers having 857 persons with 324 males and 533 females constitute 71.96 per cent of the total sample population. The
classification of all economically active population by industry is an essentiall part 'of the analysis.
I The following table shows the distribution of workers
by industrial classification as returned in 1981 Census for total population and scheduled caste and scheduled triJ?e population.
TABLE IV.2
Industrial Chsslfic:atIOll of workers of Kal1akkudf town as per 1981 Census
Total workers Scheduled caste Scheduled Tribe Classification of workers ~-------------- --~-------- ------------
Persons Males Females Persons Males Females Persons Males Females
2 3 4 S 6 7 g 9 10
TMaI Main Workers (1- IX) , ~ ."'
3,180 2,852 328 205 164 41
i (100,00) (100.00) (100.00) (100,00) (100.00) (100.00)
qJltlvators (l) 326 276 50 7 7
(10'25) (9.68) (15.25) (3.41 ) (4.27)
. Agricultural Labourers (If) 256 206 50 45 31 14
(8.05) (7.22) (15,24) (21.95) (18.90) (34,15)
Household Industry, Manufacturing, 23 17 6 2 2 Processing. servicing and .Repairs
[V(a)] (0,72) (0.60) (1. 83) (0' 98) (1 '22)
Other workers 2,575 2,353 222 151 .124 27 rID, IV. V(b) and VI to IX] (80.98) (82.501 (67.68) (73.66) (75.61) (65.85)
N. B. The figures in brackets denote the percentages.
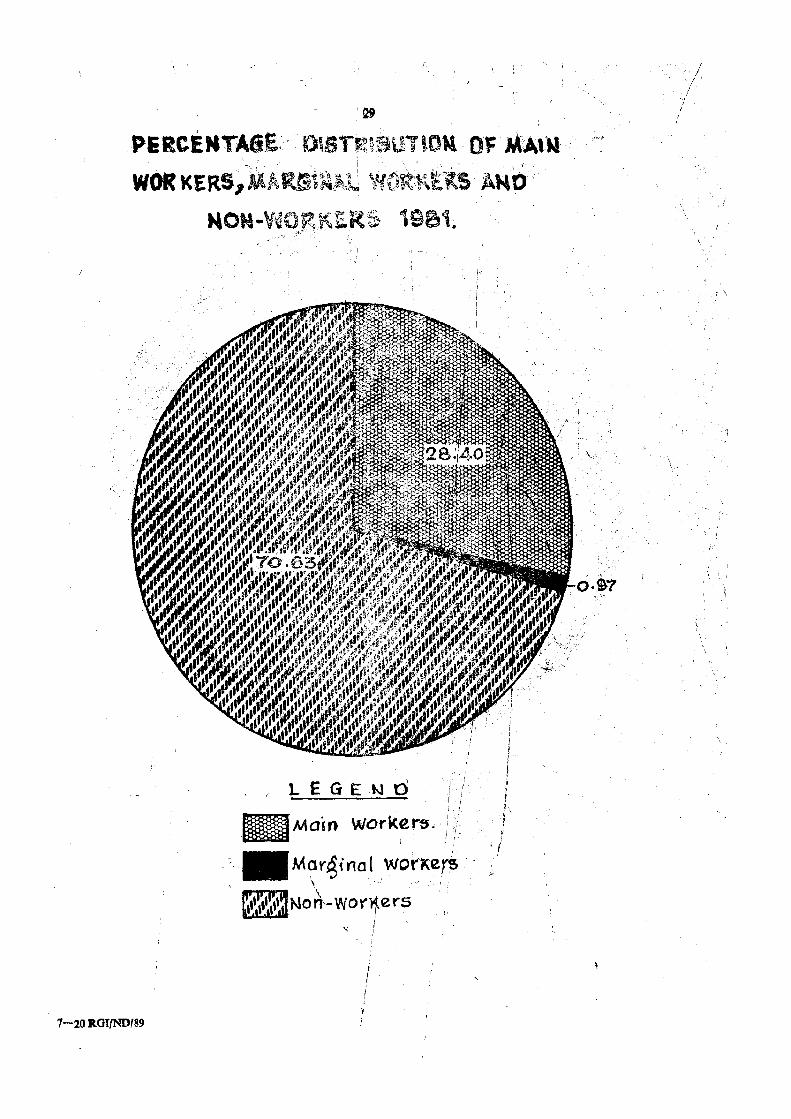
'ap ,
P&RCENTA6E,~ DtST~~SU1'OM Ot: M'Atl-l "" ' i ' , , i '\.
WOR KERS.,M/~f~l~~J~ ~~~u~l~t~S ANO
NON .. V~O~KER5 1get .~".
I "LEGENO i
;
/ mmm . W k I. ~MaUl or ertJ. 1,1:
, ,
Mar~irta I wOrKer~ , \ ":"
r II
, /
\ :
,",-',t' Nort'-wor'1-ers I
" l
I
7-20 IlOlfNDf89 r I
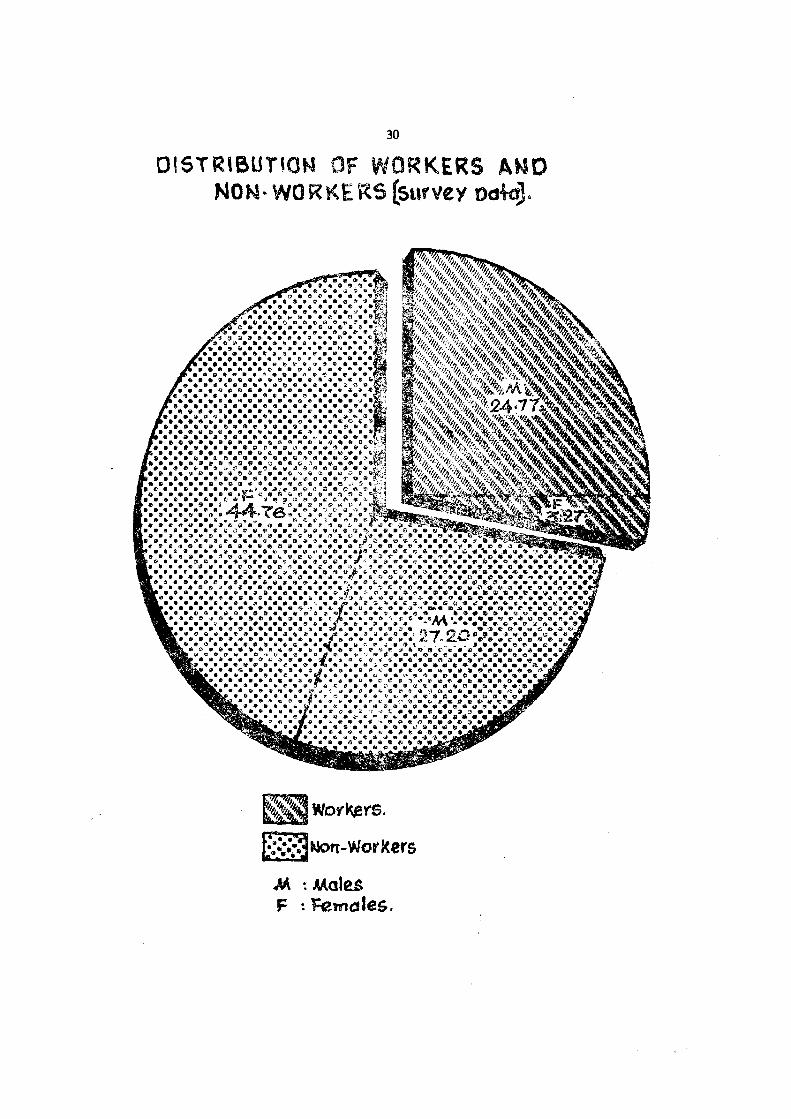
30
Of5TR\SUT'ON OF WORKERS ANO NON· WORt<E itS (survey DCS+aJ.
ijOn-Workers
Nt ~ Males F ! ):emoles.
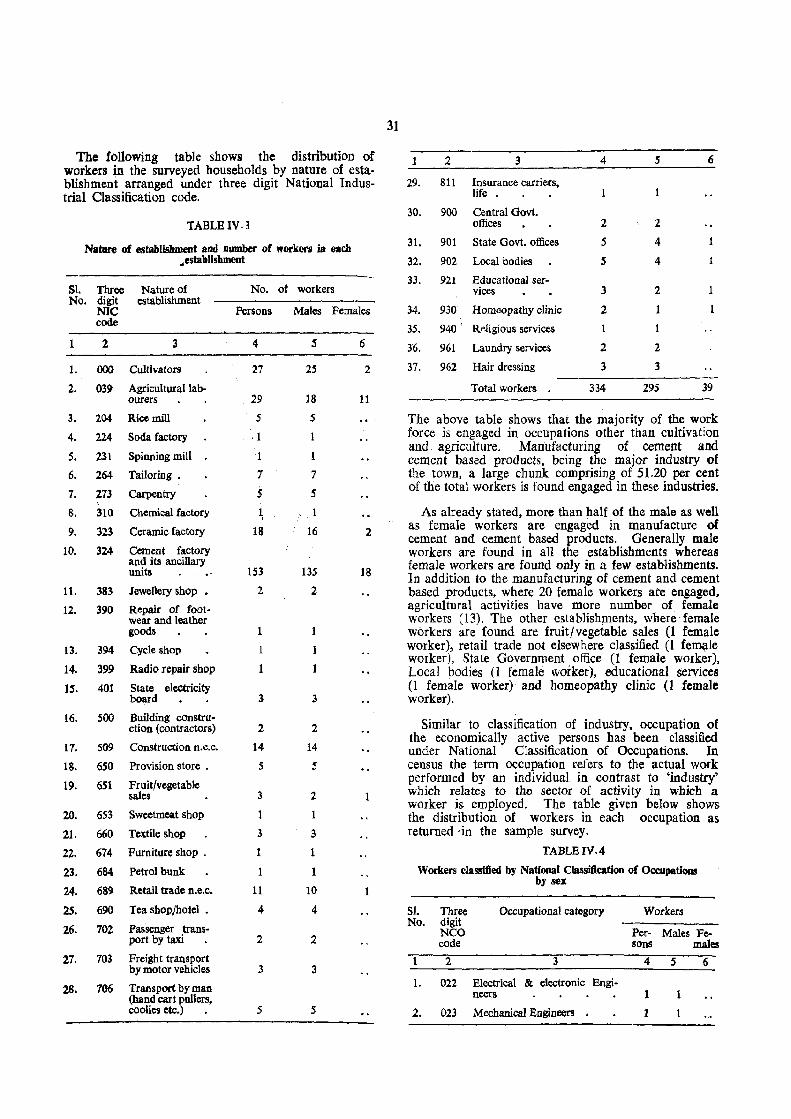
The following table shows the distribution of workers in the surveyed households by nature of establishment arranged under three digit National Industrial Classification code.
TABLEIV.3
Nature of establlshment and number of workers in each .. establishment
Nature of establishment
No. of workers SI. Three No. digit
NIe code
Persons Males Females
1 2
1. 000 Cultivators
2. 039 Agricultural lab-ourers
3. 204 Rice mill
4. 224 Soda factory
5. 231 Spinning mill
6. 264 Tailoring.
7. 273 ~entry
8.
9.
10.
11.
12.
13.
14.
IS.
16.
17.
18.
19.
20.
21.
22.
23.
24.
25.
26.
27.
310 Chemical factory
323 Ceramic factory
324 Cement factory and its ancillary units
383 Jewellery shop •
390 Repair of foot· wear and leather goods
394 Cycle shop
399 Radio repair shop
401 State electricity board
500 Building constru-ction (contractors)
S09 Construction n.e.c.
650 Provision store •
651 Fruit(vegetable sales
653 Sweetmut shop
660 Textile shop
674 Furniture shop.
684 Petrol bunk
689 Retail trade n.e.c.
690 Tea shop/hotel .
702 Passenger trans-port by taxi
703 Freight transport by motor vehicles
28. 706 Transport by man (hand cart pullers, coolies etc.)
4
27
, 29
5
,1
1
7
5
1 !
18
153
2
1
.3
2
14
5
3
3
1
11
4
2
3
5
25
18
S
1
1
7
S
16
13S
2
1
.3
2
14
S
2
1
3
1
1
10
4
2
3
5
6
2
11
2
18
1
31
2 3
29. 811 Insurance carriers, life .
30. 900 Central Govt. offices
31. 901 State Govt. offices
32. 902 Local bodies
33.
34.
35.
36.
921 Educational services
930 Homeopathy clinic
940' Rf'.ligious services
961 Laundry services
37. 962 Hair dressing
Total workers
4
2
5
5
3
2
1
2
3
334
5
1
2
4
4
2
1
2
3
295
6
39
The above table shows that the majority of the work force is engaged in occupations other than cultivation and agriculture. Manufacturing of cement and cement based products. being the major industry of the town, a large chunk comprising of 51.20 per cent of the total workers is found engaged in these industries.
As already stated, more than half of the male as well as female workers are engaged in manufacture of cement and cement based products. Generally male workers are found in all the establishments whereas female workers are found only in a few establishments. In addition to the manufacturing of cement and cement based products, where 20 female workers ate engaged, agricultural activities have more number of female workers (13). The other establish~ents, where female workers are found are fruit/vegetable sales (1 female worker), retail trade not elsewhere classified (1 fe11l{lle worker), State Government office (1 female worker). Local bodies (1 female worker), educational services (1 female worker} and homeopathy clinic (1 female worker).
Similar to classification of industry, occupation of the economically active persons has been classified under National Classification of Occupations. In census the term occupatIon refers to the actual work performed by an individual in contrast to 'industry' which relates to the sector of activity in which a worker is employed. The table given below shows the distribution of workers in each occupation as returned ,in the sample survey.
TABLEIV.4
Workers classified by National Classification of Occupations by sex
51. Three No. digit
NCO code
2
Occupational category
3
1. 022 Electrical & electronic Engi-neers
2. 023 Mechanical Engineers •
Workers
Per- Males Fe-sons males
4 5 6
1
1
1
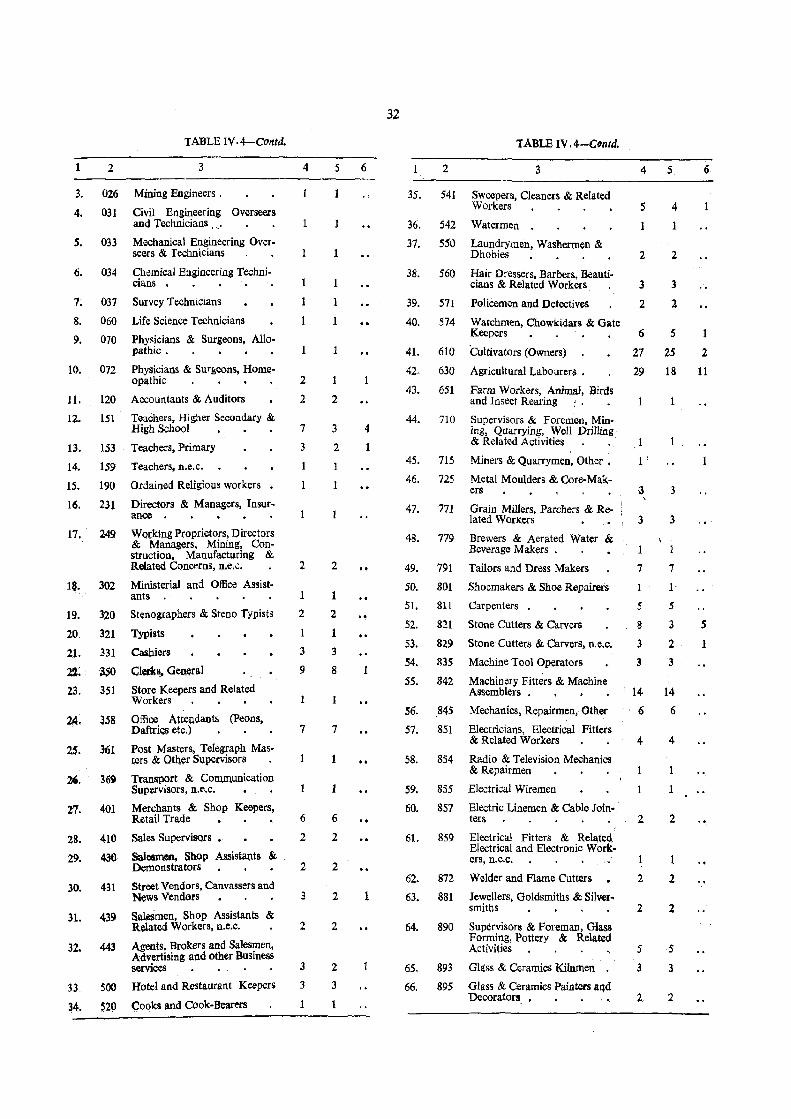
TABLE IV. 4-Contd.
1 2 3
3. 026 Mining Engineers.
4. 031 Civil Engineering Overseers and Technicians. ,_.
5. 033 Mechanical Engineering Overseers & Technicians
6. 034 Chemical Engineering Techni-cians • •
7; 037 Survey Technicians
8. 060 Life Science Technicians
9. 070 Phy~icians & Surgeons, Allopathic.
10. 072 Physicians & Sur!;eons, Homeopathic
11. 120 Accountants & Auditors
12.
13.
lSI Teachers, Higher Secondary & High School
153 Teachers, Primary
14. 159 Teachers, n.e.c.
15. 190 Ordained Religious workers
16.
17.
19.
20.
21. 22: 23.
25.
26.
'1:7.
28.
29.
30.
31.
32.
33,
~4.
231
302
320
321
331
~O
351
358
361
369
401
410
430
431
439
443
SOO
520
Directors & Managers, Insurance •
Working Proprietors, Directors & Managers, Mining, Construction, Manufacturing & Related ConCf"rlls, n.e.c.
Ministerial and Office Assistants
Stenographers & Steno Typists
Typists
Cashiers
Clerks, Geu()l'al . , Store Keepers and Related Workers
Office Attendants (peons, Daftri~ etc.)
Post Masters, Telegraph Masters & Other Supervisors
Transport & COllllIl,unication Supervisors, n.e.c.
Merchants & Shop Keepers, Retail Trade
Sales Supervisors.
Salesmen, Shop Assistants & Demonstrators
Street Vendors, Canvassers and News Vendors
S.~men, Shop Assistants & Related Workers, n.e.c.
Agents, Brokers and Salesmen, Advertising and other Business services
Hotel and Restaurant Keepers
Cooks and Cook-Bearers
4
2
2
7
3
2
1
2
3
9
1
7
6
2
2
3
2
3
3
5
1
1
1
1
2
3
2
1
2
2
1
3
8
7
6
2
2
2
2
2
3
1
32
6
4
1
'TABLE IV. 4-CtmJd.
2 3 4
35. 541 Sweepers, Cleaners & Related Workers 5
36. 542 Watermen .
37. 550 Laundrymen, Washermen & Dhobies 2
38. 560 Hair Dressers, Barbers, Beauti-cians & Related Workers 3
39. 571 Policemen and Detectives 2
40. 574 Watchmen, Chowkidars & Gate I(eepers 6
41. 610 Cuttivators (Owners) 27
42. 630 Agricultural Labourers • 29
43. 651 Farm Workers, Animal, Birds and Insect Rearing j.
44. 710 Supervisors & Foremen, Mining, Quarrying, Well Drilling & Related Activities . 1
45. 715 Miners & Quarrymen, Other. 1 '
46. 725 Metal Moulders & Core-Makers
47.
48.
49.
50.
S1.
52.
53.
54.
55.
56.
57.
58.
59.
60.
61.
62.
63.
64.
65.
66.
771
779
791
801
811
821
829
R3S
842
.845
851
Grain Millers, Parchers & Related Workers • I 3
Brewers & Aerated Water & Beverage Makers . 1
Tailors and Dress Makers 7
Shoemakers & Shoe Repairers 1
Carpenters . 5
Stone Cutters & Carvers 8
Stone Cutters & Carvers, n.e.c. 3
Machine Tool Operators 3
Machinery Fitters & Machine Assemblers. . • . i 14-
Mechanics, Repairmen, Other 6
Electricians,. Electrical Fitters & Related Workers 4
854 Radio & Television Mechanics & Repairmen
855 Electrical Wiremen
857 Electric Linemen & Cable Jointers
859
872
881
890
893
895
Electrical Fitters & Related, Electrical and Electronic Workers, n.e.c.
Welder and Flame Cutters
Jewellers, Goldsmiths & Silversmiths
Supervisors & Foreman, Glass Forming, Pottery & Related Activities
Glass & Ceramics Kilnmen
Glass & Ceramics Painters aqd Decorators
2.
2
2
5
3
2
5
4
1
2
3
1
5
2S
18
3
3
7
1
5
3
2
3
14
6
4
1
2.
2.
2
5
3
2
6
2
11
S
1
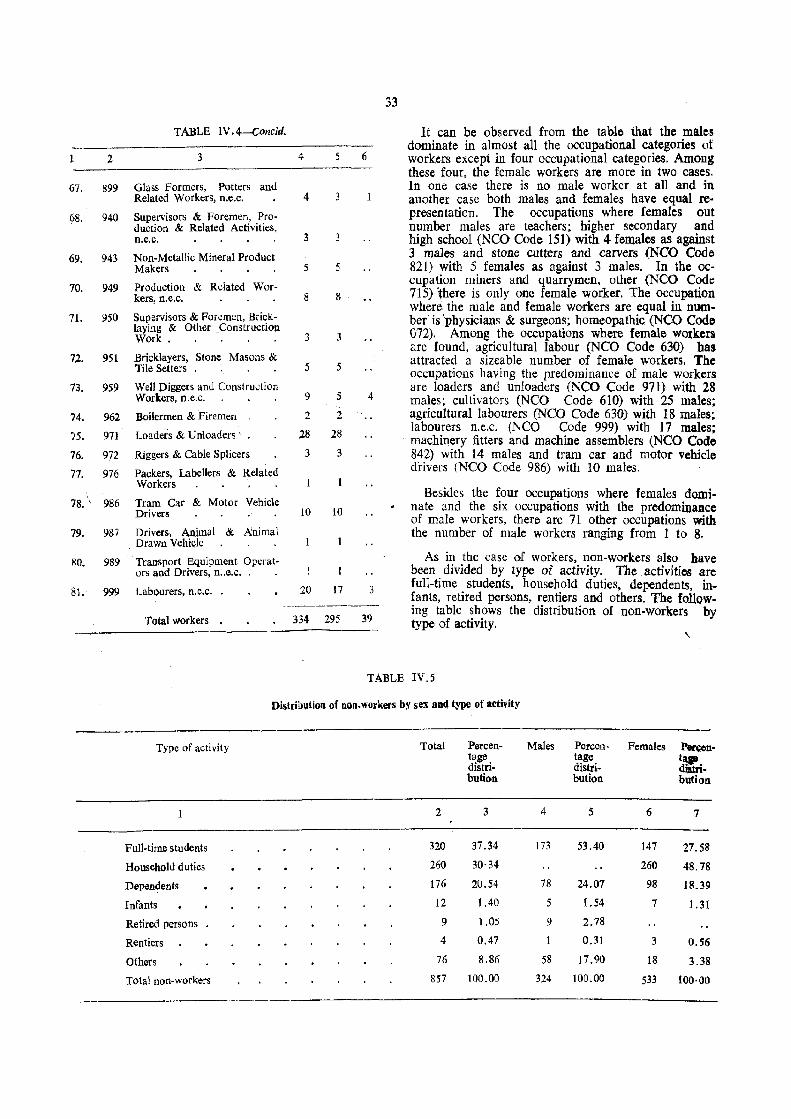
1 2
67. 899
68. 940
69. 943
70. 949
71. 950
72. 951
73. 959
74. 962
75. 971
76. 972
77. 976
78.' 986
79. 987
~O. 989
81. 999
TABLE IV. 4-Concld.
3
Glass Formers, Potters and Related Workers, n.e.c.
Supervisors & Foremen, Production & Related Activities, n.e.c.
Non-Metallic Mineral Product Makers
Production & Related Workers, n.e.c.
Sup~rvisors & Foremen, Bricklaying & Other _Construction Work.
Bricklayers, Stone Masons & Tile Setters .
Well Diggers and Construction Workers, n.e.c.
Boilermen & Firemen
Loaders & Unloaders' .
Riggers & Cable Splicers
Packers, Labellers & Related Workers
Tram Car & Motor Vehicle Drivers
Drivers, Animal & A:nimal Drawn Vehicle
Transport Equipment Operators and Drivers, n .. e.c. ,
Labourers, n.e.c.
Total workers
4
4
3
5
8
3
5
9
2
28
3
10
I
20
5
3
5
3
5
5
2
28
3
10
17
6
4
3
33
It can be observed from the table that the males dominate in almost all the occupational categories of workers except in four occupational categories. Among these four, the female workers are more in two cases. In one case there is no male worker at all and in another case both males and females have equal representation. The occupations where females out number males are teachers; higher secondary and high school (NCO Code 151) with 4 females as against 3 males and stone cutters and carvers (NCO Code 820 with 5 females as against 3 males. In the occupation miners and quarrymen, other (NCO Code 715) there is only one female worker. The occupation where the male and female workers are equal in number is 'physicians & surgeons; homeopathic (NCO Code 072). Among the occupations where female workers <:re found, agricultural labour (NCO Code 630) has attracted a sizeable number of female workers. The occupations having the predominance of male workers are loaders and unloaders (NCO Code 971) with 28 males; cultivators (NCO Code 610) with 25 males; agricultural labourers (NCO Code 630) with 18 males; labourers n.e.c. (NCO Code 999) with 17 males; machinery fitters and machine assemblers (NCO Code 842) with 14 males and tram car and motor vehlcle drivers (NCO Code 986) with 10 males.
Besides the four occupations where females dominate and the six occupations with the predominance of male workers, there are 71 other occupations with the number of male workers ranging from 1 to 8.
334 295 39
As in the case of workers, non-workers also have been divided by type of activity. The ,activitios: are full-time students, household duties, dependents, infants, retired persons, rentiers and others. The following table shows the distribution of non-workers by type of activity. ,
TABLE IV.S
Distribution of fiGn_workers by sex and type of activity
Type of activity
Full·time students
Household duties
Dependents
Infants
Retired persons
Rentiers
Others
Total non-workers
Total
2
320
260
176
12
9
4
76
857
Percen- Males tage distri. bution
3 4
37.34 173
30·34
20.54 78
1.40 5
1.05 9
0.47
8.86 58
100,()O 324
Percen- Females Per.;cn-tage
~-distri-bution bution
5 6 7
53.40 147 27.58
260 48.78 24.07 98 18.39
1.54 7 1.31 2.78
0.31 3 0.56
17.90 18 3.38 100,00 533 100·00
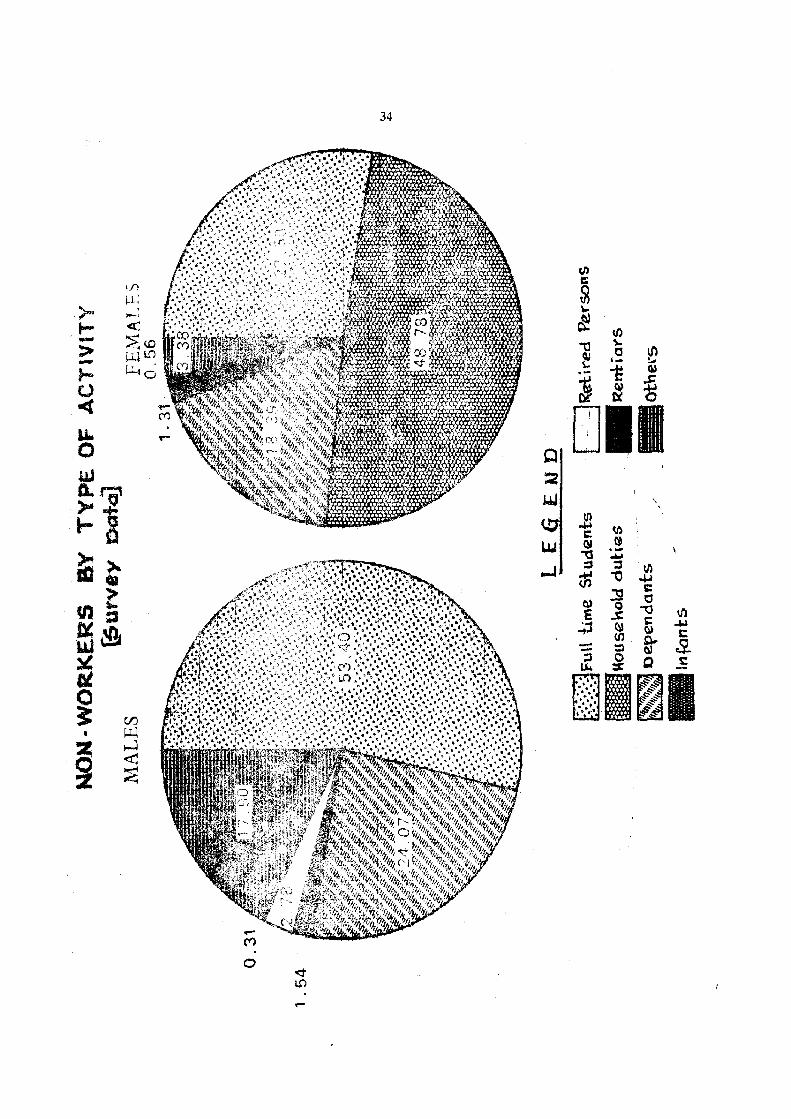
34
f/)
V' w,' -~;
C
fA r ,
t-"",""".,
c( - ~\O > - W4LD
z- H·
\..
(J 0
&
-(
tJ)
-0 ~
~ C ~
u..
\. ._ 1: '"' ~
0 ......
~ ~ ~
[] Q I
W
~~ .... 1 ~
la~
MJ
•
~ 2
~
l.U = ~
en"'"
01 ~
fX:1
-.::J .-...J ::1
..... :l
~~
~ "1j til ~
(I) ~
c:
ct
'E 0 " ..s: -0
~
..:;l <'lI t: 'I/)
(J) ~
~
~ C
::l !l
crJ
~ Q s:::
II I ~
~ ,.J < ~ ~
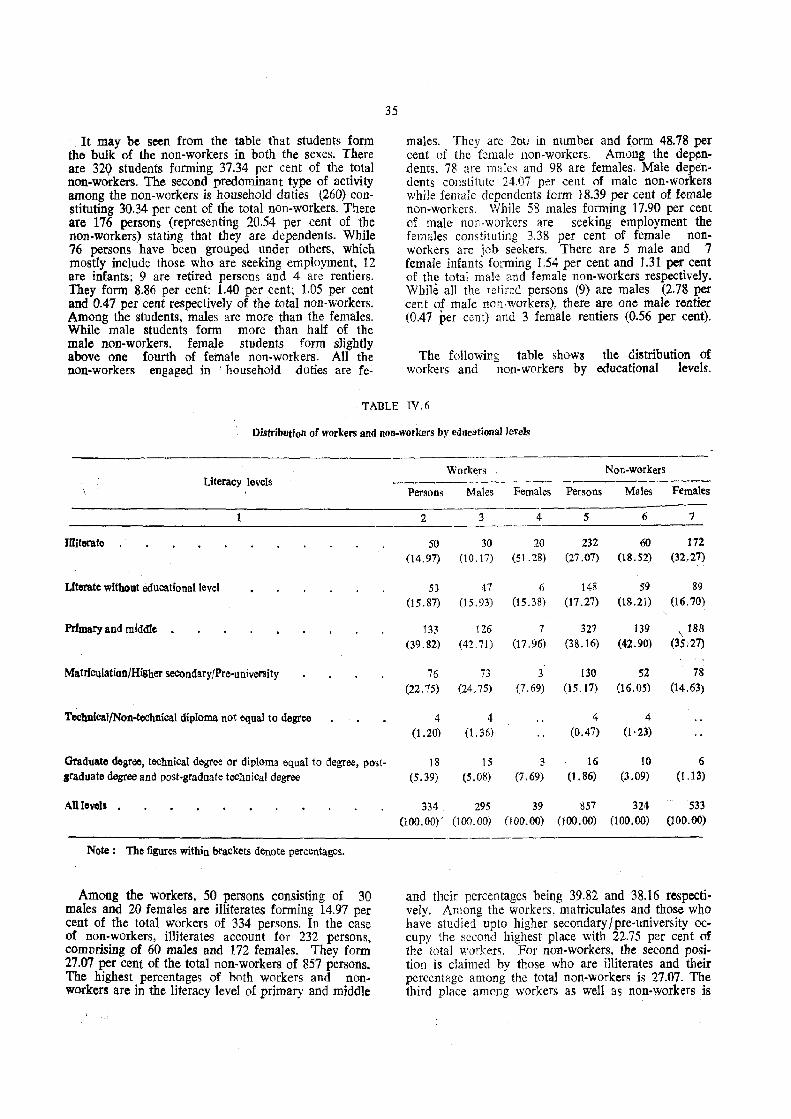
It may be seen from the table that students form tho bulk of the non-workers in both the sexes. There are 321;> students forming 37.34 per cent of the total non-workers. The second predominant type of activity among the non-workers is household duties t260) constituting 30.34 per cent of the total non-workers. There are 176 persons (representing 20.54 per cent of the non-workers) stating that they are dependents. While 76 persons have been grouped under others, which mostly include those who are seeking employment, 12 are infants; 9 are retired persons and 4 are rentiers. They form 8.86 per cent; 1.40 per cent; 1.05 per cent and 0.47 per cent respectively of the total non-workers. Among the students, males are more than the females. While male students form more than half of the male non-workers. female students form slightly above one fourth of female non-workers. An the non-workers engaged in 'household duties are fe-
35
males. They are 20u in number and form 48.78 per cent of the female non·workers, Among the dependents. 78 are males and 98 are females. Male dependents constitute 24.07 per cent of male non-workers while female dependents form 18.39 per cent of female non-workers. While 58 males forming 17.90 per cent of male nOi~-workers are seeking employment the females c01JStituting 3,38 per cent of female nonworkers are ioh seekers. There are 5 male and 7 female infants forming 1.54 per cent and 1.31 per cent of the total male and female non-workers respectively. While all the retired persons (9) are males (2.78 per cent of maJe non·workers), there are one male rentier (0.47 Per cent) and 3 female rentiers {0.56 per cent).
The following table shows the distribution of workers and non-workers by educational levels.
TABLE IV.6
Distribution of workers and oon.workers by educational leveJs
Workers Non-workers Literacy levels ------------ -----.-----------
Persons Males Females Persons MaJes Females
2 3 4 5 6 7
mitorate 50 30 20 232 60 172
(14,97) (10.17) (51.28) (27.07) (18.52) (32.27)
Literate without educational level 53 41 6 148 59 89
(15.87) (15.93) (15.38) (17.27) (18.21) (16.70)
Prfmary and middle 133 126 7 327 139 \ 188 (39.82) (42.71) (17.96) (38.16) (42.90) (35.27)
Matriculation/Higher secondary/Pre-university 76 73 3 130 52 78 (22.75) (24.75) (7.69) (15,17) (16.05) (14.63)
TechDical/Non-technical diploma not equal to degree 4 4 4 4 (1.20) (1.36) (0.47) (1. 23)
Graduate degree, technical degree or diploma equal to degree, posl- 18 15 3 16 10 6
graduate degree and past·graduate technical degree (5.39) (5.08) (7.69) (1.86) (3.09) (1,13)
AU levels 334 . 295 39 857 324 533 (100,00), (lOCI. 00) (100.00) (100.00) (100.00) (100.00)
Note: The figures within brackets denote percentages.
Among the workers, 50 persons consisting of 30 and their percentages being 39.82 and 38.16 respecti. males and 20 females are illiterates forming 14.97 per veIy. Among the workers, matriculates and those who cent of the total workers of 334 persons. In the case have studied upto higher secondary !pre-university oe-of non-workers, illiterates account for 232 persons, cupy the second highest place with 22.75 per cent of comprising of 60 males and 172 femaJes. They form the total workers. For non-workers, the second posi-27.07 per cent of the total non·workers of 857 persons. tion is claimed by those who are illiterates and their The highest percentages of both workers and non- percentage among the total non-workers is 27.07. The workers are in the literacy level of pdmary and middle third place among workers as well as non-workers is
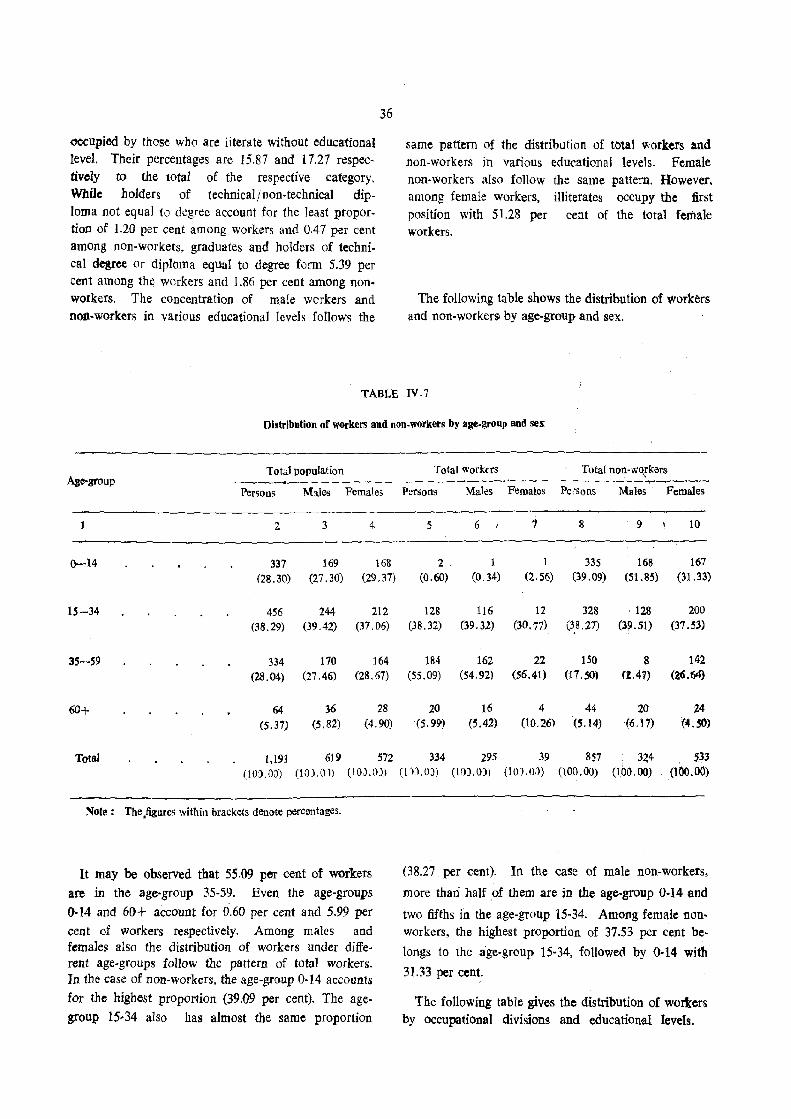
«cupied by those who are literate without educational level. Their percentages are 15.87 and 17.27 respectively to the total of the respective category. While holders of technical/non-technical diploma not equal to degree account for the least proportion of 1.20 per cent among workers and 0.47 per cent among non-workers, graduates and holders of technical degree Or diploma equal to degree ((mn 5.39 per cent among the workers and 1.86 per cent among nonworkers. The concentration of male workers and non-workers in various educational levels follows the
36
same pattern of the distribution of total workers and non-workers in various educational levels. Female non-workers also follow the same pattern. However, among female workers, illiterates occupy the first position with 51.28 per cent of the total female workers.
The following table shows the distribution of workers and non-workers by age-group and sex.
TABLE IV.7
Distribution of workers and non-workers by ~ge-group and sex
Tota1 population Age-group -----__ ._-- - - - - - --
Persons Males Females
2 3 4
0-14 337 169 168
(28.30) (27.30) (29.37)
15-34 456 244 212
(38.29) (39.42) (31.06)
35-59 334 170 164 (28.04) (27.46) (28.67)
60+ 64 36 28 (5.37) (5.82) (4.90)
Total 1,191 619 572 (10).0)) (10).0) (IOJ.OJ)
Note: The .figllres within brackets denote percentages.
It may be observed that 55.09 per cent of workers are in the age-group 35-59. Even the age-groups 0-14 and 60+ account for 0.60 per cent and 5.99 per cent of workers respectively. Among males and females also the distribution of workers under different age-groups follow the pattern of total workers. In the case of non-workers, the age-group 0-14 accounts
for ilie highest proportion (39.09 per cent). The age
group 15-34 also has almost the same proportion
Total workers Total MI1-wQ[kers -- ------------- - - - - --.1....--.......-------Persons Males Females Pec'sons Males Females
5 6 1 8 9 10
2. 1 1 335 168 167
(0.60) (0.34) (2.56) (39.09) (51.85) (31.33)
128 116 12 328 ' 128 200 (38.32) (39.31) (30.77) (3.8.27) (39.51) (37.53)
184 162 22 150 8 142
(55.09) (54.92) (56.41) (17.50) (1.47) (26.64)
20 16 4 44 20 24 (5.9'» (5.42) (lO.26) (5.14) (6.17) (4. SO)
334 295 39 857 ., 324 . 533 (tn,O)) (\l)).O)) (10).0.)) (100.00) (100,00) (1 O(). 00)
(38.27 per cent). In the case of male non-workers,
more than half of them are in the age-group 0-14 and
two fifths in the age-group 15-34. Among female nonworkers, the highest proportion of 37.53 per cent be-
longs to the a'ge-group 15-34, followed by 0-14 with
31.33 per cent.
The following table gives the distribution of worters by occupational divisions and educational levels.

8-20 RGI/ND/B9
37
DISTRIBUTION OF \VORKERS BY OCCUPATIONAL DIVISIONS
~urvey Dalaj
0-1 2 5 6 7,8&9
OCCUDATIDNAL OIVISIONS
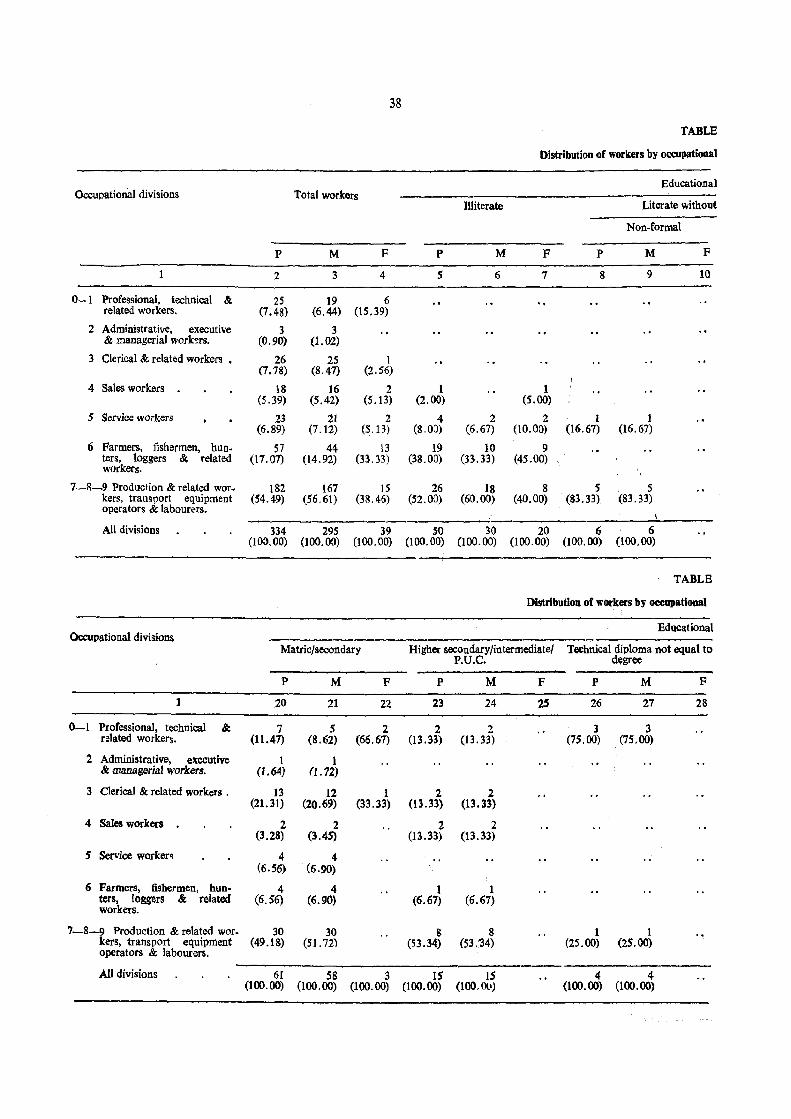
38
TABLE
Distribution of workers by occupational
Educational Occupational divisions Total workers
ntiterate Literate without
Non-formal
p M F P M F P M F
2 3 4 5 6 7 8 9 10
0-1 Professional, technical &; 25 19 6 related workers. (7.48) (6.44) (15.39)
2 Administrative, executive 3 3 & managerial work~rs. (0.90) (1.02)
3 Clerical & related workers • 26 25 I (7.78) (8.47) (2. 56}
4 Sales workers 18 16 2 1 1 (5.39) (5.42) (5.13) (2.00) (5.00)
5 Service workers 23 21 2 4 2 2 1 1 (6.89) (7.12) (S.13) (8.00) (6.67) (10.00) (16.67) (16.67)
6 Farmers, fishermen, hun- 57 44 13 19 10 9 ters, loggers workers.
& related (17.07) (14.92) (33.33) (38.00) (33.33) (45.00)
7-R_9 Production & related wor. 182 167 15 26 18 8 5 5 kers, transport equipment (54.49) (56.61) (38.46) (52.00) (60.00) (40.00) (83.33) (83.33) operators & labourers.
All divisions 334 295 39 SO 30 20 6 6 (100.00) (100. DO) (l00.00) (too. 00) (100.00) (l 00. 00) (100.00) (100.00)
TABLE
Distribution of workers by occupational
Educational Occupational divisions
Matrie/secondary Higher secondary/intermediate/ Technical diploma not equal to P.U.C. d~gree
p M F P M F P M F
1 20 21 22 23 24 25 26 27 28
0-1 Professional, technical & 7 5 2 2 2 3 3 rdated workers. (11.47) (8.62) (66.67) (13.33) (13.33) (75.00) (75.00)
2 Administrative, executive 1 1 & managerial workers. . (1.64) (1.72)
3 Clerical & related workers . 13 12 1 2 2 (21.31) (20.69) (33.33) (13.33) (13.33)
4 Sales workers . 2 2 2 2 (3.28) (3.45) (13.33) (13.33)
5 Service worlcer~ 4 4 (6.56) (6.90)
6 Farmers, fishermen, hun- 4 4 1 1 ters, loggers & related (6.56) (6.90) (6.67) (6.67) workers.
7-8-9 Production & related wor. 30 30 8 8 1 1 kers, transport equipment (49.18) (51. 72) (53.34) (53.'34) (25.00) (25.00) operators & labourers.
------All divisions 61 58 3 15 15 4 4 (100.00) (100.00) (100.00) (100.00) (100.0l1) (100.00) (100.00)
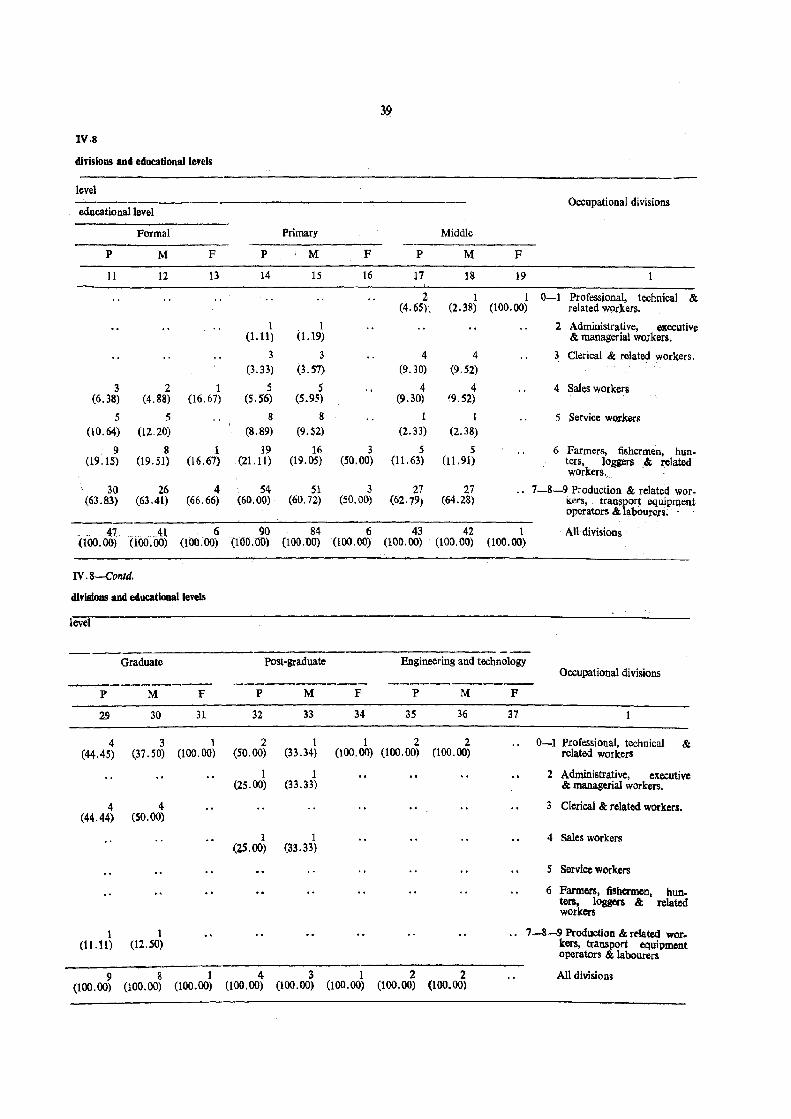
39
IV.S
divisions and educational levels
level
educatioual1evel Occupational divisions
Formal Primary Middle
P M F P M F P M F
11 12 13 14 15 16 17 18 19
2 1 I 0-1 Professional, technical & (4.65). (2.38) (100.00) related w()rker:!.
3 (6.38)
5 (10.64)
2 1 (4.88) (16.67)
5 (12.20)
1 (1.11)
3 (3.33)
5 (5.56)
8 (8.89)
, 1 (1.19)
3 (3.57)
5 (5.9~)
8
(9.52)
4 (9.30)
4 (9.30)
1 (2.33)
4
(9.52)
4 19.52)
1 (2.38)
9 8 1 19 16 3 5 5 (19.15) (19.51) (16.67) (21.11) (19.05) (50.00) (11.63) (11.91)
30 26 4 54 51 3 27 27 (63.83) (63.41) (66.66) (60.00) (60.72) (50.00) (62.79) (64.28)
2 Administrative, executive & managerial workers.
3 Clerical & related workers,
4 Sales workers
5 $ervj~ workers
6 Farmers, fishermen, hun. ters, loggers &, related workers. -
7-8-9 Production & related wor. Kers, transport equipment operators &labourers.
41 _ _ __ Al 6 90 84 6 43 42 1 (100.00) (100.00) (100:00) (100.00) (100.00) (100.00) (100.00) (100,00) (100.00)
All divisions
IV.8-Conld.
divisioDS and educational levels
level
Graduate Post-graduate Engineering and technology
p M F P M F p M
29 30 31 32 33 34 35 36
4 3 121 122 (44.45) (37.50) (100.00) (50.00) (33.34) (100.00) (100.00) (100.00)
1 1 (25.00) (33.33)
4 4 (44.44) (SO. 00)
1 1 (~.OO) (33.33)
1 1 (11.11) (12.50)
9 8 1 4 3 1 2 2 (100.00) (100.00) (100.00) (100.00) (100.00) (100.00) (100.00) (100.00)
F
37
Occupational divisions
0-1 Professional, technical & related workers
2 Administrative, executive & managerial workers.
3 Clerical & related workers.
4 Sales workers
5 Service workers
6 Farmers, fishermen, hunters, loggers & related workers
.. 7--8-9 Production & related wor. kers, transport equipment operators & labourers.
All divisions
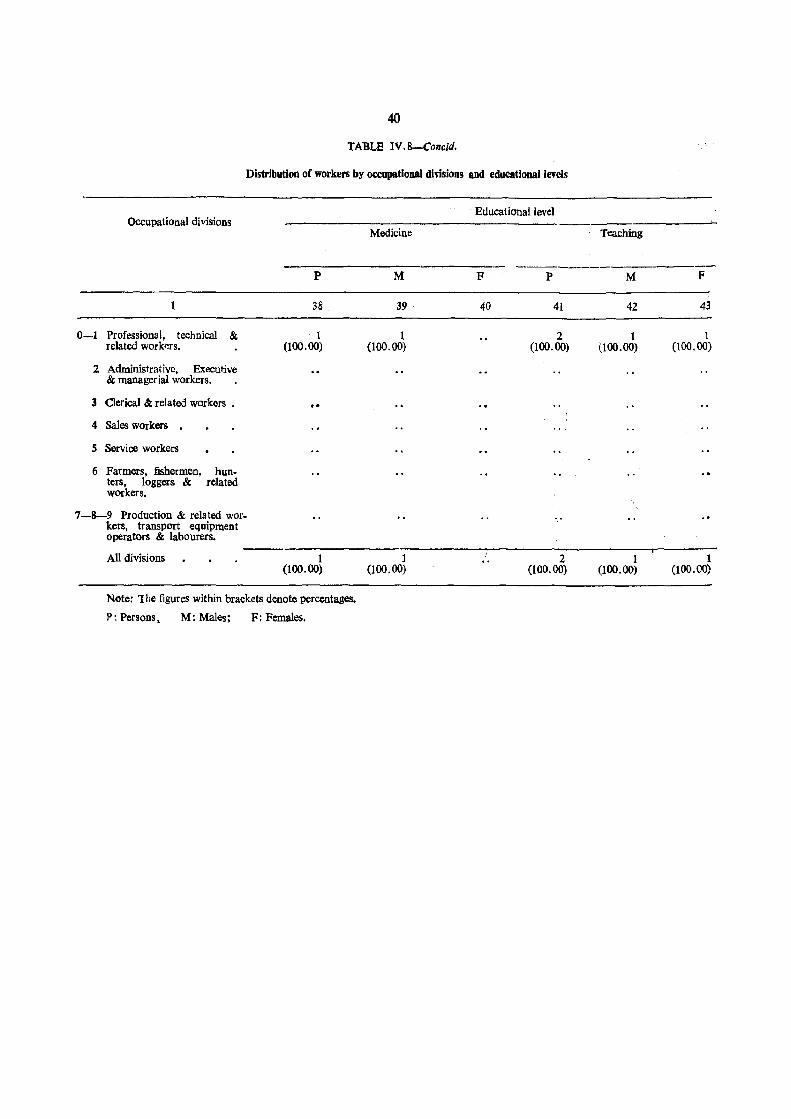
40
TABLE IV.8-Concld.
Distribution of workers by occupational divisions and educational levels
Educational level Occupational divisions
Medicine Teaching
P M F P M F
1 38 39 40 41 42 43
0-1 Professional, technical & 1 1 2 1 1 related workers. (100.00) (100.00) (100.00) (100.00) (100.00)
2 Administrative, Executive & managerial workers.
3 Oerical & related workers . .. 4 Sales workers
5 Service workers ,,'
6 Farmers, fishermen, hun-ters, loggers & related workers.
7-8-9 Production & related WOf-kers, transport equipment operators & labourers.
All divisions 1 1 2 1 1 (100.00) (100.00) (l00.00) (100.00) (100.00)
Note: 1he figures within brackets denote percentages.
P: Persons, M: Males; F: Females.
Most of the illiterates (52.00 per cent) are in the occupational division 7·8-9 (Production and related workers, transport equipment operators and labourers). Occupational division 6 (Farmers, fishermen, hunters etc.) accounts for 38.00 per cent of illiterate workers. A~ong literates without educational level nearly two third are found in division 7·8·9 (Production and related workers, transport equipment operators and labourers). Similarly nearly half or more of the workers who have educational level of primary (60.00 per cent); middle (62.77 per cent): matriculation (49.18 per cent) and higher secondary (53.34 per cent) belong
41
to the occupational division 7-8-9. The occupational division 0-1 (Professional, technical and related workers) accounts for most of the \\orkers having technical diploma not equal to degree (75.00 per cent); graduate degree (44.45 per cent) and post-graduate degree (50.00 per cent) and the entire workerS with post graduate degree in engineering and techno· logy (2 workers), medicine (1 worker) and teaching (2 workers).
The following table indicates the distribution of
workers by occupational divisions and age-groups.
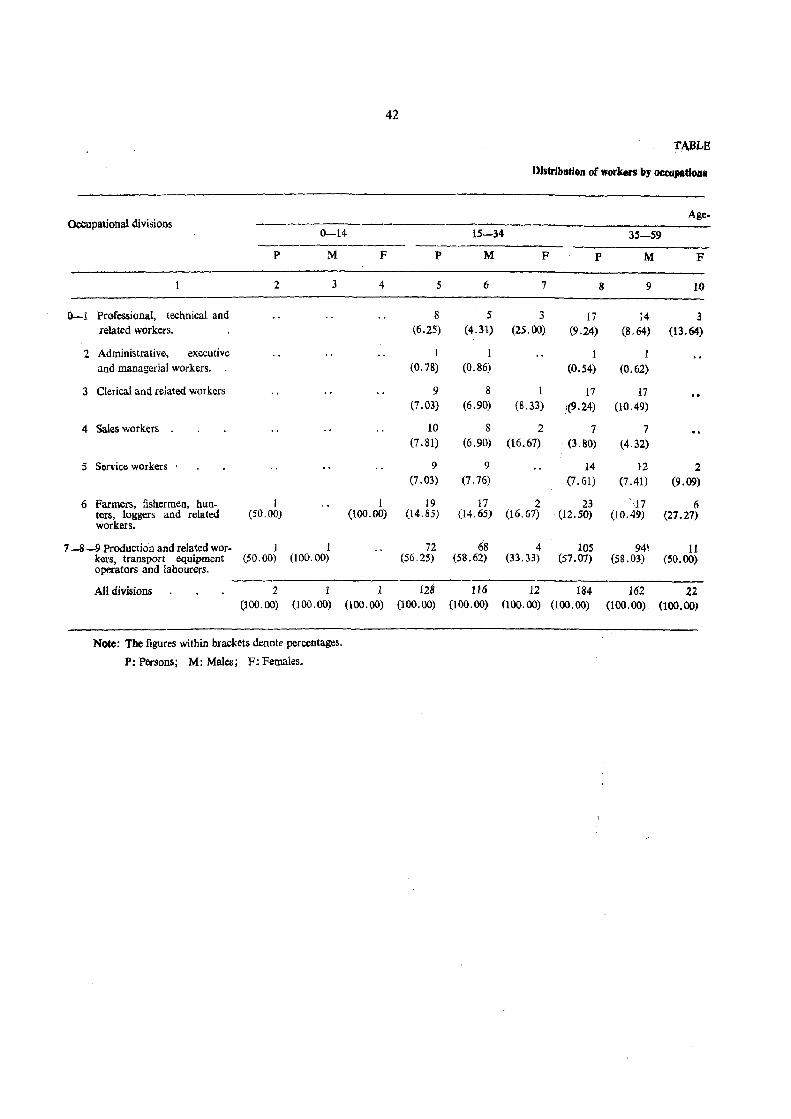
42
TABLE
Distribution of workers by OCaJpatiolla
Occupational divisions Age-
0-14 15-34 35-59 -----------P M F P M F P M F
2 3 4 5 6 7 8 9 10
0-1 Pn)fessional, technical and 8 5 3 17 14 3 related workers. (6.25) (4.31) (25.00) (9.24) (8.64) (13.64)
2 Administrative, executive I 1 1 1 and managerial workers. (0.78) (0.86) (0.54) (0.62)
3 Clerical and related workers 9 8 1 17 17 (7.03) (6.90) (8.33) !(9.24) (10.49)
4 Sales workers 10 8 2 7 7 (7.81) (6.90) (16.67) . (3.80) (4.32)
5 Service workers . 9 9 14 12 2 (7.03) (7.76) (7.61) (7.41) (9.09)
6 Farmers, fislIermen, hun- I 1 19 17 2 23 "17 6 ters, loggers and related (50.00) (100.00) (14.85) (14.65) (16.67) (12.50) (l().49) (27.27) workers.
7-8 -9 Production and related wor- 1 1 72 68 4 105 94\ 11 kers, transport equipment (50.00) (100.00) (56.25) operators and labourers.
(58.62) (33.33) (57.07) (58.03) (50.00)
All divisions 2 1 1 128 116 12 184 162 22 (100.00) (100.00) (l00.00) (100.00) (100.00) (100.00) (100.00) (100.00) . (100.00)
Note: The figures within brackets denote percentages.
P: Persons; M: Males; F:Females.
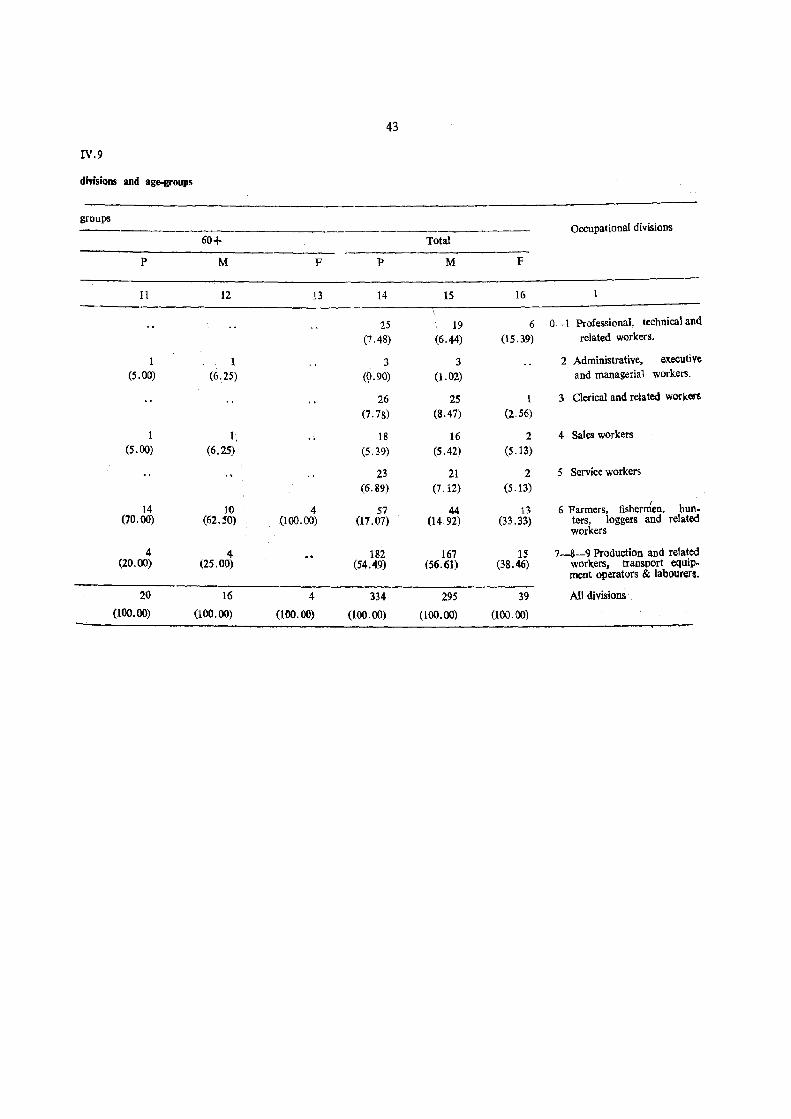
43
IV.9
dMsions and age-groups
groups Occupational divisions
60+ Total
p M F P M F
11 12 13 14 15 16
25 19 6 0-1 Professional, techIlical and
(7.48) (6.44) (15.39) related workers.
1 1 3 3 2 Administrative, executive (5.00) (6~ 25) (9·90) (1. 02) and managerial workers.
26 2S 1 3 Clerical and related workers
(7.78) (8.47) (;U6)
1 1 18 16 2 4 Sales workers (5.00) (6.25) (5.39) (5.42) (5.13)
23 21 2 5 Service workers (6.89) (7.12) (5.13)
14 10 4 57 44 13 6 Farmers, fishern1en. hun-(70.00) (62.50) .(100.00) (17.07) (14.92) (33.33) ters, loggers and related
workers
4 4 182 167 15 7-8-9 Production and related (20.00) (25.00) (54.49) (56.61) (38.46) workers, transport equip-
ment operators & labourers.
20 16 4 334 295 39 All divisions
(100.00) (100.00) (100.00) (100.00) (100.00) (100. (0)
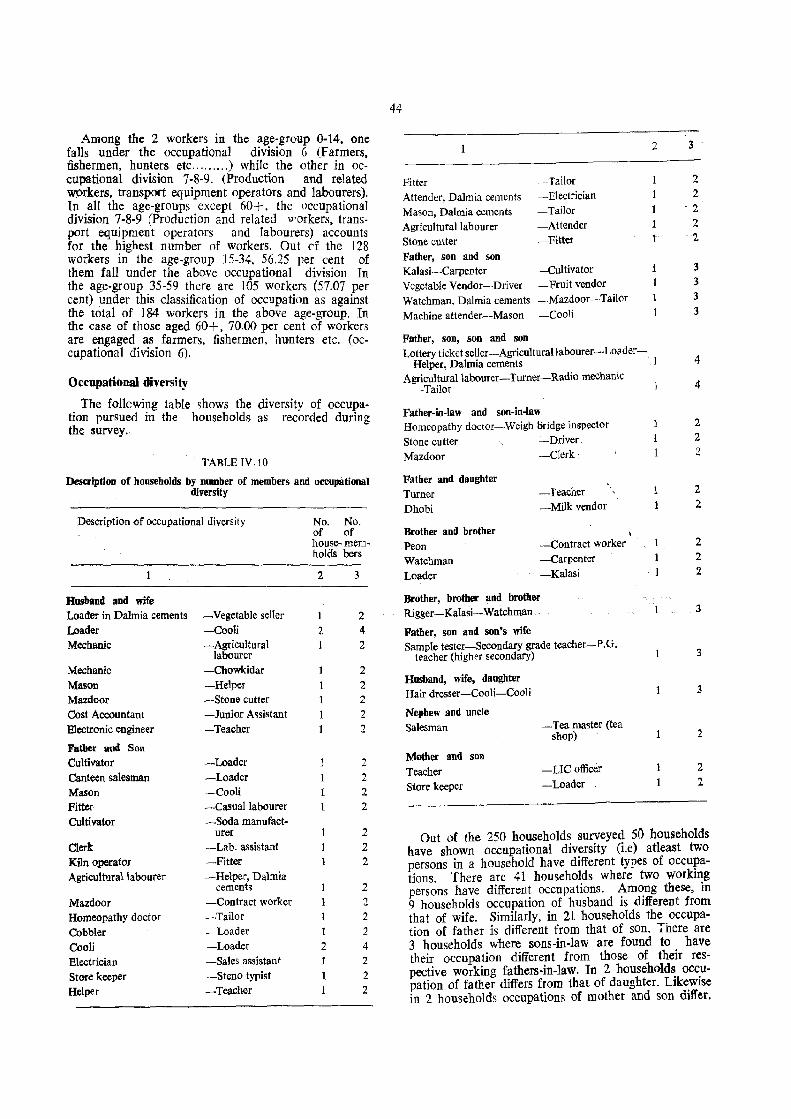
Among the 2 workers in the age-group 0-14. one falls under the occupational division 6 (Farmers, fishermen, hunters etc ......... ) while the other in oc-cupational division 7-8-9. (Production and related \\'Prkers, transport equipment operators and labourers). In all the age-groups except 60 +, the occupational division 7-8-9 (Production and related workers, transport equipment operators and labourers) accounts for the highest number of workers. Out cf the 128 workers in the age-group 15-34, 56.25 per cent of them fall under the above occupational division In the age-group 35-59 there are 105 workers (57.07 per cent) under this classification of occupation as against the total of 184 workers in the above age-group. In the case of those aged 60+, 70.00 per cent of workers are engaged as farmers, fishermen, hunters etc. (occupational division 6).
Occupational diversity
. The foIlowi~g table shows the diversity of occupatIon pursued In the households as recorded during the survey.
TABLE TV.JO
DescriptiOD of households by number of members and occupational diversity
Description of occupational diversity
Husband aDd wife Loader in Dalmia cements Loader Mechanic
Mechanic Mason Mazdoor Cost Accountant Electronic engineer
Father and Son Cultivator Canteen salesman Mason Fitter Cultivator
Clerk Kiln operator Agricultural labourer
Mazdoor Homeopathy doctor Cobbler Cooli Electrician Store keeper Helper
-Vegetable seller -Cooli -Agricultural
labourer -Chowkidar -Helper -Stone cutter -Junior A~sistant -Teacher
-Loader -Loader -Cooli -Casual labourer -Soda manufact-
urer -Lab. assistant -Fitter -Helper, Dalmia
cements -Contract worker -Tailor -Loader -Loader -Sales assistant -Steno typist -Teacher
No. No. of of house-memholds bers
2 3
2
1
2
2 4 2
2
2 2
2 2
2 2 2 2
2 2 2
2 2 2 2 4 2 2 2
44
Fitter Attender, Dalmia cements Mason, Dalmia cements Agricultural labourer Stone cutter Father, son and son Kalasi-Carpenter Vegetable Vendor-Driver
-Tailor -Electrician -Tailor -Attender -Fitter
-Cultivator -Fruit vendor
Watchman, Dalmia cements -Mazdoor-Tailor
Machine attender-Mason -Cooli
Father, SOD, son and son Lottery ticket seller -Agricultural labourer -Loader
Helper, Dalmia cements Agriculturallabourer-Turner-Radio mechanic
-Tailor
Father-in-law and son-in-law Homeopathy doctor-Weigh bridge inspector Stone cutter :_Driver Mazdoor -Clerk -
Father and daughter Turner Dhobi
Brother and brother Peon Watchman Loader
-Teacher -Milk vendor
\
-Contract worker -Carpenter -Kalasi
Brother, brother and brother Rigger-Kalasi-Watchman
Father, son and son's wife Sample tester-Secondary grade teacher-P.G.
teacher (high!'r secondary)
Husband, wife, daughter Hair dresser-Cooli-Cooli
Nephew and uncle
Salesman
Mother and son Teacher Store keeper
-Tea master (tea shop)
-LIC officer
-Loader
2
1
1
I
1
3 .
2 2
- 2
2 - 2
3 3 3 3
4
4
2
2 2
2 2
2 2 2
3
3
3
2
2 2
Out of the 250 households surveyed 50 households have shown occupational diversity (i.e) atleast two persons in a household have different types of occupations. There are 41 households where two working persons have different occupations. Among these, in 9 households occupation of husband is different from that of wife. Similarly, in 21 households the occupation of father is different from that of son. 'There are 3 households where sons-in-law are found to have their occupation different from those of their respective working fathers-in-law. In 2 households occupation of father differs from that of daughter. Likewise in 2 households occupations of mother and son differ.
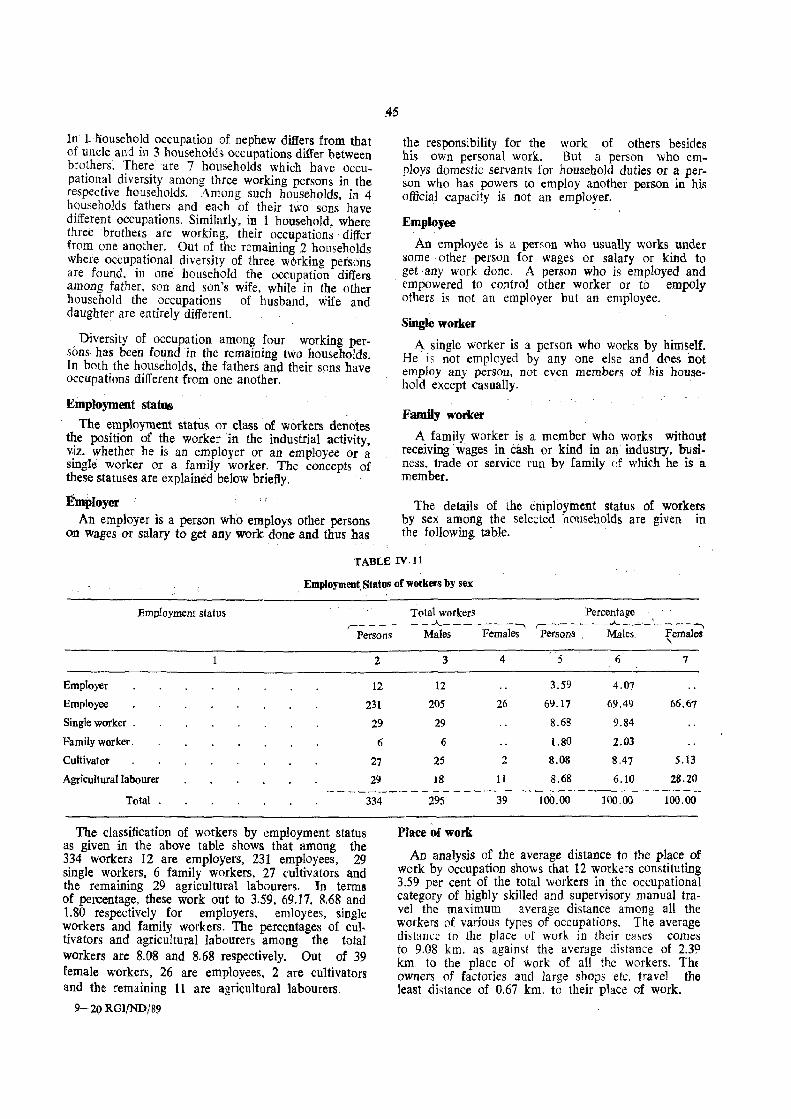
In 1 household occupation of nephew differs from that of uncle and in 3 households occupations differ between brothers. There are 7 households which have OCCll
pation~l di_versity among three working persons in the respectIve nousehoJds. Among such households. in 4 11?useholds fathers and each of their two sons have dIfferent occupations. Similarly. in 1 household. where three brothers are working, their occupations differ from one anot?er. O.ut o~ the remaining 2 hOl1seholds where occup.ahOnal dIversity of three w0rking persons are found. m one household the occupation differs among father. son and son's wife. while in the other household the occupations of husband. wife and daughter are entirely different.
Diversity of occupation among four working persons has been found in the remaining two households. In both the households. the fathers and their sons have occupations different from one another. .
Employment status
The employment status or class of workers denotes the position of the worker 'in the industrial activity v.iz. whether he is an employer or an employee or ~ single worker or a family worker. The concepts of these statuses are explained below briefly.
Employer ' I An employer is a person who employs other persons
on wages or salary to get any work done and thus has
.45
the responsibility for the work of others besides his own personal work. But a person who employs domestic servants for household duties or a person who has powers to employ another person in his official capacity is not an employer.
Employee
An employee is a person who usually works under some other person for wages or salary or kind to get ·any work done. A person who is employed and empowered to control other worker or to empoly othe~s is not an employer but an employee.
Single worker
A single worker is a person who works by himself. He is not employed by anyone else and d0es not employ any persoll. not even members of his household except casually.
FamUy worker
A family worker is a member who works without receiving wages in cash or kind in an industry. business, trade or service run by family of which he is It member.
The details of the employment status of workers by sex among the selected households are given in the following. table. .
TABLE IV.1I
Employment. Status of workers by sex
Employment status Total workers Percentage r------- A -------,
Persons Males Females , __ - _ - --A_ _._"_ ';__ __ ~
Persons Males Females \
2 3 4 5 6 1
Employer 12 12 3.59 4.07
Employee 231 205 26 69.11 69.49 66.67
Single worker . 29 29 8.68 9.84
Family worker. 6 6 l.80 2.03
Cultivator 27 25 2 8.08 8.47 5.13
Agricultural labourer 29 18 11 8.68 6.10 28.20 --------~- - -- - _----- - - - ----~---- -- ----_
Total 334
The classification of workers by employment status as given in the above table shows that among the 334 workers 12 are employers. 231 employees. 29 single workers. 6 family workers, 27 ("ultivators and the remaining 29 agricultural labourers. In terms of percentage. these work out to 3.59. 69.17. 8.68 and 1.80 respectively for employers. emloyees, single workers and family workers. The percentages of cuI· tivators and agricultural labourers among the total workers are 8.08 and 8.68 respectively. Out of 39 female workers. 26 are employees. 2 are cultivators and the remaining 11 are agricultural labourers.
9-20 RGI/ND/89
295 39 100.00 100.00 100.00
Place of work
An analysis of the average distance to the place of work by occupation shows that 12 workers constituting 3.59 per cent of the total workers in the occupational category of highly skilled and supervisory manual travel the maximum average distance among aU the workers (If various types of occupations. The average distance to the place of work in their cases comes to 9.08 km. as against the average distance of 2.39 km. to the place of work of all the workers. Tht owners of factories and large shops etc. travel the least distance of 0.67 km. to their place of work.
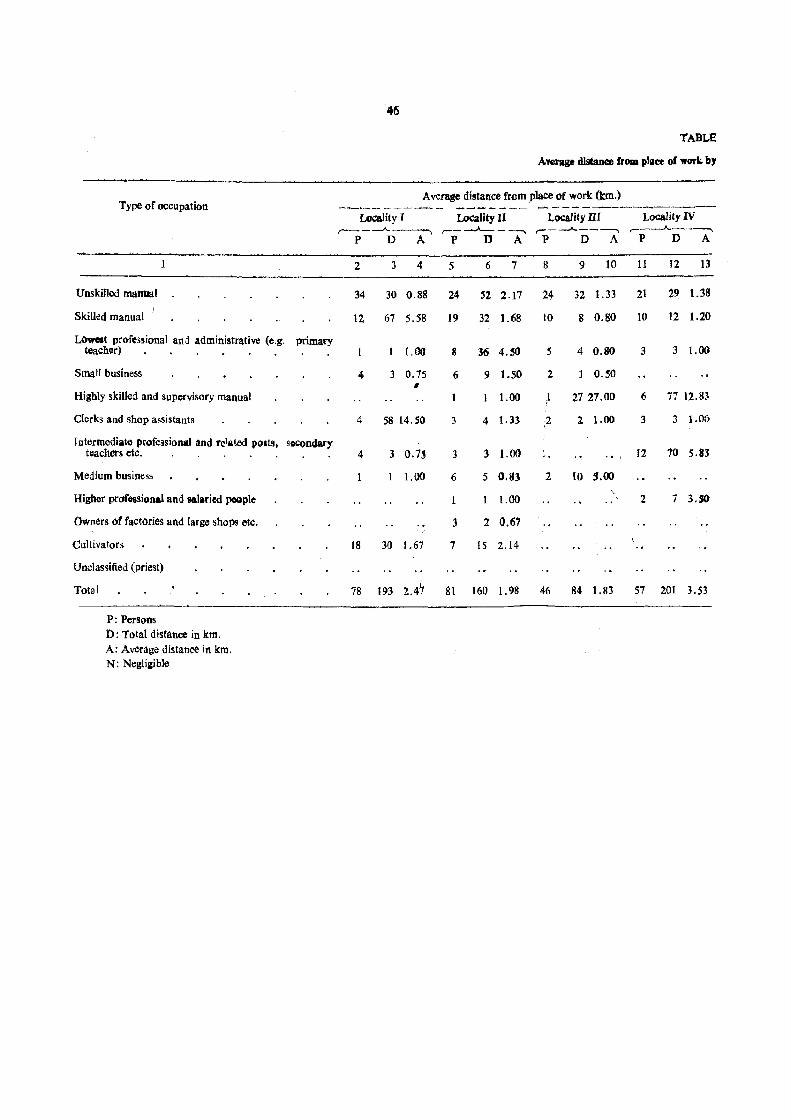
TABLE
AYerage dliltance frosa place of work by
Type of occupation Average distance from place of work (km.)
-.~------- --------- -------~----~----Lol:ality r LoCality U Locality m Locality IV
r-- _........A. --.-----. r-- _.J.-- - -~ r- - _J.". - - -----, ,-~ __ ..A... __ ~
P D A P D A P D A P D A
2 3 4 5 6 7 8 9 10 11 12 13
Unskilled manual 34 30 0.88 24 52 2.17 24 32 1.33 21 29 1.38
Skilled manual !
12 67 5.58 19 32 1.68 10 8 0.80 10 12 1.20
LOweIt profe"ional and administrative (e.g. primary teacher) . . . • . . (,00 8 36 4.~ 5 4 0.80 3 3 1.00
Small business 4 3 0.75 6 9 1.50 2 0.50 .. Highly skilled and supervisory manual 1.00 J 27 27.00 6 77 12.83
Clerks and shop a.sistants 4 58 14.50 3 4 1.33 2 2- 1.00 3 3 1.00
Intermediate professional and related posts, sOCQndary t@achers etc. . . . . . 4 3 ().7! 3 3 1.00 .. , 12 70 5.81
Medium busine,s 1.00 6 5 0.83 2 10 $.00
Higher profossional and IiIllaried poople 1.00 2 7 3.50
Owvers 01 factories and large shops etc. 3 2 0.67
Cultivators 18 30 1.67 7 15 2.14
Unc1as~ified (priest) .
Total 78 193 2.4~ 81 160 1.98 46 84 1.83 57 201 3.53
P: Persons D: Total distance in km. A: Average distance Itt km. N: Negliaib1e
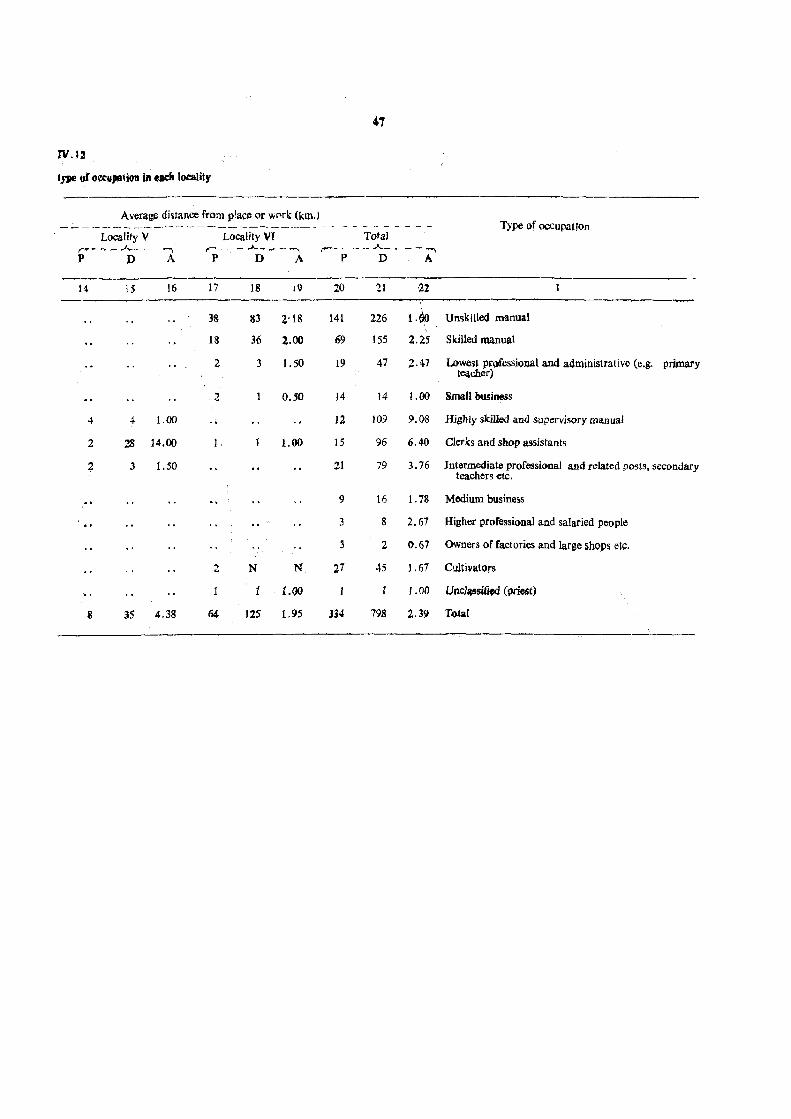
41
rv.1.3 tJ1)l of occupation ill .adllocalitr
Average distance from place or WC'rk (km.) Type of occupation ------------------------ .. ------------
Locality V Locality VI Total r""" ...... - - .,.)...,-- _,. - --.
,.-_.,- _.A- ___ .. ., ,.-- ____ .A._~ __ """'
P D A P D A P D A
14 15 16 17 18 19 20 21 n
38 83 2'18 141 226 1. <.\p Unskilled manual \
18 306 2.00 69 155 2.25 Skilled manual
2 3 1.50 19 47 2.4-7 Lowest pr()fessional and administrative (e.g. primary teacher)
2 0.50 14 14 1.00 Small iJusiness
4 4 1.00 12 109 9.08 Highly skilled and supervisory manual
2 28 14.00 1. t.00 15 96 6.40 Clerks and sh()p assistants
2 3 1.50 21 79 3.76 Intermediate professi()naJ and related posts, secondary teachers etc.
9 16 1. 78 Medium business
3 8 2.67 Higher pmfessi()naJ and salaried people
:1 2 0.61 Owners of factories and large shops etc.
2 N N 21 45 1.61 Cultivators
Loa 1.00 UncIMsitif4 (prifit)
8 35 4.38 64 125 1.95 U4 798 2.39 Total
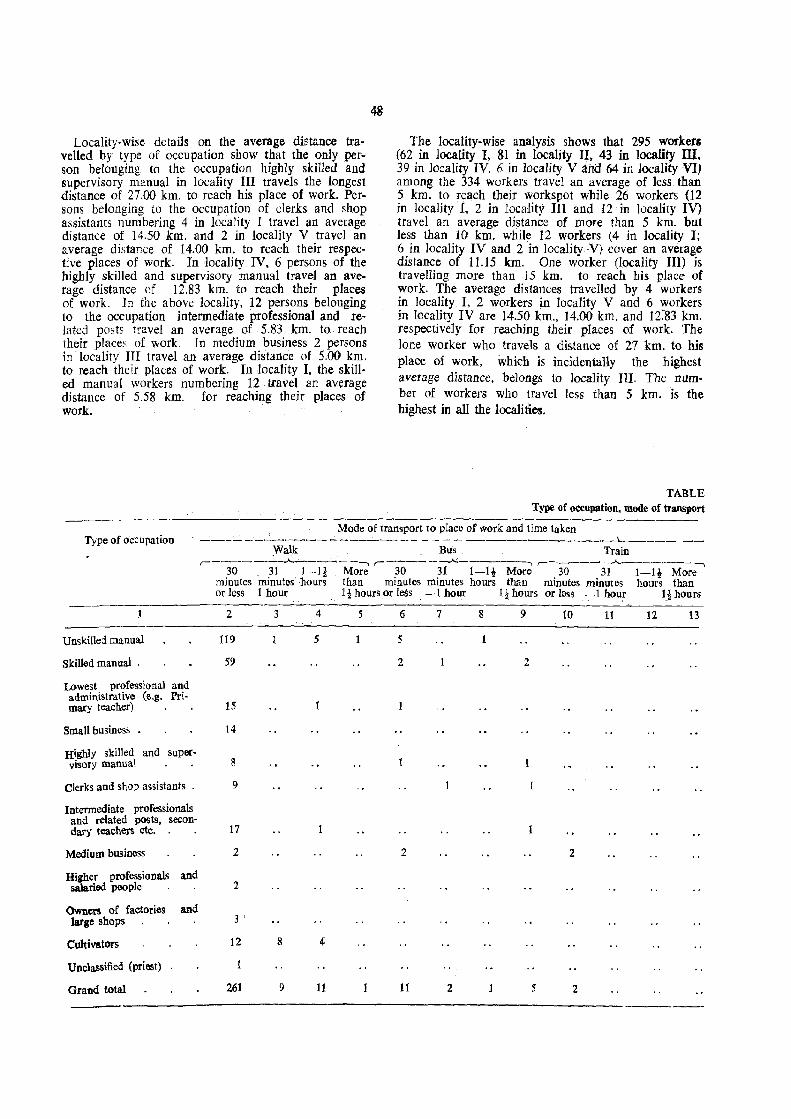
Locality-wise details on the average distance travelled by type of occupation show that the only person belonging to the occupation highly skilled and supervisory. manual in locality III travels the longest distance of 27.00 km. to reach his place of work. Persons belonging to the occupation of clerks and shop assistants numbering 4 in locality I travel an average distance of 14.50 km. and 2 in locality V travel an average distance of 14.00 km. to reach their respective places of work. In ,locality IV, 6 persons of the highly skilled and supervisory manual travel an average distance of 12.83 km. to reach their places of work. In the above locality, 12 persons belonging to the occupation intermediate professional and related posts travel an average of 5.83 km. to reach their places of work. In medium business 2 persons in locality III travel an average distance of 5.00 km. to reach their places of work. In locality I, the skilled manual workers numbering 12 travel an aVerage distance of 5.58 km. for reaching their places of work. .
48
The locality-wise analysis shows that 295 workers (62 in locality I, 81 in locality II. 43 in locality m. 39 in locality IV, 6 in locality V :1hd 64 in locality VI) among the 334 workers travel an average of less than 5 km. to r~ach their workspot while 26 workers (12 in locality I, 2 in locality III and 12 in locality IV) travel an average distance of more than 5 km. but less than 10 km. while 12 workers (4 in locality I; 6 in locality IV and 2 in locality V} cover an average distance of 11.15 km. One worker (locality III) is travelling more than 15 km. to reach his place of work. The average distances travelled by 4 workers in locality I, 2 workers in locality V and 6 workers in locality IV are 14.50 km., 14.00 km. and 12~83 km. respectively for reaching their places of work. The lone worker who travels a distance of 27 km. to his place of work, which is incidentally the highest average distance, belongs to locality IlI. The number of workers who travel less than 5 km. is the highest in all the localittes.
TABLE Type of occupation. mode of transport
---_ .. _-------------------------------------. Mode of transport to place of work and time taken·
Type of occupation . ~ ___ ---'--.---- --_____ -- - - - - ------------_-1.. __ ._- __ :Walk Bus Train
r------"'---..}t....---......:---~ r ----..::.... ----_,;..;_-----1 r-~-~ _A ___ .· ___ ~
30 31 1-1! More 30 31 I-I! More 30 31 I-Ii More minutes minutes' ·hours than minutes minutes hours than minutes minutes hours than orless Ihour . Ii hours or leSs -1 hour Ii-hours orless -1hour 1Jhours
Unskilled ma.nual
Skilled manual.
2
119
59
Lowest professional and administrative (e.g. Pri-mary teacher) 15
Small business . 14
Highly skilled and super-visory manual ., 8
Clerks and shop a~~istants . 9
Intermediate professionals and related posts. secon-dary teachers etc. 17
Medium business 2
Higher professionals and salaried people. 2
Owners of factories and large shops 3 '
Cultivators
Unclassified (priest)
Grand total
12
261
3
1
8
9
4 5
5 1
4
11
6
5
2
2
11
7 8 9 10 11 12
2
2
2 5 2

A peep into the mode of conveyance u!ed by the workers to reach their places of work and time taken. the details of which are given in the table below. shows that 282 reach. their places of work cn foot. Of these. 261 take 30 minutes or less. 9 take between 30 minutes and one hour, 11 take one hour to I-t hours and one takes more than 11- hours to reach their places of work. Bus is used by 19 workers to reach their places of work. Among these ]9 workers. it takes less than 30 minutes for 11 persons, between 30 minutes to one hour for 2 and one hour to I-t hours for one and more than 11 hours for 5 workers. There are two workers using tJ;llin as their mode of transport to reach their respective places of work and it takes less than 30 minutes for them. Cycle is the mode of transport to reach their respective places of work for 28 workers and the time taken is less than 30 minutes for all of them. Out of the remaining 3 workers, 2 workers use motor cycle and one uses jeep and the time taken' by these persons is less than 30 minutes in each case. Among the 282 workers who walk the distance to their places of work 126 are unskilled manuals while 59 are skilled manuals.
\ IV.13 to place of work and time taken
49
Mode of transport to place of work and time taken
While 24 such workers are cultivators, 18 workers are holding intermediate professional and lelated posts. The other workers who. use to walk to their places of w.ork are lower professIOnal (16); small business (14); hlghly skilled and supervisory manual (8); clerks and shoJ? assistants (9);. medium business (2); higher pro;fesslOnal and salaned people (2); owners of factories and large shops (3) and priest 0). Among the 19 w~rkers who use bus_ as mode of transport. 6 are unskilled and supervisory manual; clerks and shop assis~ tant~;\ medium business while one each is of lower professlO~al and of intermediate professional. All the workers who use train and motor cycle as their modes of transport to the workspot are engaged in medium business. Among the 28 workers using cycle. 9 workers belong to unskilled manual and 5 belong to skilled manual. There are 2 such workers each in the types of occupation of lowest professional; highly skilled and supervisory manual and intermediate professional and salaried posts. While 4 such WOf-
kers are clerks and shop assistants, 3 are cultivators.The lone worker who uses jeep is holding higher professional and salaried post.
---,.--- - Cyc\;- -----.-----M~t;~;~----------J;P--------r-"--- - - _A. - - - - - ---. ,-___ .A.._. - - - --, ,---- - ___ .A. ____ ._ __
30 31 1-11 More 30 31 I-Ii More 30 31 -I-It More' Type of occupation minutes minutes hours than minutes minutes hours than minutes minutes hours than or less _1 hour I! hours or less -1 hour 1 t hours or less -1 hour I! hours
14
9
5
2
2
4
2
3
28
15 16 17 18 19 20 21 22 23 24
..
2
2
25
Unskilled manual
Skilled manual
Lowest professional and administrative (e,g. mary teacher)
Pri-
Small business
Highly skilled visory manual
and super-
Clerks and shop assistants
Intermediate professionals and related posts, secon-dary teachers etc.
Medium business
Higher professionals and salaried people
Owners of factories and large shops
Cultivators
Unclassified (priest)
Grand total
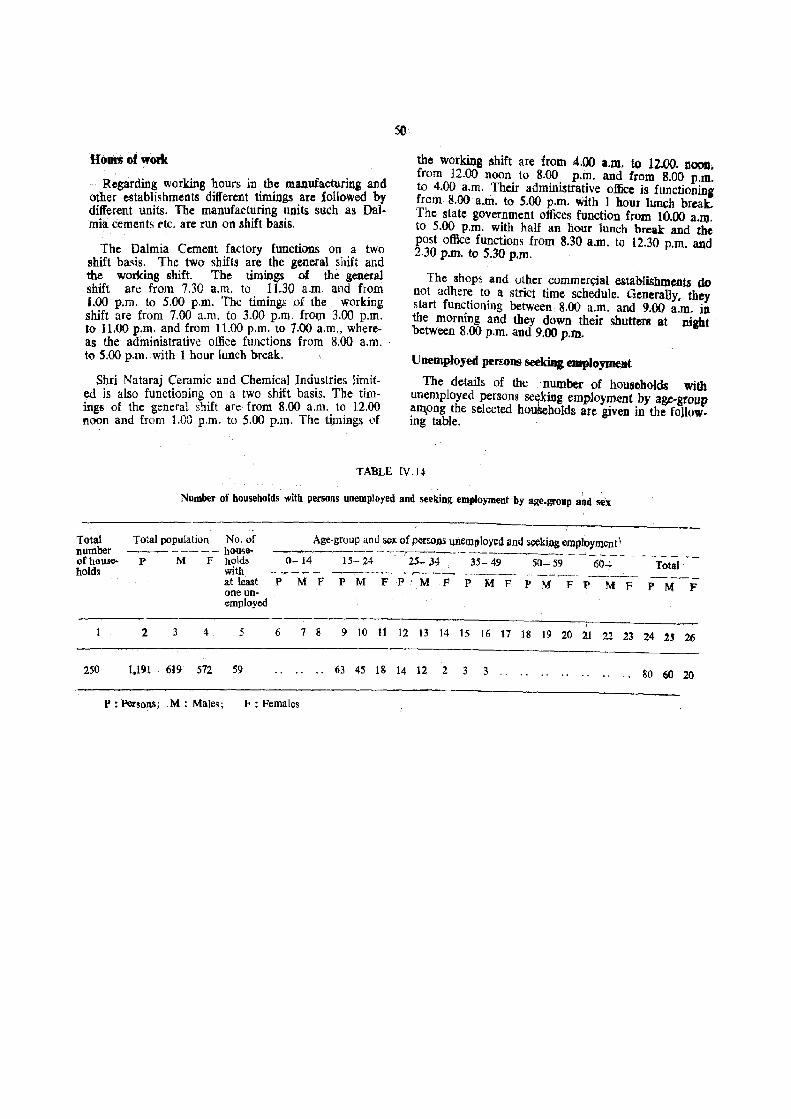
Hom of wOl'k Regarding working ~ours in. th.e manufacturioi and
other establishments dIfferent tumngs are followed by different units. The manufacturing lmits such as DalIl1ia cements t"tc. are run on shift basis.
The Dalmia Cement factory functions on a two shift basis. The two shifts are the general shift and the working shift. The timings of the general shift are from 7.30 a.m. to 11.30 a.m. and from 1.00 p.m. to 5.00 p.m. The timings of the working shift are from 7.00 a.m. to 3.00 p.m. from 3.00 p.m. to 11.00 p.m. and from 11.00 p.m. to 7.00 a.m., whereas the administrative office functions from 8.00 a.TIl. . to 5.00 p.m. with 1 hour lunch break.
Shri Nataraj Ceramic and Chemical Industries limited is also functioning on a two shift basis. The timings of the general shift are from 8.00 a.m .. t~ 12.00 noon and from l.00 p.m. to 5.00 p.m. The tlllllngs of
the working shift are from 4.00 a.m. to 12.00. noon. from 12.00 noon to 8.00 p.m. and from 8.00 p.m. to 4.00 a.m. Their administrative offk;e is function ina from 8.00 a.m. to 5.00 p.m. with 1 hour l~h break. The state government offices function from 10.00 a.m. to 5.00 p.m. with half an hour lunch break and the post office functions from 8.30 a.m. to 12.30 p.m. and 2.30 p.m. to 5.30 p.m.
The shops and other commerS;ial establishments do not adhere to a strict time schedule. Generally. they start functioning between 8.00 a.m. and 9.00 a.m. in the morning and they down their shutters at night between 8.00 p.m. and 9.00 p.m.
Unemployed perrons seeking employment.
The details of the number of househoJd8 with unemployed persons se~king employment by age-group am,ong the selected houSeholds ate given in the following table.
TABLE IV.14
Total number ofhOU5eholds
250
Number of households with persons unemployed and seeking employment by age. group a~d ~x
Total population No. of --- -- - - hou~e-
p M F holds
2 3 4
with at least one un· empI()yed
5
1.191 619 572 59
Age-group and sex of persons unemployed ilnd s~kiJl& emplpYIIlCJlt \ --_._-.__.- - ~ -r--___ ______________ __j, ________ ~ __
0- 14 15- 24 25- 34 35- 49 50- 59 60+ Total - -- -- . .....- _- -------_--- .. -- -~----- ~-.---- ._ .. _--- -~-.....-.- _- --- -P MF PM FP'MF PMFPM FP MF PM F
I
6 7 8 9 10 11 12 13 14 15 16 17 18 19 20 21 22 23 24 2J 26
.. 63 45 18 14 12 2 3 3 .. . . . . . . . . . . .. 80 60 20
P : Persons; M: Males; F : Females
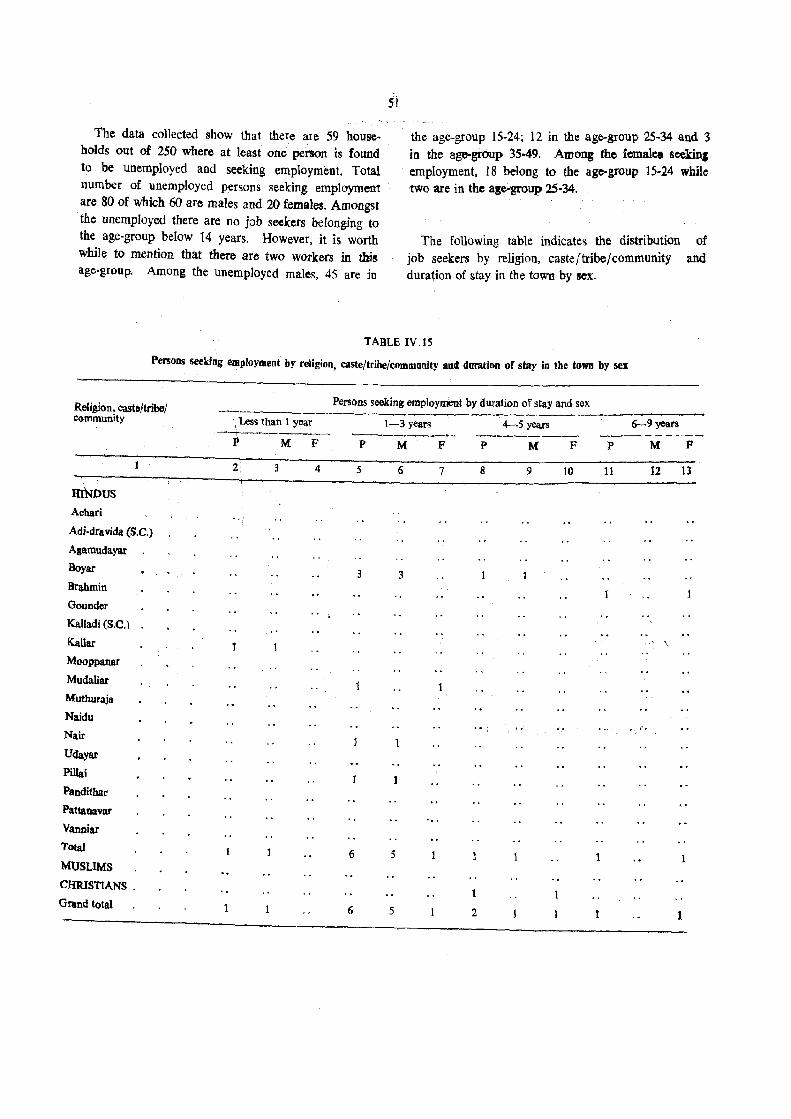
The data collected show that there are 59 households out of 250 where at least one person is found to be unemployed and seeking employment. Total number of unemployed persons seeking employment are 80 of which 60 are males and 20 females. Amongst the unemployed there are no job seekers belonging to the age-group below 14 years. However, it is worth while to mention that there are two workers in this age-group. Among the unemployed males, 45 are in
5i
the age-group 15-24; 12 in the age-group 25-34 and 3 in the age-group 35-49, Among the females seWn: employment, 18 belong to the age-group 15-24 while two ate in the ag~oup 25-34.
The following table indicates the distribution of job seekers by religion, caste/tribe/community and duration of stay in the town by sex.
TABLE IV.IS
Persons seekln~ employment by religion, caste/~ribe/commanity anel duration of stay in the town by sex
Religion. cast6/tribeJ community
lIJl..lDUS
Acbari
Adi-dravida (S.C.)
Agamuclayar
Boyar
Brahmin
Gounder
Kalladi (S.C.)
Kallar Mooppanar
Mudaliar
Muthuraja
Naidu
Nair
Udayar
Pi1Iai Panditbar
Pattanavar
Vanniar T()tal
MUSLIMS
CHRISTIANS .
Grand total
Persons seeking employment by duration of stay and sex -----~------~------~
, Less than 1 year 1-3 years --__,..__...------- -----.-----...__
P M F P M F
2'. 4 5 6 7
;'1
3 3
1 6 5
6 5
4--5 years --------~
1
2
P
8
M F
9 10
6-9 years
---------P M F
11 12 13
1
\
1
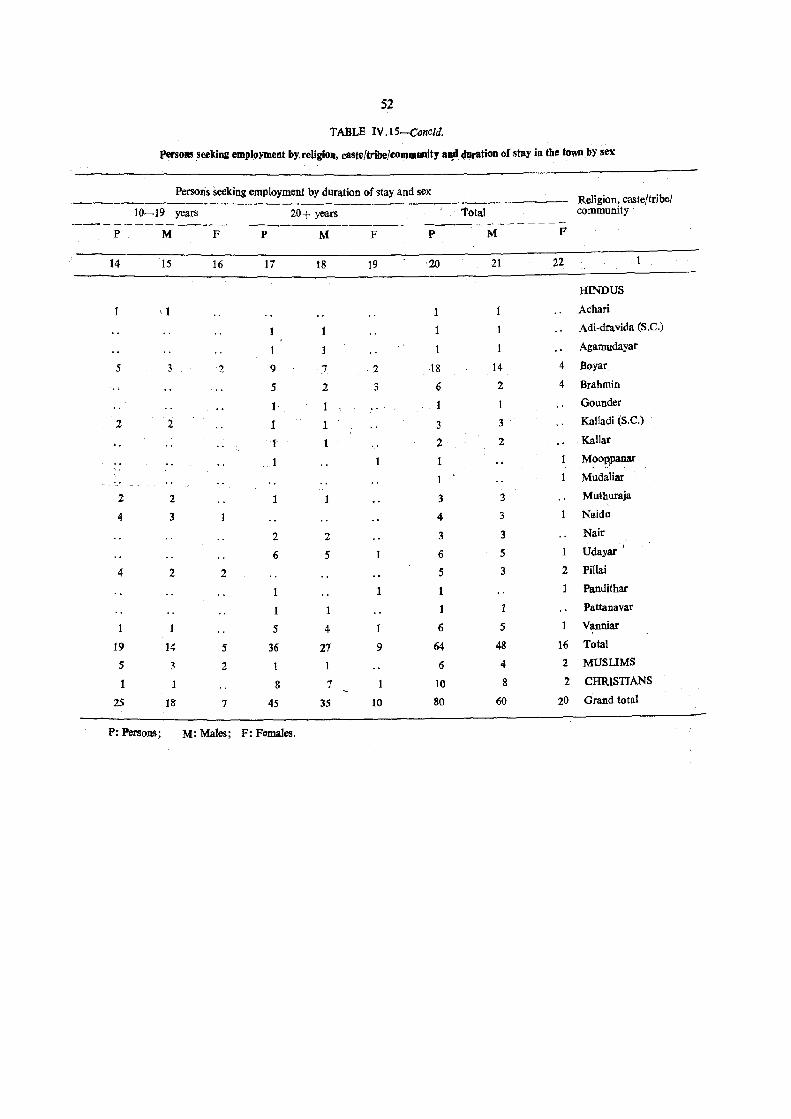
52
TABLE IV.lS-Concld.
Persons seeking empl_,yment by religion, caste/tribe/community a~d. duration of stay il,l the town by sex
Persons seeking employment by duration of stay and sex Religion, caste/tribe/
10-19 years 20+ years Total community
------------- -_---------- -~---...---~----P M F P M F P M F
14 15 16 17 18 19 20 21 22
HINDUS
\ 1 Achari
1 Adi-dravida (S.C.)
] t Agamudayar
5 2 9 7 ·2 18 14 4 Boyar
5 2 3 6 2 4 Brahmin
1· t Gounder
2 2 1 1 3 3 Kalladi (S.C.)
t 2 2 Kallar
.. 1 Moo~panar
Mudaliar
2 2 3 3 Muthuraja
4 3 4 3 Naidu
2 2 3 3 Nair
1 Udayar \
6 5 6 5
4 2 2 5 3 2 Pillai
Pandithar
Pattanavar
1 5 4 6 5 Vanniar , 19 14 5 36 27 9 64 48 16 Total
5 3 2 1 6 4 2 MUSUMS
I 8 7 10 8 2 CHRISTIANS
25 18 7 45 35 10 80 60 20 Grand total
P: Persons; M: Males; F: Females.
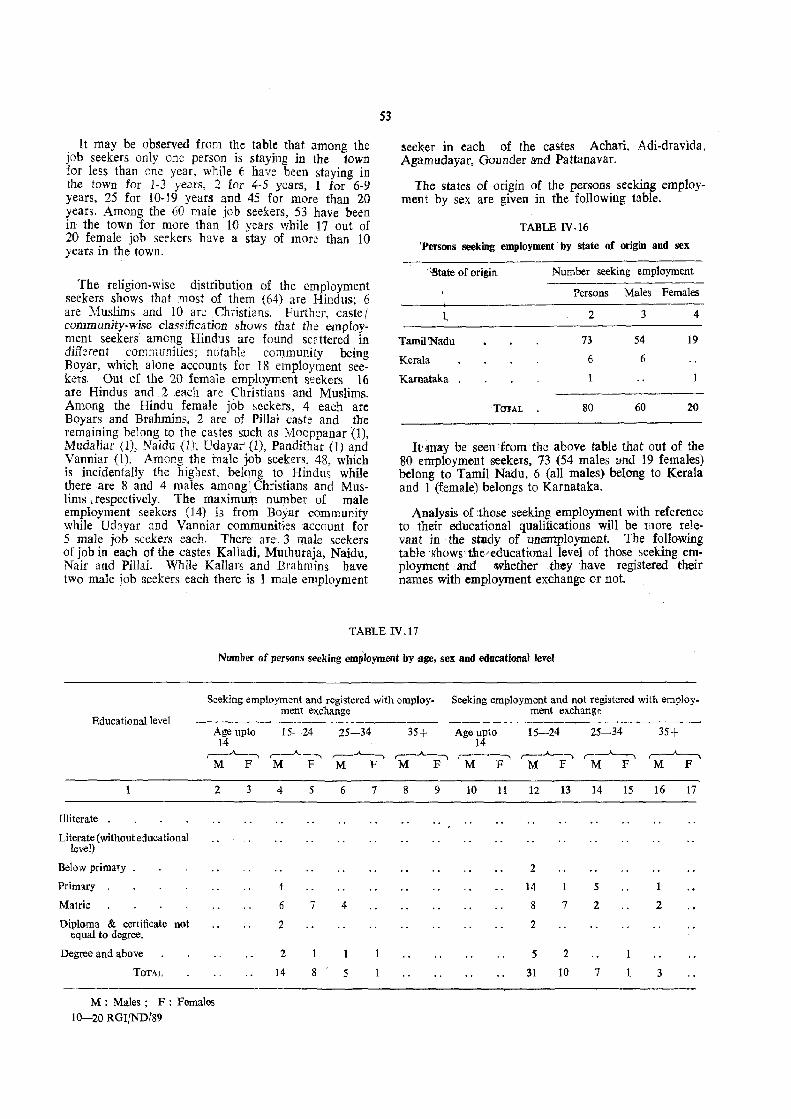
It may be observed from the table that among the job seekers only one person is staying in the town for less than one year, while 6 have been staying in the town for 1-3 years, 2 for 4-5 years, I for 6-9 years, 25 for 10-19 years and 45 for more than 20 years. Among the 60 male job seekers, 53 have been in the town for more than l() years while 17 out of 20 female job serkers have a stay of more than 10 years in the town.
The religion-wise distribution of the employment seekers shows that most of them (64) are Hindus; 6 are :Muslims and 10 arc. Christi2.ns. Further, caste f community-wise classification shows tbat the employment seekers among Hindus are found scattered in different communities; notable community being Boyar, which alone accounts for 18 employment seekers. Out of the 20 female employment seekers 16 are Hindus and 2 .e:J.ch are Christians and Muslims. Among the Hindu female job seekers, 4 each are Boyars and Brahmins, 2 are of Pillai car-te and the remaining belong to the castes such as Mooppanar {1), Mudaliar (1), Naidu (1), Udayar' (1), Pandithar {l) ap,d Vanniar (l). Amorg the male job seekers, 48, which is incidentally the highest belong to Hindus while there are 8 and 4 males among: Christians and Muslims \ respectively. The maximum number of male employment seekers (l4) is from Boyar community while Ud:lyar and Vanniar communiHes account for 5 male job seekers each. There are 3 male seekers of job in each of the castes Kalladi, Muthuraja, Naidu, Nair and Pi11ai. While KaHan; and Brahmins have two male job seekers each there is 1 male employment
53
seeker in each of the cas-tes Achari, Adi-dravida, Agamudayar, Gounder and Pattanavar.
The states of origin of the persons seeking employment by sex are given in the following table.
TABLE IV·16
'Persons seeking employment by state of origin and sex
:State of origin
1.
Tamil'Nadu
Kerala
Karnataka
Number seeking employment
Persons Males Females
2
73
6
1
80
3
54
6
60
4
19
20
It'may be seen from the above table that out of the 80 employment seekers, 13 (54 males and 19 females) -belong to Tamil Nadu, 6 (all males) belong to Kerala and I (female) belongs to Karnataka.
Analysis of those seeking employment with reference to their oollcational qualifications will be more relevant in the study of unemployment. The following table 'shows' the-educational level of those seeking employment and 'Whether they have registered their names with employment exchange or not.
TABLE IV.17
Number of persons seeking employment by age, sex and educational level
Seeking employment and registered whh emp1oy- Seeking employment and not registered with employ-ment exchange ment exchange
Educational level ------.------~-- - --_------ --- - - ~- .---....---~-----~--------.-
Age upto 15-24 25-34 35+ Age upto 15~24 25-34 35+ 14 14
r---"--, ,---'--, ,-_..A.-, ,_..A._, r----, ,..--.A._, ,-_...._____, ,-"'------, M F M F M F M F M F M F M F M F
2 3 4 5 6 7 8 9 10 11 12 13 14 15 16 17
Illiterate
Literate (without duca!ional level)
Below primary 2
Primary 4 14 1 5 1
Matric 6 7 4 8 7 2 2
Diploma & certificate not 2 2 equal to degree.
Degree and above 2 5 2 1
TOTAL 14 8 5 31 10 7 1. 3
M: Males; F: Females
10-20 RGI/NDI89
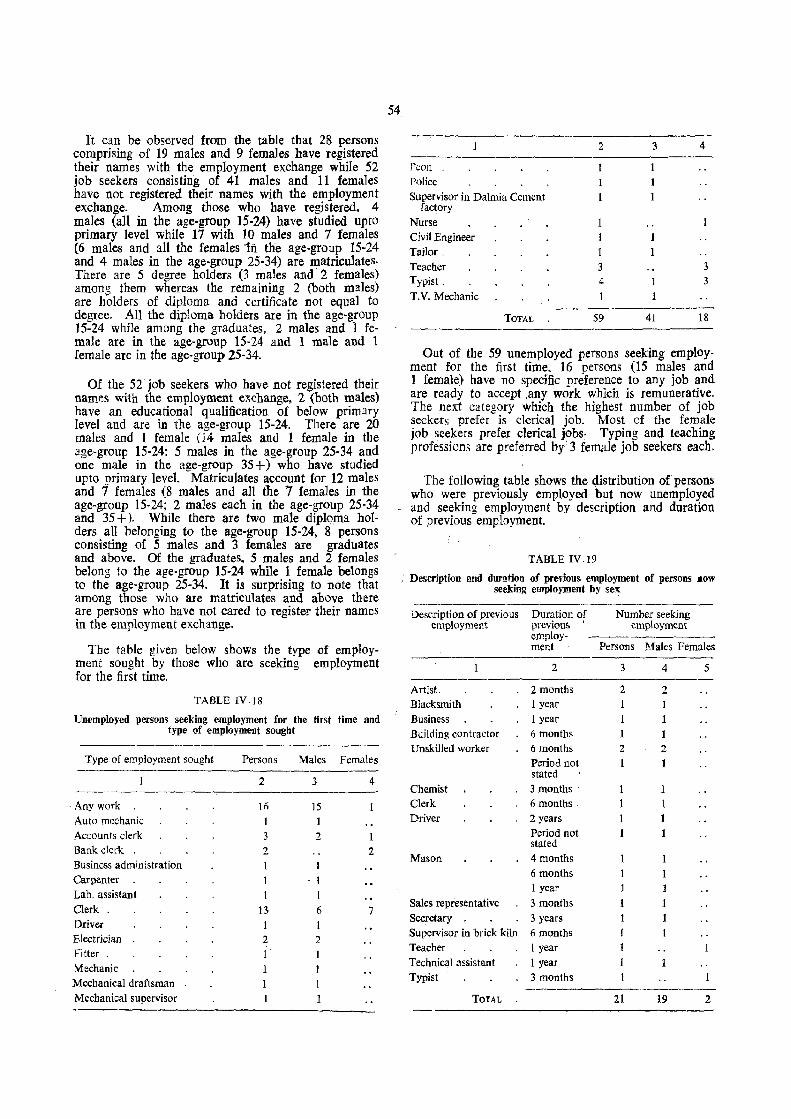
It can be observed from the table that 28 persons comprising of 19 males and 9 females have registered their names with the employment exchange while 52 job seekers consisting of 41 males and 11 females have not registered their names with the employment exchange. Among those who have registered. 4 males (all in the age·group 15·24) have studied upto primary level while 17 with 10 males and 7 females (6 males and all the females In the age-group 15·24 and 4 males in the age-group 25·34) are matriculates. There are 5 degree holders (3 males and 2 females) among them whereas the remaining 2 (both males) are holders of diploma and certificate not equal to degree. All tlie diploma holders are in the age-sroup 15·24 while among the graduates, 2 males and 1 female are in the age-group 15-24 and 1 male and 1 female are in the age-group 25-34.
Of the 52 job seekers who have not registered their nam~s with the employment exchange. 2 (both males) have an educational qualification of below primary level and are in the age-group 15-24. There are 20 males and 1 female (14 maies and 1 female in the age-group 15-24: 5 males in the age-group 25-34 and one male in the age-group 3S +) who have studied upto primary level. Matriculates account for 12 males and 7 females (8 males and all the 7 females in the age-group 15-24; 2 males each in the age-group 25-34 and 35 +). While there are two male diplQma holders all belonging to the age-group 15-24, 8 persons consisting of 5 males and 3 females are graduates and above. Of the graduates, 5 males and 2 females belong to the age-group 15-24 while 1 female belongs to the age-group 25-34. It is surprising to note that among those who are matriculates and above there are persons who have not cared to register their names in the employment exchange.
The table given below shows the type of employment sought by those who are seeking employment for the first time.
TABLE lV.18
Unemployed persom seeking employment for the first time and type of employment sought
Type of employment sought
. Any work
Auto mechanic
Accounts clerk
Bank clerk .
Business administration
Carpenter .
Lab. assistant
Clerk.
Driver
Electrician Fitter .
Mechanic Mechanical draftsman
Mechanical supervisor
Persons
2
16
3
2
13 1 2
Males
3
15
1
2
6
2
1
1
Females
4
2
7
54
Peon .
Police
Supervisor in Dalmia Cement factory
Nurse
Civil Engineer
Tailor.
Teacher Typist.
T.V. Mechanic
TOTAL
2
3
4
59
3
41
4
3 3
18
Out of the 59 unemployed persons seeking emplOyment for the first time. 16 persons (15 males and 1 female} have no specific preference to any job and are ready to accept ,any work which is remunerative. The next category which the highest number of job seekers prefer is clerical job. Most of the female job seekers prefer clerical jobs. Typing and teaching professions are preferred by 3 female job seekers each.
The following table shows the ~istribution of persons who were previously employed but now unemployed
, and seeking employment by description and duration of previous employment.
TABLE IV.19
, Description and duration of predous employment of persons now seeking employment by sex
--------------Description of previous Duration of Number seeking
employment previou!)' employment
Artist.
Blacksmith
Business
Building contractor
Unskilled worker
Chemist
Clerk
Driver
Mason
Sales representative
Secretary .
Supervisor in brick kiln
Teacher
Technical assistant
Typist
TOTAL
employ- --------men! Persons !>/fales Females
2
2 months 1 year
1 year
6 months 6 months
Period not stated
3 months 6 months
2 years
Period not stated
4 months
6 months 1 ycar
3 months
3 years
6 months
I year
1 year
3 months
3
2
2 1
4
2
1 1
2
1
1 1
1
1
5
------.--------21 19 2
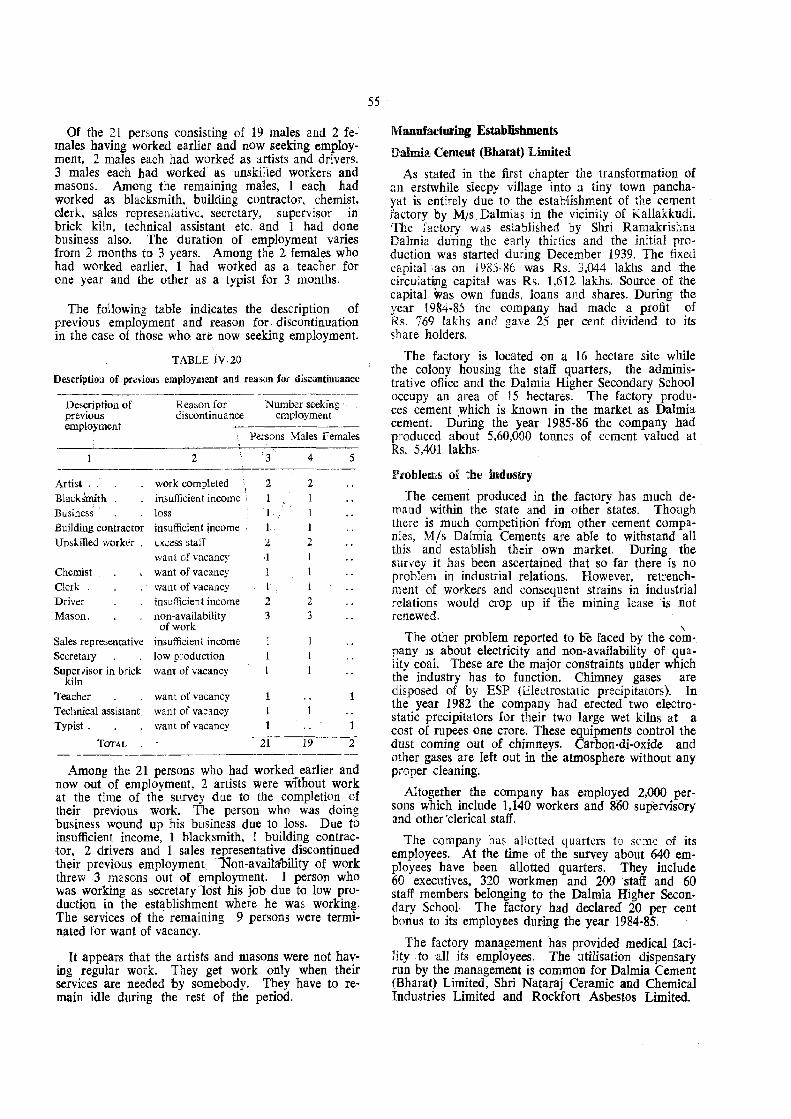
Of the 2l persons consisting of 19 males and 2 females having worked earlier and now seeking employment, 2 males each had worked as artists and drivers. 3 males each had worked as unskilled workers and masons. Among the remaining males. 1 each had worked as blacksmith, building contractor, chemist. derk, sales representative, secretary, supervisor in brick kiln. technical assistant etc. and 1 had done business also. The duration of employment varies from 2 months to 3 years. Among the 2 females who had worked earlier, 1 had worked as a teacher for one year and the other as a typist for 3 months.
The following table indicates the description of previous employment and reason for. discontinuation in the case of those who are now seeking employment.
TABLE IY.20
Description of PUViOU5 employment an!l reason for disc{)ntinuance --------.--~~~---.-~.--. -----_ .. _
Description of Reason for Number seekIng previous discontinuance employment employment
Persons Males Females
2 '3 4 5 -----~---~.-.-. .. _-----Artist. work completed 2 2 Black~lnith insufficient income \
Business loss
Building contIactor insufficient income .
Unskilled worker . cxc.::ss staff 4 2 wailt (jf vacancy 1
Chemist , want of vacancy
Clerk want of vacancy 1
Driver insufficient income 2 2 Mason. non-availability 3 3
of work Sales representative insufficient income Secretary low production 1
Supervisor in brick want of vacancy 1 kiln
Teacher want of vacancy
Technical assistant. want of va~ancy Typist. want of vacancy 1
TOTAL 21 19 2
Among the 21 persons who had worked earlier and now out of employment, 2 artists were without work at the time of the survey due to the completion of their previous work. The person who was doing business wound up his business due to loss. Due to insufficient income, 1 blacksmith. 1 building contractor, 2 drivers and 1 sales representative discontinued their previous employment '"'Non-availability of work threw 3 mEsons out of employment. 1 person who was working as secretary leist his job due to low production in the establishment where he was working. The services of the remaining 9 persons were terminated [or want of vacancy.
It appears that the artists and masons were not having regular work. They get work only when their services are needed by somebody. They have to remain idle during the rest of the period.
5S
l\fanufadurlng &tab1isbments
Dalmia Cement (Bharat) Limited
As stated in the first chapter the transformation of an erstwhile sleepy village into a tiny town panchayat is ent:rely due to the establishment of the cement factory by MiS Dalmias in the vicinity of Kallakkudi. The factory was established by Shri Ramakris:ma Dalmia during the early thirties and the initial production was started during December 1939. The fixed capital as on 1985-86 was Rs. 3,044 lakhs and the circulating capital was Rs. 1,612 lakhs. Source of the capital ~as own funds, loans and shares. During the year 1984-8;' the company had made a profit' of Rs. 769 lakhs and gave 25 per cent dividend to its share holders.
The factory is located on a 16 hectare site while the colony housing the staff quarters, the administrative office and the Dalmia Higher Secondary School occupy an area of 15 hectares. The factory produces cement which is known in the market as Dalmia cement. During the year 1985-86 the company had produced about 5,60,000 tonnes of cement valued at Rs. 5,401 lakhs·
Problems oi the industry
The cement produced in the factory has much demand within the state and in other states. Though there is much competition from other cement companies, Mis Dalmia Cements are able to withstand all this and establish their own market. During the sUr'{ey it has been ascertained that so far there is no problem in industrial relations. However,' .retrenchment of workers and consequent strains in industrial relations would crop up if The mining lease ·is not renewed.
\ The other problem reported to De faced by the com-
pany is about electricity and non-availability of quality coal. These are the major constraints under which the industry has to function. Chimney gases are disposed of by ESP (Electrostatic precipitators). In the year 1982 the company had erected two electrostatic precipitators for their two large wet kilns at a cost of rupees one crore. These equipments control the dust coming out of chimneys. Carbon-di-oxide and other gases are left out in the atmosphere without any proper cleaning.
Altogether the company has employed 2,000 perSOIlS which include 1,140 workers and 860 supervisory and other'clerical staff.
The company has allotted quarters to s(' me of its employees. At the time of the survey about 640 employees have been allotted quarters. They include 60 executives, 320 workmen and 200 staff and 60 staff members belonging to the Dalmia Higher Secondary School· The factory had declared 20 per cent bonus to its employees during the year 1984-85_
The factory management has provided medical faciHty . to all its employees. The utilisation dispensary run by the management is common for Dalmia Cement (Eharat) Limited, Shri Nataraj Ceramic and Chemical Industries Limited and Rockfort Asbestos Limited.
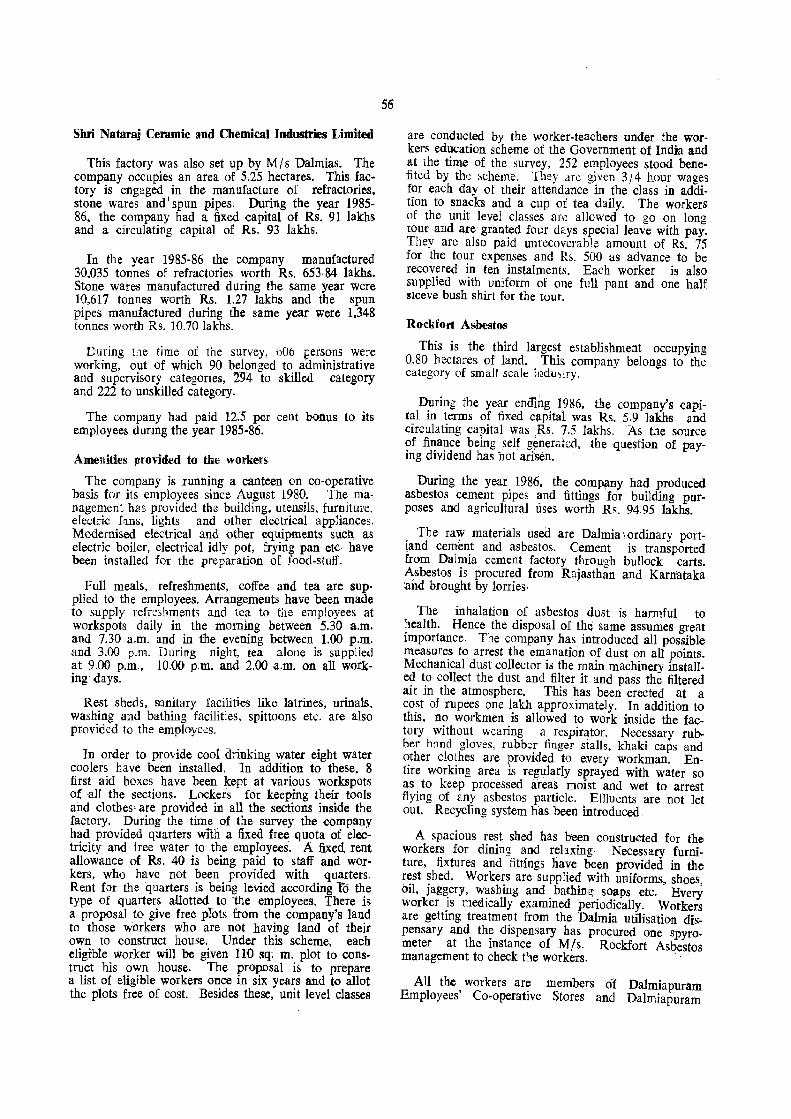
Shri Nataraj Ceramic and Chemica) Industries Limited
This factory was also set up by MIs Dalmias. The company occupies an area of 5.25 hectares. This factory is engaged in the manufacture of refractories. stone wares and I spun pipes. During the year 1985-86, the company had a fixed capital of Rs. 91 lakhs and a circulating capital of Rs. 93 lakbs.
In the year 1985-86 the company manufactured 30.035 tonnes of refractories worth Rs. 653-84 lakhs. Stone wares manufactured during the same year were 10,617 tonnes worth Rs. 1.27 lakhs and the spun pipes manufactured during the same year were 1,348 tonnes worth Rs. 1O.70Iakhs.
During (1e time of the survey, 606 persons were working, out of which 90 belonged to administrative and supervisory categories, 294 to skilled category and 222 to unskilled category.
The company had paid 12.5 per cent bonus to its employees durmg the year 1985-86.
Amenities provided to the workers
The company is running a canteen on co-operative basis for its employees since August 1980. The management has provided the building, utensils, furniture. electric £:ins, lights and other electrical appliances. Modernised electrical and other equipments suc~ as electric boiler, electrical idly pot, frying pan etc· have been installed for the preparation of food-stuff.
Full meals. refreshments, coffee and tea are supplied to the employees. Arrangements have been made to supply refreshments and tea to tile employees at workspots daily in the morning between 5.30 a.m. and 7.30 a.m. and in the evening between 1.00 p.m. and 3.00 p.m. During night. tea alone is supplied at 9.00 p.m., 10.00 p.m. and 2.00 a.m. on all working days.
Rest sheds, slanitary facilities like latrines, urinals, washing and bathing facilities, spittoons etc. are also provided to the employees.
In order to provide cool drinking water eight water coolers have been installed. In addition to these, 8 first aid boxes have been kept at various workspots of £11 the sections. Lockers for keeping their tools and clothes· are provided in all the sections inside the factory. During the time of the survey the company had provided quarters Willi a fixed free quota of electricity and free water to the employees. A fixed rent allowance of Rs. 40 is being paid to staff and workers, who have not been provided with quarters. Rent for the quarters is being levied according TO the type of quarters aBotted to the employees. There is a proposal to give free prots from the company's land to those workers who are not having land of their own to construct house. Under thIS scheme, each eligible worker will be given 110 sq: m. plot to construct his own house. The proposal is to prepare a list of eligible workers once in six years and to allot the plots free of cost. Besides these, unit level classes
56
are conducted by the worker-teachers under tbe workers education scheme of the Government of India and at the time of the survey, 252 employees stood benefited by the scheme. They arc given 3/4 hour wages for each day of their attendance in the class in addition to snacks and a cup of tea daily. The workers of the unit level classes are allowed to go on long tour and are granted four days special leave with pay. They are also paid unrecoverable amount of Rs. 75 for the tour expenses and Rs. 500 as advance to be recovered in ten instalments. Each worker is also supplied with uniform of one full pant and one half sleeve bush shirt for the tour.
Rockfort Asbestos
This is the third largest establishment occupying 0.80 hectares of land. This company belongs to the category of small scale 1ndu~lry.
During the year endihg 1986, the company's capital in terms of fixed cllpital was Rs. 5.9 lakhs and circulating capital was .Rs. 7.5 lakhs. As the source of finance being self generakd, the question of paying dividend has not arisen.
During the year 1986. the com~ny had produced asbestos cement pipes and fittings for building purposes and agricultural uses worth Rs. 94.95 lakhs.
. The ra,?, materials used are Dalmia' ordinary portLand cement and asbestos. Cement is transported from Dalmia cement factory through bullock carts. Asbestos is procured from Rajasthan and Karnataka :and brought by lorries·
The inhalation of asbestos dust is harmful to health. Hence the disposal of the same assumes great importance. The company has introdUced all possible measures to arrest the emanation of dust on all points. Mechanical dust collector is the main machinery installed to collect the dust and filter it and pass the filtered air in the atmosphere. This has been erected at a cost of rupees one lakh approximately. In addition to this, no workmen is allowed to work inside the factory without wearing a respirator. Necessary rubber hand gloves, rubber finger stalls, khaki caps and other clothes are provided to every workman. Entire working area is regularly sprayed with water so as to keep processed areas moist and wet to arrest flying of any asbestos particle. Ettluents are not let out. Recycling system has been introduced
A spacious rest shed has been constructed for the workers for dining and relaxing. Necessary furniture. fixtures and fittings nave been provided in the rest shed. Workers are supplied with uniforms shoes oil, jag~ery, w~shing and. bathing. soaps etc. ' Every worker .IS mechcally exammed penodically. Workers are gettmg treatment from the Dalmia utilisation dis. pensary and the dispensary has procured one spyrometer at the instance of Mis. Rockfort Asbestos management to check the workers. .
All the workers are members of Dalmiapuram Employees' Co-operative Stores and Dalmiapuram
Employees Co-operative Bank. They get provisions from the stores every mo:gth against recoveries from wages. Co-operative Bank lends loans to the extent of 8 times of the monthly wages to their workers 011
contingencies. /
AU the workers of the factory are members of Dahnia Recreation Club. Indoor and outdoor game facilities are provided. In addition to this, there is a fully equipped library for the workers.
The company, being a small scale industry, has not provided housing accommodation to its workers. Since the workers are from nearby villages almost everybody is having his own house. However, some executives and staff members have been provided with accommodation . in the Dalmia residential quarters on rent. With a view to improve the workers' education tm fa~ory has introduced the workers education scheme of the Government of Ind1a: in the factory. The company used to depute workers to various ·training programmes, seminars. and competitions. conducted by productivity cOUIicils especially by Tiruchchirappalli Productivity Council.
The company> had started its production in 1971. T~e main products of the c~mpany are AC pipes and fittings for. building purP9ses alld lift irrigation schemes. The company gives priority to supplies to the lift water irrigation scheme: - The products are mainly marketed within the state ano ill the adjoin" ing Ketala State. Demands from Kamataka and Andhra Pradesh are also partially met.
The company faces muca competition for its products in the market. The management is of the view that they are surviving merely on the quality of their pr?ducts, service to their dealers and their policy on pnces. •
From the beginning, the company has been paying 20 per cent bonus to its workers· With regard to industrial relation the company maintains a smooth relation with its employees. They are practising the principle of "One union for one industry". Hence only one union Exists viz. "Rockfort Asbestos National Workers Union", affiliated to INTUC. In addition to these, the company has constituted one benevolent fund for the benefit of its employees. From this fund small regular financial aids are given to the needy employees.
The management is of the opinion that perhaps they are the only company pay!ng central excise duty among the manufacturers of AC pipes and fittings. During 1987-88 budget the government has increased the tariff rate from 15 per cent to 25 per cent ad valorem. The company feels this is too much for them to }:ay ana they are seeing tbis measure as a disincentive to the enterprising units.
Akbar Saw Min
Thi! milI located at Chiaam haram SaIai was established during November, 1986. The mill is engaged
57
in sawing and sizing of timber into different sizes as required by the customers.
The mill has a fixed capital of Rs. 2 lakhs which includes a loan of Rs. 83,000 taken from the Bank of Thanjavur Limited. The circulating capital of the mill was Rs. 25,000 during the year 1985-86.
The mill employs four persons which include a manager, a skilled worker, an Ullskilled worker and a helper.
Th~ mill earns an income of abuut Rs. 36,000 per year. . This establishment is not paying any bonus to its employees. Being a small unit accommodation facility has not been provided to its workers.
Ayy:::ppan Engineering Works
This unit, located in bazaar street, was established during the year 1984. The company was started with ~m investment of Rs. 20,000 and has been engaged III the manufacture of buckets, grills, iron gates and windows.
. The establi~hment has employed. five persons whichmclude 2 SkIlled workers, 2 unskilled workers and one manager.
The establishment is paying Rs. 100 as exgratia payment to skilled workers and Rs. 50 to unskilled workers at the time of Diwali.
Hirutraya Gin:1ing Mill
.Th.is ':las. started in 1953. The capacity of the mIll IS gmnmg of 3,000 kg. of kappas cotton in each shif!. There are four gins. . The mill functions only durmg the season from Apnl to August. Thel\C are 2 male and 9 female workers. It is fun by electricity. The raw materials are got from farmers. The output are lint cotton and seeds. While lint cotton is supplied to the spinning mills in Erode, the seeds are sent to manufacturers of cattle feed.
Antnoni Muthu Udayar Rice, Flour and Rotary Mits
This mill, located in ward 4, was established during the year 1982. The mill occupies an area of 0.06 hectares. and employs 5 persons which include one opera;tor and 4 helpers.
The mill has a fixed capital of Rs. 1.5 lakhs and circulating capital of Rs. 15,000 during the period 1985-86· The mill bad earned a profit of Rs. 5,000 during the year 1985-86 and had distributed an amount of Rs. 1,000 as bQnus to its employees.
The establishment is engaged in dehusking of paddy, shelling of millet, grinding of grains, chilly etc. and crushing of oil seeds.
Lakdlmi Sf!UD Pipe Company
It was started in 1969. It produces spun pipes of various sizes ranging from '100 mm. to 900 mm. The
company meets the demands from farmers as well as from government depaftments. Generally farmers require pipes 0: smaner dimension while government departments require pipes of larger dimensions. The annual turn over of tae company is Rs. 7 to 10 lakhs. There, are 2 supervisors and, 9 workers· The reqJ.lired raw materials are cement and iron rods. The cement is obtained from Dalmia cement company while the iron rod' is procured from Tiruchchirappalli. Well water is being used for curing. 3 H.P. motor is used for lifting the water while 15 H.P. motor for packing the mixer to manufacture the pipes .. cement and gravel are mixed wi:b the help of 3 JtP. motors. The required sand is brought from Kallagam odai and other nearby places. -Gravel is brought from Podalur, 25 km. away from Kallakkudi by lorries. It is financed by the }i.}an from Tamil Nadu Industrial Investment Corporation.
Bahl, ~f'lln Pipe Con1¥any I
This corr:p~ny is ~,sist,r ¢oncern .of Lakshmi Spun Pipe 'company; It Was esuyblished iri the year 1987. This company also 'manuf~ttures I spun pipes of various A,izes. The ,annual tapllover is Rs. 2 to 3 lak~s. It has got loan from TIIC. I There are 7 wo~kers l~ the company. The procurem~nt\>f raw matenals anti method of manufa~turing 01 ispun pipeS are the same
, as,in Lakshmi Spul} Pipe (i;onipany. /
Com."Ilerdal E3tah~ishmHds
Ananth Tedmi~l Institute (Typewriting)
This institute, located at balmia main road. was established during flie year 1964. At the time of the survey the institute was offering coaching to 45 students, comprising of 32 m.ales and 13 females. Th~re is one instructor. The classes are of 1 hour duratIOn between 7 a.m. and 7' p.m: The institute is having 10 machines and charges Rs, 20 per student as tution fee per month.
Nirmala Typewriting I~sti~u,te
This institute started duriqg 1972 offers coaching only to female students. ~oth l(English .an~ Tamil. ~pin~ are being taught. lYnhke tqe other l11stltute. th1S mstltute is having two instruc.tors at .thy time of the survey. A monthly tuition fee of R~. 20 is beiJig collected frOm the students. i
• ' ,! I During the year 1987 a free teaching scheme to
teach 25 sl.udents at the instance of the Soda1 We1-fare Dep~rtmenti was introduced. The above departme~t offers aid to this scheme.
I .
, Nj~'a Scwhg Training Instl:filte·
This institute was established in 1987. At the time ofl the survey the institute was having 15 female stud,nts. The institute which is exclusively meant for f~male students, is having one instructor with 20 s wing maChines.
" I
Sf B!u!dng Esmb1il.'.nments
, "
Plmjab N~'tion.al Bank
A }?rancl,l of this bank has been functioning in Ka:Uakkudi' from 21-4-1967. There are II members working at present in the branch. It consISts of one manager, 'one officer, eight clerks (including one cashier) and ,one sub-staff. At the end of 1986, the deposit in the banK for 1986 was to the tune of Rs. 130.34 lakhs and 'the advanc~s paid was to the lune of Rs. 50.59' lakhs. There was a profit Of Rs.. 13.46 IaJcl,ls ..for 6 months period between July. 1986 .,and December, 1986. . . ,
Bank of 'fk3njll:vuri
This bank also has II: btanch in Kallakkudi. This branch was started on 25~11-68. I There are 6 members of staff wider its esfaolishment which includes one manager, three clerks and tW9 sub-staff. This, branch mobiHsed B; deposit of Rs. 55.38 lakhs durin!.. 1986 anti the advances paid was R$. 18.42 lakl:\s as on 31-12-86. It earned a profit of ·Rs. 0.48 Jakhs during the above year. ' ,
, ',i ' DaJmiapuian;i EmployetlS' Co-ogerativ~ Bank .
" \ I ~' Dabniapu\:am Employees' Co-opera v~ 1\rift ,and.
Credit ~ociety, established in Augu, st"1'1953{~as, been upgradeP ,to .+he status of a bank WIth .~t 'irom 1-3-196(i. '1 The bank offers c~dit facilities to its'mem, bers to meet,their financial needs. The ~pl9Yees of Dalmia Cements. Shri Nafaraja 'Cerafrlics~ Rook Fort Afbestos, D.C.B. Higher Seco:ldary S:hpol and D~C.B. Co-()perative .Stores are eligible t¢ b~-i!OIn,e members., I~ has 1,740 members in its roll 4-t present. The number of members was 1.920 as' 00: 3a:4-1986. The pai41 up share capital was Rs. 16,9$,599 as, on. 30-4-1986. The maximum borrowing power of a member is Rs. 12,000. The rate of interest levied is 13 per cent at present. Jewel loan upto the extent of Rs~ 10,000 is given at a rate of interest of 1 (j per ·cent. The bank has declared a dividend of 12 per cent to its share; holders. The estabLisbment of the bank has 19 personS in its roll. It bas e.arned a profit of Rs. 6J2,874.32 during, the co-operative year 1984-85'. All sorts of banking, transactions are undertaken for the benefit of its members. The bank has been accommodated in the Dalmia compound on a nominal rent. '
KaUakkuJs PJiJnru<y, Co .. operatil'e Bank
This bank was started in 1967 to issue various ioans such as agricultural loan, jewel loan, small industries loan, medium term loan for purchase of live stock, gobar gas loan etc. The area of operation of the bank extends to the neighbouring viUages viz. Kallagam, Keelarasur, Me1arasur!!lld Muduvathur besides Kallakkudi. It runs five co-operative village shops also of which two are in Kallakkudi itself. It supplies ration articles to its members besides textiles. The number of members was 2,981 in 1983-84; 3,246 in 1984 .. 85 and 3,40IVin 1985-86. 'The 'paid

up share capital was Rs. 91,837 in 1983-84; Rs. l,11,234 in 1984-E5 and Rs. 1,22,813 in 1985:-fffi in addition ta the government share af Rs. 40.000. .As the repayment of loans by members is not regular, the loan overdue fwm members is increasing every year and hence the bank is at present running -at a loss. The loss during 1985-86 was Rs. 93.743.
Chit Fund
At the time of the survey, one chit fund viz· Pandyan Chit Fund was functioning in the town. This was established during the year 1956. During the survey period there were 30 groups of chit with 6{){) members involving an amount of Rs. 12.60 lakhs. The chit fund had distributed an amomit of Rs. 7 hkhs during the accounting year 1986, netting a (~O'11missian of Rs. 35,000· The chit fmld after incurring an expenditure of Rs. 30.000 on estabi'ishment, stationery, advertisement etc. had earned a profit of Rs. 5.000 during the above accounting yea~_
MO:iey Lenders
Apart from the above chit fund, four money lenders, viz. Muthu Finance. Kumarappa Finance, Shri Ananda Finance and Meenakshi Finance were also functioning in the town.
Among these. MuthlJ Finance, started in February 1986. has distributed an amount of Rs. 25,000 (Rs. 20,QOO within the town and Rs. 5,000 in the rural areas) as on May 1987. During the above period Kumarappa Finance has distributed an amount of Rs. 70,000. This includes Rs. zro.OOO distributed within the town and eRs. 30,000 distributed in the rural areas. In case of Ananda Finance, it had distributed altogether Rs· 25,000 which includes Rs. 10,000 within the town and Rs. [5,000 in the rural areas. Meenakshi Finance had distributed an amount of Rs. 50,000, of which Rs. 30,000 within the town and Rs. 20,000 in the rural areas.
Like any other money lenders these.· money lenders also accept gold / silver jewellery and other household items as surety. Generally 90 per cent of the clients used to redeem tbeir articles within 3 months.
Other Establishments
Dalmia Cements (BhaTt) lLimiterl Employee~' Cooperative Milk Sup'ply Society Limited
This society, as the name shows, functions on cooperative basis with 125 shares. 100 shares are owned by Mis Dalmia and the remaining 15 shares are owned by others. The value of each share is Rs. 25· At the time of ilie survey tIiere were '169 heads 'Of cattle out of which 34 were milchcows. 22 dry ones, 9 working bulls, T stud bulls and tlie remaining WI were calves of different ages. Among them 59 were female calves and 42 male calves. Working bulls .are used to transport company's materials in bullock(,'lrts. Tl-Je company pays Rs. 25 per trip. The management and maintenance of the society have aI-
59
ready been dealt witli in detail in the previous chap-ter. •
Eml':oyees' State Insur:uce Corporation
There is a small office of the Employees' State In~ surance Corporation to look after the medical facilities of the workers of the cement factory etc. There are four persons employed in this office.
Offi~ of the Ass~tant CoHedol' of Central Excise
This office was established in 1978 and is housed within the Dalmia compound. There are one su~rintendent. eight inspectors and one sepoy.. ThIS office is responsible for issue and renewal of hcences: conducting survey in the factories; scrutiny and _classification of price lists filed by assessees; checklllg of raw material accounts; collection of cess on oils; sugar efc. and collection of basic. additional and special excise duties etc. During 1985-86. a sum of Rs. 22.641 crores was collected as excise duty.
As already stated there are no hotels I restaurants in the town dese'tvin~ any mention. However, there, are some sm~l1 hotels by the side of Dalmia main road and bazaar street mainly catering to the lor-al population.
The main eating houses located by the side o! Dalmia main road are Sci Narayana Hotel Mohanra] Tea Stall Lakshmi Vilas Coffee and Meals Hotel, Sri Bomb~y Tea Stall and Cool Drinks and Madurai Muniyandi Vilas Coffee and Meals Hotel.
Among these, Mohanraj Tea. Stall and Madura! Muniyandi Vilas are non-vegetanan hotels. Lakshml Vilas Coffee and Meals Hotel and Sri Narayana Hotel attract more number of customers. On an average 250 customers visit Sri Narayana Hotel and 300 customers visit Lakshmi Vilas Coffee and Meals Hotel every day. The rest of the eating houses are visited by customers ranging from 150 to 250 per day·
The hotels situated at bazaar street are Xavier Coffee Bar. Alayar Visalam Bar, Ayyanar Coffee B3.r, Ravi Chandra . Tea and Coffee Bar, Ganapathy Vilas Tiffin and Meals Hotel, Srinivasa Tea Stall and Pitchai Tea StaB. Among these, Xavier Coffee Bar, Alayar Vilasam Bar and Ayyanar Coffee Bar are non-vegetarian hotels. Ganapathi Vilas Tiffin and Meals Hotel, as the name shows, serves meals apart from serving tea. coffee and snacks. None of these hotels provides lodging facilities.
Market
KalIakkudi town is not having lany seasonal ar weekly markets. People buy their needs in grocery, clothes. vegetables, etc. from the shops located by the sides of Dalmia main road and bazaar area. No specific pattern is being followed in establishing shops. Except mutton stalls, all other shops are found mixed.
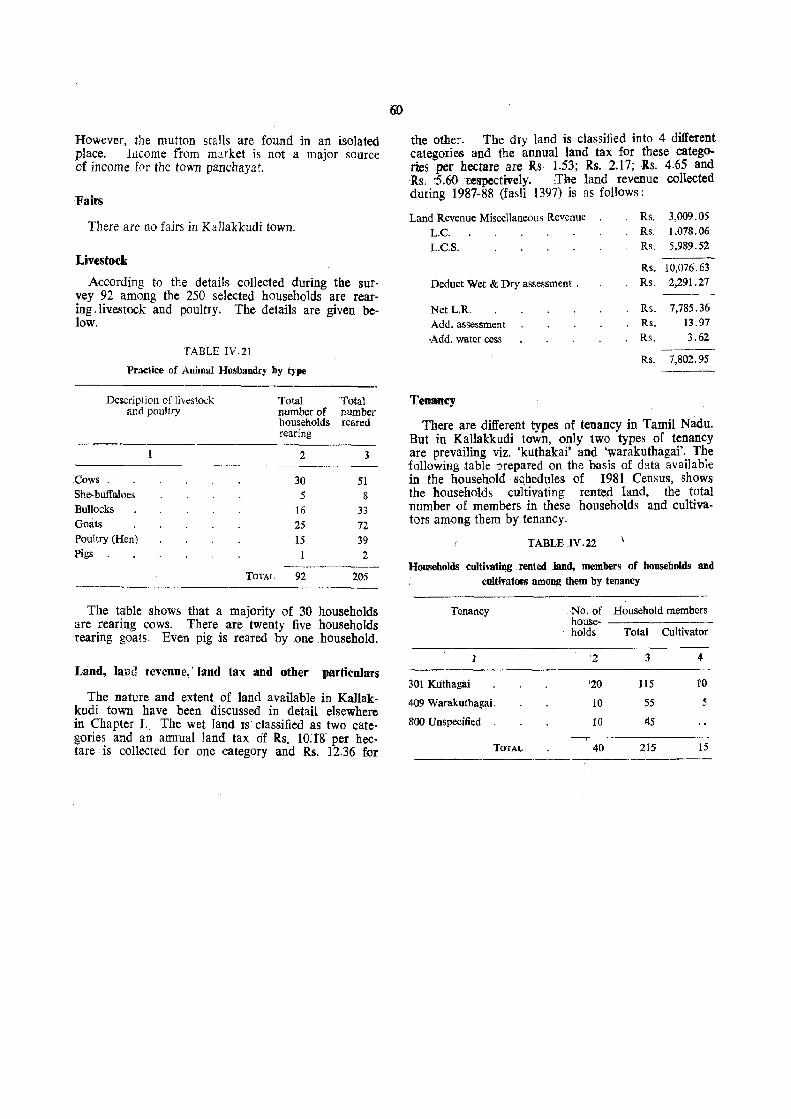
However, the mutton stalls are found in an isolated place. Income Irom market is not a major source of income for the town panchayat.
'Fairs
There are no fairs in Kallakkudi town.
Lirvestock
According to the details collected during the survey 92 among the 250 selected households are rearing .lh!estock and poultry. The details are given below.
TABLE IV.21
Pradice of Animal Husbandry by type
Description of livestock Total and poultry number of
households rearing
-----2
Cows. 30 She-buffaloes 5 Bullocks 16 Goats 25 Poultry (Hen) 15 Ap 1
TOTAL 92
Total number reared
3
51 8
33
72 39 2
205
The table shows that a majority of 30 households are rearing cows. There are twenty five households rearing goats. Even pig is reared by one household.
Land, lrulJd revenue,' land tax and other particulars
The natuTe and extent of land available in Kallak-kudi town have been aiscussed in detail elsewhere in Chapter I.. The wet land IS classified as two cate-gories and an annual land tax df Rs. 1O:[S per hec-tare is collected for one category and Rs. 12.36 for
6D
the other. The dry land is classified into 4 different categories and the annual land tax for these catego. ries per hectare are Rs· 1.?3; Rs. 2.17; Rs. 4.65 and Rs. :5.60 respectively. The Jand revenue collected during 1987-88 (fasli 1397) is as follows:
Land Revenue Miscellaneous Revenue Rs. 3,009.05
L.C. Rs. 1,078.06
L.C.S. Rs. 5,989.52
Rs. 10,076.63
Deduct Wet & Dry assessment . Rs. 2,291.27 ---
Net L.R. Rs. 7,785.36
Add. assessment Rs. 13.97
Add. water cess Rs. 3.62
Rs. 7,802.95 ----
Ten_MY
There are different types of tenancy in Tamil Nadu. But in Kallakkudi town, only two types of tenancy are prevailing viz. 'kuthakai' and 'warakuthagai'. The following ,table prepared on the basis of data available in the household sc_hedules of 1981 Census, shows the households cultivating rentep land, the total number of members in these households and cultivators among them by tenancy.
TABLE IV.22
Households cultivating rented Jand, members of households and
cultivators among them by tenancy
Tenancy No. of Household members house-holds Total Cultivator
1 2 3 4
JOI Ktithagai '20 115 10
409 Warakuthagai. 10 55 5
800 Unspecified 10 45
TOTAL 40 215 15 ._-----
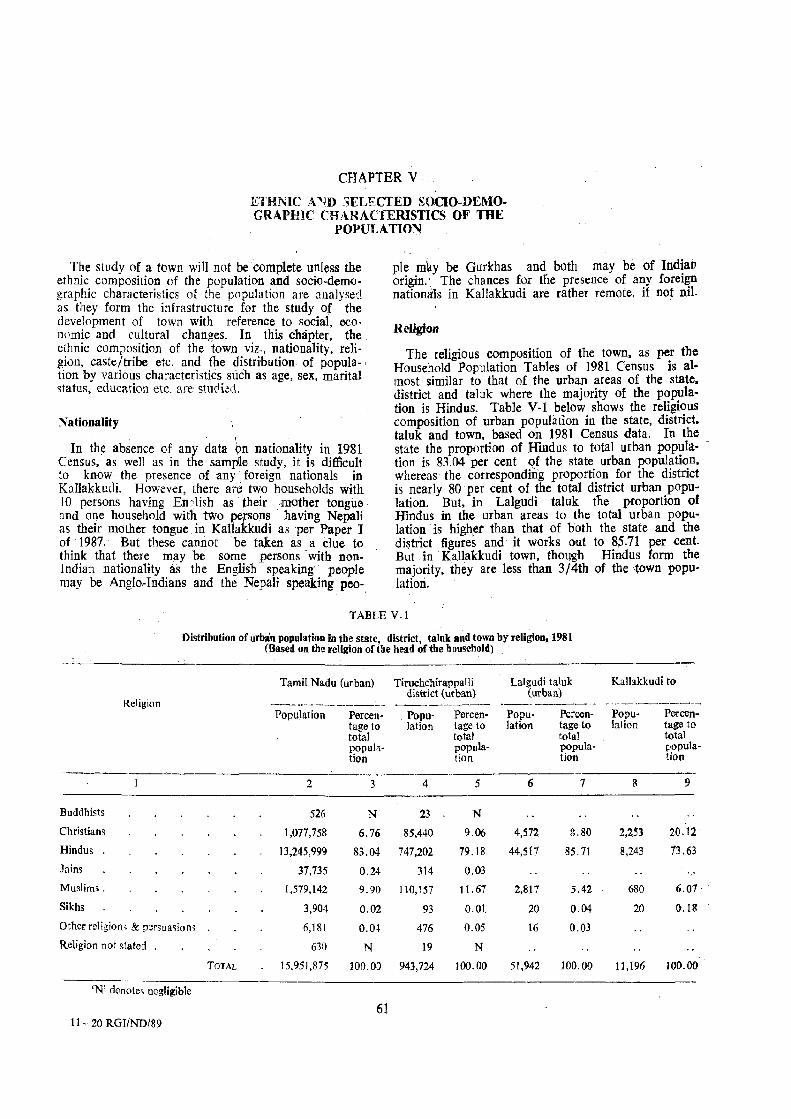
CHAPTER V
ETHNIC A~D :JELECfED SOClO-DEMOGRAPHIC CHARACTERISTICS OF mE
POPUI,ATION
The study of a town will not be complete unless the ethnic composition of the population and socia-demographic characteristics of the population are ana lyse-:! as they form the infrastructure for the study o.f the development of town with reference to social, economic and cultural changes. In this chapter, the ethnic composition of the .town viz., nationality, religion, caste/tribe etc. and tbe distribution of popula-, tion by various characteristics such as age, sex, marital status, education etc. are studied.
Nationality \
In the absence of any data <>n nationality in 1981 Census, as well as in the sample study, it is difficult to know the presence of any foreign nationals in Kanakkudi. However. there arel two households with 10 persons having En2Iish as their mother tongue and one household with two persons having Nepali as their mother tongue in Kallakkudi as per Paper I of 1987. But these cannot be taken as a clue to think that there may be some persons with nODIndian nationality as the English speaking people may be Anglo"Indians and the Nepali speaking peo-
pIe may be Gurkhas and both may be of Indiav origin.' The chances for tlie presence of any foreign natiomrls in Kallakkudi are rather remote, if not nil.
Religion
The religious composition of the town, as per the Household Population Tables of 1981 Census is almost similar to that of the urban areas of the state, district and taluk where the majority of the population is Hindus. Table V-l below shows the religious composition of urban population in the state, district. taluk and town, based on 1981 Census data. In the state the proportion of lfllldus to total urban popula- -tion is 83.04 per cent of the state urban population. whereas· the corresponding proportion for the district is nearly 80 per cent of the total district urban population. But, in Lalgudi taluk the proportion of Hindus in the urban areas to the total urban population is high,er than that of both the state and the district figures and it works out to 85.71 per cent. But in Kallakkudi town, though Hindus form the majority, they are less than 3/4th of the town population.
TABLE V.l
Distribution of urban population in the state, district, taluk and town by religion, 1981 (Based on the religion ofthe head of the household)
Tamil Nadu (urban) Tiruchchirappalli Lalgudi taluk district (urban) (urban)
Religion ---.--~~--. -~---. ---------- .---- -------Population Percen- Popu- Perc en- Popu- Percen-
tage to lation tage to lation tage to total total total popuh- popula- popula-tion lion tion
--"--2 3 4 5 6 7
Buddhists 526 N 23 N
Christian~ 1,077,758 6.76 85,440 9.06 4,572 8.80
Hindus 13,245,999 83.04 747,202 79.18 44,517 85,71
Juins 37,735 0,24 314 0.03
Muslims. 1,579,142 9.90 llO,157 11.67 2,817 5.42
Sikhs 3,904 0.02 93 0.01 20 0,04
Other reli]:ion~ & persua~iom 6,181 0.04- 476 0.05 16 0.03
Religion not stated 630 N 19 N
TOTAL 15,951,875 100.00 943,724 100.00 51,942 100,00
'N' denotes negligible
6J 11-20 RGI/ND/89
Kallakkudi t()
--._- .~----__.-Popu- Percen-lation tage to
total popula-tion
8 9
2,253 20.12
8,243 73.63
680 6.07
20 0.18
11,196 100.00
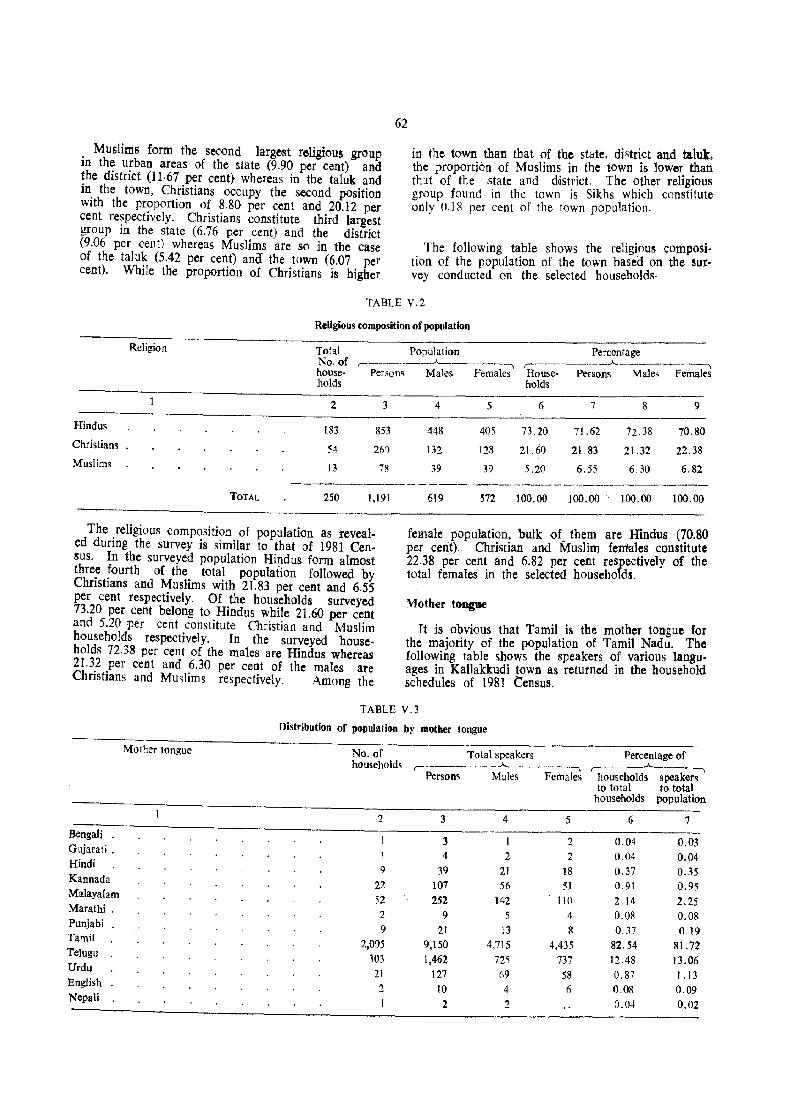
62
Muslims form the second largest religious group in the urban areas of the state (9.90 per cent) and the district (11·67 per cent} whereas in the taluk and in the town, Christians occupy the second position with the proportion of 8.80 per cent and 20.12 per cent re~pectively. Christians constitute third largest group III the state (6.76 per cent) and the district (9.06 per cent) whereas Muslims are so in the case of the taluk (5,42 per cent) ana the town (6.07 per cent). While the proportion of Christians is higher
in the town than that of the state, district and taluk, the proportion of Muslims in the town is lower than th11 of the state and district. The other religious group found in the town is Sikhs whkh constitute only 0.18 per cent of the town population.
The following table shows the religious composition of the population of the town based on the survey conducted on the selected households·
TABLE V.2
Religious composition of population
Religion Total Population Percentage No. of ,-___ ._. ___ ..A._ _____ ,
house- Persons Males Females holds
r---- _..--~- _..A..._~ ___ .....-~_~
2 3
1.83 853 Hindus
Christians
Muslims 54 26')
13 78
TOTAL 250 1,191
The religious composition of population as revealed during the survey is similar to that of 1981 Census. In the surveyed population Hindus form almost three fourth of the total population followed by Christians and Muslims with 21.83 per cent and 6.55 per cent respectively. Of the households surveyed 73.20 per cent belong to Hindus while 21.60 per cent and 5.20 per cent constitute Christian and Muslim households respectively. In the surveyed households 72.38 per cent of the males are Hindus whereas 21.32 per cent and 6.30 per cent of the males are Christians and Muslims respectiVely. Among the
4 5
448 405
132 128
39 39
House- Persons Males Females holds
6 7 8 9
73.20 71.62 72 38 70.80
21.60 21.83 21.32 22.38
5.20 6.55 6.30 6.82
619 572 100.00 ]00.00 100.00 100.00
female population, bulk of_ them are Hindus (70.80 per cent).. Christian arid Muslim feniales constitute 22.38 per cent and 6.82 per cent respectively of the total females in the selected households.
,",other tongue
It is obvious that Tamil is the mother tongue for the majority of the population of Tamil Nadu. The fonowing table shows the speakers of various languages in Kallakkudi town as returned in the household schedules of 1981 Census.
TABLE V.3
Dist~ibution of population by mother tongue
Mother tongue No. of Total speakers Percentage of households ,-----. .. - --"--_ .. -._.-._ .. _-.... ,--------"--------,
Persons Males Females households speakers to total to total
households population
2 3 4 5 6 7 Bengali
3 2 0.04 0.03 Gujarati . 1 4 2 2 0.04 0.04 Hindi
9 39 21 IB 0.37 0.35 Kannada 22 107 56 51 0.91 0.95 Malayalam 52 252 142 110 2.14 2.25 Marathi . 2 9 5 4 0.08 O.OB Punjabi 9 21 13 8 0.37 0.19 Tamil
2,005 9,150 4,715 4,435 82.54 81.72 Telugu 303 1,462 725 737 12.48 13.06 Urdu 21 127 69 58 0.87 1.13 English 2 10 4 6 0.08 0.09 Nepali
2 2 0.04 0.02
63
DISTRIBUTION OF POPULAT10N ~ELIGION (Survey DablJ-
BY
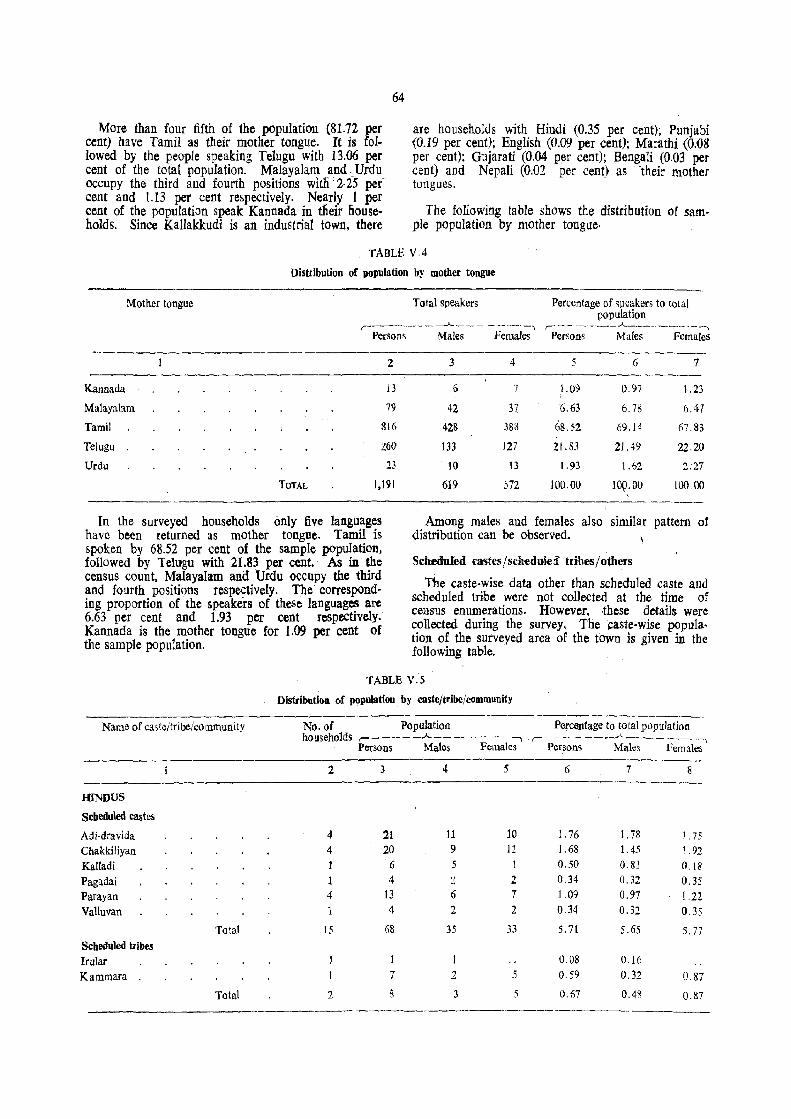
More than four fifth of the population (81.12 per cent) have Tamil as their mother tongue. It is followed by the people speaking Telugu with 13.06 per cent of the total population. Malayalam and Urdu occupy the third and fourth positions witli 2·25 per cent and 1.13 per cent respectively. Nearly 1 per cent of the population speak Kannada in tIieir nouseholds. Since Kallakkudi is an industrial town, there
64
are households with Hindi (0.35 per cent); Punjabi (0.19 per cent); English (0.09 per cent); Marathi (0.08 per cent); Gujarati (0.04 per cent); Bengali (0.03 per cent) and Nepali (0.02 per cent) as -'their mother tongues.
The following table shows the distribution of sample population by mother tongue·
TABLE VA
Distribution of population by mother tongue
Mother tongue Total speakers Percentage of speakers to total population
r----~---- - _A __ - - -----, ,.---------.--~-.-./------.---.---_."
Persom Males Females Persons Males Females
2
Kannada 13
Mab,)'alam 79
Tamil 816
Telugu ~60
Urdu 23
TOTAL 1.191
In the surveyed households only five languages have been returned as mother tongue. Tamil is spoken by 68.52 per cent of the sample population, followed by Telugu with 21.83 per cent. As in the census count. Malayalam and Urdu occupy the third and fourth p0sitions res~tively. 1]1e' corresponding proportion of the speakers of these languages are 6.63 per cent and 1.93 per cent respectively. Kannada is the mother tongue for 1.09 per cent of the sample population.
3 4 5 6 7
6 7 1.09 0,<;)7 1.23
42 37 6.63 6,71\ 6,47
42& 383 68.52 69.14 67.83
133 127 2;1.83 21.49 22.20
10 13 1.93 1.62 2.27
619 572 100.00 100·00 100.00
Among males and females also similar pattern of distribution can be observed.
Scheduled castes / sch~dule:l tribes / others
The caste-wise data other than scheduled caste and scheduled tribe were not collected at the time of cellSUS enumerations. However. these details were collected during the survey. The caste-wise population of the surveyed area of the town is given in the following table.
TABLE V.5
Name of c<\,te/tribe/community
HINDUS
Scheduled castes
Adi-dravida
Chakkiliyan Kalladi Pagadai Parayan VaUuvan
Scheduled tribes Irular Kammara .
Total
Total
Distribution of population by caste/tribe/community
No. (}f Population Percentage to total population households ,- _____ A. ___ .---- -, r-- -- -----~'----,.-- .. --.,
Ponoos Males Females Persons Males Female>
2
4 4
4
15
2
3
21 20
6
4 13 4
68
1
7
8
4 5
11 10 9 11 5 1 :! 2 6 7
2 2
35 33
2 5
3 5
6 7 8
1. 76 1.78 J.75 1.68 1.45 1.92 0.50 0.81 0,18 0.34 0.32 0.35 1.09 0.97 1.22 0,34 0.32 0,35
5.71 5.65 5,77
0,08 0.16
0.59 0.32 0.87
() 67 0.48 0.87
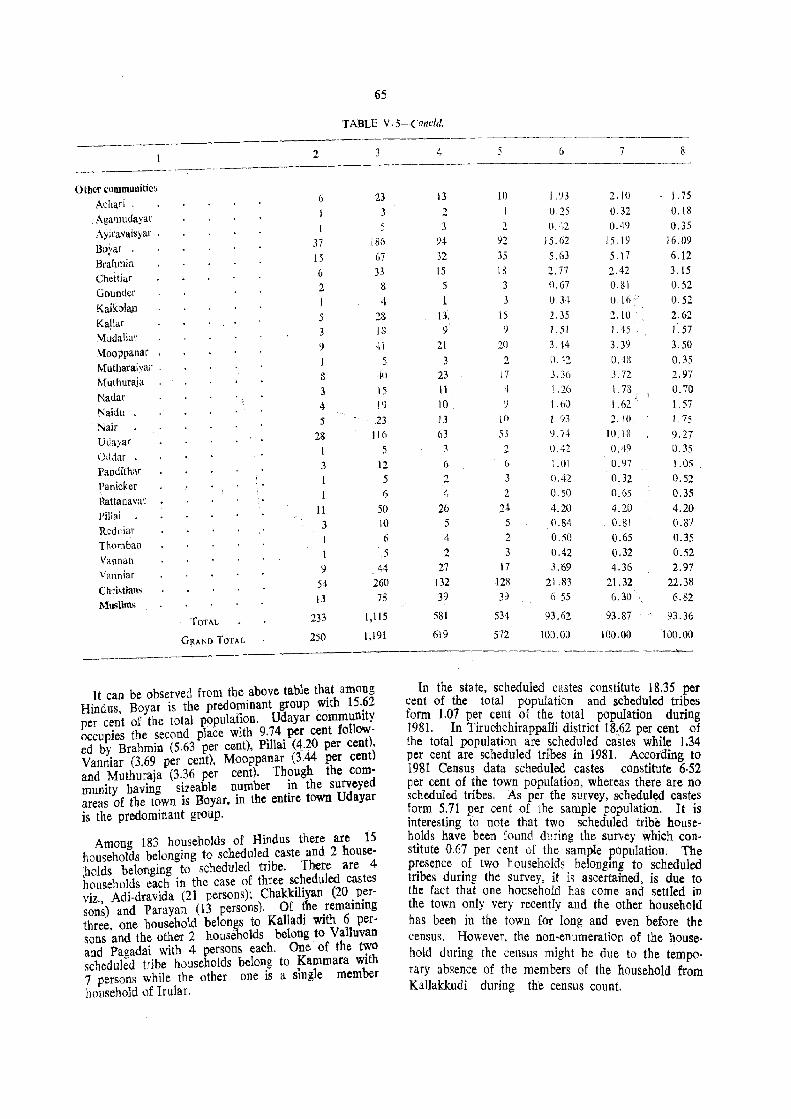
65
TABLE V.5-Concld.
2 --------_._----~-~--..
Other communities Achari 6 23
Aga;11udayar I 3
I Ayiravai~yar . Boyar 37 1~6
Brahmin 15 67
Chettiar 6 33
Gounder 2 8
4 Kaikola.n Kallar 5 28
Mudaliar 3 II)
Mooppanar ') 41
5 Mutharaiyal' . Muthuraja 8 ,10
Nadar 3 IS
Naidu 4 19
Nair 5 23
Udayar 28 1 \6
I 5 (),\,1ar Pandithar 3 12
Panicker i. 5 6
Rattanavar Pillai II 50
Reddiar 3 10
Tho;nban I 6
1 5 Vannan vanniar 9 44
Chdstia!l, 54 260
Muslims 13 78
TOTAL 233 1,115
GRAND TOTAL 250 1,191
It can be observed from the above table that among Hindus, Boyar is the predominant group with 15.~2 per cent of the total population. Udayar communIty occupies the second place with 9.74 per cent followed by Brahmin (5.63 per cent), Pillai (4.20 per cent), Vanniar (3.69 per cent), Mooppanar (3.44 per cent) and Muthuraja (3.36 per cent). Though the community having sizeable number in the surveyed areas of the town is Boyar. in the entire town Udayar is the predominant group.
Among 183 households of llindus there are 15 households belonging to scheduled caste and 2 house;holds belonging to scheduled tribe. There are 4 households each in the case of three scheduled castes viz. Adj-dravida (21 persons); Chakkiliyan (20 person~) and Parayan (13 persons). Of the remaining three, one household belongs to KaUadi with 6 persons and the other 2 housenolds belong to VaUuvan and Pagadai with 4 persons each. One of the t~o scheduled tribe households belong to Kammara WIth 7 persons while the otber one is a slngle member hOllsehold of Irular.
4 7 8
13 10 U3 :!.IU 1. 75
2 0.25 0.32 0.18
3 1 (\. +2 0.49 0.35
~'4 n 15.62 j 5.19 16.09 32 35 5.63 5.17 6.12 15 18 2.77 2.42 3.15
5 3 0.67 0.81 0.S2
1 0.31- 0.16 . 0.52
U. 15 L\5 2.10 2.62 9 ') I. 51 lAS 1.57
2\ 20 3.+4 3.39 3.50
3 2 ll.42 [U~ 0.35
23 17 3.3() 3.72 2.97 II 4 1.26 t.n 0.70
10 I) [. 60 1.62 157 13 10 I 93 2.10 I. 75 63 53 <) 74- 10.18 9.27
3 2 0,42 0.49 0.35 (, (, 1.01 0.97 1.05 ~ 3 0.42 U.32 0.52 .:.
4 2 0.50 0.65 0.35 26 2~ 4.20 4.20 4.20
5 5 0.84 U.SI 0.87 4 2 0.50 0.65 0.35 2 3 0.42 0.32 0.52
27 17 3.69 4.36 2.97 132 128 21.83 21.32 22.38 39 39 6 55 6.30 6.82
581 531- 93.62 93.87 93.36
619 572 lOO.OO 100.00 100.00
In the state, scheduled castes constitute 18.35 per cent of the total population and scheduled tribes form 1.07 p~r cent. of the. to~al population during 1981. In TIruch~hIrappal1I dIstrict 18~62 per cent of the total populatIon are scheduled castes while 1.34 per cent are scheduled tribes in 1981. According to 1981 Census data scheduled castes constitute 6·52 per cent of the town popUlation, whereas there are no scheduled tribes. As per the survey, scheduled castes !orm 5:11 per cent of the sample population. It is mterestmg to note that two scheduled tribe househ~lds have been found during the survey which constitute 0.67 per cent of the sample population. The p~esence 9f two households belonging to scheduled tnbes dunng the survey, it is ascertained, is due to the fact that one household has come and settled in the town only very recently and the other household has been in the town for long and even before the census. However, the non-enumeration of the household during the census might be due to the temporary absence of the members of the househOld from Kallakkudi during the census count.

66
Q % LU
< )( UJ t/)
)0. CO l' -t ~ a
('f 0 0 - >-t- o < ~ a. fri ell ;i ~
~ ~ ..J > I::) + "t ~ (Sl en -q-"" Wo - -~
I l ,
I l I \ :l ~ ~Qt: 0 0 LC\ ~ U'\ 0 IC\ 0 t.C\ 0 ~ ~ JO C'4 ~ - -D.. c(\!j I.£\. 0 0 n.. 0...
:l lJ. 0
~ 0 tIC': "'t\!J t!J ~ Z W lC-1--0
~ :< - '-lJ .... en ::l <J 10 o<.Y.' -~ u..) .. C/J Ci Cl en f,Q - ~ :r 0 ~ :;s t,O -I r~
t~
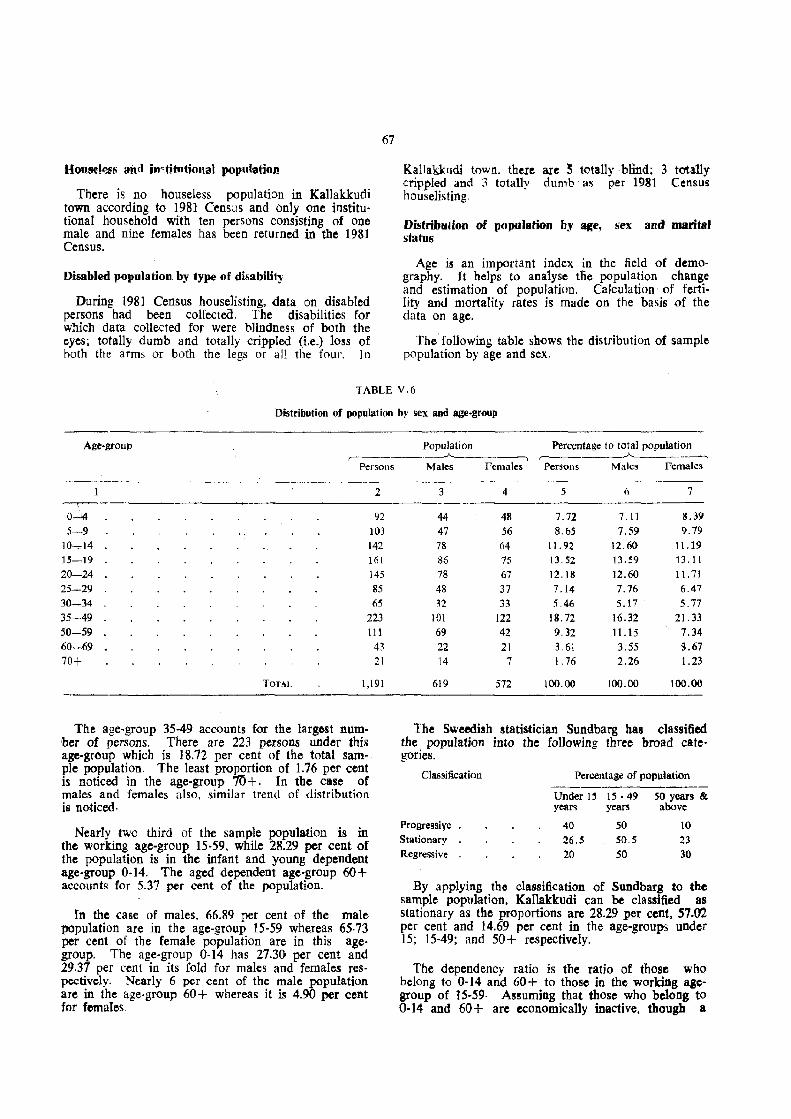
HOUseJ,e66 an{J in"titutional population
There is no houseless population in Kallakkudi town according to 1981 Census and only one institutional household with ten persons consisting of one male and nine females has been returned in the 1981 Census.
Disabled population by type of disability
During 1981 Census houselisting, data on disabled persons had been coHectea. The disabilities for which data collected for were blindness of both the eyes; totally dumb and totally crippled (i.e.) 105s of both the arms or both the legs or all the four. In
67
Kallakkudi town. there are 3 totally blind; 3 totally crippled and 3 totally dumb as per 1981 Census houselisting.
Di,o,tribulion of population by lII'e, sex and marital status
Age is an important index in the field of demography. It helps to analyse tne population change and estimation of population. Calculation of fertility and mortality rates is made on the basis of the data on age.
The following table shows the distribution of sample population by age and sex.
TABLE V.6
Distribution of population by sex and age-group
Age-group Population ~--------~----~
Percentage to total population ~ _____ ..A.. ____ --,
Persons Males Females Persons Males Females
----~-------------------------------------------------------------------------
2 3 4 5 6 7 --r-----------------------------------------0-l4 92
103 5-9 1O~14
15-19
20--24 25-29 30-34 35--49 50-59 60-69 70+
142 161
145
85 65
223 III
43
21
TOTAL 1,191
The age-group 35-49 accounts for the largest num'ber of persons. There are 223 persons under this age-group which is 18.72 per cent of the total sample population. The least proportion of 1.76 per cent is noticed in the age-group 70+. In the case of males and females also, similar trend of distribution is noticed·
Nearly .two third of the sample population is in the working age-group IS-59, while 28.29 per cent of the population is in the infant and young dependent age-group 0-14. The aged dependent age-group 60+ accounts for 5.37 per cent of the population.
In the case of males, 66.89 per cent of the male population are in the age-group 15-59 whereas 65·73 per cent of the female population are in this agegroup. The age-group 0-14 has 27.30 per cent and 29.37 per cent in its fold for males and females respectively. Nearly 6 per cent of the male population are in the age-group 60+ whereas it is 4.90 per cent for females.
44 48 7.72 7.11 8.39 47 56 8.65 7.59 9.79 78 64 11. 92 12.60 11.19
86 75 13.52 13.59 13.11 78 67 12.18 12.60 11.71 48 37 7.14 7.76 6.47 32 33 5.46 5.17 5.77
101 122 18.72 16.32 21.33 69 42 9.32 11.15 7.34 22 21 3.61 3.55 S.67 \4 7 I. 76 2.26 1.23
619 572 100.00 100.00 100.00
The Swee<iish statistician Sundbarg has classified the population into the following three broad cate· gories.
Classification Percentage: of population
Under 15 15 - 49 50 years & years years above
Progressiyc 40 50 10 Stationary 26.5 50.5 23 Regressive 20 50 30
By applying the classification of Sundbarg to the sample population, Kallakkudi can be classified as stationary as the proportions are 28.29 per cent, 57.02 per cent and 14.69 per cent in the age-groups under 15; 15-49; and 50+ respectively.
The dependency ratio is tne ratio of those who belong to 0·14 and 60+ to those in the working agegroup of IS-.59· Assuming that those who belong to 0-14 and 60+ are economically inactive. though a
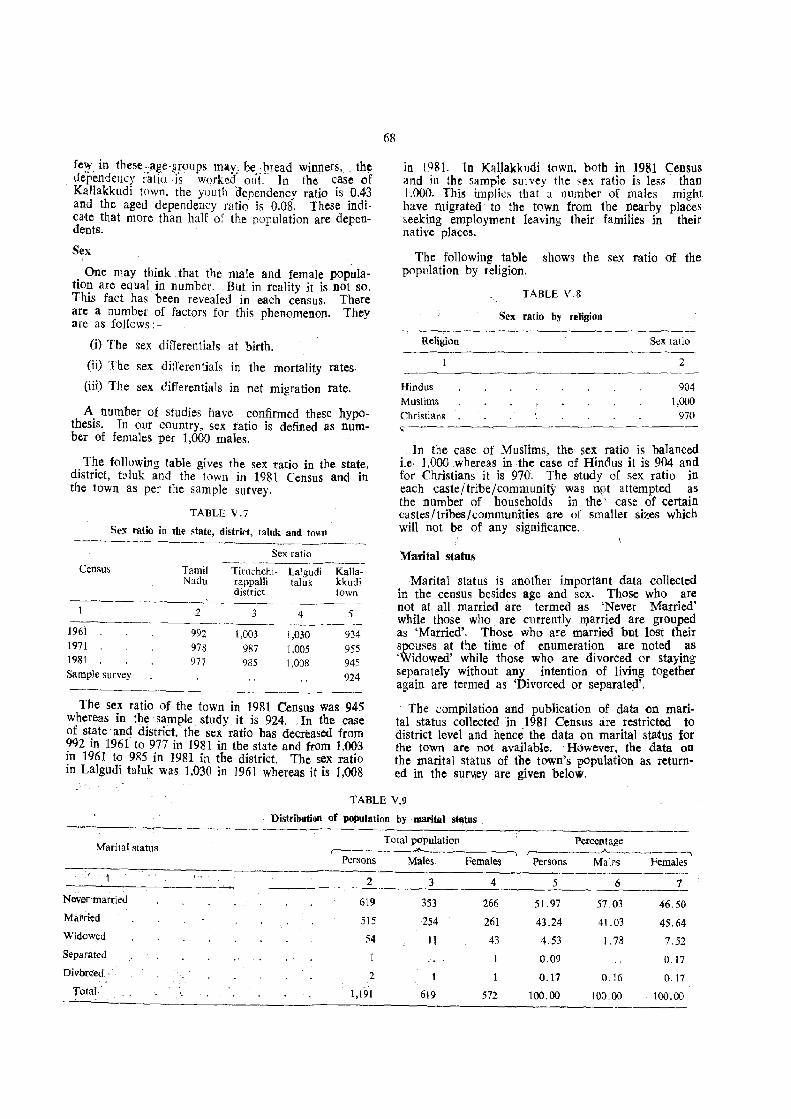
fe~. in these:;age·.1l!.olJps may; he.:l1read winners, . tb~ uependellCY ratiu ·is worked alIt. In tho case of Kallakkudi town. the youth dependency ratio is 0.43 and the aged dependency ratio is 0.08. These indicate that more than hal(of the population are dependents.
Sex
One may think. that the male and female population are equ!ll in number. But in reality it is not so. This fact has been revealed in each census. There are a number of factors for this phenomenon. They are as follows: --
(i) The sex differentials at birth.
(ii) The sex differentials in the mortality rates·
(iii) The sex differentials in net migration rate.
A number of studies have confirmed these hypothesis. In our country, sex ratio is defined as num'ber of females per 1,000 males.
The following table gives the sex ratio in the state, district, taluk and the town in 1981 Census and in the town as per the sample survey.
TABLE V.7
Sex ratio in the state, district, taluk and town
Sex ratio --~--
Censu~ Tamil Tiruchchi- lalgudi Kalla-Nadu rappalli taluK kkudi
district town ~--~---
1961
1971 1981
Sample survey
2
992 978 977
3
1,003
987 985
4 5
1,030 934 1,005 955 1,008 945
924
The sex ratio of the town in 1981 Census was 945 whereas in the sample study it is 924. In the case of state' and district. the sex ratio has decreased from 992 in 1961 to 977 in 1981 in the state and from 1,003 in 1961 to 985 in 1981 in the district. The sex ratio in Lalgudi ta1uk was ]'030 in 1961 whereas it is 1.008
68
in 1 Q81. In Kallakklldi town, both in 1981 Census and in the samp1e survey the sex ratio is less' than 1,000. This implks that a number of males might have migrated to the town from the nearby places seeking employment leaving their families in their native places.
The following table shows the sex ratio of the poplllation by religion.
TABLE V.8
Sex ratio by religion
Religion Sex ratio
2 -------------------------------------~-
Hindus
Muslims Christian~
"
904
1,000 970
In the case of Muslims, the. sex ratio is balanced i.e· 1,000 whereas in the case of Hindus it is 904 and for Christians it is 97(}. The study of sex ratio in each caste/tribe/community was Il?t attempted as the number of households in the' case of certain castes/tribes/communities are of smaller sizes which will not be of any significance.
Marital status
Marital status is another important data collected in the census besides age and sex. Those who are not at all married are termed as 'Never Married' while those who. are currently married are grouped as 'Married'. Those who are married but lost their spouses at the time of enumeration are noted as 'Widowed' while those who are divorced or staying separately without any intention of living together again are termed as 'Divorced or separated'.
The compilation and publication of data on marital status collected in 1981 Census are restricted to district level and hence the data on marital status for the town are not available. . However, the data on the marita1 status of the town's pOpula<tion as returned in the sUnICy are given below.
TABLE V.9
Marital status
Never'married
Mariied
Widowed
Separated
Divomed ..
Total'
. Distributi9l1 Qf population by marital ~tus .
Total population r-----------'*",___ --------.,
Persons Males Females
2
619
515
54
2
1,191
3
353
254
II
1
619
4
266
261
43
572
Percentage ~------~~. ------~ Persons Ma ks Females
5 6 7
51.97 57.03 46.50
43.24 41.03 45.64
4.53 l.73 7.52
0.09 0.17
0.17 0.16 0.17
100.00 100.00 100 .. 00
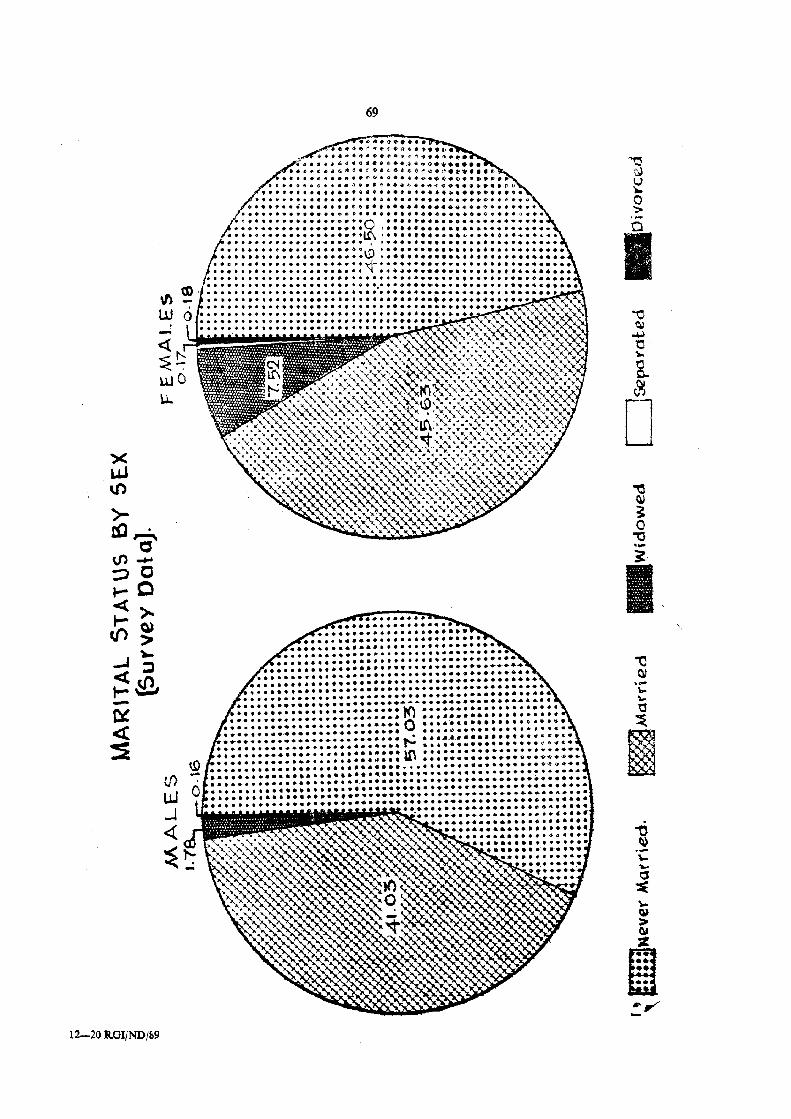
12-20 RGI/ND/&9
69
........•......................• ....•.••...•................. ~ .... .....•....•..••..................... ......•.•.•..•.....•..•••.•.• ~ ......••• ......•••..•..•........ ~ ........•..•..... • e •••••••••• ·.······~····················· ••••••••••••••••••••••••••••••••••••••• e •• $ •
••••••••••• ~ •• ~ •••••••• ~A4 •••••••• a •••• ~ •••••
. ::::::::::::::::::::::::l<l :::::::::::::::::::: . : : : : : : : :,: : : : : : : :: : : : : : : :: a :::::::::::::::!::::: :::: ~ : ::::::: -:::: ::::: : : :: r-.: :!: !-:-: : : :: : : :-: : : : : : ::. ::::::::::::::::::::::=::::~ :::::::::::::::::;;::: . .............•...•.••••••.•........ ~~ .........•.. ~ ... .•..•........••....••••. _ ••••••....................... .............•.......•......•....•.............. ~ ..... . .........•.•••....•..•.....•.......•...........•...... .............••....•.. , •.••••••..................•..... •.....................•........•..•.........••.•...•..•
~~~~~~~~~~~~.~.~.~ ........................ .
I
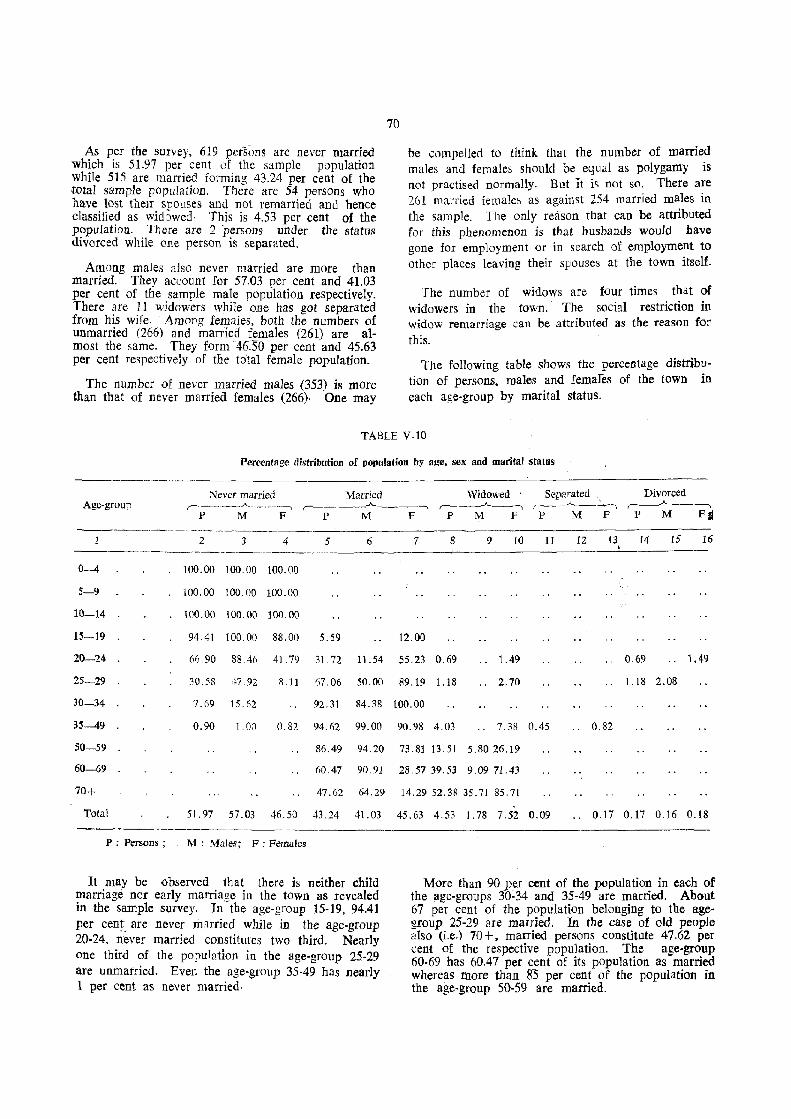
As per the survey, 619 persons are never married which is 51.97 per cent of the sam ple population while 515 are married forming 43.24 per cent of the ,total sample population. There are 54 persons who have lost their S1Jouses and not remarried and hence classified as widowed, This is 4.53 per cent of the population. There are 2 persons under the status div()fced while one person is separated.
Among males also never married are more than married. They account for 57.03 per cent and 41.03 per cent of the sample male population respectively. There are 11 widowers while one has got separated from his wife. Among females, both the numbers of unmarried (266) and married females (261) are almost the same. They form 46.50 per cent and 45.63 per cent respectively of the total female popUlation.
The number of never married males (353) is more than that of never married females (266). One may
70
he compelled to think that the number of married males and females should be equal as polygamy is not practised normally. But It is not so. There are 261 married females as against 254 married males in the sample. The only reason that can be attributed for this phenomenon is that husbands would have gone for emp10yment or in search 01' employment to other places leaving their spouses at the town itself.
The number of whlows are four times that of widowers in the town. The social restriction in widow remarriage can be attributed as the reason for this.
The following table shows the percentage distribution of persons, males and femafes of the town in each age-group by marital status.
TABLE V.IO
Percentage di~tribution of population by age, sex and marital status
Never married Married Widowed Separated , Divorced Age·group ".-__ ----"-____ -, ".- . ___ .A. ___ -, ~~-~ ~-~-~~ f--~--~
P M F P M F P M Fit P :vi F P M F
2 3 4 5 6
0-4 100.00 100.00 100.00
5-9 lOO.OO 100.00 100.00
10-14 100.00 100.00 100,00
15-19 94.41 100.00 88,00 5.59
20-24 66.90 88,46 41. 79 31.72 11.54
25-29 30,58 47 92 8,11 67,06 50,00
30-34 7.69 15,62 92,31 84.38
35-49 0.90 00 0.82 94.62 99.00
50-59 86.49 94,20
60-69 (iOA7 90,91
70+ 47.62 64.29
Total 51,97 57.03 46.50 43.24 41.03
P: Persons; M: Males; F: Females
It may be observed that there is neither child marriage nor early marriage in the town as revealed in the sample survey. In the age-group 15-19, 94.41 per cent. are never married while in the age-group 20-24, never married constitutes two third. Nearly one third of the popUlation in the age-group 25-29 are unmarried. Even the age-group 35-49 has nearly 1 per cent as never married,
7 8 9 10 11 12 13 14 15 16 I
12,00
55,23 0.69 ,. 1.49 .. 0.69 .. 1.49
89.19 1.18 2.70 ' , J .18 2.08
100.00
90.98 4,03 .. 7,38 0.45 .. 0,82
73.81 13.51 5,80 26,19
28.5739.53 9,09 71.43
14.2952.3835.71 85,71
45.63 4,53 l. 78 7.52 0.09 .. 0,17 0.17 0,16 0.18
More than 90 per cent of the population in each of the age-groups 30-34 and 35-49 are married. About 67 per cent of the population belonging to the agegroup 25-29 are married, In the case of old people also (i.e.) 70 +. married persons constitute 47.62 per cent of the respective popu1ation. The age-group 60-69 has 60.47 per cent of its population as married whereas more than 83 per cent of the population in the age-group 50-59 are married.
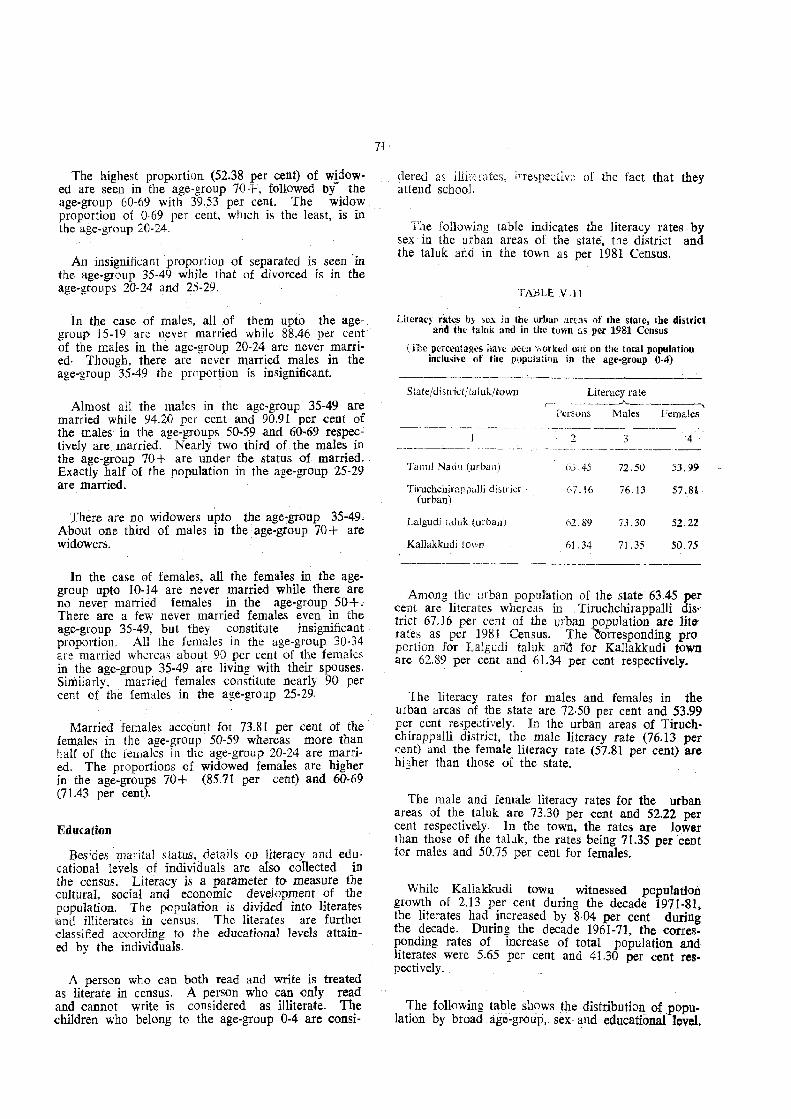
The highest proportion (52.38 per cent) of widow7 ed are seen in the age· group 70+, followed by the age-group 60-69 with 39.53 per cent. The widow proportion of 0·69 per cent, which is the least, is in the age-group 20-24.
An insignifkant proportion of separated is seen in the age-group 35-49 while that of divorced is in the age-groups 20-24 and 25-29.
In the case of males, all of them upto the agegroup J 5-19 are never married while 88.46 per cent of the males in the age-group 20-24 are never married· Though. there are never married males in the age-group 35-49 the proportion is insignificant.
Almost all the males in the age-group 35-49 are married while 94.20 per cent and 90.9l per cent of the males in the age-groups 50-59 and 60-69 respectively are married. Nearly two third of the males in the age-group 70+ are under the status of married. Exactly half of the popuTation in the age-group 25-29 are married.
There are no widowers upto the ageigroup 35-49. About one third of males in the age-group 70+ are widowers. .
In the case of females, all the females in the agegroup upto 10-14 are never married while there are no never married females in the age-group 50+. There are a few never married females even in the age-group 35-49, but they constitute insignificant proportion. All the females in the age-group 30-34 are married whereaS about 90 per cent of the females in the age-group 35-49 are living with their spouses. Similarly, married females constitute nearly 90 per cent of the females in the age-group 25-29.
Married females account fOJ 73.81 per cent of the females in the age-group 50-59 whereas more than half of the females in the age-group 20-24 are married. The proportions of widowed females are higher in the age-groups 70+ (85.7l per cent) and 60-69 (71.43 per cent).
Education
Besides ma,ital status. details on literacY and educational levels of individuals are also collected in the census. Literacy is a parameter to measure the cultural, social and economic development of the population. The population is divided into literates land illiterates in census. The literates are further classified according to the educational levels attained by the individuals.
A person who can both read and write is treated as literate in census. A person who can only read and cannot write is considered as illiterate. The children who belong to the age-group 0-4 are consi-
dered as illilnutc'i. i'Tespectiv;~ of the fact that they attend school. .
T~e following table indicates the literacy rates by sex III the urban areas of the state, the district and the taluk and in the town as per 1981 Census.
TABLE V.l\
Literacy rldcs by :,ex in the urbap arC:lS of the state, the district and the taluk and in the town as per 1981 Census
(Tile p(;l'centages ha\'e iJeen ',\(lrked Glit on the total population inclusive of the p.opulatlon ill the age-group 0-4)
---------_._-------------State/district/taluk/toWll Li teracy rate
('_ . ___ ~_____.A,_ ______ ,,",\
i'C[SOllS Males Females ------~--- ---------~--- ._----_._ ._-_-- -----_--
------~---
2 3 '4 ----"-~------ _.-
----~--. .,-----TallllJ Nao'J (urbill]) (oj. '~5 72.50 53.99
Tiruchchin\l)palli district h7.16 76.13 57.81 (urban)
Lalgudi l,t]uk (uroall) ()2.89 73.30 52.22
Kallakkudi town 61.34 71.35 50.75
Among !he urban population of the state 63.45 per c~nt are lIterates whereas in Tiruchchirappalli dis· tnct 67.16 per cent of the urban population are lit~ rates as per 19t\] Census. The Corresponding pro portion for Lalgudi taluk ari'(1 for Kallakkudi town are 62.89 per cent and 61.34 per cent respectively.
The literacy rates for males and females in the urban areas of ~he state are 72·50 per cent and 53.99 per cent respectIvely. In the urban areas of Tiruchchirnppalli district, the male literacy rate (76.13 per C~llt) and the female, literacy rate (57.81 per cent) are hIgher than those ot the state.
The male and female literacy rates for the urban areas of the taluk are 73.30 per cent and 52.22 per cent respectively. In the town, the rates are lower than those of the taluk. the rates being 71.35 per cent for males and 50.75 per cent for females.
While Kallakkudi town witnessed populatioil growth of 2.13 per cent during the decade 1971-81 the literates had increased by 8·04 per cent during the decade. During the decade 1961-71. the corresponding rates of increase of total population and literate~ were 5.65 per cent and 41.30 per cent respectively.
~he following table shows the· distribution. of populatIon by broad age-gr~up, sex and educational level.
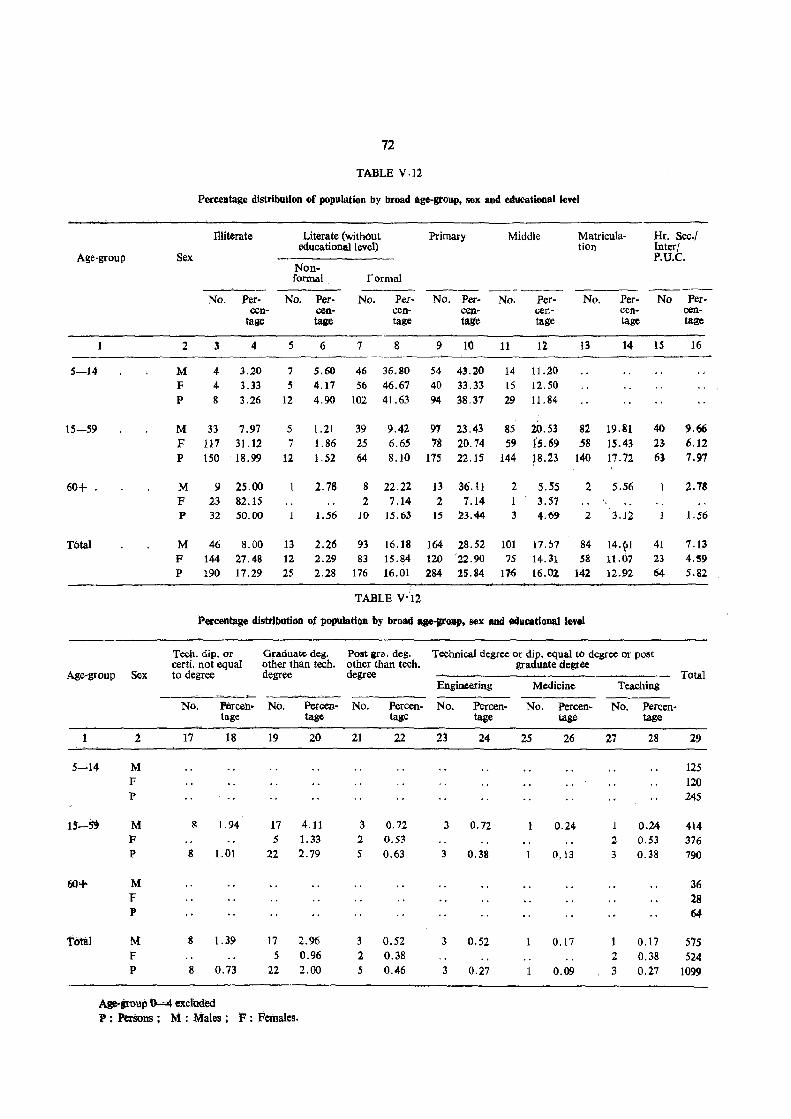
Age-group
5-14
15-59
60+ .
Total
Age-group Sex
1
5-14
to't'ill
2
M F p
M F P
M F p
M F P
72
TABLE V.12
Percentage distribution of population by broad age-group, sex and educational level
llliterate
Sex
Literate (without educational level)
Primary Middle Matriculation
Hr. Sec.! Inter! P.U.C.
Nonformal Formal
No. Per- No. Per- No. Per- No. Per- No. Per- No. Per- No Per-cen- cen- cen- cen- oen- cen- cen-
tage taKe tage talte tage tage tage
2
M F P
M F p
M F P
M F P
3 4
4 3.20 4 3.33 8 3.26
33 7.97 117 31.12 150 18.99
9 25.00 23 82.15 32 50.00
46 144 190
8.00 27.48 17.29
5
7 5
12
5
7 12
13 12 25
6 7 8
5.60 46 36.80 4.17 56 46.67 4.90 102 41.63
9
54 43..20 40 33.33 94 38.37
1. 21 1.86 1. 52
39 25 64
9.42 97 23.43 6.65 18 20.74 8.10 175 22.15
2.78 8 22.22 2 7.14
1 . .56 10 1.5.63
2.26 2.29 2.28
93 83
176
16.18 15.84 16.01
TABLE V'12
13 36.11 2 7.14
15 23.-44
164 28.52 120 22.90 284 25.84
11 12
14 11.20 15 12.50 29 11.84
85 20.53 59 15.69
144 18.23
2 5.55 1 3.57 3 4.69
101 75
176
17.57 14.31 16.01
13
82 58
140
14
19.81 15.43 17.72
2 5.56
, 2 3.12
84 58
142
14.~1 11.07 12.92
15
40 23 63
41 23 64
Percentage distribution of population by broad age-groo" sex and e4ur.ational level
Ted1. dip. or certi. not equal to degree
Graduate deg. Post ara. deg. Technical degree or dip. equal to degroe or post other than tech. other than tech. graduate degree degree degree
EngiJleering Medicine Teaching
No. POreen- No. Percen- No. Percen- No. Percen- No. Percen- No. Percen-tage tage tage taie tase tage
17 18 19 20 21 22 23 24 2S 26 27 28
1.94 17 4.11 3 0.72 3 0.72 0.24 0.24 5 1.33 2 0.53 2 0.53
8 1.01 22 2.79 5 0.63 3 0.38 0.13 3 0.38
8 1.39 17 2.96 3 0.52 3 0.52 0.17 1 0.17 5 0.96 2 0.38 2 0.38
8 0.73 22 2.00 5 0.46 3 0.27 0.09 3 0.27
16
9.66 6.12 7.97
2.78
1.56
Total
29
125 120 245
414 376
790
36
28 64
575 524
1099
Age-group Q--4 exciUd(:d 'P : Persons; M: Males; F: Females.
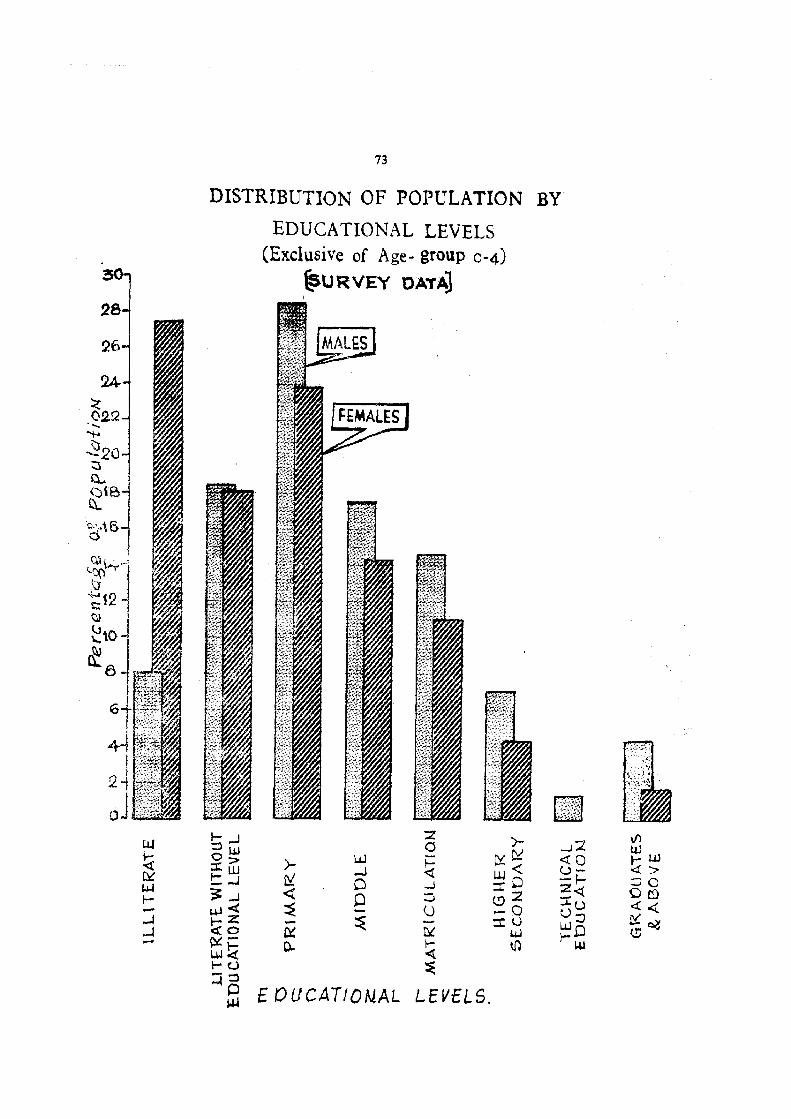
llJ
t t::t::' I.M I--..J ..J -"'
73
DISTRIBUTION OF POPULATION BY
EDUCATIONAL LEVELS (Exclusive of Age- group 0-4)
~URVEY DATA)
~ I- ..J ::z )- ....J2 ::lUJ 0
~~ 0:;:. )- UJ ~
c::ro :i:w ...J L.l.J'<l: u-t:...I ~ 0 -l -.0 -r.-~ <t Q :::. ..... :2 2._q
..J ~o :If,) 1-1-1< ~ - (J u:J
~3 - ~ :I:U Wo ~ ~ I.4J ~- 0- r- tJ1 )-~ l.W~ « 1-(...) ~ -:::I ~o £ OUCATION.AL LEVELS. ~
if'; w ~ UJ
"> :JO a r:f} <:t:<. ~~ \!J
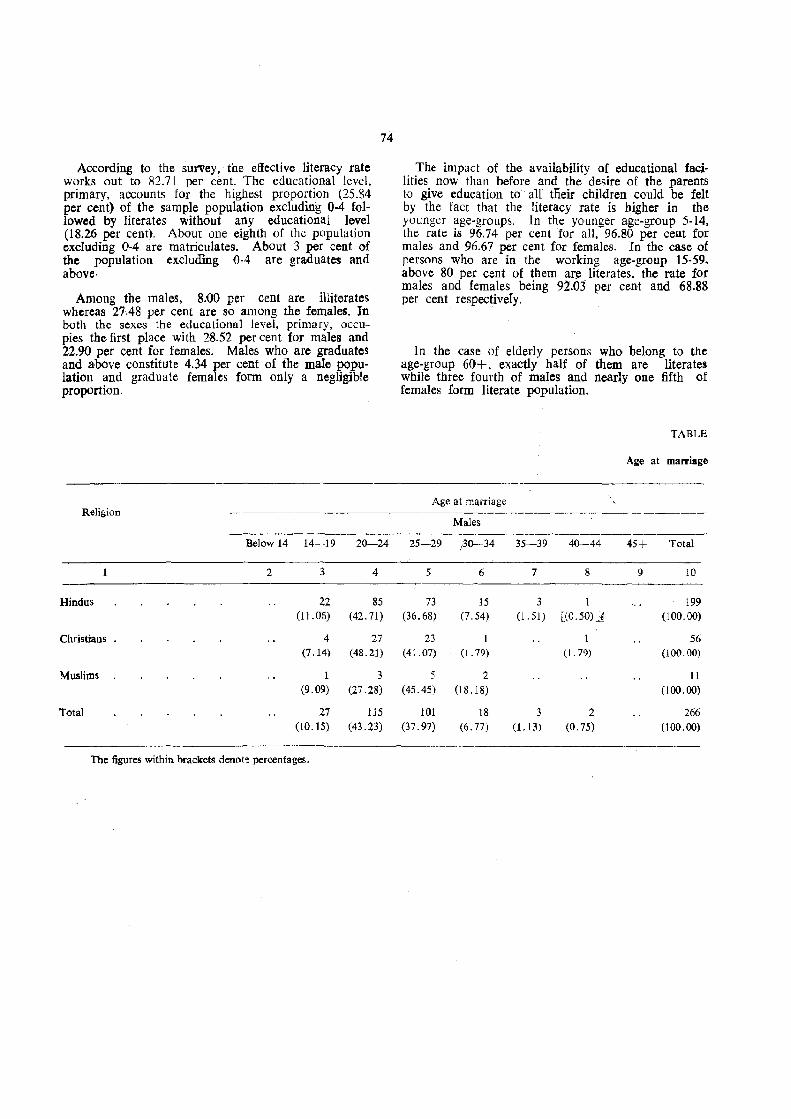
According to the survey, the effective literacy rate works out to 82.71 per cent. The educational level, primary, accounts for the highest proportion (25.84 per cent) of the sample population excluding 0-4 followed by literates without any educational level (18.26 per cent). About one eighth of tht: popUlation excluding 0-4 are matriculates. About 3 per cent of the population excluamg 0-4 are graduates and above·
Among the males, 8.00 per cent are illiterates whereas 27.48 per cent are so among the females. In both the sexes the educational level. primary, occupies the first place with 28.52 per cent for males and 22.90 per cent for females. Males who are graduates and above constitute 4.34 per cent of the male population and graduate females form only a negligible proportion.
74
The impact of the availability of educational facilities now than before and the desire of the parents to give education to a1[ t1ieir children could be felt by the fact that the literacy rate is higher in the younger age-groups. In the younger age-group 5-14, the rate is 96.74 per cent ·for all. 96.80 per cent for males and 96.67 per cent for females. In the case of persons who are in the working age-group 15-59, above 80 per cent of them are literates. the rate for males and females being 92.03 per cent and 68.88 per cent respectively.
In the case of elderly persons who belong to the age-group 60+, exactly half of them are literates while three fourth of males and nearly one fifth of females form literate population.
TABLE
Age at marriage
Age at marriage Reli{;ion --------------------------.---~---------
Males
Below 14 14-19 20-24 25-29 ~0-34 35-39 40-44 45+ Total
2 3 4 5 6 7 8 9 10
Hindus 22 85 73 15 3 1 199 (11.06) (42.71) (36.68) (7.54) (1.51) [(0.50U (100.00)
Christians 4 27 23 1 1 56 (7.14) (48.21) (41.07) (1.79) 0.79) (l00.00)
Muslims 1 3 5 2 11 (9.09) (27.28) (45.4S) (18.18) (100. (0)
Total 27 115 101 18 3 2 266 (10.15) (43.23) (37.97) (6.77) 0.13) (0.75) (100.00)
The figures within hrackets denot~ percentages.
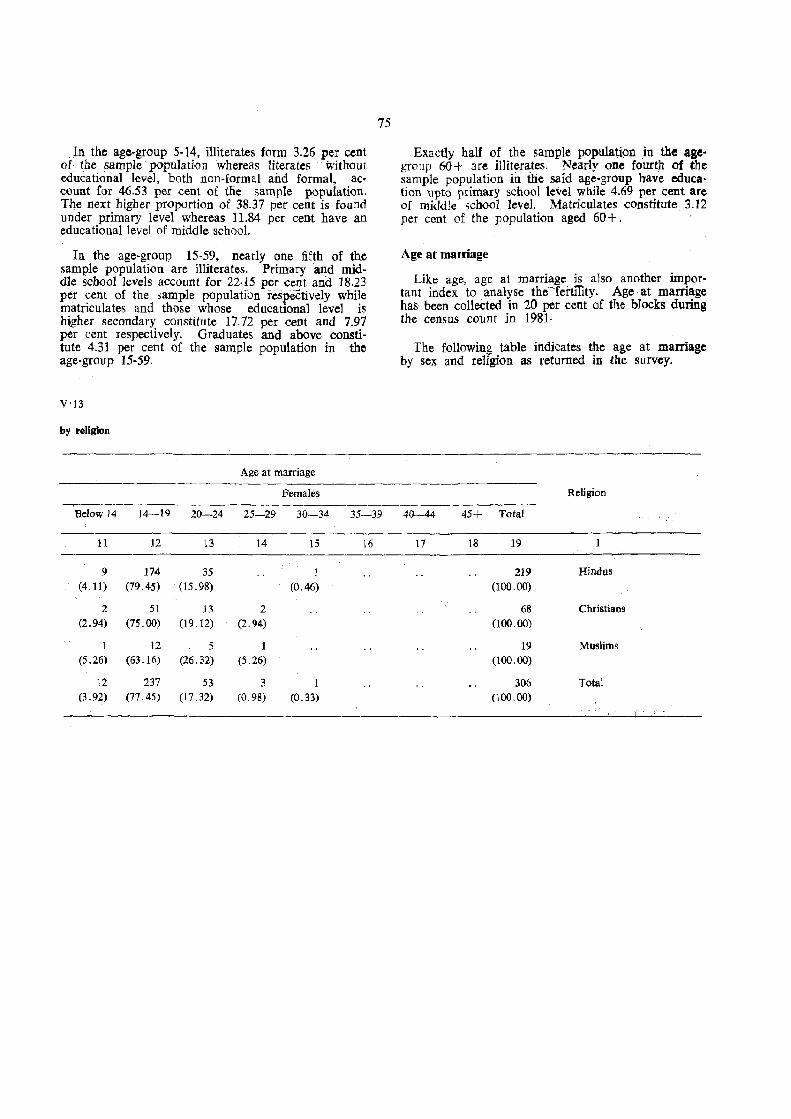
.11). the age-group 5-14, illiterates form 3.26 per cent of the sample populati(lU whereas literates wHhoul educational level, both non-formal a11d formal, account f~r 46.53 per cent of tIie sample population. The next higher propDrtion of 38.37 per cent is found under primary level whereas 11.84 per cent have an educational level of middle school.
In the age-group 15-59, nearly one fifth of th.e sample population are illiterates. Primary and middle school levels account for 22·15 per cent and 18.23 ~r cent of the sample population respeCtively while matriculates and those whose educational level is higher secondary constitute 17.72 per cent and 7.97 per cent respectively. Graduates and above constitute 4;31 per cent of the sample population in the age·group 15-59.
V'13
by religion
Age at marriage
Females
75
Exactly half of the sample population in the agegroup 60+ are illiterates. Nearly one fourth of the sample population in the safd age-group have education upto primary school level while 4.69 per cent are of middle school level. Matriculates constitute 3.12 per cent of the popUlation aged 60+.
Age at marriage
Like age, age at marriage js also another important index to analyse the-fertility. Age at marriage has· been collected in 20 per cent of the blocks during the census count in 1981·
The following table indicates the age at marriage by sex and religion as returned in the survey.
Religion -...._. ---------------
Below 14 14-19 20-24 25-29 30-3<1 35-39 40-44 45+ Total
11 12 13 14 15 16 17 18 19
9 174 35 1 219 Hindus (4.11) (79.45) • (15.98) (0.46) (100.00)
2 51 13 2 68 Christians (2.94) (75.00) (19.12) (2.94) (100.00)
1 12 5 1 19 Muslims (5.26) (63.16) (26.32) (5.26) (100.00)
12 237 53 3 1 306 Total (3.92) (77.45) (17.32) (0.98) (0.33) (100.00)
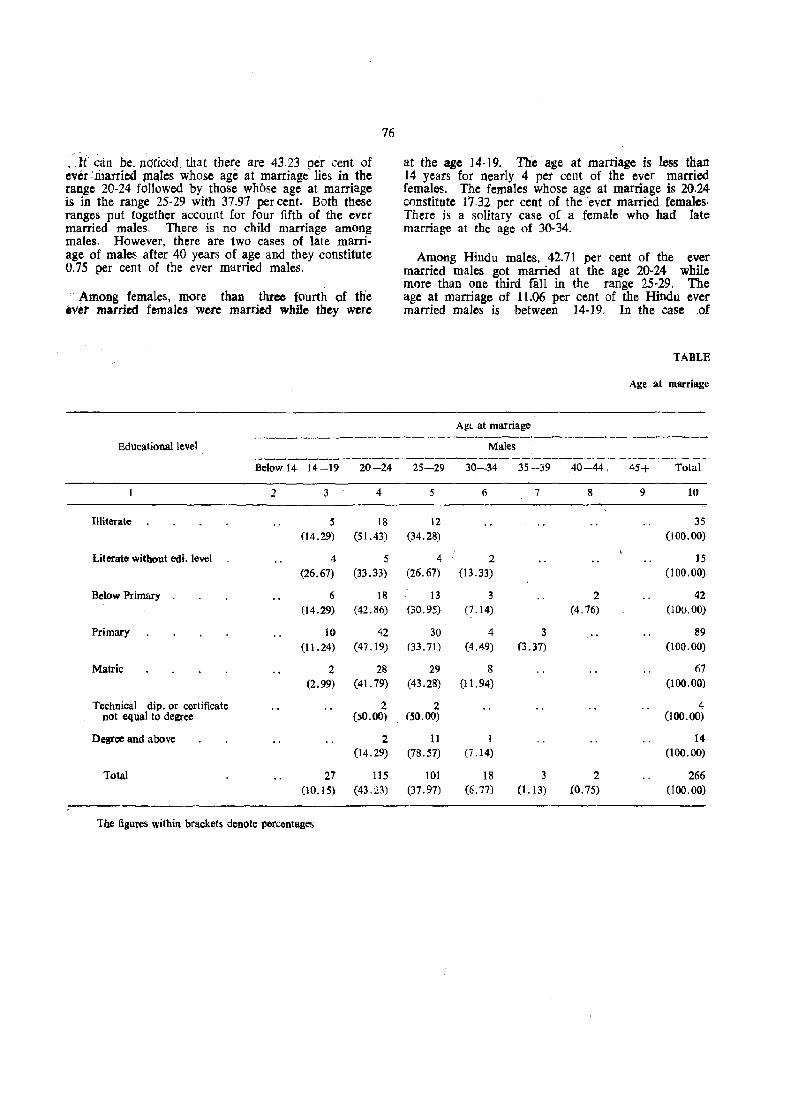
· .fi· c.in be_ IJ(Jriccd. that there are 43.23 per cent of ever :married Jll~les whose age at marriage lies in the range 20-24 followed by those whbse age at marriage is in the range 25· 29 with 37.97 per cent. Both these ranges put together account for four fifth of the ever married males. There is no child marriage among males. However. there are two cases of late marriage of males after 40 years of age and they constitute 0.75 per cent of the ever married males.
Among females, more than three fourth of the tVtt married females were married while they were
Educational level
76
at the age 14-19. The age at marriage is less than 14 years for nearly 4 per cent of the ever married females. The females whose age at marriage is 20.24 constitute 17.32 per cent of the ever married females· There is a solitary case of a female who had late marriage at the age of 30-34.
Among Hindu males, 42.71 per cent of the ever married males got married at the age 20-24 while more than one third fall in the range 25-29. The age at marriage of 11.06 per cent of the Hindu ever married males is between 14-19. In the case of
Agl at marriage
Males
TABLE
Age at mllrriage
--~~~~~-~-----~---~---------------------~-Below 14 14-19 20-24 25-29 30-34 35-39 40-44. 45+ Total
2 3 4 5 6 7 8 9 10
Illiterate 5 18 12 35 (14.29) (51.43) (34.28) (100.00)
Literate without ed}. level 4 5 4 2 15 (26.67) (33.33) (26.67) (13.33) (100.00)
Below Primary 6 18 13 3 2 42 (14.29) (42.86) (30.95) (7.14) (4.76) (l00.00)
Primary 10 42 30 4 3 89 (11.24) (47.19) (33.71) (4.49) (3.37) (100.00)
Matric 2 28 29 8 67 (2.99) (41.79) (43.28) (11.94) (100.00)
Technical dip. or certificate 2 2 4 not equal to degree ()O.OO) (50.00) (1()0.00)
Degree and above 2 11 1 14 (14.29) (78.57) (7.14) (100.00)
Total 27 1] 5 101 18 3 2 266 (10.15) (43.23) (37.97) (6.77) (1.13) 10.75) (100.00)
The figures within brackets denote percentages
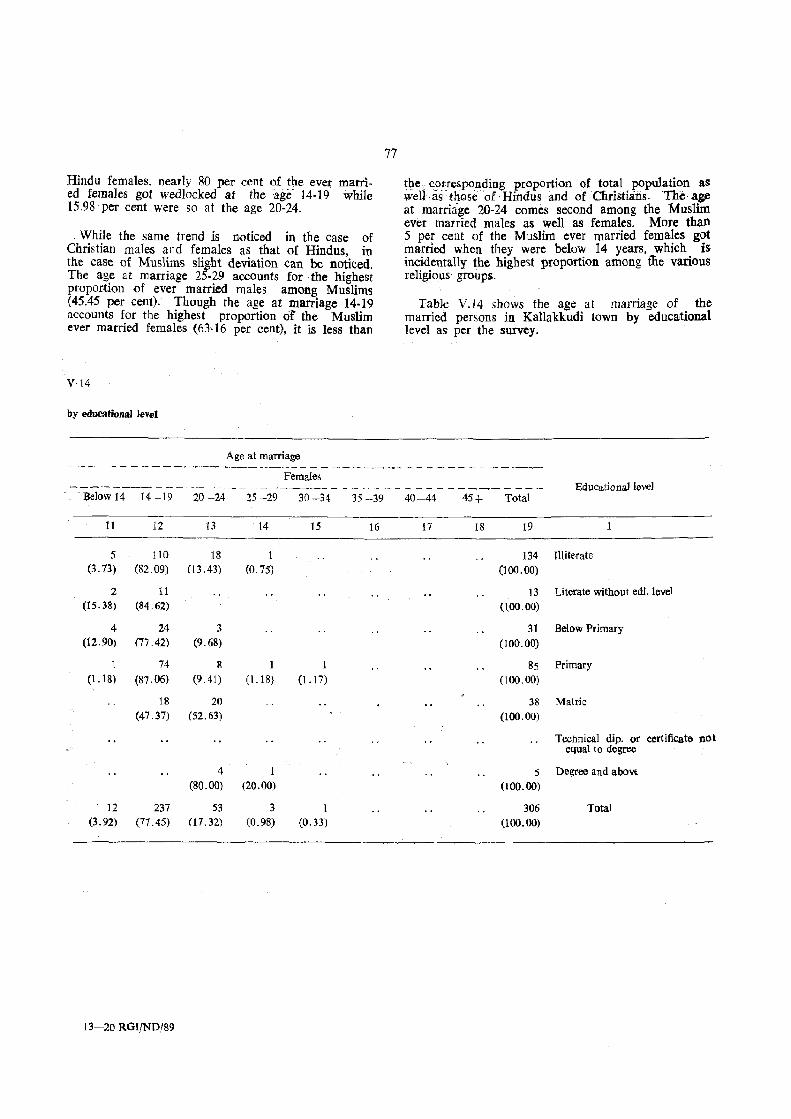
Hindu females, nearly 80 per cent of the ever married females got wed locked at the age- 14-19 while 15.98 per cent were so at the age 20-24.
While the same trend is noticed in the case of Christian males and females as that of Hindus, in the case of Muslims slight deviation can be noticed. The ll!ge at marriage 25-29 accounts for the highest proportion of ever married males among Muslims (45.45 per cent). Though the age at marriage 14-19 accounts for the highest proportion of the Muslim ever married females (63 ·16 per cent), it is less than
V·14
by educational level
Age at marriage
77
the corresponding proportion of total population as weU as:tnose or Hindus and of Christians. The a~ at marriage 20-24' comes second among the Muslim ever married males as well as females. More than 5 per cent of the Muslim ever married females got married when they were below 14 years, which is incidentally the highe'>t proportion among tne various religious' groups_
Table V.14 shows the age at marriage of the married persons in Kallakkudi town by educational level as' per the survey.
- -_- - - - -------------------~-------~ - ~ - --- .-- - - - --..... -. Females
--------- -- --- . -_ - - -- - - ----~- - - - - -- - ~ ~ - - - - - ---. -- - - - - Educational level Below 14 14 -19 20 -24 25 -29 30-34 35-39 40-44 45+ Total
11 12 13 14 15 16 l"i 18 19
5 110 18 1 134 Illiterate (3.73) (82.09) (13.43) (0.75) (100.00)
2 11 13 Literate without edt. level ({S.3S) (84.62) (100.00)
4 24 3 31 Below Primary (12.90) (77.42) (9.68) (100.00)
1 74 8 1 1 85 Primary (1. 18) (87. 06) (9.41) (1. 18) (1.17) (lOO.OO)
18 20 38 Matrie (47.37) (52.63) (100.00)
Technical dip. or equal to degree
certificate not
4 1 5 Degree and abovl (80.00) (20.00) (100.00)
12 237 53 3 I 306 Total (3.92) (17.45) (17.32) (0.98) (0.33) (100.00)
\3--20 RGIJND/89
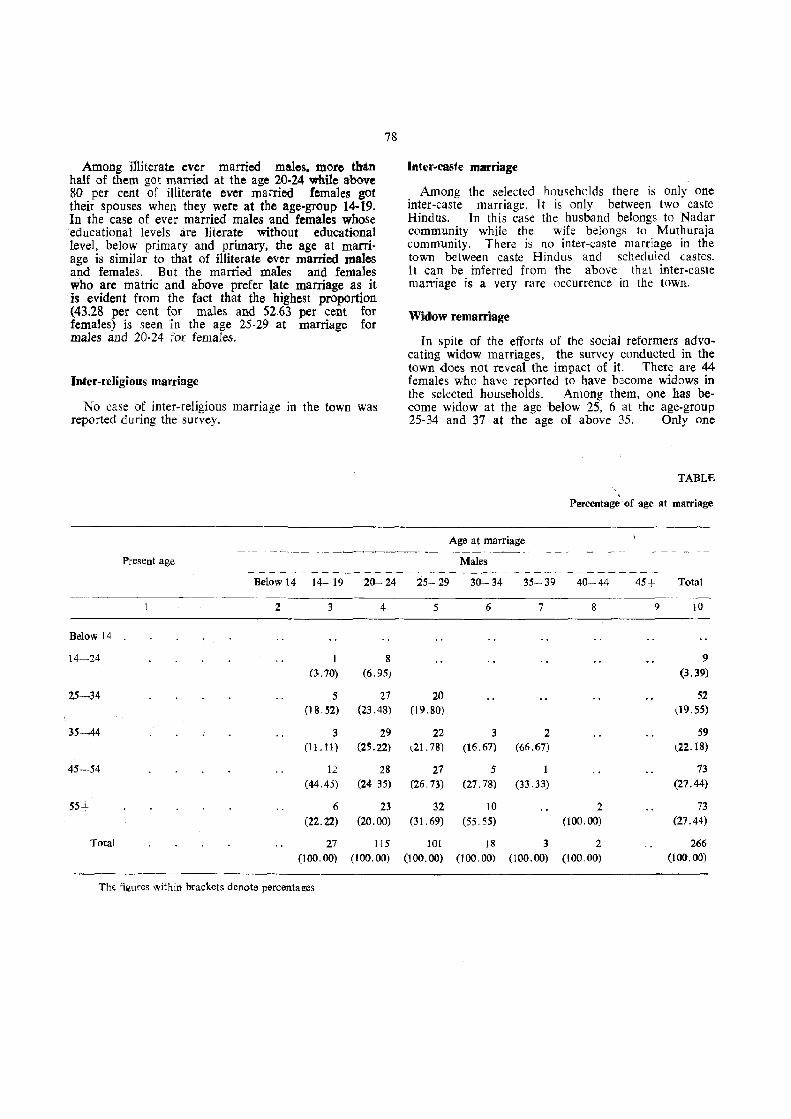
Among illiterate ever married males. more thtn half of them got married at the age 20-24 while above 80 per cent of illiterate ever married females got their spouses when they were at the age-group 14-19. In the case of ever married males and females whose educational levels are literate without educational level, below primary and primary. the age at marriage is similar to that of illiterate ever married males and females. But the married males and females who are matric and above prefer late marriage as it is evident from the fact tbat the highest proportion (43.28 per cent for males and 52.63 per cent for females) is seen in the age 25-29 at marriage for males and 20-24 for females.
Inter-religious marriage
No case of inter-religious marriage in the town was reported during the survey.
Present age
78
Inter-caste marriage
Among the selected households there is only one inter-caste marriage. It is only between two caste Hindus. In this case the husband belongs to Nadar community while the wife belongs to Muthuraja community. There is no inter-caste marriage in the town between caste Hindus and scheduled castes. It can be inferred from the above that inter-caste marriage is a very rare occurrence in the town.
Widow remarriage
In spite of the efforts of the soda] reformers advocating widow marriages, the survey conducted in the town does not reveal the impact of it. There are 44 females who have repDrted to have become widows in the selected households. Among them. one has become widow at the age below 25, 6 at the age-group 25-34 and 37 at the age of above 35. Only one
TABLE ,
Percentage of age at marriage
Age at marriage
Males ---------------------------------------
Below 14 14-19 20-- 24 25- 29 30- 34 35-39 40-44 45+ Total
2 3 4 5 6 7 8 9 10
Below 14
14-24 1 8 9 (3..70) (6.95) (3.39)
25-34 5 27 20 52 (18.52) (23.48) (19.80) \,19.55)
35-44 3 29 22 3 2 59 (11.11) (25.22) t2l.78) (16.67) (66.67) ~22.18)
45-54 12 28 27 5 1 73 (44.45) (24 35) (26.73) (27.78) (33.33) (27.44)
55+ 6 23 32 10 2 73 (22.22) (20.00) (31. 69) (55.55) (100.00) (27.44)
Total 27 115 101 18 3 2 266 (100.00) (100.00) (l 00. 00) (100. 00) (100.00) (100.00) (lOO.OO)
Th< fil.lures within hrackets denote percenta1!;es
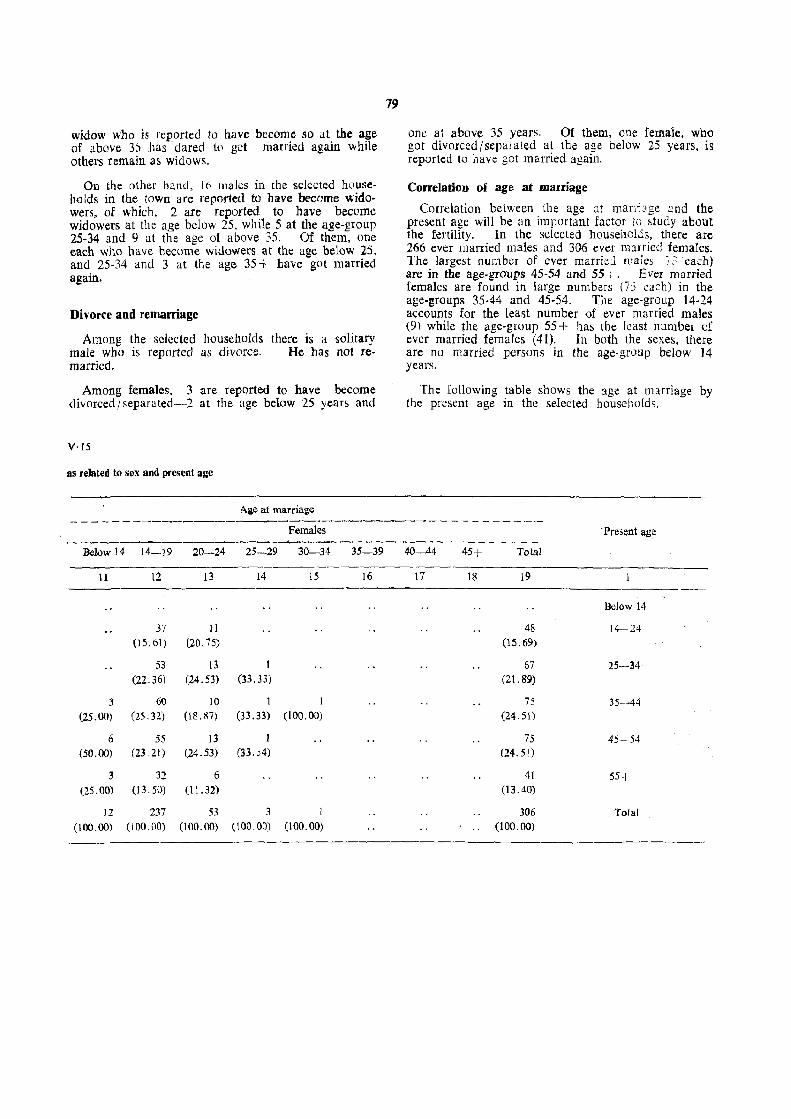
widow who is reported to have become so at the age of above 35 11as dared to get married again while others remain as widows.
AU the other hand, 16 males in the selected households in the town are repOr1ed to have become widowers, of which, 2 are reported to have become widowers at tl1e, age below 25, while 5 at the age-group 25-34 and 9 at the age of above 35. Of them, one each who have become widowers at the age below 25, and 25-34 and 3 at the age 35 + have got married again.
Divorce and remarriage
Among the selected households there is a solitary male who is reported as divorce. He has not remarried.
Among females, 3 are reported to have become divorced! separated-2 at the age below 25 years and
V·15
as related to sex and present age
Age at marriage
79
one at above 35 years. Of them, one female, who got divorced j sepal aleu al the age below 25 years. is reported to have got married again.
Correlation 01' age at marrjage
Correlation between the age at maniage and the present age will be an important factor to ~tudy about the fertility. In the selected households, there are 266 ever married males and 306 ever m:nried females. The largest number of ever marr:d males ~:' ea;::h) are in the age-groups 45-54 and 55 +. Ever married females are found in large numbers (7j each) in the age-groups 35-44 and 45-54. The age-group 14-24 accounts for the least number of ever married males (9) while the age-group 55 + has the least number of ever married females (41). In both the sexes, there are no married persons in the age-group below 14 years.
The following table shows the age at marriage by the present age in the selected households.
---------------------------------------------Females 'Present age - - ____ -.o __________ -...-__________ ~ _________ " ____
Below 14 14-19 20-24 25-29 30-34- 35-39 40-44 45+ Total
II 12 13 14 15 16 17 18 19
Below 14
37 11 48 14-24 05.61) (20.75) (15.69)
53 13 I 67 25-·34 (22.36) (24.53) (33.33) (21.89)
3 60 10 1 I 75 35~44
(25.00) (25.32) (18.87) (33.33) (100.00) (24.51)
6 55 13 I 75 4:;-- 54 (50.00) (23,21 ) (24.53) (33, ~4) (24.51 )
3 32 6 41 55+ (25.00) (13.50) (11.32) (13.40)
12 137 53 3 1 306 Total (100.00) (100,00) (100.00) (100.00) (l 00. 00) (100.00)
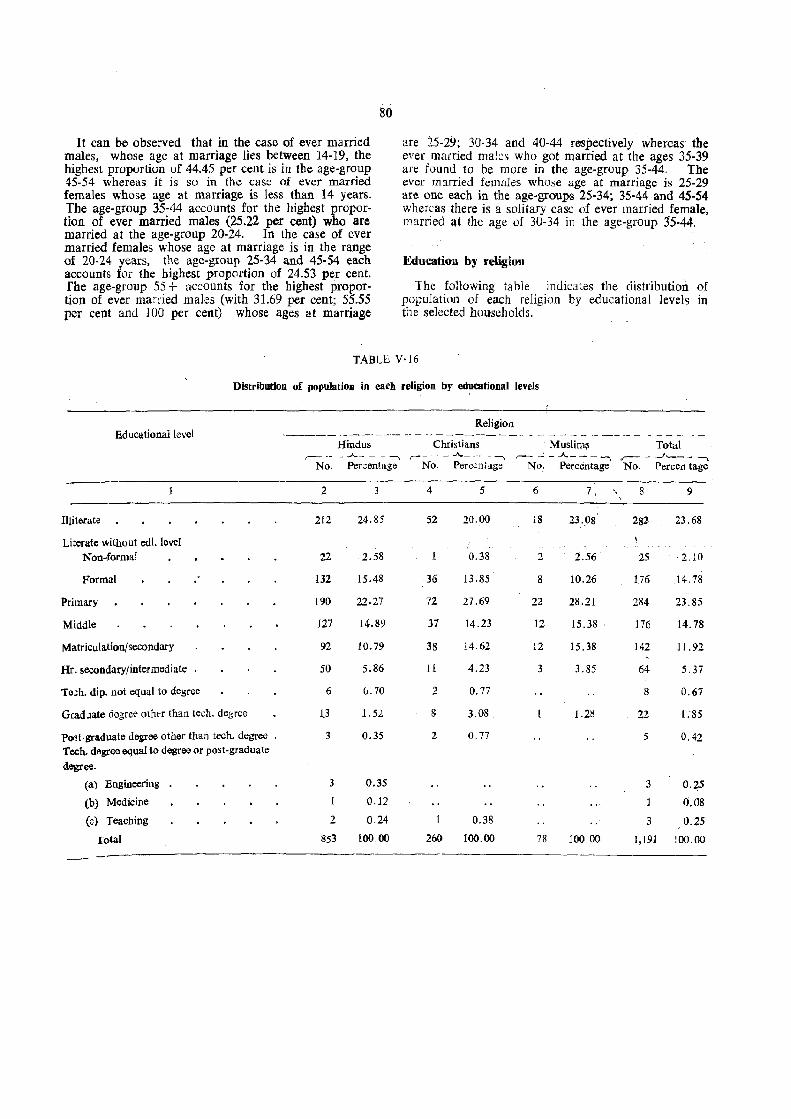
It can be observed that in the case of ever married males, whose age at marriage lies between 14-19, the highest proportion uf 44.45 per cent is in the age-group 45-54 whereas it is so in the case of ever married females whose age at maniage is less than 14 years. The age-group 35-44 accounts for the highest proportion of ever married males (25.22 per cent) who are married at the age-group 20-24. In the case of ever married females whose age at marriage is in the range of 20-24 years, the age-group 25-34 and 45-54 each accounts for the highest proportion of 24.53 per cent. fhe age-group 55 -I- accounts for the highest proportion of ever married males (with 31.69 per cent; 55.55 per cent and 100 per cent) whose ages at marriage
80
are 2.5-29; 30-34 and 40-44 respectively whereas the ever married males who got married at the ages 35-39 are found to be more in the age-group 35-44. The ever married females whose age at marriage is 25-29 are one each in the age-groups 25-34; 35-44 and 45·54 whcicas there is a solitary case of ever married female, married at the age of 30-34 in the age-group 3"5-44.
Education by religion
The following table indicates the distribution of population of each religion by educational levels in the selected households.
TABLb V·16
Distribution of population in each religion by ed~cational levels
Religion Educational1cvei ._----- --~---- -- - - - ----~-.---~ - .-' ~ - -- -- -- -- - - - - -. - -
Hindus Christians Muslim$ Total ,..-_____ ..A.._ - - ~ r-- -- - -"-_ - --~ r-- __; - A._-:-_""",\ !r-- - --'''--_ - -,
No. Per~entage No. Perc~niage No. Percentage No. Percen tage
2 4 5 6 7 8 9
Illiterate 212 24.85 52 20.00 IS 23.08 2SZ 23.68
Literate without edl. level Non-formal 22 2.58 0.38 2 2.56 25 2.10
Formal 132 15.48 36 13 .85 8 10.26 1.76 14.78
Primary 190 22.27 72 27.69 22 28.21 284 23.85
Middle 127 14.89 31 14.23 12 15.38 176 14.78
Matriculation/secondary 92 10.79 38 14.62 12 15.38 142 11.92
Hr. secondary/intermediate 50 5.86 11 4.23 3 3.85 64 5.37
Tu;h. dip. not !'qual to degree 6 (dO 2 0.77 8 0.67
GcadJate degre\.' other than tech. degree 13 1.5.2. 8 3.08 1.2~ 22 1.85
Post·graduate d~ee other than tech. degree . 3 0.35 2 0.77 5 0.42 Tech. d"gree equal to degree or post-graduate
degree.
(a) Engineering 3 0.35 3 0.25
(b) Medicine 0.12 0.08
(c) Teaching 2 0.24 0.38 3 0.25
Iotal 853 100.00 260 100.00 78 100.00 1,191 100.00
Among the variou:; religious groups, Christians have the hig:,est literacy rate of 80 per cent of the Christian Dopulation. The Muslims with a literacy rate of 76.92 pcr cent are the next in order. The least proportion of 75.15 per cent is among Hindus. Among Hindus those with primary educational level form the highest proportion of 22.27 per cent. Next comes literates without educational level with 18.06 per cent. Matriculates form 10.79 per cent of the Hindu population. Graduates and above account for 2·58 per cent of the Hindus. The corresponding pro-
81
portions among Christians and Muslims are 4.23 per cent and 1.28 per cent respectively. Among Christians and Muslims, matriculates constitute 14.62 per cent and 15.38 per cent of the respective religious population.
Education by scheduled castesjtribe~ and others
The table below shows the distribution of popUlation of each casteitribe/community among the selected households in the surveyed arcas by educational levels.
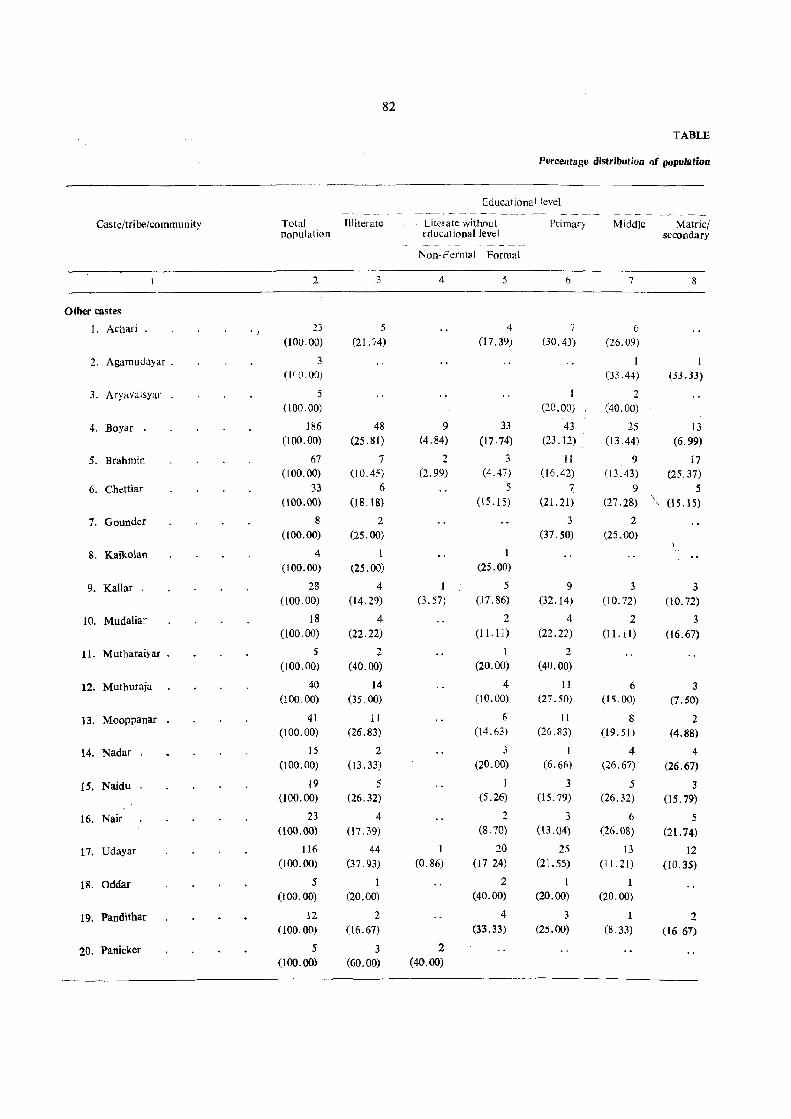
82
TABLE
Percelltage distribution Qf population
Sducat ional level - ~ - -- - - -- - --- - - -- - - - - ------------------
Caste/tribe/community Total llliteratc Literate withnut Primary Middle Mattie/ population ,ducdtionallevel secondary
_------- - - - -_--Non-ferm~J Formal
2 3 4 5 6 7 8
Other castes
I. Achari . ) 23 5 4 7 6
(100.00) (21.i4) (17.39) (30.43) (26.09)
2. Agamudayar . 3 1 (1'('.00) (33.44) (33.33)
3. Aryavaisyar 5 2 (100.00) (la.oO) (40.00)
4. Boyar 186 48 9 33 43 25 13 (100. 00) (25.81) (4.84) (17·74) (23.12) (13.44) (6.99)
5. Brahmin 67 7 2 3 II 9 17 000.00) (10.45) (2.99) (4.47) (16.42) (13.43) (25.37)
6. Chettiar 33 6 5 7. 9 5 (100.00) (18.18) (15.15) (21. 21) (27.28) , (15.15)
7. Gounder 8 2 3 2 (100. (0) (25.00) (37.50) (25.00)
8. Kaikolan 4 1 t (100.00) (25.00) (25.00)
9. Kallar 28 4 1 5 9 3 3 (lOO.OO) (14.29) (3.57) (17.86) (32.14) (10.72) (10.72)
10. Mudaliar 18 4 2 4 2 3 (100.00) (22.22) (11.11) (22.22) (11.11) (16.67)
11. Mutharaiyar . 5 2 1 2 (100.00) (40.00) (20.00) (40.00)
12. Muthuraja 40 14 4 11 6 3 (100.00) (35. (0) (10.00) (27.50) (IS. 00) (7.50)
13. Mooppanar 41 11 6 11 8 2 (l 00. 00) (26.83) (14.63) (26. g3) (19.51) (4.88)
14. Nadar 15 2 3 1 4 4 (100.00) (13.33) (20.00) (6.66) (26.67) (26.67)
1S. Naidu 19 5 3 5 3 (100.00) (26.32) (5.26) (15.79) (26.32) (15.79)
16. Nair 23 4· 2 3 6 5 (100.00) (\7.39) (8.70) (13.04) (26.08) (21. 74)
17. Udayar 116 44 1 20 25 13 12 (100. (0) (37.93) (0.86) (17.24) (21. 55) (11.21) (10.35)
18. Oddar 5 1 2 1 1 (100.00) (20.00) (40.00) (20.00) (20.00)
19. Pandithar 12 2 4 3 1 2 (100.00) (16.67) (33.33) (2:;.00) (8.33) (16 67)
20. Panicker 5 3 2 (100. om (60.00) (40.00)

V·17
by caste/tribe/community and educational I~vel
Higher sec()ndaryi intermediate
9
(4.35)
2 (40.00)
11 (5.91)
10 (14. 9~)
I (3.03)
2 (7.13)
2 (11.11)
2 (5.00)
2 (4.88)
(6,67)
2 (10.52)
1 (4.35)
1 (0,86)
Technical diploma not equal to degree
10
1 (0.54)
2 (2.99)
I (2.44)
Educational level
Graduate
11
1 (33.33)
3 (1. 61)
2 (2.99)
1 (12.50)
1 (5.56)
2 (8,70)
Postgi'aduate
12
3 (4.47)
83
Engineering Medicine Teaching Caste/tribe/community
13 14 15
Other castes
1. Achari
2. Agamudayar
3. Aryavaisyar
4. Boyar
1 5. Brahmin (1.49)
6. Chettiar
7. Gounder
1 I 8. Kaikolan (25.00) (25.00)
1 9. Kallar (3.57)
10. Mudaliar
11. Mutharaiyar
12. Muthuraja
13. Mooppanar
14. Nadar
15. Naidu
16. Nair
11. Udayar
18. Oddar
19. Pandithar
20. Panicker
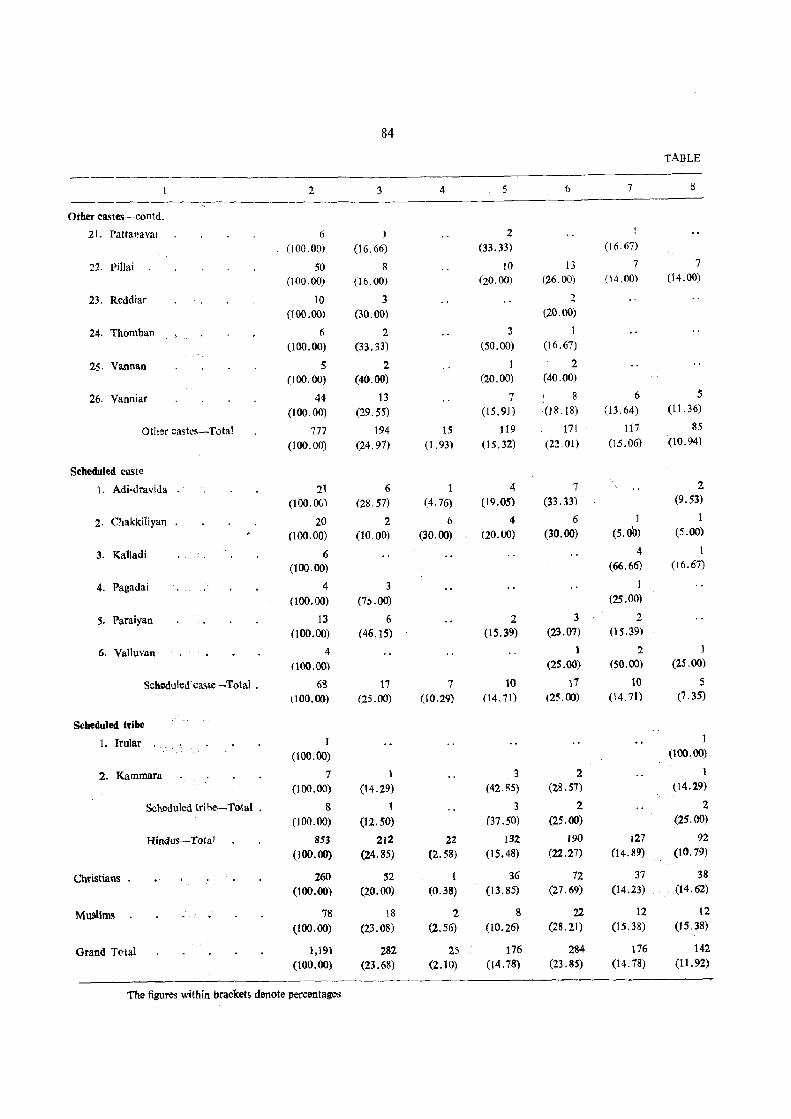
84
TABLE _-2 3 4 6 7 8
Other castes~contd.
21. Patta ... aval 6 1 2 1
(l00.00) (16.66) (33.33) (16.67)
22. Pillai 50 8 10 13 7 7
(100.00) (16.00) (20.00) (26.00) (14.00) (14.00)
23. Reddiar 10 3 2
(100.00) (30.00) (20.00)
24. Thomban 6 2 3 1
(100.00) (33.33) (50.00) (16.()7)
25. Vannan S 2 1 2
(100.00) (40.00) (20.00) (40.00)
26. Vanniar 44 13 7 8 6 5 , (11.36) (100.00) (29.55) (15.91) (18.18) (13.64)
Other castes-Total 777 194 15 119 171 117 85
(100.00) (24.97) (1.93) (15.32) (22.01) (15.06) (10.94)
Scheduled caste
1. Adi-dravida 21 6 1 4 7 2
(100.00,) (28.57) (4.76) (19.(15) (33.33) (9.53)
2. Chakkiliyan 20 2 b 4 6 1 1
(100.00) (10. (0) (30.00) (ZO.(JO) (30.00) (5.0'0) (5.00)
3. KaIJadi 6 4 I
(too. 00) (66.66) (16.67)
4. Pagadai 4 3 1
(100.00) (7:;'00) (25.00)
5. Paraiyan 13 6 2 3 2
(100.00) (46.15) (15.39) (23.07) (15.39)
6. Valluvan 4 1 2 1
(100.00) (25.00) (50.00) (25.00)
Scheduled' ca~te -Total . 68 17 7 10 17 10 5
000.(0) (25.00) (10.29) (14.71) t25. (0) (14.71) (7.35)
Scheduled tribe
1. Irular 1 1
(100.00) (100.00)
2. Kammara 7 1 3 2 1
(100.00) (14.29) (42.85) (28.57) (14.29)
Scheduled trihe-Total . 8 1 3 2 2
(l00.00) (12. SO) (37.50) (25.00) (25.00)
Hindus-Total 853 212 22 132 tOO 127 92
(100.00) (24.85) (2.58) (15.48) (22.27) (14.89) (10.79)
Christians . 260 52 1 36 72 37 38
(100.00) (20.00) (0.38) (13.85) (27.69) (14.23) (14.62)
Mu~Um~ 78 18 2 8 22 12 12
(100.00) (23.08) (2.56) (10.26) (28.21) (15.38) (15.38)
Grand T<ttal 1,191 282 25 176 2M 176 142
(100.00) (23.68) (2.10) (14.78) (23.85) (14.18) (11.92)
The figures within brackets denote percentages
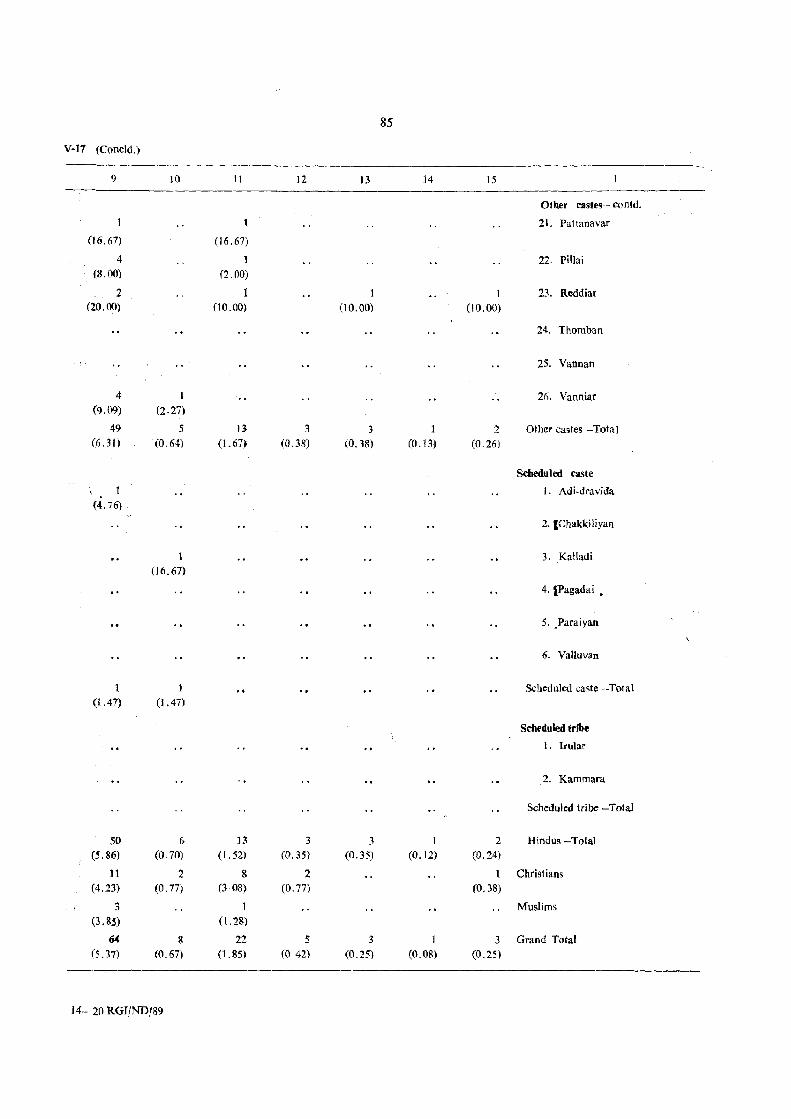
85
V-17--(Concld.)
9 10 11 ]2 13 14 15
Other castes - eontd.
21. Pattanavar
(16.67) (16.67)
4 1 22. Pillai (8.00) (2.00)
2 1 1 1 23. Reddiar (20.00) (10.00) (i0.00) (10.00)
24. Thomban
25. Vannan
4 1 26. Vanniar (9.09) (2.27)
49 5 n 3 3 1 2 Other castes -Total (6.30 (0.64) (1. 67. (0.38) (0.38) (0.13) (0.26)
Scheduled caste
1 1. Adi-dravida (4.76)
2·IChakkiliyan
1 3. Kalladi (16.67)
4·1Pagadai •
5. _Paraiyan
6. Valluvan
1 Scheduled caste --Total (1.47) (1.47)
Scheduled tribe
1. lrular
2. Kammara
Scheduled tribe -Total
50 6 13 3 3 1 2 Hindu9 -Total (5.86) (0.70) (1.52) (0.35) (0.35) (0.12) (0.24)
11 2 8 2 1 Christians (4.23) (0.77) (3 ·08) (0.77) (0.38)
3 1 Muslims (3.83) (l.28)
64 8 22 5 3 1 3 Grand Total (5.37) (0.67) (1.85) (0.42) (0.25) (0.08) (0.25)
14- 20 RGfjNDf89
In the selected households, the literates among sche· duled castes constitute 15 per cent of them while the corresponding proportion among tribes is 87.50 per cent. In the case of others among Hindus, the literacy rate is above 75 per cent.
Among ~ <>:d llled castes, the highest proportion of literates {90 per cent) is seen among ChakJdliyans, while the least (25 per cent) is recorded by Pagadais.
In the case of scheduled tribes, the solitary member of the Ii'ular community is literate, thus forming cent per cent literacy rate. In the other community of Kammara, the literacy rate is 85.71 per cent. Among scheduled castes and scheduled tribes there is not even a single graduate in the surveyed area.
Among other Hindus, the highest literacy rate is recorded among Brahmins with 89.55 per cent. Nadar community comes next with 86.67 per cent. Panicker community accounts for the least proportion of lite· rates (40.00 per cent). More than half of the population of the communities of Agamudayar (66.66 per {'ent); Brahmin (52.24 per cent); Kaikolan (50.00 per cent) and Reddiar (50.00 per cent) are matriculates and above. Graduates and above are in the commu· nities of Agamudayar {1 out of 3); Boyar (3 out of 186); Brahmin (6 out of 67); Gounder (1 cut of 8); Kaikolan (2 out of 4); Kallar (1 out of 28); Muda]iar (lout of 18); Nair (2 out of 23); Pattanavar (lout of 6); Pillai (lout of 50] and Reddiar (3 out of 10) only.
EdUcational seore
In order to study the intensity of attainments of educational levels in the town, a system known as educational score was adopted. The rQethod of cal. cu_lation of educational score is as follows. Under this system, different points to each individual with reference to different educational levels ilttained has been assigned. The points assigned to each of the educational levels are as under:
TlIiteral(; o Literate without educational level
Primary or Junior basiC 2
M~~ 2
Matriculation. higher secondary, pre·university etc. 3
Technical diJ}loma not equal to degree
Non.technical diploma not equal to degree
Graduate dt:gr(;(; other than technical degree
4
4
5
86
Technical degree or djploma equal to degree
Post-graduate degree other than technical degree
Post-graduate technical degree
Ph. D or equivalent and higher
5
5
5
6
The cumulative score of all individuals, thus assigned, is divided by total number of individuals aged 5+ to obtain the average educational score per head. The average educational scores for males and females are also obtained separately by applying the above principle mutatiJ' l12ut{JJJdis.
The following table shows the average educational score per head in the localities referred to in Chapter I.
TABLE V.18
Average educational score per head' in each locality
Average educ.ational score per head
Locality -- -----~ -- -_....!-_ - _- - ~ ~- -Persons Males Females
, 1 2 3 4
r 1.56 1.84 1. 19
TI 1.6!1 1.96 1.41
III 1. 51 1. 78 1.18
IV 2.24 2.45 2.07
V 3.94 4.25 3.11
VI 1. (Jl 1.98 1.25 ' ----_..~-------- - - - ~ ~-
Tot.al 1.77 2.03 1.48
In the sample households the average educational score is 1.77. The scores for males and females arc 2.03 and l.48 respectively. The highest score of 3.94 is in lotality V where managerial staff of the Dalmia Cements and teachers are the main inhabitants. The scores for males and females algo are the highest in this locality. This is followed by locality IV which consists of the households belonging to super· visory staff and factory workers of Dalmia Cements. The scores for persons, males and females of this locality are 2.24; 2.45 and 2.07 respectively. Tbe scores in localities IV and V are higher than that of the entire surveyed households. In the remaining four localities these are lower.
Educational score of each caste/tribe/community is shown in the {ollowing table.
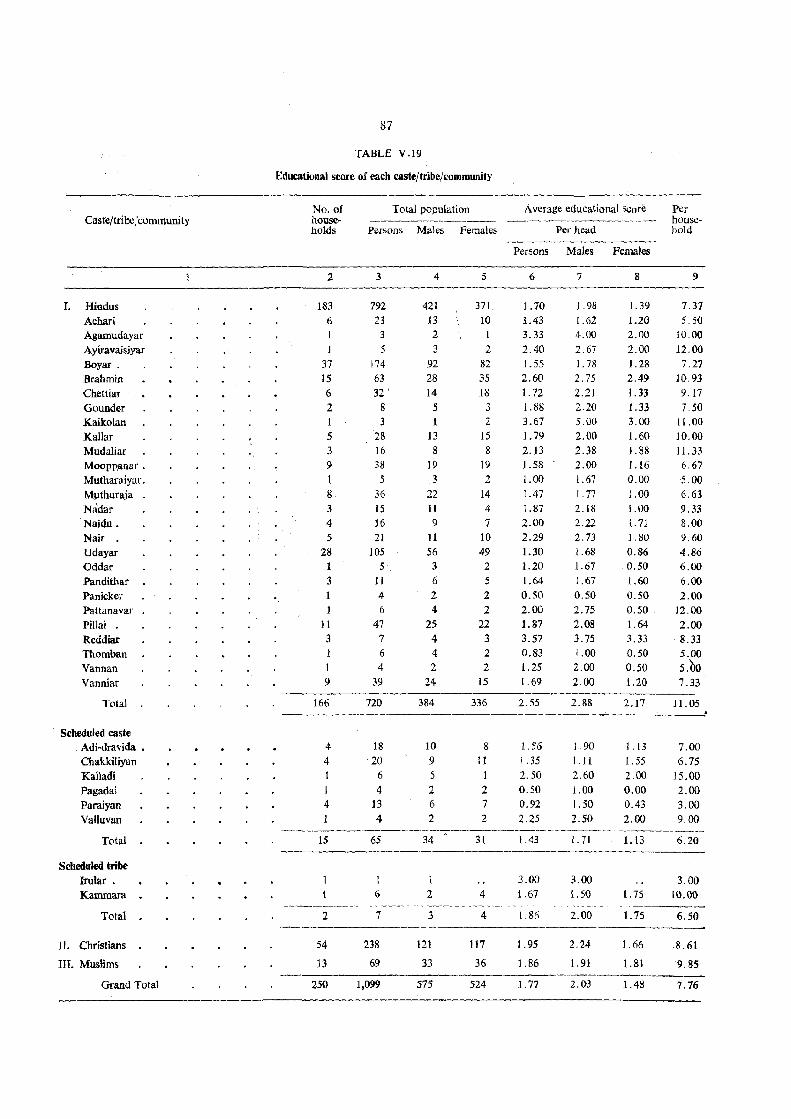
Caste/tribe/community
I. Hindus Achari Agamudayar Ayiravaisiyar Boyar • Brahmin
Chettiar
Gounder Kaikolan Kallar Mudaliar Moopp,anar . Mutharaiyar. Mpthuraja Nadar Naidu. Nair . Udayar Oddar Pandithar Panicker Pattanavar Pillai . Reddiar Thomban Vannan Vanniar
Total
Scheduled caste Adi-dravida • Chakkiliyan
Kalladi Pagadai Paraiyan Valluvan
Total
Scheduled tribe Irutar • Kammara
Tota1
II. Christians
III. Muslims
Grand Total
87
TABLE V.19
Educational score of each caste/tribe/community
No. of households
2
183 6
1
37
15 6 2 1 5 3 9 1 g
3 4 5
28 1 3 1 I
11 3 1 1
9
166
4 4
1 4
15
2
54
13
250
Total population Average educational SCore
Persons Males Females Per head
3
792 23
3 5
174 63 32 '
8 3
28 16 38
5 36 15 16
21 105
5 11 4 6
47 7
6
4 39
720
18
20 6
4 13
4
65
4
421 J3 2 3
92 28 14
5 I
13 8
19 3
22 11 9
11 56 3 6
2 4
25 4 4 2
24
384
10 9
5 2 6 2
34
5
371 10 1 2
82 35 18 3 2
15 8
19 2
14 4 1
10 49 2 5 2 2
22 3 2 2
15
336
8 II
1
2 7 2
31
Persons Males Females
6
1.70 1.43 3.33 2.40 1.55 2.60 1.72 1.88 3.67 1. 79
2.13 1.58 1.00 1.47 1.87 2.00 2.29 1.30 1.20 1.64 0.50 2.00 1. 87 3.57 0.83 1.25 1.69
2.55
1.56
1.35 2.50 0.50 0.92 2.25
1.43
7
1.98 1.62 4.00 2.67 1. 78 2.75 2.21 2.20 5.00 2.00 2.38 2.00 1.67 t.77 2.18 2.22 2.73 1.68 1.67 1.67
0.50 2.75 2.08 3.75 1.00 2.00 2.00
2.88
1.90 1. t 1 2.60 1.00 1.50 2.50
1. 71
8
1.39 1.20 2.00 2.00 1.28 2.49 1. 33
1.33 3.00 1.60 1.88 1.16 0.00 1.00 1.00 1. 71 1.80 0.86 0.50 1.60
0.50 0.50
1.64 3.33 0.50 0.50 1.20
2.17
1.13
1.55 2.00 0.00 0.43 2.00
1.13 ---------------
6
7
238
69
1,099
2
3
121
33
575
4
4
117
36
524
3.00 1.67
1.86
1.95
1.86
1.77
3.00 1. 50
2.00
2.24
1. 91
2.03
1. 7S
1. 75
1.66
1.81
1.48
Per household
9
7.37 5.50
10.00 12.00 7.27
10.93 9.11 7.50
11.00 ]0.00
11.33 6.67 5.00 6.63 9.33 8.00 9.60 4.86 6.00 6.00 2.00
12.00 2.00
.8.33 5.00 5.00 7.33
11. 05
7.00 6.75
15.00 2.00 3.00 9.00
6.20
3.00 10.00
6.50
8.61
9.85
7.76
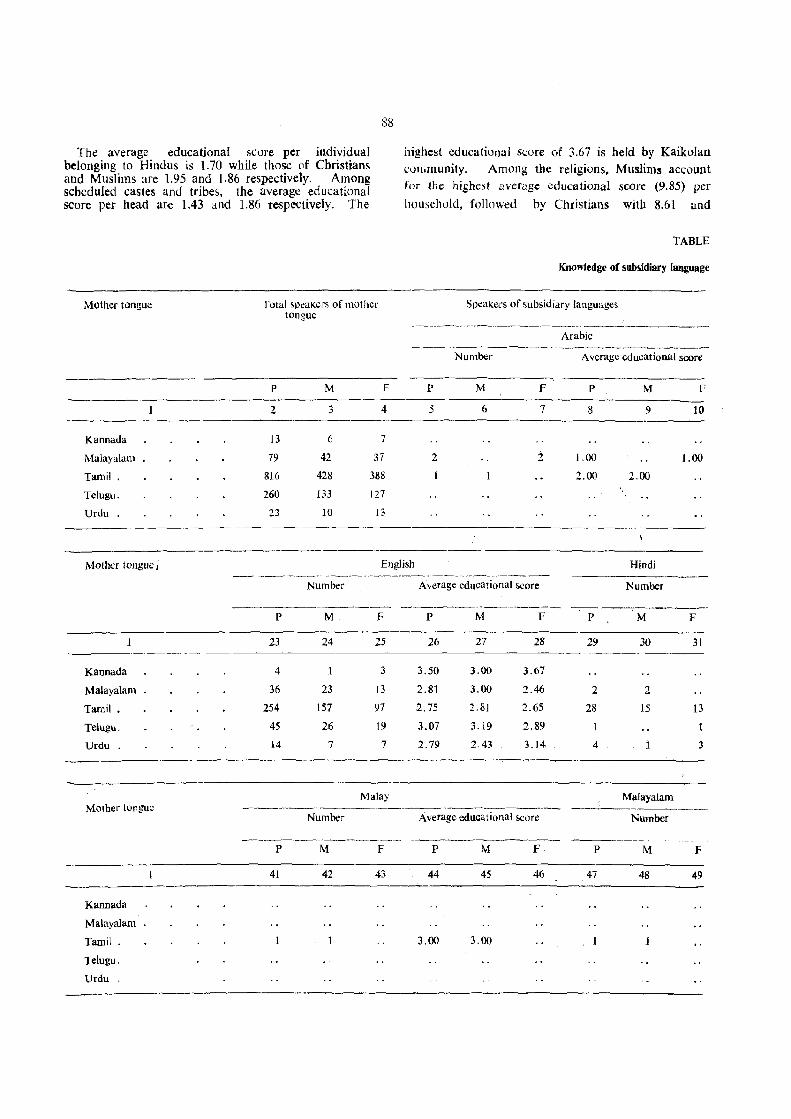
The average educational score per individual belonging to Hindus is 1.70 while those of Christians and Muslims are 1.95 and 1.86 resj)ectively. Among scheduled castes and tribes. the average educational score per head are 1.43 and 1.86 respectively. The
88
Mother tongue Total speaKers of motller tongue
Kannada
Malayalam
Tamil.
Telugu.
Urdu.
P
2
13
79
816
260
23
M F
3 4
6 7
42 37
428 388
133 127
10 13
highest educational Score of 3.67 is held by Kaikolan I:ollimunity. Among the religions. Muslims account for the highest average edu(.'Utional score (9.85) per
household. followed by Christians with 8.61 and
TABLE
Knowledge of subsidiary language
Speakers of subsidiary lal1guages
Arabic
Number Average educational score
P M F P M F
5 6 7 8 9 10
2 2 1,00 1.00
2.00 2.00
Mother tongue I English Hindi
---_-------
Kannada
Malayalam
Tamil.
Telugu.
Urdu
Mother tongue
Kannada
Malayalam
Tamil .
Telugu.
Urdu.
----~----~----------------.------
Number Average educational score
------------- -----------P M F P M F
23 24 25 26 27 28
4 3 3.50 3.00 3.67
36 23 13 2.81 3.00 2.46
254 157 97 2.75 2.81 2.65
45 26 19 3.07 3.19 2.89
14 7 7 2.79 2.43 3.14
Malay
Number Average educational score
---~---------
p M F P M F
41 42 43 44 45 46
3.00 3.00
----------Number
p M F
29 30 31 - ------_- ------
2 2
28 15 13
4 3
Malayalam
Number
P M F
47 48 49
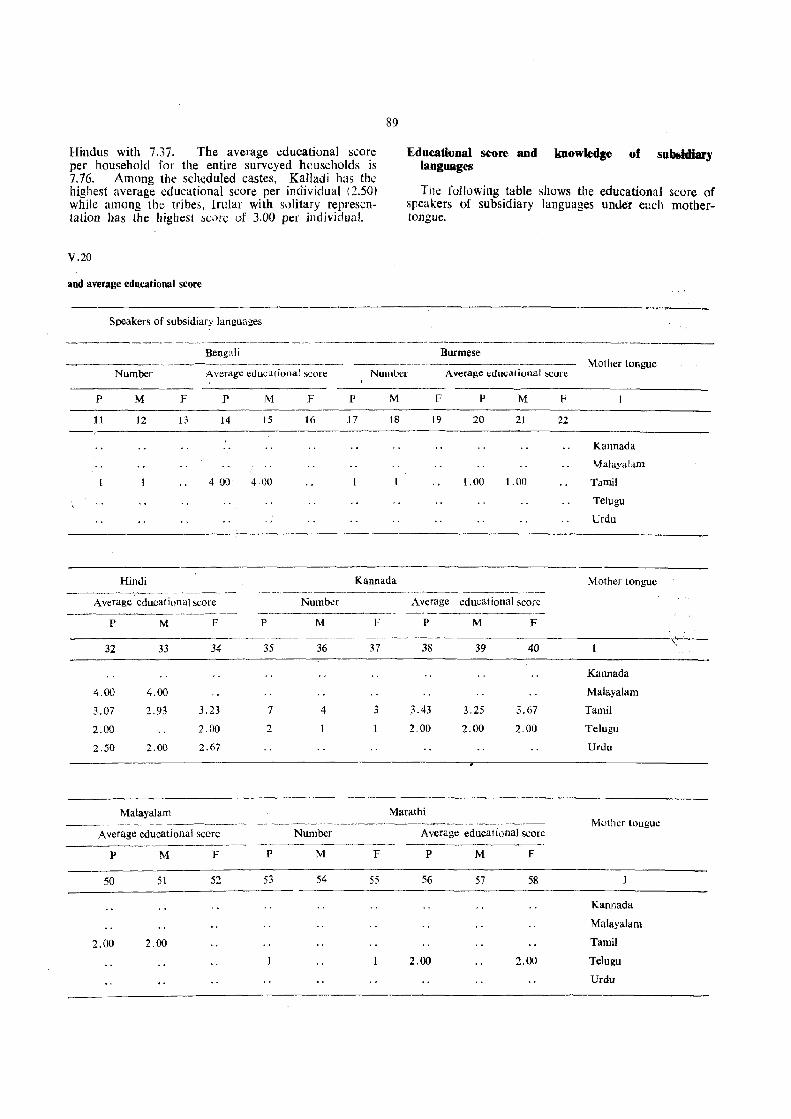
Hindus with 7.37. The average educational score per household for the entire surveyed heuseholds is 7.76. Among the scheduled castes, Kalladi has the highest average educational score per individual (2.50) while among the tribes, lrular with solitary representation has the highest SCOT.; of 3.00 per individual.
V.20
and average educational score
Speakers of subsidiary languages
Bengali ---.------
89
Eduattional score and .lmowled~ of subiidiary languages
TJle following table shows the educational score of speakers of subsidiary languages under euch mothertongue.
Burmese Mother tongue
Number Avt)ragc educational scon: Number Average educational score
P M F P M F P M F P M
11 12 13 14 15 16 17 18 19 20 21 --
400 4.00 1.00 1.00
Hindi Kannada ~--.------,,- ._- ----.~.-~ •.. - .. ---.. - ._-_-_---_. __ -_.-----_.----
Average educational score Number Average educational score ~----- -----------~- --------------
P M F P M F P M F
32 33 34 35 36 37 38 39 40
4.00 4.00
3.07 2.93 3.23 7 4 3 3.43 3.25 3.67
2.00 2.00 2 2.00 2.00 2.00
2.50 2.00 2.67
Malayalam Marathi
Average educati(}ual score Number Average educational score
p M F p M F p M F
50 51 52 53 54 55 56 57 58
2.00 2.00
2.00 2.00
F
22
Kannada
Malayalam
Tamil
Telugu
Urdu
M other tongue
Katmada
MalayaJam
Tamil
Telugu
Urdu
Mother longue
Kannada
Malayalam
Tamil
Telugu
Urdu
"
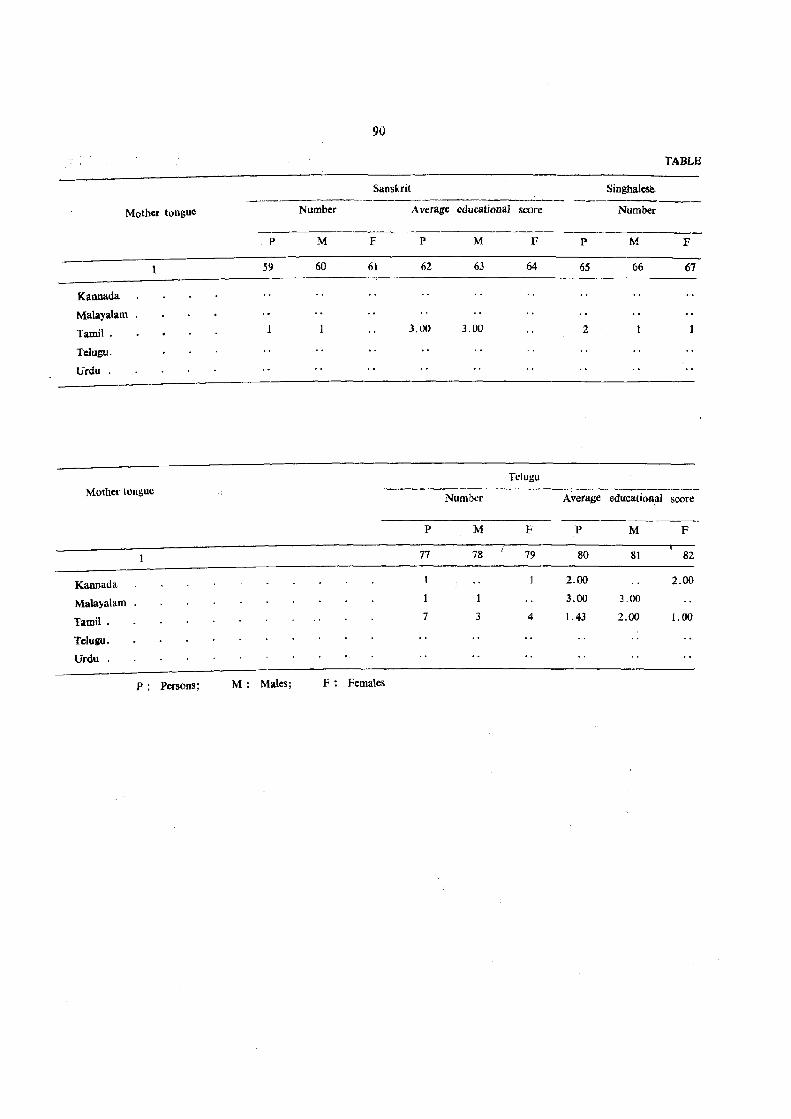
Mother tongue
Kannada
Malayalam
Tamil .
Telugu.
Urdu.
Mother tongue
Kannada
Malayalam
Tamil.
Telugu.
Urdu
P: Persons;
Number
p M
59 60
M: Males; F:
90
Sanskrit
Average educational score
F P M F
61 62 63 64
3.00 3.00
Tclugu
Number
P M F
77 78 79
1
7 3 4
Fema\es
TABLE
Singhalese
Number
p M F
65 66 67
2
Average educati(}Rai score
P M F
80 81 82
2.00 2.00
3.00 3.00
1.43 2.00 1.00
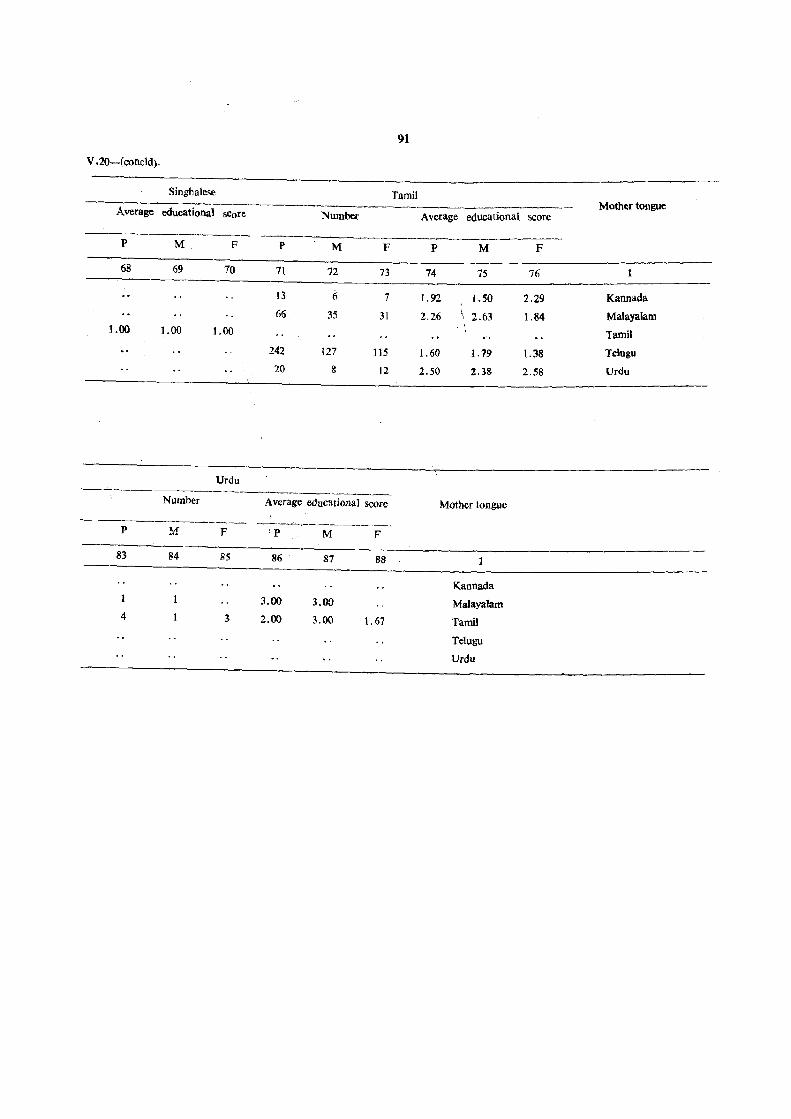
91
V.20-(concld).
Singhalese Tamil Mother tongue Average educational score Number Average educational score
p M F P M F P M F
68 69 10 71 72 73 74 75 76
13 {; 7 1.92 1.50 2.29 Kannada
66 35 31 2.26 2.63 1.84 Malayalam 1.00 1.00 1.00 Tamil
242 127 115 1. 60 1. 79 1.38 Telugu
2:0 8 12 2.50 2.38 2.58 Urdu
Urdu
Number Average educational score Mother tongue ~
~--,------~-P ~f F 'P M F
83 84 85 86 87 88
Kannada
3.00 3.00 Malayalam 4 3 2.00 3.00 1.67 Tamil
Telugu
Urdu
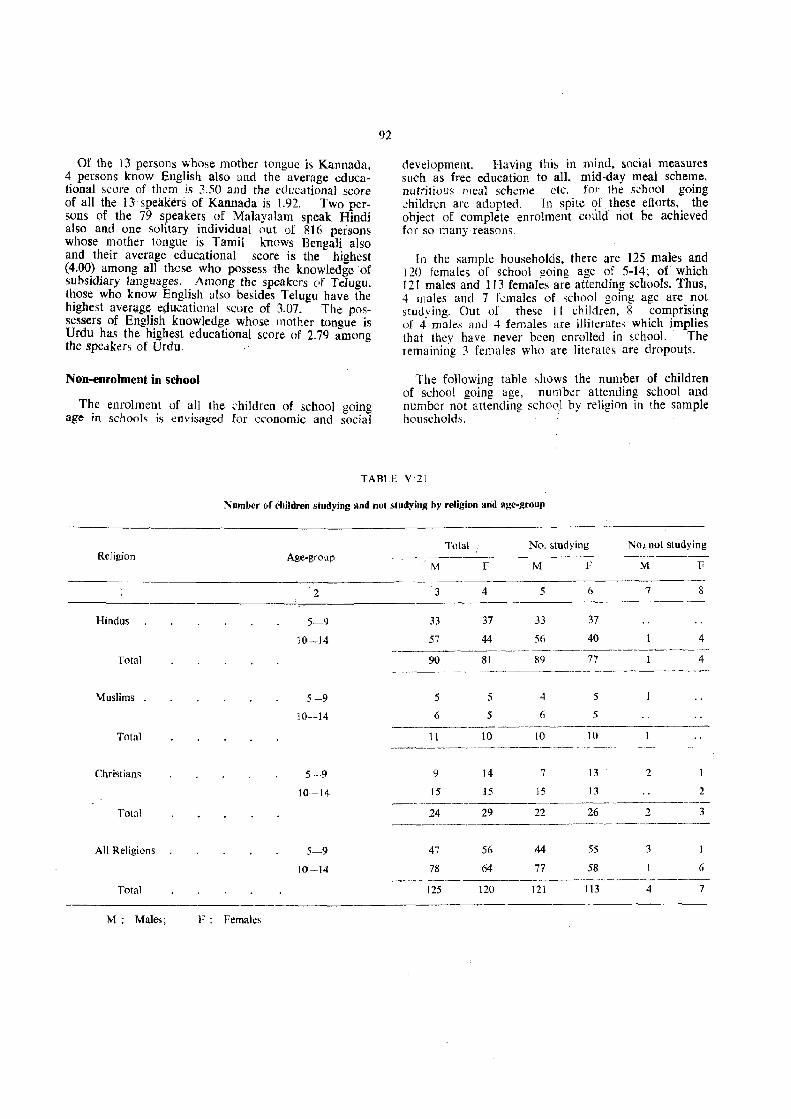
Of the 13 persons whose mother tongue is Kannada, 4 persons know English also and the average educational score of them is 3.50 and the educational score of all the 13 speakers of Kannada is 1.92. Two persons of the 79 speakers of Malayalam speak Hindi also and one solitary individual out of 816 persons whose mother tongue is Tamil knows Bengali also and their average educational score is the highest (4.00) among all those who possess the knowledge of subsidiary languages. Among the speak.:rs (Of TeIugu. those who know English also besides Telugu have the highest average e9ucational score of 3.07. The possessers of English knowledge whose mother tongue is Urdu has the highest educational score of 2.79 among the speakers of Urdu.
No~enro1ment in school
The enrolment of all the -:hildren of school going age in schools is envisaged for economic and social
92
development. Having this in mimi, social measures such as free educatiOl~ to all, mid-day meal scheme, nutritiolJs meal scheme ctc. for the s~'hool going .:hildren are adopted. In spite of. these efiorts.. the object of complete enrolment could not be achIeved for so many reasons.
In the sample households, there are 125 males Il:nd 120 females of school going age of 5-14; of whIch 12 I males and 113 females are attending schools. Thus, 4 males and 7 kmales of school going age are not studving. Out of these II children, 8 comprising of 4' males and 4 females are illiterates which implies that thev have never been enrolled in ~chool. The remaining 3 females who are literates are dropouts.
The following table ~hows the number of children of school going age. number attending school and number not attending schoo) by religion in the sample households. .
TABLE V·2t
Number of children stUdying and not studying by religion arid age-group
Total No. studying No. not studying Religion Age-group ------ ------
M F M F M F
2 3 4 5 6 7 8
Hindus 5-9 33 37 33 37
W-14 57 44 56 40 4
Total 90 81 89 77 4
Muslims 5-9 5 5 4 5
]0--14 6 5 6 5
Total 11 10 10 ]0 ------~-- ---------
Christians 5--9 9 14 7 13 2
10--14 15 15 15 13 2
Total 24 29 22 26 2 3
All Religions 5-9 47 56 44 55 3
10·-14 78 64 77 58 6
Total 125 120 121 113 4 7
M: Males; F: Females
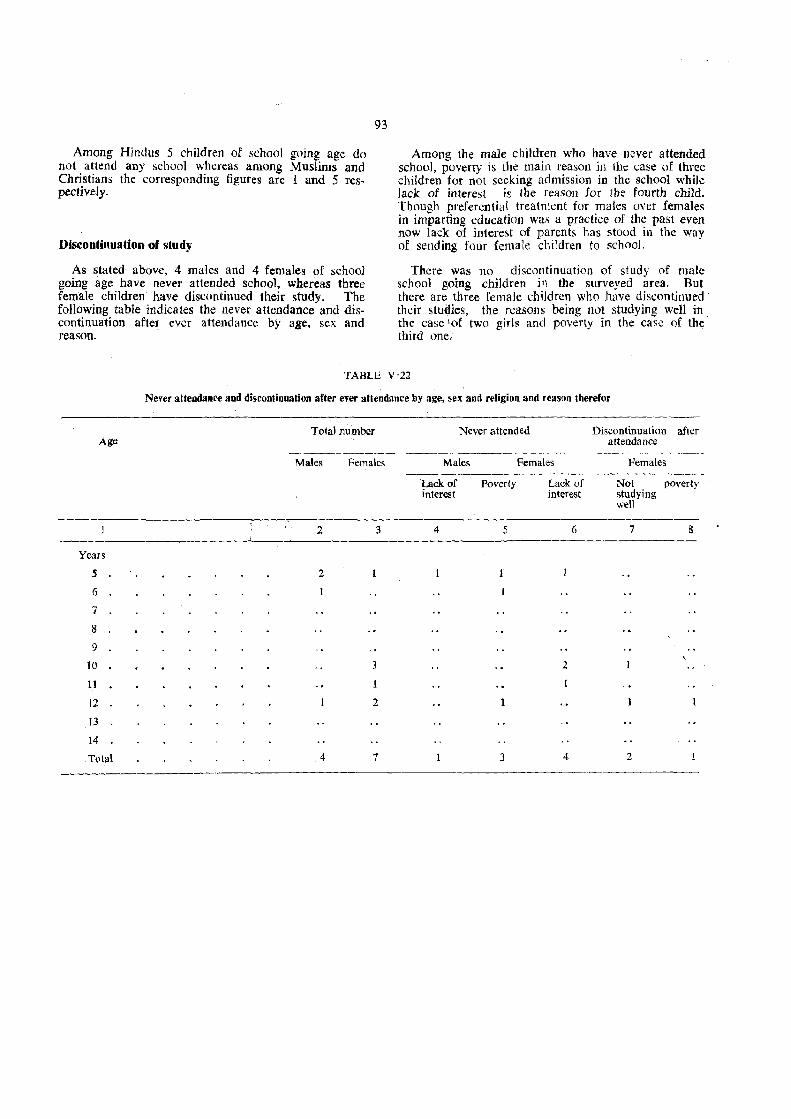
Among Hindus 5 children of school going age do not attend any school whereas among Muslims and Christians the corresponding figures are 1 and 5 respectively.
D~ontinuation of study
As stated above, 4 males and 4 females of school going age have never attended school, whereas three female children have discontinued their study. The following table indicates the never attendance and discontinuation after ever attendance by age, sex and reason.
93
Among the male children who have never attended schoo1, poverty is the main reason in the case of three children for not seeking admission in the school while lack of interest is the reason for the fourth child. Though preferential treatment for males over females in imparting education was a practice of tbe past even now lack of interest of parents has stood in the way of sending four female children to school.
There was no discontinuation of study of male school going children in the surveyed area. But there are three female children who have discontinued their studies, the reasons being not studying well in the case lof two girls and poverty in the case of the third one!
TABLE V·22
Age
Years
S
6
7
8
9
10
11
12
13
14
Tolal
Never attendance and discontinuation after ever attendance by age, sex and religion and reason therefor
Total number
-~---~~---
Males Females
2 3 -2
3
2
4 7
Never attended
------~---------
Males Females ------~~-~------
'Lack of Poverty Lack of interest interest
4 5 6
1
2
3 4
Discontinuation after attendance
Females
Not poverty studying well
7 S
\
2
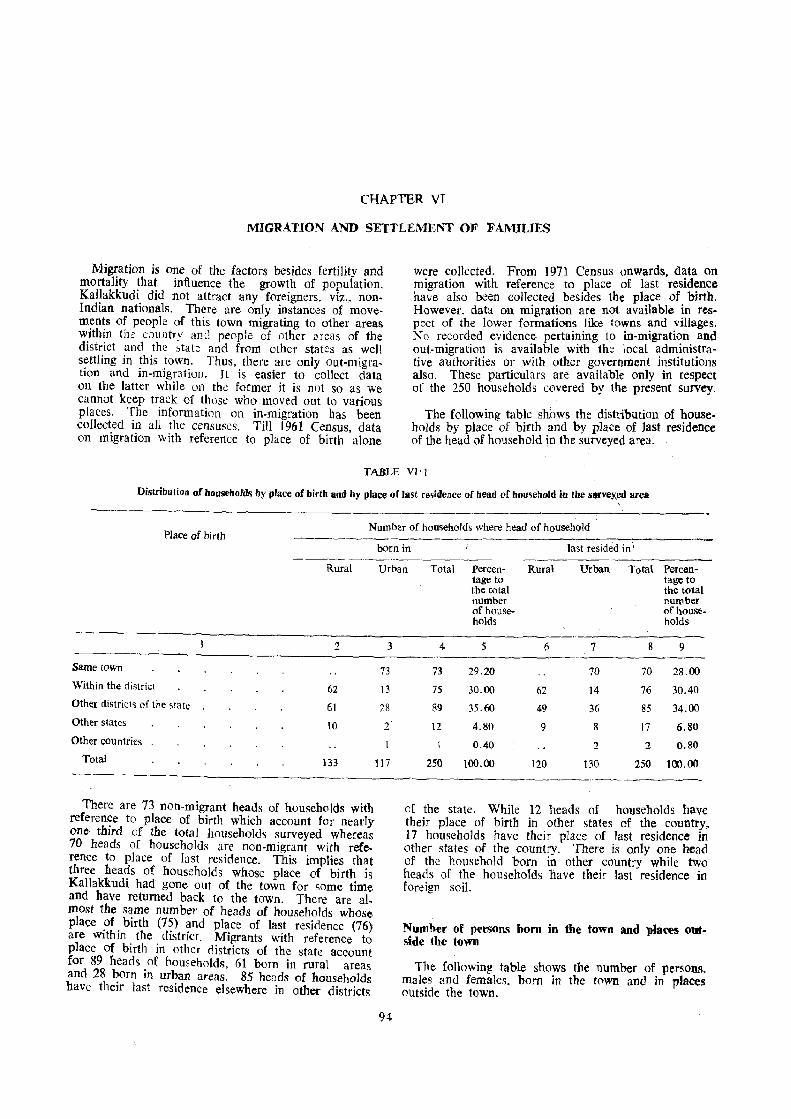
CHAPTER VI
MIGRATION AND SETTLEMENT OF FAMILIES
Migration is one of the factors besides fertility and mortality that influence the growth of population. Kallakkudi did not attract any foreigners. viz., nonIndian nationals. There are only instances of movements of people of this town migrating to other areas within th~ country an~i people of other areas of the district and the state and from other states as well settling in this town. Thus, there are only out-migration and in-migration. It is easier to collect data on the latter while on the former it is not so as we cannot keep track of those who moved out to various places. The information on in-migration has been collected in all the censuses. Till 1961 Census, data on migration with reference to place of birth alone
were collected. From 1971 Census onwards. data on migration with reference to place of last residence have also been collected besides the place of birth. However. data on migration are not available in respect of the lower formations like towns and villages. No recorded evidence pertaining to in-migration and out-migration is availa hIe with the local administrative authorities or with other government institutions also. These particulars are available only in respect of the 250 households c@vered by the present survey.
The following table shbws the distribution of households by place of birth and by place of last residence of the head of household in the surveyed a:-ea.
TABLE VI'l
Distribution of households by place of birth and by place of last residence of head of household iu tbe s .... vexed area
-Place of hi rth
Number of households where head of household
born in last resided in \ ---_.- -'-~-'--
Rural
2
Same town
Within the district 62
Other districts of the state 61
Other states 10
Other countries
Total 133
There are 73 non-migrant heads of households with reference to place of birth which account for nearly one third of the total households surveyed whereas 70 heads of households are non-migrant with refe. renee to place of last residence. This implies that three heads of households whose place of birth is Kal1akkudi had gone out of the town for some time and have returned back to the town. There are almost the same number of heads of households whose place of birth (75) and place of last residence (76) are within the district. Migrants with reference to place of birth in other districts of the state account for 89 heads of households, 61 bom in rural areas and 28 born in urban areas. 85 heads of households have their last residence elsewhere in other districts
Urban Total Percen- Rural Urban Total Percen-
3
73
13
28
2
117
94
tage to tageto the total the total number number of house- of house-holds holds
4 5 6 7 8 9
73 29.20 70 70 28.00
7S 30.00 62 14 76 30.40
89 35.60 49 36 85 34.00
12 4.80 9 8 17 6.80
0.40 2 2 0.80
250 100.00 120 130 250 100.00
of the state. While 12 heads of households have their place of birth in other states of the country, 17 households have their place of last residence in other states of the country. There is only one head of the household born in other country while two heads of the households have their last residence in foreign soil.
Number of persons bom in the town and places outside the town
The following table shows the number of persoo.'1, males and females. born in the town and in places outside the town.
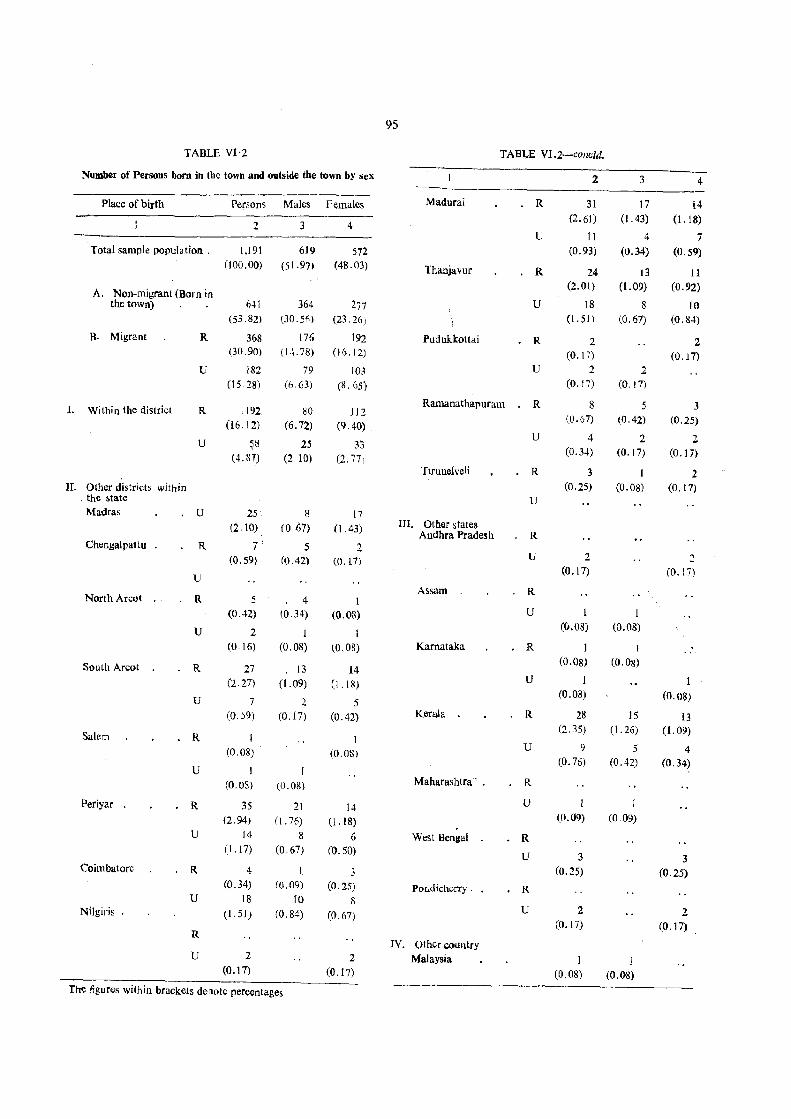
95
TABLE VI'2 TABLE VI.2-collcld.
Number of Persons born in the town and outside the town by seX 2 3 4
Place of birth Per,om Males Females Madurai R 31 J7 14
2 3 4 (2.61) (I .43) (1. 18)
U 11 4 7 Total sample population , 1,191 619 572 (0.93) (0.34) (0.59)
(100.00) (5 1.97) (48.03) Thanjavur R 24 13 11
A. Non-migrant (Barn in (2.01) (1.09) (0.92)
the town) 6~1 364 277 U 18 8 10 (53.82) (30. Sf;) (23.26) (1. 51 \ (0.67) (0.84)
B. Migrant R 368 176 192 Pudukkottai R 2 2 (30.90) ( 1·\.78) (16,12) (0.17) (0.17)
U 182 79 103 U 2 2 (15.28) (6,63) (8, 65) (0.17) (0.17)
I. Within the district R 192 Ramanathapufam R 8 3 80 IJ2
(16,12) (6.72) (9,40) (0.67) (0.42) (0,25)
U U 4 2 2
~8 25 33 (0.34) (0.17) (0.17) (U1) (2,10) (2,77)
'flfunelvcli R 3 I 2 II. OthCl' districts within (0.25) (O.OS) (0.17)
, the state U Madras U 25 ::; 17
(2,10) (0,1)7) (1,43) m, Other states Andhra Pradesh R
Chengalpattu R 7' 5 2 (0.59) (0,42) (0,17) U 2 2
u (0.17) (0.17)
North Areat Assam R
R 5 4 1 (0,42) (0,34) (0,08) U 1 1
U 2 1 I (0.08) (0.08)
(0,16) (0.08) (0.08) Karnataka R I 1 ,
South Areot R 27 13 14 (O.OS) (0,08)
(2.27) (1. 09) (1 , 18) U 1
U 7 2. 5 (0.08) (0.08)
(0, )9) (0,17) (0.42) Kerala R 28 15 13
Salem R I (2.35) (1.26) (1. 09)
(0,08) (0.08) U 9 5 4
(0.76) (0.42) (0,34) U 1
(0. OS) lO.08) Maharashtra' . R
Periyar R 35 21 14 U 1 I
(2.94) (1.76) (l , 18) (0.09) (0,09)
u 14 8 6 West Bengal R (l. 17) (0,67) (0.50)
U 3 3 Coimbatorc R 4 3 (0.25) (0,25)
(0.34) (0 , O() (0.25) POudiehvrry R U 18 10 8
Nilgids . (1.51) (0,84) (0,67) U 2 2 (0.17) (0,17)
R IV. Other country
U 2 2 Malaysia I 1 (0.17) (0.17) (0,08) (0.08)
TIw figures within brackets denote percentages
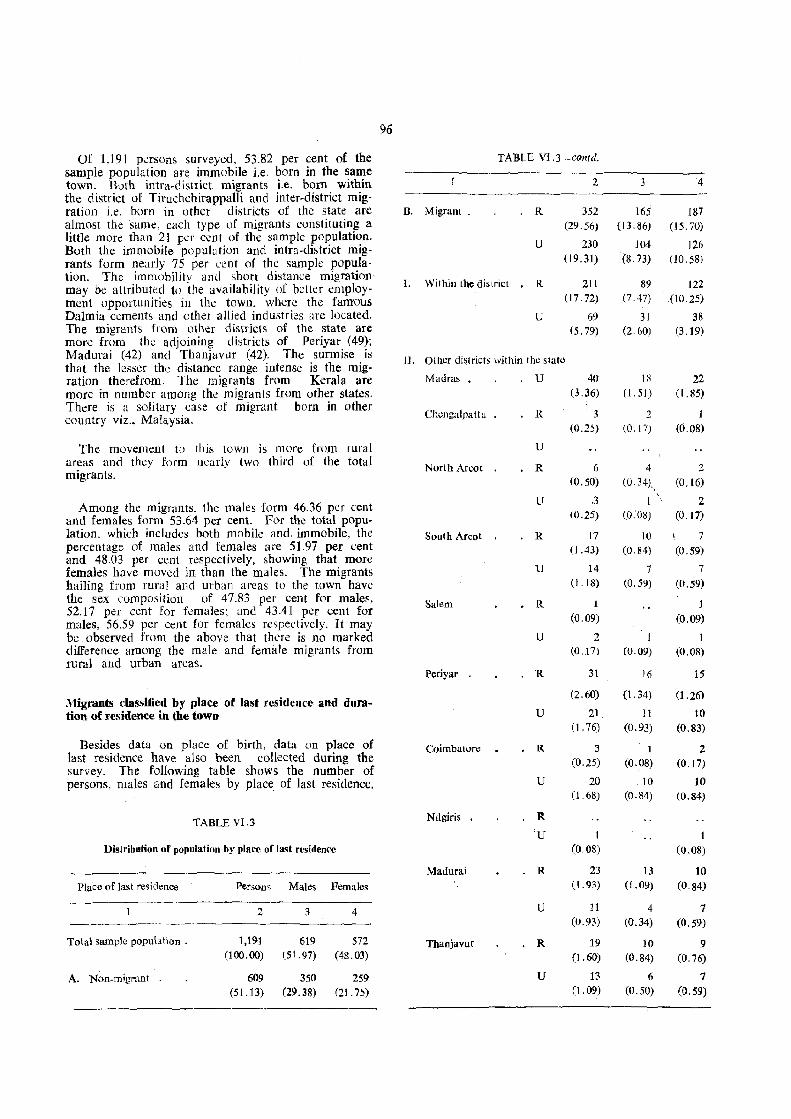
Of 1,191 persons surveyed. 53.82 per cent of the sample PQpulation an; immobile i.e. born in the same town. Both intra-district migrants i.e. born within the district of Tiruchchirappalli and inter-district migration i.e. born in other districts of the state are almost the same, each type of migrants constituting a little more than 21 per cent of the sample population. Both the immobile population and intra-district migrants form nearly 75 per cent of the sample population. The immobility and short distance migration may be attributed to the availability of better employment opportunities in the town, where the famous Dalmia cements and other allied industries are located. The migrants from other districts of the state are more from the adjoining districts of Periyar (49); Madurai (42) and Thanjavur (42). The surmise is that the lesser the distance range intense is the migration therefrom. The ill igrants from Kerala are more in number among the migrants from other states. There is a solitary case of migrant born in other country viz., Malaysia.
The movement to thit; town is more from rural areas and they form ncarly two third of the total migrants.
Among the migrants. the males form 46.36 per cent and females form 53.64 per cent. For the total population. which includes both mobile and immobile, the percentage of males and females are 51.97 per cent and 48.03 per ccnt respectively, showing that more females have moved in than the males. The migrants hailing from rural and urban areas to the town have the sex composition of 47.83 per cent for males, 52.17 per cent for females; and 43.4] per cent for males, 56.59 per cent for females respectively. It may be observed from the above that there is no marked difference among the male and female migrants from rural and urban areas.
Migrants classified by place of last residence and duration of residenc:e in the town
Besides data on place of birth, data on place of last residence have also been collected during the survey. The following table shows the number of persons, males and females by place of last residence.
TABLEYI.3
Distriblltion of population by place of last residence
Place of last residence
Total sample population.
A. Non-migrant
Persons Males Females
2
1,191
(100.00)
609 (51.13)
3
619 (51.97)
350
(29.38)
4
572 (48.03)
259 (21.75)
96
TABLE VI.3-contd.
2
B. Migrant. R 352 (29.56)
U 230
(19.31)
1. Within the district R 211
(17.72)
U 69 (5.79)
11. Other districts within the stale
Madras.
Chcngalpattu
North Areot
South Areot
Salem
Periyar
Coimbawre
Nilgiris
Madurai
Thanjavur
U
R
U
R
u
R
u
R
U
R
u
R
u
R
U
R
u
R
u
40 (3.36)
3 (0.25)
6 (0.50)
.3 (0.25)
17 (1.43)
14 (1.18)
i (0.09)
2 (0.17)
31
(2.60)
21 (1.76)
3
(0.25)
20 (1.68)
1 (0.08)
23 (1.93)
11 (0.93)
19 (1.60)
13 (1.09)
3
165 (13.86)
104
(8.73)
89 (7.47)
31 (2.60)
10 (1.51)
1 (0.17)
4
(0.34)"
1 (0.08)
10 (0.84)
7 (0.59)
I (0.09)
16
(1.34)
11 (0.93)
1
(0.08)
10 (0.84)
13 (1.09)
4 (0.34)
10 (0.84)
6 (0.50)
4
187 (15.70)
126 (10.58)
122 (10.25)
38 (3.19)
22 (1.85)
J
(0.08)
2 (0.16)
2 (0.17)
7 (0.59)
7 (0.59)
1 (0.09)
1 (0.08)
15
(1.26)
10
(0.83)
2 (0.17)
10 (0.84)
1 (0.08)
10 (0·84)
7 (0.59)
9 (0.76)
7 (0.59)
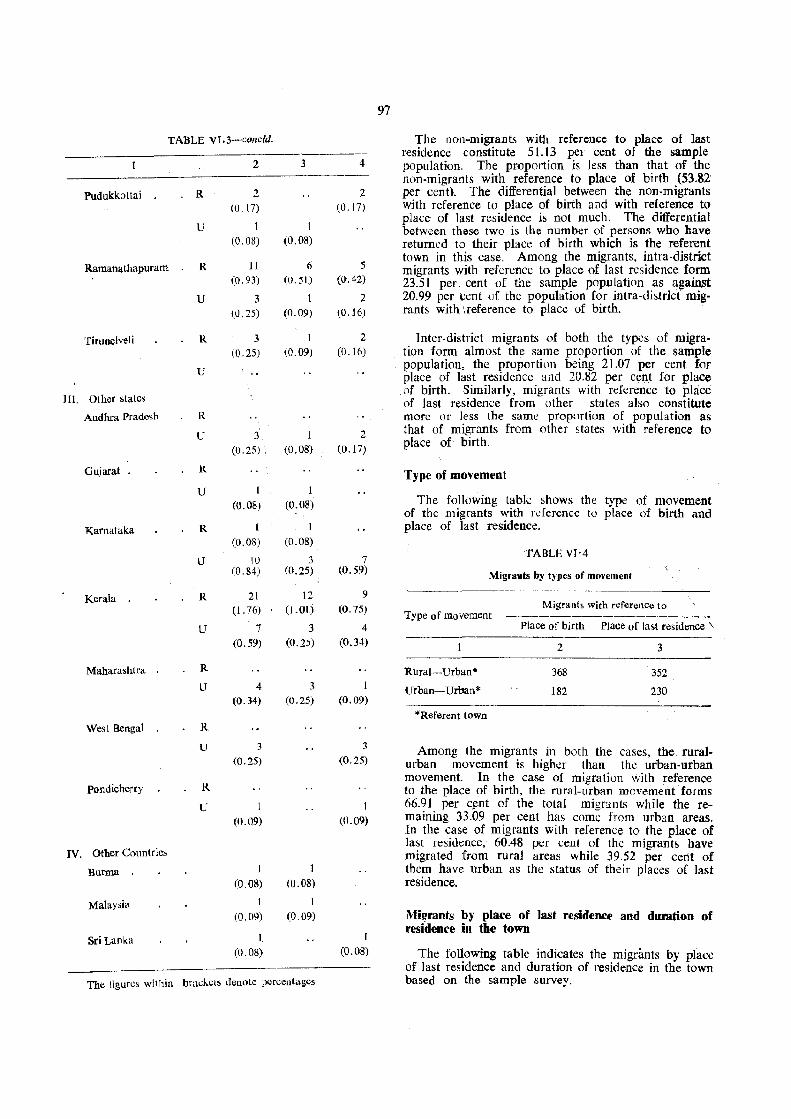
TABLE Vl.3-coflclcJ.
Pudukkottai
Ramanathapuram
Tirunelveli
111. Other states
Audhra Prade~h
Gujarat .
Karnataka
Kerala
Maharashtra
R
2
2 (0.17)
U 1
R
(0.08)
11 (0.93)
U 3
R
u
R
U
R
u
R
u
(U.25)
3
(0.25)
3'.
(0.25) .
1 (0.08)
I
(0.08)
10 (0.84)
3
I (0.08)
6 (0.51 )
1 (0.09)
I (0.09)
I (0.08)
1
(0.08)
1
(0.08)
3 (0.25)
R 21 12
u
R
U
(1. 76) , (1.01)
7
(0.59)
4 (0.34)
3 (0.2:»
3 (0.25)
West Bengal R
pondicherry
IV. Other C()untrics
Burma
Malaysiil
Sri Lanka
U
R
U
3
(0.25)
I (0.09)
J
(0.08)
1 (0.09)
1
(0.08)
1 (0.08)
1
(0.09)
Th\) ligures within bra<,;kcl5 deuote pcrcentagcs
4
2 (0.17)
5 (0.42)
2 (0.16)
2 (0.16)
2 (0.17)
7 (0.59)
9
(0.75)
4
(0.34)
1 (0.09)
3
(0.25)
1 (0.09)
1
(0.08)
97
The non-migrants with reference to place of last residence constitute 51.13 pel cent of the sample population. The proportion is Jess than that of the non-migrants with reference to place of birth (53.82: per cent), The differential between the non-migrants with reference to place of birth and with reference to place of last residence is not much. The differential between these two is the number of persons who have returned to their place of birth which is the referent town in this case. Among the migrants, intra-district migrants with reference to place of last residence. form 23.5l per. cent of the sample population as against 20.99 per cent of the population for intra-district migrants with "reference to place of birth.
Inter-district migrants of both the types of migration form almost the same proportion of the sample popUlation, the proportion being 21.07 per cent for place of last residence and 20.H2 per cent for place
. of birth. Similarly, migrants with rderence to place of last residence from other states also constitute more or Jess the same propottion of population as that of migrants from other states with reference to place of birth.
Type of movement
The following table shows the type of movement of the migrants with reference to place of birth and place of last residence.
TABLE VI'4
Migrants by types of movement
Misrants with reference to Type of movement ----------------
Rural-Urban·
Urban-Urban·
*Referent town
Place of birth Place of last residence"
2 3
368
182
352
230
Among the migrants in both the cases, tbe ruralurban movement is higher than the urban-urban movement. In the case of migration with reference to the place of birth, the rural-1~rban mcvement forms 66.91 per qmt of the total migrants while the remaining 33.09 per cent has come from urban areas. In the case of migrants with reference to the place of last residence, 60.48 per .:ent of the migrants have migrated from rural areas while 39.52 per cent of them have urban as the status of their places of last residence.
Mil!rants by place of last residem'e and dlll'ation of residence in the town
The following table indicates the migrants by place of last residence and duration of residence in the town based on the sample survey.
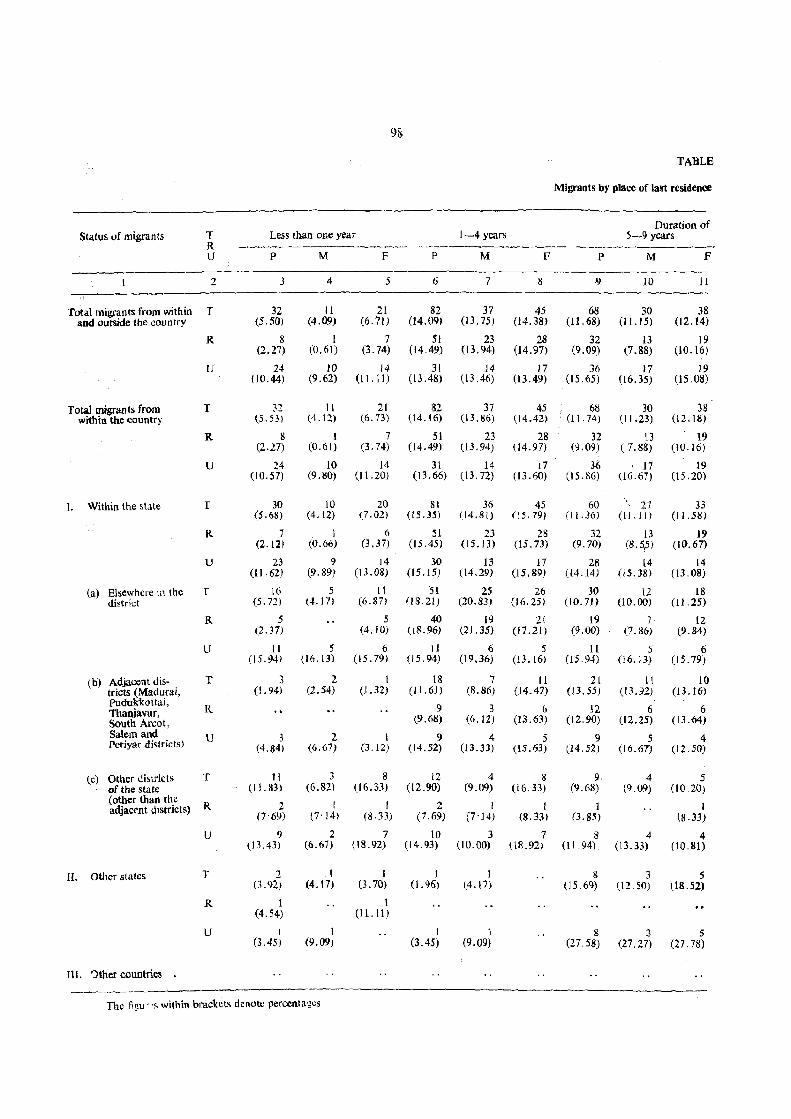
98-
TABLE
Migrants by place of last residence
Duration of Status of migrants T Less than one year 1-4 years 5-9 years
R U P M F P M F P M F
2 3 4 5 6 7 8 9 10 11
Total migrants from within T 32 11 21 82 37 45 68 30 38 and outside the country (5.50) (4.09) (6.71) (14.09) (13.75) (14 • .38) (11. 68) (1!.l5) (12.14)
R 8 I 7 51 23 28 32 13 19 (2.27) (0.61) (3.74) (14.49) (13.94) (14.97) (9.09) (7.88) (10.16)
U 24 10 14 31 14 J7 36 17 19 (10.44) (9.62) (It. 11) (13 .48) (13.46) (13.49) (15.65) (16.35) (IS .08)
Total migrants from T 32 11 21 82 37 45 68 30 38 within the country (5.53) (4.12) (6.73) (14.16) (13.86) (14.42) . (11.74) (11.23) (12.18)
R 8 1 7 51 23 28 32 t3 19 (2.27) (0.61) (3.74) (14.49) (13.94) (14.97) (9.09) ( 7.88) (10.16)
U 24 10 14 31 14 17 36 17 19 (10.57) (9.80) (1l.20) (l3.66) (13.72) (13.60) (15.86) (16.67) (15.20)
1. Within the state T 30 10 20 81 36 45 60 27 33 (5.68) (4.12) (7.02) (15.35) (14.81) (15.19) (11.36) (E 1.11) (11.58)
R 7 I 6 S1 23 28 32 13 19 (2.12) (0.66) (3.37) (15.45) (15.13) (15.73) (9.70) (8. ~5) (l().67)
U 23 9 14 30 13 IT 28 14 14 (ll.62) (9.89} (13.08) (15.15) (14.29) (15.89) (14.14) (15.38) (13.08)
Ca) Elsewhere ill the T 16 5 It :51 25 26 30 12 18 district (5.72) (4.17) (6.87) (l8.2t) (20.83) (16.25) (10.71) (10.00) (11.25)
R 5 5 40 19 2( 19 T 12 (2.37) (4.10) (18.96) (21.35) (17.21) (9.00) (7.86) (9.84)
U 11 5 6 11 6 5 II 5 6 (15.94) (16.13) (15.79) (J 5.94) (19.36) (13.16) (15.94) (16.13) (15.79)
(b) Adjacent dis- T 3 2 I 18 7 11 21 II 10 triets (Madurai, (I. 94) (2.54) (1.32) (]1.61) (8.86) (14.47) (13.55) (13.92) (13.16) Pudukkottai,
R 9 3 6 12, 6 6 Thanjavur, South AreoL (9.68) (6.12) (13.63) (12.90) (12.25) (13.64)
Salem and U 3 2 I 9 4 5 9 5 4 Periyar districts) (4.84) (6.67) (3.12) (14.52) (13.33) (15.63) (14.52) (16.67) (12.50)
Ccl Other districts T II 3 8 12 4 8 9 4 5 of the state (11.83) (6.82) (16.33) (12.90) (9.09) (16.33) (9.68) (9.09) (10.20) (other than the
R 2 [ 1 2 1 1 1 1 adjacfnt districts) (7'69) (7' 14) (8.33) (7.69) (7' 14) (8.33) (J.85) (8.33)
U 9 2 7 10 3 7 8 4 4 (13.43) (6. (7) (18. (2) (14.93) (l0.00) (18.92) (1 L. 94) (13.33) (10.81)
II. Other states T 2 1 1 1 I 8 3 5 (3.92) (4. t 7) (3.70) 0.96) (4.17) (15.69) (12.50) (18.52)
R 1 1 (4.54) (11.11)
U 1 1 I 1 8 3 5 (3.45) (9.09) (3.4S) {9.09) (27.58) (27.27) (27.78)
JlI. 'Jther countries
The ligu . ·s within brackets dellOtc percentag\)s
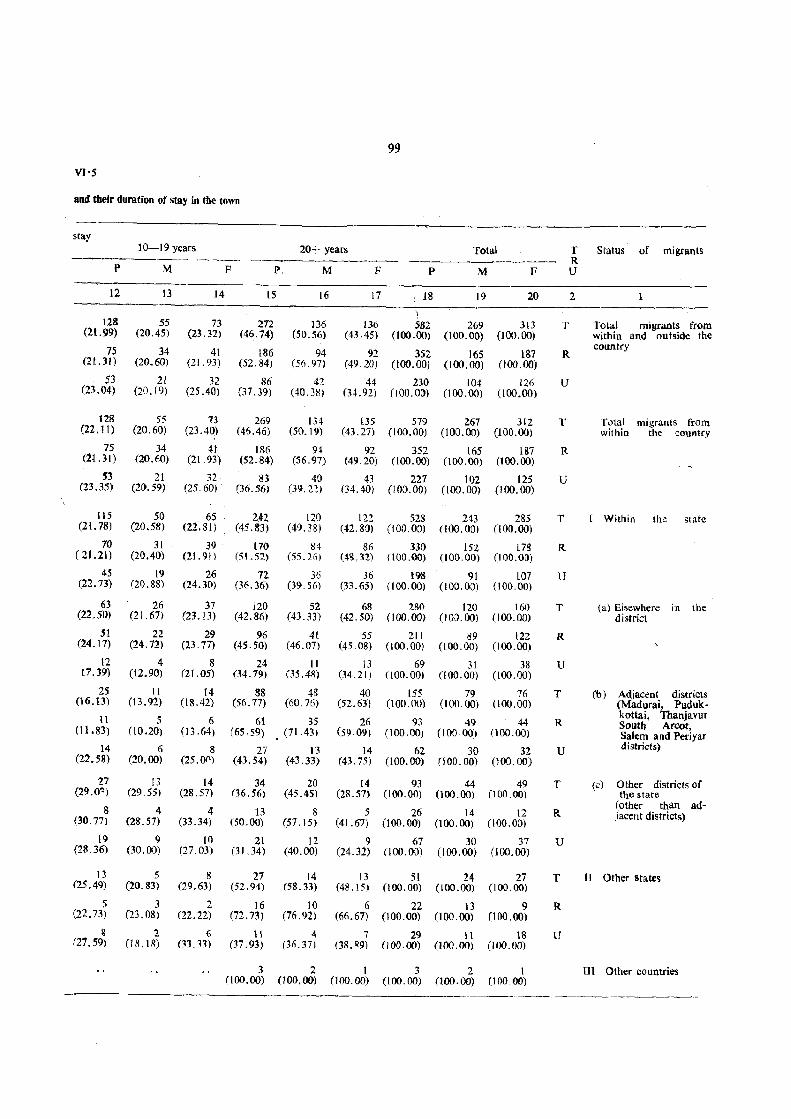
99
VI-S
and their duration of stay in the town
stay 10-19 years 20+ years Total T Status of migrants
------ R P M F P M F p M F U
12 13 14 15 16 17 18 19 20 2
\ 128 55 73 272 136 136 582 269 313 T Total migrants from
(21.99) (20.45) (23.32) (46.74) (50.56) (43.45) (100.00) (100.00) (100.00) within and outside the
75 34 41 186 94 92 352 165 L87 R country
(2 t.3 I ) (20.60) (21.93) (52.84) (56.97) (49.20) (tOO.OO) (100.00) (100.00)
53 21 32 86 42 44 230 104 126 U (23.04) (20.19) (25.40) (37.39) (40.3~) 04.92) (100.00) (100. ()() (100.00)
128 55 n 269 134 [35 579 267 3[2 T Total migrants from C22.11) (20.60) (23.40) (46.46) (50.19) (43.27) (100.00) (100.00) (100.00) within the country
75 34 41 186 94 92 352 165 187 R (2L31) (20.60) (21.93) (52.84) (56.97) (49.20) (l00.00) (100.00) (100.00)
53 21 32 83 40 43 227 102 125 U (23.35) (21).59) (25.60) (36.56) (39.21) (34.40) (100.00) (IO~).QO) (100.00)
115 50 65 U2 120 122 528 2t3 285 T [ Within the state (21. 78) (20.58) (22,81) (45.83) (49.38) (42.80) (100.0:)) (100.00) (l 00. OO}
70 31 39 110 8i 86 330 IS2 173 R ( 21.21) (20.40) (21.91} (51. 52) (~5.26) (4~U2) (I0D.00) (100.00) (IOD.O()
45 19 26 72 36 36 198 91 L07 U (22.73) (20.88) (24.30) (36.36) (39.56) (33.65) (100.00) (too. 00) (IOD.OO)
63 26 31 120 52 68 280 120 160 T (a) Elsewhere in the (22.50) (21.67) (23.13) (42.86) (43.33) (42.50) (100.00) (10:>. (0) (100.00) district
51 22 29 96 41 55 211 89 122 R (24.17) (24.72) (23.77) (45.50) (46.07) (45.08) (100.00) (lOO.OO) (100.00)
12 4 8 24 II 13 69 31 38 U 17.39) (12.90) (21.05) (34.79) (35.4R) (34.21 ) (100.00) (lOO.OO) (100.00)
2S 11 14 88 48 40 155 79 76 T (b) Adjacent districts (16.13) (13.92) (18.42) (56.77) (60.76) (52.63 ) (100.00) (100. (0) (100.00) (Madurai, Puduk·
It 5 6 61 35 26 93 49 44 R kottai, Thanjavuf South ArcOI, (II. 83) (10.20) (13.64) (65.59) . (71.43) (59.09) (100.00) (100 00) 000.00) Salem and Periyar
14 6 8 27 I3 14 62 30 32 U districts) (22.58) (20.00) (25.0(\) (43.54) (43.33) (43.75) (100.00) (100.00) (100.00)
27 13 14 34 20 [4 93 44 49 T (c) Other distrkts of (29.0') (29.55) (28.57) (36.56) (45.45) (28.57) (100.00) (100.00) (100.00) the state
8 (other than ad-4 4 13 8 5 26 14 12 R jacent districts) (30.77) (28.57) (33.34) (50.00) (57.15) (41 .67) (100.00) (too. 00) (100.00)
19 9 10 21 12 9 67 30 37 U (28.36) (30.00) (27.03) (31.34) (40.00) (24.32) (100.00) (100.00) (100.00)
13 5 8 27 14 13 51 24 27 T H Other states (25.49) (20.83) (29.63) (52.94) (58.33) (48.15) (i00.00) (100.00) (100.00)
5 3 2 16 10 6 22 13 9 R (22.73) (23.08) (22.22) (72.73) (76.92) (66.67) (100.00) (100.00) (100.00)
g 2 6 \I 4 7 29 11 18 U 127.59) (18.18) OJ.H) (37.93) (36.37) (38.89) (I (){).OO) (100.00) (100.00)
3 2 1 3 2 1 III Other countries (100.00) (100. (J() (100.00) (100.00) (100.00) (100.00)
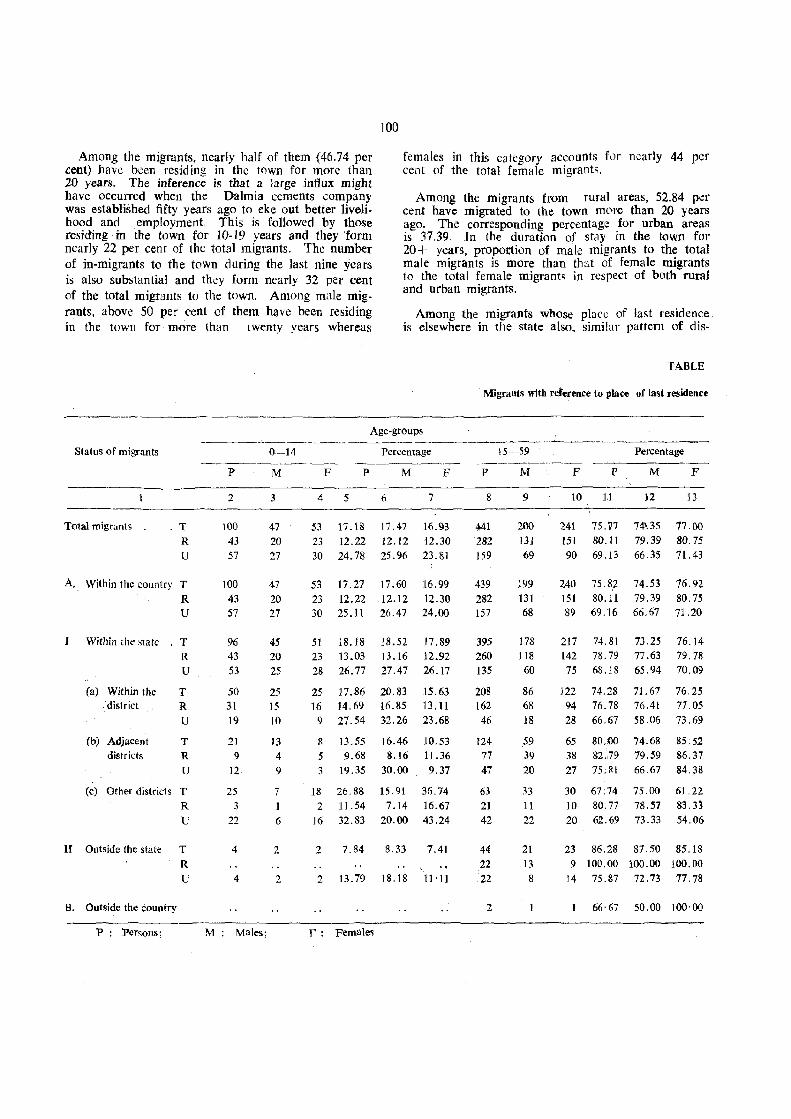
Among the migrants, nearly balf of them (46.74 per cent) have been residing in the town for more than 20 years. The inference is that a large influx might have occurred when the Dalmia cements company was established fifty years ago to eke out better livelihood and employment. This is followed by those residing in the town for 10-19 years and they form nearly 22 per cent of the total migrants. The number of in-migrants to the town during the last nine years is also substantial and they form nearly 32 per cent of the total migrants to the town. Among male migrants. above SO per cent of them have been residing in the town for more than twenty years whereas
100
females in this category accounts for nearly 44 per cent of the total female migrants.
Among the migrants from rural areas, 52.84 per cent have :migrated to the town more than 20 years ago. The corresponding percentage for urban areas is 37.39. In the duration of stay in the town for 20 + years, proportion of ma le migrants to the total male migrants is more than that of female migrants to the total female migrants in respect of both rural and urban migrants.
Among the migrants whose place of last residence is elsewhere in the state also, similar pattern of dis-
TABLE
Migrants with re,ference to place of last residence
Age-groups
Status of migrants
Total migrants T R U
A. Within the country T
R U
I Within the state . T
(a) Within the
district
(b) Adjacent districts
R
U
T R U
T R U
(c) Other districts T
R
U
II Outside the state T
B. Outside the country
P: Persons;
R U
p
2
100 43
57
100 43 57
96 43
53
50 31 19
21 9
12
25 3
22
4
4
M: Males;
0--14
M
3
47 20
27
47 20 27
45 20 25
25 15 10
13 4 9
7
1
6
2
2
F p
4 5
53 23 30
53 23 30
17.18 12.22 24.78
17.27 12.22 25.11
Percentage
M
6
17.47 12.12 25.96
17.60 12.12 26.47
F
7
16.93
12.30 23.81
16.99 12.30 24.00
5] 18.18 18.52 17.89 23 13.03 13.16 12.92 28 26.77 27.47 26.17
25 17.86 16 14.69
9 27.54
8 13.55 5 9.68 3 19.35
18 26.88 2 11.54
16 32.83
2 7.84
ZO.83 .15.63 16.85 13.11
32.26 23.68
16.46 10.53 8.16 11.36
30.00 9.37
15.91 7.14
20.00
36.74 16.67 43.24
8.33 7.41
2 13.79 18.18 11·11
F: Females
p
#1 282 159
439 282 157
395
260 135
208 162
46
124 77 47
63 21 42
44 22 22
2
15-59
M
9
200
131 69
199
131 68
178 118 60
86 68 18
59 39 20
33 11 22
21 13
8
Percentage
F p
10 11
241 151
90
240 151 89
75.77 80.11 69.13
75.8~
80.11 69.16
M
12
74\35 79.39 66.35
74.53 79.39 66.67
F
13
77.l)0 80.75 11.43
76.92 80.75 71.20
217 74.81 73.25 76.14 142 78.79 77.63 79.78 75 68.18 65.94 70.09
122 94 28
65 38 27
74.28 71.67 76.78 76.41 66.67 58.06
80.00 74.68 82.,79 79.59 75.~1 66.67
30 67.74 10 80.77 20 62.69
75.00 78.57 73.33
76.25 77.05 73.69
85.52 86.37 84.38
61.22 83.33 54.06
23 86.28 87.50 85.18 9 100.00 100.00 100.00
14 75.87 72.73 77.78
66·67 50.00 100·00
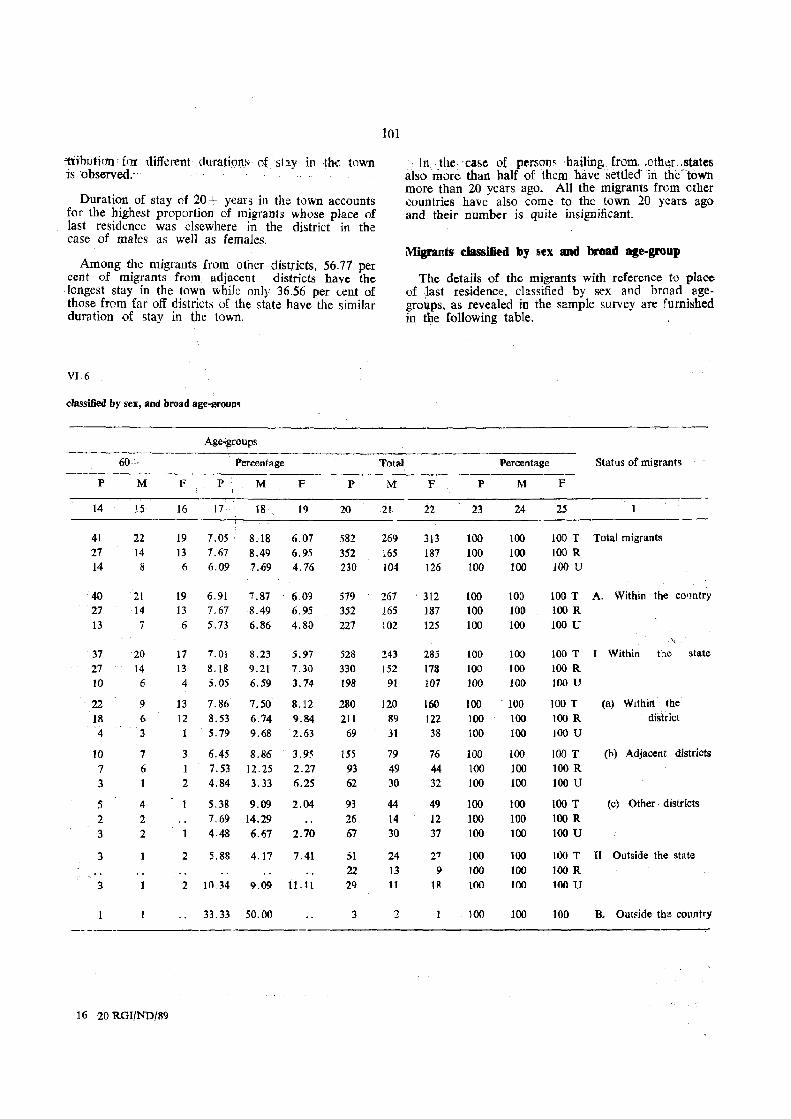
1:ijbuticm' f(.ll' different duratipn:> of slay in ·the tovm is 'observed;
Duration. of stay of 20 + years in the town accounts for the highest proportion of migrants whose place of last residence was elsewhere in the district in the case of males as well as females.
Among the migrants from other districts. 56.77 per cent of migrants fwm adjacent districts have the longest stay in the town while only 36.56 per (;ent of those from far off districts of the state have the similar duration of stay in t.he town.
VJ·6
classified by sex, and broad age·$"OuPs
p
14
41 27 14
40 27 13
37 27 10
22 18 4
10 7 3
5 2 3
3
3
60+
M
15
22 14
8
21 14 7
20
14 6
9
6 3
7 6
4 2 2
Age.:groups
Percentage
F p M F
16 17 18 c 19
19 7.05 8.18 6.07 13 7.67 8.49 6.95 6 6.09 7.~9 4.76
19 6.91 7.87 6.09 13 7.67 8.49 6.95 6 5.73 6.86 4.80
17 7.01 8.23 5.97 13 8.18 9.21 7.30 4 5.05 6.59 3.74
13 12 1
3 ]
2
2
7.86 7.50 8.53 6.74 5.79 9.68
6.45 8.86 7.53 12.25 4.84 3.33
8.12 9.84 2.63
3.95 2.27 6.25
5.38 9.09 2.04 7.69 14.29 4.48 6.67 2.70
5.88 4.17 7.41
2 10.34 9.09 11.11
33.33 50.00 ----------
16-20 ROI{ND/89
p
20
582 352 230
579 352 227
528 330 198
280 211 69
155 93 62
93 26 67
51
22 29
3
101
Total
M
21
269 165 104
267 165
102
243 152
91
120 89 31
79 49 30
44 14 30
24 13 11
:2
. In· the· case of p('.rsotls hailing.from .. Qth~r..states also more than half of ·them have settled' in the--town more than 20 years ago. All the migrants from other countries have also come to the town 20 years ago and their number is quite insignificant.
Migrants dassl6ed by ~ex and broad age-group
The details of the migrants with reference to place of .last residence, classified by sex and broad agegfO"q.ps, as revealed in the sample survey are furnished in t~e following table.
F
22
313 187 126
312 187 125
285 178 107
160 122
38
76 44 32
49 12 37
2' 9
18
p
2:1
100 100 100
100 100 100
100 100
100
100 100
100
100 100 100
]00
100 100
100 100 100
100
Percentage
M
24
100 100 100
100 100 100
100 100 100
100
100 100
100 100 100
100 100 100
100 100 100
100
Status of migrants
p
25
100 T Total migrants 100 R 100 U
100 T A. Within the coomtry 100 R 100 U
"-100 T [ Within the state
100 R 100 U
100 T (a) Within the 100 R district
100 U
100 T (h) Adjacent districts 100 R 100 U
100 T 100 R 100 U
(c) Other districts
100 T II Outside the state 100 R 100 U
100 B. OutFide the country
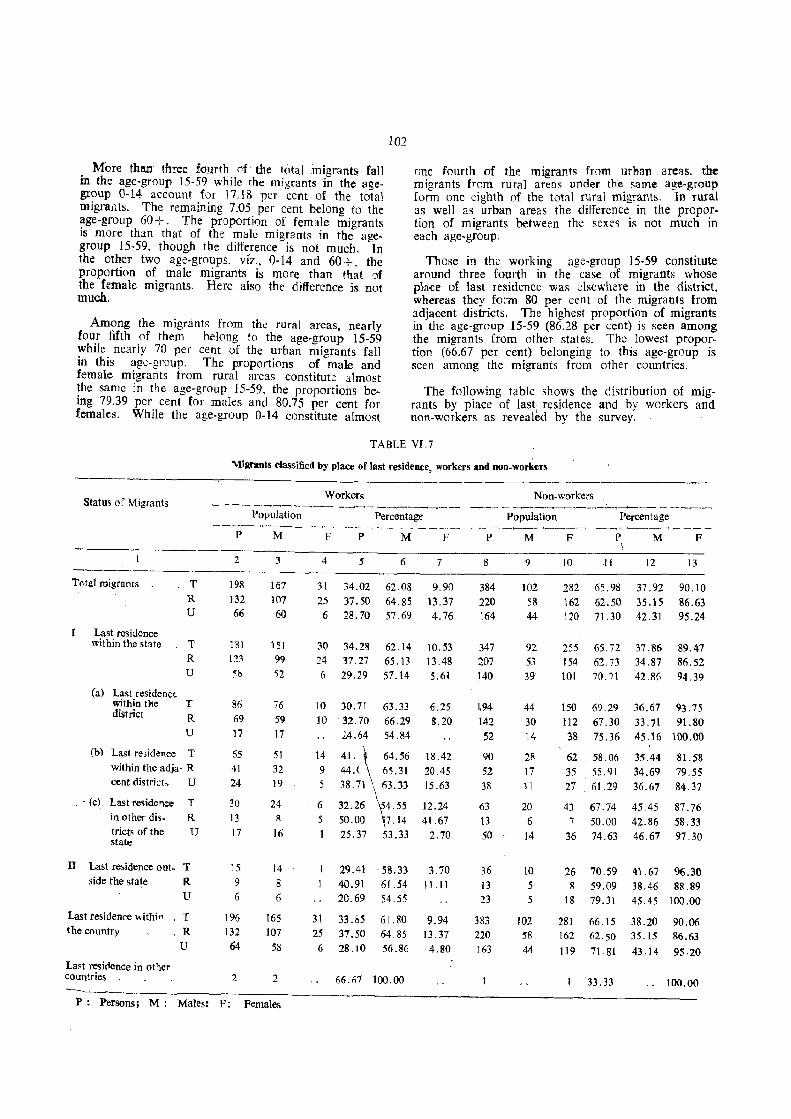
More than· three fourth Qf the total migrants- fall in the age-group 15-59 while the migrants in the agegroup 0-14 account for 17.18 pcr cent of the total migrants. The remaining 7.05 per cent belong to the age-group 60 -:- . The proportion of female migrants is more than that of the male migrants in the agegroup 15-59, though the difference is not much. In the other two age-groups, vi'z., 0-14 and 60+, the proportion of male migrants is more than that I)f the female migrants. Here also the difference is not much.
102
onc fourth of the migrants from urban areiiS. the migrants from rural areas under the same age-group form one eighth of the total rural migrants. In Tural as well as urban areas the difference in the proportion of migrants between the sexes is not much in each age-group.
Those in the working age-group 15-59 constitute around three fourth in the case of migrants whose place of last residence was elsewhere in the district, whereas they fo;m 80 per cent of the migrants from adjacent districts. The highest proportiO'n of migrants in the age-group ] 5-59 (86.28 per cent) is seen among the migrants from other states. The lowest proportion (66.67 per cent) belonging to this age-group is seen among the migrants from other countries.
Among the migrants from the rural areas, nearly four fifth of them belong to the age-group 15-59 while nearly 7(J per cent of the urban migrants fall in this age-group. The proportions of male and female migrants from rural areas constitute almost the same in the age-group 15-59, the proportions being 79.39 per cent for males and 80.75 per cent for females. While the age-group 0-14 constitute almost
The following table shows the distribution of migrants by piace of last residence and by workers and non-workers as revealed by the survey.
Statm of Migrants
TMal migrants
Last residence within the state
(a) La~t residenc~ within the district
T R U
T R U
T
R U
(b) Last re;idence T
within the adja' R cent district, U
.. (c) Last re~idence T
in other dis- R triets of the U state
IT Last re;,idence out- T side the state R
Last residence within the country
La~t resi(ience in other countries
U
T R U
TABLE VI.7
Migrants classified by place of last residence, workers and non-workers
Workers Non-workers - - - - -_ .......... _ -_-- ----- -------_-- -~~ - --_......__---------- - ~-.-.---
P
2
198 132 66
181 123 ~b
86
69 17
65 41
24
30 13 17
15
9 6
196 132 64
2
Population
M
3
167 107
60
151 99 52
76 59 17
51 32 19
24 11
16
14
8
6
165 107
5b
2
F
4
31
25 6
30 24 6
10 10
14 9
5
6 5
1
31 25
6
Percentage
P
5
34.02 37.50 28.70
34.28 37.27 29.29
M
6
62.08 64.85 57.69
62.14 65.13 57.14
30.71 63.33 32.70 66.29 ~4.64 54.84
41. \64.56 44.( 65.31 38.71 63.33
32.26 4.55 50.00 7.14 25.37 53.33
29.41 40.91 20.69
58.33 61.54 54.55
F
7
9.90 13.37 4.76
10.53 13.48 5.6i
6.25 g.20
18.42 20.45 15.63
]2.24 4{'67
2.70
3.70 11.11
33.05 37.50 28.10
61.80 9.94 64.85 ]3.37 56.86 4.80
66.67 100.00
p
8
384 220 164
347 207 140
194 142 52
90 52 38
63 13 50
36 13 23
383 220 ]63
Population Percentage
M
9
102 58 44
92 53 39
44 30 14
28 17 11
20 6
14
10 5 5
102 58 44
F
10
282 162 120
255 154 101
150 112 38
62 35 27
43 7
36
II
P \
65.98 62.50 71.30
65.72 62.73 70."'1
69.29 67.30 75.36
58.06 55.91
61.29
67.74 50.00 74.63
26 70.59 8 59.09
18 79.31
281 66.15 162 62.50
119 71.81
33.33
M
12
37.92 35.15 42.31
37.86 34.87 42.86
F
13
90.10 86.63 95.24
89.47 86.52 94.39
36.67 93.75 33.71 91.80 45.16 100.00
35.44 81.58 34.69 79.55 36.67 84.37
45.45 87.76 42.86 58.33 46.67 97.30
41.67 96.30 38.46 88.89
45.45 100.00
38.20 35.15
43.14
90.06 86.63
95·20
100.00
P: Persons; M: Males: F: Females
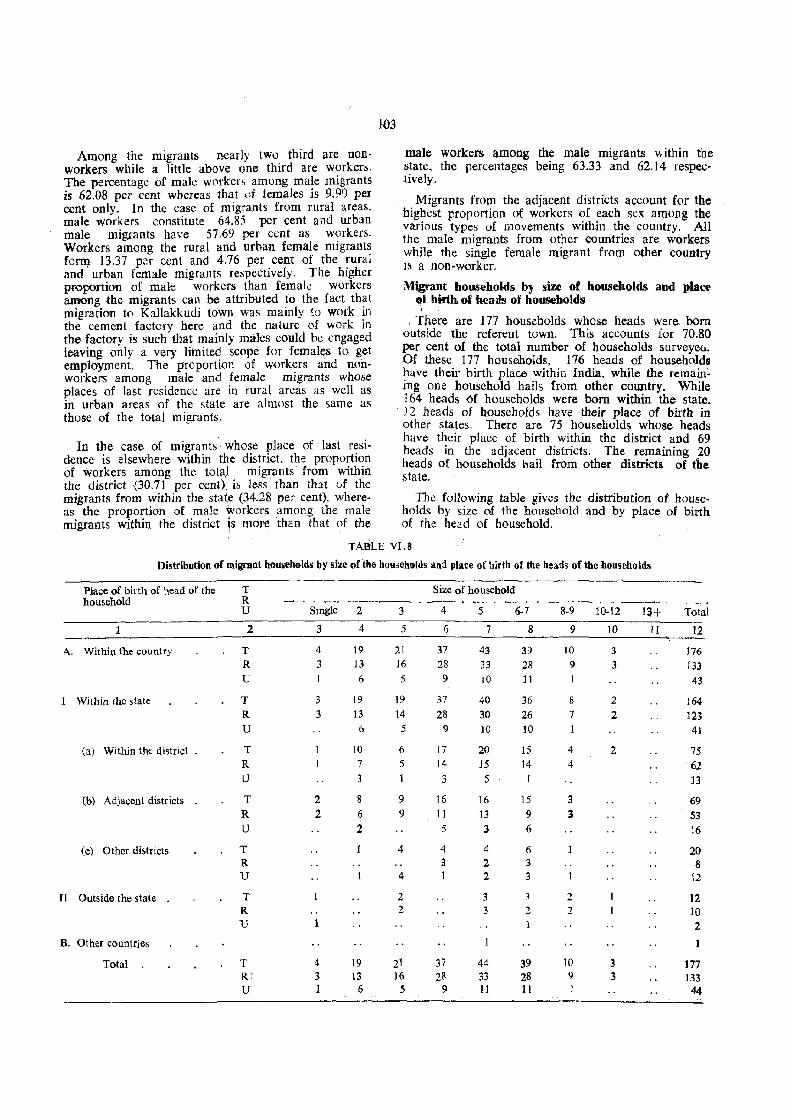
Among the migrants nearly two third are nonworkers while a little above one third are workers. The percentage of male workers among male migrants is 62.08 per cent whereas that of females is 9.90 per cent only_ In the case of migrants from rural areas, male workers constitute 64.85 per cent and urban male migrants have 57.69 per cent as workers. Workers a1TI(mg the rural and urba.n female migrants fo~ 13.37 p2f cent and 4.76 per cent of the rural and urban female migrants respectively. The higher proportion of male workers than femak workers among the migrants can be attributed to the fact that migration to Kallakkudi town was mainly !o work in the cement factory here and the nature of work in the factory is such that mainly males could be engaged leaving only a very Iitnited scope for females to get employment. The proporti{)n of workers and nonworkers among male and female migrants whose places of last residence are in rural areas as well as in urban areas of the state are almost the same as those of the total migrants.
In the case of migrants' whose place of last residence is elsewhere within the district. the proportion of workers among the total migrants' from within the district (30.71 per cent): is less than that vf the migrants from within the state (34.28 per cent), whereas the proportion of male workers among the male migrants within the district is more than that of the
103
male workers among the male migrants v. ithin the s~ate, the percentages being 63.33 and 62.14 respectwely.
. Migrants from the adjacent districts account for the highest proportion of workers of each sex among the various types of movements within the country. All the male migrants from other countries are workers while the single female migrant from other country is a non-worker.
Migrant households by size of households and place ~f birth of beads of households \
, Tbere are 177 households whose heads were born outside the referent town. This accounts for 70.80 per cent of the total number of households surveyeu. Of these 177 households, 176 heads of hQuseholds ~ave their birth place within India. while the remainmg one household hails from other country_ While 164 heads 6f households were born within the state. ) 2 heads of households have their place of birth in other states. There are 75 households whose heads have their place of birth within the district and 69 heads in the adjacent districts. The remaining 20 heads of households hail from other districts of the state.
The following table gives the distribution of households by size of the household and by place of birth of the head of household.
TABLE V1.8
Distribution of migrant households by size of the hou,eholds and place of birth of the heads of tbe households
Place of bi! th of head of the household
A. Within the country
1 Within rhe state
(a) Within the district .
(b) Adjacent districts .
(c) Other di,tricts
II Outside the state .
B. Other countrjes
Total .
T R U
2
T R
U
T R U
T R U
T R U
T R U
T R U
Size of household
~-'S~~--2--3~---4---5---67J----i9-10-i2---i'i+ .--. ThW 3 4 5 6 7 8 9 10 11 12
4
3
3 3
2 2
1
4 3 1
19 13
6
19
13
6
10
7
3
8 6
2
19 13
6
21 16
5
19
14 5
6 5
9
9
4
4
2 2
21 16
5
37 28 9
.17
28 9
17 14
3
16
11 5
4 3 1
37 28
9
43
33 10
40
30 10
20 15 5
16
13
3
4 2 2
3 3
44 33 11
39 28 11
36 26 10
15 14
15
9 6
6 3
39 28 11
10
9
8
7
4 4
3 3
2 2
10 9 1
3 3
2
2
2
3 3
176
133
43
164
123 41
75 62 13
69 53 16
20 8
12
12 10
2
177 133 44
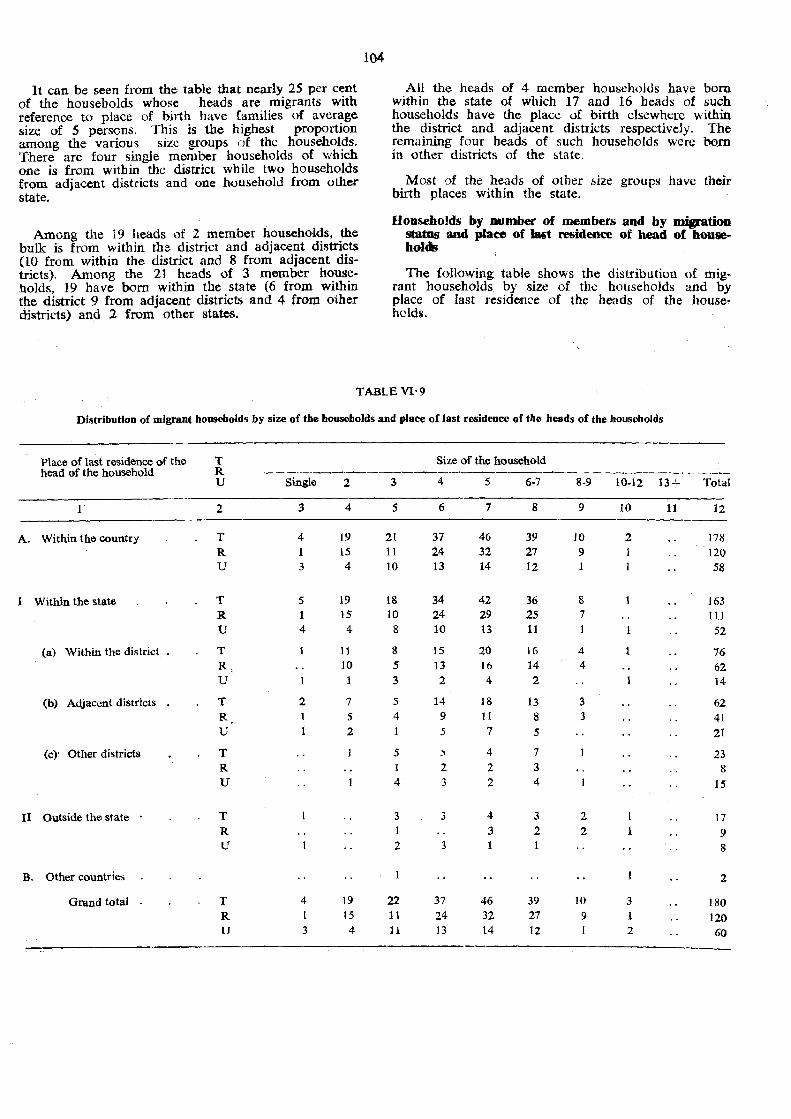
It can be seen from the table that nearly 25 per cent of the households whose heads are migrants with reference tOo place of bilih have families of average size of 5 persons. This is the highest proportion among the various size groups of the households. There are four single member households of which one is from within the district while two households from adjacent districts and one household from othel" state.
Among the 19 heads of 2 member households. the bulk is from within the district and adjacent districts 00 from within the district and 8 from adjacent districts). Among the 21 heads of 3 member households. 19 have bom within the state (6 from within the district 9 from adjacent districts and 4 from other districts) and 2 from other states.
104
All the heads of 4 member households have born within the state of which 17 and 16 heads of such households have the place of birth elsewhere within the district and adjacent districts respectively. The remaining four heads of such households were born in other districts of the state.
Most ':J.f the heads of other size groups have their birth places within the state.
Households by number of members and by D:l!iFation stams and plaee of _t residence of head of households
The following table shows the distribution of migrant households by size of the households and by pJace of last residence of the heads of the house. holds.
TABLE VI· 9
Distribution of migrant households by size of the households and place of last re5idence of the hesds of the households
Place of last residence of the T Size of the household head of the household R - - ----~-~---------------- - - ---.----- - ---
U Single 2 3 4 5 6-7 8-9 10-12 13+ Total
1 2 3 4 5 6 7 8 9 10 11 12
A. Within the country T 4 19 21 37 46 39 10 2 178 R 15 11 24 32 27 9 120 U 3 4 10 13 14 12 58
1 Within the state T 5 19 18 34 42 36 8 163 R 1 15 10 24 29 25 7 HI U 4 4 8 10 13 11 1 52
(a) Within the district • T 1 11 8 15 20 16 4 76
Ri 10 5 13 16 14 4 62 U 1 1 3 2 4 2 1 14
(b) Adjacent districts T 2 7 5 14 18 13 3 62 R 1 5 4 9 11 8 3 41 U 1 2 5 7 5 21
(c)' Other districts T 5 .) 4 7 23 R 1 2 2 3 8 U 4 3 2 4 15
II Outside the state T 3 3 4 3 2 17 R 1 3 2 2 1 9 U 2 3 8
B. Other countries 2
Grand total T 4 19 22 37 46 39 10 3 180 R 1 15 11 24 32 27 9 1 120 U 3 4 11 13 14 12 2 60
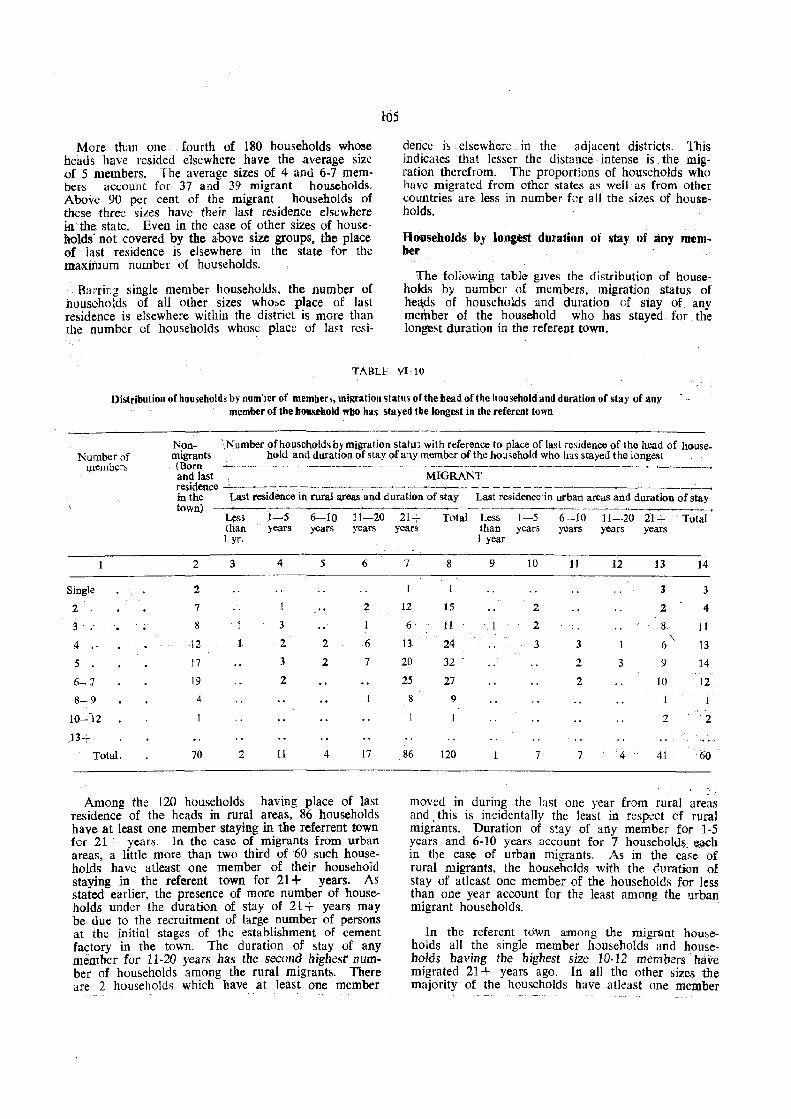
More than one fourth of 180 households whose heads have resided elsewhere have the average size of 5 members. The average sizes of 4 and 6-7 members ac~oul1t for 37 and 39 migrant households. Above 90 per cent of the migrant households of these three sizes have their last residence elsewhere in the state. Even in the case of other sizes of households not covered by the above size groups, the place of last residence is elsewhere in the state for the maximum number of households.
. BarriLg single member households. the number of households of all other sizes whose place of last residence is elsewhere within the district is more than the number of households whose place of last resi-
lOS
dence is elsewhere in the adjacent districts. This indicates that lesser the distance intense is the migration therefrom. The proportions of households who have migrated from other states as well as from other countries are less in number for all the sizes of households.
Housebolds by longest duration of stay of any member
The following table' gives the distribution of households by number of members. migration status of heaps of households and duration of siay of any member of the household who has stayed for the longest duration in the referent town.
TABLE VI'10
Distribution of households by num~)er of members, migration status ortbe head of the huusehold and duration of stay of any member of tbe household who has stayed the longest in the referent town
Non- ',Number of households by migration stalu> with reference to place of last residence of the head of house. Number of Q1ember~
migrants hold and duration of stay of any member of the hOll>ehold who ha~ stayed the longest (Born .............. -----~ .-------..----~------,__"--------__.---,___----..,--
and last '. MIGRANT residence -_- ---.---.-~----.-- - - - --------------------in the last residence in rural areas and duration of stay Last residence in urban areas and duration of stay town) ___ ........... _-----_-------_.-----...---- - - ----......-----.....__----,__,___,..-.---
Single
2 .
3 - .
4
5
6-7
8-9
10--12
13+ Total.
2
2
7
8
12
17
19
4
70
L~s titan 1 yr.
3
2
J-5 6---10 11-20 years years years
4 5 6
2
3 1
2 2 6
3 2 7
2
11 4 17
Among the 120 households having place of last residence of the heads in rural areas, 86 households have at least one member staying in tbe referrent town for 21 + years. In the case of migrants from urban areas, a little more than two third of 60 such households bave atleast (Jne member of their househoid staying in the referent town for 21 + years. As stated: earlier, the presence of more number of households under the duration of stay of 21 + years may be due to the recruitment of large number of persons at the initial stages of the establishment of cement factory in the town. The duration of stay of any member for 11-20 years has the second highesr number of households among the rural migrants. There are 2 households which have at least one member
21+ Total Less 1-5 6-10 11-20 21+ Total years than years
I year years years years
7 8 9 10 11 12 13 14
3 3
12 15 2 2 4
6 11 2 8 11 13 24 3 3 6' 13
20 32 2 3 9 14
25 27 2 10 12 8 9 1 i
2 :i
86 120 7 7 .. 4 41 60
moved in during the last one year from rural areas and. this is incidentally the least in respect of rural migrants. Duration of stay of any member for 1-5 years and 6-10 years account for 7 housel1{)lds: ~h in the case of urban migrants. As in the case . of rural migrants, the households with the duration of stay of atleast one member of the households for less than one year account for the least among the urban migrant households. . .
In the referent town among the migrant households all the single member households and households having the highest size 10·12 members have migrated 21 + years ago. In all the other sizes the majority of the househOlds have atkast one member
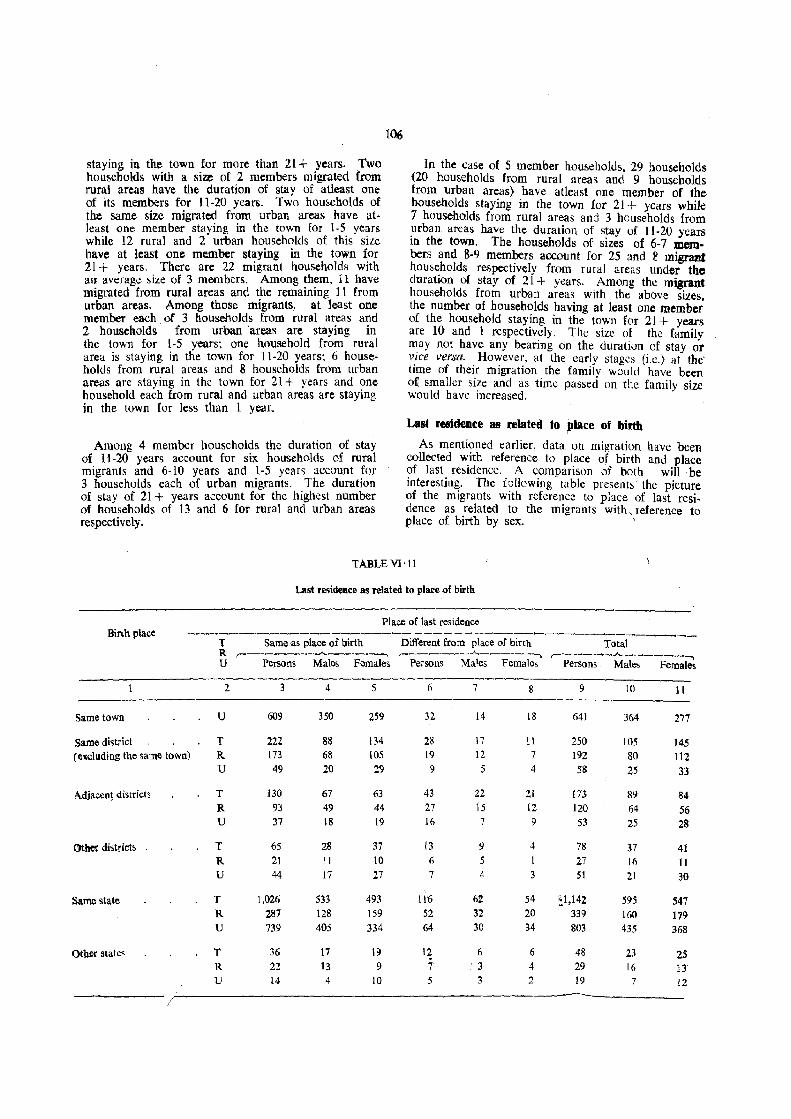
staying in the town for more than 21 + years. Two hou~eholds with a size of 2 members migrated from rural areas have the duration of stay of atleast one of its members for 11-20 years. Two households of the same size migrated from urban areas have atleast one member staying in the town for 1-5 years while 12 rural and 2 urban households of this size have at least one member staying in the town for 21 + years. There are 22 migrant households with an average size of 3 members. Among them, 11 have migrated from rural areas and the remaining 11 from urban areas. Among those migrants, at least one member each 0{ 3 households from rural areas and 2 households from urban 'areas are staying in the town for 1-5 years: one household from rural area is staying in the town for 11-20 years: 6 households from rural areas and 8 households from urban areas are staying in the town for 21 + years and one household each from rural and. urban areas are staying in the town for less than 1 year.
Among 4 member households the duration of stay of 11-20 years account for six households of rural migrants and 6-10 years and 1-5 years account for 3 households each of urban migrants. The duration of stay of 21 + years account for the highest number of households of 13 and 6 for rural and urban areas respectively.
106
In the case of 5 member households, 29 households (20 households from rural areas and 9 households from urban areas) have atleast one member of the households staying in the town for 21 + years while 7 households from rural areas and 3 households from urban areas have the duration of stay of 11-20 ,Years in the tOWD. The households of sizes of 6-7 mem. bers and 8-9 members acrount for 25 and E !Digram househo'lds respectively from rural areas under the duration of stay of 21 + years. Among the migrant households from urban areas with the abon sizes. the number of households having at least one member of the household staying in the town for 21 + years are 10 and 1 respectively. The size of the family may not have any bearing on the duration of stay or vice versa'. However, at the early stages (i.e.) at the' time of their migration the family would have been o£ smaller size and as time passed on the family size would have increased.
Last ~ideDce 38 related to place of birth
As mentioned earlier, data. on migration have been collected with reference to place of birth and place of last residence. A comparison of both will be interesting. The following table presents I the picture of the migrants with reference to pJace of last residence as related to the migrants with., reference to place of birth by sex. '
TABLE VI·11
Last residence as related to place of birth
Place of last residence BirLhplace --,.-.-_,...._---.--------_..-.---_---_ ------.--~---....._.-.~-___.,--------
T Same as place of birth Different from place of birth Total R
,-____ ---A. ___ ---, ,-~----..--..A--~---l r-------..A...-~ ______
U Pers()ns Males Females Persons Males Females Persons Males Females
2 4 5 Ii 7 8 9 10 11
Same town U 609 350 259 32. 14 18 641 364 277
Same district T 222 88 134 28 17 11 250 105 145 (ellC!llding the same town) R 173 68 105 19 12 7 192 80 112
U 49 20 29 9 5 4 58 25 33
Adjacen! districts T 130 67 63 43 22 21 173 89 84 R 93 49 44 27 15 12 120 64 56 U 37 18 \9 16 7 9 53 25 28
()tiler district~ T 65 28 37 13 9 4 78 37 41 R 21 11 10 6 5 21 16 11 U 44 17 27 7 4 3 51 21 30
Same state T \,026 533 493 \16 62 54 ~1.142 595 547 R 287 128 159 52 32 20 339 160 179 U 739 405 334 64 30 34 803 435 368
Other states T 36 17 1') 12 6 6 48 23 2S R 22 13 9 7 ' 3 4 29 16 13 U 14 4 10 5 3 2 19 7 12 ----
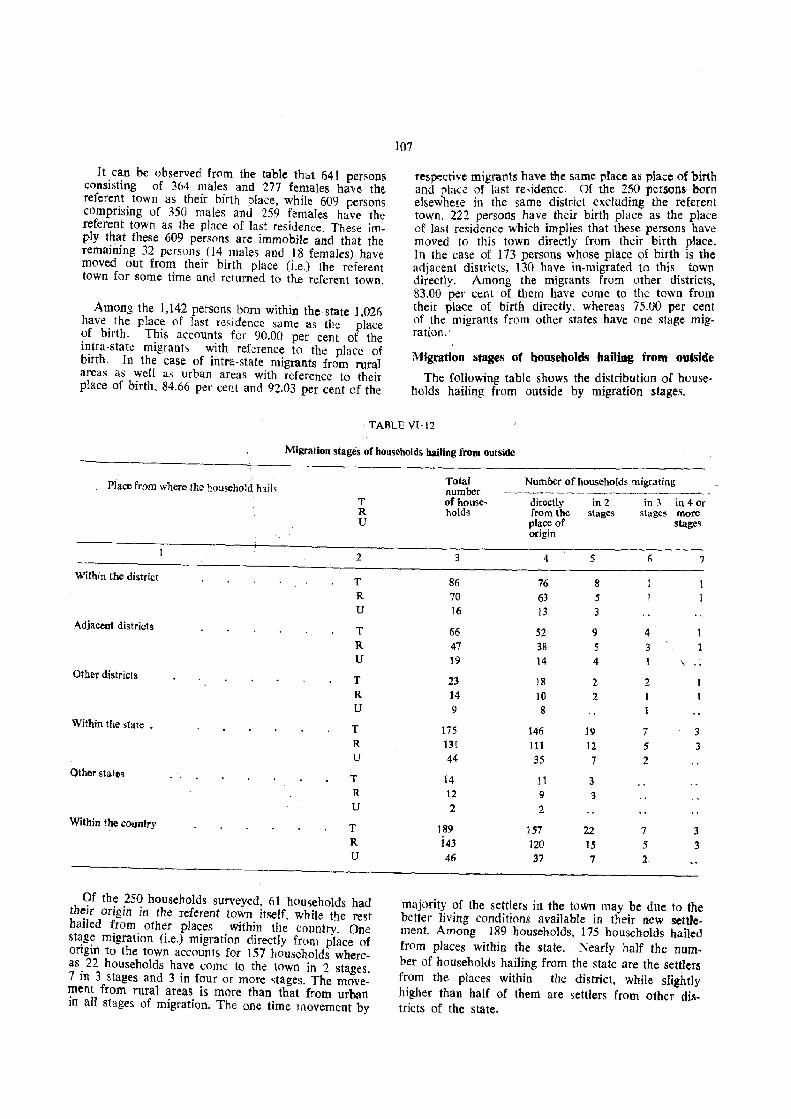
It can be observed from the table that 641 persons consisting of 364 males and 277 females have the. referent town as their birth place, while 609 persons comprising of 350 males and 259 females have the referent town as the place of last residence. These imply that these 609 persons are immobile and that the remaining 32 persons {14 males and 18 females) have moved out from their birth place (Le.) the referent town for some time and returned to the referent town.
Among the 1,142 persons born within the state 1.026 have the place of last residence same as the place of birth. This accounts for 90.00 per cent of the intra-stat\! migrants with reference· to the place of birth. In the case of intra-state migrants from rural areas as well as urban areas with reference to their place of birth, 84.66 per cent and 92.03 per cent of the
107
res~C'tive migrants have the sa.me place as. place of birth and plaa of last fe;',idenc.c .. Of the 2~O persons horn elsewhe!e in the same distrIct excludIng the referent town, 222 persons have their birth place as the place of last residence which implies that these persons have moved to this town directly from their birth place. In the case of 173 persons whose place of birth is the adjacent districts, 130 ha~e in-migrated to this. t?wn directly. Among the migrants from other dlstncts, 83.00 per cent of them have come to the town from their place of birth directly. whereas 75.00 per c~nt of the migrants from other states have olle stage migration.
Migration stages of households hailing from outside
The following table shows the distribution of households hailing from outside by migration stages.
TABLE VJ·12
Migration stages of households hailing from outSide
Place from where the household hails T R U
2
Within tbe district T R U
Adjacent districts T R U
Other districts T R U
Within the state • T R
U Other states T
R
U
Within the country T R U
Of the 250 households surveyed, 61 households had their origin in the referent town itself, while t!le rest hailed from other places within the country. One st~g~ migration (i.e.) migration directly from place of orIgm to the town accounts for 157 households whereas 22 households have come to the town in 2 stages. 7 in 3 stages and 3 in four or more stages. The movement from rural areas is more than that from urban in al1 stages of migration. The one time Jrlovement by
Total Number of households migrating number - -~-- - - - -_.-_-----_-_ of house- directly in 2 in 3 in 40)' holds from the ~tages stages more
place of stages origin
3 4 5 6 7
86 76 8 70 63 5 16 13 3
66 52 9 4 47 38 5 3 19 14 4 \ "
23 18 2 2 14 10 2 9 8
175 146 19 7 3 131 111 12 5 3 44 35 7 2
14 II 3 12 9 3 2 2
189 157 22 7 3 i43 ]20 15 5 3 46 37 7 2
majority of the settlers in the town may be due to the better living conditions available in their new settJement. Among 189 households, 175 households hailed from places within the state. Nearly half the number of households hailing from the state are the settlers from the places within the district, while slightly higher than half of them are settlers from other districts of the state.
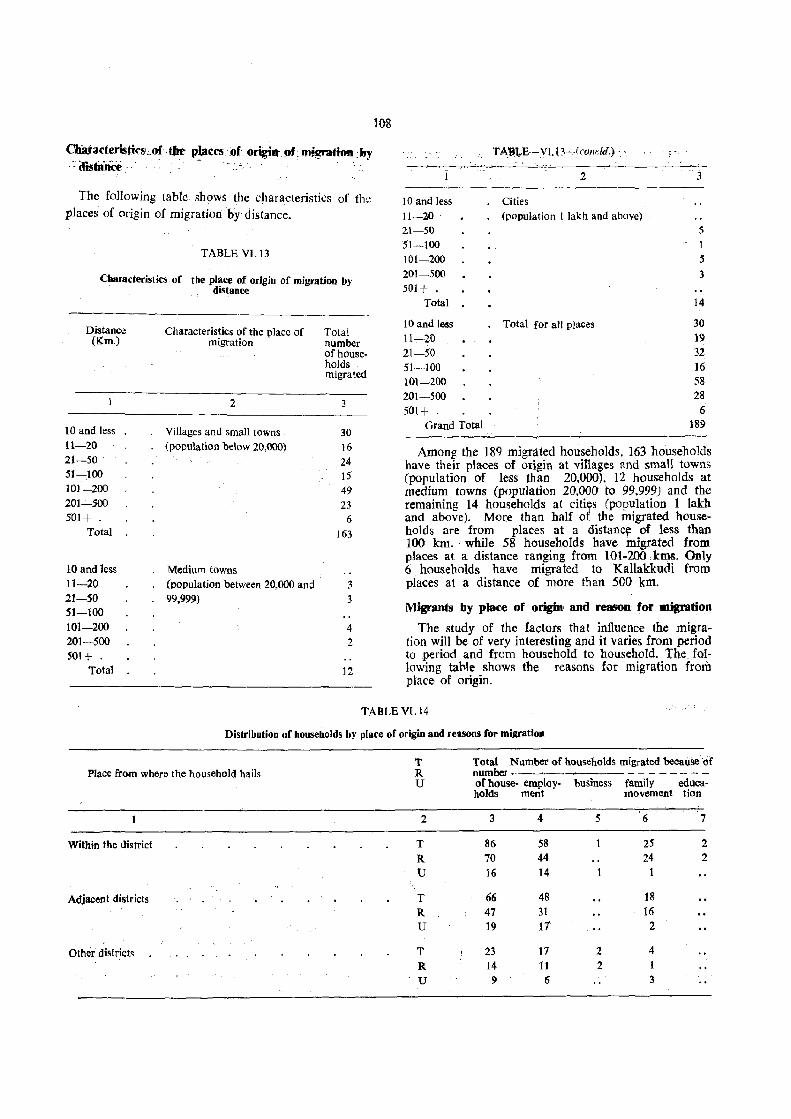
Chaiaderirsti("s'; of . tire P!aCC5 of origin' of. migration: by . ~ itisbilice .' '.' -. : ~. . . " .. _
The following table shows the characteristics of the places of origin of migration-by distance.
TABLE VI. 13
Characteristics of the place of origin of migration by distance
Distance (Km.)
10 and less 11-20 21-50 51-100 101-200 201-500 501+ .
Total
10 and less 11-20 21-50 51-100 101-200 201-500 501+ .
Total
Characteristics of the place of Total migration number
2
Villages and small towns (population below 20,000)
Medium towns (population between 20,000 and 99,999)
of households migrated
3
30
16 24 15 49 23
6 163
3 3
4 2
12
108
TA'liJt;,E·-VI.l3~·(cowld.) ..
2 _ 3
10 and less Cities Jl-20 . (population I lakh and above) 21-50 5
51-100 1 101-200 5 201-500 3 501+ •
Total 14
10 and less Total for all places 30 11-:-20 19
21-50 32 51-100 16 101-200 58 201-500 28 501+ . 6
Grand Total 189
Among the 189 migrated households, 163 households have their places of origin at villages and small towns (population of less than 20,000), 12 households at medium towns (population 20.000 to 99.999) and the remaining 14 households at citi~s (population 1 lath and above). More than half of the migrated households are from places at a distancy of less than 100 km. while 58 households have migrated from places at a distance ranging from 101-200 km&. Only 6 . households have migrated to Kallakkudi from places at a distance of more than 500 km.
Migrants by plaKe of oript and reason, for. migTation
The study of the factors that influence the migration will be of very interesting and it varies from period to period and from household to household. The following table shows the reasons for migration from place of origin.
TABLE VI.14
Distribution of households by place of origin and rellsons for migration
Place from where the household hails
Within the district
Adjacent districts
Other districts
T R U
2
T R U
T R U
T R U
Total Number of households migrated because of number ---.------ - - - - - - - -of house- employ- business family educa-holds ment movement tion
3
86 70 16
66 47 19
23 14 9
4
58 44 14
48 31 11
17 11
(1
5
2 2
6
25 24
18 16
2
4 1 3
7
2 2
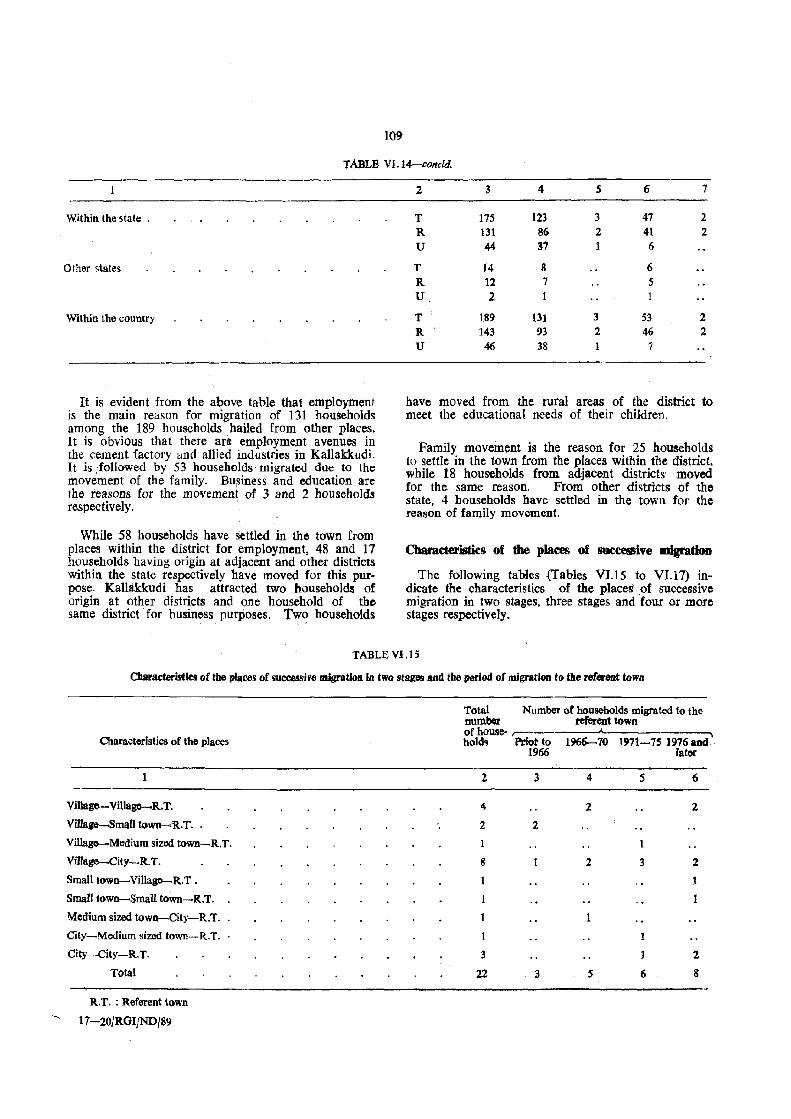
109
TABLE VI. 14-concld
Within the state .
Other states
Within the country
It is evident from the above table that employment is the main reason for migration of 131 h{)useholds among the 189 households bailed from other places. It is obvious that there are employment avenues in the cement factory and allied industries in Kallakkudi. It is. followed by 53 households· migrated due to the movement of the family. Business and education are the reasons for the movement of 3 and 2 households respectively.
While 58 households have settled in the town from places within the district for employment, 48 and. 17 households having origin at adjacent and other districts within the state respectively have moved for this purpose. KaUakkudi has attracted two households of origin at other districts and one household of the same district for business pu~ses. Tw~ households
2 3 4 5 6 7
T 175 123 3 47 2 R 131 86 2 41 2 U 44 37 6
T 14 8 6 R 12 7 5 U 2
T 1.89 131 3 53 2 R 143 93 2 46 2 U 46 38 7
have moved from the rural areas of the district to meet the educational needs of their children.
Family movement is the reason for 2S households to settle in the town from the places within the district. while 18 households from adjacent districts moved for the same reason, From other districts of the state, 4 households have settled in the town for the reason of family movement.
Characteristics of tile places of succe8ve migration
The following tables {Tables VI.15 to VI.17) indicate the characteristics of the placeS' of successive migration in two stages. three stages and four or more stages respectively.
TABLE VI.lS
Characteristia of the places of successive migration in twa stages SlId the period or ntigratiOll to the referent town
Charactoristics of the places
Village-Village-R.T.
Village-Small town-<R.T.
Village-Medium sizod town-R.T.
Village-City-R. T.
Small town-Villagc-R.T.
Small town-Small town-R.T.
Medium sized town-City-R.T.
CitY-Medium sized town-R.T.
City-City-R.T.
Total
R.T. : Referent town
17-20/ROI/ND/89
Total Number of households migrated to the number referent tOwn of house- r--holds Prior to 196fj.......70 1971-75 1976and
2
4
2
1
8
3
22
1966 later
3 4
2
2
2
3 5
5
3
1
6
6
2
2
1
1
2
8
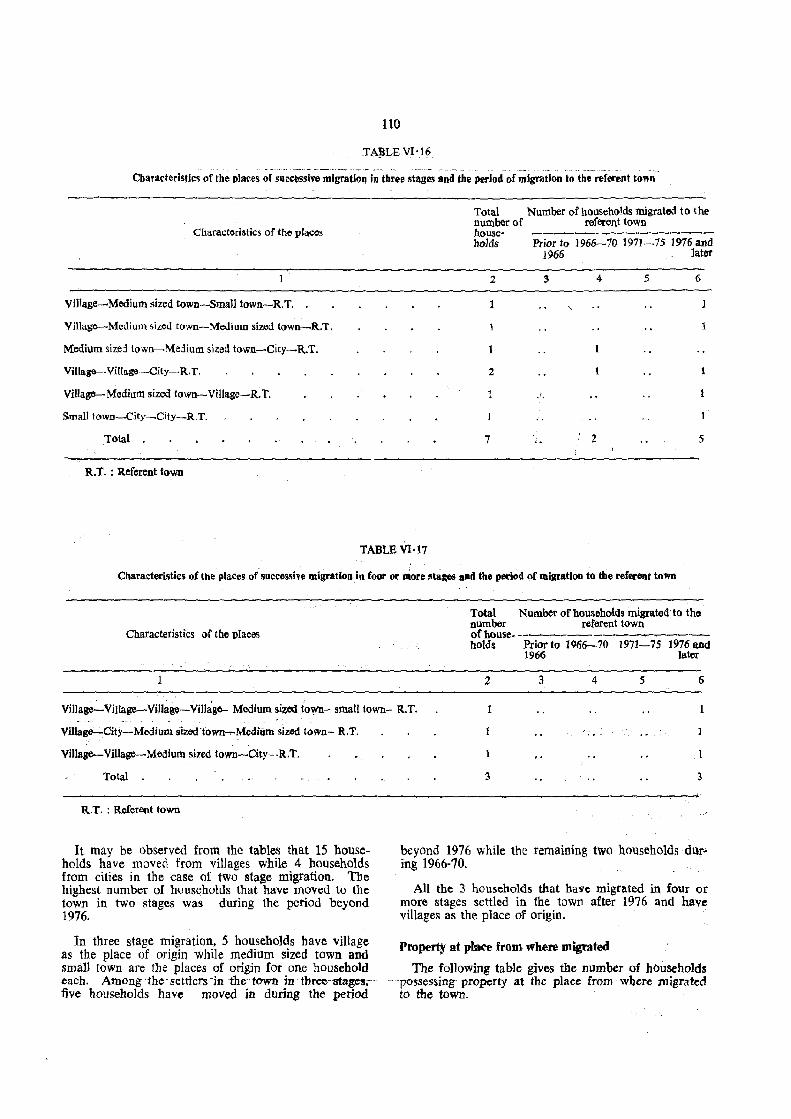
110
_TABLE VH6 . - -- '-' -
• ,-<- _" •• '
CharacteriStics of the places of succl\Sslve mlgratlo!! in three stages and the period of migration to the referent town
Characteristics of the places
Vil1age~Mooium ~ized town-Small town-R.T.
Vi11age~Medium sized town-Medium sizod town-R.'!.
Medium size::! town-Me::!ium sized town-CitY-R.T.
Villag6--Village-City-R.T.
VilIagG-Medium sized town-Villago--R.T.
Small town-City-CitY-RT,
Total .
R.T. : Referent town
Total Number of households migrated to the number of referent town house- ------~--~-----holds Prior to 1966--70 1971-75 1976 and
1966 later
2 3 4 5 6
,
2 1
J.
1
7 2 5
TABLE VI· 17
Cbaracteristics of the places of successive migration in foor 0 .. more stages aDd the period of migration to the referent town
Characteristics of the places
Total Number of households migrated to tho number referent town of houSe- -----------~----holds Priorto 1966--70 1971-75 1976and
1966 later
:2 3 4 5 6
Village-Vjilage~Viliage-VjJl~ge- Medium sized town- small towu- R.T.
Village-City-Medium si:Zed'town..,..Medium sized town- R.T.
Village-Village-Medium sized town-CitY-R.T.
Total .
R.T. : Referent town
It may be observed from the tables that 15 households have moved from villages while 4 households from cities in the case of two stage migration. The highest number of huuseholds that have moved to the town in two stages was during the period beyond 1976.
In three stage migration, 5 households have vHlage as the place of origin while medium sized town and small town are the places of origin for one household each. Among -the -settlers-in the town in three-1!tages.uve households have moved in during the period
3 3
beyond 1976 while the remaining two households dUring 1966-70.
All the 3 households that have migrated in four or more stages settled in the town after 1976 and have villages as the place of origin.
Property at place from· where migrated
The following table gives the number of hbuseholds -~ 'possessing property at the place from where migra-ted
to the town.
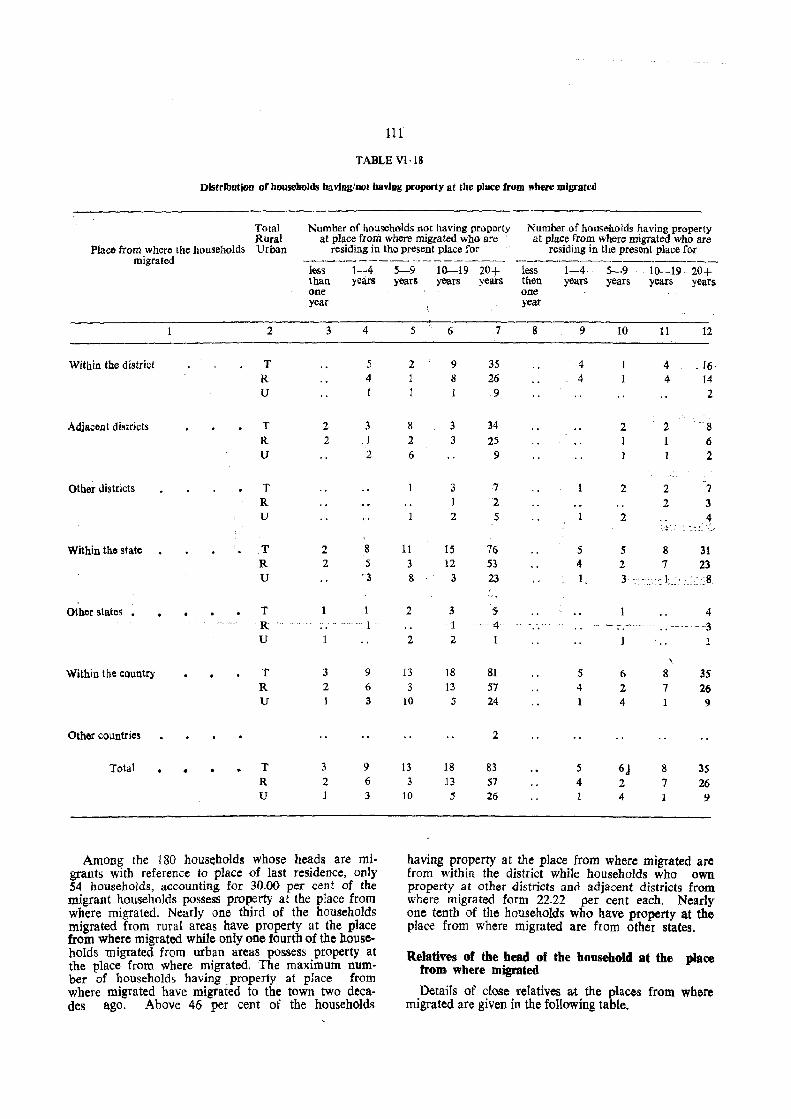
111
TABLE VI·lS
DistributiOn of households ba ving/oot bavlng pl'lJPerty at the place from where migrated
Total Number of households not having property Number of households having property Rliral at place from where migrated who are at place from where migrated who are
Place from where the households Urban residing in the present place for residing in the present place for migrated ----------~-------- -----------.-------~.-
less 1-4 than years one year
2 3 4
Within the district T 5 R 4 U
Adjacent districts T 2 3 R 2 . 1 U 2
Other dis tricts T R U
Within tho state T 2 8 R 2 5 U '3
Other states . T 1
R 1 U
Within the cl)untry T 3 9
R 2 6 u 3
Other countrie~
Total • T 3 9
R 2 6 U 3
Among the 180 households whose heads are migrants with reference to place of last residence. only 54 households, accounting for 30.00 per cent of the migrant households possess property at the place from where migrated. Nearly one third of the households migrated from rural areas have property at the place from where migrated while only onc fourth of the households migrated from urban areas possess property at the place from where migrated. The maximum number of households having property at place from where migrated have migrated to the town two decades ago. Above 46 per cent of the households
5-9 10--19 20+ less 1-4 5-9 . 10--19 20+ years years years then years years years years
one year
5 6 .7 B 9 10 11 12
2 9 35 4 4 .16 1 8 26 4 4 14 1 9 2
8 3 34 2 2 B 2 3 25 I 6 6 9 1 2
3 7 2 2 7 2 2 3
2 5 2 ,4 - .~-' "
11 15 76 5 5 8 31 3 12 53 4 2 7 23 8 3 23 1, 3 .:; 1 .. : 8
2 3 5 1 4 1 .. ,~ 4 .... -,_ ;-.~-.-~ .. -~;_; ." _. .. -3
2 2
'.
13 18 81 5 6 8 35 3 13 57 4 2 7 26
10 5 24 4 9
2
13 18 83 5 6j 8 35 3 13 57 4 2 7 26
10 :; 26 4 I 9
having property at the place from where migrated are from within the district while households who own property at other districts anel adjacent districts from where migrated form 22.22 per cent each. Nearly one tenth of the households who have property at the pJace from where migrated are from other states.
Rel~<tives of the head of the household at the place from, where migrated
Details of close relatives at the pLaces from where migrated are given in the following table.
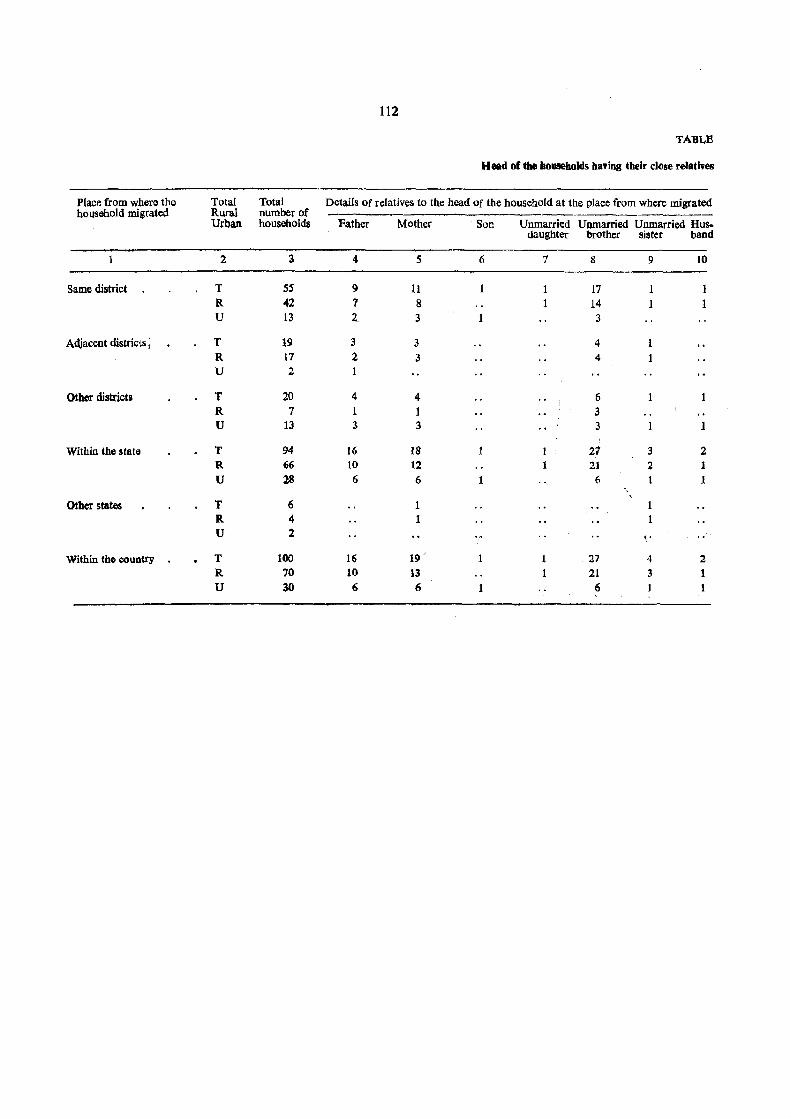
112
TABLE
Head of the households ha?ing their close relatives
Place from whet"" the Total Total Details of relatives to the head of the household at the place from where migrated hOllsehold migrated Rural number of
Urban households Father Mother Son Unmarried Unmarried Unmarried Hus-daughter brother sister band
1 2 3 4 5 6 7 8 9 10
Same district T S5 9 11 17 1 R 42 1 8 14 1 U 13 2 3 3
A~acent districts; T 19 3 3 4 R 17 2 3 4 U 2
Other districts T 20 4 4 6 R 7 1 1 3 U 13 3 3 3 1
Within the stata T 94 16 18 27 3 2 R 66 10 12 21 2 1 U l8 6 6 6 1
Other states T 6 1 R 4 1 U 2 \.
Within tho country T 100 16 19 ~ 1 27 4 2 R 70 10 13 1 21 3 U 30 6 6 6
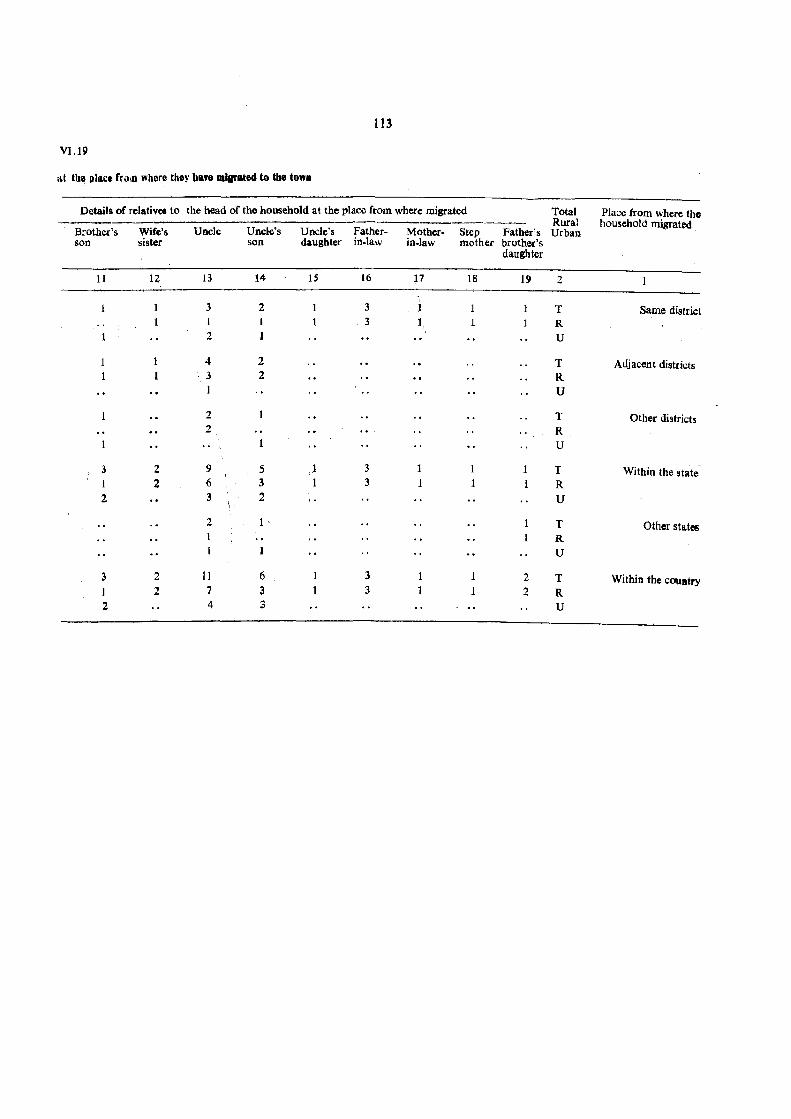
113
VI.19
ilt tIJIl plllc. fruln wnere they have IIlll"ate4 to the to"n
Details of relatives to the head of the household at the place from where migrated Total Place from where the Rural household migrated
Brother's Wife's Uncle Uncle's Uncle's Father- Mother- Step Father's Urban son sister son daughter in-law in-law mother brother's
daughter
11 12 13 14 IS 16 17 18 19 2
3 2 3 i T Same district 1 1 3 1 R 2 1 U
4 2 T Adjacent districts 3 2 R 1 U
2 T Other districts 2 R
1 U
3 2 9 5 1 3 1 1 T Within the state 1 2 6 3 1 3 1 1 R 2 3 2 U
2 T Other states 1 R
U
3 2 11 6 3 1 1 2 T Within the cOUDtry 2 7 3 3 1 2 R
2 4 3 U
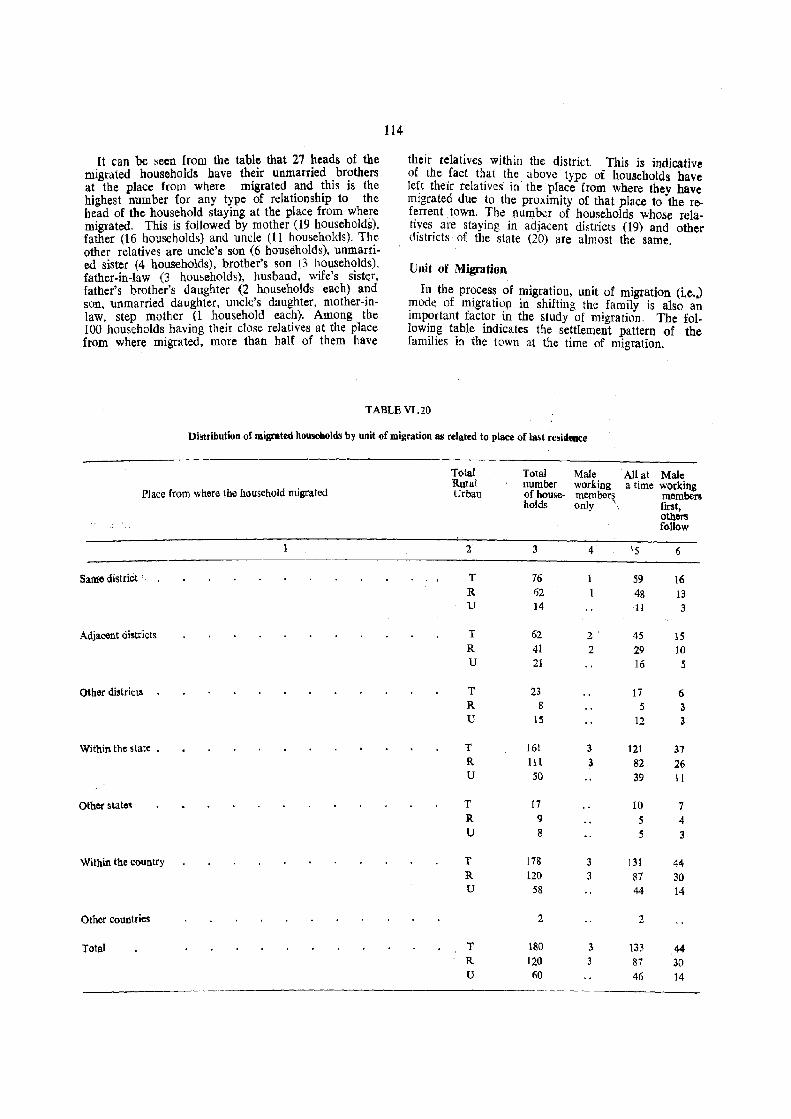
It can be seen from the table that 27 heads of the migrated households have their unmarried brothers at the place from where migrated ~nd !his is the highest number for any type of relatlOnshlp to the head of the household staying at the place from where migrated. This is followed by mother (19 households), father (16 households) and uncle (11 householDs). Th~ other relatives are uncle's son (6 households), unmarned sister (4 households), brother's son (3 households), father-in-law (3 households), husband, wife's sister, father's brother's daughter (2 households each) and son, unmarried daughter, uncle.'s daughter, mother-inlaw, step mother (1 household eac?). Among. the 100 households having their close relatIves at the place from where migrated, more than half of them have
114
their relatives within the district. This is indicative of the fact that the above type of bouseholds have le~t their relatives in the place from where they haVe mIgrated due to the proximity of that place to tbe referrent town. The l,1umber of households whose relatives are staying in adjacent districts (19) and other districts of the state (20) are almost the same.
Vnit of M.iga.tion
In the process of migration, unit of migration (Le.') ~ooe of migrati~J;1 in shifting the family is also an Important factor ill the study of migration. The following table indicates the settlement pattern of the families in the town at the time of migration.
TABLE VI. 20
Distribution of migrated housebolds by unit of migration as related to place of last residence
Total Total Male All at Male Rural number working a time working
Place from where the household migrated Urban of house- members members holds only \ first,
others follow
2 3 4 '5 6
Same district . T 76 59 16 R 62 48 13 U 14 11 3
Adjacent districts T 62 2· 45 15 R 41 2 29 10 U 21 16 5
Other district! T 23 17 6 R 8 5 3 U 15 12 3
Within the state . T 161 3 121 37 R 111 3 82 26 U 50 39 11
Other state~ T 17 10 7 R 9 5 4 U 8 5 3
Within the country T 178 3 131 44 R 120 3 87 30 U 58 44 14
Other countries 2 2
Total T 180 3 133 44 R 120 3 87 30 U 60 46 14
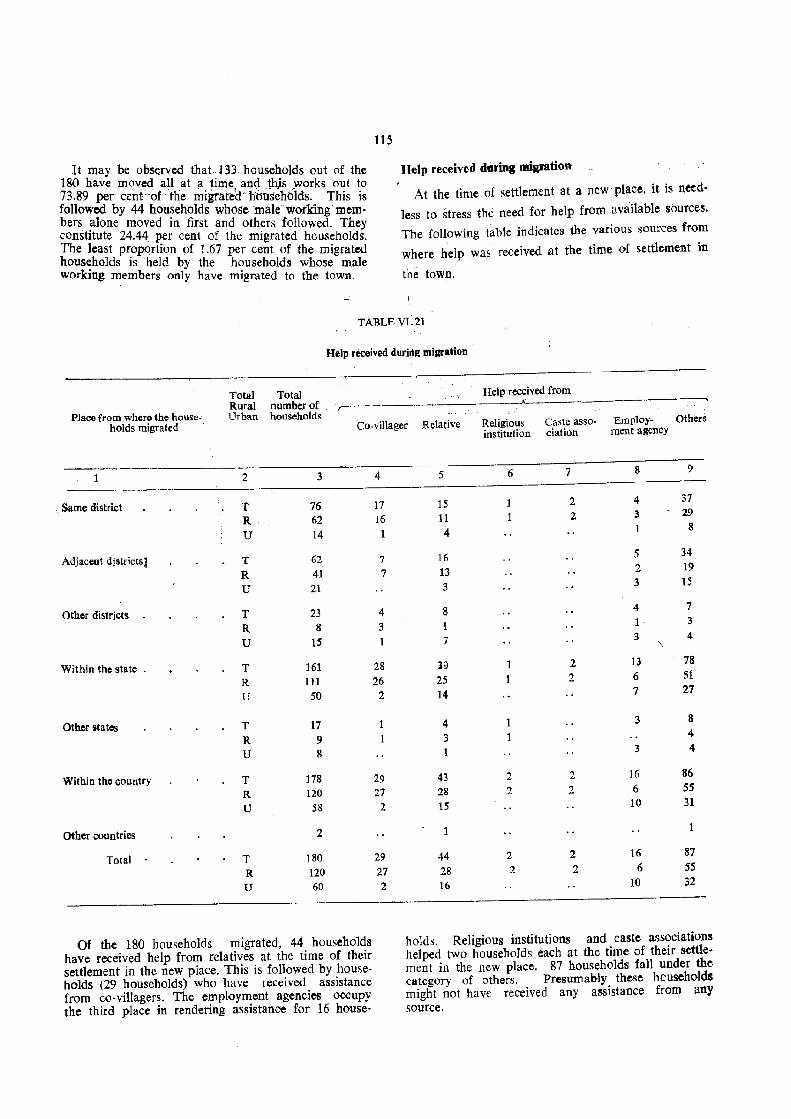
115
It may be observed. that .133 households out of the Help received during migration l~O have moved all at a. ~ime, aD9 thjs :works out to 7j.89 per ccnt- of the mlgrated- hOllsehblds. This is At the time of settlement at a ncw place, it is need·
followed by 44 households whose ·male working memo less to stress the need for help from ,\vailable sources. bers ,alone moved in first and others followed. They constItute 24.44 per cent of the migrated households. The following table indicates the various sources from
The least proportion of 1.67 per cent of the migrated where help was received ,at the time of settlement in households is held by the households whose male working members only have migrated to the town. the town.
TARLEVr:,21
Help received during migration
Total Total Help received from Rural number of , .A. ---,
Urban households Place from where the house- Others holds migrated Co-villager Relative Religious Caste asso- Employ-
institution ciation ment agency
2 3
" Same district T 76 R 62
U 14
Adjacent distdctsi T 62 R 41 U 21
Other districts T 23 R 8
U IS
Within the state . T 161
R III U 50
Other states T 17 R 9 U 8
Within the country T 178
R 120 U 58
Other countries 2
Total T 180
R 120 U 60
Of the 180 households migrated, 44 households have received help from relatives at the time of their settlement in the new place. This is followed by house· holds (29 households) who have received assistance from co-villagers. The employment agencies occupy the third place in rendering assistance for 16 house-
4
17 16 1
7 7
4 3
28 26 2
29 27
2
29 27 2
5 6 7 8 9
15 1 2 4 37
11 1 2 3 - 29
4 1 8
16 5 34
13 2 19
3 3 15
8 4 7 3
7 3 4 "
39 2 13 78
25 2 6 51
14 7 27
4 1 3 8
3 1 4 3 4
43 2 2 16 86
28 2 2 6 5S
15 10 31
44 2 2 16 87
28 2 2 6 55
16 10 32
holds. Religious institutions and caste associations helped two households each at the time of their settlement in the new place. 87 househo1ds fall under the category of others. Presumably these hcuseholds might not have received any assistance from any source.
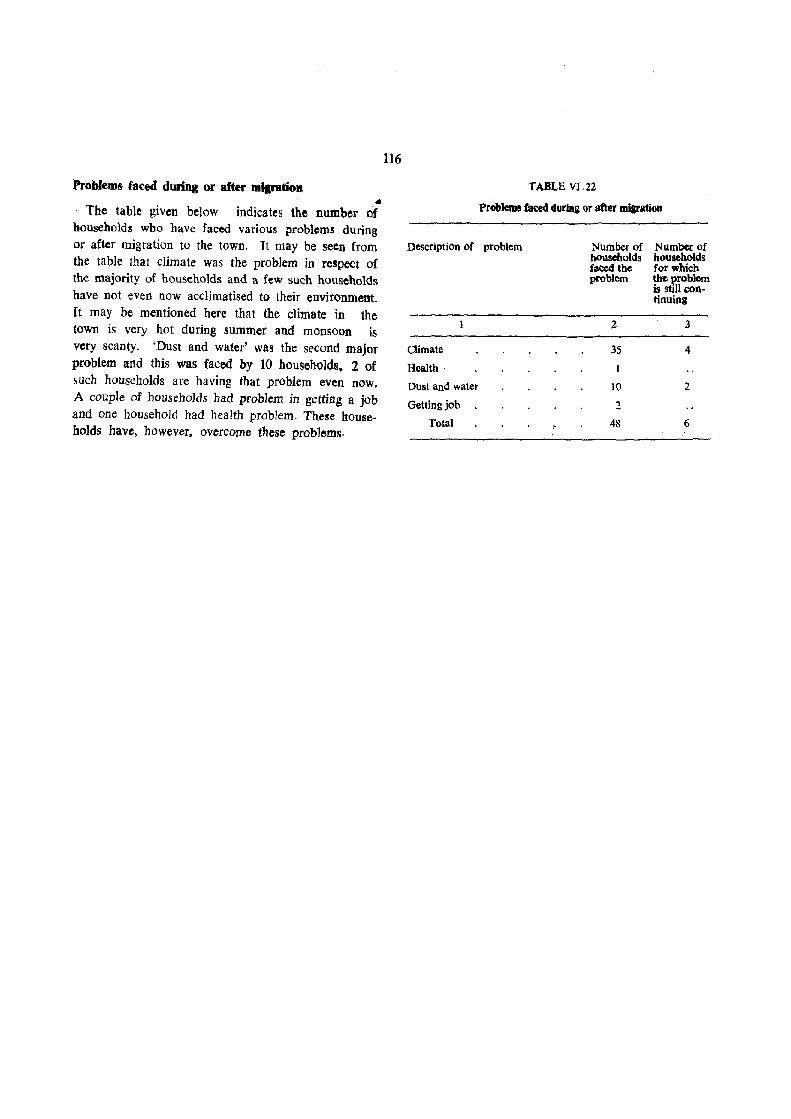
Problems faced during or after mip'llDoft ...
The table given below indicates the number of households who have faced various problems during or after migration to the town. It may be seen from the table that climate was the problem in respect of the majority of households and a few such households have not even now acclimatised to their environment. [t may be mentioned here that the climate in the town is very hot during summer and monsoon is very scanty. 'Dust and water' was the sl'cond major problem and this was faced by 10 households. 2 of such households are having that problem even now. A couple of households had problem in getting a job and one household had health problem. These households have, however, overcome these problems.
116
TASLE VI.22
Problems fated durbtg or after miaration
Description of problem
Climate
Health·
Dust and water
Getting job
Total
Number of households faced the problem
2
3S
10
2
48
Number of households for which the problem is still con-tinuing
3
4
2
6
CHAPTER VII
NFIGHROlJRHOOD PATTERN
The concept of neighbourhood in the urban context is very difficult to define in precise terms. Urban way of Hfe is opposed to the preservation (If neighbourhood life. The social composition of people bl~ing heterogenous. high 'density and accelerated rate (1f mobility of urban population are some of the factors which are opposed to the preservation of JJdghboUIhood life. This is true in cosmopolitan cities like Madras. Bombay or Calcutta where social control to the views of the neighbourhood may not be pO'isible or in a diluted form. However. neighbourhood is to be found in towns and cities especially in residential areas which are not over densely settled and whi,:h possess a population for the most part. homogeneous and exhibiting a low rate of mobility. The concept of neighbourhood has different implications for different type of individuals in different position of social and geogr<lphical mobility and may vary in the ca~e of families with different constellations of ethnic group attachments etc.
Cities during their course of growth normally divide their residential areas accordinj!; to social class criteria. Hence, ill considering neighbourhood pattern the social class of any area. its function and the bt'haviour that constitutes the neighbourhood are all to he taken into consideration.
1n geographical terms a neighbourhood is a distinct part of the town having known boundaries and distinguished from other neighbourhoods by similarity of housing and more particularly by a certain homogeneity of s(lcial class within the area.
As urban life is characterised by :tnonymity, it is usual that one may live for years in a town without knowing ones neighbour. Urban way of life is sophisticated that the fellow feeling among neighbours does not go beyond a polite expression of good will and any aid given to others is channeJised thr(lugh administrative organisation, which lacks a personal touch of human relationship as found in a rural setting. In rural areas much importance is given to the neighbourhood and have installed in themselves a regimentation or social control to the views cof the dwellers of their neighbourhood.
In Kallakkudi town, where vestiges of fural atmosphere have not been disappeared at all and where custom and practice smacking sylvan odour is the order. the study of neighbourhood is very meaningful. As indicated earJier the town !'overs nn aren of 11.00 Sq. km. with a population of only 11.196. The size of population and the compactness with which they reside provide a congenial atmosphere t'o define the town as a whole a single neighbourhol)d. However. an attempt has been made in consultation with
18-20/RGJjl\'D/89 117
the town panchayat authorities to 1ind out the existence of different diffused neighbourhoods within the town with the inhabitants having face tLl face contact with one another.
, Kallakkudi has almost all its public and private institutions in Dalmia compound and in DaJmia main road. The shops are located in Dalmia main road opposite to Dalmia compound and on either sides of the bazaar road. For their day-to-day requirements, su;::h as purchase of commodities, people have to de~ pend on the bazaar area and Dalmia main road area. For high school education and medical attention, they have to depend upon the institutions within the Dalmia c'ompoulld. For cinema, people have to go to the area called Ambal talkies area. Except in the Dalmia comround, multistorey residential apartments are not found elsewhere. Most of the blocks of the D,Jlmia quarters are multistorey huildings. In the other area outside the Dalmia compound, people mostly live in single storey houses or huts whi·ch are more or le~s close to each other. T1Je area outside the Dalmla compound has developt:d on its own. without any well laid plan.
As far as Kallakkudi town is concerned it has already been broadly divided into 6 localities as follows based on local information and as per the Primary Census Abstract. 1981 for the COllduct of the survey.
locality I
Locality 11
LocalityIH
Locality IV
Locality V
Locality VI
Cultivators & workers (Ward Nos. 1. 2 & 4)
Mcn.:hant&. work~rs and culti-valors
(Ward Nos. 3, 5 & 6)
Me!~chanls and factory employees (Ward Nos. 7 & 12)
Supervisory staff and factory employees (Ward Nos. 8, 12 & J 3)
Managcria I staff and teachers (Ward No. 14)
Harijans and workers (Ward Nos. 9 & 10)
The above cate~orisation of the 'Whole town into different localities ~is based on economic criteria.
The matters like ethnic association of these localities and the problems faced by the households in these lo;:alities are discussed in the chapters to follow.
While studying neighbourhond slight modification has been made in the above classification to have a more socio-economic homogeneity. Th;! resultant

r
118
neighbourhoods are as follows: 1. Bazaar area, 2. Dal- at the rate of 8 to 12 persons in each locality to can-rnia m~in road, Chidambaram saIai, Vanniar colony, vass the neighbourhood and community life sc]Jedule. 3. Ranjan Colony and Ambal talkies area 4. Dalmia
The particulars of the selected intervjewees are as second colony and 5. Dalmia main colony. In these 5 neighbourboods altogether 49 persons \\'ere selected follows.
TABLE VII, 1
Particulars of selected interviewees
Dl!Scription of neighbourhood Sex No. of Age-group Religion to which they Educational level Duration of stay in inter. belong the neighbourhood viewees --_._---.---
Hindu Muslim Chris· tian
2 3 4 5 6 7 8 9
Bazaar area M 10 Below 20 9 2 Illiterate! Below 1 year
F 20-34 2 Upto matric 8 1-3 years
35--59 8 Above n;latric 2 4-9 60+ 10+ .. 9
Dalmia main road, M 10 Below 20 7 3 Illiterate Below 1 year
Chidambaram s;llai, Vanninr F 2')·-24 3 Upto matric 7 \ 1-3 years
COlony 35-59 6 Above matric ;, 4-9 2
60+ 1 10+ S
H,arijan colony and M 12 Below 20 6 6 Illiterate Below 1 year
Ambal talkies area F 20-34 2- Upto matric II 1-3 years
35-59 8 Above mat ric 1 4-9 60+ 2 l()+
" 12
Dalmia second colony M 7 Below 20 Illiterate Below I year
(Gandhi Nagar) F 1 20-34 7 Upto mateie 7 1-3 years
35-59 8 Above matric 4-9 "
1
60+ 10+ 7
Dalmia main colony M 8 Below 20 8 Illiterate Below 1 year
F 20-34 1 Upto matrie 2 [ -3 years
35-59 7 Above matric 6 4-9 3
60+ 10-;- 4
The following table shows the main characteristics of the above neighbourhood as described by persons belonging to different religions ..
Name of neighbourhood
Bazaar area
TABLE VII. 2
Main characteristics of neighbourhood as described by the interviewees
Characteristics of the neighbourhoo:d as described by the interviewees
2
Udayars & factory workers
Udayars & cultivators U dayars & agricultural labourers
Number of interviewees and the religion to which they belong
Hindu
3
2
4 3
Christian Muslim
4 5
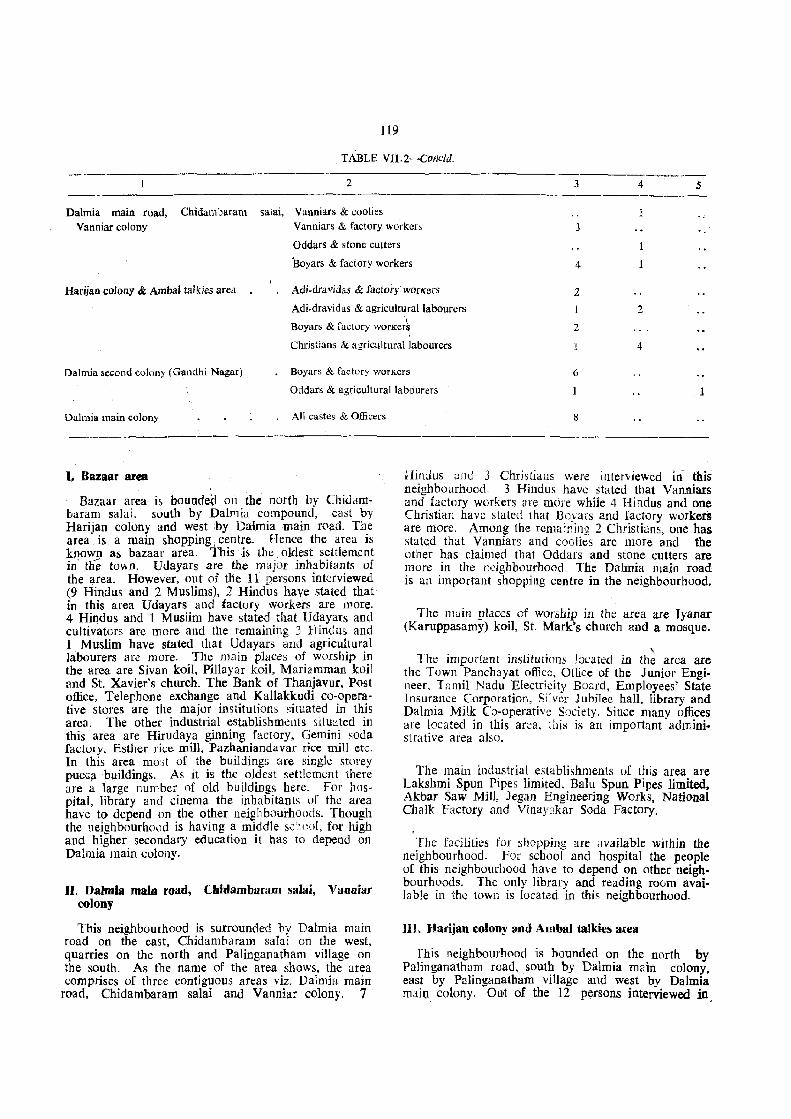
119
TABLE vn.2-COliCld.
2 3 4 5
Dalmia main road, Chidambaram salai, Vanniars & coolies Vanniar colony Vanniars & factory wO~'kcr, 3
Oddars & stone cutters
'soyars & factory workers 4
Harijan colony & Ambal talkies area Adi-dravidas & factory worKers 2
Adi-dravidas & agricultural labourers 2 \
Boyars & facLory worKers 2
Christians & agricultural labourers 4
Dalmia second colony (Gandhi Nagar) Boyars & factory worKers 6
Ojdars & agricuiturallabourers
Dalmia main colony All castes & Officers
I~ Bazaar area
Bazaar area is bounded on the north by Chid ambaram salai, south by Dalmia compound, east by Harijan colony and west by Dalmia main road. Th.e area is a main shopping i centre. Hence the area IS
known as bazaar area. This is tbe oldest settlement in' tb-e town. Udayars are ~he major .inh~bita~ts of the area. However, out of the 11 persons mtervlewed (9 Hindus and 2 Muslims), :2 Hindus have stated that in this area Udayars and factory workers are n'ore. 4 Hindus and 1 Muslim have stated that Udayars and cultivatcrs are more and the remaining 3 Hindus and 1 Muslim have stated that Udayars and agricultural labourers are more. The muin places of worship in the area are Sivan koil, Pillayar koil, Mariamman koil and St. Xavier's church. The Bank of Thanjavur, Post office, Telephone exchange and Kallakkudi co-operative stores are the major institutions f!ituated in this area. The other industrial establishments siluiited in this area are Hirudaya ginning factory, Gemini soda factory, Esther ri;;e mill, Pazhaniandavar rice mill etc. In this area mOit of the buildings afe single stl)rey pucGa b~ildings. As it is the. ol~est settlement 1!1ere are a large number of old bUlldmgs here. For 1105-
pitaf, library and cinema the inhabitants of the area have to depend on the other neighbourhoods. Though the neighbourhood is having a middle s,:'wol, for high and higher secondary education it has to depend on Dalmia main colony.
II. Dalmia main road, Lbidambamm salai, Vanniar colony
This neighbourhood is surrounded by Dalmia main road on the east, Chidambaram salai on the west, quarries on the north and Palinganatham village on the south. As the name of the area shows. the area comprises of three contiguous areas viz. Dalmia main
road, Chidambaram salai and Vanniar colony. 7
:;
Hindus aJld 3 Christians were interviewed in this neighbourhood. 3 Hindus have ,;tated that Vanniars and factory workers ,lre more while 4 Hindus and one Christian have stated that Boyars and factory wlukets are more. Among (he remaining 2 Christians, one has stated that Vanniars and coolies are more !),nd the other has claimed that Oddars and stone cutters are more in the neighbourhood, The Dafmia main road is an important shopping centre in the neighbourhood.
The nUlin places of worship in the area are Iyanar (Karuppasamy) koil, st. Mark's church and a mosque.
\ The important institutions located in the area are
the Town Panchayat office, Office of the Junior Engineer, Tamil Nadu Electricity Board, Employees' State Insurance Corporation, Silver Jubilee hall, library and Dalmia Milk Co-operative Society. Since many offices are located in this area, this is an important administrative area also.
The main industrial establishments of this area are Lakshmi Spun Pipes limited. Balu Spun Pipes limited. Akbar Saw Mill, Jegan Engineering Works, National Chalk Factory and Vinapkar Soda l-actory.
The facilities for shopping are available within the neighbourhood. For school and hospital the people of this neighbourhood have to depend on other neighbourhoods. The only library and reading rD()m availa ble in the town is located in til is neighbourhood.
III. Harijan colony and, Ambal talkies area
This neighbourhood is bounded on the north by Palinganatham road, south by Dalmia main colony. east by Palinganatham village and west by Dalmia maiQ, colony. Out of the 12 persons interviewed .in
this locality, (1 were Hindus dnd h were Christians, 2 Hindus haw stated that Adi-dravidas and factory workers are more wll ile another 2 Hindus have claimed that Boyars and factory workers are more. 5 persons consisting O[ one Hindu anJ 4 Christians have stated a-; christians and agricultural labourers <Ire more. One Hindu and 2 Christians have stake! that Adi-dravidas and agricultural labourers are more. This area is also one of the oldest settlements in the town, This is the lUllSl congested area and houses are adja<.'cnt to each other The people belonging to Adi-c1ravidas, Paraiyans and Chakkiliynas are rt:siding in clusters. a little away from the other m~in habitunts. Arnbal talkies. which was established during the year 1962 is the major landmark of th'~ area. At prescnt the ared is known as Harijan colony and Ambal talkies area. Majority uf the inhabitanb of this neighbourhood are manual labourers. The main religious institutions in thi~ nei!!hbourhood are Mariamman koil and St. Antony's "~hurch. The only cinema talkies available in the town is located in this area. For all other lacilitics. such as shopping, ho~pital etc. the people of this neighbourhood have to depend on other ncighbourhoods One primary school is aVfiilable, in the neighbourhood. After primary education p~ople have to send their wards either to bazaar area QX .to Dalmia main coleny for further education. Since th .. ere are no factories in the area the people of this Iltea arc dependent on other nighbourhbOds such as Dalmia main colony. bazaar area. Dalmia main road. Chidambaram sala i. Vanniar colony etc. for earning their livelihood. A large chunk of workers of this neighbouJhood are employed in the (IUarri,.s owned by Mis Dalmias.
JY. Dalmia se("ond colony (Gandhi Nagar)
Dalmia second colony is also knl)Wn as Gandhi Nagar. On its northern side. the neighbourhood Harijan col OilY and Ambal talkies area is located. on ib
southern and western sides Dalmia main colony is located ,:no on its eastern side Palinganatham village fs located. This cL)lony was cstablished by Mis Dalmias for accommodating the sweepers and blasters.. who generally belong to Boyar and Vanniar communities. 7 Hindus and one Muslim were interviewed in tl:tis 10CJlity. The majority i.)f the interviewed persons have stated that Hoyars and factory workers are the major inhabitants of the area. Kaliamman koil is the place of worship availahle in the neighbourhood. For all the social and commercial bcilities this neighbourhood has to cJepend on other neighbourhoods. The lJOuses. bei ng well planned and maintained by Mis Dalmias. the households do not face any problem ill this reg:i1'CL
V. Dalmia main colony
This 1leighbourhGlxI is bounded on the r,(lrth by DaJmia second coloJ1Y, south lind east t,y Palinganatham village and west by Dalmia main road. Being
120
the residential quarters of Mis Dalmias this is a welt planned area. 8 persons were interviewed, in the area. All the interviewed persons were Hindus. As per the statement of these persons there is no concentration of any particular ethnic group in this neighbourhood. People belonging to all ccmmunities can be found in this neighbourhood. The entire DaImia colony is encompassed by a c,)mpound wan. The road~ and buildings in this neighbourhood present an cxcelknt look as compared to thl! mads and buildings in other areas. There are two temples viz. Pillayar
Jwil <lnd ChilllurUJIlou)eeswarar kuij, the former dedicated to Lord Ganesh and the latter dedicated to Lord Siva. The ten1p]cs are vi~lled daily by the residents 01' the other neigbb(lL!rhoods also. For purchase of their requirement,,; the people of this neighbourhood need not go OLlt as they !can get everything in the Dalmia employees co-op~rative store. Medical llnd re~realioJ1al facilities afe a Iso available within the neighbourhood. The Dalmia Utilisati,on Dispensary, which serves the entire t(JWJ1. is within lITe neighbourhood. The Dalmid Re{;feation Club \'.'hich mainly ser-
\ yes the residents of tbe Dalmia colony'js located with-in the neighbourhood. The Dalmia Higher Secondary School is located' within the neighbourhood. Hence edl.lcational facilities upto h\gher secondary level are available within the neighbourhood. This is the only higher secondary school availabl<:! in the town. Students from I:earby villages are also attending this school. For university education there are 110 colleges in the Jleighbourhood or in the town. For co liege and othetl higher education, people depend on Tiruchchirappalli. the district head quarters. A branch of Punjab National Bank, Dalmiapur am Employees Co-operative bank. a post office and an office of the Asst. Collector of Central Excise are the other institutions located within this neighbourhood. besides Dalmia Cements and Nar:araj Ceramics.
Participation in cultutal. religious and social activities wi1hin the neigbbourhood
The social. cultural and religious activities of any place are the periodic festivals and cultural activities organised at the places of worship and other common places such as town hall, maidan etc. In each of the five neighbourhoods the informants have reported their partidpation as spectators and devotees etc. in festivals celebrdted in the places of wor~hip while a few have attended the pnlitical meetings held at Pilla.var koil thidal and Kamaraj thilbl. A table showing tIle p~rticulars of cultural. re]jgious and soda! activities inSide the neigh bourhoGd as reported by the persons belonging to different religions is given. below:
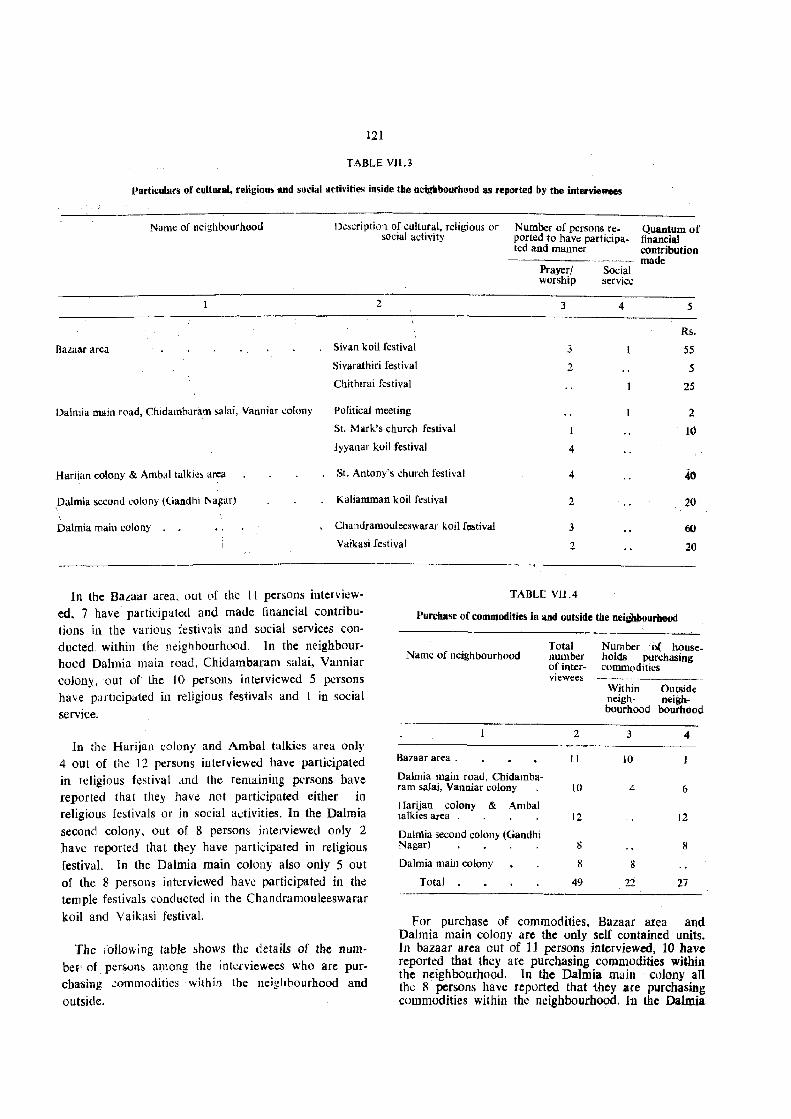
121
TABLE VH.3
Particulars of tultiHal, religiou. and social activities inside the ocigllbgurhooll as reported by the interviewees
Name of ncighbournood Dcscri ptioll of cultural, religiolls or social activity
Number of persons re- Quantum of ported to haw participa- financial ted and manner contribution
Bazaar area
Dalmia main road, Cnidambaram salai, Vanniar colony
Harijan colony & Amba! talkie~ area
palmia second colony (Gandhi Na~ar)
Dalmia main colony .
2
Sivan koiL festival
Sivarathiri festival
Chithirai festival
Political meeting
st. Mdlrk's churcb festival
lyyanar koil festival
st. Antony's church festival
Kaliamman koil festival
Chandramouleeswarar koil f05tival
Vaikasi festival
Prayer! worship
3
3
2
4
4
2
3
2
TABLE Vl1.4
Social service
4
made
S
Rs.
55
5
2S
2
10
40
20
60
20
In the Bazaar area. out 0f the II persons interviewed, 7 have participated and made financial contributions in the various festivals and social services conducted. within the neighbourhood. In the neighbourhoed Dalmia main road, Chidambaram salai, Vanniar colony, out of the ]0 persons interviewed 5 persons have participated in religious festivals and 1 in social
service.
Purchase of commodities in and outside the neighbourhood
In the Harijan colony and Ambal talkies area only 4 out of the 12 persons interviewed have participated in religious festival and the remaining pnsons have reported that they have not participated either in religious festivals or in social activities. In the Dalmia second colony, out of 8 persons intervjewed only 2 have reported that they have participated in religious festival. In the Dalmia main colony also only 5 out of the 8 persons interviewed have participated in the temple festivals conducted in the Chandramouleeswarar
koil and Vaikasi festival.
The following table shows the details of the number' of persons among the inkrviewees who are purchasiIlg ';Qmmodities within the neighhourhQod and
outside.
Name of neighbourhood
Bazaar area .
Dalmia main road, Cbidambaram salai, Vanniar colony
Harijan colony & Ambal talkies area .
Daltl~ia second colony (Gandhi Nagar)
Dalmia main colony
Total
Total numbel' of interviewees
2
1 J
to
12
8
8
49
Number 0( house_ holds purchasing commodities
Within Outside neigh- neigh-bourhood bourbood
3
10
4
8
22
4
6
J2
11
27
For purchase of commodities. Bazaar area and Dalmia main colony are the only self contained units. In bazaar area out of 11 persons interviewed, 10 have reported that they are purchasing commodities within the neighbourhood. In the Dalmia main colony all the 8 persons have reported that they are purchasing commodities within the neighbourhood. In the Dalmia
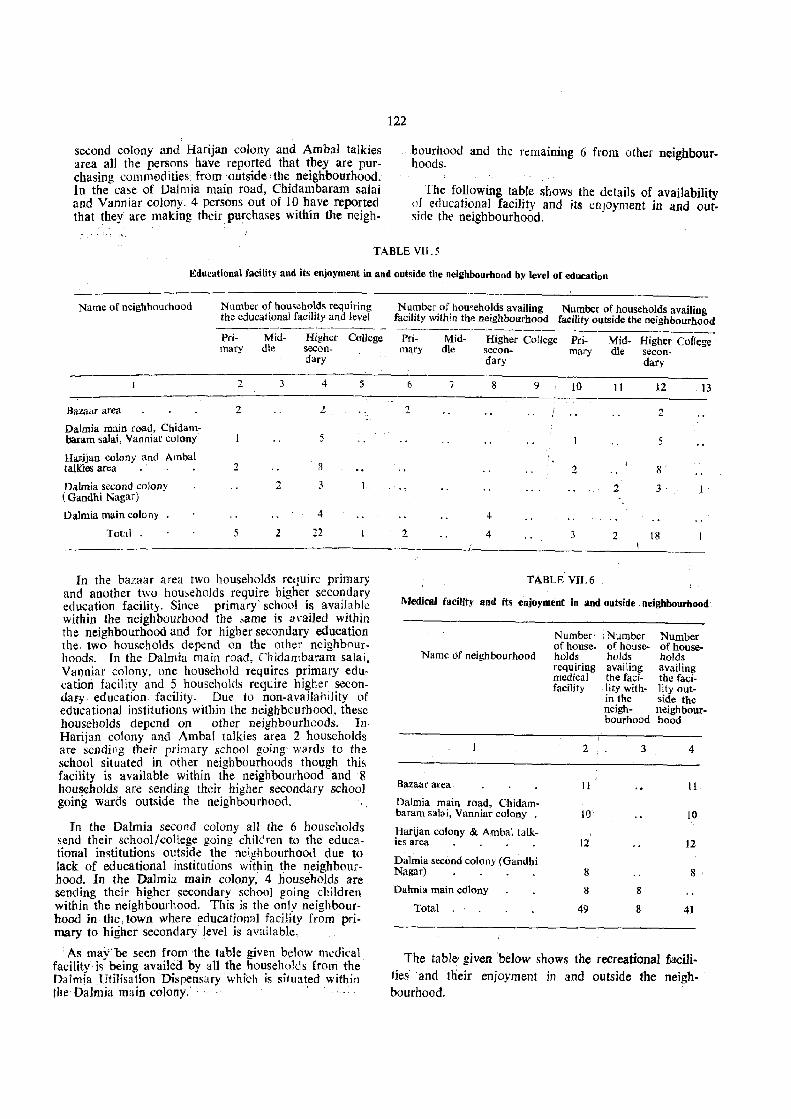
second colony and Harijan colony and Arnbal talkies area all the persons have reported that they are purchasing C0111111€ldities from outside' the neighbourhood. In the case of Dalmia main road, Chidambaram salai and Vanniar colony. 4 persons out of 10 have reported that they are making their purchases within the neigh-
122
bourhood and the remaining 6 from other neighbourhoods.
The following table shows the details of availability of educational facility and its enjoyment in and out~irle the neighbourhood.
TABLE VII.5
Educational facility and its enjoyment in and outside the neighbourhood by level of education
Name of neighbouchood
Bazaar area
Dalmia main road, Chidalllbararn salai, Vanniar colony
Harijan colony and Ambal talk1es area '
Dalmia second colony (Gandhi Nagar)
Dalmia main colony
Total.
Number of households requiring the educational facility and level
Primary
2
2
2
5
Middle
3
2
2
Higher College secon-dary
4
2
5
3
3
4
22
5
In the bazaar area two households re(luire primary and another two households require higher secondary education facility. Since primary' school is available within the neighbourhood the same is availed within the neighbourhood and for higher secondary education the two households depend on the other neighbourhoods. In the Dalmia main road, Chidambaram saJai. Vanniar colony, one household requires primary education facility and 5 households reqLire higher secondary education facility. Due to non-availability of educational institutions within the neighbourhood, these households depend on other neighbourhoods. In Harijan colony and Ambal talkies area 2 households are sending their primary school going wards to the school situated in other neighbourhoods though this facility is available within the neighbourhood and 8 households are sending their higher secondary school going wards outside the neighbourhood.
In the Dalrnia second colony all the 6 households send their school/college going children to the educational institutions outside the neighbourhood due to lack of educational institutions within the neighb(lur. hood. In the Dalmia main colony, 4 households are sending their higher secondary school going cbldren within the neighbourhood. This is the only neighbourhood in the, town where educational facility from primary to higher secondary level is available,
'As may'be seen from the table given below medical facility 1S being availed by all the households from the Dalmia Utilisation Dispensary which is situated within tbe Dalmia main colony. .
N~I?b(;r.of.houoeho~ds availing Number of households availing facIlity wlthm the neighbourhood facility outside the neighbourhood
Pri-ma,ry
6
2
2
Middle
7
Higher College Pri-secon- mary dary
4
4
9 10
2
3
TABLE VIL6
Mid- Higher Coflege dIe secon·
11
2
2
dary
12
2
5
8
3
18
13
Medical facility and its enjoyment in and outside neighbourhood
Name of neighbourhood
Bazaar area
Dalmia main road, Chidam· baram sahli, Vanniar colony .
Harijan colony & Ambal talkies area
Dalmia second colony (Gandhi Nagar)
Dalmia main colony
Total
Number' of households requiring medical facility
2
11
10
J2
8
8
49
: Number Number of house- of house-holds holds availing availing the faci- the faci-lity with- lity but-in the side the neigh- neighbour-bourhood hood
3
8
8
4
11
10
12
8
41
The table- given 'below shows the recreational jjacili· ties' and thejr enjoyment in and outside the neighbourhood.
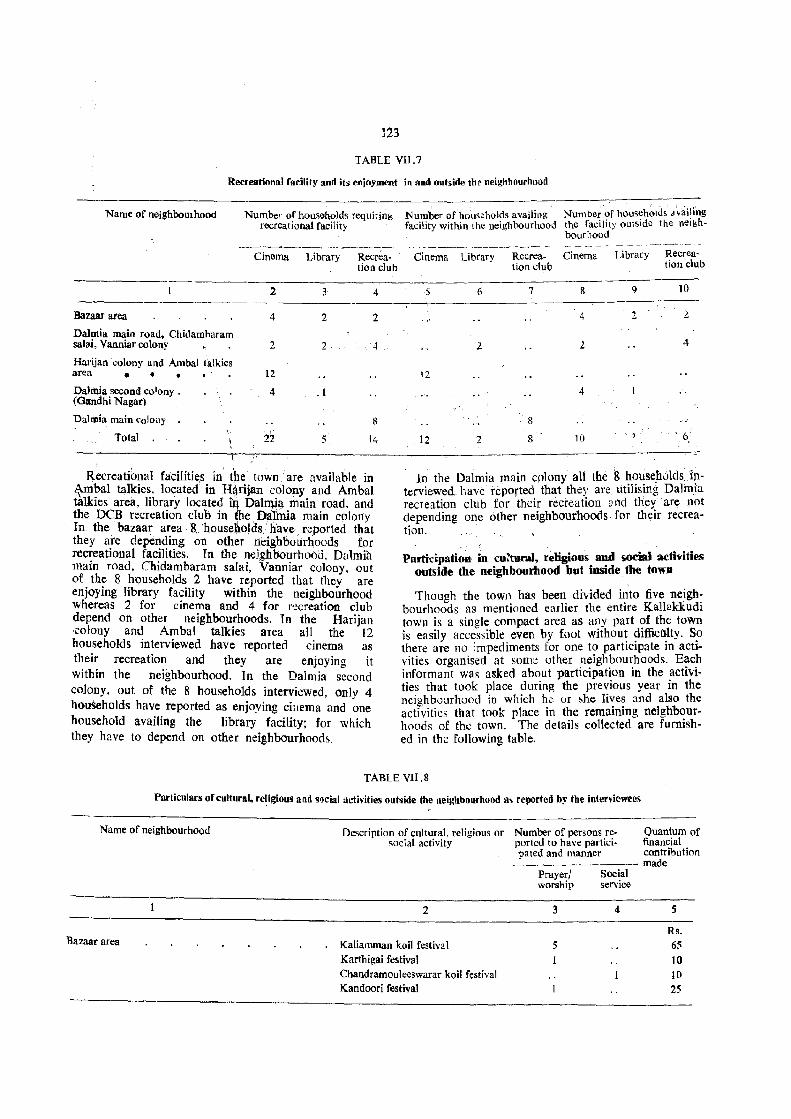
123
TABLE VIl.7
Recreational farility and it~ enjoyment in and out~ide the neighl1ollrhood
Name of neighboUlhood Number of households requiring recreational facility
Cinema Library Recreation club
Bazaar area
Dalmia maio road, Chidamharam sallli, Vannw- colony
Harijan colony and Ambal talkies area _. • '
Dalinia second colony . (Gandhi Nagar)
2
4
2
12
4
3 4
2 2
2
.1
Dalmia main colony
Total 22 5
8
14
/.
Recreational faCilities in t~e town. are available in ~mbal talkies. located in H~rijan colony aud Aruba] talkies area, library located iq Dal~~a main road. and the OCB re-creation club in the, Da:hnia main colony. In the bazaar area 8, households, have reported that they ai:c depending on other neighbourhoods for recreational facilities. In the neighbourhood. Da1mia main road, Chidambaram saIai. Vanniar colony, out of the 8 households 2 have reported that they are enjoying libmry facility within the neighbourhood whereas 2 for cinema and 4 for r~creation club depend on other neighbourhoods. Tn the Harijan ·colony and Ambal talkies area all the 12 households interviewed have reported cinema as their recreation and they are enjoying it within the neighbourhood. In the Dalmia second colony, out of the 8 households interviewed, only 4 households have reported as enjoying Cil lema and one household availing the library facility; for which they h:we to depend on other neighbourhoods.
Number of housello1ds availing Number of households Jvaili'ng facility within lhe neigllbourhood the facility outside the neigh
bourhood
Cinema Library
6
2
12
12 2
Recreation club
7
8
8
Cinema
8
4
2
4
10
Library
9
2
Recreation club
10
2.
4
In the Dalmia main colony all the 8 houselwlds interviewed have reported that they are utilising Dalinia. recreation club for their recreation Dnd they are ~ot depending one other neighbourhoods for thl!ir recreation.
Partidpation in cu:tDml, religious and social activities outside the neigbbourhood but inside tile town
Though the town has been divided into five neigh~ bourhoods as mentioned earlier the entire Kallnkkudl town is a single compact area as aJ?Y part ?f the town is easily accessible even by foot wlthou~ ~bffic~lty. S!l there are no impediments for one to partICIpate m actIvities organised at some other _n~igh~ou~hoods. E~c~ informant was asked about partICIpatIon In the actlv1-ties that took place during the previous year in the neighboarhood in which he or she lives and also the activities that took place in the remaining neighbour. hoods of the town. The details collected are furnished in the following table.
TABLE VII.S
Particulars of cultural, .. e~igious and SOCial activities outside the neighb()urhood as reJ)Orted by the iuterviewees
Name of neighbourhood
Bazaar area
Dcscription of cultural, religious or Number of persons rc-social activity ported to have partici
pated and manner
2
Kaliamman koil festival Karthigai festival Chandramouleeswarar koil festival Kandoori festival
Prayerl worship
3
5
Social service
4
Quantum of financial contribution made
S
Rs. 65
10 10
25
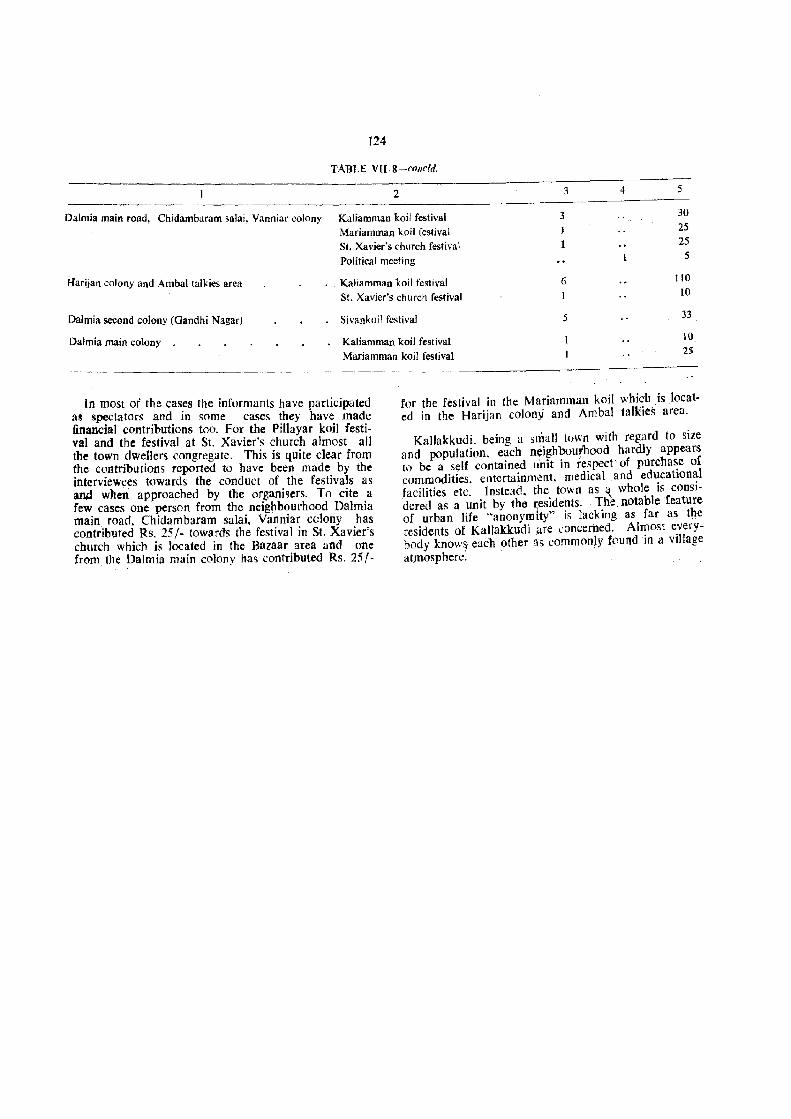
124
TABLE VII.8-(,ol/cld.
2 4 5
Dalmia main road, Chidambaram salai, Vanniar colony Kaliamman koil festival Mariamman koil festival St. Xavier's church festival
Political meeting
3 30 25 25
5
Harijan colony and Amba! talkies area Kaliamman koil festival 6 110
10 St. Xavier's church festival
Dalmia second colony (Gandhi Nagar)
Da!mia main colony
Sivankoil festival 5 33
Kaliamman koil festival
Mariamman koil festival
10
25
----------------------
In most of the cases the informants have participated as spectators and in some cases they have made financial contributions too. For the Pillayar koi) festival and the festival at Sr. Xavier's church almost all the town dwellers congregate. This is quite dear from the contributions reported to have been made by the interviewees towards the conduct of the festivals as and when approached by the organisers. To cite a few cases one person from the neighbourhood Dalmia main road, Chidarnbaram salai. Vanniar cdony has contributed Rs. 25/- towards the festival in st. Xavier's church which is located in the Bazaar area and one from the Dalmia main colony has contributed Rs. 25!-
for the festival in the Mariamman koil which is located in the Harijan colony and Ambal talkies area.
Kallakkudi. being a small t()wn with regard to size and population, each n~ighboulhood hardly appears to be a self contained unit in respect' of purchase of commodities, entertainm'::nt, medical .and educationa.l facilities etc. Instead, the town tis i;!,_ whole is considered as a unit by the residents. The. notable feature of urban life "anonymity" is lacking as far as the residents of Kallakkudi .are concerned. Almost everybody know~ each other 1s commonly found in a village atJUosp here.
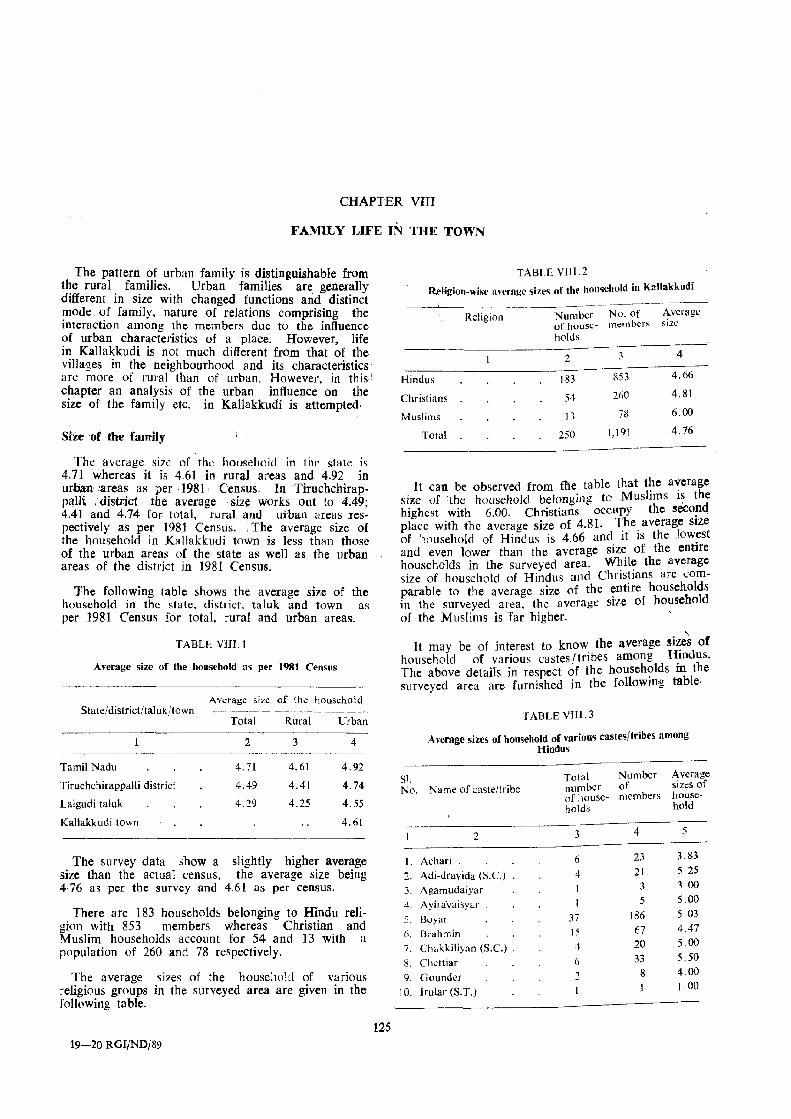
CHAPTER VIII
FAMILY LIFE IN THE TOWN
The pattern of urban family is distinguishable from t~e rural. faI?ilies. Urban families are generally dIfferent In SIze with changed functions and distinct !ll0de ~f family, nature of relations comprising the mteractlOn among the members due to the influence of urban characteristics of a place. However, life in Kallakkudi is not much different from that of the villages in the neighbourhood and its characteristics are more of rural than of urban. However, in this' chapter an analysis of the urban influence on the size of the family etc. in Kallakkudi is attempted.
Size of the family
The average si7c of the household in the state is 4.71 whereas it is 4.61 in rural areas and 4.92 in urban' 'areas as per 1981, Census. In Tiruchchirapp<llli .. district the average siz~ works out to 4.49; 4.41 and 4.74 for total, rural and urban areas respectively as per 1981 Census. The average size of the household in Kallakkudi town is less than those of the urban areas of the state as well as the urban areas of the district in 1981 Census.
The following table shows the average size of the household in the state. district, taluk and town as per 1981 Census for total, rural and urban areas.
TABLE VllI.l
Average size of the household as per 1981 Census
Average size of the household State/districtftaluK/town
Total Rural Urban
2 3 4
Tamil Nadu 4.71 4.61 4.92
Tiruchchirappalli district 4.49 4.41 4.74
Lalgudi taluk 4.29 4.25 4.55
Kallakkudi town 4.61
The survey data show a slightly higher average size than the actual census, the average size being 4·76 as per the survey and 4.6l as per census.
There are 183 households belonging to Hindu religion with 853 members whereas Christian and Muslim households account for 54 and 13 with a population of 260 and 78 respectively.
The average si7es of the household of various religious groups in the surveyed area are given in the following table.
19-20 RGJ/NDj89
l25
TABLE VlIJ 2
Religion-wise average sizes of the household in Kallakkudi .-.~--------
Number No. of Average uf house- members size Religion
holds
2 3 4
Hindus 183 853 4.66
Christians
Muslims
Total
54
J3
250
260 4.81
78 6.00
1,191 4.76
It can be observed from file table that the average size of 'the household belonging to Muslims i~ the highest with 6.00. Christians occupy the seco~d place with the average size of 4.81. T.he. average SIZe of household of Hindus is 4.66 and 1t 1S the lowest and even lower than the average size of the entire households in the surveyed area. Wt:il? the average size of household of Hindus and Chnstmns are comparable to the average size of the ~ntire households in the surveyed area. the average size of household of the Muslims is far higher.
" It may be of interest to know the average si~s of household of various castes /tribes among Hmdus. The above detaifs in respect of the househ?lds in the surveyed area are furnished in the followmg table·
Sl.
TABLE VIII. 3
Average sizes of household of various castes/tribes among Hindus
Total Number No. Name of caste/tribe number of
of house- members holds
Average sizes of household
2 3 4 5
I. Achari 6 23 3.83
2. Adi-dravida (S.c.)
3. Agamudaiyar
4. Ayinivaisyar
5. Boyar
6. Brahmin
4 21 5.25
3 3.00
5 5.00
37 186 5.03
15 67 4.47
7. Chakkiliyan (S.c.) .
8. Ch.:ttiar
4 20 5.00
6 33 5.50
9. Goundcl' :2 8 4.00
10. Irulal' (S.T.) 1.00
TABLE
2 3 4 5
11. Kaikolan 4 4.00
12. Kallar 5 28 5.60
13. KaJladi (S.C.) 1 6 6·00 14. Kamnlar.l (S.T.) 1 7 7.00 15. Mudaliar 3 18 6.00
16. Mooppanar 9 41 4.56 17. Mutharaiyar . 1 5 5.00
18. Muthuraja 8 40 5.00 19. Nadar 3 15 5.00
20. Naidu 4 19 4.75 21. Nair 5 23 4.60 22. Udayar 28 116 4.14
In the cases of the communities where the average size of households is high (6 or more) and low (less than 4) no reason for this phenomenon could be attributed in view of the smaner number of households involved in working out the average size. In all other cases, where the sample is large, the size is around 5 which compares with the average size of households of the entire sampled households.
126
V [II. 3-concld.
2 3 4 5
23. Oddar 5 5·00
24. Pagadai (S.C.) 4 4.00
25. Pandithar 3 12 4.00
26. Panicker 1 5 5.00
27. Paraiyiln (S.C.) 4 13 3.25
28. Pattanavar 6 6.00
29. Pillai II 50 4.55
30. Reddiar 3 10 3.33
31. Thomban 6 6.00
32. Valluvan (S.C.) 1 4 4.00
33. Vannan 1 5 5.00
34. Vanniar 9 44 4.89
Compositwn of households by the Dumber of members and by the age of heoo of the householdS
I
In the ta-ble to follow, composition of houschold8 by number of members by the age of head of household as returned in th~ sampI,e survey is presented.
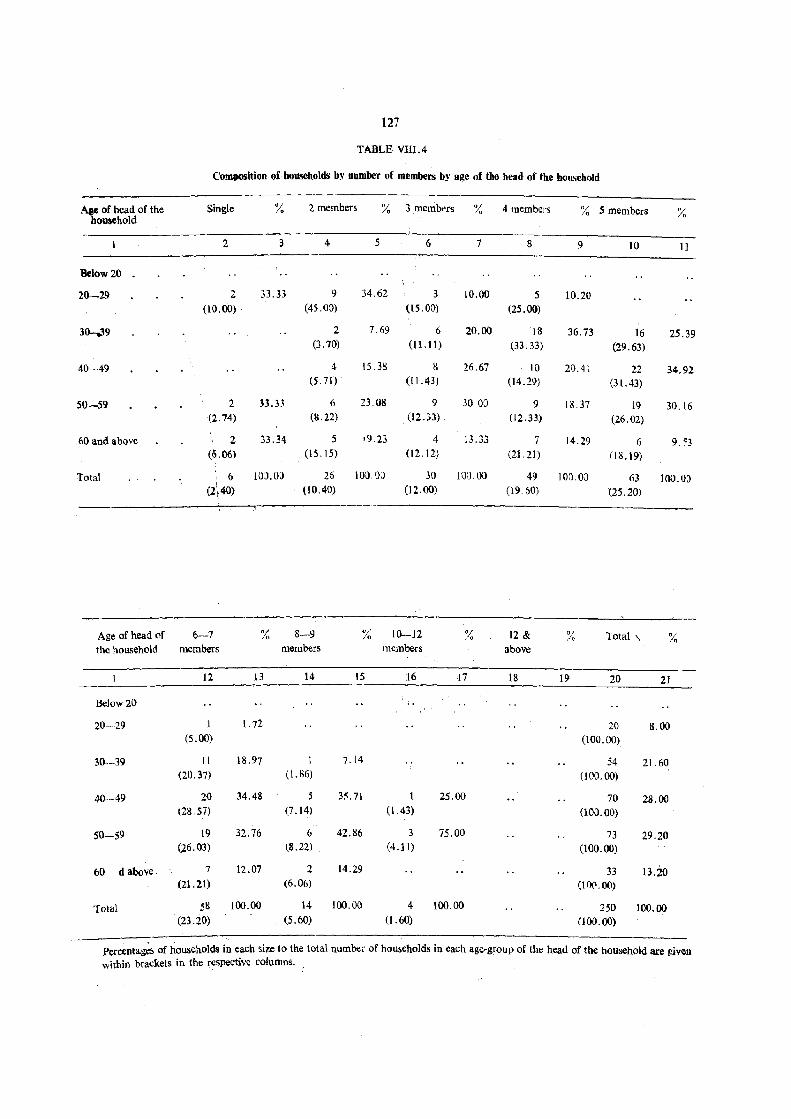
121
TABLE VIll.4
Composition of households by number of members by age of the head of the household
Aae of head or the household
Single % 2 members % 3 ,memb~rs % 4 members % 5 members %
2 3 4 5 6 7 8 9 10 11
Below 20
20-29 2 33.33 9 34,62 3 10.00 5 10.20 (10,00) (45.00) (l5,OO) (25.00)
30-,39 2 7,69 6 20.00 18 36.73 16 25.39 (3.70) (11.11) (33.33) (29.63)
40-49 4 15,3S 8 26.67 10 20.41 22 34.92 (5.71) , (11.43) (14.29) (31. 43)
50-59 2 33.3.' 6 23,08 9 30,00 9 18,37 19 30.16 (2.74) (8.22) (12.33) (12.33) (26.02)
60 and abovc 2 33.34 5 19,23 4 13.33 7 14.29 6 9. <3 (6.06) (15,15) (12,12) (21. 21) ( 18.19)
Total 6 tOJ.O\) 26 lOIl,Q[) 30 1(Ji) Oil 49 10~.OJ 63 100.0) (2~40) (10.40) (12.00) (19.60) (25.20)
Age of head of 6-7 % 8-9 % 10-12 % 12 & 01 Total '\ .. /0 In
the household members members members above
12 \3 14 IS 16 17 18 19 20 21
Below 20
20~· 29 1 1.72 2Q 8,00 (5.00) (100.00)
30--39 II 18.97 I 7.14 54 21.60 (20,37) (I. 86) (100.00)
40--49 20 34,48 5 35.71 1 25.00 70 28.00 (28.57) (7.14) (1.43) (l00.00)
SO-59 19 32.76 6 42.S6 3 75.00 73 29.20 (26.03) (8.22) (4.11) (100.00)
60 d above. 7 12.07 2 14.29 33 13.20 (21.21) (6.06) (1(){l.00)
Total 58 100.00 14 100.00 4 100.00 250 100.00 (23.20) (5.60) (1.60) (100.00)
Percentag~s of households in each size to the total number of hou~eholds in each age-group of the head of the household are given within brackets in the respective columns.
It can be observed from the table that there are six §ingle member households f()rming' 2.40 per cent of the total households. Five member households are the highest in number and they form a little more than one fourth of the total househ()lds. Households with 6-7 members occupy the second place. Their number is 58 and they constitute 23,2D per cent of the total households· Nearly 20.00 per cent of the total are four member households. Households with 3 members and 2 members account for 12.00 per cent and 10.40 per cent of the total households respectively. There are four households having 10 or more members.
The highest proportion of heads of households belongs to the age-group 50-5!7 with 29.20 per cent of the total households which is closely followed by households where the heads are in the age-group 40-49 and they form 28.00 per cent of the total number ()f households. More than one eighth of the heads of households comprising of 13'.10 per cent of the total are aged 6U +. The heads of the households in the age-groups 20-29 and 30-39 f()rm 8·00 per cent and 21.60 per cent respective!y at the rotal number or households. There is no head of the household whose age is helow 20 years.
Composition of housebolds by sex and age
Generally each househo1d will have both males and females of yarious age-groups. There may be unisexual households also. Considering those aged 15 anci above as adults and those aged upto 14 as minors there are 155 households out of the 250 surveyed h()useholds, consisting of both adult males and females and minors of both sexes. These households account for 62 per cent of the total households which is incidentally the highest proportion. Composition of adult males and females alone is found in 74 households which constitute 29.60 per cent of the total sample households. There are 6 households consisting of adult males only wliile there are four households having only adult females. The number of households havin!! adult males and minors is 6 and the number of ho~useholds with adult females and minors is 5· The table be10w sh()ws me composition of households by age and sex.
TABLE VIII.5
Composition of households by age and sex of members of households --~~ .~-~.-~------~---------
Number of households having
adult adult adult adult males male~ male~ females and and only onry females females and minor males andfor females
-------2 3 4
IS5 74 6 4
(62.00) (29 60) (2 AO) (I .60)
adult males and minor males and/or female~
5
6 (2.40)
adult females and minor males and/or feml'lle~
6
5 (2.00)
Total
7
250 (100.00)
----------~-----
The ligures within brackets denote percentages.
128
Nature of relation of members to head of households
The following table shows the distribution of househ{.llds by nature of reTation of members to heads of households
TABLE VllLG
Distribution of households by nature of relation of meBlbers to heads of households
Sl. No.
Nature of relation of members to head of hou~ehold
Number of households
2 • 3
l. Self 6
2. Self, spouse 16
3, Self, spouse, unmarried sons and/or daughters 147 r
·1. Self, spouse, married son and son's wife wilh or without unmarried son and/or daughter 17
S. Sdf (male), unmarried son/daugliter 5
6. Self (female), unmarried sc·n!daughtcr 12
7. Self, spouse with or without unmarried sonl daughter and widowed father 5
8. Self, spouse with or without unmarried >on! daughter and widowed mother 10
9. Self (m;:tic), unmarried brother/sister
to. Others
0) Stlf (female), widowed b[{lther
(ii) Self, spouse, unmarried sister, unmarried son/daughter and widowed mother
(iii) Self,spr·use, married daughter and daughter's hu~band
(iv) S~lf (female), married son and son's wife
(v) Self, ,po use, widowed daughter.
(vi) Self (female), daughter's soa
(vii) Self, spouse, unmarried son, wire's widowed fathel
(viii) Self. spouse wilh unmarried sen and wife's unmarried brother
(ix) Self (femqle) with unmarried son and widowed mother
(x) Sell, SDouse, unmarried son and brother's unmarried son
7
(xi) Self, spouse, married daughter at'd daughter's husband, daugnter-s daughter, daughter's son and unmarried daughter 4
(xii) Self (male) with widowed mother
(xiii) Self, spouse with unmarried daughter, father and mother and unmarried brother
(xiv) Self, l>p()use, unmarried son and married daughtci
(xv) Self, spo-use, unmauied son/daughter wilh wife's father and mother. • ~. •
(xvi) Self, spouse, unmarried son with father only (mother staying et~ewhere) . , .
2
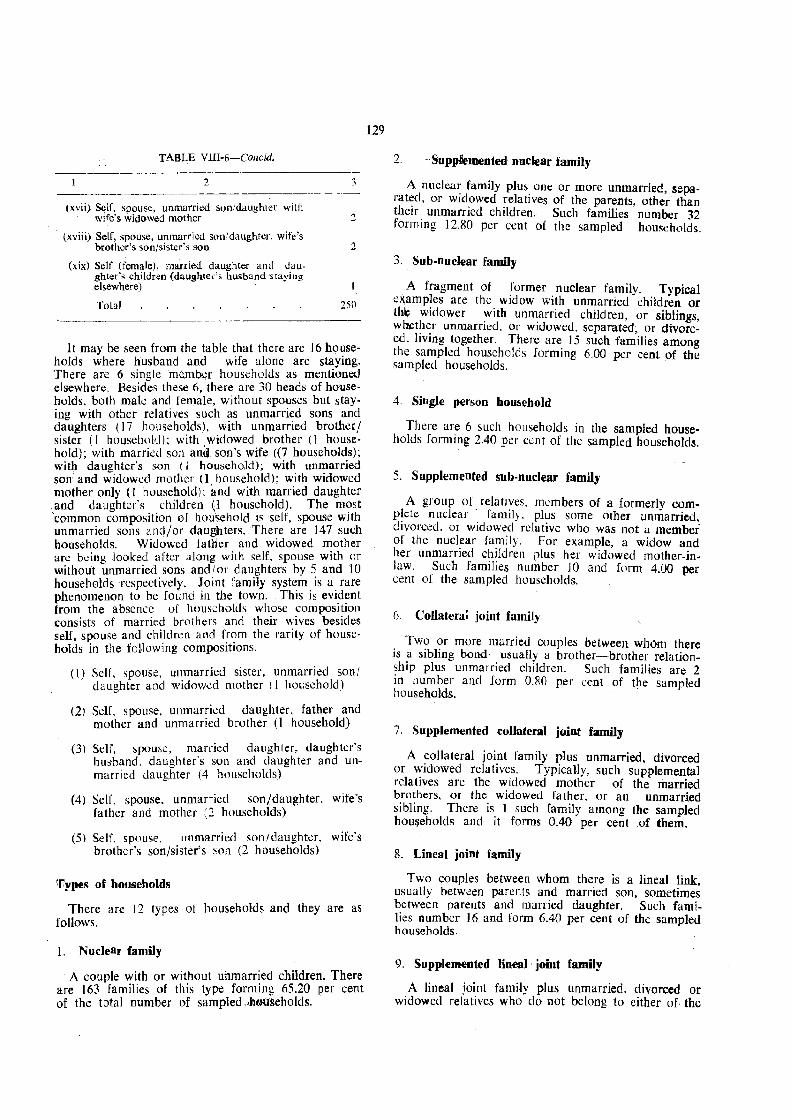
TABLE VUI-6-Co/lc:/d.
2
(xvii) Self, spouse, unmarried son/daughter with wife's widowed mother
(xviii) Self, spouse, unmarried son/daughter, wife's brother's son/sister's son
(xix) Self (female), married daughter and daughter's children (daughtef's husband staying elsewhere)
3
2
2
Total 250
It may be seen from the table that there are 16 households where husband and wife alone are stayil,lg. There are 6 single me.mber househulds as mentioned elsewhere. Besides these 6, there are 30 heads of households, both male and female, without spouses but stay· ing with other relatives such as unmarried sons and daughters (17 households), with unmarried brother/ sister (1 household); with widowed brother (1 house· hold); with marri..:d son and son's wife «7 households); with daughter's son (I household); with unmarried SOlT and widowed mother (1 household); with widowed mother only (I household); and with married daughter
. and daughter's children (1 household). The most 'common composition of household is self, spouse with unmarried sons and/or daug!hters. There are l47 such households. Widowed fatHer and widowed mother are being looked after along with self, spouse with or w.ithout unmarried sons and! or daughters by 5 and 10 households respectively. Joint family system is a rare phenomenon to be found in the town. This is evident from the absence of huusdlOIJs whost: composition consists of married brothers and their wives besides self, spouse and children and from the rarity of households in the following compositions.
(I) Self, spouse, unmarried sister, unmarried son/ daughter and widow,;;d mother (I household)
(2) Self. spouse, unmarried daughter, father and mother and unmarried brother (l household)
(31 Sdf, spouse, married daughter, daughter's hus·band, daughter's son and daughter and unmarried daughter (4 households)
(4) Self, spouse. unmarried son/daughter, wife's father and mother (2 households)
(5) Self, spouse, unmarried son/daughter, wife's brother's son/sister's son (2 households)
Types of hOllseholds
There are 11 types of households and they are as follows.
1. Nuclear family
A couple with or without unmarried children. There are 163 families of this type forming 65.20 per cent of the total number of sampled .J)touseholds,
129
2. 'Supplemented nuclear family
. A nuclea~ family plus. om: or more unmarried, sepa[at~d, or wld.owed relatIves of the parents, other than ~helf. unmamed children. Such families number 32 formIng 12.80 per ccnt of the sampled households.
3 .. Sub-nuclear family
A fragment of former nuclear family. Typical examples are the widow with unmarried children or th~ widower ~ith un~arried children, or siblings, w~t~~r unmarned, or wldowt:u, separated, or divorced, hVlllg together. There are 15 such families among the sampled households forming 6.00 per cent of the sampled households. .
4 Single person bOUbehold
There are 6 such households in the sampled households forming 2.40 per cent of the sampled households.
5. Supplemented sub·nuclear family
A group of. relati~es, members of a formerly comp~ete nuclear . famIly, plus some other unmarried. dIvorced. or WIdowed relative who was not a member of the nuel,ear fa!11ily. For example, a widow and her unmamed chIldren rlus her widowed mother-inlaw. Such families number 10 3nd form 4.00 per cent of the sampled households.
6. Collateral joint family
. Tw? ?r more married couples between whom. there IS ~ slblmg bond-usually il brother-brother relation~hlp plus unmarried children. Such families are 2 111 number and form 0.80 per cent of the sampled households. .
7. Supplemented collateral joint family
A collateral joint family plus unmarried divorced or widowed relatives. Typically, such supplemental relatives are the widowed mother of the married brothers, or the widowed father, or an unmarried sibling. There is I such family among the sampled hou~eholds and it forms 0.40 per cent of them.
8_ Lineal joint family
Two couples between whom there is a lineal link, usually between parents and married son, sometimes between parents and married daughter. Such families number 16 and form 6.40 per cent of the sampled households.
9. Supplemented lineal, joint family
A lineal joint famj.Jy plus unmarried, divorced or widowed relatives who do not belong to either of. the

lineally linked nuclear families; for example the father's widower brother or the son's wife's unmarried brother. There are 4 such families forming 1.60 per
cent of the sampled households.
10. Lineal coUateral joint family
Three or more couples linked lineally and colla
terally. Typically, parents and their two or more married sons, plus the unmarried children of the three or more couples. There is 1 such family among the
sampled households forming 0.40 per cent of the total
sampled households.
130
11. Supplemented lineal collateral joint family
A lineal collateral joint family plus unmarried, widowd, separated' relatives who belong to none of the nuclear families lineally and collaterally linked; for example, the father's widowed sister or brother, or an unmarried nephew of the father. There is no such family among the sampled households.
12. Olhers
Those not cover,ed above. There is no such family among the sampled households.
In the following table, the distribution of households in each type by educational level of the head of the household is presented.
TABLE VIIl.7
Distribution of households by type allil educational level of head of ll<.iusehold
Number of households where e;lucatiooal.lCvel of head oCp.ousehold is -~-----"--.---~---------.----------~~---~-------
SI. Type of hOU5i:hulu illiterate literate below without I)rimary
primary malric diploma and degree and Totul above Nc.
I!ducatio-ce~ti6\;atc not equal
nallevel
2 3
1. NllClear 22
2. Supplemented nuclear 7
3. Suh-nuclear . 5
4_ Single person 3
5. Supplemented sub-nudcar (>
6. Collateral j0int
7. Supplemented collateral joint
8. Lineal joint 3
9. Supplcl]J.:nted lineal joint
10. Lineal collatcralj )int
Total 47
Among the 163 nuclear families. heads of 22 households are illiterates. The literacy level of the maximum number of heads of the households is 'primary' (64 households) among the nuclear families. Nearly one fourth of the heads of households of supplemented nuclear fami,lies are not literates. Illiterates constitute one third of the heads of the sub-nuclear families. Of the 6 single person families, 3 persons arc
.. illiterates. Under supplemented suh-nuc1car families 6 Otlt 10 heads of hou5eholds are illitera tes and the
4
3
4
to degree
5 6 7 8 9 10
24 64 40 3 7 163
2 11 9 2 32
2 4 4 I:>
6
2 10
2
6 7 16
3 .. 4
38 92 57 3 9 2<;0
rest are ,literates. While the solitary household under the supplemented collateral joint family has an illiterate head, all the heads of households under collateral joint, supplemented lineal joint and lineal collateral joint families are literates.· .
The foliC/wing table indicates the distribution of various types of households by the type of occupation of hea,ds of households as returned in the sample survey in the town.
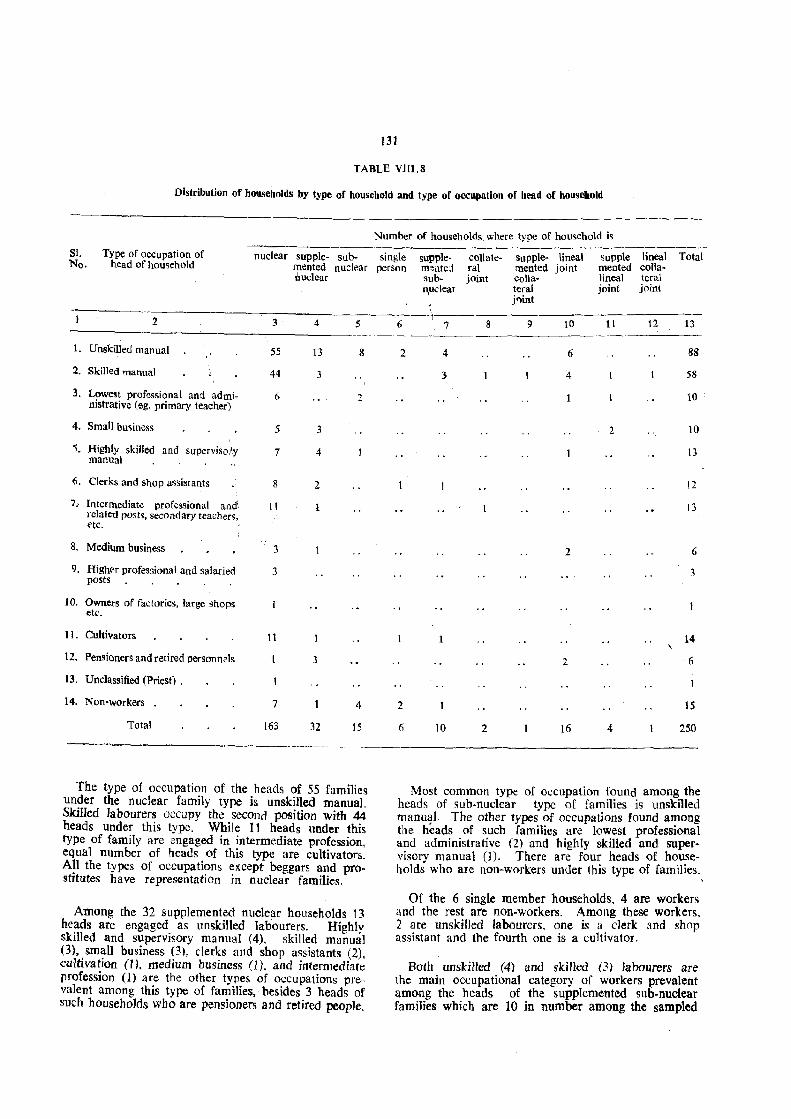
131
TABLE VIII.S
Distribution of households by type of household and type of occupation of head of household
SI. Type of occupation of nuclear sup ple- sub-No. head of household mentect nuclear
nuclear
2 3 4 5
I. Unskilled manual 55 13 S
2. Skilled manual 44 3
3. Lowest professional and admi- 6 2 nistrative (eg. primary teacher)
4. Small business 5 3
5. Highly skilled and supervisory 7 4 manual
6. Clerks and shop assistants 8 2
7: Intermediate profession31 and II related posts, secondary teaChers" etc. '
8. Medium business 3
9. High('r professional and salaried 3 posts
10. Owners of factories, large shops etc.
11. Cultivators 11
12. Pensioners and retired personnels 3
13. Unclassified (priest) .
14. Non-workers 7 4
Total 163 32 15
The type of occupation of the heads of 55 families under the nuclear family type is unskilled manual. SkiI1ed labourers occupy the second position with 44 heads under this type. While 11 heads under this type of family are engaged in intermediate profession, equal number of heads of this type are cultivators. All the types of occupations except beggars and prostitutes have representation in nuclear families.
Among the 32 supplemented nuclear households 13 heads are engaged as unskilled labourers. Highly skilled and supervisory mannal (4), skilled manual (3). small business (3), clerks and shop assistants (2), cultivation (1). medium business (1), and jntermediate profession (1) are the other types of occupations prevalent among this type of families. besides 3 heads of such households who are pensioners and retired people.
Number of households where type of household is
single supple- collate- supple- lineal supple lineal Total person m~n!eJ ral mentect joint mented colla-
sub- jOint colla- lineal teral ~udear teral joint joint
j..,int
6 7 8 9 10 11 12 13
2 4 6 88
3 4 58
10
2 10
13
12
13
2 6
3
14
2 6
2 15
6 10 2 16 4 250
Most common type of occupation found among the heads of sub-nuclear type o[ families is unskilled manual. The other types of occupations found among the heads of such families are lowest professional and administrative (2) and highly skilled and supervisory manual (1). There arc four heads of households who are non-workers under this type of families.
Of the 6 single member households, 4 are workers and the rest are non-workers. Among these workers, 2 are unskilled labourers, one is a clerk and shop assistant and the fourth one is a cultivator.
Both unskilled (4) and skiUed (3) labourers are the main occupational category of workers prevalent among the heads of the supplemented sub-nuclear families which are 10 in number among the sampled
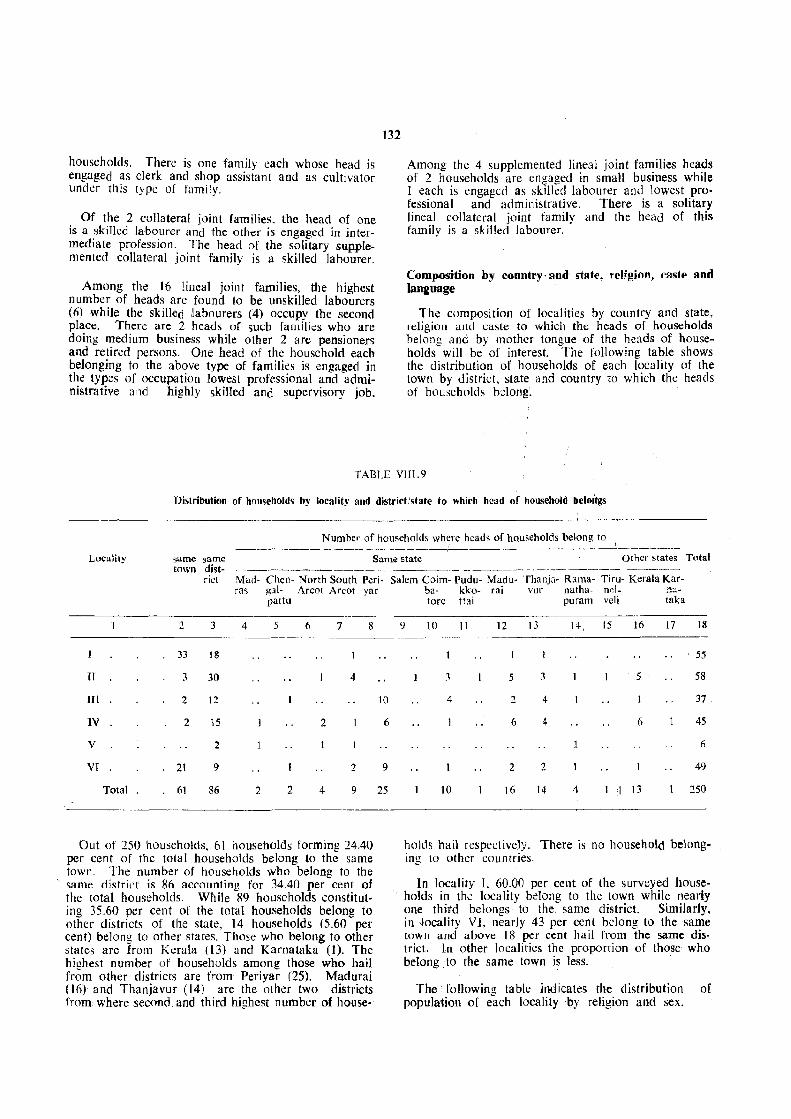
132
households. There is one family each whose head is engaged as clerk and shop assistant and as cultivator under this type of family.
Of the 2 collateral joint families. the head of one is a skilled labourer and the other is engaged in intermediate profession. The head of the solitary supplemented collateral .ioint family is a skilled labourer.
Among the 16 lineal joint families, the highest number of heads are found to be unskilled labourers (6) while the skilled labourers (4) occupy the second place. There are 2 heads of such families whu are doing medium business while other 2 are pensioners and retired persons. One head of the household each belonging to the above type of families is engaged in the types of occupation lowest professional and administrative and highly skilled and supervisory job.
Among the 4 supplemented lineal joint families heads of 2 households are engaged in small business while 1 each is engaged as skilled labourer and lowest professional and administrative. There is a solitary lineal collateral joint family and the head of this family is a skilled labourer.
Composition by conntry· and ~tlJte, religion, caste and language
The composition of localities by country and state, religion and caste to which the heads of households belong and by mother tongue of the heads of households will be of interest. The following table shows the distribution of households of each locality of the town by district, state and country to which the heads of households belong.
TABLE VIIl.9
Distribution of household~ b~' locality and district/state to which head of household beloitg,~
Number of households where heads of hO'useholds belong 10 \
~~~.---~-- ----~-----,!-..-~-.---~--------._~.-~-----
Locality same same Same state Other states Total town dist- -_- ----.---------------- - --------------- ------
riet Man- Chen- North South Peri-ras gal- Areot Areot yar
pattu
2 3 4 5 6 7 8
33 18
II 3 30 4
III 2 12
IV 2 15 2
V 2
VI 21 9 2
Total 61 86 2 2 4 9
Out of 250 households, 61 households forming 24.40 per cent of the total households belong to the same town. The number of households who belong to the same district is 86 accounting for 34.40 per cent of the total households. While 89 households constituting 35.60 per cent of the total households belong to other districts of the state, 14 households (5.60 per cent) belong to other states. Those who belong to other states are from Kerala (13) and Karnataka 0). The highest number of households among those who hail from other districts are from Periyar (25). Madurai (I6) and Thanjavur (14) are the other two districts from where second and third highest number of house-
10
6
9
25
Salem Coim- Pudu- Madu- Thanja- Rama- Tiru- Kerala Kar-ba- kko- rai vur natha- ne,l_ ;~:::._-
tore Itai puram veli, taka
9 10 II 12 13 14, 15 16 17 18
55
3 5 3 5 58
4 2 4 37
6 4 6 45
6
2 2 49
10 16 14 4 13 250
holds hail respectively. There is no household belonging to other countries.
In locality 1. 60.00 per cent of the surveyed households in the locality b.elong to the town while nearly one third belongs to the same district. Similarly, in .Jocality VI. nearly 43 per cent belong to the same town and above 18 per cent hail from the same dis· trict. In other localities the proportion of those who belong ,to the same town is less.
The following table indicates the distribution of popula1ion of each locality by religion and sex.
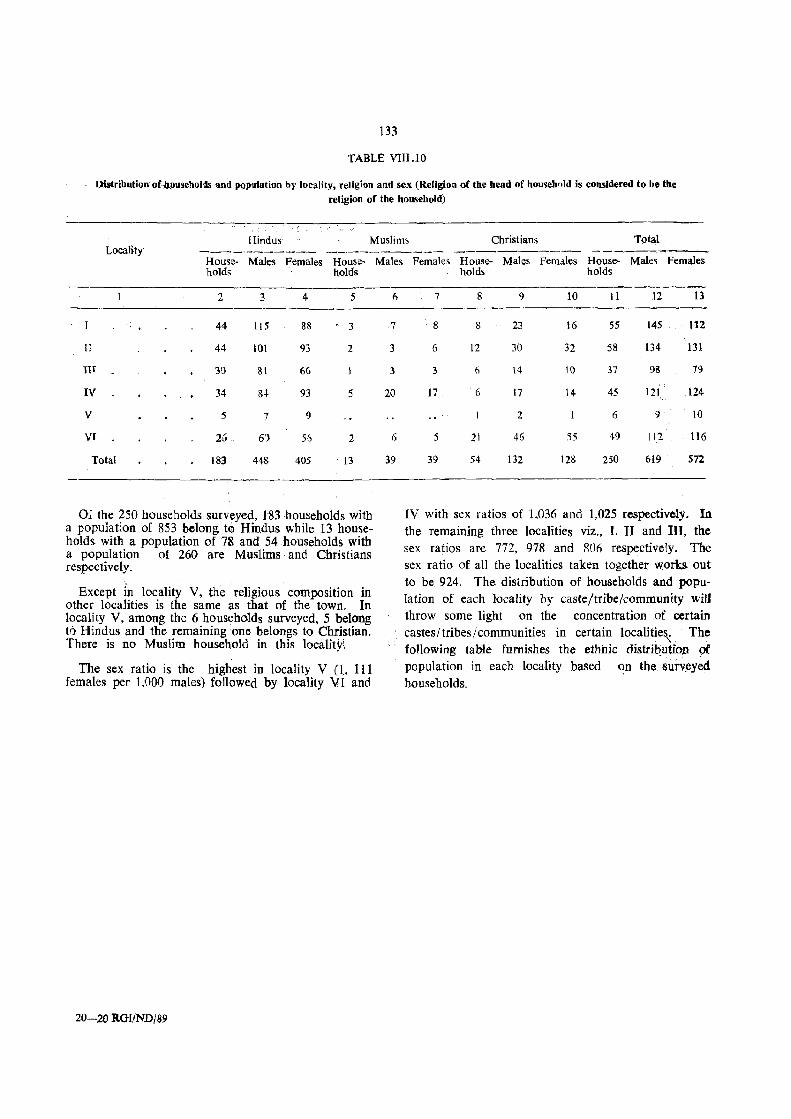
133
TABLE VULlO
l)Qtrlblltion,ofu))useltollls and PPJ)lIIation by locality, religion and sex (Religion of the head of housebl,ld is considered to be the
religion of the household)
Hindus Muslim; Christians Total Localj.ty ------------ ------~------ _--------
House- Males Females House-holds holds
2 3 4 S
44 115 88 3
II 44 101 93 2
TIT 3D 81 66
IV 34 84- 93 5
y 5 7 9
vr 26, 6') 5() 2
Total 183 448 405 13
Of the 250 households surveyed, 183 households with a population of 853 belong t<:J Hindus while 13 households with a population of 78 and 54 households with a population of 260 are Muslims and Christians respectively.
Except in locality V, the religious composition in other localities is the same as that of the town. In locality V, among the 6 households surveyed, 5 belong to Hindus and the remaining one belongs to Christian. There is no Muslim household in this localiW
The sex ratio is the highest in locality V (1, 111 females per 1.000 males) followed by locality VI and
20-20 RGI/ND/89
Males
6
·7
3
3
20
6
39
Females House- Males Females House- Ma1e~ Females holds holds
7 8 9 10 11 12 13
' 8 8 23 16 55 145 112
6 12 30 32 58 134 131
3 6 14 1() 37 98 79
17 6 17 14 45 121 124
.. 2 6 9 10
S 21 46 S5 49 1!2 116
39 54 132 128 250 619 572
IV with sex ratios of 1,036 and 1,025 respectively. In the remaining three localities viz., I, II and III, the sex ratios are 772, 978 and ROo respectively. The sex ratio of all the localities taken together works out to be 924. The distribution of households and population of each locality by caste/tribe/community will throw some light on the concentration of certain castes/tribes/communities in certain localities. The
" following table furnishes the ethnic distributiOn (}t
population in each locality based on the sui-v~yed households.
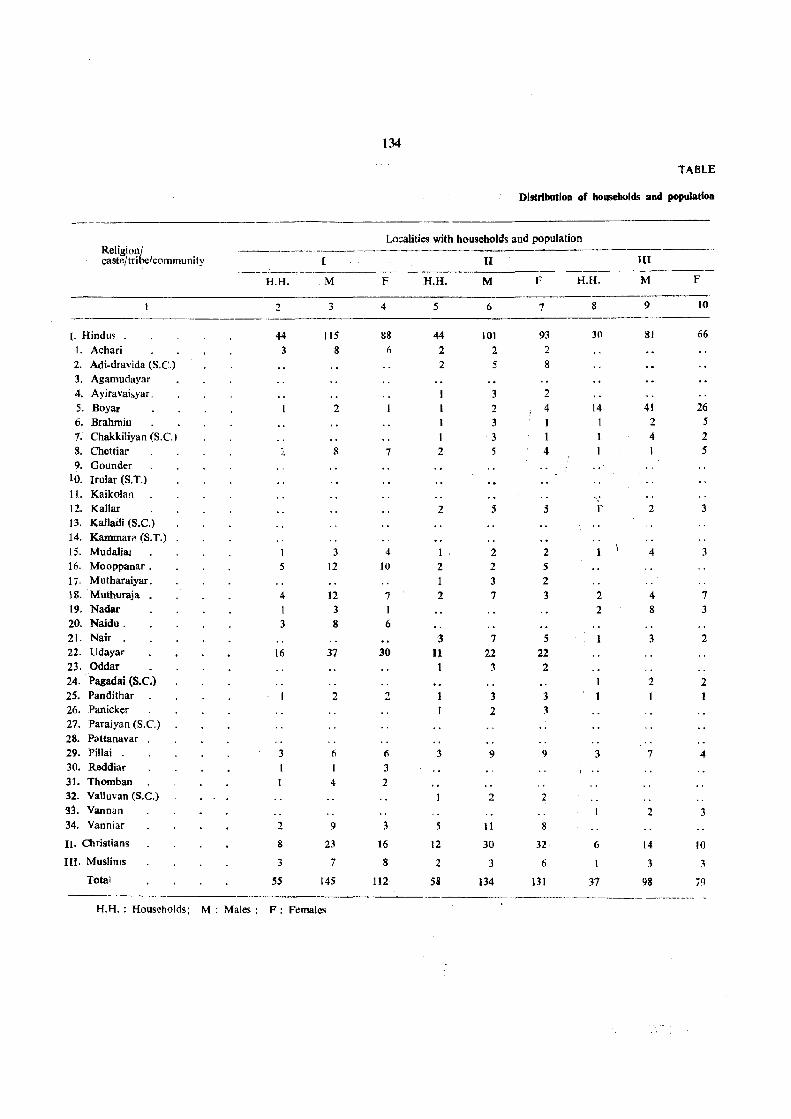
134
'TABLE
Distribution of hollJeholds an4 population
_----Lo:aJities with households and population
Religion/ ---------caste/tribe/community n III
-~--.-------.--- _--------------H.H. M F H.H. M F H.H. M F
2 3 4 5 6 7 8 9 10
I. Hindus 44 liS gS 44 lOt 93 30 81 66
1. Achari 3 8 (i 2 2 2
2. Adi-dravida (S.c.) 2 5 8
3. Agamudayar 4. Ayiravai"yar. 3 2 5. Boyar 2 2 4 14 41 26 6. Brahmin 3 2 5 1. Chakkiliyan (S.c.) t 3 4 2
8. Chettiar L. R 7 2 5 4 5 9. Gounder ..
10. rrular (S.T.)
11. Kaikolan 12. Kallar 2 5 5 r 2 3 13. Kalladi (S.C.) 14. Kamrnari' (S.T.) 15. Mudaliar 3 4 2 2 4 3 16. Mooppanar. 5 12 10 2 2 5
17· Mutharaiyar . 1 3 2 18. Muthuraja 4- 12 7 2 7 3 2 4- 7 19. Nadar I 3 1 2 8 3 20. Naidu. 3 8 6 21. Nair 3 7 S 3 2 22. lldayar 16 37 30 11 22 22 23. Oddar 3 2 24. Pagadai (S.C.) 2 2 25. Pandithar 2 1 3 3 26. Panicker 2 3 27. Paraiyan (S.c.)
28. P;.Ittanavar 29. Pillai 3 (; 6 3 9 9 3 7 4 30. Reddiar 1 3 31. Thomban 4 2 32. VaUuvan (S.c.) 2 2 33. Vannall 2 3 34. Vanniar 2 9 3 5 11 8
U. Christians 8 23 16 12 30 32 6 14 10
III. Muslims 3 7 8 2 3 6 3 ~
Total S5 14S 112 58 134 131 37 98 ill ---- -
H.H. : Households; M: Males: F: Females

135
VIII-II
by kJ(a)ity, religion, caste/trihe!cfllbmurnty and ~el;
Localities with 11ouseholds and population ----------_._._------_-----_._._- Reli1iolJ/
IV V VI Total caste tribeicom,l1Unir. -------.~-- ------- ----- -_ .. _---._._
H.H. M F H.H. M F H.H. M F H.H. M F
11 12 13 14 15 16 17 18 19 20 21 22
34 84 93 5 7 9 26 60 56 183 448 405 I. Hindus I 3 2 6 13 10 1. Achari 2 6 2 4 11 10 2. Adi-dravida (S.C.)
2 2 1 3. Agamudayar 1 3 2 4. Ayiravaisyar
9 21 30 12 28 31 37 94 92 5. Boyar 10 21 23 2 3 4 1 3 2 IS 32 35 6. Brahmin
2 7 4 9 11 7. Chakkiliyan (S.C.) 2 6 15 18 8. Chettiar
2 5 3 2 5 3 9. Gounder 10. Irular (S.T.)
3 1 3 J 1. Kaikolan
2 6 7 5 13 15 12. Kallar
\ " 5 I 5 13. Kalladi (S.C.) 2 5 1 2 5 14. Kammara (S.T.)
3 9 9 15. Mudaliar
2 7 5 9 21 20 16. Mooppanar I 3 2 17. Mutharaiyar 8 23 17 18. Muthuraja 3 11 4 19. Nadar
2 3 4 10 9 20. Naidu
3 3 13 10 21. Nair 4 28 63 53 22. Udayar
3 2 23. Oddar \ '1 2 2 24. Pagadai (S.c.) 3 6 6 25. Pandithar I 2 3 26. Panickr;r
4 6 7 4 6 7 27. Paraiyan (S.C.)
4 2 4 2 28. Pattanavar
2 4 2 11 26 24 29. Pillai
3 1 3 5 5 30. Reddiar 4 2 31. Thomban 2 2 32. ValJuvan (S.C.) 2 3 33. Vannan
2 7 6 9 27 17 34. Vanniar
6 17 14 2 21 46 5S, S4 132 128 JI. Christians
5 20 17 2 6 5 13 39 39 1Il. Muslims
45 121 124 6 Q 10 49 112 116 250 619 572 Total
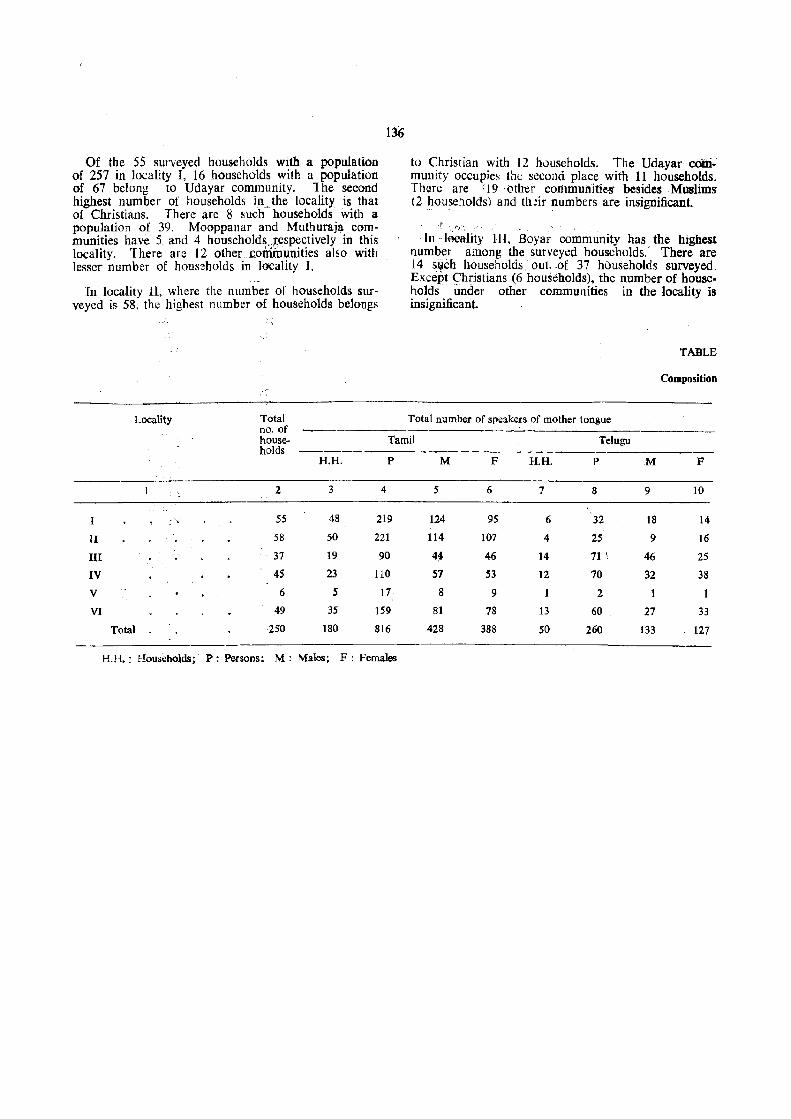
Of the 55 surveyed households with a population of 257 in locality I, 16 households with a population of 67 belong to Udayar community. 1 he second highest number of households in_the locality is that of Christians. There arc 8 such households with a population of 39. Mooppanar and Muthuraja communities have 5. and 4 households. respectively in this locality. 1 here are 12 other coiriiUunities also with lesser number of hous~holds in locality I.
In locality 11, where the number or households surveyed is 58, the highest number of households belongs
Locality Total no, of
136
to Christian with 12 households. The Udayar community occupies the second place with 11 households. There are '19 <Hher conlmunitie-s' besides Muslims (2 hous_eholds) and th::ir numbers are inSignificant.
.1' "I"j"<
In leeality lll. Boyar community has the highest number among the surveyed households. There are 14 ~~ch households. out ,of 37 hOuseholds surveyed, Except Christians (6 households). the number of households . under other communities in the locality is insignificant.
TABLE
Composition
Total number of speakers of mother tongue
house- Tamil Telugu holds
H.H. p M F H.H. P M F
2 3 4 5 6 7 8 9 10
:~' ... 55 48 219 124 95 6 32 18 14
II 58 50 221 114 107 4 25 9 16
III 37 19 90 4~ 46 14 71 \ 46 25
IV 45 23 110 57 S3 12 70 32 38
V 6 5 17 8 9 2 1
VI 49 35 159 81 78 13 60 27 33
Total 250 180 816 428 388 50 260 133 127
H.! I.: Households; P: Persons; M: M:ales; F: Females
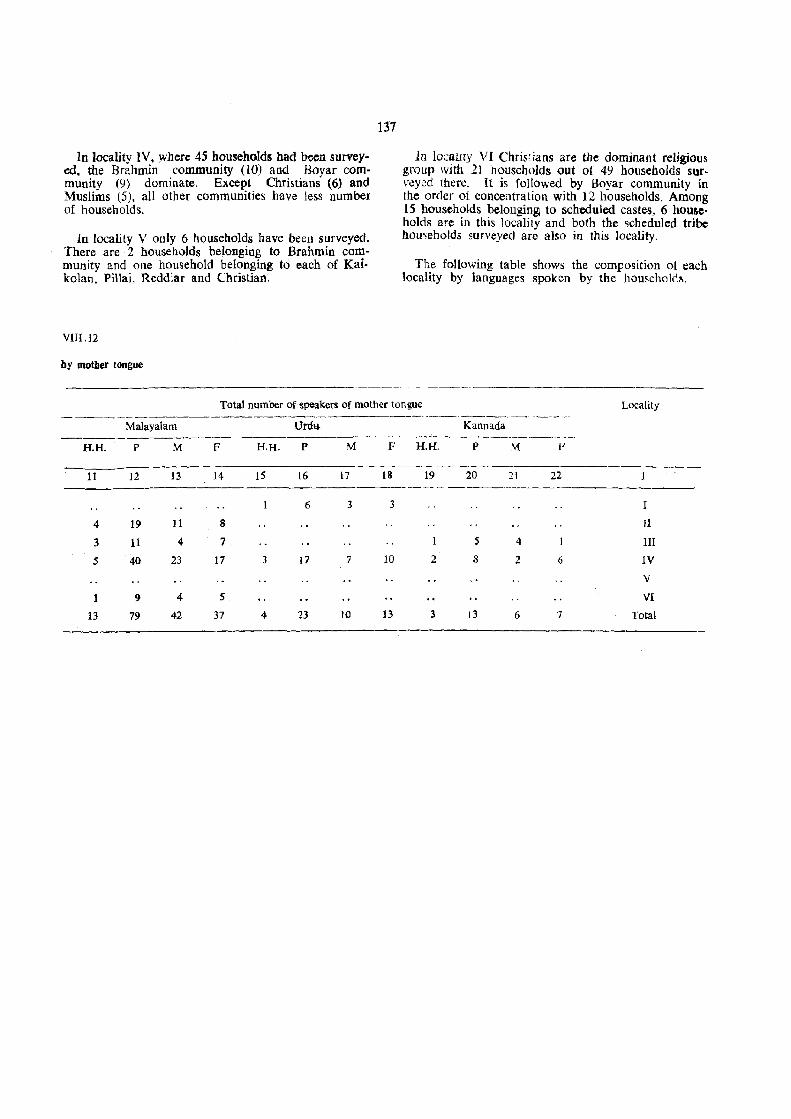
In locality IV. where 45 households had been surveyed, the Brahmin community (10) and Boyar community (9) dominate. Except Chri&lians (6) and Muslims l5), all other communities have less number of households.
In locality V only 6 households have been surveyed. There are 2 households belonging to Brahmin community and one household belonging to each of Kaikolan. Pillai. Redd;ar and Christian.
VIII .12
by mother tongue
137
In locaLity VI Chris:ians are the dominant religious group with 21 households out ot 49 households survey,~d there. It is followed by Boyar community in the order of concentration with 12 households. Among 15 households belonging to scheduled castes, 6 households are in this locality and both the scheduled tribe homeholds surveyed are also in this locality.
The following table shows the comrosition ot each locality by languages spoken by the households.
.. -----
Total number of speakers of mother tongue Locality ----~-------------------.-----.. --------~~ ~
Malayalam UrdG Kannada ------------- ---__ ._------- -----._- _-.
H.H. P M F H.H. P M F H.H. P M F
11 12 13 14 15 16 17 L8 L9 20 21 22 ----"_-
6 3 3 I
4 19 11 8 11
3 11 4 7 1 5 4 III
5 40 23 17 3 17 7 10 2 8 2 6 IV
V
1 9 4 5 VI
13 79 42 37 4 23 10 13 3 13 6 7 Total

Of Ell,; LjU llOct~dl~)lds surv<!yed, I amll is spoken by 180 households constituting 72.00 per cent of the total househo'ds. Te;ugil o.;;cur-i.;:; lllC second pia;;c with 50 housch')ld~ Iormmg 20.UU per cent of the total households. ;'I''Iaiayaiam con!t:s third with 13 households which ie; 5.20 per cent ot the total number of households surveyed. While Urdu is the mother tongue for 4 !:l)t,~I:!:;Glds l].6') per cent), Kannada is the s:Joke:l languJb'e ;n three l'1Ousellolds (1.20 1;<.:[
cent).' The p;~pOl;lOli ur 110'..ls~holds witb speakers of Tamil \:.tr;~s from 87.21 reI' ..:en' in locality 1 to 5!.l1 per cent in loc:llity 1\. i.<1:':il!JlleS II and V are the other two loca:ities w,;'..:rc more than 80 per cent of the househo:ds have i amll as theIr mothel' tongue. The highest proportwn of speakers of Telugu could be seen in locaiity IlL th~ prollortion being 37.84 per cent. Locality IV comt.;s second with 26.67 per cent of households with Telugu as mother tongue. The least proportion 01' speakers of Te1Ugll is in locality II. Households with Mabyalau1 as mother tongue are found in looliti('s If, Ill. TV and VI alone. Their concent':I,t>n i,; ~Il Inc· :'1)' IV with ILl 1 per cent. Locality VI has Lc least n'.lInbcr of households with Malayalam as th':ir mother tongue and their proportion is onlv 2.04 per ceni. Speakers of Urdu arc found ill. kl':alitic, I :1ll(\ IV :lllc1 speakers 01' Kannada are settled in localitie~ III and IV. The speakers of Drdll and Kannada are more in locality IV.
Members Rtavill!l! o,.birle. reaSOD, mltufC of Hnk with the bouseliolds
Some of the memb'2rs of the families arc compelled to stay away from their L'snal place of residence for various purposes. In Kallakkudi town. among the surveyed households, 175 members belonging to 104 families are staying outside.
The following table shows the number of households whose members are staying outside classified by religjon, caste/tribe/community hy sitate (p1ace of origin of the head of household),
TABLE YIlT. \3
Households whose close family members are staying
outside by religion and caste/tribe/community and state (place of origin of head of hOusehOl{\)
Religion and castel Total tribe/community of no, of head of household house-
holds
2
I. Hindus 81
Achari 2
Adi-dravida (S.C.) 2
Number of households whose family members are staying outside and place of origin (Of head of such households.
Tamil Nadll Kerala Karnataka
3 4 5
2
2
138
TABLE V[[I.13 --«('oneid.)
AgamudaiYar
Boyar.
Brahmin
Chakkiliyan (S.C.)
Chettiar
Gounder
In.tlar (S.T.}
Kaikolan
KaUar
Kalladi (S.c.)"
Kammara (S.T.)
Mooppanar.
Mudaliar
Muthura)a
Naidu.
Nair.
Odder.
Pandithar
l'araiyan ~S.C.)
Pillai .
Reddiar
Udayar
Val1uvan (S.C.)
Vanniar
H. Christians
III. Muslims
Total
18
10
3
3
2
2
2
6
2
8
4
11
6
t04
2 3
18
9
3
3
5
2
2
2
I,
I
6
2
8
4
16
4
9S
4
I ••
2
5
5
Of the 104 households whose members are staying outside, heads of 81 households are Hindus, 17 Christians and 6 Muslims. Among Hindus. Boyar community has the maximum number of households (18) whose members are staying outside. The next higher number of such households are of Brahmins (10).
Among the 104 households, heads of 98 households beltmg to Tamil Nadu and the rest belong to Kerala (5) and Karnataka (1).
The following tables show the details of family members who are staying outside classified by age and educational level.
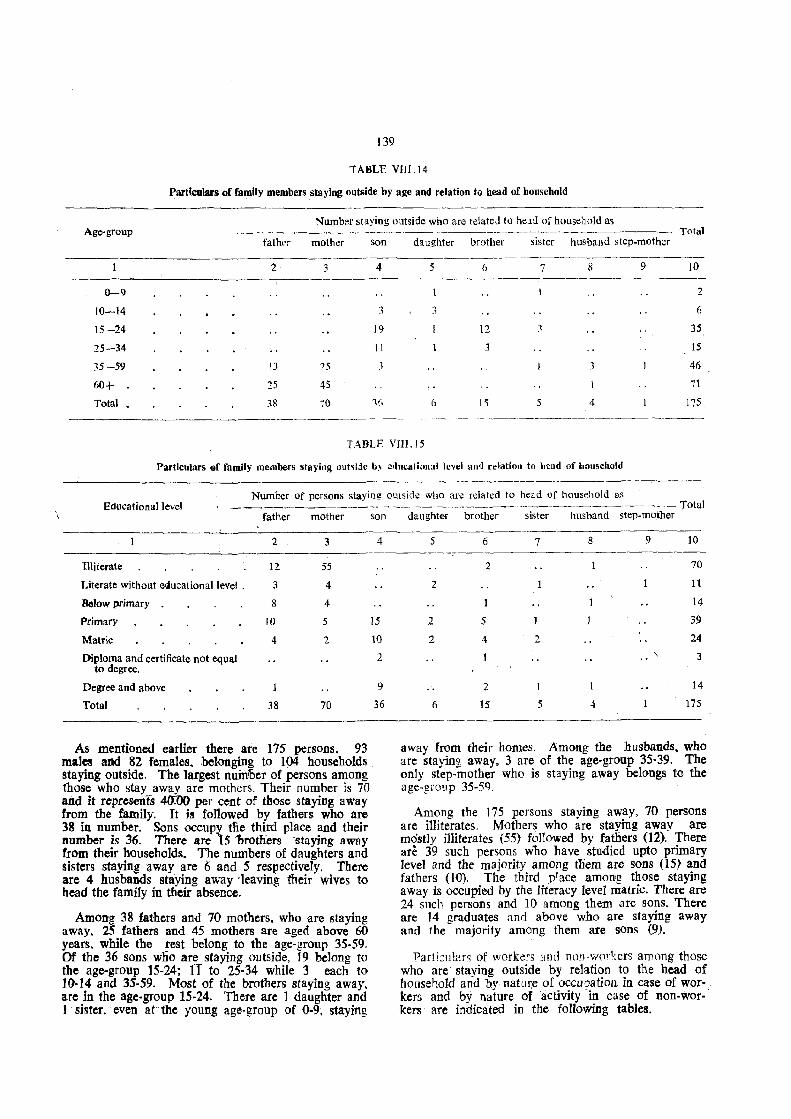
139
TABLE VIII .14
Particulars of family members staying outside by age and relation to head of household
Number staying olltside who are related to held of household as Age-group ---_. _._---- Total
fathrr mother son daughter brother sister hUSband step-mother
2 3 4 5 6 7 8 9 10 -----_-_._---------- -.-----
0-9 2
10-14 3 3 6
15-24 19 12 1 35
15-34 11 3 15
35-59 13 25 3 I 46
(,0+ 25 45 7\
Total 38 iO y; 6 15 5 4 175
----
TABLE VIlT.15
Particulars of family members staying o\lt~ijc by edllcalional level ami relation to head of household
"-------------------------Number of persons staying oUlside who are related to head of household as
____________ - __________________ --------- -------- - Total Educational level father mother son daughter brother sister husband step-mother
Illiterate
Literate without elilucational level .
Below primary
2
12
3
8
3 4
Primary
Matric
Diploma and certificate not equal to degree.
10
4
55
4
4
5
2
15
10
2
Degree and above
Total 38 70
As mentioned earlier there are 175 persons, 93 males and 82 females. belonging to 104 households" staying outside. The largest number of persons among those who stay away are mothers. Their number is 70 and it represents 4{T.OO per cent of those staying away from the ~amily. It is followed by fathers who are 38 in number. Sons occupy tne third place and their number is 36. There are 15 'brothers staying away from their households. The numbers of daughters and sisters staying away are (j and 5 respectively. There are 4 husbands staying away ·leaving their wives to head the family in their absence.
Among 38 fathers and 70 mothers, who are staying away, 25 fathers and 45 mothers are aged above 60 years, while the rest belong to the age-group 35-59. Of the 36 sons wlio are staying outside, 19 belong to the age-group 15-24; IT to 25-34 while 3 each to 1()·I4 and 35·59. Most of the brothers staying away, are in the age-group 15·24. There are 1 daughter and I sister, even at the young age-group of 0-9, staying
9
36
5
2
2
2
6
6
2
1
5
4
2
15
7
2
5
8
1
1
9 10
70
11
14
39
24
3
14
175
away from their homes. Among the husbands. who are staying away. 3 are of the age-gr()up 35-39. The only step-mother who is staying away belongs to the age-gro",p 35-59.
Among the 175 persons staying away, 70 persons are il1iterates. Motbers who are staying away are mostly illiterates (55) followed by fathers (12). There are 39 such persons WllO have studied upto primary level and the majority among tIiem are sons (I5} and fathers (10). The third place among those staying away is occupied by the literacy level matrie. There are 24 such persons and 10 among them ,are sons. There are 14 graduates and above who are staying away and the majority among them are sons (9)_
Parti2l!lars of workers '.Inc! non-w0"'-::ers among those who are' staying outside by relation to the head of household and by natu~e of occuoation in case of war-. kers and by nature of ·activity in case of non-workers are indicated in the follOwing tables.
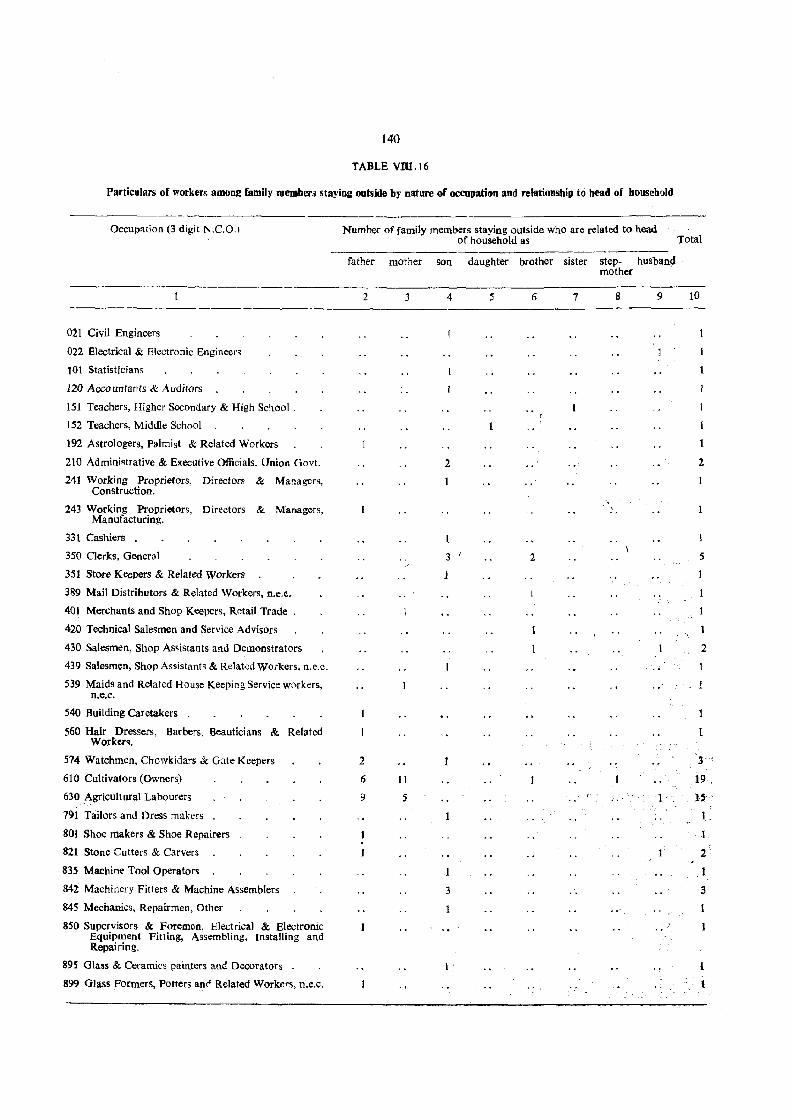
l40
TABLE Vro.16
Particulars of workers among family members staying outside by nature of occupation and relationship to head of household
Occup'Ition (3 digit N.C.O.)
021 Civil Engineers
022 Electrical & Electronic Engineers
101 Statisticians
120 Accountants & Auditors
151 Teachers, Higher Secondary & High School.
152 Teachers, Middle School
192 Astrologers, Palmist & Related Workers
210 Admini~trative & Executive Officials, Union Gov!.
241 Working Proprietors, Directors & Managers, Construction.
243 Working Proprietors, Directors & Managers, Manufacturing.
331 Cashiers
350 Clerks, General
351 Store Keepers & Related Workers
389 Mail Distributors & Related Workers, n.e.e.
401 Merchants and Shop Keepers, Rr:tail Trade .
420 Technical Salesmen and Service Advisors
430 Salesmen, Shop As~istants and Demonstrators
439 Salesmen, Shop Assistants & Relakd Workers, n.c.C.
539 Maids and Related House Keeping Service w()rkers, n.e.c.
540 Building Caretakers
560 Hair Dressers, Barbers, Beauticians & Related Worker~.
514 Watchmen, Chowkida~s & Gate Keepers
610 Cultivators (Owners)
630 Agricult ural Labourers
791 Tailors and Dress makers
801 Shoe makers & Shoe Repairers
821 Stone Cutters & Carvers
835 Machine Tool Operators
842 Machinery Fitters & Machine Assemblers
845 Mechanics, Repairmen, Other
850 Supervisors & Foremen, Electrical & Electronic Equipment Fitting, Assembling, Installing and Repairing.
895 Glass & Ceramics painters and Decorators
899 Glass Formers, Potters and Related Work~rs, n.e.c.
Number of family members staying outside who are related to head of household as
father mother son daughter brother sister step- husban~ mother
2 3 4 5 6 7 8 9
2
6
9
11
5
2
1
3
1
3
2
1 ,-
Total
10
1
1
2
5
2
3' ,
19 .
l~-'
1. _
1
2
3
I
1
1
1
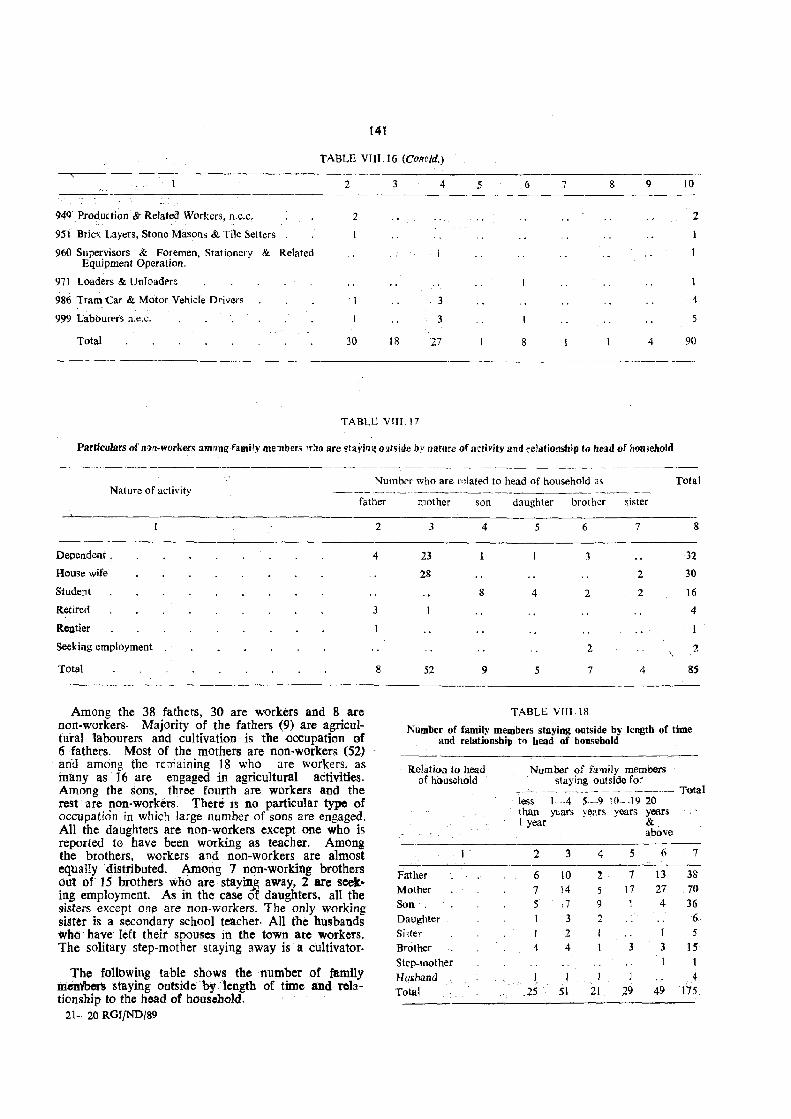
[41
TABLE VIII. 16 (Corre/d.) --_.
2 3 4 5 6 7 S 9
94Q- Production & Related Workers, n.c.c. 2
951 Brie" Layers, Stone Masons & Tile Setters
960 Supervusors & Foremen, Stationery & Related Equipment Operation.
971 Loaders & Unloadf"fs
986 Tram Car & Motor Vehicle Drivers 3
999 Labourt'rs n.e.c.
Total 30 18 27 8 4
----
TABLE VIII. I?
Particulars of R')II-workers am~T1g family mellbers wllo are stayiol~ 01tside by nature of a~liyity and reiaitio'lship to head of lIou.ehoJd
Natw'e of activity
Dependent.
House wife
Student
Retiree{
Rentier
Seeking employment
Total
Numb .. r who are rdated to head of household a~ --~- ._----------------------- -.~-- -~
father mother son daughter brother sister
2 3 4 5 6 7
4 23 3
28 2
8 4 2 2
3
2 \
8 52 9 5 7 4
TABLE Vm.18
10
2
4
5
90
Total
8
32
30
16
4
7-
85
Among the 38 fathers, 30 are workers and 8 are non-workers- Majority of the fathers (9) are agricultural labourers and cultivation, is tbe {)ccupation of 6 fathers. Most of the mothers are non-workers (52) -and among the re:naining 18 who are workers, as many as '16 are engaged in agricultural activities. Among tbe sons, three fourth are workers and the rest are non-workers. There is no particular type of occupation in which large number of sons are engaged. All the daughters are non-workers except one who is reported to have been working as teacher. Among the brothers, workers and non-workers are almost equally distributed. Among 1 non-working brothers out of 15 brothers who are stayin] away, 2 are seeking employment. As in the case of daughters, all the sisters except one are non-workers. The only working sister is a secondary school teacher. All the husbands who have left their spouses in the town are workeTs. The solitary step-mother staying away is a cultivator.
Number of family members staying outside by length of time and relationship t.... bead of household
The following table shows the number of family l:n~~ staying outside by lengtb of time and relationship to the head of household.
21- 20 RGIJND/89
Relatioa to head of h()usehold
Father Mother
Son. Daughter Sister
Brother
Step-Inother Husband Total
I'
Number of family members staying outside for
.-----,---,,-.-_ -" ------.. - T-otal less 1 -4 5--·9 10- -19 20 than y\>ars ye~rs years years I year &
above
2 3 4 5 6 7
6 10 2 7 13 38 7 14 5 17 27 70
5 ,7 9 J 4 36 3 2 6
I 2 5
4 4 3 3 IS 1
1 1 1 4 .25 51 21. 29 49 1'75
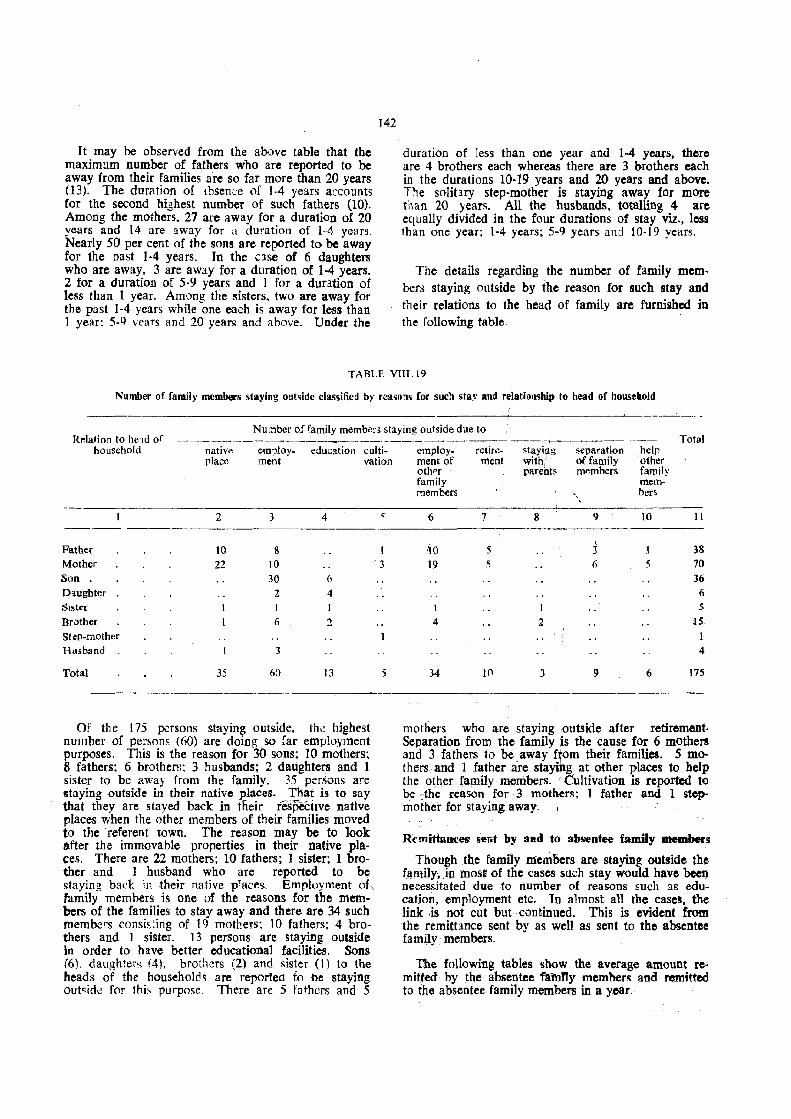
It may be observed from the above table that the maximum number of fathers who are reported to be away from their families are so far more than 20 years (13). The duration of lbsence of 1-4 years a;:counts tor the second highest number of such fathers (10). Among the mothers. 27 are away for a duration of 20 years and 14 are away for a duration of 1-·4 years. Nearly 50 per cent of the sons are reported to be away for the past 1-4 years. In the C3se of 6 daughters who are away, 3 are away for a duration of 1-4 years. 2 for a duration of 5·9 years and 1 for a duration of less than I year. Among the sisters, two are away for the past 1-4 years while one each is away for less than 1 year: 5·Q vears and 20 years and above. Under the
]42
duration of less than one year and 1-4 years, there are 4 brothers each whereas there are 3 brothers each in the durations 10-19 years and 20 years and above. The solitary step-mother is staying away for more than 20 years. All the husbands, totalling 4 are equally divided in the four durations of stay viz., less than one year; 1-4 years; 5-9 years and 10·19 years.
The details regarding the number of family memo bers staying outside by the reason for such stay and their relations to the head of family are furni!ihed in the rollowing table.
TABLE VlTI.19
Number of family members staying outside classifie:l by reaso'lS for such stay and relatiol1ship to head of household
Number of family membe;'$ staying outside due to Rdation to he ld of .--~--~-----------------'.----------+--- Total
household nativ," em?loy_ education culti-place ment vation
2 3 4 -_._-
Father 10 8 Mother 22 10 Son 30 6 Daughter 2 4 Slst .. 'C 1 BNther 6 2 St ep-mothflr Hllsband 3
Total 35 60 13
Of the l75 persons staying outside. the highest number of persons (60) are doing so rar employment purposes. This is the reason for 30 sons; 10 mothers; 8 fathers; 6 brothers: 3 husbands; 2 daughters and I sister to be away from the family. 35 persons are staying outside in their native places. That is to say that they are stayed back in tnei! resj)eChve native places when the other members of their families moved to the referent town. The reason may be to look after the immovable properties in their native places. There are 22 mothers; 10 fathers; 1 sister; 1 brother and 1 husband who are reported to be staying back in their native p!aces. Employment of" family members is one of the reasons for the members of the families to stay away and there are 34 such members (,ollsi~ting of I () mothers; 10 fathers; 4 brothers and 1 sister. 13 persons are staying outside in order to have better educational facilities. Sons (6), daughteis (4). brothers (2) and sister (1) to the heads of the households are reported. fo be staying out~id,~ for this purpose. There are 5 fatht,',rs and 5
I '3
5
cmploy- retir ..... staying separation help ment of ment with. of family other othpr parents members family family mem-members "- bers
6 7 8 9 10 11
10 \
38 5 3 19 S 6 5 7()
36 6
1 1 S
4 2 J5
I 4
34 In 3 9 6 175
mothers who are staying ;outside after retirement. Separation from the family is the cause for 6 mothers and 3 fathers to be away f~om their families. 5 mothers. and 1 father are staying at other places to belp the other family IlHlmbers. ,. Cultivation is reported to be :tbe reason for 3 mothers: I father and 1 stepmother for staying away.
Remittances selit by and to absentee family members
Though the faplily mem'()ers are staying outside the f~mily,.in mosli of tbe cases such stay would have heel) necessitated due to number of reasons such as education, employment etc. In almost all the cases, the link: ,is not cut but continued. This is evident from the remittance sent by as well as sent to the absentee family members.
The following tables show the average amount reo mittm by the absentee fa1finy members and remitted to the absentee family members in a year.
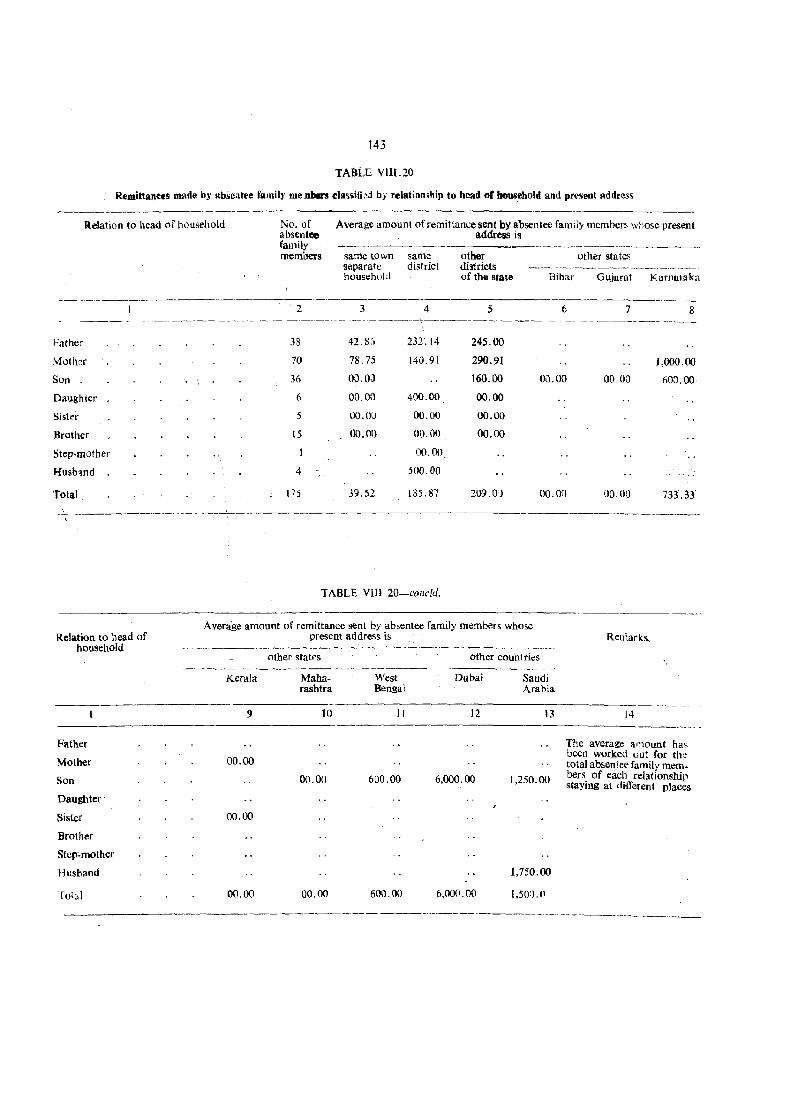
143
TABLE YIU.20
Remittances made by abseatt'e fil1llily me.nbers classithd by relati()n~hip to head or household and pre~ent address
Relation to head of household
.. ----------.. -------- ---_-
Father
Motl\'.:r
Son.
Daughter
Sister
Brother
Step-mother
Husb:utd
Total
No. of absentee family members
2
38
70
36
6
5
15
4
175
Average amount of remittance sent by absentee family members whose present . address is
same town same separate district household
3
42.8()
78.75
00. Oil
00.00
00.00
00.00
39.52
4
232".14
140.91
400.00
00.00
00.00.
00.00
500.00
185.87
other di~tricts ofth" state
5
245.00
290.91
160.00
00.00
00.00
00.00
209.0)
other states
Bihar Gujarat Karnataka
----------_.,--6 7
Oll.OO 00,00
00.00 Oil.Dll
8
1,000.00
600.00
733.33
._---- ------------- --------------_--
TABLE Ylll 20-collcld.
-.----Average amount of remittance sent by absentee family membt\fs whose
Relation to head of present address is Ren1arks, household
other stat"s other countries ------------------
Kera/a Maha- West Dubai Saudi rashtra Bengal Arabia
9 10 11 12 13 14
Father The average amount ha~
Mother 00.00 been worked out for th~ total absentee' family mem-
Son 00.00 600.00 6,000.00 1,250.00 bers of each relationship staying at rlifferent places
Daughter
Sister 00.00
Brother
Stcp"mother
Husband 1,750.00
Tol~1 00.00 00.00 600.00 6,000.00 1,50:).0
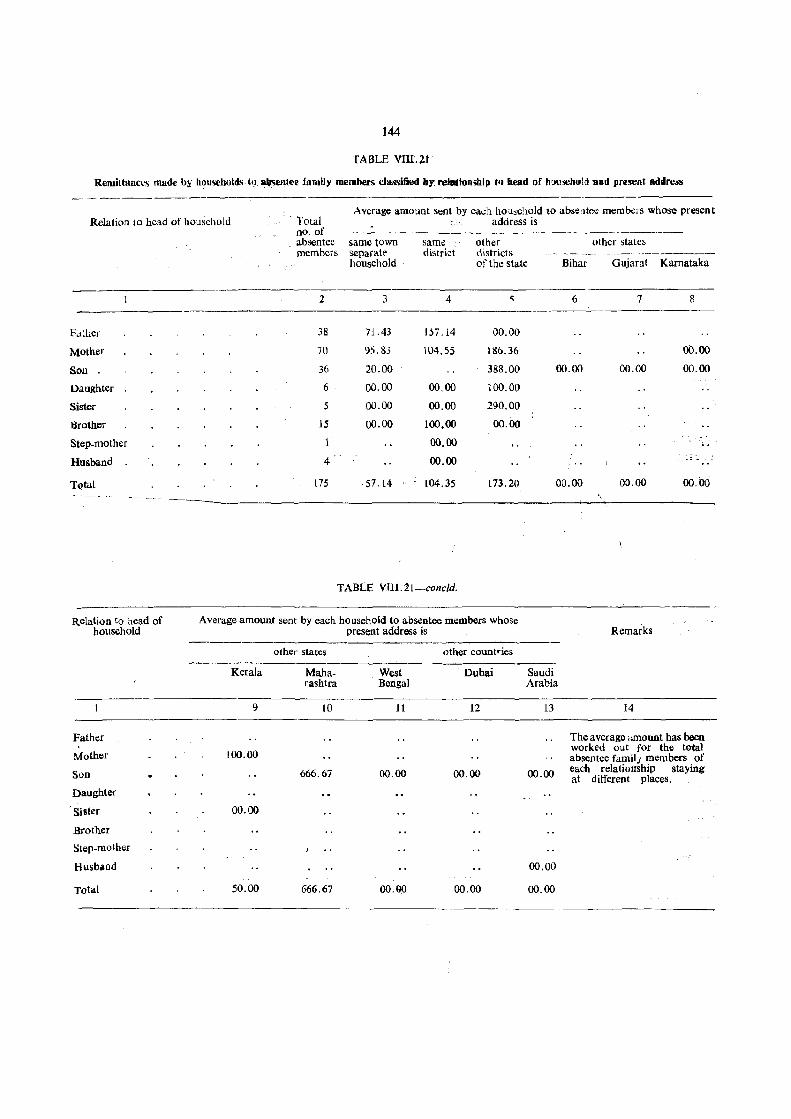
144
TABLE VIlI.2t
RemittanCL'S made by households tv al!sel.tee family members classified by: rehldon>hip to head of h[lll>ehoid and pre!Ient address
Relation to head of household - Total Average amount Sent by ca.;ll hOllsehold to abse,lt.~e membc;'s whose present
address is no. of ---~---------'--- -----~-------".--------
. absentee same town same other other states members separatt' district districts .. -.------ -----------------
hOllsehold of the state Bihar Gujarat Karnataka
2 3 4 ~ 6 7 8 ___________________________________________ c_
F.ither
Mother
Son.
Daughter
Sister
~rother
Step-mother
Husband
Total
Relation to head of household
Father
Mother
Son
Daughter
Sister
Brother
Step-mother
Husb.l1d
Total
38 71.43 157.14 00.00
70 95.83 104.55 186.36
36 20.00 388.00
6 00.00 00.00 100.00
5 00.00 00.00 290.00
15 00.00 100.00 00.00
1 00.00
4 00.00
175 57.14 104.35 173.20
TABLE VUI.21-concld.
Average amount sent by each household to absentee members whose present address is
other states other countries
Kerala Maha- West Dubai rashtra Bengal
9 10 11 12
100.00
666.67 00.00 00.00
00.00
50.00 666.67 00.00 00.00
00.00
00.00 00.00 00.00
..
00.00 00.00 00.00
"
Remarks
Saudi Arabia
13 14
The average amount has been worked out for the total absentee family members of
00.00 each relationship staying at different places.
00.00
00.00
It may be seen that among the fathers who are staying outside, those resiorog at other districts of the state have remitted the highest average amount to the family (Rs. 245). Even Those who are staying in the same town but separately sent some amount to the family. Among the mothers, a solitary mother staying in Kamataka has sent the highest average amount of Rs. l,COO. The highest amount of Rs. 6,000 has been remitted by a son who is in Dubai -to his family while Rs· 1,250 h1ls been sent by a son from Sall.di Arabia. Among the daughters, tre remittance has been made by only one daughter and the average remittance is Rs. 400. While brothers, sisters and step-mothers are not remitting any amount,
_ an average amount of Rs. 500 has been rem:ttcd by
145
the husband who is staying in the same district and an average of Rs. 1,750 has been remitted by the husbanJs staying in Saudi Arabia.
The fathers who stay outside the family but within the district receive an average of Rs. 157.14. Among t4e- motbers the highest average remittance (Rs. 186.36) lS"rci;eived by tltose in other districts of the state. Two sons staying in Maharashtra are receiving an average of Rs. 666.67. While one daughter and one sister staying in other districts of the state are receiving the
. remittances from the fami1y, one brother ~tayit1g in 'the same district is receiving the remittances. No amount is being remitted to other relatives
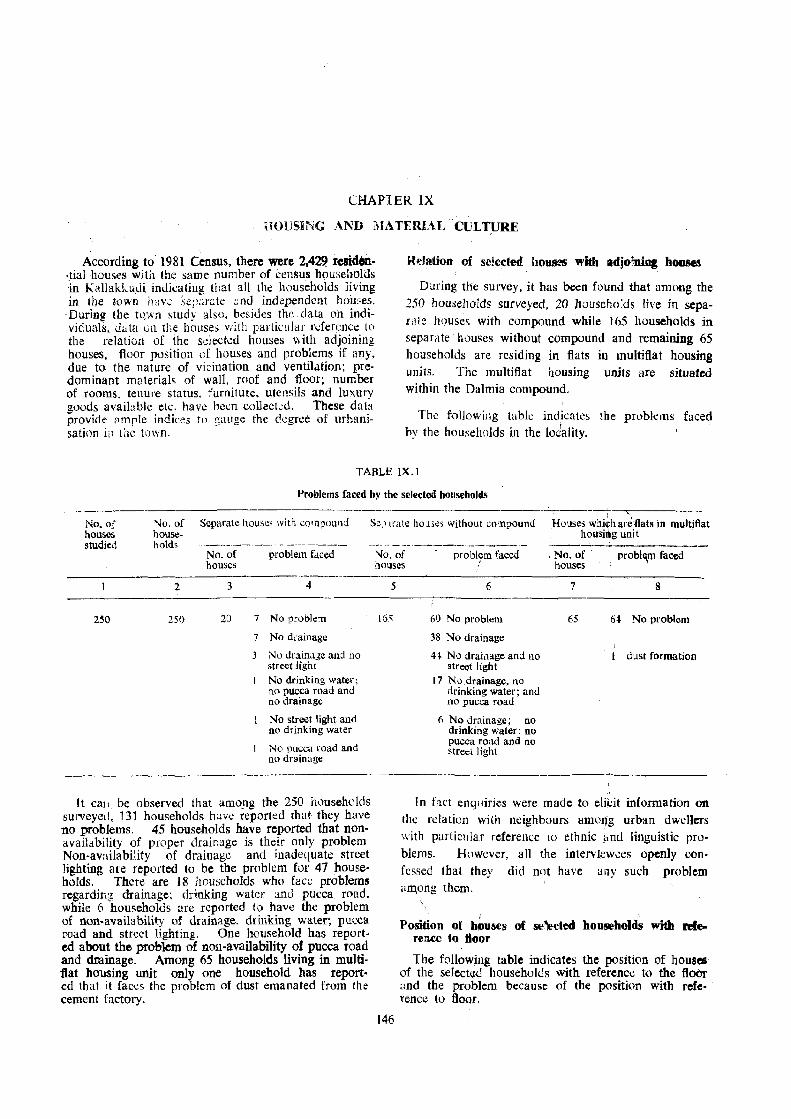
CHAPTER IX
HOUSihG AND iHA TERJ<-\ I, CULTURE
According to· 1981 Census, there were 2.422 residon,tial houses with the same number of census households in Kallakkudi inliil:ating that all th..: 11Ouseholds living in the town ;wv,; 'ser]:m:te :.;od indi,pendcnt houses.
·DLl.ring tbe tqwn stud~ also. besides the data on individualS. u,.ta Gil the houses wllh partkcdar rderence to the relation of the selected houses with adjoining houses, floor position of houses and problems if any, due to the nature of vicination and ventilation; predominant materials of wall, roof and floor; number of rooms, tenure status. furniture. utensils and luxury goods available etc. have been colleckd. these data provide amr1e indices to snuge the degree of urbanisation ill t:1C town.
Relation of selected hOBSt'S with adjoining houses
Dming the survey, it has been found that among the
250 households surveyed, 20 househo:ds live in sepafllte houses with compound while J 65 households in separate houses without compound and remaining 65
households are residing in flats in multifiat housing
units. Thc multifiat housing units are situated within the Dalmia compound.
The following table indkates the problems faced
by the households in the loJality.
TABLE lX.l
Problems faced by the selected households
No. of houses studied
2~O
No. of households
2
250
Separate houses with compound
No. of problem faced houses
3 4
20 7 No proble:n
7 No dcainage
3 No <iraina.;c and no street light No drinking water; no pucca road and no drainage
No street light and no drinking water
No Ducca road and no drainage
It eaJ: be observed that among the 250 households survcy~d, 131 households have reported that they have no problems. 45 households have reported that nonavailability of proper drainage is their only problem Non-availability of drainage and inadequate street lighting are reported to be the problem for 47 households. There are 18 households who Eace problems regardiIig drainage; drinking water and pucca road. while 6 households are reported. to have the problem of non-availability (If drainage. drinking water~ pucca road and street Hghting. One hou1>ehold has reported about the problem of non-availability of pucca road and drainage. Among 65 households living in multiflat housing unit only one household has reported that it facc,;s the problem of dust emanated from the cement factory.
S~" (rate hO'15es without co'npound Houses whi~11arcflats in multi flat housimg unit
No. of problem faced : No. of houses
: rroble,m faced houses "
5
l6.~
146
6 7 8
60 No problem 65 64 No problem
38 No drainage
4~ No drainage and no . I d~sl formation streot light
17 No drainage. no rlrinking water; and no pucca road
6 No drainage; no drinking water; no pucca road and no strett light
., In hct enquiries were made to elil:H information on
the relation with neighbours amol1g urban dwellers
with particlilar reference to ethnic .ftnU linguistic pro· blems. However. all the intervlew.;es openly confessed thaI they did nnt have allY such pWblem aJ1l,ong them.
Position of h~use]i of se~ded households with reference to 800r
The following table indicates the position of houses of the selected households with reference to the flOOr and the prob1em because of the position with reference to floor.
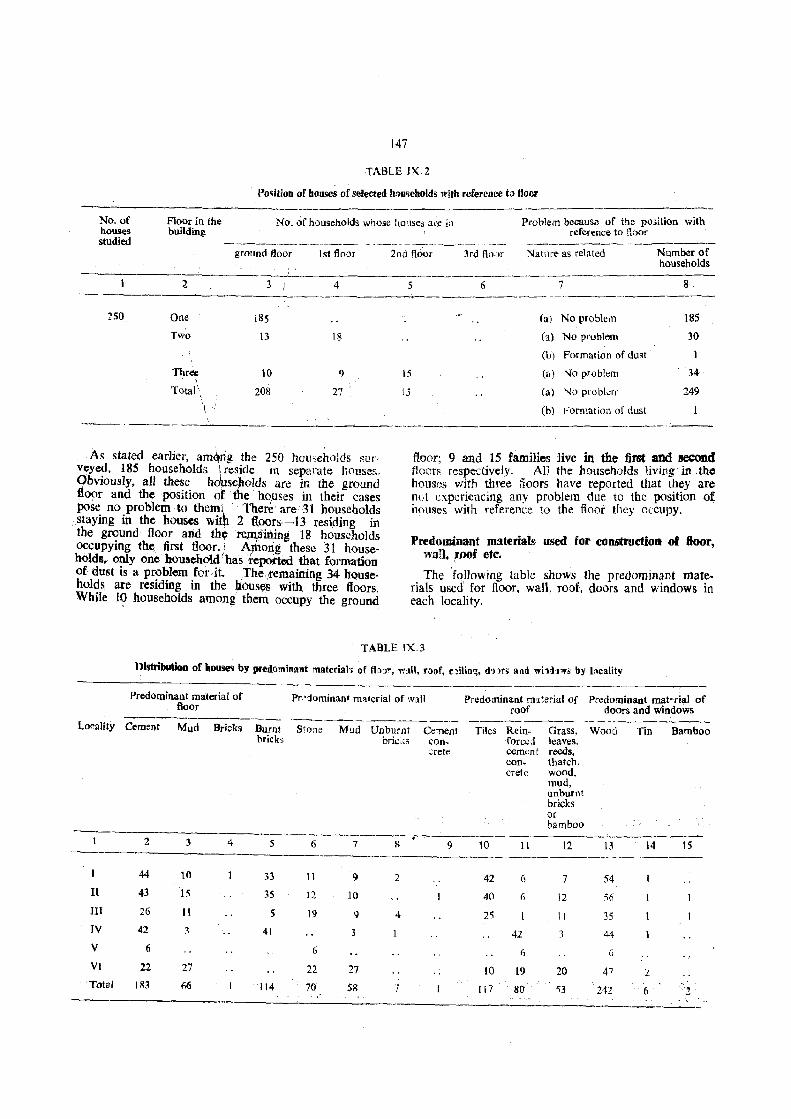
147
TABLE JX.2
Position of hOllses of s~lected hoo5eholds with reference to floor
No. of houses studied
Floor in the No. of households whose tlo'lses ace ja building
Problem becalls~ of the position with reference to Roor
ground floor
2- 3 i 4
250 One i8S
Two 13 18
Tlue,: 10 <) <
Total' 208 27
-~-- ~ ----- _.- ._---
As stated earlier, amQng the 250 homeholds ilurvcyed, 185 hQuseholds \ r'Cside m separate houses. Obviously. all these hdIseJ101ds are in the ground floor and the position of the houses in their cases pose no problem to them~ . There are 31. households
. staying in the houses with 2 6,oors-13 residing in the ground floor and thct Tem;)itting 18 households occupying the first floor. I Afoorig these 31 house· holds. only one b()usehoid (has 'repotted that furmatlon of dust is a pr?~Jem ,for it. The,remaining 34 hQuse. holds are resldmg. In the houses with three floors. While l~ households among them occupy the ground
Natllre as related Number of households
5 6 7 8 ._--_ .. _------(a) No problem 185
(a) No problem 30
(b) Formation of dust
15 (ll) No problem 34
Ij (al No probl.:111 249
(b) Formation of dust
floor; 9 and 15 families live in the tim and second fioo[R respectively. All the households living in the hOUS0S witb three doors have reported that they are not experiencing any problem due to tht: position of onUSes with reference to the floor they ol:cupy.
Predominant Jrulterials used for construction of ftoor, waH. Ioof etc.
The following table shows the predominant mate· rials used for floor, wall, roof, doors and windows in each locality.
TABLE rX.J
Distribution of houses by predo",inant material~ of flo)!, '1'1'111, nof, c)i1in~, dnr. a~d wi1!bw. by hCillit~
Predominant material of Pr.'1ominanl materia! of wall ~redominant mlt~l'ial of Predominant mat~ria) of floor roof doors and windows ----------- ---_._-------- ...... -- --___.,--.~---- -----------lO!'ality Cement Mud Bricks Burnt Stone Mud Dnburnt Cement Tiles Rein- Grass, Wood Tin Bamboo
bricks brk:(s con- forced leaves, ,retIC cem('nt reeds,
COD- thatch. crete wood,
mud, unburnt bricks or bamboo
2 3 4 5 6 7 11 -,-------.-----'
9 10 11 12 13 14 15 ----------_.
44 10 33 II 9 2 42 6 7 54 II 43 15 35 12 10 40 6 12 "6 III 26 II 5 19 9 4 2'i 11 35 TV 42 3 41 3 42 44 V 6 6 6 G VI 22 27 22 27 10 19 20 47 2 Total 1 R3 66 114 70 SR ., 117 ~ 80 ~ 'i3 ZH 6 .2
Floor
Of the 250 nouseholds surveyed. 183 households
representing 73.20 per cent of the total households
surveyed have reported to be staying in houses with cement Hooring. while 66 families :ue r;:portcd to
have houses with mud floor. They account for 26.40
per cent of the households surveyed. The remaining
one household is reported to have brick floor. In
all the localities ex<.:ept locality VI. the houses with
cement floor are more than those with mud flooring. The lone house with brick flooring is located in
lo~ity I.
Wall
The predominant material of the wall ill the case
1i'f;,1l4 hOllses.. among. the 250 houses selected is
b~~t brick. Thus 45.60 per cent of the total households have walls with burnt tricks. Stone;s reported
to be the predominant material of wall for 70 houses.
These account for 28.00 per cent of the total houses selected. Mud is the other predominant material
used for the constmction of walls in the case of 58 houses. Among the remaining, 7 houses have lIn
bumt bricks as the predominant material for walls.
There is a lone house with cement concrete wall In
localities I. II and IV most of the houses have bumt
brick walls. In locality V. all the 6 houses survey
ed have walls made of stones. In locality VI. the
walIs of the houses are made of stone (22 houses)
and mud (27 houses). Marc than half of the 37
houses surveyed in localitv lIT have stone walls.
Roofs
Among the 250 hou:-,es surveyed, 117 houses are
reported to be tiled h(luses. They form. 46.80 per
cent of the total h::)Uses surveyed. While RO houses
(32.00 per cent) have R, C. C. roofing. 53 houses
(21.20 per cent) have roofs made of grass, leaves,
reeds etc. In localities 1. 11 and Jll most (;f the
houses are tiled whereas in localities IV and V most
of the houses have RC.C. roofing. Tn locality VI,
there are almost equal number of houses with RC.C. roofing and roofing made of grass, leaves, reeds etc.
Doors and windows
Most of the houses surveyed have doors and
windows made of wood. Among the 250 houses
148
surveyed, 242 houses forming 96.80 per cent have
doors and windows made of wood. In the case of 6
houses. tin is used for doors while 2 houses have the
doors made of bamboo.
Though the houses in the town consist of both
kl1tcha and pucca. the quarters provided to its em
ployees by the Dalmia cement factory and allied con
cerns are pucca quarters. The walls of all the quar
ters are made of burnt bricks while the flooring in
most' of the cases is done with cement while in certain
Clses mosaic is the flooring material Almost all
the quarters have RC.C. roofing. The allottees
are provided with fixed free quota of electricity, free
water and flush-out latrines. There arc 700 allot·
tees. There are 8 types of quarters. Rent for the
quarters is levied according to (the type of the quarter allotted to the employ~es. ; There are 9 'A' type
quarters. These bungalow type independent quar
ters are allotted to the executive 'Qirectors. There are 3 'B' type quarters which \,are also independent
houses and allotted to. the senior executives. Under
'C type, there are 479 quarters of wlhch 11 are of
independent type while the rest are three roomed
two storied family quarters. These are also intend·
cd for executives. There are 22 quarters of 'D' type. They are all two roomed two storied family
quarters. These quarters are allotted to technical staff covered by wage board and junior executives.
There are 183 'E' type quarters; 64 'P' type quarters
and 130 'G' type' quarters. All of them are intended for staff and workers of the company. While 'E' type quarters are of two storied (ground floor; first
floor and second flam} 'F' & '(j' types are of single
storied (two- tier). There are 32 quarters under 'L' type allotted to blasters employed in the company.
These houses are tiled houses.
Rooms
. A study of the number of rooms aval1ab1e in each
house along with the number of married couples with or without- other members aged 5 + will help to
throw light on the living condition in the town. The
Table lX., 4 indicates the number of households
of various classifications and the number of rooms occupied by them.
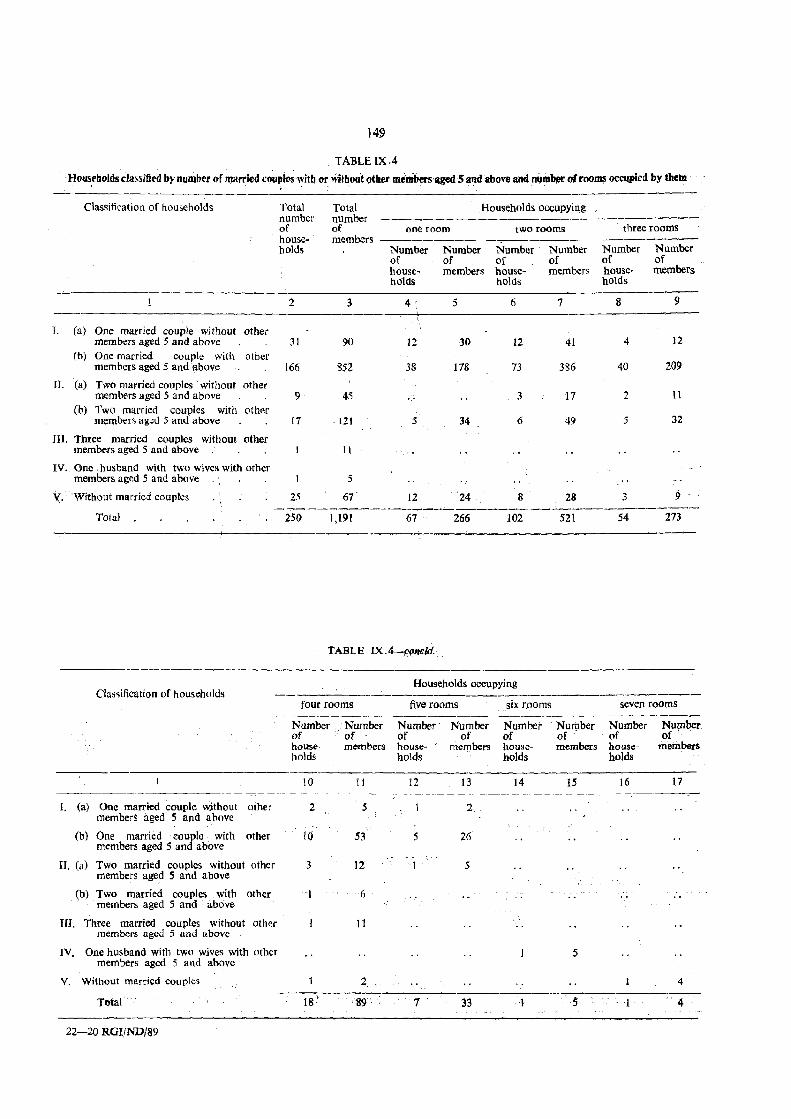
149
TABLEIX.4
, Housebolds c1a~sified by numl1er of married C()~P~ with or Without other menibers'~ged 5 attd above and m,mb,Jr of rooms occupied by them . . " , . ... .
Classificatio n of households Total Total Households occupying number number of of one room twO rooms three rooms house- members ---------holds Number Number Number Number Number Number
of of of of of of house- members house- members house- members holdS holds holds
2 3 4 " 5 6 7 8 9
1. (a) One married couple without other members aged 5 and above 31 90 12 30 12 41 4 12
(b) One married couple with other members aged 5 and Ilbove 166 852 38 178 73 386 40 209
II. (a) Two married couples 'without other members aged 5 and above 9 45 3 17 2 11
(b) Two married couples with oth~r members ageu 5 and above 17 121 5 34 6 49 5 J2
m. Three married couples without other members aged 5 and above 11
IV. One husband with two wives with other members aged 5 and above 5
\:. 'Without married couples 25 67 12 24 8 28 3 9 -------------~--.----------__:._.---~----------
Total 250 1,191 67 266 102 521 54 273
TABLE IX. 4~,~(Jnc/d."
Clas~ification of households Households occupying
-----------------------------------------four rooms five rooms six rooms seven rooms
-_------- --------- --------~
Numb~r Number Number Number Number Number Number Nutnber of of' of of of of ' of of . house- members house- members housc- members house- members holds holds holds holds
10 11 12 13 14 15 16 17 -- -- ---- -- _-_ ------ ---
I. (a) One married couple without otheT 2 5 2 members aged 5 and above
\'.
(b) One married couple- with other 10 53 26 members aged 5 and above
II. (a) Two married couples without other members aged 5 and above
3 12 5
(b) Two married couples with members aged 5 and ' above
other 6 , .
III. Three married couples without other 11 members aged 5 and above
IV. One husband with two wives with other 5 members aged 5 and above
V. Without married couples 2 4
Total 18 ' - '89' 7 33 .}- S 4
22-20 RGI/ND/89
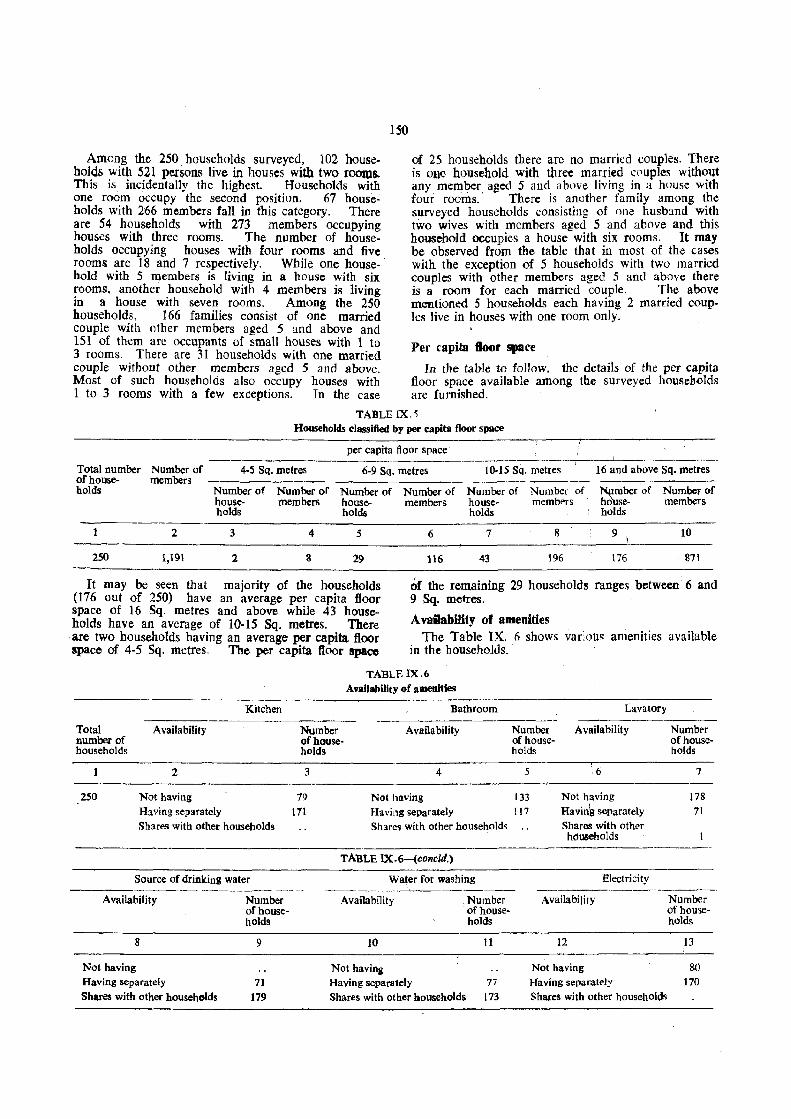
Among the 250 households surveyed, 102 household£, with 521 persons live in houses with two room&. This is incidentally the highest. Households with one room occupy the second position. 67 households with 266 members fan in this category. There are 54 households with 273 members occupying houses with three rooms. The number of households occupying houses with four rooms and five rooms are 18 and 7 respectively. While one household with 5 members is living in a house with six rooms, another household with 4 members is living in a house with seven rooms. Among the 250 households. 166 families consist of one married couple with ()ther members aged 5 and above and 151 of them are occupants of small houses with 1 to 3 rooms. There are 31 households with one married couple without other members aged 5 and above. Most of such households also occupy houses with 1 to 3 rooms with a few exceptions. In the case
150
of 2S households there arc no married coup1es. There is one hOllsehold with three married c(~uples without any member aged 5 and above living in a huuse witb four rooms.' There is another family among the surveyed households consisting of one husband with two wives with members aged 5 and above and this household occupies a house with six rooms. It may be observed from the table that in most of the cases with the exception of 5 households with two married couples with other members aged 5 and above there is a room for each married couple. The above mentioned 5 households each having 2 married couples live in houses with one room only.
Per capita floor space
In the table to follow. the details of the per capita floor space available among the surveyed households are furnished.
TABLEIX.~
Households classified by per capita floor space
per capita flOOf space
Total number Number of of house- members
4-5 Sq. metres 6-9 Sq. metres 10-15 Sq. metres 16 and above Sq. metres
Npmber of Number of holds Number of Number of Number of Number of Number of Number of house- members house- members house- membf'fS house- members holds holds holds holds
2 3 4 5 6 7 8 9 \ 10
250 1,191 2 8 29 116 43 196 176 871
It may be seen that majority of the households (176 out of 250) have an average per capita floor space of 16 Sq. metres and above while 43 households have an average of 10-15 Sq. metres. There are two households having an average per capita floor space of 4-5 Sq. metres. The per capita Hoor lpace
of the remaining 29 households ranges between 6 and 9 Sq. metres.
Total numbt"J' of households
Availability
2
Kitchen
Number of households
3
A vailabHity of amenities The Table IX. 6 shows var;ou~ amenities available
in the households.
TABLE IX.6 Availability of amenities
Bathroom
Availa bility
4
Lavatory
Number Availability of house-holds
5
Numbrf of households
7
250 Not having 7') Not having 133 Not having Havin~ separately Shares with other
178
71 Having separately 111 ShaTe~ with other households
Source of drinking water
Availability
8
Not having Having separately Shares with other households
Number of households
9
71
179
Having separately 117
Shares with other households
TABLE IX.6-(concid.)
Water fOf washing -'-----~---
Availability
10
Not having Having separately Shares with other households
Number of households
11
77 173
households
Electricity .---
Availability Number of households
12 13
Not having 80 Having separatel:, 170
Shares with other households
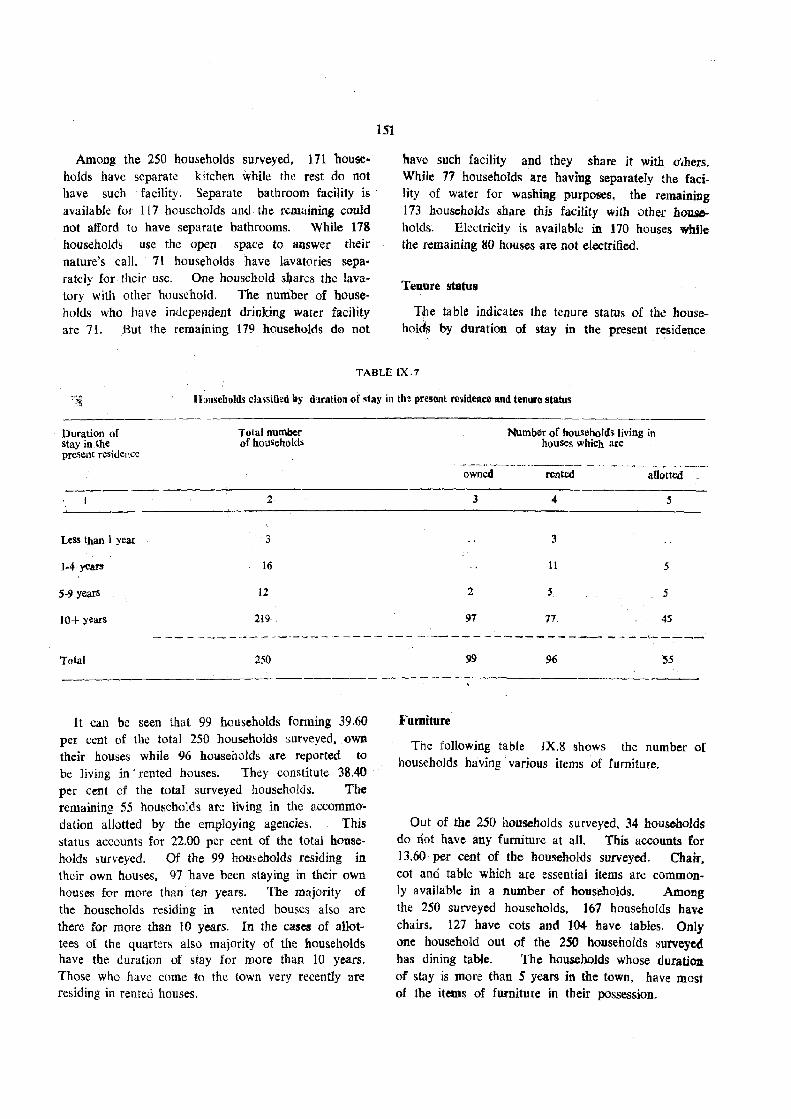
Among the 250 households surveyed, 171 bouseholds havc separate kitchen while the rest do not ha ve such facility. Separate bathroom facility is available for 1 [7 households and. the remaining could not afford to have separate bathrooms. While 178 households use the open space to answer their nature's call .. 71 households have lavatories separately for thcir use. One household shares the lavatory with other household. The number of households who have independent drinking water facility are 71. But the remaining 179 households de not
151
have such facj]jty and they share it with d.hers. While 77 households are having separately the facility of water for washing purposes, the remaining 173 households share this facility with other households. Electricity is available in 170 houses while the remaining 80 houses are not electrified.
Tenure status
The table indicates the tenure status of the househol~ by duration of stay in tbe present residence.
TABLE IX·7
Households c1.L~siiied by dllratioll of stay in th~ present re~idence and tenure status
Duration of stay in the present residence
Less than 1 year
5·9 years
10+ years
T(}tal
Total number (}f househ()ld:l
2
3
16
12
219
250
it call be seen that 99 h()useholds forming 39.60 per cent of the total 250 households :mrveyed, own their houses while 96 households are reported to be living in' rented houses. They constitute 38.40 per cent of the total surveyed households. The remaining 55 households are living in the acoornmo· dation allotted by the employing agencies. This status accounts for 22.00 pcr cent of the total households surveyed. Of the 99 households residing in their own houses. 97 have been staying in their own houses for more than ten years. The majority of the households residing in rented houses also are there for more than 10 years. In the cases of allot· tees of the quarters also majority of the households have the duration of stay for more than 10 years. Those who have come to the town very recently are residing in rented houses.
owned
3
2
97
99
.Furniture
Number of households living in houses whiCh are
rented aUQtted _
4 5
3
11 5
5 5
45
96
The following table IX.8 shows the number of households having various items of furniture.
Out of the 250 households surveyed, 34 households do riot have any furniture at all. This accounts for 13.60 per cent of the households surveyed. Chair. cot and table which are essential items are commonly available in a number of households. Among the 250 surveyed households, 167 households have chairs, 127 have cots and 104. have tables. Only one household out of the 250 households surveyed has dining table. The households whose durati02l of stay is more than 5 years in the town, have most of the items of furniture in their possession.
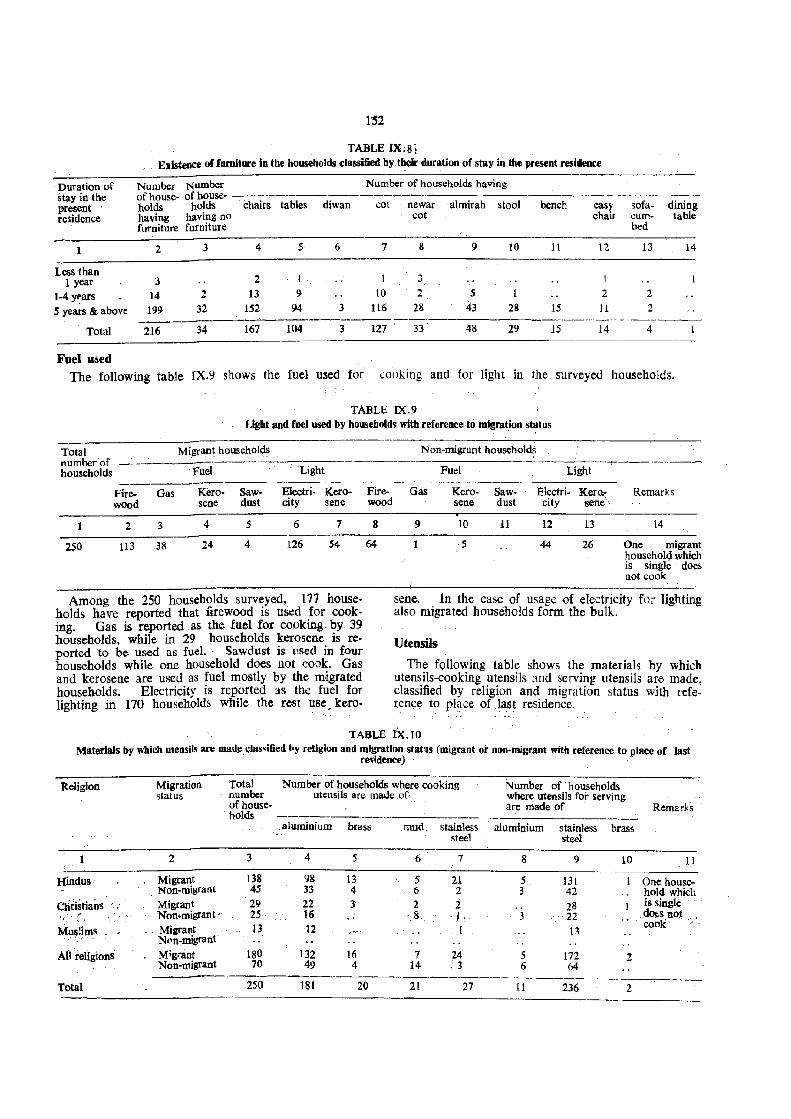
1'52
TABLE IX;8j
Ellistence of furniture in the. households classified by their duration of stay in the present residence
Duration of Number Number Number of households having st;ty in the of house- of house· ----------,---- -~.~-------
holds holds chairs tables diwan cot almirah stool bench sofa- dining present newar easy residence having having no cot chair cum- table
furniture furniture bed
1 2 3 4 5 6 7 8 9 10 11 12 13 14
Less than 2 1 I 3 I 1 year 3
1-4 y"ars 14 2 13 9 10 2 5 2 2
5 years & above 199 32 152 94 3 116 28 43 28 15 11 2 -_._------
Total 216 34 167 104 3 IZ7 33 48 29 15 14 4
Fuel used The following table JX.9 shows the fuel used for cooking and for light in the surveye<l households.
TABLE IX.9 Ught and fuel used by hl)WJeholds with reference to migration status
Total Migrant households Dumber·of households Fuel Light
------Fire- Gas Kero- Saw- Eleetri· Kero-wood sene dust city sene
2 3 4 5 6 1
250 113 38 24 4 126 54
Among the 250 households surveyed, . 177 households have reported that firewood is uSl!d .for cook· ing. Gas is reported. as the. -fuel for cookmg. by 39 households, while in 29 households kerosene is reported to be used as fuel., Sawdust is· l·.sed in four households while one household does not cook. Gas and kerosene are used as fuel mostly by the migrated households. Electricity is reported as the fuel for lighting in 170 households while the rest use, kero·
Fire· wood
8
64
Non·migrant households
Fuel Light ---r------~--
Gas Kero- Saw- Electri- Kera:: Remarks sene dust city sene'
9 10 11 12 13 14
5 44 26 One migrant household which is single does not cook
sene. In the case of usage of electricity for lighting also migrated households form the bulk.
Utensils
The following table shows the materials by which utensils-cooking utensils and serving utensils are made, classified by religion and migration status with refer:cnce to place of last residence.
TABLE DUO Materials by which utensils are madJ:.l;las,ilied by religion and ml~ratlon statlls (migrant or non-migrant witlt reference to place of last
re~ldence)
Religion Migration Total Number of households where cooking Number of households status number utensils are made of· where utensils for serving
of house· are made of . Remarks holds
.aluminium brass mud .. stainless aluminium stainless brass steel steel
2 3 4 5 6 1 8 9 10 11
Hindus Migrant 138 98 13 5 21 5 131 One house-Non-migrant 45 33 4 6 2 3 42 hold which
Christians Migrant 29 22 3 2 2 , . 28 is single 'I
,.. Non-migrant ,. 25 16 ·8 I., 3 22 d~s not , ' cook ~
~~!jms - . Migrant . 13 12 B N('n-migrant·
All religions Mig'ant 180 132 16 1 24 5 172 2 Non-migrant 70 49 4 14 '3 6 64
Total 250 181 20 21 27 11 236 2
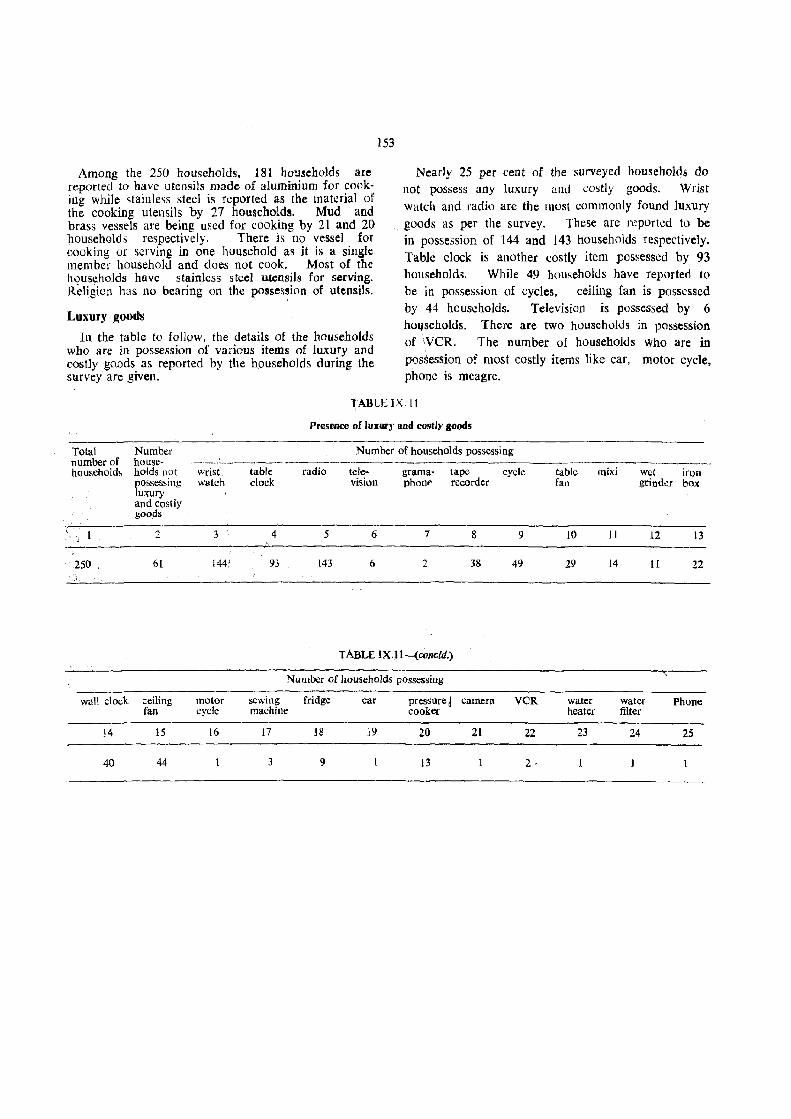
Among the 250 households, 181 hO!lseholds are reDorted to have utensils made of aluminium for cooking while stainless steel is reported as the material of the cooking utensils by 27 households. Mud and brass vessels are being used for cooking by 21 and 20 households respectively. There is no vessel for cooking or serving in one household as it is a single member household and does not cook. Most of the hQuseholds have stainless steel utensils for serving. Religion has no bearing on the possession of utensils.
Luxury goods
In the table to follow, the details of the households who are in possession of various items of luxury and costly gonds as reported by the households during the survey are given.
153
Nearly 25 per cent of the surveyed households do not possess any luxury ~Jld t:Ostly goods. Wrist
watch and radio arc the most commonly found lUxury goods as per the survey. These are n~portcd to be in possession of 144 and 143 households respectively. Table clock is another costly item vossessed by 93 household~. While 49 households have reported to be in possession of cycles, ceiling fan is possessed by 44 households. Television is possessed by 6 hOlJseholds. There are two households in possession of 'VCR. The number of households who are in possession of most costly items like car, motor cycle, phone is meagre.
l;'ABLEIX.ll
Presence of luxQl'Y and costly ,oods
Total Number Number of households possessing number of house- ----------- -households holds not wrist table radio tcle- gram a- tape cycle table llli1(i wet iron
possessing watcli clock vision phonf' recorder fan grinder box luxury and costly goods
, 1 2 3 4 5 6 7 8 9 10 11 12 13 .'J
250 61 144' 93 143 6 2 38 49 29 14 l[ 22 -, ,
TABLE IX.11-{concld.)
Number of households possessing
wall clock ceiling motor sewing fridge car pressurej camera VCR water water Phone fan cycle machine cooker heater filter
14 15 16 17 18 19 20 21 22 23 24 25
40 44 3 9 13 2·
CHAPTER X
SLUMS, BLIGHTED AND OTHER AREAS WITH SUB-STANDARD LIVING CONDITIONS
The growth of population in cities and towns is rapid due to influx of more population from nearby villages as employment avenues in these urban centres are more. This increases the pressure on the availabh:! land as the availability of land for settlement remains almost constant. The poor ecol1()mic condition Llf the new settlers prevents them from settling on the outskirts of the town and they always prefer to settle nearer to the work spot. This results in the growth and development of disorganised housing settlem~nts without any care for health and hygiene. This disorganised settlements are more commonly known as slums. The conditions prevailing in these areas have an adverse effect on the health, social relations and behavioural pattern of the residents as well as others living outside the areas. These problems and their continuance ale related to many complex factors such as changing of land values, slum landlordism, population dispersion etc.
In India. it would be appropriate to call these areas &s 'blighted areas' or more appropriately as 'slum areas' which term has gained much currency. The slum area refers to a greater than usual degree of deteriorated surroundings implying a lower socioeconomic status of the inhabitants. The phenomenon of blight is manifested by a wide variety of conditions viz. physical, environmental. economic and social factors. It is not necessarily confined to residential or denseiy populated areas. It may be present in commercial, industrial or even in unde'veloped
154
vacant areas. The physical environmental characteristics include the following. either alone or in combination. ~iz.. poorly constructed or designed dwellings with maoequate ventilation. light and sanitation, insufficient open spaces and tecreational facilities, high density of population. over-crowded dwellings, obsolescence and disrepair of structures, faulty subdivision and design of the land, usually evidenced by an inadequate street pattern, lack of open spaces and essential utilities and danger of water submersion and all other f.rctors which cause the structure to be unfit or unsaf~ for human settlement. The above environmental {;unlHtions cause ill health. spread of diseases; incIea~c in infant. mortality, jqve-nile delinquency and crime. . i ;'
, '
But ~n the -case of Kallakkudi it isi q dijf~rent story. There 13 no more empj.oyme~t opportupities to attract more people towards it. it has v .. st ,\)pen space available for settlement. The cement factory pro-vides quarters to its employees, comirj.g to the factory from places situated beyond 5 Kn). radi\ls. . In such a situation, I there is no pressure on Hmd for settlement at Kallakkudi. However, there are some pockets of congestedly inhabited areas in Kallakkudi town, like the harijan colony and Ambal talkies area. The settlements in this area lack basic facilities and have poor sanitary conditions but not worth to be identified as slums as indicated in chapter I. Even though Kallakkudi is treated as town the living conditions in Kallakkudi are not widely different from those of villages.
CHAPTER Xl
ORGANISATION OF POWER AND PRESTIGE
Since the bcgillning of human r;:ivilization man has shown a tendency towards col1ective activity and organisatioll. , Later on, th,c transfonnatiop of social and political s~t up in the,' country has changed the or~ani~tion of power and pres'tige to a large extent. In Tamil Nadu also, as elsewhere' in the country, the society was caste-ridden and some particular castes were in the forefront enjoying a dominant and privileged pOSition in sotiety, The . baCkward 'and lower castes had to face ~e~i9US s()ciaI disabilities and hardships. . Later on as a', revolt against the tyran- , nies of the h:gher castes agai~st the lower castes some ' social reform movements todk place and the higher castes lost their social and eoo'nomic monopoly. MoreoVe!r, the transformation of social and political set'-'tlp in the country after indepenqe:nce has cbanged 'the organisation of power and prestige to a large extent. The rig}?,t to elect representat~es ,to the legislative assembly and parliament was pa~sed on to. the people irrespective of their economic! and SOCIal status. Po~~~r support being ~he m~in ~riteria m public. life, pohtlClans and oth,ers Vied wlth O)rte another tf) mIngle cIooely with each sections of the Satiety forgetting caste hierarchy and caste d~etenc~, ,to ,r~tajn tbeir PO;W\lr , of influence. Earlier, b~g, landlords and wealthy people exerted much lljffuellce over the sqciety. At present political leader~ haYr ta'l)eh their place, .
Klillakkudi, ~ing a small town; does not enjoy any special significance in the national or state politics. But 'the influence exerted by the national and state politits in the life of the town is qUIte visible in the functioning of the various political parties and the local body,
Most of the influential persons in the town have pofitical affiliations and they are actively associated with one or the other political party, If is these influential persons who are evincing interest in the governance of the local body and engaged in Rocial activities.
Overall political awareness of the people cf the town. is explicitly reflected in the elections to the local body i.e. the town panchayat. Election to tlie town pan. chayat was held on a keen party based ~ontest. Kat. lak.kudi lawn panchayat board consists of one presi. dent. directly elected by the local people and 14 elect. ed members, one representing each ward and one nominated member. The 14 elected members belonged to various political parties viz., Congress (1), Dravida Munne1ra Kazhakam and the All India Anna Dravida Munnetra Kazhakam and independents. Their res~tive strength are Congress rI) 1. D.M,K. 6, AIADMK 2 and independent5 5. One lady member was nominated from the ] 3th ward during the first sitting itself. Sbri Amal D.\S8, the town panchayat president at the time of the survey, was elected as an independent candidate. It has been aSCGrtained
155
during the survey that nOne of the political p~r.ties is dominated by any particular caste or com~um~y. All parties have followers from all commumhes m the town. ' '
Sinc~ KaIIakkudi bJing a smalI town panchayat and the am~ities provided are the basic needs common to an the ~own dwellers the budget of the IOl:al qody does not reflect the functioning of various interest groups. The town does not come under the p~lfview of town plamling department and no demarcation of areas for various uses has been made. In the abseI1:ce of such restriction. there are no instanc;es of conflIct arising out of violation of land use pattern.
The major political parties functioning in the to:wn at the time of the survey were Congress (1), Dravlda Muunetra Kazhakam (DMK), All India Anna Dravida Ml!nnetra Kazhakam {AIADMK) and Janata.
11.e Congress (1) has been functioning in the town since ] 953. The party has a membership of 500 and those who are 18 years and above are eligible to become members. The main aim of the party is !be formation of a socialistic pattern of society, The party also aims at the implementation of the 20 point programme. The party used to organise cultural programrnt's and also attend to the grievances of the people like water supply, issue of perma1\enc~ rights (pattas) to lands, pension scheme for handlcapped and widows etc.
The DMK (Dravida Munnetra Kazhakam) 'party has. been functioning in the town since 1953. "At present the party has a membership of 340 persons. The condition for membership at the time of the sur~ vey was that the person should be aged 18 to become a member of the party.
The aims and objectives of the party are the improvement of Tamil language and literature, preser. vatll'n and safeguarding of the Dravidian culture and. overall 'develdpment of the state, Though in the., beginning the party had a policy of having a separate state fOT Dravi\!ians,this idea was discarded later and the party now works for a greater autonomy to the states. " The' party took a lead in organiSing antiHindi agitation throughout Tamil Nadu. The party had org~nised agitation for changing the name, of Dalmiapuram railway station as KaHakkudi railway station in the yoor 1969.' The party has 6 representatives out of the 14 ward members in the town panchayat,
The other party functioning in th~ town is the AJADMK (All India Anna Dravida Munnetra Kazhakam). This party has been functioning in the town siQ<:e 1972. The party bas a membership of BOO. Those who are above,.l8 years of age can become members~ The party is striving to achieve among other things eradication of poverty, universal edu~. tion and provision of basic amenities to eacb and everybody.
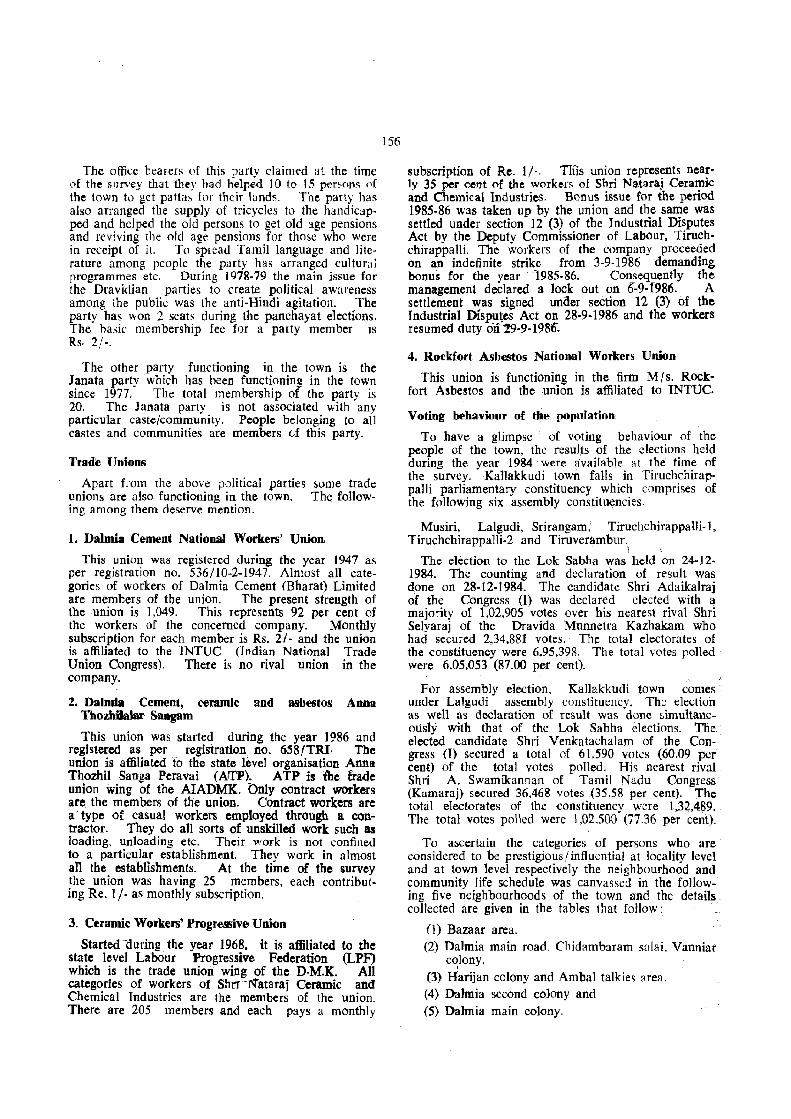
The office bearers of this p;Jfty daimed at the time pf the survey that they had helped 10 to 15 persons of the town to get patta~ for their lands. The patty has also arranged the supply of tricycles to the handicapped and helped the old persons to get old age pensions and reviving the old age pensions for those who were in receipt of it. To spread Tamil language and literature among people the party has arranged cultural programmes etc. During 1978-79 the main issue for the Dravidian parties to create political aWareness among the publie was the anti-Hindi agitation. The party has won 2 seats during the panchayat elections. The hasic membership fee for a party member is Rs. 2/-.
The other party functioning in the town is the Janata party which has been functioning in the town since 1977. The total membership of the party is 20. The Janata party is not associated with any particular caste/community. People belonging to all castes and communities are members d this party.
Trad:e Uni(ln8
Apart from the above political parties some trade unions are also functioning in the town. The follow-ing among them deserve mention.
1. Dalmia Cement National Workers' Union
This union was registered during the year 1947 as per registration no. 5J6/1O-2-l947. Almost all categories of workers of Dalmia Cement (Eharat) Limited are members of the union. The present strength of the union is 1,049. This represents 92 per cent of the workers of the concerned company. Monthly sUbscription for each member is Rs. 2/- and the union is affiliated to the INTUC (Indian National Trade Union Congress). There is no rival union in the company.
2. Dabuia Cement, ceramic and asbestos Anna Thozhila1ar Sangam
This union was started during the year 1986 and registered as per registration no. 658/TRI. The union is affiliated to the state level organisation Anna Thozhil Sanga Peravai (AIfP). ATP is the ·uade union wing of the AIADMK. bnly contract workers are the members of the union. Contract workers are a'type of casual workers employed through a CODtractor. They do all sorts of unskilled work such as loading. unloading etc. Their work is not confined to a particular establishment. They work in almost an the establishments. At the time of the survey the union was having 25 members, each contributing Re. 1 j- as monthly subscription.
3. Ceramic Workers' Progressive Union
Started ouring the year 1968. it is affiliated to the state level LabOur Progressive Federation (LPF) which is the trade union wing of the O·M.K. All categories of workers of Shrr-rq"ataraj Ceramic and Chemical Industries are the members of the union. There are 205 members and each pays a monthly
156
subscription of Re. 1/-. TIlis union represents nearly 35 per cent of the workers of Shri Nataraj Ceramic and Chemical Industries. Bonus issue for the period 1985-86 was taken up by the union and the same was settled under section 12 (3) of the Industrial Disputes Act by the Deputy Commissioner of Labour, Tiruchchirappalli. The workers of the company proceeded on an indefinite strike from 3-9-1986 demanding bonus for the year 1985-86. Conseqllently the management declared a lock out on 6-9-1986. A settlement was signed unGer seetion 12 (3) of the Industrial Disputes Act on 28-9-1986 and the workers resumed duty on ~-9-198r;.
4. Rockfort Asbestos National Workers Union
This union is functionIng in the firm Mrs. Rockfort Asbestos and tbe union is affiliated to INTUC.
Voting behavicUlf of the population
To have a glimpse· o( voting behaviour of the people of the town, the results of the elections held during the year 1984 were available at the time of the survey. Kallakkudi town falls in Tiruchchirappalli parliamentary constituency which comprises of the following six assembly constit~ncies.
Musiri, Lalgudi, Srirangam; Tiruchchirappalli-l, Tiruchchirappalli-2 and Tiruverambur.
\ The election to the Lok Sabha was held on 24-12-
1984. The counting and declaration of result was done on 28-12-1984. The candidate Shri Adaikalraj of the Congress (I) was declared elected with a majority of 1,02,905 votes over his nearest rival Shri Selyaraj of the Dravida Munnetra Kazhakam who had secured 2,34.881 votes. The total electorates of the constituency were 6,95,398. The total votes polled were 6,05,053 (87.00 per cent).
For assembly election. Kallakkudi town comes under Lalgudi assembly constitut;:m:y. The: election as well as declaration of result was done simultaneously with that of the Lok Sabha elections. The elected candidate Shri Venkatachalam of the Congress (I) secured a total of 61.590 votes (60.09 per cent) of the total votes poll~d. His nearest rival Shri A. Swamikannan of Tamil Nadu Congress (Kamaraj} secured 36.468 votes (35.58 per cent). The total electorates of the constituency were 1,32,489. The total votes poned were 1,02.500 (77.36 per cent).
To ascertain the categories of persons who are considered to be prestigious /influential at locality level and at town level respectively the neighbourhood and community life schedule was canvassed in the following five neighbourhoods of the town and the details collected are given in the tables that follow:
(1) Bazaar area. (2) Dalmia main road, Chidambaram saIai, Vanniar
c~lony,
(3) Harijan colony and Ambal talkies area. (4) Dalmia seoond colony and (5) Dalmia main colony.
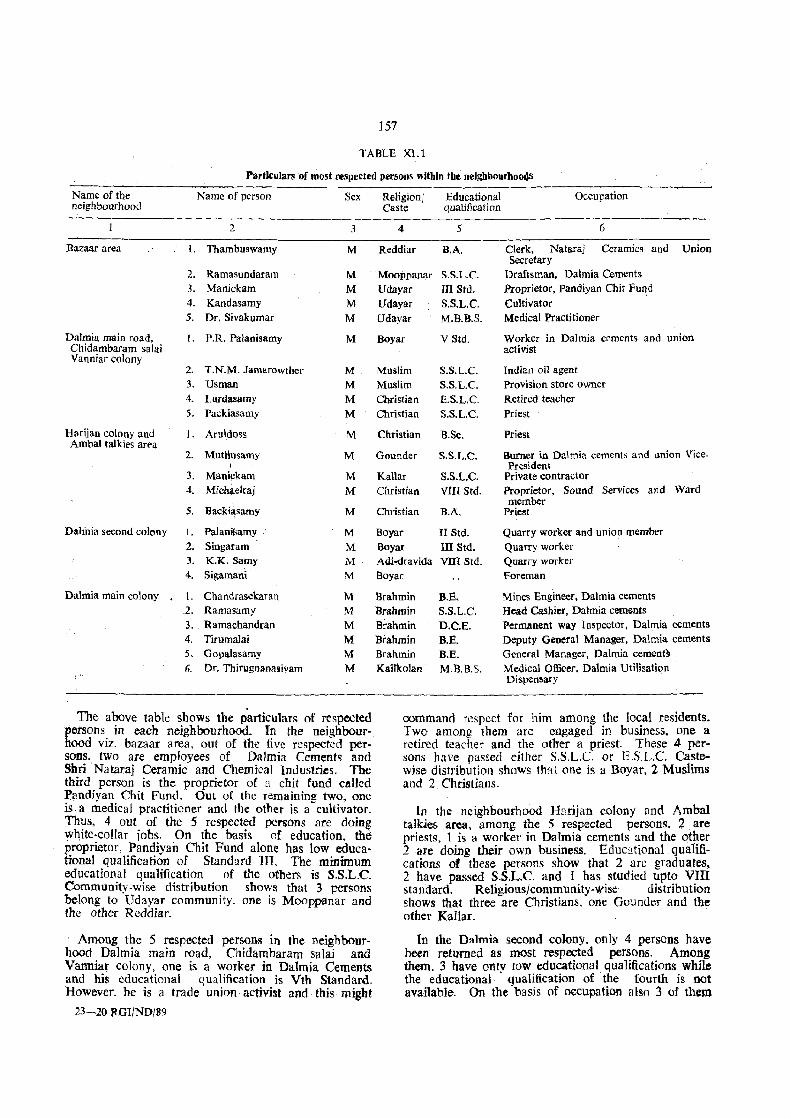
157
TABLE XI.l
Particulars of most respected persons within the neighbourho04s
Name of the neighbourhood
Name of person Sex
2 3
Bazaar area I. Thambuswamy M
2. Ramasundaram M 3. Manickam M 4. Kandasamy M 5. Dr. Sivakumar M
Dalmia main road, I. P.R. Palanisamy M Chidambaram salai Vanniar colony
2. T.N.M. Jamarowther M 3. Usman M 4. Lurdasamy M 5. Packiasamy M
H<lrijan colony and 1. Aruldoss M Ambal talkies area
2. Mutliusamy M
3. Mani~kam M 4. Michil-elraj M
5. Backi~samy M
Dalmia second colony 1. Palanilsamy M 2. Singaram M J. K.K. Samy M 4. Sigamani M
Dalmia main colony 1. Chandrasekaran M .2. Ramasamy M 3. Ramachandran M 4. Tirumalai M 5. Gopalasamy M 6. Dr. Thirugnanasivam M
The aoove table shows the particulars of respected persons in each neighbourhood. In the neighbourhood viz. bazaar area, out of the five respected persons. two are employees of Dalrnia Cements and Shri Nataraj Ceramic and Chemical Industries. The third person is the proprietor of a chit fund called Pandiyan Chit Fund. Out of the remaining two, one is a medical practitioner and the other is a-cultivator. Th~s, 4 out. of the 5 respect~d persons ar~ doin~ whIte-collar lobs. On the basts of educatIOn. the proprietor, Pandiyan Chit Fund alone has low educational qualification of Standard HI. The minimum educationa 1 aualification of the others is s.s.L.e. Comrnunity.vJise distribution shows that 3 persons belong to Udayar community. one is Mooppanar and the other Reddiar.
Among the 5 respected persons in the neighbollrhood Dalmia main road, Chidambaram salai and Vanniar colony, one is a worker in Dalmia Cements and his educational qualification is Vth Standard. However, he is a trade union activist and this might
23-20 P.GI/ND/89
Religion; Educational Occupation Caste qualification
4 5 6
Reddiar B.A. Clerk, Nataraj Ceramics and Union Secretary
Mooppanar S.S.L.c, Draftsman, Dalmia Cements Udayar III Std. Proprietor, Pandiyan Chit Fu~d
Udayar S.S.L.C. Cultivator Udayar M.B.B.S. Medical Practitioner
Boyar V Std. Worker in Dalmia cements and union activist
Muslim S.S.L.C. Indian oil agent Muslim S.S.L.C. Provision store owner Christian E.S.L.C. Retired teacher Christian S.S.L.c. Priest
Christian B.Sc. Priest
Gounder 8.S.L.C. Burner in Dalmia cements and union Vice-President
KaUar S.S.L.c. Private contractor Christian VIII Std. Proprietor, Sound Services and Ward
member Christian B.A. Priest
Boyar II Std. Quarry worker and union member Boyar III Std. Quarry worker Adi-dravida VllI Std. Quarry worker Boyar Foreman
Brahmin B.E. Mines Engineer, Dalmia cements Brahmin s.s.L.e. Head Cashier, Dalmia cements Brahmin D.C.E. Permanent way Inspector, Dalmia cements
Brahmin B.E. Deputy General Manager, Dalmia cements Brahmin B.E. General Manager, Dalmia cements Kallkolan M.B.B.S. Medical Officer, Dalmia Utilisation
Dispensary
command respect for him among the local residents. Two among them are engaged in business, one a retired teacher and the other a priest. These 4 persons have pas~ed either S.S.L.C or E.S.L.C. Castewise distribution shows th!'!.t one is a Boyar, 2 Muslims and 2 Christians.
In the neighbourhood Harijan colony and Ambal talkies area, among the 5 respected persons, 2 are priests, 1 is a worker in Da lmia cements and the other 2 are doing their own business. Educ;}tional qualifications of these persons show that 2 arc graduates, 2 have passed S.S.L.c. and I has studied upto VIII standard. ReligiousjcommunitY-\\-1se distribution shows that three are Christians, one GtJunuer and the other RaHar.
In the Dalmia second colony. only 4 persons have been returned as most respected persons. Among them. 3 have onIV lOW educational qualifications while the educational . Qualification of the fourth is not avaiJable. On the -basis of occupation also 3 of them
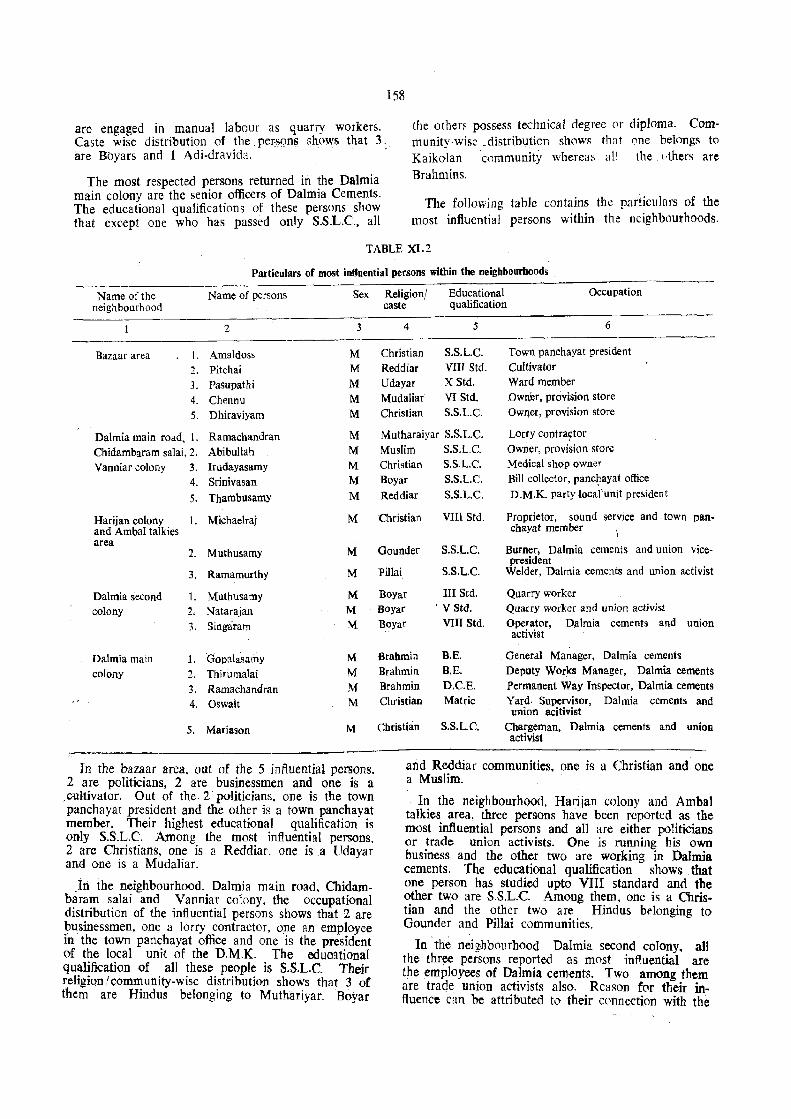
158
are engaged in manual labour as quarry workers. Caste wise distribution of the. per~SQns shows that 3. are Bbyars and 1 Adi-dravida.
the others possess technical degree or diploma. Community-wise .distribution shows that (Inc belongs to Kaikolan community wherea!i all the .l>thers are Brahmins. The most respected persons returned in the Dalmia
main colony are the senior officers of Dalmia Cements. The educational qualifications of these persons show that except one who has passed only S.S.L.c., all
The following table contains the particulars of the most influential persons within the ncighblmrhoods.
TABLE XI.2
Particulars of most ioOuential persons within the neigbbourhoods
Name of the Name of persons Sex neighbourhood
2 3
Bazaar area 1. Amaldoss M 2. Pitchai M
3. Pasupathi M
4. Chellnu M
5. Dhiraviyam M
Dalmia main road, 1. Ramachandran M
Chidambaram salai, 2. Abibullah M
Vanniar colony 3. Irudayasamy M
4. Srinivasan M
5. Thambusamy M
Harijan colony 1. Michaelraj M and AmbaI talkies area
2. Muthusamy M
3. Ramamurthy M
Dalmia second l. Muthusamy M colony 2. Natarajan M
3. Singiram M
Dalmia main 1. Gopalasamy M colony 2. Thirumalai M
3. Ramachandran M
4. Oswalt M
5. Mariason M
In the bazaar area, out of the 5 influential persons. 2 are politicians, 2 are businessmen and one is a
,cultivator. Out of the 2 politicians. one is the town panchayat president and the other is a town panchavat member. Their highest educational qualification' is only S.S.L.c. Among the most influential persons, 2 are Christians, one is a Reddiar, one is a Udayar and one is a Mudaliar.
In the neighbourhood. Dalmia main road. Otidambaram salai and Vanniar colony, the occupati011al distribution of the influential persons shows that 2 are ~usinessmen, one a lorry contractor, one an employee in the town pan~hayat office and one is the president of the local UTIlt of the D.M.K. The eduoational qualification of all these people is S.S.L.c. Their religion / community-wise distribution shows that 3 of them are Hindus belonging to Muthariyar. Boyar
Religion/ Educational Occupation caste qualification
4 5 6
Christian S.S.L.C. Town panchayat president
Reddiar VIIT Std. Cultivator
Udayar X Std. Ward member
Mudaliar VI Std. Own~r, provision store
Christian S.S.L.C. OWIler, provision store
Mutharaiyar S.S.L.c. Lorty contrartor
Muslim S.S.L.C. Owner, provision store
Christian S.S.L.C. Medical shop owner
Boyar S.S.L.C. Bill collector, pan~ayat office
Reddiar S.S.L.C. D.M.K. party locaJ'unit pre~ident
Christian VIII Std. Proprietor, sound service and town pan-chayat member
Gounder S.S.L.C. Burner, Dalmia cements and union vice-president
Pillai S.S.L.C. Welder, Dalmia cements and union activist
Boyar III Std. Quarry worker
Boyar ' V Std. Quarry worker and union activist
Boyar VIII Std. Operator, Dalmia cements and union activist
Brahmin B.E. General Manager, Dalmia cements
Brahmin B.E. Deputy Works Manager, Dalmia cements
Brahmin D.C.E. Permanent Way Inspector, Dalmia cements
Christian Mateic Yard. Supervi~or, Dalmia cements and union acitivist
Christian S.S.L.C. Chargeman, Dalmia cements and union activist
and Reddiar communities. one is a Christian and one a Muslim.
In the neighbourhood, Harijan colony and Ambal talkies. area, ~ree persons have been reported as the most influenttal persons and a11 are either politicians or ~ade union activists. One is running his own bUSIness and the other two are working in Dalmia cements. The educational qualification shows that one person has studied upto VIII standard and the ~er two are S.S.L.c. Among them, one is a ChristJan and the other two are Hindus belonging to Gounder and PiIIai communities.
In the neighbourhood Dalmia second colony, all the thr~ persons reported as most influential are the employees of Dalmia cements. Two among them are trade union activists also. Reason for their influence ,-,an be attributed to their cnnnection with the
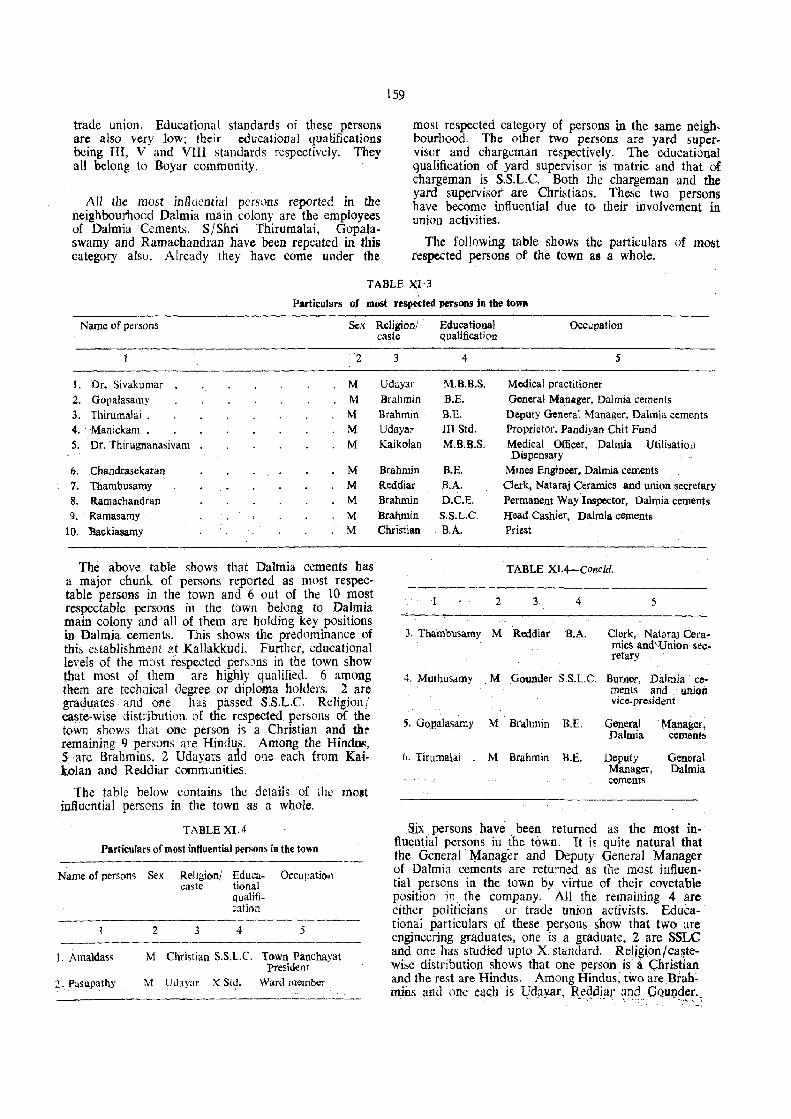
trade union. Educationa 1 standards of these persons are also very low; their educational qualifications being III, V and VUI standards rcspectivdy. They all belong to Boyar community.
All the most influential pcrsuns reported in the neighbourhood Dalmia main colony are the employees of Dalmia Cements. SjShri Thirumalai, Gopala. swamy and Ramachandran have been repeated in this category also. Already they have come under the
159
most respected category of persons in the same neigh, bourhood. The other two persons are yard supervisor and chargcman respectively. The educational qualification of yard supervisor is matric and that of chargeman is S.S.L.c. Both the chargeman and the yard supervisor are Christians. These two persons have become influential due to their involvement in union activities.
The following table shows the particulars of most respected persons of the town as a wbole.
TABLE XI·3
Particulars of most respeded persons in the tOW'll
Name of persons Sex
2
1. J)r. Sivakumar M
2. Gopalasamy M
3. Thirumalai . M 4. Manickam. M 5. Dr. Thirugnanasivam M
6. Chandrasekaran . M
7. Thambusamy M
8. Ramachandran M 9. Ramasamy M
10. Backiasa,my M
The above table shows that Dalmia cements has a major chunk of persons reported as most respectable pers()ns in the town and 6 out of the 10 most respectable persons in the town belong to Dalmia main colony and all of them are holding key positions in Dalmia cements. This sh{)ws the predominance. of this establishment I'.t Kallakkudi. Further, educational levels of the most respected persons in the town show that most of them are highly qualified. 6 among them are technical degree or diploma holders. 2 are graduates and ol'le has passed S.S.L.c. Religion! caste-wise distribution of the respected persons of the town shows that one person is a Christian and the remaining 9 persons are Hindus. Among the Hindt»;, 5 are Brahmins. 2 Udayars ~d one each from Kai· kolan and Reddiar communities.
The table below contains the detaiis of the mOlt influential persons in the town as a whole.
TABLE XI. 4
Particulars of most influential persons in the town
Name of persons Sex ReltgiOon/ Educa- Occupatio,)
1. Amaldass
1. Pasupathy
2
caste tional
3
qualification
4 5
M Christian S.S.l.C. Town Panchayat President
M. Ullayar X Std. Ward member
Religionl Educational Occupation caste qualification
3 4 5
Udayar M.B.B.S. Medical practitioner Brahmin B.E. General Manager, Dalmia cements
Brahmin B.E. Deputy General Manager, Dalmia cements Udayar III Std. Proprietor, Pandiyan Chit Fund
Kaikolan M.B.B.S. Medical Officer, Dalmia Utilisation Dispensary
Brahmin B.E. Mines Engineer, Dalmia cements Reddiar B.A. Clerk, Nataraj Ceramics and union secretary Brahmin D.C.E. Permanent Way Inspector, Dalmia cements Brahmin S.S.L.G Head Cashier, Dalmia cements Christian B.A. Priest
TABLE XI.4-Collcld.
2 3 4 5
3. Thambusamy M Reddiar B.A. Clerk, Nataraj Cera-mics and'Union secretary
4. Muthu>amy M Goundel' S.S.L.C. BurJler, Dillmia ce-
5. Gopalasarny M Brahmin B.E.
6. Tirumalai M Brahmin B.E.
ments and .. union vice-president
General ~Cj.na!;er, Dalmia cement!;
Deputy General Manager, Dalmia cements
Six. persons have been returned as the most influential persons in the town. It is quite natural that the General Manager and Deputy General Manager of Dalmia cements are returned as the most influential persons in the town by virtue of their covetable position jn. the company. All the remaining 4 are either politicians or trade union activists. Educational particulars of these persons show that two are engineering graduates, one is a graduate, 2 are SSLC and one has studied upto X. standard. Relig~on/ca~tewise distribution shows that one person is· a Christian and the rest are Hindus. Among Hindus, two are .Brah~ mins and ODe euch is U:dayar. Redpiar and GQunder. - , - ~ -\~. ... , ~,-' -:''' -. .. -. ......... -:
CHAPTER XU
LEISURE AND RECREATION, SOCIAL PARTICIPATION, SOCIAL AWARENESS, RELIGION AND CRIME
Leisure and recreation are parts of daily routine of human life and these are quite essential to develop healthy societies. Leisure and recre:ltion are universal factors among all societies surpassing geographical boundaries. Of course, the nature of recreation would vary from place to place and from society to society depending on the environmental and other conditions obtaining in particular places and ::lffiong different societies. Though people usually remain fully occupied in toiling for their daily bread they manage to fix some time every day for leisure and re-creation. Some persons deliberately plan and enjoy their leisure and recreation, while others are not so tmd they spend their leisure time enjoying one kind or the other recreation like listening to radio, watching TV, reading newspaper etc. Usually persons engaged in fixed working hours with adequate free time at their clispasal can well plan their leisure and recreation. Now-a-days there is a limitation for this category of persons also. Considerable time is being spent in commuting to place of work and back; leaving little time for leisure and recreation. However, for tbe vast majority of the people of Kallakkudi travel between home and place of work is not an impediment to enjoy leisure and recreation. In Ka11akkudi J 8 persons alone are taking more than an hour to reach their places of work while the other workers are 110t spending considerable time for this purpose. The cinema theatre, the library-eum-reading room, the mass media like radio and television etc., provide recreational facilities to the people of Kallakkudi. The places of w()rship also provide recreational facility in the sense that a significant part of the leisure tim;: of the religious minded people is devoted to worship. For others also the festivals celebr:lted in the temples, churches and mosque are nice sources of recreation.
Parks, p~aygrolUids
There is no public park or playground in the town for the use of the town dwellers. The only playground available in the town is the Dalmia school ground which 18 inside the Dalmia complex. There is a park also inside the Dalmia complex. 'There are two maidans in the town which are used more for organising political meetings than for conducting cultural activities and sports and games. These maidans are. as mentioned earlier, Pillayar koiI thidal (Pillayar koil maidan) and Kamarai thidal (Kamaraj maid an).
Libl'llry
The Dalmiapuram (Kallakkudi) Branch Library located bv the side of the Dalmia main road was opened on 8-1-1958. The library is affilhted to the Local Library Autbority, TintChcbirappalli. The lib-
160
rary is run by one librarian and one office assistantcum-peon. Initially the libntry had 2,000 books. But at the time of the survey the number of books has gone up to 10,000. This is a 'C' class library. The categorisation of libraries at".: as fellows:
The district central libraries are categorised as A dass. taluk central libraries as B class and I ibraries of major panchayats and viJlage panchayats as C class. The library has deposited an amount of Rs. 500 for safety of books with the Local Library Authority. The library charges an amount of Rs. 5 as caution deposit from each member for the safety of the bQoks issued to them. At the time of the survey there were J .000 members. The workin~ hours of the library are 9.00 to 12.00 in the morning and 3.00 to 6.00 in the evening. Fridays,. second Saturdays and other government hoHdays are obsaved as holidays for the library also. It is functioning on "\he grant given by the panchayat. On an average 75 persons visit the library every day. The types and number of books available in .eRch type in the library flre as fqllows:
Fictions 4,267, Drama 472, Political literature 434, Economics 94, Science 571, Religious books 756, Sociology 113, Law 25, Linguistics 184, and Children's books 3,084.
Cinema The size of Kallakkudi town can be gauged from
the number of cinema theatres available in the town. Kallakkudi town is having only one cinema theatre known as Sri Ambal Talkies. The theatre located in ward 9 was established during the year 1962. The theatre is in a pucca building with a floor space of 4{} ft. x 100 it. Projection length is 118 it. There are altogether 620 seats in the theatre which consist of 30 sofas, 63 chairs, ,118 seats in benches with back rest and 349 ~eats in benches without back rest. Sofa is the highest class and bench without back rest is: the lowest class. The rates are Rs. 3 for sofa, Rs. 2 for chair, Rs. 1.50 for bench with back rest and Re. 1 for bench without back rest. Usually there are two shows, first show commencing at 6.30 p.m. and second show at 9.30 p.m. On Saturdays and Sundays there are three shows including the matinee show which starts at 3.30 p.m. Average collection per day during the month preceding the month of survey VIaS Rs. 1.500 and the approximate collection during the year 1985-86 was over Rs. 5 Iakhs. Altogether there are 20 workers comprising of 1 manager, 1 asst. manager, 2 operators. 2 asst. operators, 1 electrician, 4 booking clerks 6 gate keepers, 1 watchman, 1 water boy and 1 cycl~ boy (messenger). The films usually exhibited cover various themes. such as sociaL religious, historical, comedy, crime de. The cinema is the popular source
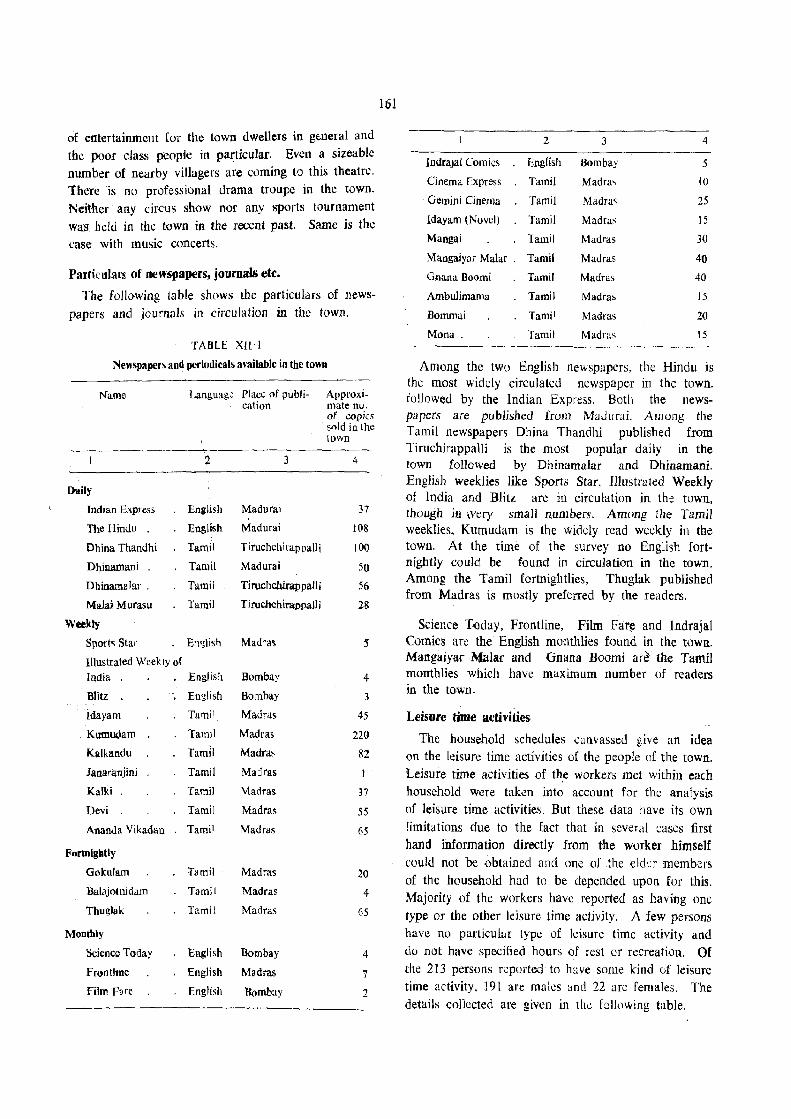
of entertainment for the town dwellers in gweral and the poor class {k-"Opie ill particular. Even a sizeable number of nearby villagers are coming to this theatrc. there is no professional drama troupc in the town. Neither any circus show nor any sports tournament Wml held in the town in the recent past. Same is the case with music concerts.
Particulars of newspapers, journals etc.
The following table shows the particulars of newSpapers and .journals in circulation in the town.
TABLE XU'I
Newspapers and periodicals available in the town
Name Language Plae" of pub'i- Approxi-cation mate nu.
of copies . ,(lId in the lown
_-----_. 2 3 4
Dai[~'
IndIan Expl ess English Madurai 37
The Hindu English Madurai 108
Dhina Thandhi Tamil TiruchchirappaU i 100
Dhinamani Tamil Madurai 50
Dbinamelal . Tamil Tiruchchirappalli 56
Malai Murasu Tamil Tirucllchira:ppaUi 28
Weekly
Sj)Oft" Star E'l~lish Madra~ 5
lllustrated Weeki y of India English Bombay 4
Blitz En~1ish Bombay 3
ldayam Tami! Madras 45
Kumudam Tamil Madras 220
Kalkandu Tamil Madra", 82
Janaranjini Tamil Ma:1rss
Kalki . Tamil Madl'as 37
Devi Tamil Madra$ 55
Ananda Vikadan Tamil Madras 65
Fortnightly
Gokulam Tamil Madras 20 Baiajot 111 dam Tamil Madras 4
Thuglak Tamil Madras 65
Monthly
Science Today English Bombay 4
Frontline English M3dras 7
Film Fare fnglisll 'R()mb:ty 2
161
2 3 4
IndraJal Comics English Bombay 5
Cinema Express Tamil Madra, 10
Gemini Cinema Tamil Madra~ 25
Idayam (Novel) Tamil Madras 15
Mangai Tamil Madras 30
Mangaiyar Malar . Tamil Madras 40
GnanaBoomi Tamil Madra~ 40
Ambulimama Tamil Madra;, 15
Bommai Tamil Madras 20
Mona. Tamil Madras 15
Among the two English newspapers. the Hindu is the most widely circulated newspaper in the town. followed by the Indian Express. Both the newspapers are published from MaduraL Among the Tamil newspapers Dhina Thandhi published from Tiruchirappalli is the most popular daily in the town followed by Dhinamalar and Dhinamani. English weeklies like Sports Star. lllustrated Weekly of India and Blitz are in circulation in the town, rhOug}l jn \very small numbers. Among the Tamil weeklies, Kumudam is the widely read weekly in the town. At the time of the survey no English fortnightly could be found in circulation in the town. Among the Tamil fortnightlies, Thuglak published from Madras is mostly preferred by the readers.
Science T()day, Frontline, Film Far~ and lndrajal Comics are the English monthlies found in the town. Mangaiyar Malar and Gnana Boomi ar~ the Tamil monthlies which have maximum number of readers in the town.
Leisure time activities
The household schedules canvassed give an idea on the leisure time activities of the people of the town. Leisure time activities of t~e workers met within each household were taken into account for the analysis of leisure time activities. But these data have its own limitations due to the fact that in several cases first hand information directly from the worker himself could not be obtained and one of the elder members of the household had to be depended upon for this. Majority of the workers have reported as having one type or the other leisure tjme actjyjty, A few persons have no particular type of leisure time activity and do not have specified hours of rest or recreation. Of the 213 persons reported to have some kind uf leisure time activity. 191 are rna lcs and 22 arc females. The details conccted are given in the following table.
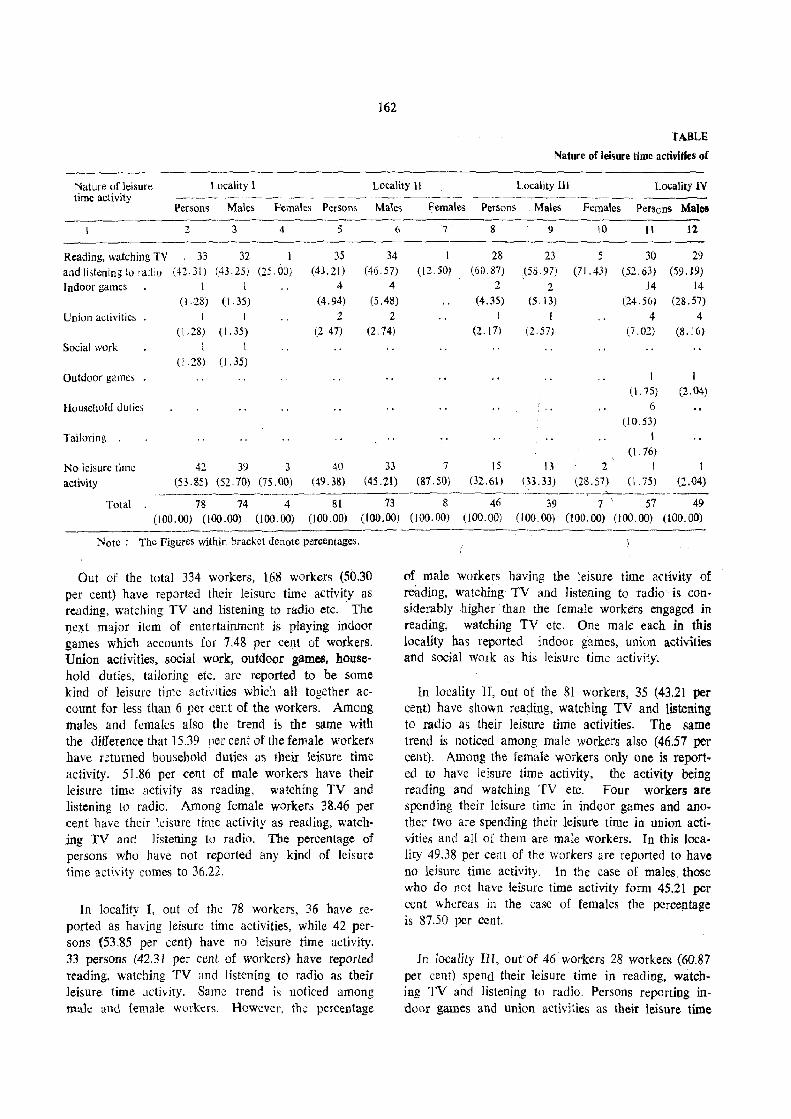
162
TABLE
Nature of leisure time activities of
Nature uf leisure time activity
Locality 1 Locality 11 Locality 11I Locality IV
Females Persons Males Persons Males Females Persons Males Females Persons Ma}ea
2 3
Reading, watching TV 33 32
and listening to rato (42.31) (43.25) Indoor games 1 [
Union activities
Social work
Outdoor gal1le,
Household duties
Tailoring .
(I 28) (\.35)
1
(\.28)
\ (1.28)
I (l. 35)
\
(1.35)
4 5
1 35
(25.08) (43.21 ) 4
(4.94)
2 (2.47)
(, 7 8
34 1 28 (46.57) (12.50) (60.87)
4 2
(5.48) (4.35)
2 [
(2.74) (2. (7)
9 [0 \l 12
23 5 30 29 (58.97) (71. 43) (52.63 ) (59.19)
2 14 14 (5.13) (24.56) (28.57)
[ 4 4 (2.57) (7.02) (8.16)
I (1.75) (2.04)
r 6 ... (10.53)
1 (1.76)
No leisure tim\.: activity
42 J,) 3 40 33 7 15 I 3 2 I I (53.85) (52.70) (75.00) (49.38) (45.21) (81.50) (32.61) (B.33) (28.57) (1.75) (2.04)
__ ~ _______ • ________ ~ ________ ~_:___ _____ " ___ ...!o.r __ . _______ _
Total 78 74 4 81 13 8 46 39 7 \ 57 49 (100.00) (100.00) (100.00) (100.00) (100.00) (100.00) (100.00) (100.00) (100.'00) (100.00) (l00.00)
Notc: The Figures within bracket denote percentages.
Out of the total 334 workers, 168 workers (50.30 per cent) have reported their leisure tim.; activity as reading, watching TV and listening to rkdio etc. The nqt major item of entertainment is playing indoor games which accounts for 7.48 per cent of workers. Union activities, social work, outdoor games. household duties, tailoring etc. are reported to be some kind of leisure time activities which all together account for less than 6 per cent of the workers. Among males and females also the trend is the same with the difference that 15.39 per cent of the female workers have returned household duties as their leisure time activity. 51.86 per cent of male workers have their leisllre time activity as reading, watching TV and listening to radio. Among female workers 38.46 per cent have their leisure time activity as reading, watching TV and listening to radio. The percentage of persons who have not reported any kind of leisure time activity comes to 36.22.
In locality 1, out of the 78 workers, 36 have reported as having leisure time activities, while 42 persons (53.85 per cent) have no leisure time activity. 33 persons (42.31 per cent of workers) have reported reading, watching TV and listening to radio as their leisure time activity. Same trend is noticed among ma.]e and female workers. However, th''': percentage
of male workers having the leisure time activity of reading, watching TV and listening to radio is considerably higher than the female workers engaged in reading, watching TV etc. One male each in this locality has reported indoor games, union ac;tivities and social work as his leisure time activity.
In locality II, out of the 81 workers, 35 (43.21 per cent) have shown reading, watching TV and listening to radio as their leisure time activities. The same trend is noticed among male workers also (46.57 per cent). Among the female workers only one is reported to have leisure time activity. the activity being reading and watching TV etc. Four workers are spending their leisure time in indoor games and another two are spending their leisure time in union activities and all of them are male workers. In this locality 49.38 per cent of the workers are reported to have no leisure time activity. In the case of males. those who do not have leisure time activity form 45.21 per cent whereas in the case of females the percentage is 87.50 per cent.
In locality III, out of 46 workers 28 workers (60.87 per cent) ,spend their leisure time in reading, watching TV and listening to radio. Persons reporting indoor games and union activities as their leisure time
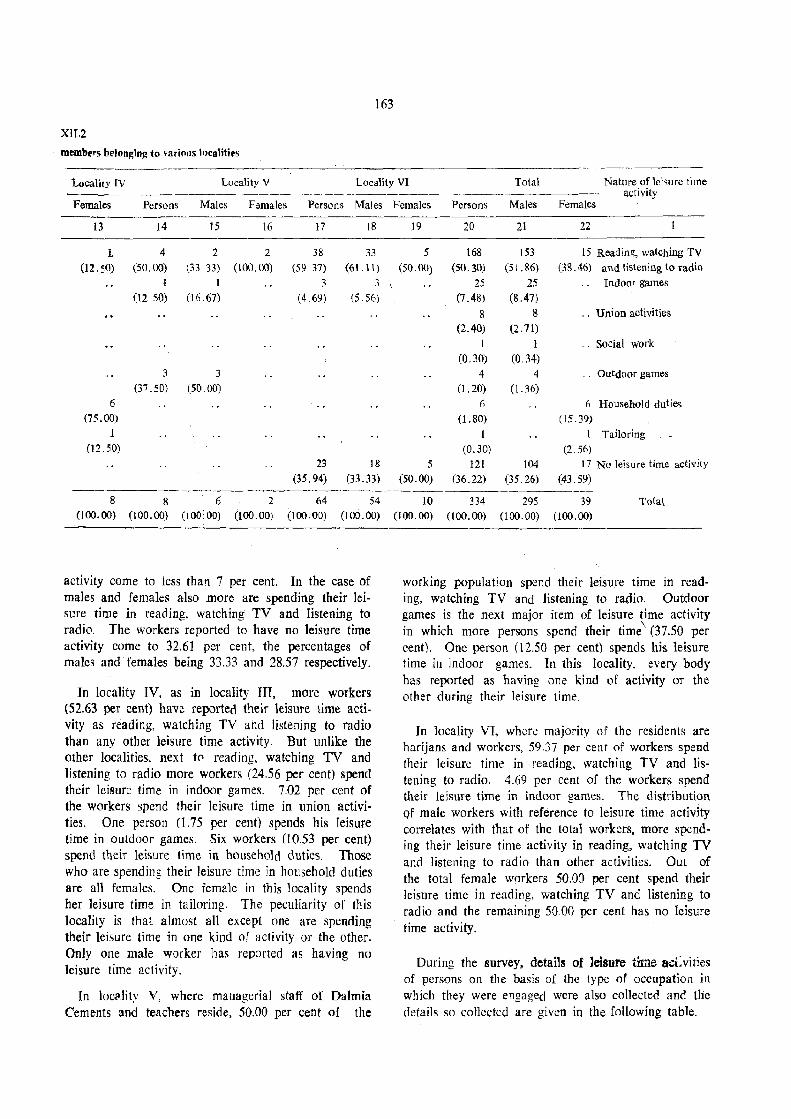
163
XII.2
members be10nging to vafiolls lOtalities
Locality [V Locality V Locality VI Total Nature of lei,ure time ~----~-~--- ---------- ---_.--_----_- activity
Females Persons Males Females Persons Males
I3 14 15 16 17 18
1 4 2 2 38 33
(12.50) (50.00) (33.33) (100.00) (59.37) (61. 11)
1 1 3 3 (12.50) (16.67) (4.69) (5.56)
3 3
(37 .50) (50.00)
6
(75.00)
1
(12.50)
23 18
(35.94) (33.33)
8 8 6 2 64 54 (100.00) (100.00) (100;00) (100.00) (100.00) (100.00)
activity come to less than 7 per cent. In the case of males and females also more are spending their leisure time in reading, watching TV and listening to radio. The workers reported to have no leisure time activity come to 32.61 per cent, the percentages of males and females being 33.33 and 28.57 respectively.
In locality IV, as in locality III, more workers (52.63 per cent) have reported their leisure time activity as reading, watching TV and listening to radio than any other leisure time activity. But unlike the other localities, next to reading, watching TV and listening to radio more workers (24.56 per cent) spend their leisure time in indoor games. 7.02 per cent of the workers spend their leisure time in union activities. One person (1.75 per cent) spends his leisure time in outdoor games. Six workers (10.53 per cent) spend their leisure time in household duties. Those who are spending their leisure time in hOl1sehold duties are all females. One fema1e in this locality spends her leisure time in tailoring. The peCUliarity of this locality is that almost aU except one are spending their leisure time in one kind of activity or the other. Only one male worker has reported as having no leisure time activity.
In 10~.Iity V, where managerial staff of Dalmia Cements and teachers reside, 50.00 per cent of the
Females Persons Males Females
19 20 21 22
5 168 153 15 Reading, watChing TV
(50.00) (50.30) (SU6) (38.46) and listening to radio
25 25 Indoor games
(7.48) (8.47)
8 8 .. Union activities
(2.40) (2.71)
1 1 .. Social work
(0.30) (0.34)
4 4 .. Outdoor games
(1.20) (1. 36)
6 6 Household dutie~
0.80) (15.39)
1 1 Tailoring
(0.30) (2.56)
5 121 104 17 No leisure time activity (50.00) (36.22) (35.26) (43.59)
10 334 295 39 Total (100.00) (100.00) (100.00) (100.00)
working population spend their leisure time in reading, watching TV and listening to radio. Outdoor games is the next major item of leisure time activity in which more persons spend their time\ (37.50 per cent). One person (12.50 per cent) spends his leisure time in indoor games. In this locality, every body has reported as having one kind of activity or the other during their leisure time.
In locality VI, where majority of the residents are harijans and workers, 59.37 per cent of workers spend their leisure time in reading, watching TV and listening to radio. 4.69 per cent of the workers spend their leisure time in indoor games. The distribution qf male workers with reference to leisure time activity correlates with that of the total workers, more spending their leisure time activity in reading, watching TV and listening to radio than other activities. Out of the total female workers 50.00 per cent spend their leisure time in reading, watching TV and listening to radio and the remaining 50.00 per cent has no leisure time activity.
During the survey, details of leisure time acLvities of persons on the basis of the type of occupation in which they were engaged were also collected and the details so collected are given in the following table.
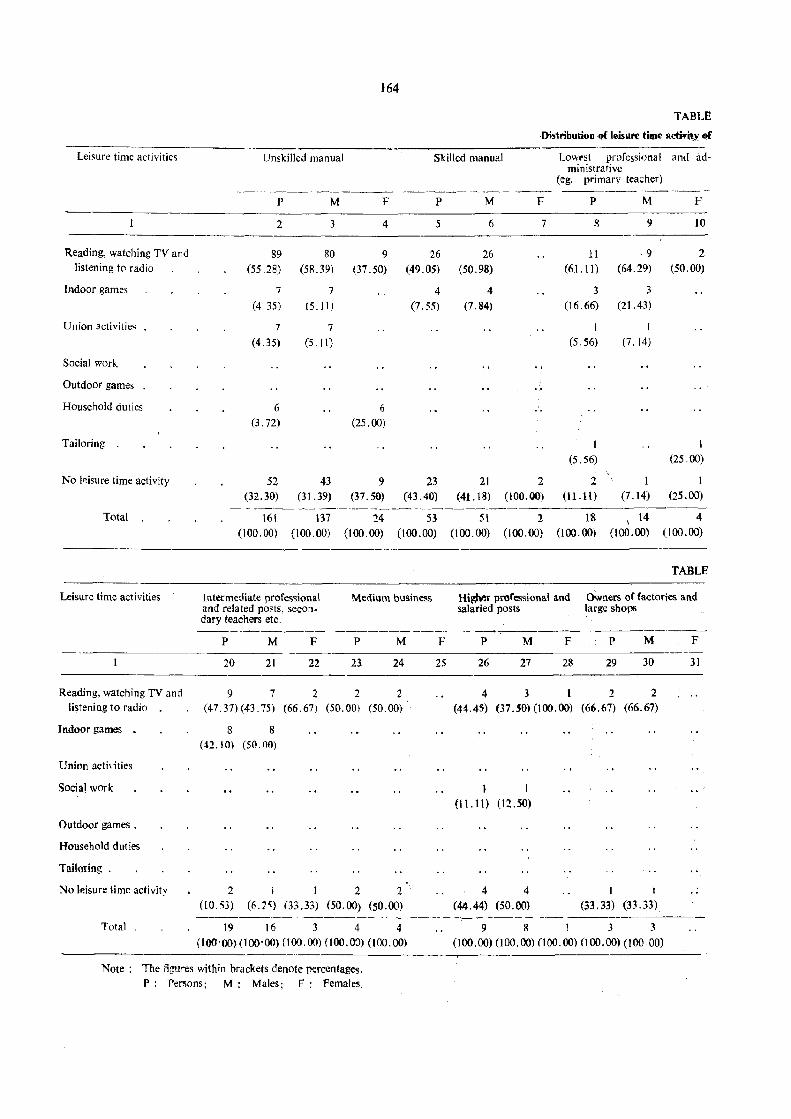
Leisure time activities
Reading, watching TV and
listening to radio
Indoor games
Union ~ctivitie.
Social work
Outdoor games
Household duties
Tailoring .
No leisure time activity
Total .
Leisure time activities
Reading, watching TV and
listening to radio
Indoor games .
Union activities
Social work
Outdoor games .
Household duties
Tailoring.
No Ip.isure time activity
Total
164
TABLE
Distribution of leisure time act~y. ~
Unskilled manual Skilled manual Lowl's! profe5sional amI ad-
p
2
89 (55.28)
7 (4.35)
7
(4,35)
6
(3.72)
52 (32.30)
M
3
80 (5R.39)
7 (5.11)
7 (5.11)
43 (31.39)
F P M
4 5 6
9 26 26
(37.50) (49.05) (50.98)
4 4 (7.55) (7.84)
6 (25.00)
9 23 21
(37.50) (43.40) (41. 18)
ministrative (eg. primary teacher)
F P M F
7 P, 9 JO
11 ·9 2
(61.11) (64.29) (50.00)
3 3
(16.66) (21.43)
1 1
(5.56) (7.14)
1 1
(5.56) (25.00)
2 2 1 1
(100.00) (11.1l) (7.14) (25.00)
161 (100.00)
137 24 53 51 2 18 \ 14 4 (100.00) (100.00) (100.00) (100.00) (100.00) (100.00) (100.00) (100.00)
Intermediate professional and related posts, secondary teachers etc.
P M F
20 21 22
9 7 2 (47.37) (43.75) (66.67)
8 8
(42.10) (50.00)
2 1 (10. ';3) (6.1'i) (33.33)
Medium business
P M
23 24
2 2 (50.00) (50.00)
2 2 (50.00) (50.00)
----------------_. 19 16 3 4 4
(100'00)(100'00) (100.00) (100.00) (100.00)
TABLE
HigMf professional and oWners of factories and salaried posts large shops
F p M F p M F
25 26 27 28 29 30 31
4 3 t 2 2
(44.45) (37.50) (100.00) (66.67) (66.67)
1 1 (1 I. I!) (12.50)
4 4 I
(44.44) (50.00) (33.33) (33.33)
9 ~ 1 3 3 (100.00) 000.00) (JOO.OO) (100.00) (100 00)
Note: The figures within brackets denote percentages.
P: Persons; M' Males; F' Females.
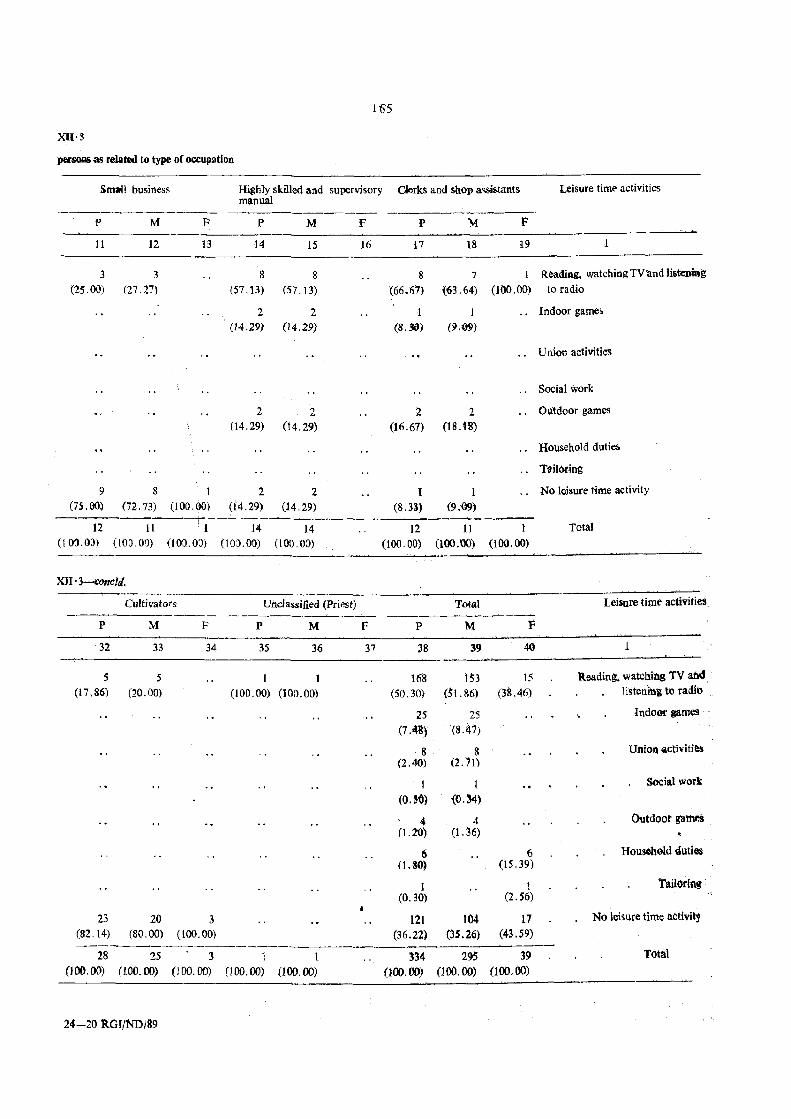
1'65
xn'3 persllllS as relaUld to type of occupation
Smail business Highly skilled and supervisory manual
~rks and shop a~sistants Leisure tim!' activities
---------p M F P M F P M F
11 12 13 14 15 16 17 18 19 1
3 3 8 8 8 7 1 Reading, watching TV and listening
(25.00) (27.27) (57.13) (57.13) (66.67) «(;3.64) (100.00) to radio
2 2 1 1 .. Indoor game~
(14.29) (14.29) (S.3t'J) (9.®)
.. Union activities
.. Social work
2 2 2 2 .. Outdoor games
(14.29) (14.29) (16.67) (18.Hl)
.. Household dutie!>
.. Tailoring
9 8 1 2 2 I 1 .. No leisure time activity
(75.00) (72.73) (100.00) (t4.29) (14.29) (8.31) (9.09) -----------i---
12 11 : 1 14 14 12 11 1 Total (lOO.O[) (l0,), Of) (100.00) (100. ()() (100.00) (l00.00) (100.'00) (100.00)
XII· 3-ronclri.
Cultivators Unclassified (Priest) Total Leisure time activities ------ ------------- --------' -~
P M F P M F P M F
32 33 34 35 36 37 38 39 40
5 5 1 1 16B 153 IS Reading. watchil.'lg TV aile!. (17.86) (20.00) (100.00) (100.00) (50.30) (51. &6) (38.46) listenIng to radio
25 25 Indo9!' games
(7 .• 1) (8.il1)
8 8 Union -activities (2.40) (2. it)
1 1 Social work
(0. !()) {O.34)
4 4 Outdoor games (1.20) (1.36)
11 6 Household ~iuties (1.80) (15.39)
1 1 TaiiOting (0.30) (2.56)
23 20 3 121 104 17 No leisure time activitj
(82.14) (80.00) (100.00) (36.22) (35.26) (43.59)
28 25 3 1 1 334- 295 39 Total
(100.00) (100.00) (l DO. 00) (!OO.OO) (100.00) (100.00) (100.00) (100.00)
24-20 RGI/ND/89
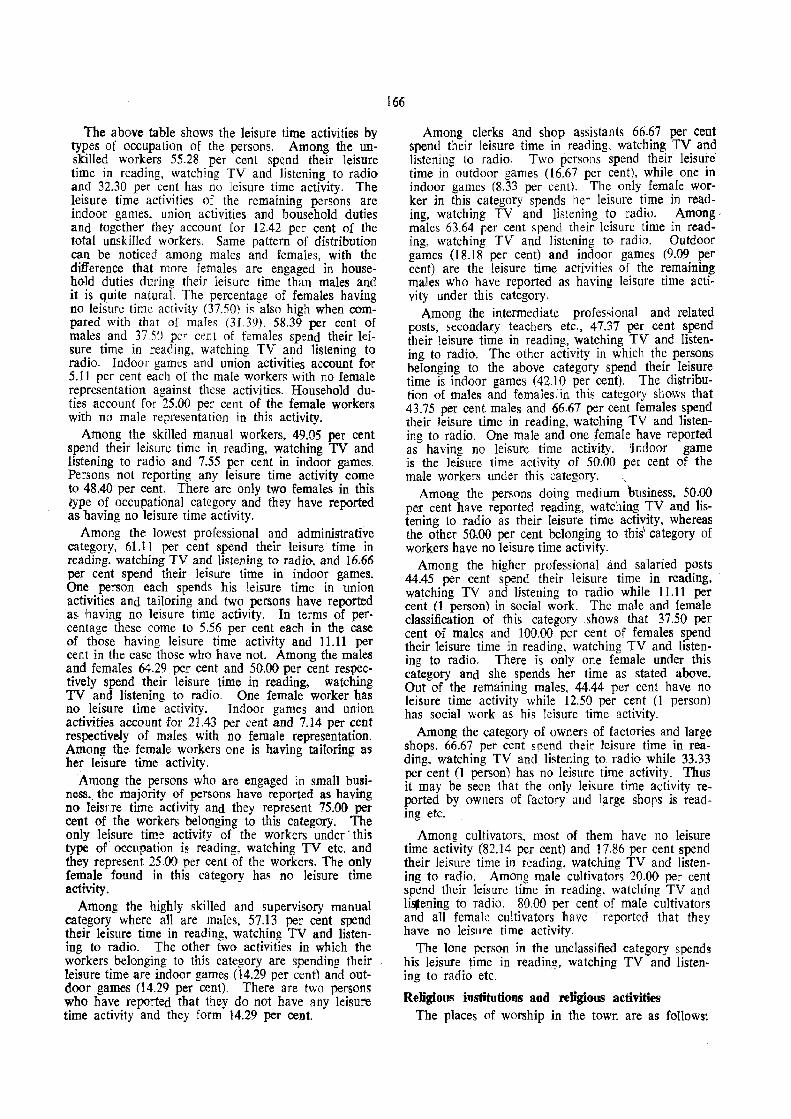
The above table shows the leisure time activities by types of occupation of the persons. Among the unskilled workers 55.28 per cent spend their leisure time in reading, watching TV and listening to radio and 32.30 per cent has no leisure time activity. The leisure time activities of the remaining persons are indoor games, union activities and household duties and together they account for 12.42 per cent of the total unskilled workers. Same pattern of distribution can be noticed among males and females, with the difference that more females are engaged in household duties during their leisure time than males and it is quite natural. The percentage of females having no leisure time activity (37.50) is also high when compared with that of males (31.39). 58.39 per cent of males and 37.50 per cent of females spend their leisure time in reading, watching TV and listening to radio. Indoor games and union activities account for 5.1l per cent each of the male workers with no female representation against these activities. Household duties account for 25.00 per cent of the female workers with no male representation in this activity.
Among the skilled manual workers. 49.05 per cent spend their leisure time in reading, watching TV and listening to radio and 7.55 peT cent in indoor games. Persons not reporting any leisure time activity come to 48.40 per cent. There are only two females in this type of occupational category and they have reported as having no leisure time activity.
Among the lowest professional and administrative category, 61.11 per cent spend their leisure time in reading, watching TV and listening to radio, and 16.66 per cent spend their leisure time in indoor games. One person each spends his leisure time in union activities and tailoring and two persons have reported as having no leisure time activity. In terms of percentage these come to 5.56 per cent each in the case of those having leisure time activity and 11.11 per cent in the caSe those who have not. Among the males and females 64.29 per cent and 50.00 per cent respectively spend their leisure time in reading. watching TV and listening to radio. One female worker has no leisure time activity. Tndoor games and union activities account for 21.43 per cent and 7.14 per cent respectively of males with no female representation. Among the female workers one is having tailoring as her leisure time activity.
Among the persons who are engaged in sman business,. the majority of persons have reported as having no leisnre time activity and they represent 75.00 per cent of the workers belonging to this category. The only ,leisure time activity of the workers under· this type of occupation is reading, watching TV etc. and they represent 25.00 per cent of the workers. The only female found in this category has no leisure time activity.
Among the highly skilled and supervisory manual category where all are males, 57.13 per cent spend their leisure time in reading, watching TV and listening to radio. The other two activities in which the workers belonging to this category are spending their leisure time are indoor games (14.29 per cent) and outdoor games (14.29 per cent). There are two persons who have reported that they do not have any leisure time activity and they form 14.29 per cent.
166
Among clerks and shop assistants 66.67 per cent spend their leisure time in reading, watchin~ TV. and listcning to radio. Two persons spend th~lr letsu~e time in outdoor games (16.67 per cent), whIle one III indoor games (8.33 per cent). The only female worker in this category spends her leisure time in read-ing, watching TV and listening to radio. Among, males 63.64 per cent spend their leisure time in reading, watching TV and listening to radio. Outdoor games (18.18 per cent) and indoor games (9.09 per cent) are the leisure time activities of the remaining males who have reported as having leisure time acti" vity under this category.
Among the intermediate professional and related posts, secondary teachers etc .• 47.37 per cent spend their leisure time in reading, watching TV and listening to radio. The other activity in which th~ pe~sons belonging to the above category spend theIr .lel~ure time is indoor games (42.10 per cent). The dIstnbution of males and females in this category shows that 43.75 per cent males and 66.67 per cent females spend their leisure time in reading, watching TV and listening to radio. One male and one female have reported as having no leisure time activity. 'Indoor game is the leisure time activity of 50.00 per cent of the male workers under this category. .,
Among the persons doing medium business, 50.00 per cent have reported reading, watching TV and lis~ tening to radio as their leisure time activity, whereas the other 5()'OO per cent belonging to thisl category of workers have no leisure time activity.
Among the higher professional and salaried posts 44.45 per cent spend their leisure time in reading, watching TV and listening to radio while 11.11 per cent (1 person) in social work. The male and female classification of this category shows that 37.50 per cent of males and 100.00 per cent of females spend their leisure time in reading, watching TV and listening to radio. There is only one female under this category and she spends her time as stated above. Out of the remaining males, 44.44 per cent have no leisure time activity while 12.50 per cent (l person) has social work as his leisure time activity.
Among the category of owners of factories and large shops, 66.67 per cent spend their leisure time in reading. watching TV and listening to radio while 33.33 per cent (l person) has no leisure time activity. Thus it may be seen that the only leisure time activity reported by owners of factory 'Iud large shops is reading etc.
Among cultivators. most of them have no leisure time activity (82.14 per cent) and 17.86 per cent spend their leisure time in reading, watching TV and listening to radio. Among male cultivators 20.00 per cent spend their leisure time in reading, watching TV and Ii1fening to radio. 80.00 per cent of male cultivators and all female cultivators have . reported that they have no leisure time activity.
The lone person in the unclassified category spends his leisure time in reading, watching TV and listening to radio etc.
Religious institutions and religious ac.tivities
The places of worship in the town are as follows:
167
Sivan koH (Pasupathy Easwaran koil) Established about 500 years ago, this temple is lo
cated in nadu veethi in ward 1. No Jegend or history is attached to this temple. The main idols worshipped in the temple are Lingam and Nithyakalyani. The main festivals conducted ill this temple are Sivarathri in the months of February-March, Panguni Uthiram in the month of March, annabhishekam in the month of November and Karthigai deepam in the . months of November-December. About 300 to 500 people congregate during these festivals. Apart from these festivals daily poojas are also being conducted in the temple.
Management and control of the affairs of the temple rest with a trust. of six members. Among the trustees one belongs to Reddiar community and the others belong to Udayar commumty. ]ncome of the temple is from the lease of its land. The temple has neadv 6 hectares of land. Annual income from these account for Rs. 4,000. In addition to the above, the temple has a fixed deposit of Rs. 10,000 in the bank. Daily pOojas are being conducted by Brahmins. People professing Hindu religion belonging to all castes numbering 25 to 30 attend the daily poojas.
Mariamman koil , This temple situated in pura veethi in ward 2 was established during 19308 and wa,s renovated in the year 1976. No legend or history is at1ached to the temple. There is nothing wbrth mentioning about the construction details of the temple. The principal deity of the temple is Mariamman. The main festival associated with the temple is Vaikasikappu-Kattu Thiruvizha which is conducted for 8 days during the month of May. Management and control of the temple rest with the same trustees who manage the Sivan koil (Pasupathi Easwaran Koil). Total annual income of the temple is from lease of land which amounts to Rs. 25,000 per year. In addition to this, donations are collected from the public at the time of the festival. The temple has nearly 1 hectare of cultivable land. Hindus belonging to all castes and communities visit the temple at the time of morning pooja. On an average 20 to 25 people visit the temple at the time of the morning pooja.
Pillayar koil (Vinayagar temple) This temple is located in nadu veethi in ward 2.
Exact date of' establishment of the temple is not known. The temple was renovated during the year 1976. No legend or history is associated with the tem
ple. Principal deity of the temple is Vinayagar. Im-portant festival of the temple is Vjnayaga Chathurthi which is being celebrated during the month of September. Income of the temple is from the shops which are situated in the temple land and from general hundi collection and donations collected at the time of the festival. Hindus belonging to all castes and communities visit the temple. On an average 10 to 15 persons visit the temple daily.
Vinayagar temple Situa_te"d by the side of Dalmia main road, this tem
ple was establihsed during the year 1932. No legend or history is associated with the origin of the temple. The main deity of the temple is Vinayagar. Vinuyaga
Chaturthi is re1ebrated during the month of September. Management and control of the temple is by the same trustees who manage the above mentioned temples. Main sou~ce of income of the temple is f~om general collection made at the time of the iest1V~J. Abo~t 10 to 15 devotees visit tbe temple for dally worshIp. Karnppusami koil
J?le temple ~t the present site in Chidambaram salal was estabhshed during the year 1956. Earlier it w~s in the n:ining area. Later on, the temple was ~hlfted to Chtdambaram salai to enable mining work In' the place where it was originally situated. There were protests from the villagers in shifting the temple to Chidambaram salai. However, after much persuasi~n the Dalmia company management managed to shift the temple to Chidambaram salai. Since then the .temple is being maintained by Dalmia cements. Du~mg t!Je months of November-December, Karthigai fe~tlV~1 IS c.elebrated for a period of 7 days. The prmclpal deIty of the temple is Karuppusami. At the time of the festival mostly Boyars congregate.
SengammaIaiyanar temple
~~is temple is also situated in Chidambaram sa1ai. Ongm of the temple is not known. There is no Iege!l~/history connected with the temple. The main deIties. of the temple are P~riy~sami. Sannasi-Sengammalalyanar an~ Solakanlllyagl.. Adl pongal is celebra~ed for a penod of 6 days dunng the Tamil month Adt (July-August). A festival called Adi Friday :is celebrated during the last Friday of Tamil month Adi. The festival extends for six days. The management and control of the affalrs of the temple rest with the same trustees who manage and control the Sivan koil (Pasupathy Easwaran koil). The main income of the temple is from the lease of nearly one hectare of wet .land. Generally 5 to 10 people visit the temple daily.
CheUi Amman koil
The temple is said to have been established 500 years ago. . Th~ principal deities of the temple are Nalla ChelhyaYl and Ayyanar. Mam festival of the temple is Vaigasi Pongal which is celebrated for a period ~f 15 days w~ich falls in the manti; of May. ~ he mam ~ource of Income of the temple is a share t rom . the mterest of Rs. 10,000 deposited as fixed deposI~ by the Pasupathy Easwaran koil and by hundi collectIOn. A monthly payment of Rs. 40 is made to the poojari for performing the daily pooja. On aD average 5 to 10 people visit the temple every day.
D~oupathy Amman koll
The temple situated by the side of the tank called 'nalla thannir kulam' was established during the year 1930. No legend or history is associated with the temple. The main deity of the temple is Dhroupathy Amman. The main festival of the temple is Chithirai Pongal which is celebrated for a period of 18 days during the month of April. The temple is managed by the same trustees who manage tlie affairs of the Sivan koil (Pasupathy Easwaran KOil). Expenditure is met through donations only.
Mariamman koil
LOCated at harijan- colony, this temple was estab-
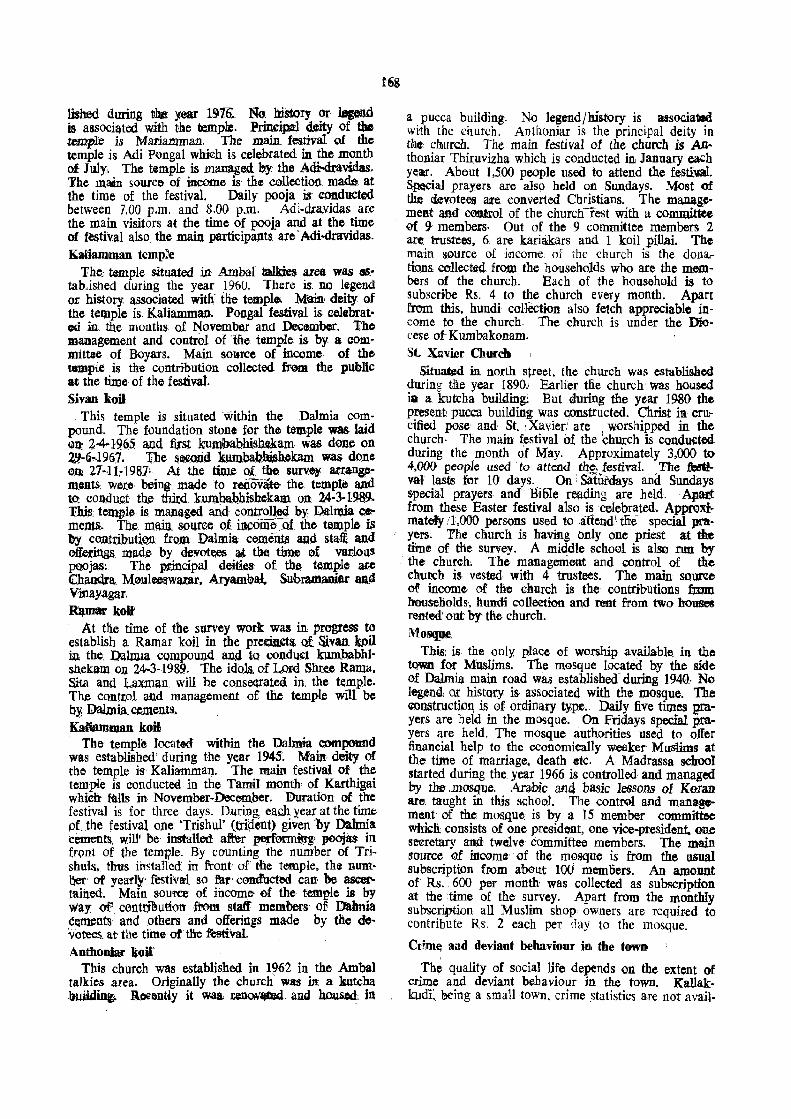
lishetl during _ ~ear arK ~ ~ry ?r logoJld is associated with the tlempU:. Pnncipal deity of tho ~le is Mariamman. The main festival 01 the temple is Adi Pongal which is celebrated. in ~e m?Uth of J uiy. The umple is managed by the A<Ji..d:raVldas. The ~a4n source of income is the C011ection ma~ at the time of the festival. Daily pooja ls. conducted between 7.{)O p.m. and 8.00 p.m. Adi-dra.vidas, are the main visitors at the time of poola ~ a~ the ~ime of festival also. the main participants are Adi·draVldas. Kaliamman temp:1e
The; temple situated in Ambal talkies ~ea was C16~ tab.ished during the year 196U. There IS. no legend or history associated witli the'temploc .. M~' deity of the temple is Kaliamman. Pongal festival IS celtbratcd in the months of Novemt)Qr and .lJ'ecembcr. The management and control of the temple is by a committee of Boyars. Main source of income of the toiBpLe is th-e contribution conceted fr-0m the public at the time of the festival. SiVaD koit
This temple is situated 'Within the Dalmia co~pound. The foundation stont for the t~Olple W38 laid tlIll! 2-4-19&5 ;wd first kum(babhishokam was done on 29.-6r-1967. ]be $~d kumbabJ.\isb.okam was, done ClIn. 27-11-1981· At the time of the: survey: 1l(taJl&~:" nt4nlS wexe being, mll'le to reitov~ the. temple and to: conduct the third. kumbabhishekam on 24-3-19.89-ThW' temple is 11!an'l-ged and ~0nt:!'oll~ by Dalmia C!" melm. The, mrun. sauree 01 UlComo ,of the temple- iii by C011tributi® from Dalmia cementa and stlUt and o&ring&. mad~ by devot~ ad; th~ ~ 0.f variQUs jJQOjas; The principal deities of the t~lIl.ple at-e £handra M0Ulcoswar:ar, AryambaJ.. Sabramamar ad Vinayagar. IDJma' koil' . At the time of tbe survey work was in progress to establish a Ramar koil in the pree.iD.cta Q{: Sivan k-oil ill. the. Dalroul cQmpoUl,lQ. an.<i to oonducl 1oJm.b.abhlsllekam on 24-3-1989. The idols. of Lord Shtee Rama, Sita and Lal;1Dan will be conse<P'~1ed in. the temple. T~ contLol and management of the temple will be b¥ Dabnia, cements, Katianmtan koil
The temple located within the Dalmia .comJ~mld was established' during the year 1945. MaID dmty of the temple is Kaliamman. The main festival of .~
. temple is conducted in the Tamil month, of. Karthlgat which falls in November-December. Duratlon ()f tile festival is for three days. During eacll y'ear_ at the time of. the festival oJ}e 'Trishul' (trilient) given oy Dalinia c:ementa will' be installed' abr ~ poojas in front of the temple. By counting the number of Trisbuls.,~ thus ih1ltalled: in wont of tlle temple, the num~" of yearly' festivll'l gO far' cootflIctM can 'be ascertained. Main source of income of the temrle is by way of contri'&uriorr fi'Om staff members' or Dahnia c~nts and others and offerings made by the de· votees. at the time of tlte ft:stival. AntlloBiar Itoil:
This church was established in 1962 in the Ambal talkies area. Originally the church' was in a kutcha ltll'UljD(I. ROiontly it w.aa. tellOV_. aru.l bD.us.ed; in
a pucca building. No legend/history is associa1llld with the church. Anthoniar is the principal deity in tke cflJurclI. The main festival of the church is An· thoniar Thiruvizha which is conducted in January each ye.a:r. About 1.500 people used to attend the festival. Spacial prayers are alsp held on Sundays. Most of the devotees ate converted Christians. The mana&emeM and OOJIh'ol of the church rest with a committee of 9 members· Out of the 9 committee members 2 are, trustees, 6, are kariakars and 1 koil piUai. The main source of income. of the church is the dona,.. tmus. collect#<! from the households who are the members of the church. Each of the household is to subscribe Rs. 4 to the church every month. Apart from this, hundi col1ection also fetch appreciable income to the church, The church is under the Diocese of- Kumbakonam. Sf. ~.vier Church
Situated in. north street, the church was established during tile year 1890) Earlier tlie church was housed ia a kutcha building; But during the year 1980 the present pucca building was ®DStructed. Christ in. cru:cified pose and St. : Xavier,' are ,worshipped in the church· The main festival bf the church is condu~tod during the month of May. Approximately 3,()()() to 4,00Q peop1e used . to attend tb~ J_estiV'aI. , ~ The festival' lasts fur 10 days. On Saturdays and Sundays Sf)ecial prayers and Bio1e reading are held. Apafll: from these Easter festival also is celebrated. Approximately /1,000 persons USed to ,altend\ tni- special prayers. The cnurch is having bnly one priest at tile time of the survey. A middle school is also run by the church. The managenient and control of the chuJ.1Cn is vested with 4 trustees. The main source of income· of the church is the contributions fmm hooseholds, hundi collection and rent from two houses rented' out by the church. Mosq~e
This: is the only, place of worship available in tllc tQWD for Muslims. The mosque locatoo by the side of Dahnia main road was established during 1940: No legena. o.r history is associated with the Dlosque. The eolllltructio~ is of ordinary ty.~.. Daily five times pm. yers are held in the mosque. On Fridays, special. prayers are held. The mosque authorities used to offer financial help to the economically weaker Muslims at the' time of marriage, death etc. A Madrassa school started during the year 1966 is controlled and managed by tlm .IDQSque. Arabic 8414 basic lessons of Karan are taught in this school. The contNl and management of the mosque. is by a 15 member committee whidi: consists of one president, one vice-president. one sooretary and twelve commiftee members. The main source of income of the mosque is from the u&Ua1 subscription from about 100 memDers. An amount of Rs. 600 per month· was collected as subscription at the time of the survey. Apart from the monthly SUbscription all Muslim shop owners are required to contribute Rs. 2 each per day to the mosque.
Cfirn~ and deviant behaviour in the town
The quality of social life depends on the extent of crime and deviant behaviour in the town. KaUakkudi~ being a small town, crime statistics are not avail-
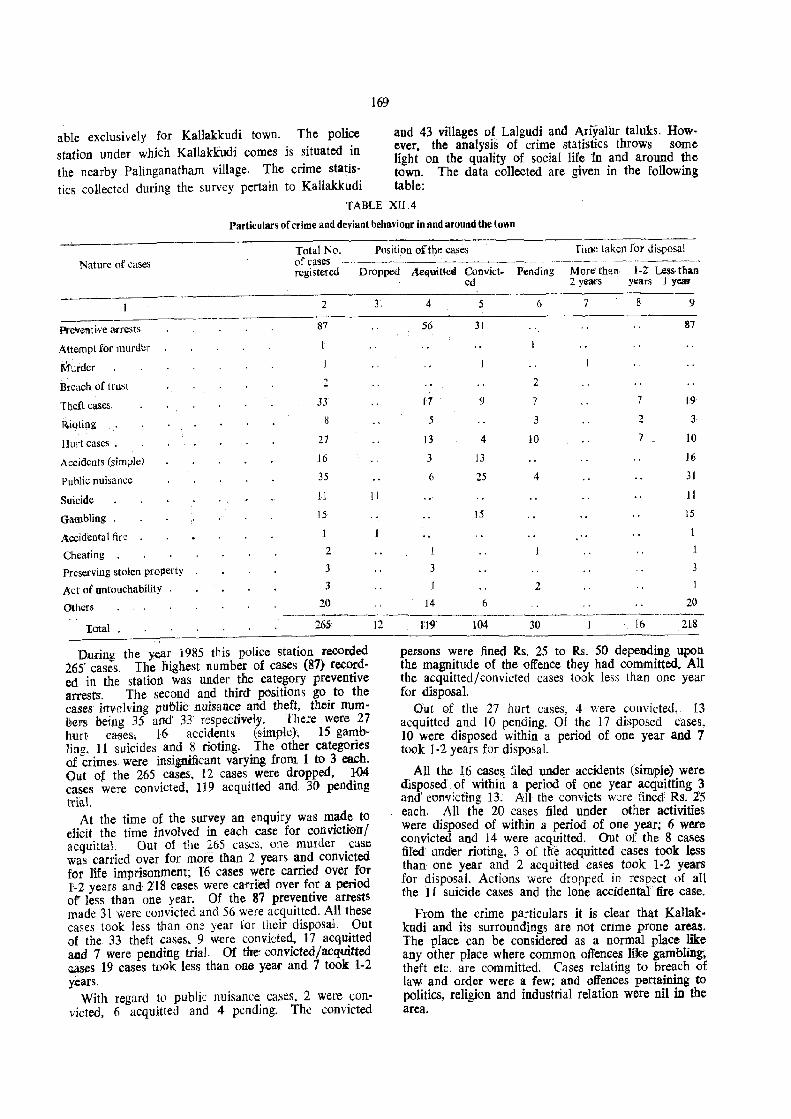
169
able exclusively for Kallakkudi town. The police and 43 villages of Lalgudi and Ariyalur taluks. How-station under which KallakICudi comes is situated in ever, the analysis of crime statistics throws some
light on the quality of social life 1n and around the the nearby Palinganatham village. The crime statis- town. The data collected are given in the following tics collected dudng the survey pertain to Kallakkudi table:
TABLE XII.4
Particulars of crime and deviant behaviour in and aruund the town
Total No. Position ofthe eases rimp. taken for d'isposal Nature of cases of cases ~"~~~--_:----' ------ - ----------
registered Dropped AeEjuitteli Convict- Pending More tllan, 1-2' Less- than cd 2 years Ylears I yea,
PreVentive arrests
l''\ttempl for murder
Murder
Breach. of trusl
Theft cases.
R.ioting
Hurt cases.
Accidents (sim;>lel
Puhlic nuisance
Suicide
Gambling
Accid'enta I fire
Cheating .
Preserving stolen property
Act of untouchability
Others
2
87
~ ,;.
JJ
H
27
16
35
11
15
1
2
3
3
20
3, 4
56
n 5
13
3
6
II
1
3
14
5 6 7 8 9
31 87
2
9 7 7 19-
3 2 3
4 10 7 10
13 16
25 4 31
11
15 15
1
1
3
2
6 20 .----------------------------_._._-
Tatal 265
During the year 1985 this pOlice station recorded 265" cases. The highest number of cases (87) recorded in the station was under the category preventive arrests". The second and third" positions go to the cases involving pulJIic nuisance and theft, their numBers ~e1ng 35 and' 33 respectiveiy. There were 27 hurt ca-ses, 16 accidents (simple), 15 gamblin!!, 11 suicides and 1\ rioting. The other categories of crimes were insignificant varying from 1 to 3 each. Out of the 265 cases. 12 cases were dropped, 104 cases were convicted, 119 acquitted and 30 pending trial.
At the time of the survey an enquiry was made to elicit the time involved in each case for convictren! acquittal. Out of the 265 cases, one murder . case was carried over for more than 2 years and conVicted for life imprisonment; 1"6 cases were carried over for 1-2 years and 218 cases were caTrial over for a period of less than one year. Of the 87 preventive arrests made 31 were convicted and 56 were acquitted. All these cases took less than one year for their disposal. Out of the 33 theft cases, 9 were convicted, 17 acquitted ami 7 were pending trial. Of the· convicted/acquitted <>Jlses 19 cases toOk less than one y.ear and 7 took 1-2 years.
With regard to public nuisance cases, 2 were convicted, 6 acquitted and 4 pending. The convicted
12 n9 104 30 16 2];8
pe1'sons were fined Rs. 25 to Rs. 50 depending upon the magnitude of the offence they had committed. All the acquitted/convicted cases took less than one year for disposal.
Out of the 27 hurt cases, 4 'were convicted, 13 acquitted and 10 pending. Of the 17 disposed cases, 10 were disposed within a period of one year and 7 took 1-2 years for disposal.
All the 16 case~ filed under accidents (simple) were disposed of within a period of one year acquitting 3 and~ con'Victing 13. All tlie convicts wae fined: Rs. 2'5 each. All the 20 cases filed under other activities were disposed of within a period of one year; 6 were convicted and 14 were acquitted. Out of the 8 cases filed under rioting, 3 of ate acquitted cases took less than one year and 2 acquitted cases took 1-2 years for disposal. Actions were dropped in resp~ct of all the I I suicide cases and the lone aCCidental' fire case.
From the crime particulars it is clear that Kallakkudi and hs surroundings are not cnme prone areas. The place can be considered as a normal place like any other place where common offences like gambling; theft etc. are committed. Cases relating to breach of law and order were a few: and offences pertaining to politics, religion and industrial relation were nil in the area.
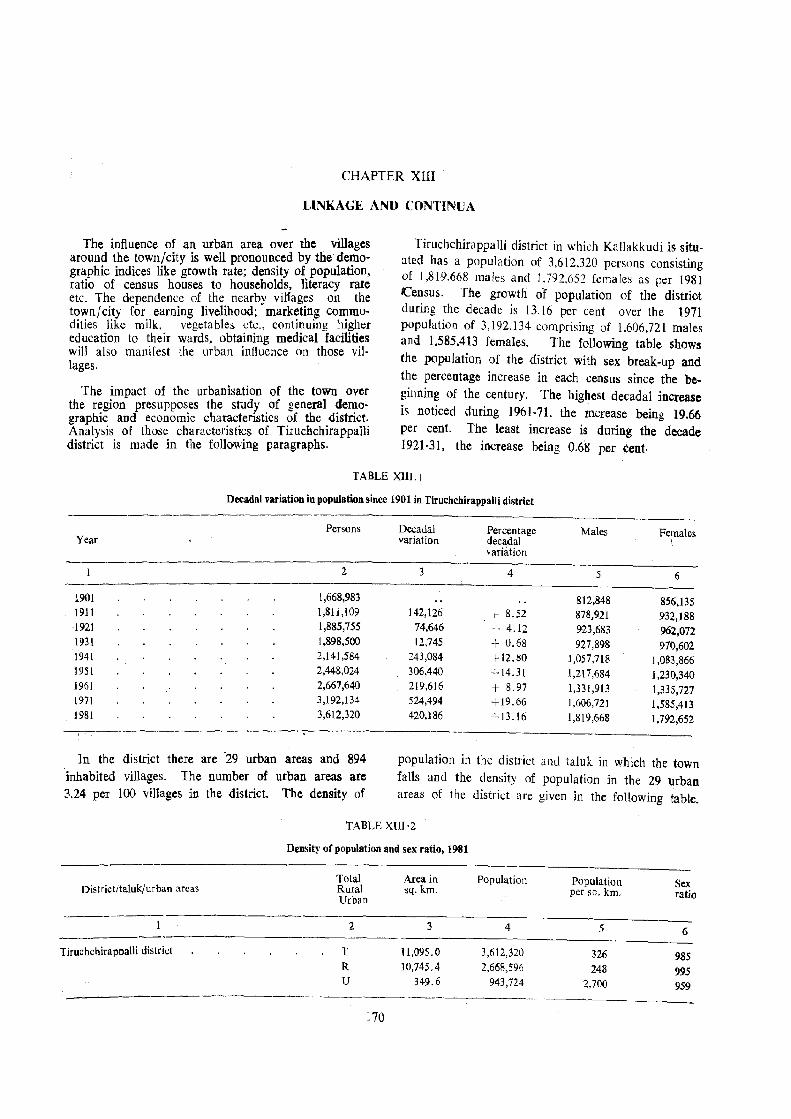
CHAPTER XIII
LINKAGE ANn CONTINUA
The influence of an urban area over the villages around the town/city is well pronounced by the-de~ographic indices like growth rate; density of. populatlOn, ratio of census houses to households, hteracy rate etc. The dependence of the nearby vil1ages on the town/city for earning livelihood; mark~tin$ con:modities like milk, vegetable!> etc., contmumg hIgher education to their wards, obtaining medical facilities will also manifest the urban influence on those viI· lages.
The impact of the urbanisation of the town over the region presupposes the study of general demographic and economic char~c~erist!cs ?f the .district: Analysis of those charactenstIcs of TIIuchchlrappa1h district is made in the following paragra.phs.
Tiruchchirappalli district in which Kallakkudi is situated has a population of 3.612,320 persons consisting of 1,819.668 males and 1.7n,c)S::!. females as per ]981 Census. The growth of population of tJhe district during the decade is 13.16 per cent over the 1971 population of 3.192,134 comprising of 1.606,721 males and ].585.413 females. The following table shows the population of the district with sex break-up and the percentage increase in each census since the be
ginning of the century. The hig~est decadal increase is noticed during 1961·71. the lficrease beinE 19.66 per cent. The least increase is during the decade 1921-31, the increase being 0.68 per cent.
TABLE XlII. j
Year
1901 1911 1921 1931 1941 1951 1961 1971 1981
Decadal variation in population since 1901 in Tiruchchirappalli district
Persons Decadal Percentage variation decadal
variation
2 3 4
1,668,983 1,8H,109 142,126 + 8.52 1,885,755 74,646 + 4.]2 1,898,500 12,745 + 0.68 2,141,584 243,084 +12.80 2,448,024 306,440 +14.31 2,667,640 219,616 + 8.97 3,192,134 524,494 +19.66 3,612,320 420,186 +13.16
Males Females \
5 6
812,848 856,135 878,921 932,188 923,683 962,072 927,898 970,602
1,057,718 1,083,866 1,217,684 1,230,340 1,331,913 1,335,727 1,606,721 1,585,413 1,819,668 1,792,652
In the district there are 29 urban areas and 894 inhabited villages. The number of urban areas are 3.24 per 100 villages in the district. The density of
population in thc district and ialuk ill which the town
falls and the density of popUlation in the 29 urban areas of the district are given in the fo1lowing table_
TABLE Xm·2
Density of population and sex ratio, 1981
Total Area in Population Population Sex Rural sq. km. per SQ. km. ratio Urban District/taluk/urban areas
2 3 4 .) 6
Tiruchchirappalli district T 11,095.0 3,612,320 326 985 R 10,745.4 2,661',596 248 995 U 349.6 943,724 2,700 959
170
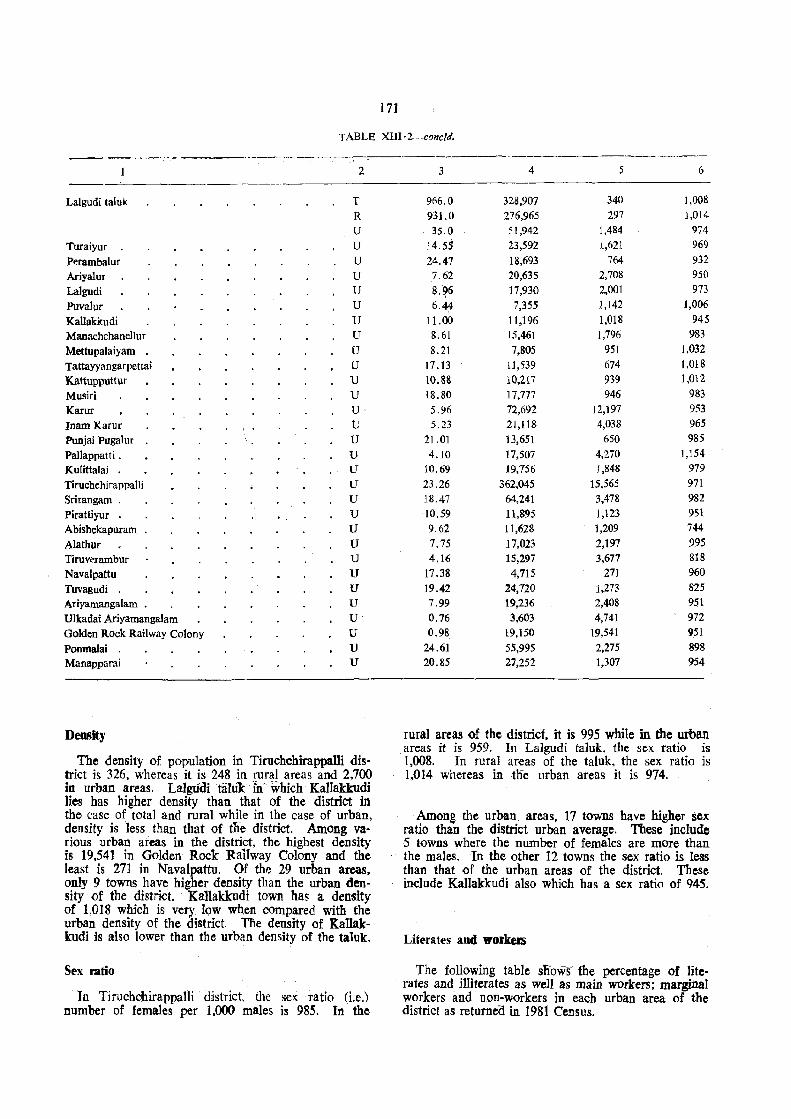
171
T ABLE XIII· 2--concfd.
---~ .. ~---
2
Lalgudi taluk T R U
Turaiyur U
P~rambalur U Ariyalur U Lalgudi U Puvalur U Kallakicudi U Manachchanellur U Mettupalaiyam U Tattayyangarpettai U Kattupputtur U Musiri U Karur U Inam Karur U Punjai Pugalur U Pallappatti . U Kulittalai U Tiruchchirappalli U Srirangam . U Pirattiyuf U Abishekapuram U Alathur U TiruVl"rambur U Navalpattu U Tuvagudi U Ariyamangalam • U Ulkadai Ariyamangalam U Golden Rock Railway Colony U Ponmalai U Manapparai U
Density
The density of population in Tiruchchirappalli district is 326, whereas it is 248 in rural areas and 2.700 in urban areas. ralgodi tiilu1c:- fn which Kallakkudi lies has higher density than that of the district in the case of total and rural while in the case of urban. density is less than that of tlie district. Among various urban areas in the district. the highest density is 19,541 in Golden Rock RaIlway Colony and the least is 271 in Navalpattu. Of the 29 urban areas, only 9 towns have higher density t1Ian the urban density of the district. Kallakkudi town has a density of 1,018 which is very low when compared with the urban density of the district.. TIe density of KalIakkudi is also lower than the urban density of the taluk.
Sex raoo
In TiruchooirappaUi district, the sex ratio (i.e.) number of females per 1,000 males is 985. In the
3 4 5 6
966.0 328,907 340 1,008
931.0 276,965 297 1,014
35.0 '1,942 1,484 974
14.55 23,592 l,621 969
24.47 18,693 764 932
7.62 20,635 2,708 950
8.~6 17,930 2,001 973
6.4;4- 7,355 1,142 1,006
11.00 11,196 1,018 945
8.61 15,461 1,796 983
8.21 7,805 951 1,032
17.13 11,539 674 1,018
10.88 10,217 939 I,Ot2
18.80 17,777 946 983
5.96 72,692 12,197 953
5.23 21,118 4,038 965
21.01 13,651 650 985
4.10 17,507 4,270 1,154
10.69 19,756 1,848 979
23.26 362,045 15,565 971
18.47 64,241 3,478 982
10.59 11,895 1,123 951
9.62 11,628 1,209 744
7.75 17,023 2,197 995
4.16 15,297 3,677 818
17.38 4,715 271 960
19.42 24,720 1,273 825
7.99 19,236 2,408 951
0.76 3,603 4,741 972
0.98 19,150 19,541 951
24.61 55,995 2,275 898
20.85 27,252 1,307 954
rural areas of the district. it is 995 while in the lWban areas it is 959. In Lalgudi taluk, the sex ratio is 1,008. In rural areas of the taluk. the sex ratio js 1,014 whereas in die urban areas it is 974.
Among the urban areas, 17 towns have higher sex ratio than the district urban average. These include 5 towns where the number of females are more than the males. In the other 12 towns the sex ratio is less than that of the urban areas of the district. These include Kallakkudi also which has a sex ratio of 945.
Literates and workers
The following table sIiows~ the percentage of lite. rates and illiterates as well as main workers; marginal
workers and non-workers in each urban area of the district as retume<i in 1981 Census.
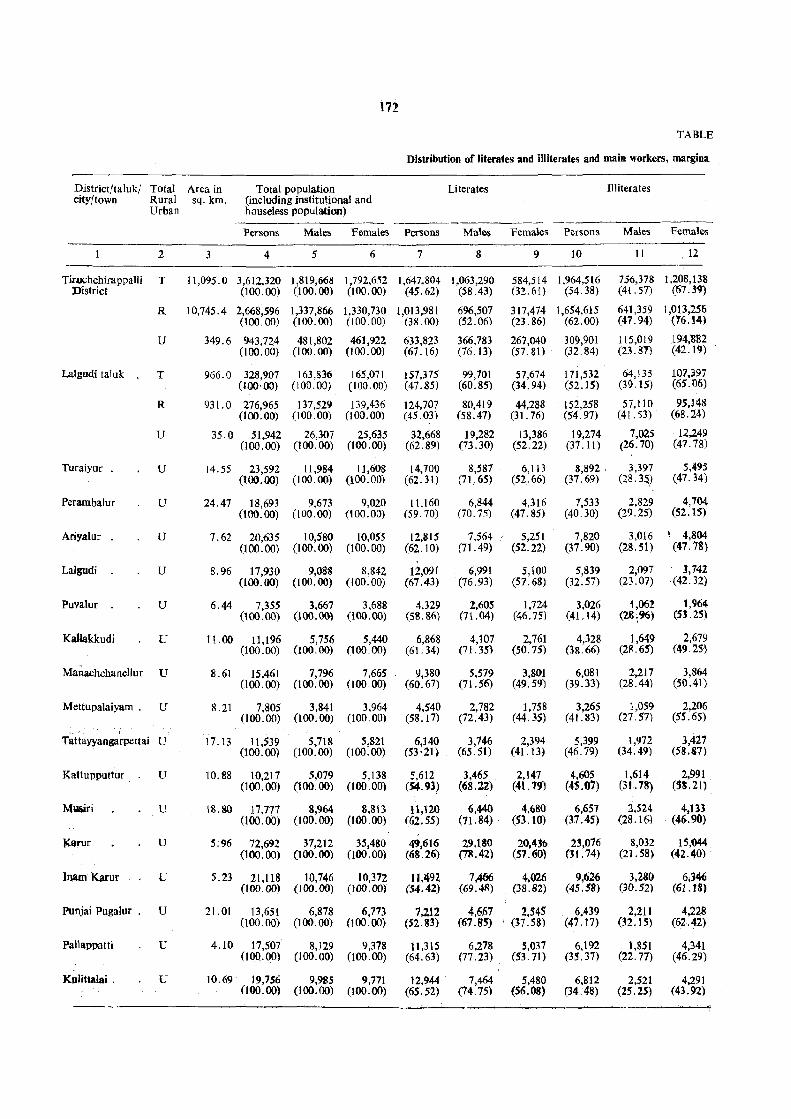
\72
TABLE
Distribution of literates and illlterates and main workers, margina
District/taluk/ Total Area in Total population {including institutional and houseless population)
Literates Illiterates city-/town Rural sq. km.
Urban
Persons Males Females Persons Ma1es Females Persons Males Females
2 3 4 5 6 7 8 9 10 11 12
Ti;ruchchirappalli T 11,095.0 3,612,320 1,819,668 1,792,6<;2 1,647,804 1,063,290 584,514 1,964,516 756,378 1,208,1311 District (100.00) (100.00) (100.00) (45.62) (58.43) (32.61) (54.38) (4{'57) (67.39)
R 10,745.4 2,668,596 1,337,866 1,330,730 1,013,981 696,507 317,474 1,654,615 641,359 1,013,256 (100.00) (100.00) (100.00) (38.00) (52.06) (23.86) (62.00) (47.94) (16.14)
U 349.6 943,724 481,802 461,922 633,823 366,783 267,040 309,901 115,019 194,882 (100.00) (100.00) (100.00) (67.16) (76.13) (57.81) (32.84) (23.m (42.19)
Lalgudi taluk . T 966.0 328,907 163,836 I 65,07l 157,375 99,701 57,674 171,532 64,135 107,397 (tOO· 00) (100.00) (100.00) (47.85) (60.85) (34.94) (52.15) (39.15) (65.06)
R 931.0 276,965 137,529 139,436 124,707 80,419 44,288 152,258 57,110 95,148 (100.00) (IOO~OO) (100.00) (45.03) (58.47) (31. 76) (54.97) (41.53) (68.24)
U 35.0 51,942 26,307 25,635 32,668 19,282 13,386 19,274 7,0.25 12,249 (100.00) (100.00) (100.00) (62.89) (73.30) (52.22) (37.11) (26.70) (47.78)
Turaiyur . u 14.55 23,592 11,984 11,608 14,700 8,587 6,113 8,892 3,397 5,495 (too. 00) (IOO.OO) (100.00) (62.31) (71.65) (52.66) (37.69) (28.3~) (47.34)
Perambalur 24.47 18,693 9,673 9,020 11,160 6,844 4,316 7,533 2,829 4,704 (too. 00) (100.00) (100.00) (59.70) (70.75) (47.85) (40.30) (29.25) (52.15)
u
Ariyalur U 7.62 20,635 10,580 10,055 12,815 7,564 5,251 7,820 3,016 \ 4,804 (100.00) (100.00) (100.00) (62.10) (71.49) (52.22) (37.90) (28.51) (47.78)
Lalgudi u 8.96 17,930 9,088 8,842 12,091 6,99! 5,100 5,839 2,097 3,742 (100.00) (100.00) (100.00) (67.43) (76.93) (57.68) (32.57) (23.07) (42.32)
Puvalur U 6.44 7,355 3,667 3,688 4,329 2,605 1,724 3,026 1,062 1,964 (\00.00) (100.00) (100.00) (58.86) (71.04) (46.75) (41.\4) (28\%) (Sl.2Si
Kallakkudi U 11.00 11,196 5,756 5,440 6,868 4,107 2,761 4,328 1,649 2,679 (100.00) (100.00) (100.00) (61.34) (71.35) (50. 75) (38~66) (211.65) (49.2S}
Manachchancllur U 8.61 15,461 7,796 7,665 9,380 5,579 3,801 6,081 2,217 3,864 (100.00) (100.00) (100.00) (60.67) (71.56) (49.59) (39.33) (28~44) (50.41)
Mettupalaiyam. U 8.21 7,805 3,841 3.964 4,540 2,782 1,758 3,265 1,059 2,206 (100.00) (100.00) (100.00) (58.17) (72.43) (44.35) (41.83) (27.57) (55.65)
~ , Tattayyangarpettai U 17.13 11,539 5,718 5,821 6,140 3,746 2,394 5,399 1,972 3,427
(100.00) (100.00) (100.00) (53'21) (65.51) (41.13) (46.79) (34.49) (58.S7)
Kattupputtuf 10.88 10,217 5,079 5,138 5,612 3,465. 2,147 4,605 1,614 2,991 (100.00) (100.00) (100.00) (S4.1)1) (68.22) (41.19) (4S.07) (31.18) (S8.21)
U
Musiri 18.80 17,777 8,964 8,813 11,120 6,440 4,680 6,651 2,524 4,133 (100.00) (100.00) (100.00) (62.55) (71.84)· (53.10) (37.45) (28.16) (46.90)
u
l'arur 5.96 72,692 37,212 35,480 49,616 29,180 20,436 23,016 8,032 IS,M4 (100.00) (100.00) (100.00) (68.26) (71'l.42) (57.60) (31.74) (21.58) (42.40) ~
u
IlIUll Karur U 5.23 21,118 10,746 10,372 11,492 7,466 4,026 9,626 3,280 6;346 (100.00) (100.00) (100.00) (54.42) (69.4R). (38.82) (45.58) (30.52) (6l.t8)
Punjai Pugalur. U 21. 01 13,65) 6,878 6,773 7.212 4,667. 2,545 ~ 6,439 2,211 4,228 (100.00) (100.00) (100.00) (S2.13) (67.85)' (37.58) (47.17) (32.15) (62.42)
Pallappatti 4.10 17,507 8,129 9,378 11,315 6,278 5,037 6,192 1,851 4,341 (iOQ.OO) (100.00) (100.00) (64.63) (77.23) (53.71) (35.37) (22.77) (46.29)
u
Kulittalai . 10.69 19,756 9,985 9,771 12,944 7,464 5,480 6,812 2,521 4,291 (100.00) (1()O.OO) (100.00) (65.52) (74.75) (56.08) (34.48) (25.25) (43.92)
u
---.-------------------'--~---~------~-
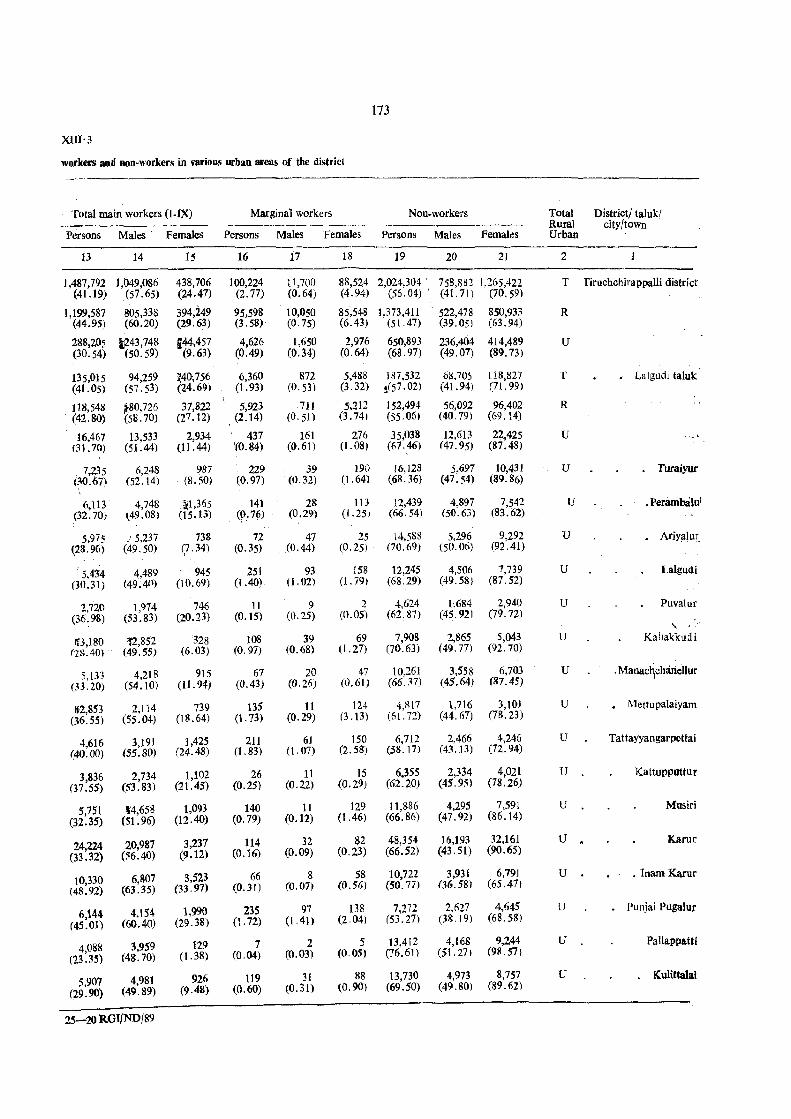
173
xm'3 workers and non-workers in various urban areas of the district
Total main workers (I-IX) Marginal workers Non-workers ---~----~--
Persons Males Females Persons Males Females Persons Males Females
13 14 16 17 18 19 20 21
1,487,792 1,049,086 438,706 100,224 11,700 88,524 2,024,304' 758,882 1,265,422 (41.19) (57.65) (24.47) (2.77) (0.64) (4.94) (56.04) \ (41.71) (70.59)
1,199,587 805,338 (44.95) (60.20)
288,205 l243,748 (30.54) (50.59)
394,249 (29.63)
144,457 (9.63)
95,598 (3.58)
4,626 (0.49)
10,050 (0.75)
1,650 CO. 34)
85,548 1,373,411 522,478 850,933 (6.43) (51.47) (39.05) (63.94)
2,976 650,893 236,404 414,489 (0.64) (68.97) (49.07) (89.73)
135,015 94,259 ~4(},756 6,360 872 5,488 187,532 6/!.70') 118,827 (41.05) (57.53) (24.69) (1.93) (0.53) (3.32) ~(57.02) (41.94) (71.99)
118,548 ,80,726 37,822 5,923 711 5,212 152,494 56,092 96,402 (42.80) (.)8.70) (27.12) (2.14) (0.51) (3.74) (55.06) (40.79) (69.14)
16,467 13,533 2,934 437 161 276 35,038 12,613 2Z,425 (31.70) (51.44) (11.44) '(0.84) (0.61) (1.08) (67.46) (47.95) (87.48)
7,235 6,248 987: 229 39 190 16,128 5,697 10,431 (30.67) (52.14) (8.50) (0.97) (0.32) (1.64) (6U6) (47.54) (89.86)
6,113 4,748 ~],365 141 28 113 12,439 4,897 7,542 (32.70) l49.08) (15.13) CO. 76) (0.29) (1.25) (66.54) (50.63) (83.62)
5,975 .' 5,237 738 i2 47 25 l4,588 5,296 9,292 (28.96) (49.50) (7.34) (0.35) (0.44) (0.25) (70.69) (50.06) (92.41)
5,434 4,489 945 251 93 158 12,245 4,506 7,739 00.31) (49;4() (10.69) (1.40) (1.02) (1.79) (68.29) (49.58) (87.52)
2,720 1,974 746 11 9 2 4,624 1,.684 2,940 (36. 98) (53.83) (20.23) (0.15) (0.25) (0.05) (62.87) (45.92) (79.72)
IB,180 ~2,852 328 108 39 69 7,908 2,865 5,043 (2&.40) (49.55) (6.03) (0.97) (0.68) (1.27) (70.63) (49.77) (92.70)
5,133 4,218 915 67 20 47 10.261 3,558 6,703 m.20) (54.10) (11.94) (0.43) (0.26) (0.61) (66:37) (45.64) (87.45)
[f2,853 2,114 739 135 11 124 4,817 1,716 3,101 (36.55) (55.04) (18.64) (1.73) (0.29) (3.t3) (61.72) (44.67) (78.23)
4,616 3,191 1,425 211 61 150 6,712 2,466 4,246 (40.00) (55.80) (24.48) (l.83) (1.07) (2.58) (58.17) (43.13) (72.94)
3,836 2,734 1,102 (37.55) (53.83) (21.45)
5,751 14,658 1,093 (32.35) (51.96) (12.40)
24,224 20,987 3,237 (33.32) (56.40) (9.12)
10,330 6,807 3,523 (48.92) (63.35) (33.97)
6,144 4,154 1.99() (45.01) (60.40) (29.38)
4,088 3,959 129 (13.35) (48.70) (1.38)
5,901 4,981 926 (19.90) (49.89) (9.48)
25-20 ROIfND/89
26 (0.25)
140 (0.79)
114 (0.16)
66 «(Ut)
235 (1.72)
7 (0.04)
119 (0.60)
11 (0.22)
15 6,355 2,334 4,021 (0.29) (62.20} (45.95) (78.26)
11 129 11,886 4,295 7,591 (0.12) (1.46) (66.86) (47.92) (86.14)
32 82 48,354 16,193 32,161 (0.09) (0.23) (66.52) (43.51) (90.65)
8 58 10,722 3.931 6,79J (0.07) (0.56) (50.77) 06.58) (65.47)
97 138 7,272 2.627 4,645 (1.41) (2.04) (53.27) (38.19) (68.58)
2 5 13,412 4,168 9,244 (0.03) (0.05) (76.61) (51.27) (9R.57)
31 88 13,730 4.973 8,757 (0.31) (0.90) (69.50) (49.80) (89.62)
Total District} talukl Rural city/town' Urban
2
T Tiruchchirappalli district
R
u
T
R
u
U
u
u
u
u
U
U
u
u
u
u
u .
u
u
u
u
•. Lalgudi taluk·
.'
TuraiYUf
. Perambalui
AriYil}ur,
Lalgudi
Puvalur
, Kal1a'kkudi
. Manac~chariellur
• Mettupalaiyam
Tattayyangarpettai
KattuppuUur
Musiri
Karur
.InamKarur
punjai PUgalur
PaUappaUi
. KuliHalai
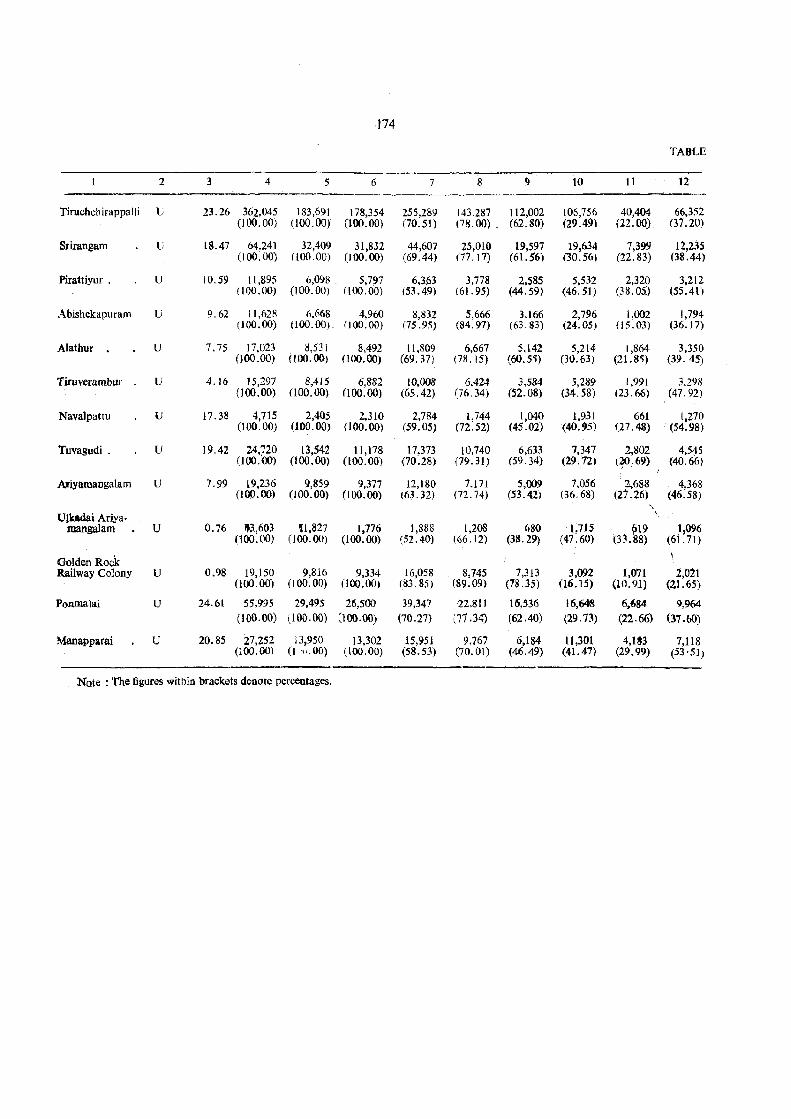
174
TABi"E
2 3 4 5 6 7 8 9 to 11 12
Tiruchchirappai Ii U 23.26 362,045 183,691 178,354 255,289 143.287 112,002 106,756 40,404 66,352 (100.00) (100.00) 000.00) (70.51 ) (78.00) . (62.80) (29.49) (22. (0) 07.20)
Srirangam U 18.47 64,241 32,409 31,832 44,607 25,010 19,597 19,634 7,399 12,235 (100.00) (100.00) (100.00) (69.44) (77.17) (61.56) (30.56) (22.83) (38.44)
Pirattiyur . U 10.59 11,895 6,098 5,797 6,3.63 3,778 2,585 5,532 2,320 3,212 (100.00) (100.00) (100.00) (53.49) (61.95) (44.59) (46.5] ) (38. OS) (55.41)
Abishekapuram U 9.62 11,628 6.668 4,960 8,832 5,666 3.166 2,796 1,002 1,794 (100.00) (100.00) (100.00) (75.95) (84.97) (63.83) (24.05) (15.03) (36.17)
Alathur U 7.75 17,023 8,531 8,492 11,809 6,667 5,142 5,214 1,864 3,350 (100.00) (100. (0) (100.00) (69.37) (78.15) (60. S~) (30.63 ) (21.8'i) (39. 45)
Tiruverambur lJ 4.16 15,297 8,415 6,882 10,008 6.424 3.584 5,289 1,991 3.298 (l00.00) (l00.00) (100.00) (65.42) (76.34) (52.08) (34.58) (23.66) (47.92)
Navalpattu U 17.38 4,715 2,405 2,310 2,784 1,744 1,040 1,9,31 661 1,270 000.00) (100.00) (100.00) (59.05) (72.52) (45.02) (40.'5) t27.4S) (54.98)
Tuvagudi . U 19.42 24,720 13,542 tl ,178 17.373 10,740 6,633 7,347 2,802 4,545 (100.'00) (100.00) (too. 00) (70:28) (79.31) (59.34) (29;12) (~.69) {40.66}
AriYlUIIllngalam U 7.99 19,236 9,859 9,377 12,180 7.171 5,009 7.056 . 2,688 4,368 (100.00) (l00.00) (100.00) (6).32) (72.74) (53.42) (36.68) (27.26) (46.58)
\,
Ulkadai Ariya· ,
mangalam U 0.76 1f3.,603 'tl,827 1,776 1,888 1,208 680 l.715 619 1,096 (l00.00) (100.00) (100.00) (52.40) (66.12) (38.29) (47:60) (33.88) (61.71)
Golden Rock Railway Colony U 0.98 19,150 9,816 9,334 16,058 8,745 7,313 3,092 1,071 2,021
(100.00) (l00.00) (100.00) (83.85) (89.09) (7US) (16.15) (10.91) .(21.65)
Ponmalai U 24.61 55;995 29,495 16,500 39,347 22,811 16,536 16,648 6,684 9,964 (10(}.00) (100.00) (100.00) (70.27) (77 .34) (62.40) (29.73) (22.66) (37.60)
Manapparai U 20.85 27,252 13,950 13,302 15,951 9.767 6,184 11,301 4,1~3 7,118 (100.00) (I '\'. (0) (100.00) (58.53) (70.01) (46.49) (41.47) (29.99) (53'51)
Note : The figures within brackets denote percentages.
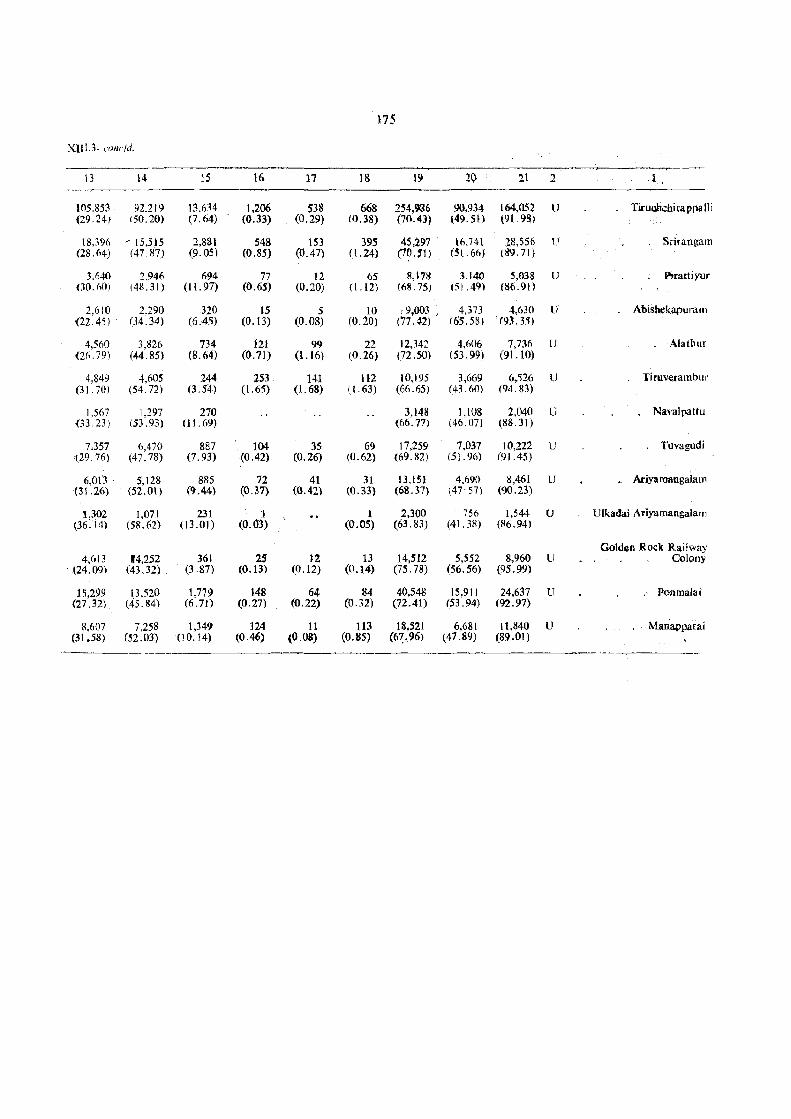
175
xuu· (;()ile/d.
~.-
13 14 15 16 17 18 19 20 21 1 1,
105,853 92-219 13.634 1,206 538 668 254,9a6 90,934 [64,052 lJ Tiruubchitappalli (29.24f 150.20) (7.64) (0.33) (0.29) fO.38) (70.43) (49.51) (91.98)
18,396 / 15,515 2,881 548 153 395 45,Z97 16,741 Z8,556 U Srirangam (28.64) (47.87) (9.05) (0.85) (0.47) (l .24) (70.SlJ (51 . (6) (89.71)
,
3.640 2,94" 694 77 12 65 8,1711 3.140 5,038 U Pirattiyur 00.(0) (48.31 ) (II. 97) (O.6j) (0.20) (1.12) (68.75) (5 J .49) (86.91)
2.610 2.290 320 15 5 10 ,9,003 .' 4,373 . 4,630 U Abishekapumm (22.45) . (34.34) (6,45) (0.13) (0.08) (0.20) t77.42) (65.58) (9.:U.'I)
4.560 3,S26 734 12] 99 22 12,342 4.606 7,736 U Alathur (26.79) (44.85) (8.64) (0.71) (l.16) (0.26) (72 .50) (53.99) (91.10)
4.849 4.605 244 253 14.1 112 10,195 3,669 6,526 U Tiruverambur (31.70) (54.72) (3.54) (1.65) (l.68) (I (3) (66.65) (43.60) (94.83)
1,567 1,297 270 3,148 1.108 2,040 U Navalpattu (33.23 ) (53.93) 111. (9) (66.77) (46.07) (88.31)
7.357 6.470 887 104 35 69 17,259 7,037 10,222 U Tuvagudi 129.76) (47.78) (7.93) (0.42) (0.26) (0.62) (69.82) (51. 96) (91.45)
6,013· 5,]28 885 72 41 31 13.IS] 4,690 8,461 U Ariyamangalam (31.2(,) (52.01 ) (9.44) (0.37) (0.42) (0.33) (68.37) (47' 57) (90.23)
1,302 1,071 231 1 1 2,300 756 1,544 U Ulkadai Ariyamangalam (36.14) (58.62) (13.01) (0.03) (0.05) (63.83) (41. 38) (~6. 94)
Golden Rock Railway 4,613 14,252 361 2S 12 13 14,512 5,552 8,960 U Ollon)l
.(24.09) (43.32) (3.87) (0.13) (0.]2) (0.14) (75.78) (56.56) (95.99)
15,299 \3,520 1,779 148 64 84 40,548 15,911 24,637 U PonmaJai (27.32) (45.84) (6.71) (0.27) (0.22) (0.32) (72.41) (53.94) (92.97)
8,607 7,258 1,349 ]24 11 113 18,521 6,681 [1,840 U Manapparai (31.58) (52.03) (10.14) (0.46) (0.08) (0.85) (67.96) (47.89) (89.01)
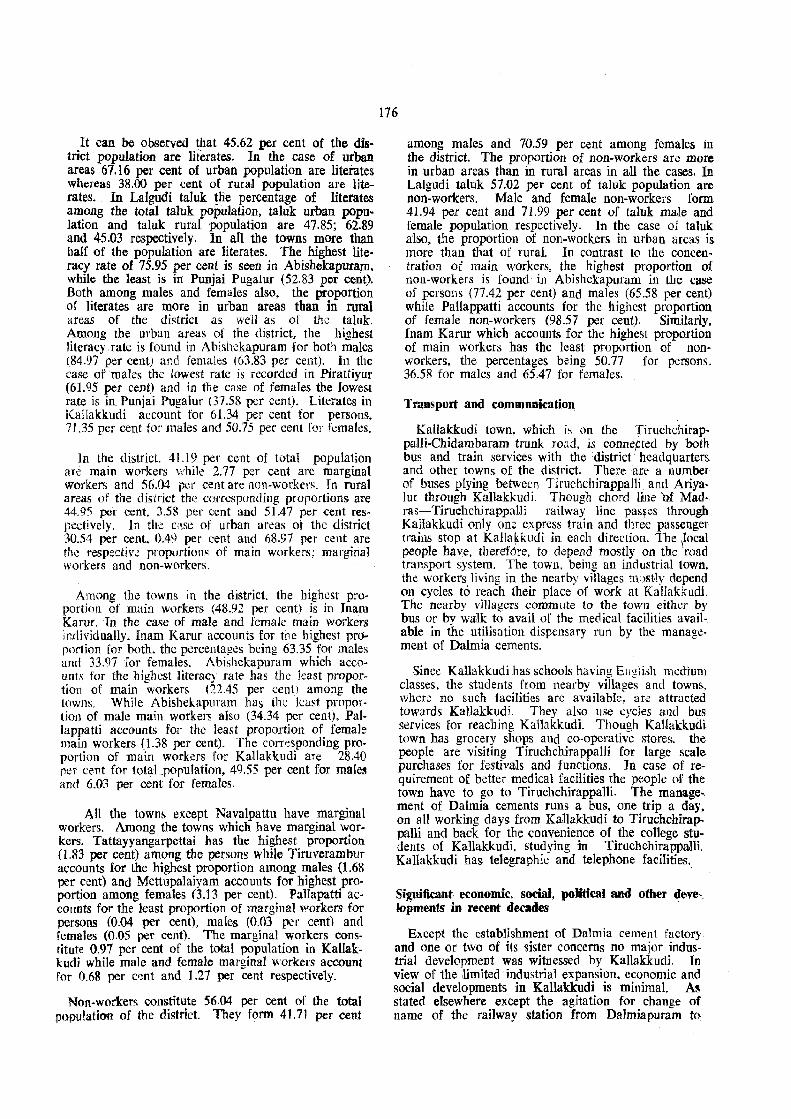
It can be observed that 45.62 per cent of the district population are literates. In the case of urban areas 67.16 per cent of urban population are literates whereas 38.00 per cent of rural population are literates. In Lalgudi taluk !lie percentage of literates among the total taluk population, taluk urban population and taluk rural population are 47.85; 62.89 and 45.03 respectively. In all the towns more than half of the population are literates. The highest literacy rate of 75.95 per cent is seen in Abishekapuram. while the least is in Punjai Pugalur (52.83 per cent). Both among males and females also, the proportion or literates are more in urban areas than in rural areas of the district as well as of the taluk. Among the urban areas of the district, the highest literacy. rate is found in Abishekapuram for both males (84.97 per cent) and females (63.83 per cent). In the case of maks the lowest rate is recorded in Pirattiyur (61.95 per cent) and in the case of females the lowest rate is in Punjai Puga.Iur (37.58 per cent). Literates in Kallakkudi account tor 61.34 per cent for persons, 71.35 per cent for males and 50.75 per cent [or females.
In the district. 41.19 per cent of total population are main workers \'/hile 2.77 per cent are marginal workers and 56.04 per cent are non-workers. r n rural areas of the district th,;~ corresponding proportions are 44.95 per cent. 3.58 pCI' cent and 51.47 per cent resp~ctively. In the case ot urban areas ot the district 30.54 per cent, 0.49 per cent and 68.97 per cent are the respective proportions of main workers: marginal workers and non-workers.
Among the towns in the district. the highest proportion of main workers (48.92 per cent) is in Inam Karur. In the case of male and female main workers individually. lnam Kal"ur accounts for the highest proportion for both. the percentages being 63.35 for males and 33.91 for females. Abishekapuram which accounts for the highest literacy rate has the least proportion of main workers (22.45 per cent, among the towns. While Abisbekapuram has the ll:ast proportion of male main workers also (34.34 per cent). Pallappatti accounts for the least proportion of female main workers (1.38 per cent). The corresponding proportion of main workers for Kallakkudi are 28.40 [Jer cent for totaLpopulation, 4g.55 per cent for males and 6.03 per cent for females.
All the towns except Navalpattu have marginal workers. Among the towns which have marginal workers, Tattayyangarpettai has the highest proportion (1.83 per cent) among the persons while Tiruverambur accounts for the highest proportion among males (1.68 per cent) and Mettupalaiyam accounts for highest proportion among females (3.13 per cent). Pallapatti accounts for the least proportion of marginal workers for persons (0.04 per cent), males (0.03 per cent) and females (0.05 per cent). The marginal workers constitute 0.97 per cent of the total population in Kanakkudi while male and female marginal ·workel's account for 0.68 per c~nt and 1.27 per cent respectively.
Non-workers constitute 56.04 per cent of the total population of the district. They form 41.71 per cent
176
among males and 70.59 per cent among females in the district. The proportion of non-workers are more in urban areas than in rural areas in ail the cases. In Lalgudi taluk 57.02 per cent of taluk population are non-workers. Male and female non-workers form 41.94 per cent and 71.99 per cent of taluk male and female population respectively. In the case of taluk also, the proportion of non-workers in urban areas is. more than that of rural. In contrast to the concentration of main workers, the highest proportion of non-workers is found in Abishekapuram in the case of persons (77.42 per cent) and males (65.58 per cent) while PaUappatti accounts for the highest proportion of female non-workers (98.57 per cent). Similarly, fnam Karur which accounts for the highest proportion of main workers has the least proportion of nonworkers, the percentages being 50.77 for persons, 36.511 for males and 65.47 for females.
Transport and communialtion
Kallakkudi town, which is on the Tiruchchirappalli-Chidambaram trunk road, is connepted by both bus and train services with the district· headquarters and other towns of the district. There are a number of buses plying between Tiruchchirappalli and Ariyalur through Kallakkudi. Thougb chord line 'Qf Madras-Tiruchchirappalli railway line pas~es through Kallakkudi only one express train and three passenger trains stop at Kalla1ckudi in each direction. The \local people hav,e. therct'ore, to depend mostly on the road transport system. The town, being an industrial town, the workers living in the nearby villages m<)stly depend on cycles to reach their place of work at Ka!lakkudL The nearby villagers commute to the town either by bus or by wa]k to avail of the medical facilities available in the utilisation dispensary run by the management of Dalmia cements.
Since Kal1akkudi bas schools having ElIl!lish medium classes, the students from nearby villages and towns, where no such facilities are available, are attracted towards Kallakkudi. They also use cycles and bus services for reaching Kal1akkudi. Though KaUakkudi town has grocery shops and co· operative stores. the people are visiting Tiruchchirappalli for large scale purchases for festivals and functions. In case of requirement of better medical facilities the people of the town have to go to TiruchchirappaUi. The manage .. ment of Dalmia cements runs a bus, one trip a day, on all working days from Kallakkudi to TiruchchirappaUi and back for the convenience of the college students of Kallakkudi, studying in Tiruchchirappalii. KalIakkudi has telegraphic and telephone facilities.,
Sig)Hficant economic, sodal, poUtical and other deve, Jopments in recent decades '
Except the establishment of Dalmia cement factory and one or two of its sister concerns no major industrial development was witnessed by Kallakkudi. In. view of the 'limited industrial expansion. economic and social developments in Kallakkudi is minimal. As stated elsewhere except the agitation for change of name of the railway station from Dalmiapuram tn
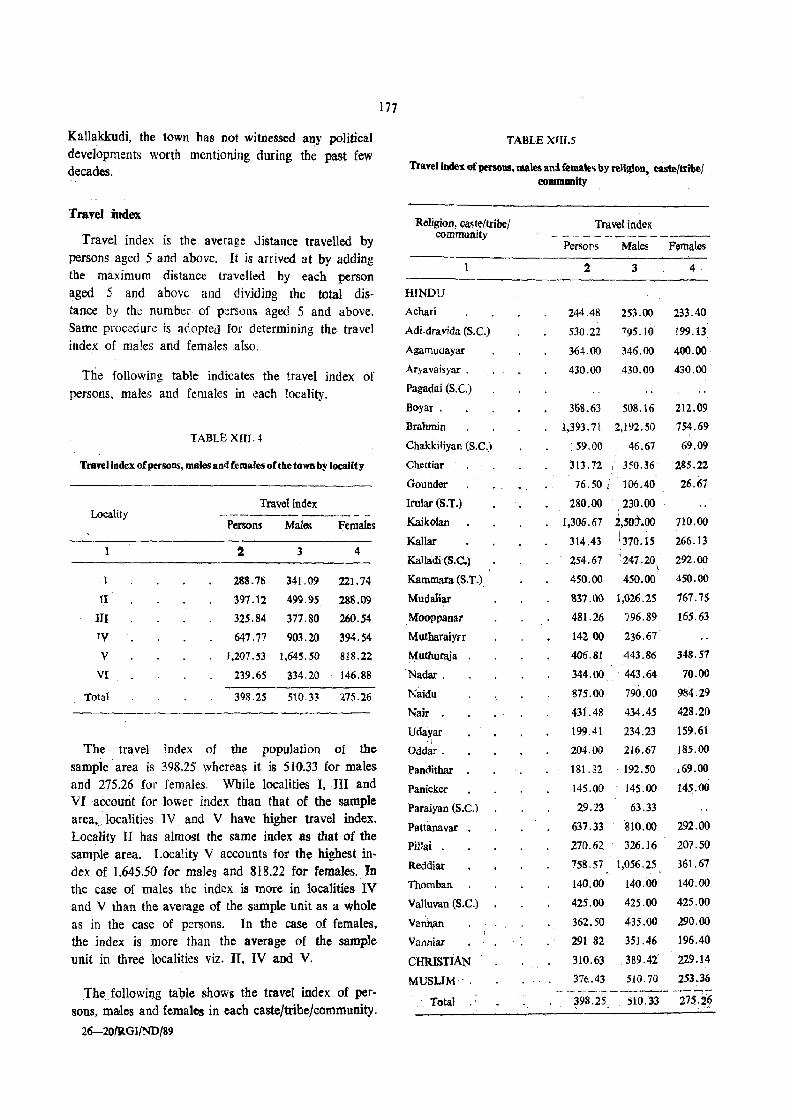
Kallakkudi, the town has not witnessed any political developments worth mentioning during the past few decades.
Travel index
Travel index is the average Jistance travelled by persons aged 5 and above. It 1S arrived at by adding the maximum distance travened by each person aged 5 and above and dividing the total distance by the number of persons aged 5 and above. Same procedure is adopted for determining the travel index of males and females also.
The following table indicates the travel index of persons, males and females in each locality.
TABLE Xm.4
TN\"e] index of persons, males and females of the town by locality
Locality
l
II
III TV V
VI
Total
Travel index
Persons
2
288.78
397.12
325.84
647.77
Males
3
341.09
499.95
377.80
903.20
Females
4
221.74
288.09
260.54
394.54
1,207.53 1,645.50 818.22
239.65 334.20 146.88
398.25 510.3~ 275.26
The travel index of the population of the
sample area is 398.25 wherea~ it is 510.33 for males and 275.26 for females. While localities I, III and VI account for lower index than that of the sample area"l()Calities IV. and V have higher travel index. Locality II has almost the same index as that of the sample area. Locality V accounts for the highest index of 1,645.S0 for males and 818.22 for females. In the case of males the index is more in localities IV and V than the average of the sample unit as a whole as in the case of p::rsons. In the case of females, the index is more than the average of the sample unit in three localities viz. n, IV and V.
The. following table shows the travel index of persons, ma<les and females in each caste/tribe/community.
26-20fRGI/NDf89
177
TABLE xrrr.s
Travel index of prnons, males and fema~ by religion, caste/tribe/
Religion, caste/tribe! community
HINDU
Achari
Adi-dravida (S.C.)
Agamudayar
Aryavaisyar .
Pagadai (S.C.)
Boyar .
Brahmin
Chakki1iyan (S.C.)
Chettiar
Gounder
lrular (S.T.)
Kaiko)an
Kallar.
Kalladi (S.C.)
Kammara (S.T.)
Mudaliar
Mooppanar
Mutharaiyrr
Muthuraja
Nadar .
Naidu
Nair
Udayar i
Oddar.
Panc:lithar
Panicker
Paraiyan (S.c.)
Pattanavar
PHlai
Reddiar
Thomban
Valluvan (S.C.)
Vacl"an
Vanniar
CHRISTIAN
MUSUM'
Total
community .
Travel index
Persons Males Females
2 3 4
244.48
530.22
364.00
253.00 233.40
795.10 .199.13
346.00 400.00
430.00 430.00 430.00
368.63 508.16 212.09
q93.71 2,192.50
, 59.00 46.67
313.72
76.50 i
280.00
1,306.67
314.43
254.67
450.00
837.00
481.26
14200
I 350.36
106.40
230.00
i,50&.OO i 370. is '247.20
\
.450.00
1,026.25
796.89
236.67
406.81 ,443.86
344.00 443.64
875.00
431.48
790.00
434.45
199.41 234.23
204.00 216.67
181.82 192.50
145.00 145.00
29.23 63,33
637.33 810.00
270.62 326.16
758.57 1,056.25
140.00 140.00
425.00
362.50
291 82
310.63
425.00
435.00
351.46
389.42
754.69
69.09
285.22
26.67
710.00
266.13
292.00
450.00
767.75
165.63
348.51
70.00
984.29
428.20
159.61
185.00
169.00
145.00
292.00
207.50
361.67
140.00
425.00
290.00
196.40
229.14
376.43 510.70 253.36
- -j98~25' -.'510.33'- -275:26
It may be observed that the Brahmms account for the highest travel index (1,393.7l) among various castes/tribes/communities. It is closely followed by Kaikolan community with 1;306.67 as index. The other communities which have hieher trave1 index are Mudaliar (837.00). Naidu - (875.00), Rcddiar (758.57), J>attanavar (637.33) and Adi-dravida (530.22). In the case of males the highest index (2,500.00) is seen amo~g Kaikohms, followed by Bnlhmi"s (2,192.50) In the case oj female~. Naidu accounts for the highest index of 984.29 foHowed by Brahmins with an inde'~ of 754,69. In all the communities, except four. the males h~l_V:: travell-;d extensively than the females. The four communities where the travel indices of females exceed those of males are A~amudayars. Chakkiliyans, Kalladi and Naidu.
Places from/to where people commute (or
(i) Earning livelihood
. Kallakkudi, being an industrial town. offers employment opportunities in Dalmia cement factory and its allied industries to the people of neighbouring vi.l!ageS :"10 some extent. The employees who hail from places more than 5 km away from KaUakkudi are provided with housing accommodation al'l.d hence their commutation to Kallakkudi -does not arise. Th@se who are from vil1ages of less than 5 kID. away are not provided with quarters and they reach the worlcspot by walk or cycle. As regards' these who are employed elsewhere and residing in _ Kalla1ckudi. no data. are . .available. However, such persons if there are any, ~ainly depend on bus services.
(ii) Marketing of commodities like milk, vegt>tab!e$ etc.
In Kallakkudi the management of Dalmia cements, runs:a milk society and it caters to the needs of the occupants I(}f the quarters to a certain extent. The sQciety its~lf purchases milk from the nearby villages such as Kil:irasur, Varaghalure, Mela~3sur, Pll11ambadL Thappai etc. to meet the demand. In addition to this. milkmen from· these villages supply milk to the local people. A bout 250 Its. of milk is being brought t() Kanakkudi"every day from the neighbouring viUag~~. Ve!tetables also. come from these villages and certajn. items, of ,ve~etables are procured from Tiruchchirappalli d1~o.· Eggs and fish are procured from ThirocbchirappalU ancJ brought to Kallakkudi for sales,
.... ) Parti'~o .' "':-018 and entertainment lUI _ ....... "' .. 0 ID,,~ ..
In KallakkuGi. tbenUs only one cinema .1heatre to cater to the entertainm~nt needs of -the local people. The people of the nearby vijlages patro!Jize the dtlema to some extent. Besides this, there, IS no place. (if entertainment worth \1l~tjoning ~xcept the·~~on clul? maititained by th~ manage~ent· of Da:l:qt!a !=ements. The recreation club prOVIdes to all t¥ -tntp-lo:yees t~ faciHties s~ch' as reading room!J~rary. radio. kits for indoor and _outdoor_ ganJes. etc. The
cl'ub also-·,otgimists· various sports activiti~s. tournaments and Dther entertainments sLlch as mUS1C, dramas. film shows and patti mandrams. It arranges ~tionalf sta 12 level tournaments in table tennis, football. volley ball, basket ball etc. In addition. the club organises annual tOUT for the employees and their family members at subsidised rates
(iv) Re~diDg 'in educatioual iDstitutiollS
. Though Kallakkudi c:lq(:s not have any colleges in It, i~ h~s one higher secondary school with English medIUm "classes. As there' is no higher secondary school offering courses' in English medium in the surrounding viLlages/towns. the people who are interested in sending their wards to English medium schools. send their children to this school. The residents of the town have to send their children for higher studies to other places like Tiruchchiraralli etc.
(v) Obtaining medical facilities I
In Kallakkudi, there is no governnjent or private hospital except the utilisation dispensaty run by Oalmia cements. It offers some basiC mediCal i facilities to th ~ local people and to the people ~n the nearby villages. . .. ' I \
, \
I
RickshawS' ply from ftle town. and' newsPaper vendors go .
" Since Kallakkudi is a small town there is no pro
blem of going from one end to the other. As such there are 'no rickshaws plying in the town. The door delivery of newspaper by newspaper vendors is also rarely dOM as the individuals used to get their copies of ~ 'newspapers of their choices directly from the ~hops whe1;'e newspapers, magazines etc .. are sold.
. In order to study the penetration and otherwise of urban influence of tne :town on the nearby villages. demographic and other characteristics of certain selectcd villages have been analysed. The villages on different
l routes at different distances within a radius of 5 km .• 5-10 km. 19-15 km. and 15-120 km. from the town have been selected. There are;' 22 such viIlag;s selected for this purpose. ThouM there are 9 hypotheses with· regard to certain dem<)graphic characteristics and . economic conditions, in the absence Qf availability of data. the analysis is: restricted to certain hypotheses with regard' to popUlation and density: ratio of households to census houses and literacy rate. Due to want of data. the hypotheses with regard .te ratio of workers in secondary and tertiary sectors; l':esence o.f market; availability of amenities and ser.VIces: ·uses of land: distribution of amenities and services and sale and! purchase of cummodities could not !Je tested-.. -
iN' 'Villages widl hi~ urban inftueDte tend to hale Jarger population aDd greater density compaftd to other viUages of the region
, :'Tr.~ .. f?!lo~}ng -~a?le shows. the population.' area aM tJen~Jty of· 't~e ~elccted Vlnages. .. -..
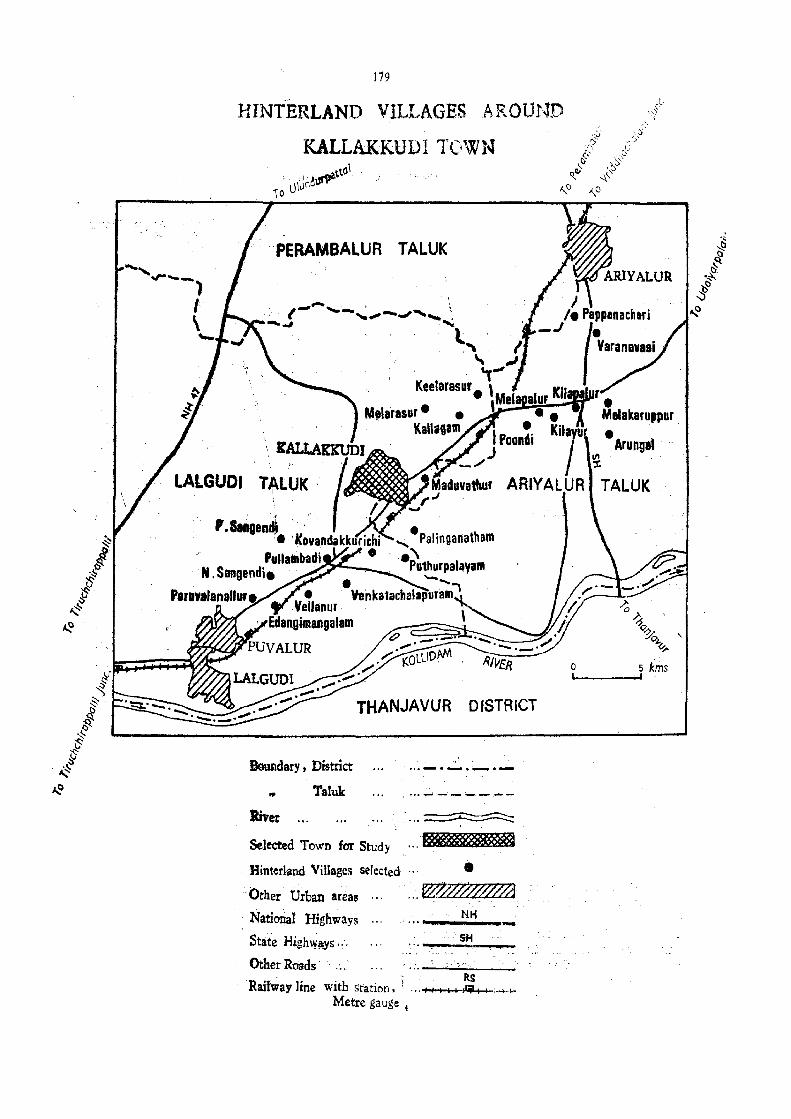
119
HINTERLAND VILLAGES AROUND
KALLAKKUDI TOWN
PERAMBAlUR TALUK
LALGUOI T~~~J~.I~L ,. Sanaend; .. ( ~
• 'I(ovandakkurichi 'tiliallbadl •
No Sangendi.
o 5 kms
THANJAVUR DISTRICT
Bowldary, District ... -.- .. _.-TaJuk ... ---:-----
Rivet
Selected Town for Study
Hinterland Villages seJected ... •
. Other Urban areas ." W~77~~~"'7"'T?7h7?0j71
National Highways .. 0 NH_
State HighW#Oys o.~ , SH
Other Roads' . .. . .
ROt r'b ; Rs al way me WIt station,: ... , I I I I I" I I .__,_ ....
Metre gauge!
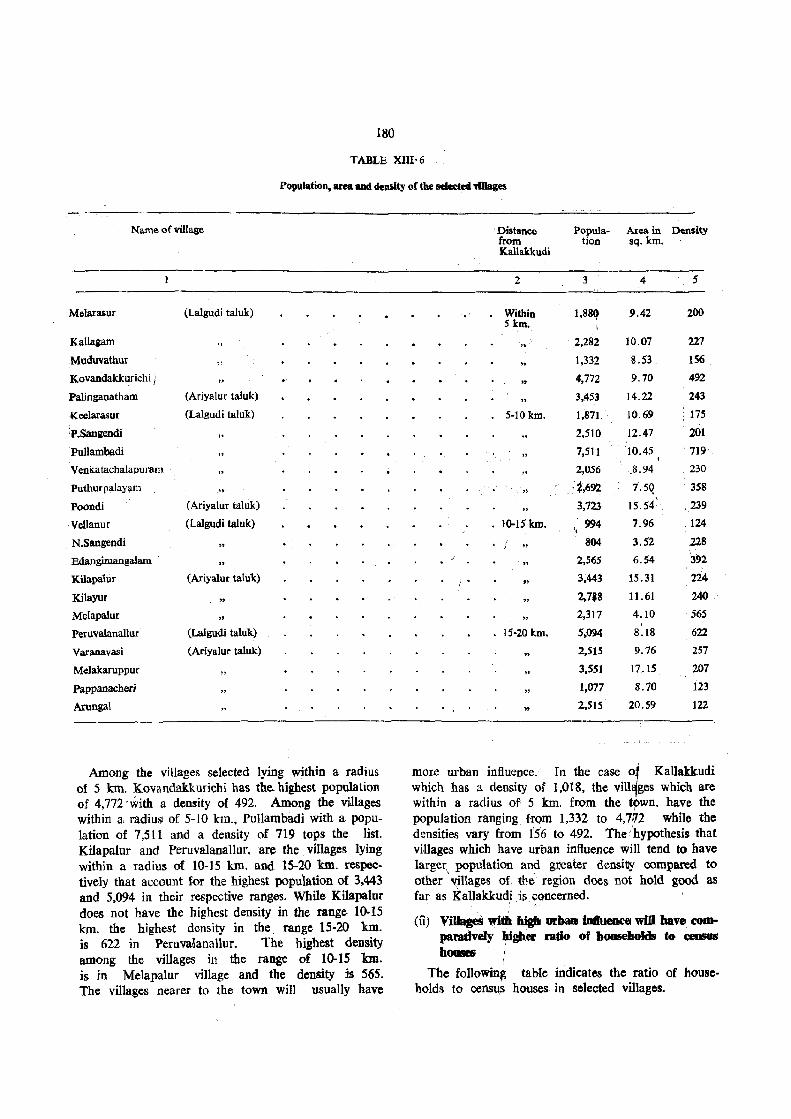
180
TABLE XlII· 6
Population, area and density of the sdected 'WIIIages
_._---_.-Name of village
Melarasur (Lalgudi taluk)
Kallagam
Muduvathur " Kovandaklcurichi i
Palinganatham (Ariyalur taluk)
Keelarasur (Lalgudi taluk)
:p.Sangendi
Pullaml>adi
Venkatachalapuram
PuthurpaJayam
Poondi (Ariyalur tal uk)
Vellanur (Lalgudi taluk)
N.Sangendi
Edangimangalam " Kilapalur (Ariyalur taluk)
Kilayur
Melapalur " Peruvalanallur (Lalgudi taluk)
Varanavasi (Ariyalur taluk)
Melakaruppur
Pappanacheri
Arungal
Among the villages selected lying within a radius of 5 kIn. Kovandakkurichi has the highest population of 4,772 . with a density of 492. Among the villages within a, radiuS! of 5-10 km., Pllllambadi with a population of 7,511 and a density of 719 tops the list. Kilapalur and Peruvalanal1ur, are the villages lying within a radius of 10-15 km. and 15-20 km. respectively that account for the highest population of 3.443 and 5,094 in their respective ranges. While Kilapalur does not have the highest density in the range lO-15 km. the highest density in the, range 15-20 km. is 622 in Peru'VaJlanallur. The highes.t density among the villages in the range of 10-15 km. ]S In Melapalur village and the density is 565. The villages nearer to the town will usually have
Distance Popula- Area in Density from tion sq.km. Kallaklcudi
2 3 4 5
. Within I,S8q 9.42 200 Skm.
" 2,282 10.07 '121
1,332 8.53 156
4,772 9.70 492
3,453 14.'12 243
5-10 km. 1,871 10.69 : 175
2,510 12.47 201
1,511 10.45 - 119
2,056 _8.94 230
-.. 'i,692 7,5Q 358
3,723 15.54' ,239
. 10-15 kIn. Ii
994 1.96 ,124
" 804 3.52 228
2,565 6.54 392
i' " 3;443 15.31 224
2.7i8 11.61 240
2,317 4.10 565
• 15-20 km. 5,094 8.18 622
2,515 9.76 257
3,551 17.15 207
1,077 8.70 123
" 2,515 20.59 122
more urban influence. In the case Of Kallakkudi which has a density of 1,018, the vill~ges which are within a radius of 5 km. from the town, have the population ranging from 1,332 to 4,7h while the densities vary froin 1'56 to 492. The /hypothesis that viUages which have urban influence will tend to have larger, population and gx:eafer density compared to other ~i11ages of, the region does not hold good as far as Kallakkud~ is c-oncerned.
(ii) VillageS 1lVitb high! urban infIumce wiJ. bve, comparativel~ lUglter ndio of hoo6eholds to ~ houses '
The following table indicates the ratio of house· holds to censu~ houses in selected villages.
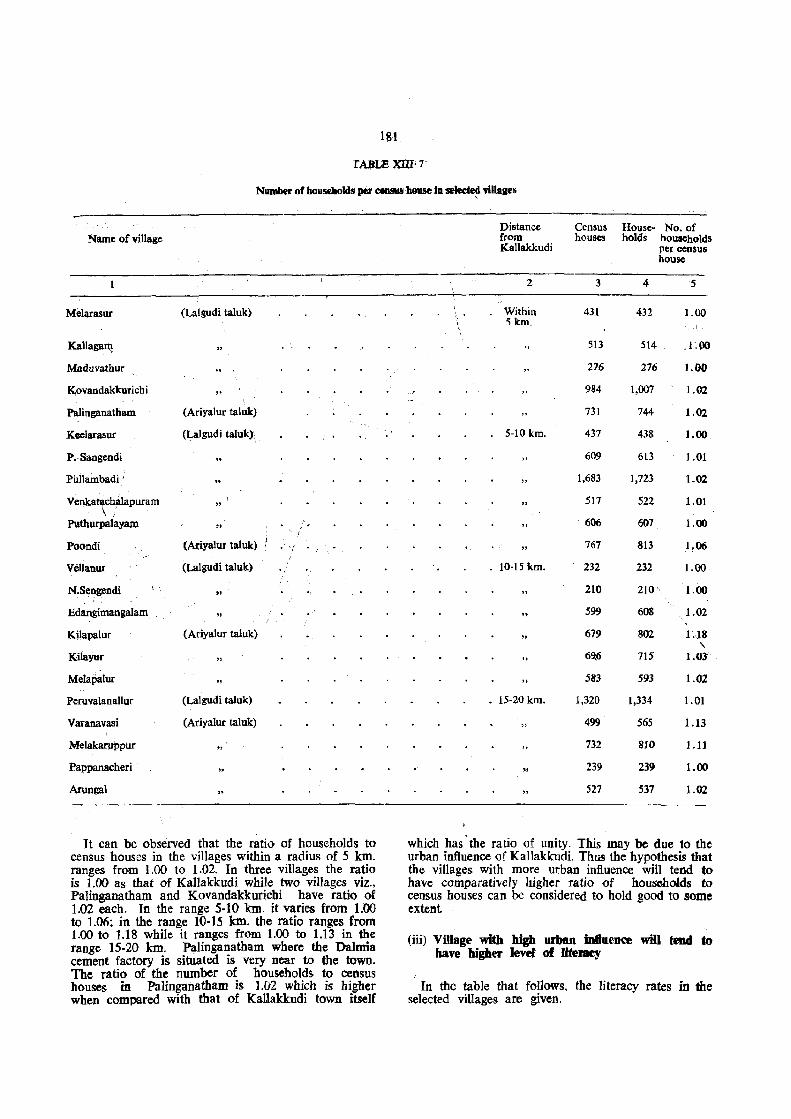
lSI
TABLE KIln'
Number of houstholds per C8IIliWi house in ~ villages
Name of village
Melarasur (Lalgudi taluk)
Kallaga~
Maduvathur
Kovandakkurichi " Palinganatham (Ariyalur taluk)
Keelarasur (Lalgudi taluk),
P.·Sangendi
Pilllambadi ' " Yenka"tchalapuram " Puthurpatayaro : . .
" ,/
Poondi (Ariyalur taluk) .',1
Yellanur (Lalgudi taluk)
N.Sengendi
Edangimangalam
Kilapalur (Ariyalur taluk)
Kilayur
Melapalur
Peruvalanallur CLalgudi taluk)
Yaranavasi (Ariyalur taluk)
MelakaruPpur
Pappanacheri
Arungal
It can be observed that the ratio of households to census houses in the villages within a radius of 5 km. ranges from 1.00 to 1.02. In three villages the ratio is 1.00 as that of Kallakkudi while two villages viz., Palinganatharn and Kovandakkurichi have ratio of 1.02 each. In the range 5·10 km. it varies from 1.00 to 1.06; in the range 10·15 km. the ratio ranges from 1.00 to 1.18 while it ranges from 1.00 to 1.13 in the range 15·20 km. PaHnganatham where the Dalmia cement factory is situated is very near to the town. The ratio of the number of households to census houses in Palinganatham is 1.02 which is higher when compared with that of KaUakkudi town itself
Distance Census House· No. of irom houses holds households Kallakkudi per census
house
2 3 4 5
, Within 431 432 1.00 ~ I, • 5 krn.
513 514 .1.00
276 276 1.00
984 1,007 1.02
731 744 1.02
5-10 km. 437 438 1.00
609 613 1.01
1,683 1,723 1.02
517 522 1.01
606 607 1.00
767 813 1,06
. 10·15 km. 232 232 1.00
210 210' 1.00
599 608 1.02
679 802 LI8 \
69.6 715 1.03'
" 583 593 1.02
• 15-20 km. 1,320 1,334 1.01
499 565 1.13
732 810 1.11
239 239 1.00
527 537 1.02
which has· the ratio of unity. This may be due to the urban influence of Kallakkudi. Thus the hypothesis that the villages with more urban influence will tend to have comparatively higher ratio of households to census houses can be considered to hold good to some extent .
(iii) Village with high urban intIu.cnce will teDd to have higher level of literacy
In the table that follows, the literacy rates in the selected villages are given.
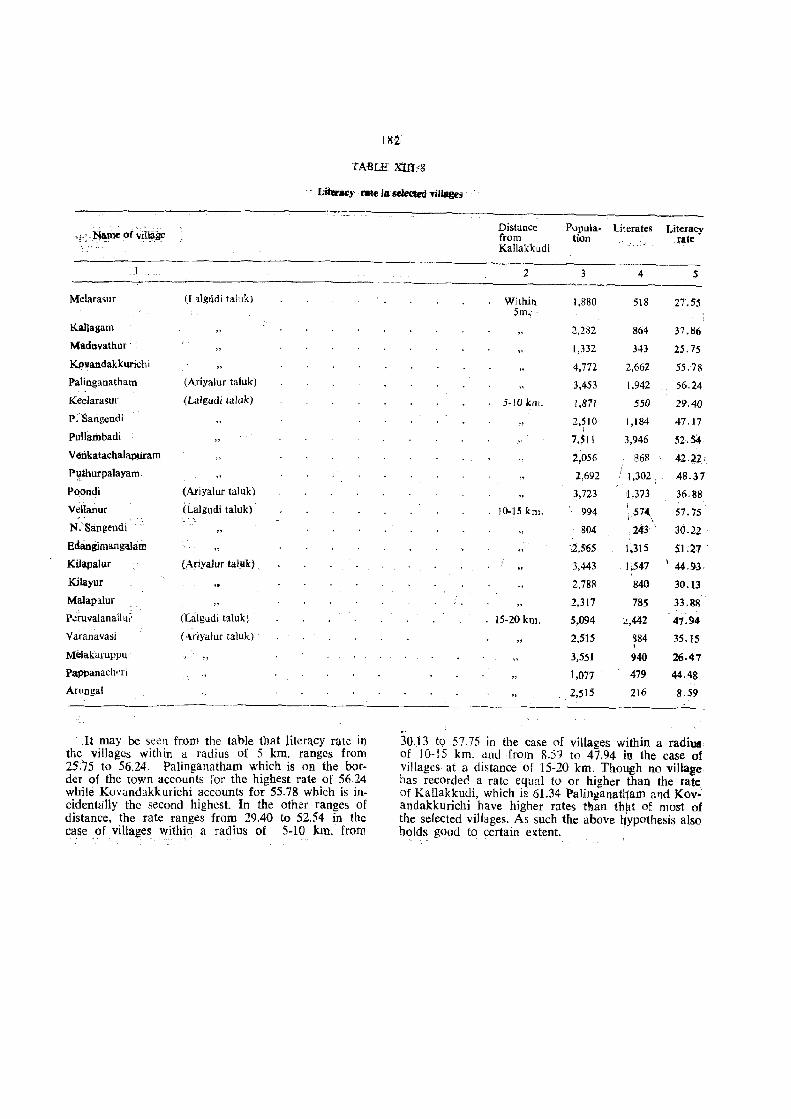
181
TABLE Xlll:'8
•. L~y .... te in selected 'lilJages' .
,!.; .~of vi1~
-----J
Melarasur (LllgUdi laluk)
Kallagam
Maduvathur .
K$lvandakkurichi
Palinganatham (Ariyalur taluk)
Keelarasur (l..algudi taluk)
P. Sangendi
Pullamhadi
Veokatachalapuram
P\lthurpalayam.
Poondi (Ariyalur tal uk)
Vellanur (Lalgudi taluk)
N.Sangendi
Edangimangalam
Ki.lapalur (Ariyalur taluk)
](jjayur
Malapalur
Piruvalanall u;: (Lalgudi taluk) .
Varanavasi ( --\riyalur taluk)
MeIakaruPPul' "
P~anacll''l'i
Arungal
It may be seen from the table that litera.cy rate in the villages within a radius of 5 km. ranges from 25'.75 to 56.24. Palinganatham which is on the bor· der of the town accounts for the highest rate of 56,24 while Kovanuakkurichi accounts for 55.78 which is in· cidentally the second highest. In the other ranges of distance, the rate ranl!es from 29.40 to 52.54 in the case of villages within a radius of 5·10 km. from
Distance Popula. Literates LiteraCy from tion . ,ate Kallakkudi
2 3 4 S
Within 1,880 518 27.55 5m,- .
2,282 864 37.86
1,332 343 25.75
4,772 2,662 55.78-
3,453 1,942 56.24
5-10 km. 1,871 550 29.40
2,~IO I
1,184 47.17
7,511 3,946 52.54
2~056 868 42.~2
2,692 i 1,302 I 48.37
3,723 ~ ,373 36.88 10-15 km. 994
I ,,574 57.15
804 ; 243 ' 30.22
2,5'65 1~315 51.27
3,443 1;547 \ 44.9-3.
2,78R 840 30.13
2,317 785 33.88
15-20 km. 5,094 .,,442 47.94
2,515 ~84 35.15
3,551 940 26.47
1,077 479 44.4&
2,515 216 8.59
30J 3 t9 57.75 in the case of villages within a radiUA of 10-15 km. and from 8.59 to 47.94 in the case of villages at a distance of 15·20 km. Though no village has recorded a rate equal to or higher than the rate of Kallakkudi, which is 61.34 Palinganat~am and Kevandakkurichi have higher rates than that of most of the selected villages. As such the above ~ypothesis also holds good to certain ex.tent.
CHAPTER_ XL\' . <.
CONCLUSION
Kallakkudi town with a population of '11,196 is one of the class IV towns of Tamil Nadn. The town was declared as a town pall'Chayat by the state government during the year 1958 and it was declared as a census town' during 1961 census. But the origin of the town !lates back to the establi!hment of the Dalmia eemdt (Bharat) Umit~d here in the early thirties. However, the growth of the town for the last 25 years' is not anything \ .remarkable. The town has not attracted any new industry except the already existing cement and allied products. There has. not ~en any change in the physiqal botindary. of the tOW!t This may be due to the 'ra~ that the physical features ofKalIakkudi are not\ conducive to the emergence of a - large sized urban centre. The very ex~stence N the town depends orl, the production of tement aod aIHed prod~l(~ts which t\re again'depel'ldertt on th~ limestone mines in and atound Kallakkudi which 'are ,exhaustive in nature. . \Moreover, the centeht iriClnstry bas to face much' tom~tition in the market. The. trading activity in th,e town is confined . ftf retail trade Only. Hence there .ls n9t much scope for trade also. The decadal growth nite ,of the town ft9m 19M to 1971 was 5.65 percent,. and from i971 to 1981 q:te growth rate was 2.13 per cent· whiCh are much below the state growth rate (22JO p~r ceht in 1961-71 and 17.50 per cent in 1971-S1} and national growth rate _(24.80.per cent in 1961-71 and 25.00 per
'cent in. 197.1-81). 'This indi<;jltes that the grow~ of population m the town may be due to surplus of bIrths
, over .deaths rather than the inflUx of migrants. .
The social structure of the town is the same as .1'te:vailing in tbe state, district and taluk. Hindus are in majority in the town and they are followed by Chr+stjan~ and Muslims. Among Hindus, the maior "oo~ity found in the town is Boyar and it is followed by Ud~ar and Brahmin. Among scheduled castes, Adi-dravida and Chakkiliyan are the major castes. Though 1981 Census has not returned any scheduled tribes, at the time of field survey two households were found; one belonging to Irular and the other belonging to Kammara communities. The household belonging to Irular community has migrated to the town after the 1981 Census and the household belonging to Kammara community might have been temporarily out of the town at the time of census and that is why 1981 Census has not returned any scheduled tribe. Though there are no definite areas allotted for the residence of a particular caste or community, in the Harijan colony and Ambal talkies area people belonging to Adi.dravida, Chakkiliyan and Paraiyan are more. The people of various communitie~ in the town reside in harmonious and cordial relationship. There has never been any report of serious incident to disturb communal harmony among
the people of the. town. Moreover most of the people of the t~wn know each other.
\ . .bl modem cities, the sites for industry. commerce,
residentlai colonies etc.; are regulamell by a master plan, so that the functional areas can be cleaI'1y .demarcated. The town and country planning organisation lays much stress on this aspect. As far as Kallak-
, kudi town is conCerned neither the town has an~ master plan nor it is covered by' the town and country planning organisation as it is a town panchayat. Nevertheless within the Dalmia compound everything is well plaimed": In sh"orf, it is a self contained 'unit Household things are available at Dalmia co-oper-dtive stores, medical facilities are available at Dall1lia qtilization dispensary. and for schooling the Dalmia Hjgh,er Secondary School)s located. within the Dalmia cQmpound. . The area" outside the Dalmia compound has grown in a haphazard manner without any adequate planning .. The~ residential house~. are .• fOl;lnd scattered all over' the town and educational lllsbtutions are fOUIid in the midst of residential houses. No proPer p~an has, heendrawn up for utilizatiol1 of land.
183
.Considering the size of the town and the :rineniti~s available, these are sufficient for the town. There are five nursery schools. one primary sclJOol, one ,ri'liddIe school and one higher secondary school. Th~ medical facilities are also moderately available. The Da,Imia utilization dispensary located within the Dalmia compound' caters to the medical needs of the whole town dwe11ers. The town panchayat office is mainly respDnsible for general civic amenities such as maintenance of roads. drainage, water supply and public lighting etc. outside the" Dalmia compound. But within the Dalmia compound tbe amenities and other services· are provided by the management of Dalmia cements. Within the Dalmia compound even the roads are maintained by Pahnia cements. . The main sources of income of the town panchayat' are through various taxes and government grants.
The role of the town in providing services and amenities to its hinterland is negligible. Most of the hinterlands depend upon Lalgudi and Ariyalur towns. Lalgudi, being the taluk headquarters has much influence than Ariyalur town which is the taluk headquart~rs of another taJuk. Lalgudi lies 19 km. southwest of Kallakkudi and Ariya.lur lies 25 kro. northeast of KaJIakkudi. 22 villages on train route as well as on bus route emanating from the town were studied so as to study the impact of the town on the vilJages and vice versa. Since t1}e work force commuting to the town from the hinterland is very limited the influence of the town on these vi11ages is negligible except for the supply of milk and vegetables
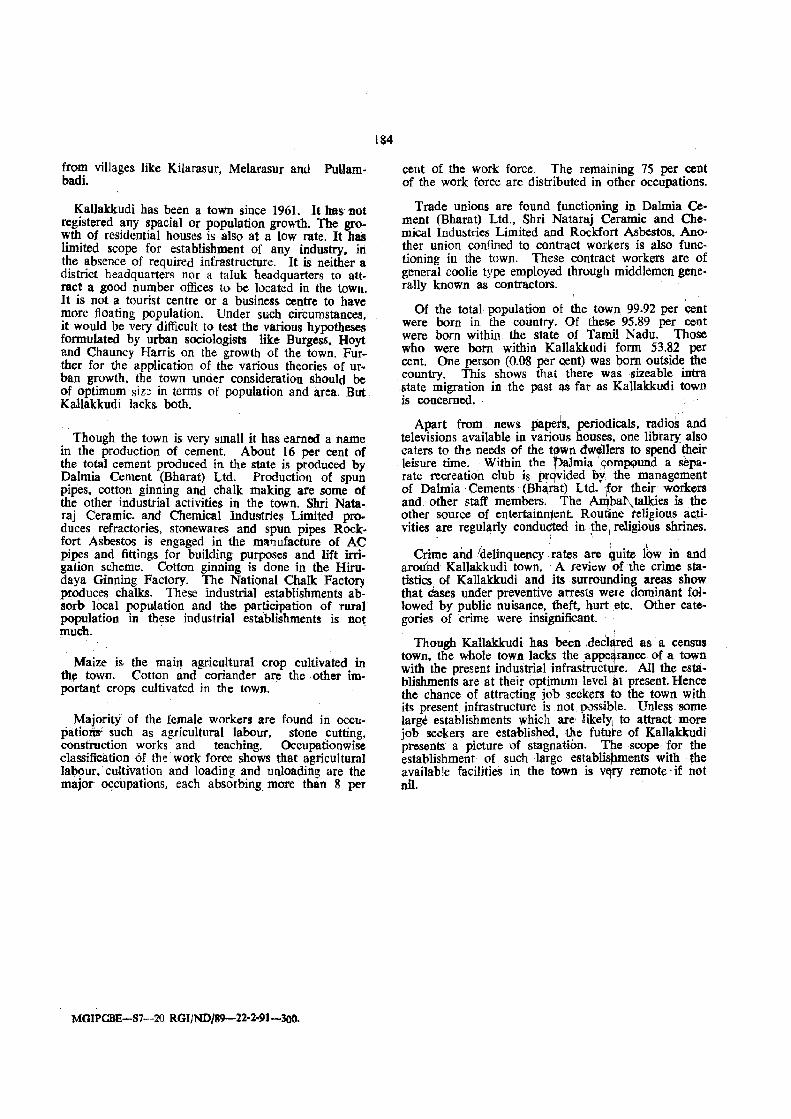
from villages like Kilarasur, Melarasur and Pullambadi.
KaUakkudi has been a town since 1961. It has not registered any spacial or population growth. The growth of residential houses is also at a low rate. It has limited scope for establishment of any industry. in the absence of required infrastructure. It is neither a district headquarters nor a taluk headquarters to attract a good number offices to be located in the town. It is not a tourist centre or a business centre to have more floating population. Under such circumstances it would be very difficult to test the various hypothese~ formulated by urban sociologists like Burgess. Hoyt and Chauncy Harris on the growth of the town. Further for the application of the various theories of ur. ban growth. the town under consideration should be of optimum SiD in terms of population and area. But Kallakkudi lacks both.
Though the town is very small it has earned a name in the production of cement. About 16 per cent of the total cement produced in the state is produced by Dalmia Cement (Bharat) Ltd. Production of spun pipes, cotton ginning and chalk making are some at the other industrial activities in the town. Shri Nataraj Ceramic. and Chemical Industries Limited produces refractories. stonewares and spun pipes Rockfort Asbestos is engaged in the ml\f}ufacture of AC pipes and fittings for building purposes and lift irri· gation scheme. Cotton ginning is done in the Hirudaya Ginning Factory. The National Chalk Factory produces chalks. These industrial establishments ab-80rb local population and the participation of rural population in these industrial establishments is not much.· .
Maize is the main agricultural crop cultivated in tlJe town. Cotton and coriander are the other important crops cultivated in the town.
Majority of the female workers are found in OCCllpatiotilt' . such as agricultural labour. stone cutting, construction works and teaching. Occupationwise classification of the work force shows that agricultural labour. cultivation and loading and unloading are the major ~cupations, each absorbing more than 8 per
MGIPCBE-S7-20 RGIIND/89-22-2-91-3QO.
184
cent of the work force. The remaining 7S per cent of the work force are distributed in other occupations.
Trade unions are found functioning in Dalmia Cement (Bharat) Ltd.. Shri Nataraj Ceramic and Chemical Industries Limited and Roekfort Asbestos. Another union confined to contract workers is also functioning in the town. These contract workers are of general coolie type employed through middlemen genera.lly known as contractors.
Of the total population of the town 99.92 per cent were born in. the country. Of these 95.89 per CCJ;lt
were born within the state of Tamil Nadu. Those who were born within Kallakkudi form 53.82 per cent. One person (0.08 per cent) was l;lom outside the country. This shows that there was sizeable intra state migration in the past ~S far as Kallakkudi town is concerned.
Apart from news pa~s. periodicals. radios and televisions available in various houses, one li"rary also ca ters to the needs of the tpwn dw,Uers to spend their leisure time. Within the Da.1mia. qomp;>und a separate recreation club is p~qvided by the management of Dalmia· Cements· (Bha,rytt) Ltd. Ifor their workers and, other staff members. The Anlbat\talkies is the other source of entertainment Rou~ne religious acJivities ~re regularly condu~ted in Pte l religious shrines.
.' I \
Crime and/delinquency rates are quite low in and around Kallakkudi town. A review of the crime statistics. of Kallakkudi and its surrounding areas sho)\' that ciases under preventive arrests were dominant fol· lowed by public nuisance. theft. hurt .etc. Other categories of crime were insignificant.
Though Kallakkudi has been tdeclared as' a census town. the whole town lacks the _appe4rance of a town with the present industrial infrastructure. All the establishments are at their optimum level at present. Hence the chance of attracting job seekers to the town with its present infrastructure is not ptJSsible. Unless some large establishments which are' .likely, to attract more job seekers are established. the future of Kallakkudi presents a picture of stagnatipn. The scope for the establishment of such large establisproents with ,the available facilities in the town is v~ry remote if not nil. '
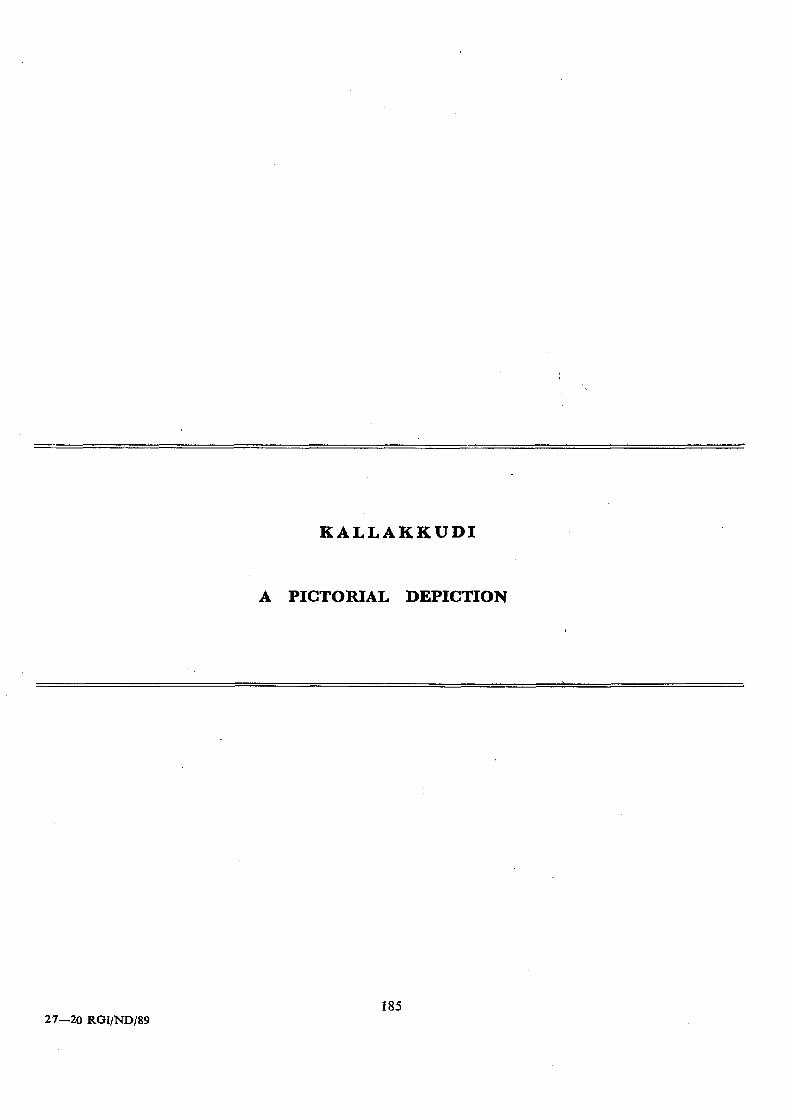
KALLAKKUDI
A PICTORIAL DEPICTION
185 27-20 RGI/NDj89
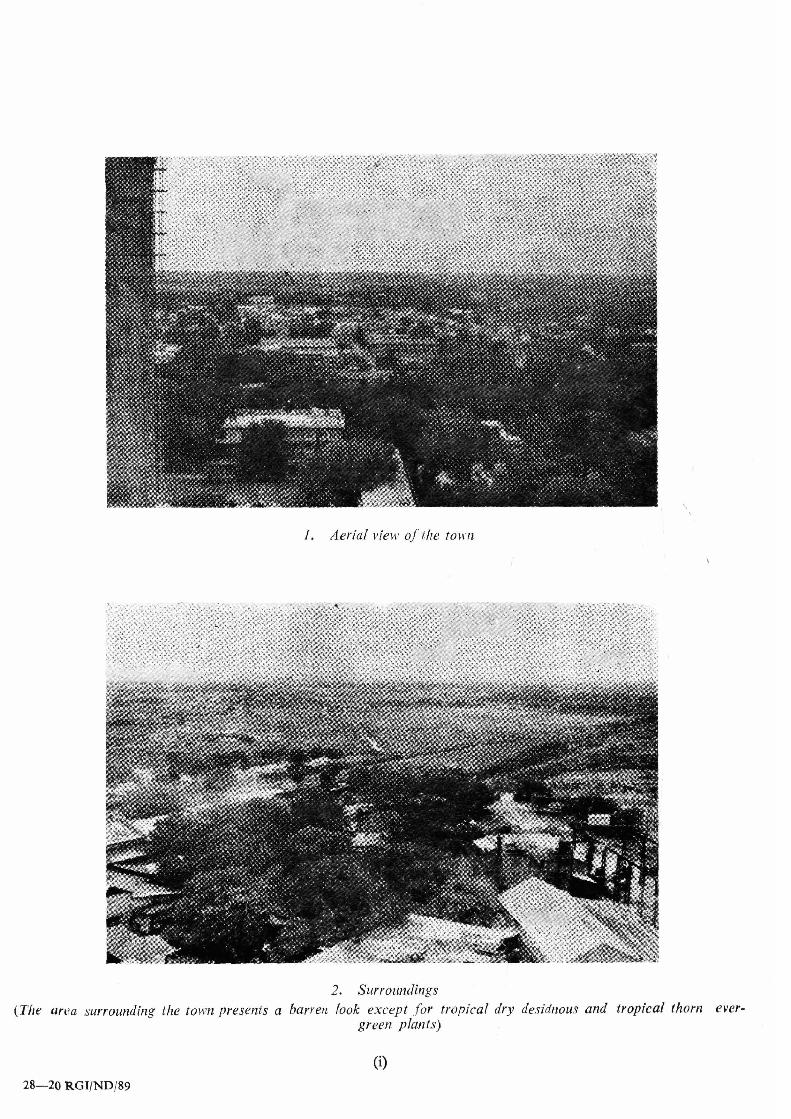
I. Aerial view of the t01l'11
2. Surroundings (The art1a surrounding the to wn presents a barren look except f or tropical dry desidnous and tropical thorn ever
green plants)
(i)
28- 20 RGI/ND/89
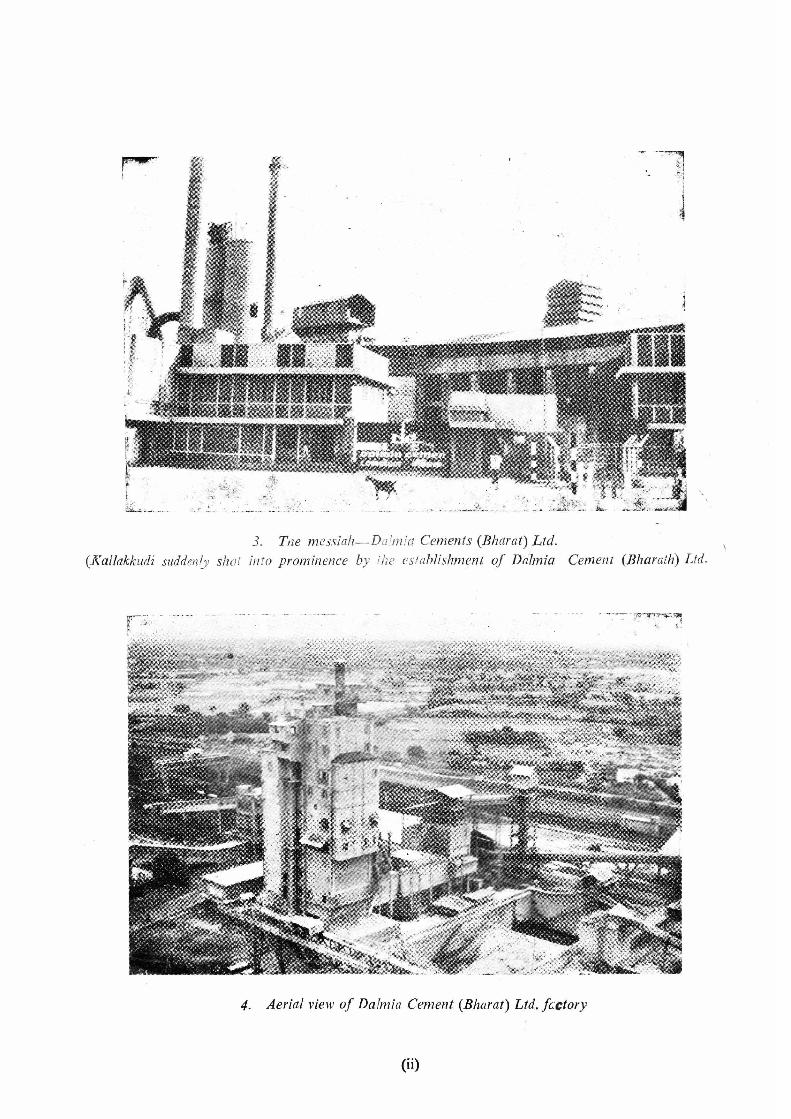
'.
3. Tile m essiah- Da!m!a Cements (Bharat) Ltd.
(Kallakkudi suddenly shot in fo prominence by ihe establishment oj Va/mia Cement (Bharath) Ltd.
4. Aerial view oj Da fmia Cement (Bharat) Ltd. Jcctory
(ii)
. ~- -_".--=- ~-:?--'"T!7~-:-T''1
~ ~
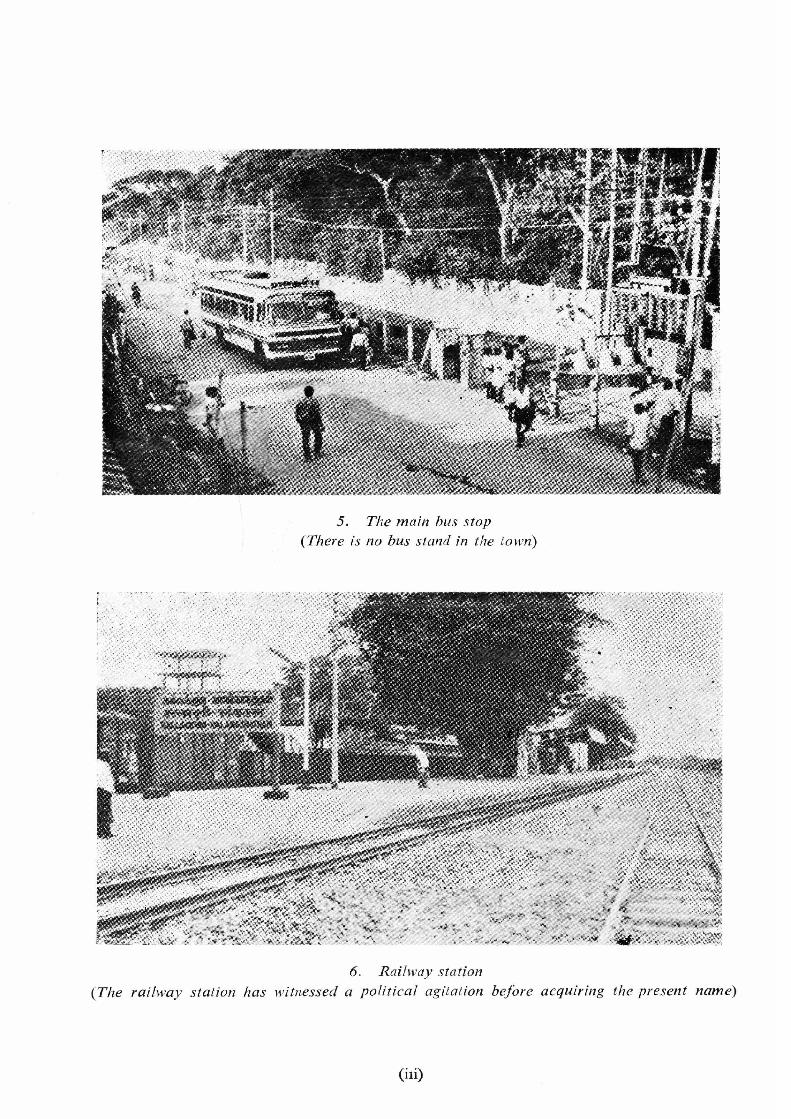
5. The main bus stop (There is no bus stand in the town)
6. Railway station (The railway station has witnessed a political agitation before acquiring the present name)
(iIi)
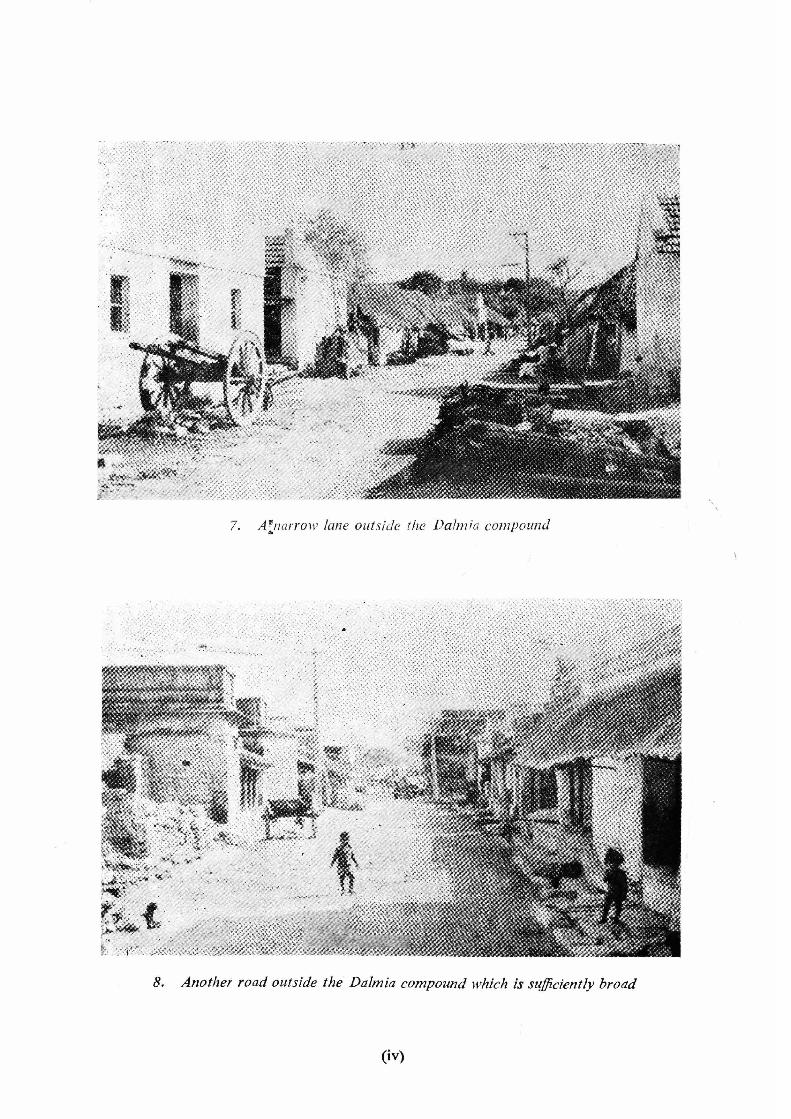
'.
7. A'!"narro w lane outside the Dalmia compound ..
8. Another road outside the Dalmia compound Ivlziclz is sufficiently broad
(iv)
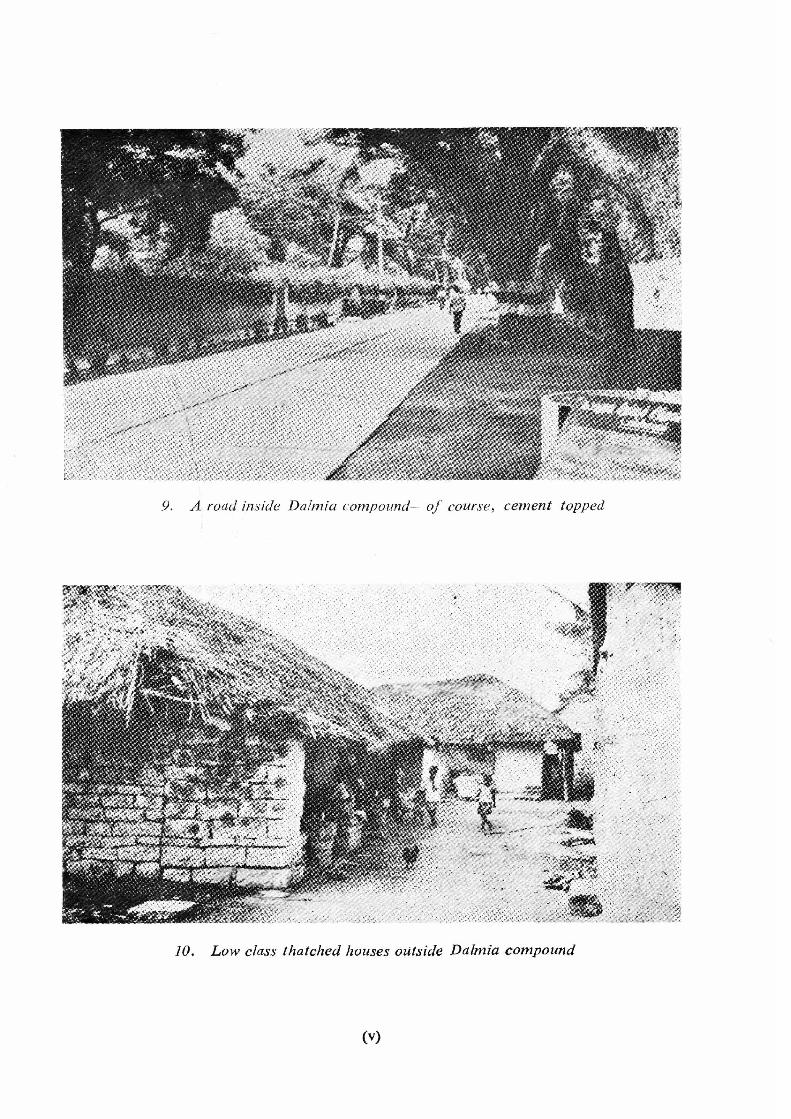
9. A road inside Da!mia compound-- of course, cement topped
10. Low class thatched houses outside Dalmia compound
(v)
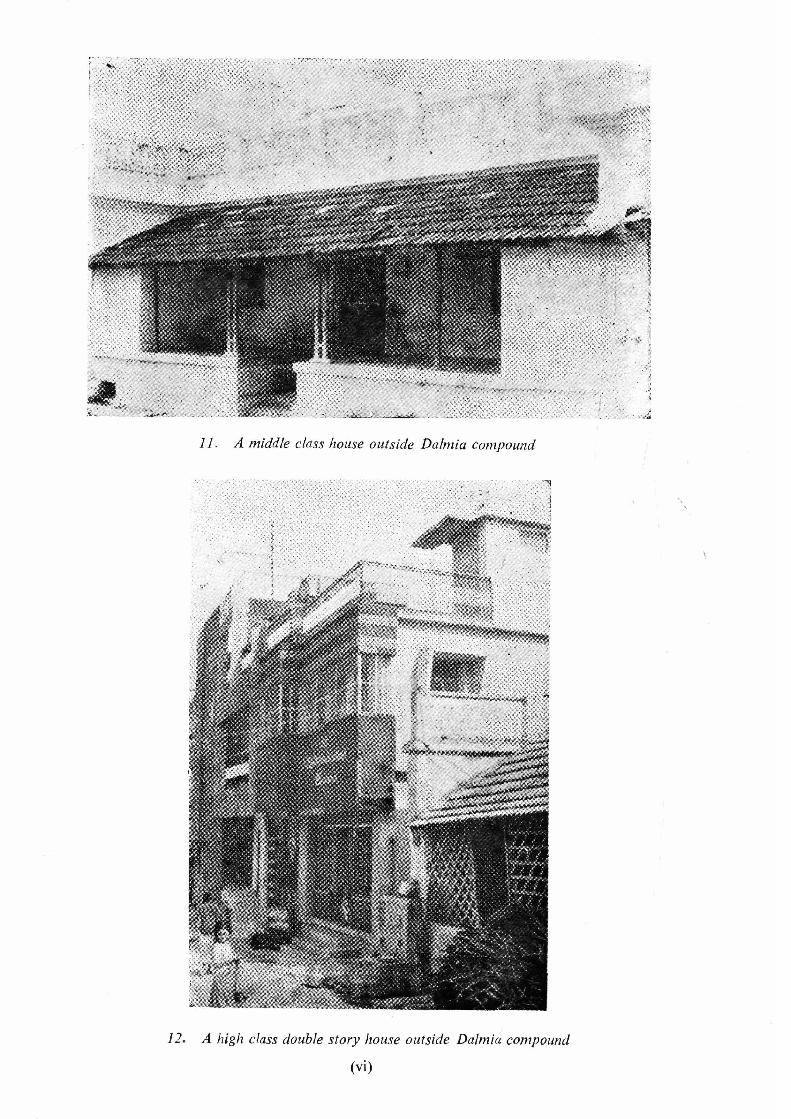
11. A middle class house outside Dalmia compound
12. A high class double story house outside Da/miu compound
(vi)
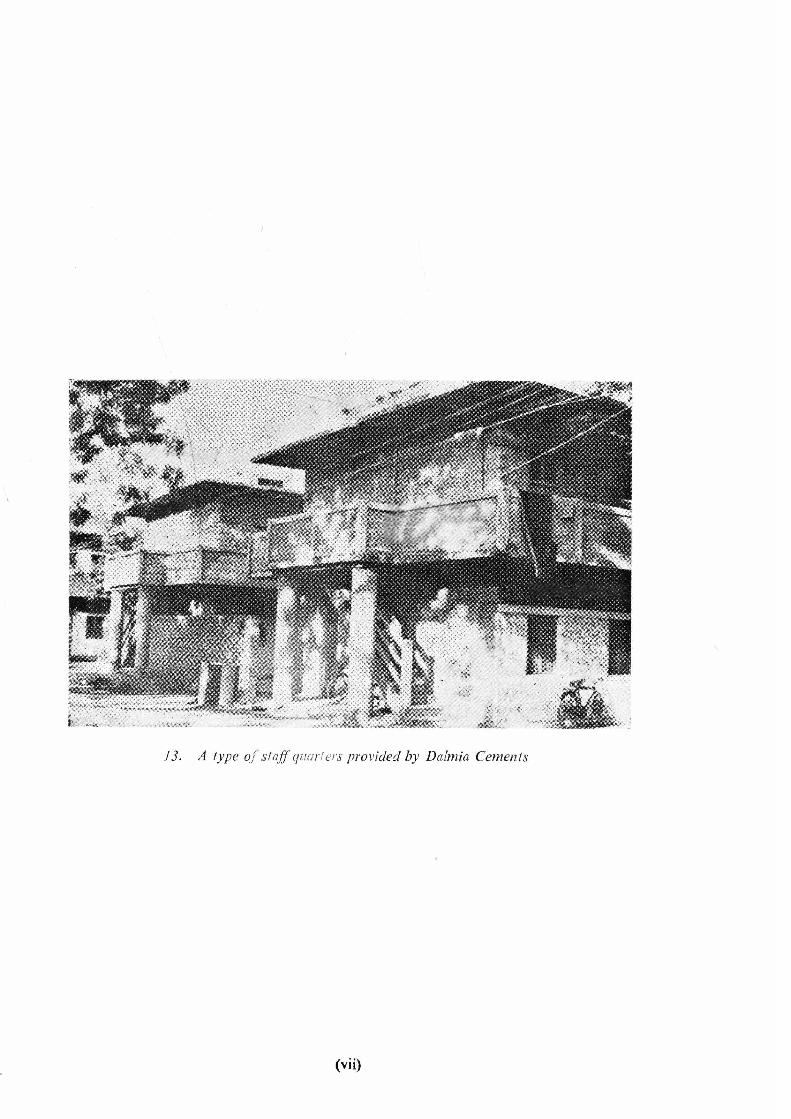
J 3. A type of staff qllariers provided by Da!mia Cements
(vii)
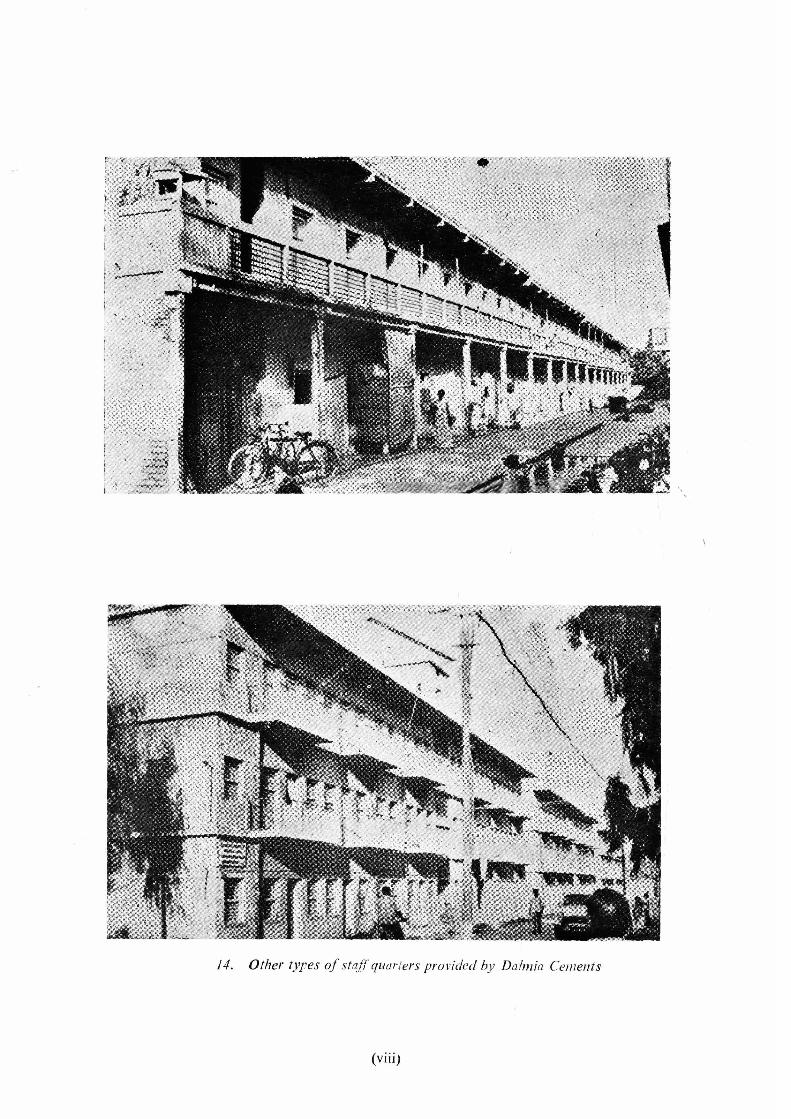
'.
14. Other types of staff quarlers provided by Da!mia Cements
(viii)
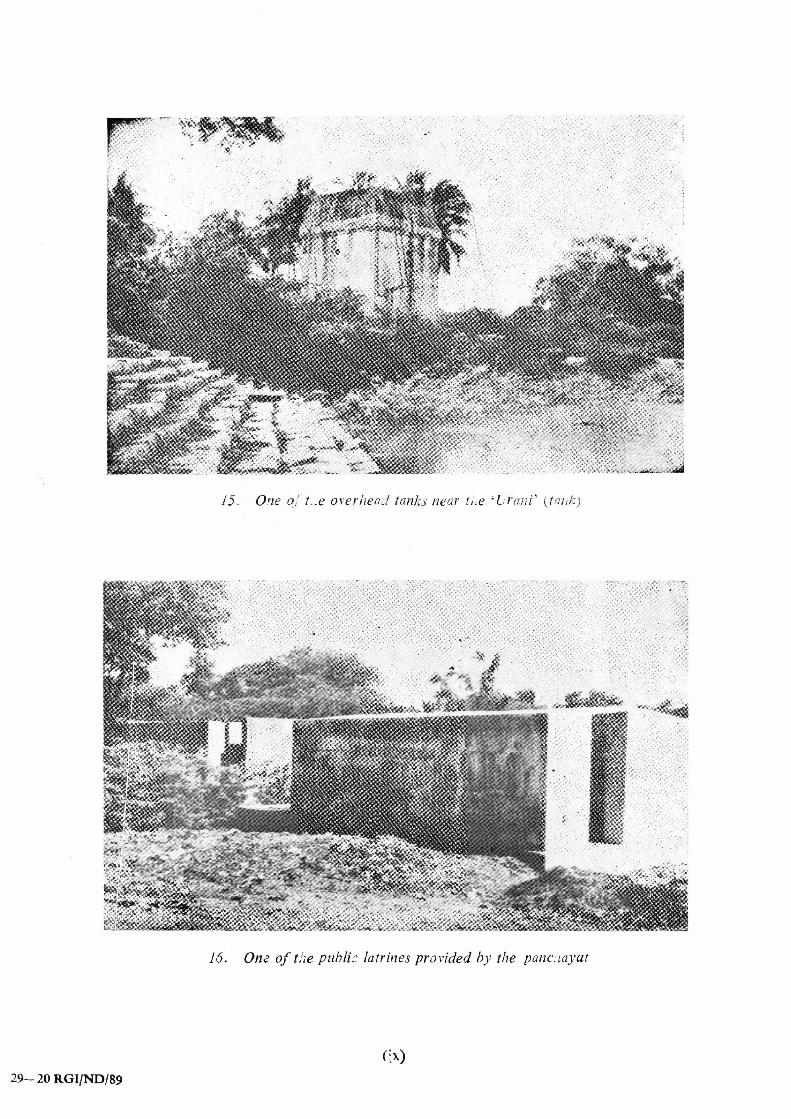
15. One 0/ t .. e overhead tanks near [/ ,e ' Cran i ' (tank)
16. On.? of the p~ibli :; latrines provided by the panc.wyat
( ~ x)
29- 20 RGI/ND/89

17. Seo t of l awn adm;nisiraiion-Tolfn Panchayal qlfice
18. Administrative OJJice-Dalmia Cements
(x)
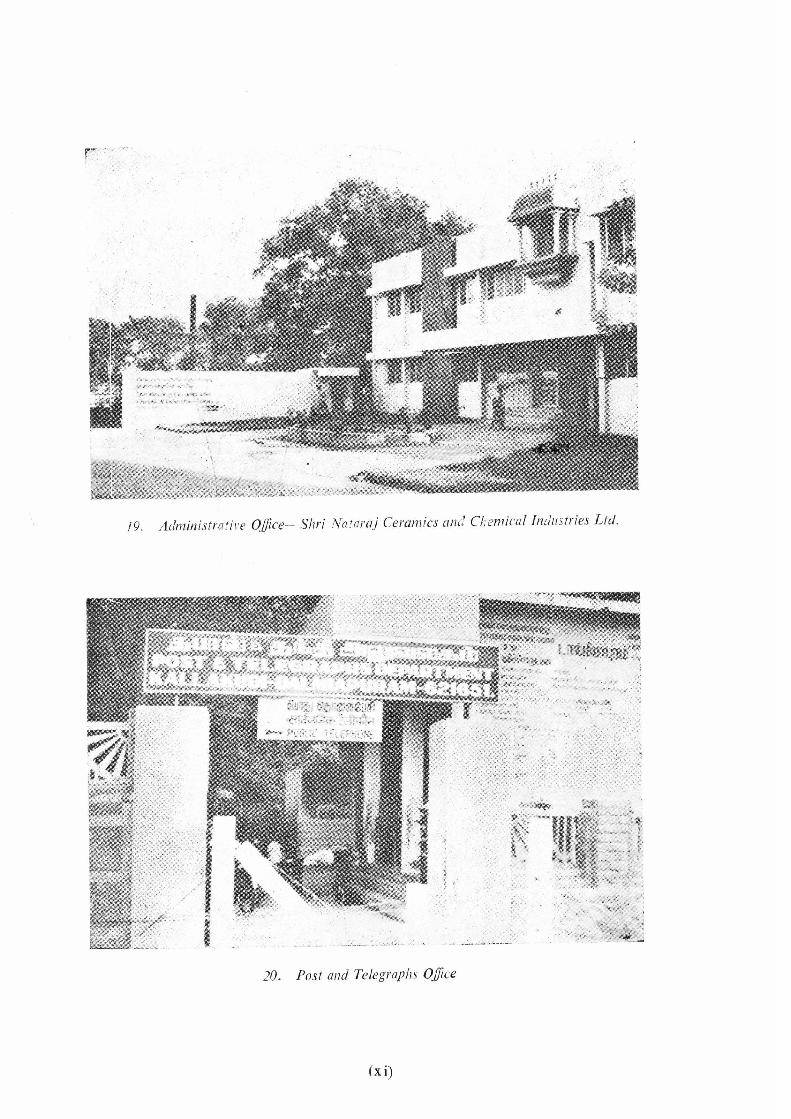
79 . Administrafire Office-- Shri Na! araj Ceramics an(.' Chemical Industries Ltd.
20. Post and Telegraphs Office
(xi)
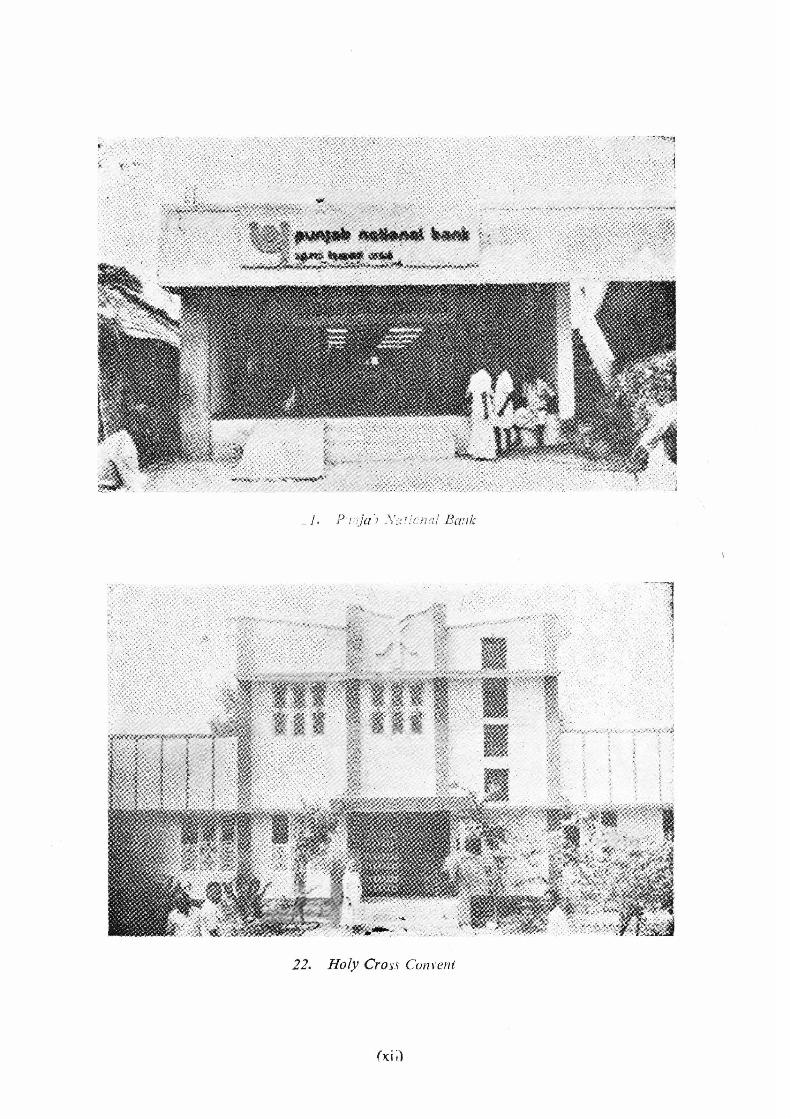
22. Holy Cross Conl'ent
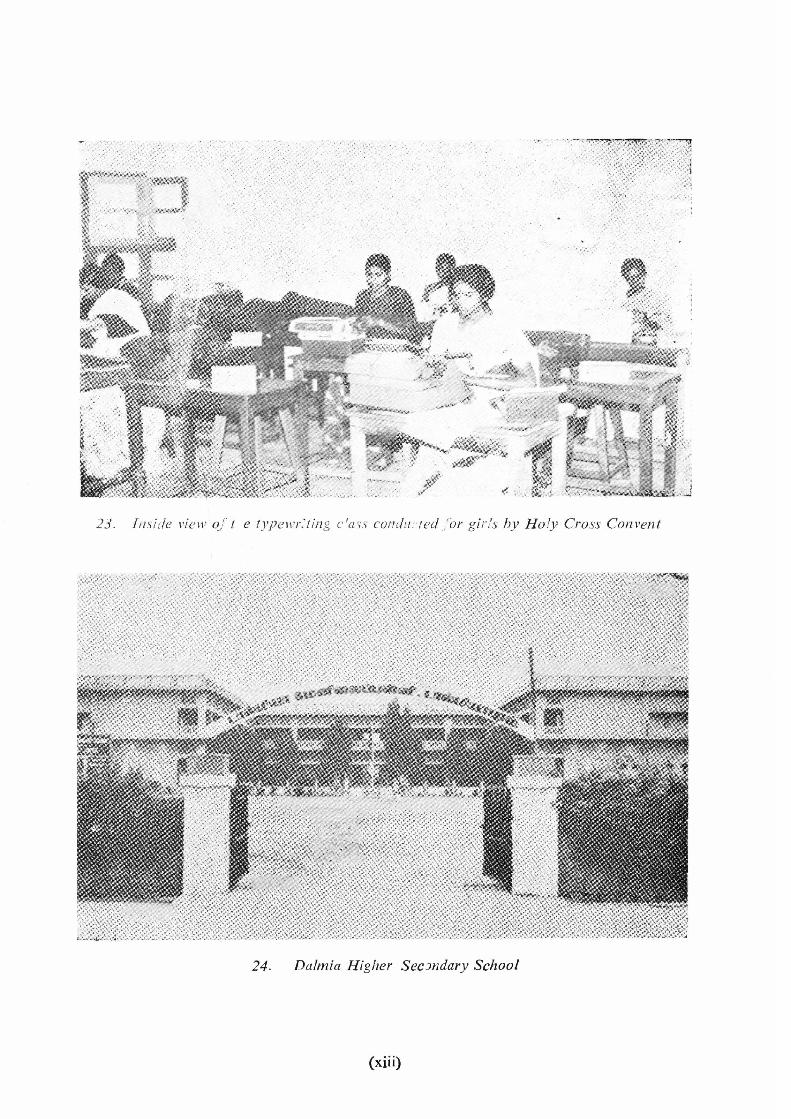
23. I nside view 0/ t e typell ,,.:ting c'a,,'s cOl1du :'ted/ or girls by H oly Cross Convent
24. Dalmia Higher SecJndary School
(xiii)
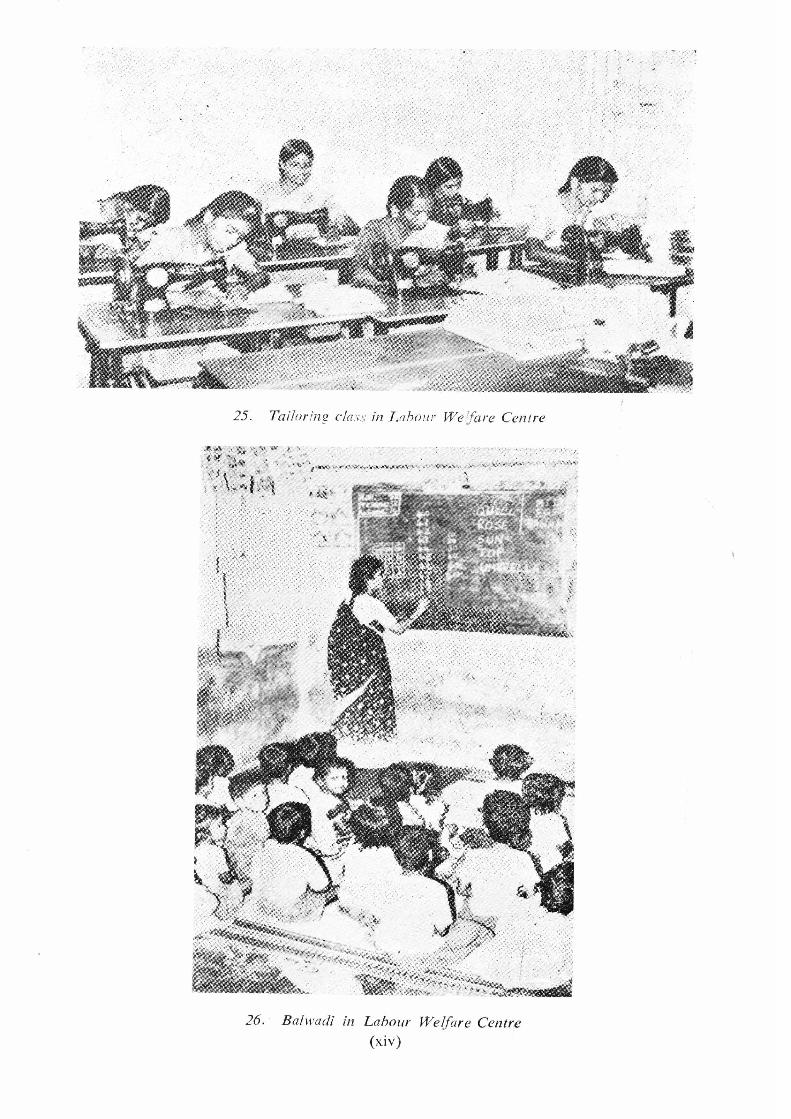
25. Tailoring class in L abour We 1are Centre
26. · B a/wadi in Labour Welfare Centre (xiv)
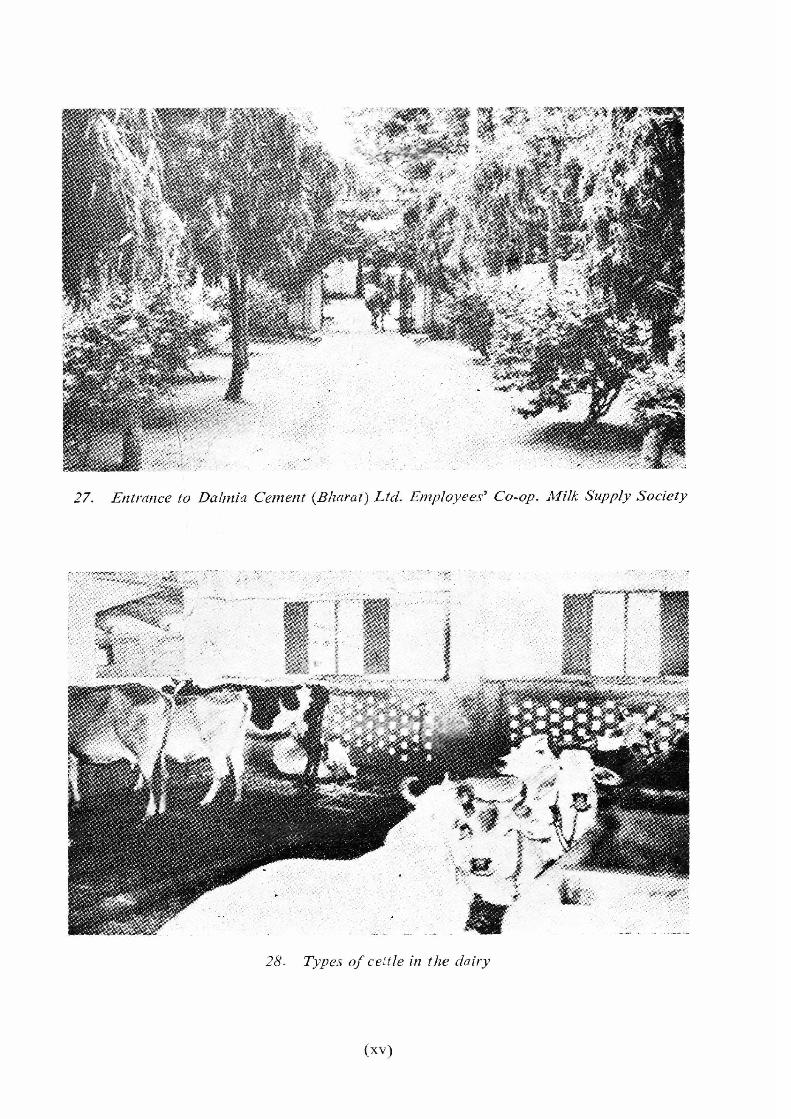
27. Entrance to Dalmia Cement (Bharat) Ltd. Employees' Co-op. Milk Supply Society
28. Types of celtle in the dairy
(xv)

29. A cow in the dairy-Indigenous variety
\ '.
30. A itud bull in the dairy
(xvi)
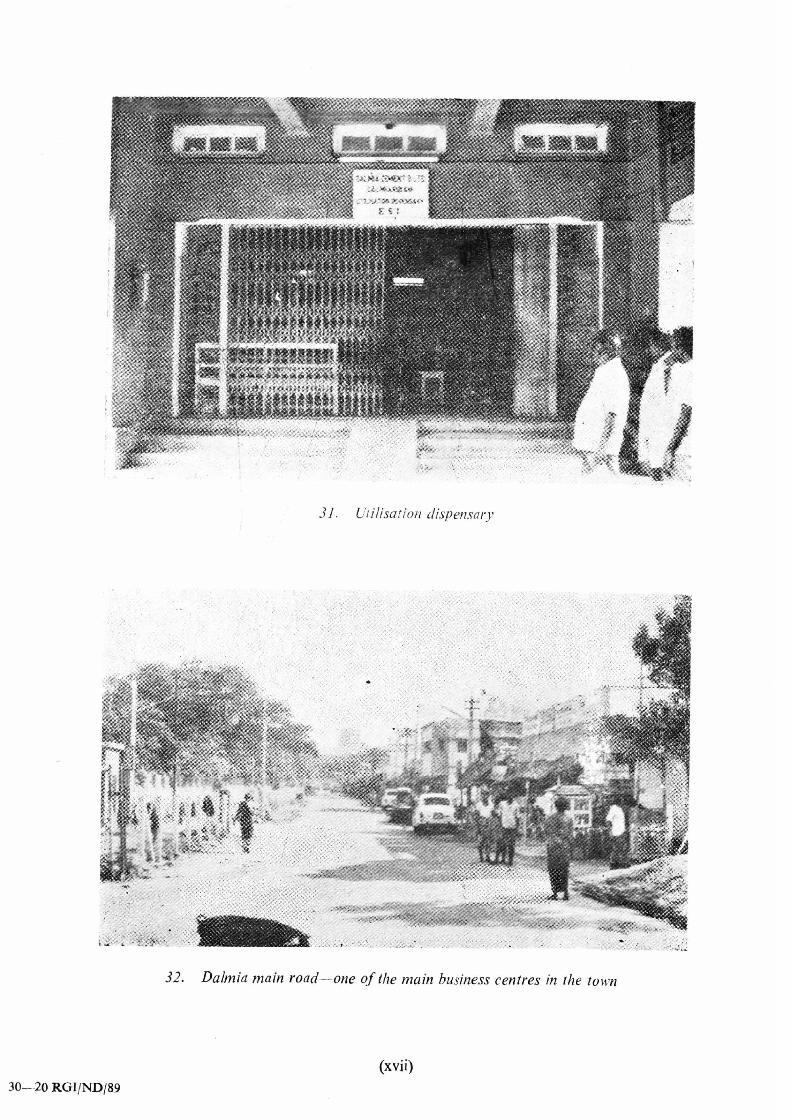
31. Utilisation dispensary
32. Dalmia main road- one of the main business centres in the town
(xvii)
30- 20 RGIJND/89
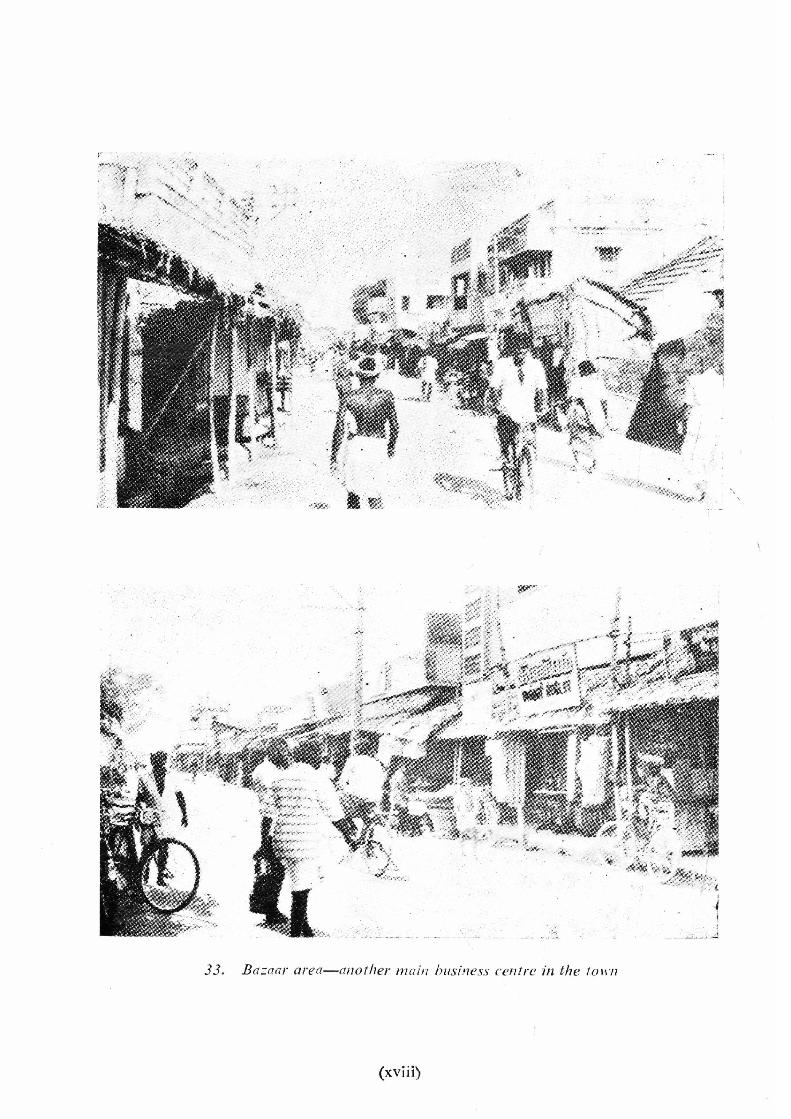
33. B azaar area-another main business centre in the 101\'11
(xviii)
I 1
____ --..1____ ..;_ . ..:-l
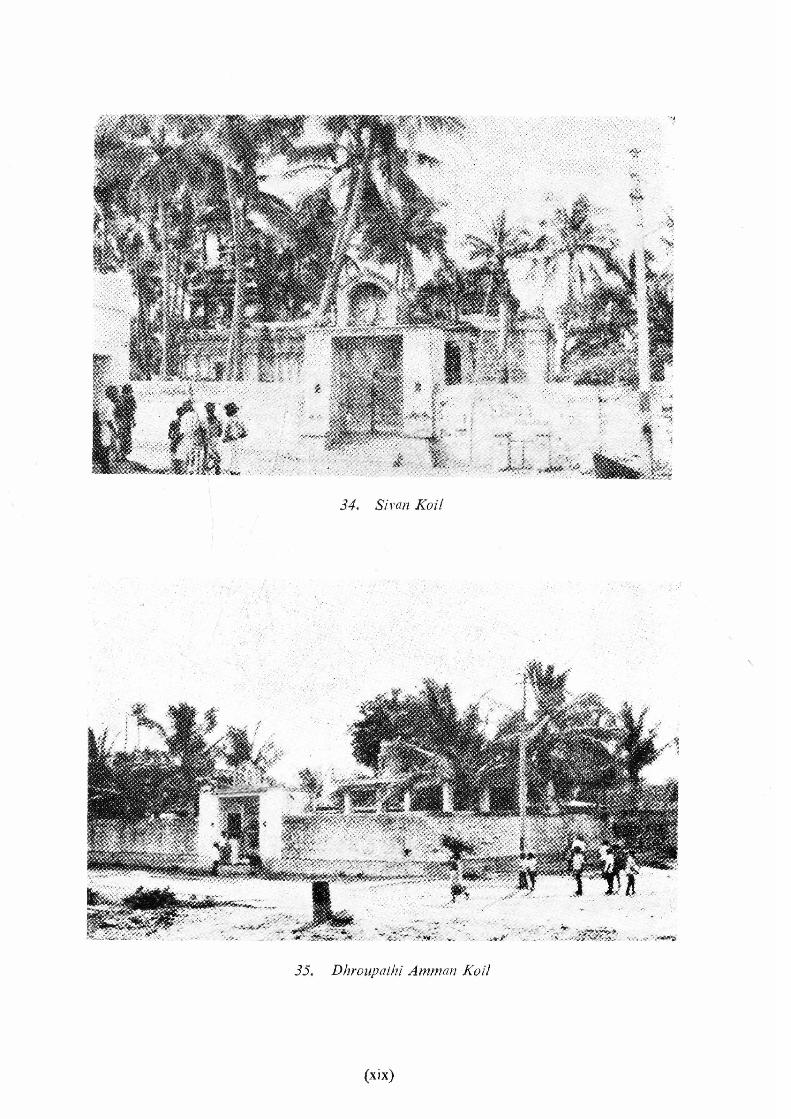
34. Sivan Koil
.,..,.;,. . . __ ~.''''' ~ ~ K!:O:'
-~ ~~;~~;J;;;~ _.:_ ' ~.--
35. Dhroupathi Amman Koil
(xix)
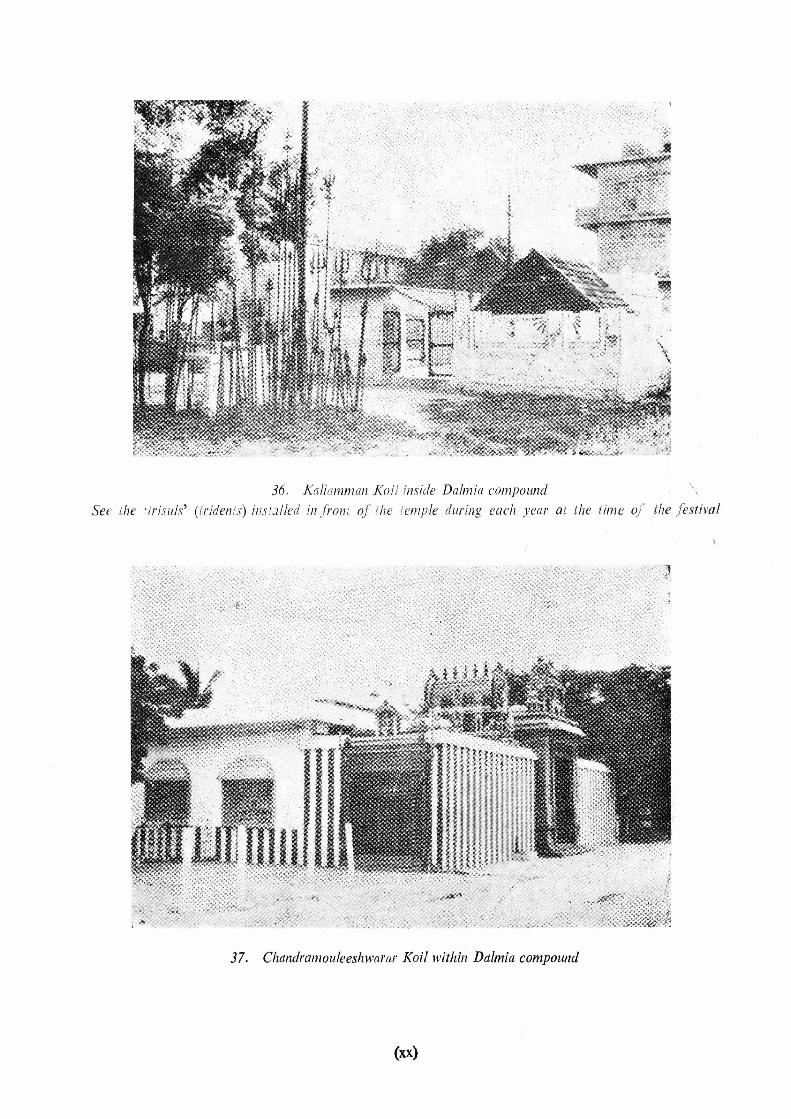
36, Kaliamman Ko i! inside Dalmia compound '. See the '/r;suls' Uriden is) il1stalled in /roni of ihe temple during each year ai the time 0)' the f est ival
37. Chandramouleeshwarar Koil within Dalmia compound
(xx)
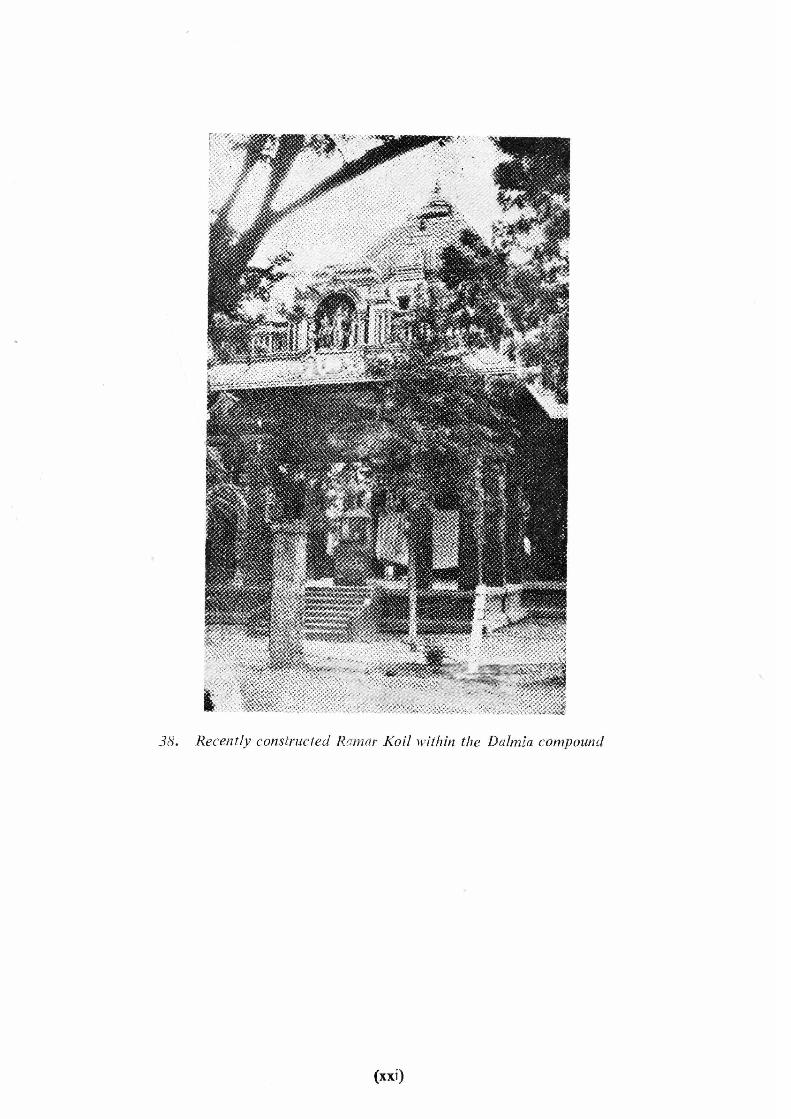
38. Recently constructed Ramar Koil within the Dalmla compound
(xxi)
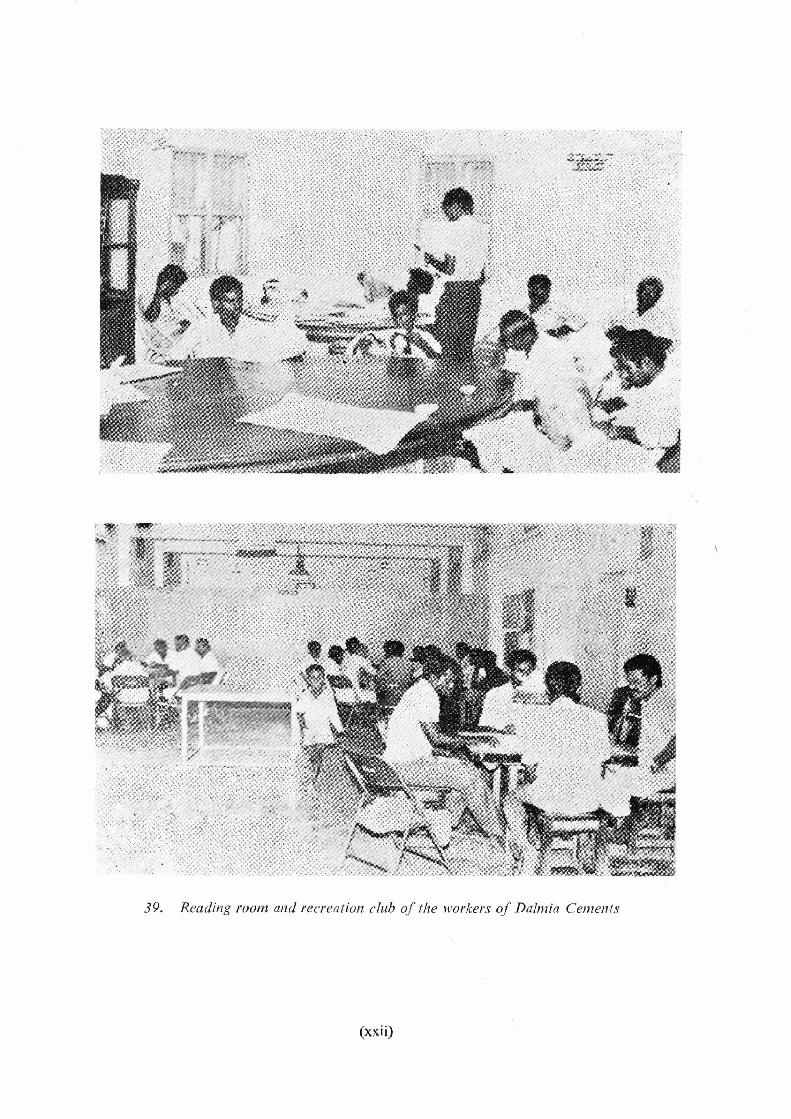
39. Reading room and recreation club of the workers of Dalmia Cements
(xxii)
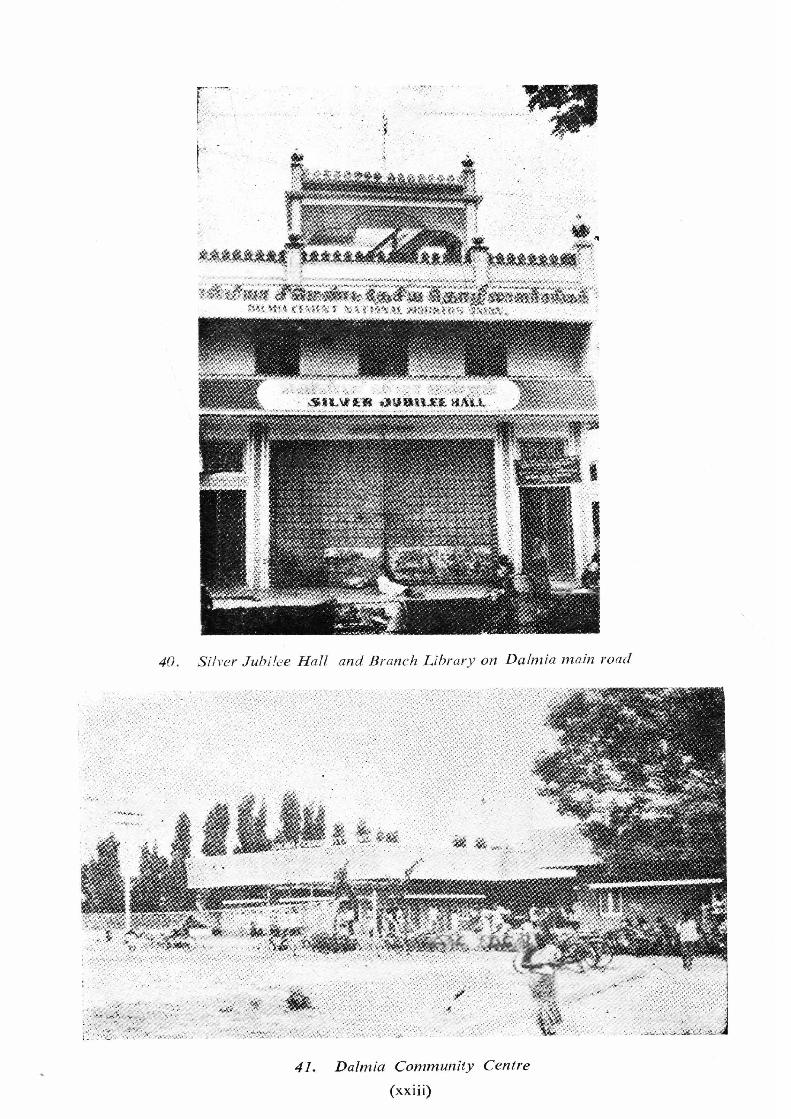
40. Silver Jubi!ee H all and Branch Library on Dalmia m ain ro ad
41. Dalmia Community Centre
(xxiii)
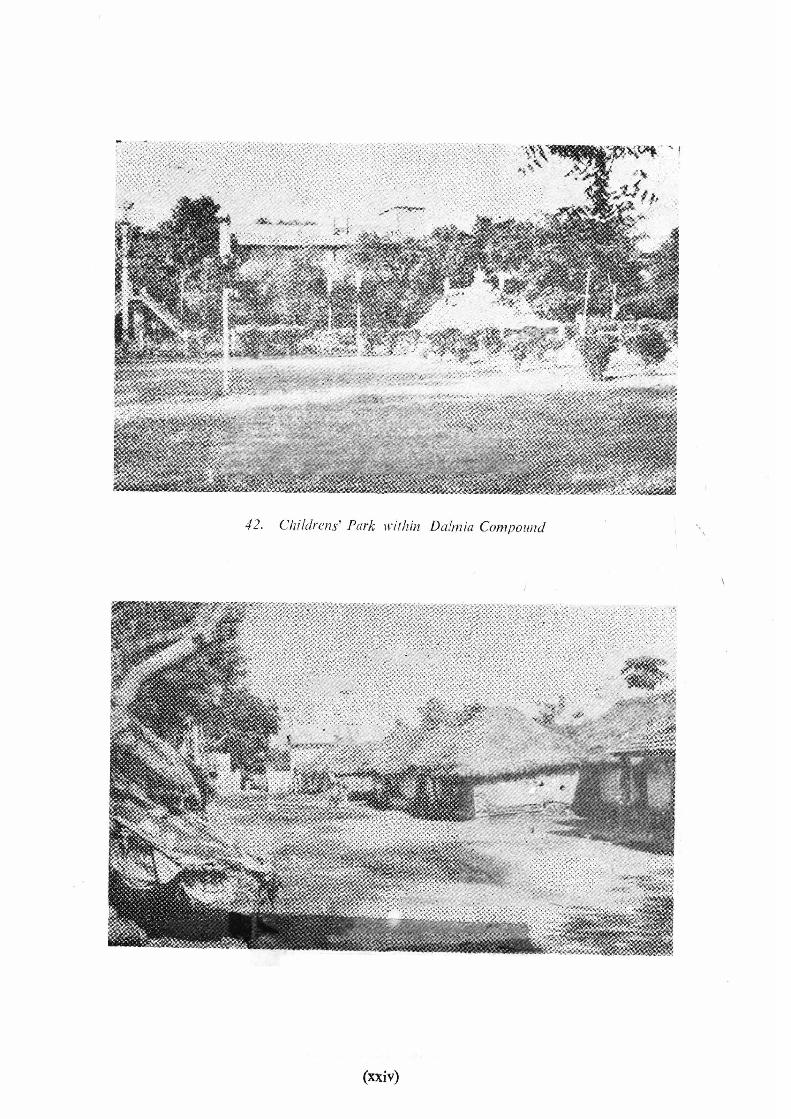
42. Childrens' Park within Dalmia Compound
(xxiv)