TOWN COUNCIL MEETING Agenda - Los Gatos
300
TOWN OF LOS GATOS TOWN COUNCIL FINANCE COMMITTEE MEETING DECEMBER 10, 2018 TOWN COUNCIL CHAMBERS – 110 E. MAIN STREET LOS GATOS, CA 4:00PM MEETING CALLED TO ORDER ROLL CALL CONSENT ITEMS (TO BE ACTED UPON BY A SINGLE MOTION) (Items appearing on the Consent Calendar are considered routine and may be approved by one motion. Unless there are separate discussion and/or actions requested by the Board/Commission/Committee, staff, or a member of the public, it is requested that items under the Consent Calendar be acted on simultaneously. Any member of the Board/Commission/Committee or public may request to have an item removed from the Consent Calendar for comment and action.) 1. Approve Council Finance Committee Meeting Draft Minutes of October 1, 2018. 2. Recommend to the Town Oversight Committee Investing OPEB Assets in the California Employers’ Retiree Benefit Trust (CERBT) Strategy 2. VERBAL COMMUNICATIONS (Members of the public may address the Committee on any matter that is not listed on the agenda. Unless additional time is authorized by the Committee, remarks shall be limited to three minutes.) OTHER BUSINESS (Up to three minutes may be allotted to each speaker on any of the following items.) 3. Recommend to the Town Council to review and accept the Draft Comprehensive Annual Financial Report (CAFR) for the fiscal year ended June 30, 2018. 4. Discuss Budget Stabilization, Catastrophic, Internal Service Funds (ISF), and Compensated Absences Reserves. ADJOURNMENT Rob Rennie, Chair Barbara Spector, Vice Chair Terry Duryea, Committee Member Rick Tinsley, Committee Member IN COMPLIANCE WITH THE AMERICANS WITH DISABILITIES ACT, IF YOU NEED SPECIAL ASSISTANCE TO PARTICIPATE IN THIS MEETING, PLEASE CONTACT THE CLERK DEPARTMENT AT (408) 354-6834. NOTIFICATION 48 HOURS BEFORE THE MEETING WILL ENABLE THE TOWN TO MAKE REASONABLE ARRANGEMENTS TO ENSURE ACCESSIBILITY TO THIS MEETING [28 CFR §35.102-35.104]
-
Upload
khangminh22 -
Category
Documents
-
view
0 -
download
0
Transcript of TOWN COUNCIL MEETING Agenda - Los Gatos
TOWN OF LOS GATOS TOWN COUNCIL FINANCE COMMITTEE MEETING
DECEMBER 10, 2018 TOWN COUNCIL CHAMBERS – 110 E. MAIN STREET
LOS GATOS, CA 4:00PM
MEETING CALLED TO ORDER
ROLL CALL
CONSENT ITEMS (TO BE ACTED UPON BY A SINGLE MOTION) (Items appearing on
the Consent Calendar are considered routine and may be approved by one motion. Unless there are separate discussion and/or actions requested by the Board/Commission/Committee, staff, or a member of the public, it is requested that items under the Consent Calendar be acted on simultaneously. Any member of the Board/Commission/Committee or public may request to have an item removed from the Consent Calendar for comment and action.) 1. Approve Council Finance Committee Meeting Draft Minutes of October 1, 2018. 2. Recommend to the Town Oversight Committee Investing OPEB Assets in the California
Employers’ Retiree Benefit Trust (CERBT) Strategy 2.
VERBAL COMMUNICATIONS (Members of the public may address the Committee on any
matter that is not listed on the agenda. Unless additional time is authorized by the Committee, remarks shall be limited to three minutes.)
OTHER BUSINESS (Up to three minutes may be allotted to each speaker on any of the
following items.) 3. Recommend to the Town Council to review and accept the Draft Comprehensive Annual
Financial Report (CAFR) for the fiscal year ended June 30, 2018. 4. Discuss Budget Stabilization, Catastrophic, Internal Service Funds (ISF), and Compensated
Absences Reserves.
ADJOURNMENT
Rob Rennie, Chair Barbara Spector, Vice Chair
Terry Duryea, Committee Member Rick Tinsley, Committee Member
IN COMPLIANCE WITH THE AMERICANS WITH DISABILITIES ACT, IF YOU NEED SPECIAL ASSISTANCE TO PARTICIPATE IN THIS MEETING, PLEASE CONTACT THE CLERK DEPARTMENT AT (408) 354-6834. NOTIFICATION 48 HOURS BEFORE THE MEETING WILL ENABLE THE TOWN
TO MAKE REASONABLE ARRANGEMENTS TO ENSURE ACCESSIBILITY TO THIS MEETING [28 CFR §35.102-35.104]
110 E. Main Street Los Gatos, CA 95030 ● 408-354-6832 www.losgatosca.gov
TOWN OF LOS GATOS
COUNCIL FINANCE COMMITTEE
AGENDA REPORT
MEETING DATE: 12/10/2018
ITEM NO: 1
DRAFT MINUTES OF THE COUNCIL FINANCE COMMITTEE MEETING
OCTOBER 1, 2018 The Council Finance Committee of the Town of Los Gatos conducted a meeting on Monday, October 1, 2018, at 4:00 p.m. MEETING CALLED TO ORDER AT 4:00 P.M. ROLL CALL Present: Mayor Rob Rennie, Council Member Barbara Spector, Committee Member Terry Duryea, and Committee Member Rick Tinsley. Staff Present: Town Manager Laurel Prevetti, Assistant Town Manager Arn Andrews, Finance Director Stephen Conway, Town Attorney Rob Schultz, and Finance and Budget Manager Gitta Ungvari CONSENT ITEMS 1. Approve Council Finance Committee Meeting Draft Minutes of August 6, 2018. Opened Public Comment. Phil Koen - Commented that the minutes should be more detailed for transparency. He commented on
that the Finance Committee presentation (9/6/2018) was not identical to the Council presentation (9/18/2018) and provided an exhibit of the Town’s Comparison of Santa Clara County Municipalities Cash Position chart and his own analysis.
Committee members discussed the Town’s practice of action minutes and opportunities for more detail on the motion and that non-voting members should emphasize what additional information should be documented at the time of the motion. There was also a discussion on the process of setting the agenda for the Committee meetings. MOTION: Motion by Council Member Spector to approve Council Finance Committee
Meeting Draft Minutes of August 8, 2018 with the Committee Members’ recommended changes. Seconded by Chair Rob Rennie.
VOTE: Motion passed unanimously.

PAGE 2 OF 4 SUBJECT: DRAFT MINUTES OF THE COUNCIL FINANCE COMMITTEE MEETING OF
OCTOBER 1, 2018 OCTOBER 16, 2018
C:\Users\lseastrom\Desktop\New folder\01 Item 1 - Minutes for 10-1-2018 Finance Committee Meeting Draft.docx 12/5/2018 11:07:27 AM
VERBAL COMMUNICATIONS Phil Koen - Referenced the September 21st, 2018 Bartel Presentation to the Council Oversight
Committee and provided excerpt material from the presentation and CALPERS actuarial evaluations. He recommended that excess cash balances should be used to pay an additional lump-sum payment to CalPERS.
OTHER BUSINESS 2. Review the quarterly performance report for the Town of Los Gatos IRS Section 115 Pension
Trust for the period ending June 30, 2018. Mr. Andrew Brown (PARS) presented via teleconference the IRS Section 115 Pension Trust fund quarterly performance. Opened Public Comment. Phil Koen - Distributed a CalPERS performance report and recommended to distribute it with the
quarterly performance report and to benchmark the IRS 115 Trust performance to CalPERS performance.
Closed Public Comment. Staff and Mr. Brown addressed the Committee’s and the public questions. Based on the Committee’s discussion, staff agreed that the quarterly process of the fund performance relative to the benchmark will be part of the standard review process for both the Council Finance Committee and for the Council Oversight Board. The Council Finance Committee and the Council Oversight Board will also annually review the asset allocation and determine if this is still the appropriate asset allocation under management at that time. 3 Review the performance report for the California Employers’ Retiree Benefit Trust (CERBT)
for the period ending June 30, 2018. Stephen Conway, Finance Director, presented the staff report. Opened Public Comment. None
Closed Public Comment.

PAGE 3 OF 4 SUBJECT: DRAFT MINUTES OF THE COUNCIL FINANCE COMMITTEE MEETING OF
OCTOBER 1, 2018 OCTOBER 16, 2018
C:\Users\lseastrom\Desktop\New folder\01 Item 1 - Minutes for 10-1-2018 Finance Committee Meeting Draft.docx 12/5/2018 11:07:27 AM
The Committee reviewed the report and asked questions of staff. 4 Discuss and recommend to the Town Council proposed revisions to the Town of Los Gatos
IRS Section 115 Pension Trust and California Employers’ Retiree Benefit Trust (CERBT) Investment Policy.
Arn Andrews, Assistant Town Manager, presented the staff report. Opened Public Comment. Phil Koen - Distributed excerpts from the staff report and September 21st, 2018 Bartel Presentation and
commented on his concerns regarding the staff report and the IRS 115 Trust. He commented that the IRS 115 was designed for budget stabilization and the policy language does not reflect that. Mr. Koen noted that the only way to fund pension unfunded liability is to pay CalPERS directly.
Closed Public Comment. Staff addressed the Committee’s questions. After discussion with different point of views explored, the Committee recommended that the new language in the Policy clarify the potential multiple purposes for the use of the 115 funds. In addition, the Committee requested to review the reserve levels in various Town funds at a future meeting. MOTION: Motion by Council Member Spector recommend to the Town Council proposed
revisions to the Town of Los Gatos IRS Section 115 Pension Trust and California Employers’ Retiree Benefit Trust (CERBT) Investment Policy by clarifying that: “Funds in the 115 Pension Trust may be used for long-term capital accumulation and appreciation, additional discretionally payments (ADPs), and pension contribution management strategies.” Seconded by Chair Rob Rennie.
VOTE: Motion passed unanimously.

PAGE 4 OF 4 SUBJECT: DRAFT MINUTES OF THE COUNCIL FINANCE COMMITTEE MEETING OF
OCTOBER 1, 2018 OCTOBER 16, 2018
C:\Users\lseastrom\Desktop\New folder\01 Item 1 - Minutes for 10-1-2018 Finance Committee Meeting Draft.docx 12/5/2018 11:07:27 AM
ADJOURNMENT: The meeting adjourned at 6:09 p.m.
This is to certify that the foregoing is a true
and correct copy of the minutes of the
September 1, 2018 meeting as approved by the
Council Finance Committee. Gitta Ungvari, Finance and Budget Manager

PREPARED BY: ARN ANDREWS ASSISTANT TOWN MANAGER Reviewed by: Town Manager, Finance Director, and Town Attorney
110 E. Main Street Los Gatos, CA 95030 ● 408-354-6832
www.losgatosca.gov
TOWN OF LOS GATOS
FINANCE COMMITTEE REPORT
MEETING DATE: 12/10/2018
ITEM NO: 2
ITEM NO: 11
DATE: NOVEMBER 30, 2018
TO: COUNCIL FINANCE COMMITTEE
FROM: LAUREL PREVETTI, TOWN MANAGER
SUBJECT: RECOMMEND TO THE TOWN OVERSIGHT COMMITTEE INVESTING OPEB ASSETS IN THE CALIFORNIA EMPLOYERS’ RETIREE BENEFIT TRUST (CERBT) STRATEGY 2
RECOMMENDATION:
Recommend to the Town Oversight Committee investing OPEB assets in the California Employers’ Retiree Benefit Trust (CERBT) Strategy 2.
BACKGROUND: The Town provides a healthcare benefit for all eligible employees. The healthcare plan pays all, or a portion of, health insurance premiums for qualified retirees and their survivors and dependents. Healthcare benefits are also referred to as Other Post-Employment Benefits or OPEB. The Town’s healthcare plan is managed as an Internal Revenue Code Section 115 Trust which is administered by the Town Pension and OPEB Trusts Oversight Committee. The Oversight Committee (composed of the Town Council) is responsible for the management and control of the healthcare assets. The healthcare assets are maintained at CalPERS and currently invested in the CalPERS managed California Employers’ Retiree Benefit Trust (CERBT) Strategy 1. In 2009, the Town Council approved a Finance Department recommendation to initiate a ten-year phase in of pre-funding future OPEB obligations. Prior to 2009, the Town like most other cities, followed the generally accepted government accounting principle of paying OPEB benefits on a “pay as you go” basis. This method recognized only the current cost of payments to actual retirees but didn’t recognize the future cost of benefits related to active employees. The Finance Department recommendation also included participating in the CERBT Fund. As

PAGE 2 OF 4 SUBJECT: RECOMMEND TO THE TOWN OVERSIGHT COMMITTEE INVESTING OPEB ASSETS
IN CERBT STRATEGY 2 DATE: NOVEMBER 30, 2018
C:\Users\lseastrom\Desktop\New folder\Item 2 -OPEB Trust Asset Allocation Final.docx 12/5/2018 11:08 AM SLL
BACKGROUND (continued): the table below illustrates, the Town has pre-funded $12,360,000 since the Trust Fund was established. In addition, the Town’s investment in CERBT Strategy 1 has earned approximately $4.2 million in investment earnings with an average annualized rate of return of 8.33%.
Account summary as of July 31, 2018 (Source: CalPERS Annual Review)
Initial contribution (6/29/2009) $400,000
Additional contributions $11,960,000
Disbursements ($0)
CERBT expenses ($53,431)
Investment earnings $4,212,256
Total assets $16,518,825
Average annualized internal rate of return (6/29/2009-7/31/2018) 8.33%
Since the initial $400,000 prefunding in 2009 the OPEB funded status has grown steadily due to the additional contributions and investment earnings. Based on the June 30, 2017 Retiree Healthcare Plan Actuarial Valuation performed by Bartel Associates, the funded status of the plan has grown to 55%.
Valuation Date Total OPEB Liability Actuarial Value of
Assets Funded Status
6/30/2013 $19,211,000 $4,866,000 25%
6/30/2015 $20,977,000 $8,238,000 39%
6/30/2017 $24,773,000 $13,605,000 55%
Projected 6/30/2018 $26,390,000 $16,148,000 61.2%
Source: Bartel Associates Actuarial Valuations

PAGE 3 OF 4 SUBJECT: RECOMMEND TO THE TOWN OVERSIGHT COMMITTEE INVESTING OPEB ASSETS
IN CERBT STRATEGY 2 DATE: NOVEMBER 30, 2018
C:\Users\lseastrom\Desktop\New folder\Item 2 -OPEB Trust Asset Allocation Final.docx 12/5/2018 11:08 AM SLL
BACKGROUND (continued): It is important to note that during the development of the 2017 actuarial valuation the Oversight Committee elected to lower the discount rate from 7.25% to 6.75%. Since the development of the 2017 actuarial valuation, the Town’s bargaining groups and Management and Confidential employees agreed to eliminate the current retiree healthcare benefit prospectively for new employees. In addition, CalPERS released the 2018 investment return data for the CERBT strategies. Based on the significance of the aforementioned changes, staff asked Bartel Associates to update the 2017 valuation. With the lowering of the discount rate by 50 basis points (bps), the elimination of the healthcare benefit prospectively, and the updated 2018 investment returns, it is appropriate to revisit the asset allocation options provided by CalPERS. DISCUSSION: CalPERS CERBT Asset Allocation Strategies The California Employers’ Retiree Benefit Trust (CERBT) provides multiple options for investment of the Town’s healthcare assets. The CalPERS managed CERBT provides three distinct asset allocations. Each asset allocation has varying degrees of exposure to equity, fixed income, Treasury Inflation Protected Securities (TIPS), Real Estate Investment Trusts (REITs), and commodities. Following are the three asset allocations:
2018 Asset Allocation Targets
Strategy 1 Strategy 2 Strategy 3
2018 2018 2018
Global Equity 59%
40%
22%
Fixed Income 25%
43%
50%
Global Real Estate (REITs) 8%
8%
8%
Treasury Inflation Protected Securities
(TIPS)
5%
5%
16%
Commodities 3%
4%
5%

PAGE 4 OF 4 SUBJECT: RECOMMEND TO THE TOWN OVERSIGHT COMMITTEE INVESTING OPEB ASSETS
IN CERBT STRATEGY 2 DATE: NOVEMBER 30, 2018
C:\Users\lseastrom\Desktop\New folder\Item 2 -OPEB Trust Asset Allocation Final.docx 12/5/2018 11:08 AM SLL
DISCUSSION (continued): The differing investment options provided by CalPERS represent varying degrees of investment risk/return profiles. As the table below illustrates a reduction in equity exposure correlates to a reduction in long-term expected returns and a reduction in the variability of those returns as expressed by standard deviation. It is generally accepted practice that the expected return of an asset allocation should track the discount rate used for actuarial valuations. Given the expected return profiles of the three CERBT strategies, Strategy 2 most closely aligns (7.01%) with the current discount rate of 6.75%.
2018 Asset Allocation Strategies
Strategy 1 Strategy 2 Strategy 3
2018 2018 2018
Expected Long Term Annualized Rate
of Investment Return 7.59% 7.01% 6.22%
Discount Rate
Determined by
Actuary
(Currently 6.75%)
Determined by
Actuary
(Currently 6.75%)
Determined by
Actuary
(Currently 6.75%)
Standard Deviation of Expected
Investment Returns 11.83% 9.24% 7.28%
CONCLUSION: Staff recommends that the Council Finance Committee recommend to the Town Oversight Committee approval of staff recommended asset allocation California Employers’ Retiree Benefit Trust (CERBT) Strategy 2. Approval of this recommendation will align the current discount rate (6.75%) used for the Healthcare Actuarial Valuations with the appropriate CalPERS long-term expected return (7.01%) associated with CERBT Strategy 2. In addition the lower volatility associated with the asset allocation of CERBT Strategy 2 will reduce the relative risk of the assets under management.

PREPARED BY: STEPHEN CONWAY Finance Director Reviewed by: Town Manager, Assistant Town Manager, and Town Attorney
110 E. Main Street Los Gatos, CA 95030 ● 408-354-6832 www.losgatosca.gov
TOWN OF LOS GATOS
COUNCIL FINANCE COMMITTEE REPORT
MEETING DATE: 12/10/2018 ITEM NO: 3 DESK ITEM
DATE: DECEMBER 10, 2018
TO: COUNCIL FINANCE COMMITTEE
FROM: LAUREL PREVETTI, TOWN MANAGER
SUBJECT: RECOMMEND TO THE TOWN COUNCIL TO REVIEW AND ACCEPT THE DRAFT COMPREHENSIVE ANNUAL FINANCIAL REPORT FOR THE FISCAL YEAR ENDED JUNE 30, 2018
REMARKS: Attachment 2 contains public comments received after the distribution of the Council Finance Committee packet between 11 a.m. on Friday December 7, 2018 and before 11:00 a.m. on Monday December 10, 2018. Below are responses to a Council Finance Committee’s member inquiries (in bold type) regarding the Draft Comprehensive Annual Financial Report (CAFR). The inquiries
1) An inquiry about increased expenses reported on the Statement of Activities calculated by the Committee member at 25% from in total expenses since 2016. Generally, the primary reason for the large percentage increases are the result of capital project expenditures that are reflected in the Parks and Public Works category, with substantial expenditures in the Almond Grove for fiscal year end 2018 and 2017 as compared to 2016. The Town Council put a hold on capital project activity in 2016 which is reflected in much lower Parks and Public Works expenditures. After adjusting for capital projects, the increases are attributable as explained in the Management’s Discussion and Analysis (MD&A).
2) An inquiry on the nature of the increase to Non-Major Governmental Funds of $814K for the year. The primary reason for the increase can be found on pages 102 and 103 of the Draft 2018 CAFR wherein substantial revenues $807K were received in the Storm Drains fund from development projects.

PAGE 2 OF 2 SUBJECT: RECOMMEND TO THE TOWN COUNCIL TO REVIEW AND ACCEPT THE DRAFT
COMPREHENSIVE ANNUAL FINANCIAL REPORT FOR THE FISCAL YEAR ENDED JUNE 30, 2018
DATE: DECEMBER 10, 2018
N:\MGR\AdminWorkFiles\Council Committee - FINANCE\2018\12-10-2018\Item 3 - Desk Item.docx 12/10/2018 1:21 PM
REMARKS (continued):
3) A general question on workers compensation claims and practices. Staff has not analyzed other cities annual costs, yet the Town is very proactive in providing employee safety training, holding regular safety committee meetings, offering wellness programs, and taking other steps to manage this cost.
4) An inquiry of the budget variances on page 42 of the Draft 2018 CAFR at a more detailed level than provided on the MD&A on page 26. Staff verified with its auditor that the primary purpose of the MD&A is to discuss the major reasons for variances as opposed to line-by-line detail. More detailed analysis is a separate scope of work that is outside of the CAFR presentation.
5) A general question/comment about the nature of the Town’s OPEB liability as to the legal obligation imposed on the Town. The Town’s independent actuaries and auditors recognize an obligation exists.
6) An inquiry similar that expressed interest in the details regarding the transfers to the Internal Service Funds. All transfers in or out of Internal Service Funds are Council approved as per the schedules attached to Item 4 Desk Item.
7) A suggestion to add OPEB along with Pension on deferred inflows/outflows. Staff agrees and will make that change on the final CAFR.
8) A suggestion to check for a typo on capital asset additions. Staff agrees, and will change the amount to $9.984 million in the final draft CAFR to agree to the footnote totals on page 67.
Attachment previously distributed with the Staff Report: 1. Draft Comprehensive Annual Financial Report for the Fiscal Year Ended June 30, 2018. Attachment received with Desk Item: 2. Public comments received after the distribution of the Council Finance Committee packet
between 11 a.m. on Friday December 7, 2018 and before 11:00 a.m. on Monday December 10, 2018.
GUNGVARI
Typewritten Text
ATTACHMENT 2


PREPARED BY: STEPHEN CONWAY Finance Director Reviewed by: Town Manager, Assistant Town Manager, and Town Attorney
110 E. Main Street Los Gatos, CA 95030 ● 408-354-6832 www.losgatosca.gov
TOWN OF LOS GATOS
COUNCIL FINANCE COMMITTEE REPORT
MEETING DATE: 12/10/2018 ITEM NO: 3
ADDENDUM
DATE: DECEMBER 5, 2018
TO: COUNCIL FINANCE COMMITTEE
FROM: LAUREL PREVETTI, TOWN MANAGER
SUBJECT: RECOMMEND TO THE TOWN COUNCIL TO REVIEW AND ACCEPT THE DRAFT COMPREHENSIVE ANNUAL FINANCIAL REPORT FOR THE FISCAL YEAR ENDED JUNE 30, 2018
REMARKS: After the distribution of the Finance Committee Packet, staff discovered a typographical error on page 4 of the Staff Report. The correct sentence referring to the excess revenue is:
“Presented in this statement is a $4.4 million excess of revenues over expenditures for the fiscal year.“
Attachment (previously distributed with the Staff Report): 1. Draft Comprehensive Annual Financial Report for the Fiscal Year Ended June 30, 2018.

PREPARED BY: STEPHEN CONWAY Finance Director Reviewed by: Town Manager, Assistant Town Manager, and Town Attorney
110 E. Main Street Los Gatos, CA 95030 ● 408-354-6832 www.losgatosca.gov
TOWN OF LOS GATOS
COUNCIL FINANCE COMMITTEE REPORT
MEETING DATE: 12/10/2018
ITEM NO: 3
DATE: DECEMBER 4, 2018
TO: COUNCIL FINANCE COMMITTEE
FROM: STEPHEN CONWAY, FINANCE DIRECTOR
SUBJECT: RECOMMEND TO THE TOWN COUNCIL TO REVIEW AND ACCEPT THE DRAFT COMPREHENSIVE ANNUAL FINANCIAL REPORT FOR THE FISCAL YEAR ENDED JUNE 30, 2017
RECOMMENDATION: Recommend to the Town Council to review and accept the Draft Comprehensive Annual Financial Report (CAFR) for the fiscal year ended June 30, 2018.
BACKGROUND: The Town contracts with an independent certified public accountant to examine the books, records, inventories, and reports of all officers and employees who receive, handle, or disburse public funds each fiscal year. The FY 2017/18 audit was performed by Badawi & Associates CPA’s, an experienced firm specializing in audit services for California public agencies. The firm also prepared the Draft CAFR for the Town of Los Gatos (see Attachment 1).
The information contained in the CAFR provides detailed financial information which the Los Gatos community and others can use to better understand the fiscal standing of the Town. In addition, the financial information contained in the document is reviewed by the credit rating agencies annually and used to affix a credit rating for the Towns outstanding debt obligations. In 2018, Moody’s rating service affirmed the Town’s general credit rating of Aaa. The Aaa rating is well above the median rating of Aa3 for similar sized cities nationwide. DISCUSSION: At the meeting, Finance staff will present to the Town Council Finance Committee the draft audited Comprehensive Annual Financial Report (CAFR) dated June 30, 2018. Town’s independent auditor will be available for the Committee’s discussion.

PAGE 2 OF 4 SUBJECT: RECOMMEND TO THE TOWN COUNCIL TO REVIEW AND ACCEPT THE DRAFT
COMPREHENSIVE ANNUAL FINANCIAL REPORT FOR THE FISCAL YEAR ENDED JUNE 30, 2018
DATE: DECEMBER 4, 2018
C:\Users\lseastrom\Desktop\New folder\Item 3 - FY 2017-18 CAFR Finance Committee Staff Report.docx 12/5/2018 11:08 AM
DISCUSSION (Cont’d): Highlights of the draft audited financial results include: Financial Section. The auditor has given the Town’s financial statements a “clean” audit opinion for the year ended June 30, 2018 (see the fourth paragraph of the auditor’s opinion on Page 13 of the Financial Section of the report) giving reasonable assurance that the financial statements are “free of material misstatement.”
Statement of Net Position. The Statement of Net Position (page 34) serves as a useful indicator of a government’s financial position. The Town had net assets of $109.2 million at fiscal year end as compared to $117 million the prior year, an overall decrease of 6.6% for the fiscal year.
The Town’s net position decreased by $7.8 million during the fiscal year largely as a result of the beginning FY 2017/18 net position being restated and reduced by approximately $8.5 million as required by the implementation of GASB 75 regarding the financial reporting of other post-employment benefits (OPEB). Prior to the implementation of GASB 75, the Town was only required to report its Net OPEB Obligation (NOO) in the notes section of its CAFR. With this latest GASB pronouncement, all of the Town’s pension and OPEB obligations are reflected fully in the financial statements.
The largest portion of the net assets, $102.1 million, represents the Town’s investment in its capital assets and infrastructure. Restricted assets of $7.0 million are resources that are subject to external restrictions on how they may be used. The remaining $0.2 million in net assets are unrestricted legally, but have been designated as to use in various reserve accounts or held in Internal Service Funds. Again, this is an overall financial position indicator and is not the amount of current resources available for budgetary purposes.
Management’s Discussion and Analysis (MD&A) (pages 18 through 29)
Page 18 of the CAFR begins the MD&A section of the report wherein summaries are presented for the Town on an entity-wide basis and fund type basis. Information is provided in this section with a year-to-year view, explaining how fund balances have changed between fiscal years ending June 30, 2017 and June 30, 2018. Information is also presented on the adopted General Fund budget and any significant budget adjustments made during FY 2017/18 (page 25). Basic Financial Statements (pages 31 through 89, including footnotes)
Located within this section are basic financial statements, including the “entity-wide” Statement of Net Position and Statement of Activities, financial statements for the fund types

PAGE 3 OF 4 SUBJECT: RECOMMEND TO THE TOWN COUNCIL TO REVIEW AND ACCEPT THE DRAFT
COMPREHENSIVE ANNUAL FINANCIAL REPORT FOR THE FISCAL YEAR ENDED JUNE 30, 2018
DATE: DECEMBER 4, 2018
C:\Users\lseastrom\Desktop\New folder\Item 3 - FY 2017-18 CAFR Finance Committee Staff Report.docx 12/5/2018 11:08 AM
DISCUSSION (Cont’d):
including Governmental Funds (such as the General Fund), Proprietary Funds, and the Private Purpose Trust Funds (Redevelopment Successor Agency). An important item for consideration is the General Fund Budget and Actual presented on page 42. Presented in this statement is a $4.2 million excess of revenues over expenditures for the fiscal year. This result for the fiscal year provided a source to fund the Budget Stabilization and Catastrophic Reserves at 25% of operating expenditures, provide an additional $690,000 of funding to the Pension/OPEB Reserve, and allocate $3.7 million to the Capital Projects Reserve per the Town’s adopted General Fund Reserve Policy.
The footnotes section provides details on significant items such as the Town’s cash and investments (Note 2 beginning on page 63), its long term obligations (Certificates of Participation) related to bonded debt (Note 6 page 69), the net pension liability for both the Town’s miscellaneous and safety pension plans (Note 9 page 73), and a discussion of the Town’s other post-employment benefit plan (Note 10 page 79).
Required Supplementary Information (pages 92 through 96)
The Schedules of Pension Plan Contributions are provided in this section.
Supplementary Information (pages 98 through 113)
This section provides budget to actual information for “non-major” funds which represent less than 10% of the Town’s total assets/liabilities/revenues or expenditures.
Statistical Section (pages 117 through 133)
This section presents demographic statistics and ten-year historical financial data for the Town, including information on assessed valuations, fund balances, debt, property tax rates, personnel (full-time equivalent) history, principle employers, and other financial and demographic disclosures.
CONCLUSION: Mr. Ahmed Badawi, C.P.A., managing partner of Badawi & Associates, will be participating in the Committee meeting. If you have questions prior to the meeting, please contact Director Conway and staff will share responses to the questions to the full Committee. Upon review and recommendation of the draft CAFR by the Council Finance Committee, staff is bringing the final CAFR forward to the Town Council for its consideration on Tuesday, December 18, 2018.

PAGE 4 OF 4 SUBJECT: RECOMMEND TO THE TOWN COUNCIL TO REVIEW AND ACCEPT THE DRAFT
COMPREHENSIVE ANNUAL FINANCIAL REPORT FOR THE FISCAL YEAR ENDED JUNE 30, 2018
DATE: DECEMBER 4, 2018
C:\Users\lseastrom\Desktop\New folder\Item 3 - FY 2017-18 CAFR Finance Committee Staff Report.docx 12/5/2018 11:08 AM
FISCAL IMPACT: There is no fiscal impact to provide recommendation to the Town Council for this report.
Attachment: 1. Draft Comprehensive Annual Financial Report for the Fiscal Year Ended June 30, 2018.

C A L I F O R N I A
T L G
Comprehensive Annual Financial ReportFiscal Year ending June 30, 2018
lseastrom
Typewritten Text
ATTACHMENT 1
lseastrom
Typewritten Text
lseastrom
Typewritten Text
lseastrom
Typewritten Text
lseastrom
Typewritten Text

Dra
ft 12
/04/
2018
Cover Photos: Ravon
lseastrom
Typewritten Text
lseastrom
Typewritten Text
lseastrom
Typewritten Text
lseastrom
Typewritten Text
lseastrom
Typewritten Text
lseastrom
Typewritten Text
lseastrom
Typewritten Text
lseastrom
Typewritten Text

Dra
ft 12
/04/
2018
TOWN OF LOS GATOS
CALIFORNIA

Dra
ft 12
/04/
2018

Dra
ft 12
/04/
2018
TOWN HISTORY
The name Los Gatos comes from “El Rancho de Los Gatos.” A ranch established in 1839 by aMexican land grant and so named because of the large number of mountain lions in the area. In1854, James Alexander Forbes purchased some of this land and built a flour mill. In 1860, thefirst hotel was opened to provide a stage stop on the toll road which had been built between SanJose and Santa Cruz.
Wheat production gave way to orchards, and rapid growth ensued when the railroad reachedLos Gatos in 1878. The residential subdivisions of Broadway, Bayview, Fairview, and AlmondGrove were built in the 1880’s. By 1887, the population had grown to 1,500 and Los Gatans votedto incorporate.
Fruit industries faded slowly during the Depression and World War II, but the postwar periodbrought an influx of people and associated residential and commercial development. Highway17 was constructed through the center of Town. Growth levelled off in the early 1970’s, leavingLos Gatos with its small town atmosphere and pedestrian oriented downtown.
Because of its distance from other centers of population, Los Gatos developed as a completecommunity including residential, business and industrial elements. Preserving Los Gatos as acomplete and well balanced community has been and remains a prominent goal of thecommunity. From the first 100 acre Town site in 1890 with a population of 1,652, Los Gatos grewslowly so that by 1963 the area was 6.3 square miles, with a population of 11,750. Today LosGatos covers between 14 and 15 square miles and has a population of 30,601. This growth overthe last 80 years resulted in a community with vibrant business districts, well maintainedneighborhoods, and lovely parks and open spaces.
As it exists now, the Town’s boundaries encompass a wide variety of terrain, ranging from levelland to steep and densely wooded hillsides. The sharp visual contrasts among these features andcharming architecture create a picturesque setting of the Town. In the midst of the growth ofSilicon Valley, Los Gatos attracts people with a preference for the Town’s distinctive, high qualitynatural and urban environment.

Dra
ft 12
/04/
2018

Dra
ft 12
/04/
2018
TOWN OF LOS GATOS, CALIFORNIA
COMPREHENSIVE ANNUAL FINANCIAL REPORTFOR THE FISCAL YEAR ENDED JUNE 30, 2018
TABLE OF CONTENTS
INTRODUCTORY SECTION:
Letter of Transmittal........................................................................................................................... 1Organization Chart.............................................................................................................................. 7Principal Officers............................................................................................................................... .. 8GFOA Award ............................................................................................................................... ........ 9
FINANCIAL SECTION:
Independent Auditor’s Report .......................................................................................................... 13
Management’s Discussion and Analysis............................................................................................ 18
Basic Financial Statements:
Government Wide Financial Statements:Statement of Net Position ....................................................................................................... 34Statement of Activities............................................................................................................. 35
Fund Financial Statements:Governmental Funds:Balance Sheet ....................................................................................................................... 38Reconciliation of the Governmental Funds Balance Sheet to theStatement of Net Position ................................................................................................ 39
Statement of Revenues, Expenditures and Changes in Fund Balances................................ 40Reconciliation of Governmental Funds Statement of Revenues, Expenditures,and Changes in Fund Balances to the Statement of Activities ......................................... 41
Statement of Revenue, Expenditures and Changes in Fund Balances –Budget and Actual (GAAP) General Fund ......................................................................... 42
Proprietary Funds – Internal Service Funds:Statement of Net Position.................................................................................................... 44Statement of Revenue, Expenses and Changes in Net Position........................................... 45Statement of Cash Flows...................................................................................................... 46
Fiduciary Funds:Statement of Fiduciary Net Position .................................................................................... 48Statement of Changes in Fiduciary Net Position .................................................................. 49
Notes to the Basic Financial Statements......................................................................................... 51
Required Supplementary Information:
Schedule of Proportionate Share of Net Pension Liability:CalPERS Misc. Agent Multiple Employer Plan ............................................................................. 92CalPERS Safety Cost Sharing Plan................................................................................................ 93
Schedule of Pension Plans ContributionsMiscellaneous Agent Multiple Employer Plan ............................................................................ 94Safety Cost Sharing Plan.............................................................................................................. 94
Actuarial Methods and Assumptions used for Pension ActuariallyDetermined Contributions........................................................................................................... 94
Schedule of Changes in Net OPEB Liability and Related Ratios ...................................................... 95Schedule of Employer Contributions .............................................................................................. 95Actuarial Methods and Assumptions used for 2017/18 OPEB ActuariallyDetermined Contribution ............................................................................................................ 96

Dra
ft 12
/04/
2018
TOWN OF LOS GATOS, CALIFORNIA
COMPREHENSIVE ANNUAL FINANCIAL REPORTFOR THE FISCAL YEAR ENDED JUNE 30, 2018
TABLE OF CONTENTS
SUPPLEMENTARY INFORMATION:
Major Governmental Fund Schedules (other than the General Fund):Schedule of Revenue, Expenditures and Changes in Fund Balance –Budget and Actual (GAAP) Appropriated Reserves Fund ............................................................ 99
Nonmajor Governmental Funds:Combining Balance Sheets.............................................................................................................. 100Combining Schedule of Revenues, Expenditures and Changes inFund Balances.............................................................................................................................. 102
Budgeted Nonmajor Funds Combining Schedule of Revenues, Expenditures andChanges in Fund Balances – Budget and Actual (GAAP).............................................................. 104
Internal Service Funds:Combining Statement of Net Position ............................................................................................ 108Combining Statement of Revenue, Expenses and Changes in Net Position ................................... 109Combining Statement of Cash Flows .............................................................................................. 110
Private Purpose Trust Funds:Combining Statement of Fiduciary Net Position............................................................................. 112Combining Statement of Changes in Fiduciary Net Position........................................................... 113
STATISTICAL SECTION:Net Position by Component............................................................................................................ 118Changes in Net Position .................................................................................................................. 119Fund Balances, Governmental Funds.............................................................................................. 120Changes in Fund Balances, Governmental Funds ........................................................................... 121Assessed Value and Estimated Actual Value of Taxable Property .................................................. 122Direct and Overlapping Property Tax Rates.................................................................................... 123Principal Property Tax Payers ......................................................................................................... 124Property Tax Levies and Collections................................................................................................ 125Ratios of Outstanding Debt by Type ............................................................................................... 126Direct and Overlapping Governmental Activities Debt................................................................... 127Legal Debt Margin........................................................................................................................... 128Demographic and Economic Statistics ............................................................................................ 129Principal Employers......................................................................................................................... 130Full time Equivalent Town Government Employees by Function/Program ................................... 131Operating Indicators by Function/Program .................................................................................... 132Capital Assets Statistics by Function/Program................................................................................ 133
OTHER INDEPENDENT AUDITOR’S REPORTS:
Independent Auditor’s Report on Internal Control over Financial Reporting and on Complianceand Other Matters Based on an Audit of Financial Statements Performed in Accordance withGovernment Auditing Standards................................................................................................. 137

Dra
ft 12
/04/
2018
INTRODUCTORY SECTION

Dra
ft 12
/04/
2018
This page intentionally left blank

Dra
ft 12
/04/
2018
TOWNOFLOSGATOS
OFFICE OF THE TOWNMANAGER
December 4, 2018
Honorable Mayor and Town Council,
I am pleased to submit the Town’s Comprehensive Annual Financial Report (CAFR) forthe fiscal year ending June 30, 2018. This report was prepared by the FinanceDepartment in conjunction with the Town Manager’s Office, which assumesresponsibility for the accuracy of the data and the completeness and fairness of thepresentation and all disclosures. The information in this report is intended to presentthe reader with a comprehensive view of the Town’s financial position and the results ofits operations for the fiscal year ending June 30, 2018, along with additional disclosuresand financial information designed to enable the reader to gain an understanding of theTown’s financial activities.
This report was prepared as prescribed in Governmental Accounting Standards Board(GASB) Statement No. 34, Basic Financial Statements and Management’s Discussion andAnalysis for State and Local Governments (GASB 34). This GASB Statement requiresmanagement to provide a narrative introduction, overview, and analysis to accompanythe basic financial statements in the form of a Management’s Discussion and Analysis(MD&A). This letter of transmittal is designed to complement the MD&A and should beread in conjunction with it. The MD&A can be found immediately following theIndependent Auditor’s Report.
This Comprehensive Annual Financial Report is organized into three sections:
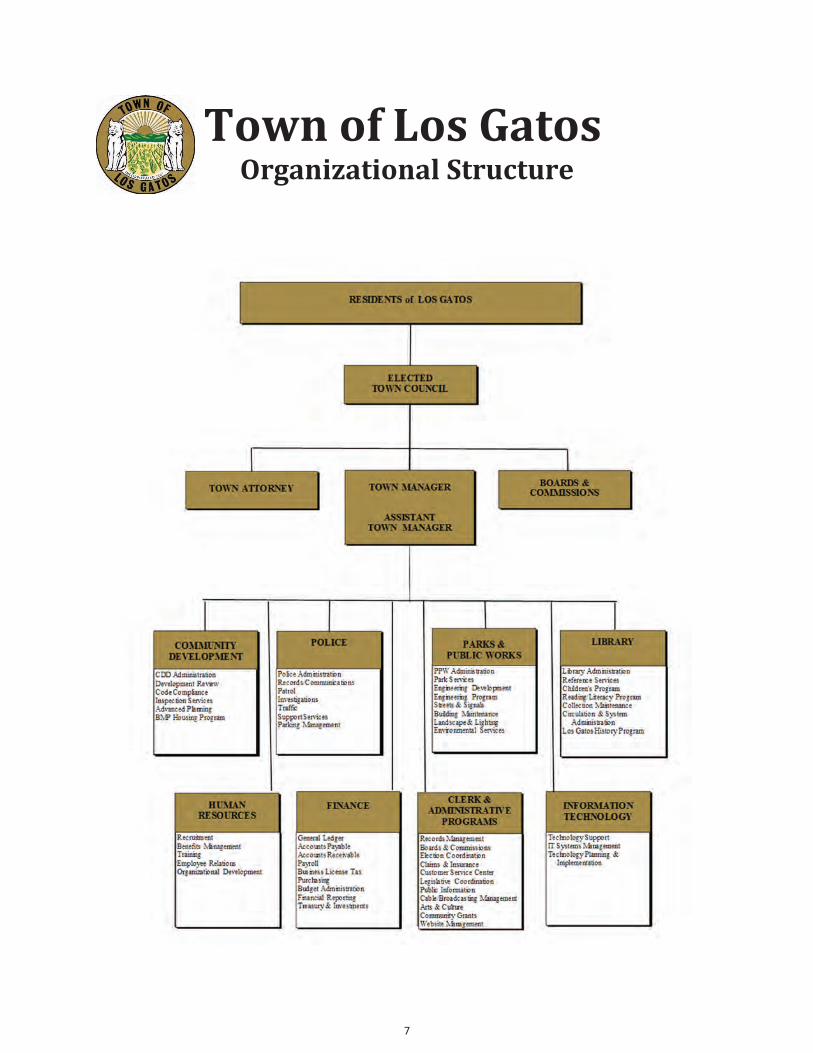
I. The Introductory Section includes the table of contents, letter of transmittal,listing of elected officials, Town administrative personnel, and an organizationchart delineating organizational structure.
II. The Financial Section includes the independent auditors’ opinion, the MD&A, thebasic financial statements, notes to the financial statements, combiningstatements of non major funds, and required supplemental information.
III. The Statistical Section includes both financial and non financial data about theTown.
1

Dra
ft 12
/04/
2018
Mayor and Town CouncilDecember 4, 2018
The Comprehensive Annual Financial Report is prepared in accordance with GenerallyAccepted Accounting Principles (GAAP) promulgated by the Governmental AccountingStandards Board (GASB) and includes the audit report of Badawi & Associates, theTown’s independent certified public accountants.
This Comprehensive Annual Financial Report will be submitted to the GovernmentFinance Officers Association for consideration of its Achievement of Excellence Award infinancial reporting certification. This award is granted only to entities whose reportsmeet the highest standards of municipal financial reporting.
THE REPORTING ENTITY AND ITS SERVICES
Los Gatos is a general law Town, incorporated under the laws of California in 1887. TheTown is located in the foothills and level terrain of the Santa Clara Valley, in an areareferred to internationally as “Silicon Valley.” From the first 100 acre Town site and an1890 population of 1,652, Los Gatos grew slowly so that by 1963 the area was 6.3square miles, with a population of 11,750. Today Los Gatos covers approximately 15square miles with a population of 30,601. This growth over the last 80 years resulted ina community with vibrant business districts, well maintained neighborhoods, and lovelyparks and open spaces. Preserving Los Gatos as a complete and well balancedcommunity has been, and remains a prominent goal for the community.
Five council members are elected at large for staggered four year terms to govern theTown. The Mayor and Vice Mayor are appointed by the Council from its own ranks andserve for one year terms. The Town Manager and Town Attorney are appointed andsupervised directly by the Council. The Town Manager oversees traditional municipalservices such as Public Safety, Parks and Public Works, Community Development, aPublic Library, and Town Administration including Human Resources and Finance.
This report includes all funds of the Town of Los Gatos. As of February 1, 2012, inaccordance with Assembly Bill 1X26, the Redevelopment Agency (RDA) for the Town ofLos Gatos was dissolved. Until its dissolution, the Town of Los Gatos RedevelopmentAgency was governed by a board that was the same as the Town’s governing body.Therefore, the financial activities of the Redevelopment Agency through January 31,2012 had been blended into the Town’s basic financial statements. As a result of thedissolution, the RDA Successor Agency private purpose trust fund was created while theCertificates of Participation (COP) RDA Debt Service Fund and Redevelopment AgencyLow & Moderate Housing Capital Projects Fund were closed out as of June 30, 2012 andare now being held in the Successor Agency Trust Fund.
2

Dra
ft 12
/04/
2018
Mayor and Town CouncilDecember 4, 2018
ECONOMIC CONDITIONS AND OUTLOOK
Consistent with other Silicon Valley communities, the economy is strong andeconomically sensitive revenues, such as Property Tax, Transient Occupancy Tax,Business License Tax and License and Permit revenues have increased as projected. TheTown is seeing early indications of softening in the housing market with homes for salestaying on the market longer than the previous year. However, the value of the homesales remains high. A recent report listed the San Jose Sunnyvale Santa ClaraMetropolitan Statistical Area (MSA) as one of the markets with home prices the furthestabove pre recession peaks nationally at 57 percent.
General Fund revenues (including transfer ins) increased 8.1% from the prior year.Property tax revenues are a significant source of support for General Fund operations,comprising approximately 39% of General Fund revenues in FY 2017/18. For FY 2017/18property tax receipts of $16.0 million were $1.2 million higher than the prior year’scollection, reflecting the continued desirability of the Town, its environment, cultureand educational opportunities. Based on valuation projections by the Santa ClaraCounty Assessor’s Office, Los Gatos property values are anticipated to continue withmoderate growth rates for the near term. Property taxes also increased moderatelydue to a change in property tax distribution methodology due to the dissolution of theCalifornia redevelopment agencies. It should be noted that this increase represents asmall portion of the total loss of redevelopment tax increment previously collected priorto the aforementioned redevelopment dissolution which occurred in February 2012.
The Town relies heavily on sales tax revenues to support General Fund operations,comprising approximately 18.7% of General Fund revenues in FY 2017/18. For FY2017/18 sales tax receipts of $7.6 million were $1.2 million lower than the prior year’scollection. Sales tax revenues continue to trend lower due to the negative impactassociated with increased online sales versus brick and mortar shopping, decreasedgasoline prices during much of the fiscal year and the continued impact of the 2011business model change of Netflix.
Effective February 1, 2012, redevelopment agencies were dissolved and suspended allactivities, with the exception of the implementation of existing contracts and paymentof enforceable obligations entered into prior to February 1, 2012. While the SuccessorAgency will continue to receive tax increment revenue to pay enforceable obligations,like debt service, funding for administrative services and various programreimbursements has been eliminated.
The Town is also preparing for an increase in pension employer rates due to changes toeconomic and demographic actuarial assumptions adopted by CalPERS. Town Council isproactively managing and working to control the anticipated cost escalation in itspension and other post employment benefits (OPEB). To date the Council has adopted
3

Dra
ft 12
/04/
2018
Mayor and Town CouncilDecember 4, 2018
additional discretionary pension strategies in excess of $16.0 million and prefunded$12.0 million towards OPEB obligations.
Despite the reductions to various sources of local government revenue and increasingcosts due to unfunded federal and state mandates, the Town has maintained highservice levels due to the General Fund’s strong fiscal health through FY 2017/18. Towncontinues its outreach to the community, the League of California Cities, and locallegislators to prevent and limit any future revenue losses and mandated cost increases.
MAJOR INITIATIVES
Major initiatives addressing the critical capital asset and infrastructure needs of theTown were a priority for the fiscal year. Approximately $9.2 million in Towninfrastructure and other capital asset improvements were made in FY 2017/18,including $3.9 million in street improvement projects including improvements to majorarterials and neighborhood collector streets to enhance pedestrian and traffic safetyTown wide, $0.1 million in vehicle and equipment, and approximately $0.1 million onretaining walls and park improvements. In addition, the Town invested $5.1 million invarious projects that are currently in progress, including approximately $4.8 million onthe Almond Grove Street project, and other facility, park, and infrastructureimprovement projects.
Additional infrastructure improvements are scheduled in accordance with the Town’sapproved Capital Improvement Plan, and will continue into future years. All of theseimprovements are funded either through grants, or via revenues accumulated fromprior year budget savings and/or excess revenues per Town Council policy.
ACCOUNTING SYSTEM AND BUDGETARY CONTROL
The effectiveness of internal control is considered in the development and evaluation ofthe Town’s accounting system. Internal accounting controls are designed to providereasonable but not absolute assurance regarding:
1) safeguarding of assets against loss from unauthorized loss or disposition,
2) accuracy and reliability of accounting data, and
3) adherence to managerial policy.
The concept of reasonable assurance recognizes that the cost of internal control shouldnot outweigh the benefits, and that management must make estimates and judgmentsin evaluating these costs and benefits.
4

Dra
ft 12
/04/
2018
Mayor and Town CouncilDecember 4, 2018
All governmental fund types use the modified accrual basis of accounting. This meansthat revenues are recorded when measurable and available rather then when received.Measurable means the amount can be determined and available means the cash isreceived within sixty days after the end of the fiscal year. Expenditures are recordedwhen the liability is incurred, rather than when paid. An exception to this rule isprincipal and interest on general long term debt, which is not recognized by debt servicefunds until it is due.
Proprietary (internal service) funds are accounted for using the accrual basis ofaccounting, similar to that used by corporations. Proprietary fund revenues arerecognized when they are earned rather than when the cash is received, even if the cashis not available and proprietary fund expenses are recognized when they are incurred.
With the implementation of GASB 34, the Town now prepares its Basic FinancialStatements on the accrual basis.
Internal accounting procedures have been developed to provide reasonable assuranceregarding the safeguarding of assets and the reliability of financial records for preparingfinancial statements and maintaining asset accountability.
An annual operating budget and five year capital improvement plan is adopted by theTown Council on a basis consistent with generally accepted accounting principles. Allbudget adjustments and transfers between funds must be approved by the TownCouncil during the fiscal year. The Town Manager is authorized to transferunencumbered appropriations within a budget category, within a fund. Appropriationsare valid for each fiscal year and lapse at year end.
AWARDS
The Town’s Comprehensive Annual Financial Report for the fiscal year ended June 30,2017 was awarded a Certificate of Achievement for Excellence in Financial Reporting bythe national Government Finance Officers Association. This prestigious awardrecognizes the report’s conformance with strict accounting and reporting standardsestablished by the Government Accounting Standards Board and government financeorganizations. This award is annual in nature and valid for one year only. This year’sreport will be submitted for award consideration by this organization, as we believe itcontinues to meet these standards.
INDEPENDENT AUDIT
State law requires an annual audit of the Town’s accounts by independent certifiedpublic accountants. The accounting firm of Badawi & Associates performs this functionfor the Town of Los Gatos, and their report is included in the financial section of theCAFR.
5

Dra
ft 12
/04/
2018
Mayor and Town CouncilDecember 4, 2018
ACKNOWLEDGEMENTS
The preparation of this Comprehensive Annual Financial Report, as presented herein, isthe result of the combined efforts and dedicated services of the excellent staff of theDepartment of Finance. Special thanks to Gitta Ungvari, Finance and Budget Manager,Mark Gaeta, Accountant; Melissa Ynegas, Finance Analyst; Diane Howard, PayrollSpecialist; and Kenneth Stiles, Administrative Technician for their efforts in preparingthis report.
Respectfully submitted,
____________________________ ___________________________________Laurel Prevetti Stephen D. ConwayTown Manager Director of Finance
6
Dra
ft 12
/04/
2018
Town of Los GatosOrganizational Structure
7

Dra
ft 12
/04/
2018
TOWN OF LOS GATOSPRINCIPAL OFFICERS
JUNE 30, 2018
TOWN COUNCIL
Mayor Rob RennieVice Mayor Steven LeonardisCouncil Member Marcia JensenCouncil Member Marico SayocCouncil Member Barbara Spector
COUNCIL APPOINTEES
Town Manager Laurel PrevettiTown Attorney Robert Schultz
APPOINTED OFFICIALSAssistant Town Manager Arn AndrewsChief of Police Peter DecenaCommunity Development Director Joel PaulsonParks and Public Works Director Matt MorleyLibrary Director Ryan BakerFinance Director Stephen ConwayHuman Resources Director Lisa Velasco
8

Dra
ft 12
/04/
2018
9

Dra
ft 12
/04/
2018
This page intentionally left blank
10

Dra
ft 12
/04/
2018
FINANCIAL SECTION
11

Dra
ft 12
/04/
2018
This page intentionally left blank
12

Dra
ft 12
/04/
2018
INDEPENDENT AUDITOR’S REPORT
To the Honorable Mayor and Members of the Town Council of theTown of Los Gatos
Los Gatos, California
Report on the Financial Statements
We have audited the accompanying financial statements of the governmental activities, each major fund, and theaggregate remaining fund information of the Town of Los Gatos, California, as of and for the year ended June 30,2018, and the related notes to the financial statements, which collectively comprise the Town’s basic financialstatements as listed in the table of contents.
Management’s Responsibility for the Financial Statements
Management is responsible for the preparation and fair presentation of these financial statements in accordancewith accounting principles generally accepted in the United States of America; this includes the design,implementation, and maintenance of internal control relevant to the preparation and fair presentation offinancial statements that are free from material misstatement, whether due to fraud or error.
Auditor’s Responsibility
Our responsibility is to express opinions on these financial statements based on our audit. We conducted our auditin accordance with auditing standards generally accepted in the United States of America and the standardsapplicable to financial audits contained in Government Auditing Standards, issued by the Comptroller General of theUnited States. Those standards require that we plan and perform the audit to obtain reasonable assurance aboutwhether the financial statements are free from material misstatement.
An audit involves performing procedures to obtain audit evidence about the amounts and disclosures in thefinancial statements. The procedures selected depend on the auditor’s judgment, including the assessment of therisks of material misstatement of the financial statements, whether due to fraud or error. In making those riskassessments, the auditor considers internal control relevant to the entity’s preparation and fair presentation of thefinancial statements in order to design audit procedures that are appropriate in the circumstances, but not for thepurpose of expressing an opinion on the effectiveness of the entity’s internal control. Accordingly, we express nosuch opinion. An audit also includes evaluating the appropriateness of accounting policies used and thereasonableness of significant accounting estimates made by management, as well as evaluating the overallpresentation of the financial statements.
We believe that the audit evidence we have obtained is sufficient and appropriate to provide a basis for our auditopinions.
13

Dra
ft 12
/04/
2018
To the Honorable Mayor and Members of the Town Council of the Town of Los Gatos
Los Gatos, California Page 2
Opinions
In our opinion, the financial statements referred to above present fairly, in all material respects, the respectivefinancial position of the governmental activities, each major fund, and the aggregate remaining fund informationof the Town as of June 30, 2018, and the respective changes in financial position and, where applicable, cash flowsthereof for the year then ended in accordance with accounting principles generally accepted in the United States ofAmerica.
Other Matters
Required Supplementary Information
Accounting principles generally accepted in the United States of America require that the management’s discussionand analysis, budgetary comparison information pension related schedules and OPEB related schedules on pages18 29 and 92 96 be presented to supplement the basic financial statements. Such information, although not a partof the basic financial statements, is required by the Governmental Accounting Standards Board, who considers it tobe an essential part of financial reporting for placing the basic financial statements in an appropriate operational,economic, or historical context. We have applied certain limited procedures to the required supplementaryinformation in accordance with auditing standards generally accepted in the United States of America, whichconsisted of inquiries of management about the methods of preparing the information and comparing theinformation for consistency with management’s responses to our inquiries, the basic financial statements, and otherknowledge we obtained during our audit of the basic financial statements. We do not express an opinion or provideany assurance on the information because the limited procedures do not provide us with sufficient evidence toexpress an opinion or provide any assurance.
Other Information
Our audit was conducted for the purpose of forming opinions on the financial statements that collectively comprisethe Town of Los Gatos, California’s basic financial statements. The introductory section, major funds (other thanGeneral fund and Special revenue funds) budgetary schedules, combining and individual nonmajor fund financialstatements, and statistical section are presented for purposes of additional analysis and are not a required part ofthe basic financial statements.
The major funds (other than General fund and Special revenue funds) budgetary schedules, combining andindividual nonmajor fund financial statements are the responsibility of management and were derived from andrelate directly to the underlying accounting and other records used to prepare the basic financial statements. Suchinformation has been subjected to the auditing procedures applied in the audit of the basic financial statementsand certain additional procedures, including comparing and reconciling such information directly to the underlyingaccounting and other records used to prepare the basic financial statements or to the basic financial statementsthemselves, and other additional procedures in accordance with auditing standards generally accepted in theUnited States of America. In our opinion, the combining and individual nonmajor fund financial statements are fairlystated, in all material respects, in relation to the basic financial statements as a whole.
The introductory and statistical sections have not been subjected to the auditing procedures applied in the audit ofthe basic financial statements and, accordingly, we do not express an opinion or provide any assurance on them.
14

Dra
ft 12
/04/
2018
To the Honorable Mayor and Members of the Town Council of the Town of Los Gatos
Los Gatos, California Page 3
Other Reporting Required by Government Auditing Standards
In accordance with Government Auditing Standards, we have also issued our report dated [DATE] on ourconsideration of the Town’s internal control over financial reporting and on our tests of its compliance with certainprovisions of laws, regulations, contracts, and grant agreements and other matters. The purpose of that report is todescribe the scope of our testing of internal control over financial reporting and compliance and the results of thattesting, and not to provide an opinion on internal control over financial reporting or on compliance. That report isan integral part of an audit performed in accordance with Government Auditing Standards in considering the Town’sinternal control over financial reporting and compliance.
Badawi and AssociatesCertified Public AccountantsOakland, California[DATE]
15

Dra
ft 12
/04/
2018
This page intentionally left blank
16

Dra
ft 12
/04/
2018
Management’s Discussion and Analysis
17

Dra
ft 12
/04/
2018
MANAGEMENT’S DISCUSSION AND ANALYSIS
The following discussion and analysis of the Town of Los Gatos financial performanceprovides an overview of the Town’s financial activities for the fiscal year ending June 30,2018. This information is presented in conjunction with the audited financialstatements that follow this section.
FINANCIAL HIGHLIGHTS
Town assets exceeded its liabilities at the close of FY 2017/18 by $109,262,066 (netposition). Of this amount, $170,590 (unrestricted net position) may be used to meetthe Town’s ongoing obligations to its community and creditors.
The Town’s net position decreased by $7.8 million during the fiscal year largely as aresult of the beginning FY 2017/18 net position being restated and reduced byapproximately $8.5 million as required by the implementation of GASB 75 regardingthe financial reporting of other post employment benefits (OPEB). Prior to theimplementation of GASB 75 the Town was only required to report its Net OPEBObligation (NOO) in the notes section of its CAFR. With this latest GASBpronouncement all of the Town’s pension and OPEB obligations will now bereflected fully in the financial statements.
Total fund balances for governmental funds at year end were $49,353,921, adecrease of $3,797,817 (7%) from the prior year. Fund balances decreased primarilyfor increased expenditures, capital spending, and the $1.2 million transfer to theTown IRS 115 Pension Trust.
At the end of FY 2017/18, fund balance for the General Fund was $30,428,684,approximately 82% of General Fund expenditures for the current fiscal year.
The Town’s total capital assets increased by $5,833,077 to $102,098,729 net ofdepreciation.
OVERVIEW OF THE FINANCIAL STATEMENTS
The financial statements presented herein include all of the activities of the Town andits component units using the integrated approach as prescribed by GASB Statement No.34.
Government Wide Financial Statements
The government wide financial statements present the financial picture of the Townfrom an economic resources measurement focus using the accrual basis of accounting.
18

Dra
ft 12
/04/
2018
The statement of net position presents information on all of the Town’s assets andliabilities, with the difference between the two reported as net position. Over time,increases or decreases in net position may serve as a useful indicator of whether thefinancial position of the Town is improving or deteriorating.
The statement of activities presents information showing how the Town’s net positionchanged during the most recent fiscal year. All changes in net position are reported assoon as the underlying event giving rise to the change occurs, regardless of the timing ofrelated cash flows. Thus, revenues and expenses are reported in this statement forsome items that will only result in cash flows in future fiscal periods (e.g., uncollectedtaxes and earned but unused vacation leave).
Both of the government wide financial statements distinguish functions of the Townthat are principally supported by taxes and intergovernmental revenues (governmentalactivities) from other functions that are intended to recover all or a significant portion oftheir costs through user fees and charges (business–type activity). The governmentalactivities of the Town include public safety, parks and public works, communitydevelopment, library, community services, debt service, and general government. TheTown has no business type activities.
The government wide financial statements include not only the Town itself (known asthe primary government), but also a legally separate Town of Los Gatos RedevelopmentAgency (the Agency) for which the Town was financially accountable. In accordancewith Assembly Bill (AB) 1X26 which provides for the dissolution of all redevelopmentagencies in the State of California, the Town of Los Gatos agreed to serve as thesuccessor agency and thereby to hold the assets until they were distributed to otherunits of state and local government. In accordance with AB 1X26, the Town of Los GatosRedevelopment Agency dissolved and ceased to operate as a legal entity on February 1,2012.
Prior to February 1, 2012, the final seven months of activity of the redevelopmentagency continued to be reported in the governmental funds of the Town. AfterFebruary 1, 2012, the assets and activities of the dissolved redevelopment agency arereported in a fiduciary fund (RDA Successor Agency private purpose trust fund) in thefinancial statements of the Town. Additional information on the dissolution of the RDAand this fiduciary fund can be found in Note 12 in the notes to basic financialstatements.
Fund Financial Statements
A fund is a grouping of related accounts that is used to maintain control over resourcesthat have been segregated for specific activities or objectives. The Town, like other localgovernments, uses fund accounting to ensure and demonstrate compliance with
19

Dra
ft 12
/04/
2018
finance related legal requirements. The funds of the Town are segregated into threecategories: governmental funds, proprietary funds, and fiduciary funds.
Governmental funds – The Town’s basic services are reported in governmental funds,which focus on how money flows into and out of those funds and the balances left atyear end that are available for spending. These funds are reported using the modifiedaccrual basis of accounting, which measures cash and other financial assets that canreadily be converted to cash. The governmental fund statements provide a detailedshort term view of the Town’s general government operations and the basic services itprovides. Governmental fund information helps determine whether there are more orfewer financial resources that can be spent in the near future to finance the Town’soperations. Both the governmental fund balance sheet and the governmental fundstatement of revenues, expenditures, and changes in fund balances provide areconciliation to facilitate this comparison between governmental funds andgovernmental activities.
Proprietary funds – The Town maintains one type of proprietary fund: internal servicefunds. Proprietary funds are reported using the accrual basis of accounting. Internalservice funds are an accounting tool used to accumulate and allocate costs internallyamong the Town’s various functions. The Town uses internal service funds to accountfor its fleet of vehicles, computer equipment, risk management activities, and otheritems. The Internal Service funds are included within governmental activities in thegovernment wide financial statements.
Fiduciary funds – Fiduciary funds are used to account for resources held for the benefitof parties outside the Town. Fiduciary funds are not reflected in the government widefinancial statements because the resources of those funds are not available to supportthe Town’s own programs.
Included in fiduciary funds is the RDA Successor Agency private purpose Trust Fundcreated upon the dissolution of the former Redevelopment Agency. The Trust Fund wascreated to hold the assets of the former Redevelopment Agency until they aretransferred for governmental purposes to other entities, or distributed to the underlyingtaxing jurisdictions in Santa Clara County after the payment of enforceable obligations.
Notes to basic financial statements
The notes provide additional information essential to a full understanding of the dataprovided in the government wide and fund financial statements. The notes to basicfinancial statements can be found on pages 51 89 of this report.
20

Dra
ft 12
/04/
2018
Government wide Financial Analysis
Net position may serve over time as a useful indicator of a government’s financialposition. In the case of the Town, assets exceeded liabilities by $109 million at the endof the current fiscal year.
2018 2017Current and other Assets 77,527,309$ 76,851,804$Capital Assets 102,098,729 96,265,652Total Assets 179,626,038$ 173,117,456$
Deferred Outflows Pension 19,177,172 15,666,410Current Liabilities 19,125,206 15,368,467Long Term Liabilities Outstanding 66,492,020 50,630,426Total Liabilities 85,617,226$ 65,998,893$
Deferred Inflows Pension 3,923,918 5,778,114Net PositionNet Investment in Capital Assets 102,098,729 96,265,652Restricted 6,992,747 5,627,707Unrestricted 170,590 15,134,420Total Net Position 109,262,066$ 117,027,779$
Town of Los GatosNet Position
Governmental ActivitesFor the Year Ended June 30, 2018
Capital assets represent approximately 57% of the Town’s total assets consisting ofinvestments made by the Town in permanent or long lived assets (e.g., land, buildings,infrastructure, machinery and equipment), less any related debt used to acquire thoseassets still outstanding. The Town uses these capital assets to provide services toresidents and customers; consequently, these assets are not available for futurespending. Although the Town’s investment in its capital assets is reported net of relateddebt, it should be noted that the resources needed to repay this debt must be providedfrom other sources since the capital assets themselves cannot be used to liquidate theseliabilities.
For the current year, Net Investment in Capital Assets increased by $5,833,077 as aresult of approximately $10 million in capital improvements made during the fiscal year,offset by $4.2 million in capital assets depreciation and retirements.
An additional portion of the Town’s net position (6.4%) represents resources that aresubject to external restrictions on how they may be used. The balance of unrestrictednet position may be used to meet the Town’s ongoing obligations to citizens, customers,and creditors. The Town’s unrestricted net position represents approximately 0.2% ofthe Town’s net position at year end.
21

Dra
ft 12
/04/
2018
Governmental activities
2018 2017Revenues:Program revenues:
Charges for Services 11,982,107$ 10,162,547$Operating Grants and Contributions 1,906,224 1,503,108Capital Grants and Contributions 348,437 779,880
General Revenues:Property Taxes 15,958,406 14,756,214Sales Taxes 7,466,253 8,925,276Franchise Taxes 2,474,814 2,366,908Other Taxes 2,667,840 2,351,223Motor Vehicle in Lieu 16,483 14,056Investment Earnings 333,120 192,260Miscellaneous 622,105 528,946
Total Revenues 43,775,789 41,580,418
Expenses:Police Department 15,545,521 14,587,597Parks and Public Works 10,047,003 9,502,707General Government 9,155,819 6,771,628Community Development 4,667,609 5,093,459Library Services 3,087,684 2,868,748Sanitation 536,296 466,762
Total Expenses 43,039,932 39,290,901
Change in Net Position 735,857 2,289,517
Net Position, beginning 117,027,779 112,514,506Prior Period Adjustments GASB 75 (8,501,570) 2,223,756Net Position, as restated GASB 75 108,526,209 114,738,262
Net Position, Ending 109,262,066$ 117,027,779$
Town of Los GatosStatement of Activities
For the Year Ended June 30, 2018
As shown in the schedule above, governmental activities for the year decreased theTown’s net position by $7,765,713. Key elements of the decrease in net position are asfollows:
Property tax revenues collected for the Town accounted for 37% of total Townrevenues. Property tax revenues for Town activities increased by $1.2 million or8.1%, from FY 2016/17 due primarily to the continued strong economy, the
22

Dra
ft 12
/04/
2018
continued strong demand for housing in Los Gatos, and several newdevelopments being added to the tax roll.
Sales tax revenue of $7.5 million accounted for approximately 17% of the Town’stotal revenues for the year. The 16% decrease of approximately $1.5 millionfrom the prior year collections is largely due to the timing of the final “triple flip”payment and the reclassification of other sales tax revenue to the prior period.
Other taxes and miscellaneous revenues of $3.3 million accounted for 7.5% oftotal revenues, increasing by 14% from the prior year. This increase wasprimarily the result of the higher amount of Transient Occupancy Tax collected inFY 2017/18 as compared to the prior year.
Investment earnings of $602,420 net of amortized premiums increased by$140,680 from the prior year. This increase is due primarily to the increasinginterest rate environment in anticipation of stronger economic growth.
Total expenditures increased by approximately $3.7 million from the prior year.This increase was largely due to increased pension expenses and the $1.2 millioncontributed to the Town’s IRS 115 Pension Trust during FY 2017/18.
Unrestricted fund balance of $170,590 as of June 30, 2018 reflecting a $15million decrease resulting primarily from the net impacts of the implementationof GASB 75 and net additions to infrastructure in the current fiscal year. Foradditional information, please refer to Note 1 and Note 10.
FINANCIAL ANALYSIS OF THE TOWN’S FUNDS
The Town uses fund accounting to ensure and demonstrate compliance with financerelated legal requirements.
Governmental funds
The focus of the Town’s governmental funds is to provide information on near terminflows, outflows, and balances of spendable resources. As of the end of FY 2017/18,the Town’s governmental funds reported combined ending fund balances of$49,353,921, a decrease of $3,797,817 in comparison with the prior year. Fund balancesdecrease primarily due to capital expenditures and additional $1.2 million transfer tothe Town IRS 115 Pension Trust Fund.
Approximately 86% or $42,361,174 of the total amount of governmental fund balancesof $49,353,921 is committed, assigned or unassigned fund balance, which is availablefor spending subject to Town direction and approval. The remainder of fund balance isrestricted therefore not available for new spending but limited as to use for (1)
23

Dra
ft 12
/04/
2018
providing for appropriated capital projects ($6,794,063); and (2) to provide fordedicated repair and maintenance in lighting and landscape districts ($198,684).
General Fund The General Fund is the chief operating fund of the Town. It accounts forall financial resources except those required to be accounted for in another fund. Atthe end of the current fiscal year, the General Fund net fund balance increased byapproximately 5% from prior year balances to $30,428,684. This increase is primarilydue to higher than expected receipt of economically sensitive revenues.
Other Major Funds
General Fund Appropriated Reserve (GFAR) Capital Projects Fund The GFAR fund isused as the primary capital projects fund for the Town and is used for the acquisitionand construction of major capital projects in the Town. Fund balance decreased by$5,800,599 to $12,301,432. The decrease is primarily due to capital projectexpenditures made to invest in the Town’s infrastructure.
Other Non Major Other Governmental Funds These funds consist primarily of specialrevenue funds used to account for specific revenue sources for which expenditures arerestricted by law or regulation to finance particular functions or activities of the Townand other non major capital projects funds. Total fund balances for other non majorother governmental funds increased by $814,551 to $6,623,805.
Proprietary funds
The Town’s proprietary funds provide the same type of information found in thegovernment wide financial statements, but in more detail.
Internal Service Funds The Town has seven internal service funds: Workers’Compensation, Self Insurance, Stores, Vehicle Maintenance, Facilities Maintenance,Information Technology, and Equipment Replacement funds. Revenues to these fundsare generated from fees charged to the Town’s operating programs for servicesprovided.
The Equipment Replacement Fund charges replacement costs while the VehicleMaintenance Fund charges vehicle maintenance costs to all user departments based onequipment assignment and usage of equipment. Net operating income before transfersat year end for both funds was $36,216 and $80,421 respectively versus $41,729 and$101,507 in the prior year. The decrease in Equipment Replacement Fund isattributable to the cyclical nature of fleet purchases in accordance with the Town’s fleetreplacement schedule. The decrease in operating income in the Vehicle MaintenanceFund from the prior year is attributable to increased operating expenses incurred duringthe fiscal year.
24

Dra
ft 12
/04/
2018
The Facilities Maintenance, Stores, and Information Technology Funds charge premiumsbased on use and labor charges to provide Town wide facilities maintenance, mail andoffice inventory and duplication charges, and information technology services. Netoperating income (loss) before transfers at year end was ($16,693), $27,353, and($94,893) respectively. Expenditures exceeded revenues in the Facilities MaintenanceFund due to increased heating, ventilation and air conditioning maintenance andunscheduled repair costs experienced during the year. Information Technology Fundalso experienced increased repair, replacement, and licensing costs. The Office Storeexpenditures decreased during the current fiscal year due to decreased printingvolumes.
The Workers’ Compensation and Self Insurance Funds charge premiums based onexposure levels by department for liability, property, workers’ compensation and selfinsurance costs. Net operating income before transfers at year end was ($281,528) and$109,329 respectively, versus ($123,074) and ($250,079) in the prior year. The decreaseof operating income for the year for Workers’ Compensation Fund reflects the adverseexperience of loss claims in the fiscal year as compared to the prior year. The generalliability claim payments and settlements were decreased in the current fiscal year.
GOVERNMENT FUNDS BUDGETARY HIGHLIGHTS:
Budget Adjustments
Comparing the FY 2017/18 original budget (or adopted) General Fund Expenditures of$37,844,035 (excluding budgeted transfers out and debt payment that get reimbursed)the final budget amount of $39,374222 shows a net increase of $1.5 million. Additionsto the original budget included approved encumbrance carry forwards of $34,852 andadditions of $1,495,335 in net miscellaneous adjustments approved by Town Councilthroughout the fiscal year.
OriginalBudget
+ApprovedCarry
forwards
+Prior Year
Encumbrances
+Misc.
Adjustments &Mid Year
Adjustments
=FinalBudget
$37,844,035 $0 $34,852 $1,495,335 $39,374,222
The increase in General Fund appropriations occurred primarily from the followingselected budget adjustments made during the fiscal year.
$1,200,000 increase for transfer to the Town’s IRS 115 Pension Trust.
$100,350 increase for below market priced housing program for repairs and saleservices of 108 Sierra Linda property.
25

Dra
ft 12
/04/
2018
$45,000 budget adjustment for additional legal services related to the North 40lawsuit and preparing the wireless ordinance.
$29,115 to align the budget to the revenue that the Town received from aninsurance reimbursement to replace Community Emergency Response Teamequipment.
$22,000 adjustment to improve ergonomic working conditions in Town offices andrelocate the Building Division staff offices.
$16,000 adjustment to cover non anticipated tuition reimbursements that aremandated through the approved Memoranda of Understanding (MOU).
$9,000 expenditure budget adjustment to fund the replacement of the drinkingfountains at Oak Hill Play Lot and Live Oak Manor Park. The existing concretedrinking fountains are in poor condition and are near the end of their useful life.
$10,000 for well testing and monitoring required by the County of Santa Clara.Before 1990, an underground oil tank on Town property leaked into the surroundingsoil. The Town began cleanup operations but did not complete the ongoingmonitoring element. Town staff began testing in FY 2014/15, and as a result, moretesting and samples were required by the County. The County has required that thisproject be closed out.
$8,200 increase due to increased cost and activity of mandated utility locationservices.
$7,000 to provide additional training (e.g. Americans with Disability Act compliance)for the Community Development Department.
$24,000 combined expenditure budget increase to cover non anticipated crossdepartmental operational expenditures (including membership support for the SafeRoutes to School, staff training, park map printing services, and background checkfor increased hiring).
Comparing the FY 2017/18 final amended budget to the actual result shows $2.4 millionin savings due to operational cost savings primarily from savings related to staffvacancies.
Capital Assets
As of June 30, 2018, the Town’s investment in capital assets for its governmental activityis recorded at $102,098,729 (net of accumulated depreciation). The investment incapital assets includes land, buildings and improvements, infrastructure, construction inprogress and machinery and equipment. During FY 2017/18 the Town’s approximate$9.2 million investment in capital assets for the current year represented approximately5.1% of total assets for governmental activities. Major capital asset events during thecurrent fiscal year include the following:
26

Dra
ft 12
/04/
2018
$4.9 million net increase to Construction in Progress, the majority of thatamount ($4.8 million) expended on the Almond Grove Street RehabilitationProject.
$3.9 million addition to street improvement projects including improvements tomajor arterials and neighborhood collector streets to enhance pedestrian andtraffic safety Town wide.
$761K in equipment purchases including approximately $352K in vehicle fleetreplacements, $169K for a wheel loader, $100K for skid steer, and approximately$124K for public safety radio communications upgrade.
Approximately $118K expended on retaining wall, park improvement, andparking lot improvement projects
GovernmentalActivities
Infrastructure 45,826,289$Buildings 22,414,082Land 20,333,684Equipment 2,960,020Construction in Progress 10,564,654
102,098,729$
Net Investment in Capital AssetsTown of Los Gatos
For the Year Ended June 30, 2018
Additional information on the Town’s capital assets is found in Note 5 of this financialreport.
Economic Factors and Next Year’s Budgets and Rates
A product of an ongoing examination of how the Town provides cost effective services,the Town’s budget emphasizes outcomes or results for the community and allows forlonger term financial planning decisions.
During the development and adoption of the Town’s FY 2018/19 budget, the TownCouncil and management considered the following factors:
The Town continues to focus on priority issues that involve maintaining public safetyand Town infrastructure including streets and parks; and providing library,community development, and other services. These priorities are coordinated withother Core Goals that protect the Town’s fiscal health and ensure cost efficient andeffective delivery of Town wide administrative services. The Town’s proactive
27

Dra
ft 12
/04/
2018
approach to reducing operating expenditures, identifying revenue enhancements,and implementing operating efficiencies has been an effective fiscal approach.
Reflecting the strength of the local economy, the FY 2018/19 operating budget is abalanced budget, with use of General Fund reserves dedicated for one time uses.The FY 2018/19 Budget maintains existing service levels while recommendingmodest additions in strategically important areas. This budget incorporatesinvestments toward future equipment replacement, additional annual discretionarypension payments, and increased capacity for the Town’s burgeoning technologyinfrastructure. The FY 2018/19 budget has been balanced largely due to revenueenhancements, resulting from the positive economy and the Town’s growth in theeconomically sensitive revenue sources such as Property Tax, Transient OccupancyTax, and Business Licenses. In regard to expenditures, the Town’s employer paidbenefits are expected to increase for the foreseeable future, including obligatedpension contributions, the pre funding of premiums for retiree health coverage, andthe increasing costs of current health plans. Specific trends affecting the fundbalance forecast include:
General property tax collections represent approximately 28.9% (not includingthe State’s property tax “backfill” shifts) of the Town’s General Fund revenues.Property tax collections are expected to increase 4% in FY 18/19 from the prioryear’s tax collections. This forecast is based on data from the Santa Clara CountyTax Assessor’s Office.
The Town anticipates a decrease in general sales tax for FY 2018/19. Sales taxestimates of $7.7 million for FY 2018/19 were budgeted reflecting a 2.9%decrease from the prior year’s adopted sales tax budget. The negative impact isassociated with increased on line sales versus brick and mortar shopping,decreased gasoline prices, and by the continuing impact of the 2011 businessmodel change of Netflix. In addition, at the November 6, 2018 election the Townof Los Gatos residents approved a ballot measure enacting a one eighth cent($0.125%) sales tax for 20 years, providing about $800,000 annually, requiringIndependent Citizens Oversight with public review of spending, and all revenuescontrolled locally. The Sales tax Measure will be effective starting April 1, 2019.Staff will incorporate the new sales tax figures in the FY 2019/20 budget.
The Town’s investment portfolio experienced a slight increase in its overallweighted average annual yield, rising from 1.25% at June 30, 2017 to 1.73% atJune 30, 2018. Anticipating increasing interest rates for FY 2018/19 coupled withreduced cash balances due to capital expenditures, investment earnings areexpected to remain at the same level as the prior fiscal year.
Transient Occupancy Tax (TOT) revenues are expected to be higher in FY2018/19 as personal and business related travel is expected to remain strong.
28

Dra
ft 12
/04/
2018
The Town’s pension plans over the past several decades, like all other CalPERSparticipants, have experienced unfavorable investment returns, changes in actuarialassumptions, and unfavorable demographic shifts which have outweighed anypositive plan experiences. To address this unfunded status, the Town took proactivesteps including initiating the prefunding of OPEB obligations, budgeting additionaldiscretionary pension payments to accelerate reduction of unfunded liabilities, andmost recently partnering with the Town’s employee groups to eliminate the existingretiree healthcare benefit for new employees. Even with these proactive steps, theTown continues to be impacted by the continuing rising cost of pension relatedbenefits. Over the next five fiscal years, the Town’s five year plan includes increasingpension costs due to further changes in actuarial assumptions or lowering thediscount rate. The Town’s pension plan with CalPERS is currently funded at 69.6% forsafety group and 73.9% for miscellaneous group based upon the June 30, 2017Actuarial Valuation.
Requests for Information
This financial report is designed to provide residents, taxpayers, customers, investors,and creditors, with a general overview of the Town’s finances and to demonstrate theTown’s accountability for the money it receives. Questions about this report or requestsfor any additional information, should be directed to Stephen Conway, Director ofFinance, at 110 East Main Street, Los Gatos, California, 95030, or phone (408) 354 6828.
29

Dra
ft 12
/04/
2018
This page intentionally left blank
30

Dra
ft 12
/04/
2018
Basic Financial Statements
31

Dra
ft 12
/04/
2018
This page intentionally left blank
32

Dra
ft 12
/04/
2018
TOWN OF LOS GATOS, CALIFORNIA
COMPREHENSIVE ANNUAL FINANCIAL REPORTFOR THE FISCAL YEAR ENDED JUNE 30, 2018
GOVERNMENTWIDE FINANCIAL STATEMENTSSTATEMENT OF NET POSITION AND STATEMENT OF ACTIVITIES
The purpose of the Statement of Net Position and the Statement of Activities is to summarize the entire financialactivities and financial position of the Town. They are prepared on the same basis of accounting (accrual) usedby most businesses, which means they include all the Town’s assets and liabilities, as well as its revenues andexpenses. The effect of the entire Town’s transactions is accounted for, regardless of when cash changes hands,and all material internal transactions between funds have been eliminated.
The Statement of Net Position report the Town’s total assets, deferred outflows of resources, liabilities, anddeferred inflows of resources, including capital assets and long term debt, and presents similar information tothe old balance sheet format while focusing the reader on the composition of the Town’s net position (assetsminus liabilities). The Statement of Net Position summarizes the financial position of the Town’s governmentalactivities in a single column.
The Town’s governmental activities include the activities of the General Fund, Special Revenue Funds, CapitalProjects Funds and Debt Service Funds. These funds are serviced by the Town’s Internal Service Funds; thereforeinternal service activities are consolidated with governmental activities after eliminating inter fund transactionsand balances.
The Statement of Activities reports increases and decreases in the Town’s net position and is prepared on thefull accrual basis of accounting, which means it includes all the Town’s revenues and expenses regardless ofwhen cash changed hands. This differs from the “modified accrual” basis of accounting used in the fund financialstatements, which reflect only current assets, current liabilities, available revenues and measurableexpenditures.
The format of the Statement of Activities presents the Town’s expenses before revenues and by program.Program revenues (revenues generated directly by specific programs) are deducted from program expenses toarrive at the net expense of each governmental program, which is offset by general revenues as listed beforethe change in net position. From these components, the change in net position is computed and reconciled tothe Statement of Net Position.
Both of these statements include the financial activities of the Town.
The Statement of Net Position, Statement of Activities, fund financial statements and the notes to financialstatements comprise the Basic Financial Statements of the Town. The term “Basic Financial Statements”replaced the term “General Purpose Financial Statements” which is no longer used.
33

Dra
ft 12
/04/
2018
GovernmentalActivities
ASSETSCash and investments 73,938,079$Restricted cash and investments 37,229Receivables:Accounts 1,432,662Interest 231,743Intergovernmental 1,621,833
Materials, supplies and deposits 28,011Long term notes receivables 237,752Capital Assets:Nondepreciable 30,898,338Depreciable, net of accumulated depreciation 71,200,391
Total Assets 179,626,038
DEFERRED OUTFLOWS OF RESOURCESPension contributions subsequent to measurement date 4,620,844Pension related amounts 11,621,015OPEB contributions subsequent to measurement date 2,935,313
Total Deferred Outflows of Resources 19,177,172
LIABILITIESAccounts payable 4,395,611Accrued payroll and benefits 1,463,684Due to other governments 25,945Unearned Revenue 4,491,047Deposits 6,822,127Claims payable 1,604,067Long term liabilities:Due within one year:Compensated absences 322,725
Due in more than one year:Net OPEB liability 11,165,000Net pension liabilities 53,204,508Compensated absences 2,122,512
Total Liabilities 85,617,226
DEFERRED INFLOWS OF RESOURCESPension related amounts 3,622,918OPEB related amounts 301,000
Total Deferred Inflows of Resources 3,923,918
NET POSITIONNet investment in capital assets 102,098,729Restricted for:Capital projects 6,794,063Lighting and landscape repairs and maintenance 198,684
Total Restricted Net Position 6,992,747Unrestricted 170,590
Total Net Position 109,262,066$
TOWN OF LOS GATOSSTATEMENT OF NET POSITION
JUNE 30, 2018
The notes to the financial statements are an integral part of this statement.
34

Dra
ft 12
/04/
2018
Net (Expense)Revenues andChanges inNet Position
Operating CapitalCharges for Grants and Grants and Governmental
Functions/Programs Expenses Services Contributions Contributions ActivitiesGovernmental Activities:General government 9,155,819$ 1,701,146$ $ $ (7,454,673)$Public safety 15,545,521 1,888,359 895,730 (12,761,432)Parks and public works 10,047,003 4,150,068 953,294 348,437 (4,595,204)Community development 4,667,609 3,456,390 (1,211,219)Library services 3,087,684 14,702 57,200 (3,015,782)Sanitation 536,296 771,442 235,146
Total Governmental Activities 43,039,932$ 11,982,107$ 1,906,224$ 348,437$ (28,803,164)
General revenues:Taxes:Property taxes 15,958,406Sales taxes 7,466,253Franchise taxes 2,474,814Other taxes 2,667,840
Motor vehicle in lieu 16,483Investment earnings 333,120Miscellaneous 622,105
Total general revenues 29,539,021
Change in Net Position 735,857
Net Position Beginning, as restated 108,526,209
Net Position Ending 109,262,066$
TOWN OF LOS GATOSSTATEMENT OF ACTIVITIES
FOR THE FISCAL YEAR ENDED JUNE 30, 2018
Program Revenues
The notes to the financial statements are an integral part of this statement.
35

Dra
ft 12
/04/
2018
This page intentionally left blank
36
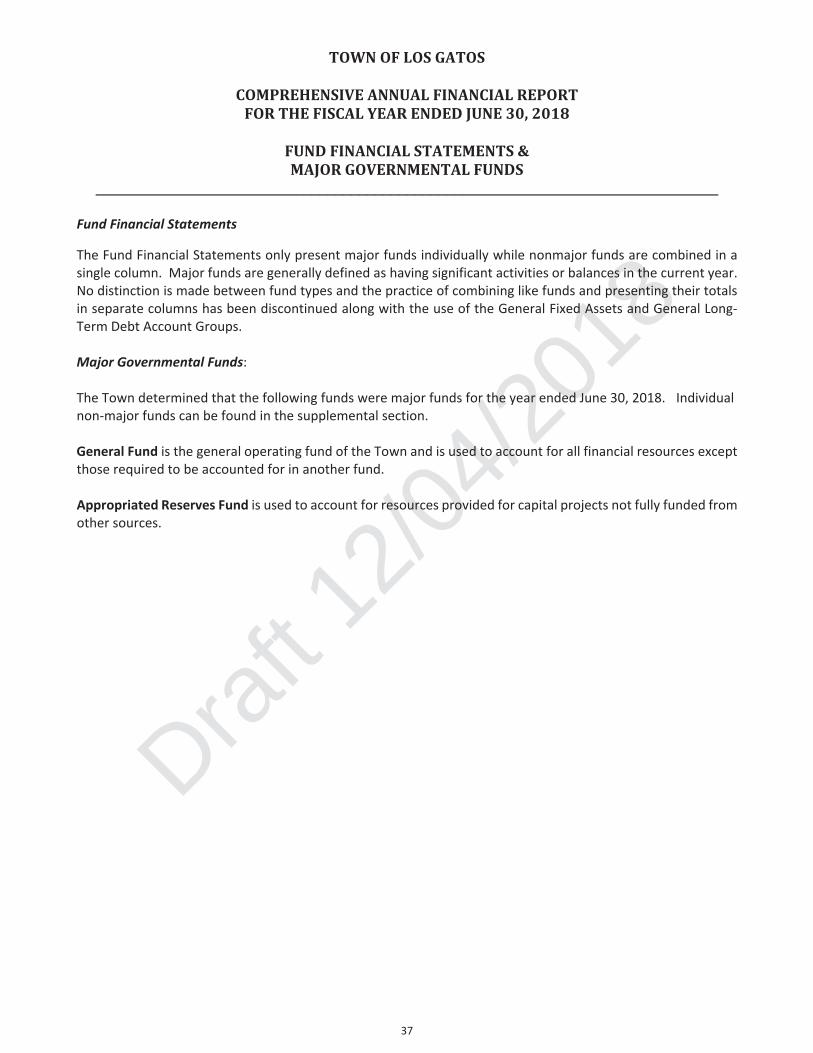
Dra
ft 12
/04/
2018
TOWN OF LOS GATOS
COMPREHENSIVE ANNUAL FINANCIAL REPORTFOR THE FISCAL YEAR ENDED JUNE 30, 2018
FUND FINANCIAL STATEMENTS &MAJOR GOVERNMENTAL FUNDS
______________________________________________________________________________
Fund Financial Statements
The Fund Financial Statements only present major funds individually while nonmajor funds are combined in asingle column. Major funds are generally defined as having significant activities or balances in the current year.No distinction is made between fund types and the practice of combining like funds and presenting their totalsin separate columns has been discontinued along with the use of the General Fixed Assets and General LongTerm Debt Account Groups.
Major Governmental Funds:
The Town determined that the following funds were major funds for the year ended June 30, 201 . Individualnon major funds can be found in the supplemental section.
General Fund is the general operating fund of the Town and is used to account for all financial resources exceptthose required to be accounted for in another fund.
Appropriated Reserves Fund is used to account for resources provided for capital projects not fully funded fromother sources.
37

Dra
ft 12
/04/
2018
OtherNonmajor Total
Appropriated Governmental GovernmentalGeneral Reserves Funds Funds
ASSETSCash & Investments 37,907,933$ 18,042,657$ 7,239,621$ 63,190,211$Receivables:Accounts 1,096,925 52,579 145,406 1,294,910Interest 231,743 231,743Intergovernmental 1,496,784 125,050 1,621,834Due from Other Funds 68,569 68,569Long term notes 159,000 78,752 237,752
Total Assets 40,960,954$ 18,095,236$ 7,588,829$ 66,645,019$
LIABILITIESAccounts Payable 786,001$ 2,518,749$ 827,718$ 4,132,468$Accrued Payroll and Benefits 1,424,228 3,882 1,428,110Due to other governments 25,992 25,992Unearned revenue 1,151,197 3,275,055 64,855 4,491,107Deposits 6,822,127 6,822,127Due to Other Funds 68,569 68,569Compensated Absences 322,725 322,725
Total Liabilities 10,532,270 5,793,804 965,024 17,291,098
FUND BALANCERestricted for:Capital Outlay 606,933 6,187,130 6,794,063Repairs and Maintenance 198,684 198,684Committed to:Budget Stabilization 5,037,243 5,037,243Catastrophic 5,037,243 5,037,243CalPERS/OPEB 2,878,913 2,878,913Almond Grove Street Project 5,571,087 5,571,087Assigned to:Open Space 562,000 562,000Parking 1,460,210 1,460,210Sustainability 140,553 140,553Strategic Planning 129,090 129,090Capital Projects 14,421,203 4,613,202 19,034,405Carryover Encumbrances 99,927 99,927Comcast PEG 50,000 50,000Compensated Absences 2,122,512 2,122,512Special Revenue Funds 237,991 237,991
Total Fund Balances 30,428,684 12,301,432 6,623,805 49,353,921
Total Liabilities, Deferred Inflow of Resources andFund Balances 40,960,954$ 18,095,236$ 7,588,829$ 66,645,019$
TOWN OF LOS GATOSGOVERNMENTAL FUNDS
JUNE 30, 2018BALANCE SHEET
The notes to the financial statements are an integral part of this statement.
38

Dra
ft 12
/04/
2018
49,353,921$
102,098,179
6,841,647
15,653,577
(3,576,458)
2,935,313
(301,000)
Net Pension Liability (50,455,601)$Net OPEB Liability (11,165,000)Compensated absences (2,122,512) (63,743,113)
109,262,066$Net Position Governmental Activities
Long term liabilities are not due and payable in the currentperiod and, therefore, are not reported in the Governmental Funds.
LONG TERM LIABILITIES
The difference between projections and actual results in OPEB plans is not included in theplan's actuarial study until the next fiscal year and are reported as deferred inflows ofresources in the Statement of Net Position.
Contributions and similar items will not be included in the calculation of the City's netOPEB liability of the plan year included in this report and have been deferred andreported as deferred outflows of resources.
DEFERRED INFLOWS OF RESOURCES
The difference between projections and actual results in pension plans is not included in theplan's actuarial study until the next fiscal year and are reported as deferred inflows ofresources in the Statement of Net Position.
DEFERED OUTFLOWS OF RESOURCES
Contributions and similar items will not be included in the calculation of the City's netpension liability of the plan year included in this report and have been deferred andreported as deferred outflows of resources.
DEFERRED INFLOWS OF RESOURCES
certain activities such as insurance, central services and maintenance to individualgovernmental funds. The net current assets of the internal service funds are thereforeincluded as Governmental Activities in the Statement of Net Position.
DEFERED OUTFLOWS OF RESOURCES
Capital assets used in the Governmental Activities are not financial resources and,therefore, are not reported in the Governmental Funds.
ALLOCATION OF INTERNAL SERVICE FUND NET POSITIONInternal service funds are used by management to charge the cost of management of
CAPITAL ASSETS
TOWN OF LOS GATOSRECONCILIATION OF THE GOVERNMENTAL FUNDS BALANCE SHEET TO
THE GOVERNMENT WIDE STATEMENT OF NET POSITION GOVERNMENTAL ACTIVITIESJUNE 30, 2018
Fund Balance Total Governmental Funds
Amounts reported for Governmental Activities in the Statement of Net Position aredifferent from those reported in the Governmental Funds because of the following:
The notes to the financial statements are an integral part of this statement.
39

Dra
ft 12
/04/
2018
OtherNonmajor Total
Appropriated Governmental GovernmentalGeneral Reserves Funds Funds
REVENUESProperty Taxes 15,958,406$ $ 34,574$ 15,992,980$Sales Taxes 7,592,206 7,592,206Other Taxes 2,636,002 31,838 2,667,840Licenses & Permits 4,697,560 204,391 1,035,093 5,937,044Intergovernmental 1,010,166 261,534 853,203 2,124,903Charges for Services 4,625,136 424,556 345,365 5,395,057Fines and Forfeitures 676,212 676,212Franchise Fees 2,474,814 2,474,814Interest 244,762 31,945 56,231 332,938Use of Property 32,206 32,206Other 581,946 58,898 640,844
Total Revenues 40,529,416 981,324 2,356,304 43,867,044
EXPENDITURESCurrent:General Government 8,770,082 8,770,082Public Safety 14,423,554 14,423,554Parks and Public Works 7,099,527 26,159 7,125,686Community Development 4,192,165 4,192,165Library Services 2,529,017 2,529,017Sanitation and Other 521,147 521,147Capital Outlay 8,894,531 883,527 9,778,058
Total Expenditures 37,014,345 8,894,531 1,430,833 47,339,709
EXCESS (DEFICIENCY) OF REVENUESOVER EXPENDITURES 3,515,071 (7,913,207) 925,471 (3,472,665)
OTHER FINANCING SOURCES (USES)Proceeds from sales of assets 378,219 378,219Transfers in 538,536 2,638,224 3,176,760Transfers (out) (3,243,595) (525,616) (110,920) (3,880,131)
Total Other Financing Sources (Uses) (2,326,840) 2,112,608 (110,920) (325,152)
NET CHANGES IN FUND BALANCES 1,188,231 (5,800,599) 814,551 (3,797,817)
BEGINNING FUND BALANCES, ASRESTATED 29,240,453 18,102,031 5,809,254 53,151,738
ENDING FUND BALANCES 30,428,684$ 12,301,432$ 6,623,805$ 49,353,921$
TOWN OF LOS GATOSGOVERNMENTAL FUNDS
STATEMENT OF REVENUES, EXPENDITURES AND CHANGES IN FUND BALANCESFOR THE FISCAL YEAR ENDED JUNE 30, 2018
The notes to the financial statements are an integral part of this statement.
40

Dra
ft 12
/04/
2018
NET CHANGE IN FUND BALANCES TOTAL GOVERNMENTAL FUNDS (3,797,817)$
Amounts reported for Governmental Activities in the Statement of Activities aredifferent because of the following:
CAPITAL ASSET TRANSACTIONS
Governmental funds report capital outlays as expenditures. However, in the Statement ofActivities the cost of those assets is capitalized and allocated over their estimated usefullives and reported as depreciation expense.Expenditures for capital assets (additions) 9,864,158$Proceeds from sale of assets (378,219)Gain on sale of assets 34,698Current Year Depreciation (3,686,603) 5,834,034
OPEB PLAN CONTRIBUTIONS AND EXPENSEIn governmental funds, actual contributions to OPEB plans are reported as expenditures in the yearincurred. However, in the Government Wide Statement of Activities, only the current year OPEBexpense as noted in the plans' valuation reports is reported as an expense, as adjusted for deferredinflows and outflows of resources. 317,658
PENSION PLAN CONTRIBUTIONS AND EXPENSEIn governmental funds, actual contributions to pension plans are reported as expenditures in the yearincurred. However, in the Government Wide Statement of Activities, only the current year pensionexpense as noted in the plans' valuation reports is reported as an expense, as adjusted for deferredinflows and outflows of resources. (2,983,954)
ALLOCATION ON INTERNAL SERVICE FUND ACTIVITY
Internal service funds are used by management to charge the costs of certain activities toindividual funds. The net revenue of the internal service fund is reported with governmental activities. 563,576
PENSION PLAN CONTRIBUTIONS AND EXPENSEIn governmental funds, actual contributions to pension plans are reported as expenditures in the yearincurred. However, in the Government Wide Statement of Activities, only the current year pensionexpense as noted in the plans' valuation reports is reported as an expense, as adjusted for deferred 928,313inflows and outflows of resources.
UNAVAILABLE REVENUE IN GOVERNMENTAL FUNDSIn governmental funds, certain revenues that were not available in prior year, were deferred on thegovernmental funds in prior year and are recognized as revenue in the current fiscal year. However,those revenues were recognized in the Government Wide Statement of Activities in prior year (125,953)
CHANGE IN NET POSITION GOVERNMENTAL ACTIVITIES 735,857$
JUNE 30, 2018
TOWN OF LOS GATOSRECONCILIATION OF THE STATEMENT OF REVENUES, EXPENDITURES,
AND CHANGES IN FUND BALANCES TOTHE GOVERNMENT WIDE STATEMENT OF ACTIVITIES GOVERNMENTAL ACTIVITIES
The notes to the financial statements are an integral part of this statement.
41

Dra
ft 12
/04/
2018
Variance WithFinal Budget
Original Final PositiveBudget Budget Actual (Negative)
REVENUESProperty Taxes 14,652,443$ 15,370,934$ 15,958,406$ 587,472$Sales Taxes 7,972,195 7,681,546 7,592,206 (89,340)Other Taxes 2,067,000 2,257,000 2,636,002 379,002Franchise Fees 2,287,390 2,317,390 2,474,814 157,424Licenses & Permits 4,483,829 4,558,829 4,697,560 138,731Intergovernmental 716,081 738,281 1,010,166 271,885Charges for Services 3,138,297 3,288,645 4,625,136 1,336,491Fines and Forfeitures 695,400 695,400 676,212 (19,188)Interest 270,723 270,723 244,762 (25,961)Use of Property 31,959 31,959 32,206 247Other 554,711 392,153 581,946 189,793
Total Revenues 36,870,028 37,602,860 40,529,416 2,926,556
EXPENDITURESCurrent:General Government:Town Council 205,092 205,092 192,183 12,909Town Attorney 353,383 426,466 354,205 72,261Administrative Services 3,562,823 3,580,561 3,193,995 386,566Non Departmental 3,992,490 5,148,232 5,029,699 118,533Total General Government 8,113,788 9,360,351 8,770,082 590,269Public Safety 15,455,232 15,505,674 14,423,554 1,082,120Community Development 4,376,673 4,520,505 4,192,165 328,340Parks & Public Works 7,117,324 7,184,147 7,099,527 84,620Library Services 2,781,018 2,803,545 2,529,017 274,528
Total Expenditures 37,844,035 39,374,222 37,014,345 2,359,877
EXCESS (DEFICIT) OF REVENUESOVER EXPENDITURES (974,007) (1,771,362) 3,515,071 5,286,433
OTHER FINANCING SOURCES (USES)Proceeds from sale of assets 1,000 1,000 378,219 377,219Transfers In 538,536 538,536 538,536Transfers Out (3,082,227) (3,243,595) (3,243,595)
Total Other Financing Sources (Uses) (2,543,691) (2,705,059) (2,326,840) 377,219
NET CHANGES IN FUND BALANCES (3,517,698)$ (4,476,421)$ 1,188,231 5,663,652$
BEGINNING FUND BALANCE 29,240,453
ENDING FUND BALANCE 30,428,684$
BUDGET AND ACTUAL (GAAP)FOR THE FISCAL YEAR ENDED JUNE 30, 2018
TOWN OF LOS GATOSGENERAL FUND
STATEMENT OF REVENUES, EXPENDITURES AND CHANGES IN FUND BALANCE
The notes to the financial statements are an integral part of this statement.
42

Dra
ft 12
/04/
2018
OWN OF LOS GATOS, CALIFORNIA
COMPREHENSIVE ANNUAL FINANCIAL REPORTFOR THE FISCAL YEAR ENDED JUNE 30, 2018
PROPRIETARY FUNDS – INTERNAL SERVICE FUNDS
Internal service funds account for Town operations financed and operated in a manner similar to a privatebusiness enterprise. The intent of the Town is that the cost of providing goods and services to other Town fundsbe financed through user charges to those funds.
The concept of major funds does not extend to internal service funds because they are used for internal activitiesonly. In the Government Wide Statement of Activities, the net revenues and expenses of the internal servicefunds are allocated to the Town departments or programs that generated them, thus eliminating internal servicefunds.
43

Dra
ft 12
/04/
2018
GovernmentalActivities
Internal ServiceFunds
ASSETSCurrent Assets:Cash & investments 10,747,866$Restricted cash & investments 37,229Accounts Receivable 137,813Materials, supplies, and deposits 28,011
Total current assets 10,950,919Noncurrent Assets:Capital assets, net of accumulated depreciation 558
Total Assets 10,951,477
DEFERRED OUTFLOWS OF RESOURCESPension Plan Contributions 238,311Pension related amounts 349,971
Pension contributions 588,282
LIABILITIESCurrent Liabilities:Accounts payable 263,152Accrued payroll and benefits 35,526
Total current liabilities 298,678
Noncurrent liabilities:Claims payable 1,604,067Net pension liabilities 2,748,907
Total noncurrent liabilities 4,352,974
Total Liabilities 4,651,652
DEFERRED INFLOWS OF RESOURCESPension related amounts 46,460
46,460
NET POSITIONNet Investment in capital assets 558Restricted for workers compensation claims 37,229Unrestricted 6,803,860
Total Net Position 6,841,647$
TOWN OF LOS GATOSPROPRIETARY FUNDS
STATEMENT OF NET POSITIONJUNE 30, 2018
The notes to the financial statements are an integral part of this statement.
44

Dra
ft 12
/04/
2018
GovernmentalActivities
Internal ServiceFunds
OPERATING REVENUESCharges for services 5,042,430$Interest 5Use of money and property 221,761Other local taxes 31,838Other 364,171
Total Operating Revenues 5,660,205
OPERATING EXPENSESSalaries and related expenses 1,585,094Insurance expenses 725,283Depreciation 957Services and Supplies 3,488,666
Total Operating Expenses 5,800,000
Operating Income (139,795)
Transfers in (Note 4) 703,371
Net transfers 703,371
Change in Net Position 563,576
BEGINNING NET POSITION 6,278,071
ENDING NET POSITION 6,841,647$
TOWN OF LOS GATOSPROPRIETARY FUNDS
STATEMENT OF REVENUE, EXPENSESAND CHANGES IN NET POSITION
FOR THE FISCAL YEAR ENDED JUNE 30, 2018
The notes to the financial statements are an integral part of this statement.
45

Dra
ft 12
/04/
2018
GovernmentalActivities
Internal ServiceFunds
CASH FLOWS FROM OPERATING ACTIVITIESReceipts from customers 5,568,072$Payments to suppliers (3,453,927)Payments to employees (1,371,843)Claims paid (469,607)
Net cash provided (used) by operating activities 272,695
CASH FLOWS FROM NONCAPITAL FINANCING ACTIVITIESTransfers Out 703,371
Net cash provided (used) by noncapital financing activities 703,371
Net Increase(Decrease) in Cash and Investments 976,066
Cash and investments beginning of year 9,809,029
Cash and investments end of year 10,785,095$
Reconciliation of Operating Income to Cash Flowsfrom Operating Activities:Operating Income (139,795)$Adjustments to reconcile operating income to cash flowsfrom operating activities:
Depreciation 957Change in assets and liabilities:Receivables, net (92,133)Material and supplies (2,991)Deferred outflows of resources (60,225)Net pension liabilities 258,452Deferred inflows of resources 19,950Accounts payable 37,897Accrued payroll and benefits (4,926)Claims payable 255,676Due to other government (167)
Cash Flows From Operating Activities 272,695$
TOWN OF LOS GATOSPROPRIETARY FUNDS
STATEMENT OF CASH FLOWSFOR THE FISCAL YEAR ENDED JUNE 30, 2018
The notes to the financial statements are an integral part of this statement.
46

Dra
ft 12
/04/
2018
TOWN OF LOS GATOS, CALIFORNIA
COMPREHENSIVE ANNUAL FINANCIAL REPORTFOR THE FISCAL YEAR ENDED JUNE 30, 2018
FIDUCIARY FUNDS
Trust funds are used to account for assets held by the Town as a trustee agent for individuals, privateorganizations and other governments. The financial activities of these funds are excluded from the governmentwide financial statements, but are presented in separate Fiduciary Fund financial statements.
Library Private Purpose Trust Fund was established to provide for the servicing of donations and bequests tothe Town's Library Program.
RDA Successor Agency Private Purpose Trust Fund was established to account for the assets and liabilitiestransferred from the dissolution of the Town’s former Redevelopment Agency and the continuing operationsrelated to existing Redevelopment Agency obligations.
47

Dra
ft 12
/04/
2018
TotalPrivate
Purpose Trust Pension TrustFunds Fund
ASSETSCash and investments (Note 2) 2,199,020$ $Restricted cash and investments (Note 2) 1,985,864 1,206,851Accounts receivable 38,500Loans receivable (Note 3) 563,761Capital assets (Note 5):Nondepreciable 5,257,422Depreciable, net of accumulated depreciation 1,627,084
Total Assets 11,671,651 1,206,851
LIABILITIESAccounts payable 11,380Due to other governments (Note 13) 189Interest payable 326,266Long term debt (Note 6):Due within one year 1,150,000Due in more than one year 16,981,855
Total Liabilities 18,469,690
NET POSITIONHeld in trust (6,798,039) 1,206,851
Total Net Position (6,798,039)$ 1,206,851$
TOWN OF LOS GATOSFIDUCIARY FUNDS
STATEMENT OF FIDUCIARY NET POSITIONJUNE 30, 2018
The notes to the financial statements are an integral part of this statement.
48

Dra
ft 12
/04/
2018
TotalPrivate
Purpose Trust Pension TrustFunds Fund
ADDITIONSProperty taxes 1,958,325$ $Investment earnings 29,512 7,228Contributions 1,200,000Gifts, bequests and endowments 74,315Other 1,914,739
Total Additions 3,976,891 1,207,228
DEDUCTIONSProgram expenses of former RDA 1,927,753Interest and fiscal agency expenses of RDA 749,832Library services 77,252Trust administation expenses 377Depreciation expense 101,693
Total Deductions 2,856,530 377
CHANGE IN NET POSITION 1,120,361 1,206,851
NET POSITION BEGINNING OF YEAR (7,918,400)
NET POSITION END OF YEAR (6,798,039)$ 1,206,851$$
TOWN OF LOS GATOSFIDUCIARY FUNDS
STATEMENT OF CHANGES IN FIDUCIARY NET POSITIONFOR THE FISCAL YEAR ENDED JUNE 30, 2018
The notes to the financial statements are an integral part of this statement.
49

Dra
ft 12
/04/
2018
This page intentionally left blank
50

Dra
ft 12
/04/
2018
Notes to Basic Financial Statements
51

Dra
ft 12
/04/
2018
TOWN OF LOS GATOS, CALIFORNIANOTES TO BASIC FINANCIAL STATEMENTS
JUNE 30, 2018
NOTE 1 SUMMARY OF SIGNIFICANT ACCOUNTING POLICIES
A. Description of the Financial Reporting Entity
The Town of Los Gatos (the “Town”) operates under a Council Manager form of government and providesthe following services: public safety (including police and emergency management), parks and public works,community development, library, public improvements, planning and zoning, and general administrationservices. Redevelopment services were provided primarily through the Redevelopment Agency of the Townwhich was dissolved on February 1, 2012.
The Town is largely a residential community located in the foothills of the Santa Cruz Mountains and wasincorporated as a municipal corporation in 1887. The Town’s population as of January 1, 2018 was 30,601.
As required by generally accepted accounting principles, these financial statements present the Town as thePrimary Government and any component units for which the Town is considered financially accountable.
B. Description of Blended Component Units
The Town did not report any component units as a part of the primary government because the TownCouncil was not the governing body of any entities and no separate entity provided services entirely to theTown.
C. Description of Joint Ventures and Public Entity Risk Pool
As described in Note 11, the Town participates in two joint ventures and public entity risk pool activitiesthrough formally organized separate legal entities. The financial activities of the Association of Bay AreaGovernments Plan Corporation (“ABAG”) and the Local Agency Workers’ Compensation Excess Joint PowersAuthority (“LAWCX”) are not included in the accompanying basic financial statements as boards are separatefrom and independent of the Town administration.
D. Basis of Presentation
The Town’s Basic Financial Statements are prepared in conformity with accounting principles generallyaccepted in the United States of America. The Government Accounting Standards Board (“GASB”) is theacknowledged standard setting body for establishing accounting and financial reporting standards followedby governmental entities in the U.S.A.
The accompanying financial statements are presented on the basis set forth in Government AccountingStandards Board Statements No. 34, Basic Financial Statements—and Management’s Discussion andAnalysis—for State and Local Governments, No. 36, Recipient Reporting for Certain Non exchange Revenues,an Amendment of GASB Statement No. 33, No. 37, Basic Financial Statements—and Management’sDiscussion and Analysis—for State and Local Governments; Omnibus, and No. 38, Certain FinancialStatement Note Disclosures.
These Statements require that the financial statements described below be presented.
52
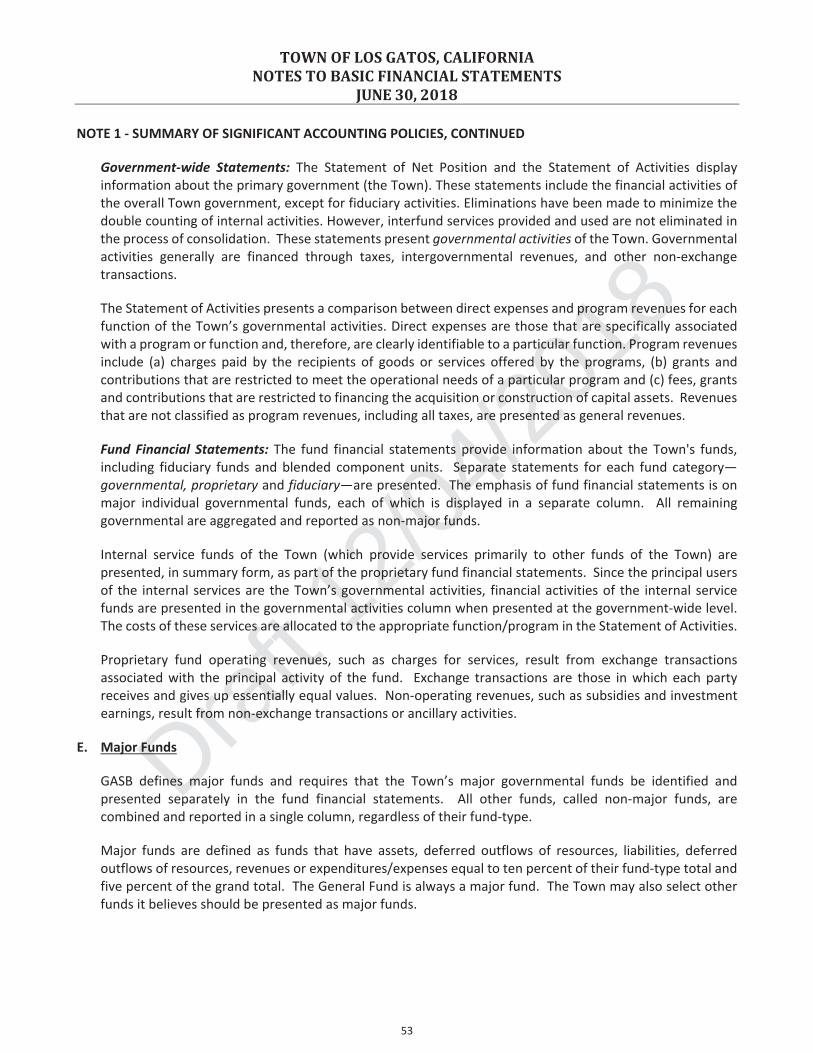
Dra
ft 12
/04/
2018
TOWN OF LOS GATOS, CALIFORNIANOTES TO BASIC FINANCIAL STATEMENTS
JUNE 30, 2018
NOTE 1 SUMMARY OF SIGNIFICANT ACCOUNTING POLICIES, CONTINUED
Government wide Statements: The Statement of Net Position and the Statement of Activities displayinformation about the primary government (the Town). These statements include the financial activities ofthe overall Town government, except for fiduciary activities. Eliminations have been made to minimize thedouble counting of internal activities. However, interfund services provided and used are not eliminated inthe process of consolidation. These statements present governmental activities of the Town. Governmentalactivities generally are financed through taxes, intergovernmental revenues, and other non exchangetransactions.
The Statement of Activities presents a comparison between direct expenses and program revenues for eachfunction of the Town’s governmental activities. Direct expenses are those that are specifically associatedwith a program or function and, therefore, are clearly identifiable to a particular function. Program revenuesinclude (a) charges paid by the recipients of goods or services offered by the programs, (b) grants andcontributions that are restricted to meet the operational needs of a particular program and (c) fees, grantsand contributions that are restricted to financing the acquisition or construction of capital assets. Revenuesthat are not classified as program revenues, including all taxes, are presented as general revenues.
Fund Financial Statements: The fund financial statements provide information about the Town's funds,including fiduciary funds and blended component units. Separate statements for each fund category—governmental, proprietary and fiduciary—are presented. The emphasis of fund financial statements is onmajor individual governmental funds, each of which is displayed in a separate column. All remaininggovernmental are aggregated and reported as non major funds.
Internal service funds of the Town (which provide services primarily to other funds of the Town) arepresented, in summary form, as part of the proprietary fund financial statements. Since the principal usersof the internal services are the Town’s governmental activities, financial activities of the internal servicefunds are presented in the governmental activities column when presented at the government wide level.The costs of these services are allocated to the appropriate function/program in the Statement of Activities.
Proprietary fund operating revenues, such as charges for services, result from exchange transactionsassociated with the principal activity of the fund. Exchange transactions are those in which each partyreceives and gives up essentially equal values. Non operating revenues, such as subsidies and investmentearnings, result from non exchange transactions or ancillary activities.
E. Major Funds
GASB defines major funds and requires that the Town’s major governmental funds be identified andpresented separately in the fund financial statements. All other funds, called non major funds, arecombined and reported in a single column, regardless of their fund type.
Major funds are defined as funds that have assets, deferred outflows of resources, liabilities, deferredoutflows of resources, revenues or expenditures/expenses equal to ten percent of their fund type total andfive percent of the grand total. The General Fund is always a major fund. The Town may also select otherfunds it believes should be presented as major funds.
53

Dra
ft 12
/04/
2018
TOWN OF LOS GATOS, CALIFORNIANOTES TO BASIC FINANCIAL STATEMENTS
JUNE 30, 2018
NOTE 1 SUMMARY OF SIGNIFICANT ACCOUNTING POLICIES, CONTINUED
The Town reported the following major governmental funds in the accompanying financial statements:
General Fund is the general operating fund of the Town and is used to account for all financial resourcesexcept those required to be accounted for in another fund.
Appropriated Reserves Fund is used to account for resources provided for capital projects not fullyfunded from other sources.
The Town also reports the following fund types:
Internal Service Funds are used to account for services, which are provided to other departments on a costreimbursement basis. Those services include workers compensation, self insurance, stores, vehiclemaintenance, buildingmaintenance, information technology (calledmanagement information systems), andequipment replacement.
Fiduciary Funds include Private Purpose Trust Funds and agency funds used to account for assets held bythe Town as an agent for individuals, private organizations, and other governments. The financial activitiesof this fund are excluded from the government wide financial statement but are presented in a separateFiduciary Fund financial statement.
The Town reported the following Fiduciary Funds in the accompanying financial statements:
Library Private Purpose Trust Fund provides for the servicing of donations and bequests to the Town'sLibrary Program and includes the following:
History Project Private Purpose Trust Fund was established to provide for the servicing ofdonations, bequests, grant monies and expenditures to the history project partnership of LosGatos Public Library and the Museum of Los Gatos.
Clelles Ness Private Purpose Trust Fundwas established by Ansten R. Ness, M.D. and the Boardof Library Trustees for the Town of Los Gatos, as a memorial to his wife, Clelles Ness to use theincome and principal of the trust estate to providematerials and services not ordinarily availablefrom public funds.
Susan E. (Betty) McClendon Private Purpose Trust Fund is a bequest to the Los Gatos PublicLibrary from the estate of Susan McClendon was established to be used solely for children'sservices.
Barberra J. Cassin Private Purpose Trust Fund is a bequest to the Town from the estate ofBarberra J. Cassin was established to be distributed to the Los Gatos Public Library for thepurpose of establishing an endowment fund, which is to be used for the support of science, thearts and humanities projects.
54

Dra
ft 12
/04/
2018
TOWN OF LOS GATOS, CALIFORNIANOTES TO BASIC FINANCIAL STATEMENTS
JUNE 30, 2018
NOTE 1 SUMMARY OF SIGNIFICANT ACCOUNTING POLICIES, CONTINUED
RDA Successor Agency Private Purpose Trust Fund accounts for the assets, liabilities and operationstransferred from the dissolution of the Town’s Redevelopment Agency, which includes the following:
Certificates of Participation issued to finance several capital improvement projects throughoutthe Town.
Redevelopment projects and related property tax revenue. Affordable Housing Set Aside Program obligations. Repayment of obligations incurred by the Town’s Redevelopment Agency prior to its dissolution.
Pension Trust Fund accounts for the assets accumulated for the purpose of funding future increases inpension contribution
F. Basis of Accounting
The government wide and fiduciary fund (except for agency funds) financial statements are reported usingthe economic resources measurement focus and the full accrual basis of accounting. Revenues are recordedwhen earned and expenses are recorded at the time liabilities are incurred, regardless of when the relatedcash flows take place. Agency funds have no measurement focus.
Governmental funds are reported using the current financial resourcesmeasurement focus and themodifiedaccrual basis of accounting. Under this method, revenues are recognized when measurable and available.The Town considers property tax revenues reported in the governmental funds to be available if therevenues are collected or are reasonably expected to be collected within sixty days after year end. Forrevenues other than property taxes, the Town generally applies the sixty day period rule but would makeexceptions considering the measurable and available criteria. Expenditures are recorded when the relatedfund liability is incurred, except for principal and interest on general long term debt, which is recognizedupon becoming due and payable; and except for claims, judgments and compensated absences, which arerecognized when estimable and probable. Governmental capital asset acquisitions are reported asexpenditures in governmental funds. Proceeds of governmental long term debt and acquisitions undercapital leases are reported as other financing sources.
Those revenues susceptible to accrual are property and sales taxes, certain intergovernmental revenues,and interest revenue. Fines, forfeitures, licenses and permits, and charges for services are not susceptible toaccrual because they are not measurable until received in cash.
Non exchange transactions, in which the Town gives or receives value without directly, receiving or givingequal value in exchange, include taxes, grants, entitlements, and donations. On the accrual basis, revenuefrom taxes is recognized in the fiscal year for which the taxes are levied or assessed. Revenue from grants,entitlements, and donations is recognized in the fiscal year in which all eligibility requirements have beensatisfied.
55

Dra
ft 12
/04/
2018
TOWN OF LOS GATOS, CALIFORNIANOTES TO BASIC FINANCIAL STATEMENTS
JUNE 30, 2018
NOTE 1 SUMMARY OF SIGNIFICANT ACCOUNTING POLICIES, CONTINUED
The Town may fund programs with a combination of cost reimbursement grants, categorical block grantsand/or general revenues. Thus, both restricted and unrestricted net position may be available to financeprogram expenditures. The Town’s policy is to first apply restricted grant resources to such programsfollowed by general revenues as necessary.
Certain indirect costs are included in program expenses reported for individual functions and activities.
The Town applies all applicable GASB pronouncements for certain accounting and financial reportingguidance including those applicable to accounting and reporting for proprietary operations. In December of2010, GASB issued GASBS No. 62, Codification of Accounting and Financial Reporting Guidance Contained inPre November 30, 1989 FASB and AICPA Pronouncements. This statement incorporates pronouncementsissued on or before November 30, 1989 into GASB authoritative literature. This includes pronouncementsby the Financial Accounting Standards Board (FASB), Accounting Principles Board Opinions (APB), and theAccounting Research Bulletins of the American Institute of Certified Public Accountants' (AICPA) Committeeon Accounting Procedure, unless those pronouncements conflict with or contradict with GASBpronouncements.
Pension For purposes of measuring the net pension liability and deferred outflows/inflows of resourcesrelated to pensions, and pension expense, information about the fiduciary net position of the City’sCalifornia Public Employees’ Retirement System (CalPERS) plans (the Plans) and additions to/deductionsfrom the Plans’ fiduciary net position have been determined on the same basis as they are reported byCalPERS. For this purpose, benefit payments (including refunds of employee contributions) are recognizedwhen due and payable in accordance with the benefit terms. Investments are reported at fair value.
Other Postemployment Benefits (OPEB)
For purposes of measuring the net OPEB liability, deferred outflows of resources and deferred inflows ofresources related to OPEB, and OPEB expense, information about the fiduciary net position of the Town’splan (OPEB Plan) and additions to/deductions from the OPEB Plan’s fiduciary net position have beendetermined on the same basis. For this purpose, benefit payments are recognized when currently due andpayable in accordance with the benefit terms. Investments are reported at fair value. Generally acceptedaccounting principles require that the reported results must pertain to liability and asset information withincertain defined timeframes. For this report, the following timeframes are used:
Valuation Date June 30, 2017Measurement Date June 30, 2017Measurement Period July 1, 2016 to June 30, 2017
Cash and Cash Equivalents The Town’s cash and cash equivalents are considered to be cash on hand,demand deposits, and short term investments with original maturities of three months or less from the dateof acquisition.
State of California statutes and the Town’s investment policy authorize the Town to invest in obligations ofthe U.S. Treasury, its agencies and instrumentalities, collateralized, non negotiable certificates of deposits,commercial paper rated A 1/P 1, medium term corporate notes rated A or its equivalent or better byMoody’s or Standard & Poor’s, asset backed corporate notes, bankers’ acceptances, mutual funds, and theState Treasurer’s investment pool (Local Agency Investment Fund).
56

Dra
ft 12
/04/
2018
TOWN OF LOS GATOS, CALIFORNIANOTES TO BASIC FINANCIAL STATEMENTS
JUNE 30, 2018
NOTE 1 SUMMARY OF SIGNIFICANT ACCOUNTING POLICIES, CONTINUED
The Town does not enter into repurchase or reverse repurchase agreements.
Investments Investments are recorded at fair value in accordance with GASB Statement No. 72, Fair ValueMeasurement and Application. Accordingly, the change in fair value of investments is recognized as anincrease or decrease to investment assets and investment income. This statement changed the definition offair value and is effective for periods beginning after June 15, 2015.
Fair value is defined as the price that would be received to sell an asset or paid to transfer a liability in anorderly transaction. In determining this amount, three valuation techniques are available:
Market approach This approach uses prices generated for identical or similar assets or liabilities. Themost common example is an investment in a public security traded in an active exchange such as theNYSE.
Cost approach This technique determines the amount required to replace the current asset. Thisapproach may be ideal for valuing donations of capital assets or historical treasures.
Income approach This approach converts future amounts (such as cash flows) into a current discountedamount.
Each of these valuation techniques requires inputs to calculate a fair value. Observable inputs have beenmaximized in fair value measures, and unobservable inputs have been minimized.
Materials, Supplies and Deposits These assets are held for consumption and are stated at cost using thefirst in, first out method. The costs are recorded as expenditures at the time the item is consumed.
Interfund Receivables and Payables Transactions between funds that are representative oflending/borrowing arrangements outstanding at the end of the fiscal year are referred to as “advancesto/advances from other funds”. All other outstanding balances between funds are reported as “due to/fromother funds”.
Advances Advances between funds are offset by a nonspendable fund balance in applicable Town funds toindicate the extent to which they are not available for appropriation and are not expendable availablefinancial resources.
Capital Assets Capital assets are valued at historical cost or estimated historical cost if actual historical costis not available. Contributed capital assets are valued at their estimated fair value on the date contributed.Donated capital assets, donated works of art and similar items, and capital assets received in a serviceconcession arrangement are reported at acquisition value. Capital assets, including infrastructure, arerecorded if acquisition or construction costs exceeds $10,000.
As required by GASB, the Town depreciates capital assets with limited useful lives over their estimated usefullives. The purpose of depreciation is to spread the cost of capital assets equitably among all users over thelife of these assets. The amount charged to depreciation expense each year represents that year’s pro ratashare of the cost of capital assets. The Town depreciates using the straight line method which means thecost of the asset is divided by its expected useful life in years and the result is charged to expense each yearuntil the asset is fully depreciated.
57
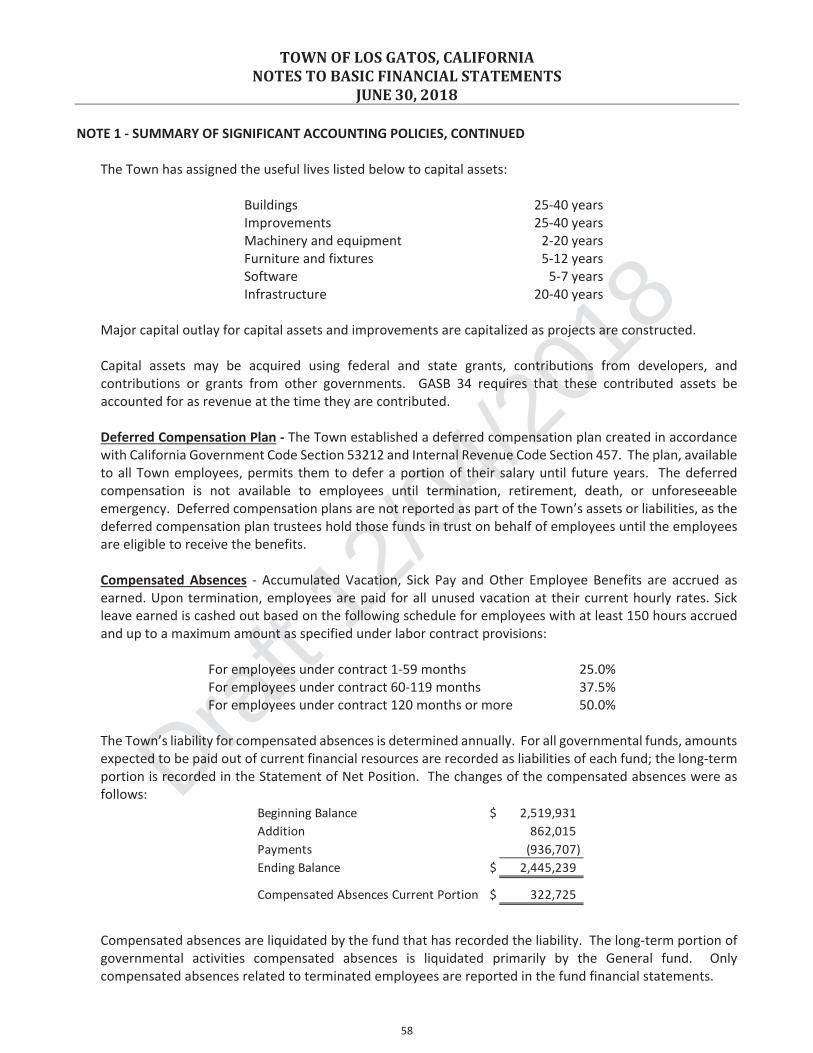
Dra
ft 12
/04/
2018
TOWN OF LOS GATOS, CALIFORNIANOTES TO BASIC FINANCIAL STATEMENTS
JUNE 30, 2018
NOTE 1 SUMMARY OF SIGNIFICANT ACCOUNTING POLICIES, CONTINUED
The Town has assigned the useful lives listed below to capital assets:
Buildings 25 40 yearsImprovements 25 40 yearsMachinery and equipment 2 20 yearsFurniture and fixtures 5 12 yearsSoftware 5 7 yearsInfrastructure 20 40 years
Major capital outlay for capital assets and improvements are capitalized as projects are constructed.
Capital assets may be acquired using federal and state grants, contributions from developers, andcontributions or grants from other governments. GASB 34 requires that these contributed assets beaccounted for as revenue at the time they are contributed.
Deferred Compensation Plan The Town established a deferred compensation plan created in accordancewith California Government Code Section 53212 and Internal Revenue Code Section 457. The plan, availableto all Town employees, permits them to defer a portion of their salary until future years. The deferredcompensation is not available to employees until termination, retirement, death, or unforeseeableemergency. Deferred compensation plans are not reported as part of the Town’s assets or liabilities, as thedeferred compensation plan trustees hold those funds in trust on behalf of employees until the employeesare eligible to receive the benefits.
Compensated Absences Accumulated Vacation, Sick Pay and Other Employee Benefits are accrued asearned. Upon termination, employees are paid for all unused vacation at their current hourly rates. Sickleave earned is cashed out based on the following schedule for employees with at least 150 hours accruedand up to a maximum amount as specified under labor contract provisions:
For employees under contract 1 59 months 25.0%For employees under contract 60 119 months 37.5%For employees under contract 120 months or more 50.0%
The Town’s liability for compensated absences is determined annually. For all governmental funds, amountsexpected to be paid out of current financial resources are recorded as liabilities of each fund; the long termportion is recorded in the Statement of Net Position. The changes of the compensated absences were asfollows:
Beginning Balance $ 2,519,931Addition 862,015Payments (936,707)Ending Balance $ 2,445,239
Compensated Absences Current Portion $ 322,725
Compensated absences are liquidated by the fund that has recorded the liability. The long term portion ofgovernmental activities compensated absences is liquidated primarily by the General fund. Onlycompensated absences related to terminated employees are reported in the fund financial statements.
58

Dra
ft 12
/04/
2018
TOWN OF LOS GATOS, CALIFORNIANOTES TO BASIC FINANCIAL STATEMENTS
JUNE 30, 2018
NOTE 1 SUMMARY OF SIGNIFICANT ACCOUNTING POLICIES, CONTINUED
Unearned Revenue Unearned revenue arises when assets are received before revenue recognition criteriahave been satisfied. Grants and entitlements received before eligibility requirements are met are recordedas unearned revenue. In the governmental fund financial statements, receivables associated with nonexchange transactions that will not be collected within the availability period have been recorded asdeferred inflows from unavailable revenue.
Long Term Liabilities In the government wide financial statements and private purpose trust funds longterm debt and other long term obligations are reported as liabilities in the applicable statement of netposition. Bond premiums and discounts, as well as issuance costs, are deferred and amortized over the lifeof the bonds using the straight linemethod. Bonds payable are reported net of the applicable bond premiumor discount.
In the fund financial statements, governmental fund types recognize bond premiums and discounts, as wellas bond issuance costs, during the current period. The face amount of debt issued is reported as otherfinancing sources. Premiums received on debt issuances are reported as other financing sources whilediscounts on debt issuances are reported as other financing uses. Issuance costs, whether or not withheldfrom the actual debt proceeds received, are reported as debt service expenditures.
Deferred Outflows/Deferred Inflows of Resources Deferred outflows of resources is a consumption of netposition by the Town that is applicable to a future reporting period, for example, prepaid items and deferredcharges.
Deferred inflows of resources is an acquisition of net position by the Town that is applicable to a futurereporting period, for example, unearned revenue and advance collections.
Net Position In the government wide financial statements, net position is classified in the followingcategories:
Net Investment in Capital Assets This amount consists of capital assets net of accumulated depreciationand reduced by outstanding debt that attributed to the acquisition, construction, or improvement of theassets. In addition, deferred outflows of resources and deferred inflows of resources that are attributable tothe acquisition, construction, or improvement of those assets or related debt also are included in the netinvestment in capital assets component of net position.
Restricted Net Position This amount is restricted by external creditors, grantors, contributors, or laws orregulations of other governments.
Unrestricted Net Position This amount is all net position that does not meet the definition of "netinvestment in capital assets" or "restricted net position."
Fund Balances The Town does not have a policy identifying a minimum unassigned fund balance. Becauseamounts in the nonspendable, restricted, committed, and assigned categories are subject to varyingconstraints on their use, the remaining fund balances are otherwise unassigned.
In accordance with Government Accounting Standards Board 54, Fund Balance Reporting and GovernmentalFund Type Definitions, the Town classifies governmental fund balances as follows:
59

Dra
ft 12
/04/
2018
TOWN OF LOS GATOS, CALIFORNIANOTES TO BASIC FINANCIAL STATEMENTS
JUNE 30, 2018
NOTE 1 SUMMARY OF SIGNIFICANT ACCOUNTING POLICIES, CONTINUED
Non spendable includes fund balance amounts that cannot be spent either because it is not in spendableform or because of legal or contractual constraints.
Restricted includes fund balance amounts that are constrained for specific purposes which are externallyimposed by providers, such as creditors or amounts constrained due to constitutional provisions orenabling legislation.
Committed includes fund balance amounts that are constrained for specific purposes that are internallyimposed by the government through Council Resolution which is a formal action of the highest level ofdecision making authority and does not lapse at year end. Committed fund balances are imposed by theTown Council.
Assigned includes fund balance amounts that are intended to be used for specific purposes that areneither considered restricted or committed. Fund balance may be assigned by the Town Manager or theFinance Director.
Unassigned includes fund balances within the funds which have not been classified within the abovementioned categories. the general fund is the only fund that reports a positive unassigned fund balanceamount. In other governmental funds it is not appropriate to report a positive unassigned fund balanceamount. However, in governmental funds other than the general fund, if expenditures incurred for specificpurposes exceed the amounts that are restricted, committed, or assigned to those purposes, it may benecessary to report a negative unassigned fund balance in that fund.
The Town uses restricted/committed amounts to be spent first when both restricted and unrestricted fundbalance is available unless there are legal documents/contracts that prohibit doing this, such as a grantagreement requiring dollar for dollar spending. Additionally, the Town would first use committed, thenassigned, and lastly unassigned amounts of unrestricted fund balance when expenditures are made.
Use of Estimates The preparation of financial statements in conformity with generally accepted accountingprinciples requires management to make estimates and assumptions that affect the reported amounts ofassets and liabilities and disclosure of contingent asset and liabilities at the dates of the financial statementsand the reported amounts of revenues and expenditures/expenses during the reporting periods. Actualresults could differ from those estimates.
Subsequent Events Management has considered subsequent events through December XX, 2018, the datewhich the financial statements were available to be issued. The financial statements include all events ortransactions, including estimates, required to be recognized in accordance with generally acceptedaccounting principles. Management has determined that there are no non recognized subsequent eventsthat require additional disclosure other than described in Note 15.
Property Tax Levy, Collection and Maximum Rates State of California Constitution Article XIII A providesthat the combined maximum property tax rate on any given property may not exceed 1% of its assessedvalue unless an additional amount for general obligation debt has been approved by voters. Assessed valueis calculated at 100% of market value as defined by Article XIII A and may be adjusted by no more than 2%per year unless the property is sold, transferred, or substantially improved. The State Legislature hasdetermined the method of distribution of receipts from a 1% tax levy among the counties, cities, schooldistricts and other districts.
60

Dra
ft 12
/04/
2018
TOWN OF LOS GATOS, CALIFORNIANOTES TO BASIC FINANCIAL STATEMENTS
JUNE 30, 2018
NOTE 1 SUMMARY OF SIGNIFICANT ACCOUNTING POLICIES, CONTINUED
The County of Santa Clara assesses properties, bills for and collects property taxes on the following schedule:
Secured UnsecuredValuation/lien dates January 1 January 1Levy dates January 1 January 1Due dates (delinquent as of) 50% on November 1 (December 10) March 1 (August 31)
50% on February 1 (April 10)
The term "unsecured" refers to taxes on personal property other than land and buildings. These taxes aresecured by liens on the property being taxed. Property taxes levied are recorded as revenue and receivableswhen they are collected during the fiscal year of levy or within 60 days of year end.
Budgets and Budgetary Accounting The Town follows the procedures below when establishing thebudgetary data reflected in the financial statements:
1. The TownManager submits to the Town Council a proposed operating and capital improvement budgetfor the fiscal year commencing the following July 1. The budgets include the proposed expenditures andthe means of financing them.
2. Public hearings are conducted to obtain taxpayer comments.
3. The budget is legally enacted through adoption of Town resolution by Council.
4. The TownManager is authorized to implement the programs as approved in the adopted budget. Withina specific fund, the Town Manager may transfer appropriations between categories, departments,projects and programs as needed to implement the adopted budget, whereas the Town Council mustauthorize budget increases and decreases, and transfers between funds.
5. Budgets are adopted on a basis consistent with generally accepted accounting principles except forproprietary funds which budget for capital outlays but not depreciation. Budgets were adopted for theGeneral Fund, Special Revenue Funds, Internal Service Funds and Capital Projects Funds.
6. Budgeted amounts are as originally adopted or as amended by Town Council. Individual amendmentswere not material in relation to original appropriations.
Excess of Expenditures over Appropriations There were no significant expenditures in excess of budgetduring for the year ended June 30, 2018.
Encumbrances Under encumbrance accounting, purchase orders, contract and other commitments forexpenditures are recorded in order to reserve that portion of the applicable appropriation. Encumbranceaccounting is employed as an extension of formal budgetary integration in all funds. Encumbrancesoutstanding at year end are reported as restrictions, commitments or assignments of fund balances sincethey do not constitute expenditures or liabilities; unexpended and unencumbered appropriations lapse atyear end in all funds. Encumbered appropriations are carried forward to the following year.
61

Dra
ft 12
/04/
2018
TOWN OF LOS GATOS, CALIFORNIANOTES TO BASIC FINANCIAL STATEMENTS
JUNE 30, 2018
NOTE 1 SUMMARY OF SIGNIFICANT ACCOUNTING POLICIES, CONTINUED
Reclassifications Certain accounts in the prior year financial statements have been reclassified for thepresentation in the current year financial statements.
G. Accounting and Reporting Changes
GASB Statement No. 75, Accounting and Financial Reporting for Postemployment Benefits OtherThan Pensions The objective of this statement is to address reporting by governments that provideother postemployment benefits (OPEB) to their employees and for governments that finance OPEBfor employees of other governments. The Town restated its beginning net position as part ofimplementation of this statement.
GASB Statement No. 81, Irrevocable Split Interest Agreements – The objective of this statement is toimprove accounting and financial reporting for irrevocable split interest agreements by providingrecognition and measurement guidance for situations in which a government is a beneficiary of theagreement. The requirements of this statement did not apply to the Town for the current fiscal year.
GASB Statement No. 85,Omnibus 2017 – The objective of this statement is to address practice issuesthat have been identified during implementation and application of certain GASB Statements. ThisStatement addresses a variety of topics including issues related to blending component units,goodwill, fair value measurement and application, and other postemployment benefits (OPEB).There was no effect on net position as a result of implementation of this statement.
GASB Statement No. 86, Certain Debt Extinguishment Issues – The objective of this statement is toimprove consistency in accounting and financial reporting for in substance defeasance of debt byproviding guidance for transactions in which cash and other monetary assets acquired with onlyexisting resources—resources other than the proceeds of refunding debt—are placed in anirrevocable trust for the sole purpose of extinguishing debt. This Statement also improves accountingand financial reporting for prepaid insurance on debt that is extinguished and notes to financialstatements for debt that is defeased in substance. The requirements of this statement did not applyto the Town for the current fiscal year.
NOTE 2 CASH AND INVESTMENTS
The Town pools cash from all sources and all funds except Restricted Cash and Restricted Investments so that itcan be invested at the maximum yield, consistent with safety and liquidity, while existing funds have cashavailable for expenditures.
Cash and Investments Defined The Town includes only cash deposits in banks as cash. Investments in LAIF andgovernment securities mutual funds are net in the order of liquidity, since they may be withdrawn withoutpenalty. U.S. Treasuries, U.S. Agencies and Certificates of Deposit are the Town’s least liquid investments, sincethey must be held to maturity.
62

Dra
ft 12
/04/
2018
TOWN OF LOS GATOS, CALIFORNIANOTES TO BASIC FINANCIAL STATEMENTS
JUNE 30, 2018
NOTE 2 CASH AND INVESTMENTS, CONTINUED
Cash Deposits with Banks and Custodial Credit Risk California Law requires banks and savings and loaninstitutions to pledge government securities with a fair value of 110% of the Town’s cash on deposit, first trustdeed mortgage notes with a value of 150% of the deposit, or letters of credit issued by the Federal Home LoanBank of San Francisco with a value of 100% of the deposit as collateral. Under California Law this collateral isheld in the Town’s name and places the Town ahead of general creditors of the institution. The Town’s cashdeposits are collateralized under this law.
The bank balance of the Town’s cash deposits was $19,398,300 and the book balance was $18,948,901 as ofJune 30, 2018. The bank balance and the carrying amount differed due to deposits in transit and outstandingchecks.
Investments The Town and its fiscal agent invest in individual investments and in investment pools. Individualinvestments are evidenced by specific identifiable pieces of paper called “securities instruments,” or by anelectronic entry registering the owner in the records of the institution issuing the security, called the book entrysystem. In order to maximize security, the Town employs the Trust department of a bank as the custodian of allits investments, regardless of their form.
Fair Value Measurements GASB 72 established a hierarchy of inputs to the valuation techniques above. Thishierarchy has three levels:
Level 1 inputs are quoted prices in active markets for identical assets or liabilities. Level 2 inputs are quoted market prices for similar assets or liabilities, quoted prices for identical or
similar assets or liabilities in markets that are not active, or other than quoted prices that are notobservable
Level 3 inputs are unobservable inputs, such as a property valuation or an appraisal.
Local Agency Investment Fund (LAIF) The Town invests in the California State Treasurer’s Local AgencyInvestment Fund. LAIF, established in 1977, is regulated by California Government Code Section 16429 and isunder the day to day administration of the State Treasurer. As of June 30, 2018, LAIF had approximately $22.5billion in investments. Of that amount, 97.33% is invested in non derivative financial products and 2.67% instructured notes and asset backed securities. These investments are described as follows:
1. Structured Notes are debt securities (other than asset backed securities) whose cash flow characteristics(coupon rate, redemption amount, or stated maturity) depend upon one or more indices and/or that haveembedded forwards or options.
2. Asset Backed Securities, the bulk of which are mortgage backed securities, entitle their purchasers toreceive a share of the cash flows from a pool of assets such as principal and interest repayments from a poolof mortgages (such as Collateralized Mortgage Obligations) or credit card receivables.
63

Dra
ft 12
/04/
2018
TOWN OF LOS GATOS, CALIFORNIANOTES TO BASIC FINANCIAL STATEMENTS
JUNE 30, 2018
NOTE 2 CASH AND INVESTMENTS, CONTINUED
Risk DisclosuresInterest Rate Risk is the risk that changes in market interest rates will adversely affect the fair value of aninvestment. Generally, the longer the maturity of an investment, the greater the sensitivity of its fair value tothe changes in market interest rates. One of the ways that the Town manages its exposure to interest rate riskis by purchasing a combination of shorter term and longer term investments and by timing cash flows frommaturities so that a portion of the portfolio is maturing or coming close tomaturity evenly over time as necessaryto provide the cash flow and liquidity needed for operations. Information about the sensitivity of the fair valuesof the Town's investments to market interest rate fluctuations is provided in the summary of cash andinvestments table on the following page that shows the distribution of the Town's investments by maturity.
Credit Risk is the risk of loss due to the failure of the security issuer. This risk is measured by the assignment ofa rating by a nationally recognized statistical rating organization. The summary of cash and investments table onthe following page shows the minimum rating under the actual rating of the Town’s investments at year end.
Custodial Credit Risk is the risk that in the event of the failure of the counterparty (e.g., broker dealer) to atransaction, a government will not be able to recover the value of its investment or collateral securities that arein the possession of another party. The Town’s money market fund and investment in LAIF are not categorizedas to custodial credit risk. Its U.S. Government Agency Securities investment is held by a third party financialinstitution under the third party’s trust department’s name and thus not exposed to custodial credit risk.
Concentration of Credit Risk is the risk that the Town’s investments are exposed because the types ofinvestments have been too limited. The Town’s Policy states that, with the exception of US Treasury securitiesand LAIF, no more than 50% of the Town’s total investment portfolio will be invested in one single security typeor with a single financial institution. The Town was in compliance with this policy as of June 30, 2018.
The following table summarizes the Town’s policy related to maturities and concentration of investments:
Investment TypeMaximumMaturity
MaximumPortfolio
Percentage
US Treasury Obligations 5 years NoneUS Agency Obligations 5 years NoneBankers Acceptances 180 days 30%Commercial Paper 270 days 25%Medium Term Notes 5 years 30%Collateralized CD's 5 years 30%CA LAIF N/A 65m
Money Market Funds N/A 20%
64

Dra
ft 12
/04/
2018
TOWN OF LOS GATOS, CALIFORNIANOTES TO BASIC FINANCIAL STATEMENTS
JUNE 30, 2018
NOTE 2 CASH AND INVESTMENTS, CONTINUED
The following is a summary of the Town’s Cash and Investments (stated at fair value) as of June 30, 2018:
Investment Type/Cash DepositAvailable forOperations Restricted Total
Concentrationof Credit Risk
MinimumRating
Inputlevel
Time toMature(Years)
WeightedAverageMaturity
US Treasury Securities 6,627,355$ $ 6,627,355$ 11.59% Aaa 1 0 2 1.11 yearsUS Instrumentality Security 29,663,273 29,663,273 51.89% Aaa 2 0 2 1.16 yearsCorporate Securities 14,409,372 14,409,372 25.21% A1 2 1 2 1.26 yearsGovernment Securities MoneyMarket Mutual funds 183,203 183,203 0.32% Not Rated 2 n/a n/aLAIF 6,282,764 6,282,764 10.99% Not Rated n/a n/a n/a
Total investments 57,165,967 57,165,967 100.00%
Cash Deposit with Banks 18,948,901 37,230 18,986,131Money Market Accounts 17,381 1,985,863 2,003,244Investment held in pension trust 1,206,851 1,206,851Cash on hand at Town 4,850 4,850
Town Cash and Investments 76,137,099$ 3,229,944$ 79,367,043$
Cash and investments are classified in the financial statements as shown below, based on whether or not theiruse is restricted by Town debt or Agency agreements.
NOTE 3 LONG TERM NOTES RECEIVABLE
The Town had the following long term notes receivable as of June 30, 2018:
Total Town Fiduciary Funds TotalCash and Investments available for operations 73,938,079$ 2,199,020$ 76,137,099$Restricted cash and investments 37,229 3,192,715 3,229,944
Total cash and investments 73,975,308$ 5,391,735$ 79,367,043$
Description Interest Rate Maturity BalanceGeneral Fund:
Rehab Loan to Charities Various Various 159,000$Total General Fund 159,000
Community Development Block Grant Fund (CDBG):Housing Conservation Loans 0 5% Various 78,752
Total CDBG 78,752
Total Long Term Notes Receivable Government Wide Statement of Net Position 237,752
Successor Agency Affordable HousingProject Match Various Various 563,761
Total Long Term Notes Receivable 801,513$
6

Dra
ft 12
/04/
2018
TOWN OF LOS GATOS, CALIFORNIANOTES TO BASIC FINANCIAL STATEMENTS
JUNE 30, 2018
NOTE 3 LONG TERM NOTES RECEIVABLE, CONTINUED
Active Home Loans and Housing Conservation Loans The Town used CDBG Funds (funded through federalgrants) to assist low andmoderate income homeowners to improve their homes and to fund low income housingrental properties acquisition and rehabilitation. These loans are secured by deeds of trust.
ProjectMatch The Successor Agency has a loan agreementwith ProjectMatch, a nonprofit benefit corporation,to acquire and rehabilitate four or five bedroom single family homes. The property is to provide affordablehousing rental to very low income senior households. The loan receivable is evidenced by a promissory note andsecured by a deed of trust. From inception of the loan through June 30, 2018, no interest or principal paymentshave been made.
NOTE 4 INTERFUND TRANSACTIONS
Interfund Receivables and Payables Amounts due to or due from other funds reflect interfund balances forservices rendered or short term loans expected to be repaid in the next fiscal year. Advances to or from otherfunds are long term loans between funds that are to be repaid in their entirety over several years.
Transfers With Council approval resources may be transferred from one fund to another. Transfers pay forcapital projects or capital outlays, lease or debt service payments, operating expenses and low and moderateincome housing projects. Transfers between funds during the fiscal year ended June 30, 2018 were as follows:
Transfer In Transfer OutGeneral Fund 538,536$ 3,243,595$Appropriated Reserve Fund 2,638,224 525,616Non major Gov't Funds 110,920Internal Service Funds 703,371
Total Transfers 3,880,131$ 3,880,131$
66

Dra
ft 12
/04/
2018
TOWN OF LOS GATOS, CALIFORNIANOTES TO BASIC FINANCIAL STATEMENTS
JUNE 30, 2018
NOTE 5 CAPITAL ASSETS
Changes in the Town’s capital assets during the fiscal year are shown as follows:
Depreciation expense is charged to functions and programs based on their usage of the related assets. Theamount allocated to each function or program is as follows:
Balance at Adjustments Transfers and Balance atJune 30, 2017 and Additions Retirements June 30, 2018
Capital Assets not being Depreciated
Land 20,333,684$ $ $ 20,333,684$Construction in Progress 5,629,017 5,056,379 (120,742) 10,564,654
Total Capital Assets not being Depreciated 25,962,701 5,056,379 (120,742) 30,898,338
Capital Assets being Depreciated
Buildings and Improvements 30,039,607 12,168 (360,830) 29,690,945Equipment & Vehicle 10,889,173 761,239 (230,407) 11,420,005Infrastructure - A ll Other 22,473,084 245,365 22,718,449Infrastructure - Streets 56,756,057 3,909,749 60,665,806
Total Capital Assets being Depreciated 120,157,921 4,928,521 (591,237) 124,495,205
Less Accumulated Depreciation for:
Buildings and Improvements 6,779,398 517,010 (19,545) 7,276,863Equipment & Vehicle 7,947,752 740,403 (228,170) 8,459,985Infrastructure - A ll Other 4,991,945 742,494 5,734,439Infrastructure - Streets 30,135,875 1,687,652 31,823,527
Total accumulated depreciation 49,854,970 3,687,559 (247,715) 53,294,814
Net Capital Assets being Depreciated 70,302,951 1,240,962 (343,522) 71,200,391
Go vernmental A ct ivity C apital A ssets, N et 96,265,652$ 6,297,341$ (464,264)$ 102,098,729$
DepreciationGovernmental Activities ExpenseGeneral Government 185,602$Public Safety 425,383Parks & Public Works 2,551,682Community Services 49,726Library 391,339Sanitation 83,827
Total Governmental Activities 3,687,559$
67

Dra
ft 12
/04/
2018
TOWN OF LOS GATOS, CALIFORNIANOTES TO BASIC FINANCIAL STATEMENTS
JUNE 30, 2018
NOTE 5 CAPITAL ASSETS, CONTINUED
Changes in the RDA Successor Agency trust fund capital assets during the fiscal year are shown as follows:
NOTE 6 LONG TERM OBLIGATIONS
The Town generally incurs long term debt to finance projects or purchase assets, which will have useful livesequal to or greater than the related debt. As of February 1, 2012, the Town transferred long term debt issuedby the Redevelopment Agency to the Successor Agency trust as a part of the RDA dissolution. The followingsummarizes the changes in long term debt in the Successor Agency trust fund during the fiscal year ended June30, 2018:
Long TermDebt Interest Rate Maturity Date Original Issue
BeginningBalance Deletion
EndingBalance
DueWithinOne Year
Due in MoreThan One
Year2002 COP 2.5 5% 8/1/2031 10,725,000$ 7,115,000$ 335,000$ 6,780,000$ 350,000$ 6,430,000$2010 COP 2.5 4.25% 8/1/2028 15,675,000 11,670,000 770,000 10,900,000 800,000 10,100,000Subtotal COP 26,400,000 18,785,000 1,105,000 17,680,000 1,150,000 16,530,000Premiums 735,095 489,510 37,655 451,855 451,855Total Long Term Debt 27,135,095$ 19,274,510$ 1,142,655$ 18,131,855$ 1,150,000$ 16,981,855$
2002 Certificates of Participation (2002 COPs) On July 18, 2002, the Town and the Los Gatos RedevelopmentAgency issued $10,725,000 in 2002 COPs, Series A, to finance the acquisition, construction, rehabilitation,equipping and improvement of several capital improvement projects. The Town had pledged lease payments ofreal property and facilities comprised of the Parks and Public Works Service Center and Baseball Field, as well asParking Lot No. 1, 2, and 3, as collateral for the repayment of the Certificates. Principal payments are dueannually on August 1st, with interest payments due semi annually on February 1st and August 1st.
2010 Certificates of Participation (2010 COPs) On June 1, 2010, $15,675,000 of 2010 COPs were issued tofinance the acquisition, construction, and improvement of a library on the Town’s Civic Center campus, to beowned and operated by the Town. Principal payments are due annually on August 1, with interest payments duesemi annually on February 1 and August 1.
Balance at Adjustments Transfers and Balance atJune 30, 2017 and Additions Reti rements June 30, 2018
Capita l Assets not being DepreciatedLand 5,257,422$ $ $ 5,257,422$
Total Capita l Assets not being Depreciated 5,257,422 5,257,422
Capita l Assets being DepreciatedBui ldings and Improvements 4,067,708 4,067,708
Total Capita l Assets being Depreciated 4,067,708 4,067,708
Less Accumulated Depreciation for:Bui ldings and Improvements 2,338,931 101,693 2,440,624
Total accumulated depreciation 2,338,931 101,693 2,440,624
Net Capita l Assets being Depreciated 1,728,777 (101,693) 1,627,084
Successor Agency Capital Assets, Net 6,986,199$ (101,693)$ $ 6,884,506$
68

Dra
ft 12
/04/
2018
TOWN OF LOS GATOS, CALIFORNIANOTES TO BASIC FINANCIAL STATEMENTS
JUNE 30, 2018
NOTE 6 LONG TERM OBLIGATIONS, CONTINUED
To assist the Town in paying the cost of acquisition and construction of various projects, the Town and itsRedevelopment Agency entered into lease and reimbursement agreements in 2002 and 2010. Under theagreements, the Agency will use available net tax increment revenues resulting from the projects’ effect on landvalues to repay the Town for all lease payments made by the Town to the Agency under the lease agreementsfor the projects. Net tax increment revenues are all taxes allocated to and paid into the Successor Agency privatepurpose trust fund.
Future debt service requirements of the 2002 and 2010 Certificates of Participation are as follows:
The Successor Agency must maintain a required amount of cash and investments with the trustee under theterms of the COPs’ debt agreements. These funds are pledged as reserves to be used if the Successor Agencyfails tomeet its obligations under the debt agreements and totaled $1,985,862 as of June 30, 2018. The CaliforniaGovernment Code requires these funds to be invested in accordance with Town ordinances, bond indentures orState statues. All these funds have been invested as permitted under the Code.
NOTE 7 SPECIAL ASSESSMENT DISTRICT DEBT WITHOUT COMMITMENT
Special assessment districts are established in various parts of the Town to provide improvements to propertieslocated in those districts. Properties are assessed for the cost of the improvements. These assessments arepayable over the term of the debt issued to finance the improvements and are used to pay debt service on debtissued to fund the improvements.
The Town is acting only as an agent and has no legal liability with respect to the payment of any indebtednessof the Downtown Parking Assessment District. There was no non obligated debt outstanding as of June 30,2018.
NOTE 8 FUND BALANCES
Fund balance for governmental funds is reported in classifications (nonspendable, restricted, committed,assigned, and unassigned) that comprise a hierarchy based primarily on the extent to which the government isbound to honor constraints on the specific purposes for which amounts in those funds can be spent.
Fiscal YearEnded June 30, Principal Interest Total
2019 1,150,000 759,073 1,909,0732020 1,195,000 710,024 1,905,0242021 1,250,000 658,494 1,908,4942022 1,300,000 599,850 1,899,8502023 1,355,000 538,713 1,893,713
2024 2028 7,780,000 1,742,894 9,522,8942029 2032 3,650,000 275,656 3,925,656
Total COP Debt Service 17,680,000$ 5,284,704$ 22,964,704$
69

Dra
ft 12
/04/
2018
TOWN OF LOS GATOS, CALIFORNIANOTES TO BASIC FINANCIAL STATEMENTS
JUNE 30, 2018
NOTE 8 FUND BALANCES, CONTINUED
As of June 30, 2018, fund balances were classified as follows:
BeginningBalance Adjusments
AdjustedBeginningBalance Additions Deletions
EndingBalance
Restricted forCapital Outlay 5,428,064$ 5,428,064 1,365,999 6,794,063$Repairs and Maintenance 199,643 199,643 959 198,684
Committed to:Budget Stabilization 4,969,847 4,969,847 67,396 5,037,243Catastrophic 4,969,847 4,969,847 67,396 5,037,243CalPERS/OPEB Reserve 3,388,913 3,388,913 690,000 1,200,000 2,878,913Almond Grove Street Project 12,155,902 12,155,902 6,584,815 5,571,087
Assigned to:Open Space 562,000 562,000 562,000Parking 1,460,210 1,460,210 1,460,210Sustainability 140,553 140,553 140,553Strategic Planning 2,600,000 2,600,000 2,470,910 129,090Capital Projects 14,510,361 14,510,361 4,524,044 19,034,405Carryover Encumbrances 34,852 34,852 65,075 99,927Comcast PEG 50,000 50,000 50,000Compensated Absences 2,440,170 2,440,170 317,658 2,122,512Special Revenue Fund 181,547 181,547 56,444 237,991
Unassigned 59,829 59,829 59,829Total Fund Balance AllGovernmental Funds 53,091,909$ 59,829 53,151,738 5,470,355 10,633,212 49,353,921$
Restricted
Capital Outlay funded from storm drain fees, construction taxes and debt proceeds are legally restricted formajor capital projects.
Repairs and Maintenance reflects legally restricted balances for repairs and maintenance of lighting andlandscape property and open space property that are financed with special tax assessments on the benefitingproperty.
70

Dra
ft 12
/04/
2018
TOWN OF LOS GATOS, CALIFORNIANOTES TO BASIC FINANCIAL STATEMENTS
JUNE 30, 2018
NOTE 8 FUND BALANCES, CONTINUED
Committed
Stabilization Arrangements
The Town Council has established by resolution the budget stabilization arrangement and the catastrophearrangement. The total balances in these arrangements are to be maintained at 25% of annual General Fundongoing, operating expenditures, excluding one time expenditures divided equally between both arrangements.When either arrangement is used, Town Council will develop a 1 to 5 year reserve replenishment plan to meetthe minimum threshold of 25% of General Fund ongoing, operating expenditures, excluding one timeexpenditures. The arrangements can be used when:
Unforeseen emergencies, such as a disaster or catastrophic event occur Significant decrease in property or sales tax, or other economically sensitive revenues Loss of businesses considered to be significant sales tax generators Reductions in revenue due to actions by the state /federal government Workflow /technical system improvements to reduce ongoing, personnel costs and enhance customer
service One time maintenance of service levels due to significant economic /budget constraints One time transitional costs associated with organizational restructuring to secure long term personnel
cost savings.Should any of the events listed above occur that require the expenditure of Town resources beyond thoseprovided for in the annual budget, the Town Manager or designee shall have authority to approve Catastrophicor budget stabilization arrangement appropriations. The Town Manager or designee shall then present to theTown Council a budget amendment confirming the nature of the event and authorizing the appropriation ofreserve funds.
PERS Unfunded Liability committed fund balance will be used to fund net pension liabilities for the Town'sMiscellaneous and Safety pension plans administered by CALPERS. In FY 17/18 the Town approved an updateto its General Fund reserve policy providing to the extent possible that additional annual deposits be calculatedand placed into this reserve with the goal of moving the payment of the unfunded liability from a 29 year to a20 year amortization period.
Almond Grove Street Project committed fund balance will be used for the infrastructure repairs, improvementsand construction along Almond Grove Street.
Assigned
Open Space assigned fund balance will be used to make selective open space acquisitions.Postemployment Medical assigned fund balance will be used to aid in funding actuarially determinedrequirements for retiree medical costs.
Parking assigned fund balance will be used to mitigate parking issues within the Town.
Sustainability assigned fund balance will be used to fund ongoing sustainability initiatives and programs.
71

Dra
ft 12
/04/
2018
TOWN OF LOS GATOS, CALIFORNIANOTES TO BASIC FINANCIAL STATEMENTS
JUNE 30, 2018
NOTE 8 FUND BALANCES, CONTINUED
Strategic Planning assigned fund balance will be used to fund Town Council identified strategic prioritiesincluding infrastructure, unfunded liability reduction, and strategic operating budget allocations based uponTown Council direction.
Productivity Enhancements assigned fund balance will be used to fund requests that result in streamlining orimproving existing service levels.
Capital Projects assigned fund balance will be used for the acquisition and construction of capital facilities.
Carryover Encumbrances assigned fund balance will be used for encumbered items re appropriated in thefollowing year.
Comcast PEG assigned fund balance will be used to fund capital improvements linked to the televising of counciland planning commission meetings.
Compensated Absences assigned fund balancewill be used for vacation and sick pay benefits owed to employeesas of June 30, 2018 that were not an obligation of the General Fund because of their long term nature.
Special Revenue Fund assigned fund balance will be used for the activities of the respective revenue fund.
NOTE 9 EMPLOYEES' RETIREMENT PLAN
(a) General Information about the Pension Plans
Plan Description All qualified employees are eligible to participate in the Town’s pooled Safety Plan, a costsharing multiple employer defined benefit pension plan and the Town’s Miscellaneous (all other) Plan, an agentmultiple employer defined benefit pension plan administered by the California Public Employees' RetirementSystem (CalPERS), which acts as a common investment and administrative agent for its participating memberemployers. Benefit provisions under the Plans are established by State statute and Town resolution. CalPERSissues publicly available reports that include a full description of the pension plans regarding benefit provisions,assumptions and membership information that can be found on the CalPERS website. Audited financialstatements of CalPERS can be obtained from its website https://www.calpers.ca.gov/page/forms publications.
Benefits Provided CalPERS provides service retirement and disability benefits, annual cost of living adjustmentsand death benefits to plan members, who must be public employees and beneficiaries. Benefits are based onyears of credited service, equal to one year of full time employment. Members with five years of total serviceare eligible to retire at age 50 with statutorily reduced benefits. All members are eligible for non duty disabilitybenefits after 10 years of service. The death benefit is one of the following: the Basic Death Benefit, Lump Sum,or the 1959 Survivor Benefit. The cost of living adjustments for each plan are applied as specified by the PublicEmployees’ Retirement Law.
72

Dra
ft 12
/04/
2018
TOWN OF LOS GATOS, CALIFORNIANOTES TO BASIC FINANCIAL STATEMENTS
JUNE 30, 2018
NOTE 9 EMPLOYEES' RETIREMENT PLAN, CONTINUED
(a) General Information about the Pension Plan, Continued
The Plan’s provisions and benefits in effect at June 30, 2018, are summarized as follows:
Employees Covered
At June 30, 2017, the following employees were covered by the benefit terms for the Miscellaneous and SafetyPlans:
Miscellaneous SafetyActive 110 36Transferred 96 17Separated 81 1Retired 221 73
Total 508 127
Contributions – Section 20814 (c) of the California Public Employees’ Retirement Law requires that the employercontribution rates for all public employers be determined on an annual basis by the actuary and shall be effectiveon the July 1 following notice of a change in the rate. Funding contributions for both Plans are determinedannually on an actuarial basis as of June 30 by CalPERS. The actuarially determined rate is the estimated amountnecessary to finance the cost of benefits earned by employees during the year, with an additional amount tofinance any unfunded accrued liability. The Town is required to contribute the difference between theactuarially determined rate and the contribution rate of employees.
Tier 1 Tier 2 PEPRA Tier 1 PEPRA
Hire Date
Prior to
September 15,
2012
Prior to
September 15,
2012 and
before January
1, 2013 with
reciprocity or
member of
CalPERS
On or after
January 1, 2013
Before January
1, 2013 with
reciprocity or
member of
CalPERS
On or after
January 1, 2013
Benefit Formula 2.5% @ 55 2% @ 60 2% @ 62 3% @ 50 2.7% @ 57
Benefit vesting schedule 5 years 5 years 5 years 5 years 5 years
Benefit payments Monthly for Life Monthly for Life Monthly for Life Monthly for Life Monthly for Life
Retirement age 55 60 62 62 62
Monthly benefits as a % of eligible compensation 2% to 2.5% 1% to 2.5% 1.5% to 2.5% 3% 2% to 2.7%
Required employee contribution rates 8.00% 7.00% 6.75% 9.00% 12.25%
Required employer contribution rates 21.418% 12.729%
Required payment of unfunded liability 1,700,602$ $936,513 30
Miscellaneous Safety
9.932%
73

Dra
ft 12
/04/
2018
TOWN OF LOS GATOS, CALIFORNIANOTES TO BASIC FINANCIAL STATEMENTS
JUNE 30, 2018
NOTE 9 EMPLOYEES' RETIREMENT PLAN, CONTINUED
(b) Net Pension Liability
The Town’s net pension liability for the Miscellaneous Plan is measured as the total pension liability, less thepension plan's fiduciary net position.
For the Safety Plan, net pension liability is measured as the proportionate share of the net pension liability. Thenet pension liability of each of the Plans is measured as of June 30, 2017, using an annual actuarial valuation asof June 30, 2016 rolled forward to June 30, 2017 using standard update procedures. The Town’s proportion ofthe net pension liability (Safety Plan) was based on a projection of the Town’s long term share of contributionsto the pension plans relative to the projected contributions of all participating employers, actuariallydetermined. The Town’s proportionate share of the net pension liability for the Safety Plan as of themeasurement date June 30, 2017 was as follows:
A summary of principal assumptions and methods used to determine the net pension liability is shown below.
Actuarial Assumptions The total pension liabilities in the June 30, 2016 actuarial valuations were determinedusing the following actuarial assumptions:
Proportionate Share ofNet Pension Liability
Proportion June 30, 2016 0.22394%Proportion June 30, 2017 0.37515%Change Increase (Decrease) 0.15121%
Miscellaneous AgentMultiple Employer Plan Safety Cost Sharing Plan
Valuation Date June 30, 2016 June 30, 2016Measurement Date June 30, 2017 June 30, 2017Actuarial Cost MethodActuarial Assumptions:Discount Rate 7.15% 7.15%Inflation 2.75% 2.75%Salary IncreasesInvestment Rate of Return 7.15% 7.15%Mortality (1)Post Retirement Benefit Increase
Entry Age Normal Cost Method
Varies by Entry Age and Service
Derived using CalPERS' Membership Data for all FundsContract COLA up to 2.75% until Purchasing PowerProtection Allowance Floor on Purchasing Powerapplies, 2.75% thereafter
(1) The morta l i ty table used was developed based on CalPERS speci fic data . The tableincludes 20 years of morta l i ty improvements us ing Society of Actuaries Sca le BB. For moredeta i l s on this table, please refer to the Apri l 2014 CalPERS Exerience Study and Review ofActuaria l Assumptions report ava i lable on the CalPERS webs i te.
74

Dra
ft 12
/04/
2018
TOWN OF LOS GATOS, CALIFORNIANOTES TO BASIC FINANCIAL STATEMENTS
JUNE 30, 2018
NOTE 9 EMPLOYEES' RETIREMENT PLAN, CONTINUED
(b) Net Pension Liability, continued
The underlying mortality assumptions and all other actuarial assumptions used in the June 30, 2015valuation were based on the results of a January 2014 actuarial experience study for the period 1997 to 2011.Further details of the Experience Study can found on the CalPERS website.
Discount Rate The discount rate used to measure the total pension liability was 7.15% for the Plan and reflectsthe long term expected rate for the Plan net of investment expenses and without reduction for administrativeexpenses. To determine whether the municipal bond rate should be used in the calculation of a discount ratefor each plan, CalPERS conducted cash flow projections for plans with a higher likelihood of running out ofassets with too high of a discount rate. Based on the testing, none of the tested plans ran out of assets.Therefore, the current 7.15 percent discount rate is adequate and the use of the municipal bond ratecalculation is not necessary. The long term expected discount rate of 7.15 percent will be applied to all plansin the Public Employees Retirement Fund (PERF). The stress test results are presented in a detailed reportthat can be obtained from the CalPERS website.
In determining the long term expected rate of return, CalPERS took into account both short term and long termmarket return expectations as well as the expected pension fund cash flows. Using historical returns of all thefunds’ asset classes, expected compound returns were calculated over the short term (first 10 years) and thelong term (11+ years) using a building block approach. Using the expected nominal returns for both short termand long term, the present value of benefits was calculated for each fund. The expected rate of return wasset by calculating the single equivalent expected return that arrived at the same present value of benefits forcash flows as the one calculated using both short term and long term returns. The expected rate of returnwas then set equivalent to the single equivalent rate calculated above and adjusted to account for administrativeexpenses.
The table below reflects the long term expected real rate of return by asset class. The rate of return wascalculated using the capital market assumptions applied to determine the discount rate and asset allocation.
NewStrategic Real Return Real Return
Asset Class Allocation Years 1 10(a) Years 11+(b)
Global Equity 47.00% 4.90% 5.38%Global Fixed Income 19.00% 0.80% 2.27%Inflation Sensitive 6.00% 0.60% 1.39%Private Equity 12.00% 6.60% 6.63%Real Estate 11.00% 2.80% 5.21%Infrastructure and Forestland 3.00% 3.90% 5.36%Liquidity 2.00% 0.40% 0.90%
Total 100%
(a) An expected inflation of 2.5% used for this period.(b) An expected inflation of 3.0% used for this period.
75

Dra
ft 12
/04/
2018
TOWN OF LOS GATOS, CALIFORNIANOTES TO BASIC FINANCIAL STATEMENTS
JUNE 30, 2018
NOTE 9 EMPLOYEES' RETIREMENT PLAN, CONTINUED
(c) Changes in the Net Pension Liability
The change in the Net Pension Liability for the Miscellaneous Plan follows:
For the measurement period ended June 30, 2017, the Town contributed $1,786,150 for the safety Cost SharingPlan.
As of June 30, 2018, the Town reported net pension liabilities for its proportionate share of the net pensionliability of the safety Cost Sharing Plan of $22,415,954.
Sensitivity of the Net Pension Liability to Changes in the Discount Rate The following presents the netpension liability of the Town for each plan, calculated using the discount rate for the Plan, as well as whatthe Local Government’s net pension liability would be if it were calculated using a discount rate that is 1percentage point lower or 1 percentage point higher than the current rate:
Miscel laneous Plan Total Fiduciary NetPension Net Pens ionLiabi l i ty Pens ion Liabi l i ty
Beginning Balance 92,546,421$ 64,652,531$ 27,893,890$
Service Costs 1,651,550 1,651,550Interest on Tota l Pens ion Liabi l i ty 6,820,536 6,820,536Changes of Assumptions 5,481,432 5,481,432Difference Between Actua l and Expected Experience (892,479) (892,479)Net Plan to Plan Resource MovementEmployer Contributions 2,407,496 (2,407,496)Employee Contributions 682,891 (682,891)Net Investment Income 7,171,443 (7,171,443)Employee Contribution Refunds and Benefi t Payments (5,138,083) (5,138,083)Adminis trative Expenses (95,455) 95,455Other Miscel laneous Income
Net Changes 7,922,956 5,028,292 2,894,664
Ending Balance 100,469,377$ 69,680,823$ 30,788,554$
7

Dra
ft 12
/04/
2018
TOWN OF LOS GATOS, CALIFORNIANOTES TO BASIC FINANCIAL STATEMENTS
JUNE 30, 2018
NOTE 9 EMPLOYEES' RETIREMENT PLAN, CONTINUED
(c) Changes in the Net Pension Liability, Continued
Sensitivity to Changesin the Discount Rate
MiscellaneousAgent MultipleEmployer Plan
Safety CostSharing Plan Total
1% Decrease (6.15%)Net Pension Liability $ 43,929,077 $ 34,416,889 $ 78,345,966
Current Discount Rate (7.15%)Net Pension Liability $ 30,788,554 $ 22,415,954 $ 53,204,508
1% Increase (8.15%)Net Pension Liability $ 19,959,680 $ 12,605,789 32,565,469$
Pension Plan Fiduciary Net Position – Detailed information about the pension plan’s fiduciary net position isavailable in a separately issued CalPERS financial report.
(d) Pension Expenses and Deferred Outflows/Inflows of Resources Related to Pensions
For the year ended June 30, 2018, the Town recognized pension expense of $5,112,099 for the MiscellaneousAgent Multiple Employer Plan and $2,710,876 for the Safety Cost Sharing Plan. The Town recognized totalpension expense for all plans of $7,822,975.
At June 30, 2018, the Town reported deferred outflows of resources and deferred inflows of resources relatedto pension from the following sources for the Miscellaneous Agent Multiple Employer Plan:
DeferredOutflows ofResources
Deferred Inflowsof Resources
Pension contributions subsequent tomeasurement date 2,669,133$ $
Changes in assumptions 2,989,872Difference between expected and actual experiences (519,342)Net differences between projected and actual
earnings on plan investments 929,473
Totals 6,588,478$ (519,342)$
Miscellaneous
77

Dra
ft 12
/04/
2018
TOWN OF LOS GATOS, CALIFORNIANOTES TO BASIC FINANCIAL STATEMENTS
JUNE 30, 2018
NOTE 9 EMPLOYEES' RETIREMENT PLAN, CONTINUED
(d) Pension Expenses and Deferred Outflows/Inflows of Resources Related to Pensions, Continued
$2,669,133 reported as deferred outflows of resources related to contributions subsequent to themeasurementdatewill be recognized as a reduction of the net pension liability in the year ended June 30, 2019. Other amountsreported as deferred outflows of resources and deferred inflows of resources related to pensions will berecognized as pension expense as follows:
Fiscal Year Ended June30,
DeferredOutflows/(Inflows)
of Resources2019 1,999,069$2020 1,529,2352021 398,0402022 (526,340)
Thereafter
At June 30, 2018, the Town reported deferred outflows of resources and deferred inflows of resources relatedto pensions from the following sources for the Safety Cost Sharing Plan:
DeferredOutflows ofResureces
DeferredInflows ofResources
Pension contributions subsequent tomeasurement date 1,951,711$ $
Changes in assumptions 3,632,700 (278,710)Difference between expected and actual experiences 250,488 (65,309)Changes in employer's proportion 2,226,559 (2,240,707)Differences between the employer's contributions and
the employer's proportionate share of contributio 799,852 (518,851)Net differences between projected and actual
earnings on plan investments 792,071
Totals 9,653,381$ (3,103,576)$
Safety
78

Dra
ft 12
/04/
2018
TOWN OF LOS GATOS, CALIFORNIANOTES TO BASIC FINANCIAL STATEMENTS
JUNE 30, 2018
NOTE 9 EMPLOYEES' RETIREMENT PLAN, CONTINUED
(d) Pension Expenses and Deferred Outflows/Inflows of Resources Related to Pensions, Continued
$1,951,711 reported as deferred outflows of resources related to contributions subsequent to themeasurementdate will be recognized as a reduction of the net pension liability in the year end June 30, 2019. Other amountsreported as deferred outflows of resources and deferred inflows of resources related to pensions will berecognized as pension expense as follows:
Fiscal Year EndedJune 30,
DeferredOutflows/(Inflows)
of Resources2019 1,016,264$2020 2,330,3802021 1,448,0632022 (463,469)
Thereafter
(e) Payable to the Pension Plan
At June 30, 2018, the Town reported a payable of $83,235 and $54,145 for the outstanding amount ofcontributions to the Miscellaneous Agent Multiple Employer Plan and the Safety Cost Sharing Plan for the yearended June 30, 2018.
(f) IRS Section 115 Trust
In March, 2018 the Town established an IRS Section 115 Trust (Trust) with Public Agencies Retirement Services(PARS), an entity independent of CalPERS, in order to prefund the pension liabilities for both the Miscellaneousand Safety defined benefit pension plans. The Town contributed $1,200,000 to the Trust for the fiscal yearending June 2018 which is not reflected in any of the deferral amounts in the tables above as it is separate fromthe plans.
NOTE 10 OTHER POSTEMPLOYMENT BENEFITS
Plan Description The Town makes contributions to California Employer’s Retiree Benefit Trust (CERBT), anagent multiple employer defined benefit healthcare plan administered by CalPERS. The purpose of the CERBTFund is to provide California government employers with a trust throughwhich theymay prefund retireemedicalcosts and Other Post Employment Benefits (OPEB). The Town uses CERBT as its investment vehicle and requestsdisbursements on an as needed basis to reimburse the Town for the cost of retiree health insurance benefits.Benefit provisions and all other requirements are established by state statute and Town ordinance. Copies ofPERS' annual financial report may be obtained from their Executive Office, 400 P Street, Sacramento, CA 95814.
79

Dra
ft 12
/04/
2018
TOWN OF LOS GATOS, CALIFORNIANOTES TO BASIC FINANCIAL STATEMENTS
JUNE 30, 2018
NOTE 10 OTHER POSTEMPLOYMENT BENEFITS, CONTINUED
In accordancewith the Public Employees'Medical and Hospital Care Act (PEMHCA), employees qualify for retireehealth benefits upon five (5) years of service if they meet the vesting requirements as set forth by Cal PERS andtake a service or disability retirement from Town employment. Additionally, the employee must actually draw aCalPERS pension within ninety (90) days of separation from the Town, provided the employee remains with theTown's health plan through COBRA. For employees who retire on or after February 1, 2016, at Medicareeligibility, the Town will align contributions to the full cost of the employee’s enrollment, including enrollmentof familymembers, in a health benefits plan or plans up to amaximum of 100% Single Party and 90%Dependentsfor Kaiser Bay Area Basic/Medicare/Combo per month.
Upon retirement, employees have the option to roll over their sick leave accrual into a Town managed fund.Employees can request reimbursement of medical expenses from the fund up to the value of their sick leave atretirement.
Contributions The contribution requirements of plan members and the Town are established and may beamended by the Town. The required contribution is based on projected pay as you go financing requirements,with an additional amount to prefund benefits as determined by the Town. For the measurement period July 1,2016 June 30, 2017, the Town contributed $3,878,000 to the plan which included $1,040,000 of cash benefitpayments, administrative fees of $9,000, and $229,000 of implied subsidy benefit payments. All relatedobligations are paid from the Town’s General Fund.
Covered Participants
Actuarial Methods and Assumptions Projections of benefits for financial reporting purposes are based on thesubstantive plan (the plan as understood by the employer and the plan members) and include the types ofbenefits provided at the time of each valuation and the historical pattern of sharing of benefit costs betweenthe employer and plan members to that point. Actuarially determined amounts are subject to continual revisionas actual results are compared with past expectations and new estimates are made about the future. Theactuarial methods and assumptions used include techniques that are designed to reduce the effects of shortterm volatility in actuarial accrued liabilities and the actuarial value of assets, consistent with the long termperspective of the calculations.
Inactive employees or beneficiariescurrently receiving benefi ts 122
Inactive employees enti tled to butnot yet receiving benefi ts 50
Active employees 148
Total 320
80

Dra
ft 12
/04/
2018
TOWN OF LOS GATOS, CALIFORNIANOTES TO BASIC FINANCIAL STATEMENTS
JUNE 30, 2018
NOTE 10 OTHER POSTEMPLOYMENT BENEFITS, CONTINUED
For the June 30, 2017 actuarial valuation, the actuarial assumptions used are as follows:
Valuation Date June 30, 2017Measurement Date June 30, 2017Actuaria l Cost Method Entry Age Normal Cost MethodActuaria l Assumptions :Discount Rate 6.75%Inflation 2.75%Contribution Pol icy Pre funded through CERBT with the Strategy 1 asset a l locationSa lary Increases Varies by Entry Age and ServiceProjected Salary Increase 3.00%Investment Rate of Return 6.75%Morta l i ty, Reti rement,Diabi l i ty, Termination
CalPERS 1997 2015 Experience Study
Morta l i ty Improvement Post reti rement morta l i ty projected ful ly generational withSca le MP 2017
Healthcare Trend Non Medicare 7.5% for 2019, decreas ing to an ultimate rate of4.0% in 2076 and later years
Medicare 6.5% for 2019, decreas ing to an ultimate rate of 4.0%in 2076 and later years
Participation at Reti rement Actives in insurance program: 100%Actives in cash al location program: 90%Waived reti rees aged <65: 20%Waived reti rees aged 65: 0%Reti rees with s ickleave convers ion accounts wi l l continue toparticipate after account exhausted
81

Dra
ft 12
/04/
2018
TOWN OF LOS GATOS, CALIFORNIANOTES TO BASIC FINANCIAL STATEMENTS
JUNE 30, 2018
NOTE 10 OTHER POSTEMPLOYMENT BENEFITS, CONTINUED
The long term expected rate of return on OPEB plan investments was determined using a building blockmethodin which expected future real rates of return (expected returns, net of OPEB plan investment expense andinflation) are developed for each major asset class. These ranges are combined to produce the long termexpected rate of return by weighting the expected future real rates of return by the target asset allocationpercentage and by adding expected inflation. The target allocation and best estimates of arithmetic real rates ofreturn for each major asset class are summarized in the following table:
Discount Rate The discount rate used to measure the total OPEB liability was 6.75 percent. The projection ofcash flows used to determine the discount rate assumed that City contributions will be made at rates equal tothe actuarially determined contribution rates. Based on those assumptions, the OPEB plan’s fiduciary netposition was projected to be available to make all projected OPEB payments for current active and inactiveemployees and beneficiaries. Therefore, the long term expected rate of return on OPEB plan investments wasapplied to all periods of projected benefit payments to determine the total OPEB liability.
Target Expected RealAsset Class Al location* Rate of Return
Publ ic Equity 57.00% 4.82%Fixed Income 27.00% 1.47%TIPS 5.00% 1.29%Commodities 3.00% 0.84%REITS 8.00% 3.76%
Assumed Long Term Rate of Inflation 2.75%Assumed Long Term Investment Expenses n/aExpected Long Term Net Rate of Return, Rounded 6.75%
Discount Rate** 6.75%
*Provided by CalPERS' Strategic Asset A llocation Analysis Overview in August 2014 – Strategy 1.
**The fiduciary net position is pro jected to be sufficient to make pro jected benefit payments, and
the plan assets are expected to be invested using the strategy to achieve the expected return.
82

Dra
ft 12
/04/
2018
TOWN OF LOS GATOS, CALIFORNIANOTES TO BASIC FINANCIAL STATEMENTS
JUNE 30, 2018
NOTE 10 OTHER POSTEMPLOYMENT BENEFITS, CONTINUED
Net OPEB Liability – The net OPEB liability is calculated by subtracting the fiduciary net position (FNP) of thePlan from the total OPEB liability as determined by the actuary. The table that follows displays the changes thatapplied to the total OPEB liability, FNP, and Net OPEB liability during the measurement period of July 1, 2016through June 30, 2017.
Due to these changes, the Town achieved an OPEB Plan funding status of 54.9% for the June 30, 2017measurement date.
Tota l OPEB Plan Fiduciary Net OPEBLiabi l i ty Net Pos i tion Liabi l i ty/(Asset)
Balance at June 30, 2017(6/30/16 measurement date) $ 23,301,000 $ 9,964,000 $ 13,337,000
Changes in the year:Service cost 1,134,000 1,134,000Interest on the total pens ion l iabi l i ty 1,607,000 1,607,000Differences between actua l andexpected experienceChanges in assumptionsChanges in benefi t termsContributions employer 3,878,000 (3,878,000)Contributions employeeNet investment income 1,049,000 (1,049,000)Adminis trative expenses (14,000) 14,000Benefi t payments , including refundsof employee contributions (1,269,000) (1,269,000)
Net changes 1,472,000 3,644,000 (2,172,000)
Balance at June 30, 2017(6/30/17 measurement date) $ 24,773,000 $ 13,608,000 $ 11,165,000
Increase (Decrease)
6/30/2018 6/30/2017Measurement Date 6/30/2017 6/30/2016Total OPEB Liabi l i ty (TOL) 24,773,000 23,301,000Fiduciary Net Pos i tion* (FNP) 13,608,000 9,964,000Net OPEB Liabi l i ty (NOL) 11,165,000 13,337,000Funded Status (FNP/TOL) 54.9% 42.8%
* Changes in Plan Fiduciary Net Position are from CalPERS' auditedCERBT "Schedule of Changes in Fiduciary Net Position by Employer"for the Fiscal Year Ended June 30, 2017.
Fisca l Year Ending
83

Dra
ft 12
/04/
2018
TOWN OF LOS GATOS, CALIFORNIANOTES TO BASIC FINANCIAL STATEMENTS
JUNE 30, 2018
NOTE 10 OTHER POSTEMPLOYMENT BENEFITS, CONTINUED
Sensitivity of Actuarial Assumptions – The following tables indicate how much the net OPEB liability varies ifthe discount rate and healthcare trend rate used to calculate the liability are increased or decreased by onepercentage point.
Discount Rate 1% Decrease Current Rate 1% Increase(5.75%) (6.75%) (7.75%)
Net OPEB Liability $ 14,395,000 11,165,000$ 8,500,000$
Healthcare Trend1% Decrease Current Trend 1% Increase
Net OPEB Liability $ 8,871,000 11,165,000$ 13,584,000$
OPEB Expense and Deferred Outflows/Inflows of Resources Related to OPEB Gains and losses related tochanges in total OPEB liability and fiduciary net position are recognized in OPEB expense systematically overtime. Partial amounts are first recognized in OPEB expense for the year the gain or loss occurs. The remainingamounts are categorized as deferred outflows and deferred inflows of resources related to OPEB and are to berecognized in future OPEB expense. The recognition period differs depending on the source of the gain or loss.The measurement period July 1, 2016 through June 30, 2017 gains and losses are spread evenly over a 5 yearperiod. The total OPEB expense recognized in the fiscal year ending June 30, 2018 was $2,007,000 and the Townreported deferrals from the following sources:
DeferredOutflows ofResources
DeferredInflows ofResources
Employer contribu ons made subsequent tothe measurement date 2,935,313$ $Di erence between expected and actual experie (301,000)
Totals 2,935,313$ (301,000)$
OPEB
84

Dra
ft 12
/04/
2018
TOWN OF LOS GATOS, CALIFORNIANOTES TO BASIC FINANCIAL STATEMENTS
JUNE 30, 2018
NOTE 10 OTHER POSTEMPLOYMENT BENEFITS, CONTINUED
The $2,935,313 reported as deferred outflows of resources related to contributions subsequent to the June 30,2017 measurement date will be recognized as a reduction of the net OPEB liability during the fiscal year endingJune 30, 2019. Other amounts reported as deferred outflows of resources related to OPEB will be recognized asexpense as follows:
Fiscal Year Ended June30,
DeferredOutflows/(Inflows)
of Resources2019 (75,000)$2020 (75,000)2021 (75,000)2022 (76,000)
Thereafter
NOTE 11 RISK MANAGEMENT
The Town participates in the following public entity risk pools through formally organized and separate legalentities. The Town does not have an equity interest in the joint ventures. These entities exercise full powers andauthorities within the scope of the related agreements including the preparation of annual budgets,accountability for all funds, the power to make and execute contracts and the right to sue and be sued.Obligations and liabilities of the separate entities are not those of the Town, although the Town retains anongoing financial interest or an ongoing financial responsibility.
Pooled Liability Assurance Network Joint Powers Authority (PLAN JPA) The Town participates in PLAN, whichcovers general liability claims in the amount up to $5,000,000 plus $15,000,000 in excess liability for totalcoverage of $20,000,000 per occurrence. The Town has a deductible or uninsured liability of up to $50,000 perclaim. PLAN also provides all risk property coverage of $100,000,000, excluding flood and earthquake coverage.The Town has a $5,000 deductible for property damage and a $10,000 deductible for vehicle damage. Once theTown’s deductible is met, PLAN becomes responsible for payment of all claims up to the limit. Financialstatements may be obtained from PLAN at 375 Beale Street, San Francisco, CA 94105.
Local Agency Workers’ Compensation Joint Powers Authority (LAWCX) The Town is a member of LAWCX forcoverage of workers’ compensation claims. The Town has a $250,000 self insured retention level or uninsuredliability for all employees. Once the Town’s deductible is met, LAWCX becomes responsible for claims up to$1,000,000. For claims greater than $1,000,000, LAWCX has a commercial policy providing coverage. Financialstatements may be obtained from LAWCX at 1750 Creekside Oaks Dr., Suite 200, Sacramento, California, 95833.The Town has not significantly reduced its insurance coverage from the prior year and settlements have notexceeded insurance coverage for the past three years.
Liability for Uninsured Claims The Town is required to record its liability for uninsured claims and to reflect thecurrent portion of this liability as an expenditure in its financial statements. As discussed above, the Town hascoverage for such claims, but it has retained the risk for the deductibles, or uninsured portion of these claims.
85

Dra
ft 12
/04/
2018
TOWN OF LOS GATOS, CALIFORNIANOTES TO BASIC FINANCIAL STATEMENTS
JUNE 30, 2018
NOTE 11 RISK MANAGEMENT, CONTINUED
The change in Workers’ Compensation and Self Insurance Service Funds’ claims liabilities, is based on historicaltrend information provided by its third party administrator and was computed as follows as of June 30, 2018:
Workers' SelfCompensation Insurance
Internal InternalService Fund Service Fund Total
Claims payable balance June 30, 2016 1,034,066$ 119,472$ 1,153,538$Claims incurred 716,153 229,151 945,304Claims paid (650,483) (99,967) (750,450)Claims payable balance June 30, 2017 1,099,736 248,656 1,348,392Claims incurred 1,028,359 105,000 1,133,359Claims paid (655,770) (221,913) (877,683)Claims payable balance June 30, 2018 1,472,324$ 131,743$ 1,604,067$
NOTE 12 REDEVELOPMENT AGENCY DISSOLUTION
On December 29, 2011, the California Supreme Court upheld Assembly Bill 1X 26 (“the Bill”) that provides forthe dissolution of all redevelopment agencies in the State of California. This action impacted the reporting entityof the Town that previously had reported a redevelopment agency as a blended component unit.
In accordance with the timeline set forth in the Bill (as modified by the California Supreme Court on December29, 2011) all redevelopment agencies in the State of California were dissolved and ceased to operate as a legalentity as of February 1, 2012.
In future fiscal years, successor agencies will only be allocated revenue in the amount that is necessary to paythe estimated annual installment payments on enforceable obligations of the former redevelopment agencyuntil all enforceable obligations of the prior redevelopment agency have been paid in full and all assets havebeen liquidated.
86

Dra
ft 12
/04/
2018
TOWN OF LOS GATOS, CALIFORNIANOTES TO BASIC FINANCIAL STATEMENTS
JUNE 30, 2018
NOTE 13 COMMITMENTS AND CONTINGENCIES
Federal and State Grants The Town participates in several federal and state grant programs. These are subjectto examination by grantors and the amount, if any, of disallowed expenditures cannot be determined at thistime. The Town expects such amounts, if any, to be immaterial.
Litigation The Town is subject to litigation arising from the normal course of business. The Town Attorneybelieves there is no pending litigation which is likely to have a material adverse effect on the financial positionof the Town.
Successor Agency As of June 30, 2018, the Successor Agency trust fund reported a net deficit of $7,333,783.
Encumbrances As of June 30, 2018, the town had the following encumbered balances that were carried intothe next fiscal year:
NOTE 14 TOWN/SUCCESSOR AGENCY GRANTS, COOPERATIVE AGREEMENTS
Public Improvement Grants and Cooperative Agreements
In January of 2011, the Redevelopment Agency entered into a public improvement grant and cooperativeagreement with the Town for the purpose of funding the acquisition of public land and designing andconstructing various public improvements to be owned by the Town provided that the projects were inaccordance with the Redevelopment Agency’s five year implementation plan and redevelopment plan.
The improvement plan, as identified in the agreement, called for approximately $24 million to be granted to theTown for the following projects:
a. Expansion and improvement of current and new downtown parkingb. Highway 9 improvements from Highway 17 to Monte Serenoc. Almond Grove Area street, sidewalk and other improvementsd. Downtown Los Gatos gateways, signage, banners and arte. Storm drain, retaining wall, street and other improvementsf. New Los Gatos library building
During the fiscal year ended June 30, 2012, the rights and obligations resulting from this cooperative agreementwere transferred to the Successor Agency Trust Fund as a part of the Town’s dissolution of its RedevelopmentAgency.
General Fund 99,927$Appropriated Reserves Fund 4,411,598Non major Governmental Funds 371,367
Total Encumbrances 4,882,892$
87

Dra
ft 12
/04/
2018
TOWN OF LOS GATOS, CALIFORNIANOTES TO BASIC FINANCIAL STATEMENTS
JUNE 30, 2018
NOTE 14 TOWN/SUCCESSOR AGENCY GRANTS, COOPERATIVE AGREEMENTS, CONTINUED
Affordable Housing Cooperative Agreement
In March of 2011, the Redevelopment Agency entered into an affordable housing cooperative agreement withthe Town for the purpose of funding affordable housing projects and programs to be developed and/oradministered by the Town in accordance with the Redevelopment Agency’s five year implementation plan andredevelopment plan. The improvement plan, as identified in the agreement, called for approximately $16million to be granted to the Town for the following projects:
a. Development of affordable housing at 224 Main St.b. Development of affordable housing at Dittos Lanec. Partnership with Senior Housing Solutions for the creation of senior housing in Los Gatosd. Partnerships for the conversion of existing residential developments dedicated to affordable housinge. Grants to the Santa Clara County Housing Trust for the development of affordable housing.
During the fiscal year ended June 30, 2012, the rights and obligations resulting from this cooperative agreementwere transferred to the Successor Agency Trust Fund as a part of the Town’s dissolution of its RedevelopmentAgency.
NOTE 15 SUBSEQUENT EVENT CALIFORNIA PUBLIC EMPLOYEES RETIREMENT SYSTEM LOWERS DISCOUNTRATE
In an effort to enhance the long terms fiscal sustainability of its pension plans state wide, the California PublicEmployees' Retirement System (CalPERS) Board of Administration voted on December 21, 2016 to lower thediscount rate from 7.5 percent to 7.0 percent over the next three years. The discount rate changes are to beimplemented over three fiscal years in the following step reductions:
FY 2017 2018: 7.375% FY 2018 2019: 7.25% FY 2019 2020: 7.00%
Lowering the discount rate, also known as the assumed rate of return, is expected to result in increased employerrequired contributions for Town’s miscellaneous and safety plans for normal costs and the payment related foramortization of the Town’s unfunded actuarial liabilities. Active members hired after January 1, 2013, under thePublic Employees' Pension Reform Act will also see their contribution rates rise. Normal cost is the cost ofpension benefits for one year.
The three year reduction of the discount rate will result in average employer rate increases of about 1 percentto 3 percent of normal cost as a percent of payroll for most miscellaneous retirement plans, and a 2 percent to5 percent increase for most safety plans. Additionally, CalPERS reported that the Town can expect a 30 to 40percent increase in their current unfunded accrued liability payments.
88

Dra
ft 12
/04/
2018
TOWN OF LOS GATOS, CALIFORNIANOTES TO BASIC FINANCIAL STATEMENTS
JUNE 30, 2018
NOTE 15 SUBSEQUENT EVENT CALIFORNIA PUBLIC EMPLOYEES RETIREMENT SYSTEM LOWERS DISCOUNTRATE, CONTINUED
No actuarial valuations or future employer contribution rates are available from CALPERS at this time. The Townestimates the potential financial impact beginning in fiscal year 2018/19 is that barring unanticipated assetvaluation gains, the annual Town employer pension contributions may rise above current five year forecastprojections in a range from $355,000 to $950,000 per year based upon the CALPERS press release projections.
NOTE 16 – PRIOR PERIOD ADJUSTMENTS
The Town recorded prior period adjustments to adjust the net OPEB obligation, net OPEB liability, OPEBdeferred contributions and other miscellaneous adjustments as follow:
Government wide Statements
Fund Financial Statements
Fund Balanceas PreviouslyReported Other
Fund Balanceas Restated
Government FundsGeneral Fund $ 29,180,624 $ 59,829 $ 29,240,453
Net Position,as PreviouslyReported
Net OPEBObligation
Net OPEBLiability
OPEB DeferredContribution Other
Net Position asRestated
Government Wide StatementsGovernmental Activities 117,027,779$ 897,601$ (13,337,000)$ 3,878,000$ 59,829$ 108,526,209$
Prior Period Adjustment
89

Dra
ft 12
/04/
2018
This page intentionally left blank
90

Dra
ft 12
/04/
2018
Required Supplementary Information
91

Dra
ft 12
/04/
2018
TOWN OF LOS GATOS, CALIFORNIA
COMPREHENSIVE ANNUAL FINANCIAL REPORTFOR THE FISCAL YEAR ENDED JUNE 30, 2018
Schedule of Proportionate Share of Net Pension Liability – CalPERS Misc. Agent Multiple Employer Plan
Measurement Date 6/30/2017 6/30/2016 6/30/2015 6/30/2014
Total Pension LiablityService Cost 1,651,550$ 1,560,679$ 1,491,925$ 1,579,547$Interest on total pension liability 6,820,536 6,697,247 6,483,032 6,268,015Difference between expected and actualexperience (892,479) (357,870) (623,495)Changes in assumptions 5,481,432 (1,513,132)Changes in benefitsBenefit payments, including refunds of employeecontributions (5,138,083) (4,953,756) (4,748,786) (4,241,487)Net change in total pension liability 7,922,956 2,946,300 1,089,544 3,606,075Total pension liability beginning 92,546,421 89,600,121 88,510,577 84,904,502Total pension liability ending (a) 100,469,377$ 92,546,421$ 89,600,121$ 88,510,577$
Plan fiduciary net positionContributions employer 2,407,496 2,223,782 1,941,765 1,796,079Contributions employee 682,891 691,770 679,796 668,167Plan to plan resource movement (28,866) 22,561Projected Earnings on Plan Investments 4,328,173Recognized Difference between Projected and ActualEarning 1,166,344Net Investment Income 7,171,443 369,185 1,470,873Net Difference between Projected and Actual Earnings 4,665,374Benefit payments, including refunds of employeecontribution (5,138,083) (4,953,756) (4,748,786) (4,241,487)Administrative Expenses (95,455) (40,462) (74,706)Net change in plan fiduciary net position 5,028,292 (1,738,347) (708,497) 8,382,650Plan fiduciary net position beginning 64,652,531 66,390,878 67,099,375 58,716,725Plan fiduciary net position ending (b) 69,680,823$ 64,652,531$ 66,390,878$ 67,099,375$
Net pension liability ending (a) (b) 30,788,554$ 27,893,890$ 23,209,243$ 21,411,202$
Plan fiduciary net position as a percentage of thetotal pension liability 69.36% 69.86% 74.10% 75.81%
Covered payroll 9,190,767 9,198,318 8,487,940 8,406,315
Net pension liability as a percentage of covered payroll 334.99% 303.25% 273.44% 254.70%
Notes to Schedule:Benefit changes: The figures above do not include any liability impact that may have resulted from plan changes which occurredafter June 30, 2016. This applies for voluntary benefit changes as well as any offers of Two Years Additional Service Credit.Changes in assumptions: For 2015, the discount rate was changed from 7.5% (net of administrative expense) to 7.65%. In 2017 thediscount rate changed from 7.65% to 7.15%.
*Fiscal year 2015 was the 1st year of implementation, therefore only four years are shown.
92
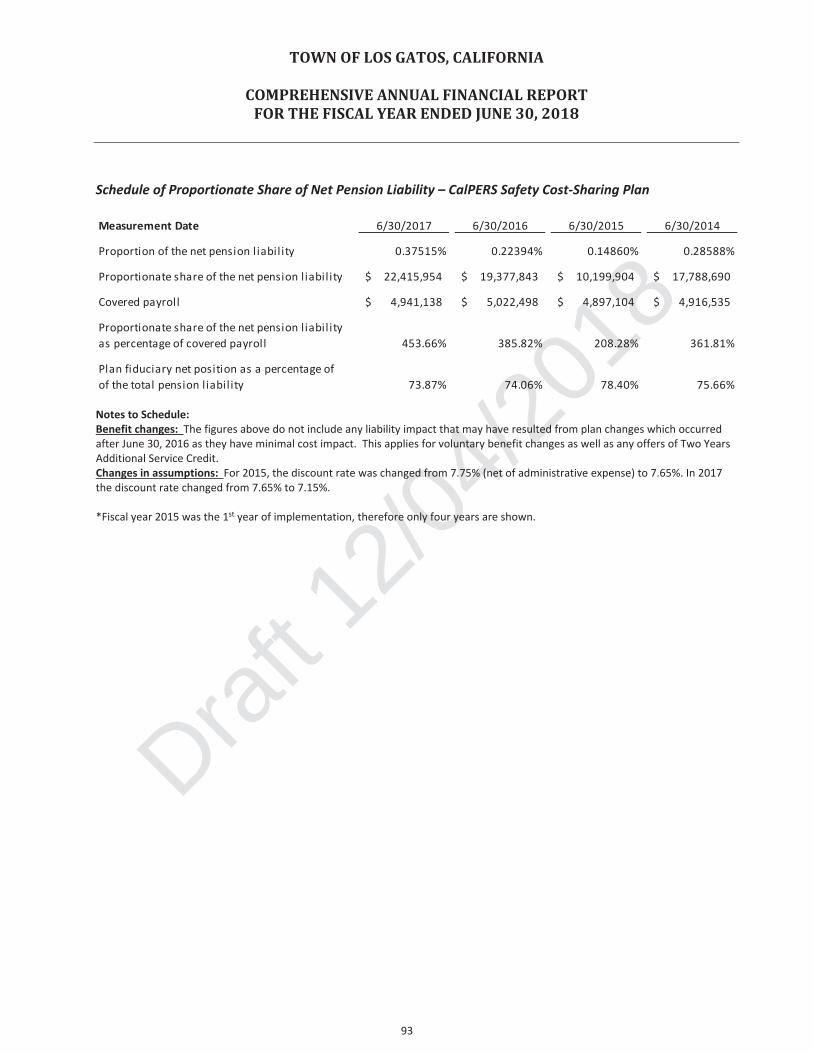
Dra
ft 12
/04/
2018
TOWN OF LOS GATOS, CALIFORNIA
COMPREHENSIVE ANNUAL FINANCIAL REPORTFOR THE FISCAL YEAR ENDED JUNE 30, 2018
Schedule of Proportionate Share of Net Pension Liability – CalPERS Safety Cost Sharing Plan
Notes to Schedule:Benefit changes: The figures above do not include any liability impact that may have resulted from plan changes which occurredafter June 30, 2016 as they have minimal cost impact. This applies for voluntary benefit changes as well as any offers of Two YearsAdditional Service Credit.Changes in assumptions: For 2015, the discount rate was changed from 7.75% (net of administrative expense) to 7.65%. In 2017the discount rate changed from 7.65% to 7.15%.
*Fiscal year 2015 was the 1st year of implementation, therefore only four years are shown.
Measurement Date 6/30/2017 6/30/2016 6/30/2015 6/30/2014
Proportion of the net pension liabil ity 0.37515% 0.22394% 0.14860% 0.28588%
Proportionate share of the net pension liabil ity 22,415,954$ 19,377,843$ 10,199,904$ 17,788,690$
Covered payroll 4,941,138$ 5,022,498$ 4,897,104$ 4,916,535$
Proportionate share of the net pension liabil ityas percentage of covered payroll 453.66% 385.82% 208.28% 361.81%
Plan fiduciary net position as a percentage ofof the total pension liability 73.87% 74.06% 78.40% 75.66%
93

Dra
ft 12
/04/
2018
TOWN OF LOS GATOS, CALIFORNIA
COMPREHENSIVE ANNUAL FINANCIAL REPORTFOR THE FISCAL YEAR ENDED JUNE 30, 2018
Schedule of Pension Plan Contributions – Miscellaneous Agent Multiple Employer Plan
Fiscal Year 2018 2017 2016 2015
Actuarially Determined Contribution 2,669,133$ 2,407,496$ 2,223,782$ 1,941,765$Contributions in Relation to the ActuariallyDetermined Contribution (2,669,133) (2,407,496) (2,223,782) (1,941,765)Contribution Deficiency (Excess) $ $ $ $
Covered Payroll 11,269,313 9,190,767 9,198,318 8,487,940
Contributions as a Percentage of CoveredPayroll 23.68% 26.19% 24.18% 22.88%
*Fiscal year 2015 was the 1st year of implementation, therefore only four years are shown.
Schedule of Pension Plan Contributions – Safety Cost Sharing Plan
Fiscal Year 2018 2017 2016 2015
Actuarially Determined Contribution 1,951,711$ 1,738,150$ 1,586,129$ 1,999,757$Contributions in Relation to the ActuariallyDetermined Contribution (1,951,711) (1,738,150) (1,586,129) (1,999,757)Contribution Deficiency (Excess) $ $ $ $
Covered Payroll 3,716,402 4,941,138 5,022,498 4,897,104
Contributions as a Percentage of CoveredPayroll 52.52% 35.18% 31.58% 40.84%
*Fiscal year 2015 was the 1st year of implementation, therefore only four years are shown.
Actuarial Methods and Assumptions used for Pension Actuarially Determined Contributions
Actuaria l Cost Method Entry Age NormalAmortization Method For detai l s , see June 30, 2014 CalPERS Funding Valuation ReportAmortization Period For detai l s , see June 30, 2014 CalPERS Funding Valuation ReportAsset Va luation Method Market Value of Assets . For deta i l s , see June 30, 2014 CalPERS
Funding Valuation ReportInflation 2.75%Salary Increases Varies by Entry Age and ServicePayrol l Growth 3.00%Investment Rate of Return 7.5% Net of Pens ion Plan Investment and Adminis trative
Expenses ; includes Inflation.
Reti rement Age CalPERS 1997 2011 experience studyMorta l i ty CalPERS 1997 2011 experience study
Pre reti rement and post reti rement morta l i ty rates include 20years of projected morta l i ty improvement us ing Scale BBpubl ished by the Society of Actuaries .
94

Dra
ft 12
/04/
2018
TOWN OF LOS GATOS, CALIFORNIA
COMPREHENSIVE ANNUAL FINANCIAL REPORTFOR THE FISCAL YEAR ENDED JUNE 30, 2018
Schedule of Changes in Net OPEB Liability and Related Ratios
Measurement Date 6/30/2017Changes in Total OPEB LiablityService Cost 1,134,000$Interest on net liability 1,607,000Difference between expected and actualexperienceChanges in assumptionsChanges in benefitsBenefit payments (1,269,000)
Net change in total OPEB liability 1,472,000Total OPEB liability beginning 23,301,000Total OPEB liability ending (a) 24,773,000$
Changes in plan fiduciary net positionContributionss employer 3,878,000Contributionss employeeNet Investment Income 1,049,000Benefit payments (1,269,000)Administrative Expenses (14,000)Net change in plan fiduciary net position 3,644,000Plan fiduciary net position beginning 9,964,000Plan fiduciary net position ending (b) 13,608,000$
Net OPEB liability ending (a) (b) 11,165,000$
Plan fiduciary net position as a percentage of the 54.9%total OPEB liability
Covered payroll 14,985,716
Net pension liability as a percentage of covered 74.50%payroll
Schedule of Employer Contributions
Fiscal Year 2018
Actuarially Determined Contribution (ADC) 2,129,000$Actual Contributions 2,935,000Contribution deficiency/(excess) (806,000)Covered employee payroll 14,985,716Contributions as a percentage of covered payroll 19.6%
95

Dra
ft 12
/04/
2018
TOWN OF LOS GATOS, CALIFORNIA
COMPREHENSIVE ANNUAL FINANCIAL REPORTFOR THE FISCAL YEAR ENDED JUNE 30, 2018
Actuarial Methods and Assumptions used for 2017/18 OPEB Actuarially Determined Contribution
Valuation Date June 30, 2015Actuaria l Cost Method Entry Age Normal , Level Percentage of Payrol lAmortization Method Leverl percent of payAmortization Period 21 year fixed period for 2017/18Asset Valuation Method Investment gains and losses spread over 5 year
rol l ing periodDiscount Rate 7.25%General Inflation 3.00%Medical Trend Non medicare 6.5% for 2018, decreas ing to an
ultimate rate of 5.0% in 2021Medicare 6.7% for 2018, decreas ing to anultimate rate of 5.0% in 2021
Morta l i ty CalPERS 1997 2011 experience studyMorta l i ty Improvement Morta l i ty Improvement Scale MP 2014 modified
to converge to ultimate morta l i ty improvementrates in 2022
96

Dra
ft 12
/04/
2018
Supplementary Information
97

Dra
ft 12
/04/
2018
TOWN OF LOS GATOS, CALIFORNIA
COMPREHENSIVE ANNUAL FINANCIAL REPORTFOR THE FISCAL YEAR ENDED JUNE 30, 2017
MAJOR GOVERNMENT FUND SCHEDULES(OTHER THAN THE GENERAL FUND) ANDNONMAJOR GOVERNMENTAL FUNDS
Schedule of Revenue, Expenditures and Changes in Fund Balances – Budget and Actual (GAAP):
Appropriated Reserves Fund is used to account for resources provided for capital projects not fully funded fromother sources.
Capital Projects Funds:
Storm Drain Basin Funds were established to account for fees paid in conjunction with the development inspecified drainage areas.
Construction Tax Funds were established to account for tax levies on building additions or alterations includingcapital improvements, underground utilities and parks.
Gas Tax Fundwas established to account for revenue and expenditures under the State of California Streets andHighways Code Sections 2106, 2107 and 2107.5. The revenues must be used for the maintenance andconstruction of streets.
Special Revenue Funds:
Community Development Block Grant Fund was established to account for grant funds received and expendedunder the Community Development Act of 1974.
Non Point Source Maintenance Fund was established to comply with obligations under the National PollutantDischarge Elimination system permit issued by the California Regional Water Quality Control Board.
Lighting and Landscape Fund was established to account for maintenance of trees, landscaping, irrigationsystems and lighting within the boundaries of Tract No. 8439.
98

Dra
ft 12
/04/
2018
VarianceOriginal Final PositiveBudget Budget Actual (Negative)
REVENUESLicenses & permits 110,000$ 110,000$ 204,391$ 94,391$Intergovernmental 760,663 1,890,723 261,534 (1,629,189)Charges for services 471,429 506,058 424,556 (81,502)Interest 20,000 20,000 31,945 11,945Other 337,519 58,898 (278,621)
Total Revenues 1,362,092 2,864,300 981,324 (1,882,976)
EXPENDITURESCapital outlay 8,397,999 22,173,568 8,894,531 13,279,037
Total Expenditures 8,397,999 22,173,568 8,894,531 13,279,037
EXCESS (DEFICIENCY) OF REVENUESOVER EXPENDITURES (7,035,907) (19,309,268) (7,913,207) 11,396,061
OTHER FINANCING SOURCES (USES)Transfers in 2,482,227 2,718,432 2,638,224 (80,208)Transfers (out) (507,824) (605,824) (525,616) 80,208
Total Other Financing Sources (Uses) 1,974,403 2,112,608 2,112,608
CHANGE IN FUND BALANCE (5,061,504)$ (17,196,660)$ (5,800,599) 11,396,061$
BEGINNING FUND BALANCE 18,102,031
ENDING FUND BALANCE 12,301,432$
BUDGET AND ACTUAL (GAAP)FOR THE FISCAL YEAR ENDED JUNE 30, 2018
TOWN OF LOS GATOSAPPROPRIATED RESERVES FUND
COMBINING SCHEDULE OF REVENUES, EXPENDITURES AND CHANGES IN FUND BALANCE
99

Dra
ft 12
/04/
2018
TotalStorm Construction Gas Capital CommunityDrains Tax Tax Projects DevelopmentFunds Fund Fund Funds Fund
ASSETS
Cash & Investments 2,583,655$ 2,997,984$ 1,364,108$ 6,945,747$ 94,412$
Receivables:Accounts
Intergovernmental Receivable 66,370 66,370 58,344
Long Term Notes Receivable 78,752
Total Assets 2,583,655$ 2,997,984$ 1,430,478$ 7,012,117$ 231,508$
LIABILITIESAccounts Payable 97,657$ $ 727,330$ 824,987$ $
Accrued Payroll and BenefitsDue to other fundsUnearned revenue 64,855
Total Liabilities 97,657 727,330 824,987 64,855
FUND BALANCE
Restricted for:Repairs and Maintenance
Capital Projects 2,485,998 2,997,984 703,148 6,187,130Assigned for:Special Revenue Funds 166,653
Total Fund Balances 2,485,998 2,997,984 703,148 6,187,130 166,653
Total Liabilities and Fund Balances 2,583,655$ 2,997,984$ 1,430,478$ 7,012,117$ 231,508$
$ $ (Continued)
CAPITAL PROJECTS FUNDS
TOWN OF LOS GATOSNONMAJOR GOVERNMENTAL FUNDS
COMBINING BALANCE SHEETSJUNE 30, 2018
100

Dra
ft 12
/04/
2018
TotalNon Point Total NonmajorSource Lighting and Special Revenue Governmental
Maintenance Landscaping Funds Funds
$ 199,462$ 293,874$ 7,239,621$
145,406 145,406 145,406
336 58,680 125,050
78,752 78,752
145,406$ 199,798$ 576,712$ 7,588,829$
1,617$ 1,114$ 2,731$ 827,718$
3,882 3,882 3,88268,569 68,569 68,569
64,855 64,855
74,068 1,114 140,037 965,024
198,684 198,684 198,684
6,187,130
71,338 237,991 237,991
71,338 198,684 436,675 6,623,805
145,406$ 199,798$ 576,712$ 7,588,829$
(Concluded)
SPECIAL REVENUE FUNDS
101

Dra
ft 12
/04/
2018
Storm Construction Gas TotalDrain Tax Tax Capital ProjectsFunds Fund Fund Funds
REVENUESProperty Taxes $ $ $ $Other Taxes 31,838 31,838License and permits 803,770 803,770Intergovernmental 852,300 852,300Charges for ServicesInterest 3,478 37,030 13,307 53,815Other
Total Revenues 807,248 68,868 865,607 1,741,723
EXPENDITURESCurrent:Parks and Public WorksSanitation and OtherCapital Outlay 126,692 749,965 876,657
Total Expenditures 126,692 749,965 876,657
EXCESS (DEFICIENCY) OF REVENUESOVER EXPENDITURES 680,556 68,868 115,642 865,066
OTHER FINANCING SOURCES (USES)Transfers (out) (106,000) (106,000)
Total Other Financing Sources (Uses) (106,000) (106,000)
Changes in Fund Balances 680,556 68,868 9,642 759,066
Fund Balances Beginning of year, as restated 1,805,442 2,929,116 693,506 5,428,064
Fund Balances End of year 2,485,998$ 2,997,984$ 703,148$ 6,187,130$
(Continued)
CAPITAL PROJECTS FUNDS
TOWN OF LOS GATOSNONMAJOR GOVERNMENTAL FUNDS
COMBINING SCHEDULE OF REVENUES, EXPENDITURES, AND CHANGES IN FUND BALANCESFOR THE FISCAL YEAR ENDED JUNE 30, 2018
102

Dra
ft 12
/04/
2018
Community Non Point TotalDevelopment Source Lighting and Special Revenue
Fund Maintenance Landscaping Funds Total
$ $ 34,574$ 34,574$ 34,574$31,838
231,323 231,323 1,035,093903 903 853,203
345,365 345,365 345,3652,416 2,416 56,231
577,591 36,990 614,581 2,356,304
26,159 26,159 26,159521,147 521,147 521,147
6,870 6,870 883,527
521,147 33,029 554,176 1,430,833
56,444 3,961 60,405 925,471
(4,920) (4,920) (110,920)
(4,920) (4,920) (110,920)
56,444 (959) 55,485 814,551
166,653 14,894 199,643 381,190 5,809,254
166,653$ 71,338$ 198,684$ 436,675$ 6,623,805$
(Concluded)
SPECIAL REVENUE FUNDS
103

Dra
ft 12
/04/
2018
Variance VariancePositive Positive
Budget Actual (Negative) Budget Actual (Negative)REVENUES
Property taxes $ $ $ $ $ $
Other taxesLicense and permits 231,323 231,323
Intergovernmental 903 903Charges for services 353,071 345,365 (7,706)
Interest
Total Revenues 584,394 577,591 (6,803)
EXPENDITURESParks and public worksSanitation and other 564,910 521,147 43,763Capital outlay
Total Expenditures 564,910 521,147 43,763
EXCESS (DEFICIENCY) OF REVENUESOVER EXPENDITURES 19,484 56,444 36,960
OTHER FINANCING SOURCES (USES)Operating transfers (out)
Total Other Financing Sources (Uses)
CHANGE IN FUND BALANCE $ $ 19,484$ 56,444 36,960$
BEGINNING FUND BALANCE 166,653 14,894
ENDING FUND BALANCE 166,653$ 71,338$
(Continued)
BLOCK GRANTNON POINT
SOURCE MAINTENANCE
TOWN OF LOS GATOSBUDGETED NONMAJOR FUNDS
COMBINING SCHEDULE OF REVENUES, EXPENDITURES AND CHANGES IN FUND BALANCESBUDGET AND ACTUAL (GAAP)
FOR THE FISCAL YEAR ENDED JUNE 30, 2018
COMMUNITY DEVELOPMENT
104

Dra
ft 12
/04/
2018
Variance Variance VariancePositive Positive Positive
Budget Actual (Negative) Budget Actual (Negative) Budget Actual (Negative)
38,220$ 34,574$ (3,646)$ $ $ $ $ $ $
30,000 31,838 1,83892,500 803,770 711,270
641 2,416 1,775 8,740 3,478 (5,262) 14,280 37,030
38,861 36,990 (1,871) 101,240 807,248 706,008 44,280 68,868 1,838
31,533 26,159 5,374
82,500 6,870 75,630 179,750 126,692 53,058 112,000 112,000
114,033 33,029 81,004 179,750 126,692 53,058 112,000 112,000
(75,172) 3,961 79,133 (78,510) 680,556 759,066 (67,720) 68,868 136,588
(4,920) (4,920)
(4,920) (4,920)
(80,092)$ (959) 79,133$ (78,510)$ 680,556 759,066$ (67,720)$ 68,868 136,588$
199,643 1,805,442 2,929,116
198,684$ 2,485,998$ 2,997,984$
(Continued)
STORM DRAIN FUNDS CONSTRUCTION TAXLIGHTING AND LANDSCAPING
105

Dra
ft 12
/04/
2018
Variance VariancePositive Positive
Budget Actual (Negative) Budget Actual (Negative)REVENUES
Property taxes $ $ $ 38,220$ 34,574$ (3,646)$
Other taxes 30,000 31,838 1,838License and permits 323,823 1,035,093 711,270
Intergovernmental 866,940 852,300 (14,640) 866,940 853,203 (13,737)Charges for services 353,071 345,365 (7,706)
Interest 1,100 13,307 12,207 24,761 56,231 8,720
Total Revenues 868,040 865,607 (2,433) 1,636,815 2,356,304 696,739
EXPENDITURESParks and public works 31,533 26,159 5,374Sanitation and other 564,910 521,147 43,763Capital outlay 1,213,812 749,965 463,847 1,588,062 883,527 704,535
Total Expenditures 1,213,812 749,965 463,847 2,184,505 1,430,833 753,672
EXCESS (DEFICIENCY) OF REVENUESOVER EXPENDITURES (345,772) 115,642 461,414 (547,690) 925,471 1,473,161
OTHER FINANCING SOURCES (USES)Operating transfers (out) (106,000) (106,000) (110,920) (110,920)
Total Other Financing Sources (Uses) (106,000) (106,000) (110,920) (110,920)
CHANGE IN FUND BALANCE (451,772)$ 9,642 461,414$ (658,610)$ 814,551 1,473,161$
BEGINNING FUND BALANCE 693,506 5,809,254
ENDING FUND BALANCE 703,148$ 6,623,805$
FOR THE FISCAL YEAR ENDED JUNE 30, 2018
TOWN OF LOS GATOSBUDGETED NONMAJOR FUNDS
COMBINING SCHEDULE OF REVENUES, EXPENDITURES AND CHANGES IN FUND BALANCESBUDGET AND ACTUAL (GAAP)
TOTALS
(Concluded)
GAS TAX
106

Dra
ft 12
/04/
2018
TOWN OF LOS GATOS, CALIFORNIA
COMPREHENSIVE ANNUAL FINANCIAL REPORTFOR THE FISCAL YEAR ENDED JUNE 30, 2017
PROPRIETARY FUNDSINTERNAL SERVICE FUNDS
Internal service funds are used to finance and account for special activities and service performed by adesigned department for other departments in the Town on a cost reimbursement basis.
The concept of major funds does not extend to internal service funds because they are used for internalactivities only. In the Government Wide Statement of Activities, the net revenues and expenses of theinternal service funds are allocated to the Town departments or programs that generated them, thuseliminating internal service funds
However, internal service funds are still presented separately in the fund financial statements and include thefollowing funds:
Equipment Replacement Fund was established to account for the replacement of major Town equipment andall vehicle replacement.
Workers’ Compensation Fund was established to account for future claims that may occur related to workerscompensation injuries.
Self Insurance Fund was established to account for future general liability claims against the Town.
Stores Fund was established to account for the purchase of photocopy equipment, postage and bulk meterexpenses.
Information Technology Fund was established to account for the replacement of management informationcomputer systems and components.
Vehicle Maintenance Fundwas established to account for preventative maintenance and repair provided for allTown vehicles and equipment.
Building Maintenance Fund was established to account for preventative maintenance and repair for all Townbuildings.
107

Dra
ft 12
/04/
2018
Equipment Worker's Self Information Vehicle Facilities
Replacement Comp Insurance Stores Technology Maintenance Maintenance TotalASSETS
Cash & Investments 2,345,816$ 2,170,510$ 1,424,107$ 229,147$ 3,080,748$ 605,934$ 891,604$ 10,747,866$Restricted Cash &Investments 37,229 37,229Receivables:
Accounts 118,926 2,092 312 16,483 137,813Materials, Supplies andDeposits 173 27,838 28,011Equipment (Net) 558 558
Total Assets 2,345,816 2,326,665 1,424,107 229,320 3,082,840 634,084 908,645 10,951,477
Deferred Outflows ofResourcesPension Plan
Contributions 31,528 22,116 84,921 38,716 61,030 238,311
Pension related amounts 23,064 55,707 124,698 56,850 89,652 349,971Total DeferredOutflows of Resources 54,592 77,823 209,619 95,566 150,682 588,282
LIABILITIES
Accounts Payable 17,203 25,349 437 1,530 120,455 6,520 91,658 263,152Accrued Payroll andBenefits 343 3,430 5,161 14,072 6,202 6,318 35,526Due to OtherGovernments
Claims Payable 1,472,324 131,743 1,604,067Net Pension Liabilities 255,060 363,674 979,569 446,588 704,016 2,748,907
Total Liabilities 17,546 1,756,163 501,015 1,530 1,114,096 459,310 801,992 4,651,652
Deferred Inflows ofResourcesPension related amounts 4,312 6,146 16,555 7,549 11,898 46,460Total Deferred Inflowsof Resources 4,312 6,146 16,555 7,549 11,898 46,460
NET POSITIONNet investment in capitalassets 558 558Restricted for:Workers compensationclaims 37,229 37,229Unrestricted 2,328,270 583,553 994,769 227,790 2,161,808 262,791 244,879 6,803,860
Total Net Position 2,328,270$ 620,782$ 994,769$ 227,790$ 2,161,808$ 262,791$ 245,437$ 6,841,647$
TOWN OF LOS GATOSINTERNAL SERVICE FUNDS
COMBINING STATEMENT OF NET POSITIONJUNE 30, 2018
108

Dra
ft 12
/04/
2018
Equipment Worker's Self Information Vehicle FacilitiesReplacement Comp Insurance Stores Technology Maintenance Maintenance Total
OPERATINGREVENUESCharges forservices 622,313$ 884,190$ 506,519$ 127,786$ 1,172,455$ 586,654$ 1,142,513$ 5,042,430$Interest 5 5Use of money andproperty 221,761 221,761Other local taxes 31,838 31,838Other 50,303 250,945 62,923 364,171
Total OperatingRevenues 672,616 1,135,140 506,519 127,786 1,172,455 586,654 1,459,035 5,660,205
OPERATINGEXPENSESSalaries andbenefits 11,533 136,961 203,614 581,371 269,302 382,313 1,585,094Insuranceexpenses 597,424 127,859 725,283Depreciationexpenses 957 957Services andsupplies 624,867 682,283 65,717 100,433 685,977 236,931 1,092,458 3,488,666
Total OperatingExpenses 636,400 1,416,668 397,190 100,433 1,267,348 506,233 1,475,728 5,800,000
Operating Income(loss) 36,216 (281,528) 109,329 27,353 (94,893) 80,421 (16,693) (139,795)
Transfers in 398,000 5,371 300,000 703,371
Net Transfers 398,000 5,371 300,000 703,371
Change in NetPosition 434,216 (281,528) 109,329 27,353 (89,522) 80,421 283,307 563,576
BEGINNING NETPOSITION 1,894,054 902,310 885,440 200,437 2,251,330 182,370 (37,870) 6,278,071ENDING NETPOSITION 2,328,270$ 620,782$ 994,769$ 227,790$ 2,161,808$ 262,791$ 245,437$ 6,841,647$
TOWN OF LOS GATOSINTERNAL SERVICE FUNDS
COMBINING STATEMENT OF REVENUES AND CHANGES IN NET POSITIONFOR THE FISCAL YEAR ENDDED JUNE 30, 2018
109

Dra
ft 12
/04/
2018
Equipment Worker's Self Information Vehicle FacilitiesReplacement Comp Insurance Stores Technology Maintenance Maintenance Total
CASH FLOWS FROMOPERATING ACTIVITIES
Receipts from customers 674,205$ 1,016,214$ 506,519$ 127,786$ 1,172,219$ 586,342$ 1,484,787$ 5,568,072$Payments to suppliers (623,774) (672,578) (67,566) (99,485) (621,183) (264,691) (1,104,650) (3,453,927)Payments to employees (11,516) (116,874) (174,351) (503,918) (234,832) (330,352) (1,371,843)Claims paid (224,835) (244,772) (469,607)
Net Cash Provided (Used)by Operating Activitie 38,915 1,927 19,830 28,301 47,118 86,819 49,785 272,695
CASH FLOWS FROMNONCAPITAL FINANCINGACTIVITIESTransfers Out 398,000 5,371 300,000 703,371
Net Cash Provided (Used)by Noncapital FinancingActivities 398,000 5,371 300,000 703,371
Net Increase(Decrease) inCash and Investments 436,915 1,927 19,830 28,301 52,489 86,819 349,785 976,066
Cash and investmentsbeginning of year 1,908,901 2,205,812 1,404,277 200,846 3,028,259 519,115 541,819 9,809,029
Cash and investmentsend of year 2,345,816$ 2,207,739$ 1,424,107$ 229,147$ 3,080,748$ 605,934$ 891,604$ 10,785,095$
$Reconciliation of Operating
Income to Cash Flowsfrom Operating Activities:
Operating Income 36,216$ (281,528)$ 109,329$ 27,353$ (94,893)$ 80,421$ (16,693)$ (139,795)$Adjustments to reconcile
operating income tocash flows fromoperating activities:
Depreciation 957 957Change in assets andliabilities:
Receivables, net 1,589 (118,926) (236) (312) 25,752 (92,133)Material and supplies (173) (2,818) (2,991)Deferred outflows ofresources (5,587) (7,960) (21,447) (9,778) (15,453) (60,225)
Net pension liabilities 23,940 34,186 92,103 41,988 66,235 258,452Deferred inflows ofresources 1,851 2,638 7,107 3,243 5,111 19,950Accounts payable 1,093 9,705 (1,849) 1,121 64,794 (24,775) (12,192) 37,897Accrued payroll andbenefits 17 (117) 399 (310) (983) (3,932) (4,926)Claims payable 372,589 (116,913) 255,676Due to othergovernment (167) (167)
Cash Flows FromOperating Activities 38,915$ 1,927$ 19,830$ 28,301$ 47,118$ 86,819$ 49,785$ 272,695$
TOWN OF LOS GATOSINTERNAL SERVICE FUNDS
COMBINING STATEMENT OF CASH FLOWSFOR THE FISCAL YEAR ENDED JUNE 30, 2018
110

Dra
ft 12
/04/
2018
TOWN OF LOS GATOS, CALIFORNIA
COMPREHENSIVE ANNUAL FINANCIAL REPORTFOR THE FISCAL YEAR ENDED JUNE 30, 2017
FIDUCIARY FUNDSPRIVATE PURPOSE TRUST FUNDS
Library Private Purpose Trust Fund was established to provide for the servicing of donations and bequeststo the Town's Library Program.
RDA Successor Agency Private Purpose Trust Fund was established to account for the assets and liabilitiestransferred from the dissolution of the Town's former Redevelopment Agency and the continuingoperations related to existing Redevelopment Agency obligations.
111

Dra
ft 12
/04/
2018
RDASuccessor
Library Agency TotalASSETSCash and investments (Note 2) 508,770$ 1,690,250$ 2,199,020$Restricted cash and investments (Note 2) 1,985,864 1,985,864Accounts receivable 38,500 38,500Loans receivable (Note 3) 563,761 563,761Capital assets (Note 5):Nondepreciable 5,257,422 5,257,422Depreciable, net of accumulated depreciation 1,627,084 1,627,084
Total Assets 547,270 11,124,381 11,671,651
LIABILITIESAccounts payable 11,337 43 11,380Due to other governments 189 189Interest payable 326,266 326,266Long term debt (Note 6):Due within one year 1,150,000 1,150,000Due in more than one year 16,981,855 16,981,855
Total Liabilities 11,526 18,458,164 18,469,690
NET POSITIONHeld in trust 535,744 (7,333,783) (6,798,039)
Total Net Position 535,744$ (7,333,783)$ (6,798,039)$
TOWN OF LOS GATOSPRIVATE PURPOSE TRUST FUNDS
COMBINING STATEMENT OF FIDUCIARY NET POSITIONJUNE 30, 2018
112

Dra
ft 12
/04/
2018
RDASuccessor
Library Agency TotalADDITIONSProperty taxes $ 1,958,325$ 1,958,325$Investment earnings 6,724 22,788 29,512Gifts, bequests and endowments 74,315 74,315Other 1,914,739 1,914,739
Total Additions 81,039 3,895,852 3,976,891
DEDUCTIONSProgram expenses 1,927,753 1,927,753Interest and fiscal agency expenses of RDA 749,832 749,832Library services 77,252 77,252Depreciation expense 101,693 101,693
Total Deductions 77,252 2,779,278 2,856,530
CHANGE IN NET POSITION 3,787 1,116,574 1,120,361
NET POSITION BEGINNING OF YEAR 531,957 (8,450,357) (7,918,400)
NET POSITION END OF YEAR 535,744$ (7,333,783)$ (6,798,039)$
TOWN OF LOS GATOSPRIVATE PURPOSE TRUST FUNDS
COMBINING STATEMENT OF CHANGES IN FIDUCIARY NET POSITIONFOR THE FISCAL YEAR ENDED JUNE 30, 2018
113

Dra
ft 12
/04/
2018
This page intentionally left blank
114

Dra
ft 12
/04/
2018
STATISTICAL SECTION
115

Dra
ft 12
/04/
2018
This page intentionally left blank
116

Dra
ft 12
/04/
2018
STATISTICAL (UNAUDITED)
This part of the Town of Los Gatos Comprehensive Annual Financial Report (“CAFR”) presents the detailedinformation as a context for understanding what the information in the financial statements, note disclosures,and required supplementary information says about the Town’s overall financial health.
Financial Trends
These schedules contain trend information to help the reader understand how Town’s financialperformance andwell being have changed over time. (Schedule 1, Schedule 2, Schedule 3, and Schedule4).
Revenue Capacity
These schedules contain information to help the reader assess one of the Town’s most significant localrevenue source, the property tax (Schedule 5, Schedule 6, Schedule 7, and Schedule 8).
Debt Capacity
These schedules present information to help the reader assess the affordability of the Town’s currentlevels of outstanding debt and its ability to issue additional debt in the future (Schedule 9, Schedule 10,and Schedule 11)
Demographic and Economic Information
These schedules offer demographic and economic indicators to help the reader understand theenvironment within which the Town’s financial activities take place (Schedule 12, Schedule 13, andschedule 14).
Operating Information
These schedules contain service and infrastructure data to help the reader understand how theinformation in the Town’s CAFR relates to the services the Town provides and activities it performs(Schedule 15 and Schedule 16).
117

Dra
ft 12
/04/
2018
Town of Los Gatos Schedule 1Net Position by ComponentLast Ten Fiscal Years(Accrual Basis of Accounting)
Fiscal Net Investment TotalYear in Capital Assets Restricted Unrestricted Net Position
2009 52,665,506 15,663,436 51,619,635 119,948,5772010 50,129,550 26,723,994 47,191,225 124,044,7692011 72,567,355 14,652,823 29,017,520 116,237,698 (1)2012 90,333,451 5,167,236 37,192,210 132,692,8972013 92,558,523 3,949,583 41,480,377 137,988,4832014 93,251,117 4,485,246 44,393,265 142,129,6282015 93,687,029 5,663,182 7,180,919 106,531,130 (2)2016 93,383,855 6,386,014 12,744,637 112,514,5062017 96,265,652 5,627,707 15,134,420 117,027,7792018 102,098,729 6,992,747 170,590 109,262,066
(1) The decrease in Restricted Net Position from FY 2010 to FY 2011 was primarily due to the issuance of the$15.7 million Certificates of Participation in FY 2010.
(2) The decrease in Restricted Net Position GASB 68 Implementation of Unfunded Pension Liability of Statementof Net Position.
0
5,000,000
10,000,000
15,000,000
20,000,000
25,000,000
30,000,000
35,000,000
40,000,000
45,000,000
50,000,000
55,000,000
60,000,000
65,000,000
70,000,000
75,000,000
80,000,000
85,000,000
90,000,000
95,000,000
Net Investment in Capital Assets Restricted Unrestricted
118

Dra
ft 12
/04/
2018
Townof
LosG
atos
Sche
dule2
ChangesinNet
Position
LastTenFiscalYears
(AccrualBa
sisof
Accoun
ting)
Expe
nses
2008
/09
2009
/10
2010
/11
2011
/12
2012
/13
2013
/14
2014
/15
2015
/16
2016
/17
2017
/18
Governmen
talA
ctivities:
Gene
ralG
overnm
ent
5,32
3,467
$4,64
7,801
$5,18
0,153
$6,14
5,143
$6,56
4,768
$6,95
5,804
$6,46
5,852
$6,99
3,661
$6,77
1,628
$9,15
5,819
$Po
liceDe
partmen
t13
,467
,503
13,266
,849
13,495
,885
14,124
,798
13,731
,754
14,119
,786
12,644
,221
12,825
,688
14,587
,597
15,545
,521
Parksa
ndPu
blicWorks
8,67
1,678
7,45
8,085
7,15
5,905
7,82
7,332
7,82
9,315
8,15
4,616
8,06
9,352
8,32
0,623
9,50
2,707
10,047
,003
Commun
ityDe
velopm
ent
3,38
9,151
3,52
2,477
3,09
9,269
3,43
4,551
4,09
4,188
4,42
4,040
4,04
7,738
3,22
7,224
5,09
3,459
4,66
7,609
Commun
ityService s
1,16
2,284
1,27
0,240
666,01
5LibraryServices
2,06
7,476
2,03
8,009
1,89
2,805
1,93
8,577
2,12
8,823
2,23
4,431
2,55
3,414
2,52
2,142
2,86
8,748
3,08
7,684
Sanitatio
n40
7,04
865
5,71
334
2,89
315
8,20
539
3,20
536
3,18
049
1,35
952
8,580
466,76
253
6,296
Rede
velopm
ent
2,93
9,550
6,99
2,935
16,794
,022
919,82
11,27
7,063
21,687
InterestandFees
631,15
961
2,700
1,27
8,381
1,12
3,842
TotalG
overnm
entalA
ctivitie s
38,059
,316
$40
,464
,809
$49
,905
,328
$35
,672
,269
$36
,019
,116
$36
,273
,544
$34
,271
,936
$34
,417
,918
$39
,290
,901
$43
,039
,932
$
Program
Revenu
esCh
argesfor
Services:
Gene
ralG
overnm
ent
1,15
5,409
$1,33
7,772
$1,15
6,931
$1,13
1,424
$1,41
6,593
$2,17
9,077
$1,88
8,213
$1,51
7,012
$1,66
9,020
$1,70
1,146
$Po
liceDe
partmen
t1,35
8,361
2,11
0,357
2,15
3,843
2,32
4,397
2,45
0,630
3,20
6,579
3,52
9,166
3,27
8,585
2,07
6,688
1,88
8,359
Parksa
ndPu
blicWorks
637,93
377
9,300
810,02
21,21
5,382
3,04
4,401
1,55
0,867
2,20
6,765
1,51
6,108
2,15
5,841
4,15
0,068
Commun
ityDe
velopm
ent
2,70
0,614
3,40
4,087
3,09
7,192
3,44
8,433
4,64
9,444
5,15
6,061
5,02
7,497
4,35
9,146
3,80
3,626
3,45
6,390
Commun
ityServices
147,89
513
4,366
98,803
LibraryServices
56,932
57,633
39,491
37,662
50,696
51,775
53,123
46,192
46,746
14,702
Sanitatio
n13
5,00
013
5,000
135,000
135,000
403,294
328,648
328,868
368,81
341
0,626
771,44
2Ope
ratin
gGrantsandCo
ntrib
utions:
Gene
ralG
overnm
ent
8,834
10,237
15,638
6,45
38,40
615
,291
PoliceDe
partmen
t53
8,62
981
,997
27,748
29,980
91,360
42,661
24,838
98,138
837,32
989
5,730
Parksa
ndPu
blicWorks
633,92
359
4,77
580
9,27
299
3,827
835,724
994,096
907,74
574
9,300
665,77
995
3,294
Commun
ityServices
190,447
124,287
182,68
3LibraryServices
10,462
13,996
10,662
109
4014
,662
4,06
212
,228
57,200
Sanitatio
n39
,891
25,103
9,00
2CapitalG
rantsa
ndCo
ntrib
utions:
Gene
ralG
overnm
ent
169,270
176,70
5Parksa
ndPu
blicWorks
1,33
0,638
3,07
4,453
2,37
5,759
641,81
12,75
7,660
2,27
4,879
2,33
8,154
1,61
0,657
770,600
348,437
Commun
ityDe
velopm
ent
19,360
9,280
TotalProgram
Revenu
e s8,94
4,968
$11
,883
,363
$10
,922
,046
$9,96
4,478
$15
,877
,518
$15
,818
,665
$16
,485
,136
$13
,571
,470
$12
,445
,535
$14
,236
,768
$
Gene
ralR
even
ues
2008
/09
2009
/10
2010
/11
2011
/12
2012
/13
2013
/14
2014
/15
2015
/16
2016
/17
2017
/18
Prop
ertyTaxes
18,343
,063
$18
,856
,081
$18
,226
,001
$14
,088
,866
$11
,968
,377
$11
,712
,312
$12
,931
,603
$13
,763
,458
$14
,756
,214
$15
,958
,406
$SalesT
axes
8,48
7,000
8,31
7,217
9,97
1,409
9,88
9,100
8,75
7,428
8,02
9,571
8,20
2,678
7,50
1,175
8,92
5,276
7,46
6,253
Franchise
Taxes
2,21
5,430
2,25
8,892
2,36
6,908
2,47
4,814
Other
Taxes
2,66
4,698
2,62
3,622
2,90
6,264
3,69
8,753
3,32
4,791
3,71
8,405
2,06
2,893
1,99
7,497
2,35
1,223
2,66
7,840
Motor
VehicleinLieu
101,26
592
,595
139,814
15,238
15,790
13,068
12,308
14,056
16,483
Investmen
tEarnings
2,94
9,119
1,15
5,929
760,90
5a
331,420
b(133
,375
)b
772,200
b42
8,77
269
8,324
192,260
333,120
Losson
Disposalof
CapitalA
ssets
Saleof
Prop
erty
6,52
5,000
(870
,127
)54
,425
Misc
ellane
ous
66,802
52,459
41,943
2,27
5,160
1,15
4,647
350,468
813,324
598,170
528,946
622,10
5ExtraordinaryGa
in(Loss)Dissolutionof
RDA
11,864
,453
295,10
1
TotalGe
neralReven
ues
39,136
,947
$31
,097
,903
$31
,176
,209
$42
,162
,990
$25
,437
,184
$24
,596
,024
$26
,654
,700
$26
,829
,824
$29
,134
,883
$29
,539
,021
$
Chan
geinNet
Positio
n10
,022
,599
$2,51
6,457
$(7,807
,073)
$16
,455
,199
$5,29
5,586
$4,14
1,145
$8,86
7,900
$5,98
3,376
$2,28
9,517
$73
5,857
$
a.Investmen
tEarningsreven
uewas
downdu
eto
theecon
omydo
wnturn.
b.Investmen
tEarningsreven
uewas
downdu
eto
declininginterestratesa
ndredu
cedcash
balances
119

Dra
ft 12
/04/
2018
Townof
LosG
atos
Sche
dule3
Fund
Balance,Go
vernmen
talFun
d sLastTenFiscalYears
(Mod
ified
AccrualBasisof
Accoun
ting)
2008
/09
2009
/10
2010
/11
2011
/12
2012
/13
2013
/14
2014
/15
2015
/16
2016
/17
2017
/18
Gene
ralFun
dRe
served
8,16
5,607
$4,49
1,589
$$
$$
$$
$$
$Unreserved
16,861
,75 2
18,594
,984
Non
spen
dable
1,50
0,000
Restricted
Committed
20,019
,18 7
15,129
,925
12,953
,399
Assig
ned
21,806
,78 1
21,992
,886
20,758
,156
23,791
,749
24,121
,256
9,55
5,085
14,050
,699
17,475
,285
Unassigne
d2,43
3,556
4,01
9,409
7,50
2,446
1,36
3,376
TotalG
eneralFund
25,027
,359
$23
,086
,573
$25
,740
,337
$26
,012
,295
$28
,260
,602
$25
,155
,125
$24
,121
,256
$29
,574
,272
$29
,180
,624
$30
,428
,684
$
AllO
ther
Governmen
talFun
dsRe
served
15,265
,127
$10
,525
,384
$$
$$
$$
$$
$Unreserved,repo
rted
in:
SpecialReven
ueFund
s52
2,10
522
5,50
9CapitalProjectFund
s11
,203
,52 1
24,454
,347
Debt
ServiceFund
s7,52
6,557
6,95
3,732
Non
spen
dable
Restricted
14,764
,33 4
5,16
7,236
3,94
9,583
4,48
5,246
5,66
3,182
6,38
6,014
5,62
7,707
6,99
2,747
Committed
3,69
6,000
10,354
,584
5,57
1,087
Assig
ned
4,78
6,547
5,38
9,674
6,09
7,182
8,19
1,823
15,346
,558
11,099
,076
7,92
8,994
6,36
1,403
Unassigne
d(23,88
9)10
7,107
157,208
183,04
520
6,87
5To
talA
llOther
Governmen
talFun
ds34
,517
,310
$42
,158
,972
$19
,526
,992
$10
,664
,017
$10
,203
,973
$12
,860
,114
$21
,216
,615
$21
,181
,090
$23
,911
,285
$18
,925
,237
$
TotalFun
dBa
lances
59,544
,66 9
$65
,245
,545
$45
,267
,329
$36
,676
,312
$38
,464
,575
$38
,015
,239
$45
,337
,871
$50
,755
,362
$53
,091
,909
$49
,353
,921
$
FiscalYear
120

Dra
ft 12
/04/
2018
Townof
LosG
atos
Sche
dule5
ChangesinFund
Balances,G
overnm
entalFun
dsLastTenFiscalYears
(Mod
ified
AccrualBasisof
Accoun
ting)
2008
/09
2009
/10
2010
/11
2011
/12
2012
/13
2013
/14
2014
/15
2015
/16
2016
/17
2017
/18
Revenu
es:
Taxes
29,643
,262
$29
,967
,385
$31
,549
,352
$27
,676
,719
$24
,596
,799
$23
,475
,393
$23
,208
,820
$23
,269
,892
$25
,945
,129
$26
,253
,026
$Intergovernm
ental
2,13
4,35
24,08
2,72
53,24
8,30
31,66
9,72
92,61
5,19
12,44
0,12
72,92
1,00
22,57
3,47
51,71
5,58
02,12
4,90
3Ch
argesfor
Service
3,42
1,13
14,41
8,07
44,10
7,38
65,55
0,67
16,52
9,23
45,83
7,58
15,79
4,38
64,77
3,00
14,21
0,17
45,39
5,05
7Licenses
&Pe
rmit s
2,69
2,18
72,97
7,19
92,96
7,81
93,24
2,34
84,01
5,87
15,34
3,26
56,46
7,77
15,44
2,13
35,07
5,50
35,93
7,04
4Investmen
tIncom
e2,94
9,12
01,17
4,20
369
1,02
229
1,48
4(133
,380
)77
2,16
442
8,73
569
8,30
819
2,97
833
2,93
8Fine
sand
Forfeitures
618,77
166
2,69
973
7,90
380
9,79
068
8,12
579
5,72
086
8,56
487
9,27
791
7,10
567
6,21
2Franchise
Fees
2,21
5,43
02,25
8,89
22,36
6,90
82,47
4,81
4Use
ofProp
ert y
60,749
51,948
38,502
38,974
38,910
37,741
32,209
31,723
32,096
32,206
Othe r
1,58
1,07
82,10
5,33
32,90
4,86
25,41
2,32
84,57
7,58
43,64
8,27
73,13
0,97
52,39
6,99
22,93
5,24
264
0,84
4
TotalReven
ues
43,100
,650
45,439
,566
46,245
,149
44,692
,043
42,928
,334
42,350
,268
45,067
,892
42,323
,693
43,390
,715
43,867
,044
Expe
nditu
res:
Curren
tPu
blicSafet y
12,971
,105
12,821
,499
13,004
,041
13,392
,953
13,370
,032
13,742
,189
13,747
,198
13,763
,316
13,251
,288
14,423
,554
PublicWorks
5,78
5,58
45,15
2,74
55,22
2,50
45,44
0,96
05,61
6,19
75,61
1,28
35,84
0,09
76,30
7,26
66,63
3,74
87,12
5,68
6Co
mmun
ityDe
velopm
ent
3,28
0,85
63,45
2,91
42,97
3,58
73,22
6,19
54,23
5,83
24,33
5,59
94,21
8,50
03,69
5,50
43,79
3,93
04,19
2,16
5Co
mmun
ityServices
1,14
9,29
01,26
1,98
166
3,64
5LibraryServices
2,00
7,51
81,99
9,43
01,80
6,61
11,80
5,47
92,05
5,06
92,13
1,43
82,26
8,84
42,33
2,26
82,50
8,67
72,52
9,01
7Sanitatio
n&Othe r
375,48
364
2,51
231
4,89
911
6,60
735
9,72
532
2,81
741
1,86
345
2,72
646
6,76
252
1,14
7Ge
neralG
overnm
ent
5,14
5,35
55,48
3,75
36,31
8,70
68,04
6,79
48,33
1,44
48,49
9,85
48,64
7,45
19,14
4,79
710
,314
,262
8,77
0,08
2Re
developm
ent
3,86
1,52
58,69
2,21
618
,958
,126
3,28
2,15
51,27
7,06
321
,687
CapitalO
utlay
7,75
9,57
716
,141
,561
15,839
,303
10,929
,491
6,56
8,65
34,09
7,66
23,80
0,47
83,24
1,65
76,86
7,03
49,77
8,05
8De
btService
PrincipalRep
aymen
t44
5,00
046
5,00
048
5,00
093
4,16
7InterestandFiscalCh
arges
638,22
162
0,35
61,01
9,88
11,14
3,18
5
TotalExpen
ditures
43,419
,514
56,733
,967
66,606
,303
48,317
,986
41,814
,015
38,762
,529
38,934
,431
38,937
,534
43,835
,701
47,339
,709
Excess(Deficiency)of
Revenu
esOver(Und
er)E
xpen
ditures
(318
,864
)(11,29
4,40
1)(20,36
1,15
4)(3,625
,943
)1,11
4,31
93,58
7,73
96,13
3,46
13,38
6,15
9(444
,986
)(3,472
,665
)
Other
FinancingSources(Uses):
Debt
Issuance
16,428
,095
TransfersIn
5,37
0,70
84,02
8,90
53,92
8,10
73,73
5,44
02,84
1,88
13,41
8,87
28,97
7,22
03,31
5,84
67,90
7,69
23,17
6,76
0TransfersO
u t(4,731
,885
)(3,461
,724
)(3,545
,168
)(3,661
,894
)(2,463
,850
)(2,921
,409
)(7,788
,049
)(1,284
,514
)(7,612
,012
)(3,880
,131
)Proceeds
from
Saleof
Prop
ert y
378,21
9Proceeds
from
Issuance
ofDe
b t4,43
5
TotalO
ther
FinancingSources(Uses)
638,82
316
,995
,276
382,93
973
,546
378,03
149
7,46
31,18
9,17
12,03
1,33
230
0,11
5(325
,152
)
SpecialItem:
Saleof
Prop
ert y
6,52
5,00
0ExtraordinaryGa
in(Loss)RD
ADissolution
(5,038
,620
)29
5,91
3Prep
aymen
tofP
ensio
nObligation s
(4,534
,538
)
Net
Change
inFund
Balances
319,95
9$
5,70
0,87
5$
(19,97
8,21
5)$
(3,552
,397
)$
1,49
2,35
0$
4,08
5,20
2$
7,32
2,63
2$
5,41
7,49
1$
(144
,871
)$
(3,797
,817
)$
Debt
Serviceas
aPe
rcen
tage
ofNon
CapitalExpen
ditures
3.04
%2.67
%2.96
%5.56
%0.00
%0.00
%0.00
%0.00
%0.00
%0.00
%
1Increase
dueto
SERA
Fpaym
enttoStateintheam
ount
of$2
.2M
andincreasedPassThroughPaym
ents.
2Theincrease
incapitaloutlayisdu
eto
purchaseso
flandforlow
mod
erateho
usingprojectsintheam
ount
of$4
.3M
andpu
rchase
ofland
fora
sportspark
intheam
ount
of$3
.1M
FiscalYear
12

Dra
ft 12
/04/
2018
Town of Los Gatos Schedule 5Assessed Value and Estimated Actual Value of Taxable PropertyLast Ten Fiscal Years
Utilityand Total
Fiscal Unsecured Percent Secured Percent Total Estimated DirectYear Property Change Property Change Assessed Full Market Tax Rate
2009 216,402,089 7.33% 7,949,991,620 7.53% 8,166,393,709 31,799,966,480 1.04492010 241,286,055 11.50% 8,076,101,607 1.59% 8,317,387,662 32,304,406,428 1.05842011 217,353,236 9.92% 8,044,692,600 0.39% 8,262,045,836 32,178,770,400 1.05552012 217,297,593 0.03% 8,152,459,157 1.34% 8,369,756,750 32,609,836,628 1.04992013 211,268,609 2.77% 8,465,420,032 3.84% 8,676,688,641 33,861,680,128 1.05082014 224,079,502 6.06% 9,238,816,900 9.14% 9,462,896,402 36,955,267,600 1.04932015 227,331,042 1.45% 9,767,782,505 5.73% 9,995,113,547 39,071,130,020 1.05442016 217,035,545 4.53% 10,417,804,357 6.65% 10,634,839,902 41,671,217,428 1.05332017 304,443,013 40.27% 11,240,554,198 7.90% 11,544,997,211 44,962,216,792 1.05602018 330,504,877 8.56% 11,969,049,272 6.48% 12,299,554,149 47,876,197,088 1.0659
Source: Santa Clara County Assessed Value Report
0
2000
4000
6000
8000
10000
12000
20092010
20112012
20132014
20152016
20172018
Mil
lions
Utility and Unsecured Property
Secured Property
122

Dra
ft 12
/04/
2018
Town of Los Gatos Schedule 6Direct and Overlapping Property Tax RatesLast Ten Fiscal Years
Santa Clara SchoolFiscal Basic County County Bonds Valley Water District BondsYear Wide Levy and Levies District and Loans Total
2009 1.0000 0.0388 0.0061 0.0970 1.14192010 1.0000 0.0510 0.0074 0.1021 1.16052011 1.0000 0.0483 0.0072 0.1449 1.20042012 1.0000 0.0435 0.0064 0.1393 1.18922013 1.0000 0.0439 0.0069 0.1523 1.20312014 1.0000 0.0423 0.0070 0.1417 1.19102015 1.0000 0.0479 0.0065 0.1442 1.19862016 1.0000 0.0476 0.0057 0.1381 1.19142017 1.0000 0.0474 0.0086 0.1223 1.17832018 1.0000 0.0597 0.0062 0.1177 1.1836
Source: Santa Clara County Book of Tax Rates
0.00
0.25
0.50
0.75
1.00
1.25
Per
Hu
nd
red
$
Santa Clara Valey Water District County County Bonds and Levies
School District Bonds and Loans
Basic County Wide Levy
123

Dra
ft 12
/04/
2018
Townof
LosG
atos
Sche
dule7
PrincipleProp
erty
TaxPayers
LastFive
FiscalYears*
Percen
tage
Percen
tage
Percen
tage
Percen
tage
Percen
tage
ofTo
talCity
ofTo
talCity
ofTo
talCity
ofTo
talCity
ofTo
talCity
Taxable
Taxable
Taxable
Taxable
Taxable
Taxable
Taxable
Taxable
Taxable
Taxable
Assessed
Assessed
Assessed
Assessed
Assessed
Assessed
Assessed
Assessed
Assessed
Assessed
ASSESSEE
NAM
EVa
lue
Value
Value
Value
Value
Value
Value
Value
Value
Value
750University
LLC
18,600
,000
$0.20
%19
,000
,000
$0.21
%19
,379
,620
$0.21
%19
,675
,159
$0.21
%25
,241
,863
$0.27
%Albe
rtoWay
Holdings
LLC
23,607
,964
0.26
%23
,715
,141
0.26
%24
,188
,966
0.26
%24
,557
,845
0.27
%25
,048
,998
0.27
%An
nR.
Desantis
13,823
,779
0.15
%Bo
ccardo
Corporation
38,617
,912
0.42
%38
,772
,905
0.42
%21
,617
,318
0.23
%21
,918
,921
0.24
%22
,211
,650
0.24
%CH
Realty
IVDo
wning
LP19
,916
,443
0.22
%D&
KLosG
atos
LLC
15,901
,809
0.17
%15
,974
,003
0.17
%16
,293
,163
0.18
%Da
vidA.
andShariFlickTrustee
15,388
,884
0.17
%Do
nahu
eSchriber
Realty
Grou
pLP
53,872
,083
0.58
%DS
Down ing
LosG
atos
LLC
20,006
,861
0.22
%21
,980
,568
0.24
%22
,315
,770
0.24
%DS
Village
Square
22,799
,599
0.25
%ElCaminoHo
spita
l20
,803
,609
0.23
%26
,477
,160
0.29
%26
,880
,933
0.29
%23
,353
,576
0.25
%Eq
uestria
n3Investmen
tsLLC
29,584
,251
0.32
%Go
odSamarita
nHo
spita
lLP
19,710
,897
0.21
%19
,602
,594
0.21
%19
,880
,366
0.22
%22
,402
,756
0.24
%22
,516
,823
0.24
%GradeWay
Associations
VI15
,094
,623
0.16
%15
,163
,152
0.16
%GreenEye s
L LC
12,793
,404
0.14
%Grosveno
rUSA
Ltd.
22,886
,720
0.25
%22
,990
,624
0.25
%23
,449
,975
0.25
%He
alth
Care
REITInc,
20,671
,960
0.22
%20
,765
,810
0.22
%20
,089
,903
0.22
%20
,396
,274
0.22
%InternationalH
otel
30,144
,617
0.33
%KayKaoruandGo
SasakiSr.,Trustees
22,752
,809
0.25
%24
,744
,983
0.27
%25
,122
,131
0.27
%25
,624
,027
0.28
%Kn
owlesL
osGa
tosL
LC47
,986
,850
0.52
%48
,204
,708
0.52
%49
,167
,836
0.53
%49
,917
,644
0.54
%50
,915
,995
0.55
%KSLCapitalPartners
43,383
,370
0.47
%43
,580
,326
0.47
%30
,134
,614
0.33
%30
,105
,945
0.33
%25
,893
,946
0.28
%Leland
ELester,Trustee
29,004
,169
0.31
%LG
Busin
essP
arkBldg
3LLC
61,947
,284
0.67
%53
,465
,724
0.58
%LG
Busin
essP
arkBldg
4LLC
43,937
,857
0.48
%LG
Busin
essP
arkLLC
47,276
,977
0.51
%39
,347
,485
0.43
%17
,507
,261
0.19
%31
,070
,572
0.34
%LG
HotelLLC
15,448
,057
0.17
%15
,497
,395
0.17
%LosG
atos
Hot elCorp.
18,134
,182
0.20
%15
,573
,314
0.17
%15
,676
,113
0.17
%Lyon
BaytreeAp
artm
entsLLC
14,674
,716
0.16
%Safeway
Inc.
24,394
,468
0.26
%SanJose
Water
Works
33,626
,381
0.36
%36
,693
,453
0.40
%37
,081
,049
0.40
%38
,710
,728
0.42
%41
,202
,805
0.45
%SI32
LLC
150,56
3,11
91.63
%14
1,34
8,89
41.53
%14
3,44
2,26
91.55
%14
6,31
7,94
41.58
%SobratoInterestsIVLLC
169,80
9,67
61.84
%20
,869
,338
0.23
%44
,930
,482
0.49
%42
,240
,994
0.46
%43
,071
,837
0.47
%SRIO
ldTo
wnLLC
30,981
,771
0.34
%31
,122
,427
0.34
%31
,744
,252
0.34
%32
,228
,351
0.35
%32
,872
,917
0.36
%SummerhillProspe
ctAv
enue
LLC
18,274
,508
0.20
%Wealth
capLosG
atos
121
109,10
0,00
01.18
%11
1,28
2,00
01.20
%Wealth
capLosG
atos
3184
,000
,000
0.91
%85
,680
,000
0.93
%To
tal
Principaltaxpayers
650,25
2,24
3$
7.68
%39
4,33
7,47
3$
6.49
%66
3,13
7,20
2$
7.18
%81
4,16
4,56
8$
8.81
%91
6,63
3,38
1$
9.92
%
Total
Allrealprope
rtiesa
ssessedby
theTo
wn(1)
9,23
7,88
7,98
0$
9,76
6,76
5,02
5$
10,416
,786
,877
$11
,239
,536
,718
$11
,968
,031
,792
$
(1)Assessed
valueinclud
eson
lyne
tsecured
realprop
ertie
s.(2)Exclud
esthevalueof
taxexem
ptprop
ertie
s
Source
Data:C
alifo
rniaMun
icipalStatistics,Inc.
2017
/18
2016
/17
2015
/16
2014
/15
2013
/14
124

Dra
ft 12
/04/
2018
Town of Los Gatos Schedule 8Property Tax Levies and CollectionsLast Ten Fiscal Years
Value ofRedevelopment
Agency Value ofTown Redevelopment Total Property Value of Town Property Property
Property Tax Property Tax Tax Levied Property subject Subject to Subject toFiscal Levied and Levied and and to Local Tax Local LocalYear Collected Collected Collected Rate Tax Rate Tax Rate
2009 7,465,403$ 8,574,251$ 16,039,654$ 8,166,393,709$ 1,096,883,582$ 9,263,277,291$2010 7,608,137 9,022,863 16,630,999 8,317,387,662 1,134,135,499 9,451,523,1612011 7,567,880 6,861,650 14,429,530 8,262,045,836 1,117,973,351 9,380,019,1872012 7,520,265 3,349,254 10,869,519 8,369,756,750 1,109,305,673 9,479,062,4232013 8,253,442 8,253,442 8,676,688,641 1,167,752,021 9,844,440,6622014 9,120,626 9,120,626 9,462,896,402 1,249,873,303 10,712,769,7052015 9,787,519 9,787,519 9,995,113,547 1,318,214,863 11,313,328,4102016 10,388,424 10,388,424 10,634,839,902 1,395,509,489 12,030,349,3912017 11,345,588 11,345,588 11,544,997,211 1,537,577,241 13,082,574,4522018 12,060,228 12,060,228 12,299,554,149 1,650,746,473 13,950,300,622
Sources: Santa Clara County Auditor Controller Office and the Town of Los Gatos
$7.0
$7.5
$8.0
$8.5
$9.0
$9.5
$10.0
$10.5
$11.0
$11.5
$12.0
$12.5
$13.0
$13.5
$14.0
$14.5
Bil
lio
ns
Value of Property
$7.0
$8.0
$9.0
$10.0
$11.0
$12.0
$13.0
$14.0
$15.0
$16.0
$17.0
$18.0
Mil
lio
ns
Tax Levied
125

Dra
ft 12
/04/
2018
Town of Los Gatos Schedule 9
Ratios of Outstanding Debt by Type
Last Ten Fiscal Years
1992 2002 2010Certificate Certificate Certificate Total Total Percentage of
Fiscal of of of Governmental Primary Personal PerYear Participation Participation Participation Activities Government Income Capita2009 685,000 9,370,000 10,055,000 10,055,000 5.5% 329.702010 470,000 9,120,000 15,675,000 25,265,000 25,265,000 19.4% 820.242011 240,000 8,865,000 15,675,000 24,780,000 24,780,000 19.7% 835.722012 0.0% 1) 0.002013 0.0% 0.002014 0.0% 0.002015 0.0% 0.002016 0.0% 0.002017 0.0% 0.002018 0.0% 0.00
Debt was transferred to the Successor Agency Trust Fund as a part of the RDA dissolution
Notes: Details regarding the Town's outstanding debt can be found in the notes to the financial statements
(1) See Schedule 12 for personal income and population data
Governmental Activities
1)
126

Dra
ft 12
/04/
2018
Town of Los Gatos Schedule 10Direct and Overlapping Governmental Activities DebtAs of June 30, 2017
2017/18 Assessed Valuation: $12,299,554,149Estimated Shareof Direct and
Total Debt at Overlapping DebtDIRECT AND OVERLAPPING BONDED DEBT: % Applicable (1) June 30, 2018 at June 30, 2018
Overlapping Tax & Assesment Debt
Santa Clara County 2.735% 1,012,400,000$ 27,689,140$
West Valley Mission Community College District 9.468% 495,110,000 46,877,015
Campbell Union High School District 8184.000% 210,265 17,208,088
Los Gatos Saratoga Joint Union High School District 34.433% 105,845,000 36,445,609
Cambrian School District 0.265% 50,384,944 133,520
Campbell Union High School District 8.355% 176,094,922 14,712,731
Los Gatos Union School District 70.774% 85,175,000 60,281,755
Saratoga Union School District 0.034% 25,833,902 8,784
Union School District 20.946% 108,953,505 22,821,401
Midpeninsula Regional Open Space District 4.633% 93,350,000 4,324,906
Santa Clara Valley Water District Benefit Assessment District 2.735% 82,285,000 2,250,495Total Overlapping Tax and Assesmet Debt 232,753,444
Overlapping General Fund DebtSanta Clara County General Fund Obligations 2.735% 599,642,965 16,400,235
Santa Clara County Pension Obligations 2.735% 357,547,175 9,778,915
Santa Clara County Board of Education Certificates of Participation 2.735% 4,985,000 136,340
West Valley Mission Community College District General Fund Obligations 9.468% 63,060,000 5,970,521
Campbell Union High School District General Fund Obligations 8.184% 10,000,000 818,400
Los Gatos Saratoga Joint Union High School District Certificates of Participation 34.433% 4,424,000 1,523,316
Campbell Union School District General Fund Obligations 8.355% 2,895,000 241,877
Saratoga Union School District Certificates of Participation 0.034% 3,905,000 1,328
Santa Clara County Vector Control District Certificates of Participation 2.735% 2,470,000 67,555
Midpeninsula Regional Open Space Park District General Fund Obligations 4.633% 123,040,600 5,700,471Total Gross Overlapping General Fund Debt 40,638,958Less: Santa Clara County Supported Obligations 11,187,913
Total Overlapping General Fund Debt 29,451,045
Overlapping Tax Increment Debt ( Successor Agency)Town of Los Gatos Certificated of Participations 17,680,000
Total of Overlapping Tax Increment Debt 17,680,000
Total Direct DebtTotal Gross Overlapping Dept 292,220,742Total Net Overlapping Debt 281,032,829
Gross Combined Total Debt 291,072,402 (2)Net Combined Total Debt 279,884,489
Ratios to 2015/16 Assessed Valuation:Total Overlapping Tax and Assessment Debt: 1.89%Total Direct Debt: 0.00%Gross Combined Total Debt: 2.37%Net Combined Total Debt: 2.28%
Ratios to Redevelpment Incremental Valuation ( $1,327,219,986):Total Overlapping Tax Increment Debt: 1.33%
Source Data: California Municipal Statistics, Inc.
(1) The percentage of overlapping debt applicable to the city is estimated using taxable assessed property value. Applicable percentageswere estimated by determining the portion of the overlapping district's assessed value that is within the boundaries of the city divided bythe distric's total taxable asessed value.
(2) Excludes tax and revenue anticipation notes, enterprise revenue, mortgage revenue bonds and non bonded capital lease obligations.
127

Dra
ft 12
/04/
2018
Townof
LosG
atos
Sche
dule11
LegalD
ebtM
arginInform
ation,
LastTenFiscalYears
(InThou
sand
sofD
ollars)
Assessed
Value
11,198
,237
,798
$De
btLimit
1,67
9,73
5,67
0De
btAp
plicableto
Limit:
LegalD
ebtM
argin
1,67
9,73
5,67
0$
2008
/09
2009
/10
2010
/11
2011
/12
2012
/13
2013
/14
2014
/15
2015
/16
2016
/17
2017
/18
Debt
Limit
1,10
2,76
6$
1,18
5,72
7$
1,20
4,55
1$
1,19
5,03
5$
1,21
6,13
1$
1,26
3,13
8$
1,37
9,25
4$
1,44
4,94
3$
1,55
6,25
2$
1,67
9,73
6$
Debt
Applicableto
Limit
LegalD
ebtM
argin
1,10
2,76
6$
1,18
5,72
7$
1,20
4,55
1$
1,19
5,03
5$
1,21
6,13
1$
1,26
3,13
8$
1,37
9,25
4$
1,44
4,94
3$
1,55
6,25
2$
1,67
9,73
6$
TotalN
etDe
btAp
plicableto
theLimit
asaPe
rcen
tage
ofDe
btLimit
0.00
%0.00
%0.00
%0.00
%0.00
%0.00
%0.00
%0.00
%0.00
%0.00
%
Notes:
(1)T
heTo
wnof
LosG
atos
isagene
rallaw
city
andhasa
debt
limitof
15%.
(2)E
xclude
sRDA
asessedvaluationandde
bttransferredto
theSuccessorA
gencytrusta
sapartof
theRD
Adissolution.
LegalD
ebtM
arginCalculation
forF
iscalYear
2017
/18
FiscalYear
128

Dra
ft 12
/04/
2018
Townof
LosG
atos
Sche
dule12
Demograph
icandEcon
omicStatistics
LastTenFiscalYears
Person
alIncome
PerC
apita
Public
Coun
tyFiscal
(thou
sand
sPe
rson
alMed
ian
Scho
olUne
mploymen
tYear
Popu
latio
nof
dollars)
Income
Age
Enrollm
ent
Rate
Ende
d(1)
(2)
(3)
(4)
(5)
(6)
2009
30,497
1,70
1,15
355
,781
45.35
6,00
611
.8%
2010
30,802
1,78
7,07
058
,018
45.09
6,10
011
.3%
2011
29,651
1,83
3,41
061
,833
44.22
6,18
410
.3%
2012
29,808
1,85
4,89
262
,228
42.64
6,35
28.7%
2013
30,247
2,14
0,64
170
,772
45.80
6,42
06.8%
2014
30,443
2,26
7,91
274
,497
45.80
6,52
25.7%
2015
30,505
2,19
7,88
572
,050
46.10
6,62
23.8%
2016
31,376
2,28
6,08
772
,861
46.30
6,64
63.5%
2017
31,314
2,28
1,56
972
,861
46.50
6,63
13.8%
2018
30,601
2,29
0,63
874
,855
46.81
6,58
82.6%
Source:
(1)Ca
liforniaStateDe
pt.ofFinan
cePo
pulatio
nRe
search
Unit(Ja
nuary20
16)
(2)Ca
liforniaStateDe
pt.ofFinan
ceEstim
ateequa
lscoun
typercap
itaaverag
etim
espo
pulatio
n(3)Ca
liforniaStateDe
ptof
Fina
nce
coun
typercap
itaat:lab
ormarketin
fo.edd
.ca.go
v(4)Clarita
sdem
ograph
icsnap
shot
repo
rt(5)LosG
atos
Saratoga
JointU
nion
andLosG
atos
UnionElem
entary
Scho
olDistricts
(6)Stateof
California,Em
ploymentD
evelop
mentD
ept.,
Labo
rMarketInfo.Div.
129

Dra
ft 12
/04/
2018
Townof
LosG
atos
Sche
dule13
PrincipalEmployers
LastTenFiscalYears
Percen
tage
Percen
tage
Percen
tage
Percen
tage
Percen
tage
Percen
tage
Percen
tage
Percen
tage
Percen
tage
Percen
tage
ofTotalTow
nof
TotalTow
nof
TotalTow
nof
TotalTow
nof
TotalTow
nof
TotalTow
nof
TotalTow
nof
TotalTow
nof
TotalTow
nof
TotalTow
nPricipalEm
ployers
Emp.
Employmen
tEm
p.Em
ploymen
tEm
p.Em
ploymen
tEm
p.Em
ploymen
tEm
p.Em
ploymen
tEm
p.Em
ploymen
tEm
p.Em
ploymen
tEm
p.Em
ploymen
tEm
p.Em
ploymen
tEm
p.Em
ploymen
t
ColumbiaHe
alth
Care
Assoc/MissionOaksH
ospital
2,00
012
.31%
2,00
012
.17%
2,00
012
.60%
2,00
013
.89%
2,00
013
.29%
2,00
013
.52%
0.00
%0.00
%0.00
%0.00
%
800
4.92
%70
04.26
%70
04.41
%70
04.86
%70
04.65
%70
04.73
%56
03.73
%56
03.53
%56
03.49
%56
03.43
%
LosG
atos
Union
Scho
olDistrict
300
1.85
%30
01.83
%30
01.89
%27
51.91
%27
51.83
%23
71.60
%27
31.82
%28
01.76
%27
41.71
%26
71.64
%
LosG
atos
Saratoga
High
Scho
olDistrict
300
1.85
%30
01.83
%30
01.89
%27
01.88
%27
01.79
%25
61.73
%15
71.05
%15
70.99
%37
02.30
%36
72.25
%
0.00
%28
01.70
%80
05.04
%80
05.56
%90
05.98
%82
55.58
%1,53
010
.19%
1,97
612
.45%
1,86
411
.61%
2,11
712
.98%
200
1.23
%25
01.52
%25
01.57
%25
01.74
%25
01.66
%25
01.69
%31
42.09
%31
41.98
%31
41.95
%31
41.92
%
AlainPine
lRealto
rs0.00
%22
01.34
%22
01.39
%15
01.04
%15
01.00
%15
61.05
%15
61.04
%14
60.92
%14
80.92
%13
10.80
%
200
1.23
%0.00
%0.00
%0.00
%0.00
%0.00
%0.00
%0.00
%0.00
%0.00
%
CourtsideTenn
isClub
200
1.23
%20
01.22
%20
01.26
%20
01.39
%20
01.33
%29
51.99
%44
02.93
%44
02.77
%46
82.91
%54
23.32
%
Townof
LosG
atos
189
1.16
%14
80.90
%13
80.87
%13
60.94
%13
80.92
%14
40.97
%15
71.05
%15
81.00
%16
01.00
%15
90.97
%
0.00
%0.00
%0.00
%0.00
%0.00
%0.00
%17
91.19
%17
91.13
%17
91.11
%17
91.10
%
Vasona
CreekHe
alth
Care
Center
0.00
%0.00
%0.00
%0.00
%0.00
%0.00
%23
31.55
%23
31.47
%23
31.45
%23
31.43
%
Good
Samarita
nRe
gion
alCancer
Center
0.00
%0.00
%0.00
%0.00
%0.00
%0.00
%20
01.33
%20
01.26
%20
01.25
%20
01.23
%
Roku
0.00
%0.00
%0.00
%0.00
%0.00
%0.00
%0.00
%48
73.07
%55
43.45
%66
44.07
%
Terraces
ofLosG
atos
0.00
%0.00
%0.00
%0.00
%0.00
%0.00
%0.00
%22
81.44
%22
81.42
%22
81.40
%
Who
leFood
s
2014
/15
2011
/12
2012
/13
2013
/14
ElCaminoHo
spita
l,LosG
atos
2008
/09
2009
/10
2010
/11
2015
/16
Netflix
Safeway
Verizon
2017
/18
2016
/17
130

Dra
ft 12
/04/
2018
Townof
LosG
atos
Sche
dule14
Fulltim
eEquivalent
Employeesb
yFunctio
n/Program
LastTenFiscalYears
2008
/09
2009
/10
2010
/11
2011
/12
2012
/13
2013
/14
2014
/15
2015
/16
2016
/17
2017
/18
Functio
n/Program
Gene
ralG
overnm
ent
19.95
18.35
18.90
20.15
20.40
20.73
20.97
20.97
21.35
21.97
Police
61.00
60.00
59.50
60.50
58.00
57.50
60.00
59.00
59.00
59.00
Cultu
reandRe
creatio
n5.25
5.25
3.25
Econ
omicDe
velopm
ent
1.00
1.00
1.00
1.00
0.50
0.63
0.63
0.63
0.75
Library
10.35
10.35
8.60
8.60
8.60
10.30
10.80
11.00
12.25
12.25
Planning
18.80
17.80
15.00
16.00
17.50
17.50
19.50
19.00
19.26
19.63
PublicWorks
37.00
35.00
32.50
32.00
31.00
31.50
32.00
33.50
33.50
34.50
Total
153.35
147.75
138.75
138.25
135.50
137.53
143.90
144.10
145.98
148.10
Fulltim
eeq
uivalent
employmen
tisc
alculatedas
oneor
moreem
ployee
positions
totalingon
efullyear
ofserviceor
approxim
ately2,08
0ho
ursa
year.
Fulltim
eEquivalent
Employeesa
sofJun
e30
131

Dra
ft 12
/04/
2018
Townof
LosG
atos
Sche
dule15
Ope
ratin
gIndicators
LastTenFiscalYears
FUNCT
ION/PRO
GRA
M
Gen
eralgovernmen
t2008/09
2009/10
2010/11
2011/12
2012/13
2013/14
2014/15
2015/16
2016/17
2017/18
BuildingPe
rmits
Issued
Resid
entia
lPermits
Issued
676
733
711
747
738
813
805
899
744
849
Resid
entia
lPermits
Value
48,162,274
51,090,808
42,974,043
66,072,341
75,227,889
87,307,822
76,896,111
85,000,754
53,625,891
63,083,249
CommercialPe
rmits
Issued
24117
128
107
137
139
133
147
135
105
CommercialPe
rmits
Value
4,356,307
7,908,146
31,289,431
17,663,124
46,855,615
138,676,507
178,195,997
20,185,884
50,024,177
16,626,196
PublicallyOwne
dPe
rmits
Issued
211
11Pu
blicallyOwne
dPe
rmits
Value
2,308,160
5,732,014
40,000
Resid
entia
lParking
Perm
itsNum
bero
fSpe
cialEven
tPermits
Issued
7687
9689
125
133
127
107
118
113
Num
bero
fAnn
ualPermits
Issued
752
686
713
1,223
1,320
1,376
1,570
1,363
1,251
1,342
CityClerk
Num
bero
fCou
ncilRe
solutio
nsPassed
143
167
7659
7486
7261
6969
Num
bero
fOrdinan
cesP
assed
1316
613
2016
911
517
Num
bero
fCon
tractsPassed
197
206
218
227
220
196
222
283
240
262
Gene
ralServices
Num
bero
fPurchaseOrdersIssue
d396
365
336
358
318
301
277
334
331
322
Police
PhysicalArrests
925
831
872
690
648
641
695
987
1,030
1,164
ParkingViolations
11,148
11,512
14,377
12,938
11,991
14,421
13,321
13,975
12,863
11,784
Traffic
Violations
2,588
3,008
2,718
2,908
3,333
4,747
4,633
5,400
4,634
4,757
DUIA
rrests
88110
9889
8662
4858
6051
Library
Circulated
eaudiob
ooks
1,516
1,852
1,994
3,388
4,774
2,414
*5,867
*7,761
10,006
8,844
Other
PublicWorks
Street
Resurfacing/Overla
y/Re
constructio
n(m
iles)
3.5
4.7
4.7
8.0
8.0
10.0
1.8
8.0
10.0
2.6
ADACo
mpliance:Cu
rbRa
mps
913
1719
1919
2311
3068
Traffic
Circles
11
11
11
11
1Street
Poles
1,575
1,605
1,708
1,611
1,611
1,611
1,609
1,609
1,609
1,762
Plan
ning
andDe
velopm
entD
epartm
ent
Building&SafetyInspectio
nsPe
rformed
10,367
9,055
10,977
11,738
11,902
12,764
11,652
8,655
14,722
13,918
Rede
velopm
ent:Num
bero
factiveprojects
33
1
Source:Tow
nof
LosG
atos,Finan
ceDe
partment
FiscalYe
ar
*July2013
theLibrarysepa
ratedfrom
NorthernCA
DigitalLibrary,Patrons
hadno
longer
accessto
collections
ofmultip
lelibrarie
s.By
2014
theLibraryha
sexpan
dedits
conten
tsgiving
patron
saccesstomorematerials.
132

Dra
ft 12
/04/
2018
Townof
LosG
atos
Sche
dule16
CapitalA
sset
Statisticsb
yFunctio
n/Program
LastTenFiscalYears
2008
/09
2009
/10
2010
/11
2011
/12
2012
/13
2013
/14
2014
/15
2015
/16
2016
/17
2017
/18
Functio
n/Program
Police
Num
bero
fStatio
ns1
22
22
22
22
2Num
bero
fPatrolU
nits
1514
1414
1414
1414
1414
ParkingEnforcem
entV
ehicles
32
22
22
22
22
Other
PublicWorks
Streets(miles)
112
112
112
112
112
112
112
112
112
112
Streetlights
2,19
02,11
22,11
52,11
62,11
62,10
91,60
91,60
91,60
91,76
2Traffic
Signals
2828
2829
2929
2930
3030
Parksa
ndRe
creatio
nNum
bero
fParks
1212
1212
1212
1212
1212
Num
bero
fCom
mun
ityCe
nters
11
11
11
11
11
Parking
Num
bero
fParking
Garages
11
11
11
11
11
Num
bero
fParking
Lots
2222
2222
2222
2222
2222
Num
bero
fOffStreet
ParkingGa
rage
Spaces
1,12
61,12
61,12
61,12
61,12
61,12
61,12
61,12
61,12
61,12
6
Source:Tow
nof
LosG
atos,Finan
ceDe
partment
FiscalYe
ar
133

Dra
ft 12
/04/
2018
This page intentionally left blank
134

Dra
ft 12
/04/
2018
OTHER INDEPENDENT AUDITOR’S REPORT
135

Dra
ft 12
/04/
2018
This page intentionally left blank
136
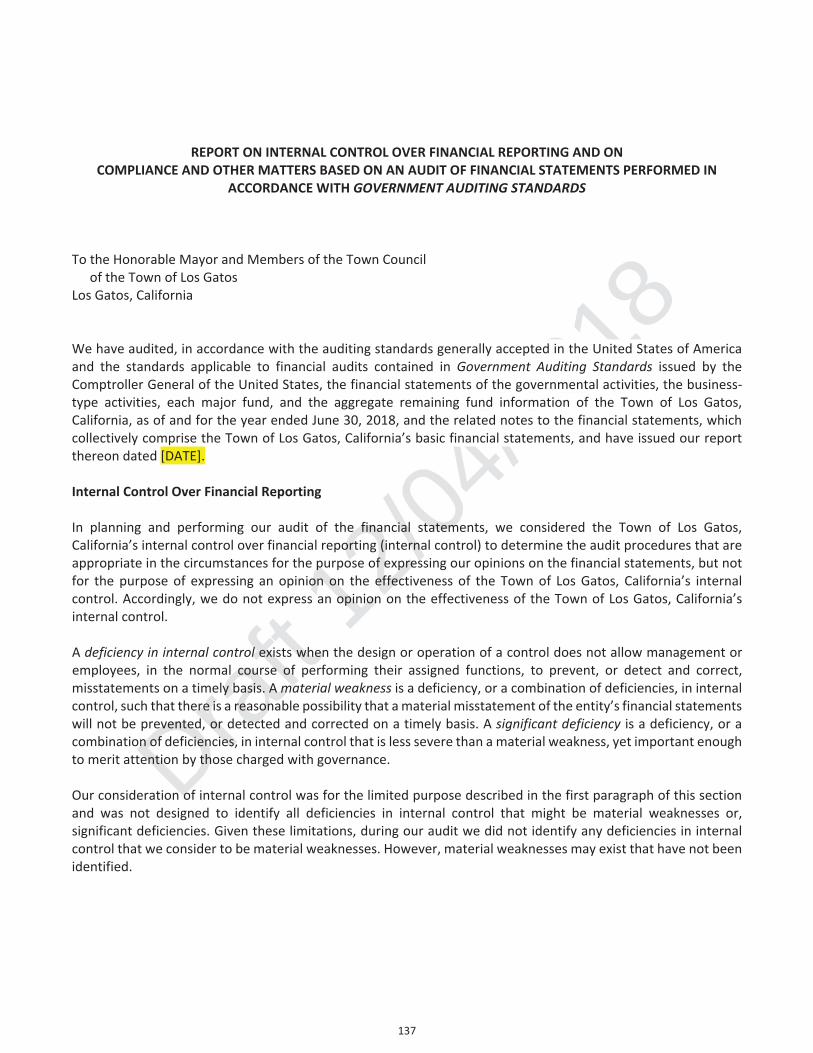
Dra
ft 12
/04/
2018
REPORT ON INTERNAL CONTROL OVER FINANCIAL REPORTING AND ONCOMPLIANCE AND OTHER MATTERS BASED ON AN AUDIT OF FINANCIAL STATEMENTS PERFORMED IN
ACCORDANCE WITH GOVERNMENT AUDITING STANDARDS
To the Honorable Mayor and Members of the Town Councilof the Town of Los Gatos
Los Gatos, California
We have audited, in accordance with the auditing standards generally accepted in the United States of Americaand the standards applicable to financial audits contained in Government Auditing Standards issued by theComptroller General of the United States, the financial statements of the governmental activities, the businesstype activities, each major fund, and the aggregate remaining fund information of the Town of Los Gatos,California, as of and for the year ended June 30, 2018, and the related notes to the financial statements, whichcollectively comprise the Town of Los Gatos, California’s basic financial statements, and have issued our reportthereon dated [DATE].
Internal Control Over Financial Reporting
In planning and performing our audit of the financial statements, we considered the Town of Los Gatos,California’s internal control over financial reporting (internal control) to determine the audit procedures that areappropriate in the circumstances for the purpose of expressing our opinions on the financial statements, but notfor the purpose of expressing an opinion on the effectiveness of the Town of Los Gatos, California’s internalcontrol. Accordingly, we do not express an opinion on the effectiveness of the Town of Los Gatos, California’sinternal control.
A deficiency in internal control exists when the design or operation of a control does not allow management oremployees, in the normal course of performing their assigned functions, to prevent, or detect and correct,misstatements on a timely basis. Amaterial weakness is a deficiency, or a combination of deficiencies, in internalcontrol, such that there is a reasonable possibility that amaterial misstatement of the entity’s financial statementswill not be prevented, or detected and corrected on a timely basis. A significant deficiency is a deficiency, or acombination of deficiencies, in internal control that is less severe than a material weakness, yet important enoughto merit attention by those charged with governance.
Our consideration of internal control was for the limited purpose described in the first paragraph of this sectionand was not designed to identify all deficiencies in internal control that might be material weaknesses or,significant deficiencies. Given these limitations, during our audit we did not identify any deficiencies in internalcontrol that we consider to be material weaknesses. However, material weaknesses may exist that have not beenidentified.
137

Dra
ft 12
/04/
2018
To the Honorable Mayor and Members of the Town Councilof the Town of Los Gatos
Los Gatos, CaliforniaPage 2
Compliance and Other Matters
As part of obtaining reasonable assurance about whether the Town of Los Gatos, California’s financialstatements are free from material misstatement, we performed tests of its compliance with certainprovisions of laws, regulations, contracts, and grant agreements, noncompliance with which could have adirect and material effect on the determination of financial statement amounts. However, providing anopinion on compliance with those provisions was not an objective of our audit, and accordingly, we do notexpress such an opinion. The results of our tests disclosed no instances of noncompliance or other mattersthat are required to be reported under Government Auditing Standards.
Purpose of this Report
The purpose of this report is solely to describe the scope of our testing of internal control and complianceand the results of that testing, and not to provide an opinion on the effectiveness of the entity’s internalcontrol or on compliance. This report is an integral part of an audit performed in accordancewithGovernmentAuditing Standards in considering the entity’s internal control and compliance. Accordingly, thiscommunication is not suitable for any other purpose.
Badawi & AssociatesCertified Public AccountantsOakland, CaliforniaDATE
138

PREPARED BY: STEPHEN CONWAY Finance Director Reviewed by: Town Manager, Assistant Town Manager, and Town Attorney
110 E. Main Street Los Gatos, CA 95030 ● 408-354-6832
www.losgatosca.gov
TOWN OF LOS GATOS
FINANCE COMMITTEE REPORT
MEETING DATE: 12/10/2018 ITEM NO: 4 DESK ITEM
DATE: DECEMBER 10, 2018
TO: COUNCIL FINANCE COMMITTEE
FROM: LAUREL PREVETTI, TOWN MANAGER
SUBJECT: DISCUSS BUDGET STABILIZATION, CATASTROPHIC, INTERNAL SERVICE FUNDS (ISF), AND COMPENSATED ABSENCES RESERVES
REMARKS: Attachment 2 contains public comments received after the distribution of the Council Finance Committee packet between 11 a.m. on Friday December 7, 2018 and before 11:00 a.m. on Monday December 10, 2018. A public comment referenced the consultant utilized for this Agenda item. Attachment 3 contains the consultant’s professional qualifications. Below are responses to a Council Finance Committee’s member inquiry regarding the staff report 1) The Internal Service Funds are generating cash which is being transferred out somewhere for some other use. Where are we transferring to? The table below provides a five-year detail of Council authorized transfers that illustrate the approval and purpose for each fund transfer out. Staff is also including a schedule of Council approved transfers into Internal Service Funds.

PAGE 2 OF 3 SUBJECT: DISCUSS BUDGET STABILIZATION, CATASTROPHIC, INTERNAL SERVICE FUNDS
(ISF), AND COMPENSATED ABSENCES RESERVES DATE: DECEMBER 10, 2018
N:\MGR\AdminWorkFiles\Council Committee - FINANCE\2018\12-10-2018\Item 4 - Desk Item.docx 12/10/2018 1:22 PM
REMARKS (continued):
Internal Service Fund Transfers In as Approved by Town Council
FY 2017/18 FY 2016/17 FY 2015/16 FY 2014/15 FY 2013/14
611 Town Liability (ABAG)Vehicle Maintenance Fund Adopted Budget Liability Program BA-15-26 500,000$
612 Workers Comp
621 Information TechnologyGeneral Fund BT-18-10 PD Wall Maps 5,371$
631 Equipment ReplacementGeneral Fund Adopted Budget Repay Almond Grove Alloc 300,000$ CIP GFAR BA-18-13 Equipment Purchase (Tractor) 98,000$ General Fund (PD Foundation) MAV Equipment 15,000$ Information Technology Fund IT Master Plan Equipment 16,066$
632 Vehicle Maintenance
633 Facilities MaintenanceGeneral Fund Adopted Budget 300,000$
Internal Service Fund Transfers Out as Approved by Town Council
FY 2017/18 FY 2016/17 FY 2015/16 FY 2014/15 FY 2013/14
611 Town Liability (ABAG)
612 Workers Comp
621 Information TechnologyEquipment Replacement Fund 631 IT Master Plan Equipment 16,066$
631 Equipment ReplacementCIP 411-821-2402 PD & PPW Radio Replacement 295,680$ CIP 411-811-0003 Almond Grove Street Rehab 1,488,687$
632 Vehicle MaintenanceABAG Fund 611 Liability Prog 1202 500,000$
633 Facilities MaintenanceCIP 411-821-2302 Corp Yard Building 12,146$ Capital Projects 411 CIP Old Library Reuse 664,441$ 89,977$ Capital Projects 411 CIP HVAC 200,000$ Capital Projects 411 CIP PPW Admin Building 40,207$ 9,793$ Capital Projects 411 CIP GFAR 8011 20,000$ Capital Projects 411 CIP Civic Center Deck Waterproofing 69,096$ Capital Projects 411 CIP Electric Vehicle Charging Station 50$

PAGE 3 OF 3 SUBJECT: DISCUSS BUDGET STABILIZATION, CATASTROPHIC, INTERNAL SERVICE FUNDS
(ISF), AND COMPENSATED ABSENCES RESERVES DATE: DECEMBER 10, 2018
N:\MGR\AdminWorkFiles\Council Committee - FINANCE\2018\12-10-2018\Item 4 - Desk Item.docx 12/10/2018 1:22 PM
REMARKS (continued): 2) We never use more than about $5M a year yet the Internal Service Fund cash balance is almost always over $10M. Is $10M too much to carry?
The approximate $10.7 million cash balance held by the Town in its Internal Service Funds at June 30, 2018 is spread out into seven internal service funds covering various risks and Town-wide services, such as workers compensation, general liability, facilities maintenance and repair, information technology services and related software/hardware, among others. Staff prepared a survey of comparable cities in Santa Clara County and found that there are variety of ways these risks and operations are funded with some cities only carrying three internal service funds and some with 9 funds. The peer analysis reveals that the majority of our comparable cities manage budgetary risks through the provision of Internal Service Fund structures or by holding funds in in a General Fund reserve account.
Attachment previously distributed with the Staff Report: 1. Analysis of the Budget Stabilization and Catastrophic Reserves Attachment received with this Desk Item: 2. Public comments received after the distribution of the Council Finance Committee packet
between 11 a.m. on Friday December 7, 2018 and before 11:00 a.m. on Monday December 10, 2018.
3. William C. Statler Biography

GUNGVARI
Typewritten Text
GUNGVARI
Typewritten Text
ATTACHMENT 2


ATTACHMENT A A RISK-BASED ANALYSIS OF GENERAL FUND RESERVE REQUIREMENTS FOR THE CITY OF NEWPORT BEACH, CALIFORNIA DRAFT – MAY 2018

A Risk-Based Analysis of General Fund Reserve Requirements for the City of Newport Beach,
California
Draft – May 2018
Produced by:
The Government Finance Officers Association

A Risk-Based Analysis of General Fund Reserve Requirements for the City of Newport Beach
Produced by the Government Finance Officers Association Page 2 of 57
Table of Contents
Section 1 - Executive Summary ..................................................................................................................... 3
Section 2 - Introduction ................................................................................................................................ 6
Section 3 - The Approach to Uncertainty ...................................................................................................... 8
Section 4 - Extreme Events ......................................................................................................................... 12
Section 5 - Revenue Volatility ..................................................................................................................... 33
Section 6 - Secondary Risks ......................................................................................................................... 43
Section 7 - Putting it All Together ............................................................................................................... 50
Section 8 - Next Steps ................................................................................................................................. 55
Section 9 - Appendix 1: Reserves in Comparable Cities .............................................................................. 56

A Risk-Based Analysis of General Fund Reserve Requirements for the City of Newport Beach
Produced by the Government Finance Officers Association Page 3 of 57
Section 1 - Executive Summary A local government’s “reserves” are the portion of fund balance serves as a hedge against risk. The City of Newport Beach (City) has asked the question: “what is the right amount of general fund reserves for us?” The Government Finance Officers Association (GFOA) has helped the City answer this question by examining the risks that the City is subject to.
First, we identified the risks that posed the most clear and present danger to the City. According to the City’s disaster management plan, these include earthquakes, floods, and fires. Landslides and high winds could also be potentially damaging, but less so than earthquakes, floods, and fires. We also accounted for the other risks, such as the potential for decreased revenues and increased pension costs due to an economic downturn.
Next, for each risk we calculated the probability that the City would experience one of the aforementioned risks over a ten-year period and, if an event did occur, what the magnitude of the loss would be for the City’s general fund. To calculate the probability and magnitude of events, we primarily used the following sources of data:
• Newport Beach’s own experience. For example, the City’s revenue losses during 2001 “Dot.Bomb” recession and 2007 “Great Recession” provide insight into the potential losses the City could incur during a future recession.
• The experience of other California cities. Fortunately, Newport Beach hasn’t had a lot of direct experience with many of the extreme events it is at risk for. The experiences of other California cities can serve as analogues.
• Research produced by other agencies. For example, the United States Geological Survey makes available information on the likelihood of earthquakes in the Los Angeles area.
• Expertise of City staff. City staff work every day on preparing the City for the risks it faces. Staff helped us fill in gaps in the source of data above. For example, the City’s fire chief helped estimate the cost to respond to a wildfire.
We modeled each risk individually and then combined each individual risk into a ten-year model of the City’s reserves. Our analysis produced the graph below. The vertical axis represents a given amount of reserves that the City might choose to hold. The horizontal axis represents the level of confidence the City could have that a given amount of reserves would be sufficient to cover the losses the City might incur over a ten-year period. For example, the City can be 80% confident that a reserve of $10.4 million would cover the City’s extraordinary general fund expenditures for the risks covered in this report over a ten-year period.

A Risk-Based Analysis of General Fund Reserve Requirements for the City of Newport Beach
Produced by the Government Finance Officers Association Page 4 of 57
Exhibit 1.1: Confidence that a Given Level of General Fund Reserves will be Sufficient over 10 Years
Reserves (Millions of Dollars)
Percent Confidence
GFOA cannot prescribe a precise level of reserves because the exact amount the City might wish to maintain is a product of the City’s appetite for risk. However, we can make a number of suggestions to help the City identify a risk management strategy that makes sense for Newport Beach.
• There is a point at which the curve begins to rise sharply. This is the point at which the City starts to receive less value from reserves. In the graph above, this is between the 80% confidence level ($10.4 million) and 90% confidence level ($13.0 million). This represents the range at which reserves produce the best value for the City.
• The City should supplement reserves with other risk management strategies. Understandably, City officials might not be satisfied with an 80% or 90% chance of being able to cover damages from the risks we described in this report. Other financial risk management tools like debt or insurance could be used to provide additional confidence.
• The City may wish to have some reserves beyond our efficient range to account for the fact that
our analysis cannot account for every risk the City could possibly experience. Our analysis does cover the most clear and present dangers to the City, but some additional amount of reserves could be prudent.

A Risk-Based Analysis of General Fund Reserve Requirements for the City of Newport Beach
Produced by the Government Finance Officers Association Page 5 of 57
• The City can examine the reserves held by comparable cities. Our examination of comparable cities suggests that the efficient range of reserves we found is in line with the emergency reserves maintained by other cities.
• The City could elect to hold more reserves than our recommended efficient range based on global
climate change. Our analysis is based on historical records. Global climate change could increase the City’s vulnerability to naturally occurring extreme events.1 Hence, historical data could underestimate the likelihood and/or severity of extreme events in the future. Unfortunately, no one can say precisely what the impact of climate change will be. Hence, GFOA could not make an objective adjustment to the results of our analysis. This means that there could be a case for reserving a higher amount than the efficient range described above (or pursuing other risk management strategies). GFOA’s Microsoft Excel risk model2 provides the City with the ability to adjust the likelihood and/or magnitude of future extreme events, if it would like to test different scenarios. For example, if we were to double the likelihood of a flood then the 80% and 90% confidence levels increase to $10.8 million and $13.5 million, respectively.
• Select a range of preferred reserves, instead of a single target number. GFOA’s research into how local governments can best maintain financial sustainability has found that decision-making “boundaries” are essential. For example, if the City were to adopt a policy to maintain reserves between X% and Y% of revenues, then that would constitute a clear boundary that defines when reserves are too high and too low. Compare this to if the City just adopted a policy of that reserves should be at X% of revenues. It is then impossible to say how far reserves can go above or below this number and still be at acceptable levels. A range also can accommodate the risk appetites of more City officials. Thus, a range might be more reflective of the preferences of a greater number of people.
1 According to “The Impact of Climate Change on Natural Disaster”, an article from NASA’s “Earth Observatory”: “outcomes of an increase in global temperatures include increased risk of drought and increased intensity of storms, including tropical cyclones with higher wind speeds, a wetter Asian monsoon, and, possibly, more intense mid-latitude storms.” https://earthobservatory.nasa.gov/Features/RisingCost/rising_cost5.php?src=share 2 GFOA provides the model to the City so that the City can update the model on its own.

A Risk-Based Analysis of General Fund Reserve Requirements for the City of Newport Beach
Produced by the Government Finance Officers Association Page 6 of 57
Section 2 - Introduction “Reserves” are the portion of a local government’s fund balance that are available to respond to the unexpected. Reserves are the cornerstone of financial flexibility. Reserves provide a government with options to respond to emergencies and afford a buffer against shocks and other forms of risk. Managing reserves, though, can be a challenge. Foremost, is the question of how much money to maintain in a general fund reserve? How much is enough and when does a reserve become too much? This can be a sensitive question because money held in reserve is money taken from constituents, and the argument could be made that excessive reserves should be returned to residents in the form of lower taxes/fees or enhanced services.
The City of Newport Beach has been considering this question recently, especially given its vulnerability to extreme events like earthquakes and floods and because of the potential for revenue instability owing to an economic downturn. The City engaged the GFOA to help produce a recommendation to help the City decide how much reserves is appropriate for the general fund. GFOA is a non-profit association of over 19,000 state and local government finance professionals and elected officials from across North America. A key part of GFOA’s mission is to promote best practices in public finance, including reserve policies.
GFOA’s approach to reserves does not suppose “one-size-fits-all.” But, GFOA’s “Best Practice” on general fund reserves recommends, at a minimum, that general-purpose governments, regardless of size, maintain reserves of no less than two months of regular operating revenues or regular operating expenditures (i.e., reserves equal to about 16.7 percent of revenues).3 However, this 16.7 percent is only intended as a rule-of-thumb, and it needs to be adjusted according to local conditions. To make the adjustment, GFOA worked with the City to conduct an analysis of the risks influencing the need for reserves as a hedge against uncertainty and loss.
A “risk” is defined as the probability and magnitude of a loss, disaster, or other undesirable event.4 The GFOA’s framework of risk assessment is based on the risk management cycle: identify risk; assess risk; identify risk mitigation approaches; assess expected risk reduction; and select and implement mitigation methods. The framework focuses primarily on risk retention, or using reserves, to manage risk. However, the framework also encourages the City to think about how other risk management methods might alleviate the need to hold larger reserves. In other words, can the City manage its risks in some other way besides holding reserves? For example, could insurance or debt instruments complement the City’s reserve strategy? A thorough examination of the risk factors should lead to a range of desired reserves and improve the City’s understanding of its overall risk profile.
3 GFOA Best Practice. “Appropriate Level of Unrestricted Fund Balance in the General Fund.” GFOA. 2009. 4 Definition of risk taken from: Douglas W. Hubbard. The Failure of Risk Management: Why It’s Broken and How to Fix It. John Wiley and Sons, Inc. Hoboken, New Jersey. 2009.

A Risk-Based Analysis of General Fund Reserve Requirements for the City of Newport Beach
Produced by the Government Finance Officers Association Page 7 of 57
As a first step to this project, GFOA conducted a review of the risk factors influencing the amount of reserves a municipal government should hold.5 This review enabled the City and GFOA to classify factors as either primary or secondary risks. Exhibit 1.1 lists how the risk factors were classified.
Exhibit 2.1 – Categorization of Risk Factors that Influence Reserve Levels for Newport Beach
Primary Risk Factors
Vulnerability to extreme events and public safety concerns, with emphasis on:
• Earthquakes
• Floods (includes landslides and tsunamis)
• Fires
• High Winds
Revenue source stability, particularly as it relates to the potential for revenue decline from an economic downturn
Secondary Risk Factors
Pension costs increase owing to underperformance of plan assets during an economic downturn
Leverage from indebtedness (other than pensions)
Liquidity concerns
Expenditure spikes (e.g., from impending lawsuits)
Growth
The next section gives an overview of how we analyze these risks and what you can expect to see in the rest of this report.
5 The risk factors and basic review method were developed and published in the GFOA publication: Shayne C. Kavanagh. Financial Policies. (Government Finance Officers Association: Chicago, IL) 2012.

A Risk-Based Analysis of General Fund Reserve Requirements for the City of Newport Beach
Produced by the Government Finance Officers Association Page 8 of 57
Section 3 - The Approach to Uncertainty The accomplished forecasting scientist, Spyros Makridakis, suggests a “Triple-A” approach for dealing with highly uncertain phenomena.6
1. Accept. First we must accept that we are subject to uncertainty. For example, earthquakes could experience a great deal of variability, from a barely noticeable tremor to “the big one”.
2. Assess. Next, we must assess the potential impact of the uncertainty, with history providing a useful reference point. The experiences of other local governments is also a good reference point. For example, we used the historical experiences of Newport Beach and other California cities to estimate the potential impact of future extreme events.
3. Augment. The range of uncertainty we actually face will almost always be greater than what we initially assess it to be. Therefore, we must augment our understanding of risk beyond what our historical experiences show us. For example, the City has not experienced a major wildfire recently. This does not mean there is no risk of a future wildfire. Also, the City has not experienced a major earthquake, but it could in the future. We can augment our understanding of risk using a technique called “Probability Management”.7 Probability Management is an application of modern information processing technology that allows us to simulate thousands of potential events (e.g., wildfires, earthquakes) so that we can observe the probability of events of various magnitudes coming to pass.
In order to use Probability Management, we express any given type of extreme event as a range of possibilities that the City might experience. This range is called a “distribution”. A distribution is a shape that signifies how frequently the City might expect to experience a certain type of event and/or how severe the event might be. The most common type of distribution is called the “normal distribution”, more popularly known as the “bell curve”. Many phenomena fit a bell curve. To help us understand how to read a distribution, we can start with an example that is related to everyday life: Exhibit 3.1 shows a bell curve for the height of American men. The horizontal axis of Exhibit 3.1 represents height. The vertical axis represents frequency. 5’9” is the most common height, so it is shown at the top of the curve. Much taller men, like NBA centers, would be found on the right-hand side of the curve. Very short men would be found on the left.
6 See: Spyros Makridakis, Robin Hogarth, and Anil Gaba. Dance with Chance: Making Luck Work for You. (Oneworld Publications: Oxford, England). 2009. 7 The discipline of “Probability Management” was developed by Dr. Sam Savage, author of The Flaw of Averages. You can learn more about Probability Management at probabilitymanagement.org.

A Risk-Based Analysis of General Fund Reserve Requirements for the City of Newport Beach
Produced by the Government Finance Officers Association Page 9 of 57
Exhibit 3.1 – The Normal Distribution for American Men
Frequency
Height
The normal distribution can help analyze the City’s risk. To illustrate, the severity of an economic downturn is roughly normally distributed. A few economic downturns are slight, few are severe, but most are closer to average.
Another common type of distribution we use in our analysis is called a “lognormal” distribution. A lognormal distribution is shown in Exhibit 3.2. Earthquakes, for example, fit a lognormal distribution. Exhibit 3.2 shows that tremors of a small magnitude are the most common type of earthquake, by far. Large magnitude earthquakes are very rare.
Exhibit 3.2 – Lognormal Distribution for Earthquakes
Frequency
Magnitude
Very Short Very Tall
Average 5’9”

A Risk-Based Analysis of General Fund Reserve Requirements for the City of Newport Beach
Produced by the Government Finance Officers Association Page 10 of 57
Expressing Newport Beach’s vulnerability as distributions allows us to calculate the probability that an event of a given magnitude will come to pass. When we associate a dollar amount with that event, we can estimate the probability or chance that Newport Beach will need to have a given amount of money on-hand to respond. Exhibit 3.3 is not a distribution, but is a type of graphic we will use often in this report. It is called a “cumulative probability chart”. It shows that increasing amounts of reserves are needed to gain more confidence that the City will have enough money to cover the extraordinary cost to the general fund arising from an earthquake. We can see that reserving $2.0 million will give the City a 90% chance of being able to cover the costs that the general fund would incur as a result of an earthquake. The curve is relatively flat for most of the chart and then begins to move sharply upward. This is because increasingly large amounts of money are needed to cover the costs from the most extreme earthquakes.
Exhibit 3.3 - Percent of Earthquake’s Covered by Varying General Fund Reserve Levels
As we move to the right of the graph, the amount Newport Beach needs to reserve to cover the cost of an earthquake increases. At the top right, as the line color changes to orange, it indicates an
increasing level of reserves to address greater than 95% confidence level.
For most risks the City faces, GFOA recommends a range of possible reserve amounts for the City to consider. This is because there is never one single, objectively best amount of reserves to hold. The amount of reserves the City will want hold will partially be a function of the City’s willingness to take on risk. If City officials are willing to take on risk, they might opt for lower reserves and spending more money on current services. If officials are more risk averse, they might opt for higher reserves. GFOA’s recommended ranges of reserves are based on where reserves produce the best value or “bang for the buck”. For example, on Exhibit 3.3 we see that to go from 95% confidence to 99% confidence would require an extraordinary amount of money. Conversely, to go from 75% to 80% does not cost nearly as much. Hence, we recommend that the City pick reserve targets that offer the best value. On Exhibit 3.3, we see that range lies between $1.1 million and $2.0 million for earthquakes. Other strategies for covering risk beyond these amounts may be more financially savvy (e.g., debt or insurance).
$0.0
$1.0
$2.0
$3.0
$4.0
$5.0
$6.0
5% 10% 15% 20% 25% 30% 35% 40% 45% 50% 55% 60% 65% 70% 75% 80% 85% 90% 95% 99%
Mill
ions
At 85% confidence level, the City would require $1.1 million in reserves.
At 90% confidence level, the City would require $2.0 million in reserves.

A Risk-Based Analysis of General Fund Reserve Requirements for the City of Newport Beach
Produced by the Government Finance Officers Association Page 11 of 57
In Section 4 of this report, we will review all of the City’s primary risks posed by extreme events. In Section 5, we cover revenue instability owing to economic downturns. We will analyze them in the manner described above and suggest where reserves offer the greatest value. Section 6 reviews secondary risk factors that have less weighty implications for the City’s reserve strategy. These risks will be analyzed in a similar way to the primary risks.
After we analyze the individual risks, in Section 7, we will consider the risks holistically. This section will address the following concerns:
• It is highly unlikely that the City will experience many of the extreme events discussed in this report in a short time period. This means that simply adding the reserve amounts for each event on top of one another would cause the City to reserve more than its appetite for risk suggests is needed.
• Considering the risks over a multi-year time period provides a more complete perspective on potential vulnerability and how to use reserves.
• The occurrence of one risk could impact the likelihood of another. For example, a severe economic downturn could lead to lower returns on the City’s pension assets, leading to higher pension costs.
In Section 8, we provide our recommended steps for how the City might move forward using our analysis.

A Risk-Based Analysis of General Fund Reserve Requirements for the City of Newport Beach
Produced by the Government Finance Officers Association Page 12 of 57
Section 4 - Extreme Events Although Newport Beach has received reimbursement from insurance and public agencies in the past for natural disasters and has insurance coverages that would help in recovery from future disasters, having adequate reserves in place is important to quickly and decisively respond to extreme events. For example, FEMA reimbursement will not over all the costs the City incurs and it could be months, if not years, to receive reimbursement. As the City’s hazard mitigation plan indicates, earthquakes, floods, wildfires, landslides, and strong winds are potentially the most costly natural disasters for Newport Beach.8 In discussions with City staff, the first three disasters represent the greatest risk and will be the focus of this section of the analysis.
Fortunately, Newport Beach has not experienced a substantial earthquake in recent history. Therefore, we have no historical data to suggest what damage an earthquake might do. Instead, we will rely on historical data for earthquakes that have occurred in other areas in California. We use these cases to establish the range of potential damage that Newport Beach might experience.
We cannot assume that all the points along the range of potential damages is equally likely – for example, it is more likely that Newport Beach will experience seismic activity of smaller magnitude than a large seismic event. Theory suggests, and our examination of the data confirms, that the range of potential damages takes the shape of a lognormal curve. Simply stated, Newport Beach is much more likely to incur natural disasters of less severity and lower cost with greater frequency than higher cost, more severe
8 City of Newport Beach, CA, “Local Hazard Mitigation Plan,” 2016.
FEMA, CalOES, and Reserves
The U.S. Federal Emergency Management Agency (FEMA) reimburses local governments for monies spent in response to a federally-declared disaster. The California Governor's Office of Emergency Services (CalOES) provides assistance to local governments for State of California-declared disasters.
In both cases, reimbursement is only partial (typically 75 percent for FEMA) and is often not immediate. Therefore, local governments must have the financial capacity to respond quickly and decisively, independent of other governmental financial support.
Frequency
of Quake
Exhibit 4.1 – Sample Lognormal Curve
Severity of Quake
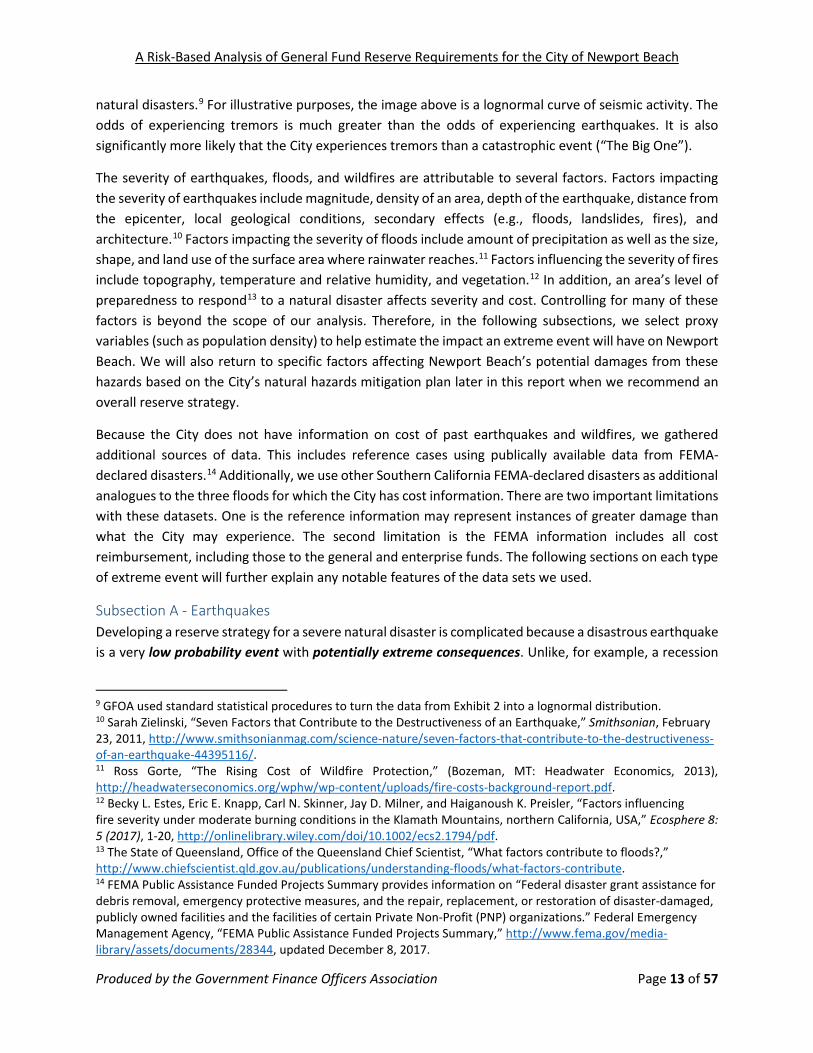
A Risk-Based Analysis of General Fund Reserve Requirements for the City of Newport Beach
Produced by the Government Finance Officers Association Page 13 of 57
natural disasters.9 For illustrative purposes, the image above is a lognormal curve of seismic activity. The odds of experiencing tremors is much greater than the odds of experiencing earthquakes. It is also significantly more likely that the City experiences tremors than a catastrophic event (“The Big One”).
The severity of earthquakes, floods, and wildfires are attributable to several factors. Factors impacting the severity of earthquakes include magnitude, density of an area, depth of the earthquake, distance from the epicenter, local geological conditions, secondary effects (e.g., floods, landslides, fires), and architecture.10 Factors impacting the severity of floods include amount of precipitation as well as the size, shape, and land use of the surface area where rainwater reaches.11 Factors influencing the severity of fires include topography, temperature and relative humidity, and vegetation.12 In addition, an area’s level of preparedness to respond13 to a natural disaster affects severity and cost. Controlling for many of these factors is beyond the scope of our analysis. Therefore, in the following subsections, we select proxy variables (such as population density) to help estimate the impact an extreme event will have on Newport Beach. We will also return to specific factors affecting Newport Beach’s potential damages from these hazards based on the City’s natural hazards mitigation plan later in this report when we recommend an overall reserve strategy.
Because the City does not have information on cost of past earthquakes and wildfires, we gathered additional sources of data. This includes reference cases using publically available data from FEMA-declared disasters.14 Additionally, we use other Southern California FEMA-declared disasters as additional analogues to the three floods for which the City has cost information. There are two important limitations with these datasets. One is the reference information may represent instances of greater damage than what the City may experience. The second limitation is the FEMA information includes all cost reimbursement, including those to the general and enterprise funds. The following sections on each type of extreme event will further explain any notable features of the data sets we used.
Subsection A - Earthquakes Developing a reserve strategy for a severe natural disaster is complicated because a disastrous earthquake is a very low probability event with potentially extreme consequences. Unlike, for example, a recession
9 GFOA used standard statistical procedures to turn the data from Exhibit 2 into a lognormal distribution. 10 Sarah Zielinski, “Seven Factors that Contribute to the Destructiveness of an Earthquake,” Smithsonian, February 23, 2011, http://www.smithsonianmag.com/science-nature/seven-factors-that-contribute-to-the-destructiveness-of-an-earthquake-44395116/. 11 Ross Gorte, “The Rising Cost of Wildfire Protection,” (Bozeman, MT: Headwater Economics, 2013), http://headwaterseconomics.org/wphw/wp-content/uploads/fire-costs-background-report.pdf. 12 Becky L. Estes, Eric E. Knapp, Carl N. Skinner, Jay D. Milner, and Haiganoush K. Preisler, “Factors influencing fire severity under moderate burning conditions in the Klamath Mountains, northern California, USA,” Ecosphere 8: 5 (2017), 1-20, http://onlinelibrary.wiley.com/doi/10.1002/ecs2.1794/pdf. 13 The State of Queensland, Office of the Queensland Chief Scientist, “What factors contribute to floods?,” http://www.chiefscientist.qld.gov.au/publications/understanding-floods/what-factors-contribute. 14 FEMA Public Assistance Funded Projects Summary provides information on “Federal disaster grant assistance for debris removal, emergency protective measures, and the repair, replacement, or restoration of disaster-damaged, publicly owned facilities and the facilities of certain Private Non-Profit (PNP) organizations.” Federal Emergency Management Agency, “FEMA Public Assistance Funded Projects Summary,” http://www.fema.gov/media-library/assets/documents/28344, updated December 8, 2017.

A Risk-Based Analysis of General Fund Reserve Requirements for the City of Newport Beach
Produced by the Government Finance Officers Association Page 14 of 57
that will almost certainly happen within the foreseeable future due to routine economic cycles, Newport Beach may not experience a severe earthquake for many years. For a risk factor like revenue volatility (due to a recession) it makes sense to reserve an amount that is within the relatively well-defined range suggested by the City’s historical experiences because we know that: A) a recession will happen in the foreseeable future, and B) certain tax revenues will decline by a roughly predictable amount at that time.
To deal with the unique problems posed by a severe earthquake, we turn to the emerging field of municipal “resiliency.”15 Resiliency is defined as a government’s ability to absorb an extreme event and bounce back from it. Further, resiliency is enhanced when a government has multiple options to respond to an extreme event. When considering financial preparedness to respond, a municipality has three basic options.
• Reserves. Reserves are under the complete control of a municipality, thus provide the most flexibility.
• Debt. A municipality could access the debt market to pay for costs of responding. • Insurance. A municipality could purchase insurance to provide reimbursement of costs incurred.
For a lower probability event with potentially extreme consequences, there are disadvantages to relying exclusively on reserves. Chief among them include, the length of time to accumulate sufficient reserves to cover the costs associated with a catastrophic event and the important opportunity costs of holding these monies in reserve – for example, a municipality could use the money to lower taxes or provide more services. The resiliency philosophy suggests that we should think about how all three options could be used to create financial preparedness to deal with an extreme event or a natural disaster.
In order to think about how the three funding mechanisms above might apply to the City’s financial preparedness strategy for earthquakes, we first need to better define the range of damages the City could experience. To do this, we draw from earthquake events listed in FEMA’s database for California cities and towns. The reference examples reflect a similar seismic hazard risk profile as Newport Beach, according to the U.S. Geological Survey.16 In fact, Newport Beach experienced some light shaking from the 2010 Baja California earthquake listed below, but did not incur major unexpected costs to its general fund.17 Exhibit 4.A.1 lists the events (including magnitude of earthquake, as applicable), estimated damages18 adjusted for inflation to 2017 dollars, population density at the year of the event, and estimated damages per capita.
15 See for example, the Rockefeller Foundations “100 Resilient Cities” program, of which GFOA is a partner. www.100resilientcities.org. 16 U.S. Geological Survey, “Simplified 2014 Hazard Map (PGA, 2% in 50 years), https://earthquake.usgs.gov/hazards/hazmaps/conterminous/2014/images/HazardMap2014_lg.jpg 17 City of Newport Beach, CA, “Local Hazard Mitigation Plan,” 2016. 18 GFOA estimates the total cost using the typical FEMA reimbursement rate of 75 percent of total cost.

A Risk-Based Analysis of General Fund Reserve Requirements for the City of Newport Beach
Produced by the Government Finance Officers Association Page 15 of 57
Exhibit 4.A.1: Estimated Damages from Select California Earthquakes
Estimated Damages
(2017 $)
Population Density (year
of event)
Estimated Damage per
Capita
2003 San Simeon - 6.6 magnitude
Arroyo Grande $30,943 2,849 $11
Atascadero $36,888,800 1,077 $34,248
Morro Bay $380,373 1,960 $194
Pismo Beach $32,552 2,315 $14
San Luis Obispo $9,815 3,464 $3
Guadalupe $948,145 4,975 $191
Santa Maria $52,292 3,855 $14
Subtotal $38,342,920 20,495 $1,871
2010 Baja California - 7.2 magnitude
Brawley $48,205 3,249 $15
Calexico $9,002,756 4,597 $1,958
Calipatria $180,405 2,071 $87
El Centro $2,100,258 3,845 $546
Holtville $3,294,249 5,164 $638
Imperial $695,131 2,518 $276
Subtotal $15,321,004 21,444 $714
2014 South Napa - 6.0 magnitude
American Canyon $71,048 4,229 $17
Calistoga $7,866 2,040 $4
Napa $11,171,809 4,485 $2,491
Yountville $681,714 1,884 $362
Benicia $103,049 2,160 $48
Vallejo $717,781 3,920 $183
Subtotal $12,753,267 18,718 $681
TOTAL $66,417,191 60,657 $1,095
Mean $3,495,642 3,192 $1,095
Median $380,373 3,249 $117
Sources: Federal Emergency Management Agency and U.S. Census Bureau
Compared to the other two earthquakes referenced, the 2010 Baja California earthquake incurred the lowest damage per capita at $714. However, Calexico’s damages per capita were higher than the other affected municipalities in the dataset for the event. Atascadero’s damages from the 2003 San Simeon earthquake are the highest amongst the reference examples and represents an extreme case due to high

A Risk-Based Analysis of General Fund Reserve Requirements for the City of Newport Beach
Produced by the Government Finance Officers Association Page 16 of 57
cost of repairing its historic city hall building.19 Due to this and for the purpose of the analysis, we remove Atascadero from the sample cost per capita and will return to it at the end of this subsection.
Because the estimated damages reflect total cost to the entire municipal government and this analysis focuses on the general fund only, we need to adjust these figures to make them relevant to the general fund. We do this by assuming that the general fund’s share of the assets owned by the municipality will be roughly analogous to the share of damages experienced by the general fund.20 This ratio is shown in the exhibit below as general fund’s share of total assets. We apply this ratio to the estimated damages per capita figures shown in Exhibit 4.A.1. Exhibit 4.A.2 lists the estimated general fund damage per capita.21
To arrive at a general fund reserve recommendation, we first translate the reference cost per capita in Exhibit 4.A.2 and apply it to Newport Beach’s current population density of 3,641 residents per square mile. This results in total estimated cost ranging from $6,000 to $7.3 million, which is far too vast to be of much help in making decisions about Newport Beach’s financial strategy. Therefore, we assume potential earthquake damage to take the shape of a lognormal distribution, where the City is much more likely to experience a minor rather than an extreme earthquake.22
19 Creig P. Sherbune, “Financing City Hall: A look at who’s paying the $34 million,” Atascadero News, September 23, 2011, http://www.atascaderonews.com/v2_news_articles.php?heading=0&story_id=4237&page=72. 20 We exclude land since land is not susceptible to earthquake damage in the same way as the built environment. 21 According to Holtville’s FY 2016 CAFR, it does not maintain a complete accounting of capital assets. Thus, the relative share of capital assets for governmental activities is unavailable and we exclude it from the reference set as well. 22 GFOA used standard statistical procedures to turn the data from Exhibit 3.A.2 into a lognormal distribution.
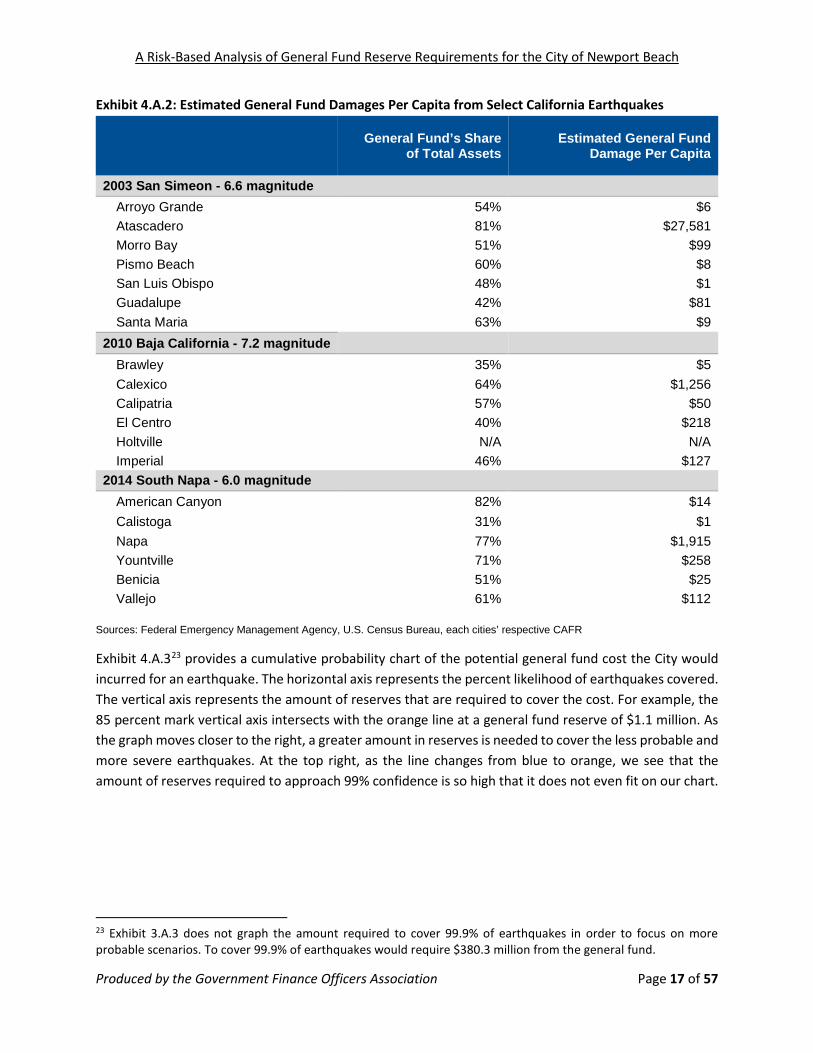
A Risk-Based Analysis of General Fund Reserve Requirements for the City of Newport Beach
Produced by the Government Finance Officers Association Page 17 of 57
Exhibit 4.A.2: Estimated General Fund Damages Per Capita from Select California Earthquakes
General Fund’s Share
of Total Assets Estimated General Fund
Damage Per Capita
2003 San Simeon - 6.6 magnitude
Arroyo Grande 54% $6
Atascadero 81% $27,581
Morro Bay 51% $99
Pismo Beach 60% $8
San Luis Obispo 48% $1
Guadalupe 42% $81
Santa Maria 63% $9
2010 Baja California - 7.2 magnitude
Brawley 35% $5
Calexico 64% $1,256
Calipatria 57% $50
El Centro 40% $218
Holtville N/A N/A
Imperial 46% $127
2014 South Napa - 6.0 magnitude
American Canyon 82% $14
Calistoga 31% $1
Napa 77% $1,915
Yountville 71% $258
Benicia 51% $25
Vallejo 61% $112
Sources: Federal Emergency Management Agency, U.S. Census Bureau, each cities’ respective CAFR
Exhibit 4.A.323 provides a cumulative probability chart of the potential general fund cost the City would incurred for an earthquake. The horizontal axis represents the percent likelihood of earthquakes covered. The vertical axis represents the amount of reserves that are required to cover the cost. For example, the 85 percent mark vertical axis intersects with the orange line at a general fund reserve of $1.1 million. As the graph moves closer to the right, a greater amount in reserves is needed to cover the less probable and more severe earthquakes. At the top right, as the line changes from blue to orange, we see that the amount of reserves required to approach 99% confidence is so high that it does not even fit on our chart.
23 Exhibit 3.A.3 does not graph the amount required to cover 99.9% of earthquakes in order to focus on more probable scenarios. To cover 99.9% of earthquakes would require $380.3 million from the general fund.

A Risk-Based Analysis of General Fund Reserve Requirements for the City of Newport Beach
Produced by the Government Finance Officers Association Page 18 of 57
Exhibit 4.A.3 - Percent of Earthquake’s Covered by Varying General Fund Reserve Levels
As we move to the right of the graph, the amount Newport Beach needs to reserve to cover the cost of an earthquake increases. At the top right, as the line color changes to orange, it indicates an increasing level of reserves to address greater than 95% confidence level.
Of course, the City can be more confident by setting aside more reserves. But to be completely confident, the City would need to reserve a very high amount, and as we discussed earlier, there are significant opportunity costs in doing so. Instead, Newport Beach might consider how reserves, debt, and insurance can work together. First, let us consider establishing some basic principles.
• Reserves make the most sense at the left-hand side of the curve. Here the City gets the most “bang for the buck” because each extra dollar of reserves buys the greatest increases in confidence.
• Debt is probably the most useful closer to the middle of the curve. The middle of the curve represents severe but not catastrophic damage. Here, the City would likely need to fund a significant response to a disaster but the City’s tax base would not be so impaired (e.g., stores closed and residents dislocated on a long-term basis) that paying back the debt would be problematic.
• Insurance is probably most useful closer to the right-hand side of the curve. The right-hand side of the curve represents catastrophic damage. In this case, the City’s tax base might be impaired for a significant duration making repayment of debt difficult. Further, the premium payments for insurance coverage for only a catastrophic event would be less than for coverage that includes both severe and catastrophic events. Insurance can also complement the City’s risk mitigation strategy should it decide to reserve an amount closer to the left-hand side of the curve.
Exhibit 4.A.3 shows the “value” the City gets from reserves. Where the curve is flatter, the value of reserves is high because a relatively modest increase in the size of reserves “buys” a substantial increase in the confidence the City can have that its reserves will be adequate for an earthquake. Where the curve
$0.0
$1.0
$2.0
$3.0
$4.0
$5.0
$6.0
5% 10% 15% 20% 25% 30% 35% 40% 45% 50% 55% 60% 65% 70% 75% 80% 85% 90% 95% 99%
Mill
ions
At 85% confidence level, the City would require $1.1 million in reserves.
At 90% confidence level, the City would require $2.0 million in reserves.

A Risk-Based Analysis of General Fund Reserve Requirements for the City of Newport Beach
Produced by the Government Finance Officers Association Page 19 of 57
gets steeper, the City needs to put aside more money to gain less confidence. In Exhibit 4.A.3, we can see that the “value” provided by reserves starts to decrease significantly after about $1.1 million. For example, the City can be 80 percent confident of covering the damage from an earthquake at $745,000. It can “buy” an extra 5 percentage points of confidence to get to 85 percent with a reserve of $850,000 – a difference of $233,000. By way of comparison, going to 90 percent confidence, requires a reserve of $2.0 million. In other words, to increase confidence from 85 percent to 90 percent requires nearly doubling the reserve amount, and to go from 90 to 95 percent requires over two and a half times the reserve. This pattern suggests the following range for reserves:
• On the low end, $1.1 million. This is the point up to which the curve is flattest. That means it is where each additional 5 percent of confidence requires an approximately similar increase in reserves. $1.1 million provides the City with an 85 percent likelihood of being able to cover all damages from an earthquake with general fund reserves.
• On the high end, $2.0 million. This is the point where the City can be 90 percent confident it could cover all damages from an earthquake with general fund reserves. It is also the point right before the curve turns much more sharply upwards, where much greater levels of reserve are necessary to be more confident.
Choosing a number within the range suggested above will depend on the City’s appetite for risk. In considering these numbers, we must also remember that the City of Newport Beach itself has not incurred large costs from an earthquake and that the numbers above are all based on analogues generated from the experience of other cities. Hence, it is useful to consider how Newport Beach’s vulnerability to earthquakes might compare to other cities’. First, all of the cities used as analogues in this report have a similar seismic hazard risk profile to Newport Beach, according to the U.S. Geological Survey. So, the analogues should be roughly comparable. However, the cities might differ in some of their specific characteristics that make them more vulnerable or less vulnerable to damages. To gain more insight on this point, we compared the disaster management plans of different cities in the region to see the potential earthquake damages that were contemplated for each city.24 We found, for example, that Newport Beach’s plan contemplated slightly lower damages25 from an earthquake at the San Andreas fault, compared to the average for the plans we examined.26 However, we also found that Newport Beach’s “worst case scenario” from activity along the San Joaquin Hills fault was considered to be more severe than that of the other cities’.27 As we saw in Exhibit 4.A.3, using reserves for the most severe
24 We reviewed only disaster management plans produced by the same consultant as the consultant used by Newport Beach for its disaster management plan. The intent was to compare plans that were developed using similar methodologies and assumptions. 25 Because the disaster management plans do not estimate costs that would be incurred by the municipal governments themselves in the event of an earthquake, we compared the reports using building-related economic losses. Building losses include structural and non-structural damage buildings as well as their contents. Income losses relate to the inability to operate during a period because of damages sustained during a disaster as well as money spent on temporary living expenses due to displacement. Presumably the costs incurred by the municipal governments would be proportional. 26 Damages were scaled to population to increase comparability. 27 These plans contemplated damages to the entire community, including private property, overlapping governments, and more. So, the plans did not offer insight into the potential cost of an earthquake to the municipal

A Risk-Based Analysis of General Fund Reserve Requirements for the City of Newport Beach
Produced by the Government Finance Officers Association Page 20 of 57
possible earthquake is not economical. Hence, this suggests that the City might wish to give special consideration to financial risk management strategies for damages in excess of reserves.
For potential damages in excess of the reserve target the City selects, Newport Beach should consider other financing tools like debt and insurance. The scope of this analysis is limited to general fund reserves, so GFOA cannot provide more specific guidance on the exact points on the curve in Exhibit 4.A.3 at which the City should consider debt versus insurance, but we can provide the following recommendations to help the City develop a more robust strategy:
• Develop a contingent capital arrangement. For damage levels at which the City chooses to use debt, the City should arrive at pre-arranged terms with a lender to be able to access a loan when the need arises. This will eliminate the need to negotiate terms during high-stress periods in the aftermath of an extreme event, and the City will have a much more favorable negotiating position before an event than immediately after.
• Consider inter-fund borrowing. A loan does not necessarily have to come from an external creditor. If the City has resources in other funds that are not likely to be compromised by a severe disaster, the City could use inter-fund borrowing to provide the resources needed by the general fund. Similar to a contingent capital agreement with an external lender, the City should develop a robust internal borrowing policy prior to an event to govern the terms of the loan.
• Consider “parametric” insurance in addition to traditional indemnity insurance. Indemnity insurance is the type of insurance that most governments have traditionally purchased, where the insurance corresponds to the value of the assets being insured, and reimbursement is paid out after a certain deductible has been met. The advantage of traditional indemnity insurance is that there is a known damage threshold past which the City is covered. Parametric insurance is a newer type of insurance for providing coverage for extreme events, having increased in popularity in the last 15 years or so. Parametric coverage provides the policyholder (the City) with a payment amount that is defined ahead of time, should a defined event come to pass (an earthquake of a certain magnitude). Parametric insurance could be more useful for providing an injection of liquidity because the holder of the policy receives the defined payment immediately upon verification by a third party that the given event occurred, which usually would be within a matter of days. As a simple illustration, a parametric policy might provide the City of Newport Beach with $5 million upon the occurrence of a 7.0 magnitude earthquake, after the U.S. Geological Survey verifies the magnitude of the quake. This feature of parametric insurance also eliminates much of the administrative hassle that would be associated with a traditional indemnity policy (e.g., working with claims adjusters). A final advantage is that the proceeds from the policy payout are completely fungible – the City could use them to fund whatever service it deems necessary whereas indemnity policies might require the policyholder to use the funds to repair or replace the asset that was insured. But, an important disadvantage of parametric insurance is that the policy is triggered by the magnitude of the event, not the damages incurred by the City. So, if the City were to experience a 6.9 magnitude quake, to continue our previous example, it would receive nothing from a parametric policy regardless of
government. However, it reasonable to assume that the cost to municipal government would be roughly proportionate to the damage done to the entire community.

A Risk-Based Analysis of General Fund Reserve Requirements for the City of Newport Beach
Produced by the Government Finance Officers Association Page 21 of 57
the damages it experienced. Additionally, parametric insurance is still a relatively new insurance instrument, and fewer insurance companies sell parametric policies compared to indemnity policies. A robust insurance strategy could make use of both traditional indemnity and parametric insurance. For example, traditional indemnity insurance could be used to protect against loss of the City’s assets, while parametric insurance could be used to compensate the City for the losses in tax revenue it would experience from an impaired tax base, for instance.
As mentioned earlier in this subsection, the estimated damages recorded by Atascadero from the 2003 San Simeon earthquake represent an extreme case. For these extreme events, alternative financing tools aside from reserves may be prudent. Additionally, Atascadero’s example highlights additional strategies for Newport Beach to explore. As seen with Atascadero’s city hall, historic buildings are vulnerable when seismic activity occurs. To help mitigate risk associated with historic buildings, the City could explore retrofitting, insurance, and other mitigation strategies for buildings that poise the greatest risk as identified in the City’s disaster management plan.
Earthquake Checkpoints A severe earthquake is a very low probability event with potentially extreme consequences. This
means that reserves are not a sufficient risk management tool, on their own. This is because there would be significant opportunity costs to accumulate enough reserves to cover the cost of a severe earthquake
The City should complement its reserves with debt and/or insurance instruments to provide additional financial capacity to respond to an extreme event.
A reserve between $1.1 million and $2.0 million should be sufficient to provide the City with 85% to 90% confidence that it will be able to cover the cost of an earthquake. This is the range of reserves that is the most “efficient” use of reserves.
Subsection B – Floods (Includes Landslides & Tsunamis) As a coastal city, Newport Beach faces the risk of flooding from storms, high waves, tsunamis, and rising sea levels. The Santa Ana River, San Diego Creek, and San Joaquin Hills’ streams can also cause flooding, with San Diego Creek flooding having caused significant damage to the City.28 The City has experienced three severe storm and flooding events that were FEMA-declared disasters in December 2004 to January 2005, February 2005, and December 2010 to January 2011. The three events serve as references to what the City could experience, but to further explore the possibility of potential damages, we reviewed FEMA’s database for additional severe storms and flooding in Orange County. Exhibit 4.B.1 lists the cities, estimated damages29,30 adjusted for inflation to 2017 dollars, population density the year of the event, and estimated damages per capita. Exhibit 4.B.2 adjusts the estimated damage per capita amounts to focus only the general fund. As with the previous section on
28 City of Newport Beach, “Local Hazard Mitigation Plan,” 2016. 29 GFOA estimates the total cost using the typical FEMA reimbursement rate of 75 percent of total cost. 30 GFOA used figures provided by Newport Beach for two of the events that had differing reimbursement rates from FEMA to account for reimbursement from California Governor's Office of Emergency Services.

A Risk-Based Analysis of General Fund Reserve Requirements for the City of Newport Beach
Produced by the Government Finance Officers Association Page 22 of 57
earthquakes, we identify the general fund’s share of capital assets using information from each respective cities’ most recent comprehensive annual financial report. Doing this allows us to focus on the general fund, which is the focus of our report. Finally, it should be noted that FEMA’s data groups floods and landslides together. Hence, the figures used in this section of the report include potential damages from both types of events.
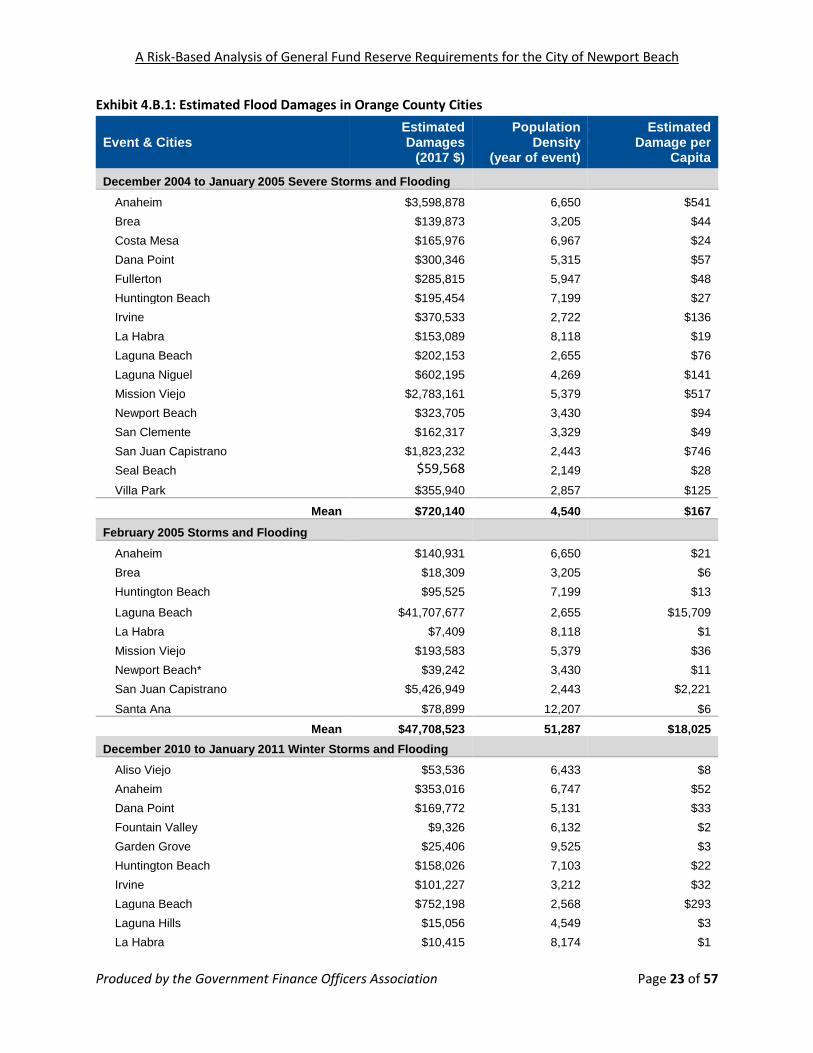
A Risk-Based Analysis of General Fund Reserve Requirements for the City of Newport Beach
Produced by the Government Finance Officers Association Page 23 of 57
Exhibit 4.B.1: Estimated Flood Damages in Orange County Cities
Event & Cities Estimated Damages
(2017 $)
Population Density
(year of event)
Estimated Damage per
Capita
December 2004 to January 2005 Severe Storms and Flooding
Anaheim $3,598,878 6,650 $541
Brea $139,873 3,205 $44
Costa Mesa $165,976 6,967 $24
Dana Point $300,346 5,315 $57
Fullerton $285,815 5,947 $48
Huntington Beach $195,454 7,199 $27
Irvine $370,533 2,722 $136
La Habra $153,089 8,118 $19
Laguna Beach $202,153 2,655 $76
Laguna Niguel $602,195 4,269 $141
Mission Viejo $2,783,161 5,379 $517
Newport Beach $323,705 3,430 $94
San Clemente $162,317 3,329 $49
San Juan Capistrano $1,823,232 2,443 $746
Seal Beach $59,568 2,149 $28
Villa Park $355,940 2,857 $125
Mean $720,140 4,540 $167
February 2005 Storms and Flooding
Anaheim $140,931 6,650 $21
Brea $18,309 3,205 $6
Huntington Beach $95,525 7,199 $13
Laguna Beach $41,707,677 2,655 $15,709
La Habra $7,409 8,118 $1
Mission Viejo $193,583 5,379 $36
Newport Beach* $39,242 3,430 $11
San Juan Capistrano $5,426,949 2,443 $2,221
Santa Ana $78,899 12,207 $6
Mean $47,708,523 51,287 $18,025
December 2010 to January 2011 Winter Storms and Flooding
Aliso Viejo $53,536 6,433 $8
Anaheim $353,016 6,747 $52
Dana Point $169,772 5,131 $33
Fountain Valley $9,326 6,132 $2
Garden Grove $25,406 9,525 $3
Huntington Beach $158,026 7,103 $22
Irvine $101,227 3,212 $32
Laguna Beach $752,198 2,568 $293
Laguna Hills $15,056 4,549 $3
La Habra $10,415 8,174 $1

A Risk-Based Analysis of General Fund Reserve Requirements for the City of Newport Beach
Produced by the Government Finance Officers Association Page 24 of 57
Lake Forest $199,308 4,336 $46
Mission Viejo $272,051 5,260 $52
Newport Beach* $252,499.05 3,578 $71
Rancho Santa Margarita $102,462 3,692 $28
San Clemente $1,641,417 3,395 $483
San Juan Capistrano $264,001 2,450 $108
Santa Ana $13,379 11,901 $1
Seal Beach $19,902 2,141 $9
Tustin $9,943 6,818 $1
Mean $232,786 5,429 $66
January 2017 Severe Winter Storms and Flooding
Dana Point $16,041.69 5,233 $3
Huntington Beach $69,783.05 7,501 $9
Laguna Beach $60,545.96 2,620 $23
Newport Beach $6,292.03 3,641 $2
Placentia $10,366.21 7,949 $1
San Juan Capistrano $53,170.35 2,569 $21
Santa Ana $109,245.72 12,256 $9
Westminster $11,433.36 9,111 $1
Yorba Linda $228,128 3,503 $65
Mean $62,778 6,043 $15
Reference Group Mean $1,211,674 5,310 $417
Reference Group Median $153,089 5,131 $28
Sources: Federal Emergency Management Agency, U.S. Census Bureau, and City of Newport Beach, CA
* Figure provided by the City, which differs from the FEMA database and may contain reimbursement from California Governor's Office
of Emergency Services.

A Risk-Based Analysis of General Fund Reserve Requirements for the City of Newport Beach
Produced by the Government Finance Officers Association Page 25 of 57
Exhibit 4.B.2: Estimated General Fund Damages Per Capita from Select California Floods
Event & Cities General Fund Share
of Capital Assets Estimated GF
Damage Per Capita
Anaheim 32% $173
Brea 64% $28
Costa Mesa 100% $24
Dana Point 100% $57
Fullerton 78% $38
Huntington Beach 72% $20
Irvine 100% $136
La Habra 66% $12
Laguna Beach 66% $50
Laguna Niguel 100% $141
Mission Viejo 99% $510
Newport Beach 78% $74
San Clemente 51% $25
San Juan Capistrano 42% $311
Seal Beach 59% $16
Villa Park 100% $125
February 2005 Storms and Flooding
Anaheim 32% $7
Brea 64% $4
Huntington Beach 72% $10
Laguna Beach 66% $10,326
La Habra 66% $1
Mission Viejo 99% $35
Newport Beach* 78% $9
San Juan Capistrano 42% $927
Santa Ana 80% $5
December 2010 to January 2011 Winter Storms and Flooding
Aliso Viejo 100% $8
Anaheim 32% $17
Dana Point 100% $33
Fountain Valley 50% $1
Garden Grove 61% $2
Huntington Beach 72% $16
Irvine 100% $32
Laguna Beach 66% $193
Laguna Hills 88% $3
La Habra 66% $1
Lake Forest 100% $46
Mission Viejo 99% $51
Newport Beach 78% $55

A Risk-Based Analysis of General Fund Reserve Requirements for the City of Newport Beach
Produced by the Government Finance Officers Association Page 26 of 57
Rancho Santa Margarita 100% $28
San Clemente 51% $246
San Juan Capistrano 42% $45
Santa Ana 80% $1
Seal Beach 59% $5
Tustin 87% $1
January 2017 Severe Winter Storms and Flooding
Dana Point 100% $3
Huntington Beach 72% $7
Laguna Beach 66% $15
Newport Beach 78% $1
Placentia 78% $1
San Juan Capistrano 42% $9
Santa Ana 80% $7
Westminster 86% $1
Yorba Linda 90% $58
Sources: Federal Emergency Management Agency, U.S. Census Bureau, each cities’ respective CAFR
The estimated general fund damages range greatly for the over 50 reference examples, but there are more instances of lower cost damages than higher cost damages. At the lower end, there were several cities that recorded under $1 per capita in general fund damages, including La Habra for the February 2005 storms and flooding, La Habra, Santa Ana, and Tustin for the December to January 2011 winter storms and flooding, and Placentia and Westminster for the January 2017 severe winter storms and flooding. Consecutive days of rain resulted in large damages recorded for the February 2005 storms and flooding disaster. At the higher end, Laguna Beach recorded $10,300 in general fund damages per capita, followed by San Juan Capistrano at $927. The volume of rain left Laguna Beach’s soil saturated, which resulted in a landslide the following May.31 Significant rain in San Juan Capistrano almost compromised the levee at San Juan Creek and improvements have been underway since to mitigate the creek’s flooding risk.32 This pattern of many smaller floods and few very large ones suggests a lognormal distribution, like we used for earthquakes.
As with the earthquake analysis, to make the reference cases more applicable to Newport Beach, we apply each reference’s general fund cost per capita to the City’s current population density of 3,641 residents per square mile. The lognormal distribution of the referenced floods is shown in Exhibit 4.B.3.33 The horizontal axis represents the percent of floods that should be covered by the amount of general fund reserves shown on the vertical axis.
31 U.S. Department of Commerce, National Oceanic and Atmospheric Administration, “A History of Significant Weather Events in Southern California,” updated May 2017, https://www.weather.gov/media/sgx/documents/weatherhistory.pdf. 32 Orange County, CA Public Works, “Background Information,” http://www.ocflood.com/nfc/projects_a/sjc/background. 33 Exhibit 4.B.3 does not graph the amount required to cover 99.9% of floods in order to focus on more probable scenarios. To cover 99.9% of floods would require $41.5 million.

A Risk-Based Analysis of General Fund Reserve Requirements for the City of Newport Beach
Produced by the Government Finance Officers Association Page 27 of 57
As the line changes from blue to orange, it represents the increasing amount of reserves that are required beyond the 95 percent confidence level. Note, as stated earlier, these figures represent total estimated cost of floods in 2017 dollars, exclusive of any FEMA reimbursement. For example, if the City wants to cover 75 percent of possible flood events, it would reserve an amount of $217,000. As we move to the right, we see that it requires greater reserves to cover each additional 5 percent of floods. To cover 90 percent of floods would require $652,000, over twice as much that is required to cover 75 percent of floods. This is because the right hand side of the graph represents increasingly extreme and, therefore, increasingly unlikely possible future floods. In order to cover the most extreme floods (those above our 95th percentile), the City might consider other strategies besides general fund reserves because of the high cost of covering additional flood possibilities. Examples of such strategies might be loans and insurance.
Exhibit 4.B.3 - Percent of Floods Covered by Varying Reserve Levels5
To cover 75% of floods, the City would reserve $217,000.
34 State of California Governor’s Office of Emergency Management, “2013 California Multi-Hazard Mitigation Plan,” Chapter 6 - Other Hazards: Risks And Mitigation, http://www.caloes.ca.gov/for-individuals-families/hazard-mitigation-planning/state-hazard-mitigation-plan.
$0.0
$0.2
$0.4
$0.6
$0.8
$1.0
$1.2
$1.4
$1.6
$1.8
$2.0
5% 10% 15% 20% 25% 30% 35% 40% 45% 50% 55% 60% 65% 70% 75% 80% 85% 90% 95% 99%
Mill
ion
s
At 75% confidence level, the City would need a reserve of $217,000.
At 90% confidence level, the City would need a reserve of $652,000.
The Risk of Tsunamis
A tsunami is a tidal wave caused by the displacement of a large body of water. Multiple kinds of geological events could cause a tsunami, such as an earthquake or volcano. FEMA has recorded only one tsunami causing damage to California cities. Due to a 2011 tsunami, three cities incurred damages, ranging from about $7,000 to $104,000 (for the entire city government, not just general fund). Of course, many other tsunamis have landed on California: over 80 in the last 150 years.34 Although this data set is limited, it does appear that most tsunamis would cause damage that is roughly comparable to other types of flooding Newport Beach might experience.

A Risk-Based Analysis of General Fund Reserve Requirements for the City of Newport Beach
Produced by the Government Finance Officers Association Page 28 of 57
So, to summarize a recommended reserve range:
• On the low end, $217,000. This is the 75 percent confidence level and is the point at which the City will get the most value from reserves. After this point, each additional 5 percentage points of confidence requires over 1.3 times the amount of reserve. We can consider this a less risk averse reserve strategy.
• On the high end, $652,000. This is the 90 percent confidence level. At this point, over two times as much reserves are required as at the 75% confidence level. This might be considered a more risk averse approach.
When selecting a reserve target, the City might also take into account its current flood mitigation efforts, including infrastructure improvements to flood walls, etc.35 Such mitigation efforts might prevent some floods from occurring at all and/or lessen the impact.
Flood Checkpoints Floods are similar to earthquakes in that they are rare events with potentially extreme
consequences. Newport Beach has experienced three floods in its recent history, giving us some useful past
experience to draw upon to estimate future risk. We supplemented this with the experience of other cities in the region.
A reserve between $217,000 and $652,000 should be sufficient to provide the City with 75% to 90% confidence that it will be able to cover the cost of a flood. This is the range of reserves that is the most “efficient” use of reserves.
Subsection C – Fires The City of Newport Beach is vulnerable to fires because of the area’s weather, topography, and vegetation. In the past, the City and surrounding areas have experienced fires, with the most severe in recent years affecting nearby Laguna Beach in 1993.36 The City’s primary risk from wildfires arises from its proximity to Crystal Cove State Park. In recent years, fortunately, the City has not experienced fires for which it incurred damages. Also, nearby cities with comparable risk of wildfire have not experienced many fires either. So, rather than draw from analogues as with other extreme events, we worked with the City’s Fire Chief to estimate the potential cost the City could incur for a fire. According to the Fire Chief, most fires last about four to six hours, with the maximum duration being approximately 12 hours. This is simply because there is not enough vegetation in Newport Beach to cause a large-scale fire.
If the City were to experience a fire, it can contract with the County as well as the State of California Office of Emergency Services through an assistance-by-hire agreement to help address the fire. The table below provides a summary of items needed and estimates from City’s Fire Chief on the number of units needed for each item to fight a 4-hour and 12-hour fire. Each unit would be required for the full duration of the fire. The table also includes the hourly rate per the assistance-by hire-agreement. This allows us to calculate the total estimated cost for a 4-hour and 12-hour fire.
35 City of Newport Beach, CA, “Local Hazard Mitigation Plan,” 2016. 36 City of Newport Beach, CA, “Local Hazard Mitigation Plan,” updated 2016.

A Risk-Based Analysis of General Fund Reserve Requirements for the City of Newport Beach
Produced by the Government Finance Officers Association Page 29 of 57

A Risk-Based Analysis of General Fund Reserve Requirements for the City of Newport Beach
Produced by the Government Finance Officers Association Page 30 of 57
Exhibit 3.C.1: Estimated Cost of 4-Hour and 12-Hour Fire to City of Newport Beach
# of Units Needed Total Cost
Item 4-hour
fire 12-hour
fire Hourly
Rate 4-hour
fire 12-hour
fire
Hand Crew (Firefighter) 18.00 36.00 $36.84 $2,652 $15,915
Hand Crew Supervisor (Fire Captain) 1.00 2.00 $71.56 $286 $1,717
Hand Crew Supervisor (Fire App. Engineer) 1.00 2.00 $62.77 $251 $1,506
Hand Crew Supervisor (Firefighter) 1.00 1.00 $55.97 $224 $672
Heavy Fire Equipment Operator 1.00 1.00 $96.11 $384 $1,153
Fire Pilot 1.00 2.00 $73.49 $294 $1,764
Lead Fire Pilot 1.00 1.00 $84.50 $338 $1,014
Type 3 Engine 2.00 2.00 $80.00 $640 $1,920
Crew Carrying Vehicle 1.00 2.00 $21.75 $87 $522
Dozer Transport 1.00 1.00 $73.25 $293 $879
Dozer 1.00 1.00 $72.50 $290 $870
Dozer Trailer 1.00 1.00 $14.00 $56 $168
Dozer Tender 1.00 1.00 $26.00 $104 $312
Fuel Tender 1.00 1.00 $36.75 $147 $441
Patrol Unit (Type 6) 1.00 3.00 $80.00 $320 $2,880
Water Tender 1.00 1.00 $36.75 $147 $441
Helicopter - Bell Super Huey 1.00 1.00 $1,329.74 $5,319 $15,957
Helicopter - Bell 412 1.00 1.00 $4,191.13 $16,765 $50,294
Total $28,598 $98,425
The potential cost that the City could incur is not as simple as a range between $28,600 and $98,400. This is because there is uncertainty that a fire might cost less or more than these estimated figures. In fact, research shows that when people estimate a range of possibilities for an uncertain event, they usually make the range too narrow. In other words, they underestimate the amount of risk.37 This is not a failure in judgment – it is just the way in which the human mind works. After all, if people were able to accurately judge risk, we would not need projects like the one GFOA is performing for Newport Beach. In fact, GFOA had the opportunity to validate this proposition at another local government. We asked the fire chief in that jurisdiction to estimate variability in fire size and then compared the cost to data from actual fires we collected from the region. We found that the chief underestimated the variability in fire size in a manner very similar to how research suggests people routinely underestimate uncertainty.
This does not mean that the figures in Exhibit 3.C.1 are not helpful – to the contrary, they provide an excellent starting point which we can transform into a probabilistic distribution. We created a distribution that extends the tails of the distribution beyond the range suggested by Exhibit 3.C.1. We set the size of the tails by doubling the size of the range from Exhibit 3.C.1. Research suggests that human judges
37 Jack Soll and Joshua Klayman (2004). “Over-confidence in Interval Estimates”. Journal of Experimental Psychology: Learning Memory and Cognition. 30, pages 299-314.

A Risk-Based Analysis of General Fund Reserve Requirements for the City of Newport Beach
Produced by the Government Finance Officers Association Page 31 of 57
typically underestimate uncertainty by about 50%. Doubling the range compensates for this. Exhibit 3.C.2 shows the resulting probabilistic cumulative probability chart of fire cost.
Exhibit 3.C.2 – Confidence that Wild Fire Cost will be Covered by Reserves
The incremental cost to cover fires increases at the 85th percentile or when reserve reach $118,500.
The horizontal axis shows the confidence a given reserve will cover the cost of a fire. The vertical axis shows the amount of reserves. As the line moves from left to right, we see cost increasing and the color change from blue to orange to reflect greater uncertainty to cover closer to 100% of fires. Up until the 85th percentile, each additional 5 percent incremental coverage of fires will require about 10% more reserves. The cost then increases to about 20% more reserves by the 95th percentile and to 35% more by the 99th percentile. Here is the range in between which reserves are most “efficient”:
• Reserve $118,500 to cover 85% of fires as a less risk-averse approach. This represents the point on the graph where the City maintains maximum incremental coverage through reserves.
• Reserve $159,000 to cover 95% of fires as a more risk-averse approach. This is where the City would get greater coverage through reserves before the incremental cost noticeably increases.
Newport Beach also benefits from a strong mutual aid system among the local governments in the region. Newport Beach also undertakes fire prevention programs, training, vegetation management, and other related activities to lessen the impact of wildfires in the area. This helps manage the fire risk that the City is subject to from fires and complements the City’s reserve strategy.
Fire Checkpoints The City has not experienced a wildfire in many years. This means there is no useful historical data
to draw upon. Therefore, we worked with the City’s Fire Chief to estimate a range of potential costs. We used statistical techniques to widen the range we developed with the Fire Chief. This was
intended to compensate for the natural human tendency to underestimate future uncertainty. A reserve between $118,500 and $159,000 should be sufficient to give the City 85% to 95%
confidence that it could cover the cost of a wildfire. This is the most “efficient” use of reserves.
$0
$25,000
$50,000
$75,000
$100,000
$125,000
$150,000
$175,000
$200,000
$225,000
$250,000
5% 10% 15% 20% 25% 30% 35% 40% 45% 50% 55% 60% 65% 70% 75% 80% 85% 90% 95% 99%
At 95% confidence level, the City would need a reserve of $159,000.
At 85% confidence level, the City would need a reserve of $118,500.

A Risk-Based Analysis of General Fund Reserve Requirements for the City of Newport Beach
Produced by the Government Finance Officers Association Page 32 of 57
Subsection D – High Winds Newport Beach is subject to high winds on a regular basis, but the damages are not as potentially severe as for the other risks we have examined. Hence, high winds is a higher frequency, lower consequence event compared to the others we have examined so far. For our analysis, we assumed that the City would be exposed to some costs to respond to high winds every year. We found damages have ranged between $60,000 and $140,000 per year. However, we only had a few years’ worth of data to consult. Hence, we doubled the range of potential damages. Doubling a range that is based on little data is a rule of thumb for approximating the range in which 95% of future events should fall.38
We assumed that the City’s regular budget was capable of absorbing the damage from an “average” year, or about $100,000. Therefore, reserves would only be necessary for wind damages that were beyond what happens in an average year. Exhibit 3.D.1 shows the reserves the City would need for a given level of confidence. The City wouldn’t need any reserves for about 50% confidence and below, because wind damages up to that point would be covered by the regular City budget. The required reserves increases rapidly after that. 95% confidence would require about $86,000.
Exhibit 3.D.1 – Reserves Required for High Winds Damage (in thousands of dollars)
Reserves
(thousands of dollars)
Level of Confidence
High Wind Checkpoints High winds are a high frequency, lower consequence event. The City’s budget can absorb lower wind damages. Reserves can help with higher damages.
$86,000 would give the City 95% confidence of being able to cover the costs of a high wind event. 38 See: Spyros Makridakis, Robin Hogarth, and Anil Gaba. Dance with Chance: Making Luck Work for You. (Oneworld Publications: Oxford, England). 2009.

A Risk-Based Analysis of General Fund Reserve Requirements for the City of Newport Beach
Produced by the Government Finance Officers Association Page 33 of 57
Section 5 - Revenue Volatility An important risk for any local government is revenue volatility, primarily owing to downturns in the economy. For example, Newport Beach’s revenue declined about 9% from fiscal year (FY) 2008 to FY 2010 due to the Great Recession. Reserves can be used to help a local government make a “soft landing” in the event of a revenue downturn.
In this section of the report, we will analyze the City’s vulnerability to revenue downturns. In Newport Beach, property taxes are, by far, the single most important revenue source at about half of general fund revenues. Sales taxes are the second most important at about 15%. Transient occupancy taxes are the third largest at about 12%. The remaining revenues comprise about a quarter of general fund revenues and include sources such as building permits and business licenses. Exhibit 5.1 summarizes the City’s general fund revenue portfolio between FY 2013 and FY 2017.
In the subsections below, we will examine each of the major revenues. The objective is to determine if the composition of the revenue base has changed such that the City of Newport Beach is more vulnerable or less vulnerable to revenue downturns than in the past. This is important because in the last section we will use the City’s historical revenue data to analyze risk to the revenue portfolio as a whole.
Subsection A - Property Taxes In addition to being the largest revenue source, property taxes are also the most stable. While general fund revenues declined 9% from FY 2008 to FY 2010, property tax revenues increased by 1.5%. Exhibit 5.A.1 compares the change in property tax to the changes to the City’s other revenue sources during this period.
The most obvious reason for the property tax’s strength is that Newport Beach is a very desirable locale, next to the Pacific Ocean. For example, when it comes to home values, Newport Beach is in the top five to six percent of California cities.40 Also, Newport Beach is in the top third of California cities where the average home value has now met or exceeded 2007-08 highs.41
39 Percentages are based on an average of fiscal years 2013 through 2017. 40 According to Zillow’s average home valuation database, Newport Beach has 40th highest average home value out of the 719 California cities included in their database. 41 According to Zillow’s average home valuation database.
Exhibit 5.1 – Composition of Newport Beach’s General Fund Revenue Portfolio39
Property taxes, are by far, the most important revenue source
Exhibit 5.A.1 – Change in Revenues, FY 2008 to FY 2010
Property Taxes 1.5% Sales Taxes -20.2% Transient Occupancy Tax -11.7% Other -19.2% Total -9.2%
0.0% 20.0% 40.0% 60.0%
Property Taxes
Sales Taxes
Transient OccupancyTax
Other

A Risk-Based Analysis of General Fund Reserve Requirements for the City of Newport Beach
Produced by the Government Finance Officers Association Page 34 of 57
Another strength of the City of Newport Beach’s property tax base is the composition of its largest taxpayers. For example, some cities have a few taxpayers that constitute a very large proportion of the total tax base. This presents a risk if those taxpayers cease to do business in the locale. The prototypical example would be a large manufacturing plant in an industry that is undergoing significant structural changes. In Newport Beach, the largest property taxpayer is The Irvine Company, which accounts for about 2.87% of the total taxable assessed value in the City. The Irvine Company buys and holds real estate. Hence, even if the Irvine Company ran into financial difficulties, it seems unlikely that its real estate assets would lose much, if any, value. Past The Irvine Company, the next largest property taxpayer, PH Finance LLC, constitutes only 0.53% of the City’s total taxable assessed value and the share of the tax base attributable the largest taxpayers declines from there: the 10th largest, John Hancock Life Insurance, comprises 0.21% of the total taxable value. So, as demonstrated above, the largest property taxpayers in Newport Beach do not comprise an overwhelming portion of the tax base. Further, the nature of their holdings do not seem to pose a risk of precipitous declines in value due to changing business conditions because they are not concentrated in a potentially vulnerable sector of the economy.
According to City staff, most of the property development activity that is taking place in Newport Beach is infill development, turnover of property, and significant remodeling of existing properties. There could also be occasional appeals of assessed values, if the property market gets overheated. However, none of these factors seem capable of introducing enough volatility into property tax revenues to change the tax’s traditional role of imparting stability to the City’s revenues.
Property Tax Checkpoints Property tax is the City’s largest revenue source. Property tax revenues did not decline at all during the Great Recession. Hence, it has a stabilizing
influence on City revenues. The City’s tax base is diverse. This is a source of stability.
Subsection B - Sales Taxes As we saw in Exhibit 5.A.1, sales taxes experienced the greatest decline during the Great Recession. For many cities, sales taxes are a volatile revenue that are vulnerable to economic downturns. To gain better insight into sales tax volatility, we can break down Newport Beach’s tax base by type of tax producer. The data available to GFOA from the City’s contracted sales tax analyst, HdL, breaks sales taxes down into eight categories of sales tax producers. Three of those categories produce just over 70% of the City’s revenues: autos and transportation (30%), restaurants and hotels (22%), and general consumer goods (20%). Exhibit 5.B.1 shows the three major categories of sales taxes.42 It also includes all other locally produced sales taxes as the “other” line. Finally, county and state pools are shown as a separate line.
42 This data is expressed in calendar years, rather than fiscal years.

A Risk-Based Analysis of General Fund Reserve Requirements for the City of Newport Beach
Produced by the Government Finance Officers Association Page 35 of 57
Exhibit 5.B.1 – City Sales Taxes by Category of Tax Producer (in millions)
Restaurants and hotels have overtaken general consumer goods as a portion of the tax base. The former is a more stable producer.
In Exhibit 5.B.1, we can see that all categories declined during 2008 through 2010, though some more than others. General consumer goods experienced the sharpest decline at 24%. Autos and transportation was second at 19%. A 19% decline was not too much more than the declines experienced by the “county and state pools” or “other” categories. However, the size of autos and transportation category makes a 19% decline more impactful. The restaurants and hotels category was barely effected by the Great Recession as evidenced by its 5% decline.
Turning our attention to the recovery from the Great Recession, we can see that autos and transportation recovered well. In fact, it now produces a slightly higher share of all sales taxes than it did before the Great Recession. Since restaurants and hotels did not fall far, the segment recovered quickly and continued to grow. General consumer goods, however, has not recovered to pre-recession levels and has even declined in recent years. In fact, it fell behind restaurants and hotels in importance as a sales tax producer. This is probably not too surprising given the pressure that traditional retailer have faced from on-line retail. The “other” and county and state pool categories recovered well. The “other” category includes business and industry taxes, which were very volatile during the Great Recession. These taxes dropped sharply and recovered sharply. The “other” category also includes consumer essentials, like food and fuel that didn’t change much during the Great Recession. Hence, these sub-categories balanced each other out to some extent, thereby preventing the “other” category from exhibiting dramatic behavior.
The implication is that the sales tax base does not appear to be any more vulnerable to recessions than it has been in the past. In fact, the sales tax base might now be somewhat less vulnerable because general

A Risk-Based Analysis of General Fund Reserve Requirements for the City of Newport Beach
Produced by the Government Finance Officers Association Page 36 of 57
consumer goods has been overtaken by restaurants and hotels as a major sales tax producer. The latter category proved more resistant to economic downturns during the Great Recession. Further, Newport Beach now participates in a County sales tax pool for on-line sales, which does offset at least some potential future loss of brink-and-mortar stores to on-line sales.
Sales Tax Checkpoints Sales tax is a volatile revenue. During the Great Recession, it had the sharpest decline of any of
the City’s major revenue sources. Since the Great Recession, restaurants and hotels have superseded general consumer goods in
importance as a source of sales tax revenue. The former appears to be a much more reliable producer during economic downturns. This means that the City’s sales tax revenues may be more stable than in the past.
Subsection C - Transient Occupancy Taxes The transient occupancy tax (TOT) is essentially the City’s hotel bed tax. Exhibit 5.A.1 shows that TOT can be vulnerable to economic downturns, but perhaps not as volatile as other revenue sources. In Newport Beach, the top five TOT-producing hotels make up over 60% of the City’s total TOT revenue. The Resort at Pelican Hill is particularly important at over a quarter of TOT revenue. Hence, this means the City is theoretically vulnerable to a business interruption at one of the key hotels.
Of course, it is in the financial interest of the hotels to be at peak capacity as much as possible and, since 2008, the TOT revenue produced has been up across all properties. This appears to be due to steadily rising room rates, while maintaining a consistent level of occupancy. Between calendar year 2010 and 2017, the average daily hotel room rate is up 54%, while occupancy rates are up only 13%.43 This has contributed to a doubling of TOT revenues between 2009 and 2017.44 The City’s long-term forecasting consultant, Beacon Economics, expects this upward trend to continue. In fact, for the period of FY 2017 through FY 2022, Beacon predicts that TOT will grow 25% more than property tax and 50% more than sales tax.45 Hence, it would appear that the hotel sector in the City is fundamentally healthy.
The foregoing suggests that a general economic downturn is probably the most significant risk to TOT revenues. Given the continuing, if not increasing, strength of Newport Beach’s hotel sector, TOT does not appear to be any more vulnerable to a downturn than it has been in the past.
Earlier, we mentioned that a business interruption to a large hotel might be a theoretical risk given that larger hotels produce the lion’s share of TOT revenue. For example, a fire at one of the major hotels that makes the hotel unoccupiable could cause a drop in revenues at that hotel. However, given that the hotel operator would have a clear incentive to put the rooms back in service as soon as possible and given that other hotels in Newport Beach would likely be able to pick up excess demand,46 this risk does not appear
43 “2016 – 2017 Newport Beach and Company Annual Report: Go Beyond”. New Beach & Company. 44 The City also added some rooms during this time period. 45 “City of Newport Beach Revenue Forecast” Beacon Economics. January 2017. 46 The occupancy rate in Newport Beach hotels is around 75%. The City’s occupancy reports suggests that Newport Beach hotels typically experience and occupancy rate that is close to the Orange County average, so are not especially overcrowded compared to other hotels in the region.

A Risk-Based Analysis of General Fund Reserve Requirements for the City of Newport Beach
Produced by the Government Finance Officers Association Page 37 of 57
to be large and would certainly be absorbable within a reserve that is sufficient to cover an economic downturn.
Transient Occupancy Tax Checkpoints TOT is Newport Beach’s fastest growing major revenue source. TOT is vulnerable to economic downturns, but not as vulnerable as sales taxes or many other
minor City revenue sources. The hotel industry appears strong in Newport Beach, given steady rising room rates and stable
occupancy. Hence, it does not appear that the TOT is much more vulnerable to an economic downturn than before.
Subsection D - Other Revenues When considered together, the City’s other revenue sources are larger than both TOT and sales taxes. They also can be vulnerable to economic downturns, as we saw in Exhibit 5.A.1. In fact, the decline in other revenues was only slightly less than the decline in sales taxes. As of FY 2017, the top five most important individual revenue sources within the other category are business license taxes, paramedic service fees, building permits, plan checking fees, and cable franchise fees. However, these sources only produced about 30% of other revenue. Newport Beach, in FY 2017, had almost 100 individual revenue sources that produced over $100,000 and 15 sources that produced over $1 million. This shows the diversity of these revenues.
Comparing the individual sources that make up other revenues between the Great Recession and FY 2017, we can see that there have been some changes that would decrease potential volatility. For example, investment income was an important revenue at the start of the Great Recession and declined precipitously. Investment income does not break into the top ten other revenues in FY 2017. The top two other revenues in FY 2017 are business license taxes and paramedic service fees, both of which proved much more resistant to the economic downturn than most other revenues. Cable franchise fees and parking fines are also both important revenues in FY 2017 (as they were before) and proved more resistant to the downturn than most other revenues.
There have also been a few changes that might increase vulnerability. Building permits and plan checking fees are now more important than they had been at the start of the Great Recession and both demonstrated higher-than-average vulnerability to the downturn. However, the changes that could increase vulnerability should be at least balanced out by the changes that decrease vulnerability.
Other Revenue Checkpoints During the Great Recession, “other revenues” declined only slightly less than sales taxes, the
City’s most volatile revenue. Since the Great Recession, the composition of “other revenues” has changed somewhat. Some
less volatile revenues have gained more prominence. However, some volatile revenues are still important. Overall, “other revenues” should be at least as stable, if not more stable, than in the past.

A Risk-Based Analysis of General Fund Reserve Requirements for the City of Newport Beach
Produced by the Government Finance Officers Association Page 38 of 57
Subsection E - Risk Analysis of All City Revenues To analyze the risk that an economic downturn poses to the City’s revenues we will start with the City’s historical experience with past downturns. Earlier, we discussed some of the year-to-year changes in the City’ revenues during the Great Recession. However, in order to make the best use of the City’s data for risk analysis we need to use monthly and/or quarterly data. Monthly or quarterly data will give us a more precise estimate of how long the revenue downturn lasted. Annual revenue figures are essentially an average of all 12 months. However, if, for example, three of those months are part of an economic downturn and nine are part of the subsequent recovery, then the year as a whole will show revenue growth. This could cause us to underestimate the length of time City revenues are negatively impacted by an economic downturn.
In order to make the best use of monthly/quarterly data for risk analysis, we need to remove the effects of what is known as “seasonal” variation. This means that there is some regularly occurring variance in the revenue that is independent from economic cycles. For instance, in Newport Beach, the final months of the calendar year always provides the most sales tax revenue, presumably due to holiday spending. So, if those months produce more revenue than the City was generating during the preceding fall months, that does not necessarily mean that an economic downturn has ended – it could just indicate seasonal variation. A simple way to remove season variation is to create a 12-month moving average. This means that for every single month in our data set we take an average consisting of that month plus the six months prior and the five months after (for a total of 12 months). This essentially averages out annual seasonal variation and gives us a purer sense of the impact of economic cycles on Newport Beach’s revenue.
In Exhibit 5.E.1 monthly revenues are plotted out from December 1998 to December 2016. The blue line represents the 12-month moving average, while the red line is actual monthly revenues. We can see that the red lines exhibit large swings during the year such that it is hard to pick out when there is an economic downturn. The blue line removes seasonal effects, which results in a much smoother line. We can see the economic downturns much more easily – which are highlighted by the green circles. The Great Recession is the right-hand circle and revenues declined by about 13% from the high just before the downturn started to the point at which revenues turned back upwards.
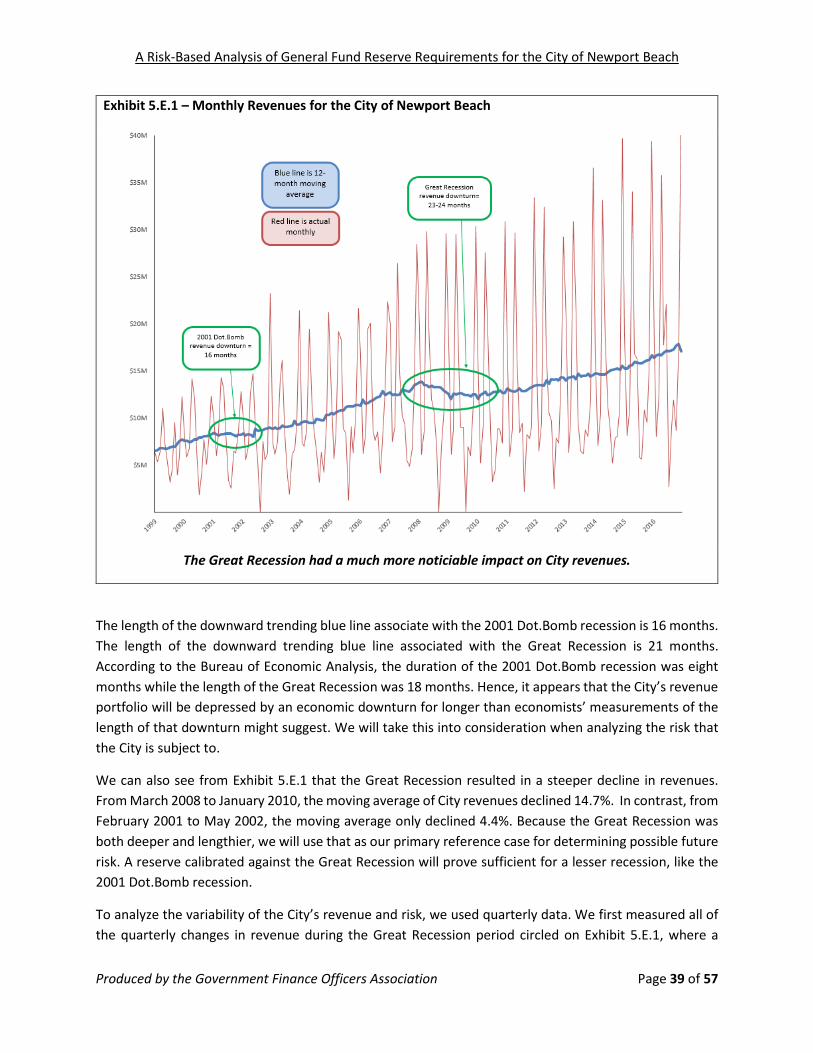
A Risk-Based Analysis of General Fund Reserve Requirements for the City of Newport Beach
Produced by the Government Finance Officers Association Page 39 of 57
Exhibit 5.E.1 – Monthly Revenues for the City of Newport Beach
The Great Recession had a much more noticiable impact on City revenues.
The length of the downward trending blue line associate with the 2001 Dot.Bomb recession is 16 months. The length of the downward trending blue line associated with the Great Recession is 21 months. According to the Bureau of Economic Analysis, the duration of the 2001 Dot.Bomb recession was eight months while the length of the Great Recession was 18 months. Hence, it appears that the City’s revenue portfolio will be depressed by an economic downturn for longer than economists’ measurements of the length of that downturn might suggest. We will take this into consideration when analyzing the risk that the City is subject to.
We can also see from Exhibit 5.E.1 that the Great Recession resulted in a steeper decline in revenues. From March 2008 to January 2010, the moving average of City revenues declined 14.7%. In contrast, from February 2001 to May 2002, the moving average only declined 4.4%. Because the Great Recession was both deeper and lengthier, we will use that as our primary reference case for determining possible future risk. A reserve calibrated against the Great Recession will prove sufficient for a lesser recession, like the 2001 Dot.Bomb recession.
To analyze the variability of the City’s revenue and risk, we used quarterly data. We first measured all of the quarterly changes in revenue during the Great Recession period circled on Exhibit 5.E.1, where a

A Risk-Based Analysis of General Fund Reserve Requirements for the City of Newport Beach
Produced by the Government Finance Officers Association Page 40 of 57
“quarter” was any consecutive three-month period (we did not limit ourselves to calendar year quarters). This gave us a sample of plausible changes in revenue during a hypothetical future recession. We found that the average quarterly change in revenue was a decline of 0.9%. We also found that changes were roughly normally distributed around this average, meaning they took the approximate shape of the “bell curve” that we introduced at the beginning of this report. We then were able to simulate potential revenue declines over multiple subsequent quarters. For example, we found that for a hypothetical 4-quarter recession there was only a 1% chance of a decline in revenue of 14.95% or more and a 10% chance of a decline of 10.53% or more. This gave us the probable depth of a recession for every quarter in a hypothetical future recession.
The next step was to define the likelihood of different potential lengths of future recession. To do so, we gathered data on the lengths of all recessions that occurred in the U.S. since 1950. However, we also found that Newport Beach’s revenue downturns had lasted longer than both the 2001 Recession and Great Recession, by about three to four months. Hence, we assumed that Newport Beach’s revenues would also experience a one-quarter longer downturn in future recessions. With this in mind, we found the average length of a recession was four and 1/3 quarters. However, the lengths of the recessions were not normally distributed around this average. The shape was closer to the “lognormal” distribution we saw earlier in this report, where shorter recessions were more likely and very long recessions unlikely. This gave use the probable length of a hypothetical future recession.
By combining length and depth, we can get the amount of reserves that Newport Beach would need to be prepared for a hypothetical future recession. The results are shown in Exhibit 5.E.2. The vertical axis shows various possible reserve levels, expressed as a percent of revenues. The horizontal axis shows how confident the City would be that a given level of reserves could replace 100% of the City’s revenue decline during a hypothetical future recession. First, let’s review a few points of interest about Exhibit 5.E.2:
• The exhibit does not call out specific recession lengths or depths because they are all combined on the blue line. For example, a recession that would require a 10% fund balance to replace all revenue could be a product of shorter but a deeper recession or a longer but shallower recession. The point on the line that intersects with the 10% reserve reflects all such possibilities.
• It is unlikely that the City would replace every last dollar of lost revenue with reserves during an actual recession. Rather, it would cut some spending. Hence, GFOA’s recommendations can be adjusted downward according to how much the City feels it could cut from its budget. We will reflect the possibility for downward adjustment in Section 7 of this report.

A Risk-Based Analysis of General Fund Reserve Requirements for the City of Newport Beach
Produced by the Government Finance Officers Association Page 41 of 57
Exhibit 5.E.2 – Reserves Required to Replace Revenues Lost During a Recession
Reserves as a % of Revenue
Confidence that reserves will remain above $0 during a future Recession
Around 70% confidence provides the best “value” reserve level. Above 90% confidence, the value of additional reserves declines rapidly.
In Exhibit 5.E.2, the point at which the City gets the most “value” for its reserve is about 70% confidence or a reserve of 8.0% of revenues. Past this point, it costs proportionately more money to “buy” an extra 5 percentage points of confidence. To illustrate, to go from 65% confidence to 70% confidence the reserve must go from 7.4% to 8.0%. But, to go from 70% confidence to 75% confidence the reserve must go from 8.0% to 8.8%. To go from 75% to 80% confidence requires 9.6% reserves. Past 90% confidence, the curve becomes even steeper, making additional confidence even more “expensive.”
Hence, the City of Newport Beach might consider a range of possible reserves to guard against revenues declined from an economic downturn. Recall that earlier in this report we saw that the City’s revenue sources do not appear to be any more vulnerable to an economic downturn than they have been in the past. This means the numbers below, which are based on historical data, should provide a reasonable representation of current risk. If anything, they may be somewhat conservative given that some of Newport Beach’s revenues may now be less vulnerable to downturns than in the past. As a point of reference, at their lowest point, the City’s quarterly revenues declined about 10% from their highs right before the Great Recession.
• Low end: A reserve equal to 8.0% of revenue, giving the City 70% confidence of being able to replace 100% of all revenue lost from a recession. Assuming annual revenues of about $205 million, this translates to a reserve of about $16.4 million.
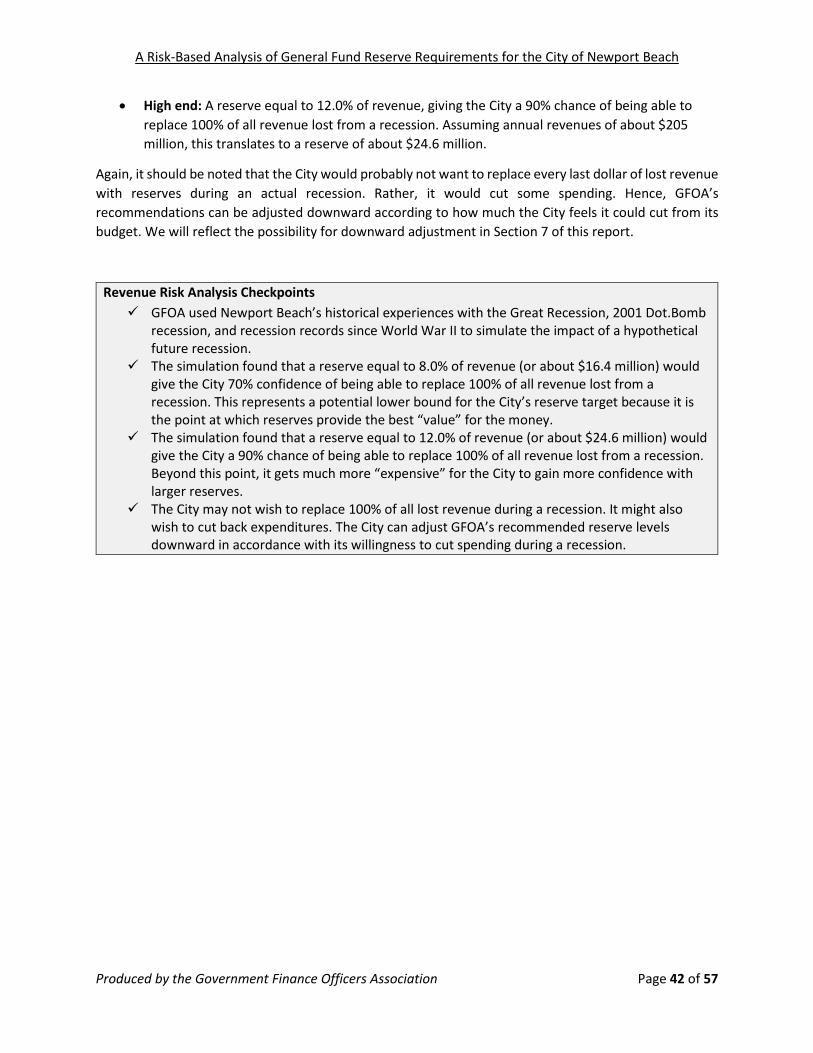
A Risk-Based Analysis of General Fund Reserve Requirements for the City of Newport Beach
Produced by the Government Finance Officers Association Page 42 of 57
• High end: A reserve equal to 12.0% of revenue, giving the City a 90% chance of being able to replace 100% of all revenue lost from a recession. Assuming annual revenues of about $205 million, this translates to a reserve of about $24.6 million.
Again, it should be noted that the City would probably not want to replace every last dollar of lost revenue with reserves during an actual recession. Rather, it would cut some spending. Hence, GFOA’s recommendations can be adjusted downward according to how much the City feels it could cut from its budget. We will reflect the possibility for downward adjustment in Section 7 of this report.
Revenue Risk Analysis Checkpoints GFOA used Newport Beach’s historical experiences with the Great Recession, 2001 Dot.Bomb
recession, and recession records since World War II to simulate the impact of a hypothetical future recession.
The simulation found that a reserve equal to 8.0% of revenue (or about $16.4 million) would give the City 70% confidence of being able to replace 100% of all revenue lost from a recession. This represents a potential lower bound for the City’s reserve target because it is the point at which reserves provide the best “value” for the money.
The simulation found that a reserve equal to 12.0% of revenue (or about $24.6 million) would give the City a 90% chance of being able to replace 100% of all revenue lost from a recession. Beyond this point, it gets much more “expensive” for the City to gain more confidence with larger reserves.
The City may not wish to replace 100% of all lost revenue during a recession. It might also wish to cut back expenditures. The City can adjust GFOA’s recommended reserve levels downward in accordance with its willingness to cut spending during a recession.

A Risk-Based Analysis of General Fund Reserve Requirements for the City of Newport Beach
Produced by the Government Finance Officers Association Page 43 of 57
Section 6 - Secondary Risks This section of the report addresses other risk factors that have less weighty implications for the City’s reserve strategy than those described in the previous sections. These include pensions; non-pension debt; expenditure spikes; liquidity; future growth; and existing claims on the City’s fund balance.
Subsection A - Pensions Like many cities in California, Newport Beach faces a substantial pension liability. The City has been forward-thinking in developing and following a plan to fund its pension liabilities. For the purposes of this report, we will examine one specific pension scenario: the impact of a recession.47 This is because the purpose of reserves is to buffer the City against shocks. A recession is a shock. The City’s normal, on-going pension liability is a known and predictable financial stressor that should be dealt with through the City’s normal budgeting and long-term financial planning process.
The pension plan that the City is a part of CalPERS assumes a 7% annual return.48 A recession would cause CalPERS’s investments to perform below expectations. If the investments perform below expectations, the City eventually has to make up the difference with increased contributions. This unplanned additional expenditure would add more financial pressure in the aftermath of an economic downturn. It should be noted that CalPERS is administered in such a way that member municipalities would not feel the consequences of investment underperformance immediately – there is about a two-year lag. This means that the City would have forewarning of an increase in its contribution after investments underperform. However, since that increase would come on the heels of a recession it would certainly be an inopportune time for the City to make additional pension payments. Therefore, there may be some role for reserves to help cushion the blow.
To calculate the potential increase in contribution costs from a recession, we first obtained a distribution of CalPERS expected returns. The average expected return is 7%. That means returns are expected to be below 7% half of the time and above 7% the other half of the time.
Based on information from CalPERS, we learned that returns are expected to take the shape of a normal distribution or bell curve. This means that most the time returns will stay close to 7% but a wider variation is possible. Using estimates from CalPERS and records of what has happened during past recessions, we found that returns during a recession might range from 6.2% to -11%. -11% would be an extreme result, while something close to 6% would be much more likely during a recession.
Next, we estimated potential recession lengths. Using past recessions as reference cases, we found the likelihood of a recession lasting one, two, or three years.49 Of course, a three-year recession is very unlikely, and a two-year recession is unlikely.50 Most recessions would last about a year or so.
47 A recession is a significant decline in economic activity that lasts longer than a few months. 48 CalPERS, “CalPERS to Lower Discount Rate to Seven Percent Over the Next Three Years,” December 21, 2016, https://www.calpers.ca.gov/page/newsroom/calpers-news/2016/calpers-lower-discount-rate. 49 We gathered recession lengths for every recession since 1950 and used that to simulate future recession lengths. 50 The Great Recession lasted 18 months. The Great Depression lasted just over 3.5 years.

A Risk-Based Analysis of General Fund Reserve Requirements for the City of Newport Beach
Produced by the Government Finance Officers Association Page 44 of 57
We then simulated thousands of possible recessions, where each recession lasted somewhere between one and three years and the rate of return for each year of the recession was somewhere between 6.2% and -11%. We then connected these variable rates of return to a pension contribution model developed by Newport Beach City staff. This gave us a range of potential contribution increases due to a recession.
Exhibit 6.A.1 shows the results for a five-year period. Years 1, 2, and 3 are the potential recession years. The additional pension cost to the City will always be zero in years 1 and 2 because the CalPERS system is designed to defer the initial impact from investment underperformance. Year 3 is when the additional costs are felt. In the vast majority of cases, a recession will be over by the third year. However, in extreme cases a recession could go into a third year. Years 4 and 5 are recovery years, when the economy will very likely have emerged from a recession. The rows in the exhibit show the percent confidence the City can have that a given amount of money would be sufficient to cover the additional contribution costs in a given year.
Exhibit 6.A.1 – Additional Pension Contributions in the Wake of a Recession
Confidence Year 1 Year 2 Year 3 Year 4 Year 5 Total* 50% $0 $0 $1,600,000 $2,700,000 $3,400,000 $7,800,000 60% $0 $0 $1,800,000 $3,100,000 $4,100,000 $9,100,000 70% $0 $0 $2,000,000 $3,800,000 $5,100,000 $11,000,000 80% $0 $0 $2,500,000 $4,800,000 $6,400,000 $13,500,000 90% $0 $0 $3,500,000 $6,300,000 $8,300,000 $17,700,000
*Total is a simulation for the entire three years at once, not counting each year individually. Hence, the results are slightly different than if all three years were just summed arithmetically.
For the purposes of reserve planning, the numbers of greatest interest in Exhibit 6.A.1 are probably the bolded and italicized ones in Year 3: the 70%, 80%, and 90% confidence levels. These represent particularly harsh recessions. During a harsher recession, the City is presumably facing greater pressure on its revenues and the recession would be longer, so the increased costs for pensions would be that much more of a burden. By contrast, a recession at the 50% or 60% confidence level would likely be over after one year, giving the City an entire year of recovery before having to shoulder increased pension costs.
For building a reserve for this risk, the City probably would not want to reserve the entire bolded/italicized amounts shown in Exhibit 6.A.1. This is because the City will have forewarning of the impending costs and could structure its budget accordingly. However, it might want some reserves in place so that budget cuts do not have to be as dramatic as they would in the absence of reserves. For instance, a $2 million reserve might assume that the City will cut $1.5 million in costs. $1.5 million is about equal to the amount needed to cover the pension cost increase that would be associated with an average recession. $1.5 million in cuts plus $2 million in reserves is $3.5 million or 90% confidence. A $1 million reserve might assume that the City will cut deeper. For example, this means the City would be willing to cut $2.5 million in the case of a very severe recession.
As we get into years 4 and 5 on Exhibit 6.A.1, the use of reserves becomes much more of a City policy issue than an issue of technical risk analysis. The City will have at least one and, probably, two years of
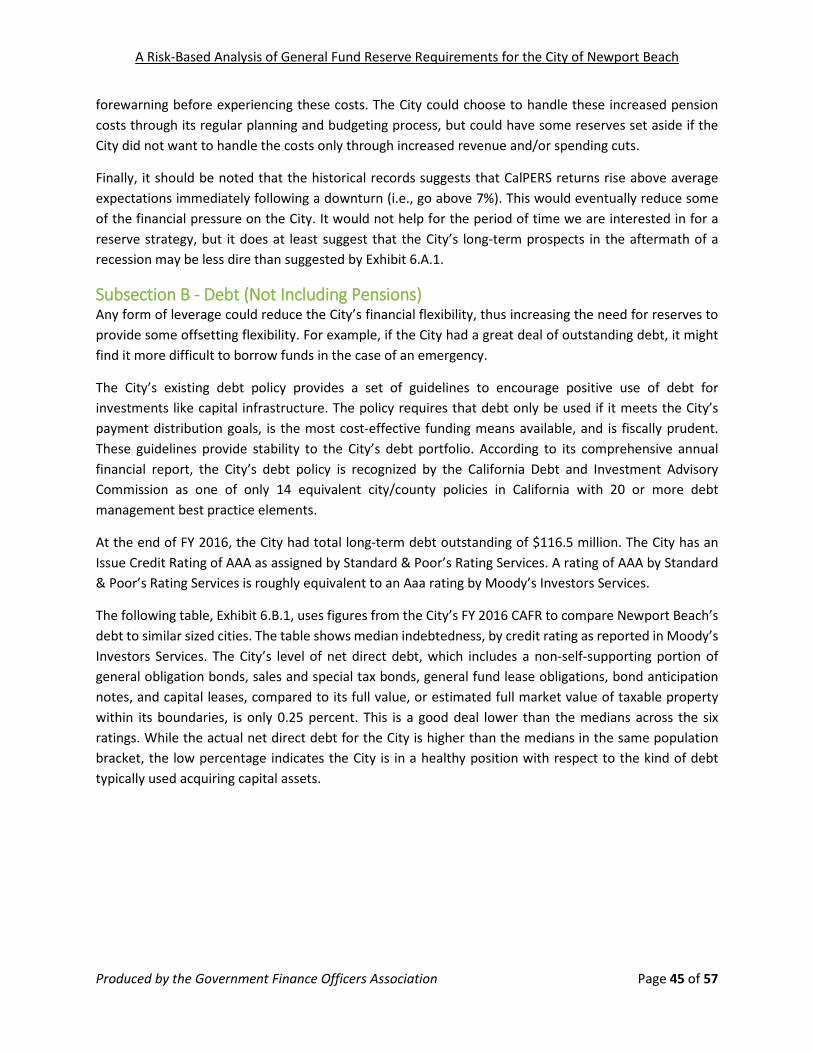
A Risk-Based Analysis of General Fund Reserve Requirements for the City of Newport Beach
Produced by the Government Finance Officers Association Page 45 of 57
forewarning before experiencing these costs. The City could choose to handle these increased pension costs through its regular planning and budgeting process, but could have some reserves set aside if the City did not want to handle the costs only through increased revenue and/or spending cuts.
Finally, it should be noted that the historical records suggests that CalPERS returns rise above average expectations immediately following a downturn (i.e., go above 7%). This would eventually reduce some of the financial pressure on the City. It would not help for the period of time we are interested in for a reserve strategy, but it does at least suggest that the City’s long-term prospects in the aftermath of a recession may be less dire than suggested by Exhibit 6.A.1.
Subsection B - Debt (Not Including Pensions) Any form of leverage could reduce the City’s financial flexibility, thus increasing the need for reserves to provide some offsetting flexibility. For example, if the City had a great deal of outstanding debt, it might find it more difficult to borrow funds in the case of an emergency.
The City’s existing debt policy provides a set of guidelines to encourage positive use of debt for investments like capital infrastructure. The policy requires that debt only be used if it meets the City’s payment distribution goals, is the most cost-effective funding means available, and is fiscally prudent. These guidelines provide stability to the City’s debt portfolio. According to its comprehensive annual financial report, the City’s debt policy is recognized by the California Debt and Investment Advisory Commission as one of only 14 equivalent city/county policies in California with 20 or more debt management best practice elements.
At the end of FY 2016, the City had total long-term debt outstanding of $116.5 million. The City has an Issue Credit Rating of AAA as assigned by Standard & Poor’s Rating Services. A rating of AAA by Standard & Poor’s Rating Services is roughly equivalent to an Aaa rating by Moody’s Investors Services.
The following table, Exhibit 6.B.1, uses figures from the City’s FY 2016 CAFR to compare Newport Beach’s debt to similar sized cities. The table shows median indebtedness, by credit rating as reported in Moody’s Investors Services. The City’s level of net direct debt, which includes a non-self-supporting portion of general obligation bonds, sales and special tax bonds, general fund lease obligations, bond anticipation notes, and capital leases, compared to its full value, or estimated full market value of taxable property within its boundaries, is only 0.25 percent. This is a good deal lower than the medians across the six ratings. While the actual net direct debt for the City is higher than the medians in the same population bracket, the low percentage indicates the City is in a healthy position with respect to the kind of debt typically used acquiring capital assets.

A Risk-Based Analysis of General Fund Reserve Requirements for the City of Newport Beach
Produced by the Government Finance Officers Association Page 46 of 57
Exhibit 6.B.1 - Comparison of Newport Beach’s Financial Indicators to Cities with Between 50,000 and 100,000 in Population by Credit Rating
Newport Beach Aaa Aa A Baa Ba
Net Direct Debt as % of Full Value 0.25% 0.6% 1.1% 2.0% 3.9% N/A
Net Direct Debt ($000s) $116,544 $59,300 $64,143 $78,275 $170,848 N/A
Source: “2015 US Local Government Medians – Tax Base Growth Reinforces Sector Stability as Pension Troubles Remain,” Moody’s Investors Service (March 30, 2017).
Exhibit 6.B.2 includes a group of California cities that are comparable to Newport Beach based on a combination of factors, including geography, population, general fund revenue portfolio, and size. The exhibit provides summary statistics from each of the cities’ FY 2016 CAFR and includes four commonly used measures of indebtedness. The measures are categorized as “Measures of Direct Debt” and “Measures of Overall Debt.”
Direct debt considers only bonded debt issued by the City of Newport Beach. Within this category, the first measure is debt service (principal and interest payments) as a percent of City expenditures. This figure gauges the pressure placed on the budget by debt payments. The second measure shows direct debt as a percent of the City’s full assessed value. This shows debt burden relative to the City’s tax base.
Overall debt captures the full burden placed on the public by debt issued by all local governments that overlap Newport Beach. Within this category, the first measure shows the burden placed on citizens by municipal indebtedness inclusive of direct and overlapping debt. The second measure compares direct debt plus the debt of overlapping jurisdictions as a percent of the full assessed value of properties in the jurisdiction.
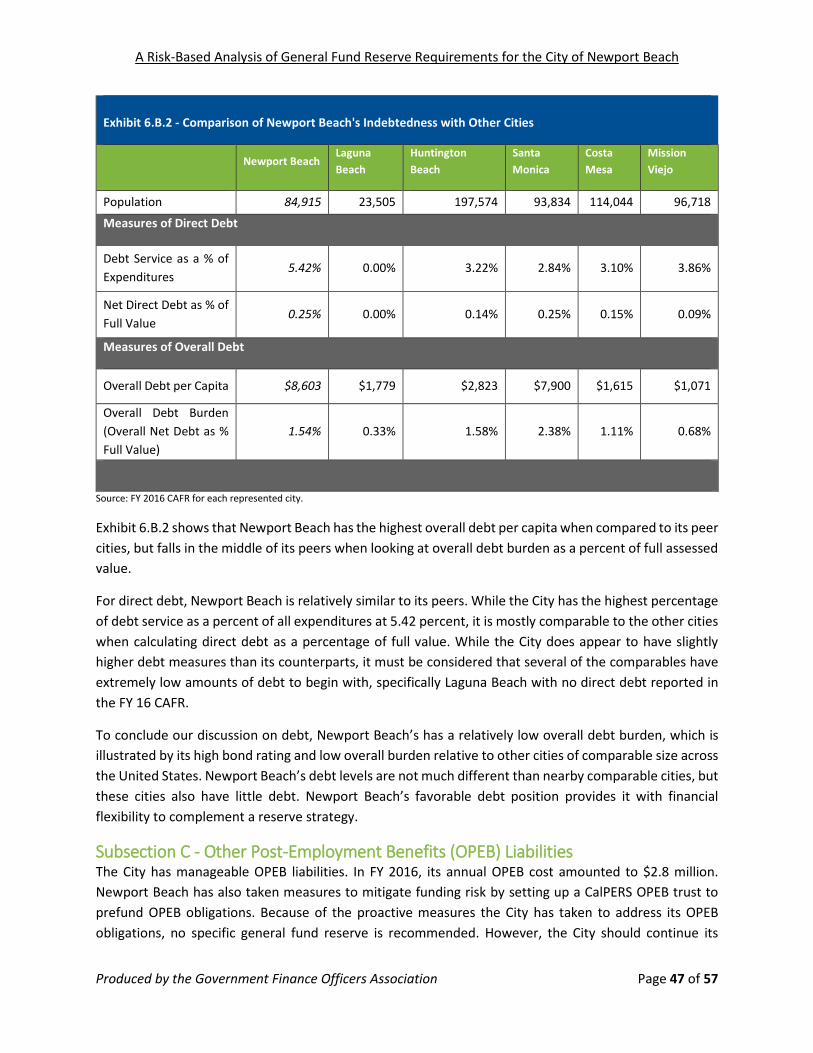
A Risk-Based Analysis of General Fund Reserve Requirements for the City of Newport Beach
Produced by the Government Finance Officers Association Page 47 of 57
Exhibit 6.B.2 - Comparison of Newport Beach's Indebtedness with Other Cities
Newport Beach
Laguna Beach
Huntington Beach
Santa Monica
Costa Mesa
Mission Viejo
Population 84,915 23,505 197,574 93,834 114,044 96,718
Measures of Direct Debt
Debt Service as a % of Expenditures
5.42% 0.00% 3.22% 2.84% 3.10% 3.86%
Net Direct Debt as % of Full Value
0.25% 0.00% 0.14% 0.25% 0.15% 0.09%
Measures of Overall Debt
Overall Debt per Capita $8,603 $1,779 $2,823 $7,900 $1,615 $1,071
Overall Debt Burden (Overall Net Debt as % Full Value)
1.54% 0.33% 1.58% 2.38% 1.11% 0.68%
Source: FY 2016 CAFR for each represented city.
Exhibit 6.B.2 shows that Newport Beach has the highest overall debt per capita when compared to its peer cities, but falls in the middle of its peers when looking at overall debt burden as a percent of full assessed value.
For direct debt, Newport Beach is relatively similar to its peers. While the City has the highest percentage of debt service as a percent of all expenditures at 5.42 percent, it is mostly comparable to the other cities when calculating direct debt as a percentage of full value. While the City does appear to have slightly higher debt measures than its counterparts, it must be considered that several of the comparables have extremely low amounts of debt to begin with, specifically Laguna Beach with no direct debt reported in the FY 16 CAFR.
To conclude our discussion on debt, Newport Beach’s has a relatively low overall debt burden, which is illustrated by its high bond rating and low overall burden relative to other cities of comparable size across the United States. Newport Beach’s debt levels are not much different than nearby comparable cities, but these cities also have little debt. Newport Beach’s favorable debt position provides it with financial flexibility to complement a reserve strategy.
Subsection C - Other Post-Employment Benefits (OPEB) Liabilities The City has manageable OPEB liabilities. In FY 2016, its annual OPEB cost amounted to $2.8 million. Newport Beach has also taken measures to mitigate funding risk by setting up a CalPERS OPEB trust to prefund OPEB obligations. Because of the proactive measures the City has taken to address its OPEB obligations, no specific general fund reserve is recommended. However, the City should continue its

A Risk-Based Analysis of General Fund Reserve Requirements for the City of Newport Beach
Produced by the Government Finance Officers Association Page 48 of 57
practice to make its full actuarially required contribution and to administer the OPEB trust that is has created.
Subsection D – Expenditure Spikes The City does not have large impending lawsuits against it. There is an external reserve to cover any lawsuits the City may face. If that fund were to be depleted, there may be cause for concern, but historically this has not been an issue. Of course, if the City encounters a situation in the future where a large impending lawsuit materializes, it will want to adjust its risk management strategy. However, for now, there does not appear to be compelling evidence that additional reserves are needed.
Subsection E – Liquidity According to historical revenue data, the City receives about 45 percent of its annual revenue between July 1 and December 1. Most of that 45 percent comes during the month of December from property taxes; about 21% of the City’s entire yearly revenues are collected in December. This means that the City’s revenue receipts are slightly weighted towards the latter part of the fiscal year. However, this appears to be a relatively minor risk that can be addressed in two ways.
First, the reserves recommended in this report can serve as “de facto working capital”. The relatively minor liquidity concerns the City might experience could be absorbed within its regular reserves.
Second, the City’s investment policies and practices can provide for sufficient liquidity to ensure that the City’s idle funds are available when needed during the early part of the year. For example, the City staff perform cash flow analysis monthly and have a plan in place to liquidate investment maturities as cash is needed. The City’s investment strategy also anticipates these peaks and valleys in the City revenue inflows.
Subsection F – Growth Population growth has remained relatively stable and plateaued. Hence, a potential resource strain due to population growth is not a risk.
Subsection G - Claims on General Fund Balance The reserves that the City sets aside for risk mitigation are a subset of the City’s fund balances. Fund balance is the difference between the general fund’s assets and liabilities. Sometimes, there are claims on fund balances that make those balance unavailable for risk mitigation.
The City’s FY 16 CAFR details claims on the City’s existing fund balance. As of FY 2016, the General Fund balance was $81.8 million.
$15.2 million of this is classified as nonspendable. These nonspendable funds are long-term loan receivables, prepaid items, and inventories. The restricted general fund balance amounts to $3.1 million, intended for use in a variety of general fund activities including affordable housing and oceanfront encroachment. This total of about $18.1 million constitutes a solid claim that makes this portion of fund balance unavailable for risk mitigation.

A Risk-Based Analysis of General Fund Reserve Requirements for the City of Newport Beach
Produced by the Government Finance Officers Association Page 49 of 57
The City has $2.7 million classified as committed by City Council. Much of this is an encumbrance reserve. While the City could, hypothetically, redirect these funds to other purposes, it is not the City’s intent to redirect these funds. Hence, we might also consider these commitments to be a claim on fund balance.
Assigned fund balance is about $4.2 million. Most of this is a wastewater subsidy. While intended to be more flexible than a “commitment”, the City still has expressed an intention to use this money for something other than risk management.
That leaves $56.6 million as unassigned fund balance. Unassigned fund balance doesn’t have claims on it and could be used for risk mitigation.
In conclusion, the City has a substantial amount of unassigned fund balance. The City also has some assigned and committed restrictions are self-imposed, so, if needed, the City could draw on these in an emergency.
Secondary Risk Checkpoints Of the secondary risks we examined, only the possibility of increased pension payments in the
aftermath of a recession appears to be significant risk. The way in which CALPERS is administered has the effect of deferring the effects of investment
underperformance on the City for a two-year period. This means the City would not face immediate increased pension costs during an economic downturn. There is then a five year smoothing beyond that.
A reserve of between $2.0 million and $3.5 million would give the City 70% to 90% confidence of being able to cover the increased pension costs in the third year after an economic downturn (i.e., after the aforementioned two-year period passes).
The City could also experience increased annual pension costs four and five years after a recession. However, because this is a number of years after a recession occurs, planning for these costs might be better handled through the City’s long-term planning and budgeting process, rather than reserves.

A Risk-Based Analysis of General Fund Reserve Requirements for the City of Newport Beach
Produced by the Government Finance Officers Association Page 50 of 57
Section 7 - Putting it All Together In Sections 4, 5, and 6, we examined individual risks such as earthquakes, floods, fires, and revenue losses due to economic downturns. We examined each of these risks individually in order to best understand the nature of each risk, and we found a range of reserves that represents an “efficient” use of reserves for mitigating each individual risk. However, to arrive at a final reserve strategy for the City we need to consider these risks as a group. Considering the risks as a group has important advantages.
The first advantage is that considering risks as a group recognizes the diversity in the risks that the City faces. This diversity actually is an advantage for City finances! Diversity in risks means we should not simply add together each of the reserve ranges for each individual risk. This may overstate the amount of reserves that the City really needs. This is because it is very unlikely that the City will experience a severe earthquake, recession, fire, and flood all within a short time period. Exhibit 7.1 below illustrates using fires and floods. Let’s imagine that the City wanted to be 95% confident that it could cover the damages from a flood and a fire. The table shows the amounts needs for each individual risk and then adds them together in a simple summation, arriving at $1.6 million. The “combined distribution” column creates an entirely new distribution from the data we have for fires and floods together. The 95% confidence level for this new distribution is only $1.47 million or about 8 percent less than the simple summation. This is recognizing that it is highly unlikely that the City will experience a severe fire and a severe flood at once. Rather, it is more likely that at least one of the events would be much milder. When we consider all of the City’s risks in this manner, the reserves required to achieve a given level of confidence will be much less than when each risk is considered in isolation.
Exhibit 7.1 – Reserve Needed to be 95% Confident for Fire and Flood Risk
Fire Flood Simple Summation
Combined Distribution
Difference
95% Confident
$159,000 $1,431,000 $1,590,000 $1,473,589 8%
The second advantage of considering all of the risks together is that not all of the risks have an equal chance of occurring over a given time period. For example, Newport Beach has experienced three floods in its recent history, but no earthquakes. This suggests that floods are more likely to occur than earthquakes. The City’s reserve strategy should reflect this fact. In the bullet points below, we show the relative chance of each of the major risks occurring over a ten-year period. We can use these probabilities to build a probabilistic model of risks over a long-term time horizon. You will note that some of the extreme events are expressed as a fraction. Of course, the City can’t experience a portion of an event, but the fraction does impact our simulation of risk. For instance, the City can expect to experience 1/3 of a wildfire in a ten-year period. If we created three different ten-year simulations, we might expect one of them to include a wildfire. We can create hundreds or even thousands of ten-year simulations, so there will be many that include a wildfire.

A Risk-Based Analysis of General Fund Reserve Requirements for the City of Newport Beach
Produced by the Government Finance Officers Association Page 51 of 57
• Revenue loss due to a recession. Historical data suggests that it is highly likely (over 90% chance) that there will be at least one recessionary year in a ten-year period.51 The historical data also tells us there is a considerable chance of having more than one recessionary year in a ten-year period.
• Earthquake. Data obtained through the US Geological Survey (USGS) suggests that the Los Angeles area has about a 32% chance of experiencing an earthquake of a magnitude of at least 6.0 over a ten-year period.52 Of course, not every part of the Los Angeles region will be relevant to the risks faced by Newport Beach. However, given that some faults further from Newport Beach still pose a threat (i.e., San Andreas) much of the LA region is still relevant. Hence, we judged it prudent to use the probability for the entire Los Angeles region.53
• Flood. The City has experienced three FEMA-declared flood disasters between 2004 and 2017, a 13-year period. Hence, over ten-year period we might expect “2.3” floods.
• Fire. The City has experienced one wildfire every 30 years. This means the City can expect “1/3” of a wildfire every ten years.
The final advantage of considering all of the risks together is that we can consider “risk interdependencies”. This simply means that the occurrence of one risk could impact the probability and/or magnitude of a related risk. Perhaps the strongest and most obvious dependency is between revenue losses from a recession and spikes in pension costs due to CalPERS investment under-performance – both are caused by an economic downturn and both are worse for the City the worse the recession gets. We examined the potential for other interdependencies as well, but concluded that they weren’t as important. For example, could an earthquake lead to a wildfire? The City’s Fire Chief advised us that the areas where a wildfire could start are not exposed to infrastructure that could be damaged and start a fire as a result (e.g., electrical lines). Could an earthquake lead to tsunami? The USGS analyzed the potential impact of a 7.8 earthquake on the southernmost 200 miles of the San Andreas fault, the area thought to be at greatest risk to produce a large quake. The USGS found that because of the large distance from the earthquake to the coast, tsunamis are not a significant risk.54
To realize the advantages described above, we built a model that considers the City’s risks over a ten-year time horizon. As with our other models, the model runs hundreds or even thousands of simulations of possible futures for Newport Beach. Here are the key assumptions behind the model:
• Probability of an undesirable event. The probability of any undesirable event occurring (e.g., fire, flood, earthquake, etc.) is consistent with the assumptions described above.
• Magnitude of an undesirable event. Should a simulation show that an undesirable event occurs in a given year, the magnitude is generated randomly in a manner identical to the individual risk models we showed earlier in this report.
51 We took economic data since 1950 and used that to calculate the odds of a recession occurring in a ten year period, including how many of those years would be recession years. 52 Edward H. Field, et al. “Long-Term Time-Dependent Probabilities for the Third Uniform California Earthquake Rupture Forecast”. Bulletin of the Seismological Society of America, Vol. 105, No. 2A, pp. 511–543, April 2015. 53 Further, data to calculate a probability specifically for Newport Beach or Orange County was not available. This means that the probability of an earthquake occurring is probably somewhat overstated. We tried using a somewhat lower probability to see what the difference was and observed that implications for reserves was not large. 54 Lucile Jones, et al. “The ShakeOut Scenario”. US Geological Survey. 2008.

A Risk-Based Analysis of General Fund Reserve Requirements for the City of Newport Beach
Produced by the Government Finance Officers Association Page 52 of 57
• Interdependencies. Should our simulation show that a recession occurs in a given year, then both a revenue loss and a pension loss of similar magnitude will be triggered.
• FEMA reimbursement. The City could recoup some of its losses from extreme events due to reimbursements from FEMA. The model assumes the reimbursements are received two years after the event occurs.55 The model also assumes that a disaster must cost the City at least $100,000 to receive any reimbursement (anything smaller would not be declared a FEMA-eligible disaster). We also assume the City will be reimbursed at the customary rate of 75% of incurred costs.
• The City cuts spending to help offset the impact of an extreme event. The City will not use reserves to absorb the full impact of an extreme event, like a recession or natural disaster (either increased costs or revenue losses). At least some of the loss could be absorbed by cutting back on the City’s regular spending. A discussion with City staff and the Finance Committee suggests that the City could be able to cut about 2% of its budget in order to absorb unexpected financial impacts. The cut could be accomplished through a number of different strategies, such has deferring maintenance of existing city assets, deferring purchases of certain new assets, and cutting back on some operating transfers out of the general fund. Smaller cuts in the City’s operating expenditures also help absorb the loss.
• City cuts spending in other areas to in response to spike in pension costs. Similar to the revenue loss, it is assumed that the City’s reserve would not absorb the entire amount of a pension cost increase. Again, it is assumed spending cuts will absorb 70% of the first year of pension cost increases in the aftermath of recession. For subsequent years, it is assumed that 100% of increased costs would be accommodated within the City’s regular budget.
• A reserve of $10 million is the City’s “red line”. All of the analysis assumes the City will want to stay above at least $10 million dollars in its reserve. This recognizes the fact that the risk analysis cannot account for every possible problem that could ever befall the City. $10 million is the City’s stated preference for a cushion against these unknowable risks.
We combined all of the information described above to create at ten-year probabilistic model. The model produces a curve, much like what we presented for the City’s individual risk factors. The curve is presented in Exhibit 7.2. It shows the level of confidence the City can have that a given level of general fund reserves will prove sufficient over a ten-year period to cover the extraordinary costs incurred by the general fund as a result of the risks covered in this report. “Sufficient” is defined as the reserves not dropping below $10 million. For example, the City can be 80% confident that a reserve of $19.4 million would cover the City general funds extraordinary expenditures over a ten-year period, without needing to go below $10 million in the City’s remaining reserve.
55 Our research shows that FEMA reimbursements are completed 18 months after the disaster occurs, on average. So, this is a conservative assumption.

A Risk-Based Analysis of General Fund Reserve Requirements for the City of Newport Beach
Produced by the Government Finance Officers Association Page 53 of 57
Exhibit 7.2 – Confidence that a Given Level of General Fund Reserves will be Sufficient over 10 Years
Reserves (Millions of Dollars)
Percent Confidence
As with the other curves we have shown in this report, there is a point at which the curve begins to rise sharply. This is the point at which the City starts to receive less value from reserves. In Exhibit 7.2, this is between the 70% confidence level ($14.8 million) and 90% confidence level ($25.5 million). This represents the range at which reserves produce the best value for the City (note the City would need to add its $10 million dollar “red line” to these amounts to get the total desired reserve). However, there are a number of other factors that are worth considering as part of settling on a reserve level:
Other risk management mechanisms can complement reserves. Understandably, City officials might not be satisfied with an 80% or 90% chance of being able to cover damages from the risks we described in this report. Other financial risk management tools like debt or insurance could be used to provide additional confidence beyond that provided by reserves.
Our analysis is not inclusive of every risk the City could possibly face. We used the City’s disaster management plan to identify the risks that posed the most clear and present danger to the City. However, it is possible that the City could experience a shock that no one was expecting. Hence, there is a case for reserving more than our analysis suggest is efficient. This could provide additional protection against risks that no one can foresee. That is why the City set a $10 million minimum reserve “red line” that our reserve analysis took into account.

A Risk-Based Analysis of General Fund Reserve Requirements for the City of Newport Beach
Produced by the Government Finance Officers Association Page 54 of 57
Our analysis is based on historical records. Global climate change could increase the City’s vulnerability to naturally occurring extreme events.56 This means that historical data could underestimate the likelihood and/or severity of extreme events in the future. Unfortunately, no one can say precisely what the impact of climate change will be. Hence, GFOA can’t speculate if an upward adjustment to the reserves is necessary and, if so, by how much. However, this does mean that there could be a case for reserving a higher amount than the efficient range described above (or pursuing other risk management strategies). Also, GFOA’s Microsoft Excel57 risk model provides the City with the ability to adjust the likelihood and/or magnitude of future extreme events, if it would like to test different scenarios.
The reserves held by comparable cities. The reserves held by comparable cities can provide context to the City of Newport Beach’s officials for selecting their own reserve levels. Appendix 1 contains a detailed comparison of Newport Beach’s fund balance with those of Laguna Beach, Huntington Beach, Santa Monica, Costa Mesa, and Mission Viejo. The comparison shows that Newport Beach has more reserves set aside specifically for responding to emergencies than the other cities. Newport Beach has an amount equal to about 23% of annual revenue. Of the three other cities that have reserves set aside specifically for emergencies, those cities have an average reserve of about 10% of annual revenues. By way of comparison, the 90% confidence reserve we showed in Exhibit 7.2 is about $13 million, which equates to around 7% of annual revenue. In the two paragraphs above, we suggested a few rationales for why the City might wish to have reserves somewhat higher than our suggested “efficient” range. If GFOA’s range were augmented a bit, the resulting reserve would be pretty similar to the amount maintained by the other cities.
The City’s desired level of reserves should be memorialized in a formal policy and expressed as a percent of revenue or expenditures. The City already has such a policy, so the policy can be updated based on how the City wishes to use GFOA’s analysis to adjust its desired level of reserves. The dollar figures contained in this report can be converted into a percent of the City’s annual revenues or expenditures. This way, the dollar amount will automatically adjust with changes in the City’s budget.
The City’s desired level of reserves should be a range, rather than a single number. GFOA’s research into how local governments can best maintain financial sustainability has found that decision-making “boundaries” are essential. For example, if the City were to adopt a policy to maintain reserves between X% and Y% of revenues, then that would constitute a clear boundary that defines when reserves are too high or too low. Compare this to if the City just adopted a policy that reserves should be at X% of revenues. It is then impossible to say how far reserves can go above or below this number and still be an acceptable amount. A range also can accommodate the risk appetites of more City officials. Thus, a range could be more reflective of the preferences of a greater number of people and, thereby, get more support.
56 According to “The Impact of Climate Change on Natural Disaster”, an article from NASA’s “Earth Observatory”: “outcomes of an increase in global temperatures include increased risk of drought and increased intensity of storms, including tropical cyclones with higher wind speeds, a wetter Asian monsoon, and, possibly, more intense mid-latitude storms.” https://earthobservatory.nasa.gov/Features/RisingCost/rising_cost5.php?src=share 57 GFOA has provided the model to the City so it can run its own scenarios

A Risk-Based Analysis of General Fund Reserve Requirements for the City of Newport Beach
Produced by the Government Finance Officers Association Page 55 of 57
Section 8 - Next Steps Based on the information presented in this report, we suggest that Newport Beach take the following steps:
#1 - Pick a desired range of reserves.
This can be based on what our analysis suggests is efficient. It will also depend on City officials’ appetite for risk. Section 7 provided a number of suggested factors that might help City officials decide on their preferred level of reserves.
#2 - Consider how debt and insurance can complement the reserve strategy.
Debt and/or insurance can provide protection to the City past the point where reserves are efficient.
In the case of debt, the City might be able use a line of credit with a local lending institution (the City already has a $1 million line of credit with a local bank), certificates of participation, or revenue anticipation notes. The City might also think about interfund borrowing opportunities. Equipment/facility replacement funds, worker’s compensation fund, facility maintenance funds might all be able to make short-term loans to the general fund in the case of an emergency. The City could develop policies to provide the flexibility to use these borrowing tools while also providing the necessary guidelines and limitations to ensure that borrowing occurs in a fiscally prudent manner.
The City could also investigate newer types of insurance instruments, like parametric policies. Parametric policies were described earlier in this report.
#3 - Memorialize the City’s desired range of a reserve in a formal policy.
We strongly recommend expressing this as a range, rather than a single number. A range provides a “boundary” within which decisions must be made.

A Risk-Based Analysis of General Fund Reserve Requirements for the City of Newport Beach
Produced by the Government Finance Officers Association Page 56 of 57
Section 9 - Appendix 1: Reserves in Comparable Cities To help the City consider the exact amount of reserves to maintain, Exhibit 9.1 provides a table of General Fund balances as a percent of General Fund revenues for California cities that are comparable to the City of Newport Beach. Several notes should be made about Exhibit 9.1 in order for the reader to fully understand its meaning. First, “fund balance” is an accounting term describing the difference between assets and liabilities in the General Fund. “Reserves” (which are the main topic of GFOA’s analysis for Newport Beach) are the portion of fund balance set aside, by City Council policy, as a hedge against risk. Hence, not all “fund balance” is necessarily available as a reserve. The three right-most columns of Exhibit 8.1 shows how much each city holds in fund balance as a percent of general revenue. Each of the three columns in this exhibit examines fund balances from a different perspective on the relationship between fund balance and risk mitigation.
The column #1 shows “unrestricted” fund balance as a percentage of General Fund operating revenue. This is an accounting term describing fund balances that do not have constraints placed on their use by an outside entity (e.g., a bond covenant might restrict the use of some portion of fund balance to debt service) and are spendable (e.g., do not represent inventory or other non-liquid assets). This the broadest definition of fund balance we show in Exhibit 9.1. An “unrestricted” fund balance may still have constraints placed upon its use, but these constraints would be created by the city government itself. One common constraint is to dedicate some portion of fund balance to hedging against the types of risks described in this report. However, other constraints have nothing to do with risk mitigation - to illustrate: a common self-imposed constraint is setting aside fund balance to pay for a special capital project. Newport Beach has imposed several such constraints; for example, the city has about $790,000 in funding committed for NPTV programming. While such a constraint could be removed and, thus, the entirety of monies in the “unrestricted” category made available for risk mitigation, it is not the intent of the city to do so.
Column #2 shows the amount of fund balance available for risk mitigation after fund balances having self-imposed restrictions (not germane to risk mitigation) are removed from consideration. Because have removed funds that are the subject of self-imposed restrictions, this category is narrower than the first category. This leaves self-imposed restrictions that are specifically germane to risk mitigation as well as unrestricted fund balance (i.e., fund balance for which no restrictions at all have been identified). Unrestricted fund balance could easily be used for responding to emergency events, if needed.
Column #3 includes only those fund balances that have been specifically identified by the city government as intended for creating a risk mitigating reserve. It should be noted that since the analysis in Exhibit 9.1 is based only upon the information included in each city’s FY 2016 CAFR, it is possible the amount dedicated to risk mitigation could be somewhat higher for some of the cities as a legislative policy document might call for maintaining a given amount in fund balance as a reserve without creating an accounting restriction that would show up in the financial report. For example, Newport Beach’s CAFR dos not call out risk mitigating reserve in the financial statements, but one is described in the management discussion and analysis.
It is also important to note that some cities, like Laguna Beach, account for emergency reserves in a fund outside of the general fund. These other funds appear to be substantively similar in purpose to the

A Risk-Based Analysis of General Fund Reserve Requirements for the City of Newport Beach
Produced by the Government Finance Officers Association Page 57 of 57
general fund reserve Newport Beach is considering, but just are located in a separate fund. This does not include reserves that are found in utility funds or other funds with operational responsibilities apart from the general fund. We have included these amounts in column three to provide for greater comparability between the cities.
Exhibit 9.1- Fund Balances as Percent of General Fund Revenue
City Population (#1)
Unrestricted
(#2) Available for
Risk Mitigation
(#3) Dedicated to Risk
Mitigation
Newport Beach 84,915 32% 28% 23%
Laguna Beach 23,505 83% 33% 8%
Huntington Beach 197,574 27% 11% 11%
Santa Monica 93,834 96% 19% 0%
Costa Mesa 114,044 51% 38% 12%
Mission Viejo 96,718 55% 24% 0%
Average 101,765 57% 25% 9% Median 95,276 53% 26% 10%
Sources: FY 2016 CAFR for each city.
Given that column #3 is the most relevant to our analysis, it bears a closer look. Starting, with the City of Newport Beach’s, we see a reserve equal to 23% of revenues. This is the City’s Contingency Reserve. The reserve can be found as part of “Unassigned” fund balance in the City’s CAFR and amounts to $45.8 million. The City’s policy states that this amount exists to provide assistance in emergency situations.
Many of Newport Beach’s peer cities have similar emergency funds set up. Laguna Beach’s Disaster Contingency Fund exists outside the General Fund, and has a total fund balance of $6.2 million to be used exclusively for repairing public facilities and protecting lives/property. During FY 16, Huntington Beach’s City Council established the Economic Uncertainties Reserve in the General Fund, which creates a reserve to be used for catastrophic events and natural disasters. The Council’s goal was to commit the value of two months of the General Fund expenditure adopted budget amount to this fund. The City of Santa Monica’s Disaster Relief Fund typically assists with covering expenses of a natural disaster. As of FY 16, the City’s fund had a net zero balance; the City received and promptly used a Federal and State Earthquake grant in FY 16 of $2.7 million. Additionally, $15,123 was transferred from the Disaster Relief Fund to the General Fund to “close out” the fund. It is unclear whether or not the fund will remain in use. While the City had a fund of that amount at some point during the year, the year-end balance is a net zero. The City of Costa Mesa has significant committed funds for declared disasters in the general fund. The fund currently has $14.1 million dollars, and per City ordinance, any fund balance utilized must be replenished. The City of Mission Viejo had no existing emergency or disaster fund.
Exhibit 9.1 shows that Newport Beach has the most available for contingency.

Government Finance Officers AssociationMay 2013
A Risk-Based Analysis of
General Fund ReserveRequirements
A Case Study of the City of Colorado Springs

Copyright 2013 by theGovernment Finance Officers Association203 N. LaSalle Street, Suite 2700Chicago, Illinois 60601www.gfoa.org
By Shayne C. Kavanagh, Senior Manager of Research, GFOA
Reviewers: Marc D. Joffe, Principal Consultant, Public Sector Credit Solutions, and Bill Statler, Consultant andTrainer; retired Director of Finance & Information Technology, City of San Luis Obispo, California.
The GFOA would like to thank the City of Colorado Springs for allowing us to share this information, and PublicSector Digest for their assistance.
The Research and Consulting Center is the management analysis and consulting arm of the GovernmentFinance Officers Association and is nationally recognized for its comprehensive analytical and advisory serv-ices, and specialized research on state and local government finance. Since beginning operations in 1977, theGFOA Research and Consulting Center has provided advisory services to hundreds of local, county, and stategovernments; public utilities; elementary and secondary education systems; and transit authorities.
The GFOA’s Research and Consulting Center encourages enquires about this study or about repeating theanalysis for other governments — please contact Shayne Kavanagh at 312-977-9700 or [email protected].

Executive Summary............................................................................................................4
1. Introduction ....................................................................................................................7
2. Primary Risk Factor Analysis ........................................................................................9
Revenue Source Stability ......................................................................................9
Infrastructure........................................................................................................14
Vulnerability to Extreme Events and Public Safety Concerns............................15
3. Secondary Risk Factor Analysis ..................................................................................17
Leverage................................................................................................................17
Expenditure Volatility............................................................................................19
Growth of the Community ....................................................................................20
Liquidity ................................................................................................................20
4. Recommendations ......................................................................................................22
Recommended Reserve Target for Colorado Springs ........................................22
Other Ideas to Support the General Fund Reserve Strategy ............................26
Appendix 1. Sales Tax Revenues in Boulder, Colorado ................................................31
Endnotes ..........................................................................................................................32
The Case of the City of Colorado Springs

4
Executive Summary
Reserves are the cornerstone of financial flexibility. Reserves provide a government with options forresponding to unexpected issues and a buffer against shocks and other forms of risk. Managing re-serves, however, can be a challenge. The main question is how much money to maintain in reserve –how much is enough, and when does it become too much? This can be a sensitive question, sincemoney held in reserve is money taken from constituents, and it can be argued that excessive reservesshould be returned to citizens in the form of lower taxes.
The City of Colorado Springs, Colorado, has been considering this question, especially in light of itsvolatile revenue portfolio and the fact that it cannot easily increase taxes to compensate for otherchanges in its financial condition; for example, the Taxpayer Bill of Rights – a statewide provision re-stricting all governments in the state from raising tax rates without voter approval – limits the City’sability to increase taxes. The City engaged the Government Finance Officers Association to help pro-duce an answer. The GFOA is a non-profit association of approximately 17,500 state and local govern-ment finance professionals and elected officials from across North America, and a key part of itsmission is to promote best practices and good public finance, including reserve policies.
The GFOA worked with Colorado Springs to analyze the risks (based on the model originally de-scribed in the GFOA publication, Financial Policies) that influence the level of reserves the City needsas a hedge against uncertainty and loss. Three primary risks were identified: volatility of sales tax rev-enue; the potential for the City’s storm sewer and bridge infrastructure to fail; and the City’s vulnera-bility to extreme events such as wildfires, floods, and, to a lesser extent, snowstorms. Secondary riskfactors were also examined, including cash flow and the potential for unexpected spikes in expendi-tures. In addition, a benchmarking survey of the reserves held by comparable cities provided context.
CALCULATING THE RESERVEThe GFOA reviewed three primary risk factors in order to assess the potential magnitude of theCity's exposure. The "Triple-A” approach to accounting for uncertainties was an important part ofGFOA's analysis.
Accounting for Uncertainty – The “Triple-A” Approach
Sizing a reserve requires estimating highly uncertain events, like natural disasters and economic downturns. To develop an adequate response, the GFOA used the “Triple-A” approach:1
• Accept. First, we must accept that we are subject to uncertainty, including events that we haven’t evenimagined.
• Assess. Next, we must assess the potential impact of the uncertainty. Historical reference cases are auseful baseline.
• Augment. The range of uncertainty we really face will almost always be greater than we assess it to be, sowe should augment that range. Historical reference cases provide a baseline, but that baseline may not beadequate to account for all future possibilities.

5
Revenue Volatility. The City’s primary concern was the volatility of sales tax income, and its most im-portant vulnerability in this area would be an economic downturn. The GFOA reviewed sales taxvolatility back to 1996 in order to observe monthly variations and longer-term trends. Past experi-ences suggested that Colorado Springs should prepare for a 20 percent decline in sales tax revenuesover 25 months as a plausible worst-case scenario; this would equal about $23 million in reserves.However, since the City would presumably reduce its spending in the event of such a severe down-turn, the reserve fund wouldn’t have to cover the entire decline in revenue. The City budget office es-timated that the budget could be reduced by almost $10 million without creating a major disruptionto services (although there would of course be some degree of negative impact on service quality).Thus, Colorado Springs should maintain a reserve of at least $13 million to cover the remaining por-tion of the worst-case revenue gap and to help the City make a “soft landing” under those circum-stances. An additional $7.5 million is required to cover the other revenues that make up the generalfund; these were found to be considerably less volatile than the sales tax.
Infrastructure Risks. A government might need general fund reserves to repair or replace an asset thatfails unexpectedly. In Colorado Springs, the two major asset classes deemed to have the greatest as-sociated risk were bridges and storm sewers. Thirteen bridge structures had a high risk rating, withan estimated replacement value of almost $23 million – an average of roughly $1.75 million perbridge. A reserve that covers one or two bridges should be adequate, but covering three might bemore prudent, for a $5.25 million reserve. No installation dates or condition assessments were avail-able for the 406 miles of storm lines the City manages, but the estimated replacement cost for allstorm sewers was a little more than $588 million.2 Since this lack of information made it impossibleto assess the risk of failure, the best that could be done was to make an assumption. The GFOA didknow that about 10 percent of the total dollar value of the City’s bridge inventory is in the higher-riskcategory, so it started with that number for storm sewers, which translates to $58 million. The rec-ommended reserve amount is about 20 percent of the high-risk bridges, which equates to $11.6 mil-lion for storm sewers.
Extreme Events. Finally, the City is subject to extreme events that pose significant threat to life andproperty, particularly wildfires and floods. Historically, however, the financial impact of these eventshas been manageable. For example, the 2012 wildfire was the worst in Colorado history, but the totalcost to the City was only $3.75 million – out of an annual budget of approximately $220 million. Ofcourse, the scale of future events is uncertain, as is the timing of FEMA reimbursement and the por-tion of event response costs that would likely already be covered by existing budgeted resources. Tak-ing this into account, a reserve of $5 million to $7.5 million for extreme events appears reasonable.
Adding It Up. The analysis above, along with the analysis of the secondary risk factors (particularlyuncertainty regarding future payments for pension liabilities and expenditures for unfavorable law-suit judgments) led to the following reserve components. The GFOA further recommended that thereserve amounts be categorized by component, making the purpose of the reserve more transparent.For example, having a reserve for emergencies and a reserve for economic uncertainty would maketheir purpose more clear than one all-encompassing reserve.4
6
Budgetary Uncertainty Reserve
$13 million for sales tax economic uncertainty +
$7.5 million for economic uncertainty in other revenues +
$6.25 million for pension payment uncertainty =
$27 million, or approximately 12.5 percent of general fund revenues3 as budgetary uncertainty reserve
Emergency Reserve
$5.25 million for critical bridge failure +
$11.6 million for critical storm sewer replacement +
$5 million to $7.5 million for extreme events +
$2 million to $4 million for expenditure spikes from lawsuits =
$27 million, or approximately 12.5 percent of general fund revenues as an emergency reserve
Combining the components gives us a target of approximately 25 percent of general fund rev-enues, which is in line with the range of reserves actually maintained by other cities that are compa-rable to Colorado Springs. It is also greater than the 16 percent the GFOA considers a minimumbaseline level.5

7
1. Introduction
Reserves are the cornerstone of financial flexibility. Reserves provide a government with options torespond to unexpected issues and afford a buffer against shocks and other forms of risk. Managingreserves, though, can be a challenge. Foremost is the question of how much money to maintain inreserve. How much is enough and when does a reserve become too much? This can be a sensitivequestion because money held in reserve is money taken from constituents and the argument couldbe made that excessive reserves should be returned to citizens in the form of lower taxes.
The City of Colorado Springs (the “City”) has been considering this question recently, especially inlight of the volatility of its revenue portfolio and the fact that the City cannot easily increase its taxesto compensate for other changes in its financial condition.6 The City engaged the Government Fi-nance Officers Association (GFOA) to help produce an answer. The GFOA is a nonprofit associationof over 17,000 state and local government finance professionals and elected officials from acrossNorth America. A key part of GFOA’s mission is to promote best practices in good public finance, in-cluding reserve policies.
The GFOA’s approach to reserves does not suppose “one-size-fits-all.” GFOA’s Best Practice on gen-eral fund reserves recommends, at a minimum, that general-purpose governments, regardless ofsize, maintain unrestricted fund balance in their general fund of no less than two months of regulargeneral fund operating revenues or regular general fund operating expenditures (i.e., reserves equalto about 16 percent of revenues).7 However, this 16 percent is only intended as a baseline, and itneeds to be adjusted according to local conditions. To make the adjustment, the GFOA worked withthe City to conduct an analysis of the risks that influence the need for reserves as a hedge against un-certainty and loss.
A risk is defined as the probability and magnitude of a loss, disaster, or other undesirable event.8 TheGFOA’s framework of risk assessment is based on the risk management cycle: identify risks; assessrisks; identify risk mitigation approaches; assess expected risk reduction; and select and implementmitigation method. The framework focuses primarily on risk retention, or using reserves, to managerisk. However, the framework also encourages the City to think about how other risk managementmethods might alleviate the need to retain risk. For example, perhaps a risk could be transferred by
The Origin of this Report
This report was originally developed as a consulting product for the City of Colorado Springs. The City graciouslygave the GFOA its permission to use the report for more general education and information sharing about risk-based assessment of reserve requirements.

8
purchasing insurance or relying on another organization or accounting fund to manage the risk. Itmight also be possible to avoid a risk by discontinuing activities that are creating a risk for the gen-eral fund. Hence, a thorough examination of the risk factors should not only help lead to customizedreserve target size, but also should improve the City’s understanding of the risks it faces and its over-all financial risk profile.
As a first step in this project, the GFOA conducted a basic review of the risk factors that generally in-fluence the amount of reserves a municipal government should hold.9 This review enabled the Cityand the GFOA to classify factors as either primary risks or as secondary risks. Exhibit 1.1 lists how therisk factors were classified.
The next section presents an overview of the primary risk factors and the City’s level of exposure.The third section reviews secondary risk factors that have less weighty implications for the City’sgeneral fund reserve strategy, but which still should be considered. The fourth and final section ofthe report presents the findings of the analysis, including a customized target reserve level for theCity’s general fund and other ideas to improve the financial health of the City.
Exhibit 1.1 Categorization of Risk Factors that Influence Reserve Levels for Colorado Springs
Primary Risk Factors
Revenue (Sales Tax) Volatility
Infrastructure Upkeep
Vulnerability to Extreme Events and Public Safety Concerns
Secondary Risk Factors
Leverage
Expenditure Volatility
Liquidity/Cash Flow
Growth of the Community

9
2. Primary Risk Factor Analysis
This section presents the three most important risk factors examined by the GFOA and the City’s ex-posure: the volatility of the City’s revenue portfolio, maintenance/replacement of the City’s infra-structure (focusing on bridges and storm sewers), and vulnerability to extreme events and publicsafety concerns.
REVENUE SOURCE STABILITYVolatile revenue sources call for a higher reserve level in order to avoid the need for sudden servicecutbacks should revenues drop unexpectedly. Some revenues are inherently volatile. The sales tax isusually considered to be a volatile revenue source because it is much more sensitive to swings in theeconomy than a revenue source like the property tax, for instance. This is an important considerationfor Colorado Springs, considering that sales taxes (and the closely associated use tax) account forover half of the general fund’s revenues.10 No other revenue source comprises more than a fifth ofgeneral fund revenue (the next largest is transfers from other funds, at about 17 percent); the prop-erty tax, normally a large revenue source for municipal governments, accounts for less than 10 per-cent.
This section will first analyze the volatility of the sales tax, as well as two closely associated revenues– the use tax and sales tax audit revenue. Following that, the stability of the general fund’s other im-portant revenue sources will be examined.
Sales and Use TaxA first step is to understand the level and nature of volatility in the sales tax. The sales tax appears tofollow fairly predictable seasonal patterns. Exhibit 2.1 shows annual sales tax revenues for 2007through 2011 and Exhibit 2.2 shows monthly sales tax revenue since 2006.11 In Exhibit 2.1, use tax andrevenues from sales tax audits are removed. These revenues add “noise” to the pure sales tax data,making it more difficult to analyze. They are also much smaller revenue sources – use tax is 7 percentthe size of sales tax and audit revenues are 3 percent of all sales tax revenue. These revenues will bediscussed later in the report.
Exhibit 2.1 Five-Year Trends for Sales Tax
2011 2010 2009 2008 2007
Revenue $111,735,533 $108,212,533 $101,247,887 $107,356,298 $113,211,788
Annual Change 3.3% 6.9% -5.7% -5.2% 1.7%

10
The red circles in Exhibit 2.2 denote January revenues, which are always the highest of the year dueto holiday shopping. The green circles show revenues from July, October, and April, which all see rev-enue spikes (due to quarterly sales tax filings for smaller vendors). This pattern and even the relativemagnitude of the spikes are quite consistent from year to year, even as far back as 1996. In fact, a sta-tistical analysis shows that only a 2 percent change in sales tax revenue is attributable to randomvariation. About 91 percent is due to fundamental economic trends/business cycles (also known sim-ply as “trend-cycle”), and 7 percent is explained by seasonal variation.12
This means that random fluctuations in the sales tax should not concern the City. However, it alsomeans that the influence of economic cycles is very strong. An unexpected shift in the economycould have serious ramifications for City revenues, as the City has experienced in the wake of the2001 recession and the more recent Great Recession. Exhibit 2.3 (on the following page) shows thetrend-cycle line for sales tax13 overlaid on monthly sales tax revenues. The red arrows show the begin-ning and end-points of significant downtrends. The first one started in April 2001 and lasted untilMay 2003. The trend-cycle declined 6.6 percent over 25 months, or about a quarter percent permonth. The second started in July 2007 and lasted until April 2009. The trend-cycle declined 11.2percent, or just over half a percent per month.
Obviously, the decline associated with the Great Recession was much sharper than the 2001 reces-sion, both in terms of overall decline and speed of the decline. In fact, so severe was some of the fi-nancial fallout from the Great Recession that some have dubbed it what acclaimed financial thinkerNasim Talib has termed a “Black Swan” event – a rare and unpredictable event that has an extremeimpact.14 Black Swans are, by definition, impossible to predict, so the best that anyone can do is tobe prepared. The accomplished forecasting scientist Spyros Makridakis has suggested a “Triple-A”approach (described on the next page) for dealing with this kind of uncertainty.15
Exhibit 2.2 Seasonal Peaks in City Sales Tax Revenue
There are four consistent spikes in sales tax revenue during the year, with January being the most important. The other spikes occur in July, October, and April.

11
1. Accept. First we must accept that we are subject to uncertainty. Even though the sales tax issubject to relatively little random variation, it is clearly subject to Black Swans. Because it isrelatively easy to imagine scenarios that could cause the Colorado Springs economy to suffer(e.g., European financial crisis, federal debt crisis, a significant reduction in military spendingdue to federal budget shortfalls, etc.), we must also accept that the economy is subject to addi-tional potentially dangerous unknowns that we cannot imagine.
2. Assess. Next we must assess the potential impact of the uncertainty. Past history can provide auseful reference point. We saw earlier that a downturn in the trend-cycle has lasted as long as25 months and has been as severe as a 0.53 percent monthly decline. The rate of decline ismore relevant to the discussion of general fund reserves because a more protracted declineshould be dealt with by restructuring the budget, not necessarily with continuous use of fundbalance. Even so, it is important to consider both.
3. Augment. The range of uncertainty we really face will almost always be greater than we assess itto be, so we should augment that range. For example, we used the experience of the Great Re-cession as a reference point for our worst-case monthly decline (0.53 percent). However, manyeconomists believe that the effects of the Great Recession would have been much worse hadthe federal government not taken the actions that it did.16 Who is to say that continued grid-lock in the federal political system (or other circumstances) won’t prevent an effective mitigat-ing response to the next crisis? As a rule of thumb, Makridakis suggests doubling your rangeof uncertainty if you have little historical data to rely on or multiplying it by 1.5 if you havemore. We have a good deal of data, so a 1.5 multiplier seems appropriate, giving us a 0.8 per-cent monthly decline. That translates to a potential 20 percent decline over 25 months. Thisdoes not necessarily mean that the City should reserve this entire amount, though, because
Exhibit 2.3 Sales Tax Monthly Revenue and Trend-Cycle
The City has experienced two major downturns in the sales tax trend-cycle. The first one started in April 2001 and lasted untilMay 2003. The trend-cycle declined 6.6 percent over 25 months. The second started in July 2007 and lasted until April 2009.The trend-cycle declined 11.2 percent.

12
presumably, in the event of a financial Black Swan, the City would take action to reducespending – not just continue to spend as it had before. The implications of the sales tax analy-sis, along with the other analyses performed by the GFOA, for the City’s reserve strategy willbe addressed in the fourth section of this report.
As mentioned earlier, audit revenues were removed from the sales tax data for purposes of this analy-sis. As Exhibit 2.4 shows, from 2007 through 2011, audit revenues ranged between $3.3 million and$2.2 million. It has experienced some fairly significant swings in this time as well. However, a $1 mil-lion potential for variation is probably not material in the entire City revenue portfolio. The City ex-pects sales tax audit revenues to continue into the future within the same general range that theyhave occurred in the past.
Use taxes were also removed from the sales tax data. Exhibit 2.5 (on the following page) shows thefive-year trend analysis for use taxes. Use taxes are not quite as volatile as audit revenues, but are stillrather volatile. In fact, GFOA’s statistical analysis showed that almost 15 percent of the variation inuse tax is attributable to simple randomness (compared to 2 percent for sales tax). However, moreimportantly, the use tax has experienced a notable decline since 2008. Examination of the long-termhistory shows that the revenue experienced a rapid increase in 2005, coinciding with the construc-tion boom and use taxes from commercial construction and manufacturing equipment. Revenuestayed at about this level until 2008, when tax revenue declined considerably as these industries ex-perienced a slowdown in their growth. Hence, the change we see in Exhibit 2.5 is less a product ofrandom variation and more a product of a fundamental change in the tax base. Hence, use taxes havelikely settled in at a new, lower level of yield that is reflective of reduced economic activity in com-mercial construction and manufacturing equipment (in fact, the lowest level since 1996). As such,there is probably little risk of another significant downside move.17 In fact, an analysis of the sourcesof the use tax shows that income from construction-related trades has fallen substantially in recentyears. For example, revenue from building general contractors in 2011 was 12 percent of what it was in2007, and revenue from subcontractors was 27 percent of 2007 levels. Also, total vacancy rates forcommercial properties have hovered around 10 percent for the last two years, up from 7.7 percent in2008. This indicates that there may be excess capacity in Colorado Springs, such that a significantuptick in building is not likely in the near term.
Sales Tax Point of Comparison
Appendix 1 provides a similar analysis of monthly sales tax data from the City of Boulder, Colorado, in order toprovide a sense of context for how volatile sales tax revenue is in another jurisdiction.
Exhibit 2.4 Five-Year Trends for Sales Tax Audit Revenue
2011 2010 2009 2008 2007
Revenue $3,284,390 $2,369,723 $3,250,245 $2,189,116 $2,210,099
Annual Change 32.8% -27.1% 48.5% -0.9% 51.3%

13
While sales tax is clearly the most important revenue, an analysis of reserve requirements shouldtake account of other revenues as well, given that other revenues comprise half of the City’s budget.Below is a summary of other major sources of revenue and their associated volatility risk.
Property Taxes. Property taxes comprise only about 9 to 10 percent of the City’s budget. The City hasexperienced a steady decline in property tax revenues in recent years, with a primary cause being areassessment and lower property values owing to the decline in the housing market. Nationally, thehousing market seems to have stabilized, at least to the point where another major decline is un-likely.18 An examination of Colorado Springs’ housing prices shows that Colorado Springs seems toessentially follow national trends.19
Charges for Service. Charges for service are about 6 to 7 percent of the general fund budget. Revenuesfrom charges for service have fallen substantially in recent years, now budgeted at 70 percent of the2009 actual revenues. This is mostly due to a sharp decline in charges for services forconstruction/development regulation. Hence, the user fees do have some vulnerability to economiccycles. A reserve could be useful, but the City might also consider other policies to mitigate risk. Forexample, a policy that sets cost recovery goals for fees would prompt a discussion of how to reducecosts if revenues were not up to expectations. Regardless, it may be helpful to have a small reserve inorder to allow gradual adjustments to drop-offs in revenues. In recent history, the total charges forservice revenues have dropped $3 million in one year. At this point, fees that are more sensitive toeconomic conditions (e.g., construction-related fees) have probably reached or are approaching abottom. Accordingly, a $3 million reserve should probably be more than adequate.
Intergovernmental Revenue. Intergovernmental revenue is about 9 to 10 percent of the general fundbudget. By far, the most important component of this is the highway users tax, at about 90 percent ofthe total. The highway users tax is intended to support traffic safety and road maintenance programs.There has been political pressure at the state level to reduce the resources that support the tax, but,so far, this has not happened. However, if one of these efforts were successful the City would find it-self with reduced revenue. City staff believes that the Funding Advancements for Surface Trans-portation and Economic Recovery (FASTER) portion of the highway users tax is the most vulnerableto being eliminated (about $1.5 million), so reserve strategy could focus on replacing that amount forone year (after which point the City would presumably have adapted).
The City also receives a number of grants for capital projects, and some for operations. These grantsare not accounted for in the general fund, but if the grants were to be lost there could be some pres-sure on the general fund to continue the associated service. For capital projects, the City would likelycancel or defer the project or find another source of funding, rather than using reserve to make upthe shortfall from a lost grant. Lost grants for operations may require some support from the generalfund in order to provide continuity in service (assuming the City cannot simply discontinue the serv-ice). A reserve of $3 million appears to be adequate to cover this risk, based on the level of grantsused to support core operating programs currently.
Exhibit 2.5 Five-Year Trends for Use Tax
2011 2010 2009 2008 2007$
Revenue $6,024,785 $6,454,560 $5,668,451 $8,490,105 $9,264,952
Annual Change -6.7% 13.9% -33.2% -8.4% -12.4%

14
Transfers from Other Funds. The City receives about 17 percent of its revenue from transfers fromother funds (from City utilities). This transfer is a matter of City Council policy. There do not appearto be any major threats to the continued economic viability of this policy, so any change would have apolitical genesis. A decision to reduce the transfer should be made in the context of how it will im-pact the budget, so a reserve should not be necessary.
INFRASTRUCTURE
Healthy infrastructure makes for an economically vital community. However, worn infrastructureposes a potential risk of untimely failure. General fund reserves may be needed to repair or replacean asset that fails unexpectedly. In Colorado Springs, the two asset classes that were deemed to be ofthe greatest importance are bridges and storm sewers.
Exhibit 2.6 shows a risk profile for bridges and culverts. Risk is defined as the product of probabilityof failure and the consequences of failure. Probability of failure is based on the bridge sufficiencyindex (BSI) provided by the City staff. A lower BSI indicates a bridge that is in worse condition andultimately a higher risk (probability) to fail. Consequence is based on cost – the higher the replace-ment cost of an asset, the higher the consequence to the City if that asset were to fail.20 As can beseen in the exhibit, 13 bridge structures have been identified as having a high risk rating (thosebridges in the red area, which have a total score of between 8 and 10, when the scores from each axisare added together). These bridges have an estimated replacement value of $22,752,672. This aver-ages to about $1.75 million per bridge. A reserve that covers one or two bridges should be adequate,
Exhibit 2.6Risk Profile for Bridges and Culverts
Grant Policy
The City auditors have pointed out that overreliance on grants is a potential risk for the City. A policy that limitsthe City’s exposure to the risky elements of grants could be helpful. Section 4 of this report describes how grantpolicies might be helpful.

15
but using the “Triple-A” rule (described earlier) of doubling our expectation for uncertainty, prepar-ing for the premature failure of three of these bridges might be more prudent. This equates to a $5.25million reserve.
In addition to the bridges and culverts, the City manages 406 miles of storm lines. However, neitherinstall dates nor condition assessments were available for any storm lines. The estimated replace-ment cost for all storm sewers is $588,052,836.21 Since the information necessary to assess risk of fail-ure is not available, the best that can be done is to make an assumption. We do know that about 10percent of the total dollar value of the City’s bridge inventory is in the higher risk category, so it maybe reasonable to start with that number for storm sewers, which would translate to $58 million. Wealso know that about 20 percent high risk category of bridges was recommended as a reserveamount, which would equate to $11.6 million.
We will review how this analysis for bridges and storm sewers fits into an overall reserve strategy inSection 4 of this report.
VULNERABILITY TO EXTREME EVENTS AND PUBLIC SAFETY CONCERNSThis factor concerns the extreme events (e.g., natural disasters) the City is vulnerable to, the publicsafety programs that must be funded during the occurrence of an extreme event, and the federal orstate programs that would help and how long it would take to get assistance. For example, reim-bursement from the Federal Emergency Management Agency (FEMA) does not always occur rightaway, so it is important to have reserves to absorb the cost in the meantime, and FEMA does not nec-essarily reimburse 100 percent of the cost of responding to an event.
Discussions with the City’s Emergency Operations Manager reveal that Colorado Springs is most atrisk for wildfires and floods. Wildfires are probably the most important risk, as the fires of 2012 un-derlined. About 20-25 percent of homes in Colorado Springs are subject to wildfire risk, althoughfires that damage homes are not that common. The most recent fire was the most destructive in Col-orado history. It impacted around 12,000 acres and burned 347 homes. By comparison, the most re-cent other fires of an extreme size were in 2005 and 2000 and impacted 35 and 800 acres,respectively. No homes were burned in either of those fires – in fact, one must look back to around1950 to find the last time before 2012 that homes in the City of Colorado Springs were burned bywildfire.
Large wild fires can be expensive to respond to, requiring police and fire personnel for suppression ofthe fire and evacuation of people. Many other city departments are involved in the recovery efforts.FEMA reimbursement is not immediate and does not typically cover all the City’s costs of respond-ing. Further, a fire is likely to interrupt the City’s sales tax revenue.
Currently, the City only has estimated costs for the most recent fire, which is $3.75 million in person-nel time, mutual aid costs, and other direct expenses. The estimate pertains to the actual firefightingwithin the City limits and the emergency protective measures taken (e.g., evacuation, security, acti-vation of the emergency operations center, etc.). Of this, the expenses eligible for a 75 percent FEMAreimbursement are estimated to be $2.15 million. Adding together the FEMA ineligible expenses,plus the 25 percent unreimbursed expenses results in a figure of $2.14 million. At least some of thisrepresents expenses that the City would have incurred anyhow (e.g., firefighters on duty). The Citygovernment did not incur any significant direct property damage as a result of the fire (probablyaround $30,000), but there may be some indirect damage to storm sewers later on, as a result of in-creased run-off, from the fire-damaged areas. The City engages in mitigation efforts, such as defor-estation of areas that are at risk for wildfire, but it is still important for the City to retain a reserve tobe prepared for future wildfires.

16
Floods are also a concern because they damage infrastructure, require a City emergency response,and require debris removal afterwards. The most severe floods were in 1935 and 1965. Otherwise,smaller floods occur about 6 or 7 times in a 10-year period. The last flood that qualified as a FEMAdisaster occurred in 1999, though it wasn’t on the scale of the 1965 or 1935 floods. The cost to the Cityto address the flood damage of 1999 was $2,670,158. The federal share of the project was 75 percent,or $2,002,619; the state share was 12.5 percent, or $333,770; and the City share was the remaining 12.5percent, or $333,770. This would equate to about $3.67 million in total costs and $460,000 for theCity’s final share in today’s dollars.
Blizzards represent a final, less severe risk. The magnitude of impact is not as great as for fires orfloods, but the City still incurs an unexpected cost. The last significant cost was in 2007, when theCity needed to appropriate an additional $400,000 to deal with snow storms.
In summary, Colorado Springs faces a risk from several types of extreme events that have the poten-tial to cause loss of life and property and to disrupt business. The City has taken steps to protect thehealth, safety, and welfare of the community in light of these risks. Fortunately, however, these ex-treme events do not appear to constitute a large risk to the City’s financial position. For example, areserve of $4 million (compared to annual City revenues of about $220 million) would be more thanadequate to cover the cost of either the most recent fire or a flood of similar severity to the 1999flood, before FEMA reimbursement.
However, using Makridakis’s “Triple-A” approach (described earlier), it may behoove the City to aug-ment the level of risk it is preparing for. We have a very limited number of data points to inform us,so a higher multiplier seems appropriate. If we multiplied $3.75 million by 2 we would get $7.5 mil-lion. However, much of an extreme event’s cost would be reimbursed by other parties (e.g., a 75 per-cent reimbursement from FEMA) and some of this figure would represent costs the City would incuranyhow (e.g., regular salaries for public safety personnel), so a $7.5 million reserve might be exces-sive. Discussions with City staff indicated that the City would have incurred about one third of themost recent fire’s costs in the normal cost of doing business, and that about half of the reimburse-ment from FEMA can be expected to be received within six months of the expenditure. Using this asa reference point, a reserve of $3.3 million might represent the minimum prudent reserve amountbecause it accounts for the fact that the City will have to bear some of the costs of responding to anextreme event in its regular budget, and that another significant portion of the cost will be reim-bursed quickly by FEMA. A reserve of $5 million might be a middle ground because it does not ac-count for FEMA reimbursement (which is outside the control of the City).
Section 3 will consider the all the foregoing analyses together in order to present a final recom-mended reserve target for the City.

17
3. Secondary Risk Factor AnalysisThis section presents an overview of risk factors that are less complex or of lower magnitude than theprimary risk factors, but that also have implications for the City’s general fund reserve strategy.
LEVERAGEA highly leveraged organization has less flexibility. Examples of leverage include long-term debt,pension obligations, and obligations for post-employment health care. Reserves are a critical sourceof financial flexibility, so high leverage may call for higher reserves. This section will address each ofthe aforementioned sources of leverage.
DebtThe City has very little debt. Exhibit 3.1 demonstrates this by comparing the City’s level of indebted-ness to other cities. Exhibit 3.1 includes a group of cities that Colorado Springs has identified as “Bestin Class” for the purpose of comparing the City’s business practices to those of other, similar cities.Exhibit 3.1 also includes two “sales tax comparable” cities – Colorado cities that receive a large por-tion of their revenue from sales taxes, but are not otherwise as similar to Colorado Springs. Finally,the exhibit provides summary statistics of all these municipalities. Exhibit 3.1 compares debt along
Exhibit 3.1Comparison of Colorado Springs’ Indebtedness with Other Cities
“Best in Class Cities”Colorado Fort Collins Oklahoma Denver Indianapolis CharlotteSprings City
Population 422,816 144,875 580,000 619,968 820,445 731,424
Debt per Capita 256 342 1,072 2,702 1,445 1,829
Debt Service as a % of Expenditures 5.9% 3.5% 10.2% 10% 13.8% 15.2%
Sales Tax Comparables Summary StatisticsColorado Lone Tree Centennial Average MedianSprings
Population 422,816 11.097 100,377 553,255 599,984
Debt per Capita 256 2,558 28 1,274 1,258
Debt Service as a% of Expenditures 5.9% 10.4% 0.3% 9.8% 10.1%
The City has substantially lower debt levels than the average of the comparison group.

18
two commonly used measures of indebtedness. The first, debt per capita, measures the burdenplaced on citizens by municipal indebtedness. The second measure is debt service (principal and in-terest payments) as a percent of city expenditures. This figure measures the pressure placed on thebudget by debt payments. Colorado Springs is well below the average on both of these measures.This means that Colorado Springs should not find its financial flexibility reduced by excess debt. Infact, the City’s debt capacity could offer an alternative source of financial flexibility. For example, ifthe City were found liable for an exceedingly large judgment that was due immediately, it might beable to use debt instruments to pay the amount over time.
The reader should note that the GFOA did not use only the general fund financial information to cal-culate these ratios, but rather used the broader categories of “governmental activities” and “govern-mental funds,” which can be found in any comprehensive annual financial report. This is because allthe cities accounted for debt in different funds, so looking at just the general fund would provide apartial, and inaccurate, impression. However, the aforementioned categories have fairly standardmeanings across government and they include most of the general government services one wouldtypically associate with a municipality, such as public safety and public works. Therefore, they ad-dress debt of a general nature, which does have direct relevance to the financial flexibility of the gen-eral fund.
These general government categories, though, exclude utilities and other more business-like activi-ties. The business-like category of services was excluded for two main reasons. First, municipalitiesdo not provide these types of services as consistently as they do general government services. Second,these services, particularly utilities, often carry large amounts of debt, and would therefore have hada major impact on the indebtedness measures. However, this debt has a much more indirect rela-tionship to the financial flexibility of the general fund.
Pensions
The City is involved in four different self-funded pension arrangements, all of which are closed tonew participants.
• The Old Hire Police Pension Fund has been closed and has 166 total members. The plan is 81percent funded as of January 1, 2012. GFOA Best Practices call for 100 percent funding of pen-sion liabilities.22 The plan has an unfunded liability of $16.1 million, which translates into anannual actuarial required contribution (ARC) of $1.5 million for 2013, up from $1.4 million in2012.
• The New Hire Pension Plan – Police Component has 650 members and a funded ratio of 80.2percent. The plan has an unfunded liability of $48.8 million, which translates into an annualARC of $10.6 million for 2013, up from $9.6 million in 2012.
• The Old Hire Fire Pension Fund has 193 members and is 84.1 percent funded. The plan has anunfunded liability of $15.5 million, which translates into an annual ARC of $1.5 million for 2013,which is about the same as 2012.
• The New Hire Pension Plan – Fire Component has 286 members and is 79.2 percent funded.The plan has an unfunded liability of $25.9 million, which translates into an annual ARC of $4.7million for 2013, which is down from $ 5.2 million in 2012.
The City also participates in two statewide plans. The Colorado Public Employees Retirement Associ-ation for is for civilian employees. As of December 31, 2011, the PERA Local Government Division’sfunded ratio was 69.3 percent, with an unfunded liability of $1.277 billion. Of course, this underfund-ing could have some impact on the City in the form of increased contribution rates in the future. TheFire and Police Pension Association of Colorado provides a defined benefit plan for sworn officers. Itis funded at over 100 percent as of January 1, 2011.

19
Another issue common to all pension funds is the assumed rate of return on pension fund assets.Pension funds often assume return rates of around 7 to 8 percent annually. The recent performanceof investment markets has led some to question the return assumptions the Colorado Public Em-ployees Retirement Association uses. If circumstances were to require the association to lower its re-turn assumptions, then member governments would have to increase contributions to make up thedifference.23
Assuming that the City keeps up with its ARC payments, the unfunded accrued liabilities should, intheory,24 be covered by the end of the amortization period (which can vary with the plan, but typi-cally is between 20 and 30 years). Keeping up with the ARC payments is a matter of City budgetarypolicy, and not really an issue that should be addressed through using reserves. However, given theuncertainty around pension issues, it is difficult to say when increases would occur or how muchthey might be. Accordingly, it would be prudent to hold some reserve to help make a more gradualadjustment to any potential large increases in contribution rates. The City currently pays about $10.5million in annual contributions to the Colorado Public Employees Retirement Association and about$14.5 million to the other pensions, for total of about $25 million. A reserve of $6.25 million wouldcover a 25 percent increase in pension costs. Of course, an increase in the City’s contribution wouldbe felt over many years, but the reserve will allow the City to make a gradual adjustment or to moreeasily absorb a larger increase in contributions in one year.
The City has considered different actions to mitigate its pension liabilities, including increasing thecontributions required from employees and switching to a defined contribution pension plan. It hasalso shifted away from a single-employer plan to the state plan for the most newly hired sworn offi-cers, which should be less volatile and help mitigate risk.
Other Post-Employment Benefits (OPEB)The City allows retired sworn police officers to stay on a City-sponsored medical plan. The cost ofthis benefit is paid for by the City as it is incurred. The City’s annual required contribution for OPEBis $2.2 million and there is a net obligation of $11.2 million. The City has taken steps to contain itsOPEB liability, such as eliminating the City-provided subsidy for retiree health care for new hires andgoing to a flat (instead of variable) subsidy for existing employees. Hence, similar to pensions, theCity will likely not experience near-term, large expenditure spikes or a drastic decrease in the City’sfinancial flexibility owing to OPEB liabilities. Also, like pensions, the financial pressure created byOPEB liabilities is best addressed through the budget process, not general fund reserves.
EXPENDITURE VOLATILITYThis risk factor refers to potential spikes in expenditure, usually arising from a special, non-recurringcircumstance. Expenditures of a recurring nature should not be addressed through the use of re-serves, since reserves do not represent a sustainable source of funding for recurring expenditures.Rather, recurring expenditures should be accommodated in the operating budget.
In Colorado Springs, lawsuits appear to be the most important potential source of expenditurespikes, especially because the City’s risk management funds do not carry a large amount of reservesthemselves, requiring the general fund to backstop them.
Discussions with the City’s attorney and risk management professional reveal the following:
• The City faces a number of litigation cases each year. The average potential liability tends to bepretty consistent from year to year. The City normally budgets between $600,000 and $800,000each year for claims, which generally has proven sufficient. In more recent years, the number oflitigation cases has risen somewhat, but this does not appear to be a significant trend.

20
• The City is a facing a couple of extraordinary special cases. Due to the sensitivity of the cases,they will not be discussed in detail in this report, but there is a significant degree of uncer-tainty around the amount the City could be liable for and if the City will be liable for anythingat all. Hypothetically, the liability could represent tens of millions of dollars, but the City At-torney believes that an amount of between $2 million and $4 million is a more realistic esti-mate of the City’s potential risk. Also, under certain circumstances the City could negotiate amulti-year payment schedule for a large liability.
• In the State of Colorado, certain forms of cancer have been designated as work-related injuriesfor firefighters. Hence, the City’s worker’s compensation fund will face an increased liability,which will, in part, be covered by the general fund (since the general fund is one of the con-tributing funds to the worker’s compensation fund). This would not create an expenditurespike, but rather would manifest as an increased annual contribution (probably not to exceed$1 million to $2 million per year). Accordingly, this change to the City’ recurring expenditurestructure should be handled through the City’s budget process.
In conclusion, it would seem prudent for the City to account for at least some of the risk associatedwith the extraordinary lawsuits in its reserves. The final section of this report will address how thisrisk fits in with the City’s total reserve goals.
GROWTH OF THE COMMUNITYRapid growth of the community could call for larger levels of reserves, lest service requirements ex-pand beyond the City’s ability to continue services in the face of revenue interruption. For instance,property tax revenues may not be received until a couple of years after development occurs, yet thegovernment will still need to provide for the public safety, health, and welfare of these members ofthe community in the meantime. Colorado Springs is a moderate growth community in a highergrowth region. The City averages 1.5 percent growth in a region that grows 2 percent annually. TheCity does not rely heavily on property taxes, so is not heavily impacted by a lag between when serv-ices are required by a new development and when revenues are received. Also, the City requires de-velopers to build much of the infrastructure associated with development (roads, parks, etc.), so itdoes not have to cover that expense. In conclusion, the fact that Colorado Springs is only expectingmoderate growth in the next few years and that its development financing approach does not requireCity resources for large capital outlays means that the implications of growth for the City’s reservesare minimal.
LIQUIDITYA larger amount of unreserved fund balance may be needed to avoid cash flow problems if the aver-age maturity of receivables significantly exceeds the average maturity of payables. A common exam-ple of this can be found in governments that are heavily reliant on property taxes. The bulk of taxesmay only be received at one or two times during the year, requiring reserves to bridge the monthswith lower receipts. As stated, Colorado Springs is not very reliant on property taxes at all. In fact, itsrevenue tends to come in fairly evenly over the year. Exhibit 3.2 (on the following page) shows theprojected monthly balances for 2012. As the chart shows, the City’s ending balance actually movessteady upwards for almost the entire year, eventually dropping near the end (due to bond repay-ments), but still ending up higher than it started. Hence, the City does not appear to have a liquidityproblem that requires reserves to cover the gap.

21
The City’s ending balances rise steadily throughout most of the year.
Exhibit 3.2The City’s Projected Monthly Ending Balances for 2012
140,000,000
120,000,000
100,000,000
80,000,000
60,000,000
40,000,000
20,000,000
0
Jan
-12
Feb
-12
Ma
r-12
Ap
r-12
Ma
y-1
2
Jun
-12
Jul-
12
Au
g-1
2
Se
p-1
2
Oct
-12
No
v-1
2
De
c-12

22
4. RecommendationsThis section provides GFOA’s recommendations to Colorado Springs, based on the analysis pre-sented in this paper. The first sub-section addresses the primary purpose of this report: to recom-mend a reserve target for Colorado Springs. The second sub-section provides other ideas related toreserve management strategy that Colorado Springs might find helpful, based on GFOA’s experiencewith best practices in public finance.
RECOMMENDED RESERVE TARGET FOR COLORADO SPRINGSThis section establishes the recommended reserve target for Colorado Springs. As a first step, the re-port will review the essential findings of the analysis for each risk factor. Next, the report will providesome helpful comparative information, such as the reserve levels maintained by other cities as wellas rating agency standards. Finally, all of this information will be synthesized to reach a reserve tar-get.
Comparative Reserve InformationWhen considering a reserve target it is helpful to consult outside standards. Two widely cited stan-dards are GFOA’s Best Practices and rating agency guidelines. The GFOA Best Practice recommends,at a minimum, that general-purpose governments, regardless of size, maintain unrestricted fundbalance in their general fund of no less than two months (16 percent) of regular general fund operat-ing revenues or regular general fund operating expenditures.25 Standard & Poor’s considers reservesof between 1 percent and 4 percent of revenues to be “adequate,” while reserves above 15 percent are“very strong.”26
It is also useful to consider the experiences of other governments. Exhibit 4.1 compares ColoradoSprings’ unrestricted fund balances as a percent of general fund revenues to the same cities that ap-peared in the debt comparison (Exhibit 3.1). “Unrestricted fund balance” is usually used to describethe portion of fund balance that is available to serve as a reserve for the types of risk mitigation pur-poses that were described in this report (i.e., respond to extreme events, protect against revenuedownturns, etc.). This is because unrestricted fund balance is the portion of fund balance that doesnot have restrictions placed on its use by outside authorities.

23
As Exhibit 4.1 shows, the typical unrestricted fund balance falls somewhere in between 20 percentand 25 percent of general fund revenues. Most of the cities in the analysis were closer to 20 percent,but two outliers (Indianapolis and Centennial) pulled up the average.
The average level of unrestricted fund balance (i.e., reserves) falls between 20 percent and 25 percentfor the comparable group. Colorado Springs falls within this range right now. The outliers in thecomparable group (Indianapolis and Centennial) have special circumstances.
Indianapolis had a very large amount of “committed” fund balance, which is a subcategory of “unre-stricted” fund balance. “Committed” fund balance is considered to be the most constrained of threesubcategories of unrestricted fund balance because the City’s management has committed those re-serves for a very specific purpose (the other two subcategories are “assigned” and “unassigned”).While it is impossible to say from Indianapolis’s public reports, it could be that this unusually largeamount has been accumulated to pay for a special project of some kind or is otherwise not intendedas a hedge against risk. In fact, if this amount is removed, Indianapolis’s reserve drops to 22 percent –much more consistent with the other cities. None of the other cities had nearly as large an amount,by any measure, of committed reserves. For example, 61 percent of Indianapolis’s reserves are com-mitted, while Colorado Springs only has about 3 percent in this category and Denver has about 8 per-cent, making Denver’s fund balances the most highly committed after Indianapolis.
As for Centennial, about 75 percent of Centennial’s reserves are in the “unassigned” subcategory (theleast constrained of the three), which suggests that Centennial has simply accumulated a muchhigher relative level of reserves than the other governments in Exhibit 4.1. Interestingly, Centennialalso has, by far, the lowest debt burden of any of the cities (see Exhibit 3.1). This high reserve, cou-pled with an extremely low debt burden suggests that Centennial has a significantly different eco-nomic base than the other cities. For example, the median household income in Centennial is$85,500, compared to $51,000 in Colorado Springs and $55,400 in the State of Colorado. The medianhome value in Centennial is $260,000, compared to $182,000 in Colorado Springs and $205,000 in theState of Colorado.27 In 2010, the unemployment rate in Centennial was 4.8 percent, compared to 9.4percent in Colorado Springs. Although neither municipality relies very heavily on property taxes, it isinteresting to note that the total assessed value of properties in Centennial is 34 percent greater on aper person basis than in Colorado Springs. Finally, Centennial’s general fund revenues are, on a percapita basis, 20 percent greater than those of Colorado Springs, even though Centennial appears to
Exhibit 4.1Unrestricted Fund Balance Comparison
“Best in Class Cities”Colorado Fort Collins Oklahoma Denver Indianapolis CharlotteSprings City
Unrestricted Fund Balance as a % of Revenues 22.6% 23.1% 12.7% 18.3% 56.9% 17.3%
Sales Tax Comparables Summary StatisticsColorado Lone Tree Centennial Average MedianSprings
Unrestricted Fund Balanceas a% of Revenues 22.6% 29.6% 52.9% 25.2% 20.5%
The average level of unrestricted fund balance (i.e., reserves) falls between 20 percent and 25 percent for the comparablegroup. Colorado Springs falls within this range right now. The outliers in the comparable group (Indianapolis and Centennial)have special circumstances.

24
provide a more limited set of services to its citizens (for example, Centennial is served by a separatefire protection district and recreation district, while Colorado Springs provides these service di-rectly). These distinctive characteristics have likely made it more practical for Centennial to accumu-late a sizable reserve.
Putting it All Together: The Reserve RecommendationIn order to reach the final recommendation for a reserve target for Colorado Springs, let’s first reviewthe individual analysis results from each of the risk factors.
Primary Risk Factor – Revenue (Sales Tax) Volatility. While the sales tax does show some volatility, thisis due almost entirely to economic cycles and seasonal effects (as opposed to random variation).Therefore, the most important vulnerability the City has with respect to sales taxes is an economicdownturn. A review of past economic downturns leads us to believe that the City should prepare fora potential 20 percent decline in sales tax revenues over 25 months as a plausible “worst case sce-nario” (this amounts to about $23 million in reduced revenue). However, the City would presumablyreduce its spending in the event of such a severe downturn, such that a reserve to cover the entireamount of the revenue decline would not be necessary. The City budget office estimates that thebudget could be reduced by just under $10 million without creating a major disruption to services(though service quality would be negatively affected to some degree, of course). This means the Cityshould maintain a reserve of at least $13 million to fill the remaining portion of the revenue gap andto help the City make a “soft landing” in the case of a major revenue decline.
The City’s other revenue sources are fairly stable as a group, but as a prudent measure the GFOA hasrecommended establishing some reserves to account for volatility. These reserves added up to $7.3million.
Primary Risk Factor – Infrastructure. General fund reserves may be needed to repair or replace an assetthat fails unexpectedly. In Colorado Springs, the two asset classes that were deemed to be of thegreatest importance are bridges and storm sewers.
Thirteen bridge structures have been identified as having a high risk rating. These bridges have anestimated replacement value of $22,752,672, an average of about $1.75 million per bridge. A reservethat covers one or two bridges should be adequate; it might be more prudent, however, to use the“Triple-A” rule of doubling our expectation for uncertainty and prepare for the premature failure ofthree of these bridges. This equates to a $5.25 million reserve.
The City manages 406 miles of storm lines. Installation dates and condition assessments were un-available for any storm lines. The estimated replacement cost for all storm sewers is $588,052,836.28
Since the information necessary to assess risk of failure is not available, the best that can be done isto make an assumption. We do know that about 10 percent of the total dollar value of the City’sbridge inventory is in the higher risk category, so it may be reasonable to start with that number forstorm sewers, which would translate to $58 million. We also know that about 20 percent high riskcategory of bridges was recommended as a reserve amount, which would equate to $11.6 million.
Primary Risk Factor – Vulnerability to Extreme Events. Although the City is subject to extreme eventsthat pose a significant threat to life and property, historical experience has demonstrated that the fi-nancial impacts of these events have been manageable. For example, the most recent fire was theworst in Colorado history, but the total cost to the City was only $3.75 million (the City’s annualbudget is about $220 million). Taking into account the uncertainty associated with the scale of futureextreme events as well, as well as the timing of FEMA reimbursement and the portion of event re-sponse costs that are likely going to be already covered by existing budgeted resources a reserve forextreme events of $5 million seems reasonable, but an argument for a reserve of up to $7.5 millioncould also be made.
25
Secondary Risk Factor – Leverage. The City has very little debt, so the City’s reserve strategy does notneed to account for reduced financial flexibility from debt.
The City has some financial pressure from pension obligations. It participates in a number of plans,none of which is 100 percent funded. The Colorado Public Employees Retirement Association is aparticular concern for City officials because it has a low funding ratio and its assumptions around thereturn on plan assets have been publicly questioned for being too high. Both of these factors meanthat the Association may require significantly increased contributions from its member govern-ments.
Assuming that the City keeps up with its annual pension payments, the unfunded accrued liabilitiesshould, in theory, be covered by the end of the amortization period (which can vary with the plan,but typically is between 20 and 30 years). Keeping up with the ARC payments is a matter of Citybudgetary policy, and not really an issue that should be addressed through using reserves. However,given the uncertainty around pension issues, it is difficult to say when increases would occur or howmuch they might be. Accordingly, it would be prudent to hold some reserve to help make a moregradual adjustment to any potential large increases in contribution rates. The City currently paysabout $10.5 million in annual contributions to the Colorado Public Employees Retirement Associa-tion and about $14.5 million to the other pensions, for total of about $25 million. A reserve of $6.25million would cover a 25 percent increase in pension costs. Of course, an increase in the City’s contri-bution will be felt over many years, but the reserve will allow the City to make a gradual adjustmentor to more easily absorb a larger increase in contributions in one year.
Secondary Risk Factor – Expenditure Volatility. The City is facing a few large lawsuits that could entailsignificant settlement costs if judgment goes against the City. The City attorney believes that $2 mil-lion to $4 million is a reasonable range to prepare for.
Secondary Risk Factor – Liquidity/Cash Flow. The City faces no important liquidity or cash flow prob-lems that create a shortage of working capital.
Secondary Risk Factor – Growth of the Community. The fact that Colorado Springs is only expectingmoderate growth in the next few years and that its development financing approach does not requireCity resources for large capital outlays means that the implications of growth for the City’s reservesare minimal.
In summary, the components of a recommended reserve are:
• $13 million for sales tax economic uncertainty
• $7.5 million for economic uncertainty in other revenues
• $6.25 million for pension payment uncertainty
• $5.25 million for critical bridge failure and $11.6 million critical storm sewer replacement, for atotal of $16.85 million
• $5 million to $7.5 million for extreme events
• $2 million to $4 million for expenditure spikes from law suits
Many cities express their reserve policy target as single number (e.g., 16 percent of revenues). How-ever, the GFOA has found that leading municipalities often find it helpful to segment their reservesinto different categories because this makes the purpose of the reserve more transparent. For exam-ple, a reserve for “emergencies” and a reserve for “economic uncertainty” would provide more clarityon the purpose of the reserves than one all-encompassing reserve. The first three bullets above couldcomprise the budgetary uncertainty reserve, while the last three would form the emergency reserve,

26
leading to the following targets (which have been rounded to the nearest whole numbers for ease ofuse in policymaking):29
Budgetary Uncertainty Reserve
$13 million for sales tax economic uncertainty +$7.5 million for economic uncertainty in other revenues +$6.25 million for pension payment uncertainty =
$27 million or about 12.5% of general fund revenues30 as budgetary uncertainty reserve
Emergency Reserve
$5.25 million for critical bridge failure and $11.6 million critical storm sewer replacement, for atotal of $16.85 million +$5-7.5 million for extreme events +$2-4 million for expenditure spikes from lawsuits =
$27 million or about 12.5% of general fund revenues as an emergency reserve
This provides a target of about 25 percent of general fund revenues, which is also in line with therange of reserves maintained by cities comparable to Colorado Springs and is above what the GFOAconsiders to be the minimum baseline level that a government should maintain (16 percent).31 Thesereserves would be considered part of the “unrestricted” portion of the City’s fund balance.32
OTHER IDEAS TO SUPPORT THE GENERAL FUND RESERVE STRATEGYThis section presents other ideas that Colorado Springs may wish to consider, relative to its reservestrategy. These ideas include: enhanced sales tax monitoring, a user fee cost recovery policy, avolatile revenue policy, a short-term borrowing policy, and a grants policy.
Sales Tax MonitoringBecause a potential decline in sales tax revenue is the major driver for the City’s need to retain re-serves, it might consider additional methods to monitor the potential direction of its sales tax rev-enue. The City already employs some fairly sophisticated long-range forecasting methods. It shouldcontinue to refine these practices, and continue looking for leading indicators of sales tax perform-ance. However, the GFOA did not conduct an in-depth examination of the City’s long-range forecast-ing methods, so this report will focus on how some of the techniques presented in this paper mightbe helpful going forward.
First, the City might monitor a 12-month, centered moving average, updating it each month. As Ex-hibit 2.3 demonstrated, the 12-month moving average reveals long-term trends that are not as readilyapparent from monthly data, especially when month-to-month fluctuations are so dramatic (even ifthe fluctuations are rather predictable). If the moving average starts to turn down, it could indicate areal trend. Of course, the problem with this approach is that a moving average will always be five tosix months behind, since the analysis must wait for the historical data to become available. A moreimmediately useful technique would be to compare monthly fluctuations to the average. If a monththat is normally a high-yield month does not come in as strong as expected or if a month with nor-mally low yield is particularly bad, it could portend trouble. Exhibit 4.2 (on the following page)shows how the months of the year compare to both the 12-month moving average and to the monthbefore it (e.g., how January compared to December, etc.). The month-to-month numbers are oftenlarger because revenues sometimes go from peak to valley and vice versa very quickly. The month-to-month numbers will also be easier to use, because they don’t rely on the availability of moving aver-age data.

27
User Fee Cost Recovery PolicyUser fees represent about 6 percent of all general fund revenue. User fees are an increasingly popularway to fund municipal services because they assign the cost of the service directly to the customer, asopposed to the general taxpayer. The City could strengthen its user fee base by adopting an officialpolicy on the extent to which it will seek to recover the costs of providing services through a user fee.
A user fee cost recovery policy could be very detailed – setting precise targets for the percent of costto recover for different types of services.33 However, most governments take an approach that allowsfor more discretion, where the policy establishes full recovery as the goal for user fees, but recognizesthat there will be occasional exceptions. This policy from Minneapolis, Minnesota, illustrates:
The city shall establish user charges and fees at a level that reflects the service costs… Full costcharges shall be imposed unless it is determined that policy, legal, or market factors require lower fees.
This policy approach will require that it be decided, on a case-by-case basis, where subsidization of aservice with general tax dollars is appropriate.
User fees can be a complex and, sometimes, controversial revenue source. It may be helpful to estab-lish a policy that describes the fundamental goals of user fees and a mechanism for regular fee re-view. The GFOA has made available considerable detailed information on fee policies.34
Volatile Revenue PolicyAs we have seen, the sales tax can be strongly influenced by the state of the economy. Just as an eco-nomic downturn can depress sales taxes, a buoyant economy can lead to a rapid increase. This pres-ents a financial risk if these new revenues are used to fund recurring expenditures (e.g., newon-going programs and their associated personnel) and if these new revenues stem from an unsus-tainable level of consumer spending. A volatile revenue policy encourages a government to examineits past revenue trends to determine when it may next experience an anomalously high level of rev-enue income, and then to apply this revenue toward non-recurring uses, such as paying off debt,building up a reserve, or special projects that will reduce future operating costs.
Exhibit 4.2Average Monthly Variations in Sales Tax Revenue
Average % Difference Average % of the from Previous Month 12-Month Moving Average
January 35.7% 125.0%
February -33.8% 82.5%
March 3.1% 84.4%
April 22.1% 103.1%
May -10.9% 91.4%
June 7.8% 98.5%
July 15.2% 113.0%
August -8.2% 102.5%
September -0.3% 102.2%
October 5.6% 107.4%
November -8.0% 95.4%
December -4.5% 92.4%

28
The policy for the City and County of Denver, Colorado, illustrates this type of policy:
It is not prudent to allocate sales tax revenue that exceeds the normal growth rate (defined as the aver‐age annual growth rate over the last ten years) to ongoing programs. Therefore, sales tax revenuesthat exceed the normal growth rate should be used for one‐time expenditures or to increase reservesfor the inevitable economic downturns.
Short-term Borrowing PolicyAs Exhibit 3.1 showed, the City has a very low level of debt. Debt can be a source of financial flexibil-ity, thereby mitigating the need to hold reserves. Short-term debt could be useful if the City finds it-self with the need for a temporary cash infusion (to deal with an unexpected situation). However,short-term borrowing from external sources is usually considered undesirable due to, among otherthings, the administrative costs of arranging the deal. Accordingly, a policy usually places limits onshort-term external borrowing. For example, a policy might specify that short-term instruments beused only if the transaction costs plus interest of the short-term debt are less than the cost of inter-nal financing and if available cash is insufficient to meet working capital requirements. A policycould also state that short-term debt issued for operating purposes will be limited to cases wherethere is reasonable certainty that a known revenue source will be received in the current fiscal yearsufficient to repay the debt, or where there is a clear financial emergency.
For many governments, interfund borrowing is preferred to external borrowing. For example, theCity’s utility may make a loan to the general fund or vice versa. This is another way to increase finan-cial flexibility, beyond that provided by reserves. A policy for interfund loans is useful because, if notcarefully managed, the loans can become a cross-fund subsidization, which could lead to one groupof taxpayers or ratepayers subsidizing another group. A policy can establish terms and guidelines tohelp avoid overly burdensome loans. The following are suggested elements for an internal loan pol-icy:
Definition of a Loan vs. a Transfer. A policy should differentiate a loan from a transfer since the impli-cations of each are different. Essentially, the difference is that operating transfers move financial re-sources from one fund to another, permanently, while interfund borrowings are usually made fortemporary cash flow reasons and are not intended to result in a transfer of financial resources by theend of the fiscal year.
Criteria for Making Loans. Just as a private lender would apply criteria to a potential borrower, a policyshould describe the general conditions under which an internal loan is permissible. A policy shoulddescribe these conditions and designate the appropriate authority responsible for authorizing theloan. Here are some examples of such conditions:
• The lending fund has funds available.
• The borrowing will not adversely impact the lending fund’s long-term financial condition.
• A specific source of repayment has been identified in the borrowing fund.
• The loan can be repaid within a specified period of time.
• Any legal requirements/restrictions are satisfied.
Interest Rates and Terms. A policy should also provide guidelines on terms and interest rates. Typi-cally, interest rates would match prevailing rates, with the exact rate set by the finance office. Forlong-term loans, a repayment schedule must be set, but the loan should typically be fully amortized,preferably on a level or accelerated repayment schedule.

29
Grants PolicyGrants are an attractive form of funding for many local governments because they offer the possibil-ity to reduce reliance on taxes and fees drawn from the community. On the other hand, grants canharm the government’s long-term financial position if they lead to implementation of an ongoingprogram that later requires support from general tax dollars when the grant expires. Further, manygrants require matching funds and overhead costs that might end up diverting funds from higher-priority services. A policy can encourage grant-seeking, but should also recognize the risks of overre-liance on grants and direct the organization to manage those risks. The policy from the City of LongBeach, California, instructs staff to analyze the long-term costs and benefits of a grant before accept-ing it:
City staff will seek out, apply for, and effectively administer federal, state, and other grants that ad‐dress the city’s priorities and policy objectives and provide a positive benefit to the city. Before anygrant above $50,000 is pursued, staff shall provide a detailed pro‐forma to the city manager that ad‐dresses the immediate and long‐term costs and benefits to the city. A pro‐forma must be submitted tothe city manager for all grants prior to accepting the grant award.
A policy should direct that any grants pursued are consistent with the government’s mission andstrategic priorities. Spotsylvania County’s policy states that “before applying for and accepting inter-governmental aid, the county will assess the merits of a particular program as if it were funded withlocal tax dollars.”
After the grant has been accepted, a policy should address the possibility that the grant will end,leaving the government to decide whether to continue the program. Spotsylvania County’s policyreads that “local tax dollars will not be used to make up for losses of intergovernmental aid withoutfirst reviewing the program and its merits as a budgetary increment.”
Infrastructure Maintenance/Replacement ScheduleRather than reserving funds to guard against the failure of worn assets, the City should develop aplan and schedule to maintain and replace assets, as needed. Exhibit 4.3 (on the following page)shows what yearly capital expenditures would be to keep up with bridge and culvert replacements.Obviously, the pattern is quite volatile. The City might consider translating this into a regular sched-ule, with a set annual contribution to funding that schedule. The GFOA estimates that a $10.9 mil-lion approximate annual contribution would be necessary to fund the schedule. Not only would thisreduce the amount the City would have to hold in reserve (since assets would not deteriorate to criti-cal condition), but it would greatly reduce the actual risk the City faces.

30
For storm sewers, the average annual contribution for a regular maintenance/replacement schedule would be about $36 million, though this is a less precise figure because the underlying information on asset condition is not as detailed.
Exhibit 4.3:Estimate of Annual Bridge and Culvert Replacement Costs
18,000,000
16,000,000
14,000,000
12,000,000
10,000,000
8,000,000
6,000,000
4,000,000
2,000,000
02012 2014 2016 2018 2020 2022 2024 2026 2028 2030
2013 2015 2017 2019 2021 2023 2025 2027 2029 2031
2032 2034 2036 2038 2040 2042 2044 2046 2048 20502033 2035 2037 2039 2041 2043 2045 2047 2049
18,000,000
16,000,000
14,000,000
12,000,000
10,000,000
8,000,000
6,000,000
4,000,000
2,000,000
0
Failure Cost

31
Appendix 1. Sales Tax Revenues in Boulder, ColoradoIn order to provide a little better comparative context for examining Colorado Springs’ sales tax, theGFOA requested permission from the City of Boulder to use its monthly sales tax data in a similaranalysis to Colorado Springs.’ Exhibit A1.1 shows Boulder’s revenues since June 2004. Like ColoradoSprings, Boulder has four “spikes” during the year, with a holiday spike being the largest. Boulder’ssales tax revenue is a little more volatile, with about 4 percent of the variation attributable to randomfactors.
Boulder also experienced a protracted decline in its trend-cycle in the wake of the Great Recession –a 10 percent drop over 21 months. This is just under half a percent per month, not too different fromColorado Springs.
Exhibit A1Monthly Sales Tax Revenue from the City of Boulder, Colorado

32
1 The Triple-A approach is adapted from: Spyros Makridakis, Robin Hogarth, and AnilGaba. Dance with Chance: Making Luck Work for You (Oneworld Publications: Oxford, Eng-land, 2009).
2 Drainage basins, open drainage features, discharge points, and point features are not in-cluded in the replacement cost. Adding these items would likely push it to more than $1 bil-lion.
3 Targets have been rounded to nearest “whole” numbers for ease of use in policymaking.Also, see the main body of the report for a discussion of the independence of the risk factorsand the implication for sizing the reserve.
4 Based on the 2012 budget estimate of approximately $220 million in general fund revenue.
5 See the GFOA best practice, Appropriate Level of Unrestricted Fund Balance in the Gen-eral Fund, available at www.gfoa.org. According to this best practice document, governmentsshould establish a formal policy of maintaining reserves equal to about 16 percent of rev-enues or expenditures, and the actual target should be based on an analysis of the salientrisks the government faces – which in many cases calls for a reserve level of more than 16percent.
6 TABOR, for example, limits the City’s ability to increase taxes.
7 GFOA Best Practice, “Appropriate Level of Unrestricted Fund Balance in the GeneralFund” (2009).
8 Definition of risk taken from Douglas W. Hubbard, The Failure of Risk Management: WhyIt’s Broken and How to Fix It (Hoboken, New Jersey: John Wiley and Sons, Inc., 2009).
9 The risk factors and basic review method were developed and published in: Shayne C.Kavanagh, Financial Policies (Chicago: Government Finance Officers Association, 2012).
10 The use tax is much smaller than the sales tax – comprising only around 5 percent of thetotal of the two.
11 This is City general fund only and excludes other sales tax revenues, such as the 2002public safety sales tax (which is accounted for outside of the general fund, in a special rev-enue fund).
12 The GFOA used a method of data de-seasonalization known as multiplicative decomposi-tion to arrive at this conclusion.
13 The trend-cycle line is calculated by taking a 12-month centered moving average of ac-tual monthly sales tax revenue. For example, the moving average for January 2005 would be
Endnotes

33
an average of August 2004 through July 2005. February 2005 would be an average of Septem-ber 2004 through August 2005, and so on. A 12-month moving average smooths out seasonalvariation, leaving only the trend-cycle.
14 The term “Black Swan” derives from a belief held in England before 1697 that all swanswere white – in fact, the term “Black Swan” was a common metaphor for an impossibility.Black swans were discovered in Australia in 1697, demonstrating the limits of human knowl-edge about the world.
15 See Makridakis, Hogarth, and Gaba, Dance with Chance, 2009.
16 Of course, the long-term impacts of those actions are still unknown.
17 According to the Case-Shiller Housing Index, home prices nationally since 2009 have var-ied in a range consistent with housing values in 2003. As of this writing, values have experi-enced increases for six consecutive months.
18 According to David M. Blitzer, Chairman of the Index Committee at S&P Dow Jones In-dices (which includes the Case-Shiller Housing Index), “the housing market seems to be stabi-lizing, but we are definitely in a wait-and-see mode for the next few months.”
19 Based on sales prices from Zillow.com.
20 Note that further analysis could be conducted with City staff to refine asset replacementcosts, as well as reviewing the risk rating to incorporate more factors into the consequence(i.e., traffic count, location, major structure, etc.).
21 Drainage basins, open drainage features, discharge points, and point features are not in-cluded in the replacement cost, which would likely push it over $1 billion.
22 See GFOA Best Practice, “Sustainable Funding Practices of Defined Benefit PensionPlans” (2009), www.gfoa.org. An 80 percent funded ratio is often cited as an acceptable fund-ing benchmark, but this figure does not have a sound actuarial basis. See, for example, Gi-rard Miller, “Pension Puffery,” www.governing.com. Miller does state that an 80 percentfunding ratio might be acceptable at the bottom of an investment market because the fundedratio will presumably rise with the market. Conversely, though, the funded ratio should beabove 100 percent at the top of a market to protect against a fall.
23 On top of this, the City is leasing its hospital system, so the employees will no longer becontributing to the Colorado Public Employees Retirement Association, which adds further un-certainty to the City’s future pension position.
24 Even if all ARC payments are made, an employer could still end up with an unfunded lia-bility at the end of the amortization period if the actuarial assumptions used to calculate theARC do not hold up (e.g., the rate of return on plan investments).
25 GFOA Best Practice, “Appropriate Level of Unrestricted Fund Balance in the GeneralFund” (2009), www.gfoa.org.
26 David G. Hitchcock, Karl Jacob, and James Wiemken, Key General Obligation RatioCredit Ranges – Analysis vs. Reality (New York: Standard & Poor’s, 2008).
27 Based on values from Zillow.com.
28 Drainage basins, open drainage features, discharge points, and point features are not in-cluded in the replacement cost, which would likely push it over $1 billion.
29 Note that many of the risks listed in the table can be considered “independent,” meaningthat the occurrence of one risk has little to do with the potential occurrence of another risk. Forexample, the occurrence of an extreme event has little or nothing to do with whether the City

34
also experiences an increase in its pension payments. In these cases, there could be a justifi-cation for holding less reserves than the total of the two numbers because it is rather unlikelythat the City will experience both of these problems at once. However, other risks are not in-dependent. For example, an economic downturn that causes a reduction in sales tax revenuewould likely also impact other revenues, a natural disaster could make the City more likely toexperience a critical infrastructure failure, or a natural disaster could result in interruption tosales tax revenue. Because the risk factors appear to have at least some level of significantinter-dependency (a level which is difficult to know), the approach of adding the reserve com-ponents together represents a conservative approach to sizing reserves for Colorado Springs.This approach would leave the City without any exposure to risk arising from risk factor de-pendency. Note that zero exposure to risk also means that the City will hold more reservesthat it will probably need at any one time.
30 Based on about $220 million general fund revenue, as per 2012 budget estimates.
31 See GFOA Best Practice, “Appropriate Level of Unrestricted Fund Balance in the GeneralFund” (2009), www.gfoa.org. The Best Practice states that reserves equal to about 16 percentof revenues or expenditures is the minimum a government should consider for its policy andthat the actual target that a government adopts should be based on an analysis of the salientrisks that a government faces (which in many cases may call for a higher reserve level than16 percent).
32 Within the “unrestricted” portion of fund balance, the City could choose to locate the re-serves within the “unassigned” or “committed” categories. Municipal governments typicallychoose the unassigned category because the accounting requirements to place funds in thecommitted category are more stringent (e.g., the commitment must be made by formal actionof the City Council and the language describing the conditions for using the reserves mustmeet a high level of precision).
33 See for example, the policy of the City of San Luis Obispo, California, which is availableon the GFOA website at www.gfoa.org/finanicalpolicies.
34 See Kavanagh, Financial Policies, 2009.
BIOGRAPHY
Bill served as the Director of Finance & Information
Technology for the City of San Luis Obispo for twenty-two
years and for ten years as finance officer for the City of Simi
Valley before that. Under his leadership, the City of San Luis
Obispo received national recognition for excellence in its
financial planning and reporting systems.
Bill has also played a large leadership role in the municipal finance profession. He
served on the Board of Directors of the League of California Cities in 2009-10 and as
President of the League’s Fiscal Officers Department in 2002-03. He was President of
the California Society of Municipal Finance Officers (CSMFO) in 2001 and served on its
Board of Directors and as a Chair and Senior Advisor on several committees.
Additionally, he served as a member of the California Committee on Municipal
Accounting and on the GFOA’s Budget and Fiscal Policy Committee.
In 2011, Bill was awarded the CSMFO’s Distinguished Service Award for dedicated
service and outstanding contribution to the municipal finance profession; and in 2012, he
received the Cal-ICMA’s Ethical Hero Award for his services to the City of Bell in the
aftermath of well-publicized scandals.
After 37 years of public service, Bill retired from the City of San Luis Obispo in May 2010.
In the “third act” of his career, Bill continues to be deeply involved in the municipal
finance profession as a consultant, trainer and writer, including co-authoring the
Guide to Local Government Finance in California. which has gained wide recognition as
the industry standard on this topic.
124 Cerro Romauldo Avenue San Luis Obispo, CA 93405 805.544.5838 ◼ Cell: 805.459.6326 [email protected]
www.bstatler.com
William C. Statler
Fiscal Policy ◼ Financial Planning ◼ Analysis ◼ Training ◼ Organizational Review
. . . . . . . . .
GUNGVARI
Typewritten Text
ATTACHMENT 3

PREPARED BY: STEPHEN CONWAY Finance Director Reviewed by: Town Manager, Assistant Town Manager, and Town Attorney
110 E. Main Street Los Gatos, CA 95030 ● 408-354-6832
www.losgatosca.gov
TOWN OF LOS GATOS
FINANCE COMMITTEE REPORT
MEETING DATE: 12/10/2018 ITEM NO: 4
ADDENDUM
DATE: DECEMBER 5, 2018
TO: COUNCIL FINANCE COMMITTEE
FROM: LAUREL PREVETTI, TOWN MANAGER
SUBJECT: DISCUSS BUDGET STABILIZATION, CATASTROPHIC, INTERNAL SERVICE FUNDS (ISF), AND COMPENSATED ABSENCES RESERVES
REMARKS: After the distribution of the Finance Committee Packet, staff discovered a graphing error on page 8 of the Staff Report. The correct graph is presented below:

PAGE 2 OF 2 SUBJECT: DISCUSS BUDGET STABILIZATION, CATASTROPHIC, INTERNAL SERVICE FUNDS
(ISF), AND COMPENSATED ABSENCES RESERVES DATE: DECEMBER 5, 2018
N:\MGR\AdminWorkFiles\Council Committee - FINANCE\2018\12-10-2018\Item 4 - Addendum.docx 12/6/2018 8:44 AM
ATTACHMENT (previously distributed with the Staff Report): 1. Analysis of the Budget Stabilization and Catastrophic Reserves

PREPARED BY: STEPHEN CONWAY Finance Director Reviewed by: Town Manager, Assistant Town Manager, and Town Attorney
110 E. Main Street Los Gatos, CA 95030 ● 408-354-6832
www.losgatosca.gov
TOWN OF LOS GATOS
FINANCE COMMITTEE REPORT
MEETING DATE: 12/10/2018
ITEM NO: 4
ITEM NO: 11
DATE: DECEMBER 4, 2018
TO: COUNCIL FINANCE COMMITTEE
FROM: LAUREL PREVETTI, TOWN MANAGER
SUBJECT: DISCUSS BUDGET STABILIZATION, CATASTROPHIC, INTERNAL SERVICE FUNDS (ISF), AND COMPENSATED ABSENCES RESERVES
RECOMMENDATION: Discuss Budget Stabilization, Catastrophic, Internal Service Funds (ISF), and Compensated Absences Reserves. BACKGROUND: On August 8, 2018, the Council Finance Committee reviewed and discussed preliminary estimates of operating cash balances that would be reported on the Town’s annual financial report for the year ended June 30, 2018. The balances reported were “pre-audit” and as such were subject to change. On September 18, 2018, the report was presented to the Town Council providing a similar opportunity to discuss Town funds in more detail. At that meeting, the Town Council requested further information regarding Government Finance Officers Association (GFOA) standards for establishing budget stabilization and catastrophic reserves. At its October 2018 meeting, the Council Finance Committee requested further information regarding the Internal Service Fund (ISF) reserves. This agenda item contains information for the Committee’s review and discussion pertaining to the Town’s Budget Stabilization, Catastrophic, Internal Service Funds (ISF), and Compensated Absences Reserves. The GFOA provides fund balance guidance and a methodology for establishing General Fund reserves, but none for internal service funds. Since internal service fund reserve policy is not required under general accounting principles, local agencies all treat the issue differently. Members of the California Society of Municipal Finance Officers (CSMFO) often conduct surveys

PAGE 2 OF 11 SUBJECT: DISCUSS BUDGET STABILIZATION, CATASTROPHIC, INTERNAL SERVICE FUNDS
(ISF), AND COMPENSATED ABSENCES RESERVES DATE: DECEMBER 4, 2018
C:\Users\lseastrom\Desktop\New folder\Item 4 - Budget Stabilization, Catastrophic, Internal Service Funds (ISF), and Compensated Absences Reserves.docx 12/5/2018 11:08 AM
BACKGROUND (continued): among its 2,000 members, which represent over 300 agencies. A recent member survey of California cities with ISF reserve policies received a limited response from the Cities of Saratoga, La Palma, and Garden Grove. The City of Orange also conducted a reserve survey which obtained 17 responses; however, only eight of those responding agencies have Internal Service Fund (ISF) reserve policies. The table below provides a summary of examples from the surveys.
Town Internal Service Funds
City of Saratoga City of La Palma City of Garden
Grove
City of Morro Bay
Self-Insurance No
Recommendation $1,000,000
90% Confidence Level
Workers’ Compensation
No Recommendation
NA 90% Confidence
Level
Information Technology
No Recommendation
100% of Replacement
Value IT Network
50% of Replacement
Cost
$100,000 to $150,000
Office Stores No
Recommendation NA NA
Equipment Replacement
No Recommendation
33% of Replacement
Value
50% Replacement
Value
20% to 33% of Replacement Value
Vehicle Maintenance
No Recommendation
NA 50%
Replacement Value
20% to 33% of Replacement Value
Facilities Maintenance
No Recommendation
$50,000 NA
$50,000 to $75,000
The survey results illustrate the general lack of ISF reserve policies and the range of approaches adopted by cities that do. It should be noted that the City of Garden Grove utilized outside consultants (Revenue & Cost Specialists, LLC) for the review of their policies and as a result, made conservative recommendations on funding levels. As part of that review, Revenue Cost Specialists also reviewed the City of La Palma’s reserve policies. Overall, there is no consistency in the types of ISFs among agencies, the reserve levels for such funds, or even the adoption of any policy.
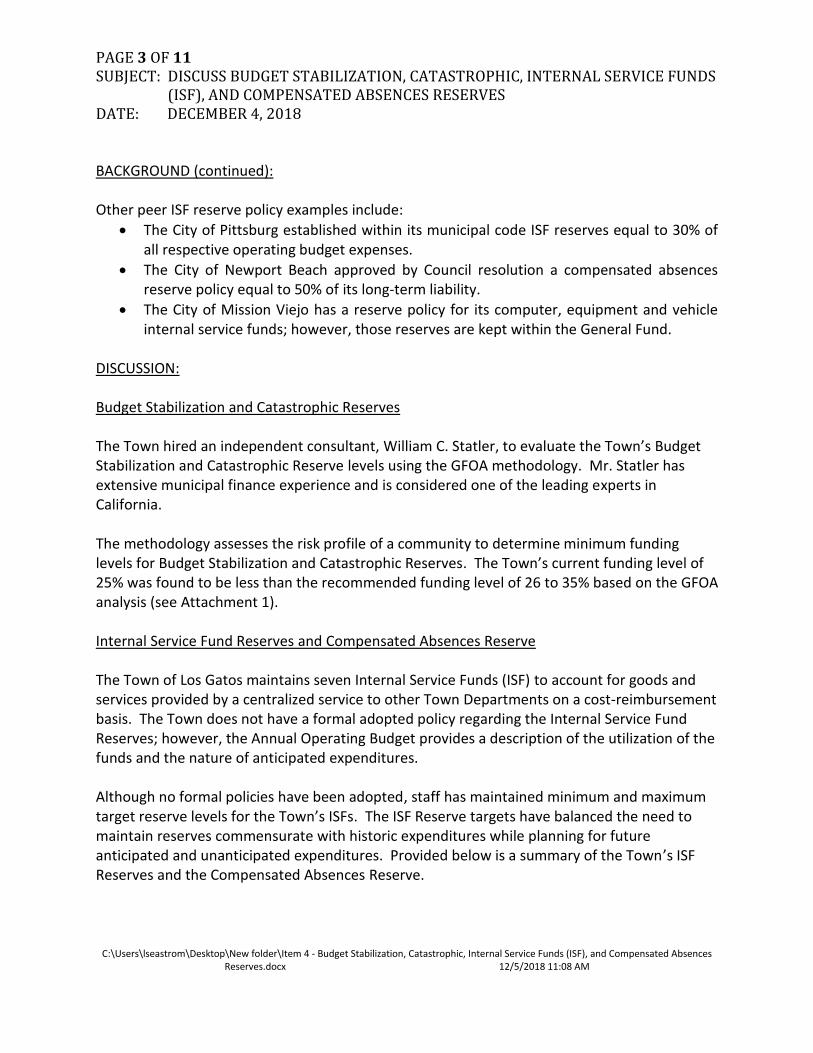
PAGE 3 OF 11 SUBJECT: DISCUSS BUDGET STABILIZATION, CATASTROPHIC, INTERNAL SERVICE FUNDS
(ISF), AND COMPENSATED ABSENCES RESERVES DATE: DECEMBER 4, 2018
C:\Users\lseastrom\Desktop\New folder\Item 4 - Budget Stabilization, Catastrophic, Internal Service Funds (ISF), and Compensated Absences Reserves.docx 12/5/2018 11:08 AM
BACKGROUND (continued): Other peer ISF reserve policy examples include:
• The City of Pittsburg established within its municipal code ISF reserves equal to 30% of all respective operating budget expenses.
• The City of Newport Beach approved by Council resolution a compensated absences reserve policy equal to 50% of its long-term liability.
• The City of Mission Viejo has a reserve policy for its computer, equipment and vehicle internal service funds; however, those reserves are kept within the General Fund.
DISCUSSION: Budget Stabilization and Catastrophic Reserves The Town hired an independent consultant, William C. Statler, to evaluate the Town’s Budget Stabilization and Catastrophic Reserve levels using the GFOA methodology. Mr. Statler has extensive municipal finance experience and is considered one of the leading experts in California. The methodology assesses the risk profile of a community to determine minimum funding levels for Budget Stabilization and Catastrophic Reserves. The Town’s current funding level of 25% was found to be less than the recommended funding level of 26 to 35% based on the GFOA analysis (see Attachment 1). Internal Service Fund Reserves and Compensated Absences Reserve The Town of Los Gatos maintains seven Internal Service Funds (ISF) to account for goods and services provided by a centralized service to other Town Departments on a cost-reimbursement basis. The Town does not have a formal adopted policy regarding the Internal Service Fund Reserves; however, the Annual Operating Budget provides a description of the utilization of the funds and the nature of anticipated expenditures. Although no formal policies have been adopted, staff has maintained minimum and maximum target reserve levels for the Town’s ISFs. The ISF Reserve targets have balanced the need to maintain reserves commensurate with historic expenditures while planning for future anticipated and unanticipated expenditures. Provided below is a summary of the Town’s ISF Reserves and the Compensated Absences Reserve.

PAGE 4 OF 11 SUBJECT: DISCUSS BUDGET STABILIZATION, CATASTROPHIC, INTERNAL SERVICE FUNDS
(ISF), AND COMPENSATED ABSENCES RESERVES DATE: DECEMBER 4, 2018
C:\Users\lseastrom\Desktop\New folder\Item 4 - Budget Stabilization, Catastrophic, Internal Service Funds (ISF), and Compensated Absences Reserves.docx 12/5/2018 11:08 AM
Liability Self Insurance Internal Service Fund (Pooled Liability Assurance Network Joint Powers Authority) The Town is a member of an insurance pool, established to provide general liability, property insurance, and risk management services. This self-insurance program is funded through departmental charges based on established assessment rates per labor dollar expended. Service rates are established to maintain fund balance capacity at a minimum of three times the annual operating expense. This rule of thumb (or target) provides a funding source for potential claims against the Town. Excess funding is reduced through lower service rates and transfers back to the General Fund. The graph below illustrates the last ten fiscal years actual spending trends compared with the fund levels and target.
DISCUSSION (continued):
The ten-year average annual fund expenses are $640,000, which translate to an approximate reserve target of $1,900,000. The ten-year average annual fund balance is $1.4 million with a recent FY 2016/17 Fund Balance of $885,440, and the FY 2017/18 Fund Balance of $994,769. Staff recommends keeping the Self-Insurance Fund balance reserve target at $1,900,000.
Workers’ Compensation Internal Service Fund The Town’s Workers’ Compensation Program provides for anticipated liabilities for worker compensation benefits. The Town self-insures for benefits provided to Town employees and volunteers for work-related injuries up to $250,000 and has excess insurance coverage for

PAGE 5 OF 11 SUBJECT: DISCUSS BUDGET STABILIZATION, CATASTROPHIC, INTERNAL SERVICE FUNDS
(ISF), AND COMPENSATED ABSENCES RESERVES DATE: DECEMBER 4, 2018
C:\Users\lseastrom\Desktop\New folder\Item 4 - Budget Stabilization, Catastrophic, Internal Service Funds (ISF), and Compensated Absences Reserves.docx 12/5/2018 11:08 AM
DISCUSSION (continued): claims up to $25 million. The Town belongs to the Local Agency Workers’ Compensation Excess (LAWCX) Joint Powers Authority for the purpose of pooling for this excess insurance. A third party administrator, Innovative Claims Solutions, Inc. (ICS), handles the Town’s day-to-day workers’ compensation claims administration. The revenues to fund the Workers Compensation program are derived as a percentage of salary each payroll period. Each Department pays a portion of the program’s cost based on gross wages and level of risk for the various job classifications within the Department. The annual appropriation to this fund represents the self-insurance premiums paid by the operating Departments. Service rates are established which maintain fund balance capacity at approximately two and one-half times the annual operating expenditures. Any excess funds are returned through reduced rates and fund balance transfers as needed.
The ten-year average annual fund expenses are $1,000,000, which translates to an approximate reserve target of $2,500,000. The ten-year average annual fund balance is $1.7 million with a recent FY 2016/17 Fund Balance of $902,310, and a FY 2017/18 Fund Balance of $620,782. Staff recommends keeping the Workers’ Compensation Fund balance target at $2,500,000.

PAGE 6 OF 11 SUBJECT: DISCUSS BUDGET STABILIZATION, CATASTROPHIC, INTERNAL SERVICE FUNDS
(ISF), AND COMPENSATED ABSENCES RESERVES DATE: DECEMBER 4, 2018
C:\Users\lseastrom\Desktop\New folder\Item 4 - Budget Stabilization, Catastrophic, Internal Service Funds (ISF), and Compensated Absences Reserves.docx 12/5/2018 11:08 AM
DISCUSSION (continued): Information Technology Fund Information Technology Services (IT) supports the delivery of services to all the Town’s employees and customers through the use of SMART technology (Sensible, Multi-modal, Accessible, Responsive, and Time-phased Technology). Key services include the maintenance, replacement, and upgrade of existing technology and the support for new information technology initiatives. The IT Program receives revenues through charges to General Fund and Special Revenue departmental programs based on service and equipment replacement costs. Service rates are adjusted to build fund balance capacity for future technology projects and the continued need to identify and invest in information technology opportunities. The Town is preparing its IT Master Plan that will provide a comprehensive review of the future costs related to IT replacement.
The ten-year average annual fund expenses are $1,050,000. The ten-year average annual fund balance is $2.2 million with a recent FY 2016/17 Fund Balance of $2,251,330, and the FY 2017/18 Fund Balance of $2,161,808. Staff recommends keeping the fund balance target at $2,500,000. The Town’s recommendation regarding the current fund balance target will be re-evaluated based on the completed IT Master Plan.

PAGE 7 OF 11 SUBJECT: DISCUSS BUDGET STABILIZATION, CATASTROPHIC, INTERNAL SERVICE FUNDS
(ISF), AND COMPENSATED ABSENCES RESERVES DATE: DECEMBER 4, 2018
C:\Users\lseastrom\Desktop\New folder\Item 4 - Budget Stabilization, Catastrophic, Internal Service Funds (ISF), and Compensated Absences Reserves.docx 12/5/2018 11:08 AM
DISCUSSION (continued): Stores Photocopy and printer equipment, postage, and bulk mail expenditures are centrally funded through the Town’s Office Stores Program, and subsequently charged back to the appropriate Department for services and materials utilized on a monthly basis. Due to limited personnel activity in the operations of this program, there are no staffing, key projects, or performance measures accounted for in this fund. The Office Stores Program maintains approximately 36 printers and copiers. The lease and maintenance program includes toner and repairs for all copiers and printers and the Office Stores Fund pays for copy paper for use on the printers and copiers on the program.
The ten-year average annual fund expenses are $120,000. The ten-year average annual fund balance is $190,000 with a FY 2016/17 Fund Balance of $200,437, and a FY 2017/18 Fund Balance of $227,437.
Equipment Replacement Fund
The Equipment Replacement Program provides funding for the replacement of Town vehicles, equipment, and information technology with a value greater than $10,000. The initial capital costs associated with an asset are charged to the program budget where the asset exists. The program having custody and utilizing the asset pays the replacement cost amortized over the

PAGE 8 OF 11 SUBJECT: DISCUSS BUDGET STABILIZATION, CATASTROPHIC, INTERNAL SERVICE FUNDS
(ISF), AND COMPENSATED ABSENCES RESERVES DATE: DECEMBER 4, 2018
C:\Users\lseastrom\Desktop\New folder\Item 4 - Budget Stabilization, Catastrophic, Internal Service Funds (ISF), and Compensated Absences Reserves.docx 12/5/2018 11:08 AM
DISCUSSION (continued):
life of the asset through internal service charges. These internal service charges accumulate the needed funding to replace the Town’s vehicle and equipment assets at the end of their useful lives. The result of this funding structure is a smoothing of operating expenditures and a more accurate reflection of the actual cost of operations. Replacement is based on the vehicle meeting predetermined age and/or mileage criteria as set forth in the Equipment Replacement Policy. To date the Town maintains approximately $6.8 million in base cost assets.
The ten-year average annual fund expenses are $600,000. The ten-year average annual fund balance is $2.7 million with FY 2016/17 Fund Balance of $1,894,054, and a FY 2017/18 Fund Balance of $2,382,270.
Staff maintains a Town-wide equipment replacement list to identify annual anticipated equipment replacement costs utilizing useful life criteria. The replacement list forecasts average annual replacement costs of $1.2 million through 2033 with FY 2018/19 budgeted expenditures of $1.6 million. Staff recommends maintaining a target fund balance of $2,000,000.

PAGE 9 OF 11 SUBJECT: DISCUSS BUDGET STABILIZATION, CATASTROPHIC, INTERNAL SERVICE FUNDS
(ISF), AND COMPENSATED ABSENCES RESERVES DATE: DECEMBER 4, 2018
C:\Users\lseastrom\Desktop\New folder\Item 4 - Budget Stabilization, Catastrophic, Internal Service Funds (ISF), and Compensated Absences Reserves.docx 12/5/2018 11:08 AM
DISCUSSION (continued):
Vehicle Maintenance Fund
The Vehicle Maintenance Fund maintains the Town’s vehicles and equipment to ensure each piece is safe and functional. Program staff provide preventive maintenance and repair for the Town’s fleet and light to heavy duty construction equipment. A combination of in-house personnel and outside contractors provide maintenance and repair services for the Town’s vehicles and equipment.
The ten-year average annual fund expenses are $560,000. The ten-year average annual fund balance is $380,000 with FY 2016/17 Fund Balance of $182,370, and a FY 2018/19 Fund Balance of $262,790. No target is needed for this Fund.
Facilities Maintenance Fund
The Facilities Maintenance Fund provides services to ensure Town facilities are safe and functional for public and employee use. Services include custodial services, elevator maintenance, cell phone services, heating and ventilation systems, building improvements, facility security, and lighting systems. Facilities staff also plan, schedule, and manage small and large building facility projects such as building remodeling, public access infrastructure improvements, floor covering, work space reconfigurations, roof repairs, heating and air

PAGE 10 OF 11 SUBJECT: DISCUSS BUDGET STABILIZATION, CATASTROPHIC, INTERNAL SERVICE FUNDS
(ISF), AND COMPENSATED ABSENCES RESERVES DATE: DECEMBER 4, 2018
C:\Users\lseastrom\Desktop\New folder\Item 4 - Budget Stabilization, Catastrophic, Internal Service Funds (ISF), and Compensated Absences Reserves.docx 12/5/2018 11:08 AM
conditioning system improvements, electrical services, and all other aspects required to keep the Town’s facilities functional and safe. Revenues for this fund are obtained through DISCUSSION (continued): assessment chargebacks to Town Departments, based upon a percentage of square footage assigned to each Department. The Facilities Maintenance Program pays for all operating expenditures, including utilities, repairs, and maintenance and the Departments in turn fund the program’s expenditures through these chargebacks. The Town is preparing its Facilities Master Plan that will a comprehensive review of the future costs related to facilities replacement.
The ten-year average annual fund expenses are $560,000. The ten-year average annual fund balance is $650,000 with FY 2016/17 Fund Balance of ($37,870), and the FY 2017/18 Fund Balance of $245,437. Staff recommends keeping the fund balance target at $1,000,000. The Town’s recommendation regarding the current fund balance target will be re-evaluated based on the completed Facilities Master Plan.
Compensated Absences Reserve
Since the early 1990’s, the Town has set aside sufficient balances to fully pay its accrued compensated absence balances for all Town employees at fiscal year-end. This practice

PAGE 11 OF 11 SUBJECT: DISCUSS BUDGET STABILIZATION, CATASTROPHIC, INTERNAL SERVICE FUNDS
(ISF), AND COMPENSATED ABSENCES RESERVES DATE: DECEMBER 4, 2018
C:\Users\lseastrom\Desktop\New folder\Item 4 - Budget Stabilization, Catastrophic, Internal Service Funds (ISF), and Compensated Absences Reserves.docx 12/5/2018 11:08 AM
provides assurance that the Town has resources to pay off all accrued liabilities which are reflected as a long term liability on the Statement of Net Position. If these assets were not set
DISCUSSION (continued):
aside, the Unrestricted Net Position would be negatively impacted by approximately $2.4 million for the fiscal year ending June 30, 2018.
CONCLUSION: Staff looks forward to discussing this report with the Town Council Finance Committee. COORDINATION:
This report was coordinated with the Town Manager’s Office and the Finance Department. ATTACHMENT:
1. Analysis of the Budget Stabilization and Catastrophic Reserves

lseastrom
Typewritten Text
ATTACHMENT 1
lseastrom
Typewritten Text
lseastrom
Typewritten Text
lseastrom
Typewritten Text
lseastrom
Typewritten Text