Towards the development of a standardized method for ...
26
* Corresponding authors: Email: [email protected]; [email protected] a Institute for a Sustainable Environment, Clarkson University, Potsdam, NY b Civil and Environmental Engineering, Clarkson University, Potsdam, NY c Center for Air Resources Engineering and Science, Clarkson University, Potsdam, NY d Department of Public Health Sciences, University of Rochester Medical Center, Rochester, NY e AEACS, LLC, New Kensington, PA Supplementary information for Towards the development of a standardized method for extraction and analysis of PFAS in biological tissues Adam D. Point, a Thomas M. Holsen,* b Sujan Fernando, c Philip K. Hopke,* d and Bernard S. Crimmins b,e S1. Interlaboratory Studies. van Leeuwen et al. 1 organized a 38 participant worldwide per- and polyfluoroalkyl substances (PFAS) interlaboratory study (ILS) targeting 13 analytes in a study standard mixture and multiple environmental and human matrices distributed to all participants. All environmental matrices except water were spiked with most of the target analytes, enabling assignment of known (“assigned”) concentrations. Fractions of submitted data exceeding the study’s acceptability threshold (z-score <|2|) for each distributed matrix decreased as follows: standard solution (76%) > human blood (67%) > human plasma (63%) > fish liver extract (55%) > surface water (31%) > fish tissue (17%). 1 A follow-up ILS distributed surface water, fish fillet tissue, a shared standard solution to evaluate variabilities with participants’ (21) in-house standards, and three separate solutions containing a total of nine isotopically-labeled ( 13 C or 2 H) PFAS. 2 The precision of the submitted data improved relative to the 2006 results. However, precision data for individual laboratories (mean %RSD for all analytes for a single lab; 12% for water and 6.8% for fish) were considerably better than the cumulative precision. 2 Additionally, mean reported values for some analytes fell below the spiked concentrations and the majority of minimum reported concentrations were approximately 50% of the spiked concentration, with a value of 34% for perfluorooctane sulfonate (PFOS). 2 Inefficient extraction was the likely cause of these low values, since losses during sample preparation should have been accounted for via surrogate addition. Lindström et al. 3 coordinated an additional 15-participant ILS published in 2009 involving a shared study standard and two NIST human blood serum standard reference materials (SRMs; 1589a and 1957). A shared mass-labeled standard containing 13 C-labeled PFOS, perfluorooctanoic acid (PFOA), and perfluorononanoic acid (PFNA) was also distributed, and was used by some participants. SRM 1589a contains lower PFAS concentrations than 1957, and had fewer detects and higher uncertainties. Although improvements were realized relative to van Leeuwen et al., 1 precision remained poor. 3 However, the SRM 1957 data exhibited greater precision than the study standard data, which highlights matrix cleanliness is not necessarily a predictor of method performance. Besides SRM 1957 data having higher precision than that of the study standard, an additional peculiar irregularity emerges when results from Lindström et al. 3 are compared to those of van Leeuwen et al.. 2 Since these two studies examined different matrices, the data are not directly comparable. However, both exercises distributed a study reference standard that included three common mass-labeled compounds from the same manufacturer. Interestingly, participants performed better at accurately determining target analytes in the study reference standard in the van Leeuwen et al. 2 study despite avoiding the use of mass-labeled standards in their determinations. Participants in Lindström et al. 3 were allowed the liberty to choose their methods, which likely included mass-labelled standards, although the report is not explicit. A subsequent six-participant ILS provided the first assigned perfluorinated alkyl acid (PFAA) SRM values for the two human blood serum (NIST SRMs 1957 and 1958) and two human milk SRMs (NIST SRMs 1953 and 1954). 4 SRMs 1954 and 1958 Electronic Supplementary Material (ESI) for Environmental Science: Water Research & Technology. This journal is © The Royal Society of Chemistry 2019
-
Upload
khangminh22 -
Category
Documents
-
view
0 -
download
0
Transcript of Towards the development of a standardized method for ...
*Corresponding authors: Email: [email protected]; [email protected] a Institute for a Sustainable Environment, Clarkson University, Potsdam, NY b Civil and Environmental Engineering, Clarkson University, Potsdam, NY c Center for Air Resources Engineering and Science, Clarkson University, Potsdam, NY dDepartment of Public Health Sciences, University of Rochester Medical Center, Rochester, NY eAEACS, LLC, New Kensington, PA
Supplementary information for
Towards the development of a standardized method for extraction and
analysis of PFAS in biological tissues
Adam D. Point,a Thomas M. Holsen,*b Sujan Fernando,c Philip K. Hopke,*d and Bernard S. Crimminsb,e
S1. Interlaboratory Studies. van Leeuwen et al.1 organized a 38 participant worldwide per- and polyfluoroalkyl substances
(PFAS) interlaboratory study (ILS) targeting 13 analytes in a study standard mixture and multiple environmental and human
matrices distributed to all participants. All environmental matrices except water were spiked with most of the target analytes,
enabling assignment of known (“assigned”) concentrations. Fractions of submitted data exceeding the study’s acceptability
threshold (z-score <|2|) for each distributed matrix decreased as follows: standard solution (76%) > human blood (67%) >
human plasma (63%) > fish liver extract (55%) > surface water (31%) > fish tissue (17%).1
A follow-up ILS distributed surface water, fish fillet tissue, a shared standard solution to evaluate variabilities with
participants’ (21) in-house standards, and three separate solutions containing a total of nine isotopically-labeled (13C or 2H)
PFAS.2 The precision of the submitted data improved relative to the 2006 results. However, precision data for individual
laboratories (mean %RSD for all analytes for a single lab; 12% for water and 6.8% for fish) were considerably better than the
cumulative precision.2 Additionally, mean reported values for some analytes fell below the spiked concentrations and the
majority of minimum reported concentrations were approximately 50% of the spiked concentration, with a value of 34% for
perfluorooctane sulfonate (PFOS).2 Inefficient extraction was the likely cause of these low values, since losses during sample
preparation should have been accounted for via surrogate addition.
Lindström et al.3 coordinated an additional 15-participant ILS published in 2009 involving a shared study standard and
two NIST human blood serum standard reference materials (SRMs; 1589a and 1957). A shared mass-labeled standard
containing 13C-labeled PFOS, perfluorooctanoic acid (PFOA), and perfluorononanoic acid (PFNA) was also distributed, and was
used by some participants. SRM 1589a contains lower PFAS concentrations than 1957, and had fewer detects and higher
uncertainties. Although improvements were realized relative to van Leeuwen et al.,1 precision remained poor.3 However, the
SRM 1957 data exhibited greater precision than the study standard data, which highlights matrix cleanliness is not necessarily a
predictor of method performance. Besides SRM 1957 data having higher precision than that of the study standard, an
additional peculiar irregularity emerges when results from Lindström et al.3 are compared to those of van Leeuwen et al..2 Since
these two studies examined different matrices, the data are not directly comparable. However, both exercises distributed a
study reference standard that included three common mass-labeled compounds from the same manufacturer. Interestingly,
participants performed better at accurately determining target analytes in the study reference standard in the van Leeuwen et
al.2 study despite avoiding the use of mass-labeled standards in their determinations. Participants in Lindström et al.3 were
allowed the liberty to choose their methods, which likely included mass-labelled standards, although the report is not explicit.
A subsequent six-participant ILS provided the first assigned perfluorinated alkyl acid (PFAA) SRM values for the two
human blood serum (NIST SRMs 1957 and 1958) and two human milk SRMs (NIST SRMs 1953 and 1954).4 SRMs 1954 and 1958
Electronic Supplementary Material (ESI) for Environmental Science: Water Research & Technology.This journal is © The Royal Society of Chemistry 2019

S2
were spiked with a suite of 172 organohalogen contaminants (no PFAAs) resulting in four SRMs from two initial samples, two
spiked (SRMs 1954 and 1958), and two unspiked (SRMs 1953 and 1957). While multiple extraction and cleanup methods were
employed by participating analysts, all participants utilized multiple mass-labelled standards spiked prior to extraction in order
to quantify the target analytes.4 In comparison with van Leeuwen et al.,1 significant precision improvements were apparent for
the human serum matrix (SRM 1957). Resultant ILS reference values were in good agreement with previously established
consensus values.3
Seven laboratories participated in an ILS organized by Reiner et al.5 lead to establishment of reference values for PFOS
and information values for several other PFAAs for three NIST SRMs including 1946 and 1947 (Great Lakes fish tissue) and 1577c
( bovine liver). NIST SRM 2974a (mussel tissue) was also distributed, but only PFOS data were reported by two of the three
participating laboratories, and these values differed by 40%. Overall, there was good agreement among participants’ submitted
PFOS data (%RSDs of 3.65% and 6.61% for SRMs 1946 and 1947, respectively) with lower precision for the other analytes
(%RSDs >15%). Reiner et al.6 sought to establish PFAS reference values for less frequently analyzed abiotic matrices by
organizing an eight-participant ILS. Poor agreement among the submitted data (analyte-specific %RSDs 10-165%) contrasted
with the generally increasing trend in precision over time demonstrated by previously summarized ILSs. Internal standard
calibration was universally applied among participants. However, there were inconsistencies in the internal standards used
when a corresponding mass-labeled counterpart (i.e. perfluorobutane sulfonate (PFBS) in SRM 2585; house dust) was not
commercially available. Furthermore, the use of one sample preparation procedure for all of the matrices was cited as an
additional possible contributor to discrepancies in the submitted data.
Reiner et al.6 sought to establish PFAS reference values for less frequently analyzed abiotic matrices by organizing an
eight-participant ILS. Poor agreement among the submitted data (analyte-specific %RSDs 10-165%) contrasted with the
generally increasing trend in precision over time demonstrated by previously summarized ILSs. Internal standard calibration
was universally applied among participants. However, there were inconsistencies in the internal standards used when a
corresponding mass-labeled counterpart (i.e. perfluorobutane sulfonate (PFBS) in SRM 2585; house dust) was not commercially
available. Furthermore, the use of one sample preparation procedure for all of the matrices was cited as an additional possible
contributor to discrepancies in the submitted data.
While precision generally improved over time, it is important to note that the ILSs that displayed increased precision
also generally included fewer participants compared to studies reporting low precision. For instance, data for PFAS in fish
muscle tissue was submitted by 27 and 15 participants in the 20061 and 20092 ILSs documented by van Leeuwen et al.,
respectively, with corresponding %RSD ranges of 65-236% and 22-47%. This contrasts with the relative errors of 3.7% and 6.6%
among seven participants for the PFOS reference values in Great Lakes fish tissue SRMs 1946 and 1947, respectively, reported
in 2012 by Reiner et al.5 Additionally, the number of replicate analyses performed by individual participants was generally low
(n=3-6), with a range of 2-26 for any single analytical method (some participants applied multiple methods).4,5 Since specific
guidelines regarding analyzing replicates in multiple batches and/or on multiple days are not supplied in the text of the cited
ILSs, participants may have combined replicate analyses into few or even a single batch, which would also contribute to
increased precision.
The reviewed ILSs highlight the potential for substantial variability during PFAS quantification, regardless of analyzed
matrix. Application of well-defined native standards (purity and isomer composition), appropriate mass-labeled surrogate
standards (ideally using isotope dilution), and use of cleanup procedures which adequately remove interferences from
environmental sample matrices were commonly identified in these ILSs as keys to producing high quality, reproducible data.

S3
Additionally, use of external calibration methods for PFAS quantitation was illadvised.1 With the exception of native standard
quality, the causes of inconsistency identified by the reviewed ILSs can be generally simplified as differential exchange of
analytes between two steps in the analytical method. The availability of isotopically-labeled surrogates for most commonly
analyzed PFAS enables the use of isotope dilution methods, which counteracts most of these complications. However, the
following section highlights known instances of low and/or variable surrogate recoveries that likely contributed to poor
precision of past PFAS analytical methods that necessarily applied a relatively narrow array of surrogates to a broad range of
target analytes. Additionally, low and/or variable surrogate recoveries have potential to jeopardize QA/QC requirements in
modern methods if unaddressed.

S4
Table S1. Comparison of PFAS interlaboratory studies
Reference Matrix Spikeda Participants Precisionb
van Leeuwen et al. (2006)1
Standard mixture N/A 38; 13 countries
25-256 %RSD (PFHxS, PFNA)
80-202% [analyte means; (in-house)/(shared)]
Human plasma X 17 submissions
32-64 %RSD (PFOS, PFHxS)
Human whole blood X 29-90 %RSD (PFHxS, PFOSA)
Fish muscle
27 submissions
65-236 %RSD (PFBS, PFNA)
Fish liver extract 37-202 %RSD (PFHxS, PFHpA)
Surface water X 47-250 %RSD (PFBS, PFHxS)
van Leeuwen et al. (2009)2
Standard mixture N/A 21 95-105% [analyte means; (in-house)/(shared)]
Fish muscle 15 submissions 22-47 %RSD (PFDA, PFOSA)**
Surface water 17 submissions 16-69 %RSD (PFBA, PFOSA)**
Lindström et al. (2009)3
Standard mixture N/A
15
44-101 %RSD (PFNA, PFDS)
Human serum (SRM 1957) X 5-133 %RSD (PFDS, PFDoA)
Human serum (SRM 1589a) X 14-139 %RSD (PFOS, PFDoA)
Keller et al. (2010)4
Human serum (SRM 1957) X 6 7-26 %RSD (PFOS, PFDA)
Human milk (SRM 1954) X 3 19 %***(PFOS)
Reiner et al. (2012)5
Fish tissue (SRM 1946) X 7 3.65% ***( PFOS only)
Fish tissue (SRM 1947) X 7 6.61%*** (PFOS only)
Bovine liver (SRM 1577c) X 3 23.8%*** (PFOS only)
Mussel tissue (SRM 2974a) X 2 submissions 40% difference (PFOS only)
Reiner et al. (2015)6
Sediment (SRM 1941b) X 6 >60 %RSD (PFOS)
Sediment (SRM 1944) X 7 >60 %RSD (PFOS)
House dust (SRM 2585) X 3 <10-81 %RSD (PFOS, PFBS)
Soil (SRM 2586) X 6 32 %RSD (PFOS)
Sludge (SRM 2781) X 5 10-165 %RSD (~30% for PFOS) adescribes whether target analytes were added to the matrix prior to distribution to participants ( = yes, X = no) bvalues represent pooled, unreduced data (n occasionally <3) unless otherwise specified. Analyte abbreviations in parentheses correspond to min, max values from cited reference, respectively **based on solvent-based calibration curve quantification data (standard addition also performed) *** calculated as (expanded uncertainty)/(reference or consensus value)*100
S5
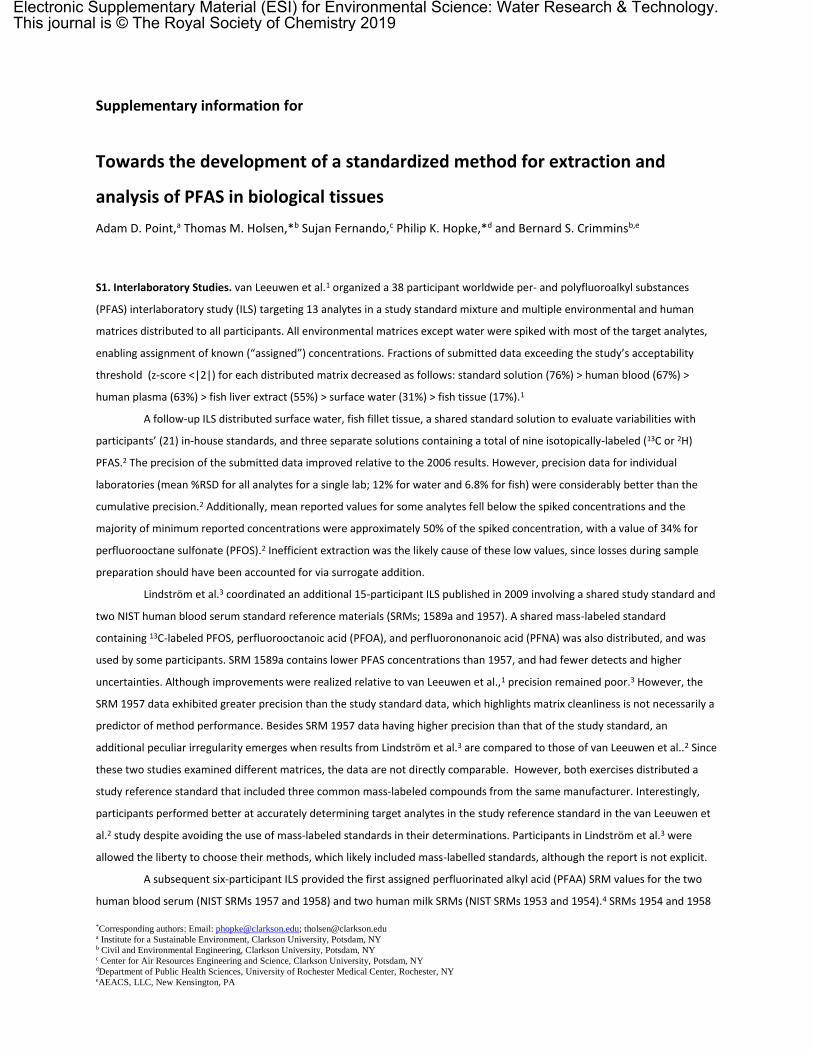
Table S2. Description of target analytes and mass-labeled standards used
Compound Full name Formula Surrogate
Native PFCAs
PFBA Perfluorobutanoic acid CF3(CF2)2 COOH PFBA13C
PFPeA Perfluoropentanoic acid CF3(CF2)3 COOH PFHxA13C
PFHxA Perfluorohexanoic acid CF3(CF2)4 COOH PFHxA13C
PFHpA Perfluoroheptanoic acid CF3(CF2)5 COOH PFOA13C
PFOA Perfluorooctanoic acid CF3(CF2)6 COOH PFOA13C
PFNA Perfluorononanoic acid CF3(CF2)7 COOH PFNA13C
PFDA Perfluorodecanoic acid CF3(CF2)8 COOH PFDA13C
PFUnA Perfluoroundecanoic acid CF3(CF2)9 COOH PFUnA13C
PFDoA Perfluorododecanoic acid CF3(CF2)10 COOH PFDoA13C
PFTrA Perfluorotridecanoic acid CF3(CF2)11 COOH PFDoA13C
PFTeA Perfluorotetradecanoic acid CF3(CF2)12 COOH M2PFTeA
PFHxDA Perfluorohexadecanoic acid CF3(CF2)14 COOH M2PFHxDA
Native PFSAs
PFBS Potassium perfluoro-1-butanesulfonate CF3(CF2)3SO3- PFHxS18O
PFHxS Sodium perfluoro-1-hexanesulfonate CF3(CF2)5SO3- PFHxS18O
PFOS Sodium perfluoro-1-octanesulfonate CF3(CF2)7SO3- PFOS13C
PFDS Sodium perfluoro-1-decanesulfonate CF3(CF2)9SO3- PFOS13C
Mass-labeled PFCAs
PFBA13C Perfluoro[1,2,3,4-13C4]butanoic acid PFHxA13C Perfluoro[1,2-13C2]hexanoic acid M5PFHxA* Perfluoro[1,2,3,4,6-13C5]hexanoic acid
PFOA13C Perfluoro[1,2,3,4-13C4]octanoic acid PFNA13C Perfluoro[1,2,3,4,5-13C5]nonanoic acid PFDA13C Perfluoro[1,2-13C2]decanoic acid PFUnA13C Perfluoro[1,2-13C2]undecanoic acid M7PFUnA* Perfluoro[1,2,3,4,5,6,7-13C7]undecanoic acid
PFDoA13C Perfluoro[1,2-13C2]dodecanoic acid M2PFTeA** Perfluoro[1,2-13C2]tetradecanoic acid M2PFHxDA** Perfluoro[1,2-13C2]hexadecanoic acid Mass-labeled PFSAs
PFHxS18O Sodium perfluoro-1-hexane[18O2]sulfonate
PFOS13C Sodium perfluoro-1-[1,2,3,4-13C4]octanesulfonate
*Used as UPLC injection standard
**Purchased as individual solution and added to mass-labeled mixture

S6
Table S3. UPLC solvent gradient
Time (min)
Flow (mL/min) %A %B
T2-T1 Change
0.0 0.4 75 25
1.0 0.4 75 25
1.5 0.4 40 60 Linear
9.6 0.4 0 100 Linear
14 0.4 0 100
14.5 0.4 75 25 Linear
20 0.4 75 25
S7
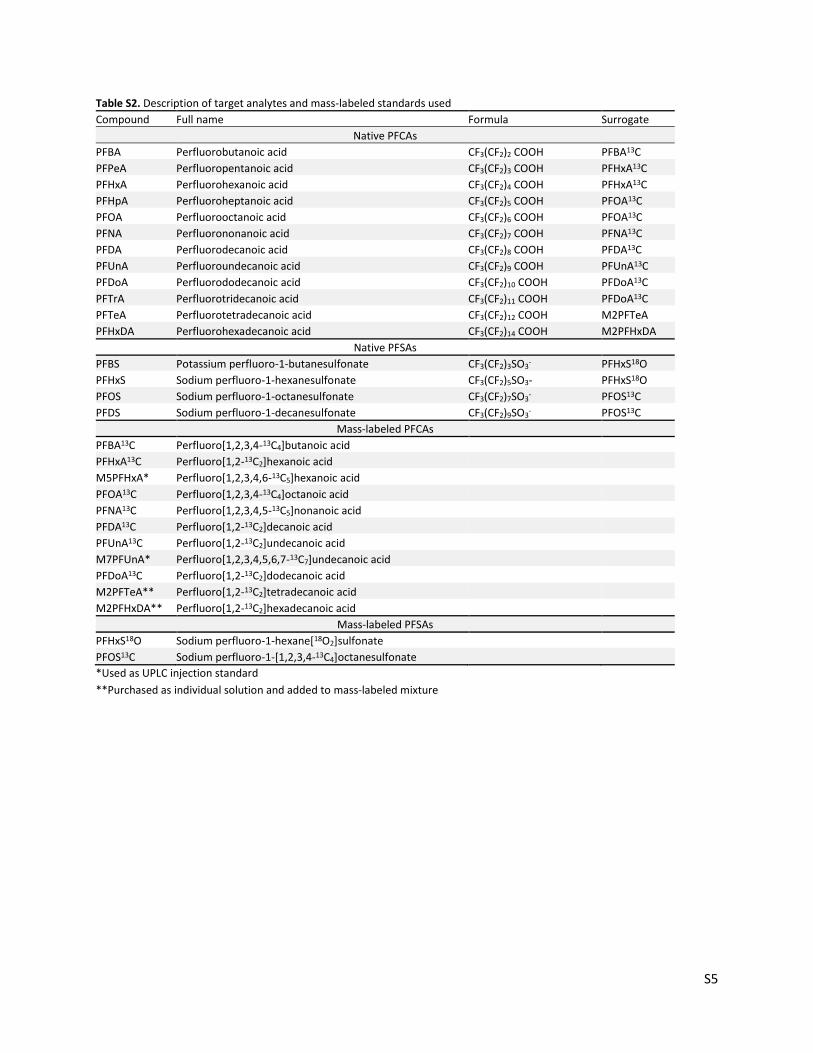
Table S4. Compound-specific instrumental parameters
Compound Quantification transition (m/z)
Confirmation m/z
Retention timea (min) RF lens (V) Collision Energyb (V)
PFBA 213→169
3.05 30 10
PFBA13C 217→172
30 10
PFPeA 263→219
3.57 30 10
PFBS 299→80.2 99.2, 169 3.60 115 50, 50, 25
PFHxA 313→269 119 4.13 40 10, 15
PFHxA13C 315→270
40 10
M5PFHxA 318→273 35 10
PFHxS 399→80.2 99.2, 169.1 4.74 135 45, 35, 29
PFHxS18O 403→103
135 30
PFHpA 363→319 169 4.80 45 15, 20
PFOA 413→369 169 5.54 50 10, 20
PFOA13C 417→372
50 10
PFOS 498.9→80 99 6.15 160 40
PFOS13C 503→99
160 40
PFNA 463→419 219 6.30 50 10, 20
PFNA13C 468→423 422.986 50 10
PFDA 513→469 219 7.02 55 10, 20
PFDA13C 515→470
55 10
PFDS 598.9→80.3 99.1, 230.1 7.52 170 60, 60, 50
PFUnA 563→519 169 7.71 62 20, 25
PFUnA13C 565→520
62 10
M7PFUnA 570→525
62 10
PFDoA 613→569 169 8.35 67 15, 25
PFDoA13C 615→570
67 10
PFTrA 663→619 169 8.95 50 15, 25
PFTeA 713→669 219 9.49 75 15, 25
M2PFTeA 715→670 75 15
PFHxDA 813→769 219 10.51 50 15
M2PFHxDA 815→770
50 15 a Identical values for native and mass-labeled analogs b Multiple values correspond to m/z values listed left to right starting with the quantification transition

S8
Table S5. Summary of surrogate recoveries obtained using SOP 10.4
Tissue samples n=300
Method blanks n=26
Compound Mean St. dev. %RSD
Mean St. dev. %RSD
PFBA13C 72% 13% 18% 87% 12% 13%
PFHxA13C 83% 14% 17% 87% 12% 13%
PFHxS18O 92% 11% 12% 94% 9% 9%
PFOA13C 78% 20% 26% 91% 12% 14%
PFOS13C 93% 12% 13% 92% 8% 9%
PFNA13C 83% 8% 9% 90% 7% 7%
PFDA13C 83% 8% 9% 89% 6% 7%
PFUnA13C 89% 7% 8% 90% 7% 8%
PFDoA13C 88% 11% 13% 87% 8% 9%
M2PFTeA 93% 18% 19% 79% 9% 11%
M2PFHxDA 96% 21% 22% 60% 13% 22%
M7PFUnAa 97% 11% 12% 97% 9% 9%
Overall meanb: 86% 13% 15% 86% 9% 11% a used as UPLC injection standard b overall means exclude M7PFUnA value
Extracted species for which the surrogate recoveries listed in Table S5 were obtained include:
lake trout (Salvelinus namaycush), walleye (Sander vitreus), spottail shiner (Notropis hudsonius), emerald shiner (Notropis
atherinoides), yellow perch (Perca flavescens), white perch (Morone Americana), trout perch (Percopsis omiscomaycus), round
goby (Neogobius melanostomus), gizzard shad (Dorosoma cepedianum), rainbow smelt (Osmerus mordax), slimy sculpin (Cottus
cognatus), deepwater sculpin (Myoxocephalus thompsonii), bloater (Coregonus hoyi), alewife (Alosa pseudoharengus), Mysis
(Mysis diluviana), and bulk zooplankton and phytoplankton homogenates.

S9
Figure S1. Mean (n=3) normalized peak areas vs. PFAA perfluorinated chain length for each vial material and solvent composition tested. * indicates PFSA. Bars represent sequential injections from day one (Inj. 1-3), day two (Inj. 4), day 2 after vortexing for 2 min (Vortex), and day 2 after sonicating for 2 min (Sonicate). For each vial type, plotted values for each compound are normalized to the mean of the first injections from the solutions containing 25% water. Error bars represent ± std. dev.

S10
S2. Ionization Suppression: Preliminary data suggested that low apparent surrogate recovery for the isotopically labeled
surrogate used for PFOA (PFOA13C) was likely due to ionization suppression. To test this hypothesis, several matrix spikes were
processed alongside samples to test for ionization suppression and/or enhancement during MS analysis. For these tests, a
duplicate of one sample in the batch being processed was extracted following SOP 10.4 and spiked with the surrogate mixture
and injection standard immediately prior to instrumental analysis. Lake trout (Salvelinus namaycush) tissue was used for these
tests because lake trout is the predominant species extracted using SOP 10.4. The results of these matrix spikes are provided in
Table S6. Note that only one of three matrix blanks (matrix blank 2) yielded low PFOA13C recovery. This is due to the quantity of
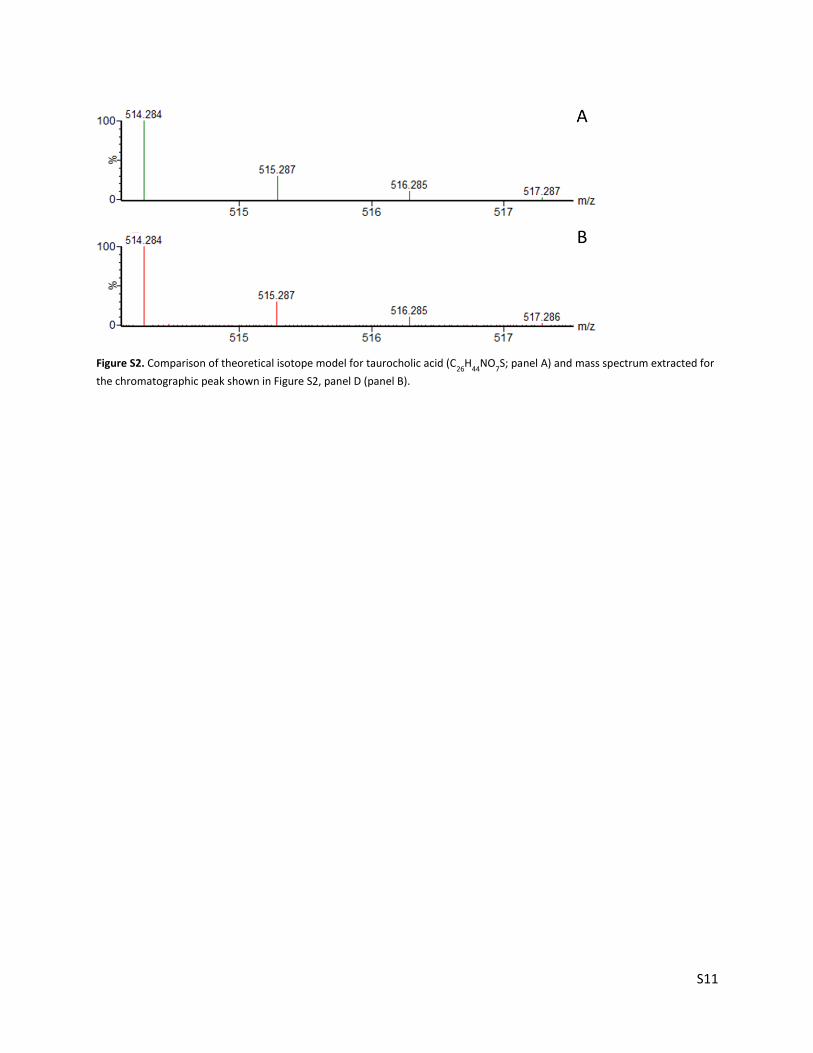
coextracted matrix interference present. Based on the evidence presented in Figures S2 and S3, this matrix interference is
assumed to be taurocholic acid. The sodium salt of taurocholic acid is the primary component of carnivorous animals’ bile, and
functions as a facilitator of intestinal and liver transport of fats and sterols.7 Taurocholic acid possesses structural properties
similar to that of PFAAs, allowing it to be carried through the weak anion exchange solid phase extraction procedure.
Presumably, the variability of this interference’s concentration is due to some degree of heterogeneity among tissue
homogenates. During full scan MS analysis, this matrix interference is clearly visible as a large hump in the total ion
chromatogram which elutes from the LC column starting very near PFOA, and is present in nearly all biological tissue samples
extracted using SOP 10.4. However, only when this species is extracted in sufficient quantity does its chromatographic peak
overlap with that of PFOA and cause suppression. This result is demonstrated in Figure S2. Peaks in panels A and B
(corresponding to matrix blank 1 from Table S6) do not overlap significantly, and no matrix suppression was observed.
However, peaks in panels C and D (corresponding to matrix blank 2 from Table S6) overlap and matrix suppression was
observed. It should be noted that PFOA is not expected to bioaccumulate in fish due to rapid elimination,8 and is generally not
present above the detection limit in the majority of species that have been analyzed following SOP 10.4 to date. Additionally,
isotope dilution is utilized for PFOA quantification in SOP 10.4, which should negate the influence of ionization suppression.
Table S6. Summary of matrix suppression/enhancement encountered using SOP 10.4
Compound Matrix blank 1 Matrix blank 2 Matrix blank 3
PFBA13C 92% 98% 89%
PFHxA13C 109% 117% 109%
PFHxS18O 91% 93% 90%
PFOA13C 113% 54% 103%
PFOS13C 105% 91% 90%
PFNA13C 99% 97% 92%
PFDA13C 98% 101% 99%
PFUnA13C 100% 98% 98%
PFDoA13C 98% 94% 96%
M2PFTeA 88% 99% 111%
M2PFHxDA 105% 112% 113%
M7PFUnAa 102% 105% 117% a used as UPLC injection standard
S11
Figure S2. Comparison of theoretical isotope model for taurocholic acid (C26
H44
NO7S; panel A) and mass spectrum extracted for
the chromatographic peak shown in Figure S2, panel D (panel B).

S12
Table S7. Reproducibility of duplicate sample analyses using SOP 10.4 (n=16)
Compound Mean % diff. 95% CI
PFHxS 6.9 3.5 – 10.3
PFNA 9.0 5.9 – 12.0
PFOS 6.1 3.5 – 8.7
PFDS 6.5 2.5 – 10.5
PFDA 7.3 4.5 – 10.2
PFUnA 5.0 3.4 – 6.6
PFDoA 7.1 4.3 – 10.0
PFTrA 10.5 6.4 – 14.6
PFTeA 6.4 3.1 – 9.7
Figure S3. Comparison of peak areas (displayed above each peak) for PFOA13
C (panels A and C) and total ion chromatograms (panels B and D) for two matrix blanks processed following SOP 10.4. Panels A and B correspond to matrix blank 1 in Table S6, and panels C and D correspond to matrix blank 2. These matrix blanks were extracts of two different whole lake trout homogenates spiked with surrogate immediately prior to UPLC-MS analysis. Taurocholic acid (mass spectrum available in Figure S1, panel B) contributed virtually the entire signal integrated in the peaks displayed in panels B and D.
S13
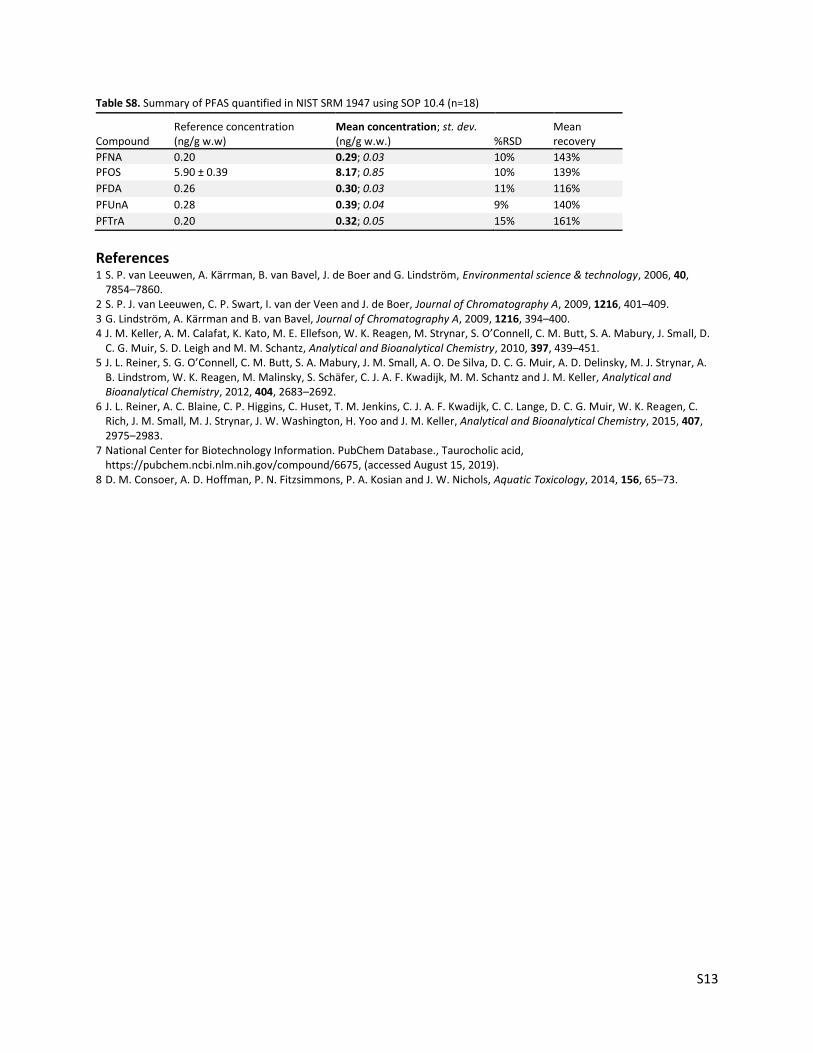
Table S8. Summary of PFAS quantified in NIST SRM 1947 using SOP 10.4 (n=18)
Compound Reference concentration (ng/g w.w)
Mean concentration; st. dev. (ng/g w.w.) %RSD
Mean recovery
PFNA 0.20 0.29; 0.03 10% 143%
PFOS 5.90 ± 0.39 8.17; 0.85 10% 139%
PFDA 0.26 0.30; 0.03 11% 116%
PFUnA 0.28 0.39; 0.04 9% 140%
PFTrA 0.20 0.32; 0.05 15% 161%
References 1 S. P. van Leeuwen, A. Kärrman, B. van Bavel, J. de Boer and G. Lindström, Environmental science & technology, 2006, 40,
7854–7860. 2 S. P. J. van Leeuwen, C. P. Swart, I. van der Veen and J. de Boer, Journal of Chromatography A, 2009, 1216, 401–409. 3 G. Lindström, A. Kärrman and B. van Bavel, Journal of Chromatography A, 2009, 1216, 394–400. 4 J. M. Keller, A. M. Calafat, K. Kato, M. E. Ellefson, W. K. Reagen, M. Strynar, S. O’Connell, C. M. Butt, S. A. Mabury, J. Small, D.
C. G. Muir, S. D. Leigh and M. M. Schantz, Analytical and Bioanalytical Chemistry, 2010, 397, 439–451. 5 J. L. Reiner, S. G. O’Connell, C. M. Butt, S. A. Mabury, J. M. Small, A. O. De Silva, D. C. G. Muir, A. D. Delinsky, M. J. Strynar, A.
B. Lindstrom, W. K. Reagen, M. Malinsky, S. Schäfer, C. J. A. F. Kwadijk, M. M. Schantz and J. M. Keller, Analytical and Bioanalytical Chemistry, 2012, 404, 2683–2692.
6 J. L. Reiner, A. C. Blaine, C. P. Higgins, C. Huset, T. M. Jenkins, C. J. A. F. Kwadijk, C. C. Lange, D. C. G. Muir, W. K. Reagen, C. Rich, J. M. Small, M. J. Strynar, J. W. Washington, H. Yoo and J. M. Keller, Analytical and Bioanalytical Chemistry, 2015, 407, 2975–2983.
7 National Center for Biotechnology Information. PubChem Database., Taurocholic acid, https://pubchem.ncbi.nlm.nih.gov/compound/6675, (accessed August 15, 2019).
8 D. M. Consoer, A. D. Hoffman, P. N. Fitzsimmons, P. A. Kosian and J. W. Nichols, Aquatic Toxicology, 2014, 156, 65–73.
*Corresponding authors: Email: [email protected]; [email protected] a Institute for a Sustainable Environment, Clarkson University, Potsdam, NY b Civil and Environmental Engineering, Clarkson University, Potsdam, NY c Center for Air Resources Engineering and Science, Clarkson University, Potsdam, NY dDepartment of Public Health Sciences, University of Rochester Medical Center, Rochester, NY eAEACS, LLC, New Kensington, PA
Clarkson University
Center for Air Resources Engineering and Science
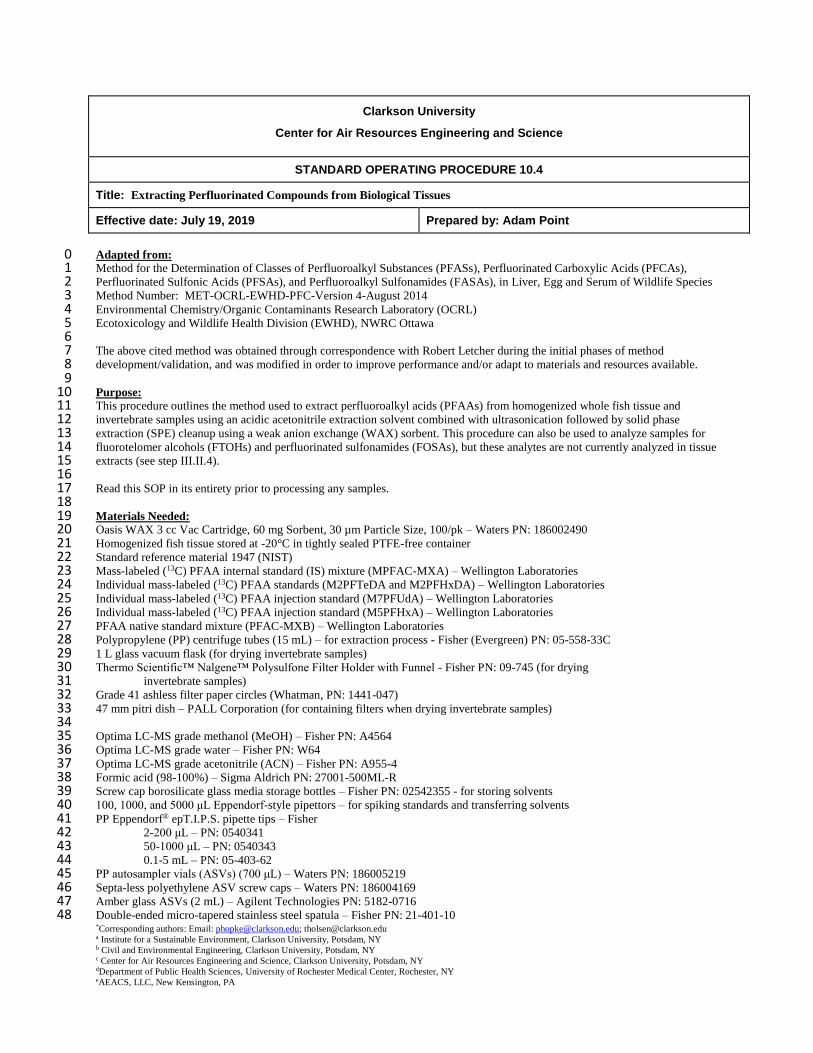
STANDARD OPERATING PROCEDURE 10.4
Title: Extracting Perfluorinated Compounds from Biological Tissues
Effective date: July 19, 2019 Prepared by: Adam Point
Adapted from: 0 Method for the Determination of Classes of Perfluoroalkyl Substances (PFASs), Perfluorinated Carboxylic Acids (PFCAs), 1 Perfluorinated Sulfonic Acids (PFSAs), and Perfluoroalkyl Sulfonamides (FASAs), in Liver, Egg and Serum of Wildlife Species 2 Method Number: MET-OCRL-EWHD-PFC-Version 4-August 2014 3 Environmental Chemistry/Organic Contaminants Research Laboratory (OCRL) 4 Ecotoxicology and Wildlife Health Division (EWHD), NWRC Ottawa 5 6 The above cited method was obtained through correspondence with Robert Letcher during the initial phases of method 7 development/validation, and was modified in order to improve performance and/or adapt to materials and resources available. 8 9 Purpose: 10 This procedure outlines the method used to extract perfluoroalkyl acids (PFAAs) from homogenized whole fish tissue and 11 invertebrate samples using an acidic acetonitrile extraction solvent combined with ultrasonication followed by solid phase 12 extraction (SPE) cleanup using a weak anion exchange (WAX) sorbent. This procedure can also be used to analyze samples for 13 fluorotelomer alcohols (FTOHs) and perfluorinated sulfonamides (FOSAs), but these analytes are not currently analyzed in tissue 14 extracts (see step III.II.4). 15 16 Read this SOP in its entirety prior to processing any samples. 17 18 Materials Needed: 19 Oasis WAX 3 cc Vac Cartridge, 60 mg Sorbent, 30 µm Particle Size, 100/pk – Waters PN: 186002490 20 Homogenized fish tissue stored at -20°C in tightly sealed PTFE-free container 21 Standard reference material 1947 (NIST) 22 Mass-labeled (13C) PFAA internal standard (IS) mixture (MPFAC-MXA) – Wellington Laboratories 23 Individual mass-labeled (13C) PFAA standards (M2PFTeDA and M2PFHxDA) – Wellington Laboratories 24 Individual mass-labeled (13C) PFAA injection standard (M7PFUdA) – Wellington Laboratories 25 Individual mass-labeled (13C) PFAA injection standard (M5PFHxA) – Wellington Laboratories 26 PFAA native standard mixture (PFAC-MXB) – Wellington Laboratories 27 Polypropylene (PP) centrifuge tubes (15 mL) – for extraction process - Fisher (Evergreen) PN: 05-558-33C 28 1 L glass vacuum flask (for drying invertebrate samples) 29 Thermo Scientific™ Nalgene™ Polysulfone Filter Holder with Funnel - Fisher PN: 09-745 (for drying 30 invertebrate samples) 31 Grade 41 ashless filter paper circles (Whatman, PN: 1441-047) 32 47 mm pitri dish – PALL Corporation (for containing filters when drying invertebrate samples) 33 34 Optima LC-MS grade methanol (MeOH) – Fisher PN: A4564 35 Optima LC-MS grade water – Fisher PN: W64 36 Optima LC-MS grade acetonitrile (ACN) – Fisher PN: A955-4 37 Formic acid (98-100%) – Sigma Aldrich PN: 27001-500ML-R 38 Screw cap borosilicate glass media storage bottles – Fisher PN: 02542355 - for storing solvents 39 100, 1000, and 5000 μL Eppendorf-style pipettors – for spiking standards and transferring solvents 40 PP Eppendorf® epT.I.P.S. pipette tips – Fisher 41 2-200 μL – PN: 0540341 42 50-1000 μL – PN: 0540343 43 0.1-5 mL – PN: 05-403-62 44 PP autosampler vials (ASVs) (700 μL) – Waters PN: 186005219 45 Septa-less polyethylene ASV screw caps – Waters PN: 186004169 46 Amber glass ASVs (2 mL) – Agilent Technologies PN: 5182-0716 47 Double-ended micro-tapered stainless steel spatula – Fisher PN: 21-401-10 48
S15
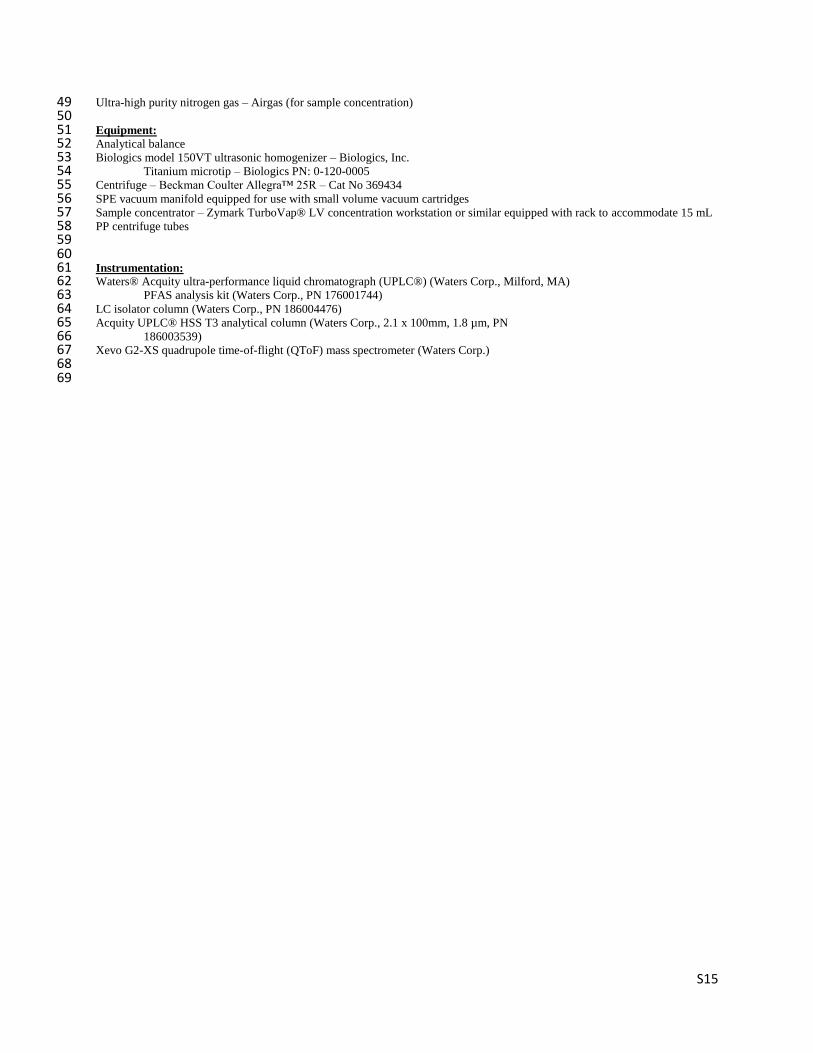
Ultra-high purity nitrogen gas – Airgas (for sample concentration) 49 50 Equipment: 51 Analytical balance 52 Biologics model 150VT ultrasonic homogenizer – Biologics, Inc. 53 Titanium microtip – Biologics PN: 0-120-0005 54 Centrifuge – Beckman Coulter Allegra™ 25R – Cat No 369434 55 SPE vacuum manifold equipped for use with small volume vacuum cartridges 56 Sample concentrator – Zymark TurboVap® LV concentration workstation or similar equipped with rack to accommodate 15 mL 57 PP centrifuge tubes 58 59 60 Instrumentation: 61 Waters® Acquity ultra-performance liquid chromatograph (UPLC®) (Waters Corp., Milford, MA) 62 PFAS analysis kit (Waters Corp., PN 176001744) 63 LC isolator column (Waters Corp., PN 186004476) 64 Acquity UPLC® HSS T3 analytical column (Waters Corp., 2.1 x 100mm, 1.8 µm, PN 65 186003539) 66 Xevo G2-XS quadrupole time-of-flight (QToF) mass spectrometer (Waters Corp.) 67 68 69

S16
I. Solvent and Surrogate Preparation 70 71 I.I. Solid-liquid extraction: 72
1. Acetonitrile + 0.2 % formic acid ........................................... 6 mL/sample 73 a. 200 μL formic acid per 100 mL 74
2. MeOH ................................................................................... 4 mL/sample to clean sonicator tip 75 + 3x 50 mL PP cent. tubes full for rinsing tip 76
3. ACN ...................................................................................... 50 mL tube full for rinsing sonicator tip 77 78
79 I.II. SPE: 80
1. 2% aq. formic acid ............................................................... 1 mL/sample 81 a. 2 mL formic acid per 100 mL 82
2. 1% NH4OH in MeOH ........................................................... 6 mL/sample 83 a. 1 mL 28% NH4OH per 100 mL 84
3. Water .................................................................................... ~13 mL/sample 85 4. MeOH ................................................................................... 5 mL per sample 86
87 Table 1. Quick reference guide for solvent preparation 88
Solvent Amount per batch of 12 samples
Extraction
Methanol Three 50 mL tubes + 100 mL for rinsing
Acetonitrile Two 50 mL tubes
Acetonitrile + 0.2% formic acid 80 mL + 160 µL formic acid
SPE
Water + 2% formic acid 20 mL water + 400 µL formic acid
Water 175 mL
Methanol 75 mL
Methanol + 1% ammonium hydroxide 80 mL + 800 µL ammonium hydroxide
89 Table 2. Quick reference guide for surrogate preparation for 24 samples (2 batches) 90
Methanol 2,000 ng/mL C4-C12 surrogate 1,000 ng/mL C14 + C16 surrogate
1408 µL (704 µL x2) 64 µL 128 µL
91 92
II. Sample Extraction 93 94
1. Defrost samples at room temperature immediately prior to extraction (0.5-4 hrs depending on sample mass) or in 95 refrigerator overnight 96
2. Obtain clean stainless steel spatulas 97 a. Can use each end of a spatula for different samples as long as the unused end does not touch any surface 98
(including your glove) during mixing and weighing of the first sample 99 a. Follow cleaning procedure applicable for trace contaminant analysis. Rinse with methanol immediately 100
before use and allow spatula to air dry before touching sample 101 i. To dry multiple spatulas at a time, two pieces of methanol rinsed aluminum foil can be folded into 102
triangular strip and laid on the bench top parallel to each other approximately 1-2 inches apart. 103 Place the methanol rinsed spatulas across these pieces of foil to keep them from touching the bench 104 top or other surface while drying. 105
ii. These foil drying strips can be placed in a Ziploc bag and reused 106 3. Obtain two 15 mL PP centrifuge tubes per sample and label 2 tubes for each sample ID 107 4. Rinse one set of these tubes with methanol by using a 5 mL pipettor to add approximately 1 mL of methanol to each 108
tube, then cap the tube, shake, and discard the methanol 109 a. Rinsing with methanol cleans tube and helps keep tissue from sticking to walls 110
5. Remove as much methanol from the tube as possible prior to weighing samples 111 112
II.I Invertebrate samples 113 Perform the following steps for preparing invertebrate samples (plankton, insect larvae, Mysis, amphipods, 114 oligochaetes, etc.) 115
Invertebrate samples are normally frozen with excess water in the sample jar. This water must be removed by following the steps 116 below prior to weighing the sample 117
1. Obtain thawed samples to be extracted 118
S17
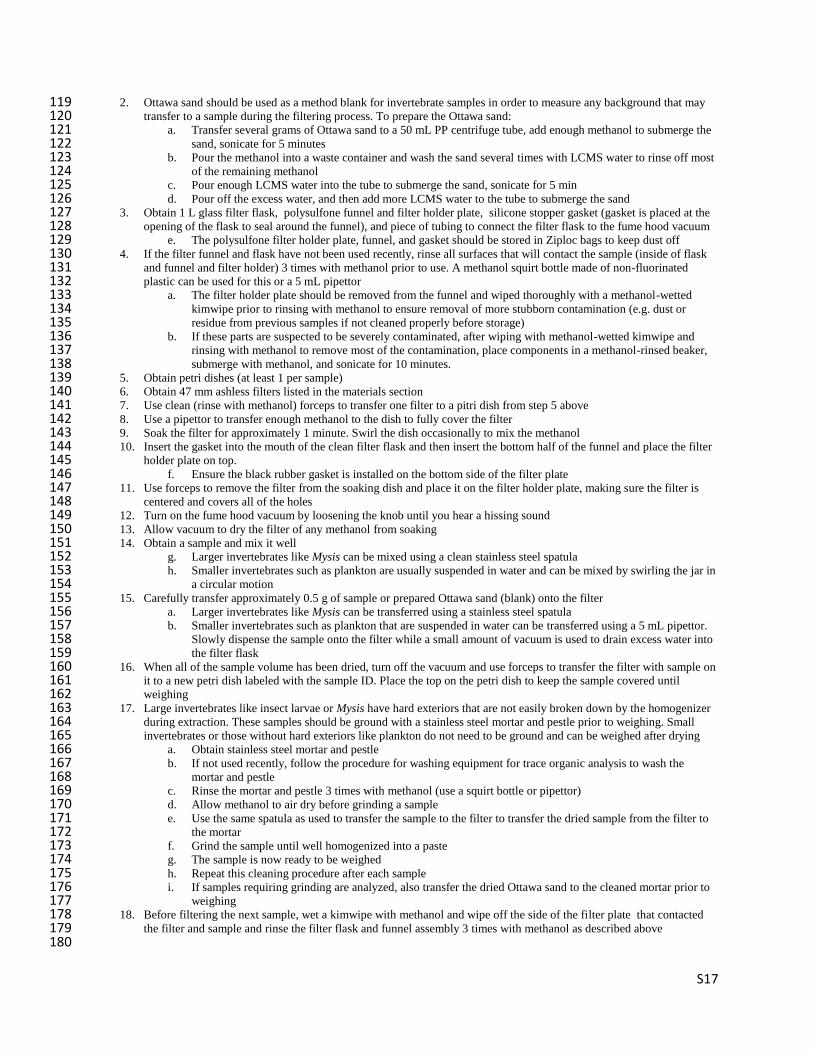
2. Ottawa sand should be used as a method blank for invertebrate samples in order to measure any background that may 119 transfer to a sample during the filtering process. To prepare the Ottawa sand: 120
a. Transfer several grams of Ottawa sand to a 50 mL PP centrifuge tube, add enough methanol to submerge the 121 sand, sonicate for 5 minutes 122
b. Pour the methanol into a waste container and wash the sand several times with LCMS water to rinse off most 123 of the remaining methanol 124
c. Pour enough LCMS water into the tube to submerge the sand, sonicate for 5 min 125 d. Pour off the excess water, and then add more LCMS water to the tube to submerge the sand 126
3. Obtain 1 L glass filter flask, polysulfone funnel and filter holder plate, silicone stopper gasket (gasket is placed at the 127 opening of the flask to seal around the funnel), and piece of tubing to connect the filter flask to the fume hood vacuum 128
e. The polysulfone filter holder plate, funnel, and gasket should be stored in Ziploc bags to keep dust off 129 4. If the filter funnel and flask have not been used recently, rinse all surfaces that will contact the sample (inside of flask 130
and funnel and filter holder) 3 times with methanol prior to use. A methanol squirt bottle made of non-fluorinated 131 plastic can be used for this or a 5 mL pipettor 132
a. The filter holder plate should be removed from the funnel and wiped thoroughly with a methanol-wetted 133 kimwipe prior to rinsing with methanol to ensure removal of more stubborn contamination (e.g. dust or 134 residue from previous samples if not cleaned properly before storage) 135
b. If these parts are suspected to be severely contaminated, after wiping with methanol-wetted kimwipe and 136 rinsing with methanol to remove most of the contamination, place components in a methanol-rinsed beaker, 137 submerge with methanol, and sonicate for 10 minutes. 138
5. Obtain petri dishes (at least 1 per sample) 139 6. Obtain 47 mm ashless filters listed in the materials section 140 7. Use clean (rinse with methanol) forceps to transfer one filter to a pitri dish from step 5 above 141 8. Use a pipettor to transfer enough methanol to the dish to fully cover the filter 142 9. Soak the filter for approximately 1 minute. Swirl the dish occasionally to mix the methanol 143 10. Insert the gasket into the mouth of the clean filter flask and then insert the bottom half of the funnel and place the filter 144
holder plate on top. 145 f. Ensure the black rubber gasket is installed on the bottom side of the filter plate 146
11. Use forceps to remove the filter from the soaking dish and place it on the filter holder plate, making sure the filter is 147 centered and covers all of the holes 148
12. Turn on the fume hood vacuum by loosening the knob until you hear a hissing sound 149 13. Allow vacuum to dry the filter of any methanol from soaking 150 14. Obtain a sample and mix it well 151
g. Larger invertebrates like Mysis can be mixed using a clean stainless steel spatula 152 h. Smaller invertebrates such as plankton are usually suspended in water and can be mixed by swirling the jar in 153
a circular motion 154 15. Carefully transfer approximately 0.5 g of sample or prepared Ottawa sand (blank) onto the filter 155
a. Larger invertebrates like Mysis can be transferred using a stainless steel spatula 156 b. Smaller invertebrates such as plankton that are suspended in water can be transferred using a 5 mL pipettor. 157
Slowly dispense the sample onto the filter while a small amount of vacuum is used to drain excess water into 158 the filter flask 159
16. When all of the sample volume has been dried, turn off the vacuum and use forceps to transfer the filter with sample on 160 it to a new petri dish labeled with the sample ID. Place the top on the petri dish to keep the sample covered until 161 weighing 162
17. Large invertebrates like insect larvae or Mysis have hard exteriors that are not easily broken down by the homogenizer 163 during extraction. These samples should be ground with a stainless steel mortar and pestle prior to weighing. Small 164 invertebrates or those without hard exteriors like plankton do not need to be ground and can be weighed after drying 165
a. Obtain stainless steel mortar and pestle 166 b. If not used recently, follow the procedure for washing equipment for trace organic analysis to wash the 167
mortar and pestle 168 c. Rinse the mortar and pestle 3 times with methanol (use a squirt bottle or pipettor) 169 d. Allow methanol to air dry before grinding a sample 170 e. Use the same spatula as used to transfer the sample to the filter to transfer the dried sample from the filter to 171
the mortar 172 f. Grind the sample until well homogenized into a paste 173 g. The sample is now ready to be weighed 174 h. Repeat this cleaning procedure after each sample 175 i. If samples requiring grinding are analyzed, also transfer the dried Ottawa sand to the cleaned mortar prior to 176
weighing 177 18. Before filtering the next sample, wet a kimwipe with methanol and wipe off the side of the filter plate that contacted 178
the filter and sample and rinse the filter flask and funnel assembly 3 times with methanol as described above 179 180
S18
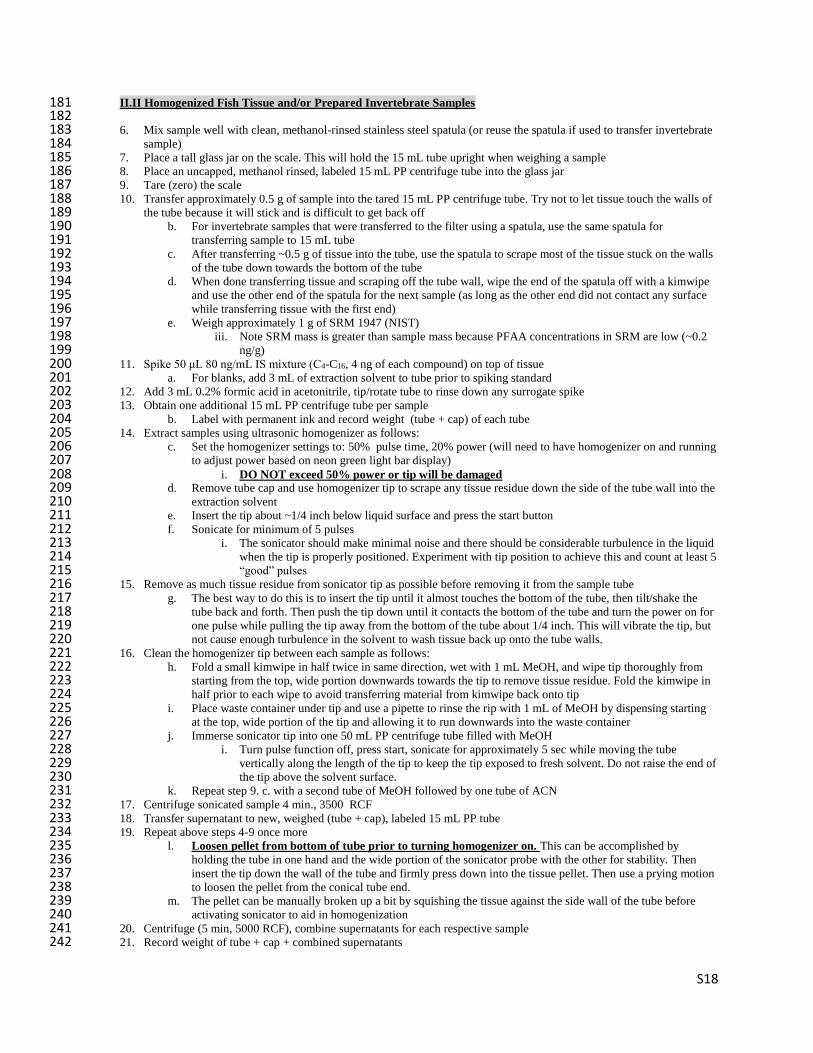
II.II Homogenized Fish Tissue and/or Prepared Invertebrate Samples 181 182
6. Mix sample well with clean, methanol-rinsed stainless steel spatula (or reuse the spatula if used to transfer invertebrate 183 sample) 184
7. Place a tall glass jar on the scale. This will hold the 15 mL tube upright when weighing a sample 185 8. Place an uncapped, methanol rinsed, labeled 15 mL PP centrifuge tube into the glass jar 186 9. Tare (zero) the scale 187 10. Transfer approximately 0.5 g of sample into the tared 15 mL PP centrifuge tube. Try not to let tissue touch the walls of 188
the tube because it will stick and is difficult to get back off 189 b. For invertebrate samples that were transferred to the filter using a spatula, use the same spatula for 190
transferring sample to 15 mL tube 191 c. After transferring ~0.5 g of tissue into the tube, use the spatula to scrape most of the tissue stuck on the walls 192
of the tube down towards the bottom of the tube 193 d. When done transferring tissue and scraping off the tube wall, wipe the end of the spatula off with a kimwipe 194
and use the other end of the spatula for the next sample (as long as the other end did not contact any surface 195 while transferring tissue with the first end) 196
e. Weigh approximately 1 g of SRM 1947 (NIST) 197 iii. Note SRM mass is greater than sample mass because PFAA concentrations in SRM are low (~0.2 198
ng/g) 199 11. Spike 50 μL 80 ng/mL IS mixture (C4-C16, 4 ng of each compound) on top of tissue 200
a. For blanks, add 3 mL of extraction solvent to tube prior to spiking standard 201 12. Add 3 mL 0.2% formic acid in acetonitrile, tip/rotate tube to rinse down any surrogate spike 202 13. Obtain one additional 15 mL PP centrifuge tube per sample 203
b. Label with permanent ink and record weight (tube + cap) of each tube 204 14. Extract samples using ultrasonic homogenizer as follows: 205
c. Set the homogenizer settings to: 50% pulse time, 20% power (will need to have homogenizer on and running 206 to adjust power based on neon green light bar display) 207
i. DO NOT exceed 50% power or tip will be damaged 208 d. Remove tube cap and use homogenizer tip to scrape any tissue residue down the side of the tube wall into the 209
extraction solvent 210 e. Insert the tip about ~1/4 inch below liquid surface and press the start button 211 f. Sonicate for minimum of 5 pulses 212
i. The sonicator should make minimal noise and there should be considerable turbulence in the liquid 213 when the tip is properly positioned. Experiment with tip position to achieve this and count at least 5 214 “good” pulses 215
15. Remove as much tissue residue from sonicator tip as possible before removing it from the sample tube 216 g. The best way to do this is to insert the tip until it almost touches the bottom of the tube, then tilt/shake the 217
tube back and forth. Then push the tip down until it contacts the bottom of the tube and turn the power on for 218 one pulse while pulling the tip away from the bottom of the tube about 1/4 inch. This will vibrate the tip, but 219 not cause enough turbulence in the solvent to wash tissue back up onto the tube walls. 220
16. Clean the homogenizer tip between each sample as follows: 221 h. Fold a small kimwipe in half twice in same direction, wet with 1 mL MeOH, and wipe tip thoroughly from 222
starting from the top, wide portion downwards towards the tip to remove tissue residue. Fold the kimwipe in 223 half prior to each wipe to avoid transferring material from kimwipe back onto tip 224
i. Place waste container under tip and use a pipette to rinse the rip with 1 mL of MeOH by dispensing starting 225 at the top, wide portion of the tip and allowing it to run downwards into the waste container 226
j. Immerse sonicator tip into one 50 mL PP centrifuge tube filled with MeOH 227 i. Turn pulse function off, press start, sonicate for approximately 5 sec while moving the tube 228
vertically along the length of the tip to keep the tip exposed to fresh solvent. Do not raise the end of 229 the tip above the solvent surface. 230
k. Repeat step 9. c. with a second tube of MeOH followed by one tube of ACN 231 17. Centrifuge sonicated sample 4 min., 3500 RCF 232 18. Transfer supernatant to new, weighed (tube + cap), labeled 15 mL PP tube 233 19. Repeat above steps 4-9 once more 234
l. Loosen pellet from bottom of tube prior to turning homogenizer on. This can be accomplished by 235 holding the tube in one hand and the wide portion of the sonicator probe with the other for stability. Then 236 insert the tip down the wall of the tube and firmly press down into the tissue pellet. Then use a prying motion 237 to loosen the pellet from the conical tube end. 238
m. The pellet can be manually broken up a bit by squishing the tissue against the side wall of the tube before 239 activating sonicator to aid in homogenization 240
20. Centrifuge (5 min, 5000 RCF), combine supernatants for each respective sample 241 21. Record weight of tube + cap + combined supernatants 242

S19
22. Immediately prior to SPE, mix combined supernatants well by vortexing 1 min, 500 rpm and sonication in a bath 243 sonicator for 5 minutes. Centrifuge 5 min, 5525 RCF to settle any solids 244 245
246
III. SPE 247 If using a 12 port manifold, this can be done in batches of 6 samples for easier regulation of solvent flow through the SPE 248 cartridges. Prior to beginning SPE, each port on the manifold should be disassembled and cleaned by sonicating in methanol. 249 This eliminates carryover contamination from previous batches found to occur if components are simply rinsed with methanol. 250 251 III.I. Cleaning SPE Manifold 252 253
1. When not in use, cover the SPE manifold with a large Ziploc bag to keep dust off 254 2. Obtain a cleaned glass beaker large enough to contain all SPE manifold components (≥200 mL). Rinse 3 times with 255
methanol using solvent from media storage bottle or pour straight from 4 L stock bottle (avoid squirt bottles if 256 possible due to higher risk of contamination). 257
3. Remove bag dust cover from manifold and remove each of the plastic stopcocks by grabbing it and pulling straight up 258 while twisting 259
4. Disassemble each stopcock by holding the piece that accepts the cartridge with one hand and pulling the rotating 260 cylinder-shaped portion straight out while twisting with the other hand 261
5. Place disassembled stopcocks into rinsed beaker 262 6. Remove lid from SPE manifold. Loosen and remove each plastic retaining nut for each port; place in rinsed beaker 263 7. Replace manifold lid on glass housing and unscrew each port’s threaded adapter from top of lid; place into beaker 264
a. If not removed with the stopcock, remove the stainless steel solvent guide needles from each threaded adapter 265 by tapping lightly on a hard, clean surface (e.g. top of SPE manifold lid) 266
8. With all components removed from manifold lid and inside rinsed beaker, fill beaker with enough methanol (from 4 L 267 stock bottle) to submerge all components 268
9. Sonicate for 10 minutes in bath sonicator 269 10. Obtain shallow non-fluorinated plastic (e.g. HDPE or PP) container such as a food storage container with lid and rinse 270
inside surfaces 3 times with methanol 271 a. This container will hold SPE components once sonicated so they can be more easily grabbed and assembled 272 b. If this container is visibly dirty or has not been used for this purpose for a long time, wet a kimwipe with 273
methanol and wipe inner surfaces well to clean prior to rinsing. 274 c. After use, this container should be left in a fume hood until residual methanol is evaporated and then covered 275
and stored in a drawer or cabinet (keeps dust off). 276 11. After sonicating, pour excess methanol into waste container 277
a. Put on new, clean pair of gloves and hold components from falling out of beaker while pouring trying to only 278 touch portions of components which don’t contact sample 279
12. Dump components into methanol-rinsed plastic container 280 13. Reassemble all components in reverse order as disassembly (threaded fitting, nut, stainless needle, stopcock) 281
282 283
S20
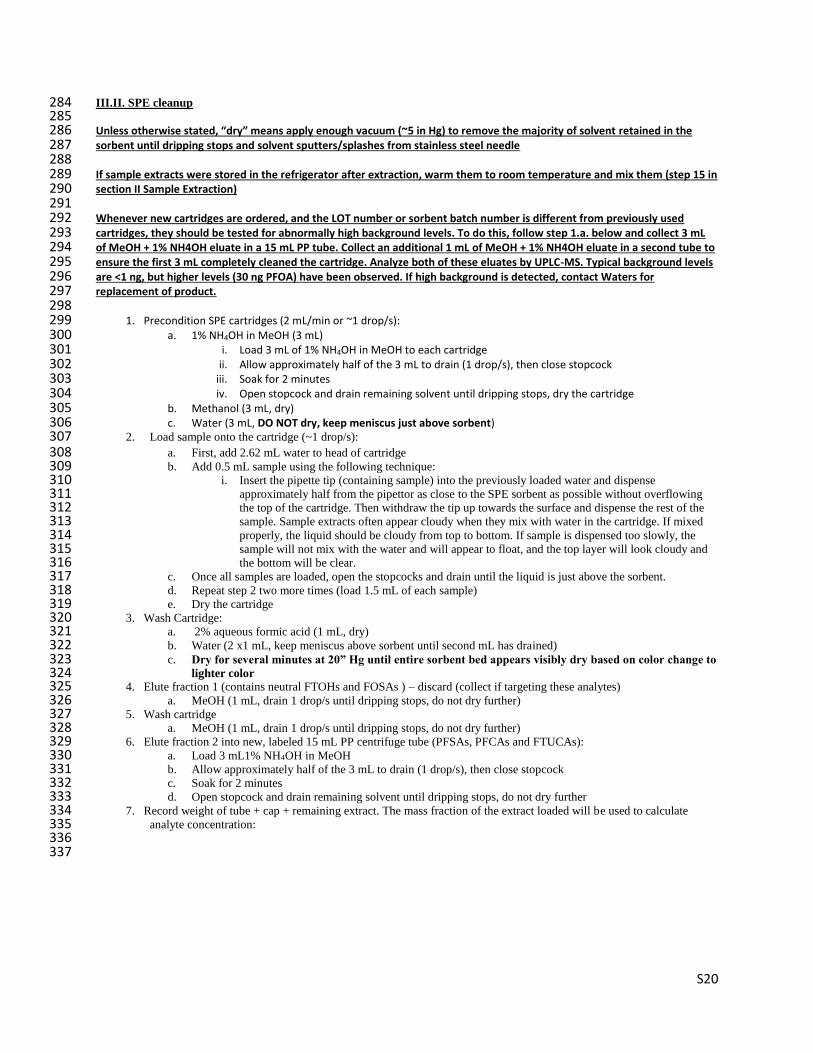
III.II. SPE cleanup 284 285 Unless otherwise stated, “dry” means apply enough vacuum (~5 in Hg) to remove the majority of solvent retained in the 286 sorbent until dripping stops and solvent sputters/splashes from stainless steel needle 287 288 If sample extracts were stored in the refrigerator after extraction, warm them to room temperature and mix them (step 15 in 289 section II Sample Extraction) 290 291 Whenever new cartridges are ordered, and the LOT number or sorbent batch number is different from previously used 292 cartridges, they should be tested for abnormally high background levels. To do this, follow step 1.a. below and collect 3 mL 293 of MeOH + 1% NH4OH eluate in a 15 mL PP tube. Collect an additional 1 mL of MeOH + 1% NH4OH eluate in a second tube to 294 ensure the first 3 mL completely cleaned the cartridge. Analyze both of these eluates by UPLC-MS. Typical background levels 295 are <1 ng, but higher levels (30 ng PFOA) have been observed. If high background is detected, contact Waters for 296 replacement of product. 297 298
1. Precondition SPE cartridges (2 mL/min or ~1 drop/s): 299 a. 1% NH4OH in MeOH (3 mL) 300
i. Load 3 mL of 1% NH4OH in MeOH to each cartridge 301 ii. Allow approximately half of the 3 mL to drain (1 drop/s), then close stopcock 302
iii. Soak for 2 minutes 303 iv. Open stopcock and drain remaining solvent until dripping stops, dry the cartridge 304
b. Methanol (3 mL, dry) 305 c. Water (3 mL, DO NOT dry, keep meniscus just above sorbent) 306
2. Load sample onto the cartridge (~1 drop/s): 307 a. First, add 2.62 mL water to head of cartridge 308 b. Add 0.5 mL sample using the following technique: 309
i. Insert the pipette tip (containing sample) into the previously loaded water and dispense 310 approximately half from the pipettor as close to the SPE sorbent as possible without overflowing 311 the top of the cartridge. Then withdraw the tip up towards the surface and dispense the rest of the 312 sample. Sample extracts often appear cloudy when they mix with water in the cartridge. If mixed 313 properly, the liquid should be cloudy from top to bottom. If sample is dispensed too slowly, the 314 sample will not mix with the water and will appear to float, and the top layer will look cloudy and 315 the bottom will be clear. 316
c. Once all samples are loaded, open the stopcocks and drain until the liquid is just above the sorbent. 317 d. Repeat step 2 two more times (load 1.5 mL of each sample) 318 e. Dry the cartridge 319
3. Wash Cartridge: 320 a. 2% aqueous formic acid (1 mL, dry) 321 b. Water (2 x1 mL, keep meniscus above sorbent until second mL has drained) 322 c. Dry for several minutes at 20” Hg until entire sorbent bed appears visibly dry based on color change to 323
lighter color 324 4. Elute fraction 1 (contains neutral FTOHs and FOSAs ) – discard (collect if targeting these analytes) 325
a. MeOH (1 mL, drain 1 drop/s until dripping stops, do not dry further) 326 5. Wash cartridge 327
a. MeOH (1 mL, drain 1 drop/s until dripping stops, do not dry further) 328 6. Elute fraction 2 into new, labeled 15 mL PP centrifuge tube (PFSAs, PFCAs and FTUCAs): 329
a. Load 3 mL1% NH4OH in MeOH 330 b. Allow approximately half of the 3 mL to drain (1 drop/s), then close stopcock 331 c. Soak for 2 minutes 332 d. Open stopcock and drain remaining solvent until dripping stops, do not dry further 333
7. Record weight of tube + cap + remaining extract. The mass fraction of the extract loaded will be used to calculate 334 analyte concentration: 335
336 337
S21
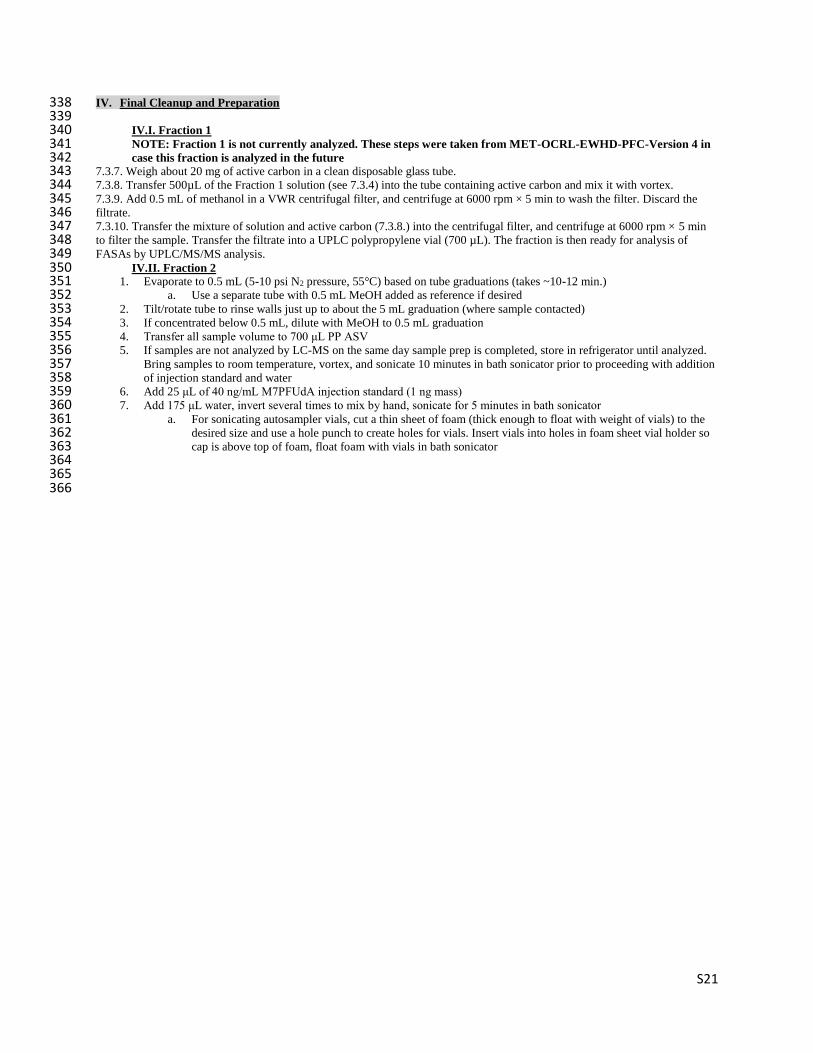
IV. Final Cleanup and Preparation 338 339
IV.I. Fraction 1 340 NOTE: Fraction 1 is not currently analyzed. These steps were taken from MET-OCRL-EWHD-PFC-Version 4 in 341 case this fraction is analyzed in the future 342
7.3.7. Weigh about 20 mg of active carbon in a clean disposable glass tube. 343 7.3.8. Transfer 500µL of the Fraction 1 solution (see 7.3.4) into the tube containing active carbon and mix it with vortex. 344 7.3.9. Add 0.5 mL of methanol in a VWR centrifugal filter, and centrifuge at 6000 rpm × 5 min to wash the filter. Discard the 345 filtrate. 346 7.3.10. Transfer the mixture of solution and active carbon (7.3.8.) into the centrifugal filter, and centrifuge at 6000 rpm × 5 min 347 to filter the sample. Transfer the filtrate into a UPLC polypropylene vial (700 µL). The fraction is then ready for analysis of 348 FASAs by UPLC/MS/MS analysis. 349
IV.II. Fraction 2 350 1. Evaporate to 0.5 mL (5-10 psi N2 pressure, 55°C) based on tube graduations (takes ~10-12 min.) 351
a. Use a separate tube with 0.5 mL MeOH added as reference if desired 352 2. Tilt/rotate tube to rinse walls just up to about the 5 mL graduation (where sample contacted) 353 3. If concentrated below 0.5 mL, dilute with MeOH to 0.5 mL graduation 354 4. Transfer all sample volume to 700 μL PP ASV 355 5. If samples are not analyzed by LC-MS on the same day sample prep is completed, store in refrigerator until analyzed. 356
Bring samples to room temperature, vortex, and sonicate 10 minutes in bath sonicator prior to proceeding with addition 357 of injection standard and water 358
6. Add 25 μL of 40 ng/mL M7PFUdA injection standard (1 ng mass) 359 7. Add 175 μL water, invert several times to mix by hand, sonicate for 5 minutes in bath sonicator 360
a. For sonicating autosampler vials, cut a thin sheet of foam (thick enough to float with weight of vials) to the 361 desired size and use a hole punch to create holes for vials. Insert vials into holes in foam sheet vial holder so 362 cap is above top of foam, float foam with vials in bath sonicator 363 364
365 366

S22
V. LC-MS Analysis 367 V.I. Calibration standard preparation (all dilutions done in methanol) 368
Working Stock Solutions: 369 NATIVE: 370 100 ng/mL Native standard PFAA solution (product code PFAC-MXB): make 400 μL per batch of calibration standards 371
Can make larger amount (>400 μL and use for multiple batches, store in refrigerator) 372 Add 50 μL of 2 μg/mL stock solution per 1 mL total volume 373 Diluted Native Working Solutions: 374 10 ng/mL→ 450 μL MeOH + 50 μL of 100 ng/mL stock 375 1 ng/mL → 450 μL MeOH + 50 μL of 10 ng/mL stock 376 0.1 ng/mL → 450 μL MeOH + 50 μL of 1 ng/mL stock 377 378 SURROGATE: 379 1 μg/mL C14, C16 PFAA solution (product codes: M2PFTeDA, M2PFHxDA): 380
First make a 5 μg/mL mixed stock solution: 381 400 μL MeOH + 50 μL of 50 μg/mL each M2PFTeDA and M2PFHxDA stocks 382
Then dilute 5x: 383 800 μL MeOH + 200 μL of 5 μg/mL mixed stock 384 385 80 ng/mL C4-C12 (product code MPFAC-MXA) + C14, C16 combined PFAA solution: 386 Spike 50 μL (4 ng) per sample at prior to extraction, dilute 8x prior to spiking to calibration standards 387 Add 40 μL of 2 μg/mL 13C-labelled mixture stock solution per 1 mL total volume 388 Add 80 μL of 1 μg/mL M2PFTeDA/M2PFHxDA mixture solution per 1 mL total volume 389 390 INJECTION STANDARD: 391 40 ng/mL internal standard solution (product code M7PFUdA): 392 Spike 25 μL (1 ng) per sample immediately prior to injection 393 Make a 10x dilution of 50 μg/mL stock: 394 450 μL MeOH + 50 μL of 50 μg/mL stock 395 396
Make a 5x dilution of the above 5 μg/mL stock 397 800 μL MeOH + 200 μL 5 μg/mL stock 398 399 Add 40 μL of above 1 μg/mL stock per 1 mL total volume 400 401 Table 3. Calibration standard specifics 402
Native mass (in
700 μL) MeOH (μL) Native stock
Surrogate
(μL)
Inj. Std.
(μL)
Water
(μL)
0.01 ng 350 100 μL 0.1 ng/mL stock
50 25 175
0.05 ng 400 50 μL 1 ng/mL stock
0.2 ng 250 200 μL 1 ng/mL stock
1 ng 350 100 μL 10 ng/mL stock
5 ng 400 50 μL 100 ng/mL stock
20 ng 250 200 μL 100 ng/mL stock
403 404

S23
Table 4. Description of target analytes and mass-labeled standards used 405
Compound Full name Formula Surrogate
Native PFCAs
PFPeA Perfluoropentanoic acid CF3(CF2)3 COOH PFHxA13C
PFHxA Perfluorohexanoic acid CF3(CF2)4 COOH PFHxA13C
PFHpA Perfluoroheptanoic acid CF3(CF2)5 COOH PFOA13C
PFOA Perfluorooctanoic acid CF3(CF2)6 COOH PFOA13C
PFNA Perfluorononanoic acid CF3(CF2)7 COOH PFNA13C
PFDA Perfluorodecanoic acid CF3(CF2)8 COOH PFDA13C
PFUnA Perfluoroundecanoic acid CF3(CF2)9 COOH PFUnA13C
PFDoA Perfluorododecanoic acid CF3(CF2)10 COOH PFDoA13C
PFTrA Perfluorotridecanoic acid CF3(CF2)11 COOH PFDoA13C
PFTeA Perfluorotetradecanoic acid CF3(CF2)12 COOH M2PFTeA
PFHxDA Perfluorohexadecanoic acid CF3(CF2)14 COOH M2PFHxDA
Native PFSAs
PFBS Potassium perfluoro-1-butanesulfonate CF3(CF2)3SO3- PFHxS18O
PFHxS Sodium perfluoro-1-hexanesulfonate CF3(CF2)5SO3- PFHxS18O
PFOS Sodium perfluoro-1-octanesulfonate CF3(CF2)7SO3- PFOS13C
PFDS Sodium perfluoro-1-decanesulfonate CF3(CF2)9SO3- PFOS13C
Mass-labeled PFCAs
PFBA13C Perfluoro[1,2,3,4-13C4]butanoic acid
PFHxA13C Perfluoro[1,2-13C2]hexanoic acid
M5PFHxA* Perfluoro[1,2,3,4,6-13C5]hexadecanoic acid
PFOA13C Perfluoro[1,2,3,4-13C4]octanoic acid
PFNA13C Perfluoro[1,2,3,4,5-13C5]nonanoic acid
PFDA13C Perfluoro[1,2-13C2]decanoic acid
PFUnA13C Perfluoro[1,2-13C2]undecanoic acid
M7PFUnA* Perfluoro[1,2,3,4,5,6,7-13C7]undecanoic acid
PFDoA13C Perfluoro[1,2-13C2]dodecanoic acid
M2PFTeA Perfluoro[1,2-13C2]tetradecanoic acid
M2PFHxDA Perfluoro[1,2-13C2]hexadecanoic acid
Mass-labeled PFSAs
PFHxS18O Sodium perfluoro-1-hexane[18O2]sulfonate
PFOS13C Sodium perfluoro-1-[1,2,3,4-13C4]octanesulfonate
406 1. Inject 10 μL of standards and samples to UPLC-MS 407 2. Calculate analyte concentration in each sample as follows: 408
409 Analyte concentration (ng/g wet weight) = mTL / (VFconcentration * MFSPE * msample) 410
411 mTL = mass (ng) calculated (TargetLynx software) based on internal standard calibration 412 VFconcentration = volume fraction of sample transferred to ASV after concentration 413 (=1 if entire sample transferred) 414 MFSPE = mass fraction of combined supernatant loaded to SPE cartridge 415 msample = mass (g) of sample extracted 416 417
418
S24
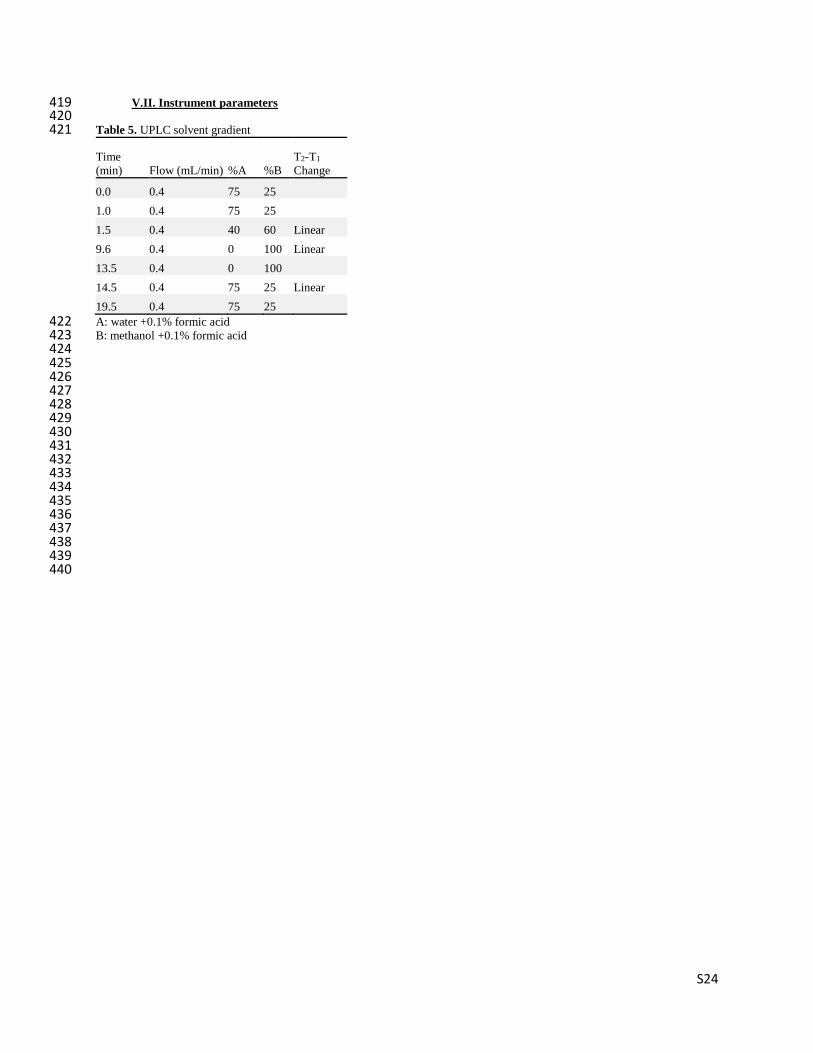
V.II. Instrument parameters 419 420 Table 5. UPLC solvent gradient 421
Time
(min) Flow (mL/min) %A %B
T2-T1
Change
0.0 0.4 75 25
1.0 0.4 75 25
1.5 0.4 40 60 Linear
9.6 0.4 0 100 Linear
13.5 0.4 0 100
14.5 0.4 75 25 Linear
19.5 0.4 75 25
A: water +0.1% formic acid 422 B: methanol +0.1% formic acid 423 424 425 426 427 428 429 430 431 432 433 434 435 436 437 438 439
440

S25
Table 4. Compound-specific instrumental parameters (Waters Xevo G2-XS QToF) 441
Compound [M-H]- m/z
[M-H-CO2]- m/z
Retention time* (min, target, max)
Cone Voltage*1 (V)
Collision Energy*1 (eV)
PFBA 212.979 168.988 2.10, 2.55, 2.80 3 2
PFBA13C 216.994 171.999
PFPeA 262.975 218.986 2.80, 2.96, 3.25 5 2
PFBS 298.943 N/A 2.80, 3.00, 3.25 30 10
PFHxA 312.973 268.983 3.25, 3.47, 3.80 5 2
PFHxA13C 314.973 269.985
PFHxS 398.937 N/A 3.80, 4.01, 4.42 30 15
PFHxS18O 402.937 N/A
PFHpA 362.970 318.979 3.80, 4.08, 4.42 5 2
PFOA 412.966 368.976 4.42, 4.79, 5.15 5 2
PFOA13C 416.978 371.985
PFOS 498.930 N/A 5.15, 5.39, 6.00 30 15
PFOS13C 502.943 N/A
PFNA 462.962 418.973 5.15, 5.54, 6.00 30 3
PFNA13C 467.980 422.986
PFDA 512.960 468.971 6.00, 6.28, 6.60 30 3
PFDA13C 514.966 469.974
PFDS 598.923 N/A 6.60, 6.77, 7.40 30 15
PFUnA 562.957 518.967 6.60, 6.98, 7.40 30 4
PFUnA13C 564.962 519.969
M7PFUnA 569.981 524.987
PFDoA 612.954 568.964 7.40, 7.63, 8.00 30 6
PFDoA13C 614.960 569.968
PFTrA 662.950 618.960 8.00, 8.22, 8.55 30 6
PFTeA 712.947 668.956 8.55, 8.77, 9.30 30 6
M2PFTeA 714.953 669.960
PFHxDA 812.940 768.950 9.30, 9.74, 10.40 30 6
M2PFHxDA 814.947 769.954
442 443
S26
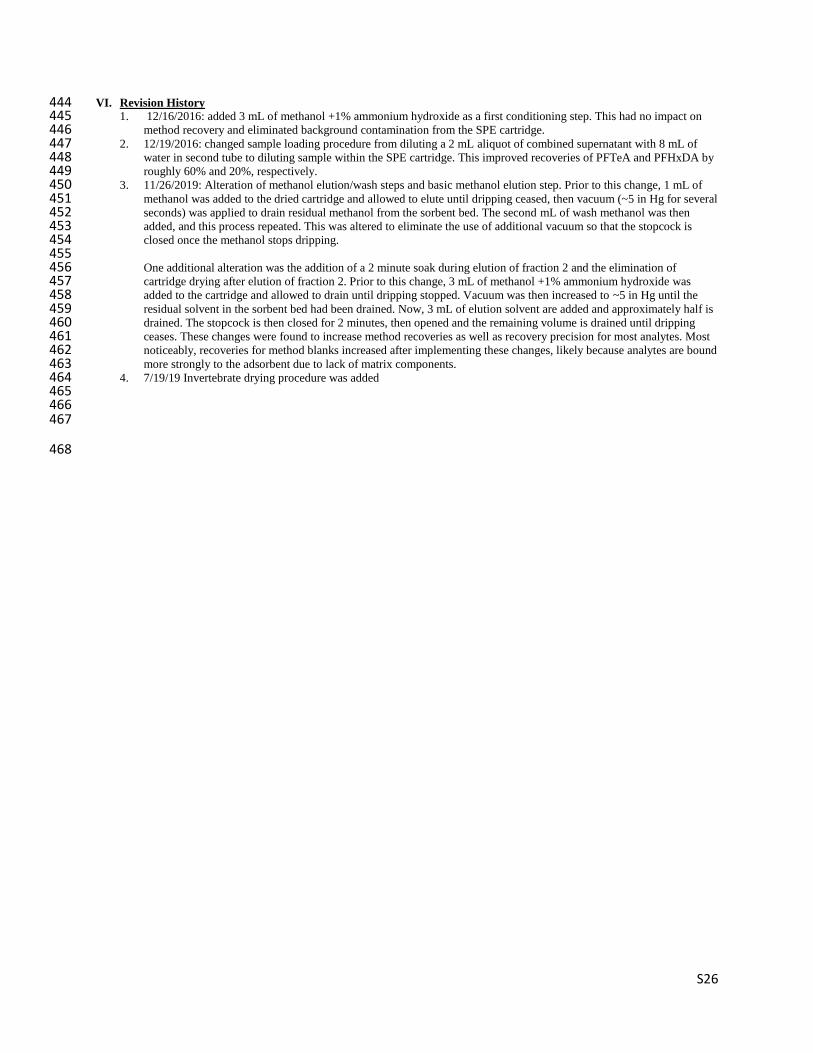
VI. Revision History 444 1. 12/16/2016: added 3 mL of methanol +1% ammonium hydroxide as a first conditioning step. This had no impact on 445
method recovery and eliminated background contamination from the SPE cartridge. 446 2. 12/19/2016: changed sample loading procedure from diluting a 2 mL aliquot of combined supernatant with 8 mL of 447
water in second tube to diluting sample within the SPE cartridge. This improved recoveries of PFTeA and PFHxDA by 448 roughly 60% and 20%, respectively. 449
3. 11/26/2019: Alteration of methanol elution/wash steps and basic methanol elution step. Prior to this change, 1 mL of 450 methanol was added to the dried cartridge and allowed to elute until dripping ceased, then vacuum (~5 in Hg for several 451 seconds) was applied to drain residual methanol from the sorbent bed. The second mL of wash methanol was then 452 added, and this process repeated. This was altered to eliminate the use of additional vacuum so that the stopcock is 453 closed once the methanol stops dripping. 454 455 One additional alteration was the addition of a 2 minute soak during elution of fraction 2 and the elimination of 456 cartridge drying after elution of fraction 2. Prior to this change, 3 mL of methanol +1% ammonium hydroxide was 457 added to the cartridge and allowed to drain until dripping stopped. Vacuum was then increased to ~5 in Hg until the 458 residual solvent in the sorbent bed had been drained. Now, 3 mL of elution solvent are added and approximately half is 459 drained. The stopcock is then closed for 2 minutes, then opened and the remaining volume is drained until dripping 460 ceases. These changes were found to increase method recoveries as well as recovery precision for most analytes. Most 461 noticeably, recoveries for method blanks increased after implementing these changes, likely because analytes are bound 462 more strongly to the adsorbent due to lack of matrix components. 463
4. 7/19/19 Invertebrate drying procedure was added 464 465 466
467
468