Ad-Hoc vs. Standardized and Optimized Arthropod Diversity Sampling
16
Diversity 2009, 1, 36-51; doi:10.3390/d1010036 diversity ISSN 2071-1050 www.mdpi.com/journal/diversity Article Ad-Hoc vs. Standardized and Optimized Arthropod Diversity Sampling Pedro Cardoso 1,2, *, Luís C. Crespo 3 , Rui Carvalho 4 , Ana C. Rufino 3 and Sérgio S. Henriques 4 1 Smithsonian Institution, National Museum of Natural History, Washington, DC, USA 2 Azorean Biodiversity Group–CITA-A, University of Azores, Angra do Heroísmo, Portugal 3 IMAR–Coimbra Interdisciplinary Center, University of Coimbra, Coimbra, Portugal; E-mails: [email protected] (L.C.C.); [email protected] (A.C.R.) 4 Department of Biology, University of Évora, Évora, Portugal; E-mails: [email protected] (R.C.); [email protected] (S.S.H.) * Author to whom correspondence should be addressed; E-Mail: [email protected]; Tel.: +1-202-633-0661; Fax: + 1-202-786-3141. Received: 6 August 2009 / Accepted: 25 August 2009 / Published: 1 September 2009 Abstract: The use of standardized and optimized protocols has been recently advocated for different arthropod taxa instead of ad-hoc sampling or sampling with protocols defined on a case-by-case basis. We present a comparison of both sampling approaches applied for spiders in a natural area of Portugal. Tests were made to their efficiency, over-collection of common species, singletons proportions, species abundance distributions, average specimen size, average taxonomic distinctness and behavior of richness estimators. The standardized protocol revealed three main advantages: (1) higher efficiency; (2) more reliable estimations of true richness; and (3) meaningful comparisons between undersampled areas. Keywords: abundance classes; accumulation curves; Araneae; biodiversity assessment; Iberian Peninsula; Portugal; rank-abundance curves; species richness estimators OPEN ACCESS
Transcript of Ad-Hoc vs. Standardized and Optimized Arthropod Diversity Sampling

Diversity 2009, 1, 36-51; doi:10.3390/d1010036
diversity ISSN 2071-1050
www.mdpi.com/journal/diversity
Article
Ad-Hoc vs. Standardized and Optimized Arthropod Diversity Sampling
Pedro Cardoso 1,2,*, Luís C. Crespo 3, Rui Carvalho 4, Ana C. Rufino 3 and Sérgio S. Henriques 4
1 Smithsonian Institution, National Museum of Natural History, Washington, DC, USA 2 Azorean Biodiversity Group–CITA-A, University of Azores, Angra do Heroísmo, Portugal 3 IMAR–Coimbra Interdisciplinary Center, University of Coimbra, Coimbra, Portugal;
E-mails: [email protected] (L.C.C.); [email protected] (A.C.R.) 4 Department of Biology, University of Évora, Évora, Portugal;
E-mails: [email protected] (R.C.); [email protected] (S.S.H.)
* Author to whom correspondence should be addressed; E-Mail: [email protected];
Tel.: +1-202-633-0661; Fax: + 1-202-786-3141.
Received: 6 August 2009 / Accepted: 25 August 2009 / Published: 1 September 2009
Abstract: The use of standardized and optimized protocols has been recently advocated
for different arthropod taxa instead of ad-hoc sampling or sampling with protocols defined
on a case-by-case basis. We present a comparison of both sampling approaches applied for
spiders in a natural area of Portugal. Tests were made to their efficiency, over-collection of
common species, singletons proportions, species abundance distributions, average
specimen size, average taxonomic distinctness and behavior of richness estimators. The
standardized protocol revealed three main advantages: (1) higher efficiency; (2) more
reliable estimations of true richness; and (3) meaningful comparisons between
undersampled areas.
Keywords: abundance classes; accumulation curves; Araneae; biodiversity assessment;
Iberian Peninsula; Portugal; rank-abundance curves; species richness estimators
OPEN ACCESS

Diversity 2009, 1
37
1. Introduction
Ad-hoc sampling of species diversity, either unplanned or planned on a case by case basis, is often
used as an approach for obtaining the maximum information about areas in a minimum amount of
time. Depending on the purpose, this can even be the only option available, as the resources required
to test the best method or combination of methods may not be available. This approach can be very
efficient for some well known taxa if the objective is solely to compile species lists of the study areas
[1-3]. If the samplers are taxon specialists, a very fast accumulation of species is possible. If the
species lists are complete or close to it, it is even possible to compare communities sampled with ad-
hoc, not standardized, sampling. However, for mega-diverse groups like spiders or other arthropods
this is rarely the case.
More than 40,000 species of spiders are known [4] and probably even more remain undescribed.
Several hundred species can coexist at certain times of the year in very small and restricted areas [5].
This high local diversity is possible in many biomes, from temperate Mediterranean forests [6] to
tropical forests [5,7]. Therefore, to know what species live where is a challenge. With many small,
cryptic and even locally rare species, it is unrealistic to compile complete species lists, even if this list
is intended for areas as little as one hectare and for a time-frame as short as one or two weeks [6-10].
Without sound species lists and/or a measure of effort, comparisons are usually impossible, incomplete
or even biased.
Standardized sampling is most often employed in ecological studies of arthropods. It allows the
immediate comparison of communities even if species lists are incomplete [11-14], unless the
completeness is so low that only an almost random fraction of the communities is in fact sampled.
Besides, standardized sampling allows for obtaining relative abundance data in addition to species
richness. This way, statistical inference is possible, not only in ecology but also in conservation
biology, biogeography or other areas. Usually, a combination of methods is required in such sampling
[15-18]. However, this approach is frequently less efficient than ad-hoc sampling in obtaining species
lists [2] because it is usual that most of the individuals will belong to the fraction of more common
species [10]. For this reason, recent advances in sampling strategies have led to the development of
field protocols that are both standardized and optimized [19].
For Iberian and Mediterranean spiders, a field protocol nicknamed COBRA–Conservation Oriented
Biodiversity Rapid Assessment–has been recently developed [19]. Based on extremely intensive
sampling of different habitats in Portugal [6,8,9], it is both standardized and optimized. It is also
flexible, in the sense that different sub-protocols with varying degrees of effort have been proposed to
cope with different objectives or available resources (human, time or financial). The work now
presented intends to compare the ad-hoc and COBRA sampling approaches when applied to a
protected area of central Portugal. Our objective was not to compare areas, but rather different
approaches that shared the common goal of inventorying the spiders of a heterogeneous natural area
with different habitats. We wanted to compare an ad-hoc sampling (not limited in area, time or
methods) to a fully standardized and optimized protocol (with standardization and optimization in
area, time and methods). For the purpose we compared eight parameters that were thought to possibly
provide different outcomes according to the approach adopted:

Diversity 2009, 1
38
(1) Efficiency of increasing observed species richness by unit of time; as experts usually know how
to look for specific taxa and how to capture them with minimum time spent in the task, we
hypothesized that the ad-hoc sampling, as long as done by experts, would be more efficient.
(2) Efficiency of increasing observed species richness by individual; as quantitative sampling
demands that even the most commonly collected species keep being collected, we hypothesized that
the ad-hoc sampling would also be a more efficient approach when comparisons were made by
individuals captured.
(3) Over-collecting of common species; as ad-hoc samplers tend not to collect species already
sampled and positively identified, we hypothesized that over-collecting would be much stronger with
the standardized protocol.
(4) Proportion of singletons; as ad-hoc samplers tend to look for new individuals of species for
which only one specimen was collected, this proportion was hypothesized to be smaller for
ad-hoc sampling.
(5) Species abundance distribution; related with the two former parameters, we hypothesized that
the ad-hoc sampling would present a much more even species abundance distribution.
(6) Average size of specimens; because ad-hoc sampling heavily relies on spotting many
conspicuous species, we hypothesized that the average size of specimens captured by it would be
larger than the one of standardized sampling.
(7) Taxonomic distinctness; as many experts are specialized in some taxa (families or genera), we
hypothesized that there would be a higher taxonomic bias in ad-hoc sampling, with respective smaller
average taxonomic differentiation between observed species.
(8) Behavior of richness estimators; because the relative abundance data of species should be more
reliable with standardized sampling, we hypothesized that non-parametric species richness estimators
would perform better, with more asymptotic curves, with this protocol.
2. Results and Discussion
A total of 202 species were collected in the Paúl de Arzila Nature Reserve, 163 of these with ad-hoc
sampling and 140 with standardized sampling [20]. As for the latter, in the first of the two habitats
sampled, a riparian corridor, 82 species were collected, while in the second habitat, a meadow,
94 species were collected. The number of individuals was higher for the COBRA protocol despite the
lower number of species, causing a much higher sampling intensity (Table 1).
For this work we did not try to limit the ad-hoc sampling to the delimited areas sampled by the
standardized protocol. Neither did we try to limit the analyses of the first to the short sampling period
of the latter. Or to use the same sampling methods in both approaches. We recognize that all these
issues—sampling area, phenology and methodology—do influence, even decisively, the outcome of
any sampling. However, this seemingly unbalanced comparison was the key issue of this study. We
wanted to compare a completely ad-hoc sampling, with no restrictions in area, time or methods, to a
fully standardized and optimized approach, with the objective of inventorying a natural area with
different habitat types. The optimization involved choosing a minimum number of areas as dissimilar
as possible in vegetation structure, to capture a maximum number of species (in this case a riparian
corridor and a meadow). It also involved choosing the best time for collecting in order to maximize
Diversity 2009, 1
39
species richness [21]. Finally, it involved choosing the best possible combination of methods [19]. If
we had limited the ad-hoc dataset to any of these restrictions it would be a standardized (although not
optimized) sampling and not ad-hoc.
Table 1. Overall results for the different sampling approaches and sites.
Ad-hoc
COBRA
Total Riparian corridor Meadow
Person-days 24 8 4 4
Individuals (n) 1375 2538 1566 972
Species richness (S) 163 140 82 94
Sampling intensity (n/S) 8 18 19 10
Singletons (%) 36 (22%) 37 (26%) 25 (30%) 30 (32%)
Doubletons (%) 22 (13%) 7 (5%) 8 (10%) 8 (9%)
Estimated richness
Chao 1 192 238 121 150
Chao 2 207 194 112 128
Jackknife 1 221 178 108 124
Jackknife 2 240 202 122 140
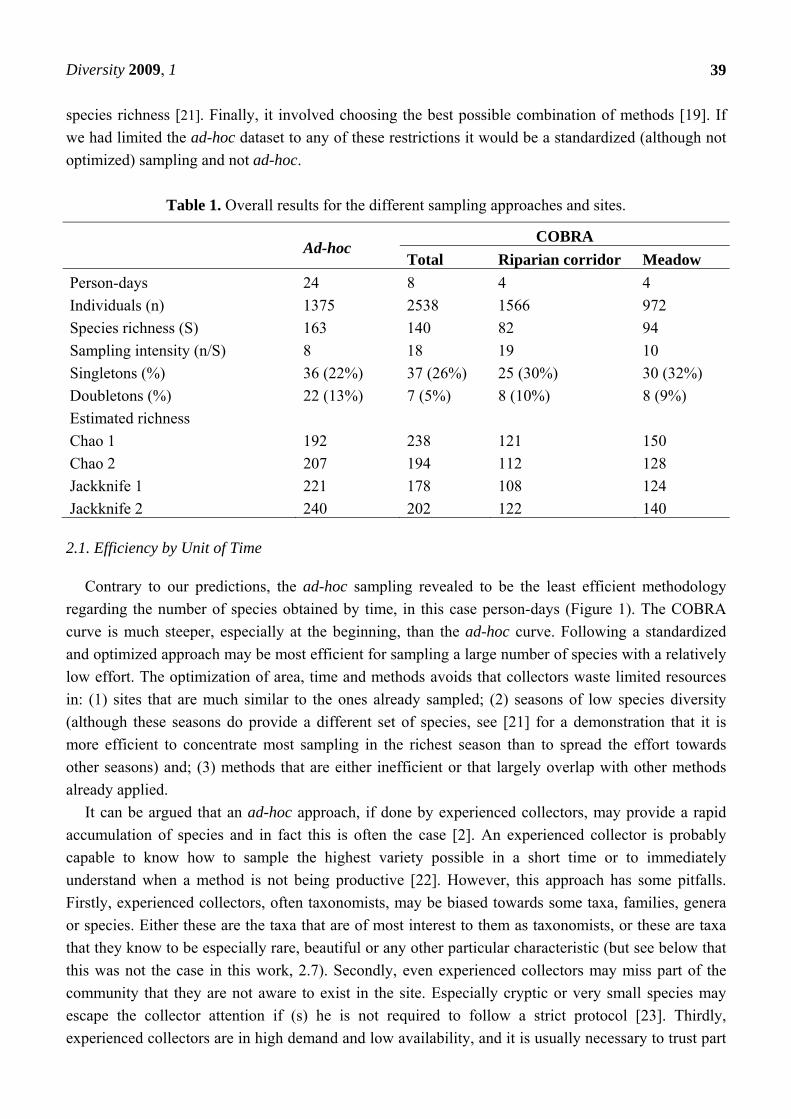
2.1. Efficiency by Unit of Time
Contrary to our predictions, the ad-hoc sampling revealed to be the least efficient methodology
regarding the number of species obtained by time, in this case person-days (Figure 1). The COBRA
curve is much steeper, especially at the beginning, than the ad-hoc curve. Following a standardized
and optimized approach may be most efficient for sampling a large number of species with a relatively
low effort. The optimization of area, time and methods avoids that collectors waste limited resources
in: (1) sites that are much similar to the ones already sampled; (2) seasons of low species diversity
(although these seasons do provide a different set of species, see [21] for a demonstration that it is
more efficient to concentrate most sampling in the richest season than to spread the effort towards
other seasons) and; (3) methods that are either inefficient or that largely overlap with other methods
already applied.
It can be argued that an ad-hoc approach, if done by experienced collectors, may provide a rapid
accumulation of species and in fact this is often the case [2]. An experienced collector is probably
capable to know how to sample the highest variety possible in a short time or to immediately
understand when a method is not being productive [22]. However, this approach has some pitfalls.
Firstly, experienced collectors, often taxonomists, may be biased towards some taxa, families, genera
or species. Either these are the taxa that are of most interest to them as taxonomists, or these are taxa
that they know to be especially rare, beautiful or any other particular characteristic (but see below that
this was not the case in this work, 2.7). Secondly, even experienced collectors may miss part of the
community that they are not aware to exist in the site. Especially cryptic or very small species may
escape the collector attention if (s) he is not required to follow a strict protocol [23]. Thirdly,
experienced collectors are in high demand and low availability, and it is usually necessary to trust part
Diversity 2009, 1
40
of the work to less experienced personnel. In such case, an ad-hoc approach could be much less
efficient. This is not to say that it is desirable to trust exclusively on inexperienced collectors. At least
some of the collectors should be experienced so that they are proficient with all collecting methods and
can pass on such knowledge to trainees. Additionally, the consistency between different teams
performing the same protocol is maximized if some of the collectors have previously done this same
type of sampling, establishing common and universal practices.
Figure 1. Randomized accumulation curves and respective confidence limits for the
species richness obtained by the ad-hoc and COBRA approaches. Curves are drawn either
with person-days or individuals as measures of effort.
2.2. Efficiency by Individuals Captured
As hypothesized, the comparison of ad-hoc and COBRA sampling with the number of individuals
as effort measure concludes that the first is more efficient than the latter (Figure 1). The ad-hoc
sampling curve is steeper and seems to be further from the asymptote than the COBRA one. It should
be noticed however, that the area covered by the first was much larger than the two sampling plots of
the latter, which for itself may account for such differences. Additionally, the ad-hoc samplers did not
collect individuals when they were readily identifiable as a previously collected species. This
procedure eliminated an unknown, but certainly large, part of the individuals from the analyses.
Capturing more individuals may be desirable if, for example, some species are hard to tell apart and
require an understanding of intraspecific variation for their correct identification [24]. New species for
science also usually require a large number of specimens for their detailed description and large
numbers are mostly provided by standardized sampling [25,26]. On the other hand, capturing many
Diversity 2009, 1
41
individuals of the same species may not be desirable if such species are disproportionately dominating
the samples [10] or if some species have a low number of individuals in the site and a large proportion
is collected, endangering the population. In any case, almost no intensive semi-quantitative protocols
made to date have ever reached the point of richness decreasing during the course of sampling [8].
2.3. Over-Collecting of Common Species
The Simpson measure of evenness was found to be similar for both approaches (E1/D Ad-hoc = 0.228;
COBRA = 0.241; p = 0.188). In fact, although not significantly, the standardized approach produced
slightly more even samples. It seems therefore that there is no over-collecting of common species by
the standardized protocol, which could lead either to a waste of resources both during sampling and
latter during sorting [10], or to the depletion of fauna in the sampling sites [8].
2.4. Singletons Proportion
The proportion of singletons was not found to be statistically different (Ad-hoc = 0.221;
COBRA = 0.240; p = 0.486). Although ad-hoc samplers did intentionally look for new individuals of
species for which only one specimen was collected, the differences between approaches are not
significant. As the COBRA used complementary sampling areas and methods, the number of spatial
and methodological edge effects (as defined by [10,27]) is probably much reduced compared to any
protocol that would use a single method in a single site. Most singletons in high diversity sites can be
explained by low sampling effort [28]. As long as the overall effort reaches a minimum, the number of
singletons can be much reduced, even with protocols that do not explicitly aim at this reduction.
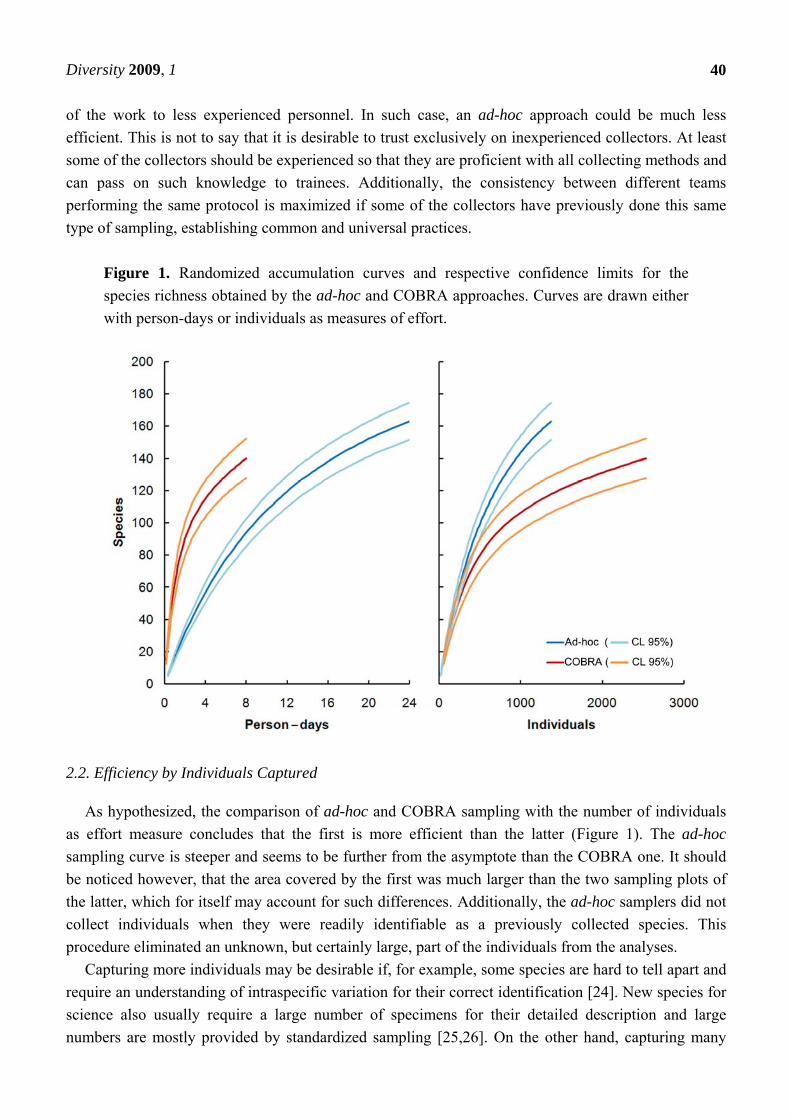
2.5. Species Abundance Distribution
The species sampled by both approaches are divided by abundance classes in different ways (Figure 2).
The ad-hoc approach reveals a unimodal pattern with the octave for species with two and three
individuals being dominant and few species having high abundances. The COBRA sampling reveals a
bimodal pattern with singletons and species with between four and seven individuals being the most
represented. It also includes many species with high abundances. The second abundance class,
representing species with two or three individuals, therefore has a significantly higher proportion of
species for the ad-hoc sampling. Conversely, most of the high abundance classes present significantly
higher proportions of species for the standardized protocol.
The differences found between approaches reveal that the way individuals are apparently
distributed by species is strongly dependent on sampling artifacts. One or none of the approaches
accurately reflects relative species abundances in the community. The reasons behind such dependency
in sampling approach are varied and related to the differences in efficiency. While a collector doing
ad-hoc sampling may avoid collecting species that have already been sampled in reasonable numbers,
a standardized sampling is unbiased in this respect. Hence the larger number of abundant species in the
latter (Figure 2) [27-29]. On the other hand, ad-hoc samplers also tried to intentionally avoid
singletons by looking for new individuals of such species. Hence the higher proportion of the second
abundance class for ad-hoc sampling (Figure 2).
Diversity 2009, 1
42
Figure 2. Abundance classes (octaves) for the species communities sampled by the ad-hoc
and COBRA approaches. The latter was rarefied to the same number of individuals of the
ad-hoc sampling and its 95% confidence limits are indicated, as are the significance levels
of comparing the two approaches (* p < 0.05; ** p < 0.01; *** p < 0.001).
2.6. Average Specimen Size
Contrary to predictions, the average size of captured specimens was significantly larger for the
standardized sampling (Ad-hoc = 5.191 mm; COBRA = 5.645 mm; p < 0.001). This was surprising as
the ad-hoc sampling heavily relied on spotting conspicuous species and this may cause severe biases
towards some taxa [30]. However, two factors may be playing an important role in this pattern. Firstly,
the ad-hoc sampling included winter samples that largely contain linyphiids, some of the smallest and
most abundant European spiders [21]. This family is not as common during Spring, when the
standardized samples took place. Secondly, some species with higher abundances in the standardized
samples were relatively large (Phrurolithus minimus, 218 individuals, 2.6 mm of average body size;
Trochosa ruricola, 217, 9.7 mm; Tetragnatha montana, 206, 8.1 mm; Kochiura aulica, 141, 3 mm)
compared with the most abundant species in the ad-hoc samples (Zodarion atlanticum, 142
individuals, 2.8 mm of average body size). The pattern found is therefore very dependent on the
community structure sampled, masking any effects of sampling approaches.
2.7. Average Taxonomic Distinctness
The average taxonomic distinctness was similar for both approaches (Ad-hoc = 1.577; COBRA =
1.562; p = 0.126). As the explicit objective of both was to inventory the local spider diversity,

Diversity 2009, 1
43
irrespective of any families or preferential taxa, results end up being similar. Apparently, either ad-hoc
sampling or standardized sampling could be used to properly represent the community present at
heterogeneous areas, with no evident taxonomic bias.
2.8. Behavior of Richness Estimators
According to the different algorithms, both approaches apparently sampled more than 50% of the
species estimated to be present at the reserve (Table 1). However, the behavior of all algorithms is far
from ideal, with none reaching the asymptote and all providing very different values (Figure 3). Also,
the percentage of singletons is higher than 20% in all cases (Table 1) and the singletons and
doubletons curves have not crossed by the end of the sampling process (Figure 3). This means that the
richness should be much underestimated and in fact we cannot infer on the true richness of the sites, or
their sampling completeness, with the existing algorithms. Accurate estimation of species richness
with non-parametric estimators requires inventories close to completeness [28] and that was not the
case. Both sampling approaches would have to be much more exhaustive, with a higher sampling
intensity, to allow the true richness of the areas to be assessed.
However, in the case of the two spots sampled by the COBRA protocol, we could estimate
beforehand that the effort and combination of methods applied should capture close to 50% of the
species present at each site at the time of sampling [19]. The true richness of each spot should probably
be at least 164 species at the riparian corridor and 188 species at the meadow, values substantially
higher than the ones provided by the non-parametric estimators. Given the behavior of these, typical of
underestimation, the given values should in fact be closer to the sites’ true richness. These results
emphasize the importance of having some kind of reference for what portion of the community is
expected to be sampled before committing to a sampling protocol [19]. Any other approach, even if as
efficient, would require the use of probably more unreliable estimators to assess the true richness of
the site.
3. Experimental Section
3.1. Study Area
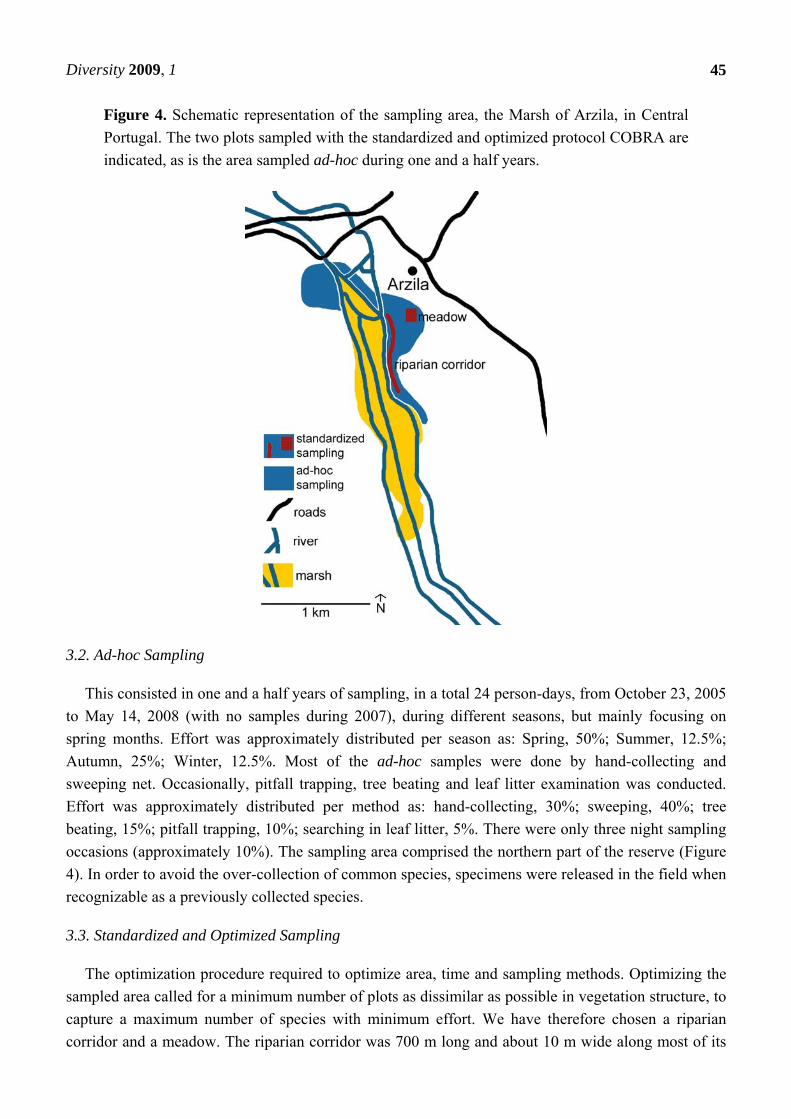
The study area was the Marsh of Arzila, located 11 km west of Coimbra, central Portugal, with the
UTM coordinates of 29TNE38 (using 10 × 10 km squares), at an altitude of 25 m (Figure 4). This
damp habitat comprises an area of about 150 ha (3 km × 500 m), at the south margin of the Mondego
River. The annual mean temperature is 15.3 ºC, being the minimum mean temperature 4.9 ºC in
January and the maximum mean temperature 27.5 ºC in August. The mean annual precipitation
recorded is 891 mm and the mean annual relative air humidity is 75%. This area, currently classified as
a Nature Reserve, was very close to a drainage process in 1980, under the Hydroagricultural Plan for
the Lower Mondego; however, different studies [31,32] granted the current conservation status to the
area.

Diversity 2009, 1
44
Figure 3. Randomized accumulation curves for observed species richness, singletons,
doubletons, and several different non-parametric species richness estimators.
Diversity 2009, 1
45
Figure 4. Schematic representation of the sampling area, the Marsh of Arzila, in Central
Portugal. The two plots sampled with the standardized and optimized protocol COBRA are
indicated, as is the area sampled ad-hoc during one and a half years.
3.2. Ad-hoc Sampling
This consisted in one and a half years of sampling, in a total 24 person-days, from October 23, 2005
to May 14, 2008 (with no samples during 2007), during different seasons, but mainly focusing on
spring months. Effort was approximately distributed per season as: Spring, 50%; Summer, 12.5%;
Autumn, 25%; Winter, 12.5%. Most of the ad-hoc samples were done by hand-collecting and
sweeping net. Occasionally, pitfall trapping, tree beating and leaf litter examination was conducted.
Effort was approximately distributed per method as: hand-collecting, 30%; sweeping, 40%; tree
beating, 15%; pitfall trapping, 10%; searching in leaf litter, 5%. There were only three night sampling
occasions (approximately 10%). The sampling area comprised the northern part of the reserve (Figure
4). In order to avoid the over-collection of common species, specimens were released in the field when
recognizable as a previously collected species.
3.3. Standardized and Optimized Sampling
The optimization procedure required to optimize area, time and sampling methods. Optimizing the
sampled area called for a minimum number of plots as dissimilar as possible in vegetation structure, to
capture a maximum number of species with minimum effort. We have therefore chosen a riparian
corridor and a meadow. The riparian corridor was 700 m long and about 10 m wide along most of its

Diversity 2009, 1
46
length, surrounded by water on both sides. The main vegetation at the arboreal stratum was Salix alba,
Salix atrocinerea, Fraxinus angustifolia and Fraxinus excelsior. The herbaceous stratum was mainly
comprised by Geranium purpureum, Urtica membranacea, Rubus ulmifolis, Arundo donax, Cirsium
vulgare and Lythrum salicaria. The meadow was about 80 m × 60 m, surrounded by several different
plantations of Pinus pinaster, Quercus faginea, Vitis vinifera and Eucalyptus globulus. The main
vegetation was Holcus lanatus, Dittrichia viscosa, Lythrum junceum, Tolpis barbata and
Andryala integrifolia.
Optimizing the sampling season required all samples to be taken during the Spring species richness
peak, from 11 to 28 of May, 2008 [21].
The optimization also required choosing the best possible combination of methods. Although a
target of 80/90% of species captured and listed is usual for vertebrates, even at large scales [33,34],
this requires a very large and often unreasonable effort for arthropods [6,8]. To each plot we have
therefore applied the COBRA50 protocol [19]. This semi-quantitative protocol was optimized to
capture close to 50% of the species present in each site, independently of the habitat, with minimum
effort [19]. As predetermined by the protocol, we applied a different set of methods to each plot,
according to the habitats in question and the vegetation layers that were present (Table 2). The overall
number of samples was nevertheless the same for both plots (24). With this protocol, each person-day
of work is equivalent to six person-hours, so that fatigue does not influence the results [19]. Therefore,
each plot had the equivalent to four person-days of effort.
Table 2. Number of samples per method at each plot sampled with the standardized and
optimized protocol [19]. Each sample is equivalent to one person-hour of collecting and a
pitfall sample is made by 4 pooled traps (for an explanation of methods see [6,8,9]). Most
methods were performed on May 11, 2008, except for pitfall traps which were left in the
field from 14 to 28 of May, 2008.
Site Riparian corridor Meadow
Aerial sampling night 4 0
Beating day 2 0
Beating night 2 0
Ground sampling night 0 4
Sweeping day 2 4
Sweeping night 2 4
Pitfall traps 12 12
Total 24 24
3.4. Statistical Analyses
Testing the efficiency of increasing the observed species richness by unit of time (objective 1)
required comparing both approaches (the ad-hoc sampling and the summed results for both COBRA
plots) by means of accumulation curves drawn by person-days of fieldwork. Some authors argued that
all comparisons of species richness between communities should be made with effort rescaled by
individuals [35,36]. Although this is true for species richness comparisons, our goal was to compare

Diversity 2009, 1
47
the effort required to attain certain richness levels and not to compare final values per se. In such case
it is better to make comparisons with some direct measure of effort or standard sampling unit [33,37].
The curves and 95% confidence limits followed the Mao Tau values [38,39] as computed by the
EstimateS software [40]. The efficiency by captured individuals (objective 2) was compared in the
same way as the previous analysis but with curves resampled by the number of individuals.
To test if the COBRA would collect more specimens of the most abundant species than the ad-hoc
sampling (objective 3) we compared them using the Simpson’s measure of evenness [41]:
E1/D = (1/D)/S (1)
where S is the species richness and D is the Simpson index [42,43]:
D = Σ pi2 (2)
where pi is the proportion of individuals in each species. The evenness measure changes between 0 and
1, with maximum value when all species are equally abundant, and is independent of richness.
However, in order to give statistical significance to the comparison between approaches, we had to
rarify the largest “community”, as given by the COBRA protocol, with rarefaction and permutation
tests [35,44]. The evenness value of the ad-hoc sampling was compared with the 95% confidence
limits of the values calculated for the same number of individuals randomly chosen from the
standardized sampling. The confidence limits were given by the 0.025 and 0.975 percentiles of all
permutations. If the value for the smaller sample falls outside the limits of the larger sample then there
is a significant difference between samples. Custom Java code was written to calculate the index and
confidence limits for the COBRA protocol with 1,000 permutations (code available from the first
author by request).
For comparing the proportion of singletons between the two approaches (objective 4) the same code
used for the previous analysis was used to do 1,000 permutation tests, this time with the percentage of
species represented by a single individual as the variable.
The species abundance distributions (objective 5) were also made after rarefaction of the COBRA
protocol with 1,000 permutations so that it would be comparable with the ad-hoc sampling. Classes
were determined by dividing species according to a log2 division of octaves [43]. To guarantee that all
octaves had twice the number of abundance values as the previous, the first octave included only the
singletons. The second octave included all species with two or three individuals, with the following
octaves having inclusive lower bounds of 4, 8, 16, 32, 64 and 128 individuals. Because the number of
species captured by each approach was different, we compared the distributions based on the
proportion of species falling into each abundance class. Finally, we calculated the 95% confidence
limits for the COBRA protocol after rarefaction, and attributed significance values for each
comparison of sampling approaches in the same abundance class.
To calculate the average size of captured specimens (objective 6) required that an average size was
attributed to all species. This was based on different literature according to the family or genus. When
males and females had different sizes, with males almost invariably presenting the smallest values, the
average of both was calculated. The size of each specimen was assumed to be the average size of its
species. For comparison of approaches, the same software used for the previous analyses was used
once again to do 1,000 permutation tests, this time with the size of individuals as the variable.
Diversity 2009, 1
48
The average taxonomic distinctness (avTD) (objective 7) was calculated based on the inclusion of
species in families and genera [45]. The taxonomic distinctness between two species was considered to
be 2 when they belonged to different families, 1 when they belonged to the same family but different
genera and 0 when they had the same genus. Values for all possible pairwise comparisons between
species were calculated for the ad-hoc approach and their average was calculated as the avTD [46,47].
For the standardized sampling, 1,000 permutations were done, always with the same number of
individuals as the ad-hoc approach, randomly chosen from the larger sampling, and the avTD
calculated for each of the permutations. Confidence limits could therefore be also calculated for avTD
values.
The software package EstimateS [40] was used to calculate randomized species accumulation
curves for the observed species richness (using the Mao Tau procedure), singleton and doubleton
curves and various non-parametric richness estimators (Chao1, Chao2, first and second order
Jackknife), using 1,000 randomizations in all calculations (objective 8). All curves were sample-based
and rescaled to individuals [35]. The behavior of estimators was assessed according to their ability to
asymptote and provide reliable values.
4. Conclusions
Both approaches, ad-hoc sampling and use of a standardized and optimized protocol may prove
advantageous under different circumstances. However, in the case studied, the COBRA protocol
revealed two main advantages: (1) it was more efficient when effort was measured by person-days of
fieldwork; (2) it allowed a probably more reliable estimation of the true number of species present in
each area at the time of sampling than using mostly unpredictable species richness estimators. An
additional advantage is that (3) it allows meaningful comparisons between areas even when these
are undersampled.
Acknowledgements
We thank Manuel Santos and Lino Nossa for the permission to collect in Paúl de Arzila Nature
Reserve. Also, Jorge Paiva for identifying the most common plant species in the Reserve. To Robert
Bosmans, José Antonio Barrientos, Stano Pekár, Nikolaj Scharff and Pedro Sousa for help in the
identification of specimens. And finally to Harith Morgadinho, Gonçalo Ferreira and Sandra Videira
who occasionally participated in the ad-hoc sampling.
References
1. Droege, S.; Cyr, A.; Larivée, J. Checklists: an under-used tool for the inventory and monitoring of
plants and animals. Conserv. Biol. 1998, 12, 1134-1138.
2. Gordon, J.E.; Newton, A.C. Efficient floristic inventory for the assessment of tropical tree
diversity: a comparative test of four alternative approaches. For. Ecol. Manage. 2006, 237,
564-573.

Diversity 2009, 1
49
3. Roberts, R.L.; Donald, P.F.; Green, R.E. Using simple species lists to monitor trends in animal
populations: new methods and a comparison with independent data. Anim. Conserv. 2007, 10,
332-339.
4. Platnick, N.I. The world spider catalog. American Museum of Natural History, version 9.5, 2009;
Available online: http://research.amnh.org/entomology/spiders/catalog/index.html (accessed
August 3, 2009).
5. Coddington, J.A.; Griswold, C.E.; Silva-Dávila, D.; Peñaranda, E.; Larcher, S.F. Designing and
testing sampling protocols to estimate biodiversity in tropical ecosystems. In The Unity of
Evolutionary Biology: Proceedings of the Fourth International Congress of Systematic and
Evolutionary Biology; Dudley, E.C., Ed.; Dioscorides Press: Portland, OR, USA, 1991; pp. 44-60.
6. Cardoso, P.; Scharff, N.; Gaspar, C.; Henriques, S.S.; Carvalho, R.; Castro, P.H.; Schmidt, J.B.;
Silva, I.; Szüts, T.; Castro, A.; Crespo, L.C. Rapid biodiversity assessment of spiders (Araneae)
using semi-quantitative sampling: a case study in a Mediterranean forest. Insect Conserv. Divers.
2008, 1, 71-84.
7. Sørensen, L.L.; Coddington, J.A.; Scharff, N. Inventorying and estimating subcanopy spider
diversity using semiquantitative sampling methods in an afromontane forest. Environ. Entomol.
2002, 31, 319-330.
8. Cardoso, P.; Gaspar, C.; Pereira, L.C.; Silva, I.; Henriques, S.S.; Silva, R.R.; Sousa, P. Assessing
spider species richness and composition in Mediterranean cork oak forests. Acta Oecol. 2008, 33,
114-127.
9. Cardoso, P.; Henriques, S.S.; Gaspar, C.; Crespo, L.C.; Carvalho, R.; Schmidt, J.B.; Sousa, P.;
Szűts, T. Species richness and composition assessment of spiders in a Mediterranean scrubland. J.
Insect Conserv. 2009, 13, 45-55.
10. Scharff, N.; Coddington, J.A.; Griswold, C.E.; Hormiga, G.; Bjorn, P.P. When to quit? Estimating
spider species richness in a northern European deciduous forest. J. Arachnol. 2003, 31, 246-273.
11. Duelli, P. Biodiversity evaluation in agricultural landscapes: an approach at two different scales.
Agr. Ecosyst. Environ. 1997, 62, 81-91.
12. Duelli, P.; Obrist, M.K.; Schmatz, D.R. Biodiversity evaluation in agricultural landscapes:
above-ground insects. Agr. Ecosyst. Environ. 1999, 74, 33-64.
13. Jones, D.T.; Eggleton, P. Sampling termite assemblages in tropical forests: testing a rapid
biodiversity assessment protocol. J. Appl. Ecol. 2000, 37, 191-203.
14. Stork, N.E.; Samways, M.J.; Eeley, H.A.C. Inventorying and monitoring biodiversity. Trends
Ecol. Evol. 1996, 11, 39-40.
15. Delabie, J.H.C.; Fisher, B.L.; Majer, J.D.; Wright, I.W. Sampling effort and choice of methods. In
Ants–Standard Methods for Measuring and Monitoring Biodiversity, Agosti, D., Majer, J.D.,
Alonso, L.E., Schultz, T.R., Eds.; Biological Diversity Handbook Series, Smithsonian Institution
Press: Washington, DC, USA, 2000; pp. 145-154.
16. Ellison, A.M.; Record, S.; Arguello, A.; Gotelli, N.J. Rapid inventory of the ant assemblage in a
temperate hardwood forest: species composition and assessment of sampling methods. Environ.
Entomol. 2007, 36, 766-775.
Diversity 2009, 1
50
17. Missa, O.; Basset, Y.; Alonso, A.; Miller, S.E.; Curletti, G.; Meyer, M.D.; Eardley, C.; Mansell,
M.W.; Wagner, T. Monitoring arthropods in a tropical landscape: relative effects of sampling
methods and habitat types on trap catches. J. Insect Conserv. 2009, 13, 103-118.
18. Snyder, B.A.; Draney, M.L.; Sierwald, P. Development of an optimal sampling protocol for
millipedes (Diplopoda). J. Insect Conserv. 2006, 10, 277-288.
19. Cardoso, P. Standardization and optimization of arthropod inventories–the case of Iberian spiders.
Biodivers. Conserv. 2009, in press, DOI 10.1007/s10531-009-9690-7.
20. Crespo, L.C.; Cardoso, P.; Carvalho, R.; Henriques, S.S.; Rufino, A.C. Spiders (Arachnida:
Araneae) from the Paúl de Arzila Natural Reserve (Portugal). Bol. Soc. Entomol. Aragonesa 2009,
44, 305-313.
21. Cardoso, P.; Silva, I.; Oliveira, N.G.; Serrano, A.R.M. Seasonality of spiders (Araneae) in
Mediterranean ecosystems and its implications in the optimum sampling period. Ecol. Entomol.
2007, 32, 516-526.
22. Hedgren, O.; Weslien, J. Detecting rare species with random or subjective sampling: a case study
of red-listed saproxylic beetles in Boreal Sweden. Conserv. Biol. 2008, 22, 212-215.
23. Cáceres, M.E.S.; Lücking, R.; Rambold, G. Efficiency of sampling methods for accurate
estimation of species richness of corticolous microlichens in the Atlantic rainforest of
northeastern Brazil. Biodivers. Conserv. 2008, 17, 1285-1301.
24. Barrientos, J.A. Le statut taxonomique des Oxyopes Latreille, 1804, de la Péninsule Ibérique. Rev.
Arachnol. 1984, 5, 153-159.
25. Barrientos, J.A.; Cardoso, P. The genus Malthonica Simon, 1898 in the Iberian Peninsula
(Araneae: Agelenidae). Zootaxa 2007, 1460, 59-68.
26. Pekár, S.; Cardoso, P. Ant-eating spiders (Araneae, Zodariidae) of Portugal: additions to the
current knowledge. Zootaxa 2005, 1009, 51-60.
27. Longino, J.; Colwell, R.K.; Coddington, J.A. The ant fauna of a tropical rainforest: estimating
species richness three different ways. Ecology 2002, 83, 689-702.
28. Coddington, J.A.; Agnarsson, I.; Miller, J.A.; Kuntner, M.; Hormiga, G. Undersampling bias: the
null hypothesis for singleton species in tropical arthropod surveys. J. Anim. Ecol. 2009, 78,
573-584.
29. Diekmann, M.; Kühne, A.; Isermann, M. Random vs non-random sampling: effects on patterns of
species abundance, species richness and vegetation-environment relationships. Folia Geobot.
2007, 42, 179-190.
30. Dennis, R.L.H.; Shreeve, T.G.; Isaac, N.J.B.; Roy, D.B.; Hardy, P.B.; Fox, R.; Asher, J. The
effects of visual apparency on bias in butterfly recording and monitoring. Biol. Conserv. 2006,
128, 486-492.
31. Ferrand de Almeida, F.; Ferrand de Almeida, P.; Ferrand de Almeida, N.; Moura, A.; Silva, M.;
Paiva, J.; Nogueira, I.; Soares, A.; Reis, R.; Godinho, M.; Oliveira, J. Aspectos faunísticos,
florísticos, geológicos e geográficos do Paúl de Arzila. Cienc. Biol. 1983, 5, 43-78.
32. Ferrand de Almeida, F.; Ferrand de Almeida, N.; Ferrand de Almeida, P. Nova contribuição para
o conhecimento da fauna do Paúl de Arzila. Cienc. Biol. 1984, 5, 191-194.
33. Moreno, C.E.; Halffter, G. Assessing the completeness of bat biodiversity inventories using
species accumulation curves. J. Appl. Ecol. 2000, 37, 149-158.

Diversity 2009, 1
51
34. Thompson, G.G.; Thompson, S.A.; Withers, P.C.; Fraser J. Determining adequate trapping effort
and species richness using species accumulation curves for environmental impact assessments.
Austral Ecol. 2007, 32, 570-580.
35. Gotelli, N.J.; Colwell, R.K. Quantifying biodiversity: procedures and pitfalls in the measurement
and comparison of species richness. Ecol. Lett. 2001, 4, 379-391.
36. Willott, S.J. Species accumulation curves and the measure of sampling effort. J. Appl. Ecol. 2001,
38, 485-487.
37. Moreno, C.E.; Halffter, G. On the measure of sampling effort used in species accumulation
curves. J. Appl. Ecol. 2001, 38, 487-490.
38. Colwell, R.K.; Mao, C.X.; Chang, J. Interpolating, extrapolating, and comparing incidence-based
species accumulation curves. Ecology 2004, 85, 2717-2727.
39. Mao, C.X.; Colwell, R.K.; Chang, J. Estimating the species accumulation curve using mixtures.
Biometrics 2005, 61, 433-441.
40. Colwell, R.K. EstimateS: statistical estimation of species richness and shared species from
samples. Version 8, 2006.
41. Smith, B.; Wilson, J.B. A consumer's guide to evenness indices. Oikos 1996, 76, 70-82.
42. Simpson, E.H. Measurement of diversity. Nature 1949, 163, 688.
43. Magurran, A.E. Measuring Biological Diversity, 2nd ed.; Blackwell Publishing: Oxford, UK, 2004.
44. Norris, K.C. Quantifying change through time in spider assemblages: sampling methods, indices
and sources of error. J. Insect Conserv. 1999, 3, 309-325.
45. Floerl, O.; Inglis, G.J.; Gordon, D.P. Patterns of taxonomic diversity and relatedness among
native and non-indigenous bryozoans. Divers. Distrib. 2009, 15, 438-449.
46. Clarke, K.R.; Warwick, R.M. A taxonomic distinctness index and its statistical properties. J. Appl.
Ecol. 1998, 35, 523-531.
47. Warwick, R.M.; Clarke, K.R. Practical measures of marine biodiversity based on relatedness of
species. Oceanogr. Mar. Biol. Annu. Rev. 2001, 39, 207-231.
© 2009 by the authors; licensee Molecular Diversity Preservation International, Basel, Switzerland.
This article is an open-access article distributed under the terms and conditions of the Creative
Commons Attribution license (http://creativecommons.org/licenses/by/3.0/).