Towards the Development of a Multi-disciplinary Flight Trajectory Optimization Tool - GATAC
10
Page 1 of 10 Proceedings of ASME Turbo Expo 2012 GT2012 June 11-15, 2012, Copenhagen, Denmark GT2012-69862 Towards the Development of a Multi-disciplinary Flight Trajectory Optimization Tool — GATAC Weiqun Gu ① , Rukshan Navaratne ① , Daniele Quaglia ① , Yang Yu ① , Kenneth Chircop ② , Irfan Madani ① Huamin Jia ① , Vishal Sethi ① , Roberto Sabatini ① , David Zammit-Mangion ①② ① - Cranfield University, ② - University of Malta ABSTRACT Reducing the impact on the environment and the associated commercial implications are two major challenges that the global commercial aviation industry is addressing with significant commitment today. In this respect, Clean Sky, which is a €1.6 billion Joint Technology Initiative part funded by the European Commission is the largest ever programme addressing the greening of air transportation in response to the Advisory Council for Aeronautics Research in Europe (ACARE) goals of reducing CO 2 and perceived noise emissions by 50% and NO x by 80% by 2020 compared to 2000 condition. This paper presents research work carried out within the Systems for Green Operation Integrated Technology Demonstrator (ITD) of Clean Sky that is associated with GATAC, a trajectory and route planning tool to enable the multi-objective optimization of flight trajectories and missions. The design and operational methodology of the tool, the optimization algorithms and models are discussed and the results of a preliminary application for a long-range commercial flight are presented. INTRODUCTION Aviation has become an essential commodity in today's global society, with 2.2 billion passengers travelling every year. As a result, the air transport industry is addressing growing public concern on the impact of air travel on the environment, which includes air pollution, noise and climate change. Although today air transport only produces two percent of CO 2 emissions through the burning of fossils fuels, this is expected to increase to 3% by 2050 with the continuous and steady growth of traffic. In recent years, emissions from combustion processes have become a great public concern due to their impact on health and the environment. Indeed, the past decade has witnessed rapid changes both in the regulations for controlling gas turbine emissions and in the technologies used to meet these regulations. During this period, air transport grown rapidly and is now perceived as one of the world’s fastest growing energy-use sector and aviation is directly impacted by energy trends and the perceived impact of fossil fuel burn on the environment. Clean Sky is a Joint Technology Initiative (JTI) that aims to identify, develop and validate the key technologies necessary to achieve major steps towards the ACARE 2020 environmental goals of reducing CO 2 by 50%, NO x by 80% and perceived noise by 50% compared to 2000 figures. It is organized in six Integrated Technology Demonstrators (ITDs) and a Technology Evaluator (TE) to evaluate and demonstrate the outputs of the ITDs [1]. An activity under the System for Green Operations (SGO) ITD is focusing on the development of a trajectory and route planner that can optimize trajectories under multiple constraints, including air traffic constraints. This involves the development of models, optimization algorithms and the software environment in which the optimization can be performed. The SGO ITD will also optimize trajectories and missions to demonstrate the environmental gains that can be achieved if such optimized flight profiles are flown. This paper reflects the research on trajectory optimization work carried out by Cranfield University within the Clean Sky SGO-ITD. It describes the techniques used for multi-disciplinary optimization of flight trajectories, software environment developed (referred as to as the optimization framework), the models and tools as well as a preliminary application of a long-haul flight in terms of fuel consumption and time. The paper concludes with a discussion of further work that can follow on the achieved results.
Transcript of Towards the Development of a Multi-disciplinary Flight Trajectory Optimization Tool - GATAC
Page 1 of 10
Proceedings of ASME Turbo Expo 2012
GT2012
June 11-15, 2012, Copenhagen, Denmark
GT2012-69862Towards the Development of a Multi-disciplinary Flight Trajectory Optimization Tool — GATAC
Weiqun Gu①, Rukshan Navaratne①, Daniele Quaglia①, Yang Yu①, Kenneth Chircop②, Irfan Madani①
Huamin Jia①, Vishal Sethi①, Roberto Sabatini①, David Zammit-Mangion①②
① - Cranfield University, ② - University of Malta
ABSTRACT
Reducing the impact on the environment and the associated
commercial implications are two major challenges that the global
commercial aviation industry is addressing with significant
commitment today. In this respect, Clean Sky, which is a €1.6 billion
Joint Technology Initiative part funded by the European Commission is
the largest ever programme addressing the greening of air
transportation in response to the Advisory Council for Aeronautics
Research in Europe (ACARE) goals of reducing CO2 and perceived
noise emissions by 50% and NOx by 80% by 2020 compared to 2000
condition.
This paper presents research work carried out within the Systems
for Green Operation Integrated Technology Demonstrator (ITD) of
Clean Sky that is associated with GATAC, a trajectory and route
planning tool to enable the multi-objective optimization of flight
trajectories and missions. The design and operational methodology of
the tool, the optimization algorithms and models are discussed and the
results of a preliminary application for a long-range commercial flight
are presented.
INTRODUCTION
Aviation has become an essential commodity in today's global
society, with 2.2 billion passengers travelling every year. As a result, the
air transport industry is addressing growing public concern on the
impact of air travel on the environment, which includes air pollution,
noise and climate change. Although today air transport only produces
two percent of CO2 emissions through the burning of fossils fuels, this is
expected to increase to 3% by 2050 with the continuous and steady
growth of traffic. In recent years, emissions from combustion processes
have become a great public concern due to their impact on health and
the environment. Indeed, the past decade has witnessed rapid changes
both in the regulations for controlling gas turbine emissions and in the
technologies used to meet these regulations. During this period, air
transport grown rapidly and is now perceived as one of the world’s
fastest growing energy-use sector and aviation is directly impacted by
energy trends and the perceived impact of fossil fuel burn on the
environment.
Clean Sky is a Joint Technology Initiative (JTI) that aims to
identify, develop and validate the key technologies necessary to achieve
major steps towards the ACARE 2020 environmental goals of reducing
CO2 by 50%, NOx by 80% and perceived noise by 50% compared to
2000 figures. It is organized in six Integrated Technology Demonstrators
(ITDs) and a Technology Evaluator (TE) to evaluate and demonstrate
the outputs of the ITDs [1]. An activity under the System for Green
Operations (SGO) ITD is focusing on the development of a trajectory
and route planner that can optimize trajectories under multiple
constraints, including air traffic constraints. This involves the
development of models, optimization algorithms and the software
environment in which the optimization can be performed. The SGO ITD
will also optimize trajectories and missions to demonstrate the
environmental gains that can be achieved if such optimized flight
profiles are flown.
This paper reflects the research on trajectory optimization work
carried out by Cranfield University within the Clean Sky SGO-ITD. It
describes the techniques used for multi-disciplinary optimization of
flight trajectories, software environment developed (referred as to as
the optimization framework), the models and tools as well as a
preliminary application of a long-haul flight in terms of fuel
consumption and time. The paper concludes with a discussion of
further work that can follow on the achieved results.
Page 2 of 10
MATHEMATICAL DESCRIPTIONS AND CHARACTERISTIC
ANALYSIS OF MULTI-DISCIPLINARY FLIGHT
TRAJECTORY OPTIMIZATION
Optimization is defined as the science of determining the best
solution of mathematical problems which represent reality [2]. In
practice, flight trajectory for green operations has several and often
conflicting performance indices to minimize to obtain a trajectory
which satisfy all the constraints imposed. Therefore multi-objective (or
multi-disciplinary) optimization is involved in the process. The number
of objectives involved might vary from a phase of flight to another;
hence different objectives can be applied to flight trajectory planning
optimization. For example a combination of fuel consumption, flight
time, gaseous emissions like NOx or CO2, contrails and noise generated
by aircraft activity can be taken into account within the optimization
process.
Generally, a multi-disciplinary optimization problem is defined as
follow [3]:
UL
Tm
qk
pj
FFF
xxx
x
x
xxxxF
,,2,1,0)(h
,,2,1,0)(g
tosubject
)](,,)(,)([)(min
k
j
21
(1)
Where m is the number of objective functions, p and q are
respectively the number of inequality and equality constraints, x is a
vector of decision variables, )(xiF is the ith objective function and
Lx andUx are respectively the lower and upper boundary vectors.
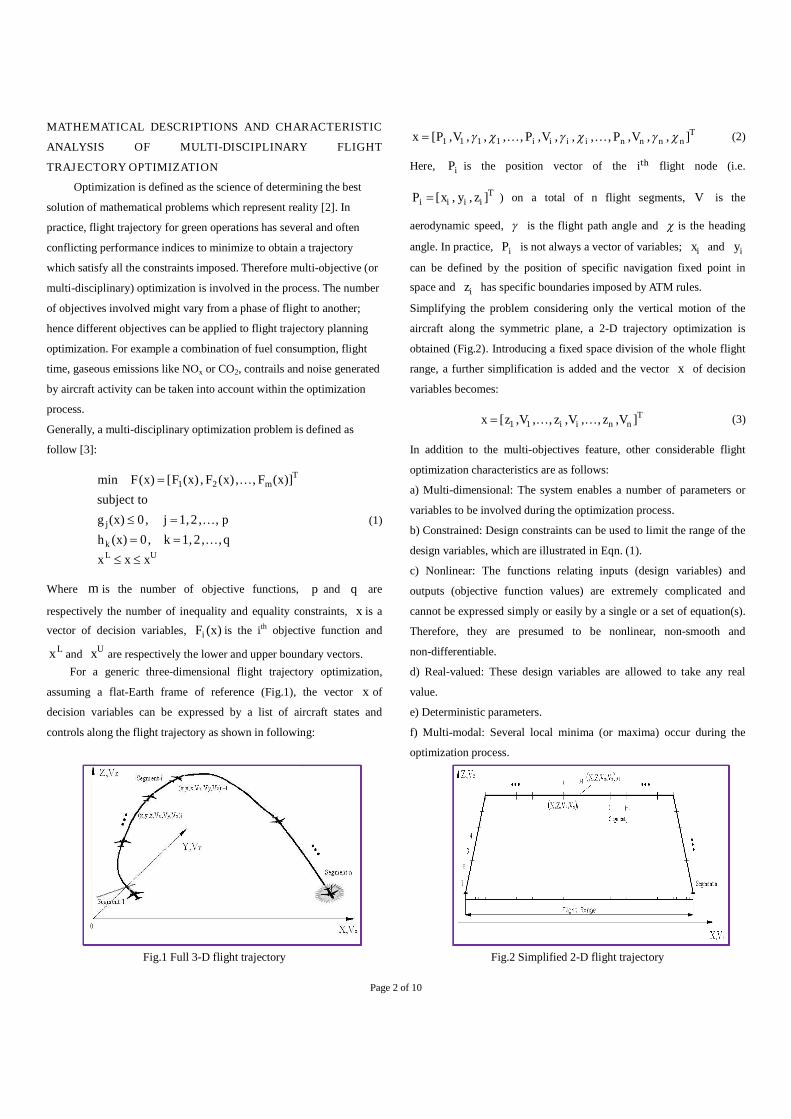
For a generic three-dimensional flight trajectory optimization,
assuming a flat-Earth frame of reference (Fig.1), the vector x of
decision variables can be expressed by a list of aircraft states and
controls along the flight trajectory as shown in following:
Tnnnniiii VVV ],,,,,,,,,,,,,[ 1111 PPPx (2)
Here, iP is the position vector of the i୲୦ flight node (i.e.
Tiiii zyx ],,[P ) on a total of n flight segments, V is the
aerodynamic speed, is the flight path angle and is the heading
angle. In practice, iP is not always a vector of variables; ix and iy
can be defined by the position of specific navigation fixed point in
space and iz has specific boundaries imposed by ATM rules.
Simplifying the problem considering only the vertical motion of the
aircraft along the symmetric plane, a 2-D trajectory optimization is
obtained (Fig.2). Introducing a fixed space division of the whole flight
range, a further simplification is added and the vector x of decision
variables becomes:
Tnnii VzVzVz ],,,,,,,[ 11 x (3)
In addition to the multi-objectives feature, other considerable flight
optimization characteristics are as follows:
a) Multi-dimensional: The system enables a number of parameters or
variables to be involved during the optimization process.
b) Constrained: Design constraints can be used to limit the range of the
design variables, which are illustrated in Eqn. (1).
c) Nonlinear: The functions relating inputs (design variables) and
outputs (objective function values) are extremely complicated and
cannot be expressed simply or easily by a single or a set of equation(s).
Therefore, they are presumed to be nonlinear, non-smooth and
non-differentiable.
d) Real-valued: These design variables are allowed to take any real
value.
e) Deterministic parameters.
f) Multi-modal: Several local minima (or maxima) occur during the
optimization process.
Fig.1 Full 3-D flight trajectory Fig.2 Simplified 2-D flight trajectory
Page 3 of 10
METHODOLOGY AND OPTIMIZATION FRAMEWORK
Based on the characteristics of the optimization problem explained
in the previous section, a tool which is based on a framework called
GATAC (Green Aircraft Trajectory under ATM constraints) [4]
equipped with Genetic Algorithm (GA) optimizer and aircraft airframe
and system models as the core as well as cost function models such as
noise and emission models has been developed by SGO ITD [1].
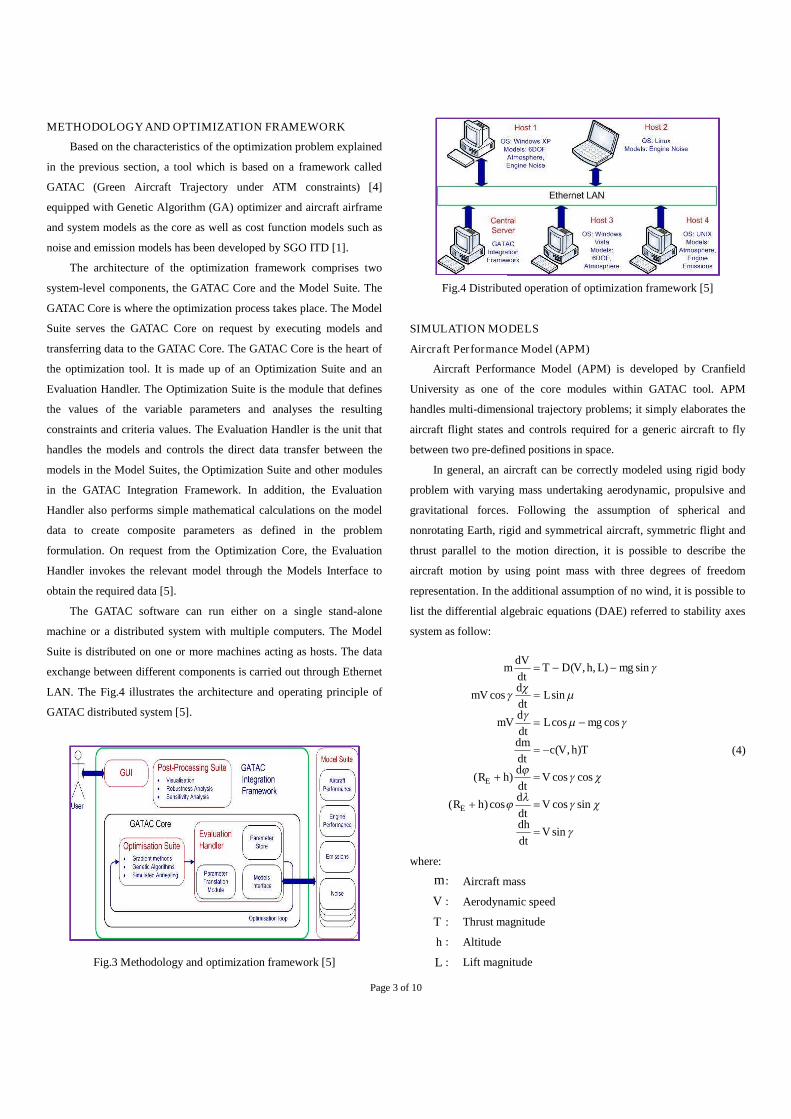
The architecture of the optimization framework comprises two
system-level components, the GATAC Core and the Model Suite. The
GATAC Core is where the optimization process takes place. The Model
Suite serves the GATAC Core on request by executing models and
transferring data to the GATAC Core. The GATAC Core is the heart of
the optimization tool. It is made up of an Optimization Suite and an
Evaluation Handler. The Optimization Suite is the module that defines
the values of the variable parameters and analyses the resulting
constraints and criteria values. The Evaluation Handler is the unit that
handles the models and controls the direct data transfer between the
models in the Model Suites, the Optimization Suite and other modules
in the GATAC Integration Framework. In addition, the Evaluation
Handler also performs simple mathematical calculations on the model
data to create composite parameters as defined in the problem
formulation. On request from the Optimization Core, the Evaluation
Handler invokes the relevant model through the Models Interface to
obtain the required data [5].
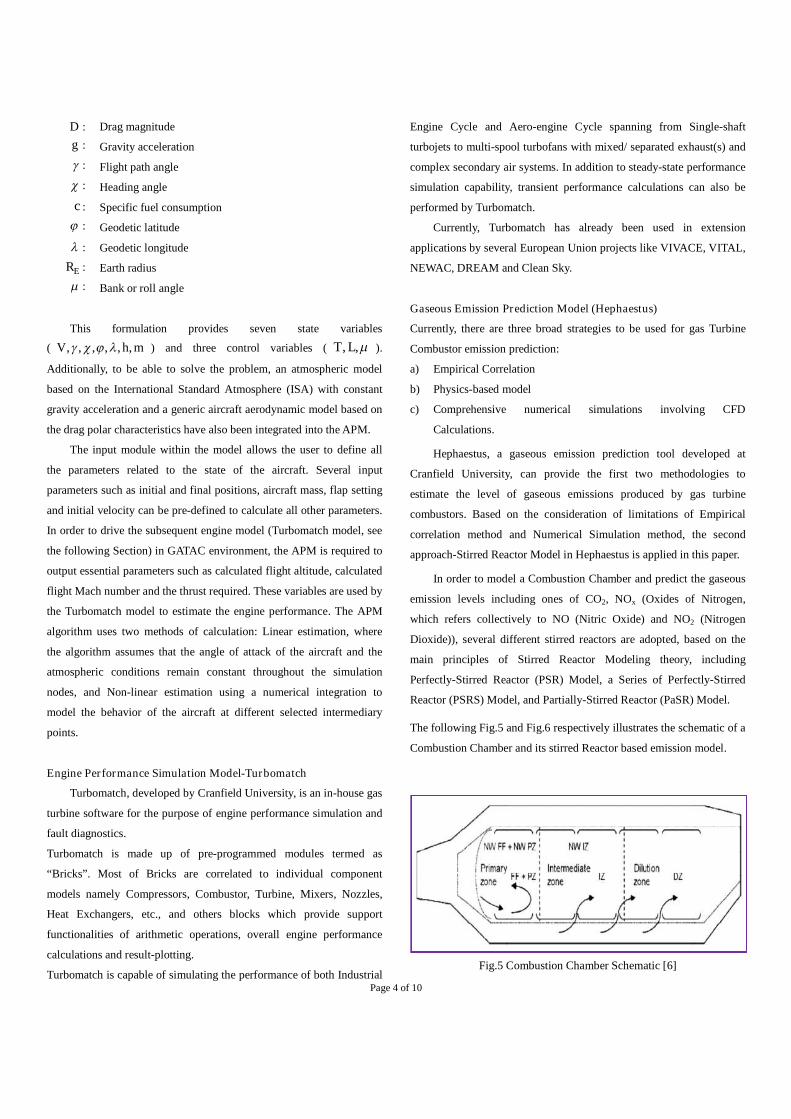
The GATAC software can run either on a single stand-alone
machine or a distributed system with multiple computers. The Model
Suite is distributed on one or more machines acting as hosts. The data
exchange between different components is carried out through Ethernet
LAN. The Fig.4 illustrates the architecture and operating principle of
GATAC distributed system [5].
Fig.3 Methodology and optimization framework [5]
Fig.4 Distributed operation of optimization framework [5]
SIMULATION MODELS
Aircraft Performance Model (APM)
Aircraft Performance Model (APM) is developed by Cranfield
University as one of the core modules within GATAC tool. APM
handles multi-dimensional trajectory problems; it simply elaborates the
aircraft flight states and controls required for a generic aircraft to fly
between two pre-defined positions in space.
In general, an aircraft can be correctly modeled using rigid body
problem with varying mass undertaking aerodynamic, propulsive and
gravitational forces. Following the assumption of spherical and
nonrotating Earth, rigid and symmetrical aircraft, symmetric flight and
thrust parallel to the motion direction, it is possible to describe the
aircraft motion by using point mass with three degrees of freedom
representation. In the additional assumption of no wind, it is possible to
list the differential algebraic equations (DAE) referred to stability axes
system as follow:
sin
sincoscos)(
coscos)(
),(
coscos
sincos
sin),,(
Vdt
dh
Vdt
dhR
Vdt
dhR
ThVcdt
dm
mgLdt
dmV
Ldt
dmV
mgLhVDTdt
dVm
E
E
(4)
where:
m : Aircraft mass
V : Aerodynamic speed
T : Thrust magnitude
h : Altitude
L : Lift magnitude
Page 4 of 10
D : Drag magnitude
g : Gravity acceleration
: Flight path angle
: Heading angle
c : Specific fuel consumption
: Geodetic latitude
: Geodetic longitude
ER : Earth radius
: Bank or roll angle
This formulation provides seven state variables
( mhV ,,,,,, ) and three control variables ( ,, LT ).
Additionally, to be able to solve the problem, an atmospheric model
based on the International Standard Atmosphere (ISA) with constant
gravity acceleration and a generic aircraft aerodynamic model based on
the drag polar characteristics have also been integrated into the APM.
The input module within the model allows the user to define all
the parameters related to the state of the aircraft. Several input
parameters such as initial and final positions, aircraft mass, flap setting
and initial velocity can be pre-defined to calculate all other parameters.
In order to drive the subsequent engine model (Turbomatch model, see
the following Section) in GATAC environment, the APM is required to
output essential parameters such as calculated flight altitude, calculated
flight Mach number and the thrust required. These variables are used by
the Turbomatch model to estimate the engine performance. The APM
algorithm uses two methods of calculation: Linear estimation, where
the algorithm assumes that the angle of attack of the aircraft and the
atmospheric conditions remain constant throughout the simulation
nodes, and Non-linear estimation using a numerical integration to
model the behavior of the aircraft at different selected intermediary
points.
Engine Performance Simulation Model-Turbomatch
Turbomatch, developed by Cranfield University, is an in-house gas
turbine software for the purpose of engine performance simulation and
fault diagnostics.
Turbomatch is made up of pre-programmed modules termed as
“Bricks”. Most of Bricks are correlated to individual component
models namely Compressors, Combustor, Turbine, Mixers, Nozzles,
Heat Exchangers, etc., and others blocks which provide support
functionalities of arithmetic operations, overall engine performance
calculations and result-plotting.
Turbomatch is capable of simulating the performance of both Industrial
Engine Cycle and Aero-engine Cycle spanning from Single-shaft
turbojets to multi-spool turbofans with mixed/ separated exhaust(s) and
complex secondary air systems. In addition to steady-state performance
simulation capability, transient performance calculations can also be
performed by Turbomatch.
Currently, Turbomatch has already been used in extension
applications by several European Union projects like VIVACE, VITAL,
NEWAC, DREAM and Clean Sky.
Gaseous Emission Prediction Model (Hephaestus)
Currently, there are three broad strategies to be used for gas Turbine
Combustor emission prediction:
a) Empirical Correlation
b) Physics-based model
c) Comprehensive numerical simulations involving CFD
Calculations.
Hephaestus, a gaseous emission prediction tool developed at
Cranfield University, can provide the first two methodologies to
estimate the level of gaseous emissions produced by gas turbine
combustors. Based on the consideration of limitations of Empirical
correlation method and Numerical Simulation method, the second
approach-Stirred Reactor Model in Hephaestus is applied in this paper.
In order to model a Combustion Chamber and predict the gaseous
emission levels including ones of CO2, NOx (Oxides of Nitrogen,
which refers collectively to NO (Nitric Oxide) and NO2 (Nitrogen
Dioxide)), several different stirred reactors are adopted, based on the
main principles of Stirred Reactor Modeling theory, including
Perfectly-Stirred Reactor (PSR) Model, a Series of Perfectly-Stirred
Reactor (PSRS) Model, and Partially-Stirred Reactor (PaSR) Model.
The following Fig.5 and Fig.6 respectively illustrates the schematic of a
Combustion Chamber and its stirred Reactor based emission model.
Fig.5 Combustion Chamber Schematic [6]
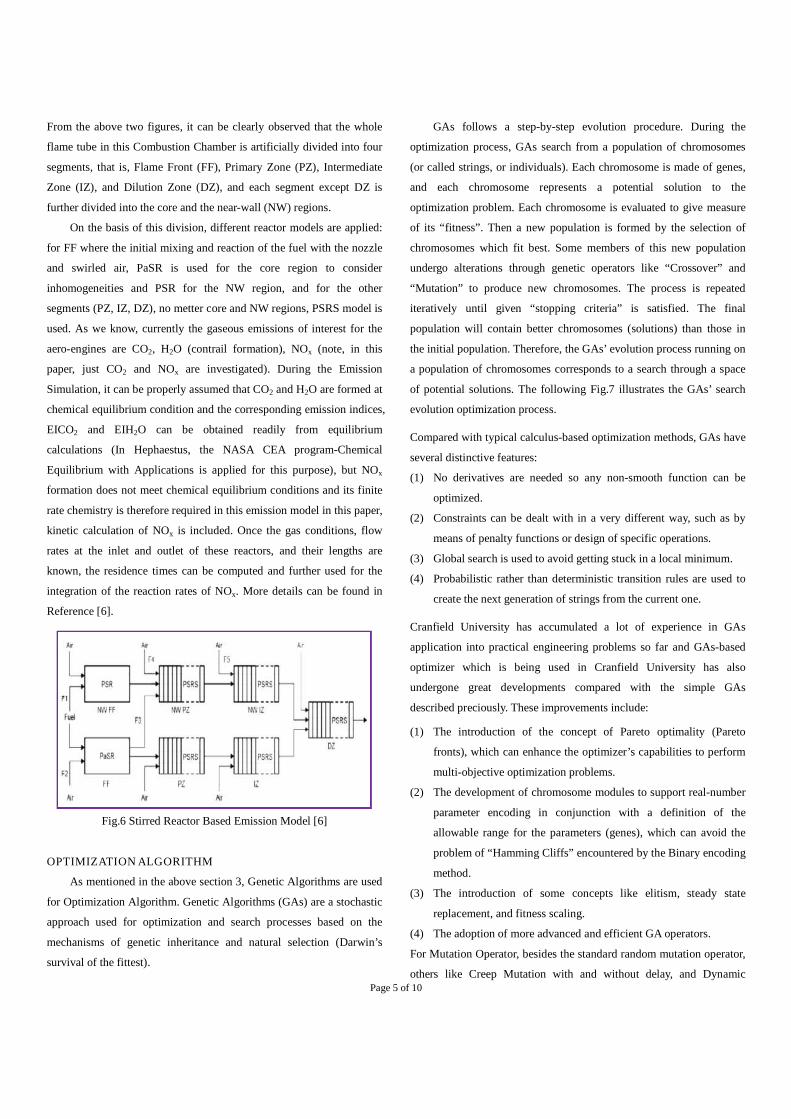
Page 5 of 10
From the above two figures, it can be clearly observed that the whole
flame tube in this Combustion Chamber is artificially divided into four
segments, that is, Flame Front (FF), Primary Zone (PZ), Intermediate
Zone (IZ), and Dilution Zone (DZ), and each segment except DZ is
further divided into the core and the near-wall (NW) regions.
On the basis of this division, different reactor models are applied:
for FF where the initial mixing and reaction of the fuel with the nozzle
and swirled air, PaSR is used for the core region to consider
inhomogeneities and PSR for the NW region, and for the other
segments (PZ, IZ, DZ), no metter core and NW regions, PSRS model is
used. As we know, currently the gaseous emissions of interest for the
aero-engines are CO2, H2O (contrail formation), NOx (note, in this
paper, just CO2 and NOx are investigated). During the Emission
Simulation, it can be properly assumed that CO2 and H2O are formed at
chemical equilibrium condition and the corresponding emission indices,
EICO2 and EIH2O can be obtained readily from equilibrium
calculations (In Hephaestus, the NASA CEA program-Chemical
Equilibrium with Applications is applied for this purpose), but NOx
formation does not meet chemical equilibrium conditions and its finite
rate chemistry is therefore required in this emission model in this paper,
kinetic calculation of NOx is included. Once the gas conditions, flow
rates at the inlet and outlet of these reactors, and their lengths are
known, the residence times can be computed and further used for the
integration of the reaction rates of NOx. More details can be found in
Reference [6].
Fig.6 Stirred Reactor Based Emission Model [6]
OPTIMIZATION ALGORITHM
As mentioned in the above section 3, Genetic Algorithms are used
for Optimization Algorithm. Genetic Algorithms (GAs) are a stochastic
approach used for optimization and search processes based on the
mechanisms of genetic inheritance and natural selection (Darwin’s
survival of the fittest).
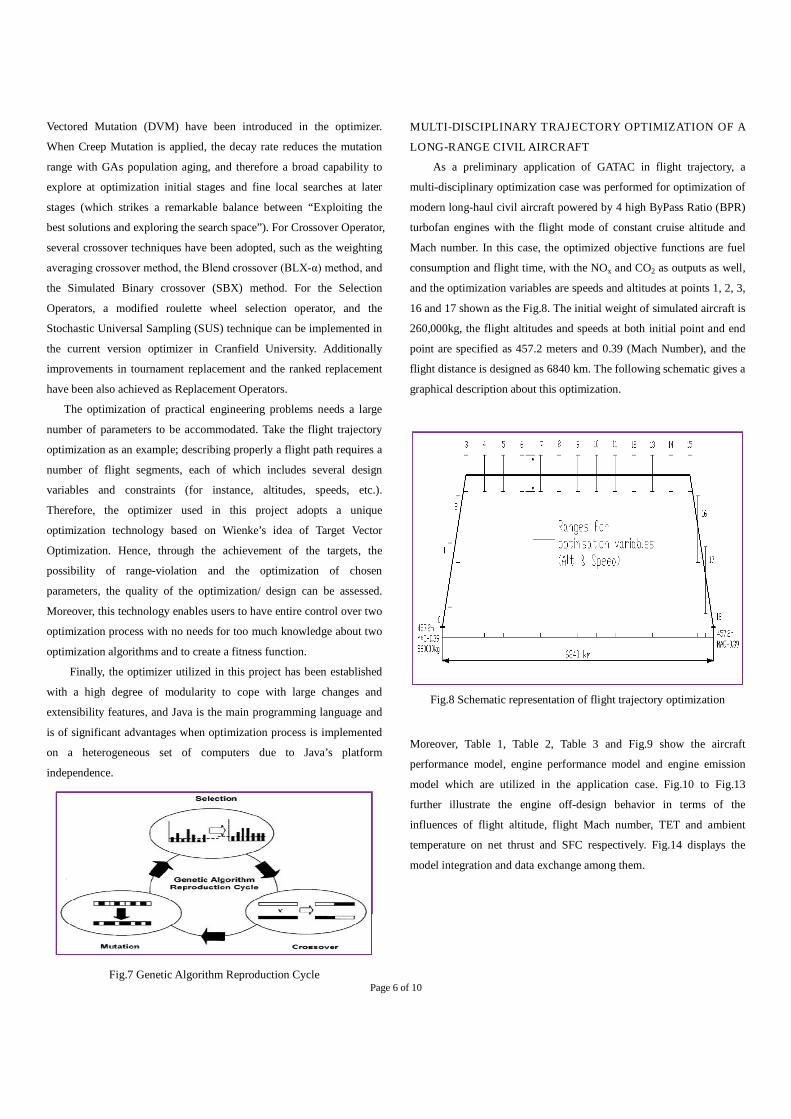
GAs follows a step-by-step evolution procedure. During the
optimization process, GAs search from a population of chromosomes
(or called strings, or individuals). Each chromosome is made of genes,
and each chromosome represents a potential solution to the
optimization problem. Each chromosome is evaluated to give measure
of its “fitness”. Then a new population is formed by the selection of
chromosomes which fit best. Some members of this new population
undergo alterations through genetic operators like “Crossover” and
“Mutation” to produce new chromosomes. The process is repeated
iteratively until given “stopping criteria” is satisfied. The final
population will contain better chromosomes (solutions) than those in
the initial population. Therefore, the GAs’ evolution process running on
a population of chromosomes corresponds to a search through a space
of potential solutions. The following Fig.7 illustrates the GAs’ search
evolution optimization process.
Compared with typical calculus-based optimization methods, GAs have
several distinctive features:
(1) No derivatives are needed so any non-smooth function can be
optimized.
(2) Constraints can be dealt with in a very different way, such as by
means of penalty functions or design of specific operations.
(3) Global search is used to avoid getting stuck in a local minimum.
(4) Probabilistic rather than deterministic transition rules are used to
create the next generation of strings from the current one.
Cranfield University has accumulated a lot of experience in GAs
application into practical engineering problems so far and GAs-based
optimizer which is being used in Cranfield University has also
undergone great developments compared with the simple GAs
described preciously. These improvements include:
(1) The introduction of the concept of Pareto optimality (Pareto
fronts), which can enhance the optimizer’s capabilities to perform
multi-objective optimization problems.
(2) The development of chromosome modules to support real-number
parameter encoding in conjunction with a definition of the
allowable range for the parameters (genes), which can avoid the
problem of “Hamming Cliffs” encountered by the Binary encoding
method.
(3) The introduction of some concepts like elitism, steady state
replacement, and fitness scaling.
(4) The adoption of more advanced and efficient GA operators.
For Mutation Operator, besides the standard random mutation operator,
others like Creep Mutation with and without delay, and Dynamic
Page 6 of 10
Vectored Mutation (DVM) have been introduced in the optimizer.
When Creep Mutation is applied, the decay rate reduces the mutation
range with GAs population aging, and therefore a broad capability to
explore at optimization initial stages and fine local searches at later
stages (which strikes a remarkable balance between “Exploiting the
best solutions and exploring the search space”). For Crossover Operator,
several crossover techniques have been adopted, such as the weighting
averaging crossover method, the Blend crossover (BLX-α) method, and
the Simulated Binary crossover (SBX) method. For the Selection
Operators, a modified roulette wheel selection operator, and the
Stochastic Universal Sampling (SUS) technique can be implemented in
the current version optimizer in Cranfield University. Additionally
improvements in tournament replacement and the ranked replacement
have been also achieved as Replacement Operators.
The optimization of practical engineering problems needs a large
number of parameters to be accommodated. Take the flight trajectory
optimization as an example; describing properly a flight path requires a
number of flight segments, each of which includes several design
variables and constraints (for instance, altitudes, speeds, etc.).
Therefore, the optimizer used in this project adopts a unique
optimization technology based on Wienke’s idea of Target Vector
Optimization. Hence, through the achievement of the targets, the
possibility of range-violation and the optimization of chosen
parameters, the quality of the optimization/ design can be assessed.
Moreover, this technology enables users to have entire control over two
optimization process with no needs for too much knowledge about two
optimization algorithms and to create a fitness function.
Finally, the optimizer utilized in this project has been established
with a high degree of modularity to cope with large changes and
extensibility features, and Java is the main programming language and
is of significant advantages when optimization process is implemented
on a heterogeneous set of computers due to Java’s platform
independence.
Fig.7 Genetic Algorithm Reproduction Cycle
MULTI-DISCIPLINARY TRAJECTORY OPTIMIZATION OF A
LONG-RANGE CIVIL AIRCRAFT
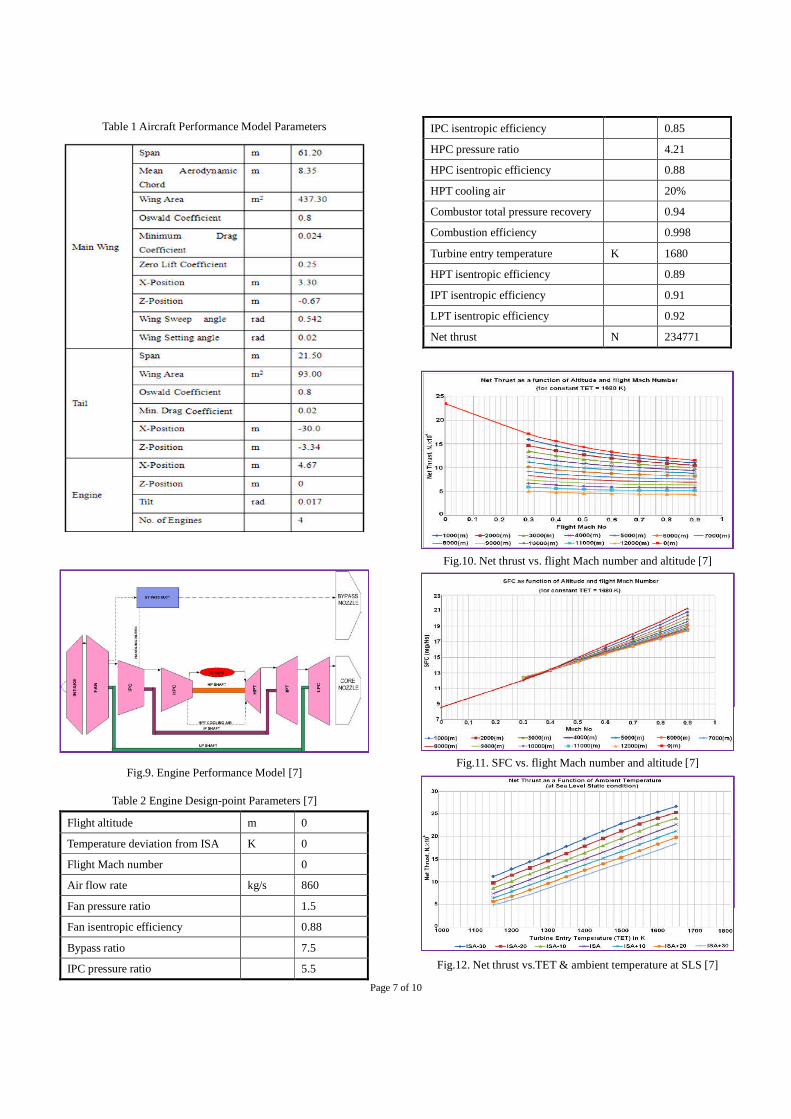
As a preliminary application of GATAC in flight trajectory, a
multi-disciplinary optimization case was performed for optimization of
modern long-haul civil aircraft powered by 4 high ByPass Ratio (BPR)
turbofan engines with the flight mode of constant cruise altitude and
Mach number. In this case, the optimized objective functions are fuel
consumption and flight time, with the NOx and CO2 as outputs as well,
and the optimization variables are speeds and altitudes at points 1, 2, 3,
16 and 17 shown as the Fig.8. The initial weight of simulated aircraft is
260,000kg, the flight altitudes and speeds at both initial point and end
point are specified as 457.2 meters and 0.39 (Mach Number), and the
flight distance is designed as 6840 km. The following schematic gives a
graphical description about this optimization.
Fig.8 Schematic representation of flight trajectory optimization
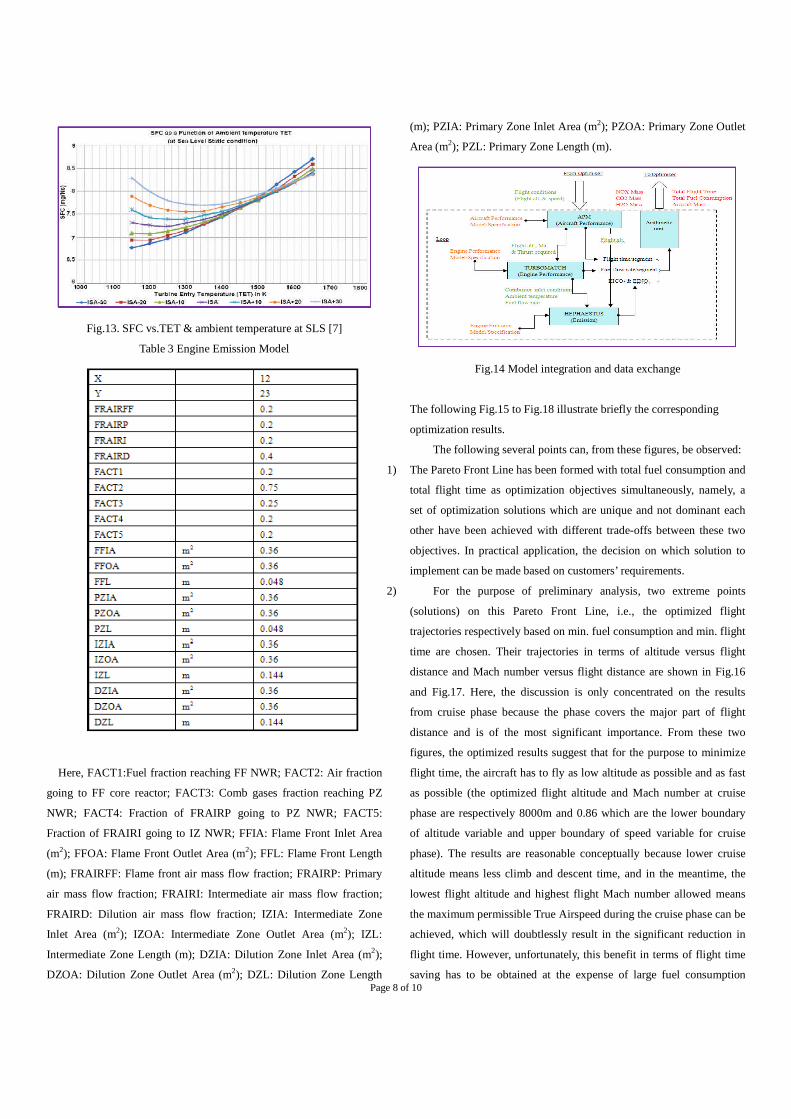
Moreover, Table 1, Table 2, Table 3 and Fig.9 show the aircraft
performance model, engine performance model and engine emission
model which are utilized in the application case. Fig.10 to Fig.13
further illustrate the engine off-design behavior in terms of the
influences of flight altitude, flight Mach number, TET and ambient
temperature on net thrust and SFC respectively. Fig.14 displays the
model integration and data exchange among them.
Page 7 of 10
Table 1 Aircraft Performance Model Parameters
Fig.9. Engine Performance Model [7]
Table 2 Engine Design-point Parameters [7]
Flight altitude m 0
Temperature deviation from ISA K 0
Flight Mach number 0
Air flow rate kg/s 860
Fan pressure ratio 1.5
Fan isentropic efficiency 0.88
Bypass ratio 7.5
IPC pressure ratio 5.5
IPC isentropic efficiency 0.85
HPC pressure ratio 4.21
HPC isentropic efficiency 0.88
HPT cooling air 20%
Combustor total pressure recovery 0.94
Combustion efficiency 0.998
Turbine entry temperature K 1680
HPT isentropic efficiency 0.89
IPT isentropic efficiency 0.91
LPT isentropic efficiency 0.92
Net thrust N 234771
Fig.10. Net thrust vs. flight Mach number and altitude [7]
Fig.11. SFC vs. flight Mach number and altitude [7]
Fig.12. Net thrust vs.TET & ambient temperature at SLS [7]
Page 8 of 10
Fig.13. SFC vs.TET & ambient temperature at SLS [7]
Table 3 Engine Emission Model
Here, FACT1:Fuel fraction reaching FF NWR; FACT2: Air fraction
going to FF core reactor; FACT3: Comb gases fraction reaching PZ
NWR; FACT4: Fraction of FRAIRP going to PZ NWR; FACT5:
Fraction of FRAIRI going to IZ NWR; FFIA: Flame Front Inlet Area
(m2); FFOA: Flame Front Outlet Area (m2); FFL: Flame Front Length
(m); FRAIRFF: Flame front air mass flow fraction; FRAIRP: Primary
air mass flow fraction; FRAIRI: Intermediate air mass flow fraction;
FRAIRD: Dilution air mass flow fraction; IZIA: Intermediate Zone
Inlet Area (m2); IZOA: Intermediate Zone Outlet Area (m2); IZL:
Intermediate Zone Length (m); DZIA: Dilution Zone Inlet Area (m2);
DZOA: Dilution Zone Outlet Area (m2); DZL: Dilution Zone Length
(m); PZIA: Primary Zone Inlet Area (m2); PZOA: Primary Zone Outlet
Area (m2); PZL: Primary Zone Length (m).
Fig.14 Model integration and data exchange
The following Fig.15 to Fig.18 illustrate briefly the corresponding
optimization results.
The following several points can, from these figures, be observed:
1) The Pareto Front Line has been formed with total fuel consumption and
total flight time as optimization objectives simultaneously, namely, a
set of optimization solutions which are unique and not dominant each
other have been achieved with different trade-offs between these two
objectives. In practical application, the decision on which solution to
implement can be made based on customers’ requirements.
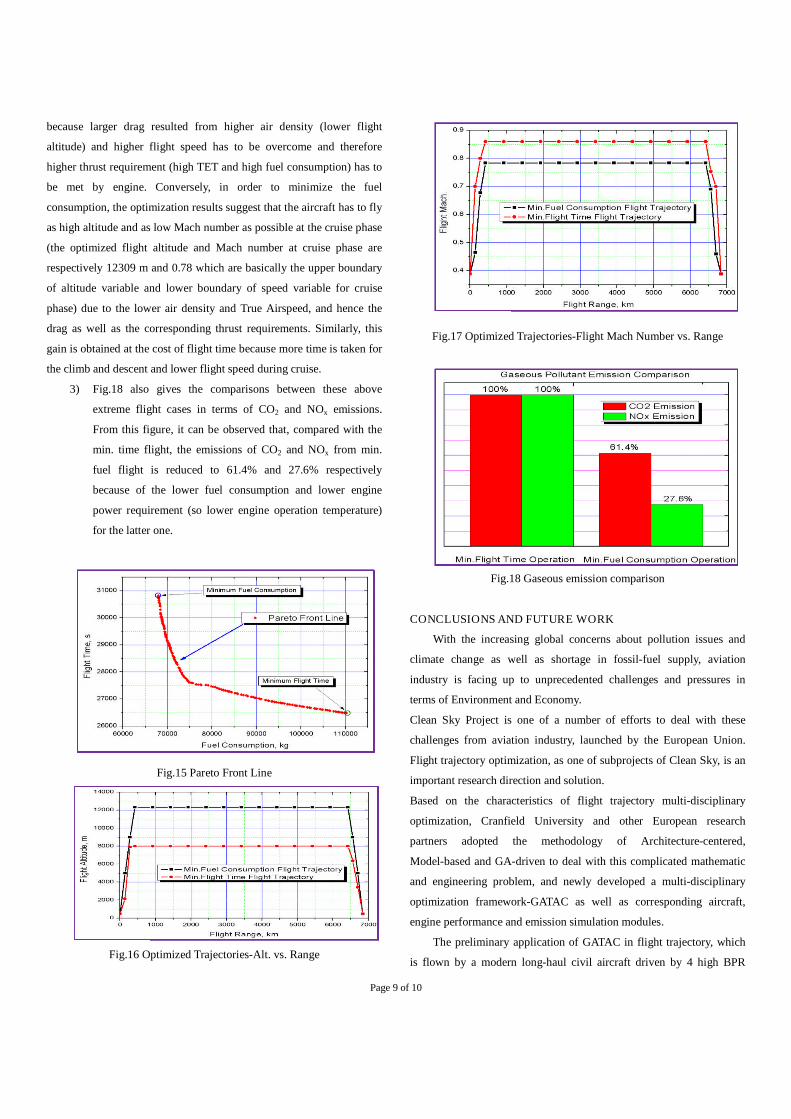
2) For the purpose of preliminary analysis, two extreme points
(solutions) on this Pareto Front Line, i.e., the optimized flight
trajectories respectively based on min. fuel consumption and min. flight
time are chosen. Their trajectories in terms of altitude versus flight
distance and Mach number versus flight distance are shown in Fig.16
and Fig.17. Here, the discussion is only concentrated on the results
from cruise phase because the phase covers the major part of flight
distance and is of the most significant importance. From these two
figures, the optimized results suggest that for the purpose to minimize
flight time, the aircraft has to fly as low altitude as possible and as fast
as possible (the optimized flight altitude and Mach number at cruise
phase are respectively 8000m and 0.86 which are the lower boundary
of altitude variable and upper boundary of speed variable for cruise
phase). The results are reasonable conceptually because lower cruise
altitude means less climb and descent time, and in the meantime, the
lowest flight altitude and highest flight Mach number allowed means
the maximum permissible True Airspeed during the cruise phase can be
achieved, which will doubtlessly result in the significant reduction in
flight time. However, unfortunately, this benefit in terms of flight time
saving has to be obtained at the expense of large fuel consumption
Page 9 of 10
because larger drag resulted from higher air density (lower flight
altitude) and higher flight speed has to be overcome and therefore
higher thrust requirement (high TET and high fuel consumption) has to
be met by engine. Conversely, in order to minimize the fuel
consumption, the optimization results suggest that the aircraft has to fly
as high altitude and as low Mach number as possible at the cruise phase
(the optimized flight altitude and Mach number at cruise phase are
respectively 12309 m and 0.78 which are basically the upper boundary
of altitude variable and lower boundary of speed variable for cruise
phase) due to the lower air density and True Airspeed, and hence the
drag as well as the corresponding thrust requirements. Similarly, this
gain is obtained at the cost of flight time because more time is taken for
the climb and descent and lower flight speed during cruise.
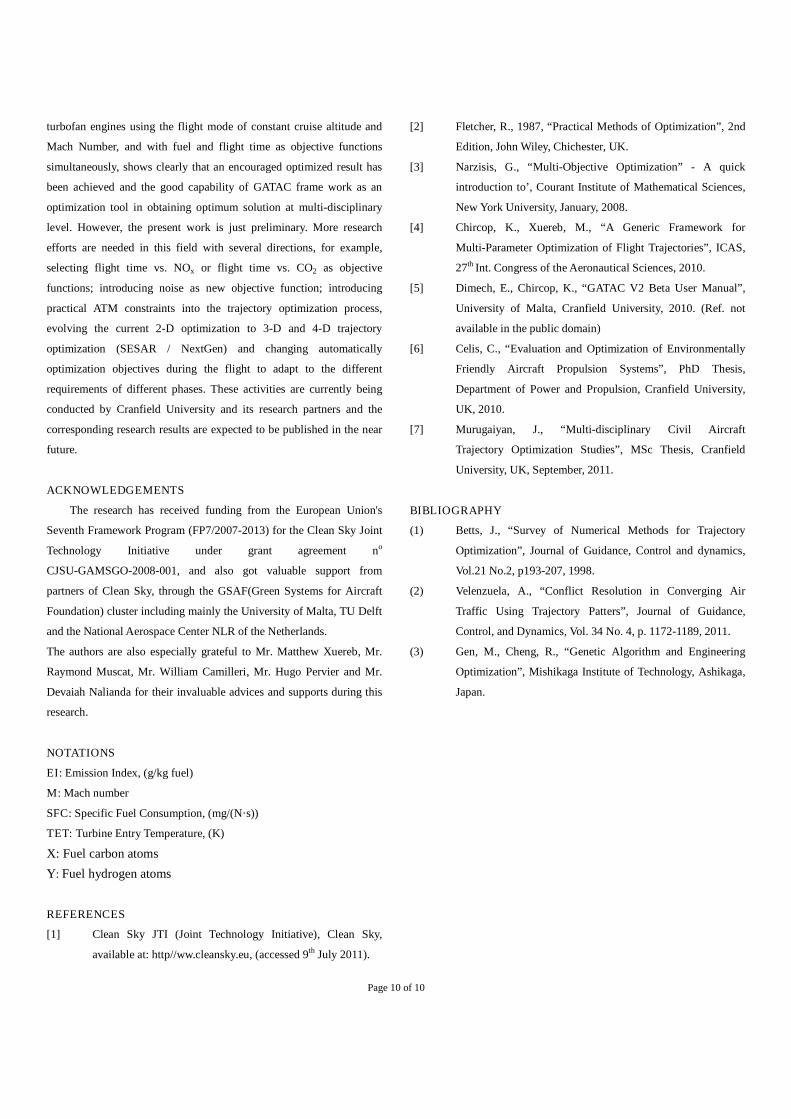
3) Fig.18 also gives the comparisons between these above
extreme flight cases in terms of CO2 and NOx emissions.
From this figure, it can be observed that, compared with the
min. time flight, the emissions of CO2 and NOx from min.
fuel flight is reduced to 61.4% and 27.6% respectively
because of the lower fuel consumption and lower engine
power requirement (so lower engine operation temperature)
for the latter one.
Fig.15 Pareto Front Line
Fig.16 Optimized Trajectories-Alt. vs. Range
Fig.17 Optimized Trajectories-Flight Mach Number vs. Range
Fig.18 Gaseous emission comparison
CONCLUSIONS AND FUTURE WORK
With the increasing global concerns about pollution issues and
climate change as well as shortage in fossil-fuel supply, aviation
industry is facing up to unprecedented challenges and pressures in
terms of Environment and Economy.
Clean Sky Project is one of a number of efforts to deal with these
challenges from aviation industry, launched by the European Union.
Flight trajectory optimization, as one of subprojects of Clean Sky, is an
important research direction and solution.
Based on the characteristics of flight trajectory multi-disciplinary
optimization, Cranfield University and other European research
partners adopted the methodology of Architecture-centered,
Model-based and GA-driven to deal with this complicated mathematic
and engineering problem, and newly developed a multi-disciplinary
optimization framework-GATAC as well as corresponding aircraft,
engine performance and emission simulation modules.
The preliminary application of GATAC in flight trajectory, which
is flown by a modern long-haul civil aircraft driven by 4 high BPR
Page 10 of 10
turbofan engines using the flight mode of constant cruise altitude and
Mach Number, and with fuel and flight time as objective functions
simultaneously, shows clearly that an encouraged optimized result has
been achieved and the good capability of GATAC frame work as an
optimization tool in obtaining optimum solution at multi-disciplinary
level. However, the present work is just preliminary. More research
efforts are needed in this field with several directions, for example,
selecting flight time vs. NOx or flight time vs. CO2 as objective
functions; introducing noise as new objective function; introducing
practical ATM constraints into the trajectory optimization process,
evolving the current 2-D optimization to 3-D and 4-D trajectory
optimization (SESAR / NextGen) and changing automatically
optimization objectives during the flight to adapt to the different
requirements of different phases. These activities are currently being
conducted by Cranfield University and its research partners and the
corresponding research results are expected to be published in the near
future.
ACKNOWLEDGEMENTS
The research has received funding from the European Union's
Seventh Framework Program (FP7/2007-2013) for the Clean Sky Joint
Technology Initiative under grant agreement no
CJSU-GAMSGO-2008-001, and also got valuable support from
partners of Clean Sky, through the GSAF(Green Systems for Aircraft
Foundation) cluster including mainly the University of Malta, TU Delft
and the National Aerospace Center NLR of the Netherlands.
The authors are also especially grateful to Mr. Matthew Xuereb, Mr.
Raymond Muscat, Mr. William Camilleri, Mr. Hugo Pervier and Mr.
Devaiah Nalianda for their invaluable advices and supports during this
research.
NOTATIONS
EI: Emission Index, (g/kg fuel)
M: Mach number
SFC: Specific Fuel Consumption, (mg/(N·s))
TET: Turbine Entry Temperature, (K)
X: Fuel carbon atoms
Y: Fuel hydrogen atoms
REFERENCES
[1] Clean Sky JTI (Joint Technology Initiative), Clean Sky,
available at: http//ww.cleansky.eu, (accessed 9th July 2011).
[2] Fletcher, R., 1987, “Practical Methods of Optimization”, 2nd
Edition, John Wiley, Chichester, UK.
[3] Narzisis, G., “Multi-Objective Optimization” - A quick
introduction to’, Courant Institute of Mathematical Sciences,
New York University, January, 2008.
[4] Chircop, K., Xuereb, M., “A Generic Framework for
Multi-Parameter Optimization of Flight Trajectories”, ICAS,
27th Int. Congress of the Aeronautical Sciences, 2010.
[5] Dimech, E., Chircop, K., “GATAC V2 Beta User Manual”,
University of Malta, Cranfield University, 2010. (Ref. not
available in the public domain)
[6] Celis, C., “Evaluation and Optimization of Environmentally
Friendly Aircraft Propulsion Systems”, PhD Thesis,
Department of Power and Propulsion, Cranfield University,
UK, 2010.
[7] Murugaiyan, J., “Multi-disciplinary Civil Aircraft
Trajectory Optimization Studies”, MSc Thesis, Cranfield
University, UK, September, 2011.
BIBLIOGRAPHY
(1) Betts, J., “Survey of Numerical Methods for Trajectory
Optimization”, Journal of Guidance, Control and dynamics,
Vol.21 No.2, p193-207, 1998.
(2) Velenzuela, A., “Conflict Resolution in Converging Air
Traffic Using Trajectory Patters”, Journal of Guidance,
Control, and Dynamics, Vol. 34 No. 4, p. 1172-1189, 2011.
(3) Gen, M., Cheng, R., “Genetic Algorithm and Engineering
Optimization”, Mishikaga Institute of Technology, Ashikaga,
Japan.