Cross-disciplinary higher education of data science
18
ETH Library Cross-disciplinary Higher Education of Data Science– Beyond the Computer Science Student Journal Article Author(s): Pournaras, Evangelos Publication date: 2017-12 Permanent link: https://doi.org/10.3929/ethz-b-000172373 Rights / license: Creative Commons Attribution 4.0 International Originally published in: Data Science 1(1-2), https://doi.org/10.3233/DS-170005 This page was generated automatically upon download from the ETH Zurich Research Collection . For more information, please consult the Terms of use .
-
Upload
khangminh22 -
Category
Documents
-
view
1 -
download
0
Transcript of Cross-disciplinary higher education of data science

ETH Library
Cross-disciplinary HigherEducation of Data Science–Beyond the Computer ScienceStudent
Journal Article
Author(s):Pournaras, Evangelos
Publication date:2017-12
Permanent link:https://doi.org/10.3929/ethz-b-000172373
Rights / license:Creative Commons Attribution 4.0 International
Originally published in:Data Science 1(1-2), https://doi.org/10.3233/DS-170005
This page was generated automatically upon download from the ETH Zurich Research Collection.For more information, please consult the Terms of use.

Data Science 1 (2017) 101–117 101DOI 10.3233/DS-170005IOS Press
Cross-disciplinary higher education of datascience – beyond the computer sciencestudent
Evangelos PournarasProfessorship of Computational Social Science, ETH Zurich, Clausiusstrasse 50, 8092, Zurich,SwitzerlandE-mail: [email protected]; ORCID: https://orcid.org/0000-0003-3900-2057
Editor: Tobias Kuhn (https://orcid.org/0000-0002-1267-0234)Solicited reviews: Filip Ilievski (https://orcid.org/0000-0002-1735-0686); Núria Queralt-Rosinach(https://orcid.org/0000-0003-0169-8159); Davide Ceolin (https://orcid.org/0000-0002-3357-9130)
Received 1 April 2017Accepted 27 May 2017
Abstract. The majority of economic sectors are transformed by the abundance of data. Smart grids, smart cities, smart health,Industry 4.0 impose to domain experts requirements for data science skills in order to respond to their duties and the challengesof the digital society. Business training or replacing domain experts with computer scientists can be costly, limiting for thediversity in business sectors and can lead to sacrifice of invaluable domain knowledge. This paper illustrates experience andlessons learnt from the design and teaching of a novel cross-disciplinary data science course at a postgraduate level in a top-class university. The course design is approached from the perspectives of the constructivism and transformative learning theory.Students are introduced to a guideline for a group research project they need to deliver, which is used as a pedagogical artifactfor students to unfold their data science skills as well as reflect within their team their domain and prior knowledge. In contrast toother related courses, the course content illustrated is designed to be self-contained for students of different discipline. Withoutassuming certain prior programming skills, students from different discipline are qualified to practice data science with open-source tools at all stages: data manipulation, interactive graphical analysis, plotting, machine learning and big data analytics.Quantitative and qualitative evaluation with interviews outlines invaluable lessons learnt.
Keywords: Education, data science, cross-discipline, big data, research methodology, learning, constructivism theory,transformative theory
1. Introduction
The pervasiveness of Internet of Things and ubiquitous computing brings unprecedented transforma-tions in several sectors of economy. Nowadays, design, operational, management and regulatory deci-sions in smart cities, smart grids, smart health services and Industry 4.0 rely on streams of massive data.This radically alters the skills set of domain experts required to automate, analyze and optimize suchcomplex systems [14]. Data science becomes of a paramount importance with research communities
This article is published online with Open Access and distributed under the terms of the Creative Commons Attribution License (CC BY 4.0).
2451-8484 © 2017 – IOS Press and the authors.

102 E. Pournaras / Cross-disciplinary higher education of data science – beyond the computer science student
expressing active interest on the educational practices for data science [12,26]. Experts’ skills on statis-tics are not adequate as data may be unstructured, very large in size, may require real-time processingand advanced machine learning techniques that go beyond descriptive statistics [14]. On the one hand,training domain experts to new skills of data science is costly and not all enterprises have the resourcesfor this purpose. On the other hand, replacing the domain experts with computer scientists, who are for-mally trained on data science may result in imbalances in the job market and lack of diversity, cohesionand domain knowledge. Note that recent rapid development and significant discoveries in the areas ofcomplex networks and biology, for instance mapping human genome, have been made with data sci-ence methodologies applied by domain experts rather than computer scientists [33,44]. There is ongoingresearch on introducing formal models for such discoveries [29].
Given the evident lack of plurality and the high interest for data scientists in the job market [31,48], academic institutes need to respond to their role and educate a broad range of scientists in datascience with novel didactic and pedagogical approaches tailored beyond the computer science student.The experience aggregated by the design of such a novel educational course is the focus of this paper.The contributions of this paper are (i) the analysis of effects and implications by design choices made toaddress a cross-discipline approach to data science as well as (ii) lessons learnt after teaching a cross-disciplinary data science course for 3 years at a top-class university.
The design and teaching of a postgraduate data science course in a cross-disciplinary context canbenefit from the constructivism and transformative learning theory. By using research methodologiesapplied in data science research projects used as pedagogical artifacts, students can benefit from theconcepts of the two learning theories: learners’ prior knowledge and experience as well as habits ofmind and point of view.
This paper illustrates the experience and lessons learnt from the design and teaching of a cross-discipline data science course at ETH Zurich. It shows how the course overcomes challenges observedin related courses reviewed in this paper such as creating a self-contained content or effectively choosingsoftware tools for teaching, for instance, data manipulation and graphical analysis. Moreover, the diver-sity of (i) the students, (ii) the projects selected and (iii) the project teams is discussed along with its roleto students’ success. The course and learning objectives, as defined within the Bloom’s taxonomy, areassessed with quantitative and qualitative information aggregated from official university evaluations aswell as personal interviews conducted for the purpose of this paper. Several lessons learnt are derivedrelated to the content size, the difficulty level, the role of diversity, the choice of software tools, therole of the research projects as a pedagogical artifact as well as the data requirements that students andlecturers need to take care of.
This paper is outlined as follows: Section 2 discusses the perspective of learning theory on data sci-ence. Section 3 introduces the course “Data Science in Techno-socio-economic Systems” designed andtaught at ETH Zurich. Section 4 illustrates the self-contained content of the course. Section 5 introducesthe guideline of data science research projects and shares experiences on students’ work. Section 6 il-lustrates a quantitative and qualitative evaluation of the course and outlines future evaluation. Section 7compares several aspects of the illustrated course with other data science educational programs andcourses. Section 8 summarizes the lessons learnt and the societal implications of cross-disciplinary datascience education. Finally, Section 9 concludes this paper.

E. Pournaras / Cross-disciplinary higher education of data science – beyond the computer science student 103
2. Perspectives of learning theory on data science
To the best of the author’s knowledge, there is very limited relevant work on how learning theoryapplies to data science education, and especially in the cross-discipline education of data science. Thissection discusses the perspective of two relevant theories in this context, the constructivism and trans-formative learning theory.
A constructivism pedagogical approach to data science benefits from the prior knowledge and experi-ences on which learners of different background have been exposed [9]. Beyond the technical computerscience content of data science, the background knowledge that learners bring is invaluable to contextu-alize and develop data science knowledge and practices, as well as articulate a domain-specific reasoningvia posing valid research questions and hypotheses from learners’ field of expertise [16].
Data science education with learning methods from the perspective of Papert’s constructionism [38]promote the use of data science tools and techniques as self-learning artifacts to facilitate the constructionof new knowledge [1]: learning the actual data science methods and generate new knowledge fromtheir applicability on a domain. In this sense, data science can be seen as an intellectual environmentthat students actively use as an evocative object [47] to solve a domain problem, while this use entailspracticing data science and therefore the development of new skills and knowledge. This view is inline with the learning approach of ‘to-think-with’ and ‘to-learn-with’ technology (data science in thiscontext) [42].
The transformative learning theory is relevant to the education of data science in a cross-disciplinarycontext. The theory explains how learners revise and interpret meaning [45] and articulates learning asthe cognitive process of effecting change in a frame of reference composed of two dimensions: habits ofmind and points of view. Emotions are involved [27] and ideas may not be easily accepted if the peda-gogical approach does not encounter the diversity of the learners, i.e. values, associations and conceptsthey have formed [34]. This is especially relevant for cross-disciplinary data science education.
For instance, consider the cognitive process of data speculation by learners of different disciplines,e.g. a (visual) exploratory analysis of residential energy demand data. Self-reflection on this process isevident given the habits of mind and view point of learners. An electrical engineer may speculate aboutsystem robustness, for instance power peaks causing blackouts. In contrast, an economist may interpretdata in economic terms, meaning a power peak may imply low energy prices. And a social scientistsmay link power peaks to human behavior, for instance human mobility (returning back from work),residential activities and an overall certain lifestyle. Moreover, a computer scientist may find these dataas privacy-intrusive given a prior knowledge on inference techniques capable of, for instance, detectingwith high accuracy TV programs chosen by exclusively using data of the TV power consumption [21].Such ethical concerns may influence the individuals’ choices of the data analytics methods applied oversensitive personal data. The learning process as well as the educational content should encounter for thisdiversity and should have the capacity to be integrative of different learners’ experiences.
3. A cross-disciplinary data science course
This section outlines a relevant cross-disciplinary data science course created at ETH Zurich. The3-credit course entitled Data Science in Techno-socio-economic Systems is designed for MSc studentsand it is part of the department “Humanities, Social and Political Sciences” (GESS1). The course was
1Available at https://www.gess.ethz.ch/en/ (last accessed: March 2017).
104 E. Pournaras / Cross-disciplinary higher education of data science – beyond the computer science student
designed in 2014 and has been running for the three years of 2015–2017 during spring semesters. Thelecturers, including the author, have been two computer scientists with specialization in distributed sys-tems and big data as well as a physicist. All lecturers have experience in multi-disciplinary research andwork for the group “Computation Social Science” (COSS2).
Within the computer science curricula, ETH Zurich offers data science related courses for instance,data mining, big data, machine learning and others. Most of these courses are offered by renownedinternational experts and they concern state-of-the-art methods and techniques of data science, mainlyfrom an academic viewpoint, i.e. analytical expressions and complexity analysis of machine learningalgorithms. For this reason, most of these courses are mainly designed for students with a strong mathe-matical or computer science background. A similar trend is observed in the vast majority of science andtechnical universities as reviewed in Section 7. The course “Data Science in Techno-socio-economicSystems” is designed to establish a broader scope of data science education that is highly cross-disciplinary, practical, yet, research-oriented. Without being an introductory course to the aforemen-tioned more advanced and computer science-oriented courses, “Data Science in Techno-socio-economicSystems” minimizes the content overlap, while providing evident learning opportunities to students thatattend more advanced courses to unfold advanced knowledge and skills in a new educational context.
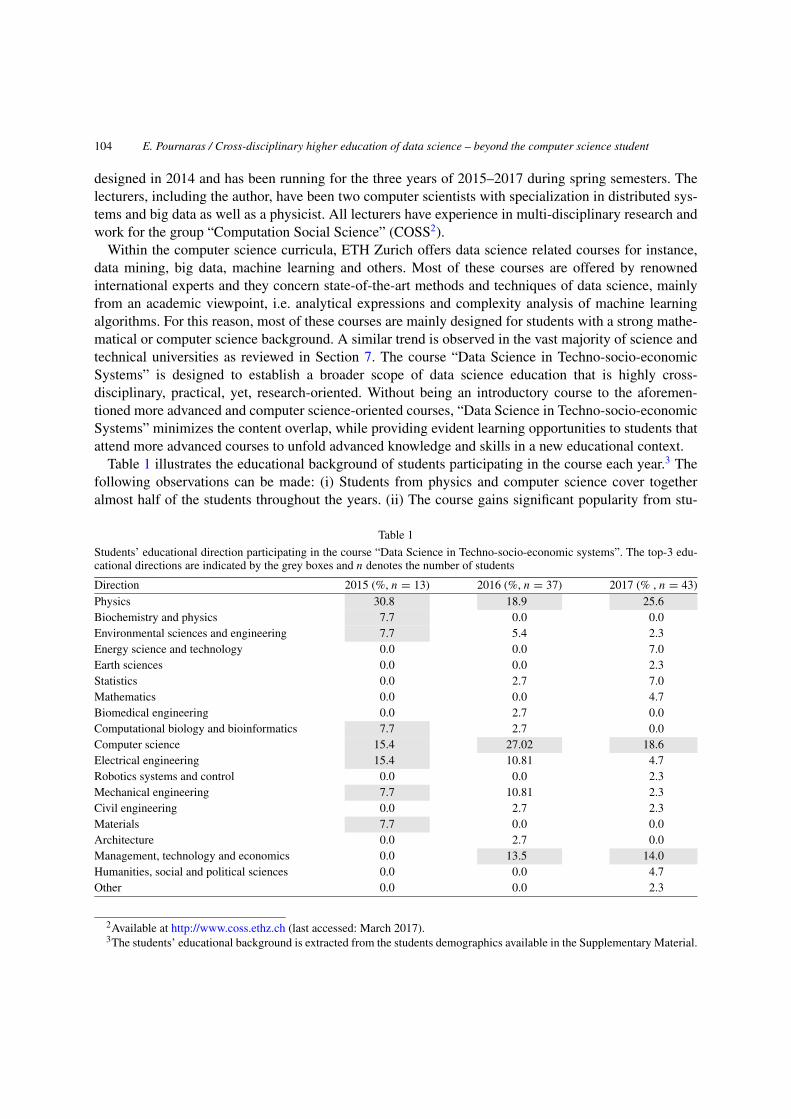
Table 1 illustrates the educational background of students participating in the course each year.3 Thefollowing observations can be made: (i) Students from physics and computer science cover togetheralmost half of the students throughout the years. (ii) The course gains significant popularity from stu-
Table 1
Students’ educational direction participating in the course “Data Science in Techno-socio-economic systems”. The top-3 edu-cational directions are indicated by the grey boxes and n denotes the number of students
Direction 2015 (%, n = 13) 2016 (%, n = 37) 2017 (% , n = 43)Physics 30.8 18.9 25.6Biochemistry and physics 7.7 0.0 0.0Environmental sciences and engineering 7.7 5.4 2.3Energy science and technology 0.0 0.0 7.0Earth sciences 0.0 0.0 2.3Statistics 0.0 2.7 7.0Mathematics 0.0 0.0 4.7Biomedical engineering 0.0 2.7 0.0Computational biology and bioinformatics 7.7 2.7 0.0Computer science 15.4 27.02 18.6Electrical engineering 15.4 10.81 4.7Robotics systems and control 0.0 0.0 2.3Mechanical engineering 7.7 10.81 2.3Civil engineering 0.0 2.7 2.3Materials 7.7 0.0 0.0Architecture 0.0 2.7 0.0Management, technology and economics 0.0 13.5 14.0Humanities, social and political sciences 0.0 0.0 4.7Other 0.0 0.0 2.3
2Available at http://www.coss.ethz.ch (last accessed: March 2017).3The students’ educational background is extracted from the students demographics available in the Supplementary Material.

E. Pournaras / Cross-disciplinary higher education of data science – beyond the computer science student 105
Table 2
Students’ semester status participating in the course “Data Science in Techno-socio-economic systems”. The top-3 semestersare indicated by the grey boxes and n denotes the number of students
Semester 2015 (%, n = 13) 2016 (%, n = 37) 2017 (%, n = 43)1st – BSc 0.0 0.0 0.02nd – BSc 0.0 0.0 0.03rd – BSc 0.0 2.70 0.04th – BSc 0.0 5.41 0.05th – BSc 0.0 0.0 0.06th – BSc 15.39 2.70 20.937th – BSc 0.0 0.0 0.08th – BSc 7.69 4.41 0.01st – MSc 0.0 2.70 0.02nd – MSc 61.54 51.35 46.513rd – MSc 0.0 5.41 2.334th – MSc 0.0 2.70 13.95Doctoral student 7.69 21.62 13.95Other 7.69 0.0 2.33
dents following the direction “Management, technology and economics”. (iii) Diversity in the directionsincreases over the years.
Table 2 illustrates the semester status of the students who have participated.4 There are three maincategories of students attending the course: (i) 6th semester BSc students (last year BSc students), (ii) 2ndsemester MSc students (first year MSc students) and (iii) PhD students. Therefore, the course succeedsto attract a broad range of students groups including mature BSc students, MSc students who early planto get involved with data science education and PhD students who acquire data science skills in the theirPhD project or intend to learn research methodologies applied in data science.
4. Self-contained data science education
The goal of the course is to teach a large spectrum of postgraduate students data science and guidethem to develop skills with which they can independently practice data science starting from data collec-tion to oral/written presentation of results. Figure 1 illustrates learning objectives of the course accordingto Bloom’s taxonomy [2]. The educational content relies on epistemic concepts of science and researchin order to cultivate a problem-oriented mindset as well as confidence by learning rigorous method-ologies and conventions: formulating research questions/hypotheses, presenting results in a quantitativemanner, combining the behavioral and design science research strategies [11].
Moreover, the education relies exclusively on open and free software. It has been shown that closedand proprietary software compromises empirical research and replication of results in data science [15].
Content-wise, the course covers the following topics:
• Fundamentals: data collection, data modeling, data manipulation, databases, plotting and visual-ization.
• Data mining and machine learning: classification, decision-trees, clustering, prediction, neuralnetworks and others.
4The students’ semester status is extracted from the students demographics available in the Supplementary Material.

106 E. Pournaras / Cross-disciplinary higher education of data science – beyond the computer science student
Fig. 1. Learning objectives of the course “Data Science in Techno-socio-economic systems” according to Bloom’s taxonomy.
• Big data analytics: MapReduce, parallel computing, data streaming and social media.• Applications: smart grids, smart cities, traffic systems, social media, mobility, localization, activity
recognition, privacy-preserving social sensing and mining.
The course makes no assumption of pre-requisite knowledge, e.g. certain programming skills, andtherefore, it is designed to build up a minimal knowledge at all stages of data science. Data manipula-tion proves to be one of the most challenging educational material to design here. It is the “makes yourhands dirty” job, a critical requirement for the direct involvement of students in data science as it involvesprocessing tabular data, removing missing values or outliers, aggregating, filtering, formatting and trans-forming data. Although most programming languages, e.g. python, scala, java, etc., provide advanceddata manipulation methods, teaching a general-purpose programming language in a cross-disciplinaryaudience of students entails several drawbacks and limitations: (i) steep learning curve, especially fornon-computer scientists, (ii) potential distraction from the main goals of the course, (iii) hard to make achoice for a programming language that would meet the expectations and desires of an heterogeneousaudience [50], (iv) may raise motivational issues for students who already perform data manipulationwith a programming language of their convenience.
The solution here has been AWK,5 a standardized interpreted unix programming language that is veryeasy to learn, it is a mature language with plenty of online learning material and serves the educationalpurpose of the course. AWK handles all I/O operations as well as resource management, i.e. memory, andtherefore allows students to entirely focus on calculations over data. AWK has been a new experiencefor the vast majority of students, even for computer scientists with systems background who learn aboutthe use of AWK in a new context: data science. Although there is very limited [28] formal educational
5Available at https://www.gnu.org/software/gawk/manual/ (last accessed: May 2017).

E. Pournaras / Cross-disciplinary higher education of data science – beyond the computer science student 107
material of teaching AWK for data science, several online sources6 praise the features of the languagefor this purpose.
Concerning databases, the focus is on running SQL queries. The free visual environment of MAMP7
is used that comes with easy installation and configuration of Apache, PHP and MySQL. Moreover,the educational material on plotting includes Gnuplot8 that is free and open-source, supports graphicalanalysis, can interoperate with AWK and can provide high-quality graphics. Gephi9 is shown as a toolfor studying and visualizing complex networks, although an extensive coverage of this topic is out of thescope of the course.
The part on data mining and machine learning provides an overview to supervised and unsupervisedmachine learning algorithms and how to choose one for a certain problem. Teaching these algorithmsfrom a mathematical perspective is covered in depth in other courses that require a narrower focus. In-stead, this course aims at qualifying students to make informed decisions about the algorithms they useand their implications. For instance, it is shown that clustering of time series subsequences is meaning-less despite a long lasting research that adopts this method [30]. Similarly, extracting a user profile fromhistorical discrete data by using the centroids of clusters may result in a profile that does not correspondto reality, as the mean may not appear in the historic data. The cluster medoids may be more relevant insuch a case [40]. Data over-fitting and under-fitting are discussed as well.
The part on big data analytics covers batch vs. real-time data processing using Hadoop10 and Storm.11
Students are familiarized with the Hadoop architecture, job running, and terminology in addition togaining a deep understanding of the MapReduce model. Several examples in pseudo-code are given,however, scripts and batch execution routines are illustrated as black boxes that students could use intheir projects with lightweight modifications and the help of the tutors. Finally, emphasis is given on thechallenges of big data such as distinguishing causation from correlations, especially spurious ones thatappear when big data allow a massive number of variable combinations.
The course is highly application-oriented. One of the goals of the course is to develop domain knowl-edge and expertise in a cross-disciplinary context. In other words, the students do not only apply datascience methods in an application domain but instead they are given the opportunity to understand inmore depth challenges of different domains and how data science methodologies can be used to tacklethese challenges. Several case-study applications come from the multi-disciplinary research of the tutors[20,39,40], adjusted in an educational context. They are accompanied by the datasets and the softwarecode for the repeatability and expansion of the results by the students. To improve the cross-disciplinarityoutcome of the course, lecturers of different discipline can give lectures about applications in the future.Moreover, earlier successful students’ projects are presented to develop a psychological construct ofself-efficacy in the course [7]. This proves to be particularly essential for students’ confidence and ex-pectations at the beginning, when they define the goals of their projects.
6Examples: http://www.gregreda.com/2013/07/15/unix-commands-for-data-science/, http://datascienceatthecommandline.com, http://john-hawkins.blogspot.ch/2013/09/using-awk-for-data-science.html (last accessed: May 2017).
7Available at https://www.mamp.info/en/ (last accessed: May 2017).8Available at http://gnuplot.sourceforge.net (last accessed: May 2017).9Available at https://gephi.org (last accessed: May 2017).10Available at http://hadoop.apache.org (last accessed: May 2017).11Available at http://storm.apache.org (last accessed: May 2017).

108 E. Pournaras / Cross-disciplinary higher education of data science – beyond the computer science student
5. Data science research projects
Students are evaluated based on a group research project of 2–3 people that they have to carry outthroughout the semester. The grade of the project covers entirely the grade of the course and it is formedbased on the following criteria: (i) scientific clarity-25%, (ii) technical clarity-25%, (iii) writing andcontent presentation-25%, (iv) oral presentation-25%, (v) data generation and collection-10% bonus.The latter acknowledges the key role that data construction plays on scientific practices of theory devel-opment [16].
Unlike a more conventional project report, the research project for this course has several formalrequirements that reflect on the knowledge quality of the course material required to successfully practicedata science as well as effectively present results in writing and orally. In this sense, the research projectcan be seen as a pedagogical artifact reflecting on the constructivism learning theory [9]. The projectrequirements are defined by an educational guideline that is based on fundamental epistemic conceptsand conventions of research philosophy and strategy applied in the context of data science. The outlineof the guideline is the following:
1. Define the challenge.2. Define the outcome and its significance.3. Reason about a data science approach.4. Select the data sources.5. Define evaluation metrics and measurements.6. Build the data analytics pipeline.7. Perform validation and evaluation.8. Draw conclusions and future work.
In Step 1, defining the challenge involves the formulation of a research question or hypothesis ac-companied by related work. In other words, the students are encouraged to develop a problem-solvingmindset from the very beginning of their project work. However, the guideline is not strict at this pointas it is known that new research questions and hypotheses may become apparent during the exploratorydata analysis. The outcome and the significance of a project in Step 2 concerns the broader positioningof students’ work in society. Is the outcome an artifact, such as an algorithm or an engineered system?Or just a better understanding of an observed phenomenon? Can the results be used to design a newpolicy? And for whom is the outcome relevant? An end user, a policy-maker or a system operator?A certain problem can be studied with other approaches beyond data science, for instance, agent-basedsimulation or analytical approaches. Justifying the intractability of a mathematical problem or reasoningabout the data science approach is part of Step 3 of the guideline. The Step 4 of the guideline standsfor the selection of data sources. Datasets need to meet project requirements, e.g. quality, size, format,granularity level etc. For instance, when a data science project on smart grid focuses on residential en-ergy consumption, data about the aggregate load of a power grid are not relevant. In this case, residentialsmart meter energy data are required or advanced methods for energy disaggregation [32]. The guidelineencourages students to be quantitative in their presentations and for this reason they need to define spe-cific meaningful metrics and measurements in Step 5. For instance, the relationships in a social networkcan be measured with topological and graph spectral properties. When these networks are temporal, therespective temporal metrics should be applied [37]. The data analytics pipeline in Step 6 is the design ofthe data manipulation, processing and analytics performed. Step 7 suggests a high-quality presentationof quantitative results. Step 8 completes the guideline with explicitly stating the conclusions and futurework.

E. Pournaras / Cross-disciplinary higher education of data science – beyond the computer science student 109
The guideline is presented to the students at the very first lecture followed by lectures with projectexamples that adhere to the guideline. Students are asked to deliver an early one-page proposal at the3rd week of the semester outlining the challenge they tackle, why they employ a data science approach,what the related work is in the problem area and what data they intend to use. At the end of the semester,students deliver their report and present their project to the course instructors as well as all other studentsin the class, who can challenge their classmates with questions.
Table 3 illustrates students’ projects during the first and the second year of the course. The followingtwo key observations can be made: (i) The diversity of the projects is very high ranging from analysis oftwitter data, mobile sensing, Internet of Things, analysis of scientific publications, analysis of traffic andenvironmental data, medical applications and other. (ii) The diversity of the students’ background in theteams formed is not high. The group formation trend is that students either form teams with colleaguesthey know from their own study program or they are more comfortable when they work together with
Table 3
Students’ projects and diversity in their educational direction
Number Project Student 1 Student 2 Student 31 Graphical Analysis of Nervousnet Proximity Data Computer
Science–
2 How Can We Identify Crowds’ Behaviour Using NoiseData?
Electricalengineering
Physics –
3 Identifying community structures by geo-locatedTwitter data
Environmentalscience andengineering
Materials –
4 Topic extraction and analysis from scientificpublications
Biochemistryand physics
Computationalbiology andbioinformatics
Electricalengineering
5 Public Opinion on Climate Change Physics Physics –6 Real-time human activity recognition from
accelerometer data using Convolutional NeuralNetworks
Computerscience
– –
7 Spurious relationships in Twitter data Physics Physics Physics8 Are cyclists on the move according to weather
conditions?Computerscience
Computerscience
Mechanicalengineer
9 Identifying Opinion Leaders in Social Networks Computerscience
Computerscience
Computerscience
10 Why do you leave your bicycle at home today? Factorsthat influence the number of bicycles in the city ofZurich
EnvironmentalSciences andengineering
EnvironmentalSciences andengineering
–
11 A Case Study for Urban Stress Level Monitoring Mechanicalengineering
Architecture Mechanicalengineering
12 Quantitative Evaluation of Gender Bias in Astronomy Physics Physics Physics13 Analysis of Language Mobility using Twitter Messages Management,
technologyandeconomics
Management,technologyand economics
Management,technologyand economics
14 Sentiment Analysis on Twitter Data Computerscience
Computerscience
Computationalbiology andbioinformatics
15 Schizophrenia Classification Challenge Report Computerscience
Electricalengineering
Electricalengineering

110 E. Pournaras / Cross-disciplinary higher education of data science – beyond the computer science student
people from the same background, even if they choose a project that is not in the domain area of theirexpertise, for instance Project 4 and 15.
However there are some exceptions worth mentioning and discussing. For instance, Project 11 hasbeen a challenging project, though very successful and resulted in a prestigious scientific publication inconference proceedings [22]. This project was conducted by an architect and two mechanical engineersand involved an advanced data collection process in the context of smart cities using mobile phones,wearables and several environmental sensors carried by participants in the study. The goal of the projectwas to measure several urban qualities in a city path, for instance, greenery, stress, noise pollution andothers. Project 13 is another successful project ran by students of the same, but highly inter-disciplinarystudy program and resulted in a scientific publication as well [35]. The goal of the project is to measurethe spatio-temporal language mobility evolution and detect real-world events as well as tourism patternsvia Twitter and the analysis of 10TB of tweets.12
There are also projects though that faced some serious challenges. For example, Project 10 studiedcorrelations between the use of bicycles and the weather in Zurich. It proved not to be straightforwardfor the students to go beyond descriptive statistics and a regression analysis of the data without additionalsupervision effort. In this particularly case, the low diversity of the group played a critical role. At the endthe students managed to compare classification results on weather phenomena between k-means cluster-ing and the Gaussian Data finite mixture model fitted by the EM algorithm [19]. Project 2 also proved tobe especially challenging for the students due to the low data quality by privacy-preservation constraintsintroduced during the data collection process [36]. In this case, the initial hypothesis was whether the ac-tivity of the Chaos Communication Congress13 could be detected via noise sensors, for instance, parallelsessions, breaks, human interactions and other. During the 2014 edition of the congress, the Nervous-net14 team deployed a smart phone platform for an anonymous privacy-preserving data collection thatinvolves smart phone sensors as well as a GPS-free privacy-preserving localization mechanism usingbluetooth beacons [36]. As the platform relies on a volunteering and participatory data collection pro-cess, the collected dataset is highly sparse, yet contains data from a wide range of sensors. By exclusivelynarrowing the scope of the project down to the noise sensor, students could not detect events with a highaccuracy and statistical confidence despite the heavy interpolation applied. However, during the project,they started experimenting with the other sensor data available and turned their project on mining sensordata into a sensor fusion project that improved the detection accuracy significantly. A lesson learnt hereis that practicing data science under the constraint of privacy-preservation requires an explicit address-ing in the data science course design with more advanced techniques and the education of alternativeapproaches, for instance, privacy-preserving data analytics using summarization and differential privacy[39].
6. Course evaluation and students’ feedback
The course has received so far two official evaluations by the students conducted on behalf of ETHZurich. The general satisfaction has been 4.4/5.0 and the lecturers’ evaluation 4.5/5.0 on the follow-ing aspects: understandable and clear explanation of the subject, learning goals, lecture significance,motivation to active participation, and material made available.
12Available at https://archive.org/details/twitterstream. (last accessed: May 2017).13Available at https://www.ccc.de/en/ (last accessed: May 2017).14Available at http://www.nervousnet.ethz.ch (last accessed: May 2017).

E. Pournaras / Cross-disciplinary higher education of data science – beyond the computer science student 111
Table 4
Educational background of interviewees
Interviewee Direction1 Architecture2 Mechanical engineering3 Computer science4 Mechanical engineering5 Management, technology and economics
For the purpose of this paper, the author conducted interviews15 with 5 students that attended thecourse during the first two years to acquire further information about its effectiveness within a cross-disciplinary educational scope and the research-oriented methodology on teaching data science. Theeducational background of the interviewees is outlined in Table 4.
The interview is guided by the following agenda questions:
1. How effective was the course for you?2. Was this course too easy or too hard for you?3. If you are a computer scientist, what were beneficial and limiting factors after attending a data
science course designed beyond the computer scientist?4. If you are not a computer scientist, what were beneficial and limiting factors for you after attending
a data science course taught by computer scientists and including other computer science students?5. How successful was the course to provide you the minimum set of skills to practice data science?6. How effective was in this course to learn doing research by practicing data science?7. How effective was in this course to learn data science by doing some research?
Questions 6 and 7 reflect on how students perceive constructionism learning methods [38], data sci-ence as an evocative object [47] and the learning approach of ‘to-think-with’ and ‘to-learn-with’ tech-nology (data science in this context) [42]. Questions 3 and 4 reflect on how students experience thetransformative learning approach [45]. They are formulated from the perspective of the computer sci-entist vs. non-computer scientist to encounter the diversity [34] and the dimensions within the frame ofreference of the cognitive learning process [45]: habits of mind and points of view.
During the interviews, the effectiveness of the course was communicated by Interviewee 2 as “a verynice change from my normal study life” and “learnt a lot of interdisciplinary skills”. Interviewee 5 gaveemphasis on group work by stating that “got to work closely with people, learn how they work andthink, brainstorming and share ideas, make friends”. Interviewee 4 realized that “Later on in my studiesI could see a lot of areas where a data science approach could be useful, so I am happy to tell thatI acquired some basic skills to practice data science.”, while Interviewee 1 experienced the course as“a good overview for techniques in data science”. However, Interviewee 3 noticed that “I would like tohave known more about the exact technical details of the example applications that were presented.”and “as a computer science student I really like the implementation details.” This indicates that it is verychallenging to capture the right level of detail for a broad range of students with different expectations.This challenge is also identified in earlier work on data science education [23].
Interviewee 5 mentioned that the course had the “appropriate” difficulty level and Interviewee 3 foundthe course “relatively easy” as the interviewee felt “familiar with most technical details discussed duringthe course”. In contrast, Interviewee 2 said that the “course is one of the most complex and time intensive
15The full text of the interviews is available in the Supplementary Material.

112 E. Pournaras / Cross-disciplinary higher education of data science – beyond the computer science student
courses I did in GESS” but also mentioned that “the level was perfect to learn new skills”. In similarline is Interviewee 4 by stating that “the course was pretty hard for me, but the effort was worth it”.Interviewee 1 identified that the course “was challenging but not too hard, especially since we had towork in groups for our final projects”.
Question 3 answered by Interviewee 3 revealed that “a lot of time the course was focused on datascience technical stuff I was already familiar with”. However the student also stated that “A benefit wasseeing all those applications on the real world, which we don’t usually focus on in computer science”.Question 4 was answered by the rest of the interviewees. Interviewee 2 mentioned that “I profited fromknowledge and experience of other participants and lecturers and learned new terms of data scienceand statistics” but also stated that “I did not have a lot of background knowledge about the hard skillsand libraries. This wasn’t limiting for the course but for the project we did, because we needed a lot oftime to find the right sources and libraries”. Interviewee 5 listed as benefits “(i) coaching from the COSSteam, (ii) learn about social data, opportunities, limitations, (iii) presentations by the other teams: givesideas, insights and (iv) learn some new tools, e.g. mawk”. It was mentioned as limiting factor the “Toomuch material covered during the lectures”. Interviewee 4 found beneficial the “The way of thinkingof a data scientist” while Interviewee 1 “would have preferred to have hands on examples/tutorials ofvarious techniques in a given programming language”.
The answers on Question 5 share similar remarks on the beneficial and limiting factors of Questions 3and 4. Interviewee 5 mentioned “better to focus on the top-3 tools and techniques” with Interviewee 1agreeing, though adding that “it helped point students in the right direction for which techniques might beuseful for which questions”. Interviewee 2 reacted very positively by stating “Very successful, I learnedthe skills to approach a big data problem and subdividing it into smaller problems. I also got to knownice tools to do that in real problems such as Weka and scikit (a python library).” and Interviewee 4“I could see a lot of areas where a data science approach could be useful, so I am happy to tell that Iacquired some basic skills to practice data science.”
Answers to Questions 6 and 7 have a high heterogeneity, evidently showing how students perceive thelink between data science and research methodologies. For Interviewee 1, “was nice to learn techniquesfrom other disciplines” and “nice to have a project to test your solutions”, though “could have helpedto have intermediate homework/assignments as well”. Interviewee 2 finds doing research by practicingdata science as “quite effective”, however, leaning data science by doing some research proves to be“quite time consuming”. Interviewee 4 confidently states that “if there wasn’t our project, I would notunderstand cluster-based approaches as I do so now” and supports that doing projects is “the best wayto learn”. Interviewee 5 believes that this course should have “part of the lecture devoted to how toconduct research in general”, though practicing data science cannot obviously cover the whole broadspectrum of research methodology. In contrast, Interviewee 5 perceived the learning of data science bydoing some research as “One of my best ETH experiences so far”.
Although this evaluation provides several insights about the course performance, other aspects canbe evaluated as part of future work: success in job market, lecturers’ multi-disciplinarity in the learningoutcome, comparison to web science curricula [13], applicability of this cross-disciplinary design otherdata science courses.
7. Comparison of related work on data science education
There is an ongoing interest on data science education. Research work mainly focuses on the designof large undergraduate and postgraduate programs [3,4,18,23]. Data science is usually an organizational

E. Pournaras / Cross-disciplinary higher education of data science – beyond the computer science student 113
frame of the curriculum in which well-established courses lie such as programming, data mining, bigdata and machine learning.
Nevertheless some limited earlier work illustrates experiences from recent courses tailored to datascience. For instance, an inter-disciplinary approach to data science at Wright State University is earlierillustrated [6]. In contrast to the course illustrated in this paper, the inter-disciplinarity is limited to stu-dents studying computer science and management of information systems. Moreover, the content mainlyfocuses on statistics and programming skills without covering topics such as big data or a broader rangeof data mining algorithms. Furthermore, the integration of data science related courses in the statisticscurricula of six universities is earlier reviewed and comparison is made on the topics covered [23]. Fromthe six courses, only the one of the Smith College is entirely designed as an data science course. More-over, the courses mainly focus on cultivating programming skills in R and other technologies. They donot involve research concepts and are not designed to function in a cross-disciplinary context. How-ever the tutors of the courses identify challenges encountered in the course of ETH Zurich as well. Forinstance keeping students with varied computational skills and backgrounds on the same page and mo-tivational level or assembling consistent material from different sources suggest space for improvement.
There are also educational programs that mainly focus on massive open online courses of data science.Issues such as standards for sharing data [49], technologies for these types of courses, e.g. OpenEdX arecovered [18]. Gamification is a promising concept to engage students in a cross-disciplinary context. Forinstance, the Learn2Mine [5] platform uses notifications and badges as feedback and rewards. Earnedbadges mark progress that unlock the ability to earn “Learned” and “Mastery” status for lessons taught.Leaderboards promote the development of reputation and competition among learners. The potentialexploration of these methods in the illustrated course is part of future work.
8. Lessons learnt and societal implications
The design and teaching of the course “Data Science in Techno-socio-economic Systems” in a cross-disciplinary audience of students results in several lessons learnt that can be summarized as follows:
• Content size and level: Although the students express in overall a high satisfaction about the sizeof the material and the difficulty level, a few remarks indicate that there is space for improvement.The feedback suggests that working/lab sessions during the class may motivate further the non-computer scientists to improve their knowledge as well as the computer scientists to practice theirskills during the course. Moreover, if the educational curriculum allows an increase in the coursecredits, the students could work on deliverables during the semester and undertake formal examsat the end of semester as a more systematic way to track and capitalize progress throughout thesemester.
• Diversity: It is shown that the proposed course design motivates a high level of diversity in the ed-ucational background of the participating students as well as in the projects students choose. How-ever, the diversity of the teams can improve by accommodating the formation of teams, stretchingmore the role of diversity in the evident success of the projects or by incentivizing with a bonusgrade cross-disciplinary teams.
• Software tools: For a lecturer teaching data science in a cross-disciplinary audience, the choiceof software tools is not straightforward and to certain extent it is a trade-off between the level oftechnical challenge and meeting the minimum course requirements. The opposing views of Inter-viewee 2 and 3 here are representative of the challenge that is also identified in earlier work [23].

114 E. Pournaras / Cross-disciplinary higher education of data science – beyond the computer science student
The experience gained from the course shows that the choice of AWK for data manipulation andGnuplot for plotting and graphical analysis are some reference examples for how to deal with suchtrade-offs. A data scientist trained and relying on a broad spectrum of open-source software toolsis more versatile in the job market than a data scientist trained for commercial software solutions.Moreover, rigorous evaluation and replication of results benefits from free and open-source tools[15]. It is essential for tutors to cultivate in students the knowledge, skills and critical thinking re-quired to independently make informed choices about the use of the most appropriate software toolsfor a certain data science task.
• Research as a pedagogical artifact: The research project proves to be a highly rewarding ex-perience for students to learn data science and evidently has a high pedagogical value within across-disciplinary educational context. Students acknowledge the challenge to apply rigorous sci-entific methodologies on which they may not have earlier formal training. However, the researchprojects undoubtedly have a motivational value, provide freedom to students to unfold their interestsand they are an actual opportunity to apply data science skills in real-world problems. From theoryperspective, a data science research project at a MSc level, in the way it is setup, serves well theconstructivism and transformative learning theories: prior knowledge of learners, habits of minds,points of view find reflection. Research projects run the risk of being too ambitious in the scope ofa semester course, may rely on false assumptions or lack focus and therefore require a significantlevel of personalized supervision and feedback as the transformative theory suggests [43]. This isespecially the case at the beginning during which tutors need to accommodate students’ confidenceand convey a spirit of self-efficacy.
• Data requirements: Data itself impose both explicit and implicit constraints on what a data sci-entist can learn from the data. The experience on the course shows that students can often overes-timate or underestimate such constraints in data science projects. Factors such as quality, dimen-sionality, granularity as well as functional/non-functional requirements during data collection, forinstance, informational self-determination and privacy-preservation alter the opportunity space onwhat someone can learn from data. Scraping the surface of the available data and putting underscrutiny different graphical views, aggregation levels and data transformations shapes the solutionto a data science problem or even reshapes a new solution to a different problem that was not evidentor intended before this process.
The facilitation of cross-disciplinary data science education in university curricula qualifies a new gen-eration of versatile professionals with the capability to communicate and work together with a broaderrange of experts. Moreover, making accessible data science to a wider range of domain experts can re-duce business training costs. Similarly, academic education of data science with open-source and freesoftware tools can reduce business costs on expensive commercial software suites.
Data science education using research methodologies cultivates to citizens a higher awareness aboutwhat data mean, a cognitive reasoning based on empirical evidence, critical thinking and constructivedoubt. In other words, it cultivates these mental capacities to withstand the challenges of our nowadaysdigital societies [25] concerning the interpretation and wise use of information from (social) media [17],populism leading to ineffective voting [8,10], privacy and autonomy violations from big data profil-ing technologies or profit-oriented recommender systems [24,41], manipulative actions and means ofpropaganda in social networks and beyond [46].

E. Pournaras / Cross-disciplinary higher education of data science – beyond the computer science student 115
9. Conclusion
This paper concludes that cross-disciplinary data science education is highly challenging and requiresa very different approach in the design of study courses than data science education exclusively forcomputer scientists. However, this paper shows that cross-disciplinary data science education is feasibleand highly rewarding for students. The perspective of constructivism and transformative learning theoryproves effective for the design of a novel course with these challenging requirements. In contrast torelated courses, the position of this paper is that learning data science in this cross-disciplinary contexthas a value by itself as the students’ diversity and the blend of skills in collaborative research projectscreate multifaceted learning opportunities that cannot unfold otherwise. This is empirically shown viathe design, development and teaching of a new cross-disciplinary data science course at a top-classuniversity and the experiences aggregated throughout the lifetime of the course.
This paper contributes lessons learnt such as how to make choices in regards to the content size anddifficulty level, the diversity of students, students’ projects and project teams, the choice of softwaretools for different data science tasks, the use of research projects as a pedagogical artifact and how datarequirements influence what a student can learn from data. Cross-disciplinary data science educationqualifies more versatile data scientists in the job market, can reduce business costs for training andultimately cultivate a more democratic and participatory citizen prepared to respond to the upcomingchallenges of the digital society [25].
Acknowledgement
Special thanks go to Dr. Izabela Moise for her contribution and our collaboration to design and runthe MSc course “Data Science in Techno-socio-economic Systems”. The author would also like to thankProf. Dr. Dirk Helbing, the Computational Social Science (COSS) group and the department of Human-ities, Social and Political Sciences (GESS) at ETH Zurich for hosting and supporting this course. I amgrateful to the interviewees, as well as all students attending this course for making cross-disciplinaryeducation of data science such an enriching and constructive teaching experience. Last but not least,I would like to thank Pia Scherrer and Benno Volk for their feedback on the paper and the invaluableexperience I had in their course “Foundations of Teaching and Learning” at ETH Zurich.
References
[1] E. Ackermann, Piaget’s constructivism, papert’s constructionism: What’s the difference, Future of Learning Group Pub-lication 5(3) (2001), 438. http://learning.media.mit.edu/content/publications/EA.Piaget%20_%20Papert.pdf.
[2] L.W. Anderson, D.R. Krathwohl, P. Airasian, K. Cruikshank, R. Mayer, P. Pintrich, J. Raths and M. Wittrock, A Taxonomyfor Learning, Teaching and Assessing: A Revision of Bloom’s Taxonomy, Longman Publishing, New York, 2001. https://www.amazon.com/Taxonomy-Learning-Teaching-Assessing-Educational/dp/080131903X.
[3] P. Anderson, J. Bowring, R. McCauley, G. Pothering and C. Starr, An undergraduate degree in data science: Curriculumand a decade of implementation experience, in: Proceedings of the 45th ACM Technical Symposium on Computer ScienceEducation, ACM, 2014, pp. 145–150. doi:10.1145/2538862.2538936.
[4] P. Anderson, J. McGuffee and D. Uminsky, Data science as an undergraduate degree, in: Proceedings of the 45th ACMTechnical Symposium on Computer Science Education, ACM, 2014, pp. 705–706. doi:10.1145/2538862.2538868.
[5] P.E. Anderson, C. Turner, J. Dierksheide and R. McCauley, An extensible online environment for teaching data scienceconcepts through gamification, in: Frontiers in Education Conference (FIE), 2014 IEEE, IEEE, 2014, pp. 1–8. https://doi.org/10.1109/FIE.2014.7044205.

116 E. Pournaras / Cross-disciplinary higher education of data science – beyond the computer science student
[6] D. Asamoah, D. Doran and S. Schiller, Teaching the foundations of data science: An interdisciplinary approach, 2015,arXiv preprint arXiv:1512.04456.
[7] A. Bandura, Self-efficacy: Toward a unifying theory of behavioral change, Psychological Review 84(2) (1977), 191–215.doi:10.1037/0033-295X.84.2.191.
[8] J. Bartlett, Populism, social media and democratic strain, in: Democracy in Britain: Essays in Honour of James Cornford,2014, pp. 91–96. https://www.ippr.org/publications/democracy-in-britain-essays-in-honour-of-james-cornford.
[9] R.E. Bleicher and J. Lindgren, Success in science learning and preservice science teaching self-efficacy, Journal of ScienceTeacher Education 16(3) (2005), 205–225. doi:10.1007/s10972-005-4861-1.
[10] G. Brown, Review of education in mathematics, data science and quantitative disciplines: Report to the group of eightuniversities, in: Group of Eight (NJ1), 2009. https://go8.edu.au/sites/default/files/docs/go8mathsreview_0.pdf.
[11] S.A. Carlsson, S. Henningsson, S. Hrastinski and C. Keller, Socio-technical is design science research: Developing designtheory for is integration management, Information Systems and e-Business Management 9(1) (2011), 109–131. doi:10.1007/s10257-010-0140-6.
[12] N.L. Cassel, M. Posner, D. Dicheva, D. Goelman, H. Topi and C. Dichev, Advancing data science for students of allmajors, in: Proceedings of the 2017 ACM SIGCSE Technical Symposium on Computer Science Education, ACM, 2017,pp. 722–722. https://doi.org/10.1145/3017680.3022362.
[13] E. Coskun and S. White, Evolving a web science curriculum, in: Proceedings of the 16th Koli Calling InternationalConference on Computing Education Research, Koli Calling ’16, ACM, New York, NY, USA, 2016, pp. 170–171. doi:10.1145/2999541.2999566.
[14] T.H. Davenport and D.J. Patil, Data scientist: The sexiest job of the 21st century – a new breed of professional holds the keyto capitalizing on big data opportunities. But these specialists aren’t easy to find – and the competition for them is fierce,in: Harvard Business Review, 2012, p. 70. https://hbr.org/2012/10/data-scientist-the-sexiest-job-of-the-21st-century.
[15] R.P. Dos Santos, Big data as a mediator in science teaching: A proposal, 2014. https://arxiv.org/abs/1405.6328.[16] R. Duschl, Science education in three-part harmony: Balancing conceptual, epistemic, and social learning goals, Review
of Research in Education 32(1) (2008), 268–291. doi:10.3102/0091732X07309371.[17] U. Eco, Faith in Fakes, Random House, 2014. https://en.wikipedia.org/wiki/Faith_in_Fakes.[18] G. Fox, S. Maini, H. Rosenbaum and D. Wild, Data science and online education, in: Cloud Computing Technology and
Science (CloudCom), 2015 IEEE 7th International Conference on, IEEE, 2015, pp. 582–587. doi:10.1109/CloudCom.2015.82.
[19] C. Fraley and A.E. Raftery, Model-based clustering, discriminant analysis, and density estimation, Journal of the Ameri-can Statistical Association 97(458) (2002), 611–631. doi:10.1198/016214502760047131.
[20] S. Gambs, M.-O. Killijian, I. Moise and M.N. del Prado Cortez, Mapreducing gepeto or towards conducting a privacyanalysis on millions of mobility traces, in: Parallel and Distributed Processing Symposium Workshops & PhD Forum(IPDPSW), 2013 IEEE 27th International, IEEE, 2013, pp. 1937–1946. doi:10.1109/IPDPSW.2013.180.
[21] U. Greveler, P. Glösekötterz, B. Justusy and D. Loehr, Multimedia content identification through smart meter power usageprofiles, in: Proceedings of the International Conference on Information and Knowledge Engineering (IKE), The SteeringCommittee of the World Congress in Computer Science, Computer Engineering and Applied Computing (WorldComp),2012, p. 1. https://www.nds.rub.de/media/nds/veroeffentlichungen/2012/07/24/ike2012.pdf.
[22] D. Griego, V. Buff, E. Hayoz, I. Moise and E. Pournaras, Sensing and mining urban qualities in smart cities, in: Proceed-ings of the 31st IEEE International Conference on Advanced Information Networking and Applications – (AINA 2017),IEEE, 2017. https://doi.org/10.1109/AINA.2017.14.
[23] J. Hardin, R. Hoerl, N.J. Horton, D. Nolan, B. Baumer, O. Hall-Holt, P. Murrell, R. Peng, P. Roback, D. Temple Lang etal., Data science in statistics curricula: Preparing students to “think with data”, The American Statistician 69(4) (2015),343–353. doi:10.1080/00031305.2015.1077729.
[24] N. Helberger, K. Karppinen and L. D’Acunto, Exposure diversity as a design principle for recommender systems, in:Information, Communication & Society, 2016, pp. 1–17. https://doi.org/10.1080/1369118X.2016.1271900.
[25] D. Helbing and E. Pournaras, Society: Build digital democracy, Nature 527 (2015), 33–34. doi:10.1038/527033a.[26] B. Howe, M.J. Franklin, J. Freire, J. Frew, T. Kraska and R. Ramakrishnan, Should we all be teaching intro to data science
instead of intro to databases? in: Proceedings of the 2014 ACM SIGMOD International Conference on Management ofData, ACM, 2014, pp. 917–918. https://doi.org/10.1145/2588555.2600092.
[27] K. Illeris, Transformative learning in the perspective of a comprehensive learning theory, Journal of TransformativeEducation 2(2) (2004), 79–89. doi:10.1177/1541344603262315.
[28] J. Janssens, Data Science at the Command Line, O’Reilly Media, 2014. http://shop.oreilly.com/product/0636920032823.do.
[29] A. Karpatne, G. Atluri, J. Faghmous, M. Steinbach, A. Banerjee, A. Ganguly, S. Shekhar, N. Samatova and V. Kumar,Theory-guided data science: A new paradigm for scientific discovery, 2016, arXiv preprint arXiv:1612.08544.

E. Pournaras / Cross-disciplinary higher education of data science – beyond the computer science student 117
[30] E. Keogh, J. Lin and W. Truppel, Clustering of time series subsequences is meaningless: Implications for previous andfuture research, in: Data Mining, 2003. ICDM 2003. Third IEEE International Conference on, IEEE, 2003, pp. 115–122.http://www.cs.ucr.edu/~eamonn/meaningless.pdf.
[31] J.Y. Kim and C.K. Lee, An empirical analysis of requirements for data scientists using online job postings, InternationalJournal of Software Engineering and Its Applications 10(4) (2016), 161–172. doi:10.14257/ijseia.2016.10.4.15.
[32] J.Z. Kolter and M.J. Johnson, Redd: A public data set for energy disaggregation research, in: Workshop on DataMining Applications in Sustainability (SIGKDD), Vol. 25, San Diego, CA, 2011, pp. 59–62. http://redd.csail.mit.edu/kolter-kddsust11.pdf.
[33] V. Marx, Biology: The big challenges of big data, Nature 498(7453) (2013), 255–260. doi:10.1038/498255a.[34] J. Mezirow, Transformative learning: Theory to practice, New Directions for Adult and Continuing Education 1997(74)
(1997), 5–12. doi:10.1002/ace.7401.[35] I. Moise, E. Gaere, R. Merz, S. Koch and E. Pournaras, Tracking language mobility in the Twitter landscape, in: Proceed-
ings of the 4th International Workshop on Data Science and Big Data Analytics (DSBDA 2016), IEEE, 2017. https://doi.org/10.1109/ICDMW.2016.0099.
[36] F. Musciotto, S. Delpriori, P. Castagno and E. Pournaras, Mining social interactions in privacy-preserving temporal net-works, in: Advances in Social Networks Analysis and Mining (ASONAM), 2016 IEEE/ACM International Conference on,IEEE, 2016, pp. 1103–1110. doi:10.1109/ASONAM.2016.7752378.
[37] V. Nicosia, J. Tang, C. Mascolo, M. Musolesi, G. Russo and V. Latora, Graph metrics for temporal networks, in: TemporalNetworks, Springer, 2013, pp. 15–40. https://doi.org/10.1007/978-3-642-36461-7_2.
[38] S. Papert, Mindstorms: Children, Computers, and Powerful Ideas, Basic Books, 1980. https://en.wikipedia.org/wiki/Mindstorms_(book).
[39] E. Pournaras, J. Nikolic, P. Velásquez, M. Trovati, N. Bessis and D. Helbing, Self-regulatory information sharing inparticipatory social sensing, EPJ Data Science 5(1) (2016), 14. doi:10.1140/epjds/s13688-016-0074-4.
[40] E. Pournaras, M. Vasirani, R.E. Kooij and K. Aberer, Decentralized planning of energy demand for the management ofrobustness and discomfort, IEEE Transactions on Industrial Informatics 10(4) (2014), 2280–2289. doi:10.1109/TII.2014.2332114.
[41] F. Ricci, L. Rokach and B. Shapira, Recommender systems: Introduction and challenges, in: Recommender Systems Hand-book, Springer, 2015, pp. 1–34. doi:10.1007/978-1-4899-7637-6_1.
[42] M. Rosa, Constructing Identities through online Role Playing Game: relationships with the teaching and learning ofmathematics in a distance learning course, PhD thesis, UNESP – São Paulo State University, 2008. https://arxiv.org/pdf/1405.6328.pdf.
[43] G.M. Slavich and P.G. Zimbardo, Transformational teaching: Theoretical underpinnings, basic principles, and core meth-ods, Educational Psychology Review 24(4) (2012), 569–608. doi:10.1007/s10648-012-9199-6.
[44] O. Sporns, Making sense of brain network data, Nature Methods 10(6) (2013), 491–493. doi:10.1038/nmeth.2485.[45] E.W. Taylor, Transformative learning theory, New Directions for Adult and Continuing Education 2008(119) (2008),
5–15. doi:10.1002/ace.301.[46] D. Trottier and C. Fuchs, Social Media, Politics and the State: Protests, Revolutions, Riots, Crime and Policing in the Age
of Facebook, Twitter and YouTube, Vol. 16, Routledge, 2014. https://www.routledge.com/Social-Media-Politics-and-the-State-Protests-Revolutions-Riots-Crime/Trottier-Fuchs/p/book/9781138798243.
[47] S. Turkle, Evocative Objects: Things We Think with, MIT Press, 2011. https://mitpress.mit.edu/books/evocative-objects.[48] W.M.P. Van der Aalst, Data scientist: The engineer of the future, in: Enterprise Interoperability VI, Springer, 2014, pp. 13–
26. https://doi.org/10.1007/978-3-319-04948-9_2.[49] K. Veeramachaneni, F. Dernoncourt, C. Taylor Z. Pardos and U.-M. O’Reilly, Moocdb: Developing data standards for
mooc data science, in: AIED 2013 Workshops Proceedings Volume, Citeseer, 2013, p. 17. http://citeseerx.ist.psu.edu/viewdoc/summary?doi=10.1.1.368.1935.
[50] B. Wixom, T. Ariyachandra, D. Douglas, M. Goul, B. Gupta, L. Iyer, U. Kulkarni, J.G. Mooney, G. Phillips-Wren andO. Turetken, The current state of business intelligence in academia: The arrival of big data 34(1) (2014), 1. http://aisel.aisnet.org/cais/vol34/iss1/1/.