A cross disciplinary framework for linking farms with regional groundwater and salinity management...
13
A cross disciplinary framework for linking farms with regional groundwater and salinity management targets Shahbaz Khan *, Tariq Rana, Munir A. Hanjra International Centre of Water for Food Security, Charles Sturt University, Cooperative Research Centre for Irrigation Futures, CSIRO Land and Water, Locked Bag 588, Wagga Wagga Campus, NSW 2678, Australia 1. Backdrop During the second half of the 20th century the global food system has responded to the doubling of world population by more than doubling food production. Crop yield growth and intensification have been the dominant factors, and irrigated agriculture has played a major role. About 40% of the global harvest came from just 20% of croplands that are irrigated (FAO, 2003; Khan et al., 2006). Irrigation has delivered multi- faceted social benefits, virtually shielding irrigated commu- agricultural water management 95 (2008) 35–47 article info Article history: Received 21 April 2007 Accepted 4 September 2007 Published on line 29 October 2007 Keywords: Groundwater Irrigation Net recharge Salinity SWAGMAN model Waterlogging abstract Irrigation delivers major benefits in food security and human development. Irrigation also leads to waterlogging and salinity which threaten the sustainability of irrigated agriculture and pose major socioeconomic and environmental risks. The issue can be addressed by limiting net recharge to groundwater such that the water and salt keep natural equilibria. Often the information on net recharge within catchments is unavailable, particularly at lower spatial scales such as the farm or paddock; this offers little guidance for on-farm land and water management decisions—basic decisions that ultimately impact regional net recharge and waterlogging and salinity dynamics. This paper develops a cross disciplinary framework based on the concept of net recharge for setting paddock scale targets and to link these to the regional targets and community’s goals for sustainable irrigation management. A management model, cast in a dynamic programming format to integrate a detailed hydrological model with an economic model was applied to estimate the productivity, profitability and sustainability of irrigated agriculture in a region of the Murray Darling Basin in Australia. SWAGMAN 1 Farm model was used to determine paddock scale net recharge. This interactive model enables an individual farmer to choose a profit optimizing crop mix while lowering net recharge; this in turn leads to a win-win outcome for all farmers. The net recharge metric can be used for the conversion of diffuse source groundwater recharge to a point source recharge at paddock scale, enabling the definition of private property rights to a common pool problem and assigning individual responsibilities for its management—a vexing issue and a new concept for the commons literature. Net recharge shows significant spatial and temporal variation which warrants a targeted/zonal approach to address the issue. Regional and targeted strategies and actions to address the issue are identified. Apart from its applied and action research orientation, the development of paddock scale net recharge metric is perhaps the most significant conceptual contribution of this research which can lead to shared management of groundwater aquifers. # 2007 Elsevier B.V. All rights reserved. * Corresponding author. Tel.: +61 2 69332927; fax: +61 2 69332647. E-mail address: [email protected] (S. Khan). available at www.sciencedirect.com journal homepage: www.elsevier.com/locate/agwat 0378-3774/$ – see front matter # 2007 Elsevier B.V. All rights reserved. doi:10.1016/j.agwat.2007.09.005
-
Upload
independent -
Category
Documents
-
view
1 -
download
0
Transcript of A cross disciplinary framework for linking farms with regional groundwater and salinity management...
A cross disciplinary framework for linking farms withregional groundwater and salinity management targets
Shahbaz Khan *, Tariq Rana, Munir A. Hanjra
International Centre of Water for Food Security, Charles Sturt University, Cooperative Research Centre for Irrigation Futures,
CSIRO Land and Water, Locked Bag 588, Wagga Wagga Campus, NSW 2678, Australia
a g r i c u l t u r a l w a t e r m a n a g e m e n t 9 5 ( 2 0 0 8 ) 3 5 – 4 7
a r t i c l e i n f o
Article history:
Received 21 April 2007
Accepted 4 September 2007
Published on line 29 October 2007
Keywords:
Groundwater
Irrigation
Net recharge
Salinity
SWAGMAN model
Waterlogging
a b s t r a c t
Irrigation delivers major benefits in food security and human development. Irrigation also
leads to waterlogging and salinity which threaten the sustainability of irrigated agriculture
and pose major socioeconomic and environmental risks. The issue can be addressed by
limiting net recharge to groundwater such that the water and salt keep natural equilibria.
Often the information on net recharge within catchments is unavailable, particularly at
lower spatial scales such as the farm or paddock; this offers little guidance for on-farm land
and water management decisions—basic decisions that ultimately impact regional net
recharge and waterlogging and salinity dynamics. This paper develops a cross disciplinary
framework based on the concept of net recharge for setting paddock scale targets and to link
these to the regional targets and community’s goals for sustainable irrigation management.
A management model, cast in a dynamic programming format to integrate a detailed
hydrological model with an economic model was applied to estimate the productivity,
profitability and sustainability of irrigated agriculture in a region of the Murray Darling Basin
in Australia. SWAGMAN1 Farm model was used to determine paddock scale net recharge.
This interactive model enables an individual farmer to choose a profit optimizing crop mix
while lowering net recharge; this in turn leads to a win-win outcome for all farmers. The net
recharge metric can be used for the conversion of diffuse source groundwater recharge to a
point source recharge at paddock scale, enabling the definition of private property rights to a
common pool problem and assigning individual responsibilities for its management—a
vexing issue and a new concept for the commons literature. Net recharge shows significant
spatial and temporal variation which warrants a targeted/zonal approach to address the
issue. Regional and targeted strategies and actions to address the issue are identified. Apart
from its applied and action research orientation, the development of paddock scale net
recharge metric is perhaps the most significant conceptual contribution of this research
which can lead to shared management of groundwater aquifers.
# 2007 Elsevier B.V. All rights reserved.
avai lab le at www.sc iencedi rec t .com
journal homepage: www.e lsev ier .com/ locate /agwat
1. Backdrop
During the second half of the 20th century the global food
system has responded to the doubling of world population by
more than doubling food production. Crop yield growth and
* Corresponding author. Tel.: +61 2 69332927; fax: +61 2 69332647.E-mail address: [email protected] (S. Khan).
0378-3774/$ – see front matter # 2007 Elsevier B.V. All rights reservedoi:10.1016/j.agwat.2007.09.005
intensification have been the dominant factors, and irrigated
agriculture has played a major role. About 40% of the global
harvest came from just 20% of croplands that are irrigated
(FAO, 2003; Khan et al., 2006). Irrigation has delivered multi-
faceted social benefits, virtually shielding irrigated commu-
d.
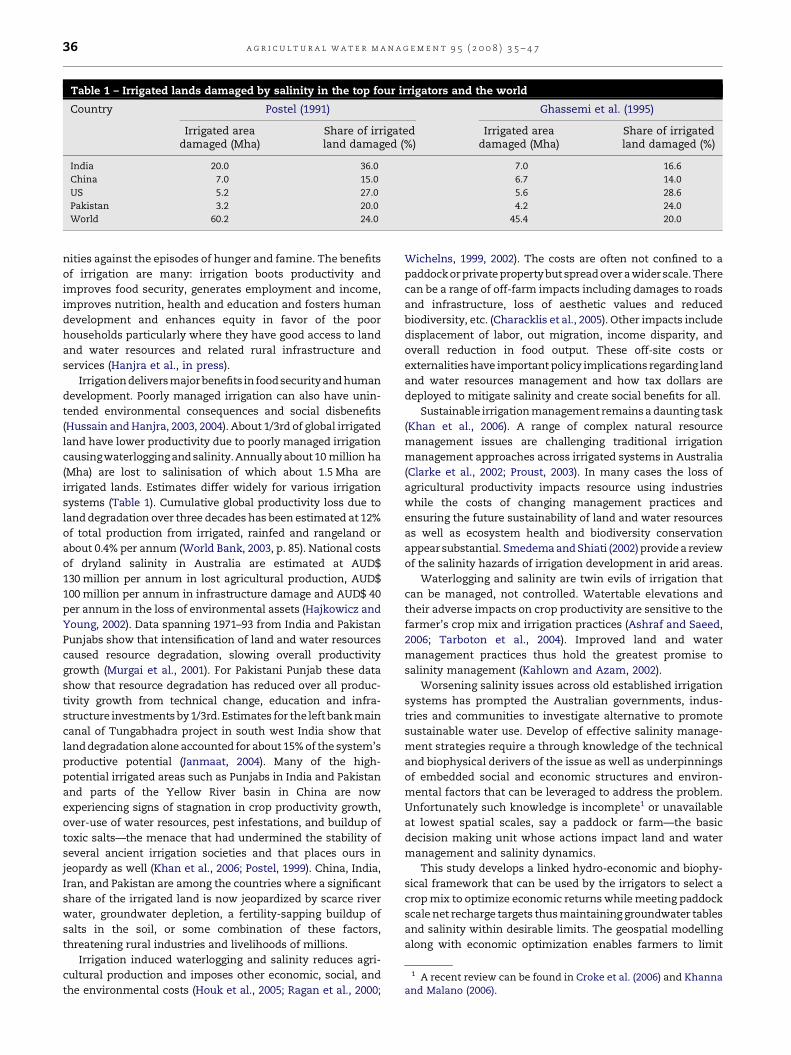
Table 1 – Irrigated lands damaged by salinity in the top four irrigators and the world
Country Postel (1991) Ghassemi et al. (1995)
Irrigated areadamaged (Mha)
Share of irrigatedland damaged (%)
Irrigated areadamaged (Mha)
Share of irrigatedland damaged (%)
India 20.0 36.0 7.0 16.6
China 7.0 15.0 6.7 14.0
US 5.2 27.0 5.6 28.6
Pakistan 3.2 20.0 4.2 24.0
World 60.2 24.0 45.4 20.0
1 A recent review can be found in Croke et al. (2006) and Khannaand Malano (2006).
a g r i c u l t u r a l w a t e r m a n a g e m e n t 9 5 ( 2 0 0 8 ) 3 5 – 4 736
nities against the episodes of hunger and famine. The benefits
of irrigation are many: irrigation boots productivity and
improves food security, generates employment and income,
improves nutrition, health and education and fosters human
development and enhances equity in favor of the poor
households particularly where they have good access to land
and water resources and related rural infrastructure and
services (Hanjra et al., in press).
Irrigation delivers major benefits in food securityand human
development. Poorly managed irrigation can also have unin-
tended environmental consequences and social disbenefits
(Hussain and Hanjra, 2003, 2004). About 1/3rd of global irrigated
land have lower productivity due to poorly managed irrigation
causingwaterlogging and salinity.Annually about 10 million ha
(Mha) are lost to salinisation of which about 1.5 Mha are
irrigated lands. Estimates differ widely for various irrigation
systems (Table 1). Cumulative global productivity loss due to
land degradation over three decades has been estimated at 12%
of total production from irrigated, rainfed and rangeland or
about 0.4% per annum (World Bank, 2003, p. 85). National costs
of dryland salinity in Australia are estimated at AUD$
130 million per annum in lost agricultural production, AUD$
100 million per annum in infrastructure damage and AUD$ 40
per annum in the loss of environmental assets (Hajkowicz and
Young, 2002). Data spanning 1971–93 from India and Pakistan
Punjabs show that intensification of land and water resources
caused resource degradation, slowing overall productivity
growth (Murgai et al., 2001). For Pakistani Punjab these data
show that resource degradation has reduced over all produc-
tivity growth from technical change, education and infra-
structure investments by 1/3rd. Estimates for the left bank main
canal of Tungabhadra project in south west India show that
land degradation alone accounted for about 15% of the system’s
productive potential (Janmaat, 2004). Many of the high-
potential irrigated areas such as Punjabs in India and Pakistan
and parts of the Yellow River basin in China are now
experiencing signs of stagnation in crop productivity growth,
over-use of water resources, pest infestations, and buildup of
toxic salts—the menace that had undermined the stability of
several ancient irrigation societies and that places ours in
jeopardy as well (Khan et al., 2006; Postel, 1999). China, India,
Iran, and Pakistan are among the countries where a significant
share of the irrigated land is now jeopardized by scarce river
water, groundwater depletion, a fertility-sapping buildup of
salts in the soil, or some combination of these factors,
threatening rural industries and livelihoods of millions.
Irrigation induced waterlogging and salinity reduces agri-
cultural production and imposes other economic, social, and
the environmental costs (Houk et al., 2005; Ragan et al., 2000;
Wichelns, 1999, 2002). The costs are often not confined to a
paddockor private property but spread over a wider scale. There
can be a range of off-farm impacts including damages to roads
and infrastructure, loss of aesthetic values and reduced
biodiversity, etc. (Characklis et al., 2005). Other impacts include
displacement of labor, out migration, income disparity, and
overall reduction in food output. These off-site costs or
externalities have important policy implications regarding land
and water resources management and how tax dollars are
deployed to mitigate salinity and create social benefits for all.
Sustainable irrigation management remains a daunting task
(Khan et al., 2006). A range of complex natural resource
management issues are challenging traditional irrigation
management approaches across irrigated systems in Australia
(Clarke et al., 2002; Proust, 2003). In many cases the loss of
agricultural productivity impacts resource using industries
while the costs of changing management practices and
ensuring the future sustainability of land and water resources
as well as ecosystem health and biodiversity conservation
appear substantial. Smedema and Shiati (2002) provide a review
of the salinity hazards of irrigation development in arid areas.
Waterlogging and salinity are twin evils of irrigation that
can be managed, not controlled. Watertable elevations and
their adverse impacts on crop productivity are sensitive to the
farmer’s crop mix and irrigation practices (Ashraf and Saeed,
2006; Tarboton et al., 2004). Improved land and water
management practices thus hold the greatest promise to
salinity management (Kahlown and Azam, 2002).
Worsening salinity issues across old established irrigation
systems has prompted the Australian governments, indus-
tries and communities to investigate alternative to promote
sustainable water use. Develop of effective salinity manage-
ment strategies require a through knowledge of the technical
and biophysical derivers of the issue as well as underpinnings
of embedded social and economic structures and environ-
mental factors that can be leveraged to address the problem.
Unfortunately such knowledge is incomplete1 or unavailable
at lowest spatial scales, say a paddock or farm—the basic
decision making unit whose actions impact land and water
management and salinity dynamics.
This study develops a linked hydro-economic and biophy-
sical framework that can be used by the irrigators to select a
crop mix to optimize economic returns while meeting paddock
scale net recharge targets thus maintaining groundwater tables
and salinity within desirable limits. The geospatial modelling
along with economic optimization enables farmers to limit
Map 1 – The location of study settings.
a g r i c u l t u r a l w a t e r m a n a g e m e n t 9 5 ( 2 0 0 8 ) 3 5 – 4 7 37
irrigation to levels that best suit the soil, climate and ground-
water dynamics at the paddock scale and then links these
individual decisions to wider zonal groundwater recharge
targets—a zero rise in watertable. This work can serve as a
basis for designing tradeable recharge credits at paddock scale;
to link these targets/credits to overall groundwater and salinity
management goals; to assign private property rights to a shared
common pool issue; to craft institutions for effective recharge
management; and to promote a rational dialogue between the
farmers and other stakeholders to develop a shared-vision for
sustainable irrigation management.
2. The setting and data
The Coleambally Irrigated Area (CIA) located in the southern
Murray Darling Basin in Australia served as settings for this
study (Map 1). The CIA covers about 80,000 ha and is managed
by a cooperative—Coleambally Irrigation Cooperative Ltd.
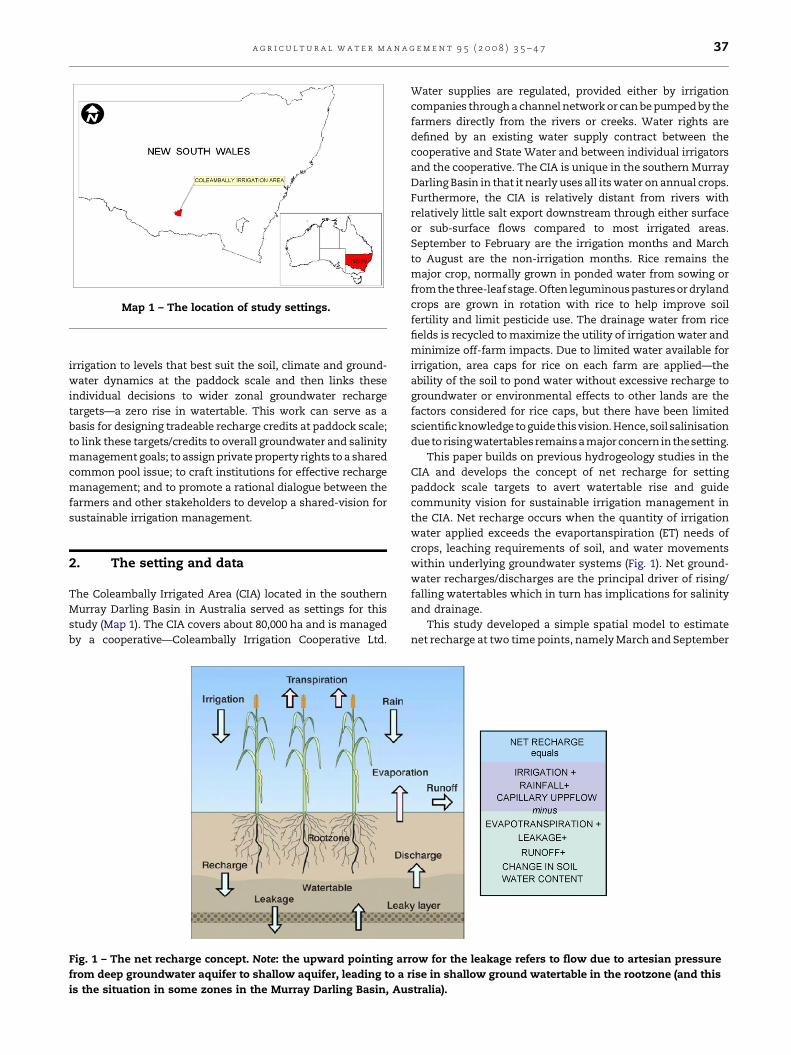
Fig. 1 – The net recharge concept. Note: the upward pointing ar
from deep groundwater aquifer to shallow aquifer, leading to a
is the situation in some zones in the Murray Darling Basin, Au
Water supplies are regulated, provided either by irrigation
companies through a channel network or can be pumped by the
farmers directly from the rivers or creeks. Water rights are
defined by an existing water supply contract between the
cooperative and State Water and between individual irrigators
and the cooperative. The CIA is unique in the southern Murray
Darling Basin in that it nearly uses all its water on annual crops.
Furthermore, the CIA is relatively distant from rivers with
relatively little salt export downstream through either surface
or sub-surface flows compared to most irrigated areas.
September to February are the irrigation months and March
to August are the non-irrigation months. Rice remains the
major crop, normally grown in ponded water from sowing or
from thethree-leaf stage. Often leguminous pastures or dryland
crops are grown in rotation with rice to help improve soil
fertility and limit pesticide use. The drainage water from rice
fields is recycled to maximize the utility of irrigation water and
minimize off-farm impacts. Due to limited water available for
irrigation, area caps for rice on each farm are applied—the
ability of the soil to pond water without excessive recharge to
groundwater or environmental effects to other lands are the
factors considered for rice caps, but there have been limited
scientificknowledge toguide this vision. Hence, soil salinisation
duetorisingwatertablesremainsamajor concern inthesetting.
This paper builds on previous hydrogeology studies in the
CIA and develops the concept of net recharge for setting
paddock scale targets to avert watertable rise and guide
community vision for sustainable irrigation management in
the CIA. Net recharge occurs when the quantity of irrigation
water applied exceeds the evaportanspiration (ET) needs of
crops, leaching requirements of soil, and water movements
within underlying groundwater systems (Fig. 1). Net ground-
water recharges/discharges are the principal driver of rising/
falling watertables which in turn has implications for salinity
and drainage.
This study developed a simple spatial model to estimate
net recharge at two time points, namely March and September
row for the leakage refers to flow due to artesian pressure
rise in shallow ground watertable in the rootzone (and this
stralia).
a g r i c u l t u r a l w a t e r m a n a g e m e n t 9 5 ( 2 0 0 8 ) 3 5 – 4 738
every year. A groundwater surface for the entire CIA was
developed using the contouring software ‘SURFER’. The
groundwater table data from 800 piezometers located in
settings monitored between 1994 and 2004 was used. Net
recharge was estimated by computing the volume change
between the two surfaces. The resulting soil volume was then
multiplied by the effective porosity (5%) to calculate the
change in the volume of groundwater.
The interpolation method called Krigging available within
the SURFER software was used with a linear variogram model
to derive shallow groundwater surfaces. The data was gridded
to easting from 378,590 to 420,875 m, and northing from
6,120,000 to 6,162,175 m. The resultant mesh was then blanked
out using a digitised boundary map of the CIA. The blanking
operation meant that data outside the boundary of the CIA
was ignored in any calculations. Piezometric data gridded and
blanked thus formed each piezometric surface and these
surfaces were determined for March and September of each
year. The groundwater surface of succeeding period was
deducted from the surface of the previous period to compute
the net volume change between the two periods. If the volume
change was positive then net recharge had occurred; and if the
volume change was negative then net discharge had occurred.
The analysis was based in the following assumptions:
� T
he piezometers less than 15 m deep accurately reflectwatertable level. This holds mostly but some areas where
aquifer confinement occurs to a greater or lesser degree may
impact the validity of this assumption.
� T
he effective porosity value used (5%) will affect themagnitude of the estimate but the estimate will not distort
the result between net recharge or discharge; and it will not
affect the trend over time as this methodology was based on
seasonal differences. Since this analysis uses a uniform
effective porosity for the whole area, errors will be created as
the piezometric rise/fall in a clayey soil and sandy soil but
will be assessed to represent the same volume change, when
in reality may not the case.
� T
he results obtained from the area wide analysis arerepresentative averages of the irrigation area, and can
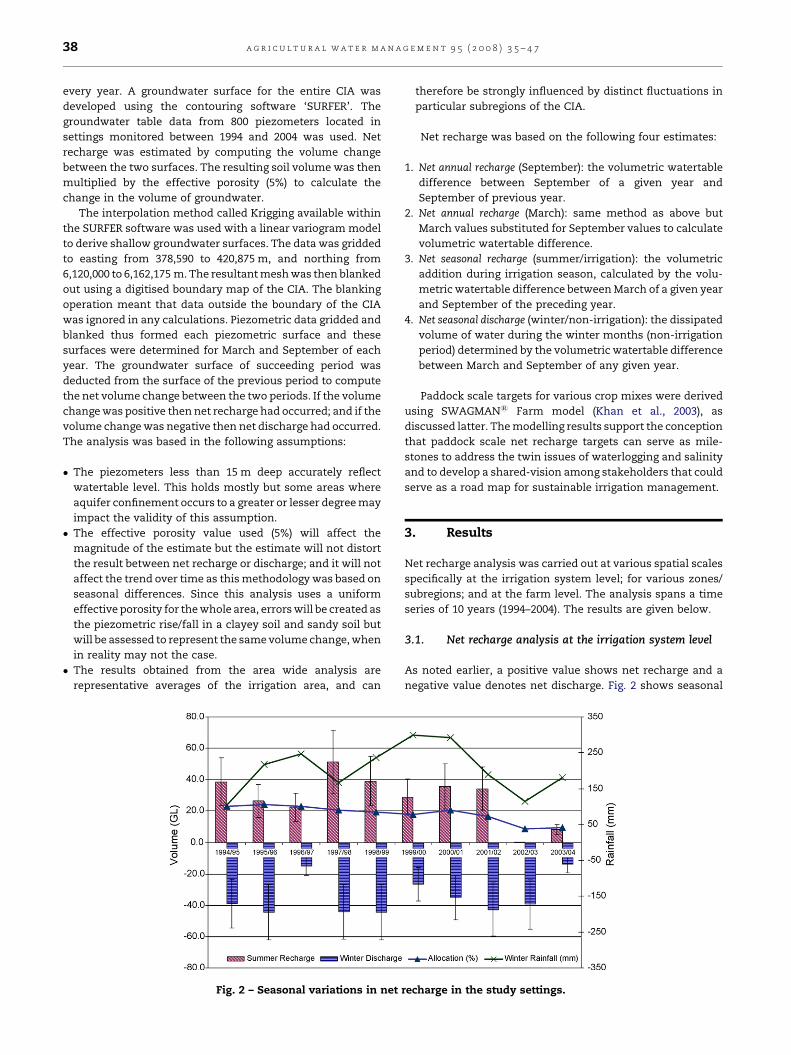
Fig. 2 – Seasonal variations in net
therefore be strongly influenced by distinct fluctuations in
particular subregions of the CIA.
Net recharge was based on the following four estimates:
1. N
rec
et annual recharge (September): the volumetric watertable
difference between September of a given year and
September of previous year.
2. N
et annual recharge (March): same method as above butMarch values substituted for September values to calculate
volumetric watertable difference.
3. N
et seasonal recharge (summer/irrigation): the volumetricaddition during irrigation season, calculated by the volu-
metric watertable difference between March of a given year
and September of the preceding year.
4. N
et seasonal discharge (winter/non-irrigation): the dissipatedvolume of water during the winter months (non-irrigation
period) determined by the volumetric watertable difference
between March and September of any given year.
Paddock scale targets for various crop mixes were derived
using SWAGMAN1 Farm model (Khan et al., 2003), as
discussed latter. The modelling results support the conception
that paddock scale net recharge targets can serve as mile-
stones to address the twin issues of waterlogging and salinity
and to develop a shared-vision among stakeholders that could
serve as a road map for sustainable irrigation management.
3. Results
Net recharge analysis was carried out at various spatial scales
specifically at the irrigation system level; for various zones/
subregions; and at the farm level. The analysis spans a time
series of 10 years (1994–2004). The results are given below.
3.1. Net recharge analysis at the irrigation system level
As noted earlier, a positive value shows net recharge and a
negative value denotes net discharge. Fig. 2 shows seasonal
harge in the study settings.
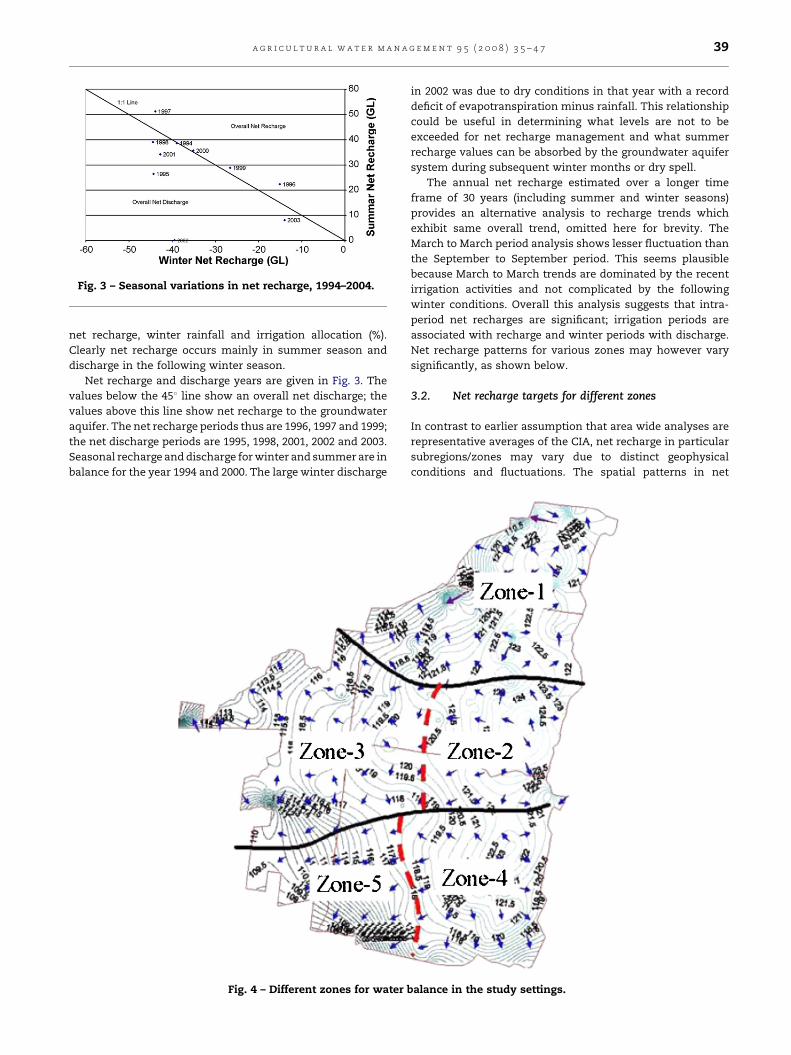
Fig. 3 – Seasonal variations in net recharge, 1994–2004.
a g r i c u l t u r a l w a t e r m a n a g e m e n t 9 5 ( 2 0 0 8 ) 3 5 – 4 7 39
net recharge, winter rainfall and irrigation allocation (%).
Clearly net recharge occurs mainly in summer season and
discharge in the following winter season.
Net recharge and discharge years are given in Fig. 3. The
values below the 458 line show an overall net discharge; the
values above this line show net recharge to the groundwater
aquifer. The net recharge periods thus are 1996, 1997 and 1999;
the net discharge periods are 1995, 1998, 2001, 2002 and 2003.
Seasonal recharge and discharge for winter and summer are in
balance for the year 1994 and 2000. The large winter discharge
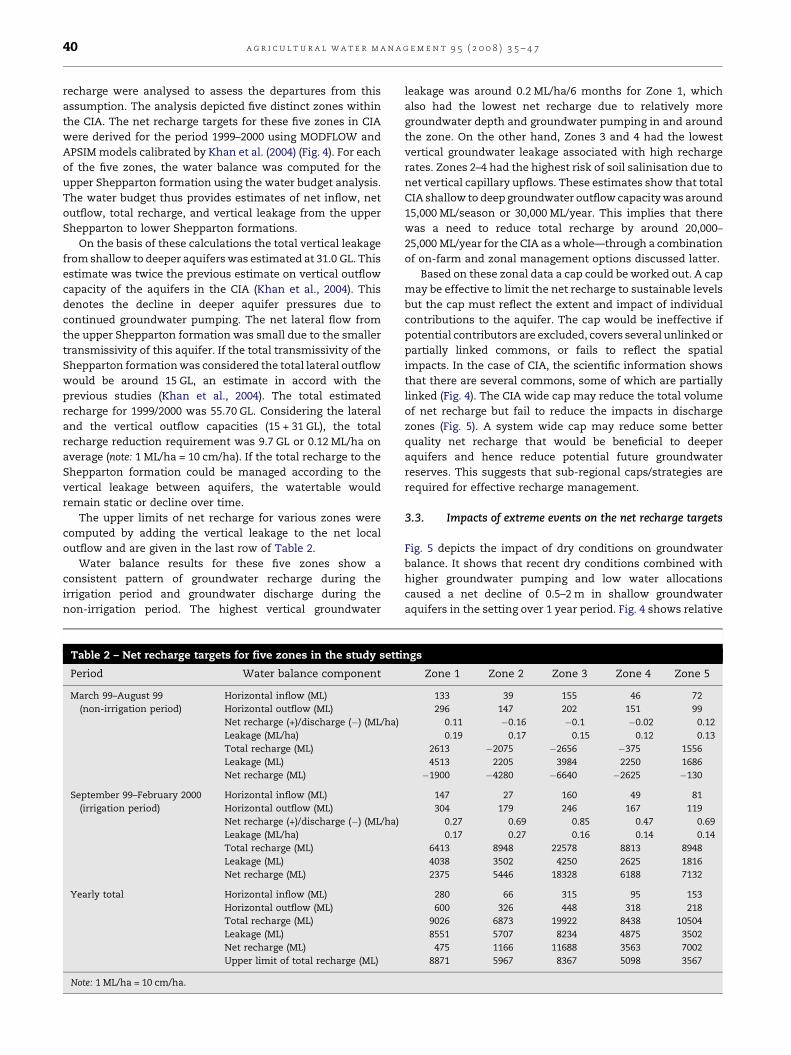
Fig. 4 – Different zones for water b
in 2002 was due to dry conditions in that year with a record
deficit of evapotranspiration minus rainfall. This relationship
could be useful in determining what levels are not to be
exceeded for net recharge management and what summer
recharge values can be absorbed by the groundwater aquifer
system during subsequent winter months or dry spell.
The annual net recharge estimated over a longer time
frame of 30 years (including summer and winter seasons)
provides an alternative analysis to recharge trends which
exhibit same overall trend, omitted here for brevity. The
March to March period analysis shows lesser fluctuation than
the September to September period. This seems plausible
because March to March trends are dominated by the recent
irrigation activities and not complicated by the following
winter conditions. Overall this analysis suggests that intra-
period net recharges are significant; irrigation periods are
associated with recharge and winter periods with discharge.
Net recharge patterns for various zones may however vary
significantly, as shown below.
3.2. Net recharge targets for different zones
In contrast to earlier assumption that area wide analyses are
representative averages of the CIA, net recharge in particular
subregions/zones may vary due to distinct geophysical
conditions and fluctuations. The spatial patterns in net
alance in the study settings.
a g r i c u l t u r a l w a t e r m a n a g e m e n t 9 5 ( 2 0 0 8 ) 3 5 – 4 740
recharge were analysed to assess the departures from this
assumption. The analysis depicted five distinct zones within
the CIA. The net recharge targets for these five zones in CIA
were derived for the period 1999–2000 using MODFLOW and
APSIM models calibrated by Khan et al. (2004) (Fig. 4). For each
of the five zones, the water balance was computed for the
upper Shepparton formation using the water budget analysis.
The water budget thus provides estimates of net inflow, net
outflow, total recharge, and vertical leakage from the upper
Shepparton to lower Shepparton formations.
On the basis of these calculations the total vertical leakage
from shallow to deeper aquifers was estimated at 31.0 GL. This
estimate was twice the previous estimate on vertical outflow
capacity of the aquifers in the CIA (Khan et al., 2004). This
denotes the decline in deeper aquifer pressures due to
continued groundwater pumping. The net lateral flow from
the upper Shepparton formation was small due to the smaller
transmissivity of this aquifer. If the total transmissivity of the
Shepparton formation was considered the total lateral outflow
would be around 15 GL, an estimate in accord with the
previous studies (Khan et al., 2004). The total estimated
recharge for 1999/2000 was 55.70 GL. Considering the lateral
and the vertical outflow capacities (15 + 31 GL), the total
recharge reduction requirement was 9.7 GL or 0.12 ML/ha on
average (note: 1 ML/ha = 10 cm/ha). If the total recharge to the
Shepparton formation could be managed according to the
vertical leakage between aquifers, the watertable would
remain static or decline over time.
The upper limits of net recharge for various zones were
computed by adding the vertical leakage to the net local
outflow and are given in the last row of Table 2.
Water balance results for these five zones show a
consistent pattern of groundwater recharge during the
irrigation period and groundwater discharge during the
non-irrigation period. The highest vertical groundwater
Table 2 – Net recharge targets for five zones in the study setti
Period Water balance component
March 99–August 99
(non-irrigation period)
Horizontal inflow (ML)
Horizontal outflow (ML)
Net recharge (+)/discharge (�) (ML/ha)
Leakage (ML/ha)
Total recharge (ML)
Leakage (ML)
Net recharge (ML)
September 99–February 2000
(irrigation period)
Horizontal inflow (ML)
Horizontal outflow (ML)
Net recharge (+)/discharge (�) (ML/ha)
Leakage (ML/ha)
Total recharge (ML)
Leakage (ML)
Net recharge (ML)
Yearly total Horizontal inflow (ML)
Horizontal outflow (ML)
Total recharge (ML)
Leakage (ML)
Net recharge (ML)
Upper limit of total recharge (ML)
Note: 1 ML/ha = 10 cm/ha.
leakage was around 0.2 ML/ha/6 months for Zone 1, which
also had the lowest net recharge due to relatively more
groundwater depth and groundwater pumping in and around
the zone. On the other hand, Zones 3 and 4 had the lowest
vertical groundwater leakage associated with high recharge
rates. Zones 2–4 had the highest risk of soil salinisation due to
net vertical capillary upflows. These estimates show that total
CIA shallow to deep groundwater outflow capacity was around
15,000 ML/season or 30,000 ML/year. This implies that there
was a need to reduce total recharge by around 20,000–
25,000 ML/year for the CIA as a whole—through a combination
of on-farm and zonal management options discussed latter.
Based on these zonal data a cap could be worked out. A cap
may be effective to limit the net recharge to sustainable levels
but the cap must reflect the extent and impact of individual
contributions to the aquifer. The cap would be ineffective if
potential contributors are excluded, covers several unlinked or
partially linked commons, or fails to reflect the spatial
impacts. In the case of CIA, the scientific information shows
that there are several commons, some of which are partially
linked (Fig. 4). The CIA wide cap may reduce the total volume
of net recharge but fail to reduce the impacts in discharge
zones (Fig. 5). A system wide cap may reduce some better
quality net recharge that would be beneficial to deeper
aquifers and hence reduce potential future groundwater
reserves. This suggests that sub-regional caps/strategies are
required for effective recharge management.
3.3. Impacts of extreme events on the net recharge targets
Fig. 5 depicts the impact of dry conditions on groundwater
balance. It shows that recent dry conditions combined with
higher groundwater pumping and low water allocations
caused a net decline of 0.5–2 m in shallow groundwater
aquifers in the setting over 1 year period. Fig. 4 shows relative
ngs
Zone 1 Zone 2 Zone 3 Zone 4 Zone 5
133 39 155 46 72
296 147 202 151 99
0.11 �0.16 �0.1 �0.02 0.12
0.19 0.17 0.15 0.12 0.13
2613 �2075 �2656 �375 1556
4513 2205 3984 2250 1686
�1900 �4280 �6640 �2625 �130
147 27 160 49 81
304 179 246 167 119
0.27 0.69 0.85 0.47 0.69
0.17 0.27 0.16 0.14 0.14
6413 8948 22578 8813 8948
4038 3502 4250 2625 1816
2375 5446 18328 6188 7132
280 66 315 95 153
600 326 448 318 218
9026 6873 19922 8438 10504
8551 5707 8234 4875 3502
475 1166 11688 3563 7002
8871 5967 8367 5098 3567
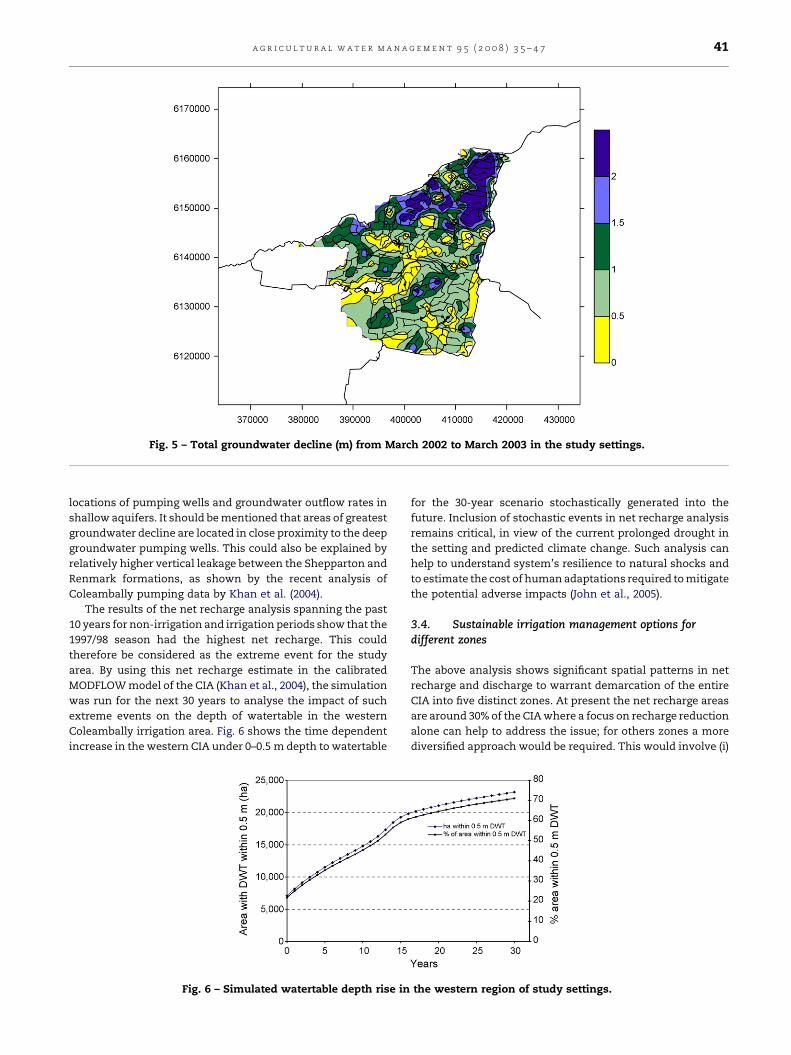
Fig. 5 – Total groundwater decline (m) from March 2002 to March 2003 in the study settings.
a g r i c u l t u r a l w a t e r m a n a g e m e n t 9 5 ( 2 0 0 8 ) 3 5 – 4 7 41
locations of pumping wells and groundwater outflow rates in
shallow aquifers. It should be mentioned that areas of greatest
groundwater decline are located in close proximity to the deep
groundwater pumping wells. This could also be explained by
relatively higher vertical leakage between the Shepparton and
Renmark formations, as shown by the recent analysis of
Coleambally pumping data by Khan et al. (2004).
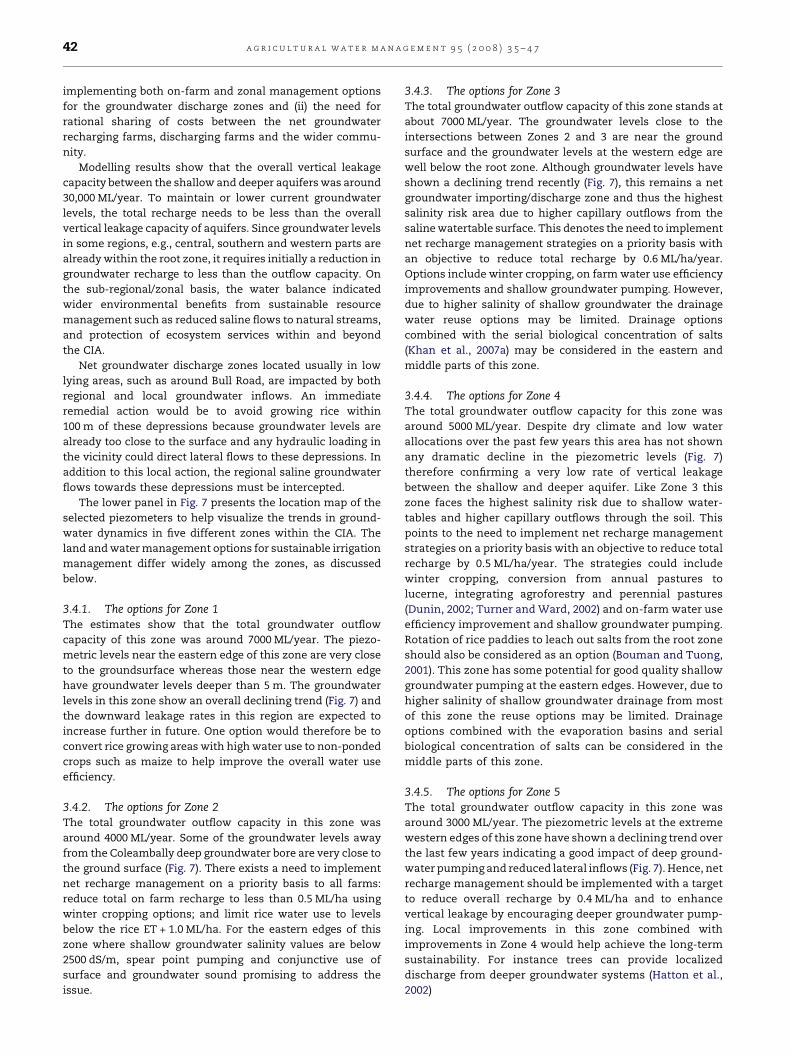
The results of the net recharge analysis spanning the past
10 years for non-irrigation and irrigation periods show that the
1997/98 season had the highest net recharge. This could
therefore be considered as the extreme event for the study
area. By using this net recharge estimate in the calibrated
MODFLOW model of the CIA (Khan et al., 2004), the simulation
was run for the next 30 years to analyse the impact of such
extreme events on the depth of watertable in the western
Coleambally irrigation area. Fig. 6 shows the time dependent
increase in the western CIA under 0–0.5 m depth to watertable
Fig. 6 – Simulated watertable depth rise in
for the 30-year scenario stochastically generated into the
future. Inclusion of stochastic events in net recharge analysis
remains critical, in view of the current prolonged drought in
the setting and predicted climate change. Such analysis can
help to understand system’s resilience to natural shocks and
to estimate the cost of human adaptations required to mitigate
the potential adverse impacts (John et al., 2005).
3.4. Sustainable irrigation management options fordifferent zones
The above analysis shows significant spatial patterns in net
recharge and discharge to warrant demarcation of the entire
CIA into five distinct zones. At present the net recharge areas
are around 30% of the CIA where a focus on recharge reduction
alone can help to address the issue; for others zones a more
diversified approach would be required. This would involve (i)
the western region of study settings.
a g r i c u l t u r a l w a t e r m a n a g e m e n t 9 5 ( 2 0 0 8 ) 3 5 – 4 742
implementing both on-farm and zonal management options
for the groundwater discharge zones and (ii) the need for
rational sharing of costs between the net groundwater
recharging farms, discharging farms and the wider commu-
nity.
Modelling results show that the overall vertical leakage
capacity between the shallow and deeper aquifers was around
30,000 ML/year. To maintain or lower current groundwater
levels, the total recharge needs to be less than the overall
vertical leakage capacity of aquifers. Since groundwater levels
in some regions, e.g., central, southern and western parts are
already within the root zone, it requires initially a reduction in
groundwater recharge to less than the outflow capacity. On
the sub-regional/zonal basis, the water balance indicated
wider environmental benefits from sustainable resource
management such as reduced saline flows to natural streams,
and protection of ecosystem services within and beyond
the CIA.
Net groundwater discharge zones located usually in low
lying areas, such as around Bull Road, are impacted by both
regional and local groundwater inflows. An immediate
remedial action would be to avoid growing rice within
100 m of these depressions because groundwater levels are
already too close to the surface and any hydraulic loading in
the vicinity could direct lateral flows to these depressions. In
addition to this local action, the regional saline groundwater
flows towards these depressions must be intercepted.
The lower panel in Fig. 7 presents the location map of the
selected piezometers to help visualize the trends in ground-
water dynamics in five different zones within the CIA. The
land and water management options for sustainable irrigation
management differ widely among the zones, as discussed
below.
3.4.1. The options for Zone 1The estimates show that the total groundwater outflow
capacity of this zone was around 7000 ML/year. The piezo-
metric levels near the eastern edge of this zone are very close
to the groundsurface whereas those near the western edge
have groundwater levels deeper than 5 m. The groundwater
levels in this zone show an overall declining trend (Fig. 7) and
the downward leakage rates in this region are expected to
increase further in future. One option would therefore be to
convert rice growing areas with high water use to non-ponded
crops such as maize to help improve the overall water use
efficiency.
3.4.2. The options for Zone 2The total groundwater outflow capacity in this zone was
around 4000 ML/year. Some of the groundwater levels away
from the Coleambally deep groundwater bore are very close to
the ground surface (Fig. 7). There exists a need to implement
net recharge management on a priority basis to all farms:
reduce total on farm recharge to less than 0.5 ML/ha using
winter cropping options; and limit rice water use to levels
below the rice ET + 1.0 ML/ha. For the eastern edges of this
zone where shallow groundwater salinity values are below
2500 dS/m, spear point pumping and conjunctive use of
surface and groundwater sound promising to address the
issue.
3.4.3. The options for Zone 3The total groundwater outflow capacity of this zone stands at
about 7000 ML/year. The groundwater levels close to the
intersections between Zones 2 and 3 are near the ground
surface and the groundwater levels at the western edge are
well below the root zone. Although groundwater levels have
shown a declining trend recently (Fig. 7), this remains a net
groundwater importing/discharge zone and thus the highest
salinity risk area due to higher capillary outflows from the
saline watertable surface. This denotes the need to implement
net recharge management strategies on a priority basis with
an objective to reduce total recharge by 0.6 ML/ha/year.
Options include winter cropping, on farm water use efficiency
improvements and shallow groundwater pumping. However,
due to higher salinity of shallow groundwater the drainage
water reuse options may be limited. Drainage options
combined with the serial biological concentration of salts
(Khan et al., 2007a) may be considered in the eastern and
middle parts of this zone.
3.4.4. The options for Zone 4The total groundwater outflow capacity for this zone was
around 5000 ML/year. Despite dry climate and low water
allocations over the past few years this area has not shown
any dramatic decline in the piezometric levels (Fig. 7)
therefore confirming a very low rate of vertical leakage
between the shallow and deeper aquifer. Like Zone 3 this
zone faces the highest salinity risk due to shallow water-
tables and higher capillary outflows through the soil. This
points to the need to implement net recharge management
strategies on a priority basis with an objective to reduce total
recharge by 0.5 ML/ha/year. The strategies could include
winter cropping, conversion from annual pastures to
lucerne, integrating agroforestry and perennial pastures
(Dunin, 2002; Turner and Ward, 2002) and on-farm water use
efficiency improvement and shallow groundwater pumping.
Rotation of rice paddies to leach out salts from the root zone
should also be considered as an option (Bouman and Tuong,
2001). This zone has some potential for good quality shallow
groundwater pumping at the eastern edges. However, due to
higher salinity of shallow groundwater drainage from most
of this zone the reuse options may be limited. Drainage
options combined with the evaporation basins and serial
biological concentration of salts can be considered in the
middle parts of this zone.
3.4.5. The options for Zone 5The total groundwater outflow capacity in this zone was
around 3000 ML/year. The piezometric levels at the extreme
western edges of this zone have shown a declining trend over
the last few years indicating a good impact of deep ground-
water pumping and reduced lateral inflows (Fig. 7). Hence, net
recharge management should be implemented with a target
to reduce overall recharge by 0.4 ML/ha and to enhance
vertical leakage by encouraging deeper groundwater pump-
ing. Local improvements in this zone combined with
improvements in Zone 4 would help achieve the long-term
sustainability. For instance trees can provide localized
discharge from deeper groundwater systems (Hatton et al.,
2002)
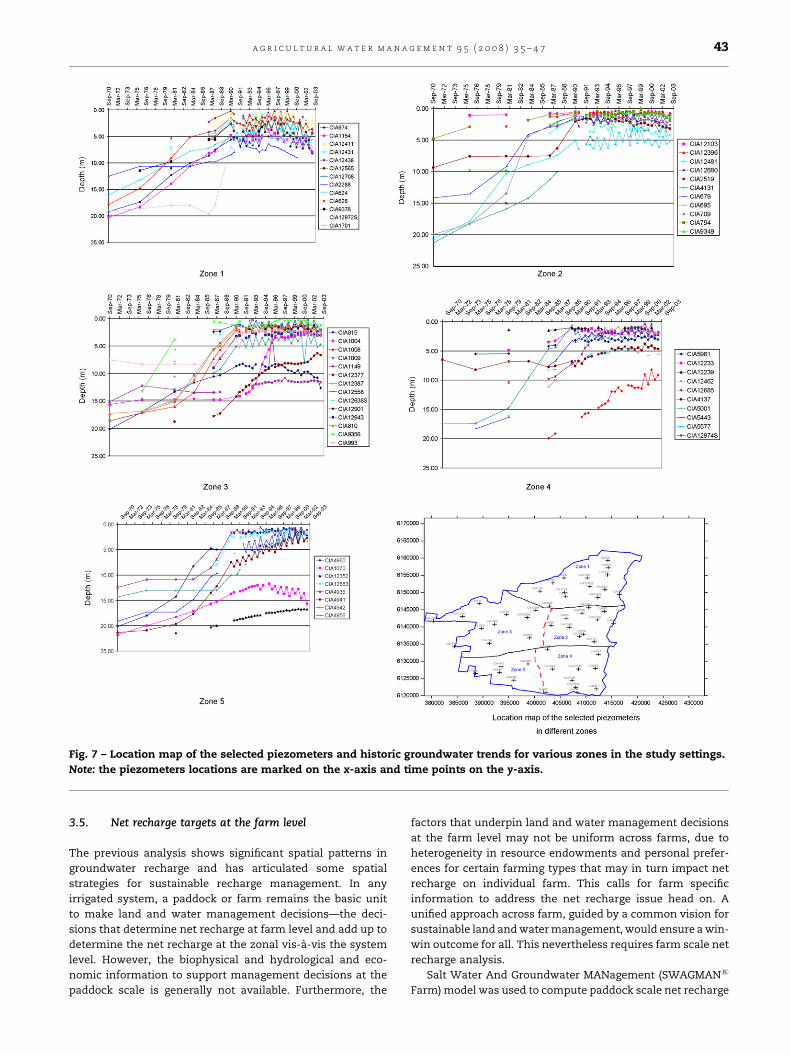
Fig. 7 – Location map of the selected piezometers and historic groundwater trends for various zones in the study settings.
Note: the piezometers locations are marked on the x-axis and time points on the y-axis.
a g r i c u l t u r a l w a t e r m a n a g e m e n t 9 5 ( 2 0 0 8 ) 3 5 – 4 7 43
3.5. Net recharge targets at the farm level
The previous analysis shows significant spatial patterns in
groundwater recharge and has articulated some spatial
strategies for sustainable recharge management. In any
irrigated system, a paddock or farm remains the basic unit
to make land and water management decisions—the deci-
sions that determine net recharge at farm level and add up to
determine the net recharge at the zonal vis-a-vis the system
level. However, the biophysical and hydrological and eco-
nomic information to support management decisions at the
paddock scale is generally not available. Furthermore, the
factors that underpin land and water management decisions
at the farm level may not be uniform across farms, due to
heterogeneity in resource endowments and personal prefer-
ences for certain farming types that may in turn impact net
recharge on individual farm. This calls for farm specific
information to address the net recharge issue head on. A
unified approach across farm, guided by a common vision for
sustainable land and water management, would ensure a win-
win outcome for all. This nevertheless requires farm scale net
recharge analysis.
Salt Water And Groundwater MANagement (SWAGMAN1
Farm) model was used to compute paddock scale net recharge
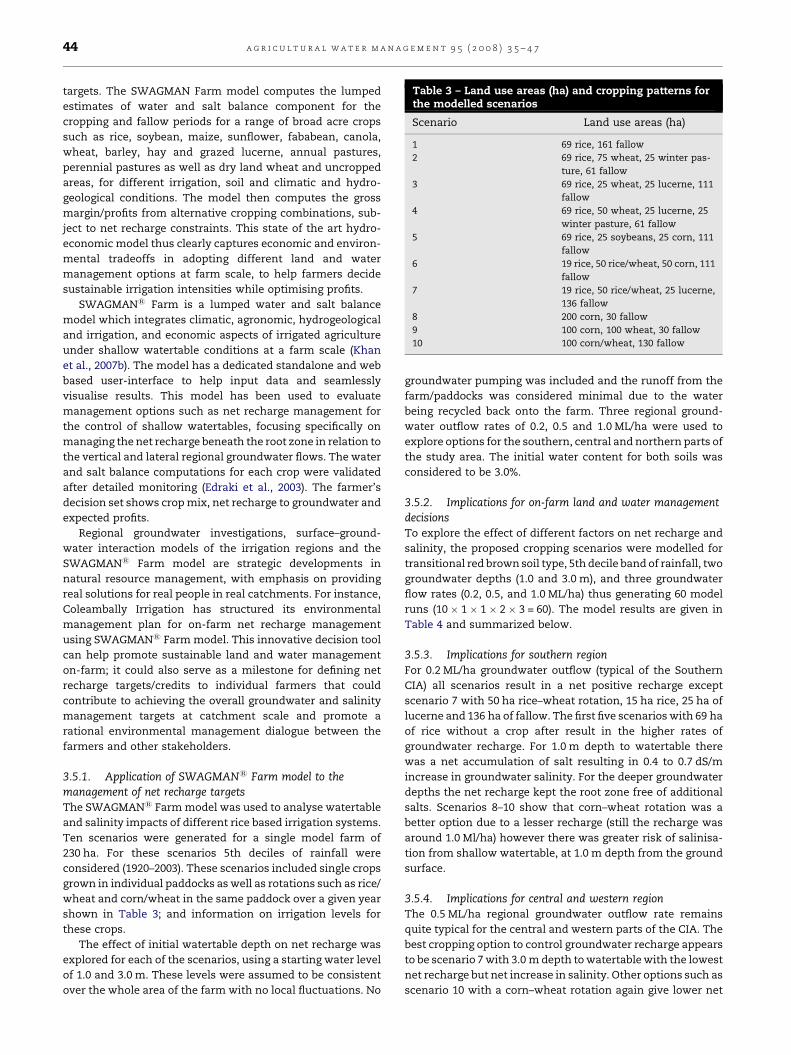
Table 3 – Land use areas (ha) and cropping patterns forthe modelled scenarios
Scenario Land use areas (ha)
1 69 rice, 161 fallow
2 69 rice, 75 wheat, 25 winter pas-
ture, 61 fallow
3 69 rice, 25 wheat, 25 lucerne, 111
fallow
4 69 rice, 50 wheat, 25 lucerne, 25
winter pasture, 61 fallow
5 69 rice, 25 soybeans, 25 corn, 111
fallow
6 19 rice, 50 rice/wheat, 50 corn, 111
fallow
7 19 rice, 50 rice/wheat, 25 lucerne,
136 fallow
8 200 corn, 30 fallow
9 100 corn, 100 wheat, 30 fallow
10 100 corn/wheat, 130 fallow
a g r i c u l t u r a l w a t e r m a n a g e m e n t 9 5 ( 2 0 0 8 ) 3 5 – 4 744
targets. The SWAGMAN Farm model computes the lumped
estimates of water and salt balance component for the
cropping and fallow periods for a range of broad acre crops
such as rice, soybean, maize, sunflower, fababean, canola,
wheat, barley, hay and grazed lucerne, annual pastures,
perennial pastures as well as dry land wheat and uncropped
areas, for different irrigation, soil and climatic and hydro-
geological conditions. The model then computes the gross
margin/profits from alternative cropping combinations, sub-
ject to net recharge constraints. This state of the art hydro-
economic model thus clearly captures economic and environ-
mental tradeoffs in adopting different land and water
management options at farm scale, to help farmers decide
sustainable irrigation intensities while optimising profits.
SWAGMAN1 Farm is a lumped water and salt balance
model which integrates climatic, agronomic, hydrogeological
and irrigation, and economic aspects of irrigated agriculture
under shallow watertable conditions at a farm scale (Khan
et al., 2007b). The model has a dedicated standalone and web
based user-interface to help input data and seamlessly
visualise results. This model has been used to evaluate
management options such as net recharge management for
the control of shallow watertables, focusing specifically on
managing the net recharge beneath the root zone in relation to
the vertical and lateral regional groundwater flows. The water
and salt balance computations for each crop were validated
after detailed monitoring (Edraki et al., 2003). The farmer’s
decision set shows crop mix, net recharge to groundwater and
expected profits.
Regional groundwater investigations, surface–ground-
water interaction models of the irrigation regions and the
SWAGMAN1 Farm model are strategic developments in
natural resource management, with emphasis on providing
real solutions for real people in real catchments. For instance,
Coleambally Irrigation has structured its environmental
management plan for on-farm net recharge management
using SWAGMAN1 Farm model. This innovative decision tool
can help promote sustainable land and water management
on-farm; it could also serve as a milestone for defining net
recharge targets/credits to individual farmers that could
contribute to achieving the overall groundwater and salinity
management targets at catchment scale and promote a
rational environmental management dialogue between the
farmers and other stakeholders.
3.5.1. Application of SWAGMAN1 Farm model to themanagement of net recharge targetsThe SWAGMAN1 Farm model was used to analyse watertable
and salinity impacts of different rice based irrigation systems.
Ten scenarios were generated for a single model farm of
230 ha. For these scenarios 5th deciles of rainfall were
considered (1920–2003). These scenarios included single crops
grown in individual paddocks as well as rotations such as rice/
wheat and corn/wheat in the same paddock over a given year
shown in Table 3; and information on irrigation levels for
these crops.
The effect of initial watertable depth on net recharge was
explored for each of the scenarios, using a starting water level
of 1.0 and 3.0 m. These levels were assumed to be consistent
over the whole area of the farm with no local fluctuations. No
groundwater pumping was included and the runoff from the
farm/paddocks was considered minimal due to the water
being recycled back onto the farm. Three regional ground-
water outflow rates of 0.2, 0.5 and 1.0 ML/ha were used to
explore options for the southern, central and northern parts of
the study area. The initial water content for both soils was
considered to be 3.0%.
3.5.2. Implications for on-farm land and water managementdecisionsTo explore the effect of different factors on net recharge and
salinity, the proposed cropping scenarios were modelled for
transitional red brown soil type, 5th decile band of rainfall, two
groundwater depths (1.0 and 3.0 m), and three groundwater
flow rates (0.2, 0.5, and 1.0 ML/ha) thus generating 60 model
runs (10 � 1 � 1 � 2 � 3 = 60). The model results are given in
Table 4 and summarized below.
3.5.3. Implications for southern region
For 0.2 ML/ha groundwater outflow (typical of the Southern
CIA) all scenarios result in a net positive recharge except
scenario 7 with 50 ha rice–wheat rotation, 15 ha rice, 25 ha of
lucerne and 136 ha of fallow. The first five scenarios with 69 ha
of rice without a crop after result in the higher rates of
groundwater recharge. For 1.0 m depth to watertable there
was a net accumulation of salt resulting in 0.4 to 0.7 dS/m
increase in groundwater salinity. For the deeper groundwater
depths the net recharge kept the root zone free of additional
salts. Scenarios 8–10 show that corn–wheat rotation was a
better option due to a lesser recharge (still the recharge was
around 1.0 Ml/ha) however there was greater risk of salinisa-
tion from shallow watertable, at 1.0 m depth from the ground
surface.
3.5.4. Implications for central and western regionThe 0.5 ML/ha regional groundwater outflow rate remains
quite typical for the central and western parts of the CIA. The
best cropping option to control groundwater recharge appears
to be scenario 7 with 3.0 m depth to watertable with the lowest
net recharge but net increase in salinity. Other options such as
scenario 10 with a corn–wheat rotation again give lower net
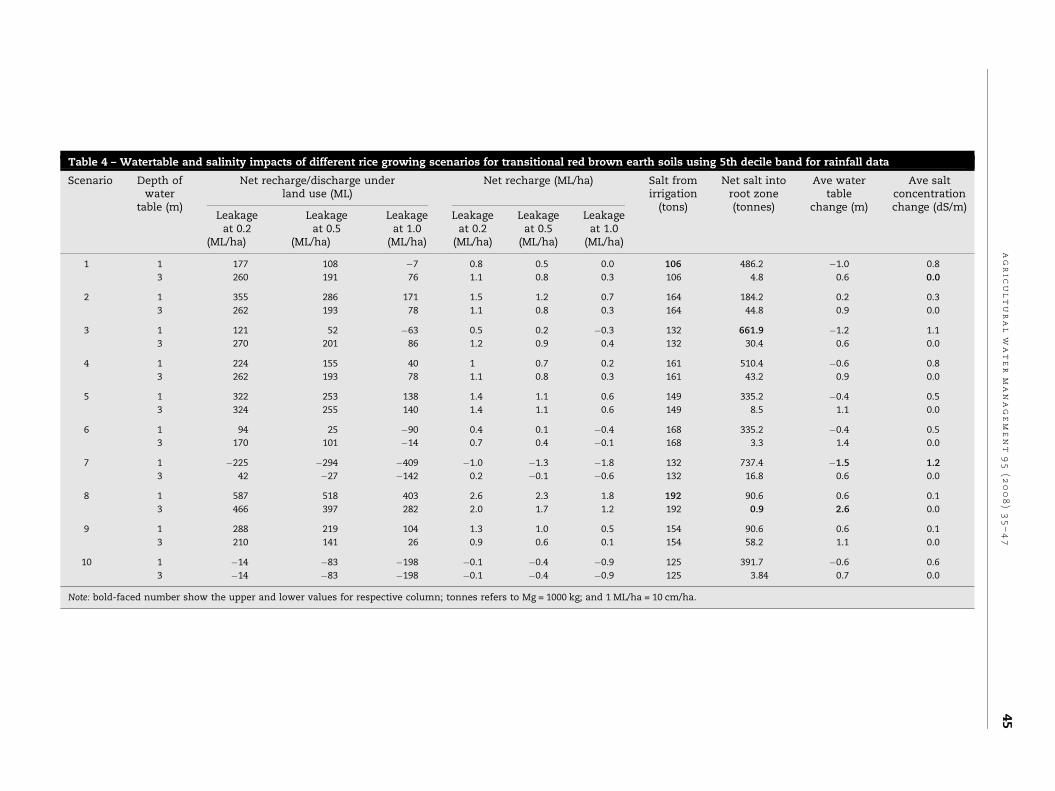
Table 4 – Watertable and salinity impacts of different rice growing scenarios for transitional red brown earth soils using 5th decile band for rainfall data
Scenario Depth ofwater
table (m)
Net recharge/discharge underland use (ML)
Net recharge (ML/ha) Salt fromirrigation
(tons)
Net salt intoroot zone(tonnes)
Ave watertable
change (m)
Ave saltconcentrationchange (dS/m)
Leakageat 0.2
(ML/ha)
Leakageat 0.5
(ML/ha)
Leakageat 1.0
(ML/ha)
Leakageat 0.2
(ML/ha)
Leakageat 0.5
(ML/ha)
Leakageat 1.0
(ML/ha)
1 1 177 108 �7 0.8 0.5 0.0 106 486.2 �1.0 0.8
3 260 191 76 1.1 0.8 0.3 106 4.8 0.6 0.0
2 1 355 286 171 1.5 1.2 0.7 164 184.2 0.2 0.3
3 262 193 78 1.1 0.8 0.3 164 44.8 0.9 0.0
3 1 121 52 �63 0.5 0.2 �0.3 132 661.9 �1.2 1.1
3 270 201 86 1.2 0.9 0.4 132 30.4 0.6 0.0
4 1 224 155 40 1 0.7 0.2 161 510.4 �0.6 0.8
3 262 193 78 1.1 0.8 0.3 161 43.2 0.9 0.0
5 1 322 253 138 1.4 1.1 0.6 149 335.2 �0.4 0.5
3 324 255 140 1.4 1.1 0.6 149 8.5 1.1 0.0
6 1 94 25 �90 0.4 0.1 �0.4 168 335.2 �0.4 0.5
3 170 101 �14 0.7 0.4 �0.1 168 3.3 1.4 0.0
7 1 �225 �294 �409 �1.0 �1.3 �1.8 132 737.4 �1.5 1.2
3 42 �27 �142 0.2 �0.1 �0.6 132 16.8 0.6 0.0
8 1 587 518 403 2.6 2.3 1.8 192 90.6 0.6 0.1
3 466 397 282 2.0 1.7 1.2 192 0.9 2.6 0.0
9 1 288 219 104 1.3 1.0 0.5 154 90.6 0.6 0.1
3 210 141 26 0.9 0.6 0.1 154 58.2 1.1 0.0
10 1 �14 �83 �198 �0.1 �0.4 �0.9 125 391.7 �0.6 0.6
3 �14 �83 �198 �0.1 �0.4 �0.9 125 3.84 0.7 0.0
Note: bold-faced number show the upper and lower values for respective column; tonnes refers to Mg = 1000 kg; and 1 ML/ha = 10 cm/ha.
ag
ric
ul
tu
ra
lw
at
er
ma
na
ge
me
nt
95
(2
00
8)
35
–4
74
5
a g r i c u l t u r a l w a t e r m a n a g e m e n t 9 5 ( 2 0 0 8 ) 3 5 – 4 746
recharge (0.4–0.6 ML/ha). All other options result in net
recharge greater than 0.7 ML/ha.
3.5.5. Implications for northern region
The regional groundwater outflow rates of 1.0 ML/ha and
watertable depth of 3.0 m roughly represents the groundwater
conditions in the Northern CIA. For these conditions cropping
scenarios 7 and 10 result in lowest net recharge (�0.3 and
0.1 ML/ha). If rice–wheat rotation with some area under
lucerne or a corn–wheat rotation were practiced the net
recharge can be reduced very close or below the target levels.
3.5.6. On-farm actions matterThe model results in Table 4 suggest that on-farm land and
water management decisions have a strong bearing on net
recharge and salinity dynamics. For instance, net recharge/
discharge could vary from �1.8 to 2.6 ML/ha; salts from
irrigation from 106.0 to 192.0 tonnes (tonnes refers to
Mg = 1000 kg); net salts into the root zone from 0.9 to
661.9 tonnes; salt concentration change under land use from
0.0 to 1.2 dS/m; and average water table change from �1.5 to
2.6 m—depending on farm scale land and water management
actions. Coordinating farmer’s production decisions based on
sound scientific frameworks such as SWAGMAN Farm model
offers the best pathway to achieve sustainable irrigation
management.
4. Summary and conclusions
Shallow groundwater salinity induced by irrigation can be
managed by keeping irrigation applications below the net
recharge—a concept that links the evapotranspiration needs
of crops, leaching requirements of soil, and water move-
ment within underlying groundwater systems. Often net
recharge within a catchment/basin is unknown or existing
knowledge is incomplete, particularly at lower spatial scales
such as the farm or paddock; this offers little guidance for
on-farm land and water management decisions that
together impact basin wide net recharge and waterlogging
and salinity dynamics.
This paper developed the concept of net recharge for
setting paddock scale recharge targets and to link these to the
regional targets and community’s goals for sustainable
irrigation management. A management model, cast in a
dynamic programming format to integrate a detailed hydro-
logical model with an economic model was applied to estimate
the productivity, profitability and sustainability of irrigated
agriculture in a region of the southern Murray Darling Basin in
Australia. SWAGMAN1 Farm model was used to determine
paddock scale net recharge. This interactive model enables an
individual farmer to choose a profit optimizing crop mix while
lowering net recharge through better irrigation management.
A unified action by all irrigators across farms within the
catchment can lead to a win-win outcome for all farmers.
The results of biophysical and hudrogeological modelling
reported in this study provide evidence of considerable spatial
variations in net recharge across different zones within the
study area, requiring a spatially targeted approach to address
the recharge issue. This implies that achieving overall
recharge targets for the irrigation area as a whole alone
would be ineffective—one size fits all approaches would be a
blunt policy tool that would do more harm than the good, say
be eliminating some beneficial recharges/return flows. It also
implies that sustainable irrigation management requires a
more informed and science-based policy response for effec-
tively targeting the issue. Thus, recharge reduction strategies
offer promise in those zones where net recharge occurs;
limiting discharge would be desirable for the net discharge
zones; and different salinity mitigation strategies would be
called for in zones of shallow groundwater and high salt
concentration. The modelling results show that on-farm land
and water management actions offer the greatest promise to
mitigate salinity and waterlogging.
To guide on-farm land and water management decisions,
an explicit attempt was made to determine paddock scale net
recharge targets. SWAGMAN1 Farm model was used for this
purpose. This model enables farmers to determine paddock
scale net recharge targets while optimizing profits. But
alternatively irrigators optimize productivity and profitability
subject to a zero net recharge constraint, promoting sustain-
able irrigation management. The paddock scale targets can
then be linked to overall recharge targets at catchment scale to
meet community’s vision for sustainable irrigation manage-
ment.
The development of paddock scale net recharge metric is
perhaps the most significant contribution of this study. The
management of paddock scale net recharge target across
farms and optimization of profits achieves a win-win outcome
for all farmers. The recharge management metric enables the
conversion of diffuse source recharge to point source recharge
at paddock scale, enabling the conversion of private property
rights to a common pool issue and assigning individual
responsibilities for its management. To help refine this work,
future research should calibrate the model in other irrigation
systems facing waterlogging and salinity issues as well as
cover additional dimensions such as:
� H
ydro-economic ranking of on-farm and regional optionsfor regional groundwater management.
� H
ydrological assessment of downstream environmentalbenefits of net recharge management emanating from
promising on-farm and regional groundwater management
options.
� D
esign and testing of market based instruments for sharingenvironmental costs and benefits among the stakeholders.
This way forward would entail building enduring partner-
ships between biophysical scientists, economists and other
professional as well governments, irrigators and wider
community to help promote the development of sustainable
irrigation management tools and practices.
Acknowledgements
The authors wish to acknowledge funding support by the
Coleambally Irrigation Cooperative Limited, the Cooperative
Research Centre for Irrigation Futures and the Cooperative
Research Centre for Sustainable Rice Production, Australia.
a g r i c u l t u r a l w a t e r m a n a g e m e n t 9 5 ( 2 0 0 8 ) 3 5 – 4 7 47
r e f e r e n c e s
Ashraf, M., Saeed, M., 2006. Effect of improved cultural practiceson crop yield and soil salinity under relatively salinegroundwater applications. Irrigation Drainage Syst. 20,111–124.
Bouman, B.A.M., Tuong, T.P., 2001. Field water management tosave water and increase its productivity in irrigated lowlandrice. Agric. Water Manage. 49, 11–30.
Characklis, G.W., Griffin, R.C., Bedient, P.B., 2005. Measuring thelong-term regional benefits of salinity reduction. J. Agric.Resour. Econ. 30, 69–93.
Clarke, C.J., George, R.J., Bell, R.W., Hatton, T.J., 2002. Drylandsalinity in south-western Australia: its origins, remedies,and future research directions. Austr. J. Soil Res. 40, 93–113.
Croke, B.F.W., Ticehurst, J.L., Letcher, R.A., Norton, J.P.,Newham, L.T.H., Jakeman, A.J., 2006. Integrated assessmentof water resources: Australian experiences. Water Resour.Manage. 2, 351–373.
Dunin, F.X., 2002. Intergrating agroforestry and perennialpastures to mitigate water logging and secondary salinity.Agric. Water Manage. 53, 259–270.
Edraki, M., Smith, D., Humphreys, E., Khan, S., O’Connell, N.,Xevi, E., 2003. Validation of the SWAGMAN1 Farm andSWAGMAN1 Destiny models. CSIRO Land and WaterTechnical Report 44/03, Australia.
FAO, 2003. World Agriculture: Towards 2015/2030. An FAOPerspective. FAO/Earthscan, Rome, Italy.
Ghassemi, F., Jakeman, A.J., Nix, H.A., 1995. Salinisation of Landand Water Resources: Human Causes, Extent, Management,and Case Studies. University of New South Wales Press,Sydney, Australia.
Hajkowicz, S., Young, M.D., 2002. An economic analysis ofrevegetation for dryland salinity control on the Lower EyrePeninsula in South Australia. Land Degrad. Dev. 13, 417–428.
Hanjra, M.A., Ferede, T., Gutta, D.G. Pathways to reduce ruralpoverty in Ethiopia: investing in irrigation water, educationand markets. Afr. Water J., in press.
Hatton, T.J., Bartle, G.A., Silberstein, R.P., Salama, R.B., Hodgson,G., Ward, P.R., Lambert, P., Williamson, D.R., 2002.Predicting and controlling water logging and groundwaterflow in sloping duplex soils in western Australia. Agric.Water Manage. 53, 57–81.
Houk, E., Frasier, M., Schuck, E., 2005. Irrigation technologydecisions in the presence of waterlogging and soil salinity.Global Business Econ. Rev. 7, 343–352.
Hussain, I., Hanjra, M.A., 2003. Does irrigation water matter forrural poverty alleviation? Evidence from South and South-East Asia. Water Policy 5, 429–442.
Hussain, I., Hanjra, M.A., 2004. Irrigation and povertyalleviation: review of the empirical evidence. IrrigationDrainage 53, 1–15.
Janmaat, J., 2004. Calculating the cost of irrigation induced soilsalinization in the Tungabhadra project. Agric. Econ. 31,81–96.
John, M., Pannell, D., Kingwell, R., 2005. Climate change and theeconomics of farm management in the face of land
degradation: dryland salinity in Western Australia. Can. J.Agric. Econ. 43, 443–459.
Kahlown, M.A., Azam, M., 2002. Individual and combined effectof waterlogging and salinity on crop yields in the Indusbasin. Irrigation Drainage 51, 329–338.
Khan, S., Abbas, A., Blackwell, J., Gabriel, H.F., Ahmad, A., 2007a.Hydrogeological assessment of serial biologicalconcentration of salts to manage saline drainage. Agric.Water Manage. 92, 64–72.
Khan, S., O’Connel, N., Triaq, R., Xevi, E., 2007b. Hydrologic-economic model for managing irrigation intensity inirrigation areas under watertable and soil salinity targets.Environ. Model. Assess. doi:10.1007/s10666-10006-19081-10663.
Khan, S., Paydar, Z., Rana, T., 2004. Net recharge targets to meetregional environmental goals. CSIRO Land and WaterTechnical Report No. 12/04, Commonwealth of Australia,Canberra.
Khan, S., Triaq, R., Yuanlai, C., Blackwell, J., 2006. Can irrigationbe sustainable? Agric. Water Manage. 80, 87–99.
Khan, S., Xevi, E., Meyer, W.S., 2003. Salt, water, andgroundwater management models to determinesustainable cropping patterns in shallow salinegroundwater regions of Australia. J. Crop Prod. 7, 321–336.
Khanna, M., Malano, H.M., 2006. Modelling of basin irrigationsystems: a review. Agric. Water Manage. 83, 87–99.
Murgai, R., Ali, M., Byerlee, D., 2001. Productivity growth andsustainability in post Green-Revolution agriculture: the caseof Indian and Pakistani Punjabs. World Bank Res. Observer16, 199–218.
Postel, S., 1991. Accounting for nature. Worldwatch (March–April), 28–33.
Postel, S.L., 1999. Pillar of Sand: Can the Irrigation Miracle Last?W.W. Norton, New York.
Proust, K., 2003. Ignoring the signals: irrigation salinity in NewSouth Wales, Australia. Irrigation Drainage 52, 39–49.
Ragan, G.E., Young, R.A., Makela, C.J., 2000. New evidence on theeconomic benefits of controlling salinity in domestic watersupplies. Water Resour. Res. 36, 1087.
Smedema, L.K., Shiati, K., 2002. Irrigation and salinity: aperspective review of the salinity hazards of irrigationdevelopment in the arid zone. Irrigation Drainage Syst. 16,161–174.
Tarboton, K.C., Wallender, W.W., Raghuwanshi, N.S., 2004.Farm salinity appraisal with water reuse. IrrigationDrainage Syst. 18, 255–273.
Turner, N.C., Ward, P.R., 2002. The role of agroforestry andperennial pasture in mitigating water logging andsecondary salinity: summary. Agric. Water Manage. 53, 271–275.
Wichelns, D., 1999. An economic model of waterlogging andsalinization in arid regions. Ecol. Econ. 30, 475–491.
Wichelns, D., 2002. An economic perspective on the potentialgains from improvements in irrigation water management.Agric. Water Manage. 52, 233–248.
World Bank, 2003. World Development Report 2003: SustainableDevelopment in a 767 Dynamic World-TransformingInstitutions, Growth, and Quality of Life. The World 768Bank, Washington, DC.