Towards purification of adenoviral vectors based on membrane technology
25
1 Towards purification of adenoviral vectors based on membrane technology 1 C. Peixoto 1 , T.B. Ferreira 1 , M.F.Q. Sousa 1 , M.J.T. Carrondo 1,2 , P. M. Alves 1,* 2 3 4 5 6 7 8 9 10 11 Running title: Membrane technology for adenovirus purification 12 13 14 15 1 – ITQB-UNL/IBET, Apartado 12, P-2780-901 Oeiras, Portugal; 16 2 – Laboratório de Engenharia Bioquímica, FCT/UNL, P-2825 Monte da Caparica, 17 Portugal. 18 19 20 * Corresponding author mailing address: 21 ITQB-UNL/IBET, Apartado 12, P-2780-901 Oeiras, Portugal; 22 phone: ++ 351 21 446 94 21 23 fax: ++ 351 21 442 11 61 24 e-mail: [email protected] 25 26
-
Upload
independent -
Category
Documents
-
view
3 -
download
0
Transcript of Towards purification of adenoviral vectors based on membrane technology

1
Towards purification of adenoviral vectors based on membrane technology 1
C. Peixoto1, T.B. Ferreira1, M.F.Q. Sousa1, M.J.T. Carrondo1,2, P. M. Alves1,* 2
3
4
5
6
7
8
9
10
11
Running title: Membrane technology for adenovirus purification 12
13
14
15
1 – ITQB-UNL/IBET, Apartado 12, P-2780-901 Oeiras, Portugal; 16
2 – Laboratório de Engenharia Bioquímica, FCT/UNL, P-2825 Monte da Caparica, 17
Portugal. 18
19
20
* Corresponding author mailing address: 21
ITQB-UNL/IBET, Apartado 12, P-2780-901 Oeiras, Portugal; 22
phone: ++ 351 21 446 94 21 23
fax: ++ 351 21 442 11 61 24
e-mail: [email protected] 25
26

2
Abstract 1
Given increasing applications of recombinant adenoviruses for gene therapy and 2
vaccination there is a need for highly robust and fast purification platforms for their 3
large scale manufacture. 4
Traditional chromatographic methods using resins as matrices have several 5
limitations such as high-pressure drops, slow processing rates due to pore diffusion 6
and channelling of the feed through the bed. In contrast, membrane adsorbers offer the 7
advantage of fast, gentle and effective isolation. Furthermore, membranes are easy to 8
use, no column packing is needed and, when used as disposables, no cleaning 9
validation is necessary, representing a substantial advantage to meet cGMP 10
requirements. In this work a strategy for purification of adenovirus vectors from cell 11
culture bulks fully based on membrane devices is presented. 12
Ultrafiltration membranes with molecular weight cutoffs of 300, 500 and 750 13
kDa were tested for concentration of cell culture supernatant after an initial 14
clarification step. The results show that the use of ultrafiltration/diafiltration 15
membranes not only concentrates the virus but also leads to a removal of 90% of host 16
cell DNA and proteins in the retentate. 17
Two membrane adsorbers (Sartobind Q and Sartobind Anion Direct) were 18
evaluated for adenovirus vectors capture and purification. In order to define the best 19
operating conditions, the effect of pH, conductivity and recirculation of load bulk on 20
the recovery yield of infectious adenoviruses were evaluated. Sartobind Anion Direct 21
allows for higher recovery yields (up to 62 %) of infectious adenoviruses than 22
Sartobind Q; identical ratios between total and infectious adenoviruses (TP/IP) were 23
achieved for both membrane adsorbers. 24
The overall recovery yield of the process is approximately 52%, this work 25
credit membrane technology as an alternative for the concentration and purification of 26
3
adenoviruses and as a promising solution for downstream processing of other viral 1
vectors. 2
3
Key words: adenovirus vectors, downstream processing, membrane adsorber, anion-4
exchange, purification 5
6
7
8
9
10
11
12
13
14
15
16
17
18
19
20
21
22
23
24
25
26

4
Introduction 1
The use of recombinant adenoviruses for vaccination and gene therapy 2
requires fast and highly efficient purification protocols that allow for the maintenance 3
of viral infectivity, high recoveries of infectious particles, removal of contaminating 4
DNA and host cell proteins while also permitting to concentrate the viral samples for 5
final delivery. Concentration of adenoviruses is critical to obtain high titer vector 6
stocks and to decrease the handling volume thus simplifying the ensuring purification 7
steps. Process scalability is also a prerequisite for large scale production of 8
adenoviruses for vaccines or gene therapy (Bauer, Pilaro et al. 2002; Tatsis and Ertl 9
2004). 10
A number of chromatography-based methodologies have been reported for 11
purification of adenoviruses (Green, Huang et al. 2002; Arcand, Bernier et al. 2003; 12
Kamen and Henry 2004; Lusky 2005), anion exchange chromatography being the 13
driving force for most of the processes described in the literature (Altaras, Aunins et 14
al. 2005). However, most chromatographic media exclude adenoviruses due to their 15
pore size distribution, leading to very low binding capacities. Indeed, as media 16
transport of solutes into the porous lumen of beads occurs by diffusion, for large 17
biomolecules, even for pores larger than 100 nm, mass transfer is still limiting 18
(Thoemmes and Kula 1995; Charcosset 2006). Furthermore, resins require column 19
packing, long regeneration times and the packed resin is susceptible to fouling (Ghosh 20
2002). 21
Latest improvements in membrane materials and chemistries have generated 22
renewed interest in applications of membrane chromatography for bioprocessing 23
(Charcosset 2006; van Reis and Zydney 2007). Membrane adsorbers work on the 24
same principles as resin-based chromatography systems, i.e. by binding of the ligand 25

5
to the membrane. The major difference between membrane and resin supports is the 1
porosity; the larger pores of anion exchange membranes strongly reduce diffusion 2
limitations, with concomitant improvement of flow rates and chromatography 3
kinetics. Furthermore, membrane chromatography can be used as a disposable device, 4
without the need for washing, cleaning or regeneration, significantly shortening the 5
processing time, decreasing buffer volumes and lessening validation issues when 6
working under a GMP environment. 7
Membrane adorbers have been used as alternatives to column chromatography 8
for the final polishing step (removal of endotoxins and viruses) in antibody 9
production (Zhou and Tressel 2006) as well as for plasmid DNA purification (Syren, 10
Rozkov et al. 2007). Several examples were described for virus capture and/or 11
purification using membrane adsorbers (Karger, Bettin et al. 1998; Specht, Han et al. 12
2004; Kalbfuss, Wolff et al. 2007) and tangential flow filtration of adenovirus using 13
hollow fibers has previously been reported by our group (Peixoto, Ferreira et al. 14
2006); the relevance of membrane pore size under process conditions has also been 15
established (Subramanian, Altaras et al. 2005). Moreover, membrane chromatography 16
was applied for adenoviruses purification (Duffy, O'Doherty A et al. 2005; Lajmi, 17
Kutner et al. 2007). Nevertheless, a complete purification process addressing only 18
membrane technology has not been reported yet. 19
This work described the development of a fast, robust and scaleable 20
purification process solely based on membrane technology, fulfilling the requirements 21
for disposable technologies in the biopharmaceutical industry. The process hereby 22
described and developed is divided into three parts: (i) Clarification by dual 23
microfiltration and concentration by cross-flow ultrafiltration, followed by (ii) 24
purification using anion exchange membrane adsorbers and (iii) concentration and 25

6
buffer exchange for final delivery formulation. Similar downstream processes might 1
be applicable to less prevalent adenoviruses serotypes which are emerging (Konz, 2
Livingood et al. 2005; Stone and Lieber 2006), with slight modifications. 3
4
Materials and Methods 5
Cell line and medium 6
293 cells (purchased from ATCC (ATCC-CRL-1573)), were adapted to 7
suspension and grown in shake flasks (Corning, USA) in CD293 supplemented with 4 8
mM of glutamine (all from Invitrogen, UK) in a humidified atmosphere of 8% CO2 in 9
air at 37ºC. Cells were routinely propagated twice a week using an inoculum of 10
0.5×10⁶ cell/ml. Cell concentration and viability were determined by counting cells on 11
a Fuchs-Rosenthal haemocytometer (Brand, Germany) using the trypan blue 12
(Invitrogen, UK) dye exclusion method. 13
14
Virus production 15
A replication-defective adenovirus type 5 (Ad5) expressing GFP protein was 16
used. For all experiments virus production was performed in a 5 Liter bioreactor 17
(Sartorius, B.Braun, Germany). The dissolved oxygen and pH were controlled at 80% 18
of air saturation and 7.2, respectively. Infections were done using a MOI of 10; for the 19
downstream experiments the adenoviruses were harvested at 72 hours post infection 20
(hpi). The amount of infectious particles in the bulk (before purification) was in the 21
range of 109 to 1010 IP/ml. 22
23
Quantitation of infectious particles 24
Adenovirus titration was done according (Cote, Bourget et al. 1997). Briefly, 25

7
anchorage-dependent 293 cells were culture in 24 well plates at 0.25×10⁶ cell/ml. One 1
day later, cells were infected with 1 ml of serial dilutions of the adenoviruses in 2
infection medium (DMEM + 10% (v/v) FBS). After 17 to 20 h of incubation the 3
supernatant was collected and the cells were trypsinised and harvested. Cell 4
suspensions were immediately analyzed in a flow cytometer CyFlow® Space (Partec, 5
Germany) equipped with a blue solid state laser set at 488 nm and data analysis was 6
performed using FlowMax® software (Partec, Germany). 7
8
Measurement of total adenovirus vectors by quantitative real time PCR 9
Total adenoviruses were quantified by real time PCR. Viral DNA was 10
extracted and purified with the “High Pure Viral Nucleic Acid Kit” (Roche 11
Diagnostics, Germany). Purified adenoviral DNA previously purified and quantified 12
(Peixoto, Ferreira et al. 2006) was used as external standard to quantify adenovirus 13
type 5. 14
The size of the amplicon is 600 bp. DNA amplifications were done using the Light 15
Cycler system with “Fast Start Master SYBR Green I kit” (Roche Diagnostics, 16
Germany). For a 20 µl PCR reaction, 2 µl DNA template and 18 µl of mastermix were 17
added to each capillary. The mastermix was prepared to obtain a final concentration 18
of 2 mM MgCl2 and 0.5 µM of each primer in each capillary. The oligonucleotide 19
primers used were: 20
The presence of adenovirus serotype 5 (Ad5) was detected by the forward (5' 21
GAAAAGGCTGTCCGTGTCC 3´) and reverse (5' CTAAACATCGCGGCCAAG 3´) 22
primers, designed to amplify a fragment of the E1A gene of 600 bp. DNA was 23
denatured for 10 min at 95ºC. The standard amplification program included 40 three-24
step cycles: (i) denaturation-heating at 95ºC for 1 second, (ii) annealing-cooling at 25

8
60ºC during 8 seconds and (iii) elongation-heating at 72ºC for 24 seconds. 1
Fluorescence was acquired at the end of the elongation step of each cycle. Data was 2
analyzed using the Light Cycler software and the “fit points method” described 3
elsewhere (Rasmussen, Morrison et al. 1998). 4
5
Downstream Process 6
Clarification and concentration 7
To promote cell lysis, 0.1% Triton X-100 (Merck, Germany) was added to the 8
bulk at the end of bioreaction (72 h); the bioreactor agitation rate was increased to 9
1000 rpm for 1 minute; afterwards the bulk was incubated for 30 min at 37 ºC with 10
Benzonase (15U/ml) (Merck, Darmstadt). Clarification was carried out by 11
microfiltration (MF) with a flow rate of 90 ml/min using Sartobran 0.45µm filter 12
(Sartorius AG, Germany) with 100 cm2 of filtration area or with a flow rate of 70 13
ml/min using Sartopure 2 polyethersulfone membrane capsules (Sartorius AG, 14
Germany), with a pre-filter of 0.8 µm followed by a 0.45 µm filter and with 50 cm2 of 15
filtration area. 16
The clarified bulks were concentrated by tangential flow filtration using 17
polysulfone hollow-fiber cartridges with of 750, 500 and 300 kDa cut-offs and 420 18
cm2 of total filtration area each one as well as 1 mm of lumen diameter fibers (GE 19
Healthcare, USA). The cartridges were coupled to QuixStand apparatus (GE 20
Healthcare, USA) and the recirculation flow rate used with the hollow fiber cartridges 21
was constant and equal to 600 ml/min, with continuos recirculation of the concentrate 22
to the feed with no backpressure on the permeate until rentante volume reached 10% 23
of the initial feed volume. 24
25
Anion exchange membrane chromatography 26

9
Preliminary anion exchange experiments were performed with Sartobind Q 1
MA75 and Sartobind Anion Direct (2.5 ml) provided by Sartorius AG. The 2
membranes were coupled to an Akta Explorer chromatography system (GE 3
Healthacare, USA). UV, conductivity and pH were monitored on line. 4
Both membrane adsorbers were equilibrated with 10 mM Tris-HCl pH 8.0 5
before loading with 50 ml of concentrated, clarified bulk (previously concentrated and 6
clarified). The pH of the bioreactor bulk was adjusted by addition of NaOH and/or by 7
diafiltration with Vivaspin 20 with a 100 kDa cut-off (Sartorius AG, Germany) using 8
appropriate buffer capacities (10 mM Tris-HCl pH 8.0). The loading of the 9
membranes was performed using a flow rate of 3 ml/min or by recirculation for 60 10
min with a flow rate of 20 ml/min; capture of adenoviruses was monitored by 11
recovering samples every 10 min up to one hour. Adsorbed viruses were displaced by 12
a linear salt gradient increasing to 1 M NaCl or by a salt step (0.2 M, 0.65 M and 1 M 13
NaCl). Samples of the feed, flowthrough and eluate were collected and analyzed for 14
total and infectious adenoviruses particles. 15
To evaluate scaleability a membrane capsule of Sartobind Anion Direct with 16
900 cm2 of area was used. The membrane was coupled to Quixstand system and fed 17
with a recirculation flow rate of 200 ml/min. Membrane adsorbers were cleaned with 18
1 M NaOH between runs and rinsed with 20% ethanol before storage at 4ºC. 19
After purification with membrane adsorbers, the adenoviruses were further 20
concentrated using polysulfone hollow-fiber cartridge with 300 kDa cut-off and 420 21
cm2 of filtration area as well as 1 mm of lumen diameter fibers (GE Healthcare, 22
USA) ultrafiltration was performed using a recirculation flow rate of 600 ml/min with 23
no backpressure on permeate side until concentrated volume reach 10% of the initial 24
feed volume. A sterile microfiltration with Filtropur S 0.2 µm (Sarstedt, Germany) 25
was performed before storage at 4ºC. 26

10
1
Analysis by size exclusion chromatography 2
The purified adenoviruses were analyzed by size exclusion chromatography using a 3
prepacked Hiprep 16/60 Sephacryl S-300 column (1.6 cm of diameter and 60 cm of 4
length) coupled to an AKTA explorer (both GE Healthcare, USA). The elution buffer 5
was 10 mM Tris-HCl pH 8.0 used with a flow rate of 54 cm/h. 6
7
Protein and DNA analysis 8
Protein analysis by sodium dodecyl sulfate/polyacrylamide gel electrophoresis 9
(SDS-PAGE) was performed with 4-12% NuPage (Invitrogen, UK) gradient precast 10
gels using MES running buffer (Invitrogen). Protein bands were visualized by Simply 11
Blue Safe Stain (Invitrogen, UK). The total protein in the samples for loading the 12
SDS-PAGE were quantified using a BCA kit 23225 (Pierce, USA) on 96 well plates. 13
Western blot analysis was carried out using an Invitrogen PAGE and semi dry transfer 14
unit (Amersham Biosciences, USA) and the proteins of interest detected with a 15
polyclonal rabbit anti-adenovirus type 5 (Abcam, UK) in combination with alkaline 16
phosphatase conjugated anti-rabbit immunoglobulin G (IgG) (Sigma, MO) using 17
BCIP/NBT substrate (Pierce, USA). 18
Quantification of residual DNA content was undertaken by PicoGreen dsDNA Assay 19
Kit (Molecular Probes, USA). 20
21
Endotoxins quantitation 22
The endotoxin level in the end-products was determined by LAL test (Limulus 23
Amebocyte Lysate QCL-1000 kit, Cambrex). 24
25
26
11
Results and Discussion 1
Clarification and Concentration 2
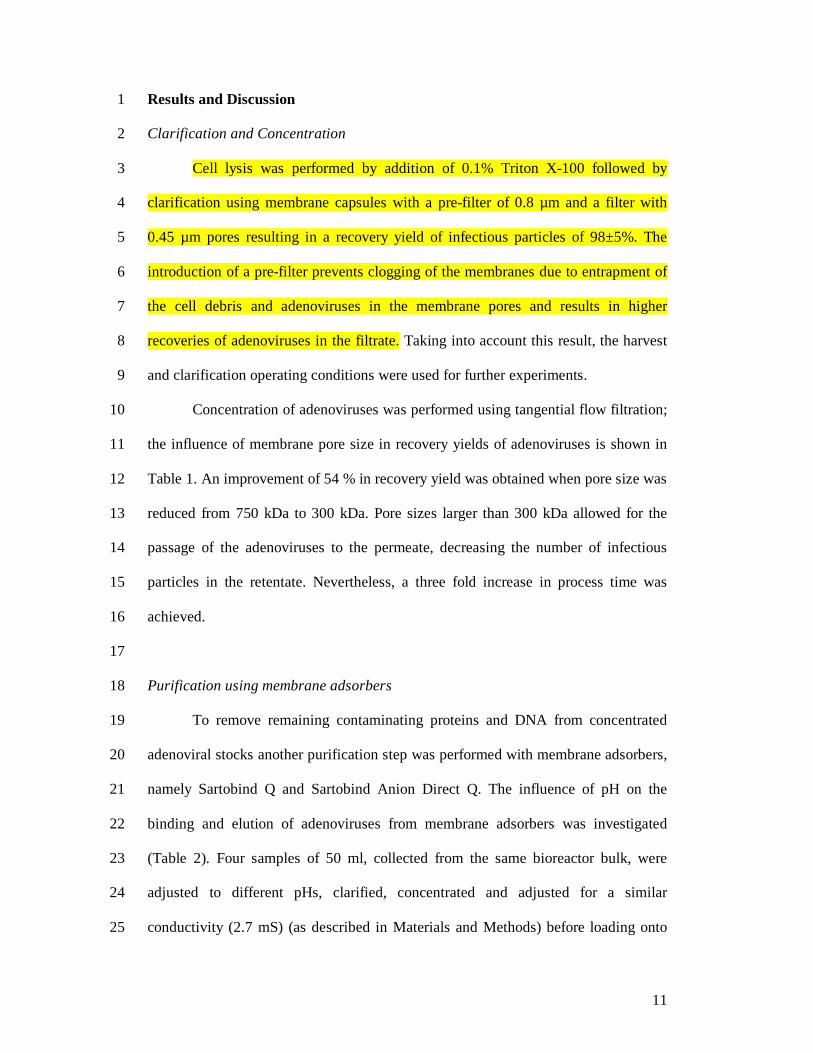
Cell lysis was performed by addition of 0.1% Triton X-100 followed by 3
clarification using membrane capsules with a pre-filter of 0.8 µm and a filter with 4
0.45 µm pores resulting in a recovery yield of infectious particles of 98±5%. The 5
introduction of a pre-filter prevents clogging of the membranes due to entrapment of 6
the cell debris and adenoviruses in the membrane pores and results in higher 7
recoveries of adenoviruses in the filtrate. Taking into account this result, the harvest 8
and clarification operating conditions were used for further experiments. 9
Concentration of adenoviruses was performed using tangential flow filtration; 10
the influence of membrane pore size in recovery yields of adenoviruses is shown in 11
Table 1. An improvement of 54 % in recovery yield was obtained when pore size was 12
reduced from 750 kDa to 300 kDa. Pore sizes larger than 300 kDa allowed for the 13
passage of the adenoviruses to the permeate, decreasing the number of infectious 14
particles in the retentate. Nevertheless, a three fold increase in process time was 15
achieved. 16
17
Purification using membrane adsorbers 18
To remove remaining contaminating proteins and DNA from concentrated 19
adenoviral stocks another purification step was performed with membrane adsorbers, 20
namely Sartobind Q and Sartobind Anion Direct Q. The influence of pH on the 21
binding and elution of adenoviruses from membrane adsorbers was investigated 22
(Table 2). Four samples of 50 ml, collected from the same bioreactor bulk, were 23
adjusted to different pHs, clarified, concentrated and adjusted for a similar 24
conductivity (2.7 mS) (as described in Materials and Methods) before loading onto 25

12
Sartobind Q 75. The highest yield was obtained at pH 8.0 (aprox. 43 % of virus 1
recovered); thus a constant pH of 8.0 was used for all subsequent steps. 2
To determine the elution profiles for the membrane adsorbers, linear gradient 3
elutions were performed with increasing salt concentrations (NaCl). These profiles 4
allow for the determination of the separation capacity of the media and the 5
conductivity at which the adenoviruses were displaced from the membrane. 6
Adenovirus eluted in the range of 35-60 mS/cm conductivity with a concentration of 7
7.2 ×10⁸ TP/ml, whereas the majority of the bound contaminants eluted at 15-20 8
mS/cm (Fig. 1A). Based on this chromatographic profile, elution of the adenoviruses 9
using NaCl steps was attempted in order to achieve concentration factors compatible 10
with final dose formulation (Raper, Chirmule et al. 2003) and to reduce process time. 11
Three steps were defined: (i) 250 mM NaCl to elute protein contaminants; (ii) 650 12
mM to elute the adenoviruses; (iii) a third step with 1 M NaCl to wash the membrane 13
and displace the DNA (Fig. 1B); the second step was not performed at higher 14
conductivity to avoid contamination of the adenoviruses fraction with remaining 15
DNA. 16
The total amount of adenoviruses detected in flowtrough for both elution 17
modes is negligible (aprox.105 TP/ml) in respect to the final recovery yields of 18
adenoviruses. Nevertheless, the concentration factor obtained with step elution is at 19
least 6 fold higher than the concentration obtained for NaCL gradient elution (total 20
adenoviruses in the middle peak is 4.5×10⁹ TP/ml). Futhermore, a substantial 21
reduction in process time was also achieved for step gradient elution; however, the 22
yield of infectious particles in the pooled fraction was low (30-40%). Finally, it was 23
observed that variations in feed conductivity, up to 15-20 mS/cm, do not significantly 24
affect the recovery of infectious adenoviruses after elution, as determined after 25
loading adenoviruses samples from different batches (data not shown). 26

13
In an attempt to improve the process yield, the effect of feed recirculation on 1
recovery yield was evaluated. The previously concentrated sample was loaded in 2
recirculation mode for 60 min, the capture profile for Sartobind Q and Sartobind 3
Anion Direct Q (Figure 2 A and 2 B) indicate that Sartobind Anion Direct Q is more 4
efficient to capture adenoviruses than Sartobind Q. After 30 min in recirculation mode 5
only negligible amounts of infectious particles were found in flow through of the 6
Sartobind Anion Direct Q (typically less than 5% of loaded adenoviruses titer), 7
whereas comparable results were obtained for Sartobind Q only 20-30 minutes later. 8
The Sartobind Anion Direct was shown to be more suitable for the purification 9
of adenoviruses. The results also confirm that the capacity of the membranes was not 10
exceeded as the first results obtained without feed recirculation (30 - 40% of 11
recovery) could indicated. The determined capacity is in the order of 1 to 1.5×10¹³ 12
viral particle/ml of membrane volume (3 to 4×10¹¹ viral particle/ cm2). The recovery 13
yield obtained after recirculation of the feed for both Sartobinds is approximately 14
20±8 % higher than the recovery achieved without recirculation; sample loading in 15
recirculation mode improved the intermediate purification step due to a longer 16
residence time of the adenoviruses. 17
Sartobind Anion Direct was used exclusively for subsequent scale-up studies 18
due to its higher capture capacity per unit of time leading to a significant reduction in 19
process time, which may impact the robustness of the process. A 10-fold scale-up of 20
this downstream process based on membrane technology was performed in order to 21
test the robustness, scaleability of the process and further substantiate product quality. 22
The optimized operating conditions were applied in a simple process where 23
the feed was driven by a peristaltic pump and the residence time was kept constant. 24
The results and main parameters (Table 3) are in agreement with the small-scale 25
results. The total virus to infectious unit (TP/IP) ratio, a well-accepted standard 26

14
assessement and requirement for quality control of any adenoviral vector is an 1
indicator of product potency (McIntyre, 2001; Adenovirus Reference Material 2
Working group). The ratios obtained after the Sartobind Anion Direct stay below 10, 3
substantially lower than the maximum FDA required ratio of 30:1. 4
The purified adenoviruses sample was also analysed by gel electrophoresis 5
(Fig. 3); the band pattern is comparable to adenoviruses purified by other methods as 6
described in the literature (Arcand, Bernier et al. 2003). DNA level and endotoxin 7
content are in the same order of magnitude as those obtained for the small scale 8
experiments, i.e. endotoxins are below 10 EU/ml whereas DNA contaminantion was 9
reduced 90% after the ultrafiltration step; and the amount of DNA quantified after the 10
membrane adsorber purification is 13 ng per 1011 TP, meaning less than 3% of the 11
initial amount of DNA remains. However, dependending of the potency determined, 12
since the FDA specifications for adenovirus vectors (DNA content below 10 ng/dose) 13
is very restricted (Bauer, Pilaro et al. 2002), additional operation specifically aimed at 14
reducing DNA might be incorporated as increasing the amount of nuclease added in 15
the beginning of downstream process or DNA precipitation (Altaras, Aunins et al. 16
2005; Goerke, To et al. 2005). 17
After the high purity achieved with the three membrane purification steps, a 18
diafiltration/concentration step was introduced next to the anion exchange membrane, 19
to obtain the adenoviruses in the desired concentration for administration and storage. 20
The recovery yield obtained is 90% (Table 4), slightly lower than that obtained in the 21
ultrafiltration performed before purification with membrane adsorber; this can be due 22
to shearing stress effects and/or non-specific adsorption onto the membrane as the 23
viruses at this stage are much purer than at the beginning of the purification process. 24
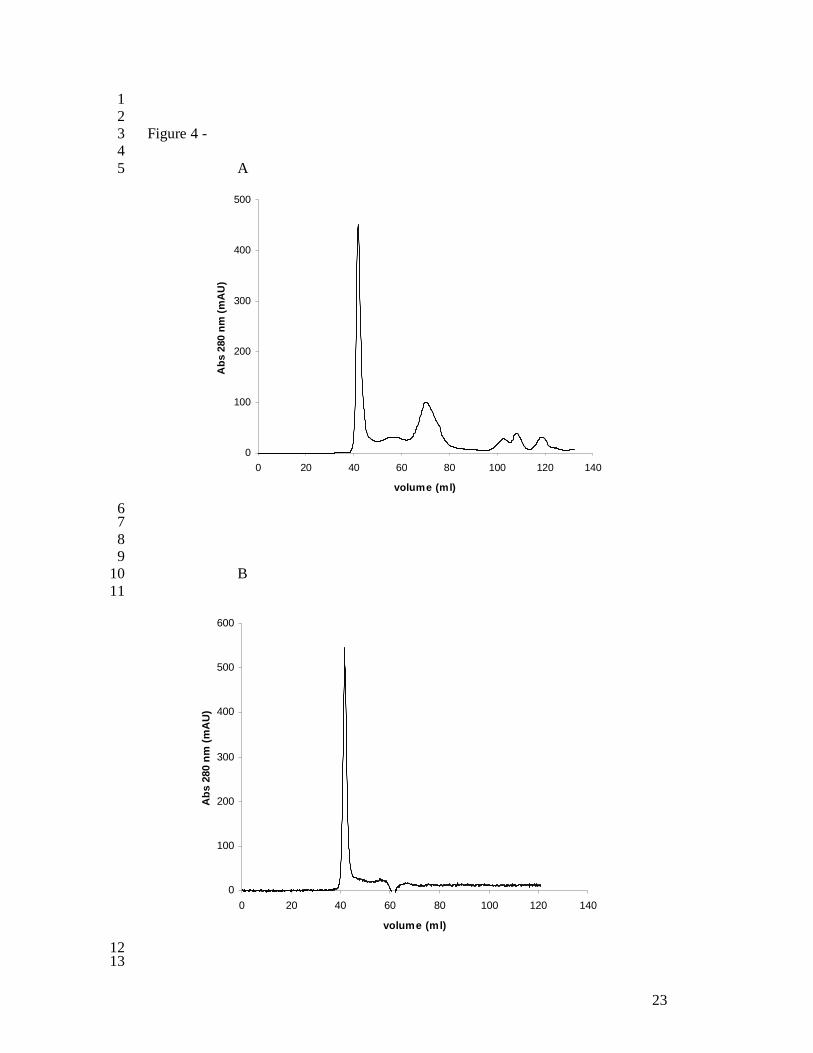
The eventual need for a final polishing step was evaluated using a size 25
exclusion chromatography column. The chromatographic profile obtained was 26

15
compared with the size exclusion chromatography analysis performed immediately 1
before the intermediate purification using Sartobind Anion Direct Q (Fig.4 A), where 2
several peaks corresponding to contaminant proteins were eluted at higher volumes 3
than adenoviruses. The chromatogram profile of the final product shows only one 4
peak corresponding to adenoviruses, with a UV detection ratio of 260 nm over 280 5
nm of 1.2. (Fig.4 B). 6
These results indicate that size exclusion is not necessary for final polishing of 7
the adenoviruses. Moreover, undesirable dilution of the final product would take place 8
if size exclusion chromatography had been used, a dilution factor of 10-15 being 9
observed. A recovery of 99±5 % was obtained after final microfiltration, this step 10
assuring sterility of the final product. 11
Integrating results obtained here with the dvances for non-Ad5-based vectors 12
(Stone and Lieber 2006) together with the possibility to correlate retention behaviour 13
with electrostatic properties of the hexon protein (Konz, Livingood et al. 2005) will 14
permit the design of a platform for purification of adenovirus vectors. 15
16
Concluding remarks 17
The scaleable purification process described herein comprises four steps based 18
on membrane technology fitting the trends for utilization of disposables. An 19
intermediate recovery yield up to 62% was obtained using Sartobind Anion Direct 20
after optimization of operating parameters, the contaminant DNA showing over 97 % 21
reduction whereas the endotoxin contents stay below 10 EU/ml. This purification 22
process represents a substantial improvement and is an appealing alternative to 23
chromatographic resins based methods, as it reduces downstream process time 24
without compromising the yields of adenoviruses for clinical trials. 25
26
16
Acknowledgements 1
The authors thank Rosário Clemente for technical support. Sartorius is also 2
acknowledged, in particular Dr. Noushin Delmdahl, for technical advice and for 3
providing the membranes. The authors acknowledge and appreciate the financial 4
support received from the European Commission (Project ICF599A4PR01) and from 5
Fundação para a Ciência e Tecnologia – Portugal (Project POCTI/BIO/46515/2002 6
and SFRH/BD/10614/2002). 7
8

17
Figure Captions 1
2 Figure 1 – Linear gradient (A) and step (B) elution profiles obtained after loading the 3
membrane adsorber (Sartobind Q75) with 50 ml of previously clarified and 4
concentrated adenoviral supernatants in 10 mM Tris-HCL pH 8.0; loading and elution 5
were performed at flow rates of 3 ml/min. The arrow indicates the peak corresponding 6
to total adenoviruses particles. 7
8 Figure 2 – Adenoviruses capture profile on Sartobind Q (A) and Sartobind Anion 9
Direct Q (B) using recirculation mode for 60 minutes; the samples were loaded at 20 10
ml/min. Co is the initial amount of infectious adenoviruses and C is the amount of 11
infectious adenoviruses at sampling time. 12
13 Figure 3 – - SDS-PAGE (A) and Western Blot (B) analysis samples derived from 14
adenoviruses purification. SDS-PAGE (A): analysis of samples collected during 15
purification using membrane technology. The gel was loaded with 25 µg of total 16
protein per well excepted lane 7 that was loaded with 100 µg of total protein. 1 - MW 17
markers (kDa); 2 - adenoviral supernatant after clarification and concentration by 18
ultrafiltration; 3 - ultrafiltration permeate; 4 - flow trough of membrane adsorber 19
(Sartobind Anion Direct); 5 - membrane wash before elution; 6 - MW markers (kDa); 20
7 - peak eluted at 650 mM .Western Blot (B): 1 – prestained molecular weight 21
markers; 2 - CsCl purified adenovirus 3 - peak eluted at 650 mM. 22
23
Figure 4 – Quality assessment of adenoviruses using size exclusion chromatography. 24
Chromatographic profile obtained before intermediate purification step (A) and after 25
purification using a Sartobind Anion Direct (B).26

18
Table 1: Effect of membrane cut-offs on the recovery yield of infectious adenoviruses 1
during tangential flow filtration 2
3
4 5 6 a) Recovery was calculated as the ratio between infectious adenoviruses titers of final concentrate and 7 infectious adenoviruses in the initial supernatant. 8 9 10 11 12 13 Table 2: Effect of loading pH on the recovery yield of infectious adenoviruses 14 purified with membrane adsorbers (Sartobind Q). 15 16
pH of Load materialª 6.5 7.4 8.0 8.5
Recovery yield of IP (%) 15 14 43 37
17 a) Four samples of 50 ml collected from the same bioreactor bulk were clarified, concentrated and 18 adjusted for conductivity. The infectious adenoviruses titer was measured by flow cytometry as 19 described in Materials and Methods. 20 21 22 23 24 Table 3: Scale-up of the purification using Sartobind Anion Direct Q membranes. 25 26
Membrane adsorber
Membrane area (cm2)
Flow (L/min)
Residence time (min )b
Total adenoviruses
load (TP) TP/IP c
Yield of infectious adenoviruses recovery
(%) Sartobind anion direct 2.5 ml a
90 0.02 0.125 2.9×10¹¹ 6±4 60±10
Sartobind anion direct 25 ml a 900 0.20 0.125 4.0×10¹⁴ 9±3 62±2
27 a) The Sartobind anion direct with 2.5 ml of membrane volume was coupled to an AkTA Explorer 28 whereas the Sartobind anion direct of 25 ml was connected with appropriate tubing to the QuixStand 29 System; the feed was driven with a peristaltic pump. 30 31 b) The residence time was kept constant for both membranes during the feed, wash and elution. 32 33 c) TP/IP – Ratio between total and infectious adenoviruses is an indicator of product potency and 34 should be 30 or less, as required by FDA 35
NMW (kDa)
Process Time (min)
Infectious adenoviruses
(IP) in retentate
Infectious adenoviruses (IP)
in permeate
Recoveryª yield of infectious adenoviruses
(%)
750 20 3.0×10⁹ 2.9×10⁹ 42 500 45 6.0×10¹⁰ 2.2×10⁹ 71 300 67 1.5×10¹⁰ 1.2×10⁶ 96

19
1 Table 4: Evaluation of downstream process steps for adenoviruses purification using 2 membrane technology. 3
4 5
Process Step TP/IP b ng DNA / 1011TP
Endotoxins
(EU/ml)
Recovery yield of IP a (%)
Clarification 167 - - 98±5
Ultrafiltration 50 - - 96±2
AEX membrane 12 - - 62±2
Ultrafiltration - - - 90±3
Sterile filtration 12 - - 99±5
Final Product 12 13 < 10 52±5
6 a) IP – infectious adenoviruses. 7 b) TP/IP – Ratio between total and infectious adenoviruses is an indicator of product potency and 8
should be 30 or less, as required by FDA. 9 10 11 12 13 14 15 16 17 18 19 20 21 22 23 24 25 26 27 28 29 30 31 32 33 34 35 36 37 38 39 40

20
Figure 1 - 1 2 3 4 A 5 6
0
20
40
60
80
100
120
0 20 40 60 80 100 120 140 160
Volume (ml)
Ab
s 28
0 n
m (
mA
U)
0
20
40
60
80
100
Co
nd
uct
ivit
y (m
S/c
m)
Abs 280 nm
Conductivity
Ad
7 8 B 9
10 11
0
500
1000
1500
2000
2500
3000
0 20 40 60 80 100 120 140 160 180 200
Volume (ml)
Ab
s 28
0 n
m (
mA
U)
0
20
40
60
80
100
Co
nd
uct
ivit
y (m
S/c
m)
Abs 280 nm
ConductivityAd
12 13

21
Figure 2 - 1 2 3 4 5 6 7 8 9 10 11 12 13 14 15 16 17 18 19 20 21 22 23 24 25 26
27 28
29 30 31 32 33 34 35 36 37 38 39 40 41 42 43 44 45 46 47 48 49 50 51
A - A - Sartobind Q
0,0
0,2
0,4
0,6
0,8
1,0
1,2
0 10 20 30 40 50 60
time (min)
C/C
o
B - Sartobind Direct Q
0,0
0,2
0,4
0,6
0,8
1,0
1,2
0 10 20 30 40 50 60
time (min)
C/C
o
A - A - Sartobind Q
0,0
0,2
0,4
0,6
0,8
1,0
1,2
0 10 20 30 40 50 60
time (min)
C/C
o
B - Sartobind Direct Q
0,0
0,2
0,4
0,6
0,8
1,0
1,2
0 10 20 30 40 50 60
time (min)
C/C
o

22
1 Figure 3 A – 2 3 4
5 6 7 8 9 10 11 12 13 14 15 16 17 18 19 Figure 3 B – 20 21
22
1 2 3 4 5 6 7kDa
9766
45
31
20
14
1 2 3 4 5 6 7kDa
9766
45
31
20
14
1 2 3
45
Hexon
III
core
23
1 2 Figure 4 - 3 4 A 5
0
100
200
300
400
500
0 20 40 60 80 100 120 140
volume (ml)
Ab
s 28
0 n
m (
mA
U)
6 7 8
9 B 10 11
0
100
200
300
400
500
600
0 20 40 60 80 100 120 140
volume (ml)
Ab
s 28
0 n
m (
mA
U)
12 13

24
Bibliography 1
Altaras, N. E., J. G. Aunins, et al. (2005). "Production and formulation of adenovirus 2
vectors." Adv Biochem Eng Biotechnol 99: 193-260. 3
Arcand, N., A. Bernier, et al. (2003). "Adenovirus type 5 (Ad5)chromatographic 4
purification process at 20L scale." Bioprocess J 2: 72-75. 5
Bauer, S. R., A. M. Pilaro, et al. (2002). Testing of Adenoviral Vector Gene Transfer 6
Products: FDA Expectations. Adenoviral Vectors for Gene Theraphy. D. T. 7
Curiel and J. T. Douglas, Academic Press: 615-654. 8
Charcosset, C. (2006). "Membrane processes in biotechnology: An overview." 9
Biotechnol Adv 24(5): 482-492. 10
Cote, J., L. Bourget, et al. (1997). "Study of adenovirus production in serum-free 11
293SF suspension culture by GFP-expression monitoring." Biotechnol Prog 12
13(6): 709-14. 13
Duffy, A. M., M. O'Doherty A, et al. (2005). "Purification of adenovirus and adeno-14
associated virus: comparison of novel membrane-based technology to 15
conventional techniques." Gene Ther 12 Suppl 1: S62-72. 16
Ghosh, R. (2002). "Protein separation using membrane chromatography: opportunities 17
and challenges." J Chromatogr A 952(1-2): 13-27. 18
Goerke, A. R., B. C. To, et al. (2005). "Development of a novel adenovirus 19
purification process utilizing selective precipitation of cellular DNA." 20
Biotechnol Bioeng 91(1): 12-21. 21
Green, A. P., J. J. Huang, et al. (2002). "A new scalable method for the purification of 22
recombinant adenovirus vectors." Hum Gene Ther 13(16): 1921-34. 23
Kalbfuss, B., M. Wolff, et al. (2007). "Direct capture of influenza A virus from cell 24
culture supernatant with Sartobind anion-exchange membrane adsorbers." J 25
Membrane Sci 299(1-2): 251-260. 26
Kamen, A. and O. Henry (2004). "Development and optimization of an adenovirus 27
production process." J Gene Med 6 Suppl 1: S184-92. 28
Karger, A., B. Bettin, et al. (1998). "Simple and rapid purification of 29
alphaherpesviruses by chromatography on a cation exchange membrane." J 30
Virol Methods 70(2): 219-224. 31
Konz, J. O., R. C. Livingood, et al. (2005). "Serotype specificity of adenovirus 32
purification using anion-exchange chromatography." Hum Gene Ther 16(11): 33
1346-53. 34

25
Lajmi, A. R., R. Kutner, et al. (2007). A membrane chromatography application: a 1
rapid, high capacity gene therapy vector purification tool. Process scale 2
bioseparations for the biopharmaceutical industry. NW, Taylor & Francis. 31: 3
541. 4
Lusky, M. (2005). "Good manufacturing practice production of adenoviral vectors for 5
clinical trials." Hum Gene Ther 16(3): 281-91. 6
Peixoto, C., T. B. Ferreira, et al. (2006). "Purification of adenoviral vectors using 7
expanded bed chromatography." J Virol Methods 132(1-2): 121-126. 8
Raper, S. E., N. Chirmule, et al. (2003). "Fatal systemic inflammatory response 9
syndrome in a ornithine transcarbamylase deficient patient following 10
adenoviral gene transfer." Mol Genet Metab 80(1-2): 148-58. 11
Rasmussen, R., T. Morrison, et al. (1998). "Quantitative PCR by continuos 12
fluorescence monitoring of a double strand DNA specific binding dye." 13
Biochemica No.2: 8-11. 14
Specht, R., B. Han, et al. (2004). "Densonucleosis virus purification by ion exchange 15
membranes." Biotechnol Bioeng 88(4): 465-73. 16
Stone, D. and A. Lieber (2006). "New serotypes of adenoviral vectors." Curr Opin 17
Mol Ther 8(5): 423-31. 18
Subramanian, S., G. M. Altaras, et al. (2005). "Pilot-Scale Adenovirus Seed 19
Production through Concurrent Virus Release and Concentration by Hollow 20
Fiber Filtration." Biotechnol Prog 21(3): 851-9. 21
Syren, P.-O., A. Rozkov, et al. (2007). "Milligram-scale parallel purification of 22
plasmid DNA using anion exchange membrane capsules and a multi-channel 23
peristaltic pump." J Chromatogr B in Press. 24
Tatsis, N. and H. C. J. Ertl (2004). "Adenoviruses as Vaccine Vectors." Mol Ther 25
10(4): 616-629. 26
Thoemmes, J. and M.-R. Kula (1995). "Membrane chromatography - an integrative 27
concept in the downstream processing of proteins." Biotechnol. Prog. 11(4): 28
357-367. 29
van Reis, R. and A. Zydney (2007). "Bioprocess membrane technology." J Membrane 30
Sci 297(1-2): 16-50. 31
Zhou, J. X. and T. Tressel (2006). "Basic Concepts in Q Membrane Chromatography 32
for Large-Scale Antibody Production." Biotechnol. Prog. 22(2): 341-349. 33
34