TOWARDS PERFORMANCE MEASUREMENT AND METRICS BASED ANALYSIS OF PLA APPLICATIONS
15
International Journal of Software Engineering & Applications (IJSEA), Vol.1, No.3, July 2010 DOI : 10.5121/ijsea.2010.1305 66 TOWARDS PERFORMANCE MEASUREMENT AND METRICS BASED ANALYSIS OF PLA APPLICATIONS Zeeshan Ahmed University of Wuerzburg, Wuerzburg Germany [email protected] ABSTRACT This article is about a measurement analysis based approach to help software practitioners in managing the additional level complexities and variabilities in software product line applications. The architecture of the proposed approach i.e. ZAC is designed and implemented to perform preprocessesed source code analysis, calculate traditional and product line metrics and visualize results in two and three dimensional diagrams. Experiments using real time data sets are performed which concluded with the results that the ZAC can be very helpful for the software practitioners in understanding the overall structure and complexity of product line applications. Moreover the obtained results prove strong positive correlation between calculated traditional and product line measures. KEYWORDS Analysis, Measurement, Software product lines, Variability 1. INTRODUCTION Driven by the problems raised in software industry, especially the maintenance of success rate of software products based on product line architecture. Due to the high expectations of customers for high quality product in short time and in possible minimum budget, software practitioners are now more focused on the use of product line architectures instead of single line product engineering and development. Product line is defined as the family of products designed to take the advantage of their common aspects and predicted variability [3]. For the time being product line approach was considered as the good solution to adopt but with the passage of time some feature interaction, process management, product integration and composition problems are identified [16] which are currently present without any solid solution. These problems requiring quantitative management based comprehensive solutions are the major responsible reasons of getting unsatisfactory results. A number of measurement analysis based solutions have been developed but still the problems are alive, discussed in section 2 of this research paper. In order to provide quantitative management based solutions to the effected products, it is mandatory to first analyze all the components and features to identify the variation points. Because without knowing the actual disease it’s very hard to cure and the wrong diagnose may lead to a disaster. Moreover, quantitative management is actually the way towards the successful project management. It applies measurement analysis to analyze product, predict the minimum possible cost and time required for software application development [18]. Measurement analysis can be applied to all artifacts of the software development life cycle to measure the performance and improve the quality. Measurement analysis allows stating quantitative organizational improvement objectives and decomposes them down to measurable software process and product characteristics. Moreover measurement analysis allows characterizing and controlling in a quantitative manner to achieve the organization’s business
-
Upload
independent -
Category
Documents
-
view
0 -
download
0
Transcript of TOWARDS PERFORMANCE MEASUREMENT AND METRICS BASED ANALYSIS OF PLA APPLICATIONS
International Journal of Software Engineering & Applications (IJSEA), Vol.1, No.3, July 2010
DOI : 10.5121/ijsea.2010.1305 66
TOWARDS PERFORMANCE MEASUREMENT AND
METRICS BASED ANALYSIS OF PLA APPLICATIONS
Zeeshan Ahmed
University of Wuerzburg, Wuerzburg Germany [email protected]
ABSTRACT
This article is about a measurement analysis based approach to help software practitioners in managing
the additional level complexities and variabilities in software product line applications. The architecture
of the proposed approach i.e. ZAC is designed and implemented to perform preprocessesed source code
analysis, calculate traditional and product line metrics and visualize results in two and three dimensional
diagrams. Experiments using real time data sets are performed which concluded with the results that the
ZAC can be very helpful for the software practitioners in understanding the overall structure and
complexity of product line applications. Moreover the obtained results prove strong positive correlation
between calculated traditional and product line measures.
KEYWORDS
Analysis, Measurement, Software product lines, Variability
1. INTRODUCTION
Driven by the problems raised in software industry, especially the maintenance of success rate
of software products based on product line architecture. Due to the high expectations of
customers for high quality product in short time and in possible minimum budget, software
practitioners are now more focused on the use of product line architectures instead of single line
product engineering and development. Product line is defined as the family of products
designed to take the advantage of their common aspects and predicted variability [3]. For the
time being product line approach was considered as the good solution to adopt but with the
passage of time some feature interaction, process management, product integration and
composition problems are identified [16] which are currently present without any solid solution.
These problems requiring quantitative management based comprehensive solutions are the
major responsible reasons of getting unsatisfactory results. A number of measurement analysis
based solutions have been developed but still the problems are alive, discussed in section 2 of
this research paper.
In order to provide quantitative management based solutions to the effected products, it is
mandatory to first analyze all the components and features to identify the variation points.
Because without knowing the actual disease it’s very hard to cure and the wrong diagnose may
lead to a disaster. Moreover, quantitative management is actually the way towards the
successful project management. It applies measurement analysis to analyze product, predict the
minimum possible cost and time required for software application development [18].
Measurement analysis can be applied to all artifacts of the software development life cycle to
measure the performance and improve the quality. Measurement analysis allows stating
quantitative organizational improvement objectives and decomposes them down to measurable
software process and product characteristics. Moreover measurement analysis allows
characterizing and controlling in a quantitative manner to achieve the organization’s business
International Journal of Software Engineering & Applications (IJSEA), Vol.1, No.3, July 2010
67
goals by mapping them to software and measurement goals by using such approaches as for
example GQM [20]. This can help project managers to track their improvements and mitigate
potential risks.
In this research paper I discuss some already proposed solutions in section 2 to identified
aforementioned problems and support software practitioners with effective and efficient
quantitative management based approach in section 3 and 4. Moreover I perform empirical
evaluation to evaluate the feature, functionality and strength of proposed solution in section 5
using real time data sets.
2. RELATED RESEARCH
2.1. Review Design
I decided to review only the most relevant and up-to-date literature with respect to the goal and
scope of this research. I started looking for explicitly available relevant literature from different
sources like internet, proceedings of some software engineering conferences and journal
publications. As the outcome, I resulted with almost more than 100 relevant research papers,
which created a review population. Therefore, I defined review criteria to filter the research
papers based on the conclusive outputs obtained from abstract, summary and conclusion. While
reading the abstract I was looking for the keywords like software product line, quantitative
management, preprocessed code, analysis, visualization, measurement and variability. After the
implementation of defined review criteria, 8 research papers were selected for detailed review.
During detailed review, I put emphasis on the validity of the proposed solutions in literature. I
have briefly described the methods discussed by the authors in the selected literature and up to
what extent they can be used to solve targeted problem.
2.2. Reviewed Literature
I have reviewed Relation-based approach [6], Static Scanning Approach [10] and Columbus
[14] as the methodologies to quantitatively analyze the C++ source code. Then I have reviewed
TUAnalyser & Visualization [19] and CodeCrawler [13] to produce visualization of obtained
results from quantitative analysis. Then I have reviewed Polymorphism Measure [1], Assessing
reusability of C++ Code: [5] and Evaluation of Object Oriented Metrics: [7] methodologies to
perform measurement analysis.
• Relation-based approach is used for simplifying the process of metrics extraction from
the C++ object oriented code [6]. In this approach relations are designed like prolog
clauses to describe the language entity relationship and to increases the code readability,
optimization and search speed.
• Static scanning approach breaks non-preprocessed C/C++ code file into a series of
lexical tokens and then matches already existing vulnerable patterns with series of
tokens [10]. Furthermore the approach was validated with the implementation of ITS4 .
• Columbus is a reverse engineering framework to extract the facts from preprocessed
C++ code by acquiring the project information is indispensable way [14]. The major
strengths of this approach are, this method can be used for reverse-engineering purposes
to study the structure, behavior and quality of the C++ code and can also be used to
track the evolution of design decisions between the architectural level and the
implementation level of a software system written in C++ [15].
International Journal of Software Engineering & Applications (IJSEA), Vol.1, No.3, July 2010
68
• TUAnalyser & Visualization approach is used to visualize the extracted information
from C++ source code by first storing the extracted information into RSF format which
then passed as input to Graphviz to produce visual output [19].
• Code Crawler is used to visualize the C++ object oriented source code semantics in
lightweight 2D & 3D and polymeric views by using a tool called FAMIX [13].
• Polymorphism measure is used to identify the software reliability problems in the early
stages of software development life cycle [1]. This measurement approach has been
categorized into two categories Static polymorphism and Dynamic polymorphism.
Static polymorphism based on the compile time and dynamic is based on the runtime
binding decisions. Furthermore five metrics are initiated to combine the early identified
polymorphism forms with inheritance relationship.
• Assessing reusability of C++ Code is a method for judging the reusability of C++ code
components and assessing indirect quality attributes from the direct attributes [5]. This
method has been divided into two phases. First phase is used to identify and analytically
validate a set of measurements for assessing direct quality attributes. The second phase
identifies and validates a set of measurements for assessing indirect quality attributes.
Moreover, a set of relations is also provided which maps directly measurable software
quality attributes to another set of quality attributes that can only be measured
indirectly.
• Evaluation of Object Oriented Metrics approach is used to analyze the measures and
their relationship with each other from object oriented code metrics defined by
Chidamber and Kemerer [17] and fault-proneness across three different versions of this
target application [7]. Proposed approach concluded with the result, that none of the
object oriented metrics performs better than LOC in anticipating fault-proneness.
2.3. Review Remarks
The reviewed literature doesn’t provide much information about the comprehensive
management for product line management, analysis of generic software and visualization for
obtained results of measurement analysis from generic software components made in C++.
Discussed related research work does, however, help and provide some approaches in analyzing
the C++ code, visualizing the data and calculating the measures. Yet, none of the reviewed
research directly deals with the target solution of this research.
3. PROPOSED SOLUTION
I propose and present a quantitative management based approach consisting of three main
components .i.e., Analysis, Visualization, and Measurement shown in Fig 1. During analysis the
preprocessed source code of product line based application is analyzed to identify the software
single and product line source code characteristics, then in measurement several traditional and
product line measures are calculated to identify the behavior and the rate of complexity and then
in the end qualitative visualization support is provided to obtained results. To provide a
comprehensive solution to the software practitioners, based on above discussed three
components in analyzing the software product preprocessed source code, identifying software
level complexities and variabilities, measuring performance by calculating source code metrics I
have proposed a solution called Zeeshan Ahmed - C++ Prepreprocessed source code analyzer
(ZAC) [23] [24] [25].
International Journal of Software Engineering & Applications (IJSEA), Vol.1, No.3, July 2010
69
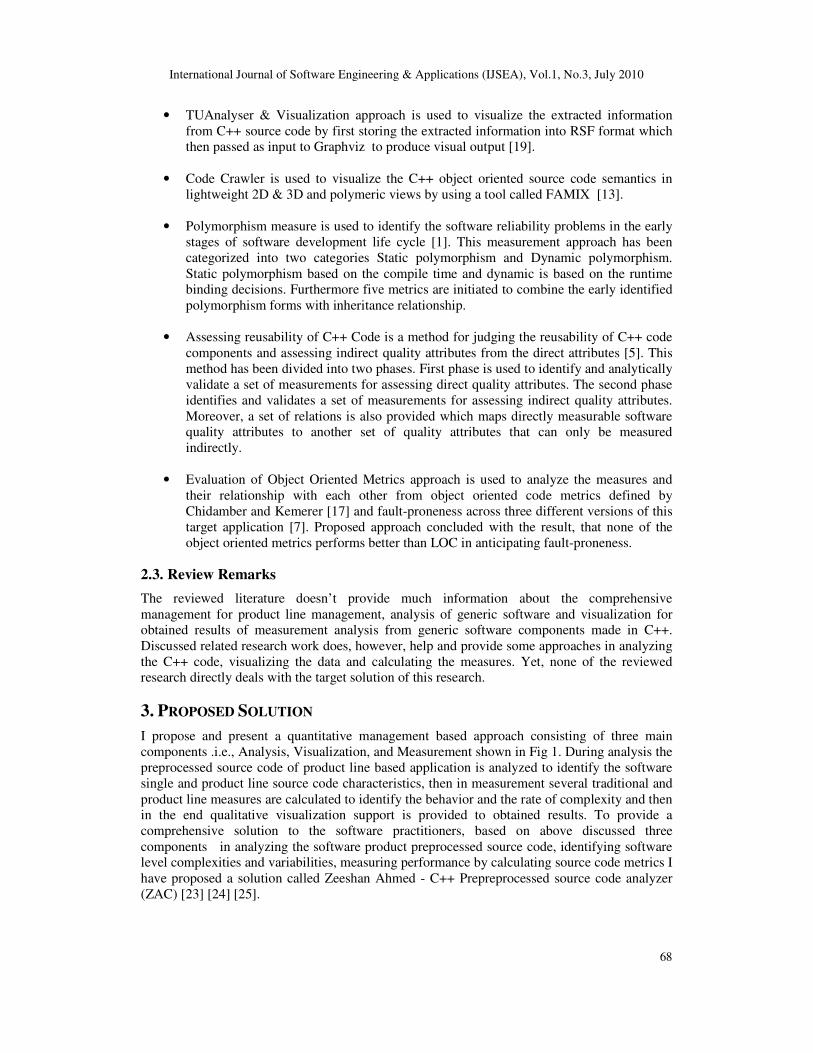
Fig 1. Measurement Analysis and Visualization
To fulfil the desired jobs and obtain required result the conceptual model of ZAC is divided in
to five main components .i.e., C++ Source Code, ZAC-Analyzer, ZAC-Data Manager, ZAC-
Measurer, and ZAC-Visualizer which works in cyclic fashion as shown in Fig 2.
Fig 2. ZAC Conceptual Model
In the first component preprocessed source code of software product written in C++
programming language is treated as input context. In second component internal source code
characteristics .i.e., namespace, includes, macros, class, methods, functions, declarations,
expressions and conditions are analyzed. In third component the resultant information is stored
and managed in a relational data base called ZAC-Data Manager. In fourth component ZAC-
Measurer using Goal Question Metrics (GQM) [20] will calculate source code metrics. In the
last component, as the last step ZAJ-Visualizer will produce visualization of obtained results in
different 2D and 3D diagrams e.g. graphs, line charts, bar charts and tree map with respect to
the context and semantic.
International Journal of Software Engineering & Applications (IJSEA), Vol.1, No.3, July 2010
70
4. ZAC
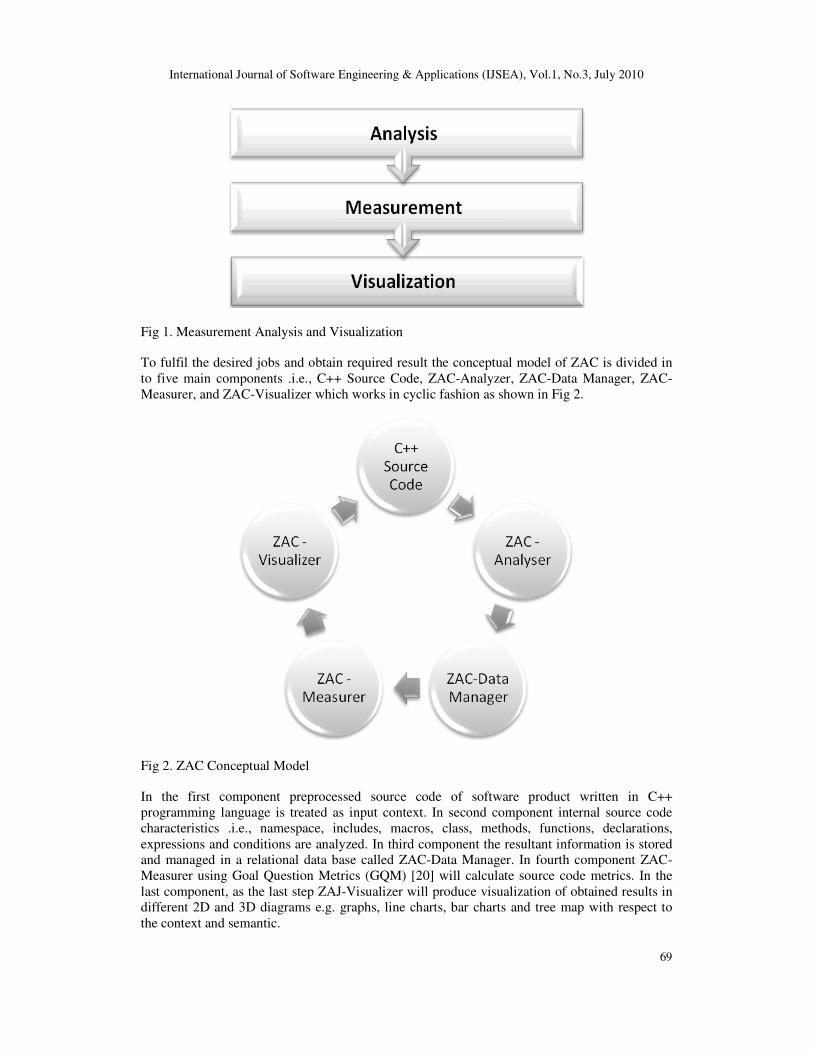
To empirically evaluate the real time strength of proposed solution, I have implemented the
proposed conceptual design of ZAC as software application. ZAC is implemented using open
source and freely available development tools and technologies as shown in Fig 3.
Fig. 3 ZAC - Involved Technologies
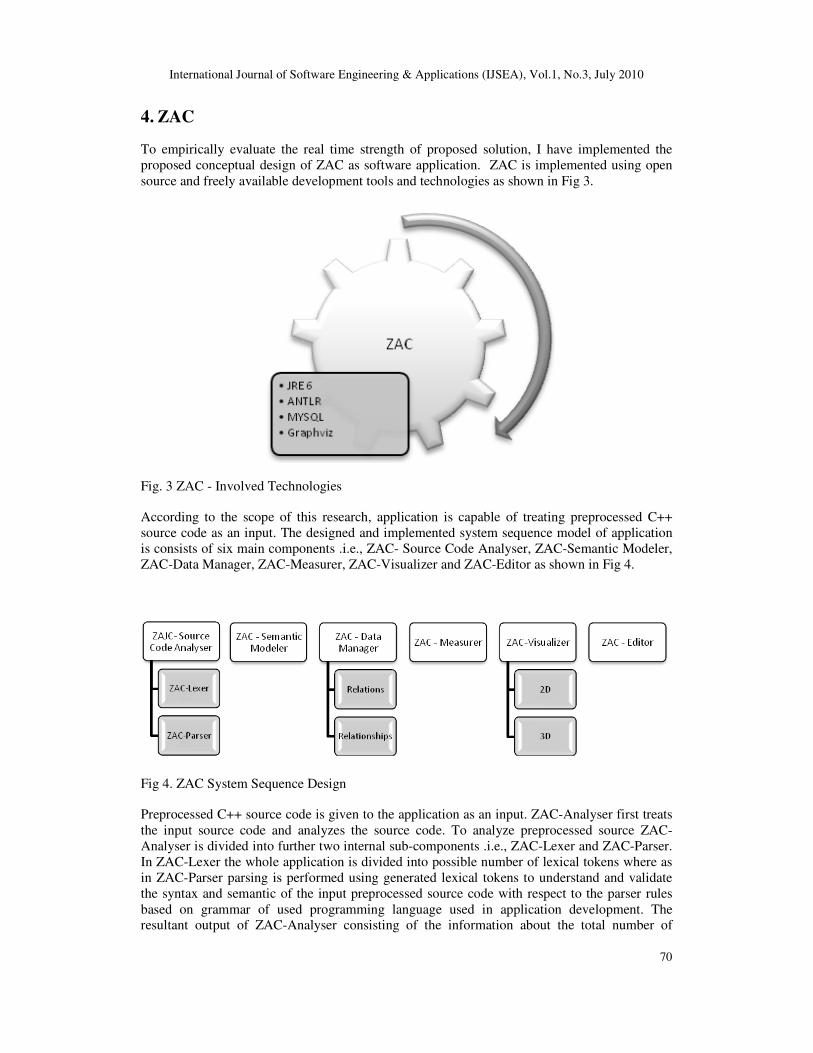
According to the scope of this research, application is capable of treating preprocessed C++
source code as an input. The designed and implemented system sequence model of application
is consists of six main components .i.e., ZAC- Source Code Analyser, ZAC-Semantic Modeler,
ZAC-Data Manager, ZAC-Measurer, ZAC-Visualizer and ZAC-Editor as shown in Fig 4.
Fig 4. ZAC System Sequence Design
Preprocessed C++ source code is given to the application as an input. ZAC-Analyser first treats
the input source code and analyzes the source code. To analyze preprocessed source ZAC-
Analyser is divided into further two internal sub-components .i.e., ZAC-Lexer and ZAC-Parser.
In ZAC-Lexer the whole application is divided into possible number of lexical tokens where as
in ZAC-Parser parsing is performed using generated lexical tokens to understand and validate
the syntax and semantic of the input preprocessed source code with respect to the parser rules
based on grammar of used programming language used in application development. The
resultant output of ZAC-Analyser consisting of the information about the total number of
International Journal of Software Engineering & Applications (IJSEA), Vol.1, No.3, July 2010
71
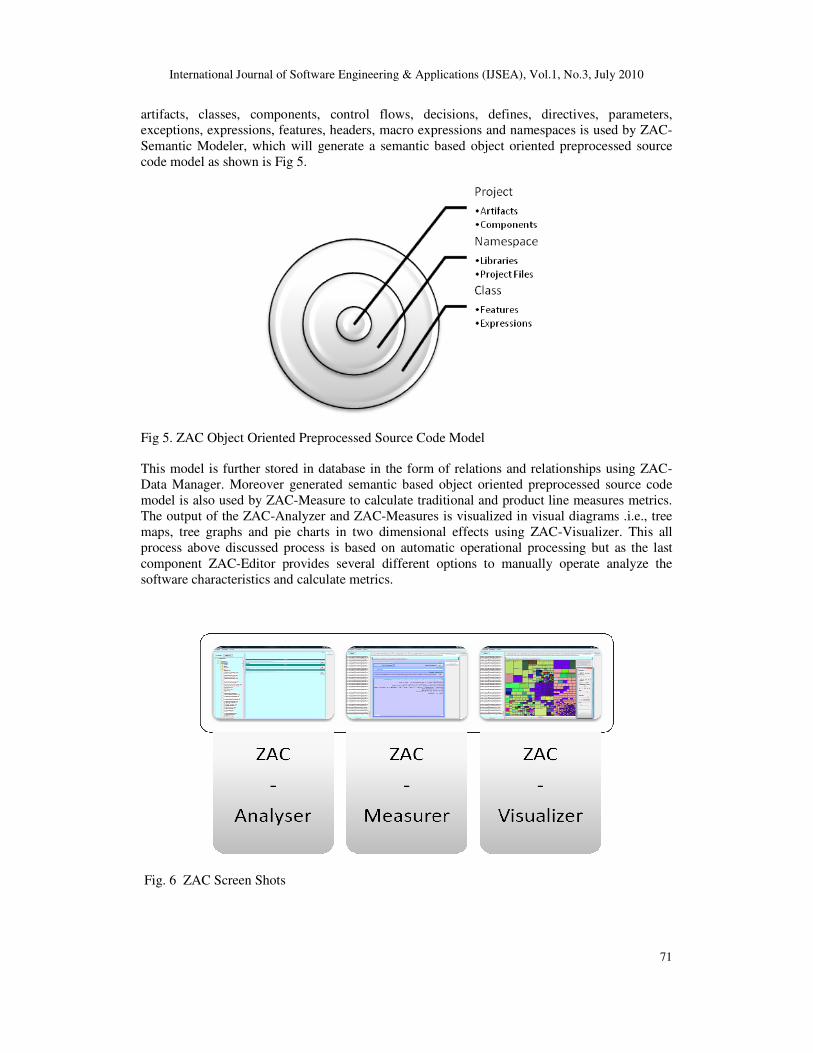
artifacts, classes, components, control flows, decisions, defines, directives, parameters,
exceptions, expressions, features, headers, macro expressions and namespaces is used by ZAC-
Semantic Modeler, which will generate a semantic based object oriented preprocessed source
code model as shown is Fig 5.
Fig 5. ZAC Object Oriented Preprocessed Source Code Model
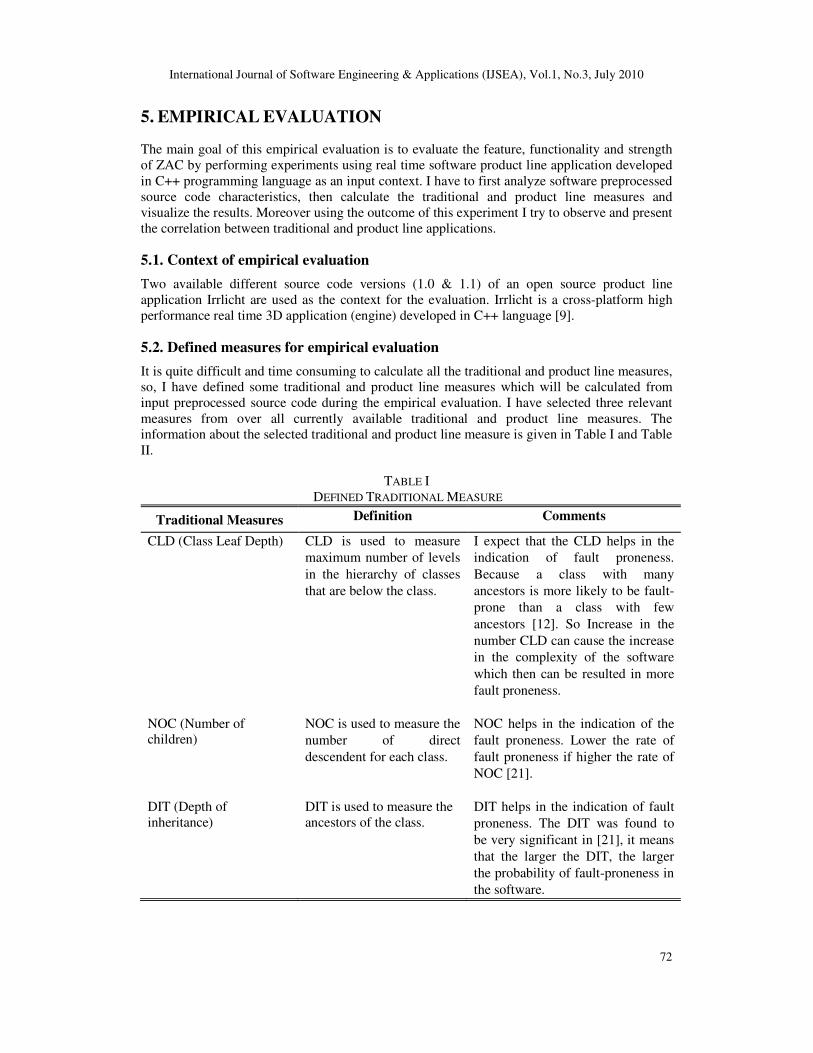
This model is further stored in database in the form of relations and relationships using ZAC-
Data Manager. Moreover generated semantic based object oriented preprocessed source code
model is also used by ZAC-Measure to calculate traditional and product line measures metrics.
The output of the ZAC-Analyzer and ZAC-Measures is visualized in visual diagrams .i.e., tree
maps, tree graphs and pie charts in two dimensional effects using ZAC-Visualizer. This all
process above discussed process is based on automatic operational processing but as the last
component ZAC-Editor provides several different options to manually operate analyze the
software characteristics and calculate metrics.
Fig. 6 ZAC Screen Shots
International Journal of Software Engineering & Applications (IJSEA), Vol.1, No.3, July 2010
72
5. EMPIRICAL EVALUATION
The main goal of this empirical evaluation is to evaluate the feature, functionality and strength
of ZAC by performing experiments using real time software product line application developed
in C++ programming language as an input context. I have to first analyze software preprocessed
source code characteristics, then calculate the traditional and product line measures and
visualize the results. Moreover using the outcome of this experiment I try to observe and present
the correlation between traditional and product line applications.
5.1. Context of empirical evaluation
Two available different source code versions (1.0 & 1.1) of an open source product line
application Irrlicht are used as the context for the evaluation. Irrlicht is a cross-platform high
performance real time 3D application (engine) developed in C++ language [9].
5.2. Defined measures for empirical evaluation
It is quite difficult and time consuming to calculate all the traditional and product line measures,
so, I have defined some traditional and product line measures which will be calculated from
input preprocessed source code during the empirical evaluation. I have selected three relevant
measures from over all currently available traditional and product line measures. The
information about the selected traditional and product line measure is given in Table I and Table
II.
TABLE I
DEFINED TRADITIONAL MEASURE
Traditional Measures Definition Comments
CLD (Class Leaf Depth) CLD is used to measure
maximum number of levels
in the hierarchy of classes
that are below the class.
I expect that the CLD helps in the
indication of fault proneness.
Because a class with many
ancestors is more likely to be fault-
prone than a class with few
ancestors [12]. So Increase in the
number CLD can cause the increase
in the complexity of the software
which then can be resulted in more
fault proneness.
NOC (Number of
children)
NOC is used to measure the
number of direct
descendent for each class.
NOC helps in the indication of the
fault proneness. Lower the rate of
fault proneness if higher the rate of
NOC [21].
DIT (Depth of
inheritance)
DIT is used to measure the
ancestors of the class.
DIT helps in the indication of fault
proneness. The DIT was found to
be very significant in [21], it means
that the larger the DIT, the larger
the probability of fault-proneness in
the software.
International Journal of Software Engineering & Applications (IJSEA), Vol.1, No.3, July 2010
73
TABLE II
DEFINED PRODUCT LINE MEASURE
Product Line
Measures
Definition Comments
NIT (Namespace
Inheritance Tree)
NIT is used to measure
the number of ancestors of
the name spaces.
NIT can also be very helpful in the indication
of fault proneness. Because namespace is one
of the major components of any product line
software application. Every component of
project like class, library etc exists inside the
namespace. If the number of namespace will
increase, then the number of ancestor
namespaces will also be increased which will
result in much complexity. So if the NIT will
increase it may possible then the number fault
proneness will also increase.
NOA (Number of
Artifacts)
NOA is used to measure
the number of artifacts
used and to measure the
direct ancestors for each
artifacts.
Each artifact of system represents the each file
of the system, like class and include file. If the
number of artifacts will increase most
probably the number of dependencies between
the artifacts will also be increase, which
ultimately causes the increase in complexity.
So higher the number of NOA higher will be
the probability of fault proneness in the
product line system.
CIR (Class
Inheritance
Relationship)
CIR measures the
relationship of each class
with other class.
CIR becomes more complex if the number of
ancestor classes will increase, especially in
the case of multiple inheritances when a child
class will be having more than one parent. So,
CIR can be very helpful in the indication of
fault proneness because if the number of CIR
will increase the probability of fault proneness
will also be increased.
5.3. Defined visualization modes for empirical evaluation
I have defined some modes of visualization to present the obtained results using ZAC during the
empirical evaluation. I have selected four modes of visualization i.e. Tree Map, Namespace
Graph, Bar chart and Inheritance graph, for the visual representation of obtained results.
5.4. Evaluation
1) Static Source Code Analysis
During the static analysis both the versions 1.0 and 1.1 of Irrlicht are analyzed using ZAC and
observed experimental units of the source code are presented in Table III. I have first performed
the analysis of source code characteristics and calculate the absolute and relative improvement
in the latest version 1.1 as compared to the version 1.0 of Irrlicht. After analyzing the results I
have come to know that the number source code with respect to each characteristic has been
decreased in Irrlicht 1.1 as compared to Irrlicht 1.0.
International Journal of Software Engineering & Applications (IJSEA), Vol.1, No.3, July 2010
74
TABLE III
GENERAL AND PRODUCT LINE SOFTWARE CHARACTERISTIC S
Characteristic
Name
Irrlicht
1.0
Irrlicht
1.1
Observation Observation
Software
characteristics
Ver 1.0 Ver 1.1 Absolute Improvement
in Ver 1.1
Relative Improvement in
Ver 1.1
Artifacts 776 698 78 10.51 %
Namespaces 8 7 1 12.50 %
Components 561 482 79 14.08 %
Decisions 703 445 258 36.70 %
Define Macros 609 447 162 26.60 %
Pragma Directives 11 10 1 9.09 %
Macro Expressions 402 276 126 31.34 %
Classes 333 207 126 37.84 %
Include 1027 532 495 48.20 %
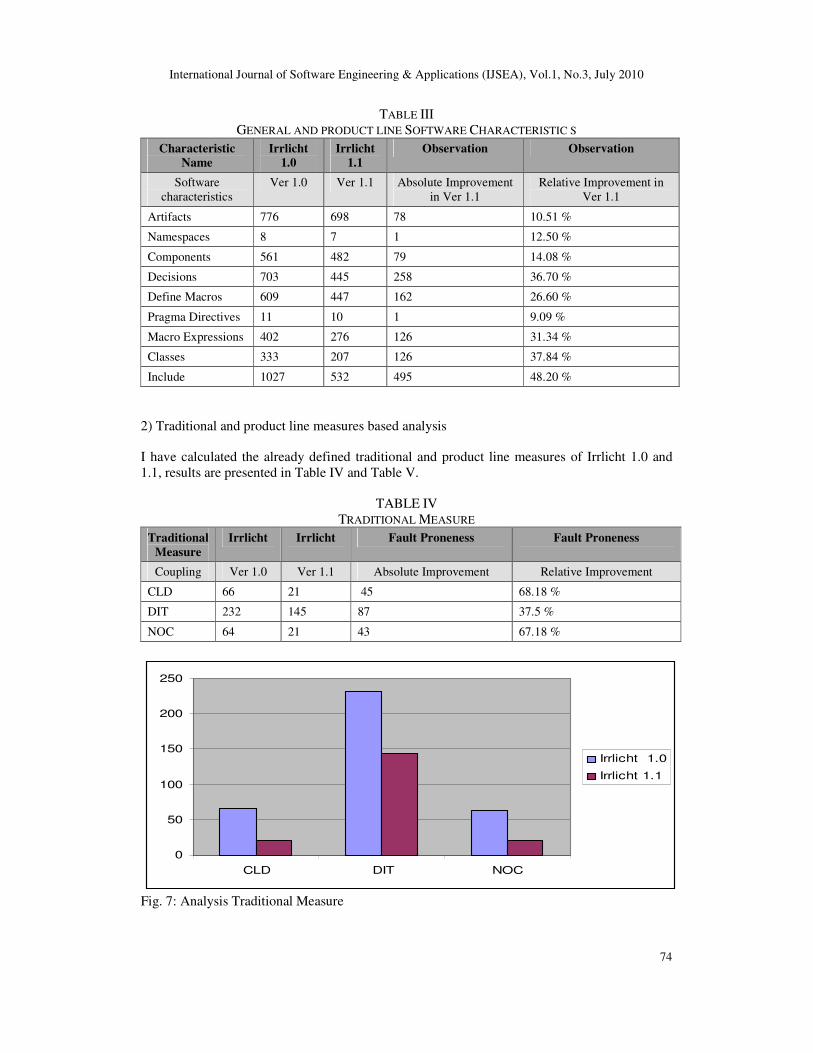
2) Traditional and product line measures based analysis
I have calculated the already defined traditional and product line measures of Irrlicht 1.0 and
1.1, results are presented in Table IV and Table V.
TABLE IV
TRADITIONAL MEASURE
Traditional
Measure
Irrlicht Irrlicht Fault Proneness Fault Proneness
Coupling Ver 1.0 Ver 1.1 Absolute Improvement Relative Improvement
CLD 66 21 45 68.18 %
DIT 232 145 87 37.5 %
NOC 64 21 43 67.18 %
0
50
100
150
200
250
CLD DIT NOC
Irrlicht 1.0
Irrlicht 1.1
Fig. 7: Analysis Traditional Measure
International Journal of Software Engineering & Applications (IJSEA), Vol.1, No.3, July 2010
75
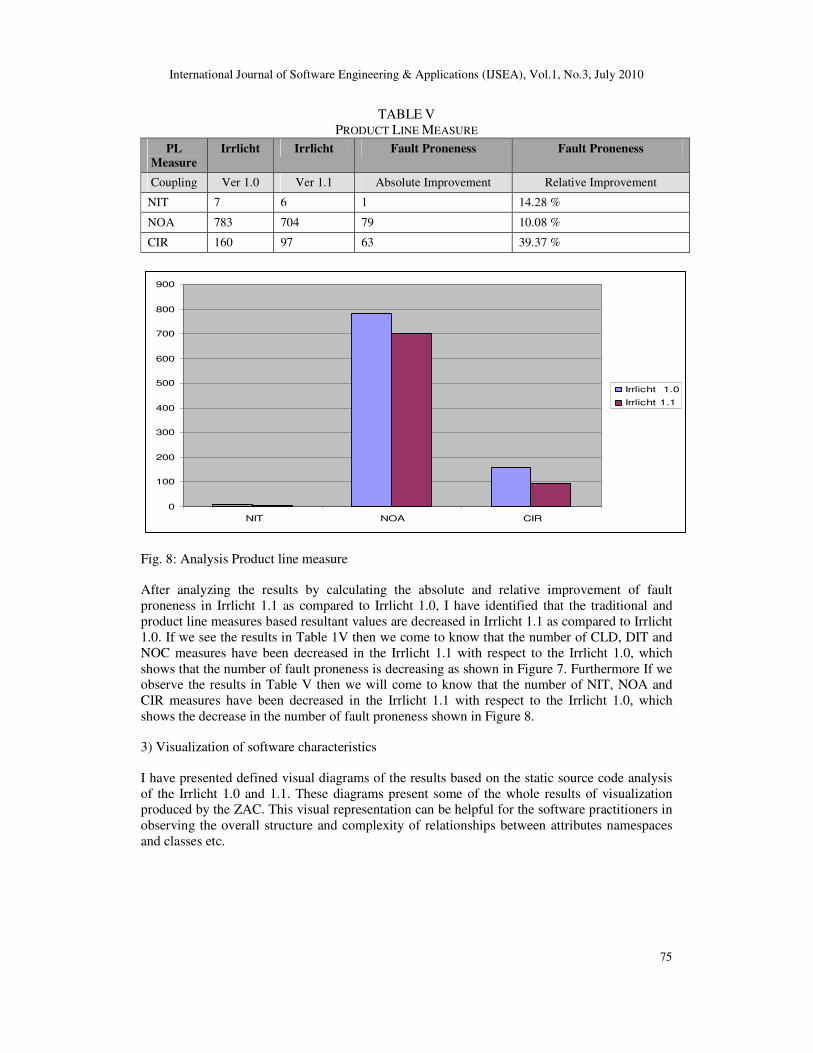
TABLE V
PRODUCT LINE MEASURE
PL
Measure
Irrlicht Irrlicht Fault Proneness Fault Proneness
Coupling Ver 1.0 Ver 1.1 Absolute Improvement Relative Improvement
NIT 7 6 1 14.28 %
NOA 783 704 79 10.08 %
CIR 160 97 63 39.37 %
0
100
200
300
400
500
600
700
800
900
NIT NOA CIR
Irrlicht 1.0
Irrlicht 1.1
Fig. 8: Analysis Product line measure
After analyzing the results by calculating the absolute and relative improvement of fault
proneness in Irrlicht 1.1 as compared to Irrlicht 1.0, I have identified that the traditional and
product line measures based resultant values are decreased in Irrlicht 1.1 as compared to Irrlicht
1.0. If we see the results in Table 1V then we come to know that the number of CLD, DIT and
NOC measures have been decreased in the Irrlicht 1.1 with respect to the Irrlicht 1.0, which
shows that the number of fault proneness is decreasing as shown in Figure 7. Furthermore If we
observe the results in Table V then we will come to know that the number of NIT, NOA and
CIR measures have been decreased in the Irrlicht 1.1 with respect to the Irrlicht 1.0, which
shows the decrease in the number of fault proneness shown in Figure 8.
3) Visualization of software characteristics
I have presented defined visual diagrams of the results based on the static source code analysis
of the Irrlicht 1.0 and 1.1. These diagrams present some of the whole results of visualization
produced by the ZAC. This visual representation can be helpful for the software practitioners in
observing the overall structure and complexity of relationships between attributes namespaces
and classes etc.
International Journal of Software Engineering & Applications (IJSEA), Vol.1, No.3, July 2010
76
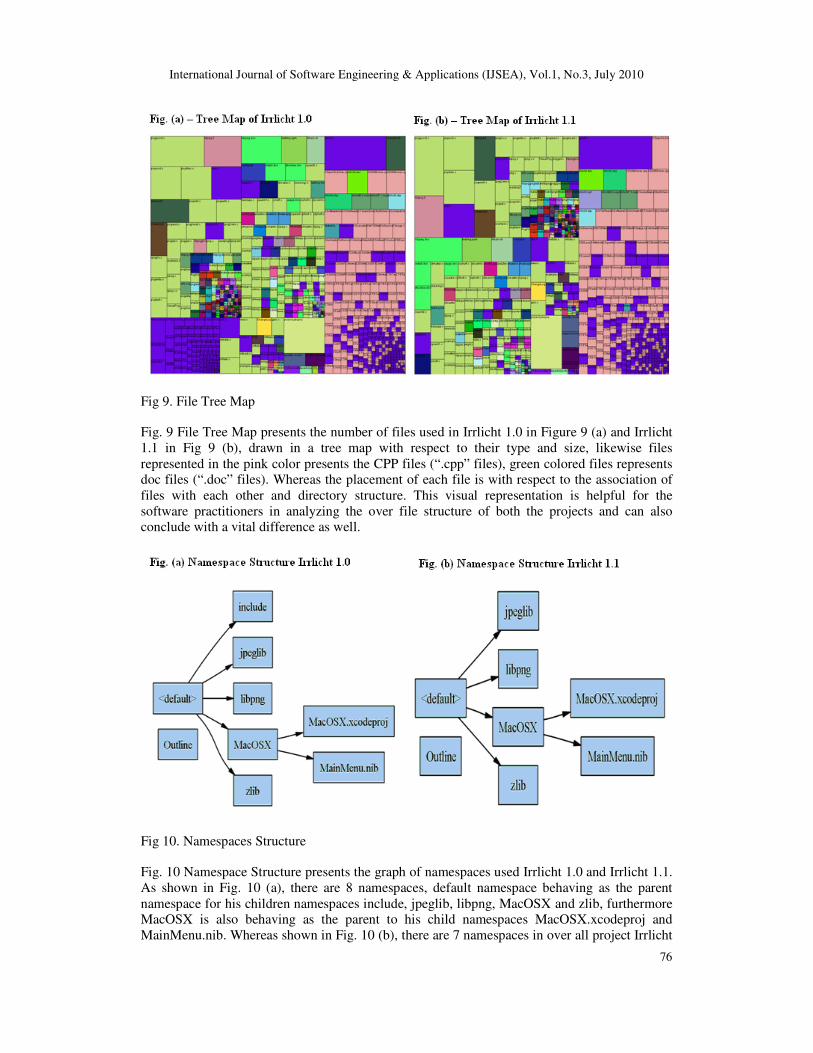
Fig 9. File Tree Map
Fig. 9 File Tree Map presents the number of files used in Irrlicht 1.0 in Figure 9 (a) and Irrlicht
1.1 in Fig 9 (b), drawn in a tree map with respect to their type and size, likewise files
represented in the pink color presents the CPP files (“.cpp” files), green colored files represents
doc files (“.doc” files). Whereas the placement of each file is with respect to the association of
files with each other and directory structure. This visual representation is helpful for the
software practitioners in analyzing the over file structure of both the projects and can also
conclude with a vital difference as well.
Fig 10. Namespaces Structure
Fig. 10 Namespace Structure presents the graph of namespaces used Irrlicht 1.0 and Irrlicht 1.1.
As shown in Fig. 10 (a), there are 8 namespaces, default namespace behaving as the parent
namespace for his children namespaces include, jpeglib, libpng, MacOSX and zlib, furthermore
MacOSX is also behaving as the parent to his child namespaces MacOSX.xcodeproj and
MainMenu.nib. Whereas shown in Fig. 10 (b), there are 7 namespaces in over all project Irrlicht
International Journal of Software Engineering & Applications (IJSEA), Vol.1, No.3, July 2010
77
1.1, default namespace behaving as the parent namespace for his children namespaces jpeglib,
libpng, MacOSX and zlib, further more MacOSX is also behaving as the parent to his child
namespaces MacOSX.xcodeproj and MainMenu.nib This visual representation is helpful for
the practitioners to analyze the overall structure of the namespaces used in the project; moreover
software practitioners can also take advantage in analyzing the complexity in namespace
relationship.
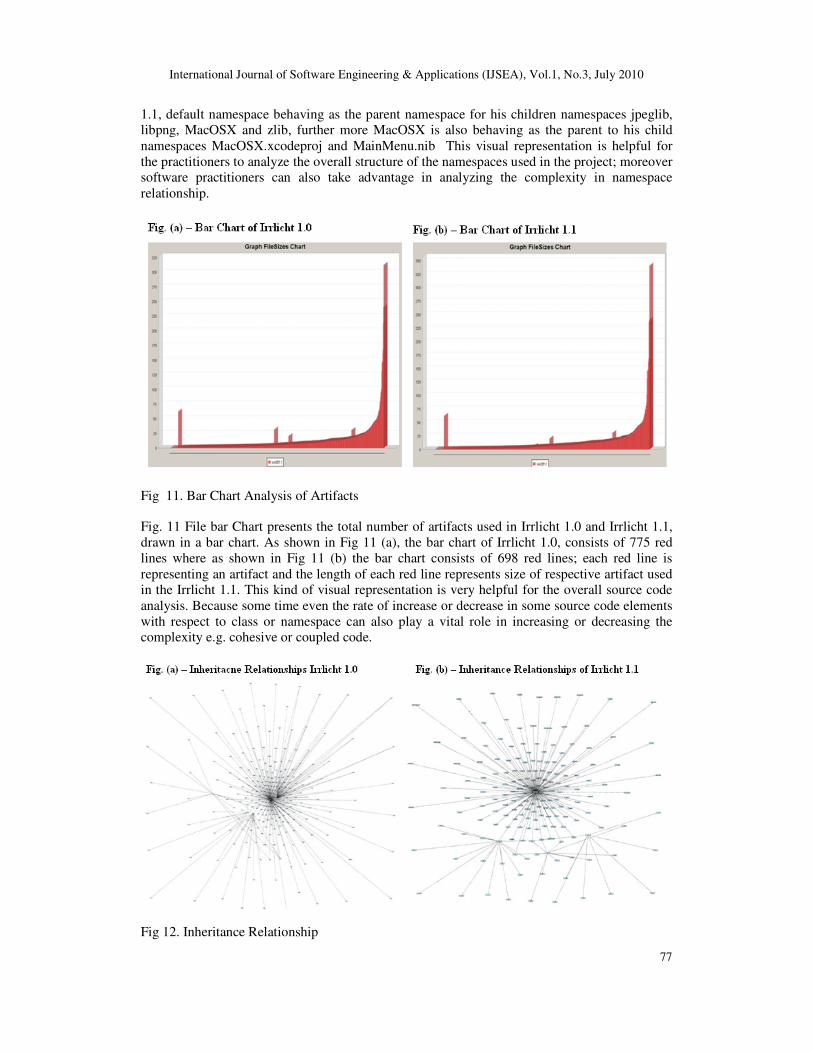
Fig 11. Bar Chart Analysis of Artifacts
Fig. 11 File bar Chart presents the total number of artifacts used in Irrlicht 1.0 and Irrlicht 1.1,
drawn in a bar chart. As shown in Fig 11 (a), the bar chart of Irrlicht 1.0, consists of 775 red
lines where as shown in Fig 11 (b) the bar chart consists of 698 red lines; each red line is
representing an artifact and the length of each red line represents size of respective artifact used
in the Irrlicht 1.1. This kind of visual representation is very helpful for the overall source code
analysis. Because some time even the rate of increase or decrease in some source code elements
with respect to class or namespace can also play a vital role in increasing or decreasing the
complexity e.g. cohesive or coupled code.
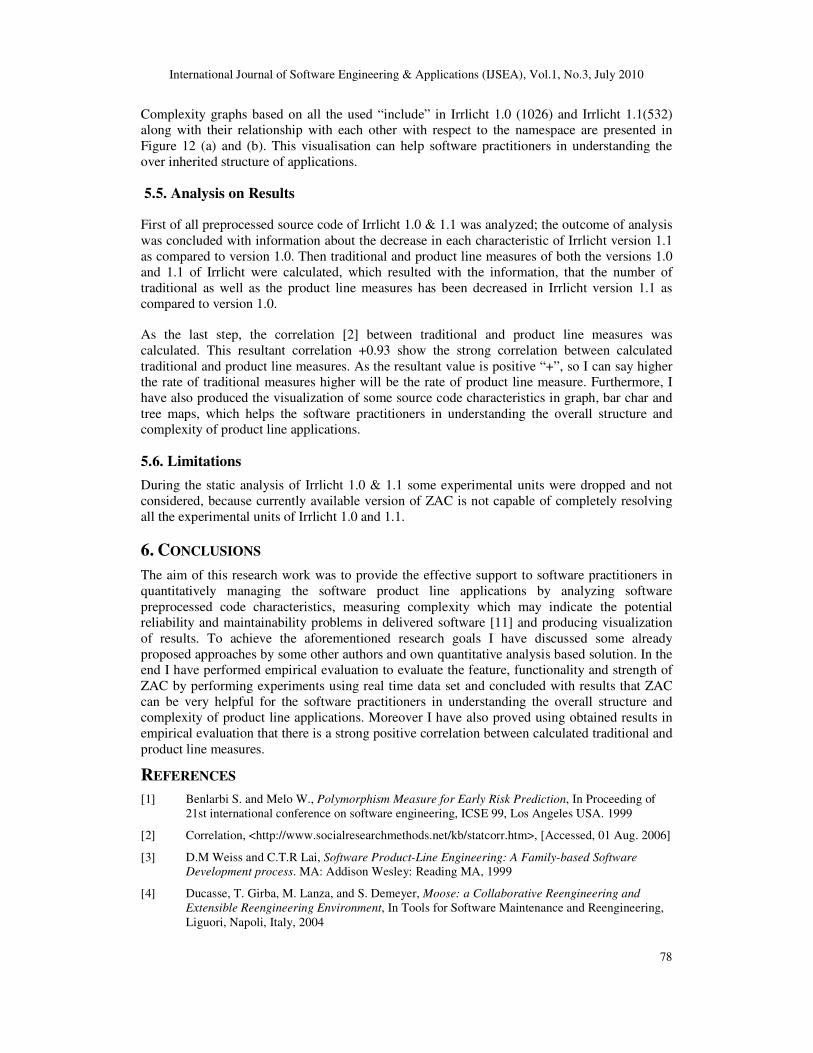
Fig 12. Inheritance Relationship
International Journal of Software Engineering & Applications (IJSEA), Vol.1, No.3, July 2010
78
Complexity graphs based on all the used “include” in Irrlicht 1.0 (1026) and Irrlicht 1.1(532)
along with their relationship with each other with respect to the namespace are presented in
Figure 12 (a) and (b). This visualisation can help software practitioners in understanding the
over inherited structure of applications.
5.5. Analysis on Results
First of all preprocessed source code of Irrlicht 1.0 & 1.1 was analyzed; the outcome of analysis
was concluded with information about the decrease in each characteristic of Irrlicht version 1.1
as compared to version 1.0. Then traditional and product line measures of both the versions 1.0
and 1.1 of Irrlicht were calculated, which resulted with the information, that the number of
traditional as well as the product line measures has been decreased in Irrlicht version 1.1 as
compared to version 1.0.
As the last step, the correlation [2] between traditional and product line measures was
calculated. This resultant correlation +0.93 show the strong correlation between calculated
traditional and product line measures. As the resultant value is positive “+”, so I can say higher
the rate of traditional measures higher will be the rate of product line measure. Furthermore, I
have also produced the visualization of some source code characteristics in graph, bar char and
tree maps, which helps the software practitioners in understanding the overall structure and
complexity of product line applications.
5.6. Limitations
During the static analysis of Irrlicht 1.0 & 1.1 some experimental units were dropped and not
considered, because currently available version of ZAC is not capable of completely resolving
all the experimental units of Irrlicht 1.0 and 1.1.
6. CONCLUSIONS
The aim of this research work was to provide the effective support to software practitioners in
quantitatively managing the software product line applications by analyzing software
preprocessed code characteristics, measuring complexity which may indicate the potential
reliability and maintainability problems in delivered software [11] and producing visualization
of results. To achieve the aforementioned research goals I have discussed some already
proposed approaches by some other authors and own quantitative analysis based solution. In the
end I have performed empirical evaluation to evaluate the feature, functionality and strength of
ZAC by performing experiments using real time data set and concluded with results that ZAC
can be very helpful for the software practitioners in understanding the overall structure and
complexity of product line applications. Moreover I have also proved using obtained results in
empirical evaluation that there is a strong positive correlation between calculated traditional and
product line measures.
REFERENCES
[1] Benlarbi S. and Melo W., Polymorphism Measure for Early Risk Prediction, In Proceeding of
21st international conference on software engineering, ICSE 99, Los Angeles USA. 1999
[2] Correlation, <http://www.socialresearchmethods.net/kb/statcorr.htm>, [Accessed, 01 Aug. 2006]
[3] D.M Weiss and C.T.R Lai, Software Product-Line Engineering: A Family-based Software
Development process. MA: Addison Wesley: Reading MA, 1999
[4] Ducasse, T. Girba, M. Lanza, and S. Demeyer, Moose: a Collaborative Reengineering and
Extensible Reengineering Environment, In Tools for Software Maintenance and Reengineering,
Liguori, Napoli, Italy, 2004
International Journal of Software Engineering & Applications (IJSEA), Vol.1, No.3, July 2010
79
[5] Fatma Dandashi and David C. Rine, A Method for Assessing the Reusability of Object- Oriented
Code Using a Validated Set of Automated Measurements, In the proceedings of the 2002 ACM
symposium on Applied computing, Pages: 997 – 1003,ISBN:1-58113-445-2, 2002
[6] Giancarlo Succi and Eric Liu. A Relations-Based Approach for Simplifying Metrics Extraction.
In Department of Electrical and Computer Engineering, University of Calgary. 2500 University
Drive NW, Calgary, AB T2N 1N4. 1999
[7] Giovanni Denaro, Mauro Pezz`e and Luigi Lavazza. An Empirical Evaluation of Object
Oriented Metrics in Industrial Setting, In The 5th Caber Net Plenary Workshop, 2003
[8] Graphviz, Graph Visualization Software, < http:// www.graphviz.org >, [Accessed, 15 Jun.
2006]
[9] Irrlicht, <http://irrlicht.sourceforge.net.> [Accessed, 15 Jun. 2006]
[10] J. Viega, J.T. Bloch, Y. Kohno and G. McGraw, ITS4: A static vulnerability scanner for C and
C++ code, acsac, p. 257, 16th Annual Computer Security Applications Conference
(ACSAC'00), 2000
[11] L. Briand and J. Wüst, The Impact of Design Properties on Development Cost in Object-
Oriented System, IEEE Transactions on Software Engineering, vol. 27, no. 11, November 2001
[12] L. Briand, J. Wuest and H. Lounis, Replicated Case Studies for Investigating Quality Factors in
Object-Oriented Designs, Empirical Software Engineering: An International Journal, 2001
[13] Michele Lanza, St´ephane Ducasse, Harald Gall and Martin Pinzger, CodeCrawler: An
Information Visualization Tool for Program Comprehension, Proceedings of the 27th
international conference on Software, ICSE 2005: 672-673, 2005
[14] Rudolf Ferenc, ´ Arp´ad Besz´edes and Tibor Gyim´othy. Extracting Facts with Columbus from
C++ Code. In proceedings of the 6th International Conference on Software. 2002
[15] Rudolf Ferenc, Juha Gustafssony, L´aszl´o M¨ullerz, and Jukka Paakkix. Recognizing Design
Patterns in C++ Programs with the Integration of Columbus and Maisa, Acta Cybern, 15(4):
669-682, 2002
[16] Silva Robak, Bogdan Franczyk, Feature interaction product lines, In Proceedings of Feature
Interaction in Composed Systems, 2001
[17] S. Chidamber and C. Kemerer. A metrics suite for object oriented design. IEEE Transactions on
Software Engineering, 20(6):476–493, June 1994
[18] The Standish group report, <http://www.standishgroup.com/quarterly_reports/index.php >,
[Accessed, 1 Aug. 2006]
[19] Thomas Gschwind, Martin Pinzger, Harald Gall, TUAnalyzer—Analyzing Templates in C++
Cod, In Proceedings of the 11th Working Conference on Reverse Engineering (WCRE’04) 2004
IEEE, 2004
[20] Victor R. Basili, Gianluigi Caldieram, H. Dieter Rombach, The Goal Question Metric
Approach”. Encyclopedia of Software Engineering, pp. 528-532, John Wiley & Sons, Inc., 1994
[21] V. R. Basili, L. C. Briand, and W. L. Melo, A Validation of Object-Oriented Design Metrics as
Quality Indicators, In IEEE Transactions on Software Engineering, volume 22, pages 751–761,
Oct. 1996.
[22] Wickenkamp Axel, Maturing a prototype of a code measurement system, Diploma Thesis,
Version 1.0. University of Kaiserslautern, May 2004
[23] Z. Ahmed, Measurement Analysis and Fault Proneness Indication in Product Line Applications
(PLA), In the proceedings of 6th International Conference on New Software Methodologies,
Tools, and Techniques (SOMET-07), ISSN 0922-6389, Rome Italy, 7-9 November 2007
[24] Z. Ahmed, Variants Handling using ZAC, ISBN-13: 978-3838341033, Book Publication,
Language: English, Published February 2010.
International Journal of Software Engineering & Applications (IJSEA), Vol.1, No.3, July 2010
80
[25] Z. Ahmed: "Statistical Semantic Modeling of Preprocessed Source Code to Identify, Measure
and Visualize the Complexities in Software Product Line Applications", In the proceedings of
4th International Statistical Conference May 9-11, Paper ID 19, Vol. 15, 1-12, ISBN 978-969-
8858-04-9, 2008
Author Bibliography
Zeeshan Ahmed is a Research Scientist, presently working in the
Department of Bioinformatics- University of Wuerzburg Germany. He
has on record more than 12 years of University Education and more than
7 years of professional experience of working within different
multinational organizations in the field of Computer Science with
emphasis on software engineering of product line architecture based
artificially intelligent systems. He also has more than 4 years experience
of teaching as lecturer and supervising research thesis to graduate and
undergraduate students in different institutes and universities.