Upper Mississippi River Spill Response Plan and Resource ...
Upload
independentCategory
view
4download
0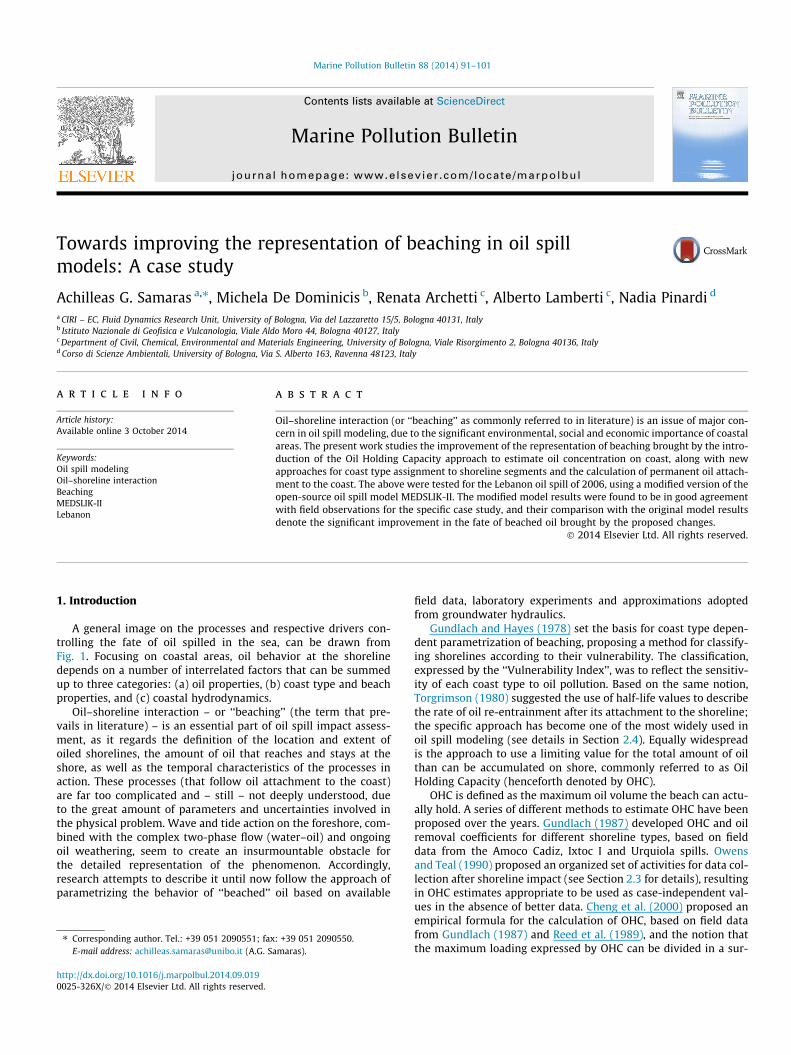
Marine Pollution Bulletin 88 (2014) 91–101
Contents lists available at ScienceDirect
Marine Pollution Bulletin
journal homepage: www.elsevier .com/locate /marpolbul
Towards improving the representation of beaching in oil spillmodels: A case study
http://dx.doi.org/10.1016/j.marpolbul.2014.09.0190025-326X/� 2014 Elsevier Ltd. All rights reserved.
⇑ Corresponding author. Tel.: +39 051 2090551; fax: +39 051 2090550.E-mail address: [email protected] (A.G. Samaras).
Achilleas G. Samaras a,⇑, Michela De Dominicis b, Renata Archetti c, Alberto Lamberti c, Nadia Pinardi d
a CIRI – EC, Fluid Dynamics Research Unit, University of Bologna, Via del Lazzaretto 15/5, Bologna 40131, Italyb Istituto Nazionale di Geofisica e Vulcanologia, Viale Aldo Moro 44, Bologna 40127, Italyc Department of Civil, Chemical, Environmental and Materials Engineering, University of Bologna, Viale Risorgimento 2, Bologna 40136, Italyd Corso di Scienze Ambientali, University of Bologna, Via S. Alberto 163, Ravenna 48123, Italy
a r t i c l e i n f o
Article history:Available online 3 October 2014
Keywords:Oil spill modelingOil–shoreline interactionBeachingMEDSLIK-IILebanon
a b s t r a c t
Oil–shoreline interaction (or ‘‘beaching’’ as commonly referred to in literature) is an issue of major con-cern in oil spill modeling, due to the significant environmental, social and economic importance of coastalareas. The present work studies the improvement of the representation of beaching brought by the intro-duction of the Oil Holding Capacity approach to estimate oil concentration on coast, along with newapproaches for coast type assignment to shoreline segments and the calculation of permanent oil attach-ment to the coast. The above were tested for the Lebanon oil spill of 2006, using a modified version of theopen-source oil spill model MEDSLIK-II. The modified model results were found to be in good agreementwith field observations for the specific case study, and their comparison with the original model resultsdenote the significant improvement in the fate of beached oil brought by the proposed changes.
� 2014 Elsevier Ltd. All rights reserved.
1. Introduction
A general image on the processes and respective drivers con-trolling the fate of oil spilled in the sea, can be drawn fromFig. 1. Focusing on coastal areas, oil behavior at the shorelinedepends on a number of interrelated factors that can be summedup to three categories: (a) oil properties, (b) coast type and beachproperties, and (c) coastal hydrodynamics.
Oil–shoreline interaction – or ‘‘beaching’’ (the term that pre-vails in literature) – is an essential part of oil spill impact assess-ment, as it regards the definition of the location and extent ofoiled shorelines, the amount of oil that reaches and stays at theshore, as well as the temporal characteristics of the processes inaction. These processes (that follow oil attachment to the coast)are far too complicated and – still – not deeply understood, dueto the great amount of parameters and uncertainties involved inthe physical problem. Wave and tide action on the foreshore, com-bined with the complex two-phase flow (water–oil) and ongoingoil weathering, seem to create an insurmountable obstacle forthe detailed representation of the phenomenon. Accordingly,research attempts to describe it until now follow the approach ofparametrizing the behavior of ‘‘beached’’ oil based on available
field data, laboratory experiments and approximations adoptedfrom groundwater hydraulics.
Gundlach and Hayes (1978) set the basis for coast type depen-dent parametrization of beaching, proposing a method for classify-ing shorelines according to their vulnerability. The classification,expressed by the ‘‘Vulnerability Index’’, was to reflect the sensitiv-ity of each coast type to oil pollution. Based on the same notion,Torgrimson (1980) suggested the use of half-life values to describethe rate of oil re-entrainment after its attachment to the shoreline;the specific approach has become one of the most widely used inoil spill modeling (see details in Section 2.4). Equally widespreadis the approach to use a limiting value for the total amount of oilthan can be accumulated on shore, commonly referred to as OilHolding Capacity (henceforth denoted by OHC).
OHC is defined as the maximum oil volume the beach can actu-ally hold. A series of different methods to estimate OHC have beenproposed over the years. Gundlach (1987) developed OHC and oilremoval coefficients for different shoreline types, based on fielddata from the Amoco Cadiz, Ixtoc I and Urquiola spills. Owensand Teal (1990) proposed an organized set of activities for data col-lection after shoreline impact (see Section 2.3 for details), resultingin OHC estimates appropriate to be used as case-independent val-ues in the absence of better data. Cheng et al. (2000) proposed anempirical formula for the calculation of OHC, based on field datafrom Gundlach (1987) and Reed et al. (1989), and the notion thatthe maximum loading expressed by OHC can be divided in a sur-
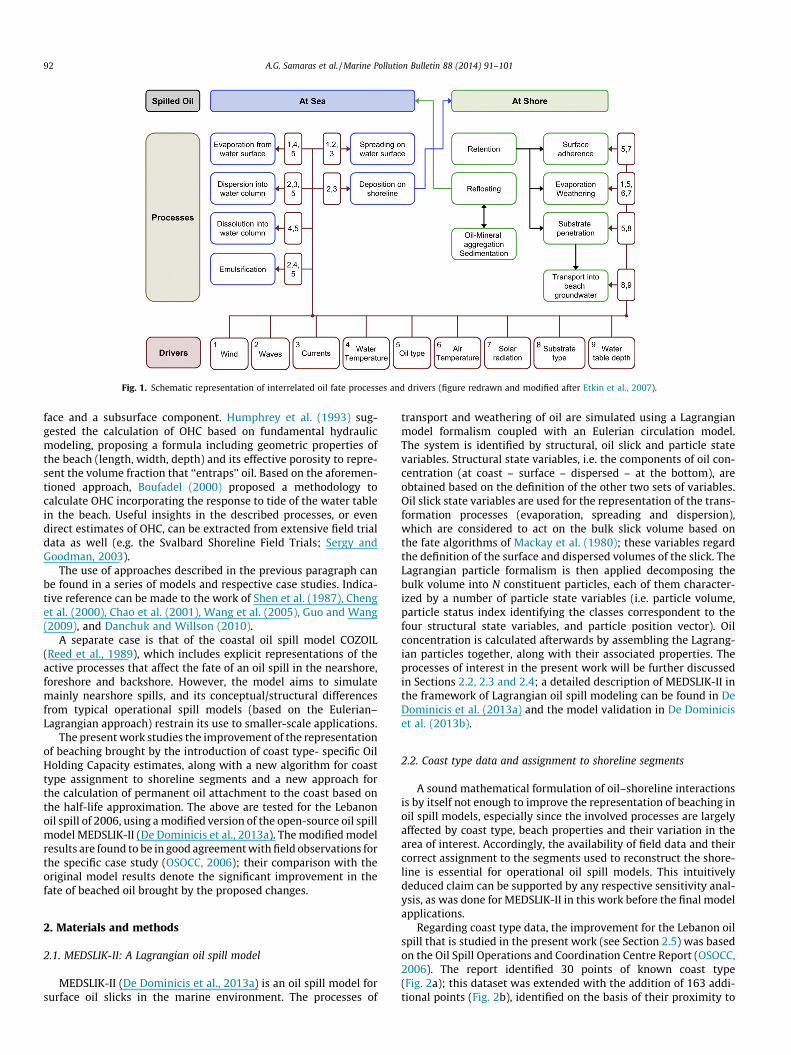
Fig. 1. Schematic representation of interrelated oil fate processes and drivers (figure redrawn and modified after Etkin et al., 2007).
92 A.G. Samaras et al. / Marine Pollution Bulletin 88 (2014) 91–101
face and a subsurface component. Humphrey et al. (1993) sug-gested the calculation of OHC based on fundamental hydraulicmodeling, proposing a formula including geometric properties ofthe beach (length, width, depth) and its effective porosity to repre-sent the volume fraction that ‘‘entraps’’ oil. Based on the aforemen-tioned approach, Boufadel (2000) proposed a methodology tocalculate OHC incorporating the response to tide of the water tablein the beach. Useful insights in the described processes, or evendirect estimates of OHC, can be extracted from extensive field trialdata as well (e.g. the Svalbard Shoreline Field Trials; Sergy andGoodman, 2003).
The use of approaches described in the previous paragraph canbe found in a series of models and respective case studies. Indica-tive reference can be made to the work of Shen et al. (1987), Chenget al. (2000), Chao et al. (2001), Wang et al. (2005), Guo and Wang(2009), and Danchuk and Willson (2010).
A separate case is that of the coastal oil spill model COZOIL(Reed et al., 1989), which includes explicit representations of theactive processes that affect the fate of an oil spill in the nearshore,foreshore and backshore. However, the model aims to simulatemainly nearshore spills, and its conceptual/structural differencesfrom typical operational spill models (based on the Eulerian–Lagrangian approach) restrain its use to smaller-scale applications.
The present work studies the improvement of the representationof beaching brought by the introduction of coast type- specific OilHolding Capacity estimates, along with a new algorithm for coasttype assignment to shoreline segments and a new approach forthe calculation of permanent oil attachment to the coast based onthe half-life approximation. The above are tested for the Lebanonoil spill of 2006, using a modified version of the open-source oil spillmodel MEDSLIK-II (De Dominicis et al., 2013a). The modified modelresults are found to be in good agreement with field observations forthe specific case study (OSOCC, 2006); their comparison with theoriginal model results denote the significant improvement in thefate of beached oil brought by the proposed changes.
2. Materials and methods
2.1. MEDSLIK-II: A Lagrangian oil spill model
MEDSLIK-II (De Dominicis et al., 2013a) is an oil spill model forsurface oil slicks in the marine environment. The processes of
transport and weathering of oil are simulated using a Lagrangianmodel formalism coupled with an Eulerian circulation model.The system is identified by structural, oil slick and particle statevariables. Structural state variables, i.e. the components of oil con-centration (at coast – surface – dispersed – at the bottom), areobtained based on the definition of the other two sets of variables.Oil slick state variables are used for the representation of the trans-formation processes (evaporation, spreading and dispersion),which are considered to act on the bulk slick volume based onthe fate algorithms of Mackay et al. (1980); these variables regardthe definition of the surface and dispersed volumes of the slick. TheLagrangian particle formalism is then applied decomposing thebulk volume into N constituent particles, each of them character-ized by a number of particle state variables (i.e. particle volume,particle status index identifying the classes correspondent to thefour structural state variables, and particle position vector). Oilconcentration is calculated afterwards by assembling the Lagrang-ian particles together, along with their associated properties. Theprocesses of interest in the present work will be further discussedin Sections 2.2, 2.3 and 2.4; a detailed description of MEDSLIK-II inthe framework of Lagrangian oil spill modeling can be found in DeDominicis et al. (2013a) and the model validation in De Dominiciset al. (2013b).
2.2. Coast type data and assignment to shoreline segments
A sound mathematical formulation of oil–shoreline interactionsis by itself not enough to improve the representation of beaching inoil spill models, especially since the involved processes are largelyaffected by coast type, beach properties and their variation in thearea of interest. Accordingly, the availability of field data and theircorrect assignment to the segments used to reconstruct the shore-line is essential for operational oil spill models. This intuitivelydeduced claim can be supported by any respective sensitivity anal-ysis, as was done for MEDSLIK-II in this work before the final modelapplications.
Regarding coast type data, the improvement for the Lebanon oilspill that is studied in the present work (see Section 2.5) was basedon the Oil Spill Operations and Coordination Centre Report (OSOCC,2006). The report identified 30 points of known coast type(Fig. 2a); this dataset was extended with the addition of 163 addi-tional points (Fig. 2b), identified on the basis of their proximity to
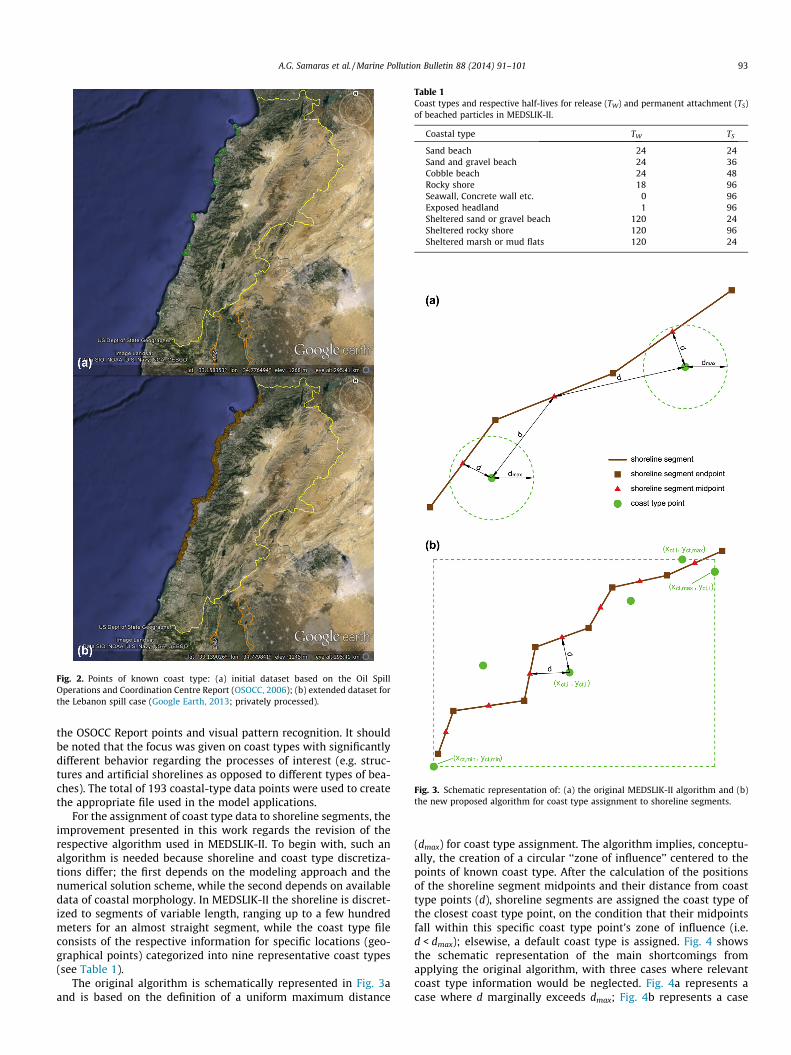
Fig. 2. Points of known coast type: (a) initial dataset based on the Oil SpillOperations and Coordination Centre Report (OSOCC, 2006); (b) extended dataset forthe Lebanon spill case (Google Earth, 2013; privately processed).
Table 1Coast types and respective half-lives for release (TW) and permanent attachment (TS)of beached particles in MEDSLIK-II.
Coastal type TW TS
Sand beach 24 24Sand and gravel beach 24 36Cobble beach 24 48Rocky shore 18 96Seawall, Concrete wall etc. 0 96Exposed headland 1 96Sheltered sand or gravel beach 120 24Sheltered rocky shore 120 96Sheltered marsh or mud flats 120 24
Fig. 3. Schematic representation of: (a) the original MEDSLIK-II algorithm and (b)the new proposed algorithm for coast type assignment to shoreline segments.
A.G. Samaras et al. / Marine Pollution Bulletin 88 (2014) 91–101 93
the OSOCC Report points and visual pattern recognition. It shouldbe noted that the focus was given on coast types with significantlydifferent behavior regarding the processes of interest (e.g. struc-tures and artificial shorelines as opposed to different types of bea-ches). The total of 193 coastal-type data points were used to createthe appropriate file used in the model applications.
For the assignment of coast type data to shoreline segments, theimprovement presented in this work regards the revision of therespective algorithm used in MEDSLIK-II. To begin with, such analgorithm is needed because shoreline and coast type discretiza-tions differ; the first depends on the modeling approach and thenumerical solution scheme, while the second depends on availabledata of coastal morphology. In MEDSLIK-II the shoreline is discret-ized to segments of variable length, ranging up to a few hundredmeters for an almost straight segment, while the coast type fileconsists of the respective information for specific locations (geo-graphical points) categorized into nine representative coast types(see Table 1).
The original algorithm is schematically represented in Fig. 3aand is based on the definition of a uniform maximum distance
(dmax) for coast type assignment. The algorithm implies, conceptu-ally, the creation of a circular ‘‘zone of influence’’ centered to thepoints of known coast type. After the calculation of the positionsof the shoreline segment midpoints and their distance from coasttype points (d), shoreline segments are assigned the coast type ofthe closest coast type point, on the condition that their midpointsfall within this specific coast type point’s zone of influence (i.e.d < dmax); elsewise, a default coast type is assigned. Fig. 4 showsthe schematic representation of the main shortcomings fromapplying the original algorithm, with three cases where relevantcoast type information would be neglected. Fig. 4a represents acase where d marginally exceeds dmax; Fig. 4b represents a case

Fig. 4. Schematic representation of the main shortcomings of the original MEDSLIK-II algorithm for coast type assignment to shoreline segments.
94 A.G. Samaras et al. / Marine Pollution Bulletin 88 (2014) 91–101
where d exceeds dmax, but since d is calculated from the segmentmidpoint, part of the specific shoreline segment still falls withinthe maximum distance buffer; Fig. 4c represents a case in longshoreline segments or small dmax values, where although thecoastal type point is practically on the shoreline, the segment mid-point does not fall within the maximum distance buffer. Further-more, an approach based on the ‘‘zone of influence’’ concept, asimplied by the definition of dmax, would require varying and notuniform dmax values dependent on coast type and local morphody-namics, information only rarely available. Accordingly, a newapproach was adopted, leading to the algorithm schematically rep-resented in Fig. 3b. The new algorithm implies, conceptually, thecreation of an outline for the area of known coast types, so that:
xct;min 6 xct;i 6 xct;max ð1Þ
yct;min 6 yct;i 6 yct;max ð2Þ
where (xct, yct) are the coast type point coordinates and the sub-script i refers to the i-th point in the respective file. After the iden-tification of the closest such point to each shoreline segment, therespective coast type is assigned to shoreline segments that fall
within the aforementioned outline without any constraintsimposed by a maximum distance. And, although coast type assign-ment would always depend primarily on the quantity and quality ofthe available data, the proposed approach ensures that within thearea covered by that data no relevant information will be neglected.The latter was confirmed by sensitivity analyses and preliminarytest-runs for the Lebanon case study, in which the original algo-rithm neglected coast type information for a significant number ofshoreline segments (thus significant shoreline length as well), whilethe new algorithm did assign the nearby coast types correctly. Theeffect of this correct coast type assignment extends to the resultspresented in Figs. 8–10 (although admittedly not clearly identifi-able), as in the particular approach used in MEDSLIK-II coast typeis associated with the essential TW and TS parameters for the half-lives of release and permanent attachment, respectively (see Sec-tion 2.4).
2.3. Oil concentration on coast
Regarding the oil concentration on coast, the original MEDSLIK-II formulation assumes, by default, a uniform limiting oil concen-tration of 5000 bbl/km (bbl = barrel). This approach lacks depen-dence on coast type, along with the fact that the aforementionedvalue is high, especially considering that it was uniformly set toall shoreline segments.
After extensive literature review (Gundlach and Reed, 1986;Gundlach, 1987; Reed et al., 1989, 1999; Lee et al., 2003; Owensand Lee, 2003; Johnson et al., 2005; Etkin et al., 2007 among oth-ers) and taking into consideration the points noted in Section 1,it was decided the improvement regarding oil concentration oncoast to be based on Oil Holding Capacity (OHC), parametrizedfor different coast types. The detailed review of Etkin et al.(2007) on oil–shoreline interaction and its simulation by oil spillmodels, suggests a combination of: (a) the Boufadel (2000) meth-odology (hydraulic oil-holding capacity model) for light oils, and(b) the SCAT (Shoreline Cleanup Assessment Team) methodologyfor medium-heavy oils. Of the two, the Boufadel (2000) methodol-ogy requires more detailed field data to be implemented, regardingbeach sediment properties (porosity, hydraulic conductivity) andgroundwater properties (existence or not of groundwater flowfrom inland areas). Given the general scarcity of such data for largecoastal stretches, this can be considered as a shortcoming of thespecific approach. In the present work, for the specific case studyof the Lebanon spill (oil with an API gravity identified equal to26 �API; API gravity = American Petroleum Institute grav-ity = 141.5/SG – 131.5, where SG is the specific gravity at 60 �F)and in the absence of case specific data, the improvement wasbased on SCAT data for the Exxon Valdez spill.
SCAT is the acronym of ‘‘Shoreline Cleanup Assessment Team’’(‘‘Shoreline Cleanup Assessment Techniques’’ also found in litera-ture), a term first developed during the Exxon Valdez oil spillimpact assessment (Owens and Teal, 1990; see also Owens andSergy, 2003). It refers to an organized set of activities for data col-lection after oil spills that affect shorelines and shoreline habitats.SCAT surveys are intended to provide a rich array of data in orderto develop a shoreline cleanup plan that maximizes the recovery ofoiled habitats and resources, while minimizing the risk of injuryfrom cleanup efforts (NOAA, 2000).
As also mentioned above, in the absence of a case-specific SCATsurvey for the Lebanon oil spill, the results of the respective one forthe ‘‘Exxon Valdez’’ spill were used as presented in Table 2(adopted by Etkin et al., 2007). The specific data regard a seriesof extensive surveys conducted on 5221 km of shoreline of eightmajor types, in Prince William Sound, Alaska. The SCAT data coasttypes were matched to the ones of MEDSLIK-II (Table 1) and thetotal oil volume units (defining OHC) were properly transformed.
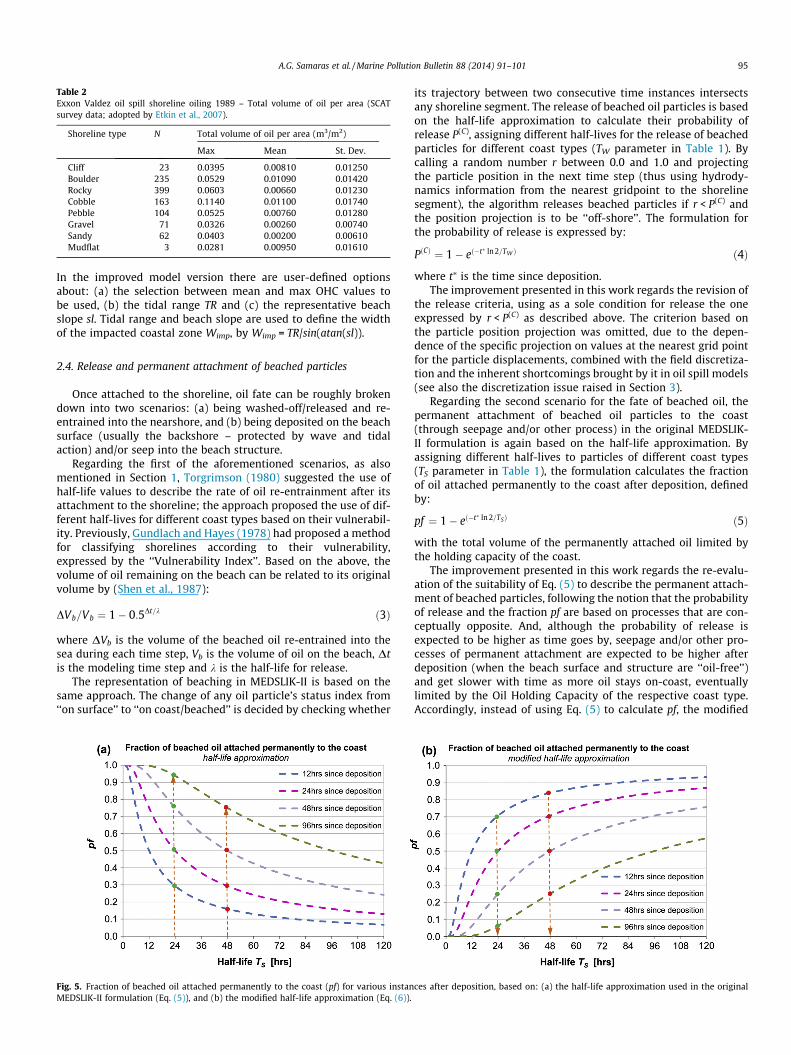
Table 2Exxon Valdez oil spill shoreline oiling 1989 – Total volume of oil per area (SCATsurvey data; adopted by Etkin et al., 2007).
Shoreline type N Total volume of oil per area (m3/m2)
Max Mean St. Dev.
Cliff 23 0.0395 0.00810 0.01250Boulder 235 0.0529 0.01090 0.01420Rocky 399 0.0603 0.00660 0.01230Cobble 163 0.1140 0.01100 0.01740Pebble 104 0.0525 0.00760 0.01280Gravel 71 0.0326 0.00260 0.00740Sandy 62 0.0403 0.00200 0.00610Mudflat 3 0.0281 0.00950 0.01610
A.G. Samaras et al. / Marine Pollution Bulletin 88 (2014) 91–101 95
In the improved model version there are user-defined optionsabout: (a) the selection between mean and max OHC values tobe used, (b) the tidal range TR and (c) the representative beachslope sl. Tidal range and beach slope are used to define the widthof the impacted coastal zone Wimp, by Wimp = TR/sin(atan(sl)).
2.4. Release and permanent attachment of beached particles
Once attached to the shoreline, oil fate can be roughly brokendown into two scenarios: (a) being washed-off/released and re-entrained into the nearshore, and (b) being deposited on the beachsurface (usually the backshore – protected by wave and tidalaction) and/or seep into the beach structure.
Regarding the first of the aforementioned scenarios, as alsomentioned in Section 1, Torgrimson (1980) suggested the use ofhalf-life values to describe the rate of oil re-entrainment after itsattachment to the shoreline; the approach proposed the use of dif-ferent half-lives for different coast types based on their vulnerabil-ity. Previously, Gundlach and Hayes (1978) had proposed a methodfor classifying shorelines according to their vulnerability,expressed by the ‘‘Vulnerability Index’’. Based on the above, thevolume of oil remaining on the beach can be related to its originalvolume by (Shen et al., 1987):
DVb=Vb ¼ 1� 0:5Dt=k ð3Þ
where DVb is the volume of the beached oil re-entrained into thesea during each time step, Vb is the volume of oil on the beach, Dtis the modeling time step and k is the half-life for release.
The representation of beaching in MEDSLIK-II is based on thesame approach. The change of any oil particle’s status index from‘‘on surface’’ to ‘‘on coast/beached’’ is decided by checking whether
Fig. 5. Fraction of beached oil attached permanently to the coast (pf) for various instanMEDSLIK-II formulation (Eq. (5)), and (b) the modified half-life approximation (Eq. (6)).
its trajectory between two consecutive time instances intersectsany shoreline segment. The release of beached oil particles is basedon the half-life approximation to calculate their probability ofrelease P(C), assigning different half-lives for the release of beachedparticles for different coast types (TW parameter in Table 1). Bycalling a random number r between 0.0 and 1.0 and projectingthe particle position in the next time step (thus using hydrody-namics information from the nearest gridpoint to the shorelinesegment), the algorithm releases beached particles if r < P(C) andthe position projection is to be ‘‘off-shore’’. The formulation forthe probability of release is expressed by:
PðCÞ ¼ 1� eð�t� ln 2=TW Þ ð4Þ
where t⁄ is the time since deposition.The improvement presented in this work regards the revision of
the release criteria, using as a sole condition for release the oneexpressed by r < P(C) as described above. The criterion based onthe particle position projection was omitted, due to the depen-dence of the specific projection on values at the nearest grid pointfor the particle displacements, combined with the field discretiza-tion and the inherent shortcomings brought by it in oil spill models(see also the discretization issue raised in Section 3).
Regarding the second scenario for the fate of beached oil, thepermanent attachment of beached oil particles to the coast(through seepage and/or other process) in the original MEDSLIK-II formulation is again based on the half-life approximation. Byassigning different half-lives to particles of different coast types(TS parameter in Table 1), the formulation calculates the fractionof oil attached permanently to the coast after deposition, definedby:
pf ¼ 1� eð�t� ln 2=TSÞ ð5Þ
with the total volume of the permanently attached oil limited bythe holding capacity of the coast.
The improvement presented in this work regards the re-evalu-ation of the suitability of Eq. (5) to describe the permanent attach-ment of beached particles, following the notion that the probabilityof release and the fraction pf are based on processes that are con-ceptually opposite. And, although the probability of release isexpected to be higher as time goes by, seepage and/or other pro-cesses of permanent attachment are expected to be higher afterdeposition (when the beach surface and structure are ‘‘oil-free’’)and get slower with time as more oil stays on-coast, eventuallylimited by the Oil Holding Capacity of the respective coast type.Accordingly, instead of using Eq. (5) to calculate pf, the modified
ces after deposition, based on: (a) the half-life approximation used in the original

96 A.G. Samaras et al. / Marine Pollution Bulletin 88 (2014) 91–101
formulation expressed by Eq. (6) was selected, still based on theexponential half-life approximation.
pf ¼ eð�t� ln 2=TSÞ ð6Þ
Fig. 5b, based on Eq. (6), presents how the fraction of perma-nently attached oil – for a given half-life – decreases with timesince deposition, instead of increasing as the original formulationdictates (Fig. 5a based on Eq. (5)).
2.5. The Lebanon oil spill
On July 13 and 15, 2006, the Jiyeh power station located about30 km South of Beirut and directly on the Lebanese coastline(Fig. 6) was hit during hostility events. Some of the impacted stor-age tanks caught on fire, with the oil not consumed in the fire beingspilled into the Mediterranean Sea. Estimates on the total amountof oil spilled (API gravity identified equal to 26 �API) range from10,000 to 15,000 tonnes (OSOCC, 2006). Fig. 7a shows the observa-tions of floating oil (classified as light and heavy) as drawn fromOSOCC (2006); Fig. 7b shows the respective results for beachedoil on different coast types.
2.6. MEDSLIK-II applications
MEDSLIK-II was used to simulate the fate of the spilled oil for27 days (648 hrs) after the accident. Applications were performedusing the original model version, as well as versions at variousstages of the implementation of the improvements presented inSections 2.2–2.4. The tidal range of the study area resulted fromOTIS (Egbert and Erofeeva, 2002) runs for the specific period. Theobjective was to evaluate the proposed improvements and to val-idate – through intercomparison with the original model results– their suitability for a new formulation of MEDSLIK-II.
The results presented in the following will be indexed as Ver-sion I, II, III or IV results. Ver. I refers to the original MEDSLIK-II ver-sion, while Ver. II, III, and IV refer to the various stages of theimplementation of the improvements of Sections 2.2–2.4, as pre-sented in Table 3. It should be noted that the improved Versionsof MEDSLIK-II presented in this work were intentionally focusedon Oil Holding Capacity and release/permanent attachment of bea-
Fig. 6. The wider study area, Lebanon and the location of Jiyeh power station(Google Earth, 2013; privately processed).
Fig. 7. Observations of: (a) floating oil (classified as light and heavy) and (b)beached oil on different coast types, as drawn from the OSOCC (2006) Report(Google Earth, 2013; privately processed).
ched particles; the importance of the improvements presented inSection 2.2 was validated during sensitivity analyses and prelimin-ary test-runs.
3. Results and discussion
MEDSLIK-II output divides beached oil into two categories: (a)‘‘fixed’’, i.e. oil permanently attached to the coast with no probabil-ity of release, and (b) ‘‘total’’, i.e. the total amount of oil that is bea-ched at any given time, comprising both ‘‘fixed’’ oil and oil locatedon coast but free to be released according to the formulation pre-sented in Section 2.4. In order to clarify any ambiguity that mayarise from the use of the aforementioned terminology, ‘‘fixed’’ oilwill be henceforth denoted as ‘‘permanent’’ (abbreviation: perm)and the amount of oil that is located on coast but is free to bereleased will be denoted as ‘‘free’’. It is intuitively deduced that

Fig. 8. Temporal evolution of permanent (perm), free and total oil located on coast for the MEDSLIK-II (a) Ver. I, (b) Ver. II, (c) Ver. III and (d) Ver. IV runs.
Table 3Annotation on MEDSLIK-II versions based on the included improvements.
Improvement Version
I II III IV
Updated coastal type data Original model version U U U
New algorithm for coastal type assignment U U U
Oil Holding Capacity approach for concentration on coast U U U
Change in release criteria U U
Modified calculation of pfaU
a pf is the fraction of beached oil attached permanently to the coast after deposition (see Eqs. (5) and (6)).
A.G. Samaras et al. / Marine Pollution Bulletin 88 (2014) 91–101 97
the total amount of oil located on coast at any given time is thesum of perm and free oil.
Fig. 8a–d present the temporal evolution of the above quantitiesfor the MEDSLIK-II Ver. I, Ver. II, Ver. III and Ver. IV runs, respec-tively, for the Lebanon oil spill. Fig. 9 presents the temporal evolu-tion of the perm and total oil on coast. Fig. 10 presents the temporalevolution of the free and total oil on coast.
Ver. I results denote the significantly different model behaviorregarding the simulation of beaching before and after the imple-mentation of the improvements presented in this work. The differ-ences are evident, not only in the quantitative comparison of Ver. Iand other Versions’ results, but in the qualitative evolution of themodeled processes as well.
The improvement brought by the introduction of the coast typespecific Oil Holding Capacity (OHC) approach (along with theupdated coast type data and the assignment algorithm) in the rep-resentation of oil concentration on coast (see also Table 3 and Sec-
tions 2.2 and 2.3) is clearly identified in Fig. 8 and the comparativegraphs of Figs. 9 and 10. Significant differences are identifiedbetween Ver. I and the other Versions’ results. Specifically, inVer. I the amount of permanent oil on coast follows the increaseof the total amount, with the free oil reaching its maximum (to arelatively low quantity) shortly after the shoreline impact, anddecreasing after that. To further elaborate, this means that the ori-ginal formulation led the majority of beached oil particles to bepractically ‘‘trapped’’ in the beach structure, leaving only a smallamount of particles with the probability of being released backto the water column. On the contrary, Ver. II, Ver. III and Ver. IVresults show permanent oil being constrained by the OHC of thevarious coast types, with a trend of reaching a maximum over time.Consequently, the respective amount of free oil particles is largerand follows the evolution of the total oil on the coast.
The improvement brought by the change in the beached parti-cle release criterion (see also Table 3 and Section 2.4) is identified
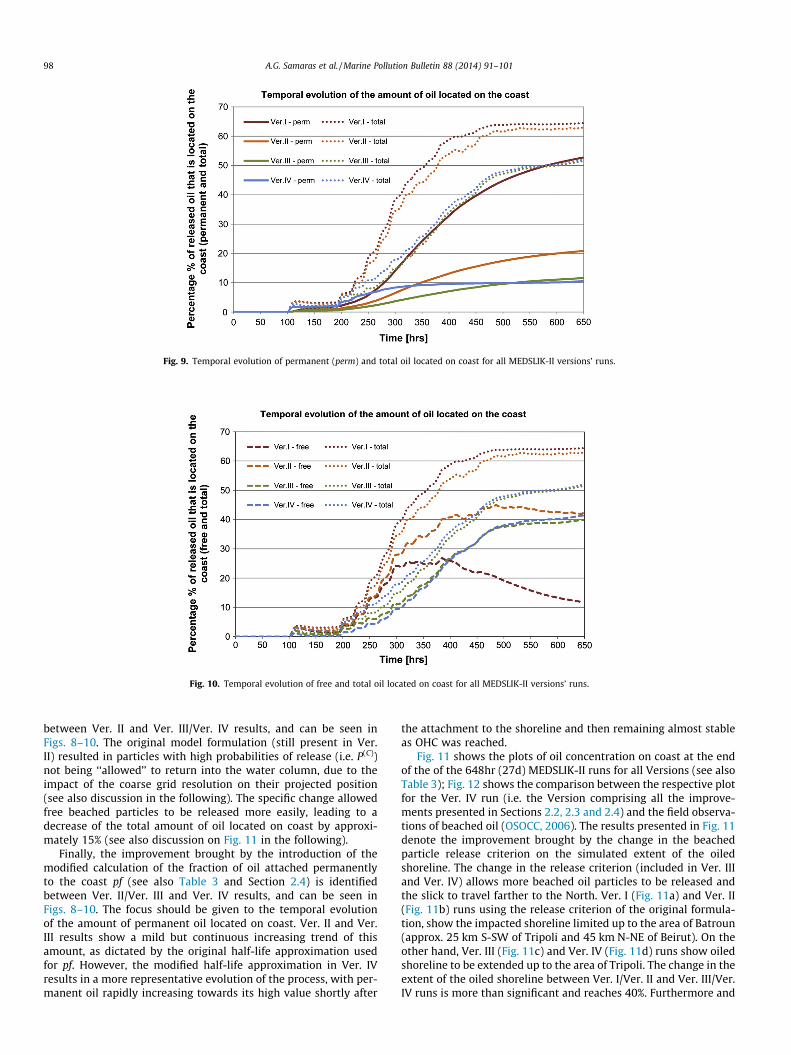
Fig. 10. Temporal evolution of free and total oil located on coast for all MEDSLIK-II versions’ runs.
Fig. 9. Temporal evolution of permanent (perm) and total oil located on coast for all MEDSLIK-II versions’ runs.
98 A.G. Samaras et al. / Marine Pollution Bulletin 88 (2014) 91–101
between Ver. II and Ver. III/Ver. IV results, and can be seen inFigs. 8–10. The original model formulation (still present in Ver.II) resulted in particles with high probabilities of release (i.e. P(C))not being ‘‘allowed’’ to return into the water column, due to theimpact of the coarse grid resolution on their projected position(see also discussion in the following). The specific change allowedfree beached particles to be released more easily, leading to adecrease of the total amount of oil located on coast by approxi-mately 15% (see also discussion on Fig. 11 in the following).
Finally, the improvement brought by the introduction of themodified calculation of the fraction of oil attached permanentlyto the coast pf (see also Table 3 and Section 2.4) is identifiedbetween Ver. II/Ver. III and Ver. IV results, and can be seen inFigs. 8–10. The focus should be given to the temporal evolutionof the amount of permanent oil located on coast. Ver. II and Ver.III results show a mild but continuous increasing trend of thisamount, as dictated by the original half-life approximation usedfor pf. However, the modified half-life approximation in Ver. IVresults in a more representative evolution of the process, with per-manent oil rapidly increasing towards its high value shortly after
the attachment to the shoreline and then remaining almost stableas OHC was reached.
Fig. 11 shows the plots of oil concentration on coast at the endof the of the 648hr (27d) MEDSLIK-II runs for all Versions (see alsoTable 3); Fig. 12 shows the comparison between the respective plotfor the Ver. IV run (i.e. the Version comprising all the improve-ments presented in Sections 2.2, 2.3 and 2.4) and the field observa-tions of beached oil (OSOCC, 2006). The results presented in Fig. 11denote the improvement brought by the change in the beachedparticle release criterion on the simulated extent of the oiledshoreline. The change in the release criterion (included in Ver. IIIand Ver. IV) allows more beached oil particles to be released andthe slick to travel farther to the North. Ver. I (Fig. 11a) and Ver. II(Fig. 11b) runs using the release criterion of the original formula-tion, show the impacted shoreline limited up to the area of Batroun(approx. 25 km S-SW of Tripoli and 45 km N-NE of Beirut). On theother hand, Ver. III (Fig. 11c) and Ver. IV (Fig. 11d) runs show oiledshoreline to be extended up to the area of Tripoli. The change in theextent of the oiled shoreline between Ver. I/Ver. II and Ver. III/Ver.IV runs is more than significant and reaches 40%. Furthermore and
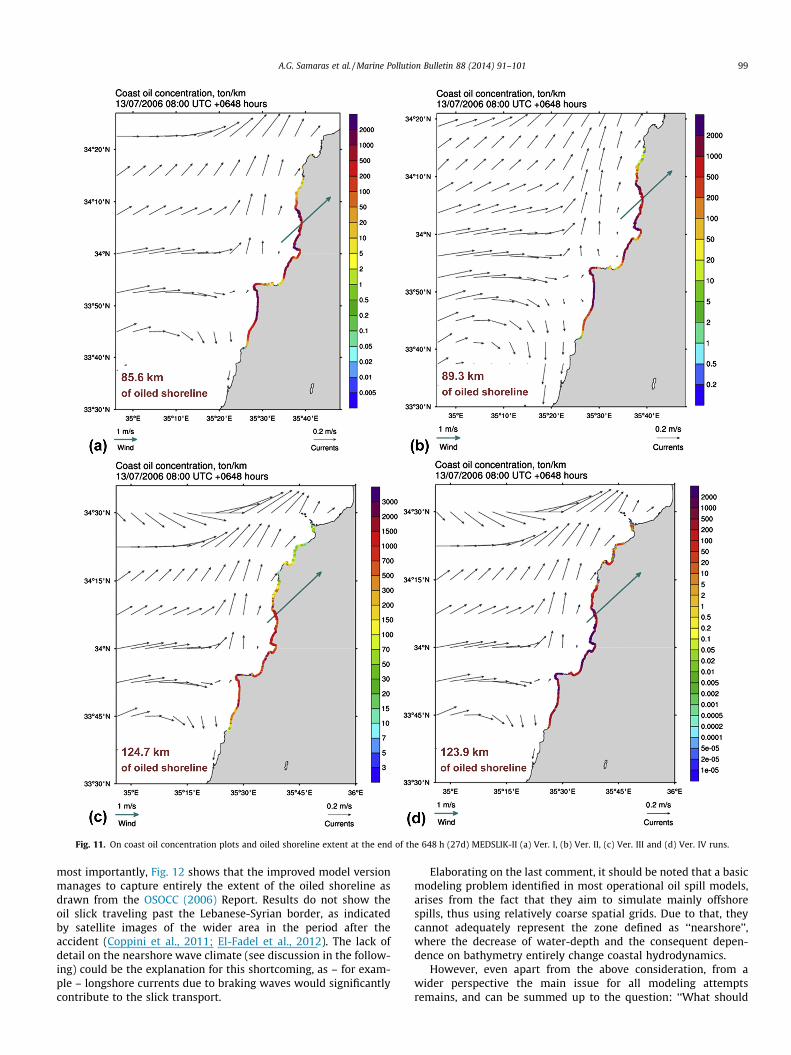
Fig. 11. On coast oil concentration plots and oiled shoreline extent at the end of the 648 h (27d) MEDSLIK-II (a) Ver. I, (b) Ver. II, (c) Ver. III and (d) Ver. IV runs.
A.G. Samaras et al. / Marine Pollution Bulletin 88 (2014) 91–101 99
most importantly, Fig. 12 shows that the improved model versionmanages to capture entirely the extent of the oiled shoreline asdrawn from the OSOCC (2006) Report. Results do not show theoil slick traveling past the Lebanese-Syrian border, as indicatedby satellite images of the wider area in the period after theaccident (Coppini et al., 2011; El-Fadel et al., 2012). The lack ofdetail on the nearshore wave climate (see discussion in the follow-ing) could be the explanation for this shortcoming, as – for exam-ple – longshore currents due to braking waves would significantlycontribute to the slick transport.
Elaborating on the last comment, it should be noted that a basicmodeling problem identified in most operational oil spill models,arises from the fact that they aim to simulate mainly offshorespills, thus using relatively coarse spatial grids. Due to that, theycannot adequately represent the zone defined as ‘‘nearshore’’,where the decrease of water-depth and the consequent depen-dence on bathymetry entirely change coastal hydrodynamics.
However, even apart from the above consideration, from awider perspective the main issue for all modeling attemptsremains, and can be summed up to the question: ‘‘What should

Fig. 12. (a) Observations of beached oil on different coast types, as drawn from the OSOCC (2006) Report (Google Earth, 2013; privately processed), and (b) on coast oilconcentration plot at the end of the 648 h (27 d) MEDSLIK-II Ver. IV run.
100 A.G. Samaras et al. / Marine Pollution Bulletin 88 (2014) 91–101
be considered as effective representation of beaching for opera-tional oil spill models?’’. The answer to that conceptually dependson the modeling objectives, but it is also largely affected by dataavailability of coast types, beach properties and oil concentrationevolution on-coast (surface and subsurface). The argument thatthe increasing computational capacity and model-coupling willallow high-resolution representations of nearshore hydrodynamics(maybe at some point even two-phase oil-water dynamics on theforeshore), can only be valid to a certain extent without detailedfield data to validate the expected improvement. All in all, consid-ering the current capabilities of operational oil spill models, thepresent scarcity of field data, and the fact that oil spill responsefor impacted coastal areas is primarily a remediation and not asampling process, the representation of beaching and the respec-tive model results (location/extent of oiled shorelines, oil concen-tration on coast, temporal characteristics of acting processes)should be evaluated accordingly.
4. Conclusions
The present work studies the improvement of the representa-tion of beaching in oil spill models. In particular, it investigatesthe effect of the introduction of the Oil Holding Capacity approachto estimate oil concentration on coast, along with a new approachfor coast type assignment to shoreline segments, the revision of therelease criteria for beached particles and a revised formula for thecalculation of permanent oil attachment to the coast based on thehalf-life approximation. The above were tested for the Lebanon oilspill of 2006, using a modified version of the open-source oil spillmodel MEDSLIK-II (De Dominicis et al., 2013a); the coast typedatabase for the specific study was also reconstructed for thenew model runs.
The modified MEDSLIK-II Version has brought significantimprovements in the representation of beaching in the model.
The final version’s run (Ver. IV – comprising all the aforementionedimprovements) was based on case-specific coast type data for theLebanon oil spill of 2006, a new algorithm for coast type assign-ment to shoreline segments and a coast type- dependent represen-tation of the oil concentration on coast based on the Oil HoldingCapacity approach. The revised criteria for the release of beachedparticles circumvented shortcomings imposed by the lack of detailin nearshore hydrodynamics, while the modified version of thehalf-life approximation for the calculation of permanent oil attach-ment to the coast lead to an overall better representation of theprocess. Furthermore, results showed a close agreement with fieldobservations, capturing entirely the extent of the oiled shoreline asdrawn from the OSOCC (2006) Report.
Given the inherent uncertainties in the understanding andmodeling of the processes following oil attachment to the coast,the alterations presented in this work are considered as a signifi-cant step towards the overall improvement of the representationof beaching in oil spill models. Accordingly, their implementationto a real case study using an open-source model is deemed to serveas a useful example for researchers involved in oil spill modeling,setting the basis for future attempts on the same path.
Acknowledgments
This work was performed and funded in the framework of theProject ‘‘TESSA – Development of Technologies for the SituationalSea Awareness’’ supported by the PON ‘‘Ricerca & Competitività2007–2013’’ program of the Italian Ministry for Education, Univer-sity and Research.
The authors would like to thank the anonymous reviewers andthe Editor, Prof. Charles Sheppard, for their constructive commentsand suggestions. The authors would also like to thank Dr. AntonioBonaduce and Dr. Lidia Bressan for their valuable help on the def-
A.G. Samaras et al. / Marine Pollution Bulletin 88 (2014) 91–101 101
inition of the tidal regime of the study area and on the use of Linuxbased OS respectively.
References
Boufadel, M.C., 2000. A mechanistic study of nonlinear solute transport in agroundwater–surface water system under steady state and transient hydraulicconditions. Water Resour. Res. 36, 2549–2565.
Chao, X., Shankar, N.J., Cheong, H.F., 2001. Two- and three-dimensional oil spillmodel for coastal waters. Ocean Eng. 28, 1557–1573.
Cheng, N.S., Law, A.W.K., Findikakis, A.N., 2000. Oil transport in surf zone. J. Hydraul.Eng. 126, 803–809.
Coppini, G., De Dominicis, M., Zodiatis, G., Lardner, R., Pinardi, N., Santoleri, R.,Colella, S., Bignami, F., Hayes, D.R., Soloviev, D., Georgiou, G., Kallos, G., 2011.Hindcast of oil-spill pollution during the Lebanon crisis in the EasternMediterranean, July-August 2006. Mar. Pollut. Bull. 62, 140–153.
Danchuk, S., Willson, C.S., 2010. Effects of shoreline sensitivity on oil spill trajectorymodelling of the Lower Mississippi River. Environ. Sci. Pollut. Res. 17, 331–340.
De Dominicis, M., Pinardi, N., Zodiatis, G., Lardner, R., 2013a. MEDSLIK-II, aLagrangian marine surface oil spill model for short-term forecasting – Part 1:Theory. Geosci. Model Develop. 6, 1851–1869.
De Dominicis, M., Pinardi, N., Zodiatis, G., Archetti, R., 2013b. MEDSLIK-II, aLagrangian marine surface oil spill model for short-term forecasting – Part 2:Numerical simulations and validations. Geosci. Model Develop. 6, 1871–1888.
Egbert, G.D., Erofeeva, S.Y., 2002. Efficient inverse modelling of barotropic oceantides. J. Atmos. Ocean. Technol. 19, 183–204.
El-Fadel, M., Abdallah, R., Rachid, G., 2012. A modelling approach toward oil spillmanagement along the Eastern Mediterranean. J. Environ. Manage. 113, 93–102.
Etkin, D.S., French-McCay, D., Michel, J., 2007. Review of the State-of-the-Art onModelling Interactions between Spilled Oil and Shorelines for the Development ofAlgorithms for Oil Spill Risk Analysis Modelling. Cortlandt Manor, New York, p. 157.
Google Earth, 2013. Map of Lebanon. � 2013 ORION-ME, US Dept. of StateGeographer, Image Landsat, Data SIO, NOAA, U.S. Navy, NGA, GEBCO.
Gundlach, E.R., 1987. Oil-holding capacities and removal coefficients for differentshoreline types to computer simulate spills in coastal waters, 1987International Oil Spill Conference. Baltimore, Maryland, USA, pp. 451–457.
Gundlach, E.R., Hayes, M.D., 1978. Vulnerability of coastal environments to oil spillimpacts. Mar. Technol. Soc. J. 12, 18–27.
Gundlach, E.R., Reed, M., 1986. Quantification of oil deposition and removal rates fora shoreline/oil spill interaction model. In: 14th Arctic and Marine Oil SpillProgram Technical Seminar, pp. 65–76.
Guo, W.J., Wang, Y.X., 2009. A numerical oil spill model based on a hybrid method.Mar. Pollut. Bull. 58, 726–734.
Humphrey, B., Owens, E.H., Sergy, G., 1993. Development of a stranded oil in coarsesediment (SOCS) model. In: 1993 International Oil Spill Conference, Tampa,Florida, USA, pp. 575–582.
Johnson, W.R., Ji, Z.-G., Marshall, C.F., 2005. Statistical estimates of shoreline oilcontact in the Gulf of Mexico, 2005 International Oil Spill Conference. Florida,USA, Miami, pp. 547–551.
Lee, K., Stoffyn-Egli, P., Tremblay, G.H., Owens, E.H., Sergy, G.A., Guénette, C.C.,Prince, R.C., 2003. Oil-mineral aggregate formation on oiled beaches: naturalattenuation and sediment relocation. Spill Sci. Technol. Bull. 8, 285–296.
Mackay, D., Paterson, S., Trudel, B., 1980. A mathematical model of oil spillbehaviour. Report to Research and Development Division, EnvironmentEmergency Branch, Environmental Impact Control Directorate, EnvironmentalProtection Service, Environment Canada, Ottawa, Canada.
NOAA – National Oceanic and Atmospheric Administration,, 2000. ShorelineAssessment Manual. National Oceanic and Atmospheric Administration, Officeof Response and Restoration, Seattle, USA, p. 54.
OSOCC – Oil Spill Operations and Coordination Centre, 2006. Lebanon Marine andCoastal Oil Pollution International Assistance Action Plan. Ministry ofEnvironment, Lebanon.
Owens, E.H., Lee, K., 2003. Interaction of oil and mineral fines on shorelines: reviewand assessment. Mar. Pollut. Bull. 47, 397–405.
Owens, E.H., Sergy, G.A., 2003. The development of the SCAT process for theassessment of oiled shorelines. Mar. Pollut. Bull. 47, 415–422.
Owens, E.H., Teal, A.R., 1990. Shoreline cleanup following the ‘‘Exxon Valdez’’ oilspill – field data collection within the SCAT program. In: 13th Arctic and MarineOil spill Program (AMOP) Technical Seminar. Environment Canada, Ottawa,Canada, pp. 411–421.
Reed, M., Gundlach, E., Kana, T., 1989. A coastal zone oil spill model: developmentand sensitivity studies. Oil Chem. Poll. 5, 411–449.
Reed, M., Johansen, O., Brandvik, P.J., Daling, P., Lewis, A., Fiocco, R., MacKay, D.,Prentki, R., 1999. Oil spill modelling towards the close of the 20th century:overview of the state of the art. Spill Sci. Technol. Bull. 5, 3–16.
Sergy, G., Goodman, R., 2003. In situ treatment and fate of oil stranded on coarse-sediment shorelines: the Svalbard shoreline field trials. Spill Sci. Technol. Bull.8, 229.
Shen, H.T., Yapa, P.D., Petroski, M.E., 1987. A simulation model for oil slick transportin lakes. Water Resour. Res. 23, 1949–1957.
Torgrimson, G.M., 1980. The On-Scene Spill Model: A User’s Guide. HazardousMaterials Response Branch, National Oceanic and Atmospheric Administration,Seattle, Washington.
Wang, S.D., Shen, Y.M., Zheng, Y.H., 2005. Two-dimensional numerical simulationfor transport and fate of oil spills in seas. Ocean Eng. 32, 1556–1571.
Copyright © 2022 FDOKUMEN