
Development of composite sustainability performance index for steel industry

� Corresponding author. Tel.: +E-mail address: cabezas.herib
1 Research Fellow, Oak Ridge2 Present address: Towson Uni
0360-5442/$ - see front matter #doi:10.1016/j.energy.2004.02.008
1-513-569-7350; fax: [email protected] (H. Cabezas).Institute for Science and Education.versity, Department of Biology, Towson, Maryland 21252, USA
2004 Elsevier Ltd. All rights reserved.
Energy 30 (2005) 1221–1231
www.elsevier.com/locate/energy
Towards a sustainability index using information theory
Christopher W. Pawlowski 1, Brian D. Fath 2, Audrey L. Mayer,Heriberto Cabezas �
US Environmental Protection Agency, Office of Research and Development, National Risk Management ResearchLaboratory, Sustainable Technology Division, Sustainable Environments Branch, 26 West Martin Luther King Drive,
Cincinnati, OH 45268-0001, USA
Abstract
We explore the use of Fisher Information as a basis for an index of sustainability. Sustainability of anecosystem refers to the robustness of a preferred dynamic regime to human and natural disturbances.Ecosystems under perturbations of varying regularity and intensity can either remain within the currentregime or transition into the neighbourhood of a regime with different (viz. less desirable) characteristics.The Fisher Information index we develop is based on the probability of finding the system in a particularstate. We apply the index to a 10-compartment food web model with five functional groups: detritus, pri-mary producers, herbivores, carnivores, and an omnivore. Fisher Information is shown to be sensitive totransients in model generated data. Such transients can be indicative of a transition to a new dynamicregime. Early detection of transitions to undesirable regimes may permit management intervention.# 2004 Elsevier Ltd. All rights reserved.
1. Introduction
While it has proven difficult to develop a consensus around the concept of sustainability,
there is a growing recognition that the current growth of human activity cannot be sustained
without significantly threatening Earth’s natural systems as we know them. This recognition
leads to the question: Given that we depend on these natural systems for a wide range of serv-
ices, what kind of future are we creating for ourselves as a species? The frequently cited defi-
nition of sustainable development given by the Brundtland Commission [1], namely
development that ‘‘meets the needs and aspirations of the present without compromising the

C.W. Pawlowski et al. / Energy 30 (2005) 1221–12311222
ability to meet those of the future,’’ is just one expression of this concern over the extent towhich we will be able to rely on ecosystem services into the future and what this portends forhuman society.
The concept of sustainability applies to integrated systems comprising humans and nature.The structures and operation of the human component (in terms of society, economy, govern-ment etc.) must be such that these reinforce or promote the persistence of the structures andoperation of the natural component (in terms of ecosystem trophic linkages, biodiversity, bio-geochemical cycles, etc.), and vice versa. Thus, one of the challenges of sustainability researchlies in linking measures of ecosystem functioning (as regards the uses to which it is put byhumans) to the structure and operation of the ecosystem itself [2]. Research in the area of indi-cators such as exergy and emergy attempts to allow us to better understand ecosystem structureand operation. These thermodynamically based indicators give a holistic perspective of ecosys-tem properties. Exergy is a measure of the state of the system, specifically its ability to do usefulwork (as measured by its distance from an environmental reference state). Emergy is a measureof the system history through its many transformations of solar radiation. Both have beenpresented as measures of system organization and indirectly as measures of sustainability [3–5].
Another challenge of sustainability research lies in linking human demand for services to thestructure and operation of human social, economic, legal and cultural systems. It would be use-ful to develop indicators for these systems in order to better understand the nature of humandemands on ecosystems and the extent to which these can be modified. However, it is difficult tounderstand these systems in terms of indicators such as exergy and emergy, which are based onthermodynamic concepts. We hold out hope that the concept of information can be used todevelop indicators that bridge the natural and human systems and make sense of the disparatestate variables of these systems.
In this paper we examine the use of Fisher Information to assess the organizational or struc-tural integrity of ecosystems. We develop a Fisher Information index (FII) in terms of the infor-mation contained in the time evolution of the state of a dynamic system. The time the systemstate spends in various sub-segments of the phase space steady state trajectory follows a charac-teristic pattern that is the result of the system’s organizational structure. As the ecosystem isstressed (under exploitation, for example), changes in this steady state pattern will occur. TheFII hopefully will indicate differences in favorable and unfavorable changes in the pattern, or atleast when such changes are occurring. Eventually we would like to link such changes tochanges in structure, and ultimately to sustainability of the combination of the ecosystem andthe exploiting system (e.g. human society).
2. Information theory
The application of information theory to ecology and biology has taken several forms. Themost common ecological application has been the use of Shannon Information as a speciesdiversity index. Information theory also has been used in the investigation of structures such asfood webs, and in evolutionary biology to assist in the explanation of the order we observe innature.

1223C.W. Pawlowski et al. / Energy 30 (2005) 1221–1231
Here, we use the concept of Fisher Information to characterize one form of informationinherent in the state of a dynamic system. This formulation of Fisher Information uses a prob-ability function based on time-in-state.
2.1. Fisher Information
The work of Ronald Fisher [6] introduced a statistical measure of indeterminacy now calledFisher Information. Fisher Information can be interpreted as a measure of the ability to esti-mate a parameter, as the amount of information that can be extracted from a set of measure-ments, and also as a measure of the state of disorder of a system or phenomenon [7]. FisherInformation, I, for one variable is calculated as follows:
I ¼ð
1
pðeÞdpðeÞde
� �2
de (1)
where e is the variability in the value of the quantity to be measured and p(e) is the probabilitydensity function (normalized probability of observing the variation). This definition can beextended to an n-dimensional system. Frieden [7] proposed Fisher Information as the basis for aunifying theory for physics and has used it to derive many fundamental equations of physicssuch as those describing relativistic quantum physics, classical electrodynamics, general relativ-ity, and classical statistical physics to name a few, and has also applied it to problems of popu-lation genetics [8]. Mathematically, Fisher Information is a local measure, since it depends onthe rate of change of the probability density function. Application of Fisher Information todynamic models of ecological systems has been developed in [9] and [10]. The underlying prob-ability density (Eq. (1)) in this work is based on the notion of time spent in a (discrete) state.For systems with periodic steady state this leads, in the limit, to a scalar form of the FisherInformation index expressed as an integral sum:
I ¼ 1
Dt
ðR
00 ðtÞ� �2R0 ðtÞð Þ4
dt (2)
where R00 ðtÞ and R
0 ðtÞ are the (scalar) acceleration and speed, respectively, of the system statealong the path trajectory, and Dt is the time over which the integral is evaluated (the period ofthe steady state). In the notation of component vectors this is given by:
I ¼ 1
Dt
ð x0ðtÞð ÞTx00ðtÞ� �2
x0ðtÞj j6dt (3)
since
R0ðtÞ ¼
ffiffiffiffiffiffiffiffiffiffiffiffiffiffiffiffiffiffiffiffiffiffiffiXn
i¼1
dxidt
� �2
vuut ¼ x0ðtÞj j and R00ðtÞ ¼ dR0ðtÞdt
¼ 1
R0ðtÞXn
i¼1
dxidt
d2xidt2
" #¼ x0ðtÞð ÞTx00ðtÞ
x0ðtÞj j

C.W. Pawlowski et al. / Energy 30 (2005) 1221–12311224
Systems that spend more time along certain sections of their steady state trajectory than inothers will have a high Fisher Information, while those that spend a more uniform amount oftime over all sections will have a low Fisher Information. When applied to simulation models,the integral of Eq. (3) is calculated numerically using the underlying differential equations beingsimulated. This integral also can be approximated using real world data by estimating trajectoryspeed and acceleration.
Our interest in Fisher Information as an index of sustainability stems from the fact that it hasthe potential to indicate changes in system organization as reflected in the dynamic behavior ofthe system state (characteristic variables). When a characteristic variable of a natural system fol-lows regular temporal patterns, in other words when the system is in some fashion ‘‘organized’’,the system has the potential to be exploited (supply services to humans). This organization takesthe form of concentrations of natural resources (trees, agriculture, minerals, etc.), processingcapacity (air, water, etc.), and aesthetic value among others. As long as this organizationalstructure and operation is maintained, it will sustain human exploitation. By the same token, achange in organization may signify a loss of services. A change in the organization or character-istic patterns of the system likely will be manifest as a change in the probability distributionunderlying the Fisher Information calculation. If this is true, then the FII will have the potentialfor early detection of organization breakdown and the attendant loss of services.
3. Illustration
In order to illustrate the Fisher Information calculation outlined above for a dynamic systemwe introduce a model ecosystem. The system comprises a food web subject to perturbations.The underlying parameters are seasonally varying, giving the system a limit cycle type behavior.Under this cyclic steady state, the Fisher Information index is constant. When perturbations (inthe form of changes in model parameters) are introduced, the index will change as the systemsettles to a new steady state. We are interested in the behavior of the Fisher Information indexover this transient period.
3.1. Ecosystem model
We developed a food web model with ten compartments aggregated into five trophic levels:three primary producers (plants), three herbivores, two carnivores, a top omnivore, and a nutri-ent compartment (Fig. 1). The 10 compartments are related as in Fig. 2. The primary producersare limited in growth by nutrient availability and by grazing from other compartments.Standard Lotka–Volterra-type equations are used to describe the mass balance for the 10compartments:
dxidt
¼ xiXnj¼0
�ejibjixj� �
� ai
!(4)
where yi is the biomass of the ith compartment, ai is the mortality parameter, bij are the flowrates between i and j, and eij is a two-dimensional Levi–Civita symbol such that eij ¼ 1 andeji ¼ �1 due to conservation constraints bij ¼ bji. The only exception to this is the first compart-

1225C.W. Pawlowski et al. / Energy 30 (2005) 1221–1231
odel. Arrows indicate direction of flows. Material recy
Fig. 1. Aggregated food web m cles back to the nutrient pool.web model. Arrows indicate direction of flows. Materia
Fig. 2. Ten-compartment food l recycles back to the nutrientpool.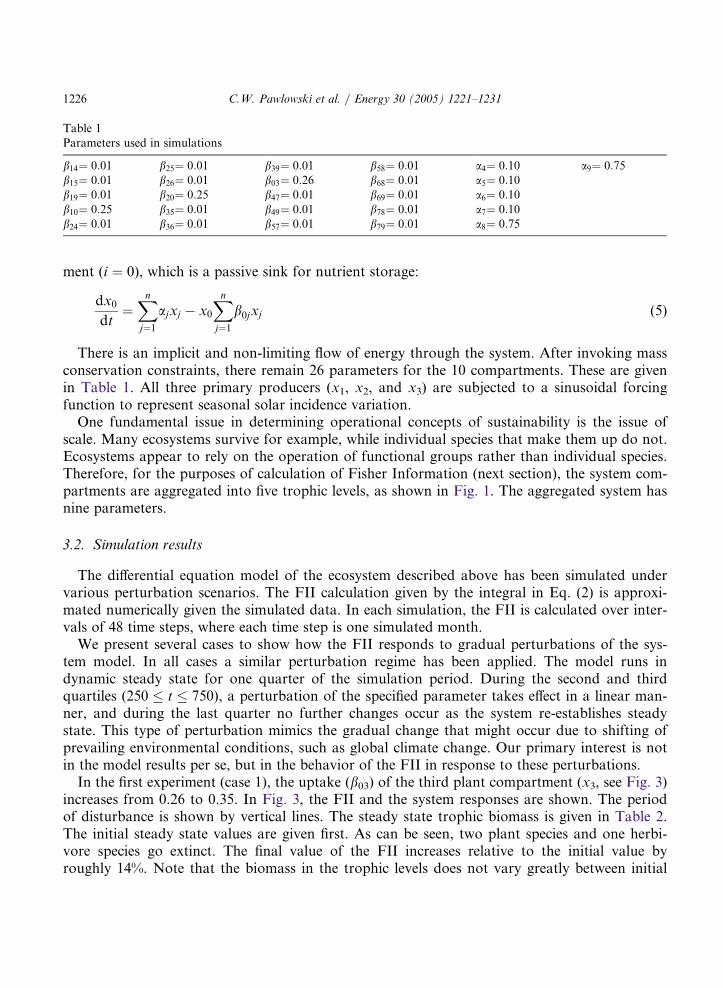
C.W. Pawlowski et al. / Energy 30 (2005) 1221–12311226
ment (i ¼ 0), which is a passive sink for nutrient storage:
dx0dt
¼Xnj¼1
ajxj � x0
Xnj¼1
b0jxj (5)
There is an implicit and non-limiting flow of energy through the system. After invoking massconservation constraints, there remain 26 parameters for the 10 compartments. These are givenin Table 1. All three primary producers (x1, x2, and x3) are subjected to a sinusoidal forcingfunction to represent seasonal solar incidence variation.
One fundamental issue in determining operational concepts of sustainability is the issue ofscale. Many ecosystems survive for example, while individual species that make them up do not.Ecosystems appear to rely on the operation of functional groups rather than individual species.Therefore, for the purposes of calculation of Fisher Information (next section), the system com-partments are aggregated into five trophic levels, as shown in Fig. 1. The aggregated system hasnine parameters.
3.2. Simulation results
The differential equation model of the ecosystem described above has been simulated undervarious perturbation scenarios. The FII calculation given by the integral in Eq. (2) is approxi-mated numerically given the simulated data. In each simulation, the FII is calculated over inter-vals of 48 time steps, where each time step is one simulated month.
We present several cases to show how the FII responds to gradual perturbations of the sys-tem model. In all cases a similar perturbation regime has been applied. The model runs indynamic steady state for one quarter of the simulation period. During the second and thirdquartiles (250 � t � 750), a perturbation of the specified parameter takes effect in a linear man-ner, and during the last quarter no further changes occur as the system re-establishes steadystate. This type of perturbation mimics the gradual change that might occur due to shifting ofprevailing environmental conditions, such as global climate change. Our primary interest is notin the model results per se, but in the behavior of the FII in response to these perturbations.
In the first experiment (case 1), the uptake (b03) of the third plant compartment (x3, see Fig. 3)increases from 0.26 to 0.35. In Fig. 3, the FII and the system responses are shown. The periodof disturbance is shown by vertical lines. The steady state trophic biomass is given in Table 2.The initial steady state values are given first. As can be seen, two plant species and one herbi-vore species go extinct. The final value of the FII increases relative to the initial value byroughly 14%. Note that the biomass in the trophic levels does not vary greatly between initial
Table 1Parameters used in simulations
b14¼ 0:01 b
25¼ 0:01 b 39¼ 0:01 b58¼ 0:01 a4¼ 0:10 a 9¼ 0:75 b15¼ 0:01 b 26¼ 0:01 b 03¼ 0:26 b68¼ 0:01 a5¼ 0:10 b19¼ 0:01 b 20¼ 0:25 b 47¼ 0:01 b69¼ 0:01 a6¼ 0:10 b10¼ 0:25 b 35¼ 0:01 b 49¼ 0:01 b78¼ 0:01 a7¼ 0:10 b24¼ 0:01 b 36¼ 0:01 b 57¼ 0:01 b79¼ 0:01 a8¼ 0:75
1227C.W. Pawlowski et al. / Energy 30 (2005) 1221–1231
and final steady states. Also, the amplitude of variation of the trophic states appears similar.
We examine the total closed path length of the trajectory over one period in order to gauge the
change in state variable variation. In this case, total closed path length decreases from 65 to 59.
While the period is the same for both steady states, the FII indicates that the system state
appears to spend more time in certain trajectory sections in the latter.In another experiment, case 2, the uptake (b25) of the second herbivore compartment (x5, see
Fig. 4) increases from 0.01 to 0.025. In Fig. 4, the FII and the system responses are shown. Two
plant species and two herbivores become extinct (Table 2). Note again that the total trophic
level biomass for the compartments does not differ greatly between the initial and final steady
states. The amplitude of variation of trophic states does appear to increase (the total closed
path length increases from 65 to 81). In this case, the final steady state FII drops, indicating a
more uniform distribution of time spent over the trajectory as the path length increases.In case 3, the change in steady state FII relative to the initial FII value is small when the
uptake (b68) of the third herbivore (x6) by the second carnivore (x8) is increased from 0.01 to
0.025 (Fig. 5). One plant species and two herbivores are lost. The amplitude of trophic state
variation decreases (total closed loop path length decreases from 65 to 54), but we infer from
the FII that the time spent over all sections of the trajectories are comparable.
Fig. 3. Fisher Index (left) and system response (right) for case 1, increase in uptake in x3.
Table 2Average steady state (SS) compartment biomass, all cases
Case P
lants Herbivores Carnivores Omnv.x9Nut.P.x0
x 1 x2 x3 x 4 x5 x6 x 7 x 80
Base SS 1 4.59 32.89 13.76 9.16 37.50 11.47 2 6.03 2 5.19 1 1.46 7.93 1 b03 increase 0.00 0.00 58.85 0.00 58.85 7.64 8.52 4 0.32 8.52 7.30 2 b25 increase 0.00 0.00 57.57 0.00 57.58 0.00 1 7.43 3 0.13 1 7.43 9.85 3 b68 increase 0.00 27.62 45.56 0.00 45.56 0.00 2 9.44 3 3.73 1.82 6.25 4 a9 decrease 0.00 51.34 0.00 1 3.17 38.18 16.16 2 0.67 2 0.67 2 0.67 9.13 5 a9 increase 2 3.92 8.95 38.24 0.00 47.14 1.95 2 5.91 3 5.19 1.95 6.72
C.W. Pawlowski et al. / Energy 30 (2005) 1221–12311228
In case 4 the mortality of the omnivore is decreased from 0.75 to 0.50 (Fig. 6). Two plant spe-cies go extinct, and the remaining plant biomass is slightly reduced. The steady state FII decreases.The amplitude of variation in the trophic state increases (total closed path length increasesfrom 65 to 75), and as in case 2, the time spent in trajectory sections becomes more uniform.
Fig. 4. Fisher Index (left) and system response (right) for case 2, increase in uptake in x5.
Fig. 5. Fisher Index (left) and system response (right) for case 3, increase in growth rate of x8.
Fig. 6. Fisher Index (left) and system response (right) for case 4, decrease in mortality of x9.

1229C.W. Pawlowski et al. / Energy 30 (2005) 1221–1231
Fig. 7 (case 5) shows the system response to an increase in the mortality of the omnivore, (x9,see Fig. 2), from 0.75 to 0.90. Here only one herbivore goes extinct (refer to Table 2). The omni-vore biomass decreases. The amplitude of variation of the trophic states decreases (total closedpath length falls from 65 to 57). Note that the FII here changes in the opposite manner to thatof case 1 (and by roughly the same proportion) despite a similar change (in both magnitude anddirection) in total closed path length, indicating that the time spent over the trajectory becomesmore uniform.
4. Discussion and conclusions
Sustainability holds meaning only insofar as we articulate our expectations of quality of lifeand relate these to our exploitation of natural systems. Our expectations are embodied in oursocial, political, cultural, economic, etc. systems, and these determine our pattern of resourceusage. Sustainability involves reconciling our patterns of use with the structure and operation ofthe natural systems we exploit, their patterns, in order to form an integrated, robust and persist-ent system.
The patterns we observe in natural systems are a response to pressures of internal (e.g. gen-etic, species composition, resource base, etc.) and external (environmental cycles, past exploi-tation, etc.) origin. These occur over varying scales (both spatial and temporal), whichdetermine the degree to which they are integrated into natural system structure and operation.New (not previously experienced), recent, or unexpected pressures can disrupt the establishedpatterns. Since human exploitation takes advantage of regularity of structure and operation innatural systems, such disruptions can be devastating. Any system susceptible to changes in itscharacteristic patterns would not be deemed sustainable under human exploitation.
What does sustainability mean in the context of the model system presented above? Themodel system has the following elements: an ‘ecosystem’ (natural system of relations betweenspecies and their environment), what can be viewed as a rudimentary ‘human’ compartment (theomnivore), and an externally (from the environment) imposed perturbation. We have notdefined a notion of sustainability for this system, which would involve services, values and
Fig. 7. Fisher Index (left) and system response (right) for case 5, increase in mortality of x9.

C.W. Pawlowski et al. / Energy 30 (2005) 1221–12311230
expectations relative to which to judge function. What we are interested in at present is the
detection of changes in the organization of the system, as reflected in changes to the steady state
of the system variables. What changes occur in the system pattern? Are these distinguishable?
What trends does the FII seem to track?The FII, as we have conceptualized it, quantifies the variation in the relative amounts of time
spent over all sections of the system state trajectory, as reflected in changes in path acceleration
relative to changes in path speed (Eq. (2) and Eq. (3)). Such changes can be the result of dis-
turbances to the system. Indeed, for the model presented, the FII responds quickly to the para-
meter disturbances applied, often before there is any obvious change in trophic level mass
distribution. Moreover, in all cases one or more species eventually goes extinct. Aggregating
species into trophic levels masks such extinctions. While the FII is not tied to species extinction
per se, it might be used to signal the possibility of such an outcome following transients. For
this model, the FII appears to drop with increases in state amplitude of variation as indicated
(roughly) by increases in path length (again, the period before and after the disturbance is the
same for this model), but the opposite is not necessarily born out by the simulations (compare
cases 1 and 5). While the FII is sensitive to transient behavior, it is not clear what changes in it
signify in terms of sustainability in general. We are currently working on determining empirical
and/or analytical relationships between FII and changes in system steady state that have impli-
cations for sustainability.For high dimensional models such as the one presented here, determining changes in steady
state dynamic organization is difficult. The FII calculation above is one way in which to reduce
complex state variable statistics to a single measure. Our work is ongoing, and must address
technical as well as conceptual challenges. We need to develop a better understanding of the FII
measurement as defined here, and to develop other measures based on the Fisher Information
concept (i.e. based on other probability distribution function definitions). Eventually the
method will need to be applied to systems that are not closed, and to real data sets rather than
system models.More importantly for any index, its utility to sustainability theory, research and practice must
be demonstrated. Sustainability is determined relative to human exploitation of natural system
function. Our ability to exploit nature relies on regular or consistent patterns of organization
and operation. Threats to these patterns include both the exploitation itself as well as environ-
mental factors. We feel an index that can detect changes in the underlying system patterns may
prove useful. To this end much work must be done in the area of selecting characteristic system
states and measures that capture the system’s utility to humans as well as its resistance to
disturbances (viz., the underlying system patterns). One must decide what sustainability means
vis a vis the exploiters (humans or otherwise) and the environment (what can possibly change
and measures that reflect what is a good defense against these changes), to pick states that
reflect these important measures, and see how these states change. In the latter, the FII might
assist in detecting when the system is breaking down or reorganizing into a form that is not
compatible with the environmental regime or human expectations/requirements.

1231C.W. Pawlowski et al. / Energy 30 (2005) 1221–1231
Acknowledgements
CWP acknowledges the support of the Oak Ridge Institute for Science and Education. BDF
and ALM acknowledge support of the EPA Postdoctoral Program.
References
[1] World Commission on Environment and Development. Our common future. Oxford, UK: Oxford UniversityPress, 1987.
[2] De Leo GA, Levin S. The multifaceted aspects of ecosystem integrity. Conservation Ecology [online] 1997;1(1):3.See also: http://www.consecol.org/vol1/iss1/art3
[3] Bastianoni S, Marchettini N. Emergy/exergy ratio as a measure of the level of organization of systems. EcolModel 1997;99(1):33–40.
[4] Bendoricchio G, Jørgensen SE. Exergy as a goal function of ecosystem dynamics. Ecol Model 1997;102(1):5–15.[5] Muller F, Windhorst W. Ecosystems as functional entities. In: Jørgensen S, Muller F, editors. Handbook of eco-
system theories and management. New York: Lewis Publishers; 2000, p. 32–49.[6] Fisher RA. Phil Trans Roy Soc Lond 1922;222:309.[7] Frieden BR. Physics from Fisher information: a unification. Cambridge: Cambridge University Press; 1998.[8] Frieden BR, Plastino A, Soffer BH. Population genetics from an information perspective. J Theor Biol
2001;208(1):49–64.[9] Cabezas H, Fath BD. Constructing a general sustainable systems theory. In: Klemes J, editor. Proceedings 4th
Conference on Process Integration, Modeling and Optimization for Energy Saving and Pollution Reduction(PRES’01), Florence, 2001. Milano, Italy: AIDIC Servizi SrI; 2001, p. 13–8.
[10] Fath BD, Cabezas H, Pawlowski CW. Regime changes in ecological systems: an information theory approach. JTheor Biol 2003;222(4):517–30.
Copyright © 2022 FDOKUMEN