Towards a Seamless World Names Database
19
Using Twitter data as demographic data A. Leak * M. Adnan ** P. Longley ** * Jill Dando Institute of Security and Crime Science UCL ** Department of Geography UCL Association of American Geographers 2014
Transcript of Towards a Seamless World Names Database
Using Twitter data as demographicdata
A. Leak∗ M. Adnan∗∗ P. Longley∗∗
∗Jill Dando Institute of Security and Crime ScienceUCL
∗∗Department of GeographyUCL
Association of American Geographers 2014

Outline
1. The World Names Database
2. Extraction of names and locations from social media data
3. Utility of such methods
4. Application
5. Summary and future work

The World Names Database
1. Representative of 2 Billion of the Earth’s population
2. 26 countries over 4 continents
3. Sourced from electoral roll and telephone directory data
Figure: Current coverage of World Names Database.
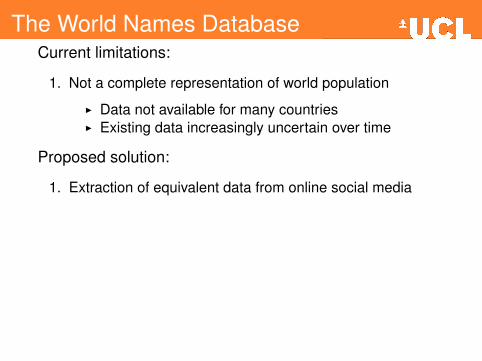
The World Names DatabaseCurrent limitations:
1. Not a complete representation of world population
I Data not available for many countriesI Existing data increasingly uncertain over time
Proposed solution:
1. Extraction of equivalent data from online social media

Data and toolsData
1. TwitterI Seamless database of 1 billion geo-located tweetsI Collected as part of the Uncertainty of Identity
project1 between Sep 2012 and Oct 2013
Figure: Current coverage of Twitter data.
1see http://www.uncertaintyofidentity.com
Data and toolsData (continued)
2. UK Enhanced Electoral Roll from CACI Ltd
I 46 million unique users
3. Spanish telephone directory
I 11 million unique records
Tools
1. PostgreSQL (PostgreSQL GDG, 2013)
2. R (R Core Team, 2013)

OSM challenges and opportunitiesOpportunities
1. Twitter has 212 million active users submitting greater than100 million messages per day
2. Rich data in both space and time
Challenges
1. Users have multiple locations
2. Users may have multiple names
3. Not all users are people. i.e @w_pat_tc posts patents withlocation data
Identification of residential area
1. All users to tweet within target geography identified
2. All tweets by identified users isolated
3. All tweets spatially joined to suitable geography
4. Users with >= 5 & > 50 % of their total tweets withinadministrative border retained

Extraction of names
1. Twitter screen names segmented and cleaned
2. Segments tested against known prefixes and suffixes
3. Segments ordered to reflect likely forename - surnamestructure
//** Mr Alistair Leak ////////2014""
////MR, ALISTAIR, LEAK
ALISTAIR, LEAK
Benchmarking: Method
1. Twitter vs data of known provenance - UK electoral roll orSpanish telephone directory
2. Both sets of users assigned to consistent nationalgeography
3. Morisitia-Horn similarity (MHS) calculated between twouser groups for each administrative zone
I MHS applied in R using Vegan Package2 (Oksanenet al., 2013)
I Score of 0 indicates equal composition of names and1 indicated no overlap
I MHS method is recognised for its ability to handlediffering sample sizes (Wolda, 1981)
2Vegan implementation is as a dissimilarity score i.e 1 - MHS

Benchmarking: UK
1. Enhanced Electoral Roll and Twitter users assigned toGADM level 2 administrative geography (Hijmans et al.,2013)
2. Morisita-Horn index of overlap calculated at GADM levels0, 1 and 2
Morisita-Horn HedrickValue 0.0902 0.9098
Table: Summary statistics for UK GADM level 0
Morisita-Horn HedrickMin. 0.0624 0.8815
Mean 0.1022 0.8978Max. 0.1185 0.9376
Table: Summary statistics for UK GADMlevel 1
Morisita-Horn HedrickMin. 0.06816 0.1145
Mean 0.33883 0.6612Max. 0.88547 0.9318
Table: Summary statistics for UK GADMlevel 2

Benchmarking: UK 2
Figure: Morisita Horn Index for UK GADM levels 1 (left) and 2 (right)
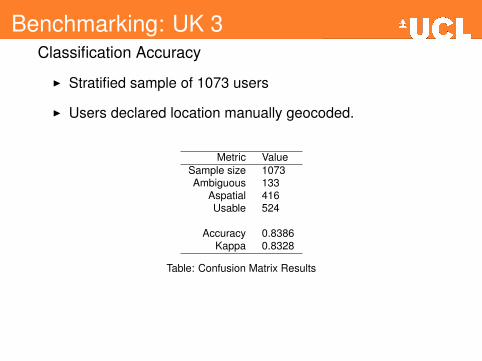
Benchmarking: UK 3Classification Accuracy
I Stratified sample of 1073 users
I Users declared location manually geocoded.
Metric ValueSample size 1073Ambiguous 133
Aspatial 416Usable 524
Accuracy 0.8386Kappa 0.8328
Table: Confusion Matrix Results

Benchmarking: Spain
1. Spanish telephone directory and Twitter users assigned toGADM level 3 administrative geography (Hijmans et al.,2013)
2. Morisita-Horn index of overlap calculated at GADM levels0, 1, 2 and 3
Morisita-Horn HedrickValue 0.2044713 0.7955287
Table: GADM level 0
Morisita-Horn HedrickMin. 0.1655 0.5997
Mean 0.2679 0.7321Max. 0.4003 0.8345
Table: GADM level 1
Morisita-Horn HedrickMin. 0.1616 0.4545
Mean 0.2947 0.7053Max. 0.5455 0.8384
Table: GADM level 2
Morisita-Horn HedrickMin. 0.1711 0.0000
Mean 0.4867 0.5133Max. 1.0000 0.8289
Table: GADM level 3

Benchmarking: Spain 2
Figure: Morisita Horn Index for Spain GADM levels 1 (top left), 2 (top right) and 3(bottom)
Mexico
1. Population of 120 million
2. Believed Twitter adoption of 11% (source: peerreach.com)
Method:
1. Users regions identified at GADM level 1 (n zones)
2. Names processes using identical method to Spain
3. For the WND, counts of surname by area standardised toreflect true population distribution
Results:
1. 165,000 users allocated a region of residence
Mexico 2
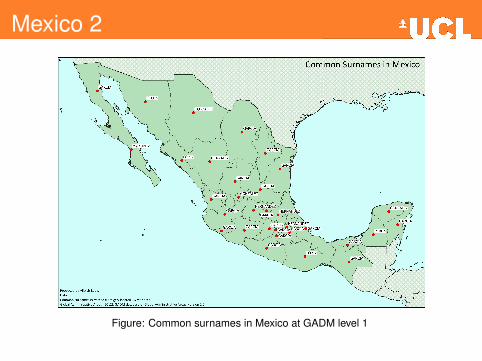
Figure: Common surnames in Mexico at GADM level 1

Conclusions and future workFurture work:
1. Further development of name extraction methodology
2. Dynamic spatial resolution based on individual users data
3. Increased automation of the location extraction framework
4. Further benchmarking of data against existing sources
Conclusions:
1. Not all countries are suitable for the Twitter based method
2. Balance between precision, accuracy and utility in terms ofspatial resolution
References
Robert Hijmans et al. GADM. 2013.
Jari Oksanen et al. vegan: Community Ecology Package. R package version2.0-10. 2013.
PostgreSQL GDG. PostgreSQL. http://www.postgresql.org. 2013.
R Core Team. R: A Language and Environment for Statistical Computing. RFoundation for Statistical Computing. Vienna, Austria, 2013.
Henk Wolda. “Similarity indices, sample size and diversity”. In: Oecologia 50.3(1981), pp. 296–302.