Towards a port marketing plan for Kingston Terminal ...
214
World Maritime University e Maritime Commons: Digital Repository of the World Maritime University World Maritime University Dissertations Dissertations 1991 Towards a port marketing plan for Kingston Terminal Operators Limited Claudia K . Gordon World Maritime University Follow this and additional works at: hp://commons.wmu.se/all_dissertations Part of the Marketing Commons , and the Transportation Commons is Dissertation is brought to you courtesy of Maritime Commons. Open Access items may be downloaded for non-commercial, fair use academic purposes. No items may be hosted on another server or web site without express wrien permission from the World Maritime University. For more information, please contact [email protected]. Recommended Citation Gordon, Claudia K., "Towards a port marketing plan for Kingston Terminal Operators Limited" (1991). World Maritime University Dissertations. 541. hp://commons.wmu.se/all_dissertations/541
-
Upload
khangminh22 -
Category
Documents
-
view
3 -
download
0
Transcript of Towards a port marketing plan for Kingston Terminal ...

World Maritime UniversityThe Maritime Commons: Digital Repository of the WorldMaritime University
World Maritime University Dissertations Dissertations
1991
Towards a port marketing plan for KingstonTerminal Operators LimitedClaudia K. GordonWorld Maritime University
Follow this and additional works at: http://commons.wmu.se/all_dissertations
Part of the Marketing Commons, and the Transportation Commons
This Dissertation is brought to you courtesy of Maritime Commons. Open Access items may be downloaded for non-commercial, fair use academicpurposes. No items may be hosted on another server or web site without express written permission from the World Maritime University. For moreinformation, please contact [email protected].
Recommended CitationGordon, Claudia K., "Towards a port marketing plan for Kingston Terminal Operators Limited" (1991). World Maritime UniversityDissertations. 541.http://commons.wmu.se/all_dissertations/541

WORLD MARITIME UMIVERS ITY
Malmoe, Sweden
TOWARDS A PORT MARKETING PLAN FOR
KINGSTON TERMINAL OPERATORS LIMITED
by
CLAUDIA K. , OORDOM
JAMAICA
A dissertation submitted to the World Maritime University in partial fulfilment of the requirements for the award of the:
Degree of Master of Science in
Ports and Shipping Administration
Year of Graduation

I certify that all material in this dissertation which is not my own work has been identified and that no material is included for which a degree has been previously conferred upon me.
The contents of this dissertation reflect my personal views and are not necessarily endorsed by the University.
OFFICE: Course Professor
WORLD MARITIME UNIVERSITY
Co-assessed by:
NAME : E. POLLOCK
VISITING PROFESSOR
Signature:
Date: it J/P./.9J.Supervised and assessed by:
NAME: P. M. Alderton
WORLD MARITIME UNIVERSITY

A C I C I S r O W L E D G H I M E l S r T
This dissertation presents the ideal forum for the author to express her gratitude for the contribution of those individuals and or institutions which, in one v/ay or the other, made her study at the World Maritime University possible, as well as those who assisted in the preparation of this paper. While it is impossible to name everyone, special mention has to be made of the following:
Firstly, to the Canadian International Development Agency (CIDA) , for providing the necessary* funding during the tv70 years of study.
The contributions of the course professor and lecturer Dr. H. E. Haralambides knov/ledge, advice and overall guidance v highly appreciated.
essor P. M. Aldertonin terms of sharedof great benef i t and
My sincere gratitude to Professor E. Pollock v/ho took time out of his busy schedule on several occasions to share with me his enormous experience as a port marketing consultant and offered valuable suggestions and comments during the production of'this paper. Assistance given me by Professors P. Houssin, H. Beth v;ere also greatly appreciated.
The management and staff of Kingston Terminal Operators Limited, for their encouragement and support. In this regard, special mention needs to be made of Messrs M. Belcher, W. Sweeney, A. Mitchell, N. Lindo and E. Banks; Mrs. V. Stennettand Ms. M. Brown.
The Management and staff of Associated British Ports (ABP) and in particular Messrs Alasdair Clarke and Joe Besch with v/hom I did my month's On-The-Job training. Thanks also to the Marketing Departments of the ports of Bremen/Bremerhaven,

Felixstowe and South Hampton v/ho were very kind in accommodating my special visits and sharing with me their wealth of experience in marketing their respective ports.
Finally, my gratitude to Mrs. 0. Daniels, Mr. H. Mack Ms. N. Wiltshire for their invaluable comments, suggestions over all technical assistance in the actual preparation of dissertation.
andandthis
CLAUDIA K. GORDON Malmoe, Sweden October, 1991.

A B S T R A C T
The objectives of this dissertation are two-fold. Firstly, it attempts to demonstrate the relevance of a comprehensive marketing approach to. the improvement of the performance of Kingston Terminal Operators Ltd (KTO), and secondly to present guidelines for the development of a marketing plan for the Terminal. For analytical purposes, the paper is divided into seven chapters.
Chapters 1 to 3 attempt to set the scene. The first two are concerned with evaluating the impact of containerization on the shipping and port sectors. While chapter 3, reviews the current trends in both the macro environment and the shipping industry, and their implications for ports.
Chapters 4 and 5 present a basic introduction to KTO and appraise its performance to date. This serves to evaluate the current problems being faced by the Terminal, and presents the framework for subsequent proposals.
Chapter 6 addresses the question of the relevance of port marketing in improving the performance of ports. Some general marketing concepts are first presented, followed by discussions of their application in ports. Where possible, examples from other ports are furnished to demonstrate applicability. Although the emphasis here is on container facilities, it is intended that the general principles outlined can be applied, in varying degrees, to other types of ports.
The final section of the paper, chapter 7, takes the form of an illustrated manual outlining the steps to be taken in developing a marketing plan for KTO. It incorporates all the analyses of the previous chapters to develop the methodology required in the actual preparation of the Marketing Plan.
t a b l e : o e * c o m t e :n t s
CHAPTE3R PAGE
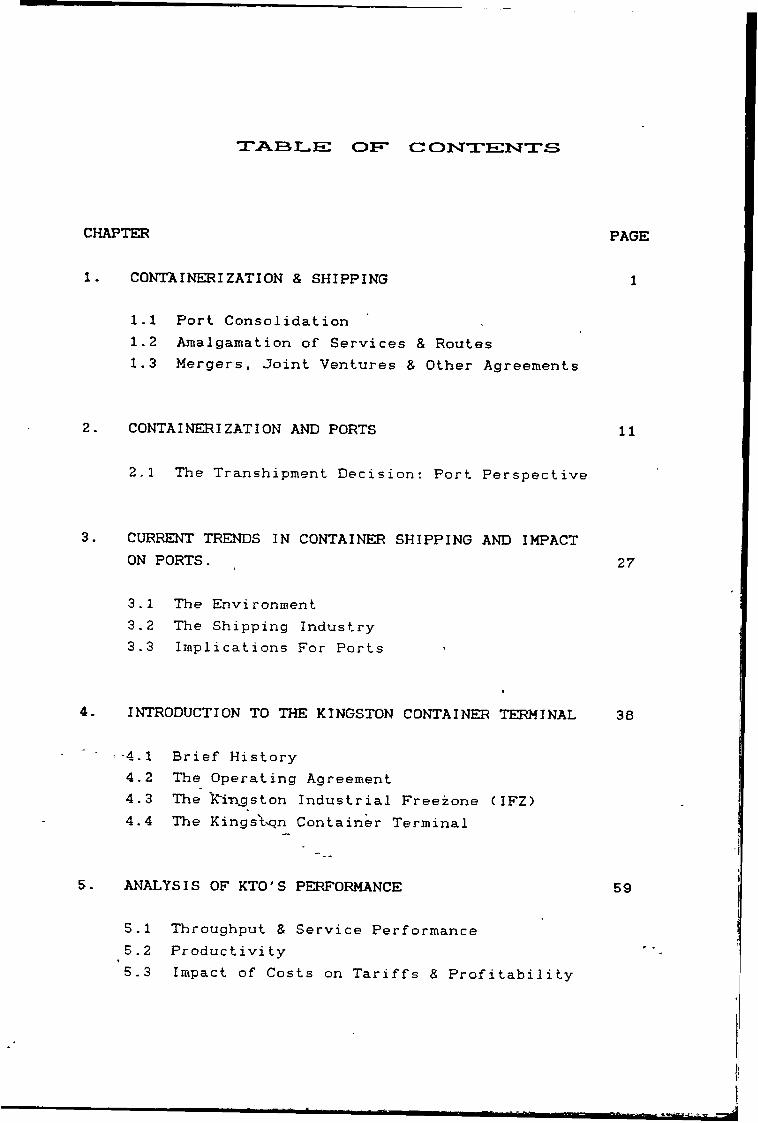
1. CONTAINERIZATION & SHIPPING 1
1.1 Port Consolidation1.2 Amalgamation of Services & Routes1.3 Mergers, Joint Ventures & Other Agreements
2. CONTAINERIZATION AND PORTS 11
2.1 The Transhipment Decision: Port Perspective
3. CURRENT TRENDS IN CONTAINER SHIPPING AND IMPACT
3.1 The Environment3.2 The Shipping Industry3.3 Implications For Ports
4. INTRODUCTION TO THE KINGSTON CONTAINER TERMINAL 38
-4.1 Brief History4.2 The Operating Agreement4.3 The K'iTxgston Industrial Freezone ( IFZ)4.4 The KingsVqn Container Terminal
5. ANALYSIS OF KTO'S PERFORMANCE 59
5.1 Throughput & Service Performance5.2 Productivity5.3 Impact of Costs on Tariffs S Profitability
ON PORTS. 27
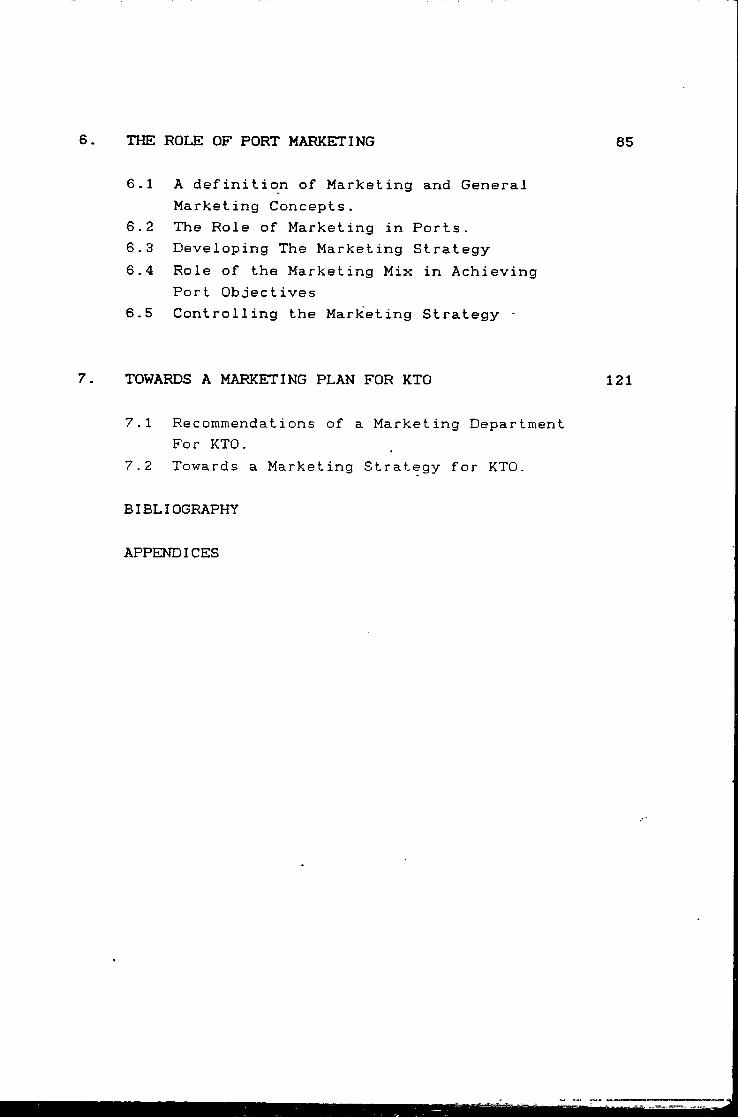
6. THE ROLE OF PORT MARKETING 85
6.1 A definition of Marketing and General Marketing Concepts.
6.2 The Role of Marketing in Ports.6.3 Developing The Marketing Strategy6.4 Role of the Marketing Mix in Achieving
Port Objectives6.5 Controlling the Marketing Strategy -
7. TOWARDS A MARKETING PLAN FOR KTO
7.1 Recomraendations of a Marketing Department For KTO.
7.2 Towards a Marketing Strategy for KTO.
BIBLIOGRAPHY
121
APPENDICES

C H A P T E R 1
COrsiXAIIMERIZ<SiXIOISI AND S H IR R IN G
INTRODUCTION
Since their inception in the 1950s containers have experienced widespread use and a-F-Forded vast economies to the shipping industry. The -First and most noticeable bene-Fit was the reduction in time vessels spent at ports - -From weeks to hours. In the face of increased trade flows following the second world war, the labour intensive nature of port operations represented a significant bottleneck in the through carriage of cargo. It was thus economically impractical for vessel operators to invest in larger tonnage since this would almost have certainly meant at least a proportionate increase in port time. Containerization, with its speedy and efficient operations, meant that larger ships could be employed and economies of scale achieved.
In contrast to conventional break-bulk operations, containership operations meant substantial investment on the part of both port and ship operators. Formerly, the level of port investment ran merely to the provision of a safe berth/pier, with cargo movements from ship to shore and vice versa, being provided largely by the ship's gear. Movement from quayside to transit area was very labour intensive, employing about 25 men per gang to unload a 15000 deadweight vessel. The level of port mechanization required to handle unitized operation therefore meant vast and unprecedented outlay of capital. This represented one of the reasons for the initial slow development of container port facilities as in many cases the level of available traffic did not justify the investment. As a means to supplement domestic traffic and therefore make investment more feasible, ports have had to cast their nets wider than the domestic market to encompass those of other countries and regions - thus acting out a
1

transhipment role.
While the possibilities -for transhipment cargo made investment worthwhile, port operators soon realized that it also represented a sti-f-Fly competitive arena, with hardly any guarantee o-f continued viability. In -Fact ship operatorsgiven the new ability to -funnel cargo to selective ports, have tended to trade ports of-F against each other, thusi ntensi-Fy i ng the competition.
In a similar situation o-F heavy investment, shipoperators, in order to ensure the levels o-F loading which would a-Fford the desired cost savings through economies o-F scale, have -Found the answer in cargo and port consolidation. Two things became clear:
(i) It was quite uneconomic -For large vessels to make direct calls to outlying ports with small cargo volumes. Such practice would in -Fact totally erode any benefits to be accrued from large scale operation.
<ii) It is far cheaper to gather cargo from the outlying ports and absorb the inland transport cost rather than make direct calls.
Shippers were therefore quoted freight rates covering the entire movement and relieved of the responsibility of transporting cargo to the port. The total transport concept as provided by shipping companies, gave them control over ports from which cargo is shipped, thereby removing the long established revenue base of most ports - their captive cargo. Thus the concepts of door-to-door service, intermodalism and through transport gained widespread application.
The fact that the idea of transhipping was not novel, meant of course that the actors in the industry were aware of its potential and even those who were initially slow to react soon came aboard. The result was fierce competition leading to over tonnaging in the case of the shipping sector and
2

excess capacity or underutilization in ports - a new problem had emerged.
To e-ffectively compete and cope with the deflationary impact of excess tonnage in the market on freight rates, shipping lines have had to devise new and innovative strategies, which enabled them to retain their market share (or improve it) through continued frequency of service as well as maintain financial viability. Broadly speaking, operating strategies employed were:
a) Port Consolidationb) Amalgamation of services and routesc) Mergers, Joint Ventures and other Agreements
1.1 PORT CONSOLIDATION
The vast investment in larger and faster ships for the container trade, required for a reasonable return oninvestment, a high degree of cargo density and minimum number of calls. As a means of achieving this, one option is to reduce the frequency of calls so as to gain fuller cargo loads. However, this has its problems in* shipperdissatisfaction and loss of market to competitors.
Another alternative was to reduce the number of ports on the itinerary, primarily those with light traffic flows. Again, the obvious disadvantage with this strategy is that it could leave the door wide open for other carriers to enter the market, taking up the slack at the 'unselected’ ports. A more viable solution was found by funnel.ing ( by sea or otherwise) cargo from the ports not on the itinerary, to selected ports which became the hub of their activities.
1.1.2 . PORT SELECTION
The decision as to which port to consolidate activities, will depend on a trade-off between the various factors which
3

a-F-Fect the economics o-F the port call. The relevantliterature highlights the following as being paramount in the shaping of route itineraries
i) Liner Pricing Policyii) The relative cost of sea transportiii) Transport convexity ratioiv) Consignment and ship sizev) Port Pricingvi) The quality of port services
i) Liner Pricing Policy ; In liner shipping, the practice of equalization pricing is employed wherein the freight charged for shipping a given cargo from a port at one end of the route to any of the range of base ports at the opposite end, was the same. As mentioned previously, it was the shipper’s responsibility and cost to get the cargo to a port frequented by the Line. This meant that in order to minimize their costs the port closest to the cargo source would often be selected. This also meant that to secure this cargo ships had to call at the ports. The elimination of traditional ports of call would therefore lead to increased transportation cost to shippers not sited near the hub port.
In order to implement a selective port call system without incurring a loss of customers, a form of absorption pricing was used: The inland transport cost was subsidized bythe sea freight or the resultant savings gained'on the long haul leg was used to subsidize feedering costs.
ii) Relative cost of Sea transport: The decisionwhether to transport cargo overland or make an additional port call will depend on the cost and time trade-off of the different modes of transport. In general, the cost oftransport by sea tends to be 10 to 50 times cheaper than land based.modes. The cost of sea transport is also affected by
World Deepsea Container Shipping by Roy Pearson , & J. Fossey. Gower Publishing Co. 1983. Page 132.
4

ship size, speed and age.
iii) Transport convexity ratios; As an input into the decision process the convexity ratio measures the relationship between marine distances saved or incurred as a result o-F making or not making a call. This is particularly useful where one port serves as a minor cargo area. In general an additional call is feasible if the distance the ship has to divert to make the call is less than that of feedering over land. = Of course, if maritime transport is decided best, based on this criterion, the question of whether to use a mainline or feeder vessel is relevant.
i v) call, the Therefore the ship diversion multiport ships than be shipped
Consignment and average ship size: For each portentire ship and her attendant costs are involved, the greater the cargo available and or the smaller size the more economical it becomes to make a to include a port in the itinerary. Thus a itinerary tends to be-more feasible for smaller mainliners. The average distance the cargo is to will also affect the decision of ship size.
Port with later
pricing and quality of on in this paper.
port services will be dealt
From the above it will be seen that each of these criteria of themselves will not be sufficient to create an optimal solution but rather a simultaneous optimizing of each variable. Obviously, an additional port call should not only enhance the line’s revenue inflow, but impact positively on its profit position as well. Therefore, the decision to extend an itinerary involves a constant balancing of to be incurred and potential revenues to be gained. That is, the impact of the additional call on the entire system.
1.2 AMALGAMATION OF SERVICES AND ROUTES
5Ibid. 1. Page 136

The e-F-fect of containerization on ship size has already been highlighted: Container ships had far more carryingcapacity and operate at higher speeds than the conventional general cargo ships, spent less time in port and were therefore more productive. In order to maintain the desired service frequency and fill these substantially larger vessels, changes had to be made to some of the former operatingpractices. One such change involved the amalgamation of routes and services. A brief look at the impact ofcontainerization on the route itineraries and services offered by shipowners is relevant.
The effect of selective port calling on shipping itineraries and operations can be readily seen: Instead ofmulti-port calling, it became economical to call at a few ports located strategically along the route, where cargo was concentrated and fed to various other ports. The most far reaching change in ship itineraries since containerization has been the introduction of the global strategy originally by two operators: Evergreen and US Lines. Far reaching, since at the time of its introduction in 1984/85 the container routes were already experiencing massive over tonnaging, and based on the logistics of such a global service, some 34 new ships of larger than average capacity appeared on the market for the new Round-the-world (RTW) service.
The increase in tonnage in a market already over supplied and experiencing fierce competition for the available cargo seemed foolhardy. However, in a market so fiercelycompetitive and where the strategy for survival (at least in the short term) largely involves rate undercuts to lure business away from competitors, operators must ensure that vessels are operated in such a way that capacity utilization and thus slot earning capability is improved beyond that of rivals and that operational costs are also lower. Thus thedeployment of newer, larger, faster and more fuel efficient vessels by the RTW operators impacted favourably on their operating costs, thus providing the competitive edge. However, the main benefit from the adoption of RTW itinerary
6
is the possibility to cross subsidize di-f'Ferent trade routes thereby ensuring not only stimulation o-F trade but high vessel utilization. ® In -fact, this is the crucial element in any RTW strategy and the US Lines -Failed largely because by adopting a unidirectional service route compared with Evergreen's east and west—about, they were unable to -Fill their substantially larger vessels. ^
A concomitant o-F the move to load centering is the development o-F door—to—door services by ship operators so that shippers not located close to the selected port will not be disadvantaged. Thus a through rate is quoted covering the movement of cargo from consignor to consignee regardless of the various modes of transport used to achieve this. This gave rise to the concepts of intermodalism/multimodalism and large investment by some of the larger operators in road and rail networks ( and even recently into air transport) to facilitate inland on-carriage. Thus the use of double stacked train in the carriage of containerized cargo between the US East and West coasts became a feature of APL, and piggyback operators are a regular feature of the roads.
The development of a reliable information network through EDI allowed for smoother transportation logistics and more recently the Just In Time (JIT) concept. What JIT affords is the ready availability of goods to various manufacturers and retailers, where needed and when needed, thus keeping inventory costs down.
The ship operator providing these services can be seen as a transport specialist who will employ any mode of transport (and not necessarily including sea transport) to get cargo to the client on time. The role and responsibility of the ship
= Traffic & Competition on Round-The-World Container Routes. Page 61-62. Drewry Shippinrg Consultants. January, 1986.
^ Round-The-World Services: Its All Square.Containerization International. November, 1982. Page 65.
7

operator has signi-ficantly changed -from the days where it began and end at the ship's rail and included just voyage -from A to B and possibly loading and discharge o-f cargo. This change o-F responsibility is amply re-Flected in the IMO Convention on Multimodal ism. Today, the total transport concept is more active since the ship owner has integrated both backwards and -Forwards, the services it supplies to its clients.
1.3 MERGERS, JOINT VENTURES AND OTHER AGREEMENTS
At this juncture, it is necessary to look at the impact of containerization on the liner shipping conferences as this will place in perspective the new forms of cooperation and organizational designs which emerged.
Conferences have existed in the deep sea liner trade since the 1870s when the Calcutta - UK conference was established.= The primary aim of such an organization is to stabilize the market served (in terms of shipping tonnage and thus freight rates) and guarantee revenue to its members. The need for a stabilized market is a result of the inherent problems faced by companies offering liner service, that is, frequency of sailing at fixed tariffs (in the short run).
Fixed schedules imply a. commitment to sail at a particular time and this is true whether a full ship load is received or not. The load factor is again dependent on frequency of sailing of not just a particular line, but also its competitors. Hence a situation of over tonnaging can occur on a route where there is no regulation of tonnage as exemplified by the open conference system in US trade.
The formation of a cooperative organization by shipowners
Conferences operating out of the European Community by B. Allen. Paper presented at Worlpl Maritime University in 1991.
8

regulating the availability o-F supply o-F shipping services and guaranteeing revenue to each member (through a cargo sharing ■Formula) was a means o-F ensuring the desired stability (both ■From shipowner and shipper’s viewpoint), by placing a limit on the competition between member lines.
O-F course, the objective o-F tonnage regulation meant that not all lines desirous o-F joining the con-Ference were accepted. This ability to dispense or re-Fuse membership and there-Fore to some extent determine the financial viability of new lines was a powerful tool and often used. This was a prime reason for the UNCTAD international code of conduct, dictating mandatory admission of national shipping lines to conferences serving their country’s trade.
Conferences not only regulated tonnage but tariffs, frequency, fleet size and ports of call. Tariffs were established on a commodity basis with the higher value cargo attracting a higher rate and therefore subsidizing the lower valued ones. Schedules and frequencies are organized to prevent intra-conference competition (eg. two conference ships should not call at the same port at the same time). Market share of liner cargo is allotted to each member and if exceeded the revenue has to be handed over to the conference for redistribution to members.
Conferences therefore developed into a powerful force within a trade and under the conventional liner system it was rare that ’outsiders' could survive. As a new line in a trade, there was the choice of trying to develop a market by securing a port and shippers which could take a long time (depending on the strength of the existing conference) and outsiders largely went bankrupt. Another option was to seek to join the conference and be given a share of the conference trade and have a more or less secure revenue base.
The advent of containerization has seen a considerable weakening in the power of conferences and the growth of outsiders. Whereas in the 1950s conferences controlled over
9

70% o-f trade on most routes, today its between 40 and 60%. "Competition with the conference in the days of conventional vessels required the acquisition of substantial expertise on shore and at sea for the handling and stowage of cargo". With containerization, the emphasis is on marketing, the efficiency and flexibility of service now rest with the ports.
Other factors that have limited the power of conferences are the emergence of shipper’s councils with negotiating powers regarding freight rates, and service quality; governmental intervention primarily through the UNCTAD Code of Conduct and cargo reservation practices; different ship sizes, designs and cost structures. The latter is important. For a conference to exist or work at all, its members should have similar cost curves and hence no incentive to compete on pr i ce.
It is within this scenario of weakening conference powers and loss of control on capacity, that shipping companies have sought new and innovative methods of survival. With themassive capital investment required to operate a container fleet, the stability of revenue became even more vital. But the power of the* conference is so weakened that vicious competition from both within and from outsiders, resulted in loss of conference market share, excess tonnage (further exacerbated by the mandatory admittance of national lines to conferences under the Liner Code) that operators had to resort to other means of cooperation. Such cooperation may be found in the establishment of shipping pools, joint ventures and consortia, joint service, slot chartering and other operating agreements.
^ Conferences operating out of the European Community by B. L. Allen. Page 12
10

C H A R T E R 2
COMT AIIMERI Z AT IOM AIMD RORTS
Be-fore discussing the impact of containerization on ports it is important to review the general functions of ports as a link in the transportation chain. This will serve to better illustrate whether, and to what extent the basic functions of ports have altered.
The transport chain can be viewed as a system with three major subsystems:
a) the nodes, which consist of interfaces between different modes or link of the chain
b) the links which consists of railroads, highways, air routes, inland waterways, marine routes, and
c) the flows which involves the movement of thedifferent means of transport along these routes with cargo and people.The marine port represents a very important node in the
total transport system as it is the interface between the sea link and the land link. It is here that the largestpossibilities for inefficiencies exist, since large amounts of cargo (or people) are transferred from one means of transport, processed/stored and passed on in smaller quantities to another mode of transport. This implies that to prevent bottlenecks, congestion and increased costs, adequate facilities will need to be made available.
This does not mean the provision of port facilities
11

should be o-F the order to cover any conceivable volume o-f tra-F-Fic. Rather, such a strategy would certainly result in very high port costs and therefore the aim of minimizing cost in the total transport system would still be frustrated.Instead, it becomes necessary for a trade-off to be made between the cost of providing a given level of port facilities as against the cost of not doing so. For example, the cost ofa ship waiting for a berth (and the probability of loss ofbusiness to the port) against the cost of provision of an additional berth. This will depend on the port's objectives. If the aim is to attract transhipment traffic, then this becomes more important.
The foregoing has two implications: Firstly, the portauthority must view the port as a part of the entiretransportation system in order to properly evaluate exactly where additional investment in the expansion of facilities is required. Another example will serve to illustrate; It must be carefully investigated whether the long lines of lorries awaiting receival or delivery of cargo is a result of too small a gate complex to accommodate the peaks, or whether it is the congestion on roadways which have caused a 'lumping' of arrivals. While the former . reason would necessitate an expansion/reorganization of the gate complex the latter would suggest that improvements need to be made to the roadinfrastructure. In such a case the upgrading of the portfacility would actually result in a worsening of thesituation.
Secondly, the trade off situation implies that suboptimalities will necessarily have to occur in the different subsystems in order to minimize the cost of the whole. Andconversely, that optimalities in the parts will notnecessarily constitute minimization of the whole.
Besides facilitating the change between different modes
12

o-F transport, the following may also be said of ports;
<i) They are the point where change of economic and commercial systems occur such as customs formalities, payment of duties and taxes, change of ownership, quality control- inspection and so on.
(ii) They generate economic activity within a country and facilitate trade. In addition to its facilitation role, port activities themselves tend to generate the development of commercial activities relating to the various support services required by shipping. Such as ship chandlering, warehousing, bunkering, agencies and forwarders, banking and insurance, drydocking and so on.
With the post war trade boom, the advent of containerization and the possibility to use larger ships and high technology cargo handling equipment to achieve improved productivity, the volume of cargo passing through ports have experienced quantum increases; between 1970 and 1984 world container fleet increased at an annual rate of 18’/. with capacity moving from 195,000 TEUs to 2 million, and containerized cargo from 47 million tonnes to over 225 million - an annual growth rate of 127.. Since these containerswill have to be handled at ports, at least a similar growth rate in throughput can be concluded^
This rapid and rather widespread growth in container traffic is placing considerable pressures on port authorities and port operators. Not only in terms of providing new facilities, adapting old ones or expanding present facilities, but also in terms of operational organization, as theincreased volume of cargo now being handled means that the
Improving Port Performance; Container Terminal Development. A project of UNCTAD S< SIDA. Page 3.
13

possibilities for congestion is now magnified.
Under the conventional system where ship size was constrained, the depth alongside required was relatively shallow, and ships were often equipped with their own cargo handling gear, the port’s role was limited primarily to the provision of stevedores, forklifts and warehouses for cargo. Indeed the geography of ports in this era was characterized by massive shed structures, some owned by consignees, from which cargo was sold. Thus the level of investment in portfacilities was moderate and extended primarily to land andbuildings.
Container operations on the other hand, are highly dependent on high capacity specialized equipment and therefore high investment cost to port developers. This is not merely a function of initial capital outlay but operating and maintenance costs as well (eg. approximately $ 6 - 9 million a year for equipment costing say $30 million). ®
Further, the features of conventional berths with their narrow aprons have disappeared and are replaced by the vast expanse of land required for stacking containers. The factthat ports lie in cities with vibrant commercial activitiesmeans that the cost of such prime and often scarce land for port expansion is quite considerable. This has frequently meant large investments in land reclamation.
Also serving to increase the cost of container operations relative to conventional, is the increase in ship’s draft. The newest container vessels have draft exceeding 12m and in many cases this has meant extensive and expensive dredging
== Operating Maintenance Features of Container Handling Systems. Researched by B. J. Thomas & D. Keith Roach for UNCTAD. Page 3.
14

tidal ports, maintenance dredging is also considerable.
These -factors have led to the emergence o-F new concepts in the management and operation of ports:
(i) The Terminal as a system. Here the concept of the port as a subsystem of the total transport system needed to be developed further to embrace the new operational requirements dictated by containers. In order for the container port to carry out its function effectively the entire operation within the terminal needed of itself to be viewed as that of a system with its own subsystem, complementary and interdependent. This relationship is depicted below.
The type of quay transfer system used will determine the quantity of storage space required, which in turn will impact on the efficiency of the loading and discharging operation and in turn be determined by the rate at which cargoes clear the port. The output of the whole system is therefore constrained by the capacity of its weakest link.
(ii) The Terminal Operator: Cargo passing through aconventional general cargo port was handled and facilitated by several organizations, such as the stevedoring company for shipboard activities, a cargo handling company for quay transfer, port authority for transit shed and so on. Each
15

ownwith its own objectives, management structures and administrative procedures. Coordination o-F activities was there-Fore poor and duplication often occurred. In order to obtain the economies afforded by containerization and dictated by the scale of investments, it became essential that the integrated nature of the various activities be recognized and a coordinated approach adopted - that is unity of command should prevail in the management of port facilities.
The high level of investment in both infra and superstructure in most countries, and especially in the case of the developing world, meant that this responsibility has fallen to the government. Thus government (central or local) became owners of the port and can choose to operate the facility. This was however not often the case. Operation of the conventional facilities were often carried out by private companies and thus the necessary expertise in port operations resided with private operators. Therefore, they were often contracted by governments to operate the container facility. Thus the concept of the Terminal operator emerged where port facilities were either leased out by the port authority on a long term basis to terminal operators or an operating company is established jointly between the port authority and stevedoring companies.
Containerization necessitated changes not only in port operational and management practices but had far reaching effect on the requirement for and the level of port labour employed. The conventional system of employment of often casual labour was well suited to an industry of largely unpredictable activities (due to unpredictable vessel arrivals) fluctuations in trade, the relatively unskilled nature of tasks and the general availability of labour in excess of demand. Liner services afforded some level of predictability in traffic and thus labour requirements could be calculated. So dock workers were registered, rostered and
16

experiencBd some stability o-F tenure and earnings. Later, in order to ensure an economic level o-F earnings (especially in some countries where registered dock workers numbered tens o-f thousand) manning levels in excess o-F the actual required was often laid down by unions.
The combined unitization of cargo and speciali cargo handling equipment served not only to increase productivity per gang but reduce the number of men required per gang from roughly 26 to something within the- range of 12 to 14. Additionally, the introduction of the through transport system has meant that much of the traditional dock work is devolved to consignees/consignors, ICD's and other off—dock cargo processing facilities.
The social, economic and political consequences are enormous, and with the displacement of labour which .ensued, labour discontent in the form of strikes and go slows can ruin a port if proper management techniques are not applied to manage this change. The level of skill required of today's dock worker is now of a high level and preferably multifaceted. This new breed of dock worker is remuneratedhandsomely and it is frequently found that crane drivers are among the most highly paid port employees.
2.1 THE TRANSHIPMENT DECISION: PORT PERSPECTIVE
From the discussion in chapter 1, it was seen that the decision to tranship was that of the carrier as a part of his operating strategy. The primary benefit to him being the ability to serve a wider market, parts of which would not have been economical to service via direct calls with mainline vessels. The decision to tranship was based on economicfactors such as load level, diversion distances and so on, as well as characteristics of the various ports to be served. In
17

the discussion o-F the impact of containerization on ports, the vast capital investment required to develop a container terminal was mentioned and that in many developing countries the only entity that can obtain finance on such a scale is the government.
Containerized cargo is primarily manufactured cargo, and the production centre for these is usually located in the developed market economies and more recently in Asia’s Newly Industrialized Countries (NIC). Exports of the developing countries tend on the other hand, to be mostly of primary products such as ores and agricultural produce (most of which does lend themselves to containerization) although some limited amount of manufacturing exports does take place. Thus in many cases the actual or potential level of container cargo may not be sufficient to justify the level of investment required in even a single container terminal facility.
Port planners are therefore faced with the decision: should the country construct a container terminal and try to attract transhipment traffic in order to make it economically viable and therefore justify its existence, or should they allow their trade to be transhipped via another country/port and feedered to them thus requiring relatively minimal investment. Obviously the decision will be based on a complex mix of political and socio-economic cost benefitconsiderations.
2.1.1 RISKS AND BENEFITS OF TRANSHIPMENT
Based on a UNCTAD report on transhipment ports, ® the risks and benefits of a transhipment port may be said to affect primarily shippers, shipping lines and in addition to these, the national economy. The benefits attributed to the
=* Development Improvement of ports: Transhipment ports TD/B/C.4/293. 1985
18

shippers are:
a) reduction in maritime transport cost will result in cheaper services. Here it is assumed that economy o-f scale achieved by carriers will be passed on to the shipper in the -Form o-F reduced rates and this o-F course depends on the contestability o-F the market.
b) greater sailing frequencies
c> connections with a wider range of foreign ports and thus
d) the possibility of new trade markets.
The primary disadvantages is that those on the feedering end of the service may have longer transit times, increased probability of cargo loss or damage due to multiple handling and ports and that disruption at the transhipment port imperils the security of supply. These constituted the primary grounds for shippers resistance in the beginning, to having their cargoes transhipped.
The major disadvantage to national shipping lines is the possible inability to compete with the larger carriers calling at the port, in terms of securing long haul cargoes. In such a case national lines may find their role relegated to the feedering option not in terms of increased market opportunity but for survival.
Local shipping lines can however, also derive some benefits from transhipment activities of a port. The improved efficiency afforded by modern cargo handling facilities and dictated by the fast turnaround time and increased productivity for vessels necessary at a transhipment port, will also accrue to national lines and serve to strengthen
19
their competitive position. Transhipment also o-F-fers new markets -For local lines through the possibility to set up ■Feedering operations if the mainline carriers do not have their own feeder networks.
The foregoing merits and demerits of the transhipment option will likewise impact on the national economy in varying degrees. Additionally, the existence of a transhipment facility generating increased port activity and traffic growth and establishing wide trade links, will serve to encourage the development of industrial services within the port estate, such as export processing zones, which in turn increases port activity.
A transhipment port is also a very lucrative means of earning foreign exchange and this is very important in the developing world where this is often a scarce commodity.
Finally, the use of feeder* vessels allows access to smaller ports thereby affording the option (as far as the load centre country is concerned) of wider distribution of cargo by the cheaper water means and relieving the pressure on inland transport. For countries on both end of the feederingservices, it also affords greater spread in the development of the country and serves to promote intra regional trade.
2.1.2 MINIMUM REQUIREMENTS FOR A TRANSHIPMENT PORT
The previous discussion concentrated on the various factors which influence the selection of ports on the itinaries of shipowners. From a port standpoint, it is essential to be aware of, and understand the interrelationship between these factors so as to be better able to predict the response of ship operators to a given change in any of these parameters. With these in mind, if a port’s decision is to
20
try and attract transhipment traffic, the following criteria are also relevant, more so because the majority of these are largely within the ability of the port to furnish orinfluence:
a) The level of national tradeb) Potentially available traffic volumec) Physical locationd) Port facilitiese) Efficiency and Organization of port operationsf) Competitive arena ( national and regional)g) Pricingh) Existence of Free Zone/Port, storage and assembly
processing of cargo
i) Range of container and -other shipping services available
j) Availability of feeder services to and from relevantfeeder port; level of hinterland development and
inland transportation.
k) Customs procedures (fast and efficient)l) Freedom of trade and the existence of
market/preferential trade agreements with other countries.
m) Government regulations.
These requirements are largely self explanatory. However the following points need to be made. While a high level of domestic traffic is not a prerequisite for being selected as a transhipment port, it has already been shown that the cargo uplift factor is considered by ship operators. Therefore a good cargo base relative to neighbouring countries enhances the potential of being selected.
21

What is most important however, is the -Future tra-F-Fic potential. Here the analysis is not limited to that o-F the country/port hinterland under consideration, but the entire region. It is regional trade which creates transhipment opportunities -For ports and not necessarily domestic trade. This point is repeatedly demonstrated in ports such as Singapore and Colombo whose actual trade relative to other countries for which they serve as transhipment points (India, Thailand etc) is quite small, yet today they are flourishing regional transhipment ports.
Of course this brings heavily into play the factor of government regulations which might adversely affect the ports possibilities for developing the transhipment trade. For example, one of the reasons for Colombo being used as a transhipment port for cargo destined for India is because of Indian Government regulations re transhipment.
In an effort to minimize voyage costs, the port that will be of interest to ship operators will tend to be that which offers the minimum deviation from the major trade routes. Thus port planners, especially in countries with large land mass should also bear this in mind when deciding where to establish a port.
Port .facilities should be well maintained and of sufficient capacity to accommodate the expected vessel sizes. This means that tugs, where needed should be available; handling equipment, storage facilities, cranes and berths. . In the transhipment business where the whole aim of the exercise is cost reduction, this assumes even greater importance to the success of the port.
This brings us to the requirement for a high level of efficiency and organisation. Port management must employ a commercial approach to the running of ports. There needs to be proper selection and training of employees and most
22
importantly, a degree o-F -Freedom and -Flexibility in decision making. For example, the level of authority accorded to management must not merely extend to the repetition of goals, objectives and rates. Instead especially in the case of the latter, they must be in a position to use discretion in negotiating these rates in accordance with prevailing market situation (charging what the market can bear). Of course to implement such decisions without it being disastrous to the company, the decision maker must be aware of all the elements which enter into play, namely the cost structure of the ports and the basis of the established tariffs.
2.1.3 UNDERUTILIZATION IN CONTAINER PORTS
Notwithstanding the vast investment required to set up container facilities and the general shortage of capital in developing countries the number of world container ports have increased rapidly since the 1770s. This is because following on the rationale of cost justification in the face of low domestic volume, many countries/ports have decided to bid for the available transhipment traffic. Obviously if several ports within a region develop transhipment facilities then there is that much less traffic available to each. Thus the situation of overcapacity and underutilization (different sides of the same coin) is evident in far too many ports.
A large part of the reason for overcapacity rests with port planners and decision makers. In order to justify the cost level very optimistic forecasts are sometimes used, or competition understated, if mentioned at all. Also the lureof scarce foreign exchange inflows expected from such a service is enough to make the need for in depth analysis of the market secondary.
In developing terminal facilities, the level of increase
23

in regional and national trade expected over the planning horizon will greatly determine the terminal capacity required. However, whilst trade projections may or may not materialize, the -facility, once constructed can rarely be altered. A fourth reason is the influence of shipowners. In deciding whether or not a market will exist for its proposed transhipment facility, port planners often rely on the feedback it receives from the prospective users - the ship operators. The fact that it is in the interest of the shipowners to have a wide choice of ports at which to call will generally mean that the response received by the port planners is very positive. In fact it is in their interest not to discourage ports which are willing to provide transhipment facilities. The tendency is to encourage as many ports as are willing to make the investment and need not choose from among them before they have all made the necessary investment, and even the favoured one will find that the decision, of necessity, is not permanent, so the inter-port competition can be exploited in the future. ^ While thecreation of such a cut throat atmosphere may impact favourably on the efficiency of the competing ports, the same cannot however be said for the financial performance of the unselected ports.
2.1.4 ROLE OF AGREEMENTS
The only means of protecting port investment is to have a guaranteed traffic volume or a guaranteed level of facility usage. This may be possible through agreements between;
a) The port and the ship operator; This normally involves joint development of port facilities and therefore spreads the investment risk and assures the port of a level of
Development 8< Improvement of Ports; Transhipment ports'. UNCTAD TD/B/C. 4/293
24
usage. While contracts/agreements of this nature arewidespread in the developed world, it is a rare occurrence in developing countries (Singapore the major exception) and may only occur if the port is in such a dominant position and expected to generate much traffic. In which case one may argue that the port would not necessarily need the contract and should probably go for a common user approach. From a carrier’s point of view such contracts restrict flexibility and endanger the competition between ports on which they rely for improved port efficiency.
b) Agreements between ports. Ports compete not only on efficiency but on pricing. Thus published tariffs and actual charge will tend to differ from customer to customer. While this flexible approach is in accordance with that advocated earlier, it is often found that the size of the variation is dependent on how desperate the pbrt management is to secure a particular line and not necessarily because this is what the market will bear.
There is scope therefore for ports to restrict competition among themselves through the charging of not dissimilar prices. In effect the formation of a cartel similar to conferences. This approach has several drawbacks. The effective functioning of any cartel assumes a similar cost structure for its members so that there is little incentive to reduce prices to lure cargo.
Unlike shipping different management affect cost levels, employ its stevedores as, and when needed, than that port which base he can reduce p detriment of the next
lines, ports are disparate entities with structures and policies which greatly For example, a Terminal which does not directly but subcontracts this function will have a lower level of fixed costs employs them directly. With a lower cost rices and still make a profit, to the port.
25
profit, to

It can be argued that such an environment will -Force other ports to seek economies through cost reductions. However the structure o-F port relationships is o-Ften dictated by government and can take decades to change (as exempli-Fied by the registered dock worker scheme in the UK). O-F course, assuming similar cost structures and a willingness tocooperate, the problem of policing the actual rates charged would also emerge.
Another alternative arrangement that can be made between ports is the possibility for joint investment in return for a share in both the control of operation and profit. This is probably a more feasible alternative to that presented earlier, since it would avoid, in the initial stages,unnecessary waste of capital while accruing the benefits of transhipment. This would however (like the price fixingagreement) work best between ports of the same country in terms of operational logistics. It must be stated that while the proposed agreements between ports has obvious advantages, hardly any inclination at cooperation between ports along these lines has been shown to date.
c) Agreements between Governments. Agreements could be made between governments to either invest jointly in port facilities or share different aspects of the transhipment services between countries. For example, one provides the port facilities and the other the feeder service.
26
c h #=»r x e :r 3
CURRENT,TRENDS IN CONTAINER BHIPPINS AND IMPACT ON PORTS
The two previous chapters were concerned with presenting a picture of the impact of containerisation on the evolution of ports. In particular, it was shown that historically the port’s role in the change process has been typified by reactionary measures. They were not innovators but facilitators. This behaviour may be seen as very much in line with the generic function of ports, that is, as facilitators of trade and the interface between maritime and other transport modes. Thus the impetus for change - technological and operational - resided with the carriers, and the survival of the ports depended on their ability to anticipate, and respond effectively to this challenge, in order to prevent being marginalised and indeed survival was often at stake.
However, the all-powerful role of carriers in trade/transport has been significantly diluted over the years due particularly to the decline in conference power and the rise to power of shippers' organizations. While the ports themselves have not really gained power, it may be said that they are nevertheless in a stronger position by virtue of the carriers being in a less dominant one. However, they are still a long way off from, and may never be in the position of calling the shots.
.In this chapter, based on recent trends, an attempt will be made to forecast the general environment in which ports will have to operate in the future and where appropriate, the response of some ports to the challenge.
3.1 n-E ENVIRQM ENT
The demand for shipping and port services is derived based on the need and ability of geographically disparate nations to trade, and in turn is affected by fluctuations in trade. Trade, on the other hand, is affected by a host of factors encompassing the more obvious economic and
27

political, technological ones as well as the unpredictable, such as natural disasters. Thus an analysis of the more predictable of these * leading indicators' can offer invaluable insight to industry management by not only indicating tsfiat future demand for port services will be, but by offering hints as to where the markets are and how they may tailor the port's services to respond to these changes.
By and large, it is agreed that the prospects for future trade is one of sustained healthy growth in the 90s. It is expected that world economic growth will average 3.2 to 3.5 percent per annum While this remains in keeping with the general growth of the '80s, the pjattern of trade is expected to c±»ange mainly ckae to:
1. THE STATE OF THE US ECONOMY
The growth of the '80s was led by US imports - largely from the Asian economies. However, with the yawning trade deficit and softening of the Dollar, as well as the strengthening of the Asian currencies, there is in progress a realignment of trade on a more bDalanced level. That is, US imports are expected to decline while their exports increase.
2. REGIONALISATION OF TRADE
The impending economic integration of Western Europe will make it into the single largest trading group in which there will be free movement of persons, goods, services and capital, which is in turn expected to fuel economic growth of the region. The removal of all tariff barriers between the community memhers will mean that trade between them is more competitive relative to non-members. This in itself constitute a barrier to trade as far as non-members are concerned. It has also resulted in what is increasingly referred to as the globalisation of production, which has the irresistible benefits of increasing investment inflows to the region, thereby stimulating both production and employment.
‘World trade to the year 2000. Implications for shipping: AsianShipbuilding in the 1990s Conference. By Ben Hackett S< Doug Beck. Page2.
28
The indirect disbenefit may well be that unless the trade CDffbetween technological efficiency in production (thus reduced costs) and the relatively higher cost of European labour (especially in the more northerly states) is positive, the European consumer may be faced withhigher costs for locally produced commodities. This will of course render imports more competitive, given a constant level of tariff on imports. In this regard one can expect the 'industrial banana' (great prodicing areas of Europe) to shift to the south where labour is cheaper.
Not only has the EC been a catalyst to the decentralisation ofproduction, but the potential benefits of such integration has not entirely escaped the notice of other regions. There has been an increase in the number of agreements - bilateral and multilateral - aimed at accruing these same benefits. Witness for example the USA — Canada FreeTrade Agreement and the proposed America's Initiative. For economic unions that already existed, new purpose has been added, thus theresurgence of activity in say CARICCM (Caribbean Cormion Market).
Other factors' besides collective political action are at work to undermine international trade in favour of regional trade: Namely, theunequal development of the different countries within a region. In almost every region with maybe the exception of Africa, there exists a marked distinction in the economic development of the countries. For example Northern Europe versus Southern Europe, West more developed than East; USA and Canada more developed than Central, South America and the Caribbean; In Asia, Japan and increasingly South Korea are ahead (in terms of econmic development) of say China, ASEAN, India and so on. Granted, this position has always existed, but its importance is now underlined in this movement towards regional trade which it facilitates, by virtue of the presenting the possibility for investors to exploit the various comparative advantages of the different countries (sub region). Thus 'the fastest interregional trade growth should occur between Japan and the Asian NICs, as the Asian NICs will increasingly become a feeder of the fast growing Japanese appetite for imported products, and Japanese direct investment in
29
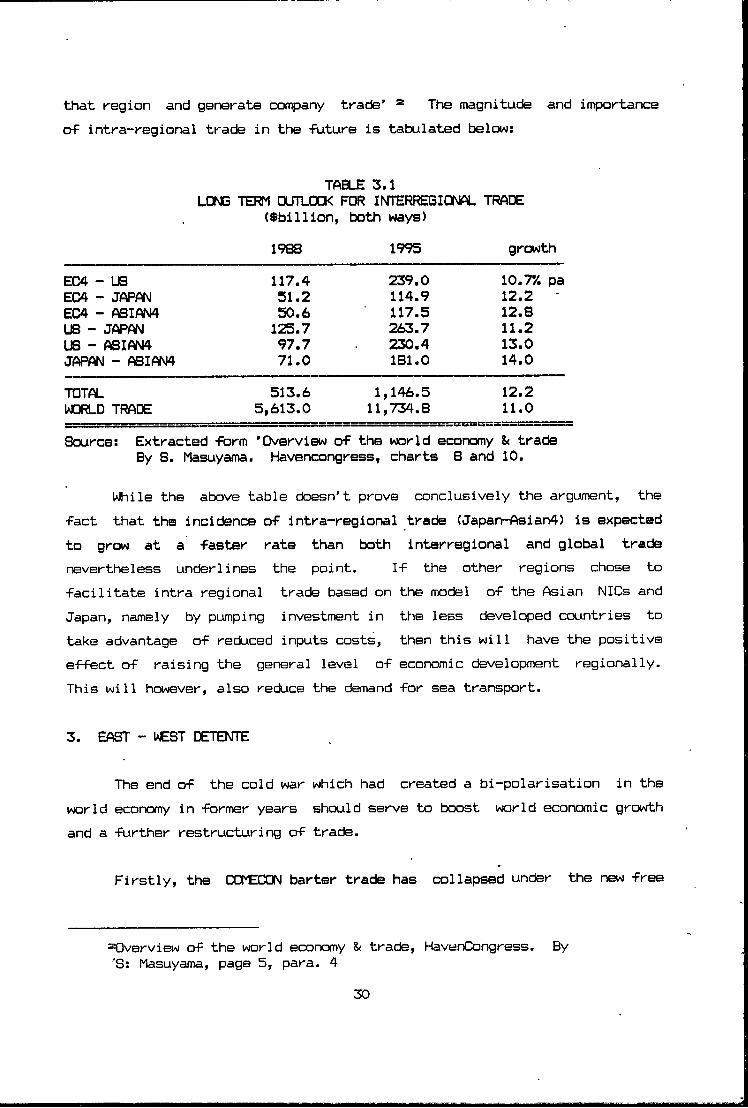
that region and generate company trade’ = The magnitude and importance of intra-regional trade in the -future is tabulated below:
TABLE 3.1LONG TEF31 OUTLOOK FOR INTERREGIONAL TRADE
($blllion, both ways)1988 1995 growth
EC4 - US 117.4 239.0 10.7V. paEC4 - JAP«\J 51.2 114.9 12.2EC4 - fsifm 50.6 117.5 12.8US - JAPWM 125.7 263.7 11.2US - ASIW4 97.7 230.4 13.0JAPAN - ASIWM4 71.0 181.0 14.0TOTAL 513.6 1,146.5 12.2WORLD TRADE 5,613.0 11,734.8 11.0Source: Extracted form ’Overview of the world economy & trade
By S. Masuyama. Havencongress, charts 8 and 10.
While the above table ckDesn't prove conclusively the argument, the fact that the incidence of intra-regional trade (Japan-Asian4) is expected to grow at a faster rate than both interregional and global tradenevertheless underlines the point. If the other regions chose to facilitate intra regional trade based on the model of the Asian NICs and Japan, namely by pumping investment in the less developed countries to take advantage of reduced inputs costs, then this will have the positive e-fFect of raising the general level of economic development regionally. This will however, also reduce the demand -for sea transport.
3. EAST - WEST DETENTE
The end of the cold war which had created a bi-polarisation in the world economy in -former years should serve to boost world economic growth and a -further restructuring of trade.
Firstly, the COMECON barter trade has collapsed under the new free
Overview of the world economy & trade, HavenCongress. By 'S: Masuyama, page 5, para. 4
30

market system, as the countries try to secure hard currency necessary to survive and develop. This offers vast potential for trade in the short to medium term, since their exports tend to be primarily of heavy industry and natural resources while import demand is for manufactured goods and services. Potential t'ide will be limited, in the short run to their ability to pay.
The reduced level of military spending now possible through the warmer East-West relations has also the effect, if channeled into productive processes, to impact positively on world economic growth. The other side of this is that, the Developing countries will face stiff competition from these emerging free market economies for the available investments, aids and loans. This coupled with the debt problems will result in further weakening of their economies.
In general therefore, while the world economy and trade is expected to record healthy growth in the future (3.5 and 11% p.a. respectively) the demand for shipping services, by virtue of being depenctent not only on quantity but also on the distance shipped, is expected to record less growth due to the above mentioned factors.
TABLE 3.2GROWTH IN VOLUME OF COMMODITIES SHIPPED
(Average Annual growth rate)
CRUDE & PETROLEUM PROD.IRON ORECOALGRAINBAUXITE it ALUMim PHOSPHATE ORESource; Extracted from JAMRI report on Medium to Longterm Analysis
of the Shipping Market (1990-2005)
The general trend of expected decline observed in the table above is explained by Dr. Joon-Soo Jon as being attributable to ’...the decline of
19S5-S9 1 1989-95 1 1995-20005.8*/. i 2.1*/. 1.5V.2.7 1 -0.3 0.63.8 1 2.3 2.71.8 1 1.9 1.74.7 1 0.5
l_ 1.1 1 1.0___________
31

heavy industry in the developed countries, the localisation of natural resources and the industrialisation of developing countries’ Theoutlook for growth in the general cargo sector and in particular, the liner trade seems brighter, although still not up to the level of world trade. Viz; Increased demand for manufactured and semi manufactured goods is rapidly increasing, facilitated by increased containerisation. One forecast speculates that growth in the liner trade should average around 5.1% per annum, reflecting strong growth in consumer demand and globalisation of world production."
3.2 n-E SHIPPING INDUSTRY
For the shipping industry the implications of the above discussion can be translated as slower growth in the major arterial routes, but expansion in intra-regional activity:
TABLE 3.3EXPECTED AWMUAL GROWTH IN CONTAINER TRADET------------------------------------------- 1--------------------------------------11 ROUTE 1 1984-89 1
11989-94 1
1 1iNorth America-Asia I 8.4% 1 5.1% i1 " " -Europe I 3 .4 1 2 .6 1lEurope-Asia I 9 .0 1 7 .7 11 Intra-Asian 1 10.6 1 9 .9 11 " Europe 1 4 .6 1 4 .9 1I_ _ _ _ _ _ _ _ _ _ _ _ _ _ _ _ _ _ _ _ _ I. . . . . . . . . 1- - - - - - - - - - - - - 1
Source: Extracted from Containerisation International1990. Based on T^/DRI forecasts.
Other factors which will impact on the industry include;1. The trend towards increasing ship sizes. As of May 1989 around
38% of the capacity on order was for ships of 3000 TEU and more, many of
= hanges in Shipping Environment & Counter Strategies of Korea Towards year 2000. Page 151, para. 3■ World trade to year 2000; Implications for shipping. Presented to Asian Shipbuilding Conference, Busan, Korea in 1990, by 'B. Hecket & Doug Beck.
32

which were to be delivered in the 1990s This trend towards largermainline vessels has also influenced (for operational reasons) required size of feeder ships. Coupled with the existing overtonnage, then it can be expected that the downward pressure on liner rates will continue in the foreseeable future as carriers scramble for the available cargo to ensure economic load factors.
2. Adoption of differentiated marketing strategies_by carriers.Through the 80s the industry has seen the emergence of two distinct marketing strategies by carriers. Dn the one hand there are those who position themselves as global carriers offering customers not only door to door transport but also more sophisticated logistics, thereby becoming an almost indispensable part of the client's JIT distribution system. In contrast, other carriers adopted the approach of not vying for this global integrated service, but have positioned themselves as niche operators, specialising in a particular region or aspect of the total service package. This has resulted, in both cases, in increased investment in EDI - a necessity for logistics service - to provide shippers with accurate and timely information.
3. The increasing trend towards customer-oriented services. This is set to continue as shippers continue to demand better and more sophisticated services and carriers are forced for competitive reasons to comply. The rise of shippers power and outsiders have seen a weakening of conferences which is expected to continue in the future. This is a result of the conference's increasing inability to control tonnage and enforce rate levels - the purpose for which they were created.
4. The changing pattern of carrier cooperation. The emergence of market strategies based on service differentiation led to, and increased the importance of brand supremacy. Under this scenario, the inappropriateness of consortia, has therefore led to its decline in favour of operating agreements. The latter, while ensuring economies of scale, does not involve the loss of or a merger of carriers' identity in the
= Top 20 Carriers Consolidate. June, T990. Pages 46-50.
33
Containerization International-

market place. It therefore offers the possibility to engender the much sought after customer loyalty.
Increased usage of non-ISO standard boxes. The philosophy behind containerisation was to enable the packaging and transport of cargo
origin to destination with minimal handling to the cargo itself, while in transit. It means that the form used to unitize the cargo must be interchangable between different transport modes and can be handled by standard equipment. A standard for containers v s therefore essential.
The creation of specific box sizes by the International Standard Organization (ISO) has largely governed the container sizes in use today. However, an increasing trend towards introducing different container sizes is much in evidence. This will have serious implications for the ability of existing port equipment to handle these new containers.
3.3 IMPLICATIONS FOR PORTS
Given that cargo handled in ports tend to grow at a higher rate than trade (due primarily to double handling), it can be inferred that cargo handled at ports in the coming decade or so will experience an average annual increase in excess of 5.15(. This in turn implies an increase in the demand for cargo handling services. On the other hand, falling liner rates means that carriers are more sensitive to costs and therefore that ports, in order to win the patronage of carriers will need to play their role in recLicing carrier costs. While the response is normally that of tariff rebates, by far the largest contribution ports can make in the redaction of the transport cost is through short vessel stay in port. A survey to identify what is most important to the ship operators from a port standpoint reveals that port cost was by no means the top priority, but rather fast and efficient service.
The trend of increased ship size holds several implications for ports and their developmental plans. Obviously there will be the need to increase the depth of channels and berths, and to accommodate the higher
34
throughput per vessel per berth, there will be a need -For more stacking areas to be made available -For each ship’s interchange and a given trade volume. The requirement -For -Fast turnaround will be stronger than ever thus also implying necessary increases in number oT cranes per ship, their speed and outreach. In general, increased efficiency is required in container cranes in order to enable reductions in ship’s capital costs, operating costs and inventory costs of loaded cargoes, by shortening the turnaround time in port and total time cargoes are in transit.*
The degree of flexibility with which the port responds to the challenges of change can be the decisive factor to its survival. Thus, ports in responding to changes must select the appropriate strategy which will satisfy customers while maximizing its returns on investment. Dr. H. Beth highlights two broad responses. Namely,
1) Capital widening, which involves the quantitative improvement of facilities, and,
2) Capital deepening, which depicts a qualitative response where strategies for the better utilization of current resources are employed such as rationalisation and increased productivity of existing facilities.
In practice it may iasII be that the optimum strategy comprises a combination of the two. For example, a port responding to the challenge of bigger ships will almost certainly need to deepen access channels and so on. They will also need to invest in new cranes (post panamax). But there may not exist the need to build additional berths since ' as was already stated, there will be fewer ships, ceteris paribus. What may be necessary is reallocation of berth lengths in keeping with the prevailing vessel lengths.
Changes in world shipping 8t counter strategies of Korea towards the year 2000. By Dr. Joon-Soo Jon
Developments in ltorld Shipping - Effect on ports, page 2. Presented at a Lecture to the World Maritime University in June, 1991.
35

Also the need to provide additional transit area may be avoided by the employment o policies which engender more efficient utilization of the existing areas, such as shortening of storage periods and strong penalties for tardy removal of cargo, divesture of CFS functions to other warehouses and the increased use of ICD’s (inland container depots).
In the era of containers computerisation of the port operations and planning is vital to improved operational efficiency, and in order to find the most feasible and cost effective solution to the issues of port development, finance and management. The leading ports of the world have sought and found the competitive edge in the various services they afford clients through a comprehensive computer system, involving in some caseslinkages with ports at the other end of the trade route. Although this isadmittedly,a very advanced and complex undertaking, the logic is however clear: By direct communication with the other end of the trade routethey are able to know, as soon as the vessel sails, all the various details of the cargoes destined for their port. Thus they are able toplan well in advance for its arrival.
The rise of individual marketing strategies through servicedif-ferentiation aimed at customer loyalty, and the decline of consortia in favour of operating agreements, poses both opportunities and threats for ports. One possible disadvantage is the need to widen the marketingeffort. For example, ports in their marketing activities could target three or so lines through a consortia, since the decision as to ports of call was collective. Similarly, with the breakaway, ports which had secured these lines may find they run the serious risk of losing a substantial portion of business.
On the positive side, this resurgence of independent carriers has opened up the market of potential customers as far as ports are concerned. Thus given equivalent efficiency in various ports and no great geographical/trade disadvantages, there should be a trend towards a more even distribution of carriers among ports. Ports can also seek to exploit the increased powers of shippers to influence carriers, to their advantage. This may be done by appealing directly to shippers who can use
36

their clout to decide on the ports -from which their cargo should be shipped.
Thus, in the -future, ports will undoubtedly need to concentrate on development o-F services both qualitatively and quantitatively but on an eT-Ficient and cost effective basis since it is unlikely that they will be able to pass on all their' increased costs to carriers/shippers and remain competitive. It will also mean that ports will need to be innovative in both the provision of services and more active in influencing the ports through which cargoes are shipped.
In addition, in the planning of equipment purchase, management has to be cognizant of current trends which may render equipment prematurely obsolete. One significant example is the increased popularity of nonstandard ISO boxes by shippers in order to secure cost benefits. A proposal was placed before ISO by A BI (American National Standards Institute) to legitimize such sizes as 48 feet boxes although the payload is to remain the same as that of the 40 feet This has implicationsfor the size of crane and yard equipment spreaders, the size of the slot per box allocated in the transit areas, and, in the case of the former, management will want to build in an option -For adjustment/extension when purchasing equipment. The proposal of increased size while maintaining current allowable weight, raises the' issue of control to ensure that overweight boxes do not damage costly equipment.
From the foregoing it would seem quite clear that ports .need to register a voice in the organizations that take decisions which impact on their activities. For this there will be the need for unity. This will undoubtedly be the determinant of how success-Fully ports will perform in the -Future.
USA proposal for ISO series 2 High Cube container size. ISD/TC 104 WG.4 no. 28. Prepared September 23, 1988
37
C H A R T E R ^
INTRODUCTION TO THE KINGSTON CONTAINER TERMINAL
In 1975 Jamaica and in particular the Port o-F Kingston joined the ranks of countries vying for the container transhipment business. The decision was taken by the Port Authority to construct a container terminal to facilitate the growing containerised trade of the country and at the same time capitalise on the lack of such facilities in the region as a whole, by offering transhipment for the region and for certain other trades. This was seen as being possible due to the strategic location of the island, representing minimal deviation from the trade routes utilizing the Panama Canal.
The existing port estate was extended by land reclammation and a f.our berth terminal was developed and started operation in 1975. The strategy to vie fortranshipment traffic has been largely successful as TEUs handled at the Terminal rose steadily during the first 12 years of operations, to peak at over 253,000 in 1987. Estimates by the Ocean Shipping Consultants projected that the port of Kingston would have been handling over 265,000 TEUs by 1990.»
However, several events have since occurred todrammatically alter this picture. Namely, the destabilization of the Panamanian economy and the resultant impact on its freezone activities; the increasing use of the US land-bridge for cargo movements between its East and West coasts; and the stigma of illicit drug trafficking, from the port which was largely responsible for the withdrawal of a major transhipment line at the end of 1987. Today, traffic at the Terminal
World Container Ports to 2000.Consultants, 1986. Page 166
38
Ocean Shipping

averages about 90,000 moves or just over 100,000 TEUs.
The Terminal is therefore facing a crisis. In the face of downward spiralling of traffic, the increased port costs with its impact on profitability, and the more recent industrial relations problem, the Terminal faces the very real danger of losing her present, if somewhat tarnished status as one of the premier container facility in the region. And with the increasing competition now faced from ports such as Cristobal, San Juan and Santo Domingo, any further loss of business could affect its survival.
In this chapter, a brief history of the development of the port is given, the general operational structure of the Terminal and in chapter 5 a situation analysis detailing performance to date and problems faced by the Terminal. It is hoped that this will present the background for the subsequent chapters in which it is suggested that the port may be able to resolve some of its more crippling problems and improve its declining transhipment market by adopting a comprehensive marketing plan.
4.1 BRIEF HISTORY
Since the early 17th Century during the English occupation of Jamaica, the Kingston harbour has been the centre of the Island's shipping and commercial activities. With over 8 square miles of navigable water and depth of over 90 feet, large ships could berth safely alongside the shore, discharge cargo and sail again quickly — a necessity during the period when Port Royal (the most easterly end of the Harbour) served as a base for the activities of the reknowned English pirate. Sir Henry Morgan. The ensuing years saw activities of the port being relocated from Port Royal (after it w^s destroyed by earthquake in 1692) westerly, to what is
39
today known as Newport West.
As the rapid increase in the demand -For sugar and other agricultural produce increased profits and gave wealth to the city, Kingston grew in size and importance to the Island. The development o-F port structures within the harbour was hard put to keep pace with that o-F the Island’s commerce. The prol i-Feration o-F -Finger piers to handle the rising tide o-F goods -Flowing through the port, concentrated a large number o-F ships on a relatively small area o-F coastline. This resulted in acute congestion in the port, as the road in-Frastructure o-F the city was not designed to take that level of traffic.
By the mid 1950s private developers began dredging and reclamation operations on the shoreline west of the city, resulting in the replacement of the pier structures with modern lateral quays. This was part of an integrated plan to link the development of the port with the general plan for that of the city and outlying areas.
The operation of the Newport West facilities (then berths 1 - 9) was to be entrusted to two of the old wharf companies, viz: Kingston Wharves and Western Terminals.
4.1.1 THE PORT AUTHORITY OF JAMAICA
Established in 1966 as a statutory body, it is directly responsible to the Ministry of Public Utilities and Transport for matters pertaining to the Island’s ports and is thus entrusted with their overall supervision, and in general the various shipping related facilities found on the port estate. "As such it was empowered to:
a) Fix and review wharfage rates for all public wharves in the Island
40
b) Regulate the use of port facilitiesc) Provide and operate port facilities and related
services •d) Operate and lease such facilities as may be vested
in C i13e) Maintain and improve port facilitiesf) Regulate and control navigation within the limits of
the ports of the Islandg)' Provide for pilotage.services in all ports of the
Island" *
In 1972 the Government assumed responsibility -for all -Future port development. The decision was taken to build a modern transhipment container terminal and -Free port •facilities. "This was conceived as a part of a coordinated policy for:
i) developing the Port of Kingston to meet the future shift to container and transhipment traffic
ii) attracting foreign investment; and
iii) expanding exports" ^
thereby contributing to Jamaica's economic growth. The idea behind the double development of both the Terminal and Freezone complex is that both should work in tandem. The responsibility for policy implementation was also divested to the Port Authority. Given this responsibility, the Port Authority of Jamaica (PAJ), a relative newcomer to the port business, recognised its lack of expertise in the area of port operations. So in order to secure the loan necessary to build the facilities, entered into operating agreements with the two
=KTD 10th Anniversary Booklet, page 7.^Report to the Port Authority by Public Relations
Associates41

existing' whar-F companies, whereby it provides capital and the private sector the expertise.
Between 1975-1979 the container terminal was operated by Kingston Wharves .and Western Terminals <KW & WT) on a joint venture basis. The container Terminal was subsequently made autonomous with these two companies becoming equal shareholders in the new company - Kingston Terminal Operators Limited (KTO) . "KTO is a limited liability company with sta-F-F taken originally -From the joint venture partners. This new company was given responsibility -For the total operations o-F the Terminal, and for advising the PAJ, the owners of the facility, on the purchase of equipment." ^
Here it should be noted that the container terminal comprises berths 8 - 11, but the PAJ owns only berths 10 and 11. It will be recalled that berths 8 and 9 are the property of KW. However, a special arrangement with the PAJ was concluded whereby these berths are operated in conjunction with berths 10 and 11 as the container facility at no charge to the PAJ (this arrangement is claused in the Terminal Operators Agreement, Appendix 4.1).
Such agreements characterise the relationship between the PAJ and the private sector, resulting in a conflicting and overlapping structure regarding the ownership and operations of the public wharves (see figure 4.1). obvious area ofconflict is the fact that private interests who own and operate a portion of the port's facilities are being regulated by the PAJ who not only set the wharfage rates but also own and operate competing facilities. This situation is further worsened by the fact that these private concerns have seen a portion of their traffic diverted to the container facility.
■ KTQ's 10th Anniversary Handbook, page 7.42
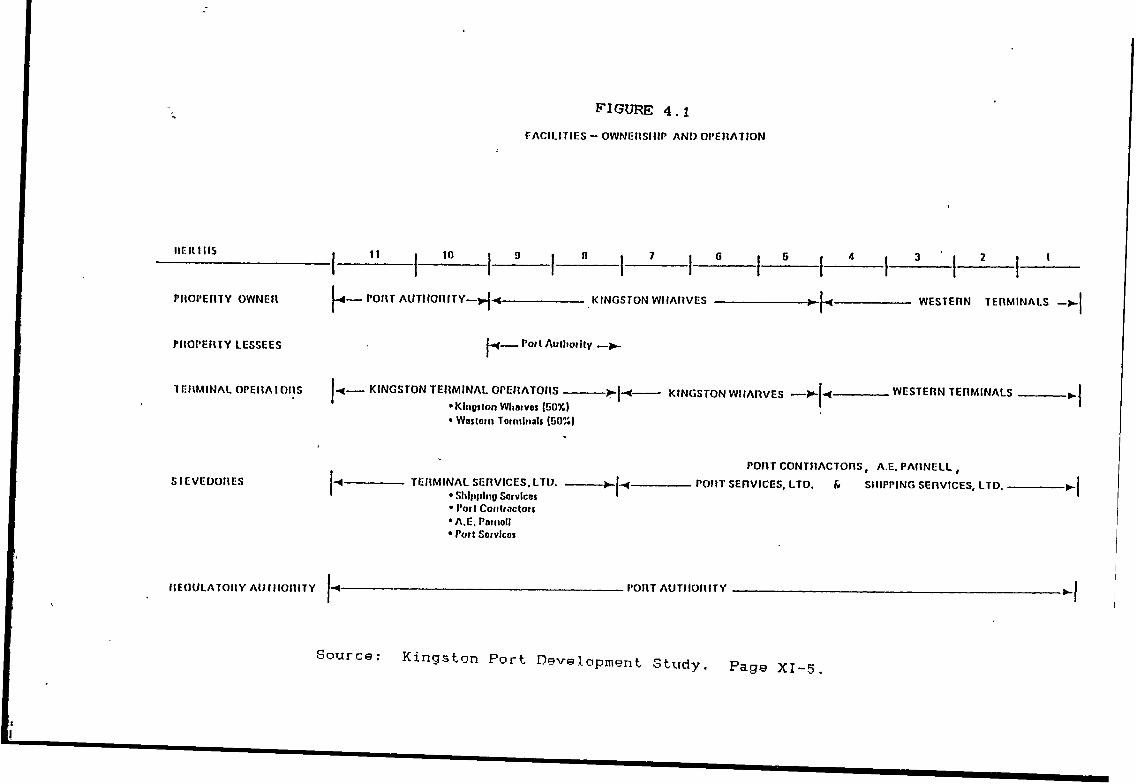
figure 4 . 1
IlF .lltllS
PUOPEHTY OWNCH
PIIOI’ERTY LESSEES
lEMMINAU OPEMAIOnS
SIEVEDOHES
flEOULATOtJY AU lM O niTY
FACILITIES - OWNEHSHIP ANO OPEriATION
11 I 10 t o
— P O U T A U T I I O m T Y — >^-<.
n 7 G 4 3 2 1
KINGSTON WIIAITVES ------------------------------------ WESTERN TERMINALS —
h- . P o r t A u l h o i i l y — ^
- - K I N G S T O N T E R M I N A L O P E R A T O R S - - - - - - - - - K I N G S T O N W H A R V E S — _ _ _ _ _ _ _ _ W E S T E R N T E R M I N A L S*Kliio<ton Wliaivos | G 0 % ) ^* W o s l o t n Tormliiali ( D 0 % )
P O R T C O N T R A C T O R S , A.E. P A R N E L L ,T E R M I N A L S E R V I C E S , L T D . - - - - - - - - P O R T S E R V I C E S , L T D . & S H I P P I N G S E R V I C E S . L T D .
• Sliljiplng SorvIcGS '• Port CotilracloM• A.E. P a m o l t• PofI Soivicot
H- P O R T A U T H O R I T Y
Source; Kingston Fort Developmsnt Study Page XI-5 .
under the direction o-F the PAJ, in order to increase the utilisation o-f the Terminal. As a means o-F compensation however, a -Further agreement was entered into between the parties, whereby "...wharfage on those containers directed away (domestic cargo) from their facilities is remitted to them in its entirety". =
4.2 THE OPERATING AGREEMENT
Although the appendixed Operating Agreement is not current (having expired in 1987), it is not substantially different frorrt the current one and thus is adequate for purpose of illustrating the impact of certain clauses on the Terminal’s operations.
Responsibility for equipment and plant maintenance under clause 7 falls to the Terminal Operators. However, clause 8 gives the PAJ responsibility for the provision of spare parts. The obvious advantage of this arrangement is that the PAJ, being a governmental institution has more ready access to lines of credit and is therefore in a position to garner the necessary scarce foreign exchange for the purchase of the spare parts. Although there exists an efficient means of communication between the Terminal and the Authority regarding spares needed, the fact that the purchasing entity is physically divorced from that doing the actual using, has resulted in certain inefficiencies and time lag in ordering. The problem of late arrival is often experienced and in some instances it was found that the parts actually received were of an incorrect specification - an expensive mistake.
For the above reasons it was often found that while there existed shortage of some spare parts, very high inventory
“Kingston Port Development Study, Page Xl-6.19 O-F Terminal Operating Agreement, Appendix 4.1
43
Also Clause

the Terminallevels existed -For others. To this end management recently devised an inventory system to calculate the Economic Order Quantity (EDQ) -For some 0 "F the more crucial parts. The success o-F this system will of course depend on an accurate assessment o-F the lag time between ordering with the PAJ and receiving.
Another crucial i-F obvious -Factor will be actual usage rate versus predicted. With the increasing breakdown of ship- to-shore cranes being experienced, and thus the need for constant repair, forecasting usage rate is not at all easy. It is worthwhile to mention this experience of crane breakdowns is a result of the continual postponement of a long overdue refurbishing of these equipment. Such capitalexpenditure is the preserve of the PAJ and since the refurbishing exercise will require outlay of foreign exchange for both parts and overseas experts, it is delayed until the PAJ is prepared to spend the money. This is one of the inherent disadvantages in the present arrangement, since the PAJ is responsible for several port facilities and at any one time, the Container Terminal may not be number one on its priority list regarding the allocation of foreign exchange.
Clause 11 stipulates that the Operator (KTO) is to "provide adequate security for the container terminal and all the plant and equipment thereon...". At the same time it is the regulated responsibility of the Shipping Association of Jamaica (SAJ) to provide security for the entire port estate. As such, operating within the Terminal are at least two different security organisations. The security provided by KTO has largely been with regards to cargo security in the container yard and freight stations, while that provided by the SAJ covered the entire perimeter of the Terminal including access and exits, security aboard vessels and container security. In the mid ’80s the Terminal experienced serious security problems which threatened its existence and has
44
resulted in a wider involvement by the PAJ in Terminal security matters. This involvement has also seen the introduction of another security organisation on the Terminal.
Regarding the marketing of the Terminal, clause 22 establishes joint responsi1bi1ty between the parties for this funciton. However, in reality port marketing is spearheaded by the PAJ and constitutes primarily promotional tours with some members of the Terminal's management team being included in the delegation. To some extent the logic of such anarrangement is overwhelming: since the PAJ is responsible for other port facilities such as the freezone, it can best launch an integrated promotional campaign. The great disadvantage to the Terminal of not having its own in-house marketing department is that Terminal marketing activities is seen as a. once-off activity, carried out a few times per year to try and drum up business, instead of an ongoing activity involving constant service improvement, market evaluation and forward planning.
4.3 THE KINGSTON INDUSTRIAL FREEZONE (IFZ)
Although this paper’s major • concern is with thetranshipment terminal, it is felt that in as far as the freezone constituted a part of the plan for overall port development, a brief analysis of its success in terms of its goals could serve to place in context any evaluation of the transhipment port’s own performance. The proposed twindevelopment of a freezone complex and a transhipment terminal was viewed by the Government as being vital to economic development of the country.
The primary goal of the IFZ was to foster trade expansion and increased employment from the expected investment inflows,
45
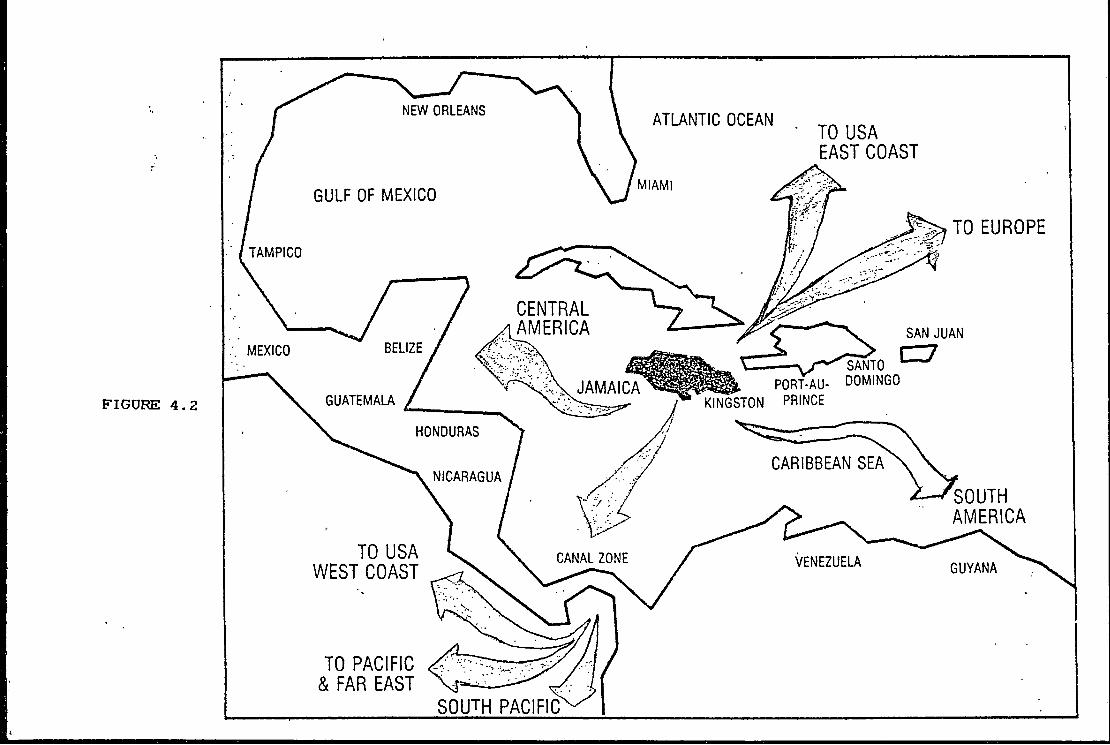
FIGURE 4.2
i
while transhipment would increase foreign exchange earnings. A sort of symbiotic relationship was envisioned between the port and the IFZ wherein the former, by providing modern port facilities would attract regular scheduled service to the port, thereby enabling efficient transportation of the Island’s trade and make Kingston more attractive for Freezone Investments. The IFZ on the other hand, would serve not only to feed cargo to the port, but by the very fact that its operation represents expanded trade for the Island, attract more lines to the port.
One of the essential criterion for the successful operation of a freezone and indeed a transhipment port is location. Here Jamaica has the benefit of being ideallylocated (see figure 4.2), viz:
i) Jamaica is strategically located between Europe and South America and is directly on the route via the Panama Canal from the Far East to Europe and to the East Coast of North America.
ii) The Island is centrally located relative to the rest of the Caribbean, Central America, South America and the Gulf area of the USA.
It was therefore felt that with this natural advantage the Island could become the hub for cargo destined not only for the region but also Europe and the Far East (this, as will be seen later, materialised to some extent when the port was^ chosen by Evergreen as a hub in its round-the-wor1d service). In fact, it was a widely held belief that if this natural resource was properly exploited, the Island had the potential to become to these various regions "what Singapore was to the
t
46

Far East" and indeed at the time there was no reason notto believe this.
Basic Criteria For Success-Ful Operation of a Freezone
To successFully compete For Freezone investment on the international market, a wide range oF incentives and Facilities need to be provided by the host country. Using Eric Pollock's classiFication, these need to be bothphysical, and non-physical as set out below:
PHYSICALa) geographical locationb) availability oF appropriate port Facilitiesc) adequate land area (100 acres minimum)d) availability oF laboure) " oF cheap power and waterF) availability oF buildings
NON PHYSICALg) Favourable investment conditions and general
Financial and economic stabilityh) tax concessionsi) reasonable rentals For Facilitiesj) minimum Fuss and bureaucracy.
The. Kingston Freezone Company Ltd. is a joint holding oF the Port Authority and the Government oF Jamaica, established in 1976. Over 150 acres oF land is dedicated to itsdevelopment with just over a third being already developed into standard Factory warehouse modules. The area is well
<*>Paper based on speech by Hon. Eric Bell (then Minister oF Public Utility 8< transport) at the Opening oF the Port Authority Seminar. 27/3/74.
■ Free Ports, Free Trade Zones, Export Processing Zones Economic Develoment, page 15
47
served by electricity and water as well as the major motorways o-F the Bustamante Industrial Estate on which it is located. With well over a -Fi-fth of the Island’s labour force being unemployed, investors in the Kingston Freezone have the benefit of not only a vast pool of semi and unskilled labour but also at a cheap cost, as these employees were normally paid at the national minimum wage of US$18.00 per week for a 40 hour week. Jamaica’s favourable geographical location has already been mentioned and it may be readily seen that with the freezone being located adjacent to the modern container facility the second criterion was also met, thus completing the physical requirements.
A wide range of financial and operational incentives were put in place, viz:
"TAX EXEMPTIONS - 100’/. tax holiday on profits
CUSTOMS PROCEDURES - waiving of import licencingrequirements minimal customs formalities
DUTY EXEMPTION - no duty is levied on capitalgoods, consumer goods, raw material or imports for construction, extension orrepair of Freezone premises - including office equipment
PROFIT REPATRIATION - there are no restrictions on therepatriation of profits by companies operating in the Zone client companies are permitted to operate foreign currency accounts in accordance with the Exchange Control regulations of
48

the Bank of Jamaica.
WORK PERMITS - work permit applications areexempt from normal taxation". ®
In the marketing of the complex, a further selling point was the benefits exporters of Jamaican made products would receive from the various international Agreements that the Island was a Signatory to. Such as the Caribbean Basin Initiative, Lome Convention, GATT, Caribcan and Caricom.
The Freezone targeted the full scale light manufacturing industry, thereby attracting activities in assembly of machinery, production of packaging material, printing and garment manufacturing. Over 90% of the‘labour employed on the Zone are engaged in the latter activity. Table I givesperformance data on the Zone for the periods
TABLE 4.1
1982-1989
111 YEAR 1 EMPLOYMENT
1 FDREIBN EXCHANGE 1 EARNINGS (US$) 1
11CONTAINERS IN 1 OUT
____________1_________________r-1 1982 i 875 . 1 1,100,000 I
1 407 1 1631 1983 1 960 1 1,700,000 1 331 1 1671 1984 1 3,134 1 2,400,000 1 456 1 2051 1985 1 5,085 1 7,000,000 1 542 1 3811 1986 1 7,781 1 10,800,000 1 727 1 5961 1987 1 11,049 1 30,500,000 1 945 1 9141 1988 1 6,559 1 28,700,000 1 750 1 8791L.1989 1 7,441 1 27,700,000
-----------------------------------------------1
— J_____ 684 1 ____________L 650SOURCE: Statistics Dept, at the Kingston Freezone
Employment rose impressively from the 1982 level of 875, peaking at 11,049 in 1987. A similar trend will be observed in the performance of the container port but it is reasonable to conclude that there exists no significance to this
® Kingston Export Freezone. Produced by Communications Consultant Ltd., 1987. For the PAJ.
49

correlation. As to the reason -For the drammatic reduction in -Freezone employment -Following on 1987, it can only be speculated that this may have been a result o-F the widespread industrial action by the Freezone employees in demand o-F better pay and working conditions which led to some companies pulling out, while others cut sta-F-F. Un-Fortunately -Further interviews with the Freezone Statistician was not possible, and so it can only be assumed that this was the case.
Studies done on the implementation and bene-Fits o-F the Freezone, where any attempt was made to actually quanti-Fy the expected bene-Fits, were also unobtainable. This renders the task o-F concluding the extent to which its objectives were achieved, difficult. What is obvious however, is that in more than any other area the Freezone has been successful in tapping a respectable portion of Island's unemployed labour, force. Also in the light of the volume of containers entering the country because of the existence of the zone, it may be deduced that with the maximum of 1859 achieved in 1987 being just over 1'/. of the containers passing through the Terminal for the same period, the Freezone has largely not achieved the goal of feeding cargo to the Terminal.
4.4 THE KINGSTON CONTAINER TERMINAL
Having briefly reviewed the performance of the Freezone primarily in order to assess impact on the Container Terminal, the objective now is to present a brief outline of the facilities of the Terminal itself, the operational structure and the current labour arrangement thereon. It is hoped that by so doing, a framework will be presented which will enable a better undertstanding of the Terminal and possible reasons for the level of performance discussed in the next chapter.
50

It will be recalled that responsibility -For the operation of the Island’s only specialised container facility was entrusted to an operating company - Kingston Terminal Operators Limited (KTO). For the purposes of this paper, the Kingston Container Terminal and KTO will be regarded as one and the same, since for all practical purposes this body is responsible for the operation of the Terminal on a profitable and efficient basis. Although as have been shown, the ability to do so effectively is constrained by the reliance on the PAJ for.certain crucial decisions such as investment.
4.4.1 FACILITIES
The Kingston transhipment container terminal (also referred to as KTO) began operations in 1P75 with 2 Paceco gantry portainer cranes for its shipside operations along 2,100 ft of berthing space. These were complemented by a tractov— trailer system for the quay transfer operation along with medium span transtainers for stacking. Shore-side operations, namely receivals, deliveries and transfers to the Container Freight Stations (CFS) were achieved through the use of straddle carriers, tractors and forklifts.
By 1991 the equipment inventory of the Terminal included:
-5 gantry cranesm 2 Paceco Vickers installed 1972% 2 " Dominion Bridge 1982* 1 Post Panamax 1991- 1 140ton mobile crane- 12 medium span rubber tyred gantries- IB Valmet straddle carriers- 16 Tractor heads- 54 chassis- 1 30 ton Kalmar Forklift and an assortment
of smaller forklifts
51

- 72 receptacles for integral reefer units- 16 reefer towers (accommodate 64 containers)- 30 clip on units.
It is important to note the ages of the gantry cranes. The two Vickers which were installed in 1772 are now over 18 years old and as far as shipping technology is concerned, their inability to efficiently service the present generation of vessels calling at the Terminal have rendered them more or less obsolete. Thus as will be later discussed, the problem of frequent breakdown and thus replacement options are presently being considered by the Terminal’s management. Recently, there has been a move to phase out the Tractor- trailer relay system in favour of the straddle carrier direct system to take advantage of a more speedier quay transfer possibilities and less space requirements afforded by the latter system. However, some problems are being experienced since the question of the age of the gantries and thus 'air height’ and clearance needed to ensure a safe operation. Consideration is being given to the installation of sensors on the cranes.
Constrained by depth of the channel leading to the harbour, the maximum allowed draft is 39’. Total Terminal area is approximately 37 hectares, of which there is over 6,500 TEL) used for container stacking.
Other facilities provided directly by the Terminal include transhipment cargo reconsolidation utilizing its two Container Freight Stations (CFS). Vessel storage planning using the Terminal Information Control System (TICS) which is an online system providing up-to-the minute information on container movements in and out of the Terminal. This facility is provided to the shipping lines as part of the general service and as such attracts no direct cost to the users. Indirect port facilities (ancilliary) include a network of
52

Agents along the entire water -Front, bunkering -Facilities, cold storage, hauglage companies, brokers, container repair -Facilities, warehousing and various banking institutions.
4.4.2 LABOUR
KTQ currently employs about IBO workers allocated with varying densities among the departments. The operations, CFS and maintenance departments will on average be accountable -For about BO’/. o-F the total sta-Ff. None o-F the Terminal’s employees are engaged in stevedoring activities. Instead, this -Function is subcontracted to a stevedoring company — Terminal Services Limited (TSL) — which in turn -Furnishes them from a 'Port Worker’ labour pool maintained by the BAJ, while itself supplying the supervisory personnel. KTO’s staff are used as far as direct ship operations are concerned, in longshore activities, that is, the location and carriage of containers to and from stacking area to guay apron.
Thus, working a vessel will essentially involve labour from three separate organisations: KTO, TSL and SAJ. Set out below is the typical gang strength required to work 'a Lift-OnLift-Off (LO-LO) vessel:
TSL: 1 Supercargo - assigned to ship1 Time keeper 1 Dispatcher1 Foreman
SAJ: 2 Operators (crane)2 Signalmen13 Lashers 1 Bearsman 1 Waterman 4 Oangwaymen
- assigned to ship
24
53

The above mentioned are in turn supervised by a KTO team comprisi ng;
1 Asst. Operations Manager - assigned to Terminal1 Stowage coordinator - " " Ship2 Stack clerks - " " Ship2 Tally clerks2 Karrili-Ft Operators
The orders for gangs are placed by KTO's operations department which is in direct contact with the Shipping Agents. A typical gang strength (excluding supervisors and those assigned to the vessel or Terminal) constitutes 27 men. This is considered large and seem to suggest that the Terminal is not accruing the benefits of reduced demand for labour afforded by mechanization.
A very important point which emerges is that KTO is notdirectly responsible for the recru-itment and training of thosepersons who directly affect its ability to perform as cruciala service as vessel operations efficiently, and thereforerespond to the needs of carriers for fast turnaround ofvessels. Thus even with the most meticulous planning and terminal arrangement, the desired increase in productivity isnot always attainable. As will be discussed in more detaillater on, the Terminal is plagued with low productivity andmore recently, increasing labour unrest which is seriouslyaffecting its credibility as a reliable and efficient port inthe shipping community.
4.4.3 OPERATIONAL STRUCTURE
To carry out its function KTO is divided into six (6) departments. Viz; Administration, Accounts,Operation/Planning, Maintenance, CFS and Data departments.
54
A D M IN IS TR A TIO N : It may be said that the this departmentcarries out all the non—technical -functions o-F the Terminal. Based on these activities it can be further divided into the 'Executive' Admininstration and Personnel. The former is headed by the Managing Director with whom the major policy decisions rest. Under his office and in association with the General Manager and Deputy General Manager, the public relations function of the Terminal is carr.ied out. These three also comprise the major link between the PAJ and KTD and usually participate in port promotional tours. The Personnel Department is run by a Personnel Manager and carries out a wide range of functions traditional to personnel departments, ranging from manpower recruitment to administration of the employee health scheme.
ACCOUNTS: Headed by the Accountant/DfficeManager/Financial Controller, this department has a wide range of functions. As such, certain functional sub-departments headed by their respective surpervisors are evident. Namely, Accounts Receivable, Accounts Payable, Administration, Payroll, Statistics, Inventory and Dispatch. The Acccounts department’s function is vital to the organization as it is from the comprehensive records kept that information is available for revenue collection and management control. It was not surprising therefore that not only did the Terminal computerisation process begin in this department but it was responsible for the actual spearheading of the port computerisation process. The Administrative section of this department is responsible for, among other things, the’generation of the monthly accounts of the Terminal and accompanying reports, cash flow management, budget preparation and Tariff review computations. The Accounts department, because of its various functions therefore represents the nucleus of the Terminal’s information system.
The . activities of the operations
55
OPERATIONS/PLANNINB:

department may broadly be divided into two areas: thoseactivities related to ship operations and those to the receiving and delivering -functions. On this basis, the operations department, headed by 2 Operations managers, is divided into sub departments under the direct control o-f individual Assistant Operations Managers (AOMs).
Ship Operations; This involves vessel preplanning, ordering o-f stevedores, and during the actual vessel working, the location and carriage o-f containers to and -from ship's si de.
Receiving & Delivering; The two sub departmentsconcerned are responsible -for the receival and delivery o-f FCL containers -from and to consignees. It is the -function of the Equipment Control department to verify the necessary- documentat ion prior to releasing or accepting the containers. The deliveries department is responsible for the mounting and grounding of containers leaving or entering the Terminal and which are not to remain on chasses. Of course this is normally done on the advice of Shipping Agents.
The foregoing activities are carried out with some degree of efficiency by the use of computerised container tracking system and 2-way UHF radios and more recently portable terminal, enabling efficient communication and the rapid storage and retrieval of containers as well as vessel storage planning.
Df>TA PROCESSING DEPARTMENT'. The Data Department is responsible for the computerisation of port functions. It grew out of the Accounts Department where the computerisation process was started and received departmental status in 1988/89. To date it has achieved a high degree o,fcomputerisation in all aspects of port activities with the priority areas of accounts and Operations being fully
56

computerised.
It employs the strategy of developing inhouse programmers and utilizes two computer systems which operate in parallel. The first and oldest is the IBM System 38 which is housed in the central port computer facility for the entire port of Kingston (Port Computer Services Ltd). On this system resides the TICS system developed by HTDATA, Gothenburg, Sweden, and modified by local programmers to fit the Terminal’s needs. Software for the payroll department and in general the Terminal’s accounting system is also housed on the IBM 38.
As just mentioned this system belongs to PCS, and the Terminal (along with all other port users) is charged for the use of the service on a real time basis, and where applicable, for programming services. This arrangement was made at the beginning of the computerisation process (early 80’s) when neither the volume of traffic nor the inhouse expertise was available at the Terminal to justify the investment in its own computer facility on an economical basis. However, today, the Terminal could justify having its own system and as will be discussed later there may exist a case for the Terminal management to actually opt for this.
Whilst the first system is a portwide network system and thus affords the interchange of information /data between the port and agents, the second system - Xenix 3B6 - is an inhouse network system which contains spreadsheets and various other management information softwares.
CFS AND MAINTENANCE DEPARTMENTS’. The CFS department carries out those functions typical of container freight stations. That is, the consolidation and deconsolidation of cargo into/out of containers. Although this function is performed primarily on domestic cargo, it is also carried out on transhipment cargo. The Maintenance department in addition
57

to being responsible for the maintenance of the Terminal’s equipment, for which purpose it is staffed with engineers, electricians, mechanics and so on, is the depository for the Terminal’s spare parts inventory, which as mentioned above, is administered by the Accounts Department.
58

C H A R X E R 5
ANALYSIS OF KTO'S PERFORMANCE
The UNCTAD publication on Port Per-formance Indicators highlights two broad categories o-F performance indicators; those which answer the question of revenue versus cost performance (Financial Indicators) and those which measure output and productivity at the Terminal, (Operational Indicators). In this chapter, an analysis of KTO’sperformance to date is undertaken based on available statistics and an attempt will be made to highlight the problems faced. However, recommendations for possiblesolutions will be deferred to the final chapter in this dissertation, since from the view point of the Author, solutions require an integrated approach encompassing all the various terminal subsystems and not a piecemeal approach.
Applying the important measures of cargo handling performance postulated by G. De Nonie =, the framework of this chapter will look at the Terminal’s performance in terms of:
a) Outputb) Servicec) Utilizationd) Productivity
and to complete the picture, the trend in Terminal tariffs will be briefly analysed, the intention being to highlight the possbile impact of all the above on the level of tarrifs. It
TD/B/C.4/131/Supp.1/Rev.1Basic Principles of Berth Operations (Ship-to-Shore Iper, Lb Havre. Page 8.
59system).
will be readily appreciated that the four indicators listed above are necessarily inter—related and the arguments for one or the other will tend to overlap.
An evaluation of OUTPUT entails not only the quantity of work done in a particular period of time (throughput), but also embraces an analysis of the quality of cargo handling operation as manifested by such measures as moves per ship working hour at berth and in port, and gang or crane output per hour. SERVICE quality tends also to be measured byship’s time in port (turnaround) and moves per gang hour. Therefore, to prevent repetition, these two will be dealt with together. PRODUCTIVITY will be analyzed separately, while the degree of UTILIZATION will be mentioned where appropriate.
5.1 OUTPUT & SERVICE PERFORMANCE
5.1.1 THROUGHPUT
In accordance with the country’s advantageous geographical location relative to the trunk line shipping routes, and her proximity to the Panama Canal mentioned in the previous chapter, KTO targeted, as potential users of its transhipment facility, the following services: ^
1. Far East to US Gulf & East Coasts2. US West Coast to Europe3. US East & Gulf Coasts to Oceania4. Europe to West Coast South America5. Europe to East Zc Gulf Coast of North America6 . Eurpoe to Central America and Caribbean7. US to Caribbean & Central America
=*Kingston Port Development Study, 1985. Pages V-1 to V-18.
60

Obviously, the potential traffic from each service is related to the degree of economic activity of the regions concerned. Thus given the burgeoning economic activity in Asia and the resultant increase in trade between her and both the developing and developed world, trade with the Far East and between the US Gulf and East Coasts presented by far the largest transhipment possibilities for Kingston.
The Terminal’s marketing efforts were therefore directed primarily at the operators of these services. This strategy was largely successful as the Terminal managed at a relatively early stage to secure some of the largest operators on the route such as ZIM and Evergreen Lines, which used Kingston as their only direct mainline port of call in the Caribbean; Zim on its service between the Far East and Europe/Meditarranean and Evergreen in its Round-The-Wor1d(RTW) service. SeaLand, another major operator used Kingston as a distribution hub for regional cargo.
Appendix 5.1, shows throughput at the Terminal for 11 years (1980—1990). As depicted in figure 5.1 below, container throughput experienced moderate fluctuations for the period 1980-1984 (average 5'/.) but enjoyed explosive growth for the ensuing three years (rates of up to 54*/.) before suffering a rather rapid decline (average 14%) to the 1990 recording of 88,113 - below the 1980 level of 95,273 !
It will also be observed that domestic throughput over the period remained relatively stable, recording no dramatic increases, except between 1987 and 1989 before declining in the final year. This is basically a reflection of the state of the Jamaican economy for which very limited growth rates (average 2%) were recorded. The ’boom’ in 1988 can be attributed to the influx of relief and reconstruction cargoes following the 1988 hurricane. Thus the norm in terms of
61
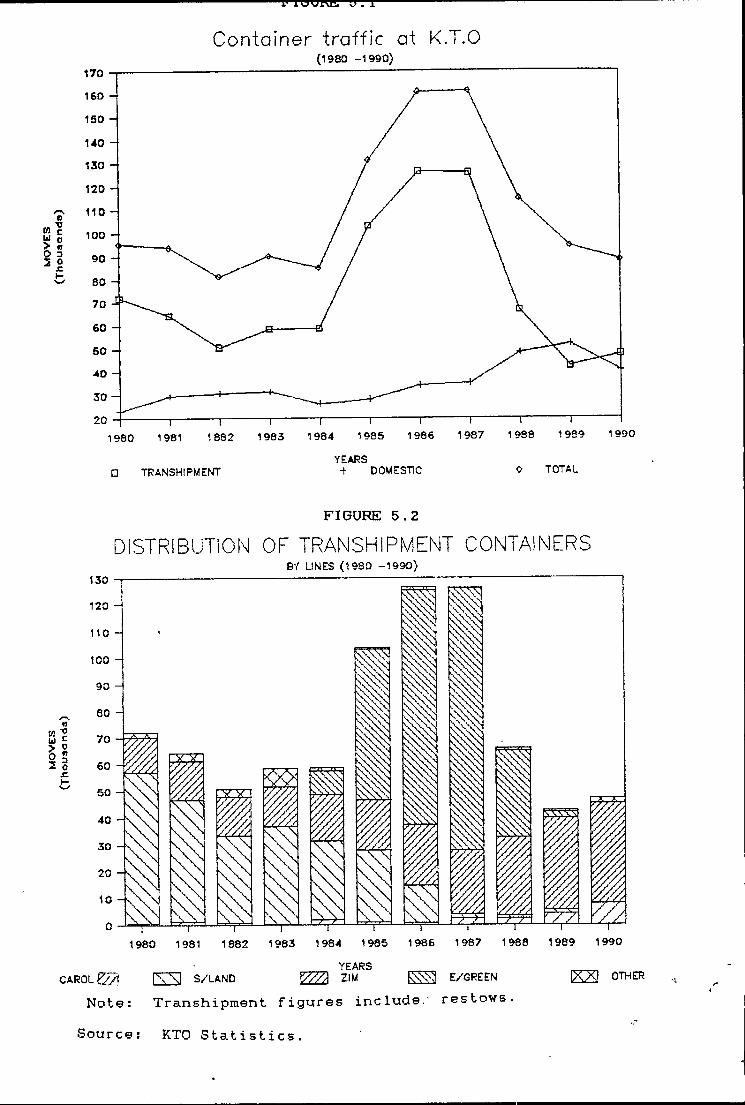
CTh0
U30
t,<ia
) (T
ho
usa
nd
s)
i' luufVB, y . iC onta ine r tra ff ic at K.T.O
(1980 -1 9 9 0 )
YEARSO TRANSHIPMENT + DOMESTIC 0- TOTAL
FIGURE 5.2DISTRIBUTION OF TRANSHIPMENT CONTAINERS
BY LINES (19 80 -1 9 9 0 )
_____ YEARS ..........C A R O L S ^ I X S S/LAND ^ ZIM ^ E/GREEN OTHER
Note: Transhipment figures include.' restows.Source: KTO Statistics.

domestic tra.-f-Fic is relative stability.
A look at -figure 5.2 detailing the distribution of transhipment containers on a per line basis offers some answers to the overall erratic performace observed. In 1980 SeaLand accounted for over 78*/. of the transhipment traffic handled at the Terminal. It was already mentioned that Kingston was of value to SeaLand as a distribution centre for regional cargo. However, in the mid 80s the line transferred its Caribbean distribution hub from Kingston to San Juan, Puerto Rico (where it has leased its own Terminal) as the latter was regarded as being more strategically located geographically to merge the Line’s several services within the Caribbean Basin Thus by 1987 there was notranshipment activity from this line.
The Terminal however, managed to stem the tide of decreasing transhipment traffic by securing Evergreen's use of its facilities in its RTW service. Thus the remarkable levels of growth experienced. Again it will be noted that three years after calling at the Terminal, Evergreen was responsible for roughly 78*/. of total transhipment activity. Whether it was the nuisance of having its ships seized and fined (later mitigated) by the US Customs for illicit narcotics or the inefficiency of Terminal operations that led to the line withdrawing its transhipment business at the port (the line still calls for domestic traffic), the effect is the downward trend in container throughput observed. The point here is that KTO has successively found itself in a position wherein it relies on a single carrier (or a limited number) for the bulk of its business and thus the loss of their patronage tend to have a disproportionate impact on the Terminal’s traffic, revenue and ultimately its profitability.
'^Kingston Port Development Study, 1985. Page IV-1262

The only stabilizing presence (in terms o-F volume handled) has .been the ZIM Israeli Line which while exhibiting comparatively modest growth (average IT/.) has nevertheless done so on a sustained level and is now, by virtue of default, the port’s major carrier.
The question arises as to why Kingston has found herself in a position of relying heavily on a limited number of carriers which subject to their whims and fancies, results in unstable throughput performance, and conversely, why hasn't KTO sought to widen its base of users and so prevent such a situation? The rather obvious answer is that it has become increasingly difficult for the port to attract new/major operators due to:
1. The impact of the US landbridge2. Increased intef port competition, and,3. Inadequate port facility ~ or rather poor
timing of investment .
Impact of the US landbridge
Initiated by American President Lines(APL), the use of rail to transport containerised cargo between the Pacific and Atlantic Oceans has gained popularity among other vessel operators. This is because sending the cargo by rail between the US East and West Coasts saves upwards of 7 days ® and thus reduce costs and required fleet size, in comparison with the all-water route via the Panama Canal. This increased usage of landbridge is highlighted by the fact that of the top 20 carriers in terms of TEU capacity (shown in the table 5.1) only five (25*/.) do not employ the use of the US land bridges in their services. If the fact that two of these ’non-users’
Structural Changes in Ocean Liner Transport: ProspectsS( Implications for Policy Formulation. UN Economic Commission For Latin America & the Caribbean, 1987. Page 16.63

(Scandutch and SNCDV) have no service which would necessitate the use o-f either the landbridge or the Panama Canal is considered, then the percentage of these mega carriers which have so far opted for the use of the bridge service jumps to over BOY,.
TABLE 5.1Top 20 Carriers in terms of TEU capacity as at March 25, 1990.1 — 1 in 1
1 1 No. of 1 CAPACITY PANAMA! U8 !1I. 11 Ships 1 (TEU) 1 CANAL 1LANDBRIDGE! _ 1__ 11 EVERGREEN [ 67 i 130,916 X ! X !1 SEALAND I 63 I 115,367 X 11 MAERSK 1 53 1 94,703 — 1 X !1 NYK 1 56 1 78,148 - 1 X !1 MDL 1 55 1 70,334 - 1 X !1 APL 1 35 1 66,380 - ! X !1 OOCL 1 30 1 58,117 - 1 X !1 K-LINE 1 35 1 55,462 - 1 X !1 COSCC SHANGI 55 1 54,505 - 1 X !1 HAPAG-LLOYDI 32 1 53,178 » 1 X !1 HANJIN 1 25 1 49,621 - 1 X !1 P&O CDNTS. 1 26 1 49,368 . I X 11 YANBMING | 20 1 46,817 - 1 X !1 ZIM 1 46 1 44,817 X ! 11 NEDLLDYD 1 42 1 40,335 X !1 BSC 1 59 1 36,760 - 1 11 NOL 1 • IS 1 35,294 — j X !1 SCANDUTCH | 20 1 32,948 — 1 I1 SNCDV 1 40 1 31,204 — 1 — 11JU CGM 1 27 1 29,040 1 X !.1. , 1_________ 1
SOURCES; 1. Containerisation International, June, 1990 Top 20 Carriers Consolidate, pages 46-50
2. Containerisation International Year book 1991
Another consequence of the increased landbridge usage is the removal of restriction re vessel size which was formerly dictated by the limits of the Panama Canal. Thus ships with capacity in excess of 3,000 TEU are gaining in popularity and it is significant that over 96% of such existing vessels belong to these operators ^ and this could further explain
Containerisation International.64
June, 1990.
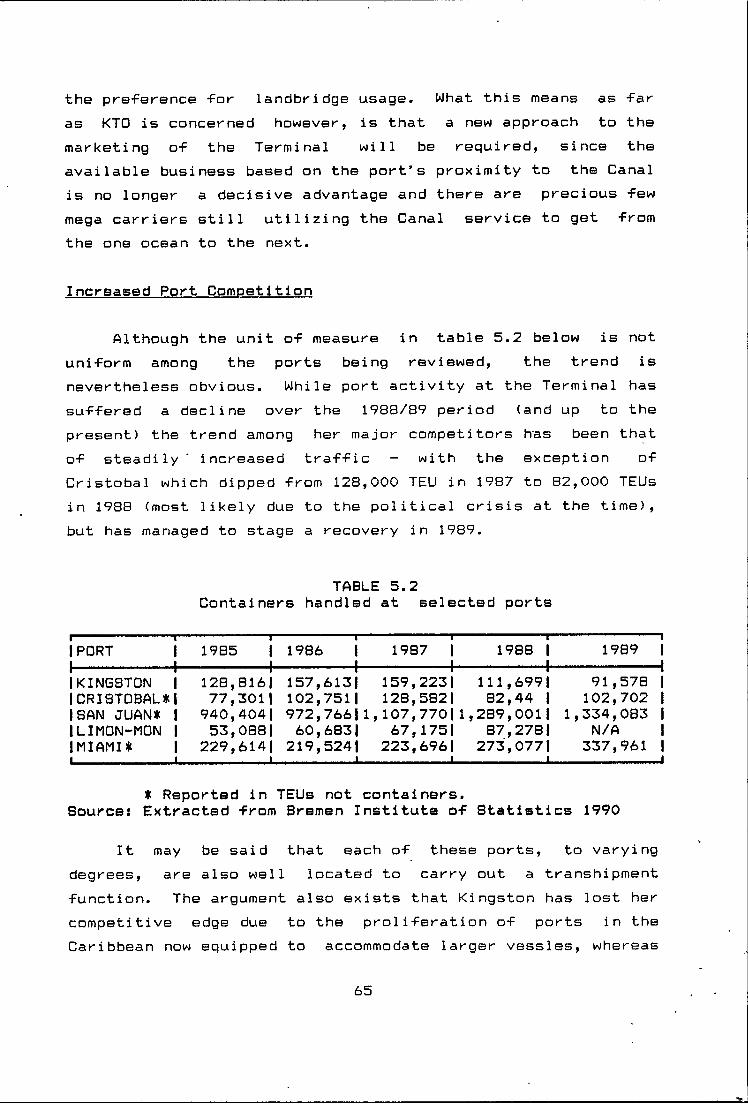
the preference for landbridge usage. What this means as far as KTO is concerned however, is that a new approach to the marketing of the Terminal will be required, since the available business based on the port’s proximity to the Canal is no longer a decisive advantage and there are precious few mega carriers still utilizing the Canal service to get from the one ocean to the next.
Increased Port Competition
Although the unit of measure in table 5.2 below is not uniform among the ports being reviewed, the trend is nevertheless obvious. While port activity at the Terminal has suffered a decline over the 1988/89 period (and up to the present) the trend among her major competitors has been that of steadily ' increased traffic - with the exception of Cristobal which dipped from 128,000 TED in 1987 to 82,000 TEUs in 1988 (most likely due to the political crisis at the time), but has managed to stage a recovery in 1989.
TABLE 5.2Containers handled at selected ports
1 '' ' .........IPDRTIT—11
119S5 1 1........... I""*19S6 1 1 19S7 1 1
1...19SS 1 1 19S9 “I
1 KINGSTON 1 12S,816i 157,613i 159,223i lll,699i 91,5751 CRISTOBAL* 1 77,3011 102,7511 12S,5S2| S2,44 1 102,702ISAN JUAN* 1 940,4041 972,76611 ,107,77011 ,2S9,0011 1,334,053ILIMON-MON 1 53,OSS! 60,6S3| 67,1751 S7,27S| N/AIMIAMI*1__________ I 229,6141 ________ L.
219,52411 223,6961 ________l_ 273,0771 ________1_ 337,961
* Reported in TEUs not containers.Source: Extracted from Bremen Institute of Statistics 1990
It may be said that each of these ports, to varying degrees, are also well located to carry out a transhipment function. The argument also exists that Kingston has lost her competitive edge due to the proliferation of ports in the Caribbean now equipped to accommodate larger vessles, whereas
65

as recent as 1985 Kingston was the only port with su-F-ficient dra-Ft to accommodate the larger mainline vessels. However, there is strong evidence pointing to the -Fact that competition is now, and will continue in the -Future to be, not so much •From other Caribbean and 6ul-F ports but from an entirely new range of ports, that is those on the West Coast of North America.
This is particularly evident when it is borne in mind that Kingston’s major transhipment business stemmed from cargo which originated in the Far East and destined for the Caribbean and this, based on the discussion above, haslargely been siphoned off by the rail services operating between both coasts of North America.
Port facility and timing of investment
As hinted at earlier, the loss of Evergreen's 80,000 transhipment moves per annum was purportedly a result of the rather costly inconvenience of having the Line’s ships seized and fined by the US Customs, following the discovery of illicit drugs in containers originating from Kingston.However, based on discussions with a former associate of that company it would seem that the finding of drugs onboardthe vessel was merely the proverbial 'last straw’ - a culmination of the general dissatisfaction with the level of service and perceived commitment of the Terminal’s management as manifested by the slow development of facilities.
This dissatisfaction may have had its origins not only in
■^Kingston Port Development Study, 1985. Table IV-5, page IV-21.
® Prof. E. Frankel was responsible for designing Evergreen’s feedering network in the Caribbean and had occasion to visit Kingston. The Author held discussions with him when he came to WMU in May, 1991 as a visiting professor.
66
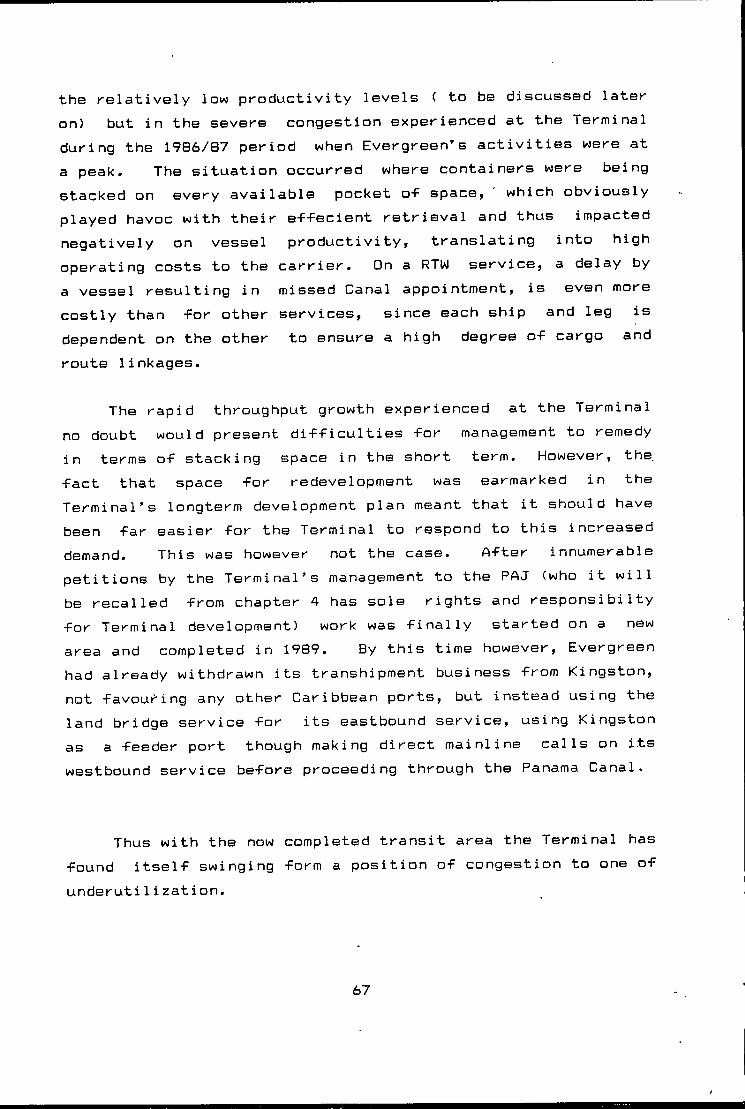
the relatively low productivity levels ( to be discussed later on) but in the severe congestion experienced at the Terminal during the 1986/87 period when Evergreen's activities were at a peak. The situation occurred where containers were being stacked on every available pocket o-f space, which obviously played havoc with their eTTecient retrieval and thus impacted negatively on vessel productivity, translating into high operating costs to the carrier. On a RTW service, a delay by a vessel resulting in missed Canal appointment, is even more costly than -for other services, since each ship and leg is dependent on the other to ensure a high degree of cargo and route linkages.
The rapid throughput growth experienced at the Terminal no doubt would present difficulties for management to remedy in terms of stacking space in the short term. However, the fact that space for redevelopment was earmarked in the Terminal's longterm development plan meant that it should have been far easier for the Terminal to respond to this increased demand. This was however not the case. After innumerable petitions by the Terminal’s management to the PAJ (who it will be recalled from chapter 4 has sole rights and responsibi1ty for Terminal development) work was finally started on a new area and completed in 1989. By this time however. Evergreen had already withdrawn its transhipment business from Kingston, not favour^ing any other Caribbean ports, but instead using the land bridge service for its eastbound service, using Kingston as a feeder port though making direct mainline calls on its westbound service before proceeding through the Panama Canal.
Thus with the now completed transit area the Terminal has found itself swinging form a position of congestion to one of underutilization.
67
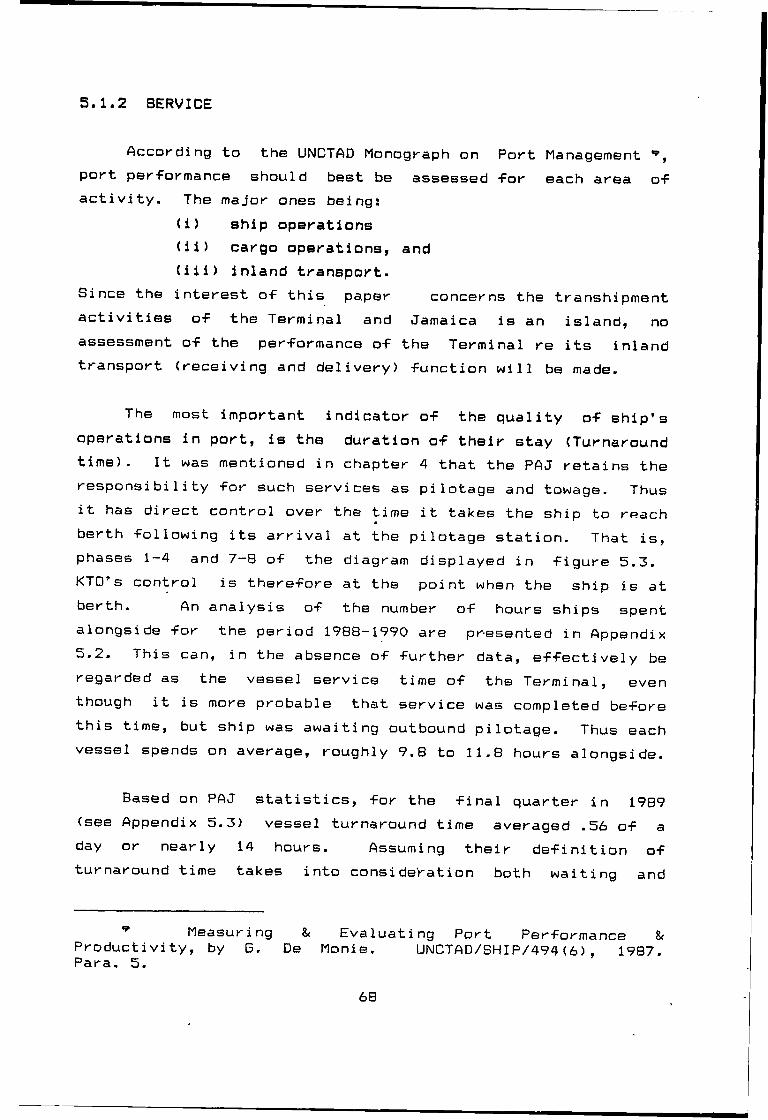
5.1.2 SERVICE
According to the UNCTAD Monograph on Port Management port per-Formance should best be assessed -For each area 0 "F activity. The major ones being:
(i) ship operations <ii) cargo operations, and (iii) inland transport.
Since the interest o-F this paper concerns the transhipment activities o-F the Terminal and Jamaica is an island, no assessment of the performance of the Terminal re its inland transport (receiving and delivery) function will be made.
The most important indicator of the quality of ship’s operations in port, is the duration of their stay (Turnaround time). It was mentioned in chapter 4 that the PAJ retains the responsibility for such services as pilotage and towage. Thus it has direct control over the time it takes the ship to reach berth following its arrival at the pilotage station. That is, phases 1-4 and 7-8 of the diagram displayed in figure 5.3. KTO’s control is therefore at the point when the ship is at berth. An analysis of the number of hours ships spentalongside for the period 1988-1970 are presented in Appendix 5.2. This can, in the absence of further data, effectively be regarded as the vessel service time of the Terminal, even though it is more probable that service was completed before this time, but ship was awaiting outbound pilotage. Thus each vessel spends on average, roughly 9.8 to 11.8 hours alongside.
Based on PAJ statistics, for the final quarter in 1989 (see Appendix 5.3) vessel turnaround time averaged .56 of a day or nearly 14 hours. Assuming their definition of turnaround time takes into consideration both waiting and
Measuring & Evaluating Port Performance & Productivity, by G. De Monie. UNCTAD/SHIP/494(6), 1987.Para. 5.
68

FIGURE 5.3 BHJEAK-DOVW OF SBIP'S TIME IN PONT
ToUl tlM In
Pro- and post berthlnff waiting tine
TXjo« at b«rth
Operational tine at berth
COOEi
portDepartureafterregisterii
• Pre-berth'ing [ I waiting tine •j---------i
'Pre-berthing vaiting tine SailIng delay
Time at berth
{Operatlonnl tlaa at berth
i----- ------ 1-------- ------1---
Freeberth! I Proceeds
available! 1 to berth--1 j Altematelr working and non working poriode_____1____
Arrifal at port
leavingportafterregiataring
Returns to port
1Arrival at berth
Start of operations
Finieh of operation
Leavesberth
leaves port
(1) (2) (3) (4)i ( 5) deberthing to warp ) ((6) Reberthing after warping ) (7) (8)
Source: Principles of Berth OperationsDeMonie Ship to Shore. by G.
ONCTAD PORTS SECTION UNDP moJBCT RAF/78/oU

SBrvice time, then estimated waiting time -For the vessel is about 3.7 hours or 38% o-F service time. Given that the optimal berth occupancy is one that gives a waiting to service time ratio o-F between 20—30% then the estimated waitingtime -For vessels would seem to indicate some degree o-F congestion. However, based again on PAJ statistics -For the same period, we are given a berth occupancy averaging 28.16% which, -For a 4 berth system entails <assuming random arrival) an almost zero waiting time. It is there-Fore logical to conclude, based on these -Figures, that the waiting experienced by ships in receiving a berth is not a result of berth unavailability but rather delays in the provision of the other port services such as pilotage or towage, which arecompulsory. Although the figures are not available to enable an analysis of the waiting time for say pilots, suffice it to say that if the prime concern of the Terminal’s management is to reduce port cost to its carriers, implying primarily reduced turnaround time, then it must seek to influence the various organizations in the port which affect the ship's time in port.
The most popular and controversial measure of the level of service to port users, is the moves per gang or crane hours. This is because it indicates the performance of labour/equipment which has a direct bearing on the total vessel service time. A look at KTD's productivity reportfor the period 1.01.90 to 28.02.91 for its major transhipment carrier reveals that gross moves per crane hour (or gang hour) averages just around 13 moves (see Appendix 5.4), or more importantly, in only 69.5% of the time can Zim expect a performance rate in excess of 13 moves per hour of operation, and only 2% of the time can the Terminal expect to achieve its standard performance level of 20 moves per hour, depicted in figure 5.4. Therefore, if as the statistics indicate, there
Port Development; A Handbook developing countries.69
i nfor planners

FREQUENCY DISTRIBUTION '
f ig u r e 5 .5
SCATTER PLOT OF PRODUCTIVITYVESSEL SIZE: ZIM (2.1.90 - 26.2.91)
Source: KTO Productivity Report for period 1.1.90 to 28.2.91
is only a buccbbb rate of 2%, then an analysis of the reasons for the divergence between targeted and achieved performance levels is essential.
In evaluating a port’s performance it is important to look at the various factors which may have contributed to the observed level of productivity. The relevant 1 iterature’- suggests the following:
(i) Ship size & type(ii) Total containers discharged/loaded per vessel call(iii) Weather conditions(iv) Port of call sequence in a given range
(v) Balance or lack of balance between the various terminal subsystems
(vi) Motivation S< quality of container Terminal personnel<vii) Number, type & capacity of cranes employed on a vessel(viii) Stowage position in, 8< distribution over the bays of the vessel
(ix) Number of outsized containers(x) Lashing systems utilized for on-deck containers(xi) proportion of import/export/transshipment/transit conta i ners.
The factors which influence productivity of the ship operations are therefore primarily (a) ship related and (b) port related.
Ship related factors
Further analysis of the productivity levels for the various vessels of call for Zim Line are as presented below:
UNCTAD Monographs on Port Management 6 - "Measuring & Evaluating Port Performance"
70
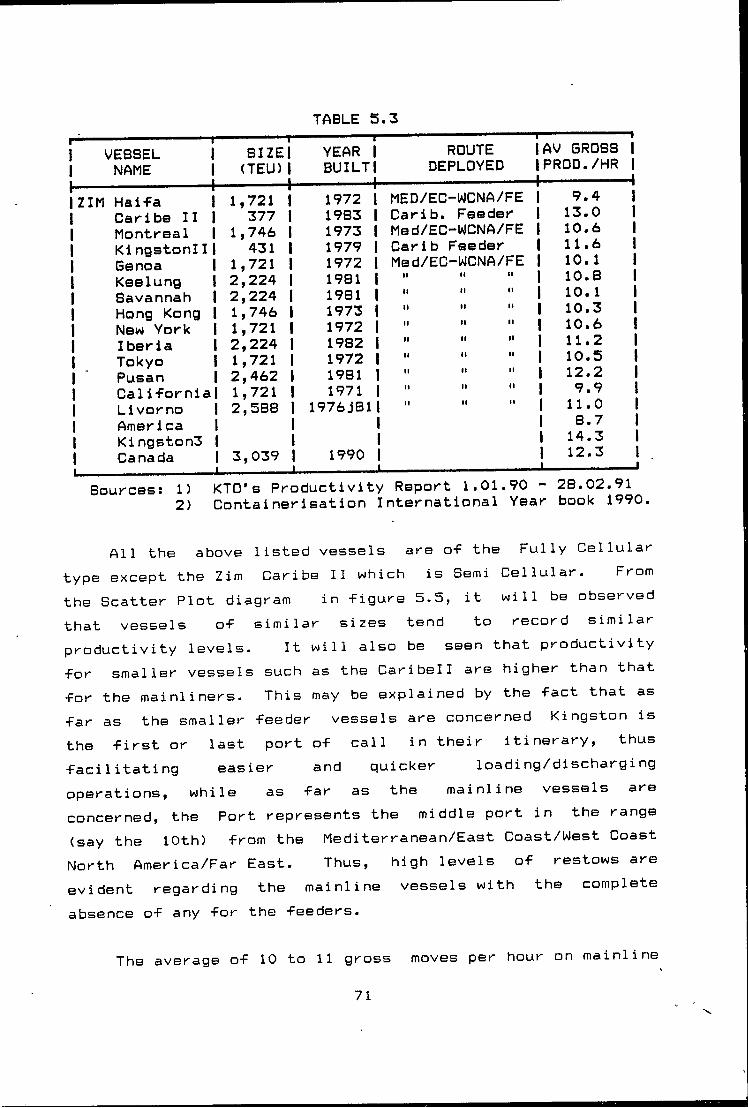
TABLE 5.3
VESSELNAME
SIZEI (TEU)1 1
YEAR 1 BUILTlROUTE
DEPLOYEDAV GROSS PROD./HR
J--------------IZIM Haifa 1,721 i 1972 i MED/EC-WCNA/FE 9.4
Caribe II 377 1 1983 1 Carib. Feeder 13.0Montreal 1,746 1 1973 I Med/EC-WCNA/FE 10.6Ki ngstoniI 431 1 1979 1 Carib Feeder 11.6Genoa 1,721 1 1972 1 Med/EC-WCNA/FE 10. 1Keelung 2,224 1 1981 1 n M M 10.8Savannah 2,224 1 1981 1 10.1Hong Kong 1,746 1 1973 1 I I I I I I 10.3New York 1,721 1 1972 1 I I I I I I 10.6Iberia 2,224 1 1982 1 I I I I I I 11.2Tokyo 1,721 1 1972 1 I t I I I I 10.5Pusan 2,462 1 1981 1 I I I I I I 12.2California 1,721 1 1971 1 I I I I I I 9.9Livorno 2,588 1 1976JB11 I I I I I I 11.0Amer i ca 1 8.7Ki ngston3 1 14.3Canada 3,039 1 1990 1 12.3
Sources: 1) 2 )
KTO’s Productivity Containerisation IReport 1.01.90 - nternational Year
28.02.91 book 1990.
All the above listed vessels are of the Fully Cellular type except the Zlm Caribe II which is Semi Cellular. From the Scatter Plot diagram in figure 5.5, it will be observed that vessels of similar sizes tend to record similar productivity levels. It will also be seen that productivity for smaller vessels such as the Caribell are higher than that for the mainliners. This may be explained by the fact that as far as the smaller feeder vessels are concerned Kingston is the first or last port of call in their itinerary, thus facilitating easier and quicker loading/dischargingoperations, while as far as the mainline vessels areconcerned, the Port represents the middle port in the range (say the 10th) from the Mediterranean/East Coast/West Coast North America/Far East. Thus, high levels of restows are evident regarding the mainline vessels with the complete absence of any for the feeders.
The average of 10 to 11 gross71
moves per hour on mainline

vessels is quite below average and considering that these are the more expensive ships (on a daily running cost basis), it is important to look at the possible factors which affect their level of productivity.
It becomes apparent • that these are primarily old ships (first and second generation) with over 50*/. of them having been built in the 1970s. The result is a poorer level of functional performance on areas such as hatch coamings and lashing gears. Thus a significant percentage of the delays recorded are attributable to the ship. The definition of ship’s delay embraces dead gang hours (idle labour awaiting vessel’s arrival) as well as delays caused during the opening of bays, lashing etc. Popular figures for these ship related delays run between 8-12 hours. While this is in no way conclusive evidence since it would be necessary to know exactly how many of the hours stated are attributable to defects in the vessel’s gears, the argument is howeverstrengthened when the following is considered: The feedership Zim Kingston II was built in 1979 and averaged 11.6 moves /hour as against the other feeder Caribell built in 1983 which returns 13 moves/hour. In 1991 the Kingston II was replaced by the Kingston III, a newer ship and immediately productivity jumps to 14.3 moves per hour.
While the argument for the correlation betweenproductivity levels and age of vessels is no doubt valid, it is somewhat complicated by a look at productivity figures for Evergreen (E/G) line (over the same period) which has substantially modern vessels, reveals a very low average of just over 11 moves with the modal being roughly 12-13 moves. Here again, it must be pointed out that the report being analysed indicates that of the 339 total hours delays incurred in E/G’s 45 vessel calls, over bT.'/, was attributable to the ship. In order then to have an unbiased view of theTerminal’s productivity levels, it is essential to take out
%72
the impact o-F ship’s delay, the new level would then re-Flect the actual terminal per-formance.
Ideally, it would have been more profitable to be able to deduct only the hours lost awaiting a vessel’s arrival, since delays caused in unlashing and so on, while not being under the strict domain of the Terminal, are indeed operational delays and should be reflected in the productivity figures.
Further, information on the time the vessel spends awaiting pilots, tugs etc should be added to the dead gang hours since such delays are the fault of the port if not exactly that of the Terminal. However, although these refinements are not available in the data at hand, a clearer picture of the Terminal’s performance is possible, by deducting the delay figures given as being attributable to the ship. The probability distribution depicted in figure 5.6, shows that nearly 90*/. of the time E/6 can expect a handling rate of 20 moves/hour with the average being about 16 moves - certainly an improved picture if not exactly the level required.
Terminal related factors
Regarding the factors pinpointed above as having a possible impact on productivity, the Terminal has little or no control. What the Terminal can and does have control over is the performance level of its equipment, the balance between the various Terminal subsystems and can certainly influence labour productivity.
Equipment Performance
A high degree of equipment performance assumes minimal
&73
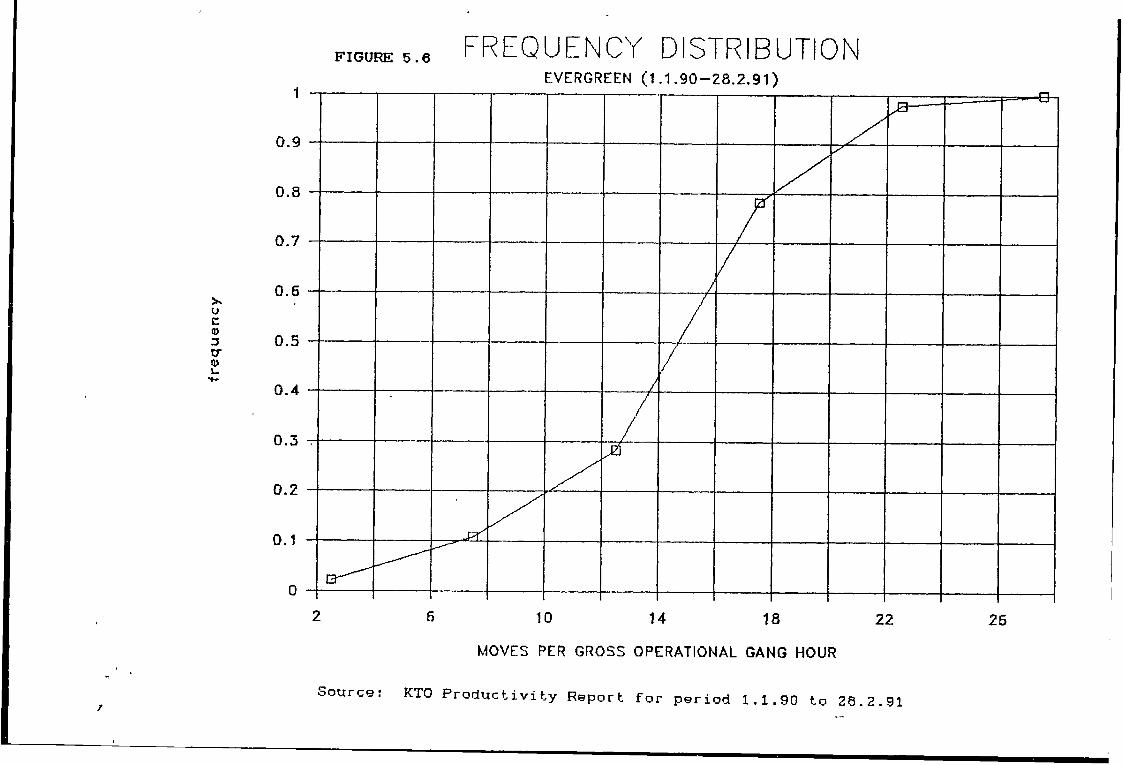

downtime during operations and this in turn implies certain preconditions, such as an effective preventative maintenance programme, skilled engineering staff and availability of spare parts on a timely basis. The Terminal retains a highlyskilled and knowledgeable maintenance staff and a team of these engineers are at the Terminal on a round the clock basis. There is also a preventive maintenace programme in place.
It is found however, that the degree of success attainable by this team is very much dependent on, or affected by (a) the lack of spare parts and (b) the age of the ship to shore gantries. By the latter it is meant that themaintenance of these cranes, due to their limited number, tends to be carried out when they are free rather than when it is scheduled. This is of course understandable, but added to the fact that the machines are, as far as the ships calling at the port are concerned, technologically obsolete (inability to handle safely vessels with 5 high containers on deck), their substantial ages and thus the performance condition, dictates that a higher degree of maintenance is necessary to retain historic performance. During the 13 months examined, 26"/i of the delays reported on the productivity report were attributable to Gantry failure. The fact that these cranes experienced reduced utilization (a result of reduced terminal throughput) and thus should have more time for maintenance, would seem to indicate that it is becoming increasingly difficult for the repair team to keep them in operational condition.
In contrast to the performance of cranes, less than 8'/. of the operational delays were caused by breakdown of yard equipment such as straddle carriers'. This is because these are not only largely new, but are available in enough quantities to enable rapid substitution in the event of a breakdown. This brings home the importance of the existence
74

o-F some degree of excess capacity or slack in the system. To be more explicit, the Terminal’s fleet of gantries falls way behind the recommended minimum. Given that 2 gantries are needed for a single berth or on average 1.5 cranes per berth for multi—berth terminals it means for KTD’s four berthsthe recommended fleet size is a minimum of 6 cranes. KTO up until 1991 had only 4 cranes, averaging 1 per berth. What this means is that at no time can the berths be fully occupied with any ship working more than one gang per ship. Given that its a transhipment terminal, we should not only expect vessels of a relatively large size, but in addition ensure them the rapid turnaround they need to remain competitive. Thisimplies the availability of at least 2 cranes per ship.
The Terminal is considering extending its berthing facilities by an extra berth but has recently only acquired a single new crane, bringing the fleet up to 5. But 5 berths will dictate at least some 7 cranes. It is very important that the Terminal plans its development, not on an ad hoc basis but taking into consideration the various elements which make up the system - that is develop a model of the optimum number/capacity required for each subsystem to reducebottlenecks and improve turnaround time.
Other factors affecting the ability of the Terminal to produce a high level of service includes the layout of the stacking area and the degree of illumination of the Terminal at nights. In the case of the former, a few years previously this was not carried out as would have been desired by the operations team due to shortage of stacking areas coinciding with surge in terminal traffic, and, as already been stated severe congestion ensued which rendered any attempt at an organized yard layout futile. This' problem has largely been solved by the reduction in traffic, but more importantly by
Improving Port Performance Development. UNCTAD S< SIDA Project.
75
Container Terminal
the paving o-F additional area to bring the total stacking area to 6500 TEU.
The problem o-F poor lighting has been one plaguing the Terminal -For several years. A use-Ful exercise would be to plot the varying levels o-F productivity against the shi-Fts so as to see precisely, the impact o-F illumination on productivity. Although one would normally expect lower levels •For the night shift as against day even with perfect lighting, the factor of poor lighting, in KTD’s case would undoubtedly reflect itself in the observations of low productivity (below 13 moves) being recorded for the night shifts. Unfortunately, the relevant data are not readily available, but suffice to say that the Terminal’s managaement have long realised the possible impact of inadequate lighting on the Terminal’s performance and has been agitating for its upgrade. This area' of investment comes under the responsibility of the PAJ. Work on this started in 1990 and it is hoped will be completed in 1991.
Another nagging problem suffered by the Terminal is that of its surface condition. There seem to be the constant need for repaving and remarking of the box slots. This undoutedly has its effect on costs, service quality and the necessary maintenance level required for the yard equipment.
5.2 PRODUCTIVITY
The basic concept of productivity seeks to establish a relationship between quantity and quality of goods or services produced against the quantity of resources used in their production. The main indicator of improving productivity being a decreasing ratio of input to output at constant
76

As a continuationquality = . As a continuation in the analysis o-f KTO’s per-FoKnianee, this section will be concet^ned, -firstly, with the trend in Terminal costs and the various factors impacting to produce the observed levels, and secondly, productivity of both labour and equipment and the impact of these on Terminal costs. It is expected that from these analyses andsuggested reasons, a clear picture will emerge which will indicate the measures which need to be taken to reduce costs and improve productivity. .
If figure 5.1 showing trend in container throughput at the Terminal is taken in conjunction with figure 5.7 showing trend in total cost, it is immediately evident that while throughput experienced differing degrees of fluctuation, costs were for the main, constantly rising. Also, the period of most intensive cost increases (19B4-1987) coincided with that of increased traffic, which on a global scale tends to imply a high degree of variable costs. However, the fact that plummeting traffic levels following the 1987 period recorded only a slight decrease in total costs before it reverted to the previous level, seems to suggest the opposite. It should be noted that for the peak year 1987 really represented 15 months spending pro rated and presented for 12 months for comparative reasons. It is therefore conceivable that1987’s 12 month approximation could be more within the range of say $55M and thus we would be faced with a constantly rising cost curve, further solidifying the impression of primarily fixed costs.
The breakdown of costs as displayed in figure 5.8 reveals that of the five elements comprising the total cost the one exhibiting the widest variation and one which is consistent
1=* Productivity Management - A Practical Handbook by Joseph Prokopenko. ILO, 1987. Page 5.
KTQ changed its financial year from Jan - Dec to Apr-Mar in 1987. Thus the Audit covered 15 months.
77
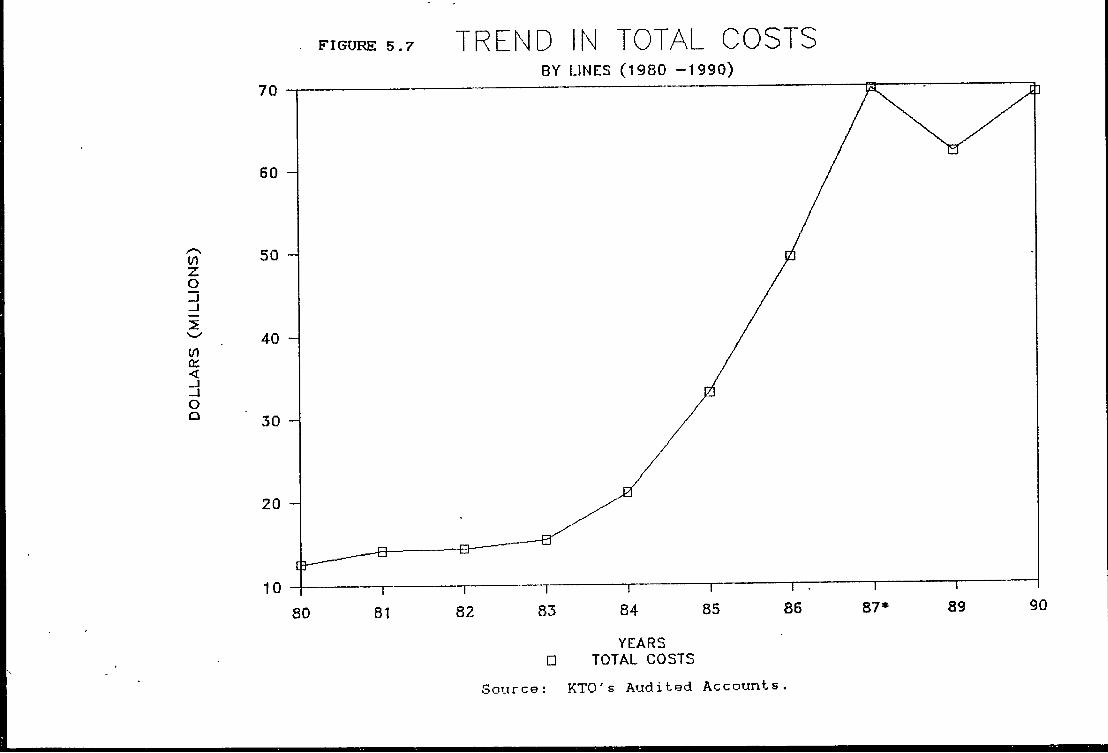
DO
LLA
RS
(MIL
LIO
NS
)
FIGUEIE 5 .7
70
60 -
50 -
40 -
30 -
20 -
80 81
TREND IN TOTAL COSTSBY LINES (1980 -1990)
82 83 84 85YEARS
□ TOTAL COSTS
T ~ -------------1 r86 87* 89
Source: KTO's Audited Accounts.
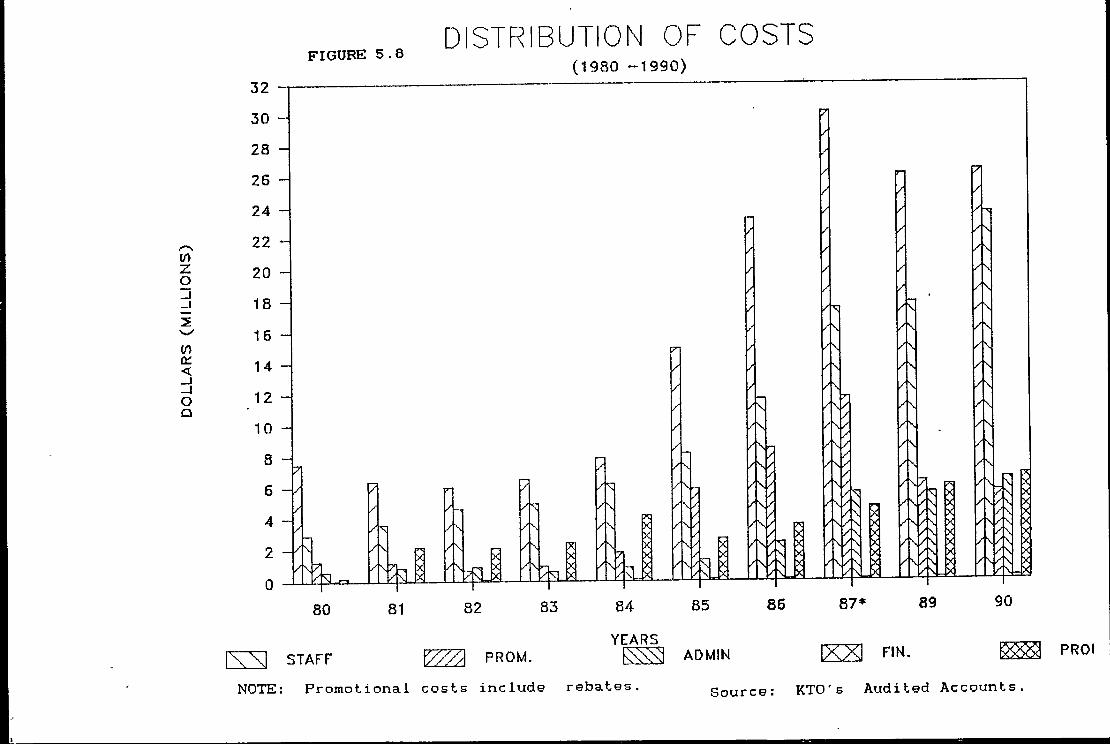
-ZLO
if)Qi.<_JOa
FIGURE 5.8 DISTRIBUTION OF COSTS(1980 -1990)
STAFF PROM.YEARS ADMIN
NOTE: Promotional costs include rebates.IXXI FIN.
Source: KTO's Audited Accounts.PROI

exhibiting the widest variation and one which is consistent with the behaviour observed in total costs is the Direct Expense category. It represented the largest area o-F Terminal expenditure, standing at over J$23M in 1986 or 47/i o-F total cost.
The Direct Operating cost, as the term implies, represents all those costs incurred by the port in 't:he provision o-F its service to users and which would not have been incurred i-F there was no tra-F-Fic at the Terminal, that is, container handling costs. It there-Fore encompasses costs such as stevedoring, stripping & stuf-Fing o-F containers, mounting and grounding and repair and maintenance costs among others. As such this essentially represents variable costs and by de-Finition should vary with the level o-F Terminal activity. Variable costs (vc) seem only to be -Flexible upwards and recorded only a marginal decrease despite a substantial one in throughput. Thus the VC component o-F the Terminal’s costs may be said to have evolved overtime into -Fixed costs. The reasons -For this are manyfold, and can be partly attributed to constantly rising labour and equipment costs fuelled by high inflation and the basis of the stevedoring arrangement in effect with TSL.
In chapter 4 it was mentioned that stevedoring operations at the Terminal are carried out on a subcontract basis by TSL. It was also mentioned that the straddle carrier relay system was employed by the Terminal in the quay transfer operation. What was however not stated was that the leg of the quaytransfer involving movement from the apron to the stackingarea was also carried out by TSL with KTQ’s personnel being utilized in the actual stacking. It is not clear whether thisarrangement is union dictated. However, what is clear isthat KTD paid nearly J$7M in 1990 to TSL for this service.
This underlines the fact that substantial savings may be
78

carrier direct system -For its quay trans-Fer operations, as this would eliminate the need to employ TSL labour andtrucks. Again, it is not quite clear .what the prevailing arrangements are -For work allocation on the Terminal as there exists some complex associations. For example, several o-F the a-Forementioned trucks used by TSL are actually owned by the PAJ and bought for use on the Terminal. One would therefore expect that these would represent equipment at the disposal of KTO in much the same way as the straddle carriers and cranes. KTO is however billed for their usage by TSL.
Before proceeding further, a brief description of the basis of stevedoring charges will be instructive. To repeat, TSL is contracted by the Terminal’s management to provide stevedoring labour which it in turn recruits (on a need basis) from a central labour pool run by the SAJ. The labour engaged by TSL from the SAJ are paid at the union negotiated rates. TSL itself provides the supervisory personnel for the stevedoring and switching operations. Therefore in the case of stevedoring, KTO's payment to TSL has to cover wages and fringe benefits of both these categories.
TSL bills KTO, based not on hourly basis, but at a fixed cost per box moved. In the case of stevedoring it is the cost per shift divided by the estimated number of moves per shift (20 per hour for Lo-Lo and 10 for Ro-Ro) The cost ofTSL supervisory personnel which represents a fixed annual cost is recouped by charging KTD a rate based on their total cost allocated over the estimated annual moves.
This charging practice is analogous to the Sliding-Scales method. According to the theory, the main advantage of
Internal Report on cost of services provided by KTO. Port charging practices by B.J. Thomas, MaritimePolicy & Management 1978, vol.5 page 124
79 t

this method is that "a productivity agreement is built into the contract based on the knowledge that as per-Formance measured in Cmoves/gang/hourl increases, so average total costs -Fall". Thus the rationale is that since revenuereceived by the stevedoring company is based on box moves and not hours, while its costs (primarily labour) are incurred largely on a hourly basis, then by increasing the moves per hour (higher productivity), that much less stevedoring cost will be incurred by them -For a given revenue.
However, the system breaks down simply because the interests o-F the stevedoring company and that o-F the stevedores themselves are diammetrica1ly opposed: It is inthe interest of TSL to improve productivity but from a wage point of view not beneficial to the stevedores. This problem is a result of the fact that the labour institution and the- stevedoring company per se are separate entities and that stevedores are wage earners and not salaried employees. This of course explains the relatively stagnant levels ofproductivity achieved by the Terminal to date — around 13 moves per gross gang hours.
The Terminal's management to some extent attempted to protect itself against this low productivity level by building in the calculation of the stevedoring rate, a higher level of performance (20 moves per hour) thereby penalising TSL for non performance, and the intention being to create an incentive for improved performance. However, the degree to which this is actually effective is questionable. It is conceivable, even logical, that TSL, faced with this situation and knowing quite well the more probable performance level of the stevedores, would make allowance for this in their presentation of the overheads used in the calculation.
801 7“ Ibid. 16
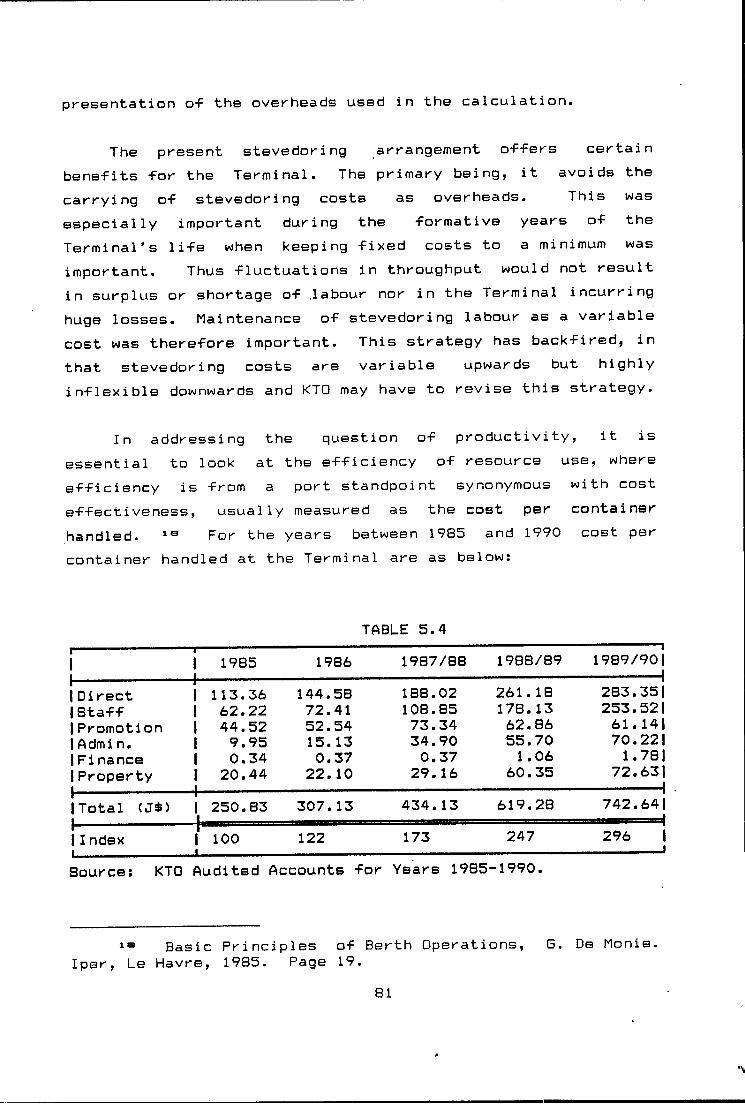
presentation o-f the overheads used in the calculation.
The present stevedoring arrangement offers certain benefits for the Terminal. The primary being, it avoids the carrying of stevedoring costs as overheads. This wasespecially important during the formative years of the Terminal's life when keeping fixed costs to a minimum was important. Thus fluctuations in throughput would not result in surplus or shortage of .labour nor in the Terminal incurring huge losses. Maintenance of stevedoring labour as a variable cost was therefore important. This strategy has backfired, in that stevedoring costs are variable upwards but highly inflexible downwards and KTO may have to revise this strategy.
In addressing the question of productivity, it is essential to look at the efficiency of resource use, where efficiency is from a port standpoint synonymous with cost sffectiveness, usually measured as the cost per container handled. For the years between 1985 and 1990 cost percontainer handled at the Terminal are as below:
TABLE 5.4II------I DirectI Staff I Promotion I A dm i n.IF i nance I PropertyI----------ITotal (J$)I----------------11ndexI-------------
I1
1985113.3662.2244.529.950.3420.44250.83100
1986144.58 72.41 52.54 15. 13 0.37 22.10307.13122
1987/88 1988/89188.02108.8573.3434.900.3729.16
261.IB 178.13 62.86 55.70 1.06
60.35434.13 619.28173 247
Source: KTO Audited Accounts for Years 1985-1990.
' "I1989/901283.351 253.521 61.141 70.221 1.781
72.631------ 1742.641..^296 I
Basic Principles of Berth Operations, Iper, Le Havre, 1985. Page 19.
81
G. De Monie.
From a cost standpoint it may be said that during this period the e-f-Ficiency o-f the terminal in terms o-F coste-F-Fectiveness worsened dramatically with cost per box displaying steep increases, re-Flecting in 1990 an almost 300% increase over the base year 1985.
5.3 IMPACT OF COSTS ON TARIFFS AND PROFITABILITY
Be-Fore remarking on’the impact o-F port per-Formance on the level O-F tari-Ff, a brie-F commentary on the structure and allocation o-F revenues is necessary. The allocation o-F thevarious port costs incurred by the Terminal’s users is shown in Appendix 5.5. Except in the cases o-F wharfage (see discussion of the Agreement in chapter 4) and stripping and stuffing, KTD is not involved in the collection or billing for services which do not constitute a part of its revenue. Thus Harbour Fees, Pilotage, and Towage are contracted by carriers directly with the PAJ.
The general structure and content of the container tariffs is simple. Regarding the loading and discharging and quay transfer activity, a single rate is quoted for domestic and transhipment boxes respectively, regardless of box size. The rate for transhipment is a onp way rate, that is, discharge is billed separately from loading. The loading/discharging rate per box covers all activities from ship's side to transit area. Thus there is no separate contract between the stevedoring company and the carriers.
The flow diagram below summarizes the container handling charges associated with various stages of the handling process.
82
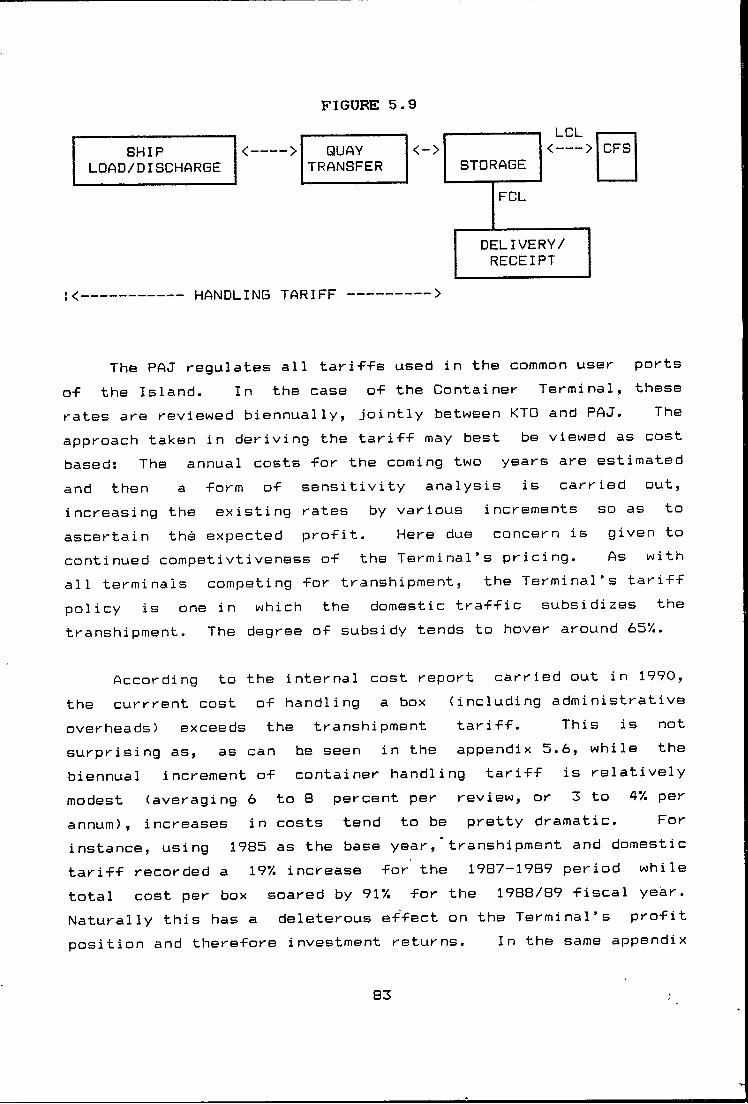
FIGURE 5.9
SHIP <--- > QUAY <->LCL <-- > CFS
LQAD/DISCHARBE TRANSFER STORAGEFCL
DELIVERY/RECEIPT
1 < ■ HANDLING TARIFF
The PAJ regulates all tari-F-Fs used in the common user ports o-F the Island. In the case o-F the Container Terminal, these rates are reviewed biennually, jointly between KTO and PAJ. The approach taken in deriving the tariff may best be viewed as cost based: The annual costs for the coming two years are estimatedand then a form of sensitivity analysis is carried out, increasing the existing rates by various increments so as to ascertain the expected profit. Here due concern is given tocontinued competivtiveness of the Terminal’s pricing. As with all terminals competing for transhipment, the Terminal’s tariff policy is one in which the domestic traffic subsidizes the transhipment. The degree of subsidy tends to hover around 65/.
According to the internal cost report carried out in 1990, the currrent cost of handling a box (including administrative overheads) exceeds the transhipment tariff. This is notsurprising as, as can be seen in the appendix 5.6, while the biennual increment of container handling tariff is relatively modest (averaging 6 to 8 percent per review, or 3 to 4’/. per annum), increases in costs tend to be pretty dramatic. For instance, using 1985 as the base year,'transhipment and domestic tariff recorded a 19’/. increase for the 1987-1989 period while total cost per box soared by 91’/. for the 1988/89 fiscal year. Naturally this has a deleterous effect on the Terminal’s profit position and therefore investment returns. In the same appendix
83

a steady decline in unit profit is evident, almost without exception, for the years 1985-1990.
Given the need to remain competitive in the transhipment arena, the Terminal’s first priority must be to restrain and reduce costs along with improving service quality. It may well be that both can be achieved through more efficient and productive use of resources.
84
c h i !=*r x e :r
XME ROI—E OR RORX MARKETXI NO
The paper has, so far, progressed from a general discussion of the impact of the trends in container shipping on ports, to a more specific analysis of problems encountered by a container terminal, KTO. This chapter aims atpresenting an approach that can be, and indeed has been adopted by many ports, in meeting the challenges of the dynamic container shipping environment - the marketingapproach. The aim is not to present marketing as a panacea for all the port's problems. Instead, it is hoped that by presenting a systematic yet integrative plan of action, the marketing approach applied to ports, and indeed anyorganization, represent an invaluable tool for analyzing the market. It therefore places the port in a better position respond to or initiate changes to its benefit.
After looking at a definition of marketing and some general marketing concepts, the focus of this chapter will be to highlight the need for a marketing approach in ports. By so doing, it is intended that the ground work will have been laid for the final chapter concerned with hov-j to develop a marketing plan for KTO. Therefore, the current chapter will be dealing with the role and scope of port marketing while the final will concentrate on the 'how to' or 'doing' aspect.-
6.1 A DEFINITION OF MARKETING AND GENERAL MARKETING CONOEPTB.
The term marketing usually conjures images of advertising and other promotional efforts. While this is undoubtedly a marketing activity, it is not itself marketing. Broadly speaking marketing may be defined as "...the part of Cthel
85

business concerned with the way in which a product is sold..."This implies that there are two prerequisites in
marketing the company’s product or services, namely
(1) a structure or marketing department with theresponsibility -for organizing, -Formulating, and executing the -Firm’s marketing strategy, and(2) the method or strategy itself.
Modern marketing theory which traces the evolution of marketing from the periods of a role primarily restricted to selling and distribution, today would tend to disagree with this basic concept of marketing as "part of the business" activity and instead advocate that "marketing is so basic Cto the firml that it cannot be considered a separate function ... it is the whole business seen from the point of view of its final result, that is, from the customer's point of view". == The implications are that the organization of the various activities of the company should be centered around and be interrelated to the marketing department which then constitute the hub ~ a modern marketing company.
Similarly, there are distinct approaches to thearrangement or method of marketing. These concepts may be classified as
a) the product conceptb) the selling concept and,c) the marketing concept or more recently, the
social marketing concept.
Under the product concept the firm concentrated its efforts on the creation of a good product under the
^Collins Cobuild English Language Dictionary ^Marketing Management by Philip Kotler, page 3
86

assumptions that, given a good product, reasonably priced, little marketing effort is required to achieve desired sales and profit levels. The emphasis was therefore not so much on the utility of the product to the consumer as a marketing tool, but on quality/price trade-off.
This approach typified that taken by most port management wherein, having developed their facilities, they resolved to compete based on pricing and quality of service. This approach was and still is to a large extent valid. But gone are the days when the availability of well equipped and competitively priced port facilities were hard to come by , or conversely, when cargo belonging to the port’s hinterland could be regarded as captive, and the demand for services seemingly endless. In addition to increased competition, this approach is rendered further incomplete by the fact that while cost/quality trade-off is still important, it now comprises only one of the many considerations in the port selection process.
With the manifest deficiencies of the product concept approach in meeting the firm’s goals, another concept was developed, that is, the selling concept. Here in contradistinction to the product concept, the firm took the view that its products would not be sold unless it approached customers with a substantial selling and promotional effort.
Unfortunately, this approach normally meant a shift in focus, with the creation of a quality product becoming secondary. For this strategy to work it would mean that customers were not too concerned with quality and if dissatisfied would not communicate this to other potential users, and most importantly from a port stand point, that the company was not dependent on repeat business.
I n approaches
87
the above two to marketing, the
product/service was developed with little consideration as to the speci-fic needs o-F customers, and the predominant ■factor was to achieve profit objectives. The marketing concept still maintains this profit objective, but sees it as being achievable not merely through the development of high quality reasonably priced products or through intensive selling and promotional efforts but instead the emphasis shifted from company-based to customer-oriented.
The key task of the organization was geared at the identification of customer needs, wants and values and to fulfilling these satisfactorily and more effectively and efficiently than competitors, on a profitable basis. Customer satisfaction was seen as the key to that of the organizational goals. Such an approach has several implications:
i) the organization conceives of its mission interms of satisfying a defined set of wants of a defined set of customers
ii) active marketing research is undertaken to determine these wants
iii) a recognition that all customer-impinging company activities must be placed under integrated marketing control, and
iv) the company believes that doing a good jobof satisfying customers, wins their loyalty, repeat business and favourable word of mouth promotion - all of which are crucial in satisfying the organization’s goals.
The social marketing concept takes as an additional element, the consideration of general public welfare in responding to needs and wants of the market.
88
Having outlined the evolution o-F the various concepts under which -Firms carry out their marketing activities, it is now possible to move -From a generic definition of marketing to a more specific and practical one. Marketing or more accurately marketing management, can be defined as the analysis, planning, implementation and control of programs designed to bring about desired changes with target markets for the purpose of achieving organization goals. Three elements emerge as being essential to successfully marketing a company;
i) a product oriented to the customer’s needs and » ’ wants
ii) a marketing organization or department, effective in bringing the product/service in contact with the potential customers, and,
iii) a marketing plan, which identifies strategies and responsibilities for implementing action programsto achieve organizational objectives.
Marketing management thus presents a unified plan__ofaction for the achievement of organizational goals. The major benefits to be gained from such a unified plan of action are threefold;
i) It engenders coordination between the various activities within the organization and thus strengthens it.
ii) It allows for the organization to specify expected development in the industry and thus use them to forecast and plan.
iii) As a concomitant of i) & ii) strategic marketing planning eliminates surprises, and creates an effective climate for managing change.
89
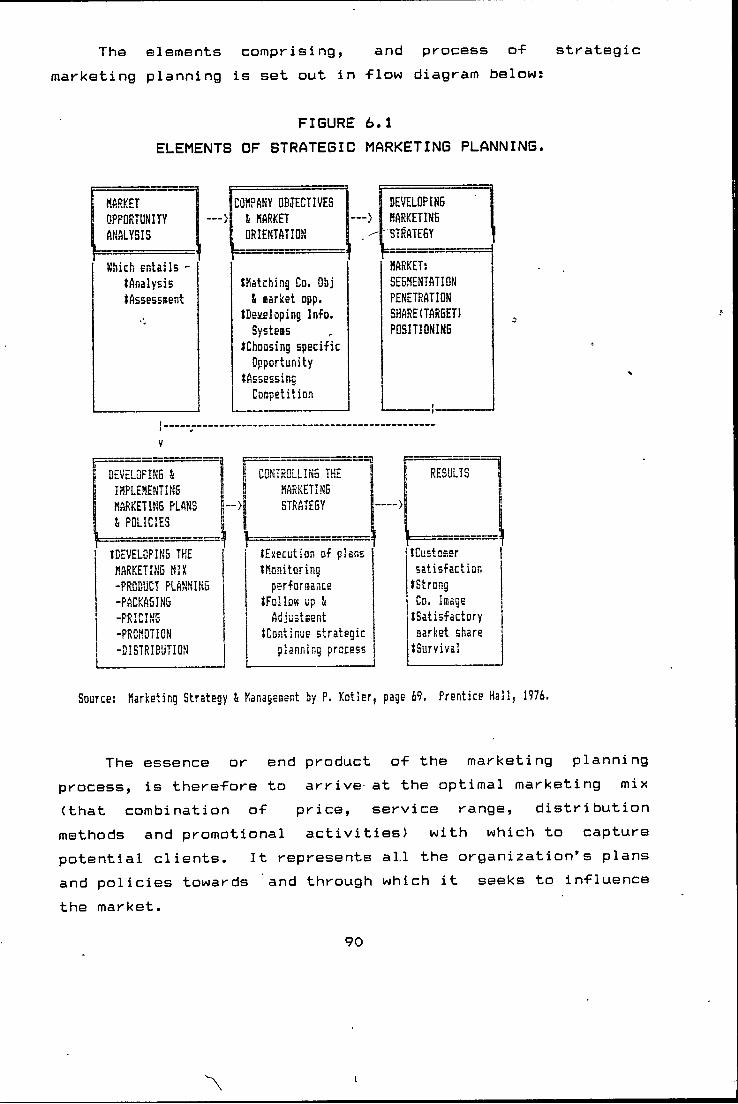
The elements comprising, and process o-f strategic marketing planning is set out in flow diagram below:
FIGURE 6.1ELEMENTS OF STRATEGIC MARKETING PLANNING.
HARKETOPPORTUNITYANALYSIS
— >CQRPANY OBJECTIVES
& RARKET ORIENTATION
DEVEL0PIN5RARKETINB
"STRATEOY
Hhich entails - tAnalysis lAssesssent
tRatching Co. Obj & earket opp.
{Developing Info.Systeas
{Choosing specific Opportunity
{Assessing Cospetition
HARKET; SE5RENTATI0N PENETRATION SHARE(TARBET) PDSITIONINB
1
V
BEVELQPINS 4 | IHPLERENTINS 1 RARKETINB PLANS | 4 POLICIES'i J
~ >
CONTROLLING THE RARKETING STRATEGY
1 iI
RESULTS
1 - - - -... ....... ...{DEVELOPING THE {Execution of plans tCustoaerRARKETING HII tHonitoring satisfaction-PRODUCT PLANNING perforaance-PACKA6IN6 {fcllots up 4 Co. laage.pptrTMf: Adjustssfit {Satisfactory-PROMOTION {Continue strategic earket share-DISTRIBUTION planning process {Survival
Source: Rarketing Strategy & Ranagesent by P. Kotler, page 69, Prentice Hal!, 1976.
The essence or end product of the marketing planning process, is therefore to arrive at the optimal marketing mix (that combination of price, service range, distribution methods and promotional activities) with which to capture potential clients. It represents all the organization’s plans and policies towards and through which it seeks to influence the market.
90

6.2 THE ROLE OF MARKETING IN PORTS
Changes in ship size, transport cost and the need -For intermodal interchanges have significantly affected the port routing decisions of ship operators. The tendency is for a large percentage of a region or country's traffic to be concentrated at a few ports, especially in the deepsea trades, from which other locations are served. There exist mega ports where well in excess of 50/4 of the traffic handled are often not destined to or originating from their immediate hinterland or even country. Witness Colombo, where 70/4 of its containerized cargo is transhipment * .
The corollary is that there are ports which will experience undef— utilization by virtue of their traffic being handled in another country's port. In the case of non-island states, the need for a port can all but disappear.
Based on the manufacturing concept of using marketing techniques to stimulate demand, port management often tends to view the role of marketing in ports as being limited to i ncreasi no the utilization of port facilities. While this is no doubt a very important function, it nevertheless represent a rather narrow perspective. A more liberal view may be to regard marketing in the light of imorovi no the utilization of port facilities. The distinction is subtle, but nonetheless important. The former bears the connotation of increasing the throughput, while the latter places•emphasis on the efficient utilization of port facilities, including
a) more efficient allocation of resourcesb) attracting new traffic
^ Lecture on Port Marketing by E. Pollock. WMU, Malmo Sweden. August, 1991.
91
c) Ksducing unl't cost of opsratlons and Ltlt,i(nat.elyy d> Improving the port's profit position.
An additional and important function of port marketing can also be identified. Viz:
e> Improving customer and worker relations.
It is within the context of these functions that the relevance of the planning process (or marketing scope) described earlier, will be discussed.
r,. . - •6.2.1 IMPORTANCE OF SETTING PORT OBJECTIVES
The existence of a port selection process (discussed in chapter 1) implies that the choice of ports of call is not fixed, but subject, in varying degrees, to external influences. This means there is scope for the port’s management to influence the carriers and cargo interests decision as to the ports to be used. The means by which it seeks to influence their action must however be based on the overall objectives of the port as derived based on a situation audi t.
The need for clearly defined port goals and objectives is very basic to its long term existence, since it represents the company’s mission translated into precise targets and thus serves as a powerful management tool. It provides (a) the people in the company with a specific sense of their role in the company’s overall plan, (b) a basis for consistentcoordinated decision making and planning among the various echelon of management and stimulate or motivate action for their achievement, and (c) a basis from which to measure actual performance and thus represents a vital control tool.
(5iven the port’s mission, formulation of objectives (in
92

terms o-F what markets to target and with what services) should include :
a) Environmental Analysis & Forecastb) Industry Analysis and competitionc) Analysis o-F Organizational Strengths & Weaknessesd) Development o-F Market in-Formation system
The analytic process just described may be summarized in the diagram below:
FIGURE 6.2 PROCESS OF STRATEGIC PLANNING^ » - ' < • * ' •
SDurcE! UNCTAD Sesinar papers on Strategic Planning for Senior Shipping Hanagers
The mission oF ports may often not be stated explicitly but may be deduced based on the policies or objectives adopted. R. 0. Goss identifies three frequently stated objectives of seaports Namely,
i) to increase employment in the localityii) to maximize profits, and,iii) to create added value through economic efficiency.
Moving from the broad policy objectives, ports need _ to
•^Economic Policies & Seaports: 1.Management 1990. vol. #17.
93
Maritime Policy &

in order to determine where theanalyze the market opportunities lie and how to respond to them. Based on the process outlined above, the first step is an analysis o-F the present environment and -Forecast o-F its -Future behavior.
6.2.1 ENVIRONMENTAL ANALYSIS FORECAST
The demand -For port services is derived based on the need to transport goods -From one country to another or within a country through the use o-F maritime transport. There-Fore key •Factors which in-Fluence the demand -For port services are necessarily those that a-F-Fect trade in general. Such as general state O'F the national regional and global economy, commodities traded, shifts in pattern of trade, political events, currency fluctuations and so on. These were discussed in chapter 3 and may be summarized as follows:
- World economic growth is expected to average around 3% annually to the year 2000.
- The trend to the organization of regional trade blocs.
- New trade opportunities in Eastern Europe.- A shift in trade flow between USA and her trading
partners in an effort to reduce the balance of trade deficit.
- Weakening of the US dollar.- Trend in larger ship sizes, and non-standard ISO
boxes.- Liner trade is expected to average a rate of
growth, half that of the 11'/. expected for trade in general (see chapter 3, page ).
Another factor to be added is the short term impact of the increased oil prices as a result of the recent Middle East war, on the economies of oil dependent non-producing countries. It can be expected that this will . impact
94
negatively on their economic growth and there-Fore trade.
The above macroeconomic environmental conditions hold several implications for ports, which was also underlined in chapter 3. The most significant however, is the fact that cost efficiency will in the future be emphasized as the decisive factor in port survival, especially in the face of declining freight rates and the regionalisation of trade which can render the use of larger ships not as cost effective from a carrier stand point, as originally anticipated- The port’s management has to decide whether the objective should be towards say, providing the highest possible service, or the most economical — being a trade off between, service and quality.
6.2.2 INDUSTRY ANALYSIS & COMPETITION
"The essence of formulating competitive [marketing! strategy is relating a company to its environment. ...the key aspect of the firm's environment is the industry or industries in which it competes." ® An industry analysis includes therefore, a look at the company itself as well as the various actors in the industry which shapes its performance. These analyses will therefore look internally to pinpoint the organization’s strengths and weaknesses, then externally to identify opportunities and threats in order to formulate the appropriate strategies so as to minimize the impact of threats and or maximize the opportunities.
The internal analysis includes:
a) identification of the company’s major activities and its customers
=Note on the Structural Analysis of Industries by Michael E. Porter Harvard Business School (376-054). 1975. Page 1.
95
b) customers' requirements "From the organization and the price they are willing to pay. From a carrier standpoint, the decision to transship is based on the trade-o-F-F between the cost o-F making additional call (with a larger more expensive vessel), loading and discharging relatively small volumes o-F cargo,
\ and the cost o-F discharging a series o-F smaller consignments at one port and using smaller ships or inland transportation to convey them to -Final destination. Therefore as discussed in chapter 2, the choice of transhipment port must represent a combination of operational efficiency anxd low overall port costs. Indeed it is the former which by impacting on vessel turnaround time that is of great importance.
Cargo interests are concerned with speedy and safe transit of cargo through the port at minimum cost. . Operational efficiency itself assumes the provision of adequate port facilities and a well trained and highly motivated labour force. Price of port services must be distinguished from and is secondary to port costs to the users. The latter by virtue of including ship’s time, reflects to a great extent operational efficiency.
c) the company’s aspirations in the market place
d) identification of the company’s strengths and weaknesses in meeting customer needs relative to competitors
e) Legal/political constraints which will affect future growth and development.
An assessment of the other actors in the market who
96
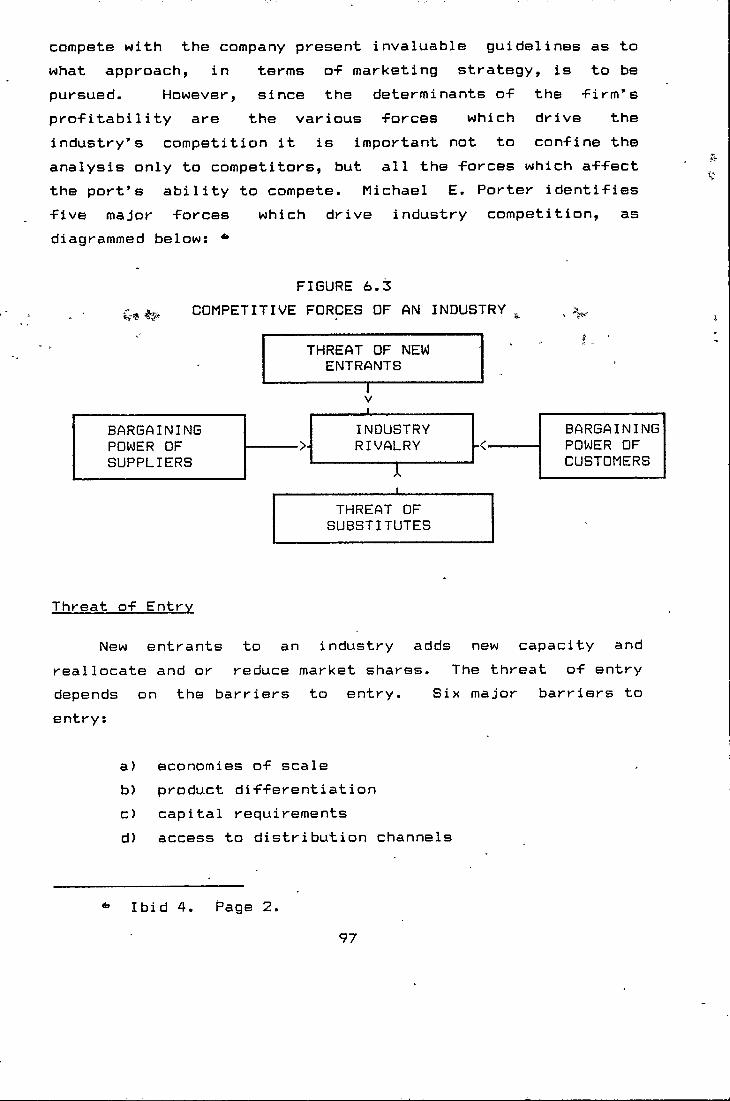
compete with the company present invaluable guidelines as to what approach, in terms o-F marketing strategy, is to be pursued. However, since the determinants o-F the -Firm’s pro-Fitabi 1 i ty are the various -Forces which drive the industry’s competition it is important not to con-Fine the analysis only to competitors, but all the forces which affect the port’s ability to compete. Michael E. Porter identifies five major forces which drive industry competition, as diagrammed below: ^
FIGURE 6.3 COMPETITIVE FORCES OF AN INDUSTRY
Threat of Entry
New entrants to an industry adds new capacity and reallocate and or reduce market shares. The threat of entry depends on the barriers to entry. Six major barriers to entry:
a) economies of scaleb) product differentiationc) capital requirementsd) access to distribution channels
97Ibid 4. Page 2.

e) other cost advantages -F) Governmen-t policy.
Based on the six -Factors listed above, it may be concluded that there are no substantial barriers to entry in the Port Industry. In that, it is di-Fficult to use a strategy based on di-Fferentiation and while capital requirements are substantial, governments and international lending agencies are willing to give ’ so-Ft loans’ -For port development. Government intervention through subsidies can also render a cost ine-F-Ficient port, price competitive. Government policies regarding permission to develop port -Facilities, by virtue limitation o-F jurisdiction, tend to deter new entrants only in the domestic arena.
The port industry is in a no win situation in this regard, since while there exists relatively low entry barriers, the market is still not contestable. This is so despite the -Fact that there exists possibilities to sell port equipment and reutilize port lands (often prime land), because governments usually prefer to continue subsidizing a port than have it closed. This attitude is often a function of the importance of the port and port related industries as employers of labour as well as the fear of depending on another country/port to handle its trade.
Competitive Rivalry
Rivalry occurs because one or more competitors either feels the pressure or sees the opportunity to improve position. It normally takes the form of price competition, advertising battles, product introductions and increased customer service." The degree of competition in theindustry is dependent on:
98■’Ibid 4. Page 8.

a) number o-F competitors, their size and relative power
’ b) rate o-F industry growth'c) level o-F -Fixed costsd) degree to which product di-F-Ferentiation is
possiblee) high exit barriers■F) capacity
The port industry is characterized by a prol iferation o-F ports o-F varying sizes with the top 10 accounting -For over 40% o-F total throughput in 1989 . ® The port recording thelargest throughput (TED) in 1988 was the port o-F Hong Kong with over 4 million TEUs representing a market share o-F 5.5%. KTO was itself ranked 42nd in the world container port traffic league, with over 180,000 TEUs representing a .25% market share. The big ports in the industry do not compete overtly on the basis of price, but rather on service innovations and performance standards. Relatively speaking, the dominance of a port is limited largely to the region it is in and the trade of that region.
After recording double digit rates of growth in the 1980s liner traffic growth is slowing considerably - a result of the declining possibilities for further containerisation of trade, especially in developed countries. This coupled with the larger number of container facilities in existence and those coming on stream, is a recipe for increased competition especially for transshipment traffic. The highly mechanized nature of container port operations dictates a high degree of fixed costs which in turn affect pricing strategies. Added to (d), (e) and (f)> it is evident therefore that the portindustry is a highly competitive one.
®Containerisation International Yearbook, 1991.99

Substi tutes
While there are no direct substitutes for port services, ports by virtue of being the interface between land and sea transport are nevertheless affected by factors which reduce the need for this interface. In the case of KTO., the use of the US Landbridge as against the Panama Canal has resulted in the restructuring of trade routes and decline in the demand for KTD’s services.
Bargaining Power of Users. i. 'V ,
• ‘ 'Buyers or customers compete with the industry by forcing down prices, demanding higher quality or more services, and playing competitors off against each other - all at the expense of industry profitability' . This quote aptly describes the position of ports today with respect to carriers. The fiercely competitive nature of the port industry gives port users and in particular carriers, enormous leverage in terms of dictating the service quality and significantly influencing the price the ports charge. That this erodes port profitability is evident. Huge investments are undertaken by ports to achieve or retain the competitive edge. At the same time the level of tariff cannot be significantly increased to provide a reasonable return on investment, relative to cost of capital. For example during a study tour to the port of Rotterdam, it was mentioned by a speaker from a stevedoring company that one of the biggest stevedoring companies on the port records a turnover of several billion US dollars, yet makes a profit of a couple million. This would seem to indicate the cut throat nature of the competition which forces such high cost levels, or a need for cost controls. Carriers are made even more powerful when their contribution. to the port's traffic is a large proportion
Note on Structural Analysis of Industries by Michael E. Porter. Havard Business School (376-054). 1975. Page 12.
100
d -F total Terminal tra-F-fic.
Bargaining Power o-F Suppliers
From a port stand point, the most important and power-Ful suppliers are the stevedoring bompany and labour unions. Terminal Operators rely on stevedoring companies to provide well trained and motivated labour -Force at an economic cost. Thus both its operational and cost e-Fficiency relies heavily on the stevedoring companies. Also the power o-F unions cannot be overemphasized. Tightly unionized labour can bargain away the competitive position o-F ports as demonstrated by the. UK experience under the Dock Labour Scheme. It was shown that with the present labour arrangement on the Terminal, KTO -Finds itsel-F in a position o-F dwindling pro-Fits in the -Face o-F high labour costs, while increasing labour unrest is serving to undermine the credibility of the port and ultimately throughput.
By setting port objectives, it not only provides a plan of action and means of management control, but by virtue of dictating an analysis of the port’s current position and the prevailing environment in which it operates, it forcesmanagement to make assumptions and forecasts of the future behavior of the market. They are therefore in a position to better seize any market opportunities that may arise or mitigate the impact of any threats. This assessment of the competitive position of the port is referred to as the SWOT (Strengths, Weaknesses, Opportunities and Threats) approach and is an essential step in formulating port objectives and therefore, marketing strategy.
6.2.2 MARKET OPPORTUNITY ANALYSIS IN A PORT CONTEXT
Market opportunity analysis aims at identifying scope for
101
•future growth and development of the port, by examining trends in the market and evaluating whether opportunities exist which can be exploited on a profitable basis. Generally speaking, the opportunity -for a port to grow will depend on the vibrancy o-F the national economy’s trade and the existence o-f good port infrastructure at competing ports. It will also depend on the region’s trade and the efficiency of the transport link between the various countries. It is the latter which will provide transhipment possibilities for ports.
In searching for transhipment opportuni.ties the following considerations are applicable:_ # •i) what are the transhipment motives of carriers,
and,ii) how the port can cater to these needs.
E. Pollock highlights the following as being themajor driving force behind a line’s decision to transship:
- rationalization of services, reduction on costs and increasing operational flexibility
- logistical advantages such as the exchange ofcontainers between different services operated by the same line or consortia. This also widens the market served, by increasing the number ' of destinations that can be reached from one port.
sufficient reduction of ship’s time so that fleet size can be reduced
- where the geography of certain countries, for example those with long coastlines and high inland
Based on a discussion with Prof. Pollock during the authors visti to London, March, 1991.
102

transport cost, may necessitate calling at several ports, so -Fragmenting the cargo availability of each port
- when an existing service is operating with capacity for extra cargo
- when extra capacity is planned either in the form of larger vessels and or additional vessels, making possible increases in service frequency. Such situations increase the need for extra cargo, hence
, the search for additional markets
- possibilities also arise when lines are introducing new services, which may still be at a formative stage of development
- conditions at other ports which preclude or make direct calls less favourable as far as the line is concerned.
Additionally, the trend in shipping services offered by carriers to shippers can offer a port scope to carry out a transhipment role. More and more carriers are catering to the needs of shippers in other respects than mere transportation. Thus keeping abreast of the latest developments in this area, will also indicate the future role expected of ports.
6.2.3 DEVELOPING A PORT MARKET INFORMATION SYSTEM
In order to carry out the foregoing analyses, an efficient and up to date' market information system isessential. Decision makers must constantly be on the alert for leading indicators of business activity, signals and signs that will alert them to possible changes, new markets, changes in competitors’ strategy, or general development in the
103
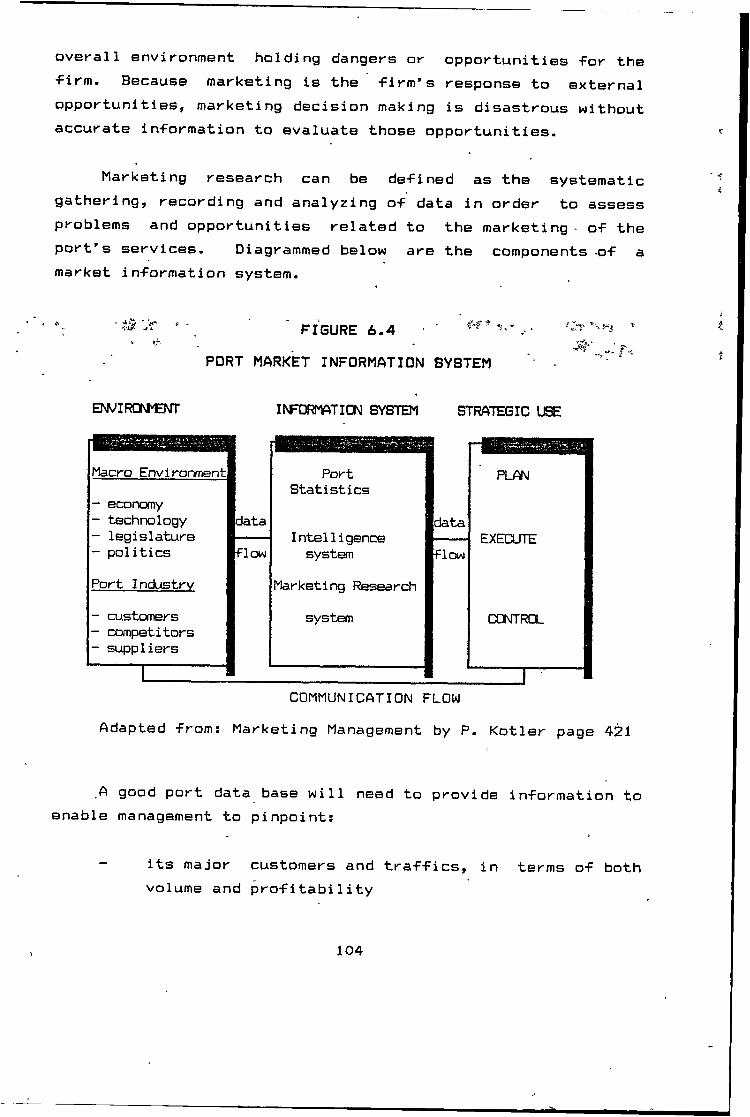
overall environment holding dangers or opportunities -For the •Firm. Because marketing is the firm’s response to external opportunities, marketing decision making is disastrous without accurate information to evaluate those opportunities.
Marketing research can be defined as the systematic gathering, recording and analyzing of data in order to assess problems and opportunities related to the marketing of the
s services. Diagrammed below are the components of a market information system.
* ■■ figure 6 . 4 ■ ■' ‘ -St*'PORT MARKET INFORMATION SYSTEM ^
EIWIROISMENT IIVFDRMATION SYSTEM STRATEGIC USE
Macro Environment Port PLANStatistics- economy- technology data data- legislature Intelligence EXECUTE- politics Flow system FlowPort Industrv Marketing Research- customers system CONTROL- competitors- suppliers
1 _____ ILJ'COMMUNICATION FLOW
Adapted from: Marketing Management by P. Kotler page 421
,A good port data base will need to provide information to enable management to pinpoint:
its major customers and traffics, in terms of both volume and profitability
104

general -financial per-formance o-F the port
operational data regarding capacity and manpower
- activities or developments planned by ' competing ports which can a-F-Fect demand -for the port's services
~ current and -future changes in the pattern and volume o-F trade -for particular countries and a regions
- operating strategies . o-F major carriers, including. present and targeted users of the port’s facilities
financial position and market share of current and potential customers
governmental regulations that will impact on the port.
Some of these data are available from the port’saccounting system, while others will dictate the need for external market research. Appendix 6.1 tables some important sources of shipping industry information, while Appendix 6.2 provides some considerations in carrying out a frequently used market research technique in the shipping industry - postal market surveys.
Having reached the point of identification of objectives in the context of market opportunities versus the port's present position, the next step is to devise the strategy (plans) to achieve the objectives.
105

6.3 DEVELOPING THE MARKETING STRATEGY
The development o-F a marketing strategy or plan o-F action involves two basic steps. The -First is the selection o-F target markets and the second, the development o-F e-F-Fective marketing proarama to win these markets.
6.3.1 MARKET SEGMENTATION & TARGETING
Market segmentation is • the process whereby management tries to identi-Fy di-F-Ferent user groups who would probably be most receptive to using the port’s -Facilities, and so target them -For their marketing e-F-Fort. By selecting target markets the port is able to utilize its resources more e-F-Ficiently by -Focusing on a specific group’s needs and wants. In the selection of market segments the following criteria must apply:
i > measurable
ii access i ble so that the firm can focus its efforts at it. Chances of success must take account of, and. identify how satisfied the target is with their present port of call.
iiiJ substantia1 enough to be exploited on a profitable basis. This is important since it would not be cost effective nor profitable to develop the service for a segment too small to offer favourable return on required investment.
Market segmentation also involves selecting target markets, since it . is not possible to pursue all traffics due to resource limitations; there is little point in winning new business only to lose existing customers due to congestion or lack of capacity. In selecting
106
target markets. due
%
consideration must be given to the existing (and planned increase in ) capacity.
Rasas o-F Port Market Segmentation and Ta>"netlnfl
Market segmentation -for ports will -Firstly be geographic, based on trade patterns and the port's proximity to the various trade routes. This will then be narrowed according to the type and -form o-F commodities being traded, and those the port is interested in pursuing.
Dividing the market on a-commodity basis is especially useful in the port development phase, since the type and form of the commodities to be handled would largely determine the type of facilities required. Similarly, it provides a useful indication of the types and probable sizes of ships that can or are expected to use the port facilities. Commodity classifications which will affect and dictate terminal facilities and thus serves as a useful basis of segmentationare;
i) dry bulk cargoii) liquid bulk cargoiii) general cargo break bulkiv) containerized cargoes: dry and refrigerated; Ro-Ro
and Lo-Lo.
Since the port cannot take its services to the lines, the factor of deviation distance (and therefore cost) to call at a port will influence the carriers decision and so must also be considered by port management. Another factor is thestrategic location of the port to blend in with the carriers- overall operational strategy -does the port afford smooth connections between the various inter-1inking services of the carriers? Based on these, specific carriers and cargo
107
interests may be targeted.
^ t was previously mentioned that a market segment in order to -Facilitate success-Ful targeting without wasting resources must be viable. This means that an evaluation o-F the various possibilities is essential. Estimates o-Fpotential tra-F-Fic volume and income level, the port’s cost o-F pursuing and servicing this market and ultimately, the expected contribution o-F this market segment to the port s overall pro-Fitabi 1 ity is essential.
6.3.2 CONSIDERATIONS IN THE DEVELOPMENT OF A PORT MARKETING MIX
The marketing mix represents the various media through which any organization seeks to secure the patronage of the target market. In general, these are identified as being the price, product/service, distribution channels and promotional- efforts. In a port setting, these therefore comprise the combination of:
i) service quality and range il) tariff levels, andHi) selling and promotional activities.
Distribution refers to, the various channels through which the product or service reaches the customer. The simultaneous production and consumption of port services necessarily means that the distribution is embedded in, and a part of the service. For this reason, considerations regarding the service, incorporates that of its delivery.
6.3.2.1 PLANNING PORT SERVICES
Planning the range and level of port services in the marketing mix entails ascertaining whether the present quality
108
This -Fact would havelevel is as desired by customers, emerged -From the analytic process based on market research. It a^o involves setting targets -For service quality, in terms of (a) productivity levels and (b) maximum vessel waiting time.
Since productivity levels are functions of the performance of labour and equipment, due consideration needs to be given to labor motivation, remuneration and training, and equipment supply and maintenance. Other factors which impact on productivity such as imbalance between the various subsystems of the port will need to be taken into account and plans made to address these.
It may be that changes will need to be made in the operational planning. Especially in the container shipping industry where the vessel's daily cost is high, rapid turnaround is vital. This is not only a function ofproductivity alongside berth, but of total time in port. It therefore becomes essential to also minimize the time spent in port before receiving a berth. Other services which impact on the ship’s stay in port such as pilotage, towage and customs documentation may need to be considered for improvement.
Additionally, it may be that there exist inadequate berthing space, which may indicate the need for newinvestment. At this point the need for targets being set cannot be over emphasized. While the ideal situation from a carrier perspective is zero waiting time, which means the availability of a berth at all times, it is not feasible to provide the needed numbers due to investment cost to the port.The port needs to establish the maximum time it can afford
to have ships waiting, bearing in mind the need to satisfy customers so as to retain their business. Based on this, some notion of the required number of berths needed can be gained.
109

Improvement o-F service to users may also be looked at through more involvement of the port in the through transport
'Hkprocess. It may be through providing information to users about alternative modes of transporting cargo to and from the port (feedering services, rail and road) and some indicative costs. It may be that there is a need to get involved in the actual arrangement of on-carriage either through contracts or direct investments.
The decision will need to be made as to whether the port should seek to increase customer satisfaction and entice new users by offering new services,* such as EDP logistics and distribution services. Some ports have seen the benefits in terms of improved customer service and operational planning, of establishing links with ports on the opposite end of their trade. Ports such as Hamburg, Bremen and Rotterdam have set up EDP links with their opposite number in Asia and the United States (Singapore and the port of New York). This ’data bridge’ gives instant information to customers on,cargo flow, while by providing data on the number and type of containers to be shipped to the port, the identity of consignees and a breakdown of the status in terms of FCLs and LCLs, it affords the port a higher degree of operational pre planning.
The cost benefit trade off needs to be considered as well as whether the existing level of port competition requires it. Clearly, if the major competitors have gained an edge by offering this facility, it may be that it will constitute an important service improvement feature for the port, in order to avoid loss of business, and so the benefits will outweigh the cost. On the other hand, if it does not already form a part of the existing competitive arsenal, then the decision to pursue its development must rest on the financial costs to be incurred versus additional revenues to be gained.
no

6.3.2.2 PORT PRICINB POLICIES
Port tari-f-Fs represent the remuneration to the port -for its various services, and in the case o-f ports operated on a commercial basis, represents the means o-f achieving its -Financial objectives. While the prices o-F the various port services are usually stated in a published tari-f-F (see appendix 6.3), in addition to planning the tari-f-f level, consideration should be given to the need -For a -Flexible pricing policy. This may be in the -Form o-f:
<i) incentive rebates -For large throughput customers;(ii) lower rates to encourage new tra-F-Fic and(iii) incentives or penalties to encourage e-f-Ficient
utilization o-F port -facilities.
A prerequisite to employing a flexible pricing policy is a knowledge of port costs. It is important to know how low charges can go if necessary, without being uneconomic. If it is desirable that each traffic/customer make a contribution to the overall profitability of the port, then this will dictate the minimum price be at least above direct costs.
A position on the desirability of special agreements with individual customers re tariffs will- need to be taken: somecustomers may prefer the simplicity of a consolidated rate while others prefer detailed breakdown-so that they have scope to arrange their operation in order to minimize outpayment. It is important for the port's management to have policies that respond to these needs, since it may affect the user's confidence in the port. Considerations as to special charges to encourage different traffic is also necessary. For example lower charges for transhipment versus domestic cargoes.
Due note must also be taken of the charges at competing ports (if available). This will indicate the scope for
111
•further increases, especially regarding increased charges in light o-f additional investment in improved port -Facilities.
6.3.2.3 SELLING & PROMOTION OF PORTS
Before looking at the factors to be considered in the port selling and promotional effort, a distinction needs to be made between marketing and promotion. Marketing has been defined as the analysis, planning, implementation and control of plans aimed at satisfying port users. It involves devising that combination of service variety and quality, price and promotional activities, that will do so effectively. This means that promotion and selling is only one of the activities necessary in marketing the port.
Promotion and selling involves the overt efforts to increase customer and the public awareness in general, and usage of the port. Typically, a port will consist of several companies - competing and complementary. It is here that the distinction becomes important since it also dictates the division of the marketing effort. the role of promoting the entire port is normally the function of the Port Authority or an association of port companies (terminal operators, stevedoring companies, Agents, forwarders, truckers etc.). The task of promoting and securing business for a particular port company, say a terminal operator, must be theresponsibility of the latter.
Port authorities and associations increase awareness of and generate interest in the port and can secure business for the port in general but should not allocate it to the port companies. For this, the individual companies should compete. While this arrangement does not preclude individual companies carrying out their own promotional activities to secure business, it does save costs and provide an integrated picture
112
o-F all the various port services to potential users. Such port bodies as the Port Authorities are therefore, allowed to solicit business but cannot conclude contracts or set rates though they may regulate it.
Whether promotion and selling efforts are being carried out at the port or company level, consideration has to be given as to whom the effort is to be directed at : shipowner, shipping agents, exporters, importers, forwarding agents, marketing boards and so on. This will depend on theirperceived power (based on market research information) to influence or control port routing. , ■
f .r
The effectiveness of the various media type for the different target audience is also important. This point cannot be over-emphasized, from both a cost and impact stand point. For example the use of television advertisements might be appropriate in a public relations effort but quite inappropriate compared to say trade journals, for reaching potential users.
6.4 ROLE OF THE MARKETING MIX IN ACHIEVING PORT OBJECTIVES
The next phase of the planning process is to develop the actual marketing strategy for the port." This involves the development of the marketing mix based on the objectives, and markets targeted. The final marketing plan must also consist of:
a) targets and projections (in terms of TEU or tonnage) by traffic types
b) a budget of both financial and human resources to beexpended in the marketing effort, and
113

c) a statement allocating the marketing actlvitlBB among the various elements of the mix.
As can be seen, this represent the actual plan formulation phase, which, as stated earlier, is the concern of chapter 7. In this section, the role of the marketing mix in addressing some of the concerns of ports will be explored. Earlier, these concerns were identified as (a) more efficient utilization of facilities and (b) improvement of customer and worker relations.
6.4,1 The role of the marketing mix in improving efficient port utilization
Inefficient usage of facilities may occur as a result of excess capacity or too high a level of usage, which results in congestion or alternating situations of peaks and troughs in usage. In the case of the existence of excess capacity the aim will be to attract new, and of course, profitable cargoes.In the case of the latter, the need may be to increment
capacity. Judicious manipulation of the marketing mix can delay or reduce the need for new investments or attract new traffic to the port.
The fact that port services cannot be produced and stored ahead of demand, and that ship arrivals are not always predictable and will often tend to bunch, means that port facilities will experience periods of under-utilization and congestion. Seasonal demand for port services may be smoothed by pursuing a pricing policy wherein lower rates are charged for usage during the off-peak periods. This should serve to shift or spread some of the demand and so reduce congestion and the need to increase capacity.
114

Alternatively, it may be possible to encourage a -Faster turnaround o-F vessels;
i) by calculating ship related charges based on time spent alongside. Increasingly, this is being used and is more e-F-Fective the shorter the time -Frame -For the charge. For example, charges based on hourly rates would be more e-F-Fective than a daily charge.
ii) higher tari-FFs may be levied on vessels lying alongside port facilities and not working cargo.
iii) higher rates may also be levied for vessels working slower than average -'
iv) incentives can also be given to encourage rapid despatch: For example, port Klang in Malaysiaoffers a reduction in wharfage charges for vessels of certain size which leave the port in under eight or six h o u r s . A n o t h e r basis which might be more fruitful from a port management point of view, is to offer similar reductions to different categories of ships, but also based on the quantity of cargo worked per call, since the time spent alongside is also a function of the cargo volume to be handled. Another example, is the strategy used by Singapore and Kaoshung <Korea) wherein ships not leaving berth within say two hours after completing work, pay extra charges, which can amount to five times normal charges. All these representeffective methods of persuading more efficient usage of berthing space.
* ‘ Lecture August, 1991.
on Port Marketing by E.' Pollock. WMU,
Similarly, more efficient usage of storage areas can be made by shortening the free periods and using an escalating rate for succeeding days above the free period.
Where situations of underutilization (not attributable to seasonal fluctuations) exist, the task is to use the marketing mix to attract new traffic. In this context it has already been shown how port marketing can serve to pinpoint new market opportunities. For a port pursuing new traffic, it is important that its tariffs be flexible in order to enable negotiations. Increasingly the trend is away from standard tariffs, in favour of individual contracts based op what the traffic will bear. This also means that there must exist proper knowledge of the carriers' revenue base.
6.4.2 The role of the marketing mix in improving customer and worker relations.
'Improving customer relations’ is a somewhat nebulous objective, but a practical one nonetheless. The port's success in maintaining or improving these relations will depend on its awareness of what is desired by the users, which is in turn a function of good market research. However, broadly speaking, the port can increase its ’popularity’ among its users by maintaining a high market profile and more importantly, by offering practical assistance when and where necessary, through:
Keeping in touch. It is through constant dialogue with customers that port management can isolate problems in both its operation and that of the customers, and can make corrections or suggestions/accommodations. Customers’ problems are often good sources of market opportunities.
116
- Providing -Facilitiss (where -Feasible) that are necessary to the customer’s operations, but which it might not be economical -For them to invest in. A good example o-F this is an electronic data processing service, especially with regards to vessel cargo planning and container tracking. These are now provided by many ports -For a nominal fee. Another example is the provision o-F storage space and processing zones -For manu-Factur i ng, along with computerized logistics system to e-F-Fect the accurate and timely distribution o-F cargo. It caters to the manu-Facturers need to reduce inventory and transport cost while still being able to respond to the market.
- Market surveys carried out by ports can serve toindicate possible sources o-F cargo. Suchin-Formation is invaluable to carriers, and with the prior approval o-F the companies surveyed can be copied to shipping lines. ■
- The port's promotional e-F-Fort is also important.While the previous steps are well known by the recipients o-F the assistance, promotion through trade journals and trade fairs are useful in broadening the awareness among other sectors of the market. Increasingly, advertisements in tradejournals are no longer limited to detailing port facilities and using catch phrases, but to explain how the port has solved a particular customer's problem - a testimonial form of advertising. Trade fairs are also invaluable sources of market contact, as well as well as advertising media, in order to increase port awareness.
The level of staff motivation correlates with that of productivity. It is therefore necessary for the port's management to seek means of improving the motivation of
117

workers. Methods such as incentive schemes and profit sharing schemes are in place in most ports. However, a significant influence to staff motivation and morale, is to receive public acknowledgement for good performance. The port of Singapore has found an effective (if not novel) means of doing this. That is, through its fortnightly port magazine. Port View. Here pictures of staff who achieved high productivity (often bannered as 'performance above par') on a vessel, are shown along with details of the vessel, the performance level, difficulties encountered and overcome during the task, and some group (eg. trophy) memento received for the performance. A port magazine can also serve to increase staff awareness and interest in the port's performance, competitors and the industry as a whole.
Thus it can be seen that the scope of the marketing mix to achieve port objectives are many and varied and limited only by management's ingenuity. It also demonstrates the need for a designated group of people to be responsible for the planning and coordination (a marketing department) of all these activities, since they impinge on all the aspects of the port.
6.5 CONTROLLING THE MARKETING STRATEGY
While planning is concerned with deciding what needs to be done, the emphasis of control is on the setting ofstandards, measurement of performance against these standards to evaluate achievement level and take corrective action.There are three levels of marketing control;
Strategic Control: This is the responsibility of topmanagement and entails an evaluation of whether the company is pursuing the best markets, offering the right products and using the most effective means of communicating it. Todetermine this a marketing audit is carried out, the aim of
118
which is to examine the organization's marketing environment, internal marketing system and its marketing activities, to determine problem areas and recommend a corrective action plan to improve e-F-Fectiveness.
ii) ftnnual Plan Control Involves various levels o-F management in determining whether the company's annual objectives are being met, using various per-Fprmance measurement tools such as
(a) revenue analysis, which tries to identify the various factors which contributed to the observed variance.^^,
■V ’ ^ '
(b) market share analysis.. Since the level ofthroughput does not itself indicate how well the port is performing relative to the industry, a market share analysis is often used. It suggests whether the changes in port performance were due to uncontrollable outside forces or whether there is a weakness in the current marketing program.
c) Expense-to-revenue ratio. This aims at keeping tabs on costs so as to ensure that the port is notoverspending to achieve its objectives. Differentratios may calculated for the various expense categories so as to detect which area of expenditure is causing the problem. Of necessity, some fluctuations will be random, so it is up to management to be able to distinguish these form 'real' fluctuations. Management needs to observe changes over several periods and plot these on a chart in order to detect the underlying trends.
d) Attitude tracking involves monitoring customers' attitudes to the port's services. If it is found that esteem for these services is falling, this can be a signal for management to take immediate action to restore
119
image or expect a downturn in its terminal usage in the ■Future and ultimately in its pro-fitabi 1 ity.
iii) Pro-Fltabi 11 tv and Control. It is not enough that the port is making a profit, management needs to know what specific areas of activity are making the profit, and how much. It is essential to gauge the profitability of each of the port’s services.■ A good costing system and a sound basis for assigning common costs are prerequisites to useful profit centre analyses.
' 4., , , - . ' ■
120
c m a f >t e : r •7’
TO W A R D S A MARICETTI K f G RLAIST R O R K T O
The objective of the previous chapter was to highlight the role and importance of marketing in the achievement of various port objectives. It concentrated mainly on outlining the marketing planning process and its relevance, or justification for its application to ports. Assuming that it was successful in establishing the desirability of the marketing approach, the natural progression is to move from the planning phase to the . 'doing' phase. That is, how to actually prepare a marketing plan. Since the principal aim of this paper is to develop a marketing strategy for KTO, this seems the ideal point at which to merge the somewhat geheral discussions in chapter 6, with the company background and analysis of chapters four and five, sind move towards a marketing strategy for KTO.
Three ingredients were mentioned in the previous chapter as being essential to any successful marketing endeavour: Namely, aservice oriented to customer needs and wants; a marketing department with the responsibility for detecting these needs, developing the required services and devising effective means of establishing customer awareness for the port and its services; and finally, a marketing plan which identifies strategies and responsibilities for their implementation. The firstrequirement can be dealt within the actual marketing plan. Accordingly this chapter will consist of two broad sections. The first will be in the form of a recommended marketing department structure for KTO, while the second will detail the steps in the preparation of an actual marketing plan or strategy, using KTO where possible, as a case study.
7.1 RECOMMENDATIONS OF A MARKETING DEPARTMENT FOR KTO
It was shown in chapter 4 that KTO does not have a marketing department and that marketing, was carried out on its behalf by the Port Authority of Jamaica (PAJ). While this had certain
121

benefits <also mentioned), given the PAJ's involvement in and responsibility for all the Jamaican ports, it is inevitable that enough attention is not given to marketing of the Container Terminal. Thus such marketing activities as research and analysis are often carried out on a 'once off' and rush basis, immediately before a promotional tour. It has been demonstrated that marketing is a continuous process of monitoring and evaluation of market developments, so as to identify growth opportunities for the port and devise strategies for exploiting them successfully.
It is therefore vital that KTO establishes its own marketing department, with the requisite responsibility and authority to carry out these functions. A division will need to be made between the future marketing role of the PAJ and this new department. Since the container terminal operated by KTO is actually owned by the PAJ, the Terminal's management will need to convince the PAJ that such a change is not an attempt to shut them out, but is critical to the future success of the port. It may be that the PAJ will continue to carry out the promotion andpublic relations functions, but KTO the other marketing aspects.
rGiven the constraints on costs and the current low level of
business at the Terminal, the proposed department should be as small as possible without impairing its functionality. The following functions are identifiable:
1. Market Analysis and Forecasting2. Identification of new services and markets3. Strategic Planning4. Customer relations5. Promotion and Public Relations
For this the minimum requirement in terms of personnel is five to seven, with responsibility for:
i) Planning (the manager),ii) Information Gatheringiii) Statistical analysis and forecastingiv) Customer relationsv) Department administration (the secretary).
122

The above manpower program assumes that the PAJ inconjunction with KTO's executives, continue to carry out the actual promotion and public relations function of the Terminal.
Planning
The Marketing Manager should have at least a first degree in the social sciences (marketing, management or economics), plus experience and broad based knowledge of the shipping industry. He should report directly to the Managing Director. It is important that he be given the necessary level of autonomy and authority to plan and carry out the port's development . It is essential for him to have good communication skills, since there will be a need to liaise with and win the cooperation of the various departments. The support of top management also playsa vital role in his ability to solicit the degree of cooperation needed from other departments. Ideally, plans will need to be developed and approved on a team work basis, incorporating all the other members of the management team. The emphasis here is teamwork. Top management will also have to ensure his accountability in terms of plans as against achievements.
Information Gathering
Information gathering is indispensable to good analysis and planning. Relevant information will surface from any and varied sources. Therefore the person responsible for this task must be patient and thorough. Since it involves a great deal of reading, extraction and classification of data, the candidate for the job should possess a literary background. Perhaps a degree or diploma in the arts or social sciences.
Statistical Analysis and Forecasting
The job of statistical analyst involves evaluating the data gathered in order to identify possible threats and opportunities. The person employed will need to make assessments of the likely impact of economic and political policies on the port; to evaluate the environment, look at current trends in
123

cargo/commodity flows and services and forecast future ones. The Marketing Manager will need to rely heavily on his skills and ability in devising the actual marketing plan. For this task, a specialist in economic analysis is necessary - whether he has a port background or not. The possession of at least a first degree in economics or statistics is essential.
Customer Relations
Customer relations involves maintaining contact with current customers so as to ascertain their problems and the degree of satisfaction with the service quality of the Terminal as well as contacting and monitoring potential customers. This is also a task for the Marketing Manager, that is keeping in contact with the customers. But in order to give more time to the planning function, he will need assistance in this respect. The person assigned this job must have excellent communication skills, as he will need not only to speak on the phone and through the mail, but also make and receive personal calls to and from customers. An important element in his ability to deal effectively with the customer will be his knowledge of their relative importance to the Terminal, in terms of traffic volume and profitability. In such a case, this individual will need to possess information on the status of the accounts of the different clients. In fact, he can be very useful in assisting the Accounts Receivable department in their collection, efforts. This function may conceivably require more than one person, depending on the customer base and the level of attention required..
Department Administration
For the daily administration of the department, a secretary is essential. She will have the responsibility of the usual secretarial duties. At this point it must be stressed that the preferable combination is a typist and a secretary. The former would have the responsibility for preparing the various external and internal communications, manning of telephones and so on, for all members of the department. The secretary would be aligned primarily to the Manager . and ensure the administrative functioning of the department in terms of meetings, appointments
124
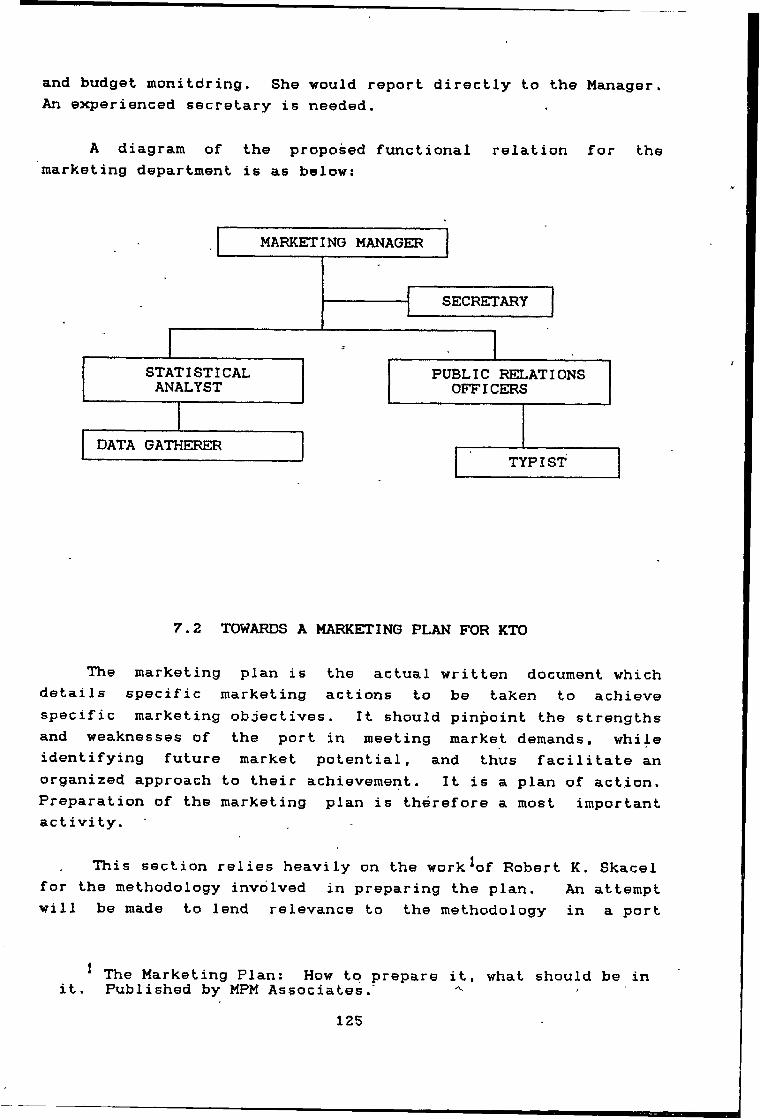
and budget monitdring. She would report directly to the Manager. An experienced secretary is needed.
A diagram of the proposed functional relation for the marketing department is as below:
7.2 TOWARDS A MARKETING PLAN FOR KTO
The marketing plan is the actual written document which details specific marketing actions to be taken to achieve specific marketing objectives. It should pinpoint the strengths and weaknesses of the port in meeting market demands, while identifying future market potential, and thus facilitate an organized approach to their achievement. It is a plan of action. Preparation of the marketing plan is therefore a most important activity.
This section relies heavily on the work^of Robert K. Skacel for the methodology involved in preparing the plan. An attempt will be made to lend relevance to the methodology in a port
The Marketing Plan: How to prepare it, what should be init. Published by MPM Associates.'125

context by using KTO as a study. It is intended that by so doing, the initial step in devising a marketing plan for the improvement of KTO's performance will have been taken.
Six broad steps in the development of a Marketing Plan can be identified. Viz:
1)2>
3)4}5)6)
The first four will form the focus of the rest of this chapter, while the guidelines for the establishment of the marketing budget is presented in Appendix 7.5. Forecast of profit is a function of throughput, price and costs. The latter two are internally decided to a large extent, and are therefore more predictable. The real task is therefore to attempt a forecast of terminal throughput. A methodology for forecasting container traffic is presented in Appendix 7.6.
Preparation of the fact base Identification of Strengths, Weaknesses, Opportunities and Threats (SWOT) 'A statement of specific objectives Development of the market strategy Establishment of a marketing budget Forecast of throughput and profit-
7.2.1 PREPARATION OF THE FACT BASE
The first step in developing the actual plan is to establish the basis for the plan. This is achieved by using the information gathered from the market information system discussed in the previous chapter. The fact base, so created, must give a thorough account of all the current conditions and situations in the marketing environment, pertinent to the current position of the Terminal, what is now being proposed as a solution and why. Since everything else flows from this fact base, it therefore represent a most crucial part of the entire plan.
Based on the analytic classification for the port fact base, presented in Appendix 7.1, the relevant fact base for KTO could be as below:
126

STATEMENT OF PURPOSE
The Kingston Container Terminal offers cargo handling services to port users.
IFACT BASE FOR KTO____________
1. THROUGHPUT
- For the years 1988-1990, a declining trend in throughput is observable. This is a result of a decline in KTO s share of the transhipment market. Recently, the domestic traffic also suffered decline due to worsening economic situation of the country.
- In the transhipment market KTO's customers consist entirely of the shipping lines, while for domestic cargo there is a combination of cargo interests and shipping lines. Their contribution to Terminal throughput is as below:
DOMESTIC TRANSHIPMENTZIM 26.6% 78.7%SEALAND 27.0 -EVERGREEN 14.0 -CAROL 20.0 16.7OTHERS 11.7 -
— Kingston serves a transhipment point via Zim for Miami, Houston, San Juan, Santo Domingo and Port-au-Prince. Domestic traffic flows are centred primarily around the USA, Far East and Europe and more recently the CARICOM countries.
2. MARKET
- Regional container throughput is increasing andtherefore the potential market for transhipment isgrowing.^
- Liner trade is expected to increase by over 5.1% to the year 2000. ^
127

2 FACT BASE FOR KTO (CONT'D)
- KTO's market share is falling.
- The Terminal is losing ground in transhipment primarily because of:
a) low service quality in terms of productivity and unreliability due to stormy labour relations.
b) poor security image re contraband in containersc) increasing use of the US Landbridged) increased port competition
“ The trend towards disintegration of consortia continues (Scandutch consortia will separate after January, 1991, for example). This has created new opportunities for ports, since these now independent lines are seeking hub ports for their operating networks.^
- Increased landbridge usage can be expected to continue in the future.
“ Increased container penetration for tropical produce is expected to continue. ®
- The latest trend in port services, in addition to storagefacilities, has been distribution logistics. Cargoinformation service using international EDP linkages has also been introduced by some of the leading ports in the industry.
- The trend in larger ships sizes necessitating required depth alongside of over 13m compared with 11 or so metres, increased crane outreach (post panamax) and air height to serve 5 high containers on deck, is now established in the industry.
128

3FACT BASE FX)R KTO <CONT'D)
- Productivity levels in ports are on the increase with market leaders such as Singapore recording average movesin exxcess of 40 per hour . Increased productivity isalso a function of newer equipment technology.
- After relative stability during the 1987-1988 period, vessel operating costs have experienced steep increasesexceeding an annual rate of 10%.^ . Shipowners will needto continue to exert tight control on costs in order to remain competitive. -
-i fi. , ■! 'a 9 '
3. THE MACRO ENVIRONMENT
- Expected change in the direction of trade due to:
* closing of gap in US balance of trade deficit and softening of the US dollar. Imports to US exxpected to decline while exports to increase.
^ creation of economic intra-regional trading blocs.In particular the reduced preference status of countries signatory to such trade treaties as LOME etc., following the European Community integration in 1992. Therefore a reduction in exports to these countries, from the developing world can be expected.
* decentralisation of production
« new market horizons for trade in Eastern Europe
^ scarcity of financial loans to developing countries expected in the future due to emand from Eastern Europe.
- World economic growth is expected to average between 3.2gto 3.5 percent.^
129
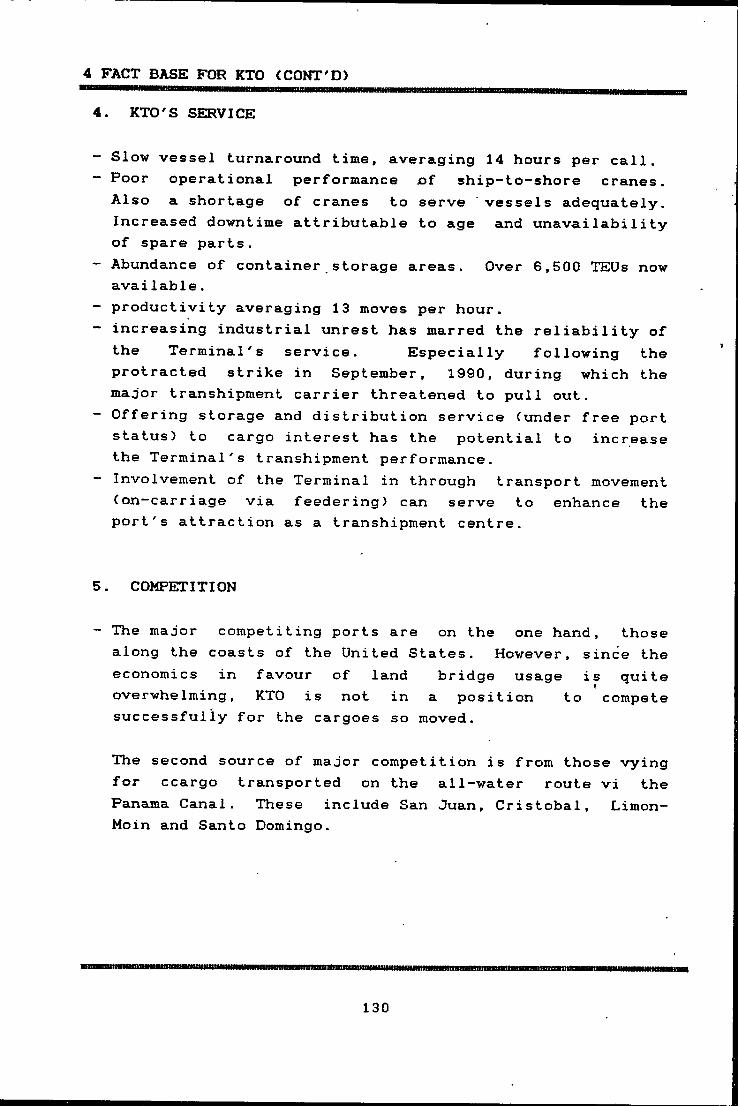
4 FACT BASE FOR KTO (CONT'D)
4. KTO'S SERVICE
- Slow vessel turnaround time, averaging 14 hours per call.- Poor operational performance of ship-to-shore cranes. Also a shortage of cranes to serve vessels adequately. Increased downtime attributable to age and unavailability of spare parts.
- Abundance of container storage areas. Over 6,500 TEUs now available.
- productivity averaging 13 moves per hour.- increasing industrial unrest has marred the reliability of
the Terminal's service. Especially following theprotracted strike in September, 1990, during which the major transhipment carrier threatened to pull out.
- Offering storage and distribution service (under free port status) to cargo interest has the potential to increase the Terminal's transhipment performance.
- Involvement of the Terminal in through transport movement (on-carriage via feedering) can serve to enhance the port's attraction as a transhipment centre.
5. COMPETITION
- The major competiting ports are on the one hand, those along the coasts of the United States. However, since the economics in favour of land bridge usage is quiteoverwhelming, KTO is not in a position to compete successfully for the cargoes so moved.
The second source of major competition is from those vying for ccargo transported on the all-water route vi the Panama Canal. These include San Juan, Cristobal, Limon- Moin and Santo Domingo.
................ ... . m
130

5 KTO FACT BASE (CONT'D)San Juan has the largest market share, but in general all competitors have been experiencing increased market share. The San Juan Terminal seems to be well developed. Cristobal's weakness is seen in terms of future scarcity of facilities relative to KTO:
KTO CRISTOBALBerthslengthdepthCranes __Storage <TEU) Reefer points
4640m 10.4 -11.9m56,500 72 plus 64 con air
2426m 10.7 - 12.2m 23,00040
In 1969 Cristobal handled over 100,000 TEUs. This means that to avoid congestion, an average dwell time of 11 to 12 days per container is necessary. It is therefore evident tliat Cristobal might face capacity problems in the future, not only in terms of transit areas, but maybe also, berthing facilities. Two cranes serving two berths also imply slow vessel turnaround and probably high vessel waiting time.
Notes1. See figure 5.12. Table 5.2 chapter 5.3. Chapter 3, page 5.4. During a field trip to Rotterdam, a visit was paid to Nedlloyds headquarters. The view of the Network Planning Manager was that, the next 5 to 10 years will determine the ports that will survive in the face of the reorganization of shipping networks, which, in his opinion, shipping companies will be making in the future.5. Trade Horizons; Annual Issue, 1990. Published by Port Import & Export Reporting Service (PIERS). USA. Page 3 of the report states that in 1989 15,000 more northbound containers of bananas & coffee accounted for more than 50% of trade increase from Central America.6. Port Views. February, 1990. Published by the Port of
Singapore Authority.7. Chapter 3, page 2.8. Lloyds Shipping Economist, Sept. 1991. Pages 6 & 7.
131

7.2.2 SWOT ANALYSIS
The SWOT analysis utilizes the management's perceptions of the various market trends, competitor's weaknesses and the company's own strengths in order to identify opportunities which may be exploited profitably. The analysis flows naturally from the prepared fact base.v/ Table 7.2 presents some guidelines in identifying problems and opportunities and these may be used to present a SWOT analysis for KTO as below:
6 SWOT ANALYSIS FOR KTO
STRENGTHS ,
1. Location of the port of Kingston relative toa) the major trade routes utilizing the Panama Canalb) the rest of the Caribbean, Central and SouthAmerica (see appendix 7.1 for comparative distances from Kingston and Cristobal to Major ports in the region).
2. Adequate availability container stacking space.3. Location of the Kingston Freezone adjacent to the
port with adequate storage and factory space.4. Adequate facilities for refrigerated cargoes.5. Modern EDP system offering container tracking and
cargo preplanning of vessels.6. Proximity to the US Landbridge makes it ideal
consolidation point for cargo between Far East and West Coast USA from the rest of the Caribbean, Central and South America.
WEAKNESSES
1. Poor labour relations and low level of motivation.2. Slow vessel turnaround due to ;
a) poor ancillary services such as pilotage and towage, and
b) an imbalance .in the cranes to berth ratio

7 SWOT ANALYSIS (CONT'D)3. High operational delays due to crane breakdown4. High operational costs5. Inability to respond to investment demands due to PAJ
regulation6. Poor Terminal surface conditions hampering operations
and impacting on equipment performance7. Dependent on a narrow base of customers for large
portion of throughput8. Poor image regarding container security against
contraband . ^9. High labour cost due to high gang strength.
OPPORTUNITIESScope exists to strengthen KTO's transhipment positionby:1. Arranging feeder service for users interested in
transhipping2. Offering storage, distribution and processing
service to cargo interests due to the existence of the IFZ and the abundance of stacking areas.
3. Actively vying for tropical produce from Central and South America to utilize the cold storage container facilities.
4. Using the existing EDP system to offer logistics services to customers for a nominal fee.
5. Further involvement in cargo consolidation for small shippers and so reduce the imbalance re empties and loaded, containers.
6. The possibility to allocate some of the existing container stacking area to container leasing companies for repositioning of boxes.
THREATS1. Increased usage of the US Land bridge2. Development of numerous container facilities in
the region3. Possible reduction in regional trade following a
reduction in the US export market and the European Community .Integration in 1992.
133

7.2.3 STATEMENT OF SPECIFIC OBJECTIVES
Objectives represent desired solutions to existing problems or the exploitation of perceived opportunities and therefore represent a natural outgrowth of the SWOT analysis. Because all previous steps in the plan led to the formulation of the objectives and all subsequent steps are geared at achieving them, the objectives represent the core of the marketing plan. In as far as is possible, objectives should be specific and measurable, with a time frame for achievement. This allows for more efficient control. Objectives are not revenue and profit goals, but desired results which lead to their achievement.
Appendix 7.3 outlines some basic considerations in setting port objectives. Possible objectives for KTO:
6 KTO PORT OBJECTIVESWBWBBiaiWBBawwitwwniniiiwiniiiiiiiiiiiiiwiim
1. Improving the service quality of the vessel operations by reducing overall turnaround time through:
a) improved productivity to say 20 moves per hour, and,
b) reduced waiting time of vessels
2 Increasea)b)
c)
customer base by attracting new trafficexpanding the service range to include storage and distribution logistics attracting smaller lines to enhance the port's on-carriage possibilities and therefore serve to attract larger lines
3. Restrain/ reduce cost per container handled
4. Improve the port's image in the market place.
IHHHWWfllllUlill
134

7.2.4 KARKETING STRATEGY DEVELOPMENT
While objectives specify desired end results, strategy outlines specific marketing programs aimed at achieving item. As will be recalled from the previous chapter, a marketing strategy consists of two basic elements:
1) Market Targeting, and,
2) The Marketing Mix. The mix can be internally directed and or market directed. Internally directed strategies aim at service and tariff development, policy formulations and so on. While externally directed strategies are those presented to the customer in order to win his patronage.
Based on the guidelines for strategy development outlined in Appendix 7.4, KTO's strategy is presented below,
9 STRATEGY FOR KTO
MARKET TARGETS
With a view to broadening the Terminal's customer base, a) KTO should continue to'target:
(i) container shipping lines using both the Panama Canal and the OS Landbridge. Emphasis should be placed on attracting a broad range of carriers of different sizes.
(ii) regional shipping lines in order to facilitate on carriage to these countries.
Where formerly the great strength of KTO waslocation relative to the Canal, and therefore ideally
its
10 KTO STRATEGY (CONT'D)
placed to serve as a transhipment point for the Europe Far East, US Gulf and East Coasts to Far East and US WestCoasts, this is- no longer the case since these trades are now largely being landbridged. A review of the mappresented in Figure 4.2 will show that KTO is also ideally placed to serve as a hub for Central and South America and the Caribbean. Further, in terms of marine distances saved KTO is better placed, relative to the major competitor, Cristobal, to act as a transhipment point for southbound cargo to the regions specified. This sub-region wasoriginally assessed by KTO but not pursued.
It has also been noted that RTW operators still tend to use the route through the Panama Canal on at least one leg of their service. However, the preferred choice to act as hub has been Cristobal. For example the Tricon groupcomprising Senator Line, Cho Yang and DSR call atCristobal on both their East and West bound service.Barber Blue Sea uses Cristobal as a hub for the Caribbean, Central and South American cargo. Evergreen, on its eastbound service now feeds Kingston's cargo overCharleston but on its westbound service, calls at both Kingston and Cristobal before continuing through the Canal.
This implies that there is still scope for KTO to attract business from some of the original routes targeted (Europe & US to Far East), but that this will involve a lot of marketing expenditure since they are already settled at Cristobal. And the degree of publicity with which Evergreen terminated its transhipment activities at Kingston has greatly tarnished the port's reputation and created some degree of skepticism among potential carriers. Since it easier to try to keep customers than to regain them after they have left KTO may want to wait until it has secured a broader base of clientele and reduced the stigma currently attached to the port before pursuing this market.
136
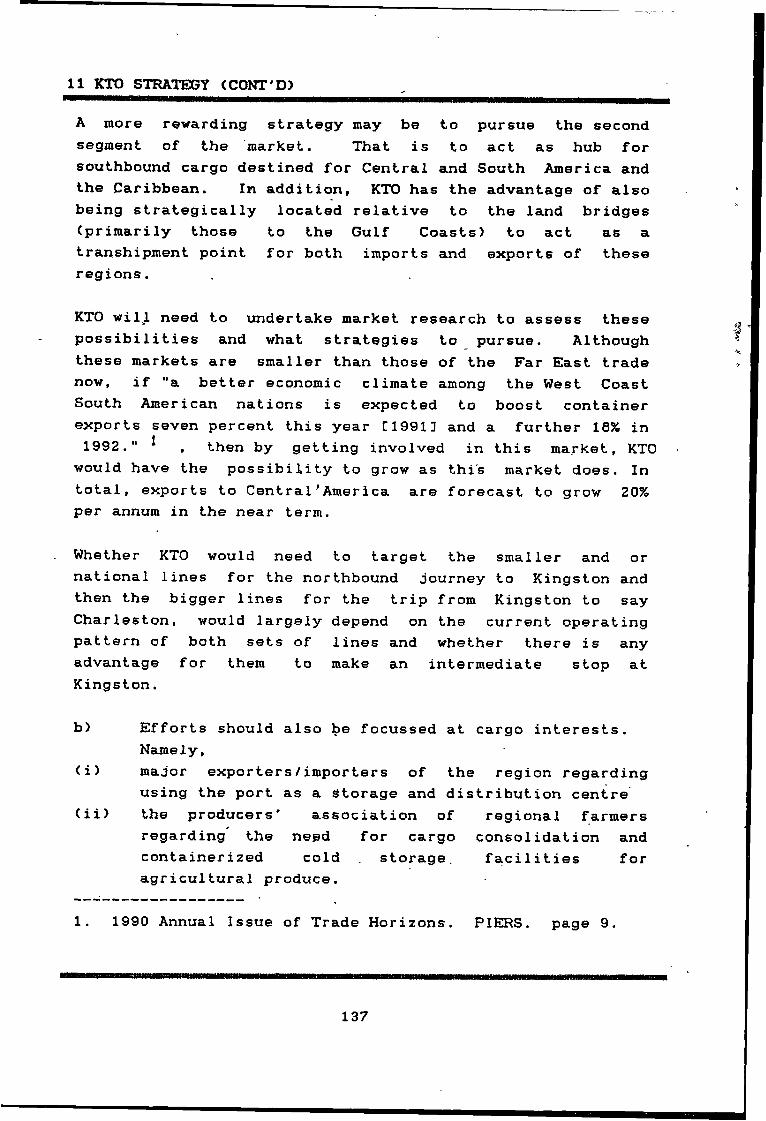
11 KTO STRATEGY (CONT'D)
A more rewarding strategy may be to pursue the second segment of the market. That is to act as hub for southbound cargo destined for Central and South America and the Caribbean. In addition, KTO has the advantage of also being strategically located relative to the land bridges (primarily those to the Gulf Coasts) to act as a transhipment point for both imports and exports of these regions.
KTO will need to undertake market research to assess these possibilities and what strategies to pursue. Although these markets are smaller than those of the Far East trade now, if "a better economic climate among the West Coast South American nations is expected to boost container exports seven percent this year C19913 and a further 18% in 1992." , then by getting involved in this market, KTO
would have the possibility to grow as this market does. In total, exports to Central'America are forecast to grow 20% per annum in the near term.
Whether KTO would need to target the smaller and or national lines for the northbound journey to Kingston and then the bigger lines for the trip from Kingston to say Charleston, would largely depend on the current operating pattern of both sets of lines and whether there is any advantage for them to make an intermediate stop at Kingston.
b) Efforts should also be focussed at cargo interests.Namely,
<i) major exporters/importers of the region regarding using the port as a storage and distribution centre
(ii> the producers' association of regional farmers regarding the need for cargo consolidation and containerized cold storage. facilities for agricultural produce.
1. 1990 Annual Issue of Trade Horizons.
137
PIERS. page 9.

12 KTO STRATEX3Y (CONT'D)£iii} container leasing companies.
As shippers spell out the criteria for service and carriers try to respond, vast opportunities have opened up for ports whose management are willing to capitalize on them. The latest shipper's preoccupation has been with the need to reduce inventory costs while still preserving their ability to respond, with minimum delays to market demand. Thisgave rise to the Just In Time (JIT) concept. As a research by Nediloyds revealed, large producing companies have changed their approach to international trade. This ismamifested in:a) a concentration primarily on production and salesb) production being organized internationally and on
a decentralized basis, and,c) a reduction in the period between product manufacture
and delivery.
This Nedlloyd interpreted to mean that these companieswould need another company '• to handle logistics and distribution. Not only is there opportunity here forshipping lines to offer logistics services, but there exists a real market opportunity for ports to act as regional distribution centres.
KTO will need to target and actively canvass shippers, and not only the lines. The question of necessary space to be used for storage arise. In this regard, the use of the neighbouring freezone would be an advantage. In otherwords, part of the task of getting business for the Terminal, will involve that of securing business for the Freezone.
The likely shippers to be targeted are the ones who are still in the process of developing thueir trade and distribution channels. In this regard, the greatestpotential rests with the ASEAN countries such as Thailand, Indonesia and Malaysia.
138
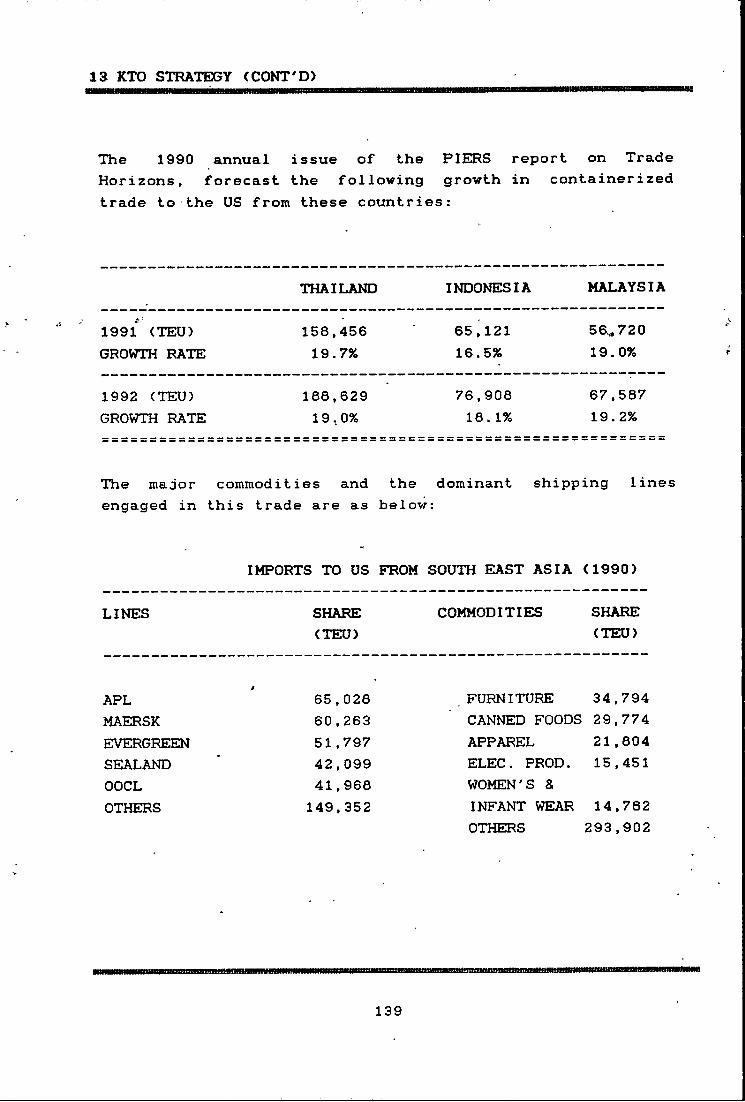
13 KTO STRATEX3Y (CONT'D)nSBB
The 1990 annual issue of the PIERS report on Trade Horizons, forecast the following growth in containerized trade to the US from these countries:
THAILAND INDONESIA MALAYSIA
1991 <TEU) GROWTH RATE
158,45619.7%
65,12116.5%
56^72019.0%
1992 (TEU) 188,629 76,908 67,587GROWTH RATE 19,0% 18.1% 19.2%
II II 11 II II 11 11 II 11 It II II11IIIIIIIIII1111IIIIIIIIIIIIIIII11IIIIItII11 11IIIIIIIIIIItII1111IIIIIIIIIIII II II II II It II 11 11 11
The major commodities and the dominant shipping lineengaged in this trade are as below
IMPORTS TO US FROM SOUTH EAST ASIA (1990)
LINES SHARE COMMODITIES SHARE(TEU) (TEU)
APL 65,028 FURNITURE 34,794MAERSK 60,263 CANNED FOODS 29,774EVERGREEN 51,797 APPAREL 21,804SEALAND 42,099 ELEC. PROD. 15,451OOCL 41,968 WOMEN'S &OTHERS 149,352 INFANT WEAR 14,782
OTHERS 293,902
139
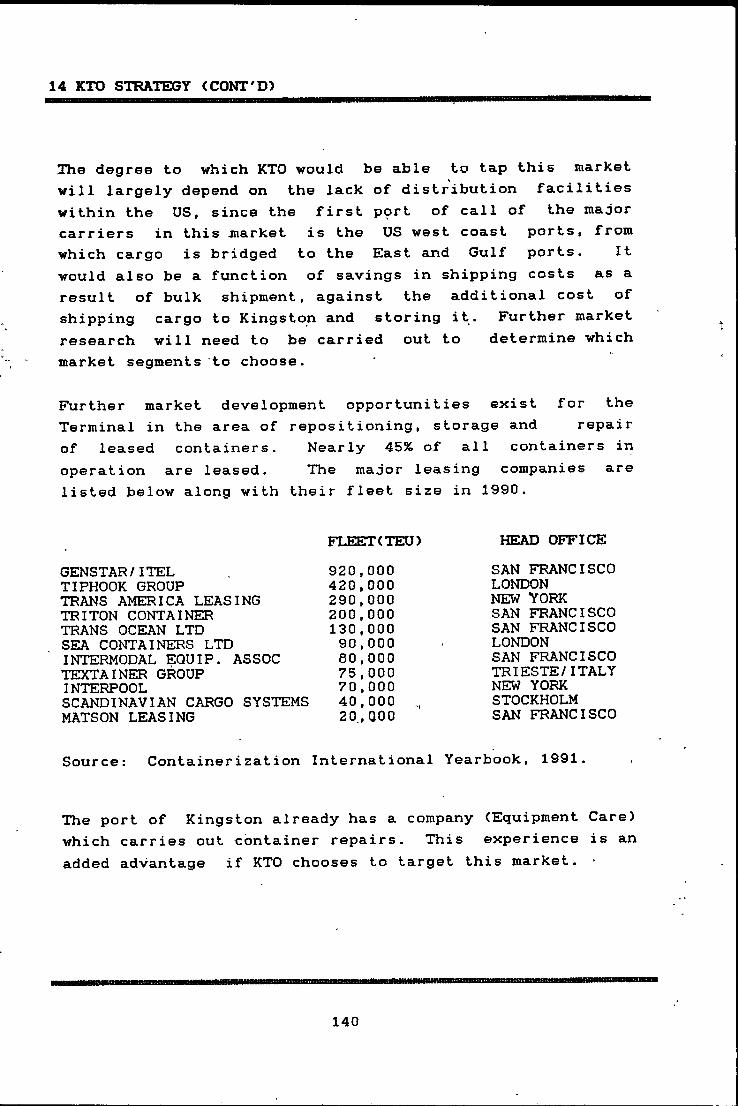
14 KTO STE?ATEX3Y <CONT'D)
The degree to which KTO would be able to tap this market will largely depend on the lack of distribution facilities within the US, since the first pprt of call of the major carriers in this market is the US west coast ports, from which cargo is bridged to the East and Gulf ports. Itwould also be a function of savings in shipping costs as a result of bulk shipment, against the additional cost of shipping cargo to Kingston and storing it. Further market research will need to be carried out to determine which market segments to choose.
Further market development opportunities exist for the Terminal in the area of repositioning, storage and repair of leased containers. Nearly 45% of all containers in operation are leased. The major leasing companies are listed below along with their fleet size in 1990.
FLEET(TEU) HEAD OFFICEGENSTAR/ITEL 920,000 SAN FRANCISCOTIPHOOK GROUP 420.000 LONDONTRANS AMERICA LEASING 290,000 NEW YORKTRITON CONTAINER 200,000 SAN FRANCISCOTRANS OCEAN LTD 130,000 SAN FRANCISCOSEA CONTAINERS LTD 90,000 LONDONINTERMODAL EQUIP. ASSOC 80,000 SAN FRANCISCOTEXTAINER GROUP 75,000 TRIESTE/ITALYINTERPOOL 70,000 NEW YORKSCANDINAVIAN CARGO SYSTEMS 40,000 , STOCKHOLMMATSON LEASING 20.,Q00 SAN FRANCISCO
Source: Containerization International Yearbook, 1991.
The port of Kingston already has a company (Equipment Care) which carries out container repairs. This experience is an added advantage if KTO chooses to target this market.
140

15 KTO STE^ATEGY (CONT'D)
2. THE MARKETING MIX
Tlie service: INTERNAL STRATEGIES
<i) The objectives: To improve service quality especially re vessel operations, through improved productivity and reduced waiting time and to increase customerbase. This requires:
(a) a solution to the problem of obsolete cranes and the increased operational breakdown being experienced, as well as a deficiency in the berths to cranes ratio.
Historically, the drawback to renewing or increasing port investment has been the reliability of KTO's management on the PAJ, resulting in considerable lag time between identification of the need and response. One solution may be for the Terminal's management to negotiate a new agreement with the PAJ, wherein a percentage of the operating surplus is not remitted to them, but retained by KTO to meet investment needs. The PAJ might wish to retain the right to approve the investment. But the fact that they are not required to fund it, should serve to speed up the process.
One basis for the percentage of earnings to be retained could be the annual depreciation cost, based on projected replacement value and port development need. A secondsolution is for KTO to look at the possibility to lease cranes. The European and Japanese markets might offer possibilities. The older cranes can be sold as there exists a market for these equipment.
<b) Solution to the problem of other port services such as pilotage and towage will depend on Management's efforts to influence the performance of these entities. The system of payment for these services on a 'work done' basis .should be implemented, with penalties (loss of revenue) for delays in performing the service.
141
16 KTO STE^ATEGY (CONT'D)(c> Measures to improve the motivation and performance
of stevedoring staff need to be taken. The primary reason for the poor productivity level on theTerminal was ascribed to:
- ' the fact that KTO had no direct control over thehiring, training, and therefore motivation of the stevedores
the fact that stevedores, being paid hourly and not per box, had little incentive to increaseproductivity. /Some incentive scheme was put in place, but the rate of incentive is not high enough to compensate for the wage loss by executing their job with dispatch.
One strategy is for KTO to adopt the approach most container terminals are today using. That is, employ crane operators directly on a salaried basis, and utilize the labour pool only for aboard shipactivities, such as lashing. Unions need to be made to recognize that containerization has changed the definition of 'dock work'. Crane operators are no longer dock workers but highly paid and skilled technicians.
An alternative strategy is for stevedores to be paid on a box rate and not a hourly basis. This has the obvious advantage of giving workers a vested interest in the level of Terminal throughput as well as afford them the knowledge that it is no longer in their interest financially, to prolong the job, since their wages would be the same. This principle has been employed in several British Ports and has been successful in improving productivity.
>
142

17 KTO STI?ATEGY (CONT'D)(ii)The objective: container handled.
To restrain and or reduce cost per
An essential step to restraining and reducing Terminal costs is to accrue the benefits . of mechanization in terms of labour reduction. The current level of 27 men -per crane (excluding supervisory personnel), closely approximates to the situation that obtains for breakbulk terminals. A survey carried out by the author into this matter of gang strength, revealed that in the ports of Rotterdam, Colombo^ New York, Malmo, Copenhagen and Los Angeles, the average gang strength ranges from 12 to 17'men. KTO cannot -expect that investments in terminal equipment will have the desired cost savings if they are over manned.
Another factor of Terminal cost is that for tractors used to move containers between ship's side and the stacking area. One area of cost reduction could be to have atrailer to each tractor. That is, each tractor/driver crew would take two to three containers instead of one. This would not only serve to reduce labour cost, but enhance the vessel operations. The other solution proposed by the Terminal, of using the straddle carriers for this purpose, would also achieve the cost savings objective.
MARKET DIRECTED SERVICE STRATEGIES
The objective: customers base.
To attract new traffic and broaden the
(i)Throuah Transport. The objective may be achieved byoffering a wider range of services to new and existing users. Different customers require different services, therefore a customer needs-oriented approach will possibly entail the port positioning itself to handle everything between the production and selling of cargoes. It willnecessarily involve the use of partners, such asforwarders, short sea vessel operators and so on. This will enable the port to offer through transport to clients.
143
18 KTO STRATEGY (CONT'D)M
On carriage arrangements will represent an essential part of KTO's service improvement strategy. The existence of a wide network of feedering possibilities can serve to attract larger lines, that would otherwise be unable to enter the relatively fragmented regional market.
<ii) Storage and Distribution servicesThe essence of the distribution logistics service is to meet the 'Just In Time' needs of cargo interests. On the
'one hand, efficient port services regarding feedering arrangements will ensure that importers receive cargo on time and on short notice, therefore reducing the need for stockpiling. While the manufacturers are able to produce on a short term basis to meet customer demand and also reduce cost of inventory build up.
Essential to this service is a reliable EDP system. In addition to facilitating easy storage and retrieval of information the EIDP system will need to enhance the port s logistics function by providing information on different routing options and costs, in the distribution process. The essence of logistics is to optimize time and cost of distribution. This means that there will be the need for a data base on the various operators on the different routes, in order for KTO to select the best partners for each route.
The aim of the storage function is to meet the need of cargo interests to reduce transportation costs, by shipping in bulk, therefore achieving economies. The ■ cargo can then be shipped to the various destinations as demand arises.
144

19 KTO STE?ATEGY (CONT'D)
The Tariffs
INTERNAL STE?ATEGIES This involves<a> establishing the cost base or minimum charge that can
be levied for KTO's services, without accruing a loss,
(b) comparison of the port's charges with those ofcompetitors to ensure competitive a price level and,
<c) policy decisions regarding the Tariff in general,such as flexibility of the published tariff, and so on.
These can be crucial in meeting the objective of attracting new customers, while retaining existing ones.
(a) KTO has a high level of fixed costs, therefore inorder to minimize unit cost and increaseprofitability, it needs to pursue a pricing strategy aimed at gaining high volume throughput. One basis for setting the price is to establish the different
' throughput and price levels at which the Terminalwill break-even. The selection of one of these price levels as the minimum charge will depend on theprobability of achieving these volumes. This provides minimum targeted throughput for the Terminal, above which, at a given charge it will make a profi t.
This does not mean that this minimum charge will be that levied at customers, rather it establishes the degree of freedom management has in negotiating rates, by establishing the floor. The difficulty in using this approach is that it tends to establish a composite rate, not one for each service and would be more useful if the Terminal is pursuing a strategy of providing consolidated rates.
145

20 KTO STRATEX3Y (CONT'D)
An alternative approach is to base the miniitium rate on the direct cost of each service. The pricing policy will be to charge^ at a rate at least above the direct cost, so that each service will contribute towards fixed costs and profitability. Assuming the establishment andapportioning of the various costs to their costs centre, some degree of accuracy in calculating the direct cost can be achieved. However, while this approach is invaluable •in underlining the minimum charge that management can levy for each service area, it does not take into considerai:ion the overall profitability of the Terminal, as it neglects the consideration of the volume of traffic needed at particular rates, to cover fixed costs.
The ideal strategy is to combine both approaches. Thus, based on direct cost established for each service, a sensitivity analysis can be carried out by incrementing this direct cost and calculating the necessary volume to achieve break-even point. The choice of rate will therefore be based on that level of traffic which is most achievable. The price so determined is the minimum charge for the particular service.
(b> In determining the final tariff level, consideration as to continued competitiveness has to be made. Many ports do not publish container handling tariffs, so it is difficult to acquire comparative data. However, a judgement can be made. For example, the comparatively low investment level at the port of Cristobal might mean that their fixed costs are not as high as KTO's and therefore charges might be lower. Consideration has also to be taken regarding vessel operators concern over escalating costs.
146

21 KTO STRATEGY (CONT'D)
EXTEEWAL PRICING STRATEGIES
— Instead of having a single published container handling tariff, KTO may conclude separate contracts with customers. The rate agreed on depending on the volume, size of ships, service required and the level of productivity desired. These charges should be founded upon an understanding of the carriers position in terms of revenue base.
This requires an approach of charging (within limits) what the traffic will bear. Thus for carriers with a market dominated by low valued- cargo, the approach will be to generally be willing to charge a lower rate than for those which move say electronics. This means management will need to know the basis on which each carrier charges his freight. The approach proposed is applicable when freight is levied on a commodity basis. The objective of this approach is to encourage a variety of traffic so as to broaden the customer base, and reduce the Terminal's dependency on a narrow range of trades and customers.
- Lower rates might be levied to encourage vessels to call at off-peak periods or when there is not a heavy demand for cranes. For example. Appendix 7.6 shows that the demand for berth and crane usage at the Terminal is heaviest on Mondays, with Saturday being the lightest. By reducing the overtime charge on weekends it might be possible to spread the demand and therefore reduce the possibilities of congestion.
- In order to attract the business of storage for container leasing companies, it might be useful of offer free storage for a certain percentage of their containers. Thus storage charges can operate as a 'loss leader' the real objective being to gain substantial revenues from the container handling activities and not necessarily directly from storage.
KtO
147

22 KTO STRATEGY (CONT'D)
- Increased vessel calls can be encouraged by giving areduction in port dues, pilotage or towage charges, after a certain number of vessel calls per customer per year has been achieved. This should be directed at transhipment carriers. However, since these areas are not revenuesources for KTO, some arrangement will need to be made with the PAJ regarding compensation. The basis of the reduction must be in terms of additional calls (and traffic) expected as against revenue loss from the rate reduction.
- A most important price strategy in securing t,ranshipment might be to offer a through (consolidated) tariff. This makes it easier for those cargo interests, wishing to tranship. The rate would need to cover all the various activities, including feedering. KTO would then pay the various partners accordingly.
The Promotion
The objective of the promotional strategy is to increase customer base and improve the image of the port.
In order to broaden the customer base, KTO needs to create awareness among current and potential users of its various services. It needs to have access to the right people and then communicate to them its services. KTO's current promotional strategies take the form of printed brochures, advertisements in trade journals and personal visits to customers or potential customers. In addition, access to cargo interests can be gained by visiting or participating in the various trade fairs (such as EXPO), forwarding and other industry conferences.
148

23 KTO STRATEX3Y (CONT'D)
Initially, the stance might be for the Terminal to send one or two members of ' the marketing staff, to observe and recommend whether the port should take part the following year. Participation is normally in the form of booths
' displaying the Terminal's facilities, services and present customers. It is essential in promoting the Terminal'sfacilities that a. distinction be made between planned__m l
^ existing facilities. It was very surprising to this author to meet a top ranking official of CGM at the Port of Bremen, and be asked about our Freezone facilities. His understanding was that we have plans to build a facility, but he was quite unaware that the facility was in existence and operating for about a decade!
A crucial part of KTO's promotional strategy will be to repair its image in terms of container security and labour stability. To this end activities will have to be focused on detailing the various security measures which are now in place and highlighting their effectiveness by pointing to the fact that, since their implementation, no further drug finds were made by the US Customs. The effect of the degree of publicity with which Evergreen withdrew transhipment activities in Kingston, and the reason published (drug finds) must not be underestimated. It is much better for the marketing team to bring up the subject of Terminal security than to be asked about it. One strategy in promoting the security of the port might be to look at the possibility of having the US Customs come and appraise our security measures. An approval might be invaluable in eradicating the current stigma.
%
149

Abraham, Bovas & Ledolter, Johannes
Adair, Karen
Alderton, P. M.i-t i
Arnold, John Jr.
Bell, Eric (Hon)
Bennathan, Esra & Walters, A. A.
Beth, H.
Bubeer, E.
Bubeer, E.
Buisseret, David (Dr)
B I B L I O O R A B H Y
Statistical Methods f Q . r _ _ F g . John Wiley & Sons, 1983.
A Training and Manpower Development Programme for KTQ. Unpublished MSc. Dissertation, 1989,
Sea Transport. Thomas Reed Publications Ltd. 3rd Ed., 1984.
Port Pricing Strategies. Louisiana Ports and Waterways Institute,Louisiana State University, 1989.
Speech at the opening of the PAJ
Forum Hotel. 27/3/74.
Port Pricing S Investment Policy for Developing Countries. Published by Oxford University Press, 1979. For World Bank.
Liner Shipping (lecture on liner shipping at WMU)
Introduction to Containers. UNCTAD/SHIP/612. 1985. page 1-36.
Container Handling Cranes.. UNCTAD/SHIP/612, 1985. Pages 319-344.
A popular history of the port of Kingston. Rev. Ed. 1981. Prepared for the SAJ.

Byers, B. D.
ContainerizationInternational
Container i zation International
Cowell, Donald
De Monie, G.
De Monie, (Drs)
De Monie, G.
De Monie, G.
Dokpesi, R. A.
The concept of a Freezone and its benefits to a National EcpnojaY. PAJ Seminar 27/3/74.
Evergreen^s evolving global strategy unfolds. Pages 10-13. Nov'83.
Round The World Services; Itg all souare. Nov. 1982, pages 61-65.
The Marketing of Services. Published by Heinemann. London. 1984
Alternative Containership S Terminal Systems: Layouts & OperationalFeatures of Pure and Combined Terminals. UNCTAD/SHIP/612, 1985. Pages 43-160.
Basic Principles of Berth Operations; <Ship-to-Shore System!. Iper,Le Hayre, 1990.
Container Terminal Capacity Calculations & Exercise on Capacity Calculations. UNCTAD/SHIP/612.1985. Pages 161 - 186.
Container Terminal Pricing. UNCTAD/SHIP/612. 1985.Pages 573 -638. •
Problems of Liner Shipping in Deyeloping Countries. International Symposium on Liner Shipping. Page 42. MIRtt 89010193.
Drewry Shipping Consultants Ltd.
Eiglier. Pierre S Langeard, Eric
Fair dough, Anthony
Ghoos, H.
Gibney, R. F.
Gilman, Sidney
Gilman, Sidney & Williams, G. F.
Gilman, Sidney
Goss, R. 0.
IcaUEJiS ,91 RTWContainer Routes. Jan. 1986.
Marketing Consumer Services. Marketing Science In,stitute. Pages 65-103.
The 1992 EEC Policy and Ita_Llke_ly Effects Caribbean Shipping. (Special Adviser, Commission of the European Community. Special paper presented to Caribbean Shipping Association. 23/10/69.
Labour Organization of a Container Terminal. UNCTAD/SHIP/612. 1985.Pages 307-318.
Container Lines; The Strategy Game (Lloyd's Shipping Economist Study) Lloyds of London Press Ltd., 1984 Containers on the North Atlantic;
Maritime Transport Centre, University of Liverpool, 1977.
The__Economics of Multiport Itineraries for Large .Container Shins. Liverpool: Marine Transport Centre, University of Li,verpool, 1975.
Hub Port Economics. Terminal Operations Conference. Page 41. Maritime Information Review (MIR) 89110235.
Economic Policies. S Seaports:!. The E..conQmic_Functions of Seaports. Maritime Policy & Management, 1990.Vol 17, No. 3. Pages 207-219.
Goss, R. 0.
Hackebt, Ben & Beck, Doug
, Hague, Paul N.
Hochstein, A.
Holden, R. E.
Huges, Colin
Jansson, J.O, Shneerson, D.
Jon, Joon-Soo (Dr)
Kim, C. K.
Economic Policies & Se.aporbg;2,— Jhs. Diversity of Port Policies.Maritime Policy & Management, 1990.Vol 17. No. 3. Pages 221-234.
World Trade to the year 20Q-P-L Implications f_oc Shipping. Presented before Asian Shipbuilding in the 1990's Conference. September, 1989. Busan, Korea.
%r - , ^
The Industrial Market Researcii Handbook. Richard Clay Ltd., 1987. 2nd Ed. Pages 296 - 303.
Strategic Planning of National Port Systems. (The US experience and implications for other count.X-LagJ-. Pages 25-45. MIR 89030784.
How Ports Win Intermodal business. Terminal Operations Conference.MIRtt 89110302.
Containerization in an LDC Environment. Maritime Policy & Management, 1977.Vol. 4. Pages 293-302.
Liner Shipping Economic_s. Published by Chapman & Hail Ltd., 1987.
Changes in the Shipping Enylx„o.nmejit_S. Counter-Strategies of Korea Toward the Year 2000. Korean Maritime Institute. MIRtt 89030221.
An Innovation in Liner Shipping: The Round-the-WorId Service as a Global Strategy. Institute of Shipping Economics & Logistics, 1987.
Kotler, Phillip
Lloyds Shipping Economist
Louis Berger Int'L
Lovelock, C. H. & Young, Robert. F.
Markin, Rom
Masuyama, S.
Mitchell, Alrick E. (Operations Manager at KTO)
Moyson, J-J.
Muller, Gerhardt
Neil son, N.
Nightingale, G. J.
Marketing Management. Analysis.Planning & Control. Prentice Hall, 1976.
Round-the-vorld US Lines & Evergreen qg global - F9l?? Pages 61-65January '83.
Kingston Port Development Study. Presented to PAJ. December, 1985.
Marketing Potential for improving Productivity in Service IndustrjLe_s Pages 107-119.
Marketing Strategy 8 Management.John Wiley & Sons, 1982.
Overview of the World Economy S Trade. Presented to the 6th Harbour Conference in Rotterdam. March, 1989.
Specific problems of the Container Terminal Operation in _the Port of Kipq.g.ipn-Cost Elements & their Impact on Container Terminal Tariffs. UNCTAD/SHIP/612. 1985. Pages 565-572.
Intermodal Freight Transportation. Westport, Conn.: Eno Foundation forTransportation, 1989. 2nd Ed.
Ports as Natural Communication Hubs for the Container Industry. World Container Congress. MIRtt 90050268.
Positioning and the Port.HavenCongress. Pages 1-19.MIRtt 69040238.

Packard, William V.Packard, William V. Shirmino Pools. Llovds of London Press Ltd., 1989.
Padelford, Norman Judson & Gibbs, Steven R.
Maritime Commerce S the Future Pf .thg. Panama Canal. Cambridge. Md.: Cornell Maritime Press, 1975.
Pearson, Roy & Fbssey, J.
World Deepsea Container Shipping Gower Publishing Company, 1983.
Pearson, Roy Container Shins 8 Shipping^ Fairplay Publication Ltd, 1988.
Pollock, E. E. CitvDort Industrialization: Snatial Analysis & Planning Strategies;. Freeports. Free Trade Zones. Export. Processing Zones & Economic Development. (British Transport Docks Board & Department of Geography, University of South Hampton). 1979.
Pollock, Eric Port Marketing. Lecture presented at World Maritime University. August, 1991.
Prokopenko, Joseph Productivity Management - A Practical international Labour
Organization, 1987.
Public Relations Associates Ltd.
Report on Development of Trans- Shipment Port & Freezone Complex, presented to PAJ. March, 1974.
Setchel1, R. Multimodal ism - For Forwarders Onlv? "The Terminal Operator as the Coordinator of the Through Transport Movement". Address presented to ICHCA 19th Biennial Conference. Stockholm, Sweden. MIR# 90010121.
Shostack, G. Lynn Breaking Free of Product Marketing.- Journal of Marketing, April, 1977.

Skacel, Robert K.
Sletmo, Gunnar K. & Williams, Ernest Jr
Stuchtey, R. W.
•lif /A
Talley, Wayne K
Tanaka, W. H.
Thomas, B. J.
Tym, Roger & Partners in Association with MDS - Transmodal Ernst & Young
UNCTAD
UNCTAD
UNCTAD
The Marketing Plan. How to Prepare It. What Should Be In It. Published by MPM Associates, 1976.
Liner Conference in the Container Aae. Macmillan, 1981. ,
^ h.Practical Approach. International Symposium on Liner Shipping. MIR# 89010163. . y.
Optimal Containership Size. Maritime Policy & Management, 1990. Vol 17. No. 3 Pages 165—175.
Experiences on the establishment & management of Free Zones with particular emphasis on Industrial Free Zone operations in Developing Countries. Paper presented at PAJ Seminar. March, 1974.
E5.lL. S.h,arfliaa.g M a r i t i m ePolicy & Management, 1978. 5 117-132.
F.LS§.Z9.U.§ ■__An evaluation of the UKfreezone experiment. 1984-1989. published June, 1990. Commissioned by H.M Treasury.
Report on Transhipment. February,1989 by ABP Research & Consultancy Ltd.
Development & Improvement of Ports - Transhipment.Ports (TD/B/C.4/293) December, 1985
Model Agreement for feeder services TD/B/C.4/280. Chapter III.October, 1984.
UNCTAD
UNCTAD
UNCTAD
UNCTAD
Vanleenhove, H.
Development in world shippin.o_L Imbalance between supply & demand in world shipping. TD/B/C.4/33 March, 1990.
Port Performance Indicators.. TD/B/C.4/131/supp. 1 Rev.- 1.
Monographs on Port Management Measuring and Evaluating Port Performance and Productivity. UNCTAD/SHIP/494(6). 1987.
The Commercial Risk Factor in Container Terminal Management. UNCTAD/SHIP/12. December, 1987.
Administrative Organization of a Container Terminal. UNCTAD/SHIP/612, 1985. Pages 193-208.
KTO's 10th Anniversary Handbook. Published by KTO & PAJ. 1984.
Kingston Export Freezone. Produced by Communications Consultants Ltd, 1987. For the PAJ.
The Ports of Jamaica Handbook 89-90 Published by PAJ & SAJ.
Caribbean Shipping Magazine. Nov 1989 & 1990. Published by Caribbean Shipping Association.
Trade Horizons. 1990 Annual Issue. Published by Port Import/Export Reporting Service (PIERS). The Journal of Commerce. NY.
US Liner Trade RevLev;:. 1st Quarter 1991 Issue. PIERS.
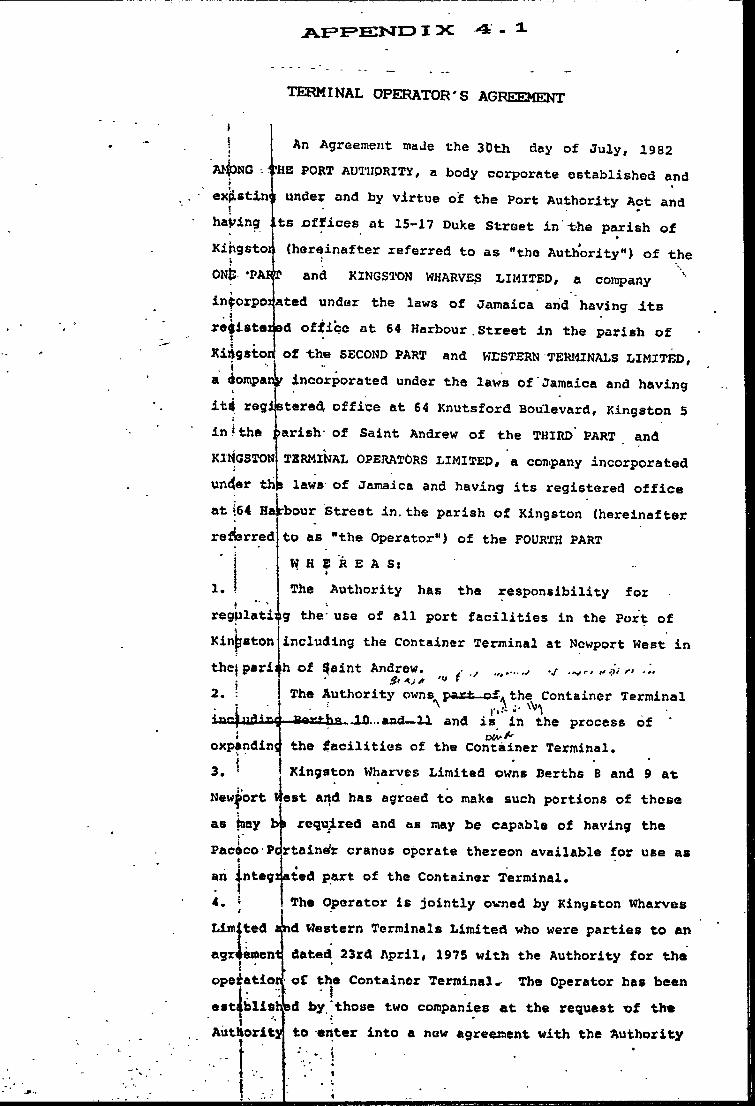
TEkMINAL OPEEULTOR'S a g r ee m e n t
; An Agreement made the 30th day of July, 1982A |OMG . -i ?HB PORT AUTlIpRITY, a body corporate established and » ,ex|istid)<f under and by virtue of the Port Authority Act and haying tts offices at 15-17 Duke Street in the parish of Kihgstoii (hereinafter referred to as "the Authority") of the ONt ‘PAFT and KINGSTON WHARVES LIMITED, a company interpolated under the laws of Jamaica and having Its reglstajed office at 64 Harbour Street in the parish of Kiigston of the SECOND PART and WESTERN TERMINALS LIMITED, a iompaEftr incorporated under the laws of Jamaica and having iti registeredr office at 64 Knutsford Boulevard, Kingston 5 in * the parish' of Saint Andrew of the THIRD PART and KINGSTON TERMINAL OPERATORS LIMITED, a company incorporated un4«r th» laws of Jamaica and having its registered office at |64 Harbour Street in.the parish of Kingston (hereinafter ^rredito as "the Operator") of the FOURTH PART
W H E R E A S :i
The Authority has the responsibility forregulating the- use of all port facilities in the Port of%Kingston
I
re
1.
including the Container Terminal at Newport West inthe|pariiih of $aint Andrew
: St Af A2. !
'w i ./
The Authority owns^ part of. the Container Terminal• L i : ^t3ac|afli3i<.torths,. and is in the process of ‘expanding the facilities of the Container Terminal,3. • Kingston Wharves Limited owns Berths 8 and 9 atNewport lest and has agreed to make such portions of these as kay b» required and as may be capable of having the Paceco ’ Pcrtaine(r cranes operate thereon available for use as
I
an jntegxated part of the Container Terminal.4. j The Operator is jointly owned by Kingston wharvesLimited and Western Terminals Limited who were parties to anagxrecent dated 23rd April, 1975 with the Authority for theopefatlos of the Container TerminalThe Operator has been
i •[ !estibllshnd by those two companies at the request of the}AutHorityj to enter into a new agreement with the Authority

009 9239195 10.04. 91809 92391950 ktD. FT. BUSTflMflNTE KGN.- 2 -
to operota the Container Terminal upon the terms' and condit^ns hereinafter mentioned, and with a view to avoiding the several deficiencies experienced in the operation .of the said Container Terminal under the agreement dated 23rd April, 1975, .particularly in the area of management and staffing. .
NOU IT IS HERESY AGREED:1.
2.
3.
4.
This Xgreement is for the management Cf the Container Terminal and any new berths as from time to time are available for operation as pert of the Container Terminal and as are made available for that purpose. 'This Agreement’ shall come into force on the 1st day of danuary, -1982 and shall, subject to the provisions of Clause 23, continue for a period of five (5) years.The operator, during ' the continuance of this Agreement, shall manage and operate the Container Terminal and any expansion of the existing facilities as one operation.Kingston Wharves X<imited shall make available for use as an integrated part of the Container Terminal such portions of .Berths 8 and required and as may be capable of having the Paccco Portainer cranes operated thereon and save for any consideration as' set out in this Agreement,)^no charge shall be made to the Authority for such use of these Berths and facilities. Kingston Wharves Limited shall be responsible for maintaining at its 'own cost Berthe 8 and 9 in a suitable condition for .use as part of the Container Terminal aforesaid.The Operator shall in respect of the opere^tion of thf Container Terminal charge and collect-for all services rendered thereat at the rates specified
5.

8 0 9 9 2 3 9 1 9 5 0 K T D . P T . B U S T f l t K W E K G N . 8 0 9 9 2 3 9 1 9 5 1 0 . 0 4 . 9 1 2 1 : 0 4
6.
n
7,
8.
yy
b y o r o , r . . d W i t h t h o , „ d . . v e o . i .
o t h o r v l . , . p e c « i c o U y . , r o . d , , „ e . ,
• h m opordUon, Of th.Cont«rn.r Toroiinl., Any rovMioo. dorivod from the tbronpApnt oherpe. fee end v.ter .„ppU«>‘'O" -«*>■ ». ». 10 end n .A.„ he «q««lly between Kl„5.te„ w,.„e, ,,i„at.d „d th.
! A u t h o r i t y e n d . h e l l „ e t f o r m p e r t o f t h e . r e v e n u e .
, : O f t h e o p e r e t i o n . o f t h . C o n t a i n e r l e r m i n e l .
. T h e o p e r a t o r . h e l l n o t ( . . v . i t I t . o u n r i . k )
I p r e n t c r e d i t f o r t h . . . r v l o e . r e n d . r « J , t t h e
' C o n U i n e r T e r m l n . l , e x c e p t w i t h i n t h e l i m i t . . „ d Y
I i n . c c o r d . n c . w i t h t h . t e r m , . p p r o v e d b y t h . V
i Authority from time to time.I
! T h e O p e r a t o r . h e l l u n d e r t e k . . n d b e r e . p o n . i b l .
: f o r t h e m . i n t e n . n = . . n d « r v i c i n , o f t h e P . c e c o
■ P o r t e i n e r treat. tn'\S;;Se„;rw;;h t h e
n e n u f e c t u r e r . n p e c i f i c e t i o n . . i t . h e l l f „ r t h . r
u n d e r t a k e . „ d b e r e . p o n . l b l e f o r t h e m e i n t e n e n c .
; e n d . . r v i c i n g o f . 1 1 p i . „ t „ a ' e , „ i p „ . „ r
: . v . l l . b l . b y t h e A u t h o r i t y , w i t h t h e a g r e e m e n t o f
i t h . o p e r a t o r , f o r u . e a t t h e C o n t a i n e r T e r m i n a l .
! T h . c o a t , a n d e x p e n . e . i n c u r r e d b y t h e O p e r a t o r i n
t h e m a i n t e n a n c e a n d . e r v i c i n g o f a l l . „ o h p l a n t
a n d e g u l p m e n t . h a l l b e t r e a t e d . . p a r t o f t h .
i U r e c t o p e r a t i n g o o . t o f t h . C o n t a i n e r T e r m i n a l .
T h e A u t h o r i t y . h a l l b e r . . p o „ . i b l . f o r t h .
p o r c h . . . o f a n d w i l l . u p p l y . p a r . p , r t , f o r t h e
e g u i p m e n t m a d e a v a i l a b l e b y t h . A u t h o r i t y f o r u e e
a t t h . C o n t a i n e r T e r m i n a l a n d a l t h o u g h t h .
A u t h o r i t y . h a l l p r o v i d e t h e n e c e . s a r y a t o r a g e
d a c i l l t i e a t h e O p e r a t o r . h a l l b e a o l e l y
W . p o n . i b l . f o r t h . . a f . o e . t o d y o f e u c h . p a r .
p b t t . w h e n d e l i v e r e d b y t h e A u t h o r i t y . T h e
O p e r a t o r . h a l l p a y t h e A u t h o r i t y f o r a u c h . p a r e
*• 4 -
' phrts as and when used by the Operator and t h e
cost of such spare parts and the personnel eiqployed to ensure their safe custody shall <be
‘ treated as part of the direct operating cost of ^t
the'container Terminal. The Operator shall takestock of such.spare parts not less than once in
■ ■ Aeevery, three Cil) months and the costs of any spare ' parts found missing shall be reimbursed to the Authority by the Operator,
9, The Insurance premiums ' In respect of dock’ facilities^ all plant and equipment, including spare parts owned by the Authority and made ; available to the Operator for use at the Container Terminal shall be paid by the Operator when due
i and shall be treated as part of the direct; operating costs of thie Container Terminal. .i ■
10, ' The Operator shall take out such policies oft
insurance in respect of such liabilities and upon such terms and conditiohs in the joint names of the Authority and the Operator as shall be agreed with the Authority as being necessary and adequate with such insurance company or companies as the
' Authority may in each case and from time to time direct or approve and the cost of such insurances shall be treated as part of the direct operating
’ cost of the Container Terminal, |it being I understood and agreed that any insurance premiums : payable in respect of Berths 8 and 9 shall not be . treated as part of the direct operating cost of the Container Terminal,
11, ] The Operator shall provide adequate security forthe Container Terminal and all the plant and equipment thereon, and the costs and expenses of
i such security shall be treated as part Of the I direct operating cost of the container Terminal.
V
.Vy
B09 5239195 10.04. 51 21:B7809 92391954 KTO. PT. BUSTM1ANTE KGN.I - 5 -
12,
13.
L
The Operator shall maintain a separate harih account for the operation of the Container Terminal and all . income and expenditure in relation thereto shall be passed through this account. The Operator shall prepare a monthly statement of accounts within thirty (30) days of the. end of the month to which the statement relates and shall within sixty (60) days of the .presentation of the relevant accounts > pay over to the Authority any surplus shown on that account. •Any deficit shown by the accounts referred to herein shall be paid by the Authority into the abovementioned bank account within sixty (60) days of the presentation of the relevant accounts. As soon as possible after the expiration of each year# the Operator shall cause the accounts to be audited by a recognised firm of Accountants acceptable to the Authority. The audited accounts shall be presented to the Authority within Ninety (90) days after the end of the year to which the accounts relate or failing this as soon as possible thereafter. The cost of such audit shall be treated aS a direct operating cost of the Container Terminal. " Any adjustment necessitated by such audit shall be effected immediately. The Authority shall have the right at its own cost to have the accounts of the Operator audited from time to time and shall be entitled to conduct such investigations into the operations and management of the Container Terminal# as the Authority considers necessary from time to time.The accounts referred to in the preceding clause shall be in such form and context as may be agreed f m*'''.time to time by the Authority and- the Operator.
!

609 9239195 10>04. 91 21:06809 92391955 KTO. FT, BUSTflMftNTE KGN.- b -
n-
14. !The Operator shall confine its expenditure in' relation to the management and operation of theI »
' Container Terminal within such limitations as may; be agreed with the Authority or failing such
«
agreement, then within such limitations sis may be * specified by the Authority provided, however that
■ it is clearly understood that any such■ specifications shall be geared towards a' r e a s o n a b l e e f f i c i e n t o p e r a t i o n . ■
. ‘ j ■ • . ■ a / ' • •15. ‘ The Operator shall maintain an efficient operation'■ and Ithall satisfy the Authority that planning andJ ' ■management is' adequate to ensure such operation
1 . *
' and shall co-operate with the Authority to this i end.
16. ’ The Authority shall provide or arrange for theI provision of all plant and equipment required for '■ the operation of the Container Terminal after■ consultation and agreement with the Operator and shall take into account the availability of any equipment purchased by the Operator prior to this Agreement or with the knowledge and consent of the Authority for the operation of the facilities.
17. (a) ' Should the Operator not conclude with the '1
yV
Authority an Agreement to operate the Container Terminal after termination of this Agreement, the Authority shall immedlatiely after such termination notify the Operator whether any equipment owned or controlled by the Operator is required and the Operator shall then make available to the Authority or to such other operator as the Authority may nominate, such equipment owned or controlled by the Operator at such rental charges as may be negotiated between the parties not being more than the current sums being paid for the use of such equipment by the user receiving most
favourable terms for their use, or within thirty (30) days of the commenceiaent of such hireage the
: Authority may purchase such equipment at cost less depreciation at the'rate or rates approved by the
I
Authority, if being the intention of this Clause ' to ensure the ability of the Authority to secure
i the continued operation of the Container Terminal I with as much equipment as was available for its ; operation during the period of this Agreement, end 1 the Operator shall be obliged to deliver such ' dguipment to the purchaser and the purchaser or ; the Authority shall make payment within thirty ! -{30) days thereof.
17. (b) I Should the Operator not conclude with the.■ Authority an Agreement to operate the Container\!Terminal after termination of this Agreement the iAuthority shall indemnify and reimburse the Operator in. respect of any eunouhts paid by the
I Operator under the provisions of The ISmployment : (Termination and {Redundancy Payments) Act or any icolleotiva Labour Agreement in force at that time ibstween the Operator and a Trade Union to its 'employees working at the Container Terminal at . tsuch date of termination of this Agreement with £uch indemnity however being limited to the periodOf employment with the Operator.
*. !18. (There the Container Terminal is not sufficiently equipped to carry out any of the functions normally carried out at a container terminal and contemplated by this Agrecanent, the Operator may frcKB time to time sub-contract such operations as may be necessary in. the circumstances but only after consultation with the Authority on the need for and the terms of any such sub-contract as may be necessary in the circumstances. In exceptional
II
609 9239195 10.04. 91 21:12609 92391959 KTO. PT. BUSTflMftNTE KGN.i - 8 -
circumstances, vhere such consultation is not possible, a sub-contract f o r a specific purpose nay be entered Into, by the Curator and notification thereof to the Authority, shall take
4 *
place at the first possible opportunity. In any event, the conclusion of any such sub-contract
I must be notified promptly and in writing to the j Authority.I
19. Kingston Wharves Limited and Western TerminalsLimited in their respective capacities as wharf operators snaxi' subject t.o the provisions of the Wharfage Act, collect and retain all wharfage payable (save as containerised transhipment cargo) for cargo passing over the Container Terminal on condition that all costs and expenses in ' connection therewith shall, be borne by them and that none of such costs and expenses are charged to the operating cost of the Container Terminal. Should the Authority decide that wharfage or any part thereof on Containerised Transhipment Cargo is to be payable, then Kingston Wharves Limited and Western Terminals Limited shall collect same and the amount so collected less the direct expenses incurred Iti such collection shall form
• I f * ' ' 'Mtr/- -it,,,part of the earnings of the operations of the Container Terminal.
20. Kingston Wharves Limited and Western terminalsLimited each agree that it will pay to the Operator for the sole account of the Authority the sum of 10 cents per ton (tonnage assessed on the
1
same basis as is used for the fixing of the tariff}
of wharfage rates) for every ton of cargo importedor exported .in containers excluding all roll-on-roll-off cargo and containerised ' transhipment cargo which is handled by or over the
I

B09 9239195 1B-B4. 91 21*13809 92391959 KTQ. PT. HJSTflMflNTE KGN.^ 9
Container Terminal in respect o£ which wharfage is collectable pursuant to iJhe tariff of 'wharfage rates. It being understood and agreed that such . amounts paid by each of Kingston Wharves, hinited and Western Terminals Limited shall not be taken
• * into account by the Operator in’ determining either the Gross Revenue of the Container Terminal or the Net Revenue.
21. The Operator shall pay over to the Authority theresidue of the .total earnings frcnn'the operations ■of the Container Temlnal after deducting from the total' earnings during any accounting period the following expenses attributable to that accounting period:(a) all salaries, wages and other costs of
personnel employed by the Operator; .(b) maintenance costs;(c) costs, if any, of renting equipment used, at
the Container Terminal;(d) . the cost of spare parte;(e) interest on working capital which may be
borrowed for the operations of the Container Terminal;
(f) insurance premiums for spare parts, the dock facilities and ail plant and equipment as provided for in Clause 9 and insurance premiums payable in accordance with 'the provisions of Clause ID;
(g) ahy other appropriate direct costs and should there be any dispute as .to whether any cost is a direct .cost, then normal accounting principles will apply in determining same; .
(h) capital charges, comprising interest payable by the Authority and depreciation on the plant, equipment and dock facilities owned by

the Authority A t the rate or rates set out in ■letter of the ■ same date as-, this agreement .between- the Authority and the Operator.;
(i) depreciation at the rate or ra.tes set out in letter^ of--the.-same date^Jis— thi-s—ag*4aaignt between the Authority—and- the—fipeeator on plant and equipment purchased and owned by the Operator and in respect of -which no other charge by way of rental or hireage is being made as o charge to the Container Terminal. Where such, equipment is used partly in respect of the Container Terminal and partly for other purposes, depreciation thereon shall be apportioned according to use;
(j) a management fee calculated to reward the Operator for its efforts as operator of One
■ and one-half per cent (1H%) ^he Gross Revenue of the Container Terminal (less the .lO rental) plus twelve per cent (12%) of the Wet Revenue. The terns -"Gross Revenue" and "Net Revenue" shall be calculated on the basis agreed by letter of the same date as this agreement between the Authority and the Operator.
The Authority and the Operator shall Work closely together for the promotion of the Container Terminal in order to aim at increasing the volume of containers now passing through the Container Terminal.v;ithout prejudice to any other rights of the parties, and notwithstanding the provisions of Clause 2, this Agreement may be terminated by either party at any time after the expiration of three (3) years from its commencement by six (6) months' previous notice in writing.
609 9239195 10.04. 91609 92391951 KTO. FT. BUSTRMfiNTE KS .- 11 -
!
2 4 . ■ Should the Operator be desirous of continuing themanagement of the Container terminal after the termination of this Agreement* the Operator shall not less than nine months before the expiration of this Agreement give to the Authority .notice in writing of such desire* whereupon both parties ’ shall forthwith enter into negotiations so as to determine the terms and conditions of theI . ■ .agreement for the continuing management of the ^ntainer. Terminal by the Operator. In the event
I
that such an agreement is not boncluded three months before, the expiration of the period of this Agreement then unless the Authority and the operator shall otherwise agree this Agreement shall upon the expiration thereof be terminated.
25. The. Authority may determine this Agreement forthwith by notice in writing to the Operator if the Operator shall go into liguida'tlon (whether
. compulsory or voluntary not being merely a voluntary liquidation for the purposes of
. amalgamation or reconstruction) or shall become insolvent or enter into an agreement with its creditors generally or shall have a receiver
V . ■
ajppointed of its assets or undertaking or any part .thereof.
26. . any dispute arising under this Agreement shall bereferred to a single arbitrator nominated by the President for the time being of the Public Accountancy Board of Jamaica in accordance with the provisions of the Arbitration Act or any statutory modificationa or re-enactment thereof fox the time beipg in force.
27. ' Nothing in this Agreement shall constitute a.. partnership between the parties hereto' nor
constitute any of them the agent of any other.
B 0 9 9 2 3 9 1 9 5 1 0 . 0 4 . 9 1 2 1 : 1 58 0 9 9 2 3 9 1 9 5 1 K T O . P T . B U S T f t M f t N T E K G N .- 12 -
28. No variation waiver or modification of any of theterms of this Agreement shall be effective unless in writing and signed by or on behalf of the parties hereto.
on any party hereto shall be well and truly served if posted by prepaid registered post in any post office in Jamaica addressed to the. party at the address hereinbefore appearing and any such notice shall be deemed to have been' received within Scvchtytwo (72) hours of the time of posting.IN NITNBSS NHBREOF the parties hereto have caused
29 Any notice required by this Agreement to bo served
this Agreement to be executed as of the date hereinbefore written.. . . •
EXECUTED under the Common Seal) of THE PORT AUTHORITY by )Lucien M. Rattray, (Seneral )Manager and H. St. John )Iffoodhamin the presence ofx-
Secretaryl..
Eof KINGSTON TERMINAL- OPERATORS) LIMITED in accordance with its) Articles of Association in the)presence of:- )
.MIV

^ f;-**
B09 92391952 KTO. PT. BUSTflMflNTE KGN.- 13 -
EXECUTED urjder the Conunon Seal) of KINGSTON WlARVES LIMITED in) accordanceiwith its Articles ) of Association in the presence) ofI- ■ )
B09 9239195 10. S4. 91 21:15
T
I ii— ~r--
EXECUTED upder the Common Seal) of WESTERN TERMINALS LIMITED ) in accordance with its )Articles of Association in the) presence oft-‘ )
TOTAL P.05

APPENDIX 5.1TRAFFIC AT TERMINAL (CONTAINERS & VESSELS) FOR 1980-1990
I YEAR{TRANSHIPMENT11
DOMESTIC { TOTAL 1 1{VESSEL • : CALLS
! 1980 { 72,029 23,244 { 95,273 { 507{ 1981 { 64,288 29,564 { 93,852 { -543{ 1882 { 50,570 1
1 30,777 { 81,347 { 506{ 1983 { 58,636 1
1 31,564 { 90,200 : 560{ 1984 { 58,888 1
1 26,133 : 85,021 { 515{ 1985 { 103,185 1
1 28,180 { 131,365 : 618{ 1986 { 126,489 t
I 34,241 : 160,730 { 548: 1987 { 126,117 1
1 35,091 { 161,208 : 496{ 1988 { 66,578 11 . 48,195 : 114,773 J 530: 1989 { 42,344 1
1 51,901 { 94,245 { 5291 1990 : 47,512 11 . 40.601 .{ 88.113 ! 412Source: Kingston Terminal Operators Ltd
APPENDIX 5.2
KTO BERTH OCCUPANCY FOR PERIOD 1988-1990
MONTH NO. OF VESSELS
1990 i!I I „
- - - - - - - - - - - - - - - - - - - - - - - » I1 TOTAL HRS 1 !NO. OF{ALONGSIDE: ‘.VESSELSI _ _ _ _ _ _ » > _ _ _ _ _ _ _ _ _ _ _ _ _ _ _ _ _ _— I — - - - - — I 1
1989 :!I I
- - - - - - - - - - - - - - - - ■“ I I:TOTAL HRS! 1 NO. OF:alongside:{vesselsI _ _ _ _ _ _ _ _ _ _ _ _ _ _ I I _ _ _ _ _ _ _ _
1988 :I— — — — — — — — J
{TOTAL HRS: {ALONGSIDE:I I— I----- — — ,
JANUARY 37 { 321.5FEBRUARY 34 { 371.9MARCH 29 { 364.6APRIL 31 { 380.2MAY 32 { 380.3JUNE 34 { 341JULY 31 { 268.4AUGUST 32 : 396.2SEPTEMBER 28 { 423.2OCTOBER 32 { .327.7NOVEMBER 40 { 627,4DECEMBER 41 { 540.9
41 : 430.1 {38 { 301.7 {46 { 453.3 {41 { 412.6 {48 { 511.3 148 { 434.6 {46 : 492 {46 { 406 {39 { 405 {43 : 404.5 :38 { 387.4 {38 { 385 • {
40 { 696.2 {37 { 402.6 {42 { 545.9 {46 { 475.4 {38 { 413.5 {53 { 576.7 {44- { 387.3 {50 { 544 {41 { 400.4 {45 { 440.1 {50 { 747.3 {41 { 528.8 {
TOTAL { 401 { 4743.3 {{ 512 { 5023.5 {{ 527 { 6158.2 {{AVERAGE . : 11.83 {{ { 9.81 {{ { 11.69 {{Source: KTO Statistics

APPENDIX 5.3
KTO TURNAROUND TIME (DAYS) FOR OCTOBER - DECEMBER 1989
MONTH ■NO. OF
SHIPSTIME
OCTOBER 43 0.53NOVEMBER 38 0.57DECEMBER 39 • 0.57
120 0.56S S 8 8 S C S S C S 8 B X S B S ===='=••===
SOURCE: TABLE 27. PORT STATISTICSOF JAMAICA. 0CT-DEC’89 PREPARED BY PAJ. JAN. 1990
APPENDIX 5.4
DISTRIBUTION OF MOVES PER GANG HOURS FOR ZIMVESSELS FOR PERIOD 1.01.90 TO 2£
MV/GRS HR MIDPOINT FREQ CUM. F(X) (F)
0 - 2 1 1 12 - 4 3 0 14 - 6 5 3 46 - 8 7 1 58 - 1 0 9 15 2010 - 12 11 33 5312 - 14 13 57 11014 - 16 15 33 14316 - 18 17 15 15818 - 20 19 5 16320 - 22 21 4 167
XF
167
0.60.62.43.0
0,7,9.6
12 ,
31, 65, 85,94.697.6
100.0
AVERAGE
10157
1353637414952559584
219113.11976
Source: KTO productivity report

APPENDIX 5.5
TARIFF RECIPIENTSKTO
OF REVENUE PAJ KW/WT
PILOTAGE - X -TOWAGE - X —WHARFAGE - — XCONTAINER HANDLING X - —RECEIPT 8c DELIVERY X - f -
STORAGE X — —STRIPPING 8( STUFFING X — _ —
MOUNTING 8( GROUNDING X ' -
APPENDIX 5.6
INDICES OF REVENUE, COST It PROFIT PER CONTAINER (1R85 BASE YEAR)
CD LH '86 '87/88 '88/89 '89/90
REVENUE:DOMESTIC 100 111 119TRANSHIPMENT 100 113 119
COST (J$) 251 307 435 619 742RATE OF EXCHANGE 4.25 5.5 5.5 5.5 6.5
COST (US$) 59 56 79 113 114
INDEX 100 95 134 191 194
PROFIT 100 70, 55 73 68
IIIIIIIIIIIIIIIIIIII II II II II II II II IIIIIIIIIIII II II II II II II II II II IIIIIIIIIIIIIIIIIIIIII IIIIIIIIIIIIIIIIIIIIIIII
85

a f »f»e:n d I :x: © - iCOMPONENTS OF A PORT INFOE?MATION SYSTEM
REQUIRED DATA DATA SOURCE
ENVIRONMENT
1.1 Macro Environment
a) Economy: Historical andforecast economic data on regional trading and partners focussing on:
GNP« Industrial production* Inflation Investment & economic activity
Foreign trade (Imp & exp) it Balance of Payments and debt* Exchange rates
Political stability* International trade agreements
Data can be found in various publications:
DRI, World Bank, IMF etc. However, the port can best keep abreast of the economic conditions of the various countries and regions through the local and international press as well as industry trade journals.
b) Technology: Developments are likely to affect the in-
transport modes and ship sizesPort & terminal cargo handling facilities
c) Legislature:* Government policy regarding
imports and exports. a Imposition and removal of
tariffs or export subsidies etc-
whi chIndustry journals such as Cargo ware, Containerisation International, Port Development International, etc.
Press and trade journals.

1.2 Port Industry
a) Customers* Trends in customer service
requirements
* Their share of the total
* Trading patterns and their trading partners over time.
In addition to sources previously quoted, such publications as PIERS, and Trade Horizons are useful. Also Market
* Level of freight rates for surveys.main commodities carried to and from the port on specific routes.Concerns: costs, service speed and efficiency, etc.
Financial performance.
b) Competitors: Information onexisting and potentially competing ports:* Capacity : over or under See above sources,
utilization.* Service quality* Throughput performance and Containerisation
market share International Yearbook Financial performance* Port development plans if Pricing* Main Customersif Labour relations
2. PORT DATA.
The UNCTAD manual on Port Statistics outlines the needs and sources of port data and information. It tables each data item of information and this is attached for reference. The table tries to identify or classify information according to the degree of importance. It is recommended that a port setting up an information system, or improving an existing system, might find it useful to work out the essential data and then, as resources permit or needs demand, add first the important data and then the useful .
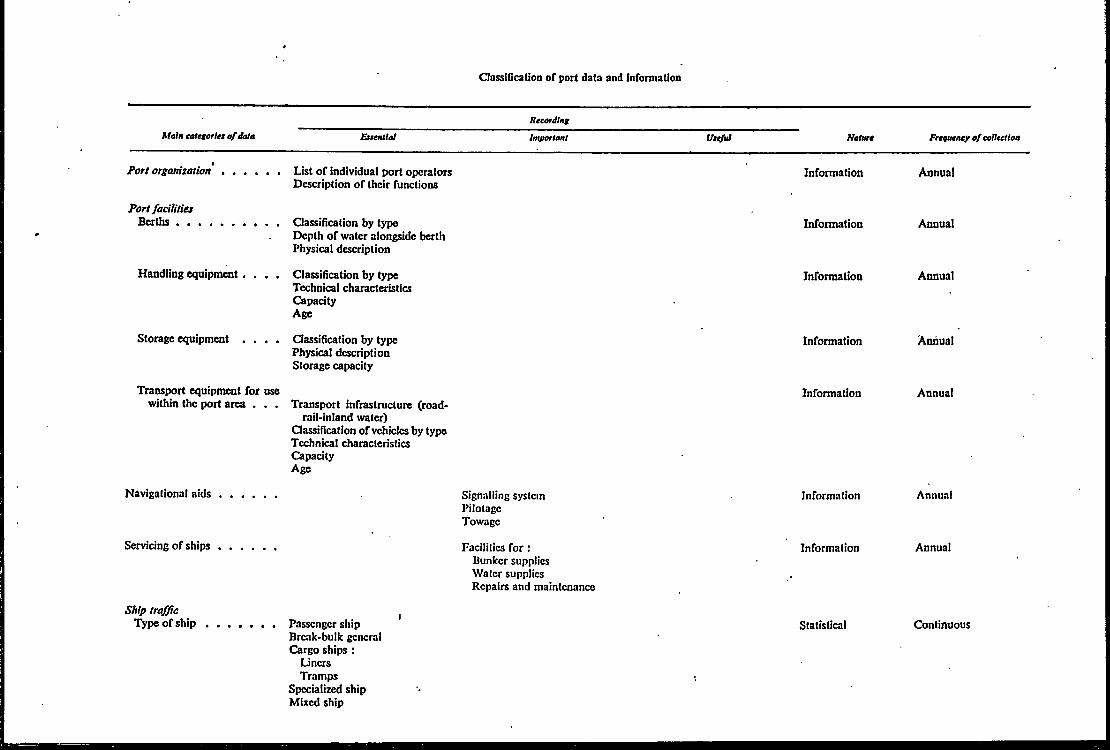
C l a s s i f i c a t i o n o f p o r t d a t a a n d i n f o r m a t i o n
Recording
Afotn calegorla o f data Etsenllal Imporlanl U ttfid Nature Frequency o f eolleetlaa
Port organization.................. List of individual port operators Description of their functions
Information Annual
Port facilities Berths................................ Oassification by type
Depth of water alongside berth Physical description
Information Annual
Handling equipment. . . . Classification by type Technical characteristics Capacity Age
Information Annual
Storage equipment . . . . Classification by type Physical description Storage capacity
Information Annual
Transport equipment for use within the port area . . . Transport infrastructure (road-
rail-inland water) Classification of vehicles by type Technical characteristics Capacity Age
Information Annual
Navigational a id s .................. Signalling systemPilotageTowage
Information Annual
Servicing of sh ip s .................. Facilities for :Bunker supplies Water supplies Repairs and maintenance
Information Annual
Ship traffic Type of s h ip ...................... Passenger ship ' Statistical Continuous
Break-bulk general Cargo ships :
Liners Tramps
Specialized ship Mixed ship

Size of ship Draught Ucani Statistical
Type of operation..................
Origin and destination of ship
Flag of the ship......................
Port operations Turn-around time of ship .
Services and facilities provided by the p o rt.........................
Goods in s to rage ...............
Supplies to ship..................
CRT or NRTDWTLength
LoadingDischargingLoading and discharging BunkeringRepairs, maintenance Other purposes
Statistical
' .I?
By country of origin and By port of origin and Statisticaldestination destination
Continuous or sampling
Continuous
Continuous or sampling
Flag Statistical Continuous
Times o f :Arrival
‘ Berthing Departure
Times o f :Pilot on board
• Start handlingHandling stoppage etc.
Record of ship delay by main causes
Successive berths allocated to each ship
Handling and transport equipment for each working period
Amount of cargo loaded and Pilot and craft at each movement discharged during each working period No. of tugs at each movement
For each unit of storage :Goods received from ships Goods dispatched to hinterland Goods received from hinterlands Goods dispatched to ships
Types and tonnages of bunker Tonnages of water
Statistical Continuous
Statistical Continuous or sampling
Statistical Continuous or sampling
K»-
‘
Statistical Continuous or saln-pling
Statistical Continuous
Accidents Accidents to ships Damage to cargoes
Information Continuous

Port labour
ClassiTication of port data and Information (continued)
For the whole port;No, of supervisory staff No. of clerical staff No. of permanent dock-workers Average number of casual
workers
Classification by age Information Weekly or monthly
Cargo flows Type of t r a f l ic ...............
Commodities
Type of packaging . . . .
Size of shipment
Type of operation
Rcc<,rtor.bs»«b,„». s.a,«falNumber of supervisory staff Number of clerical staff Number of permanent dock- workersNumber of casual workers
Goods discharged Goods loaded Goods trans-shipped Types of traffic:
Foreign Domestic Transit Entrep6t
Ocean traflic Near-sea traflic
Amount of cargo in bach class of the port commodity classification
Amount of cargo in each type of packaging
Statistical
Statistical
Statistical
Number of individual shipments in cadi class size Statistical
Transfer from ships to inland transport and vice versa for inward and outward traffic DirectThrotigli port storageThrough lighterThrough lighter and storage
Statistical
Continuous
Continuous
Continuous
Continuous
Sampling
Continuous or sampling
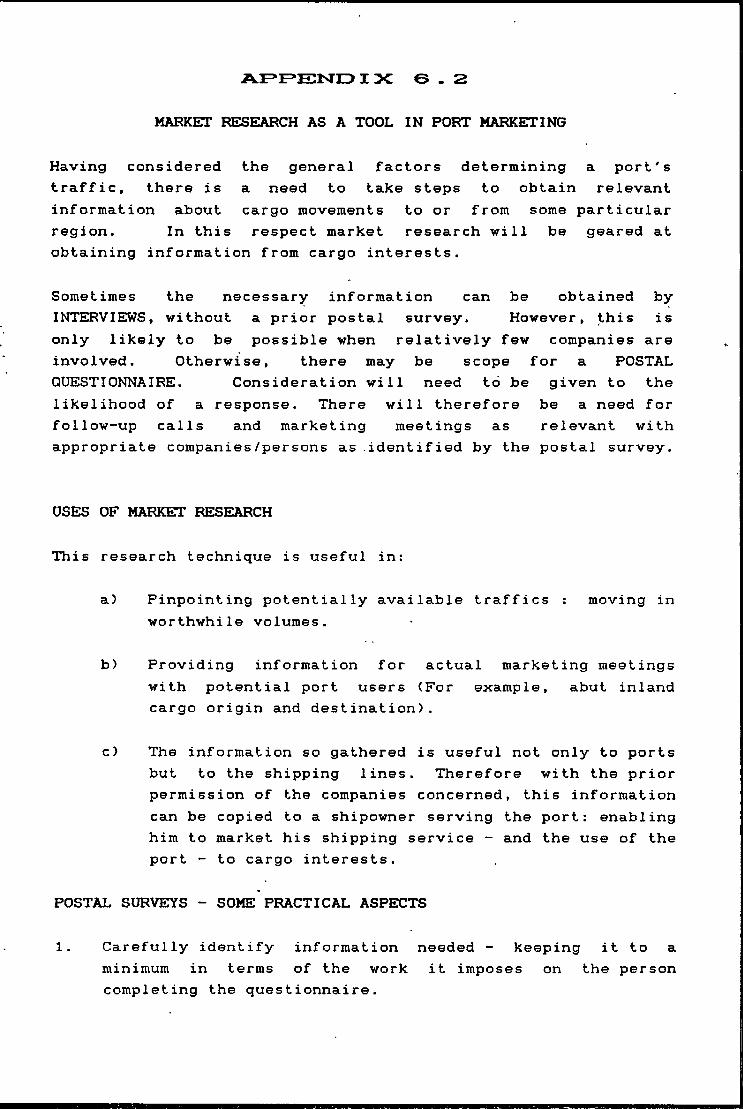
I >C e . 2
MARKET RESEARCH AS A TOOL IN PORT MARKETING
Having considered the general factors determining a port's traffic, there is a need to take steps to obtain relevant information about cargo movements to or from some particular region. In this respect market research will be geared atobtaining information from cargo interests.
Sometimes the necessary information can be obtained by INTERVIEWS, without a prior postal survey. However, this isonly likely to be possible when relatively few companies are involved. Otherwise, there may be scope for a POSTALQUESTIONNAIRE. Consideration will need to be given to thelikelihood of a response. There will therefore be a need for follow-up calls and marketing meetings as relevant withappropriate companies/persons as identified by the postal survey.
USES OF MARKET RESEARCH
This research technique is useful in:
a) Pinpointing potentially available traffics : moving inworthwhile volumes.
b) Providing information for actual marketing meetings with potential port users (For example, abut inland cargo origin and destination).
c) The information so gathered is useful not only to ports but to the shipping lines. Therefore with the prior permission of the companies concerned, this information can be copied to a shipowner serving the port: enabling him to market his shipping service - and the use of the port - to cargo interests.
P0ST7UL SURVEYS - SOME PRACTICAL ASPECTS
1. Carefully identify information needed - keeping it to a minimum in terms of the work it imposes on the person completing the questionnaire.
2. Check the draft questionnaire questions on someone who knows about the trade. This prevents irrelevant and confusing questions.
3. Time allowing, do a small 'pilot' survey with thequestionnaire before launching the full survey.
4. Length - not more than four sides. Ideally on a singlesheet folded to give four sides.
5. Draft a very careful letter to explain why the information is desired. Also explain why it is in the interest of the company to reply (such as to enable the port to meet user needs as well as possible, etc). The confidentiality with which the information will be treated must also be stated.
If it is desired that a market survey should help ashipowner canvass traffic for his ships/your port, do mention that the information will be given to the shipowner as well. This will in fact give an excellent opportunity to use the letter - composed jointly with the shipowner - to give details of his service or proposed service.
6. It is important to write and thank all companies who completed the questionnaires, whether or not they show that they are involved in the market being surveyed. It might also be useful to produce and send then a copy of a simplified version of a report on the survey (excluding all commercial information) in appreciation for their help. This helps to provide marketing contact and can improve the response rate in future surveys.
7. On the questionnaire, ask the person completing it to
write in their « Name* Telephone number if Function
indicate 'YES' or 'NO' - to whether they are involved in the market (commodity or trade) being surveyed, otherwise, companies not shipping will not
reply and their will not be any indication of how good the response rate is or to whom a reminder letter and or questionnaire should be sent.
8. After a few weeks, send a reminder letter/questionnaire to those who have not replied.
9. On the questionnaire, typical questions can include:
- Tonnages: specifying weight of cargo sent to whatever destinations the information is required on; by main commodities or specific commodities.
Cargo origins
Whether and how packaged; Container, pallets, break-bulk and so on.
- If any big changes are expected in future cargo volumes, origins and destinations or packaging. The latter may indicate need for additional port services such as cargo consolidat ion.
- Terms of shipment (fob or cif etc.)
- Who controls shipments and port routings. It may also be worthwhile asking a general question as to the broad reason for choice of port. This may be done by asking respondents to tick boxes on the questionnaire as to the most important resons.
- A last question could be one asking for any comments the company may wish to make.
Source: Extracted from E. Pollock's Lecture on Port Marketing.August, 1991.

I 3C G . 3
Conservancy -
Port Du« -
Pilotage -
Tug Hire -
Mooring/ - Unmooring
Berth Hire -
Stevedorage -
Wharfage -
Common Tariff Categories
A fixed fee for access to the port and use of the aids to navigation. This charge is based on the characteristics of the vessel It is sometimes called Light Dues, Harbor Rates or Channel Dues.A fixed fee for general use of the port facilities. This charge is based on the characteristics of the vessel It is sometimes referred to as a Harbor Dues.A unit, movement or time-related charge for piloting the vessel in and out of the port. This charge is based on the characteristics of the vesselA unit, movement or time-related charge for towing the ship to and from the berth as well as for moving the vessel within the port. This charge is based on the characteristics of the vessel or the tugboat. It is som imes referred to as Towage or Tug Services.A fixed fee for tieing up and releasing vessels at anchorage or at the the wharf. This charge is sometimes based on the characteristics of the vessel It may be referred to as Anchorage or Dolphin Rates if the vessels is at anchorage and as Berthing Fee or Line Handling if the vessel is at the wharf.A time-related charge for staying alongside the berth. This charge is based on the characteristics of the vessel as well as the length of stay. It is sometime referred to Berthage, Berth Rent, Quay Dues, Dockage, Wharf Rates or Berth Occupancy.A unit or time-related charge for transferring the cargo between the wharf and the vessel. This charge is based on the characteristics of the carg as well as the period of time the labor is employed. It is also referred to as Cargo Handling, Labor Hire, Discharging or Loading.A unit charge levied against all cargo moved across the wharf or handled in the port. This charge is based on the characteristics of the cargo. It is sometimes referred to as the General Charge or the Berth Fee.
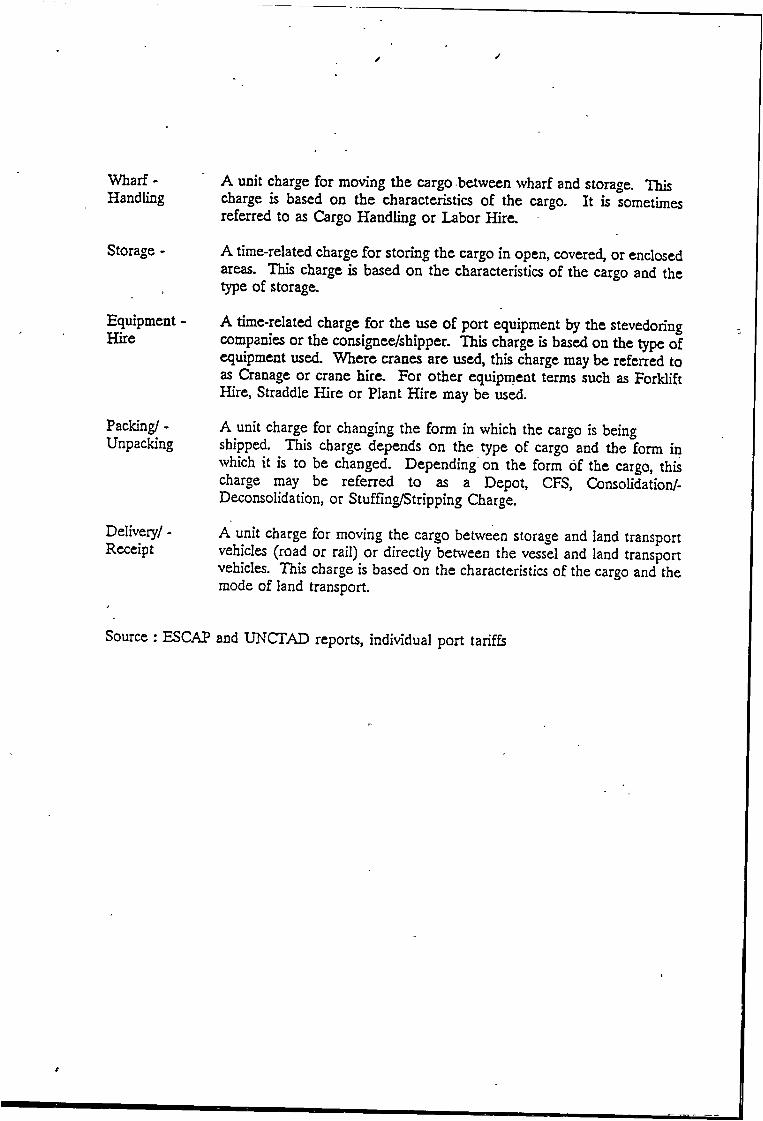
Wharf- Handling
Storage -
Equipment - Hire
Packing/ - Unpacking
Delivery/ - Receipt
A unit charge for moving the cargo between wharf and storage. This charge is based on the characteristics of the cargo. It is sometimes referred to as Cargo Handling or Labor Hire.A time-related charge for storing the cargo in open, covered, or enclosed areas. This charge is based on the characteristics of the cargo and the type of storage.A time-related charge for the use of port equipment by the stevedoring companies or the consignee/shipper. This charge is based on the type of equipment used. Where cranes are used, this charge may be referred to as Cranage or crane hire. For other equipment terms such as Forklift Hire, Straddle Hire or Plant Hire may be used.A unit charge for changing the form in which the cargo is being shipped. This charge depends on the type of cargo and the form in which it is to be changed. Depending on the form of the cargo, this charge may be referred to as a Depot, CFS, Consolidation/- Deconsolidation, or Stuffing/Stripping Charge.A unit charge for moving the cargo between storage and land transport vehicles (road or rail) or directly between the vessel and land transport vehicles. Hiis charge is based on the characteristics of the cargo and the mode of land transport.
Source : ESCAP and UNCTAD reports, individual port tariffs

AF F>E:iSrD I 3C V . 1
CLASSIFICATION FOR A PORT FACT BASE
1. THROUGHPUTTFEND: Statistical performance and rate of'growth
Breakdown by type and mix :commodity; import and export; domestic and transhipment; FCL 8< LCL; empties and loaded
MARKET; - Sources of transhipment and domestic trafficCUSTOMERS- Shipping lines' throughput contribution and
mix; • . ,Cargo interests'II
Throughput by sources/destinationsProfit contribution in terms of : Customers;transhipment and domestic traffic.
2. MARKET - State of the transhipment and domestic container market; growth rates total market size KTO's share of the marketis KTO's share of the market increasing or decreasingMarkets where KTO is losing ground and why where is the Terminal doing well and where is the performance poortrends in the market; productivity, port routing, services offered and technology
3 . TRENDS IN Trade patternsMACRO global, regional and national economic growthENVIRONMENT government regulations
trading agreements
4. SERVICE All facts about the Terminal's services; ProductivityCrane and Equipment performance Labour performance

5. COMPETITION-
6. CUSTOMER -ATTITUDE
Quality and reliability assessment Price of port servicesIdentification of additional services which will complement existing range and increase customer satisfaction.
Identification of all major competitors Strengths and weaknesses Market share (trends)Future plans PricingCapacity .
What do customers regard highly of KTO's services and what they do hot.

AF*F>E:iSrD I "Z - 2
GUIDELINES IN IDENTIFYING PROBLEMS AND OPPORTUNITIES
PROBLEMS
1. Look for deviation from anticipated results:- less market share than anticipated- fewer customers or a narrow customer base- declining market share- loss of customers- lower throughput or profit versus increased costs.
2. Look for any deterrent to smooth Terminal operational performance such as:- lack of personnel- poor equipment performance- inadequate service facilities, such as: shortage of
equipment and stacking area- unfavourable government regulations (customs or port
investment)
3. Look at any obstacles standing in the way of achieving performance goals such as
shortage of spare parts low service quality
- pricing levels- labour relations- customer dissatisfaction- low awareness in market of port facilities.
OPPORTUNITIESOpportunities are often presented disguised as problems,therefore a review of the statement of problems and the fact base can turn up opportunities associated with:
- geographical location- service advantage- emerging technology
resource advantage- changing customer needs- improvement in service facilities.

It needs to be identified whether unfavourable trends are being experienced by the Terminal only, or is it part of a wider industry problem. Thus the reason for the observed trend is important. A distinction has also to be made between solvable and unsolvable problems. In the case of the former, if its profitable for the port to attempt a solution. Thus a statement of problems and opportunities must be compiled.

AF E ElSrO I >C ’7' . 3
GUIDELINES IN THE STATEMENT OF PORT OBJECTIVES
State where relevant, assumptions underpinning the objectives. These assumptions must describe management's estimate of important developments or environmental conditions beyond the port's control which cannot be accurately predicted, but which must be considered when carrying out the plan.
Assumptions in a port context could be related to:- changes in the national, regional and global economic
conditions- inflation rate- status of major competition
availability of financing and rate of interest availability of spare parts currency fluctuation
- changes in patterns and direction of cargo flows- industry over or under capacity- economic well-being of major customers and trading
partners- impact of major innovations or expected developments
anticipated industry growth pattern and rate- company capabilities- government regulations- labour environment
It is useful to categorize these assumptions according to the areas described under competitive forces in chapter 6. Namely, Macro Economic, Industry and Company related assumptions.
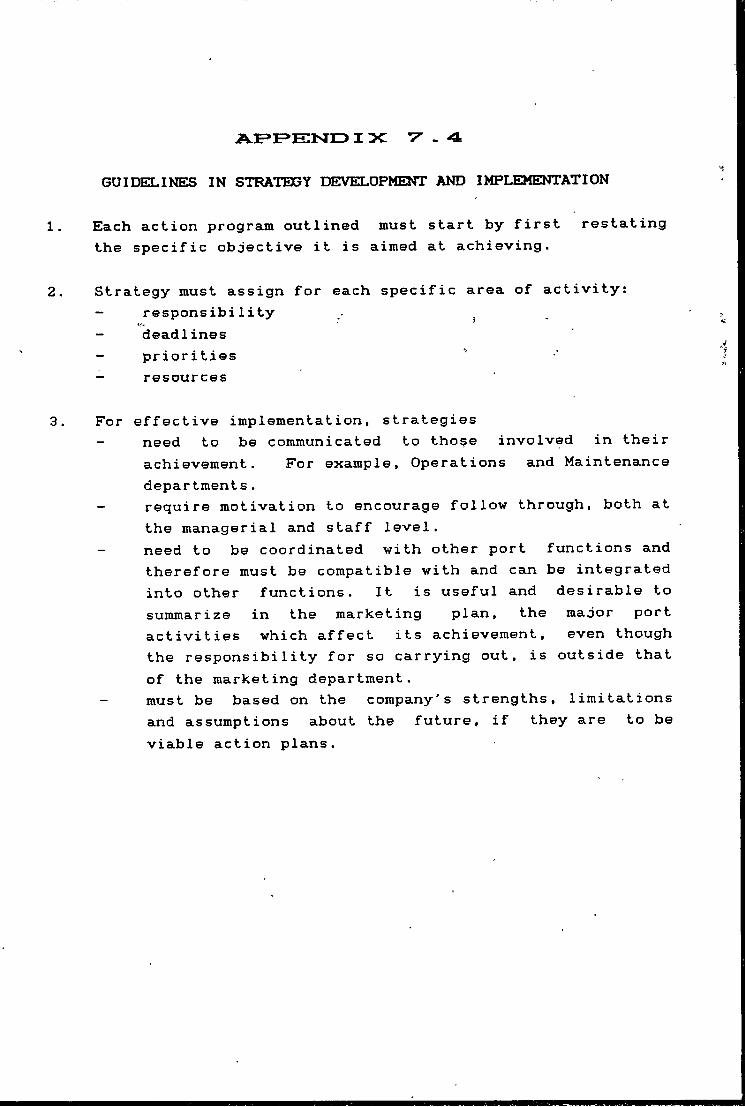
I >C - 4
GUIDELINES IN STE?ATEGY MIVELOPMENT AND IMPLEMENTATION
1. Each action program outlined must start by first restatingthe specific objective it is aimed at achieving.
2. Strategy must assign for each specific area of activity:- responsibility ,- deadlines- priorities- resources
3. For effective implementation, strategies- need to be communicated to those involved in their
achievement. For example. Operations and Maintenance departments.
- require motivation to encourage follow through, both atthe managerial and staff level.
- need to be coordinated with other port functions and therefore must be compatible with and can be integrated into other functions. It is useful and desirable to summarize in the marketing plan, the major port activities which affect its achievement, even though the responsibility for so carrying out, is outside that of the marketing department.
- must be based on the company's strengths, limitations and assumptions about the future, if they are to be viable action plans.

I :x: t' . 5CONSIDEERATIONS IN DEVISING THE MARKETING BUDGET
While strategies propose the plan of attack, the marketing budget specifies how much the various activities will cost. The first step in formulating the budget is to isolate the marketing department's area of responsibility. This may be seen ,as the activities relevant to securing and maintaining patronage of the port. Thus the relevant cost areas will,be; > '-a
a) Customer relationsb) Advertising, and,c) Promotion, including incentives and rebates
Budgetary cost estimates must be assigned to the individual marketing action plans. This implies good knowledge of the cost of the various activities. This costs includes not only data on the external activities themselves, but also on personnel costs. The marketing budget is therefore synonymous with marketing department budget.
Costs can be projected based on historical and current data from the accounting department, advertising agencies personnel department etc.
Each major budget figure must have a supporting statement to justify the allocation in terms of the goals of the activities and how necessary they are to the overall port performance.
ALTERNATIVE METHODS OF ESTABLISHING BUDGETS
There are essentially three methods of establishing budgets:
1. Mechanical method: This method is so called, becauseit involves no input from members of staff in its development, but is formulated by management and handed down. While it is simplest to establish, the fact that it is often created in isolation, means that the interests and concerns at the various levels might not have adequately been considered. This will lead to lack of identification with and understanding of the
2 .
budget, translating in reduced enthusiasm for its success.
The bottoms up method. This is more popular than the previous method, and is essentially a compilation of the master budget based on estimates and plans of various department managers. This ensures that the interests and concerns of the various organizational sub-units are considered. However, a possible problem is that plans of individual departments may be incompatible both with other departments and the organization as whole. Thus some coordinating force is necessary to prevent conflict.
3. The Cooperative method. This takes into consideration the shortcomings of the two previous approaches. It involves three phases:
a) Top management sends down a loose estimate (based on port objectives) as a planning guideline for allocation of marketing funds.
b) Marketing planners develop their strategies within those general guidelines, but with freedom to recommend exceptions, backed up by full details justifying all requests.
c) Top management fully reviews the marketing plans - which calls for a detailed marketing budget - and decide on a final approved figure.
While the merits of this method are obvious, the process is time consuming and implies a high level of communication. It can however be most effective.

AF>;E^E:isrD i x 7; - eM SZ " J . ^
GUIDELINES IN FORECASTING PORT TOAFFIC
The final step in the preparation of the marketing plan is to project the traffic level, costs and profit that the marketing strategy is intended to achieve. Forecasts of traffic should be broken down into categories to enable review against actual performance so as to pinpoint problems or opportunities which may be causing 'the variance.
Useful classifications for the projection of port traffic could be: transhipment and domestic, by
(i) commodity type <ii) geographic region (iii) carriers or<iv) services, such as storage and distribution.
These can also be used as profit centres and so establish the profitability of the different cargoes and services to the port. Here there will be the need for a sound basis of fixed cost assignment.
A forecast is rarely absolutely accurate, since it represents an attempt to estimate likely future events and thus involves uncertainty. It is usual therefore, to qualify forecasts. The finished forecast should be supported by a description of the underpinning assumptions and their effect. The method of preparing the forecast should also be described.
Forecasting methods can be divided into two major categories: Objective methods, comprising various statistical approaches, and subjective methods, based on surveys and opinions. Thestatistical approach includes methods such as moving averages, exponential smoothing and correlation, while subjective methods employ surveys of user and expert opinions. A more accurate forecast for ports might be obtained by using a combination of the two approaches.

METH0D0LCX3Y FOR FORECASTING CONTAINER TRAFFIC FOR KINGSTON.
The methodology first utilizes forecasts of trends in world trade and expected changes in commodity flows through the Caribbean. These are determined by factors such as:
- economic activity in individual nations that gives rise to international trade.
- changing industrial base of many nations
currency restrictions
- protectionism
- debt crisis.
Based on these, a forecast of cargo flows to and from specific areas which make up Kingston's transhipment market can be made. The procedures for carrying out the above analyses are outlined below.
Step 1
Utilizing both qualitative judgement and quantitative evaluations, a generic view of world trade patterns, shipping patterns, cargo types and vessel itinaries of the major carriers that ship through the Caribbean basin must be developed.
A decision as to the appropriate basis to be used to make the forecast must also be made. That is, commodities or trade routes? Here for transhipment at KTO, the appropriate basiswould be general cargo. General cargo can be derived by taking all commodities traded (based on UN trade statistics) and deduct liquid and dry bulk and other non~containerisable cargoes. This gives the maximum cargo that can be containerized. The analysis should concentrate on trade (import S export) between specific regions in the world and countries in the region,'' rather than trade routes.
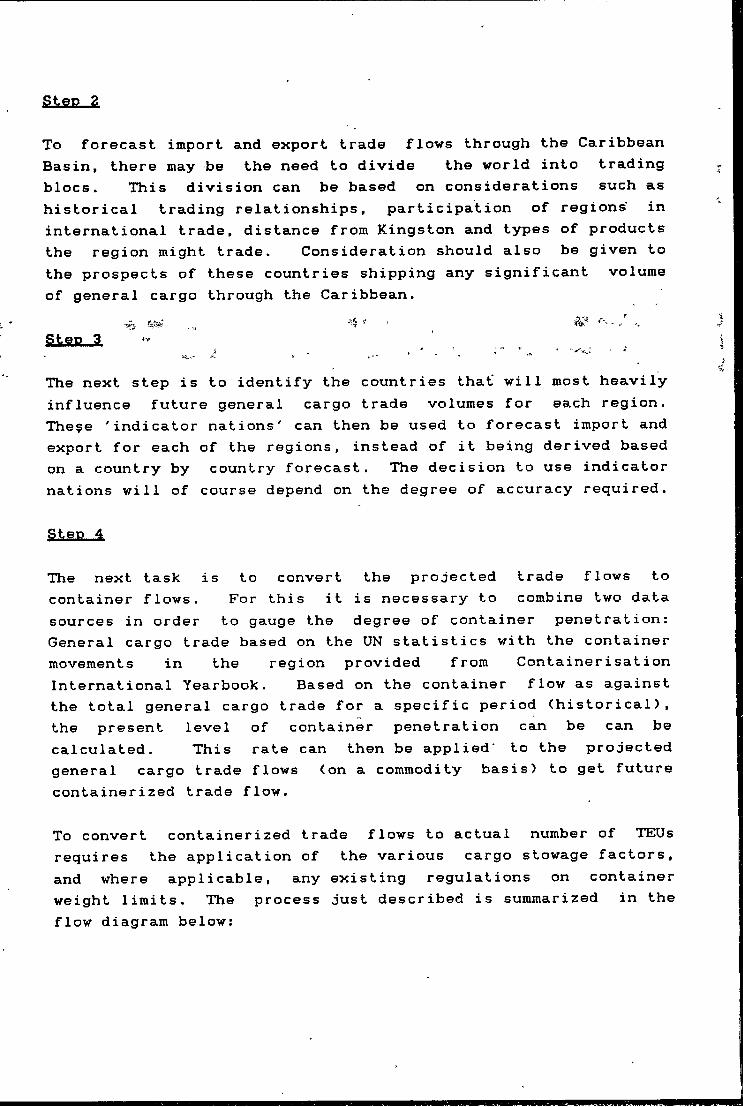
s te p 2
To forecast import and export trade flows through the Caribbean Basin, there may be the need to divide the world into trading blocs. This division can be based on considerations such as historical trading relationships, participation of regions' in international trade, distance from Kingston and types of products the region might trade. Consideration should also be given to the prospects of these countries shipping any significant volume of general cargo through the Caribbean.
3.4
The next step is to identify the countries that will most heavily influence future general cargo trade volumes for each region. The^e 'indicator nations' can then be used to forecast import and export for each of the regions, instead of it being derived based on a country by country forecast. The decision to use indicator nations will of course depend on the degree of accuracy required.
Step 4
The next task is to convert the projected trade flows to container flows. For this it is necessary to combine two data sources in order to gauge the degree of container penetration: General cargo trade based on the UN statistics with the container movements in the region provided from Containerisation International Yearbook. Based on the container flow as against the total general cargo trade for a specific period (historical), the present level of container penetration can be can be calculated. This rate can then be applied to the projected general cargo trade flows (on a commodity basis) to get future containerized trade flow.
To convert containerized trade flows to actual number of TEUs requires the application of the various cargo stowage factors, and where applicable, any existing regulations on container weight limits. The process just described is summarized in the flow diagram below;
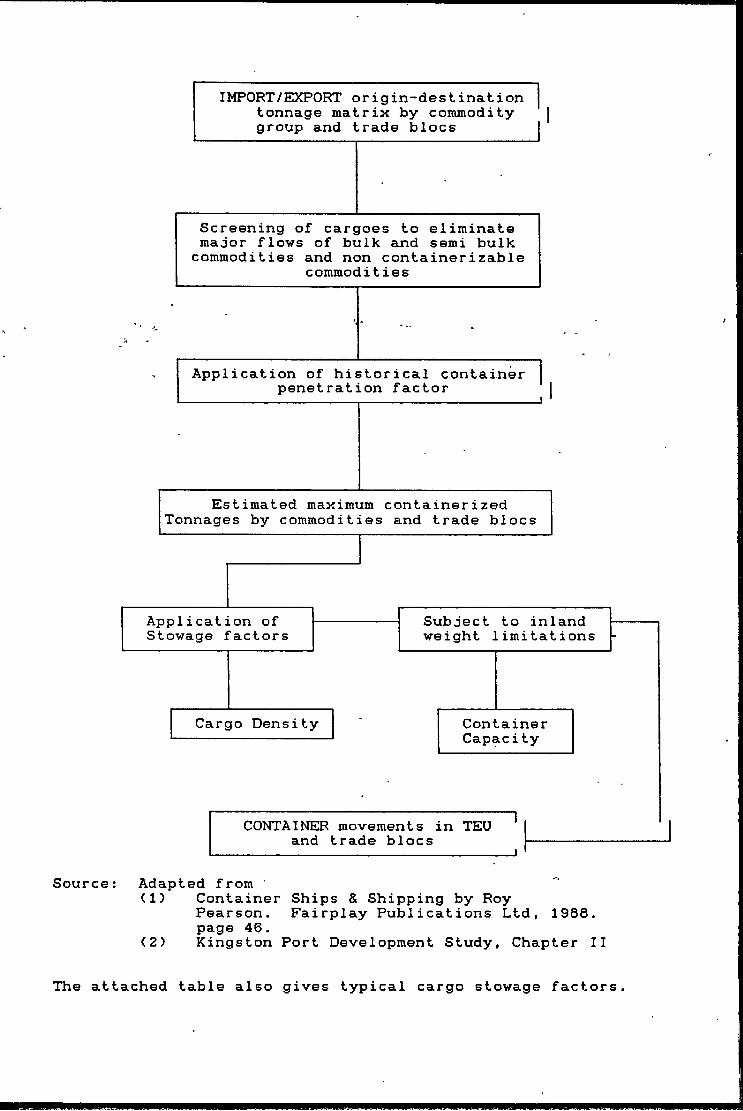
Cargo Density ContainerCapacity
CONTAINER movements in TEU and trade blocs______________________________________I
Source: Adapted from(1) Container Ships & Shipping by RoyPearson. Fairplay Publications Ltd, 1988. page 46.<2) Kingston Port Development Study, Chapter II
The attached table also gives typical cargo stowage factors.

Typiral Cargo Stoagg Factors
CoBsodity Tonnes per cubic aetreBoxlength(it)
Copper ingots 3.3 20Zinc ingots 2.5 20Pressed «ool bales 2.0 20Nuts and bolts 1.7 20Nolasses (in bulk) l.i 20Nails 1.4 20Copper coils 1.1 20Cesent (bagged) 1.0 20Cars (in KD fora) 1.0 20Plate glass 1.0 20Salt (in bulk) 1.0 20Iron I Steel scrap 1.0 20Kardvcods 0.91 20Tisber 0.8 20Coal (high grade) 0.71 20Sugar 0.71 20Cheese 0.71 20Potatoes 0.63 20Condensed Nilk 0.59 20Bacon 0.59 20Voodpulp 0.59 20Veg oil (in druas) 0.56 20Coffee (bagged) 0.56 20Rubber (bales) 0.53 20Textile products 0.14 40Furniture 0.14 40Doaestic elec gds 0.52 40Fibreglass 0.03 40
20' container 40' container18 tonnes 24 tonnes30 cbfi 66 cbi
weight out weight outspace util. 1SX space util. 51Sweight out weight outspace util. 24S space util. 15Sweight out weight outspace util. 30X space util. 18Sweight out weight outspace util. 35t space util, 21Sweight out weight outspace util. 43! space util. 26Sweight out weight outspace util. 43S space util. 26S ‘weight out weight outspace util, 55S space util. 33Sweight out weight outspace util. 60S space util, 36Sweight out weight out.space util. 60S space util. 36Sweight out weight outspace util. 60S space util, 36Sweight out weight outspate util. 60S space util. 36Sweight out weight outspace util. 60S space util, 36Sweight cut weight outspace util. 66S space util. 40Sweight cut weight cutspace util. 75S space util. 45Sweight out weight outspate util. 85S space util. 51Sweight out weight outspace util. 85S space util, SISweight cut weight outspace util. 85S space util, 51Sweight cut weight outspace util. 85S space util. 58Scubes out tfeight cutweight util. 98S space util, 62Scubes out weight cutweight util. 98S space util. 62Scubes out weight outweight util. 98S space util. 62Scubes out weight outweight util. 93S space util. 65Scubes out weight outweight util. 93S space util,65Scubes out weight outweight util.88S space util. 69Scubes out cubes outweight util.23S weight util. 39Scubes out cubes cutweight util., 23S weight util. 39Scubes out cubes outweight util, 20S weight util. 33Scubes out cubes outweight util. 5S weight util. 81

APPENDIX 7.7 COMPARATIVE DISTANCES IN NAUTICAL MILES
FROM KINGSTON & CRISTOBAL TO SELECTED PORTS!COUNTRY/PORT 1 KINGSTON JCRISTOBAL!!CENTRAL AMERICA 1
1 Tampidd 1263 1« 1473 !! Belize* 696 11 798 !! Honduras: Puerto Cortes 671 11 714 1! Guatemala: Puerto Barrios 732 11 824 !! Costa Rica:Limon/Moin 616 1 279 !! Panama:Cristobal 555 11J CARIBBEAN 1* ’Curacoa t
^586 11 766 !! Aruba ^ .529 1 632 !I Cuba:Havana 743 1 990 !! Haiti: Port-au-Prince 278 11 863 !! Dorn. Republic: Santo Domingo 428 11 891 !' Puerto Rico: Ponce 597 1t 1080 !1 San Juan 635 1I 1082 !! Antigua: St. John 867 11 1390 !! Guadeloupe: Point-A-Pitre 912 11 1440 !1 Dominica: Roseau 912 11 1145 !' Trinidad & Tobago:Port of Spain 999 11 1248 1I St. Lucia: Port of Castries 952 11 1320 !1 Barbados: Bridgetown 1045 11 1440 !I SOUTH AMERICA 1I! Columbia: Cartagena 483 I1 370 ii Barranquilla 444 11 340 !1 Santa Marta 438 11 360 !I Venuezuela:Puerto Cabello 690 tt 788 !I Maracaibo 582 11 676 !! La Guaira 730 t1 930 !1 Brazi1: Belem 2170 1t 2316 !! Recife 3027 11 3173 !! Manaus 2836 11 2982 !1 Fortaleza- 2628 11 2775 1! Guyana: Georgetown 1326 11 1550 !!US EAST COAST t1! Charleston 1060 '%1 1560 '!1 Jacksonville 1012 11 1505 !1 Miami 747 11 1200 I! New York/New Jersey 1472 11 1972 11 Port Everglades 763 t1 1217 1! New Orleans 1155 11 1403 !
Source: World Wide Distance TablesBP Tanker Company Ltd., London, 1976. Vol 1
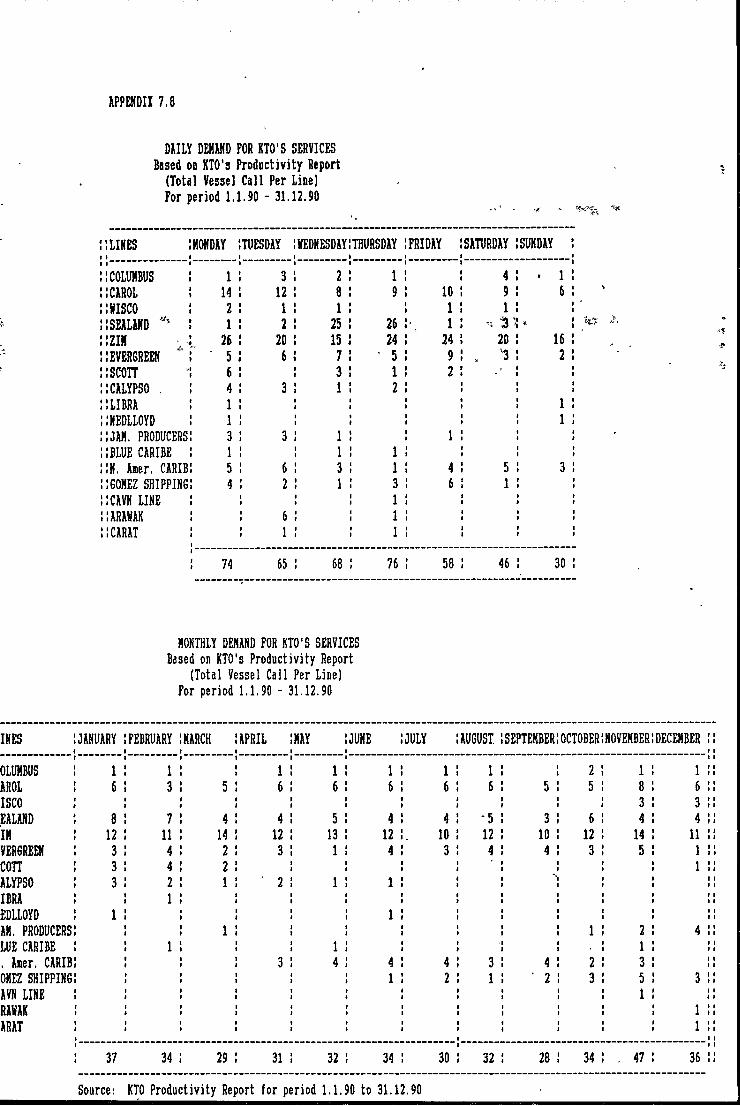
A PPEH D II 7 . 8
DAILY DEMAND FOR K T O 'S SERVICES
B a s e d o n K T O 's P r o d u c t i v i t y R e p o r t
( T o t a l V e s s e l C a l l P e r l i n e ]
F o r p e r i o d 1 . 1 . 9 0 - 3 1 . 1 2 . 9 0
{LIN ES MONDAY {TUESDAY NEDNESDAY THURSDAY {FRIDAY1
SATURDAY SUNDAY
1
! COLUMBUS 1 { 3 2 111 4 • 1
{CAROL 14 { 1 2 8 9 { 1 0 9 6
{NISCO 2 { 1 1 { 1 1
{SEALAHD 1 { 2 2 5 2 6 { 1 % t
{ZIM 2 6 { 2 0 1 5 24 { 2 4 2 0 1 6
{EVERGREEN ” 5 i 6 7 ■ 5 { 9 . ‘3 2
{scon 6 fI 3 1 { 2
{CALYPSO . 4 { 3 1 211
{LIBRA 111
1» 1
{HEDLLOYD 1 » 1 1
{JAM. PRODUCERS 3 { 3 1 { 1
{BLUE CARIBE 1I1 1 1
1t
{N. A u e r . CARIB 5 { 6 3 1 { 4 5 3
{GOMEZ S H IP P IN G 4 { 2 1 3 { 6 1
{CAVN L IN E11 1
11
{ARANAK { 6 111
{CARAT { 1 111
74 65 68 7 6 { 58 4 6 3 0
MONTHLY DEMAND FOR K T O 'S SERVICES
B a s e d o n K T O 's P r o d u c t i v i t y R e p o r t
( T o t a l V e s s e l C a l l P e r L i n e )
F o r p e r i o d 1 . 1 . 9 0 - 3 1 . 1 2 . 9 0
IN ES JANUARY FEBRUARY MARCH A PRIL MAY JUNE {JULY AUGUST. {SEPTEMBER{OCTOBER'.NOVEMBER{DECEMBER
OLUMBUS 1 1 1 1 1 1 1 { 2 1 1
AROL 6 3 5 6 6 6 6 6 { 5 5 8 6
ISCO11 3 3
EALAND 8 7 4 4 5 4 4 - 5 { 3 6 4 4
IN 1 2 11 14 1 2 13 1 2 10 1 2 { 1 0 1 2 14 11
VERGREEN 3 4 2 3 1 4 3 4 { 4 3 5 1
COTT 3 4 2 1 1
ALYPSO 3 2 1 2 1 1 t
IBRA 11I
EDLLOYD 1 11t
AM. PRODUCERS 1ft 1 2 4
LUE CARIBE 1 1 1 1
. A u e r . CARIB 3 4 4 4 3 { 4 2 3
OMEZ S H IP P IN G 1 2 1 { 2 3 5 3
AVN LIN E11 1
RAVAK11 1
ARAT11 1
3 7 3 4 29 31 3 2 34 3 0 3 2 { 2 8 3 4 . 4 7 3 6
S o u r c e : KTO P r o d u c t i v i t y R e p o r t f o r p e r i o d 1 . 1 . 9 0 t o 3 1 . 1 2 . 9 0