2050 Port Development Strategy
84
2020 Edition 2050 Port Development Strategy
-
Upload
khangminh22 -
Category
Documents
-
view
1 -
download
0
Transcript of 2050 Port Development Strategy
2020 Edition
2050 Port Development Strategy

DisclaimerThis document has been prepared by Port of Melbourne Operations Pty Ltd (PoM) on behalf of the Port of Melbourne Group (PoM Group) for planning purposes only. This is a proprietary PoM Group document and is not intended to be relied upon by any person or organisation other than the PoM Group, its employees and its authorised contractors and representatives.
Any potential infrastructure development identified in this document will be subject to financial viability, technical feasibility and environmental and planning considerations that will vary over time. The PoM Group will prepare a Port Development Strategy at five-yearly intervals (or, at its absolute discretion, more frequently). The PoM Group accepts no liability for any reliance by any third party on the information contained within this document.
The PoM Group makes no expressed or implied guarantees, representations or warranties as to whether the requirements of this document will be fulfilled, and no reliance may be placed by any person on the PoM Group meeting the strategic objectives or otherwise taking any action outlined in this document.
CopyrightThis document is subject to PoM copyright under Australian and international laws. All rights are reserved. No part of this document may be published, reproduced, adapted, communicated or transmitted in any form, in any retrieval system or media, by any means, in any jurisdiction, without the prior written permission of PoM.

Table of contentsExecutive summary 3
I Introduction 8
Planning for the future of our major trade gateway 8 How this Port Development Strategy has been created 10 How the many aspects of the Port are planned and managed 11 Port of Melbourne regulation 12 Shaping the future of the Port 13
II Key planning factors for consideration 16
The Port’s urban location, its land and facilities 18 A trade gateway for Australia’s south-east 21 Continued robust trade growth 23 Our contribution to the economy 25 Safe, reliable and adequate shipping channels 27 Responding to changing vessel needs 29 Transporting freight to and from the Port 33 Responding to landside transport growth 37 The Port’s critical operational functions 42 Managing inner-city growth and land use changes around the Port 43 Our environmental responsibilities 45
III Our plan for the Port 46
Strategic drivers and assumptions 47 Land use and infrastructure assessment 49 Port land and infrastructure development plans 49 Port waters improvements to deliver the plans 55 Port land improvements to deliver the plans 57 Landside transport and distribution network connections 59 Responding to change and embracing innovation 65 Protecting and enhancing the local environment 69 Land use planning for the future 71 Sustainability at Port of Melbourne 73
IV Next steps to deliver on the plan 75
Working with the Victorian Government 76 Program delivery and timeframes 77
Glossary 79
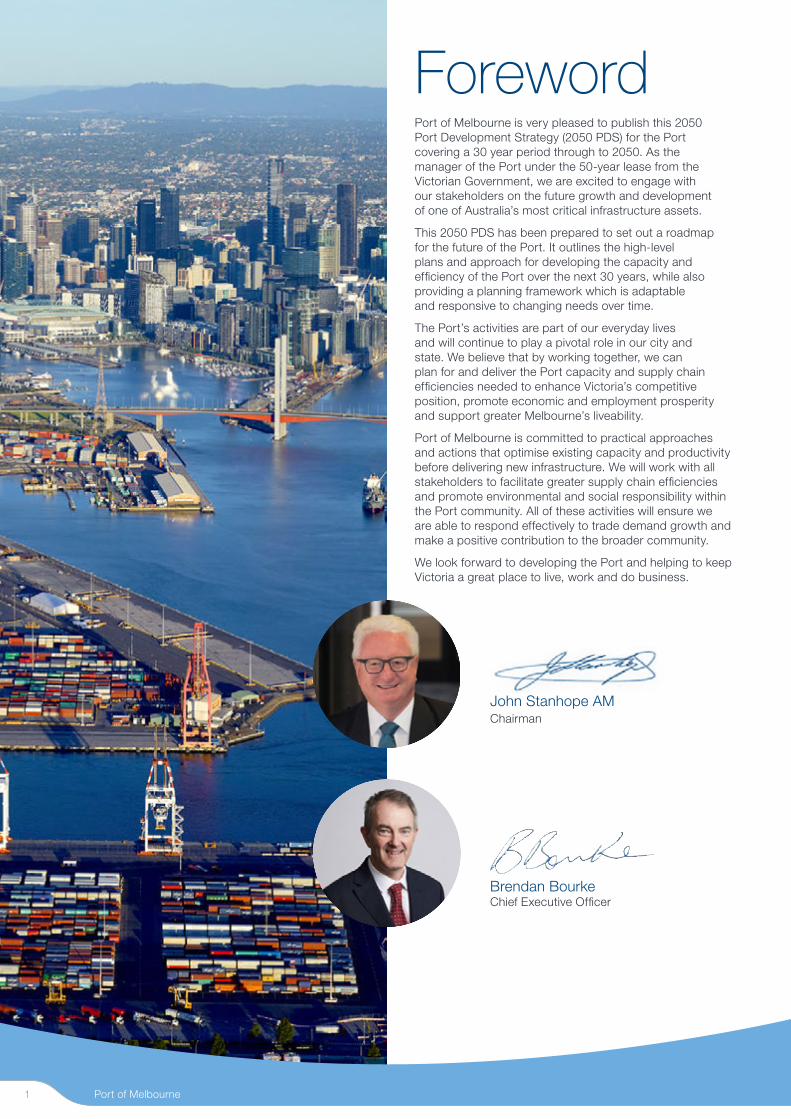
ForewordPort of Melbourne is very pleased to publish this 2050 Port Development Strategy (2050 PDS) for the Port covering a 30 year period through to 2050. As the manager of the Port under the 50-year lease from the Victorian Government, we are excited to engage with our stakeholders on the future growth and development of one of Australia’s most critical infrastructure assets.
This 2050 PDS has been prepared to set out a roadmap for the future of the Port. It outlines the high-level plans and approach for developing the capacity and efficiency of the Port over the next 30 years, while also providing a planning framework which is adaptable and responsive to changing needs over time.
The Port’s activities are part of our everyday lives and will continue to play a pivotal role in our city and state. We believe that by working together, we can plan for and deliver the Port capacity and supply chain efficiencies needed to enhance Victoria’s competitive position, promote economic and employment prosperity and support greater Melbourne’s liveability.
Port of Melbourne is committed to practical approaches and actions that optimise existing capacity and productivity before delivering new infrastructure. We will work with all stakeholders to facilitate greater supply chain efficiencies and promote environmental and social responsibility within the Port community. All of these activities will ensure we are able to respond effectively to trade demand growth and make a positive contribution to the broader community.
We look forward to developing the Port and helping to keep Victoria a great place to live, work and do business.
John Stanhope AM Chairman
Brendan Bourke Chief Executive Officer
Port of Melbourne1
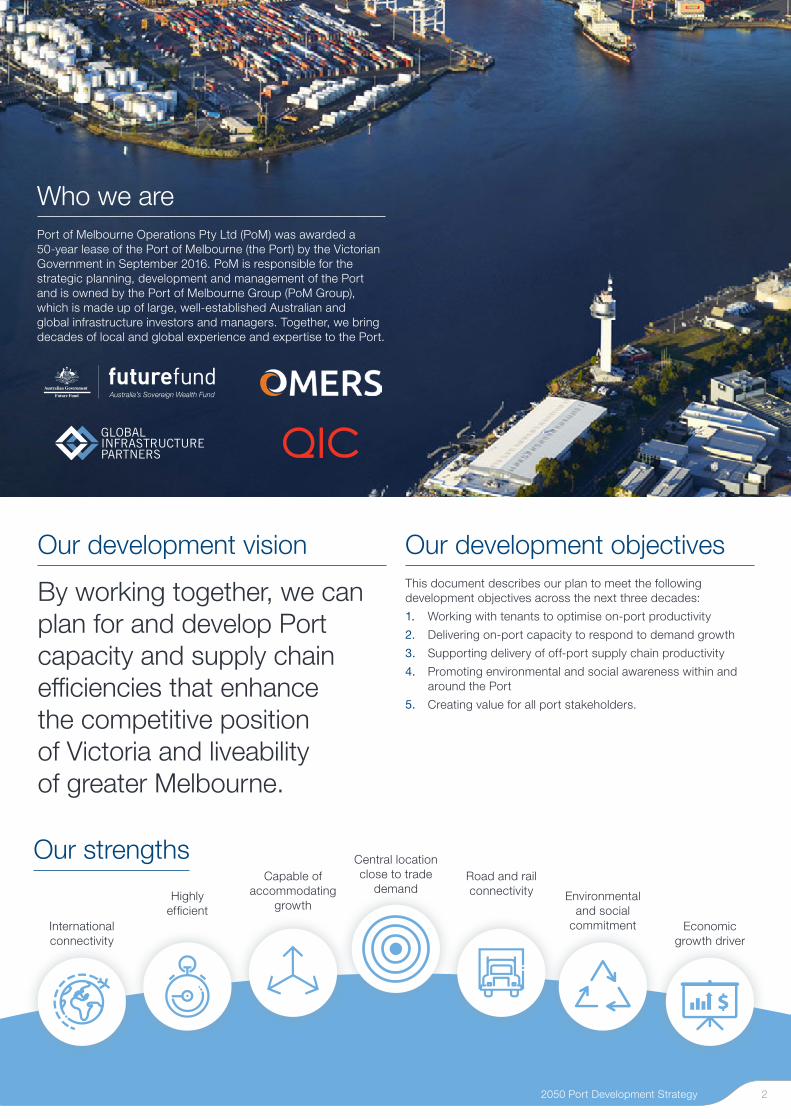
Who we are Port of Melbourne Operations Pty Ltd (PoM) was awarded a 50-year lease of the Port of Melbourne (the Port) by the Victorian Government in September 2016. PoM is responsible for the strategic planning, development and management of the Port and is owned by the Port of Melbourne Group (PoM Group), which is made up of large, well-established Australian and global infrastructure investors and managers. Together, we bring decades of local and global experience and expertise to the Port.
Our strengths
Economic growth driver
Environmental and social
commitment
Capable of accommodating
growth
Road and rail connectivity
Central location close to trade
demandHighly
efficientInternational connectivity
Our development vision
By working together, we can plan for and develop Port capacity and supply chain efficiencies that enhance the competitive position of Victoria and liveability of greater Melbourne.
Our development objectivesThis document describes our plan to meet the following development objectives across the next three decades:
1. Working with tenants to optimise on-port productivity
2. Delivering on-port capacity to respond to demand growth
3. Supporting delivery of off-port supply chain productivity
4. Promoting environmental and social awareness within and around the Port
5. Creating value for all port stakeholders.
2050 Port Development Strategy 2

Demand for Port services is growingThe Port of Melbourne (the Port) is a major business gateway for Victoria and south-eastern Australia. It is Australia’s largest container, automotive and general cargo Port and operates 24 hours a day, 365 days a year. The Port handles Victorian imports and exports, a number of Tasmanian trades, and cargoes moved to and from South Australia and southern New South Wales. The Port’s location in central Melbourne supports an efficient and effective transport and logistics industry and thousands of cargo owners across Australia’s south-eastern seaboard. The Port’s activity contributes significantly to Victoria’s economy and growth.
Freight movements are essential to business and the economy. Ensuring that commercial ships have easy access to the Port, that cargo is efficiently handled at the Port and that freight is easily transported on land helps to reduce the costs of doing business in Victoria. The building, manufacturing, retail, food, agriculture and petroleum industries rely heavily on the Port and its transport connections – and as a result, our day-to-day lives depend on the Port running well. Simply put, the better the Port works, the better Victoria works.
As our population grows and interstate and international trade increases, the demand for access to Melbourne’s Port will continue to grow. Each day, the Port handles around 8,000 Twenty-foot equivalent units (TEU)* of containers carrying a range of consumer goods including dairy products, toys, furniture and household appliances. It also handles significant volumes of other goods such as building materials used to construct our homes and infrastructure as well as petroleum products which fuel industry and passenger and freight vehicles.
A roadmap for the future
This Port of Melbourne 2050 Port Development Strategy (to which we will refer in this document as the 2050 PDS) has been prepared to set out a roadmap for the future of the Port. The 2050 PDS details the approach and high-level plans for developing the capacity and efficiency of the Port over the next 30 years, while providing a planning framework which is adaptable and responsive to changing needs over time.
* TEU is a standard measure of the number of containers used for international shipping. One TEU is one 20-foot container and hence one 40-foot container is counted as two TEU.
Executive SummaryPoM is pleased to provide this 2050 Port Development Strategy (2050 PDS) setting out the foundation for continued growth and development of the Port to the benefit of Victorian and south-eastern Australian communities.
The 2050 PDS builds upon the forecast strong growth of containers through to 2050 and the need to respond to changing user and market needs. As such, the 2050 PDS includes a commitment to growing rail at the Port, substantially expanding container capacity, particularly at Webb Dock, and working with industry, Government and all stakeholders to grow and develop the Port.
Executive summary3
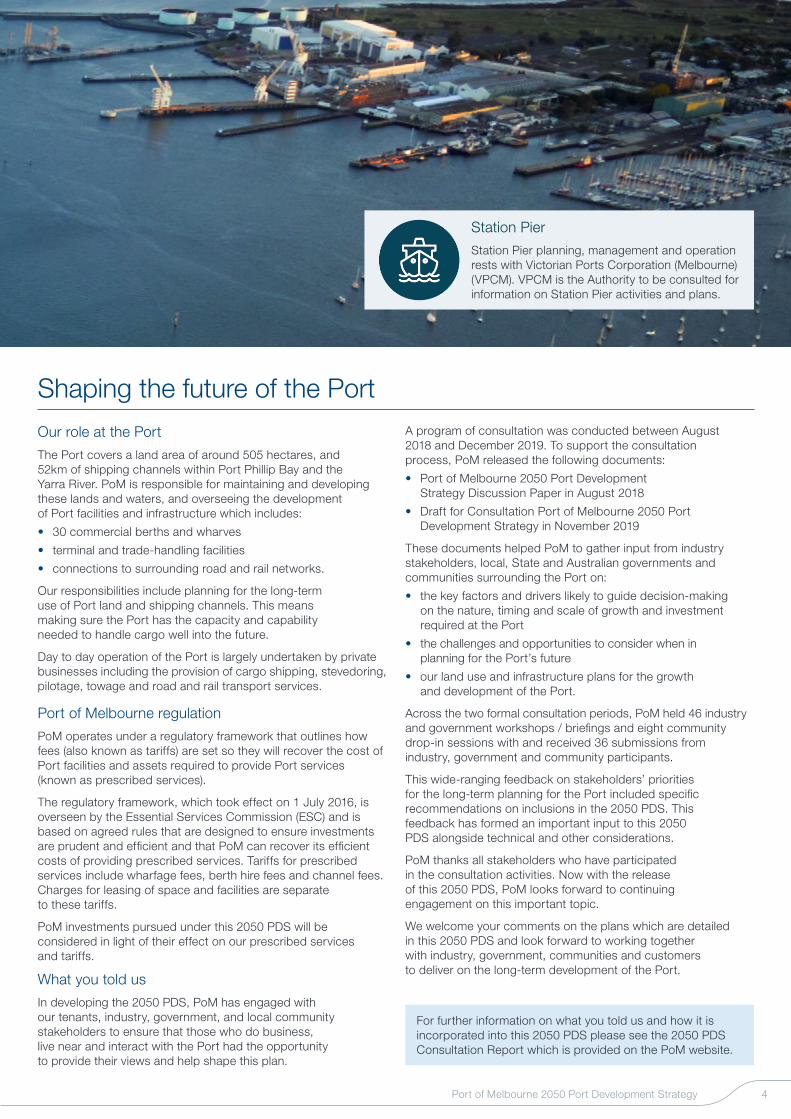
Shaping the future of the PortOur role at the Port
The Port covers a land area of around 505 hectares, and 52km of shipping channels within Port Phillip Bay and the Yarra River. PoM is responsible for maintaining and developing these lands and waters, and overseeing the development of Port facilities and infrastructure which includes:
• 30 commercial berths and wharves
• terminal and trade-handling facilities
• connections to surrounding road and rail networks.
Our responsibilities include planning for the long-term use of Port land and shipping channels. This means making sure the Port has the capacity and capability needed to handle cargo well into the future.
Day to day operation of the Port is largely undertaken by private businesses including the provision of cargo shipping, stevedoring, pilotage, towage and road and rail transport services.
Port of Melbourne regulation
PoM operates under a regulatory framework that outlines how fees (also known as tariffs) are set so they will recover the cost of Port facilities and assets required to provide Port services (known as prescribed services).
The regulatory framework, which took effect on 1 July 2016, is overseen by the Essential Services Commission (ESC) and is based on agreed rules that are designed to ensure investments are prudent and efficient and that PoM can recover its efficient costs of providing prescribed services. Tariffs for prescribed services include wharfage fees, berth hire fees and channel fees. Charges for leasing of space and facilities are separate to these tariffs.
PoM investments pursued under this 2050 PDS will be considered in light of their effect on our prescribed services and tariffs.
What you told us
In developing the 2050 PDS, PoM has engaged with our tenants, industry, government, and local community stakeholders to ensure that those who do business, live near and interact with the Port had the opportunity to provide their views and help shape this plan.
A program of consultation was conducted between August 2018 and December 2019. To support the consultation process, PoM released the following documents:
• Port of Melbourne 2050 Port Development Strategy Discussion Paper in August 2018
• Draft for Consultation Port of Melbourne 2050 Port Development Strategy in November 2019
These documents helped PoM to gather input from industry stakeholders, local, State and Australian governments and communities surrounding the Port on:
• the key factors and drivers likely to guide decision-making on the nature, timing and scale of growth and investment required at the Port
• the challenges and opportunities to consider when in planning for the Port’s future
• our land use and infrastructure plans for the growth and development of the Port.
Across the two formal consultation periods, PoM held 46 industry and government workshops / briefings and eight community drop-in sessions with and received 36 submissions from industry, government and community participants.
This wide-ranging feedback on stakeholders’ priorities for the long-term planning for the Port included specific recommendations on inclusions in the 2050 PDS. This feedback has formed an important input to this 2050 PDS alongside technical and other considerations.
PoM thanks all stakeholders who have participated in the consultation activities. Now with the release of this 2050 PDS, PoM looks forward to continuing engagement on this important topic.
We welcome your comments on the plans which are detailed in this 2050 PDS and look forward to working together with industry, government, communities and customers to deliver on the long-term development of the Port.
Station Pier
Station Pier planning, management and operation rests with Victorian Ports Corporation (Melbourne) (VPCM). VPCM is the Authority to be consulted for information on Station Pier activities and plans.
For further information on what you told us and how it is incorporated into this 2050 PDS please see the 2050 PDS Consultation Report which is provided on the PoM website.
Port of Melbourne 2050 Port Development Strategy 4
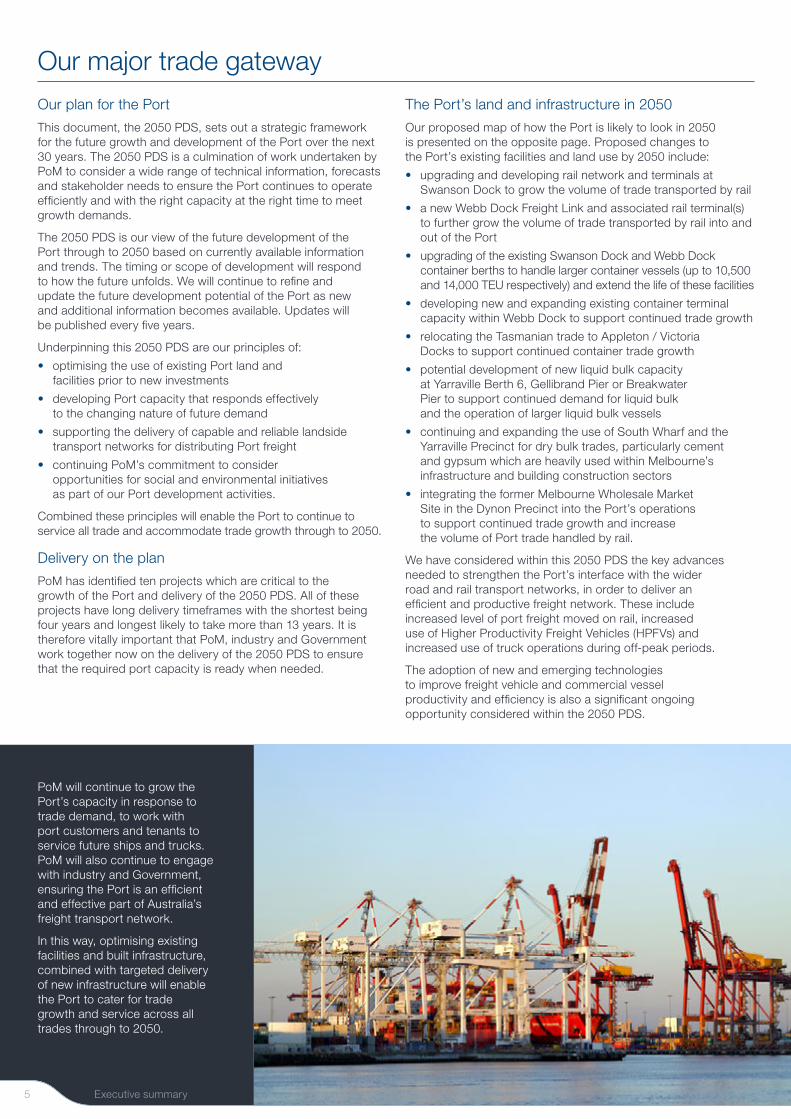
Our major trade gateway Our plan for the Port
This document, the 2050 PDS, sets out a strategic framework for the future growth and development of the Port over the next 30 years. The 2050 PDS is a culmination of work undertaken by PoM to consider a wide range of technical information, forecasts and stakeholder needs to ensure the Port continues to operate efficiently and with the right capacity at the right time to meet growth demands.
The 2050 PDS is our view of the future development of the Port through to 2050 based on currently available information and trends. The timing or scope of development will respond to how the future unfolds. We will continue to refine and update the future development potential of the Port as new and additional information becomes available. Updates will be published every five years.
Underpinning this 2050 PDS are our principles of:
• optimising the use of existing Port land andfacilities prior to new investments
• developing Port capacity that responds effectivelyto the changing nature of future demand
• supporting the delivery of capable and reliable landsidetransport networks for distributing Port freight
• continuing PoM’s commitment to consideropportunities for social and environmental initiativesas part of our Port development activities.
Combined these principles will enable the Port to continue to service all trade and accommodate trade growth through to 2050.
Delivery on the plan
PoM has identified ten projects which are critical to the growth of the Port and delivery of the 2050 PDS. All of these projects have long delivery timeframes with the shortest being four years and longest likely to take more than 13 years. It is therefore vitally important that PoM, industry and Government work together now on the delivery of the 2050 PDS to ensure that the required port capacity is ready when needed.
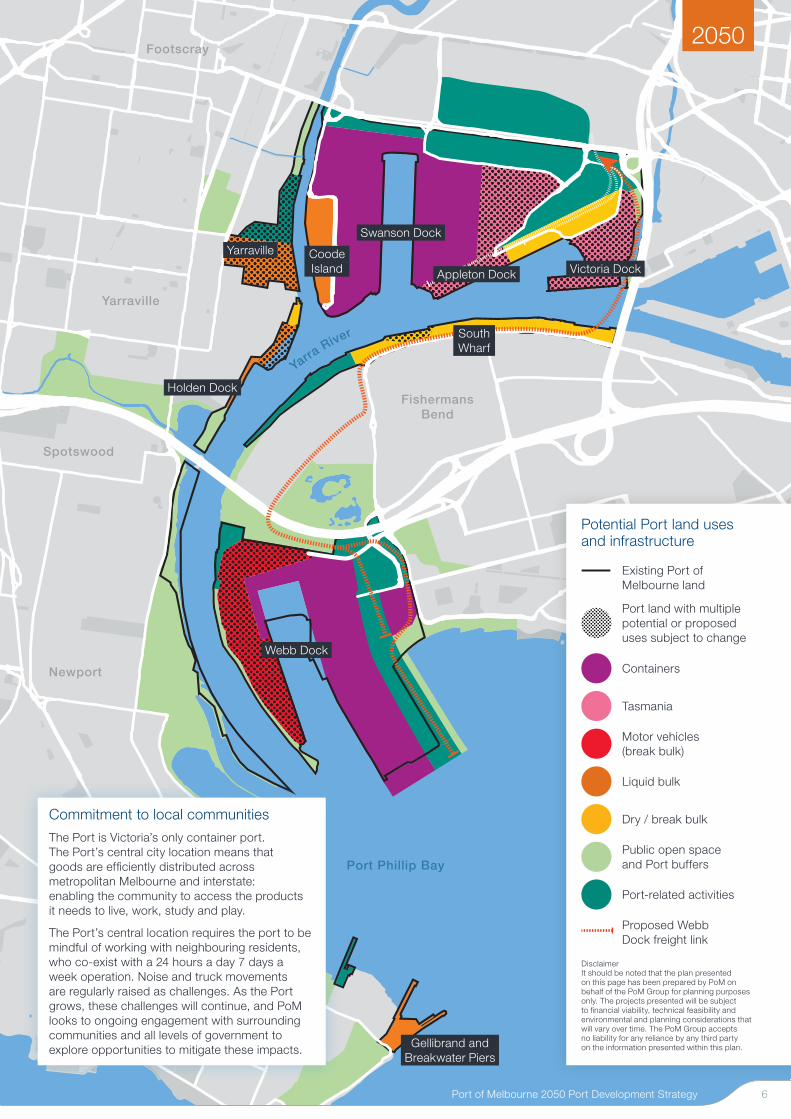
The Port’s land and infrastructure in 2050
Our proposed map of how the Port is likely to look in 2050 is presented on the opposite page. Proposed changes to the Port’s existing facilities and land use by 2050 include:
• upgrading and developing rail network and terminals atSwanson Dock to grow the volume of trade transported by rail
• a new Webb Dock Freight Link and associated rail terminal(s)to further grow the volume of trade transported by rail into andout of the Port
• upgrading of the existing Swanson Dock and Webb Dockcontainer berths to handle larger container vessels (up to 10,500and 14,000 TEU respectively) and extend the life of these facilities
• developing new and expanding existing container terminalcapacity within Webb Dock to support continued trade growth
• relocating the Tasmanian trade to Appleton / VictoriaDocks to support continued container trade growth
• potential development of new liquid bulk capacityat Yarraville Berth 6, Gellibrand Pier or BreakwaterPier to support continued demand for liquid bulkand the operation of larger liquid bulk vessels
• continuing and expanding the use of South Wharf and theYarraville Precinct for dry bulk trades, particularly cementand gypsum which are heavily used within Melbourne’sinfrastructure and building construction sectors
• integrating the former Melbourne Wholesale MarketSite in the Dynon Precinct into the Port’s operationsto support continued trade growth and increasethe volume of Port trade handled by rail.
We have considered within this 2050 PDS the key advances needed to strengthen the Port’s interface with the wider road and rail transport networks, in order to deliver an efficient and productive freight network. These include increased level of port freight moved on rail, increased use of Higher Productivity Freight Vehicles (HPFVs) and increased use of truck operations during off-peak periods.
The adoption of new and emerging technologies to improve freight vehicle and commercial vessel productivity and efficiency is also a significant ongoing opportunity considered within the 2050 PDS.
PoM will continue to grow the Port’s capacity in response to trade demand, to work with port customers and tenants to service future ships and trucks. PoM will also continue to engage with industry and Government, ensuring the Port is an efficient and effective part of Australia’s freight transport network.
In this way, optimising existing facilities and built infrastructure, combined with targeted delivery of new infrastructure will enable the Port to cater for trade growth and service across all trades through to 2050.
Executive summary5
Williamstown
Newport
FishermansBend
Port Melbourne
Yarraville
Spotswood
Footscray
Port Phillip Bay
Yarra River
Potential Port land uses and infrastructure
Existing Port of Melbourne land
Port land with multiple potential or proposed uses subject to change
Containers
Tasmania
Motor vehicles (break bulk)
Liquid bulk
Dry / break bulk
Public open space and Port buffers
Port-related activities
Proposed Webb Dock freight link
DisclaimerIt should be noted that the plan presented on this page has been prepared by PoM on behalf of the PoM Group for planning purposes only. The projects presented will be subject to financial viability, technical feasibility and environmental and planning considerations that will vary over time. The PoM Group accepts no liability for any reliance by any third party on the information presented within this plan.
2050
Swanson Dock
Victoria DockAppleton Dock
South Wharf
Holden Dock
Yarraville
Webb Dock
Gellibrand and Breakwater Piers
Coode Island
Commitment to local communities
The Port is Victoria’s only container port. The Port’s central city location means that goods are efficiently distributed across metropolitan Melbourne and interstate: enabling the community to access the products it needs to live, work, study and play.
The Port’s central location requires the port to be mindful of working with neighbouring residents, who co-exist with a 24 hours a day 7 days a week operation. Noise and truck movements are regularly raised as challenges. As the Port grows, these challenges will continue, and PoM looks to ongoing engagement with surrounding communities and all levels of government to explore opportunities to mitigate these impacts.
Port of Melbourne 2050 Port Development Strategy 6

1 Constant growth in the demand for container trade will require the Port to continue to invest and grow
• Containers are the growth engine of the Port – strong population growth andeconomic development means containers will continue to be the largest Porttrade. This requires significant upgrades to container terminals and substantialexpansion of the overall container capacity at the Port. The new Webb DockNorth container terminal will provide three new berths for container handling
• We need an integrated approach to Tasmanian trade – the substantial expansionof Webb Dock container capacity requires Tasmanian trade to be relocatedto the Appleton and Victoria Docks. This trade is a crucial component of Portoperations and early planning for this relocation has commenced to ensurethe Port can support and grow Tasmanian trade volumes into the future
• Container vessels are undergoing a step-change – we are seeing strong interest fromshipping lines for the Port and all Australian eastern seaboard ports to handle largercontainer ships. We are working with industry to maximise the size of container shipsthat can be handled at the Port, with 9,600 TEU vessels already being accommodated.We anticipate in the longer term the Port will be able to handle up to 10,500 TEU atSwanson Dock and 14,000 TEU at Webb Dock, increasing transport efficiencies,reducing the volume of ships accessing the Port and reducing the cost of doing business.
2 Investment in rail is essential to maximise the Port’s capacity and improve landside transport connections for industry
• The Swanson Precinct Port Rail Transformation Project is our first priority – we areworking with the Victorian Government to deliver this project, which is designed todeliver a major increase in rail capacity at the Port and help get more freight onto rail byimproving operational performance and commercial transparency for Port rail services.This project helps get trucks off local roads, particularly in the inner-west of Melbourne
• The Webb Dock Freight Link is crucial to container trade – given the central rolethat Webb Dock will play in handling containers into the future, it is critical thatthe Webb Dock Freight Link becomes a reality. We are committed to planning,advocating and working with the Victorian Government to deliver the freight linkby 2030, to align with the delivery of the Webb Dock North container terminal
• Integrating the former Melbourne Market Site will help us meet future demand – wesee the former Melbourne Market Site on Footscray Road as critical to the future growthand development of the Port. The Victorian Government has also identified the sitefor freight and logistics use as a priority for reducing congestion and the cost of doingbusiness. The site is located within the Port’s transport network and among near-portfacilities, making it ideal for Port use. Integrating this site into the Port would provide theadditional land needed to develop efficient cargo handling and transport operations,including rail connections, while minimising impacts on the surrounding community.
3 Infrastructure planning, approvals and delivery timeframes means that the next phase of Port expansion needs to commence now
• As with many major infrastructure projects, Port projects have very long delivery times,with delivery periods of 10 to 15 years not being uncommon. Projects like the WebbDock North container terminal and Webb Dock Freight Link could take up to 13 yearsto develop and deliver. Work on these projects needs to commence now to ensure therequired infrastructure is ready when needed to support the future trade demand.
4 We are committed to working with industry, Government and all stakeholders to grow and develop the Port
• Industry involvement will drive change and investment – we are committed toworking collaboratively with industry to maximise efficiencies across the supplychain, drive the change required to support future trade volumes and secure theinvestment needed to deliver increased Port capacity. This includes understandingand responding to changing user and industry needs and ensuring the Port isdeveloped in an environmentally, socially and commercially sustainable manner
• The Port requires government partnership to grow – the Port forms one part ofthe nation’s transport network, which connects producers and manufacturerswith customers and consumers. For Victoria to remain a great place to live,work and do business, we need to achieve a partnership with the Victorianand Australian governments that ensures Port projects are integral in Victoria’sinfrastructure planning, funding and delivery. PoM will be transparent onthe government changes which are required to support growth.
Our growth principlesThere are four key principles that underpin our plan for growth at the Port. These principles summarise the outcomes of our analysis, stakeholder feedback and strategic planning work and are the foundation of our growth and investment strategy.
Executive summary7

IntroductionPlanning for the future of our major trade gatewayThe Port of Melbourne (the Port) is a major business gateway for Victoria and south-eastern Australia. It is Australia’s largest container, automotive and general cargo Port and operates 24 hours a day, 365 days a year. The Port handles Victorian imports and exports, a number of Tasmanian trades, and trade servicing South Australia and southern New South Wales. The Port’s location in central Melbourne is a major contributor to Victoria, with Melbourne being the preferred location for national distribution centres.
Freight movements are essential to businesses and our economy. Ensuring that commercial vessels have easy access to the Port, that cargo is efficiently handled at the Port and that freight is easily transported on land helps to reduce the costs of doing business in Victoria. The manufacturing, retail, food, agriculture and petroleum industries rely heavily on the Port and its transport connections – and in turn, our day-to-day lives depend on the Port running well. Simply put, the better the Port works, the better Victoria works.
As our population grows and national and international trade increases, the demand for access to Melbourne’s Port continues to grow.
The Port will face a range of complex opportunities and challenges when it comes to its capacity and operations, its connectivity with road and rail networks and its interactions with surrounding land. The Port is located in the heart of Melbourne among growing and expanding communities, vital industrial precincts and transport corridors within the busy and popular Port Phillip Bay. Webb Dock and South Wharf, key Port growth precincts for container and dry bulk trades respectively, are located immediately adjacent to the Fishermans Bend urban renewal precinct which will undergo significant land use changes through to 2050.
As the Port Licence Holder, Port of Melbourne Operations Pty Ltd (PoM) manages the Port on behalf of the Port of Melbourne Group (PoM Group) and has a well considered future vision for this critical economic asset. It is important that we plan well to ensure the Port continues to run efficiently, meet growth and trade demands and operate responsibly. We believe that there is significant opportunity to expand the Port’s capacity by making better use of existing assets and maximising the efficiency of Port operations through considered, targeted investment.
We also know that the Port will need to grow in a way that is integrated with the surrounding community and we acknowledge the complexity of this challenge. This includes ensuring that, as a nationally critical economic asset, existing and future Port use rights are maintained and improved. These rights are identified by the Port Zone land use and Port Environs Overlay within the planning schemes of the Port of Melbourne and surrounding municipalities.
I
Port of Melbourne 2050 Port Development Strategy 8

Victorian Freight Plan Delivering the Goods
Victorian Government
Infrastructure Priority ListInfrastructure Australia
Advice on Securing Victoria’s Ports Capacity; 30-year Infrastructure Plan
Infrastructure Victoria
20-year Freight and Supply Chain Strategy
Australian Government (in development)
Council Plans and Urban Planning Strategies
Local governments
A Port Development Strategy to guide investment and growth To set out a roadmap for the future of the Port, PoM has developed a long-term strategy for Port growth and development. The 2050 Port Development Strategy (2050 PDS) sets out our high-level plans and approach for developing the capacity and efficiency of the Port over the next 30 years, and provides the strategic framework for individual Port Sector Strategies and Project Delivery Plans.
This framework also seeks to provide adaptability and responsiveness to changing needs over time and as such this 2050 PDS considers:
• local and international trade needs – the types andamount of cargo that will move through the Port
• vessel numbers, types and sizes – the number and kindsof ships that will need access to the Port and its services
• landside transport needs – the road and rail infrastructureneeded to efficiently move goods to, from and within the Port
• operational needs – the facilities, services and technologyneeded to make sure Port operations are safe and efficient
• land use and surrounding communities – how the Portcan grow in partnership with local communities.
To inform the 2050 PDS we have:
• analysed growth trends and forecasts fortrade, vessels and landside transport
• considered broader planning factors that willinform growth and development needs
• sought and received input from industry stakeholders,local government and communities surrounding the Port
• been working with the Victorian Government and otherstatutory stakeholders to ensure the 2050 PDS is integratedwith relevant plans and strategies, including those of otherports around Victoria and the development of Station Pier.
The Port Management Act 1995 (Vic) (the Act) also requires the Port manager to develop and maintain a Port Development Strategy. We have ensured that the PDS development, implementation and maintenance process aligned with the requirements of the Act, using the Victorian Government’s July 2017 Port Development Strategy Ministerial Guidelines (the Guidelines) as a framework.
Key strategies and plans relevant to the 2050 PDS:
A roadmap for the future
The PDS is our plan to guide the Port of Melbourne’s growth and development in the long-term. Like all plans, it is formed from the information we have today and reflects our best sense of the activities we will progress over the next 30 years.
All plans can change. If new information arises or our environment changes in a way which will affect key projects contained in the 2050 PDS, we will review the plans for the Port in light of these new circumstances.
Plan MelbourneVictorian Government
I Introduction9

Finalisation and publication of the 2050 PDS: 2020
We have incorporated feedback received from the community, industry and Government to finalise the 2050 PDS. The 2050 PDS has now been published and is publicly available. The 2050 PDS will guide the Port’s growth and development activities and will be reviewed every five years.
How this Port Development Strategy has been createdDeveloping a strategy for the long-term growth of the Port is complex and requires consideration of a wide range of technical information, forecasts and stakeholder needs. To make sure we have a well-balanced and well considered approach to growing the Port, the 2050 PDS has been developed taking into account feedback from community, industry and government stakeholders and a range of detailed technical considerations.
2050 PDS prepared and submitted to Government: End of 2018
The 2050 PDS has been prepared based on the work and information gathered during steps 1 and 2. The 2050 PDS was then provided to the Minister for Ports at the end of 2018, as required by the Guidelines. Based on this submission, PoM further considered the views of Government before progressing to release the 2050 PDS for broad community and industry comment.
03
Forecasts, technical assessments and analysis: Second half of 2018
Current technical analysis and strategic forecasts are essential to ensure the 2050 PDS sets the right direction for the Port’s growth, and that we are well-positioned to maximise opportunities and respond to emerging risks. Key analysis and development activities have included:
• Trade forecasts – the volume and the type of cargo that will need to move through the Port in the future
• Ship fleet forecasts – understanding the size and type of vessels that will need Port access
• Infrastructure assessments – the condition and capacity of existing Port assets and the kind of infrastructure we will need to meet the trade and ship fleet forecasts
• Road and rail transport assessments – the capacity and condition of current road and rail connections and forecasts for future needs, as well as how Port road and rail needs interact with the broader network
• Economic, social and environmental assessments – the current and future economic role of and benefits from the Port, along with social and environmental considerations associated with the Port’s continued growth and development.
02
Discussion Paper released to seek feedback: August to October 2018
Early stakeholder and community input has helped us understand which aspects of the Port’s development are of the most interest to different groups, and identify issues and opportunities to be considered through the 2050 PDS.
01
Draft 2050 PDS released for engagement: November 2019
Engagement on the draft 2050 PDS with Port tenants and industry. The draft 2050 PDS was released for public comment and to gain further feedback for consideration.04
055-
year review
Port of Melbourne 2050 Port Development Strategy 10
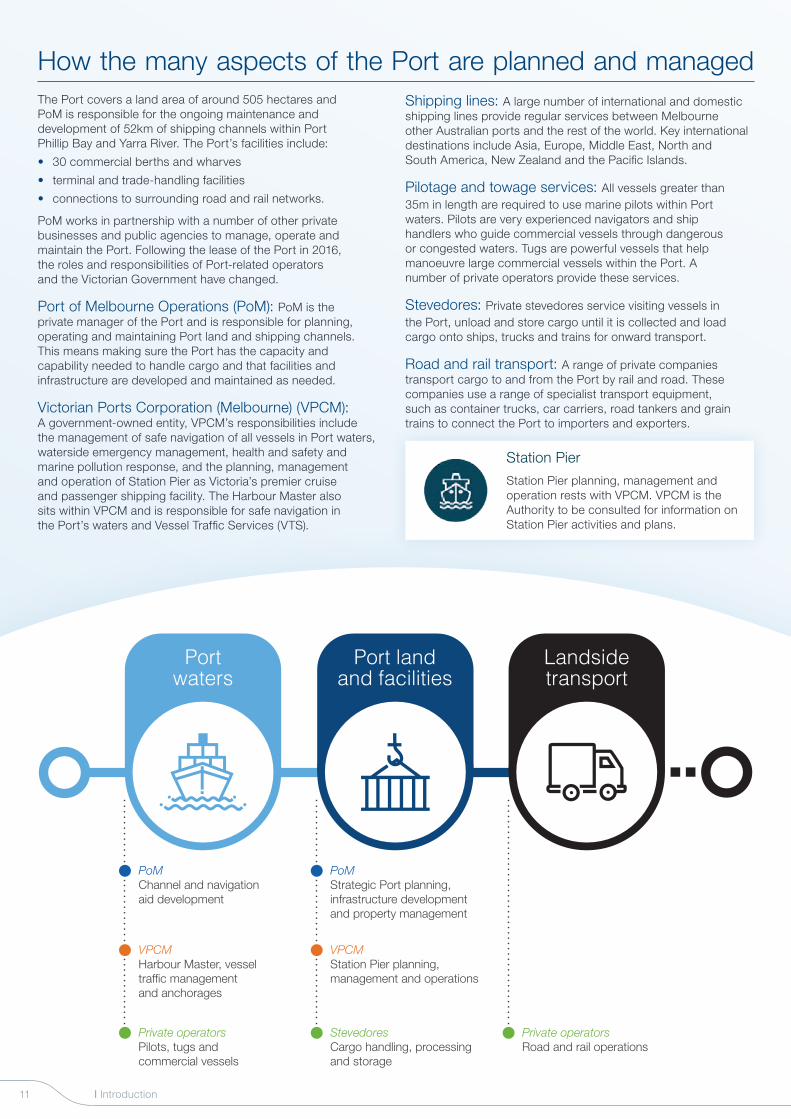
How the many aspects of the Port are planned and managedThe Port covers a land area of around 505 hectares and PoM is responsible for the ongoing maintenance and development of 52km of shipping channels within Port Phillip Bay and Yarra River. The Port’s facilities include:
• 30 commercial berths and wharves
• terminal and trade-handling facilities
• connections to surrounding road and rail networks.
PoM works in partnership with a number of other private businesses and public agencies to manage, operate and maintain the Port. Following the lease of the Port in 2016, the roles and responsibilities of Port-related operators and the Victorian Government have changed.
Port of Melbourne Operations (PoM): PoM is the private manager of the Port and is responsible for planning, operating and maintaining Port land and shipping channels. This means making sure the Port has the capacity and capability needed to handle cargo and that facilities and infrastructure are developed and maintained as needed.
Victorian Ports Corporation (Melbourne) (VPCM):A government-owned entity, VPCM’s responsibilities include the management of safe navigation of all vessels in Port waters, waterside emergency management, health and safety and marine pollution response, and the planning, management and operation of Station Pier as Victoria’s premier cruise and passenger shipping facility. The Harbour Master also sits within VPCM and is responsible for safe navigation in the Port’s waters and Vessel Traffic Services (VTS).
Shipping lines: A large number of international and domestic shipping lines provide regular services between Melbourne other Australian ports and the rest of the world. Key international destinations include Asia, Europe, Middle East, North and South America, New Zealand and the Pacific Islands.
Pilotage and towage services: All vessels greater than 35m in length are required to use marine pilots within Port waters. Pilots are very experienced navigators and ship handlers who guide commercial vessels through dangerous or congested waters. Tugs are powerful vessels that help manoeuvre large commercial vessels within the Port. A number of private operators provide these services.
Stevedores: Private stevedores service visiting vessels in the Port, unload and store cargo until it is collected and load cargo onto ships, trucks and trains for onward transport.
Road and rail transport: A range of private companies transport cargo to and from the Port by rail and road. These companies use a range of specialist transport equipment, such as container trucks, car carriers, road tankers and grain trains to connect the Port to importers and exporters.
PoMChannel and navigation aid development
VPCMHarbour Master, vessel traf�c management and anchorages
Private operatorsPilots, tugs and commercial vessels
PoMStrategic Port planning,infrastructure developmentand property management
StevedoresCargo handling, processing and storage
Private operatorsRoad and rail operations
VPCMStation Pier planning, management and operations
Port landand facilities
Portwaters
Landsidetransport
Station Pier
Station Pier planning, management and operation rests with VPCM. VPCM is the Authority to be consulted for information on Station Pier activities and plans.
I Introduction11
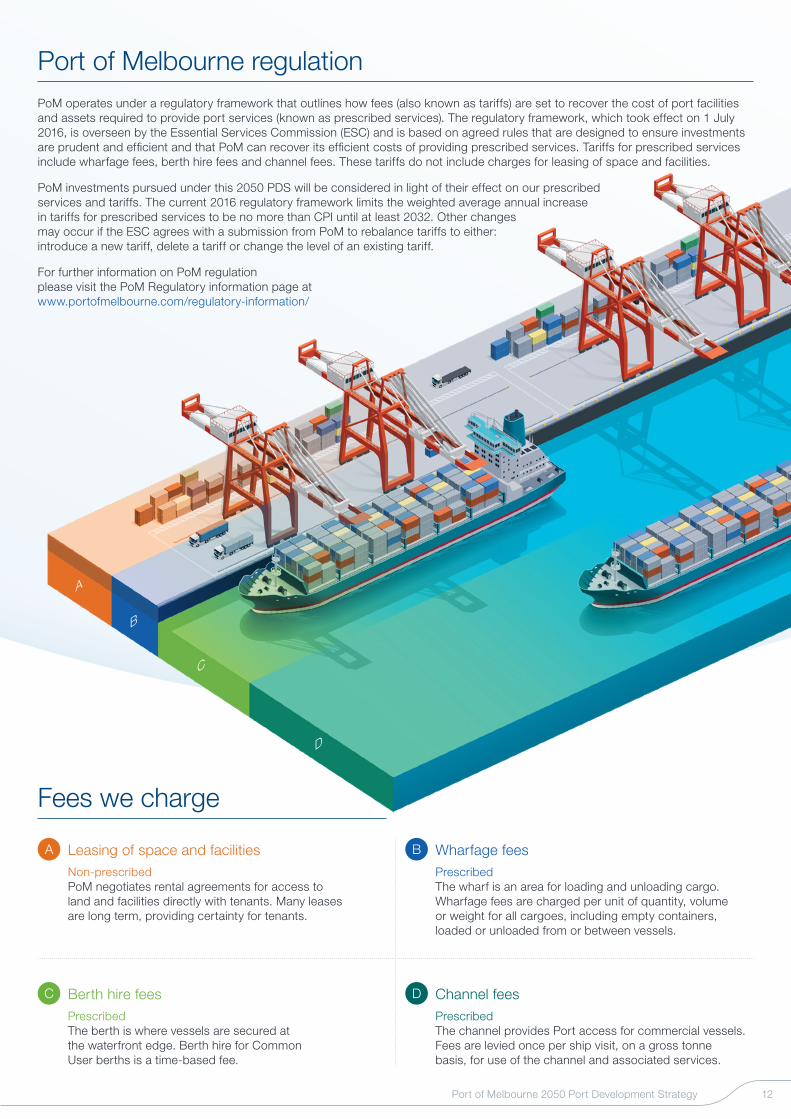
A
B
C
D
A Leasing of space and facilities Non-prescribed
PoM negotiates rental agreements for access to land and facilities directly with tenants. Many leases are long term, providing certainty for tenants.
B Wharfage fees Prescribed
The wharf is an area for loading and unloading cargo. Wharfage fees are charged per unit of quantity, volume or weight for all cargoes, including empty containers, loaded or unloaded from or between vessels.
C Berth hire fees Prescribed
The berth is where vessels are secured at the waterfront edge. Berth hire for Common User berths is a time-based fee.
D Channel fees Prescribed
The channel provides Port access for commercial vessels. Fees are levied once per ship visit, on a gross tonne basis, for use of the channel and associated services.
Port of Melbourne regulationPoM operates under a regulatory framework that outlines how fees (also known as tariffs) are set to recover the cost of port facilities and assets required to provide port services (known as prescribed services). The regulatory framework, which took effect on 1 July 2016, is overseen by the Essential Services Commission (ESC) and is based on agreed rules that are designed to ensure investments are prudent and efficient and that PoM can recover its efficient costs of providing prescribed services. Tariffs for prescribed services include wharfage fees, berth hire fees and channel fees. These tariffs do not include charges for leasing of space and facilities.
PoM investments pursued under this 2050 PDS will be considered in light of their effect on our prescribed services and tariffs. The current 2016 regulatory framework limits the weighted average annual increase in tariffs for prescribed services to be no more than CPI until at least 2032. Other changes may occur if the ESC agrees with a submission from PoM to rebalance tariffs to either: introduce a new tariff, delete a tariff or change the level of an existing tariff.
For further information on PoM regulation please visit the PoM Regulatory information page at www.portofmelbourne.com/regulatory-information/
Fees we charge
Port of Melbourne 2050 Port Development Strategy 12

Shaping the future of the Port Industry, community and stakeholder input
In developing the 2050 PDS, PoM has engaged with our tenants, industry, government and local community stakeholders, to ensure that those who do business, live near and interact with the Port have the opportunity to provide their views and help shape the 2050 PDS.
A program of consultation was conducted between August 2018 and December 2019. To support the consultation process, PoM released the following documents:
• Port of Melbourne 2050 Port Development Strategy Discussion Paper inAugust 2018
• Draft for Consultation Port of Melbourne 2050 Port Development Strategyin November 2019
These documents helped PoM to gather input from industry stakeholders, local, State and Australian governments and communities surrounding the Port on:
• the key factors and drivers likely to guide decision-making around thenature, timing and scale of growth and investment required at the Port
• the challenges and opportunities for consideration in planning for the Port’s future
• our land use and infrastructure plans for the growth and development of the Port.
The Discussion Paper sought feedback on a range of key factors that need to be considered in planning for the future of the Port.
Key factor Key questions
The Port’s urban location, its land and facilities
1. What should we consider when it comes to:
• making the most of the Port’s existing land and infrastructure
• the changing nature of the way land around the Port isbeing used by industry and the community?
• the city’s infrastructure needs, such as housing,commercial areas and road and rail networks?
Trade demand and the Port’s role as a trade gateway for Australia’s south-east
2. What do you think PoM should consider in planning for the future of the Portto make sure it continues to help make Victoria a great place to live, workand do business?
3. How can we increase the Port’s productivity and efficiency to broadenopportunities for businesses and strengthen our economic contribution?
The critical role the Port plays in our economy
4. What do you think the Port needs to consider when it comes to trade types,volumes and seasonal demands?
5. What will be our greatest demands for imports?
6. What will be our biggest export industries?
Safe, reliable and adequate shipping channels that cater to the changing number and size of vessels visiting the Port
7. What else do you think we need to consider when it comes to shippingroutes in Port Phillip Bay?
8. What kinds of vessels, and how many visits, do you think will be needed fordifferent trade types over the coming decades?
Transporting freight to and from the Port 9. What do you think we should consider when it comes to moving freight intoand out of the Port?
10. How can PoM work with the Victorian Government and road and railoperators to help keep Victoria moving?
Surrounding land uses and our environmental responsibilities
11. What do you think are going to be the most important long-term uses ofland around the Port, and what challenges or opportunities might there be?
12. What do you see as the priorities for us to consider when it comes toplanning how we use Port land?
I Introduction13
Cargo owners
Freightforwarders
Stevedores
Shipping lines
Industry associations
Governmentand VPCM
Pilotage andtowage services
Community
Road and railtransport
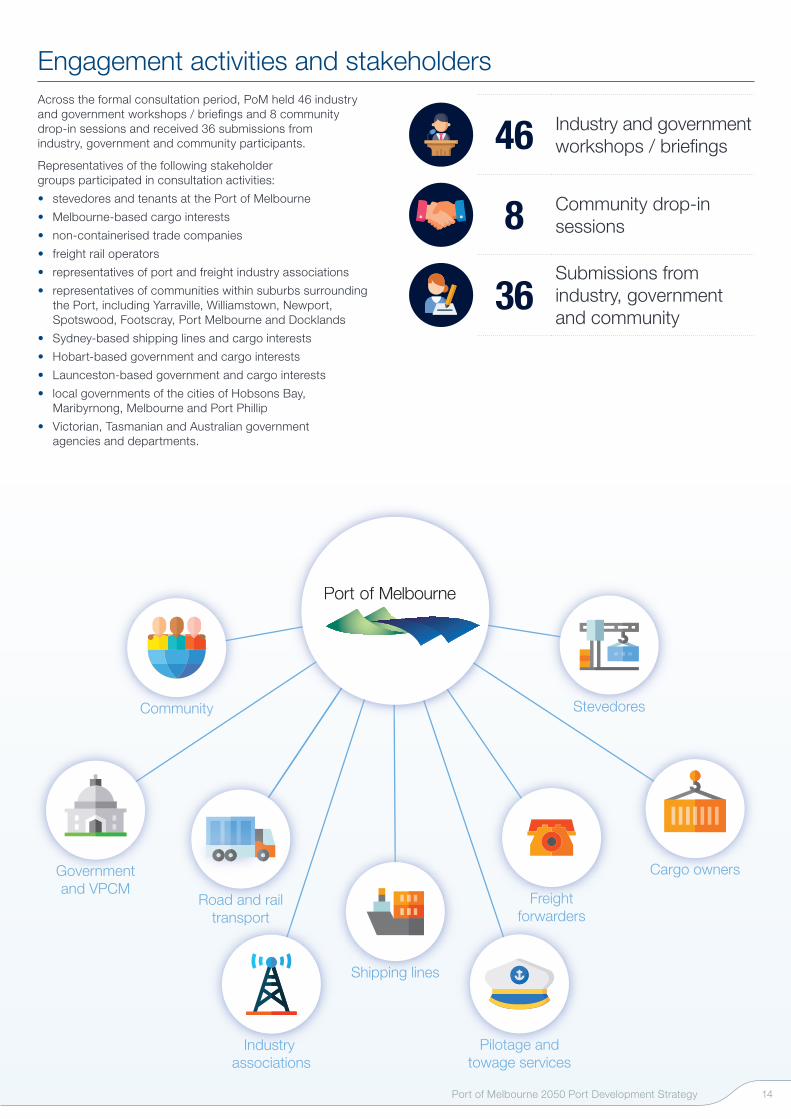
Engagement activities and stakeholders Across the formal consultation period, PoM held 46 industry and government workshops / briefings and 8 community drop-in sessions and received 36 submissions from industry, government and community participants.
Representatives of the following stakeholder groups participated in consultation activities:
• stevedores and tenants at the Port of Melbourne
• Melbourne-based cargo interests
• non-containerised trade companies
• freight rail operators
• representatives of port and freight industry associations
• representatives of communities within suburbs surroundingthe Port, including Yarraville, Williamstown, Newport,Spotswood, Footscray, Port Melbourne and Docklands
• Sydney-based shipping lines and cargo interests
• Hobart-based government and cargo interests
• Launceston-based government and cargo interests
• local governments of the cities of Hobsons Bay,Maribyrnong, Melbourne and Port Phillip
• Victorian, Tasmanian and Australian governmentagencies and departments.
46 Industry and governmentworkshops / briefings
8 Community drop-in sessions
36Submissions fromindustry, government and community
Port of Melbourne 2050 Port Development Strategy 14
Key themes from feedback PoM received wide-ranging feedback on stakeholders’ priorities for the long-term planning for the Port including specific recommendations for inclusions in the Port’s planning outlook. The stakeholder responses received have been an important input to this 2050 PDS, alongside technical considerations.
Key themes which emerged from the engagement process to date have included:
All stakeholders
• recognise the economic contribution of the Port
• would like the Port to be operated efficiently andmake the most of the Port’s existing land
• would like more freight to be moved on rail, toreduce freight-related traffic impacts includingair pollution and road congestion
• believe a coordinated approach among PoM, VictorianGovernment agencies and industry is required to shaperesponses to shared problems such as congestion in theroad network and land use planning near the Port precinct.
Port-related industries
• support the development of long term plans that respondto growth and the changing nature of trade, as required toprovide certainty for industry’s ongoing business investments
• see the need for significant improvement to railand road transport links in and out of the Port
• would like adequate protection of landside freighttransport corridors from encroaching developments
• see the potential for new technology toincrease productivity and efficiency
• recognise the crucial role of the inner-city port in keepingVictoria a great place to live, work and do business.
Communities and local governments
• consider that trade growth may also bring increasedchallenges for land use and development around thePort precinct, and effects on local communities such asincreased truck numbers, emissions, noise and safetyconcerns particularly in Melbourne’s inner west
• some residents questioned why the Port is locatedclose to central Melbourne and not relocated outsideMelbourne. Continued use of existing critical Port assetsis however the most efficient use of public funding anddelivers the lowest supply chain costs. Relocating thePort would add a huge cost burden to the State, Portcustomers and ultimately to Australian consumers
• believe that actions which raise the efficiency of Port landuse and cargo operations, along with external measuresto minimise the impact of additional truck movementsthrough the network, are important to support growth
• would like the Port environment to be protected andfacilities operated with sustainable principles in mind
• see the Port as a part of their neighbourhoods, and view Portlands and waters around the Yarra River as an important socialand environmental asset. They would like public access toriverside land and recreational boating facilities protected, andfor accessible riverside land around the Port to be improvedthrough maintenance and investment in community facilities.
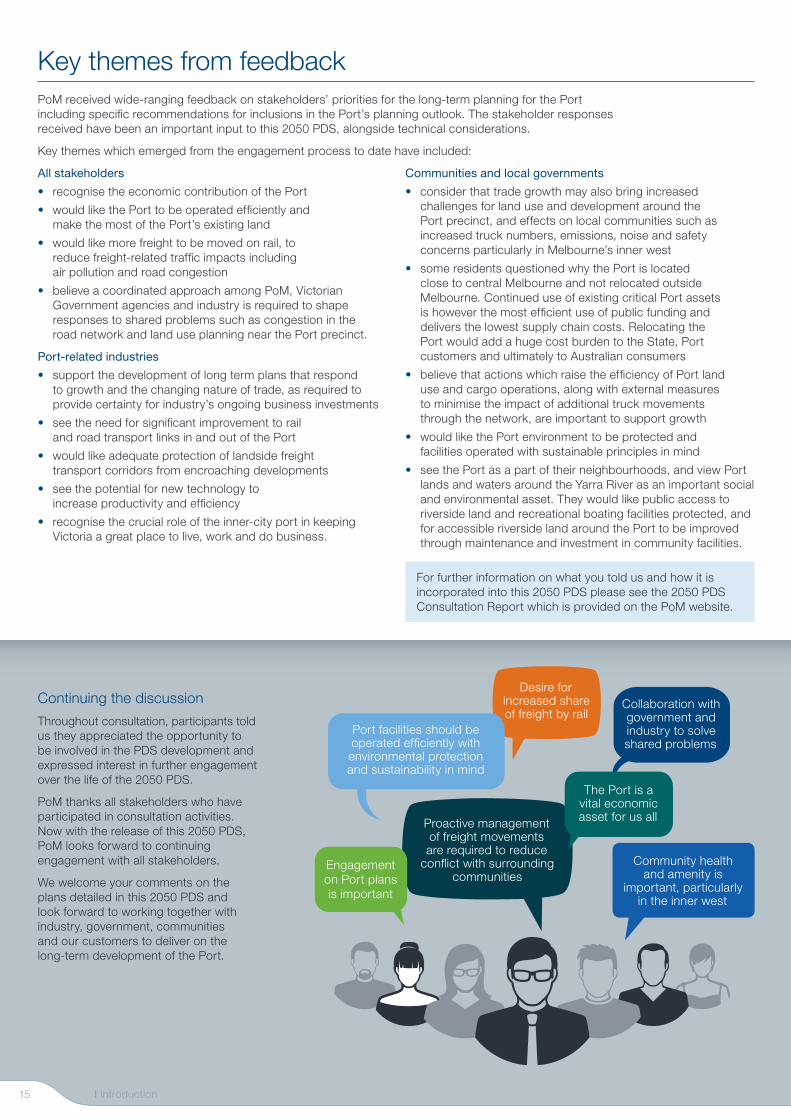
Continuing the discussion
Throughout consultation, participants told us they appreciated the opportunity to be involved in the PDS development and expressed interest in further engagement over the life of the 2050 PDS.
PoM thanks all stakeholders who have participated in consultation activities. Now with the release of this 2050 PDS, PoM looks forward to continuing engagement with all stakeholders.
We welcome your comments on the plans detailed in this 2050 PDS and look forward to working together with industry, government, communities and our customers to deliver on the long-term development of the Port.
Community health and amenity is
important, particularly in the inner west
Proactive management of freight movements are required to reduce
conflict with surrounding communities
Collaboration with government and industry to solve shared problems
Engagement on Port plans is important
The Port is a vital economic asset for us all
Desire for increased share of freight by rail
Port facilities should be operated efficiently with environmental protection and sustainability in mind
For further information on what you told us and how it is incorporated into this 2050 PDS please see the 2050 PDS Consultation Report which is provided on the PoM website.
I Introduction15

Key planning factors for consideration In planning for future Port capacity, it is important to acknowledge that there is a high degree of uncertainty about future conditions. This is due to the wide range of factors that impact on a commercial Port’s operations. This section presents important information about the Port’s growth and development so far, and the key challenges and opportunities we need to consider in planning for the Port of 2050.
These are:
• the Port’s urban location, its land and facilities
• trade demand and the Port’s role as a trade gateway for Australia’s south-east
• the critical role the Port plays in our economy
• safe, reliable and adequate shipping channels that cater to the changing number and size of vessels visiting the Port
• transporting freight to and from the Port
• surrounding land uses and our environmental responsibilities.
Again, whilst we recognise that these factors will continue to change and evolve, we will continue to monitor these key planning factors for the Port and the PDS. Including for instance, the regular review of the proposed projects. Updates to the PDS will be produced at least every five years and provide a mechanism for the Port to consider and respond to ongoing changes and emerging opportunities.
II
Port of Melbourne 2050 Port Development Strategy 16

1835
Melbourne is settled and Hobsons Bay is first used for Port-related activities.
1893
Victoria Dock delivered to provide more capacity to handle break bulk trades.
1970
s & 1
98
0s Webb Dock
developed to handle a range of container, Tasmanian and automotive trades.
1941 Port Phillip Heads
deepened to allow larger commercial vessels to visit the Port.
1969
Swanson Dock opened to provide dedicated container terminal capacity.18
51 Victoria separates from New South Wales to become a self-governing colony.
1877
Formation of the Melbourne Harbour Trust, the precursor to the Port of Melbourne.
1887
Coode Canal delivered to provide direct commercial vessel access to Queen’s Wharf (across the river from the current Crown Casino building).
II Key planning factors for consideration
1968
The evolution of our trade gateway
17

The Port’s urban location, its land and facilities Melbourne has grown around the Port – our earliest international and trading gateway. Where some other states have moved their industrial areas and ports away from capital city centres, Melbourne has continued to develop and evolve closely around these economic hubs. Through the Port, our exports are distributed around the world and imports are received for our daily needs.
Over more than 150 years, the Port has grown in line with trade and vessel needs and has also adapted in response to the city’s broader infrastructure and planning needs. The Port Phillip Heads were deepened to 14.6m in 1941 to cater for larger ships. The arrival of containerised trade during the 1960s was a significant change for the Port and prompted further development, including the construction of Swanson Dock in 1969.
Major developments such as construction of the Spencer Street Bridge in 1929 and the Bolte Bridge in 1999 affected the way ships could access various docks, spurring new and changed Port facilities.
The need to cater for larger ships resulted in the Channel Deepening Project in 2009 which has provided long-term capacity in our shipping channels.
More recently, expanded container and automotive terminal capacity at Webb Dock has provided new opportunities and changed the way the Port operates.
Today, the Port stretches from Williamstown in the west around Port Phillip Bay to Port Melbourne in the east, covering a land area of around 505 hectares and 52km of shipping channels within the Bay and the Yarra River.
The Port operates 30 commercial berths and handles the full range of Port trades – containers, liquid bulk, dry bulk and break bulk (which includes motor vehicles). It is Victoria’s only container port and handles approximately 36% of Australia’s container trade.
A facility that operates 24 hours a day, the Port is a busy, highly coordinated string of operations. Each trade type has different requirements, from the kinds of vessels that carry the cargo, to handling and storage at the Port, and onward transport by road, rail or pipeline.
The Port is much more than a place for ships to load and unload cargo. For example, new cars arriving at the Port are inspected and have a number of parts fitted while at the Port which requires purpose-built facilities.
The Port needs to ensure it has the facilities, equipment, technology and supporting infrastructure to meet these different needs while remaining agile and responsive to fluctuating demands – such as seasonal demands for different trades, like agricultural produce.
In addition to maximising the use of the land within the Port’s boundaries, much of the surrounding industrial land in Dynon, Yarraville, Newport, Fishermans Bend and Williamstown is used to support port operations. This includes freight logistics and storage, empty container storage and maintenance, and liquid and dry bulk storage and distribution.
Easy and efficient access between the Port and these facilities is an important part of the supply chain that helps keep Melbourne and Victoria moving. Though outside the Port’s area of operational responsibility, it’s important that our planning considers customer needs and integration with surrounding land, road, rail and pipeline connections.
1997
Port of Melbourne first handles one million TEU of containers in a single year.
200
9 Channel Deepening Project delivered, allowing 14m draught vessels to visit under all tidal conditions.
2016
50-year lease of the Port of Melbourne commenced following a robust sale process.
2017
Port Capacity Project delivered, expanding the container handling capacity to 4.5 million TEU. Planning for the future
As we plan for the future, we need to assess how to make the best use of Port land and existing assets to meet trade needs and ensure the Port’s facilities continue to operate efficiently and safely. We also need to consider how the Port will adapt to changes in surrounding land uses and the city’s broader infrastructure needs and development, such as road and public transport projects, housing and commercial developments and the growth of new industry.
Port of Melbourne 2050 Port Development Strategy
2019
18

Our import and export trade types and facilities Here are the different cargo types handled at our various docks and Port facilities:• Containers are currently the largest trade at the Port.
Refrigerated or non-refrigerated containers hold foodand other everyday items including clothes, beautyand medical products, appliances, wine, beef, furnitureand paper. Swanson Dock and Webb Dock caterfor containers, with Webb Dock recently upgradedto provide highly automated handling facilities
• Break bulk has the second largest footprint for cargotransported in units, pallets, bundles or barrels –like cement, sugar and fertiliser. Break bulk alsoincludes vehicles. New, purpose-built automotiveterminal and pre-delivery inspection facilities atWebb Dock handle high volumes, along with generalfacilities at Appleton Dock and Victoria Dock
• Liquid bulk berths are currently located at HoldenDock (Yarraville), Gellibrand Pier (Williamstown) andMaribyrnong (Coode Island). Liquid bulk includes crudeoil, petroleum products, chemicals and other liquids
• There are two Tasmanian trade facilities at Webb Dock.These facilities handle a mixture of containersand break bulk cargo
• The remainder of the Port consists of a mixture of dryand break bulk trades and Port-related facilities suchas freight logistics, empty containers, rail terminals andcustoms. Dry bulk is transported in large quantitieswithout packaging and includes items like cement,gypsum (for plaster board), grain and sugar. This cargois loaded directly into or unloaded from the ship’s hold.
Importance of Port environs planning
Port environs’ is the term for the area surrounding the Port. ‘Port environs planning’ is the strategic and statutory planning which applies to this area which includes local municipalities. PoM takes an integrated approach to Port environs planning; as we develop the Port’s growth plans we consider how they may affect local municipalities and planning schemes.
This approach helps us ensure that:
• the Port is able to continue to operate and grow tosupport Australia’s businesses, consumersand broader community
• developments around the Port and the wider transportnetworks take appropriate steps to minimise impactson the Port and associated freight transport activities.
Existing Port and surrounding land uses key
Containers
Tasmanian
Motor vehicles (break bulk)
Liquid bulk
Dry / break bulk
Break bulk
Cruise and ferry
Port-related activities
Industrial, freight and employment
Public open space, parks, sports fields and Port buffers
Fuel distribution facilities / oil refineries
Existing transport and distribution infrastructure key
Port navigation channels
Major Port swing basins
Major Port and other rail infrastructure
Major Port and other road infrastructure
Major Port-related pipeline infrastructure
Port of Melbourne land boundaries
Key locations and facilities planning considerations • The Port has a long and important relationship with the state’s economic prosperity
• The Port handles the full range of Port trades and is Victoria’s only container Port
• The Port is situated in an urban location among a wide range of land uses and major road and rail networks
• There has been significant investment in the Port over many years to ensure it is equipped with the infrastructure,facilities, equipment and technology needed to cater for different trade types
• There is an ongoing need to grow and develop the Port in response to changing trade demands and the state’s broaderinfrastructure needs.
II Key planning factors for consideration19

Williamstowndockyards
Newport
Fishermans Bendemployment
precinct
Dynon freight and rail land
Port Melbourne
Yarraville industrial
land
Newport industrial
land
Footscray
Port Phillip Bay
Yarra River
2019
See key on page 19
Swanson Dock
Victoria DockAppleton Dock
South Wharf
Holden Dock
Yarraville
Webb Dock
Gellibrand and Breakwater Piers (connected to the Altona oil refinery)
Coode Island
Port of Melbourne 2050 Port Development Strategy 20

SouthAustralia
A trade gateway for Australia’s south-eastThe Port serves a trade catchment that extends far beyond Victorian boundaries. With the necessary Port facilities and transport connections to handle each of the major trades, Melbourne serves as a vital freight hub for south-eastern Australia (including Tasmanian, southern New South Wales and eastern South Australia).
In 2018-19, around 2,600 commercial vessels carried a total of 37 million mass tonnes, or 97 million revenue tonnes, of cargo through the Port.
The Port’s operations bring in a multitude of goods and materials that we need to live our daily lives, build new infrastructure and operate successful businesses. Similarly, millions of tonnes of goods leave our shores from the Port, supporting Australia’s $290 billion goods export industry.
Each day the Port handles:
• over 8,250 containers
• around seven ship arrivals
• almost 860 new cars
• around 2,800 tonnes of dairy products
• over 105 containers of prams, toys, gamesand sporting goods
• more than 255 containers of furniture,mattresses and cushions
• over 160 containers of domestic appliancesincluding televisions, fridges and irons.
The Port needs to plan for, and be equipped to handle, the fluctuating demands for import and export trades throughout the year. To a certain extent, consumers drive these demands. Retailers need to have adequate stock to meet purchasing needs at different times of year – Christmas and end of year sales are such examples.
With agricultural produce such as grain, dairy and wine among our major exports, the Port experiences peaks corresponding to harvest schedules. March through to June is the peak trade period for produce exports.
Over the last 10 years, Port trade volumes have increased fairly steadily from 71 million revenue tonnes in 2008-09 to 97 million revenue tonnes in 2018-19. While the rate of change from one year to another is influenced by international economic conditions and short-term fluctuations in trade volumes, the overall 10-year trend represents a solid annual average compound growth rate of 2.1%.
Farm
Roll-off to truck
Import*
Import*
Pre-delivery, inspection and fitout
Dealerships
Retail
Warehouse
Container storage
Grain train
Silo
Export*
Revenue tonnes and mass tonnes
One revenue tonne equals weight in metric tonnes or volume in cubic metres, whichever is higher in terms of freight.
For cargo that has a weight – such as cement – its measurement is calculated in mass tonnes. Not all cargo is measured by weight, liquid cargo such as oil for example is measured by volume. The revenue tonne is the overarching measurement for all Port cargo.
The Port’s central role in the supply chain that keeps Victoria
and south eastern Australia going
Almost every facet of our economy relies on our capacity to move goods to, from and around the country.
Whether it is moving export products from regional communities, transporting cars from ports to dealerships or servicing our city with
building materials, groceries or consumer products, we are reliant on complex supply chains that are largely hidden from every-day close-up view.
*Example supply chains
II Key planning factors for consideration21

Adelaide
Melbourne
Port of Portland
Port of Geelong
Port of Melbourne
Port of Hastings
Hobart
Canberra
Sydney
South Australia
Victoria
Tasmania
New South Wales
Horsham
Donald
Warrnambool
Burnie
Devonport
Echuca
Mildura
Deniliquin
Tocumwal
Shepparton
Maryvale
Albury(Ettamogah)
Wagga Wagga
Cootamundra
Griffith
Key trade gateway planning considerations • The Port’s long-term growth and development is
underpinned by the fundamentals of trade growth
• A range of local and international factors impact on trade volumes – a big one being population growth
• There are a range of trade types, each needing different facilities and equipment at the Port
• We need to plan not only for the amount of cargo the Port will need to handle, but also the cargo type
• Container trade is the largest and fastest-growing trade handled at the Port.
TEU: Twenty-foot equivalent unit
The most common container sizes for international shipping are 20 or 40 feet long. To provide a standard measure for container trade, 40-foot containers are converted into 20-foot container equivalents. For example, one 40-foot container is counted as two 20-foot containers or two TEU.
In addition to considering overall trade growth trends, we need to consider which trades are in higher demand and therefore require greater access to trade-specific facilities at the Port.
The container trade is today the most significant Port trade, with 3 million twenty-foot-equivalent units (TEU) of containers handled during 2018-19. This equates to 75 million revenue tonnes – or around three quarters of the Port’s trade. With the rise in online shopping and international brands opening stores in Australia, container trade continues to grow.
Liquid bulk was the next largest trade in 2018-19 (6.5 million cubic metres) with around two-thirds of this trade relating to crude oil and refined petroleum product imports.
2018-19 Port trade volumes
Trades2018-19
Trade volume10-year historical
annual growth rate
Container 3m TEU 3.4%
New motor vehicles 312,000 units 0.4%
Liquid bulk 6.5m m3 3.8%
Dry bulk 4m mass tonnes 2.8%
Break bulk* 1.35m mass tonnes -2.6%
* Excludes new motor vehicles
It is important that the Port also monitors and responds to short term as well as long term trade changes. Between 2017-18 and 2018-19 a number of port trades saw major volume changes. The most significant of these was bulk grain which was down 82% due to the current drought conditions and new motor vehicles being down 12% due to a slowing local economy. In comparison wheeled units (break bulk trade) was up 10% on increased Tasmanian trade volumes.
Port of Melbourne 2050 Port Development Strategy 22
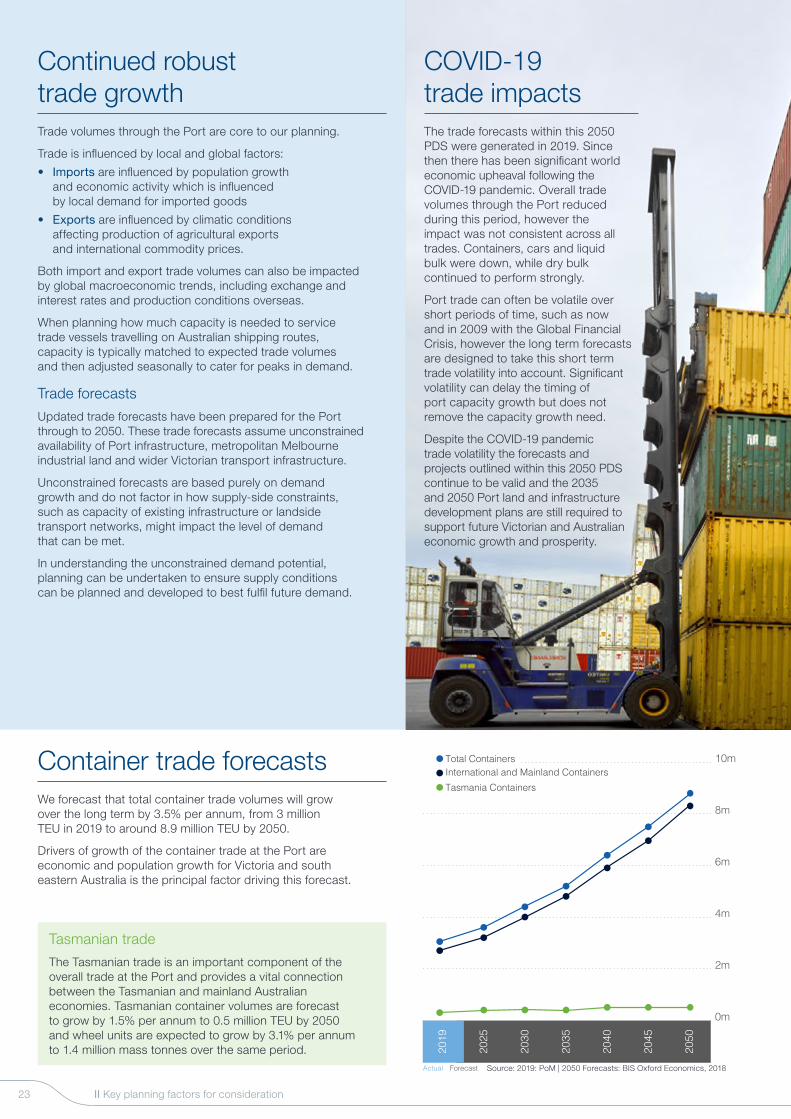
Continued robust trade growthTrade volumes through the Port are core to our planning.
Trade is influenced by local and global factors:
• Imports are influenced by population growth and economic activity which is influenced by local demand for imported goods
• Exports are influenced by climatic conditions affecting production of agricultural exports and international commodity prices.
Both import and export trade volumes can also be impacted by global macroeconomic trends, including exchange and interest rates and production conditions overseas.
When planning how much capacity is needed to service trade vessels travelling on Australian shipping routes, capacity is typically matched to expected trade volumes and then adjusted seasonally to cater for peaks in demand.
Trade forecasts
Updated trade forecasts have been prepared for the Port through to 2050. These trade forecasts assume unconstrained availability of Port infrastructure, metropolitan Melbourne industrial land and wider Victorian transport infrastructure.
Unconstrained forecasts are based purely on demand growth and do not factor in how supply-side constraints, such as capacity of existing infrastructure or landside transport networks, might impact the level of demand that can be met.
In understanding the unconstrained demand potential, planning can be undertaken to ensure supply conditions can be planned and developed to best fulfil future demand.
Container trade forecastsWe forecast that total container trade volumes will grow over the long term by 3.5% per annum, from 3 million TEU in 2019 to around 8.9 million TEU by 2050.
Drivers of growth of the container trade at the Port are economic and population growth for Victoria and south eastern Australia is the principal factor driving this forecast.
International and Mainland ContainersTasmania Containers
Total Containers
0m
2m
4m
6m
8m
10m
2019
2025
2030
2035
2040
2050
2045
Actual Forecast Source: 2019: PoM | 2050 Forecasts: BIS Oxford Economics, 2018
Tasmanian trade
The Tasmanian trade is an important component of the overall trade at the Port and provides a vital connection between the Tasmanian and mainland Australian economies. Tasmanian container volumes are forecast to grow by 1.5% per annum to 0.5 million TEU by 2050 and wheel units are expected to grow by 3.1% per annum to 1.4 million mass tonnes over the same period.
COVID-19 trade impactsThe trade forecasts within this 2050 PDS were generated in 2019. Since then there has been significant world economic upheaval following the COVID-19 pandemic. Overall trade volumes through the Port reduced during this period, however the impact was not consistent across all trades. Containers, cars and liquid bulk were down, while dry bulk continued to perform strongly.
Port trade can often be volatile over short periods of time, such as now and in 2009 with the Global Financial Crisis, however the long term forecasts are designed to take this short term trade volatility into account. Significant volatility can delay the timing of port capacity growth but does not remove the capacity growth need.
Despite the COVID-19 pandemic trade volatility the forecasts and projects outlined within this 2050 PDS continue to be valid and the 2035 and 2050 Port land and infrastructure development plans are still required to support future Victorian and Australian economic growth and prosperity.
II Key planning factors for consideration23
Trade forecast sensitivityWe have considered how sensitive the trade forecasts in this 2050 PDS may be to external factors. While the outlook will continue to evolve for each trade type, we consider that the trades most susceptible to both upside and downside changes are containers and liquid bulk. Potential upside and downside risks include:
Upside risk that trade volumes may be higher than forecast
Mainly, stronger than expected population growth may result in higher than expected demand for imports. Potential new technology or economic trends may increase asset turnover (e.g. if self-driving car fleets start to become adopted, our current cars may be replaced faster than expected) or volume shift from one trade to another (e.g., the trend towards transporting goods via containers gains pace). Where upside changes occur, we expect some future Port investments would be brought forward to respond to earlier than expected demand.
Downside risk that trade volumes may be lower than forecast
Downside risks are largely driven by economic factors which dampen demand. These include local or global recessions, lower Victorian population growth, more difficult agricultural production conditions (e.g. drought) or technology changes (such as reduced liquid bulk demand due to a move to electric cars). Likewise, where downside risks eventuate, PoM is likely to delay relevant port projects until sufficient demand growth occurs.
Key trade growth planning considerations • All Port trades are expected to grow in response to continued metropolitan Melbourne and Victorian economic
growth and development
• Different trades are predicted to grow at different rates with containers, liquid bulk and break bulk (excluding new motorvehicles) trades expected to experience highest long term growth
• There are a range of upside and downside risks associated with the trade forecasts with the key risk drivers includingpopulation growth, economic growth, climatic conditions and technology changes
• PoM continues to monitor short, medium and longer-term trade growth to align port capacity with forecast trade demand
• Economic analysis has clearly shown that the economic benefits of the Port are Victorian wide and extend into southernNSW and Tasmania. Port planning needs to cover the needs of all port users, not just metropolitan Melbourne.
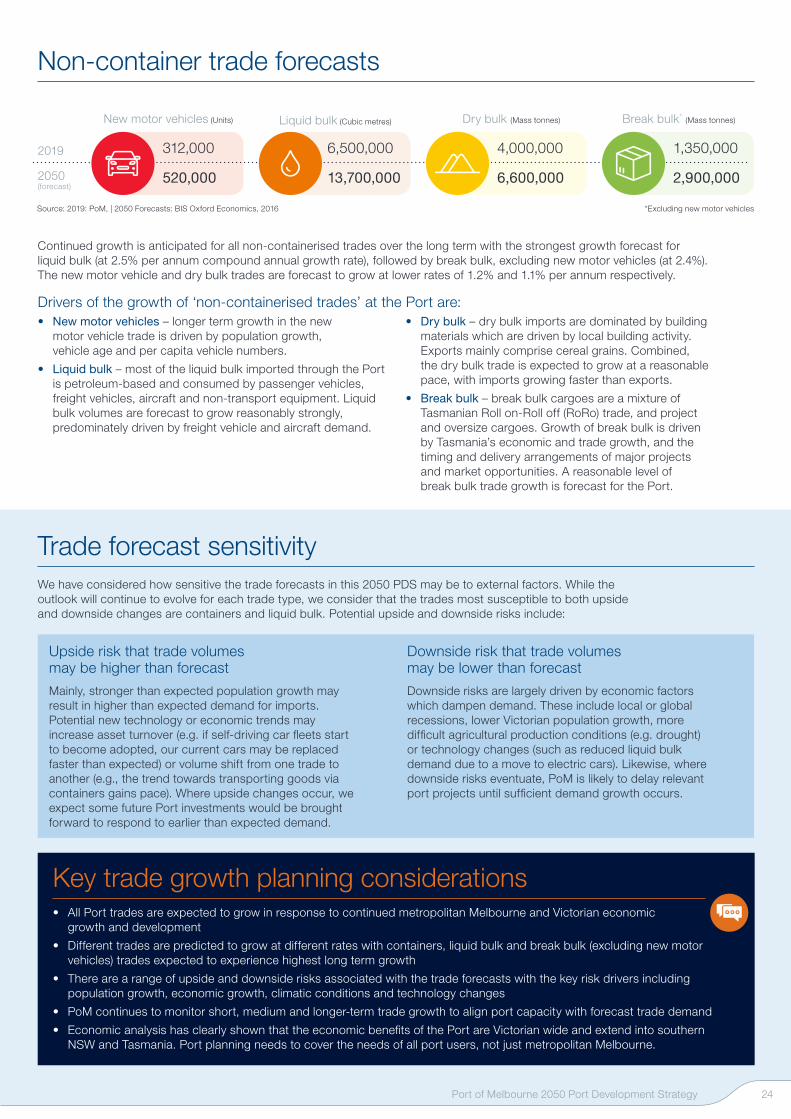
Non-container trade forecasts
Continued growth is anticipated for all non-containerised trades over the long term with the strongest growth forecast for liquid bulk (at 2.5% per annum compound annual growth rate), followed by break bulk, excluding new motor vehicles (at 2.4%). The new motor vehicle and dry bulk trades are forecast to grow at lower rates of 1.2% and 1.1% per annum respectively.
Drivers of the growth of ‘non-containerised trades’ at the Port are:• New motor vehicles – longer term growth in the new
motor vehicle trade is driven by population growth,vehicle age and per capita vehicle numbers.
• Liquid bulk – most of the liquid bulk imported through the Portis petroleum-based and consumed by passenger vehicles,freight vehicles, aircraft and non-transport equipment. Liquidbulk volumes are forecast to grow reasonably strongly,predominately driven by freight vehicle and aircraft demand.
• Dry bulk – dry bulk imports are dominated by buildingmaterials which are driven by local building activity.Exports mainly comprise cereal grains. Combined,the dry bulk trade is expected to grow at a reasonablepace, with imports growing faster than exports.
• Break bulk – break bulk cargoes are a mixture ofTasmanian Roll on-Roll off (RoRo) trade, and projectand oversize cargoes. Growth of break bulk is drivenby Tasmania’s economic and trade growth, and thetiming and delivery arrangements of major projectsand market opportunities. A reasonable level ofbreak bulk trade growth is forecast for the Port.
2019
2050 (forecast)
312,000
520,000
New motor vehicles (Units)
6,500,000
13,700,000
Liquid bulk (Cubic metres)
4,000,000
6,600,000
Dry bulk (Mass tonnes)
1,350,000
2,900,000
Break bulk* (Mass tonnes)
Source: 2019: PoM, | 2050 Forecasts: BIS Oxford Economics, 2016 *Excluding new motor vehicles
Port of Melbourne 2050 Port Development Strategy 24

Our contribution to the economy A vital economic asset
The Port is part of the critical state, national and international supply chain that supports our economy, helps Victoria maintain its competitiveness and increases productivity through the efficient movement of goods. Without an efficient Port, many Victorian businesses may choose to do business elsewhere.
The Port is also an important part of the Tasmanian economy, serving as the key domestic and international trade gateway for Tasmania.
Recent analysis has identified that in 2017-18* the Port’s operations generated total economic benefits worth $7.5 billion to the Australian economy. Of this, Victoria received $6 billion in benefits and Tasmania gained $600 million, with the remaining benefits largely going to New South Wales and South Australia.
An efficient Port is crucial to businesses whose success directly relies on their ability to import or export goods. In turn, this generates activities for Port servicing businesses across a wide range of industries. This includes pilots and tug operators, stevedores, shipping companies, container park operators and inland transport operators. Suppliers to these businesses also benefit indirectly from the level of activity generated through the Port.
Through their individual business activities, these businesses generate a level of economic output that contributes to the total economic benefit.
In delivering economic output, the net income a business earns is represented as the value-added benefit component of the total economic benefits which is available for further business investments or distributions, such as shareholder dividends.
Another component of economic benefit is employee wages which contribute to household income.
The $6 billion in total economic output benefit to the Victorian economy generated by the Port in 2017-18 included $3.1 billion in gross state product and $1.6 billion in Victorian household incomes.
* These economic findings are from the Port of Melbourne 2017-18 EconomicImpact Study recently undertaken by BDO Econsearch and GHD.
Many different functions and trades contribute to the Port’s success
The various Port functions each make a different contribution to the economy.
During 2017-18, the four largest Port functions from an economic benefit perspective were:
• land transport and storage: $2 billion
• cargo services: $1.8 billion
• ship loading/unloading: $1.7 billion
• port administration: $1 billion.
Combined, these four Port functions resulted in 87% of the total Victorian economic benefit from the Port.
How the Port’s economic output spreads across neighbouring regions
The highest level of economic benefit, totalling slightly over $4.3 billion, was brought to the inner Melbourne region, comprising the local government areas (LGAs) of Melbourne, Hobsons Bay, Port Phillip and Maribyrnong, where the majority of the Port’s daily activities are located. Two-thirds of Port-related jobs are located in these LGAs.
A strategic approach to plan for and manage the growth of Port trade will be important for business confidence across different Port-related services, and for the wider economic and social benefits that flow from high levels of employment in our local communities.
$6b: Victorian economic output
Rest of Victoria$270m
Outer west$300m
Outer east$620m
Outer north$280m
Inner Melbourne$4.3b
Outer south-east$230m
$7.5bTotal economic
benefits
Tasmania $600mOther $400mVictoria $6b
NSW $500m
Port of Melbourne operations
II Key planning factors for consideration25
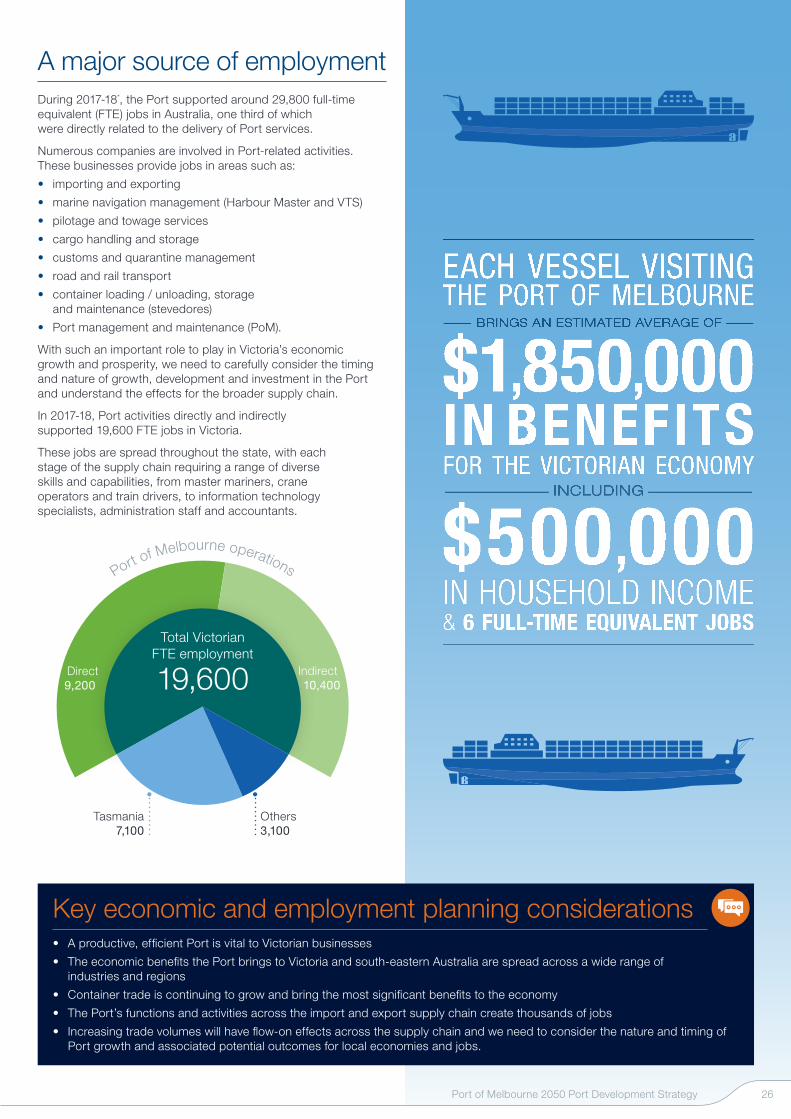
A major source of employmentDuring 2017-18*, the Port supported around 29,800 full-time equivalent (FTE) jobs in Australia, one third of which were directly related to the delivery of Port services.
Numerous companies are involved in Port-related activities. These businesses provide jobs in areas such as:
• importing and exporting
• marine navigation management (Harbour Master and VTS)
• pilotage and towage services
• cargo handling and storage
• customs and quarantine management
• road and rail transport
• container loading / unloading, storage and maintenance (stevedores)
• Port management and maintenance (PoM).
With such an important role to play in Victoria’s economic growth and prosperity, we need to carefully consider the timing and nature of growth, development and investment in the Port and understand the effects for the broader supply chain.
In 2017-18, Port activities directly and indirectly supported 19,600 FTE jobs in Victoria.
These jobs are spread throughout the state, with each stage of the supply chain requiring a range of diverse skills and capabilities, from master mariners, crane operators and train drivers, to information technology specialists, administration staff and accountants.
Tasmania7,100
Indirect10,400
Direct9,200
Others3,100
Total Victorian FTE employment
19,600
EACH VESSEL VISITING THE PORT OF MELBOURNE
BRINGS AN ESTIMATED AVERAGE OF
$1,850,000 IN BENEFITSFOR THE VICTORIAN ECONOMY
INCLUDING
$500,000 IN HOUSEHOLD INCOME& 6 FULL-TIME EQUIVALENT JOBS
Key economic and employment planning considerations • A productive, efficient Port is vital to Victorian businesses
• The economic benefits the Port brings to Victoria and south-eastern Australia are spread across a wide range of industries and regions
• Container trade is continuing to grow and bring the most significant benefits to the economy
• The Port’s functions and activities across the import and export supply chain create thousands of jobs
• Increasing trade volumes will have flow-on effects across the supply chain and we need to consider the nature and timing of Port growth and associated potential outcomes for local economies and jobs.
Port of Melbourne operations
Port of Melbourne 2050 Port Development Strategy 26

Melbourne
Geelong
Bass Strait
Port PhillipBay
Corio Bay
South Channel
Entrance
Port of MelbourneWaters Shipping
Fairway
PortMelbourne
Channel
MorningtonPeninsula
BellarinePeninsula
PointLonsdale
PointNepean
Rye
CapeSchanck
Flinders
Rosebud
MountMartha
Mornington
MountEliza
Frankston
Carrum
Mordialloc
Beaumaris
Sandringham
Brighton
St Kilda
Port Melbourne
Yarraville
Dynon
Newport
Altona
PointCook
WerribeeSouth
PointWilson
PointHenry
Portarlington
St Leonards
BarwonHeads
Port ofGeelong Waters
SouthEastDMG
Port ofMelbourne
DMG
A
B
C
D
E
Safe, reliable and adequate shipping channels The Port’s network of shipping channels
Safe, reliable and efficient shipping channels are essential for the successful operation of the Port and the continuous flow of trade in and out of the state.
Commercial vessels access our Port, and the Port of Geelong, via a series of shipping channels and fairways that connect with Port Phillip Bay and Bass Strait. The Bay is also an important community asset enjoyed by many for boating, fishing, yachting and swimming. To keep everyone safe on the Bay, there are laws and directions that govern how commercial and non-commercial vessels navigate shipping channels.
These waters are managed by VPCM with vessel traffic support provided by the VTS under the direction of the Harbour Master. The depth and width of these channels vary from 17m and 245m respectively for the Great Ship Channel at the Port Phillip Heads (the Heads) down to 14.5m and 153m for the Yarra River Channel. Different depths are required to accommodate the varying environmental conditions through the Port, with a greater depth needed at the Heads due to the wave and swell conditions.
The Channel Deepening Project completed in 2009 was a significant upgrade to the Port’s long-term capacity, allowing commercial vessels up to 14m draught to navigate the Port under all tidal conditions.
As the seabed material shifts over time, we need to undertake regular maintenance dredging to maintain the channels to their declared depths. We therefore need to plan for resettlement of the excess seabed material that is removed as part of channel maintenance activities, such as clay, silt, sand and rock. This material is resettled at two Dredge Material Grounds (DMGs) within the Bay.
As PoM is responsible for maintaining these channels and fairways, we need to plan for the numbers and types of vessels accessing the Port into the future to ensure these routes provide adequate and safe access. Just as the Government plans for road and rail network capacity, we need to consider how the Port’s waters may need to adapt to changing trade needs.
Additionally, while VPCM is responsible for the planning, management and operation of Station Pier, we need to ensure in consultation with VPCM that the growing number of cruise ships visiting Melbourne can be accommodated, and that commercial vessel planning is integrated with cruise ship planning. Likewise, we look to work collaboratively with VPCM and the Harbour Master on future commercial vessel trends and numbers to ensure continued safe vessel navigation throughout the Port.
A
Port Phillip Heads and Entrance
The Heads are formed at Point Lonsdale and Point Nepean and stand either side of the short strip of water (the Entrance) that connects Port Phillip Bay with Bass Strait. The Entrance is considered hazardous due to strong currents, unpredictable waters. The Great Ship Channel is located within the Entrance and is used by commercial shipping vessels with deep draught to transit the Heads.
B
South ChannelThe South Channel runs between the Entrance in the west and Hovell Pile (offshore from Rosebud) in the east.
C
Shipping Fairway
The Shipping Fairway is located in naturally deep water and extends northwards within Port Phillip Bay from the end of the South Channel to the start of the Port Melbourne Channel.
D
Port Melbourne Channel
The Port Melbourne Channel runs from the end of the Shipping Fairway all the way up to Station Pier. Towards the northern end, the Port Melbourne Channel intersects with the Williamstown Channel, which provides access to the majority of the Port.
E
Williamstown and Yarra River Channels
The Yarra River Channel is the northern-most shipping channel and provides access to Swanson Dock, Appleton Dock, Victoria Dock, Holden Dock and South Wharf. The Williamstown Channel links the Port Melbourne Channel with the Yarra River Channel, providing access to Gellibrand Pier and Webb Dock.
II Key planning factors for consideration27
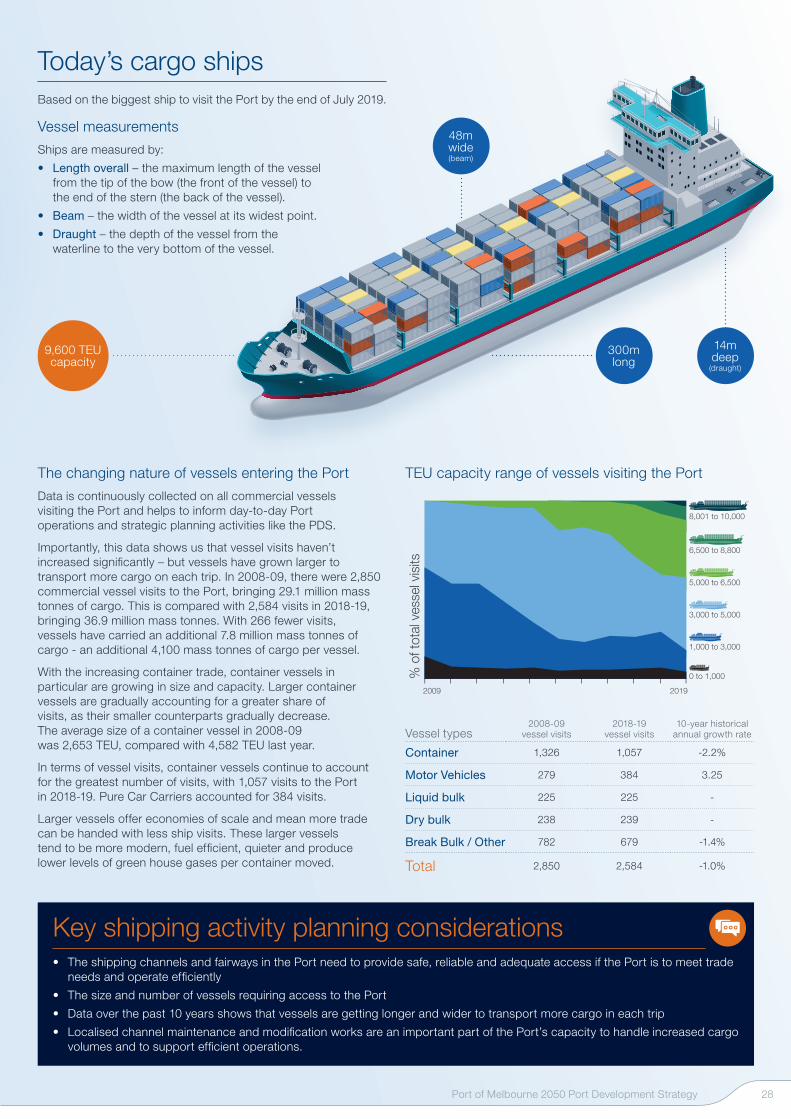
Key shipping activity planning considerations • The shipping channels and fairways in the Port need to provide safe, reliable and adequate access if the Port is to meet trade
needs and operate efficiently
• The size and number of vessels requiring access to the Port
• Data over the past 10 years shows that vessels are getting longer and wider to transport more cargo in each trip
• Localised channel maintenance and modification works are an important part of the Port’s capacity to handle increased cargovolumes and to support efficient operations.
Melbourne
Geelong
Bass Strait
Port PhillipBay
Corio Bay
South Channel
Entrance
Port of MelbourneWaters Shipping
Fairway
PortMelbourne
Channel
MorningtonPeninsula
BellarinePeninsula
PointLonsdale
PointNepean
Rye
CapeSchanck
Flinders
Rosebud
MountMartha
Mornington
MountEliza
Frankston
Carrum
Mordialloc
Beaumaris
Sandringham
Brighton
St Kilda
Port Melbourne
Yarraville
Dynon
Newport
Altona
PointCook
WerribeeSouth
PointWilson
PointHenry
Portarlington
St Leonards
BarwonHeads
Port ofGeelong Waters
SouthEastDMG
Port ofMelbourne
DMG
The changing nature of vessels entering the Port
Data is continuously collected on all commercial vessels visiting the Port and helps to inform day-to-day Port operations and strategic planning activities like the PDS.
Importantly, this data shows us that vessel visits haven’t increased significantly – but vessels have grown larger to transport more cargo on each trip. In 2008-09, there were 2,850 commercial vessel visits to the Port, bringing 29.1 million mass tonnes of cargo. This is compared with 2,584 visits in 2018-19, bringing 36.9 million mass tonnes. With 266 fewer visits, vessels have carried an additional 7.8 million mass tonnes of cargo - an additional 4,100 mass tonnes of cargo per vessel.
With the increasing container trade, container vessels in particular are growing in size and capacity. Larger container vessels are gradually accounting for a greater share of visits, as their smaller counterparts gradually decrease. The average size of a container vessel in 2008-09 was 2,653 TEU, compared with 4,582 TEU last year.
In terms of vessel visits, container vessels continue to account for the greatest number of visits, with 1,057 visits to the Port in 2018-19. Pure Car Carriers accounted for 384 visits.
Larger vessels offer economies of scale and mean more trade can be handed with less ship visits. These larger vessels tend to be more modern, fuel efficient, quieter and produce lower levels of green house gases per container moved.
2009 2019
% o
f tot
al ve
ssel
visits
6,500 to 8,800
8,001 to 10,000
5,000 to 6,500
3,000 to 5,000
1,000 to 3,000
0 to 1,000
TEU capacity range of vessels visiting the Port
Vessel types2008-09
vessel visits2018-19
vessel visits10-year historical
annual growth rate
Container 1,326 1,057 -2.2%
Motor Vehicles 279 384 3.25
Liquid bulk 225 225 -
Dry bulk 238 239 -
Break Bulk / Other 782 679 -1.4%
Total 2,850 2,584 -1.0%
Today’s cargo shipsBased on the biggest ship to visit the Port by the end of July 2019.
Vessel measurements
Ships are measured by:
• Length overall – the maximum length of the vesselfrom the tip of the bow (the front of the vessel) tothe end of the stern (the back of the vessel).
• Beam – the width of the vessel at its widest point.
• Draught – the depth of the vessel from thewaterline to the very bottom of the vessel.
300m long
9,600 TEU capacity
14m deep
(draught)
48m wide (beam)
Port of Melbourne 2050 Port Development Strategy 28

Responding to changing vessel needsAs different vessel types carry different trade to and from the Port, it’s essential we take a robust approach to forecasting them. In this section we present forecasts for the different vessel types which call at the Port.
The forecasts are driven by:
• the volume and mix of trades handled by allports along Australian shipping routes
• shipping fleet availability and industry expectations
• forecast east coast Australian populationgrowth and trade demand
• the physical limitations to handling trade at all east coastAustralian ports (including the Port of Melbourne).
Container vessel growthThe average size of container vessels is expected to continue growing gradually over time. This is in line with Australian population and market growth and changes in the global shipping fleet. The most likely container vessel fleet forecast through to 2050 based on information available to date is provided below.
Constrained forecasts for container vessels have been prepared using the following physical limit assumptions:
• Existing port infrastructure limits – the current berth andchannel infrastructure is designed for a container vessel ofaround 7,500 to 8,500 TEU. This sets the baseline vessel sizelimits within the Port (i.e. without any development initiatives)
• Use of specific operational controls – some specificoperational and relatively minor infrastructure developmentworks may be able to push these limits out to between 9,500and 10,500 TEU
• Westgate Bridge / Yarra River limits – the height of theWestgate Bridge and arrangement of the Yarra River channelare likely to result in a 10,000 to 10,500 TEU up-river limit(subject to further review and approvals)
• Port Phillip Heads / Bay limits – Infrastructure Victoriaidentified a 14,000 TEU limit at the Port Phillip Heads and Baywhich is likely to set the vessel size limit for Webb Dock in themedium and longer term (subject to further reviewand approvals).
0
800
400
1,600
1,200
Vessel visits TEU
2050
2045
2040
2035
2030
2025
2020
2019
Actual Forecast
0-3k
3k-5k
5k-6.5k
6.5k-8k
8k-10k
10k-14k
Source: GHD and PoM, 2019
Container vessel forecast
II Key planning factors for consideration29
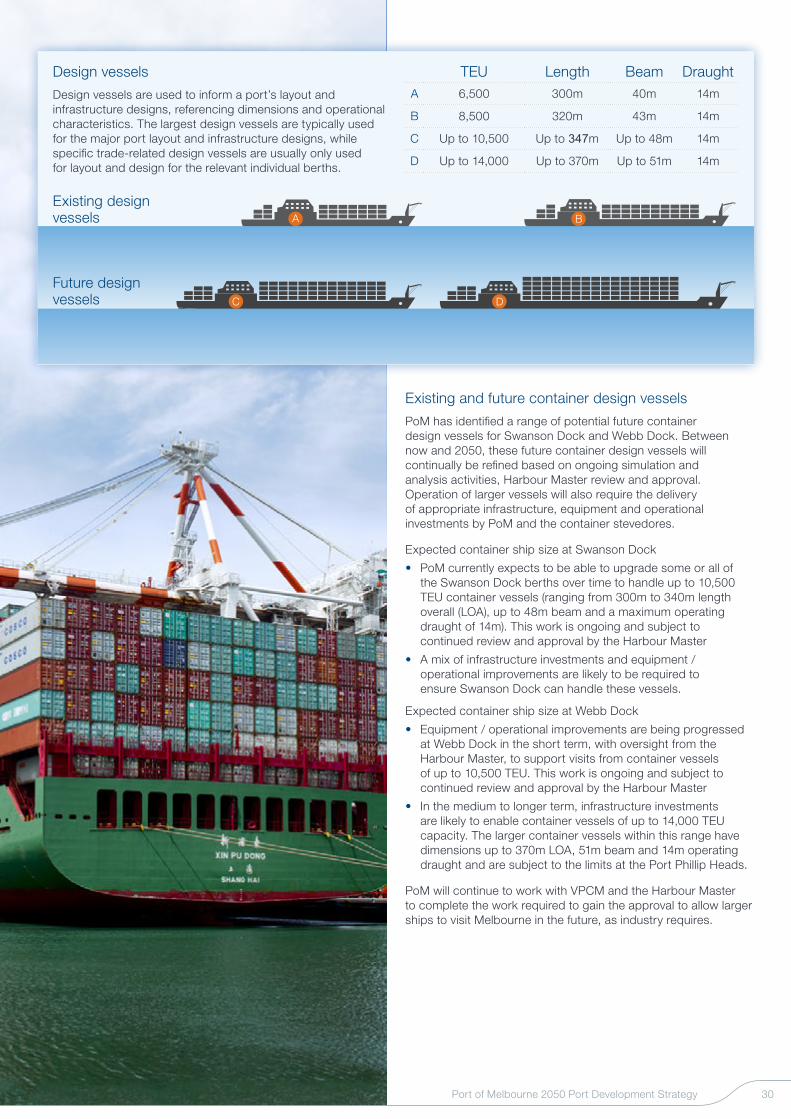
Existing and future container design vessels
PoM has identified a range of potential future container design vessels for Swanson Dock and Webb Dock. Between now and 2050, these future container design vessels will continually be refined based on ongoing simulation and analysis activities, Harbour Master review and approval. Operation of larger vessels will also require the delivery of appropriate infrastructure, equipment and operational investments by PoM and the container stevedores.
Expected container ship size at Swanson Dock
• PoM currently expects to be able to upgrade some or all ofthe Swanson Dock berths over time to handle up to 10,500TEU container vessels (ranging from 300m to 340m lengthoverall (LOA), up to 48m beam and a maximum operatingdraught of 14m). This work is ongoing and subject tocontinued review and approval by the Harbour Master
• A mix of infrastructure investments and equipment /operational improvements are likely to be required toensure Swanson Dock can handle these vessels.
Expected container ship size at Webb Dock
• Equipment / operational improvements are being progressedat Webb Dock in the short term, with oversight from theHarbour Master, to support visits from container vesselsof up to 10,500 TEU. This work is ongoing and subject tocontinued review and approval by the Harbour Master
• In the medium to longer term, infrastructure investmentsare likely to enable container vessels of up to 14,000 TEUcapacity. The larger container vessels within this range havedimensions up to 370m LOA, 51m beam and 14m operatingdraught and are subject to the limits at the Port Phillip Heads.
PoM will continue to work with VPCM and the Harbour Master to complete the work required to gain the approval to allow larger ships to visit Melbourne in the future, as industry requires.
Design vessels
Design vessels are used to inform a port’s layout and infrastructure designs, referencing dimensions and operational characteristics. The largest design vessels are typically used for the major port layout and infrastructure designs, while specific trade-related design vessels are usually only used for layout and design for the relevant individual berths.
TEU Length Beam DraughtA 6,500 300m 40m 14m
B 8,500 320m 43m 14m
C Up to 10,500 Up to 347m Up to 48m 14m
D Up to 14,000 Up to 370m Up to 51m 14m
A B
DC
Existing design vessels
Future design vessels
Port of Melbourne 2050 Port Development Strategy 30

1
3
54
2
II Key planning factors for consideration31

Note: Excludes Station Pier Tasmanian ferry or cruise vessel visits Source: GHD, 2018
Non-container vessel growthNon-container design vessels
Trade and vessel type Length Overall Beam Draught Dead weight tonnes (DWT)
1 TasmanianRoRo vessels, 700 TEU
211m 35m 7.5m NA
2 Motor VehiclesPure Car Carrier vessels, 8,000-8,500 CEU
200-265m 33-41m 12m NA
3Liquid BulkRefined petroleum product vessels, Long Range 2 (LR2) or Crude Oil Suezmax
240-290m 42-50m 14-14.5m 115,000-160,000
4 Dry Bulk Panamax vessels
220m 32m 12.5m 80,000
5 Break Bulk / OtherHandymax vessels
200m 30m 8.5m 40,000
Key ship fleet planning considerations • An increase of around 50% in the annual number of commercial vessels visits to the Port is expected between 2019 and 2050
with around 4,100 vessel visits per annum expected in 2050 compared to around 2,600 vessel visits in 2018-19. This figure excludes vessel visits to Station Pier.
• In 2050 this equates to around 11 commercial vessel visits every day to the Port (excluding vessel visits to Station Pier), up from seven commercial vessel visits per day in 2018-19.
• All commercial vessel types are expected to experience continued growth through to 2050 with the largest growth numbers forecast for Tasmanian RoRo vessels (up around 500 vessel visits), container vessels (up about 350 vessel visits) and automotive / Pure Car Carrier vessels (up about 300 vessel visits)
• The size of commercial vessels visiting the Port is also expected to grow over the next 30 plus years with the largest growth forecast for container vessels (the largest expected to be 14,000 TEU vessels by 2050) and Tasmanian RoRo vessels (with 900 TEU vessels by 2050).
Non-container vessel forecasts
Vessel numbers of other trades visiting the Port are expected to grow across the next 30 years:
• The largest growth in vessel visit numbers is for Tasmanian RoRo (Roll on-Roll off) and Motor Vehicles (Pure Car Carriers) which will increase to 1,095 and 707 annual visits to the Port respectively between now and 2050
• The most significant percentage growth is forecast for the Break Bulk / Other vessels. These are expected to grow at a rate of 5.3% per annum through to 158 visits in 2050.
200
400
600
800
1,000
1,200Annual vessel visits
2019
2025
2030
2035
2040
2050
2045
Actual
Totals
Forecast
2,7302,5752,4342,3092,1961,735 1,527
1
2
5
4
3
Source: GHD and PoM, 2019Note: Individual berths associated with these and other trades may be designed for smaller vessels. The design vessel is based on the actual trade associated with the berth and any historical physical layout or structural capacity consideration.
Port of Melbourne 2050 Port Development Strategy 32

Transporting freight to and from the Port Traffic management around the Port is complex. Freight needs to move in and out of the Port 24 hours a day, seven days a week, while balancing the needs of surrounding businesses, residents and commuters. As trade growth increases, additional demand will be placed on the road and rail networks that service the Port.
As our population grows and inner Melbourne becomes busier, the efficient movement of goods around the state becomes more challenging. The ‘peak’ periods are starting earlier and finishing later, roads are more congested and train services are competing for operational space on the rail network.
To ensure the Port continues to provide efficient and cost-effective access to import and export markets in south-eastern Australia, we need to consider how existing infrastructure can be better leveraged and explore innovative freight transport models. A focus on reducing unnecessary freight transport movements on road and rail networks will increase productivity, reduce congestion growth and, ultimately, be better for Victoria.
The Port is ideally located to connect to major road and rail networks
The Port has good connections to the major freeways and freight rail corridors and is ideally located to provide businesses with excellent access to markets across metropolitan Melbourne, regional Victoria and interstate.
There are four rail terminals within the Port and another three at the Dynon Freight Rail Terminal, which is managed by VicTrack and provides a direct connection to the Port.
Different kinds of cargo are transported by road and rail. Freight rail is mostly used for transporting container and bulk grain trades between the Port, regional Victoria and interstate. There is no significant movement of containers around metropolitan Melbourne by rail however PoM is has commenced investment in the Port Rail Transformation Project which will support metropolitan rail freight activities.
Dedicated freight rail lines run to the north and west, whereas freight rail shares passenger train lines to the south-east and east, which impacts the efficiency of transporting freight by rail in these corridors. On these south-east lines, freight trains avoid peak periods, with agreed schedules fitted around passenger trains.
The vast majority of Port-related transport activities are by road, particularly within metropolitan Melbourne. The Port’s key road access points are Footscray Road and the Todd Road / West Gate Freeway intersection. The West Gate Tunnel Project will provide an additional direct link to the Port from the West Gate Freeway and CityLink at both Mackenzie Road and Appleton Dock Road. The project is scheduled for completion in 2022.
Ensuring appropriate access to Victoria’s road and rail networks is maintained, safeguarded and protected is critical to the Port’s efficient operations.
II Key planning factors for consideration33

To Tottenham, the north and west
To Gippsland, the south east
Dynon Rd
Dock Link Rd
Whitehall StFrancis St
Hyde St
West Gate Fwy
Todd RdCityLink
CityLink
Lorimer St
Footscray Rd
Wurundjeri WayWest Gate Tunnel
Williamstown Rd
Road and rail network
Port of Melbourne land
Dynon Precinct
Road Existing major Port-related road infrastructure
Existing major Port-related road infrastructure and Port-related heavy duty truck routes (existing)
Future major Port-related road infrastructure (at grade − elevated)
Future major Port-related road infrastructure (below ground)
Existing major access points
Existing minor access points
Rail Major Port-related heavy rail infrastructure
Appleton Park Rail Terminal
Appleton Dock Bulk Grain Terminal
West Swanson Rail Terminal
Victoria Dock Terminal
South Dynon and Dynon Rail Terminals
2019
The Victorian network of pipelines directly connect to the Port
Every day the Port handles liquid products, which range from crude oil and petroleum through to food grade oils and molasses along with chemicals that are used in manufacturing and industrial processes. Many of these liquids are distributed by individual pipelines that run between the Port, storage and distribution facilities, oil refineries, manufacturing plants and major users, such as Melbourne Airport for aviation fuel. This network provides high-capacity direct connections between these facilities and reduces the level of road transport that is required to distribute Port liquid bulk trades.
Port of Melbourne 2050 Port Development Strategy 34
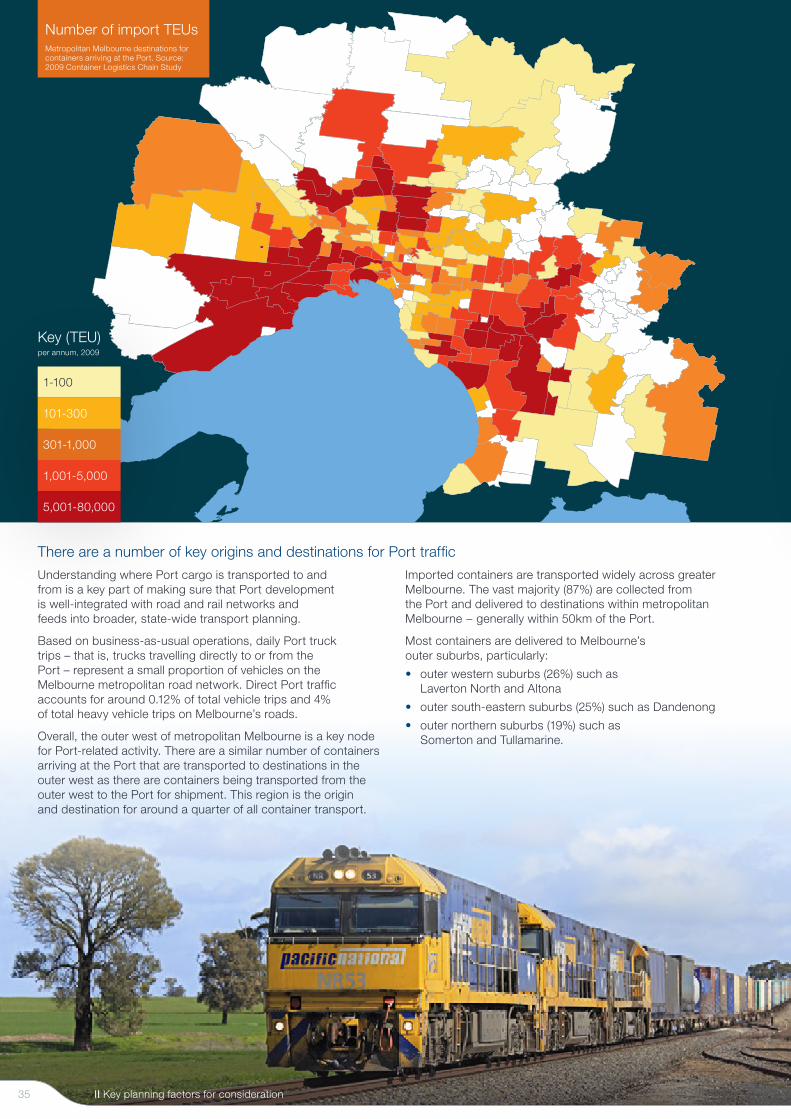
Key (TEU)per annum, 2009
1-100
101-300
301-1,000
1,001-5,000
5,001-80,000
There are a number of key origins and destinations for Port traffic
Understanding where Port cargo is transported to and from is a key part of making sure that Port development is well-integrated with road and rail networks and feeds into broader, state-wide transport planning.
Based on business-as-usual operations, daily Port truck trips – that is, trucks travelling directly to or from the Port – represent a small proportion of vehicles on the Melbourne metropolitan road network. Direct Port traffic accounts for around 0.12% of total vehicle trips and 4% of total heavy vehicle trips on Melbourne’s roads.
Overall, the outer west of metropolitan Melbourne is a key node for Port-related activity. There are a similar number of containers arriving at the Port that are transported to destinations in the outer west as there are containers being transported from the outer west to the Port for shipment. This region is the origin and destination for around a quarter of all container transport.
Imported containers are transported widely across greater Melbourne. The vast majority (87%) are collected from the Port and delivered to destinations within metropolitan Melbourne − generally within 50km of the Port.
Most containers are delivered to Melbourne’s outer suburbs, particularly:
• outer western suburbs (26%) such as Laverton North and Altona
• outer south-eastern suburbs (25%) such as Dandenong
• outer northern suburbs (19%) such as Somerton and Tullamarine.
II Key planning factors for consideration
Number of import TEUsMetropolitan Melbourne destinations for containers arriving at the Port. Source: 2009 Container Logistics Chain Study
35

Key (TEU)per annum, 2009
1-200
201-700
701-2,000
2,001-7,000
7,001-50,000
Key landside transport planning considerations • Truck traffic from the Port is a very small component of the broader network traffic, consisting of 0.12% of total trips
and 4% of the total heavy vehicle trips across metropolitan Melbourne
• The Port needs to be well-connected to road and rail networks so that freight moves efficiently between the Port and business locations
• As the city grows, there will be greater pressure on road and rail networks for both general and freight transport
• There is significant opportunity for rail to take a greater share of Port freight transport and provide increased capacity for the future through dedicated Port rail links
• Increasing Port truck productivity and operations outside peak times will be important to maintain an efficient supply chain and to help minimise the impacts of increased freight traffic on the road network.
Melbourne’s west has the largest concentration of export container origins
Compared to imports, container exports have a smaller number of origins within Melbourne and a larger number come from regional Victoria or interstate. Just over half of export containers are transferred from metropolitan Melbourne, with the largest number coming from the outer west (25%).
Inner Melbourne accounts for a relatively high proportion of container export origins (14%). West Melbourne and West Footscray are two of the biggest inner-Melbourne locations for container export origins, which is likely due to the way container shipments are staged by freight companies. Containers are often transported from interstate or regional areas and held or packed at an intermediate location close to the Port, before being delivered for shipment.
PoM is currently undertaking a new origin and destination study for the Port. This work aims to release updated origin and destination data for the Port and will be published in 2021.
Rail is mostly used for regional and interstate trade
Movement of freight by train is often used for container and bulk grain exports through the Port. Currently around 10% of the Port’s international container trade is transported to and from the Port by rail. Most of this trade has origins in regional Victoria and southern New South Wales.
Port of Melbourne 2050 Port Development Strategy
Number of export TEUsMetropolitan Melbourne origins for containers departing from the Port. Source: 2009 Container Logistics Chain Study
36

Responding to landside transport growthPort-related landside transport tasks are a very small part of all commuter and freight transport movements within metropolitan Melbourne. Notwithstanding, for a port to work at its best it is crucial that landside freight logistics operations, both road and rail-based, are moving goods in and out of the port efficiently and productively, and smoothly along the road and rail networks.
As the volumes of freight handled by the Port increase, the port-related landside logistic task will also grow. Introducing measures to increase landside freight efficiency and productivity such as increasing the use of High Productivity
Freight Vehicles (HPFVs), increasing night time access to the port and growing the proportion of port trade handled by rail, including connecting Webb Dock to the rail network, becomes critical to meeting the growth in trade volumes.
Victorian Government support for greater efficiency in the road transport industry will be critical as the Port will always rely of trucks to move the majority of port freight. PoM understands community concerns around truck numbers and supports continued efforts to make the road freight industry as efficient as possible, such that each truck trip can maximise how much cargo is moved and the number of truck trips are minimised.
Road transportRoad transport is the dominant mode of transport at the Port for moving trade to and from importers and exporters. Road provides a flexible and cost competitive transport solution over short distances and direct connections between the port and cargo origins and destinations.
Road traffic forecasts
Our forecasts for the daily Port road transport task through to 2050 show the outlook for:
• current ‘business-as-usual’ truck operations
• truck operations which factor in expected landside transport operational improvements (such as the use of HPFVs and other initiatives mentioned above).
Under the business-as-usual operations (BAU), the forecasts indicate that Port traffic could grow from 11,000 trucks per week day in 2016 to up to 34,000 in 2050 or an 3.4% annual growth rate. With an increase in the volumes of Port traffic on rail and improved truck productivity it is projected that by 2050 this growth could be reduced to a forecast 20,000 Port truck movements per week day, equating to a 1.8% annual growth rate.
Over the same period, metropolitan Melbourne heavy commercial vehicle and total network traffic are both forecast to grow. Given this, by 2050 it is forecast that Port traffic to represent a similar proportion of metropolitan heavy commercial vehicle traffic and total network traffic.
Adjusted Daily Truck volumes
Spreading Port related truck movements into non-peak and overnight times will result in a better use of road capacity, and enable a further reduction in the impact of Port related traffic on the road network. The figure below shows the relative changes in a week day daily volume spread between 2016 (actuals) and the forecast period from 2020 to 2050. This shows that improved use of the existing road capacity results in reduced reliance on the am and pm peaks to move port traffic and increased use of the available road capacity during the interpeak (9am to 3pm) and overnight (7pm to 6am) periods.
Hourly Port Freight Traffic
300
600
900
1,200
1,500
Hours
2016
2020
2030
2040
2050
Overnight
PM peak
AM peak
Interpeak
Source: GTA, 2018
10k
15k
20k
25k
30k
35kTrucks per week day:
2050
2040
2030
2020
2016
Truck fleet forecasts
The Port truck fleet is made up of a mixture of rigid, semi, B-double and Super B-double trucks, each of which is able to carry different numbers of containers. Over recent decades the Port truck fleet is moving towards larger vehicles which support increased road freight efficiency and productivity. Over the next 30 years a gradual continuation of this trend is forecast as outlined in the figure below.
2016 2030 (forecast)
2050 (forecast)
Rigid Semi B-double Super B-doubleSource: GTA, 2018
Business as usual (BAU)
Rail Mode Share reduction
Fleet Mix Change reduction
Productivity Change reduction
Weekend Spread - adjusted truck volumes
Source: GTA, 2018
II Key planning factors for consideration37

The road network surrounding the PortLocalised Port traffic forecasts and figures have been prepared for Swanson Dock and Webb Dock.
Swanson Dock• Total weekday daily Port truck movements at Swanson
Dock are forecast to grow from 8,500 to 10,500 over the next 30 years (0.6% growth per annum). This accounts for the delivery of the West Gate Tunnel Project, expected truck productivity improvements, peak spreading and improvements in Port rail capacity
• There is sufficient road network capacity servicing to Swanson Dock through to 2050.
Webb Dock• Webb Dock weekday daily truck movements are
forecast to grow from 2,400 to 9,300 between now and 2050 (4.1% growth per annum)
• The road network adjacent to Webb Dock is sufficient for the forecast trade through to 2050 provided the identified landside transport operational improvements (such as rail mode share, fleet mix, productivity and weekend spread changes) are achieved, Webb Dock Freight Link is delivered and a number of localised road network improvements are delivered.
Key road planning considerations• Provided that road and rail network improvements are delivered (including the Webb Dock Freight Link), the road network near
Swanson and Webb Dock will be sufficient for the forecast trade through to 2050
• Increasing the use of roads and rail on nights and weekends is a part of improving efficiency and productivity of freight transport
• Road and rail improvements benefitting efficient port trade and the wider Victorian community can be delivered through collaboration between PoM, the State Government and other stakeholders.
0
2m
2016 2020 2030 2040 2050 2016 2020 2030 2040 2050
4m
6m
8m
10m TEUSwanson Dock Webb Dock
Base demand and bufferBusiness as usual
Overnight operation improvement
Shift to rail
Weekend operation improvement
Truck productivity improvement
Westgate Tunnel improvement
Road improvements
Base demand and buffer
PoM will continue to undertake planning, advocating and working with the Victorian Government to deliver the Webb Dock Freight Link and localised road network enhancements. We are committed to engaging with the Victorian Government and other stakeholders to collaborate on the successful delivery of these improvements which are critical to the long term operation of Webb Dock.
PoM also supports efforts by the Victorian Government and the road freight industry to maximise the use of current freeways for port freight. In particular PoM supports the introduction of systems and technology which provide detailed and real time information on truck weight. This would allow for dynamic load limits on key routes at night when there is far less commuter traffic and the roads are not heavily used.
Source: GTA, 2018
Port of Melbourne 2050 Port Development Strategy 38
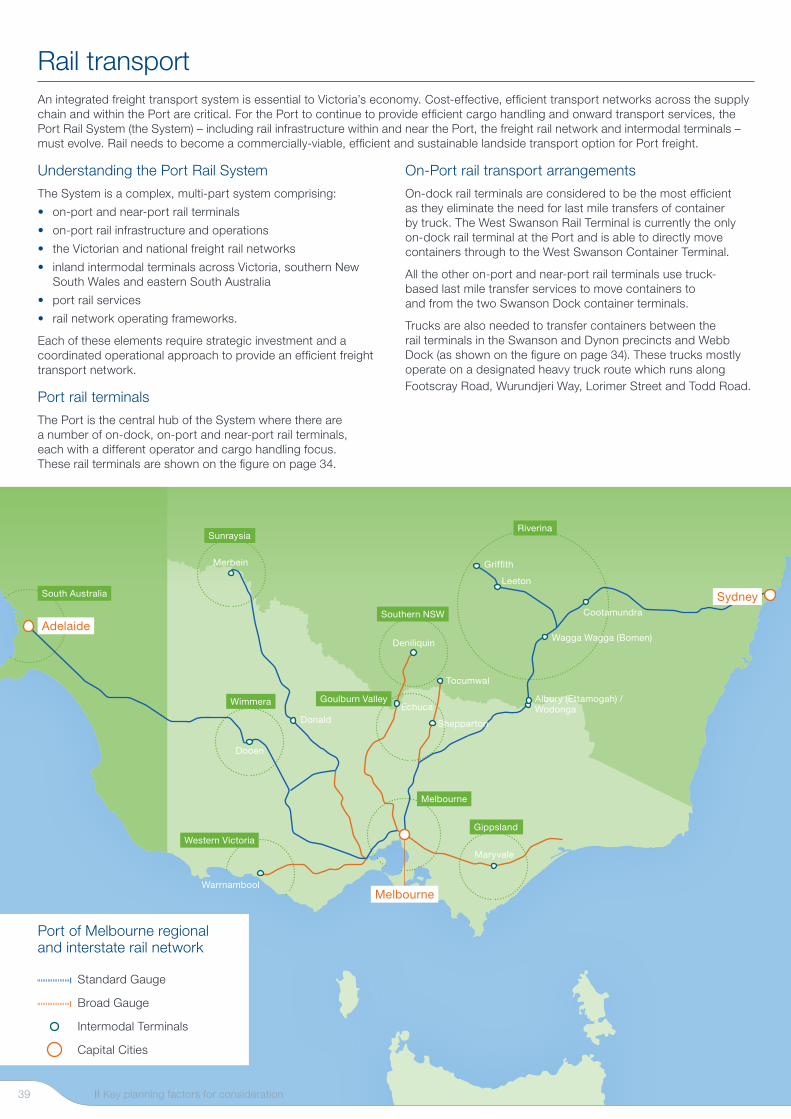
South Australia
Adelaide
Sydney
Sunraysia
Dooen
Donald
Merbein
Deniliquin
Warrnambool
Albury (Ettamogah) / Wodonga
Maryvale
Echuca
Shepparton
Tocumwal
Griffith
Leeton
Cootamundra
Wagga Wagga (Bomen)
Wimmera Goulburn Valley
Western Victoria
Melbourne
Riverina
Southern NSW
Gippsland
Melbourne
Port of Melbourne regional and interstate rail network
Standard Gauge
Broad Gauge
Intermodal Terminals
Capital Cities
Rail transportAn integrated freight transport system is essential to Victoria’s economy. Cost-effective, efficient transport networks across the supply chain and within the Port are critical. For the Port to continue to provide efficient cargo handling and onward transport services, the Port Rail System (the System) – including rail infrastructure within and near the Port, the freight rail network and intermodal terminals – must evolve. Rail needs to become a commercially-viable, efficient and sustainable landside transport option for Port freight.
Understanding the Port Rail System
The System is a complex, multi-part system comprising:
• on-port and near-port rail terminals
• on-port rail infrastructure and operations
• the Victorian and national freight rail networks
• inland intermodal terminals across Victoria, southern New South Wales and eastern South Australia
• port rail services
• rail network operating frameworks.
Each of these elements require strategic investment and a coordinated operational approach to provide an efficient freight transport network.
Port rail terminals
The Port is the central hub of the System where there are a number of on-dock, on-port and near-port rail terminals, each with a different operator and cargo handling focus. These rail terminals are shown on the figure on page 34.
On-Port rail transport arrangements
On-dock rail terminals are considered to be the most efficient as they eliminate the need for last mile transfers of container by truck. The West Swanson Rail Terminal is currently the only on-dock rail terminal at the Port and is able to directly move containers through to the West Swanson Container Terminal.
All the other on-port and near-port rail terminals use truck-based last mile transfer services to move containers to and from the two Swanson Dock container terminals.
Trucks are also needed to transfer containers between the rail terminals in the Swanson and Dynon precincts and Webb Dock (as shown on the figure on page 34). These trucks mostly operate on a designated heavy truck route which runs along Footscray Road, Wurundjeri Way, Lorimer Street and Todd Road.
II Key planning factors for consideration39

Connections to freight rail networks
The Port is connected to both Victorian broad and standard gauge networks, and the national and interstate standard gauge rail network. The near Port rail network connections are outlined on the figure on page 34 and the regional and interstate rail network connections are shown on the opposite page.
The immediate port rail connections run under Footscray Road and through the Dynon Precinct to connect to the external rail networks.
From Dynon, westbound and northbound freight trains pass through Footscray and to / from Tottenham Junction. They then run either north (towards Somerton, north-eastern Victoria and New South Wales), or south and west (towards Altona, Western Victoria and South Australia).
South-east bound freight trains, however, must navigate the busy corridor through Southern Cross and Flinders Street stations, and travel south-east on the Frankston or Pakenham passenger rail lines. This arrangement presents significant capacity restraints for port trains.
Webb Dock is not currently serviced by rail. There is, however, an unused rail corridor (reserved as the Webb Dock Rail Link) between Webb Dock and the Bolte Bridge which runs along the edge of West Gate Park and then adjacent to Wharf Road, Todd Road and Lorimer Street through to the Port boundary. PoM has just completed a planning study, with input from the State, which identified that this corridor is suitable for the construction of the Webb Dock Freight Link.
Regional and interstate intermodal terminals
A broad network of regional and interstate intermodal terminals is connected to the Port through the Port Rail System. The locations of these regional and interstate intermodal terminals and their rail network connections are shown on the opposite page.
Current and proposed Port rail services
All freight rail services into the Port today are regional Victoria and southern New South Wales services. These trains are typically 1,500m long, however can vary from around 900m to 1,800m in length depending on demand and service frequency. A typical 1,500m long container train carries around 200 TEU.
Port Rail Shuttles are the Victorian Government’s proposed freight rail services which connect the Port with intermodal facilities in the outer west, north and potentially the south-east of metropolitan Melbourne.
These Port Rail Shuttle trains are expected to have a length of up to 600m and operate to a regular scheduled service, allowing them to intermix with passenger and other freight trains on the rail networks. A 600m long Port Rail Shuttle train is expected to carry up to 84 TEU.
Key rail planning considerations• For the Port of Melbourne, rail operates in a Port Rail System. This system includes all infrastructure and parties across the
Port interface, and wider rail networks and terminals from which the Port’s trade is sourced and delivered
• Currently the role of the Port Rail System is limited to medium and long-haul container transportation and long distance bulk grain movements from regional Victorian and interstate markets
• The Port Rail System has the potential to act as a key enabler of the Port’s capacity to handle the forecast container demand. The potential to move a proportion of metropolitan Melbourne containers by rail is a significant new opportunity for the Port Rail System
• To maintain a significant medium and long-term role for rail at the Port requires the delivery of a rail or dedicated freight connection to Webb Dock Precinct. This includes the efficient integration of the rail or freight link to the Webb Dock container terminals. PoM has already commenced planning for this and looks forward to working with the Victorian Government on the delivery of the Webb Dock Freight Link.
Port of Melbourne 2050 Port Development Strategy 40

The opportunity for port railAll Port rail services have origins or destinations at intermodal terminals within regional Victoria or southern New South Wales.
There are no regular Port Rail Shuttle services between the metropolitan Melbourne intermodal terminals and the Port.
In an average week, the Port will handle around 40 trains, with these trains being up to 1,800m in length and carrying a total of around 4,000 TEU.
On an annual basis, over the past ten years, the Port typically handled around 250,000 TEU of containers on rail – currently less than 10% of the total number of containers handled at the Port.
This presents a significant opportunity to increase the share of container transport handled by rail.
Making rail the most cost-effective and efficient option
For freight that needs to travel more than 200 kilometres, market usage indicates that rail has a better cost structure than road transport.
The key reasons for this economic advantage of rail are:
• economies of scale – international and domestic container traffic volumes are generally large and consistent enough to support a regular and commercially viable train service
• higher load capacity – it is more efficient to transport heavier containers on rail. This is particularly important for export containers from regional Victoria and interstate areas which on average are much heavier than import containers destined for metropolitan Melbourne
• network service levels and consistency – due to the low volumes of passenger rail services within regional and interstate areas, freight rail also generally has access to a greater and more consistent number of train paths. Train movements through metropolitan Melbourne are more likely to be impacted by network congestion and delays.
These economic and operational advantages mean that port rail handles approximately 55% of the Port’s regional and interstate container trade.
While rail presents a strong economic case for long-distance freight transport, the 2009 Container Logistics Supply Chain Study (PoMC*, 2011) (CLSC Study) found that in 2009 around 70% of all full containers handled at the Port were being transported by road within metropolitan Melbourne.
The three largest metropolitan Melbourne container catchments for import containers are the Western (26%), Northern (25%) and South-East (19%) as shown in the figure below.
Over time, as congestion on the Melbourne road network increases and more efficient rail terminal infrastructure is provided within the Port and at the metropolitan intermodal terminals, it is anticipated that the movement of metropolitan containers by rail will become commercially viable.
In 2012, integrated road and rail network modelling indicated that up to 75% of all containerised freight from the Port could potentially move through metropolitan, regional and interstate intermodal terminals by 2050.
PoM’s more recent modelling also indicated that by 2050 it could be more cost effective to move container freight by rail than by road for all regional and interstate locations and some metropolitan Melbourne locations.
PoM has commenced the delivery of the Port Rail Transformation Project which will see more containers moved by rail more efficiently, bypassing roads in inner Melbourne. The project will increase rail terminal capacity, improve rail port operations and support the introduction of metropolitan port rail shuttle services.
* Port of Melbourne Corporation (PoMC) was the entity responsible for the Port in 2011 and commissioned the 2009 Container Logistics Chain Study.
10km
Gippsland
Hastings
Port of Melbourne
South-Eastern Catchment
Northern Catchment
Western Catchment
Somerton Intermodal Terminal
Altona Intermodal Terminal
North Western & West Victoria and South Australia
North Central Victoria
North Eastern Victoria and NSW
30km
50km
II Key planning factors for consideration41

The Port’s critical operational functionsIntegrated ship movement coordination, cargo handling and landside transport operations are carried out by shipping lines, pilotage and towage service providers, stevedores and road and rail transport operators, as outlined on page 11. Any plans for growth and development at the Port must ensure these fundamental aspects of the Port’s day-to-day operations are maintained, protected and enhanced.
While each Port trade has different handling, storage and transport needs, there are a number of essential operational functions provided at the Port. These are:
• Vessel navigation and berthing – making sure the right level and priority of access is provided to vessels, to maximise loaded capacity and meet sailing windows
• Cargo handling and vessel turnaround – ensuring there are sufficient berth numbers, operational equipment and labour available to efficiently unload and load vessels
• Cargo storage and management – providing sufficient storage areas, stacking equipment and systems to ensure that cargo can be safely, securely and efficiently stored and accessed. This is important for meeting customs and quarantine requirements and efficient cargo handling and onward transport
• Supply chain and logistics integration – the Port is just one step in the overall supply chain from producer or manufacturer through to the customer. As a result, supply chain integration is often critical to activities at the Port this particularly is the case where value added customer services, such as integrated logistics facilities, are provided within the Port.
Specific operational considerations for the Tasmanian trade
A good example of the specific nature of individual trades at the Port is the Tasmanian trade, which provides short sea shipping services between Melbourne and Tasmania.
Over time, the nature of these services has changed as the Tasmanian economy has become more integrated with the mainland economy.
Much of this trade now requires just-in-time delivery, with Tasmanian retailers shifting towards trailer freight (wheeled units), delivered direct from the Tasmanian shipping terminal to the retail store. These same-day services require quick loading and unloading of freight, leading to new, larger and more efficient Roll on-Roll off (RoRo) ships being used. This supply-chain change has reduced the need for Tasmanian distribution centres, as product can be supplied from national distribution centres, particularly in Melbourne.
Integrated logistics facilities are now also part of the service supplied by shipping lines at the Port. This provides an integrated supply chain operation, which includes landside logistics, cargo packing and unpacking and short sea shipping. This arrangement is specific to the Tasmanian trade and is an important element in the overall Bass Strait shipping service offered to customers.
Key operational planning considerations• Each of the trades handled at the Port has specific ship movement, cargo storage and handling, landside transport and
supply chain requirements. All of these requirements need to be understood and taken into account to ensure the Port’s growth continues to support trade needs.
Port of Melbourne 2050 Port Development Strategy 42

Managing inner-city growth and land use changes around the Port Planning together for long-term benefits
The long-term sustainability of the Port requires both managing the Port’s potential impact on surrounding areas and safeguarding it from any adverse impacts or constraints that may result from adjacent land use changes. Given the Port’s urban location, it is also important to meet the needs of a growing and working Port and ensure that the port and community can grow together.
The majority of the Port is governed by the Port of Melbourne Planning Scheme (the Scheme), and its land and waters are zoned Port Zone within the Scheme. This zoning acknowledges the significance of our commercial trading Port at a state and local level and provides transparency around possible land use outcomes.
Most of the land immediately surrounding the Port is zoned for industrial, commercial or public uses such as transport. A number of these areas contain critically important and hazardous facilities such as a fuel refinery and refined petroleum product distribution terminals, which are directly reliant and connected to the Port via pipelines.
Industrial areas around the Port have been long established and zoned as such by planning authorities, and work both from a functional perspective, allowing industry to co-locate with the Port to minimise supply chain costs, and also to serve as a ‘land use buffer’, providing appropriate distances between the core areas of Port operations and surrounding sensitive uses like residences and schools.
These buffers play an important role in supporting safe and efficient running of the Port, while mitigating noise and visual amenity impacts to local communities associated with port operations which continue to be undertaken 24 hours a day, 365 days a year.
PoM will continue to invest in and advocate for strong buffers as the Port is expecting to stay in its current location for 50 years. Strong buffers are required to reduce land use conflicts and provide planning certainty to both the Port and our neighbours. PoM has invested in improving the buffers on Port land which includes landscaped areas, public open space, cycling trails and shared user paths.
PoM has to plan for significant trade growth over the long term to support the Victorian economy and community. This means that all Port land will need to be used more intensively into the future.
As the city grows and demand for inner-city living increases, we are faced with the complex challenge of urban development encroaching on the Port’s boundaries and increased pressure on planning authorities to free up industrial land for alternative uses. An example of this is the ongoing renewal of Fishermans Bend which over the next thirty years will see the substantial redevelopment of adjacent Port Melbourne areas and will result in an influx of many thousands of new residents, increased levels of sensitive use within the area and substantial growth in local commuter traffic.
PoM is undertaking a review of the Port of Melbourne Planning Scheme to ensure it reflects the anticipated growth and development of the Port, and we will continue to work closely with government in planning for the Port’s future.
Development within Port land, and of land adjacent to the Port, needs to be considered in an integrated manner alongside other complementary government policies and projects to deliver positive long-term outcomes – for nearby residents and businesses, for the Port’s operations and, ultimately, for Victoria as a whole. The Port of Melbourne Planning Scheme provides statutory planning certainty for both the Port and adjacent communities.
Port Melbourne
Port Phillip Bay
Fishermans Bend
Williamstown
Newport
Yarraville
Spotswood
FootscrayKey Port of Melbourne land
Port Environs Environmental Significance Overlay (ESO)
Port buffer and public open space, parks and sporting fields
WorkSafe Advisory Areas for Major Hazard Facilities (MHF)
Newport MHF Advisory Area
Gellibrand Pier MHF Advisory Area
Coode Island MHF Advisory Area
Yarraville MHF Advisory Area
II Key planning factors for consideration43
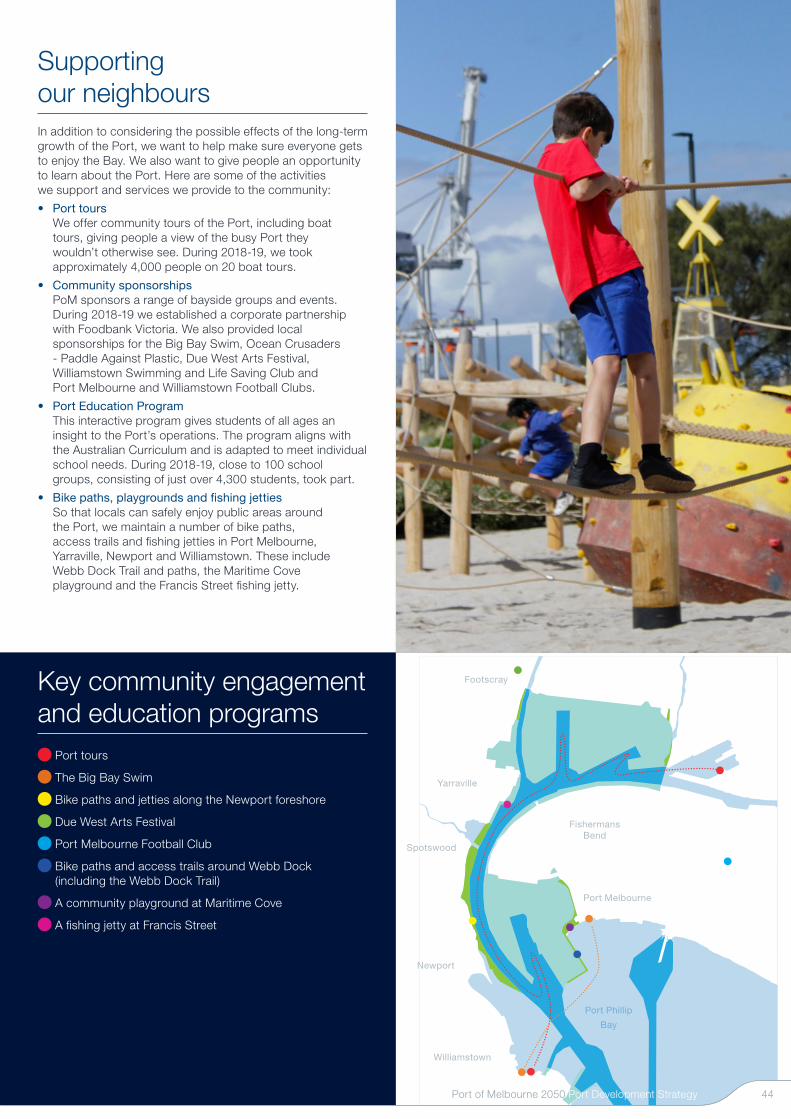
Supporting our neighboursIn addition to considering the possible effects of the long-term growth of the Port, we want to help make sure everyone gets to enjoy the Bay. We also want to give people an opportunity to learn about the Port. Here are some of the activities we support and services we provide to the community:
• Port tours We offer community tours of the Port, including boat tours, giving people a view of the busy Port they wouldn’t otherwise see. During 2018-19, we took approximately 4,000 people on 20 boat tours.
• Community sponsorships PoM sponsors a range of bayside groups and events. During 2018-19 we established a corporate partnership with Foodbank Victoria. We also provided local sponsorships for the Big Bay Swim, Ocean Crusaders - Paddle Against Plastic, Due West Arts Festival, Williamstown Swimming and Life Saving Club and Port Melbourne and Williamstown Football Clubs.
• Port Education Program This interactive program gives students of all ages an insight to the Port’s operations. The program aligns with the Australian Curriculum and is adapted to meet individual school needs. During 2018-19, close to 100 school groups, consisting of just over 4,300 students, took part.
• Bike paths, playgrounds and fishing jettiesSo that locals can safely enjoy public areas around the Port, we maintain a number of bike paths, access trails and fishing jetties in Port Melbourne, Yarraville, Newport and Williamstown. These include Webb Dock Trail and paths, the Maritime Cove playground and the Francis Street fishing jetty.
Key community engagement and education programs
Port tours
The Big Bay Swim
Bike paths and jetties along the Newport foreshore
Due West Arts Festival
Port Melbourne Football Club
Bike paths and access trails around Webb Dock (including the Webb Dock Trail)
A community playground at Maritime Cove
A fishing jetty at Francis Street
Port Phillip
Bay
Port Melbourne
Fishermans Bend
Williamstown
Newport
Yarraville
Spotswood
Footscray
Port of Melbourne 2050 Port Development StrategyPort of Melbourne 2050 44

Our environmental responsibilities We’re committed to making sure the Port operates responsibly and that port activities are undertaken in a way which manages potential impacts to the Bay and surrounding environments. A range of environmental legislation applies to the Port’s daily activities and to any major projects the Port may undertake. The significant legislation currently applicable to Port projects is outlined below, along with examples of the kinds of Port activities to which the legislation might apply.
Relevant legislation Act overview and description Port activities that may be affected
Victorian Acts
Environment Effects Act 1978
The Environment Effects Act 1978 provides for assessment of proposed works that are capable of having a significant effect on the environment.
• Dredging
• Significant land excavation
Planning and Environment Act 1987
The Planning and Environment Act 1987 establishes a framework for planning the use, development and protection of land in Victoria. It sets out the parameters for establishing planning schemes.
• Land use changes or development
• Port of Melbourne Planning Scheme
Marine and Coastal Act 2018 The Marine and Coastal Act 2018 provides for coordinated strategic planning and management for the Victorian coast and a coordinated approach for the use and development of coastal Crown land.
• Dredging
• Navigation
Aboriginal Heritage Act 2006 The Aboriginal Heritage Act 2006 provides for the protection and management of Victoria’s Aboriginal heritage.
• Any development or activity that is within a culturally significant area
Heritage Act 2017 The Heritage Act 2017 is Victoria’s principal legislation for the identification and management of heritage places and objects of state significance, historical archaeological sites and maritime heritage.
• Land use changes, development in areas of significance or impacts to buildings of significance
Road Management Act 2004 The Road Management Act 2004 establishes a coordinated management system for public roads that will promote safe and efficient state and local public road networks and the responsible use of roads.
• New Port road or rail connections
Environment Protection Act 19701 and Environment Protection Act 2017
The Environment Protection Acts 1970 and 2017 provide the Victorian framework for the protection of human health and environment from pollution and waste. This includes a general environmental duty requirement and the application of environmental policies and regulations. The Acts also provide for the Environment Protection Authority (EPA) to issue environmental works approvals and licences for activities and land uses that have the potential for significant environmental impacts.
• Port and tenant operations
Commonwealth Acts
Environment Protection and Biodiversity Conservation Act 1999
The Environment Protection and Biodiversity Conservation Act 1999 is a legal framework to protect and manage nationally and internationally important flora, fauna, ecological communities and heritage places defined as matters of national environmental significance.
• Dredging
Historic Shipwrecks Act 1976 The Historic Shipwrecks Act 1976 provides a framework for the protection of historic shipwrecks and relics within both state and Commonwealth waters.
• Dredging
Key land use planning considerations• The Port is a nationally significant commercial and industrial facility
• Land around the Port has been developed to provide necessary Port-related industrial and commercial facilities and provides an essential land use buffer between the Port and residential areas
• Over time, residential and non-Port-related development has crept closer towards the Port’s boundaries
• The Port’s operations will increase and its facilities will continue to be developed, as the surrounding communities also continue to grow, and retention and strengthening of the buffers to the Port is required
• Increased development will bring economic benefits, but could have negative impacts on both the Port’s capabilities and the community if planning isn’t holistic, integrated and well-managed
• Port activities may affect land and marine environments and are carefully planned and managed to minimise negative impacts.
1. from 1 July 2021 the Environment Protection Act 1970 will be repealed, and the Environment Protection Act 2017 will become the principal Victorian environmental legislation.
II Key planning factors for consideration45

Our plan for the PortThis section presents PoM’s proposed plans for developing the Port in line with the forecast growth. Our plans cover a list of progressive infrastructure and facility developments within the Port and the changes or improvements that are required to Port land and waters to enable delivery of these developments. The plans are illustrated in a series of maps throughout this section.
We have also considered and identified developments needed to strengthen the Port’s interface with the wider transport network and surrounding land uses to deliver an efficient and productive freight network. We further note the importance of a forward looking approach to balance the necessity of trade whilst recognising the importance of managing the environmental and community interfaces associated with Port development.
III
Port of Melbourne 2050 Port Development Strategy 46

Strategic drivers and assumptionsStrategic planning drivers
Our thinking over the planning horizon is underpinned by our long term development vision and objectives, and is shaped by a number of strategic drivers. The key drivers are:
• Maximising the use of existing Port landAll forecast trade demand can be accommodated within the Port. There is latent capacity, and therefore opportunity to increase the utilisation and productivity of existing Port land that is currently used for a broad range of direct cargo handling and supporting activities.
• Maximising productivity and efficiency of Port facilities It is important that Port facilities are working to their optimal capacity and to best practice, before new facilities are delivered.
• Effectively responding to market demand (trade growth) The development of the Port should be planned around the expected trade demand growth over the medium to long term with an appropriate allowance for faster or slower trade growth.
• Effectively responding to market demand (vessel, truck and train sizes)The Port’s physical infrastructure needs to effectively cater to the transport fleets which are likely to visit the Port.
• Maximising market driven opportunities Port of Melbourne works with stevedores or operators in response to market demand for Port facilities and in accordance with Victorian and Australian governments’ legislative and regulatory settings.
• Supporting the delivery of road, rail and pipeline capacity and reliability PoM works with the Victorian Government and other infrastructure owners to maximise the productivity and reliability of the transport and pipeline networks which are essential to the distribution of trade through the Port.
• Managing social and environmental outcomes PoM is committed to recognising social and environmental outcomes associated with trade activities through the Port, and will continue to work collaboratively with the Victorian and local governments and the wider community to understand and respond to port related interests within the broader metropolitan context.
• Supporting a broad mix of tradesPoM will continue to provide facilities within the Port to handle a broad range of trades and will work with other Victorian port infrastructure owners who use Port of Melbourne channels.
• Maintaining sufficient Port capacity during expansion activities It is important that sufficient Port capacity is maintained during capacity expansion projects. This requires close monitoring of capacity, demand, and the likely lead times for delivering new capacity, to sequence current and future development activities.
• Working collaboratively with industry, Government and community to support economic growth PoM will collaborate with all stakeholders to deliver higher productivity infrastructure and operations across the port related supply chain. This is essential to ensure the Port’s continued contribution as a nationally significant economic asset.
All of these strategic drivers have fed into the PoM strategic port planning and development approach for this 2050 PDS.
Port development planning
In this section, we have set out our proposed development plan for the Port from now until 2050. In preparing this plan we have taken into account the range of government policy initiatives and investments relevant to freight and ports, the port and wider freight industry’s published plans for freight-related investment, and existing land uses and infrastructure in place at the Port. The development plan is adaptable and will be evolved as the strategic drivers, commercial decisions and planning assumptions change over time.
Forecasts, such as the trade forecasts, by their very nature provide an indication of potential future outcomes. Actual outcomes will almost always change over time. As outlined on page 77 we will continue to monitor the Port’s growth and development and will prepare an updated PDS for the Port when required and at least every five years.
III Our plan for the Port47

Planning horizon
This 2050 PDS outlines our proposed plans for the next 30 years through to 2050. This planning horizon enables a long-term view of port development and aligns with the 25 to 30 year long-term planning recommendation outlined within the Port Development Strategy Ministerial Guidelines which were gazetted on 10 July 2017.
Planning assumptions
A range of planning assumptions underpin the preparation of this 2050 PDS. Real world deviation from these assumptions, which will undoubtedly occur over time, has the potential to influence the future development of the Port. The key planning assumptions for this 2050 PDS are:
Trade• Trade and vessel growth
Trade volume and vessel size trends are in line with the forecasts outlined earlier within this PDS.
• Container and automotive trades The Port continues to be the sole Victorian port to handle international and mainland container and automotive trades
• Bulk liquid trade Existing Victorian oil refineries continue to operate, and the existing liquid bulk market share between the Port of Melbourne, Port of Geelong and Port of Hastings is broadly maintained.
Productivity• Port terminal productivity and efficiency
Port stevedores and terminals continue to gradually grow trade handling productivity and efficiency in line with historical trends and international benchmarks.
For instance, an underlying productivity improvement for container berths of 1% per annum compounding is incorporated into this 2050 PDS. This requires container terminals to move from a 2018 capacity productivity of around 1,630 TEU per linear metre of berth to about 2,220 TEU per linear metre by 2050. Overall this is a 36% productivity improvement over the level of todays operations.
• Road and rail transport productivity and efficiency PoM, industry and the Victorian Government continue to work collaboratively together to improve the operational productivity and efficiency of road and rail transport which connects the Port to Victoria and south east Australia.
Land use• 24 hours a day port operations
Port operations and land transport activities, such as movement of freight into and out of the port by road and rail, continue to occur 24 hours a day, seven days a week and 365 days a year
• Land transport connectivity The Victorian Government continues to invest in the wider metropolitan Melbourne and Victorian road and rail networks to support Victoria’s population growth and economic development
• Port buffers and environs Existing land buffers around the Port’s land perimeter and along the Yarra and Maribyrnong Rivers, and the ‘port environs overlays’ continue to be maintained, and where relevant, strengthened to support the ongoing operation of the Port. This includes some land not managed by PoM such as Westgate Park adjacent to the Westgate Bridge and extending along the Yarra River in Port Melbourne.
Port of Melbourne 2050 Port Development Strategy 48

Land use and infrastructure assessment The 2050 PDS recognises the need for the Port’s land, and the infrastructure on it, to be used efficiently and productively across the next 30 years. PoM has undertaken a high-level assessment of how the Port’s land is currently used and how it can cater for forecast trade growth. Following this assessment, key planning outcomes for this 2050 PDS are:
• sufficient existing Port land is available to accommodate the forecast trade through to 2050
• all existing Port land including South Wharf land is essential to handle the forecast trade growth
• with some re-work of existing berths and facilities to maximise use of existing footprint, only a small increase in Port berth numbers is likely to be needed to accommodate expected future trade growth
• to respond to ongoing shipping and landside transport changes, some minor changes (both additions and subtractions) to Port land are required over the next 30 years to 2050 (as discussed on pages 55-58).
Current and future berth numbers and land use areas
2019
2035 (forecast)
2050 (forecast)
Current Port land Ber
ths
Land
Are
a(h
ecta
res)
Ber
ths
Land
Are
a(h
ecta
res)
Ber
ths
Land
Are
a(h
ecta
res)
International and mainland containers
8 139 10 190 11 190
Tasmanian containers / break bulk*
2 39 2 39 2 39
Motor vehicles / break bulk* 3 54 3 38 3 38
Liquid bulk 3 27 4 41 4 41
Dry bulk / break bulk* 9 20 9 37 9 37
Break bulk* 7 39 - - - -
Port related land - 129 - 110 - 110
Port buffers - 53 - 53 - 53
Port waters - 5 - 16 - 16
Total 29 505 28 524 29 524
Potential Future Port Land
Former Melbourne Wholesale Market Site in the Dynon Precinct
- - - 32 - 32
Total 29 505 28 556 29 556
* It should be noted that Port of Melbourne break bulk trade is also handled at the Tasmanian, automotive and dry bulk terminals.
Port land and infrastructure development plansHow we propose to develop the Port’s land and infrastructure to meet future growth forecasts
PoM has prepared Port Development Plans which consider the assumptions and forecasts described in this document and indicate proposed land use changes at the Port by 2035 and 2050. The plans show that across the next 30 years:
• new facilities and berths will be required for the international and mainland container and liquid bulk trades
• a significant proportion of the Port’s growth and development is expected to be staged over the planning period. Rather than a series of large leaps forward, we are planning for a strong and steady rate of development growth
• continued and increased use of all existing areas of the Port, including South Wharf which is used for cement and gypsum imports and directly supports Melbourne infrastructure and building sectors.
III Our plan for the Port49

Williamstowndockyards
Newport
Fishermans Bendemployment
precinct
Port Melbourne
Yarraville
Newport industrial
land
Footscray
Port Phillip Bay
Yarra River
Existing Port of Melbourne land
Containers
Tasmanian
Motor vehicles (break bulk)
Liquid bulk
Dry / break bulk
Break bulk
Public open space and Port buffers
Port-related activities
2019
Swanson Dock
Victoria DockAppleton Dock
South Wharf
Holden Dock
Yarraville
Webb Dock
Gellibrand and Breakwater Piers
Coode Island
Port of Melbourne 2050 Port Development Strategy 50

What we propose to deliver by 2035In line with our Port development objectives, there are a number of projects that we forecast will need to be delivered by 2035 to meet demand and supplement efficiency and productivity improvement projects. These nine projects are presented on the opposite page and are:
In progress Upgrading Swanson Dock East and West berths
The Swanson Dock East and West berth structures are being upgraded so they can handle larger container vessels and will have longer operating lives. These container terminals will continue to deliver a significant portion of the Port’s container handling capacity for at least the next 30 years.
In progress Port Rail Transformation Project
The Port Rail Transformation Project is designed to improve rail access at Swanson Dock through the development of a new East Swanson Rail Terminal and delivery of upgraded rail access, connections and sidings within the Port. Once delivered, this work will provide direct on-dock rail connections into the Swanson Dock container terminals.
Expanding Webb Dock East container terminal and upgrading berths
Additional container terminal berth length will be required at Webb Dock East to enable it to handle growing numbers of containers and larger container vessels. The berth extension is expected to be matched by additional land allocated for container terminal operations and upgrades to the existing container berth structures.
Relocating Tasmanian terminals to Appleton / Victoria Docks
The existing Tasmanian terminal operations will be relocated from Webb Dock to Appleton / Victoria Docks to support the delivery of the new Webb Dock North container terminal. This relocation includes the potential development of an additional berth on the northern side of Victoria Dock, if required.
Developing a Webb Dock North container terminal
During this period the new Webb Dock North container terminal will be developed in the current Tasmanian terminal location. This container terminal will provide two new container berths and will be able to handle the largest container vessels visiting the Port. The terminal will be directly connected to an on-port rail terminal which will provide a direct rail connection via the Webb Dock Freight Link.
Changes to the layout at the motor vehicle terminal and delivery of additional berth length for the Webb Dock East container terminal will also be required to support the delivery of the new Webb Dock North container terminal.
The project will also result in the excavation of the dock to the north. The material from the dock extension will be used to reclaim land at the end of Webb Dock East which will support ongoing container terminal operations, effective rail integration into the container terminal and allow us to continue to provide public open space and facilities.
In Progress Planning, advocating and working with the Victorian Government to deliver the Webb Dock Freight Link and Rail Terminal(s)
To support the expected strong growth in port operations at Webb Dock, PoM continues to actively plan, strongly advocate and work with the Victorian Government on the delivery of the Webb Dock Freight Link. In parallel we will deliver the required on-port rail terminal(s).
The link should be a dedicated heavy rail port freight link and open by 2030 to support the delivery of the Webb Dock North container terminal and growth of Webb Dock East
Land to the east of Webb Dock East will need to be reclaimed to provide integrated rail terminal(s). This land will also provide replacement public open space and facilities to maintain existing levels of port buffer areas.
Integrating the Port with the former Melbourne Wholesale Market Site in Dynon
The Victorian Government’s freight plan, Delivering the Goods, identifies the development of the former Melbourne Market site for Port use as a priority action to reduce the impact of congestion on supply chain costs and communities.
During early 2020 VicTrack undertook a public Expressions of Interest process to explore options for the lease of the former Melbourne Wholesale site and other sites within Dynon. This public process shows that the site could soon become available for redevelopment into the Port in line with the Victorian Government’s freight plan and this 2050 PDS.
PoM is planning for the use of this site following the completion of the West Gate Tunnel and Metro Tunnel projects, to maximise capacity and efficiency of the Port and allow for the planned rail connections to Webb Dock.
Developing new liquid bulk capacity
Forecast continued growth in liquid bulk trade and the need to handle larger liquid bulk vessels is expected to result in the need for expanded liquid bulk capacity within the Port. Yarraville Berth 6, Gellibrand Pier and Breakwater Pier are possible locations for berths and associated pipeline connections to provide this additional liquid bulk capacity; work is ongoing to identify the preferred arrangement and location.
Developing Yarraville land
When the West Gate Tunnel opens, Port land south of Somerville Road will be returned for Port use. PoM intends to put this land to market to identify the most optimal use, which could include liquid bulk storage and distribution, freight logistics and storage or empty container storage.
1 6
5
2
73
8
9
4
III Our plan for the Port51

5
6
6
6
8
9
1
4
4
4
2
7
8
5
3
Williamstown
Newport
FishermansBend
Port Melbourne
Yarraville
Spotswood
Footscray
Port Phillip Bay
Yarra River
2035
Swanson Dock
Victoria Dock
Appleton Dock
South Wharf
Holden Dock
Yarraville
Webb Dock
Gellibrand and Breakwater Piers
Coode Island
Existing Port of Melbourne land
Port land with multiple potential or proposed uses subject to change
Containers
Tasmanian
Motor vehicles (break bulk)
Liquid bulk
Dry / break bulk
Public open space and Port buffers
Port-related activities
Proposed Webb Dock freight link
DisclaimerIt should be noted that the plan presented on this page has been prepared by PoM on behalf of the PoM Group for planning purposes only. The projects presented will be subject to financial viability, technical feasibility and environmental and planning considerations that will vary over time. The PoM Group accepts no liability for any reliance by any third party of the information presented within this plan.
Port of Melbourne 2050 Port Development Strategy 52

What we propose to deliver by 2050Container growth is expected to continue to drive development at the Port through to 2050, leading to the need for an expanded Webb Dock North container terminal as presented on the opposite page and outlined below:
Expansion of the Webb Dock North container terminal (third berth)
A third container berth at Webb Dock North would be located on the western side and be linked to the main Webb Dock North container terminal area and the on-port rail terminal(s).
At this stage, no other changes are anticipated during this period with the Port’s facilities expected to have capacity to handle all other trades.
We will continue to monitor market and sector trends throughout the 2050 PDS delivery period to ensure that the Port is able to effectively respond to key trade and user requirements and appropriately support south-eastern Australia’s economy.
This includes maintaining future optionality to respond to potential future changes, such as a possible future expansion of the Swanson Dock Swing Basin if there is a significant trend towards longer container vessels wanting to visit Swanson Dock.
This monitoring and regular analysis will position PoM to be able to adapt and respond to emerging needs, ensuring that development activity over the coming decades does not preclude possible future needs.
1
III Our plan for the Port53

1
Williamstown
Newport
FishermansBend
Port Melbourne
Yarraville
Spotswood
Footscray
Port Phillip Bay
Yarra River
2050
Existing Port of Melbourne land
Port land with multiple potential or proposed uses subject to change
Containers
Tasmanian
Motor vehicles (break bulk)
Liquid bulk
Dry / break bulk
Public open space and Port buffers
Port-related activities
Proposed Webb Dock freight link
DisclaimerIt should be noted that the plan presented on this page has been prepared by PoM on behalf of the PoM Group for planning purposes only. The projects presented will be subject to financial viability, technical feasibility and environmental and planning considerations that will vary over time. The PoM Group accepts no liability for any reliance by any third party of the information presented within this plan.
Swanson Dock
Victoria DockAppleton Dock
South Wharf
Holden Dock
Yarraville
Webb Dock
Gellibrand and Breakwater Piers
Coode Island
Port of Melbourne 2050 Port Development Strategy 54

Realigning Yarraville Berth 6 (if required)
Should Yarraville Berth 6 be redeveloped as an additional liquid bulk berth that is able to handle Long Range 2 liquid bulk vessels (which are significantly longer and wider than the existing Medium Range 2 vessels handled at Holden Dock) a portion of the existing river bank will need to be removed. This results in a localised realignment of the existing Yarra River edge and with the new berth face being landside of the existing Yarraville Berth 6 berth face.
Lengthening and realigning of Webb Dock
The continued growth in the international and mainland container trade demand and size of vessels results in the need to undertake a range of dredging works within and around Webb Dock. This includes the removal of land to support the expansion of the existing Webb Dock container terminal in the near term, and the development of a second container terminal at Webb Dock North in the medium term.
Realigning Victoria Dock (if required)
An additional berth may be developed on the northern side of Victoria Dock to support the relocation of the Tasmanian trade from Webb Dock to Appleton / Victoria Docks. If developed this new berth will result in the removal of some existing Victoria Dock land, the demolition of the Victoria Dock slipway and may also result in additional dredging of the area between the new Victoria Dock berth and Appleton Dock to support vessel operations.
Widening Swanson Dock Swing Basin (if required)
PoM continues to explore options which expand the support for larger container vessel operations at Swanson Dock. To date this analysis has not identified the need to widen the Swanson Dock Swing Basin due to vessel size growth being focused on vessel width (beam) rather than length. There however is the future possibility for growth in vessel length and if this occurs then consideration may be given to the widening of the Swanson Dock Swing Basin.
It is also considered likely that currently emerging and future technology improvements will support improved marine navigation and shipping activities within the Port.
These include the use of:
• more powerful and manoeuvrable generations of tugs
• higher precision navigation and berthing aids (such as improved GPS systems and laser guided berthing), and commercial shipping software
• systems which improve the productivity and efficiency of commercial shipping and trade activities.
PoM, in consultation with the Harbour Master and the wider port industry, will continue to monitor these emerging technology opportunities and support their implementation, where they are identified as providing safe and efficient port operations.
4
3
2
1
How the Port’s waters accommodate larger vessels
Due to limited growth in vessel operational draughts over the forecast period PoM does not anticipate the need to undertake major deepening or dredging activities within Port channels. The Port water-related proposed projects set out in this 2050 PDS are focused on supporting trade capacity expansion within operational areas and responding to expected growth in the length and beam of specific vessel types over time.
Additionally, the Harbour Master is able to approve larger vessels to visit the Port on an individual visit basis. As such, the Port is already accepting, with Harbour Master approval, container vessels larger than the current design vessels. PoM will continue to work with the Harbour Master on specific vessel approvals and the transition to larger Port container design vessels over time.
Port waters improvements to deliver the plansIn order to deliver our proposed development plans for the Port, there are a range of specific and targeted improvements required on port waters. These improvements are designed to facilitate the ongoing growth and development of the Port to ensure that it is able to provide the required trade handling capacity and support the use of forecast vessel.
The current design vessel for the Port has a nominal container capacity of 7,500 to 8,500 TEU and dimensions of up to 320m length overall (LOA), 43m beam and 14m draught. The Port already handles larger vessels following appropriate reviews, assessments and approval from the Harbour Master.
PoM anticipates that over time, and again subject to approval from the Harbour Master, that the Port will be upgraded to support up to 10,000 to 10,500 TEU and 13,000 to 14,000 TEU container vessels within Swanson and Webb Docks respectively on a business-as-usual basis.
The key changes proposed to existing Port waters and channels arising from the projects in the Port Development Plans are presented on the opposite page and discussed below:
III Our plan for the Port55

14
2
3
Williamstown
Newport
FishermansBend
Port Melbourne
Yarraville
Spotswood
Footscray
Port Phillip Bay
Yarra River
Port of Melbourne land
Additional Port of Melbourne waters
2050
Port of Melbourne 2050 Port Development Strategy 56
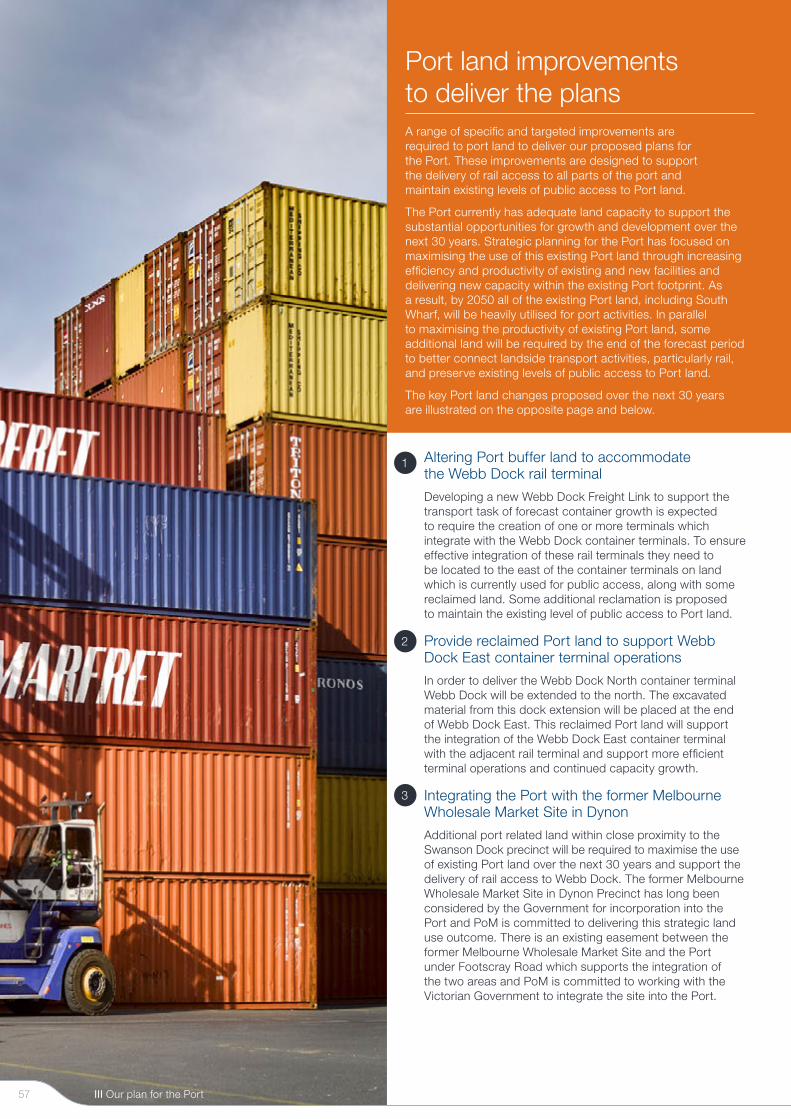
Port land improvements to deliver the plansA range of specific and targeted improvements are required to port land to deliver our proposed plans for the Port. These improvements are designed to support the delivery of rail access to all parts of the port and maintain existing levels of public access to Port land.
The Port currently has adequate land capacity to support the substantial opportunities for growth and development over the next 30 years. Strategic planning for the Port has focused on maximising the use of this existing Port land through increasing efficiency and productivity of existing and new facilities and delivering new capacity within the existing Port footprint. As a result, by 2050 all of the existing Port land, including South Wharf, will be heavily utilised for port activities. In parallel to maximising the productivity of existing Port land, some additional land will be required by the end of the forecast period to better connect landside transport activities, particularly rail, and preserve existing levels of public access to Port land.
The key Port land changes proposed over the next 30 years are illustrated on the opposite page and below.
1
2
Altering Port buffer land to accommodate the Webb Dock rail terminal
Developing a new Webb Dock Freight Link to support the transport task of forecast container growth is expected to require the creation of one or more terminals which integrate with the Webb Dock container terminals. To ensure effective integration of these rail terminals they need to be located to the east of the container terminals on land which is currently used for public access, along with some reclaimed land. Some additional reclamation is proposed to maintain the existing level of public access to Port land.
Provide reclaimed Port land to support Webb Dock East container terminal operations
In order to deliver the Webb Dock North container terminal Webb Dock will be extended to the north. The excavated material from this dock extension will be placed at the end of Webb Dock East. This reclaimed Port land will support the integration of the Webb Dock East container terminal with the adjacent rail terminal and support more efficient terminal operations and continued capacity growth.
Integrating the Port with the former Melbourne Wholesale Market Site in Dynon
Additional port related land within close proximity to the Swanson Dock precinct will be required to maximise the use of existing Port land over the next 30 years and support the delivery of rail access to Webb Dock. The former Melbourne Wholesale Market Site in Dynon Precinct has long been considered by the Government for incorporation into the Port and PoM is committed to delivering this strategic land use outcome. There is an existing easement between the former Melbourne Wholesale Market Site and the Port under Footscray Road which supports the integration of the two areas and PoM is committed to working with the Victorian Government to integrate the site into the Port.
3
III Our plan for the Port57

3
1
2
Williamstown
Newport
FishermansBend
Port Melbourne
Yarraville
Spotswood
Footscray
Port Phillip Bay
Yarra River
Port of Melbourne land
Additional Port of Melbourne land
Additional Dynon area for future port related freight and logistics activities
2050
Port of Melbourne 2050 Port Development Strategy 58
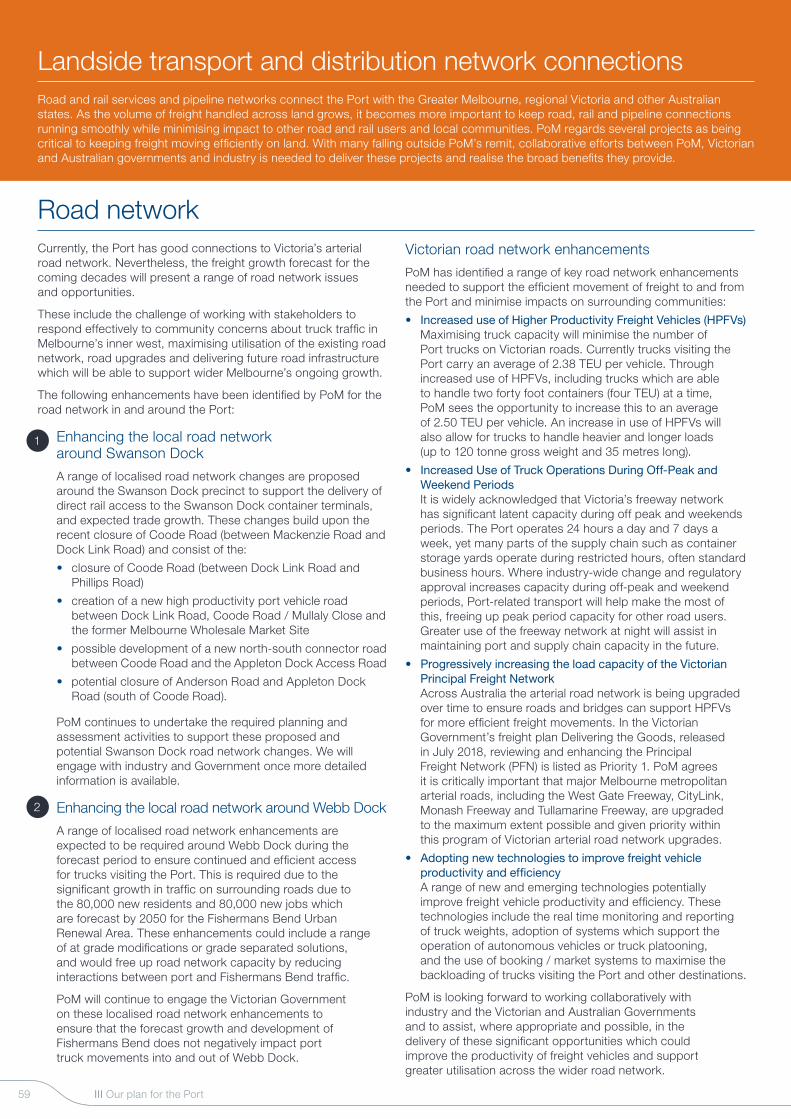
Road networkCurrently, the Port has good connections to Victoria’s arterial road network. Nevertheless, the freight growth forecast for the coming decades will present a range of road network issues and opportunities.
These include the challenge of working with stakeholders to respond effectively to community concerns about truck traffic in Melbourne’s inner west, maximising utilisation of the existing road network, road upgrades and delivering future road infrastructure which will be able to support wider Melbourne’s ongoing growth.
The following enhancements have been identified by PoM for the road network in and around the Port:
Enhancing the local road network around Swanson Dock
A range of localised road network changes are proposed around the Swanson Dock precinct to support the delivery of direct rail access to the Swanson Dock container terminals, and expected trade growth. These changes build upon the recent closure of Coode Road (between Mackenzie Road and Dock Link Road) and consist of the:
• closure of Coode Road (between Dock Link Road and Phillips Road)
• creation of a new high productivity port vehicle road between Dock Link Road, Coode Road / Mullaly Close and the former Melbourne Wholesale Market Site
• possible development of a new north-south connector road between Coode Road and the Appleton Dock Access Road
• potential closure of Anderson Road and Appleton Dock Road (south of Coode Road).
PoM continues to undertake the required planning and assessment activities to support these proposed and potential Swanson Dock road network changes. We will engage with industry and Government once more detailed information is available.
Enhancing the local road network around Webb Dock
A range of localised road network enhancements are expected to be required around Webb Dock during the forecast period to ensure continued and efficient access for trucks visiting the Port. This is required due to the significant growth in traffic on surrounding roads due to the 80,000 new residents and 80,000 new jobs which are forecast by 2050 for the Fishermans Bend Urban Renewal Area. These enhancements could include a range of at grade modifications or grade separated solutions, and would free up road network capacity by reducing interactions between port and Fishermans Bend traffic.
PoM will continue to engage the Victorian Government on these localised road network enhancements to ensure that the forecast growth and development of Fishermans Bend does not negatively impact port truck movements into and out of Webb Dock.
Victorian road network enhancements
PoM has identified a range of key road network enhancements needed to support the efficient movement of freight to and from the Port and minimise impacts on surrounding communities:
• Increased use of Higher Productivity Freight Vehicles (HPFVs) Maximising truck capacity will minimise the number of Port trucks on Victorian roads. Currently trucks visiting the Port carry an average of 2.38 TEU per vehicle. Through increased use of HPFVs, including trucks which are able to handle two forty foot containers (four TEU) at a time, PoM sees the opportunity to increase this to an average of 2.50 TEU per vehicle. An increase in use of HPFVs will also allow for trucks to handle heavier and longer loads (up to 120 tonne gross weight and 35 metres long).
• Increased Use of Truck Operations During Off-Peak and Weekend Periods It is widely acknowledged that Victoria’s freeway network has significant latent capacity during off peak and weekends periods. The Port operates 24 hours a day and 7 days a week, yet many parts of the supply chain such as container storage yards operate during restricted hours, often standard business hours. Where industry-wide change and regulatory approval increases capacity during off-peak and weekend periods, Port-related transport will help make the most of this, freeing up peak period capacity for other road users. Greater use of the freeway network at night will assist in maintaining port and supply chain capacity in the future.
• Progressively increasing the load capacity of the Victorian Principal Freight Network Across Australia the arterial road network is being upgraded over time to ensure roads and bridges can support HPFVs for more efficient freight movements. In the Victorian Government’s freight plan Delivering the Goods, released in July 2018, reviewing and enhancing the Principal Freight Network (PFN) is listed as Priority 1. PoM agrees it is critically important that major Melbourne metropolitan arterial roads, including the West Gate Freeway, CityLink, Monash Freeway and Tullamarine Freeway, are upgraded to the maximum extent possible and given priority within this program of Victorian arterial road network upgrades.
• Adopting new technologies to improve freight vehicle productivity and efficiency A range of new and emerging technologies potentially improve freight vehicle productivity and efficiency. These technologies include the real time monitoring and reporting of truck weights, adoption of systems which support the operation of autonomous vehicles or truck platooning, and the use of booking / market systems to maximise the backloading of trucks visiting the Port and other destinations.
PoM is looking forward to working collaboratively with industry and the Victorian and Australian Governments and to assist, where appropriate and possible, in the delivery of these significant opportunities which could improve the productivity of freight vehicles and support greater utilisation across the wider road network.
Landside transport and distribution network connectionsRoad and rail services and pipeline networks connect the Port with the Greater Melbourne, regional Victoria and other Australian states. As the volume of freight handled across land grows, it becomes more important to keep road, rail and pipeline connections running smoothly while minimising impact to other road and rail users and local communities. PoM regards several projects as being critical to keeping freight moving efficiently on land. With many falling outside PoM’s remit, collaborative efforts between PoM, Victorian and Australian governments and industry is needed to deliver these projects and realise the broad benefits they provide.
1
2
III Our plan for the Port59

1
2
Williamstown
Newport
FishermansBend
Port Melbourne
Yarraville
Spotswood
Footscray
Port Phillip Bay
Yarra River
Port of Melbourne land
Required Port related road infrastructure changes
Major Port-related road infrastructure
Major Port-related road infrastructure and Port-related heavy duty truck routes (existing)
Potential future high productivity port vehicle road (indicative only)
Major road entry for freight activities
Minor road entry for freight activities
West Gate Fwy Todd Rd CityLink
CityLink
Lorimer St
Footscray Rd
Wurundjeri Way
West Gate Tunnel
2050
Port of Melbourne 2050 Port Development Strategy 60

Rail networkPoM has completed Our Plan for Rail (the Plan). This Plan is the Rail Access Strategy (RAS) and hence has been prepared in accordance with the requirements of the Act. This includes that the Plan must identify rail infrastructure projects that will improve rail access at the Port and include an option for the development of a port rail terminal.
In parallel, the Victorian and Commonwealth Governments are progressing with the allocation of funding to metropolitan Melbourne intermodal terminals in order to progress the development of a Port Rail Shuttle Network (PRSN).
PoM is committed to the delivery and operation of a robust and efficient Port Rail System which is able to support the future growth and long term efficiency of the Port. In this regard, PoM has developed the Swanson Precinct Port Rail Transformation Project which forms the core of the Plan, is complementary to ongoing State and Commonwealth Government efforts and is able to deliver immediate certainty and benefits to industry.
The Port’s approach is based on the need to develop a Port Rail System that achieves the Victorian Government’s rail objectives, meets industry’s expectations and positions the Port for long term success. In this regard, the future Port Rail System has been built around the following three key prioritisation and delivery elements:
• Industry and regulatory reform – introduction of industry and regulatory reforms which are targeted at improving the efficiency, productivity and commercial transparency of activities across the port rail supply chain to ensure that rail is competitive with road transport
• Improved operational performance – introduction, use and refinement of existing operational processes, systems and arrangements which directly support the delivery of improved performance across the whole Port Rail System
• More efficient infrastructure – delivery of more efficient and higher capacity rail infrastructure which supports the operation of rail services into and out of the Port.
To support the forecast demand in trade volumes, there must be continued investment in Victorian and interstate freight rail networks and operations to support a genuine rail mode shift. This includes achieving reasonable axle loads which support efficient freight train operations and the separation, as much as is reasonably possible, of freight from passenger activities on the Victorian rail network. This is particularly the case within metropolitan Melbourne where continued strong population growth will make shared use of the passenger rail networks by freight trains increasingly more difficult over time.
PoM also supports the Victorian and Australian Governments’ delivery of new and upgraded freight rail infrastructure, including the Inland Rail Project and relocation of domestic freight rail from the Dynon Precinct to the Western Intermodal Freight Terminal. These major projects have the potential to increase rail network capacity and support delivery of Port rail services.
PoM has identified the following near port rail network projects to support the growth in trade through the Port and the landside transport reliability:
Delivery of Port Rail Transformation Project
The Port Rail Transformation Project includes the planning and delivery of improvements to rail access at the Swanson Dock container terminals and the road network connection to the Webb Dock container terminal. This Project includes the development of a new East Swanson Rail Terminal and a range of upgrades to the wider Port rail network. Once delivered, this Project will provide on-dock rail terminals at each of the Swanson Dock container terminals which are located south of Footscray Road.
In addition to the above Project works the widening of the Port’s rail access corridor into the former Melbourne Wholesale Market site land is also required. This is needed to maintain the existing level of planned future rail access at the Port and to mitigate the negative impacts from construction of the elevated West Gate Tunnel roadway support piers within the existing port rail access corridor.
Planning, advocating and working with the Victorian Government to deliver the Webb Dock Freight Link
A new Webb Dock Freight Link is needed by 2030 to provide dedicated and efficient freight links between the Webb Dock, Swanson and Dynon precincts, and the broader Victorian rail network. This freight link should be a heavy rail link and is proposed to follow the existing heavy port rail easement running along Lorimer Street, through Fishermans Bend and into Webb Dock.
The Webb Dock Freight Link is expected to be a mixture of elevated and at grade structures to support the required Yarra River crossing and ensure no new level crossings at existing roads and to maintain existing property entrances.
Delivery of new Webb Dock Rail Terminal(s)
One or more rail terminals will also need to be developed by 2030 at Webb Dock to support the Webb Dock Freight Link. These terminals need to directly interface with these existing and future Webb Dock container terminals and as a result, will be located to the east of these container terminal areas. The new rail terminal(s) will support the direct transfer of import and export containers by the Webb Dock Freight Link, a dedicated heavy rail port freight connection to the Swanson and Dynon precincts and ultimately to the wider Victoria rail network.
1
2
3
III Our plan for the Port61
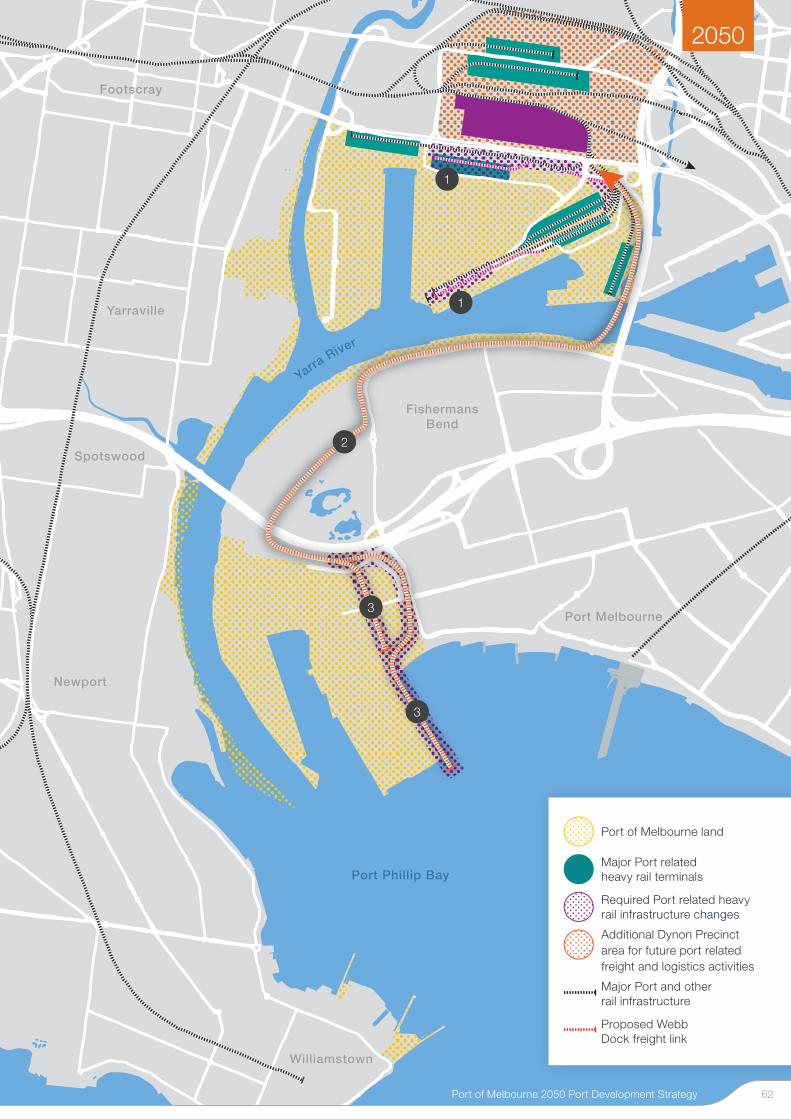
Williamstown
Newport
FishermansBend
Port Melbourne
Yarraville
Spotswood
Footscray
Port Phillip Bay
Yarra River
1
1
2
3
3
Port of Melbourne land
Major Port related heavy rail terminals
Required Port related heavy rail infrastructure changes
Additional Dynon Precinct area for future port related freight and logistics activities
Major Port and other rail infrastructure
Proposed Webb Dock freight link
2050
Port of Melbourne 2050 Port Development Strategy 62
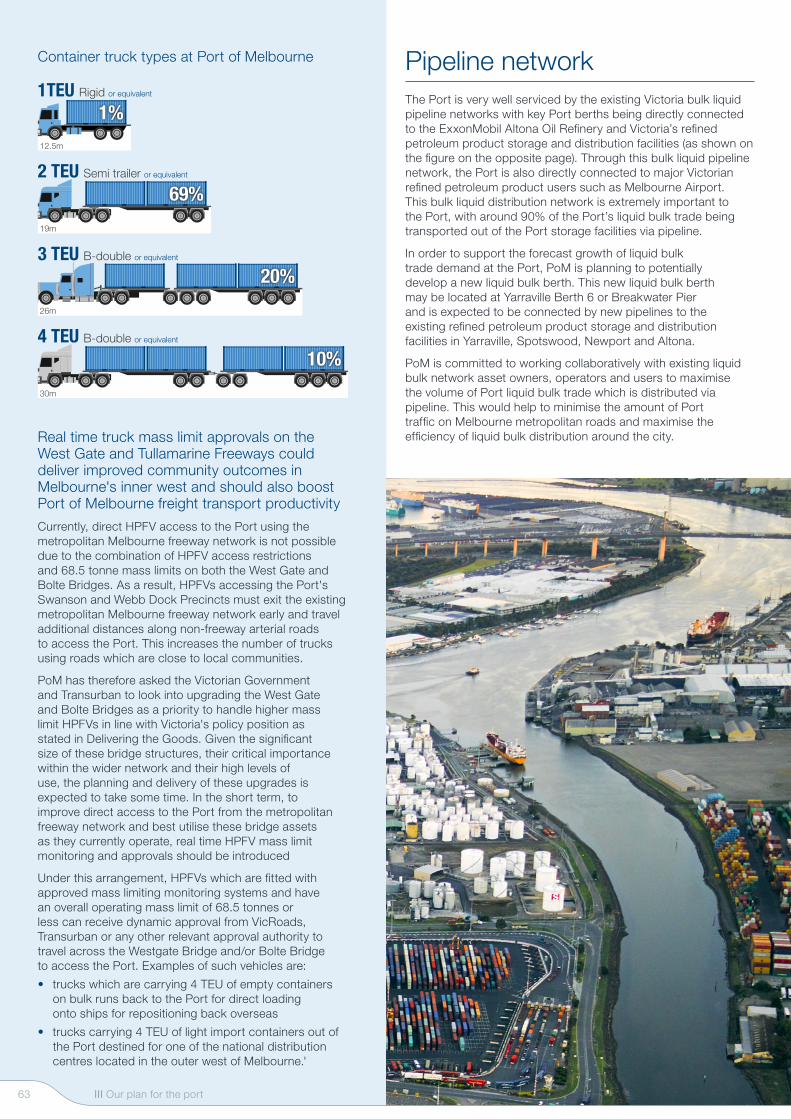
Real time truck mass limit approvals on the West Gate and Tullamarine Freeways could deliver improved community outcomes in Melbourne's inner west and should also boost Port of Melbourne freight transport productivity
Currently, direct HPFV access to the Port using the metropolitan Melbourne freeway network is not possible due to the combination of HPFV access restrictions and 68.5 tonne mass limits on both the West Gate and Bolte Bridges. As a result, HPFVs accessing the Port's Swanson and Webb Dock Precincts must exit the existing metropolitan Melbourne freeway network early and travel additional distances along non-freeway arterial roads to access the Port. This increases the number of trucks using roads which are close to local communities.
PoM has therefore asked the Victorian Government and Transurban to look into upgrading the West Gate and Bolte Bridges as a priority to handle higher mass limit HPFVs in line with Victoria's policy position as stated in Delivering the Goods. Given the significant size of these bridge structures, their critical importance within the wider network and their high levels of use, the planning and delivery of these upgrades is expected to take some time. In the short term, to improve direct access to the Port from the metropolitan freeway network and best utilise these bridge assets as they currently operate, real time HPFV mass limit monitoring and approvals should be introduced
Under this arrangement, HPFVs which are fitted with approved mass limiting monitoring systems and have an overall operating mass limit of 68.5 tonnes or less can receive dynamic approval from VicRoads, Transurban or any other relevant approval authority to travel across the Westgate Bridge and/or Bolte Bridge to access the Port. Examples of such vehicles are:
• trucks which are carrying 4 TEU of empty containers on bulk runs back to the Port for direct loading onto ships for repositioning back overseas
• trucks carrying 4 TEU of light import containers out of the Port destined for one of the national distribution centres located in the outer west of Melbourne.'
Pipeline networkThe Port is very well serviced by the existing Victoria bulk liquid pipeline networks with key Port berths being directly connected to the ExxonMobil Altona Oil Refinery and Victoria’s refined petroleum product storage and distribution facilities (as shown on the figure on the opposite page). Through this bulk liquid pipeline network, the Port is also directly connected to major Victorian refined petroleum product users such as Melbourne Airport. This bulk liquid distribution network is extremely important to the Port, with around 90% of the Port’s liquid bulk trade being transported out of the Port storage facilities via pipeline.
In order to support the forecast growth of liquid bulk trade demand at the Port, PoM is planning to potentially develop a new liquid bulk berth. This new liquid bulk berth may be located at Yarraville Berth 6 or Breakwater Pier and is expected to be connected by new pipelines to the existing refined petroleum product storage and distribution facilities in Yarraville, Spotswood, Newport and Altona.
PoM is committed to working collaboratively with existing liquid bulk network asset owners, operators and users to maximise the volume of Port liquid bulk trade which is distributed via pipeline. This would help to minimise the amount of Port traffic on Melbourne metropolitan roads and maximise the efficiency of liquid bulk distribution around the city.
12.5m
1TEU Rigid or equivalent
19m
2 TEU Semi trailer or equivalent
26m
3 TEU B-double or equivalent
30m
4 TEU B-double or equivalent
Container truck types at Port of Melbourne
III Our plan for the port63

Williamstown
Newport
FishermansBend
Port Melbourne
Yarraville
Spotswood
Footscray
Port Phillip Bay
Yarra River
Coode Island MHF
advisory area
Yarraville MHF advisory area
Newport MHF advisory area
Gellibrand Pier MHF advisory area
Port of Melbourne land
Worksafe advisory areas for major hazard facilities
Existing liquid bulk berths
Potential new liquid bulk berths
Existing liquid bulk pipelines
Potential new liquid bulk pipelines
2050
Port of Melbourne 2050 Port Development Strategy 64

Responding to changeWhile change is hardly ever predictable, PoM has strategically assessed a number of likely key areas of change over the coming decades. These have been considered as part of developing the 2050 PDS and PoM believes the Port is well-positioned to adapt to these changes.
Environmental changes• Responding to climate change and sea level rise –
the Port’s infrastructure and land has been developed based on current sea levels. In response to rising sea levels, PoM expects to upgrade some port structures and has incorporated higher sea level requirements into designs for new and upgraded port infrastructure.
Market demand changes
Assessing trade forecasts – market demand will change over time and PoM undertakes regular reviews of the short-to-long term trade forecasts to understand implications for port trade volumes, infrastructure development and land use requirements. Currently, this is especially apparent in regard to ship size, where the demand to accommodate larger ships has recently accelerated.
Port infrastructure and land changes• Increasing productivity – the drive for increased
efficiency and productivity is constant. PoM works with industry, government and the community to maintain a strong focus on maximising productivity and efficiency along the entire port-related supply chain
• Getting the most out of port land – we need to ensure we are getting the most out of our land and infrastructure, both through maximising the Port’s layout and adopting new technologies and operational improvements. PoM monitors developments in these areas both locally and abroad, such as the proposed Eagle Rail Container Logistics System from the USA or the DP World Box Bay concept
• Surrounding land use changes – the land surrounding the Port and its landside transport routes will continue to move from industry to other land uses and appropriate protections need to be strengthened in response to this change. This is a significant need and is discussed further under Land Use Planning for the Future on Page 69.
Metropolitan Melbourne growth changes• Increased metropolitan road and rail network
congestion – continued strong growth in metropolitan Melbourne will see a significant increase in congestion on both the road and rail networks. PoM’s strong focus on improving port rail access and maximising off-peak use of the road network for freight are key to keeping freight moving efficiently. The Port Rail Transformation Project and Webb Dock Freight Link are the key initiatives in maximising freight rail.
Using port land more efficiently to support the continued growth in the motor vehicle trade
A key example of including incremental change into this 2050 PDS is the requirement for Port land to be used more efficiently and productively over time. This is a case of needing to do more with less.
Motor vehicle trade is a good example of where higher trade volumes will need to be handled on a reduced area over time. By 2050, the Port expects to handle around 50% more motor vehicles, while using around 15% less land.
This arrangement will require the development of multi-story car storage facilities within the Port to ensure sufficient capacity to support vehicle off-loading and distribution activities. Multi-story car storage facilities are used at ports around the world.
While multi-story car parks are most suited today to ports with strong car export volumes, as volumes grow solutions that are not suitable now will become more attractive options.
Greater volumes of electric vehicles may also change what facilities are required within an auto terminal. This may include the need to build electric charging stations to support this automotive trade market shift.
Responding to change and embracing innovationThe Port will face a range of challenges and opportunities over the coming decades and must be prepared to adapt to change and lead innovative solutions. The 2050 PDS provides the strategic framework for the Port to grow and develop, while maintaining an agile approach that will allow PoM to adapt and respond to emerging opportunities and trends.
III Our plan for the Port65
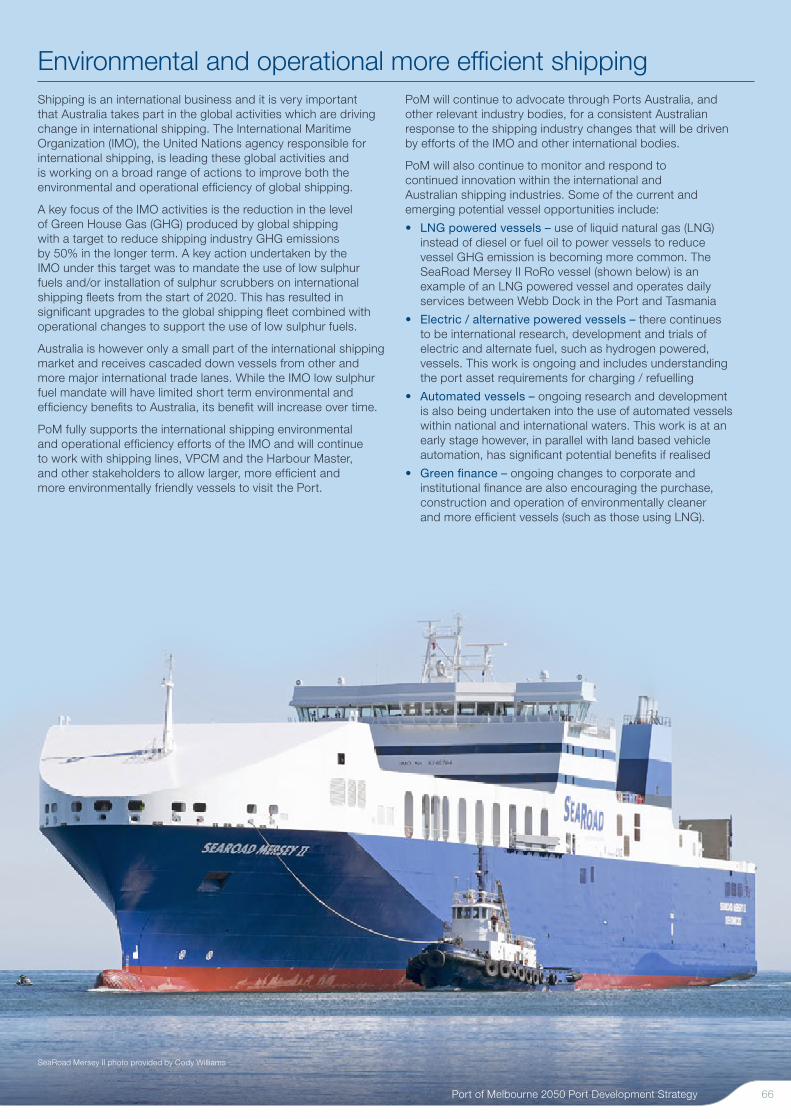
Environmental and operational more efficient shippingShipping is an international business and it is very important that Australia takes part in the global activities which are driving change in international shipping. The International Maritime Organization (IMO), the United Nations agency responsible for international shipping, is leading these global activities and is working on a broad range of actions to improve both the environmental and operational efficiency of global shipping.
A key focus of the IMO activities is the reduction in the level of Green House Gas (GHG) produced by global shipping with a target to reduce shipping industry GHG emissions by 50% in the longer term. A key action undertaken by the IMO under this target was to mandate the use of low sulphur fuels and/or installation of sulphur scrubbers on international shipping fleets from the start of 2020. This has resulted in significant upgrades to the global shipping fleet combined with operational changes to support the use of low sulphur fuels.
Australia is however only a small part of the international shipping market and receives cascaded down vessels from other and more major international trade lanes. While the IMO low sulphur fuel mandate will have limited short term environmental and efficiency benefits to Australia, its benefit will increase over time.
PoM fully supports the international shipping environmental and operational efficiency efforts of the IMO and will continue to work with shipping lines, VPCM and the Harbour Master, and other stakeholders to allow larger, more efficient and more environmentally friendly vessels to visit the Port.
PoM will continue to advocate through Ports Australia, and other relevant industry bodies, for a consistent Australian response to the shipping industry changes that will be driven by efforts of the IMO and other international bodies.
PoM will also continue to monitor and respond to continued innovation within the international and Australian shipping industries. Some of the current and emerging potential vessel opportunities include:
• LNG powered vessels – use of liquid natural gas (LNG) instead of diesel or fuel oil to power vessels to reduce vessel GHG emission is becoming more common. The SeaRoad Mersey II RoRo vessel (shown below) is an example of an LNG powered vessel and operates daily services between Webb Dock in the Port and Tasmania
• Electric / alternative powered vessels – there continues to be international research, development and trials of electric and alternate fuel, such as hydrogen powered, vessels. This work is ongoing and includes understanding the port asset requirements for charging / refuelling
• Automated vessels – ongoing research and development is also being undertaken into the use of automated vessels within national and international waters. This work is at an early stage however, in parallel with land based vehicle automation, has significant potential benefits if realised
• Green finance – ongoing changes to corporate and institutional finance are also encouraging the purchase, construction and operation of environmentally cleaner and more efficient vessels (such as those using LNG).
SeaRoad Mersey II photo provided by Cody Williams
Port of Melbourne 2050 Port Development Strategy 66

Dynamic monitoring, modelling and simulations have allowed 9,500 TEU container vessels to berth at Swanson Dock
PoM and VPCM, in association with the Port Phillip Sea Pilots and Svitzer Australia, have recently undertaken real-time monitoring, computer modelling and operational simulations to allow larger container vessels to navigate up the Yarra River and into Swanson Dock.
This work has been undertaken to fully understand the interactions with existing commercial shipping and recreational boating facilities within the Yarra River and Port and to ensure safe navigation. This involved:
• developing a hydrodynamic model of the Yarra River and Swanson Dock to fully understand the water movements associated with large vessels, including understanding interactions with berthed vessels
• dynamic computer simulation of vessel navigation runs with inputs from the hydrodynamic model, Melbourne wind and climate models and vessel and tug operational characteristics
• berth structural analysis to ensure that the vessel loads on the wharf structures during berthing and operation would be acceptable.
The culmination of this program was the recent berthing of a 9,500 TEU container vessel, the Maersk Skarstind, at the Swanson Dock East Container Terminal, as shown in the image above. This is one of the largest vessels to visit the Port to date and measures around 300m in length, 48m in beam and had an operating draught of around 11m.
Embracing innovationThe Port embraces innovation in the Australian ports sector. This was the case in 1969 when the Port opened the very first Australia container terminal at Swanson Dock; container trade is now the largest trade at the Port. In 2017, the Port opened the Webb Dock East Container Terminal, Australia’s most advanced automated container terminal at Webb Dock as part of the Port Capacity Project development.
PoM continues to review and explore innovation opportunities for the Port over time as they arise. At this stage, PoM has identified the following as key areas of innovation interest:
• Increased operational automation – it is almost certain that significant automation of key port facilities will be required to achieve required productivity and capacity levels. The Webb Dock East Container Terminal is Australia’s most automated container facility, with only the quay cranes being manually operated. Over time PoM is keen to see increased automation, where it supports higher port productivity and capacity
• Dynamic and remote monitoring of port equipment and infrastructure – a substantial amount of port equipment and infrastructure is spread out across Port Phillip Bay and the Port’s 505ha of land, some of which has only limited accessibility due to its location (in the middle of the Bay) or ongoing port operations (under wharf structures). Increased used of dynamic and remote monitoring will simplify monitoring and allow for more efficient response to identified issues
• Integration of operational systems to minimise transport impacts – there are a number of operational systems in use across the Port including terminal operating, automated gates, truck booking and empty container park systems. PoM will be looking for improved integration across these systems and increased opportunity to use the systems to deliver overall supply chain efficiency improvements. One example is increasing truck backloading to reduce the overall level of port truck movements on surrounding roads
• Improved monitoring, modelling and simulations to maximise port operations – a key innovation in increasing operational efficiency is the increased use of real-time operation monitoring, modelling and simulations. These systems allow us to test possible solutions and understand the requirements for making the most of our assets, as shown by the Swanson Dock larger vessel work presented on this page.
III Our plan for the Port67

Technology change in Australia’s transport systemsOver the 30 year period of this 2050 PDS PoM expects significant technology changes will be introduced across the transport system. This includes a number of technologies that have the potential to see mainstream adoption over the coming decades.
Significant research and development is occurring right now into major transport system technology changes like zero emission vehicles (battery electric or hydrogen) and automated vehicles (such as the automated straddle carriers within the Webb Dock East Container Terminal shown on this page). Fleets of zero emission and/or automated vehicles could significantly reduce transport system generated air and noise emissions, support greater social acceptance and deliver increased vehicle fleet productivity.
Many of these potential technology changes will however require Victorian and Commonwealth Government approvals and changes to regulation to be introduced. PoM supports these types of initiatives and will advocate, in conjunction with the freight transport industry, for Governments to support transport system innovation.
It is critical that national frameworks are applied within the transport system space as supply chains do not stop at State borders. Differing State regulations is costly and inefficient to supply chain operations and ultimately negatively impacts both industry and consumers. PoM is a member of a number of key freight transport industry peak bodies and will support their efforts to see positive transport system technical change and innovation at both state and national levels.
PoM also considers that transport system network pricing has the potential to have a positive impact on the landside transport network constraints presented within this 2050 PDS. There is an opportunity to investigate State policy responses to manage congestion within Melbourne, and reduce the transport system costs to both commuters and freight transport operators.
Port of Melbourne 2050 Port Development Strategy 68
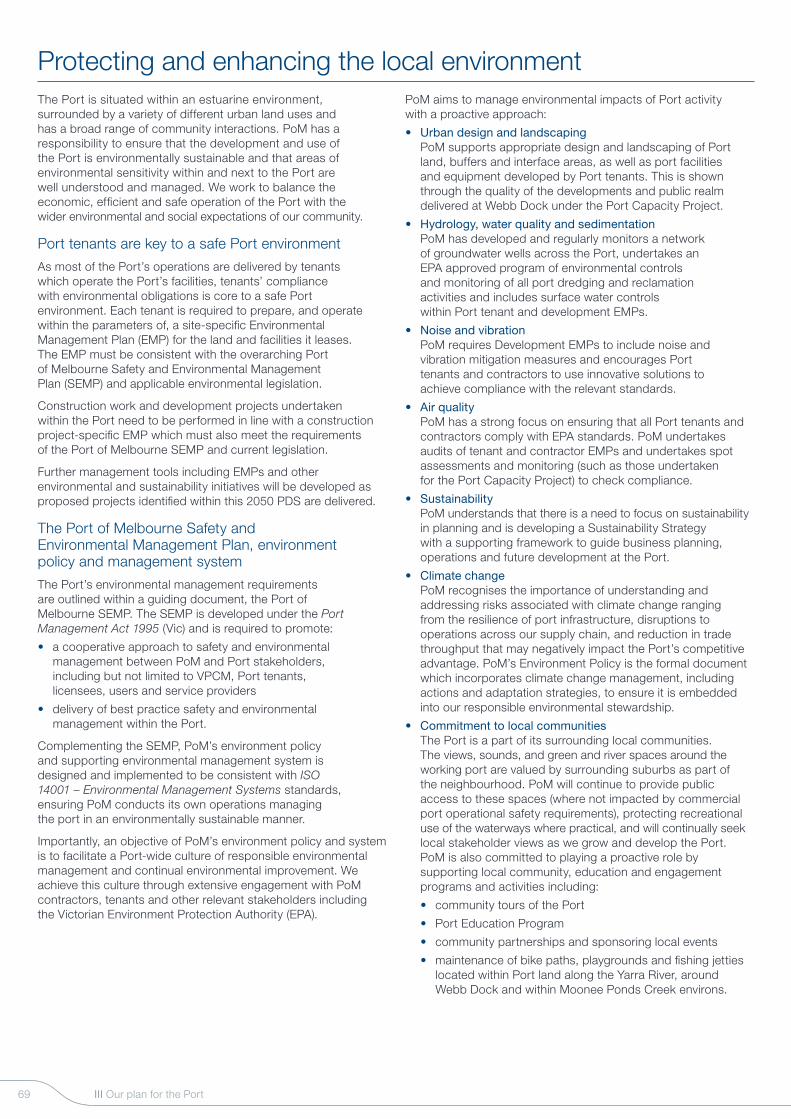
Protecting and enhancing the local environment The Port is situated within an estuarine environment, surrounded by a variety of different urban land uses and has a broad range of community interactions. PoM has a responsibility to ensure that the development and use of the Port is environmentally sustainable and that areas of environmental sensitivity within and next to the Port are well understood and managed. We work to balance the economic, efficient and safe operation of the Port with the wider environmental and social expectations of our community.
Port tenants are key to a safe Port environment
As most of the Port’s operations are delivered by tenants which operate the Port’s facilities, tenants’ compliance with environmental obligations is core to a safe Port environment. Each tenant is required to prepare, and operate within the parameters of, a site-specific Environmental Management Plan (EMP) for the land and facilities it leases. The EMP must be consistent with the overarching Port of Melbourne Safety and Environmental Management Plan (SEMP) and applicable environmental legislation.
Construction work and development projects undertaken within the Port need to be performed in line with a construction project-specific EMP which must also meet the requirements of the Port of Melbourne SEMP and current legislation.
Further management tools including EMPs and other environmental and sustainability initiatives will be developed as proposed projects identified within this 2050 PDS are delivered.
The Port of Melbourne Safety and Environmental Management Plan, environment policy and management system
The Port’s environmental management requirements are outlined within a guiding document, the Port of Melbourne SEMP. The SEMP is developed under the Port Management Act 1995 (Vic) and is required to promote:
• a cooperative approach to safety and environmental management between PoM and Port stakeholders, including but not limited to VPCM, Port tenants, licensees, users and service providers
• delivery of best practice safety and environmental management within the Port.
Complementing the SEMP, PoM’s environment policy and supporting environmental management system is designed and implemented to be consistent with ISO 14001 – Environmental Management Systems standards, ensuring PoM conducts its own operations managing the port in an environmentally sustainable manner.
Importantly, an objective of PoM’s environment policy and system is to facilitate a Port-wide culture of responsible environmental management and continual environmental improvement. We achieve this culture through extensive engagement with PoM contractors, tenants and other relevant stakeholders including the Victorian Environment Protection Authority (EPA).
PoM aims to manage environmental impacts of Port activity with a proactive approach:
• Urban design and landscaping PoM supports appropriate design and landscaping of Port land, buffers and interface areas, as well as port facilities and equipment developed by Port tenants. This is shown through the quality of the developments and public realm delivered at Webb Dock under the Port Capacity Project.
• Hydrology, water quality and sedimentation PoM has developed and regularly monitors a network of groundwater wells across the Port, undertakes an EPA approved program of environmental controls and monitoring of all port dredging and reclamation activities and includes surface water controls within Port tenant and development EMPs.
• Noise and vibration PoM requires Development EMPs to include noise and vibration mitigation measures and encourages Port tenants and contractors to use innovative solutions to achieve compliance with the relevant standards.
• Air quality PoM has a strong focus on ensuring that all Port tenants and contractors comply with EPA standards. PoM undertakes audits of tenant and contractor EMPs and undertakes spot assessments and monitoring (such as those undertaken for the Port Capacity Project) to check compliance.
• Sustainability PoM understands that there is a need to focus on sustainabilityin planning and is developing a Sustainability Strategy with a supporting framework to guide business planning, operations and future development at the Port.
• Climate change PoM recognises the importance of understanding and addressing risks associated with climate change ranging from the resilience of port infrastructure, disruptions to operations across our supply chain, and reduction in trade throughput that may negatively impact the Port’s competitive advantage. PoM’s Environment Policy is the formal document which incorporates climate change management, including actions and adaptation strategies, to ensure it is embedded into our responsible environmental stewardship.
• Commitment to local communities The Port is a part of its surrounding local communities. The views, sounds, and green and river spaces around the working port are valued by surrounding suburbs as part of the neighbourhood. PoM will continue to provide public access to these spaces (where not impacted by commercial port operational safety requirements), protecting recreational use of the waterways where practical, and will continually seek local stakeholder views as we grow and develop the Port. PoM is also committed to playing a proactive role by supporting local community, education and engagement programs and activities including:
• community tours of the Port
• Port Education Program
• community partnerships and sponsoring local events
• maintenance of bike paths, playgrounds and fishing jetties located within Port land along the Yarra River, around Webb Dock and within Moonee Ponds Creek environs.
III Our plan for the Port69

PoM provides buffer areas which support the safe and efficient running of the Port, help reduce noise, present a unique visual landscape for local communities and provide public access to the Yarra River and bay beaches
Approximately 53 hectares of existing port land is used for Port buffers. A large portion of this land is available for public access and incorporates a range of landscaping and public realm installations. Facilities include
bike paths, access trails, fishing jetties, children’s playgrounds and viewing platforms.
The recent development and upgrade of Webb Dock to support expanded container and motor vehicle trade included landscaping and new noise walls
along the eastern buffers to the precinct. Other public realm investments included bike paths along Todd Road, Maritime Cove playground within Perce
White Reserve and Webb Dock Trail, fishing jetties and a viewing platform (shown on this page) along the eastern side of Webb Dock.
These buffer landscaping areas and facilities provide space for communities to enjoy and explore the Port surrounds while helping us maintain current and future Port operations. This public open space is important and helps nurture our city-
port vision. As projects are established, PoM is committed to working with local government and the community in opening, managing and developing public open
space around the Port.
Port of Melbourne 2050 Port Development Strategy 70

Land use planning within and around the Port is undertaken in accordance with Victoria’s Planning System and is covered within a range of existing strategic and statutory planning documents, information and systems. This land use planning framework currently provides a level of protection to the Port and its operations while seeking a balanced outcome for the broad range of land uses and activities accommodated in the area.
If these protections and safeguarding become inadequate, there are potentially negative impacts for the Port, the businesses it serves, surrounding communities and ultimately the State economy.
A balanced and forward-looking approach is essential to ensure the Port’s operations in central Melbourne remain efficient and viable, for the benefit of the Victorian economy. The Port’s inner city location is fundamental to the efficiency of landside freight distribution across the metropolitan region.
PoM has identified the following opportunities to work collaboratively with the Victorian Government to improve the safeguarding and protection of the Port and its essential operations and provide greater certainty for non-Port land and uses.
Expansion of area covered by the Port of Melbourne Environmental Significance Overlay (ESO)
The Port’s 24/7 operations are required to meet business needs and support a strong economy. Over the last ten years there has been significant engagement, including through the Ports and Environs Advisory Committee and more recently the Fishermans Bend Planning Review Panel, on the need to protect the Port’s operations and growth. Safeguarding and protection has been partly delivered through the application of a Port of Melbourne Environmental Significance Overlay (ESO) on surrounding land. Subsequent government planning scheme changes to land around the Port however shows that the area covered by the ESO needs to be expanded to ensure robust safeguarding and protection of the Port’s operations and its ongoing economic contributions to Victoria, from the encroachment of sensitive uses. The additional areas needing to be protected are highlighted on the figure on the page opposite.
Increased safeguarding and protection of existing and future major hazardous facilities
The major hazard facilities (MHFs) located within and adjacent to the Port are an important part of the Port business operations and significantly contribute to the Victorian economy. Where required, future facilities will also need to be located close to the Port. PoM believes it is essential that the Victorian Government implements the 2016 Major Hazard Facilities Advisory Committee Final Report recommendations and increases the level of safeguarding and protection provided to these state significant facilities. The existing MHF advisory areas around the Port are also shown on the figure on the page opposite.
Safeguarding and protection of the Webb Dock Freight Link corridor
The dedicated freight link between Webb Dock and the Swanson / Dynon Precincts will support the high capacity movement of cargo. This provides an alternative to public road transport for Webb Dock trade through the Fishermans Bend Employment Precinct – thereby reducing the traffic load on the adjacent road network and supporting increased efficiency and productivity. As a result, it is extremely important that the existing corridor, which runs down Lorimer Street, Todd Road and Wharf Road and across Westgate Park is maintained, safeguarded and protected (as shown on figure on Page 62) in line with the recent work undertaken by PoM.
Increased safeguarding and protection of existing and future freight corridors
As business needs change, so too must the network that enables the efficient and safe transport of freight. The Principal Freight Network (PFN) is the vital connection between the Port and businesses around Victoria. Increased focus and continued priority on the safeguarding and protection of the PFN will provide confidence and allow the Port and businesses to adapt to increased and changed demand for freight transport. Carefully considering and designating appropriate new and upgraded transport corridors is also important for providing certainty to existing and future residential communities.
Safeguarding and protection of freight, warehousing and industrial land
Safeguarding and protecting areas for freight needs, such as logistics and warehousing, is an important aspect of planning for freight growth and ensuring freight is handled efficiently. It is also important for integrating the transport and land use planning policies and frameworks. Comprehensive, strategic forward planning to identify and set aside freight activity areas gives businesses and the community alike greater certainty and reduces the likelihood of conflicting land use planning in the future.
PoM is committed to working collaboratively with the Victorian and surrounding local governments to improve the safeguarding and protection of the Port within the Victorian Planning System and to manage the potential impact of the Port, its operations and the transport of goods to and from the Port now and into the future.
Land use planning for the futureFor freight growth planning to be successful, existing vital freight infrastructure must be safeguarded and protected with new corridors also identified and safeguarded for future development and use. As the Port will continue to operate in its current location until late this century, strategic land use planning must have an integrated approach in considering the city port, which is fed by freight corridors in all future central Melbourne strategic planning work.
III Our plan for the Port71
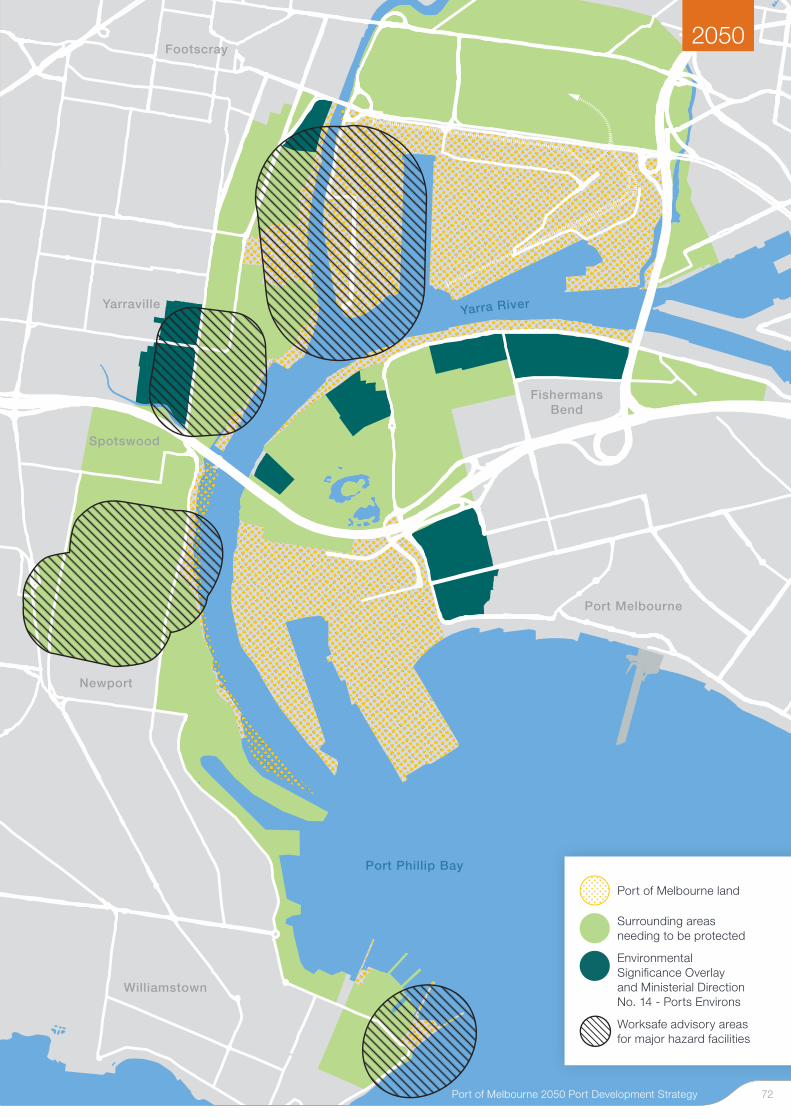
Williamstown
Newport
FishermansBend
Port Melbourne
Yarraville
Spotswood
Footscray
Port Phillip Bay
Yarra River
Port of Melbourne land
Surrounding areas needing to be protected
Environmental Significance Overlay and Ministerial Direction No. 14 - Ports Environs
Worksafe advisory areas for major hazard facilities
2050
Port of Melbourne 2050 Port Development Strategy 72
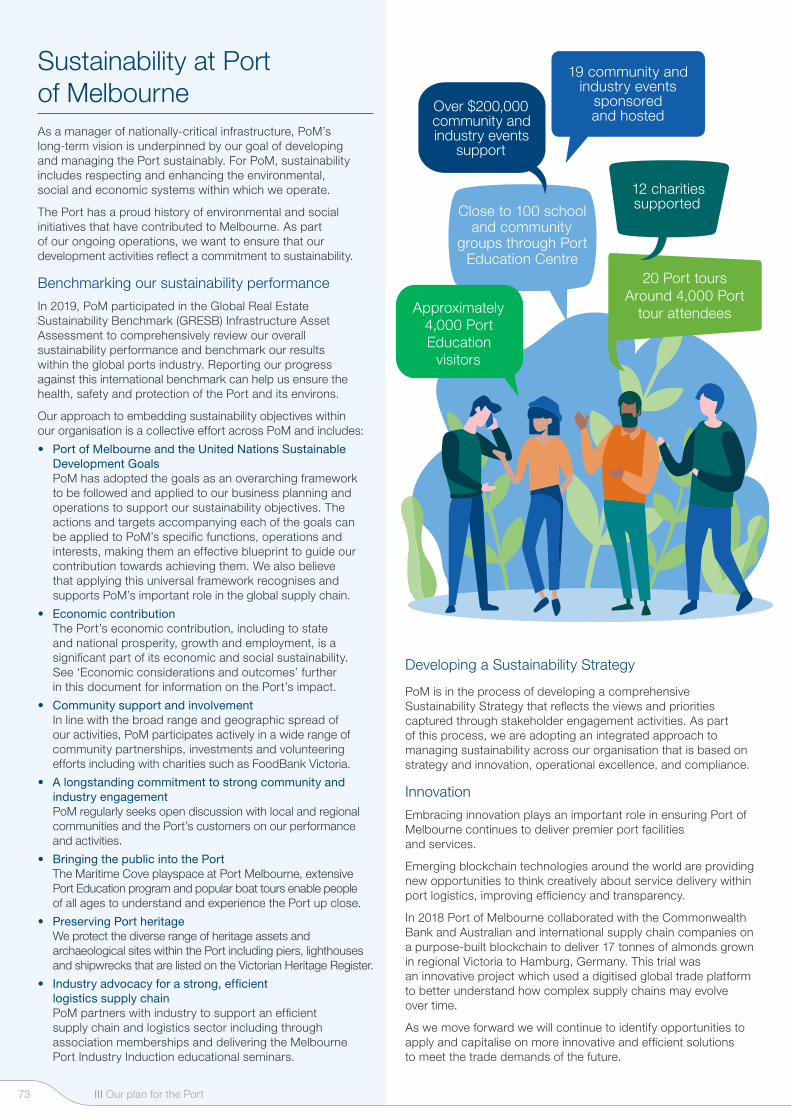
Sustainability at Port of MelbourneAs a manager of nationally-critical infrastructure, PoM’s long-term vision is underpinned by our goal of developing and managing the Port sustainably. For PoM, sustainability includes respecting and enhancing the environmental, social and economic systems within which we operate.
The Port has a proud history of environmental and social initiatives that have contributed to Melbourne. As part of our ongoing operations, we want to ensure that our development activities reflect a commitment to sustainability.
Benchmarking our sustainability performance
In 2019, PoM participated in the Global Real Estate Sustainability Benchmark (GRESB) Infrastructure Asset Assessment to comprehensively review our overall sustainability performance and benchmark our results within the global ports industry. Reporting our progress against this international benchmark can help us ensure the health, safety and protection of the Port and its environs.
Our approach to embedding sustainability objectives within our organisation is a collective effort across PoM and includes:
• Port of Melbourne and the United Nations Sustainable Development Goals PoM has adopted the goals as an overarching framework to be followed and applied to our business planning and operations to support our sustainability objectives. The actions and targets accompanying each of the goals can be applied to PoM’s specific functions, operations and interests, making them an effective blueprint to guide our contribution towards achieving them. We also believe that applying this universal framework recognises and supports PoM’s important role in the global supply chain.
• Economic contribution The Port’s economic contribution, including to state and national prosperity, growth and employment, is a significant part of its economic and social sustainability. See ‘Economic considerations and outcomes’ further in this document for information on the Port’s impact.
• Community support and involvement In line with the broad range and geographic spread of our activities, PoM participates actively in a wide range of community partnerships, investments and volunteering efforts including with charities such as FoodBank Victoria.
• A longstanding commitment to strong community and industry engagement PoM regularly seeks open discussion with local and regional communities and the Port’s customers on our performance and activities.
• Bringing the public into the Port The Maritime Cove playspace at Port Melbourne, extensive Port Education program and popular boat tours enable people of all ages to understand and experience the Port up close.
• Preserving Port heritage We protect the diverse range of heritage assets and archaeological sites within the Port including piers, lighthouses and shipwrecks that are listed on the Victorian Heritage Register.
• Industry advocacy for a strong, efficient logistics supply chain PoM partners with industry to support an efficient supply chain and logistics sector including through association memberships and delivering the Melbourne Port Industry Induction educational seminars.
Developing a Sustainability Strategy
PoM is in the process of developing a comprehensive Sustainability Strategy that reflects the views and priorities captured through stakeholder engagement activities. As part of this process, we are adopting an integrated approach to managing sustainability across our organisation that is based on strategy and innovation, operational excellence, and compliance.
Innovation
Embracing innovation plays an important role in ensuring Port of Melbourne continues to deliver premier port facilities and services.
Emerging blockchain technologies around the world are providing new opportunities to think creatively about service delivery within port logistics, improving efficiency and transparency.
In 2018 Port of Melbourne collaborated with the Commonwealth Bank and Australian and international supply chain companies on a purpose-built blockchain to deliver 17 tonnes of almonds grown in regional Victoria to Hamburg, Germany. This trial was an innovative project which used a digitised global trade platform to better understand how complex supply chains may evolve over time.
As we move forward we will continue to identify opportunities to apply and capitalise on more innovative and efficient solutions to meet the trade demands of the future.
19 community and industry events
sponsored and hosted
20 Port tours Around 4,000 Port
tour attendees
12 charities supportedClose to 100 school
and community groups through Port
Education Centre
Over $200,000 community and industry events
support
Approximately 4,000 Port Education
visitors
III Our plan for the Port73
Global port partnerships
Port of Melbourne has maintained long-standing and continual relations with international ports under the Global Port Partnerships Program. The program has included staff exchange programs, delegation visits and international conferences.
Lending a hand through fundraising
Port of Melbourne has supported a range of causes that positively contribute to society and give back to our community. This includes PoM being a Corporate Sponsor and Victorian Partner of Foodbank Victoria. PoM is also an active supporter and participant in a number of community-led environment initiatives, including Paddle Against Plastic which promotes the clean up of the Yarra River.
During 2019-20 PoM staff led a number of fundraising activities which raised funds for:
• The Royal Children’s Hospital Good Friday Appeal
• Australian Wildlife Conservation
• Wagga Women’s Health Centre
• Dup15q Australia
• Médecins Sans Frontières Australia
• Jeans for Genes
• Loud Shirt Day for Taralye
• Fred Hollows Foundation
• Wear for Success Impact 5000
• Lort Smith Animal Hospital North Melbourne
• Monash Children’s Hospital
• Arts Centre Melbourne Disadvantaged Children’s Program
• Greenpeace
• Bushfire Relief Fund
Understanding the economic benefits and outcomes
The Port of Melbourne is a major Australian asset for the movement of trade into and out of the country, and is a key driver of economic activity. The level and reach of economic activities that depend on Port operations reveal how the Port underpins Victoria’s economic activity.
Economic considerations are therefore vital to PoM’s long term planning and decision making.
PoM will continue working to deepen the understanding of the Port’s economic importance and how future Port development fits within our economy. We will work with government, businesses and community stakeholders to provide and document economic information about the Port today, and into the future. As we develop the Port over the coming 30 years, PoM will deliver a number of key economic studies including those below which have already contributed to the 2050 PDS.
• Port development and operational economic impacts To understand the current benefit the Port and its associated activities deliver within the Victorian, Tasmanian and national economies, PoM commissioned an Economic Impact Study (EIS) for the Port, based on the 2017-18 financial year data. The findings of this study are presented on pages 25 and 26 and show that the Port provides substantial contributions to the economy and local community and is also a major source of employment. This EIS builds upon similar studies undertaken in 2008-09 and 2012-13. PoM will undertake updated studies going forward to understand impact of changes over time.
• Port development and operational economic assessments In developing this 2050 PDS PoM undertook an economic assessment of a range of different Port development options and layouts. The assessment helped us better understand the key drivers of the Port’s economic benefits to Victoria and whether different forecast ship fleets, port development plans and landside transport outcomes vary the economic benefits derived. This economic assessment showed that the plans for the Port, as outlined within this 2050 PDS, have the potential to deliver up to $1.6 billion in additional benefits to the Australian economy over the next 30 years than previous long term plans for the Port. It reaffirms PoM’s view that, working collaboratively with all stakeholders, the Port is able to unlock substantial and improved long term economic benefits and outcomes.
• Project delivery economic assessments PoM will also consider preparing project specific economic assessments at the project delivery level, where the economic considerations are relevant to the strategic decision making and / or approvals associated with these projects. Typical projects for which project level economic assessments may be appropriate include future Port capacity expansion delivery, improved road and rail access to the Port, and infrastructure projects which support the operation of larger vessels or higher capacity road / rail vehicles. Projects which are partly or fully funded by government are also expected to require project specific economic assessments.
PoM will strive to maximise the value obtained through the proposed economic projects and to identify opportunities for additional and improved assessments. PoM is not resting on past achievements and is looking to continuously grow and develop the Port ultimately for the long term benefit of the Victorian and Australian communities.
Port of Melbourne Sister Ports
In 2019, Port of Melbourne hosted the 19th Sister Ports Conference, bringing together representatives from our international Port network.
Port of Osaka
Port of Yokohama
Port of Oakland
Port of Philadelphia
Port of Tianjin
Port of Shanghai
These experiences promote mutually rewarding friendship and cooperation, strengthen international trade and prosperity, and provide a platform to exchange development information, technology and expertise. Importantly, these relationships facilitate dialogue and give access to a wider range of current approaches to the shared challenges faced by ports worldwide.
Port of Melbourne 2050 Port Development Strategy 74
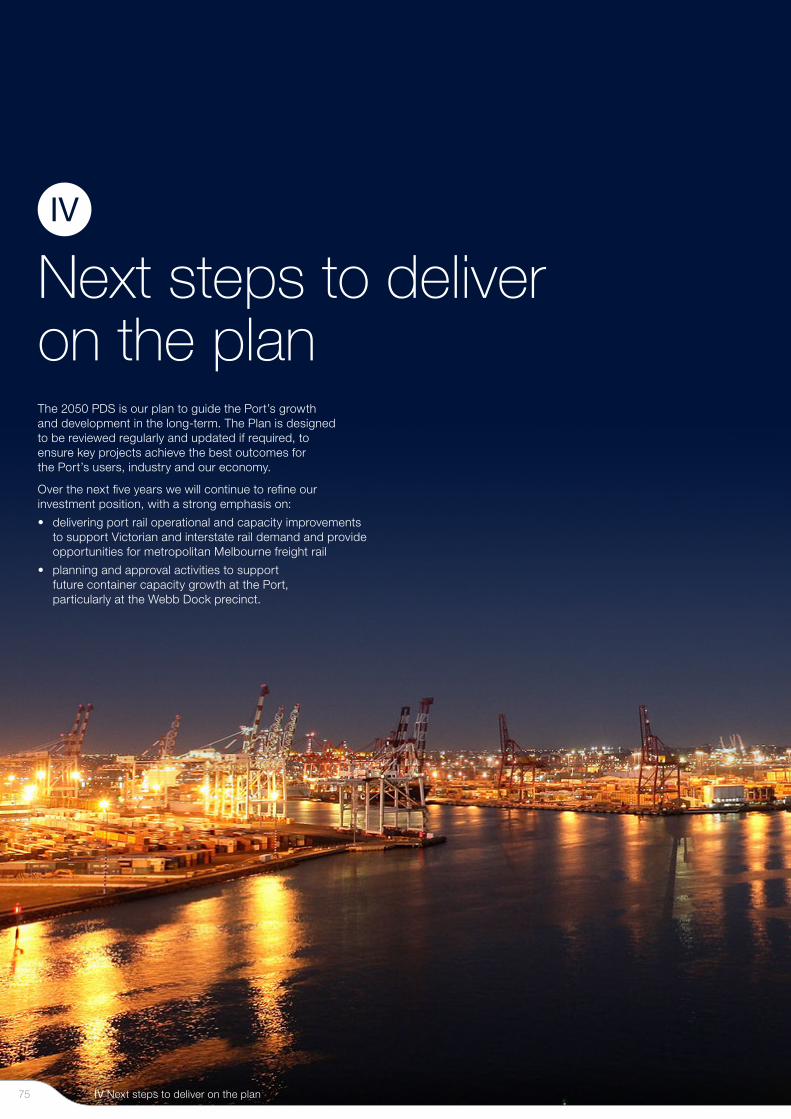
IV
Next steps to deliver on the planThe 2050 PDS is our plan to guide the Port’s growth and development in the long-term. The Plan is designed to be reviewed regularly and updated if required, to ensure key projects achieve the best outcomes for the Port’s users, industry and our economy.
Over the next five years we will continue to refine our investment position, with a strong emphasis on:
• delivering port rail operational and capacity improvements to support Victorian and interstate rail demand and provide opportunities for metropolitan Melbourne freight rail
• planning and approval activities to support future container capacity growth at the Port, particularly at the Webb Dock precinct.
IV Next steps to deliver on the plan75

Working with the Victorian GovernmentIntegrated infrastructure outcomes are essential to our economy
Trade and freight are fundamental components of the Australian economy and a key user of our country’s transport infrastructure network.
Our close working relationship with the Victorian Government is founded upon a shared belief in the important role the Port plays in Victoria’s economy. While we work closely with government and have an understanding of the government’s priorities over the short, medium and long term as set out in Delivering the Goods, we have needed to make some base assumptions to develop our plan for the future. These assumptions are that:
• continued investments will be made in the road and rail networks to support population growth across Greater Melbourne
• the Dynon Precinct, including the former Melbourne Market site, is best used for port-related freight and logistics
• there are widespread benefits in shifting more freight to rail and there is a commitment from the Victorian Government to support projects that enable this shift
• the Webb Dock Freight Link will be delivered to meet trade demand by 2030
• the Port’s efficient operations will be safeguarded and protected from urban development and potential operating constraints.
The 2050 PDS presents an opportunity for the Port, Victorian Government, the community and local governments to work together to deliver an aligned outcome for the future.
By working together, we can plan for and develop the Port to ensure we have the infrastructure needed to support trade demand. Together, we can deliver broader supply chain efficiencies that enhance the Victoria’s competitive position and liveability.
By working together with the Victorian Government we can:
Create an environment that encourages private sector investment by providing a clear vision and commitment to action by:
• progressing the key initiatives identified in Delivering the Goods and 2050 PDS
• incorporating the 2050 PDS as a reference document under the Victorian Planning Provisions
• implementing inter-agency coordination to optimise freight rail and road network capacities
• securing planning controls and protections for the Port’s activities, transport and pipeline corridors
• providing policy priority for freight to ensure the Port’s position and input to key investment decisions is taken into account – such as the West Gate Tunnel.
Send a clear message to industry that we are focused on delivering outcomes by:
• investing in the delivery of the Port Rail Transformation Project to deliver an initial investment in improved rail access at the Port
• delivering the next tranche of Port container capacity and expansion at Webb Dock, which includes facilities that can handle the largest container vessels visiting Australia
• urgently progressing the required strategic planning works and moving forward with the delivery of the Webb Dock Freight Link to ensure that it is ready for use by 2030 when trade demands
• accelerating the allocation of the former Melbourne Market site to PoM in anticipation of future availability.
Port of Melbourne 2050 Port Development Strategy 76

Project delivery and timeframesThe following steps will inform our investment planning and continue to help refine activities in the short-term.
Investment decisions
Due to the significant scale and influence of Port development projects, each investment decision must be considered in terms of timing, scope and flow-on effects both inside and outside the port gate. We will work with our tenants and customers to identify opportunities to align investment to maximise total value and deliver least-cost infrastructure.
Technical evaluations
A range of additional technical evaluations are likely to be required to confirm technical viability, maximise delivery outcomes and minimise overall delivery costs and risks for each planned project. Key areas for further consideration include:
• marine navigation studies to support both near and longer-term vessel fleet characteristics
• wharf infrastructure assessments and designs to support larger vessels, cranes and landside equipment
• road, rail and pipeline infrastructure connections, capacities and requirements (both inside and outside the port gate)
• operational improvements through:
• improved berth and terminal arrangements and layouts
• adoption of new technologies and processes that support higher operational efficiencies and productivities
• higher capacity and more productive cargo handling equipment.
Cost and timeframe estimates
Cost estimates and delivery timeframes will continue to be refined for each project. This includes more detailed consideration of development lead times including planning, approvals and sequencing to ensure we can accommodate all trades at all times.
Due to the complex nature and substantial scale of port projects, they typically have long lead and delivery times. This is illustrated by the indicative project implementation timing figure below which shows that even the shortest project delivery period for these projects is approximately four years. Larger projects such as the Webb Dock North container terminal, which is likely to require multiple approvals and more than one set of construction works, could take more than 13 years to complete. This demonstrates the level of urgency behind commencing the planning stages of the priority projects identified on page 51.
The two most complex and significant of these short-to-medium term priority projects are planning for the Webb Dock North container terminal development and the Webb Dock Freight Link. Both of these projects need to commence in 2020 to be operational by 2030 and meet forecast container trade demand.
Regulatory and development approvals
Most projects will require some form of regulatory or development approval. PoM will work collaboratively with the relevant Victorian and Commonwealth regulators to obtain the required regulatory and development approvals for these projects.
Stakeholder engagement
PoM will continue to actively seek feedback and engage with stakeholders to ensure these important projects achieve the best possible outcomes.
Indicative Project Implementation Timing
Project phase Years 1 2 3 4 5 6 7 8 9 10
Development / delivery planning
Development approvals Upgrading Swanson Dock East and West berths
Enabling works / tenant relocations
Construction works
Facility commissioning
IV Next steps to deliver on the plan77

Ongoing monitoring
This 2050 PDS has been informed by a number of key forecasts for the period through to 2050 as key input assumptions. It is expected that these forecasts and therefore the underlying planning assumptions will change over time. These assumptions will continue to be reviewed by PoM on a regular basis and as a result, PoM may reconsider the proposed phasing and delivery of port facilities and supporting waterside and landside transport infrastructure.
A key contributor to the Port’s capacity considerations is that productivity improvements will be delivered across both existing and new facilities.
While productivity gains have been achieved for container throughput in recent years, there is a need for continual monitoring of all trades to ensure that future improvements are realised.
Regular reviews and updates
Consistent with the Port Management Act 1995 (Vic) PoM will review and update the PDS at least every five years. Shorter review periods may, however, be required from time to time where significant changes in the Port business and/or wider strategic policy environment occur.
It is important to note that this 2050 PDS, and future updates, is not intended to provide a definitive infrastructure investment plan for the Port, but rather provide an overarching framework for the preferred port capacity delivery and associated infrastructure development pathway at a point in time. As a result, there may be significant changes from one Port Development Strategy through to the next.
Port of Melbourne 2050 Port Development Strategy 78

GlossaryTerm Definition
Beam A vessel’s width at its widest point.
Berth hire fees The time-based fee for vessels berthing on a Common User berth.
Break bulk Cargo that is carried in units, pallets, bundles or barrels or other non-unitised cargo such as vehicles.
Capacity The operational capacity of a berth or terminal is the maximum cargo throughput that can be achieved to provide an acceptable level of service. Capacity is usually expressed in terms of mass or revenue tonnes per annum, or TEU per annum.
Car equivalent unit (CEU) The standardised measurement for car carrying capacity of a vessel.
Channel Deepening Project The Channel Deepening Project was a major Port of Melbourne capital dredging project completed in 2009. The project means that the Port can handle 14m draught vessels under all tidal conditions.
Channel fees Charged on commercial vessels for the use of the channel and associated services.
Common User A facility not dedicated to one user or one industry.
Containerised cargo Cargo that can be physically, conveniently and economically transported within a container.
Draught The draught of a vessel is its depth – the distance between the waterline and the bottom of the hull or keel.
Dredge material Clay, silt, sand or rock removed from the seafloor.
Dredge Material Ground (DMG) An approved underwater area where dredge material is placed and stored.
Dry bulk Non-liquid cargoes that are transported and handled in bulk, such as grain, cement and fertiliser.
Dead weight tonnage (DWT) The international measurement unit for the loading capacity of a vessel in metric tonnes including the weight of cargo, passengers, crew, fuel, bunkers, provisions etc.
Environmental Management Plan (EMP)
An integrated plan which outlines the processes and activities which will be undertaken to manage the potential for environmental impacts from a facility or project.
Environmental Significance Overlay (ESO)
A planning scheme layer which is applied to land surrounding the Port and requires the use and development of the land to take into account the current and future operations of the Port.
Environment Protection Authority (EPA)
The authority responsible for the regulation of impacts on the environment, including the prevention and control of air, land and water pollution, industrial noise and waste.
Essential Services Commission (ESC)
The regulator of essential services across the Victorian energy, water, transport and local government sectors. ESC regulates the fees that PoM can charge for a range of services for the use of Port facilities and assets, which are identified as Prescribed Services.
FTE Full time equivalent (jobs or employment).
Future Fund The Future Fund is a shareholder of the PoM Group and is Australia’s sovereign wealth fund, responsible for investing for the benefit of future generations of Australians.
Global Infrastructure Partners (GIP)
Global Infrastructure Partners (GIP) is a shareholder of the PoM Group and is a leading global independent infrastructure investor combining specialist industry experience with best practice operational and financial management.
Global Real Estate Sustainability Benchmark (GRESB)
An infrastructure asset assessment which enables the sustainability of individual infrastructure assets, such as the Port, against other ports globally.
Harbour Master An official responsible for enforcing the regulations of a Port, to ensure safe navigation, the security of the harbour and the correct operation of the Port facilities.
High Productivity Freight Vehicle (HPFV)
These are larger trucks which are able to carry up to four TEU (or two 40-foot containers) and typically consist of two 40-foot long trailers and a separate prime mover.
International Maritime Organisation (IMO)
The United Nations agency responsible for improving the environmental and operational efficiency of global shipping.
Length overall (LOA) The maximum length of the vessel from the tip of the bow (the front of the vessel) to the end of the stern (the back of the vessel).
Liquid bulk Liquid cargoes that are transported and handled in bulk (e.g. crude oil, refined petroleum products and chemicals).
Major Hazard Facilities (MHFs) MHFs are sites that store, handle and process large quantities of hazardous chemicals and dangerous goods that exceed specified threshold quantities.
Glossary79
Term Definition
Mass tonnes A quantity measure that is based on the weight of the cargo.
OMERS OMERS is a shareholder of the PoM Group and is one of Canada's largest defined benefit pension plans. It invests and administers pensions for members from municipalities, school boards, emergency services and local agencies across the province of Ontario.
Port Capacity Project A major development project that involved the development of new automotive and container terminals at Webb Dock. The project was completed in 2017.
Port Development Strategy (PDS) This development strategy for the Port which has been prepared in line with the requirements of the Port Management Act 1995 (Vic) and the Victoria Government’s Port Development Strategy Ministerial Guidelines.
Port of Melbourne Group (PoM Group)
The Port of Melbourne Group is the owner of PoM. It comprises a number of large and highly experienced Australian and international infrastructure investors and managers.
Port of Melbourne Operations Pty Ltd (PoM)
The Port Licence Holder and private manager of the Port of Melbourne, on behalf of the PoM Group, under a 50-year lease from the Victorian Government.
Port Rail Shuttle Network (PRSN) The network of metropolitan Melbourne rail terminals being progressed by the Victorian and Commonwealth Governments.
Principal Freight Network (PFN) The Principal Freight Network is the part of the larger transport network over which the movement of heavy freight will be concentrated.
Prescribed Services The use of Port channels, berth pockets and wharves are Prescribed Services under the Port pricing regulation, meaning PoM can charge a fee for these services.
Pure Car Carriers (PCC) Pure Car Carriers are Roll on-Roll off (Ro Ro) vessels that are specifically designed to carry cargo that has wheels, for everything from passenger cars through to construction machinery.
Queensland Investment Corporation (QIC)
QIC is a shareholder of the PoM Group. It is a global diversified alternatives investment firm based in Australia that offers infrastructure, real estate, private equity, liquid strategies and multi-asset investment services to institutional clients.
Rail Access Strategy (RAS) The strategy document that PoM needs to prepare and issue to the Victorian Government which outlines proposed improvements to the rail access at the Port.
Revenue tonne The overarching measurement for all Port cargo. One revenue tonne equals weight in metric tonnes or volume in cubic metres, whichever is higher in terms of freight.
RoRo Roll on-Roll off (berth or vessel).
Safety and Environmental Management Plan (SEMP)
An integrated plan for the delivery of a coordinated and best practice approach to safety and environmental management across the Port.
Stevedore A dock worker or firm that employs dock workers to load and unload vessels and service ships while in Port.
Supply chain The process of moving goods from their origin, such as a farm or a factory, to the end user. Supply chains involve distribution points like airports and ports, and goods are transferred between these nodes and warehouses, distribution centres and shops. Trucks, trains, planes and other delivery vehicles are used to transport these goods.
Tariffs Fees and charges associated with import or export services and taxes.
The Port The Port of Melbourne.
Twenty-foot equivalent unit (TEU)
The standardised measurement for shipping containers, calculated by converting containers to 20-foot equivalents. E.g. one 40-foot container is counted as two 20-foot containers or two TEU.
Vessel Traffic Services (VTS) VTS, under the guidance of the Harbour Master, provides marine traffic control services to commercial vessels calling at the Port. The system uses a mixture of radar, radio and other equipment to monitor and assist with the safe navigation of vessels operating within Port waters
Victorian Environment Protection Authority (EPA)
The Victorian Government agency responsible for environmental monitoring and regulation
Victorian Ports Corporation (Melbourne) (VPCM)
A government-owned entity which is responsible for safe navigation of all vessels in Port waters, waterside emergency management and marine pollution response and the operation and development of Station Pier.
Wharfage fees Charged on the cargo being loaded and unloaded from commercial vessels and based on the quantity, volume or weight of cargo moved across the wharf.
Port of Melbourne 2050 Port Development Strategy 80

portofmelbourne.com
Who we are Port of Melbourne Operations Pty Ltd (PoM) was awarded a 50-year lease of the Port of Melbourne by the Victorian Government in September 2016. PoM is responsible for the strategic planning, development and management of the Port and is owned by the Port of Melbourne Group (PoM Group), which is made up of large, well-established Australian and global infrastructure investors and managers. Together, we bring decades of local and global experience and expertise to the Port.
Our development visionBy working together, we can plan for and develop Port capacity and supply chain efficiencies that enhance the competitive position of Victoria and liveability of greater Melbourne.
Port of Melbourne Operations Pty LtdLevel 19, 839 Collins Street, Docklands, Victoria 3008
+ 61 1300 857 662